UNITED STATES
SECURITIES AND EXCHANGE COMMISSION
Washington, D.C. 20549
FORM N-CSR
CERTIFIED SHAREHOLDER REPORT OF REGISTERED MANAGEMENT
INVESTMENT COMPANIES
Investment Company Act file number 811-03651
Touchstone Strategic Trust
(Exact name of registrant as specified in charter)
303 Broadway, Suite 1100
Cincinnati, Ohio 45202-4203
Address of principal executive offices) (Zip code)
Jill T. McGruder
303 Broadway, Suite 1100
Cincinnati, Ohio 45202-4203
(Name and address of agent for service)
Registrant’s telephone number, including area code: 800-638-8194
Date of fiscal year end: November 30
Date of reporting period: November 30, 2017
Form N-CSR is to be used by management investment companies to file reports with the Commission not later than 10 days after the transmission to stockholders of any report that is required to be transmitted to stockholders under Rule 30e-1 under the Investment Company Act of 1940 (17 CFR 270.30e-1). The Commission may use the information provided on Form N-CSR in its regulatory, disclosure review, inspection, and policymaking roles.
A registrant is required to disclose the information specified by Form N-CSR, and the Commission will make this information public. A registrant is not required to respond to the collection of information contained in Form N-CSR unless the Form displays a currently valid Office of Management and Budget (“OMB”) control number. Please direct comments concerning the accuracy of the information collection burden estimate and any suggestions for reducing the burden to Secretary, Securities and Exchange Commission, 450 Fifth Street, NW, Washington, DC 20549-0609. The OMB has reviewed this collection of information under the clearance requirements of 44 U.S.C. § 3507.
Item 1. Reports to Stockholders.
The Report to Shareholders is attached herewith.
November 30, 2017
Annual Report
Touchstone Strategic Trust
Touchstone Balanced Fund
Touchstone International Equity Fund
Touchstone Large Cap Focused Fund
Touchstone Small Company Fund

Table of Contents
This report identifies the Funds' investments on November 30, 2017. These holdings are subject to change. Not all investments in each Fund performed the same, nor is there any guarantee that these investments will perform as well in the future. Market forecasts provided in this report may not occur.
Letter from the President
Dear Shareholder:
We are pleased to provide you with the Touchstone Strategic Trust Annual Report. Inside you will find key financial information, as well as manager commentaries for the Funds, for the 12 months ended November 30, 2017.
In a year of considerable geopolitical uncertainty, steady but unspectacular economic growth provided the support needed for global capital markets to continue moving higher. The effects of 2016’s biggest political events (e.g., Brexit, President Trump’s election) extended into 2017 as the focus shifted from politics to policy. In the U.S., the much anticipated stimulus from infrastructure spending and tax reform failed to arrive in substantive form during the fiscal year. Meanwhile across the Atlantic, the United Kingdom and the European Union continue to debate the exact form of their future, post-Brexit relationship. In both cases, policy disappointments and political risks were overshadowed by solid economic growth and an improvement in corporate fundamentals. These same factors were the impetus for continued monetary policy normalization by the U.S. Federal Reserve Board (Fed), which raised short-term interest rates three times during the fiscal year and announced plans for reducing its $4.5 trillion balance sheet.
Global equity markets posted strong results during the period with most major U.S. and non-U.S. indexes generating double-digit returns. Investors’ increased appetite for risk was apparent, as emerging market equities led global equities. After trailing value-oriented stocks during much of 2016, growth stocks returned to favor and significantly outperformed across the market capitalization spectrum.
While the Fed pushed toward a normalization of U.S. monetary policy, other developed market central banks continued to provide accommodative monetary conditions in an attempt to solidify positive economic trends. After a sharp move upward following the presidential election, U.S. interest rates fluctuated in 2017, but ended the fiscal period at levels that were little changed from a year ago. Meanwhile, credit-exposed securities enjoyed the same tailwinds of a stable economy and improving corporate earnings that boosted equity prices. Corporate bonds across the credit quality spectrum generated positive returns with non-investment grade securities leading the way.
As we close out 2017 and enter 2018, the turning of the year provides a natural point to assess the recent past and to look toward the future. From a financial perspective, it has been yet another period of strong returns across many asset classes. This makes it a particularly timely juncture to take stock of your current financial situation, and with the help of your financial advisor, reassess your plans for the year – and years – ahead.
We greatly appreciate your continued support. Thank you for including Touchstone as part of your investment plan.
Sincerely,

Jill T. McGruder
President
Touchstone Strategic Trust
Management's Discussion of Fund Performance (Unaudited)
Touchstone Balanced Fund
Sub-Advised by Fort Washington Investment Advisors, Inc.
Effective October 28, 2017, the Sentinel Balanced Fund was reorganized into the Touchstone Balanced Fund. At that time,Touchstone Advisors, Inc. and Fort Washington Investment Advisors, Inc. were respectively appointed as advisor and sub-advisor to the Fund.
Investment Philosophy
The Fund seeks to achieve its investment goal of providing investors with capital appreciation and current income by generally investing in a diversified portfolio comprising 60% equity securities and 40% fixed-income securities.
With respect to equities, the Fund invests primarily in issuers having a market capitalization, at the time of purchase, above $5 billion. Equity securities include common stock and preferred stock. With respect to fixed-income, the Fund will invest primarily in bonds, including mortgage-related securities, asset-backed securities, government securities (both U.S. government securities and foreign sovereign debt), and corporate debt securities.
Fund Performance
The Touchstone Balanced Fund (Class A Shares) underperformed the S&P 500® Index and outperformed the Bloomberg Barclays U.S. Aggregate Bond Index for the 12-month period ended November 30, 2017. The Fund’s total return was 15.95 percent (calculated excluding the maximum sales charge) while the total return of the S&P 500® Index was 22.87 percent and the total return of the Bloomberg Barclays U.S. Aggregate Bond Index was 3.21 percent.
Market Environment
For the trailing 12-month period ended November 30, 2017, U.S. equities continued the bull market that began in 2009 as the market ended the period near all-time highs. Solid financial conditions and strong profit growth were the key drivers of the market. Consumer and business confidence remained high despite stalled healthcare legislation in the first half of the year. Markets benefited from an added boost in the later stages of 2017 on reports that the White House and Congressional Republican leaders were coalescing around a plan to cut the corporate tax rate. Leading the S&P 500® Index higher was Information Technology returning 41% over the period. Health Care, Utilities and Financials also outperformed the broader index over the period. Underperforming sectors included Energy and Telecommunication Services. Consumer Staples, Consumer Discretionary, Industrials, Materials and Real Estate also lagged.
Within fixed income, U.S. investment grade corporates outperformed U.S. Treasuries and securitized assets. The yield curve flattened over the twelve months with short-term rates rising as intermediate and long-term rates fell. This was driven by the combination of the U.S. Federal Reserve Board continuing to gradually raise short-term rates and lower-than-expected inflation subduing the long-end of the yield curve.
Portfolio Review
Both the equity and fixed-income portions of the portfolio contributed to Fund performance. Among equity sectors, the Fund benefited from positions in Real Estate, Industrials, Consumer Staples, Energy, Materials, Telecommunication Services and Financials. Consumer Discretionary and Health Care performed in line with the S&P 500® Index and InformationTechnology underperformed. Sector allocation was neutral to performance primarily due to offsetting underweights in the Information Technology sector, which outperformed the S&P 500® Index, and the Real Estate and Telecommunication Services sectors, which underperformed.
Management's Discussion of Fund Performance (Unaudited) (Continued)
The low interest rate environment and steady economic growth created demand for yield which provided a tailwind to spread sectors. The Fund’s allocations to U.S. Agency bonds and U.S. Corporate Credit relative to the Bloomberg Barclays U.S. Aggregate Bond Index were positive contributors to performance. Given the positive move in the market overall, the Fund’s holdings in cash detracted from performance over the period.
Outlook
In our view, the equity market is priced at fair value. Three things typically stop a bull market: a credit cycle, higher inflation or an asset bubble. On the credit side, households, corporations, the public sector and emerging markets are all doing reasonably well at this point. With regard to higher inflation, the balance of power between capital and labor is key. We believe labor costs, which comprise approximately 70 percent of corporate expenses and dominate income statements, are causing the bulk of profit erosion in the late stages of the business cycle. Wage growth is running at around 2.5 percent today.
To address asset bubbles, many point to the stocks of Facebook Inc. (InformationTechnology sector), Amazon.com Inc. (Consumer Discretionary sector), Netflix Inc (Consumer Discretionary sector) and Alphabet Inc. (Information Technology sector), the “FAANGs,” as an issue. We believe the FAANGs are undervalued to fairly valued. The makeup of these companies is a far cry from the negative earnings, price-per-click valuation based stocks of the late 1990s. The sectors where below-average discount rates must be used to justify current valuation levels are Consumer Staples, Utilities and part of the Real Estate sector, which are areas where investors typically put their money as a bond substitute. Lastly, the breadth of the market is doing well at this juncture which is a sign of a healthy market. In summary, we believe there will still be attractive returns going forward, we are not concerned about a credit crisis or higher inflation creating a top, and market breadth doesn’t seem to be an issue at this juncture.
Within fixed income, credit spreads and interest rates are at historically low levels, likely limiting total return potential to income, with little room for price appreciation. Risky assets, such as high yield corporate credit, appear rich while safe haven assets, such as U.S. Treasuries, provide little return potential with much greater downside risk.
Management's Discussion of Fund Performance (Unaudited) (Continued)
Comparison of the Change in Value of a $10,000 Investment in the Touchstone Balanced Fund - Class A*, the S&P 500® Index and the Bloomberg Barclays U.S. Aggregate Bond index
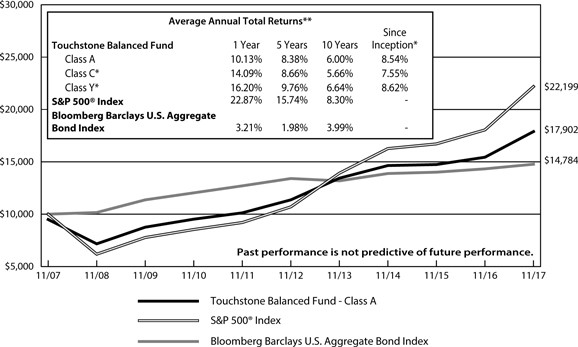
| * | The chart above represents performance of Class A shares only, which will vary from the performance of Class C shares and Class Y shares based on the differences in sales loads and fees paid by shareholders in the different classes. The inception date of Class A shares, Class C shares and Class Y shares was November 15, 1938, May 4, 1998 and August 27, 2007, respectively. Class C shares and Class Y shares performance information was calculated using the historical performance of Class A shares for periods prior to May 4, 1998 and August 27, 2007, respectively. The returns have been restated for sales loads and fees applicable to Class C and Class Y shares. The launch date of the S&P 500® Index and the Bloomberg Barclays U.S. Aggregate Bond Index was after the inception date of the Fund, therefore there is no return for inception. |
| ** | The average annual total returns shown above are adjusted for maximum sales loads and fees, if applicable. Prior to October 28, 2017, the maximum offering price per share of Class A shares was equal to the net asset value (“NAV”) per share plus a sales load equal to 5.26% of the NAV (or 5.00% of the offering price). Effective October 28, 2017, the maximum offering price per share of Class A shares is equal to the NAV per share plus a sales load equal to 6.10% of the NAV (or 5.75% of the offering price). Class C shares are subject to a contingent deferred sales charge (“CDSC”) of 1.00%. The CDSC will be assessed on an amount equal to the lesser of (1) the NAV at the time of purchase of the shares being redeemed or (2) the NAV of such shares being redeemed, if redeemed within a one-year period from the date of purchase. Class Y shares are not subject to sales charges. |
The performance of the above Fund does not reflect the deduction of taxes that a shareholder would pay on Fund distributions or the redemption of Fund shares.
Notes to Chart
S&P 500® Index is a group of 500 widely held stocks and is commonly regarded to be representative of the large capitalization stock universe.
Bloomberg Barclays U.S. Aggregate Bond Index is an unmanaged index comprised of U.S. investment grade, fixed rate bond market securities, including government, government agency, corporate and mortgage-backed securities between one and ten years.
Management's Discussion of Fund Performance (Unaudited)
Touchstone International Equity Fund
Sub-Advised by Fort Washington Investment Advisors, Inc.
Effective October 28, 2017, the Sentinel International Equity Fund was reorganized into theTouchstone International Equity Fund. At that time, Touchstone Advisors, Inc. and Fort Washington Investment Advisors, Inc. were respectively appointed as advisor and sub-advisor to the Fund.
Investment Philosophy
The Touchstone International Equity Fund invests primarily in common stocks of established companies across the capitalization spectrum located in or that conduct their business mainly in one or more foreign countries, which may include emerging markets. The process starts with a regular quantitative screening or bottom up identification of companies that meet the investment profile of high returns on capital, operating margins, and strong cash flow generation. Together, these two means of identifying companies narrows the investible universe.The Fund analyzes companies based on the following five fundamental factors: business quality, valuation, growth, management and balance sheet strength, focusing on quality at a reasonable price. Its index-agnostic portfolio construction approach seeks to result in a concentrated, high-conviction portfolio.
Fund Performance
The Touchstone International Equity Fund (Class A Shares) outperformed the MSCI EAFE Index for the 12-month period ended November 30, 2017. The Fund’s total return was 27.39 percent (calculated excluding the maximum sales charge) while the return of its benchmark was 27.27 percent.
Market Environment
Following three years of drifting stock prices, international markets finally regained their footing in the past year, surpassing pre-financial-crisis highs for the first time. Helped in part by generally rising currencies, a number of which had been trading near multi-decade lows against the U.S. dollar in real terms as the period began, the MSCI EAFE Index rose strongly in U.S. dollar terms for the 12 months ended November 30, 2017. Emerging markets stocks performed even better, rising nearly 33 percent, led by China and South Korea. Stock prices were aided by continued monetary easing in Europe and Japan, as well as investor-friendly election results in Germany and France.
Portfolio Review
TheTouchstone International Equity Fund’s relative performance benefited from outperformance in Information Technology, Health Care and Consumer Discretionary sectors. On the other hand, Financials and Energy sectors detracted from relative performance. Both sector allocation and security selection contributed to relative performance. Looking at the Fund broken down by geography, Asia Pacific was the notable driver of outperformance as the Fund benefited from its holdings in Japan, South Korea, Hong Kong and India. Europe was mixed with solid contributions in Switzerland and Italy, offset by detractors in the U.K., Netherlands, France and Germany. With the positive momentum in the broader market over the past 12 months, the Fund’s cash position detracted from relative performance.
During the 12-month period ,PC Jeweller Ltd. (Consumer Discretionary sector), Tencent Holdings Ltd. (Information Technology sector) and Savills PLC (Real Estate sector) were among the top contributors to performance. PC Jeweller, one of India’s leading branded jewelry makers and retailers, continued its growth path by expanding its national retail foot print. The company benefited as organized retailers continued to take market share from the highly fragmented, unorganized mom & pop segment. Tencent Holdings, operator of China’s dominant social networking sites, continued to deliver impressive growth. The market continued to support its share price on prospects for further monetization of its massive user base and the network effect from the secular
Management's Discussion of Fund Performance (Unaudited) (Continued)
growth of China’s on-demand economy. Savills PLC is a U.K.-based global property consultancy that provides transactional and non-transactional advisory services to commercial and residential property sectors throughout the world. The company’s strong balance sheet, quality franchise and diverse business model continued to deliver despite some macro volatility.
Stocks that detracted from performance were Aurelius Equity Opportunities SE & Co. KGaA (Financials sector), SES SA and WPP PLC (both Consumer Discretionary sector). Aurelius is a German-based private equity firm that focuses on the acquisition and turnaround of special-situation companies in Europe. We believe the company has an impressive track record of creating shareholder value. However, its share price came under pressure during the first quarter after a short seller questioned the validity of Aurelius’ business model. SES is a leading provider of fixed satellite services globally, including video broadcasting, broadband services, maritime communications and government reconnaissance.The share price came under pressure in the third and fourth quarters as improvements in data compression technology led to weaker than expected revenue growth. WPP PLC, the UK-based advertising holding company, saw its shares fall after a series of sales warnings. The company’s key clients, the global consumer goods companies, slowed their marketing spend driven by relentless cost cutting, which resulted in a de-rating for WPP and the rest of the sector.
During the 12–month period, the Fund sold ten holdings and added seven new positions. Overall sector and country exposures were mostly unchanged, though price increases of several of the Fund’s Emerging Markets holdings led to rising exposures to India and Hong Kong/China. Pressure on pharmaceutical prices and the increasing threat of competition from biosimilar drugs led to the sale of a couple of the Fund’s Health Care positions. Most of the remaining sales were a result of valuations that surpassed our comfort level.
Meanwhile, continued softness in traditional media stocks allowed us to add to the Fund’s exposure in broadcasting and advertising related businesses. A small basket of gold miners was also purchased which, in addition to meeting the Fund’s criteria in terms of valuation, growth profile, management track record and strength of balance sheet, provided the Fund with what we believe is somewhat of a hedge in the event that inflation begins to accelerate following many years of easy monetary policy across the developed world.
Outlook
The primary driver of financial markets since the end of the global financial crisis, in our opinion, has been the easy monetary policy pursued by the world’s central banks, which have collectively added an average of more than $1 trillion per annum to demand for securities since 2009. And while the Bank of Japan (BoJ) and European Central Bank (ECB) continue to grow their balance sheets, the U.S. Federal Reserve Board (Fed) has begun to unwind its own, leading to a fairly rapid slowing of central bank balance sheet growth rates in aggregate. Measures of money supply growth, which lead economic demand by long and variable lags, have begun to slow sharply in the United States and China, the world’s two largest economies. If the Europeans decide that the continuing boom in much of that region, led notably by Germany, entails more inflationary risk than economic benefit, we believe we may see them join the policy trend toward monetary tightening in 2018. The contradictions inherent in the euro, which have been masked by zero interest rates, could soon re-emerge. Although we think it is unlikely that central banks will ever actually shrink their balance sheets substantially,the transition period from the current market friendly environment to some eventual new, non-inflationary equilibrium has the potential to be tricky.
We believe the political picture is mixed if improving, with unease on the Korean peninsula and an upending of the status quo in Saudi Arabia, balanced by faster than expected progress on negotiating the terms of Brexit, a reformist government in France, renewed calm in Catalonia and stability in Germany and Japan. It should also be noted that the civil war in Syria, which has been a source of political instability in Europe due to the influx of refugees, appears to be winding down.
Management's Discussion of Fund Performance (Unaudited) (Continued)
From a stock perspective, although portions of the market, particularly in the Information Technology sector undoubtedly appeared bubbly in recent months, many of the stable growth businesses where we concentrate our attention appear reasonably valued if not cheap. We continue to find no shortage of opportunities to add to existing holdings and research potential new additions to the Fund among the universe of high quality international businesses trading at attractive prices.
Management's Discussion of Fund Performance (Unaudited) (Continued)
Comparison of the Change in Value of a $10,000 Investment in the Touchstone
International Equity Fund - Class A* and the MSCI EAFE Index
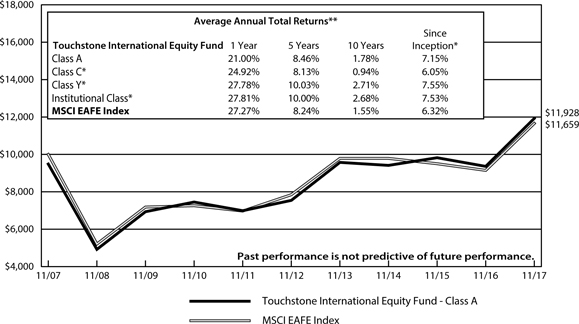
| * | The chart above represents performance of Class A shares only, which will vary from the performance of Class C shares, Class Y shares and Institutional Class shares based on the differences in sales loads and fees paid by shareholders in the different classes. The inception date of Class A shares, Class C shares, Class Y shares and Institutional Class shares was March 1, 1993, May 4, 1998, August 27, 2007 and October 30, 2017, respectively. Class C shares, Class Y and Institutional Class shares performance information was calculated using the historical performance of Class A shares for periods prior to May 4, 1998, August 27, 2007 and October 30, 2017, respectively. The returns have been restated for sales loads and fees applicable to Class C, Class Y and Institutional Class shares. The returns of the index listed above are based on the inception date of the Fund. |
| ** | The average annual total returns shown above are adjusted for maximum sales loads and fees, if applicable. Prior to October 28, 2017, the maximum offering price per share of Class A shares was equal to the net asset value (“NAV”) per share plus a sales load equal to 5.26% of the NAV (or 5.00% of the offering price). Effective October 28, 2017, the maximum offering price per share of Class A shares is equal to the NAV per share plus a sales load equal to 6.10% of the NAV (or 5.75% of the offering price). Class C shares are subject to a contingent deferred sales charge (“CDSC”) of 1.00%. The CDSC will be assessed on an amount equal to the lesser of (1) the NAV at the time of purchase of the shares being redeemed or (2) the NAV of such shares being redeemed, if redeemed within a one-year period from the date of purchase. Class Y shares and Institutional Class shares are not subject to sales charges. |
The performance of the above Fund does not reflect the deduction of taxes that a shareholder would pay on Fund distributions or the redemption of Fund shares.
Notes to Chart
The MSCI EAFE Index is a free float-adjusted market capitalization index that is designed to measure developed market equity performance excluding the U.S. and Canada.
MSCI makes no express or implied warranties or representations and shall have no liability whatsoever with respect to any MSCI data contained herein. The MSCI data may not be further redistributed or used to create indices or financial products. This report is not approved or produced by MSCI.
Management's Discussion of Fund Performance (Unaudited)
Touchstone Large Cap Focused Fund
Sub-Advised by Fort Washington Investment Advisors, Inc.
Effective October 28, 2017, the Sentinel Common Stock Fund was reorganized into the Touchstone Large Cap Focused Fund. At that time, Touchstone Advisors, Inc. and Fort Washington Investment Advisors, Inc. were respectively appointed as advisor and sub-advisor to the Fund.
Investment Philosophy
The Fund seeks to invest at least 80 percent of its assets in large capitalization securities. The Fund’s sub-advisor, Fort Washington Investment Advisors, Inc., seeks to invest in companies that are trading below what is believed to be the estimate of the companies’ intrinsic value and have a sustainable competitive advantage or a high barrier to entry in place. The barrier(s) to entry can be created through a cost advantage, economies of scale, high customer loyalty or a government barrier (e.g. license or subsidy). Fort Washington believes that the strongest barrier to entry is the combination of economies of scale and high customer loyalty.
Fund Performance
The Touchstone Large Cap Focused Fund (Class A Shares) outperformed its benchmark, the S&P 500® Index, for the 12-month period ended November 30, 2017. The Fund’s total return was 23.67 percent (calculated excluding the maximum sales charge) while the return of the benchmark was 22.87 percent.
Market Environment
For the trailing twelve-month period ended November 30, 2017, U.S. equities continued the bull market that began in 2009 as the market ended the period near all-time highs. Solid financial conditions and strong profit growth were the key drivers of the market. Consumer and business confidence remained high despite stalled healthcare legislation in the first half of the year. Markets benefited from an added boost in the later stages of 2017 on reports that the White House and Congressional Republican leaders were coalescing around a plan to cut the corporate tax rate. Leading the benchmark higher was the Information Technology sector returning 41 percent over the period. The Health Care, Utilities and Financials sectors also outperformed the broader benchmark over the period. Underperforming the benchmark by the largest margin were the Energy and Telecommunication Services sectors. The Consumer Staples, Consumer Discretionary, Industrials, Materials, and Real Estate sectors also lagged the benchmark.
Portfolio Review
Within the Fund’s holdings, sectors in which the Fund outperformed its benchmark included Real Estate, Industrials, Consumer Staples, Energy, Materials, Telecommunication Services, Health Care and Financials, while the Consumer Discretionary and Information Technology sectors underperformed. The Fund did not hold any Utilities sector stocks during the 12-month period ended November 30, 2017. Stock selection represented the largest contributor to the Fund’s outperformance while sector allocation provided a small detraction to relative performance. Top contributing stocks included Boeing Co. (Industrials sector),The Estee Lauder Companies, Inc. (Consumer Staples sector), Marriott International, Inc. (Consumer Discretionary sector), Marathon Petroleum Corp. (Energy sector), and Honeywell International, Inc. (Industrials sector). Stock holdings that detracted the most from relative performance included Amazon.com, Inc., Omnicom Group, Inc., TJX Companies, Inc. (all Consumer Discretionary sector), Merck & Co., Inc. (Health Care sector), and Signature Bank (Financials sector). Given the positive move in the market overall, holdings in cash detracted from performance over the period.
Management's Discussion of Fund Performance (Unaudited) (Continued)
Outlook
In our view, the equity market is priced at fair value. Three things typically stop a bull market: a credit cycle, higher inflation or an asset bubble. On the credit side, households, corporations, the public sector and emerging markets are all doing reasonably well at this point. With regard to higher inflation, the balance of power between capital and labor is key. We believe labor costs, which comprise approximately 70 percent of corporate expenses and dominate income statements, are causing the bulk of profit erosion in the late stages of the business cycle. Wage growth is running at around 2.5 percent today.
To address asset bubbles, many point to the stocks of Facebook Inc. (InformationTechnology sector), Amazon.com Inc. (Consumer Discretionary sector), Netflix Inc. (Consumer Discretionary sector) and Alphabet Inc. (Information Technology sector), the “FAANGs,” as an issue. We believe the FAANGs are undervalued to fairly valued. The makeup of these companies is a far cry from the negative earnings, price-per-click valuation based stocks of the late 1990s. The sectors where below-average discount rates must be used to justify current valuation levels are Consumer Staples, Utilities and part of the Real Estate sector, which are areas where investors typically put their money as a bond substitute. Lastly, the breadth of the market is doing well at this juncture which is a sign of a healthy market. In summary, we believe there will still be attractive returns going forward, we are not concerned about a credit crisis or higher inflation creating a top, and market breadth doesn’t seem to be an issue at this juncture.
Management's Discussion of Fund Performance (Unaudited) (Continued)
Comparison of the Change in Value of a $10,000 Investment in the Touchstone Large Cap
Focused Fund - Class A* and the S&P 500® Index
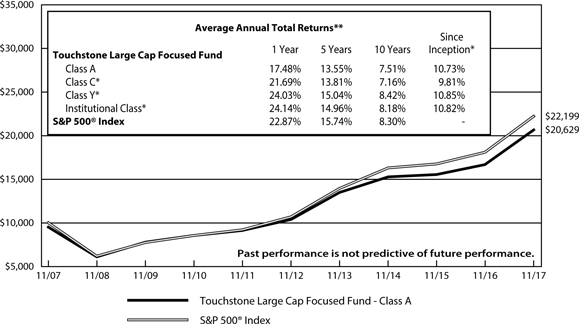
| * | The chart above represents performance of Class A shares only, which will vary from the performance of Class C shares, Class Y shares and Institutional Class shares based on the differences in sales loads and fees paid by shareholders in the different classes. The inception date of Class A shares, Class C shares, Class Y shares and Institutional Class shares was January 12, 1934, May 4, 1998, May 4, 2007 and December 23, 2014, respectively. Class C shares, Class Y shares and Institutional Class shares performance was calculated using the historical performance of Class A shares for the periods prior to May 4, 1998, May 4, 2007 and December 23, 2014, respectively. The returns have been restated for sales loads and fees applicable to Class C, Class Y and Institutional Class shares. The launch date of the S&P 500® Index was after the inception date of the Fund, therefore there is no return for inception. |
| ** | The average annual total returns shown above are adjusted for maximum sales loads and fees, if applicable. Prior to October 28, 2017, the maximum offering price per share of Class A shares was equal to the net asset value (“NAV”) per share plus a sales load equal to 5.26% of the NAV (or 5.00% of the offering price). Effective October 28, 2017, the maximum offering price per share of Class A shares is equal to the NAV per share plus a sales load equal to 6.10% of the NAV (or 5.75% of the offering price). Class C shares are subject to a contingent deferred sales charge (“CDSC”) of 1.00%. The CDSC will be assessed on an amount equal to the lesser of (1) the NAV at the time of purchase of the shares being redeemed or (2) the NAV of such shares being redeemed, if redeemed within a one-year period from the date of purchase. Class Y shares and Institutional Class shares are not subject to sales charges. |
The performance of the above Fund does not reflect the deduction of taxes that a shareholder would pay on Fund distributions or the redemption of Fund shares.
Note to Chart
S&P 500® Index is a group of 500 widely held stocks and is commonly regarded to be representative of the large capitalization stock universe.
Management's Discussion of Fund Performance (Unaudited)
Touchstone Small Company Fund
Sub-Advised by Fort Washington Investment Advisors, Inc.
Effective October 28, 2017, the Sentinel Small Company Fund was reorganized into the Touchstone Small Company Fund. At that time, Touchstone Advisors, Inc. and Fort Washington Investment Advisors, Inc. were respectively appointed as advisor and sub-advisor to the Fund.
Investment Philosophy
The Fund seeks to provide investors with growth of capital by investing primarily in common stocks of small companies that the sub-advisor believes are high quality, have superior business models, solid management teams, sustainable growth potential and are attractively valued.
Fund Performance
The Touchstone Small Company Fund (Class A Shares) underperformed its benchmark, the Russell 2000® Index, for the 12-month period ended November 30, 2017. The Fund’s total return was 17.95 percent (calculated excluding the maximum sales charge) while the return of the benchmark was 18.34 percent.
Market Environment
U.S. small equities returned a strong 18.3 percent for the 12-month period ended November 30, 2017. The small cap market traded in a narrow range for the majority of the year until mid-August, then rallied 15 percent into the end of November to close at all-time highs. While attributing the exact cause of market movements is difficult, we believe that the primary catalyst was the increased potential for corporate tax reform out of Washington.
The overall market and macroeconomic backdrop were favorable for risk assets, including small cap equities. However, U.S. small cap companies are only growing earnings in the low single digits. With this relatively low earnings growth rate, market returns have principally been driven by expansion of the market’s valuation multiples, which rose from about 18 times forward earnings to over 21 times forward earnings. Volatility remained low in 2017.
U.S. small cap performance was balanced across sectors. The Health Care, Information Technology, Telecommunication Services, and Industrials sectors led the market, though Financials, Consumer Discretionary, Materials and Real Estate also produced solid performance during the 12-month period. Energy was the only sector that experienced negative returns in the fiscal year.
Portfolio Review
The Consumer Discretionary sector was the top contributor to the Fund’s relative returns versus the benchmark during the fiscal year. With a relatively small exposure within the Fund, positioning in the Media industry was an area of particular strength. Solid performance in the Consumer Durables & Apparel and Consumer Services spaces more than offset the relative underperformance of the Fund’s Retail holdings.
The Information Technology sector also contributed positive relative performance and was another strong performing sector versus the benchmark. Semiconductors led the way and Software & Services increased while Technology hardware and equipment industry declined.
Energy was the benchmark’s only sector with negative returns during the year. The Fund’s stock selection within the Energy sector detracted from relative performance, though this was partially offset by a modest underweight to the sector. Ironically, the largest detractor to Fund performance in this fiscal year was not specific stocks in the Fund, but rather a lack of exposure to the broad market. In a year of double digit returns for the Russell 2000® Index, the Fund’s cash position was the largest detractor to relative performance. The Fund’s cash
Management's Discussion of Fund Performance (Unaudited) (Continued)
balance over the course of the year increased, driven up by infusions of cash from liquidating several positions that had either been acquired in mergers and acquisitions (M&A) deals or that no longer met the Fund’s market capitalization criteria. We were cautious in redeploying capital into a market that in our opinion appeared to be stretched from a valuation perspective.
Penn National Gaming Inc. (Consumer Discretionary sector), an owner and operator of regional gaming and racing facilities, more than doubled during the year. Gaming industry trends improved in 2017, and Penn capitalized on the industry tailwind as the continued ramp up of newer properties and business segments performed ahead of expectations. Additionally, speculation (which was eventually confirmed by Penn) for potential industry consolidation favorably impacted the stock price.
Tower Semiconductor Ltd. (Information Technology sector), a global leader in specialty semiconductor foundry services, also exhibited strong returns, nearly doubling in value during the year. The semiconductor industry experienced a strong up cycle in 2017, with demand acceleration and industry consolidation benefiting all players. Tower Semiconductor outperformed the industry with its focus on specialized niche markets that drove organic growth over 20 percent, with higher earnings and cash flow growth.
The Fund’s bottom two performing stocks were in the challenged Retail industry. Tile Shop Holdings Inc. (Consumer Discretionary sector), an operator of specialty flooring stores, executed poorly on new product introductions at the same time it was experiencing a deceleration in sales trends and margin compression. The stock lost more than half of its value during the period. Meanwhile, specialty nutrition store operator Vitamin Shoppe Inc. (Consumer Discretionary sector) declined significantly after missing earnings expectations multiple times during the year. We exited both stocks.
There were no significant changes to the Fund’s positioning during the 12-month period. Sector weights remained consistent, with Information Technology being the largest weight averaging 26 percent over the year compared to 17 percent in the benchmark. Health Care was the Fund’s second largest sector weight at 17 percent, compared to 13 percent for the benchmark. The Financials sector remained the Fund’s largest underweight at 9 percent, approximately half the size of the benchmark’s weight.
Outlook
U.S. small cap equities have experienced significant appreciation off their February 2016 market bottom, rising over 60 percent and achieving all-time highs. We believe much of the recent appreciation has been driven by the expectation of corporate tax reform. Meaningful corporate tax reform would be a positive development for U.S. small caps given their larger degree of exposure to domestic activity and earnings. M&A activity has historically been a driver of small cap and Fund returns. We believe the current environment is conducive to M&A activity and companies would gain additional impetus for deal-making should corporate taxes be reduced.
In this environment, we will continue to remain focused on executing our fundamental stock selection and portfolio construction process. We believe that an attractive risk/reward profile can be generated by investing in quality small cap companies that are poised to benefit from improvements in their business model, leadership teams, and/or industry positioning. We believe disciplined valuation analysis is needed to identify favorable entry and exit points. Our process has historically added value for shareholders and we continue to believe in its ability to drive returns going forward.
Management's Discussion of Fund Performance (Unaudited) (Continued)
Comparison of the Change in Value of a $10,000 Investment in the Touchstone Small
Company Fund - Class A* and the Russell 2000® Index

| * | The chart above represents performance of Class A shares only, which will vary from the performance of Class C shares, Class Y shares, Institutional Class shares and Class R6 shares based on the differences in sales loads and fees paid by shareholders in the different classes. The inception date of Class A shares, Class C shares, Class Y shares, Institutional Class shares and Class R6 shares was March 1, 1993, July 9, 2001, May 4, 2007, October 30, 2017 and December 23, 2014, respectively. Class C shares, Class Y shares, Institutional Class shares and Class R6 shares performance was calculated using the historical performance of Class A shares for the periods prior to July 9, 2001, May 4, 2007, October 30, 2017 and December 23, 2014, respectively. The returns have been restated for sales loads and fees applicable to Class C, Class Y, Institutional Class and Class R6 shares. The returns of the index listed above are based on the inception date of the Fund. |
| ** | The average annual total returns shown above are adjusted for maximum sales loads and fees, if applicable. Prior to October 28, 2017, the maximum offering price per share of Class A shares was equal to the net asset value (“NAV”) per share plus a sales load equal to 5.26% of the NAV (or 5.00% of the offering price). Effective October 28, 2017, the maximum offering price per share of Class A shares is equal to the NAV per share plus a sales load equal to 6.10% of the NAV (or 5.75% of the offering price). Class C shares are subject to a contingent deferred sales charge (“CDSC”) of 1.00%. The CDSC will be assessed on an amount equal to the lesser of (1) the NAV at the time of purchase of the shares being redeemed or (2) the NAV of such shares being redeemed, if redeemed within a one-year period from the date of purchase. Class Y shares, Institutional Class shares and Class R6 shares are not subject to sales charges. |
The performance of the above Fund does not reflect the deduction of taxes that a shareholder would pay on Fund distributions or the redemption of Fund shares.
Notes to Chart
Russell 2000®Index measures the performance of the small-cap segment of the U.S. equity universe.
The Frank Russell Company (FRC) is the source and owner of the data contained or reflected in this material and all trademarks and copyrights related thereto. The material may contain confidential information and unauthorized use, disclosure, copying, dissemination or redistribution is strictly prohibited. This is a Touchstone Investments presentation of the data, and FRC is not responsible for the formatting or configuration of this material or for any inaccuracy in the presentation thereof.
Tabular Presentation of Portfolios of Investments (Unaudited)
November 30, 2017
The tables below provides each Fund’s geographic allocation, credit quality or sector allocation. We hope it will be useful to shareholders as it summarizes key information about each Fund’s investments.
| Touchstone Balanced Fund | | | |
| Credit Quality* | | (% of Fixed Income Securities) | |
| AAA/Aaa | | | 87.7 | % |
| AA/Aa | | | 2.6 | |
| A/A | | | 3.0 | |
| BBB/Baa | | | 6.5 | |
| BB/Ba | | | 0.2 | |
| | | | 100.0 | % |
| Sector Allocation** | | (% of Net Assets) | |
| Fixed Income Securities | | | 23.9 | % |
| Common Stocks | | | | |
| Information Technology | | | 15.9 | |
| Health Care | | | 10.9 | |
| Financials | | | 10.0 | |
| Consumer Discretionary | | | 7.7 | |
| Consumer Staples | | | 7.0 | |
| Industrials | | | 6.8 | |
| Energy | | | 3.9 | |
| Materials | | | 1.4 | |
| Telecommunication Services | | | 1.1 | |
| Real Estate | | | 0.9 | |
| Exchange-Traded Funds | | | 9.3 | |
| Short-Term Investment Fund | | | 1.2 | |
| Other Assets/Liabilities (Net) | | | 0.0 | |
| Total | | | 100.0 | % |
| Touchstone International Equity Fund | | | |
| Geographic Allocation | | (% of Net Assets) | |
| Common Stocks | | | | |
| United Kingdom | | | 30.0 | % |
| Japan | | | 8.6 | |
| France | | | 7.9 | |
| India | | | 7.1 | |
| Canada | | | 6.7 | |
| United States | | | 5.5 | |
| Germany | | | 5.3 | |
| Switzerland | | | 4.8 | |
| Cayman Island | | | 4.4 | |
| Spain | | | 2.6 | |
| Greece | | | 2.5 | |
| Luxembourg | | | 2.5 | |
| Netherlands | | | 2.0 | |
| Denmark | | | 1.9 | |
| Italy | | | 1.7 | |
| Jersey | | | 1.6 | |
| Australia | | | 1.1 | |
| Cyprus | | | 0.8 | |
| Short-Term Investment Funds | | | 5.1 | |
| Other Assets/Liabilities (Net) | | | (2.1 | ) |
| Total | | | 100.0 | % |
| * | Credit quality ratings are from Standard & Poor's (“S&P”) and Moody's Investors Service (“Moody's”). If agency ratings differ, the higher rating will be used. Where no rating has been assigned, it may be for reasons unrelated to the creditworthiness of the issuer. |
| ** | Sector classifications are based upon the Global Industry Classification Standard (GICS®). |
Tabular Presentation of Portfolios of Investments (Unaudited) (Continued)
| Touchstone Large Cap Focused Fund | | | |
| Sector Allocation* | | (% of Net Assets) | |
| Information Technology | | | 22.9 | % |
| Financials | | | 15.1 | |
| Health Care | | | 12.3 | |
| Consumer Discretionary | | | 10.9 | |
| Industrials | | | 8.9 | |
| Consumer Staples | | | 8.1 | |
| Energy | | | 5.9 | |
| Telecommunication Services | | | 1.8 | |
| Materials | | | 1.7 | |
| Real Estate | | | 1.4 | |
| Exchange-Traded Funds | | | 8.0 | |
| Short-Term Investment Fund | | | 3.2 | |
| Other Assets/Liabilities (Net) | | | (0.2 | ) |
| Total | | | 100.0 | % |
| Touchstone Small Company Fund | | | |
| Sector Allocation* | | (% of Net Assets) | |
| Information Technology | | | 28.7 | % |
| Health Care | | | 19.8 | |
| Consumer Discretionary | | | 17.0 | |
| Industrials | | | 12.9 | |
| Financials | | | 10.0 | |
| Energy | | | 2.5 | |
| Real Estate | | | 2.4 | |
| Telecommunication Services | | | 1.2 | |
| Materials | | | 0.9 | |
| Short-Term Investment Funds | | | 6.9 | |
| Other Assets/Liabilities (Net) | | | (2.3 | ) |
| Total | | | 100.0 | % |
| * | Sector classifications are based upon the Global Industry Classification Standard (GICS®). |
Portfolio of Investments
Touchstone Balanced Fund – November 30, 2017
| | | | | | Market | |
| | | Shares | | | Value | |
| | | | | | | |
| Common Stocks — 65.6% | | | | | | | | |
| | | | | | | | | |
| Information Technology — 15.9% | | | | | | | | |
| Accenture PLC (Ireland) - Class A | | | 30,000 | | | $ | 4,440,300 | |
| Alphabet, Inc. - Class C* | | | 6,000 | | | | 6,128,460 | |
| Apple, Inc. | | | 48,000 | | | | 8,248,800 | |
| Check Point Software Technologies Ltd. (Israel)* | | | 20,000 | | | | 2,085,800 | |
| Cisco Systems, Inc. | | | 100,000 | | | | 3,730,000 | |
| Cognizant Technology Solutions Corp. - Class A | | | 33,000 | | | | 2,385,240 | |
| Facebook, Inc. - Class A* | | | 6,000 | | | | 1,063,080 | |
| Microsoft Corp. | | | 123,000 | | | | 10,352,910 | |
| Synopsys, Inc.* | | | 30,000 | | | | 2,711,400 | |
| Texas Instruments, Inc. | | | 60,000 | | | | 5,837,400 | |
| Visa, Inc. - Class A | | | 53,000 | | | | 5,967,270 | |
| | | | | | | | 52,950,660 | |
| | | | | | | | | |
| Health Care — 10.9% | | | | | | | | |
| Amgen, Inc. | | | 15,000 | | | | 2,634,900 | |
| Becton Dickinson and Co. | | | 13,000 | | | | 2,966,730 | |
| Biogen, Inc.* | | | 5,000 | | | | 1,610,850 | |
| Bristol-Myers Squibb Co. | | | 45,000 | | | | 2,843,550 | |
| Danaher Corp. | | | 18,000 | | | | 1,698,480 | |
| Eli Lilly & Co. | | | 25,000 | | | | 2,116,000 | |
| Johnson & Johnson | | | 23,000 | | | | 3,204,590 | |
| Medtronic PLC (Ireland) | | | 45,000 | | | | 3,695,850 | |
| Merck & Co., Inc. | | | 70,000 | | | | 3,868,900 | |
| Roche Holding AG ADR | | | 55,000 | | | | 1,736,900 | |
| Stryker Corp. | | | 15,000 | | | | 2,340,000 | |
| UnitedHealth Group, Inc. | | | 20,000 | | | | 4,563,400 | |
| Zoetis, Inc. | | | 40,000 | | | | 2,891,600 | |
| | | | | | | | 36,171,750 | |
| | | | | | | | | |
| Financials — 10.0% | | | | | | | | |
| American Express Co. | | | 25,000 | | | | 2,442,750 | |
| Chubb Ltd.(Switzerland) | | | 20,000 | | | | 3,042,200 | |
| CME Group, Inc. | | | 18,000 | | | | 2,691,720 | |
| Comerica, Inc. | | | 29,000 | | | | 2,415,990 | |
| Discover Financial Services | | | 18,000 | | | | 1,270,800 | |
| JPMorgan Chase & Co. | | | 39,000 | | | | 4,076,280 | |
| Morgan Stanley | | | 100,000 | | | | 5,161,000 | |
| PNC Financial Services Group, Inc. (The) | | | 27,000 | | | | 3,795,120 | |
| S&P Global, Inc. | | | 20,000 | | | | 3,309,600 | |
| Travelers Cos., Inc. (The) | | | 30,000 | | | | 4,067,100 | |
| Webster Financial Corp. | | | 18,000 | | | | 1,032,660 | |
| | | | | | | | 33,305,220 | |
| | | | | | | | | |
| Consumer Discretionary — 7.7% | | | | | | | | |
| Amazon.com, Inc.* | | | 1,000 | | | | 1,176,750 | |
| Comcast Corp. - Class A | | | 120,000 | | | | 4,504,800 | |
| Home Depot, Inc. (The) | | | 15,000 | | | | 2,697,300 | |
| Marriott International, Inc. - Class A | | | 31,100 | | | | 3,949,700 | |
| McDonald's Corp. | | | 33,000 | | | | 5,675,010 | |
| Omnicom Group, Inc. | | | 31,000 | | | | 2,214,640 | |
| Time Warner, Inc. | | | 20,000 | | | | 1,830,200 | |
| TJX Cos (The), Inc. | | | 45,000 | | | | 3,399,750 | |
| | | | | | | | 25,448,150 | |
| | | | | | | |
| Consumer Staples — 7.0% | | | | | | | | |
| CVS Health Corp. | | | 10,000 | | | | 766,000 | |
| Estee Lauder Cos., Inc. (The) - Class A | | | 28,000 | | | | 3,495,240 | |
| Kraft Heinz Co. (The) | | | 30,000 | | | | 2,441,100 | |
| PepsiCo, Inc. | | | 40,000 | | | | 4,660,800 | |
| Philip Morris International, Inc. | | | 40,000 | | | | 4,110,000 | |
| Procter & Gamble Co. (The) | | | 40,000 | | | | 3,599,600 | |
| Unilever NV (Netherlands) | | | 70,000 | | | | 4,041,800 | |
| | | | | | | | 23,114,540 | |
| | | | | | | | | |
| Industrials — 6.8% | | | | | | | | |
| 3M Co. | | | 6,500 | | | | 1,580,410 | |
| Boeing Co. (The) | | | 20,000 | | | | 5,536,000 | |
| Canadian National Railway Co. (Canada) | | | 32,000 | | | | 2,495,360 | |
| General Dynamics Corp. | | | 14,000 | | | | 2,900,240 | |
| Honeywell International, Inc. | | | 35,000 | | | | 5,458,600 | |
| United Technologies Corp. | | | 22,000 | | | | 2,671,900 | |
| Verisk Analytics, Inc.* | | | 20,000 | | | | 1,928,400 | |
| | | | | | | | 22,570,910 | |
| | | | | | | | | |
| Energy — 3.9% | | | | | | | | |
| Chevron Corp. | | | 20,000 | | | | 2,379,800 | |
| EOG Resources, Inc. | | | 25,000 | | | | 2,558,000 | |
| Exxon Mobil Corp. | | | 38,000 | | | | 3,165,020 | |
| Marathon Petroleum Corp. | | | 40,000 | | | | 2,505,200 | |
| Schlumberger Ltd. (Curacao) | | | 37,700 | | | | 2,369,445 | |
| | | | | | | | 12,977,465 | |
| | | | | | | | | |
| Materials — 1.4% | | | | | | | | |
| DowDuPont, Inc. | | | 38,460 | | | | 2,767,582 | |
| Praxair, Inc. | | | 12,000 | | | | 1,847,040 | |
| | | | | | | | 4,614,622 | |
| | | | | | | | | |
| Telecommunication Services — 1.1% | | | | | | | | |
| Verizon Communications, Inc. | | | 75,000 | | | | 3,816,750 | |
| Real Estate — 0.9% | | | | | | | | |
| Equinix, Inc. REIT | | | 6,500 | | | | 3,019,185 | |
| Total Common Stocks | | | | | | $ | 217,989,252 | |
| Principal | | | | | | |
| Amount | | | | | | |
| | | | | | | |
| U.S. Treasury Obligations — 12.4% | | | | |
| $ | 2,885,000 | | | U.S. Treasury Bond, 2.750%, 8/15/47 | | | 2,835,865 | |
| | 24,400,000 | | | U.S. Treasury Note, 2.000%, 10/31/22 | | | 24,243,688 | |
| | 2,555,000 | | | U.S. Treasury Note, 2.250%, 8/15/27 | | | 2,514,779 | |
| | 11,720,000 | | | United States Treasury Inflation | | | | |
| | | | | Indexed Bonds, 0.375%, 7/15/27 | | | 11,628,087 | |
| | | | | Total U.S. Treasury Obligations | | $ | 41,222,419 | |
Touchstone Balanced Fund (Continued)
| | | | | | Market | |
| | | Shares | | | Value | |
| | | | | | | |
| Exchange-Traded Funds — 9.3% | | | | | | | | |
| United States — 9.3% | | | | | | | | |
| iShares Core S&P Mid-Cap ETF | | | 15,000 | | | $ | 2,846,700 | |
| iShares iBoxx $ Investment Grade Corporate Bond ETF | | | 210,929 | | | | 25,452,802 | |
| iShares Russell Midcap Value Index Fund | | | 11,000 | | | | 973,610 | |
| SPDR S&P MidCap 400 ETF Trust | | | 4,300 | | | | 1,487,413 | |
| Total Exchange-Traded Funds | | | | | | $ | 30,760,525 | |
| Principal | | | | | | |
| Amount | | | | | | |
| | | | | | | |
| | | | | U.S. Government Mortgage-Backed | | | | |
| | | | | Obligations — 8.3% | | | | |
| $ | 4,395 | | | FHLMC, Pool #G08062, 5.000%, 6/1/35 | | | 4,785 | |
| | 721,657 | | | FHLMC, Pool #G08637, 4.000%, 4/1/45 | | | 754,038 | |
| | 1,212 | | | FHLMC, Pool #G18091, | | | | |
| | | | | 6.000%, 12/1/20 | | | 1,249 | |
| | 16,730 | | | FHLMC, Pool #P00020, | | | | |
| | | | | 6.500%, 10/1/22 | | | 16,875 | |
| | 2,868,862 | | | FHLMC, Pool #Q02664, 4.500%, 8/1/41 | | | 3,061,562 | |
| | 4,437,842 | | | FHLMC, Pool #Q29056, | | | | |
| | | | | 4.000%, 10/1/44 | | | 4,637,217 | |
| | 1,877,353 | | | FHLMC, Pool #Q29260, | | | | |
| | | | | 4.000%, 10/1/44 | | | 1,961,859 | |
| | 1,468,104 | | | FHLMC REMIC, Ser 3859 Class JB, | | | | |
| | | | | 5.000%, 5/15/41 | | | 1,578,120 | |
| | 839 | | | FNMA, Pool #254907, 5.000%, 10/1/18 | | | 854 | |
| | 2,286 | | | FNMA, Pool #255273, 4.500%, 6/1/19 | | | 2,325 | |
| | 642 | | | FNMA, Pool #255358, 5.000%, 9/1/19 | | | 655 | |
| | 34 | | | FNMA, Pool #687301, 6.000%, 11/1/32 | | | 38 | |
| | 1,279 | | | FNMA, Pool #690305, 5.500%, 3/1/33 | | | 1,406 | |
| | 829,493 | | | FNMA, Pool #725423, 5.500%, 5/1/34 | | | 924,956 | |
| | 765,100 | | | FNMA, Pool #725610, 5.500%, 7/1/34 | | | 853,141 | |
| | 93,811 | | | FNMA, Pool #748895, 6.000%, 12/1/33 | | | 100,898 | |
| | 439,998 | | | FNMA, Pool #AD9193, 5.000%, 9/1/40 | | | 477,300 | |
| | 938,338 | | | FNMA, Pool #AH8925, 4.500%, 3/1/41 | | | 1,005,076 | |
| | 1,092,488 | | | FNMA, Pool #AL2860, 3.000%, 12/1/42 | | | 1,095,809 | |
| | 494,737 | | | FNMA, Pool #AL5718, 3.500%, 9/1/44 | | | 510,369 | |
| | 726,421 | | | FNMA, Pool #AR9195, 3.000%, 3/1/43 | | | 728,630 | |
| | 1,270,731 | | | FNMA, Pool #AS4707, 3.500%, 4/1/45 | | | 1,312,592 | |
| | 1,684,939 | | | FNMA, Pool #AS8703, 2.500%, 2/1/32 | | | 1,683,026 | |
| | 2,117,960 | | | FNMA, Pool #AZ7347, 3.000%, 11/1/45 | | | 2,115,005 | |
| | 2,202,858 | | | FNMA, Pool #BC1809, 3.500%, 5/1/46 | | | 2,260,448 | |
| | 1,473,062 | | | GNMA, Pool #5175, 4.500%, 9/20/41 | | | 1,568,456 | |
| | 750,000 | | | GNMA, Ser 2010-169, Class AW, | | | | |
| | | | | 4.500%, 12/20/40 | | | 797,324 | |
| | 7,689,889 | | | GNMA, Ser 2012-147, Class IO, | | | | |
| | | | | 0.568%, 4/16/54(A)(B)(C) | | | 264,247 | |
| | | | | Total U.S. Government | | | | |
| | | | | Mortgage-Backed Obligations | | $ | 27,718,260 | |
| | | | | Corporate Bonds — 3.2% | | | | |
| | | | | Financials — 0.7% | | | | |
| 110,000 | | | American Express Co., | | | | |
| | | | | 3.000%, 10/30/24 | | | 109,477 | |
| | 298,000 | | | AvalonBay Communities, Inc. MTN, | | | | |
| | | | | 3.200%, 1/15/28 | | | 294,979 | |
| | 225,000 | | | Bank of America Corp. MTN, | | | | |
| | | | | 4.000%, 1/22/25 | | | 232,163 | |
| | 390,000 | | | Boston Properties LP, 3.200%, 1/15/25 | | | 388,509 | |
| | 57,000 | | | Chubb INA Holdings, Inc., | | | | |
| | | | | 4.350%, 11/3/45 | | | 62,948 | |
| | 84,000 | | | Citigroup, Inc., 3.300%, 4/27/25 | | | 84,491 | |
| | 52,000 | | | Citigroup, Inc., 4.750%, 5/18/46 | | | 55,997 | |
| | 65,000 | | | Digital Realty Trust LP, 2.750%, 2/1/23 | | | 64,357 | |
| | 85,000 | | | Fifth Third Bancorp, 2.875%, 7/27/20 | | | 85,997 | |
| | 150,000 | | | Goldman Sachs Group, Inc. (The), | | | | |
| | | | | 3.691%, 6/5/28 | | | 151,368 | |
| | 68,000 | | | JPMorgan Chase & Co., | | | | |
| | | | | 3.250%, 9/23/22 | | | 69,526 | |
| | 73,000 | | | Mid-America Apartments LP, | | | | |
| | | | | 3.750%, 6/15/24 | | | 74,833 | |
| | 102,000 | | | Morgan Stanley, 3.950%, 4/23/27 | | | 103,298 | |
| | 65,000 | | | Prudential Financial, Inc., | | | | |
| | | | | 5.625%, 6/15/43 | | | 70,444 | |
| | 65,000 | | | Sabra Health Care LP. REIT, | | | | |
| | | | | 5.125%, 8/15/26 | | | 66,067 | |
| | 110,000 | | | SL Green Operating Partnership LP, | | | | |
| | | | | 3.250%, 10/15/22 | | | 109,823 | |
| | 91,000 | | | State Street Corp., (3M LIBOR | | | | |
| | | | | +1.000%), 2.320%, 6/15/47(A) | | | 83,038 | |
| | 77,000 | | | Ventas Realty LP, 3.500%, 2/1/25 | | | 77,537 | |
| | 140,000 | | | Wells Fargo & Co., 4.125%, 8/15/23 | | | 147,339 | |
| | 63,000 | | | Wells Fargo & Co. MTN, 4.100%, 6/3/26 | | | 65,508 | |
| | | | | | | | 2,397,699 | |
| | | | | | | | | |
| | | | | Information Technology — 0.6% | | | | |
| | 105,000 | | | Activision Blizzard, Inc., 144a, | | | | |
| | | | | 6.125%, 9/15/23 | | | 110,872 | |
| | 899,000 | | | Apple, Inc., 2.750%, 1/13/25 | | | 890,356 | |
| | 110,000 | | | Apple, Inc., 4.650%, 2/23/46 | | | 125,612 | |
| | 100,000 | | | Dell International LLC / EMC Corp., | | | | |
| | | | | 144a, 6.020%, 6/15/26 | | | 109,931 | |
| | 53,000 | | | Microsoft Corp., 3.500%, 2/12/35 | | | 54,175 | |
| | 86,000 | | | Oracle Corp., 2.650%, 7/15/26 | | | 83,397 | |
| | 601,000 | | | Oracle Corp., 3.250%, 11/15/27 | | | 608,108 | |
| | 85,000 | | | QUALCOMM, Inc., 3.450%, 5/20/25 | | | 84,521 | |
| | 77,000 | | | Visa, Inc., 4.150%, 12/14/35 | | | 84,254 | |
| | | | | | | | 2,151,226 | |
| | | | | | | | | |
| | | | | Health Care — 0.4% | | | | |
| | 105,000 | | | Abbott Laboratories, | | | | |
| | | | | 3.750%, 11/30/26 | | | 106,855 | |
| | 95,000 | | | AbbVie, Inc., 4.450%, 5/14/46 | | | 99,984 | |
| | 65,000 | | | Allergan Funding SCS (Luxembourg), | | | | |
| | | | | 3.800%, 3/15/25 | | | 65,533 | |
| | 79,000 | | | Celgene Corp., 5.000%, 8/15/45 | | | 86,948 | |
| | 82,000 | | | Express Scripts Holding Co., | | | | |
| | | | | 3.300%, 2/25/21 | | | 83,393 | |
Touchstone Balanced Fund (Continued)
| Principal | | | | | Market | |
| Amount | | | | | Value | |
| | | | | | | |
| | | | | Corporate Bonds — 3.2% (Continued) | | | | |
| | | | | Health Care — (Continued) | | | | |
| $ | 82,000 | | | Forest Laboratories LLC, 144a, | | | | |
| | | | | 5.000%, 12/15/21 | | $ | 88,038 | |
| | 400,000 | | | Johnson & Johnson, 2.900%, 1/15/28 | | | 399,691 | |
| | 76,000 | | | Medtronic Global Holdings SCA | | | | |
| | | | | (Luxembourg), 3.350%, 4/1/27 | | | 77,440 | |
| | 72,000 | | | Zimmer Biomet Holdings, Inc., | | | | |
| | | | | 3.150%, 4/1/22 | | | 72,186 | |
| | 26,000 | | | Zimmer Biomet Holdings, Inc., | | | | |
| | | | | 3.375%, 11/30/21 | | | 26,344 | |
| | 139,000 | | | Zoetis, Inc., 3.250%, 2/1/23 | | | 141,312 | |
| | | | | | | | 1,247,724 | |
| | | | | | | | | |
| | | | | Telecommunication Services — 0.3% | | | | |
| | 552,000 | | | AT&T, Inc., 3.800%, 3/15/22 | | | 570,984 | |
| | 90,000 | | | AT&T, Inc., 3.900%, 8/14/27 | | | 89,452 | |
| | 88,000 | | | AT&T, Inc., 4.350%, 6/15/45 | | | 79,571 | |
| | 98,000 | | | Charter Communications Operating | | | | |
| | | | | LLC / Charter Communications | | | | |
| | | | | Operating Capital, | | | | |
| | | | | 6.484%, 10/23/45 | | | 112,697 | |
| | 115,000 | | | Qwest Corp., 6.750%, 12/1/21 | | | 122,781 | |
| | 105,000 | | | Verizon Communications, Inc., | | | | |
| | | | | 5.012%, 4/15/49 | | | 108,858 | |
| | | | | | | | 1,084,343 | |
| | | | | | | | | |
| | | | | Energy — 0.3% | | | | |
| | 55,000 | | | Canadian Natural Resources Ltd. | | | | |
| | | | | (Canada), 3.850%, 6/1/27 | | | 55,482 | |
| | 78,000 | | | Cenovus Energy, Inc. (Canada), 144a, | | | | |
| | | | | 4.250%, 4/15/27 | | | 77,164 | |
| | 66,000 | | | Concho Resources, Inc., | | | | |
| | | | | 3.750%, 10/1/27 | | | 66,331 | |
| | 64,000 | | | EOG Resources, Inc., 3.900%, 4/1/35 | | | 64,665 | |
| | 106,000 | | | Midcontinent Express Pipeline LLC, | | | | |
| | | | | 144a, 6.700%, 9/15/19 | | | 111,035 | |
| | 77,000 | | | Petroleos Mexicanos (Mexico), | | | | |
| | | | | 4.500%, 1/23/26 | | | 76,985 | |
| | 89,000 | | | Rockies Express Pipeline LLC, 144a, | | | | |
| | | | | 6.875%, 4/15/40 | | | 100,236 | |
| | 89,000 | | | Sabine Pass Liquefaction LLC, | | | | |
| | | | | 5.000%, 3/15/27 | | | 94,775 | |
| | 100,000 | | | Shell International Finance BV | | | | |
| | | | | (Netherlands), 1.875%, 5/10/21 | | | 98,550 | |
| | 224,000 | | | Western Gas Partners LP, | | | | |
| | | | | 3.950%, 6/1/25 | | | 224,039 | |
| | 90,000 | | | Williams Cos., Inc. (The), | | | | |
| | | | | 3.700%, 1/15/23 | | | 90,000 | |
| | | | | | | | 1,059,262 | |
| | | | | | | | | |
| | | | | Consumer Discretionary — 0.3% | | | | |
| | 88,000 | | | Amazon.com, Inc., 144a, | | | | |
| | | | | 2.800%, 8/22/24 | | | 87,613 | |
| | 100,000 | | | Anheuser-Busch InBev Finance, Inc., | | | | |
| | | | | 4.900%, 2/1/46 | | | 112,894 | |
| | 105,000 | | | Aptiv PLC (Jersey), 3.150%, 11/19/20 | | | 106,962 | |
| | 89,000 | | | AutoNation, Inc., 5.500%, 2/1/20 | | | 94,283 | |
| 92,000 | | | Comcast Corp., 2.850%, 1/15/23 | | | 92,869 | |
| | 60,000 | | | Ford Motor Co., 4.750%, 1/15/43 | | | 59,441 | |
| | 150,000 | | | General Motors Financial Co., Inc., | | | | |
| | | | | 3.950%, 4/13/24 | | | 153,706 | |
| | 85,000 | | | Home Depot, Inc. (The), | | | | |
| | | | | 5.950%, 4/1/41 | | | 112,349 | |
| | 72,000 | | | Time Warner, Inc., 3.800%, 2/15/27 | | | 71,791 | |
| | 105,000 | | | Wal-Mart Stores, Inc., | | | | |
| | | | | 2.350%, 12/15/22 | | | 104,384 | |
| | | | | | | | 996,292 | |
| | | | | | | | | |
| | | | | Utilities — 0.2% | | | | |
| | 98,000 | | | Dominion Energy, Inc., | | | | |
| | | | | 2.000%, 8/15/21 | | | 96,042 | |
| | 62,000 | | | Duke Energy Progress, Inc., | | | | |
| | | | | 4.150%, 12/1/44 | | | 66,303 | |
| | 79,000 | | | Fortis, Inc. (Canada), 3.055%, 10/4/26 | | | 76,230 | |
| | 100,000 | | | NextEra Energy Capital Holdings, Inc., | | | | |
| | | | | (3M LIBOR +2.125%), | | | | |
| | | | | 3.445%, 6/15/67(A) | | | 94,250 | |
| | 76,000 | | | Oncor Electric Delivery Co. LLC, 144a, | | | | |
| | | | | 3.800%, 9/30/47 | | | 77,542 | |
| | 125,000 | | | PacifiCorp, 5.750%, 4/1/37 | | | 160,503 | |
| | | | | | | | 570,870 | |
| | | | | | | | | |
| | | | | Consumer Staples — 0.1% | | | | |
| | 70,000 | | | Constellation Brands, Inc., | | | | |
| | | | | 2.650%, 11/7/22 | | | 69,216 | |
| | 60,000 | | | CVS Health Corp., 5.125%, 7/20/45 | | | 65,972 | |
| | 70,000 | | | Kraft Heinz Foods Co., 6.875%, 1/26/39 | | | 89,907 | |
| | 35,000 | | | Kroger Co. (The), 5.000%, 4/15/42 | | | 36,069 | |
| | 66,000 | | | Mead Johnson Nutrition Co., | | | | |
| | | | | 4.125%, 11/15/25 | | | 70,165 | |
| | 29,000 | | | Moody's Corp., 2.750%, 12/15/21 | | | 29,077 | |
| | 91,000 | | | Reynolds American, Inc., | | | | |
| | | | | 4.450%, 6/12/25 | | | 97,010 | |
| | | | | | | | 457,416 | |
| | | | | | | | | |
| | | | | Industrials — 0.1% | | | | |
| | 113,000 | | | Burlington Northern Santa Fe LLC, | | | | |
| | | | | 5.750%, 5/1/40 | | | 144,224 | |
| | 75,000 | | | FedEx Corp., 5.100%, 1/15/44 | | | 84,802 | |
| | 72,000 | | | Roper Technologies, Inc., | | | | |
| | | | | 3.000%, 12/15/20 | | | 73,108 | |
| | | | | | | | 302,134 | |
| | | | | | | | | |
| | | | | Real Estate — 0.1% | | | | |
| | 103,000 | | | Crown Castle International Corp., | | | | |
| | | | | 3.650%, 9/1/27 | | | 102,121 | |
| | 95,000 | | | Vornado Realty LP REIT, | | | | |
| | | | | 5.000%, 1/15/22 | | | 102,313 | |
| | | | | | | | 204,434 | |
| | | | | | | | | |
| | | | | Materials — 0.1% | | | | |
| | 166,000 | | | Westlake Chemical Corp., | | | | |
| | | | | 4.375%, 11/15/47 | | | 167,685 | |
| | | | | Total Corporate Bonds | | $ | 10,639,085 | |
Touchstone Balanced Fund (Continued)
| Principal | | | | | Market | |
| Amount | | | | | Value | |
| | | | | | | |
| | | | | Sovereign Government Obligation — 0.0% | | | | |
| $ | 89,000 | | | Province of Alberta Canada, 2.200%, | | | | |
| | | | | 7/26/22 | | $ | 87,889 | |
| | | Shares | | | | |
| Short-Term Investment Fund — 1.2% | | | | | | | | |
| Dreyfus Government Cash | | | | | | | | |
| Management, Institutional Shares, | | | | | | | | |
| 0.96%∞Ω | | | 3,801,676 | | | $ | 3,801,676 | |
| Total Investment Securities —100.0% | | | | |
| (Cost $205,533,662) | | $ | 332,219,106 | |
| | | | | |
| Other Assets in Excess of Liabilities — 0.0% | | | 74,212 | |
| | | | | |
| Net Assets — 100.0% | | $ | 332,293,318 | |
| (A) | Variable rate security - Rate reflected is the rate in effect as of November 30, 2017. |
| (B) | Interest only security - This type of security represents the right to receive the monthly interest payments on an underlying pool of mortgages. Payments of principal on the pool reduce the value of the “interest only” holding. |
| (C) | Certain variable rate securities are not based on a published reference rate and spread but are determined by the issuer or agent and are based on current market conditions. These securities do not indicate a reference rate and spread in their description. |
| * | Non-income producing security. |
| Ω | Represents the 7-day SEC yield as of November 30, 2017. |
Portfolio Abbreviations:
ADR - American Depositary Receipt
ETF - Exchange-Traded Fund
FHLMC - Federal Home Loan Mortgage Association
FNMA - Federal National Mortgage Association
GNMA - Government National Mortgage Association
LIBOR - London Inter Bank Offered Rate
LLC - Limited Liability Company
LP - Limited Partnership
MTN - Medium Term Note
PLC - Public Limited Company
REIT - Real Estate Investment Trust
REMIC - Real Estate Mortgage Investment Conduit
SPDR - Standard & Poor's Depositary Receipt
144a - This is a restricted security that was sold in a transaction qualifying for the exemption under Rule 144A of the Securities Act of 1933. This security may be sold in transactions exempt from registration, normally to qualified institutional buyers. At November 30, 2017, these securities were valued at $762,431 or 0.2% of net assets. These securities were deemed liquid pursuant to procedures approved by the Board of Trustees.
Touchstone Balanced Fund (Continued)
Other Information:
The inputs or methodology used for valuing securities may not be an indication of the risk associated with investing in those securities. For more information on valuation inputs, and their aggregation into the levels used in the table below, please refer to the security valuation section in the accompanying Notes to Financial Statements.
| | | Valuation inputs at Reporting Date: | |
| Description | | Level 1 | | | Level 2 | | | Level 3 | | | Total | |
| | | | | | | | | | | | | |
| Common Stocks | | $ | 217,989,252 | | | $ | — | | | $ | — | | | $ | 217,989,252 | |
| U.S. Treasury Obligations | | | — | | | | 41,222,419 | | | | — | | | | 41,222,419 | |
| Exchange-Traded Funds | | | 30,760,525 | | | | — | | | | — | | | | 30,760,525 | |
| U.S. Government Mortgage-Backed Obligations | | | — | | | | 27,718,260 | | | | — | | | | 27,718,260 | |
| Corporate Bonds | | | — | | | | 10,639,085 | | | | — | | | | 10,639,085 | |
| Sovereign Government Obligation | | | — | | | | 87,889 | | | | — | | | | 87,889 | |
| Short-Term Investment Fund | | | 3,801,676 | | | | — | | | | — | | | | 3,801,676 | |
| Total | | $ | 252,551,453 | | | $ | 79,667,653 | | | $ | — | | | $ | 332,219,106 | |
At November 30, 2017, equity securities valued at $1,736,900 were transferred from Level 2 to Level 1. Transfers from Level 1 to Level 2 are due to movements of a designated U.S. market index, triggering a systematic valuation model, provided by an independent third party, when required confidence levels are achieved to fair value the international equity securities. Transfers from Level 2 to Level 1 occur when there is no longer movement of the designated U.S. market index or required confidence levels were not reached in the systematic model.
See accompanying Notes to Financial Statements.
Portfolio of Investments
Touchstone International Equity Fund – November 30, 2017
| | | | | | Market | |
| | | Shares | | | Value | |
| | | | | | | |
| Common Stocks — 97.0% | | | | | | | | |
| | | | | | | | | |
| United Kingdom — 30.0% | | | | | | | | |
| | | | | | | | | |
| Consumer Discretionary — 16.7% | | | | | | | | |
| BCA Marketplace PLC | | | 2,223,000 | | | $ | 6,343,440 | |
| Compass Group PLC | | | 209,615 | | | | 4,251,134 | |
| Delphi Automotive PLC* | | | 45,000 | | | | 4,710,150 | |
| InterContinental Hotels Group PLC | | | 65,000 | | | | 3,824,865 | |
| ITV PLC | | | 2,880,000 | | | | 6,227,932 | |
| WPP PLC | | | 454,000 | | | | 8,012,375 | |
| | | | | | | | 33,369,896 | |
| | | | | | | | | |
| Consumer Staples — 2.1% | | | | | | | | |
| Reckitt Benckiser Group PLC | | | 48,000 | | | | 4,213,298 | |
| | | | | | | | | |
| Health Care — 1.2% | | | | | | | | |
| Indivior PLC* | | | 489,000 | | | | 2,452,175 | |
| | | | | | | | | |
| Industrials — 2.2% | | | | | | | | |
| Experian PLC | | | 205,000 | | | | 4,265,469 | |
| | | | | | | | | |
| Information Technology — 4.5% | | | | | | | | |
| Auto Trader Group PLC, 144a | | | 960,000 | | | | 4,366,174 | |
| AVEVA Group PLC | | | 128,000 | | | | 4,554,427 | |
| | | | | | | | 8,920,601 | |
| | | | | | | | | |
| Real Estate — 3.3% | | | | | | | | |
| Foxtons Group PLC | | | 1,750,000 | | | | 1,644,848 | |
| Savills PLC | | | 392,000 | | | | 4,980,647 | |
| | | | | | | | 6,625,495 | |
| Total United Kingdom | | | | | | | 59,846,934 | |
| | | | | | | | | |
| Japan — 8.6% | | | | | | | | |
| Consumer Discretionary — 4.2% | | | | | | | | |
| CyberAgent, Inc. | | | 120,000 | | | | 4,114,251 | |
| USS Co. Ltd. | | | 202,000 | | | | 4,274,782 | |
| | | | | | | | 8,389,033 | |
| | | | | | | | | |
| Industrials — 2.4% | | | | | | | | |
| FANUC Corp. | | | 19,000 | | | | 4,751,975 | |
| | | | | | | | | |
| Information Technology — 2.0% | | | | | | | | |
| Yahoo Japan Corp. | | | 870,000 | | | | 3,994,358 | |
| Total Japan | | | | | | | 17,135,366 | |
| | | | | | | | | |
| France — 7.9% | | | | | | | | |
| Consumer Discretionary — 5.2% | | | | | | | | |
| JCDecaux SA | | | 123,000 | | | | 5,125,486 | |
| Renault SA | | | 51,000 | | | | 5,178,398 | |
| | | | | | | | 10,303,884 | |
| | | | | | | | | |
| Industrials — 2.7% | | | | | | | | |
| Edenred SA | | | 189,000 | | | | 5,407,968 | |
| Total France | | | | | | | 15,711,852 | |
| | | | | | | | | |
| India — 7.1% | | | | | | | | |
| Consumer Discretionary — 3.9% | | | | | | | | |
| PC Jeweller Ltd. | | | 1,260,000 | | | | 7,726,489 | |
| | | | | | | | | |
| Financials — 3.2% | | | | | | | | |
| Shriram Transport Finance Co. Ltd. | | | 315,000 | | | | 6,485,521 | |
| Total India | | | | | | | 14,212,010 | |
| | | | | | | | | |
| Canada — 6.7% | | | | | | | | |
| Consumer Discretionary — 2.6% | | | | | | | | |
| Uni-Select, Inc. | | | 266,000 | | | | 5,274,022 | |
| | | | | | | | | |
| Information Technology — 2.3% | | | | | | | | |
| BlackBerry Ltd.* | | | 419,000 | | | | 4,512,630 | |
| | | | | | | | | |
| Materials — 1.8% | | | | | | | | |
| Pretium Resources, Inc.* | | | 330,000 | | | | 3,531,000 | |
| Total Canada | | | | | | | 13,317,652 | |
| | | | | | | | | |
| United States — 5.5% | | | | | | | | |
| Health Care — 2.7% | | | | | | | | |
| Medtronic PLC | | | 65,000 | | | | 5,338,450 | |
| | | | | | | | | |
| Information Technology — 2.8% | | | | | | | | |
| Mastercard, Inc. - Class A | | | 38,000 | | | | 5,717,860 | |
| Total United States | | | | | | | 11,056,310 | |
| | | | | | | | | |
| Germany — 5.3% | | | | | | | | |
| | | | | | | | | |
| Industrials — 2.9% | | | | | | | | |
| Brenntag AG | | | 93,000 | | | | 5,794,355 | |
| | | | | | | | | |
| Information Technology — 2.4% | | | | | | | | |
| SAP SE | | | 43,000 | | | | 4,861,246 | |
| Total Germany | | | | | | | 10,655,601 | |
| | | | | | | | | |
| Switzerland — 4.8% | | | | | | | | |
| | | | | | | | | |
| Consumer Staples — 2.7% | | | | | | | | |
| Nestle SA | | | 64,000 | | | | 5,475,172 | |
| | | | | | | | | |
| Industrials — 2.1% | | | | | | | | |
| Adecco Group AG | | | 55,000 | | | | 4,163,681 | |
| Total Switzerland | | | | | | | 9,638,853 | |
| | | | | | | | | |
| Cayman Islands — 4.4% | | | | | | | | |
| | | | | | | | | |
| Consumer Discretionary — 2.5% | | | | | | | | |
| Wynn Macau Ltd. | | | 1,747,000 | | | | 4,999,321 | |
| | | | | | | | | |
| Information Technology — 1.9% | | | | | | | | |
| Tencent Holdings Ltd. | | | 72,000 | | | | 3,686,483 | |
| Total Cayman Islands | | | | | | | 8,685,804 | |
| | | | | | | | | |
| Spain — 2.6% | | | | | | | | |
| | | | | | | | | |
| Utilities — 2.6% | | | | | | | | |
| Red Electrica Corp. SA | | | 225,000 | | | | 5,082,410 | |
Touchstone International Equity Fund (Continued)
| | | | | | Market | |
| | | Shares | | | Value | |
| | | | | | | |
| Common Stocks — 97.0% (Continued) | | | | | | | | |
| | | | | | | | | |
| Greece — 2.5% | | | | | | | | |
| | | | | | | | | |
| Consumer Discretionary — 2.5% | | | | | | | | |
| OPAP SA | | | 410,000 | | | $ | 5,002,021 | |
| | | | | | | | | |
| Luxembourg — 2.5% | | | | | | | | |
| | | | | | | | | |
| Consumer Discretionary — 2.5% | | | | | | | | |
| SES SA | | | 302,000 | | | | 4,987,441 | |
| | | | | | | | | |
| Netherlands — 2.0% | | | | | | | | |
| | | | | | | | | |
| Energy — 2.0% | | | | | | | | |
| Core Laboratories NV† | | | 40,000 | | | | 4,030,000 | |
| | | | | | | | | |
| Denmark — 1.9% | | | | | | | | |
| | | | | | | | | |
| Industrials — 1.9% | | | | | | | | |
| ISS A/S | | | 98,000 | | | | 3,702,701 | |
| | | | | | | | | |
| Italy — 1.7% | | | | | | | | |
| | | | | | | | | |
| Health Care — 1.7% | | | | | | | | |
| DiaSorin SpA | | | 37,000 | | | | 3,408,635 | |
| | | | | | | | | |
| Jersey — 1.6% | | | | | | | | |
| | | | | | | | | |
| Materials — 1.6% | | | | | | | | |
| Randgold Resources Ltd. | | | 34,000 | | | | 3,118,536 | |
| | | | | | | | | |
| Australia — 1.1% | | | | | | | | |
| | | | | | | | | |
| Materials — 1.1% | | | | | | | | |
| Northern Star Resources Ltd. | | | 500,000 | | | | 2,192,833 | |
| | | | | | | | | |
| Cyprus — 0.8% | | | | | | | | |
| | | | | | | | | |
| Financials — 0.8% | | | | | | | | |
| Bank of Cyprus Holdings PLC* | | | 522,424 | | | | 1,608,945 | |
| Total Common Stocks | | | | | | $ | 193,393,904 | |
| | | | | | | | | |
| Short-Term Investment Funds — 5.1% | | | | | | | | |
| Dreyfus Government Cash | | | | | | | | |
| Management, Institutional Shares, | | | | | | | | |
| 0.96%∞Ω | | | 6,176,132 | | | $ | 6,176,132 | |
| Invesco Government & Agency | | | | | | | | |
| Portfolio, Institutional Class, | | | | | | | | |
| 0.98%**∞Ω | | | 4,023,360 | | | | 4,023,360 | |
| Total Short-Term Investment Funds | | | | | | $ | 10,199,492 | |
| Total Investment Securities —102.1% | | | | |
| (Cost $163,035,423) | | $ | 203,593,396 | |
| | | | | |
| Liabilities in Excess of Other Assets — (2.1%) | | | (4,206,949 | ) |
| | | | | |
| Net Assets — 100.0% | | $ | 199,386,447 | |
| * | Non-income producing security. |
| ** | Represents collateral for securities loaned. |
| † | All or a portion of the security is on loan. The total market value of the securities on loan as of November 30, 2017 was $3,989,700. |
| Ω | Represents the 7-day SEC yield as of November 30, 2017. |
Portfolio Abbreviations:
PLC - Public Limited Company
144a - This is a restricted security that was sold in a transaction qualifying for the exemption under Rule 144A of the Securities Act of 1933. This security may be sold in transactions exempt from registration, normally to qualified institutional buyers. At November 30, 2017, these securities were valued at $4,336,174 or 2.2% of net assets. These securities were deemed liquid pursuant to procedures approved by the Board of Trustees.
Touchstone International Equity Fund (Continued)
Other Information:
The inputs or methodology used for valuing securities may not be an indication of the risk associated with investing in those securities. For more information on valuation inputs, and their aggregation into the levels used in the table below, please refer to the security valuation section in the accompanying Notes to Financial Statements.
| | | Valuation inputs at Reporting Date: | |
| Description | | Level 1 | | | Level 2 | | | Level 3 | | | Total | |
| | | | | | | | | | | | | |
| Common Stocks United Kingdom | | $ | 35,279,793 | | | $ | 24,567,141 | | | $ | — | | | $ | 59,846,934 | |
| Japan | | | — | | | | 17,135,366 | | | | — | | | | 17,135,366 | |
| France | | | 10,533,454 | | | | 5,178,398 | | | | — | | | | 15,711,852 | |
| India | | | 7,726,489 | | | | 6,485,521 | | | | — | | | | 14,212,010 | |
| Canada | | | 13,317,652 | | | | — | | | | — | | | | 13,317,652 | |
| United States | | | 11,056,310 | | | | — | | | | — | | | | 11,056,310 | |
| Germany | | | — | | | | 10,655,601 | | | | — | | | | 10,655,601 | |
| Switzerland | | | — | | | | 9,638,853 | | | | — | | | | 9,638,853 | |
| Cayman Islands | | | 4,999,321 | | | | 3,686,483 | | | | — | | | | 8,685,804 | |
| Spain | | | — | | | | 5,082,410 | | | | — | | | | 5,082,410 | |
| Greece | | | 5,002,021 | | | | — | | | | — | | | | 5,002,021 | |
| Luxembourg | | | 4,987,441 | | | | — | | | | — | | | | 4,987,441 | |
| Netherlands | | | 4,030,000 | | | | — | | | | — | | | | 4,030,000 | |
| Denmark | | | — | | | | 3,702,701 | | | | — | | | | 3,702,701 | |
| Italy | | | 3,408,635 | | | | — | | | | — | | | | 3,408,635 | |
| Jersey | | | — | | | | 3,118,536 | | | | — | | | | 3,118,536 | |
| Australia | | | — | | | | 2,192,833 | | | | — | | | | 2,192,833 | |
| Cyprus | | | 1,608,945 | | | | — | | | | — | | | | 1,608,945 | |
| Short-Term Investment Funds | | | 10,199,492 | | | | — | | | | — | | | | 10,199,492 | |
| Total | | $ | 112,149,553 | | | $ | 91,443,843 | | | $ | — | | | $ | 203,593,396 | |
At November 30, 2017, equity securities valued at $61,258,288 were transferred from Level 2 to Level 1. Transfers from Level 1 to Level 2 are due to movements of a designated U.S. market index, triggering a systematic valuation model, provided by an independent third party, when required confidence levels are achieved to fair value the international equity securities. Transfers from Level 2 to Level 1 occur when there is no longer movement of the designated U.S. market index or required confidence levels were not reached in the systematic model securities.
See accompanying Notes to Financial Statements.
Portfolio of Investments
Touchstone Large Cap Focused Fund – November 30, 2017
| | | | | | Market | |
| | | Shares | | | Value | |
| | | | | | | |
| Common Stocks — 89.0% | | | | | | | | |
| | | | | | | | | |
| Information Technology — 22.9% | | | | | | | | |
| Accenture PLC (Ireland) - Class A | | | 223,043 | | | $ | 33,012,594 | |
| Alphabet, Inc. - Class C* | | | 57,000 | | | | 58,220,370 | |
| Apple, Inc. | | | 340,315 | | | | 58,483,133 | |
| Check Point Software Technologies Ltd. (Israel)* | | | 69,183 | | | | 7,215,095 | |
| Cisco Systems, Inc. | | | 886,102 | | | | 33,051,605 | |
| Cognizant Technology Solutions Corp. - Class A | | | 200,493 | | | | 14,491,634 | |
| Facebook, Inc. - Class A* | | | 75,000 | | | | 13,288,500 | |
| Microsoft Corp. | | | 905,572 | | | | 76,221,995 | |
| Oracle Corp. | | | 413,559 | | | | 20,289,205 | |
| Synopsys, Inc.* | | | 174,504 | | | | 15,771,672 | |
| Texas Instruments, Inc. | | | 479,952 | | | | 46,694,530 | |
| Visa, Inc. - Class A | | | 475,920 | | | | 53,583,833 | |
| | | | | | | | 430,324,166 | |
| | | | | | | | | |
| Financials — 15.1% | | | | | | | | |
| American Express Co. | | | 165,720 | | | | 16,192,501 | |
| Chubb Ltd.(Switzerland) | | | 178,036 | | | | 27,081,056 | |
| CME Group, Inc. | | | 182,926 | | | | 27,354,754 | |
| Comerica, Inc. | | | 297,450 | | | | 24,780,560 | |
| Discover Financial Services | | | 152,000 | | | | 10,731,200 | |
| JPMorgan Chase & Co. | | | 325,000 | | | | 33,969,000 | |
| Morgan Stanley | | | 797,500 | | | | 41,158,975 | |
| PNC Financial Services Group, Inc. (The) | | | 262,000 | | | | 36,826,720 | |
| S&P Global, Inc. | | | 197,596 | | | | 32,698,186 | |
| Travelers Cos., Inc. (The) | | | 161,374 | | | | 21,877,473 | |
| Webster Financial Corp. | | | 190,800 | | | | 10,946,196 | |
| | | | | | | | 283,616,621 | |
| | | | | | | | | |
| Health Care — 12.3% | | | | | | | | |
| Amgen, Inc. | | | 91,644 | | | | 16,098,185 | |
| Becton Dickinson and Co. | | | 82,860 | | | | 18,909,481 | |
| Biogen, Inc.* | | | 47,905 | | | | 15,433,554 | |
| Bristol-Myers Squibb Co. | | | 244,323 | | | | 15,438,770 | |
| Danaher Corp. | | | 160,000 | | | | 15,097,600 | |
| Eli Lilly & Co. | | | 168,555 | | | | 14,266,495 | |
| Johnson & Johnson | | | 100,337 | | | | 13,979,954 | |
| Merck & Co., Inc. | | | 536,551 | | | | 29,655,174 | |
| Roche Holding AG ADR | | | 221,503 | | | | 6,995,065 | |
| Stryker Corp. | | | 122,070 | | | | 19,042,920 | |
| UnitedHealth Group, Inc. | | | 181,658 | | | | 41,448,906 | |
| Zoetis, Inc. | | | 349,008 | | | | 25,229,788 | |
| | | | | | | | 231,595,892 | |
| | | | | | | | | |
| Consumer Discretionary — 10.9% | | | | | | | | |
| Amazon.com, Inc.* | | | 12,000 | | | | 14,121,000 | |
| Comcast Corp. - Class A | | | 947,256 | | | | 35,559,990 | |
| Home Depot, Inc. (The) | | | 162,400 | | | | 29,202,768 | |
| Marriott International, Inc. - Class A | | | 196,238 | | | | 24,922,226 | |
| McDonald's Corp. | | | 186,095 | | | | 32,002,757 | |
| Omnicom Group, Inc. | | | 235,268 | | | | 16,807,546 | |
| Priceline Group, Inc. (The)* | | | 7,878 | | | | 13,705,435 | |
| Time Warner, Inc. | | | 97,440 | | | | 8,916,734 | |
| TJX Cos (The), Inc. | | | 388,219 | | | | 29,329,945 | |
| | | | | | | | 204,568,401 | |
| | | | | | | | | |
| Industrials — 8.9% | | | | | | | | |
| 3M Co. | | | 70,000 | | | | 17,019,800 | |
| Boeing Co. (The) | | | 139,549 | | | | 38,627,163 | |
| Canadian National Railway Co. (Canada) | | | 217,247 | | | | 16,940,921 | |
| General Dynamics Corp. | | | 82,579 | | | | 17,107,066 | |
| Honeywell International, Inc. | | | 239,886 | | | | 37,412,621 | |
| United Technologies Corp. | | | 208,281 | | | | 25,295,727 | |
| Verisk Analytics, Inc.* | | | 148,725 | | | | 14,340,064 | |
| | | | | | | | 166,743,362 | |
| | | | | | | | | |
| Consumer Staples — 8.1% | | | | | | | | |
| Estee Lauder Cos., Inc. (The) - Class A | | | 212,718 | | | | 26,553,588 | |
| Kraft Heinz Co. (The) | | | 183,288 | | | | 14,914,145 | |
| PepsiCo, Inc. | | | 274,751 | | | | 32,013,987 | |
| Philip Morris International, Inc. | | | 275,000 | | | | 28,256,250 | |
| Procter & Gamble Co. (The) | | | 271,672 | | | | 24,447,763 | |
| Unilever NV (Netherlands) | | | 456,408 | | | | 26,352,998 | |
| | | | | | | | 152,538,731 | |
| | | | | | | | | |
| Energy — 5.9% | | | | | | | | |
| Chevron Corp. | | | 172,149 | | | | 20,484,010 | |
| EOG Resources, Inc. | | | 192,000 | | | | 19,645,440 | |
| Exxon Mobil Corp. | | | 455,000 | | | | 37,896,950 | |
| Marathon Petroleum Corp. | | | 281,761 | | | | 17,646,691 | |
| Schlumberger Ltd. (Curacao) | | | 248,127 | | | | 15,594,782 | |
| | | | | | | | 111,267,873 | |
| | | | | | | | | |
| Telecommunication Services — 1.8% | | | | | | | | |
| Verizon Communications, Inc. | | | 656,086 | | | | 33,388,217 | |
| Materials — 1.7% | | | | | | | | |
| DowDuPont, Inc. | | | 270,314 | | | | 19,451,795 | |
| Praxair, Inc. | | | 87,298 | | | | 13,436,908 | |
| | | | | | | | 32,888,703 | |
| | | | | | | | | |
| Real Estate — 1.4% | | | | | | | | |
| Equinix, Inc. REIT | | | 55,395 | | | | 25,730,424 | |
| Total Common Stocks | | | | | | $ | 1,672,662,390 | |
| | | | | | | | | |
| Exchange-Traded Funds — 8.0% | | | | | | | | |
| iShares Core S&P Mid-Cap ETF | | | 150,000 | | | | 28,467,000 | |
| iShares Russell Mid-Cap Value ETF | | | 290,000 | | | | 25,667,900 | |
| SPDR S&P 500 ETF Trust | | | 230,000 | | | | 60,952,300 | |
| SPDR S&P MidCap 400 ETF Trust | | | 38,000 | | | | 13,144,580 | |
| Utilities Select Sector SPDR Fund | | | 385,000 | | | | 21,791,000 | |
| Total Exchange-Traded Funds | | | | | | $ | 150,022,780 | |
Touchstone Large Cap Focused Fund (Continued)
| | | | | | Market | |
| | | Shares | | | Value | |
| | | | | | | |
| Short-Term Investment Fund — 3.2% | | | | | | | | |
| Dreyfus Government Cash | | | | | | | | |
| Management, Institutional Shares, | | | | | | | | |
| 0.96%∞Ω | | | 59,525,638 | | | $ | 59,525,638 | |
| Total Investment Securities —100.2% | | | | |
| (Cost $842,837,037) | | $ | 1,882,210,808 | |
| | | | | |
| Liabilities in Excess of Other Assets — (0.2%) | | | (3,112,431 | ) |
| | | | | |
| Net Assets — 100.0% | | $ | 1,879,098,377 | |
| * | Non-income producing security. |
| Ω | Represents the 7-day SEC yield as of November 30, 2017. |
Portfolio Abbreviations:
ADR - American Depositary Receipt
ETF - Exchange-Traded Fund
PLC - Public Limited Company
REIT - Real Estate Investment Trust
SPDR - Standard & Poor's Depositary Receipt
Other Information:
The inputs or methodology used for valuing securities may not be an indication of the risk associated with investing in those securities. For more information on valuation inputs, and their aggregation into the levels used in the table below, please refer to the security valuation section in the accompanying Notes to Financial Statements.
| | | Valuation inputs at Reporting Date: | |
| Description | | Level 1 | | | Level 2 | | | Level 3 | | | Total | |
| | | | | | | | | | | | | |
| Common Stocks | | $ | 1,672,662,390 | | | $ | — | | | $ | — | | | $ | 1,672,662,390 | |
| Exchange-Traded Funds | | | 150,022,780 | | | | — | | | | — | | | | 150,022,780 | |
| Short-Term Investment Fund | | | 59,525,638 | | | | — | | | | — | | | | 59,525,638 | |
| Total | | $ | 1,882,210,808 | | | $ | — | | | $ | — | | | $ | 1,882,210,808 | |
At November 30, 2017, equity securities valued at $6,995,065 were transferred from Level 2 to Level 1. Transfers from Level 1 to Level 2 are due to movements of a designated U.S. market index, triggering a systematic valuation model, provided by an independent third party, when required confidence levels are achieved to fair value the international equity securities. Transfers from Level 2 to Level 1 occur when there is no longer movement of the designated U.S. market index or required confidence levels were not reached in the systematic model.
See accompanying Notes to Financial Statements.
Portfolio of Investments
Touchstone Small Company Fund – November 30, 2017
| | | | | | Market | |
| | | Shares | | | Value | |
| | | | | | | |
| Common Stocks — 95.4% | | | | | | | | |
| | | | | | | | | |
| Information Technology — 28.7% | | | | | | | | |
| 8x8, Inc.* | | | 1,063,000 | | | $ | 14,988,300 | |
| Acxiom Corp.* | | | 722,890 | | | | 19,698,752 | |
| Aspen Technology, Inc.* | | | 192,000 | | | | 12,848,640 | |
| Barracuda Networks, Inc.* | | | 651,238 | | | | 18,006,731 | |
| Blackhawk Network Holdings, Inc.* | | | 413,600 | | | | 15,199,800 | |
| Bottomline Technologies de, Inc.* | | | 416,600 | | | | 13,885,278 | |
| BroadSoft, Inc.* | | | 277,900 | | | | 15,284,500 | |
| Carbonite, Inc.* | | | 673,340 | | | | 16,193,827 | |
| CommVault Systems, Inc.* | | | 263,000 | | | | 14,175,700 | |
| Finisar Corp.* | | | 748,500 | | | | 14,977,485 | |
| GrubHub, Inc.*† | | | 225,200 | | | | 15,214,512 | |
| GTT Communications, Inc.* | | | 453,084 | | | | 18,327,248 | |
| j2 Global, Inc. | | | 201,685 | | | | 15,219,150 | |
| MAXIMUS, Inc. | | | 232,509 | | | | 16,061,722 | |
| Microsemi Corp.* | | | 190,000 | | | | 10,041,500 | |
| NetScout Systems, Inc.* | | | 502,800 | | | | 15,611,940 | |
| Nice Ltd. ADR | | | 189,620 | | | | 16,593,646 | |
| Nuance Communications, Inc.* | | | 751,270 | | | | 11,674,736 | |
| ON Semiconductor Corp.* | | | 636,980 | | | | 12,790,558 | |
| Open Text Corp. (Canada)† | | | 333,320 | | | | 10,869,565 | |
| Plantronics, Inc. | | | 324,040 | | | | 16,953,773 | |
| Tower Semiconductor Ltd. (Israel)* | | | 434,800 | | | | 15,309,308 | |
| VeriFone Systems, Inc.* | | | 868,000 | | | | 15,051,120 | |
| Verint Systems, Inc.* | | | 228,200 | | | | 9,983,750 | |
| | | | | | | | 354,961,541 | |
| | | | | | | | | |
| Health Care — 19.8% | | | | | | | | |
| Allscripts Healthcare Solutions, Inc.* | | | 842,500 | | | | 12,047,750 | |
| Analogic Corp. | | | 87,937 | | | | 7,281,184 | |
| AngioDynamics, Inc.* | | | 853,106 | | | | 14,656,361 | |
| Bio-Rad Laboratories, Inc. - Class A* | | | 53,964 | | | | 14,640,433 | |
| Bio-Techne Corp. | | | 107,200 | | | | 14,445,200 | |
| Capital Senior Living Corp.* | | | 902,251 | | | | 14,670,601 | |
| Diplomat Pharmacy, Inc.* | | | 678,482 | | | | 12,144,828 | |
| Globus Medical, Inc. - Class A* | | | 480,200 | | | | 18,252,402 | |
| Haemonetics Corp.* | | | 268,900 | | | | 15,542,420 | |
| HealthSouth Corp. | | | 283,500 | | | | 14,160,825 | |
| Magellan Health, Inc.* | | | 168,899 | | | | 14,271,965 | |
| MEDNAX, Inc.* | | | 220,700 | | | | 10,988,653 | |
| Natus Medical, Inc.* | | | 258,200 | | | | 10,340,910 | |
| NuVasive, Inc.* | | | 262,400 | | | | 15,137,856 | |
| Omnicell, Inc.* | | | 257,600 | | | | 13,498,240 | |
| Orthofix International NV (Curacao)* | | | 296,934 | | | | 16,099,761 | |
| Owens & Minor, Inc. | | | 532,700 | | | | 10,195,878 | |
| Tivity Health, Inc.* | | | 439,930 | | | | 16,189,424 | |
| | | | | | | | 244,564,691 | |
| | | | | | | | | |
| Consumer Discretionary — 17.0% | | | | | | | | |
| Aaron's, Inc. | | | 397,974 | | | | 15,011,579 | |
| Adtalem Global Education, Inc. | | | 417,335 | | | | 17,298,536 | |
| Bloomin' Brands, Inc. | | | 817,940 | | | | 17,561,172 | |
| Callaway Golf Co. | | | 1,026,680 | | | | 14,897,127 | |
| KB Home | | | 507,600 | | | | 15,918,336 | |
| MDC Partners, Inc. - Class A (Canada)* | | | 1,166,466 | | | | 13,531,006 | |
| Meredith Corp. | | | 219,000 | | | | 14,924,850 | |
| Penn National Gaming, Inc.* | | | 541,600 | | | | 15,576,416 | |
| Planet Fitness, Inc. - Class A* | | | 493,900 | | | | 15,987,543 | |
| Regal Entertainment Group - Class A† | | | 909,700 | | | | 18,385,037 | |
| Sleep Number Corp.* | | | 465,000 | | | | 16,363,350 | |
| Texas Roadhouse, Inc. | | | 274,700 | | | | 14,028,929 | |
| TRI Pointe Group, Inc.* | | | 1,112,000 | | | | 20,149,440 | |
| | | | | | | | 209,633,321 | |
| | | | | | | | | |
| Industrials — 12.9% | | | | | | | | |
| Crane Co. | | | 146,400 | | | | 12,498,168 | |
| EnerSys, Inc. | | | 146,000 | | | | 10,087,140 | |
| Esterline Technologies Corp.* | | | 183,100 | | | | 12,972,635 | |
| Genesee & Wyoming, Inc. - Class A* | | | 200,300 | | | | 15,787,646 | |
| Healthcare Services Group, Inc. | | | 261,000 | | | | 13,553,730 | |
| Hillenbrand, Inc. | | | 282,800 | | | | 12,881,540 | |
| Knight-Swift Transportation Holdings, Inc. | | | 321,100 | | | | 13,704,548 | |
| Mobile Mini, Inc. | | | 419,262 | | | | 15,051,506 | |
| Quanta Services, Inc.* | | | 315,270 | | | | 11,948,733 | |
| Regal Beloit Corp. | | | 183,500 | | | | 14,120,325 | |
| SkyWest, Inc. | | | 296,400 | | | | 15,427,620 | |
| Woodward, Inc. | | | 155,600 | | | | 12,035,660 | |
| | | | | | | | 160,069,251 | |
| | | | | | | | | |
| Financials — 10.0% | | | | | | | | |
| Chemical Financial Corp. | | | 286,600 | | | | 16,161,374 | |
| Evercore Partners, Inc. - Class A | | | 182,000 | | | | 15,806,700 | |
| Glacier Bancorp, Inc. | | | 543,000 | | | | 21,747,150 | |
| Heartland Financial USA, Inc. | | | 218,600 | | | | 11,039,300 | |
| Stifel Financial Corp. | | | 273,900 | | | | 15,404,136 | |
| Webster Financial Corp. | | | 240,800 | | | | 13,814,696 | |
| Western Alliance Bancorp* | | | 253,900 | | | | 14,771,902 | |
| WSFS Financial Corp. | | | 301,700 | | | | 15,266,020 | |
| | | | | | | | 124,011,278 | |
| | | | | | | | | |
| Energy — 2.5% | | | | | | | | |
| Carrizo Oil & Gas, Inc.* | | | 887,930 | | | | 17,163,687 | |
| Gulfport Energy Corp.* | | | 1,043,200 | | | | 13,352,960 | |
| | | | | | | | 30,516,647 | |
| | | | | | | | | |
| Real Estate — 2.4% | | | | | | | | |
| Corporate Office Properties Trust REIT | | | 537,400 | | | | 16,304,716 | |
| Outfront Media, Inc. REIT | | | 579,800 | | | | 13,602,108 | |
| | | | | | | | 29,906,824 | |
| | | | | | | | | |
| Telecommunication Services — 1.2% | | | | | | | | |
| Cogent Communications Holdings, Inc. | | | 317,200 | | | | 14,860,820 | |
| | | | | | | | | |
| Materials — 0.9% | | | | | | | | |
| Innophos Holdings, Inc. | | | 227,000 | | | | 10,516,910 | |
| Total Common Stocks | | | | | | $ | 1,179,041,283 | |
Touchstone Small Company Fund (Continued)
| | | | | | Market | |
| | | Shares | | | Value | |
| | | | | | | |
| Short-Term Investment Funds — 6.9% | | | | | | | | |
| Dreyfus Government Cash Management, Institutional Shares, 0.96%∞Ω | | | 54,966,342 | | | $ | 54,966,342 | |
| Invesco Government & Agency Portfolio, Institutional Class, 0.98%**∞Ω | | | 30,512,477 | | | | 30,512,477 | |
| Total Short-Term Investment Funds | | | | | | $ | 85,478,819 | |
| | | | | | | | | |
| Total Investment Securities —102.3% | | | | | | | | |
| (Cost $990,230,047) | | | | | | $ | 1,264,520,102 | |
| | | | | | | | | |
| Liabilities in Excess of Other Assets — (2.3%) | | | | | | | (27,956,446 | ) |
| | | | | | | | | |
| Net Assets — 100.0% | | | | | | $ | 1,236,563,656 | |
| * | Non-income producing security. |
| ** | Represents collateral for securities loaned. |
| † | All or a portion of the security is on loan. The total market value of the securities on loan as of November 30, 2017 was $29,931,949. |
| Ω | Represents the 7-day SEC yield as of November 30, 2017. |
Portfolio Abbreviations:
ADR - American Depositary Receipt
REIT - Real Estate Investment Trust
Other Information:
The inputs or methodology used for valuing securities may not be an indication of the risk associated with investing in those securities. For more information on valuation inputs, and their aggregation into the levels used in the table below, please refer to the security valuation section in the accompanying Notes to Financial Statements.
| | | Valuation inputs at Reporting Date: | |
| Description | | Level 1 | | | Level 2 | | | Level 3 | | | Total | |
| | | | | | | | | | | | | |
| Common Stocks | | $ | 1,179,041,283 | | | $ | — | | | $ | — | | | $ | 1,179,041,283 | |
| Short-Term Investment Funds | | | 85,478,819 | | | | — | | | | — | | | | 85,478,819 | |
| Total | | $ | 1,264,520,102 | | | $ | — | | | $ | — | | | $ | 1,264,520,102 | |
See accompanying Notes to Financial Statements.
Statements of Assets and Liabilities
November 30, 2017
| | | | | | Touchstone | | | Touchstone | | | Touchstone | |
| | | Touchstone | | | International | | | Large Cap | | | Small | |
| | | Balanced | | | Equity | | | Focused | | | Company | |
| | | Fund | | | Fund | | | Fund | | | Fund | |
| Assets | | | | | | | | | | | | | | | | |
| Investments, at cost | | $ | 205,533,662 | | | $ | 163,035,423 | | | $ | 842,837,037 | | | $ | 990,230,047 | |
| Investments, at market value (A) | | $ | 332,219,106 | | | $ | 203,593,396 | | | $ | 1,882,210,808 | | | $ | 1,264,520,102 | |
| Cash | | | — | | | | 10 | | | | 44 | | | | — | |
| Foreign currency(B) | | | — | | | | 157,657 | | | | — | | | | — | |
| Dividends and interest receivable | | | 747,543 | | | | 231,578 | | | | 3,582,655 | | | | 862,893 | |
| Receivable for capital shares sold | | | 352,682 | | | | 95,472 | | | | 394,982 | | | | 347,129 | |
| Receivable for investments sold | | | — | | | | 207,642 | | | | — | | | | 5,201,346 | |
| Receivable for securities lending income | | | — | | | | — | | | | — | | | | 7,151 | |
| Tax reclaim receivable | | | — | | | | 226,609 | | | | 134,776 | | | | 6,607 | |
| Other assets | | | 22,520 | | | | 21,913 | | | | 44,802 | | | | 55,697 | |
| Total Assets | | | 333,341,851 | | | | 204,534,277 | | | | 1,886,368,067 | | | | 1,271,000,925 | |
| | | | | | | | | | | | | | | | | |
| Liabilities | | | | | | | | | | | | | | | | |
| Bank overdrafts | | | 65 | | | | — | | | | — | | | | 12 | |
| Deferred foreign capital gains tax* | | | — | | | | 675,346 | | | | — | | | | — | |
| Payable for return of collateral for securities on loan | | | — | | | | 4,023,360 | | | | — | | | | 30,512,477 | |
| Payable for capital shares redeemed | | | 319,613 | | | | 211,721 | | | | 5,604,372 | | | | 2,711,970 | |
| Payable for investments purchased | | | 389,052 | | | | — | | | | — | | | | — | |
| Payable to Investment Advisor | | | 140,489 | | | | 107,013 | | | | 889,763 | | | | 621,780 | |
| Payable to other affiliates | | | 105,395 | | | | 29,211 | | | | 487,278 | | | | 343,725 | |
| Payable to Trustees | | | 1,875 | | | | 1,875 | | | | 1,875 | | | | 1,875 | |
| Payable for professional services | | | 26,110 | | | | 33,560 | | | | 22,080 | | | | 21,980 | |
| Payable to Transfer Agent | | | 47,992 | | | | 41,761 | | | | 176,684 | | | | 160,975 | |
| Payable for reports to shareholders | | | 16,007 | | | | 20,161 | | | | 44,478 | | | | 59,881 | |
| Other accrued expenses and liabilities | | | 1,935 | | | | 3,822 | | | | 43,160 | | | | 2,594 | |
| Total Liabilities | | | 1,048,533 | | | | 5,147,830 | | | | 7,269,690 | | | | 34,437,269 | |
| Net Assets | | $ | 332,293,318 | | | $ | 199,386,447 | | | $ | 1,879,098,377 | | | $ | 1,236,563,656 | |
| | | | | | | | | | | | | | | | | |
| Net assets consist of: | | | | | | | | | | | | | | | | |
| Paid-in capital | | $ | 189,910,730 | | | $ | 151,371,086 | | | $ | 573,231,587 | | | $ | 862,161,090 | |
| Accumulated net investment income | | | 306,053 | | | | 1,037,307 | | | | 2,586,763 | | | | — | |
| Accumulated net realized gains on investments and foreign currency transactions | | | 15,391,091 | | | | 7,102,314 | | | | 263,906,256 | | | | 100,112,511 | |
| Net unrealized appreciation on investments and foreign currency transactions | | | 126,685,444 | | | | 39,875,740 | | | | 1,039,373,771 | | | | 274,290,055 | |
| Net Assets | | $ | 332,293,318 | | | $ | 199,386,447 | | | $ | 1,879,098,377 | | | $ | 1,236,563,656 | |
| (A) Includes market value of securities on loan of: | | $ | — | | | $ | 3,989,700 | | | $ | — | | | $ | 29,931,949 | |
| (B) Cost of foreign currency: | | $ | — | | | $ | 157,657 | | | $ | — | | | $ | — | |
* See Note 2 in Notes to Financial Statements.
See accompanying Notes to Financial Statements.
Statements of Assets and Liabilities (Continued)
| | | | | | Touchstone | | | Touchstone | | | Touchstone | |
| | | Touchstone | | | International | | | Large Cap | | | Small | |
| | | Balanced | | | Equity | | | Focused | | | Company | |
| | | Fund | | | Fund | | | Fund | | | Fund | |
| | | | | | | | | | | | | |
| Pricing of Class A Shares | | | | | | | | | | | | | | | | |
| Net assets applicable to Class A shares | | $ | 258,278,511 | | | $ | 129,138,709 | | | $ | 1,321,505,949 | | | $ | 677,054,690 | |
| Shares of beneficial interest outstanding (unlimited number of shares authorized, no par value) | | | 11,530,690 | | | | 6,576,161 | | | | 27,105,402 | | | | 120,107,138 | |
| Net asset value price per share* | | $ | 22.40 | | | $ | 19.64 | | | $ | 48.75 | | | $ | 5.64 | |
| Maximum sales charge - Class A shares | | | 5.75 | % | | | 5.75 | % | | | 5.75 | % | | | 5.75 | % |
| Maximum offering price per share (100%/(100%-maximum sales charge) of net asset value adjusted to the nearest cent) - Class A shares | | $ | 23.77 | | | $ | 20.84 | | | $ | 51.72 | | | $ | 5.98 | |
| | | | | | | | | | | | | | | | | |
| Pricing of Class C Shares | | | | | | | | | | | | | | | | |
| Net assets applicable to Class C shares | | $ | 42,799,682 | | | $ | 6,924,329 | | | $ | 74,122,319 | | | $ | 104,050,918 | |
| Shares of beneficial interest outstanding (unlimited number of shares authorized, no par value) | | | 1,905,523 | | | | 375,014 | | | | 1,594,757 | | | | 29,764,994 | |
| Net asset value and offering price per share** | | $ | 22.46 | | | $ | 18.46 | | | $ | 46.48 | | | $ | 3.50 | |
| | | | | | | | | | | | | | | | | |
| Pricing of Class Y Shares | | | | | | | | | | | | | | | | |
| Net assets applicable to Class Y shares | | $ | 31,215,125 | | | $ | 63,320,151 | | | $ | 438,731,943 | | | $ | 388,403,598 | |
| Shares of beneficial interest outstanding (unlimited number of shares authorized, no par value) | | | 1,402,125 | | | | 3,254,700 | | | | 9,004,454 | | | | 63,713,779 | |
| Net asset value, offering price and redemption price per share | | $ | 22.26 | | | $ | 19.45 | | | $ | 48.72 | | | $ | 6.10 | |
| | | | | | | | | | | | | | | | | |
| Pricing of Institutional Class Shares | | | | | | | | | | | | | | | | |
| Net assets applicable to Institutional Class shares | | $ | — | | | $ | 3,258 | | | $ | 44,738,166 | | | $ | 2,626 | |
| Shares of beneficial interest outstanding (unlimited number of shares authorized, no par value) | | | — | | | | 167 | | | | 916,649 | | | | 431 | |
| Net asset value, offering price and redemption price per share | | $ | — | | | $ | 19.46 | | | $ | 48.81 | | | $ | 6.10 | |
| | | | | | | | | | | | | | | | | |
| Pricing of Class R6 Shares | | | | | | | | | | | | | | | | |
| Net assets applicable to Class R6 shares | | $ | — | | | $ | — | | | $ | — | | | $ | 67,051,824 | |
| Shares of beneficial interest outstanding (unlimited number of shares authorized, no par value) | | | — | | | | — | | | | — | | | | 11,696,301 | |
| Net asset value, offering price and redemption price per share | | $ | — | | | $ | — | | | $ | — | | | $ | 5.73 | |
* There is no sales load on subscriptions of $1 million or more. Redemptions that were part of a $1 million or more subscription may be subject to a contingent deferred sales load if redeemed within a one-year period from the date of purchase.
** Redemption price per share varies by length of time shares are held due to the terms of the contingent deferred sales charge.
See accompanying Notes to Financial Statements.
Statements of Operations
For the Year Ended November 30, 2017
| | | | | | Touchstone | | | Touchstone | | | Touchstone | |
| | | Touchstone | | | International | | | Large Cap | | | Small | |
| | | Balanced | | | Equity | | | Focused | | | Company | |
| | | Fund(B) | | | Fund(B) | | | Fund(B) | | | Fund(B) | |
| Investment Income | | | | | | | | | | | | | | | | |
| Dividends(A) | | $ | 5,463,132 | | | $ | 4,358,267 | | | $ | 39,950,628 | | | $ | 7,036,682 | |
| Interest | | | 1,340,373 | | | | 25,246 | | | | 246,474 | | | | 895,668 | |
| Income from securities loaned | | | — | | | | — | | | | — | | | | 7,151 | |
| Total Investment Income | | | 6,803,505 | | | | 4,383,513 | | | | 40,197,102 | | | | 7,939,501 | |
| Expenses | | | | | | | | | | | | | | | | |
| Investment advisory fees | | | 1,780,771 | | | | 1,339,833 | | | | 11,641,206 | | | | 7,434,256 | |
| Administration fees | | | 157,368 | | | | 90,849 | | | | 931,012 | | | | 548,434 | |
| Trustee and Compliance fees and expenses | | | 76,057 | | | | 44,721 | | | | 423,398 | | | | 273,364 | |
| Custody fees | | | 29,967 | | | | 55,449 | | | | 122,171 | | | | 76,059 | |
| Professional fees | | | 37,709 | | | | 42,062 | | | | 58,224 | | | | 53,558 | |
| Transfer Agent fees, Class A | | | 408,175 | | | | 329,763 | | | | 1,441,521 | | | | 1,277,202 | |
| Transfer Agent fees, Class C | | | 61,257 | | | | 24,600 | | | | 106,440 | | | | 173,352 | |
| Transfer Agent fees, Class Y | | | 14,595 | | | | 67,998 | | | | 420,749 | | | | 348,442 | |
| Transfer Agent fees, Institutional Class | | | — | | | | 34 | | | | 597 | | | | 31 | |
| Transfer Agent fees, Class R6 | | | — | | | | — | | | | — | | | | 794 | |
| Registration Fees, Class A | | | 17,492 | | | | 15,712 | | | | 33,111 | | | | 31,048 | |
| Registration Fees, Class C | | | 13,629 | | | | 13,691 | | | | 14,269 | | | | 17,591 | |
| Registration Fees, Class Y | | | 14,268 | | | | 24,994 | | | | 22,168 | | | | 31,359 | |
| Registration Fees, Institutional Class | | | — | | | | 270 | | | | 7,897 | | | | 454 | |
| Registration Fees, Class R6 | | | — | | | | — | | | | — | | | | 7,992 | |
| Reports to Shareholders, Class A | | | 9,679 | | | | 8,860 | | | | 45,348 | | | | 58,873 | |
| Reports to Shareholders, Class C | | | 7,089 | | | | 4,484 | | | | 10,500 | | | | 15,550 | |
| Reports to Shareholders, Class Y | | | 5,123 | | | | 9,925 | | | | 26,386 | | | | 33,398 | |
| Reports to Shareholders, Institutional Class | | | — | | | | 3,810 | | | | 5,990 | | | | 3,810 | |
| Reports to Shareholders, Class R6 | | | — | | | | — | | | | — | | | | 5,882 | |
| Distribution expenses, Class A | | | 675,286 | | | | 314,448 | | | | 3,379,466 | | | | 1,685,559 | |
| Distribution and shareholder servicing expenses, Class C | | | 456,057 | | | | 67,951 | | | | 815,288 | | | | 1,070,272 | |
| Other expenses | | | 33,020 | | | | 67,110 | | | | 156,731 | | | | 50,784 | |
| Total Expenses | | | 3,797,542 | | | | 2,526,564 | | | | 19,662,472 | | | | 13,198,064 | |
| Fees waived by the Advisor and/or Affiliates(C) | | | (28,413 | ) | | | (37,546 | ) | | | (94,117 | ) | | | (29,439 | ) |
| Net Expenses | | | 3,769,129 | | | | 2,489,018 | | | | 19,568,355 | | | | 13,168,625 | |
| Net Investment Income (Loss) | | | 3,034,376 | | | | 1,894,495 | | | | 20,628,747 | | | | (5,229,124 | ) |
| Realized and Unrealized Gains (Losses) on Investments | | | | | | | | | | | | | | | | |
| Net realized gains on investments(D) | | | 15,905,772 | | | | 7,331,990 | | | | 326,285,220 | | | | 125,291,363 | |
| Net realized gains (losses) on foreign currency transactions | | | 121 | | | | (82,018 | ) | | | 937 | | | | — | |
| Net change in unrealized appreciation (depreciation) on investments(E) | | | 30,193,699 | | | | 35,678,455 | | | | 77,569,795 | | | | 72,290,088 | |
| Net change in unrealized appreciation (depreciation) on foreign currency transactions | | | — | | | | 38,455 | | | | — | | | | — | |
| Net Realized and Unrealized Gains (Losses) on Investments | | | 46,099,592 | | | | 42,966,882 | | | | 403,855,952 | | | | 197,581,451 | |
| Change in Net Assets Resulting from Operations | | $ | 49,133,968 | | | $ | 44,861,377 | | | $ | 424,484,699 | | | $ | 192,352,327 | |
| | | $ | 39,841 | | | $ | 554,278 | | | $ | 486,517 | | | $ | 40,850 | |
| (A) | Net of foreign tax withholding of: |
| (B) | See Note 9 in Notes to Financial Statements. |
| (C) | See Note 4 in Notes to Financial Statements. |
| (D) | On November 28, 2017, the Large Cap Focused Fund had a redemption-in-kind of securities in the amount of $17,324,054. Net realized gains on investments includes the realized gain on the transaction of $14,298,673, which will not be realized by the Fund for tax purposes. |
| (E) | Includes change in deferred foreign capital gains tax of $(675,346) for the International Equity Fund. |
| | |
| | See accompanying Notes to Financial Statements. |
Statements of Changes in Net Assets
| | | | | | Touchstone | |
| | | Touchstone | | | International | |
| | | Balanced | | | Equity | |
| | | Fund(A) | | | Fund(A) | |
| | | For the Year | | | For the Year | | | For the Year | | | For the Year | |
| | | Ended | | | Ended | | | Ended | | | Ended | |
| | | November 30, | | | November 30, | | | November 30, | | | November 30, | |
| | | 2017 | | | 2016 | | | 2017 | | | 2016 | |
| From Operations | | | | | | | | | | | | | | | | |
| Net investment income (loss) | | $ | 3,034,376 | | | $ | 3,476,233 | | | $ | 1,894,495 | | | $ | 1,716,938 | |
| Net realized gains (losses) on investments and foreign currency transactions | | | 15,905,893 | | | | 2,775,604 | | | | 7,249,972 | | | | (534,656 | ) |
| Net change in unrealized appreciation (depreciation) on investments and foreign currency transactions | | | 30,193,699 | | | | 8,122,265 | | | | 35,716,910 | | | | (9,079,558 | ) |
| Change in Net Assets from Operations | | | 49,133,968 | | | | 14,374,102 | | | | 44,861,377 | | | | (7,897,276 | ) |
| Distributions to Shareholders from: | | | | | | | | | | | | | | | | |
| Net investment income, Class A | | | (3,241,942 | ) | | | (5,903,448 | ) | | | (764,365 | ) | | | (813,762 | ) |
| Net investment income, Class C | | | (199,892 | ) | | | (557,296 | ) | | | — | | | | — | |
| Net investment income, Class Y | | | (283,053 | ) | | | (306,472 | ) | | | (486,213 | ) | | | (163,018 | ) |
| Net investment income, Institutional Class | | | — | | | | — | | | | — | | | | — | |
| Net realized gains, Class A | | | (1,736,894 | ) | | | (8,375,703 | ) | | | — | | | | (3,278,878 | ) |
| Net realized gains, Class C | | | (284,357 | ) | | | (1,138,389 | ) | | | — | | | | (146,299 | ) |
| Net realized gains, Class Y | | | (102,948 | ) | | | (402,692 | ) | | | — | | | | (435,123 | ) |
| Net realized gains, Institutional Class | | | — | | | | — | | | | — | | | | — | |
| Net realized gains, Class R6 | | | — | | | | — | | | | — | | | | — | |
| Total Distributions | | | (5,849,086 | ) | | | (16,684,000 | ) | | | (1,250,578 | ) | | | (4,837,080 | ) |
| | | | | | | | | | | | | | | | | |
| Net Increase (Decrease) from Share Transactions(B) | | | (33,445,071 | ) | | | 13,554,035 | | | | (5,244,715 | ) | | | 40,844,204 | |
| | | | | | | | | | | | | | | | | |
| Total Increase (Decrease) in Net Assets | | | 9,839,811 | | | | 11,244,137 | | | | 38,366,084 | | | | 28,109,848 | |
| Net Assets | | | | | | | | | | | | | | | | |
| Beginning of period | | | 322,453,507 | | | | 311,209,370 | | | | 161,020,363 | | | | 132,910,515 | |
| End of period | | $ | 332,293,318 | | | $ | 322,453,507 | | | $ | 199,386,447 | | | $ | 161,020,363 | |
| Accumulated Net Investment Income (Loss) | | $ | 306,053 | | | $ | 590,626 | | | $ | 1,037,307 | | | $ | 475,407 | |
| (A) | See Note 9 in Notes to Financial Statements. |
| (B) | For details on share transactions by class, see Statements of Changes in Net Assets - Capital Stock Activity on pages 36 - 37. |
See accompanying Notes to Financial Statements.
Statements of Changes in Net Assets (Continued)
| | | | Touchstone | |
| Touchstone | | | Small | |
| Large Cap | | | Company | |
| Focused Fund(A) | | | Fund(A) | |
| For the Year | | | For the Year | | | For the Year | | | For the Year | |
| Ended | | | Ended | | | Ended | | | Ended | |
| November 30, | | | November 30, | | | November 30, | | | November 30, | |
| 2017 | | | 2016 | | | 2017 | | | 2016 | |
| | | | | | | | | | | |
| $ | 20,628,747 | | | $ | 28,782,872 | | | $ | (5,229,124 | ) | | $ | (3,537,031 | ) |
| | 326,286,157 | | | | 115,779,861 | | | | 125,291,363 | | | | 89,651,921 | |
| | 77,569,795 | | | | 5,723,736 | | | | 72,290,088 | | | | 34,009,436 | |
| | 424,484,699 | | | | 150,286,469 | | | | 192,352,327 | | | | 120,124,326 | |
| | | | | | | | | | | | | | | |
| | (15,710,842 | ) | | | (35,777,405 | ) | | | — | | | | — | |
| | (349,488 | ) | | | (1,690,016 | ) | | | — | | | | — | |
| | (7,901,170 | ) | | | (19,023,933 | ) | | | — | | | | — | |
| | (519,211 | ) | | | (588,231 | ) | | | — | | | | — | |
| | (77,329,736 | ) | | | (88,022,127 | ) | | | (54,250,628 | ) | | | (99,287,043 | ) |
| | (5,018,041 | ) | | | (5,826,909 | ) | | | (13,229,732 | ) | | | (24,962,262 | ) |
| | (31,927,617 | ) | | | (42,756,022 | ) | | | (20,710,154 | ) | | | (34,832,569 | ) |
| | (1,506,542 | ) | | | (1,116,259 | ) | | | — | | | | — | |
| | — | | | | — | | | | (1,025,672 | ) | | | (106,313 | ) |
| | (140,262,647 | ) | | | (194,800,902 | ) | | | (89,216,186 | ) | | | (159,188,187 | ) |
| | | | | | | | | | | | | | | |
| | (421,767,332 | ) | | | (152,606,260 | ) | | | 66,295,636 | | | | 179,997,957 | |
| | | | | | | | | | | | | | | |
| | (137,545,280 | ) | | | (197,120,693 | ) | | | 169,431,777 | | | | 140,934,096 | |
| | | | | | | | | | | | | | | |
| | 2,016,643,657 | | | | 2,213,764,350 | | | | 1,067,131,879 | | | | 926,197,783 | |
| $ | 1,879,098,377 | | | $ | 2,016,643,657 | | | $ | 1,236,563,656 | | | $ | 1,067,131,879 | |
| $ | 2,586,763 | | | $ | 6,778,552 | | | $ | — | | | $ | (3,393,354 | ) |
Statements of Changes in Net Assets - Capital Stock Activity
| | | Touchstone Balanced Fund(A) | | | Touchstone International Equity Fund(A) | |
| | | For the | | | For the | | | For the | | | For the | |
| | | Year Ended | | | Year Ended | | | Year Ended | | | Year Ended | |
| | | November 30, 2017 | | | November 30, 2016 | | | November 30, 2017 | | | November 30, 2016 | |
| | | Shares | | | Dollars | | | Shares | | | Dollars | | | Shares | | | Dollars | | | Shares | | | Dollars | |
| Class A | | | | | | | | | | | | | | | | | | | | | | | | | | | | | | | | |
| Proceeds from Shares issued | | | 1,213,883 | | | $ | 25,250,539 | | | | 1,565,029 | | | $ | 29,691,528 | | | | 1,311,801 | | | $ | 23,285,877 | | | | 1,553,659 | | | $ | 25,111,407 | |
| Proceeds from Shares issued in connection with reorganization(B) | | | — | | | | — | | | | — | | | | — | | | | — | | | | — | | | | — | | | | — | |
| Reinvestment of distributions | | | 232,528 | | | | 4,719,857 | | | | 714,717 | | | | 13,537,834 | | | | 44,226 | | | | 688,604 | | | | 243,606 | | | | 3,919,623 | |
| Cost of Shares redeemed | | | (3,376,990 | ) | | | (71,336,387 | ) | | | (2,065,116 | ) | | | (39,491,955 | ) | | | (2,162,637 | ) | | | (38,654,321 | ) | | | (1,107,176 | ) | | | (17,785,789 | ) |
| Change from Class A Share Transactions | | | (1,930,579 | ) | | | (41,365,991 | ) | | | 214,630 | | | | 3,737,407 | | | | (806,610 | ) | | | (14,679,840 | ) | | | 690,089 | | | | 11,245,241 | |
| Class C | | | | | | | | | | | | | | | | | | | | | | | | | | | | | | | | |
| Proceeds from Shares issued | | | 380,017 | | | | 7,809,067 | | | | 674,076 | | | | 12,858,314 | | | | 133,628 | | | | 2,213,614 | | | | 151,705 | | | | 2,310,222 | |
| Proceeds from Shares issued in connection with reorganization(B) | | | — | | | | — | | | | — | | | | — | | | | — | | | | — | | | | — | | | | — | |
| Reinvestment of distributions | | | 22,578 | | | | 454,129 | | | | 83,917 | | | | 1,594,901 | | | | — | | | | — | | | | 9,255 | | | | 142,064 | |
| Cost of Shares redeemed | | | (679,379 | ) | | | (14,377,072 | ) | | | (348,665 | ) | | | (6,674,997 | ) | | | (159,419 | ) | | | (2,683,483 | ) | | | (54,798 | ) | | | (835,594 | ) |
| Change from Class C Share Transactions | | | (276,784 | ) | | | (6,113,876 | ) | | | 409,328 | | | | 7,778,218 | | | | (25,791 | ) | | | (469,869 | ) | | | 106,162 | | | | 1,616,692 | |
| Class Y | | | | | | | | | | | | | | | | | | | | | | | | | | | | | | | | |
| Proceeds from Shares issued | | | 1,036,380 | | | | 21,843,739 | | | | 375,707 | | | | 7,158,331 | | | | 2,569,654 | | | | 45,276,408 | | | | 2,607,571 | | | | 41,542,080 | |
| Proceeds from Shares issued in connection with reorganization(B) | | | — | | | | — | | | | — | | | | — | | | | — | | | | — | | | | — | | | | — | |
| Reinvestment of distributions | | | 15,954 | | | | 323,761 | | | | 32,255 | | | | 607,739 | | | | 30,455 | | | | 468,087 | | | | 34,334 | | | | 545,916 | |
| Cost of Shares redeemed | | | (390,115 | ) | | | (8,132,704 | ) | | | (304,459 | ) | | | (5,727,660 | ) | | | (1,976,731 | ) | | | (35,842,676 | ) | | | (901,887 | ) | | | (14,105,725 | ) |
| Change from Class Y Share Transactions | | | 662,219 | | | | 14,034,796 | | | | 103,503 | | | | 2,038,410 | | | | 623,378 | | | | 9,901,819 | | | | 1,740,018 | | | | 27,982,271 | |
| Institutional Class(C) | | | | | | | | | | | | | | | | | | | | | | | | | | | | | | | | |
| Proceeds from Shares issued | | | — | | | | — | | | | — | | | | — | | | | 167 | | | | 3,175 | | | | — | | | | — | |
| Reinvestment of distributions | | | — | | | | — | | | | — | | | | — | | | | — | | | | — | | | | — | | | | — | |
| Cost of Shares redeemed | | | — | | | | — | | | | — | | | | — | | | | — | | | | — | | | | — | | | | — | |
| Change from Institutional Class Share Transactions | | | — | | | | — | | | | — | | | | — | | | | 167 | | | | 3,175 | | | | — | | | | — | |
| Class R6 | | | | | | | | | | | | | | | | | | | | | | | | | | | | | | | | |
| Proceeds from Shares issued | | | — | | | | — | | | | — | | | | — | | | | — | | | | — | | | | — | | | | — | |
| Reinvestment of distributions | | | — | | | | — | | | | — | | | | — | | | | — | | | | — | | | | — | | | | — | |
| Cost of Shares redeemed | | | — | | | | — | | | | — | | | | — | | | | — | | | | — | | | | — | | | | — | |
| Change from Class R6 Share Transactions | | | — | | | | — | | | | — | | | | — | | | | — | | | | — | | | | — | | | | — | |
| Change from Share Transactions | | | (1,545,144 | ) | | $ | (33,445,071 | ) | | | 727,461 | | | $ | 13,554,035 | | | | (208,856 | ) | | $ | (5,244,715 | ) | | | 2,536,269 | | | $ | 40,844,204 | |
| (A) | See Note 9 in Notes to Financial Statements. |
| (B) | See Note 9 for specific details of the Plan of Reorganization. The reorganization was completed following the close of business on March 30, 2016 by a tax-free exchange of 5,792,669 shares of the Sentinel Mid Cap Fund Class A for 21,750,338 shares of the Sentinel Small Company Fund (the “Predecessor Fund” to the Touchstone Small Company Fund) Class A , a merger conversion ratio of 3.75480448; 746,855 shares of the Sentinel Mid Cap Fund Class C for 3,030,573 shares of the Predecessor Fund Class C, a merger conversion ratio of 4.05778094; 306,597 shares of the Sentinel Mid Cap Fund Class I for 1,122,267 shares of the Predecessor Fund Class I, a merger conversion ratio of 3.66039781; and none for the Predecessor Fund Class R6 because the Sentinel Mid Cap Fund did not offer a comparable share class. |
| (C) | The International Equity Fund and Small Company Fund began issuing Institutional Class shares on October 30, 2017. |
See accompanying Notes to Financial Statements.
Statements of Changes in Net Assets - Capital Stock Activity (Continued)
| Touchstone Large Cap Focused Fund(A) | | | Touchstone Small Company Fund(A) | |
| For the | | | For the | | | For the | | | For the | |
| Year Ended | | | Year Ended | | | Year Ended | | | Year Ended | |
| November 30, 2017 | | | November 30, 2016 | | | November 30, 2017 | | | November 30, 2016 | |
| Shares | | | Dollars | | | Shares | | | Dollars | | | Shares | | | Dollars | | | Shares | | | Dollars | |
| | | | | | | | | | | | | | | | | | | | | | | |
| | 1,459,660 | | | $ | 63,541,135 | | | | 2,011,742 | | | $ | 79,630,789 | | | | 12,736,974 | | | $ | 64,922,273 | | | | 13,503,919 | | | $ | 61,857,550 | |
| | — | | | | — | | | | — | | | | — | | | | — | | | | — | | | | 21,750,338 | | | | 97,558,873 | |
| | 1,998,894 | | | | 82,231,470 | | | | 2,743,659 | | | | 108,807,856 | | | | 10,260,090 | | | | 50,274,442 | | | | 20,377,103 | | | | 91,333,636 | |
| | (8,302,661 | ) | | | (368,083,987 | ) | | | (5,680,117 | ) | | | (227,322,184 | ) | | | (35,156,499 | ) | | | (181,071,810 | ) | | | (30,416,453 | ) | | | (140,182,495 | ) |
| | (4,844,107 | ) | | | (222,311,382 | ) | | | (924,716 | ) | | | (38,883,539 | ) | | | (12,159,435 | ) | | | (65,875,095 | ) | | | 25,214,907 | | | | 110,567,564 | |
| | | | | | | | | | | | | | | | | | | | | | | | | | | | | | | |
| | 211,838 | | | | 8,585,918 | | | | 229,138 | | | | 8,735,036 | | | | 4,275,835 | | | | 13,492,231 | | | | 3,214,030 | | | | 9,681,443 | |
| | — | | | | — | | | | — | | | | — | | | | — | | | | — | | | | 3,030,573 | | | | 8,942,615 | |
| | 130,769 | | | | 5,107,041 | | | | 187,505 | | | | 7,117,912 | | | | 4,154,959 | | | | 12,714,176 | | | | 8,091,895 | | | | 23,881,812 | |
| | (806,388 | ) | | | (34,030,006 | ) | | | (531,259 | ) | | | (20,322,699 | ) | | | (11,339,284 | ) | | | (36,511,088 | ) | | | (8,674,499 | ) | | | (26,656,802 | ) |
| | (463,781 | ) | | | (20,337,047 | ) | | | (114,616 | ) | | | (4,469,751 | ) | | | (2,908,490 | ) | | | (10,304,681 | ) | | | 5,661,999 | | | | 15,849,068 | |
| | | | | | | | | | | | | | | | | | | | | | | | | | | | | | | |
| | 2,583,052 | | | | 111,976,965 | | | | 2,399,401 | | | | 95,152,331 | | | | 33,014,830 | | | | 182,189,524 | | | | 16,511,503 | | | | 81,203,549 | |
| | — | | | | — | | | | — | | | | — | | | | — | | | | — | | | | 1,122,267 | | | | 5,382,625 | |
| | 781,425 | | | | 32,153,805 | | | | 1,261,092 | | | | 49,976,190 | | | | 3,158,900 | | | | 16,678,996 | | | | 5,753,132 | | | | 27,513,172 | |
| | (7,436,364 | ) | | | (331,943,211 | ) | | | (6,597,450 | ) | | | (266,012,904 | ) | | | (18,800,069 | ) | | | (104,298,111 | ) | | | (14,489,625 | ) | | | (71,757,069 | ) |
| | (4,071,887 | ) | | | (187,812,441 | ) | | | (2,936,957 | ) | | | (120,884,383 | ) | | | 17,373,661 | | | | 94,570,409 | | | | 8,897,277 | | | | 42,342,277 | |
| | | | | | | | | | | | | | | | | | | | | | | | | | | | | | | |
| | 1,083,816 | | | | 49,314,099 | | | | 519,016 | | | | 21,445,402 | | | | 431 | | | | 2,500 | | | | — | | | | — | |
| | 48,834 | | | | 2,025,753 | | | | 42,879 | | | | 1,704,490 | | | | — | | | | — | | | | — | | | | — | |
| | (923,130 | ) | | | (42,646,314 | ) | | | (277,504 | ) | | | (11,518,479 | ) | | | — | | | | — | | | | — | | | | — | |
| | 209,520 | | | | 8,693,538 | | | | 284,391 | | | | 11,631,413 | | | | 431 | | | | 2,500 | | | | — | | | | — | |
| | | | | | | | | | | | | | | | | | | | | | | | | | | | | | | |
| | — | | | | — | | | | — | | | | — | | | | 11,135,743 | | | | 58,124,146 | | | | 2,539,283 | | | | 12,035,697 | |
| | — | | | | — | | | | — | | | | — | | | | 206,788 | | | | 1,025,672 | | | | 23,450 | | | | 106,313 | |
| | — | | | | — | | | | — | | | | — | | | | (2,126,522 | ) | | | (11,247,315 | ) | | | (189,301 | ) | | | (902,962 | ) |
| | — | | | | — | | | | — | | | | — | | | | 9,216,009 | | | | 47,902,503 | | | | 2,373,432 | | | | 11,239,048 | |
| | (9,170,255 | ) | | $ | (421,767,332 | ) | | | (3,691,898 | ) | | $ | (152,606,260 | ) | | | 11,522,176 | | | $ | 66,295,636 | | | | 42,147,615 | | | $ | 179,997,957 | |
Financial Highlights
Touchstone Balanced Fund—Class A
Selected Data for a Share Outstanding Throughout Each Period
| | | Year Ended November 30, | |
| | | 2017 | | | 2016 | | | 2015 | | | 2014 | | | 2013 | |
| Net asset value at beginning of period | | $ | 19.68 | | | $ | 19.87 | | | $ | 20.98 | | | $ | 20.23 | | | $ | 18.03 | |
| Income (loss) from investment operations: | | | | | | | | | | | | | | | | | | | | |
| Net investment income | | | 0.21 | | | | 0.23 | (A) | | | 0.43 | (A) | | | 0.26 | (A) | | | 0.23 | (A) |
| Net realized and unrealized gains (losses) on investments | | | 2.89 | | | | 0.66 | | | | (0.35 | ) | | | 1.50 | | | | 2.91 | |
| Total from investment operations | | | 3.10 | | | | 0.89 | | | | 0.08 | | | | 1.76 | | | | 3.14 | |
| Distributions from: | | | | | | | | | | | | | | | | | | | | |
| Net investment income | | | (0.25 | ) | | | (0.44 | ) | | | (0.30 | ) | | | (0.26 | ) | | | (0.26 | ) |
| Realized capital gains | | | (0.13 | ) | | | (0.64 | ) | | | (0.89 | ) | | | (0.75 | ) | | | (0.68 | ) |
| Total distributions | | | (0.38 | ) | | | (1.08 | ) | | | (1.19 | ) | | | (1.01 | ) | | | (0.94 | ) |
| Net asset value at end of period | | $ | 22.40 | | | $ | 19.68 | | | $ | 19.87 | | | $ | 20.98 | | | $ | 20.23 | |
| Total return(B) | | | 15.95 | % | | | 4.75 | % | | | 0.56 | % | | | 9.10 | % | | | 18.15 | % |
| Ratios and supplemental data: | | | | | | | | | | | | | | | | | | | | |
| Net assets at end of period (000's) | | $ | 258,279 | | | $ | 264,910 | | | $ | 263,276 | | | $ | 278,385 | | | $ | 267,627 | |
| Ratio to average net assets: | | | | | | | | | | | | | | | | | | | | |
| Net expenses | | | 1.03 | % | | | 1.01 | % | | | 1.04 | % | | | 1.07 | % | | | 1.06 | % |
| Gross expenses | | | 1.04 | % | | | 1.01 | % | | | 1.04 | % | | | 1.07 | % | | | 1.06 | % |
| Net investment income | | | 0.99 | % | | | 1.20 | % | | | 2.17 | %(C) | | | 1.29 | % | | | 1.22 | % |
| Portfolio turnover rate | | | 46 | % | | | 45 | % | | | 86 | % | | | 94 | % | | | 154 | % |
Touchstone Balanced Fund—Class C
Selected Data for a Share Outstanding Throughout Each Period
| | | Year Ended November 30, | |
| | | 2017 | | | 2016 | | | 2015 | | | 2014 | | | 2013 | |
| Net asset value at beginning of period | | $ | 19.73 | | | $ | 19.93 | | | $ | 21.04 | | | $ | 20.27 | | | $ | 18.07 | |
| Income (loss) from investment operations: | | | | | | | | | | | | | | | | | | | | |
| Net investment income | | | 0.04 | | | | 0.08 | (A) | | | 0.28 | (A) | | | 0.11 | (A) | | | 0.08 | (A) |
| Net realized and unrealized gains (losses) on investments | | | 2.91 | | | | 0.66 | | | | (0.35 | ) | | | 1.51 | | | | 2.91 | |
| Total from investment operations | | | 2.95 | | | | 0.74 | | | | (0.07 | ) | | | 1.62 | | | | 2.99 | |
| Distributions from: | | | | | | | | | | | | | | | | | | | | |
| Net investment income | | | (0.09 | ) | | | (0.30 | ) | | | (0.15 | ) | | | (0.10 | ) | | | (0.11 | ) |
| Realized capital gains | | | (0.13 | ) | | | (0.64 | ) | | | (0.89 | ) | | | (0.75 | ) | | | (0.68 | ) |
| Total distributions | | | (0.22 | ) | | | (0.94 | ) | | | (1.04 | ) | | | (0.85 | ) | | | (0.79 | ) |
| Net asset value at end of period | | $ | 22.46 | | | $ | 19.73 | | | $ | 19.93 | | | $ | 21.04 | | | $ | 20.27 | |
| Total return(B) | | | 15.09 | % | | | 3.91 | % | | | (0.23 | %) | | | 8.34 | % | | | 17.19 | % |
| Ratios and supplemental data: | | | | | | | | | | | | | | | | | | | | |
| Net assets at end of period (000's) | | $ | 42,800 | | | $ | 43,066 | | | $ | 35,344 | | | $ | 32,002 | | | $ | 30,647 | |
| Ratio to average net assets: | | | | | | | | | | | | | | | | | | | | |
| Net expenses | | | 1.79 | % | | | 1.78 | % | | | 1.82 | % | | | 1.82 | % | | | 1.86 | % |
| Gross expenses | | | 1.81 | % | | | 1.78 | % | | | 1.82 | % | | | 1.82 | % | | | 1.86 | % |
| Net investment income | | | 0.23 | % | | | 0.43 | % | | | 1.39 | %(C) | | | 0.53 | % | | | 0.42 | % |
| Portfolio turnover rate | | | 46 | % | | | 45 | % | | | 86 | % | | | 94 | % | | | 154 | % |
| (A) | The net investment income per share is based on average shares outstanding for the period. |
| (B) | Total returns shown exclude the effect of applicable sales loads. If these charges were included, the returns would be lower. |
| (C) | Includes the impact of special dividends resulting from an acquisition of Covidien plc by Medtronic, Inc. on January 26, 2015 through the formation of a new holding company, Medtronic plc, incorporated in Ireland. These special dividends enhanced the ratios of net investment income for Class A and Class C shares by 0.86% for the fiscal year ended November 30, 2015. |
See accompanying Notes to Financial Statements.
Financial Highlights (Continued)
Touchstone Balanced Fund— Class Y(A)
Selected Data for a Share Outstanding Throughout Each Period
| | | Year Ended November 30, |
| | | 2017 | | | 2016 | | | 2015 | | | 2014 | | | 2013 | |
| Net asset value at beginning of period | | $ | 19.57 | | | $ | 19.78 | | | $ | 20.90 | | | $ | 20.15 | | | $ | 17.95 | |
| Income (loss) from investment operations: | | | | | | | | | | | | | | | | | | | | |
| Net investment income | | | 0.28 | | | | 0.27 | (B) | | | 0.47 | (B) | | | 0.31 | (B) | | | 0.28 | (B) |
| Net realized and unrealized gains (losses) on investments | | | 2.84 | | | | 0.65 | | | | (0.34 | ) | | | 1.50 | | | | 2.89 | |
| Total from investment operations | | | 3.12 | | | | 0.92 | | | | 0.13 | | | | 1.81 | | | | 3.17 | |
| Distributions from: | | | | | | | | | | | | | | | | | | | | |
| Net investment income | | | (0.30 | ) | | | (0.49 | ) | | | (0.36 | ) | | | (0.31 | ) | | | (0.29 | ) |
| Realized capital gains | | | (0.13 | ) | | | (0.64 | ) | | | (0.89 | ) | | | (0.75 | ) | | | (0.68 | ) |
| Total distributions | | | (0.43 | ) | | | (1.13 | ) | | | (1.25 | ) | | | (1.06 | ) | | | (0.97 | ) |
| Net asset value at end of period | | $ | 22.26 | | | $ | 19.57 | | | $ | 19.78 | | | $ | 20.90 | | | $ | 20.15 | |
| Total return | | | 16.20 | % | | | 4.94 | % | | | 0.79 | % | | | 9.43 | % | | | 18.46 | % |
| Ratios and supplemental data: | | | | | | | | | | | | | | | | | | | | |
| Net assets at end of period (000’s) | | $ | 31,215 | | | $ | 14,477 | | | $ | 12,589 | | | $ | 17,062 | | | $ | 20,468 | |
| Ratio to average net assets: | | | | | | | | | | | | | | | | | | | | |
| Net expenses | | | 0.78 | % | | | 0.81 | % | | | 0.81 | % | | | 0.80 | % | | | 0.77 | % |
| Gross expenses | | | 0.80 | % | | | 0.81 | % | | | 0.81 | % | | | 0.80 | % | | | 0.77 | % |
| Net investment income | | | 1.25 | % | | | 1.41 | % | | | 2.39 | %(C) | | | 1.55 | % | | | 1.50 | % |
| Portfolio turnover rate | | | 46 | % | | | 45 | % | | | 86 | % | | | 94 | % | | | 154 | % |
| (A) | Effective October 28, 2017, Class I shares of the Sentinel Balanced Fund (the “Predecessor Fund”) were reorganized into Class Y shares of the Fund. |
| (B) | The net investment income per share is based on average shares outstanding for the period. |
| (C) | Includes the impact of special dividends resulting from an acquisition of Covidien plc by Medtronic, Inc. on January 26, 2015 through the formation of a new holding company, Medtronic plc, incorporated in Ireland. These special dividends enhanced the ratios of net investment income for Class Y shares by 0.86% for the fiscal year ended November 30, 2015. |
See accompanying Notes to Financial Statements.
Financial Highlights (Continued)
Touchstone International Equity Fund—Class A
Selected Data for a Share Outstanding Throughout Each Period
| | | Year Ended November 30, |
| | | 2017 | | | 2016 | | | 2015 | | | 2014 | | | 2013 | |
| Net asset value at beginning of period | | $ | 15.52 | | | $ | 16.92 | | | $ | 19.61 | | | $ | 20.18 | | | $ | 16.03 | |
| Income (loss) from investment operations: | | | | | | | | | | | | | | | | | | | | |
| Net investment income | | | 0.17 | | | | 0.18 | (A) | | | 0.13 | (A) | | | 0.25 | (A) | | | 0.16 | (A) |
| Net realized and unrealized gains (losses) on investments | | | 4.05 | | | | (0.97 | ) | | | 0.47 | | | | (0.61 | ) | | | 4.13 | |
| Total from investment operations | | | 4.22 | | | | (0.79 | ) | | | 0.60 | | | | (0.36 | ) | | | 4.29 | |
| Distributions from: | | | | | | | | | | | | | | | | | | | | |
| Net investment income | | | (0.10 | ) | | | (0.12 | ) | | | (0.34 | ) | | | (0.21 | ) | | | (0.14 | ) |
| Realized capital gains | | | — | | | | (0.49 | ) | | | (2.95 | ) | | | — | | | | — | |
| Total distributions | | | (0.10 | ) | | | (0.61 | ) | | | (3.29 | ) | | | (0.21 | ) | | | (0.14 | ) |
| Net asset value at end of period | | $ | 19.64 | | | $ | 15.52 | | | $ | 16.92 | | | $ | 19.61 | | | $ | 20.18 | |
| Total return(B) | | | 27.39 | % | | | (4.81 | %) | | | 4.49 | % | | | (1.81 | %) | | | 26.93 | % |
| Ratios and supplemental data: | | | | | | | | | | | | | | | | | | | | |
| Net assets at end of period (000’s) | | $ | 129,139 | | | $ | 114,616 | | | $ | 113,212 | | | $ | 115,216 | | | $ | 122,646 | |
| Ratio to average net assets: | | | | | | | | | | | | | | | | | | | | |
| Net expenses | | | 1.37 | % | | | 1.36 | % | | | 1.41 | % | | | 1.41 | % | | | 1.44 | % |
| Gross expenses | | | 1.39 | % | | | 1.36 | % | | | 1.41 | % | | | 1.41 | % | | | 1.44 | % |
| Net investment income | | | 0.92 | % | | | 1.11 | % | | | 0.76 | % | | | 1.22 | % | | | 0.91 | % |
| Portfolio turnover rate | | | 37 | % | | | 36 | % | | | 55 | % | | | 50 | % | | | 52 | % |
Touchstone International Equity Fund— Class C
Selected Data for a Share Outstanding Throughout Each Period
| | | Year Ended November 30, |
| | | 2017 | | | 2016 | | | 2015 | | | 2014 | | | 2013 | |
| Net asset value at beginning of period | | $ | 14.66 | | | $ | 16.06 | | | $ | 18.71 | | | $ | 19.34 | | | $ | 15.49 | |
| Income (loss) from investment operations: | | | | | | | | | | | | | | | | | | | | |
| Net investment loss | | | (0.06 | ) | | | (0.01 | )(A) | | | (0.10 | )(A) | | | (0.04 | )(A) | | | (0.11 | )(A) |
| Net realized and unrealized gains (losses) on investments | | | 3.86 | | | | (0.90 | ) | | | 0.47 | | | | (0.59 | ) | | | 3.97 | |
| Total from investment operations | | | 3.80 | | | | (0.91 | ) | | | 0.37 | | | | (0.63 | ) | | | 3.86 | |
| Distributions from: | | | | | | | | | | | | | | | | | | | | |
| Net investment income | | | — | | | | — | | | | (0.07 | ) | | | — | | | | (0.01 | ) |
| Realized capital gains | | | — | | | | (0.49 | ) | | | (2.95 | ) | | | — | | | | — | |
| Total distributions | | | — | | | | (0.49 | ) | | | (3.02 | ) | | | — | | | | (0.01 | ) |
| Net asset value at end of period | | $ | 18.46 | | | $ | 14.66 | | | $ | 16.06 | | | $ | 18.71 | | | $ | 19.34 | |
| Total return(B) | | | 25.92 | % | | | (5.82 | %) | | | 3.14 | % | | | (3.26 | %) | | | 24.92 | % |
| Ratios and supplemental data: | | | | | | | | | | | | | | | | | | | | |
| Net assets at end of period (000’s) | | $ | 6,924 | | | $ | 5,876 | | | $ | 4,732 | | | $ | 3,581 | | | $ | 3,634 | |
| Ratio to average net assets: | | | | | | | | | | | | | | | | | | | | |
| Net expenses | | | 2.45 | % | | | 2.49 | % | | | 2.70 | % | | | 2.86 | % | | | 3.04 | % |
| Gross expenses | | | 2.49 | % | | | 2.49 | % | | | 2.70 | % | | | 2.86 | % | | | 3.04 | % |
| Net investment loss | | | (0.16 | %) | | | (0.04 | %) | | | (0.60 | %) | | | (0.23 | %) | | | (0.66 | %) |
| Portfolio turnover rate | | | 37 | % | | | 36 | % | | | 55 | % | | | 50 | % | | | 52 | % |
| (A) | The net investment income (loss) per share is based on average shares outstanding for the period. |
| (B) | Total returns shown exclude the effect of applicable sales loads. If these charges were included, the returns would be lower. |
See accompanying Notes to Financial Statements.
Financial Highlights (Continued)
Touchstone International Equity Fund—Class Y(A)
Selected Data for a Share Outstanding Throughout Each Period
| | | Year Ended November 30, |
| | | 2017 | | | 2016 | | | 2015 | | | 2014 | | | 2013 | |
| Net asset value at beginning of period | | $ | 15.40 | | | $ | 16.79 | | | $ | 19.53 | | | $ | 20.13 | | | $ | 15.99 | |
| Income (loss) from investment operations: | | | | | | | | | | | | | | | | | | | | |
| Net investment income | | | 0.25 | | | | 0.23 | (B) | | | 0.18 | (B) | | | 0.38 | (B) | | | 0.26 | (B) |
| Net realized and unrealized gains (losses) on investments | | | 3.98 | | | | (0.95 | ) | | | 0.47 | | | | (0.65 | ) | | | 4.11 | |
| Total from investment operations | | | 4.23 | | | | (0.72 | ) | | | 0.65 | | | | (0.27 | ) | | | 4.37 | |
| Distributions from: | | | | | | | | | | | | | | | | | | | | |
| Net investment income | | | (0.18 | ) | | | (0.18 | ) | | | (0.44 | ) | | | (0.33 | ) | | | (0.23 | ) |
| Realized capital gains | | | — | | | | (0.49 | ) | | | (2.95 | ) | | | — | | | | — | |
| Total distributions | | | (0.18 | ) | | | (0.67 | ) | | | (3.39 | ) | | | (0.33 | ) | | | (0.23 | ) |
| Net asset value at end of period | | $ | 19.45 | | | $ | 15.40 | | | $ | 16.79 | | | $ | 19.53 | | | $ | 20.13 | |
| Total return | | | 27.78 | % | | | (4.41 | %) | | | 4.89 | % | | | (1.39 | %) | | | 27.64 | % |
| Ratios and supplemental data: | | | | | | | | | | | | | | | | | | | | |
| Net assets at end of period (000’s) | | $ | 63,320 | | | $ | 40,528 | | | $ | 14,967 | | | $ | 10,997 | | | $ | 34,561 | |
| Ratio to average net assets: | | | | | | | | | | | | | | | | | | | | |
| Net expenses | | | 1.01 | % | | | 0.99 | % | | | 1.02 | % | | | 0.92 | % | | | 0.89 | % |
| Gross expenses | | | 1.03 | % | | | 0.99 | % | | | 1.02 | % | | | 0.92 | % | | | 0.89 | % |
| Net investment income | | | 1.28 | % | | | 1.45 | % | | | 1.05 | % | | | 1.91 | % | | | 1.48 | % |
| Portfolio turnover rate | | | 37 | % | | | 36 | % | | | 55 | % | | | 50 | % | | | 52 | % |
Touchstone International Equity Fund—Institutional Class
Selected Data for a Share Outstanding Throughout The Period
| | | Period Ended |
| | | November 30, |
| | | 2017(C) |
| Net asset value at beginning of period | | $ | 18.91 | |
| Income from investment operations: | | | | |
| Net investment income | | | 0.02 | |
| Net realized and unrealized gains on investments | | | 0.53 | |
| Total from investment operations | | | 0.55 | |
| Net asset value at end of period | | $ | 19.46 | |
| Total return | | | 2.91 | %(D) |
| Ratios and supplemental data: | | | | |
| Net assets at end of period (000’s) | | $ | 3 | |
| Ratio to average net assets: | | | | |
| Net expenses | | | 0.89 | %(E) |
| Gross expenses | | | 1921.18 | %(E) |
| Net investment income | | | 1.40 | %(E) |
| Portfolio turnover rate | | | 37 | % |
| (A) | Effective October 28, 2017, Class I shares of the Sentinel International Equity Fund (the “Predecessor Fund”) were reorganized into Class Y shares of the Fund. |
| (B) | The net investment income per share is based on average shares outstanding for the period. |
| (C) | Represents the period from commencement of operations (October 30, 2017) through November 30, 2017. |
See accompanying Notes to Financial Statements.
Financial Highlights (Continued)
Touchstone Large Cap Focused Fund—Class A
Selected Data for a Share Outstanding Throughout Each Period
| | | Year Ended November 30, |
| | | 2017 | | | 2016 | | | 2015 | | | 2014 | | | 2013 | |
| Net asset value at beginning of period | | $ | 42.28 | | | $ | 43.08 | | | $ | 42.79 | | | $ | 43.31 | | | $ | 34.84 | |
| Income (loss) from investment operations: | | | | | | | | | | | | | | | | | | | | |
| Net investment income | | | 0.45 | | | | 0.53 | (A) | | | 1.01 | (A) | | | 0.56 | (A) | | | 0.44 | (A) |
| Net realized and unrealized gains (losses) on investments | | | 8.99 | | | | 2.43 | | | | (0.25 | ) | | | 4.97 | | | | 9.50 | |
| Total from investment operations | | | 9.44 | | | | 2.96 | | | | 0.76 | | | | 5.53 | | | | 9.94 | |
| Distributions from: | | | | | | | | | | | | | | | | | | | | |
| Net investment income | | | (0.51 | ) | | | (1.08 | ) | | | (0.45 | ) | | | (0.58 | ) | | | (0.43 | ) |
| Realized capital gains | | | (2.46 | ) | | | (2.68 | ) | | | (0.02 | ) | | | (5.47 | ) | | | (1.04 | ) |
| Total distributions | | | (2.97 | ) | | | (3.76 | ) | | | (0.47 | ) | | | (6.05 | ) | | | (1.47 | ) |
| Net asset value at end of period | | $ | 48.75 | | | $ | 42.28 | | | $ | 43.08 | | | $ | 42.79 | | | $ | 43.31 | |
| Total return(B) | | | 23.67 | % | | | 7.53 | % | | | 1.79 | % | | | 13.30 | % | | | 29.53 | % |
| Ratios and supplemental data: | | | | | | | | | | | | | | | | | | | | |
| Net assets at end of period (000’s) | | $ | 1,321,506 | | | $ | 1,350,861 | | | $ | 1,416,147 | | | $ | 1,577,546 | | | $ | 1,454,446 | |
| Ratio to average net assets: | | | | | | | | | | | | | | | | | | | | |
| Net expenses | | | 1.02 | % | | | 1.00 | % | | | 0.99 | % | | | 1.00 | % | | | 1.03 | % |
| Gross expenses | | | 1.02 | % | | | 1.00 | % | | | 0.99 | % | | | 1.00 | % | | | 1.03 | % |
| Net investment income | | | 0.98 | % | | | 1.32 | % | | | 2.36 | %(C) | | | 1.28 | % | | | 1.15 | % |
| Portfolio turnover rate | | | 12 | %(D) | | | 8 | % | | | 11 | % | | | 19 | % | | | 12 | % |
Touchstone Large Cap Focused Fund—Class C
Selected Data for a Share Outstanding Throughout Each Period
| | | Year Ended November 30, |
| | | 2017 | | | 2016 | | | 2015 | | | 2014 | | | 2013 | |
| Net asset value at beginning of period | | $ | 40.44 | | | $ | 41.36 | | | $ | 41.15 | | | $ | 41.82 | | | $ | 33.70 | |
| Income (loss) from investment operations: | | | | | | | | | | | | | | | | | | | | |
| Net investment income | | | — | (E) | | | 0.21 | (A) | | | 0.64 | (A) | | | 0.21 | (A) | | | 0.12 | (A) |
| Net realized and unrealized gains (losses) on investments | | | 8.67 | | | | 2.33 | | | | (0.24 | ) | | | 4.78 | | | | 9.18 | |
| Total from investment operations | | | 8.67 | | | | 2.54 | | | | 0.40 | | | | 4.99 | | | | 9.30 | |
| Distributions from: | | | | | | | | | | | | | | | | | | | | |
| Net investment income | | | (0.17 | ) | | | (0.78 | ) | | | (0.17 | ) | | | (0.19 | ) | | | (0.14 | ) |
| Realized capital gains | | | (2.46 | ) | | | (2.68 | ) | | | (0.02 | ) | | | (5.47 | ) | | | (1.04 | ) |
| Total distributions | | | (2.63 | ) | | | (3.46 | ) | | | (0.19 | ) | | | (5.66 | ) | | | (1.18 | ) |
| Net asset value at end of period | | $ | 46.48 | | | $ | 40.44 | | | $ | 41.36 | | | $ | 41.15 | | | $ | 41.82 | |
| Total return(B) | | | 22.69 | % | | | 6.71 | % | | | 0.98 | % | | | 12.40 | % | | | 28.47 | % |
| Ratios and supplemental data: | | | | | | | | | | | | | | | | | | | | |
| Net assets at end of period (000’s) | | $ | 74,122 | | | $ | 83,246 | | | $ | 89,890 | | | $ | 90,784 | | | $ | 78,259 | |
| Ratio to average net assets: | | | | | | | | | | | | | | | | | | | | |
| Net expenses | | | 1.82 | % | | | 1.79 | % | | | 1.78 | % | | | 1.79 | % | | | 1.84 | % |
| Gross expenses | | | 1.82 | % | | | 1.79 | % | | | 1.78 | % | | | 1.79 | % | | | 1.84 | % |
| Net investment income | | | 0.18 | % | | | 0.54 | % | | | 1.57 | %(C) | | | 0.50 | % | | | 0.32 | % |
| Portfolio turnover rate | | | 12 | %(D) | | | 8 | % | | | 11 | % | | | 19 | % | | | 12 | % |
| (A) | The net investment income per share is based on average shares outstanding for the period. |
| (B) | Total returns shown exclude the effect of applicable sales loads. If these charges were included, the returns would be lower. |
| (C) | Includes the impact of special dividends resulting from an acquisition of Covidien plc by Medtronic, Inc. on January 26, 2015 through the formation of a new holding company, Medtronic plc, incorporated in Ireland. These special dividends enhanced the ratios of net investment income for Class A and Class C shares by 1.22% for the fiscal year ended November 30, 2015. |
| (D) | Portfolio turnover rate excludes securities delivered from processing a redemption-in-kind. |
| (E) | Represents less than $0.005 per share. |
See accompanying Notes to Financial Statements.
Financial Highlights (Continued)
Touchstone Large Cap Focused Fund—Class Y(A)
Selected Data for a Share Outstanding Throughout Each Period
| | | Year Ended November 30, |
| | | 2017 | | | 2016 | | | 2015 | | | 2014 | | | 2013 | |
| Net asset value at beginning of period | | $ | 42.26 | | | $ | 43.06 | | | $ | 42.76 | | | $ | 43.31 | | | $ | 34.85 | |
| Income (loss) from investment operations: | | | | | | | | | | | | | | | | | | | | |
| Net Investment Income | | | 0.56 | | | | 0.64 | (B) | | | 1.12 | (B) | | | 0.68 | (B) | | | 0.56 | (B) |
| Net realized and unrealized gains (losses) on investments | | | 8.99 | | | | 2.43 | | | | (0.25 | ) | | | 4.97 | | | | 9.50 | |
| Total from investment operations | | | 9.55 | | | | 3.07 | | | | 0.87 | | | | 5.65 | | | | 10.06 | |
| Distributions from: | | | | | | | | | | | | | | | | | | | | |
| Net investment income | | | (0.63 | ) | | | (1.19 | ) | | | (0.55 | ) | | | (0.73 | ) | | | (0.56 | ) |
| Realized capital gains | | | (2.46 | ) | | | (2.68 | ) | | | (0.02 | ) | | | (5.47 | ) | | | (1.04 | ) |
| Total distributions | | | (3.09 | ) | | | (3.87 | ) | | | (0.57 | ) | | | (6.20 | ) | | | (1.60 | ) |
| Net asset value at end of period | | $ | 48.72 | | | $ | 42.26 | | | $ | 43.06 | | | $ | 42.76 | | | $ | 43.31 | |
| Total return | | | 24.03 | % | | | 7.84 | % | | | 2.07 | % | | | 13.61 | % | | | 29.93 | % |
| Ratios and supplemental data: | | | | | | | | | | | | | | | | | | | | |
| Net assets at end of period (000’s) | | $ | 438,732 | | | $ | 552,611 | | | $ | 689,502 | | | $ | 932,941 | | | $ | 941,223 | |
| Ratio to average net assets: | | | | | | | | | | | | | | | | | | | | |
| Net expenses | | | 0.74 | % | | | 0.72 | % | | | 0.71 | % | | | 0.72 | % | | | 0.72 | % |
| Gross expenses | | | 0.75 | % | | | 0.72 | % | | | 0.71 | % | | | 0.72 | % | | | 0.72 | % |
| Net Investment Income | | | 1.26 | % | | | 1.60 | % | | | 2.63 | %(C) | | | 1.55 | % | | | 1.45 | % |
| Portfolio turnover rate | | | 12 | %(D) | | | 8 | % | | | 11 | % | | | 19 | % | | | 12 | % |
Touchstone Large Cap Focused Fund— Institutional Class(E)
Selected Data for a Share Outstanding Throughout Each Period
| | | | | | | | | Period Ended |
| | | | | | | | | November |
| | | Year Ended November 30, | | | 30, |
| | | 2017 | | | 2016 | | | 2015(F) |
| Net asset value at beginning of period | | $ | 42.32 | | | $ | 43.11 | | | $ | 43.01 | |
| Income (loss) from investment operations: | | | | | | | | | | | | |
| Net investment income | | | 0.61 | | | | 0.70 | (B) | | | 1.07 | (B) |
| Net realized and unrealized gains (losses) on investments | | | 9.01 | | | | 2.41 | | | | (0.51 | ) |
| Total from investment operations | | | 9.62 | | | | 3.11 | | | | 0.56 | |
| Distributions from: | | | | | | | | | | | | |
| Net investment income | | | (0.67 | ) | | | (1.22 | ) | | | (0.46 | ) |
| Realized capital gains | | | (2.46 | ) | | | (2.68 | ) | | | — | |
| Total distributions | | | (3.13 | ) | | | (3.90 | ) | | | (0.46 | ) |
| Net asset value at end of period | | $ | 48.81 | | | $ | 42.32 | | | $ | 43.11 | |
| Total return | | | 24.14 | % | | | 7.92 | % | | | 1.31 | %(G) |
| Ratios and supplemental data: | | | | | | | | | | | | |
| Net assets at end of period (000’s) | | $ | 44,738 | | | $ | 29,927 | | | $ | 18,225 | |
| Ratio to average net assets: | | | | | | | | | | | | |
| Net expenses | | | 0.68 | % | | | 0.65 | % | | | 0.61 | %(H) |
| Gross expenses | | | 0.70 | % | | | 0.72 | % | | | 1.76 | %(H) |
| Net investment income | | | 1.32 | % | | | 1.72 | % | | | 2.65 | %(C)(H) |
| Portfolio turnover rate | | | 12 | %(D) | | | 8 | % | | | 11 | % |
| (A) | Effective October 28, 2017, Class I shares of the Sentinel Common Stock Fund (the “Predecessor Fund”) were reorganized into Class Y shares of the Fund. |
| (B) | The net investment income per share is based on average shares outstanding for the period. |
| (C) | Includes the impact of special dividends resulting from an acquisition of Covidien plc by Medtronic, Inc. on January 26, 2015 through the formation of a new holding company, Medtronic plc, incorporated in Ireland. These special dividends enhanced the ratios of net investment income for Class Y and Institutional Class shares by 1.22% and 1.30%, respectively, for the fiscal year ended November 30, 2015. |
| (D) | Portfolio turnover rate excludes securities delivered from processing a redemption-in-kind. |
| (E) | Effective October 30, 2017, Class R6 shares of the Predecessor Fund were reorganized into Institutional Class shares of the Fund. |
| (F) | Represents the period from commencement of operations (December 23, 2014) through November 30, 2015. |
See accompanying Notes to Financial Statements.
Financial Highlights (Continued)
Touchstone Small Company Fund—Class A
Selected Data for a Share Outstanding Throughout Each Period
| | | Year Ended November 30, |
| | | 2017 | | | 2016 | | | 2015 | | | 2014 | | | 2013 | |
| Net asset value at beginning of period | | $ | 5.19 | | | $ | 5.58 | | | $ | 7.19 | | | $ | 8.52 | | | $ | 7.96 | |
| Income (loss) from investment operations: | | | | | | | | | | | | | | | | | | | | |
| Net investment income (loss) | | | (0.02 | ) | | | (0.02 | )(A) | | | (0.03 | )(A) | | | — | (A)(B) | | | (0.02 | )(A) |
| Net realized and unrealized gains on investments | | | 0.89 | | | | 0.57 | | | | 0.26 | | | | 0.38 | | | | 2.25 | |
| Total from investment operations | | | 0.87 | | | | 0.55 | | | | 0.23 | | | | 0.38 | | | | 2.23 | |
| Distributions from: | | | | | | | | | | | | | | | | | | | | |
| Realized capital gains | | | (0.42 | ) | | | (0.94 | ) | | | (1.84 | ) | | | (1.71 | ) | | | (1.67 | ) |
| Net asset value at end of period | | $ | 5.64 | | | $ | 5.19 | | | $ | 5.58 | | | $ | 7.19 | | | $ | 8.52 | |
| Total return(C) | | | 17.95 | % | | | 12.52 | % | | | 5.32 | % | | | 5.40 | % | | | 34.79 | % |
| Ratios and supplemental data: | | | | | | | | | | | | | | | | | | | | |
| Net assets at end of period (000’s) | | $ | 677,055 | | | $ | 685,807 | | | $ | 596,864 | | | $ | 682,481 | | | $ | 808,145 | |
| Ratio to average net assets: | | | | | | | | | | | | | | | | | | | | |
| Net expenses | | | 1.18 | % | | | 1.22 | % | | | 1.25 | % | | | 1.20 | % | | | 1.21 | % |
| Gross expenses | | | 1.18 | % | | | 1.22 | % | | | 1.25 | % | | | 1.20 | % | | | 1.21 | % |
| Net investment income (loss) | | | (0.49 | %) | | | (0.38 | %) | | | (0.61 | %) | | | 0.06 | % | | | (0.24 | %) |
| Portfolio turnover rate | | | 82 | % | | | 61 | % | | | 70 | % | | | 59 | % | | | 23 | % |
Touchstone Small Company Fund—Class C
Selected Data for a Share Outstanding Throughout Each Period
| | | Year Ended November 30, |
| | | 2017 | | | 2016 | | | 2015 | | | 2014 | | | 2013 | |
| Net asset value at beginning of period | | $ | 3.39 | | | $ | 4.01 | | | $ | 5.72 | | | $ | 7.17 | | | $ | 6.99 | |
| Income (loss) from investment operations: | | | | | | | | | | | | | | | | | | | | |
| Net investment loss | | | (0.10 | ) | | | (0.03 | )(A) | | | (0.05 | )(A) | | | (0.04 | )(A) | | | (0.06 | )(A) |
| Net realized and unrealized gains on investments | | | 0.63 | | | | 0.35 | | | | 0.18 | | | | 0.30 | | | | 1.91 | |
| Total from investment operations | | | 0.53 | | | | 0.32 | | | | 0.13 | | | | 0.26 | | | | 1.85 | |
| Distributions from: | | | | | | | | | | | | | | | | | | | | |
| Realized capital gains | | | (0.42 | ) | | | (0.94 | ) | | | (1.84 | ) | | | (1.71 | ) | | | (1.67 | ) |
| Net asset value at end of period | | $ | 3.50 | | | $ | 3.39 | | | $ | 4.01 | | | $ | 5.72 | | | $ | 7.17 | |
| Total return(C) | | | 17.36 | % | | | 11.48 | % | | | 4.72 | % | | | 4.55 | % | | | 33.94 | % |
| Ratios and supplemental data: | | | | | | | | | | | | | | | | | | | | |
| Net assets at end of period (000’s) | | $ | 104,051 | | | $ | 110,842 | | | $ | 108,192 | | | $ | 115,642 | | | $ | 128,521 | |
| Ratio to average net assets: | | | | | | | | | | | | | | | | | | | | |
| Net expenses | | | 1.92 | % | | | 1.95 | % | | | 1.94 | % | | | 1.91 | % | | | 1.93 | % |
| Gross expenses | | | 1.92 | % | | | 1.95 | % | | | 1.94 | % | | | 1.91 | % | | | 1.93 | % |
| Net investment loss | | | (1.23 | %) | | | (1.10 | %) | | | (1.30 | %) | | | (0.66 | %) | | | (0.97 | %) |
| Portfolio turnover rate | | | 82 | % | | | 61 | % | | | 70 | % | | | 59 | % | | | 23 | % |
| (A) | The net investment income (loss) per share is based on average shares outstanding for the period. |
| (B) | Less than $0.005 per share. |
| (C) | Total returns shown exclude the effect of applicable sales loads. If these charges were included, the returns would be lower. |
See accompanying Notes to Financial Statements.
Financial Highlights (Continued)
Touchstone Small Company Fund—Class Y(A)
Selected Data for a Share Outstanding Throughout Each Period
| | | Year Ended November 30, |
| | | 2017 | | | 2016 | | | 2015 | | | 2014 | | | 2013 | |
| Net asset value at beginning of period | | $ | 5.56 | | | $ | 5.89 | | | $ | 7.48 | | | $ | 8.78 | | | $ | 8.16 | |
| Income (loss) from investment operations: | | | | | | | | | | | | | | | | | | | | |
| Net investment income (loss) | | | (0.06 | ) | | | — | (B)(C) | | | (0.01 | )(B) | | | 0.03 | (B) | | | 0.01 | (B) |
| Net realized and unrealized gains on Investments | | | 1.02 | | | | 0.61 | | | | 0.28 | | | | 0.38 | | | | 2.32 | |
| Total from investment operations | | | 0.96 | | | | 0.61 | | | | 0.27 | | | | 0.41 | | | | 2.33 | |
| Distributions from: | | | | | | | | | | | | | | | | | | | | |
| Net investment income | | | — | | | | — | | | | (0.02 | ) | | | — | | | | (0.04 | ) |
| Realized capital gains | | | (0.42 | ) | | | (0.94 | ) | | | (1.84 | ) | | | (1.71 | ) | | | (1.67 | ) |
| Total distributions | | | (0.42 | ) | | | (0.94 | ) | | | (1.86 | ) | | | (1.71 | ) | | | (1.71 | ) |
| Net asset value at end of period | | $ | 6.10 | | | $ | 5.56 | | | $ | 5.89 | | | $ | 7.48 | | | $ | 8.78 | |
| Total return | | | 18.41 | % | | | 12.95 | % | | | 5.71 | % | | | 5.62 | % | | | 35.40 | % |
| Ratios and supplemental data: | | | | | | | | | | | | | | | | | | | | |
| Net assets at end of period (000’s) | | $ | 388,404 | | | $ | 257,483 | | | $ | 220,543 | | | $ | 247,639 | | | $ | 385,692 | |
| Ratio to average net assets: | | | | | | | | | | | | | | | | | | | | |
| Net expenses | | | 0.85 | % | | | 0.89 | % | | | 0.87 | % | | | 0.85 | % | | | 0.81 | % |
| Gross expenses | | | 0.85 | % | | | 0.89 | % | | | 0.87 | % | | | 0.85 | % | | | 0.81 | % |
| Net investment income (loss) | | | (0.16 | %) | | | (0.04 | %) | | | (0.24 | %) | | | 0.46 | % | | | 0.17 | % |
| Portfolio turnover rate | | | 82 | % | | | 61 | % | | | 70 | % | | | 59 | % | | | 23 | % |
Touchstone Small Company Fund— Institutional Class
Selected Data for a Share Outstanding Throughout The Period
| | | Period Ended |
| | | November |
| | | 30, |
| | | 2017(D) |
| Net asset value at beginning of period | | $ | 5.80 | |
| Income (loss) from investment operations: | | | | |
| Net investment loss | | | (—) | (C) |
| Net realized and unrealized gains on investments | | | 0.30 | |
| Total from investment operations | | | 0.30 | |
| Net asset value at end of period | | $ | 6.10 | |
| Total return | | | 5.17 | %(E) |
| Ratios and supplemental data: | | | | |
| Net assets at end of period (000’s) | | $ | 3 | |
| Ratio to average net assets: | | | | |
| Net expenses | | | 0.79 | %(F) |
| Gross expenses | | | 2069.15 | %(F) |
| Net investment loss | | | (0.70 | %)(F) |
| Portfolio turnover rate | | | 82 | % |
| (A) | Effective October 28, 2017, Class I shares of the Sentinel Small Company Fund (the “Predecessor Fund”) were reorganized into Class Y shares of the Fund. |
| (B) | The net investment income (loss) per share is based on average shares outstanding for the period. |
| (C) | Less than $0.005 per share. |
| (D) | Represents the period from commencement of operations (October 30, 2017) through November 30, 2017. |
See accompanying Notes to Financial Statements.
Financial Highlights (Continued)
Touchstone Small Company Fund—Class R6
Selected Data for a Share Outstanding Throughout Each Period
| | | | | | | | | Period Ended |
| | | | | | | | | November |
| | | Year Ended November 30, | | 30, |
| | | 2017 | | | 2016 | | | 2015(A) |
| Net asset value at beginning of period | | $ | 5.24 | | | $ | 5.60 | | | $ | 5.44 | |
| Income (loss) from investment operations: | | | | | | | | | | | | |
| Net investment income (loss) | | | (0.03 | ) | | | 0.01 | (B) | | | (0.01 | )(B) |
| Net realized and unrealized gains on investments | | | 0.94 | | | | 0.57 | | | | 0.17 | |
| Total from investment operations | | | 0.91 | | | | 0.58 | | | | 0.16 | |
| Distributions from: | | | | | | | | | | | | |
| Realized capital gains | | | (0.42 | ) | | | (0.94 | ) | | | — | |
| Net asset value at end of period | | $ | 5.73 | | | $ | 5.24 | | | $ | 5.60 | |
| Total return | | | 18.58 | % | | | 13.07 | % | | | 2.94 | %(C) |
| Ratios and supplemental data: | | | | | | | | | | | | |
| Net assets at end of period (000’s) | | $ | 67,052 | | | $ | 13,000 | | | $ | 599 | |
| Ratio to average net assets: | | | | | | | | | | | | |
| Net expenses | | | 0.75 | % | | | 0.73 | % | | | 0.73 | %(D) |
| Gross expenses | | | 0.77 | % | | | 0.99 | % | | | 2.96 | %(D) |
| Net investment income (loss) | | | (0.07 | %) | | | 0.16 | % | | | (0.18 | %)(D) |
| Portfolio turnover rate | | | 82 | % | | | 61 | % | | | 70 | % |
| (A) | Represents the period from commencement of operations (December 23, 2014) through November 30, 2015. |
| (B) | The net investment income (loss) per share is based on average shares outstanding for the period. |
See accompanying Notes to Financial Statements.
Notes to Financial Statements
November 30, 2017
1. Organization
The Touchstone Strategic Trust (the “Trust”) is registered under the Investment Company Act of 1940, as amended (the “1940 Act”), as an open-end management investment company. The Trust was established as a Massachusetts business trust pursuant to an Agreement and Declaration of Trust dated November 18, 1982. TheTrust consists of twenty-five funds, including the following four funds (individually, a “Fund”, and collectively, the “Funds”):
Touchstone Balanced Fund (“Balanced Fund”)*
Touchstone International Equity Fund (“International Equity Fund”)*
Touchstone Large Cap Focused Fund (“Large Cap Focused Fund”)*
Touchstone Small Company Fund (“Small Company Fund”)*
* See Note 9 in Notes to Financial Statements for details on the Reorganizations.
Each Fund is diversified, with the exception of the Large Cap Focused Fund, which is non-diversified.
The Agreement and Declaration of Trust permits the Trust to issue an unlimited number of shares of beneficial interest of each Fund. The table below indicates the classes of shares that each Fund is registered to offer:
| | | | | | | | | Institutional | | |
| | | Class A | | Class C | | Class Y | | Class | | Class R6 |
| Balanced Fund | | X | | X | | X | | | | |
| International Equity Fund | | X | | X | | X | | X | | |
| Large Cap Focused Fund | | X | | X | | X | | X | | |
| Small Company Fund | | X | | X | | X | | X | | X |
The assets of each Fund are segregated, and a shareholder’s interest is limited to the Fund in which shares are held. The Funds’ prospectus provides a description of each Fund’s investment goals, policies, and strategies along with information on the classes of shares currently being offered.
2. Significant Accounting Policies
The following is a summary of the Funds’ significant accounting policies:
Each Fund is an investment company that follows the accounting and reporting guidance of Accounting Standards Codification Topic 946 applicable to investment companies.
Security valuation and fair value measurements — U.S. generally accepted accounting principles (“U.S. GAAP”) define fair value as the price the Funds would receive to sell an asset or pay to transfer a liability in an orderly transaction between market participants at the measurement date. All investments in securities are recorded at their fair value. The Funds define the term “market value”, as used throughout this report, as the estimated fair value. The Funds use various methods to measure fair value of their portfolio securities on a recurring basis. U.S. GAAP fair value measurement standards require disclosure of a hierarchy that prioritizes inputs to valuation methods.
These inputs are summarized in the three broad levels listed below:
| • | Level 1 | – | quoted prices in active markets for identical securities |
| | | | |
| • | Level 2 | – | other significant observable inputs (including quoted prices for similar securities, interest rates, prepayment speeds, credit risk, etc.) |
| | | | |
| • | Level 3 | – | significant unobservable inputs (including a Fund’s own assumptions in determining the fair value of investments) |
The inputs or methodology used for valuing securities are not necessarily an indication of the risk associated with investing in those securities.
Notes to Financial Statements (Continued)
The aggregate value by input level, as of November 30, 2017, for each Fund’s investments, as well as a reconciliation of assets for which significant unobservable inputs (Level 3) were used in determining value, if applicable, is included in each Fund’s Portfolio of Investments, which also includes a breakdown of the Fund’s investments by geographic, portfolio or sector allocation. The Funds did not hold any Level 3 categorized securities during the year ended November 30, 2017.
Changes in valuation techniques may result in transfers into or out of an investment’s assigned level within the hierarchy. All transfers in and out of the levels are recognized at the value at the end of the period. At November 30, 2017, there were no transfers between Levels 1, 2 and 3 for the Funds, except as discussed in the Portfolio of investments for the Balanced Fund and the Large Cap Focused Fund.
During the year ended November 30, 2017, there were no material changes to the valuation policies and techniques.
The Funds’ portfolio securities are valued as of the close of the regular session of trading on the New York Stock Exchange (“NYSE”) (currently 4:00 p.m., Eastern Time). Portfolio securities traded on stock exchanges are valued at the last reported sale price, official close price, or last bid price if no sales are reported. Portfolio securities quoted by NASDAQ are valued at the NASDAQ Official Closing Price (“NOCP”) or from the primary exchange on which the security trades. To the extent these securities are actively traded, they are categorized in Level 1 of the fair value hierarchy. Shares of mutual funds in which the Funds invest are valued at their respective net asset values (“NAV”) as reported by the underlying funds and are categorized in Level 1.
Debt securities held by the Funds are valued at their evaluated bid by an independent pricing service or at their last broker-quoted bid prices as obtained from one or more of the major market makers for such securities. Independent pricing services use information provided by market makers or estimates of market values through accepted market modeling conventions. Observable inputs to the models may include prepayment speeds, pricing spread, yield, trade information, dealer quotes, market color, cash flow models, the securities’ terms and conditions, among others, and are generally categorized in Level 2. Debt securities with remaining maturities of 60 days or less may be valued at amortized cost, provided such amount approximates market value and are categorized in Level 2. While this method provides consistency in valuation (and may only be used if it approximates market value), it may result in periods during which fair value, as determined by amortized cost, is higher or lower than the price that would be received if the Fund sold the investment.
Securities mainly traded on a non-U.S. exchange or denominated in foreign currencies are generally valued according to the preceding closing values on that exchange, translated to U.S. dollars using currency exchange rates as of the close of regular trading on the NYSE, and are generally categorized in Level 1. However, if an event that may change the value of a security occurs after the time that the closing value on the non-U.S. exchange was determined, but before the close of regular trading on the NYSE, the security may be priced based on fair value and generally categorized in Level 2. This may cause the value of the security, if held on the books of a Fund, to be different from the closing value on the non-U.S. exchange and may affect the calculation of the Fund’s NAV.
The Funds may use fair value pricing under the following circumstances, among others:
| • | If the value of a security has been materially affected by events occurring before the Funds’ pricing time but after the close of the primary markets on which the security is traded. |
| • | If the exchange on which a portfolio security is principally traded closes early or if trading in a particular portfolio security was halted during the day and did not resume prior to the Funds’ NAV calculation. |
| • | If a security is so thinly traded that reliable market quotations are unavailable due to infrequent trading. |
| • | If the validity of market quotations is not reliable. |
Notes to Financial Statements (Continued)
Securities held by the Funds that do not have readily available market quotations, significant observable inputs, or securities for which the available market quotations are not reliable, are priced at their estimated fair value using procedures approved by the Funds’ Board of Trustees (the “Board”) and are generally categorized in Level 3.
Investment companies — The Funds may invest in securities of other investment companies, including exchange-traded funds (“ETFs”), open-end funds and closed-end funds. Open-end funds are investment companies that issue new shares continuously and redeem shares daily. Closed-end funds are investment companies that typically issue a fixed number of shares that trade on a securities exchange or over-the-counter (“OTC”). An ETF is an investment company that typically seeks to track the performance of an index by holding in its portfolio shares of all the companies, or a representative sample of the companies, that are components of a particular index. ETF shares are traded on a securities exchange based on their market value. The risks of investment in other investment companies typically reflect the risks of the types of securities in which the other investment companies invest. Investments in ETFs and closed-end funds are subject to the additional risk that their shares may trade at a premium or discount to their NAV. When a Fund invests in another investment company, shareholders of the Fund indirectly bear their proportionate share of the other investment company’s fees and expenses, including operating, registration, trustee, licensing and marketing, as well as their share of the Fund’s fees and expenses.
Foreign currency translation — The books and records of the Funds are maintained in U.S. dollars and translated into U.S. dollars on the following basis:
| (1) | market value of investment securities, assets and liabilities at the current rate of exchange on the valuation date; and |
| (2) | purchases and sales of investment securities, income, and expenses at the relevant rates of exchange prevailing on the respective dates of such transactions. |
The Funds do not isolate that portion of gains and losses on investments in equity securities that is due to changes in the foreign exchange rates from that which is due to changes in market prices of equity securities.
Real Estate Investment Trusts — The Funds may invest in real estate investment trusts (“REITs”) that involve risks not associated with investing in stocks. Risks include declines in the value of real estate, general and economic conditions, changes in the value of the underlying property and defaults by borrowers. The value of assets in the real estate industry may go through cycles of relative underperformance and outperformance in comparison to equity securities markets in general. Dividend income is recorded using management’s estimate of the income included in distributions received from REIT investments. The actual amounts of income, return of capital and capital gains are only determined by each REIT after its fiscal year-end and may differ from the estimated amount. Estimates of income are adjusted in the Funds to the actual amounts when the amounts are determined.
Portfolio securities loaned — The Funds may lend their portfolio securities. Lending portfolio securities exposes the Funds to the risk that the borrower may fail to return the loaned securities or may not be able to provide additional collateral or that the Funds may experience delays in recovery of the loaned securities or loss of rights in the collateral if the borrower fails financially. To minimize these risks, the borrower must agree to maintain cash collateral with the Funds’ custodian. The loaned securities are secured by collateral valued at least equal, at all times, to the market value of the loaned securities plus accrued interest, if any. When the collateral falls below specified amounts, the lending agent will use its best effort to obtain additional collateral on the next business day to meet required amounts under the security lending agreement. The cash collateral is reinvested by the Funds’ custodian into an approved short-term investment vehicle. The approved short-term investment vehicle is subject to market risk.
Notes to Financial Statements (Continued)
As of November 30, 2017, the following Funds loaned securities and received collateral as follows:
| | | | | Market | | | Market | | | | |
| | | | | Value of | | | Value of | | | | |
| | | | | Securities | | | Collateral | | | Net | |
| Fund | | Security Type | | Loaned* | | | Received** | | | Amount*** | |
| International Equity Fund | | Common Stocks | | $ | 3,989,700 | | | $ | 4,023,360 | | | $ | 33,660 | |
| Small Company Fund | | Common Stocks | | | 29,931,949 | | | | 30,512,477 | | | | 580,528 | |
| * | The remaining contractual maturity is overnight for all securities. |
| ** | Gross amount of recognized liabilities for securities lending is included in the Statements of Assets and Liabilities. |
| *** | Net amount represents the net amount payable due to the borrower in the event of default. |
All cash collateral is received, held, and administered by the Funds’ custodian for the benefit of the lending Fund in its custody account or other account established for the purpose of holding collateral.
Funds participating in securities lending receive compensation in the form of fees. Securities lending income is derived from lending long securities from the Funds to creditworthy approved borrowers at rates that are determined based on trading volumes, float, short-term interest rates and market liquidity and is shown net of fees on the Statements of Operations. When a Fund lends securities, it retains the interest or dividends on the investment of any cash received as collateral, and the Fund continues to receive interest or dividends on the loaned securities.
Unrealized gain or loss on the market value of the loaned securities that may occur during the term of the loan is recognized by the Fund. The Fund has the right under the lending agreement to recover any loaned securities from the borrower on demand.
Line of Credit — Prior to October 28, 2017, the Funds had access to an unsecured line of credit of up to $20,000,000 from State Street Bank and Trust Company (“SSB”) for temporary borrowing purposes. Each Fund could borrow up to 5% of its net assets, as calculated using net assets from the previous business day, with a maximum aggregate limit of $20,000,000. Borrowings under this arrangement would bear interest at the current overnight Federal Funds rate or the London InterBank Offered Rate (“LIBOR”), whichever is greater, plus an additional 1.25%. In addition, a commitment fee equal to 0.25% per annum on the daily unused balance was paid quarterly to SSB and is included in Custody fees on the Statement of Operations. The line of credit was terminated on October 28, 2017. The average amount outstanding and weighted average interest rate for each Fund that utilized the line of credit during the period December 1, 2016 through October 27, 2017 was as follows:
| | | Daily | | | Weighted | |
| | | Average | | | Average | |
| | | Amount | | | Interest | |
| Fund | | Outstanding | | | Rate | |
| Large Cap Focused Fund | | $ | 11,853 | | | | 2.48 | % |
| Small Company Fund | | | 47,326 | | | | 2.02 | % |
When-issued or delayed delivery transactions — Each Fund may purchase or sell securities on a when-issued or delayed delivery basis. These transactions involve a commitment by the Fund to purchase or sell securities for a predetermined price or yield, with payment and delivery taking place beyond the customary settlement period. When delayed delivery purchases are outstanding, the Fund will set aside liquid assets in an amount sufficient to meet the purchase price. When purchasing a security on a delayed delivery basis, the Fund assumes the rights and risks of ownership of the security, including the risk of price and yield fluctuations, and takes such fluctuations into account when determining NAV. The Fund may dispose of or renegotiate a delayed delivery transaction after it is entered into, and may sell when-issued securities before they are delivered, which may result in a capital gain or loss. When the Fund has sold a security on a delayed delivery basis, the Fund does not participate in future gains and losses with respect to the security.
Notes to Financial Statements (Continued)
Share valuation — The NAV per share of each class of shares of each Fund is calculated daily by dividing the total value of a Fund’s assets attributable to that class, less liabilities attributable to that class, by the number of outstanding shares of that class.
The maximum offering price per share of Class A shares of the Funds is equal to the NAV per share plus a sales load equal to 6.10% of the NAV (or 5.75% of the offering price). There is no sales load on purchases of $1 million or more of Class A shares. The maximum offering price per share of Classes C, Y, Institutional Class and R6 shares of the Funds is equal to the NAV per share. Prior to October 28, 2017, the maximum offering price per share of Class A shares of the Funds was equal to the NAV per share plus a sales load equal to 5.26% of the NAV (or 5.00% of the offering price).
The redemption price per share of each class of shares of the Funds is generally equal to the NAV per share. However, Class A redemptions that were part of a no-load $1 million subscription may be subject to a contingent deferred sales charge (“CDSC”) of up to 1.00% if redeemed within a one-year period from the date of purchase. Additionally, purchases of Class C shares of the Funds are subject to a CDSC of 1.00%. The CDSC will be assessed on an amount equal to the lesser of (1) the NAV at the time of purchase of the shares being redeemed or (2) the NAV of such shares being redeemed, if redeemed within a one-year period from the date of purchase.
Redemption Fees — Prior to October 28, 2017, shareholders of the International Equity Fund and Small Company Fund were subject to redemption fees of 2% on shares held 30 calendar days or less. Shareholders of the Balanced Fund and Large Cap Focused Fund were subject to, under certain circumstances, an excessive trading fee of 2% of the amount redeemed. Both the redemption fee and excessive trading fee were subject to certain exceptions under which they may not be charged. As of October 28, 2017, the Funds are no longer subject to redemption fees or excess trading fees. For the period December 1, 2016 through October 27, 2017, these fees totaled $1,743 and are included in Cost of Shares redeemed on the Statements of Changes in Net Assets - Capital Stock Activity.
Investment income — Dividend income from securities is recognized on the ex-dividend date, net of foreign withholding taxes, if any, which are reduced by any amounts reclaimable by the Funds, where applicable. Interest income from securities is recorded on the basis of interest accrued, premium amortized and discount accreted. Realized gains and losses resulting from principal paydowns on mortgage-backed and asset-backed securities are included in interest income. Market discounts, original issue discount (“OID”) and market premiums on debt securities are accreted/amortized to interest income over the life of the security with a corresponding adjustment in the cost basis of that security. In addition, it is the Funds’ policy to accrue for foreign capital gains taxes, if applicable, on certain foreign securities held by the Funds. An estimated foreign capital gains tax is recorded daily on net unrealized gains on these securities and is payable upon the sale of such securities when a gain is realized.
Distributions to shareholders — Each Fund intends to distribute to its shareholders substantially all of its income and capital gains. Each Fund, except the Balanced Fund, declares and distributes net investment income, if any, annually, as a dividend to shareholders. The Balanced Fund declares and distributes net investment income, if any, quarterly as a dividend to shareholders. Prior to October 28, 2017, the Large Cap Focused Fund declared and distributed net investment income, if any, quarterly as a dividend to shareholders. Each Fund makes distributions of capital gains, if any, at least annually, net of applicable capital loss carryforwards. Income distributions and capital gain distributions are determined in accordance with income tax regulations. Recognition of the Funds’ net investment income from investments in underlying funds is affected by the timing of dividend declarations by the underlying funds.
Allocations — Investment income earned, realized capital gains and losses, and unrealized appreciation and depreciation for a Fund are allocated daily to each class of shares based upon its proportionate share of total net assets of the Fund. Class-specific expenses are charged directly to the class incurring the expense. Common
Notes to Financial Statements (Continued)
expenses, which are not attributable to a specific class, are allocated daily to each class of shares based upon their proportionate share of total net assets of the Fund. Expenses not directly billed to a Fund are allocated proportionally among all Funds in the Trust, and, if applicable, Touchstone Funds Group Trust, Touchstone Institutional Funds Trust, and Touchstone Variable Series Trust (collectively with the Trust, “Touchstone Fund Complex”), daily in relation to net assets of each Fund or another reasonable measure.
Security transactions — Security transactions are reflected for financial reporting purposes as of the trade date. Realized gains and losses on sales of portfolio securities are calculated using the identified cost basis.
Estimates — The preparation of financial statements in conformity with U.S. GAAP requires management to make estimates and assumptions that affect the reported amounts of assets and liabilities and disclosure of contingent assets and liabilities at the date of the financial statements and the reported amounts of income and expenses during the reporting period. Actual results could differ from those estimates.
3. Investment Transactions
Investment transactions (excluding short-term investments and U.S. Government securities) were as follows for the year ended November 30, 2017:
| | | | | | International | | | Large Cap | | | Small | |
| | | Balanced | | | Equity | | | Focused | | | Company | |
| | | Fund | | | Fund | | | Fund* | | | Fund | |
| Purchases of investment securities | | $ | 138,119,770 | | | $ | 66,987,846 | | | $ | 236,735,654 | | | $ | 909,997,057 | |
| Proceeds from sales and maturities | | $ | 131,995,286 | | | $ | 71,926,565 | | | $ | 785,423,660 | | | $ | 834,189,701 | |
*Large Cap Focused Fund had a redemption-in-kind on November 28, 2017, which resulted in a redemption out of the Fund of $17,324,054 in securities and is excluded from the proceeds from sales and maturities.
For the year ended November 30, 2017, purchases and proceeds from sales and maturities in U.S. Government Securities were $34,453,019 and $34,487,470, respectively, for the Balanced Fund. There were no purchases or proceeds from sales and maturities of U.S. Government Securities by the remaining Funds for the year ended November 30, 2017.
4. Transactions with Affiliates and Other Related Parties
Certain officers of theTrust are also officers of Touchstone Advisors, Inc. (the “Advisor”),Touchstone Securities, Inc. (the “Underwriter”), or The Bank of New York Mellon, the Sub-Administrator to the Funds and BNY Mellon Investment Servicing (U.S.) Inc., the Transfer Agent to the Funds (collectively referenced to herein as “BNY Mellon”). Such officers receive no compensation from the Trust. The Advisor and the Underwriter are each wholly-owned, indirect subsidiaries of Western & Southern Financial Group, Inc. (“Western & Southern”).
On behalf of the Funds, the Advisor pays each Independent Trustee a quarterly retainer plus additional retainers to the Lead Independent Trustee and the chairs of each standing committee. Interested Trustees do not receive compensation from the Funds. Each Independent Trustee also receives compensation for each Board meeting and committee meeting attended. Each standing committee chair receives additional compensation for each committee meeting that he or she oversees. The Advisor is reimbursed by the Funds for the Independent Trustees’ compensation and out-of-pocket expenses relating to their services. For the period October 28, 2017 through November 30, 2017, the Funds accrued Trustee-related expenses of $7,500 which are included in the Trustee and Compliance fees and expenses on the Statements of Operations. For the period December 1, 2016 through October 27, 2017, the Funds incurred Director-related expenses of $809,156 for the Directors of the Sentinel Group Funds, Inc. (the “Former Board of Directors”), which are included in the Trustee and Compliance fees and expenses on the Statements of Operations.
Notes to Financial Statements (Continued)
MANAGEMENT & EXPENSE LIMITATION AGREEMENTS
The Advisor provides general investment supervisory services for the Funds, under terms of an advisory agreement (the “Advisory Agreement”). Under the Advisory Agreement, each Fund pays the Advisor a fee, which is computed and accrued daily and paid monthly, at an annual rate based on average daily net assets of each Fund as shown in the table below.
| Balanced Fund | 0.55% on the first $200 million |
| | 0.50% on the next $200 million |
| | 0.45% on the next $600 million |
| | 0.40% on the next $1 billion |
| | 0.35% on such assets over $2 billion |
| International Equity Fund | 0.70% on the first $500 million |
| | 0.65% on the next $300 million |
| | 0.60% on the next $200 million |
| | 0.50% on the next $1 billion |
| | 0.40% on such assets over $2 billion |
| Large Cap Focused Fund | 0.70% on the first $500 million |
| | 0.65% on the next $300 Million |
| | 0.60% on the next $200 million |
| | 0.50% on the next $1 billion |
| | 0.40% on such assets over $2 billion |
| Small Company Fund | 0.70% on the first $500 million |
| | 0.65% on the next $300 million |
| | 0.60% on the next $200 million |
| | 0.50% on the next $1 billion |
| | 0.40% on such assets over $2 billion |
Prior to October 28, 2017, Sentinel Asset Management, Inc.(the “Former Advisor”), a subsidiary of NLV Financial Corp., served as the advisor to the Funds. For its services, each Fund paid the Former Advisor a monthly fee at an annual rate based on average daily net assets of each Fund as shown in the table listed above.
Effective October 28, 2017, the Advisor has entered into investment sub-advisory agreements for the Funds with Fort Washington Investment Advisors, Inc. (the “Sub-Advisor”), an affiliate of the Advisor and wholly-owned indirect subsidiary of Western & Southern. The Advisor, not the Funds, pays the sub-advisory fees to the Sub-Advisor.
Effective October 28, 2017, the Advisor entered into an expense limitation agreement (the “Expense Limitation Agreement”) to contractually limit the annual operating expenses of the Funds, excluding: dividend and interest expenses relating to short sales; interest; taxes; brokerage commissions and other transaction costs; portfolio transaction and investment related expenses, including expenses associated with the Fund s liquidity provider; other expenditures which are capitalized in accordance with U.S. GAAP; the cost of “Acquired Fund Fees and Expenses”, if any; and other extraordinary expenses not incurred in the ordinary course of business. The maximum annual operating expense limit in any year with respect to the Funds is based on a percentage of the average daily net assets of the Funds. The Advisor has agreed to separately waive class-level expenses, advisory fees and administration fees, and to reimburse expenses in order to maintain the following expense limitations for the Funds:
Notes to Financial Statements (Continued)
| | | | | | | | | | | | Institutional | | | | |
| | | Class A | | | Class C | | | Class Y | | | Class | | | Class R6 | |
| Balanced Fund | | | 1.01 | % | | | 1.78 | % | | | 0.81 | % | | | — | | | | — | |
| International Equity Fund | | | 1.36 | % | | | 2.49 | % | | | 0.99 | % | | | 0.89 | % | | | — | |
| Large Cap Focused Fund | | | 1.00 | % | | | 1.79 | % | | | 0.72 | % | | | 0.65 | % | | | — | |
| Small Company Fund | | | 1.22 | % | | | 1.95 | % | | | 0.89 | % | | | 0.79 | % | | | 0.73 | % |
These expense limitations will remain in effect for all Funds through at least October 27, 2019, but can be terminated by a vote of the Funds’ Board if it deems the termination to be beneficial to the Funds’ shareholders.
Prior to October 28, 2017, the Former Advisor had contractually agreed to reimburse certain expenses paid by the former Class I shares of each Fund to the extent necessary to prevent the total annual fund operating expense ratios of the Class I shares of each Fund, on an annualized basis, from exceeding the total annual fund operating expense ratio of the respective Class A shares of the same Fund, where applicable. On October 28, 2017, this arrangement was terminated and Class I shares of the Funds converted to Class Y shares.
Prior to October 28, 2017, the Former Advisor had contractually agreed to waive fees and/or reimburse certain expenses in order to limit total annual fund operating expenses after fee waiver and/or expense reimbursement for the Large Cap Focused Fund and the Small Company Fund former Class R6 shares, on an annualized basis, to 0.65% and 0.73%, respectively, of average daily net assets attributable to Class R6 shares. On October 28, 2017, this arrangement was terminated and Class R6 shares of the Large Cap Focused Fund converted to Institutional Class shares.
For the period October 28, 2017 through November 30, 2017, the Advisor or its affiliates waived investment advisory fees, administration fees and other operating expenses, including distribution fees, of the Funds as follows:
| | | Investment | | | | | | | | | | |
| | | Advisory | | | | | | Other Operating | | | | |
| | | Fees | | | Administration | | | Expenses | | | | |
| Fund | | Waived | | | Fees Waived | | | Waived | | | Total | |
| Balanced Fund | | $ | — | | | $ | — | | | $ | 28,413 | | | $ | 28,413 | |
| International Equity Fund | | | — | | | | 24,784 | | | | 12,762 | | | | 37,546 | |
| Large Cap Focused Fund | | | — | | | | 71,773 | | | | 22,344 | | | | 94,117 | |
| Small Company Fund | | | — | | | | 20,418 | | | | 9,021 | | | | 29,439 | |
For the period December 1, 2016 through October 27, 2017, the Former Advisor accrued investment advisory fees of the Funds, which are included in the Investment advisory fees on the Statements of Operations as follows:
| | | Investment | |
| | | Advisory | |
| | | Fees | |
| Fund | | Accrued | |
| Balanced Fund | | $ | 1,617,997 | |
| International Equity Fund | | | 1,209,465 | |
| Large Cap Focused Fund | | | 10,612,937 | |
| Small Company Fund | | | 6,719,520 | |
The Former Advisor did not waive fees or reimburse expenses.
Under the terms of the Expense Limitation Agreement, the Advisor is entitled to recover, subject to approval by the Funds’ Board, such amounts waived or reimbursed for a period of up to three years from the date on which the Advisor reduced its compensation or assumed expenses for the Funds. No recoupment will occur
Notes to Financial Statements (Continued)
unless a Fund’s operating expenses are below the expense limitation amount in effect at the time of the waiver or reimbursement and the Fund’s current expense limitation.
As of November 30, 2017, the Advisor may seek recoupment of previously waived fees and reimbursed expenses as follows:
| | | Expiration | |
| | | November 30, | |
| Fund | | 2020 | |
| Balanced Fund | | $ | 3,422 | |
| International Equity Fund | | | 33,634 | |
| Large Cap Focused Fund | | | 90,753 | |
| Small Company Fund | | | 29,439 | |
The Advisor did not recoup any amounts it previously waived or reimbursed during the year ended November 30, 2017.
For the period December 1, 2016 through October 27, 2017, the Former Advisor did not recoup any amounts it previously reimbursed for the Funds. Additionally, any amounts previously reimbursed by the Former Advisor are no longer subject to recoupment.
ADMINISTRATION AGREEMENT
The Advisor entered into an Administration Agreement with the Trust, whereby the Advisor is responsible for supplying executive and regulatory compliance services; supervising the preparation of tax returns; coordinating the preparation of reports to shareholders and reports to, and filings with, the Securities and Exchange Commission (the “SEC”) and state securities authorities, as well as materials for meetings of the Board; calculating the daily NAV per share; and maintaining the financial books and records of each Fund.
For its services, the Advisor’s annual administrative fee is:
0.145% on the first $20 billion of the aggregate average daily net assets;
0.11% on the next $10 billion of aggregate average daily net assets;
0.09% on the next $10 billion of aggregate average daily net assets; and
0.07% on the aggregate average daily net assets over $40 billion.
The fee is computed and allocated among the Touchstone Fund Complex (excluding Touchstone Institutional Funds Trust) on the basis of relative daily net assets.
The Advisor has engaged BNY Mellon as the Sub-Administrator to theTrust. BNY Mellon provides administrative and accounting services to the Trust and is compensated directly by the Advisor, not the Trust.
Prior to October 28, 2017, Sentinel Administrative Services, Inc. (the “Former Administrator”), a wholly owned subsidiary of the Former Advisor, served as the Administrator to the Funds. The Former Administrator provided a) general administrative services and b) transfer agency administrative and oversight services on behalf of the Funds. Under the general administrative services portion of the agreement, the Funds received administration services and paid the Former Administrator a monthly fee at an annual rate of 0.0375% of the first $4 billion of the aggregate average daily net assets; 0.035% of the next $3 billion of the aggregate average daily net assets and 0.0325% of the aggregate average daily net assets in excess of $7 billion. The fee was computed and allocated among the Sentinel Group Funds, Inc. on the basis of relative daily net assets. Under the transfer agency administrative and oversight services portion of the agreement, the Funds received monitoring and oversight of transfer agency vendor services and were responsible for all costs and expenses relating to the individuals designated by the Former Administrator to perform such services on behalf of the Former Administrator. The number of such
Notes to Financial Statements (Continued)
individuals designated by the Former Administrator to perform services was subject to approval by the Former Board of Directors. The Funds were also responsible for all charges of outside pricing services and other out-of-pocket expenses incurred by the Former Administrator in connection with the performance of its duties. The Funds could also reimburse the Former Administrator for sub-transfer agency, plan agent and similar fees paid by the Former Administrator to other entities that provided services to accounts underlying an omnibus account of record in accordance with policies approved by the Former Board of Directors. During the period December 1, 2016, through October 27, 2017, the Former Administrator received the following fees, which are included in the Administration fees on the Statements of Operations:
Fund
| Balanced Fund | | $ | 112,866 | |
| International Equity Fund | | | 63,844 | |
| Large Cap Focused Fund | | | 677,387 | |
| Small Company Fund | | | 385,733 | |
TRANSFER AGENT AGREEMENT
Under the terms of the Transfer Agent Agreement between the Trust and BNY Mellon, BNY Mellon maintains the records of each shareholder’s account, answers shareholders’ inquiries concerning their accounts, processes purchases and redemptions of each Fund’s shares, acts as dividend and distribution disbursing agent and performs other shareholder service functions. For these services, BNY Mellon receives a monthly fee from each Fund. In addition, each Fund pays out-of-pocket expenses incurred by BNY Mellon, including, but not limited to, postage and supplies.
The Funds may reimburse the Advisor for fees paid to intermediaries such as banks, broker-dealers, financial advisors or other financial institutions for sub-transfer agency, sub-administration and other services provided to investors whose shares of record are held in omnibus, other group accounts, retirement plans or accounts traded through registered securities clearing agents. These fees may vary based on, for example, the nature of services provided, but generally range up to 0.15% of the assets of the class serviced or maintained by the intermediary or up to $22 per sub-account maintained by the intermediary.
Prior to October 28, 2017, Boston Financial Data Services, Inc. served as the Transfer Agent to the Funds.
PLANS OF DISTRIBUTION AND SHAREHOLDER SERVICING FEE ARRANGEMENTS
The Trust has adopted distribution plans pursuant to Rule 12b-1 under the 1940 Act for each class of shares it offers that is subject to 12b-1 distribution fees, effective October 28, 2017. The plans allow each Fund to pay distribution and other fees for the sale and distribution of its shares and for services provided to shareholders. The fees charged to the Funds are limited to the actual expenses incurred. Under the Class A plan, each Fund offering Class A shares pays an annual fee of up to 0.25% of average daily net assets that are attributable to Class A shares. Under the Class C plan, each Fund offering Class C shares pays an annual fee of up to 1.00% of average daily net assets that are attributable to Class C shares (of which up to 0.75% is a distribution fee and up to 0.25% is a shareholder servicing fee).
Prior to October 28, 2017, the Class A shares of Funds had adopted a distribution plan pursuant to Rule 12b-1 under the 1940 Act, (the “Former A Plans”). Under the Former A Plans, each participating Fund paid to Sentinel Financial Services Company (the “Former Distributor”, a company in which the Former Advisor and Sentinel Financial Services, Inc., a wholly owned subsidiary of the Former Advisor, are partners), a monthly fee at the maximum annual rate of 0.25% of average daily net assets relating to Class A shares outstanding. Such fees were used to reimburse the Former Distributor for eligible expenses incurred in connection with distribution and promotion of the shares and, up to 0.25%, for the servicing of shareholders of each participating Fund.
Notes to Financial Statements (Continued)
Prior to October 28, 2017, the Funds that offered Class C shares had also adopted a Class C distribution plan applicable to its Class C shares (the “Former C Plans”). Under the Former C Plans, the Class C shares of each Fund paid to the Former Distributor a monthly fee at an annual rate of up to a total of 1.00% of average daily net assets. Such fees were used to reimburse the Former Distributor for eligible expenses incurred in connection with distribution and promotion of the shares and, up to 0.25%, for the servicing of shareholders of each participating Fund. In the first year after the purchase, this fee was designed to recover the initial sales commission of 1.00% paid by the Former Distributor to the selling financial intermediary. In subsequent years, the entire 1.00% may have been paid to the financial intermediary as additional commission and/or, up to 0.25%, for service fees.
Prior to October 28, 2017, the Funds were not assessed distribution fees on shares owned by NLV Financial Corporation and its affiliates.
For the period December 1, 2016, through October 27, 2017, the Former Distributor received the following fees, which are included in the Distribution expenses, Class A, for Class A shares and the Distribution and shareholder servicing expenses, Class C shares, for Class C share on the Statements of Operations:
| | | Class A | | | Class C | |
| Fund | | Shares | | | Shares | |
| Balanced Fund | | $ | 614,649 | | | $ | 416,269 | |
| International Equity Fund | | | 284,691 | | | | 61,377 | |
| Large Cap Focused Fund | | | 3,072,777 | | | | 747,052 | |
| Small Company Fund | | | 1,531,820 | | | | 976,000 | |
UNDERWRITING AGREEMENT
The Underwriter is the Funds’ principal underwriter and, as such, acts as exclusive agent for distribution of the Funds’ shares. Under the terms of the Underwriting Agreement between the Trust and the Underwriter, the Underwriter earned underwriting and broker commissions on the sale of Class A shares of the Funds. W&S Brokerage Services, Inc., an affiliate of the Underwriter and the Advisor, also earned broker commissions on the sale of Class A shares of the Funds. Listed below are the total underwriting and broker commissions earned by the Underwriter and its affiliate for the period October 28, 2017 through November 30, 2017:
| Fund | | Amount | |
| Balanced Fund | | $ | 2,727 | |
| International Equity Fund | | | 609 | |
| Large Cap Focused Fund | | | 3,855 | |
| Small Company Fund | | | 1,672 | |
For the period December 1, 2016 through October 27, 2017, the Former Distributor and Equity Services, Inc., a subsidiary of NLV Financial Corporation, received a sales charge added to the net asset value received by the Funds on the sale of Class A shares as follows:
| Fund | | Amount | |
| Balanced Fund | | $ | 245,869 | |
| International Equity Fund | | | 95,479 | |
| Large Cap Focused Fund | | | 280,507 | |
| Small Company Fund | | | 544,399 | |
In addition, the Underwriter collected CDSC on the redemption of Class A shares and Class C shares of the Funds listed below for the period October 28, 2017 through November 30, 2017:
| Fund | | Class A Shares | | | Class C Shares | |
| Balanced Fund | | $ | 8,248 | | | $ | 92 | |
| Large Cap Focused Fund | | | 131 | | | | 1 | |
| Small Company Fund | | | 144 | | | | 72 | |
Notes to Financial Statements (Continued)
For the period December 1, 2016 through October 27, 2017, the Former Distributor received CDSC on certain redemptions on Class C shares as follows:
| Fund | | Amount | |
| Balanced Fund | | $ | 18,710 | |
| International Equity Fund | | | 7,962 | |
| Large Cap Focused Fund | | | 11,973 | |
| Small Company Fund | | | 14,416 | |
INTERFUND TRANSACTIONS
The Funds may engage in purchase and sale transactions with funds that have a common investment advisor (or affiliated investment advisors), common Trustees and/or common Officers. During the year ended November 30, 2017, the Funds did not engage in any Rule 17a-7 transactions as defined under the 1940 Act.
5. Liquidity
ReFlow Fund LLC — The Balanced Fund, Large Cap Focused Fund and Small Company Fund may participate in the ReFlow Fund LLC liquidity program (“ReFlow”), which is designed to provide an alternative liquidity source for funds experiencing redemptions. In order to pay cash to shareholders who redeem their shares on a given day, a fund typically must hold cash in its portfolio, liquidate portfolio securities, or borrow money. ReFlow provides participating funds with another source of cash by standing ready to purchase shares from a fund up to the amount of the fund’s net redemptions on a given day, cumulatively limited to 3% of the outstanding voting shares of a Fund. ReFlow then generally redeems those shares when the fund experiences net sales. In return for this service, the Fund will pay a fee to ReFlow at a rate determined by a daily auction with other participating mutual funds.
During the period ended November 30, 2017, the Large Cap Focused Fund utilized ReFlow. ReFlow subscribed 406,220.619 shares of the Fund during the period and had redemptions-in-kind of $17,324,054. The resulting fee is recorded in other expenses on the Statements of Operations.
6. Federal Tax Information
Federal income tax — It is each Fund’s policy to continue to comply with the special provisions of the Internal Revenue Code applicable to regulated investment companies. As provided therein, in any fiscal year in which a Fund so qualifies and distributes at least 90% of its investment company taxable income, the Fund (but not the shareholders) will be relieved of federal income tax on the income distributed. It is each Fund’s policy to distribute all of its taxable income and accordingly, no provision for income taxes has been made.
In order to avoid imposition of the excise tax applicable to regulated investment companies, it is also each Fund’s intention to declare and pay as dividends in each calendar year at least 98% of its investment company taxable income (earned during the calendar year) and 98.2% of its net realized capital gains (earned during the twelve months ending October 31) plus undistributed amounts from prior years.
Notes to Financial Statements (Continued)
The tax character of distributions paid for the years ended November 30, 2017 and November 30, 2016 is as follows:
| | | Balanced | | | International | |
| | | Fund | | | Equity Fund | |
| | | Year Ended | | | Year Ended | | | Year Ended | | | Year Ended | |
| | | November 30, | | | November 30, | | | November 30, | | | November 30, | |
| | | 2017 | | | 2016 | | | 2017 | | | 2016 | |
| From ordinary income | | $ | 3,724,887 | | | $ | 6,767,216 | | | $ | 1,250,578 | | | $ | 976,876 | |
| From long-term capital gains | | | 2,124,199 | | | | 9,916,784 | | | | — | | | | 3,860,204 | |
| Total distributions | | $ | 5,849,086 | | | $ | 16,684,000 | | | $ | 1,250,578 | | | $ | 4,837,080 | |
| | | Large Cap | | | Small Company | |
| | | Focused Fund | | | Fund | |
| | | Year Ended | | | Year Ended | | | Year Ended | | | Year Ended | |
| | | November 30, | | | November 30, | | | November 30, | | | November 30, | |
| | | 2017 | | | 2016 | | | 2017 | | | 2016 | |
| From ordinary income | | $ | 24,480,711 | | | $ | 57,077,267 | | | $ | — | | | $ | — | |
| From long-term capital gains | | | 115,781,936 | | | | 137,723,635 | | | | 89,216,186 | | | | 159,188,187 | |
| Total distributions | | $ | 140,262,647 | | | $ | 194,800,902 | | | $ | 89,216,186 | | | $ | 159,188,187 | |
The following information is computed on a tax basis for each item as of November 30, 2017:
| | | Balanced | | | International | |
| | | Fund | | | Equity Fund | |
| Tax cost of portfolio investments | | $ | 205,637,034 | | | $ | 163,544,222 | |
| Gross unrealized appreciation on investments | | | 128,442,287 | | | | 45,478,345 | |
| Gross unrealized depreciation on investments | | | (1,860,215 | ) | | | (5,429,171 | ) |
| Net unrealized appreciation (depreciation) on investments | | | 126,582,072 | | | | 40,049,174 | |
| Net unrealized depreciation on foreign | | | | | | | | |
| currency and increase of deferred foreign capital gains tax | | | — | | | | (682,233 | ) |
| Undistributed ordinary income | | | 306,053 | | | | 1,546,099 | |
| Undistributed capital gains | | | 15,494,463 | | | | 7,102,321 | |
| Accumulated earnings (deficit) | | $ | 142,382,588 | | | $ | 48,015,361 | |
| | | Large Cap | | | Small Company | |
| | | Focused Fund | | | Fund | |
| Tax cost of portfolio investments | | $ | 844,591,043 | | | $ | 993,640,047 | |
| Gross unrealized appreciation on investments | | | 1,039,373,771 | | | | 295,629,810 | |
| Gross unrealized depreciation on investments | | | (1,754,006 | ) | | | (24,749,755 | ) |
| Net unrealized appreciation (depreciation) on investments | | | 1,037,619,765 | | | | 270,880,055 | |
| Undistributed ordinary income | | | 2,586,763 | | | | 16,446,256 | |
| Undistributed capital gains | | | 265,660,262 | | | | 87,076,255 | |
| Accumulated earnings (deficit) | | $ | 1,305,866,790 | | | $ | 374,402,566 | |
The difference between the tax cost of portfolio investments and the financial statement cost is primarily due to wash sale loss deferrals and passive foreign investment company (“PFIC”) adjustments.
As of November 30, 2017, the Funds had no capital loss carryforwards for federal income tax purposes.
Notes to Financial Statements (Continued)
During the year ended November 30, 2017, the following Fund utilized capital loss carryforwards as follows:
| Fund | | Utilized | |
| International Equity Fund | | $ | 229,675 | |
Under current laws, certain capital losses realized after October 31 and ordinary losses realized after December 31 may be deferred (and certain ordinary losses after October and/or December 31 may be deferred) and treated as occurring on the first day of the following fiscal year. For the year ended November 30, 2017, the Funds did not elect to defer any losses.
The Funds have analyzed their tax positions taken on federal income tax returns for all open tax years (tax years ended November 30, 2014 through 2017) and have concluded that no provision for income tax is required in their financial statements.
Certain reclassifications, the result of permanent differences between financial statement and income tax reporting requirements, have been made to the components of capital. These reclassifications have no impact on the net assets or NAV per share of the Funds. The following reclassifications, which are primarily attributed to the tax treatment of foreign currency gains/losses, reclassification of net operating losses, non-REIT return of capital reclassifications, disallowed expenses, paydown gain/losses on mortgage-backed securities, in-kind distributions for shareholder redemptions and deemed distributions on shareholder redemptions, have been made to the following Funds for the year ended November 30, 2017:
| | | | | | Accumulated | | | Accumulated | |
| | | Paid-In | | | Net Investment | | | Net Realized | |
| Fund | | Capital | | | Income(Loss) | | | Gains(Losses) | |
| Balanced Fund | | $ | (42 | ) | | $ | 405,938 | | | $ | (405,896 | ) |
| International Equity Fund | | | (1 | ) | | | (82,017 | ) | | | 82,018 | |
| Large Cap Focused Fund | | | 60,092,277 | | | | (339,825 | ) | | | (59,752,452 | ) |
| Small Company Fund | | | 13,056,434 | | | | 8,622,478 | | | | (21,678,912 | ) |
7. Commitments and Contingencies
The Funds indemnify the Trust’s officers and Trustees for certain liabilities that might arise from their performance of their duties to the Funds. Additionally, in the normal course of business, the Funds enter into contracts that contain a variety of representations and warranties and which provide general indemnifications. The Funds’ maximum exposure under these arrangements is unknown, as this would involve future claims that may be made against the Funds.
8. Principal Risks
Risks Associated with Foreign Investments — Some of the Funds may invest in the securities of foreign issuers. Investing in securities issued by companies whose principal business activities are outside the U.S. may involve significant risks not present in domestic investments. For example, there is generally less publicly available information about foreign companies, particularly those not subject to the disclosure and reporting requirements of the U.S. securities laws. Foreign issuers are generally not bound by uniform accounting, auditing, and financial reporting requirements and standards of practice comparable to those applicable to domestic issuers. Investments in foreign securities also involve the risk of possible adverse changes in investment or exchange control regulations, expropriation or confiscatory taxation, limitations on the removal of funds or other assets of a Fund, political or financial instability or diplomatic and other developments which could affect such investments. Foreign stock markets, while growing in volume and sophistication, are generally not as developed as those in the U.S., and securities of some foreign issuers (particularly those located in developing countries) may be less liquid
Notes to Financial Statements (Continued)
and more volatile than securities of comparable U.S. companies. In general, there is less overall governmental supervision and regulation of foreign securities markets, broker-dealers, and issuers than in the U.S.
Risks Associated with Concentration — Certain Funds may invest a high percentage of their assets in specific sectors of the market in order to achieve a potentially greater investment return. As a result, these Funds may be more susceptible to economic, political, and regulatory developments in a particular sector of the market, positive or negative, and may experience increased volatility on the Funds’ NAVs and magnified effect on the total return.
Risks Associated with Credit — An issuer may be unable to make timely payments of either principal or interest. This may cause the issuer’s securities to decline in value. Credit risk is particularly relevant to those Funds that invest a significant amount of their assets in junk bonds or lower-rated securities.
Risks Associated with Interest Rate Changes — As interest rates rise, the value of fixed-income securities a Fund owns will likely decrease. The price of debt securities is generally linked to the prevailing market interest rates. In general, when interest rates rise, the price of debt securities falls, and when interest rates fall, the price of debt securities rises. The price volatility of a debt security also depends on its maturity. Longer-term securities are generally more volatile, so the longer the average maturity or duration of these securities, the greater their price risk. Duration is a measure of the expected life, taking into account any prepayment or call features of the security, that is used to determine the price sensitivity of the security for a given change in interest rates. Specifically, duration is the change in the value of a fixed-income security that will result from a 1% change in interest rates, and generally is stated in years. For example, as a general rule a 1% rise in interest rates means a 1% fall in value for every year of duration. Maturity, on the other hand, is the date on which a fixed-income security becomes due for payment of principal. The negative impact on fixed income securities if interest rates increase as a result could negatively impact a Fund’s NAV.
Please see the Funds’ prospectus for a complete discussion of these and other risks.
9. Reorganizations
The shareholders of the Sentinel Balanced Fund, Sentinel International Equity Fund, Sentinel Common Stock Fund and Sentinel Small Company Fund (the “Reorganizing Funds”), each a series of Sentinel Group Funds, Inc., approved an Agreement and Plan of Reorganization providing for the transfer of all assets and liabilities of each Reorganizing Fund to the correspondingTouchstone Fund as noted below.The Balanced Fund, International Equity Fund, Large Cap Focused Fund and Small Company Fund, each a new series of the Trust, assumed the financial and performance history of the Sentinel Balanced Fund, Sentinel International Equity Fund, Sentinel Common Stock Fund and Sentinel Small Company Fund, respectively. The tax-free mergers took place on October 27, 2017.
| | | | | Net | | | Shares | |
| Reorganizing Funds | | Touchstone Funds* | | Assets | | | Outstanding | |
| Sentinel Balanced Fund | | Balanced Fund | | $ | 331,423,150 | | | | 15,092,088 | |
| Sentinel International Equity Fund | | International Equity Fund | | | 203,883,053 | | | | 10,805,595 | |
| Sentinel Common Stock Fund | | Large Cap Focused Fund | | | 1,895,170,925 | | | | 40,069,142 | |
| Sentinel Small Company Fund | | Small Company Fund | | | 1,214,732,067 | | | | 230,307,818 | |
*Class A, Class C, and Class I shares of the Reorganizing Funds were exchanged for Class A, Class C and Class Y shares, respectively, of the corresponding Touchstone Fund. Class R6 shares of the Sentinel Common Stock Fund were exchanged for Institutional Class shares of the Large Cap Focused Fund. Class R6 shares of the Sentinel Small Company Fund were exchanged for Class R6 shares of the Small Company Fund. On October 30, 2017, the International Equity Fund and Small Company Fund began issuing Institutional Class shares.
Pursuant to a Plan of Reorganization approved by the Sentinel Group Funds, Inc. Board of Directors on December 3, 2015, as of the close of business on March 30, 2016, Sentinel Small Company Fund acquired 100% of the voting equity interests, substantially all of the assets and assumed substantially all of the liabilities of Sentinel
Notes to Financial Statements (Continued)
Mid Cap Fund, a separate series of the Company, in a tax-free reorganization in exchange for shares of the Sentinel Small Company Fund. The primary reason for the transaction was to combine a smaller Fund into a larger Fund with similar investment strategies and policies. For financial reporting purposes, the net assets received and shares issued by the Sentinel Small Company Fund were recorded at fair value; however, the Sentinel Mid Cap Fund’s cost of investments were carried forward to align ongoing reporting of the Sentinel Small Company Fund’s realized and unrealized gains and losses with amounts distributable to shareholders for tax purposes. The merger conversion ratios, the number of shares and the value of shares issued by the Sentinel Small Company Fund is presented in the Statement of Changes in Net Assets – Capital Stock Activity. Net assets and acquired unrealized appreciation (depreciation) as of the reorganization date were as follows:
| | | | | | | | | | | Total | | | | |
| | | | | | | | | | | Net Assets of | | | Acquired | |
| | | | | Total | | | Total | | | Acquiring | | | Fund | |
| | | | | Net Assets of | | | Net Assets of | | | Fund | | | Unrealized | |
| | | | | Acquiring | | | Acquired | | | After the | | | Appreciation/ | |
| Acquiring Fund | | Acquired Fund | | Fund | | | Fund | | | Acquisition | | | (Depreciation) | |
| Sentinel Small Company Fund Class A | | Sentinel Mid Cap Fund Class A | | $ | 546,804,192 | | | $ | 97,558,873 | | | $ | 644,363,065 | | | $ | 9,958,785 | |
| Sentinel Small Company Fund Class C | | Sentinel Mid Cap Fund Class C | | | 97,641,067 | | | | 8,942,615 | | | | 106,583,682 | | | | (5,233,947 | ) |
| Sentinel Small Company Fund Class I | | Sentinel Mid Cap Fund Class I | | | 209,050,954 | | | | 5,382,625 | | | | 214,433,579 | | | | 7,617,354 | |
| Sentinel Small Company Fund Class R6 | | None | | | 2,116,165 | | | | — | | | | 2,116,165 | | | | — | |
| | | | | $ | 855,612,378 | | | $ | 111,884,113 | * | | $ | 967,496,491 | | | $ | 12,342,192 | |
*The net assets of the Sentinel Mid Cap Fund were primarily comprised of investments with a fair value of $112,084,254 just prior to the reorganization.
The financial statements reflect the operations of the Sentinel Small Company Fund for the period prior to the acquisition and the combined fund for the period subsequent to the acquisition. Assuming the acquisition had been completed on December 1, 2015, the beginning of the fiscal annual reporting period of the Sentinel Small Company Fund, Sentinel Small Company Fund’s pro forma results of operations for the year ended November 30, 2016 are estimated as follows.
| Increase (Decrease) in Net Assets from Operations | | | | |
| Net investment income (loss) | | $ | (3,621,210 | ) |
| Net realized gain (loss) on sales of investments, futures contracts and foreign currency transactions | | | 95,636,043 | |
| Net change in unrealized appreciation (depreciation) | | | 27,441,323 | |
| Net increase (decrease) in net assets from operations | | $ | 119,456,156 | |
Because the combined investment portfolios have been managed as a single integrated portfolio since the acquisition was completed, it is not practicable to separate the amounts of revenue and earnings of Sentinel Mid Cap Fund that have been included in the Sentinel Small Company Fund’s statement of operations since March 30, 2016.
10. Subsequent Events
Subsequent events occurring after the date of this report have been evaluated for potential impact to this report through the date financial statements were issued. There were no subsequent events that necessitated recognition or disclosure in the Funds’ financial statements.
Report of Independent Registered Public Accounting Firm
To the Board of Trustees and Shareholders of Touchstone Balanced Fund,Touchstone International Equity Fund, Touchstone Large Cap Focused Fund and Touchstone Small Company Fund.
We have audited the accompanying statements of assets and liabilities, including the portfolios of investments, of Touchstone Balanced Fund, Touchstone International Equity Fund, Touchstone Large Cap Focused Fund and Touchstone Small Company Fund (the “Funds”) (four of the funds constituting Touchstone Strategic Trust) as of November 30, 2017, and the related statements of operations, the statements of changes in net assets and the financial highlights for the year then ended. These financial statements and financial highlights are the responsibility of the Funds’ management. Our responsibility is to express an opinion on these financial statements and financial highlights based on our audits. The financial statements and financial highlights of Touchstone Balanced Fund, Touchstone International Equity Fund, Touchstone Large Cap Focused Fund and Touchstone Small Company Fund for each of the periods presented through November 30, 2016 were audited by other auditors, whose report dated January 19, 2017 expressed an unqualified opinion on those financial statements and financial highlights.
We conducted our audit in accordance with the standards of the Public Company Accounting Oversight Board (United States). Those standards require that we plan and perform the audit to obtain reasonable assurance about whether the financial statements and financial highlights are free of material misstatement. We were not engaged to perform an audit of the Funds’ internal control over financial reporting. Our audit included consideration of internal control over financial reporting as a basis for designing audit procedures that are appropriate in the circumstances, but not for the purpose of expressing an opinion on the effectiveness of the Funds’ internal control over financial reporting. Accordingly, we express no such opinion. An audit also includes examining, on a test basis, evidence supporting the amounts and disclosures in the financial statements and financial highlights, assessing the accounting principles used and significant estimates made by management, and evaluating the overall financial statement presentation. Our procedures included confirmation of securities owned as of November 30, 2017, by correspondence with the custodian, transfer agent and brokers or by other appropriate auditing procedures where replies from brokers were not received. We believe that our audit provides a reasonable basis for our opinion.
In our opinion, the financial statements and financial highlights referred to above present fairly, in all material respects, the financial position of Touchstone Balanced Fund, Touchstone International Equity Fund, Touchstone Large Cap Focused Fund and Touchstone Small Company Fund (four of the funds constituting Touchstone Strategic Trust) at November 30, 2017, and the results of their operations, the changes in their net asset and the financial highlights for the year then ended, in conformity with U.S. generally accepted accounting principles.

Cincinnati, Ohio
January 19, 2018
Other Items (Unaudited)
Qualified Dividend Income
Under the Jobs and Growth Tax Relief Reconciliation Act of 2003 (the “Act”), the following percentages of ordinary dividends paid during the fiscal year ended November 30, 2017 are designated as “qualified dividend income,” as defined in the Act, and are subject to reduced tax rates in 2017. The Fund intends to pass through the maximum allowable percentage for Form 1099 Div.
| Balanced Fund | | | 100.00 | % |
| International Equity Fund | | | 100.00 | % |
| Large Cap Focused Fund | | | 100.00 | % |
| Small Company Fund | | | 32.63 | % |
Dividend Received Deduction
For corporate shareholders, the following ordinary distributions paid during the current fiscal year ended November 30, 2017 qualify for the corporate dividends received deduction. The Funds intend to pass through the maximum allowable percentage.
| Balanced Fund | | | 100.00 | % |
| Large Cap Focused Fund | | | 100.00 | % |
| Small Company Fund | | | 31.50 | % |
For the fiscal year ended November 30, 2017, the Funds designated long-term capital gains as follows:
| Balanced Fund | | $ | 15,494,466 | |
| International Equity Fund | | $ | 7,102,321 | |
| Large Cap Focused Fund | | $ | 311,012,463 | |
| Small Company Fund | | $ | 100,198,395 | |
Foreign Tax Income and Foreign Tax Credit
The International Equity Fund intends to pass through a foreign tax credit to the shareholders. For the fiscal year ended November 30, 2017, the total amount of foreign source income is $4,734,886 or $0.46 per share. The total amount of foreign taxes to be paid is $508,227 or $0.05 per share. Shareholder’s allocable share of the foreign tax credit will be reported on Form 1099 Div.
Proxy Voting Guidelines and Proxy Voting Records
The Sub-Advisor is responsible for exercising the voting rights associated with the securities purchased and held by the Funds. A description of the policies and procedures that the Sub-Advisor uses in fulfilling this responsibility is available as an appendix to the most recent Statement of Additional Information, which can be obtained without charge by calling toll free 1.800.543.0407 or by visiting the Touchstone website at TouchstoneInvestments.com or on the Securities and Exchange Commission’s (the “Commission”) website sec.gov. Information regarding how those proxies were voted during the most recent twelve-month period ended June 30 is also available without charge by calling toll free 1.800.543.0407 or on the Commission’s website at sec.gov.
Quarterly Portfolio Disclosure
The Trust files a complete listing of portfolio holdings for each Fund as of the end of the first and third quarters of each fiscal year on Form N-Q. The complete listing (i) is available on the Commission’s website; (ii) may be reviewed and copied at the Commission’s Public Reference Room in Washington, DC; or (iii) will be made available to shareholders upon request by calling 1.800.543.0407. Information on the operation of the Public Reference Room may be obtained by calling 1.800.SEC.0330.
Other Items (Unaudited) (Continued)
Schedule of Shareholder Expenses
As a shareholder of the Funds, you incur two types of costs: (1) transaction costs, including reinvested dividends or other distributions; and (2) ongoing costs, including investment advisory fees; distribution (12b-1) fees; and other Fund expenses. This example is intended to help you understand your ongoing costs (in dollars) of investing in the Funds and to compare these costs with the ongoing costs of investing in other mutual funds. The example is based on an investment of $1,000 invested at the beginning of the period and held for the entire period (June 1, 2017 through November 30, 2017).
Actual Expenses
The first line of the table below for each share class of a Fund provides information about actual account values and actual expenses. You may use the information in this line, together with the amount you invested, to estimate the expenses that you paid over the period. Simply divide your account value by $1,000 (for example, an $8,600 account value divided by $1,000 = 8.6), then multiply the result by the number in the first line under the heading entitled “Expenses Paid During the Six Months Ended November 30, 2017” to estimate the expenses you paid on your account during this period.
Hypothetical Example for Comparison Purposes
The second line of the table below for each share class of a Fund provides information about hypothetical account values and hypothetical expenses based on the Funds’ actual expense ratio and an assumed rate of return of 5% per year before expenses, which is not the Funds’ actual return. The hypothetical account values and expenses may not be used to estimate the actual ending account balance or expenses you paid for the period. You may use this information to compare the ongoing costs of investing in the Funds and other funds. To do so, compare this 5% hypothetical example with the 5% hypothetical examples that appear in the shareholder reports of the other funds.
Please note that the expenses shown in the table are meant to highlight your ongoing costs only and do not reflect any transactional costs, such as sales charges (loads), redemption fees, or exchange fees. Therefore, the second line of the table below is useful in comparing ongoing costs only, and will not help you determine the relative total costs of owning different funds. In addition, if these transactional costs were included, your costs would have been higher.
| | | | | | | | | | | | | | | Expenses | |
| | | | | | Net Expense | | | Beginning | | | Ending | | | Paid During | |
| | | | | | Ratio | | | Account | | | Account | | | the Six Months | |
| | | | | | Annualized | | | Value | | | Value | | | Ended | |
| | | | | | November 30, | | | June 1, | | | November 30, | | | November 30, | |
| | | | | | 2017 | | | 2017 | | | 2017 | | | 2017* | |
| Touchstone Balanced Fund | | | | | | | | | | | | | | | | | | | | |
| Class A | | | Actual | | | | 1.03 | % | | $ | 1,000.00 | | | $ | 1,071.10 | | | $ | 5.35 | |
| Class A | | | Hypothetical | | | | 1.03 | % | | $ | 1,000.00 | | | $ | 1,019.90 | | | $ | 5.22 | |
| | | | | | | | | | | | | | | | | | | | | |
| Class C | | | Actual | | | | 1.78 | % | | $ | 1,000.00 | | | $ | 1,067.30 | | | $ | 9.22 | |
| Class C | | | Hypothetical | | | | 1.78 | % | | $ | 1,000.00 | | | $ | 1,016.14 | | | $ | 9.00 | |
| | | | | | | | | | | | | | | | | | | | | |
| Class Y | | | Actual | | | | 0.79 | % | | $ | 1,000.00 | | | $ | 1,072.60 | | | $ | 4.10 | |
| Class Y | | | Hypothetical | | | | 0.79 | % | | $ | 1,000.00 | | | $ | 1,021.11 | | | $ | 4.00 | |
| | | | | | | | | | | | | | | | | | | | | |
| Touchstone International Equity Fund | | | | | | | | | | | | | | | | | | | | |
| Class A | | | Actual | | | | 1.37 | % | | $ | 1,000.00 | | | $ | 1,050.30 | | | $ | 7.04 | |
| Class A | | | Hypothetical | | | | 1.37 | % | | $ | 1,000.00 | | | $ | 1,018.20 | | | $ | 6.93 | |
| | | | | | | | | | | | | | | | | | | | | |
| Class C | | | Actual | | | | 2.33 | % | | $ | 1,000.00 | | | $ | 1,044.70 | | | $ | 11.94 | |
| Class C | | | Hypothetical | | | | 2.33 | % | | $ | 1,000.00 | | | $ | 1,013.39 | | | $ | 11.76 | |
| | | | | | | | | | | | | | | | | | | | | |
| Class Y | | | Actual | | | | 1.01 | % | | $ | 1,000.00 | | | $ | 1,051.90 | | | $ | 5.20 | |
| Class Y | | | Hypothetical | | | | 1.01 | % | | $ | 1,000.00 | | | $ | 1,020.00 | | | $ | 5.11 | |
Other Items (Unaudited) (Continued)
| | | | | | | | | | | | | | | Expenses | |
| | | | | | Net Expense | | | Beginning | | | Ending | | | Paid During | |
| | | | | | Ratio | | | Account | | | Account | | | the Six Months | |
| | | | | | Annualized | | | Value | | | Value | | | Ended | |
| | | | | | November 30, | | | June 1, | | | November 30, | | | November 30, | |
| | | | | | 2017 | | | 2017 | | | 2017 | | | 2017* | |
| Touchstone International Equity Fund (Continued) | | | | | | | | | | | | | | | | | |
| Institutional Class(A) | | | Actual | | | | 0.89 | % | | $ | 1,000.00 | | | $ | 1,029.10 | | | $ | 0.74 | |
| Institutional Class | | | Hypothetical | | | | 0.89 | % | | $ | 1,000.00 | | | $ | 1,020.61 | | | $ | 4.51 | |
| | | | | | | | | | | | | | | | | | | | | |
| Touchstone Large Cap Focused Fund | | | | | | | | | | | | | | | | | | | | |
| Class A | | | Actual | | | | 1.02 | % | | $ | 1,000.00 | | | $ | 1,107.90 | | | $ | 5.39 | |
| Class A | | | Hypothetical | | | | 1.02 | % | | $ | 1,000.00 | | | $ | 1,019.95 | | | $ | 5.16 | |
| | | | | | | | | | | | | | | | | | | | | |
| Class C | | | Actual | | | | 1.81 | % | | $ | 1,000.00 | | | $ | 1,103.80 | | | $ | 9.55 | |
| Class C | | | Hypothetical | | | | 1.81 | % | | $ | 1,000.00 | | | $ | 1,015.99 | | | $ | 9.15 | |
| | | | | | | | | | | | | | | | | | | | | |
| Class Y | | | Actual | | | | 0.74 | % | | $ | 1,000.00 | | | $ | 1,109.50 | | | $ | 3.91 | |
| Class Y | | | Hypothetical | | | | 0.74 | % | | $ | 1,000.00 | | | $ | 1,021.36 | | | $ | 3.75 | |
| | | | | | | | | | | | | | | | | | | | | |
| Institutional Class | | | Actual | | | | 0.66 | % | | $ | 1,000.00 | | | $ | 1,110.00 | | | $ | 3.49 | |
| Institutional Class | | | Hypothetical | | | | 0.66 | % | | $ | 1,000.00 | | | $ | 1,021.76 | | | $ | 3.35 | |
| | | | | | | | | | | | | | | | | | | | | |
| Touchstone Small Company Fund | | | | | | | | | | | | | | | | | | | | |
| Class A | | | Actual | | | | 1.17 | % | | $ | 1,000.00 | | | $ | 1,103.70 | | | $ | 6.17 | |
| Class A | | | Hypothetical | | | | 1.17 | % | | $ | 1,000.00 | | | $ | 1,019.20 | | | $ | 5.92 | |
| | | | | | | | | | | | | | | | | | | | | |
| Class C | | | Actual | | | | 1.92 | % | | $ | 1,000.00 | | | $ | 1,100.60 | | | $ | 10.11 | |
| Class C | | | Hypothetical | | | | 1.92 | % | | $ | 1,000.00 | | | $ | 1,015.44 | | | $ | 9.70 | |
| | | | | | | | | | | | | | | | | | | | | |
| Class Y | | | Actual | | | | 0.84 | % | | $ | 1,000.00 | | | $ | 1,107.10 | | | $ | 4.44 | |
| Class Y | | | Hypothetical | | | | 0.84 | % | | $ | 1,000.00 | | | $ | 1,020.86 | | | $ | 4.26 | |
| | | | | | | | | | | | | | | | | | | | | |
| Institutional Class(A) | | | Actual | | | | 0.79 | % | | $ | 1,000.00 | | | $ | 1,051.70 | | | $ | 0.67 | |
| Institutional Class | | | Hypothetical | | | | 0.79 | % | | $ | 1,000.00 | | | $ | 1,021.11 | | | $ | 4.00 | |
| | | | | | | | | | | | | | | | | | | | | |
| Class R6 | | | Actual | | | | 0.72 | % | | $ | 1,000.00 | | | $ | 1,106.20 | | | $ | 3.80 | |
| Class R6 | | | Hypothetical | | | | 0.72 | % | | $ | 1,000.00 | | | $ | 1,021.46 | | | $ | 3.65 | |
| (A) | Represents the period from commencement of operations (October 30, 2017) through November 30, 2017. Expenses are equal to the Fund's annualized expense ratio, multiplied by the average account value over the period, multiplied by 30/365. |
| * | Expenses are equal to the Fund's annualized expense ratio, multiplied by the average account value over the period, multiplied by 183/365 (to reflect the one-half year period). |
Approval of Investment Advisory and Sub-Advisory Agreements
At a meeting held on April 18, 2017, the Board of Trustees (the “Board” or “Trustees”) of the Touchstone Strategic Trust (the “Trust”), and by a separate vote, the Independent Trustees of the Trust, approved an amendment to the Investment Advisory Agreement between the Trust and the Advisor adding each Fund and also initially approved a Sub-Advisory Agreement between the Advisor and Fort Washington Investment Advisors, Inc. (the “Sub-Advisor”) with respect to the Funds.
In determining whether to approve the amendment to the Investment Advisory Agreement and the Sub-Advisory Agreement, the Advisor and the Sub-Advisor furnished information necessary for a majority of the Independent Trustees to make the determination that approval of the amendment to the Investment Advisory Agreement and the Sub-Advisory Agreement was in the best interests of the respective Funds and their shareholders. The information provided to the Board included: (1) a comparison of the Funds’ proposed advisory fee and other fees and anticipated expense ratios with those of comparable funds; (2) performance information for investment
Other Items (Unaudited) (Continued)
strategies comparable to those to be used in managing the Funds; (3) the Advisor’s and its affiliates’ estimated revenues and costs of providing services to the Funds; and (4) information about the Advisor’s and Sub-Advisor’s personnel. Prior to voting, the Independent Trustees reviewed the proposed approval of the amendment to the Investment Advisory Agreement and the Sub-Advisory Agreement with management and with experienced independent legal counsel and received materials from such counsel discussing the legal standards for their consideration of the Investment Advisory Agreement and the Sub-Advisory Agreement with respect to the Funds. The Independent Trustees also reviewed the proposed approval of the amendment to the Investment Advisory Agreement and the Sub-Advisory Agreement with independent legal counsel in a private session at which no representatives of management were present.
In approving the amendment to the Investment Advisory Agreement, the Board considered various factors, among them: (1) the nature, extent and quality of services to be provided to the Funds, including the personnel who would be providing such services; (2) the Advisor’s anticipated compensation and profitability; (3) a comparison of expenses and performance of comparable funds and relevant indexes; (4) anticipated economies of scale; and (5) the terms of the Investment Advisory Agreement. The Board’s analysis of these factors is set forth below. The Independent Trustees were advised by independent legal counsel throughout the process.
Nature, Extent and Quality of Advisor Services. The Board considered the level and depth of knowledge of the Advisor, including the professional experience and qualifications of senior personnel. In evaluating the quality of services to be provided by the Advisor, the Board took into account its familiarity with the Advisor’s senior management through Board meetings, discussions and reports during the preceding year. The Board also took into account the Advisor’s compliance policies and procedures. The quality of administrative and other services provided to other funds managed by the Advisor, including the Advisor’s role in coordinating the activities of those funds’ other service providers, was also considered. The Board also considered the Advisor’s relationship with its affiliates and the resources available to them, as well as any potential conflicts of interest. The Board discussed the Advisor’s effectiveness in monitoring the performance of the Trust’s other subadvisors, and the Advisor’s timeliness in responding to performance issues. The Board considered the Advisor’s process for monitoring the Sub-Advisor, which would include an examination of both qualitative and quantitative elements of the Sub-Advisor’s organization, personnel, procedures, investment discipline, infrastructure and performance. The Board considered that the Advisor would conduct regular on-site compliance visits with the Sub-Advisor, during which the Advisor would examine a wide variety of factors, such as the financial condition of the Sub-Advisor, the quality of the Sub-Advisor’s systems, the effectiveness of the Sub-Advisor’s disaster recovery programs, trade allocation and execution procedures, compliance with the Sub-Advisor’s policies and procedures, results of regulatory examinations and any other factors that might affect the quality of services that the Sub-Advisor would provide to the Funds. The Board noted that the Advisor’s compliance monitoring processes also would include quarterly reviews of compliance reports, and that any issues arising from such reports and the Advisor’s compliance visits to the Sub-Advisor would be reported to the Board.
The Trustees concluded that they were satisfied with the nature, extent and quality of services to be provided to each Fund by the Advisor under the Investment Advisory Agreement.
Advisor’s Compensation and Profitability. The Board took into consideration the financial condition and anticipated profitability of the Advisor and its affiliates (including the Sub-Advisor) and the direct and indirect benefits to be derived by the Advisor and its affiliates from the Advisor’s relationship with the Funds. The Board noted that the Advisor had contractually agreed to waive advisory fees and administrative fees and/or reimburse expenses in order to limit the Funds’ net operating expenses and would pay sub-advisory fees out of the advisory fees the Advisor receives from the Funds. The Board reviewed the anticipated profitability of the Advisor’s relationship with the Funds and also considered whether the Advisor has the financial wherewithal to provide a high level of services to the Funds, noting the ongoing commitment of the Advisor’s parent company with respect to providing support and resources as needed. The Board also considered that the Funds’ prospective distributor,
Other Items (Unaudited) (Continued)
an affiliate of the Advisor, would receive Rule 12b-1 distribution fees from the Funds and would receive a portion of the sales charges on sales or redemptions of certain classes of shares. The Board also noted that the Advisor would derive benefits to its reputation and other benefits from its association with the Funds.
The Board recognized that the Advisor should be entitled to earn a reasonable level of profits in exchange for the level of services it would provide to each Fund and the entrepreneurial risk that it would assume as Advisor. Based upon their review, the Trustees concluded that the Advisor’s and its affiliates’ level of profitability, if any, to be derived from their relationship with each Fund was reasonable and not excessive.
Expenses and Performance. The Board compared each Fund’s proposed advisory fees and total expense ratios with those of comparable funds. The Board took into account the Funds’ estimated total expenses for its Class A, Class C, Class Y, Class R6 and Institutional Shares, as applicable, after estimated waivers and reimbursements. The Board also took into account that the Advisor had contractually agreed to limit the Funds’ net operating expenses for a period of time following the launch of the Funds.
The Board also considered the effect of each Fund’s potential growth and size on its performance and expenses. The Board noted that the Advisor had agreed to waive a portion of its fees and/or reimburse expenses of the Funds in order to reduce each Fund’s operating expenses to targeted levels. The Board noted that the sub-advisory fees under the Sub-Advisory Agreement with respect to each Fund would be paid by the Advisor out of the advisory fee it would receive from the Fund and considered the impact of such sub-advisory fees on the profitability of the Advisor. In reviewing the proposed expense ratios and performance of the Funds, the Board also took into account the nature, extent and quality of the services to be provided to the Funds by the Advisor and its affiliates.
The Board considered, among other data, the specific factors set forth below with respect to each Fund:
Touchstone Balanced Fund. The Fund’s proposed advisory fee and total expense ratio (net of applicable expense waivers and reimbursements) were both below the median of its peer group. The Board took into account the performance of the two investment strategies the Sub-Advisor proposed to use in combination to manage the Fund relative to its peer group and blended index.
Touchstone International Equity Fund. The Fund’s proposed advisory fee and total expense ratio (net of applicable expense waivers and reimbursements) were both below the median of its peer group. The Board took into account that the Sentinel International Equity Fund ( “International Equity”), a series of Sentinel Group Funds, Inc., was expected to be merged into the Fund during the fourth quarter of 2017. Accordingly, the Board considered the performance of International Equity relative to its peer group and index. The Board took into account that members of International Equity’s portfolio management team were expected to manage the Fund after the merger. In addition, the Board took into consideration certain differences between how International Equity is managed and how the Fund would be managed as well as the impact these differences were expected to have on the Fund’s performance.
Touchstone Large Cap Focused Fund. The Fund’s proposed advisory fee and total expense ratio (net of applicable expense waivers and reimbursements) were at and below the median, respectively, of its peer group. The Board took into account the performance of the investment strategy the Sub-Advisor proposed to use in managing the Fund relative to its peer group and index. The Board also considered the investment performance of another Touchstone Fund that the Sub-Advisor managed using a similar investment strategy to the one proposed to be used for the Fund.
Touchstone Small Company Fund. The Fund’s proposed advisory and total expense ratio (net of applicable expense waivers and reimbursements) were both below the median of its peer group. The Board took into account that the Sentinel Small Company Fund ( “Small Company”), a series of Sentinel Group Funds, Inc., was expected to be merged into the Fund during the fourth quarter of 2017. Accordingly, the Board considered
Other Items (Unaudited) (Continued)
the performance of Small Company relative to its peer group and index. The Board took into account that members of Small Company’s portfolio management team were expected to manage the Fund after the merger. In addition, the Board took into consideration certain differences between how Small Company is managed and how the Fund would be managed as well as the impact these differences were expected to have on the Fund’s performance.
Economies of Scale. The Board considered the effect of each Fund’s potential growth and size on its performance and expenses. The Board took into account management’s discussion of the Funds’ advisory fee structure. The Board considered the proposed advisory fees under the Investment Advisory Agreement as a percentage of assets at different asset levels and possible economies of scale that might be realized if the assets of each Fund increase. The Board noted that the proposed advisory fee schedule for the Funds contained breakpoints that would reduce the advisory fee rate on assets above specified levels as each Fund’s assets increased. The Board also noted that if a Fund’s assets increase over time, the Fund might realize other economies of scale if assets increase proportionally more than certain other expenses. The Board also considered the fact that, under the Investment Advisory Agreement, the advisory fee payable to the Advisor by a Fund would be reduced by the total sub-advisory fee paid by the Advisor to the Fund’s Sub-Advisor.
Conclusion. In considering the approval of the amendment to the Investment Advisory Agreement, the Board, including the Independent Trustees, did not identify any single factor as controlling, and each Trustee may have attributed different weights to the various factors. The Trustees evaluated all information available to them on a Fund-by-Fund basis, and their determinations were made separately with respect to each Fund. The Board reached the following conclusions regarding the Investment Advisory Agreement with the Advisor, among others: (a) the Advisor demonstrated that it possesses the capability and resources to perform the duties required of it under the Investment Advisory Agreement; (b) the Advisor maintains an appropriate compliance program; (c) each Fund’s proposed advisory fee is reasonable relative to those of similar funds and the services to be provided by the Advisor. Based on their conclusions, the Trustees determined with respect to each Fund that approval of the amendment to the Investment Advisory Agreement was in the best interests of the Fund and its shareholders.
In initially approving the Sub-Advisory Agreement for the Funds, the Board considered various factors with respect to each Fund and the Sub-Advisory Agreement, among them: (1) the nature, extent and quality of services to be provided to the Fund, including the personnel who would be providing such services; (2) the Sub-Advisor’s proposed compensation; (3) a comparison of the performance of comparable funds and relevant indexes; and (4) the terms of the Sub-Advisory Agreement. The Board’s analysis of these factors is set forth below. The Independent Trustees were advised by independent legal counsel throughout the process.
Nature, Extent and Quality of Services Provided; Investment Personnel. The Board considered information provided by the Advisor and the Sub-Advisor regarding the services to be provided by the Sub-Advisor. The Board took into account the affiliation of the Sub-Advisor with the Advisor, noting any potential conflicts of interest. The Board also considered the Sub-Advisor’s level of knowledge and investment style. The Board reviewed the experience and credentials of the applicable investment personnel who would be responsible for managing the investment of portfolio securities with respect to the Funds. In evaluating the quality of services to be provided by the Sub-Advisor, the Board took into account its familiarity with the Sub-Advisor’s personnel through Board meetings, discussions and reports. The Board also took into account the Sub-Advisor’s compliance policies and procedures. The Board also considered the Sub-Advisor’s regulatory and compliance history.
Sub-Advisor’s Compensation. The Board also took into consideration the financial condition of the Sub-Advisor and any indirect benefits to be derived by the Sub-Advisor and its affiliates from the Sub-Advisor’s relationship with the Funds. In considering the anticipated profitability to the Sub-Advisor, the Board noted the proposed contractual undertaking of the Advisor to maintain expense limitations for the Funds and also noted that the
Other Items (Unaudited) (Continued)
sub-advisory fees under the Sub-Advisory Agreements would be paid by the Advisor out of the advisory fees that it would receive under the Investment Advisory Agreement. In addition, the Board noted that the sub-advisory fee schedule for each Fund contained breakpoints that would reduce the sub-advisory fee rate on assets above specified levels if the Fund’s assets increased.
Sub-Advisory Fees and Fund Performance. The Board considered that each Fund would pay an advisory fee to the Advisor and that the Advisor would pay a sub-advisory fee to the Sub-Advisor out of the advisory fee it would receive from the respective Fund. The Board considered the amount to be retained by the Advisor and the sub-advisory fee to be paid to the Sub-Advisor with respect to the various services to be provided by the Advisor and the Sub-Advisor. The Board compared the proposed sub-advisory fees to be paid by the Advisor to the Sub-Advisor for managing each Fund to the sub-advisory fees paid by the Advisor to the Sub-Advisor for managing otherTouchstone Funds. Based on their review, theTrustees concluded that each Fund’s proposed sub-advisory fee was reasonable in light of the quality of services to be provided by the Sub-Advisor to the Fund and the other factors considered.
As noted above, the Board considered the long-term performance of the investment strategies the Sub-Advisor proposed to use in managing the Funds relative to that of comparable funds and relevant indexes. The Board also noted the Advisor’s expertise and resources in monitoring the performance, investment style and risk-adjusted performance of theTrust’s other sub-advisors. The Board was mindful of the Advisor’s focus on the performance of sub-advisors and the Advisor’s ways of addressing underperformance.
Conclusion. In considering the initial approval of the Sub-Advisory Agreement with respect to each Fund, the Board, including the Independent Trustees, did not identify any single factor as controlling, and each Trustee may have attributed different weights to the various factors. The Board reached the following conclusions regarding the Sub-Advisory Agreement, among others: (a) the Sub-Advisor is qualified to manage each Fund’s assets in accordance with the Fund’s investment goals and policies; (b) the Sub-Advisor maintains an appropriate compliance program; (c) each Fund’s proposed advisory and sub-advisory fee structure is reasonable relative to those of similar funds and to the services to be provided by the Advisor and the Sub-Advisor; and (d) the Sub-Advisor’s proposed investment strategies are appropriate for pursuing the investment goals of each Fund. Based on its conclusions, the Board determined that approval of the Sub-Advisory Agreement with respect to each Fund was in the best interests of the Fund and its shareholders.
Management of the Trust (Unaudited)
Listed below is required information regarding the Trustees and principal officers of the Trust. The Trust’s Statement of Additional Information includes additional information about theTrustees and is available, without charge, upon request by calling 1.800.543.0407 or by visiting the Touchstone website at TouchstoneInvestments.com.
Interested Trustees1:
| | | | | Number | |
| | | | | of Funds | |
| | | | | Overseen | |
| | | Term of | | in the | |
| Name | Position | Office And | | Touchstone | Other |
| Address | Held with | Length of | Principal Occupation(s) | Fund | Directorships |
| Year of Birth | Trust | Time Served | During Past 5 Years | Complex2 | Held During the Past 5 Years3 |
| Jill T. McGruder Touchstone Advisors, Inc. 303 Broadway Suite 1100 Cincinnati, Ohio 45202 Year of Birth: 1955 | Trustee and President | Until retirement at age 75 or until she resigns or is removed Trustee since 1999 | President and CEO of IFS Financial Services, Inc. (a holding company). | 49 | IFS Financial Services, Inc. (a holding company) from 1999 to the present; Integrity and National Integrity Life Insurance Co. from 2005 to the present; Touchstone Securities (the Trust’s distributor) from 1999 to the present; Touchstone Advisors, Inc. (the Trust’s investment advisor and administrator) from 1999 to the present; W&S Brokerage Services (a brokerage company) from 1999 to the present; W&S Financial Group Distributors (a distribution company) from 1999 to the present; Cincinnati Analysts, Inc. from 2012 to the present; Columbus Life Insurance Co. from 2016 to the present; The Lafayette Life Insurance Co. from 2016 to the present; Taft Museum of Art from 2007 to the present; YWCA of Greater Cincinnati from 2012 to the present; and LL Global, Inc. from 2016 to the present. |
| Independent Trustees: | | | | | |
| Phillip R. Cox c/o Touchstone Advisors, Inc. 303 Broadway Suite 1100 Cincinnati, Ohio 45202 Year of Birth: 1947 | Trustee | Until retirement at age 75 or until he resigns or is removed Trustee since 1999 | President and Chief Executive Officer of Cox Financial Corp. (a financial services company) from 1971 to the present. | 49 | Director of Cincinnati Bell (a communications company) from 1994 to the present; Bethesda Inc. (a hospital) from 2005 to the present; Timken Co. (a manufacturing company) from 2004 to 2014; TimkenSteel from 2014 to the present; Diebold, Inc. (a technology solutions company) from 2004 to the present; and Ohio Business Alliance for Higher Education and the Economy from 2005 to the present. |
| William C. Gale c/o Touchstone Advisors, Inc. 303 Broadway Suite 1100 Cincinnati, Ohio 45202 Year of Birth: 1952 | Trustee | Until retirement at age 75 or until he resigns or is removed Trustee since 2013 | Retired; formerly Senior Vice President and Chief Financial Officer (from 2003 to January 2015) of Cintas Corporation (a business services company). | 49 | None. |
Management of the Trust (Unaudited) (Continued)
Independent Trustees (Continued):
| | | | | Number | |
| | | | | of Funds | |
| | | | | Overseen | |
| | | Term of | | in the | |
| Name | Position(s) | Office And | | Touchstone | Other |
| Address | Held with | Length of | Principal Occupation(s) | Fund | Directorships |
| Year of Birth | Trust | Time Served | During Past 5 Years | Complex2 | Held During the Past 5 Years3 |
| Susan J. Hickenlooper c/o Touchstone Advisors, Inc. 303 Broadway Suite 1100 Cincinnati, Ohio 45202 Year of Birth: 1946 | Trustee | Until retirement at age 75 or until she resigns or is removed Trustee since 2009 | Retired; formerly Financial Analyst for Impact 100 (charitable organization) from November 2012 to 2013. | 49 | Trustee of Diocese of Southern Ohio from 2014 to the present; and Trustee of Cincinnati Parks Foundation from 2000 to 2016. |
| Kevin A. Robie c/o Touchstone Advisors, Inc. 303 Broadway Suite 1100 Cincinnati, Ohio 45202 Year of Birth: 1956 | Trustee | Until retirement at age 75 or until he resigns or is removed Trustee since 2013 | Vice President of Portfolio Management at Soin International LLC (a multinational holding company) from 2004 to the present. | 49 | SaverSystems, Inc. from 2015 to the present; Director of Buckeye EcoCare, Inc. (a lawn care company) from 2013 to the present; Trustee of Dayton Region New Market Fund, LLC (a private fund) from 2010 to the present; and Trustee of the Entrepreneurs Center, Inc. (a small business incubator) from 2006 to the present. |
| Edward J. VonderBrink c/o Touchstone Advisors, Inc. 303 Broadway Suite 1100 Cincinnati, Ohio 45202 Year of Birth: 1944 | Trustee | Until retirement at age 75 or until he resigns or is removed Trustee since 2013 | Consultant, VonderBrink Consulting LLC from 2000 to the present. | 49 | Director of Streamline Health Solutions, Inc. (healthcare IT) from 2006 to 2015; Mercy Health from 2013 to the present; Mercy Health Foundation (healthcare nonprofit) from 2008 to the present; Al Neyer Inc. (a construction company) from 2013 to the present; and BASCO Shower Door from 2011 to the present. |
| 1 | Ms. McGruder, as a director of the Advisor and the Distributor, and an officer of affiliates of the Advisor and the Distributor, is an “interested person” of the Trust within the meaning of Section 2(a) (19) of the 1940 Act. |
| 2 | As of November 30, 2017, the Touchstone Fund Complex consisted of 25 series of the Trust, 13 series of Touchstone Funds Group Trust, 1 series of Touchstone Institutional Funds Trust, and 10 variable annuity series of Touchstone Variable Series Trust. |
| 3 | Each Trustee is also a Trustee of Touchstone Funds Group Trust, Touchstone Institutional Funds Trust, and Touchstone Variable Series Trust. |
Management of the Trust (Unaudited) (Continued)
Principal Officers:
| | | Term of | |
| Name | Position | Office and | |
| Address | Held with | Length of | Principal Occupation(s) |
| Year of Birth | Trust1 | Time Served | During the Past 5 Years |
| Jill T. McGruder Touchstone Advisors, Inc. 303 Broadway Suite 1100 Cincinnati, Ohio 45202 Year of Birth: 1955 | President and Trustee | Until resignation, removal or disqualification President since 2006 | See biography above. |
| Steven M. Graziano Touchstone Advisors, Inc. 303 Broadway Suite 1100 Cincinnati, Ohio 45202 Year of Birth: 1954 | Vice President | Until resignation, removal or disqualification Vice President since 2009 | President of Touchstone Advisors, Inc. |
| Timothy D. Paulin Touchstone Advisors, Inc. 303 Broadway Suite 1100 Cincinnati, Ohio 45202 Year of Birth: 1963 | Vice President | Until resignation, removal or disqualification Vice President since 2010 | Senior Vice President of Investment Research and Product Management of Touchstone Advisors, Inc. |
| Timothy S. Stearns Touchstone Advisors, Inc. 303 Broadway Suite 1100 Cincinnati, Ohio 45202 Year of Birth: 1963 | Chief Compliance Officer | Until resignation, removal or disqualification Chief Compliance Officer since 2013 | Chief Compliance Officer of Touchstone Advisors, Inc.; Chief Compliance Officer of Envestnet Asset Management, Inc. (2009 to 2013). |
| Terrie A. Wiedenheft Touchstone Advisors, Inc. 303 Broadway Suite 1100 Cincinnati, Ohio 45202 Year of Birth: 1962 | Controller and Treasurer | Until resignation, removal or disqualification Controller and Treasurer since 2006 | Senior Vice President, Chief Financial Officer and Chief Operations Officer, of IFS Financial Services, Inc. (a holding company). |
| Ellen Blanchard The Bank of New York Mellon 201 Washington St, 13th Floor Boston, Massachusetts 02108 Year of Birth: 1973 | Secretary | Until resignation, removal or disqualification Secretary since 2015 | Director of The Bank of New York Mellon |
| 1 | Each officer also holds the same office with Touchstone Funds Group Trust, Touchstone Institutional Funds Trust, and Touchstone Variable Series Trust. |
This page intentionally left blank.
PRIVACY PROTECTION POLICY
We Respect Your Privacy
Thank you for your decision to invest with us. Touchstone and its affiliates have always placed a high value on the trust and confidence our clients place in us. We believe that confidence must be earned and validated through time. In today’s world, when technology allows the sharing of information at light speeds, trust must be reinforced by our sincere pledge to take the steps necessary to ensure that the information you share with us is treated with respect and confidentiality.
Our Pledge to Our Clients
| • | We collect only the information we need to service your account and administer our business. |
| • | We are committed to keeping your information confidential and we place strict limits and controls on the use and sharing of your information. |
| • | We make every effort to ensure the accuracy of your information. |
We Collect the Following Nonpublic Personal Information About You:
| • | Information we receive from you on or in applications or other forms, correspondence, or conversations, including, but not limited to, your name, address, phone number, social security number, assets, income and date of birth; and |
| • | Information about your transactions with us, our affiliates, or others, including, but not limited to, your account number and balance, payment history, parties to transactions, cost basis information, and other financial information. |
Categories of Information We Disclose and Parties to Whom We Disclose
We do not disclose any nonpublic personal information about our current or former clients to nonaffiliated third parties, except as required or permitted by law.
We Place Strict Limits and Controls on the Use and Sharing of Your Information
| • | We restrict access to nonpublic personal information about you to authorized employees who need the information to administer your business. |
| • | We maintain physical, electronic and procedural safeguards that comply with federal standards to protect this information. |
| • | We do not disclose any nonpublic personal information about our current or former clients to anyone, except as required or permitted by law or as described in this document. |
| • | We will not sell your personal information to anyone. |
We May Provide Information to Service Your Account
Sometimes it is necessary to provide information about you to various companies such as transfer agents, custodians, broker-dealers and marketing service firms to facilitate the servicing of your account. These organizations have a legitimate business need to see some of your personal information in order for us to provide service to you. We may disclose to these various companies the information that we collect as described above. We require that these companies, including our own subsidiaries and affiliates, strictly maintain the confidentiality of this information and abide by all applicable laws. Companies within our corporate family that may receive this information are financial service providers and insurance companies. We do not permit these associated companies to sell the information for their own purposes, and we never sell our customer information.
This policy is applicable to the following affiliated companies: Touchstone Funds Group Trust, Touchstone Strategic Trust, Touchstone Variable Series Trust, Touchstone Institutional Funds Trust, Touchstone Securities, Inc.,* and W&S Brokerage Services, Inc.
* Touchstone Securities, Inc. serves as the underwriter to the Touchstone Funds.
A Member of Western & Southern Financial Group®
The Privacy Protection Policy is not part of the Annual Report.


Go paperless, sign up today at:
www.touchstoneinvestments.com
Touchstone Investments
Distributor
Touchstone Securities, Inc.*
303 Broadway
Cincinnati, Ohio 45202-4203
800.638.8194
www.touchstoneinvestments.com
Investment Advisor
Touchstone Advisors, Inc.*
303 Broadway
Cincinnati, Ohio 45202-4203
Transfer Agent
BNY Mellon Investment Servicing (US) Inc.
4400 Computer Drive
Westborough, Massachusetts 01581
Shareholder Service
800.543.0407
* A Member of Western & Southern Financial Group
TSF-54BB-TST-SENT-AR-1711
Item 2. Code of Ethics.
| (a) | The registrant, as of the end of the period covered by this report, has adopted a code of ethics that applies to the registrant’s principal executive officer, principal financial officer, principal accounting officer or controller, or persons performing similar functions, regardless of whether these individuals are employed by the registrant or a third party. |
| (c) | There have been no amendments, during the period covered by this report, to a provision of the code of ethics that applies to the registrant’s principal executive officer, principal financial officer, principal accounting officer or controller, or persons performing similar functions, regardless of whether these individuals are employed by the registrant or a third party, and that relates to any element of the code of ethics description. |
| (d) | The registrant has not granted any waivers, including an implicit waiver, from a provision of the code of ethics that applies to the registrant’s principal executive officer, principal financial officer, principal accounting officer or controller, or persons performing similar functions, regardless of whether these individuals are employed by the registrant or a third party, that relates to one or more of the items set forth in paragraph (b) of this item’s instructions. |
Item 3. Audit Committee Financial Expert.
The registrant’s Board of Trustees has determined that the registrant has at least one audit committee financial expert serving on its audit committee. Mr. William Gale is the registrant’s audit committee financial expert and is an independent trustee within the meaning of the Investment Company Act of 1940, as amended (the “1940 Act”).
Item 4. Principal Accountant Fees and Services.
Audit Fees
| (a) | Audit fees for Touchstone Strategic Trust totaled $66,200 in fiscal 2017 including fees associated with the annual audit and filing of Form N-1A and Form NSAR. |
Audit-Related Fees
| (b) | Audit related fees totaled $7,092 for 2017. The fees for 2017 relate to the review of N-14 filings for the funds. |
Tax Fees
| (c) | The fees for tax compliance services totaled $20,780 for 2017. |
All Other Fees
| (d) | There were no other fees for the 2017 fiscal year. |
| (e)(1) | Disclose the audit committee’s pre-approval policies and procedures described in paragraph (c)(7) of Rule 2-01 of Regulation S-X. |
The Audit Committee’s pre-approval policies describe the types of audit, audit-related, tax and other services that have the general pre-approval of the Audit Committee. The pre-approval policies provide that annual audit service fees, tax services not specifically granted pre-approval, services exceeding pre-approved cost levels and other services that have not received general pre-approval will be subject to specific pre-approval by the Audit Committee. The pre-approval policies further provide that the Committee may grant general pre-approval to other audit services (statutory audits and services associated with SEC registration statements, periodic reports and other documents filed with the SEC or other documents issued in connection with securities offerings), audit-related services (accounting consultations related to accounting, financial reporting or disclosure matters not classified as “audit services,” assistance with understanding and implementing new accounting and financial reporting guidance from rulemaking authorities, agreed-upon or expanded audit procedures related to accounting and/or billing records required to respond to or comply with financial, accounting or regulatory reporting matters and assistance with internal control reporting requirements under Form N-SAR and Form N-CSR), tax services that have historically been provided by the auditor that the Committee believes would not impair the independence of the auditor and are consistent with the SEC’s rules on auditor independence and permissible non-audit services classified as “all other services” that are routine and recurring services.
All of the services described in paragraphs (b) through (d) of Item 4 were approved by the Audit Committee.
| (f) | The percentage of hours expended on the principal accountant’s engagement to audit the registrant’s financial statements for the most recent fiscal year that were attributed to work performed by persons other than the principal accountant’s full-time, permanent employees was less than fifty percent. |
| (g) | The aggregate non-audit fees for Touchstone Strategic Trust and certain entities*, totaled approximately $27,872 in 2017. |
* These include the advisors (excluding sub-advisors) and any entity controlling, controlled by or under common control with the advisors that provides ongoing services to the registrant (Funds).
| (h) | The registrant’s audit committee of the board of directors has considered whether the provision of non-audit services that were rendered to the registrant’s investment adviser (not including any sub-adviser whose role is primarily portfolio management and is subcontracted with or overseen by another investment adviser), and any entity controlling, controlled by, or under common control with the investment adviser that provides ongoing services to the registrant that were not pre-approved pursuant to paragraph (c)(7)(ii) of Rule 2-01 of Regulation S-X is compatible with maintaining the principal accountant’s independence. |
Item 5. Audit Committee of Listed Registrants.
Not applicable.
Item 6. Investments.
| (a) | Schedule of Investments in securities of unaffiliated issuers as of the close of the reporting period is included as part of the report to shareholders filed under Item 1 of this form. |
Item 7. Disclosure of Proxy Voting Policies and Procedures for Closed-End Management Investment Companies.
Not applicable.
Item 8. Portfolio Managers of Closed-End Management Investment Companies.
Not applicable.
Item 9. Purchases of Equity Securities by Closed-End Management Investment Company and Affiliated Purchasers.
Not applicable.
Item 10. Submission of Matters to a Vote of Security Holders.
There have been no material changes to the procedures by which the shareholders may recommend nominees to the registrant’s board of trustees, where those changes were implemented after the registrant last provided disclosure in response to the requirements of Item 407(c)(2)(iv) of Regulation S-K (17 CFR 229.407) (as required by Item 22(b)(15) of Schedule 14A (17 CFR 240.14a-101)), or this Item.
Item 11. Controls and Procedures.
| (a) | The registrant’s principal executive and principal financial officers, or persons performing similar functions, have concluded that the registrant’s disclosure controls and procedures (as defined in Rule 30a-3(c) under the Investment Company Act of 1940, as amended (the “1940 Act”) (17 CFR 270.30a-3(c))) are effective, as of a date within 90 days of the filing date of the report that includes the disclosure required by this paragraph, based on their evaluation of these controls and procedures required by Rule 30a-3(b) under the 1940 Act (17 CFR 270.30a-3(b)) and Rules 13a-15(b) or 15d-15(b) under the Securities Exchange Act of 1934, as amended (17 CFR 240.13a-15(b) or 240.15d-15(b)). |
| (b) | There were no changes in the registrant’s internal control over financial reporting (as defined in Rule 30a-3(d) under the 1940 Act (17 CFR 270.30a-3(d))) that occurred during the registrant’s last fiscal quarter that has materially affected, or is reasonably likely to materially affect, the registrant’s internal control over financial reporting. |
Item 12. Disclosure of Securities Lending Activities for Closed-End Management Investment Companies.
Not applicable.
Item 13. Exhibits.
| (a)(1) | Code of ethics, or any amendment thereto, that is the subject of disclosure required by Item 2 is attached hereto. |
| (a)(2) | Certifications pursuant to Rule 30a-2(a) under the 1940 Act and Section 302 of the Sarbanes-Oxley Act of 2002 are attached hereto. |
| (b) | Certifications pursuant to Rule 30a-2(b) under the 1940 Act and Section 906 of the Sarbanes- Oxley Act of 2002 are attached hereto. |
SIGNATURES
Pursuant to the requirements of the Securities Exchange Act of 1934 and the Investment Company Act of 1940, the registrant has duly caused this report to be signed on its behalf by the undersigned, thereunto duly authorized.
(Registrant) Touchstone Strategic Trust
By (Signature and Title)* /s/ Jill T. McGruder
Jill T. McGruder, President
(principal executive officer)
Date 1/29/2018
Pursuant to the requirements of the Securities Exchange Act of 1934 and the Investment Company Act of 1940, this report has been signed below by the following persons on behalf of the registrant and in the capacities and on the dates indicated.
By (Signature and Title)* /s/ Jill T. McGruder
Jill T. McGruder, President
(principal executive officer)
Date 1/29/2018
By (Signature and Title)* /s/ Terrie A. Wiedenheft
Terrie A. Wiedenheft, Controller and Treasurer
(principal financial officer)
Date 1/29/2018
* Print the name and title of each signing officer under his or her signature.