UNITED STATES
SECURITIES AND EXCHANGE COMMISSION
Washington, D.C. 20549
FORM N-CSR
CERTIFIED SHAREHOLDER REPORT OF REGISTERED MANAGEMENT INVESTMENT COMPANIES
| Investment Company Act file number | 811-03651 | |
| Touchstone Strategic Trust – December Funds |
| (Exact name of registrant as specified in charter) |
| 303 Broadway, Suite 1100 |
| Cincinnati, Ohio 45202-4203 |
| (Address of principal executive offices) (Zip code) |
| Jill T. McGruder |
| 303 Broadway, Suite 1100 |
| Cincinnati, Ohio 45202-4203 |
| (Name and address of agent for service) |
Registrant's telephone number, including area code:800-638-8194
Date of fiscal year end:December 31
Date of reporting period:December 31, 2018
Form N-CSR is to be used by management investment companies to file reports with the Commission not later than 10 days after the transmission to stockholders of any report that is required to be transmitted to stockholders under Rule 30e-1 under the Investment Company Act of 1940 (17 CFR 270.30e-1). The Commission may use the information provided on Form N-CSR in its regulatory, disclosure review, inspection, and policymaking roles.
A registrant is required to disclose the information specified by Form N-CSR, and the Commission will make this information public. A registrant is not required to respond to the collection of information contained in Form N-CSR unless the Form displays a currently valid Office of Management and Budget ("OMB") control number. Please direct comments concerning the accuracy of the information collection burden estimate and any suggestions for reducing the burden to Secretary, Securities and Exchange Commission, 450 Fifth Street, NW, Washington, DC 20549-0609. The OMB has reviewed this collection of information under the clearance requirements of 44 U.S.C. § 3507.
Item 1. Reports to Stockholders.
The Report to Shareholders is attached herewith.
December 31, 2018
Annual Report
Touchstone Strategic Trust
Touchstone Dynamic Equity Fund
Touchstone Controlled Growth with Income Fund
Touchstone Dynamic Diversified Income Fund
Touchstone Dynamic Global Allocation Fund
IMPORTANT NOTE: Beginning on January 1, 2021, as permitted by regulations adopted by the Securities and Exchange Commission, paper copies of the Touchstone Funds’ annual and semi-annual shareholder reports will no longer be sent by mail, unless you specifically request paper copies of the shareholder reports from Touchstone Funds or from your financial intermediary, such as a broker-dealer or bank. Instead, annual and semi-annual shareholder reports will be available on the Touchstone Funds’ website (TouchstoneInvestments.com/Resources), and you will be notified by mail each time a report is posted and provided with a website link to access the report.
You may elect to receive all future annual and semi-annual shareholder reports in paper, free of charge. If you already elected to receive shareholder reports electronically, you will not be affected by this change and you need not take any action. To elect to receive paper copies of shareholder reports through the mail or otherwise change your delivery method, contact your financial intermediary or, if you hold your shares directly through Touchstone Funds, visit TouchstoneInvestments.com/Resources/Edelivery or call Touchstone Funds toll-free at 1.800.543.0407. Your election to receive shareholder reports in paper will apply to all Touchstone Funds that you hold through the financial intermediary, or directly with Touchstone.

Table of Contents
This report identifies the Funds' investments on December 31, 2018. These holdings are subject to change. Not all investments in each Fund performed the same, nor is there any guarantee that these investments will perform as well in the future. Market forecasts provided in this report may not occur.
Letter from the President
Dear Shareholder:
We are pleased to provide you with the Touchstone Strategic Trust Annual Report. Inside you will find key financial information, as well as manager commentaries for the Funds, for the 12 months ended December 31, 2018.
The “synchronized global expansion” that characterized 2017 decoupled in 2018 amid the imposition of tariffs by the U.S. and China, followed by threats of yet more. U.S. economic data was generally strong. Toward year-end, however, some indicators - including home and auto sales and consumer confidence - suggested a slowdown was emerging. Decelerating growth in major economies outside the U.S. became more evident, though none entered recessionary territory. Healthy domestic economic conditions encouraged the U.S. Federal Reserve Board (Fed) to continue normalizing monetary policy with four interest rate increases, yet it also signaled a more patient approach going forward in light of declining inflation expectations. Rising U.S. interest rates, a strong labor market and relatively robust economic conditions attracted global investors to U.S. stocks and bonds and strengthened the U.S. dollar. The Bank of Japan and European Central Bank (ECB) maintained accommodative monetary policies. Hopes of normalizing their respective monetary policies in order to restock their recession-fighting tool-kits faded after mid-year amid weaker growth. The ECB did however fulfill its promise to end its quantitative easing program.
Global macroeconomic concerns led to declines across all broad U.S. and non-U.S. equity indexes. In the U.S., growth-oriented stocks led U.S. equity markets over their value-oriented counterparts, while large capitalization stocks outperformed small- and mid-capitalization stocks. Outside the U.S., emerging market and developed market equities posted double-digit declines. Those declines were compounded for domestic investors in non-U.S. equities due to the U.S. dollar’s strengthening versus most major foreign currencies.
Rising interest rates and widening credit spreads buffeted the fixed income market. The Fed’s rate hikes pushed short-term rates higher over the year, outpacing rising rates on longer maturities. The result was a significantly flatter yield curve, reaching its flattest level since 2007. This gave rise to fears throughout the year of a yield curve inversion1, which historically has been a leading indicator of recessions. While the U.S. Treasury yield curve did not invert, it did finish the year above where it started, creating a headwind for longer maturity bonds. Economic concerns also led to credit spread widening during the year, resulting in negative returns for both investment grade and high yield bonds.
The new year provides a natural point to assess the recent past and consider the future. From a financial perspective, it has been yet another period of challenged returns across many asset classes. This presents a particularly timely juncture to assess your current financial situation and, with the help of your financial advisor, weigh your plans for the year - as well as for the years ahead.
We greatly value your continued support. Thank you for including Touchstone as part of your investment plan.
Sincerely,

Jill T. McGruder
President
Touchstone Strategic Trust
1A yield curve inversion is defined as when the yield on a 2-year Treasury Bill exceeds the yield on a 10-year Treasury Bond.
Management's Discussion of Fund Performance(Unaudited)
Touchstone Dynamic Equity Fund
Sub-Advised by Wells Capital Management, Inc.
Investment Philosophy
The Fund seeks long-term capital appreciation from hedged equity investments with less risk than a fully invested, unhedged equity portfolio. A proprietary system that ranks stocks according to a quantitative model is utilized in an attempt to create a diversified and hedged portfolio, which invests in a combination of long and short stocks and options, including covered calls. A security’s intrinsic value is determined by evaluating variables such as relative valuation, price momentum, company fundamentals, liquidity and risk.
Fund Performance
The Touchstone Dynamic Equity Fund (Class A Shares) underperformed its benchmarks, the S&P 500® Index and the FTSE 3-Month T-Bill Index, for the 12-month period ended December 31, 2018. The Fund’s total return was -10.34 percent (calculated excluding the maximum sales charge), while the total return of the S&P 500® Index was -4.38 percent, and the total return of the FTSE 3-Month T-Bill Index was 1.86%.
Market Environment
U.S. equities finished the 12-month period in negative territory after advancing by double digits during the first nine months of the year. After briefly posting positive gains in November, investors who were hoping for a year-end rally were disappointed. The S&P 500® Index declined sharply in December and posted negative double-digit returns for the fourth quarter.
Market volatility returned in 2018, as worries about inflation, the threat of global trade wars and the prospect of new regulations on technology firms drove the market lower. The sell-off late in the year seemed to be sparked by concerns over the U.S. government shutdown. In particular, December started with conflicting views between the U.S. Federal Reserve Board (Fed) and the White House over rising interest rates, and ended with a confrontation between the U.S. Congress and the White House. Both led to increased market volatility.
Despite the volatility, the domestic economy remained strong. Consumer spending figures were robust, thereby driving overall growth for the economy. This growth also benefited consumer confidence, as the Conference Board Consumer Confidence Index® hit a notable high during 2018. The U.S. labor market produced strong results throughout the year. Wages increased and the unemployment rate matched the lowest in almost five decades, indicating the strong labor market will likely continue to fuel economic growth.
As a result, Fed officials raised interest rates four times in 2018 and reaffirmed their outlook for further gradual hikes well into 2019. The most recent increase of 25 basis points boosted the benchmark federal funds rate to a target range of 2.25 to 2.50 percent.
Portfolio Review
The Fund is a hedged equity fund with a portfolio comprised of equities and options. During the year, the equity component of the Fund posted negative total returns and underperformed the S&P 500® Index. The call options component of the Fund posted positive returns and outperformed the passive option component.
The equity portion of the Fund is structured to be sector-, style- and beta1-neutral relative to the S&P 500® Index, thus trying to deliver outperformance from stock selection. Overall stock selection detracted from performance during the 12-month period, which was led by negative results within the Consumer Discretionary and Health Care sectors.
Management's Discussion of Fund Performance (Unaudited) (Continued)
The Fund’s equity investment process uses a multi-characteristic approach when valuing securities. During the year, an emphasis on valuation characteristics and earnings revisions was the primary driver of underperformance. Specifically, the Fund was overweight companies with above-average earnings and cash flow relative to their price. This detracted from Fund performance as investors avoided these qualities when selecting securities. The Fund benefited from an emphasis on companies with above-average quality characteristics, such as strong profit margins and return on equity, as investors rewarded these qualities during the year.
Among the individual stocks that contributed to relative performance during the calendar year were long positions in Mastercard Inc. (Financials sector), Adobe Inc. (Information Technology sector) and Amazon.com Inc. (Consumer Discretionary sector), and short positions in Sealed Air Corp. (Materials sector), Owens-Illinois Inc. (Materials sector) and Macquarie Infrastructure Corp. (Industrials sector). Mastercard, a global payments and technology company, moved higher after reporting earnings that beat analysts’ estimates. In particular, the company’s profits benefited from more customers traveling abroad. Adobe is a software company that provides digital marketing and document management solutions. The stock moved to a record high in the first quarter of 2018 after the company beat analysts’ estimates for its fiscal first quarter. Amazon.com is the world’s largest online retailer of a wide variety of consumer goods and digital media. Amazon’s stock rallied in the first quarter of 2018 after the company reported that its fiscal third-quarter 2017 revenue and earnings beat analysts’ estimates. Sealed Air, a provider of food and product packaging solutions, moved lower after the company received a subpoena from the Securities and Exchange Commission in August for documents relating to income taxes, financial reporting and disclosures. Owens-Illinois, a manufacturer of glass containers and other packaging products, moved lower in April after the company missed earnings estimates and its rating was then downgraded by Bank of America Merrill Lynch. Macquarie Infrastructure owns, operates and invests in a diversified group of businesses in the U.S. In February the stock plunged after the company announced it would significantly reduce its dividend payout. Following the news, multiple brokerage firms lowered their recommendations on the stock.
Among the stocks that detracted from Fund performance were short positions in TESARO Inc. (Health Care sector) and Pandora Media Inc. (Communication Services sector), and long positions in Target Corp., NVR Inc. (both from the Consumer Discretionary sector), Weyerhaeuser Co. (Real Estate sector) and Freeport-McMoRan Inc. (Materials sector). TESARO, an oncology-focused biopharmaceutical company, rallied after it was announced that GlaxoSmithKline PLC agreed to purchase the company for significantly more than the prior closing price. Pandora Media, a music delivery platform, rallied as the company reported strong earnings, smaller than expected losses, and revenues that were higher than analysts predicted. Target, an upscale discount retailer, moved notably lower after posting quarterly sales and margins that disappointed investors. NVR, a homebuilder and mortgage company, moved lower after reporting revenues that missed estimates. Weyerhaeuser is a large private owner and manager of timberlands. The stock declined after the company reported third quarter net sales that were below analysts’ average estimate. Shares of Freeport-McMoRan, an international mining company, declined after copper prices moved lower following investors’ fears that the trade war between China and the U.S. will slow economic growth, thus pressuring demand for raw materials. Freeport-McMoRan also reported its second quarter revenues missed estimates, which further impacted the stock.
Outlook
The Fund’s process is based on the fundamental belief that there is persistency in the types of characteristics investors prefer. If this holds going forward, we expect the Fund to benefit from being properly positioned toward stocks believed to have characteristics favored by investors. We continue to emphasize stocks with certain attractive valuation characteristics, such as stocks with above-average cash flow-to-price ratios and earnings-to-price ratios. In addition, we will continue to focus on companies with strong quality metrics, such as stocks with return on assets and favorable profit margins. Finally, we will continue to deemphasize risk as investors avoid companies with above-average risk characteristics, such as above-average leverage.
| 1 | Beta is a measure of the volatility of a portfolio relative to its benchmark. |
Management's Discussion of Fund Performance (Unaudited) (Continued)
Comparison of the Change in Value of a $10,000 Investment in the Touchstone Dynamic
Equity Fund - Class A*, the S&P 500® Index and the FTSE 3-Month T-Bill Index
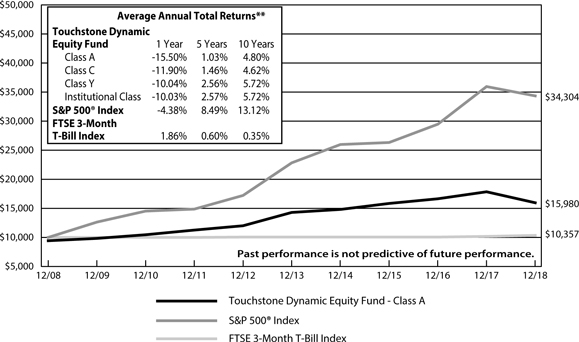
| * | The chart above represents performance of Class A shares only, which will vary from the performance of Class C shares, Class Y shares and Institutional Class shares based on the differences in sales loads and fees paid by shareholders in the different classes. |
| ** | The average annual total returns shown above are adjusted for maximum sales loads and fees, if applicable. The maximum offering price per share of Class A shares is equal to the net asset value (“NAV”) per share plus a sales load equal to 5.26% of the NAV (or 5.00% of the offering price). Prior to August 17, 2018, the maximum offering price per share of Class A shares was equal to the NAV per share plus a sales load equal to 6.10% of the NAV (or 5.75% of the offering price). Class C shares are subject to a contingent deferred sales charge (“CDSC”) of 1.00%. The CDSC will be assessed on an amount equal to the lesser of (1) the NAV at the time of purchase of the shares being redeemed or (2) the NAV of such shares being redeemed, if redeemed within a one-year period from the date of purchase. Class Y shares and Institutional Class shares are not subject to sales charges. |
The performance of the above Fund does not reflect the deduction of taxes that a shareholder would pay on Fund distributions or the redemption of Fund shares.
Notes to Chart
S&P 500® Index is a group of 500 widely held stocks and is commonly regarded to be representative of the large capitalization stock universe.
FTSE 3-Month T-Bill Index tracks the performance of U.S. Treasury Bills with a remaining maturity of three months.
Management's Discussion of Fund Performance (Unaudited)
Touchstone Controlled Growth with Income Fund
Sub-Advised by Wilshire Associates Incorporated
Investment Philosophy
The Fund is a “fund-of-funds,” which seeks to achieve its investment goal of providing investors with growth and income by investing primarily in a diversified portfolio of underlying equity, fixed-income and alternative funds (although a portion of its assets may be invested in cash, cash equivalents, or in money market funds). These underlying funds, in turn, invest in a variety of U.S. and foreign equity securities, fixed-income instruments and other investments. The Fund will allocate a significant portion of its assets to underlying funds utilizing alternative or nontraditional investment strategies, such as long-short, merger arbitrage, flexible income and credit opportunities strategies. The majority of the underlying funds in which the Fund invests will be affiliated funds; however, the Fund has the ability to invest in unaffiliated underlying funds, including exchange-traded funds (ETFs) and exchange-traded notes (ETNs), to the extent that the desired asset class exposure is not available through Touchstone Funds.
Fund Performance
The Touchstone Controlled Growth with Income Fund (Class A Shares) underperformed its first benchmark, the ICE BofA Merrill Lynch 3-Month U.S. Treasury Bill Index, and its second benchmark, the Wilshire Liquid Alternative IndexSM, for the 12-month period ended December 31, 2018. The Fund’s total return was -4.56 percent (calculated excluding the maximum sales charge) while the total return of the ICE BofA Merrill Lynch 3-Month U.S. Treasury Bill Index was 1.87 percent and the total return for the Wilshire Liquid Alternative IndexSM was -4.24 percent for the same period.
Market Environment
The U.S. stock market, represented by the Russell 3000® Index, declined in 2018. Eight of the eleven major sectors declined during 2018, with Health Care, Utilities and Information Technology ending the year with positive returns. The worst performing sectors were Energy and Materials. Large capitalization stocks outperformed small cap stocks while growth stocks outperformed their value counterparts during the twelve-month period.
Equity markets outside of the U.S. were negative for 2018 in both developed and emerging markets, with double-digit losses across the major indices. Although the European Union began the year in sound economic condition, growth declined steadily throughout the year as gains in unemployment stalled and industrial production reversed course. News out of Japan was grim with a report showing a serious economic contraction during the third quarter that threatens to end Japan’s longest expansion since the 1980’s. Emerging Markets underperformed nearly all of the major indices for 2018.
The bellwether 10-year U.S. Treasury yield ended the year at 2.69 percent, up 29 basis points from its 2017 finish of 2.40 percent. The Federal Open Market Committee increased its overnight rate four times in 2018, a total increase of 100 basis points, to a range of 2.25 percent to 2.50 percent. Credit spreads widened during the year within both the investment grade and high yield markets.
Real estate securities declined in the U.S. for the year, but slightly outperformed global real estate. Commodities were down for the one-year period as crude oil fell 25 percent from the close of 2017. Master Limited Partnerships returns were negative for the year. Finally, gold prices ended 2018 down slightly from last year.
Portfolio Review
During the year, we reduced the Fund’s fixed income duration by initiating an allocation to Touchstone Ultra Short Duration Fixed Income Fund, sourced from Touchstone Impact Bond Fund. This change was made in order to take advantage of the flat yield curve and in an effort to reduce the Fund’s interest rate risk. The
Management's Discussion of Fund Performance (Unaudited) (Continued)
allocation to Touchstone Dynamic Equity Fund was increased in order to bring the Fund’s equity beta back near its long-term target. The final notable change during the year was the shift to overweight value equities within the Fund’s long-only equity allocation. We believe value equities offer more attractive valuations relative to growth equities, and value equities have tended to exhibit lower levels of equity beta. Overall, the Fund remains somewhat conservatively positioned relative to long-term allocation targets, while still seeking to deliver attractive levels of yield, should provide downside protection and participate in equity market upside.
The Fund had an average allocation of 10.0% to long-only equities, 26.2% to Fixed Income, and a 63.8% average weight to Alternative strategies. The Fund’s largest average allocation during the year was to Touchstone Dynamic Equity Fund, which had the largest negative performance contribution and accounted for much of the relative underperformance. Touchstone Dynamic Equity Fund’s exposure to equity beta was the primary detractor from returns, while covered call writing premiums did not provide enough income to offset the equity market losses. The Fund’s only positive contributors to performance for the year were positions in Touchstone Impact Bond Fund and Touchstone Ultra Short Duration Fixed Income Fund.
Outlook
After an estimated 25 percent growth in corporate earnings during 2018, earnings are projected to grow less than 10 percent during 2019. Domestic equity markets have priced in reduced growth and on a forward price earnings (P/E) basis, we believe equities are no longer expensive. Although the Fund remains positioned somewhat conservatively relative to long-term allocation targets, it is invested in risk assets. We previously pared back our credit risk and duration risk, but we are at our target weight for long-only equities. We continue to expect a positive economic growth environment in the near future, and therefore believe that the current economic landscape warrants low (relative to historical averages) interest rates on the longer end of the curve.
Global economic growth remains positive. While the forward-looking Purchasing Manager Index (PMI), which is an indicator of economic health in the manufacturing sector of a country or a region, has fallen in recent quarters, it continues to express positive economic momentum. Although measures of inflation are rising on a global basis, we believe they will remain low by historical standards. Given that global growth and inflation remain moderate, we believe that global central banks will be cautious about tightening monetary policy and will seek to communicate policy changes to the markets well in advance. Given ultra-low foreign developed market bond yields, we favor domestic fixed income over global fixed income; however, we recognize that any weakness in the U.S. dollar could serve to benefit foreign fixed income.
Strong U.S. corporate earnings growth has helped propel domestic equity prices upwards early in 2018, but trade concerns weighed on the growth outlook for equities late in the year and led to a sharp selloff in risk assets. We believe the outlook for continued domestic and foreign gross domestic product (GDP) growth remains positive; unless economic growth slows meaningfully and recession fears grow. Rising rates may concern investors, who may believe that the increase in interest rates will weigh on corporate earnings going forward. While we acknowledge this risk, we believe that it is important to recognize the potential demand for U.S. Treasury bonds from yield-seeking foreign investors. With respect to credit markets, there is potential that further erosion in the corporate earnings outlook could lead to further spread widening, though credit spreads have already priced in some slowdown and are now trading at what we believe to be more attractive levels.
Management's Discussion of Fund Performance (Unaudited) (Continued)
Comparison of the Change in Value of a $10,000 Investment in the
Touchstone Controlled Growth with Income Fund - Class A*, the ICE BofA Merrill Lynch
3-Month U.S. Treasury Bill Index and the Wilshire Liquid Alternative IndexSM
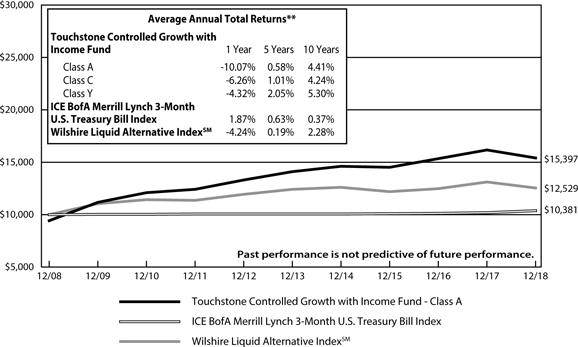
| * | The chart above represents performance of Class A shares only, which will vary from the performance of Class C shares and Class Y shares based on the differences in sales loads and fees paid by shareholders in the different classes. |
| ** | The average annual total returns shown above are adjusted for maximum sales loads and fees, if applicable. The maximum offering price per share of Class A shares is equal to the net asset value (“NAV”) per share plus a sales load equal to 5.26% of the NAV (or 5.00% of the offering price). Prior to August 17, 2018, the maximum offering price per share of Class A shares was equal to the NAV per share plus a sales load equal to 6.10% of the NAV (or 5.75% of the offering price). Class C shares are subject to a contingent deferred sales charge (“CDSC”) of 1.00%. The CDSC will be assessed on an amount equal to the lesser of (1) the NAV at the time of purchase of the shares being redeemed or (2) the NAV of such shares being redeemed, if redeemed within a one-year period from the date of purchase. Class Y shares are not subject to sales charges. |
The performance of the above Fund does not reflect the deduction of taxes that a shareholder would pay on Fund distributions or the redemption of Fund shares.
Notes to Chart
ICE BofA Merrill Lynch 3-Month U.S. Treasury Bill Index is an unmanaged index of treasury securities maturing in 90 days that assumes reinvestment of all income.
Wilshire Liquid Alternative IndexSM is an unmanaged index designed to provide a broad measure of the performance of the liquid alternative market.
Management's Discussion of Fund Performance (Unaudited)
Touchstone Dynamic Diversified Income Fund
Sub-Advised by Wilshire Associates Incorporated
Investment Philosophy
The Fund is a “fund-of-funds,“ which seeks to achieve its investment goal of providing investors with current income by investing primarily in a diversified portfolio of fixed-income and equity-income oriented underlying funds (although a portion of its assets may be invested in cash, cash equivalents, or in money market funds). The majority of the underlying funds in which the Fund invests will be affiliated funds; however, the Fund has the ability to invest in unaffiliated underlying funds, including exchange-traded funds (ETFs) and exchange-traded notes (ETNs), to the extent that the desired asset class exposure is not available through Touchstone Funds.
Fund Performance
The Touchstone Dynamic Diversified Income Fund (Class A Shares) underperformed its first benchmark, the Bloomberg Barclays U.S. Aggregate Bond Index, but outperformed its second benchmark, the MSCI All Country World Index (ACWI), for the 12-month period ended December 31, 2018. The Fund’s total return was -4.66 percent (calculated excluding the maximum sales charge), while the total return of the Bloomberg Barclays U.S. Aggregate Bond Index was 0.01 percent and the total return of the MSCI ACWI was -9.42 percent.
Market Environment
The U.S. stock market, represented by the Russell 3000® Index, declined in 2018. Eight of the eleven major sectors declined during 2018, with Health Care, Utilities and Information Technology ending the year with positive returns. The worst performing sectors were Energy and Materials. Large capitalization stocks outperformed small cap stocks while growth stocks outperformed their value counterparts during the twelve-month period.
Equity markets outside of the U.S. were negative for 2018 in both developed and emerging markets, with double-digit losses across the major indices. Although the European Union began the year in sound economic condition, growth declined steadily throughout the year as gains in unemployment stalled and industrial production reversed course. News out of Japan was grim with a report showing a serious economic contraction during the third quarter that threatened to end Japan’s longest expansion since the 1980’s. Emerging Markets underperformed nearly all of the major indices for 2018.
The bellwether 10-year U.S. Treasury yield ended the year at 2.69 percent, up 29 basis points from its 2017 finish of 2.40 percent. The Federal Open Market Committee increased its overnight rate four times in 2018, a total increase of 100 basis points, to a range of 2.25 percent to 2.50 percent. Credit spreads widened during the year within both the investment grade and high yield markets.
Real estate securities declined in the U.S. for the year, but slightly outperformed global real estate. Commodities were down for the one-year period as crude oil fell 25 percent from the close of 2017. Master Limited Partnership (MLP) returns remained negative for the year. Finally, gold prices ended 2018 down slightly from last year.
Portfolio Review
During 2018, two notable allocation changes were made to the Fund. A new allocation to Touchstone Ultra Short Duration Fixed Income Fund which modestly reduced the Fund’s investment grade fixed income duration in order to take advantage of the flat yield curve and reduce overall interest rate risk. The other notable change was an increase in MLP exposure back towards the Fund’s long-term target. These allocation changes were sourced from foreign and developed equity positions, however the Fund is overweight foreign equities relative to our long-term target. Overall, the Fund is overweight fixed income relative to our long-term target. Although this is an expression of our intended conservative positioning, we believe the Fund should still meaningfully participate in a rally in risk assets.
Management's Discussion of Fund Performance (Unaudited) (Continued)
The Fund’s permanent bias towards equity income represented a performance tailwind in 2018 as higher dividend paying equities outpaced non-dividend or low dividend yielding equities across broad equity indices. In addition, the long-term decision to underweight equities in favor of fixed income contributed positively to relative performance. However, the credit overweight within the Fund’s fixed income allocation partially offset the positive contribution of the fixed income overweight. Corporate credit markets were broadly down across the quality rating spectrum but more so in the below investment grade portion of the credit markets.
The Touchstone Value Fund was the top relative contributor within the equity allocation. The largest detractor was the Touchstone International Value Fund due to poor stock selection.
Within the Fund’s fixed income allocation, exposure to high yield credit detracted from overall performance. The largest detractor was the Touchstone Credit Opportunities Fund which is a non-investment grade credit-focused portfolio. Concurrent with the fixed income market’s sell off in corporate credit, safer, higher quality fixed income performed better. The Touchstone Impact Bond Fund, with its higher quality portfolio, represented the year’s top contributor within the fixed income allocation.
Outlook
After an estimated 25 percent growth in corporate earnings during 2018, earnings are projected to grow less than 10 percent during 2019. Domestic equity markets have priced in reduced growth and on a forward price-earnings (P/E) basis, therefore, we believe equities are no longer expensive. Although the Fund remains positioned somewhat conservatively relative to long-term allocation targets, it is invested in risk assets. We previously pared back the Fund’s credit risk and duration risk, but we are at our target weight for long-only equities. We continue to expect a positive economic growth environment in the near future, and therefore believe that the current economic landscape warrants low (relative to historical averages) interest rates on the longer end of the curve.
Global economic growth remains positive. While the forward-looking Purchasing Manager Index (PMI), which is an indicator of economic health in the manufacturing sector of a country or a region, has fallen in recent quarters, it continues to express positive economic momentum. Although measures of inflation are rising on a global basis, we believe they will remain low by historical standards. Given that global growth and inflation remain moderate, we believe that global central banks will be cautious about tightening monetary policy and will seek to communicate policy changes to the markets well in advance. Given ultra-low foreign developed market bond yields, we favor domestic fixed income over global fixed income; however, we recognize that any weakness in the U.S. dollar could serve to benefit foreign fixed income.
Strong U.S. corporate earnings growth has helped propel domestic equity prices upwards early in 2018, but trade concerns weighed on the growth outlook for equities late in the year and led to a sell-off in risk assets. We believe the outlook for continued domestic and foreign gross domestic product (GDP) growth remains positive; unless economic growth slows meaningfully and recession fears grow. Rising rates may concern investors, who may believe that the increase in interest rates will weigh on corporate earnings going forward. While we acknowledge this risk, we believe that it is important to recognize the potential demand for U.S. Treasury bonds from yield-seeking foreign investors. With respect to credit markets, there is potential that further erosion in the corporate earnings outlook could lead to further spread widening, though credit spreads have already priced in some slowdown and are now trading at what we believe to be more attractive levels.
Management's Discussion of Fund Performance (Unaudited) (Continued)
Comparison of the Change in Value of a $10,000 Investment in the
Touchstone Dynamic Diversified Income Fund - Class A*, the Bloomberg Barclays U.S. Aggregate
Bond Index and the MSCI All Country World Index

| * | The chart above represents performance of Class A shares only, which will vary from the performance of Class C shares and Class Y shares based on the differences in sales loads and fees paid by shareholders in the different classes. |
| ** | The average annual total returns shown above are adjusted for maximum sales loads and fees, if applicable. The maximum offering price per share of Class A shares is equal to the net asset value (“NAV”) per share plus a sales load equal to 5.26% of the NAV (or 5.00% of the offering price). Prior to August 17, 2018, the maximum offering price per share of Class A shares was equal to the NAV per share plus a sales load equal to 6.10% of the NAV (or 5.75% of the offering price). Class C shares are subject to a contingent deferred sales charge (“CDSC”) of 1.00%. The CDSC will be assessed on an amount equal to the lesser of (1) the NAV at the time of purchase of the shares being redeemed or (2) the NAV of such shares being redeemed, if redeemed within a one-year period from the date of purchase. Class Y shares are not subject to sales charges. |
The performance of the above Fund does not reflect the deduction of taxes that a shareholder would pay on Fund distributions or the redemption of Fund shares.
Notes to Chart
Bloomberg Barclays U.S. Aggregate Bond Index is an unmanaged index comprised of U.S. investment grade, fixed rate bond market securities, including government, government agency, corporate and mortgage-backed securities between one and ten years.
MSCI All Country World Index is an unmanaged index that measures the equity market performance of developed and emerging markets.
Source: MSCI. MSCI makes no express or implied warranties or representations and shall have no liability whatsoever with respect to any MSCI data contained herein. The MSCI data may not be further redistributed or used to create indices or financial products. This report is not approved or produced by MSCI.
Management's Discussion of Fund Performance (Unaudited)
Touchstone Dynamic Global Allocation Fund
Sub-Advised by Wilshire Associates Incorporated
Investment Philosophy
The Fund is a “fund-of-funds“, which seeks to achieve its investment goal of providing investors with capital appreciation by primarily investing in a diversified portfolio of underlying equity and fixed-income funds. These underlying funds, in turn, invest in a variety of U.S. and foreign equity and fixed-income securities (although a portion of its assets may be invested in cash, cash equivalents, or in money market funds). The majority of the underlying funds in which the Fund invests will be affiliated funds; however, the Fund has the ability to invest in unaffiliated underlying funds, including exchange-traded funds (ETFs) and exchange-traded notes (ETNs), to the extent that the desired asset class exposure is not available through Touchstone Funds. Under normal circumstances, the Fund (through its investment in underlying funds) will invest at least 40 percent of its portfolio in securities of issuers outside of the U.S.
Fund Performance
The Touchstone Dynamic Global Allocation Fund (Class A Shares) outperformed its primary benchmark the MSCI All Country World Index (ACWI), but underperformed its secondary benchmark the Bloomberg Barclays Global Aggregate Index for the 12-month period ended December 31, 2018. The Fund’s total return was -7.91 percent (calculated excluding the maximum sales charge), while the total return of the MSCI ACWI was -9.42 percent and the total return of the Bloomberg Barclays Global Aggregate Index was -1.20 percent.
Market Environment
The U.S. stock market, represented by the Russell 3000® Index, declined in 2018. Eight of the eleven major sectors declined during 2018, with Health Care, Utilities and Information Technology ending the year with positive returns. The worst performing sectors were Energy and Materials. Large capitalization stocks outperformed small cap stocks and growth stocks generally trailed value stocks during the fourth quarter but outperformed overall during the twelve-month period.
Equity markets outside of the U.S. were negative for 2018 in both developed and emerging markets, with double-digit losses across the major indices. Although the European Union began the year in sound economic condition, growth declined steadily throughout the year as gains in unemployment stalled and industrial production reversed course. News out of Japan was grim with a report showing a serious economic contraction during the third quarter that threatened to end Japan’s longest expansion since the 1980’s. Emerging Markets underperformed nearly all of the major indices for 2018.
The U.S. Treasury yield curve fell across most maturities during the fourth quarter, with the biggest decreases occurring in the intermediate to longer segment of the curve. The bellwether 10-year Treasury yield ended the year at 2.69 percent, up 29 basis points from its 2017 finish of 2.40 percent. The Federal Open Market Committee (FOMC) increased its overnight rate four times in 2018, a total increase of 100 basis points, to a range of 2.25 percent to 2.50 percent. Credit spreads widened in the fourth quarter within both the investment grade and high yield markets.
Real estate securities declined in the U.S. for the year but slightly outperformed global real estate. Commodities were down for the one-year period as crude oil fell 25 percent from the close of 2017 and gold prices ended 2018 down slightly from last year. Master Limited Partnerships (MLP) returns were negative for the year as well.
Management's Discussion of Fund Performance (Unaudited) (Continued)
Portfolio Review
Coming into the year, we notably reduced the Fund’s credit risk and that underweight to credit risk remained in place throughout 2018. This de-risking effort helped serve as a buffer to the Fund when the markets came under stress during late 2018.
During 2018, the Fund notably reduced fixed income duration in an attempt to take advantage of the flat yield curve and reduce interest rate risk. On a stand-alone basis, the Fund’s “fixed income bucket” lagged the Bloomberg Barclays Global Aggregate Index, as tilts that materially underweight U.S. dollar-hedged, foreign developed fixed income and overweight credit-oriented fixed income hurt performance.
The Fund added a modest amount of equity beta, which is expressed through an overweight to value equities. We viewed value equities to possess more attractive valuations relative to their growth equity counterparts. Within the Fund’s equity allocation domestic small caps underperformed relative to domestic large caps. This allocation decision was initiated in order to reduce exposure to the potential negative impacts of a trade war, domestic small cap equities generally have had a smaller percentage of their sales attributed to foreign markets. Further, the 2017 tax law changes were also expected to disproportionately benefit profitable small cap companies, which had less flexibility to declare profits in lower tax foreign markets, rather than the U.S. However, the late 2018 selloff in global equities weighed on the Fund’s equity allocation due to headwinds from an overweight to non-U.S. equity and value stocks within the domestic equity allocation.
In terms of absolute contribution to returns, the most notable allocations were to Touchstone Sands Capital Institutional Growth Fund and Touchstone Small Cap Value Fund. Within fixed income, the Fund’s allocation to the Vanguard Total International Bond ETF and Touchstone Ultra Short Duration Fixed Income Fund were the two largest contributors.
Outlook
After an estimated 25 percent growth in corporate earnings during 2018, earnings are projected to grow less than 10 percent during 2019. Domestic equity markets have priced in reduced growth and on a forward price-earnings (P/E) basis, we believe equities are no longer expensive. Although the Fund remains positioned some what conservatively relative to long-term allocation targets, the Fund remains invested in risk assets. We previously pared back our credit risk and duration risk, but it is our target weight for long-only equities. We continue to expect a positive economic growth environment in the near future, and therefore believe that the current economic landscape warrants low (relative to historical averages) interest rates on the longer end of the curve.
Global economic growth remains positive. While the forward-looking Purchasing Manager Index (PMI), which is an indicator of economic health in the manufacturing sector of a country or a region, has fallen in recent quarters, it continues to express positive economic momentum. Although measures of inflation are rising on a global basis, we believe they will remain low by historical standards. Given that global growth and inflation remain moderate, we believe that global central banks will be cautious about tightening monetary policy and will seek to communicate policy changes to the markets well in advance. Given ultra-low foreign developed market bond yields, we favor domestic fixed income over global fixed income; however, we recognize that any weakness in the U.S. dollar could serve to benefit foreign fixed income.
Strong U.S. corporate earnings growth has helped propel domestic equity prices upwards early in 2018, but trade concerns weighed on the growth outlook for equities late in the year and led to a sharp selloff in risk assets. Domestic equities are now slightly cheap in terms of forward P/E ratios. We believe the outlook for continued domestic and foreign gross domestic product (GDP) growth remains positive which reduces the downside risk of a further equity market selloff; unless economic growth slows meaningfully and recession fears grow. Rising rates may concern investors, who may believe that the increase in interest rates will weigh on corporate earnings going forward. While we acknowledge this risk, we believe that it is important to recognize
Management's Discussion of Fund Performance (Unaudited) (Continued)
the potential demand for U.S. Treasury bonds from yield-seeking foreign investors. With respect to credit markets, there is potential that further erosion in the corporate earnings outlook could lead to further spread widening, though credit spreads have already priced in some slowdown and are now trading at more attractive levels. Overall, the Fund remains somewhat conservatively positioned relative to long-term targets.
Comparison of the Change in Value of a $10,000 Investment in the
Touchstone Dynamic Global Allocation Fund - Class A*, the MSCI All Country World Index
and the Bloomberg Barclays Global Aggregate Index
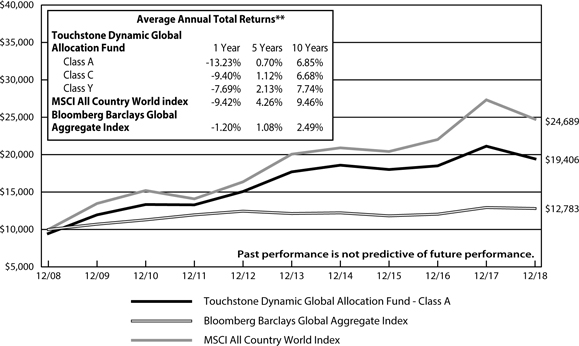
| * | The chart above represents performance of Class A shares only, which will vary from the performance of Class C shares and Class Y shares based on the differences in sales loads and fees paid by shareholders in the different classes. |
| ** | The average annual total returns shown above are adjusted for maximum sales loads and fees, if applicable. The maximum offering price per share of Class A shares is equal to the net asset value (”NAV“) per share plus a sales load equal to 5.26% of the NAV (or 5.00% of the offering price). Prior to August 17, 2018, the maximum offering price per share of Class A shares was equal to the NAV per share plus a sales load equal to 6.10% of the NAV (or 5.75% of the offering price). Class C shares are subject to a contingent deferred sales charge (”CDSC“) of 1.00%. The CDSC will be assessed on an amount equal to the lesser of (1) the NAV at the time of purchase of the shares being redeemed or (2) the NAV of such shares being redeemed, if redeemed within a one-year period from the date of purchase. Class Y shares are not subject to sales charges. |
The performance of the above Fund does not reflect the deduction of taxes that a shareholder would pay on Fund distributions or the redemption of Fund shares.
Notes to Chart
MSCI All Country World Index is an unmanaged index that measures the equity market performance of developed and emerging markets.
Bloomberg Barclays Global Aggregate Index is an unmanaged index that measures global investment grade debt from twenty-four local currency markets. This multi-currency benchmark includes treasury, government-related, corporate and securitized fixed-rate bonds from both developed and emerging markets issuers.
Source: MSCI. MSCI makes no express or implied warranties or representations and shall have no liability whatsoever with respect to any MSCI data contained herein. The MSCI data may not be further redistributed or used to create indices or financial products. This report is not approved or produced by MSCI.
Tabular Presentation of Portfolios of Investments (Unaudited)
December 31, 2018
The tables below provide each Fund’s sector allocation. We hope it will be useful to shareholders as it summarizes key information about each Fund’s investments.
| Touchstone Dynamic Equity Fund | | | |
| Sector Allocation* | | (% of Net Assets) | |
| Long Positions | | | | |
| Common Stocks | | | | |
| Information Technology | | | 23.9 | % |
| Health Care | | | 17.0 | |
| Financials | | | 14.9 | |
| Consumer Discretionary | | | 10.3 | |
| Communication Services | | | 10.0 | |
| Industrials | | | 9.5 | |
| Consumer Staples | | | 8.8 | |
| Real Estate | | | 7.3 | |
| Energy | | | 6.9 | |
| Utilities | | | 5.5 | |
| Materials | | | 3.5 | |
| Short-Term Investment Fund | | | 0.4 | |
| Other Assets/Liabilities (Net) | | | 5.1 | |
| | | | 123.1 | % |
| Short Positions | | | | |
| Common Stocks | | | | |
| Financials | | | (5.3 | )% |
| Real Estate | | | (3.2 | ) |
| Information Technology | | | (2.2 | ) |
| Industrials | | | (1.8 | ) |
| Health Care | | | (1.7 | ) |
| Materials | | | (1.5 | ) |
| Utilities | | | (1.5 | ) |
| Consumer Discretionary | | | (1.4 | ) |
| Energy | | | (0.6 | ) |
| Consumer Staples | | | (0.5 | ) |
| Communication Services | | | (0.5 | ) |
| Written Call and Put Options | | | (2.9 | ) |
| | | | (23.1 | )% |
| Total | | | 100.0 | % |
| Touchstone Controlled Growth with Income Fund | | | |
| Sector Allocation | | (% of Net Assets) | |
| Affiliated Mutual Funds | | | | |
| Alternative Funds | | | 49.9 | % |
| Fixed Income Funds | | | 40.8 | |
| Equity Funds | | | 9.7 | |
| Short-Term Investment Fund | | | 0.0 | |
| Other Assets/Liabilities (Net) | | | (0.4 | ) |
| Total | | | 100.0 | % |
| Touchstone Dynamic Diversified Income Fund | | | |
| Sector Allocation | | (% of Net Assets) | |
| Affiliated Mutual Funds | | | | |
| Fixed Income Funds | | | 58.5 | % |
| Equity Funds | | | 22.2 | |
| Exchange-Traded Funds | | | 13.4 | |
| Exchange-Traded Notes | | | 5.5 | |
| Short-Term Investment Funds | | | 8.5 | |
| Other Assets/Liabilities (Net) | | | (8.1 | ) |
| Total | | | 100.0 | % |
| Touchstone Dynamic Global Allocation Fund | | | |
| Sector Allocation | | (% of Net Assets) | |
| Affiliated Mutual Funds | | | | |
| Equity Funds | | | 53.3 | % |
| Fixed Income Funds | | | 26.9 | |
| Exchange-Traded Funds | | | 19.4 | |
| Short-Term Investment Fund | | | 0.7 | |
| Other Assets/Liabilities (Net) | | | (0.3 | ) |
| Total | | | 100.0 | % |
| * | Sector classifications are based upon the Global Industry Classification Standard (GICS®). |
Portfolio of Investments
Touchstone Dynamic Equity Fund– December 31, 2018
| | | | | | Market | |
| | | Shares | | | Value | |
| | | | | | | |
| Common Stocks†† — 117.6% | | | | | | | | |
| | | | | | | | | |
| Information Technology — 23.9% | | | | | | | | |
| Accenture PLC (Ireland) - Class A | | | 9,648 | | | $ | 1,360,464 | |
| Adobe, Inc.* | | | 5,007 | | | | 1,132,784 | |
| Advanced Micro Devices, Inc.* | | | 3,051 | | | | 56,321 | |
| Akamai Technologies, Inc.* | | | 1,730 | | | | 105,668 | |
| Amdocs Ltd. | | | 3,499 | | | | 204,971 | |
| ANSYS, Inc.* | | | 651 | | | | 93,054 | |
| Apple, Inc. | | | 18,507 | | | | 2,919,294 | |
| Automatic Data Processing, Inc. | | | 8,636 | | | | 1,132,352 | |
| Booz Allen Hamilton Holding Corp. | | | 5,153 | | | | 232,246 | |
| Cadence Design Systems, Inc.* | | | 5,848 | | | | 254,271 | |
| CDK Global, Inc. | | | 6,116 | | | | 292,834 | |
| Cisco Systems, Inc. | | | 19,385 | | | | 839,952 | |
| Cognizant Technology Solutions Corp. - Class A | | | 810 | | | | 51,419 | |
| F5 Networks, Inc.* | | | 398 | | | | 64,488 | |
| Fair Isaac Corp.* | | | 468 | | | | 87,516 | |
| Fortinet, Inc.* | | | 6,372 | | | | 448,780 | |
| Hewlett Packard Enterprise Co. | | | 3,714 | | | | 49,062 | |
| HP, Inc. | | | 15,128 | | | | 309,519 | |
| Intel Corp. | | | 19,348 | | | | 908,002 | |
| Intuit, Inc. | | | 4,775 | | | | 939,959 | |
| Leidos Holdings, Inc. | | | 1,603 | | | | 84,510 | |
| Manhattan Associates, Inc.* | | | 2,583 | | | | 109,442 | |
| Mastercard, Inc. - Class A | | | 7,091 | | | | 1,337,717 | |
| Microsoft Corp. | | | 35,098 | | | | 3,564,904 | |
| Motorola Solutions, Inc. | | | 617 | | | | 70,980 | |
| National Instruments Corp. | | | 13,386 | | | | 607,457 | |
| NetApp, Inc. | | | 4,944 | | | | 295,008 | |
| NVIDIA Corp. | | | 1,102 | | | | 147,117 | |
| Oracle Corp. | | | 9,394 | | | | 424,139 | |
| PayPal Holdings, Inc.* | | | 2,155 | | | | 181,214 | |
| QUALCOMM, Inc. | | | 3,136 | | | | 178,470 | |
| Skyworks Solutions, Inc. | | | 2,400 | | | | 160,848 | |
| Square, Inc. - Class A* | | | 3,604 | | | | 202,148 | |
| Te Connectivity Ltd. (Switzerland) | | | 718 | | | | 54,302 | |
| Teradata Corp.* | | | 373 | | | | 14,308 | |
| Texas Instruments, Inc. | | | 5,389 | | | | 509,260 | |
| Visa, Inc. - Class A | | | 1,612 | | | | 212,687 | |
| Xilinx, Inc. | | | 6,850 | | | | 583,415 | |
| | | | | | | | 20,220,882 | |
| | | | | | | | | |
| Health Care — 17.0% | | | | | | | | |
| Abbott Laboratories | | | 1,304 | | | | 94,318 | |
| AbbVie, Inc. | | | 10,869 | | | | 1,002,013 | |
| Agilent Technologies, Inc. | | | 6,987 | | | | 471,343 | |
| Alexion Pharmaceuticals, Inc.* | | | 4,030 | | | | 392,361 | |
| Align Technology, Inc.* | | | 516 | | | | 108,066 | |
| AmerisourceBergen Corp. | | | 2,174 | | | | 161,746 | |
| Amgen, Inc. | | | 2,587 | | | | 503,611 | |
| Anthem, Inc. | | | 1,303 | | | | 342,207 | |
| Baxter International, Inc. | | | 2,845 | | | | 187,258 | |
| Bristol-Myers Squibb Co. | | | 17,231 | | | | 895,667 | |
| Bruker Corp. | | | 20,821 | | | | 619,841 | |
| Cardinal Health, Inc. | | | 1,338 | | | | 59,675 | |
| Celgene Corp.* | | | 8,445 | | | | 541,240 | |
| Chemed Corp. | | | 578 | | | | 163,736 | |
| CVS Health Corp. | | | 5,024 | | | | 329,172 | |
| Danaher Corp. | | | 3,065 | | | | 316,063 | |
| Eli Lilly & Co. | | | 3,769 | | | | 436,149 | |
| Gilead Sciences, Inc. | | | 878 | | | | 54,919 | |
| Humana, Inc. | | | 2,193 | | | | 628,251 | |
| IDEXX Laboratories, Inc.* | | | 640 | | | | 119,053 | |
| Intuitive Surgical, Inc.* | | | 1,063 | | | | 509,092 | |
| Laboratory Corp. of America Holdings* | | | 458 | | | | 57,873 | |
| McKesson Corp. | | | 321 | | | | 35,461 | |
| Medtronic PLC (Ireland) | | | 869 | | | | 79,044 | |
| Merck & Co., Inc. | | | 11,123 | | | | 849,908 | |
| Mettler-Toledo International, Inc.* | | | 357 | | | | 201,912 | |
| Mylan NV* | | | 3,760 | | | | 103,024 | |
| PerkinElmer, Inc. | | | 5,191 | | | | 407,753 | |
| Pfizer, Inc. | | | 30,165 | | | | 1,316,702 | |
| PRA Health Sciences, Inc.* | | | 1,055 | | | | 97,018 | |
| Quest Diagnostics, Inc. | | | 2,932 | | | | 244,148 | |
| Regeneron Pharmaceuticals, Inc.* | | | 641 | | | | 239,414 | |
| STERIS PLC (United Kingdom) | | | 1,220 | | | | 130,357 | |
| Stryker Corp. | | | 62 | | | | 9,719 | |
| UnitedHealth Group, Inc. | | | 5,718 | | | | 1,424,468 | |
| Varian Medical Systems, Inc.* | | | 1,741 | | | | 197,273 | |
| Veeva Systems, Inc. - Class A* | | | 797 | | | | 71,188 | |
| Vertex Pharmaceuticals, Inc.* | | | 2,163 | | | | 358,431 | |
| West Pharmaceutical Services, Inc. | | | 4,796 | | | | 470,152 | |
| Zoetis, Inc. | | | 1,928 | | | | 164,921 | |
| | | | | | | | 14,394,547 | |
| | | | | | | | | |
| Financials — 14.9% | | | | | | | | |
| Affiliated Managers Group, Inc. | | | 1,902 | | | | 185,331 | |
| Ally Financial, Inc. | | | 1,484 | | | | 33,627 | |
| American Express Co. | | | 1,917 | | | | 182,728 | |
| Ameriprise Financial, Inc. | | | 5,351 | | | | 558,484 | |
| AON PLC (United Kingdom) | | | 1,232 | | | | 179,084 | |
| Bank of America Corp. | | | 47,770 | | | | 1,177,053 | |
| Bank of New York Mellon Corp. (The) | | | 2,744 | | | | 129,160 | |
| Bank OZK | | | 17,524 | | | | 400,073 | |
| Berkshire Hathaway, Inc. - Class B* | | | 8,311 | | | | 1,696,940 | |
| BlackRock, Inc. | | | 358 | | | | 140,630 | |
| Capital One Financial Corp. | | | 3,421 | | | | 258,593 | |
| Cincinnati Financial Corp. | | | 1,251 | | | | 96,852 | |
| CME Group, Inc. | | | 1,341 | | | | 252,269 | |
| CNA Financial Corp. | | | 5,971 | | | | 263,620 | |
| Comerica, Inc. | | | 3,163 | | | | 217,266 | |
| Discover Financial Services | | | 8,417 | | | | 496,435 | |
| E*TRADE Financial Corp. | | | 1,660 | | | | 72,841 | |
| East West Bancorp, Inc. | | | 2,442 | | | | 106,300 | |
| First American Financial Corp. | | | 1,070 | | | | 47,765 | |
| First Citizens BancShares, Inc. - Class A | | | 93 | | | | 35,066 | |
| FNB Corp. | | | 59,697 | | | | 587,418 | |
| Hanover Insurance Group, Inc. (The) | | | 1,634 | | | | 190,802 | |
| Huntington Bancshares, Inc. | | | 13,499 | | | | 160,908 | |
| JPMorgan Chase & Co. | | | 8,540 | | | | 833,675 | |
| LPL Financial Holdings, Inc. | | | 2,252 | | | | 137,552 | |
| M&T Bank Corp. | | | 487 | | | | 69,704 | |
| Mercury General Corp. | | | 4,710 | | | | 243,554 | |
| MetLife, Inc. | | | 4,685 | | | | 192,366 | |
Touchstone Dynamic Equity Fund(Continued)
| | | | | | Market | |
| | | Shares | | | Value | |
| | | | |
| Common Stocks†† — 117.6% (Continued) | | | | | | | | |
| | | | | | | | | |
| Financials — (Continued) | | | | | | | | |
| Old Republic International Corp. | | | 39,685 | | | $ | 816,320 | |
| Principal Financial Group, Inc. | | | 2,905 | | | | 128,314 | |
| Progressive Corp. (The) | | | 5,678 | | | | 342,554 | |
| Prudential Financial, Inc. | | | 5,638 | | | | 459,779 | |
| Regions Financial Corp. | | | 5,917 | | | | 79,169 | |
| Reinsurance Group of America, Inc. | | | 501 | | | | 70,255 | |
| S&P Global, Inc. | | | 2,189 | | | | 371,999 | |
| State Street Corp. | | | 7,127 | | | | 449,500 | |
| T Rowe Price Group, Inc. | | | 5,307 | | | | 489,942 | |
| Texas Capital Bancshares, Inc.* | | | 2,515 | | | | 128,491 | |
| Torchmark Corp. | | | 327 | | | | 24,371 | |
| Unum Group | | | 7,759 | | | | 227,959 | |
| US Bancorp | | | 1,285 | | | | 58,725 | |
| | | | | | | | 12,593,474 | |
| | | | | | | | | |
| Consumer Discretionary — 10.3% | | | | | | | | |
| Amazon.com, Inc.* | | | 1,509 | | | | 2,266,473 | |
| Aramark | | | 1,369 | | | | 39,660 | |
| Best Buy Co., Inc. | | | 3,613 | | | | 191,344 | |
| Booking Holdings, Inc.* | | | 113 | | | | 194,633 | |
| BorgWarner, Inc. | | | 1,595 | | | | 55,410 | |
| Brunswick Corp. | | | 262 | | | | 12,170 | |
| Carnival Corp. | | | 4,209 | | | | 207,504 | |
| Darden Restaurants, Inc. | | | 778 | | | | 77,691 | |
| Dollar General Corp. | | | 2,248 | | | | 242,964 | |
| Extended Stay America, Inc. | | | 32,113 | | | | 497,752 | |
| Genuine Parts Co. | | | 2,405 | | | | 230,928 | |
| Home Depot, Inc. (The) | | | 4,168 | | | | 716,146 | |
| Las Vegas Sands Corp. | | | 10,633 | | | | 553,448 | |
| Lowe's Cos., Inc. | | | 4,387 | | | | 405,183 | |
| Lululemon Athletica, Inc. (Canada)* | | | 724 | | | | 88,046 | |
| McDonald's Corp. | | | 1,878 | | | | 333,476 | |
| NIKE, Inc. - Class B | | | 8,871 | | | | 657,696 | |
| Ross Stores, Inc. | | | 1,598 | | | | 132,954 | |
| Royal Caribbean Cruises Ltd. | | | 1,778 | | | | 173,871 | |
| Starbucks Corp. | | | 3,883 | | | | 250,065 | |
| Target Corp. | | | 7,939 | | | | 524,689 | |
| TJX Cos., Inc. (The) | | | 10,254 | | | | 458,764 | |
| Ulta Beauty, Inc.* | | | 232 | | | | 56,803 | |
| Wyndham Destinations, Inc. | | | 5,855 | | | | 209,843 | |
| Yum China Holdings, Inc. (China) | | | 1,537 | | | | 51,536 | |
| Yum! Brands, Inc. | | | 941 | | | | 86,497 | |
| | | | | | | | 8,715,546 | |
| | | | | | | | | |
| Communication Services — 10.0% | | | | | | | | |
| Activision Blizzard, Inc. | | | 9,827 | | | | 457,643 | |
| Alphabet, Inc. - Class A* | | | 1,297 | | | | 1,355,313 | |
| Alphabet, Inc. - Class C* | | | 1,117 | | | | 1,156,776 | |
| AT&T, Inc. | | | 29,053 | | | | 829,173 | |
| CBS Corp. - Class B | | | 1,522 | | | | 66,542 | |
| CenturyLink, Inc. | | | 3,013 | | | | 45,647 | |
| Comcast Corp. - Class A | | | 12,249 | | | | 417,078 | |
| Discovery, Inc. - Class C* | | | 1,733 | | | | 39,998 | |
| DISH Network Corp. - Class A* | | | 10,481 | | | | 261,711 | |
| Facebook, Inc. - Class A* | | | 7,673 | | | | 1,005,854 | |
| IAC (InterActiveCorp.)* | | | 1,469 | | | | 268,886 | |
| Interpublic Group of Cos., Inc. (The) | | | 10,882 | | | | 224,496 | |
| Lions Gate Entertainment Corp. Class A | | | 11,380 | | | | 183,218 | |
| Live Nation Entertainment, Inc.* | | | 379 | | | | 18,666 | |
| Match Group, Inc. | | | 3,020 | | | | 129,165 | |
| Omnicom Group, Inc. | | | 3,713 | | | | 271,940 | |
| Sprint Corp.* | | | 21,653 | | | | 126,020 | |
| Verizon Communications, Inc. | | | 15,998 | | | | 899,408 | |
| Viacom, Inc. - Class B | | | 23,303 | | | | 598,887 | |
| Viacom, Inc. - Class A | | | 5,100 | | | | 141,831 | |
| | | | | | | | 8,498,252 | |
| | | | | | | | | |
| Industrials — 9.5% | | | | | | | | |
| 3M Co. | | | 4,543 | | | | 865,623 | |
| Allison Transmission Holdings, Inc. | | | 1,639 | | | | 71,968 | |
| Boeing Co. (The) | | | 2,424 | | | | 781,740 | |
| CH Robinson Worldwide, Inc. | | | 997 | | | | 83,838 | |
| CSX Corp. | | | 1,773 | | | | 110,156 | |
| Cummins, Inc. | | | 1,317 | | | | 176,004 | |
| Curtiss-Wright Corp. | | | 189 | | | | 19,301 | |
| Donaldson Co., Inc. | | | 1,870 | | | | 81,139 | |
| Dover Corp. | | | 234 | | | | 16,602 | |
| Eaton Corp. PLC | | | 3,618 | | | | 248,412 | |
| Emerson Electric Co. | | | 748 | | | | 44,693 | |
| Fluor Corp. | | | 498 | | | | 16,036 | |
| General Dynamics Corp. | | | 508 | | | | 79,863 | |
| General Electric Co. | | | 9,139 | | | | 69,182 | |
| Honeywell International, Inc. | | | 5,368 | | | | 709,220 | |
| Jacobs Engineering Group, Inc. | | | 1,554 | | | | 90,847 | |
| Lincoln Electric Holdings, Inc. | | | 1,914 | | | | 150,919 | |
| Lockheed Martin Corp. | | | 840 | | | | 219,946 | |
| Masco Corp. | | | 3,216 | | | | 94,036 | |
| Norfolk Southern Corp. | | | 3,022 | | | | 451,910 | |
| Oshkosh Corp. | | | 3,413 | | | | 209,251 | |
| PACCAR, Inc. | | | 2,535 | | | | 144,850 | |
| Raytheon Co. | | | 4,675 | | | | 716,911 | |
| Republic Services, Inc. | | | 4,420 | | | | 318,638 | |
| Robert Half International, Inc. | | | 10,070 | | | | 576,004 | |
| Schneider National, Inc. - Class B | | | 7,545 | | | | 140,865 | |
| Southwest Airlines Co. | | | 1,751 | | | | 81,386 | |
| Textron, Inc. | | | 1,982 | | | | 91,152 | |
| Union Pacific Corp. | | | 2,705 | | | | 373,912 | |
| United Technologies Corp. | | | 1,404 | | | | 149,498 | |
| Verisk Analytics, Inc.* | | | 1,434 | | | | 156,363 | |
| Waste Management, Inc. | | | 7,360 | | | | 654,966 | |
| | | | | | | | 7,995,231 | |
| | | | | | | | | |
| Consumer Staples — 8.8% | | | | | | | | |
| Altria Group, Inc. | | | 19,521 | | | | 964,142 | |
| Archer-Daniels-Midland Co. | | | 8,236 | | | | 337,429 | |
| Clorox Co. (The) | | | 281 | | | | 43,313 | |
| Coca-Cola Co. (The) | | | 3,159 | | | | 149,579 | |
| Colgate-Palmolive Co. | | | 1,133 | | | | 67,436 | |
| Costco Wholesale Corp. | | | 4,610 | | | | 939,103 | |
| Ingredion, Inc. | | | 4,992 | | | | 456,269 | |
| Kraft Heinz Co. (The) | | | 1,615 | | | | 69,510 | |
| Mondelez International, Inc. - Class A | | | 2,902 | | | | 116,167 | |
Touchstone Dynamic Equity Fund(Continued)
| | | | | | Market | |
| | | Shares | | | Value | |
| | | | |
| Common Stocks†† — 117.6% (Continued) | | | | | | | | |
| | | | | | | | | |
| Consumer Staples — (Continued) | | | | | | | | |
| Monster Beverage Corp.* | | | 397 | | | $ | 19,540 | |
| PepsiCo, Inc. | | | 13,722 | | | | 1,516,007 | |
| Philip Morris International, Inc. | | | 7,295 | | | | 487,014 | |
| Procter & Gamble Co. (The) | | | 12,345 | | | | 1,134,752 | |
| Sysco Corp. | | | 2,883 | | | | 180,649 | |
| Tyson Foods, Inc. - Class A | | | 6,689 | | | | 357,193 | |
| Walgreens Boots Alliance, Inc. | | | 3,517 | | | | 240,317 | |
| Walmart, Inc. | | | 4,286 | | | | 399,241 | |
| | | | | | | | 7,477,661 | |
| | | | | | | | | |
| Real Estate — 7.3% | | | | | | | | |
| Apple Hospitality REIT, Inc. REIT | | | 34,590 | | | | 493,253 | |
| AvalonBay Communities, Inc. REIT | | | 814 | | | | 141,677 | |
| Camden Property Trust REIT | | | 2,094 | | | | 184,377 | |
| CBRE Group, Inc. - Class A REIT* | | | 14,318 | | | | 573,293 | |
| Corporate Office Properties Trust REIT | | | 5,364 | | | | 112,805 | |
| EPR Properties REIT | | | 6,764 | | | | 433,099 | |
| Federal Realty Investment Trust REIT | | | 546 | | | | 64,450 | |
| Highwoods Properties, Inc. REIT | | | 7,121 | | | | 275,511 | |
| Jones Lang LaSalle, Inc. REIT | | | 1,906 | | | | 241,300 | |
| Lamar Advertising Co. - Class A REIT | | | 8,694 | | | | 601,451 | |
| Medical Properties Trust, Inc. REIT | | | 18,805 | | | | 302,384 | |
| Outfront Media, Inc. REIT | | | 14,071 | | | | 254,967 | |
| Park Hotels & Resorts, Inc. REIT | | | 14,751 | | | | 383,231 | |
| Public Storage REIT | | | 3,828 | | | | 774,825 | |
| Rayonier, Inc. REIT | | | 547 | | | | 15,146 | |
| Realogy Holdings Corp. REIT | | | 5,511 | | | | 80,901 | |
| Retail Properties of America, Inc. - Class A REIT | | | 16,626 | | | | 180,392 | |
| Simon Property Group, Inc. REIT | | | 3,024 | | | | 508,002 | |
| VICI Properties, Inc. REIT | | | 17,490 | | | | 328,462 | |
| Weingarten Realty Investors REIT | | | 6,310 | | | | 156,551 | |
| Weyerhaeuser Co. REIT | | | 2,817 | | | | 61,580 | |
| | | | | | | | 6,167,657 | |
| | | | | | | | | |
| Energy — 6.9% | | | | | | | | |
| Anadarko Petroleum Corp. | | | 599 | | | | 26,260 | |
| Baker Hughes a GE Co. | | | 24,760 | | | | 532,340 | |
| Chevron Corp. | | | 7,576 | | | | 824,193 | |
| ConocoPhillips | | | 17,516 | | | | 1,092,123 | |
| EOG Resources, Inc. | | | 3,060 | | | | 266,863 | |
| Exxon Mobil Corp. | | | 19,604 | | | | 1,336,797 | |
| Helmerich & Payne, Inc. | | | 537 | | | | 25,744 | |
| HollyFrontier Corp. | | | 542 | | | | 27,707 | |
| Marathon Petroleum Corp. | | | 5,220 | | | | 308,032 | |
| Murphy Oil Corp. | | | 5,971 | | | | 139,662 | |
| National Oilwell Varco, Inc. | | | 1,714 | | | | 44,050 | |
| Noble Energy, Inc. | | | 3,423 | | | | 64,215 | |
| ONEOK, Inc. | | | 3,224 | | | | 173,935 | |
| PBF Energy, Inc. - Class A | | | 7,889 | | | | 257,734 | |
| Phillips 66 | | | 311 | | | | 26,793 | |
| Pioneer Natural Resources Co. | | | 3,904 | | | | 513,454 | |
| Valero Energy Corp. | | | 2,883 | | | | 216,139 | |
| | | | | | | | 5,876,041 | |
| | | | | | | | | |
| Utilities — 5.5% | | | | | | | | |
| Ameren Corp. | | | 7,910 | | | | 515,969 | |
| Avangrid, Inc. | | | 10,527 | | | | 527,297 | |
| CMS Energy Corp. | | | 10,090 | | | | 500,968 | |
| DTE Energy Co. | | | 4,767 | | | | 525,800 | |
| Duke Energy Corp. | | | 3,675 | | | | 317,152 | |
| Eversource Energy | | | 7,229 | | | | 470,174 | |
| Hawaiian Electric Industries, Inc. | | | 9,739 | | | | 356,642 | |
| MDU Resources Group, Inc. | | | 25,466 | | | | 607,109 | |
| NextEra Energy, Inc. | | | 426 | | | | 74,047 | |
| Pinnacle West Capital Corp. | | | 7,349 | | | | 626,135 | |
| UGI Corp. | | | 1,893 | | | | 100,992 | |
| | | | | | | | 4,622,285 | |
| | | | | | | | | |
| Materials — 3.5% | | | | | | | | |
| Eastman Chemical Co. | | | 6,417 | | | | 469,147 | |
| Ecolab, Inc. | | | 2,916 | | | | 429,673 | |
| International Paper Co. | | | 2,143 | | | | 86,491 | |
| Linde PLC (United Kingdom) | | | 944 | | | | 147,302 | |
| LyondellBasell Industries NV - Class A | | | 6,004 | | | | 499,293 | |
| Mosaic Co. (The) | | | 5,792 | | | | 169,184 | |
| NewMarket Corp. | | | 364 | | | | 150,001 | |
| Nucor Corp. | | | 2,604 | | | | 134,913 | |
| PPG Industries, Inc. | | | 2,445 | | | | 249,952 | |
| Sonoco Products Co. | | | 4,070 | | | | 216,239 | |
| Southern Copper Corp. (Peru) | | | 7,224 | | | | 222,282 | |
| Westrock Co. | | | 4,476 | | | | 169,014 | |
| | | | | | | | 2,943,491 | |
| Total Common Stocks | | | | | | $ | 99,505,067 | |
| | | | | | | | | |
| Short-Term Investment Fund — 0.4% | | | | | | | | |
| Dreyfus Government Cash Management, Institutional Shares, 2.29%∞Ω | | | 321,283 | | | $ | 321,283 | |
| | | | | | | | | |
| Total Long Positions | | | | | | | | |
| (Cost $108,789,360) | | | | | | $ | 99,826,350 | |
| | | | | | | | | |
| Securities Sold Short — (20.2%) | | | | | | | | |
| | | | | | | | | |
| Common Stocks — (20.2%) | | | | | | | | |
| | | | | | | | | |
| Financials — (5.3%) | | | | | | | | |
| AGNC Investment Corp. | | | (10,955 | ) | | | (192,151 | ) |
| Annaly Capital Management, Inc. | | | (1,067 | ) | | | (10,478 | ) |
| Arch Capital Group Ltd. (Bermuda)* | | | (7,194 | ) | | | (192,224 | ) |
| Brighthouse Financial, Inc.* | | | (9,563 | ) | | | (291,480 | ) |
| Cboe Global Markets, Inc. | | | (1,432 | ) | | | (140,093 | ) |
| First Republic Bank | | | (4,759 | ) | | | (413,557 | ) |
| New York Community Bancorp, Inc. | | | (11,626 | ) | | | (109,401 | ) |
| Renaissancere Holdings Ltd. (Bermuda) | | | (2,088 | ) | | | (279,166 | ) |
| Signature Bank/New York NY | | | (1,025 | ) | | | (105,380 | ) |
| Sterling Bancorp | | | (7,030 | ) | | | (116,065 | ) |
| TFS Financial Corp. | | | (87,531 | ) | | | (1,411,875 | ) |
| Virtu Financial, Inc. - Class A | | | (16,503 | ) | | | (425,117 | ) |
| White Mountains Insurance Group Ltd.* | | | (964 | ) | | | (826,813 | ) |
| | | | | | | | (4,513,800 | ) |
Touchstone Dynamic Equity Fund(Continued)
| | | | | | Market | |
| | | Shares | | | Value | |
| | | | | | | |
| Common Stocks — (20.2%) (Continued) | | | | | | | | |
| | | | | | | | | |
| Real Estate — (3.2%) | | | | | | | | |
| Colony Capital, Inc., REIT | | | (3,788 | ) | | $ | (17,728 | ) |
| Columbia Property Trust, Inc., REIT | | | (5,879 | ) | | | (113,759 | ) |
| CyrusOne, Inc., REIT | | | (2,964 | ) | | | (156,736 | ) |
| Equity Commonwealth, REIT | | | (4,829 | ) | | | (144,918 | ) |
| Equity LifeStyle Properties, Inc., REIT | | | (792 | ) | | | (76,927 | ) |
| Howard Hughes Corp. (The), REIT* | | | (1,599 | ) | | | (156,094 | ) |
| Invitation Homes, Inc., REIT | | | (18,120 | ) | | | (363,850 | ) |
| JBG SMITH Properties, REIT | | | (15,752 | ) | | | (548,327 | ) |
| Macerich Co. (The), REIT | | | (5,212 | ) | | | (225,575 | ) |
| Paramount Group, Inc., REIT | | | (15,645 | ) | | | (196,501 | ) |
| SITE Centers Corp., REIT | | | (3,687 | ) | | | (40,815 | ) |
| Sun Communities, Inc., REIT | | | (1,071 | ) | | | (108,931 | ) |
| Taubman Centers, Inc., REIT | | | (5,847 | ) | | | (265,980 | ) |
| Uniti Group, Inc., REIT* | | | (17,500 | ) | | | (272,475 | ) |
| Vornado Realty Trust, REIT | | | (313 | ) | | | (19,415 | ) |
| | | | | | | | (2,708,031 | ) |
| | | | | | | | | |
| Information Technology — (2.2%) | | | | | | | | |
| 2U, Inc.* | | | (5,103 | ) | | | (253,721 | ) |
| Citrix Systems, Inc. | | | (172 | ) | | | (17,623 | ) |
| Coherent, Inc.* | | | (432 | ) | | | (45,667 | ) |
| FireEye, Inc.* | | | (7,783 | ) | | | (126,163 | ) |
| First Solar, Inc.* | | | (3,939 | ) | | | (167,230 | ) |
| Gartner, Inc.* | | | (1,424 | ) | | | (182,044 | ) |
| Guidewire Software, Inc.* | | | (2,322 | ) | | | (186,294 | ) |
| Keysight Technologies, Inc.* | | | (1,064 | ) | | | (66,053 | ) |
| LogMeIn, Inc. | | | (1,036 | ) | | | (84,507 | ) |
| Palo Alto Networks, Inc.* | | | (914 | ) | | | (172,152 | ) |
| Pegasystems, Inc. | | | (914 | ) | | | (43,717 | ) |
| Proofpoint, Inc.* | | | (2,392 | ) | | | (200,474 | ) |
| Pure Storage, Inc. - Class A* | | | (3,437 | ) | | | (55,267 | ) |
| Qorvo, Inc.* | | | (669 | ) | | | (40,628 | ) |
| Tableau Software, Inc. - Class A* | | | (737 | ) | | | (88,440 | ) |
| Workday, Inc. - Class A* | | | (704 | ) | | | (112,415 | ) |
| Worldpay, Inc. - Class A* | | | (619 | ) | | | (47,310 | ) |
| | | | | | | | (1,889,705 | ) |
| | | | | | | | | |
| Industrials — (1.8%) | | | | | | | | |
| AGCO Corp. | | | (487 | ) | | | (27,111 | ) |
| AMERCO | | | (604 | ) | | | (198,179 | ) |
| Arcosa, Inc.* | | | (6,200 | ) | | | (171,678 | ) |
| Clean Harbors, Inc.* | | | (358 | ) | | | (17,667 | ) |
| CoStar Group, Inc.* | | | (63 | ) | | | (21,252 | ) |
| Fortive Corp. | | | (3,198 | ) | | | (216,377 | ) |
| Gardner Denver Holdings, Inc.* | | | (554 | ) | | | (11,329 | ) |
| HD Supply Holdings, Inc.* | | | (1,333 | ) | | | (50,014 | ) |
| HEICO Corp. - Class A | | | (1,233 | ) | | | (77,679 | ) |
| IHS Markit Ltd. (United Kingdom)* | | | (2,765 | ) | | | (132,637 | ) |
| JetBlue Airways Corp.* | | | (4,957 | ) | | | (79,609 | ) |
| Owens Corning | | | (2,632 | ) | | | (115,755 | ) |
| Quanta Services, Inc. | | | (1,136 | ) | | | (34,194 | ) |
| Stericycle, Inc.* | | | (7,771 | ) | | | (285,118 | ) |
| WABCO Holdings, Inc.* | | | (101 | ) | | | (10,841 | ) |
| Wabtec Corp. | | | (1,130 | ) | | | (79,383 | ) |
| | | | | | | | (1,528,823 | ) |
| | | | | | | | | |
| Health Care — (1.7%) | | | | | | | | |
| Alnylam Pharmaceuticals, Inc.* | | | (4,635 | ) | | | (337,938 | ) |
| Bluebird Bio, Inc.* | | | (3,724 | ) | | | (369,421 | ) |
| DENTSPLY SIRONA, Inc. | | | (1,741 | ) | | | (64,783 | ) |
| Exact Sciences Corp.* | | | (793 | ) | | | (50,038 | ) |
| Insulet Corp.* | | | (2,038 | ) | | | (161,654 | ) |
| Integra LifeSciences Holdings Corp.* | | | (2,489 | ) | | | (112,254 | ) |
| Nektar Therapeutics* | | | (909 | ) | | | (29,879 | ) |
| Penumbra, Inc.* | | | (1,089 | ) | | | (133,076 | ) |
| Sage Therapeutics, Inc.* | | | (122 | ) | | | (11,686 | ) |
| Waters Corp.* | | | (765 | ) | | | (144,317 | ) |
| | | | | | | | (1,415,046 | ) |
| | | | | | | | | |
| Materials — (1.5%) | | | | | | | | |
| Air Products & Chemicals, Inc. | | | (91 | ) | | | (14,565 | ) |
| Ashland Global Holdings, Inc. | | | (5,873 | ) | | | (416,748 | ) |
| Berry Global Group, Inc.* | | | (1,028 | ) | | | (48,861 | ) |
| FMC Corp. | | | (259 | ) | | | (19,156 | ) |
| Owens-Illinois, Inc.* | | | (533 | ) | | | (9,189 | ) |
| Platform Specialty Products Corp.* | | | (3,415 | ) | | | (35,277 | ) |
| Sealed Air Corp. | | | (17,390 | ) | | | (605,868 | ) |
| United States Steel Corp. | | | (3,547 | ) | | | (64,697 | ) |
| WR Grace & Co. | | | (640 | ) | | | (41,542 | ) |
| | | | | | | | (1,255,903 | ) |
| | | | | | | | | |
| Utilities — (1.5%) | | | | | | | | |
| Atmos Energy Corp. | | | (200 | ) | | | (18,544 | ) |
| Consolidated Edison, Inc. | | | (3,083 | ) | | | (235,726 | ) |
| Entergy Corp. | | | (7,849 | ) | | | (675,564 | ) |
| FirstEnergy Corp. | | | (8,308 | ) | | | (311,965 | ) |
| | | | | | | | (1,241,799 | ) |
| | | | | | | | | |
| Consumer Discretionary — (1.4%) | | | | | | | | |
| Bright Horizons Family Solutions, Inc.* | | | (280 | ) | | | (31,206 | ) |
| Caesars Entertainment Corp.* | | | (10,479 | ) | | | (71,152 | ) |
| Chipotle Mexican Grill, Inc.* | | | (56 | ) | | | (24,180 | ) |
| Garrett Motion, Inc. (Switzerland)* | | | (16,786 | ) | | | (207,139 | ) |
| Hanesbrands, Inc. | | | (3,387 | ) | | | (42,439 | ) |
| Mattel, Inc.* | | | (40,618 | ) | | | (405,774 | ) |
| Mohawk Industries, Inc.* | | | (136 | ) | | | (15,907 | ) |
| ServiceMaster Global Holdings, Inc.* | | | (2,873 | ) | | | (105,554 | ) |
| Tempur Sealy International, Inc.* | | | (648 | ) | | | (26,827 | ) |
| Tesla, Inc.* | | | (839 | ) | | | (279,219 | ) |
| | | | | | | | (1,209,397 | ) |
| | | | | | | | | |
| Energy — (0.6%) | | | | | | | | |
| Cheniere Energy, Inc.* | | | (4,014 | ) | | | (237,589 | ) |
| Equitrans Midstream Corp.* | | | (1,500 | ) | | | (30,030 | ) |
| Kosmos Energy Ltd.* | | | (3,000 | ) | | | (12,210 | ) |
| Patterson-UTI Energy, Inc. | | | (2,830 | ) | | | (29,291 | ) |
| QEP Resources, Inc.* | | | (5,091 | ) | | | (28,662 | ) |
| WPX Energy, Inc.* | | | (16,929 | ) | | | (192,144 | ) |
| | | | | | | | (529,926 | ) |
| | | | | | | | | |
| Consumer Staples — (0.5%) | | | | | | | | |
| Campbell Soup Co. | | | (4,852 | ) | | | (160,068 | ) |
| TreeHouse Foods, Inc.* | | | (4,859 | ) | | | (246,400 | ) |
| | | | | | | | (406,468 | ) |
Touchstone Dynamic Equity Fund(Continued)
| | | | | | Market | |
| | | Shares | | | Value | |
| | | | | | | |
| Common Stocks — (20.2%) (Continued) | | | | | | | | |
| | | | | | | | | |
| Communication Services — (0.5%) | | | | | | | | |
| Madison Square Garden Co. (The) - Class A* | | | (52 | ) | | $ | (13,920 | ) |
| Zillow Group, Inc. - Class C* | | | (5,922 | ) | | | (187,017 | ) |
| Zillow Group, Inc. - Class A* | | | (6,245 | ) | | | (196,280 | ) |
| | | | | | | | (397,217 | ) |
| Total Common Stocks | | | | | | $ | (17,096,115 | ) |
| Total Securities Sold Short | | | | | | | | |
| (Proceeds $18,675,059) | | | | | | $ | (17,096,115 | ) |
| | | Number of | | | | | | | |
| | | of | | | Notional | | | | |
| | | Contracts | | | Amount | | | | |
| Written Call Options — (2.8%) | | | | | | | | | | | | |
| NASDAQ 100 Stock Index | | | | | | | | | | | | |
| January 2019 | | | | | | | | | | | | |
| Strike Price $6,650 | | | (5 | ) | | $ | (3,164,982 | ) | | | (18,425 | ) |
| PHLX Utility Sector | | | | | | | | | | | | |
| January 2019 | | | | | | | | | | | | |
| Strike Price $670 | | | (16 | ) | | | (1,077,584 | ) | | | (26,400 | ) |
| S&P 500 Index | | | | | | | | | | | | |
| January 2019 | | | | | | | | | | | | |
| Strike Price $1,110 | | | (14 | ) | | | (3,509,590 | ) | | | (33,880 | ) |
| S&P 500 Index | | | | | | | | | | | | |
| January 2019 | | | | | | | | | | | | |
| Strike Price $2,425 | | | (21 | ) | | | (5,264,385 | ) | | | (226,800 | ) |
| S&P 500 Index | | | | | | | | | | | | |
| January 2019 | | | | | | | | | | | | |
| Strike Price $2,430 | | | (178 | ) | | | (44,621,930 | ) | | | (1,870,780 | ) |
| S&P 500 Index | | | | | | | | | | | | |
| January 2019 | | | | | | | | | | | | |
| Strike Price $2,485 | | | (21 | ) | | | (5,264,385 | ) | | | (157,290 | ) |
| S&P 500 Index | | | | | | | | | | | | |
| January 2019 | | | | | | | | | | | | |
| Strike Price $2,640 | | | (55 | ) | | | (13,787,675 | ) | | | (36,300 | ) |
| S&P 500 Index | | | | | | | | | | | | |
| January 2019 | | | | | | | | | | | | |
| Strike Price $2,650 | | | (21 | ) | | | (5,264,385 | ) | | | (504 | ) |
| | | | | | | | | | | $ | (2,370,379 | ) |
| | | | | | | | | | | | | |
| Written Put Options — (0.1%) | | | | | | | | | | | | |
| S&P 500 Index | | | | | | | | | | | | |
| January 2019 | | | | | | | | | | | | |
| Strike Price $2,375 | | | (9 | ) | | | (2,256,165 | ) | | | (15,057 | ) |
| S&P 500 Index | | | | | | | | | | | | |
| January 2019 | | | | | | | | | | | | |
| Strike Price $2,415 | | | (14 | ) | | | (3,509,590 | ) | | | (36,540 | ) |
| | | | | | | | | | | $ | (51,597 | ) |
| | | | | | | | | | | | | |
| Total Written Options | | | | | | | | | | | | |
| (Premiums received $2,293,595) | | | | | | | | | | $ | (2,421,976 | ) |
| | | Market | |
| | | Value | |
| | | | |
| Total —94.9% | | $ | 80,308,259 | |
| | | | | |
| Other Assets in Excess of Liabilities — 5.1% | | | 4,316,641 | |
| | | | | |
| Net Assets — 100.0% | | $ | 84,624,900 | |
| * | Non-income producing security. |
| †† | All or a portion of these securities are pledged as collateral for securities sold short and written options. The total value of the securities pledged as collateral as of December 31, 2018 was $99,321,842. |
| Ω | Represents the 7-day SEC yield as of December 31, 2018. |
Portfolio Abbreviations:
PLC - Public Limited Company
REIT - Real Estate Investment Trust
Other Information:
The inputs or methodology used for valuing securities may not be an indication of the risk associated with investing in those securities. For more information on valuation inputs, and their aggregation into the levels used in the table below, please refer to the security valuation section in the accompanying Notes to Financial Statements.
| | | Valuation inputs at Reporting Date: | |
| Description | | Level 1 | | | Level 2 | | | Level 3 | | | Total | |
| Assets: | | | | | | | | | | | | | | | | |
| Long Positions | | | | | | | | | | | | | | | | |
| Common Stocks | | $ | 99,505,067 | | | $ | — | | | $ | — | | | $ | 99,505,067 | |
| Short-Term Investment Fund | | | 321,283 | | | | — | | | | — | | | | 321,283 | |
| Total Assets | | $ | 99,826,350 | | | $ | — | | | $ | — | | | $ | 99,826,350 | |
| | | | | | | | | | | | | | | | | |
| Liabilities: | | | | | | | | | | | | | | | | |
| Securities Sold Short | | | | | | | | | | | | | | | | |
| Common Stocks | | $ | (17,096,115 | ) | | $ | — | | | $ | — | | | $ | (17,096,115 | ) |
| Other Financial Instruments | | | | | | | | | | | | | | | | |
| Written Options | | | | | | | | | | | | | | | | |
| Equity Contracts | | | (2,421,976 | ) | | | — | | | | — | | | | (2,421,976 | ) |
| Total Liabilities | | $ | (19,518,091 | ) | | $ | — | | | $ | — | | | $ | (19,518,091 | ) |
| Total | | $ | 80,308,259 | | | $ | — | | | $ | — | | | $ | 80,308,259 | |
See accompanying Notes to Financial Statements.
Portfolio of Investments
Touchstone Controlled Growth with Income Fund – December 31, 2018
| | | | | | Market | |
| | | Shares | | | Value | |
| | | | | | | |
| Affiliated Mutual Funds^∞ — 100.4% | | | | | | | | |
| | | | | | | | | |
| Alternative Funds — 49.9% | | | | | | | | |
| Touchstone Arbitrage Fund | | | 1,237,605 | | | $ | 11,695,368 | |
| Touchstone Dynamic Equity Fund | | | 801,793 | | | | 11,698,156 | |
| | | | | | | | 23,393,524 | |
| | | | | | | | | |
| Fixed Income Funds — 40.8% | | | | | | | | |
| Touchstone Credit Opportunities Fund | | | 767,830 | | | | 7,117,784 | |
| Touchstone Flexible Income Fund | | | 652,312 | | | | 6,803,614 | |
| Touchstone Impact Bond Fund | | | 291,491 | | | | 2,871,190 | |
| Touchstone Ultra Short Duration Fixed Income Fund | | | 256,956 | | | | 2,369,131 | |
| | | | | | | | 19,161,719 | |
| | | | | | | | | |
| Equity Funds — 9.7% | | | | | | | | |
| Touchstone Focused Fund | | | 58,763 | | | | 2,254,750 | |
| Touchstone Value Fund | | | 276,657 | | | | 2,287,950 | |
| | | | | | | | 4,542,700 | |
| Total Affiliated Mutual Funds | | | | | | $ | 47,097,943 | |
| | | | | | | | | |
| Short-Term Investment Fund — 0.0% | | | | | | | | |
| Dreyfus Government Cash Management, Institutional Shares, 2.29%∞Ω | | | 736 | | | $ | 736 | |
| | | | | | | | | |
| Total Investment Securities —100.4% | | | | | | | | |
| (Cost $51,481,979) | | | | | | $ | 47,098,679 | |
| | | | | | | | | |
| Liabilities in Excess of Other Assets — (0.4%) | | | | | | | (203,648 | ) |
| | | | | | | | | |
| Net Assets — 100.0% | | | | | | $ | 46,895,031 | |
| ^ | All affiliated funds are invested in the Institutional Class, unless otherwise indicated. The financial statements of the underlying funds can be found on the SEC website. |
| Ω | Represents the 7-day SEC yield as of December 31, 2018. |
Other Information:
The inputs or methodology used for valuing securities may not be an indication of the risk associated with investing in those securities. For more information on valuation inputs, and their aggregation into the levels used in the table below, please refer to the security valuation section in the accompanying Notes to Financial Statements.
| | | Valuation inputs at Reporting Date: | |
| Description | | Level 1 | | | Level 2 | | | Level 3 | | | Total | |
| Affiliated Mutual Funds | | $ | 47,097,943 | | | $ | — | | | $ | — | | | $ | 47,097,943 | |
| Short-TermInvestment Fund | | | 736 | | | | — | | | | — | | | | 736 | |
| Total | | $ | 47,098,679 | | | $ | — | | | $ | — | | | $ | 47,098,679 | |
See accompanying Notes to Financial Statements.
Portfolio of Investments
Touchstone Dynamic Diversified Income Fund – December 31, 2018
| | | | | | Market | |
| | | Shares | | | Value | |
| | | | | | | |
| Affiliated Mutual Funds^∞ — 80.7% | | | | | | | | |
| | | | | | | | | |
| Fixed Income Funds — 58.5% | | | | | | | | |
| Touchstone Credit Opportunities Fund | | | 823,206 | | | $ | 7,631,119 | |
| Touchstone Flexible Income Fund | | | 387,504 | | | | 4,041,669 | |
| Touchstone High Yield Fund | | | 565,442 | | | | 4,461,339 | |
| Touchstone Impact Bond Fund | | | 771,524 | | | | 7,599,515 | |
| Touchstone Ultra Short Duration Fixed Income Fund | | | 242,233 | | | | 2,233,392 | |
| | | | | | | | 25,967,034 | |
| | | | | | | | | |
| Equity Funds — 22.2% | | | | | | | | |
| Touchstone International Value Fund | | | 353,743 | | | | 2,242,733 | |
| Touchstone Premium Yield Equity Fund - Class Y | | | 641,549 | | | | 4,901,432 | |
| Touchstone Value Fund | | | 324,667 | | | | 2,684,994 | |
| | | | | | | | 9,829,159 | |
| Total Affiliated Mutual Funds | | | | | | $ | 35,796,193 | |
| | | | | | | | | |
| Exchange-Traded Funds — 13.4% | | | | | | | | |
| iShares International Select Dividend ETF | | | 29,570 | | | | 848,955 | |
| VanEck Vectors J.P. Morgan EM Local Currency Bond ETF | | | 57,925 | | | | 1,911,525 | |
| Vanguard Emerging Markets Government Bond ETF† | | | 12,525 | | | | 933,614 | |
| Vanguard Global ex-U.S. Real Estate ETF | | | 8,420 | | | | 441,292 | |
| Vanguard REIT ETF | | | 11,665 | | | | 869,859 | |
| WisdomTree Emerging Markets High Dividend ETF† | | | 22,955 | | | | 921,643 | |
| Total Exchange-Traded Funds | | | | | | $ | 5,926,888 | |
| | | | | | | | | |
| Exchange-Traded Notes — 5.5% | | | | | | | | |
| JPMorgan Alerian MLP Index ETN† | | | 108,310 | | | $ | 2,417,479 | |
| | | | | | | | | |
| Short-Term Investment Funds — 8.5% | | | | | | | | |
| Dreyfus Government Cash Management, Institutional Shares, 2.29%∞Ω | | | 176,480 | | | | 176,480 | |
| Invesco Government & Agency Portfolio, Institutional Class, 2.30%**∞Ω | | | 3,596,055 | | | | 3,596,055 | |
| Total Short-Term Investment Funds | | | | | | $ | 3,772,535 | |
| | | | | | | | | |
| Total Investment Securities —108.1% | | | | | | | | |
| (Cost $52,367,409) | | | | | | $ | 47,913,095 | |
| | | | | | | | | |
| Liabilities in Excess of Other Assets — (8.1%) | | | | | | | (3,578,068 | ) |
| | | | | | | | | |
| Net Assets — 100.0% | | | | | | $ | 44,335,027 | |
| ** | Represents collateral for securities loaned. |
| ^ | All affiliated funds are invested in the Institutional Class, unless otherwise indicated. The financial statements of the underlying funds can be found on the SEC website. |
| † | All or a portion of the security is on loan. The total market value of the securities on loan as of December 31, 2018 was $3,557,545. |
| Ω | Represents the 7-day SEC yield as of December 31, 2018. |
Portfolio Abbreviations:
ETF - Exchange-Traded Fund
ETN - Exchange-Traded Notes
MLP - Master Limited Partnership
REIT - Real Estate Investment Trust
Other Information:
The inputs or methodology used for valuing securities may not be an indication of the risk associated with investing in those securities. For more information on valuation inputs, and their aggregation into the levels used in the table below, please refer to the security valuation section in the accompanying Notes to Financial Statements.
| | | Valuation inputs at Reporting Date: | |
| Description | | Level 1 | | | Level 2 | | | Level 3 | | | Total | |
| Affiliated Mutual Funds | | $ | 35,796,193 | | | $ | — | | | $ | — | | | $ | 35,796,193 | |
| Exchange-Traded Funds | | | 5,926,888 | | | | — | | | | — | | | | 5,926,888 | |
| Exchange-Traded Notes | | | 2,417,479 | | | | — | | | | — | | | | 2,417,479 | |
| Short-Term Investment Funds | | | 3,772,535 | | | | — | | | | — | | | | 3,772,535 | |
| Total | | $ | 47,913,095 | | | $ | — | | | $ | — | | | $ | 47,913,095 | |
See accompanying Notes to Financial Statements.
Portfolio of Investments
Touchstone Dynamic Global Allocation Fund – December 31, 2018
| | | | | | Market | |
| | | Shares | | | Value | |
| | | | | | | |
| Affiliated Mutual Funds^∞ — 80.2% | | | | | | | | |
| | | | | | | | | |
| Equity Funds — 53.3% | | | | | | | | |
| Touchstone Growth Opportunities Fund | | | 146,297 | | | $ | 4,232,363 | |
| Touchstone International Growth Opportunities Fund | | | 400,763 | | | | 6,945,220 | |
| Touchstone International Small Cap Fund | | | 182,341 | | | | 2,428,784 | |
| Touchstone International Value Fund | | | 1,840,191 | | | | 11,666,811 | |
| Touchstone Mid Cap Fund | | | 109,581 | | | | 3,325,771 | |
| Touchstone Sands Capital Institutional Growth Fund | | | 176,711 | | | | 3,348,673 | |
| Touchstone Small Cap Value Fund | | | 198,995 | | | | 4,166,954 | |
| Touchstone Value Fund | | | 1,127,980 | | | | 9,328,395 | |
| | | | | | | | 45,442,971 | |
| | | | | | | | | |
| Fixed Income Funds — 26.9% | | | | | | | | |
| Touchstone Credit Opportunities Fund | | | 354,520 | | | | 3,286,400 | |
| Touchstone Impact Bond Fund | | | 1,388,315 | | | | 13,674,901 | |
| Touchstone Ultra Short Duration Fixed Income Fund | | | 649,533 | | | | 5,988,692 | |
| | | | | | | | 22,949,993 | |
| Total Affiliated Mutual Funds | | | | | | $ | 68,392,964 | |
| | | | | | | | | |
| Exchange-Traded Funds — 19.4% | | | | | | | | |
| iShares International Treasury Bond ETF | | | 96,955 | | | | 4,699,409 | |
| VanEck Vectors J.P. Morgan EM Local Currency Bond ETF | | | 56,580 | | | | 1,867,140 | |
| Vanguard FTSE Emerging Markets ETF | | | 143,025 | | | | 5,449,252 | |
| Vanguard Total International Bond ETF | | | 84,055 | | | | 4,559,984 | |
| Total Exchange-Traded Funds | | | | | | $ | 16,575,785 | |
| | | | | | | | | |
| Short-Term Investment Fund — 0.7% | | | | | | | | |
| Dreyfus Government Cash Management, Institutional Shares, 2.29%∞Ω | | | 603,773 | | | $ | 603,773 | |
| | | | | | | | | |
| Total Investment Securities —100.3% | | | | | | | | |
| (Cost $96,977,173) | | | | | | $ | 85,572,522 | |
| | | | | | | | | |
| Liabilities in Excess of Other Assets — (0.3%) | | | | | | | (279,317 | ) |
| | | | | | | | | |
| Net Assets — 100.0% | | | | | | $ | 85,293,205 | |
| ^ | All affiliated funds are invested in the Institutional Class, unless otherwise indicated. The financial statements of the underlying funds can be found on the SEC website. |
| Ω | Represents the 7-day SEC yield as of December 31, 2018. |
Portfolio Abbreviations:
ETF - Exchange-Traded Fund
Other Information:
The inputs or methodology used for valuing securities may not be an indication of the risk associated with investing in those securities. For more information on valuation inputs, and their aggregation into the levels used in the table below, please refer to the security valuation section in the accompanying Notes to Financial Statements.
| | | Valuation inputs at Reporting Date: | |
| Description | | Level 1 | | | Level 2 | | | Level 3 | | | Total | |
| Affiliated Mutual Funds | | $ | 68,392,964 | | | $ | — | | | $ | — | | | $ | 68,392,964 | |
| Exchange-Traded Funds | | | 16,575,785 | | | | — | | | | — | | | | 16,575,785 | |
| Short-Term Investment Fund | | | 603,773 | | | | — | | | | — | | | | 603,773 | |
| Total | | $ | 85,572,522 | | | $ | — | | | $ | — | | | $ | 85,572,522 | |
See accompanying Notes to Financial Statements.
Statements of Assets and Liabilities
December 31, 2018
| | | | | | Touchstone | | | Touchstone | | | Touchstone | |
| | | Touchstone | | | Controlled | | | Dynamic | | | Dynamic | |
| | | Dynamic | | | Growth | | | Diversified | | | Global | |
| | | Equity | | | with Income | | | Income | | | Allocation | |
| | | Fund | | | Fund | | | Fund | | | Fund | |
| Assets | | | | | | | | | | | | | | | | |
| Investments, at cost | | $ | 108,789,360 | | | $ | 51,481,979 | | | $ | 52,367,409 | | | $ | 96,977,173 | |
| Affiliated securities, at market value | | $ | — | | | $ | 47,097,943 | | | $ | 35,796,193 | | | $ | 68,392,964 | |
| Non-affiliated securities, at market value(A) | | | 99,826,350 | | | | 736 | | | | 12,116,902 | | | | 17,179,558 | |
| Cash deposits held at prime broker | | | 4,767,798 | | | | — | | | | — | | | | — | |
| Dividends and interest receivable | | | 187,149 | | | | — | | | | 10,550 | | | | 10,303 | |
| Receivable for capital shares sold | | | 140,680 | | | | 215,642 | | | | 2,333 | | | | 2,869 | |
| Receivable for investments sold | | | — | | | | 119,058 | | | | 70,615 | | | | 9,193 | |
| Receivable for securities lending income | | | — | | | | — | | | | 7,577 | | | | 979 | |
| Receivable from Investment Advisor | | | — | | | | 5,153 | | | | — | | | | — | |
| Other assets | | | 13,694 | | | | 19,186 | | | | 16,333 | | | | 17,392 | |
| Total Assets | | | 104,935,671 | | | | 47,457,718 | | | | 48,020,503 | | | | 85,613,258 | |
| | | | | | | | | | | | | | | | | |
| Liabilities | | | | | | | | | | | | | | | | |
| Bank overdrafts | | | — | | | | 158,788 | | | | — | | | | — | |
| Written options, at market value(B) | | | 2,421,976 | | | | — | | | | — | | | | — | |
| Securities sold short(C) | | | 17,096,115 | | | | — | | | | — | | | | — | |
| Dividend and interest payable on securities sold short | | | 24,947 | | | | — | | | | — | | | | — | |
| Payable for return of collateral for securities on loan | | | — | | | | — | | | | 3,596,055 | | | | — | |
| Payable for capital shares redeemed | | | 609,821 | | | | 329,214 | | | | 25,736 | | | | 210,803 | |
| Payable to Investment Advisor | | | 64,177 | | | | — | | | | 282 | | | | 7,391 | |
| Payable to other affiliates | | | 15,374 | | | | 2,807 | | | | 10,269 | | | | 21,467 | |
| Payable to Trustees | | | 3,608 | | | | 3,608 | | | | 3,608 | | | | 3,608 | |
| Payable for professional services | | | 23,523 | | | | 21,014 | | | | 21,150 | | | | 21,787 | |
| Payable to Transfer Agent | | | 32,136 | | | | 34,314 | | | | 18,223 | | | | 42,978 | |
| Other accrued expenses and liabilities | | | 19,094 | | | | 12,942 | | | | 10,153 | | | | 12,019 | |
| Total Liabilities | | | 20,310,771 | | | | 562,687 | | | | 3,685,476 | | | | 320,053 | |
| | | | | | | | | | | | | | | | | |
| Net Assets | | $ | 84,624,900 | | | $ | 46,895,031 | | | $ | 44,335,027 | | | $ | 85,293,205 | |
| | | | | | | | | | | | | | | | | |
| Net assets consist of: | | | | | | | | | | | | | | | | |
| Paid-in capital | | | 84,910,789 | | | | 49,646,609 | | | | 48,828,405 | | | | 95,563,503 | |
| Distributable earnings (deficit) | | | (285,889 | ) | | | (2,751,578 | ) | | | (4,493,378 | ) | | | (10,270,298 | ) |
| Net Assets | | $ | 84,624,900 | | | $ | 46,895,031 | | | $ | 44,335,027 | | | $ | 85,293,205 | |
| (A) Includes market value of securities on loan of: | | $ | — | | | $ | — | | | $ | 3,557,545 | | | $ | — | |
| (B) Premiums received for written options: | | $ | 2,293,595 | | | $ | — | | | $ | — | | | $ | — | |
| (C) Proceeds received for securities sold short: | | $ | 18,675,059 | | | $ | — | | | $ | — | | | $ | — | |
See accompanying Notes to Financial Statements.
Statements of Assets and Liabilities(Continued)
| | | | | | Touchstone | | | Touchstone | | | Touchstone | |
| | | Touchstone | | | Controlled | | | Dynamic | | | Dynamic | |
| | | Dynamic | | | Growth | | | Diversified | | | Global | |
| | | Equity | | | with Income | | | Income | | | Allocation | |
| | | Fund | | | Fund | | | Fund | | | Fund | |
| | | | | | | | | | | | | |
| Pricing of Class A Shares | | | | | | | | | | | | | | | | |
| Net assets applicable to Class A shares | | $ | 7,542,389 | | | $ | 12,316,201 | | | $ | 26,891,514 | | | $ | 54,871,395 | |
| Shares of beneficial interest outstanding (unlimited number of shares authorized, no par value) | | | 524,200 | | | | 1,174,024 | | | | 2,217,871 | | | | 5,162,059 | |
| Net asset value per share* | | $ | 14.39 | | | $ | 10.49 | | | $ | 12.12 | | | $ | 10.63 | |
| Maximum sale charge - Class A Shares | | | 5.00 | % | | | 5.00 | % | | | 5.00 | % | | | 5.00 | % |
| Maximum offering price per share (100%/(100%-maximum sales charge) of net asset value adjusted to the nearest cent) - Class A shares | | $ | 15.15 | | | $ | 11.04 | | | $ | 12.76 | | | $ | 11.19 | |
| | | | | | | | | | | | | | | | | |
| Pricing of Class C Shares | | | | | | | | | | | | | | | | |
| Net assets applicable to Class C shares | | $ | 5,748,298 | | | $ | 5,508,621 | | | $ | 13,075,047 | | | $ | 24,896,720 | |
| Shares of beneficial interest outstanding (unlimited number of shares authorized, no par value) | | | 433,896 | | | | 527,378 | | | | 1,075,225 | | �� | | 2,398,747 | |
| Net asset value and offering price per share** | | $ | 13.25 | | | $ | 10.45 | | | $ | 12.16 | | | $ | 10.38 | |
| | | | | | | | | | | | | | | | | |
| Pricing of Class Y Shares | | | | | | | | | | | | | | | | |
| Net assets applicable to Class Y shares | | $ | 59,585,598 | | | $ | 29,070,209 | | | $ | 4,368,466 | | | $ | 5,525,090 | |
| Shares of beneficial interest outstanding (unlimited number of shares authorized, no par value) | | | 4,101,754 | | | | 2,772,149 | | | | 359,507 | | | | 514,696 | |
| Net asset value, offering price and redemption price per share | | $ | 14.53 | | | $ | 10.49 | | | $ | 12.15 | | | $ | 10.73 | |
| | | | | | | | | | | | | | | | | |
| Pricing of Institutional Class Shares | | | | | | | | | | | | | | | | |
| Net assets applicable to Institutional Class Shares | | $ | 11,748,615 | | | $ | — | | | $ | — | | | $ | — | |
| Shares of beneficial interest outstanding (unlimited number of shares authorized, no par value) | | | 805,466 | | | | — | | | | — | | | | — | |
| Net asset value, offering price and redemption price per share | | $ | 14.59 | | | $ | — | | | $ | — | | | $ | — | |
* There is no sales load on subscriptions of $1 million or more. Redemptions that were part of a $1 million or more subscription may be subject to a contingent deferred sales load if redeemed within a one-year period from the date of purchase.
** Redemption price per share varies by length of time shares are held due to the terms of the contingent deferred sales charge.
See accompanying Notes to Financial Statements.
Statements of Operations
For the Year Ended December 31, 2018
| | | | | | Touchstone | | | Touchstone | | | Touchstone | |
| | | Touchstone | | | Controlled | | | Dynamic | | | Dynamic | |
| | | Dynamic | | | Growth | | | Diversified | | | Global | |
| | | Equity | | | with Income | | | Income | | | Allocation | |
| | | Fund | | | Fund | | | Fund | | | Fund | |
| Investment Income | | | | | | | | | | | | | | | | |
| Dividends from affiliated securities | | $ | — | | | $ | 1,408,596 | | | $ | 1,501,228 | | | $ | 1,712,391 | |
| Dividends from non-affiliated securities(A) | | | 2,214,837 | | | | 10,703 | | | | 524,130 | | | | 417,974 | |
| Income from securities loaned | | | — | | | | — | | | | 32,309 | | | | 1,833 | |
| Total Investment Income | | | 2,214,837 | | | | 1,419,299 | | | | 2,057,667 | | | | 2,132,198 | |
| Expenses | | | | | | | | | | | | | | | | |
| Investment advisory fees | | | 904,841 | | | | 117,404 | | | | 100,366 | | | | 258,462 | |
| Administration fees | | | 154,355 | | | | 85,118 | | | | 72,765 | | | | 149,908 | |
| Compliance fees and expenses | | | 1,386 | | | | 1,386 | | | | 1,386 | | | | 1,386 | |
| Custody fees | | | 11,760 | | | | 6,260 | | | | 5,561 | | | | 7,696 | |
| Professional fees | | | 27,192 | | | | 23,055 | | | | 22,490 | | | | 25,589 | |
| Transfer Agent fees, Class A | | | 13,468 | | | | 16,574 | | | | 32,696 | | | | 80,542 | |
| Transfer Agent fees, Class C | | | 7,505 | | | | 5,289 | | | | 13,536 | | | | 31,101 | |
| Transfer Agent fees, Class Y | | | 65,567 | | | | 72,088 | | | | 6,169 | | | | 11,431 | |
| Transfer Agent fees, Institutional Class | | | 48 | | | | — | | | | — | | | | — | |
| Transfer Agent out-of-pocket expenses | | | 5,054 | | | | 34,919 | | | | 17,435 | | | | 44,657 | |
| Registration Fees, Class A | | | 15,753 | | | | 17,832 | | | | 17,798 | | | | 18,091 | |
| Registration Fees, Class C | | | 15,753 | | | | 17,831 | | | | 17,844 | | | | 18,124 | |
| Registration Fees, Class Y | | | 15,713 | | | | 18,574 | | | | 17,904 | | | | 17,176 | |
| Registration Fees, Institutional Class | | | 17,307 | | | | — | | | | — | | | | — | |
| Dividend expense on securities sold short | | | 640,170 | | | | — | | | | — | | | | — | |
| Interest expense on securities sold short | | | 162,524 | | | | — | | | | — | | | | — | |
| Reports to Shareholders, Class A | | | 4,808 | | | | 5,199 | | | | 6,048 | | | | 9,547 | |
| Reports to Shareholders, Class C | | | 4,414 | | | | 4,600 | | | | 4,743 | | | | 5,837 | |
| Reports to Shareholders, Class Y | | | 9,839 | | | | 15,151 | | | | 3,914 | | | | 3,972 | |
| Reports to Shareholders, Institutional Class | | | 3,828 | | | | — | | | | — | | | | — | |
| Distribution expenses, Class A | | | 26,273 | | | | 33,438 | | | | 73,827 | | | | 159,527 | |
| Distribution and shareholder servicing expenses, Class C | | | 66,720 | | | | 64,690 | | | | 155,047 | | | | 304,147 | |
| Trustee fees | | | 14,546 | | | | 14,546 | | | | 14,546 | | | | 14,546 | |
| Other expenses | | | 22,532 | | | | 11,461 | | | | 9,413 | | | | 9,996 | |
| Total Expenses | | | 2,211,356 | | | | 565,415 | | | | 593,488 | | | | 1,171,735 | |
| Fees waived and/or reimbursed by the Advisor and/or Affiliates(B) | | | (22,532 | ) | | | (324,281 | ) | | | (244,131 | ) | | | (459,868 | ) |
| Net Expenses | | | 2,188,824 | | | | 241,134 | | | | 349,357 | | | | 711,867 | |
| Net Investment Income | | | 26,013 | | | | 1,178,165 | | | | 1,708,310 | | | | 1,420,331 | |
| Realized and Unrealized Gains (Losses) on Investments | | | | | | | | | | | | | | | | |
| Net realized gains on investments in non-affiliated securities | | | 8,140,361 | | | | 5 | | | | 285,791 | | | | 56,284 | |
| Net realized gains on investments in affiliated securities | | | — | | | | 876,017 | | | | 344,109 | | | | 4,189,061 | |
| Net realized gains on written options | | | 574,555 | | | | — | | | | — | | | | — | |
| Net realized losses on securities sold short | | | (1,379,192 | ) | | | — | | | | — | | | | — | |
| Capital gain distributions received from affiliated funds | | | — | | | | 482,226 | | | | 826,892 | | | | 3,898,755 | |
| Net change in unrealized appreciation (depreciation) on investments in non-affiliated securities | | | (19,052,882 | ) | | | — | | | | (1,458,537 | ) | | | (1,273,744 | ) |
| Net change in unrealized appreciation (depreciation) on investments in affiliated securities | | | — | | | | (4,824,365 | ) | | | (3,982,101 | ) | | | (15,846,659 | ) |
| Net change in unrealized appreciation (depreciation) on written options | | | 13,186 | | | | — | | | | — | | | | — | |
| Net change in unrealized appreciation (depreciation) on securities sold short | | | 1,708,111 | | | | — | | | | — | | | | — | |
| Net Realized and Unrealized Losses on Investments | | $ | (9,995,861 | ) | | $ | (3,466,117 | ) | | $ | (3,983,846 | ) | | $ | (8,976,303 | ) |
| Change in Net Assets Resulting from Operations | | $ | (9,969,848 | ) | | $ | (2,287,952 | ) | | $ | (2,275,536 | ) | | $ | (7,555,972 | ) |
| (A) Net of foreign tax withholding of: | | $ | 226 | | | $ | — | | | $ | — | | | $ | — | |
| (B) See Note 4 in Notes to Financial Statements. | | | | | | | | | | | | | | | | |
See accompanying Notes to Financial Statements.
Statements of Changes in Net Assets
| | | | | | | | | Touchstone | |
| | | Touchstone | | | Controlled Growth | |
| | | Dynamic Equity | | | with Income | |
| | | Fund | | | Fund | |
| | | For the | | | For the | | | For the | | | For the | |
| | | Year | | | Year | | | Year | | | Year | |
| | | Ended | | | Ended | | | Ended | | | Ended | |
| | | December 31, | | | December 31, | | | December 31, | | | December 31, | |
| | | 2018 | | | 2017 | | | 2018 | | | 2017 | |
| From Operations | | | | | | | | | | | | | | | | |
| Net investment income | | $ | 26,013 | | | $ | 756,816 | | | $ | 1,178,165 | | | $ | 723,009 | |
| Net realized gains on investments, written options, securities sold short and capital gain distributions received | | | 7,335,724 | | | | 3,478,577 | | | | 1,358,248 | | | | 1,593,827 | |
| Net change in unrealized appreciation (depreciation) on investments, written options and securities sold short | | | (17,331,585 | ) | | | 4,280,320 | | | | (4,824,365 | ) | | | (273,276 | ) |
| Change in Net Assets from Operations | | | (9,969,848 | ) | | | 8,515,713 | | | | (2,287,952 | ) | | | 2,043,560 | |
| | | | | | | | | | | | | | | | | |
| Distributions to Shareholders from(A): | | | | | | | | | | | | | | | | |
| Distributed earnings, Class A | | | — | | | | — | | | | (312,451 | ) | | | — | |
| Distributed earnings, Class C | | | — | | | | — | | | | (95,603 | ) | | | — | |
| Distributed earnings, Class Y | | | (623,724 | ) | | | — | | | | (934,035 | ) | | | — | |
| Distributed earnings, Institutional Class | | | (116,348 | ) | | | — | | | | — | | | | — | |
| Net investment income, Class A | | | — | | | | (172,553 | ) | | | — | | | | (392,674 | ) |
| Net investment income, Class C | | | — | | | | (17,388 | ) | | | — | | | | (157,807 | ) |
| Net investment income, Class Y | | | — | | | | (1,502,582 | ) | | | — | | | | (705,777 | ) |
| Net investment income, Institutional Class | | | — | | | | (269,033 | ) | | | — | | | | — | |
| Net realized gains, Class A | | | — | | | | — | | | | — | | | | (251,227 | ) |
| Net realized gains, Class C | | | — | | | | — | | | | — | | | | (137,460 | ) |
| Net realized gains, Class Y | | | — | | | | — | | | | — | | | | (456,450 | ) |
| Total Distributions | | | (740,072 | ) | | | (1,961,556 | ) | | | (1,342,089 | ) | | | (2,101,395 | ) |
| | | | | | | | | | | | | | | | | |
| Net Increase (Decrease) from Share Transactions(B) | | | (22,111,564 | ) | | | (32,574,490 | ) | | | 3,961,114 | | | | 7,526,552 | |
| | | | | | | | | | | | | | | | | |
| Total Increase (Decrease) in Net Assets | | | (32,821,484 | ) | | | (26,020,333 | ) | | | 331,073 | | | | 7,468,717 | |
| | | | | | | | | | | | | | | | | |
| Net Assets | | | | | | | | | | | | | | | | |
| Beginning of period | | | 117,446,384 | | | | 143,466,717 | | | | 46,563,958 | | | | 39,095,241 | |
| End of period | | $ | 84,624,900 | | | $ | 117,446,384 | | | $ | 46,895,031 | | | $ | 46,563,958 | |
| Undistributed Net Investment Income(A) | | | N/A | | | $ | 840,099 | | | | N/A | | | $ | 75,892 | |
(A) The presentation of Distributions to Shareholders and Undistributed Net Investment Income have been updated to reflect the changes prescribed in amendments to Regulation S-X, effective November 5, 2018. The December 31, 2017 presentation was not revised.
(B) For details on share transactions by class, see Statements of Changes in Net Assets - Capital Stock Activity on pages 30 to 31.
See accompanying Notes to Financial Statements.
Statements of Changes in Net Assets (Continued)
| Touchstone | | | Touchstone | |
| Dynamic Diversified | | | Dynamic Global | |
| Income | | | Allocation | |
| Fund | | | Fund | |
| For the | | | For the | | | For the | | | For the | |
| Year | | | Year | | | Year | | | Year | |
| Ended | | | Ended | | | Ended | | | Ended | |
| December 31, | | | December 31, | | | December 31, | | | December 31, | |
| 2018 | | | 2017 | | | 2018 | | | 2017 | |
| | | | | | | | | | | |
| $ | 1,708,310 | | | $ | 1,921,042 | | | $ | 1,420,331 | | | $ | 1,769,186 | |
| | 1,456,792 | | | | 1,753,424 | | | | 8,144,100 | | | | 7,574,089 | |
| | (5,440,638 | ) | | | 724,674 | | | | (17,120,403 | ) | | | 5,789,689 | |
| | (2,275,536 | ) | | | 4,399,140 | | | | (7,555,972 | ) | | | 15,132,964 | |
| | | | | | | | | | | | | | | |
| | (1,144,104 | ) | | | — | | | | (4,731,927 | ) | | | — | |
| | (461,944 | ) | | | — | | | | (2,008,289 | ) | | | — | |
| | (207,840 | ) | | | — | | | | (516,617 | ) | | | — | |
| | — | | | | — | | | | — | | | | — | |
| | — | | | | (1,098,589 | ) | | | — | | | | (1,388,162 | ) |
| | — | | | | (562,777 | ) | | | — | | | | (479,001 | ) |
| | — | | | | (313,257 | ) | | | — | | | | (317,210 | ) |
| | — | | | | — | | | | — | | | | — | |
| | — | | | | — | | | | — | | | | (1,780,428 | ) |
| | — | | | | — | | | | — | | | | (893,346 | ) |
| | — | | | | — | | | | — | | | | (345,932 | ) |
| | (1,813,888 | ) | | | (1,974,623 | ) | | | (7,256,833 | ) | | | (5,204,079 | ) |
| | | | | | | | | | | | | | | |
| | (7,307,857 | ) | | | (10,596,050 | ) | | | (13,252,484 | ) | | | (18,882,989 | ) |
| | | | | | | | | | | | | | | |
| | (11,397,281 | ) | | | (8,171,533 | ) | | | (28,065,289 | ) | | | (8,954,104 | ) |
| | | | | | | | | | | | | | | |
| | | | | | | | | | | | | | | |
| | 55,732,308 | | | | 63,903,841 | | | | 113,358,494 | | | | 122,312,598 | |
| $ | 44,335,027 | | | $ | 55,732,308 | | | $ | 85,293,205 | | | $ | 113,358,494 | |
| | N/A | | | $ | 54,486 | | | | N/A | | | $ | — | |
Statements of Changes in Net Assets - Capital Stock Activity
| | | | | | | | | | | | | | | Touchstone Controlled Growth with | |
| | | Touchstone Dynamic Equity Fund | | | | | | Income Fund | | | | |
| | | For the Year | | | For the Year | | | For the Year | | | For the Year | |
| | | Ended | | | Ended | | | Ended | | | Ended | |
| | | December 31, 2018 | | | December 31, 2017 | | | December 31, 2018 | | | December 31, 2017 | |
| | | Shares | | | Dollars | | | Shares | | | Dollars | | | Shares | | | Dollars | | | Shares | | | Dollars | |
| Class A | | | | | | | | | | | | | | | | | | | | | | | | | | | | | | | | |
| Proceeds from Shares sold | | | 36,592 | | | $ | 583,062 | | | | 353,076 | | | $ | 5,377,621 | | | | 203,908 | | | $ | 2,273,431 | | | | 303,844 | | | $ | 3,468,209 | |
| Reinvestment of distributions | | | — | | | | — | | | | 7,994 | | | | 128,493 | | | | 24,827 | | | | 269,415 | | | | 48,990 | | | | 556,582 | |
| Cost of Shares redeemed | | | (306,473 | ) | | | (4,878,560 | ) | | | (589,851 | ) | | | (9,086,483 | ) | | | (271,195 | ) | | | (3,016,607 | ) | | | (502,871 | ) | | | (5,701,203 | ) |
| Change from Class A Share Transactions | | | (269,881 | ) | | | (4,295,498 | ) | | | (228,781 | ) | | | (3,580,369 | ) | | | (42,460 | ) | | | (473,761 | ) | | | (150,037 | ) | | | (1,676,412 | ) |
| Class C | | | | | | | | | | | | | | | | | | | | | | | | | | | | | | | | |
| Proceeds from Shares sold | | | 28,386 | | | | 401,443 | | | | 50,212 | | | | 707,386 | | | | 29,832 | | | | 325,028 | | | | 29,116 | | | | 328,559 | |
| Reinvestment of distributions | | | — | | | | — | | | | 1,002 | | | | 14,943 | | | | 8,595 | | | | 92,398 | | | | 24,655 | | | | 278,667 | |
| Cost of Shares redeemed | | | (113,226 | ) | | | (1,688,492 | ) | | | (406,227 | ) | | | (5,729,141 | ) | | | (162,310 | ) | | | (1,796,118 | ) | | | (297,154 | ) | | | (3,360,934 | ) |
| Change from Class C Share Transactions | | | (84,840 | ) | | | (1,287,049 | ) | | | (355,013 | ) | | | (5,006,812 | ) | | | (123,883 | ) | | | (1,378,692 | ) | | | (243,383 | ) | | | (2,753,708 | ) |
| Class Y | | | | | | | | | | | | | | | | | | | | | | | | | | | | | | | | |
| Proceeds from Shares sold | | | 939,168 | | | | 15,353,357 | | | | 1,098,715 | | | | 17,160,953 | | | | 3,562,335 | | | | 40,090,422 | | | | 1,581,705 | | | | 18,104,152 | |
| Reinvestment of distributions | | | 40,311 | | | | 582,489 | | | | 81,200 | | | | 1,326,786 | | | | 75,001 | | | | 816,071 | | | | 91,326 | | | | 1,037,072 | |
| Cost of Shares redeemed | | | (1,900,967 | ) | | | (30,743,577 | ) | | | (2,421,782 | ) | | | (37,844,868 | ) | | | (3,135,946 | ) | | | (35,092,926 | ) | | | (631,444 | ) | | | (7,184,552 | ) |
| Change from Class Y Share Transactions | | | (921,488 | ) | | | (14,807,731 | ) | | | (1,241,867 | ) | | | (19,357,129 | ) | | | 501,390 | | | | 5,813,567 | | | | 1,041,587 | | | | 11,956,672 | |
| Institutional Class | | | | | | | | | | | | | | | | | | | | | | | | | | | | | | | | |
| Proceeds from Shares sold | | | 630,842 | | | | 10,363,103 | | | | 192,301 | | | | 3,055,212 | | | | — | | | | — | | | | — | | | | — | |
| Reinvestment of distributions | | | 8,018 | | | | 116,348 | | | | 16,404 | | | | 269,033 | | | | — | | | | — | | | | — | | | | — | |
| Cost of Shares redeemed | | | (746,673 | ) | | | (12,200,737 | ) | | | (512,753 | ) | | | (7,954,425 | ) | | | — | | | | — | | | | — | | | | — | |
| Change from Institutional Class Share Transactions | | | (107,813 | ) | | | (1,721,286 | ) | | | (304,048 | ) | | | (4,630,180 | ) | | | — | | | | — | | | | — | | | | — | |
| | | | | | | | | | | | | | | | | | | | | | | | | | | | | | | | | |
| Change from Share Transactions | | | (1,384,022 | ) | | $ | (22,111,564 | ) | | | (2,129,709 | ) | | $ | (32,574,490 | ) | | | 335,047 | | | $ | 3,961,114 | | | | 648,167 | | | $ | 7,526,552 | |
See accompanying Notes to Financial Statements.
Statements of Changes in Net Assets - Capital Stock Activity (Continued)
| Touchstone Dynamic Diversified Income Fund | | | Touchstone Dynamic Global Allocation Fund | |
| For the Year | | | For the Year | | | For the Year | | | For the Year | |
| Ended | | | Ended | | Ended | | | Ended | |
| December 31, 2018 | | | December 31, 2017 | | | December 31, 2018 | | | December 31, 2017 | |
| Shares | | | Dollars | | | Shares | | | Dollars | | | Shares | | | Dollars | | | Shares | | | Dollars | |
| | | | | | | | | | | | | | | | | | | | | | | |
| | 123,109 | | | $ | 1,592,305 | | | | 401,156 | | | $ | 5,259,270 | | | | 202,824 | | | $ | 2,493,877 | | | | 716,112 | | | $ | 8,837,278 | |
| | 73,396 | | | | 929,562 | | | | 70,474 | | | | 920,921 | | | | 357,314 | | | | 3,983,180 | | | | 215,982 | | | | 2,698,804 | |
| | (341,364 | ) | | | (4,437,346 | ) | | | (333,704 | ) | | | (4,369,901 | ) | | | (778,529 | ) | | | (9,679,444 | ) | | | (975,863 | ) | | | (11,955,496 | ) |
| | | | | | | | | | | | | | | | | | | | | | | | | | | | | | | |
| | (144,859 | ) | | | (1,915,479 | ) | | | 137,926 | | | | 1,810,290 | | | | (218,391 | ) | | | (3,202,387 | ) | | | (43,769 | ) | | | (419,414 | ) |
| | | | | | | | | | | | | | | | | | | | | | | | | | | | | | | |
| | 11,771 | | | | 153,106 | | | | 26,492 | | | | 344,679 | | | | 47,077 | | | | 569,349 | | | | 48,124 | | | | 577,714 | |
| | 34,141 | | | | 433,706 | | | | 36,118 | | | | 472,792 | | | | 178,032 | | | | 1,921,215 | | | | 102,183 | | | | 1,250,762 | |
| | (312,170 | ) | | | (4,067,796 | ) | | | (697,581 | ) | | | (9,140,377 | ) | | | (516,091 | ) | | | (6,191,893 | ) | | | (1,433,517 | ) | | | (17,202,035 | ) |
| | | | | | | | | | | | | | | | | | | | | | | | | | | | | | | |
| | (266,258 | ) | | | (3,480,984 | ) | | | (634,971 | ) | | | (8,322,906 | ) | | | (290,982 | ) | | | (3,701,329 | ) | | | (1,283,210 | ) | | | (15,373,559 | ) |
| | | | | | | | | | | | | | | | | | | | | | | | | | | | | | | |
| | 102,586 | | | | 1,337,755 | | | | 245,116 | | | | 3,207,612 | | | | 96,808 | | | | 1,203,900 | | | | 221,787 | | | | 2,764,144 | |
| | 15,332 | | | | 194,784 | | | | 22,210 | | | | 290,334 | | | | 42,964 | | | | 487,589 | | | | 43,907 | | | | 552,987 | |
| | (261,834 | ) | | | (3,443,933 | ) | | | (578,782 | ) | | | (7,581,380 | ) | | | (631,742 | ) | | | (8,040,257 | ) | | | (518,100 | ) | | | (6,407,147 | ) |
| | | | | | | | | | | | | | | | | | | | | | | | | | | | | | | |
| | (143,916 | ) | | | (1,911,394 | ) | | | (311,456 | ) | | | (4,083,434 | ) | | | (491,970 | ) | | | (6,348,768 | ) | | | (252,406 | ) | | | (3,090,016 | ) |
| | | | | | | | | | | | | | | | | | | | | | | | | | | | | | | |
| | — | | | | — | | | | — | | | | — | | | | — | | | | — | | | | — | | | | — | |
| | — | | | | — | | | | — | | | | — | | | | — | | | | — | | | | — | | | | — | |
| | — | | | | — | | | | — | | | | — | | | | — | | | | — | | | | — | | | | — | |
| | | | | | | | | | | | | | | | | | | | | | | | | | | | | | | |
| | — | | | | — | | | | — | | | | — | | | | — | | | | — | | | | — | | | | — | |
| | | | | | | | | | | | | | | | | | | | | | | | | | | | | | | |
| | (555,033 | ) | | $ | (7,307,857 | ) | | | (808,501 | ) | | $ | (10,596,050 | ) | | | (1,001,343 | ) | | $ | (13,252,484 | ) | | | (1,579,385 | ) | | $ | (18,882,989 | ) |
Statement of Cash Flows
For the Year Ended December 31, 2018
| | | Touchstone | |
| | | Dynamic | |
| | | Equity | |
| | | Fund | |
| Cash Flows Used in Operating Activities | | | | |
| | | | | |
| Change in net assets resulting from operations | | $ | (9,969,848 | ) |
| | | | | |
| Adjustments to reconcile change in net assets resulting from operations to net cash provided by operating activities: | | | | |
| Purchases of investments | | | (332,528,728 | ) |
| Proceeds from disposition of investments | | | 358,816,183 | |
| Net proceeds from disposition of purchased options | | | 660,843 | |
| Premiums received on call and put options written | | | 25,029,413 | |
| Covers of written options | | | (23,700,221 | ) |
| Proceeds from securities sold short | | | 70,629,229 | |
| Covers of securities sold short | | | (76,144,747 | ) |
| Net sales of short term securities | | | 6,082,736 | |
| Return of capital received from investments | | | 289,339 | |
| Decrease in tax reclaim receivable | | | 207 | |
| Increase in cash deposits held at prime broker | | | (4,767,798 | ) |
| Decrease in due to prime broker | | | (1,936,681 | ) |
| Decrease in dividends and interest receivable | | | 21,849 | |
| Decrease in other assets | | | 1,121 | |
| Increase in dividend and interest payable on securities sold short | | | 9,881 | |
| Decrease in payable to Trustees | | | (3,862 | ) |
| Decrease in payable to cover written options | | | (77,262 | ) |
| Decrease in payable to Investment Advisor | | | (20,916 | ) |
| Decrease in payable to other affiliates | | | (7,795 | ) |
| Decrease in other accrued expenses and liabilities | | | (13,543 | ) |
| Net realized (gains) on investments | | | (8,140,361 | ) |
| Net realized losses on written options | | | (574,555 | ) |
| Net realized losses on securities sold short | | | 1,379,192 | |
| Net change in unrealized (appreciation) depreciation on investments | | | 19,052,882 | |
| Net change in unrealized (appreciation) depreciation on written options | | | (13,186 | ) |
| Net change in unrealized (appreciation) depreciation on securities sold short | | | (1,708,111 | ) |
| Net cash provided by operating activities | | | 22,365,261 | |
| | | | | |
| Cash Flows used in Financing Activities | | | | |
| Proceeds from shares sold | | | 26,774,097 | |
| Cash distributions paid | | | (41,235 | ) |
| Cost of shares redeemed | | | (49,098,123 | ) |
| Proceeds from interfund lending transactions | | | 11,953,577 | |
| Payments for interfund lending transactions | | | (11,953,577 | ) |
| Net cash used in financing activities | | | (22,365,261 | ) |
| | | | | |
| Net change in cash | | | — | |
| Cash - beginning of the period | | | — | |
| Cash - end of period | | $ | — | |
| | | | | |
| Supplemental disclosure of cash flow information: | | | | |
| Reinvestment of dividends and distributions | | $ | 698,837 | |
| Dividend and interest expense paid | | $ | 792,813 | |
See accompanying Notes to Financial Statements.
Financial Highlights
Touchstone Dynamic Equity Fund—Class A
Selected Data for a Share Outstanding Throughout Each Period
| | | Year Ended December 31, |
| | | 2018 | | | 2017 | | | 2016 | | | 2015 | | | 2014 | |
| Net asset value at beginning of period | | $ | 16.06 | | | $ | 15.18 | | | $ | 14.52 | | | $ | 13.59 | | | $ | 13.15 | |
| Income (loss) from investment operations: | | | | | | | | | | | | | | | | | | | | |
| Net investment income (loss) | | | (0.04 | )(A) | | | 0.06 | (A) | | | 0.19 | (A) | | | 0.13 | | | | — | (A)(B) |
| Net realized and unrealized gains (losses) on investments | | | (1.63 | ) | | | 1.04 | | | | 0.53 | | | | 0.80 | | | | 0.48 | |
| Total from investment operations | | | (1.67 | ) | | | 1.10 | | | | 0.72 | | | | 0.93 | | | | 0.48 | |
| Distributions from: | | | | | | | | | | | | | | | | | | | | |
| Net investment income | | | — | | | | (0.22 | ) | | | (0.06 | ) | | | — | | | | (0.04 | ) |
| Net asset value at end of period | | $ | 14.39 | | | $ | 16.06 | | | $ | 15.18 | | | $ | 14.52 | | | $ | 13.59 | |
| Total return(C) | | | (10.40 | %) | | | 7.18 | % | | | 4.95 | % | | | 6.84 | % | | | 3.64 | % |
| Ratios and supplemental data: | | | | | | | | | | | | | | | | | | | | |
| Net assets at end of period (000's) | | $ | 7,542 | | | $ | 12,752 | | | $ | 15,525 | | | $ | 12,029 | | | $ | 11,546 | |
| Ratio to average net assets: | | | | | | | | | | | | | | | | | | | | |
| Net expenses (including dividend and interest expense on securities sold short)(D) | | | 2.30 | % | | | 1.94 | % | | | 1.90 | % | | | 2.01 | % | | | 2.07 | % |
| Gross expenses (including dividend and interest expense on securities sold short)(E) | | | 2.40 | % | | | 2.00 | % | | | 1.91 | % | | | 2.16 | % | | | 2.18 | % |
| Net investment income (loss) | | | (0.22 | %) | | | 0.40 | % | | | 1.30 | % | | | 0.87 | % | | | 0.01 | % |
| Portfolio turnover rate | | | 267 | % | | | 236 | % | | | 245 | % | | | 235 | % | | | 236 | % |
| (A) | The net investment income (loss) per share was based on average shares outstanding for the period. |
| (B) | Less than $0.005 per share. |
| (C) | Total returns shown exclude the effect of applicable sales loads and fees. If these charges were included, the returns would be lower. |
| (D) | The ratio of net expenses to average net assets excluding dividend and interest expense on securities sold short was 1.55%, 1.55%, 1.55%, 1.55% and 1.55% for the years ended December 31, 2018, 2017, 2016, 2015 and 2014, respectively. |
| (E) | The ratio of gross expenses to average net assets excluding dividend and interest expense on securities sold short was 1.65%, 1.61%, 1.56%, 1.70% and 1.66% for the years ended December 31, 2018, 2017, 2016, 2015 and 2014, respectively. |
See accompanying Notes to Financial Statements.
Financial Highlights (Continued)
Touchstone Dynamic Equity Fund—Class C
Selected Data for a Share Outstanding Throughout Each Period
| | | Year Ended December 31, |
| | | 2018 | | | 2017 | | | 2016 | | | 2015 | | | 2014 | |
| Net asset value at beginning of period | | $ | 14.90 | | | $ | 14.03 | | | $ | 13.47 | | | $ | 12.70 | | | $ | 12.35 | |
| Income (loss) from investment operations: | | | | | | | | | | | | | | | | | | | | |
| Net investment income (loss) | | | (0.14 | )(A) | | | (0.05 | )(A) | | | 0.07 | (A) | | | 0.02 | | | | (0.09 | )(A) |
| Net realized and unrealized gains (losses) on investments | | | (1.51 | ) | | | 0.95 | | | | 0.49 | | | | 0.75 | | | | 0.44 | |
| Total from investment operations | | | (1.65 | ) | | | 0.90 | | | | 0.56 | | | | 0.77 | | | | 0.35 | |
| Distributions from: | | | | | | | | | | | | | | | | | | | | |
| Net investment income | | | — | | | | (0.03 | ) | | | — | | | | — | | | | — | |
| Net asset value at end of period | | $ | 13.25 | | | $ | 14.90 | | | $ | 14.03 | | | $ | 13.47 | | | $ | 12.70 | |
| Total return(B) | | | (11.06 | %) | | | 6.37 | % | | | 4.16 | % | | | 6.06 | % | | | 2.83 | % |
| Ratios and supplemental data: | | | | | | | | | | | | | | | | | | | | |
| Net assets at end of period (000's) | | $ | 5,748 | | | $ | 7,727 | | | $ | 12,256 | | | $ | 10,911 | | | $ | 10,486 | |
| Ratio to average net assets: | | | | | | | | | | | | | | | | | | | | |
| Net expenses (including dividend and interest expense on securities sold short)(C) | | | 3.05 | % | | | 2.69 | % | | | 2.65 | % | | | 2.76 | % | | | 2.82 | % |
| Gross expenses (including dividend and interest expense on securities sold short)(D) | | | 3.24 | % | | | 2.81 | % | | | 2.71 | % | | | 2.90 | % | | | 2.96 | % |
| Net investment income (loss) | | | (0.97 | %) | | | (0.35 | %) | | | 0.55 | % | | | 0.12 | % | | | (0.74 | %) |
| Portfolio turnover rate | | | 267 | % | | | 236 | % | | | 245 | % | | | 235 | % | | | 236 | % |
| (A) | The net investment income (loss) per share was based on average shares outstanding for the period. |
| (B) | Total returns shown exclude the effect of applicable sales loads and fees. If these charges were included, the returns would be lower. |
| (C) | The ratio of net expenses to average net assets excluding dividend and interest expense on securities sold short was 2.30%, 2.30%, 2.30%, 2.30% and 2.30% for the years ended December 31, 2018, 2017, 2016, 2015 and 2014, respectively. |
| (D) | The ratio of gross expenses to average net assets excluding dividend and interest expense on securities sold short was 2.49%, 2.42%, 2.36%, 2.44% and 2.44% for the years ended December 31, 2018, 2017, 2016, 2015 and 2014, respectively. |
See accompanying Notes to Financial Statements.
Financial Highlights (Continued)
Touchstone Dynamic Equity Fund—Class Y
Selected Data for a Share Outstanding Throughout Each Period
| | | Year Ended December 31, |
| | | 2018 | | | 2017 | | | 2016 | | | 2015 | | | 2014 | |
| Net asset value at beginning of period | | $ | 16.32 | | | $ | 15.45 | | | $ | 14.76 | | | $ | 13.80 | | | $ | 13.37 | |
| Income (loss) from investment operations: | | | | | | | | | | | | | | | | | | | | |
| Net investment income | | | 0.02 | (A) | | | 0.12 | (A) | | | 0.24 | (A) | | | 0.17 | | | | 0.04 | (A) |
| Net realized and unrealized gains (losses) on investments | | | (1.66 | ) | | | 1.05 | | | | 0.54 | | | | 0.81 | | | | 0.49 | |
| Total from investment operations | | | (1.64 | ) | | | 1.17 | | | | 0.78 | | | | 0.98 | | | | 0.53 | |
| Distributions from: | | | | | | | | | | | | | | | | | | | | |
| Net investment income | | | (0.15 | ) | | | (0.30 | ) | | | (0.09 | ) | | | (0.02 | ) | | | (0.10 | ) |
| Net asset value at end of period | | $ | 14.53 | | | $ | 16.32 | | | $ | 15.45 | | | $ | 14.76 | | | $ | 13.80 | |
| Total return | | | (10.04 | %) | | | 7.59 | % | | | 5.31 | % | | | 7.12 | % | | | 3.95 | % |
| Ratios and supplemental data: | | | | | | | | | | | | | | | | | | | | |
| Net assets at end of period (000's) | | $ | 59,586 | | | $ | 82,004 | | | $ | 96,807 | | | $ | 64,986 | | | $ | 43,349 | |
| Ratio to average net assets: | | | | | | | | | | | | | | | | | | | | |
| Net expenses (including dividend and interest expense on securities sold short)(B) | | | 1.95 | % | | | 1.60 | % | | | 1.57 | % | | | 1.71 | % | | | 1.78 | %(C) |
| Gross expenses (including dividend and interest expense on securities sold short)(D) | | | 1.95 | % | | | 1.60 | % | | | 1.57 | % | | | 1.71 | % | | | 1.76 | % |
| Net investment income | | | 0.13 | % | | | 0.74 | % | | | 1.64 | % | | | 1.17 | % | | | 0.30 | % |
| Portfolio turnover rate | | | 267 | % | | | 236 | % | | | 245 | % | | | 235 | % | | | 236 | % |
| (A) | The net investment income per share was based on average shares outstanding for the period. |
| (B) | The ratio of net expenses to average net assets excluding dividend and interest expense on securities sold short was 1.20%, 1.21%, 1.22%, 1.25% and 1.26% for the years ended December 31, 2018, 2017, 2016, 2015 and 2014, respectively. |
| (C) | Net expenses include amounts recouped by the Advisor. |
| (D) | The ratio of gross expenses to average net assets excluding dividend and interest expense on securities sold short was 1.20%, 1.21%, 1.22%, 1.25% and 1.24% for the years ended December 31, 2018, 2017, 2016, 2015 and 2014, respectively. |
See accompanying Notes to Financial Statements.
Financial Highlights (Continued)
Touchstone Dynamic Equity Fund—Institutional Class
Selected Data for a Share Outstanding Throughout Each Period
| | | Year Ended December 31, |
| | | 2018 | | | 2017 | | | 2016 | | | 2015 | | | 2014 | |
| Net asset value at beginning of period | | $ | 16.38 | | | $ | 15.51 | | | $ | 14.82 | | | $ | 13.83 | | | $ | 13.39 | |
| Income (loss) from investment operations: | | | | | | | | | | | | | | | | | | | | |
| Net investment income | | | 0.02 | (A) | | | 0.11 | (A) | | | 0.24 | (A) | | | 0.16 | | | | 0.04 | (A) |
| Net realized and unrealized gains (losses) on investments | | | (1.66 | ) | | | 1.06 | | | | 0.54 | | | | 0.83 | | | | 0.49 | |
| Total from investment operations | | | (1.64 | ) | | | 1.17 | | | | 0.78 | | | | 0.99 | | | | 0.53 | |
| Distributions from: | | | | | | | | | | | | | | | | | | | | |
| Net investment income | | | (0.15 | ) | | | (0.30 | ) | | | (0.09 | ) | | | (—) | (B) | | | (0.09 | ) |
| Net asset value at end of period | | $ | 14.59 | | | $ | 16.38 | | | $ | 15.51 | | | $ | 14.82 | | | $ | 13.83 | |
| Total return | | | (10.03 | %) | | | 7.54 | % | | | 5.27 | % | | | 7.19 | % | | | 3.98 | % |
| Ratios and supplemental data: | | | | | | | | | | | | | | | | | | | | |
| Net assets at end of period (000's) | | $ | 11,749 | | | $ | 14,964 | | | $ | 18,879 | | | $ | 9,242 | | | $ | 12,297 | |
| Ratio to average net assets: | | | | | | | | | | | | | | | | | | | | |
| Net expenses (including dividend and interest expense on securities sold short)(C) | | | 1.96 | % | | | 1.62 | % | | | 1.59 | %(D) | | | 1.71 | % | | | 1.77 | %(D) |
| Gross expenses (including dividend and interest expense on securities sold short)(E) | | | 1.96 | % | | | 1.62 | % | | | 1.54 | % | | | 1.72 | % | | | 1.76 | % |
| Net investment income | | | 0.11 | % | | | 0.72 | % | | | 1.61 | % | | | 1.17 | % | | | 0.31 | % |
| Portfolio turnover rate | | | 267 | % | | | 236 | % | | | 245 | % | | | 235 | % | | | 236 | % |
| (A) | The net investment income per share was based on average shares outstanding for the period. |
| (B) | Less than $0.005 per share. |
| (C) | The ratio of net expenses to average net assets excluding dividend and interest expense on securities sold short was 1.21%, 1.23%, 1.24%, 1.25% and 1.25% for the years ended December 31, 2018, 2017, 2016, 2015 and 2014, respectively. |
| (D) | Net expenses include amounts recouped by the Advisor. |
| (E) | The ratio of gross expenses to average net assets excluding dividend and interest expense on securities sold short was 1.21%, 1.23%, 1.19%, 1.26% and 1.24% for the years ended December 31, 2018, 2017, 2016, 2015 and 2014, respectively. |
See accompanying Notes to Financial Statements.
Financial Highlights (Continued)
Touchstone Controlled Growth with Income Fund—Class A
Selected Data for a Share Outstanding Throughout Each Period
| | | Year Ended December 31, |
| | | 2018 | | | 2017 | | | 2016 | | | 2015 | | | 2014 | |
| Net asset value at beginning of period | | $ | 11.26 | | | $ | 11.22 | | | $ | 10.83 | | | $ | 11.08 | | | $ | 10.93 | |
| Income (loss) from investment operations: | | | | | | | | | | | | | | | | | | | | |
| Net investment income | | | 0.22 | | | | 0.22 | | | | 0.15 | | | | 0.14 | | | | 0.21 | |
| Net realized and unrealized gains (losses) on investments | | | (0.73 | ) | | | 0.36 | | | | 0.47 | | | | (0.22 | ) | | | 0.17 | |
| Total from investment operations | | | (0.51 | ) | | | 0.58 | | | | 0.62 | | | | (0.08 | ) | | | 0.38 | |
| Distributions from: | | | | | | | | | | | | | | | | | | | | |
| Net investment income | | | (0.18 | ) | | | (0.33 | ) | | | (0.23 | ) | | | (0.17 | ) | | | (0.23 | ) |
| Realized capital gains | | | (0.08 | ) | | | (0.21 | ) | | | (—) | (A) | | | — | | | | — | |
| Total distributions | | | (0.26 | ) | | | (0.54 | ) | | | (0.23 | ) | | | (0.17 | ) | | | (0.23 | ) |
| Net asset value at end of period | | $ | 10.49 | | | $ | 11.26 | | | $ | 11.22 | | | $ | 10.83 | | | $ | 11.08 | |
| Total return(B) | | | (4.56 | %) | | | 5.23 | % | | | 5.82 | % | | | (0.68 | %) | | | 3.51 | % |
| Ratios and supplemental data: | | | | | | | | | | | | | | | | | | | | |
| Net assets at end of period (000's) | | $ | 12,316 | | | $ | 13,700 | | | $ | 15,327 | | | $ | 15,542 | | | $ | 17,408 | |
| Ratio to average net assets: | | | | | | | | | | | | | | | | | | | | |
| Net expenses(C) | | | 0.49 | % | | | 0.49 | % | | | 0.49 | % | | | 0.49 | % | | | 0.46 | % |
| Gross expenses(C) | | | 1.04 | % | | | 1.03 | % | | | 1.04 | % | | | 0.96 | % | | | 0.89 | % |
| Net investment income | | | 1.92 | % | | | 1.85 | % | | | 1.38 | % | | | 1.25 | % | | | 1.79 | % |
| Portfolio turnover rate | | | 62 | % | | | 39 | % | | | 41 | % | | | 92 | % | | | 11 | % |
Touchstone Controlled Growth with Income Fund—Class C
Selected Data for a Share Outstanding Throughout Each Period
| | | Year Ended December 31, |
| | | 2018 | | | 2017 | | | 2016 | | | 2015 | | | 2014 | |
| Net asset value at beginning of period | | $ | 11.21 | | | $ | 11.16 | | | $ | 10.78 | | | $ | 11.03 | | | $ | 10.88 | |
| Income (loss) from investment operations: | | | | | | | | | | | | | | | | | | | | |
| Net investment income | | | 0.17 | | | | 0.15 | | | | 0.07 | | | | 0.06 | | | | 0.12 | |
| Net realized and unrealized gains (losses) on investments | | | (0.76 | ) | | | 0.35 | | | | 0.46 | | | | (0.22 | ) | | | 0.18 | |
| Total from investment operations | | | (0.59 | ) | | | 0.50 | | | | 0.53 | | | | (0.16 | ) | | | 0.30 | |
| Distributions from: | | | | | | | | | | | | | | | | | | | | |
| Net investment income | | | (0.09 | ) | | | (0.24 | ) | | | (0.15 | ) | | | (0.09 | ) | | | (0.15 | ) |
| Realized capital gains | | | (0.08 | ) | | | (0.21 | ) | | | (—) | (A) | | | — | | | | — | |
| Total distributions | | | (0.17 | ) | | | (0.45 | ) | | | (0.15 | ) | | | (0.09 | ) | | | (0.15 | ) |
| Net asset value at end of period | | $ | 10.45 | | | $ | 11.21 | | | $ | 11.16 | | | $ | 10.78 | | | $ | 11.03 | |
| Total return(B) | | | (5.28 | %) | | | 4.52 | % | | | 4.95 | % | | | (1.45 | %) | | | 2.76 | % |
| Ratios and supplemental data: | | | | | | | | | | | | | | | | | | | | |
| Net assets at end of period (000's) | | $ | 5,509 | | | $ | 7,301 | | | $ | 9,986 | | | $ | 11,281 | | | $ | 14,357 | |
| Ratio to average net assets: | | | | | | | | | | | | | | | | | | | | |
| Net expenses(C) | | | 1.24 | % | | | 1.24 | % | | | 1.24 | % | | | 1.24 | % | | | 1.21 | % |
| Gross expenses(C) | | | 1.93 | % | | | 1.83 | % | | | 1.81 | % | | | 1.68 | % | | | 1.65 | % |
| Net investment income | | | 1.17 | % | | | 1.10 | % | | | 0.63 | % | | | 0.50 | % | | | 1.04 | % |
| Portfolio turnover rate | | | 62 | % | | | 39 | % | | | 41 | % | | | 92 | % | | | 11 | % |
| (A) | Less than $0.005 per share. |
| (B) | Total returns shown exclude the effect of applicable sales loads and fees. If these charges were included, the returns would be lower. |
| (C) | Ratio does not include expenses of the underlying funds. |
See accompanying Notes to Financial Statements.
Financial Highlights (Continued)
Touchstone Controlled Growth with Income Fund—Class Y
Selected Data for a Share Outstanding Throughout Each Period
| | | Year Ended December 31, |
| | | 2018 | | | 2017 | | | 2016 | | | 2015 | | | 2014 | |
| Net asset value at beginning of period | | $ | 11.26 | | | $ | 11.21 | | | $ | 10.83 | | | $ | 11.08 | | | $ | 10.93 | |
| Income (loss) from investment operations: | | | | | | | | | | | | | | | | | | | | |
| Net investment income | | | 0.27 | | | | 0.23 | | | | 0.16 | | | | 0.17 | | | | 0.25 | |
| Net realized and unrealized gains (losses) on investments | | | (0.75 | ) | | | 0.39 | | | | 0.48 | | | | (0.22 | ) | | | 0.16 | |
| Total from investment operations | | | (0.48 | ) | | | 0.62 | | | | 0.64 | | | | (0.05 | ) | | | 0.41 | |
| Distributions from: | | | | | | | | | | | | | | | | | | | | |
| Net investment income | | | (0.21 | ) | | | (0.36 | ) | | | (0.26 | ) | | | (0.20 | ) | | | (0.26 | ) |
| Realized capital gains | | | (0.08 | ) | | | (0.21 | ) | | | (—) | (A) | | | — | | | | — | |
| Total distributions | | | (0.29 | ) | | | (0.57 | ) | | | (0.26 | ) | | | (0.20 | ) | | | (0.26 | ) |
| Net asset value at end of period | | $ | 10.49 | | | $ | 11.26 | | | $ | 11.21 | | | $ | 10.83 | | | $ | 11.08 | |
| Total return | | | (4.32 | %) | | | 5.59 | % | | | 5.99 | % | | | (0.43 | %) | | | 3.78 | % |
| Ratios and supplemental data: | | | | | | | | | | | | | | | | | | | | |
| Net assets at end of period (000's) | | $ | 29,070 | | | $ | 25,563 | | | $ | 13,782 | | | $ | 8,802 | | | $ | 11,931 | |
| Ratio to average net assets: | | | | | | | | | | | | | | | | | | | | |
| Net expenses(B) | | | 0.24 | % | | | 0.24 | % | | | 0.24 | % | | | 0.24 | % | | | 0.21 | % |
| Gross expenses(B) | | | 0.77 | % | | | 0.82 | % | | | 0.90 | % | | | 0.79 | % | | | 0.65 | % |
| Net investment income | | | 2.17 | % | | | 2.10 | % | | | 1.63 | % | | | 1.50 | % | | | 2.04 | % |
| Portfolio turnover rate | | | 62 | % | | | 39 | % | | | 41 | % | | | 92 | % | | | 11 | % |
| (A) | Less than $0.005 per share. |
| (B) | Ratio does not include expenses of the underlying funds. |
See accompanying Notes to Financial Statements.
Financial Highlights (Continued)
Touchstone Dynamic Diversified Income Fund—Class A
Selected Data for a Share Outstanding Throughout Each Period
| | | Year Ended December 31, |
| | | 2018 | | | 2017 | | | 2016 | | | 2015 | | | 2014 | |
| Net asset value at beginning of period | | $ | 13.23 | | | $ | 12.73 | | | $ | 12.15 | | | $ | 12.66 | | | $ | 12.37 | |
| Income (loss) from investment operations: | | | | | | | | | | | | | | | | | | | | |
| Net investment income | | | 0.47 | | | | 0.44 | | | | 0.48 | | | | 0.18 | | | | 0.22 | |
| Net realized and unrealized gains (losses) on investments | | | (1.07 | ) | | | 0.53 | | | | 0.58 | | | | (0.50 | ) | | | 0.33 | |
| Total from investment operations | | | (0.60 | ) | | | 0.97 | | | | 1.06 | | | | (0.32 | ) | | | 0.55 | |
| Distributions from: | | | | | | | | | | | | | | | | | | | | |
| Net investment income | | | (0.51 | ) | | | (0.47 | ) | | | (0.48 | ) | | | (0.19 | ) | | | (0.26 | ) |
| Net asset value at end of period | | $ | 12.12 | | | $ | 13.23 | | | $ | 12.73 | | | $ | 12.15 | | | $ | 12.66 | |
| Total return(A) | | | (4.66 | %) | | | 7.74 | % | | | 8.81 | % | | | (2.54 | %) | | | 4.46 | % |
| Ratios and supplemental data: | | | | | | | | | | | | | | | | | | | | |
| Net assets at end of period (000's) | | $ | 26,892 | | | $ | 31,264 | | | $ | 28,316 | | | $ | 29,754 | | | $ | 35,689 | |
| Ratio to average net assets: | | | | | | | | | | | | | | | | | | | | |
| Net expenses(B) | | | 0.49 | % | | | 0.49 | % | | | 0.49 | % | | | 0.49 | % | | | 0.46 | % |
| Gross expenses(B) | | | 0.93 | % | | | 0.90 | % | | | 0.90 | % | | | 0.86 | % | | | 0.83 | % |
| Net investment income | | | 3.61 | % | | | 3.44 | % | | | 3.73 | % | | | 1.38 | % | | | 1.61 | % |
| Portfolio turnover rate | | | 20 | % | | | 25 | % | | | 32 | % | | | 77 | % | | | 11 | % |
Touchstone Dynamic Diversified Income Fund—Class C
Selected Data for a Share Outstanding Throughout Each Period
| | | Year Ended December 31, |
| | | 2018 | | | 2017 | | | 2016 | | | 2015 | | | 2014 | |
| Net asset value at beginning of period | | $ | 13.26 | | | $ | 12.75 | | | $ | 12.17 | | | $ | 12.67 | | | $ | 12.36 | |
| Income (loss) from investment operations: | | | | | | | | | | | | | | | | | | | | |
| Net investment income | | | 0.40 | | | | 0.38 | | | | 0.38 | | | | 0.09 | | | | 0.11 | |
| Net realized and unrealized gains (losses) on investments | | | (1.09 | ) | | | 0.50 | | | | 0.58 | | | | (0.50 | ) | | | 0.33 | |
| Total from investment operations | | | (0.69 | ) | | | 0.88 | | | | 0.96 | | | | (0.41 | ) | | | 0.44 | |
| Distributions from: | | | | | | | | | | | | | | | | | | | | |
| Net investment income | | | (0.41 | ) | | | (0.37 | ) | | | (0.38 | ) | | | (0.09 | ) | | | (0.13 | ) |
| Net asset value at end of period | | $ | 12.16 | | | $ | 13.26 | | | $ | 12.75 | | | $ | 12.17 | | | $ | 12.67 | |
| Total return(A) | | | (5.33 | %) | | | 6.93 | % | | | 7.98 | % | | | (3.22 | %) | | | 3.59 | % |
| Ratios and supplemental data: | | | | | | | | | | | | | | | | | | | | |
| Net assets at end of period (000's) | | $ | 13,075 | | | $ | 17,792 | | | $ | 25,197 | | | $ | 27,414 | | | $ | 32,961 | |
| Ratio to average net assets: | | | | | | | | | | | | | | | | | | | | |
| Net expenses(B) | | | 1.24 | % | | | 1.24 | % | | | 1.24 | % | | | 1.24 | % | | | 1.21 | % |
| Gross expenses(B) | | | 1.72 | % | | | 1.64 | % | | | 1.63 | % | | | 1.57 | % | | | 1.57 | % |
| Net investment income | | | 2.86 | % | | | 2.69 | % | | | 2.98 | % | | | 0.63 | % | | | 0.86 | % |
| Portfolio turnover rate | | | 20 | % | | | 25 | % | | | 32 | % | | | 77 | % | | | 11 | % |
| (A) | Total returns shown exclude the effect of applicable sales loads and fees. If these charges were included, the returns would be lower. |
| (B) | Ratio does not include expenses of the underlying funds. |
See accompanying Notes to Financial Statements.
Financial Highlights (Continued)
Touchstone Dynamic Diversified Income Fund—Class Y
Selected Data for a Share Outstanding Throughout Each Period
| | | Year Ended December 31, |
| | | 2018 | | | 2017 | | | 2016 | | | 2015 | | | 2014 | |
| Net asset value at beginning of period | | $ | 13.26 | | | $ | 12.75 | | | $ | 12.17 | | | $ | 12.68 | | | $ | 12.39 | |
| Income (loss) from investment operations: | | | | | | | | | | | | | | | | | | | | |
| Net investment income | | | 0.56 | | | | 0.54 | | | | 0.55 | | | | 0.22 | | | | 0.27 | |
| Net realized and unrealized gains (losses) on investments | | | (1.13 | ) | | | 0.47 | | | | 0.54 | | | | (0.51 | ) | | | 0.31 | |
| Total from investment operations | | | (0.57 | ) | | | 1.01 | | | | 1.09 | | | | (0.29 | ) | | | 0.58 | |
| Distributions from: | | | | | | | | | | | | | | | | | | | | |
| Net investment income | | | (0.54 | ) | | | (0.50 | ) | | | (0.51 | ) | | | (0.22 | ) | | | (0.29 | ) |
| Net asset value at end of period | | $ | 12.15 | | | $ | 13.26 | | | $ | 12.75 | | | $ | 12.17 | | | $ | 12.68 | |
| Total return | | | (4.40 | %) | | | 8.06 | % | | | 9.06 | % | | | (2.29 | % | ) | | 4.72 | % |
| Ratios and supplemental data: | | | | | | | | | | | | | | | | | | | | |
| Net assets at end of period (000's) | | $ | 4,368 | | | $ | 6,675 | | | $ | 10,391 | | | $ | 18,168 | | | $ | 23,466 | |
| Ratio to average net assets: | | | | | | | | | | | | | | | | | | | | |
| Net expenses(A) | | | 0.24 | % | | | 0.24 | % | | | 0.24 | % | | | 0.24 | % | | | 0.21 | % |
| Gross expenses(A) | | | 1.03 | % | | | 0.84 | % | | | 0.73 | % | | | 0.65 | % | | | 0.58 | % |
| Net investment income | | | 3.86 | % | | | 3.69 | % | | | 3.98 | % | | | 1.63 | % | | | 1.86 | % |
| Portfolio turnover rate | | | 20 | % | | | 25 | % | | | 32 | % | | | 77 | % | | | 11 | % |
(A) Ratio does not include expenses of the underlying funds.
See accompanying Notes to Financial Statements.
Financial Highlights (Continued)
Touchstone Dynamic Global Allocation Fund—Class A
Selected Data for a Share Outstanding Throughout Each Period
| | | Year Ended December 31, |
| | | 2018 | | | 2017 | | | 2016 | | | 2015 | | | 2014 | |
| Net asset value at beginning of period | | $ | 12.56 | | | $ | 11.56 | | | $ | 12.01 | | | $ | 12.89 | | | $ | 12.99 | |
| Income (loss) from investment operations: | | | | | | | | | | | | | | | | | | | | |
| Net investment income | | | 0.20 | | | | 0.21 | | | | 0.28 | | | | 0.18 | | | | 0.20 | |
| Net realized and unrealized gains (losses) on investments | | | (1.16 | ) | | | 1.39 | | | | 0.06 | | | | (0.57 | ) | | | 0.46 | |
| Total from investment operations | | | (0.96 | ) | | | 1.60 | | | | 0.34 | | | | (0.39 | ) | | | 0.66 | |
| Distributions from: | | | | | | | | | | | | | | | | | | | | |
| Net investment income | | | (0.26 | ) | | | (0.26 | ) | | | (0.28 | ) | | | (0.19 | ) | | | (0.25 | ) |
| Realized capital gains | | | (0.71 | ) | | | (0.34 | ) | | | (0.51 | ) | | | (0.30 | ) | | | (0.51 | ) |
| Total distributions | | | (0.97 | ) | | | (0.60 | ) | | | (0.79 | ) | | | (0.49 | ) | | | (0.76 | ) |
| Net asset value at end of period | | $ | 10.63 | | | $ | 12.56 | | | $ | 11.56 | | | $ | 12.01 | | | $ | 12.89 | |
| Total return(A) | | | (7.91 | %) | | | 13.96 | % | | | 2.80 | % | | | (3.09 | %) | | | 5.06 | % |
| Ratios and supplemental data: | | | | | | | | | | | | | | | | | | | | |
| Net assets at end of period (000's) | | $ | 54,871 | | | $ | 67,562 | | | $ | 62,689 | | | $ | 71,201 | | | $ | 56,893 | |
| Ratio to average net assets: | | | | | | | | | | | | | | | | | | | | |
| Net expenses(B) | | | 0.49 | % | | | 0.49 | % | | | 0.49 | % | | | 0.49 | % | | | 0.46 | % |
| Gross expenses(B) | | | 0.92 | % | | | 0.91 | % | | | 0.92 | % | | | 0.90 | % | | | 0.89 | % |
| Net investment income | | | 1.57 | % | | | 1.72 | % | | | 2.26 | % | | | 1.75 | % | | | 1.44 | % |
| Portfolio turnover rate | | | 40 | % | | | 32 | % | | | 39 | % | | | 68 | %(C) | | | 11 | % |
Touchstone Dynamic Global Allocation Fund—Class C
Selected Data for a Share Outstanding Throughout Each Period
| | | Year Ended December 31, |
| | | 2018 | | | 2017 | | | 2016 | | | 2015 | | | 2014 | |
| Net asset value at beginning of period | | $ | 12.28 | | | $ | 11.31 | | | $ | 11.77 | | | $ | 12.67 | | | $ | 12.79 | |
| Income (loss) from investment operations: | | | | | | | | | | | | | | | | | | | | |
| Net investment income | | | 0.11 | | | | 0.12 | | | | 0.19 | | | | 0.10 | | | | 0.09 | |
| Net realized and unrealized gains (losses) on investments | | | (1.13 | ) | | | 1.35 | | | | 0.05 | | | | (0.58 | ) | | | 0.45 | |
| Total from investment operations | | | (1.02 | ) | | | 1.47 | | | | 0.24 | | | | (0.48 | ) | | | 0.54 | |
| Distributions from: | | | | | | | | | | | | | | | | | | | | |
| Net investment income | | | (0.17 | ) | | | (0.16 | ) | | | (0.19 | ) | | | (0.12 | ) | | | (0.15 | ) |
| Realized capital gains | | | (0.71 | ) | | | (0.34 | ) | | | (0.51 | ) | | | (0.30 | ) | | | (0.51 | ) |
| Total distributions | | | (0.88 | ) | | | (0.50 | ) | | | (0.70 | ) | | | (0.42 | ) | | | (0.66 | ) |
| Net asset value at end of period | | $ | 10.38 | | | $ | 12.28 | | | $ | 11.31 | | | $ | 11.77 | | | $ | 12.67 | |
| Total return(A) | | | (8.55 | %) | | | 13.10 | % | | | 2.00 | % | | | (3.81 | %) | | | 4.20 | % |
| Ratios and supplemental data: | | | | | | | | | | | | | | | | | | | | |
| Net assets at end of period (000's) | | $ | 24,897 | | | $ | 33,039 | | | $ | 44,946 | | | $ | 53,417 | | | $ | 43,844 | |
| Ratio to average net assets: | | | | | | | | | | | | | | | | | | | | |
| Net expenses(B) | | | 1.24 | % | | | 1.24 | % | | | 1.24 | % | | | 1.24 | % | | | 1.21 | % |
| Gross expenses(B) | | | 1.68 | % | | | 1.66 | % | | | 1.65 | % | | | 1.62 | % | | | 1.62 | % |
| Net investment income | | | 0.82 | % | | | 0.97 | % | | | 1.51 | % | | | 1.00 | % | | | 0.69 | % |
| Portfolio turnover rate | | | 40 | % | | | 32 | % | | | 39 | % | | | 68 | %(C) | | | 11 | % |
| (A) | Total returns shown exclude the effect of applicable sales loads and fees. If these charges were included, the returns would be lower. |
| (B) | Ratio does not include expenses of the underlying funds. |
| (C) | Portfolio turnover excludes the purchases and sales of the Touchstone Growth Allocation Fund acquired on November 23, 2015. If these transactions were included, portfolio turnover would have been higher. |
See accompanying Notes to Financial Statements.
Financial Highlights (Continued)
Touchstone Dynamic Global Allocation Fund—Class Y
Selected Data for a Share Outstanding Throughout Each Period
| | | Year Ended December 31, |
| | | 2018 | | | 2017 | | | 2016 | | | 2015 | | | 2014 | |
| Net asset value at beginning of period | | $ | 12.67 | | | $ | 11.66 | | | $ | 12.11 | | | $ | 12.98 | | | $ | 13.09 | |
| Income (loss) from investment operations: | | | | | | | | | | | | | | | | | | | | |
| Net investment income | | | 0.27 | | | | 0.24 | | | | 0.32 | | | | 0.23 | | | | 0.28 | |
| Net realized and unrealized gains (losses) on investments | | | (1.21 | ) | | | 1.40 | | | | 0.05 | | | | (0.58 | ) | | | 0.40 | |
| Total from investment operations | | | (0.94 | ) | | | 1.64 | | | | 0.37 | | | | (0.35 | ) | | | 0.68 | |
| Distributions from: | | | | | | | | | | | | | | | | | | | | |
| Net investment income | | | (0.29 | ) | | | (0.29 | ) | | | (0.31 | ) | | | (0.22 | ) | | | (0.28 | ) |
| Realized capital gains | | | (0.71 | ) | | | (0.34 | ) | | | (0.51 | ) | | | (0.30 | ) | | | (0.51 | ) |
| Total distributions | | | (1.00 | ) | | | (0.63 | ) | | | (0.82 | ) | | | (0.52 | ) | | | (0.79 | ) |
| Net asset value at end of period | | $ | 10.73 | | | $ | 12.67 | | | $ | 11.66 | | | $ | 12.11 | | | $ | 12.98 | |
| Total return | | | (7.69 | %) | | | 14.21 | % | | | 3.03 | % | | | (2.75 | %) | | | 5.21 | % |
| Ratios and supplemental data: | | | | | | | | | | | | | | | | | | | | |
| Net assets at end of period (000's) | | $ | 5,525 | | | $ | 12,758 | | | $ | 14,678 | | | $ | 17,711 | | | $ | 16,719 | |
| Ratio to average net assets: | | | | | | | | | | | | | | | | | | | | |
| Net expenses(A) | | | 0.24 | % | | | 0.24 | % | | | 0.24 | % | | | 0.24 | % | | | 0.21 | % |
| Gross expenses(A) | | | 0.85 | % | | | 0.78 | % | | | 0.75 | % | | | 0.72 | % | | | 0.62 | % |
| Net investment income | | | 1.82 | % | | | 1.97 | % | | | 2.51 | % | | | 2.00 | % | | | 1.69 | % |
| Portfolio turnover rate | | | 40 | % | | | 32 | % | | | 39 | % | | | 68 | %(B) | | | 11 | % |
| (A) | Ratio does not include expenses of the underlying funds. |
| (B) | Portfolio turnover excludes the purchases and sales of the Touchstone Growth Allocation Fund acquired on November 23, 2015. If these transactions were included, portfolio turnover would have been higher. |
See accompanying Notes to Financial Statements.
Notes to Financial Statements
December 31, 2018
1. Organization
The Touchstone Strategic Trust (the “Trust”) is registered under the Investment Company Act of 1940, as amended (the “1940 Act”), as an open-end management investment company. The Trust was established as a Massachusetts business trust pursuant to an Agreement and Declaration of Trust dated November 18, 1982. TheTrust consists of twenty-two funds, including the following four funds (individually, a “Fund”, and collectively, the “Funds”):
Touchstone Dynamic Equity Fund (“Dynamic Equity Fund”)
Touchstone Controlled Growth with Income Fund (“Controlled Growth with Income Fund”)
Touchstone Dynamic Diversified Income Fund (“Dynamic Diversified Income Fund”)
Touchstone Dynamic Global Allocation Fund (“Dynamic Global Allocation Fund”)
Each Fund is diversified. Additionally, the Controlled Growth with Income Fund, Dynamic Diversified Income Fund and Dynamic Global Allocation Fund (collectively, the “Allocation Funds”) are “Funds of Funds”, sub-advised by Wilshire Associates Incorporated, which seek to achieve their investment goals by primarily investing in a diversified portfolio of affiliated and unaffiliated underlying equity, fixed income and alternative funds. These underlying funds (“Underlying Funds”), in turn, invest in a variety of U.S. and foreign equity and fixed-income securities. Under normal circumstances, the Allocation Funds expect to invest their assets among equity, fixed-income and alternative funds in the following ranges:
| | | Equity Fund | | Fixed-Income | | Alternative |
| | | Allocation | | Fund Allocation | | Fund Allocation |
| Controlled Growth with Income Fund | | 0-25% | | 25-50% | | 50-75% |
| Dynamic Diversified Income Fund | | 25-55% | | 25-55% | | 0-30% |
| Dynamic Global Allocation Fund | | 45-75% | | 25-55% | | N/A |
The investment goal of each of the Underlying Funds that the Allocation Funds invested in is as follows:
| Fund | | Investment Goal |
| Touchstone Arbitrage Fund | | Seeks to achieve positive absolute returns over the long-term regardless of market conditions. |
| Touchstone Credit Opportunities Fund | | Seeks absolute total return, primarily from income and capital appreciation. |
| Touchstone Dynamic Equity Fund | | Seeks to obtain long-term capital appreciation from hedged equity investments with lessrisk than a fully invested, unhedged equity portfolio. |
| Touchstone Flexible Income Fund | | Seeks total return through a combination of income and capital appreciation. |
| Touchstone Focused Fund | | Seeks capital appreciation. |
| Touchstone Growth Opportunities Fund | | Seeks long-term growth of capital. |
| Touchstone High Yield Fund | | Seeks to achieve a high level of income as its main goal. Capital appreciation is a secondaryconsideration. |
| Touchstone Impact Bond Fund | | Seeks high current income. Capital appreciation is secondary goal. |
| Touchstone International Growth Opportunities Fund | | Seeks long-term capital appreciation. |
| Touchstone International Small Cap Fund | | Seeks to provide investors with capital appreciation. |
| Touchstone International Value Fund | | Seeks long-term capital growth. |
| Touchstone Mid Cap Fund | | Seeks long-term capital growth. |
Notes to Financial Statements(Continued)
| Fund | | Investment Goal |
| Touchstone Premium Yield Equity Fund | | Seeks long-term growth of capital and high current income. |
| Touchstone Sands Capital Institutional Growth Fund | | Seeks long-term capital appreciation. |
| Touchstone Small Cap Value Fund | | Seeks long-term capital growth by investing primarily in stocks of small-cap companies. |
| Touchstone Ultra Short Duration Fixed Income Fund | | Seeks maximum total return consistent with the preservation of capital. |
| Touchstone Value Fund | | Seeks to provide investors with long-term capital growth. |
| Dreyfus Government Cash Management | | Seeks as high a level of current income as is consistent with the preservation of capital and the maintenance of liquidity. |
| iShares International Select Dividend ETF | | Seeks to track the investment results of an index composed of relatively high dividend paying equities in non-U.S. developed markets. |
| iShares International Treasury Bond ETF | | Seeks to track the investment results of an index composed of non-U.S. developed market government bonds. |
| JPMorgan Alerian MLP Index ETN | | Seeks to replicate, net of expenses, the Alerian MLP Index. The index tracks the performance of midstream energy Master Limited Partnerships. |
| VanEck Vectors J.P. Morgan EM Local Currency Bond ETF | | Seeks to replicate as closely as possible, before fees and expenses, the price and yield performance of the J.P. Morgan GBI-EMG Core Index (GBIEMCOR), which is comprised of bonds issued by emerging market governments and denominated in the local currency of the issuer. |
| Vanguard Emerging Markets Government Bond ETF | | Seeks to track the performance of a benchmark index that measures the investment return of U.S. dollar-denominated bonds issued by governments and government related issuers in emerging market countries. |
| Vanguard FTSE Emerging Markets ETF | | Seeks to track the performance of a benchmark index that measures the investment return of stocks issued by companies located in emerging market countries. |
| Vanguard Global ex-U.S. Real Estate ETF | | Seeks to track the performance of a benchmark index that measures the investment return of international real estate stocks. |
| Vanguard REIT ETF | | Seeks to provide a high level of income and moderate long-term capital appreciation by tracking the performance of a benchmark index that measures the performance of publicly traded equity REITs. |
| Vanguard Total International Bond ETF | | Seeks to track the performance of a benchmark index that measures the investment return of investment-grade bonds issued outside of the United States. |
| WisdomTree Emerging Markets High Dividend ETF | | Seeks to track the investment results of high-dividend-yielding companies in the emerging markets region. |
The Agreement and Declaration of Trust permits the Trust to issue an unlimited number of shares of beneficial interest of each Fund. The Dynamic Equity Fund is registered to offer the following classes of shares: Class A shares, Class C shares, Class Y shares, and Institutional Class shares. The Allocation Funds are registered to offer the following classes of shares: Class A shares, Class C shares and Class Y shares. The assets of each Fund are segregated, and a shareholder’s interest is limited to the Fund in which shares are held. The Funds’ prospectus provides a description of each Fund’s investment goal, policies, and strategies along with information on the classes of shares currently being offered.
Notes to Financial Statements(Continued)
2. Significant Accounting Policies
The following is a summary of the Funds’ significant accounting policies:
Each Fund is an investment company that follows the accounting and reporting guidance of Accounting Standards Codification Topic 946 applicable to investment companies.
Regulatory Updates —In August 2018, the Securities and Exchange Commission (the “SEC”) released its Final Rules that eliminated or amended disclosure requirements in the financial statements that were redundant or outdated in light of changes in SEC requirements or U.S. generally accepted accounting principles (“U.S. GAAP”). The Final Rules were effective November 5, 2018. Management has evaluated the SEC Final Rules and is complying with the amendments in the current financial statements.
In August 2018, the Financial Accounting Standards Board issued Accounting Standards Update (“ASU”) No. 2018-13, Fair Value Measurement (Topic 820): Disclosure Framework - Changes to the Disclosure Requirements for Fair Value Measurement, which amends and eliminates certain disclosure requirements for fair value as part of its framework project. The ASU is effective for annual and interim periods beginning after December 15, 2019. The early adoption of the removal or modification of disclosures and delay of adoption of the additional disclosures is permitted. As of December 31, 2018, the Funds have adopted the removal of applicable disclosures.
Security valuation and fair value measurements —U.S. GAAP defines fair value as the price the Funds would receive to sell an asset or pay to transfer a liability in an orderly transaction between market participants at the measurement date. All investments in securities are recorded at their fair value. The Funds define the term “market value”, as used throughout this report, as the estimated fair value. The Funds use various methods to measure fair value of their portfolio securities on a recurring basis. U.S. GAAP fair value measurement standards require disclosure of a hierarchy that prioritizes inputs to valuation methods.
These inputs are summarized in the three broad levels listed below:
| · | Level 1 – | quoted prices in active markets for identical securities |
| · | Level 2 – | other significant observable inputs (including quoted prices for similar securities, interest rates, prepayment speeds, credit risk, etc.) |
| · | Level 3 – | significant unobservable inputs (including a Fund’s own assumptions in determining the fair value of investments) |
The inputs or methodology used for valuing securities are not necessarily an indication of the risk associated with investing in those securities.
The aggregate value by input level, as of December 31, 2018, for each Fund’s investments, is included in the Funds’ Portfolio of Investments, which also includes a breakdown of the Funds’ investments by sector allocation. The Funds did not hold or transfer Level 3 categorized securities during the year ended December 31, 2018.
Changes in valuation techniques may result in transfers into or out of an investment’s assigned level within the hierarchy.
During the year ended December 31, 2018, there were no material changes to the valuation policies and techniques.
The Funds’ portfolio securities are valued as of the close of the regular session of trading on the New York Stock Exchange (“NYSE”)(currently 4:00 p.m., Eastern time or at the time as of which the NYSE establishes official closing prices). Portfolio securities traded on stock exchanges are valued at the last reported sale price, official close price, or last bid price if no sales are reported. Portfolio securities quoted by NASDAQ are valued at the NASDAQ Official Closing Price (“NOCP”) or from the primary exchange on which the security trades.
Notes to Financial Statements(Continued)
To the extent these securities are actively traded, they are categorized in Level 1 of the fair value hierarchy. Options are valued at the last quoted sales price. If there is no such reported sale on the valuation date, long option positions are valued at the most recent bid price, and short option positions are valued at the most recent ask price on the valuation date and are categorized in Level 1. Shares of mutual funds in which the Funds invest are valued at their respective net asset value (“NAV”) as reported by the Underlying Funds and are categorized in Level 1.
Securities mainly traded on a non-U.S. exchange or denominated in foreign currencies are generally valued according to the preceding closing values on that exchange, translated to U.S. dollars using currency exchange rates as of the close of regular trading on the NYSE, and are generally categorized in Level 1. However, if an event that may change the value of a security occurs after the time that the closing value on the non-U.S. exchange was determined, but before the close of regular trading on the NYSE, the security may be priced based on fair value and is generally categorized in Level 2. This may cause the value of the security, if held on the books of a Fund, to be different from the closing value on the non-U.S. exchange and may affect the calculation of that Fund’s NAV.
The Funds may use fair value pricing under the following circumstances, among others:
| · | If the value of a security has been materially affected by events occurring before the Funds’ pricing time but after the close of the primary markets on which the security is traded. |
| · | If the exchange on which a portfolio security is principally traded closes early or if trading in a particular portfolio security was halted during the day and did not resume prior to the Funds’ NAV calculation. |
| · | If a security is so thinly traded that reliable market quotations are unavailable due to infrequent trading. |
| · | If the validity of market quotations is not reliable. |
Securities held by the Funds that do not have readily available market quotations, significant observable inputs, or securities for which the available market quotations are not reliable, are priced at their estimated fair value using procedures approved by the Funds’ Board of Trustees (the “Board”) and are generally categorized in Level 3.
Allocation Funds —The Allocation Funds invest in securities of affiliated and unaffiliated funds, the Underlying Funds. The value of an investment in the Allocation Funds is based on the performance of the Underlying Funds in which they invest and the allocation of their assets among those funds. Because the Allocation Funds invest in mutual funds, shareholders of the Allocation Funds indirectly bear a proportionate share of the expenses charged by the Underlying Funds in which they invest as well as their share of the Allocation Funds’ fees and expenses. The principal risks of an investment in the Allocation Funds include the principal risks of investing in the Underlying Funds.
Investment companies —The Funds may invest in securities of other investment companies, including exchange-traded funds (“ETFs”), exchange-traded notes (“ETNs”), open-end funds and closed-end funds. Open-end funds are investment companies that issue new shares continuously and redeem shares daily. Closed-end funds are investment companies that typically issue a fixed number of shares that trade on a securities exchange or over-the-counter (“OTC”). An ETF is an investment company that typically seeks to track the performance of an index by holding in its portfolio shares of all the companies, or a representative sample of the companies, that are components of a particular index. An ETN is an investment company that typically seeks to track the performance of an index, similar to an ETF, but it does not hold any securities that it tracks. ETF and ETN shares are traded on a securities exchange based on their market value. The risks of investment in other investment companies typically reflect the risks of the types of securities in which the other investment companies invest. Investments in ETFs, ETNs and closed-end funds are subject to the additional risk that their shares may trade at a premium
Notes to Financial Statements(Continued)
or discount to their NAV. Investments in ETNs are also subject to credit risk similar to other debt securities. When a Fund invests in another investment company, shareholders of the Fund indirectly bear their proportionate share of the other investment company’s fees and expenses, including operating, registration, trustee, licensing, and marketing, as well as their share of the Fund’s fees and expenses.
Cash and cash equivalents —The Funds consider liquid assets deposited with a bank, money market funds, and certain short term debt instruments with maturities of 3 months or less to be cash equivalents and are included in the investments on the financial statements. These investments represent amounts held with financial institutions that are readily accessible to pay Fund expenses or investments. Cash and cash equivalents are valued at cost plus accrued interest, which approximates market value. The value of cash equivalents denominated in foreign currencies is determined by converting to U.S. dollars on the date of the Statements of Assets and Liabilities.
Securities sold short —The Dynamic Equity Fund may engage in selling securities short, which obligates the Fund to replace a security borrowed by purchasing the same security at the current market value. The Fund would incur a loss if the price of the security increases between the date of the short sale and the date on which the Fund replaces the borrowed security. The Fund would realize a gain if the price of the security declines between those dates. As of December 31, 2018, the Dynamic Equity Fund had securities sold short with a fair value of $(17,096,115) and pledged securities with a fair value of $99,321,842 as collateral and pledged cash collateral of $4,767,798 for both securities sold short and written options.
Options —The Dynamic Equity Fund may write or purchase financial option contracts primarily to hedge against changes in the value of equity securities (or securities that the Fund intends to purchase), against fluctuations in fair value caused by changes in prevailing market interest rates or foreign currency exchange rates and against changes in overall equity market volatility. In addition, the Fund may utilize options in an attempt to generate gains from option premiums or to reduce overall portfolio risk. The Fund’s option strategy primarily focuses on the use of writing and/or purchasing call or put options on equity indexes. When the Fund writes or purchases an option, an amount equal to the premium received or paid by the Fund is recorded as a liability or an asset and is subsequently adjusted to the current market value of the option written or purchased. Premiums received or paid from writing or purchasing options which expire unexercised are treated by the Fund on the expiration date as realized gains or losses. The difference between the premium and the amount paid or received on effecting a closing purchase or sale transaction, including brokerage commissions, is also treated as a realized gain or loss. If an option is exercised, the premium paid or received is added to the cost of the purchase or proceeds from the sale in determining whether the Fund has realized a gain or loss on investment transactions. The Fund, as writer of an option, may have no control over whether the underlying securities may be sold (call) or purchased (put) and as a result bears the market risk of an unfavorable change in the price of the security underlying the written option. The Fund, as purchaser of an option, bears the risk that the counterparties to the option may not have the ability to meet the terms of the option contracts. There is minimal counterparty credit risk involved in entering into option contracts since they are exchange-traded instruments and the exchange’s clearinghouse, as counterparty to all exchange-traded options, guarantees the options against default.The maximum risk of loss associated with writing put options is the notional amount as presented in the Portfolio of Investments. In certain circumstances, the maximum risk of loss amounts may be partially offset by recovery values of the respective referenced assets and upfront premium received upon entering into the contract. The maximum risk of loss associated with writing call options is potentially unlimited. As of December 31, 2018, the Dynamic Equity Fund had written options with a fair value of $(2,421,976) and pledged securities with a fair value of $99,321,842 as collateral and pledged cash collateral of $4,767,798 for both securities sold short and written options.
Real Estate Investment Trusts —The Dynamic Equity Fund may invest in real estate investment trusts (“REITs”) that involve risks not associated with investing in stocks. Risks associated with investments in REITs include
Notes to Financial Statements(Continued)
declines in the value of real estate, general and economic conditions, changes in the value of the underlying property and defaults by borrowers. The value of assets in the real estate industry may go through cycles of relative underperformance and outperformance in comparison to equity securities markets in general. Dividend income is recorded using management’s estimate of the income included in distributions received from REIT investments. The actual amounts of income, return of capital and capital gains are only determined by each REIT after its fiscal year-end and may differ from the estimated amount. Estimates of income are adjusted in the Fund to the actual amounts when the amounts are determined.
Derivative instruments and hedging activities —The Dynamic Equity Fund may enter into an International Swaps and Derivatives Association, Inc. Master Agreement (“ISDA Master Agreement” or “MNA”) or similar agreement with certain counterparties. An ISDA Master Agreement is a bilateral agreement between the Fund and a counterparty that governs OTC derivatives and foreign exchange contracts, and typically contains, among other things, collateral posting terms and master netting provisions in the event of a default or termination. Under an ISDA Master Agreement, a party may, under certain circumstances, offset with the counterparty certain derivative financial instrument’s payables or receivables with collateral held or posted and create one single net payment. The provisions of the ISDA Master Agreement typically permit a single net payment in the event of default (close-out netting). These default events include bankruptcy or insolvency of the counterparty. Note, however, that bankruptcy or insolvency laws of a particular jurisdiction may impose restrictions on or prohibitions against the right of offset.
When entering into a derivative transaction, the Fund may be required to post and maintain collateral or margin (including both initial and maintenance margin). Collateral and margin requirements differ by type of derivative. Margin requirements are established by the broker or clearing house for exchange-traded and centrally cleared derivatives (financial futures contracts, options, and centrally cleared swaps). Brokers can ask for margining in excess of the clearing house’s minimum in certain circumstances. Collateral terms are contract specific for OTC derivatives (forward foreign currency contracts, options, and swaps). For derivatives traded under an ISDA Master Agreement, the collateral requirements are typically calculated by netting the marked-to-market amount for each transaction under such agreement and comparing that amount to the value of any collateral currently pledged by the Fund and the counterparty. For financial reporting purposes, cash collateral that has been pledged to cover obligations of the Fund and cash collateral received from the counterparty, if any, are reported separately on the Statements of Assets and Liabilities as cash deposits held at prime broker and due to prime broker, respectively. Non-cash collateral pledged by the Fund, if any, is noted in the Portfolio of Investments. To the extent amounts due to the Fund from its counterparties are not fully collateralized, contractually or otherwise, the Fund bears the risk of loss from counterparty non-performance.
Certain ISDA Master Agreements allow counterparties to OTC derivatives transactions to terminate derivative contracts prior to maturity in the event the Fund’s net assets decline by a stated percentage or the Fund fails to meet the terms of its ISDA Master Agreement, which would cause the Fund (counterparty) to accelerate payment of any net liability owed to the counterparty (Fund).
For financial reporting purposes, the Dynamic Equity Fund does not offset derivative assets and derivative liabilities that are subject to netting arrangements in the Statements of Assets and Liabilities.
As of December 31, 2018, the Dynamic Equity Fund’s assets and liabilities that were subject to a MNA on a gross basis were as follows:
| | | Assets | | | Liabilities | |
| Derivative Financial Instruments: | | | | | | | | |
| Written Options | | $ | — | | | $ | 2,421,976 | |
Notes to Financial Statements(Continued)
The following table presents the Dynamic Equity Fund’s liabilities net of amounts available for offset under a MNA and net of the related collateral pledged by the Fund as of December 31, 2018:
| | | | | | Gross Amounts | | | | | | | | | | |
| | | | | | Available for Offset | | | | | | | | | | |
| | | Gross Amount of | | | in Statement of | | | Non-cash | | | | | | | |
| | | Recognized | | | Assets and | | | Collateral | | | Cash Collateral | | | | |
| | | Liabilities | | | Liabilities | | | Pledged | | | Pledged | | | Net Amount(B) | |
| Written Options(A) | | $ | 2,421,976 | | | $ | — | | | $ | (1,830,346 | ) | | $ | (591,630 | ) | | $ | — | |
| (A) | Pershing LLC is the counterparty. |
| (B) | Net amount represents the net amount payable due to the counterparty in the event of default. |
The following table sets forth the fair value of the Dynamic Equity Fund’s derivative financial instruments by primary risk exposure as of December 31, 2018:
| Fair Value of Derivative Investments |
| As of December 31, 2018 |
| | | Derivatives not accounted for as hedging | | Asset | | | Liability | |
| Fund | | instruments under ASC 815 | | Derivatives | | | Derivatives | |
| Dynamic Equity Fund | | Written Options - Equity Contracts* | | $ | — | | | $ | 2,421,976 | |
* Statements of Assets and Liabilities Location: Written options, at market value.
The following table sets forth the effect on the Dynamic Equity Fund’s derivative financial instruments by primary risk exposure on the Statement of Operations for the year ended December 31, 2018:
| The Effect of Derivative Investments on the Statement of Operations |
| for the Year Ended December 31, 2018 |
| | | | | | | | Change in | |
| | | | | | | | Unrealized | |
| | | | | Realized Gains | | | Appreciation | |
| | | Derivatives not accounted for as hedging | | (Losses) | | | (Depreciation) | |
| Fund | | instruments under ASC 815 | | on Derivatives | | | on Derivatives | |
| Dynamic Equity Fund | | Purchased Options - Equity Contacts* | | $ | 660,843 | | | $ | — | |
| | | Written Options - Equity Contacts** | | | 574,555 | | | | 13,186 | |
*Statements of Operations Location: Net realized gains on investments in non-affiliated securities.
**Statements of Operations Location: Net realized gains on written options and net change in unrealized appreciation (depreciation) on written options, respectively.
For the year ended December 31, 2018, the average quarterly balances of outstanding derivative financial instruments were as follows:
| | | Dynamic | |
| | | Equity | |
| | | Fund | |
| Equity contracts: | | | |
| Purchased Options - Cost* | | $ | — | |
| Written Options - Premiums received | | | (2,030,650 | ) |
* The balance at each quarter end was zero.
Portfolio securities loaned —The Funds may lend their portfolio securities. Lending portfolio securities exposes the Funds to the risk that the borrower may fail to return the loaned securities or may not be able to provide additional collateral or that the Funds may experience delays in recovery of the loaned securities or loss of rights in the collateral if the borrower fails financially. To minimize these risks, the borrower must agree to maintain cash collateral with the Funds’ custodian. The loaned securities are secured by collateral valued at least equal,
Notes to Financial Statements(Continued)
at all times, to the market value of the loaned securities plus accrued interest, if any. When the collateral falls below specified amounts, the lending agent will use its best effort to obtain additional collateral on the next business day to meet required amounts under the security lending agreement. The cash collateral is reinvested by the Funds’ custodian into an approved short-term investment vehicle. The approved short-term investment vehicle is subject to market risk.
As of December 31, 2018, the following Funds loaned securities and received collateral as follows:
| | | | | Market | | | Market | | | | |
| | | | | Value of | | | Value of | | | | |
| | | | | Securities | | | Collateral | | | Net | |
| Fund | | Security Type | | Loaned* | | | Received** | | | Amount*** | |
| Dynamic Diversified Income Fund | | Exchange-Traded Funds | | $ | 1,164,841 | | | $ | 1,194,775 | | | $ | 29,934 | |
| | | Exchange-Traded Notes | | | 2,392,704 | | | | 2,401,280 | | | | 8,576 | |
| * | The remaining contractual maturity is overnight for all securities. |
| ** | Gross amount of recognized liabilities for securities lending included in the Statements of Assets and Liabilities. |
| *** | Net amount represents the net amount payable due to the borrower in the event of default. |
All cash collateral is received, held, and administered by the Funds’ custodian for the benefit of the lending Fund in its custody account or other account established for the purpose of holding collateral in cash equivalents.
Funds participating in securities lending receive compensation in the form of fees. Securities lending income is derived from lending long securities from the Funds to creditworthy approved borrowers at rates that are determined based on daily trading volumes, float, short-term interest rates and market liquidity and is shown net of fees on the Statements of Operations. When a Fund lends securities, it retains the interest or dividends on the investment of any cash received as collateral, and the Fund continues to receive interest or dividends on the loaned securities.
Unrealized gain or loss on the market value of the loaned securities that may occur during the term of the loan is recognized by the Fund. The Fund has the right under the lending agreement to recover any loaned securities from the borrower on demand.
Share valuation —The NAV per share of each class of shares of each Fund is calculated daily by dividing the total value of a Fund’s assets attributable to that class, less liabilities attributable to that class, by the number of outstanding shares of that class.
Effective August 17, 2018, the maximum offering price per share of Class A shares of the Funds is equal to the NAV per share plus a sales load equal to 5.26% of the NAV (or 5.00% of the offering price). Prior to August 17, 2018, the maximum offering price per share of Class A shares of the Funds was equal to the NAV per share plus a sales load equal to 6.10% of the NAV (or 5.75% of the offering price). There is no sales load on purchases when aggregate purchases in all Touchstone funds equal at least $1 million. The maximum offering price per share of Classes C, Y, and Institutional Class shares of the Funds is equal to the NAV per share.
The redemption price per share of each class of shares of the Funds is generally equal to the NAV per share. However, Class A redemptions that were part of a no-load purchase due to the aggregate purchase amount in all Touchstone funds equaling at least $1 million where a Finder’s Fee was paid may be subject to a contingent deferred sales charge (“CDSC”) of up to 1.00% if redeemed within a one-year period from the date of purchase. Additionally, purchases of Class C shares of the Funds may be subject to a CDSC of 1.00% if redeemed within one year from the date of purchase. The CDSC will be assessed on an amount equal to the lesser of (1) the NAV at the time of purchase of the shares being redeemed or (2) the NAV of such shares being redeemed.
Notes to Financial Statements(Continued)
Investment income —Dividend income from securities is recognized on the ex-dividend date, net of foreign withholding taxes, if any, which are reduced by any amounts reclaimable by the Funds, where applicable. Interest income from securities is recorded on the basis of interest accrued, premium amortized and discount accreted.
Distributions to shareholders —Each Fund intends to distribute to its shareholders substantially all of its income and capital gains. The Dynamic Equity Fund declares and distributes net investment income, if any, annually as a dividend to shareholders. The Allocation Funds each declare and distribute net investment income, if any, quarterly as a dividend to shareholders. Each Fund makes distributions of capital gains, if any, at least annually, net of applicable capital loss carryforwards. Income distributions and capital gain distributions are determined in accordance with income tax regulations. Recognition of the Funds’ net investment income from investments in Underlying Funds is affected by the timing of dividend declarations by the Underlying Funds.
Allocations —Investment income earned, realized capital gains and losses, and unrealized appreciation and depreciation for a Fund are allocated daily to each class of shares based upon its proportionate share of total net assets of the Fund. Class-specific expenses are charged directly to the class incurring the expense. Common expenses, which are not attributable to a specific class, are allocated daily to each class of shares based upon their proportionate share of total net assets of the Fund. Expenses not directly billed to a Fund are allocated proportionally among all Funds in the Trust, and, if applicable, Touchstone Funds Group Trust, Touchstone Institutional Funds Trust and Touchstone Variable Series Trust (collectively with the Trust, “Touchstone Fund Complex”), daily in relation to net assets of each Fund or another reasonable measure.
Security transactions —Security transactions are reflected for financial reporting purposes as of the trade date. Realized gains and losses on sales of portfolio securities are calculated using the identified cost basis.
Estimates —The preparation of financial statements in conformity with U.S. GAAP requires management to make estimates and assumptions that affect the reported amounts of assets and liabilities and disclosure of contingent assets and liabilities at the date of the financial statements and the reported amounts of income and expenses during the reporting period. Actual results could differ from those estimates.
3. Investment Transactions
Investment transactions (excluding short-term investments and U.S. Government securities) were as follows for the year ended December 31, 2018:
| | | | | | Controlled | | | Dynamic | | | Dynamic | |
| | | Dynamic | | | Growth with | | | Diversified | | | Global | |
| | | Equity | | | Income | | | Income | | | Allocation | |
| | | Fund | | | Fund | | | Fund | | | Fund | |
| Purchases of investment securities | | $ | 332,528,728 | | | $ | 40,052,745 | | | $ | 10,021,670 | | | $ | 41,046,102 | |
| Proceeds from sales and maturities | | $ | 358,816,183 | | | $ | 35,264,562 | | | $ | 16,349,035 | | | $ | 56,150,224 | |
There were no purchases or proceeds from sales and maturities of U.S. Government securities by the Funds for the year ended December 31, 2018.
4. Transactions with Affiliates and Other Related Parties
Certain officers of theTrust are also officers of Touchstone Advisors, Inc. (the “Advisor”), Touchstone Securities, Inc. (the “Underwriter”), or The Bank of New York Mellon, the Sub-Administrator to the Funds, and BNY Mellon Investment Servicing (U.S.) Inc., the Transfer Agent to the Funds (collectively referenced to herein as “BNY Mellon”). Such officers receive no compensation from the Trust. The Advisor and the Underwriter are each wholly-owned subsidiaries of Western & Southern Financial Group, Inc.
On behalf of the Funds, the Advisor pays each Independent Trustee a quarterly retainer plus additional retainers to the Lead Independent Trustee and the chairs of each standing committee. Interested Trustees do not receive
Notes to Financial Statements(Continued)
compensation from the Funds. Each Independent Trustee also receives compensation for each Board meeting and committee meeting attended. Each standing committee chair receives additional compensation for each committee meeting that he or she oversees. The Advisor is reimbursed by the Funds for the IndependentTrustees’ compensation and out-of-pocket expenses relating to their services. The Funds accrued Trustee-related expenses of $58,184 for the year ended December 31, 2018.
MANAGEMENT & EXPENSE LIMITATION AGREEMENTS
The Advisor provides general investment supervisory services for the Funds under the terms of an advisory agreement (the “Advisory Agreement”). Under the Advisory Agreement, each Fund pays the Advisor a fee, which is computed and accrued daily and paid monthly, at an annual rate based on average daily net assets of each Fund as shown in the table below.
| Dynamic Equity Fund | 0.85% on the first $300 million |
| | 0.80% on the next $200 million |
| | 0.75% on the next $250 million |
| | 0.70% on the next $250 million |
| | 0.65% on the next $500 million |
| | 0.60% on the next $500 million |
| | 0.55% on such assets over $2 billion |
| Controlled Growth with Income Fund and | 0.20% on the first $1 billion |
| Dynamic Diversified Income Fund | 0.175% on the next $1 billion |
| | 0.15% on the next $1 billion |
| | 0.125% on such assets over $3 billion |
| Dynamic Global Allocation Fund | 0.25% on the first $1 billion |
| | 0.225% on the next $1 billion |
| | 0.20% on the next $1 billion |
| | 0.175% on such assets over $3 billion |
The Advisor has entered into investment sub-advisory agreements with the following parties (each, a “Sub-Advisor”):
| Wells Capital Management, Inc.* | Wilshire Associates Incorporated |
| Dynamic Equity Fund | Controlled Growth with Income Fund |
| | Dynamic Diversified Income Fund |
| | Dynamic Global Allocation Fund |
*Analytic Investors, LLC was acquired by Wells Capital Management, Inc.
The Advisor, not the Funds, pays sub-advisory fees to each Sub-Advisor.
The Advisor entered into an expense limitation agreement (the “Expense Limitation Agreement”) to contractually limit the annual operating expenses of the Funds, excluding: dividend and interest expenses relating to short sales; interest; taxes; brokerage commissions and other transaction costs; portfolio transaction and investment related expenses, including expenses associated with the Funds’ liquidity provider; other expenditures which are capitalized in accordance with U.S. GAAP; the cost of “Acquired Fund Fees and Expenses”, if any; and other extraordinary expenses not incurred in the ordinary course of business. The maximum annual operating expense limit in any year with respect to the Funds is based on a percentage of the average daily net assets of the Funds. The Advisor has agreed to waive a portion of its fees, and to reimburse certain fund expenses in order to maintain the following expense limitations for the Funds:
Notes to Financial Statements(Continued)
| | | | | | | | | | | | Institutional | | | Termination |
| Fund | | Class A | | | Class C | | | Class Y | | | Class | | | Date |
| Dynamic Equity Fund | | | 1.55 | % | | | 2.30 | % | | | 1.30 | % | | | 1.25 | % | | April 30, 2019 |
| Controlled Growth with Income Fund | | | 0.49 | % | | | 1.24 | % | | | 0.24 | % | | | — | | | April 30, 2019 |
| Dynamic Diversified Income Fund | | | 0.49 | % | | | 1.24 | % | | | 0.24 | % | | | — | | | April 30, 2019 |
| Dynamic Global Allocation Fund | | | 0.49 | % | | | 1.24 | % | | | 0.24 | % | | | — | | | April 30, 2019 |
During the year ended December 31, 2018, the Advisor or its affiliates waived investment advisory fees, administration fees or other operating expenses, including distribution fees of the Funds, as follows:
| | | | | | | | | Other | | | | |
| | | Investment | | | | | | Operating | | | | |
| | | Advisory | | | | | | Expenses | | | | |
| | | Fees | | | Administration | | | Waived/ | | | | |
| Fund | | Waived | | | Fees Waived | | | Reimbursed | | | Total | |
| Dynamic Equity Fund | | $ | — | | | $ | — | | | $ | 22,532 | | | $ | 22,532 | |
| Controlled Growth with Income Fund | | | 66,071 | | | | 85,118 | | | | 173,092 | | | | 324,281 | |
| Dynamic Diversified Income Fund | | | 50,538 | | | | 72,765 | | | | 120,828 | | | | 244,131 | |
| Dynamic Global Allocation Fund | | | 113,949 | | | | 149,908 | | | | 196,011 | | | | 459,868 | |
Under the terms of the Expense Limitation Agreement, the Advisor is entitled to recover, subject to approval by the Funds’ Board, such amounts waived or reimbursed for a period of up to three years from the date on which the Advisor reduced its compensation or assumed expenses for the Funds. A Fund will make repayments to the Advisor only if such repayment does not cause the Fund’s operating expenses (after the repayment is taken into account) to exceed the Fund’s expense limit in place when such amounts were waived or reimbursed by the Advisor and the Fund’s current expense limitation.
As of December 31, 2018, the Advisor may seek recoupment of previously waived fees and reimbursed expenses as follows:
| | | Expires on or | | | Expires on or | | | Expires on or | | | | |
| | | before | | | before | | | before | | | | |
| | | December 31, | | | December 31, | | | December 31, | | | | |
| Fund | | 2019 | | | 2020 | | | 2021 | | | Total | |
| Controlled Growth with Income Fund | | $ | 135,822 | | | $ | 166,696 | | | $ | 263,135 | | | $ | 565,653 | |
| Dynamic Diversified Income Fund | | | 198,988 | | | | 161,926 | | | | 151,287 | | | | 512,201 | |
| Dynamic Global Allocation Fund | | | 352,954 | | | | 324,451 | | | | 296,428 | | | | 973,833 | |
The Advisor did not recoup any amounts it previously waived or reimbursed during the year ended December 31, 2018.
ADMINISTRATION AGREEMENT
The Advisor entered into an Administration Agreement with the Trust, whereby the Advisor is responsible for: supplying executive and regulatory compliance services; supervising the preparation of tax returns; coordinating the preparation of reports to shareholders and reports to, and filings with the SEC and state securities authorities, as well as materials for meetings of the Board; calculating the daily NAV per share; and maintaining the financial books and records of each Fund.
For its services, the Advisor’s annual administrative fee is:
0.145% on the first $20 billion of the aggregate average daily net assets;
0.11% on the next $10 billion of aggregate average daily net assets;
0.09% on the next $10 billion of aggregate average daily net assets; and
0.07% on the aggregate average daily net assets over $40 billion.
Notes to Financial Statements(Continued)
The fee is computed and allocated among the Touchstone Fund Complex (excluding Touchstone Institutional Funds Trust) on the basis of relative daily net assets.
The Advisor has engaged BNY Mellon as the Sub-Administrator to theTrust. BNY Mellon provides administrative and accounting services to the Trust and is compensated directly by the Advisor, not the Trust.
TRANSFER AGENT AGREEMENT
Under the terms of the Transfer Agent Agreement between the Trust and BNY Mellon, BNY Mellon maintains the records of each shareholder’s account, answers shareholders’ inquiries concerning their accounts, processes purchases and redemptions of each Fund’s shares, acts as dividend and distribution disbursing agent, and performs other shareholder service functions. For these services, BNY Mellon receives a monthly fee from each Fund. In addition, each Fund pays out-of-pocket expenses incurred by BNY Mellon, including, but not limited to, postage and supplies.
The Funds may reimburse the Advisor for fees paid to intermediaries such as banks, broker-dealers, financial advisors or other financial institutions for sub-transfer agency, sub-administration and other services provided to investors whose shares of record are held in omnibus, other group accounts, retirement plans or accounts traded through registered securities clearing agents. These fees may vary based on, for example, the nature of services provided, but generally range up to 0.15% of the assets of the class serviced or maintained by the intermediary or up to $22 per sub-account maintained by the intermediary.
PLANS OF DISTRIBUTION AND SHAREHOLDER SERVICING FEE ARRANGEMENTS
The Trust has adopted distribution plans pursuant to Rule 12b-1 under the 1940 Act for each class of shares it offers that is subject to 12b-1 distribution fees. The plans allow each Fund to pay distribution and other fees for the sale and distribution of its shares and for services provided to shareholders. The fees charged to the Funds are limited to the actual expenses incurred. Under the Class A plan, each Fund offering Class A shares pays an annual fee of up to 0.25% of average daily net assets that are attributable to Class A shares. Under the Class C plan, each Fund offering Class C shares pays an annual fee not to exceed 1.00% of average daily net assets that are attributable to Class C shares (of which up to 0.75% is a distribution fee and up to 0.25% is a shareholder servicing fee).
UNDERWRITING AGREEMENT
The Underwriter is the Funds’ principal underwriter and, as such, acts as exclusive agent for distribution of the Funds’ shares. Under the terms of the Underwriting Agreement between the Trust and the Underwriter, the Underwriter earned underwriting and broker commissions on the sale of Class A shares of the Funds. W&S Brokerage Services, Inc., an affiliate of the Underwriter and the Advisor, also earned broker commissions on the sale of Class A shares of the Funds. Listed below are the total underwriting and broker commissions earned by the Underwriter and its affiliate during the year ended December 31, 2018:
| Fund | | Amount | |
| Dynamic Equity Fund | | $ | 651 | |
| Controlled Growth with Income Fund | | | 1,379 | |
| Dynamic Diversified Income Fund | | | 7,158 | |
| Dynamic Global Allocation Fund | | | 16,663 | |
In addition, the Underwriter collected CDSC on the redemption of Class C shares of the Funds listed below during the year ended December 31, 2018:
| Fund | | Amount | |
| Dynamic Equity Fund | | $ | 47 | |
| Controlled Growth with Income Fund | | | 249 | |
| Dynamic Diversified Income Fund | | | 37 | |
| Dynamic Global Allocation Fund | | | 311 | |
Notes to Financial Statements(Continued)
INTERFUND TRANSACTIONS
Pursuant to Rule 17a-7 under the 1940 Act, the Funds may engage in purchase and sale transactions with funds that have a common investment advisor (or affiliated investment advisors), common Trustees and/or common Officers. During the year ended December 31, 2018, the Funds did not engage in any Rule 17a-7 transactions.
AFFILIATED INVESTMENTS
A summary of each Allocation Fund’s transactions in affiliated Underlying Funds during the year ended December 31, 2018 is as follows:
Controlled Growth with Income Fund
| | | | | | | | | | | | | | | Net Change | | | | | | | | | | |
| | | | | | | | | | | | | | | in Unrealized | | | | | | | | | | |
| | | Market Value | | | Purchases at | | | Proceeds | | | Net Realized | | | Appreciation | | | Market Value | | | Dividend | | | Shares | |
| Underlying Fund* | | 12/31/2017 | | | cost | | | from sales | | | Gain(Loss)** | | | (Depreciation) | | | 12/31/2018 | | | Income | | | 12/31/2018 | |
| Touchstone Arbitrage Fund | | $ | 11,569,058 | | | $ | 7,734,277 | | | $ | 7,057,349 | | | $ | 1,356 | | | $ | (551,974 | ) | | $ | 11,695,368 | | | $ | 263,010 | | | | 1,237,605 | |
| Touchstone Dynamic Equity Fund | | | 10,355,379 | | | | 10,272,642 | | | | 7,497,429 | | | | 679,380 | | | | (2,111,816 | ) | | | 11,698,156 | | | | 115,817 | | | | 801,793 | |
| Touchstone Credit Opportunities Fund | | | 7,003,110 | | | | 5,227,332 | | | | 4,384,821 | | | | 119,095 | | | | (766,193 | ) | | | 7,117,784 | | | | 490,877 | | | | 767,830 | |
| Touchstone Flexible Income Fund | | | 7,890,620 | | | | 4,205,905 | | | | 4,869,687 | | | | 126,020 | | | | (511,457 | ) | | | 6,803,614 | | | | 294,360 | | | | 652,312 | |
| Touchstone Impact Bond Fund | | | 4,636,565 | | | | 3,140,894 | | | | 4,751,671 | | | | (81,921 | ) | | | (72,677 | ) | | | 2,871,190 | | | | 146,623 | | | | 291,491 | |
| Touchstone Ultra Short Duration Fixed Income Fund | | | — | | | | 3,618,517 | | | | 1,244,904 | | | | 655 | | | | (5,137 | ) | | | 2,369,131 | | | | 26,485 | | | | 256,956 | |
| Touchstone Focused Fund | | | 4,803,374 | | | | 1,726,350 | | | | 4,004,240 | | | | 189,960 | | | | (361,722 | ) | | | 2,254,750 | | | | 17,308 | | | | 58,763 | |
| Touchstone Value Fund | | | — | | | | 4,126,831 | | | | 1,454,462 | | | | 323,698 | | | | (443,389 | ) | | | 2,287,950 | | | | 54,116 | | | | 276,657 | |
| Total: | | $ | 46,258,106 | | | $ | 40,052,748 | | | $ | 35,264,563 | | | $ | 1,358,243 | | | $ | (4,824,365 | ) | | $ | 47,097,943 | | | $ | 1,408,596 | | | | | |
Dynamic Diversified Income Fund
| | | | | | | | | | | | | | | Net Change | | | | | | | | | | |
| | | Market Value | | | Purchases at | | | Proceeds | | | Net Realized | | | in Unrealized | | | Market Value | | | Dividend | | | Shares | |
| Underlying Fund* | | 12/31/2017 | | | cost | | | from sales | | | Gain(Loss)** | | | (Depreciation) | | | 12/31/2018 | | | Income | | | 12/31/2018 | |
| Touchstone Credit Opportunities Fund | | $ | 9,437,346 | | | $ | 780,405 | | | $ | 1,851,025 | | | $ | 111,040 | | | $ | (762,084 | ) | | $ | 7,631,119 | | | $ | 479,846 | | | | 823,206 | |
| Touchstone Flexible Income Fund | | | 5,441,041 | | | | 690,164 | | | | 1,845,522 | | | | 76,392 | | | | (298,149 | ) | | | 4,041,669 | | | | 162,433 | | | | 387,504 | |
| Touchstone High Yield Fund | | | 5,548,170 | | | | 375,267 | | | | 1,069,362 | | | | 24,251 | | | | (416,987 | ) | | | 4,461,339 | | | | 262,982 | | | | 565,442 | |
| Touchstone Impact Bond Fund | | | 11,547,620 | | | | 706,579 | | | | 4,345,509 | | | | (153,091 | ) | | | (156,084 | ) | | | 7,599,515 | | | | 283,834 | | | | 771,524 | |
| Touchstone International Value Fund | | | 3,252,838 | | | | 1,041,862 | | | | 1,578,661 | | | | 78,239 | | | | (551,545 | ) | | | 2,242,733 | | | | 101,248 | | | | 353,743 | |
| Touchstone Premium Yield Equity Fund, Class Y | | | 6,171,456 | | | | 1,408,808 | | | | 1,676,827 | | | | 566,803 | | | | (1,142,442 | ) | | | 4,901,432 | | | | 129,090 | | | | 641,549 | |
| Touchstone Ultra Short Duration Fixed Income Fund | | | — | | | | 2,538,131 | | | | 299,591 | | | | (298 | ) | | | (4,850 | ) | | | 2,233,392 | | | | 24,910 | | | | 242,233 | |
| Touchstone Value Fund | | | 3,493,649 | | | | 554,706 | | | | 887,360 | | | | 467,665 | | | | (649,960 | ) | | | 2,684,994 | | | | 56,885 | | | | 324,667 | |
| Total: | | $ | 44,892,120 | | | $ | 8,095,922 | | | $ | 13,553,857 | | | $ | 1,171,001 | | | $ | (3,982,101 | ) | | $ | 35,796,193 | | | $ | 1,501,228 | | | | | |
*All affiliated fund investments are invested in the Institutional Class shares, unless otherwise indicated.
**Includes capital gain distributions.
Notes to Financial Statements(Continued)
Dynamic Global Allocation Fund
| | | | | | | | | | | | | | | Net Change | | | | | | | | | | |
| | | | | | | | | | | | | | | in Unrealized | | | | | | | | | | |
| | | Market Value | | | Purchases at | | | Proceeds | | | Net Realized | | | Appreciation | | | Market Value | | | Dividend | | | Shares | |
| Underlying Fund* | | 12/31/2017 | | | cost | | | from sales | | | Gain(Loss)** | | | (Depreciation) | | | 12/31/2018 | | | Income | | | 12/31/2018 | |
| Touchstone Growth Opportunities Fund | | $ | 4,562,458 | | | $ | 1,559,726 | | | $ | 1,423,860 | | | $ | 567,596 | | | $ | (636,833 | ) | | $ | 4,232,363 | | | $ | 3,939 | | | | 146,297 | |
| Touchstone International Growth Fund | | | 11,503,616 | | | | 28,384 | | | | 11,291,784 | | | | 1,745,404 | | | | (1,985,620 | ) | | | — | | | | — | | | | — | |
| Touchstone International Growth Opportunities Fund | | | — | | | | 11,519,453 | | | | 1,574,264 | | | | 720,043 | | | | (2,724,149 | ) | | | 6,945,220 | | | | 17,463 | | | | 400,763 | |
| Touchstone International Small Cap Fund | | | 3,452,813 | | | | 1,594,940 | | | | 1,707,368 | | | | 754,586 | | | | (1,485,465 | ) | | | 2,428,784 | | | | 42,698 | | | | 182,341 | |
| Touchstone International Value Fund | | | 13,728,716 | | | | 4,235,266 | | | | 3,696,695 | | | | 74,343 | | | | (2,674,819 | ) | | | 11,666,811 | | | | 518,698 | | | | 1,840,191 | |
| Touchstone Mid Cap Fund | | | 4,711,920 | | | | 168,713 | | | | 1,386,785 | | | | 465,710 | | | | (544,870 | ) | | | 3,325,771 | | | | 5,231 | | | | 109,581 | |
| Touchstone Sands Capital Emerging Markets Growth Fund | | | 3,398,715 | | | | 322,097 | | | | 3,413,755 | | | | 290,994 | | | | (598,051 | ) | | | — | | | | — | | | | — | |
| Touchstone Sands Capital Institutional Growth Fund | | | 5,633,716 | | | | 664,225 | | | | 2,967,079 | | | | 634,162 | | | | (105,966 | ) | | | 3,348,673 | | | | — | | | | 176,711 | |
| Touchstone Small Cap Value Fund | | | — | | | | 5,874,505 | | | | 392,612 | | | | 282,405 | | | | (1,303,699 | ) | | | 4,166,954 | | | | 15,727 | | | | 198,995 | |
| Touchstone Small Cap Value Opportunities Fund | | | 2,370,254 | | | | 1,381,151 | | | | 3,615,730 | | | | 340,730 | | | | (122,303 | ) | | | — | | | | — | | | | — | |
| Touchstone Value Fund | | | 11,830,088 | | | | 4,627,207 | | | | 5,583,326 | | | | 2,104,879 | | | | (2,608,998 | ) | | | 9,328,395 | | | | 225,447 | | | | 1,127,980 | |
| Touchstone Credit Opportunities Fund | | | 4,331,898 | | | | 1,205,900 | | | | 1,924,064 | | | | 58,099 | | | | (348,491 | ) | | | 3,286,400 | | | | 219,224 | | | | 354,520 | |
| Touchstone Impact Bond Fund | | | 21,099,433 | | | | 1,610,270 | | | | 8,452,096 | | | | (234,444 | ) | | | (348,262 | ) | | | 13,674,901 | | | | 532,618 | | | | 1,388,315 | |
| Touchstone Ultra Short Duration Fixed Income Fund | | | 4,462,671 | | | | 3,219,254 | | | | 1,664,940 | | | | (2,513 | ) | | | (25,780 | ) | | | 5,988,692 | | | | 131,346 | | | | 649,533 | |
| Touchstone Dynamic Equity Fund | | | 4,537,972 | | | | 196,142 | | | | 4,686,583 | | | | 285,822 | | | | (333,353 | ) | | | — | | | | — | | | | — | |
| | | $ | 95,624,270 | | | $ | 38,207,233 | | | $ | 53,780,941 | | | $ | 8,087,816 | | | $ | (15,846,659 | ) | | $ | 68,392,964 | | | $ | 1,712,391 | | | | | |
*All affiliated fund investments are invested in the Institutional Class shares, unless otherwise indicated.
** Includes capital gain distributions.
5. Liquidity
Interfund Lending —Pursuant to an Exemptive Order issued by the SEC on March 28, 2017, the Funds, along with certain other funds in the Touchstone Fund Complex, may participate in an interfund lending program. The interfund lending program provides an alternate credit facility that allows the Funds to lend to or borrow from other participating funds in the Touchstone Fund Complex, subject to the conditions of the Exemptive Order. The Funds may not borrow under the facility for leverage purposes and the loans’ duration may be no more than 7 days.
During the year ended December 31, 2018, the following Funds participated as borrowers in the interfund lending program. The daily average amount borrowed, weighted average interest rate and interest expense were as follows:
Notes to Financial Statements(Continued)
| | | | | | Weighted | | | | |
| | | Daily Average | | | Average Interest | | | Interest | |
| Fund | | Amount Borrowed | | | Rate | | | Expense* | |
| Dynamic Equity Fund | | $ | 32,750 | | | | 1.30 | % | | $ | 433 | |
| Controlled Growth with Income | | | 109,786 | | | | 1.88 | % | | | 2,088 | |
*Included in Other expenses in the Statements of Operations.
6. Federal Tax Information
Federal Income Tax —It is each Fund’s policy to continue to comply with the special provisions of the Internal Revenue Code applicable to regulated investment companies. As provided therein, in any fiscal year in which a Fund so qualifies and distributes at least 90% of its investment company taxable income, the Fund (but not the shareholders) will be relieved of federal income tax on the income distributed. It is each Fund’s policy to distribute all of its taxable income and accordingly, no provision for income taxes has been made.
In order to avoid imposition of the excise tax applicable to regulated investment companies, it is also each Fund’s intention to declare and pay as dividends in each calendar year at least 98% of its investment company taxable income (earned during the calendar year) and 98.2% of its net realized capital gains (earned during the twelve months ending October 31) plus undistributed amounts from prior years.
The tax character of distributions paid for the years ended December 31, 2018 and December 31, 2017 is as follows:
| | | Dynamic | | | Controlled Growth | |
| | | Equity Fund | | | with Income Fund | |
| | | Year Ended | | | Year Ended | | | Year Ended | | | Year Ended | |
| | | December 31, | | | December 31, | | | December 31, | | | December 31, | |
| | | 2018 | | | 2017 | | | 2018 | | | 2017 | |
| From ordinary income | | $ | 740,072 | | | $ | 1,961,556 | | | $ | 966,908 | | | $ | 1,451,009 | |
| From long-term capital gains | | | — | | | | — | | | | 375,181 | | | | 650,386 | |
| Total distributions | | $ | 740,072 | | | $ | 1,961,556 | | | $ | 1,342,089 | | | $ | 2,101,395 | |
| | | Dynamic Diversified | | | Dynamic Global | |
| | | Income Fund | | | Allocation Fund | |
| | | Year Ended | | | Year Ended | | | Year Ended | | | Year Ended | |
| | | December 31, | | | December 31, | | | December 31, | | | December 31, | |
| | | 2018 | | | 2017 | | | 2018 | | | 2017 | |
| From ordinary income | | $ | 1,813,888 | | | $ | 1,974,623 | | | $ | 1,890,065 | | | $ | 2,205,466 | |
| From long-term capital gains | | | — | | | | — | | | | 5,366,768 | | | | 2,998,613 | |
| Total distributions | | $ | 1,813,888 | | | $ | 1,974,623 | | | $ | 7,256,833 | | | $ | 5,204,079 | |
The following information is computed on a tax basis for each item as of December 31, 2018:
| | | Dynamic | | | Controlled Growth | |
| | | Equity Fund | | | with Income Fund | |
| Tax cost of portfolio investments | | $ | 108,942,777 | | | $ | 51,507,211 | |
| Gross unrealized appreciation on investments | | | 686,346 | | | | — | |
| Gross unrealized depreciation on investments | | | (9,802,773 | ) | | | (4,408,532 | ) |
| Net unrealized appreciation (depreciation) on investments | | | (9,116,427 | ) | | | (4,408,532 | ) |
| Gross unrealized appreciation on short sales | | | 1,910,311 | | | | — | |
| Gross unrealized depreciation on short sales | | | (331,367 | ) | | | — | |
| Net unrealized appreciation (depreciation) on short sales | | | 1,578,944 | | | | — | |
| Undistributed ordinary income | | | 2,959,798 | | | | 418,106 | |
| Undistributed capital gains | | | 4,291,796 | | | | 1,238,848 | |
| Distributable earnings (deficit) | | $ | (285,889 | ) | | $ | (2,751,578 | ) |
Notes to Financial Statements(Continued)
| | | Dynamic Diversified | | | Dynamic Global | |
| | | Income Fund | | | Allocation Fund | |
| Tax cost of portfolio investments | | $ | 52,474,058 | | | $ | 97,203,964 | |
| Gross unrealized appreciation on investments | | | 65,779 | | | | 338,418 | |
| Gross unrealized depreciation on investments | | | (4,626,742 | ) | | | (11,969,860 | ) |
| Net unrealized appreciation (depreciation) on investments | | | (4,560,963 | ) | | | (11,631,442 | ) |
| Undistributed ordinary income | | | 67,585 | | | | 53,154 | |
| Undistributed capital gains | | | — | | | | 1,307,990 | |
| Distributable earnings (deficit) | | $ | (4,493,378 | ) | | $ | (10,270,298 | ) |
The difference between the tax cost of portfolio investments and the financial statement cost is primarily due to wash sale loss deferrals and a non-taxable distribution basis outstanding.
During the year ended December 31, 2018, the following Funds utilized capital loss carryforwards or had capital loss carryforwards expire:
| Fund | | Utilized | | | Expired | |
| Dynamic Diversified Income Fund | | $ | 1,358,027 | | | $ | 3,443,339 | |
| Dynamic Global Allocation Fund | | | 1,947,286 | | | | — | |
The Funds have analyzed their tax positions taken or to be taken on federal income tax returns for all open tax years (tax years ended December 31, 2015 through 2018) and have concluded that no provision for income tax is required in their financial statements.
Certain reclassifications, the result of permanent differences between financial statement and income tax reporting requirements, have been made to the components of capital. These reclassifications have no impact on the net assets or NAV per share of the Funds. The following reclassifications, which are primarily attributed to the expiration of prior year capital loss carryforwards, have been made to the following Funds for the year ended December 31, 2018:
| | | Paid-In | | | Distributable | |
| Fund | | Capital | | | Earnings | |
| Dynamic Equity Fund | | $ | 105,323 | | | $ | (105,323 | ) |
| Dynamic Diversified Income Fund | | | (3,454,886 | ) | | | 3,454,886 | |
7. Commitments and Contingencies
The Funds indemnify the Trust’s officers and Trustees for certain liabilities that might arise from their performance of their duties to the Funds. Additionally, in the normal course of business, the Funds enter into contracts that contain a variety of representations and warranties and which provide general indemnifications. The Funds’ maximum exposure under these arrangements is unknown, as this would involve future claims that may be made against the Funds.
8. Principal Risks
Risks Associated with Credit —An issuer may be unable to make timely payments of either principal or interest. This may cause the issuer’s securities to decline in value. Credit risk is particularly relevant to those Funds that invest a significant amount of their assets in junk bonds or lower-rated securities.
Risks Associated with Interest Rate Changes —The price of debt securities is generally linked to the prevailing market interest rates. In general, when interest rates rise, the price of debt securities falls, and when interest rates fall, the price of debt securities rises. The price volatility of a debt security also depends on its maturity. Longer-term securities are generally more volatile, so the longer the average maturity or duration of these securities,
Notes to Financial Statements(Continued)
the greater their price risk. Duration is a measure of the expected life, taking into account any prepayment or call features of the security, that is used to determine the price sensitivity of the security for a given change in interest rates. Specifically, duration is the change in the value of a fixed-income security that will result from a 1% change in interest rates, and generally is stated in years. For example, as a general rule a 1% rise in interest rates means a 1% fall in value for every year of duration. Maturity, on the other hand, is the date on which a fixed-income security becomes due for payment of principal. The negative impact on fixed income securities if interest rates increase as a result could negatively impact a Fund’s NAV.
Risks Associated with Leverage —By investing the proceeds received from selling securities short, the Dynamic Equity Fund is employing leverage, which creates special risks. The use of leverage may increase the Fund’s exposure to long or short equity positions and may cause the Fund’s NAV to be more volatile than if the Fund had not used leverage. This could result in increased volatility of returns.
Please see the Funds’ prospectus for a complete discussion of these and other risks.
9. Subsequent Events
Subsequent events occurring after the date of this report have been evaluated for potential impact to this report through the date the financial statements were issued.
At a meeting of the Board of Trustees (the “Board”) of the Trust held on February 12, 2019, the Board approved the reorganization of the Controlled Growth with Income Fund into the Dynamic Diversified Income Fund. The reorganization is expected to be completed on or about April 26, 2019.
There were no other subsequent events that necessitated recognition or disclosure in the Funds’ financial statements.
Report of Independent Registered Public Accounting Firm
To the Shareholders of Touchstone Dynamic Equity Fund, Touchstone Controlled Growth with Income Fund, Touchstone Dynamic Diversified Income Fund and Touchstone Dynamic Global Allocation Fund and the Board of Trustees of Touchstone Strategic Trust
Opinion on the Financial Statements
We have audited the accompanying statements of assets and liabilities of Touchstone Dynamic Equity Fund, Touchstone Controlled Growth with Income Fund,Touchstone Dynamic Diversified Income Fund and Touchstone Dynamic Global Allocation Fund (collectively referred to as the “Funds”) (four of the funds constituting the Touchstone Strategic Trust (the “Trust”)), including the portfolios of investments, as of December 31, 2018, and the related statements of operations for the year then ended, statement of cash flows of Touchstone Dynamic Equity Fund for the year then ended, the statements of changes in net assets for each of the two years in the period then ended, the financial highlights for each of the five years in the period then ended and the related notes (collectively referred to as the “financial statements”). In our opinion, the financial statements present fairly, in all material respects, the financial position of each of the Funds (four of the funds constituting the Touchstone Strategic Trust) at December 31, 2018, the results of their operations and the cash flows of Touchstone Dynamic Equity Fund for the year then ended, the changes in their net assets for each of the two years in the period then ended and their financial highlights for each of the five years in the period then ended, in conformity with U.S. generally accepted accounting principles.
Basis for Opinion
These financial statements are the responsibility of the Trust’s management. Our responsibility is to express an opinion on each of the Funds’ financial statements based on our audits. We are a public accounting firm registered with the Public Company Accounting Oversight Board (United States) (“PCAOB”) and are required to be independent with respect to the Trust in accordance with the U.S. federal securities laws and the applicable rules and regulations of the Securities and Exchange Commission and the PCAOB.
We conducted our audits in accordance with the standards of the PCAOB. Those standards require that we plan and perform the audit to obtain reasonable assurance about whether the financial statements are free of material misstatement, whether due to error or fraud. The Trust is not required to have, nor were we engaged to perform, an audit of the Trust’s internal control over financial reporting. As part of our audits, we are required to obtain an understanding of internal control over financial reporting, but not for the purpose of expressing an opinion on the effectiveness of the Trust’s internal control over financial reporting. Accordingly, we express no such opinion.
Our audits included performing procedures to assess the risks of material misstatement of the financial statements, whether due to error or fraud, and performing procedures that respond to those risks. Such procedures included examining, on a test basis, evidence regarding the amounts and disclosures in the financial statements. Our procedures included confirmation of securities owned as of December 31, 2018, by correspondence with the custodian, transfer agents, and brokers or by other appropriate auditing procedures where replies from brokers were not received. Our audits also included evaluating the accounting principles used and significant estimates made by management, as well as evaluating the overall presentation of the financial statements. We believe that our audits provide a reasonable basis for our opinion.

We have served as the auditor of one or more Touchstone Investments’ investment companies since 1999.
Cincinnati, Ohio
February 19, 2019
Other Items(Unaudited)
Qualified Dividend Income
Under the Jobs and Growth Tax Relief Reconciliation Act of 2003 (the “Act”), the following percentages of ordinary dividends paid during the fiscal year ended December 31, 2018 are designated as “qualified dividend income,” as defined in the Act, and are subject to reduced tax rates. The Funds intend to pass through the maximum allowable percentage for Form 1099 Div.
| Dynamic Equity Fund | | | 100.00 | % |
| Controlled Growth with Income Fund | | | 32.28 | % |
| Dynamic Diversified Income Fund | | | 20.06 | % |
| Dynamic Global Allocation Fund | | | 47.69 | % |
Dividend Received Deduction
For corporate shareholders, the following ordinary distributions paid during the fiscal year ended December 31, 2018 qualify for the corporate dividends received deduction. The Funds intend to pass through the maximum allowable percentage.
| Dynamic Equity Fund | | | 100.00 | % |
| Controlled Growth with Income Fund | | | 29.17 | % |
| Dynamic Diversified Income Fund | | | 10.02 | % |
| Dynamic Global Allocation Fund | | | 20.74 | % |
For the fiscal year ended December 31, 2018, the Funds designated long-term capital gains as follows:
| Dynamic Equity Fund | | $ | 4,291,796 | |
| Controlled Growth with Income Fund | | $ | 1,239,272 | |
| Dynamic Global Allocation Fund | | $ | 5,866,164 | |
Foreign Tax Income & Foreign Tax Credit
Dynamic Diversified Income Fund and Dynamic Global Allocation Fund intend to pass through a foreign tax credit to their respective shareholders. For the fiscal year ended December 31, 2018, the total amount of foreign source income is $335,102 or $0.09 per share and $945,226 or $0.12 per share, respectively. The total amount of foreign taxes to be paid is $20,417 or $0.006 per share and $54,544 or $0.007 per share, respectively. Shareholders’ allocable share of the foreign tax credit will be reported on Form 1099 Div.
Proxy Voting Guidelines and Proxy Voting Records
The Sub-Advisors are responsible for exercising the voting rights associated with the securities purchased and held by the Funds. A description of the policies and procedures that the Sub-Advisors use in fulfilling this responsibility is available as an appendix to the most recent Statement of Additional Information, which can be obtained without charge by calling toll free 1.800.543.0407 or by visiting the Touchstone website at TouchstoneInvestments.com or on the Securities and Exchange Commission’s (the “Commission”) website sec.gov. Information regarding how those proxies were voted during the most recent twelve-month period ended June 30, which will be filed by August 31 of that year, is also available without charge by calling toll free 1.800.543.0407 or on the Commission’s website at sec.gov.
Quarterly Portfolio Disclosure
The Trust files a complete listing of portfolio holdings for each Fund as of the end of the first and third quarters of each fiscal year on Form N-Q. Effective March 2019, this information will be filed on Form N-PORT and will be publicly available 60 days after the end of the period. The complete listing of the Fund’s portfolio holdings is available on the Commission’s website and will be made available to shareholders upon request by calling 1.800.543.0407.
Other Items(Unaudited) (Continued)
Schedule of Shareholder Expenses
As a shareholder of the Funds, you incur two types of costs: (1) transaction costs, such as sales charges (loads); and (2) ongoing costs, including investment advisory fees; distribution (12b-1) fees; and other Fund expenses. This example is intended to help you understand your ongoing costs (in dollars) of investing in the Funds and to compare these costs with the ongoing costs of investing in other mutual funds.
The example is based on an investment of $1,000 invested at the beginning of the period and held for the entire period (July 1, 2018 through December 31, 2018).
Actual Expenses
The first line for each share class of a Fund in the table below provides information about actual account values and actual expenses. You may use the information in this line, together with the amount you invested, to estimate the expenses that you paid over the period. Simply divide your account value by $1,000 (for example, an $8,600 account value divided by $1,000 = 8.6), then multiply the result by the number in the first line under the heading entitled “Expenses Paid During the Six Months Ended December 31, 2018” to estimate the expenses you paid on your account during this period.
Hypothetical Example for Comparison Purposes
The second line for each share class of a Fund in the table below provides information about hypothetical account values and hypothetical expenses based on the Funds’ actual expense ratio and an assumed rate of return of 5% per year before expenses, which is not the Funds’ actual return. The hypothetical account values and expenses may not be used to estimate the actual ending account balance or expenses you paid for the period. You may use this information to compare the ongoing costs of investing in the Funds and other funds. To do so, compare this 5% hypothetical example with the 5% hypothetical examples that appear in the shareholder reports of the other funds.
Please note that the expenses shown in the table below are meant to highlight your ongoing costs only and do not reflect any transactional costs, such as sales charges (loads). Therefore, the second line for each share class of a Fund in the table below is useful in comparing ongoing costs only, and will not help you determine the relative total costs of owning different funds. In addition, if these transactional costs were included, your costs would have been higher.
| | | | | | | | | | | | | | Expenses | |
| | | | | Net Expense | | | Beginning | | | Ending | | | Paid During | |
| | | | | Ratio | | | Account | | | Account | | | the Six Months | |
| | | | | Annualized | | | Value | | | Value | | | Ended | |
| | | | | December 31, | | | July 1, | | | December 31, | | | December 31, | |
| | | | | 2018 | | | 2018 | | | 2018 | | | 2018* | |
| Touchstone Dynamic Equity Fund | | | | | | | | | | | | | | | | |
| Class A | | Actual | | | 2.20 | % | | $ | 1,000.00 | | | $ | 898.20 | | | $ | 10.53 | ** |
| Class A | | Hypothetical | | | 2.20 | % | | $ | 1,000.00 | | | $ | 1,014.12 | | | $ | 11.17 | ** |
| | | | | | | | | | | | | | | | | | | |
| Class C | | Actual | | | 2.95 | % | | $ | 1,000.00 | | | $ | 894.70 | | | $ | 14.09 | ** |
| Class C | | Hypothetical | | | 2.95 | % | | $ | 1,000.00 | | | $ | 1,010.33 | | | $ | 14.95 | ** |
| | | | | | | | | | | | | | | | | | | |
| Class Y | | Actual | | | 1.85 | % | | $ | 1,000.00 | | | $ | 899.60 | | | $ | 8.86 | ** |
| Class Y | | Hypothetical | | | 1.85 | % | | $ | 1,000.00 | | | $ | 1,015.88 | | | $ | 9.40 | ** |
| | | | | | | | | | | | | | | | | | | |
| Institutional Class | | Actual | | | 1.89 | % | | $ | 1,000.00 | | | $ | 899.70 | | | $ | 9.05 | ** |
| Institutional Class | | Hypothetical | | | 1.89 | % | | $ | 1,000.00 | | | $ | 1,015.68 | | | $ | 9.60 | ** |
| | | | | | | | | | | | | | | | | | | |
| Touchstone Controlled Growth with Income Fund*** | | | | | | | | | | | | | | |
| Class A | | Actual | | | 0.49 | % | | $ | 1,000.00 | | | $ | 955.60 | | | $ | 2.42 | |
| Class A | | Hypothetical | | | 0.49 | % | | $ | 1,000.00 | | | $ | 1,022.74 | | | $ | 2.50 | |
Other Items(Unaudited) (Continued)
| | | | | | | | | | | | | | Expenses | |
| | | | | Net Expense | | | Beginning | | | Ending | | | Paid During | |
| | | | | Ratio | | | Account | | | Account | | | the Six Months | |
| | | | | Annualized | | | Value | | | Value | | | Ended | |
| | | | | December 31, | | | July 1, | | | December 31, | | | December 31, | |
| | | | | 2018 | | | 2018 | | | 2018 | | | 2018* | |
| Class C | | Actual | | | 1.24 | % | | $ | 1,000.00 | | | $ | 951.50 | | | $ | 6.10 | |
| Class C | | Hypothetical | | | 1.24 | % | | $ | 1,000.00 | | | $ | 1,018.95 | | | $ | 6.31 | |
| | | | | | | | | | | | | | | | | | | |
| Class Y | | Actual | | | 0.24 | % | | $ | 1,000.00 | | | $ | 956.80 | | | $ | 1.18 | |
| Class Y | | Hypothetical | | | 0.24 | % | | $ | 1,000.00 | | | $ | 1,024.00 | | | $ | 1.22 | |
| | | | | | | | | | | | | | | | | | | |
| Touchstone Dynamic Diversified Income Fund*** | | | | | | | | | | | | | | |
| Class A | | Actual | | | 0.49 | % | | $ | 1,000.00 | | | $ | 962.90 | | | $ | 2.42 | |
| Class A | | Hypothetical | | | 0.49 | % | | $ | 1,000.00 | | | $ | 1,022.74 | | | $ | 2.50 | |
| | | | | | | | | | | | | | | | | | | |
| Class C | | Actual | | | 1.24 | % | | $ | 1,000.00 | | | $ | 959.20 | | | $ | 6.12 | |
| Class C | | Hypothetical | | | 1.24 | % | | $ | 1,000.00 | | | $ | 1,018.95 | | | $ | 6.31 | |
| | | | | | | | | | | | | | | | | | | |
| Class Y | | Actual | | | 0.24 | % | | $ | 1,000.00 | | | $ | 964.20 | | | $ | 1.19 | |
| Class Y | | Hypothetical | | | 0.24 | % | | $ | 1,000.00 | | | $ | 1,024.00 | | | $ | 1.22 | |
| | | | | | | | | | | | | | | | | | | |
| Touchstone Dynamic Global Allocation Fund*** | | | | | | | | | | | | | | |
| Class A | | Actual | | | 0.49 | % | | $ | 1,000.00 | | | $ | 920.90 | | | $ | 2.37 | |
| Class A | | Hypothetical | | | 0.49 | % | | $ | 1,000.00 | | | $ | 1,022.74 | | | $ | 2.50 | |
| | | | | | | | | | | | | | | | | | | |
| Class C | | Actual | | | 1.24 | % | | $ | 1,000.00 | | | $ | 917.30 | | | $ | 5.99 | |
| Class C | | Hypothetical | | | 1.24 | % | | $ | 1,000.00 | | | $ | 1,018.95 | | | $ | 6.31 | |
| | | | | | | | | | | | | | | | | | | |
| Class Y | | Actual | | | 0.24 | % | | $ | 1,000.00 | | | $ | 921.20 | | | $ | 1.16 | |
| Class Y | | Hypothetical | | | 0.24 | % | | $ | 1,000.00 | | | $ | 1,024.00 | | | $ | 1.22 | |
| * | Expenses are equal to the Fund's annualized expense ratio, multiplied by the average account value over the period, multiplied by 184/365 (to reflect one-half year period). |
| ** | Excluding interest and dividend expenses on securities sold short, your actual cost of investment in Class A, Class C, Class Y and Institutional Class would be $7.42, $10.98, $5.75 and $5.94, respectively, and your hypothetical cost of investment in Class A, Class C, Class Y and Institutional Class would be $7.88, $11.67, $6.11, and $6.31, respectively. |
| *** | The annualized expense ratios for the Allocation Funds do not include fees and expenses of the Underlying Funds in which the Allocation Funds invest. |
Advisory and Sub-Advisory Agreement Approval Disclosure
At a meeting held on November 15, 2018, the Board of Trustees (the “Board” or “Trustees”) of the Touchstone Strategic Trust (the “Trust”), and by a separate vote, the Independent Trustees of the Trust, approved the continuance of the Investment Advisory Agreement between the Trust and the Advisor with respect to each Fund of the Trust, and the continuance of the Sub-Advisory Agreement between the Advisor and each Fund’s respective Sub-Advisor.
In determining whether to approve the continuation of the Investment Advisory Agreement and the Sub-Advisory Agreements, the Advisor furnished information necessary for a majority of the Independent Trustees to make the determination that the continuance of the Investment Advisory Agreement and each Sub-Advisory Agreement was in the best interests of the respective Funds and their shareholders. The information provided to the Board included: (1) industry data comparing advisory fees and total expense ratios of comparable funds; (2) comparative performance information; (3) the Advisor’s and its affiliates’ revenues and costs of providing services to the Funds; and (4) information about the Advisor’s and Sub-Advisors’ personnel. Prior to voting, the Independent Trustees reviewed the proposed continuance of the Investment Advisory Agreement and the Sub-Advisory Agreements
Other Items(Unaudited) (Continued)
with management and experienced independent legal counsel and received materials from such counsel discussing the legal standards for their consideration of the proposed continuation of the Investment Advisory Agreement and each Sub-Advisory Agreement. The Independent Trustees also reviewed the proposed continuation of the Investment Advisory Agreement and each Sub-Advisory Agreement with independent legal counsel in private sessions at which no representatives of management were present.
In approving the Funds’ Investment Advisory Agreement, the Board considered various factors, among them:
(1) the nature, extent and quality of services provided to the Funds, including the personnel providing such services; (2) the Advisor’s compensation and profitability; (3) a comparison of fees and performance with comparable funds; (4) economies of scale; and (5) the terms of the Investment Advisory Agreement. The Board’s analysis of these factors is set forth below. The Independent Trustees were advised by independent legal counsel throughout the process.
Nature, Extent and Quality of Advisor Services.The Board considered the level and depth of knowledge of the Advisor, including the professional experience and qualifications of senior personnel. In evaluating the quality of services provided by the Advisor, the Board took into account its familiarity with the Advisor’s senior management through Board meetings, discussions and reports during the preceding year. The Board also took into account the Advisor’s compliance policies and procedures. The quality of administrative and other services, including the Advisor’s role in coordinating the activities of the Funds’ other service providers, was also considered. The Board also considered the Advisor’s relationship with its affiliates and the resources available to them, as well as any potential conflicts of interest.
The Board discussed the Advisor’s effectiveness in monitoring the performance of each Sub-Advisor, and the Advisor’s timeliness in responding to performance issues. The Board considered the Advisor’s process for monitoring each of the Sub-Advisors, which includes an examination of both qualitative and quantitative elements of the Sub-Advisor’s organization, personnel, procedures, investment discipline, infrastructure and performance. The Board considered that the Advisor conducts periodic compliance due diligence of each Sub-Advisor, during which the Advisor examines a wide variety of factors, such as the financial condition of the Sub-Advisor, the quality of the Sub-Advisor’s systems, the effectiveness of the Sub-Advisor’s disaster recovery programs, trade allocation and execution procedures, compliance with the Sub-Advisor’s policies and procedures, results of regulatory examinations and any other factors that might affect the quality of services that the Sub-Advisor provides to the applicable Fund(s). The Board noted that the Advisor’s compliance monitoring processes also include quarterly reviews of compliance certifications, and that any issues arising from such reports and the Advisor’s compliance visits to the Sub-Advisors are reported to the Board.
The Trustees concluded that they were satisfied with the nature, extent and quality of services provided to each Fund by the Advisor under the Investment Advisory Agreement.
Advisor’s Compensation and Profitability.The Board took into consideration the financial condition and profitability of the Advisor and its affiliates and the direct and indirect benefits derived by the Advisor and its affiliates from the Advisor’s relationship with the Funds. The information considered by the Board included operating profit margin information for the Advisor’s business as a whole. The Board noted that the Advisor had waived a portion of advisory fees and administrative fees and/or reimbursed expenses in order to limit each Fund’s net operating expenses. The Board also noted that the Advisor pays the Sub-Advisors’ sub-advisory fees out of the advisory fees the Advisor receives from the Funds. The Board reviewed the profitability of the Advisor’s relationship with the Funds both before and after tax expenses, and also considered whether the Advisor has the financial wherewithal to continue to provide services to the Funds, noting the ongoing commitment of the Advisor’s parent company with respect to providing support and resources as needed. The Board considered that the Funds’ distributor, an affiliate of the Advisor, receives Rule 12b-1 distribution fees from the Funds
Other Items(Unaudited) (Continued)
and receives a portion of the sales charges on sales or redemptions of certain classes of shares. The Board also noted that the Advisor derives benefits to its reputation and other benefits from its association with the Funds.
The Board recognized that the Advisor should be entitled to earn a reasonable level of profits in exchange for the level of services it provides to each Fund and the entrepreneurial risk that it assumes as Advisor. Based upon their review, the Trustees concluded that the Advisor’s and its affiliates’ level of profitability, if any, from their relationship with each Fund was reasonable and not excessive.
Expenses and Performance.The Board compared the respective advisory fees and total expense ratios for each of the Funds with various comparative data, including the median and average advisory fees and total expense ratios of each Fund’s respective peer group. The Board also considered, among other data, the Funds’ respective performance results during the six-month, twelve-month and thirty-six-month periods ended September 30, 2018, and noted that the Board reviews on a quarterly basis detailed information about each Fund’s performance results, portfolio composition and investment strategies. The Board also took into account current market conditions and their effect on the Funds’ performance.
The Board also considered the effect of each Fund’s growth and size on its performance and expenses. The Board noted that the Advisor had waived a portion of the fees and/or reimbursed expenses of the Funds in order to reduce the Funds’ respective operating expenses to targeted levels. The Board noted that the sub-advisory fees under the Sub-Advisory Agreement with respect to each Fund were paid by the Advisor out of the advisory fees it receives from the Fund and considered the impact of such sub-advisory fees on the profitability of the Advisor. In reviewing the respective total expense ratios and performance of each of the Funds, the Board also took into account the nature, extent and quality of the services provided to the Funds by the Advisor and its affiliates.
The Board considered, among other data, the specific factors and related conclusions set forth below with respect to each Fund:
Touchstone Dynamic Equity Fund. The Fund’s advisory fee and total expense ratio (net of applicable expense waivers and reimbursements) were below the median and above the median, respectively, of its peer group. The Board noted that the Advisor was currently waiving and/or reimbursing a portion of the Fund’s fees and/or expenses. The Fund’s performance for the six- and twelve-month periods ended September 30, 2018 was in the 4th quintile of its peer group, while the Fund’s performance for the thirty-six-month period ended September 30, 2018 was in the 3rd quintile of its peer group. The Board noted management’s discussion of the Fund’s performance, including both its recent and long-term performance. Based upon their review, the Trustees concluded that the Fund’s overall performance was satisfactory relative to the performance of funds with similar investment objectives and relevant indices, and that the advisory fee was reasonable in light of the services received by the Fund from the Advisor and the other factors considered.
Touchstone Controlled Growth with Income Fund. The Fund’s advisory fee and total expense ratio (net of applicable expense waivers and reimbursements) were below the median and above the median, respectively, of its peer group. The Board noted that the Advisor was currently waiving and/or reimbursing a portion of the Fund’s fees and/or expenses. The Fund’s performance for the six- and twelve-month periods ended September 30, 2018 was in the 2nd quintile of its peer group, while the Fund’s performance for the thirty-six month period ended September 30, 2018 was in the 1st quintile of its peer group. Based upon their review, the Trustees concluded that the Fund’s overall performance was satisfactory relative to the performance of funds with similar investment objectives and relevant indices, and that the advisory fee was reasonable in light of the services received by the Fund from the Advisor and the other factors considered.
Touchstone Dynamic Diversified Income Fund. The Fund’s advisory fee and total expense ratio (net of applicable expense waivers and reimbursements) were above the median of its peer group. The Board noted that the Advisor
Other Items(Unaudited) (Continued)
was currently waiving and/or reimbursing a portion of the Fund’s fees and/or expenses. The Fund’s performance for the six-month period ended September 30, 2018 was in the 3rd quintile of its peer group, the Fund’s performance for the twelve-month period ended September 30, 2018 was in the 4th quintile of its peer group, and the Fund’s performance for the thirty-six-month period ended September 30, 2018 was in the 2nd quintile of its peer group. The Board noted management’s discussion of the Fund’s performance including both its recent and long-term performance. Based upon their review, the Trustees concluded that the Fund’s overall performance was satisfactory relative to the performance of funds with similar investment objectives and relevant indices, and that the advisory fee was reasonable in light of the services received by the Fund from the Advisor and the other factors considered.
Touchstone Dynamic Global Allocation Fund. The Fund’s advisory fee and total expense ratio (net of applicable expense waivers and reimbursements) were above the median and at the median, respectively, of its peer group. The Board noted that the Advisor was currently waiving and/or reimbursing a portion of the Fund’s fees and/or expenses. The Fund’s performance for the six- and thirty-six-month periods ended September 30, 2018 was in the 4th quintile of its peer group, while the Fund’s performance for the twelve-month period ended September 30, 2018 was in the 3rd quintile of its peer group. The Board noted management’s discussion of the Fund’s performance, including both its recent and long-term performance. Based upon their review, the Trustees concluded that the Fund’s overall performance was satisfactory relative to the performance of funds with similar investment objectives and relevant indices, and that the advisory fee was reasonable in light of the services received by the Fund from the Advisor and the other factors considered.
Economies of Scale.The Board considered the effect of each Fund’s current size and potential growth on its performance and expenses. The Board took into account management’s discussion of the Funds’ advisory fee structure. The Board considered the effective advisory fees under the Investment Advisory Agreement as a percentage of assets at different asset levels and possible economies of scale that might be realized if the assets of each Fund increase. The Board noted that the advisory fee schedules for the Funds contain breakpoints that would reduce the respective advisory fee rate on assets above specified levels as the respective Fund’s assets increased. The Board also noted that if a Fund’s assets increase over time, the Fund also might realize other economies of scale if assets increase proportionally more than certain other expenses. The Board also considered the fact that, under the Investment Advisory Agreement, the advisory fee payable to the Advisor by a Fund was reduced by the total sub-advisory fee paid by the Advisor to the Fund’s Sub-Advisor.
Conclusion.In considering the renewal of the Funds’ Investment Advisory Agreement, the Board, including the Independent Trustees, did not identify any single factor as controlling, and each Trustee may have attributed different weights to the various factors. The Trustees evaluated all information available to them on a Fund-by-Fund basis, and their determinations were made separately with respect to each Fund. The Board reached the following conclusions regarding the Funds’ Investment Advisory Agreement with the Advisor, among others: (a) the Advisor demonstrated that it possesses the capability and resources to perform the duties required of it under the Investment Advisory Agreement; (b) the Advisor maintains an appropriate compliance program; (c) the overall performance of each Fund is satisfactory relative to the performance of funds with similar investment objectives and relevant indices; and (d) each Fund’s advisory fee is reasonable in light of the services received by the Fund from the Advisor and the other factors considered. Based on their conclusions, the Trustees determined with respect to each Fund that continuation of the Investment Advisory Agreement was in the best interests of the Fund and its shareholders.
In approving the Funds’ respective Sub-Advisory Agreements, the Board considered various factors with respect to each Fund and the applicable Sub-Advisory Agreement, among them: (1) the nature, extent and quality of services provided to the Fund, including the personnel providing such services; (2) the Sub-Advisor’s compensation; (3) a comparison of the sub-advisory fee and performance with comparable funds; and (4) the terms of the
Other Items(Unaudited) (Continued)
Sub-Advisory Agreement. The Board’s analysis of these factors is set forth below. The Independent Trustees were advised by independent legal counsel throughout the process.
Nature, Extent and Quality of Services Provided; Investment Personnel.The Board considered information provided by the Advisor regarding the services provided by each Sub-Advisor, including information presented periodically throughout the previous year. The Board noted that, on a periodic basis, the Board meets with portfolio managers of the Sub-Advisors to discuss their respective performance and investment processes and strategies. The Board considered each Sub-Advisor’s level of knowledge and investment style. The Board reviewed the experience and credentials of the applicable investment personnel who are responsible for managing the investment of portfolio securities with respect to the Funds. The Board also noted each Sub-Advisor’s brokerage practices.
Sub-Advisor’s Compensation, Profitability and Economies of Scale.The Board also took into consideration the financial condition of each Sub-Advisor and any indirect benefits derived by each Sub-Advisor and its affiliates from the Sub-Advisor’s relationship with the Funds. In considering the profitability to each Sub-Advisor of its relationship with the Fund(s), the Board noted the undertaking of the Advisor to maintain expense limitations for the Funds and also noted that the sub-advisory fees under the Sub-Advisory Agreements were paid by the Advisor out of the advisory fees that it receives under the Investment Advisory Agreement and are negotiated at arm’s-length. As a consequence, the profitability to each Sub-Advisor of its relationship with a Fund was not a substantial factor in the Board’s deliberations. For similar reasons, the Board did not consider the potential economies of scale in each Sub-Advisor’s management of the applicable Fund to be a substantial factor in its consideration, although the Board noted that the sub-advisory fee schedule for each Fund contained breakpoints that would reduce the sub-advisory fee rate on assets above specified levels as the applicable Fund’s assets increased.
Sub-Advisory Fees and Fund Performance.The Board considered that each Fund pays an advisory fee to the Advisor and that the Advisor pays the sub-advisory fee to the Sub-Advisor out of the advisory fees it receives from the respective Fund. The Board also compared the sub-advisory fees paid by the Advisor to fees charged by the Touchstone Dynamic Equity Fund’s Sub-Advisor to manage comparable institutional separate accounts. The Board considered the amount retained by the Advisor and the sub-advisory fee paid to each Sub-Advisor with respect to the various services provided by the Advisor and the Sub-Advisor. The Board also noted that the Advisor negotiated the sub-advisory fee with each of the Sub-Advisors at arm’s-length. The Board reviewed the sub-advisory fee for each Fund in relation to various comparative data, including the median and average sub-advisory fees of each Fund’s peer group, and considered the following information:
Touchstone Dynamic Equity Fund. The Fund’s sub-advisory fee was at the median of its peer group. Based upon their review, the Trustees concluded that the sub-advisory fee was reasonable in light of the services received by the Fund from the Sub-Advisor and the other factors considered.
Touchstone Controlled Growth with Income Fund. The Fund’s sub-advisory fee was at the median of its peer group. Based upon their review, the Trustees concluded that the sub-advisory fee was reasonable in light of the services received by the Fund from the Sub-Advisor and the other factors considered.
Touchstone Dynamic Diversified Income Fund. The Fund’s sub-advisory fee was above the median of its peer group. Based upon their review, the Trustees concluded that the sub-advisory fee was reasonable in light of the services received by the Fund from the Sub-Advisor and the other factors considered.
Touchstone Dynamic Global Allocation Fund. The Trustees considered the Fund’s sub-advisory fee relative to the fees paid by other funds to their sub-advisors. Based upon their review, the Trustees concluded that the sub-advisory fee was reasonable in light of the services received by the Fund from the Sub-Advisor and the other factors considered.
Other Items(Unaudited) (Continued)
As noted above, the Board considered each Fund’s performance during the six-month, twelve-month and thirty-six-month periods ended September 30, 2018, as compared to each Fund’s peer group and noted that the Board reviews on a quarterly basis detailed information about each Fund’s performance results, portfolio composition and investment strategies. The Board also noted the Advisor’s expertise and resources in monitoring the performance, investment style and risk-adjusted performance of each Sub-Advisor. The Board also was mindful of the Advisor’s ongoing monitoring of each Sub-Advisor’s performance and the measures undertaken by the Advisor to address any underperformance.
Conclusion.In considering the renewal of the Sub-Advisory Agreement with respect to each Fund, the Board, including the Independent Trustees, did not identify any single factor as controlling, and each Trustee may have attributed different weights to the various factors. The Board reached the following conclusions regarding each Sub-Advisory Agreement, among others: (a) the Sub-Advisor is qualified to manage each Fund’s assets in accordance with the Fund’s investment goals and policies; (b) the Sub-Advisor maintains an appropriate compliance program; (c) the overall performance of each Fund is satisfactory relative to the performance of funds with similar investment objectives and relevant indices; (d) each Fund’s sub-advisory fee is reasonable in light of the services received by the Fund from the Sub-Advisor and the other factors considered; and (e) the Sub-Advisor’s investment strategies are appropriate for pursuing the investment goals of each Fund. Based on its conclusions, the Board determined that approval of the Sub-Advisory Agreement with respect to each Fund was in the best interests of the Fund and its shareholders.
Management of the Trust(Unaudited)
Listed below is required information regarding the Trustees and principal officers of the Trust. The Trust’s Statement of Additional Information includes additional information about the Trustees and is available, without charge, upon request by calling 1.800.543.0407 or by visiting the Touchstone website at TouchstoneInvestments.com.
Interested Trustee1:
| | | | | | | | | Number | | |
| | | | | | | | | of Funds | | |
| | | | | | | | | Overseen | | |
| | | | | Term of | | | | in the | | |
| Name | | Position(s) | | Office And | | | | Touchstone | | Other |
| Address | | Held with | | Length of | | Principal Occupation(s) | | Fund | | Directorships |
| Year of Birth | | Trust | | Time Served | | During Past 5 Years | | Complex2 | | Held During the Past 5 Years3 |
Jill T. McGruder
Touchstone Advisors, Inc. 303 Broadway
Suite 1100 Cincinnati, Ohio 45202
Year of Birth: 1955 | | Trustee and President | | Until retirement at age 75 or until she resigns or is removed Trustee since 1999 | | President and CEO of IFS Financial Services, Inc. (a holding company). | | 48 | | IFS Financial Services, Inc. (a holding company) from 1999 to the present; Integrity and National Integrity Life Insurance Co. from 2005 to the present; Touchstone Securities (the Trust’s distributor) from 1999 to the present; Touchstone Advisors (the Trust’s investment advisor and administrator) from 1999 to the present; W&S Brokerage Services (a brokerage company) from 1999 to the present; W&S Financial Group Distributors (a distribution company) from 1999 to the present; Cincinnati Analysts, Inc. from 2012 to the present; Columbus Life Insurance Co. from 2016 to the present; The Lafayette Life Insurance Co. from 2016 to the present; Taft Museum of Art from 2007 to the present; YWCA of Greater Cincinnati from 2012 to the present; and LL Global, Inc. from 2016 to the present. |
| Independent Trustees: | | | | | | | | | | |
Phillip R. Cox
c/o Touchstone Advisors, Inc.
303 Broadway
Suite 1100
Cincinnati, Ohio 45202
Year of Birth: 1947 | | Trustee | | Until retirement at age 75 or until he resigns or is removed Trustee since 1999 | | President and Chief Executive Officer of Cox Financial Corp. (a financial services company) from 1971 to the present. | | 48 | | Director of Cincinnati Bell (a communications company) from 1994 to the present; Bethesda Inc. (a hospital) from 2005 to the present; Timken Co. (a manufacturing company) from 2004 to 2014; TimkenSteel from 2014 to the present; Diebold, Inc. (a technology solutions company) from 2004 to the present; and Ohio Business Alliance for Higher Education and the Economy from 2005 to the present. |
William C. Gale
c/o Touchstone Advisors, Inc.
303 Broadway
Suite 1100
Cincinnati, Ohio 45202
Year of Birth: 1952 | | Trustee | | Until retirement at age 75 or until he resigns or is removed Trustee since 2013 | | Retired; formerly Senior Vice President and Chief Financial Officer (from 2003 to January 2015) of Cintas Corporation (a business services company). | | 48 | | None. |
Management of the Trust(Unaudited) (Continued)
Independent Trustees (Continued):
| | | | | | | | | Number | | |
| | | | | | | | | of Funds | | |
| | | | | | | | | Overseen | | |
| | | | | Term of | | | | in the | | |
| Name | | Position(s) | | Office And | | | | Touchstone | | Other |
| Address | | Held with | | Length of | | Principal Occupation(s) | | Fund | | Directorships |
| Year of Birth | | Trust | | Time Served | | During Past 5 Years | | Complex2 | | Held During the Past 5 Years3 |
Susan J. Hickenlooper c/o Touchstone Advisors, Inc. 303 Broadway Suite 1100 Cincinnati, Ohio 45202
Year of Birth: 1946 | | Trustee | | Until retirement at age 75 or until she resigns or is removed Trustee since 2009 | | Retired; formerly Financial Analyst for Impact 100 (charitable organization) from November 2012 to 2013. | | 48 | | Trustee of Diocese of Southern Ohio from 2014 to the present; and Trustee of Cincinnati Parks Foundation from 2000 to 2016. |
Kevin A. Robie
c/o Touchstone Advisors, Inc. 303 Broadway
Suite 1100 Cincinnati, Ohio 45202 Year of Birth: 1956 | | Trustee | | Until retirement at age 75 or until he resigns or is removed Trustee since 2013 | | Vice President of Portfolio Management at Soin International LLC (a multinational holding company) from 2004 to the present. | | 48 | | Director of SaverSystems, Inc. from 2015 to the present; Director of Buckeye EcoCare, Inc. (a lawn care company) from 2013 to the present; Trustee of Dayton Region New Market Fund, LLC (a private fund) from 2010 to the present; and Trustee of the Entrepreneurs Center, Inc. (a small business incubator) from 2006 to the present. |
Edward J. VonderBrink
c/o Touchstone Advisors, Inc.
303 Broadway
Suite 1100
Cincinnati, Ohio 45202
Year of Birth: 1944 | | Trustee | | Until retirement at age 75 or until he resigns or is removed Trustee since 2013 | | Consultant, VonderBrink Consulting LLC from 2000 to the present. | | 48 | | Director of Streamline Health Solutions, Inc. (healthcare IT) from 2006 to 2015; Mercy Health from 2013 to the present; Mercy Health Foundation (healthcare nonprofit) from 2008 to the present; Al Neyer Inc. (a construction company) from 2013 to the present; and BASCO Shower Door from 2010 to the present. |
| 1 | Ms. McGruder, as a director of the Advisor and the Distributor, and an officer of affiliates of the Advisor and the Distributor, is an “interested person” of the Trust within the meaning of Section 2(a)(19) of the 1940 Act. |
| 2 | As of December 31, 2018, the Touchstone Fund Complex consists of 22 series of the Trust, 15 series of Touchstone Funds Group Trust, 1 series of Touchstone Institutional Funds Trust, and 10 variable annuity series of Touchstone Variable Series Trust. |
| 3 | Each Trustee is also a Trustee of Touchstone Funds Group Trust, Touchstone Institutional Funds Trust, and Touchstone Variable Series Trust. |
Management of the Trust(Unaudited) (Continued)
The following is a list of the Principal Officers of the Trust, the length of time served, and principal occupations for the past five years.
Principal Officers:
| | | | | Term of | | |
| Name | | Position(s) | | Office and | | |
| Address | | Held with | | Length of | | Principal Occupation(s) |
| Year of Birth | | Trust1 | | Time Served | | During Past 5 Years |
Jill T. McGruder
Touchstone Advisors, Inc.
303 Broadway
Suite 1100 Cincinnati, Ohio 45202
Year of Birth: 1955 | | President and Trustee | | Until resignation, removal or disqualification President since 2006 | | See biography above. |
Steven M. Graziano
Touchstone Advisors, Inc. 303 Broadway Suite 1100 Cincinnati, Ohio 45202
Year of Birth: 1954 | | Vice President | | Until resignation, removal or disqualification Vice President since 2009 | | President of Touchstone Advisors, Inc. |
Timothy D. Paulin
Touchstone Advisors, Inc. 303 Broadway Suite 1100 Cincinnati, Ohio 45202 Year of Birth: 1963 | | Vice President | | Until resignation, removal or disqualification Vice President since 2010 | | Senior Vice President of Investment Research and Product Management of Touchstone Advisors, Inc. |
Timothy S. Stearns Touchstone Advisors, Inc. 303 Broadway Suite 1100 Cincinnati, Ohio 45202 Year of Birth: 1963 | | Chief Compliance Officer | | Until resignation, removal or disqualification Chief Compliance Officer since 2013 | | Chief Compliance Officer of Touchstone Advisors, Inc.; Chief Compliance Officer of Envestnet Asset Management, Inc. (2009 to 2013). |
Terrie A. Wiedenheft Touchstone Advisors, Inc. 303 Broadway Suite 1100 Cincinnati, Ohio 45202 Year of Birth: 1962 | | Controller and Treasurer | | Until resignation, removal or disqualification Controller and Treasurer since 2006 | | Senior Vice President, Chief Financial Officer, and Chief Operations Officer of IFS Financial Services, Inc. (a holding company). |
Meredyth A. Whitford
Western & Southern
Financial Group
400 Broadway
Cincinnati, Ohio 45202
Year of Birth: 1981 | | Secretary | | Until resignation, removal or disqualification Secretary since 2018 | | Counsel - Securities/Mutual Funds of Western & Southern Financial Group (2015 to present); Associate at Morgan Lewis & Bockius LLP (law firm) (2014 to 2015); Associate at Bingham McCutchen LLP (law firm) (2008 to 2014). |
1Each officer also holds the same office with the Touchstone Funds Group Trust, Touchstone Institutional Funds Trust, and Touchstone Variable Series Trust.
This page intentionally left blank.
This page intentionally left blank.
This page intentionally left blank.
PRIVACY PROTECTION POLICY
We Respect Your Privacy
Thank you for your decision to invest with us. Touchstone and its affiliates have always placed a high value on the trust and confidence our clients place in us. We believe that confidence must be earned and validated through time. In today’s world, when technology allows the sharing of information at light speeds, trust must be reinforced by our sincere pledge to take the steps necessary to ensure that the information you share with us is treated with respect and confidentiality.
Our Pledge to Our Clients
| · | We collect only the information we need to service your account and administer our business. |
| · | We are committed to keeping your information confidential and we place strict limits and controls on the use and sharing of your information. |
| · | We make every effort to ensure the accuracy of your information. |
We Collect the Following Nonpublic Personal Information About You:
| · | Information we receive from you on or in applications or other forms, correspondence, or conversations, including, but not limited to, your name, address, phone number, social security number, assets, income and date of birth; and |
| · | Information about your transactions with us, our affiliates, or others, including, but not limited to, your account number and balance, payment history, parties to transactions, cost basis information, and other financial information. |
Categories of Information We Disclose and Parties to Whom We Disclose
We do not disclose any nonpublic personal information about our current or former clients to nonaffiliated third parties, except as required or permitted by law.
We Place Strict Limits and Controls on the Use and Sharing of Your Information
| · | We restrict access to nonpublic personal information about you to authorized employees who need the information to administer your business. |
| · | We maintain physical, electronic and procedural safeguards that comply with federal standards to protect this information. |
| · | We do not disclose any nonpublic personal information about our current or former clients to anyone, except as required or permitted by law or as described in this document. |
| · | We will not sell your personal information to anyone. |
We May Provide Information to Service Your Account
Sometimes it is necessary to provide information about you to various companies such as transfer agents, custodians, broker-dealers and marketing service firms to facilitate the servicing of your account. These organizations have a legitimate business need to see some of your personal information in order for us to provide service to you. We may disclose to these various companies the information that we collect as described above. We require that these companies, including our own subsidiaries and affiliates, strictly maintain the confidentiality of this information and abide by all applicable laws. Companies within our corporate family that may receive this information are financial service providers and insurance companies. We do not permit these associated companies to sell the information for their own purposes, and we never sell our customer information.
This policy is applicable to the following affiliated companies: Touchstone Funds Group Trust, Touchstone Strategic Trust, Touchstone Variable Series Trust, Touchstone Institutional Funds Trust, Touchstone Securities, Inc.* and W&S Brokerage Services, Inc.
* Touchstone Securities, Inc. serves as the underwriter to the Touchstone Funds.
A Member of Western & Southern Financial Group®
The Privacy Protection Policy is not part of the Annual Report.


Touchstone Investments
Distributor
Touchstone Securities, Inc.*
303 Broadway
Cincinnati, Ohio 45202-4203
800.638.8194
www.touchstoneinvestments.com
Investment Advisor
Touchstone Advisors, Inc.*
303 Broadway
Cincinnati, Ohio 45202-4203
Transfer Agent
BNY Mellon Investment Servicing (US) Inc.
4400 Computer Drive
Westborough, Massachusetts 01581
Shareholder Service
800.543.0407
* A Member of Western & Southern Financial Group
TSF-54CC-TST-AR-1812
Item 2. Code of Ethics.
| (a) | The registrant, as of the end of the period covered by this report, has adopted a code of ethics that applies to the registrant’s principal executive officer, principal financial officer, principal accounting officer or controller, or persons performing similar functions, regardless of whether these individuals are employed by the registrant or a third party. |
| (c) | There have been no amendments, during the period covered by this report, to a provision of the code of ethics that applies to the registrant’s principal executive officer, principal financial officer, principal accounting officer or controller, or persons performing similar functions, regardless of whether these individuals are employed by the registrant or a third party, and that relates to any element of the code of ethics description. |
| (d) | The registrant has not granted any waivers, including an implicit waiver, from a provision of the code of ethics that applies to the registrant’s principal executive officer, principal financial officer, principal accounting officer or controller, or persons performing similar functions, regardless of whether these individuals are employed by the registrant or a third party, that relates to one or more of the items set forth in paragraph (b) of this item’s instructions. |
Item 3. Audit Committee Financial Expert.
The registrant’s Board of Trustees has determined that the registrant has at least one audit committee financial expert serving on its audit committee. Mr. William Gale is the registrant’s audit committee financial expert and is an independent trustee within the meaning of the Investment Company Act of 1940, as amended (the “1940 Act”).
Item 4. Principal Accountant Fees and Services.
Audit Fees
| (a) | Audit fees for Touchstone Strategic Trust (December Funds) totaled $68,000 and $63,200 for the fiscal years ended December 31, 2018 and December 31, 2017, respectively, including fees associated with the annual audits and filings of Form N1A and Form N-CEN. |
Audit-Related Fees
| (b) | The aggregate fees billed in each of the last two fiscal years for assurance and related services by the principal accountant that are reasonably related to the performance of the audit of the registrant's financial statements and are not reported under paragraph (a) of this Item are $0 and $0 for the fiscal years ended December 31, 2018 and December 31, 2017, respectively. |
Tax Fees
| (c) | The aggregate fees billed in each of the last two fiscal years for professional services rendered by the principal accountant for tax compliance, tax advice, and tax planning were $14,350 and $13,810 for the fiscal years ended December 31, 2018 and December 31, 2017, respectively. The fees relate to the preparation of federal income and excise tax returns, and review of capital gains distribution calculations. |
All Other Fees
| (d) | The aggregate fees billed in each of the last two fiscal years for products and services provided by the principal accountant, other than the services reported in paragraphs (a) through (c) of this Item are $337 and $997 for the fiscal years ended December 31, 2018 and December 31, 2017, respectively. The fees relate to the PFIC Analyzer and Global Withholding Tax Reporter subscriptions. |
| (e)(1) | Disclose the audit committee's pre-approval policies and procedures described in paragraph (c)(7) of Rule 2-01 of Regulation S-X. |
The Audit Committee’s pre-approval policies describe the types of audit, audit-related, tax and other services that have the general pre-approval of the Audit Committee. The pre-approval policies provide that annual audit service fees, tax services not specifically granted pre-approval, services exceeding pre-approved cost levels and other services that have not received general pre-approval will be subject to specific pre-approval by the Audit Committee. The pre-approval policies further provide that the Committee may grant general pre-approval to other audit services (statutory audits and services associated with SEC registration statements, periodic reports and other documents filed with the SEC or other documents issued in connection with securities offerings), audit-related services (accounting consultations related to accounting, financial reporting or disclosure matters not classified as “audit services,” assistance with understanding and implementing new accounting and financial reporting guidance from rulemaking authorities, agreed-upon or expanded audit procedures related to accounting and/or billing records required to respond to or comply with financial, accounting or regulatory reporting matters and assistance with internal control reporting requirements under Form N-CSR), tax services that have historically been provided by the auditor that the Committee believes would not impair the independence of the auditor and are consistent with the SEC’s rules on auditor independence and permissible non-audit services classified as “all other services” that are routine and recurring services.
| (e)(2) | All services described in paragraphs (c) through (d) of Item 4 were approved by the Audit Committee. |
| (f) | The percentage of hours expended on the principal accountant's engagement to audit the registrant's financial statements for the most recent fiscal year that were attributed to work performed by persons other than the principal accountant's full-time, permanent employees was less than fifty percent. |
The aggregate non-audit fees for Touchstone Variable Series Trust and certain entities*, totaled approximately $848,686 and $14,807 for the fiscal years ended December 31, 2018 and December 31, 2017, respectively.* These include the advisors (excluding sub-advisors) and any entity controlling, controlled by or under common control with the advisors that provides ongoing services to the registrant (Funds).
| (h) | The registrant's audit committee of the board of directors has considered whether the provision of non-audit services that were rendered to the registrant's investment adviser (not including any sub-adviser whose role is primarily portfolio management and is subcontracted with or overseen by another investment adviser), and any entity controlling, controlled by, or under common control with the investment adviser that provides ongoing services to the registrant that were not pre-approved pursuant to paragraph (c)(7)(ii) of Rule 2-01 of Regulation S-X is compatible with maintaining the principal accountant's independence. |
Item 5. Audit Committee of Listed Registrants.
Not applicable.
Item 6. Investments.
| (a) | Schedule of Investments in securities of unaffiliated issuers as of the close of the reporting period is included as part of the report to shareholders filed under Item 1 of this form. |
Item 7. Disclosure of Proxy Voting Policies and Procedures for Closed-End Management Investment Companies.
Not applicable.
Item 8. Portfolio Managers of Closed-End Management Investment Companies.
Not applicable.
Item 9. Purchases of Equity Securities by Closed-End Management Investment Company and Affiliated Purchasers.
Not applicable.
Item 10. Submission of Matters to a Vote of Security Holders.
There have been no material changes to the procedures by which the shareholders may recommend nominees to the registrant’s board of trustees, where those changes were implemented after the registrant last provided disclosure in response to the requirements of Item 407(c)(2)(iv) of Regulation S-K (17 CFR 229.407) (as required by Item 22(b)(15) of Schedule 14A (17 CFR 240.14a-101)), or this Item.
Item 11. Controls and Procedures.
| (a) | The registrant’s principal executive and principal financial officers, or persons performing similar functions, have concluded that the registrant’s disclosure controls and procedures (as defined in Rule 30a-3(c) under the Investment Company Act of 1940, as amended (the “1940 Act”) (17 CFR 270.30a-3(c))) are effective, as of a date within 90 days of the filing date of the report that includes the disclosure required by this paragraph, based on their evaluation of these controls and procedures required by Rule 30a-3(b) under the 1940 Act (17 CFR 270.30a-3(b)) and Rules 13a-15(b) or 15d-15(b) under the Securities Exchange Act of 1934, as amended (17 CFR 240.13a-15(b) or 240.15d-15(b)). |
| (b) | There were no changes in the registrant’s internal control over financial reporting (as defined in Rule 30a-3(d) under the 1940 Act (17 CFR 270.30a-3(d))) that occurred during the registrant’s last fiscal quarter that has materially affected, or is reasonably likely to materially affect, the registrant’s internal control over financial reporting. |
Item 12. Disclosure of Securities Lending Activities for Closed-End Management Investment Companies.
Not applicable.
Item 13. Exhibits.
| (a)(1) | Code of ethics, or any amendment thereto, that is the subject of disclosure required by Item 2 is attached hereto. |
| (a)(2) | Certifications pursuant to Rule 30a-2(a) under the 1940 Act and Section 302 of the Sarbanes-Oxley Act of 2002 are attached hereto. |
| (b) | Certifications pursuant to Rule 30a-2(b) under the 1940 Act and Section 906 of the Sarbanes- Oxley Act of 2002 are attached hereto. |
SIGNATURES
Pursuant to the requirements of the Securities Exchange Act of 1934 and the Investment Company Act of 1940, the registrant has duly caused this report to be signed on its behalf by the undersigned, thereunto duly authorized.
| (Registrant) | Touchstone Strategic Trust | |
| By (Signature and Title)* | /s/ Jill T. McGruder | |
| | Jill T. McGruder, President | |
| | (principal executive officer) | |
Pursuant to the requirements of the Securities Exchange Act of 1934 and the Investment Company Act of 1940, this report has been signed below by the following persons on behalf of the registrant and in the capacities and on the dates indicated.
| By (Signature and Title)* | /s/ Jill T. McGruder | |
| | Jill T. McGruder, President | |
| | (principal executive officer) | |
| By (Signature and Title)* | /s/ Terrie A. Wiedenheft | |
| | Terrie A. Wiedenheft, Controller and Treasurer | |
| | (principal financial officer) | |
| * | Print the name and title of each signing officer under his or her signature. |