UNITED STATES
SECURITIES AND EXCHANGE COMMISSION
Washington, D.C. 20549
FORM N-CSR
CERTIFIED SHAREHOLDER REPORT OF REGISTERED MANAGEMENT INVESTMENT COMPANIES
Investment Company Act file number 811-03651
Touchstone Strategic Trust-March Funds
(Exact name of registrant as specified in charter)
303 Broadway, Suite 1100
Cincinnati, Ohio 45202-4203
(Address of principal executive offices) (Zip code)
E. Blake Moore, Jr.
303 Broadway, Suite 1100
Cincinnati, Ohio 45202-4203
(Name and address of agent for service)
Registrant's telephone number, including area code: 800-638-8194
Date of fiscal year end: March 31
Date of reporting period: March 31, 2022
Form N-CSR is to be used by management investment companies to file reports with the Commission not later than 10 days after the transmission to stockholders of any report that is required to be transmitted to stockholders under Rule 30e-1 under the Investment Company Act of 1940 (17 CFR 270.30e-1). The Commission may use the information provided on Form N-CSR in its regulatory, disclosure review, inspection, and policymaking roles.
A registrant is required to disclose the information specified by Form N-CSR, and the Commission will make this information public. A registrant is not required to respond to the collection of information contained in Form N-CSR unless the Form displays a currently valid Office of Management and Budget ("OMB") control number. Please direct comments concerning the accuracy of the information collection burden estimate and any suggestions for reducing the burden to Secretary, Securities and Exchange Commission, 450 Fifth Street, NW, Washington, DC 20549-0609. The OMB has reviewed this collection of information under the clearance requirements of 44 U.S.C. § 3507.
Item 1. Reports to Stockholders.
| (a) | The Report to Shareholders is attached herewith. |
| Touchstone Strategic Trust |
| Touchstone Flexible Income Fund |
| Touchstone Focused Fund |
| Touchstone Global ESG Equity Fund |
| Touchstone Growth Opportunities Fund |
| Touchstone Mid Cap Growth Fund |
| Touchstone Sands Capital Emerging Markets Growth Fund |
| Touchstone Strategic Income Opportunities Fund |
This report identifies the Funds' investments on March 31, 2022. These holdings are subject to change. Not all investments in each Fund performed the same, nor is there any guarantee that these investments will perform as well in the future. Market forecasts provided in this report may not occur.
Letter from the President
Dear Shareholder:
We are pleased to provide you with the Touchstone Strategic Trust Annual Report. Inside you will find key financial information, as well as manager commentaries for the Funds, for the twelve months ended March 31, 2022.
A rising inflation theme defined the economic backdrop in the U.S. and developed markets for much of the twelve month period. The U.S. Federal Reserve Board (Fed) dropped “transitory” from its official statements during the fourth quarter 2021 regarding the nature of inflation’s impact on the U.S. economy. This was fortuitous timing because producer and consumer prices increased throughout the latter part of the twelve-month period. U.S. labor market conditions were mixed as job openings remained at historic high levels during much of the period while the labor participation rate sat at a multi-decade low. Labor shortages impacted the broader economy through supply chain issues, hospital staffing and various retail segments such as restaurants. Given tight labor market conditions and elevated inflation readings, the Fed embarked on a monetary tightening posture, beginning with a quarter percent increase to the Federal Funds rate. Additionally, the Fed indicated that it would potentially begin to unwind the $9 trillion in bonds held on its balance sheet during the course of calendar year 2022. These factors, along with rising geopolitical tensions that began with the Russian invasion of Ukraine in February 2022, weighed heavily on capital markets. Economic sanctions imposed on Russia added to the inflationary pressures on commodities such as energy and agriculture. Developed market economies outside the U.S. also experienced similar inflationary and geopolitical concerns, resulting in weak economic growth despite the maintenance of accommodative monetary policies of most developed markets’ central banks. Emerging market economies experienced mixed results with some commodity exporting countries benefitting (e.g. South Africa, Brazil & Saudi Arabia) while the commodity importing countries struggled (e.g. China).
U.S. equity markets posted mixed results over the twelve-month period as larger capitalization stocks outperformed smaller capitalization stocks. Value equities outperformed their growth counterparts within the small- and mid-cap ranges. However, growth outperformed among the mega-caps due largely to the weight and strength of the Information Technology sector and related constituents. From a market capitalization perspective, small-caps, which have tended to be more economically sensitive, underperformed mid-caps while mid-caps underperformed large-caps.
As previously described, the Fed’s acknowledgement of persistent inflation and communication to the market regarding rate hikes and the unwinding of its balance sheet served as an impetus for the yield curve to rise significantly, which created a performance headwind for high quality bonds. Key investment grade bond indexes declined for the twelve-month period. However, below investment grade credit and bank loans performed better on a relative basis.
Markets such as these reaffirm our belief in the importance of the steady hands of financial professionals, trust in your investment strategy, and the risks of trying to time the market. Additionally, we believe that environments that are more volatile and uncertain create opportunities for active managers to add value, especially those that are Distinctively Active. We greatly appreciate your continued support. Thank you for including Touchstone as part of your investment plan.
Sincerely,
E. Blake Moore Jr.
President
Touchstone Strategic Trust
Management's Discussion of Fund Performance (Unaudited)
Touchstone Flexible Income Fund
Sub-Advised by Bramshill Investments, LLC
Investment Philosophy
The Touchstone Flexible Income Fund seeks total return through a combination of income and capital appreciation by investing primarily in income producing securities. The Fund’s sub-advisor, Bramshill Investments, LLC, implements a tactical fixed-income strategy, actively managing the portfolio by rotating among asset classes and tactically hedging during various interest rate and market environments. The sub-advisor seeks to identify relative value across asset classes and capture opportunities primarily within the corporate, U.S. Treasury, municipal and preferred security markets. The Fund focuses on liquid securities with transparent pricing and actively-traded capital structures.
Fund Performance
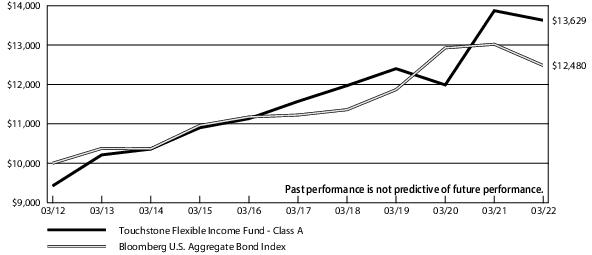
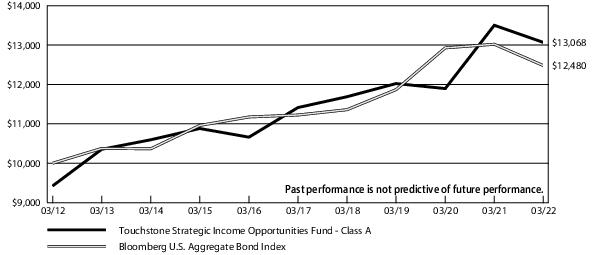
The Touchstone Flexible Income Fund (Class A Shares) outperformed its benchmark, the Bloomberg U.S. Aggregate Bond Index, for the 12 months ended March 31, 2022. The Fund’s total return was -1.76% (calculated excluding the maximum sales charge) while the total return of the benchmark was -4.15%.
Market Environment
The 12-month period ended March 31, 2022 was difficult for Fixed Income in general as the Bloomberg U.S. Aggregate Bond Index (benchmark) posted a negative return due primarily to the sell-off in U.S. Treasury rates. The steep, more consistent sell-off in U.S. Treasuries began towards the end of third quarter of 2021 when the U.S. Federal Reserve Board’s (Fed) pivoted its guidance regarding tightening rates and tapering asset purchases. Since that pivot, inflationary signals continued to climb steadily, even before the conflict in Ukraine instigated by Russia started. After the start of the conflict, sanctions against Russia from many nations around the world further exacerbated the surge of prices of many commodities (especially oil, wheat and fertilizer), causing even more dramatic increases in inflationary metrics resulting in the sell-off in rates globally. Although the Fed’s messaging was consistent during the last six months of the period, thus far the Fed has only announced a quarter percent rate hike and the official end to incremental asset purchases as of the end of the first quarter of 2022. Given the difference between the yield of the 10 year U.S. Treasury and the yield of 2 year U.S. Treasury Note is negative (inverted), which has historically signaled U.S. economic struggles, we believe that the U.S. economy may struggle in the near- or medium-term.
The recent volatility seen in U.S. stocks has been a result of many headwinds. These headwinds include the sell-off in global rates, concerns regarding inflationary pressures (potential effect on margins); the Russia/Ukraine conflict in Europe and associated sanctions; rising U.S. mortgage rates starting to cool U.S. housing demand and mortgage origination; stringent fiscal and monetary policies; regulatory and housing-related issues in China; supply-side constraints for corporations coping with ongoing COVID-19 pandemic related stresses (supply chain); and the demand destruction starting to become noticeable as consumers start to pull back.
Throughout the period, there was a surge in pricing for some major macroeconomic variables such as housing, oil, natural gas, construction costs and various other commodities, all of which experienced varying degrees of inflationary pressures due to supply chain issues and general shortages versus heightened demand stemming from generous stimulus packages distributed directly to U.S. consumers during the past few years. As mentioned earlier, some of this inflationary pressure was further exacerbated due to the Russia/Ukraine conflict, which caused further spikes in commodities that are overweight in regards to production in Eastern Europe, such as oil, wheat and fertilizer as examples. Away from this episodic conflict, we feel the view of further “runaway inflation” and an increase in benchmark yields to temper it will continue to some extent, however, we also believe a fair amount of it has already been priced in by the markets.
Portfolio Review
Our main tenets have been to focus on investment opportunities with high current income, relatively short duration (generally inside 5 years of duration) combined with high confidence of a low probability of default (we continue to be focused on underlying fundamentals and credit quality).
At the end of the period, a majority of the Fund was invested across Preferred Securities and Agency Commercial Mortgage Backed Securities (ACMBS) holdings. The Fund’s Preferred Securities allocation remained its largest asset class, declining from rising U.S. Treasury yields at the beginning of the first quarter of 2022, and further fueled by widening credit spreads. The Preferred allocation was centered on securities with fixed coupons for 5 years and then reset at a spread off of U.S. Treasuries, thus seeking to mitigate interest rate risk. We avoided several low coupon perpetual preferred securities which declined during the period, and invested Fund holdings in less interest rate sensitive structures which outperformed the index. The ACMBS positions were
Management's Discussion of Fund Performance (Unaudited) (Continued)
generally backed by multi-family residential housing properties, which performed well compared to other commercial sectors such as retail or lodging (which we actively avoided, as we did not like the fundamentals of those sub-sectors).
The Fund’s allocation to Investment Grades Securities, specifically, the Investment Grade Corporate allocation in the Fund increased. The Investment Grade Structured Products Securities allocation in the Fund also increased. We focused on investing a portion of cash equivalents and monthly distributions into these shorter duration securities as a defensive measure as short-term U.S. Treasuries sold-off. However, shortly after the Russia/Ukraine conflict commenced, we invested in short term U.S. treasury bills instead to optimize liquidity.
The Fund’s High Yield allocation increased slightly, although its High Yield Corporate Securities allocation decreased because we favored high coupon first lien secured bonds that were trading to short call dates. These issues sit senior in the capital structure and were further secured by unencumbered collateral packages. Furthermore, we saw value in several High Yield / Loan Closed-End Funds, which trade at discounts to NAV. However, the High Yield Structured Products Securities allocation in the Fund increased. We continue to be constructive with the risk/reward of these securities as we focus predominantly on housing related transactions that have good fundamentals, which seeks to provide for a low probability of default with relatively low duration and high current income. Further, we tactically added to this exposure at higher yields during the last quarter of the period.
Municipal Bonds allocation in the Fund increased slightly. Municipal Bonds, as an asset class, have typically been susceptible to an increase in long-term rates. Therefore, Municipal Bonds were under pressure in the first quarter of 2022. We see relative value opportunities in closed end funds, which traded at discounts to NAV and offered competitive yields. However, we are cautious to add exposure as the technical picture in Municipal Bonds is still poor and we believe this will continue to pressure all security types in the asset class.
The U.S. Treasury allocation in the Fund increased. We invested in short term U.S. Treasuries in order to minimize the cash drag from the larger allocation of cash given our desire for the Fund to remain liquid. However, the Cash equivalent allocation in the Fund decreased. Overall, a combination of cash and short dated U.S. Treasuries increased as we continued to be patient and look to further aggregate cash flows generated from the securities held by the Fund. We may continue to reinvest any cash flows received into short term U.S. Treasuries and/or other short duration investments in order to prepare for any corrections and/or better entry points.
We deployed various hedges during the period to counter a portion of the duration exposure.
Outlook and Conclusion
We believe most of the pricing pressure (inflation) due to current shortages and supply chain disruptions have already started to abate (albeit slowly) and we do not expect wages to grow fast enough to sustain long-term inflation. Certain commodities and inflationary metrics have already come down off their recently recorded highs (for example, used cars, lumber and coal). We do acknowledge that certain inflationary elements such as home prices and wages may remain historically high, while owner equivalent rent (“OER,” which contributes to approximately one-third of U.S. consumer price index) may continue to rise in the near term as it has lagged the sharp increase experienced in U.S. housing indices over the last year and a half.
On the other hand, if incremental government spending is injected into the economy and/or more of the unemployed population re-enters the workforce now that COVID-19 related unemployment insurance benefits have all officially expired and stimulus related savings have been spent, inflationary pressures may re-emerge if demand continues to outweigh supply. We view this as less likely as it appears the inflationary pressures will not be sustained at these historically high levels, and we anticipate them decreasing to more normal historical levels faster than the Fed is currently expecting. We think other variables could potentially provide headwinds for the Fed to raise rates for a sustained period as it has messaged. The U.S. is still dealing with potential geopolitical issues in Eastern Europe and Asia, COVID-19 related supply chain constraints, and worse than anticipated employment metrics and inflation gauges which may cause the Fed to delay its scheduled easing.
In general, the greatest headwind to the Fund is its lower duration and cash equivalents exposure, which are the things that are potentially cushioning it from inflation, rising U.S. Treasury yields, credit deterioration, etc. We are constantly monitoring rates, as we are aware that our largest allocations in Preferred Securities and ACMBS can be somewhat sensitive to longer U.S. Treasuries.
We continue to be wary of and avoid highly credit sensitive asset classes (e.g. High Yield Corporate Bonds), although they are currently much more fairly priced on a risk-adjusted basis than they have been in a few years. In our view, we will remain tentative to rotate into such investments as they have a meaningfully higher probability of default. We will look to take advantage of investment opportunities in this space on a tactical basis.
Management's Discussion of Fund Performance (Unaudited) (Continued)
As always, we remain diligent and patient as we focus on avoiding positions that have the potential to experience extreme illiquidity, which could be caused by an unforeseen event. We will seek to capitalize on portfolio rotation, asset allocation, opportunistic investing, etc. We do not currently see any obvious fundamental issues in any of the asset classes / sectors in which the Fund is currently invested.
The Fund is conservatively positioned and liquid. We anticipate allocating that liquidity into more optimal risk-adjusted returns on a tactical basis and believe that our active portfolio management methodologies will be important going forward.
Comparison of the Change in Value of a $10,000 Investment in the Touchstone Flexible Income Fund - Class A* and the Bloomberg U.S. Aggregate Bond Index
| Average Annual Total Returns** |
| Touchstone Flexible Income Fund | 1 Year | 5 Years | 10 Years |
| Class A | -4.93% | 2.12% | 3.14% |
| Class C | -3.47% | 2.55% | 3.13% |
| Class Y | -1.61% | 3.56% | 4.02% |
| Institutional Class* | -1.45% | 3.68% | 4.11% |
| Bloomberg U.S. Aggregate Bond Index | -4.15% | 2.14% | 2.24% |
| * | The chart above represents performance of Class A shares only, which will vary from the performance of Class C shares, Class Y shares and Institutional Class shares based on the differences in sales loads and fees paid by shareholders in the different classes. The inception date of Institutional Class shares was September 10, 2012. Institutional Class shares performance information was calculated using the historical performance of Class Y shares for the periods prior to September 10, 2012. The returns have been restated for sales loads and fees applicable to Institutional Class shares. |
| ** | The average annual total returns shown above are adjusted for maximum sales loads and fees, if applicable. The maximum offering price per share of Class A shares is equal to the net asset value (“NAV”) per share plus a sales load equal to 3.36% of the NAV (or 3.25% of the offering price). Class C shares are subject to a contingent deferred sales charge (“CDSC”) of 1.00%. The CDSC will be assessed on an amount equal to the lesser of (1) the NAV at the time of purchase of the shares being redeemed or (2) the NAV of such shares being redeemed, if redeemed within a one-year period from the date of purchase. Class Y shares and Institutional Class shares are not subject to sales charges. |
The performance of the above Fund does not reflect the deduction of taxes that a shareholder would pay on Fund distributions or the redemption of Fund shares.
Note to Chart
Bloomberg U.S. Aggregate Bond Index is an unmanaged index comprised of U.S. investment grade, fixed rate bond market securities, including government, government agency, corporate and mortgage-backed securities between one and ten years.
Management's Discussion of Fund Performance (Unaudited)
Touchstone Focused Fund
Sub-Advised by Fort Washington Investment Advisors, Inc.
Investment Philosophy
The Touchstone Focused Fund seeks to provide investors with capital appreciation by investing in companies of all capitalizations that are trading below what is believed to be the estimate of their intrinsic value and have a sustainable competitive advantage or a high barrier to entry in place. The barrier(s) to entry can be created through a cost advantage, economies of scale, high customer loyalty or a government barrier (e.g. license or subsidy). The Fund's sub-advisor, Fort Washington Investment Advisors, Inc., believes that the strongest barrier to entry is the combination of economies of scale and high customer loyalty.
Fund Performance
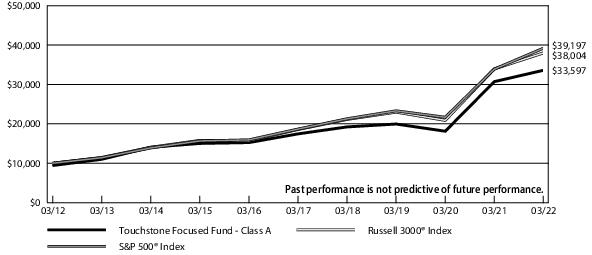
The Touchstone Focused Fund (Class A Shares) underperformed its benchmark, the Russell 3000® Index, for the twelve month period ended March 31, 2022. The Fund’s total return was 9.38% (calculated excluding the maximum sales charge) while the benchmark’s total return was 11.92%.
Market Environment
For the 12 months ended March 31, 2022, the performance of the U.S. equity market as reflected by the Russell 3000® Index was generally positive. The market did experience volatility however as investors grappled with several headwinds. In the third quarter of 2021, items that concerned investors included COVID-19 Delta variant spread, anti-business Chinese regulatory action, and rising inflation driven by supply constraints. U.S. equities rallied during the fourth quarter to reach all-time highs ending 2021. In the first quarter of 2022, the equity markets pulled back amid the Russian invasion of Ukraine and persistently high inflation readings. Among the benchmark sectors that performed best for the period were Energy, Real Estate, and Information Technology. The Communication Services, Industrials, and Consumer Discretionary sectors were the worst performers.
Portfolio Review
Within the Fund’s portfolio, the sectors that outperformed the most relative to the benchmark were Health Care, Financials, and Information Technology. Among the sectors that lagged the most relative to the benchmark included Materials, Consumer Discretionary, and Consumer Staples. Stock selection positively added to relative performance however, sector allocation more than offset the security selection gains, primarily driving the Fund to underperform the benchmark during the period. Negative sector allocation decisions were driven primarily by an overweight to the Communication Services sector and an underweight to the Energy sector.
The three stocks that contributed the most to performance were Alphabet Inc. (Communication Services sector), Jones Lang LaSalle Inc. (Real Estate sector), and Berkshire Hathaway Inc. (Financials sector). Alphabet outperformed primarily due to a rebound in digital advertising as the economy recovered from the pandemic. Jones Lang LaSalle outperformed primarily due to reporting strong margin expansion and revenue growth as the commercial property market continued to recover from the pandemic. Berkshire Hathaway outperformed due to strong performance from its various businesses, share buy backs during the period, and exposure to inflation resistant businesses.
Stocks detracting from performance include Meta Platforms, Inc. (Communication Services sector), Alibaba Group Holdings Ltd. (Consumer Discretionary sector), and Allegiant Travel Company (Industrials sector). Meta underperformed after the company issued lower than expected earnings guidance and reported lower than expected earnings during the first quarter of 2022 due to higher investments in the Meta and Reels segments. Alibaba underperformed primarily due to investor concern over government intervention in China. Allegiant underperformed primarily due to the COVID-19 Delta variant’s impact on travel and elevated fuel costs toward the end of the period.
From a market capital (cap) perspective, the Fund ended the period with no weight in smaller cap stocks (companies with a market cap below $2 billion). This allocation decision had a positive impact to performance during the period as small cap stocks underperformed. Among the remainder of the market cap segments relative to the benchmark, the Fund ended the period with an overweight in mid-cap businesses (companies with a market cap between $2 billion and $10 billion) and an underweight to larger cap businesses (companies with a market cap above $10 billion). Cash holdings ended the period at 2.7 percent.
Investments made in international companies, which comprised 2.2 percent of assets at the end of the period, underperformed the benchmark.
During the period, the Fund added Smartsheet Inc. (Information Technology sector), Coca-Cola FEMSA (Consumer Discretionary sector), BioMarin Pharmaceuticals, Inc. (Health Care sector), Visa Inc. (Information Technology sector), Airbnb,
Management's Discussion of Fund Performance (Unaudited) (Continued)
Inc. (Consumer Discretionary sector), Markel Corp. (Financials sector), and Paypal Holdings, Inc. (Information Technology sector). The Fund exited Starbucks Corp. (Consumer Discretionary sector), Avnet, Inc. (Information Technology sector), JD.com Inc. (Consumer Discretionary sector), International Business Machines Corp. (Information Technology sector), Trip.com Group Ltd. (Consumer Discretionary sector), and Signature Bank (Financials sector).
As the period came to a close, the Fund had an overweight in Communication Services, Consumer Discretionary, and Financials sectors and an underweight in the Energy, Materials, Consumer Staples, Information Technology, and Real Estate sectors. The weights in the Healthcare and Industrial sectors were roughly in line with the index. The Fund held no positions in the Utilities sector.
Outlook and Conclusion
During the first quarter of 2022, the macroeconomic environment took a notable turn with uncertainty increasing primarily due to the Russia invasion of Ukraine and persistently high inflation readings. The quarter included a brief 10-year/2-year yield curve inversion, significant increases in commodity prices, and a major shift in monetary policy expectations with the rates market moving from pricing in three quarter point hikes in 2022 to nine quarter point hikes. While the U.S. economy is still healthy by virtue of strong consumer demand, business spending, and labor market conditions, we see an elevated probability of a slowdown in the back half of the year mainly due to the lag effects of higher interest rates and higher prices.
Based on our outlook, we have been mitigating risk through a combination of long standing elements of our process and gradual shifts in portfolio positioning. Several components of our process help mitigate the impact of higher inflation and interest rates. First, consistently using conservative discount rates provides a cushion when rates rise. Second, focusing on barriers to entry in fundamental analysis, specifically businesses with pricing power, is especially important today as companies are increasingly looking to pass on cost pressures. Last, prioritizing a margin of safety with each holding provides additional risk mitigation for challenging market environments. Over the last 12-months, the team has been gradually reducing risk in terms of both sector weights and exposures within sectors. Sector weights in Consumer Discretionary and Communication Services have decreased while the Consumer Staples weight and the cash position have increased. Within Financials for example, we have shifted weight from a bank with growing exposure to crypto to a more traditional specialty lines property and casualty insurance business.
The Fund continues to emphasize businesses with higher barriers to entry and returns on capital. We have continued to gradually dial back risk in the portfolio while looking for opportunities that fit our framework through the volatility. We believe this moderate shift in risk posture combined with continued disciplined execution of our process will benefit the Fund going forward
Management's Discussion of Fund Performance (Unaudited) (Continued)
Comparison of the Change in Value of a $10,000 Investment in the Touchstone Focused Fund - Class A*, the Russell 3000® Index and the S&P 500® Index
| Average Annual Total Returns** |
| Touchstone Focused Fund | 1 Year | 5 Years | 10 Years |
| Class A | 3.91% | 12.65% | 12.88% |
| Class C* | 7.58% | 13.15% | 13.09% |
| Class Y | 9.71% | 14.33% | 13.87% |
| Institutional Class | 9.75% | 14.41% | 13.98% |
| Russell 3000® Index | 11.92% | 15.40% | 14.28% |
| S&P 500® Index | 15.65% | 15.99% | 14.64% |
| * | The chart above represents performance of Class A shares only, which will vary from the performance of Class C shares, Class Y shares and Institutional Class shares based on the differences in sales loads and fees paid by shareholders in the different classes. The inception date of Class C shares was April 12, 2012. Class C shares performance information was calculated using the historical performance of Class Y shares for the periods prior to April 12, 2012. The returns have been restated for sales loads and fees applicable to Class C shares. |
| ** | The average annual total returns shown above are adjusted for maximum sales loads and fees, if applicable. The maximum offering price per share of Class A shares is equal to the net asset value (“NAV”) per share plus a sales load equal to 5.26% of the NAV (or 5.00% of the offering price). Class C shares are subject to a contingent deferred sales charge (“CDSC”) of 1.00%. The CDSC will be assessed on an amount equal to the lesser of (1) the NAV at the time of purchase of the shares being redeemed or (2) the NAV of such shares being redeemed, if redeemed within a one-year period from the date of purchase. Class Y shares and Institutional Class shares are not subject to sales charges. |
The performance of the above Fund does not reflect the deduction of taxes that a shareholder would pay on Fund distributions or the redemption of Fund shares.
Notes to Chart
Russell 3000® Index measures the performance of the 3,000 largest U.S. companies based on total market capitalization, which represents approximately 98% of the investable U.S. equity market.
S&P 500® Index is a group of 500 widely held stocks and is commonly regarded to be representative of the large capitalization stock universe.
The Frank Russell Company (FRC) is the source and owner of the Russell 3000® Index data contained or reflected in this material and all trademarks and copyrights related thereto. The material may contain confidential information and unauthorized use, disclosure, copying, dissemination or redistribution is strictly prohibited. This is a Touchstone Investments presentation of the data, and FRC is not responsible for the formatting or configuration of this material or for any inaccuracy in the presentation thereof.
Management's Discussion of Fund Performance (Unaudited)
Touchstone Global ESG Equity Fund
Sub-Advised by Rockefeller & Co., LLC
Investment Philosophy
The Touchstone Global ESG Equity Fund seeks long-term growth of capital. The Fund primarily invests in equity securities of U.S. and non-U.S. companies and generally focuses on larger, more established companies. The Fund selects investments based on an evaluation of a company’s sustainability and impact practices which considers environmental, social and governance (ESG) impacts and risks of a company, how well the company manages these impacts and risks, and ascertains the company’s willingness and ability to take a leadership position in implementing best practices.
Fund Performance
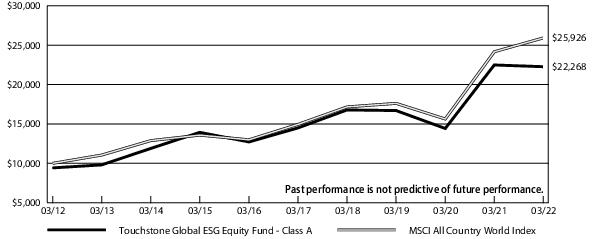
The Touchstone Global ESG Equity Fund (Class A Shares) underperformed its benchmark, the MSCI All Country World Index, for the 12-month period ended March 31, 2022. The Fund’s total return was -0.98% (calculated excluding the maximum sales charge), while the total return of the benchmark was 7.28%.
Market Environment
The 12-month period ending March 31, 2022 marked the transition from pandemic recovery to the prospects of normalcy as vaccination rates rose and borders slowly re-opened. Market returns were weaker than the prior year with the U.S. still posting solid returns, which outperformed Europe’s results while equities in the Asia Pacific region declined. Vaccine rollouts in the U.S. began to accelerate during the spring months, allowing the U.S. to recover faster than other markets as it gradually scaled back COVID-19 pandemic restrictions. Other regions were one to two quarters behind the U.S. in dispersing vaccines, but Asia’s “COVID-Zero” policy weighed on global GDP.
Over the course of the past year, global economies faced COVID-19 flare-ups such as the Delta variant during the summer months and the less contagious Omicron variant in late November. In each instance, the Chicago Board Options Exchange's CBOE Volatility Index spiked, depressing the 10-year yield, and the markets sold off but recovered given lower fatality rates. Nonetheless, the uncertainty associated with these new variants was a hindrance to the re-opening of economies.
U.S. consumers remained resilient as government stimulus programs and improving unemployment rates strengthened household balance sheets. Using credit card balances as a barometer, balances in the U.S. declined from the fourth quarter 2019 to the fourth quarter 2021. Yet, over the course of calendar year 2021, U.S. consumers continued to spend a higher share of their disposable income on durable goods averaging $2.0 trillion annualized vs $1.5 trillion prior to the pandemic. The step up in consumption levels, combined with lean inventories and supply chain issues, forced inflation rates higher over the course of the year.
Supply chain bottlenecks have been a persistent problem since the COVID-19 outbreak. The problem manifested itself in two forms: not enough labor and not enough components to manufacture the product. The effects of lower inventory of goods and stimulus induced spending pushed the U.S. Consumer Price Index from 2.6% in March 2021 to 7.9% as of February 2022. U.S. Federal Reserve Board (Fed) Chair, Jerome Powell, had maintained that inflation was “transitory” for the majority of 2021 but changed that stance in November. 10-year U.S. Treasury yields rose from 1.4%, when the word “transitory” was dropped, to 2.3% by the end of March 2022 in anticipation of rising Fed Funds Rate.
High inflation rates weighed on consumer sentiment with the University of Michigan Consumer Sentiment Index declining from 85.5 in June 2021 to 59.4 in March 2022. The unfortunate circumstances surrounding Russia’s invasion of Ukraine only exacerbated the inflation problem. The subsequent global response to the Ukrainian invasion has been a tidal wave of sanctions against Russian entities paralyzing segments of global trade namely energy and agriculture. As a result, Brent crude prices spiked north of $100/bbl, European gas prices tripled on the onset of Russian attack and have since settled 50% higher, and grain prices have soared.
High commodity costs also influenced the foreign exchange markets over the past six months. Resource rich exporting nations experienced a strengthening of their currencies such as the Brazilian Real and Australian dollar, while net importers face headwinds such as the Japanese Yen and Euro. In addition to swift currency movement, we think the current account balances could experience a deterioration with Asian countries most exposed to this risk.
China became collateral damage to Russian sanctions in early March 2022 as investors sold Chinese stocks fearing that China would be sanctioned for transacting with Russia. The Chinese market has underperformed since late 2020 as the regulatory environment became challenging and the property market deteriorated.
Management's Discussion of Fund Performance (Unaudited) (Continued)
The U.S. market continued its outperformance due to stable regulatory environment, innovative companies, and strong capital markets. Growth dramatically outperformed Value from April 2021 to December 2021 as lingering global COVID-19 infection surges delayed economic openings and a dovish Fed position continued for most of the year in support of long duration equities. It is worth noting that the U.S. economy performed well during this period, and companies outperformed earnings expectations for the year. 2021 Earnings Per Share estimates for the S&P 500 Index was $175 in April 2021 but was revised higher during the year to finish at $207. However, as expectations of inflation continued to increase, 10-year yields began to follow suit in anticipation of pending rate increases during January 2022 and February 2022. The impact of this was a significant decline in long duration equities while the reflation trade performed positively in the final quarter of the 12-month period.
From a sector perspective, Energy, Health Care, and Information Technology were the strongest sectors while Communication Services, Consumer Discretionary, and Industrials were the weakest.
Portfolio Review
The Fund underperformed the benchmark on a relative basis, due primarily to stock selection within Health Care and Consumer Discretionary sectors and in part to the Fund’s relative underweight to Energy and Metal & Mining, which outperformed during the period on the back of higher commodity prices. On a regional basis, North America was the largest detractor during the period.
Healthcare, led by weakness in BridgeBio and Koninklijke Philips NV ("Philips"), was the largest detracting sector. BridgeBio’s weakness was a result of a phase 3 study for ATTR-CM, an under-diagnosed heart condition whereby the heart muscle stiffens and leads to heart failure. BridgeBio’s acoramidis failed to meet its primary end-point with patients on the drug performing no better than those on placebo. We sold the Fund’s position during the period. Philips was negatively impacted by supply chain disruptions and litigation risks stemming from the recall of their CPAP device. The recalled product represents approximately four percent of sales and we believe the impact to market value likely exceeds the future litigation costs.
Alibaba Group Holdings Ltd. was the largest detracting stock due to regulatory changes occurring across many industries in China. We view the sell-off in Alibaba as overdone and with the stock selling at 15x expected earnings, consider the political and regulatory risk already priced into the valuation.
Industrials was the largest contributing sector, with shares of RELX PLC contributing on improving growth in Risk and Science Technical & Medical. Within Financials, First Horizon Corp. was one of the largest contributors during the period as the stock price rallied following news of takeover by TD Bank.
The Fund made several changes during the 12-month period, including the additions of RELX, Elanco Animal Health Inc., Centene Corp, and Epiroc AB-A.
In early 2021, the Fund initiated a position in RELX. RELX, a U.K.-based information services company, develops information-based analytics and decision tools in the Scientific, Technical & Medical, Risk, Legal and Exhibitions sectors. We view these as steady businesses with solid barriers to entry and recurring revenues, which are not currently being reflected in the valuation. RELX scores high across the board on ESG metrics, including in key areas of privacy and data security and talent attraction and retention.
In the third quarter 2021, the Fund initiated a position in Elanco Animal Health Inc. Elanco Animal Health is a U.S.- based provider of farm animal and pet health medicine. We believe there is a longer-term margin expansion opportunity, in part due to its acquisition of Bayer’s animal health business and the expected synergies, and due to revenue growth acceleration as drugs in its pipeline rollout. We believe the company has room for improvement in their Board composition, product quality and safety, and corporate compliance. The company has demonstrated focus on improving their ESG quality by conducting an ESG materiality assessment, disclosing the company’s environmental impact and establishing goals in line with the United Nation’s Sustainable Development Goals.
In the fourth quarter 2021, the Fund initiated a position in Centene, a U.S.-based leading managed care organization (MCO) providing insurance products for government sponsored healthcare programs such as Medicaid, Health Exchanges and Medicare Advantage. As a preeminent provider of government sponsored health plans, we believe Centene should be able to grow topline growth driven by population growth, medical cost inflation, program expansion and share gains for both the MCO industry in general and Centene specifically. Additionally, Centene has a margin expansion plan into 2024. With the stock trading at the low end of its peers and below historical averages, we view the company as attractive given this earnings growth profile. Focus areas of engagement include health and demographic risk and privacy and data security.
In the first quarter 2022, the Fund initiated a position in Epiroc. Epiroc, based in Sweden, is a leading manufacturer of mining equipment and on the cutting edge of automating mining processes. Mining is inherently a dangerous activity given remote locations and hazardous conditions. We believe the company should benefit from increased demand as customers display greater willingness to adopt automated mining equipment, which will enhance worker safety and improve yields. Epiroc is a leader in working to reduce the industry’s carbon footprint by beginning to roll out electrified powertrains to help lower greenhouse gas
Management's Discussion of Fund Performance (Unaudited) (Continued)
emissions and targeting emission-free underground equipment by 2025 and 2030 for surface equipment. The company’s sustainability goals, including halving its Co2 emissions by 2030, were approved last year by the Science Based Targets Initiative as being in line with keeping global warming at a maximum 15o C, consistent with the latest climate science and the goal of the Paris Climate Agreement.
The Fund also eliminated several positions including Aflac Inc., Agnico Eagle Mines, Kohl’s Corp, and First Horizon Corp. Aflac was sold as we found its valuation unattractive given its lack of revenue and earnings growth as new policy sales continue to be sluggish in both Japan and the U.S. We sold Kohl’s as it approached our price target after significantly outperforming. First Horizon was sold on news of a takeover offer by TD Bank.
Outlook and Conclusion
We believe the recent rise in the U.S. treasury yields is indication of a delayed appreciation by the markets, and central banks, of the increasing inflationary pressures brought on by pandemic-related stimulus and monetary policy. As such, this has led to multiple contractions in areas of the market where valuations were elevated, and the start of a rotation towards more reasonably valued areas of the market. We believe this rotation has room to continue, with the recent geopolitical tensions leading to a temporary disruption to this trend as investors have flocked back to growth stocks reflecting increased concerns about recession. However, the markets will likely pivot whenever there is a lasting ceasefire with recent leaders like oil & gas, chemicals, and defense taking a backseat to financials and industrials. In the meanwhile, companies with stretched balance sheets will likely be hurt until recession fears are allayed. With the timing of a ceasefire hard to predict, we believe the prudent course of action is to extend horizons past this war and stay invested in durable businesses over the long-term that are not dependent on Russia to sell their products or to produce key inputs for their business. Ultimately, we expect much of the world to look the same and to snap back from this conflict, but the relationship with Russia will likely remain strained for years.
We continue to believe that a normalization of interest rates should be a positive contributor to our strategy as long duration equities face multiple compression offset by financials and other reflationary sectors. While Brent crude oil prices have spiked in recent months due to Russian sanctions, we believe that directionally, the probabilities are starting to skew towards modestly weaker prices. Sequential energy cost improvement should benefit global consumers especially within the non-U.S. markets, which would be supportive of those markets.
Management's Discussion of Fund Performance (Unaudited) (Continued)
Comparison of the Change in Value of a $10,000 Investment in the Touchstone Global ESG Equity Fund - Class A* and the MSCI All Country World Index
| Average Annual Total Returns** |
| Touchstone Global ESG Equity Fund | 1 Year | 5 Years | 10 Years |
| Class A | -5.94% | 7.68% | 8.33% |
| Class C | -2.71% | 8.05% | 8.30% |
| Class Y | -0.74% | 9.23% | 9.25% |
| Institutional Class* | -0.74% | 9.25% | 9.28% |
| MSCI All Country World Index | 7.28% | 11.64% | 10.00% |
| * | The chart above represents performance of Class A shares only, which will vary from the performance of Class C shares, Class Y shares and Institutional Class shares based on the differences in sales loads and fees paid by shareholders in the different classes. The inception date of Institutional Class shares was May 4, 2015. Institutional Class shares performance information was calculated using the historical performance of Class A shares for periods prior to May 4, 2015. The returns have been restated for sales loads and fees applicable to Institutional Class shares. |
| ** | The average annual total returns shown above are adjusted for maximum sales loads and fees, if applicable. The maximum offering price per share of Class A shares is equal to the net asset value (“NAV”) per share plus a sales load equal to 5.26% of the NAV (or 5.00% of the offering price). Class C shares are subject to a contingent deferred sales charge (“CDSC”) of 1.00%. The CDSC will be assessed on an amount equal to the lesser of (1) the NAV at the time of purchase of the shares being redeemed or (2) the NAV of such shares being redeemed, if redeemed within a one-year period from the date of purchase. Class Y shares and Institutional Class shares are not subject to sales charges. |
The performance of the above Fund does not reflect the deduction of taxes that a shareholder would pay on Fund distributions or the redemption of Fund shares.
Notes to Chart
MSCI All Country World Index measures the equity market performance of developed and emerging markets.
MSCI makes no express or implied warranties or representations and shall have no liability whatsoever with respect to any MSCI data contained herein. The MSCI data may not be further redistributed or used to create indices or financial products. This report is not approved or produced by MSCI.
Management's Discussion of Fund Performance (Unaudited)
Touchstone Growth Opportunities Fund
Sub-Advised by Westfield Capital Management Company, L.P.
Investment Philosophy
The Touchstone Growth Opportunities Fund seeks long-term growth of capital by primarily investing in stocks of U.S. companies with large, medium and small market capitalizations. The Fund’s portfolio managers place focus on companies they believe to have demonstrated records of achievement with excellent prospects for earnings growth over a 1- to 3-year period. The Fund's sub-advisor, Westfield Capital Management Company, L.P., looks for companies that it believes are reasonably priced with high forecasted earnings potential.
Fund Performance
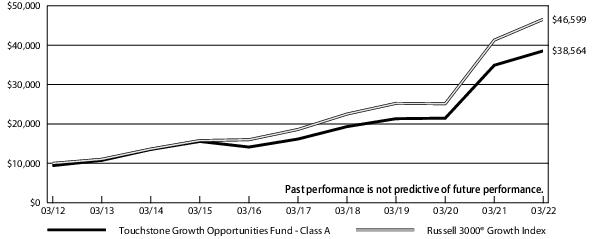
The Touchstone Growth Opportunities Fund (Class A Shares) underperformed its benchmark, the Russell 3000® Growth Index, for the 12-month period ended March 31, 2022. The Fund’s total return was 10.48% (calculated excluding the maximum sales charge), while the total return of the benchmark was 12.86%.
Market Environment
The 12-month market and economic environment ending March 31, 2022 is best described in its quarterly sub-periods. Beginning with the second quarter of 2021, which marked the fifth consecutive quarterly gain since the first quarter 2020 COVID-19-related sell-off, secular growth stocks outperformed pro-cyclical stocks and value, as a factor. U.S. equities finished the third quarter 2021 primarily lower as investors digested a myriad of concerns including the COVID-19 Delta variant, ‘peak everything,’ persistent supply chain disruptions, and rising input costs. U.S. equities rose in the final quarter of 2021 to close out the year near all-time highs, despite a tumultuous final month in which the COVID-19 Omicron variant swept across the globe with astonishing speed and the U.S Federal Reserve Board (Fed) pivoted policy to tackle rising inflationary pressures. After notching fresh all-time highs in the first days of 2022, U.S. equities ended the year’s first quarter markedly lower, booking the first quarterly decline since the start of the COVID-19 pandemic. Growth lagged value and small caps lagged large caps over first quarter 2022 as slowing growth, persistent inflation, the COVID-19 Omicron variant, and increased recessionary fears plagued investor sentiment. Central to the narrative for the quarter was the breakout of war in Ukraine, which created a tragic humanitarian crisis, but also exacerbated already disrupted supply chains and drove sharp price responses in commodity markets already reeling from supply/demand imbalances. For U.S. equities, this uncertainty created by an unclear geopolitical outcome was compounded further by increasingly hawkish Fed posturing. Expectations for interest rate hikes in 2022 jumped in rather dramatic fashion from two hikes estimated at the beginning of the year to nine at period-end. The result of swiftly changing market expectations impacted all corners of the market during the final quarter of the period as risk was repriced across the investable universe.
From a style perspective within the broad U.S. equities market, value equities outperformed growth in the small- and mid-cap segments, but large-cap growth equities continued to outpace their large-cap value counterparts.
Within the Russell 3000® Growth Index, all sectors generated positive returns with the lone exception of Materials. Energy was the strongest sector by a wide margin, but the Information Technology, Financials, and Consumer Staples sectors outperformed the broader Index. In terms of factor performance, the earnings yield factor, a proxy for value, and volatility outperformed.
Portfolio Review
The Fund’s relative underperformance was driven by relative weakness within Information Technology, Health Care and Consumer Discretionary, which outweighed relative strength within Communication Services and Energy.
The Information Technology sector was the primary detractor from relative results during the period. Financial Technology company Fidelity National Information Services, Inc. was the largest detractor from relative results. Fidelity underperformed as investors rotated away from growth at a reasonable price (GARP) fintech towards high growth, high multiple payments and value financials, including banks. The market has decided that larger, slower-growing payment companies are ceding share at an accelerating pace. We think this is exaggerated, and believe the market is missing the magnitude of the cyclical recovery in volumes and revenue yields in the merchant segment and the duration of the growth opportunity in the banking segment. Additionally, the Fund’s underweight position to Microsoft Corporation weighed on relative results. Microsoft outperformed following better than expected results and strong guidance throughout the year. The Fund maintains a large position in Microsoft, but is underweight given the large benchmark weight, as we have allocated capital to other areas, which we believe have more attractive risk/reward.
Health Care also detracted from performance. Turning Point Therapeutics, Inc. a targeted precision oncology company, detracted from relative returns within the sector as data from its two lead assets missed investor expectations. We exited the position following the negative data release as we thought it no long represented a “best idea” within the sector. Biopharmaceutical company, Biogen,
Management's Discussion of Fund Performance (Unaudited) (Continued)
Inc. also detracted from relative results. Biogen underperformed around negative headlines for its approved Alzheimer’s drug Aduhelm. In November, headlines broke of Aduhelm patients experiencing brain swelling, which was an additional drag on sentiment. In addition, the company lowered near term expectations for Aduhelm. Given this backdrop, we decided to exit the position to fund other ideas with what we believed have better risk/reward characteristics.
Consumer Discretionary sector also detracted from performance. Optical retailer National Vision Holdings, Inc. detracted from relative results. Management has been conservative historically, but uncertainty created by cycling challenging prior year comparisons coupled with some difficult to predict timing issues combined with guidance that fell short of investor expectations put pressure on the stock. Over a multi-year period, we believe National Vision’s sales performance and market share gains remain impressive and consistent with its long-term trend rate of growth. We continue to favor the stock believing its market share gain opportunity remains compelling among low-cost solutions, and we think the business should continue to generate consistent sales and profit growth at an attractive valuation.
Communication Services was the strongest relative performing sector during the period driven by strong stock selection. Live Nation Entertainment, Inc. a global entertainment promotor, operator and manager contributed to relative outperformance. The stock rose after the company reported impressive results during the period, importantly with strong leading indicators for tour lineups for the 2022/2023 calendar year. Moving forward, we believe Live Nation is poised to capitalize on increased attendance at in-person entertainment events as restrictions and concerns ease, and pent-up demand is released across the globe.
Energy also contributed to relative returns. Devon Energy Corporation, an oil and natural gas exploration and production company, was a top contributor over the period. The stock outperformed as investors came to appreciate the discipline of their healthy dividends and robust buybacks combined with rising oil prices. Oil prices were already up double digits prior to the Russian invasion of Ukraine, which applied further upward pressure on oil prices, in turn driving the stock price higher. We believe Devon has the potential to generate a substantial portion of its market cap in cash while simultaneously growing in the low-single-digits, which is attractive given the highly inflationary backdrop.
We continue to believe having a balance of high-quality cyclical and secular growth companies will provide more consistency over time. Depending on the market environment and where we are finding the best earnings growth opportunities, we will tilt the portfolio to take advantage of the current opportunity set. For example, in 2021, we were finding the most significant earnings upside potential in cyclicals and recovery-oriented stocks. As a result, we added to our cyclical/recovery exposure in 2021. More recently, we have been taking advantage of the market volatility and adding to some high conviction, higher growth, high quality names as valuations have become more attractive. This was especially apparent within Communication Services and Information Technology sectors, where we have added the most exposure over the last year. For example, we recently purchased ZoomInfo Technologies, Inc. in Communication Services, and Marvell Technology, Inc. and HubSpot, Inc. within Information Technology.
The Fund’s largest sector change was in Health Care, as we rotated capital into the sectors discussed above. Despite these changes, the Fund continues to have a healthy absolute weight in Health Care and remains overweight relative to the benchmark as we believe the sector has a great secular backdrop and innovation, especially within biopharma and medical devices,
It is important to remember that we take a bottom-up, fundamental approach when identifying securities for inclusion within the Fund and sector exposures are the result of our fundamental conviction in individual companies.
Outlook and Conclusion
The central debate from here revolves around the strong possibility of the U.S. cascading into a recession. We believe that waning fiscal stimulus, slowing earnings growth, and second order effects from conflict in Eastern Europe will create an environment in which the economy is unable to endure an interest rate hiking cycle. In addition, the fabled 10-year/2-year yield curve inversion has been repeatedly cited as evidence of the strong possibility of recession in the U.S. We understand the challenges of today’s market and the uncertainty present however would contend that many crosscurrents exist. Counterbalancing some of the market threats listed previously are strong, if not robust, consumer balance sheets with massive built up savings, strong corporate balance sheets with low leverage, a healthy labor market flush with available jobs, and limited investment alternatives to equities given the negative real interest rates. We anticipate that the environment will continue to be a stock-picker’s market and will remain favorable to our investment style moving forward.
We believe that companies with strong underlying earnings growth that trade at reasonable valuations will be favored at the expense of high multiple momentum growth stocks. If the market environment plays out like we think it will, with rising interest rates and rising inflation, earnings multiples are likely to compress with the most pronounced impact being felt by those companies with the longest duration assets most heavily influenced by discount rates. In addition, falling correlations are increasing the importance and impact of good stock picking. With persistent inflation likely for the foreseeable future, our focus will remain on high-quality
Management's Discussion of Fund Performance (Unaudited) (Continued)
operators with pricing power, which are, positioned advantageously for uncertain input costs and continued supply chain disruptions. We believe having a balanced portfolio of secular and cyclical growth will lead to favorable results over time and market environments.
Comparison of the Change in Value of a $10,000 Investment in the Touchstone Growth Opportunities Fund - Class A* and the Russell 3000® Growth Index
| Average Annual Total Returns** |
| Touchstone Growth Opportunities Fund | 1 Year | 5 Years | 10 Years |
| Class A | 4.96% | 17.58% | 14.45% |
| Class C | 8.77% | 18.09% | 14.44% |
| Class Y | 10.75% | 19.28% | 15.43% |
| Institutional Class | 10.84% | 19.40% | 15.54% |
| Russell 3000® Growth Index | 12.86% | 20.16% | 16.64% |
| * | The chart above represents performance of Class A shares only, which will vary from the performance of Class C shares, Class Y shares and Institutional Class shares based on the differences in sales loads and fees paid by shareholders in the different classes. |
| ** | The average annual total returns shown above are adjusted for maximum sales loads and fees, if applicable. The maximum offering price per share of Class A shares is equal to the net asset value (“NAV”) per share plus a sales load equal to 5.26% of the NAV (or 5.00% of the offering price). Class C shares are subject to a contingent deferred sales charge (“CDSC”) of 1.00%. The CDSC will be assessed on an amount equal to the lesser of (1) the NAV at the time of purchase of the shares being redeemed or (2) the NAV of such shares being redeemed, if redeemed within a one-year period from the date of purchase. Class Y shares and Institutional Class shares are not subject to sales charges. |
The performance of the above Fund does not reflect the deduction of taxes that a shareholder would pay on Fund distributions or the redemption of Fund shares.
Notes to Chart
Russell 3000® Growth Index measures the performance of those Russell 3000® companies with higher price-to-book ratios and higher forecasted growth values.
The Frank Russell Company (FRC) is the source and owner of the Index data contained or reflected in this material and all trademarks and copyrights related thereto. The material may contain confidential information and unauthorized use, disclosure, copying, dissemination or redistribution is strictly prohibited. This is a Touchstone Investments presentation of the data, and FRC is not responsible for the formatting or configuration of this material or for any inaccuracy in the presentation thereof.
Management's Discussion of Fund Performance (Unaudited)
Touchstone Mid Cap Growth Fund
Sub-Advised by Westfield Capital Management Company, L.P.
Investment Philosophy
The Touchstone Mid Cap Growth Fund seeks to increase the value of Fund shares by primarily investing in stocks of mid-cap U.S. companies. The Fund’s portfolio managers place focus on companies that they believe to have a demonstrated record of achievement with excellent prospects for earnings growth over a 1-to-3-year period. The Fund's sub-advisor, Westfield Capital Management Company, L.P., looks for companies that it believes are reasonably priced with high forecasted earnings potential.
Fund Performance
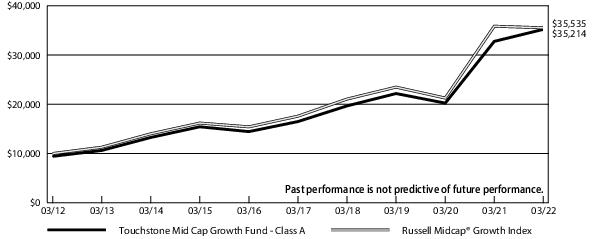
The Touchstone Mid Cap Growth Fund (Class A Shares) outperformed its benchmark, the Russell Midcap® Growth Index, for the 12-month period ended March 31, 2022. The Fund’s total return was 7.43% (calculated excluding the maximum sales charge), while the total return of the benchmark was -0.89%.
Market Environment
The 12-month market and economic environment ending March 31, 2022 is best described in its quarterly sub-periods. Beginning with the second quarter of 2021, which marked the fifth consecutive quarterly gain since the first quarter 2020 COVID-19-related sell-off, secular growth stocks outperformed pro-cyclical stocks and value, as a factor. U.S. equities finished the third quarter of 2021 primarily lower as investors digested a myriad of concerns including the COVID-19 Delta variant, ‘peak everything,’ persistent supply chain disruptions, and rising input costs. U.S. equities rose in the final quarter of 2021 to close out the year near all-time highs, despite a tumultuous final month in which the COVID-19 Omicron variant swept across the globe with astonishing speed and the U.S Federal Reserve Board (Fed) pivoted policy to tackle rising inflationary pressures. After notching fresh all-time highs in the first days of 2022, U.S. equities ended the year’s first quarter markedly lower, booking the first quarterly decline since the start of the COVID-19 pandemic. Growth lagged value and small caps lagged large caps over first quarter 2022 as slowing growth, persistent inflation, the COVID-19 Omicron variant, and increased recessionary fears plagued investor sentiment. Central to the narrative for the quarter was the breakout of war in Ukraine, which created a tragic humanitarian crisis, but also exacerbated already disrupted supply chains and drove sharp price responses in commodity markets already reeling from supply/demand imbalances. For U.S. equities, this uncertainty created by an unclear geopolitical outcome was compounded further by increasingly hawkish Fed posturing. Expectations for interest rate hikes in 2022 jumped in rather dramatic fashion from two hikes estimated at the beginning of the year to nine at period-end. The result of swiftly changing market expectations impacted all corners of the market during the final quarter of the period as risk was repriced across the investable universe.
Over the entire 12-month period within the broad U.S. equities market, value equities outperformed growth in the small- and mid-cap segments, but large-cap growth equities continued to outpace their large-cap value counterparts.
The Russell Midcap® Growth Index declined modestly, led lower by losses in the Communication Services, Consumer Staples, and Consumer Discretionary sectors. The Energy sector produced outsized gains while Financials, Real Estate, Information Technology and Industrials were also positive. In terms of factor performance within the Index, the momentum and earnings yield factor, a proxy for value, outperformed while the growth and volatility factors underperformed.
Portfolio Review
The Fund’s relative outperformance was driven by stock selection within Communication Services, Financials, and Consumer Discretionary though stock selection was a positive contributor in all sectors. There were no significant detractors on a sector basis during the period.
Communication Services was the strongest relative performer during the period with performance driven by strong stock selection. Live Nation Entertainment, Inc. a global entertainment promotor, operator and manager was the top contributing stock within the sector. The stock rose after the company reported impressive results during the period, importantly with strong leading indicators for tour lineups for the 2022/2023 calendar year. Moving forward, we believe Live Nation is poised to capitalize on increased attendance at in-person entertainment events as restrictions and concerns ease, and pent-up demand is released across the globe.
Financials also contributed positively to relative and absolute performance during the year, primarily driven by strong stock selection. The Fund’s holdings across capital markets, consumer finance and insurance all generated positive relative returns. Arthur J. Gallagher & Co., which provides insurance brokerage and risk management services, added to relative returns after releasing results during the period that surpassed consensus and provided growth forecasts for 2022, which were above expectations. We believe Arthur J. Gallagher is well-positioned, as the company has shown consistency and is more domestically-focused compared to peers.
Management's Discussion of Fund Performance (Unaudited) (Continued)
Consumer Discretionary was another source of relative and absolute strength. Beauty products retailor Ulta Beauty, Inc. was the largest contributor to relative results. The stock outperformed following an impressive earnings report where it released strong 2022 earnings per share guidance. While Ulta has seen strong acceleration in same store sales, we believe it can continue to grow through partnerships with new and innovative digitally native brands such a Kylie Cosmetics and continued investment in personalized digital marketing.
We continue to believe having a balance of high-quality cyclical and secular growth companies will provide for consistency over time. Depending on the market environment and where we are finding the best earnings growth opportunities, we will tilt the Fund’s portfolio in an effort to take advantage of the current opportunity set. For example, in 2021, we were finding the most significant earnings upside potential in cyclicals and recovery-oriented stocks. As a result, we added to the Fund’s cyclical/recovery exposure in 2021, including Financials and Energy as we thought names within these areas had the highest earnings recovery potential. Both of these were sources of positive contribution to relative returns. More recently, we have taken advantage of the market volatility and added to some high conviction, higher growth, high quality names as valuations have become more attractive. This was especially apparent within the Information Technology sector, where we have added the most exposure over the last year. For example, within Information Technology we recently bought Zscaler, Inc., a disruptive network security pioneer with leading growth & margins. With a large total addressable market, superior architecture to support sustainable growth, robust sales productivity, alongside a strong management team, we believe that Zscaler provides a compelling risk/reward and long-term opportunity for impressive growth.
The Fund’s largest sector change was in Health Care, as we rotated capital into the sectors discussed above. Despite these changes, the Fund’s absolute exposure remains large and remains overweight relative to its benchmark, as we believe the sector has a great secular backdrop and innovation, especially within biopharma and medical devices.
It is important to remember that we take a bottom-up, fundamental approach when identifying securities for inclusion within the strategy and sector exposures are the result of our fundamental conviction in individual companies.
Outlook and Conclusion
The central debate from here revolves around the strong possibility of the U.S. cascading into a recession. We believe that waning fiscal stimulus, slowing earnings growth, and second order effects from conflict in Eastern Europe will create an environment in which the economy is unable to endure an interest rate hiking cycle. In addition, the fabled 10-year/2-year yield curve inversion has been repeatedly cited as evidence of the strong possibility of recession in the U.S. We understand the challenges of today’s market and the uncertainty present however would contend that many crosscurrents exist. Counterbalancing some of the market threats listed previously are strong, if not robust, consumer balance sheets with massive built up savings, strong corporate balance sheets with low leverage, a healthy labor market flush with available jobs, and limited investment alternatives to equities given the negative real interest rates. We anticipate that the environment will continue to be a stock-picker’s market and will remain favorable to our investment style moving forward.
We believe that companies with strong underlying earnings growth that trade at reasonable valuations will be favored at the expense of high multiple momentum growth stocks. If the market environment plays out like we think it will, with rising interest rates and rising inflation, earnings multiples are likely to compress with the most pronounced impact being felt by those companies with the longest duration assets most heavily influenced by discount rates. In addition, falling correlations are increasing the importance and impact of good stock picking. With persistent inflation likely for the foreseeable future, our focus will remain on high-quality operators with pricing power, which are, positioned advantageously for uncertain input costs and continued supply chain disruptions. We believe having a balanced portfolio of secular and cyclical growth will lead to favorable results over time and market environments.
Management's Discussion of Fund Performance (Unaudited) (Continued)
Comparison of the Change in Value of a $10,000 Investment in the Touchstone Mid Cap Growth Fund - Class A* and the Russell Midcap® Growth Index
| Average Annual Total Returns** |
| Touchstone Mid Cap Growth Fund | 1 Year | 5 Years | 10 Years |
| Class A | 2.08% | 15.02% | 13.42% |
| Class C | 5.76% | 15.45% | 13.40% |
| Class Y | 7.65% | 16.66% | 14.38% |
| Class R6* | 7.89% | 16.78% | 14.50% |
| Institutional Class | 7.79% | 16.74% | 14.48% |
| Russell Midcap® Growth Index | -0.89% | 15.10% | 13.52% |
| * | The chart above represents performance of Class A shares only, which will vary from the performance of Class C shares, Class Y shares, Class R6 shares and Institutional Class shares based on the differences in sales loads and fees paid by shareholders in the different classes. The inception date of Class R6 shares was February 10, 2020. Class R6 shares performance information was calculated using the historical performance of Institutional Class shares for periods prior to February 10, 2020. The returns have been restated for fees applicable to Class R6 shares. |
| ** | The average annual total returns shown above are adjusted for maximum sales loads and fees, if applicable. The maximum offering price per share of Class A shares is equal to the net asset value (“NAV”) per share plus a sales load equal to 5.26% of the NAV (or 5.00% of the offering price). Class C shares are subject to a contingent deferred sales charge (“CDSC”) of 1.00%. The CDSC will be assessed on an amount equal to the lesser of (1) the NAV at the time of purchase of the shares being redeemed or (2) the NAV of such shares being redeemed, if redeemed within a one-year period from the date of purchase. Class Y shares, Class R6 shares and Institutional Class shares are not subject to sales charges. |
The performance of the above Fund does not reflect the deduction of taxes that a shareholder would pay on Fund distributions or the redemption of Fund shares.
Notes to Chart
Russell Midcap® Growth Index measures the performance of those Russell Midcap® companies with higher price-to-book ratios and higher forecasted growth values.
The Frank Russell Company (FRC) is the source and owner of the Index data contained or reflected in this material and all trademarks and copyrights related thereto. The material may contain confidential information and unauthorized use, disclosure, copying, dissemination or redistribution is strictly prohibited. This is a Touchstone Investments presentation of the data, and FRC is not responsible for the formatting or configuration of this material or for any inaccuracy in the presentation thereof.
Management's Discussion of Fund Performance (Unaudited)
Touchstone Sands Capital Emerging Markets Growth Fund
Sub-Advised by Sands Capital Management, LLC
Investment Philosophy
The Touchstone Sands Capital Emerging Markets Growth Fund seeks long-term capital appreciation. The Fund invests in equity and equity-related securities issued by companies located in Emerging or Frontier Markets countries. The Fund’s sub-advisor, Sands Capital Management LLC, uses a “bottom-up” approach to investment selection, as opposed to sector or regional allocations that focuses on a company’s long-term business fundamentals. Sands Capital seeks companies that have: sustainable above-average earnings growth; a leadership position in a promising business space; significant competitive advantages such as profitability, superior quality or distribution relative to competitors or strong brand and consumer loyalty; a clear mission in an understandable business model; financial strength; and a rational valuation in relation to competitors, the market and business prospects.
Fund Performance
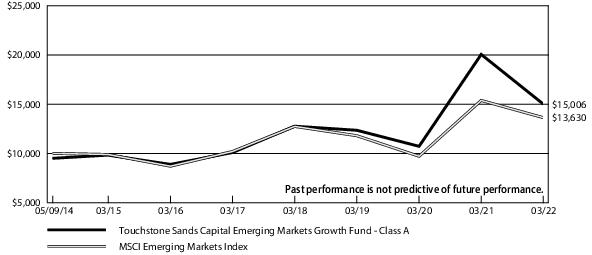
The Touchstone Sands Capital Emerging Markets Growth Fund (Class A Shares) underperformed its benchmark, the MSCI Emerging Markets Index, for the 12-month period ended March 31, 2022. The Fund’s total return was -25.16% (calculated excluding the maximum sales charge), while the total return of the benchmark was -11.37%.
Market Environment
Emerging Markets growth equities led the decline, which underperformed Emerging Markets value equities. Mid-East & Africa contributed most to the benchmark’s return from a regional perspective, while Emerging Asia was the top detractor. From a sector perspective, Financials and Utilities were top contributors, while Consumer Discretionary and Communication Services detracted the most.
Portfolio Review
The Fund underperformed the benchmark for the 12-month period, as growth equities significantly underperformed value equities. Security selection was the primary driver of relative results, while regional and sector allocation were also headwinds. Currency effect was a modest contributor. No regions positively contributed to the Fund’s relative results for the period, and Asia/Pacific ex-Japan was the top detractor. From a sector perspective, the Health Care sector was a positive contributor, while the Communication Services and Financials sectors were the top detractors.
Among the absolute individual contributors to the Fund’s relative results were Apollo Hospitals Enterprise Ltd., Bajaj Finance Ltd., Titan Company Ltd., Globant SA, and Bank Central Asia Tbk PT. Bajaj Finance’s third-quarter fiscal 2021 results (period ended December 31, 2021) were strong, given abating pandemic pressures in India. The business reported its fastest quarter-over-quarter loan growth in years, and its highest-ever absolute profit. Year-over-year metrics are misleading due to pandemic disruptions, but on a quarter-over-quarter basis, the loan book, gross operating income, and net income grew 9, 19, and 44 percent, respectively. Bajaj produced these results despite taking a precautionary excess provision of 60 basis points to cushion any potential impact from a third COVID-19 wave. Asset quality continued to improve, with non-performing loans reaching pre-pandemic levels. Combined with the upfront provisions, we expect Bajaj will be able to normalize credit costs in the coming quarters, supporting further profitability improvements. Finally, phase one of Bajaj’s digital transformation officially launched, and early metrics indicate that its consumer-facing app is gaining traction among the existing borrower base and successfully onboarding new clients. Management disclosed that additional features will continue to be launched every several months through October until the complete platform is live. Bajaj Finance remains one of our highest-conviction financial services businesses. Titan benefited over the past year as the business tracked our investment case. The stock’s price was bolstered by Indian equities more broadly, which outperformed global equities. Our investment case for Titan is simple, in our view: we expect the business to be a primary beneficiary from secular demand growth for jewelry in India, as it leverages its large omnichannel operation to take share from its informal competitors. We then anticipated its scale advantages and higher penetration of studded jewelry to result in margin leverage over time. In the third-quarter of its fiscal 2021 period (ended December 31, 2021), Titan’s jewelry sales grew 33 percent year-over-year, which is notable, given the difficult comparable of 22 percent growth in the comparable quarter last year. In addition to re-opening dynamics, we also believe Titan’s growth was attributable to its digital sales efforts. Titan’s Tanishq website is ranked first for desktop traffic in India, with 3 million monthly visits. Meanwhile, active application users have grown from 30,000 in mid-2000 to 175,000 today. Ultimately, we expect Titan to grow its share of Indian jewelry spending from 6 to 15 percent, driving annualized earnings growth in excess of 25 percent over the next five years. Bank Central Asia benefited from the broader rise in Indonesian equities, along with strong fourth-quarter fiscal 2021 results (period ending December 31, 2021). The business saw a gradual loan growth acceleration in the second half of last year, and expects this momentum to sustain as the COVID-19 pandemic’s impact wanes. Moreover, the tailwinds of a favorable commodity cycle (generally positive for Indonesian macro), rising interest rates, and normalizing credit costs should increase the likelihood of positive earnings surprises going forward. We believe Bank Central Asia
Management's Discussion of Fund Performance (Unaudited) (Continued)
remains early in capitalizing on its digital initiatives, including its independent digital bank Blu. In its first year of operations, Blu BDA Digital amassed a Know-Your-Customer-vetted customer base of approximately 600,000 and $80 million in deposits (compared with 1.2 million customers and $200 million in deposits at Indonesia’s largest digital bank). While the business remains expensive based on near-term valuation metrics, it remains, in our view, a high-quality banking franchise that faces an improving macro and business outlook.
Among the top individual detractors were Tencent Holdings Ltd., Yandex N.V., Alibaba Group Holdings Ltd., Sea Ltd., and TCS Group Holdings PLC. Tencent fell over the past year, along with Chinese technology shares more broadly, amid persistent geopolitical tensions and regulatory pressures. We have adopted a more negative view on the broader Chinese internet sector, but we still believe Tencent is a compelling business, with a strong management team and several large and under-monetized opportunities, including international AAA games, advertising (Wechat, short video), and software-as-a-service (Tencent Meeting, Tencent Documents, WeCom). We estimate that Tencent’s revenue could be at least 40 percent higher if it monetized these opportunities. Yandex and TCS Group fell, along with Russian equities more broadly, after Russia invaded Ukraine in late February. We sold both businesses, as the invasion made it clear to us that Russia is not currently investable for long-term equity investors due to structural governance and geopolitical risks. We had been trimming the Fund’s direct Russian exposure earlier in the year to mitigate risk, but a full-blown invasion was not our base-case scenario. At this time, there’s no way for us to forecast the impact of the conflict and sanctions on Russian businesses or the Russian economy. We will continue to monitor Yandex and TCS Group.
During the period we purchased Haidilao International Holdings, Kanzhun Ltd., TCS Group Holdings PLC, Country Garden Services Holding Co. Ltd., NIO Inc., NAVER Corp., Kakao Pay Corp., One97 Communications Ltd., Nu Holdings Ltd., Tata Consultancy Services, Ltd., and Reliance Industries Ltd. We sold New Oriental Education, Trip, CD Projekt, Prosus, Allegro, Vincom Retail, Yandex, TCS Group, Tencent Music, and One97 Communications.
Regional and sector exposures are largely a byproduct of the Fund’s bottom-up investment process, and the portfolio positioning at the end of the period. Emerging Asia was the strategy’s largest absolute regional weight and Latin America was the largest regional overweight. The Fund had no exposure to Eastern Europe, and Asia/Pacific ex-Japan was the largest underweight. From a country perspective, India was the largest absolute and relative weight. China was the second-largest absolute weight, but also the third-largest underweight, at 24% versus 30% for the benchmark. South Korea was the largest country underweight. The portfolio had no exposure to Russia.
From a sector perspective, Financials was the largest absolute weight and Consumer Discretionary was the largest overweight. The Fund had no exposure to the Utilities sector. The Information Technology sector was the largest underweight.
Outlook and Conclusion
Looking ahead, we anticipate overall growth to reaccelerate over the next several quarters, due to easier comparables and stabilizing regulation. The events and volatility seen this year emphasize to us the importance of seeking growth underpinned by powerful secular forces, which are unlikely to be derailed by changing central bank policy, energy prices, or near-term corporate guidance. If we can identify most of these businesses capable of growing regardless of market environment—and our forecasts are directionally right—then we expect that fundamentals will overwhelm any short-term stock-specific headwinds.
Examples of the secular trends underpinning Fund businesses are: Financial Penetration, Life Sciences Innovation, Mobile Internet, and Industry Digital Transformation.
In Emerging Markets Growth, we seek to add value by “going where the growth is”: seeking to identify those select few businesses that will sustain above-average growth by harnessing innovation and benefiting from secular change.
Management's Discussion of Fund Performance (Unaudited) (Continued)
Comparison of the Change in Value of a $10,000 Investment in the Touchstone Sands Capital Emerging Markets Growth Fund - Class A* and the MSCI Emerging Markets Index
| Average Annual Total Returns** |
| Touchstone Sands Capital Emerging Markets Growth Fund | 1 Year | 5 Years | Since
Inception* |
| Class A* | -28.91% | 7.17% | 5.28% |
| Class C* | -26.42% | 7.47% | 5.19% |
| Class Y* | -24.89% | 8.57% | 6.25% |
| Class R6* | -24.80% | 8.59% | 6.27% |
| Institutional Class* | -24.81% | 8.66% | 6.34% |
| MSCI Emerging Markets Index | -11.37% | 5.98% | 4.00% |
| * | The chart above represents performance of Class A shares only, which will vary from the performance of Class C shares, Class Y shares, Class R6 shares and Institutional Class shares based on the differences in sales loads and fees paid by shareholders in the different classes. The inception date of Class A shares, Class C shares, Class Y shares, Class R6 shares and Institutional Class shares was November 16, 2018, November 16, 2018, May 9, 2014, April 26, 2021 and May 9, 2014, respectively. Class A shares and Class C shares performance information was calculated using the historical performance of Class Y shares for periods prior to November 16, 2018. Class R6 shares performance information was calculated using the historical performance of Class Y shares for periods prior to April 26, 2021. The returns have been restated for sales loads and fees applicable to Class A shares, Class C shares and Class R6 shares. The returns of the index listed above are based on the inception date of the Fund. |
| ** | The average annual total returns shown above are adjusted for maximum sales loads and fees, if applicable. The maximum offering price per share of Class A shares is equal to the net asset value (“NAV”) per share plus a sales load equal to 5.26% of the NAV (or 5.00% of the offering price). Class C shares are subject to a contingent deferred sales charge (“CDSC”) of 1.00%. The CDSC will be assessed on an amount equal to the lesser of (1) the NAV at the time of purchase of the shares being redeemed or (2) the NAV of such shares being redeemed, if redeemed within a one-year period from the date of purchase. Class Y shares, Class R6 shares and Institutional Class shares are not subject to sales charges. |
The performance of the above Fund does not reflect the deduction of taxes that a shareholder would pay on Fund distributions or the redemption of Fund shares.
Notes to Chart
MSCI Emerging Markets Index is a free float-adjusted market capitalization index that is designed to measure equity market performance of emerging markets.
MSCI makes no express or implied warranties or representations and shall have no liability whatsoever with respect to any MSCI data contained herein. The MSCI data may not be further redistributed or used to create indices or financial products. This report is not approved or produced by MSCI.
Management's Discussion of Fund Performance (Unaudited)
Touchstone Strategic Income Opportunities Fund
Sub-Advised by Fort Washington Investment Advisors, Inc.
Investment Philosophy
The Touchstone Strategic Income Opportunities Fund seeks a high level of current income with a focus on capital preservation by investing primarily in public fixed income securities. The Fund's sub-advisor, Fort Washington Investment Advisors, Inc. ("Fort Washington"), employs a high conviction, yield-oriented investment approach with a relatively focused number of issuers, coupled with sector diversification and diligent risk management resulting in attractive risk-adjusted returns via high levels of income.
Fund Performance
The Touchstone Strategic Income Opportunities Fund (Class A Shares) outperformed its benchmark, the Bloomberg U.S. Aggregate Bond Index, for the 12-month period ended March 31, 2022. The Fund’s total return was -3.22% (calculated excluding the maximum sales charge) while the total return for the benchmark was -4.15%. Effective July 17, 2021, the AIG Flexible Credit Fund and the AIG Strategic Bond Fund merged into the newly created Touchstone Strategic Income Opportunities Fund. The Touchstone Strategic Income Opportunities Fund adopted the performance and accounting history of the AIG Strategic Bond Fund (the Predecessor Fund); however, the Touchstone Strategic Income Opportunities Fund has a new, separate and distinct investment strategy and sub-advisor. Prior to July 17, 2021, the Fund’s performance history is that of the AIG Strategic Bond Fund.
Market Environment
The market environment over the last 12 months has been full of uncertainty and volatility. The second quarter of 2021 saw a broad reopening of the economy from lockdowns stemming from the COVID-19 global pandemic. This coincided with an improving labor market that saw unemployment reach 3.9% by the end of 2021, despite starting the year at 6.7%. Markets performed exceptionally well during this period as economic growth returned to pre-pandemic levels and financial conditions remained extremely accommodative. Despite progress made through highly effective vaccines to combat COVID-19, several variants emerged throughout the year causing setbacks to the global economic rebound. The first problematic variant, Delta, led to a broad disruption in supply chains across the economy during a period of heightened demand. These supply chain concerns weighed on financial markets while also putting continued upward pressure on inflation. As Delta subsided, the highly contagious Omicron variant spread rapidly across the world. Markets quickly turned volatile as cases spiked, but the severity of the variant was less than expected, and markets rallied into year-end.
The first quarter of 2022 saw the fading of pandemic-related economic growth concerns, but persistently high inflation continues to shape the outlook for monetary policy and subsequent risks to the economy and risk assets. Additionally, the Russian invasion of Ukraine introduced a number of short- and long-term concerns, ranging from the direct impacts of higher commodity prices to the geopolitical implications of ongoing military conflict, sanctions, and humanitarian concerns.
U.S. economic growth experienced a sharp rebound in fourth quarter of 2021, growing 6.9%, and we believe is expected to moderate towards trend over the upcoming quarters. The impact of the Omicron variant on economic activity appears to have been limited, evidenced by accelerating monthly job gains over the last several months in the period and consumer spending that was largely unaffected. Along with strong job growth, above average wage growth bodes well for consumer income and the overall outlook for consumer spending. Recent increases in food and fuel prices, partly as a result of the Russian invasion of Ukraine, temper this optimism somewhat as consumers will have to spend more of their income on essential items, reducing demand for other discretionary spending.
Business spending has remained resilient, as the economy has faced a number of challenges over the past several quarters. Strong underlying demand provides a solid foundation, but supply and labor shortages have limited the pace of growth and put upward pressure on input prices. Supply chains are expected to ease somewhat, but new risks from a resurgence of COVID-19 in China and spillover effects of the invasion of Ukraine are likely to keep these issues at the forefront for longer than anticipated.
Along with consumers and businesses, persistently high inflation is top of mind for the U.S. Federal Reserve Board (Fed). Reported inflation is well above the Fed’s 2% target and is forecast to remain elevated for the next several months. High inflation combined with a strong labor market outlook has led the Fed to intensify their hawkish stance further in 2022. In March 2022, the Fed raised rates 25 basis points and indicated further increases were imminent and balance sheet reduction would commence mid-year. Since then, Fed officials have guided markets to a much faster pace of rate hikes, including the possibility of multiple 50 basis point hikes at upcoming meetings.
Interest rates adjusted sharply higher over the past year to reflect these expectations. Short-term rates were impacted the most, with the 2-year Treasury increasing 2.2% during the 12-month period. 10- and 30-year Treasury yields were 60 and 4 basis points higher, respectively, resulting in a significant flattening of the yield curve. Current market expectations are for the Fed to raise the
Management's Discussion of Fund Performance (Unaudited) (Continued)
Fed Funds rate to ~2.50% by the end of 2022. As the yield curve has become increasingly flat and inverted in some maturities, markets indicate confidence that the Fed will be able to contain inflation, but also concerned about the impact of tighter policy on future growth.
Risk assets performed well throughout most of 2021 before becoming volatile in the fourth quarter 2021 amid the COVID-19 Omicron wave. They continued to weaken in the first quarter 2022 as markets adjusted to expectations of tighter Fed policy and implications of the Russian invasion of Ukraine. Credit spreads entered 2022 near the tightest levels seen since 2000, before widening sharply as Ukraine fell under attack. Spreads recovered somewhat but ended the period wider across the spectrum of credit sectors. Certain regions within Emerging Markets Debt were the most impacted as several countries face important first- and second-order effects of the situation in Ukraine. Domestic credit spreads, both investment grade and high yield, ended the period below median historical spread levels, reflecting the expectation that economic growth will be able to weather effects of tighter policy and risks from geopolitical tension
Portfolio Review
Both interest rate management and sector allocation drove the relative outperformance compared to the benchmark.
The Fund was positioned with an average duration of approximately 4 years during the period, compared to 6.7 years for the benchmark. Treasury yields moved materially higher during the period, with the 10 Year Treasury yield increasing by 1.1%. As interest rates moved higher, the shorter duration of the Fund benefited performance compared to the benchmark.
Sector allocation added to performance relative to the benchmark during the period. An overweight exposure to High Yield was a key contributor to relative returns as the sector outperformed the broader market during the period.
Security selection was a modest contributor to relative returns for the period. Outperformance within Investment Grade Credit, High Yield, and Securitized all contributed to returns, but were offset by underperformance within Emerging Markets Debt.
Outlook and Conclusion
We believe the macro environment remains supportive of risk assets. The Fund is positioned to benefit from outperformance of risk assets, as well as security selection opportunities identified by the sub-advisor.
In terms of the Fund’s risk budget, we are targeting an overweight to spread risk supported by a positive view of the U.S. economy and fair valuations generally near median historical levels. The U.S. economy has considerable momentum, leaving many COVID-19 pandemic-related risks behind, leading to one of the strongest labor markets in history and increasing expectations of solid growth over the next several quarters. Credit spreads experienced volatility in first quarter 2022, but generally reflect the expectation that the economy will remain resilient in spite of emerging risks. Risks include the impact of Fed tightening on growth and inflation, as well as ongoing risks from the Russian invasion of Ukraine. The effects of tighter monetary policy represent a risk to growth, but we believe underlying momentum is strong and overall growth can remain solid as the Fed begins to raise rates and reduce the balance sheet. The Fed’s goal will be to reduce inflation to target and generate a “soft landing” for growth. As monetary policy changes, we intend to adjust positioning as these risks evolve. The impact of the situation in Ukraine has been sharply higher prices in certain commodities and downside risk to growth, focused in Europe. At this point, we judge these risks as manageable for the U.S. economy unless there is a significant escalation in the conflict.
In terms of positioning for the Fund, sector allocation reflects our overall positive outlook on valuations, attractive relative value, and opportunities within each sector. We continue to favor non-agency exposure within the securitized debt sector, with an overweight exposure to asset-backed securities, collateralized loan obligations and commercial mortgage-backed securities. The Fund continues to maintain an exposure to Emerging Markets Debt. Valuations remain attractive relative to domestic credit, especially in the high yield portion of the market. Latin America remains the largest exposure within the sector.
In terms of interest rate risk and Fund positioning, portfolio duration increased modestly during the period to 4.5 years and the Fund is positioned with a steepening bias. A significant amount of Fed tightening has been priced into short maturities and we believe yields generally represent fair value. Long-term rates are at risk to rise if economic growth remains resilient amid the expected policy tightening and potential for faster balance sheet reduction.
Our economic outlook supports credit spreads at current to tighter levels and a steady move higher in rates, particularly in the long-end. The Fund is positioned to take advantage of this outlook through its overweight to credit spread risk and underweight to duration. The Fund has generated yield through a high conviction multi-sector approach. Its yield has the potential to cushion it from higher interest rates. In this yield and high interest rate risk environment, we believe the Fund is a compelling solution for fixed income investors.
Management's Discussion of Fund Performance (Unaudited) (Continued)
Comparison of the Change in Value of a $10,000 Investment in the Touchstone Strategic Income Opportunities Fund - Class A* and the Bloomberg U.S. Aggregate Bond Index
| Average Annual Total Returns** |
| Touchstone Strategic Income Opportunities Fund* | 1 Year | 5 Years | 10 Years | Since
Inception |
| Class A | -7.75% | 1.75% | 2.71% | 5.46% |
| Class C | -4.97% | 2.03% | 2.49% | 5.22% |
| Class Y* | -2.97% | 2.98% | — | 2.90% |
| Institutional Class* | — | — | — | -4.94% |
| Bloomberg U.S. Aggregate Bond Index | -4.15% | 2.14% | 2.24% | 4.76% |
| * | The chart above represents performance of Class A shares only, which will vary from the performance of Class C shares, Class Y shares and Institutional Class shares based on the differences in sales loads and fees paid by shareholders in the different classes. The inception date of Class Y shares and Institutional Class shares was January 29, 2015 and July 19, 2021, respectively. The returns of the Index are based on the inception date of the Predecessor Fund. |
| ** | The average annual total returns shown above are adjusted for maximum sales loads and fees, if applicable. Effective July 17, 2021, the maximum offering price per share of Class A shares is equal to the net assets value (“NAV”) per share plus a sales load equal to 3.36% of the NAV (or 3.25% of the offering price). Prior to July 17, 2021, the maximum offering price per share of Class A shares was equal to the NAV per share plus a sales load equal to 3.90% of the NAV (or 3.75% of the offering price).Class C shares are subject to a contingent deferred sales charge (“CDSC”) of 1.00%. The CDSC will be assessed on an amount equal to the lesser of (1) the NAV at the time of purchase of the shares being redeemed or (2) the NAV of such shares being redeemed, if redeemed within a one-year period from the date of purchase. Class Y shares and Institutional Class shares are not subject to sales charges. |
The performance of the above Fund does not reflect the deduction of taxes that a shareholder would pay on Fund distributions or the redemption of Fund shares.
Note to Chart
Bloomberg U.S. Aggregate Bond Index is an unmanaged index comprised of U.S. investment grade, fixed rate bond market securities, including government, government agency, corporate and mortgage-backed securities between one and ten years.
Tabular Presentation of Portfolio of Investments (Unaudited)
March 31, 2022
The tables below provide each Fund’s geographic allocation, sector allocation and/or credit quality. We hope it will be useful to shareholders as it summarizes key information about each Fund’s investments.
Touchstone Flexible Income Fund
| Credit Quality*(% of Fixed Income Securities) |
| AAA/Aaa | 37.6% |
| AA/Aa | 1.0 |
| A/A | 4.4 |
| BBB/Baa | 12.8 |
| BB/Ba | 4.6 |
| B/B | 2.8 |
| Not Rated | 36.8 |
| Total | 100.0% |
| Credit Quality*(% of Preferred Stocks) |
| A/A | 4.1% |
| BBB/Baa | 58.1 |
| BB/Ba | 31.4 |
| B/B | 6.4 |
| Total | 100.0% |
| Sector Allocation**(% of Net Assets) |
| Fixed Income Securities | 63.6% |
| Preferred Stocks | |
| Financials | 7.6 |
| Utilities | 2.1 |
| Energy | 0.4 |
| Communication Services | 0.2 |
| Investment Funds | 8.2 |
| Short-Term U.S. Treasury Obligations | 13.0 |
| Short-Term Investment Funds | 4.5 |
| Exchange-Traded Fund | (2.7) |
| Other Assets/Liabilities (Net) | 3.1 |
| Total | 100.0% |
Touchstone Focused Fund
| Sector Allocation**(% of Net Assets) |
| Information Technology | 26.2% |
| Health Care | 13.4 |
| Consumer Discretionary | 13.1 |
| Communication Services | 12.5 |
| Financials | 12.2 |
| Industrials | 9.1 |
| Consumer Staples | 4.7 |
| Real Estate | 3.1 |
| Energy | 1.7 |
| Materials | 1.4 |
| Short-Term Investment Fund | 2.7 |
| Other Assets/Liabilities (Net) | (0.1) |
| Total | 100.0% |
Touchstone Global ESG Equity Fund
| Geographic Allocation(% of Net Assets) |
| Common Stocks | |
| United States | 55.0% |
| Japan | 8.6 |
| France | 5.7 |
| Sweden | 4.5 |
| South Korea | 4.4 |
| Germany | 4.0 |
| United Kingdom | 3.9 |
| Singapore | 2.5 |
| China | 2.1 |
| Switzerland | 1.9 |
| India | 1.7 |
| Italy | 1.7 |
| Netherlands | 1.4 |
| Denmark | 0.7 |
| Thailand | 0.7 |
| Short-Term Investment Funds | 3.9 |
| Other Assets/Liabilities (Net) | (2.7) |
| Total | 100.0% |
* Credit quality ratings are from S&P Global Ratings ("S&P") and Moody's Investors Service (“Moody's”). If agency ratings differ, the higher rating will be used. Where no rating has been assigned, it may be for reasons unrelated to the creditworthiness of the issuer.
** Sector classifications are based upon the Global Industry Classification Standard (GICS®).
Tabular Presentation of Portfolio of Investments (Unaudited) (Continued)
Touchstone Growth Opportunities Fund
| Sector Allocation*(% of Net Assets) |
| Information Technology | 42.8% |
| Communication Services | 13.5 |
| Consumer Discretionary | 11.5 |
| Industrials | 10.1 |
| Health Care | 10.1 |
| Financials | 4.6 |
| Consumer Staples | 2.4 |
| Real Estate | 1.5 |
| Materials | 1.5 |
| Energy | 1.1 |
| Short-Term Investment Fund | 1.0 |
| Other Assets/Liabilities (Net) | (0.1) |
| Total | 100.0% |
Touchstone Mid Cap Growth Fund
| Sector Allocation*(% of Net Assets) |
| Information Technology | 35.2% |
| Health Care | 18.1 |
| Industrials | 15.2 |
| Consumer Discretionary | 11.0 |
| Financials | 8.1 |
| Communication Services | 3.9 |
| Real Estate | 3.2 |
| Energy | 1.9 |
| Materials | 1.3 |
| Short-Term Investment Fund | 1.9 |
| Other Assets/Liabilities (Net) | 0.2 |
| Total | 100.0% |
Touchstone Sands Capital Emerging Markets Growth Fund
| Geographic Allocation(% of Net Assets) |
| Common Stocks | |
| India | 29.6% |
| China | 22.6 |
| Taiwan | 13.3 |
| Argentina | 10.3 |
| Brazil | 8.1 |
| Hong Kong | 3.8 |
| South Korea | 3.2 |
| Indonesia | 2.6 |
| Thailand | 1.5 |
| Kazakhstan | 1.0 |
| Short-Term Investment Funds | 6.4 |
| Other Assets/Liabilities (Net) | (2.4) |
| Total | 100.0% |
* Sector classifications are based upon the Global Industry Classification Standard (GICS®).
Tabular Presentation of Portfolio of Investments (Unaudited) (Continued)
Touchstone Strategic Income
Opportunities Fund
| Credit Quality*(% of Fixed Income Securities) |
| AAA/Aaa | 9.9% |
| A/A | 12.4 |
| BBB/Baa | 48.1 |
| BB/Ba | 15.3 |
| B/B | 12.0 |
| CCC | 1.7 |
| Not Rated | 0.6 |
| Total | 100.0% |
| Sector Allocation**(% of Net Assets) |
| Corporate Bonds | 53.1% |
| Asset-Backed Securities | 18.9 |
| U.S. Treasury Obligations | 9.3 |
| Common Stocks | |
| Industrials | 1.0 |
| Information Technology | 0.9 |
| Health Care | 0.9 |
| Financials | 0.9 |
| Energy | 0.5 |
| Materials | 0.4 |
| Consumer Staples | 0.4 |
| Communication Services | 0.4 |
| Sovereign Government Obligations | 4.4 |
| Commercial Mortgage-Backed Securities | 4.1 |
| Preferred Stocks | |
| Financials | 1.8 |
| Real Estate | 0.3 |
| Agency Collateralized Mortgage Obligations | 0.5 |
| Rights | 0.0 |
| Short-Term Investment Fund | 1.3 |
| Other Assets/Liabilities (Net) | 0.9 |
| Total | 100.0% |
* Credit quality ratings are from S&P Global Ratings ("S&P") and Moody's Investors Service (“Moody's”). If agency ratings differ, the higher rating will be used. Where no rating has been assigned, it may be for reasons unrelated to the creditworthiness of the issuer.
** Sector classifications are based upon the Global Industry Classification Standard (GICS®).
Portfolio of Investments
Touchstone Flexible Income Fund – March 31, 2022
Principal
Amount | | | | Market
Value |
| | Agency Collateralized Mortgage Obligations — 30.8% |
| $ 47,369,327 | FHLMC Multifamily Structured Pass Through Certificates, Ser K109, Class X1, 1.582%, 4/25/30(A)(B)(C) | | | $ 4,890,272 |
| 34,511,276 | FHLMC Multifamily Structured Pass Through Certificates, Ser K110, Class X1, 1.697%, 4/25/30(A)(B)(C) | | | 3,766,895 |
| 7,005,157 | FHLMC Multifamily Structured Pass Through Certificates, Ser K110, Class X3, 3.404%, 6/25/48(A)(B)(C) | | | 1,551,303 |
| 28,800,000 | FHLMC Multifamily Structured Pass Through Certificates, Ser K110, Class XAM, 1.868%, 4/25/30(A)(B)(C) | | | 3,714,653 |
| 34,710,202 | FHLMC Multifamily Structured Pass Through Certificates, Ser K111, Class X1, 1.571%, 5/25/30(A)(B)(C) | | | 3,630,986 |
| 19,436,545 | FHLMC Multifamily Structured Pass Through Certificates, Ser K111, Class X3, 3.177%, 4/25/48(A)(B)(C) | | | 3,993,950 |
| 35,663,000 | FHLMC Multifamily Structured Pass Through Certificates, Ser K111, Class XAM, 1.797%, 5/25/30(A)(B)(C) | | | 4,482,293 |
| 66,877,526 | FHLMC Multifamily Structured Pass Through Certificates, Ser K112, Class X1, 1.432%, 5/25/30(A)(B)(C) | | | 6,449,655 |
| 15,300,000 | FHLMC Multifamily Structured Pass Through Certificates, Ser K112, Class X3, 3.002%, 7/25/48(A)(B)(C) | | | 3,046,206 |
| 10,630,000 | FHLMC Multifamily Structured Pass Through Certificates, Ser K112, Class XAM, 1.663%, 5/25/30(A)(B)(C) | | | 1,240,377 |
| 10,743,000 | FHLMC Multifamily Structured Pass Through Certificates, Ser K113, Class XAM, 1.590%, 6/25/30(A)(B)(C) | | | 1,202,525 |
| 19,500,000 | FHLMC Multifamily Structured Pass Through Certificates, Ser K114, Class X3, 2.736%, 8/25/48(A)(B)(C) | | | 3,503,352 |
| 21,702,896 | FHLMC Multifamily Structured Pass Through Certificates, Ser K115, Class X3, 2.958%, 9/25/48(A)(B)(C) | | | 4,249,920 |
| 26,000,000 | FHLMC Multifamily Structured Pass Through Certificates, Ser K116, Class X3, 3.021%, 9/25/47(A)(B)(C) | | | 5,259,998 |
| 39,700,000 | FHLMC Multifamily Structured Pass Through Certificates, Ser K117, Class XAM, 1.434%, 9/25/30(A)(B)(C) | | | 4,082,939 |
| 24,368,853 | FHLMC Multifamily Structured Pass Through Certificates, Ser K118, Class X3, 2.693%, 10/25/48(A)(B)(C) | | | 4,436,396 |
| 4,900,000 | FHLMC Multifamily Structured Pass Through Certificates, Ser K119, Class X3, 2.727%, 9/25/48(A)(B)(C) | | | 897,097 |
| 11,576,808 | FHLMC Multifamily Structured Pass Through Certificates, Ser K120, Class X3, 2.740%, 11/25/48(A)(B)(C) | | | 2,161,874 |
| 16,073,000 | FHLMC Multifamily Structured Pass Through Certificates, Ser K121, Class X3, 2.772%, 11/25/48(A)(B)(C) | | | 3,042,500 |
| 9,700,000 | FHLMC Multifamily Structured Pass Through Certificates, Ser K122, Class X3, 2.631%, 1/25/49(A)(B)(C) | | | 1,748,875 |
| 7,569,056 | FHLMC Multifamily Structured Pass Through Certificates, Ser K123, Class X3, 2.628%, 2/25/49(A)(B)(C) | | | 1,375,335 |
Principal
Amount | | | | Market
Value |
| | Agency Collateralized Mortgage Obligations — 30.8%
(Continued) |
| $ 9,255,000 | FHLMC Multifamily Structured Pass Through Certificates, Ser K124, Class X3, 2.620%, 2/25/49(A)(B)(C) | | | $ 1,689,119 |
| 16,150,000 | FHLMC Multifamily Structured Pass Through Certificates, Ser K125, Class X3, 2.654%, 2/25/49(A)(B)(C) | | | 2,994,643 |
| 38,058,448 | FHLMC Multifamily Structured Pass Through Certificates, Ser K127, Class X3, 2.654%, 3/25/49(A)(B)(C) | | | 7,111,385 |
| 18,230,000 | FHLMC Multifamily Structured Pass Through Certificates, Ser K128, Class X3, 2.789%, 4/25/31(A)(B)(C) | | | 3,584,565 |
| 10,595,456 | FHLMC Multifamily Structured Pass Through Certificates, Ser K130, Class X3, 3.096%, 8/25/48(A)(B)(C) | | | 2,398,504 |
| 41,864,611 | FHLMC Multifamily Structured Pass Through Certificates, Ser K130, Class XAM, 1.214%, 7/25/31(A)(B)(C) | | | 4,041,463 |
| 10,451,281 | FHLMC Multifamily Structured Pass Through Certificates, Ser K131, Class X3, 2.947%, 9/25/31(A)(B)(C) | | | 2,261,917 |
| 29,501,666 | FHLMC Multifamily Structured Pass Through Certificates, Ser K132, Class X3, 2.888%, 8/25/31(A)(B)(C) | | | 6,267,756 |
| 9,413,138 | FHLMC Multifamily Structured Pass Through Certificates, Ser K134, Class X3, 2.661%, 10/25/49(A)(B)(C) | | | 1,849,812 |
| 219,974,616 | FHLMC Multifamily Structured Pass Through Certificates, Ser K136, Class X1, 0.398%, 12/25/31(A)(B)(C) | | | 6,552,098 |
| 21,000,000 | FHLMC Multifamily Structured Pass Through Certificates, Ser K136, Class X3, 2.825%, 12/25/31(A)(B)(C) | | | 4,434,278 |
| 96,675,000 | FHLMC Multifamily Structured Pass Through Certificates, Ser K136, Class XAM, 0.567%, 12/25/31(A)(B)(C) | | | 4,493,802 |
| 19,801,000 | FHLMC Multifamily Structured Pass Through Certificates, Ser K137, Class X3, 2.780%, 1/25/49(A)(B)(C) | | | 4,257,015 |
| 31,585,759 | FHLMC Multifamily Structured Pass Through Certificates, Ser K139, Class X3, 3.140%, 2/25/49(A)(B)(C) | | | 7,195,002 |
| 97,300,000 | FHLMC Multifamily Structured Pass Through Certificates, Ser K139, Class XAM, 0.871%, 2/25/32(A)(B)(C) | | | 6,237,815 |
| 31,370,856 | FHLMC Multifamily Structured Pass Through Certificates, Ser K140, Class X3, 3.047%, 2/25/32(A)(B)(C) | | | 6,890,110 |
| 5,835,659 | FHLMC Multifamily Structured Pass Through Certificates, Ser K-1515, Class X3, 3.680%, 3/25/38(A)(B)(C) | | | 1,988,431 |
| 18,435,033 | FHLMC Multifamily Structured Pass Through Certificates, Ser K-1516, Class X3, 3.456%, 10/25/38(A)(B)(C) | | | 6,045,489 |
| 34,948,066 | FHLMC Multifamily Structured Pass Through Certificates, Ser K-1517, Class X1, 1.330%, 7/25/35(A)(B)(C) | | | 4,649,379 |
| 52,485,811 | FHLMC Multifamily Structured Pass Through Certificates, Ser K-1517, Class X3, 3.281%, 8/25/38(A)(B)(C) | | | 16,280,558 |
| 11,201,391 | FHLMC Multifamily Structured Pass Through Certificates, Ser K-1519, Class X3, 2.800%, 12/25/38(A)(B)(C) | | | 3,055,150 |
Touchstone Flexible Income Fund (Continued)
Principal
Amount | | | | Market
Value |
| | Agency Collateralized Mortgage Obligations — 30.8%
(Continued) |
| $ 54,937,438 | FHLMC Multifamily Structured Pass Through Certificates, Ser K-1520, Class X1, 0.472%, 2/25/36(A)(B)(C) | | | $ 2,644,254 |
| 5,000,000 | FHLMC Multifamily Structured Pass Through Certificates, Ser K-1520, Class X3, 3.092%, 4/25/39(A)(B)(C) | | | 1,457,401 |
| 54,072,888 | FHLMC Multifamily Structured Pass Through Certificates, Ser K-1521, Class X1, 0.981%, 8/25/36(A)(B)(C) | | | 5,437,499 |
| 15,100,238 | FHLMC Multifamily Structured Pass Through Certificates, Ser K739, Class X3, 2.811%, 11/25/48(A)(B)(C) | | | 1,928,832 |
| 16,196,664 | FHLMC Multifamily Structured Pass Through Certificates, Ser K741, Class X3, 2.448%, 3/25/49(A)(B)(C) | | | 1,909,666 |
| 16,000,000 | FHLMC Multifamily Structured Pass Through Certificates, Ser K742, Class X3, 2.595%, 4/25/28(A)(B)(C) | | | 2,115,920 |
| 9,500,000 | FHLMC Multifamily Structured Pass Through Certificates, Ser K743, Class X3, 2.955%, 6/25/49(A)(B)(C) | | | 1,443,710 |
| 39,018,396 | FHLMC Multifamily Structured Pass Through Certificates, Ser K744, Class X3, 2.967%, 8/25/49(A)(B)(C) | | | 6,181,255 |
| 47,774,075 | FHLMC Multifamily Structured Pass Through Certificates, Ser K745, Class X3, 2.674%, 9/25/49(A)(B)(C) | | | 6,969,038 |
| 146,903,000 | FHLMC Multifamily Structured Pass Through Certificates, Ser K745, Class XAM, 1.011%, 9/25/28(A)(B)(C) | | | 8,398,944 |
| 155,000,000 | FHLMC Multifamily Structured Pass Through Certificates, Ser K746, Class XAM, 0.586%, 10/25/28(A)(B)(C) | | | 5,330,543 |
| 52,159,495 | FHLMC Multifamily Structured Pass Through Certificates, Ser K747, Class X3, 2.550%, 12/25/49(A)(B)(C) | | | 7,541,501 |
| 31,882,039 | FRESB Mortgage Trust, Ser 2020-SB79, Class X1, 1.102%, 7/25/40(A)(B)(C) | | | 1,931,800 |
| 51,386,292 | FRESB Mortgage Trust, Ser 2020-SB81, Class X1, 1.062%, 10/25/40(A)(B)(C) | | | 3,253,795 |
| 42,195,992 | FRESB Mortgage Trust, Ser 2021-SB82, Class X1, 1.115%, 10/25/40(A)(B)(C) | | | 2,148,911 |
| 55,119,260 | FRESB Mortgage Trust, Ser 2021-SB83, Class X1, 0.876%, 1/25/41(A)(B)(C) | | | 2,674,337 |
| 33,213,530 | FRESB Mortgage Trust, Ser 2021-SB84, Class X1, 0.562%, 1/25/41(A)(B)(C) | | | 1,278,020 |
| 76,844,479 | FRESB Mortgage Trust, Ser 2021-SB85, Class X1, 0.407%, 3/25/41(A)(B)(C) | | | 2,654,808 |
| 92,288,227 | FRESB Mortgage Trust, Ser 2021-SB87, Class X1, 0.675%, 4/25/41(A)(B)(C) | | | 3,969,713 |
| 89,074,243 | FRESB Mortgage Trust, Ser 2021-SB88, Class X1, 0.726%, 5/25/41(A)(B)(C) | | | 3,705,489 |
| 133,398,666 | FRESB Mortgage Trust, Ser 2022-SB94, Class X1, 0.059%, 11/25/41(A)(B)(C) | | | 2,866,457 |
| 147,466,339 | FRESB Multifamily Structured Pass Through Certificates, Ser 2021-SB86, Class X1, 0.360%, 3/25/41(A)(B)(C) | | | 5,286,536 |
| 67,409,613 | FRESB Multifamily Structured Pass Through Certificates, Ser 2021-SB89, Class X1, 0.614%, 6/25/41(A)(B)(C) | | | 2,719,803 |
| 4,051,996 | GNMA, Ser 2012-147, Class IO, 0.559%, 4/16/54(A)(B)(C) | | | 61,795 |
Principal
Amount | | | | Market
Value |
| | Agency Collateralized Mortgage Obligations — 30.8%
(Continued) |
| $ 13,026,675 | GNMA, Ser 2016-110, Class IO, 0.948%, 5/16/58(A)(B)(C) | | | $ 620,549 |
| 21,878,728 | GNMA, Ser 2016-158, Class IO, 0.758%, 6/16/58(A)(B)(C) | | | 892,285 |
| 15,304,772 | GNMA, Ser 2016-52, Class IO, 0.752%, 3/16/58(A)(B)(C) | | | 585,844 |
| 21,130,827 | GNMA, Ser 2017-76, Class IO, 0.821%, 12/16/56(A)(B)(C) | | | 1,012,534 |
| 17,533,206 | GNMA, Ser 2017-94, Class IO, 0.584%, 2/16/59(A)(B)(C) | | | 698,334 |
| | Total Agency Collateralized Mortgage Obligations | $260,725,265 |
| | Corporate Bonds — 25.5% | |
| | Financials — 11.7% | |
| 10,242,000 | Ally Financial, Inc., Ser B, 4.700%(D) | 9,589,124 |
| 17,433,000 | Ally Financial, Inc., Ser C, 4.700%(D) | 15,864,030 |
| 3,378,000 | Bank of New York Mellon Corp. (The), Ser G, 4.700%(D) | 3,459,072 |
| 20,978,000 | Charles Schwab Corp. (The), Ser G, 5.375%(D)(E) | 21,607,340 |
| 6,485,000 | Citigroup, Inc., Ser W, 4.000%(D) | 6,241,812 |
| 12,391,000 | Citizens Financial Group, Inc., Ser F, 5.650%(D) | 12,887,260 |
| 6,506,000 | Fifth Third Bancorp, Ser L, 4.500%(D) | 6,392,145 |
| 7,844,000 | FS KKR Capital Corp., 2.625%, 1/15/27 | 7,193,733 |
| 13,936,000 | Regions Financial Corp., Ser D, 5.750%(D) | 14,510,860 |
| 1,559,000 | Truist Financial Corp., Ser Q, 5.100%(D) | 1,580,826 |
| | | | | 99,326,202 |
| | Utilities — 6.7% | |
| 15,427,000 | Edison International, Ser A, 5.375%(D) | 14,883,198 |
| 14,958,000 | Pacific Gas and Electric Co., 3.250%, 2/16/24 | 14,898,610 |
| 26,867,000 | Sempra Energy, 4.875%(D)(E) | 27,001,335 |
| | | | | 56,783,143 |
| | Energy — 5.1% | |
| 26,892,000 | BP Capital Markets PLC (United Kingdom), 4.875%(D) | 26,959,230 |
| 4,124,000 | Enbridge, Inc. (Canada), 2.150%, 2/16/24 | 4,073,480 |
| 4,302,000 | Energy Transfer LP, (3M LIBOR +3.018%), 3.334%, 11/1/66(B) | 3,577,543 |
| 5,566,000 | Energy Transfer LP, Ser G, 7.125%(D) | 5,454,680 |
| 3,352,000 | Energy Transfer LP, Ser H, 6.500%(D) | 3,294,346 |
| | | | | 43,359,279 |
| | Consumer Discretionary — 2.0% | |
| 3,679,000 | Macy's Retail Holdings LLC, 144a, 5.875%, 3/15/30 | 3,640,241 |
| 4,176,000 | Macy's Retail Holdings LLC, 144a, 6.125%, 3/15/32 | 4,123,800 |
| 3,304,000 | Magallanes, Inc., 144a, 3.428%, 3/15/24 | 3,325,355 |
| 5,184,000 | Marriott Ownership Resorts, Inc., 144a, 6.125%, 9/15/25 | 5,313,600 |
| | | | | 16,402,996 |
| | Total Corporate Bonds | $215,871,620 |
| Shares | | | | |
| | Preferred Stocks — 10.3% | |
| | Financials — 7.6% | |
| 648,929 | AGNC Investment Corp. REIT, Ser F, 6.125%(D)(E) | 15,139,513 |
| 526,082 | Annaly Capital Management, Inc. REIT, Ser I, 6.750%(D) | 13,004,747 |
| 128,065 | Bank of America Corp., Ser GG, 6.000%(D) | 3,334,813 |
| 118,512 | Hartford Financial Services Group, Inc. (The), 7.875%, 4/15/42 | 2,959,245 |
| 62,822 | JPMorgan Chase & Co., Ser LL, 4.625%(D) | 1,382,712 |
| 254,594 | National Rural Utilities Cooperative Finance Corp., Ser US, 5.500%, 5/15/64 | 6,588,893 |
| 290,000 | New Residential Investment Corp. REIT, Ser D, 7.000%(D) | 7,015,100 |
Touchstone Flexible Income Fund (Continued)
| Shares | | | | MarketValue |
| | Preferred Stocks — 10.3% (Continued) | |
| | Financials — (Continued) | |
| 190,088 | Reinsurance Group of America, Inc., 6.200%, 9/15/42 | $ 4,828,235 |
| 136,380 | Stifel Financial Corp., 5.200%, 10/15/47 | 3,391,771 |
| 190,829 | Virtus AllianzGI Convertible & Income Fund, Ser A, 5.625%(D) | 4,801,258 |
| 70,650 | Wells Fargo & Co., Ser Z, 4.750%(D)† | 1,566,310 |
| | | | | 64,012,597 |
| | Utilities — 2.1% | |
| 349,698 | Brookfield Renewable Partners LP (Canada), Ser 17, 5.250%(D)† | 7,924,157 |
| 241,181 | Duke Energy Corp., Ser A, 5.750%(D) | 6,251,412 |
| ��� 129,791 | Entergy Louisiana LLC, 4.875%, 9/1/66 | 3,281,116 |
| 670 | Entergy New Orleans LLC, 5.000%, 12/1/52 | 16,790 |
| | | | | 17,473,475 |
| | Energy — 0.4% | |
| 87,656 | Enbridge, Inc. (Canada), Ser 5, 5.375%(D) | 1,884,604 |
| 46,849 | Enbridge, Inc. (Canada), Ser J, 4.887%(D) | 1,040,048 |
| 32,865 | Enbridge, Inc. (Canada), Ser L, 4.959%(D) | 741,105 |
| | | | | 3,665,757 |
| | Communication Services — 0.2% | |
| 69,235 | AT&T, Inc., 5.350%, 11/1/66 | 1,748,876 |
| | Total Preferred Stocks | $86,900,705 |
| | Investment Funds — 8.2% | |
| 243,314 | Allspring Income Opportunities± | 1,922,181 |
| 632,004 | BlackRock Corporate High Yield Fund, Inc.± | 6,806,683 |
| 67,704 | BlackRock Credit Allocation Income Trust± | 850,362 |
| 79,468 | BlackRock Debt Strategies Fund, Inc.± | 828,057 |
| 85,539 | BlackRock Ltd. Duration Income Trust± | 1,226,629 |
| 106,398 | BlackRock MuniHoldings Fund, Inc.± | 1,514,043 |
| 508,210 | BlackRock MuniVest Fund, Inc.±† | 4,146,994 |
| 172,804 | BlackRock MuniYield Quality Fund III, Inc.± | 2,168,690 |
| 57,063 | Cohen & Steers Ltd. Duration Preferred & Income Fund, Inc.± | 1,307,884 |
| 189,904 | Eaton Vance Municipal Bond Fund± | 2,183,896 |
| 88,974 | First Trust High Income Long/Short Fund± | 1,197,590 |
| 2,215 | First Trust Intermediate Duration Preferred & Income Fund± | 48,708 |
| 508,571 | Invesco Municipal Opportunity Trust± | 5,823,138 |
| 218,213 | Invesco Municipal Trust± | 2,511,632 |
| 1,496,043 | Invesco Senior Income Trust±† | 6,373,143 |
| 403,563 | Invesco Trust for Investment Grade Municipals± | 4,689,402 |
| 3,041 | Neuberger Berman High Yield Strategies Fund, Inc.± | 34,728 |
| 410,295 | Nuveen AMT-Free Quality Municipal Income Fund±† | 5,391,276 |
| 1,022,301 | Nuveen Credit Strategies Income Fund± | 6,317,820 |
| 271,927 | Nuveen Preferred & Income Opportunities Fund± | 2,333,134 |
| 136,877 | Nuveen Preferred & Income Securities Fund± | 1,149,767 |
| 348,195 | Nuveen Quality Municipal Income Fund± | 4,651,885 |
| 880,136 | Western Asset High Income Opportunity Fund, Inc.± | 3,934,208 |
| 126,382 | Western Asset High Yield Defined Opportunity Fund, Inc.± | 1,754,182 |
| | Total Investment Funds | $69,166,032 |
Principal
Amount | | | | |
| | Asset-Backed Securities — 6.0% |
| $ 830,236 | American Credit Acceptance Receivables Trust, Ser 2020-3, Class B, 144a, 1.150%, 8/13/24 | | | 829,979 |
| 283,010 | American Credit Acceptance Receivables Trust, Ser 2021-1, Class A, 144a, 0.350%, 5/13/24 | | | 282,895 |
| 652,000 | ARI Fleet Lease Trust, Ser 2018-B, Class A3, 144a, 3.430%, 8/16/27 | | | 648,954 |
Principal
Amount | | | | MarketValue |
| | Asset-Backed Securities — 6.0% (Continued) |
| $ 91,674 | Arivo Acceptance Auto Loan Receivables Trust, Ser 2019-1, Class A, 144a, 2.990%, 7/15/24 | | | $ 91,864 |
| 550,000 | Carmax Auto Owner Trust, Ser 2021-1, Class A3, 0.340%, 12/15/25 | | | 536,748 |
| 3,214,306 | Credit Acceptance Auto Loan Trust, Ser 2019-1A, Class C, 144a, 3.940%, 6/15/28 | | | 3,220,684 |
| 443,582 | Dell Equipment Finance Trust, Ser 2019-2, Class A3, 144a, 1.910%, 10/22/24 | | | 444,072 |
| 727,527 | Dell Equipment Finance Trust, Ser 2021-1, Class A2, 144a, 0.330%, 5/22/26 | | | 723,659 |
| 1,217,186 | Drive Auto Receivables Trust, Ser 2021-1, Class A3, 0.440%, 11/15/24 | | | 1,215,484 |
| 1,713,558 | DT Auto Owner Trust, Ser 2019-3A, Class C, 144a, 2.740%, 4/15/25 | | | 1,715,602 |
| 1,158,435 | Exeter Automobile Receivables Trust, Ser 2020-2A, Class B, 144a, 2.080%, 7/15/24 | | | 1,158,857 |
| 83,334 | Flagship Credit Auto Trust, Ser 2021-1, Class A, 144a, 0.310%, 6/16/25 | | | 82,739 |
| 735,865 | Freed ABS Trust, Ser 2020-FP1, Class B, 144a, 3.060%, 3/18/27 | | | 735,821 |
| 705,000 | GLS Auto Receivables Trust, Ser 2021-2A, Class C, 144a, 1.080%, 6/15/26 | | | 676,044 |
| 673,329 | Hyundai Auto Receivables Trust, Ser 2018-A, Class B, 3.140%, 6/17/24 | | | 673,752 |
| 812,454 | Hyundai Auto Receivables Trust, Ser 2018-B, Class A4, 3.290%, 1/15/25 | | | 815,025 |
| 3,500,000 | Mercedes-Benz Master Owner Trust, Ser 2019-BA, Class A, 144a, 2.610%, 5/15/24 | | | 3,505,732 |
| 276,531 | Mid-State Capital Corp. Trust, Ser 2005-1, Class M2, 7.079%, 1/15/40 | | | 284,881 |
| 6,567,816 | Mountain View CLO X Ltd. (Cayman Islands), Ser 2015-10A, Class AR, 144a, (3M LIBOR +0.820%), 1.064%, 10/13/27(B) | | | 6,562,713 |
| 969,582 | Palmer Square Loan Funding Ltd. (Cayman Islands), Ser 2019-1A, Class A1, 144a, (3M LIBOR +1.050%), 1.304%, 4/20/27(B) | | | 969,580 |
| 1,100,000 | Palmer Square Loan Funding Ltd. (Cayman Islands), Ser 2019-2A, Class C, 144a, (3M LIBOR +3.250%), 3.504%, 4/20/27(B) | | | 1,096,411 |
| 491,318 | Palmer Square Loan Funding Ltd. (Cayman Islands), Ser 2019-3A, Class A1, 144a, (3M LIBOR +0.850%), 1.330%, 8/20/27(B) | | | 490,850 |
| 1,190,418 | Palmer Square Loan Funding Ltd. (Cayman Islands), Ser 2019-4A, Class A1, 144a, (3M LIBOR +0.900%), 1.159%, 10/24/27(B) | | | 1,189,836 |
| 750,000 | Palmer Square Loan Funding Ltd. (Cayman Islands), Ser 2021-1A, Class B, 144a, (3M LIBOR +1.800%), 2.054%, 4/20/29(B) | | | 750,121 |
| 3,000,000 | Palmer Square Loan Funding Ltd. (Cayman Islands), Ser 2021-1A, Class D, 144a, (3M LIBOR +6.000%), 6.254%, 4/20/29(B) | | | 3,000,528 |
| 355,080 | Palmer Square Loan Funding Ltd. (Cayman Islands), Ser 2021-3A, Class A1, 144a, (3M LIBOR +0.800%), 1.054%, 7/20/29(B) | | | 353,966 |
| 3,799,899 | Pawneee Equipment Receivables LLC, Ser 2021-1, Class A1, 144a, 0.302%, 10/17/22 | | | 3,793,429 |
| 316,367 | Santander Drive Auto Receivables Trust, Ser 2020-4, Class A3, 0.480%, 7/15/24 | | | 316,268 |
| 100,000 | Santander Retail Auto Lease Trust, Ser 2019-B, Class C, 144a, 2.770%, 8/21/23 | | | 100,145 |
| 5,180,000 | Tesla Auto Lease Trust, Ser 2019-A, Class A4, 144a, 2.200%, 11/21/22 | | | 5,188,661 |
| 65,000 | Tesla Auto Lease Trust, Ser 2020-A, Class A4, 144a, 0.780%, 12/20/23 | | | 64,302 |
Touchstone Flexible Income Fund (Continued)
Principal
Amount | | | | MarketValue |
| | Asset-Backed Securities — 6.0% (Continued) |
| $ 1,024,166 | Verizon Owner Trust, Ser 2019-A, Class A1A, 2.930%, 9/20/23 | | | $ 1,027,264 |
| 3,613,381 | Verizon Owner Trust, Ser 2020-A, Class A1A, 1.850%, 7/22/24 | | | 3,614,426 |
| 857,185 | Welk Resorts LLC, Ser 2017-AA, Class A, 144a, 2.820%, 6/15/33 | | | 845,765 |
| 3,708,512 | Westlake Automobile Receivables Trust, Ser 2021-2A, 144a, 0.320%, 4/15/25 | | | 3,677,264 |
| | Total Asset-Backed Securities | $50,684,321 |
| | Non-Agency Collateralized Mortgage Obligations — 1.0% |
| 60,697 | Bear Stearns Asset Backed Securities Trust, Ser 2003-AC7, Class A2, 5.750%, 1/25/34(B)(C) | | | 59,375 |
| 5,171 | Merrill Lynch Mortgage Investors Trust, Ser 2003-A1, Class 2A, (12M LIBOR +1.625%), 2.956%, 12/25/32(B) | | | 5,116 |
| 120,289 | Morgan Stanley Mortgage Loan Trust, Ser 2004-7AR, Class 2A6, 2.474%, 9/25/34(B)(C) | | | 123,438 |
| 9,757 | RALI Series Trust, Ser 2004-QS6, Class A1, 5.000%, 5/25/19 | | | 9,146 |
| 8,087,678 | Redwood Funding Trust, Ser 2020-1, Class A, 144a, 4.750%, 7/27/59(B)(C) | | | 8,079,353 |
| | Total Non-Agency Collateralized Mortgage Obligations | $8,276,428 |
| | Commercial Mortgage-Backed Securities — 0.3% |
| 29,766,116 | BANK, Ser 2020-BN26, Class XA, 1.230%, 3/15/63(A)(B)(C) | | | 2,201,931 |
| 749,941 | VCC Trust, Ser 2020-MC1, Class A, 144a, 4.500%, 6/25/45(B)(C) | | | 749,941 |
| | Total Commercial Mortgage-Backed Securities | $2,951,872 |
| | Short-Term U.S. Treasury Obligations — 13.0% | |
| 20,000,000 | U.S. Treasury Bills, 0.260%, 5/10/22# | | | 19,995,667 |
| 40,000,000 | U.S. Treasury Bills, 0.513%, 8/4/22# | | | 39,889,097 |
| 25,000,000 | U.S. Treasury Bills, 0.730%, 9/8/22# | | | 24,899,611 |
| 25,000,000 | U.S. Treasury Bills, 1.144%, 2/23/23(E)# | | | 24,678,833 |
| | Total Short-Term U.S. Treasury Obligations | $109,463,208 |
| Shares | | | | |
| | Short-Term Investment Funds — 4.5% | |
| 37,937,720 | Dreyfus Government Cash Management, Institutional Shares, 0.19%∞Ω | 37,937,720 |
| 354,825 | Invesco Government & Agency Portfolio, Institutional Class, 0.25%∞Ω** | 354,825 |
| | Total Short-Term Investment Funds | $38,292,545 |
| | Total Short-Term Securities | $147,755,753 |
| | Total Long Positions—99.6%
(Cost $872,546,389) | $842,331,996 |
| | Securities Sold Short — (2.7)% | |
| | Exchange-Traded Fund — (2.7)% | |
| (50,000) | SPDR S&P 500 ETF Trust | (22,582,000) |
| | Total Securities Sold Short
(Proceeds $21,817,364) | $(22,582,000) |
| | Total Investment Securities—96.9% | $819,749,996 |
| | Other Assets in Excess of Liabilities — 3.1% | 26,660,572 |
| | Net Assets — 100.0% | $846,410,568 |
| (A) | Interest only security - This type of security represents the right to receive the monthly interest payments on an underlying pool of mortgages. Payments of principal on the pool reduce the value of the “interest only” holding. |
| (B) | Variable rate security - Rate reflected is the rate in effect as of March 31, 2022. |
| (C) | Certain variable rate securities are not based on a published reference rate and spread but are determined by the issuer or agent and are based on current market conditions. These securities do not indicate a reference rate and spread in their description. |
| (D) | Perpetual Bond - A bond or preferred stock with no definite maturity date. |
| (E) | All or a portion of these securities are pledged as collateral for securities sold short. The total value of the securities pledged as collateral as of March 31, 2022 was $88,427,022. |
| ± | Closed-end Fund. |
| ** | Represents collateral for securities loaned. |
| † | All or a portion of the security is on loan. The total market value of the securities on loan as of March 31, 2022 was $348,419. |
| # | Zero coupon bond - Rate shown reflects effective yield to maturity at time of purchase. |
| ∞ | Open-End Fund. |
| Ω | Represents the 7-Day SEC yield as of March 31, 2022. |
| Portfolio Abbreviations: |
| ABS – Asset-Backed Security |
| CLO – Collateralized Loan Obligation |
| ETF – Exchange-Traded Fund |
| FHLMC – Federal Home Loan Mortgage Corporation |
| FRESB – Freddie Mac Multifamily Securitization Small Balance Loan |
| GNMA – Government National Mortgage Association |
| IO – Interest Only |
| LIBOR – London Interbank Offered Rate |
| LLC – Limited Liability Company |
| LP – Limited Partnership |
| PLC – Public Limited Company |
| REIT – Real Estate Investment Trust |
| S&P – Standard & Poor's |
| SPDR – Standard & Poor's Depositary Receipt |
| 144a - This is a restricted security that was sold in a transaction qualifying for the exemption under Rule 144a of the Securities Act of 1933. This security may be sold in transactions exempt from registration, normally to qualified institutional buyers. At March 31, 2022, these securities were valued at $67,432,763 or 8.0% of net assets. These securities were deemed liquid pursuant to procedures approved by the Board of Trustees. |
Touchstone Flexible Income Fund (Continued)
Other Information:
The inputs or methodology used for valuing securities may not be an indication of the risk associated with investing in those securities. For more information on valuation inputs, and their aggregation into the levels used in the table below, please refer to the security valuation section in the accompanying Notes to Financial Statements.
| Valuation Inputs at Reporting Date: |
| Description | Level 1 | Level 2 | Level 3 | Total |
| Assets: | | | | |
| Agency Collateralized Mortgage Obligations | $— | $260,725,265 | $— | $260,725,265 |
| Corporate Bonds | — | 215,871,620 | — | 215,871,620 |
| Preferred Stocks | 86,900,705 | — | — | 86,900,705 |
| Investment Funds | 69,166,032 | — | — | 69,166,032 |
| Asset-Backed Securities | — | 50,684,321 | — | 50,684,321 |
| Non-Agency Collateralized Mortgage Obligations | — | 8,276,428 | — | 8,276,428 |
| Commercial Mortgage-Backed Securities | — | 2,951,872 | — | 2,951,872 |
| Short-Term U.S. Treasury Obligations | — | 109,463,208 | — | 109,463,208 |
| Short-Term Investment Funds | 38,292,545 | — | — | 38,292,545 |
| Total Assets | $194,359,282 | $647,972,714 | $— | $842,331,996 |
| Liabilities: | | | | |
| Securities Sold Short | | | | |
| Exchange-Traded Fund | $(22,582,000) | $— | $— | $(22,582,000) |
| Total Liabilities | $(22,582,000) | $— | $— | $(22,582,000) |
| Total | $171,777,282 | $647,972,714 | $— | $819,749,996 |
See accompanying Notes to Financial Statements.
Portfolio of Investments
Touchstone Focused Fund – March 31, 2022
| Shares | | | | Market
Value |
| | Common Stocks — 97.4% | |
| | Information Technology — 26.2% | |
| 433,946 | Apple, Inc. | $ 75,771,311 |
| 293,550 | Microsoft Corp. | 90,504,401 |
| 257,624 | Oracle Corp. | 21,313,234 |
| 96,771 | PayPal Holdings, Inc.* | 11,191,566 |
| 129,288 | salesforce, Inc.* | 27,450,428 |
| 268,610 | Smartsheet, Inc. - Class A* | 14,714,456 |
| 183,412 | SS&C Technologies Holdings, Inc. | 13,759,568 |
| 114,131 | Texas Instruments, Inc. | 20,940,756 |
| 100,160 | Visa, Inc. - Class A | 22,212,483 |
| 67,768 | Workday, Inc. - Class A* | 16,227,725 |
| | | | | 314,085,928 |
| | Health Care — 13.4% | |
| 136,341 | AmerisourceBergen Corp. | 21,093,316 |
| 196,209 | BioMarin Pharmaceutical, Inc.* | 15,127,714 |
| 456,188 | Bristol-Myers Squibb Co. | 33,315,410 |
| 85,360 | HCA Healthcare, Inc. | 21,392,923 |
| 191,981 | Johnson & Johnson | 34,024,792 |
| 71,297 | UnitedHealth Group, Inc. | 36,359,331 |
| | | | | 161,313,486 |
| | Consumer Discretionary — 13.1% | |
| 77,543 | Airbnb, Inc. - Class A* | 13,318,786 |
| 81,610 | Alibaba Group Holding Ltd. (China) ADR* | 8,879,168 |
| 15,555 | Amazon.com, Inc.* | 50,708,522 |
| 206,190 | Choice Hotels International, Inc. | 29,229,494 |
| 101,262 | Cracker Barrel Old Country Store, Inc. | 12,022,837 |
| 99,985 | Floor & Decor Holdings, Inc. - Class A* | 8,098,785 |
| 339,477 | Frontdoor, Inc.* | 10,133,389 |
| 166,942 | Hilton Worldwide Holdings, Inc.* | 25,331,779 |
| | | | | 157,722,760 |
| | Communication Services — 12.5% | |
| 24,246 | Alphabet, Inc. - Class C* | 67,718,836 |
| 428,212 | Comcast Corp. - Class A | 20,048,886 |
| 289,405 | Fox Corp. - Class A | 11,417,027 |
| 173,061 | Meta Platforms, Inc. - Class A* | 38,481,844 |
| 34,417 | Netflix, Inc.* | 12,892,264 |
| | | | | 150,558,857 |
| | Financials — 12.2% | |
| 748,902 | Bank of America Corp. | 30,869,741 |
| 156,397 | Berkshire Hathaway, Inc. - Class B* | 55,194,065 |
| 87,331 | Goldman Sachs Group, Inc. (The) | 28,827,963 |
| 88,194 | LPL Financial Holdings, Inc. | 16,111,280 |
| 10,242 | Markel Corp.* | 15,109,408 |
| | | | | 146,112,457 |
| | Industrials — 9.1% | |
| 134,971 | Allegiant Travel Co.* | 21,917,941 |
| 26,978 | Deere & Co. | 11,208,280 |
| 223,158 | Hexcel Corp. | 13,271,206 |
| 119,016 | Hubbell, Inc. | 21,871,570 |
| Shares | | | | Market
Value |
| | | |
| | Industrials — (Continued) | |
| 29,879 | Parker-Hannifin Corp. | $ 8,478,465 |
| 320,900 | Raytheon Technologies Corp. | 31,791,563 |
| | | | | 108,539,025 |
| | Consumer Staples — 4.7% | |
| 326,549 | Coca-Cola Femsa SAB de CV (Mexico) ADR | 17,943,868 |
| 223,361 | Monster Beverage Corp.* | 17,846,544 |
| 213,062 | Philip Morris International, Inc. | 20,015,044 |
| | | | | 55,805,456 |
| | Real Estate — 3.1% | |
| 426,011 | Americold Realty Trust REIT | 11,877,186 |
| 107,719 | Jones Lang LaSalle, Inc.* | 25,794,392 |
| | | | | 37,671,578 |
| | Energy — 1.7% | |
| 251,542 | Exxon Mobil Corp. | 20,774,854 |
| | Materials — 1.4% | |
| 227,014 | DuPont de Nemours, Inc. | 16,703,690 |
| | Total Common Stocks | $1,169,288,091 |
| | Short-Term Investment Fund — 2.7% | |
| 32,203,893 | Dreyfus Government Cash Management, Institutional Shares, 0.19%∞Ω | 32,203,893 |
| | Total Investment Securities—100.1%
(Cost $664,454,397) | $1,201,491,984 |
| | Liabilities in Excess of Other Assets — (0.1%) | (609,074) |
| | Net Assets — 100.0% | $1,200,882,910 |
| * | Non-income producing security. |
| ∞ | Open-End Fund. |
| Ω | Represents the 7-Day SEC yield as of March 31, 2022. |
| Portfolio Abbreviations: |
| ADR – American Depositary Receipt |
| REIT – Real Estate Investment Trust |
Other Information:
The inputs or methodology used for valuing securities may not be an indication of the risk associated with investing in those securities. For more information on valuation inputs, and their aggregation into the levels used in the table below, please refer to the security valuation section in the accompanying Notes to Financial Statements.
| Valuation Inputs at Reporting Date: |
| Description | Level 1 | Level 2 | Level 3 | Total |
| Common Stocks | $1,169,288,091 | $— | $— | $1,169,288,091 |
| Short-Term Investment Fund | 32,203,893 | — | — | 32,203,893 |
| Total | $1,201,491,984 | $— | $— | $1,201,491,984 |
See accompanying Notes to Financial Statements.
Portfolio of Investments
Touchstone Global ESG Equity Fund – March 31, 2022
| Shares | | | | Market
Value |
| | Common Stocks — 98.8% | |
| | United States — 55.0% | |
| | Communication Services — 3.5% | |
| 98,517 | Meta Platforms, Inc. - Class A* | $ 21,906,240 |
| | Consumer Discretionary — 2.0% | |
| 2,028 | Amazon.com, Inc.* | 6,611,178 |
| 49,434 | Ralph Lauren Corp. | 5,607,793 |
| | Financials — 13.0% | |
| 99,281 | Arch Capital Group Ltd.* | 4,807,186 |
| 195,270 | Discover Financial Services | 21,516,802 |
| 119,992 | Globe Life, Inc. | 12,071,195 |
| 170,681 | OneMain Holdings, Inc. | 8,091,986 |
| 137,785 | Reinsurance Group of America, Inc. | 15,081,946 |
| 57,843 | The Allstate Corp. | 8,011,834 |
| 52,464 | Willis Towers Watson PLC | 12,393,046 |
| | Health Care — 10.0% | |
| 30,580 | Alnylam Pharmaceuticals, Inc.* | 4,993,408 |
| 17,238 | Becton Dickinson & Co. | 4,585,308 |
| 79,879 | BioMarin Pharmaceutical, Inc.* | 6,158,671 |
| 169,862 | Centene Corp.* | 14,300,682 |
| 296,928 | Elanco Animal Health, Inc.* | 7,746,852 |
| 48,685 | Eli Lilly & Co. | 13,941,923 |
| 102,053 | Medtronic PLC | 11,322,780 |
| | Industrials — 3.6% | |
| 208,023 | Carrier Global Corp. | 9,542,015 |
| 15,348 | Deere & Co. | 6,376,480 |
| 18,787 | United Rentals, Inc.* | 6,673,330 |
| | Information Technology — 21.5% | |
| 87,104 | Apple, Inc. | 15,209,229 |
| 94,736 | Applied Materials, Inc. | 12,486,205 |
| 87,230 | Fidelity National Information Services, Inc. | 8,759,637 |
| 49,083 | First Solar, Inc.* | 4,110,210 |
| 92,675 | II-VI, Inc.* | 6,718,011 |
| 49,410 | Keysight Technologies, Inc.* | 7,805,298 |
| 150,375 | Micron Technology, Inc. | 11,712,709 |
| 116,434 | Microsoft Corp. | 35,897,767 |
| 60,558 | New Relic, Inc.* | 4,050,119 |
| 66,546 | TE Connectivity Ltd. | 8,716,195 |
| 41,394 | Visa, Inc. - Class A | 9,179,947 |
| 60,038 | WEX, Inc.* | 10,713,781 |
| | Materials — 1.4% | |
| 22,821 | Martin Marietta Materials, Inc. | 8,783,575 |
| | Total United States | 345,883,338 |
| | Japan — 8.6% | |
| | Communication Services — 1.8% | |
| 22,800 | Nintendo Co. Ltd. | 11,508,575 |
| | Consumer Discretionary — 5.1% | |
| 128,400 | Denso Corp. | 8,191,935 |
| 927,900 | Panasonic Corp. | 9,011,839 |
| 140,300 | Sony Group Corp. | 14,433,463 |
| | Industrials — 1.7% | |
| 213,800 | Hitachi Ltd. | 10,699,450 |
| | Total Japan | 53,845,262 |
| | France — 5.7% | |
| | Industrials — 3.8% | |
| 188,521 | Cie de Saint-Gobain | 11,217,074 |
| 76,184 | Schneider Electric SE | 12,790,559 |
| Shares | | | | Market
Value |
| | | |
| | France — (Continued) | |
| | Materials — 1.9% | |
| 68,219 | Air Liquide SA | $ 11,934,500 |
| | Total France | 35,942,133 |
| | Sweden — 4.5% | |
| | Financials — 3.3% | |
| 1,009,441 | Svenska Handelsbanken AB - Class A† | 9,282,257 |
| 758,652 | Swedbank AB - Class A† | 11,330,954 |
| | Industrials — 1.2% | |
| 369,402 | Epiroc AB - Class A | 7,901,089 |
| | Total Sweden | 28,514,300 |
| | South Korea — 4.4% | |
| | Communication Services — 2.0% | |
| 403,182 | KT Corp. ADR* | 5,781,630 |
| 236,001 | KT Corp. | 6,912,582 |
| | Consumer Staples — 0.4% | |
| 23,170 | E-MART, Inc. | 2,675,958 |
| | Financials — 2.0% | |
| 242,053 | KB Financial Group, Inc. | 12,130,222 |
| | Total South Korea | 27,500,392 |
| | Germany — 4.0% | |
| | Consumer Discretionary — 0.8% | |
| 67,563 | Continental AG* | 4,843,337 |
| | Industrials — 1.2% | |
| 160,644 | Deutsche Post AG | 7,671,054 |
| | Materials — 0.7% | |
| 77,020 | HeidelbergCement AG | 4,365,046 |
| | Real Estate — 1.3% | |
| 180,498 | Vonovia SE | 8,413,088 |
| | Total Germany | 25,292,525 |
| | United Kingdom — 3.9% | |
| | Financials — 2.6% | |
| 26,914,045 | Lloyds Banking Group PLC | 16,389,777 |
| | Industrials — 1.3% | |
| 254,862 | RELX PLC | 7,930,733 |
| | Total United Kingdom | 24,320,510 |
| | Singapore — 2.5% | |
| | Financials — 1.7% | |
| 1,174,300 | Oversea-Chinese Banking Corp. Ltd. | 10,653,081 |
| | Real Estate — 0.8% | |
| 2,927,900 | CapitaLand Integrated Commercial Trust REIT | 4,843,743 |
| | Total Singapore | 15,496,824 |
| | China — 2.1% | |
| | Communication Services — 1.1% | |
| 143,200 | Tencent Holdings Ltd. | 6,600,710 |
| | Consumer Discretionary — 1.0% | |
| 56,489 | Alibaba Group Holding Ltd. ADR* | 6,146,003 |
| 6,819 | JD.com, Inc.* | 193,761 |
| | Total China | 12,940,474 |
| | Switzerland — 1.9% | |
| | Health Care — 1.9% | |
| 30,267 | Roche Holding AG | 11,975,498 |
Touchstone Global ESG Equity Fund (Continued)
| Shares | | | | Market
Value |
| | Common Stocks — 98.8% (Continued) | |
| | India — 1.7% | |
| | Financials — 1.7% | |
| 571,920 | ICICI Bank Ltd. ADR | $ 10,832,165 |
| | Italy — 1.7% | |
| | Utilities — 1.7% | |
| 1,572,415 | Enel SpA | 10,498,630 |
| | Netherlands — 1.4% | |
| | Health Care — 1.4% | |
| 291,243 | Koninklijke Philips NV | 8,881,075 |
| | Denmark — 0.7% | |
| | Industrials — 0.7% | |
| 162,498 | Vestas Wind Systems A/S | 4,766,850 |
| | Thailand — 0.7% | |
| | Industrials — 0.7% | |
| 2,149,400 | Airports of Thailand PCL* | 4,262,446 |
| | Total Common Stocks | $620,952,422 |
| | Short-Term Investment Funds — 3.9% | |
| 2,942,399 | Dreyfus Government Cash Management, Institutional Shares, 0.19%∞Ω | 2,942,400 |
| 21,634,913 | Invesco Government & Agency Portfolio, Institutional Class, 0.25%∞Ω** | 21,634,913 |
| | Total Short-Term Investment Funds | $24,577,313 |
| | Total Investment Securities — 102.7%
(Cost $512,792,535) | $645,529,735 |
| | Liabilities in Excess of Other Assets — (2.7)% | (16,802,945) |
| | Net Assets — 100.0% | $628,726,790 |
| * | Non-income producing security. |
| ** | Represents collateral for securities loaned. |
| † | All or a portion of the security is on loan. The total market value of the securities on loan as of March 31, 2022 was $18,547,086. |
| ∞ | Open-End Fund. |
| Ω | Represents the 7-Day SEC yield as of March 31, 2022. |
| Portfolio Abbreviations: |
| ADR – American Depositary Receipt |
| PCL – Public Company Limited |
| PLC – Public Limited Company |
| REIT – Real Estate Investment Trust |
Other Information:
The inputs or methodology used for valuing securities may not be an indication of the risk associated with investing in those securities. For more information on valuation inputs, and their aggregation into the levels used in the table below, please refer to the security valuation section in the accompanying Notes to Financial Statements.
| Valuation inputs at Reporting Date: |
| Description | Level 1 | Level 2 | Level 3 | Total |
| Common Stocks | | | | |
| United States | $345,883,338 | $— | $— | $345,883,338 |
| Japan | — | 53,845,262 | — | 53,845,262 |
| France | — | 35,942,133 | — | 35,942,133 |
| Sweden | — | 28,514,300 | — | 28,514,300 |
| South Korea | 5,781,630 | 21,718,762 | — | 27,500,392 |
| Germany | — | 25,292,525 | — | 25,292,525 |
| United Kingdom | — | 24,320,510 | — | 24,320,510 |
| Singapore | — | 15,496,824 | — | 15,496,824 |
| China | 6,146,003 | 6,794,471 | — | 12,940,474 |
| Switzerland | — | 11,975,498 | — | 11,975,498 |
| India | 10,832,165 | — | — | 10,832,165 |
| Italy | — | 10,498,630 | — | 10,498,630 |
| Netherlands | — | 8,881,075 | — | 8,881,075 |
| Denmark | — | 4,766,850 | — | 4,766,850 |
| Thailand | — | 4,262,446 | — | 4,262,446 |
| Short-Term Investment Funds | 24,577,313 | — | — | 24,577,313 |
| Total | $393,220,449 | $252,309,286 | $— | $645,529,735 |
See accompanying Notes to Financial Statements.
Portfolio of Investments
Touchstone Growth Opportunities Fund – March 31, 2022
| Shares | | | | Market
Value |
| | Common Stocks — 99.1% | |
| | Information Technology — 42.8% | |
| 97,822 | Apple, Inc. | $ 17,080,699 |
| 19,115 | Applied Materials, Inc. | 2,519,357 |
| 25,561 | Fidelity National Information Services, Inc. | 2,566,836 |
| 27,386 | Global Payments, Inc. | 3,747,500 |
| 4,858 | HubSpot, Inc.* | 2,307,258 |
| 28,051 | Lumentum Holdings, Inc.* | 2,737,778 |
| 35,860 | Marvell Technology, Inc. | 2,571,521 |
| 30,798 | Microsoft Corp. | 9,495,331 |
| 13,622 | NVIDIA Corp. | 3,716,899 |
| 25,349 | QUALCOMM, Inc. | 3,873,834 |
| 15,818 | salesforce, Inc.* | 3,358,478 |
| 7,073 | ServiceNow, Inc.* | 3,938,883 |
| 20,615 | Visa, Inc. - Class A | 4,571,789 |
| 13,309 | Workday, Inc. - Class A* | 3,186,973 |
| 30,998 | Zendesk, Inc.* | 3,728,749 |
| | | | | 69,401,885 |
| | Communication Services — 13.5% | |
| 4,236 | Alphabet, Inc. - Class A* | 11,781,799 |
| 25,111 | Live Nation Entertainment, Inc.* | 2,954,058 |
| 22,904 | Meta Platforms, Inc. - Class A* | 5,092,933 |
| 35,742 | ZoomInfo Technologies, Inc.* | 2,135,227 |
| | | | | 21,964,017 |
| | Consumer Discretionary — 11.5% | |
| 2,833 | Amazon.com, Inc.* | 9,235,438 |
| 8,805 | Home Depot, Inc. (The) | 2,635,601 |
| 63,307 | MGM Resorts International | 2,655,095 |
| 54,478 | Tapestry, Inc. | 2,023,858 |
| 2,045 | Tesla, Inc.* | 2,203,692 |
| | | | | 18,753,684 |
| | Industrials — 10.1% | |
| 24,804 | Advanced Drainage Systems, Inc. | 2,946,963 |
| 19,862 | AMETEK, Inc. | 2,645,221 |
| 16,546 | Encore Wire Corp. | 1,887,402 |
| 21,723 | ITT, Inc. | 1,633,787 |
| 5,075 | TransDigm Group, Inc.* | 3,306,566 |
| 14,770 | Union Pacific Corp. | 4,035,312 |
| | | | | 16,455,251 |
| | Health Care — 10.1% | |
| 23,896 | Ascendis Pharma A/S (Denmark) ADR* | 2,804,435 |
| 4,800 | Bio-Rad Laboratories, Inc. - Class A* | 2,703,504 |
| 15,258 | Elanco Animal Health, Inc.* | 398,081 |
| 25,783 | Horizon Therapeutics PLC* | 2,712,630 |
| 12,278 | ICON PLC (Ireland)* | 2,986,255 |
| 3,000 | IDEXX Laboratories, Inc.* | 1,641,180 |
| 5,388 | Thermo Fisher Scientific, Inc. | 3,182,422 |
| | | | | 16,428,507 |
| Shares | | | | Market
Value |
| | | |
| | Financials — 4.6% | |
| 11,811 | American Financial Group, Inc. | $ 1,719,918 |
| 14,615 | Arthur J Gallagher & Co. | 2,551,779 |
| 17,045 | Morgan Stanley | 1,489,733 |
| 4,000 | S&P Global, Inc. | 1,640,720 |
| | | | | 7,402,150 |
| | Consumer Staples — 2.4% | |
| 6,677 | Costco Wholesale Corp. | 3,844,950 |
| | Real Estate — 1.5% | |
| 52,328 | Spirit Realty Capital, Inc. REIT | 2,408,135 |
| | Materials — 1.5% | |
| 12,995 | Vulcan Materials Co. | 2,387,181 |
| | Energy — 1.1% | |
| 29,420 | Devon Energy Corp. | 1,739,605 |
| | Total Common Stocks | $160,785,365 |
| | Short-Term Investment Fund — 1.0% | |
| 1,655,135 | Dreyfus Government Cash Management, Institutional Shares, 0.19%∞Ω | 1,655,135 |
| | Total Investment Securities—100.1%
(Cost $94,170,392) | $162,440,500 |
| | Liabilities in Excess of Other Assets — (0.1%) | (190,491) |
| | Net Assets — 100.0% | $162,250,009 |
| * | Non-income producing security. |
| ∞ | Open-End Fund. |
| Ω | Represents the 7-Day SEC yield as of March 31, 2022. |
| Portfolio Abbreviations: |
| ADR – American Depositary Receipt |
| PLC – Public Limited Company |
| REIT – Real Estate Investment Trust |
Other Information:
The inputs or methodology used for valuing securities may not be an indication of the risk associated with investing in those securities. For more information on valuation inputs, and their aggregation into the levels used in the table below, please refer to the security valuation section in the accompanying Notes to Financial Statements.
| Valuation Inputs at Reporting Date: |
| Description | Level 1 | Level 2 | Level 3 | Total |
| Common Stocks | $160,785,365 | $— | $— | $160,785,365 |
| Short-Term Investment Fund | 1,655,135 | — | — | 1,655,135 |
| Total | $162,440,500 | $— | $— | $162,440,500 |
See accompanying Notes to Financial Statements.
Portfolio of Investments
Touchstone Mid Cap Growth Fund – March 31, 2022
| Shares | | | | Market
Value |
| | Common Stocks — 97.9% | |
| | Information Technology — 35.2% | |
| 165,684 | Advanced Micro Devices, Inc.* | $ 18,115,888 |
| 256,006 | Ciena Corp.* | 15,521,644 |
| 139,543 | Cognizant Technology Solutions Corp. - Class A | 12,512,821 |
| 14,120 | EPAM Systems, Inc.* | 4,188,133 |
| 136,239 | Fortinet, Inc.* | 46,558,316 |
| 210,477 | Global Payments, Inc. | 28,801,673 |
| 42,262 | HubSpot, Inc.* | 20,071,914 |
| 756,316 | Lightspeed Commerce, Inc. (Canada)* | 23,044,948 |
| 377,386 | Microchip Technology, Inc. | 28,356,784 |
| 53,519 | MongoDB, Inc.* | 23,740,493 |
| 268,520 | NetApp, Inc. | 22,287,160 |
| 98,850 | Nice Ltd. (Israel) ADR* | 21,648,150 |
| 648,124 | Nutanix, Inc. - Class A* | 17,382,686 |
| 274,852 | ON Semiconductor Corp.* | 17,208,484 |
| 69,966 | Palo Alto Networks, Inc.* | 43,554,535 |
| 159,742 | Splunk, Inc.* | 23,739,258 |
| 48,181 | Teledyne Technologies, Inc.* | 22,771,786 |
| 156,152 | Teradyne, Inc. | 18,461,851 |
| 296,959 | Zendesk, Inc.* | 35,721,198 |
| 79,813 | Zscaler, Inc.* | 19,257,281 |
| | | | | 462,945,003 |
| | Health Care — 18.1% | |
| 185,043 | Ascendis Pharma A/S (Denmark) ADR* | 21,716,646 |
| 498,681 | Avantor, Inc.* | 16,865,391 |
| 59,027 | Cooper Cos., Inc. (The) | 24,649,085 |
| 65,548 | DexCom, Inc.* | 33,534,357 |
| 240,797 | Horizon Therapeutics PLC* | 25,334,252 |
| 157,930 | ICON PLC (Ireland)* | 38,411,735 |
| 60,527 | IDEXX Laboratories, Inc.* | 33,111,901 |
| 70,294 | Insulet Corp.* | 18,725,619 |
| 153,758 | Quest Diagnostics, Inc. | 21,043,320 |
| 254,824 | Rocket Pharmaceuticals, Inc.* | 4,041,509 |
| | | | | 237,433,815 |
| | Industrials — 15.2% | |
| 161,264 | AMETEK, Inc. | 21,477,140 |
| 198,384 | Copart, Inc. * | 24,891,240 |
| 89,674 | IDEX Corp. | 17,193,196 |
| 92,733 | Rockwell Automation, Inc. | 25,968,022 |
| 43,656 | TransDigm Group, Inc.* | 28,443,630 |
| 295,761 | TransUnion | 30,563,942 |
| 152,785 | Waste Connections, Inc. | 21,344,064 |
| 230,461 | WESCO International, Inc.* | 29,992,195 |
| | | | | 199,873,429 |
| | Consumer Discretionary — 11.0% | |
| 136,480 | Etsy, Inc.* | 16,961,735 |
| 81,911 | Expedia Group, Inc.* | 16,027,525 |
| 150,447 | Hilton Worldwide Holdings, Inc.* | 22,828,828 |
| 51,635 | Lululemon Athletica, Inc.* | 18,858,651 |
| 671,899 | Tapestry, Inc. | 24,961,048 |
| 72,179 | Ulta Beauty, Inc.* | 28,743,121 |
| 63,257 | Vail Resorts, Inc. | 16,463,899 |
| | | | | 144,844,807 |
| Shares | | | | Market
Value |
| | | |
| | Financials — 8.1% | |
| 143,287 | Arthur J Gallagher & Co. | $ 25,017,910 |
| 125,317 | First Republic Bank | 20,313,886 |
| 135,728 | LPL Financial Holdings, Inc. | 24,794,791 |
| 38,768 | MSCI, Inc. | 19,495,652 |
| 185,561 | Tradeweb Markets, Inc. - Class A | 16,305,245 |
| | | | | 105,927,484 |
| | Communication Services — 3.9% | |
| 199,991 | Live Nation Entertainment, Inc.* | 23,526,941 |
| 468,920 | ZoomInfo Technologies, Inc.* | 28,013,281 |
| | | | | 51,540,222 |
| | Real Estate — 3.2% | |
| 409,074 | Douglas Emmett, Inc. REIT | 13,671,253 |
| 83,750 | Essex Property Trust, Inc. REIT | 28,933,950 |
| | | | | 42,605,203 |
| | Energy — 1.9% | |
| 425,869 | Devon Energy Corp. | 25,181,634 |
| | Materials — 1.3% | |
| 119,418 | Celanese Corp. | 17,061,250 |
| | Total Common Stocks | $1,287,412,847 |
| | Short-Term Investment Fund — 1.9% | |
| 24,971,844 | Dreyfus Government Cash Management, Institutional Shares, 0.19%∞Ω | 24,971,844 |
| | Total Investment Securities—99.8%
(Cost $998,832,415) | $1,312,384,691 |
| | Other Assets in Excess of Liabilities — 0.2% | 3,067,902 |
| | Net Assets — 100.0% | $1,315,452,593 |
| * | Non-income producing security. |
| ∞ | Open-End Fund. |
| Ω | Represents the 7-Day SEC yield as of March 31, 2022. |
| Portfolio Abbreviations: |
| ADR – American Depositary Receipt |
| PLC – Public Limited Company |
| REIT – Real Estate Investment Trust |
Other Information:
The inputs or methodology used for valuing securities may not be an indication of the risk associated with investing in those securities. For more information on valuation inputs, and their aggregation into the levels used in the table below, please refer to the security valuation section in the accompanying Notes to Financial Statements.
| Valuation Inputs at Reporting Date: |
| Description | Level 1 | Level 2 | Level 3 | Total |
| Common Stocks | $1,287,412,847 | $— | $— | $1,287,412,847 |
| Short-Term Investment Fund | 24,971,844 | — | — | 24,971,844 |
| Total | $1,312,384,691 | $— | $— | $1,312,384,691 |
See accompanying Notes to Financial Statements.
Portfolio of Investments
Touchstone Sands Capital Emerging Markets Growth Fund – March 31, 2022
| Shares | | | | Market
Value |
| | Common Stocks — 96.0% | |
| | India — 29.6% | |
| | Consumer Discretionary — 4.9% | |
| 2,184,002 | Jubilant Foodworks Ltd. | $ 75,470,926 |
| 2,935,284 | Titan Co. Ltd. | 97,784,222 |
| | Consumer Staples — 2.6% | |
| 2,226,113 | Britannia Industries Ltd. | 93,862,039 |
| | Energy — 1.6% | |
| 1,638,309 | Reliance Industries Ltd. | 56,665,137 |
| | Financials — 13.0% | |
| 1,996,308 | Bajaj Finance Ltd. | 189,585,976 |
| 11,695,459 | Bandhan Bank Ltd., 144a | 47,109,665 |
| 7,021,565 | HDFC Bank Ltd. | 135,234,127 |
| 14,297,279 | ICICI Prudential Life Insurance Co. Ltd., 144a | 93,981,135 |
| | Health Care — 4.7% | |
| 2,808,904 | Apollo Hospitals Enterprise Ltd. | 166,701,302 |
| | Information Technology — 0.9% | |
| 674,489 | Tata Consultancy Services Ltd. | 33,148,029 |
| | Materials — 1.9% | |
| 1,714,383 | Asian Paints Ltd. | 69,371,161 |
| | Total India | 1,058,913,719 |
| | China — 22.6% | |
| | Communication Services — 6.1% | |
| 1,454,526 | Kanzhun Ltd. ADR* | 36,232,243 |
| 3,912,506 | Tencent Holdings Ltd. | 180,344,394 |
| | Consumer Discretionary — 9.1% | |
| 9,262,292 | Alibaba Group Holding Ltd.* | 126,399,838 |
| 9,041,502 | ANTA Sports Products Ltd. | 112,159,855 |
| 17,783,929 | Haidilao International Holding Ltd., 144a† | 34,217,262 |
| 2,297,382 | JD Health International, Inc., 144a* | 13,755,807 |
| 1,817,771 | NIO, Inc. ADR* | 38,264,080 |
| | Consumer Staples — 2.2% | |
| 5,862,979 | Foshan Haitian Flavouring & Food Co. Ltd. - Class A | 80,522,615 |
| | Health Care — 4.1% | |
| 5,003,830 | Hangzhou Tigermed Consulting Co. Ltd. Class H, 144a | 60,348,929 |
| 10,851,458 | Wuxi Biologics Cayman, Inc., 144a* | 86,167,115 |
| | Real Estate — 1.1% | |
| 9,721,447 | Country Garden Services Holdings Co., Ltd. | 40,952,780 |
| | Total China | 809,364,918 |
| | Taiwan — 13.3% | |
| | Communication Services — 5.6% | |
| 1,681,207 | Sea Ltd. ADR* | 201,391,787 |
| | Information Technology — 7.7% | |
| 2,637,620 | Taiwan Semiconductor Manufacturing Co. Ltd. ADR | 274,998,261 |
| | Total Taiwan | 476,390,048 |
| | Argentina — 10.3% | |
| | Consumer Discretionary — 7.1% | |
| 214,337 | MercadoLibre, Inc.* | 254,949,575 |
| | Information Technology — 3.2% | |
| 435,000 | Globant SA* | 114,000,450 |
| | Total Argentina | 368,950,025 |
| | Brazil — 8.1% | |
| | Consumer Staples — 1.8% | |
| 12,611,000 | Raia Drogasil SA | 63,411,924 |
| Shares | | | | Market
Value |
| | | |
| | Brazil — (Continued) | |
| | Financials — 3.4% | |
| 4,550,137 | NU Holdings Ltd. - Class A*† | $ 35,127,058 |
| 2,816,619 | XP, Inc. - Class A* | 84,780,232 |
| | Industrials — 1.8% | |
| 5,059,415 | Localiza Rent a Car SA | 65,045,902 |
| | Information Technology — 1.1% | |
| 2,038,743 | Pagseguro Digital Ltd. - Class A* | 40,876,797 |
| | Total Brazil | 289,241,913 |
| | Hong Kong — 3.8% | |
| | Financials — 3.1% | |
| 10,354,259 | AIA Group Ltd. | 108,117,990 |
| | Health Care — 0.7% | |
| 1,355,921 | Hutchison China Ltd. ADR* | 25,654,025 |
| | Total Hong Kong | 133,772,015 |
| | South Korea — 3.2% | |
| | Communication Services — 2.6% | |
| 341,797 | NAVER Corp. | 94,995,315 |
| | Information Technology — 0.6% | |
| 168,661 | Kakaopay Corp.*† | 20,557,346 |
| | Total South Korea | 115,552,661 |
| | Indonesia — 2.6% | |
| | Financials — 2.6% | |
| 168,751,800 | Bank Central Asia Tbk PT | 93,702,044 |
| | Thailand — 1.5% | |
| | Consumer Staples — 1.5% | |
| 27,744,900 | CP ALL PCL | 54,053,214 |
| | Kazakhstan — 1.0% | |
| | Financials — 1.0% | |
| 721,915 | Kaspi.KZ JSC GDR | 35,809,005 |
| | Total Common Stocks | $3,435,749,562 |
| | Short-Term Investment Funds — 6.4% | |
| 147,920,444 | Dreyfus Government Cash Management, Institutional Shares, 0.19%∞Ω | 147,920,444 |
| 81,188,062 | Invesco Government & Agency Portfolio, Institutional Class, 0.25%∞Ω** | 81,188,062 |
| | Total Short-Term Investment Funds | $229,108,506 |
| | Total Investment Securities — 102.4%
(Cost $3,413,254,410) | $3,664,858,068 |
| | Liabilities in Excess of Other Assets — (2.4)% | (86,833,319) |
| | Net Assets — 100.0% | $3,578,024,749 |
| * | Non-income producing security. |
| ** | Represents collateral for securities loaned. |
| † | All or a portion of the security is on loan. The total market value of the securities on loan as of March 31, 2022 was $75,956,336. |
| ∞ | Open-End Fund. |
| Ω | Represents the 7-Day SEC yield as of March 31, 2022. |
Touchstone Sands Capital Emerging Markets Growth Fund (Continued)
| Portfolio Abbreviations: |
| ADR – American Depositary Receipt |
| GDR – Global Depositary Receipt |
| JSC – Joint Stock Company |
| PCL – Public Company Limited |
| 144a - This is a restricted security that was sold in a transaction qualifying for the exemption under Rule 144a of the Securities Act of 1933. This security may be sold in transactions exempt from registration, normally to qualified institutional buyers. At March 31, 2022, these securities were valued at $335,579,913 or 9.4% of net assets. These securities were deemed liquid pursuant to procedures approved by the Board of Trustees. |
Other Information:
The inputs or methodology used for valuing securities may not be an indication of the risk associated with investing in those securities. For more information on valuation inputs, and their aggregation into the levels used in the table below, please refer to the security valuation section in the accompanying Notes to Financial Statements.
| Valuation inputs at Reporting Date: |
| Description | Level 1 | Level 2 | Level 3 | Total |
| Common Stocks | | | | |
| India | $— | $1,058,913,719 | $— | $1,058,913,719 |
| China | 74,496,323 | 734,868,595 | — | 809,364,918 |
| Taiwan | 476,390,048 | — | — | 476,390,048 |
| Argentina | 368,950,025 | — | — | 368,950,025 |
| Brazil | 289,241,913 | — | — | 289,241,913 |
| Hong Kong | 25,654,025 | 108,117,990 | — | 133,772,015 |
| South Korea | — | 115,552,661 | — | 115,552,661 |
| Indonesia | 93,702,044 | — | — | 93,702,044 |
| Thailand | — | 54,053,214 | — | 54,053,214 |
| Kazakhstan | — | 35,809,005 | — | 35,809,005 |
| Short-Term Investment Funds | 229,108,506 | — | — | 229,108,506 |
| Total | $1,557,542,884 | $2,107,315,184 | $— | $3,664,858,068 |
See accompanying Notes to Financial Statements.
Portfolio of Investments
Touchstone Strategic Income Opportunities Fund – March 31, 2022
Principal
Amount | | | | Market
Value |
| | Corporate Bonds — 53.1% | |
| | Financials — 12.1% | |
| $ 2,232,000 | Ares Capital Corp., 4.250%, 3/1/25 | $ 2,233,231 |
| 2,605,000 | Bank of Nova Scotia (The) (Canada), Ser 2, 3.625%, 10/27/81 | 2,244,106 |
| 2,350,000 | Barclays PLC (United Kingdom), 2.894%, 11/24/32 | 2,131,846 |
| 1,234,000 | BNP Paribas SA (France), 144a, 4.625%, 3/13/27 | 1,263,878 |
| 975,000 | Charles Schwab Corp. (The), 4.000%(A) | 875,667 |
| 975,000 | Charles Schwab Corp. (The), 5.000%(A) | 971,344 |
| 1,309,000 | Citigroup, Inc., Ser W, 4.000%(A) | 1,259,913 |
| 2,000,000 | Corestates Capital III, 144a, (3M LIBOR +0.570%), 1.076%, 2/15/27(B) | 1,920,108 |
| 1,260,000 | Credit Acceptance Corp., 6.625%, 3/15/26 | 1,285,200 |
| 2,026,000 | First Maryland Capital II, (3M LIBOR +0.850%), 1.167%, 2/1/27(B) | 1,942,548 |
| 502,000 | FirstCash, Inc., 144a, 4.625%, 9/1/28 | 467,488 |
| 3,330,000 | Goldman Sachs Group, Inc. (The), 3.615%, 3/15/28 | 3,328,430 |
| 2,165,000 | Golub Capital BDC, Inc., 2.050%, 2/15/27 | 1,920,074 |
| 1,487,000 | Icahn Enterprises LP / Icahn Enterprises Finance Corp., 5.250%, 5/15/27 | 1,459,379 |
| 1,677,000 | Navient Corp., 6.750%, 6/15/26 | 1,710,540 |
| 3,248,000 | PNC Capital Trust, (3M LIBOR +0.570%), 1.093%, 6/1/28(B) | 3,037,176 |
| 1,625,000 | Prudential Financial, Inc., 5.125%, 3/1/52 | 1,642,712 |
| 1,650,000 | Sabra Health Care LP REIT, 3.900%, 10/15/29 | 1,585,741 |
| 2,145,000 | Sixth Street Specialty Lending, Inc., 2.500%, 8/1/26 | 1,980,060 |
| 2,000,000 | STORE Capital Corp. REIT, 2.750%, 11/18/30 | 1,810,004 |
| 3,059,000 | Truist Bank, Ser A, (3M LIBOR +0.670%), 1.180%, 5/15/27(B) | 2,917,183 |
| 1,625,000 | Truist Financial Corp., Ser Q, 5.100%(A) | 1,647,750 |
| | | | | 39,634,378 |
| | Energy — 7.1% | |
| 1,706,000 | Cenovus Energy, Inc. (Canada), 5.250%, 6/15/37 | 1,848,434 |
| 1,432,000 | Cheniere Energy, Inc., 4.625%, 10/15/28 | 1,442,754 |
| 1,260,000 | CQP Holdco LP / BIP-V Chinook Holdco LLC, 144a, 5.500%, 6/15/31 | 1,239,761 |
| 2,350,000 | Energy Transfer LP, 5.250%, 4/15/29 | 2,507,961 |
| 795,000 | FS Luxembourg Sarl (Brazil), 144a, 10.000%, 12/15/25 | 833,232 |
| 762,000 | Genesis Energy LP / Genesis Energy Finance Corp., 5.625%, 6/15/24 | 757,253 |
| 250,000 | Genesis Energy LP / Genesis Energy Finance Corp., 6.500%, 10/1/25 | 246,575 |
| 293,000 | Genesis Energy LP / Genesis Energy Finance Corp., 8.000%, 1/15/27 | 299,669 |
| 218,000 | Hilcorp Energy I LP / Hilcorp Finance Co., 144a, 5.750%, 2/1/29 | 218,131 |
| 1,323,000 | Hilcorp Energy I LP / Hilcorp Finance Co., 144a, 6.000%, 2/1/31 | 1,326,307 |
| 750,000 | KazMunayGas National Co. JSC (Kazakhstan), 144a, 5.750%, 4/19/47 | 662,985 |
| 1,124,000 | MC Brazil Downstream Trading SARL (Brazil), 144a, 7.250%, 6/30/31 | 1,032,619 |
| 405,000 | Mesquite Energy, Inc., 144a, 7.250%, 2/15/23 | 4,050 |
| 1,922,000 | Murphy Oil Corp., 6.375%, 7/15/28 | 2,001,282 |
| 1,604,000 | NGPL PipeCo LLC, 144a, 7.768%, 12/15/37 | 2,013,422 |
| 1,149,000 | Parkland Corp. (Canada), 144a, 4.500%, 10/1/29 | 1,065,290 |
| 350,000 | Petroleos Mexicanos (Mexico), 6.375%, 1/23/45 | 279,926 |
| 750,000 | Petroleos Mexicanos (Mexico), 6.625%, 6/15/35 | 672,195 |
| 1,810,000 | Petroleos Mexicanos (Mexico), 6.750%, 9/21/47 | 1,471,349 |
| 1,324,000 | Precision Drilling Corp. (Canada), 144a, 6.875%, 1/15/29 | 1,343,860 |
| 922,000 | Southwestern Energy Co., 8.375%, 9/15/28 | 1,014,200 |
| 1,200,000 | YPF SA (Argentina), 144a, 8.500%, 7/28/25 | 1,026,600 |
| | | | | 23,307,855 |
Principal
Amount | | | | Market
Value |
| | | |
| | Communication Services — 6.7% | |
| $ 1,386,000 | Arches Buyer, Inc., 144a, 4.250%, 6/1/28 | $ 1,292,944 |
| 2,995,000 | British Telecommunications PLC (United Kingdom), 5.125%, 12/4/28 | 3,140,923 |
| 1,160,000 | Cars.com, Inc., 144a, 6.375%, 11/1/28 | 1,151,729 |
| 1,689,000 | Charter Communications Operating LLC / Charter Communications Operating Capital, 6.484%, 10/23/45 | 1,924,483 |
| 1,255,000 | Connect Finco SARL / Connect US Finco LLC (United Kingdom), 144a, 6.750%, 10/1/26 | 1,276,824 |
| 1,485,000 | CSC Holdings LLC, 144a, 4.625%, 12/1/30 | 1,241,891 |
| 1,460,000 | Directv Financing LLC / Directv Financing Co-Obligor, Inc., 144a, 5.875%, 8/15/27 | 1,437,078 |
| 1,260,000 | Gray Escrow II, Inc., 144a, 5.375%, 11/15/31 | 1,204,831 |
| 2,074,000 | Netflix, Inc., 6.375%, 5/15/29 | 2,345,238 |
| 1,525,000 | Paramount Global, 4.200%, 5/19/32 | 1,527,390 |
| 916,000 | Photo Holdings Merger Sub, Inc., 144a, 8.500%, 10/1/26 | 872,893 |
| 2,309,000 | Stagwell Global, 144a, 5.625%, 8/15/29 | 2,188,309 |
| 2,228,000 | T-Mobile USA, Inc., 3.875%, 4/15/30 | 2,236,825 |
| | | | | 21,841,358 |
| | Industrials — 5.5% | |
| 1,175,000 | ADT Security Corp. (The), 144a, 4.875%, 7/15/32 | 1,081,000 |
| 1,260,000 | Amsted Industries, Inc., 144a, 4.625%, 5/15/30 | 1,194,140 |
| 922,000 | Boeing Co. (The), 5.805%, 5/1/50 | 1,064,164 |
| 1,440,000 | Cimpress PLC (Ireland), 144a, 7.000%, 6/15/26 | 1,379,232 |
| 1,745,000 | Fortress Transportation & Infrastructure Investors LLC, 144a, 6.500%, 10/1/25 | 1,727,550 |
| 2,026,000 | General Electric Co., 4.156%(A) | 1,944,960 |
| 1,330,000 | Meritor, Inc., 144a, 4.500%, 12/15/28 | 1,331,729 |
| 2,103,000 | Oshkosh Corp., 3.100%, 3/1/30 | 1,955,914 |
| 1,269,000 | Pactiv Evergreen Group Issuer Inc / Pactiv Evergreen Group Issuer LLC, 144a, 4.000%, 10/15/27 | 1,176,997 |
| 1,337,000 | Seaspan Corp. (Hong Kong), 144a, 5.500%, 8/1/29 | 1,250,095 |
| 1,274,000 | Stericycle, Inc., 144a, 3.875%, 1/15/29 | 1,184,820 |
| 878,000 | TransDigm, Inc., 144a, 6.250%, 3/15/26 | 902,694 |
| 2,045,000 | Weir Group PLC (The) (United Kingdom), 144a, 2.200%, 5/13/26 | 1,912,296 |
| | | | | 18,105,591 |
| | Consumer Discretionary — 5.1% | |
| 2,001,000 | Brunswick Corp., 4.400%, 9/15/32 | 1,978,569 |
| 1,375,000 | Carriage Services, Inc., 144a, 4.250%, 5/15/29 | 1,284,250 |
| 1,458,000 | Churchill Downs, Inc., 144a, 4.750%, 1/15/28 | 1,414,260 |
| 462,000 | Ford Motor Co., 4.750%, 1/15/43 | 417,606 |
| 860,000 | Ford Motor Credit Co. LLC, 4.125%, 8/17/27 | 842,301 |
| 3,330,000 | General Motors Financial Co., Inc., 3.100%, 1/12/32 | 2,993,504 |
| 2,825,000 | Imperial Brands Finance PLC (United Kingdom), 144a, 3.500%, 7/26/26 | 2,766,781 |
| 1,950,000 | Magallanes, Inc., 144a, 5.141%, 3/15/52 | 1,995,523 |
| 1,440,000 | Royal Caribbean Cruises Ltd., 144a, 5.375%, 7/15/27 | 1,383,523 |
| 975,000 | Toll Brothers Finance Corp., 3.800%, 11/1/29 | 942,814 |
| 577,000 | Wynn Macau Ltd. (Macao), 144a, 4.875%, 10/1/24 | 540,493 |
| | | | | 16,559,624 |
| | Consumer Staples — 4.6% | |
| 1,552,000 | Albertsons Cos., Inc. / Safeway, Inc. / New Albertsons LP / Albertsons LLC, 144a, 5.875%, 2/15/28 | 1,552,000 |
| 1,911,000 | Anheuser-Busch Cos. LLC / Anheuser-Busch InBev Worldwide, Inc. (Belgium), 4.900%, 2/1/46 | 2,124,322 |
| 1,177,000 | BellRing Brands, Inc., 144a, 7.000%, 3/15/30 | 1,203,753 |
| 1,591,000 | Chobani LLC / Chobani Finance Corp., Inc., 144a, 4.625%, 11/15/28 | 1,467,697 |
Touchstone Strategic Income Opportunities Fund (Continued)
Principal
Amount | | | | Market
Value |
| | Corporate Bonds — 53.1% (Continued) | |
| | Consumer Staples — (Continued) | |
| $ 1,968,000 | JBS Finance Luxembourg Sarl, 144a, 2.500%, 1/15/27 | $ 1,827,800 |
| 982,000 | Performance Food Group, Inc., 144a, 4.250%, 8/1/29 | 894,848 |
| 1,469,000 | QVC, Inc., 4.375%, 9/1/28 | 1,340,276 |
| 1,652,000 | Turning Point Brands, Inc., 144a, 5.625%, 2/15/26 | 1,602,440 |
| 1,500,000 | Ulker Biskuvi Sanayi AS (Turkey), 144a, 6.950%, 10/30/25 | 1,309,920 |
| 1,752,000 | United Rentals North America, Inc., 3.750%, 1/15/32 | 1,633,740 |
| | | | | 14,956,796 |
| | Utilities — 4.3% | |
| 1,950,000 | CMS Energy Corp., 4.750%, 6/1/50 | 1,930,500 |
| 2,145,000 | Edison International, 4.125%, 3/15/28 | 2,130,808 |
| 850,000 | Eskom Holdings SOC Ltd. (South Africa), 144a, 8.450%, 8/10/28 | 827,060 |
| 1,498,000 | FirstEnergy Transmission LLC, 144a, 5.450%, 7/15/44 | 1,634,668 |
| 812,000 | Genneia SA (Argentina), 144a, 8.750%, 9/2/27 | 764,295 |
| 2,145,000 | Pacific Gas & Electric Co., 2.500%, 2/1/31 | 1,849,241 |
| 1,200,000 | PPL Capital Funding, Inc., Ser A, (3M LIBOR +2.665%), 3.661%, 3/30/67(B) | 1,053,000 |
| 1,600,000 | Southern Co. (The), 4.456%, 3/15/57(B) | 1,592,659 |
| 2,720,000 | WEC Energy Group, Inc., (3M LIBOR +2.112%), 2.619%, 5/15/67(B) | 2,306,560 |
| | | | | 14,088,791 |
| | Materials — 3.2% | |
| 2,602,000 | Braskem Netherlands Finance BV (Brazil), 144a, 5.875%, 1/31/50 | 2,581,184 |
| 2,500,000 | Cemex SAB de CV (Mexico), 144a, 3.875%, 7/11/31 | 2,281,275 |
| 332,000 | Hudbay Minerals, Inc. (Canada), 144a, 4.500%, 4/1/26 | 323,700 |
| 1,018,000 | Hudbay Minerals, Inc. (Canada), 144a, 6.125%, 4/1/29 | 1,048,540 |
| 400,000 | Indonesia Asahan Aluminium Persero PT (Indonesia), 6.530%, 11/15/28 | 444,444 |
| 1,700,000 | Indonesia Asahan Aluminium Persero PT (Indonesia), 144a, 5.450%, 5/15/30 | 1,773,950 |
| 2,200,000 | Metinvest BV (Ukraine), 144a, 7.750%, 10/17/29 | 924,000 |
| 1,400,000 | OCP SA (Morocco), 144a, 5.125%, 6/23/51 | 1,162,000 |
| | | | | 10,539,093 |
| | Health Care — 2.4% | |
| 1,770,000 | CVS Health Corp., 5.050%, 3/25/48 | 2,008,614 |
| 1,264,000 | MEDNAX, Inc., 144a, 5.375%, 2/15/30 | 1,221,694 |
| 1,260,000 | Mozart Debt Merger Sub, Inc., 144a, 3.875%, 4/1/29 | 1,163,925 |
| 2,102,000 | Mylan, Inc., 4.550%, 4/15/28 | 2,128,702 |
| 1,260,000 | US Acute Care Solutions LLC, 144a, 6.375%, 3/1/26 | 1,244,250 |
| | | | | 7,767,185 |
| | Real Estate — 1.7% | |
| 1,320,000 | Diversified Healthcare Trust REIT, 9.750%, 6/15/25 | 1,389,300 |
| 1,260,000 | Howard Hughes Corp. (The), 144a, 4.375%, 2/1/31 | 1,185,030 |
| 1,260,000 | Iron Mountain, Inc. REIT, 144a, 4.875%, 9/15/27 | 1,246,203 |
| 1,000,000 | Logan Group Co. Ltd. (China), 7.500%, 8/25/22 | 260,000 |
| 1,455,000 | RHP Hotel Properties LP / RHP Finance Corp. REIT, 144a, 4.500%, 2/15/29 | 1,367,700 |
| | | | | 5,448,233 |
| | Information Technology — 0.4% | |
| 1,326,000 | Clarivate Science Holdings Corp., 144a, 4.875%, 7/1/29 | 1,247,514 |
| | Total Corporate Bonds | $173,496,418 |
| | Asset-Backed Securities — 18.9% |
| 2,000,000 | AB BSL CLO 3, Ltd. (Cayman Islands), Ser 2021-3A, Class D, 144a, (3M LIBOR +3.200%), 3.389%, 10/20/34(B) | | | 1,907,882 |
| 5,970,000 | AB Issuer LLC, Ser 2021-1, Class A2, 144a, 3.734%, 7/30/51 | | | 5,430,342 |
Principal
Amount | | | | Market
Value |
| | Asset-Backed Securities — 18.9% (Continued) |
| $ 5,000,000 | Birch Grove CLO 2, Ltd. (Cayman Islands), Ser 2021-2A, Class C, 144a, (3M LIBOR +2.250%), 2.498%, 10/19/34(B) | | | $ 4,903,855 |
| 5,000,000 | BSPRT Issuer, Ltd. (Cayman Islands), Ser 2018-FL4, Class E, 144a, (1M LIBOR +3.050%), 3.447%, 9/15/35(B) | | | 4,934,765 |
| 4,948,052 | FOCUS Brands Funding LLC, Ser 2017-1A, Class A2IB, 144a, 3.857%, 4/30/47 | | | 4,872,817 |
| 4,962,500 | Hardee's Funding LLC, Ser 2021-1A, Class A2, 144a, 2.865%, 6/20/51 | | | 4,511,950 |
| 2,100,000 | Medalist Partners Corporate Finance CLO VI, Ltd. (Cayman Islands), Ser 2020-1A, Class B, 144a, (3M LIBOR +2.700%), 2.941%, 4/17/33(B) | | | 2,024,045 |
| 5,000,000 | Mill City Mortgage Loan Trust, Ser 2017-2, Class B2, 144a, 3.545%, 7/25/59(B)(C) | | | 4,835,716 |
| 4,962,500 | Neighborly Issuer LLC, Ser 2021-1A, Class A2, 144a, 3.584%, 4/30/51 | | | 4,657,202 |
| 5,000,000 | New Mountain CLO 3, Ltd. (Cayman Islands), Ser CLO-3A, Class C, 144a, (3M LIBOR +2.100%), 2.231%, 10/20/34(B) | | | 4,892,160 |
| 2,250,000 | Palmer Square CLO, Ltd. (Cayman Islands), Ser 2021-4A, Class D, 144a, (3M LIBOR +2.950%), 3.133%, 10/15/34(B) | | | 2,206,937 |
| 6,242,000 | STWD, Ltd. (Cayman Islands), Ser 2021-FL2, Class D, 144a, (1M LIBOR +2.800%), 3.268%, 4/18/38(B) | | | 6,164,539 |
| 5,500,000 | TRTX Issuer, Ltd. (Cayman Islands), Ser 2019-FL3, Class C, 144a, (SOFR30A +2.214%), 2.264%, 10/15/34(B) | | | 5,475,019 |
| 5,000,000 | Whitebox CLO I, Ltd. (Cayman Islands), Ser 2019-1A, Class BR, 144a, (3M LIBOR +2.050%), 2.309%, 7/24/32(B) | | | 4,959,565 |
| | Total Asset-Backed Securities | $61,776,794 |
| | U.S. Treasury Obligations — 9.3% |
| 5,800,000 | U.S. Treasury Bond, 1.875%, 2/15/51 | | | 5,070,469 |
| 27,000,000 | U.S. Treasury Note, 0.750%, 5/31/26 | | | 25,141,641 |
| | Total U.S. Treasury Obligations | $30,212,110 |
| Shares | | | | |
| | Common Stocks — 5.4% | |
| | Industrials — 1.0% | |
| 39,560 | Covia | 484,610 |
| 3,131 | Lockheed Martin Corp. | 1,382,024 |
| 14,248 | Raytheon Technologies Corp. | 1,411,549 |
| | | | | 3,278,183 |
| | Information Technology — 0.9% | |
| 11,323 | International Business Machines Corp. | 1,472,217 |
| 8,328 | Texas Instruments, Inc. | 1,528,021 |
| | | | | 3,000,238 |
| | Health Care — 0.9% | |
| 20,366 | Bristol-Myers Squibb Co. | 1,487,329 |
| 8,008 | Johnson & Johnson | 1,419,258 |
| | | | | 2,906,587 |
| | Financials — 0.9% | |
| 33,406 | Bank of America Corp. | 1,376,994 |
| 4,198 | Goldman Sachs Group, Inc. (The) | 1,385,760 |
| | | | | 2,762,754 |
| | Energy — 0.5% | |
| 18,042 | Exxon Mobil Corp. | 1,490,089 |
| 2,237,868 | Hi-Crush, Inc.(D) | 22,379 |
| | | | | 1,512,468 |
Touchstone Strategic Income Opportunities Fund (Continued)
| Shares | | | | MarketValue |
| | Common Stocks — 5.4% (Continued) | |
| | Materials — 0.4% | |
| 19,412 | DuPont de Nemours, Inc. | $ 1,428,335 |
| | Consumer Staples — 0.4% | |
| 15,196 | Philip Morris International, Inc. | 1,427,512 |
| | Communication Services — 0.4% | |
| 58,809 | AT&T, Inc. | 1,389,657 |
| | Total Common Stocks | $17,705,734 |
Principal
Amount | | | | |
| | Sovereign Government Obligations — 4.4% |
| $ 1,350,000 | Angolan Government International Bond, 144a, 8.000%, 11/26/29 | | | 1,354,887 |
| 1,222,000 | Bahamas Government International Bond, 144a, 6.000%, 11/21/28 | | | 945,535 |
| 1,177,000 | Chile Government International Bond, 3.100%, 5/7/41 | | | 1,039,138 |
| 1,295,000 | Colombia Government International Bond, 3.125%, 4/15/31 | | | 1,096,541 |
| 400,000 | Colombia Government International Bond, 7.375%, 9/18/37 | | | 449,000 |
| 320,000 | Colombia Government International Bond, 10.375%, 1/28/33 | | | 432,403 |
| 1,350,000 | Dominican Republic International Bond, 4.875%, 9/23/32 | | | 1,221,763 |
| 1,530,000 | Ecuador Government International Bond, 144a, 1.000%, 7/31/35 | | | 1,000,635 |
| 657,000 | Ecuador Government International Bond, 144a, 5.000%, 7/31/30 | | | 548,602 |
| 1,350,000 | Egypt Government International Bond, 8.500%, 1/31/47 | | | 1,148,553 |
| 955,000 | Gabon Government International Bond, 144a, 6.625%, 2/6/31 | | | 904,099 |
| 1,350,000 | Ghana Government International Bond, 144a, 8.627%, 6/16/49 | | | 938,088 |
| 1,192,000 | Mexico Government International Bond, 2.659%, 5/24/31 | | | 1,084,350 |
| 1,000,000 | Nigeria Government International Bond, 144a, 7.625%, 11/28/47 | | | 830,900 |
| 985,000 | Republic of Uzbekistan International Bond, 144a, 3.700%, 11/25/30 | | | 849,563 |
| 200,000 | Ukraine Government International Bond, 144a, 7.253%, 3/15/33 | | | 82,950 |
| 1,020,000 | Ukraine Government International Bond, 7.253%, 3/15/33 | | | 423,045 |
| | Total Sovereign Government Obligations | $14,350,052 |
| | Commercial Mortgage-Backed Securities — 4.1% |
| 5,000,000 | BX Commercial Mortgage Trust, Ser 2020-VIV2, Class C, 144a, 3.542%, 3/9/44(B)(C) | | | 4,576,078 |
| 5,000,000 | CGMS Commercial Mortgage Trust, Ser 2017-B1, Class D, 144a, 3.000%, 8/15/50 | | | 4,176,120 |
| 2,202,000 | GS Mortgage Securities Corp. Trust, Ser 2017-SLP, Class E, 144a, 4.591%, 10/10/32(B)(C) | | | 2,158,620 |
| 2,530,000 | Wells Fargo Re-REMIC Trust, Ser 2013-FRR1, Class BK26, 144a, 1/27/45# | | | 2,410,694 |
| | Total Commercial Mortgage-Backed Securities | $13,321,512 |
| Shares | | | | |
| | Preferred Stocks — 2.1% | |
| | Financials — 1.8% | |
| 95,203 | First Republic Bank, Ser K, 4.125%(A) | 1,963,086 |
| 32,500 | JPMorgan Chase & Co., Ser JJ, 4.550%(A) | 710,450 |
| Shares | | | | MarketValue |
| | | |
| | Financials — (Continued) | |
| 48,750 | JPMorgan Chase & Co., Ser MM, 4.200%(A) | $ 1,027,650 |
| 69,778 | Morgan Stanley, Ser DMT1, 4.250%(A) | 1,500,925 |
| 36,977 | US Bancorp, Ser L, 3.750%(A) | 728,816 |
| | | | | 5,930,927 |
| | Real Estate — 0.3% | |
| 12,224 | Public Storage REIT, 4.000%(A) | 252,181 |
| 36,304 | Public Storage REIT, 3.900%(A) | 728,259 |
| | | | | 980,440 |
| | Total Preferred Stocks | $6,911,367 |
Principal
Amount | | | | |
| | Agency Collateralized Mortgage Obligations — 0.5% |
| $26,566,657 | FRESB Mortgage Trust, Ser 2020-SB78, Class X1, 1.158%, 6/25/40(B)(C)(E) | 1,735,353 |
| | Rights — 0.0% |
| 27,942 | Vistra Energy Corp. Tax Return Rights, 0.000%, 12/6/26 | 36,045 |
| Shares | | | | |
| | Short-Term Investment Fund — 1.3% | |
| 4,136,088 | Dreyfus Government Cash Management, Institutional Shares, 0.19%∞Ω | 4,136,087 |
| | Total Investment Securities—99.1%
(Cost $345,305,920) | $323,681,472 |
| | Other Assets in Excess of Liabilities — 0.9% | 2,851,072 |
| | Net Assets — 100.0% | $326,532,544 |
| (A) | Perpetual Bond - A bond or preferred stock with no definite maturity date. |
| (B) | Variable rate security - Rate reflected is the rate in effect as of March 31, 2022. |
| (C) | Certain variable rate securities are not based on a published reference rate and spread but are determined by the issuer or agent and are based on current market conditions. These securities do not indicate a reference rate and spread in their description. |
| (D) | Level 3- For more information on valuation inputs, and their aggregation into the levels used in the table below, please refer to the security valuation section in the accompanying Notes to Financial Statements. |
| (E) | Interest only security - This type of security represents the right to receive the monthly interest payments on an underlying pool of mortgages. Payments of principal on the pool reduce the value of the “interest only” holding. |
| # | Zero coupon bond - Rate shown reflects effective yield to maturity at time of purchase. |
| ∞ | Open-End Fund. |
| Ω | Represents the 7-Day SEC yield as of March 31, 2022. |
| Portfolio Abbreviations: |
| CLO – Collateralized Loan Obligation |
| FRESB – Freddie Mac Multifamily Securitization Small Balance Loan |
| JSC – Joint Stock Company |
| LIBOR – London Interbank Offered Rate |
| LLC – Limited Liability Company |
| LP – Limited Partnership |
| PLC – Public Limited Company |
| REIT – Real Estate Investment Trust |
| REMIC – Real Estate Mortgage Investment Conduit |
| SOC – State-Owned Company |
| SOFR30A – Secured Overnight Financing Rate 30 Day Average |
| 144a - This is a restricted security that was sold in a transaction qualifying for the exemption under Rule 144a of the Securities Act of 1933. This security may be sold in transactions exempt from registration, normally to qualified institutional buyers. At March 31, 2022, these securities were valued at $162,018,624 or 49.6% of net assets. These securities were deemed liquid pursuant to procedures approved by the Board of Trustees. |
Touchstone Strategic Income Opportunities Fund (Continued)
Other Information:
The inputs or methodology used for valuing securities may not be an indication of the risk associated with investing in those securities. For more information on valuation inputs, and their aggregation into the levels used in the table below, please refer to the security valuation section in the accompanying Notes to Financial Statements.
| Valuation Inputs at Reporting Date: |
| Description | Level 1 | Level 2 | Level 3 | Total |
| Assets: | | | | |
| Corporate Bonds | $— | $173,496,418 | $— | $173,496,418 |
| Asset-Backed Securities | — | 61,776,794 | — | 61,776,794 |
| U.S. Treasury Obligations | — | 30,212,110 | — | 30,212,110 |
| Common Stocks | 17,198,745 | 484,610 | 22,379 | 17,705,734 |
| Sovereign Government Obligations | — | 14,350,052 | — | 14,350,052 |
| Commercial Mortgage-Backed Securities | — | 13,321,512 | — | 13,321,512 |
| Preferred Stocks | 6,911,367 | — | — | 6,911,367 |
| Agency Collateralized Mortgage Obligations | — | 1,735,353 | — | 1,735,353 |
| Rights | — | 36,045 | — | 36,045 |
| Short-Term Investment Fund | 4,136,087 | — | — | 4,136,087 |
| Other Financial Instruments* | | | | |
| Futures | | | | |
| Interest rate contracts | 136,488 | — | — | 136,488 |
| Total Assets | $28,382,687 | $295,412,894 | $22,379 | $323,817,960 |
| Liabilities: | | | | |
| Other Financial Instruments* | | | | |
| Futures | | | | |
| Interest rate contracts | $(344,149) | $— | $— | $(344,149) |
| Total Liabilities | $(344,149) | $— | $— | $(344,149) |
| Total | $28,038,538 | $295,412,894 | $22,379 | $323,473,811 |
| * | Other Financial Instruments are derivative instruments not reflected in total investments. Amounts shown represent unrealized appreciation (depreciation) on futures contracts and is included in Payable for variation margin on futures contracts on the Statement of Assets and Liabilities. |
| Measurements Using Unobservable Inputs (Level 3) | |
| Assets | Common Stocks and
Corporate Bonds |
| Beginning balance, March 31, 2021 | $509,081 |
| Purchases and Sales | (1,349,026) |
| Accrued discounts (premiums) | 2,981 |
| Net realized gain (loss) | (2,048,301) |
| Change in unrealized appreciation (depreciation) | 2,907,644 |
| Ending balance, March 31, 2022 | $22,379 |
| Net Change in Unrealized Appreciation/Depreciation for Investments in Securities still held at March 31, 2022 | $38,740 |
Common
Stocks | Fair Value | Valuation
Technique | Unobservable
Input |
| Hi-Crush, Inc. | $22,379 | Market Value | N/A |
Futures Contracts
At March 31, 2022, $197,015 was segregated with the broker as collateral for futures contracts. The Fund had the following futures contracts, brokered by Wells Fargo, open at March 31, 2022:
| Description | Expiration Date | Number of
Contracts | Notional Value | Unrealized
Appreciation/
(Depreciation) |
| Short Futures: | | | | |
| 10-Year Ultra Long U.S. Treasury Bond | 6/21/2022 | 202 | $27,501,175 | $136,488 |
| Long Futures: | | | | |
| 5-Year U.S. Treasury Note | 6/30/2022 | 494 | 56,999,774 | (344,149) |
| | | | | $(207,661) |
See accompanying Notes to Financial Statements.
Statements of Assets and Liabilities
March 31, 2022
| | Touchstone
Flexible
Income
Fund | Touchstone
Focused
Fund | Touchstone
Global ESG
Equity Fund | Touchstone
Growth
Opportunities
Fund | Touchstone
Mid Cap
Growth
Fund | Touchstone
Sands Capital
Emerging
Markets
Growth Fund | Touchstone
Strategic
Income
Opportunities
Fund |
| Assets | | | | | | | |
| Investments, at cost | $872,546,389 | $664,454,397 | $512,792,535 | $94,170,392 | $998,832,415 | $3,413,254,410 | $345,305,920 |
| Investments, at market value * | $842,331,996 | $1,201,491,984 | $645,529,735 | $162,440,500 | $1,312,384,691 | $3,664,858,068 | $323,681,472 |
| Cash | — | — | — | — | — | 2,125,362 | 3,026 |
| Cash deposits held at prime broker (A) | 22,565,042 | — | — | — | — | — | 197,015 |
| Foreign currency † | 3 | — | 456,152 | — | — | 2,569,098 | — |
| Dividends and interest receivable | 5,882,312 | 683,689 | 2,070,663 | 41,344 | 420,218 | 2,575,166 | 2,811,379 |
| Receivable for capital shares sold | 832,118 | 99,439 | 272,302 | 26,582 | 5,824,943 | 14,931,792 | 63,171 |
| Receivable for investments sold | 19,999,100 | 364,479 | 2,534,684 | 3,323,954 | — | 13,926,829 | 915,895 |
| Receivable for securities lending income | 5,396 | — | 19,550 | — | — | 188,542 | 37 |
| Tax reclaim receivable | — | — | 323,965 | — | 3,913 | 73,623 | 5,936 |
| Other assets | 41,690 | 44,003 | 29,001 | 20,907 | 65,150 | 104,028 | 34,216 |
| Total Assets | 891,657,657 | 1,202,683,594 | 651,236,052 | 165,853,287 | 1,318,698,915 | 3,701,352,508 | 327,712,147 |
| |
| Liabilities | | | | | | | |
| Bank overdrafts | 19,797,632 | — | — | — | — | — | — |
| Due to prime broker | — | — | — | — | — | — | 17 |
| Dividends payable | 136,601 | — | — | — | — | — | — |
| Securities sold short** | 22,582,000 | — | — | — | — | — | — |
| Payable for return of collateral for securities on loan | 354,825 | — | 21,634,913 | — | — | 81,188,062 | — |
| Deferred foreign capital gains tax | — | — | — | — | — | 26,240,983 | — |
| Payable for capital shares redeemed | 1,559,008 | 674,089 | 214,137 | 72,186 | 1,823,705 | 11,500,441 | 758,329 |
| Payable for investments purchased | — | — | — | 3,331,633 | — | — | — |
| Payable to Investment Advisor | 368,628 | 621,910 | 335,235 | 87,114 | 733,399 | 2,994,352 | 159,137 |
| Payable to other affiliates | 147,132 | 163,793 | 83,648 | 24,664 | 219,714 | 407,264 | 98,212 |
| Payable to Trustees | 14,289 | 14,289 | 14,289 | 14,289 | 14,289 | 14,289 | 14,289 |
| Payable for professional services | 35,420 | 28,692 | 36,447 | 24,619 | 32,653 | 73,142 | 29,586 |
| Payable for reports to shareholders | 14,781 | 19,109 | 11,827 | 4,080 | 49,580 | 64,258 | 10,113 |
| Payable for transfer agent services | 226,731 | 267,400 | 169,846 | 35,905 | 353,853 | 748,287 | 93,100 |
| Payable for variation margin on futures contracts | — | — | — | — | — | — | 12,596 |
| Other accrued expenses and liabilities | 10,042 | 11,402 | 8,920 | 8,788 | 19,129 | 96,681 | 4,224 |
| Total Liabilities | 45,247,089 | 1,800,684 | 22,509,262 | 3,603,278 | 3,246,322 | 123,327,759 | 1,179,603 |
| Net Assets | $846,410,568 | $1,200,882,910 | $628,726,790 | $162,250,009 | $1,315,452,593 | $3,578,024,749 | $326,532,544 |
| Net assets consist of: | | | | | | | |
| Paid-in capital | 877,588,247 | 632,240,254 | 471,883,261 | 92,694,550 | 977,463,306 | 3,770,094,643 | 393,924,913 |
| Distributable earnings (deficit) | (31,177,679) | 568,642,656 | 156,843,529 | 69,555,459 | 337,989,287 | (192,069,894) | (67,392,369) |
| Net Assets | $846,410,568 | $1,200,882,910 | $628,726,790 | $162,250,009 | $1,315,452,593 | $3,578,024,749 | $326,532,544 |
| *Includes market value of securities on loan of: | $348,419 | $— | $18,547,086 | $— | $— | $75,956,336 | $— |
| †Cost of foreign currency: | $3 | $— | $461,498 | $— | $— | $2,563,348 | $— |
| **Proceeds received for securities sold short: | $21,817,364 | $— | $— | $— | $— | $— | $— |
| (A) | Represents segregated cash for securities sold short, futures contracts and swap agreements. |
See accompanying Notes to Financial Statements.
Statements of Assets and Liabilities (Continued)
| | Touchstone
Flexible
Income
Fund | Touchstone
Focused
Fund | Touchstone
Global ESG
Equity Fund | Touchstone
Growth
Opportunities
Fund | Touchstone
Mid Cap
Growth
Fund | Touchstone
Sands Capital
Emerging
Markets
Growth Fund | Touchstone
Strategic
Income
Opportunities
Fund |
| Pricing of Class A Shares | | | | | | | |
| Net assets applicable to Class A shares | $113,880,493 | $53,027,554 | $457,749,962 | $61,006,472 | $299,763,007 | $19,693,819 | $177,573,583 |
Shares of beneficial interest outstanding
(unlimited number of shares authorized, no par value) | 10,777,185 | 878,186 | 19,847,470 | 1,579,037 | 8,684,924 | 1,258,251 | 54,289,821 |
| Net asset value price per share* | $10.57 | $60.38 | $23.06 | $38.64 | $34.52 | $15.65 | $3.27 |
| Maximum sales charge - Class A shares | 3.25% | 5.00% | 5.00% | 5.00% | 5.00% | 5.00% | 3.25% |
Maximum offering price per share
(100%/(100%-maximum sales charge) of net asset value adjusted to the nearest cent) - Class A shares | $10.93 | $63.56 | $24.27 | $40.67 | $36.34 | $16.47 | $3.38 |
| |
| Pricing of Class C Shares | | | | | | | |
| Net assets applicable to Class C shares | $37,087,115 | $20,147,368 | $5,565,431 | $1,769,074 | $17,918,035 | $9,107,496 | $42,045,885 |
Shares of beneficial interest outstanding
(unlimited number of shares authorized, no par value) | 3,567,464 | 365,657 | 300,110 | 68,048 | 1,108,136 | 592,398 | 12,805,706 |
| Net asset value and offering price per share** | $10.40 | $55.10 | $18.54 | $26.00 | $16.17 | $15.37 | $3.28 |
| |
| Pricing of Class Y Shares | | | | | | | |
| Net assets applicable to Class Y shares | $661,265,641 | $1,108,883,265 | $155,663,978 | $25,850,758 | $657,182,254 | $1,186,957,229 | $106,650,162 |
Shares of beneficial interest outstanding
(unlimited number of shares authorized, no par value) | 62,368,999 | 18,114,192 | 6,468,113 | 631,004 | 17,896,583 | 75,423,491 | 32,687,745 |
| Net asset value, offering price and redemption price per share | $10.60 | $61.22 | $24.07 | $40.97 | $36.72 | $15.74 | $3.26 |
| |
| Pricing of Institutional Class Shares | | | | | | | |
| Net assets applicable to Institutional Class shares | $34,177,319 | $18,824,723 | $9,747,419 | $73,623,705 | $229,027,898 | $1,252,461,045 | $262,914 |
Shares of beneficial interest outstanding
(unlimited number of shares authorized, no par value) | 3,224,216 | 305,909 | 404,324 | 1,756,398 | 6,142,310 | 79,138,214 | 80,690 |
| Net asset value, offering price and redemption price per share | $10.60 | $61.54 | $24.11 | $41.92 | $37.29 | $15.83 | $3.26 |
| |
| Pricing of Class R6 Shares | | | | | | | |
| Net assets applicable to Class R6 shares | $— | $— | $— | $— | $111,561,399 | $1,109,805,160 | $— |
Shares of beneficial interest outstanding
(unlimited number of shares authorized, no par value) | — | — | — | — | 2,986,861 | 70,123,375 | — |
| Net asset value, offering price and redemption price per share | $— | $— | $— | $— | $37.35 | $15.83 | $— |
| * | There is no sales load on subscriptions of $1 million or more for all funds except for Flexible Income Fund and Strategic Income Opportunities Fund. There is no sales load on subscriptions of $500,000 or more for Flexible Income Fund and Strategic Income Opportunities Fund. Redemptions that were part of a $500,000 or $1 million or more subscription, as applicable, may be subject to a contingent deferred sales load if redeemed within a one-year period from the date of purchase. |
| ** | Redemption price per share varies by length of time shares are held due to the terms of the contingent deferred sales charge. |
See accompanying Notes to Financial Statements.
This page intentionally left blank.
Statements of Operations For the Year Ended March 31, 2022
| | Touchstone
Flexible
Income
Fund | Touchstone
Focused
Fund | Touchstone
Global ESG
Equity Fund | Touchstone
Growth
Opportunities
Fund | Touchstone
Mid Cap
Growth
Fund | Touchstone
Sands Capital
Emerging
Markets
Growth Fund | Touchstone
Strategic
Income
Opportunities
Fund |
| Investment Income | | | | | | | |
| Dividends* | $7,211,289 | $12,276,115 | $12,606,317 | $1,330,284 | $7,921,327 | $25,954,826 | $580,805 |
| Interest** | 28,266,848 | — | — | — | — | 8,753 | 12,562,468 |
| Income from securities loaned | 281,571 | — | 82,044 | 83 | 971 | 572,709 | 37 |
| Total Investment Income | 35,759,708 | 12,276,115 | 12,688,361 | 1,330,367 | 7,922,298 | 26,536,288 | 13,143,310 |
| Expenses | | | | | | | |
| Investment advisory fees | 4,817,788 | 7,758,320 | 4,515,162 | 1,290,098 | 9,836,332 | 46,158,304 | 2,171,582 |
| Administration fees | 1,119,727 | 1,611,946 | 901,274 | 223,043 | 1,834,265 | 5,979,730 | 358,258 |
| Compliance fees and expenses | 3,073 | 3,073 | 3,073 | 3,073 | 3,073 | 3,073 | 2,312 |
| Custody fees | 62,112 | 18,625 | 60,943 | 16,062 | 28,320 | 1,082,119 | 61,363 |
| Professional fees | 53,694 | 52,822 | 51,927 | 28,472 | 62,379 | 168,555 | 72,338 |
| Transfer Agent fees, Class A(A) | 91,011 | 42,788 | 322,672 | 48,358 | 275,293 | 24,152 | 254,443 |
| Transfer Agent fees, Class C | 25,648 | 16,348 | 5,748 | 1,480 | 16,320 | 13,982 | 54,892 |
| Transfer Agent fees, Class Y | 519,548 | 755,480 | 115,521 | 29,448 | 753,189 | 1,750,866 | 157,868 |
| Transfer Agent fees, Institutional Class | 21,527 | 11,006 | 3,406 | 29,455 | 129,007 | 688,720 | 36 |
| Transfer Agent fees, Class R6 | — | — | — | — | 308 | 278 | — |
| Registration Fees, Class A(A) | 16,566 | 13,984 | 22,583 | 14,330 | 17,928 | 17,377 | 20,403 |
| Registration Fees, Class C | 13,597 | 10,770 | 9,788 | 9,597 | 12,609 | 12,899 | 18,054 |
| Registration Fees, Class Y | 39,347 | 30,991 | 16,817 | 10,767 | 25,115 | 125,357 | 27,763 |
| Registration Fees, Institutional Class | 8,369 | 9,266 | 7,705 | 16,909 | 22,787 | 62,207 | 2,699 |
| Registration Fees, Class R6 | — | — | — | — | 6,252 | 4,807 | — |
| Dividend expense on securities sold short | 373,514 | — | — | — | — | — | — |
| Interest expense on securities sold short | 98,250 | — | — | — | — | — | — |
| Reports to Shareholders, Class A(A) | 9,208 | 4,092 | 21,013 | 4,157 | 15,509 | 7,116 | 31,698 |
| Reports to Shareholders, Class C | 4,041 | 2,405 | 3,098 | 1,626 | 3,094 | 6,831 | 8,060 |
| Reports to Shareholders, Class Y | 22,428 | 46,293 | 8,680 | 2,343 | 79,668 | 127,258 | 22,754 |
| Reports to Shareholders, Institutional Class | 3,103 | 2,169 | 3,207 | 1,892 | 27,055 | 42,899 | 1,947 |
| Reports to Shareholders, Class R6 | — | — | — | — | 1,016 | 2,078 | — |
| Shareholder servicing fees, Class Y | — | — | — | — | — | — | 58,213 |
| Distribution and shareholder servicing expenses, Class A(A) | 305,319 | 134,735 | 959,860 | 156,795 | 800,853 | 64,150 | 576,891 |
| Distribution and shareholder servicing expenses, Class C | 412,490 | 242,401 | 67,981 | 18,561 | 185,743 | 113,654 | 501,776 |
| Trustee fees | 26,076 | 26,076 | 26,076 | 26,076 | 26,076 | 26,076 | 27,813 |
| Other expenses | 98,948 | 358,101 | 156,907 | 68,683 | 488,936 | 298,979 | 77,122 |
| Total Expenses | 8,145,384 | 11,151,691 | 7,283,441 | 2,001,225 | 14,651,127 | 56,781,467 | 4,508,285 |
| Fees waived and/or reimbursed by the Advisor and/or Affiliates(B) | (179,442) | (10,171) | (19,880) | (174,803) | (155,930) | (13,312) | (467,674) |
| Net Expenses | 7,965,942 | 11,141,520 | 7,263,561 | 1,826,422 | 14,495,197 | 56,768,155 | 4,040,611 |
| Net Investment Income (Loss) | 27,793,766 | 1,134,595 | 5,424,800 | (496,055) | (6,572,899) | (30,231,867) | 9,102,699 |
| Realized and Unrealized Gains (Losses) on Investments | | | | | | | |
| Net realized gains (losses) on investments(C)(D) | (2,361,762) | 105,788,449 | 60,530,953 | 19,382,164 | 231,808,914 | (237,687,034) | 7,665,701 |
| Net realized gains on securities sold short | 6,896,005 | — | — | — | — | — | — |
| Net realized gains on written options | 520,097 | — | — | — | — | — | — |
| Net realized gains on futures contracts | — | — | — | — | — | — | 101,305 |
| Net realized gains on swap agreements | 1,989 | — | — | — | — | — | — |
| Net realized gains on forward foreign currency contracts | — | — | — | — | — | — | 289,517 |
| Net realized gains (losses) on foreign currency transactions | — | — | 65,036 | — | — | (292,401) | 10,916 |
| Capital gain distributions | 22,470 | — | — | — | — | — | — |
| Net change in unrealized appreciation (depreciation) on investments†(E) | (49,222,327) | 6,341,938 | (68,875,694) | (1,297,245) | (115,521,773) | (971,046,589) | (28,336,933) |
| Net change in unrealized appreciation (depreciation) on securities sold short | (764,636) | — | — | — | — | — | — |
| Net change in unrealized appreciation (depreciation) on futures contracts | — | — | — | — | — | — | (207,661) |
| Net change in unrealized appreciation (depreciation) on forward foreign currency contracts | — | — | — | — | — | — | (564,784) |
| Net change in unrealized appreciation (depreciation) on foreign currency transactions | — | — | (17,358) | — | — | 81,354 | 2,132 |
| Net Realized and Unrealized Gains (Losses) on Investments | (44,908,164) | 112,130,387 | (8,297,063) | 18,084,919 | 116,287,141 | (1,208,944,670) | (21,039,807) |
| Change in Net Assets Resulting from Operations | $(17,114,398) | $113,264,982 | $(2,872,263) | $17,588,864 | $109,714,242 | $(1,239,176,537) | $(11,937,108) |
| *Net of foreign tax withholding of: | $36,692 | $— | $1,287,727 | $— | $22,225 | $3,210,177 | $— |
| **Net of foreign tax withholding of: | $— | $— | $— | $— | $— | $— | $29,465 |
| †Includes increase in deferred foreign capital gains tax of: | $— | $— | $— | $— | $— | $671,126 | $— |
| (A) | Transfer Agent Fees, Registration Fees, Reports to Shareholders and Distribution and Shareholder Servicing Expenses for the Strategic Income Opportunities Fund include amounts for Class B shares of $10,630, $3,948, $1,619, and $39,904, respectively. Class B shares merged into Class A shares on July 16, 2021. |
| (B) | See Note 4 in Notes to Financial Statements. |
| (C) | Includes foreign capital gains taxes paid of $13,435,009 for the Sands Capital Emerging Markets Growth Fund. |
| (D) | For the year ended March 31, 2022, the Focused Fund, the Growth Opportunities Fund, the Mid Cap Growth Fund and the Sands Capital Emerging Markets Growth Fund had a redemption-in-kind of securities in the amount of $49,584,624, $10,433,824, $152,205,388 and $50,688,037, respectively. Net realized gains (losses) on investments includes the realized gain on the transaction of $29,739,350, $5,504,973, $60,289,147 and $29,697,936, respectively, which will not be recognized by the Fund for tax purposes. |
| (E) | Change in unrealized appreciation (depreciation) does not include net appreciation of $4,299,043, for the Strategic Income Opportunities Fund in connection with the Fund's reorganization. See Note 9 in the Notes to Financial Statements. |
See accompanying Notes to Financial Statements.
This page intentionally left blank.
Statements of Changes in Net Assets
| | Touchstone
Flexible Income
Fund | Touchstone
Focused Fund | Touchstone
Global ESG
Equity Fund |
| | For the
Year Ended
March 31,
2022 | For the
Year Ended
March 31,
2021 | For the
Year Ended
March 31,
2022 | For the
Year Ended
March 31,
2021 | For the
Year Ended
March 31,
2022 | For the
Year Ended
March 31,
2021 |
| From Operations | | | | | | |
| Net investment income (loss) | $27,793,766 | $28,534,916 | $1,134,595 | $2,222,448 | $5,424,800 | $4,274,188 |
| Net realized gains (losses) on investments, securities sold short, written options, futures contracts, swap agreements, forward foreign currency contracts, foreign currency transactions and capital gain distributions received | 5,078,799 | (3,408,359) | 105,788,449 | 113,770,654 | 60,595,989 | 66,392,214 |
| Net change in unrealized appreciation (depreciation) on investments, securities sold short, futures contracts, forward foreign currency contracts and foreign currency transactions | (49,986,963) | 76,082,971 | 6,341,938 | 380,150,794 | (68,893,052) | 198,003,928 |
| Change in Net Assets from Operations | (17,114,398) | 101,209,528 | 113,264,982 | 496,143,896 | (2,872,263) | 268,670,330 |
| |
| Distributions to Shareholders: | | | | | | |
| Distributed earnings, Class A | (3,914,740) | (5,278,794) | (2,981,004) | (2,153,855) | (55,428,678) | (1,587,449) |
| Distributed earnings, Class B | — | — | — | — | — | — |
| Distributed earnings, Class C | (1,030,204) | (1,865,099) | (1,434,791) | (1,430,957) | (801,994) | — |
| Distributed earnings, Class Y | (22,656,138) | (26,122,141) | (65,864,852) | (53,264,171) | (18,663,839) | (940,684) |
| Distributed earnings, Institutional Class | (1,622,568) | (1,479,966) | (1,697,569) | (817,067) | (1,214,241) | (65,145) |
| Distributed earnings, Class R6 | — | — | — | — | — | — |
| Total Distributions | (29,223,650) | (34,746,000) | (71,978,216) | (57,666,050) | (76,108,752) | (2,593,278) |
| Change in Net Assets from Share Transactions(B) | 103,096,464 | 82,253,829 | 11,900,180 | (36,832,260) | 7,273,709 | (78,741,029) |
| |
| Total Increase (Decrease) in Net Assets | 56,758,416 | 148,717,357 | 53,186,946 | 401,645,586 | (71,707,306) | 187,336,023 |
| |
| Net Assets | | | | | | |
| Beginning of period | 789,652,152 | 640,934,795 | 1,147,695,964 | 746,050,378 | 700,434,096 | 513,098,073 |
| End of period | $846,410,568 | $789,652,152 | $1,200,882,910 | $1,147,695,964 | $628,726,790 | $700,434,096 |
| (A) | See Note 9 in Notes to Financial Statements. |
| (B) | For details on share transactions by class, see Statements of Changes in Net Assets - Capital Stock Activity in pages 52-55. |
See accompanying Notes to Financial Statements.
Statements of Changes in Net Assets (Continued)
Touchstone
Growth Opportunities
Fund | Touchstone
Mid Cap
Growth Fund | Touchstone
Sands Capital Emerging
Markets Growth Fund | Touchstone
Strategic Income Opportunities Fund |
For the
Year Ended
March 31,
2022 | For the
Year Ended
March 31,
2021 | For the
Year Ended
March 31,
2022 | For the
Year Ended
March 31,
2021 | For the
Year Ended
March 31,
2022 | For the
Year Ended
March 31,
2021 | For the
Year Ended
March 31,
2022(A) | For the
Year Ended
March 31,
2021 |
| | | | | | | | |
| $(496,055) | $(557,556) | $(6,572,899) | $(7,641,364) | $(30,231,867) | $(22,877,687) | $9,102,699 | $9,833,238 |
| 19,382,164 | 33,445,786 | 231,808,914 | 272,551,221 | (237,979,435) | 34,300,447 | 8,067,439 | 9,010,153 |
| (1,297,245) | 49,085,637 | (115,521,773) | 354,354,600 | (970,965,235) | 1,243,531,916 | (29,107,246) | 21,780,178 |
| 17,588,864 | 81,973,867 | 109,714,242 | 619,264,457 | (1,239,176,537) | 1,254,954,676 | (11,937,108) | 40,623,569 |
| |
| | | | | | | | |
| (10,095,137) | (5,299,262) | (48,088,579) | (21,913,745) | (393,240) | — | (5,076,894) | (5,433,173) |
| — | — | — | — | — | — | (92,062) | (385,245) |
| (389,665) | (276,553) | (5,041,824) | (2,351,555) | (119,388) | — | (846,395) | (1,251,979) |
| (4,474,202) | (2,983,605) | (98,678,809) | (39,864,933) | (29,163,383) | — | (3,939,569) | (4,228,308) |
| (11,185,510) | (6,264,896) | (50,376,807) | (28,507,143) | (41,115,494) | — | (4,036) | — |
| — | — | (5,039,178) | (111,845) | (13,193,519) | — | — | — |
| (26,144,514) | (14,824,316) | (207,225,197) | (92,749,221) | (83,985,024) | — | (9,958,956) | (11,298,705) |
| 9,872,785 | (69,060,834) | 44,308,317 | (195,258,516) | 543,334,433 | 1,791,364,885 | (18,679,977) | 41,008,916 |
| |
| 1,317,135 | (1,911,283) | (53,202,638) | 331,256,720 | (779,827,128) | 3,046,319,561 | (40,576,041) | 70,333,780 |
| |
| | | | | | | | |
| 160,932,874 | 162,844,157 | 1,368,655,231 | 1,037,398,511 | 4,357,851,877 | 1,311,532,316 | 367,108,585 | 296,774,805 |
| $162,250,009 | $160,932,874 | $1,315,452,593 | $1,368,655,231 | $3,578,024,749 | $4,357,851,877 | $326,532,544 | $367,108,585 |
Statements of Changes in Net Assets - Capital Stock Activity
| | Touchstone
Flexible Income
Fund | Touchstone
Focused Fund |
| | For the Year
Ended
March 31, 2022 | For the Year
Ended
March 31, 2021 | For the Year
Ended
March 31, 2022 | For the Year
Ended
March 31, 2021 |
| | Shares | Dollars | Shares | Dollars | Shares | Dollars | Shares | Dollars |
| Class A | | | | | | | | |
| Proceeds from Shares issued | 1,667,801 | $18,708,179 | 2,840,796 | $31,345,303 | 251,214 | $15,729,509 | 251,563 | $12,943,588 |
| Reinvestment of distributions | 287,086 | 3,194,417 | 403,612 | 4,461,293 | 40,130 | 2,514,954 | 35,107 | 1,821,706 |
| Cost of Shares redeemed | (2,092,760) | (23,321,227) | (2,228,003) | (24,536,572) | (241,848) | (15,316,752) | (223,201) | (10,767,368) |
| Change from Class A Share Transactions | (137,873) | (1,418,631) | 1,016,405 | 11,270,024 | 49,496 | 2,927,711 | 63,469 | 3,997,926 |
| Class C | | | | | | | | |
| Proceeds from Shares issued | 570,123 | 6,275,318 | 735,883 | 7,973,288 | 13,299 | 768,119 | 11,317 | 524,313 |
| Reinvestment of distributions | 84,578 | 926,694 | 146,221 | 1,591,133 | 24,476 | 1,402,008 | 28,001 | 1,345,159 |
| Cost of Shares redeemed | (1,144,286) | (12,561,013) | (1,954,282) | (21,048,203) | (139,769) | (8,043,500) | (216,361) | (9,639,449) |
| Change from Class C Share Transactions | (489,585) | (5,359,001) | (1,072,178) | (11,483,782) | (101,994) | (5,873,373) | (177,043) | (7,769,977) |
| Class Y | | | | | | | | |
| Proceeds from Shares issued | 22,477,042 | 252,114,312 | 19,864,583 | 220,062,508 | 491,672 | 30,921,050 | 396,405 | 19,966,667 |
| Reinvestment of distributions | 1,864,466 | 20,791,361 | 2,171,185 | 24,083,355 | 998,513 | 63,493,935 | 975,935 | 51,346,021 |
| Cost of Shares redeemed | (14,691,501) | (163,062,234) | (15,443,838) | (169,306,158) | (1,290,574) | (81,764,429) | (1,950,332) | (95,698,599) |
| Change from Class Y Share Transactions | 9,650,007 | 109,843,439 | 6,591,930 | 74,839,705 | 199,611 | 12,650,556 | (577,992) | (24,385,911) |
| Institutional Class | | | | | | | | |
| Proceeds from Shares issued | 4,586,557 | 51,827,041 | 1,396,030 | 15,517,816 | 1,139,671 | 73,216,877 | 1,838,766 | 89,867,250 |
| Reinvestment of distributions | 102,953 | 1,154,181 | 93,094 | 1,031,402 | 26,163 | 1,671,930 | 14,676 | 776,182 |
| Cost of Shares redeemed | (4,708,529) | (52,950,565) | (806,241) | (8,921,336) | (1,117,980) | (72,693,521) | (2,008,192) | (99,317,730) |
| Change from Institutional Class Share Transactions | (19,019) | 30,657 | 682,883 | 7,627,882 | 47,854 | 2,195,286 | (154,750) | (8,674,298) |
| Change from Share Transactions | 9,003,530 | $103,096,464 | 7,219,040 | $82,253,829 | 194,967 | $11,900,180 | (846,316) | $(36,832,260) |
See accompanying Notes to Financial Statements.
Statements of Changes in Net Assets - Capital Stock Activity (Continued)
Touchstone
Global ESG
Equity Fund | Touchstone
Growth Opportunities
Fund |
For the Year
Ended
March 31, 2022 | For the Year
Ended
March 31, 2021 | For the Year
Ended
March 31, 2022 | For the Year
Ended
March 31, 2021 |
| Shares | Dollars | Shares | Dollars | Shares | Dollars | Shares | Dollars |
| | | | | | | | |
| 432,087 | $11,322,133 | 396,735 | $8,721,587 | 116,102 | $5,145,067 | 87,918 | $3,266,253 |
| 2,136,876 | 52,709,823 | 60,977 | 1,507,353 | 235,351 | 9,694,083 | 130,107 | 5,057,274 |
| (1,705,650) | (44,459,413) | (2,085,406) | (46,097,121) | (157,163) | (6,656,749) | (162,699) | (6,232,248) |
| 863,313 | 19,572,543 | (1,627,694) | (35,868,181) | 194,290 | 8,182,401 | 55,326 | 2,091,279 |
| | | | | | | | |
| 24,229 | 516,469 | 26,993 | 529,386 | 5,591 | 158,216 | 2,453 | 68,989 |
| 38,229 | 754,402 | — | — | 13,708 | 380,795 | 9,531 | 269,741 |
| (122,724) | (2,672,085) | (246,181) | (4,330,629) | (13,344) | (417,551) | (78,433) | (2,196,413) |
| (60,266) | (1,401,214) | (219,188) | (3,801,243) | 5,955 | 121,460 | (66,449) | (1,857,683) |
| | | | | | | | |
| 1,119,047 | 30,099,850 | 1,187,900 | 26,934,242 | 62,537 | 2,694,760 | 225,691 | 7,953,280 |
| 684,123 | 17,627,865 | 34,565 | 886,951 | 100,436 | 4,383,031 | 71,950 | 2,931,242 |
| (2,065,129) | (56,169,100) | (2,286,476) | (50,260,030) | (245,530) | (10,959,478) | (498,231) | (18,257,698) |
| (261,959) | (8,441,385) | (1,064,011) | (22,438,837) | (82,557) | (3,881,687) | (200,590) | (7,373,176) |
| | | | | | | | |
| 55,768 | 1,586,151 | 219,555 | 5,270,130 | 418,535 | 18,866,379 | 290,108 | 10,798,698 |
| 36,893 | 951,899 | 1,577 | 40,541 | 250,571 | 11,185,510 | 150,998 | 6,264,896 |
| (176,204) | (4,994,285) | (975,584) | (21,943,439) | (540,597) | (24,601,278) | (2,070,981) | (78,984,848) |
| (83,543) | (2,456,235) | (754,452) | (16,632,768) | 128,509 | 5,450,611 | (1,629,875) | (61,921,254) |
| 457,545 | $7,273,709 | (3,665,345) | $(78,741,029) | 246,197 | $9,872,785 | (1,841,588) | $(69,060,834) |
Statements of Changes in Net Assets - Capital Stock Activity (Continued)
| | Touchstone
Mid Cap
Growth Fund | Touchstone
Sands Capital Emerging
Markets Growth Fund |
| | For the Year
Ended
March 31, 2022 | For the Year
Ended
March 31, 2021 | For the Year
Ended
March 31, 2022(A) | For the Year
Ended
March 31, 2021 |
| | Shares | Dollars | Shares | Dollars | Shares | Dollars | Shares | Dollars |
| Class A(D) | | | | | | | | |
| Proceeds from Shares issued | 609,620 | $22,987,724 | 1,067,011 | $34,084,944 | 932,246 | $19,378,943 | 1,005,659 | $20,130,781 |
| Proceeds from Shares issued in connection with reorganization(C) | — | — | — | — | — | — | — | — |
| Reinvestment of distributions | 1,172,612 | 43,046,572 | 541,386 | 19,879,699 | 18,043 | 338,842 | — | — |
| Cost of Shares redeemed | (1,648,188) | (65,483,714) | (2,471,731) | (85,865,487) | (650,702) | (13,094,200) | (302,118) | (5,795,374) |
| Shares issued (reacquired) upon automatic conversion | — | — | — | — | — | — | — | — |
| Change from Class A Share Transactions | 134,044 | 550,582 | (863,334) | (31,900,844) | 299,587 | 6,623,585 | 703,541 | 14,335,407 |
| Class B(D) | | | | | | | | |
| Proceeds from Shares issued | — | — | — | — | — | — | — | — |
| Reinvestment of distributions | — | — | — | — | — | — | — | — |
| Share conversion in connection with reorganization(C) | — | — | — | — | — | — | — | — |
| Cost of Shares redeemed | — | — | — | — | — | — | — | — |
| Shares issued (reacquired) upon automatic conversion | — | — | — | — | — | — | — | — |
| Change from Class B Share Transactions | — | — | — | — | — | — | — | — |
| Class C | | | | | | | | |
| Proceeds from Shares issued | 256,212 | 4,681,124 | 76,143 | 1,468,504 | 247,366 | 5,076,527 | 392,695 | 8,087,311 |
| Proceeds from Shares issued in connection with reorganization(C) | — | — | — | — | — | — | — | — |
| Reinvestment of distributions | 284,933 | 4,912,253 | 111,664 | 2,265,668 | 5,585 | 103,264 | — | — |
| Cost of Shares redeemed | (344,107) | (6,896,222) | (713,332) | (13,647,825) | (121,471) | (2,287,859) | (32,579) | (574,799) |
| Shares issued (reacquired) upon automatic conversion | — | — | — | — | — | — | — | — |
| Change from Class C Share Transactions | 197,038 | 2,697,155 | (525,525) | (9,913,653) | 131,480 | 2,891,932 | 360,116 | 7,512,512 |
| Class Y(E) | | | | | | | | |
| Proceeds from Shares issued | 3,105,793 | 124,588,934 | 3,838,529 | 135,254,385 | 48,172,669 | 986,485,910 | 49,959,576 | 1,004,168,771 |
| Proceeds from Shares issued in connection with reorganization(C) | — | — | — | — | — | — | — | — |
| Reinvestment of distributions | 2,372,638 | 92,627,783 | 967,681 | 37,362,145 | 1,333,117 | 25,169,244 | — | — |
| Cost of Shares redeemed | (3,743,224) | (153,939,239) | (4,940,786) | (175,997,171) | (42,471,629) | (813,009,608) | (18,838,544) | (356,921,406) |
| Change from Class Y Share Transactions | 1,735,207 | 63,277,478 | (134,576) | (3,380,641) | 7,034,157 | 198,645,546 | 31,121,032 | 647,247,365 |
| Institutional Class | | | | | | | | |
| Proceeds from Shares issued | 5,904,177 | 248,082,533 | 7,022,230 | 257,938,408 | 43,802,336 | 910,162,747 | 76,112,190 | 1,483,255,179 |
| Reinvestment of distributions | 946,844 | 37,513,952 | 513,798 | 20,068,967 | 1,433,905 | 27,215,524 | — | — |
| Cost of Shares redeemed | (10,207,590) | (421,663,326) | (11,629,901) | (432,407,355) | (99,672,313) | (2,063,656,334) | (19,830,368) | (360,985,578) |
| Change from Institutional Class Share Transactions | (3,356,569) | (136,066,841) | (4,093,873) | (154,399,980) | (54,436,072) | (1,126,278,063) | 56,281,822 | 1,122,269,601 |
| Class R6 | | | | | | | | |
| Proceeds from Shares issued | 3,279,068 | 128,766,328 | 120,268 | 4,562,600 | 81,005,724 | 1,661,844,627 | — | — |
| Reinvestment of distributions | 103,297 | 4,098,831 | 2,862 | 111,845 | 131,400 | 2,492,653 | — | — |
| Cost of Shares redeemed | (510,052) | (19,015,216) | (8,652) | (337,843) | (11,013,749) | (202,885,847) | — | — |
| Change from Class R6 Share Transactions | 2,872,313 | 113,849,943 | 114,478 | 4,336,602 | 70,123,375 | 1,461,451,433 | — | — |
| Change from Share Transactions | 1,582,033 | $44,308,317 | (5,502,830) | $(195,258,516) | 23,152,527 | $543,334,433 | 88,466,511 | $1,791,364,885 |
| (A) | Represents the period from commencement of operations (April 26, 2021) through March 31, 2022 for Class R6. |
| (B) | Represents the period from commencement of operations (July 19, 2021) through March 31, 2022 for Institutional Class. |
| (C) | See Note 9 in Notes to Financial Statements |
| (D) | Effective July 16, 2021, Class B shares of the AIG Strategic Bond Fund were reorganized into Class A shares of the Touchstone Strategic Income Opportunities Fund. |
| (E) | Effective July 16, 2021, Class W shares of the AIG Strategic Bond Fund were reorganized into Class Y shares of the Touchstone Strategic Income Opportunities Fund. |
See accompanying Notes to Financial Statements.
Statements of Changes in Net Assets - Capital Stock Activity (Continued)
Touchstone
Strategic Income Opportunities Fund |
For the Year
Ended
March 31, 2022(B) (C) | For the Year
Ended
March 31, 2021 |
| Shares | Dollars | Shares | Dollars |
| | | | |
| 4,815,857 | $16,755,101 | 11,723,775 | $40,489,625 |
| 26,968,139 | 94,970,590 | — | — |
| 1,239,383 | 4,277,504 | 1,375,200 | 4,733,156 |
| (28,766,399) | (100,196,298) | (10,140,821) | (35,002,379) |
| — | — | 1,474,886 | 5,083,563 |
| 4,256,980 | 15,806,897 | 4,433,040 | 15,303,965 |
| | | | |
| 27,227 | 94,973 | 2,206,559 | 7,531,595 |
| 22,614 | 79,292 | 99,176 | 340,859 |
| (3,685,534) | (12,956,491) | — | — |
| (423,691) | (1,483,312) | (2,218,556) | (7,622,904) |
| — | — | (287,296) | (976,210) |
| (4,059,384) | (14,265,538) | (200,117) | (726,660) |
| | | | |
| 394,276 | 1,380,604 | 3,688,032 | 12,667,482 |
| 9,310,842 | 32,869,573 | — | — |
| 183,496 | 634,467 | 278,824 | 960,806 |
| (8,410,971) | (29,216,271) | (7,168,100) | (24,718,370) |
| — | — | (1,184,165) | (4,107,353) |
| 1,477,643 | 5,668,373 | (4,385,409) | (15,197,435) |
| | | | |
| 7,611,638 | 26,407,679 | 34,392,953 | 118,154,325 |
| 26,820,573 | 94,266,176 | — | — |
| 794,450 | 2,740,342 | 939,055 | 3,234,705 |
| (42,985,020) | (149,585,379) | (23,435,348) | (79,759,984) |
| (7,758,359) | (26,171,182) | 11,896,660 | 41,629,046 |
| | | | |
| 84,145 | 293,419 | — | — |
| 1,194 | 4,036 | — | — |
| (4,649) | (15,982) | — | — |
| 80,690 | 281,473 | — | — |
| | | | |
| — | — | — | — |
| — | — | — | — |
| — | — | — | — |
| — | — | — | — |
| (6,002,430) | $(18,679,977) | 11,744,174 | $41,008,916 |
| Touchstone Flexible Income Fund—Class A |
| Selected Data for a Share Outstanding Throughout Each Period |
| | Year Ended March 31, |
| | 2022 | 2021 | 2020 | 2019 | 2018 |
| Net asset value at beginning of period | $11.11 | $10.05 | $10.75 | $10.81 | $10.71 |
| Income (loss) from investment operations: | | | | | |
| Net investment income | 0.34 | 0.41 | 0.34 | 0.39 | 0.26 |
| Net realized and unrealized gains (losses) on investments | (0.52) | 1.16 | (0.68) | (0.01) | 0.11 |
| Total from investment operations | (0.18) | 1.57 | (0.34) | 0.38 | 0.37 |
| Distributions from: | | | | | |
| Net investment income | (0.36) | (0.41) | (0.36) | (0.38) | (0.27) |
| Realized capital gains | — | (0.10) | — | (0.06) | — |
| Total distributions | (0.36) | (0.51) | (0.36) | (0.44) | (0.27) |
| Net asset value at end of period | $10.57 | $11.11 | $10.05 | $10.75 | $10.81 |
| Total return(A) | (1.76%) | 15.72% | (3.33%) | 3.59% | 3.46% |
| Ratios and supplemental data: | | | | | |
| Net assets at end of period (000's) | $113,880 | $121,317 | $99,460 | $110,460 | $136,609 |
| Ratio to average net assets: | | | | | |
| Net expenses (including dividend and interest expense on securities sold short) | 1.09%(B) | 1.04% | 1.05%(B) | 1.04% | 1.06%(B) |
| Gross expenses (including dividend and interest expense on securities sold short) | 1.11%(C) | 1.09% | 1.14%(C) | 1.11% | 1.14%(C) |
| Net investment income | 3.05% | 3.79% | 3.12% | 3.50% | 2.60% |
| Portfolio turnover rate | 61% | 103% | 136% | 171% | 100%(D) |
| Touchstone Flexible Income Fund—Class C |
| Selected Data for a Share Outstanding Throughout Each Period |
| | Year Ended March 31, |
| | 2022 | 2021 | 2020 | 2019 | 2018 |
| Net asset value at beginning of period | $10.94 | $9.90 | $10.60 | $10.67 | $10.57 |
| Income (loss) from investment operations: | | | | | |
| Net investment income | 0.25 | 0.32 | 0.24 | 0.30 | 0.20 |
| Net realized and unrealized gains (losses) on investments | (0.51) | 1.15 | (0.66) | (0.01) | 0.09 |
| Total from investment operations | (0.26) | 1.47 | (0.42) | 0.29 | 0.29 |
| Distributions from: | | | | | |
| Net investment income | (0.28) | (0.33) | (0.28) | (0.30) | (0.19) |
| Realized capital gains | — | (0.10) | — | (0.06) | — |
| Total distributions | (0.28) | (0.43) | (0.28) | (0.36) | (0.19) |
| Net asset value at end of period | $10.40 | $10.94 | $9.90 | $10.60 | $10.67 |
| Total return(A) | (2.52%) | 14.89% | (4.09%) | 2.77% | 2.73% |
| Ratios and supplemental data: | | | | | |
| Net assets at end of period (000's) | $37,087 | $44,389 | $50,767 | $66,926 | $100,800 |
| Ratio to average net assets: | | | | | |
| Net expenses (including dividend and interest expense on securities sold short) | 1.84%(B) | 1.79% | 1.80%(B) | 1.79% | 1.81%(B) |
| Gross expenses (including dividend and interest expense on securities sold short) | 1.87%(C) | 1.85% | 1.91%(C) | 1.86% | 1.89%(C) |
| Net investment income | 2.30% | 3.04% | 2.37% | 2.75% | 1.85% |
| Portfolio turnover rate | 61% | 103% | 136% | 171% | 100%(D) |
| (A) | Total returns shown exclude the effect of applicable sales loads and fees. If these charges were included, the returns would be lower. |
| (B) | The ratio of net expenses to average net assets excluding dividend and interest expense on securities sold short for Class A was 1.04%, 1.04% and 1.06% and for Class C was 1.79%, 1.79% and 1.81% for the years ended March 31, 2022, 2020, and 2018, respectively. |
| (C) | The ratio of gross expenses to average net assets excluding dividend and interest expense on securities sold short for Class A was 1.06%, 1.13% and 1.14% and for Class C was 1.82%, 1.90% and 1.89% for the years ended March 31, 2022, 2020 and 2018, respectively. |
| (D) | Portfolio turnover excludes the purchases and sales of securities of the Sentinel Multi-Asset Income Fund acquired on October 27, 2017. If these transactions were included, portfolio turnover would have been higher. |
See accompanying Notes to Financial Statements.
Financial Highlights (Continued)
| Touchstone Flexible Income Fund—Class Y |
| Selected Data for a Share Outstanding Throughout Each Period |
| | Year Ended March 31, |
| | 2022 | 2021 | 2020 | 2019 | 2018 |
| Net asset value at beginning of period | $11.15 | $10.08 | $10.78 | $10.85 | $10.75 |
| Income (loss) from investment operations: | | | | | |
| Net investment income | 0.36 | 0.44 | 0.37 | 0.42 | 0.31 |
| Net realized and unrealized gains (losses) on investments | (0.53) | 1.17 | (0.68) | (0.02) | 0.09 |
| Total from investment operations | (0.17) | 1.61 | (0.31) | 0.40 | 0.40 |
| Distributions from: | | | | | |
| Net investment income | (0.38) | (0.44) | (0.39) | (0.41) | (0.30) |
| Realized capital gains | — | (0.10) | — | (0.06) | — |
| Total distributions | (0.38) | (0.54) | (0.39) | (0.47) | (0.30) |
| Net asset value at end of period | $10.60 | $11.15 | $10.08 | $10.78 | $10.85 |
| Total return | (1.61%) | 16.07% | (3.07%) | 3.75% | 3.71% |
| Ratios and supplemental data: | | | | | |
| Net assets at end of period (000's) | $661,266 | $587,810 | $464,910 | $459,861 | $628,693 |
| Ratio to average net assets: | | | | | |
| Net expenses (including dividend and interest expense on securities sold short) | 0.84%(A) | 0.79% | 0.80%(A) | 0.79% | 0.82%(A) |
| Gross expenses (including dividend and interest expense on securities sold short) | 0.85%(B) | 0.83% | 0.87%(B) | 0.84% | 0.90%(B) |
| Net investment income | 3.30% | 4.04% | 3.37% | 3.75% | 2.84% |
| Portfolio turnover rate | 61% | 103% | 136% | 171% | 100%(C) |
| Touchstone Flexible Income Fund—Institutional Class |
| Selected Data for a Share Outstanding Throughout Each Period |
| | Year Ended March 31, |
| | 2022 | 2021 | 2020 | 2019 | 2018 |
| Net asset value at beginning of period | $11.14 | $10.08 | $10.78 | $10.84 | $10.74 |
| Income (loss) from investment operations: | | | | | |
| Net investment income | 0.37 | 0.45 | 0.40 | 0.44 | 0.33 |
| Net realized and unrealized gains (losses) on investments | (0.52) | 1.16 | (0.70) | (0.02) | 0.08 |
| Total from investment operations | (0.15) | 1.61 | (0.30) | 0.42 | 0.41 |
| Distributions from: | | | | | |
| Net investment income | (0.39) | (0.45) | (0.40) | (0.42) | (0.31) |
| Realized capital gains | — | (0.10) | — | (0.06) | — |
| Total distributions | (0.39) | (0.55) | (0.40) | (0.48) | (0.31) |
| Net asset value at end of period | $10.60 | $11.14 | $10.08 | $10.78 | $10.84 |
| Total return | (1.45%) | 16.19% | (3.02%) | 3.95% | 3.81% |
| Ratios and supplemental data: | | | | | |
| Net assets at end of period (000's) | $34,177 | $36,136 | $25,798 | $59,138 | $86,578 |
| Ratio to average net assets: | | | | | |
| Net expenses (including dividend and interest expense on securities sold short) | 0.74%(A) | 0.69% | 0.70%(A) | 0.69% | 0.72%(A) |
| Gross expenses (including dividend and interest expense on securities sold short) | 0.84%(B) | 0.84% | 0.88%(B) | 0.82% | 0.86%(B) |
| Net investment income | 3.40% | 4.14% | 3.47% | 3.85% | 2.94% |
| Portfolio turnover rate | 61% | 103% | 136% | 171% | 100%(C) |
| (A) | The ratio of net expenses to average net assets excluding dividend and interest expense on securities sold short for Class Y was 0.79%, 0.79% and 0.82% and for Institutional Class was 0.69%, 0.69% and 0.72% for the years ended March 31, 2022, 2020 and 2018, respectively. |
| (B) | The ratio of gross expenses to average net assets excluding dividend and interest expense on securities sold short for Class Y was 0.80%, 0.86% and 0.90% and for Institutional Class was 0.79%, 0.87% and 0.86% for the years ended March 31, 2022, 2020 and 2018, respectively. |
| (C) | Portfolio turnover excludes the purchases and sales of securities of the Sentinel Multi-Asset Income Fund acquired on October 27, 2017. If these transactions were included, portfolio turnover would have been higher. |
See accompanying Notes to Financial Statements.
Financial Highlights (Continued)
| Touchstone Focused Fund—Class A |
| Selected Data for a Share Outstanding Throughout Each Period |
| | Year Ended March 31, |
| | 2022 | 2021 | 2020 | 2019 | 2018 |
| Net asset value at beginning of period | $58.43 | $36.45 | $42.68 | $42.93 | $41.47 |
| Income (loss) from investment operations: | | | | | |
| Net investment income (loss)(A) | (0.10) | (0.02) | 0.14 | 0.14 | 0.17 |
| Net realized and unrealized gains (losses) on investments | 5.72 | 24.92 | (3.56) | 1.39 | 4.02 |
| Total from investment operations | 5.62 | 24.90 | (3.42) | 1.53 | 4.19 |
| Distributions from: | | | | | |
| Net investment income | (0.03) | — | (0.10) | (0.01) | — |
| Realized capital gains | (3.64) | (2.92) | (2.71) | (1.77) | (2.73) |
| Total distributions | (3.67) | (2.92) | (2.81) | (1.78) | (2.73) |
| Net asset value at end of period | $60.38 | $58.43 | $36.45 | $42.68 | $42.93 |
| Total return(B) | 9.38% | 69.38% | (9.14%) | 3.82% | 10.13% |
| Ratios and supplemental data: | | | | | |
| Net assets at end of period (000's) | $53,028 | $48,419 | $27,889 | $55,399 | $167,354 |
| Ratio to average net assets: | | | | | |
| Net expenses (including liquidity provider expenses) | 1.15%(C) | 1.22%(C) | 1.20%(D) | 1.20% | 1.20% |
| Gross expenses (including liquidity provider expenses) | 1.15%(E) | 1.22%(E) | 1.19% | 1.32% | 1.29% |
| Net investment income (loss) | (0.17%) | (0.05%) | 0.31% | 0.32% | 0.40% |
| Portfolio turnover rate | 14%(F) | 18%(F) | 13% | 12% | 8%(F) |
| Touchstone Focused Fund—Class C |
| Selected Data for a Share Outstanding Throughout Each Period |
| | Year Ended March 31, |
| | 2022 | 2021 | 2020 | 2019 | 2018 |
| Net asset value at beginning of period | $53.97 | $34.06 | $40.26 | $40.89 | $39.90 |
| Income (loss) from investment operations: | | | | | |
| Net investment loss(A) | (0.53) | (0.36) | (0.18) | (0.18) | (0.14) |
| Net realized and unrealized gains (losses) on investments | 5.30 | 23.19 | (3.31) | 1.32 | 3.86 |
| Total from investment operations | 4.77 | 22.83 | (3.49) | 1.14 | 3.72 |
| Distributions from: | | | | | |
| Realized capital gains | (3.64) | (2.92) | (2.71) | (1.77) | (2.73) |
| Net asset value at end of period | $55.10 | $53.97 | $34.06 | $40.26 | $40.89 |
| Total return(B) | 8.58% | 68.10% | (9.80%) | 3.03% | 9.34% |
| Ratios and supplemental data: | | | | | |
| Net assets at end of period (000's) | $20,147 | $25,241 | $21,961 | $33,875 | $41,635 |
| Ratio to average net assets: | | | | | |
| Net expenses (including liquidity provider expenses) | 1.91%(C) | 1.96%(C) | 1.95% | 1.95% | 1.94% |
| Gross expenses (including liquidity provider expenses) | 1.91%(E) | 1.96%(E) | 1.98% | 1.95% | 1.94% |
| Net investment loss | (0.92%) | (0.79%) | (0.44%) | (0.43%) | (0.34%) |
| Portfolio turnover rate | 14%(F) | 18%(F) | 13% | 12% | 8%(F) |
| (A) | The net investment income (loss) per share was based on average shares outstanding for the period. |
| (B) | Total returns shown exclude the effect of applicable sales loads and fees. If these charges were included, the returns would be lower. |
| (C) | The ratio of net expenses to average net assets excluding liquidity provider expenses for Class A was 1.14% and 1.20% and for Class C was 1.90% and 1.94%, for the years ended March 31, 2022 and 2021, respectively. |
| (D) | Net expenses include amounts recouped by the Advisor. |
| (E) | The ratio of gross expenses to average net assets excluding liquidity provider expenses for Class A was 1.14% and 1.20% and for Class C was 1.90% and 1.94% for the years ended March 31, 2022 and 2021, respectively. |
| (F) | Portfolio turnover excludes securities delivered from processing redemptions-in-kind. |
See accompanying Notes to Financial Statements.
Financial Highlights (Continued)
| Touchstone Focused Fund—Class Y |
| Selected Data for a Share Outstanding Throughout Each Period |
| | Year Ended March 31, |
| | 2022 | 2021 | 2020 | 2019 | 2018 |
| Net asset value at beginning of period | $59.10 | $36.82 | $43.12 | $43.50 | $42.21 |
| Income (loss) from investment operations: | | | | | |
| Net investment income(A) | 0.08 | 0.13 | 0.26 | 0.27 | 0.31 |
| Net realized and unrealized gains (losses) on investments | 5.80 | 25.21 | (3.58) | 1.39 | 4.08 |
| Total from investment operations | 5.88 | 25.34 | (3.32) | 1.66 | 4.39 |
| Distributions from: | | | | | |
| Net investment income | (0.12) | (0.14) | (0.27) | (0.27) | (0.37) |
| Realized capital gains | (3.64) | (2.92) | (2.71) | (1.77) | (2.73) |
| Total distributions | (3.76) | (3.06) | (2.98) | (2.04) | (3.10) |
| Net asset value at end of period | $61.22 | $59.10 | $36.82 | $43.12 | $43.50 |
| Total return | 9.71% | 69.89% | (8.86%) | 4.13% | 10.43% |
| Ratios and supplemental data: | | | | | |
| Net assets at end of period (000's) | $1,108,883 | $1,058,713 | $680,934 | $879,704 | $972,273 |
| Ratio to average net assets: | | | | | |
| Net expenses (including liquidity provider expenses) | 0.86%(B) | 0.91%(B) | 0.91% | 0.91% | 0.91% |
| Gross expenses (including liquidity provider expenses) | 0.86%(C) | 0.91%(C) | 0.91% | 0.91% | 0.91% |
| Net investment income | 0.12% | 0.27% | 0.60% | 0.61% | 0.69% |
| Portfolio turnover rate | 14%(D) | 18%(D) | 13% | 12% | 8%(D) |
| Touchstone Focused Fund—Institutional Class |
| Selected Data for a Share Outstanding Throughout Each Period |
| | Year Ended March 31, |
| | 2022 | 2021 | 2020 | 2019 | 2018 |
| Net asset value at beginning of period | $59.38 | $36.98 | $43.30 | $43.68 | $42.38 |
| Income (loss) from investment operations: | | | | | |
| Net investment income(A) | 0.09 | 0.16 | 0.30 | 0.30 | 0.34 |
| Net realized and unrealized gains (losses) on investments | 5.84 | 25.33 | (3.60) | 1.39 | 4.11 |
| Total from investment operations | 5.93 | 25.49 | (3.30) | 1.69 | 4.45 |
| Distributions from: | | | | | |
| Net investment income | (0.13) | (0.17) | (0.31) | (0.30) | (0.42) |
| Realized capital gains | (3.64) | (2.92) | (2.71) | (1.77) | (2.73) |
| Total distributions | (3.77) | (3.09) | (3.02) | (2.07) | (3.15) |
| Net asset value at end of period | $61.54 | $59.38 | $36.98 | $43.30 | $43.68 |
| Total return | 9.75% | 70.00% | (8.79%) | 4.20% | 10.54% |
| Ratios and supplemental data: | | | | | |
| Net assets at end of period (000's) | $18,825 | $15,323 | $15,267 | $29,382 | $22,556 |
| Ratio to average net assets: | | | | | |
| Net expenses (including liquidity provider expenses) | 0.84%(B) | 0.85%(B) | 0.83% | 0.83% | 0.83% |
| Gross expenses (including liquidity provider expenses) | 0.88%(C) | 0.94%(C) | 0.92% | 0.92% | 0.92% |
| Net investment income | 0.15% | 0.32% | 0.68% | 0.69% | 0.77% |
| Portfolio turnover rate | 14%(D) | 18%(D) | 13% | 12% | 8%(D) |
| (A) | The net investment income per share was based on average shares outstanding for the period. |
| (B) | The ratio of net expenses to average net assets excluding liquidity provider expenses for Class Y was 0.85% and 0.89% and for Institutional Class was 0.83% and 0.83% for the years ended March 31, 2022 and 2021, respectively. |
| (C) | The ratio of gross expenses to average net assets excluding liquidity provider expenses for Class Y was 0.85% and 0.89% and for Institutional Class was 0.87% and 0.92% for the years ended March 31, 2022 and 2021, respectively. |
| (D) | Portfolio turnover excludes securities delivered from processing redemptions-in-kind. |
See accompanying Notes to Financial Statements.
Financial Highlights (Continued)
| Touchstone Global ESG Equity Fund—Class A |
| Selected Data for a Share Outstanding Throughout Each Period |
| | Year Ended March 31, |
| | 2022 | 2021 | 2020 | 2019 | 2018 |
| Net asset value at beginning of period | $26.16 | $16.84 | $19.94 | $22.01 | $21.52 |
| Income (loss) from investment operations: | | | | | |
| Net investment income | 0.18 | 0.14(A) | 0.17(A) | 0.15 | 0.03 |
| Net realized and unrealized gains (losses) on investments | (0.27) | 9.26 | (2.78) | (0.29) | 3.37 |
| Total from investment operations | (0.09) | 9.40 | (2.61) | (0.14) | 3.40 |
| Distributions from: | | | | | |
| Net investment income | (0.23) | (0.08) | (0.15) | (0.17) | (0.17) |
| Realized capital gains | (2.78) | — | (0.34) | (1.76) | (2.74) |
| Total distributions | (3.01) | (0.08) | (0.49) | (1.93) | (2.91) |
| Net asset value at end of period | $23.06 | $26.16 | $16.84 | $19.94 | $22.01 |
| Total return(B) | (0.98%) | 55.86% | 13.61% | (0.37%) | 15.57% |
| Ratios and supplemental data: | | | | | |
| Net assets at end of period (000's) | $457,750 | $496,574 | $347,021 | $445,608 | $485,413 |
| Ratio to average net assets: | | | | | |
| Net expenses | 1.09% | 1.12% | 1.17% | 1.17% | 1.19% |
| Gross expenses | 1.09% | 1.12% | 1.18% | 1.17% | 1.22% |
| Net investment income | 0.74% | 0.63% | 0.84% | 0.70% | 0.58% |
| Portfolio turnover rate | 32% | 62% | 60% | 40% | 72%(C) |
| Touchstone Global ESG Equity Fund—Class C |
| Selected Data for a Share Outstanding Throughout Each Period |
| | Year Ended March 31, |
| | 2022 | 2021 | 2020 | 2019 | 2018 |
| Net asset value at beginning of period | $21.59 | $13.97 | $16.65 | $18.68 | $18.62 |
| Income (loss) from investment operations: | | | | | |
| Net investment loss | (0.03) | (0.04)(A) | —(A)(D) | (0.06) | (0.05) |
| Net realized and unrealized gains (losses) on investments | (0.21) | 7.66 | (2.31) | (0.21) | 2.85 |
| Total from investment operations | (0.24) | 7.62 | (2.31) | (0.27) | 2.80 |
| Distributions from: | | | | | |
| Net investment income | (0.03) | — | (0.03) | — | — |
| Realized capital gains | (2.78) | — | (0.34) | (1.76) | (2.74) |
| Total distributions | (2.81) | — | (0.37) | (1.76) | (2.74) |
| Net asset value at end of period | $18.54 | $21.59 | $13.97 | $16.65 | $18.68 |
| Total return(B) | (1.85%) | 54.55% | (14.34%) | (1.18%) | 14.75% |
| Ratios and supplemental data: | | | | | |
| Net assets at end of period (000's) | $5,565 | $7,782 | $8,099 | $14,926 | $37,513 |
| Ratio to average net assets: | | | | | |
| Net expenses | 1.99% | 1.99% | 1.99% | 1.99% | 1.99% |
| Gross expenses | 2.10% | 2.14% | 2.14% | 2.03% | 2.05% |
| Net investment income (loss) | (0.16%) | (0.24%) | 0.02% | (0.12%) | (0.23%) |
| Portfolio turnover rate | 32% | 62% | 60% | 40% | 72%(C) |
| (A) | The net investment income (loss) per share was based on average shares outstanding for the period. |
| (B) | Total returns shown exclude the effect of applicable sales loads and fees. If these charges were included, the returns would be lower. |
| (C) | Portfolio turnover excludes the purchases and sales of securities of the Sentinel Sustainable Core Opportunities Fund acquired on October 27, 2017. If these transactions were included, portfolio turnover would have been higher. |
| (D) | Less than $0.005 per share. |
See accompanying Notes to Financial Statements.
Financial Highlights (Continued)
| Touchstone Global ESG Equity Fund—Class Y |
| Selected Data for a Share Outstanding Throughout Each Period |
| | Year Ended March 31, |
| | 2022 | 2021 | 2020 | 2019 | 2018 |
| Net asset value at beginning of period | $27.16 | $17.48 | $20.66 | $22.75 | $22.11 |
| Income (loss) from investment operations: | | | | | |
| Net investment income | 0.25 | 0.20(A) | 0.24(A) | 0.21 | 0.16 |
| Net realized and unrealized gains (losses) on investments | (0.28) | 9.62 | (2.88) | (0.31) | 3.41 |
| Total from investment operations | (0.03) | 9.82 | (2.64) | (0.10) | 3.57 |
| Distributions from: | | | | | |
| Net investment income | (0.28) | (0.14) | (0.20) | (0.23) | (0.19) |
| Realized capital gains | (2.78) | — | (0.34) | (1.76) | (2.74) |
| Total distributions | (3.06) | (0.14) | (0.54) | (1.99) | (2.93) |
| Net asset value at end of period | $24.07 | $27.16 | $17.48 | $20.66 | $22.75 |
| Total return | (0.74%) | 56.22% | (13.37%) | (0.09%) | 15.90% |
| Ratios and supplemental data: | | | | | |
| Net assets at end of period (000's) | $155,664 | $182,806 | $136,239 | $207,080 | $189,837 |
| Ratio to average net assets: | | | | | |
| Net expenses | 0.90% | 0.90% | 0.90% | 0.90% | 0.94% |
| Gross expenses | 0.90% | 0.93% | 0.94% | 0.93% | 0.99% |
| Net investment income | 0.93% | 0.85% | 1.11% | 0.97% | 0.82% |
| Portfolio turnover rate | 32% | 62% | 60% | 40% | 72%(B) |
| Touchstone Global ESG Equity Fund—Institutional Class |
| Selected Data for a Share Outstanding Throughout Each Period |
| | Year Ended March 31, |
| | 2022 | 2021 | 2020 | 2019 | 2018 |
| Net asset value at beginning of period | $27.20 | $17.50 | $20.68 | $22.77 | $22.13 |
| Income (loss) from investment operations: | | | | | |
| Net investment income | 0.29 | 0.19(A) | 0.24(A) | 0.22 | 0.20 |
| Net realized and unrealized gains (losses) on investments | (0.32) | 9.64 | (2.88) | (0.32) | 3.38 |
| Total from investment operations | (0.03) | 9.83 | (2.64) | (0.10) | 3.58 |
| Distributions from: | | | | | |
| Net investment income | (0.28) | (0.13) | (0.20) | (0.23) | (0.20) |
| Realized capital gains | (2.78) | — | (0.34) | (1.76) | (2.74) |
| Total distributions | (3.06) | (0.13) | (0.54) | (1.99) | (2.94) |
| Net asset value at end of period | $24.11 | $27.20 | $17.50 | $20.68 | $22.77 |
| Total return | (0.74%) | 56.21% | (13.35%) | (0.10%) | 15.95% |
| Ratios and supplemental data: | | | | | |
| Net assets at end of period (000's) | $9,747 | $13,271 | $21,739 | $44,382 | $42,196 |
| Ratio to average net assets: | | | | | |
| Net expenses | 0.89% | 0.89% | 0.89% | 0.89% | 0.89% |
| Gross expenses | 0.94% | 0.97% | 0.95% | 0.93% | 1.01% |
| Net investment income | 0.94% | 0.86% | 1.12% | 0.98% | 0.87% |
| Portfolio turnover rate | 32% | 62% | 60% | 40% | 72%(B) |
| (A) | The net investment income (loss) per share was based on average shares outstanding for the period. |
| (B) | Portfolio turnover excludes the purchases and sales of securities of the Sentinel Sustainable Core Opportunities Fund acquired on October 27, 2017. If these transactions were included, portfolio turnover would have been higher. |
See accompanying Notes to Financial Statements.
Financial Highlights (Continued)
| Touchstone Growth Opportunities Fund—Class A |
| Selected Data for a Share Outstanding Throughout Each Period |
| | Year Ended March 31, |
| | 2022 | 2021 | 2020 | 2019 | 2018 |
| Net asset value at beginning of period | $41.07 | $27.94 | $32.71 | $32.79 | $30.20 |
| Income (loss) from investment operations: | | | | | |
| Net investment loss | (0.21)(A) | (0.20) | (0.04) | (0.05) | (0.11) |
| Net realized and unrealized gains on investments | 4.97 | 17.44 | 0.99 | 3.10 | 5.89 |
| Total from investment operations | 4.76 | 17.24 | 0.95 | 3.05 | 5.78 |
| Distributions from: | | | | | |
| Realized capital gains | (7.19) | (4.11) | (5.72) | (3.13) | (3.19) |
| Net asset value at end of period | $38.64 | $41.07 | $27.94 | $32.71 | $32.79 |
| Total return(B) | 10.48% | 62.56% | 0.63% | 10.40% | 19.51% |
| Ratios and supplemental data: | | | | | |
| Net assets at end of period (000's) | $61,006 | $56,877 | $37,150 | $42,404 | $39,901 |
| Ratio to average net assets: | | | | | |
| Net expenses (including liquidity provider expenses) | 1.25%(C) | 1.24% | 1.25%(C) | 1.24% | 1.24% |
| Gross expenses (including liquidity provider expenses) | 1.31%(D) | 1.34% | 1.41%(D) | 1.37% | 1.38% |
| Net investment loss | (0.48%) | (0.55%) | (0.12%) | (0.17%) | (0.32%) |
| Portfolio turnover rate | 47%(E) | 65% | 101%(E) | 94%(E) | 86% |
| Touchstone Growth Opportunities Fund—Class C |
| Selected Data for a Share Outstanding Throughout Each Period |
| | Year Ended March 31, |
| | 2022 | 2021 | 2020 | 2019 | 2018 |
| Net asset value at beginning of period | $29.84 | $21.19 | $26.18 | $27.08 | $25.60 |
| Income (loss) from investment operations: | | | | | |
| Net investment loss | (0.38)(A) | (0.77) | (0.23) | (0.49) | (0.29) |
| Net realized and unrealized gains on investments | 3.73 | 13.53 | 0.96 | 2.72 | 4.96 |
| Total from investment operations | 3.35 | 12.76 | 0.73 | 2.23 | 4.67 |
| Distributions from: | | | | | |
| Realized capital gains | (7.19) | (4.11) | (5.72) | (3.13) | (3.19) |
| Net asset value at end of period | $26.00 | $29.84 | $21.19 | $26.18 | $27.08 |
| Total return(B) | 9.64% | 61.29% | (0.09%) | 9.54% | 18.65% |
| Ratios and supplemental data: | | | | | |
| Net assets at end of period (000's) | $1,769 | $1,853 | $2,724 | $3,863 | $8,680 |
| Ratio to average net assets: | | | | | |
| Net expenses (including liquidity provider expenses) | 2.00%(C) | 1.99% | 2.00%(C) | 1.99% | 1.99% |
| Gross expenses (including liquidity provider expenses) | 2.64%(D) | 2.70% | 2.61%(D) | 2.32% | 2.29% |
| Net investment loss | (1.23%) | (1.30%) | (0.87%) | (0.92%) | (1.07%) |
| Portfolio turnover rate | 47%(E) | 65% | 101%(E) | 94%(E) | 86% |
| (A) | The net investment income (loss) per share was based on average shares outstanding for the period. |
| (B) | Total returns shown exclude the effect of applicable sales loads and fees. If these charges were included, the returns would be lower. |
| (C) | The ratio of net expenses to average net assets excluding liquidity provider expenses for Class A was 1.24% and 1.24% and for Class C was 1.99% and 1.99% for the years ended March 31, 2022 and 2020, respectively. |
| (D) | The ratio of gross expenses to average net assets excluding liquidity provider expenses for Class A was 1.30% and 1.40% and for Class C was 2.63% and 2.60% for the years ended March 31, 2022 and 2020, respectively. |
| (E) | Portfolio turnover excludes securities delivered from processing redemptions-in-kind. |
See accompanying Notes to Financial Statements.
Financial Highlights (Continued)
| Touchstone Growth Opportunities Fund—Class Y |
| Selected Data for a Share Outstanding Throughout Each Period |
| | Year Ended March 31, |
| | 2022 | 2021 | 2020 | 2019 | 2018 |
| Net asset value at beginning of period | $43.08 | $29.11 | $33.78 | $33.69 | $30.87 |
| Income (loss) from investment operations: | | | | | |
| Net investment income (loss) | (0.11)(A) | (0.12) | 0.04 | 0.03 | (0.02) |
| Net realized and unrealized gains on investments | 5.19 | 18.20 | 1.01 | 3.19 | 6.03 |
| Total from investment operations | 5.08 | 18.08 | 1.05 | 3.22 | 6.01 |
| Distributions from: | | | | | |
| Realized capital gains | (7.19) | (4.11) | (5.72) | (3.13) | (3.19) |
| Net asset value at end of period | $40.97 | $43.08 | $29.11 | $33.78 | $33.69 |
| Total return | 10.75% | 62.93% | 0.92% | 10.67% | 19.80% |
| Ratios and supplemental data: | | | | | |
| Net assets at end of period (000's) | $25,851 | $30,742 | $26,610 | $43,703 | $47,554 |
| Ratio to average net assets: | | | | | |
| Net expenses (including liquidity provider expenses) | 1.00%(B) | 0.99% | 1.00%(B) | 0.99% | 0.99% |
| Gross expenses (including liquidity provider expenses) | 1.10%(C) | 1.13% | 1.14%(C) | 1.08% | 1.07% |
| Net investment income (loss) | (0.23%) | (0.30%) | 0.13% | 0.08% | (0.07%) |
| Portfolio turnover rate | 47%(D) | 65% | 101%(D) | 94%(D) | 86% |
| Touchstone Growth Opportunities Fund—Institutional Class |
| Selected Data for a Share Outstanding Throughout Each Period |
| | Year Ended March 31, |
| | 2022 | 2021 | 2020 | 2019 | 2018 |
| Net asset value at beginning of period | $43.90 | $29.58 | $34.22 | $34.08 | $31.16 |
| Income (loss) from investment operations: | | | | | |
| Net investment income (loss) | (0.06)(A) | (0.06) | 0.06 | 0.09 | 0.01 |
| Net realized and unrealized gains on investments | 5.27 | 18.49 | 1.02 | 3.21 | 6.10 |
| Total from investment operations | 5.21 | 18.43 | 1.08 | 3.30 | 6.11 |
| Distributions from: | | | | | |
| Net investment income | — | — | — | (0.03) | — |
| Realized capital gains | (7.19) | (4.11) | (5.72) | (3.13) | (3.19) |
| Total distributions | (7.19) | (4.11) | (5.72) | (3.16) | (3.19) |
| Net asset value at end of period | $41.92 | $43.90 | $29.58 | $34.22 | $34.08 |
| Total return | 10.84% | 63.13% | 1.00% | 10.79% | 19.94% |
| Ratios and supplemental data: | | | | | |
| Net assets at end of period (000's) | $73,624 | $71,461 | $96,361 | $71,406 | $185,831 |
| Ratio to average net assets: | | | | | |
| Net expenses (including liquidity provider expenses) | 0.90%(B) | 0.89% | 0.90%(B) | 0.89% | 0.89% |
| Gross expenses (including liquidity provider expenses) | 1.02%(C) | 1.03% | 1.05%(C) | 1.01% | 1.01% |
| Net investment income (loss) | (0.13%) | (0.20%) | 0.23% | 0.18% | 0.03% |
| Portfolio turnover rate | 47%(D) | 65% | 101%(D) | 94%(D) | 86% |
| (A) | The net investment income (loss) per share was based on average shares outstanding for the period. |
| (B) | The ratio of net expenses to average net assets excluding liquidity provider expenses for Class Y was 0.99% and 0.99% and for Institutional Class was 0.89% and 0.89% for the years ended March 31, 2022 and 2020, respectively. |
| (C) | The ratio of gross expenses to average net assets excluding liquidity provider expenses for Class Y was 1.09% and 1.13% and for Institutional Class was 1.01% and 1.04% for the years ended March 31, 2022 and 2020, respectively. |
| (D) | Portfolio turnover excludes securities delivered from processing redemptions-in-kind. |
See accompanying Notes to Financial Statements.
Financial Highlights (Continued)
| Touchstone Mid Cap Growth Fund—Class A |
| Selected Data for a Share Outstanding Throughout Each Period |
| | Year Ended March 31, |
| | 2022 | 2021 | 2020 | 2019 | 2018 |
| Net asset value at beginning of period | $37.71 | $24.89 | $29.26 | $28.05 | $25.91 |
| Income (loss) from investment operations: | | | | | |
| Net investment loss | (0.26)(A) | (0.28) | (0.07) | (0.09) | (0.08)(A) |
| Net realized and unrealized gains (losses) on investments | 3.44 | 15.64 | (2.06) | 3.36 | 4.95 |
| Total from investment operations | 3.18 | 15.36 | (2.13) | 3.27 | 4.87 |
| Distributions from: | | | | | |
| Net investment income | — | — | (0.01) | — | — |
| Realized capital gains | (6.37) | (2.54) | (2.23) | (2.06) | (2.73) |
| Total distributions | (6.37) | (2.54) | (2.24) | (2.06) | (2.73) |
| Net asset value at end of period | $34.52 | $37.71 | $24.89 | $29.26 | $28.05 |
| Total return(B) | 7.43% | 61.98% | (8.78%) | 12.77% | 19.28% |
| Ratios and supplemental data: | | | | | |
| Net assets at end of period (000's) | $299,763 | $322,432 | $234,307 | $262,492 | $218,727 |
| Ratio to average net assets: | | | | | |
| Net expenses (including liquidity provider expenses) | 1.21%(C) | 1.23%(C) | 1.25% | 1.27% | 1.29% |
| Gross expenses (including liquidity provider expenses) | 1.21%(D) | 1.23%(D) | 1.25% | 1.27% | 1.29% |
| Net investment loss | (0.65%) | (0.75%) | (0.24%) | (0.35%) | (0.29%) |
| Portfolio turnover rate | 60%(E) | 65%(E) | 82% | 71% | 76% |
| Touchstone Mid Cap Growth Fund—Class C |
| Selected Data for a Share Outstanding Throughout Each Period |
| | Year Ended March 31, |
| | 2022 | 2021 | 2020 | 2019 | 2018 |
| Net asset value at beginning of period | $20.79 | $14.56 | $18.08 | $18.27 | $17.84 |
| Income (loss) from investment operations: | | | | | |
| Net investment loss | (0.30)(A) | (0.78) | (0.32) | (0.49) | (0.20)(A) |
| Net realized and unrealized gains (losses) on investments | 2.05 | 9.55 | (0.97) | 2.36 | 3.36 |
| Total from investment operations | 1.75 | 8.77 | (1.29) | 1.87 | 3.16 |
| Distributions from: | | | | | |
| Realized capital gains | (6.37) | (2.54) | (2.23) | (2.06) | (2.73) |
| Net asset value at end of period | $16.17 | $20.79 | $14.56 | $18.08 | $18.27 |
| Total return(B) | 6.53% | 60.65% | (9.55%) | 11.91% | 18.38% |
| Ratios and supplemental data: | | | | | |
| Net assets at end of period (000's) | $17,918 | $18,939 | $20,918 | $32,831 | $90,502 |
| Ratio to average net assets: | | | | | |
| Net expenses (including liquidity provider expenses) | 2.04%(C) | 2.07%(C) | 2.07% | 2.04% | 2.04% |
| Gross expenses (including liquidity provider expenses) | 2.04%(D) | 2.07%(D) | 2.07% | 2.04% | 2.04% |
| Net investment loss | (1.48%) | (1.59%) | (1.06%) | (1.12%) | (1.04%) |
| Portfolio turnover rate | 60%(E) | 65%(E) | 82% | 71% | 76% |
| (A) | The net investment loss per share was based on average shares outstanding for the period. |
| (B) | Total returns shown exclude the effect of applicable sales loads and fees. If these charges were included, the returns would be lower. |
| (C) | The ratio of net expenses to average net assets excluding liquidity provider expenses for Class A were 1.19% and 1.22% and for Class C were 2.02% and 2.06% for the years ended March 31, 2022 and 2021. |
| (D) | The ratio of gross expenses to average net assets excluding liquidity provider expenses for Class A were 1.19% and 1.22% and for Class C were 2.02% and 2.06% for the years ended March 31, 2022 and 2021. |
| (E) | Portfolio turnover excludes securities delivered from processing redemptions-in-kind. |
See accompanying Notes to Financial Statements.
Financial Highlights (Continued)
| Touchstone Mid Cap Growth Fund—Class Y |
| Selected Data for a Share Outstanding Throughout Each Period |
| | Year Ended March 31, |
| | 2022 | 2021 | 2020 | 2019 | 2018 |
| Net asset value at beginning of period | $39.68 | $26.04 | $30.50 | $29.07 | $26.70 |
| Income (loss) from investment operations: | | | | | |
| Net investment loss | (0.18)(A) | (0.18) | (—)(B) | (0.03) | (0.01)(A) |
| Net realized and unrealized gains (losses) on investments | 3.59 | 16.36 | (2.17) | 3.52 | 5.11 |
| Total from investment operations | 3.41 | 16.18 | (2.17) | 3.49 | 5.10 |
| Distributions from: | | | | | |
| Net investment income | — | — | (0.06) | — | — |
| Realized capital gains | (6.37) | (2.54) | (2.23) | (2.06) | (2.73) |
| Total distributions | (6.37) | (2.54) | (2.29) | (2.06) | (2.73) |
| Net asset value at end of period | $36.72 | $39.68 | $26.04 | $30.50 | $29.07 |
| Total return | 7.65% | 62.40% | (8.58%) | 13.05% | 19.62% |
| Ratios and supplemental data: | | | | | |
| Net assets at end of period (000's) | $657,182 | $641,218 | $424,403 | $452,407 | $375,617 |
| Ratio to average net assets: | | | | | |
| Net expenses (including liquidity provider expenses) | 0.99%(C) | 0.99%(C) | 1.01% | 1.02% | 1.02% |
| Gross expenses (including liquidity provider expenses) | 0.99%(D) | 0.99%(D) | 1.01% | 1.02% | 1.02% |
| Net investment loss | (0.43%) | (0.52%) | (—%)(B) | (0.10%) | (0.02%) |
| Portfolio turnover rate | 60%(E) | 65%(E) | 82% | 71% | 76% |
| Touchstone Mid Cap Growth Fund—Institutional Class |
| Selected Data for a Share Outstanding Throughout Each Period |
| | Year Ended March 31, |
| | 2022 | 2021 | 2020 | 2019 | 2018 |
| Net asset value at beginning of period | $40.16 | $26.32 | $30.79 | $29.32 | $26.90 |
| Income (loss) from investment operations: | | | | | |
| Net investment income (loss) | (0.14)(A) | (0.20) | 0.01 | (0.01) | (—)(A)(B) |
| Net realized and unrealized gains (losses) on investments | 3.64 | 16.58 | (2.18) | 3.54 | 5.15 |
| Total from investment operations | 3.50 | 16.38 | (2.17) | 3.53 | 5.15 |
| Distributions from: | | | | | |
| Net investment income | — | — | (0.07) | — | — |
| Realized capital gains | (6.37) | (2.54) | (2.23) | (2.06) | (2.73) |
| Total distributions | (6.37) | (2.54) | (2.30) | (2.06) | (2.73) |
| Net asset value at end of period | $37.29 | $40.16 | $26.32 | $30.79 | $29.32 |
| Total return | 7.79% | 62.50% | (8.49%) | 13.10% | 19.62% |
| Ratios and supplemental data: | | | | | |
| Net assets at end of period (000's) | $229,028 | $381,463 | $357,769 | $349,865 | $95,176 |
| Ratio to average net assets: | | | | | |
| Net expenses (including liquidity provider expenses) | 0.88%(C) | 0.91%(C) | 0.94% | 0.97%(F) | 0.99% |
| Gross expenses (including liquidity provider expenses) | 0.91%(D) | 0.92%(D) | 0.94% | 0.97% | 0.99% |
| Net investment income (loss) | (0.32%) | (0.44%) | 0.06% | (0.06%) | 0.01% |
| Portfolio turnover rate | 60%(E) | 65%(E) | 82% | 71% | 76% |
| (A) | The net investment income (loss) per share was based on average shares outstanding for the period. |
| (B) | Less than $0.005 per share or 0.005%. |
| (C) | The ratio of net expenses to average net assets excluding liquidity provider expenses for Class Y were 0.97% and 0.98% and for Institutional Class were 0.86% and 0.90% for the years ended March 31, 2022 and 2021. |
| (D) | The ratio of gross expenses to average net assets excluding liquidity provider expenses for Class Y were 0.97% and 0.98% and for Institutional Class were 0.89% and 0.91% for the years ended March 31, 2022 and 2021. |
| (E) | Portfolio turnover excludes securities delivered from processing redemptions-in-kind. |
| (F) | Net expenses include amounts recouped by the Advisor. |
See accompanying Notes to Financial Statements.
Financial Highlights (Continued)
| Touchstone Mid Cap Growth Fund—Class R6 |
| Selected Data for a Share Outstanding Throughout Each Period |
| | Year Ended March 31, | Period Ended
March 31,
2020(A) |
| | 2022 | 2021 |
| Net asset value at beginning of period | $40.18 | $26.32 | $35.72(B) |
| Income (loss) from investment operations: | | | |
| Net investment loss | (0.09)(C) | (0.11) | (—)(D) |
| Net realized and unrealized gains (losses) on investments | 3.63 | 16.51 | (9.40) |
| Total from investment operations | 3.54 | 16.40 | (9.40) |
| Distributions from: | | | |
| Realized capital gains | (6.37) | (2.54) | — |
| Net asset value at end of period | $37.35 | $40.18 | $26.32 |
| Total return | 7.89% | 62.58% | (26.32%)(E) |
| Ratios and supplemental data: | | | |
| Net assets at end of period (000's) | $111,561 | $4,603 | $2 |
| Ratio to average net assets: | | | |
| Net expenses (including liquidity provider expenses) | 0.79%(F) | 0.85%(F) | 0.89%(G) |
| Gross expenses (including liquidity provider expenses) | 0.88%(H) | 1.47%(H) | 1,279.20%(G) |
| Net investment loss | (0.23%) | (0.37%) | (0.02%)(G) |
| Portfolio turnover rate | 60%(I) | 65%(I) | 82% |
| (A) | Represents the period from commencement of operations (February 10, 2020) through March 31, 2020. |
| (B) | Net asset value at the beginning of period is based on the net asset value of Institutional Class shares on February 10, 2020. |
| (C) | The net investment loss per share was based on average shares outstanding for the period. |
| (D) | Less than $0.005 per share. |
| (E) | Not annualized. |
| (F) | The ratio of net expenses to average net assets excluding liquidity provider expenses for Class R6 were 0.77% and 0.84% for the years ended March 31, 2022 and 2021. |
| (G) | Annualized. |
| (H) | The ratio of gross expenses to average net assets excluding liquidity provider expenses for Class R6 were 0.86% and 1.46% for the years ended March 31, 2022 and 2021. |
| (I) | Portfolio turnover excludes securities delivered from processing redemptions-in-kind. |
See accompanying Notes to Financial Statements.
Financial Highlights (Continued)
| Touchstone Sands Capital Emerging Markets Growth Fund—Class A |
| Selected Data for a Share Outstanding Throughout Each Period |
| | Year Ended March 31, | Period Ended
March 31,
2019(A) |
| | 2022 | 2021 | 2020 |
| Net asset value at beginning of period | $21.25 | $11.36 | $13.15 | $11.21(B) |
| Income (loss) from investment operations: | | | | |
| Net investment income (loss) | (0.21) | (0.13) | 0.05(C) | (0.01) |
| Net realized and unrealized gains (losses) on investments | (5.07) | 10.02 | (1.77) | 1.95 |
| Total from investment operations | (5.28) | 9.89 | (1.72) | 1.94 |
| Distributions from: | | | | |
| Net investment income | (0.32) | — | (0.07) | — |
| Net asset value at end of period | $15.65 | $21.25 | $11.36 | $13.15 |
| Total return(D) | (25.16%) | 87.06% | (13.19%) | 17.31%(E) |
| Ratios and supplemental data: | | | | |
| Net assets at end of period (000's) | $19,694 | $20,369 | $2,897 | $1,349 |
| Ratio to average net assets: | | | | |
| Net expenses | 1.60% | 1.60% | 1.60% | 1.60%(F) |
| Gross expenses | 1.60% | 1.77% | 2.62% | 4.89%(F) |
| Net investment income (loss) | (1.03%) | (1.22%) | 0.35% | (0.94%)(F) |
| Portfolio turnover rate | 28%(G) | 27% | 20% | 31% |
| Touchstone Sands Capital Emerging Markets Growth Fund—Class C |
| Selected Data for a Share Outstanding Throughout Each Period |
| | Year Ended March 31, | Period Ended
March 31,
2019(A) |
| | 2022 | 2021 | 2020 |
| Net asset value at beginning of period | $20.91 | $11.26 | $13.11 | $11.21(B) |
| Income (loss) from investment operations: | | | | |
| Net investment loss | (0.35) | (0.14) | (0.05)(C) | (0.04) |
| Net realized and unrealized gains (losses) on investments | (4.99) | 9.79 | (1.75) | 1.94 |
| Total from investment operations | (5.34) | 9.65 | (1.80) | 1.90 |
| Distributions from: | | | | |
| Net investment income | (0.20) | — | (0.05) | — |
| Net asset value at end of period | $15.37 | $20.91 | $11.26 | $13.11 |
| Total return(D) | (25.69%) | 85.70% | (13.81%) | 16.95%(E) |
| Ratios and supplemental data: | | | | |
| Net assets at end of period (000's) | $9,107 | $9,637 | $1,135 | $59 |
| Ratio to average net assets: | | | | |
| Net expenses | 2.35% | 2.35% | 2.35% | 2.35%(F) |
| Gross expenses | 2.46% | 2.82% | 5.24% | 57.88%(F) |
| Net investment loss | (1.78%) | (1.97%) | (0.40%) | (1.69%)(F) |
| Portfolio turnover rate | 28%(G) | 27% | 20% | 31% |
| (A) | Represents the period from commencement of operations (November 16, 2018) through March 31, 2019. |
| (B) | Net asset value at the beginning of period is based on the net asset value of Class Y shares on November 16, 2018. |
| (C) | The net investment income (loss) per share was based on average shares outstanding for the period. |
| (D) | Total returns shown exclude the effect of applicable sales loads and fees. If these charges were included, the returns would be lower. |
| (E) | Not annualized. |
| (F) | Annualized. |
| (G) | Portfolio turnover excludes securities delivered from processing redemptions-in-kind. |
See accompanying Notes to Financial Statements.
Financial Highlights (Continued)
| Touchstone Sands Capital Emerging Markets Growth Fund—Class Y |
| Selected Data for a Share Outstanding Throughout Each Period |
| | Year Ended March 31, |
| | 2022 | 2021 | 2020 | 2019 | 2018 |
| Net asset value at beginning of period | $21.36 | $11.38 | $13.16 | $13.56 | $10.70 |
| Income (loss) from investment operations: | | | | | |
| Net investment income (loss) | (0.17) | (0.11) | 0.08(A) | (0.03) | (0.06) |
| Net realized and unrealized gains (losses) on investments | (5.08) | 10.09 | (1.77) | (0.37) | 2.92 |
| Total from investment operations | (5.25) | 9.98 | (1.69) | (0.40) | 2.86 |
| Distributions from: | | | | | |
| Net investment income | (0.37) | — | (0.09) | — | — |
| Net asset value at end of period | $15.74 | $21.36 | $11.38 | $13.16 | $13.56 |
| Total return | (24.89%) | 87.71% | (12.96%) | (3.02%) | 26.82% |
| Ratios and supplemental data: | | | | | |
| Net assets at end of period (000's) | $1,186,957 | $1,460,473 | $423,992 | $318,093 | $207,209 |
| Ratio to average net assets: | | | | | |
| Net expenses | 1.29% | 1.26% | 1.33%(B) | 1.35%(B) | 1.47% |
| Gross expenses | 1.29% | 1.26% | 1.31% | 1.35% | 1.49% |
| Net investment income (loss) | (0.71%) | (0.88%) | 0.62% | (0.45%) | (0.73%) |
| Portfolio turnover rate | 28%(C) | 27% | 20% | 31% | 27% |
| Touchstone Sands Capital Emerging Markets Growth Fund—Institutional Class |
| Selected Data for a Share Outstanding Throughout Each Period |
| | Year Ended March 31, |
| | 2022 | 2021 | 2020 | 2019 | 2018 |
| Net asset value at beginning of period | $21.47 | $11.43 | $13.21 | $13.61 | $10.73 |
| Income (loss) from investment operations: | | | | | |
| Net investment income (loss) | (0.29) | (0.11) | 0.09(A) | (0.03) | (0.06) |
| Net realized and unrealized gains (losses) on investments | (4.97) | 10.15 | (1.77) | (0.37) | 2.94 |
| Total from investment operations | (5.26) | 10.04 | (1.68) | (0.40) | 2.88 |
| Distributions from: | | | | | |
| Net investment income | (0.38) | — | (0.10) | — | — |
| Net asset value at end of period | $15.83 | $21.47 | $11.43 | $13.21 | $13.61 |
| Total return | (24.81%) | 87.79% | (12.87%) | (2.94%) | 26.84% |
| Ratios and supplemental data: | | | | | |
| Net assets at end of period (000's) | $1,252,461 | $2,867,373 | $883,508 | $524,670 | $374,452 |
| Ratio to average net assets: | | | | | |
| Net expenses | 1.20% | 1.21%(B) | 1.25%(B) | 1.25% | 1.37% |
| Gross expenses | 1.20% | 1.20% | 1.24% | 1.27% | 1.41% |
| Net investment income (loss) | (0.62%) | (0.83%) | 0.70% | (0.35%) | (0.63%) |
| Portfolio turnover rate | 28%(C) | 27% | 20% | 31% | 27% |
| (A) | The net investment income (loss) per share was based on average shares outstanding for the period. |
| (B) | Net expenses include amounts recouped by the Advisor. |
| (C) | Portfolio turnover excludes securities delivered from processing redemptions-in-kind. |
See accompanying Notes to Financial Statements.
Financial Highlights (Continued)
| Touchstone Sands Capital Emerging Markets Growth Fund—Class R6 |
| Selected Data for a Share Outstanding Throughout The Period |
| | Period Ended
March 31,
2022(A) |
| |
| Net asset value at beginning of period | $22.37 |
| Income (loss) from investment operations: | |
| Net investment income | 0.15 |
| Net realized and unrealized losses on investments | (6.31) |
| Total from investment operations | (6.16) |
| Distributions from: | |
| Net investment income | (0.38) |
| Net asset value at end of period | $15.83 |
| Total return | (27.85%)(B) |
| Ratios and supplemental data: | |
| Net assets at end of period (000's) | $1,109,805 |
| Ratio to average net assets: | |
| Net expenses | 1.17%(C) |
| Gross expenses | 1.17%(C) |
| Net investment loss | (0.59%)(C) |
| Portfolio turnover rate | 28%(D) |
| (A) | Represents the period from commencement of operations (April 26, 2021) through March 31, 2022. |
| (B) | Not annualized. |
| (C) | Annualized. |
| (D) | Portfolio turnover excludes securities delivered from processing redemptions-in-kind. |
See accompanying Notes to Financial Statements.
Financial Highlights (Continued)
| Touchstone Strategic Income Opportunities Fund—Class A |
| Selected Data for a Share Outstanding Throughout Each Period |
| | Year Ended March 31, |
| | 2022 | 2021 | 2020 | 2019 | 2018 |
| Net asset value at beginning of period | $3.47 | $3.15 | $3.31 | $3.38 | $3.40 |
| Income (loss) from investment operations: | | | | | |
| Net investment income(A) | 0.08 | 0.10 | 0.11 | 0.13 | 0.11 |
| Net realized and unrealized gains (losses) on investments | (0.19) | 0.33 | (0.15) | (0.04) | (0.03) |
| Total from investment operations | (0.11) | 0.43 | (0.04) | 0.09 | 0.08 |
| Distributions from: | | | | | |
| Net investment income | (0.09) | (0.11) | (0.12) | (0.16) | (0.10) |
| Net asset value at end of period | $3.27 | $3.47 | $3.15 | $3.31 | $3.38 |
| Total return(B) | (3.22%) | 13.87% | (1.37%) | 2.86% | 2.41% |
| Ratios and supplemental data: | | | | | |
| Net assets at end of period (000's) | $177,574 | $173,600 | $143,815 | $153,979 | $196,712 |
| Ratio to average net assets: | | | | | |
| Net expenses | 1.03% | 1.10% | 1.10% | 1.14% | 1.33% |
| Gross expenses | 1.14% | 1.37% | 1.37% | 1.37% | 1.33% |
| Net investment income | 2.38% | 2.91% | 3.14% | 3.89% | 3.15% |
| Portfolio turnover rate | 155%(C) | 111% | 85% | 123% | 149% |
| Touchstone Strategic Income Opportunities Fund—Class C |
| Selected Data for a Share Outstanding Throughout Each Period |
| | Year Ended March 31, |
| | 2022 | 2021 | 2020 | 2019 | 2018 |
| Net asset value at beginning of period | $3.48 | $3.16 | $3.32 | $3.39 | $3.41 |
| Income (loss) from investment operations: | | | | | |
| Net investment income(A) | 0.06 | 0.08 | 0.08 | 0.11 | 0.09 |
| Net realized and unrealized gains (losses) on investments | (0.20) | 0.33 | (0.14) | (0.04) | (0.03) |
| Total from investment operations | (0.14) | 0.41 | (0.06) | 0.07 | 0.06 |
| Distributions from: | | | | | |
| Net investment income | (0.06) | (0.09) | (0.10) | (0.14) | (0.08) |
| Net asset value at end of period | $3.28 | $3.48 | $3.16 | $3.32 | $3.39 |
| Total return(B) | (4.03%) | 13.11% | (2.04%) | 2.18% | 1.75% |
| Ratios and supplemental data: | | | | | |
| Net assets at end of period (000's) | $42,046 | $39,402 | $49,730 | $52,782 | $71,103 |
| Ratio to average net assets: | | | | | |
| Net expenses | 1.74% | 1.78% | 1.78% | 1.81% | 1.98% |
| Gross expenses | 1.88% | 2.05% | 2.05% | 2.04% | 1.98% |
| Net investment income | 1.62% | 2.26% | 2.47% | 3.22% | 2.50% |
| Portfolio turnover rate | 155%(C) | 111% | 85% | 123% | 149% |
| (A) | The net investment income (loss) per share was based on average shares outstanding for the period. |
| (B) | Total returns shown exclude the effect of applicable sales loads and fees. If these charges were included, the returns would be lower. |
| (C) | Portfolio turnover excludes the purchases and sales of securities of the AIG Flexible Credit Fund acquired on July 16, 2021 (See Note 9 in the Notes to Financial Statements). If these transactions were included, portfolio turnover would have been higher. |
See accompanying Notes to Financial Statements.
Financial Highlights (Continued)
| Touchstone Strategic Income Opportunities Fund—Class Y |
| Selected Data for a Share Outstanding Throughout Each Period |
| | Year Ended March 31, |
| | 2022(A) | 2021 | 2020 | 2019 | 2018 |
| Net asset value at beginning of period | $3.46 | $3.15 | $3.31 | $3.37 | $3.39 |
| Income (loss) from investment operations: | | | | | |
| Net investment income(B) | 0.09 | 0.10 | 0.11 | 0.14 | 0.11 |
| Net realized and unrealized gains (losses) on investments | (0.19) | 0.33 | (0.14) | (0.03) | (0.02) |
| Total from investment operations | (0.10) | 0.43 | (0.03) | 0.11 | 0.09 |
| Distributions from: | | | | | |
| Net investment income | (0.10) | (0.12) | (0.13) | (0.17) | (0.11) |
| Net asset value at end of period | $3.26 | $3.46 | $3.15 | $3.31 | $3.37 |
| Total return | (2.97%) | 13.77% | (1.16%) | 3.38% | 2.65% |
| Ratios and supplemental data: | | | | | |
| Net assets at end of period (000's) | $106,650 | $140,047 | $89,806 | $52,676 | $70,239 |
| Ratio to average net assets: | | | | | |
| Net expenses | 0.79% | 0.90% | 0.91% | 0.94% | 1.14% |
| Gross expenses | 0.91% | 1.17% | 1.18% | 1.17% | 1.14% |
| Net investment income | 2.62% | 3.08% | 3.28% | 4.06% | 3.34% |
| Portfolio turnover rate | 155%(C) | 111% | 85% | 123% | 149% |
| Touchstone Strategic Income Opportunities Fund—Institutional Class |
| Selected Data for a Share Outstanding Throughout The Period |
| | Period Ended
March 31,
2022(D) |
| |
| Net asset value at beginning of period | $3.50 |
| Income (loss) from investment operations: | |
| Net investment income(B) | 0.06 |
| Net realized and unrealized gains (losses) on investments | (0.23) |
| Total from investment operations | (0.17) |
| Distributions from: | |
| Net investment income | (0.07) |
| Net asset value at end of period | $3.26 |
| Total return | (4.94%)(E) |
| Ratios and supplemental data: | |
| Net assets at end of period (000's) | $263 |
| Ratio to average net assets: | |
| Net expenses | 0.65%(F) |
| Gross expenses | 3.91%(F) |
| Net investment income | 2.56%(F) |
| Portfolio turnover rate | 155%(C) |
| (A) | Effective July 16, 2021, Class W shares of the AIG Strategic Bond Fund were reorganized into Class Y shares of the Fund. |
| (B) | The net investment income (loss) per share was based on average shares outstanding for the period. |
| (C) | Portfolio turnover excludes the purchases and sales of securities of the AIG Flexible Credit Fund acquired on July 16, 2021 (See Note 9 in the Notes to Financial Statements). If these transactions were included, portfolio turnover would have been higher. |
| (D) | Represents the period from commencement of operations (July 19, 2021) through March 31, 2022. |
| (E) | Not annualized. |
| (F) | Annualized. |
See accompanying Notes to Financial Statements.
Notes to Financial Statements
March 31, 2022
1. Organization
The Touchstone Strategic Trust (the “Trust”) is registered under the Investment Company Act of 1940, as amended (the “1940 Act”), as an open-end management investment company. The Trust was established as a Massachusetts business trust pursuant to an Agreement and Declaration of Trust dated November 18, 1982. The Trust consists of nineteen funds, including the following seven funds (individually, a "Fund", and collectively, the “Funds”):
| Touchstone Flexible Income Fund ("Flexible Income Fund”) |
| Touchstone Focused Fund ("Focused Fund”) |
| Touchstone Global ESG Equity Fund ("Global ESG Equity Fund”) |
| Touchstone Growth Opportunities Fund ("Growth Opportunities Fund”) |
| Touchstone Mid Cap Growth Fund ("Mid Cap Growth Fund”) |
| Touchstone Sands Capital Emerging Markets Growth Fund ("Sands Capital Emerging Markets Growth Fund”) |
| Touchstone Strategic Income Opportunities Fund ("Strategic Income Opportunities Fund”) |
Each Fund is diversified, with the exception of the Focused Fund, the Growth Opportunities Fund and the Sands Capital Emerging Markets Growth Fund, which are non-diversified.
The Agreement and Declaration of Trust permits the Trust to issue an unlimited number of shares of beneficial interest of each Fund. The table below indicates the classes of shares that each Fund is registered to offer:
| | Class A | Class C | Class Y | Institutional
Class | Class R6 |
| Flexible Income Fund | X | X | X | X | |
| Focused Fund | X | X | X | X | |
| Global ESG Equity Fund | X | X | X | X | |
| Growth Opportunities Fund | X | X | X | X | |
| Mid Cap Growth Fund | X | X | X | X | X |
| Sands Capital Emerging Markets Growth Fund | X | X | X | X | X |
| Strategic Income Opportunities Fund | X | X | X | X | |
The assets of each Fund are segregated, and a shareholder’s interest is limited to the Fund in which shares are held. The Funds’ prospectus provides a description of each Fund’s investment goal, policies, and strategies along with information on the classes of shares currently being offered.
2. Significant Accounting Policies
The following is a summary of the Funds’ significant accounting policies:
Each Fund is an investment company that follows the accounting and reporting guidance of Accounting Standards Codification Topic 946 applicable to investment companies.
Security valuation and fair value measurements — U.S. generally accepted accounting principles (“U.S. GAAP”) defines fair value as the price the Funds would receive to sell an asset or pay to transfer a liability in an orderly transaction between market participants at the measurement date. All investments in securities are recorded at their fair value. The Funds define the term “market value”, as used throughout this report, as the estimated fair value. The Funds use various methods to measure fair value of their portfolio securities on a recurring basis. U.S. GAAP fair value measurement standards require disclosure of a hierarchy that prioritizes inputs to valuation methods. These inputs are summarized in the three broad levels listed below:
• Level 1 − quoted prices in active markets for identical securities
• Level 2 − other significant observable inputs (including quoted prices for similar securities, interest rates, prepayment speeds, credit risk, etc.)
• Level 3 − significant unobservable inputs (including a Fund’s own assumptions in determining the fair value of investments)
The inputs or methodology used for valuing securities are not necessarily an indication of the risk associated with investing in those securities.
The aggregate value by input level, as of March 31, 2022, for each Fund’s investments, is included in each Fund’s Portfolio of Investments, which also includes a breakdown of the Fund’s investments by geographic, portfolio or sector allocation. The Strategic Income Opportunities Fund held Level 3 categorized securities during the year ended March 31, 2022. Refer to the Portfolio of Investments for a reconciliation of Level 3 holdings.
Changes in valuation techniques may result in transfers into or out of an investment’s assigned level within the hierarchy.
Notes to Financial Statements (Continued)
The Funds' portfolio securities are valued as of the close of the regular session of trading on the New York Stock Exchange (“NYSE”) (currently 4:00 p.m., Eastern Time or at the time as of which the NYSE establishes official closing prices). Portfolio securities traded on stock exchanges are valued at the last reported sale price, official close price, or last bid price if no sales are reported. Portfolio securities quoted by NASDAQ are valued at the NASDAQ Official Closing Price (“NOCP”) or from the primary exchange on which the security trades. To the extent these securities are actively traded, they are categorized in Level 1 of the fair value hierarchy. Options and futures are valued at the last quoted sales price. If there is no such reported sale on the valuation date, long option positions are valued at the most recent bid price, and short option positions are valued at the most recent ask price on the valuation date and are categorized in Level 1. Shares of mutual funds in which the Funds invest are valued at their respective net asset value (“NAV”) as reported by the underlying funds (the “Underlying Funds”) and are categorized in Level 1.
Debt securities held by the Funds are valued at their evaluated bid by an independent pricing service or at their last broker-quoted bid prices as obtained from one or more of the major market makers for such securities. Independent pricing services use information provided by market makers or estimates of market values through accepted market modeling conventions. Observable inputs to the models may include prepayment speeds, pricing spread, yield, trade information, dealer quotes, market color, cash flow models, the securities’ terms and conditions, among others, and are generally categorized in Level 2. Investments in asset-backed and mortgage-backed securities are valued by independent pricing services using models that consider estimated cash flows of each tranche of the security, establish a benchmark yield and develop an estimated tranche specific spread to the benchmark yield based on the unique attributes of the tranche, and are generally categorized in Level 2. Debt securities with remaining maturities of 60 days or less may be valued at amortized cost, provided such amount approximates market value and are categorized in Level 2. While this method provides consistency in valuation (and may only be used if it approximates market value), it may result in periods during which fair value, as determined by amortized cost, is higher or lower than the price that would be received if the Fund sold the investment.
Foreign currency exchange contracts are valued at the mean between the bid and ask prices and are determined as of the close of regular trading on the NYSE. Interpolated values are derived when the settlement date of the contract is an interim date for which quotations are not available and are categorized in Level 2.
Securities mainly traded on a non-U.S. exchange or denominated in foreign currencies are generally valued according to the preceding closing values on that exchange, translated to U.S. dollars using currency exchange rates as of the close of regular trading on the NYSE, and are generally categorized in Level 1. However, if an event that may change the value of a security occurs after the time that the closing value on the non-U.S. exchange was determined, but before the close of regular trading on the NYSE, the security may be priced based on fair value and is generally categorized in Level 2. This may cause the value of the security, if held on the books of a Fund, to be different from the closing value on the non-U.S. exchange and may affect the calculation of that Fund’s NAV. The Funds may use fair value pricing under the following circumstances, among others:
• If the value of a security has been materially affected by events occurring before the Funds' pricing time but after the close of the primary markets on which the security is traded.
• If the exchange on which a portfolio security is principally traded closes early or if trading in a particular portfolio security was halted during the day and did not resume prior to the Funds' NAV calculation.
• If a security is so thinly traded that reliable market quotations are unavailable due to infrequent trading.
• If the validity of market quotations is not reliable.
Securities held by the Funds that do not have readily available market quotations, significant observable inputs, or securities for which the available market quotations are not reliable, are priced at their estimated fair value using procedures approved by the Funds' Board of Trustees (the “Board”) and are generally categorized in Level 3.
Collateralized Loan Obligations — The Flexible Income Fund and Strategic Income Opportunities Fund may invest in collateralized loan obligations (“CLOs”). CLOs are types of asset-backed securities. A CLO is an entity that is backed by syndicated bank loans. The cash flows of the CLO can be split into multiple segments, called “tranches,” which will vary in risk profile and yield. The riskiest segment is the subordinated or “equity” tranche. This tranche bears the greatest risk of defaults from the underlying assets in the CLO and serves to protect the other, more senior, tranches from default in all but the most severe circumstances. Since it is shielded from defaults by the more junior tranches, a “senior” tranche will typically have higher credit ratings and lower yields than their underlying securities, and often receive higher ratings from one or more of the nationally recognized rating agencies. Despite the protection from the more junior tranches, senior tranches can experience substantial losses due to actual defaults, increased sensitivity to future defaults and the disappearance of one or more protecting tranches as a result of changes in the credit profile of the underlying pool of assets.
Investment companies — The Funds may invest in securities of other investment companies, including exchange-traded funds (“ETFs”), open-end funds and closed-end funds. Open-end funds are investment companies that issue new shares continuously and redeem shares daily. Closed-end funds are investment companies that typically issue a fixed number of shares that trade on a
Notes to Financial Statements (Continued)
securities exchange or over-the-counter (“OTC”). An ETF is an investment company that typically seeks to track the performance of an index by holding in its portfolio shares of all the companies, or a representative sample of the companies, that are components of a particular index. ETF shares are traded on a securities exchange based on their market value. The risks of investment in other investment companies typically reflect the risks of the types of securities in which the other investment companies invest. Investments in ETFs and closed-end funds are subject to the additional risk that their shares may trade at a premium or discount to their NAV. When a Fund invests in another investment company, shareholders of the Fund indirectly bear their proportionate share of the other investment company’s fees and expenses, including operating, registration, trustee, licensing, and marketing, as well as their share of the Fund’s fees and expenses.
Securities sold short —The Flexible Income Fund may engage in selling securities short, which obligates the Fund to replace a security borrowed by purchasing the same security at the current market value. The Fund would incur a loss if the price of the security increases between the date of the short sale and the date on which the Fund replaces the borrowed security. The Fund would realize a gain if the price of the security declines between those dates.
As of March 31, 2022, the Flexible Income Fund had securities sold short as shown on the Portfolio of Investments.
Options — The Flexible Income Fund and Strategic Income Opportunities Fund may write or purchase financial option contracts primarily to hedge against changes in the value of equity securities (or securities that the Fund intends to purchase), against fluctuations in fair value caused by changes in prevailing market interest rates or foreign currency exchange rates and against changes in overall equity market volatility. In addition, the Fund may utilize options in an attempt to generate gains from option premiums or to reduce overall portfolio risk. The Fund’s option strategy primarily focuses on the use of writing and/or purchasing call or put options on equity indexes. When the Fund writes or purchases an option, an amount equal to the premium received or paid by the Fund is recorded as a liability or an asset and is subsequently adjusted to the current market value of the option written or purchased. Premiums received or paid from writing or purchasing options which expire unexercised are treated by the Fund on the expiration date as realized gains or losses. The difference between the premium and the amount paid or received on effecting a closing purchase or sale transaction, including brokerage commissions, is also treated as a realized gain or loss. If an option is exercised, the premium paid or received is added to the cost of the purchase or proceeds from the sale in determining whether the Fund has realized a gain or loss on investment transactions. The Fund, as writer of an option, may have no control over whether the underlying securities may be sold (call) or purchased (put) and as a result bears the market risk of an unfavorable change in the price of the security underlying the written option. The Fund, as purchaser of an option, bears the risk that the counterparties to the option may not have the ability to meet the terms of the option contract. There is minimal counterparty credit risk involved in entering into option contracts since they are exchange-traded instruments and the exchange’s clearinghouse, as counterparty to all exchange-traded options, guarantees the options against default. The maximum risk of loss associated with writing put options is the notional amount as presented in the Portfolio of Investments. In certain circumstances, the maximum risk of loss amounts may be partially offset by recovery values of the respective referenced assets and upfront premium received upon entering into the contract. The maximum risk of loss associated with writing call options is potentially unlimited.
As of March 31, 2022, the Flexible Income Fund and Strategic Income Opportunities Fund did not hold any options.
Futures Contracts — The Strategic Income Opportunities Fund may buy and sell futures contracts and related options to manage its exposure to changing interest rates and securities prices. Some strategies reduce the Fund’s exposure to price fluctuations, while others tend to increase its market exposure. Futures and options on futures can be volatile instruments and involve certain risks that could negatively impact the Fund’s return. In order to avoid leveraging and related risks, when the Fund purchases futures contracts, it will collateralize its position by depositing an amount of cash or liquid securities, equal to the market value of the futures positions held, less margin deposits, in a segregated account with its custodian or otherwise “cover” its position in a manner consistent with the 1940 Act or the rules of the Securities and Exchange Commission (the “SEC”) or interpretations thereunder. Collateral equal to the current fair value of the futures position will be determined on a daily basis.
When the contract is closed, the Fund records a realized gain or loss equal to the difference between the proceeds from (or cost of) the closing transactions and the Fund’s basis in the contract. Risks of entering into futures contracts include the possibility that a change in the value of the contract may not correlate with the changes in the value of the underlying instruments. Second, it is possible that a lack of liquidity for futures contracts could exist in the secondary market resulting in an inability to close a futures position prior to its maturity date. Third, the purchase of a futures contract involves the risk that the Fund could lose more than the original margin deposit required to initiate the futures transaction. Finally, the risk exists that losses could exceed amounts disclosed on the Statements of Assets and Liabilities. There is minimal counterparty credit risk involved in entering into futures contracts since they are exchange-traded instruments and the exchange’s clearinghouse, as counterparty to all exchange-traded futures, guarantees the futures against default.
As of March 31, 2022, the Strategic Income Opportunities Fund had futures contracts as shown on the Portfolio of Investments.
Notes to Financial Statements (Continued)
Swap Contracts — The Flexible Income Fund and Strategic Income Opportunities Fund may enter into swap transactions to help enhance the value of its portfolio or manage its exposure to different types of investments. Swaps are financial instruments that typically involve the exchange of cash flows between two parties on specified dates (settlement dates), where the cash flows are based on agreed-upon prices, rates, indexes, etc. The nominal amount on which the cash flows are calculated is called the notional amount. Swaps are individually negotiated and structured to include exposure to a variety of different types of investments or market factors, such as interest rates, foreign currency rates, mortgage securities, corporate borrowing rates, security prices, indexes or inflation rates.
Swap agreements may increase or decrease the overall volatility of the investments of a Fund and its share price. The performance of swap agreements may be affected by a change in the specific interest rate, currency, or other factors that determine the amounts of payments due to and from a Fund. If a swap agreement calls for payments by a Fund, the Fund must be prepared to make such payments when due. In addition, if the counterparty’s creditworthiness declines, the value of a swap agreement would be likely to decline, potentially resulting in losses.
Generally, bilateral swap agreements and OTC swaps have a fixed maturity date that will be agreed upon by the parties. The agreement can be terminated before the maturity date only under limited circumstances, such as default by one of the parties or insolvency, among others, and can be transferred by a party only with the prior written consent of the other party. A Fund may be able to eliminate its exposure under a swap agreement either by assignment or by other disposition, or by entering into an offsetting swap agreement with the same party or a similarly creditworthy party. If the counterparty is unable to meet its obligations under the contract, declares bankruptcy, defaults or becomes insolvent, a Fund may not be able to recover the money it expected to receive under the contract.
Cleared swaps are transacted through futures commission merchants that are members of central clearinghouses with the clearinghouses serving as a central counterparty. Pursuant to rules promulgated under the Dodd-Frank Wall Street Reform and Consumer Protection Act, central clearing of swap agreements is currently required for certain market participants trading certain instruments, and central clearing for additional instruments is expected to be implemented by regulators until the majority of the swaps market is ultimately subject to central clearing.
Swaps are marked-to-market daily based upon values received from third party vendors or quotations from market makers. For OTC swaps, any upfront premiums paid or received are recorded as assets or liabilities, respectively, and are shown as premium paid on swap agreements or premium received on swap agreements in the Statements of Assets and Liabilities. For swaps that are centrally cleared, initial margins, determined by each relevant clearing agency, are posted and segregated at a broker account registered with the Commodity Futures Trading Commission, or the applicable regulator. The change in value of swaps, including accruals of periodic amounts of interest to be paid or received on swaps, is recorded as unrealized appreciation or depreciation. Daily changes in the value of centrally cleared swaps are recorded in the Statements of Assets and Liabilities as receivable or payable for variation margin on swap agreements and settled daily. Upfront premiums and liquidation payments received or paid are recorded as realized gains or losses at the termination or maturity of the swap. Net periodic payments received or paid by the Fund are recorded as realized gain or loss.
A swap agreement can be a form of leverage, which can magnify a Fund’s gains or losses. In order to reduce the risk associated with leveraging, the (a) Fund may cover its current obligations under swap agreements according to guidelines established by the SEC. If the (a) Fund enters into a swap agreement on a net basis, it will segregate assets with a daily value at least equal to the excess, if any, of the Fund’s accrued obligations under the swap agreement over the accrued amount the Fund is entitled to receive under the agreement. If the (a) Fund enters into a swap agreement on other than a net basis, it will segregate assets with a value equal to the full amount of the Fund’s accrued obligations under the agreement.
As of March 31, 2022, the Flexible Income Fund and Strategic Income Opportunities Fund did not hold any swap contracts.
Foreign currency translation — The books and records of the Funds are maintained in U.S. dollars and translated into U.S. dollars on the following basis:
| (1) | market value of investment securities, assets and liabilities at the current rate of exchange on the valuation date; and |
| (2) | purchases and sales of investment securities, income, and expenses at the relevant rates of exchange prevailing on the respective dates of such transactions. |
The Funds do not isolate that portion of gains and losses on investments in equity securities that is due to changes in the foreign exchange rates from that which is due to changes in market prices of equity securities.
Forward foreign currency contracts — The Strategic Income Opportunities Fund may enter into forward foreign currency contracts. A forward foreign currency contract is an agreement between two parties to buy and sell a specific currency at a price that is set on the date of the contract. The forward contract calls for delivery of the currency on a future date that is specified in the contract. Risks related to the use of forwards include the possible failure of counterparties to meet the terms of the forward
Notes to Financial Statements (Continued)
agreement, the failure of the counterparties to timely post collateral, the risk that currency movements will not occur thereby reducing a Fund’s total return, and the potential for losses in excess of a Fund’s initial investment.
The market value of a forward foreign currency contract fluctuates with changes in foreign currency exchange rates. Forward foreign currency contracts are marked to market daily and the change in value is recorded by a Fund as an unrealized gain or loss. Realized gains or losses, equal to the difference between the value of the contract at the time it was opened and the value at the time it was closed, are recorded upon delivery or receipt of the currency.
As of year ended March 31, 2022, the Strategic Income Opportunities Fund did not hold any forward foreign currency contracts.
Real Estate Investment Trusts — The Funds may invest in real estate investment trusts (“REITs”) that involve risks not associated with investing in stocks. Risks associated with investments in REITs include declines in the value of real estate, general and economic conditions, changes in the value of the underlying property and defaults by borrowers. The value of assets in the real estate industry may go through cycles of relative underperformance and outperformance in comparison to equity securities markets in general. Dividend income is recorded using management’s estimate of the income included in distributions received from REIT investments. The actual amounts of income, return of capital and capital gains are only determined by each REIT after its fiscal year-end and may differ from the estimated amount. Estimates of income are adjusted in the Funds to the actual amounts when the amounts are determined.
Derivative instruments and hedging activities — The Flexible Income Fund and Strategic Income Opportunities Fund may enter into an International Swaps and Derivatives Association, Inc. Master Agreement (“ISDA Master Agreement” or “MNA”) or similar agreement with certain counterparties. An ISDA Master Agreement is a bilateral agreement between a Fund and a counterparty that governs OTC derivatives and foreign exchange contracts, and typically contains, among other things, collateral posting terms and master netting provisions in the event of a default or termination. Under an ISDA Master Agreement, a party may, under certain circumstances, offset with the counterparty certain derivative financial instruments’ payables or receivables with collateral held or posted and create one single net payment. The provisions of the ISDA Master Agreement typically permit a single net payment in the event of default (close-out netting). These default events include bankruptcy or insolvency of the counterparty. Note, however, that bankruptcy or insolvency laws of a particular jurisdiction may impose restrictions on or prohibitions against the right of offset.
When entering into a derivative transaction, a Fund may be required to post and maintain collateral or margin (including both initial and maintenance margin). Collateral and margin requirements differ by type of derivative. Margin requirements are established by the broker or clearing house for exchange-traded and centrally cleared derivatives (financial futures contracts, options, and centrally cleared swaps). Brokers can ask for margining in excess of the clearing house’s minimum in certain circumstances. Collateral terms are contract specific for OTC derivatives (forward foreign currency contracts, options, and swaps). For derivatives traded under an ISDA Master Agreement, the collateral requirements are typically calculated by netting the marked-to-market amount for each transaction under such agreement and comparing that amount to the value of any collateral currently pledged by the Fund and the counterparty. For financial reporting purposes, cash collateral that has been pledged to cover obligations of the Fund and cash collateral received from the counterparty, if any, are reported separately on the Statements of Assets and Liabilities as cash deposits held at prime broker and due to prime broker, respectively. Non-cash collateral pledged by the Fund, if any, is noted in the Portfolio of Investments. To the extent amounts due to the Fund from its counterparties are not fully collateralized, contractually or otherwise, the Fund bears the risk of loss from counterparty non-performance.
Certain ISDA Master Agreements allow counterparties to OTC derivatives transactions to terminate derivative contracts prior to maturity in the event a Fund’s net assets decline by a stated percentage or the Fund fails to meet the terms of its ISDA Master Agreement, which would cause the Fund (counterparty) to accelerate payment of any net liability owed to the counterparty (Fund).
For financial reporting purposes, the Funds do not offset derivative assets and derivative liabilities that are subject to netting arrangements in the Statements of Assets and Liabilities.
As of March 31, 2022, the Funds did not hold any assets and liabilities that were subject to a MNA.
Notes to Financial Statements (Continued)
The following table sets forth the effect of the Funds' derivative financial instruments by primary risk exposure on the Statements of Operations for the year ended March 31, 2022:
| Fund | Derivatives not accounted for as hedging
instruments under ASC 815 | Realized Gains
(Losses)
on Derivatives | Change in
Unrealized
Appreciation
(Depreciation)
on Derivatives |
| Flexible Income Fund | Purchased Options - Equity Contracts* | $(6,340,614) | $— |
| | Written Options - Equity Contracts** | 520,097 | — |
| | Swap Agreements - Credit Contracts*** | 1,989 | — |
| Strategic Income Opportunities Fund | Futures - Interest Rate Contracts**** | 101,305 | (207,661) |
| | Forwards - Foreign Currency Exchange Contracts***** | 289,517 | (564,784) |
| * | Statements of Operations Location: Net realized gains (losses) on investments. |
| ** | Statements of Operations Location: Net realized gains on written options. |
| *** | Statements of Operations Location: Net realized gains on swap agreements. |
| **** | Statements of Operations Location: Net realized gains on futures contracts and net change in unrealized appreciation (depreciation) on futures contracts, respectively. |
| ***** | Statements of Operations Location: Net realized gains on forward foreign currency contracts and net change in unrealized appreciation (depreciation) on forward foreign currency contracts, respectively. |
For the year ended March 31, 2022, the average quarterly balances of outstanding derivative financial instruments for the Funds were as follows:
| | Flexible Income Fund | Strategic Income Opportunities Fund |
| Equity Contracts: | | |
| Purchased Options - Cost* | $— | $— |
| Written Options - Premiums received* | — | — |
| Credit Contracts: | | |
| Credit Default Swaps - Notional value* | — | — |
| Forward currency exchange contracts: | | |
| U.S. dollar amount delivered | — | 3,863,566 |
| U.S. dollar amount received | — | 6,059,815 |
| Interest Rate Contracts: | | |
| Futures Contracts - Notional Value | — | 16,900,190 |
| * | The balance at each quarter end was zero. |
Portfolio securities loaned — The Funds may lend their portfolio securities. Lending portfolio securities exposes the Funds to the risk that the borrower may fail to return the loaned securities or may not be able to provide additional collateral or that the Funds may experience delays in recovery of the loaned securities or loss of rights in the collateral if the borrower fails financially. To minimize these risks, the borrower must agree to maintain cash collateral with the Funds' custodian. The loaned securities are secured by collateral valued at least equal, at all times, to the market value of the loaned securities plus accrued interest, if any. When the collateral falls below specified amounts, the lending agent will use its best effort to obtain additional collateral on the next business day to meet required amounts under the security lending agreement. The cash collateral is reinvested by the Funds' custodian into an approved short-term investment vehicle. The approved short-term investment vehicle is subject to market risk.
As of March 31, 2022, the following Funds loaned securities and received collateral as follows:
| Fund | Security Type | Market Value of
Securities Loaned* | Market Value of
Collateral Received** | Net
Amount*** |
| Flexible Income Fund | Preferred Stocks and Investment Funds | $348,419 | $354,825 | $6,406 |
| Global ESG Equity Fund | Common Stocks | 18,547,086 | 21,634,913 | 3,087,827 |
| Sands Capital Emerging Markets Growth Fund | Common Stocks | 75,956,336 | 81,188,062 | 5,231,726 |
| * | The remaining contractual maturity is overnight for all securities. |
| ** | Gross amount of recognized liabilities for securities lending included in the Statements of Assets and Liabilities. |
| *** | Net amount represents the net amount payable due to the borrower in the event of default. |
Notes to Financial Statements (Continued)
All cash collateral is received, held, and administered by the Funds' custodian for the benefit of the lending Fund in its custody account or other account established for the purpose of holding collateral in cash equivalents.
Funds participating in securities lending receive compensation in the form of fees. Securities lending income is derived from lending long securities from the Funds to creditworthy approved borrowers at rates that are determined based on daily trading volumes, float, short-term interest rates and market liquidity and is shown net of fees on the Statements of Operations. When a Fund lends securities, it retains the interest or dividends on the investment of any cash received as collateral, and the Fund continues to receive interest or dividends on the loaned securities.
Unrealized gain or loss on the market value of the loaned securities that may occur during the term of the loan is recognized by the Fund. The Fund has the right under the lending agreement to recover any loaned securities from the borrower on demand.
Line of Credit — Prior to July 17, 2021, the AIG Strategic Bond Fund, the predecessor fund to the Strategic Income Opportunities Fund (the "Predecessor Fund"), had access to a $75 million committed unsecured line of credit and a $50 million uncommitted unsecured line of credit. The committed and uncommitted lines of credit were renewable on an annual basis with State Street Bank and Trust Company for temporary borrowing purposes. Interest on each of the committed and uncommitted lines of credit was payable at a variable rate per annum equal to the Applicable Rate plus one and one quarter of one percent (1.25%). The Applicable Rate per annum was equal to the higher of (a) the Federal Funds Effective Rate on such date and (b) the Overnight Bank Funding Rate on such date, plus, in each case, 10 basis points. Notwithstanding anything to the contrary, if the Federal Funds Effective Rate or the Overnight Bank Funding Rate was less than zero, then the Federal Funds Effective Rate or the Overnight Bank Funding Rate, was deemed to be zero for the purposes of determining the rate. There was also a commitment fee of 30 basis points per annum on the daily unused portion of the committed line of credit.
Borrowing under the line of credit commenced when the Predecessor Fund’s cash shortfall exceeded $100,000. The line of credit was terminated on July 16, 2021. For the period April 1, 2021 through July 16, 2021, the Predecessor Fund had the following borrowing:
| Fund | Days
Outstanding | Interest
Charge | Average
Debt
Utilized | Weighted
Average
Interest |
| Strategic Income Opportunities Fund | 2 | $22 | $275,000 | 1.46% |
Share valuation — The NAV per share of each class of shares of each Fund is calculated daily by dividing the total value of a Fund’s assets attributable to that class, less liabilities attributable to that class, by the number of outstanding shares of that class.
The maximum offering price per share of Class A shares of the equity funds (all funds except the Flexible Income Fund and the Strategic Income Opportunities Fund) is equal to the NAV per share plus a sales load equal to 5.26% of the NAV (or 5.00% of the offering price).The maximum offering price per share of Class A shares of the Flexible Income Fund and the Strategic Income Opportunities Fund is equal to the NAV per share plus a sales load equal to 3.36% of the NAV (or 3.25% of the offering price). There is no sales load on equity or fixed income fund purchases when aggregate purchases in all Touchstone funds equal at least $1 million or $500,000, respectively. The maximum offering price per share of Class C, Class Y, Institutional Class and Class R6 shares of the Funds is equal to the NAV per share. Prior to July 17, 2021, the maximum offering price per share of Class A shares of the Strategic Income Opportunities Fund's Predecessor Fund was equal to the NAV per share plus a sales load equal to 3.90% of the NAV (or 3.75% of the offering price).
The redemption price per share of each class of shares of the Funds is generally equal to the NAV per share. However, Class A redemptions that were part of a no-load purchase due to the aggregate purchase amount in all Touchstone Funds equaling at least $1 million for equity funds or $500,000 for fixed income funds where a Finder’s Fee was paid may be subject to a contingent deferred sales charge (“CDSC”) of up to 1.00% or 0.50%, for equity or fixed income funds, respectively, if redeemed within a one-year period from the date of purchase. Additionally, purchases of Class C shares of the Funds are subject to a CDSC of 1.00% if redeemed within a one-year period from the date of purchase. The CDSC will be assessed on an amount equal to the lesser of (1) the NAV at the time of purchase of the shares being redeemed or (2) the NAV of such shares being redeemed.
Investment income — Dividend income from securities is recognized on the ex-dividend date, net of foreign withholding taxes, if any, which are reduced by any amounts reclaimable by the Funds, where applicable. Interest income from securities is recorded on the basis of interest accrued, premium amortized and discount accreted. Realized gains and losses resulting from principal paydowns on mortgage-backed and asset-backed securities are included in interest income. Market discounts, original issue discounts and market premiums on debt securities are accreted/amortized to interest income over the life of the security or to the appropriate call date, as applicable, with a corresponding adjustment in the cost basis of that security. In addition, it is the Funds’ policy to accrue for foreign capital gains taxes, if applicable, on certain foreign securities held by the Funds. An estimated foreign capital gains tax is recorded daily on net unrealized gains on these securities and is payable upon the sale of such securities when a gain is realized.
Notes to Financial Statements (Continued)
Distributions to shareholders — Each Fund intends to distribute to its shareholders substantially all of its income and capital gains. Each Fund, except for the Flexible Income Fund and the Strategic Income Opportunities Fund, declares and distributes net investment income, if any, annually, as a dividend to shareholders. The Flexible Income Fund and the Strategic Income Opportunities Fund declare and distribute net investment income, if any, monthly as a dividend to shareholders. Each Fund makes distributions of capital gains, if any, at least annually, net of applicable capital loss carryforwards. Income distributions and capital gain distributions are determined in accordance with income tax regulations. Recognition of the Funds' net investment income from investments in Underlying Funds is affected by the timing of dividend declarations by the Underlying Funds.
Allocations — Investment income earned, realized capital gains and losses, and unrealized appreciation and depreciation for a Fund are allocated daily to each class of shares based upon its proportionate share of total net assets of the Fund. Class-specific expenses are charged directly to the class incurring the expense. Common expenses, which are not attributable to a specific class, are allocated daily to each class of shares based upon their proportionate share of total net assets of the Fund. Expenses not directly billed to a Fund are allocated proportionally among all Funds in the Trust, and, if applicable, Touchstone Funds Group Trust and Touchstone Variable Series Trust (collectively with the Trust, “Touchstone Fund Complex”), daily in relation to net assets of each Fund or another reasonable measure.
Security transactions — Security transactions are reflected for financial reporting purposes as of the trade date. Realized gains and losses on sales of portfolio securities are calculated using the identified cost basis.
Estimates — The preparation of financial statements in conformity with U.S. GAAP requires management to make estimates and assumptions that affect the reported amounts of assets and liabilities and disclosure of contingent assets and liabilities at the date of the financial statements and the reported amounts of income and expenses during the reporting period. Actual results could differ from those estimates.
LIBOR Transition — Many debt securities, derivatives and other financial instruments in which the Funds may invest, as well as any borrowings made by the Funds from banks or from other lenders, utilize the London Interbank Offered Rate (“LIBOR”) as the reference or benchmark index for interest rate calculations. LIBOR is a measure of the average interest rate at which major global banks can borrow from one another. Plans are underway to phase out the use of LIBOR by June 30, 2023. The ICE Benchmark Administration Limited, the administrator of LIBOR, ceased publishing most LIBOR maturities, including some U.S. LIBOR maturities, on December 31, 2021, and is expected to cease publishing the remaining and most liquid U.S. LIBOR maturities on June 30, 2023. Before then, it is expected that market participants have or will transition to the use of different reference or benchmark indices. However, there is currently no definitive information regarding the future utilization of LIBOR or of any particular replacement index. As such, the potential effect of a transition away from LIBOR on the Funds’ investments cannot yet be determined.
3. Investment Transactions
Investment transactions (excluding short-term investments and U.S. Government securities) were as follows for the year ended March 31, 2022:
| | Flexible
Income
Fund | Focused
Fund* | Global ESG
Equity Fund | Growth
Opportunities
Fund* | Mid Cap
Growth
Fund* | Sands Capital
Emerging
Markets
Growth Fund* | Strategic
Income
Opportunities
Fund |
| Purchases of investment securities | $305,172,645 | $163,796,905 | $218,747,825 | $80,663,822 | $833,735,608 | $1,700,351,861 | $427,484,236 |
| Proceeds from sales and maturities | $335,615,579 | $182,385,469 | $285,268,367 | $87,921,197 | $846,693,464 | $1,255,845,795 | $608,274,800 |
| * | Focused Fund, Growth Opportunities Fund, Mid Cap Growth Fund and Sands Capital Emerging Markets Growth Fund had a redemption-in-kind out of the Fund of $57,700,533, $12,728,779, $169,610,090 and $50,688,037, respectively. The redemptions were comprised of securities of $49,584,624, $10,433,824, $152,205,388 and $50,688,037 which are excluded from the proceeds from sales and maturities and cash in the amount of $8,115,909, $2,294,955, $17,404,702 and $0 for the Focused Fund, Growth Opportunities Fund, Mid Cap Growth Fund and Sands Capital Emerging Markets Growth Fund respectively. |
For the year ended March 31, 2022, purchases and proceeds from sales and maturities in U.S. Government Securities were $223,503,438 and $94,818,383, respectively, for the Flexible Income Fund and $144,446,724 and $159,100,281 respectively, for the Strategic Income Opportunities Fund. There were no purchases or proceeds from sales and maturities of U.S. Government securities by the other Funds for the year ended March 31, 2022.
Notes to Financial Statements (Continued)
4. Transactions with Affiliates and Other Related Parties
Certain officers of the Trust are also officers of Touchstone Advisors, Inc. (the “Advisor”), Touchstone Securities, Inc. (the “Underwriter”), or The Bank of New York Mellon (“BNY Mellon”), the Sub-Administrator to the Funds. Such officers receive no compensation from the Trust. The Advisor and the Underwriter are each wholly-owned subsidiaries of Western & Southern Financial Group, Inc. ("Western & Southern").
On behalf of the Funds, the Advisor pays each Independent Trustee a quarterly retainer plus additional retainers to the Lead Independent Trustee and the chairs of each standing committee. Interested Trustees do not receive compensation from the Funds. Each Independent Trustee also receives compensation for each Board meeting and committee meeting attended. Each standing committee chair receives additional compensation for each committee meeting that he or she oversees. The Advisor is reimbursed by the Funds for the Independent Trustees’ compensation and out-of-pocket expenses relating to their services. The Funds accrued Trustee-related expenses of $176,959 for the Funds’ Board for the year ended March 31, 2022. For the period April 1, 2021 through July 16, 2021, the Strategic Income Opportunities Fund's Predecessor Fund incurred Trustee related expenses of $7,310 for the Trustees of the SunAmerica Income Funds, which are included in the Trustee fees on the Statements of Operations.
MANAGEMENT & EXPENSE LIMITATION AGREEMENTS
The Advisor provides general investment supervisory services for the Funds, under the terms of an advisory agreement (the “Advisory Agreement”). Under the Advisory Agreement, each Fund pays the Advisor a fee, which is computed and accrued daily and paid monthly, at an annual rate based on average daily net assets of each Fund as shown in the table below.
| Flexible Income Fund | 0.60% on the first $500 million
0.50% on such assets in excess of $500 million |
| Focused Fund | 0.70% on the first $100 million
0.65% on the next $400 million
0.60% on such assets in excess of $500 million |
| Global ESG Equity Fund | 0.65% on the first $1 billion
0.60% on such assets in excess of $1 billion |
| Growth Opportunities Fund | 0.75% on the first $500 million
0.70% on the next $500 million
0.65% on such assets in excess of $1 billion |
| Mid Cap Growth Fund | 0.75% on the first $500 million
0.70% on the next $500 million
0.65% on the next $200 million
0.60% on such assets in excess of $1.2 billion |
| Sands Capital Emerging Markets Growth Fund | 1.00% |
| Strategic Income Opportunities Fund* | 0.55% on the first $250 million
0.50% on the next $250 million
0.45% on such assets in excess $500 million |
* Prior to July 17, 2021, the Strategic Income Opportunities Fund's Predecessor Fund paid SunAmerica Asset Management, LLC (the "Predecessor Advisor") 0.65% on the first $350 million and 0.60% on such assets over $350 million. For the period April 1, 2021 through July 16, 2021, the Predecessor Advisor received $679,368 in advisory fees. For the period July 17, 2021 through March 31, 2022, the Advisor received $1,492,214 in advisory fees.
The Advisor has entered into investment sub-advisory agreements with the following parties (each, a “Sub-Advisor”):
| Bramshill Investments, LLC | Sands Capital Management, LLC |
| Flexible Income Fund | Sands Capital Emerging Markets Growth Fund |
| Fort Washington Investment Advisors, Inc.* | Westfield Capital Management Company, L.P. |
| Focused Fund | Growth Opportunities Fund |
| Strategic Income Opportunities Fund | Mid Cap Growth Fund |
| Rockefeller & Co., LLC | |
| Global ESG Equity Fund | |
| * | Affiliate of the Advisor and wholly-owned subsidiary of Western & Southern. |
The Advisor pays sub-advisory fees to each Sub-Advisor from its advisory fee.
The Advisor entered into an expense limitation agreement (the “Expense Limitation Agreement”) to contractually limit the annual operating expenses of the Funds, excluding: dividend and interest expenses relating to short sales; interest; taxes; brokerage commissions and other transaction costs; portfolio transaction and investment related expenses, including expenses associated with
Notes to Financial Statements (Continued)
the Funds’ liquidity providers; other expenditures which are capitalized in accordance with U.S. GAAP; the cost of “Acquired Fund Fees and Expenses”, if any; and other extraordinary expenses not incurred in the ordinary course of business. The maximum annual operating expense limit in any year with respect to the Funds is based on a percentage of the average daily net assets of the Funds. The Advisor has agreed to waive a portion of its fees, and to reimburse certain fund expenses in order to maintain the following expense limitations for the Funds:
| | Class A | Class C | Class Y | Institutional
Class | Class R6 | Termination Date |
| Flexible Income Fund | 1.04% | 1.79% | 0.79% | 0.69% | — | July 29, 2022 |
| Focused Fund | 1.20% | 1.95% | 0.95% | 0.83% | — | July 29, 2022 |
| Global ESG Equity Fund | 1.17% | 1.99% | 0.90% | 0.89% | — | July 29, 2022 |
| Growth Opportunities Fund | 1.24% | 1.99% | 0.99% | 0.89% | — | July 29, 2022 |
| Mid Cap Growth Fund | 1.39% | 2.14% | 1.14% | 0.86% | 0.77% | July 29, 2022 |
| Sands Capital Emerging Markets Growth Fund | 1.60% | 2.35% | 1.35% | 1.25% | 1.19% | July 29, 2022 |
| Strategic Income Opportunities Fund* | 1.00% | 1.71% | 0.75% | 0.65% | — | July 29, 2023 |
| * | Effective July 17, 2021. Prior to July 17, 2021, the expense limitation for Class A, B, C and W was 1.40%, 2.05%, 2.05%, and 1.20%, respectively. |
The Expense Limitation Agreement can be terminated by a vote of the Funds’ Board if it deems the termination to be beneficial to the Funds’ shareholders.
During the year ended March 31, 2022, the Advisor or its affiliates waived or reimbursed investment advisory fees, administration fees or other operating expenses, including distribution fees of the Funds, as follows:
| Fund | Investment
Advisory
Fees Waived | Administration
Fees Waived | Other Operating
Expenses
Reimbursed/
Waived | Total |
| Flexible Income Fund | $— | $11,865 | $167,577 | $179,442 |
| Focused Fund | — | — | 10,171 | 10,171 |
| Global ESG Equity Fund | — | — | 19,880 | 19,880 |
| Growth Opportunities Fund | — | 44,586 | 130,217 | 174,803 |
| Mid Cap Growth Fund | — | 28,824 | 127,106 | 155,930 |
| Sands Capital Emerging Markets Growth Fund | — | — | 13,312 | 13,312 |
| Strategic Income Opportunities Fund | — | 83 | 467,591 | 467,674 |
Under the terms of the Expense Limitation Agreement, the Advisor is entitled to recover, subject to approval by the Funds’ Board, such amounts waived or reimbursed for a period of up to three years from the date on which the Advisor reduced its compensation or assumed expenses for the Funds. A Fund will make repayments to the Advisor only if such repayment does not cause the Fund's operating expenses (after the repayment is taken into account) to exceed the Fund's expense limit in place when such amounts were waived or reimbursed by the Advisor and the Fund's current expense limitation.
As of March 31, 2022, the Advisor may seek recoupment of previously waived fees and reimbursed expenses as follows:
| Fund | Expires on
or before
March 31, 2023 | Expires on
or before
March 31, 2024 | Expires on
or before
March 31, 2025 | Total |
| Flexible Income Fund | $557,404 | $298,950 | $140,862 | $997,216 |
| Focused Fund | 22,297 | 15,681 | 10,171 | 48,149 |
| Global ESG Equity Fund | 107,012 | 59,632 | 12,644 | 179,288 |
| Growth Opportunities Fund | 198,248 | 167,127 | 122,533 | 487,908 |
| Mid Cap Growth Fund | 3,760 | 38,995 | 155,930 | 198,685 |
| Sands Capital Emerging Markets Growth Fund | 25,128 | 3,514 | — | 28,642 |
| Strategic Income Opportunities Fund | — | — | 62,969 | 62,969 |
The Advisor did not recoup any amounts it previously waived or reimbursed during the year ended March 31, 2022.
ADMINISTRATION AGREEMENT
The Advisor entered into an Administration Agreement with the Trust, whereby the Advisor is responsible for: supplying executive and regulatory compliance services; supervising the preparation of tax returns; coordinating the preparation of reports to
Notes to Financial Statements (Continued)
shareholders and reports to and filings with the Securities and Exchange Commission (“SEC”) and state securities authorities, as well as materials for meetings of the Board; calculating the daily NAV per share; and maintaining the financial books and records of each Fund.
For its services, the Advisor’s annual administrative fee is:
0.145% on the first $20 billion of the aggregate average daily net assets;
0.11% on the next $10 billion of aggregate average daily net assets;
0.09% on the next $10 billion of aggregate average daily net assets; and
0.07% on the aggregate average daily net assets over $40 billion.
The fee is computed and allocated among the Touchstone Fund Complex on the basis of relative daily net assets.
The Advisor has engaged BNY Mellon as the Sub-Administrator to the Trust. BNY Mellon provides administrative and accounting services to the Trust and is compensated directly by the Advisor, not the Trust.
TRANSFER AGENT AGREEMENT
Under the terms of the Transfer Agent Agreement between the Trust and BNY Mellon Investment Servicing (U.S.) Inc. (“Transfer Agent”), the Transfer Agent to the Funds maintains the records of each shareholder’s account, answers shareholders’ inquiries concerning their accounts, processes purchases and redemptions of each Fund’s shares, acts as dividend and distribution disbursing agent, and performs other shareholder service functions. For these services, the Transfer Agent receives a monthly fee from each Fund. In addition, each Fund pays out-of-pocket expenses incurred by the Transfer Agent, including, but not limited to, postage and supplies.
The Funds may reimburse the Advisor for fees paid to intermediaries such as banks, broker-dealers, financial advisors or other financial institutions for sub-transfer agency, sub-administration and other services provided to investors whose shares of record are held in omnibus, other group accounts, retirement plans or accounts traded through registered securities clearing agents. These fees, which are included in Transfer Agent fees in the Statements of Operations, may vary based on, for example, the nature of services provided, but generally range up to 0.15% of the assets of the class serviced or maintained by the intermediary or up to $22 per sub-account maintained by the intermediary. Prior to July 17, 2021, DST Asset Manager Solutions, Inc. served as the Transfer Agent to the Strategic Income Opportunities Fund's Predecessor Fund.
Prior to July 17, 2021, the Strategic Income Opportunities Fund's Predecessor Fund had a service agreement with AIG Fund Services, Inc. ("ASC"), an affiliate of the Predecessor Advisor. Under the service agreement, ASC performed certain shareholder account functions by assisting the Strategic Income Opportunities Fund's Predecessor Fund's transfer agent, DST Asset Manager Solutions, Inc. (the “Predecessor Transfer Agent"), in connection with the services that it offered to the Strategic Income Opportunities Fund's Predecessor Fund. The service agreement, pursuant to which ASC received a fee from the Strategic Income Opportunities Fund's Predecessor Fund to compensate ASC for services rendered based upon an annual rate of 0.22% of average daily net assets.
PLANS OF DISTRIBUTION AND SHAREHOLDER SERVICING FEE ARRANGEMENTS
The Trust has adopted distribution plans pursuant to Rule 12b-1 under the 1940 Act for each class of shares it offers that is subject to 12b-1 distribution fees. The plans allow each Fund to pay distribution and other fees for the sale and distribution of its shares and for services provided to shareholders. The fees charged to the Funds are limited to the actual expenses incurred. Under the Class A plan, each Fund offering Class A shares pays an annual fee not to exceed 0.25% of average daily net assets that are attributable to Class A shares. Under the Class C plan, each Fund offering Class C shares pays an annual fee not to exceed 1.00% of average daily net assets that are attributable to Class C shares (of which up to 0.75% is a distribution fee and up to 0.25% is a shareholder servicing fee).
Prior to July 17, 2021, the Strategic Income Opportunities Fund's Predecessor Fund had adopted a distribution plan pursuant to Rule 12b-1 under the 1940 Act. The Predecessor Fund paid AIG Capital Services, Inc. (the “Former Distributor”) a distribution fee at an annual rate of 0.10%, 0.75% and 0.75% of average daily net assets, for Class A shares, Class B shares and Class C shares, respectively, of average daily net assets. Such fees were used to compensate the Former Distributor for eligible expenses incurred in connection with distribution and promotion of the shares. Each respective class of shares under such plan also paid the Former Distributor an account maintenance fee up to an annual rate of 0.25% of the aggregate average daily net assets of such class of shares for payments to broker-dealers for providing continuing account maintenance.
Prior to July 17, 2021, the Strategic Income Opportunities Fund's Predecessor Fund had an administrative and shareholder services agreement with the Former Distributor. The Former Distributor was paid an annual fee of 0.15% of average daily net assets of
Notes to Financial Statements (Continued)
Class W shares (which were converted to Class Y shares effective July 16, 2021) as compensation for providing administrative and shareholder services to Class W shareholders.
UNDERWRITING AGREEMENT
The Underwriter is the Funds’ principal underwriter and, as such, acts as exclusive agent for distribution of the Funds’ shares. Under the terms of the Underwriting Agreement between the Trust and the Underwriter, the Underwriter earned underwriting and broker commissions on the sale of Class A shares of the Funds. W&S Brokerage Services, Inc., an affiliate of the Underwriter and the Advisor, also earned broker commissions on the sale of Class A shares of the Funds. Listed below are the total underwriting and broker commissions earned by the Underwriter and its affiliate during the year ended March 31, 2022:
| Fund | Amount |
| Flexible Income Fund | $ 3,602 |
| Focused Fund | 6,984 |
| Global ESG Equity Fund | 14,431 |
| Growth Opportunities Fund | 6,482 |
| Mid Cap Growth Fund | 33,296 |
| Sands Capital Emerging Markets Growth Fund | 5,728 |
| Strategic Income Opportunities Fund* | 1,304 |
| * | For the period July 17, 2021 to March 31, 2022. For the period April 1, 2021 to July 16, 2021, the Former Distributor earned $3,942 on the sale of Class A shares. |
In addition, the Underwriter collected CDSC on the redemption of Class A shares and Class C shares of the Funds listed below during the year ended March 31, 2022:
| Fund | Class A | Class C |
| Flexible Income Fund | $ 60 | $ 222 |
| Focused Fund | — | 24 |
| Global ESG Equity Fund | — | 5 |
| Mid Cap Growth Fund | — | 52 |
| Strategic Income Opportunities Fund* | — | 89 |
| * | For the period July 17, 2021 to March 31, 2022. For the period April 1, 2021 to July 16, 2021, the Former Distributor collected CDSC of $5,156, $6,419, and $566 on the redemption of Class A shares, Class B shares, and Class C shares, respectively. |
INTERFUND TRANSACTIONS
Pursuant to Rule 17a-7 under the 1940 Act, the Funds may engage in purchase and sale transactions with funds that have a common investment advisor (or affiliated investment advisors), common Trustees and/or common Officers. During the year ended March 31, 2022, the Funds did not engage in any Rule 17a-7 transactions.
5. Liquidity
ReFlow Fund LLC — The Funds may participate in the ReFlow Fund LLC liquidity program (“ReFlow”), which is designed to provide an alternative liquidity source for funds experiencing redemptions. In order to pay cash to shareholders who redeem their shares on a given day, a fund typically must hold cash in its portfolio, liquidate portfolio securities, or borrow money. ReFlow provides participating funds with another source of cash by standing ready to purchase shares from a fund up to the amount of the fund’s net redemptions on a given day, cumulatively limited to 3% of the outstanding voting shares of a Fund. ReFlow then generally redeems those shares (in cash or in-kind) when the Fund experiences net sales, at the end of a maximum holding period determined by ReFlow, or at other times at ReFlow’s discretion. In return for this service, the Fund will pay a fee to ReFlow at a rate determined by a daily auction with other participating mutual funds.
During the year ended March 31, 2022, the following Funds utilized ReFlow. The shares ReFlow subscribed to and redemptions-in-kind were as follows:
| Fund | Shares ReFlow
Subscribed to | Redemptions-in-kind |
| Focused Fund | 910,694 | $ 49,584,624 |
| Growth Opportunities Fund | 282,576 | 10,433,824 |
| Mid Cap Growth Fund | 4,053,759 | 152,205,388 |
Interfund Lending — Pursuant to an Exemptive Order issued by the SEC on March 28, 2017, the Funds, along with certain other funds in the Touchstone Fund Complex, may participate in an interfund lending program. The interfund lending program
Notes to Financial Statements (Continued)
provides an alternate credit facility that allows the Funds to lend to or borrow from other participating funds in the Touchstone Fund Complex, subject to the conditions of the Exemptive Order. The Funds may not borrow under the facility for leverage purposes and the loans’ duration may be no more than 7 days.
During the year ended March 31, 2022, the following Fund participated as a lender in the interfund lending program. The daily average amount loaned, weighted average interest rate and interest income were as follows:
| Fund | Daily Average
Amount Loaned | Weighted Average
Interest Rate | Interest
Income* |
| Sands Capital Emerging Markets Growth Fund | $ 186,835 | 0.68% | $ 1,279 |
| * | Included in Interest in the Statements of Operations. |
During the year ended March 31, 2022, the following Fund participated as a borrower in the interfund lending program. The daily average amount borrowed, weighted average interest rate and interest expense were as follows:
| Fund | Daily Average
Amount Borrowed | Weighted Average
Interest Rate | Interest
Expense* |
| Sands Capital Emerging Markets Growth Fund | $ 306,338 | 0.68% | $ 2,097 |
| * | Included in Other expenses in the Statements of Operations. |
6. Federal Tax Information
Federal Income Tax — It is each Fund’s policy to continue to comply with the special provisions of the Internal Revenue Code applicable to regulated investment companies. As provided therein, in any fiscal year in which a Fund so qualifies and distributes at least 90% of its investment company taxable income, the Fund (but not the shareholders) will be relieved of federal income tax on the income distributed. It is each Fund’s policy to distribute all of its taxable income and accordingly, no provision for income taxes has been made.
In order to avoid imposition of the excise tax applicable to regulated investment companies, it is also each Fund’s intention to declare and pay as dividends in each calendar year at least 98% of its investment company taxable income (earned during the calendar year) and 98.2% of its net realized capital gains (earned during the twelve months ending October 31) plus undistributed amounts from prior years.
The tax character of distributions paid for the years ended March 31, 2022 and March 31, 2021 are as follows:
| | Flexible Income Fund | Focused Fund | Global ESG Equity Fund |
| | Year Ended
March 31,
2022 | Year Ended
March 31,
2021 | Year Ended
March 31,
2022 | Year Ended
March 31,
2021 | Year Ended
March 31,
2022 | Year Ended
March 31,
2021 |
| From ordinary income | $29,223,650 | $34,746,000 | $8,186,308 | $2,666,017 | $13,578,798 | $2,593,278 |
| From long-term capital gains | — | — | 63,791,908 | 55,000,033 | 62,529,954 | — |
| Total distributions | $29,223,650 | $34,746,000 | $71,978,216 | $57,666,050 | $76,108,752 | $2,593,278 |
| | Growth Opportunities Fund | Mid Cap Growth Fund | Sands Capital Emerging Markets Growth Fund |
| | Year Ended
March 31,
2022 | Year Ended
March 31,
2021 | Year Ended
March 31,
2022 | Year Ended
March 31,
2021 | Year Ended
March 31,
2022 | Year Ended
March 31,
2021 |
| From ordinary income | $10,829,312 | $4,515,690 | $63,548,224 | $— | $83,985,024 | $— |
| From long-term capital gains | 15,315,202 | 10,308,626 | 143,676,973 | 92,749,221 | — | — |
| Total distributions | $26,144,514 | $14,824,316 | $207,225,197 | $92,749,221 | $83,985,024 | $— |
| | Strategic Income Opportunities Fund |
| | Year Ended
March 31,
2022 | Year Ended
March 31,
2021 |
| From ordinary income | $9,958,956 | $11,298,705 |
| Total distributions | $9,958,956 | $11,298,705 |
Notes to Financial Statements (Continued)
The following information is computed on a tax basis for each item as of March 31, 2022:
| | Flexible
Income Fund | Focused
Fund | Global
ESG Equity Fund |
| Tax cost of portfolio investments | $874,209,102 | $664,454,397 | $516,510,853 |
| Gross unrealized appreciation on investments | 7,384,788 | 555,723,558 | 174,480,499 |
| Gross unrealized depreciation on investments | (39,261,894) | (18,685,971) | (45,461,617) |
| Net unrealized appreciation (depreciation) on investments | (31,877,106) | 537,037,587 | 129,018,882 |
| Gross unrealized appreciation on foreign currency transactions | — | — | 6,485 |
| Gross unrealized depreciation on short sales and foreign currency transactions | (764,636) | — | (29,526) |
| Net unrealized appreciation (depreciation) on short sales and foreign currency transactions | (764,636) | — | (23,041) |
| Undistributed ordinary income | 519,842 | 1,277,609 | 1,533,211 |
| Undistributed capital gains | 944,221 | 30,327,460 | 26,314,477 |
| Accumulated earnings (deficit) | $(31,177,679) | $568,642,656 | $156,843,529 |
| | Growth
Opportunities
Fund | Mid Cap
Growth
Fund | Sands Capital
Emerging Markets
Growth Fund | Strategic
Income
Opportunities
Fund |
| Tax cost of portfolio investments | $94,548,982 | $1,001,345,628 | $3,558,757,690 | $345,382,682 |
| Gross unrealized appreciation on investments | 69,772,803 | 356,622,195 | 670,209,935 | 2,823,003 |
| Gross unrealized depreciation on investments | (1,881,285) | (45,583,132) | (564,109,557) | (24,524,213) |
| Net unrealized appreciation (depreciation) on investments | 67,891,518 | 311,039,063 | 106,100,378 | (21,701,210) |
| Gross unrealized appreciation on derivatives and foreign currency transactions | — | — | 25,042 | 5 |
| Gross unrealized depreciation on foreign currency transactions and deferred foreign capital gains tax | — | — | (26,240,984) | — |
| Net unrealized appreciation (depreciation) on derivatives, foreign currency transactions and deferred foreign capital gains tax | — | — | (26,215,942) | 5 |
| Capital loss carryforwards | — | — | (248,815,220) | (45,653,203) |
| Late year ordinary losses deferrals | — | — | (23,139,110) | (37,961) |
| Undistributed ordinary income | 863,482 | 7,443,814 | — | — |
| Undistributed capital gains | 800,459 | 19,506,410 | — | — |
| Accumulated earnings (deficit) | $69,555,459 | $337,989,287 | $(192,069,894) | $(67,392,369) |
The difference between the tax cost of portfolio investments and the financial statement cost is primarily due to wash sale loss deferrals, trust preferred securities, callable bond and investments in passive foreign investment company (“PFIC”) adjustments.
As of March 31, 2022, the Funds had the following capital loss carryforwards for federal income tax purposes:
| Fund | No Expiration
Short Term | No Expiration
Long Term | Total |
| Sands Capital Emerging Markets Growth Fund | $ 248,815,220 | $ — | $ 248,815,220 |
| Strategic Income Opportunities Fund | 586,141 | 45,067,062 | 45,653,203 |
The capital loss carryforwards may be utilized in future years to offset net realized capital gains, if any, prior to distributing such gains to shareholders. Future utilization is subject to limitations under current tax law.
During the year ended March 31, 2022, the following Funds utilized capital loss carryforwards:
| Fund | Utilized |
| Flexible Income Fund | $ 4,468,859 |
| Strategic Income Opportunities Fund | 6,200,271 |
Notes to Financial Statements (Continued)
Under current laws, certain capital losses realized after October 31 and ordinary losses realized after December 31 may be deferred (and certain ordinary losses after October and/or December 31 may be deferred) and treated as occurring on the first day of the following fiscal year. For the year ended March 31, 2022, the following Funds elected to defer the following losses:
| Fund | Realized
Capital Losses | Ordinary
Losses | Total |
| Sands Capital Emerging Markets Growth Fund | $ — | $ 23,139,110 | $ 23,139,110 |
| Strategic Income Opportunities Fund | — | 37,961 | 37,961 |
The Funds have analyzed their tax positions taken or to be taken on federal income tax returns for all open tax years (tax years ended March 31, 2019 through 2022) and have concluded that no provision for income tax is required in their financial statements.
Certain reclassifications, the result of permanent differences between financial statement and income tax reporting requirements, have been made to the components of capital as presented on the Statements of Assets and Liabilities. These reclassifications have no impact on the net assets or NAV per share of the Funds. The following reclassifications, which are primarily attributed to the tax treatment of net operating losses, in-kind distributions for shareholder redemptions, and deemed distributions on shareholder redemptions have been made to the following Funds for the year ended March 31, 2022:
| Fund | Paid-In
Capital | Distributable
Earnings |
| Focused Fund | $ 40,468,668 | $ (40,468,668) |
| Growth Opportunities Fund | 7,939,261 | (7,939,261) |
| Mid Cap Growth Fund | 100,236,178 | (100,236,178) |
| Sands Capital Emerging Markets Growth Fund | 25,989,606 | (25,989,606) |
| Strategic Income Opportunities Fund | 27,948,544 | (27,948,544) |
7. Commitments and Contingencies
The Funds indemnify the Trust’s officers and Trustees for certain liabilities that might arise from their performance of their duties to the Funds. Additionally, in the normal course of business, the Funds enter into contracts that contain a variety of representations and warranties and which provide general indemnifications. The Funds' maximum exposure under these arrangements is unknown, as this would involve future claims that may be made against the Funds.
8. Principal Risks
Risks Associated with Foreign Investments – Some of the Funds may invest in the securities of foreign issuers. Investing in securities issued by companies whose principal business activities are outside the U.S. may involve significant risks not present in domestic investments. For example, there is generally less publicly available information about foreign companies, particularly those not subject to the disclosure and reporting requirements of the U.S. securities laws. Foreign issuers are generally not bound by uniform accounting, auditing, and financial reporting requirements and standards of practice comparable to those applicable to domestic issuers. Investments in foreign securities also involve the risk of possible adverse changes in investment or exchange control regulations, expropriation or confiscatory taxation, limitations on the removal of funds or other assets of a Fund, political or financial instability or diplomatic and other developments which could affect such investments. Political and military events, including in North Korea, Venezuela, Russia, Ukraine, Iran, Syria, and other areas of the Middle East, and nationalist unrest in Europe and South America, may cause market disruptions. Foreign stock markets, while growing in volume and sophistication, are generally not as developed as those in the U.S., and securities of some foreign issuers (particularly those located in developing countries) may be less liquid and more volatile than securities of comparable U.S. companies. In general, there is less overall governmental supervision and regulation of foreign securities markets, broker-dealers, and issuers than in the U.S.
Risks Associated with Sector Concentration – Certain Funds may invest a high percentage of their assets in specific sectors of the market in order to achieve a potentially greater investment return. As a result, these Funds may be more susceptible to economic, political, and regulatory developments in a particular sector of the market, positive or negative, and may experience increased volatility in the Funds' NAVs and magnified effect on the total return.
Risks Associated with Credit – An issuer may be unable to make timely payments of either principal or interest. This may cause the issuer’s securities to decline in value. Credit risk is particularly relevant to those Funds that invest a significant amount of their assets in junk bonds or lower-rated securities.
Risks Associated with Cyber Security - With the increased use of technologies, such as mobile devices and "cloud"-based service offerings and the dependence on the Internet and computer systems to perform necessary business functions, the Funds' service providers are susceptible to cyber security risks that could result in losses to a Fund and its shareholders. Cyber security breaches are
Notes to Financial Statements (Continued)
either intentional or unintentional events that allow an unauthorized party to gain access to Fund assets, customer data, or proprietary information, or cause a Fund or Fund service provider to suffer data corruption or lose operational functionality. A cyber security breach could result in the loss or theft of customer data or funds, loss or theft of proprietary information or corporate data, physical damage to a computer or network system, or costs associated with system repairs, any of which could have a substantial impact on a Fund. Cyber security incidents could cause a Fund, the Advisor, a Sub-Advisor, or other service provider to incur regulatory penalties, reputational damage, compliance costs associated with corrective measures, litigation costs, or financial loss. They may also result in violations of applicable privacy and other laws. In addition, such incidents could affect issuers in which a Fund invests, thereby causing the Fund’s investments to lose value.
Risks Associated with Interest Rate Changes – The price of debt securities is generally linked to the prevailing market interest rates. In general, when interest rates rise, the price of debt securities falls, and when interest rates fall, the price of debt securities rises. The price volatility of a debt security also depends on its maturity. Longer-term securities are generally more volatile, so the longer the average maturity or duration of these securities, the greater their price risk. Duration is a measure of the expected life, taking into account any prepayment or call features of the security, that is used to determine the price sensitivity of the security for a given change in interest rates. Specifically, duration is the change in the value of a fixed-income security that will result from a 1% change in interest rates, and generally is stated in years. For example, as a general rule a 1% rise in interest rates means a 1% fall in value for every year of duration. Maturity, on the other hand, is the date on which a fixed-income security becomes due for payment of principal. The negative impact on fixed income securities if interest rates increase as a result could negatively impact a Fund’s NAV.
Risks Associated with Leverage – The use of leverage (borrowing money to purchase properties or securities) will cause the Fund to incur additional expenses and significantly magnify losses in the event of underperformance of the assets purchased with borrowed money. In addition, a lender may terminate or refuse to renew any credit facility. If the Fund is unable to access additional credit, it may be forced to sell investments at inopportune times, which may further depress the returns of the Fund.
Risks Associated with Health Crises – An outbreak of respiratory disease caused by COVID-19 was first detected in China in December 2019 and subsequently spread internationally. As of the date of issuance of these financial statements, COVID-19 has resulted in closing borders, enhanced health screenings, disruptions to healthcare service preparation and delivery, quarantines, cancellations, disruptions to supply chains and customer activity, as well as general concern and uncertainty. The impact of COVID-19 may be short term or may last for an extended period of time and has resulted in a substantial economic downturn. Health crises caused by outbreaks, such as the coronavirus outbreak, may exacerbate other pre-existing political, social and economic risks. The impact of this outbreak, and other epidemics and pandemics that may arise in the future, has and could continue to negatively affect the worldwide economy, as well as the economies of individual countries, individual companies, including certain Fund service providers and issuers of the Fund's investments, and the market in general in significant and unforeseen ways. Any such impact could adversely affect a Fund’s performance, the performance of the securities in which a Fund invests and may lead to losses on your investment in a Fund.
Please see the Funds’ prospectus and statement of additional information for a complete discussion of these and other risks.
9. Fund Reorganizations
Strategic Income Opportunities Fund:
The shareholders of the AIG Flexible Credit Fund, a series of SunAmerica Income Funds, approved an Agreement and Plan of Reorganization providing for the transfer of all assets and liabilities of the AIG Flexible Credit Fund to the Strategic Income Opportunities Fund. Additionally, the shareholders of the AIG Strategic Bond Fund approved an Agreement and Plan of Reorganization providing for the transfer of all assets and liabilities to the Strategic Income Opportunities Fund. The Strategic Income Opportunities Fund commenced operations on July 16, 2021 following the completion of the reorganizations and assumed the accounting and performance history of the AIG Strategic Bond Fund (the Predecessor Fund). The tax-free reorganizations took place on July 16, 2021.
Notes to Financial Statements (Continued)
The following is a summary of shares outstanding, net assets, net asset value per share and unrealized appreciation immediately before and after the tax-free reorganizations.
| | Before Reorganization | After
Reorganization |
| | AIG Flexible Credit Fund | AIG Strategic Bond Fund | Touchstone Strategic Income Opportunities Fund |
| Class A | | | |
| Shares | 23,288,989(A) | 46,882,190 | 73,850,329 |
| Net Assets | $82,014,099 | $165,102,430 | $260,073,020 |
| Net Asset Value | $3.52(A) | $3.52 | $3.52 |
| Class B* | | | |
| Shares | — | 3,679,150(D) | $— |
| Net Assets | $— | $12,956,491 | $— |
| Net Asset Value | $— | $3.52 | $— |
| Class C | | | |
| Shares | 9,310,842(B) | 10,069,753 | 19,380,595 |
| Net Assets | $32,869,573 | $35,547,801 | $68,417,374 |
| Net Asset Value | $3.53(B) | $3.53 | $3.53 |
| Class Y** | | | |
| Shares | 26,820,573(C) | 29,268,862 | 56,089,435 |
| Net Assets | $94,266,176 | $102,869,883 | $197,136,059 |
| Net Asset Value | $3.51(C) | $3.51 | $3.51 |
| Fund Total | | | |
| Shares Outstanding | 59,420,404 | 89,899,955 | 149,320,359 |
| Net Assets | $209,149,848 | $316,476,605 | $525,626,453 |
| Unrealized Appreciation (Depreciation) | $4,299,043 | $8,409,184 | $12,708,227 |
(A) Reflects a 0.9620:1 stock split which occurred on the date of the reorganization, July 16, 2021.
(B) Reflects a 0.9654:1 stock split which occurred on the date of the reorganization, July 16, 2021.
(C) Reflects a 0.9653:1 stock split which occurred on the date of the reorganization, July 16, 2021.
(D) Reflects a 0.9983:1 stock split which occurred on the date of the reorganization, July 16, 2021.
* Class B shares of the AIG Strategic Bond Fund were exchanged for Class A shares of the Touchstone Strategic Income Opportunities Fund.
** Class W shares of the AIG Strategic Bond Fund were exchanged for Class Y shares of the Touchstone Strategic Income Opportunities Fund.
Assuming the reorganization had been completed on April 1, 2021, the Strategic Income Opportunities Fund’s results of operations for the year ended March 31, 2022 would have been as follows:
| Net investment income | $11,850,858 |
| Net realized and unrealized gain(loss) on investments | $(19,331,668) |
| Net decrease in net assets resulting from operations | $(7,480,810) |
Because the combined investment portfolios have been managed as a single portfolio since the reorganization was completed, it is not practical to separate the amounts of revenue and earnings to the Strategic Income Opportunities Fund that have been included in its statement of operations since the reorganization.
10. Subsequent Events
Subsequent events occurring after the date of this report have been evaluated for potential impact to this report through the date the financial statements were issued.
At a meeting of the Board of the Trust held on May 19, 2022, the Advisor proposed, and the Board approved, the following changes to the Global ESG Equity Fund, which will take effect on or about July 29, 2022: (1) a name change to the Touchstone Non-US ESG Equity Fund, (2) a change to the Fund's 80% investment policy to remove investments in U.S. companies, (3) a change in the Fund's primary benchmark from the MSCI All Country World Index to the MSCI All Country World Ex-USA Index, and (4) a reduction to the contractual expense limitation agreement for Class C shares of the Fund.
There were no other subsequent events that necessitated recognition or disclosure in the Funds’ financial statements.
Report of Independent Registered Public Accounting Firm
To the Shareholders of Touchstone Flexible Income Fund, Touchstone Focused Fund, Touchstone Global ESG Equity Fund, Touchstone Growth Opportunities Fund, Touchstone Mid Cap Growth Fund, and Touchstone Sands Capital Emerging Markets Growth Fund and the Board of Trustees of Touchstone Strategic Trust.
Opinion on the Financial Statements
We have audited the accompanying statements of assets and liabilities of Touchstone Flexible Income Fund, Touchstone Focused Fund, Touchstone Global ESG Equity Fund, Touchstone Growth Opportunities Fund, Touchstone Mid Cap Growth Fund, and Touchstone Sands Capital Emerging Markets Growth Fund (collectively referred to as the “Funds”) (six of the funds constituting the Touchstone Strategic Trust (the “Trust”)), including the portfolios of investments, as of March 31, 2022, and the related statements of operations for the year then ended, the statements of changes in net assets for each of the two years in the period then ended, the financial highlights for each of the five years in the period then ended and the related notes (collectively referred to as the “financial statements”). In our opinion, the financial statements present fairly, in all material respects, the financial position of each of the Funds (six of the funds constituting the Touchstone Strategic Trust) at March 31, 2022, the results of their operations, the changes in their net assets for each of the two years in the period then ended and their financial highlights for each of the five years in the period then ended, in conformity with U.S. generally accepted accounting principles.
Basis for Opinion
These financial statements are the responsibility of the Trust’s management. Our responsibility is to express an opinion on the Fund’s financial statements based on our audits. We are a public accounting firm registered with the Public Company Accounting Oversight Board (United States) ("PCAOB") and are required to be independent with respect to the Trust in accordance with the U.S. federal securities laws and the applicable rules and regulations of the Securities and Exchange Commission and the PCAOB.
We conducted our audits in accordance with the standards of the PCAOB. Those standards require that we plan and perform the audit to obtain reasonable assurance about whether the financial statements are free of material misstatement, whether due to error or fraud. The Trust is not required to have, nor were we engaged to perform, an audit of the Trust’s internal control over financial reporting. As part of our audits we are required to obtain an understanding of internal control over financial reporting but not for the purpose of expressing an opinion on the effectiveness of the Trust’s internal control over financial reporting. Accordingly, we express no such opinion.
Our audits included performing procedures to assess the risks of material misstatement of the financial statements, whether due to error or fraud, and performing procedures that respond to those risks. Such procedures included examining, on a test basis, evidence regarding the amounts and disclosures in the financial statements. Our procedures included confirmation of securities owned as of March 31, 2022, by correspondence with the custodian, transfer agent, and brokers or by other appropriate auditing procedures where replies from brokers were not received. Our audits also included evaluating the accounting principles used and significant estimates made by management, as well as evaluating the overall presentation of the financial statements. We believe that our audits provide a reasonable basis for our opinion.
We have served as the auditor of one or more Touchstone Investments’ investment companies since 1999.
Cincinnati, Ohio
May 23, 2022
Report of Independent Registered Public Accounting Firm
To the Board of Trustees of Touchstone Strategic Trust and the Shareholders of the Touchstone Strategic Income Opportunities Fund
Cincinnati, Ohio
Opinion on the Financial Statements
We have audited the accompanying statement of assets and liabilities of the Touchstone Strategic Income Opportunities Fund (the “Fund”), a series of Touchstone Strategic Trust, including the schedule of investments, as of March 31, 2022, the related statement of operations, the statement of changes in net assets, the financial highlights for the year then ended, and the related notes (collectively referred to as the “financial statements”). In our opinion, the financial statements present fairly, in all material respects, the financial position of the Fund as of March 31, 2022, the results of its operations, the changes in its net assets, and the financial highlights for the year then ended in conformity with accounting principles generally accepted in the United States of America.
The statement of changes in net assets for the year ended March 31, 2021, and the financial highlights for each of the four years in the period ended March 31, 2021 have been audited by other auditors, whose report dated May 27, 2021 expressed unqualified opinion on such financial highlights.
Basis for Opinion
These financial statements are the responsibility of the Fund’s management. Our responsibility is to express an opinion on the Fund’s financial statements based on our audits. We are a public accounting firm registered with the Public Company Accounting Oversight Board (United States) (“PCAOB”) and are required to be independent with respect to the Fund in accordance with the U.S. federal securities laws and the applicable rules and regulations of the Securities and Exchange Commission and the PCAOB.
We conducted our audit in accordance with the standards of the PCAOB. Those standards require that we plan and perform the audit to obtain reasonable assurance about whether the financial statements are free of material misstatement, whether due to error or fraud. The Fund is not required to have, nor were we engaged to perform, an audit of its internal control over financial reporting. As part of our audit, we are required to obtain an understanding of internal control over financial reporting, but not for the purpose of expressing an opinion on the effectiveness of the Fund’s internal control over financial reporting. Accordingly, we express no such opinion.
Our audit included performing procedures to assess the risks of material misstatement of the financial statements, whether due to error or fraud, and performing procedures that respond to those risks. Such procedures included examining, on a test basis, evidence regarding the amounts and disclosures in the financial statements. Our audit also included evaluating the accounting principles used and significant estimates made by management, as well as evaluating the overall presentation of the financial statements. Our procedures included confirmation of securities owned as of March 31, 2022, by correspondence with the custodian and brokers; when replies were not received from brokers, we performed other auditing procedures. We believe that our audits provide a reasonable basis for our opinion.
We have served as the auditor of one or more Touchstone Investments’ investment companies since 2021.
Philadelphia, Pennsylvania
May 23, 2022
Qualified Dividend Income
Under the Jobs and Growth Tax Relief Reconciliation Act of 2003 (the “Act”), the following percentages of ordinary dividends paid during the fiscal year ended March 31, 2022 are designated as “qualified dividend income,” as defined in the Act, and are subject to reduced tax rates. The Funds intend to pass through the maximum allowable percentage for Form 1099 Div.
| Focused Fund | 100.00 % |
| Global ESG Equity Fund | 100.00 % |
| Growth Opportunities Fund | 11.10 % |
| Mid Cap Growth Fund | 51.10 % |
| Sands Capital Emerging Markets Growth Fund | 19.94 % |
| Strategic Income Opportunities Fund | 5.98 % |
Dividend Received Deduction
For corporate shareholders, the following ordinary distributions paid during the fiscal year ended March 31, 2022 qualify for the corporate dividends received deduction. The Funds intend to pass through the maximum allowable percentage.
| Focused Fund | 100.00 % |
| Global ESG Equity Fund | 43.91 % |
| Growth Opportunities Fund | 21.48 % |
| Mid Cap Growth Fund | 48.50 % |
| Strategic Income Opportunities Fund | 5.36 % |
For the fiscal year ended March 31, 2022, the Funds designated long-term capital gains as follows:
| Flexible Income Fund | $ 944,221 |
| Focused Fund | $ 71,604,613 |
| Global ESG Equity Fund | $ 62,529,954 |
| Growth Opportunities Fund | $ 17,829,107 |
| Mid Cap Growth Fund | $ 184,413,772 |
Proxy Voting Guidelines and Proxy Voting Records
The Sub-Advisors are responsible for exercising the voting rights associated with the securities purchased and held by the Funds. A description of the policies and procedures that the Sub-Advisors use in fulfilling this responsibility is available as an appendix to the most recent Statement of Additional Information, which can be obtained without charge by calling toll free 1.800.543.0407 or by visiting the Touchstone website at TouchstoneInvestments.com or on the Securities and Exchange Commission’s (the “Commission”) website sec.gov. Information regarding how those proxies were voted during the most recent twelve-month period ended June 30, which will be filed by August 31 of that year, is also available without charge by calling toll free 1.800.543.0407 or on the Commission’s website at sec.gov.
Quarterly Portfolio Disclosure
Each Fund’s holdings as of the end of the third month of every fiscal quarter will be disclosed on Form N-PORT within 60 days of the end of the fiscal quarter. The complete listing of each Fund’s portfolio holdings is available on the Commission’s website and will be made available to shareholders upon request by calling 1.800.543.0407.
Schedule of Shareholder Expenses
As a shareholder of the Funds, you incur two types of costs: (1) transaction costs, including sales charges (loads) and (2) ongoing costs, including investment advisory fees; shareholder servicing fees; and other Fund expenses. This example is intended to help you understand your ongoing costs (in dollars) of investing in the Funds and to compare these costs with the ongoing costs of investing in other mutual funds.
The example is based on an investment of $1,000 invested at the beginning of the period and held for the entire period (October 1, 2021 through March 31, 2022).
Other Items (Unaudited) (Continued)
Actual Expenses
The first line for each share class of a Fund in the table below provides information about actual account values and actual expenses. You may use the information in this line, together with the amount you invested, to estimate the expenses that you paid over the period. Simply divide your account value by $1,000 (for example, an $8,600 account value divided by $1,000 = 8.6), then multiply the result by the number in the first line under the heading entitled “Expenses Paid During the Six Months Ended March 31, 2022” to estimate the expenses you paid on your account during this period.
Hypothetical Example for Comparison Purposes
The second line for each share class of a Fund in the table below provides information about hypothetical account values and hypothetical expenses based on the Funds’ actual expense ratio and an assumed rate of return of 5% per year before expenses, which is not the Funds’ actual return. The hypothetical account values and expenses may not be used to estimate the actual ending account balance or expenses you paid for the period. You may use this information to compare the ongoing costs of investing in the Funds and other funds. To do so, compare this 5% hypothetical example with the 5% hypothetical examples that appear in the shareholder reports of the other funds.
Please note that the expenses shown in the table below are meant to highlight your ongoing costs only and do not reflect any transactional costs, such as sales charges (loads). Therefore, the second line for each share class of a Fund in the table below is useful in comparing ongoing costs only, and will not help you determine the relative total costs of owning different funds. In addition, if these transactional costs were included, your costs would have been higher.
| | | Net Expense
Ratio
Annualized
March 31,
2022 | Beginning
Account
Value
October 1,
2021 | Ending
Account
Value
March 31,
2022 | Expenses
Paid During
the Six Months
Ended
March 31,
2022* |
| Flexible Income Fund | | | | | |
| Class A | Actual | 1.15% | $1,000.00 | $954.50 | $5.60** |
| Class A | Hypothetical | 1.15% | $1,000.00 | $1,019.20 | $5.79** |
| Class C | Actual | 1.90% | $1,000.00 | $951.10 | $9.24** |
| Class C | Hypothetical | 1.90% | $1,000.00 | $1,015.46 | $9.55** |
| Class Y | Actual | 0.89% | $1,000.00 | $954.90 | $4.34** |
| Class Y | Hypothetical | 0.89% | $1,000.00 | $1,020.49 | $4.48** |
| Institutional Class | Actual | 0.82% | $1,000.00 | $955.80 | $4.00** |
| Institutional Class | Hypothetical | 0.82% | $1,000.00 | $1,020.84 | $4.13** |
| Focused Fund | | | | | |
| Class A | Actual | 1.15% | $1,000.00 | $1,012.70 | $5.77*** |
| Class A | Hypothetical | 1.15% | $1,000.00 | $1,019.20 | $5.79*** |
| Class C | Actual | 1.91% | $1,000.00 | $1,009.00 | $9.57*** |
| Class C | Hypothetical | 1.91% | $1,000.00 | $1,015.41 | $9.60*** |
| Class Y | Actual | 0.86% | $1,000.00 | $1,014.30 | $4.32*** |
| Class Y | Hypothetical | 0.86% | $1,000.00 | $1,020.64 | $4.33*** |
| Institutional Class | Actual | 0.84% | $1,000.00 | $1,014.60 | $4.22*** |
| Institutional Class | Hypothetical | 0.84% | $1,000.00 | $1,020.74 | $4.23*** |
| Global ESG Equity Fund | | | | | |
| Class A | Actual | 1.02% | $1,000.00 | $968.40 | $5.01 |
| Class A | Hypothetical | 1.02% | $1,000.00 | $1,019.85 | $5.14 |
| Class C | Actual | 1.99% | $1,000.00 | $963.60 | $9.74 |
| Class C | Hypothetical | 1.99% | $1,000.00 | $1,015.01 | $10.00 |
| Class Y | Actual | 0.90% | $1,000.00 | $969.40 | $4.42 |
| Class Y | Hypothetical | 0.90% | $1,000.00 | $1,020.44 | $4.53 |
| Institutional Class | Actual | 0.89% | $1,000.00 | $969.00 | $4.37 |
| Institutional Class | Hypothetical | 0.89% | $1,000.00 | $1,020.49 | $4.48 |
| Growth Opportunities Fund | | | | | |
| Class A | Actual | 1.27% | $1,000.00 | $1,005.60 | $6.35**** |
| Class A | Hypothetical | 1.27% | $1,000.00 | $1,018.60 | $6.39**** |
| Class C | Actual | 2.02% | $1,000.00 | $1,001.70 | $10.08**** |
| Class C | Hypothetical | 2.02% | $1,000.00 | $1,014.86 | $10.15**** |
| Class Y | Actual | 1.02% | $1,000.00 | $1,006.70 | $5.10**** |
| Class Y | Hypothetical | 1.02% | $1,000.00 | $1,019.85 | $5.14**** |
Other Items (Unaudited) (Continued)
| | | Net Expense
Ratio
Annualized
March 31,
2022 | Beginning
Account
Value
October 1,
2021 | Ending
Account
Value
March 31,
2022 | Expenses
Paid During
the Six Months
Ended
March 31,
2022* |
| Institutional Class | Actual | 0.92% | $1,000.00 | $1,007.30 | $4.60**** |
| Institutional Class | Hypothetical | 0.92% | $1,000.00 | $1,020.34 | $4.63**** |
| Mid Cap Growth Fund | | | | | |
| Class A | Actual | 1.21% | $1,000.00 | $962.10 | $5.92***** |
| Class A | Hypothetical | 1.21% | $1,000.00 | $1,018.90 | $6.09***** |
| Class C | Actual | 2.04% | $1,000.00 | $958.40 | $9.96***** |
| Class C | Hypothetical | 2.04% | $1,000.00 | $1,014.76 | $10.25***** |
| Class Y | Actual | 0.99% | $1,000.00 | $962.90 | $4.84***** |
| Class Y | Hypothetical | 0.99% | $1,000.00 | $1,020.00 | $4.99***** |
| Institutional Class | Actual | 0.88% | $1,000.00 | $963.70 | $4.31***** |
| Institutional Class | Hypothetical | 0.88% | $1,000.00 | $1,020.54 | $4.43***** |
| Class R6 | Actual | 0.79% | $1,000.00 | $964.00 | $3.87***** |
| Class R6 | Hypothetical | 0.79% | $1,000.00 | $1,020.99 | $3.98***** |
| Sands Capital Emerging Markets Growth Fund | | | | | |
| Class A | Actual | 1.60% | $1,000.00 | $719.90 | $6.86 |
| Class A | Hypothetical | 1.60% | $1,000.00 | $1,016.95 | $8.05 |
| Class C | Actual | 2.35% | $1,000.00 | $717.70 | $10.06 |
| Class C | Hypothetical | 2.35% | $1,000.00 | $1,013.21 | $11.80 |
| Class Y | Actual | 1.33% | $1,000.00 | $721.10 | $5.71 |
| Class Y | Hypothetical | 1.33% | $1,000.00 | $1,018.30 | $6.69 |
| Institutional Class | Actual | 1.21% | $1,000.00 | $721.70 | $5.19 |
| Institutional Class | Hypothetical | 1.21% | $1,000.00 | $1,018.90 | $6.09 |
| Class R6 | Actual | 1.16% | $1,000.00 | $721.90 | $4.98 |
| Class R6 | Hypothetical | 1.16% | $1,000.00 | $1,019.15 | $5.84 |
| Strategic Income Opportunities Fund | | | | | |
| Class A | Actual | 0.93% | $1,000.00 | $948.50 | $4.52 |
| Class A | Hypothetical | 0.93% | $1,000.00 | $1,020.29 | $4.68 |
| Class C | Actual | 1.69% | $1,000.00 | $945.20 | $8.20 |
| Class C | Hypothetical | 1.69% | $1,000.00 | $1,016.50 | $8.50 |
| Class Y | Actual | 0.73% | $1,000.00 | $949.60 | $3.55 |
| Class Y | Hypothetical | 0.73% | $1,000.00 | $1,021.29 | $3.68 |
| Institutional Class | Actual | 0.49% | $1,000.00 | $952.80 | $2.39 |
| Institutional Class | Hypothetical | 0.49% | $1,000.00 | $1,022.49 | $2.47 |
| * | Expenses are equal to the Fund’s annualized expense ratio, multiplied by the average account value over the period, multiplied by 182/365 (to reflect one-half year period). |
| ** | Excluding dividend and interest expense on securities sold short, your actual cost of investment in Class A, Class C, Class Y and Institutional Class would be $5.08, $8.72, $3.82 and $3.48, respectively, and your hypothetical cost of investment in Class A, Class C, Class Y and Institutional Class would be $5.25, $9.01, $3.95 and $3.59, respectively. |
| *** | Excluding liquidity provider expenses, your actual cost of investment in Class A, Class C, Class Y and Institutional Class would be $5.71, $9.51, $4.26 and $4.16, respectively, and your hypothetical cost of investment in Class A, Class C, Class Y and Institutional Class would be $5.73, $9.54, $4.27 and $4.17, respectively. |
| **** | Excluding liquidity provider expenses, your actual cost of investment in Class A, Class C, Class Y and Institutional Class would be $6.22, $9.95, $4.97 and $4.47, respectively, and your hypothetical cost of investment in Class A, Class C, Class Y and Institutional Class would be $6.26, $10.01, $5.00 and $4.50, respectively. |
| ***** | Excluding liquidity provider expenses, your actual cost of investment in Class A, Class C, Class Y, Institutional Class and Class R6 would be $5.79, $9.84, $4.72, $4.18 and $3.74, respectively, and your hypothetical cost of investment in Class A, Class C, Class Y, Institutional Class and Class R6 would be $5.96, $10.12, $4.86, $4.30 and $3.85, respectively. |
Liquidity Risk Management
The Funds have adopted and implemented a written liquidity risk management program (the “LRM Program”) as required by Rule 22e-4 under the Investment Company Act of 1940. Rule 22e-4 requires that each Fund adopt a program that is reasonably designed to assess and manage the Funds’ liquidity risk, which is the risk that a Fund could not meet redemption requests without significant dilution of remaining investors’ interests in a Fund.
Assessment and management of a Fund’s liquidity risk under the LRM Program takes into consideration certain factors, such as a Fund’s investment strategy and the liquidity of its portfolio investments during normal and reasonably foreseeable stressed conditions, its short- and long-term cash-flow projections during both normal and reasonably foreseeable stressed conditions, and its cash and cash-equivalent holdings and access to other funding sources. As required by the rule, the LRM Program includes policies and procedures for classification of Fund portfolio holdings in four liquidity categories, maintaining certain levels of highly liquid investments, and limiting holdings of illiquid investments.
Other Items (Unaudited) (Continued)
The Board of Trustees of the Trust approved the appointment of a LRM Program administrator responsible for administering the LRM Program and for carrying out the specific responsibilities set forth in the LRM Program, including reporting to the Board on at least an annual basis regarding the LRM Program’s operation, its adequacy, and the effectiveness of its implementation for the past year (the “Program Administrator Report”). The Board has reviewed the Program Administrator Report covering the period from May 15, 2021 through May 12, 2022 (the “Review Period”). The Program Administrator Report stated that during the Review Period the LRM Program operated and was implemented effectively to manage the Funds’ liquidity risk.
Advisory and Sub-Advisory Agreement Approval Disclosure
At a meeting held on November 18, 2021, the Board of Trustees (the “Board” or “Trustees”) of the Touchstone Strategic Trust (the “Trust”), and by a separate vote, the Independent Trustees of the Trust, approved the continuance of the Investment Advisory Agreement between the Trust and the Advisor with respect to each Fund of the Trust, and the continuance of the Sub-Advisory Agreement between the Advisor and each Fund’s respective Sub-Advisor, except with respect to the Investment Advisory Agreement and the Sub-Advisory Agreement for Touchstone Strategic Income Opportunities Fund, which were approved at a meeting held in January 2021.
In determining whether to approve the continuation of the Investment Advisory Agreement and the Sub-Advisory Agreements, the Advisor furnished information necessary for a majority of the Independent Trustees to make the determination that the continuance of the Investment Advisory Agreement and each Sub-Advisory Agreement was in the best interests of the respective Funds and their shareholders. The information provided to the Board included: (1) industry data comparing advisory fees and total expense ratios of comparable funds; (2) comparative performance information; (3) the Advisor’s and its affiliates’ revenues and costs of providing services to the Funds; and (4) information about the Advisor’s and Sub-Advisors’ personnel. Prior to voting, the Independent Trustees reviewed the proposed continuance of the Investment Advisory Agreement and the Sub-Advisory Agreements with management and experienced independent legal counsel and received materials from such counsel discussing the legal standards for their consideration of the proposed continuation of the Investment Advisory Agreement and each Sub-Advisory Agreement. The Independent Trustees also reviewed the proposed continuation of the Investment Advisory Agreement and each Sub-Advisory Agreement with independent legal counsel in private sessions at which no representatives of management were present.
In approving the Funds’ Investment Advisory Agreement, the Board considered various factors, among them: (1) the nature, extent and quality of services provided to the Funds, including the personnel providing such services; (2) the Advisor’s compensation and profitability; (3) a comparison of fees and performance with comparable funds; (4) economies of scale; and (5) the terms of the Investment Advisory Agreement. The Board’s analysis of these factors is set forth below. The Independent Trustees were advised by independent legal counsel throughout the process.
Nature, Extent and Quality of Advisor Services. The Board considered the level and depth of knowledge of the Advisor, including the professional experience and qualifications of senior personnel. In evaluating the quality of services provided by the Advisor, the Board took into account its familiarity with the Advisor’s senior management through Board meetings, discussions and reports during the preceding year. The Board also took into account the Advisor’s compliance policies and procedures. The quality of administrative and other services, including the Advisor’s role in coordinating the activities of the Funds’ other service providers, was also considered. The Board also considered the Advisor’s relationship with its affiliates and the resources available to them, as well as any potential conflicts of interest.
The Board discussed the Advisor’s effectiveness in monitoring the performance of each Sub-Advisor, including the Sub-Advisor that was an affiliate of the Advisor, and the Advisor’s timeliness in responding to performance issues. The Board considered the Advisor’s process for monitoring each of the Sub-Advisors, which includes an examination of both qualitative and quantitative elements of the Sub-Advisor’s organization, personnel, procedures, investment discipline, infrastructure and performance. The Board considered that the Advisor conducts periodic due diligence of each Sub-Advisor, during which the Advisor examines a wide variety of factors, such as the financial condition of the Sub-Advisor, the quality of the Sub-Advisor’s systems, the effectiveness of the Sub-Advisor’s disaster recovery programs, trade allocation and execution procedures, compliance with the Sub-Advisor’s policies and procedures, results of regulatory examinations and any other factors that might affect the quality of services that the Sub-Advisor provides to the applicable Fund(s). The Board noted that the Advisor’s monitoring processes also include quarterly reviews of compliance certifications, and that any issues arising from such reviews and the Advisor’s due diligence reviews of the Sub-Advisors are reported to the Board.
The Trustees concluded that they were satisfied with the nature, extent and quality of services provided to each Fund by the Advisor under the Investment Advisory Agreement.
Advisor’s Compensation and Profitability. The Board took into consideration the financial condition and profitability of the Advisor and its affiliates (including the Sub-Advisor to one of the Funds) and the direct and indirect benefits derived by the Advisor and its
Other Items (Unaudited) (Continued)
affiliates from the Advisor’s relationship with the Funds. The information considered by the Board included operating profit margin information for the Advisor’s business as a whole. The Board noted that the Advisor had waived a portion of advisory fees and administrative fees and/or reimbursed expenses in order to limit all but one of the Fund’s net operating expenses. The Board also noted that the Advisor pays the Sub-Advisors’ sub-advisory fees out of the advisory fees the Advisor receives from the Funds. The Board reviewed the profitability of the Advisor’s relationship with the Funds both before and after tax expenses, and also considered whether the Advisor has the financial wherewithal to continue to provide services to the Funds, noting the ongoing commitment of the Advisor’s parent company with respect to providing support and resources as needed. The Board considered that the Funds’ distributor, an affiliate of the Advisor, receives Rule 12b-1 distribution fees from the Funds and receives a portion of the sales charges on sales or redemptions of certain classes of shares. The Board also noted that the Advisor derives benefits to its reputation and other benefits from its association with the Funds.
The Board recognized that the Advisor should be entitled to earn a reasonable level of profits in exchange for the level of services it provides to each Fund and the entrepreneurial risk that it assumes as Advisor. Based upon their review, the Trustees concluded that the Advisor’s and its affiliates’ level of profitability, if any, from their relationship with each Fund was reasonable and not excessive.
Expenses and Performance. The Board compared the respective advisory fees and total expense ratios for each of the Funds with various comparative data, including the median and average advisory fees and total expense ratios of each Fund’s respective peer group. The Board also considered, among other data, the Funds’ respective performance results during the six-month, twelve-month, and thirty-six-month periods ended September 30, 2021 and noted that the Board reviews on a quarterly basis detailed information about each Fund’s performance results, portfolio composition and investment strategies. The Board also took into account current market conditions and their effect on the Funds’ performance.
The Board also considered the effect of each Fund’s growth and size on its performance and expenses. The Board noted that the Advisor had waived a portion of the fees and/or reimbursed expenses for all but one of the Funds in order to reduce those Funds’ respective operating expenses to targeted levels. The Board noted that the sub-advisory fees under the Sub-Advisory Agreement with respect to each Fund were paid by the Advisor out of the advisory fees it receives from the Fund and considered the impact of such sub-advisory fees on the profitability of the Advisor. In reviewing the respective total expense ratios and performance of each of the Funds, the Board also took into account the nature, extent and quality of the services provided to the Funds by the Advisor and its affiliates.
The Board considered, among other data, the specific factors and related conclusions set forth below with respect to each Fund:
Touchstone Flexible Income Fund. The Fund’s advisory fee and total expense ratio (net of applicable expense waivers and reimbursements) were each above the median, of its peer group. The Board noted that the Advisor was waiving a portion of the Fund’s fees and/or reimbursing a portion of the Fund’s operating expenses. The Fund’s performance for the six-, twelve- and thirty-six-month periods ended September 30, 2021 was in the 2nd quintile of its peer group. Based upon their review, the Trustees concluded that the overall performance of the Fund was satisfactory relative to the performance of funds with similar investment objectives and relevant indices, and that the advisory fee was reasonable in light of the services received by the Fund from the Advisor and the other factors considered.
Touchstone Focused Fund. The Fund’s advisory fee and total expense ratio (net of applicable expense waivers and reimbursements) were each above the median of its peer group. The Fund’s performance for the six-month period ended September 30, 2021 was in the 3rd quintile of its peer group, while the Fund’s performance for the twelve- and thirty-six-month periods ended September 30, 2021 was in the 1st quintile of its peer group. Based upon their review, the Trustees concluded that the overall performance of the Fund was satisfactory relative to the performance of funds with similar investment objectives and relevant indices, and that the advisory fee was reasonable in light of the services received by the Fund from the Advisor and the other factors considered.
Touchstone Global ESG Equity Fund. The Fund’s advisory fee and total expense ratio (net of applicable expense waivers and reimbursements) were each below the median of its peer group. The Board noted that the Advisor was waiving a portion of the Fund’s fees and/or reimbursing a portion of the Fund’s operating expenses. The Fund’s performance for the six-month period ended September 30, 2021 was in the 5th quintile of its peer group, the Fund’s performance for the twelve-month period ended September 30, 2021 was in the 3rd quintile of its peer group, and the Fund’s performance for the thirty-six-month period ended September 30, 2021 was in the 4th quintile of its peer group. The Board noted management’s discussion of the Fund’s performance. Based upon their review, the Trustees concluded that the overall performance of the Fund was satisfactory relative to the performance of funds with similar investment objectives and relevant indices, and that the advisory fee was reasonable in light of the services received by the Fund from the Advisor and the other factors considered.
Touchstone Growth Opportunities Fund. The Fund’s advisory fee and total expense ratio (net of applicable expense waivers and reimbursements) were each at the median of its peer group. The Board noted that the Advisor was waiving a portion of the Fund’s fees and/or reimbursing a portion of the Fund’s operating expenses. The Fund’s performance for the six-month period ended September 30, 2021 was in the 4th quintile of its peer group, the Fund’s performance for the twelve-month period ended
Other Items (Unaudited) (Continued)
September 30, 2021 was in the 3rd quintile of its peer group, while the Fund’s performance for the thirty-six--month period ended September 30, 2021 was in the 2nd quintile of its peer group. Based upon their review, the Trustees concluded that the overall performance of the Fund was satisfactory relative to the performance of funds with similar investment objectives and relevant indices, and that the advisory fee was reasonable in light of the services received by the Fund from the Advisor and the other factors considered.
Touchstone Mid Cap Growth Fund. The Fund’s advisory fee and total expense ratio (net of applicable expense waivers and reimbursements) were below the median and above the median, respectively, of its peer group. The Board noted that the Advisor was waiving a portion of the Fund’s fees and/or reimbursing a portion of the Fund’s operating expenses. The Fund’s performance for the six-month period ended September 30, 2021 was in the 1st quintile of its peer group, the Fund’s performance for the twelve-month period ended September 30, 2021 was in the 3rd quintile of its peer group, and the Fund’s performance for the thirty-six-month period ended September 30, 2021 was in the 2nd quintile of its peer group. Based upon their review, the Trustees concluded that the overall performance of the Fund was satisfactory relative to the performance of funds with similar investment objectives and relevant indices, and that the advisory fee was reasonable in light of the services received by the Fund from the Advisor and the other factors considered.
Touchstone Sands Capital Emerging Markets Growth Fund. The Fund’s advisory fee and total expense ratio (net of applicable expense waivers and reimbursements) were each above the median of its peer group. The Board noted that the Advisor was waiving a portion of the Fund’s fees and/or reimbursing a portion of the Fund’s operating expenses. The Fund’s performance for the six- and thirty-six-month periods ended September 30, 2021 was in the 1st quintile of its peer group, and the Fund’s performance for the twelve-month period ended September 30, 2021 was in the 2nd quintile of its peer group. Based upon their review, the Trustees concluded that the overall performance of the Fund was satisfactory relative to the performance of funds with similar investment objectives and relevant indices, and that the advisory fee was reasonable in light of the services received by the Fund from the Advisor and the other factors considered.
Economies of Scale. The Board considered the effect of each Fund’s current size and potential growth on its performance and expenses. The Board took into account management’s discussion of the Funds’ advisory fee structure. The Board considered the effective advisory fees under the Investment Advisory Agreement as a percentage of assets at different asset levels and possible economies of scale that might be realized if the assets of each Fund increase. The Board noted that the advisory fee schedule for each Fund, except the Touchstone Sands Capital Emerging Markets Growth Fund, contains breakpoints that would reduce the respective advisory fee rate on assets above specified levels as the applicable Fund’s assets increased and considered the necessity of adding breakpoints with respect to the Touchstone Sands Capital Emerging Markets Growth Fund. The Board determined that adding breakpoints at specified levels to the advisory fee schedule of the Touchstone Sands Capital Emerging Markets Growth Fund would not be appropriate at this time. The Board noted that if a Fund’s assets increase over time, the Fund might realize other economies of scale if assets increase proportionally more than certain other expenses. The Board also considered the fact that, under the Investment Advisory Agreement, the advisory fee payable to the Advisor by a Fund was reduced by the total sub-advisory fee paid by the Advisor to the Fund’s Sub-Advisor.
Conclusion. In considering the renewal of the Funds’ Investment Advisory Agreement, the Board, including the Independent Trustees, did not identify any single factor as controlling, and each Trustee may have attributed different weights to the various factors. The Trustees evaluated all information available to them on a Fund-by-Fund basis, and their determinations were made separately with respect to each Fund. The Board reached the following conclusions regarding the Funds’ Investment Advisory Agreement with the Advisor, among others: (a) the Advisor demonstrated that it possesses the capability and resources to perform the duties required of it under the Investment Advisory Agreement; (b) the Advisor maintains an appropriate compliance program; (c) the overall performance of each Fund is satisfactory relative to the performance of funds with similar investment objectives and relevant indices; and (d) each Fund’s advisory fee is reasonable in light of the services received by the Fund from the Advisor and the other factors considered. Based on their conclusions, the Trustees determined with respect to each Fund that continuation of the Investment Advisory Agreement was in the best interests of the Fund and its shareholders.
In approving the Funds’ respective Sub-Advisory Agreements, the Board considered various factors with respect to each Fund and the applicable Sub-Advisory Agreement, among them: (1) the nature, extent and quality of services provided to the Fund, including the personnel providing such services; (2) the Sub-Advisor’s compensation; (3) a comparison of the sub-advisory fee and performance with comparable funds; and (4) the terms of the Sub-Advisory Agreement. The Board’s analysis of these factors is set forth below. The Independent Trustees were advised by independent legal counsel throughout the process.
Nature, Extent and Quality of Services Provided; Investment Personnel. The Board considered information provided by the Advisor regarding the services provided by each Sub-Advisor, including information presented periodically throughout the previous year. The Board noted the affiliation of one of the Sub-Advisors with the Advisor, noting any potential conflicts of interest. The Board also noted that, on a periodic basis, the Board meets with portfolio managers of the Sub-Advisors to discuss their respective performance and investment processes and strategies. The Board considered each Sub-Advisor’s level of knowledge and investment
Other Items (Unaudited) (Continued)
style. The Board reviewed the experience and credentials of the applicable investment personnel who are responsible for managing the investment of portfolio securities with respect to the Funds. The Board also noted each Sub-Advisor’s brokerage practices.
Sub-Advisor’s Compensation, Profitability and Economies of Scale. The Board also took into consideration the financial condition of each Sub-Advisor and any indirect benefits derived by each Sub-Advisor and its affiliates from the Sub-Advisor’s relationship with the Funds. In considering the profitability to each Sub-Advisor of its relationship with the Funds, the Board noted the undertaking of the Advisor to maintain expense limitations for the Funds and also noted that the sub-advisory fees under the Sub-Advisory Agreements were paid by the Advisor out of the advisory fees that it receives under the Investment Advisory Agreement and in addition, with respect to the unaffiliated Sub-Advisors, are negotiated at arm’s-length. As a consequence, the profitability to each Sub-Advisor of its relationship with a Fund was not a substantial factor in the Board’s deliberations. For similar reasons, the Board did not consider the potential economies of scale in each Sub-Advisor’s management of the applicable Fund to be a substantial factor in its consideration, although the Board noted that, with the exception of the Touchstone Sands Capital Emerging Markets Growth Fund, the sub-advisory fee schedule for all of the Funds contained breakpoints that would reduce the sub-advisory fee rate on assets above specified levels as the applicable Fund’s assets increased.
Sub-Advisory Fees and Performance Information. The Board considered that each Fund pays an advisory fee to the Advisor and that the Advisor pays the sub-advisory fee to the Sub-Advisor out of the advisory fee it receives from the respective Fund. The Board also compared the sub-advisory fees paid by the Advisor to fees charged by the Sub-Advisor to manage comparable institutional separate accounts. The Board considered the amount retained by the Advisor and the sub-advisory fee paid to each Sub-Advisor with respect to the various services provided by the Advisor and the Sub-Advisor. The Board also noted that the Advisor negotiated the sub-advisory fee with each of the unaffiliated Sub-Advisors at arm’s-length. The Board reviewed the sub-advisory fee for each Fund in relation to various comparative data, including the median and average sub-advisory fees of each Fund’s peer group, and considered the following information:
Touchstone Flexible Income Fund. The Fund’s sub-advisory fee was above the median of its peer group. Based upon their review, the Trustees concluded that the Fund’s sub-advisory fee was reasonable in light of the services received by the Fund from the Sub-Advisor and the other factors considered.
Touchstone Focused Fund. The Fund’s sub-advisory fee was above the median of its peer group. Based upon their review, the Trustees concluded that the Fund’s sub-advisory fee was reasonable in light of the services received by the Fund from the Sub-Advisor and the other factors considered.
Touchstone Global ESG Equity Fund. The Fund’s sub-advisory fee was at the median of its peer group. Based upon their review, the Trustees concluded that the Fund’s sub-advisory fee was reasonable in light of the services received by the Fund from the Sub-Advisor and the other factors considered.
Touchstone Growth Opportunities Fund. The Fund’s sub-advisory fee was above the median of its peer group. Based upon their review, the Trustees concluded that the Fund’s sub-advisory fee was reasonable in light of the services received by the Fund from the Sub-Advisor and the other factors considered.
Touchstone Mid Cap Growth Fund. The Fund’s sub-advisory fee was below the median of its peer group. Based upon their review, the Trustees concluded that the Fund’s sub-advisory fee was reasonable in light of the services received by the Fund from the Sub-Advisor and the other factors considered.
Touchstone Sands Capital Emerging Markets Growth Fund. The Fund’s sub-advisory fee was above the median of its peer group. Based upon their review, the Trustees concluded that the Fund’s sub-advisory fee was reasonable in light of the services received by the Fund from the Sub-Advisor and the other factors considered.
As noted above, the Board considered each Fund’s performance during the six-month, twelve-month, and thirty-six-month periods ended September 30, 2021 and as compared to each Fund’s peer group and noted that the Board reviews on a quarterly basis detailed information about each Fund’s performance results, portfolio composition and investment strategies. The Board also noted the Advisor’s expertise and resources in monitoring the performance, investment style and risk-adjusted performance of each Sub-Advisor. The Board also was mindful of the Advisor’s ongoing monitoring of each Sub-Advisor’s performance and the measures undertaken by the Advisor to address any underperformance.
Conclusion. In considering the renewal of the Sub-Advisory Agreement with respect to each Fund, the Board, including the Independent Trustees, did not identify any single factor as controlling, and each Trustee may have attributed different weights to the various factors. The Board reached the following conclusions regarding each Sub-Advisory Agreement, among others: (a) the Sub-Advisor is qualified to manage each Fund’s assets in accordance with the Fund’s investment goals and policies; (b) the Sub-Advisor maintains an appropriate compliance program; (c) the overall performance of each Fund is satisfactory relative to the performance of funds with similar investment objectives and relevant indices; (d) each Fund’s sub-advisory fee is reasonable in light of the services received by the Fund from the Sub-Advisor and the other factors considered; and (e) the Sub-Advisor’s investment
Other Items (Unaudited) (Continued)
strategies are appropriate for pursuing the investment goals of each Fund. Based on its conclusions, the Board determined that approval of the Sub-Advisory Agreement with respect to each Fund was in the best interests of the Fund and its shareholders.
Management of the Trust (Unaudited)
Listed below is required information regarding the Trustees and principal officers of the Trust. The Trust’s Statement of Additional Information includes additional information about the Trustees and is available, without charge, upon request by calling 1.800.543.0407 or by visiting the Touchstone website at TouchstoneInvestments.com.
| Interested Trustees1: |
Name
Address
Year of Birth | Position
Held with
Trust | Term of
Office And
Length of
Time Served | Principal Occupation(s)
During Past 5 Years | Number
of Funds
Overseen
in the
Touchstone
Fund
Complex2 | Other
Directorships
Held During Past 5 Years3 |
Jill T. McGruder
Touchstone Advisors, Inc.
303 Broadway
Suite 1100
Cincinnati, Ohio 45202
Year of Birth: 1955 | Trustee | Until retirement at age 75 or until she resigns or is removed
Trustee since 1999 | President of Touchstone Funds from 1999 to 2020; Director and CEO of IFS Financial Services, Inc. (a holding company) since 1999; and Senior Vice President and Chief Marketing Officer of Western & Southern Financial Group, Inc. (a financial services company) since 2016. | 36 | Director, Integrity Life Insurance Co. and National Integrity Life Insurance Co. since 2005; Director, Touchstone Securities (the Distributor) since 1999; Director, Touchstone Advisors (the Advisor) since 1999; Director, W&S Brokerage Services, Inc. since 1999; Director, W&S Financial Group Distributors, Inc. since 1999; Director, Insurance Profillment Solutions LLC since 2014; Director, Columbus Life Insurance Co. since 2016; Director, The Lafayette Life Insurance Co. since 2016; Director, Gerber Life Insurance Company since 2019; Director, Western & Southern Agency, Inc. since 2018; and Director, LL Global, Inc. (not-for-profit trade organization with operating divisions LIMRA and LOMA) since 2016. |
E. Blake Moore, Jr.
Touchstone Advisors, Inc.
303 Broadway
Suite 1100
Cincinnati, Ohio 45202
Year of Birth: 1958 | President and Trustee | Until retirement at age 75 or until he resigns or is removed
Trustee since 2021 | President, Touchstone Funds since 2021; Chief Executive Officer of Touchstone Advisors, Inc. and Touchstone Securities, Inc. since 2020; President, Foresters Investment Management Company, Inc. from 2018 to 2020; President, North American Asset Management at Foresters Financial from 2018 to 2020; Managing Director, Head of Americas at UBS Asset Management from 2015 to 2017; and Executive Vice President, Head of Distribution at Mackenzie Investments from 2011 to 2014. | 36 | Trustee, College of Wooster since 2008; and Director, UBS Funds from 2015 to 2017. |
| Independent Trustees: |
Karen Carnahan
c/o Touchstone Advisors, Inc.
303 Broadway
Suite 1100
Cincinnati, Ohio 45202
Year of Birth: 1954 | Trustee | Until retirement at age 75 or until she resigns or is removed
Trustee since 2019 | Retired; formerly Chief Operating Officer of Shred-it (a business services company) from 2014 to 2015; formerly President & Chief Operating Officer of the document management division of Cintas Corporation (a business services company) from 2008 to 2014. | 36 | Director, Cintas Corporation since 2019; Director, Boys & Girls Club of West Chester/Liberty since 2016; and Board of Advisors, Best Upon Request from 2020 to 2021. |
William C. Gale
c/o Touchstone Advisors, Inc.
303 Broadway
Suite 1100
Cincinnati, Ohio 45202
Year of Birth: 1952 | Trustee | Until retirement at age 75 or until he resigns or is removed
Trustee since 2013 | Retired; formerly Senior Vice President and Chief Financial Officer of Cintas Corporation (a business services company) from 1995 to 2015. | 36 | None. |
Management of the Trust (Unaudited) (Continued)
| Independent Trustees (Continued): |
Name
Address
Year of Birth | Position
Held with
Trust | Term of
Office And
Length of
Time Served | Principal Occupation(s)
During Past 5 Years | Number
of Funds
Overseen
in the
Touchstone
Fund
Complex2
(Continued) | Other
Directorships
Held During Past 5 Years3 |
Susan J. Hickenlooper, CFA(4)
c/o Touchstone Advisors, Inc.
303 Broadway
Suite 1100
Cincinnati, Ohio 45202
Year of Birth: 1946 | Trustee | Until retirement at age 75 or until she resigns or is removed
Trustee since 2009 | Retired from investment management. | 36 | Trustee, Episcopal Diocese of Southern Ohio from 2014 to 2018. |
Susan M. King
c/o Touchstone Advisors, Inc.
303 Broadway
Suite 1100
Cincinnati, Ohio 45202
Year of Birth: 1963 | Trustee | Until retirement at age 75 or until she resigns or is removed
Trustee since 2021 | Formerly, Partner of ID Fund LLC (2020 to 2021); formerly, Senior Vice President, Head of Product and Marketing Strategy of Foresters Financial (2018 to 2020); formerly, Managing Director, Head of Sales Strategy and Marketing, Americas of UBS Asset Management (2015 to 2017); formerly, Director, Allianz Funds, Allianz Funds Multi-Strategy Trust and AllianzGI Institutional Multi-Series Trust (2014 to 2015); and formerly, Director, Alliance Capital Cash Management Offshore Funds (2003 to 2005). | 36 | Trustee, Claremont McKenna College since 2017; Trustee, Israel Cancer Research Fund since 2019; and Board Member of WHAM! (Women's Health Access Matters) since 2021. |
Kevin A. Robie
c/o Touchstone Advisors, Inc.
303 Broadway
Suite 1100
Cincinnati, Ohio 45202
Year of Birth: 1956 | Trustee | Until retirement at age 75 or until he resigns or is removed
Trustee since 2013 | Retired; formerly Vice President of Portfolio Management at Soin LLC (private multinational holding company and family office) from 2004 to 2020. | 36 | Director, SaverSystems, Inc. since 2015; Director, Buckeye EcoCare, Inc. from 2013 to 2018; Director, Turner Property Services Group, Inc. since 2017; Trustee, Dayton Region New Market Fund, LLC (private fund) since 2010; and Trustee, Entrepreneurs Center, Inc. (business incubator) since 2006. |
William H. Zimmer III
c/o Touchstone Advisors, Inc.
303 Broadway
Suite 1100
Cincinnati, Ohio 45202
Year of Birth: 1953 | Trustee | Until retirement at age 75 or until he resigns or is removed
Trustee since 2019 | Independent Treasury Consultant since 2014. | 36 | Director, Deaconess Associations, Inc. (healthcare) since 2001; Trustee, Huntington Funds (mutual funds) from 2006 to 2015; and Director, National Association of Corporate Treasurers from 2011 to 2015. |
1 Ms. McGruder, as a director of the Advisor and the Distributor, and an officer of affiliates of the Advisor and the Distributor, is an “interested person” of the Trust within the meaning of Section 2(a)(19) of the 1940 Act. Mr. Moore, as an officer of the Advisor and the Distributor, is an “interested person” of the Trust within the meaning of Section 2(a)(19) of the 1940 Act.
2 As of March 31, 2022, the Touchstone Fund Complex consisted of 19 series of the Trust, 13 series of Touchstone Funds Group Trust and 4 variable annuity series of Touchstone Variable Series Trust.
3 Each Trustee is also a Trustee of Touchstone Funds Group Trust and Touchstone Variable Series Trust.
4 Upon the recommendation of the Governance Committee, the Board extended the mandatory retirement age for Ms. Hickenlooper for a one-year period to allow her to remain a Trustee of the Trust through December 31, 2022.
Management of the Trust (Unaudited) (Continued)
| Principal Officers: |
Name
Address
Year of Birth | Position(s)
Held with
Trust1 | Term of
Office And
Length of
Time Served | Principal Occupation(s)
During Past 5 Years |
E. Blake Moore, Jr.
Touchstone Advisors, Inc.
303 Broadway
Suite 1100
Cincinnati, Ohio 45202
Year of Birth: 1958 | President and Trustee | Until resignation, removal or disqualification
President since January 2021 | See biography above. |
Timothy D. Paulin
Touchstone Advisors, Inc.
303 Broadway
Suite 1100
Cincinnati, Ohio 45202
Year of Birth: 1963 | Vice President | Until resignation, removal or disqualification
Vice President since 2010 | Senior Vice President of Investment Research and Product Management of Touchstone Advisors, Inc. |
Timothy S. Stearns
Touchstone Advisors, Inc.
303 Broadway
Suite 1100
Cincinnati, Ohio 45202
Year of Birth: 1963 | Chief Compliance Officer | Until resignation, removal or disqualification
Chief Compliance Officer since 2013 | Chief Compliance Officer of Touchstone Advisors, Inc. |
Terrie A. Wiedenheft
Touchstone Advisors, Inc.
303 Broadway
Suite 1100
Cincinnati, Ohio 45202
Year of Birth: 1962 | Controller and Treasurer | Until resignation, removal or disqualification
Controller and Treasurer since 2006 | Senior Vice President, Chief Financial Officer and Chief Operations Officer, of IFS Financial Services, Inc. (a holding company) and Senior Vice President and Chief Administration Officer within the Office of the Chief Marketing Officer of Western & Southern Financial Group (2021 to Present). |
Meredyth A. Whitford-Schultz
Western & Southern
Financial Group
400 Broadway
Cincinnati, Ohio 45202
Year of Birth: 1981 | Secretary | Until resignation, removal or disqualification
Secretary since 2018 | Senior Counsel - Securities/Mutual Funds of Western & Southern Financial Group (2015 to present); Associate at Morgan Lewis & Bockius LLP (law firm) (2014 to 2015); Associate at Bingham McCutchen LLP (law firm) (2008 to 2014). |
(1)Each officer also holds the same office with Touchstone Funds Group Trust and Touchstone Variable Series Trust.
This page intentionally left blank.
PRIVACY PROTECTION POLICY
We Respect Your Privacy
Thank you for your decision to invest with us. Touchstone and its affiliates have always placed a high value on the trust and confidence our clients place in us. We believe that confidence must be earned and validated through time. In today’s world, when technology allows the sharing of information at light speeds, trust must be reinforced by our sincere pledge to take the steps necessary to ensure that the information you share with us is treated with respect and confidentiality.
Our Pledge to Our Clients
• We collect only the information we need to service your account and administer our business.
• We are committed to keeping your information confidential and we place strict limits and controls on the use and sharing of your information.
• We make every effort to ensure the accuracy of your information.
We Collect the Following Nonpublic Personal Information About You:
• Information we receive from you on or in applications or other forms, correspondence, or conversations, including, but not limited to, your name, address, phone number, social security number, assets, income and date of birth; and
• Information about your transactions with us, our affiliates, or others, including, but not limited to, your account number and balance, payment history, parties to transactions, cost basis information, and other financial information.
Categories of Information We Disclose and Parties to Whom We Disclose
We do not disclose any nonpublic personal information about our current or former clients to nonaffiliated third parties, except as required or permitted by law.
We Place Strict Limits and Controls on the Use and Sharing of Your Information
• We restrict access to nonpublic personal information about you to authorized employees who need the information to administer your business.
• We maintain physical, electronic and procedural safeguards that comply with federal standards to protect this information.
• We do not disclose any nonpublic personal information about our current or former clients to anyone, except as required or permitted by law or as described in this document.
• We will not sell your personal information to anyone.
We May Provide Information to Service Your Account
Sometimes it is necessary to provide information about you to various companies such as transfer agents, custodians, broker-dealers and marketing service firms to facilitate the servicing of your account. These organizations have a legitimate business need to see some of your personal information in order for us to provide service to you. We may disclose to these various companies the information that we collect as described above. We require that these companies, including our own subsidiaries and affiliates, strictly maintain the confidentiality of this information and abide by all applicable laws. Companies within our corporate family that may receive this information are financial service providers and insurance companies. We do not permit these associated companies to sell the information for their own purposes, and we never sell our customer information.
This policy is applicable to the following affiliated companies: Touchstone Funds Group Trust, Touchstone Strategic Trust, Touchstone Variable Series Trust, Touchstone Securities, Inc.,* and W&S Brokerage Services, Inc.
*Touchstone Securities, Inc. serves as the underwriter to the Touchstone Funds.
A Member of Western & Southern Financial Group®
The Privacy Protection Policy is not part of the Annual Report.
Touchstone Investments
Distributor
Touchstone Securities, Inc.*
303 Broadway
Cincinnati, Ohio 45202-4203
800.638.8194
www.touchstoneinvestments.com
Investment Advisor
Touchstone Advisors, Inc.*
303 Broadway
Cincinnati, Ohio 45202-4203
Transfer Agent
BNY Mellon Investment Servicing (US) Inc.
4400 Computer Drive
Westborough, Massachusetts 01581
Shareholder Service
800.543.0407
* A Member of Western & Southern Financial Group
Item 2. Code of Ethics.
| (a) | The registrant, as of the end of the period covered by this report, has adopted a code of ethics that applies to the registrant’s principal executive officer, principal financial officer, principal accounting officer or controller, or persons performing similar functions, regardless of whether these individuals are employed by the registrant or a third party. |
| (c) | There have been no amendments, during the period covered by this report, to a provision of the code of ethics that applies to the registrant’s principal executive officer, principal financial officer, principal accounting officer or controller, or persons performing similar functions, regardless of whether these individuals are employed by the registrant or a third party, and that relates to any element of the code of ethics description. |
| (d) | The registrant has not granted any waivers, including an implicit waiver, from a provision of the code of ethics that applies to the registrant’s principal executive officer, principal financial officer, principal accounting officer or controller, or persons performing similar functions, regardless of whether these individuals are employed by the registrant or a third party, that relates to one or more of the items set forth in paragraph (b) of this item’s instructions. |
| (f) | A copy of the code of ethics is attached hereto as Exhibit 13(a)(1). |
Item 3. Audit Committee Financial Expert.
The registrant’s Board of Trustees has determined that the registrant has at least one audit committee financial expert serving on its audit committee. Ms. Karen Carnahan is the registrant’s audit committee financial expert and is an independent trustee within the meaning of the Investment Company Act of 1940, as amended (the “1940 Act”).
Item 4. Principal Accountant Fees and Services.
Audit Fees
| (a) | Audit fees for Touchstone Strategic Trust (March Funds) totaled $141,100 and $117,600 for the fiscal years ended March 31, 2022 and March 31, 2021, respectively, including fees associated with the annual audits and filings of Form N-1A and Form N-CEN. |
Audit-Related Fees
| (b) | The aggregate fees billed in each of the last two fiscal years for assurance and related services by the principal accountant that are reasonably related to the performance of the audit of the registrant's financial statements and are not reported under paragraph (a) of this Item are $6,800 and $5,500 for the fiscal years ended March 31, 2022 and March 31, 2021, respectively. The fees for 2022 relate to the review of Form N-1A filings and the fees for 2021 relate to additional fees for valuation procedures. |
Tax Fees
| (c) | The aggregate fees billed in each of the last two fiscal years for professional services rendered by the principal accountant for tax compliance, tax advice, and tax planning were $78,690 and $39,555 for the fiscal years ended March 31, 2022 and March 31, 2021, respectively. The fees relate to the preparation of federal income and excise tax returns, review of capital gains distribution calculations and tax agent services. |
All Other Fees
| (d) | The aggregate fees billed in each of the last two fiscal years for products and services provided by the principal accountant, other than the services reported in paragraphs (a) through (c) of this Item are $38,186 and $18,354 for the fiscal years ended March 31, 2022 and March 31, 2021, respectively. The fees relate to tax research and the PFIC analyzer and Global Withholding Tax Reporter subscriptions. |
| (e)(1) | Disclose the audit committee's pre-approval policies and procedures described in paragraph (c)(7) of Rule 2-01 of Regulation S-X. |
The Audit Committee’s pre-approval policies describe the types of audit, audit-related, tax and other services that have the general pre-approval of the Audit Committee. The pre-approval policies provide that annual audit service fees, tax services not specifically granted pre-approval, services exceeding pre-approved cost levels and other services that have not received general pre-approval will be subject to specific pre-approval by the Audit Committee. The pre-approval policies further provide that the Committee may grant general pre-approval to other audit services (statutory audits and services associated with SEC registration statements, periodic reports and other documents filed with the SEC or other documents issued in connection with securities offerings), audit-related services (accounting consultations related to accounting, financial reporting or disclosure matters not classified as “audit services,” assistance with understanding and implementing new accounting and financial reporting guidance from rulemaking authorities, agreed-upon or expanded audit procedures related to accounting and/or billing records required to respond to or comply with financial, accounting or regulatory reporting matters and assistance with internal control reporting requirements under Form N-CSR), tax services that have historically been provided by the auditor that the Committee believes would not impair the independence of the auditor and are consistent with the SEC’s rules on auditor independence and permissible non-audit services classified as “all other services” that are routine and recurring services.
| (e)(2) | All of the services described in paragraphs (b) through (d) of Item 4 were approved by the Audit Committee. |
| (f) | The percentage of hours expended on the principal accountant's engagement to audit the registrant's financial statements for the most recent fiscal year that were attributed to work performed by persons other than the principal accountant's full-time, permanent employees was less than fifty percent. |
| (g) | The aggregate non-audit fees for Touchstone Strategic Trust (March Funds) and certain entities*, totaled approximately $568,578 and $719,238 for the fiscal years ended March 31, 2022 and March 31, 2021, respectively. |
* These include the advisors (excluding non-affiliated sub-advisors) and any entity controlling, controlled by or under common control with the advisors that provides ongoing services to the registrant (Funds).
| (h) | The registrant's audit committee of the Board of Trustees has considered whether the provision of non-audit services that were rendered to the registrant's investment adviser (not including any sub-adviser whose role is primarily portfolio management and is subcontracted with or overseen by another investment adviser), and any entity controlling, controlled by, or under common control with the investment adviser that provides ongoing services to the registrant that were not pre-approved pursuant to paragraph (c)(7)(ii) of Rule 2-01 of Regulation S-X is compatible with maintaining the principal accountant's independence. |
(i) Not applicable.
(j) Not applicable.
Item 5. Audit Committee of Listed Registrants.
Not applicable.
Item 6. Investments.
| (a) | Schedule of Investments in securities of unaffiliated issuers as of the close of the reporting period is included as part of the report to shareholders filed under Item 1(a) of this form. |
Item 7. Disclosure of Proxy Voting Policies and Procedures for Closed-End Management Investment Companies.
Not applicable.
Item 8. Portfolio Managers of Closed-End Management Investment Companies.
Not applicable.
Item 9. Purchases of Equity Securities by Closed-End Management Investment Company and Affiliated Purchasers.
Not applicable.
Item 10. Submission of Matters to a Vote of Security Holders.
There have been no material changes to the procedures by which the shareholders may recommend nominees to the registrant’s board of trustees, where those changes were implemented after the registrant last provided disclosure in response to the requirements of Item 407(c)(2)(iv) of Regulation S-K (17 CFR 229.407) (as required by Item 22(b)(15) of Schedule 14A (17 CFR 240.14a-101)), or this Item.
Item 11. Controls and Procedures.
| (a) | The registrant’s principal executive and principal financial officers, or persons performing similar functions, have concluded that the registrant’s disclosure controls and procedures (as defined in Rule 30a-3(c) under the Investment Company Act of 1940, as amended (the “1940 Act”) (17 CFR 270.30a-3(c))) are effective, as of a date within 90 days of the filing date of the report that includes the disclosure required by this paragraph, based on their evaluation of these controls and procedures required by Rule 30a-3(b) under the 1940 Act (17 CFR 270.30a-3(b)) and Rules 13a-15(b) or 15d-15(b) under the Securities Exchange Act of 1934, as amended (17 CFR 240.13a-15(b) or 240.15d-15(b)). |
| (b) | There were no changes in the registrant’s internal control over financial reporting (as defined in Rule 30a-3(d) under the 1940 Act (17 CFR 270.30a-3(d))) that occurred during the period covered by this report that has materially affected, or is reasonably likely to materially affect, the registrant’s internal control over financial reporting. |
Item 12. Disclosure of Securities Lending Activities for Closed-End Management Investment Companies.
Not applicable.
Item 13. Exhibits.
SIGNATURES
Pursuant to the requirements of the Securities Exchange Act of 1934 and the Investment Company Act of 1940, the registrant has duly caused this report to be signed on its behalf by the undersigned, thereunto duly authorized.
(Registrant) Touchstone Strategic Trust
| By (Signature and Title)* | /s/ E. Blake Moore, Jr. | |
| | E. Blake Moore, Jr., President | |
| | (principal executive officer) | |
Pursuant to the requirements of the Securities Exchange Act of 1934 and the Investment Company Act of 1940, this report has been signed below by the following persons on behalf of the registrant and in the capacities and on the dates indicated.
| By (Signature and Title)* | /s/ E. Blake Moore, Jr. | |
| | E. Blake Moore, Jr., President | |
| | (principal executive officer) | |
| By (Signature and Title)* | /s/ Terrie A. Wiedenheft | |
| | Terrie A. Wiedenheft, Controller and Treasurer | |
| | (principal financial officer) | |
* Print the name and title of each signing officer under his or her signature.