UNITED STATES
SECURITIES AND EXCHANGE COMMISSION
Washington, D.C. 20549
FORM N-CSR
CERTIFIED SHAREHOLDER REPORT OF REGISTERED MANAGEMENT INVESTMENT COMPANIES
Investment Company Act file number 811-03651
Touchstone Strategic Trust – June Funds
(Exact name of registrant as specified in charter)
303 Broadway, Suite 1100
Cincinnati, Ohio 45202-4203
(Address of principal executive offices) (Zip code)
E. Blake Moore, Jr.
303 Broadway, Suite 1100
Cincinnati, Ohio 45202-4203
(Name and address of agent for service)
Registrant's telephone number, including area code: 800-638-8194
Date of fiscal year end: June 30
Date of reporting period: June 30, 2022
Form N-CSR is to be used by management investment companies to file reports with the Commission not later than 10 days after the transmission to stockholders of any report that is required to be transmitted to stockholders under Rule 30e-1 under the Investment Company Act of 1940 (17 CFR 270.30e-1). The Commission may use the information provided on Form N-CSR in its regulatory, disclosure review, inspection, and policymaking roles.
A registrant is required to disclose the information specified by Form N-CSR, and the Commission will make this information public. A registrant is not required to respond to the collection of information contained in Form N-CSR unless the Form displays a currently valid Office of Management and Budget ("OMB") control number. Please direct comments concerning the accuracy of the information collection burden estimate and any suggestions for reducing the burden to Secretary, Securities and Exchange Commission, 450 Fifth Street, NW, Washington, DC 20549-0609. The OMB has reviewed this collection of information under the clearance requirements of 44 U.S.C. § 3507.
Item 1. Reports to Stockholders.
| (a) | The Report to Shareholders is attached herewith. |
| Touchstone Strategic Trust |
| Touchstone Balanced Fund |
Touchstone Core Municipal Bond Fund
(formerly Touchstone Ohio Tax-Free Bond Fund) |
| Touchstone International Equity Fund |
| Touchstone International Growth Fund |
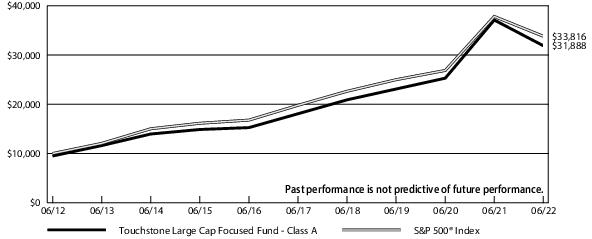
| Touchstone Large Cap Focused Fund |
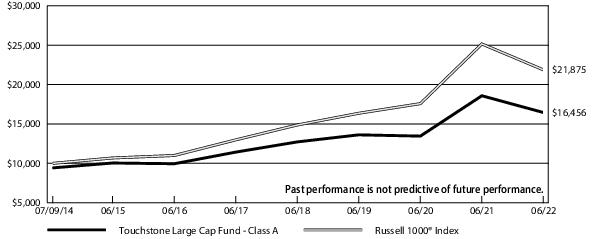
| Touchstone Large Cap Fund |
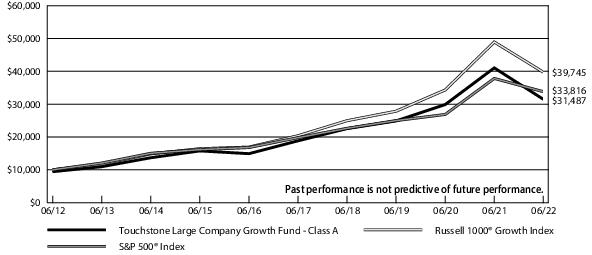
| Touchstone Large Company Growth Fund |
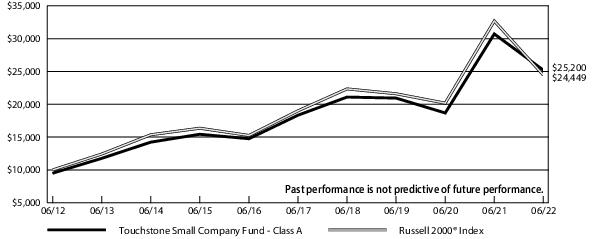
| Touchstone Small Company Fund |
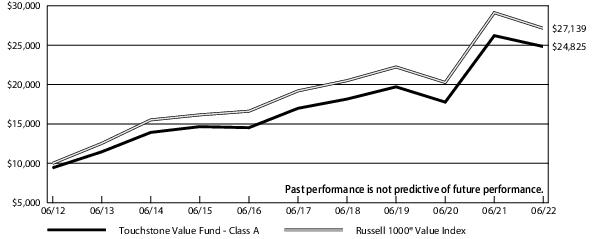
| Touchstone Value Fund |
This report identifies the Funds' investments on June 30, 2022. These holdings are subject to change. Not all investments in each Fund performed the same, nor is there any guarantee that these investments will perform as well in the future. Market forecasts provided in this report may not occur.
Letter from the President
Dear Shareholder:
We are pleased to provide you with the Touchstone Strategic Trust Annual Report. Inside you will find key financial information, as well as manager commentaries for the Funds, for the twelve months ended June 30, 2022.
Since the middle of 2021, investor sentiment has progressively moved negative given rising inflationary pressures, higher commodity costs, supply chain challenges, Russia’s surprising invasion of Ukraine and U.S. Federal Open Market Committee (FOMC or Fed) actions regarding rate increases. By the end of the 12-month period, in the spring of 2022, the impact of the Ukrainian invasion was priced into the market and investor concern had shifted back to Fed rate policy and the potential for an economic recession either in the 2nd half of this year or 2023. These recessionary concerns were exacerbated by negative growth in U.S. gross domestic product (GDP) reported for Q1 2022 and inflationary pressures which continued throughout the first half of 2022. The change in the Consumer Price Index (CPI) remained above 8 percent annualized with some consumer staples such as food and fuel registering in the double digit levels of inflationary growth. Outside the U.S., inflationary issues persisted as well, primarily in the developed markets of Western Europe as Germany, Italy and France felt the impact of supply chain challenges and slowing natural gas and oil imports from Russia following their invasion of Ukraine. Faced with inflationary pressures, the Fed raised the overnight Federal Funds Rate a significant level, up by 1.5 percent (150 basis points) over the first half of 2022, their first rate hike since 2018. The U.S. dollar strengthened as rising interest rates in the U.S. created an attractive proposition for foreign investors to earn a positive interest return compared to near zero or negative rates abroad. Broadly, both developing and developed markets were impacted by the strong U.S. dollar.
Given the aforementioned macroeconomic backdrop during 12-month period, geopolitical concerns and diminishing expectations for the Fed’s ability to achieve a “soft landing”, it is not surprising that equity markets posted negative returns. The S&P 500 Index was down -10.6 percent during the 12-month period and moved into Bear Market territory by declining over 20 percent from its January 2022 peak to the end of June 2022. Expectedly, more defensive sectors such as Health Care, Utilities, and Consumer Staples performed relatively better than growth-leaning sectors such as Information Technology, Communication Services and Consumer Discretionary. The Energy sector was a standout performer, benefitting from the aforementioned inflationary environment and rising oil and natural gas prices. Larger capitalization stocks and value-oriented stocks outperformed smaller and middle capitalization stocks and growth style stocks. This would be expected given current recessionary concerns, and that smaller and middle capitalization companies tending to be more sensitive to domestic economic conditions as opposed to their more economically diverse large capitalization brethren. Outside the U.S., equity markets fared worse, materially impacted by the strong dollar headwind. Developed markets, measured by the MSCI EAFE Index declined -17.8 percent. Developed markets such as France, Germany, Switzerland and Japan led the MSCI EAFE Index’s decline as well as the non-Energy cyclical and growth-oriented sectors as witnessed in the U.S. equity market. Similarly, the emerging markets, measured by the MSCI Emerging Markets Index was down -8.1 percent on a local currency basis, also outperforming the U.S. equity markets but down -11.5 percent on a U.S. dollar basis. Cyclical sectors led the overall emerging markets’ index decline. Countries such as Taiwan, South Korea and India declined the most.
During the 12-month period, the U.S. fixed income markets priced in the persistent inflation and anticipated aggressive Fed rate moves. The Treasury yield curve experienced an increase across all relevant maturities but saw the largest increase in the six month to five year portion of the curve. These moves in yield represented a headwind for the investment grade universe, reflected in a Bloomberg U.S. Aggregate Bond Index (Agg) decline of -10.3 percent. The Bloomberg Municipal Bond Index declined -8.6 percent as municipal bonds were also impacted by the rising yield curve. In the U.S. credit markets, the looming concerns of inflation and higher future financing rates weighed on the corporate debt space as both investment grade and non-investment grade corporate bond spreads widened out. The ICE Bank of America U.S. Cash Pay Index, a measure of non-investment grade corporate bonds, declined -12.6 percent as a result of widening spreads. The leverage loan market also experienced a sell-off during the quarter, but were more defensive than the high yield bond market as rates increased and leveraged loans are priced at floating interest rates rather than fixed interest rates. The Credit Suisse Leveraged Loan Index declined -2.3 percent.
Letter from the President (continued)
Markets such as these reaffirm our belief in the importance of the steady hands of financial professionals, trust in your investment strategy, and the risks of trying to time the market. Additionally, we believe that environments that are more volatile create more opportunity for active managers to add value, especially those that are Distinctively Active. We greatly value your continued support. Thank you for including Touchstone as part of your investment plan.
Sincerely,
E. Blake Moore Jr.
President
Touchstone Strategic Trust
Management's Discussion of Fund Performance (Unaudited)
Touchstone Balanced Fund
Sub-Advised by Fort Washington Investment Advisors, Inc.
Investment Philosophy
The Touchstone Balanced Fund (the “Fund”) seeks to achieve its investment goal of providing investors with capital appreciation and current income by generally investing in a diversified portfolio comprising 60% equity securities and 40 % fixed-income securities.
With respect to equities, the Fund invests primarily in issuers having a market capitalization, at the time of purchase, above $5 billion. Equity securities include common stock and preferred stock. With respect to fixed-income, the Fund will invest primarily in bonds, including mortgage-related securities, asset-backed securities, government securities (both U.S. government securities and foreign sovereign debt), and corporate debt securities.
Fund Performance
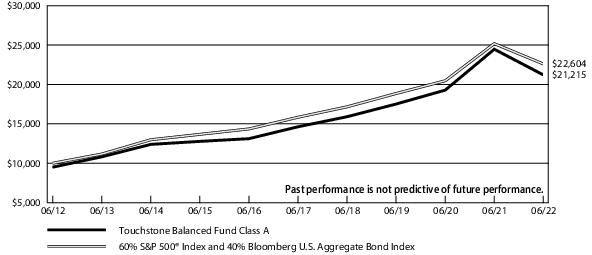
The Touchstone Balanced Fund (Class A Shares) underperformed its blended benchmark, 60% of the S&P 500® Index and 40% of the Bloomberg U.S. Aggregate Bond Index, for the 12-month period ended June 30, 2022. The Fund’s total return was -13.32% (calculated excluding the maximum sales charge) while the total return of the blended benchmark was -10.24%.
Market Environment
The market environment over the last 12 months has been full of uncertainty and volatility. 2021 saw a broad reopening of the economy from lockdowns stemming from the COVID-19 global pandemic. This coincided with an improving labor market that saw unemployment reach 3.9% by the end of 2021, despite starting the year at 6.7%. Markets performed exceptionally well during the period as economic growth returned to pre-pandemic levels and financial conditions remained extremely accommodative. Despite progress made through highly effective vaccines to combat COVID-19, several COVID-19 variants emerged throughout the year causing setbacks to the global economic rebound. The first problematic variant, Delta, led to a broad disruption in supply chains across the economy during a period of heightened demand. These supply chain concerns weighed on financial markets while also putting continued upward pressure on inflation. As Delta subsided, the highly contagious Omicron variant spread rapidly across the world. Markets quickly turned volatile as cases spiked, but the severity of the variant was less than expected, and markets rallied into year end.
The first quarter of 2022 saw the fading of pandemic-related economic growth concerns, but persistently high inflation continued to shape the outlook for monetary policy and subsequent risks to the economy and risk assets. Additionally, the Russian invasion of Ukraine introduced a number of short- and long-term concerns, ranging from the direct impact of higher commodity prices to the geopolitical implications of ongoing military conflict, sanctions, and humanitarian concerns.
The second quarter of 2022 was characterized by a continuation of several themes from the prior quarter. Bond yields moved higher as inflation remained too high and persistent. This led to the U.S. Federal Reserve Board (“Fed”) accelerating interest rate increases and drove market expectations for the Fed Funds rate in mid-2023 to 3.50-3.75%. Risk assets underperformed as these Fed expectations fueled concern that the Fed may have to risk causing a recession to control inflation.
U.S. economic growth (as measured by gross domestic product) in the first quarter of 2022 was -1.6%, but the details of the data did not indicate broad economic weakness. Inventory and trade were the primary detractors of growth and were perceived as unlikely to be repeated in subsequent quarters. Consumer and business demand was solid, indicating a healthy pace of underlying growth. Consumers were in a very good position to weather a drag from Fed tightening, as monthly job gains and incomes remained supportive. Across a broad array of indicators, the labor market was in exceptionally strong condition and consumers were confident in their ability to easily find and/or switch jobs. These robust labor market conditions led to above average wage growth across the spectrum. We believe that this bodes well for consumer income and spending, but the strength was also a source of unease for policymakers who were focused on the potential impact of inflation. Inflation dampened the mood of consumers as the prices of many essential items continued to climb in the quarter, leading to concern that spending on discretionary items would suffer as consumers have to spend more of their income on essential items.
Business spending has been a consistently solid contributor to the economy in spite of a number of challenges. Rising costs, delays/availability of input materials, and continued labor shortages have limited growth, but businesses have proven resilient. Moving into the second half of 2022, business spending is subject to downside risks to growth from the ongoing war in Ukraine, China economic slowing, and tighter financial conditions.
Inflation data, and the response from the Fed, remains the primary focus of markets. Inflation reported in second quarter of 2022 indicated broad-based strength, dampening hopes that inflation would decisively move lower into the second half of the year.
Management's Discussion of Fund Performance (Unaudited) (Continued)
This data, along with indications that higher inflation is becoming embedded in consumer expectations, led the Fed to respond aggressively. A 0.50% increase in May was followed by a 0.75% increase in June. Market expectations are for the Fed to raise interest rates a further 2.00% to nearly 3.50% at year-end. Recent Fed communications have solidified its commitment to reducing inflation closer to the 2% target, even if the ultimate impact induces a recession.
Interest rates increased materially over the last year to reflect persistently higher inflation and more aggressive Fed tightening. The 10 Year Treasury yield ended the period at 3.02% compared to 1.47% a year ago. Current market expectations are for the Fed to end the tightening cycle in mid-2023 and begin to lower rates later that year. This indicates increasing concern that the sharp rise in the Fed Funds rate will materially restrain economic growth over the next several quarters. Toward the end of the second quarter, interest rates declined from the highest levels as economic data softened. If growth continues to moderate and inflation softens over the next several months, we believe interest rates have likely peaked for 2022.
Risk assets underperformed over the last year amid increasing concern over Fed tightening and the impact on future growth. Credit spreads across sectors and quality ranges widened, with many sectors ending the second quarter at the widest levels of the past year. We believe the foundation of strong consumers and businesses allow the economy to withstand tighter Fed policy, increasing the chances that a decline in economic activity will be shallow and not result in significant weakness.
Portfolio Review
Allocation between equities and fixed income was a neutral impact to relative performance during the period as equities and fixed income were both down during the period. Security selection detracted from relative performance, due to underperformance within fixed income and equities.
The fixed income component of the Fund trailed its benchmark due to its overweight to credit sectors such as Emerging Markets Debt and Investment Grade Credit. These sectors underperformed as credit spreads widened as risks increased throughout the period. The equity portfolio trailed during the period, due to both security selection and sector allocation. Sector allocation detracted from returns within equities due to the Fund’s overweight to Communication Services, the worst performing sector within the benchmark. Security selection within Communication Services and Consumer Discretionary also detracted from returns. This was offset partially by strong selection within Health Care and Industrials. Positions in Bristol-Myers Squibb Company, UnitedHealth Group (both Health Care sector), Raytheon Technologies Corp. (Industrials sector), and Schlumberger Limited (Energy sector) were the top contributors to attribution, while overweight exposures to Meta Platforms Inc., Netflix Inc. (both Communication Services sector), and Alibaba Group Holdings Ltd. (Consumer Discretionary sector) detracted from returns.
Duration did not have a material impact to relative returns compared to the benchmark during the period. Despite periods of tactical duration positioning compared to the benchmark, the overall relative performance impact was negligible. Similar to duration, yield curve positioning did not have a material impact on performance during the 12-month period.
Outlook and Conclusion
The Fund is overweight credit spread risk because in our view the U.S. economy can withstand expected Fed tightening, largely supported by a healthy consumer, with any decline in activity likely to be shallow, and valuations that are generally compelling and above the 60th percentile relative to history. Risks are squarely focused on the evolution of inflation and the resulting reaction from the Fed. While there are signs that the economy is slowing, inflation data has yet to take a decisive turn lower. The Fed is aggressively raising rates to combat inflation and is unlikely to change posture until it sees a string of data that confirms inflation is heading back towards 2%. The effects of tighter monetary policy represent the biggest risk to growth, but we believe the underlying foundation is solid and there is a path to a soft landing for growth. As our view of the economy and monetary policy changes and as risks evolve, we will adjust positioning.
We believe valuations have adjusted appropriately given the macro environment and potential risks. If conditions improve, the Fund is positioned well to benefit. If volatility continues and economic growth deteriorates further, the Fund’s fixed income allocation is positioned to add opportunistically if risk assets experience weakness. Additionally, we believe positive fixed income security selection can benefit in many different market environments. Within equities, the Fund remains overweight Communication Services and Health Care. The largest underweights are Utilities, Consumer Staples, and Consumer Discretionary.
Management's Discussion of Fund Performance (Unaudited) (Continued)
Comparison of the Change in Value of a $10,000 Investment in the Touchstone Balanced Fund - Class A* and the 60% S&P 500® Index and 40% Bloomberg U.S. Aggregate Bond Index
| Average Annual Total Returns** |
| Touchstone Balanced Fund | 1 Year | 5 Years | 10 Years |
| Class A | -17.64% | 6.61% | 7.81% |
| Class C | -14.81% | 6.90% | 7.70% |
| Class Y | -13.13% | 7.93% | 8.60% |
| Class R6* | -13.12% | 7.77% | 8.39% |
| 60% S&P 500® Index and 40% Bloomberg U.S. Aggregate Bond Index | -10.24% | 7.37% | 8.50% |
| * | The chart above represents performance of Class A shares only, which will vary from the performance of Class C shares, Class Y shares and Class R6 shares based on the differences in sales loads and fees paid by shareholders in the different classes. The inception date of Class R6 shares was October 28, 2021. Class R6 shares performance information was calculated using the historical performance of Class A shares for the period prior to October 28, 2021. The returns have been restated for sales loads and fees applicable to Class R6 shares. |
| ** | The average annual total returns shown above are adjusted for maximum sales loads and fees, if applicable. The maximum offering price per share of Class A shares is equal to the net asset value (“NAV”) per share plus a sales load equal to 5.26% of the NAV (or 5.00% of the offering price). Class C shares are subject to a contingent deferred sales charge (“CDSC”) of 1.00%. The CDSC will be assessed on an amount equal to the lesser of (1) the NAV at the time of purchase of the shares being redeemed or (2) the NAV of such shares being redeemed, if redeemed within a one-year period from the date of purchase. Class Y shares and Class R6 shares are not subject to sales charges. |
The performance of the above Fund does not reflect the deduction of taxes that a shareholder would pay on Fund distributions or the redemption of Fund shares.
Notes to Chart
S&P 500® Index is a group of 500 widely held stocks and is commonly regarded to be representative of the large capitalization stock universe.
Bloomberg U.S. Aggregate Bond Index is an unmanaged index comprised of U.S. investment grade, fixed rate bond market securities, including government, government agency, corporate and mortgage-backed securities between one and ten years.
Management's Discussion of Fund Performance (Unaudited)
Touchstone Core Municipal Bond Fund
Sub-Advised by Sage Advisory Services, Ltd. Co.
Investment Philosophy
The Touchstone Core Municipal Bond Fund (the “Fund”) seeks a high level of current income exempt from federal income taxes, consistent with the protection of capital by investing primarily in high-quality, municipal debt issued by U.S. states and their subdivisions, authorities, instrumentalities and corporations, as well as obligations issued by U.S. territories.
Fund Performance
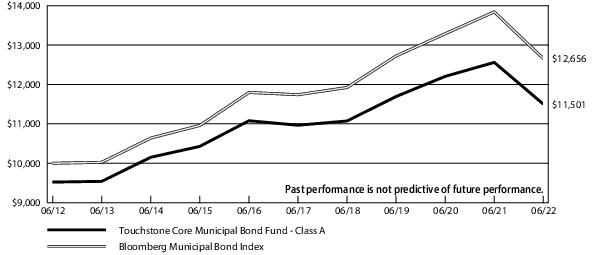
The Touchstone Core Municipal Bond Fund (Class A Shares) outperformed its benchmark, the Bloomberg Municipal Bond Index, for the 12-month period ended June 30, 2022. The Fund’s total return was -8.43% (calculated excluding the maximum sales charge) while the total return of the benchmark was -8.57%.
Market Environment
Relative to the calm first half of the 12-month period ended June 30, 2022, the second half of the period will go down as a historically significant period for all the wrong reasons. Inflation levels and rate moves not seen in decades combined with a war and related supply shocks led to a rare mix of deep negative returns in both equities and fixed income. Unfortunately for investors, surging inflation after several years of excess liquidity and stimulus forced markets though a rapid and painful shift. The result was global equities repricing lower by 20% and broad investment grade bonds down 10% in the second half of the period. To put the carnage into perspective, this was the worst string of quarters for equities since the back half of 2008 and worst back-to-back quarters for bonds since the fourth quarter of 1979/first quarter of 1980.
Heading into 2022, consensus centered around a gradual slowdown in growth but a strong first half of the reporting period, as the effects of COVID Omicron faded, and easing supply chains weakened inflationary pressures. The first wrench to this outlook was persistently high inflation, which prompted the U.S. Federal Reserve Board (“Fed”) to shift to a more aggressive plan, and the second was the tragic invasion of Ukraine. This changed the alchemy of crafting an outlook, as growth downgrades, a dramatic repricing of rates, and geopolitical risks took center stage.
Broad fixed income had a modestly better second quarter in 2022 than the first though both saw mid-single digit percentage declines. Yields moved significantly higher across the curve and the curve flattened in anticipation of aggressive policy. Investment grade and high yield credit spreads also widened in the first half of 2022, creating one of the worst fixed income backdrops in decades with negative returns across all sectors. Longer duration segments saw the deepest negative returns, with longer duration Treasuries and credit experiencing double-digit drawdowns. During the second quarter of 2022, this dynamic shifted with yields more range-bound over the last couple of months and spread widening accelerating on a more pessimistic economic outlook. This led to credit and higher-risk fixed income underperforming in the second quarter of 2022.
The municipal market experienced a complete reversal as record investor inflows during 2021 turned abruptly into record outflows in 2022, pushing yields to their highest levels in almost a decade. As a result, municipal yields underperformed comparable Treasury yields, driving Municipal to Treasury yield ratios to attractive valuations across the curve. Municipal credit quality has remained robust throughout the year as state and local governments continue to benefit from record tax collections and billions of dollars in COVID-19 relief funding. With this backdrop, municipal credit spreads, on the other hand, only experienced modest spread widening. Not surprisingly, higher credit quality outperformed lower credit quality, but not to the extent that one would expect in a risk-off market. Finally, the Treasury yield reversal in mid-June seems indicative of a market capitulation trade that should provide a firmer tone to the municipal market going into the second half of the year.
Portfolio Review
The Fund’s outperformance during the period was primarily attributable to the shorter duration of the Fund’s portfolio compared to the broader market, sector selection, and security selection. The Fund’s overweight to A-rated bonds and underweight to AAA and BBB-rated bonds detracted from performance.
On October 28, 2021, the Fund changed its name, investment goal, principal investment strategies, diversification status and sub-advisor. As part of the Fund’s transition from an Ohio-specific to a national mandate and new sub-advisor, Sage Advisory Services, Ltd. Co., significant changes were made to the Fund. The Fund’s state allocation went from 100 percent allocation to Ohio to less than 20 percent by the end of June 2022. In conjunction with that transition, we realigned the portfolio to mirror our Firm’s investment outlook. The Fund’s duration, curve allocation, and credit/sector weightings were realigned and actively managed to maximize the return profile of the Fund.
Management's Discussion of Fund Performance (Unaudited) (Continued)
The Fund is slightly long duration relative to the index in anticipation of a stronger tone to the municipal market over the summer months. The curve positioning remains overweight 3-year and longer duration, with the underweight inside of 3 years.
Outlook and Conclusion
We anticipate continued yield volatility as the market continues to wrestle with inflation expectations and the potential for an economic recession. Fed funds policy will be a major driver of both the direction of yields and the economic outlook for the near future. Mid-term elections will add uncertainty into the markets, further enhancing the volatility outlook. Despite this challenging environment, we expect yields to be below the peaks of the year and result in a slightly positive return environment for the latter half of 2022.
The Fund’s credit weighting remains heavily tilted toward single-A credits, followed by a slight overweight in BBB and lower credits. The largest credit underweight is in AAA credits, which will only be realigned if a significant and prolonged recession is anticipated. Sector distribution remains neutral General Obligation, overweight to Revenue, and no allocation to Pre-refunded bonds. Sector shifts will be driven primarily by valuation metrics and market availability as sector-specific supply has been limited due to multiple market-related factors. Finally, the Fund’s allocation to Ohio-specific credits will continue to be transitioned, but only if attractive swap opportunities present themselves. The remaining Ohio credits continue to provide excellent value-based return opportunities.
Management's Discussion of Fund Performance (Unaudited) (Continued)
Comparison of the Change in Value of a $10,000 Investment in the Touchstone Core Municipal Bond Fund - Class A* and the Bloomberg Municipal Bond Index
| Average Annual Total Returns** |
| Touchstone Core Municipal Bond Fund | 1 Year | 5 Years | 10 Years |
| Class A | -11.41% | -0.02% | 1.41% |
| Class C | -10.17% | 0.17% | 1.29% |
| Class Y* | -8.19% | 1.21% | 2.06% |
| Institutional Class* | -8.13% | 1.26% | 2.08% |
| Bloomberg Municipal Bond Index | -8.57% | 1.51% | 2.38% |
| * | The chart above represents performance of Class A shares only, which will vary from the performance of Class C shares, Class Y shares and Institutional Class shares based on the difference in sales loads and fees paid by shareholders in the different classes. The inception date of Class Y shares and Institutional Class shares was August 30, 2016. Class Y shares and Institutional Class shares performance information was calculated using the historical performance of Class A shares for the periods prior to August 30, 2016. The returns have been restated for sales loads and fees applicable to Class Y shares and Institutional Class shares. |
| ** | The average annual total returns shown above are adjusted for maximum sales loads and fees, if applicable. The maximum offering price per share of Class A shares is equal to the net asset value (“NAV”) per share plus a sales load equal to 3.36% of the NAV (or 3.25% of the offering price). Class C shares are subject to a contingent deferred sales charge (“CDSC”) of 1.00%. The CDSC will be assessed on an amount equal to the lesser of (1) the NAV at the time of purchase of the shares being redeemed or (2) the NAV of such shares being redeemed, if redeemed within a one-year period from the date of purchase. Class Y shares and Institutional Class shares are not subject to sales charges. |
The performance of the above Fund does not reflect the deduction of taxes that a shareholder would pay on Fund distributions or the redemption of Fund shares.
Note to Chart
Bloomberg Municipal Bond Index is a widely recognized unmanaged index of municipal bonds with maturities of at least one year.
Management's Discussion of Fund Performance (Unaudited)
Touchstone International Equity Fund
Sub-Advised by Fort Washington Investment Advisors, Inc.
Investment Philosophy
The Touchstone International Equity Fund (the “Fund”) seeks growth of capital by investing primarily in common stocks of established companies across the capitalization spectrum, located in or that conduct their business mainly in one or more foreign countries. The investment philosophy focuses on quality at a reasonable price, where quality is defined based on the following five fundamental factors: business quality, valuation, growth, management and balance sheet strength.
Fund Performance
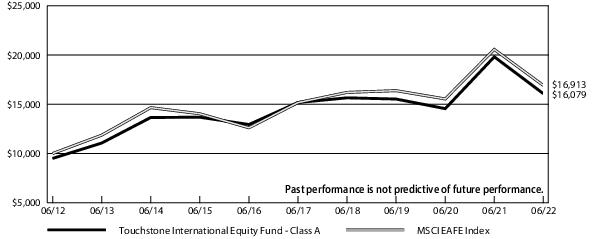
The Touchstone International Equity Fund (Class A Shares) underperformed its benchmark, the MSCI EAFE Index, for the twelve month period ended June 30, 2022. The Fund’s total return was -18.87% (calculated excluding the maximum sales charge) while the benchmark’s total return was -17.77%.
Market Environment
We entered the second half of calendar year 2021 in the midst of a vigorous global economic recovery, fueled by the cumulative impact of more than a year of unprecedented monetary and fiscal stimulus. The lifting of COVID lockdown measures in a number of countries, helped by the accelerated vaccine rollout, also pushed global economic demand. Unfortunately signs of cracks started to emerge, with a number of headwinds dominating market sentiment as we neared the end of 2021. Still, global markets finished the year on a positive note with many global markets soaring to new or near all-time highs.
The first half of calendar 2022 was different from the year that preceded it. A number of negative factors in late 2021 manifested themselves with a vengeance, leading to deepening worries of a global recession and a widespread rout of global equities. Inflation proved to be more than just transitory, as U.S. Federal Reserve Board (“Fed”) Chairman Powell initially characterized it, hitting a multi-decade high. The war in Ukraine and the subsequent escalating sanctions on Russia worked to exacerbate already heightened inflationary pressures and supply chain disruptions. In an attempt to tame stubborn inflation and rising inflation expectations, various central banks played catch-up and implemented a series of interest rate hikes, with others signaling their intention to follow suit. In March, the Fed raised interest rates, followed by two successive hikes, lifting the benchmark rate by 150 basis points cumulatively year-to-date, the fastest hike in many decades. The European Central Bank and the Bank of England also rushed to combat inflation. The Bank of England implemented rate hikes while the European Central Bank confirmed plans to raise rates, with both institutions reversing asset purchases for the first time in years. In contrast, the Bank of Japan stayed firm in maintaining its current easing stance and China implemented modest economic stimulus measures amid a new round of COVID Omicron cases and stringent lockdown measures in a number of its major cities. In sum, all of these factors have significantly increased the possibility of a global recession, contributing to a precipitous drop in global equities during the first half of 2022. The MSCI EAFE Index closed down nearly 20% for the first six months of 2022 and 18% for the twelve months ending June 2022, respectively.
For the twelve months ending June 2022, developed market equities significantly outpaced emerging market stocks, though both saw sharp declines. Poor Chinese equity performance was partly responsible for emerging markets’ relative lackluster performance. A number of cities in China, including Shanghai with the world’s busiest port, were essentially shut down amid China’s heavy-handed “zero-COVID” policy lockdown measures. Chinese equities were also hit due to the government’s broadening regulatory crackdown on various industries, as well as its fragile property market. The strengthening U.S. dollar, especially against developing country currencies, also contributed to emerging markets’ underperformance.
From an investment-style standpoint, while Value outpaced Growth in the twelve-month period ending June 2022, market weakness has been broad based. Growth stocks were at the epicenter of the pain during the first half of 2022, a departure from 2021. Rising rates, stubbornly high inflation and growing recessionary fears prompted investors to rotate out of high valuation, growth-sensitive stocks. By market capitalization, large companies were comparatively more resilient than their smaller company counterparts as they benefited from investors’ broad risk aversion given the mounting economic concerns.
Most sectors registered a loss during the last twelve-month period. Dramatic declines were felt in the Information Technology sector as investors rotated away from more expensive, often unprofitable stocks. The Consumer Discretionary and Industrials sectors were also hit with escalating recessionary fears. Traditionally defensive sectors such as Utilities, Consumer Staples and Health Care provided some refuge. Energy was a huge positive outlier on the back of surging oil and gas prices, especially after the war broke out in Ukraine in February, 2022.
During the last twelve-month period, a number of commodity prices leapt at an historic pace in response to the war, given Russia’s role as a key producer of several important commodities including oil, gas, fertilizers and wheat. However, some industrial metals prices started to soften in April 2022 as investors began pricing in a deteriorating economic outlook. Gold, long considered a
Management's Discussion of Fund Performance (Unaudited) (Continued)
safe-haven asset, managed to hold onto its value. The once highly touted crypto market has cooled of late with the price of Bitcoin slipping by nearly 70% off its recent high.
Bonds sold off sharply over the last twelve-month period with the U.S. 10-year Treasury yield nearly doubling, amid surging inflation and the Fed’s more hawkish stance, though bond prices rallied heading into period end amid rising growth concerns, slightly curtailing the negative returns. The U.S. dollar continued to strengthen against most currencies, benefiting from broad risk aversion and relatively faster rising U.S. interest rates.
Portfolio Review
The Fund’s relative performance benefitted from holdings in Materials, Consumer Discretionary, Consumer Staples and Energy, while detractors from relative performance largely came from Industrials and Health Care. By geography, holdings in Canada, Japan, and India were the positive drivers of relative performance. On the other hand, the U.K., Germany, Brazil, China and Switzerland detracted from relative performance. The Fund’s relatively high cash position was a positive factor in a declining market. Given the Fund’s concentration and bottom-up approach, it is more meaningful to discuss the drivers of performance attribution from the perspective of individual holdings.
Among the contributors to relative performance included Pretium Resources (Canada, Materials sector), Indian Energy Exchange (India, Financials sector), TotalEnergies SE (France, Energy sector), TGS ASA (Norway, Energy sector), and Nippon Telegraph and Telephone Corporation (Japan, Communication Services sector).
Pretium Resources is a Canada-based junior gold miner, whose Brucejack mine in northwestern British Columbia is potentially one of the largest and highest-grade gold mining assets in the world. Australia-based Newcrest Mining agreed to acquire Pretium in a cash and shares deal at an attractive 23% premium, adding to a wave of consolidation in the sector. From our perspective, it was only a matter of time before such an attractive asset in a stable jurisdiction with exploration upside attracted merger & acquisition interest.
Indian Energy Exchange is India’s pioneering platform for trading electricity, with participants including electricity generators, distribution companies, traders and industrial users of electricity. The exchange provides an efficient means for the allocation of electricity supply and a transparent pricing mechanism, having established a dominant market position with a virtual monopoly in the country. The combination of steadily rising electricity demand, increasing penetration of its platform and high operating leverage supports steady double-digit earnings growth, virtually all of which we believe is likely to be distributed to shareholders given the low capital requirements of the business. In addition to reporting continued strong results, the company launched a natural gas exchange, significantly increasing its total addressable market.
Energy was the only sector in the benchmark to generate positive returns over the fiscal year period as the Russia-Ukraine military conflict sent oil prices soaring and acted as a reminder of Europe’s dependence on Russian energy. The Fund’s energy holdings include TotalEnergies SE and TGS ASA. TotalEnergies is one of the world’s largest integrated energy companies. The French-based company operates in upstream oil and gas exploration and production, low carbon energy businesses, as well as refining and marketing and chemicals, with operations in more than 130 countries. TotalEnergies has some of the highest production growth and returns with among the lowest carbon intensity in the industry, a solid balance sheet, and was the only European major not to have cut its dividends during the downturn. TGS ASA is a Norwegian provider of marine seismic data for the global oil and gas industry. It operates an asset-light flexible business model, focusing on the multi-client segment and providing marine data acquisition services using vessels and crews contracted from third parties, allowing it to generate the best returns among its peers throughout a full cycle. Oil services providers like TGS tend to have outsized leverage to higher oil prices and have benefitted from accelerating investment in exploration following a multiyear lull in spending.
Nippon Telegraph and Telephone is Japan’s leading telecom company with leadership in fixed-line, broadband services, and operates the country’s largest wireless telecom carrier NTT DoCoMo. It also provides IT and communications systems integration services worldwide via its subsidiaries NTT Communications and NTT Data. The market continues to appreciate NTT’s defensive profile in an uncertain macro environment, including its solid balance sheet, cash flow generation, track record of extracting synergies, and unlocking cost savings, as well as its consistency in maintaining an attractive shareholder return policy.
Among the detractors from relative performance were Adecco Group AG (Switzerland, Industrials sector), Samsung Electronics (South Korea, Information Technology sector), JCDecaux SA (France, Communication Services sector), Fresenius SE & Co. KGaA (Germany, Health Care sector), and Boa Vista Servicos S.A. (Brazil, Industrials sector).
Swiss-based Adecco is the largest recruitment provider globally with a presence in more than 60 countries. The company offers services in the broad categories of temporary staffing, permanent placement, career transition, talent development as well as outsourcing and consulting. The share prices of staffing companies like Adecco has been under pressure on concerns of a macro slowdown in the face of rising interest rates. In addition, the market has been skeptical about a recent large and potentially expensive acquisition to improve its business mix by increasing exposure to higher-margin professional and in-house services
Management's Discussion of Fund Performance (Unaudited) (Continued)
businesses. We like the company’s exposure to the secular trend of growing temporary employment, the high returns on capital, and consistent cash generation. As a dominant player in a highly fragmented industry, we think Adecco benefits from economies of scale and has a strong brand to attract talent and employers. The company’s ability to service global contracts also gives it a competitive advantage over smaller competitors, especially with the industry trending towards multinational companies fully outsourcing global hiring functions.
South Korea-based Samsung Electronics is one of the world’s leading semiconductor producers. It has a dominant market position in memory chips aided by the company’s leading-edge process technologies. Samsung also has leadership in smartphones, mobile network equipment, display panels and consumer electronics. Semiconductor stocks have been under pressure in anticipation of a cycle downturn given the weakening demand for end-market products and resulting inventory correction, though we think that Samsung should be relatively more resilient given its diversified portfolio of products. With an overcapitalized balance sheet, the company has continued to increase its commitment to shareholder returns, which potentially should also provide support to its stock price.
JCDecaux is the global leader in the highly fragmented outdoor advertising market, with a total of more than 1.1 million advertising panels in over 75 countries. The outdoor signs of the French advertising group can be seen across big cities and at transport hubs around the world. Its share price came under pressure on concerns over the persistent COVID lockdowns in China as well as downgrades of its outlook given the likelihood of a recession. Outdoor advertisers are on the front lines of consumer and travel activities and suffer from high operational gearing due to their fixed-cost nature. Despite the current challenges, we believe JCDecaux has the strongest financial position among its peers and is well-positioned to benefit from further consolidation opportunities in its industry. We believe the increasing digitization of the company’s advertising panels will help drive top-line growth and improve financial returns over time.
Fresenius is a German-based diversified global health care provider with businesses in kidney dialysis, hospital construction and operation, as well as technologies and products for infusion, transfusion and clinical nutrition. Fresenius has a dominant position in most of its respective markets and its core businesses are well-positioned to grow, supported by demographics and growing per capita health care consumption. Its share price has been under pressure as the company continues to work through a series of operational challenges since COVID. Moreover, a negative ruling by the U.S. Supreme Court on the reimbursement model has led to some uncertainty in its dialysis business.
Boa Vista Servicos operates Brazil’s second-largest credit bureau, offering business and consumer credit data and analytics, as well as fraud management services. The company was established in 2010 via the spin-out of the Sao Paulo Chamber of Commerce’s credit analysis service. Following investments from private equity investors, the company expanded its footprint nationwide via a series of acquisitions, including the local operations of Equifax. We like the company’s prospects for solid top-line growth, given Brazil’s underpenetrated consumer credit market, its net cash balance sheet and strong market position among Brazil’s new fintech providers. Despite its attractive profile, the stock’s price has been under pressure in sympathy with its local fintech peers and due to a weaker growth outlook as a result of sharply rising interest rates and a difficult macro backdrop in Brazil.
The Fund added new holdings including PagSeguro Digital Ltd. (Brazil, Technology sector), Rotork plc (United Kingdom, Industrials sector), ASML NA (Netherlands, Technology sector), LVMH Moet Hennessy-Louis Vuitton SE (France, Consumer Discretionary sector), AVEVA Group plc (United Kingdom, Technology sector), Sanofi NA (France, Healthcare sector), Megacable Holdings SAB (Mexico, Communication Services) and Fuchs Petrolub (Germany, Materials sector). During the second half of 2021, the Fund added a few defensive holdings while selling growth stocks that had outperformed and were trading at a dizzying premium. We also trimmed some industrial cyclicals that had mostly anticipated continued economic recovery. However, the intense selling we observed in the first half of 2022 gave us an opportunity to increase the Fund’s weight towards high-quality growth businesses whose valuations have started looking more reasonable. Funds were raised by selling some defensive names that had held up well during the downturn and outpaced their underlying fundamentals. Despite these changes, sector and country allocations remained stable.
PagSeguro is the leading disruptor in Brazil’s merchant acquiring market, focusing on micro-merchants and small and medium sized enterprises was added. The company also acts as a card issuer to consumers and individual entrepreneurs. Founded in 2006, the company is able to leverage off the network and expertise of its parent, UOL (Universo Online), which is the largest Internet content and services company in Brazil. PagSeguro quickly gained market share from the entrenched incumbent payment providers by offering point-of-sale devices for sale at a price considerably less than their competitors charged for a year’s rental. The company’s product particularly appealed to the nation’s large underbanked population of small merchants. We like PagSeguro’s entrepreneurial culture, operating in a still underpenetrated market for digital payments. After a collapse in the share price over the past year following a sharp run up in interest rates, the valuation is as cheap as it’s been since the company was listed in 2018 while the prospects for secular growth remain intact.
We purchased U.K.-based Rotork, a global market leader in flow control products and solutions for the oil and gas, water, chemical and other industrial markets. The company’s products include actuators, gearboxes, valves and related accessories, and
Management's Discussion of Fund Performance (Unaudited) (Continued)
instrumentation and control products for managing the movement of liquids, gases and powders. We like the company’s strong market position across diversified market segments, which help reduce the volatility of demand over the course of the business cycle, and have been long-time admirers of management’s track record of generating margins much higher than industrial peers and returns well in excess of their cost of capital. In the wake of a number of years of global underinvestment in oil and gas and resulting subdued topline growth at Rotork, we think the company could be poised for a period of renewed growth as Europe reasserts its energy independence. Following a period of weak share price performance we like the risk-reward balance for this well capitalized, high quality industrial business.
We initiated a position in Dutch-based ASML NA. The firm provides a complete range of lithography equipment, including 100 percent market share in the most advanced Extreme Ultraviolet systems. Exponential demand growth for devices using semiconductors and the emerging national security imperative for self-sufficiency in semiconductor technology will continue to underpin the demand for manufacturing equipment. The recent panic selling gave us the opportunity to purchase ASML at a favorable price, given its best-in-class execution and monopolistic product position.
We repurchased LVMH SE and AVEVA Group PLC after having sold them in the months before the pandemic when the stocks’ prices became too rich. Based in Paris, LVMH SE is the world’s leading luxury goods maker and retailer. The company has an impressive portfolio of prestigious brands in diversified segments, with many brands holding leadership positions in their respective markets. Some of its high-profile brands include Louis Vuitton, Tiffany, Bulgari, Dior, Hennessy, Sephora and Givenchy. We like LVMH’s brand, scale and pricing power and believe the company will continue to benefit from consumers’ insatiable appetite for luxury goods for years to come. AVEVA Group plc is a software provider in product lifecycle management for highly complex industrial and engineering assets. Its market has high barriers to entry and AVEVA is poised to benefit from global megatrends in technology (IoT, AI, and the energy transition) underpinning its long-term growth prospects.
The Fund added Sanofi SA, a French based global pharmaceutical company which manufactures products for various therapeutic areas. A lack of focus had resulted in subpar growth and returns for Sanofi in the past. However, this is changing as Sanofi’s CEO and CFO work to address its past weaknesses: cost, product focus and pipeline. Dupixent, its most promising product, is performing better than expectations while headwinds from its diabetes exposure are subsiding as that segment now represents less than 10% of total sales. We believe the combined effect of all of these positive developments should lift its earnings and support the undervalued stock. Paul Hudson, Sanofi’s CEO, is known in the industry for his ability to find promising drugs and focus research and development efforts, as he has done previously at Novartis. We think this should help reinvigorate Sanofi’s drug pipeline, boding well for its long-term future.
We also bought Megacable Holdings SAB. The company provides cable television, broadband internet and telephone services in Mexico. The company operates in a geographical area which supports a favorable quasi-duopoly with benign regulation. Corporate earnings have been growing steadily and average revenue per user resilient over the last few years. Megacable is well positioned to benefit from increasing broadband penetration in Mexico. To meet this demand, the company has been investing in the broadband business with internally generated funds. Despite the heavy capital investment, the company is able to distribute a generous dividend of around 4% to its shareholders and still maintain a very healthy balance sheet.
Fuchs Petrolub was also added. The company is the largest independent supplier of lubricants in the world. Founded in 1931, it produces and sells about 10,000 different high-value lubricants and related specialty products for various industrial applications worldwide. The recent underperformance of Fuch’s share price is largely due to concerns over higher costs for base oil and chemical additives, as well as logistics, putting pressure on its margins in the near term. However, the company has the pricing power to pass on the costs with a time lag of two to three quarters. Fuchs is also confident that they have a range of competitive products targeted for the electric vehicle market, including high-value greases for electric motors and battery coolants that have higher average selling prices than engine oil. The company has a consistent record of market share gains within global lubricants, generates high returns and has a strong balance sheet.
During the period, the Fund sold Gruma SAB deCV (Mexico, Consumer Discretionary), Nippon Telegraph and Telephone (Japan, Communication Services), Calbee Inc. (Japan, Consumer Discretionary), Compass Group plc (United Kingdom, Consumer Discretionary), Alibaba Group (China, Consumer Discretionary), Nayuki Holdings Limited (China, Consumer Discretionary), Indian Energy Exchange Ltd. (India, Financials sector) and Pretium Resources.
Gruma SAB de CV is the largest producer of corn flour and tortillas in the world, operating almost 80 plants worldwide and with sales totaling $5bn from over 100 countries. With 70% share in the Mexican corn flour market, the company benefits from massive economies of scale. Gruma is also the largest producer of tortillas in the US, operating under the ubiquitous Mission brand, where the company has nearly 50% share in the supermarket channel. The Fund has owned the name for some time and still like the combination of slow, stable top line growth, and growing dividend payout. However, after its recent relative outperformance, especially in the face of increasing input costs, we decided to take profits.
Management's Discussion of Fund Performance (Unaudited) (Continued)
Nippon Telegraph and Telephone is another name we sold. The company recently bought out the minority shareholders of separately listed NTT DoCoMo, Japan’s largest wireless telecom operator with nearly 80 million subscribers. The company has significant opportunities to unlock cost savings, sports a strong balance sheet and generates solid free cash flow annually, which it is using to increase dividends and engage in a proactive buyback program. We decided to take profits after its considerable stock price outperformance in a mature, low-growth environment.
We also exited the Fund’s position in Calbee Inc., a leader in Japan’s snack food industry with well over 50% domestic market share in the categories where they compete. Its domestic market, while not growing, is stable and provides the company with reliable cash flow while management aims to grow its overseas business, especially in Indonesia, China and the U.K. where it already has a sizable presence. We also appreciate the company’s net cash balance sheet and track record of consistently growing dividends. However, following some relative share price outperformance we exited the position due to the risk of margin compression from escalating input costs.
Prior holding Compass Group PLC was sold once again after we bought it back in the wake of pandemic induced weakness in the business and share price. Compass is a leading player in the highly fragmented global catering market, providing catering and support services to offices, hospitals, factories, stadiums and universities. The Fund had previously held the stock prior to the onset of the pandemic, having sold our position due to its rich valuation in late 2019. When the price declined early in 2020, we took advantage to re-establish a position in this high quality franchise. Subsequently the market has anticipated a full recovery in the business, parts of which remain below pre-pandemic levels, once again leaving the stock price expensive on near term earnings.
We exited Fund positions in Alibaba Group, the dominant player in China’s large and fast growing e-commerce market and Nayuki Holdings Limited, a premium teahouse chain in China with attractive unit business economics. After the Chinese government’s broadening regulatory crackdown in various industries and its iron-fist Covid policy lockdown measures, we thought it prudent to reduce exposure there.
Indian Energy Exchange is another name we sold. The company operates an electricity trading platform for the physical delivery of electricity in India. Established in 2008, Indian Energy Exchange has achieved a dominant market position with a virtual monopoly in the country. We believe the combination of steadily rising electricity demand, increasing penetration of Indian Energy Exchange’s transparent and efficient day ahead power market, and high operating leverage should lead to steady double digit earnings growth, virtually all of which has the potential to be distributed to shareholders given the low capital requirements of the business. However, with the stock price rising significantly from our initial purchase, we could no longer justify its valuation and decided to take profit.
Lastly, we sold Pretium Resources, a gold mining company based in Vancouver, Canada after it entered into a binding agreement to be acquired by Newcrest Mining Ltd. an Australia-based mining company.
Outlook and Conclusion
We believe that central banks generally and the U.S. Federal Reserve Board in particular waited far too long to curtail the economy. The result has been new 40 year highs in inflation rates across much of the developed world, forcing a belated but aggressive response from central bankers as well as a sharp rise in market interest rates across the yield curve. Combined with continued constraints on supply, resulting from Russian sanctions, China’s “zero-COVID” policy, as well as pandemic-induced absenteeism and early retirements, policy makers find themselves in a once in a generation dilemma. While much of the air has already come out of the most egregiously valued bubble assets, notably money losing technology companies and digital currencies, many valuations remain elevated, dependent on continued near record negative real interest rates. As central bankers make increasingly hawkish noises, markets have now come to anticipate further monetary tightening through the second half of 2022 and even into next year. Recently, expectations have been growing of a recession as soon as the second half of this year, particularly in Europe, where the sharp rise in energy prices, accelerated by the situation in Ukraine, is leading to a significant fall in consumer and business confidence. The continent remains acutely vulnerable to any further reduction of oil and gas flows from Russia, against which many European countries have seemingly declared economic war.
Despite generational highs in inflation plus expectations of further monetary tightening and probable economic recession, we’re relatively sanguine about the prospects for inflation peaking and rolling over in the coming months. This confidence mostly comes from the sharp slowdown in money supply growth in the past 18 months, as trillions in central bank financed government handouts, the cause of the inflationary impulse to begin with, are now well and truly behind us. Although the U.S. labor market remains tight, there are indications of softening demand for labor, with rising initial jobless claims and some significant layoff announcements among previously fast growing businesses. In addition there’s already been a dramatic rise in mortgage interest rates and thus a commensurate fall in housing affordability, which is now nearing 30 year lows. In fact, the recent combination of rising house pricing and higher mortgage rates has led to a 70% increase in the monthly payment for an average new home purchase in just the last two years.
Management's Discussion of Fund Performance (Unaudited) (Continued)
There’s also ample evidence of the pandemic era stay-at-home spending bubble having popped, leading to sharp increases in retail inventory levels, typically a harbinger of future deflation, though admittedly pent up demand and prices for travel and entertainment services remain strong so far. Overall, although less confident about this call for impending deflation than we were about our expectation for a rise in inflation 18 months ago, on balance we think the odds favor lower than expected inflation and thus less monetary tightening than the market was pricing in even a few weeks ago. What we’re less sure about is whether the financial plumbing is equipped to handle the reversal of almost 15 years of near zero interest rates and continual quantitative easing, though we’re somewhat comforted by the strength of private sector balance sheets and the capitalization levels of the U.S. banking system.
The pandemic has by now mostly become a nonissue for markets, with most countries choosing to “live with COVID” now that the majority of populations have been vaccinated or infected, and in any case the surviving strains of the virus appear to be less virulent. The one glaring exception to the rule is China, where the virus first appeared nearly three years ago and where the authorities continue to clamp down on any outbreaks. On the one hand they’ve managed to successfully suppress several potentially devastating outbreaks, including in Shanghai and Beijing, though this has come at significant economic and social cost. Meanwhile, economic easing measures have accelerated in recent months, in particular with respect to the all-important property sector, though we continue to wonder if it’s too late to avoid a major correction of this, the world’s biggest asset bubble, given the financial leverage that’s propping it up.
Japan is once again reaching an inflection point. With official and market interest rates rising in the rest of the developed world, Japan’s authorities are sticking with their policy of near zero rates across the yield curve, leading to a sharp fall in the value of the yen, which is now at its lowest level in real terms in 50 years, and an accompanying rise in the level of the Bank of Japan’s holdings of Japanese government bonds, the market for which is now evaporating. With central government debt to gross domestic product of 250%, of which fully half is held by the central bank, and continued large fiscal deficits, a tipping point must be reached sooner or later, though arguably the steady collapse of the yen is already reflecting this. Perhaps more ominous still is the thought of Japan as the canary in the coal mine, since if the yen and Japanese financial markets really tip into something approaching hyperinflation, as some expect, this is unlikely to bode well for many other countries which share Japan’s penchant for fiscal profligacy funded by money printing. Fortunately the drop in recent weeks of market interest rates elsewhere in the world has taken some pressure off of the yen and Japanese bond markets, at least in the short term.
The flip side of the weak yen is the strong dollar, which despite all time low real interest rates and the freezing of hundreds of billions of Russian foreign reserves, continues to win the prize for least bad fiat currency. Although it’s still relatively soon to tell, a rising dollar has the potential to strain the competitiveness of dollar-linked emerging markets and the finances of dollar borrowers, but on the other hand reduce the strain on Europe’s export-oriented manufacturing sector emanating from rising energy costs.
In summary, the post-pandemic era has begun with a variety of daunting challenges for policy makers and investors. Fine tuning the economic policy response in the wake of a once in a generation monetary bubble, while managing a costly energy transition in the face of ongoing geopolitical uncertainties with respect to Russia, is likely to prove tricky, to say the least. For investors, while real interest rates remain low and asset prices overall look somewhat elevated, we believe there are growing pockets of value, particularly in more cyclically sensitive sectors. Given our expectation that monetary tightening could be over sooner than the market believes, combined with the financial strength and attractive valuations of the businesses the Fund owns, we feel good about the prospects for the Fund into the second half of 2022 and beyond.
Management's Discussion of Fund Performance (Unaudited) (Continued)
Comparison of the Change in Value of a $10,000 Investment in the Touchstone International Equity Fund - Class A* and the MSCI EAFE Index
| Average Annual Total Returns** |
| Touchstone International Equity Fund | 1 Year | 5 Years | 10 Years |
| Class A | -22.91% | 0.13% | 4.86% |
| Class C | -20.15% | 0.21% | 4.35% |
| Class Y | -18.61% | 1.48% | 5.80% |
| Institutional Class* | -18.52% | 1.58% | 5.83% |
| MSCI EAFE Index | -17.77% | 2.20% | 5.40% |
| * | The chart above represents performance of Class A shares only, which will vary from the performance of Class C shares, Class Y shares and Institutional Class shares based on the differences in sales loads and fees paid by shareholders in the different classes. The inception date of Institutional Class shares was October 30, 2017. Institutional Class shares performance information was calculated using the historical performance of Class A shares for the period prior to October 30, 2017. The returns have been restated for sales loads and fees applicable to Institutional Class shares. |
| ** | The average annual total returns shown above are adjusted for maximum sales loads and fees, if applicable. The maximum offering price per share of Class A shares is equal to the net asset value (“NAV”) per share plus a sales load equal to 5.26% of the NAV (or 5.00% of the offering price). Class C shares are subject to a contingent deferred sales charge (“CDSC”) of 1.00%. The CDSC will be assessed on an amount equal to the lesser of (1) the NAV at the time of purchase of the shares being redeemed or (2) the NAV of such shares being redeemed, if redeemed within a one-year period from the date of purchase. Class Y shares and Institutional Class shares are not subject to sales charges. |
The performance of the above Fund does not reflect the deduction of taxes that a shareholder would pay on Fund distributions or the redemption of Fund shares.
Notes to Chart
The MSCI EAFE Index is a free float-adjusted market capitalization index that is designed to measure developed market equity performance excluding the U.S. and Canada.
MSCI makes no express or implied warranties or representations and shall have no liability whatsoever with respect to any MSCI data contained herein. The MSCI data may not be further redistributed or used to create indices or financial products. This report is not approved or produced by MSCI.
Management's Discussion of Fund Performance (Unaudited)
Touchstone International Growth Fund
Sub-Advised by DSM Capital Partners LLC
Investment Philosophy
The Touchstone International Growth Fund (the “Fund”) seeks long-term capital appreciation by primarily investing in international equity securities of large capitalization companies believed to offer the best opportunity for reliable growth at attractive stock valuations. The Fund utilizes a bottom-up idea-driven growth style with a distinct valuation discipline. It seeks to identify companies which are believed to exhibit certain quality characteristics, including: predictable growth, solid fundamentals, attractive profitability and successful management.
Fund Performance
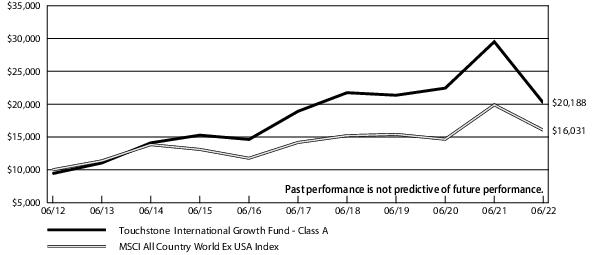
The Touchstone International Growth Fund (Class A shares) underperformed its benchmark, the MSCI All Country World Ex-U.S. Index, for the 12-month period ended June 30, 2022. The Fund’s total return was -31.60%, (calculated excluding the maximum sales charge), while the total return of the benchmark was -19.42%.
Market Environment
Global equities ended the period with a large decline. Since peaking in November 2021, the market is systematically correcting the price distortions created by an era of artificially low interest rates that were contrived by monetary authorities worldwide. Many central banks have started to raise interest rates, some aggressively so, with the notable exception of the Bank of Japan. The U.S. Federal Reserve Board has also started shrinking its balance sheet, which serves as another form of tightening.
Developed markets outperformed emerging markets over the 12-month period. France, U.K., Canada and Switzerland were the primary contributors. Within emerging market equities, countries such as China, Brazil, and South Korea declined the most.
Stylistically, Value outperformed Growth over the 12-month period. Large capitalization stocks outperformed their mid-and small capitalization counterparts as larger companies tend to have more diverse business lines and revenue sources compared to the more economically-sensitive smaller capitalization companies.
Within the benchmark, only the Energy sector finished in positive territory over the 12-month period. The Financials and Utilities sectors also outperformed while the Information Technology and Consumer Discretionary were the weakest sectors.
Portfolio Review
The Fund’s relative underperformance versus its benchmark was primarily due to stock selection in the Consumer Discretionary, Communications Services, and Financials sectors, as well as the portfolio’s overweight to the Consumer Discretionary and Information Technology sectors. The Fund’s underweight in the Energy sector, the benchmark’s strongest sector during the period, also detracted from relative performance in the period.
The holdings that contributed most to the Fund’s performance during the period included AstraZeneca (Healthcare sector), Endava (Technology sector), Dollarama (Consumer Discretionary sector), Linde (Materials sector) and Microsoft Corp. (Information Technology sector).
The weakest contributors to the Fund’s performance during the period included Nexi SpA (Information Technology sector), New Oriental Education (Consumer Discretionary sector), Naver Corp. (Communication Services sector), Alibaba Group (Consumer Discretionary sector) and Evolution AB (Consumer Discretionary sector).
The Fund’s positioning during the 12-month period has been consistent with our investment philosophy. Over the period, we have taken steps to align the valuation level of the portfolio to one more reflective of the 1990’s when interest rates were higher and the ten-year U.S. Treasury Bond yield was 5% or more. Accordingly, we have sold entirely or trimmed the higher price/earnings ratio ("P/E") positions, while starting new positions and adding to existing positions of lower P/E growth stocks. Over the reporting period, the lower P/E growth stocks purchased have defended well. However, performance was negatively impacted by the portfolio’s investments in China. President Xi and the Chinese government’s regulatory and reform efforts caused significant disruptions to businesses operating in the areas of internet platforms, education, real estate and finance. While Xi’s policies may be intended to create “common prosperity”, they have caused economic growth headwinds across the country, especially when combined with commodity and energy cost increases, and ongoing COVID-related shutdowns.
Management's Discussion of Fund Performance (Unaudited) (Continued)
Outlook and Conclusion
Over the past few months, the headwinds of rising inflation causing increased interest rates have brought into question not just market valuations, but the prospects for global economic growth as well. In many developed economies the rate of inflation remains at 40-year highs. The U.S. Consumer Price Index (CPI) increased 8.6% over the year ended May 2022, up from 8.3% in April. Within the CPI, the gas component rose 107%; the food component was up 10.1%; and the shelter index increased 5.5 %. In the Eurozone, the May CPI reading increased 8.1% year over year, and accelerated from 7.4% in April. The U.K. CPI in May was 9.1%. At this time, only China and Japan are reporting very modest signs of inflation.
As a result, central banks are raising interest rates at an accelerated pace to bring inflation under control. In contrast to views of just six months ago, many forecasters expect interest rate hikes to be aggressive and front-end loaded. In addition, inflation causes consumers to devote a larger percentage of their income to essentials like gas, energy for heating and cooling, food and rent, leaving less discretionary spending available for items such as clothing, restaurants and travel.
The global supply chain continues to be a persistent issue for any business manufacturing and shipping products. Russian sanctions and China’s COVID lockdowns make the procurement of raw materials and the production of goods much more difficult. Freight congestion remains fairly high, and while freight costs may begin to decline, they remain well above historical levels. If demand starts to wane at the consumer and industrial level, some of the supply chain pressures may ease to the benefit of many manufacturers in 2023.
Although changes to the portfolio have been limited the last several quarters, given the likelihood of continued near term volatility due to concerns over high inflation and rising interest rates, we will continue to initiate and add to positions opportunistically. Accordingly, we believe careful attention to the valuation of the portfolio is warranted. With gross domestic product forecasts being cut, we are also paying close attention to the resiliency of earnings growth for our companies.
After the 2008 Great Financial Crisis the Federal Reserve and other central banks reduced interest rates to zero or even negative levels in order to encourage investors holding cash to invest in the global economy and hasten the economic recovery. However, as a result of their zero interest rate policy as well as Quantitative Easing, “risk assets” such as stocks, private equity, high yield and investment grade bonds, and real estate all moved much higher very quickly from the lows of the financial crisis, with some reaching speculative valuation levels. With interest rates normalizing, valuations will continue to matter and investors will not be rewarded for investing in speculative assets as they were over the past five years or more.
In our view, the investment environment going forward will be much more like the 1990s, than the historically unique period since the Great Financial Crisis in 2008. As a result, we believe valuations will normalize and excessive valuations will continue to slowly decline, much as they did after the internet bubble in 2000. In our view, interest rates will likely move higher, perhaps to levels similar to the 1990s. Consistent with what occurred after the 2000 bubble, we expect the rebound in technology and other growth stocks to be slower and more selective when compared to the period after 2008/2009.
DSM Capital Partners LLC has always focused on investments in what are believed to be predictable non-cyclical businesses with reasonable absolute valuations. In 2021, we were focused on adding lower P/E growth stocks to the portfolio that would defend in a difficult market as a result of higher interest rates. At DSM, we continue to focus on identifying new investment candidates whose business fundamentals over the intermediate to longer term remain strong, but whose valuations have declined significantly, providing a very attractive entry level to drive future returns. In 2022, we believe it is an exciting time to be a growth stock investor.
Management's Discussion of Fund Performance (Unaudited) (Continued)
Comparison of the Change in Value of a $10,000 Investment in the Touchstone International Growth Fund - Class A* and the MSCI All Country World Ex USA Index
| Average Annual Total Returns** |
| Touchstone International Growth Fund | 1 Year | 5 Years | 10 Years |
| Class A* | -35.03% | 0.12% | 7.28% |
| Class C* | -32.75% | 0.57% | 7.11% |
| Class Y* | -31.39% | 1.59% | 8.15% |
| Institutional Class | -31.34% | 1.69% | 8.23% |
| MSCI All Country World Ex USA Index | -19.42% | 2.50% | 4.83% |
| * | The chart above represents performance of Class A shares only, which will vary from the performance of Class C shares, Class Y shares and Institutional Class shares based on the differences in sales loads and fees paid by shareholders in the different classes. The inception date of Class A shares, Class C shares and Class Y shares was August 15, 2016. Class A shares, Class C shares and Class Y shares performance information was calculated using the historical performance of Institutional Class shares for periods prior to August 15, 2016. The returns have been restated for sales loads and fees applicable to Class A, Class C and Class Y shares. |
| ** | The average annual total returns shown above are adjusted for maximum sales loads and fees, if applicable. The maximum offering price per share of Class A shares is equal to the net asset value (“NAV”) per share plus a sales load equal to 5.26% of the NAV (or 5.00% of the offering price). Class C shares are subject to a contingent deferred sales charge (“CDSC”) of 1.00%. The CDSC will be assessed on an amount equal to the lesser of (1) the NAV at the time of purchase of the shares being redeemed or (2) the NAV of such shares being redeemed, if redeemed within a one-year period from the date of purchase. Class Y shares and Institutional Class shares are not subject to sales charges. |
The performance of the above Fund does not reflect the deduction of taxes that a shareholder would pay on Fund distributions or the redemption of Fund shares.
Note to Chart
MSCI All Country World Ex USA Index is an unmanaged, capitalization-weighted index composed of companies representative of both developed and emerging markets excluding the United States.
MSCI makes no express or implied warranties or representations and shall have no liability whatsoever with respect to any MSCI data contained herein. The MSCI data may not be further redistributed or used to create indices or financial products. This report is not approved or produced by MSCI.
Management's Discussion of Fund Performance (Unaudited)
Touchstone Large Cap Focused Fund
Sub-Advised by Fort Washington Investment Advisors, Inc.
Investment Philosophy
The Touchstone Large Cap Focused Fund (the “Fund”) seeks capital appreciation by investing in large capitalization companies that are trading below what is believed to be the estimate of their intrinsic value and have a sustainable competitive advantage or a high barrier to entry in place. The barrier(s) to entry can be created through a cost advantage, economies of scale, high customer loyalty or a government barrier (e.g. license or subsidy). Fort Washington Investment Advisors, Inc. believes that the strongest barrier to entry is the combination of economies of scale and high customer loyalty.
Fund Performance
The Touchstone Large Cap Focused Fund (Class A Shares) underperformed the S&P 500® Index for the 12-month period ended June 30, 2022. The Fund’s total return was -14.07% (calculated excluding the maximum sales charge) while the return of its benchmark was -10.62%.
Market Environment
Over the twelve-month period, U.S. equities declined. The third quarter 2021 marked the weakest quarterly return for many U.S. equity indices since the pandemic recovery began in the second quarter of 2020. Headwinds that concerned investors during the quarter included COVID-19 Delta variant spread, anti-business Chinese regulatory action, and rising inflation driven by supply constraints. In the fourth quarter of 2021, U.S. equities rallied to reach all-time highs despite a surge in COVID cases and anticipated U.S. Federal Reserve Board (Fed) tightening. U.S. equities declined slightly in the first quarter of 2022 and significantly in the second quarter of 2022 amid the Russian invasion of Ukraine, high inflation reports, and Federal Reserve tightening. The benchmark sectors that led the market higher during the period were Energy, Utilities, and Consumer Staples. The Communication Services sector was the worst performer for the index, followed by Consumer Discretionary, Information Technology, and Industrials.
Portfolio Review
Sectors in which the Fund outperformed the benchmark include Health Care, Industrials, Financials, and Information Technology. Sectors where the Fund underperformed were Consumer Staples, Real Estate, Communication Services, Energy, Consumer Discretionary, and Materials. Sector allocation was negative primarily due to an overweight in Communication Services and an underweight in Utilities.
The three stocks that contributed most to performance were UnitedHealth Group (Healthcare sector), Bristol-Myers Squibb (Healthcare sector), and Raytheon Technologies Corp. (Industrials sector). UnitedHealth Group Inc. outperformed as the firm delivered bottom line results that beat expectations over the period and increased 2022 guidance during the second quarter. Bristol-Myers Squibb outperformed as it continues to make solid progress with recently launched drugs and its pipeline. Raytheon saw outperformance due to increased commercial aerospace demand during the period and potential increases in defense spending due to elevated geopolitical risk.
The three stocks that detracted the most from performance were Meta Platforms Inc. (Communication Services sector), Netflix Inc. (Communication Services sector), and Alibaba Group Holdings Ltd. (Consumer Discretionary sector). Shares in Meta Platforms underperformed after the company issued lower than expected guidance during the first quarter of 2022 and reported lower than expected earnings due to higher investments in the Meta and Reels segments. Shares in Netflix underperformed primarily due to lower than expected guidance for net subscriber additions which prompted investor concern over market saturation. Alibaba underperformed primarily due to continued concern regarding the regulatory environment in China during the period.
Outlook and Conclusion
In the first half of 2022, the U.S. equity market officially entered bear market territory down more than 20% from the most recent peak. Investors felt the weight of inflation reaching multi-decade highs, Russia invading Ukraine, economic growth slowing, and the Federal Reserve rapidly implementing restrictive policy measures. Amidst this backdrop, U.S. equity performance was led by inflation beneficiaries and defensive sectors like Energy, Utilities, Staples, and Health Care. Longer duration sectors like Information Technology and Communication Services lagged in the second quarter of 2022, continuing the trend we witnessed in the first quarter. While the U.S. economy is still relatively healthy by virtue of consumer demand, business spending, and labor market conditions, we continue to see an elevated probability of a slowdown in the back half of the year mainly due to the lag effects of higher interest rates and higher prices.
Management's Discussion of Fund Performance (Unaudited) (Continued)
Based on our outlook, the investment team has been mitigating risk through a combination of long standing elements of our process and gradual shifts in portfolio positioning. Several components of our Large Cap Focused Equity process help mitigate the impact of higher inflation and interest rates. First, consistently using conservative discount rates provides a cushion when rates rise. Second, focusing on barriers to entry in fundamental analysis, specifically businesses with pricing power, is especially important today as companies are increasingly looking to pass on cost pressures. Last, prioritizing what we believe to be a margin of safety with each holding seeks to provide additional risk mitigation for challenging market environments. Additionally, since early 2021, the Large Cap Focused Equity team has been gradually reducing risk in the portfolio in terms of both sector weights and exposures within sectors. Sector weights in Consumer Discretionary and Communication Services have decreased while the Consumer Staples weight and the cash position have increased. Within Financials for example, we have shifted weight from a bank with growing exposure to crypto currency to a more traditional specialty lines property and casualty insurance business. Within Industrials, we have shifted weight from a short cycle manufacturer of motion and control technologies to a high barrier aerospace and defense company.
At the end of the period, the Fund continued to emphasize businesses with higher barriers to entry and returns on capital. We have continued to gradually dial back risk in the portfolio while looking for opportunities that fit our framework through the volatility. We believe this moderate shift in risk posture combined with continued disciplined execution of our process will benefit the portfolio going forward.
Management's Discussion of Fund Performance (Unaudited) (Continued)
Comparison of the Change in Value of a $10,000 Investment in the Touchstone Large Cap Focused Fund - Class A* and the S&P 500® Index
| Average Annual Total Returns** |
| Touchstone Large Cap Focused Fund | 1 Year | 5 Years | 10 Years |
| Class A | -18.38% | 10.88% | 12.29% |
| Class C | -15.57% | 11.12% | 12.15% |
| Class Y | -13.86% | 12.31% | 13.18% |
| Class R6* | -13.90% | 12.07% | 12.90% |
| Institutional Class* | -13.85% | 12.37% | 13.15% |
| S&P 500® Index | -10.62% | 11.31% | 12.96% |
| * | The chart above represents performance of Class A shares only, which will vary from the performance of Class C shares, Class Y shares, Class R6 shares and Institutional Class shares based on the differences in sales loads and fees paid by shareholders in the different classes. The inception date of Class R6 shares and Institutional Class shares was October 28, 2021 and December 23, 2014, respectively. Class R6 shares and Institutional Class shares performance was calculated using the historical performance of Class A shares for the periods prior to October 28, 2021 and December 23, 2014, respectively. The returns have been restated for sales loads and fees applicable to Class R6 shares and Institutional Class shares. |
| ** | The average annual total returns shown above are adjusted for maximum sales loads and fees, if applicable. The maximum offering price per share of Class A shares is equal to the net asset value (“NAV”) per share plus a sales load equal to 5.26% of the NAV (or 5.00% of the offering price). Class C shares are subject to a contingent deferred sales charge (“CDSC”) of 1.00%. The CDSC will be assessed on an amount equal to the lesser of (1) the NAV at the time of purchase of the shares being redeemed or (2) the NAV of such shares being redeemed, if redeemed within a one-year period from the date of purchase. Class Y shares, Class R6 shares and Institutional Class shares are not subject to sales charges. |
The performance of the above Fund does not reflect the deduction of taxes that a shareholder would pay on Fund distributions or the redemption of Fund shares.
Note to Chart
S&P 500® Index is a group of 500 widely held stocks and is commonly regarded to be representative of the large capitalization stock universe.
Management's Discussion of Fund Performance (Unaudited)
Touchstone Large Cap Fund
Sub-Advised by The London Company
Investment Philosophy
The Touchstone Large Cap Fund (the “Fund”) seeks long-term capital growth by investing primarily in common stocks of large-capitalization U.S. listed companies. The Fund seeks to purchase financially stable large-cap companies that it believes are consistently generating high returns on unleveraged operating capital, run by shareholder-oriented management, and trading at a discount to the company’s respective private market values.
Fund Performance
The Touchstone Large Cap Fund (Class A Shares) outperformed its benchmark, the Russell 1000® Index, for the 12-month period ended June 30, 2022. The Fund’s total return was -11.44% (calculated excluding the maximum sales charge) while the benchmark’s total return was -13.04%.
Market Environment
For the twelve-month period ending June 30, 2022, the major U.S. stock indices declined. The first 6 months of the period was relatively strong reflecting reasonably strong economic growth and an accommodative monetary policy. As the period progressed, fears over how rising inflation and more hawkish comments and actions from the U.S. Federal Reserve Board (Fed) would impact the economy caused broad based selling in the equity markets.
Small cap stocks performed the worst, followed by the mid cap stocks. Even though they declined, large cap stocks fared the best. Value stocks outperformed Growth stocks across the board and defensive stocks performed better than cyclical names.
The Omicron strain of COVID emerged late in 2021 and in February 2022, Russia invaded Ukraine, both of which have further constrained supply chains and stoked inflation. With regard to monetary policy, a strong labor market combined with high inflation resulted in a shift toward tighter monetary policy earlier in the year from the Federal Reserve.
The war in Ukraine has also caused Energy prices to spike with the price of crude oil moving from $70-80 per barrel pre-invasion to a high of approximately $130 post invasion. It has since settled out to the $100-110 range. This caused the energy sector to be the strongest sector during the period.
In terms of factors impacting stocks during the period, Value, Yield, Quality, and Momentum factors were the strongest. Volatility was the only group where the factors consistently performed poorly. Growth factors did well, but dividend growth was clearly the best and while Quality overall was strong, companies with weaker balance sheets (more leverage) did better.
Portfolio Review
The Fund’s outperformance was a result of strong stock selection, partially offset by underweight positions in the leading sectors, Energy, Health Care, and Utilities. In terms of stock selection, the best performing stocks based on relative performance vs. the benchmark during the period were O’Reilly Automotive Inc. (Consumer Discretionary sector), Progressive Corp. (Financials sector), Berkshire Hathaway Inc. (Financials sector), Pfizer Inc. (Health Care sector), and Church & Dwight Co. Inc. (Consumer Staples sector).
O’Reilly Automotive outperformance during the quarter was led by its share gains and the recovery in its Pro customers. Auto parts stocks have historically outperformed when consumers are experiencing higher inflation. That said, lapping stimulus payments and the severity of winter weather with the delay in spring weather impacted ticket count. O’Reilly remains the gold standard for service, part availability, and logistics in this industry. The average age of cars on the road continues to rise and is now in the sweet spot for auto repairs and failures. O’Reilly has a strong balance sheet and recent insider buying activity has been favorable.
Progressive outperformed reflecting improved profitability in its latest quarterly results. The company continues to execute its plan to slow premium growth in favor of maintaining its 96% combined ratio. Results in the Personal Auto Loss ratio have improved suggesting its pricing actions have continued to stick and rate hikes have been successful. Progressive’s segmentation and virtuous cycle of risk selection should translate to a more profitable book coming out of this cycle. We remain attracted to its best-in-class operations and conservative underwriting philosophy.
Berkshire Hathaway benefited from the market pivoting to safety for the first six months of the year. Recent earnings results reflected quality, as most BRK-B businesses were able to push through price hikes in light of the inflationary environment. We believe that Berkshire Hathaway’s strong balance sheet positions the company well to capitalize on potential disruptions in the insurance market during a downturn.
Management's Discussion of Fund Performance (Unaudited) (Continued)
Pfizer outperformed the broader market as we believe fundamentals should be relatively insulated from macroeconomic weakness. Pfizer has been the big winner in the pharma industry over the course of the COVID pandemic with its Comirnaty vaccine and Paxlovid therapeutic. Vaccine profits positioned Pfizer with ~$24B of cash and equivalents on the balance sheet as of 3/31, and the company has commenced putting that cash to work on business development. Notably, Pfizer announced the acquisition of Biohaven in the quarter. As Pfizer deploys capital to expand the pipeline and continues to execute on research and development, we think concerns around medium-term growth should be addressed. Pfizer pays a growing dividend above 3%.
After a slow start to 2021, Church & Dwight posted a strong rally to end the year, and has outperformed market in 2022 due to the defensive nature of its business. The company experienced solid organic sales growth despite lower product availability impacting demand, and effectively managed costs through the challenging market environment. They continue to execute on their disciplined merger and acquisition strategy, announcing an acquisition of a fast-growing mouthwash brand (TheraBreath) to add to their oral care portfolio during the quarter. Church and Dwight’s leading portfolio of diversified consumer staple products provides durable cash flow generation and a quality source of downside protection.
Among the individual stocks that detracted from Fund performance during the period were Meta Platforms Inc. (Communication Services sector), CarMax Inc. (Consumer Discretionary sector), Citrix Systems Inc. (Information Technology sector), FedEx Corp. (Industrials sector), and BlackRock Inc. (Financials sector).
Meta is being hit by a confluence of headwinds in the current operating environment. The company reported better-than-feared results back in April, which included revenues at the midpoint of guidance. Stock weakness since then can be attributed to a perceived slowdown in the ad industry as consumers are dealing with high inflation and companies continue to struggle with inventory positions. Despite near-term headwinds, we continue to believe Meta is structurally advanced in the oligopolistic digital ad industry with its leading ad platform sitting atop services that continue to grow (measured by monthly average users).
After being a top contributor in the first half of 2021, CarMax underperformed in the period due to concerns around the used car market, normalized average selling prices, and higher interest rates. Used car sales have improved at CarMax recently due to higher prices as unit volumes were negative. The wholesale and financing businesses are solid. Management is focused on growing profitable market share in multiple channels by utilizing its omni platform and existing infrastructure. CarMax continues to disrupt the used car ecosystem and we maintain our conviction in the stock.
Citrix Systems was weak during the second half of 2021. There were a number of internal issues that negatively impacted the company including a shift to subscription based sales, as well as a complicated technical selling process. An activist firm, Elliott Management, started purchasing shares of the company late in the year and helped oust the CEO. The Chairman accepted the interim CEO role for a second time. We sold the stock in the fourth quarter of 2021.
FedEx was weak in the third quarter of 2021 after issuing higher guidance for capital spending, mostly for additional airplane purchases. Investors remain concerned that the FedEx network cannot support the incredibly high package and freight volumes seen across the industry today. FedEx yields have been trending upwards but margin leverage has been elusive. More recently the stock has outperformed after announcing a series of initiatives to increase shareholder value, but not enough to overcome the performance earlier in the period.
BlackRock underperformed reflecting the company’s ties to the broader equity market. We understand the correlation of Blackrock’s AUM and fee revenue to market moves in the near term, but we continue to see Blackrock as a well-run company and a secular winner in the asset management industry. Despite market volatility, we expect underlying organic growth to continue. Blackrock is a good fit to our investment process with its strong balance sheet, high margins, and consistent capital return.
During the period, we trimmed two long-term holdings, Altria Group Inc. and Berkshire Hathaway, and added to the position in BlackRock.
The trim of Altria reflected recent strength and our desire to reduce the position to closer to 4% of the portfolio. We maintain high conviction in the company. The trim of Berkshire Hathaway was also on recent strength and we continue to believe the outlook is strong. Post the trim, Berkshire Hathaway will be closer to 7% of the portfolio.
We added to Blackrock on recent weakness. The stock traded off with the broader equity market. With roughly 50% of its $9.6T in AUM tied to equities, we realize it will trade with the broader equity market. That said, we believe the company is well positioned for continued growth in its various ETF products, generates attractive EBIT margins (over 35%), and maintains a strong balance sheet. With the recent downdraft in the stock, we believe current valuation (12x EV/earnings before interest, taxes, depreciation, and amortization (EBITDA)(enterprise multiple)) is an attractive time to add to a long-term holding.
Management's Discussion of Fund Performance (Unaudited) (Continued)
Outlook and Conclusion
Looking ahead, as the Fed attempts to navigate a soft landing, we recognize that economic data may continue to decelerate and valuation multiples for stocks could compress further. With persistently high inflation combined with a tight labor market, we should expect additional rate hikes from the Fed while Quantitative Tightening continues. This less accommodative monetary policy will continue to impact the economy. We recognize the difficulty in navigating a soft landing, so the odds of a recession over the next 12-18 months have increased.
On a positive note, the U.S. consumer remains in reasonably good shape. Unemployment is low, wages are rising, and there are still ample savings remaining from the pandemic. With consumer spending such an important part of U.S. gross domestic product (GDP), the strong labor market could limit the downside risk to the economy over the next few months. Things could change quickly though and higher rates may lead to slower growth and greater job losses. Longer term, we remain positive on the U.S. economy and expect real GDP growth in the 2-3% range driven by growth in the labor force and improving productivity.
In terms of the equity market, we note that multiple compression may continue reflecting higher interest rates and higher than normal inflation. A slowing economy could also lead to weaker earnings for many companies. Therefore, we expect greater volatility in stock prices and lower expected returns relative to the strong returns generated from 2009-2021.
We believe the Fund provides the opportunity to own a group of competitively advantaged businesses (judged by return on capital), with strong balance sheets (lower net debt/EBITDA), at reasonable valuations. Finally, we believe in the quality of the Fund’s holdings for the next few years and believe it is positioned well.
Management's Discussion of Fund Performance (Unaudited) (Continued)
Comparison of the Change in Value of a $10,000 Investment in the Touchstone Large Cap Fund - Class A* and the Russell 1000® Index
| Average Annual Total Returns** |
| Touchstone Large Cap Fund | 1 Year | 5 Years | Since
Inception* |
| Class A | -15.87% | 6.30% | 6.44% |
| Class C | -13.01% | 6.76% | 6.45% |
| Class Y | -11.20% | 7.84% | 7.50% |
| Institutional Class | -11.15% | 7.94% | 7.61% |
| Russell 1000® Index | -13.04% | 11.00% | 10.31% |
| * | The chart above represents performance of Class A shares only, which will vary from the performance of Class C shares, Class Y shares and Institutional Class shares based on the differences in sales loads and fees paid by shareholders in the different classes. The inception date of the Fund was July 9, 2014. The returns of the index listed above are based on the inception date of the Fund. |
| ** | The average annual total returns shown above are adjusted for maximum sales loads and fees, if applicable. The maximum offering price per share of Class A shares is equal to the net asset value (“NAV”) per share plus a sales load equal to 5.26% of the NAV (or 5.00% of the offering price). Class C shares are subject to a contingent deferred sales charge (“CDSC”) of 1.00%. The CDSC will be assessed on an amount equal to the lesser of (1) the NAV at the time of purchase of the shares being redeemed or (2) the NAV of such shares being redeemed, if redeemed within a one-year period from the date of purchase. Class Y shares and Institutional Class shares are not subject to sales charges. |
The performance of the above Fund does not reflect the deduction of taxes that a shareholder would pay on Fund distributions or the redemption of Fund shares.
Note to Chart
Russell 1000® Index measures the performance of the 1,000 largest companies in the Russell 3000® Index.
The Frank Russell Company (FRC) is the source and owner of the data contained or reflected in this material and all trademarks and copyrights related thereto. The material may contain confidential information and unauthorized use, disclosure, copying, dissemination or redistribution is strictly prohibited. This is a Touchstone Investments presentation of the data, and FRC is not responsible for the formatting or configuration of this material or for any inaccuracy in the presentation thereof.
Management's Discussion of Fund Performance (Unaudited)
Touchstone Large Company Growth Fund
Sub-Advised by DSM Capital Partners LLC
Investment Philosophy
The Touchstone Large Company Growth Fund (the “Fund”) seeks long-term capital appreciation by primarily investing in U.S. equity securities of large capitalization companies believed to offer the best opportunity for reliable growth at attractive stock valuations. The Fund utilizes a bottom-up idea-driven growth style with a distinct valuation discipline. It seeks to identify companies which are believed to exhibit certain quality characteristics, including: predictable growth, solid fundamentals, attractive profitability and successful management.
Fund Performance
The Touchstone Large Company Growth Fund (Class A shares) underperformed its benchmark, the Russell 1000® Growth Index, for the 12-month period ended June 30, 2022. The Fund’s total return was -23.29% (calculated excluding the maximum sales charge), while the total return of the benchmark was -18.77%.
Market Environment
U.S. equities ended the period with a large decline. Since peaking in November 2021, the market systematically corrected the price distortions created by an era of artificially low interest rates that were contrived by monetary authorities worldwide. Many central banks raised interest rates, some aggressively so, with the notable exception of the Bank of Japan. The U.S. Federal Reserve Board (Fed) has also started shrinking its balance sheet, which serves as another form of tightening. From a sector perspective, Utilities finished in positive territory for the period. The Consumer Discretionary, Communication Services, and Information Technology were the worst performing sectors. Growth-oriented sectors underperformed while defensive Utilities sector and the Consumer Staples sector outperformed at the end of the period. Stylistically, Value outperformed Growth as the inflationary pressures that impacted domestic equity markets and impacted higher growth companies negatively. Large capitalization stocks outperformed their mid and small capitalization counterparts for the period as larger companies tended to have more diverse business lines and revenue sources compared to the more economically sensitive smaller capitalization companies.
Portfolio Review
During the 12-month period the Fund’s underperformance versus the benchmark was primarily due to stock selection in the Information Technology and Communications Services sectors. These detractors were partially offset by the Fund’s cash position in the declining market environment and its stock selection within the Health Care and Financials sectors.
Among the holdings that contributed most to the Fund’s performance during the period were UnitedHealth Group Inc. (Healthcare sector), Fortinet Inc. (Information Technology sector), Aon plc (Financials sector), Automatic Data Processing Inc. (Industrials sector) and EPAM Systems Inc. (Technology sector).
Among the weakest contributors to the Fund’s performance during the period were PayPal Holdings Inc. (Financials sector), Meta Platforms Inc. (Communication Services sector), Amazon.com Inc. (Consumer Discretionary sector), Netflix Inc. (Communication Services sector) and Adobe Inc. (Technology sector).
The Fund’s positioning during the 12-month period has been consistent with our investment philosophy. Over the period, we have taken steps to align the valuation level of the portfolio to one more reflective of the 1990’s when interest rates were higher and the ten-year U.S. Treasury Note’s yield was 5% or more. Accordingly, we have sold entirely or trimmed the higher price/earnings ratio ("P/E") positions, while starting new positions and adding to existing positions of lower P/E growth stocks. Over the reporting period, the lower P/E growth stocks purchased have defended well. However, performance was negatively impacted by Meta Platforms, Netflix and PayPal Holdings as each experienced significant declines following challenging earnings reports.
Outlook and Conclusion
Over the past few months, the headwinds of rising inflation causing increased interest rates have brought into question not just market valuations, but the prospects for global economic growth as well. In many developed economies, the rate of inflation remains at 40-year highs. The U.S. Consumer Price Index (CPI) increased 8.6% over the year ended May 2022, up from 8.3% in April. Within the CPI, the gas component rose 107%; the food component was up 10.1%; and the shelter index increased 5.5%. In the Eurozone, the May CPI reading increased 8.1% year over year, and accelerated from 7.4% in April. The U.K. CPI in May was 9.1%. At this time, only China and Japan are reporting very modest signs of inflation.
As a result, central banks are raising interest rates at an accelerated pace to bring inflation under control. In contrast to views of just six months ago, many forecasters expect interest rate hikes to be aggressive and front-end loaded. In addition, inflation causes
Management's Discussion of Fund Performance (Unaudited) (Continued)
consumers to devote a larger percentage of their income to essentials like gas, energy for heating and cooling, food and rent, leaving less discretionary spending available for items such as clothing, restaurants and travel.
The global supply chain continues to be a persistent issue for any business manufacturing and shipping products. Russian sanctions and China’s COVID lockdowns make the procurement of raw materials and the production of goods much more difficult. Freight congestion remains fairly high, and while freight costs may begin to decline, they remain well above historical levels. If demand starts to wane at the consumer and industrial level, some of the supply chain pressures may ease to the benefit of many manufacturers in 2023.
Although changes to the portfolio have been limited the last several quarters, given the likelihood of continued near term volatility due to concerns over high inflation and rising interest rates, we will continue to initiate and add to positions opportunistically. Accordingly, we believe careful attention to the valuation of the portfolio is warranted. With gross domestic product forecasts being cut, we are also paying close attention to the resiliency of earnings growth for our companies.
After the 2008 Great Financial Crisis the Fed and other central banks reduced interest rates to zero or even negative levels in order to encourage investors holding cash to invest in the global economy and hasten the economic recovery. However, as a result of their zero interest rate policy as well as Quantitative Easing, “risk assets” such as stocks, private equity, high yield and investment grade bonds, and real estate all moved much higher very quickly from the lows of the financial crisis, with some reaching speculative valuation levels. With interest rates normalizing, valuations will continue to matter and investors will not be rewarded for investing in speculative assets as they were over the past five years or more.
In our view, the investment environment going forward will be much more like the 1990s, than the historically unique period since the Great Financial Crisis in 2008. As a result, valuations will normalize and excessive valuations will continue to slowly decline, much as they did after the internet bubble in 2000. In our view, interest rates will likely move higher, perhaps to levels similar to the 1990s. Consistent with what occurred after the 2000 bubble, we expect the rebound in technology and other growth stocks to be slower and more selective when compared to the period after 2008/2009.
DSM Capital Partners LLC has always focused on investments in what are believed to be predictable non-cyclical businesses with reasonable absolute valuations. In 2021, we were focused on adding lower P/E growth stocks to the portfolio that would defend in a difficult market as a result of higher interest rates. At DSM, we continue to focus on identifying new investment candidates whose business fundamentals over the intermediate to longer term remain strong, but whose valuations have declined significantly, providing a very attractive entry level to drive future returns. In 2022, we believe it is an exciting time to be a growth stock investor.
Management's Discussion of Fund Performance (Unaudited) (Continued)
Comparison of the Change in Value of a $10,000 Investment in the Touchstone Large Company Growth Fund - Class A*, the Russell 1000® Growth Index and the S&P 500® Index
| Average Annual Total Returns** |
| Touchstone Large Company Growth Fund | 1 Year | 5 Years | 10 Years |
| Class A* | -27.12% | 9.52% | 12.15% |
| Class C* | -24.49% | 10.00% | 11.98% |
| Class Y* | -23.09% | 11.10% | 13.10% |
| Institutional Class | -23.03% | 11.21% | 13.18% |
| Russell 1000® Growth Index | -18.77% | 14.29% | 14.80% |
| S&P 500® Index | -10.62% | 11.31% | 12.96% |
| * | The chart above represents performance of Class A shares only, which will vary from the performance of Class C shares, Class Y shares and Institutional Class shares based on the differences in sales loads and fees paid by shareholders in the different classes. The inception date of Class A shares, Class C shares and Class Y shares was August 15, 2016. Class A shares, Class C shares and Class Y shares performance information was calculated using the historical performance of Institutional Class shares for periods prior to August 15, 2016. The returns have been restated for sales loads and fees applicable to Class A, Class C and Class Y shares. |
| ** | The average annual total returns shown above are adjusted for maximum sales loads and fees, if applicable. The maximum offering price per share of Class A shares is equal to the net asset value (“NAV”) per share plus a sales load equal to 5.26% of the NAV (or 5.00% of the offering price). Class C shares are subject to a contingent deferred sales charge (“CDSC”) of 1.00%. The CDSC will be assessed on an amount equal to the lesser of (1) the NAV at the time of purchase of the shares being redeemed or (2) the NAV of such shares being redeemed, if redeemed within a one-year period from the date of purchase. Class Y shares and Institutional Class shares are not subject to sales charges. |
The performance of the above Fund does not reflect the deduction of taxes that a shareholder would pay on Fund distributions or the redemption of Fund shares.
Note to Chart
Russell 1000® Growth Index measures the performance of those Russell 1000 companies with higher price-to-book ratios and higher forecasted growth values.
The Frank Russell Company (FRC) is the source and owner of the data contained or reflected in this material and all trademarks and copyrights related thereto. The material may contain confidential information and unauthorized use, disclosure, copying, dissemination or redistribution is strictly prohibited. This is a Touchstone Investments presentation of the data, and FRC is not responsible for the formatting or configuration of this material or for any inaccuracy in the presentation thereof.
S&P 500® Index is a group of 500 widely held stocks and is commonly regarded to be representative of the large capitalization stock universe.
Management's Discussion of Fund Performance (Unaudited)
Touchstone Small Company Fund
Sub-Advised by Fort Washington Investment Advisors, Inc.
Investment Philosophy
The Touchstone Small Company Fund (the “Fund”) seeks to provide investors with growth of capital by investing primarily in common stocks of small companies that the sub-advisor believes are high quality, have superior business models, solid management teams, sustainable growth potential and are attractively valued.
Fund Performance
The Touchstone Small Company Fund (Class A Shares) outperformed its benchmark, the Russell 2000® Index for the 12-month period ended June 30, 2022. The Fund’s total return was -17.95% (calculated excluding the maximum sales charge) while the total return of the benchmark was -25.20%.
Market Environment
Small cap equities experienced a challenging market environment for the year ended June 30, 2022. Over the course of the 12-month period, economic growth and corporate profit growth remained strong. However, equity valuations contracted meaningfully, driving the entirety of the equity market in declines. Equity market valuations contracted primarily due to the end of unprecedented fiscal and monetary stimulus; accelerating inflationary pressures; and higher interest rates.
From a sector perspective, Energy and Utilities were the only positive sectors for the 12-month period. Consumer Staples, Financials, Industrials, Real Estate, and Materials outperformed the overall small cap market. Information Technology, Consumer Discretionary, Health Care, and Communication Services sectors underperformed the overall small cap market.
Portfolio Review
The Fund’s top three performing sectors for the 12-month period ended June 30, 2022 were Health Care, Information Technology, and Industrials. Stock selection was a strong relative positive contributor to returns. The Fund’s three bottom performing sectors were Financials, Energy, and Utilities. Financials sector performance was impacted by negative stock selection, while the Fund’s underweight allocation to the outperforming Energy and Utilities sectors detracted from relative performance.
Among the Fund’s top five performing stocks were Tower Semiconductor Corp. (Information Technology sector), a leading foundry of high-value analog semiconductor solutions; Vocera Communications (Communication Services sector), a provider of communication technology to health care systems; Premier Inc. (Health Care sector), a provider of supply chain and technology solutions to health care systems; Quanta Services Inc. (Industrials sector), an engineering and construction company providing services to the utility, energy, and renewable energy markets; and Box Inc. (Technology sector), a provider of software for companies to manage data in the cloud. Tower Semiconductor and Vocera Communications were both acquired.
Among the Fund’s bottom five performers were Tactile Systems Technology Inc. (Health Care sector), a provider of at-home therapies for chronic conditions; 8X8 Inc. (Information Technology sector), a provider of communication services; Foot Locker Inc. (Consumer Discretionary sector), a specialty retailer of footwear; American Eagle Outfitters (Consumer Discretionary sector), a specialty retailer of apparel; and Pacwest Bancorp (Financials sector), a regional bank. The Fund exited four of these positions but continues to hold American Eagle Outfitters.
Outlook and Conclusion
We believe economic growth rates will continue to moderate due to a slow down and normalization in demand across several sectors that benefitted from pent-up demand and fiscal and monetary stimulus. We also expect inflationary pressures and higher interest rates to negatively impact economic growth. However, we are seeing clear signs across sectors that moderating demand and increasing supply should moderate inflation looking forward, with price levels declining in certain areas of the economy. The U.S. Federal Reserve Board has followed through on a more aggressive plan to raise interest rates. While we expect short-term rates to continue to increase in the third quarter and early fourth quarter of 2022, expectations could peak as inflation and growth moderate. We believe that the political environment is having a negative impact on consumer and business sentiment. However, material legislative changes impacting the economic outlook positively or negative seem unlikely. Small cap earnings forecasts peaked in May 2022. We anticipate earnings forecasts will continue to weaken due to moderating economic growth and higher costs.
Small cap equities are trading at their lowest price to earnings valuation since the great financial crisis. While we expect earnings forecasts to decline, we believe high quality, free cash flow generating companies with strong balance sheets have increasingly attractive expected forward returns.
Management's Discussion of Fund Performance (Unaudited) (Continued)
We remain focused on executing our fundamental stock selection and portfolio management process. We believe that stocks experience a four-stage investment cycle and our research process is focused on the dynamics that apply to each stage of the investment cycle. We believe that excess returns and lower volatility are driven by the ability to successfully identify a stock’s current stage and the potential for it to transition to a different stage of its investment cycle.
Comparison of the Change in Value of a $10,000 Investment in the Touchstone Small Company Fund - Class A* and the Russell 2000® Index
| Average Annual Total Returns** |
| Touchstone Small Company Fund | 1 Year | 5 Years | 10 Years |
| Class A | -22.04% | 5.46% | 9.68% |
| Class C | -19.23% | 5.71% | 9.63% |
| Class Y | -17.81% | 6.81% | 10.56% |
| Class R6* | -17.73% | 6.95% | 10.59% |
| Institutional Class* | -17.70% | 6.83% | 10.55% |
| Russell 2000® Index | -25.20% | 5.17% | 9.35% |
| * | The chart above represents performance of Class A shares only, which will vary from the performance of Class C shares, Class Y shares, Institutional Class shares and Class R6 shares based on the differences in sales loads and fees paid by shareholders in the different classes. The inception date of Institutional Class shares and Class R6 shares was October 30, 2017 and December 23, 2014, respectively. Institutional Class shares and Class R6 shares performance was calculated using the historical performance of Class A shares for the periods prior to October 30, 2017 and December 23, 2014, respectively. The returns have been restated for sales loads and fees applicable to Institutional Class and Class R6 shares. |
| ** | The average annual total returns shown above are adjusted for maximum sales loads and fees, if applicable. The maximum offering price per share of Class A shares is equal to the net asset value (“NAV”) per share plus a sales load equal to 5.26% of the NAV (or 5.00% of the offering price). Class C shares are subject to a contingent deferred sales charge (“CDSC”) of 1.00%. The CDSC will be assessed on an amount equal to the lesser of (1) the NAV at the time of purchase of the shares being redeemed or (2) the NAV of such shares being redeemed, if redeemed within a one-year period from the date of purchase. Class Y shares, Institutional Class shares and Class R6 shares are not subject to sales charges. |
The performance of the above Fund does not reflect the deduction of taxes that a shareholder would pay on Fund distributions or the redemption of Fund shares.
Notes to Chart
Russell 2000® Index measures the performance of the small-cap segment of the U.S. equity universe.
The Frank Russell Company (FRC) is the source and owner of the data contained or reflected in this material and all trademarks and copyrights related thereto. The material may contain confidential information and unauthorized use, disclosure, copying, dissemination or redistribution is strictly prohibited. This is a Touchstone Investments presentation of the data, and FRC is not responsible for the formatting or configuration of this material or for any inaccuracy in the presentation thereof.
Management's Discussion of Fund Performance (Unaudited)
Touchstone Value Fund
Sub-Advised by Barrow, Hanley, Mewhinney & Strauss, LLC
Investment Philosophy
The Touchstone Value Fund (the “Fund”) seeks long-term capital growth by primarily investing in equity securities of large- and mid-cap companies believed to be undervalued. The Fund uses traditional methods of stock selection — research and analysis — to identify companies that have price-to-earnings and price-to-book ratios below the market, that also have above-average dividend yields, and that focus on companies that are out of favor due to internal or external challenges judged to be short-term in nature. Stock selection is driven by fundamental analysis on individual companies rather than by broad market themes.
Fund Performance
The Touchstone Value Fund (Class A Shares) outperformed its benchmark, the Russell 1000® Value Index, for the 12-month period ended June 30, 2022. The Fund’s total return was -5.30% (calculated excluding the maximum sales charge), while the total return of the benchmark was -6.82% for the same period.
Market Environment
Value outperformed growth significantly in the past twelve months; valuation multiples compressed with higher rates and inflation weighed heavily on growth stocks. Further compression would likely remain a tailwind for value, though given the strength of the outperformance, a pause may unfold at some point. Importantly, we believe the long-term setup remains positive given: attractive valuations, the eventual improvement in economic growth, and increasing importance of dividends amidst the market volatility as a stable source of return relative to earnings growth and multiple expansion. Earnings estimates have proven surprisingly resilient this year.
Portfolio Review
The Fund benefitted from the value rally that began in late 2020 and outperformed the value index over the period. Additionally, stock selection and an underweight in the Information Technology sector as well as stock selection in the Financials and Health Care sectors contributed. An overweight position in the Energy sector also positively contributed to relative performance. Conversely, selection in Industrials as well as selection in Communication Services and Consumer Staples were the largest detractors from relative performance.
Among the top individual contributors to relative performance included Hess Corporation (Energy sector), Pioneer Natural Resources Company (Energy sector) and Elevance Health, Inc. (Health Care sector).
Hess Corporation, a global independent oil and gas producer, outperformed with the benefits of higher oil prices and several positive announcements that the company had during the quarter. The company increased its quarterly dividend by 50% after its second offshore production platform in Guyana began oil production at the end of the first quarter. Concurrently, with the completion of three new exploration wells, the company announced the addition of one billion barrels of gross reserves in its Guyana offshore asset, totaling 11 billion barrels of gross total reserves. The stock currently trades at 8x forward price/earnings ratio (P/E) and offers a 1.5% dividend yield with a commitment to return 75% of excess cash flow to shareholders via dividends and share repurchases.
Pioneer Natural Resources Company, an exploration and production company focused on Texas’ Permian Basin remains attractive and trades at less than 11x forward P/E with meaningful dividend yields that will continue to increase from strong payout ratios and reasonable capital expenditure spending. As well, we continue to engage with the management team who is committed to reducing greenhouse gas (GHG) emissions. Pioneer has reduced its GHG emissions by 20% over the last two years.
Managed Care Organization (MCO) Elevance Health (formerly Anthem, Inc.) outperformed in the period. We have long believed that MCOs represent one of the cheapest parts of the healthcare sector. With Medicare For All not garnering sufficient support within the Democratic Party, we believe that a major overhang on the industry has been removed. During the period, despite COVID and utilization variabilities, MCOs delivered strong results, resulting in a partial upward re-rating on the stock valuations. Over time, we expect other investors to start appreciating the strong margin stability and growth opportunities that are not fully reflected in certain stocks, such as Elevance.
Among the largest individual detractors to relative performance included Altice USA, Inc. (Communication Services sector), Vertiv Holdings Co. (Industrials sector) and Stanley Black & Decker, Inc. (Industrials sector).
Altice USA, Inc. Class A underperformed in the second half of 2021 as the CEO disclosed disappointing net advertising trends at a sell-side conference in September. The operational underperformance appears manageable and is mostly contained to one-third of
Management's Discussion of Fund Performance (Unaudited) (Continued)
the footprint that competes with another fiber optic product (Verizon FIOS). Altice plans to address this by accelerating fiber investments in the areas where there is solid competitive overlap, which should help to stabilize market share and return the company to net subscriber growth. The step-up in investment will weigh on free cash flow and earnings before interest, taxes, depreciation, and amortization (EBITDA) in 2022, which will limit the share repurchase program for some time. Cable names in general came under pressure in the fourth quarter as several companies pre-announced worse net advertising trends. Investors are still trying to determine whether this is due to increased competition from fiber and/or fixed wireless broadband, or whether fewer people moving/less churn in a world still recovering from a pandemic – all of which has called into question what a new normal environment looks like. Long-term, we continue to believe that broadband is an essential service and, in an environment wherein more people are working from home, having fast and reliable internet is more critical than ever. Trading at 7.5x EV/trough EBITDA appears too cheap in an environment in which peers trade for 10x EV/EBITDA (enterprise multiple).
Vertiv Holdings, a leader in electrical and cooling products for data centers, detracted from relative performance. Margins have remained depressed from the rapid cost inflation the company experienced, but price increases in shorter lead time channels have started to deliver the expected reversal. Management, led by Dave Cote, has taken the necessary steps but it will take some time for those efforts to flow through the longer lead time channels and backlog. The long-term outlook for its business remains positive, with industry growth expected of 5-7% annually, and supported by its diversified customer base, recurring revenue, and high barriers to entry. As the company’s pricing power flows through in the balance of the year, we believe results should improve significantly helping shares recover.
Stanley Black & Decker, a global leader in power tools, hand tools, and other industrial accessories detracted from relative performance as inflationary pressures and supply chain constraints weighed heavily on management’s outlook. Incremental pricing efforts are underway and should help margin recovery, but may not fully offset rising costs, leading management to reduce guidance for earnings and free cash flow. Near term headwinds, including concerns over slowing residential and economic growth, sent shares lower, and have overshadowed the meaningful portfolio simplification story underway to help unlock the significant valuation discount that exists currently. The recent divestiture of a small oil and gas business continues the efforts by management in this regard and expectations remain for further such transactions in the future.
The largest new holdings in the Fund’s portfolio are Air Products and Chemicals, Inc. (Materials sector), M&T Bank Corporation (Financials sector), VICI Properties Inc. (Real Estate sector), Perrigo Co. (Healthcare sector), and Fidelity National Information Services (Information Technology sector). The largest eliminated holdings were Goldman Sachs Group, Inc. (Financials sector), Raytheon Technologies Corporation (Industrials sector), MGM Growth Properties (Real Estate sector), Ralph Lauren Corporation (Consumer Staples sector), and General Dynamics Corporation (Industrials sector). Overall, we began selling the stocks that were rewarded in the post-COVID economic reopening and purchasing stocks that had fallen out of favor in the year-to-date sell off in 2022.
Outlook and Conclusion
Value-led markets historically have lasted much longer, on average, and have performed with greater magnitude than the current run. Barrow Hanley has previously demonstrated a strong track record of delivering outperformance when value cycles occur and the current period strengthens the resolve that a long-term secular value cycle is underway. The investment process has been proven over multiple market cycles; adhering to the long-standing active, fundamental, and valuation-focused discipline and has delivered consistent and repeatable results. We continue to look for stocks in every sector, more recently several stocks in the Materials sector and the Financials sector as we believe both will benefit from interest rate increases and higher inflation.
Management's Discussion of Fund Performance (Unaudited) (Continued)
Comparison of the Change in Value of a $10,000 Investment in the Touchstone Value Fund - Class A* and the Russell 1000® Value Index
| Average Annual Total Returns** |
| Touchstone Value Fund | 1 Year | 5 Years | 10 Years |
| Class A | -10.03% | 6.61% | 9.52% |
| Class C | -6.98% | 7.06% | 9.50% |
| Class Y | -5.06% | 8.16% | 10.45% |
| Class R6* | -4.98% | 8.18% | 10.46% |
| Institutional Class | -5.02% | 8.31% | 10.58% |
| Russell 1000® Value Index | -6.82% | 7.17% | 10.50% |
| * | The chart above represents performance of Class A shares only, which will vary from the performance of Class C shares, Class Y shares, Institutional Class shares and Class R6 shares based on the differences in sales loads and fees paid by shareholders in the different classes. The inception date of Class R6 shares was October 28, 2021. Class R6 shares performance was calculated using the historical performance of Class A shares for the periods prior to October 28, 2021. The returns have been restated for sales loads and fees applicable to Class R6 shares. |
| ** | The average annual total returns shown above are adjusted for maximum sales loads and fees, if applicable. The maximum offering price per share of Class A shares is equal to the net asset value (“NAV”) per share plus a sales load equal to 5.26% of the NAV (or 5.00% of the offering price). Class C shares are subject to a contingent deferred sales charge (“CDSC”) of 1.00%. The CDSC will be assessed on an amount equal to the lesser of (1) the NAV at the time of purchase of the shares being redeemed or (2) the NAV of such shares being redeemed, if redeemed within a one-year period from the date of purchase. Class Y shares, Class R6 shares and Institutional Class shares are not subject to sales charges. |
The performance of the above Fund does not reflect the deduction of taxes that a shareholder would pay on Fund distributions or the redemption of Fund shares.
Note to Chart
Russell 1000® Value Index measures those Russell 1000 companies with lower price-to-book ratios and lower expected growth values.
The Frank Russell Company (FRC) is the source and owner of the data contained or reflected in this material and all trademarks and copyrights related thereto. The material may contain confidential information and unauthorized use, disclosure, copying, dissemination or redistribution is strictly prohibited. This is a Touchstone Investments presentation of the data, and FRC is not responsible for the formatting or configuration of this material or for any inaccuracy in the presentation thereof.
Tabular Presentation of Portfolios of Investments (Unaudited)
June 30, 2022
The tables below provide each Fund’s geographic allocation, sector allocation and/or credit quality. We hope it will be useful to shareholders as it summarizes key information about each Fund’s investments.
Touchstone Balanced Fund
| Credit Quality*(% of Fixed Income Securities) |
| AAA/Aaa | 39.9% |
| AA/Aa | 8.8 |
| A/A | 16.1 |
| BBB/Baa | 31.3 |
| BB/Ba | 1.0 |
| B/B | 0.7 |
| Not Rated | 2.2 |
| Total | 100.0% |
| Sector Allocation**(% of Net Assets) |
| Common Stocks | |
| Information Technology | 17.9% |
| Health Care | 10.9 |
| Communication Services | 8.8 |
| Financials | 6.8 |
| Industrials | 5.3 |
| Consumer Discretionary | 5.3 |
| Consumer Staples | 3.2 |
| Energy | 2.4 |
| Real Estate | 1.3 |
| Materials | 0.8 |
| Fixed Income Securities | 31.5 |
| Exchange-Traded Fund | 1.5 |
| Preferred Stocks | |
| Financials | 0.4 |
| Real Estate | 0.0 |
| Short-Term Investment Funds | 4.3 |
| Other Assets/Liabilities (Net) | (0.4) |
| Total | 100.0% |
Touchstone Core Municipal Bond Fund
| Credit Quality*(% of Fixed Income Securities) |
| AAA/Aaa | 2.4% |
| AA/Aa | 51.0 |
| A/A | 35.0 |
| BBB/Baa | 4.9 |
| BB/Ba | 0.7 |
| Cash Equivalents | 6.0 |
| Total | 100.0% |
| Portfolio Allocation(% of Net Assets) |
| Fixed Rate Revenue Bonds | 70.0% |
| General Obligation Bonds | 27.1 |
| Short-Term Investment Fund | 6.6 |
| Other Assets/Liabilities (Net) | (3.7) |
| Total | 100.0% |
* Credit quality ratings are from S&P Global Ratings ("S&P") and Moody's Investors Service (“Moody's”). If agency ratings differ, the higher rating will be used. Where no rating has been assigned, it may be for reasons unrelated to the creditworthiness of the issuer.
** Sector classifications are based upon the Global Industry Classification Standard (GICS®).
Tabular Presentation of Portfolios of Investments (Unaudited) (Continued)
Touchstone International Equity Fund
| Geographic Allocation(% of Net Assets) |
| Common Stocks | |
| France | 16.5% |
| United Kingdom | 14.8 |
| Switzerland | 13.3 |
| Germany | 8.0 |
| Mexico | 4.8 |
| Japan | 4.8 |
| United States | 3.2 |
| Canada | 3.1 |
| Brazil | 3.0 |
| Hong Kong | 3.0 |
| South Korea | 2.9 |
| Greece | 2.7 |
| India | 2.6 |
| China | 2.0 |
| Norway | 1.7 |
| Tanzania | 1.3 |
| Netherlands | 1.0 |
| Spain | 1.0 |
| Short-Term Investment Fund | 7.9 |
| Other Assets/Liabilities (Net) | 2.4 |
| Total | 100.0% |
Touchstone International Growth Fund
| Geographic Allocation(% of Net Assets) |
| Common Stocks | |
| Canada | 15.2% |
| India | 12.4 |
| France | 11.5 |
| United Kingdom | 11.0 |
| United States | 6.2 |
| Switzerland | 5.7 |
| Israel | 4.1 |
| Singapore | 3.9 |
| Sweden | 3.7 |
| Taiwan | 3.3 |
| Germany | 3.0 |
| Spain | 2.9 |
| South Korea | 2.7 |
| Thailand | 2.5 |
| Italy | 2.1 |
| Japan | 1.6 |
| Netherlands | 0.8 |
| Short-Term Investment Funds | 15.1 |
| Other Assets/Liabilities (Net) | (7.7) |
| Total | 100.0% |
Touchstone Large Cap Focused Fund
| Sector Allocation*(% of Net Assets) |
| Information Technology | 28.1% |
| Health Care | 15.3 |
| Communication Services | 13.6 |
| Financials | 11.2 |
| Consumer Discretionary | 7.9 |
| Industrials | 7.8 |
| Consumer Staples | 4.5 |
| Energy | 3.3 |
| Real Estate | 1.9 |
| Materials | 1.4 |
| Short-Term Investment Fund | 5.1 |
| Other Assets/Liabilities (Net) | (0.1) |
| Total | 100.0% |
Touchstone Large Cap Fund
| Sector Allocation*(% of Net Assets) |
| Information Technology | 18.5% |
| Financials | 18.2 |
| Consumer Discretionary | 12.3 |
| Communication Services | 10.9 |
| Consumer Staples | 10.0 |
| Industrials | 9.3 |
| Materials | 8.4 |
| Health Care | 6.0 |
| Real Estate | 3.1 |
| Short-Term Investment Fund | 3.3 |
| Other Assets/Liabilities (Net) | 0.0 |
| Total | 100.0% |
* Sector classifications are based upon the Global Industry Classification Standard (GICS®).
Tabular Presentation of Portfolios of Investments (Unaudited) (Continued)
Touchstone Large Company Growth Fund
| Sector Allocation*(% of Net Assets) |
| Information Technology | 40.2% |
| Communication Services | 14.6 |
| Health Care | 12.6 |
| Financials | 8.3 |
| Consumer Discretionary | 7.5 |
| Consumer Staples | 5.0 |
| Materials | 3.0 |
| Industrials | 1.6 |
| Short-Term Investment Fund | 7.6 |
| Other Assets/Liabilities (Net) | (0.4) |
| Total | 100.0% |
Touchstone Small Company Fund
| Sector Allocation*(% of Net Assets) |
| Industrials | 19.3% |
| Health Care | 18.1 |
| Information Technology | 17.5 |
| Consumer Discretionary | 16.1 |
| Financials | 10.5 |
| Real Estate | 6.7 |
| Materials | 5.7 |
| Communication Services | 3.7 |
| Energy | 1.3 |
| Short-Term Investment Funds | 2.2 |
| Other Assets/Liabilities (Net) | (1.1) |
| Total | 100.0% |
Touchstone Value Fund
| Sector Allocation*(% of Net Assets) |
| Health Care | 16.9% |
| Financials | 16.1 |
| Consumer Discretionary | 11.5 |
| Energy | 11.5 |
| Materials | 9.8 |
| Industrials | 9.6 |
| Information Technology | 8.6 |
| Communication Services | 6.2 |
| Consumer Staples | 3.2 |
| Real Estate | 2.7 |
| Utilities | 1.9 |
| Short-Term Investment Fund | 1.2 |
| Other Assets/Liabilities (Net) | 0.8 |
| Total | 100.0% |
* Sector classifications are based upon the Global Industry Classification Standard (GICS®).
Portfolio of Investments
Touchstone Balanced Fund – June 30, 2022
| Shares | | | | Market
Value |
| | Common Stocks — 62.7% | |
| | Information Technology — 17.9% | |
| 6,138 | Accenture PLC - Class A | $ 1,704,216 |
| 220,570 | Apple, Inc. | 30,156,330 |
| 54,320 | International Business Machines Corp. | 7,669,441 |
| 154,402 | Microsoft Corp. | 39,655,066 |
| 133,039 | Oracle Corp. | 9,295,435 |
| 60,853 | PayPal Holdings, Inc.* | 4,249,973 |
| 62,590 | salesforce, Inc.* | 10,329,854 |
| 101,750 | SS&C Technologies Holdings, Inc. | 5,908,622 |
| 60,000 | Texas Instruments, Inc. | 9,219,000 |
| 57,538 | Visa, Inc. - Class A | 11,328,657 |
| 33,884 | Workday, Inc. - Class A* | 4,729,529 |
| | | | | 134,246,123 |
| | Health Care — 10.9% | |
| 5,751 | Alcon, Inc. (Switzerland) | 401,937 |
| 66,655 | AmerisourceBergen Corp. | 9,430,349 |
| 10,765 | Becton Dickinson & Co. | 2,653,895 |
| 103,668 | BioMarin Pharmaceutical, Inc.* | 8,590,967 |
| 157,376 | Bristol-Myers Squibb Co. | 12,117,952 |
| 10,000 | CVS Health Corp. | 926,600 |
| 2,153 | Embecta Corp.* | 54,514 |
| 49,687 | HCA Healthcare, Inc. | 8,350,397 |
| 94,799 | Johnson & Johnson | 16,827,771 |
| 31,591 | Merck & Co., Inc. | 2,880,152 |
| 10,047 | Stryker Corp. | 1,998,650 |
| 34,685 | UnitedHealth Group, Inc. | 17,815,257 |
| | | | | 82,048,441 |
| | Communication Services — 8.8% | |
| 12,835 | Alphabet, Inc. - Class C* | 28,075,921 |
| 184,897 | AT&T, Inc. | 3,875,441 |
| 211,054 | Comcast Corp. - Class A | 8,281,759 |
| 139,358 | Fox Corp. - Class A | 4,481,753 |
| 88,558 | Meta Platforms, Inc. - Class A* | 14,279,977 |
| 19,479 | Netflix, Inc.* | 3,406,293 |
| 31,985 | Walt Disney Co. (The)* | 3,019,384 |
| 44,729 | Warner Bros Discovery, Inc.* | 600,263 |
| | | | | 66,020,791 |
| | Financials — 6.8% | |
| 226,643 | Bank of America Corp. | 7,055,397 |
| 77,164 | Berkshire Hathaway, Inc. - Class B* | 21,067,315 |
| 1,410 | CME Group, Inc. | 288,627 |
| 47,404 | Goldman Sachs Group, Inc. (The) | 14,079,936 |
| 6,547 | Markel Corp.* | 8,466,908 |
| | | | | 50,958,183 |
| | Industrials — 5.3% | |
| 14,471 | Boeing Co. (The)* | 1,978,475 |
| 12,358 | Deere & Co. | 3,700,850 |
| 17,319 | FedEx Corp. | 3,926,390 |
| 4,260 | Honeywell International, Inc. | 740,431 |
| 57,917 | Hubbell, Inc. | 10,342,818 |
| 137,571 | Raytheon Technologies Corp. | 13,221,949 |
| 164,527 | Southwest Airlines Co.* | 5,942,715 |
| | | | | 39,853,628 |
| | Consumer Discretionary — 5.3% | |
| 42,282 | Airbnb, Inc. - Class A* | 3,766,480 |
| 35,598 | Alibaba Group Holding Ltd. (China) ADR* | 4,046,781 |
| 188,220 | Amazon.com, Inc.* | 19,990,846 |
| 61,986 | Hilton Worldwide Holdings, Inc. | 6,907,720 |
| 65,658 | Starbucks Corp. | 5,015,615 |
| | | | | 39,727,442 |
| Shares | | | | Market
Value |
| | | |
| | Consumer Staples — 3.2% | |
| 110,390 | Monster Beverage Corp.* | $ 10,233,153 |
| 8,485 | PepsiCo, Inc. | 1,414,110 |
| 106,067 | Philip Morris International, Inc. | 10,473,056 |
| 12,856 | Procter & Gamble Co. (The) | 1,848,564 |
| | | | | 23,968,883 |
| | Energy — 2.4% | |
| 20,000 | Chevron Corp. | 2,895,600 |
| 111,879 | Exxon Mobil Corp. | 9,581,318 |
| 146,582 | Schlumberger NV | 5,241,772 |
| | | | | 17,718,690 |
| | Real Estate — 1.3% | |
| 57,090 | Jones Lang LaSalle, Inc.* | 9,982,757 |
| | Materials — 0.8% | |
| 108,662 | DuPont de Nemours, Inc. | 6,039,434 |
| | Total Common Stocks | $470,564,372 |
Principal
Amount | | | | |
| | Corporate Bonds — 13.7% | |
| | Financials — 4.6% | |
| $ 1,300,000 | AerCap Ireland Capital DAC / AerCap Global Aviation Trust (Ireland), 2.450%, 10/29/26 | 1,133,486 |
| 770,000 | Allstate Corp. (The), 1.450%, 12/15/30 | 613,385 |
| 896,000 | American Express Co., 2.250%, 3/4/25 | 861,490 |
| 2,116,421 | American Financial Group, Inc., 5.250%, 4/2/30 | 2,127,134 |
| 876,000 | Ares Capital Corp., 3.250%, 7/15/25 | 810,595 |
| 511,000 | Bank of America Corp., 2.687%, 4/22/32 | 430,142 |
| 804,000 | Bank of America Corp., 3.705%, 4/24/28 | 767,694 |
| 1,212,000 | Bank of America Corp., MTN, 4.000%, 1/22/25 | 1,207,584 |
| 884,000 | Bank of Montreal (Canada), 3.803%, 12/15/32 | 820,674 |
| 1,216,000 | Bank of Nova Scotia (The) (Canada), Ser 2, 3.625%, 10/27/81 | 920,729 |
| 1,166,000 | Barclays PLC (United Kingdom), 2.894%, 11/24/32 | 939,818 |
| 555,000 | Berkshire Hathaway Finance Corp., 4.250%, 1/15/49 | 514,426 |
| 433,000 | BNP Paribas SA (France), 144a, 4.625%, 3/13/27 | 424,383 |
| 1,409,000 | Charles Schwab Corp. (The), 1.150%, 5/13/26 | 1,272,628 |
| 1,130,000 | Charles Schwab Corp. (The), 5.000%(A) | 1,011,970 |
| 868,000 | Citigroup, Inc., 0.981%, 5/1/25 | 813,859 |
| 747,000 | Citigroup, Inc., 3.200%, 10/21/26 | 711,734 |
| 446,000 | Citigroup, Inc., 4.750%, 5/18/46 | 400,445 |
| 914,000 | Cooperatieve Rabobank UA (Netherlands), 144a, 1.106%, 2/24/27 | 807,161 |
| 1,268,000 | Corestates Capital III, 144a, (3M LIBOR +0.570%), 1.981%, 2/15/27(B) | 1,175,451 |
| 862,000 | Credit Suisse AG (Switzerland), 3.700%, 2/21/25 | 843,502 |
| 850,000 | Goldman Sachs Group, Inc. (The), 2.615%, 4/22/32 | 707,595 |
| 1,611,000 | Goldman Sachs Group, Inc. (The), 3.615%, 3/15/28 | 1,526,827 |
| 720,000 | Goldman Sachs Group, Inc. (The), 3.691%, 6/5/28 | 683,762 |
| 758,000 | HSBC Holdings PLC (United Kingdom), 3.900%, 5/25/26 | 741,704 |
| 1,255,000 | Huntington Bancshares, Inc., 2.550%, 2/4/30 | 1,075,947 |
| 936,000 | JPMorgan Chase & Co., 2.956%, 5/13/31 | 810,067 |
| 963,000 | JPMorgan Chase & Co., 3.509%, 1/23/29 | 902,202 |
| 942,000 | Lloyds Banking Group PLC (United Kingdom), 3.574%, 11/7/28 | 882,793 |
| 1,225,000 | Mastercard, Inc., 2.000%, 11/18/31 | 1,035,622 |
| 1,066,000 | Morgan Stanley, 3.950%, 4/23/27 | 1,034,617 |
| 460,000 | Morgan Stanley, 5.297%, 4/20/37 | 446,642 |
| 1,162,000 | Northwestern Mutual Life Insurance Co. (The), 144a, 3.850%, 9/30/47 | 970,571 |
Touchstone Balanced Fund (Continued)
Principal
Amount | | | | MarketValue |
| | Corporate Bonds — 13.7% (Continued) | |
| | Financials — (Continued) | |
| $ 370,000 | PNC Bank NA, 2.700%, 11/1/22 | $ 369,844 |
| 1,024,000 | PNC Capital Trust, (3M LIBOR +0.570%), 2.150%, 6/1/28(B) | 952,311 |
| 1,115,000 | Prudential Financial, Inc., 5.125%, 3/1/52 | 1,029,312 |
| 984,000 | Toronto-Dominion Bank (The) (Canada), MTN, 1.150%, 6/12/25† | 908,709 |
| 1,461,000 | Truist Bank, Ser A, (3M LIBOR +0.670%), 2.080%, 5/15/27(B) | 1,344,120 |
| 380,000 | Truist Financial Corp., MTN, 2.850%, 10/26/24 | 372,854 |
| 63,000 | Wells Fargo & Co., MTN, 4.100%, 6/3/26 | 62,041 |
| | | | | 34,465,830 |
| | Consumer Discretionary — 1.4% | |
| 83,385 | Air Canada 2015-1 Class A Pass Through Trust (Canada), 144a, 3.600%, 3/15/27 | 79,049 |
| 1,405,000 | BAT Capital Corp. (United Kingdom), 3.557%, 8/15/27 | 1,287,293 |
| 672,000 | Brunswick Corp., 4.400%, 9/15/32 | 582,243 |
| 658,000 | Ford Motor Co., 3.250%, 2/12/32 | 487,924 |
| 498,000 | Ford Motor Credit Co. LLC, 3.664%, 9/8/24 | 474,888 |
| 1,560,000 | General Motors Financial Co., Inc., 3.100%, 1/12/32 | 1,257,346 |
| 587,000 | General Motors Financial Co., Inc., 5.650%, 1/17/29 | 586,686 |
| 646,000 | Home Depot, Inc. (The), 5.950%, 4/1/41 | 737,855 |
| 949,000 | Hyundai Capital America, 144a, 2.650%, 2/10/25 | 905,973 |
| 941,000 | Lowe's Cos., Inc., 4.500%, 4/15/30 | 931,987 |
| 688,000 | Magallanes, Inc., 144a, 4.279%, 3/15/32 | 617,117 |
| 688,000 | Magallanes, Inc., 144a, 5.141%, 3/15/52 | 581,253 |
| 1,596,000 | Procter & Gamble Co. (The), 1.200%, 10/29/30 | 1,306,833 |
| 1,090,000 | Toll Brothers Finance Corp., 3.800%, 11/1/29 | 926,353 |
| | | | | 10,762,800 |
| | Industrials — 1.2% | |
| 804,000 | Amcor Flexibles North America, Inc., 2.630%, 6/19/30 | 660,857 |
| 501,000 | Boeing Co. (The), 5.805%, 5/1/50 | 463,610 |
| 947,000 | Burlington Northern Santa Fe LLC, 5.750%, 5/1/40 | 1,043,347 |
| 644,000 | Carrier Global Corp., 3.577%, 4/5/50 | 490,594 |
| 1,180,000 | CNH Industrial Capital LLC, 1.450%, 7/15/26 | 1,043,437 |
| 635,000 | FedEx Corp., 5.100%, 1/15/44 | 614,447 |
| 917,000 | John Deere Capital Corp., MTN, 2.450%, 1/9/30 | 822,826 |
| 804,000 | Mohawk Industries, Inc., 3.625%, 5/15/30 | 719,087 |
| 793,000 | Norfolk Southern Corp., 4.837%, 10/1/41 | 778,909 |
| 926,000 | Parker-Hannifin Corp., 4.250%, 9/15/27 | 922,630 |
| 584,000 | Roper Technologies, Inc., 2.950%, 9/15/29 | 516,975 |
| 1,364,000 | Weir Group PLC (The) (United Kingdom), 144a, 2.200%, 5/13/26 | 1,200,628 |
| | | | | 9,277,347 |
| | Information Technology — 1.1% | |
| 1,513,000 | Apple, Inc., 2.750%, 1/13/25 | 1,495,363 |
| 619,000 | Apple, Inc., 4.650%, 2/23/46 | 640,348 |
| 1,398,000 | Broadcom, Inc., 4.150%, 11/15/30 | 1,283,976 |
| 1,136,000 | Microchip Technology, Inc., 0.983%, 9/1/24 | 1,060,359 |
| 476,000 | Microsoft Corp., 3.500%, 2/12/35 | 457,712 |
| 974,000 | NXP BV / NXP Funding LLC (China), 5.350%, 3/1/26 | 993,543 |
| 590,000 | Oracle Corp., 2.650%, 7/15/26 | 544,451 |
| 390,000 | Oracle Corp., 3.600%, 4/1/40 | 291,886 |
| 673,000 | Visa, Inc., 4.150%, 12/14/35 | 671,317 |
| 683,000 | VMware, Inc., 1.400%, 8/15/26 | 605,040 |
| | | | | 8,043,995 |
| | Utilities — 1.0% | |
| 1,018,000 | CMS Energy Corp., 4.750%, 6/1/50 | 891,992 |
| 536,000 | Duke Energy Progress LLC, 4.150%, 12/1/44 | 481,851 |
| 538,000 | Edison International, 4.125%, 3/15/28 | 502,377 |
Principal
Amount | | | | MarketValue |
| | | |
| | Utilities — (Continued) | |
| $ 879,000 | Electricite de France SA (France), 144a, 4.875%, 9/21/38 | $ 781,253 |
| 898,000 | FirstEnergy Transmission LLC, 144a, 5.450%, 7/15/44 | 838,254 |
| 1,111,000 | Ohio Power Co., Ser R, 2.900%, 10/1/51 | 800,207 |
| 971,000 | Pacific Gas and Electric Co., 3.500%, 8/1/50 | 652,687 |
| 789,000 | PacifiCorp., 5.750%, 4/1/37 | 837,807 |
| 1,754,000 | WEC Energy Group, Inc., (3M LIBOR +2.112%), 3.524%, 5/15/67(B) | 1,353,965 |
| | | | | 7,140,393 |
| | Communication Services — 0.9% | |
| 856,000 | AT&T, Inc., 3.850%, 6/1/60 | 666,400 |
| 462,000 | AT&T, Inc., 4.500%, 5/15/35 | 439,467 |
| 1,158,000 | British Telecommunications PLC (United Kingdom), 144a, 3.250%, 11/8/29 | 1,035,289 |
| 953,000 | Charter Communications Operating LLC / Charter Communications Operating Capital, 6.484%, 10/23/45 | 928,714 |
| 739,000 | Comcast Corp., 4.000%, 3/1/48 | 646,673 |
| 1,409,000 | Netflix, Inc., 6.375%, 5/15/29 | 1,416,186 |
| 336,000 | Paramount Global, 4.950%, 5/19/50 | 283,504 |
| 1,007,000 | T-Mobile USA, Inc., 3.875%, 4/15/30 | 942,354 |
| 937,000 | Verizon Communications, Inc., 2.987%, 10/30/56 | 655,549 |
| | | | | 7,014,136 |
| | Real Estate — 0.9% | |
| 914,000 | Crown Castle International Corp. REIT, 3.650%, 9/1/27 | 863,963 |
| 730,000 | Equinix, Inc. REIT, 2.900%, 11/18/26 | 679,324 |
| 1,012,000 | Host Hotels & Resorts LP REIT, Ser F, 4.500%, 2/1/26 | 995,481 |
| 806,000 | Invitation Homes Operating Partnership LP REIT, 4.150%, 4/15/32 | 733,811 |
| 654,000 | Mid-America Apartments LP REIT, 3.750%, 6/15/24 | 652,222 |
| 820,000 | Realty Income Corp. REIT, 4.600%, 2/6/24 | 827,414 |
| 717,000 | Sabra Health Care LP REIT, 5.125%, 8/15/26 | 698,476 |
| 314,000 | STORE Capital Corp. REIT, 4.500%, 3/15/28 | 306,776 |
| 589,000 | STORE Capital Corp. REIT, 4.625%, 3/15/29 | 575,779 |
| | | | | 6,333,246 |
| | Health Care — 0.8% | |
| 827,000 | AbbVie, Inc., 4.450%, 5/14/46 | 755,003 |
| 725,000 | Alcon Finance Corp. (Switzerland), 144a, 3.800%, 9/23/49 | 579,475 |
| 798,000 | Becton Dickinson and Co., 4.685%, 12/15/44 | 740,894 |
| 784,000 | CommonSpirit Health, 4.187%, 10/1/49 | 662,498 |
| 733,000 | CVS Health Corp., 5.125%, 7/20/45 | 709,557 |
| 904,000 | DH Europe Finance II Sarl, 3.250%, 11/15/39 | 753,478 |
| 506,000 | HCA Inc., 5.375%, 9/1/26 | 501,742 |
| 725,000 | Mylan, Inc., 4.550%, 4/15/28 | 692,282 |
| 930,000 | UnitedHealth Group, Inc., 3.500%, 8/15/39 | 814,628 |
| | | | | 6,209,557 |
| | Energy — 0.8% | |
| 712,000 | Boardwalk Pipelines LP, 4.800%, 5/3/29 | 691,219 |
| 613,000 | Canadian Natural Resources Ltd. (Canada), 6.250%, 3/15/38 | 650,604 |
| 635,000 | Cenovus Energy, Inc. (Canada), 5.250%, 6/15/37 | 622,561 |
| 662,000 | Continental Resources, Inc., 144a, 5.750%, 1/15/31 | 637,963 |
| 754,000 | Energy Transfer LP, 4.150%, 9/15/29 | 691,653 |
| 621,000 | MC Brazil Downstream Trading SARL (Brazil), 144a, 7.250%, 6/30/31 | 493,502 |
| 808,000 | Midwest Connector Capital Co. LLC, 144a, 3.900%, 4/1/24 | 793,496 |
| 610,000 | NGPL PipeCo LLC, 144a, 7.768%, 12/15/37 | 665,977 |
Touchstone Balanced Fund (Continued)
Principal
Amount | | | | MarketValue |
| | Corporate Bonds — 13.7% (Continued) | |
| | Energy — (Continued) | |
| $ 663,000 | Petroleos Mexicanos (Mexico), 6.625%, 6/15/35 | $ 452,584 |
| 592,000 | Valero Energy Corp., 4.000%, 6/1/52 | 475,331 |
| | | | | 6,174,890 |
| | Consumer Staples — 0.8% | |
| 1,077,000 | 7-Eleven, Inc., 144a, 0.950%, 2/10/26 | 951,239 |
| 1,164,000 | Anheuser-Busch Cos. LLC / Anheuser-Busch InBev Worldwide, Inc. (Belgium), 4.900%, 2/1/46 | 1,100,202 |
| 944,000 | Ashtead Capital, Inc. (United Kingdom), 144a, 4.000%, 5/1/28 | 853,432 |
| 1,240,000 | JBS Finance Luxembourg Sarl, 144a, 2.500%, 1/15/27 | 1,075,998 |
| 398,000 | JBS USA LUX SA / JBS USA Food Co. / JBS USA Finance, Inc., 144a, 4.375%, 2/2/52 | 281,474 |
| 321,000 | Kroger Co. (The), 5.000%, 4/15/42 | 311,688 |
| 908,000 | Mars, Inc., 144a, 3.875%, 4/1/39 | 824,622 |
| 517,000 | Starbucks Corp., 3.350%, 3/12/50 | 393,745 |
| | | | | 5,792,400 |
| | Materials — 0.2% | |
| 535,000 | Braskem America Finance Co. (Brazil), 144a, 7.125%, 7/22/41 | 501,476 |
| 567,000 | Braskem Netherlands Finance BV (Brazil), 144a, 5.875%, 1/31/50 | 447,879 |
| 903,000 | Sherwin-Williams Co. (The), 4.500%, 6/1/47 | 803,998 |
| | | | | 1,753,353 |
| | Total Corporate Bonds | $102,967,947 |
| | U.S. Treasury Obligations — 5.8% |
| 4,565,000 | U.S. Treasury Bond, 1.750%, 8/15/41 | | | 3,493,117 |
| 4,650,000 | U.S. Treasury Bond, 2.250%, 2/15/52 | | | 3,859,500 |
| 9,985,000 | U.S. Treasury Bond, 2.375%, 2/15/42 | | | 8,513,773 |
| 5,234,342 | U.S. Treasury Inflation Indexed Bond, 0.125%, 2/15/52 | | | 4,157,485 |
| 15,224,000 | U.S. Treasury Note, 0.750%, 5/31/26 | | | 13,947,206 |
| 3,195,000 | U.S. Treasury Note, 1.500%, 1/31/27 | | | 2,987,450 |
| 1,095,000 | U.S. Treasury Note, 1.875%, 2/15/32 | | | 994,739 |
| 6,000,000 | U.S. Treasury Note, 2.750%, 4/30/27 | | | 5,927,812 |
| | Total U.S. Treasury Obligations | $43,881,082 |
| | Commercial Mortgage-Backed Securities — 3.4% |
| 825,000 | BANK, Ser 2018-BN14, Class A3, 3.966%, 9/15/60 | | | 810,949 |
| 26,751,310 | BANK, Ser 2019-BN21, Class XA, 0.987%, 10/17/52(B)(C)(D) | | | 1,264,858 |
| 905,000 | BANK, Ser 2020-BN26, Class A4, 2.403%, 3/15/63 | | | 794,357 |
| 1,150,000 | BANK, Ser 2022-BNK39, Class A4, 2.928%, 2/15/55 | | | 1,033,809 |
| 870,000 | BBCMS Mortgage Trust, Ser 2021-C11, Class A5, 2.322%, 9/15/54 | | | 740,528 |
| 2,520,000 | BBCMS Mortgage Trust, Ser 2021-C12, Class A5, 2.689%, 11/15/54 | | | 2,206,465 |
| 670,000 | BBCMS Mortgage Trust, Ser 2022-C14, Class A5, 2.946%, 2/15/55(B)(D) | | | 598,836 |
| 900,000 | BPR Trust, Ser 2021-KEN, Class B, 144a, (1M LIBOR +1.950%), 3.274%, 2/15/29(B) | | | 887,984 |
| 1,500,000 | BX Commercial Mortgage Trust, Ser 2020-VIV3, Class B, 144a, 3.662%, 3/9/44(B)(D) | | | 1,319,661 |
| 1,500,000 | BX Commercial Mortgage Trust, Ser 2020-VIV4, Class A, 144a, 2.843%, 3/9/44 | | | 1,288,960 |
| 755,000 | Citigroup Commercial Mortgage Trust, Ser 2020-GC46, Class A5, 2.717%, 2/15/53 | | | 673,614 |
| 1,230,000 | COMM Mortgage Trust, Ser 2015-DC1, Class A5, 3.350%, 2/10/48 | | | 1,203,383 |
| 1,220,000 | COMM Mortgage Trust, Ser 2018-HOME, Class A, 144a, 3.942%, 4/10/33(B)(D) | | | 1,151,396 |
Principal
Amount | | | | MarketValue |
| | Commercial Mortgage-Backed Securities — 3.4% (Continued) |
| $ 700,000 | GS Mortgage Securities Trust, Ser 2017-FARM, Class B, 144a, 3.659%, 1/10/43(B)(D) | | | $ 631,434 |
| 1,205,000 | GS Mortgage Securities Trust, Ser 2020-GC47, Class A5, 2.377%, 5/12/53 | | | 1,049,480 |
| 1,000,000 | HONO Mortgage Trust, Ser 2021-LULU, Class B, 144a, (1M LIBOR +1.450%), 2.774%, 10/15/36(B) | | | 963,766 |
| 562,000,000 | Independence Plaza Trust, Ser 2018-INDP, Class XCP, 144a, 0.249%, 7/10/35(B)(C)(D) | | | 920,444 |
| 2,485,000 | JP Morgan Chase Commercial Mortgage Securities Trust, Ser 2017-JP7, Class A5, 3.454%, 9/15/50 | | | 2,392,255 |
| 500,000 | JPMorgan Chase Commercial Mortgage Securities Trust, Ser 2018-MINN, Class A, 144a, (1M LIBOR +1.27%), 2.594%, 11/15/35(B) | | | 493,226 |
| 1,100,000 | Morgan Stanley Capital I Trust, Ser 2018-H3, Class AS, 4.177%, 7/15/51 | | | 1,088,450 |
| 825,000 | SG Commercial Mortgage Securities Trust, Ser 2019-787E, Class A, 144a, 4.163%, 2/15/41 | | | 781,558 |
| 770,000 | Wells Fargo Commercial Mortgage Trust, Ser 2018-AUS, Class B, 144a, 4.194%, 8/17/36(B)(D) | | | 718,042 |
| 2,220,000 | Wells Fargo Commercial Mortgage Trust, Ser 2019-C53, Class A4, 3.040%, 10/15/52 | | | 2,036,053 |
| 262,558 | WFRBS Commercial Mortgage Trust, Ser 2014-C19, Class A3, 3.660%, 3/15/47 | | | 261,774 |
| | Total Commercial Mortgage-Backed Securities | $25,311,282 |
| | U.S. Government Mortgage-Backed Obligations — 3.1% |
| 1,542 | FHLMC, Pool #G08062, 5.000%, 6/1/35 | | | 1,625 |
| 139,845 | FHLMC, Pool #G08637, 4.000%, 4/1/45 | | | 141,130 |
| 811,120 | FHLMC, Pool #Q02664, 4.500%, 8/1/41 | | | 839,141 |
| 1,372,845 | FHLMC, Pool #Q29056, 4.000%, 10/1/44 | | | 1,385,454 |
| 733,893 | FHLMC, Pool #Q29260, 4.000%, 10/1/44 | | | 740,633 |
| 2,029,876 | FHLMC REMIC, Pool #QD2143, 2.000%, 12/1/51 | | | 1,773,628 |
| 1,622,388 | FHLMC REMIC, Pool #SD8148, 3.000%, 5/1/51 | | | 1,516,313 |
| 310 | FNMA, Pool #690305, 5.500%, 3/1/33 | | | 323 |
| 312,473 | FNMA, Pool #725423, 5.500%, 5/1/34 | | | 334,893 |
| 279,813 | FNMA, Pool #725610, 5.500%, 7/1/34 | | | 300,067 |
| 52,946 | FNMA, Pool #748895, 6.000%, 12/1/33 | | | 54,140 |
| 106,816 | FNMA, Pool #AD9193, 5.000%, 9/1/40 | | | 112,499 |
| 312,928 | FNMA, Pool #AH8925, 4.500%, 3/1/41 | | | 323,363 |
| 168,891 | FNMA, Pool #AL5718, 3.500%, 9/1/44 | | | 166,231 |
| 318,856 | FNMA, Pool #AR9195, 3.000%, 3/1/43 | | | 305,174 |
| 568,214 | FNMA, Pool #BC1809, 3.500%, 5/1/46 | | | 556,512 |
| 1,925,033 | FNMA, Pool #BT7156, 2.000%, 8/1/51 | | | 1,681,941 |
| 2,120,479 | FNMA, Pool #CB1336, 2.000%, 8/1/41 | | | 1,899,812 |
| 681,268 | FNMA, Pool #FM4996, 2.000%, 12/1/50 | | | 596,322 |
| 2,025,059 | FNMA, Pool #FM5085, 2.000%, 12/1/50 | | | 1,769,799 |
| 642,068 | FNMA, Pool #FM5166, 3.000%, 12/1/50 | | | 600,485 |
| 540,734 | FNMA, Pool #FM5279, 3.500%, 11/1/50 | | | 524,938 |
| 464,500 | FNMA, Pool #FM5468, 2.500%, 1/1/36 | | | 445,300 |
| 614,776 | FNMA, Pool #FM5682, 2.500%, 1/1/51 | | | 555,651 |
| 1,771,007 | FNMA, Pool #FM7913, 2.000%, 4/1/36 | | | 1,659,961 |
| 2,098,867 | FNMA, Pool #FM8360, 2.500%, 8/1/51 | | | 1,899,510 |
| 2,030,821 | FNMA, Pool #FM8361, 2.500%, 8/1/51 | | | 1,833,768 |
| 747,011 | FNMA, Pool #MA4166, 3.000%, 10/1/40 | | | 707,048 |
| 482,612 | GNMA, Pool #5175, 4.500%, 9/20/41 | | | 505,356 |
| | Total U.S. Government Mortgage-Backed Obligations | $23,231,017 |
| | Asset-Backed Securities — 2.5% |
| 1,000,000 | AB BSL CLO 2 Ltd. (Cayman Islands), Ser 2021-2A, Class B1, 144a, (3M LIBOR +1.650%), 2.694%, 4/15/34(B) | | | 941,348 |
Touchstone Balanced Fund (Continued)
Principal
Amount | | | | MarketValue |
| | Asset-Backed Securities — 2.5% (Continued) |
| $ 1,500,000 | AB BSL CLO 3, Ltd. (Cayman Islands), Ser 2021-3A, Class B, 144a, (3M LIBOR +1.700%), 2.763%, 10/20/34(B) | | | $ 1,416,464 |
| 357,489 | Adams Outdoor Advertising LP, Ser 2018-1, Class A, 144a, 4.810%, 11/15/48 | | | 352,180 |
| 345,189 | CF Hippolyta Issuer LLC, Ser 2020-1, Class A1, 144a, 1.690%, 7/15/60 | | | 313,090 |
| 1,344,188 | CLI Funding VI LLC, Ser 2020-3A, Class A, 144a, 2.070%, 10/18/45 | | | 1,213,525 |
| 846,563 | Driven Brands Funding LLC, Ser 2019-1A, Class A2, 144a, 4.641%, 4/20/49 | | | 809,406 |
| 373,982 | Elara HGV Timeshare Issuer LLC, Ser 2019-A, Class B, 144a, 2.910%, 1/25/34 | | | 352,125 |
| 1,027,000 | Jack in the Box Funding LLC, Ser 2019-1A, Class A2II, 144a, 4.476%, 8/25/49 | | | 984,478 |
| 995,000 | Jack in the Box Funding LLC, Ser 2022-1A, Class A2I, 144a, 3.445%, 2/26/52 | | | 907,633 |
| 376,110 | Jersey Mike's Funding, Ser 2019-1A, Class A2, 144a, 4.433%, 2/15/50 | | | 357,891 |
| 950,000 | Jimmy Johns Funding LLC, Ser 2022-1A, Class A2I, 144a, 4.077%, 4/30/52 | | | 887,137 |
| 1,150,000 | Madison Park Funding XLIX Ltd. (Cayman Islands), Ser 2021-49A, Class B1, 144a, (3M LIBOR +1.700%), 2.744%, 10/19/34(B) | | | 1,093,400 |
| 573,777 | Mill City Mortgage Loan Trust, Ser 2018-3, Class M3, 144a, 3.250%, 8/25/58(B)(D) | | | 507,850 |
| 841,500 | Neighborly Issuer LLC, Ser 2021-1A, Class A2, 144a, 3.584%, 4/30/51 | | | 730,359 |
| 525,000 | New Mountain CLO 1 Ltd. (Cayman Islands), Ser CLO-1A, Class AR, 144a, (3M LIBOR +1.200%), 2.244%, 10/15/34(B) | | | 504,468 |
| 1,500,000 | Palmer Square CLO, Ltd. (Cayman Islands), Ser 2021-4A, Class B, 144a, (3M LIBOR +1.650%), 2.694%, 10/15/34(B) | | | 1,425,728 |
| 997,500 | Planet Fitness Master Issuer LLC, Ser 2022-1A, Class A2I, 144a, 3.251%, 12/5/51 | | | 893,651 |
| 1,500,000 | Rockford Tower CLO, Ltd. (Cayman Islands), Ser 2021-3A, Class B, 144a, (3M LIBOR +1.750%), 2.813%, 10/20/34(B)(E) | | | 1,415,715 |
| 395,881 | TAL Advantage VII LLC, Ser 2020-1A, Class A, 144a, 2.050%, 9/20/45 | | | 359,340 |
| 1,400,000 | Textainer Marine Containers, Ltd. (China), Ser 2021-3A, Class A, 144a, 1.940%, 8/20/46 | | | 1,210,005 |
| 1,400,000 | Towd Point Mortgage Trust, Ser 2015-6, Class B1, 144a, 3.775%, 4/25/55(B)(D) | | | 1,309,801 |
| 1,140,000 | Towd Point Mortgage Trust, Ser 2019-4, Class M1B, 144a, 3.000%, 10/25/59(B)(D) | | | 972,932 |
| | Total Asset-Backed Securities | $18,958,526 |
| Shares | | | | |
| | Exchange-Traded Fund — 1.5% | |
| 133,451 | iShares JP Morgan USD Emerging Markets Bond ETF | 11,386,039 |
Principal
Amount | | | | |
| | Non-Agency Collateralized Mortgage Obligations — 1.5% |
| $ 115,615 | Agate Bay Mortgage Trust, Ser 2013-1, Class B3, 144a, 3.564%, 7/25/43(B)(D) | | | 114,054 |
| 385,337 | Agate Bay Mortgage Trust, Ser 2015-4, Class B2, 144a, 3.528%, 6/25/45(B)(D) | | | 375,388 |
| 456,477 | Agate Bay Mortgage Trust, Ser 2015-7, Class B1, 144a, 3.655%, 10/25/45(B)(D) | | | 441,112 |
| 216,363 | CSMC Trust, Ser 2013-IVR3, Class B2, 144a, 3.398%, 5/25/43(B)(D) | | | 213,258 |
Principal
Amount | | | | MarketValue |
| | Non-Agency Collateralized Mortgage Obligations — 1.5%
(Continued) |
| $ 350,629 | CSMC Trust, Ser 2015-1, Class B3, 144a, 3.931%, 1/25/45(B)(D) | | | $ 340,397 |
| 388,149 | CSMC Trust, Ser 2015-WIN1, Class B3, 144a, 3.792%, 12/25/44(B)(D) | | | 375,938 |
| 561,838 | GS Mortgage-Backed Securities Trust, Ser 2021-PJ6, Class A2, 144a, 2.500%, 11/25/51(B)(D) | | | 481,096 |
| 1,340,371 | GS Mortgage-Backed Securities Trust, Ser 2021-PJ8, Class A8, 144a, 2.500%, 1/25/52(B)(D) | | | 1,227,565 |
| 685,699 | JP Morgan Mortgage Trust, Ser 2017-1, Class B2, 144a, 3.458%, 1/25/47(B)(D) | | | 630,454 |
| 1,126,707 | JP Morgan Mortgage Trust, Ser 2020-5, Class B1, 144a, 3.598%, 12/25/50(B)(D) | | | 1,003,621 |
| 1,493,960 | JP Morgan Mortgage Trust, Ser 2021-10, Class A4, 144a, 2.500%, 12/25/51(B)(D) | | | 1,351,567 |
| 1,397,426 | Mill City Mortgage Loan Trust, Ser 2019-1, Class M1, 144a, 3.500%, 10/25/69(B)(D) | | | 1,290,020 |
| 166,980 | Sequoia Mortgage Trust, Ser 2015-2, Class A19, 144a, 3.500%, 5/25/45(B)(D) | | | 156,445 |
| 898,701 | Sequoia Mortgage Trust, Ser 2018-CH3, Class B1B, 144a, 4.756%, 8/25/48(B)(D) | | | 896,614 |
| 815,384 | Sequoia Mortgage Trust, Ser 2018-CH3, Class B2B, 144a, 4.756%, 8/25/48(B)(D) | | | 811,912 |
| 1,337,315 | Wells Fargo Mortgage Backed Securities Trust, Ser 2021-2, Class A3, 144a, 2.500%, 6/25/51(B)(D) | | | 1,213,196 |
| | Total Non-Agency Collateralized Mortgage Obligations | $10,922,637 |
| | Agency Collateralized Mortgage Obligations — 0.9% |
| 528,014 | FHLMC REMIC, Ser 3859, Class JB, 5.000%, 5/15/41 | | | 551,471 |
| 515,000 | FHLMC REMIC, Ser 4991, Class HB, 2.000%, 7/25/50 | | | 407,795 |
| 1,650,000 | FHLMC REMIC, Ser 5178, Class CV, 2.000%, 11/25/40 | | | 1,335,468 |
| 1,500,000 | FNMA REMIC, Ser 2019-35, Class KB, 3.000%, 7/25/49 | | | 1,331,527 |
| 2,150,000 | FNMA REMIC, Ser 2022-16, Class KB, 2.500%, 11/25/49 | | | 1,791,543 |
| 1,370,000 | FREMF Mortgage Trust, Ser 2019-K103, Class B, 144a, 3.573%, 12/25/51(B)(D) | | | 1,249,118 |
| 251,367 | GNMA, Ser 2010-169, Class AW, 4.500%, 12/20/40 | | | 257,448 |
| 4,028,375 | GNMA, Ser 2012-147, Class IO, 0.555%, 4/16/54(B)(C)(D) | | | 58,717 |
| | Total Agency Collateralized Mortgage Obligations | $6,983,087 |
| | Sovereign Government Obligations — 0.6% |
| 674,000 | Bahamas Government International Bond, 144a, 6.000%, 11/21/28 | | | 477,299 |
| 650,000 | Chile Government International Bond, 3.100%, 5/7/41 | | | 494,553 |
| 801,000 | Chile Government International Bond, 3.100%, 1/22/61 | | | 541,549 |
| 663,000 | Colombia Government International Bond, 3.250%, 4/22/32 | | | 479,074 |
| 725,000 | Ecuador Government International Bond, 144a, 5.000%, 7/31/30 | | | 466,734 |
| 680,000 | Egypt Government International Bond, 144a, 5.875%, 2/16/31 | | | 421,822 |
| 680,000 | Ghana Government International Bond, 144a, 7.625%, 5/16/29 | | | 330,344 |
| 777,000 | Mexico Government International Bond, 3.771%, 5/24/61 | | | 494,568 |
Touchstone Balanced Fund (Continued)
Principal
Amount | | | | MarketValue |
| | Sovereign Government Obligations — 0.6% (Continued) |
| $ 655,000 | Nigeria Government International Bond, 144a, 7.625%, 11/28/47 | | | $ 391,363 |
| 650,000 | Republic of Uzbekistan International Bond, 144a, 3.700%, 11/25/30 | | | 469,050 |
| | Total Sovereign Government Obligations | $4,566,356 |
| Shares | | | | |
| | Preferred Stocks — 0.4% | |
| | Financials — 0.4% | |
| 18,730 | Bank of America Corp., Ser NN, 4.375%(A)† | 357,556 |
| 19,645 | Bank of America Corp., Ser QQ, 4.250%(A) | 363,433 |
| 28,250 | JPMorgan Chase & Co., Ser JJ, 4.550%(A)† | 554,265 |
| 20,386 | JPMorgan Chase & Co., Ser MM, 4.200%(A) | 377,956 |
| 7,114 | US Bancorp, Ser L, 3.750%(A) | 122,956 |
| 24,880 | US Bancorp, Ser M, 4.000%(A) | 461,773 |
| 7,910 | Wells Fargo & Co., Ser AA, 4.700%(A) | 152,900 |
| 11,825 | Wells Fargo & Co., Ser DD, 4.250%(A) | 207,884 |
| | | | | 2,598,723 |
| | Real Estate — 0.0% | |
| 10,809 | Public Storage REIT, Ser P, 4.000%(A) | 197,480 |
| | Total Preferred Stocks | $2,796,203 |
| | Short-Term Investment Funds — 4.3% | |
| 30,804,400 | Dreyfus Government Cash Management, Institutional Shares, 1.35%∞Ω | 30,804,400 |
| 1,732,824 | Invesco Government & Agency Portfolio, Institutional Class, 1.38%∞Ω** | 1,732,824 |
| | Total Short-Term Investment Funds | $32,537,224 |
| | Total Investment Securities—100.4%
(Cost $694,430,587) | $754,105,772 |
| | Liabilities in Excess of Other Assets — (0.4%) | (2,996,678) |
| | Net Assets — 100.0% | $751,109,094 |
| (A) | Perpetual Bond - A bond or preferred stock with no definite maturity date. |
| (B) | Variable rate security - Rate reflected is the rate in effect as of June 30, 2022. |
| (C) | Interest only security - This type of security represents the right to receive the monthly interest payments on an underlying pool of mortgages. Payments of principal on the pool reduce the value of the “interest only” holding. |
| (D) | Certain variable rate securities are not based on a published reference rate and spread but are determined by the issuer or agent and are based on current market conditions. These securities do not indicate a reference rate and spread in their description. |
| (E) | Security has no stated coupon and is considered an equity position in the collateralized loan obligation (“CLO”). CLO equity investments are entitled to recurring distributions which are generally equal to the excess cash flow generated from the underlying investments after payment of the contractual payments to debt holders and fund expenses. |
| * | Non-income producing security. |
| ** | Represents collateral for securities loaned. |
| † | All or a portion of the security is on loan. The total market value of the securities on loan as of June 30, 2022 was $1,695,572. |
| ∞ | Open-End Fund. |
| Ω | Represents the 7-Day SEC yield as of June 30, 2022. |
| Portfolio Abbreviations: |
| ADR – American Depositary Receipt |
| CLO – Collateralized Loan Obligation |
| DAC – Designated Activity Company |
| ETF – Exchange-Traded Fund |
| FHLMC – Federal Home Loan Mortgage Corporation |
| FNMA – Federal National Mortgage Association |
| FREMF – Freddie Mac Multifamily Securitization |
| GNMA – Government National Mortgage Association |
| IO – Interest Only |
| LIBOR – London Interbank Offered Rate |
| LLC – Limited Liability Company |
| LP – Limited Partnership |
| MTN – Medium Term Note |
| PLC – Public Limited Company |
| REIT – Real Estate Investment Trust |
| REMIC – Real Estate Mortgage Investment Conduit |
| 144a - This is a restricted security that was sold in a transaction qualifying for the exemption under Rule 144a of the Securities Act of 1933. This security may be sold in transactions exempt from registration, normally to qualified institutional buyers. At June 30, 2022, these securities were valued at $60,366,279 or 8.0% of net assets. These securities were deemed liquid pursuant to procedures approved by the Board of Trustees. |
Other Information:
The inputs or methodology used for valuing securities may not be an indication of the risk associated with investing in those securities. For more information on valuation inputs, and their aggregation into the levels used in the table below, please refer to the security valuation section in the accompanying Notes to Financial Statements.
| Valuation Inputs at Reporting Date: |
| Description | Level 1 | Level 2 | Level 3 | Total |
| Common Stocks | $470,564,372 | $— | $— | $470,564,372 |
| Corporate Bonds | — | 102,967,947 | — | 102,967,947 |
| U.S. Treasury Obligations | — | 43,881,082 | — | 43,881,082 |
| Commercial Mortgage-Backed Securities | — | 25,311,282 | — | 25,311,282 |
| U.S. Government Mortgage-Backed Obligations | — | 23,231,017 | — | 23,231,017 |
| Asset-Backed Securities | — | 18,958,526 | — | 18,958,526 |
| Exchange-Traded Fund | 11,386,039 | — | — | 11,386,039 |
| Non-Agency Collateralized Mortgage Obligations | — | 10,922,637 | — | 10,922,637 |
| Agency Collateralized Mortgage Obligations | — | 6,983,087 | — | 6,983,087 |
| Sovereign Government Obligations | — | 4,566,356 | — | 4,566,356 |
| Preferred Stocks | 2,796,203 | — | — | 2,796,203 |
| Short-Term Investment Funds | 32,537,224 | — | — | 32,537,224 |
| Total | $517,283,838 | $236,821,934 | $— | $754,105,772 |
See accompanying Notes to Financial Statements.
Portfolio of Investments
Touchstone Core Municipal Bond Fund – June 30, 2022
Principal
Amount | | | | Market
Value |
| | Fixed Rate Revenue Bonds – 70.0% |
| $ 500,000 | Alaska Municipal Bond Bank Auth., Revenue, 5.000%, 12/01/33 | $ 562,692 |
| 500,000 | American Municipal Power Inc, Revenue, 5.000%, 02/15/35 | 558,586 |
| 500,000 | Brevard County Health Fac. Auth., Revenue, 5.000%, 04/01/52 | 524,763 |
| 500,000 | Central Florida Expressway Auth., Revenue, 5.000%, 07/01/28 | 562,623 |
| 450,000 | City of Erie Higher Education Building Authority, Revenue, 5.000%, 05/01/47 | 464,598 |
| 550,000 | City of Lake Worth Beach FL Consolidated Utility Revenue, 4.000%, 10/01/52 | 518,026 |
| 500,000 | City of Panama City Beach, 4.000%, 11/01/44 | 486,385 |
| 500,000 | Cleveland, OH, Airport System Rev. Ser B, 5.000%, 01/01/37 | 538,344 |
| 500,000 | Cobb County Kennestone Hospital Auth., Revenue, 4.000%, 04/01/52 | 464,680 |
| 500,000 | Connecticut State Health & Educational Fac. Auth., Revenue, 5.000%, 07/01/26 | 539,706 |
| 700,000 | County of Miami-Dade FL Aviation Revenue, Revenue Ser A, 5.000%, 10/01/33 | 770,704 |
| 575,000 | County of St Louis, Revenue, 5.000%, 05/01/27 | 639,252 |
| 1,000,000 | Cuyahoga County, OH COP, 5.000%, 12/01/32 | 1,036,015 |
| 685,000 | DeKalb-Jackson Water Supply District Inc, Revenue Ser A, 5.000%, 07/01/32 | 770,424 |
| 500,000 | Florida Development Finance Corp., Revenue Ser A, 5.000%, 06/15/30 | 521,943 |
| 510,000 | Florida Governmental Utility Auth., Revenue Ser A, 5.000%, 10/01/25 | 547,301 |
| 500,000 | Fort Pierce Utilities Auth., Revenue, 4.000%, 10/01/52 | 474,969 |
| 500,000 | Georgetown , TX, Utility System Revenue, 5.000%, 08/15/25 | 538,072 |
| 425,000 | Georgetown , TX, Utility System Revenue, 5.000%, 08/15/35 | 477,116 |
| 500,000 | Greater Jasper School Building Corp., Revenue, 5.000%, 07/15/29 | 557,074 |
| 350,000 | Guam Power Auth., Revenue Ser A, 5.000%, 10/01/26 | 371,777 |
| 500,000 | Hamilton County, OH, 5.000%, 02/01/30 | 511,603 |
| 1,080,000 | Hamilton County, OH, 5.000%, 05/15/33 | 1,116,042 |
| 500,000 | Hamilton County, OH, 5.000%, 08/15/40 | 529,030 |
| 1,000,000 | Hamilton County, OH EDR, 5.000%, 06/01/33 | 1,065,049 |
| 465,000 | Harris County Cultural Education Fac. Finance Corp., Revenue Ser A, 5.000%, 07/01/52 | 490,072 |
| 500,000 | Hospitals & Higher Education Fac. Auth. of Philadelphia/The, Revenue, 5.000%, 07/01/37 | 540,991 |
| 675,000 | Illinois State Toll Highway Authority, Revenue Ser A, 5.000%, 01/01/46 | 729,782 |
| 500,000 | Iowa Higher Education Loan Auth., Revenue, 5.375%, 10/01/52 | 515,574 |
| 525,000 | Jacksonville, FL, Revenue Ser R, 5.000%, 10/01/35 | 593,560 |
| 500,000 | JEA Electric System Revenue, 5.000%, 10/01/28 | 560,677 |
| 595,000 | Kentucky Public Energy Auth., Revenue Ser 1, 4.000%, 02/01/30 | 602,796 |
| 500,000 | Kentucky State Property & Building Commission, Revenue Ser A, 5.000%, 11/01/23 | 518,692 |
| 500,000 | Lancaster School District Ser A, 4.125%, 11/01/50 | 471,261 |
| 500,000 | Lehigh County, PA, Revenue, 5.000%, 07/01/28 | 553,589 |
| 500,000 | Louisville/Jefferson County Metropolitan Government, Revenue Ser A, 5.000%, 05/15/52 | 510,935 |
| 500,000 | Maryland Stadium Auth., Revenue, 5.000%, 06/01/28 | 559,543 |
| 555,000 | Massachusetts School Building Auth., Revenue Ser A, 5.000%, 08/15/45 | 614,618 |
Principal
Amount | | | | Market
Value |
| | |
| $ 575,000 | Metropolitan Transportation Authority, Revenue, 5.000%, 11/15/22 | $ 581,676 |
| 435,000 | Michigan Finance Auth., Revenue Ser A, 5.000%, 12/01/34 | 484,649 |
| 500,000 | Michigan Finance Authority, Revenue, 5.000%, 06/01/32 | 542,538 |
| 500,000 | Monroeville Finance Auth., Revenue Ser B, 5.000%, 02/15/29 | 552,771 |
| 500,000 | Municipal Electric Authority of Georgia, 5.000%, 07/01/52 | 517,080 |
| 750,000 | New Jersey Educational Fac. Auth., Revenue Ser A, 5.000%, 07/01/26 | 815,162 |
| 500,000 | New Jersey Transportation Trust Fund Authority, Revenue, 5.000%, 06/15/45 | 521,394 |
| 500,000 | New York State Dormitory Auth., Revenue, 5.000%, 07/01/29 | 534,079 |
| 500,000 | New York State Dormitory Auth., Revenue, 5.000%, 05/01/52 | 518,461 |
| 365,000 | New York State Dormitory Auth., Revenue Ser A, 5.000%, 10/01/34 | 407,309 |
| 500,000 | Newark Higher Education Finance Corp., Revenue Ser A, 4.000%, 04/01/57 | 434,339 |
| 500,000 | North Kent Sewer Auth., Revenue, 5.000%, 11/01/23 | 519,759 |
| 650,000 | North Sumter County Utility Dependent District, Revenue Ser N, 5.000%, 10/01/49 | 709,129 |
| 500,000 | Ohio Higher Educational Fac. Commission, 5.000%, 03/01/34 | 506,461 |
| 525,000 | Ohio State University (The) Ser A, 4.000%, 12/01/33 | 528,594 |
| 500,000 | Oregon State Fac. Auth., Revenue Ser A, 5.000%, 06/01/52 | 529,241 |
| 500,000 | Pasco County School Board, COP Ser B, 5.000%, 08/01/46 | 539,875 |
| 500,000 | Pennsylvania Higher Educational Fac. Auth., Revenue Ser A, 5.000%, 05/01/32 | 560,700 |
| 695,000 | Pennsylvania Turnpike Commission, Revenue, 5.000%, 12/01/44 | 739,662 |
| 500,000 | Pittsburg Successor Agency Redevelopment Agency, 5.000%, 08/01/23 | 516,599 |
| 500,000 | Polaris Career Center COP, 5.000%, 11/01/35 | 535,705 |
| 500,000 | Regional Transportation District, Revenue, 5.000%, 01/15/29 | 527,973 |
| 555,000 | School District of Broward County, COP Ser B, 5.000%, 07/01/36 | 623,503 |
| 580,000 | South Carolina Jobs-Economic Development Auth., Revenue Ser A, 4.000%, 04/01/52 | 548,195 |
| 520,000 | South Carolina Public Service Auth., Revenue Ser A, 4.000%, 12/01/52 | 462,719 |
| 305,000 | South Carolina Public Service Authority, Revenue Ser B, 5.000%, 12/01/43 | 322,042 |
| 585,000 | South Wayne County Water and Sewer Authority, Revenue Ser S, 4.000%, 02/15/37 | 592,405 |
| 510,000 | State Board of Higher Education of the State of North Dakota, Revenue Ser A, 5.000%, 04/01/29 | 555,304 |
| 400,000 | State of Ohio, 4.000%, 11/15/40 | 370,769 |
| 500,000 | Tobacco Settlement Financing Corp, Revenue, 5.000%, 06/01/30 | 533,842 |
| 500,000 | Town of Upland, Revenue EDR, 4.000%, 09/01/43 | 475,147 |
| 540,000 | Wildwood Utility Dependent District, Revenue, 5.000%, 10/01/41 | 599,604 |
| 500,000 | Wisconsin Health & Educational Fac. Auth., Revenue, 5.000%, 10/01/28 | 555,387 |
| 500,000 | Wisconsin Health & Educational Fac. Auth., Revenue, 5.000%, 12/01/38 | 542,917 |
| 240,000 | Yamhill County, OR, Revenue, 4.000%, 12/01/41 | 230,727 |
| | Total Fixed Rate Revenue Bonds | $40,944,581 |
| | General Obligation Bonds – 27.1% |
| 500,000 | Chicago Board of Education, UTGO, 4.000%, 12/01/47 | 436,750 |
Touchstone Core Municipal Bond Fund (Continued)
Principal
Amount | | | | Market
Value |
| | General Obligation Bonds – 27.1% (Continued) |
| $ 500,000 | Clark County School District, LTGO Ser D, 5.000%, 06/15/24 | $ 527,855 |
| 500,000 | Farmington Independent School District No 192, UTGO Ser C, 5.000%, 02/01/23 | 509,789 |
| 700,000 | Fort Zumwalt School District, UTGO, 5.000%, 03/01/32 | 783,840 |
| 485,000 | Fowler Public School District, UTGO Ser II, 4.000%, 05/01/50 | 487,130 |
| 100,000 | Gold Hill Mesa Metropolitan District No 2, LTGO Ser A, 5.000%, 12/01/28 | 107,256 |
| 150,000 | Gold Hill Mesa Metropolitan District No 2, LTGO Ser A, 5.000%, 12/01/29 | 160,478 |
| 1,000,000 | Hamilton County, OH LTGO Ser A, 5.000%, 12/01/37 | 1,089,898 |
| 500,000 | Indianapolis Board of School Commissioners, LTGO, 5.000%, 07/15/24 | 527,716 |
| 500,000 | Jackson, MS, UTGO, 5.000%, 03/01/28 | 563,782 |
| 500,000 | Maricopa County Special Health Care District, UTGO, 5.000%, 07/01/28 | 561,741 |
| 500,000 | Maui County, HI, UTGO, 5.000%, 03/01/24 | 525,381 |
| 610,000 | Milwaukee, WI, UTGO Ser N3, 5.000%, 04/01/29 | 696,888 |
| 500,000 | Nassau County, NY, LTGO Ser A, 5.000%, 04/01/29 | 571,883 |
| 500,000 | New Orleans, LA, Revenue Ser A, 5.000%, 12/01/50 | 549,031 |
| 510,000 | Novi Community School District, UTGO Ser I, 5.000%, 05/01/42 | 557,616 |
| 500,000 | Olathe, KS, 5.000%, 08/01/23 | 514,723 |
| 250,000 | Prairiestar Metropolitan District No 2, LTGO Ser A, 5.000%, 12/01/46 | 272,595 |
| 650,000 | Romulus Community Schools, Revenue Ser A, 4.000%, 05/01/23 | 661,792 |
| 500,000 | Salem, OR, UTGO, 5.000%, 06/01/24 | 528,972 |
| 500,000 | School District of Broward County, UTGO, 5.000%, 07/01/51 | 560,221 |
| 440,000 | School District of Philadelphia/The, LTGO Ser D, 5.000%, 09/01/25 | 473,896 |
| 500,000 | State of Mississippi, Revenue Ser C, 5.000%, 10/01/36 | 553,740 |
| 500,000 | State of New Jersey, UTGO, 5.000%, 06/01/29 | 561,943 |
| 500,000 | Sterling Heights, MI, LTGO, 5.000%, 04/01/29 | 567,589 |
| 1,000,000 | Toledo, OH, LTGO, 4.000%, 12/01/35 | 1,036,934 |
Principal
Amount | | | | Market
Value |
| | |
| $ 585,000 | Town of Stratford, UTGO, 5.000%, 05/15/33 | $ 652,151 |
| 300,000 | Upper Arlington, OH LTGO, 4.000%, 12/01/32 | 310,793 |
| 535,000 | Washington Township Health Care District, UTGO Ser A, 4.000%, 08/01/38 | 522,538 |
| | Total General Obligation Bonds | $15,874,921 |
| Shares | | | | |
| | Short-Term Investment Fund — 6.6% |
| 3,842,597 | Dreyfus Government Cash Management Institutional Shares, 1.350%∞Ω | 3,842,597 |
| | Total Investment Securities—103.7%
(Cost $63,345,880) | $60,662,099 |
| | Liabilities in Excess of Other Assets — (3.7%) | $(2,184,322) |
| | Net Assets — 100.0% | $58,477,777 |
| ∞ | Open-End Fund. |
| Ω | Represents the 7-Day SEC yield as of June 30, 2022. |
| Portfolio Abbreviations: |
| COP–Certificates of Participation |
| EDR–Economic Development Revenue |
| LTGO–Limited Tax General Obligation |
| UTGO–Unlimited Tax General Obligation |
Other Information:
The inputs or methodology used for valuing securities may not be an indication of the risk associated with investing in those securities. For more information on valuation inputs, and their aggregation into the levels used in the table below, please refer to the security valuation section in the accompanying Notes to Financial Statements.
| Valuation Inputs at Reporting Date: |
| Description | Level 1 | Level 2 | Level 3 | Total |
| Municipal Bonds | $— | $56,819,502 | $— | $56,819,502 |
| Short-Term Investment Fund | 3,842,597 | — | — | 3,842,597 |
| Total | $3,842,597 | $56,819,502 | $— | $60,662,099 |
See accompanying Notes to Financial Statements.
Portfolio of Investments
Touchstone International Equity Fund – June 30, 2022
| Shares | | | | Market
Value |
| | Common Stocks — 89.7% | |
| | France — 16.5% | |
| | Communication Services — 3.1% | |
| 189,700 | JCDecaux SA* | $ 3,194,962 |
| | Consumer Discretionary — 7.3% | |
| 117,100 | Accor SA* | 3,194,670 |
| 102,000 | Cie Generale des Etablissements Michelin SCA | 2,785,719 |
| 2,500 | LVMH Moet Hennessy Louis Vuitton SE | 1,532,195 |
| | Energy — 3.8% | |
| 74,500 | TotalEnergies SE | 3,921,454 |
| | Health Care — 2.3% | |
| 23,200 | Sanofi | 2,339,629 |
| | Total France | 16,968,629 |
| | United Kingdom — 14.8% | |
| | Consumer Staples — 2.7% | |
| 36,500 | Reckitt Benckiser Group PLC | 2,745,248 |
| | Health Care — 3.2% | |
| 1,203,400 | ConvaTec Group PLC, 144a | 3,298,498 |
| | Industrials — 2.9% | |
| 58,200 | Bunzl PLC | 1,932,865 |
| 350,000 | Rotork PLC | 1,028,162 |
| | Information Technology — 3.6% | |
| 54,500 | AVEVA Group PLC | 1,496,163 |
| 68,000 | Spectris PLC | 2,252,811 |
| | Real Estate — 2.4% | |
| 1,054,576 | Foxtons Group PLC | 421,707 |
| 165,900 | Savills PLC | 2,045,578 |
| | Total United Kingdom | 15,221,032 |
| | Switzerland — 13.3% | |
| | Consumer Staples — 2.8% | |
| 25,000 | Nestle SA | 2,921,819 |
| | Health Care — 5.5% | |
| 31,500 | Novartis AG | 2,670,590 |
| 9,000 | Roche Holding AG | 3,008,699 |
| | Industrials — 2.7% | |
| 80,200 | Adecco Group AG | 2,733,604 |
| | Materials — 2.3% | |
| 55,200 | Holcim AG | 2,367,503 |
| | Total Switzerland | 13,702,215 |
| | Germany — 8.0% | |
| | Health Care — 2.6% | |
| 87,900 | Fresenius SE & Co. KGaA | 2,673,192 |
| | Industrials — 1.9% | |
| 29,100 | Brenntag SE | 1,905,416 |
| | Information Technology — 1.4% | |
| 16,100 | SAP SE | 1,467,523 |
| | Materials — 2.1% | |
| 86,400 | FUCHS PETROLUB SE | 2,118,280 |
| | Total Germany | 8,164,411 |
| | Mexico — 4.8% | |
| | Communication Services — 1.5% | |
| 650,687 | Megacable Holdings SAB de CV | 1,579,678 |
| | Consumer Staples — 3.3% | |
| 2,492,100 | Kimberly-Clark de Mexico SAB de CV - Class A | 3,383,194 |
| | Total Mexico | 4,962,872 |
| Shares | | | | Market
Value |
| | | |
| | Japan — 4.8% | |
| | Consumer Discretionary — 2.8% | |
| 163,800 | USS Co. Ltd. | $ 2,838,992 |
| | Industrials — 2.0% | |
| 13,300 | FANUC Corp. | 2,084,633 |
| | Total Japan | 4,923,625 |
| | United States — 3.2% | |
| | Health Care — 3.2% | |
| 37,000 | Medtronic PLC | 3,320,750 |
| | Canada — 3.1% | |
| | Materials — 3.1% | |
| 178,800 | Barrick Gold Corp. | 3,161,504 |
| | Brazil — 3.0% | |
| | Industrials — 1.7% | |
| 1,772,200 | Boa Vista Servicos SA | 1,811,667 |
| | Information Technology — 1.3% | |
| 127,800 | Pagseguro Digital Ltd. - Class A* | 1,308,672 |
| | Total Brazil | 3,120,339 |
| | Hong Kong — 3.0% | |
| | Consumer Discretionary — 3.0% | |
| 514,000 | Galaxy Entertainment Group Ltd. | 3,079,155 |
| | South Korea — 2.9% | |
| | Information Technology — 2.9% | |
| 68,000 | Samsung Electronics Co. Ltd. | 2,999,300 |
| | Greece — 2.7% | |
| | Consumer Discretionary — 2.7% | |
| 191,300 | OPAP SA | 2,751,549 |
| | India — 2.6% | |
| | Communication Services — 2.2% | |
| 855,900 | Indus Towers Ltd. | 2,275,074 |
| | Consumer Discretionary — 0.4% | |
| 1,326,194 | PC Jeweller Ltd.* | 389,015 |
| | Total India | 2,664,089 |
| | China — 2.0% | |
| | Communication Services — 2.0% | |
| 44,300 | Tencent Holdings Ltd. | 2,005,246 |
| | Norway — 1.7% | |
| | Energy — 1.7% | |
| 123,800 | TGS ASA | 1,738,165 |
| | Tanzania — 1.3% | |
| | Communication Services — 1.3% | |
| 930,000 | Helios Towers PLC* | 1,368,696 |
| | Netherlands — 1.0% | |
| | Information Technology — 1.0% | |
| 2,200 | ASML Holding NV | 1,039,364 |
| | Spain — 1.0% | |
| | Industrials — 1.0% | |
| 20,000 | Befesa SA, 144a | 974,864 |
| | Total Common Stocks | $92,165,805 |
Touchstone International Equity Fund (Continued)
| Shares | | | | Market
Value |
| | Short-Term Investment Fund — 7.9% | |
| 8,114,973 | Dreyfus Government Cash Management, Institutional Shares, 1.35%∞Ω | $ 8,114,973 |
| | Total Investment Securities — 97.6%
(Cost $105,860,648) | $100,280,778 |
| | Other Assets in Excess of Liabilities — 2.4% | 2,491,005 |
| | Net Assets — 100.0% | $102,771,783 |
| * | Non-income producing security. |
| ∞ | Open-End Fund. |
| Ω | Represents the 7-Day SEC yield as of June 30, 2022. |
| Portfolio Abbreviations: |
| PLC – Public Limited Company |
| 144a - This is a restricted security that was sold in a transaction qualifying for the exemption under Rule 144a of the Securities Act of 1933. This security may be sold in transactions exempt from registration, normally to qualified institutional buyers. At June 30, 2022, these securities were valued at $4,273,362 or 4.2% of net assets. These securities were deemed liquid pursuant to procedures approved by the Board of Trustees. |
Other Information:
The inputs or methodology used for valuing securities may not be an indication of the risk associated with investing in those securities. For more information on valuation inputs, and their aggregation into the levels used in the table below, please refer to the security valuation section in the accompanying Notes to Financial Statements.
| Valuation inputs at Reporting Date: |
| Description | Level 1 | Level 2 | Level 3 | Total |
| Common Stocks | | | | |
| France | $— | $16,968,629 | $— | $16,968,629 |
| United Kingdom | 421,707 | 14,799,325 | — | 15,221,032 |
| Switzerland | — | 13,702,215 | — | 13,702,215 |
| Germany | — | 8,164,411 | — | 8,164,411 |
| Mexico | 4,962,872 | — | — | 4,962,872 |
| Japan | — | 4,923,625 | — | 4,923,625 |
| United States | 3,320,750 | — | — | 3,320,750 |
| Canada | 3,161,504 | — | — | 3,161,504 |
| Brazil | 3,120,339 | — | — | 3,120,339 |
| Hong Kong | — | 3,079,155 | — | 3,079,155 |
| South Korea | — | 2,999,300 | — | 2,999,300 |
| Greece | — | 2,751,549 | — | 2,751,549 |
| India | — | 2,664,089 | — | 2,664,089 |
| China | — | 2,005,246 | — | 2,005,246 |
| Norway | — | 1,738,165 | — | 1,738,165 |
| Tanzania | 1,368,696 | — | — | 1,368,696 |
| Netherlands | — | 1,039,364 | — | 1,039,364 |
| Spain | — | 974,864 | — | 974,864 |
| Short-Term Investment Fund | 8,114,973 | — | — | 8,114,973 |
| Total | $24,470,841 | $75,809,937 | $— | $100,280,778 |
See accompanying Notes to Financial Statements.
Portfolio of Investments
Touchstone International Growth Fund – June 30, 2022
| Shares | | | | Market
Value |
| | Common Stocks — 92.6% | |
| | Canada — 15.2% | |
| | Consumer Discretionary — 3.2% | |
| 34,250 | Dollarama, Inc. | $ 1,972,195 |
| | Financials — 7.6% | |
| 21,050 | Bank of Montreal | 2,024,215 |
| 6,440 | Royal Bank of Canada | 623,587 |
| 30,700 | Toronto-Dominion Bank (The) | 2,013,197 |
| | Industrials — 2.0% | |
| 48,100 | CAE, Inc.* | 1,185,311 |
| | Real Estate — 2.4% | |
| 24,220 | Granite Real Estate Investment Trust REIT | 1,485,526 |
| | Total Canada | 9,304,031 |
| | India — 12.4% | |
| | Financials — 9.4% | |
| 54,420 | HDFC Bank Ltd. ADR | 2,990,923 |
| 153,710 | ICICI Bank Ltd. ADR | 2,726,816 |
| | Information Technology — 3.0% | |
| 21,900 | Larsen & Toubro Infotech Ltd., 144a | 1,108,068 |
| 17,730 | Tata Consultancy Services Ltd. | 736,272 |
| | Total India | 7,562,079 |
| | France — 11.5% | |
| | Industrials — 2.1% | |
| 4,230 | Teleperformance | 1,306,157 |
| | Information Technology — 9.4% | |
| 26,950 | Capgemini SE† | 4,647,801 |
| 29,050 | Worldline SA, 144a* | 1,083,547 |
| | Total France | 7,037,505 |
| | United Kingdom — 11.0% | |
| | Consumer Discretionary — 2.9% | |
| 114,675 | Entain PLC* | 1,745,086 |
| | Health Care — 7.4% | |
| 34,360 | AstraZeneca PLC | 4,532,834 |
| | Information Technology — 0.7% | |
| 34,330 | Kainos Group PLC | 463,450 |
| | Total United Kingdom | 6,741,370 |
| | United States — 6.2% | |
| | Communication Services — 3.0% | |
| 470 | Alphabet, Inc. - Class A* | 1,024,252 |
| 5,205 | Meta Platforms, Inc. - Class A* | 839,307 |
| | Financials — 1.7% | |
| 16,140 | Charles Schwab Corp. (The) | 1,019,725 |
| | Information Technology — 1.5% | |
| 3,475 | Microsoft Corp. | 892,484 |
| | Total United States | 3,775,768 |
| | Switzerland — 5.7% | |
| | Health Care — 5.7% | |
| 23,850 | Alcon, Inc. | 1,672,399 |
| 5,650 | Sonova Holding AG | 1,805,636 |
| | Total Switzerland | 3,478,035 |
| | Israel — 4.1% | |
| | Information Technology — 4.1% | |
| 12,895 | Nice Ltd. ADR* | 2,481,643 |
| Shares | | | | Market
Value |
| | | |
| | Singapore — 3.9% | |
| | Financials — 3.9% | |
| 110,300 | DBS Group Holdings Ltd. | $ 2,360,134 |
| | Sweden — 3.7% | |
| | Consumer Discretionary — 3.7% | |
| 24,480 | Evolution AB, 144a | 2,239,456 |
| | Taiwan — 3.3% | |
| | Information Technology — 3.3% | |
| 24,970 | Taiwan Semiconductor Manufacturing Co. Ltd. ADR | 2,041,297 |
| | Germany — 3.0% | |
| | Communication Services — 1.6% | |
| 21,170 | Stroeer SE & Co. KGaA | 956,283 |
| | Information Technology — 1.4% | |
| 9,350 | SAP SE | 852,257 |
| | Total Germany | 1,808,540 |
| | Spain — 2.9% | |
| | Health Care — 2.9% | |
| 94,650 | Grifols SA | 1,794,979 |
| | South Korea — 2.7% | |
| | Communication Services — 2.7% | |
| 8,860 | NAVER Corp. | 1,652,626 |
| | Thailand — 2.5% | |
| | Consumer Staples — 2.5% | |
| 3,228,200 | Thai Beverage PCL | 1,499,741 |
| | Italy — 2.1% | |
| | Information Technology — 2.1% | |
| 154,700 | Nexi SpA, 144a* | 1,284,697 |
| | Japan — 1.6% | |
| | Communication Services — 1.6% | |
| 58,700 | Kakaku.com, Inc. | 974,952 |
| | Netherlands — 0.8% | |
| | Information Technology — 0.8% | |
| 1,004 | ASML Holding NV | 474,328 |
| | Total Common Stocks | $56,511,181 |
| | Short-Term Investment Funds — 15.1% | |
| 4,418,910 | Dreyfus Government Cash Management, Institutional Shares, 1.35%∞Ω | 4,418,910 |
| 4,804,762 | Invesco Government & Agency Portfolio, Institutional Class, 1.38%∞Ω** | 4,804,762 |
| | Total Short-Term Investment Funds | $9,223,672 |
| | Total Investment Securities — 107.7%
(Cost $71,822,774) | $65,734,853 |
| | Liabilities in Excess of Other Assets — (7.7)% | (4,706,722) |
| | Net Assets — 100.0% | $61,028,131 |
| * | Non-income producing security. |
| ** | Represents collateral for securities loaned. |
| † | All or a portion of the security is on loan. The total market value of the securities on loan as of June 30, 2022 was $4,456,197. |
| ∞ | Open-End Fund. |
| Ω | Represents the 7-Day SEC yield as of June 30, 2022. |
Touchstone International Growth Fund (Continued)
| Portfolio Abbreviations: |
| ADR – American Depositary Receipt |
| PCL – Public Company Limited |
| PLC – Public Limited Company |
| REIT – Real Estate Investment Trust |
| 144a - This is a restricted security that was sold in a transaction qualifying for the exemption under Rule 144a of the Securities Act of 1933. This security may be sold in transactions exempt from registration, normally to qualified institutional buyers. At June 30, 2022, these securities were valued at $5,715,768 or 9.4% of net assets. These securities were deemed liquid pursuant to procedures approved by the Board of Trustees. |
Other Information:
The inputs or methodology used for valuing securities may not be an indication of the risk associated with investing in those securities. For more information on valuation inputs, and their aggregation into the levels used in the table below, please refer to the security valuation section in the accompanying Notes to Financial Statements.
| Valuation inputs at Reporting Date: |
| Description | Level 1 | Level 2 | Level 3 | Total |
| Common Stocks | | | | |
| Canada | $9,304,031 | $— | $— | $9,304,031 |
| India | 5,717,739 | 1,844,340 | — | 7,562,079 |
| France | — | 7,037,505 | — | 7,037,505 |
| United Kingdom | 463,450 | 6,277,920 | — | 6,741,370 |
| United States | 3,775,768 | — | — | 3,775,768 |
| Switzerland | — | 3,478,035 | — | 3,478,035 |
| Israel | 2,481,643 | — | — | 2,481,643 |
| Singapore | — | 2,360,134 | — | 2,360,134 |
| Sweden | — | 2,239,456 | — | 2,239,456 |
| Taiwan | 2,041,297 | — | — | 2,041,297 |
| Germany | — | 1,808,540 | — | 1,808,540 |
| Spain | — | 1,794,979 | — | 1,794,979 |
| South Korea | — | 1,652,626 | — | 1,652,626 |
| Thailand | — | 1,499,741 | — | 1,499,741 |
| Italy | — | 1,284,697 | — | 1,284,697 |
| Japan | — | 974,952 | — | 974,952 |
| Netherlands | — | 474,328 | — | 474,328 |
| Short-Term Investment Funds | 9,223,672 | — | — | 9,223,672 |
| Total | $33,007,600 | $32,727,253 | $— | $65,734,853 |
See accompanying Notes to Financial Statements.
Portfolio of Investments
Touchstone Large Cap Focused Fund – June 30, 2022
| Shares | | | | Market
Value |
| | Common Stocks — 95.0% | |
| | Information Technology — 28.1% | |
| 1,201,107 | Apple, Inc. | $ 164,215,349 |
| 278,071 | International Business Machines Corp. | 39,260,845 |
| 824,262 | Microsoft Corp. | 211,695,209 |
| 701,356 | Oracle Corp. | 49,003,744 |
| 302,023 | PayPal Holdings, Inc.* | 21,093,286 |
| 321,608 | salesforce, Inc.* | 53,078,184 |
| 571,750 | SS&C Technologies Holdings, Inc. | 33,201,523 |
| 315,055 | Texas Instruments, Inc. | 48,408,201 |
| 292,038 | Visa, Inc. - Class A | 57,499,362 |
| 174,337 | Workday, Inc. - Class A* | 24,333,958 |
| | | | | 701,789,661 |
| | Health Care — 15.3% | |
| 348,761 | AmerisourceBergen Corp. | 49,342,706 |
| 526,434 | BioMarin Pharmaceutical, Inc.* | �� 43,625,586 |
| 770,169 | Bristol-Myers Squibb Co. | 59,303,013 |
| 244,688 | HCA Healthcare, Inc. | 41,122,265 |
| 517,873 | Johnson & Johnson | 91,927,636 |
| 190,852 | UnitedHealth Group, Inc. | 98,027,313 |
| | | | | 383,348,519 |
| | Communication Services — 13.6% | |
| 64,858 | Alphabet, Inc. - Class C* | 141,873,632 |
| 1,011,459 | AT&T, Inc. | 21,200,181 |
| 1,091,924 | Comcast Corp. - Class A | 42,847,098 |
| 764,057 | Fox Corp. - Class A | 24,572,073 |
| 418,579 | Meta Platforms, Inc. - Class A* | 67,495,864 |
| 96,805 | Netflix, Inc.* | 16,928,290 |
| 220,347 | Walt Disney Co. (The)* | 20,800,757 |
| 244,689 | Warner Bros Discovery, Inc.* | 3,283,726 |
| | | | | 339,001,621 |
| | Financials — 11.2% | |
| 1,968,763 | Bank of America Corp. | 61,287,592 |
| 390,709 | Berkshire Hathaway, Inc. - Class B* | 106,671,371 |
| 235,028 | Goldman Sachs Group, Inc. (The) | 69,808,017 |
| 32,165 | Markel Corp.* | 41,597,386 |
| | | | | 279,364,366 |
| | Consumer Discretionary — 7.9% | |
| 209,864 | Airbnb, Inc. - Class A* | 18,694,685 |
| 192,099 | Alibaba Group Holding Ltd. (China) ADR* | 21,837,814 |
| 955,520 | Amazon.com, Inc.* | 101,485,779 |
| 280,155 | Hilton Worldwide Holdings, Inc. | 31,220,473 |
| 327,273 | Starbucks Corp. | 25,000,385 |
| | | | | 198,239,136 |
| | Industrials — 7.8% | |
| 72,848 | Boeing Co. (The)* | 9,959,778 |
| 58,789 | Deere & Co. | 17,605,542 |
| 94,428 | FedEx Corp. | 21,407,772 |
| Shares | | | | Market
Value |
| | | |
| | Industrials — (Continued) | |
| 301,108 | Hubbell, Inc. | $ 53,771,867 |
| 651,093 | Raytheon Technologies Corp. | 62,576,548 |
| 820,086 | Southwest Airlines Co.* | 29,621,506 |
| | | | | 194,943,013 |
| | Consumer Staples — 4.5% | |
| 582,968 | Monster Beverage Corp.* | 54,041,134 |
| 594,112 | Philip Morris International, Inc. | 58,662,619 |
| | | | | 112,703,753 |
| | Energy — 3.3% | |
| 614,529 | Exxon Mobil Corp. | 52,628,264 |
| 801,837 | Schlumberger NV | 28,673,691 |
| | | | | 81,301,955 |
| | Real Estate — 1.9% | |
| 271,521 | Jones Lang LaSalle, Inc.* | 47,478,162 |
| | Materials — 1.4% | |
| 613,323 | DuPont de Nemours, Inc. | 34,088,492 |
| | Total Common Stocks | $2,372,258,678 |
| | Short-Term Investment Fund — 5.1% | |
| 128,231,516 | Dreyfus Government Cash Management, Institutional Shares, 1.35%∞Ω | 128,231,516 |
| | Total Investment Securities—100.1%
(Cost $1,771,486,471) | $2,500,490,194 |
| | Liabilities in Excess of Other Assets — (0.1%) | (2,315,233) |
| | Net Assets — 100.0% | $2,498,174,961 |
| * | Non-income producing security. |
| ∞ | Open-End Fund. |
| Ω | Represents the 7-Day SEC yield as of June 30, 2022. |
| Portfolio Abbreviations: |
| ADR – American Depositary Receipt |
Other Information:
The inputs or methodology used for valuing securities may not be an indication of the risk associated with investing in those securities. For more information on valuation inputs, and their aggregation into the levels used in the table below, please refer to the security valuation section in the accompanying Notes to Financial Statements.
| Valuation Inputs at Reporting Date: |
| Description | Level 1 | Level 2 | Level 3 | Total |
| Common Stocks | $2,372,258,678 | $— | $— | $2,372,258,678 |
| Short-Term Investment Fund | 128,231,516 | — | — | 128,231,516 |
| Total | $2,500,490,194 | $— | $— | $2,500,490,194 |
See accompanying Notes to Financial Statements.
Portfolio of Investments
Touchstone Large Cap Fund – June 30, 2022
| Shares | | | | Market
Value |
| | Common Stocks — 96.7% | |
| | Information Technology — 18.5% | |
| 125,712 | Apple, Inc. | $ 17,187,344 |
| 140,712 | Cisco Systems, Inc. | 5,999,960 |
| 87,078 | Fiserv, Inc.* | 7,747,330 |
| 64,587 | Texas Instruments, Inc. | 9,923,792 |
| 53,193 | Visa, Inc. - Class A | 10,473,170 |
| | | | | 51,331,596 |
| | Financials — 18.2% | |
| 65,730 | Berkshire Hathaway, Inc. - Class B* | 17,945,604 |
| 19,870 | BlackRock, Inc. | 12,101,625 |
| 176,276 | Charles Schwab Corp. (The) | 11,137,118 |
| 81,412 | Progressive Corp. (The) | 9,465,773 |
| | | | | 50,650,120 |
| | Consumer Discretionary — 12.3% | |
| 75,299 | CarMax, Inc.* | 6,813,053 |
| 35,848 | Home Depot, Inc. (The) | 9,832,031 |
| 30,715 | Lowe's Cos., Inc. | 5,364,989 |
| 19,112 | O'Reilly Automotive, Inc.* | 12,074,197 |
| | | | | 34,084,270 |
| | Communication Services — 10.9% | |
| 7,272 | Alphabet, Inc. - Class C* | 15,907,136 |
| 46,664 | Meta Platforms, Inc. - Class A* | 7,524,570 |
| 135,534 | Verizon Communications, Inc. | 6,878,351 |
| | | | | 30,310,057 |
| | Consumer Staples — 10.0% | |
| 215,538 | Altria Group, Inc. | 9,003,022 |
| 99,986 | Church & Dwight Co., Inc. | 9,264,703 |
| 83,197 | Nestle SA (Switzerland) ADR | 9,683,299 |
| | | | | 27,951,024 |
| | Industrials — 9.3% | |
| 42,570 | FedEx Corp. | 9,651,045 |
| 42,555 | Norfolk Southern Corp. | 9,672,326 |
| 25,151 | Old Dominion Freight Line, Inc. | 6,445,698 |
| | | | | 25,769,069 |
| | Materials — 8.4% | |
| 31,026 | Air Products & Chemicals, Inc. | 7,461,132 |
| 31,174 | Martin Marietta Materials, Inc. | 9,328,508 |
| 21,635 | NewMarket Corp. | 6,511,270 |
| | | | | 23,300,910 |
| Shares | | | | Market
Value |
| | | |
| | Health Care — 6.0% | |
| 49,632 | Johnson & Johnson | $ 8,810,176 |
| 152,464 | Pfizer, Inc. | 7,993,688 |
| | | | | 16,803,864 |
| | Real Estate — 3.1% | |
| 328,648 | STORE Capital Corp. REIT | 8,571,140 |
| | Total Common Stocks | $268,772,050 |
| | Short-Term Investment Fund — 3.3% | |
| 9,286,040 | Dreyfus Government Cash Management, Institutional Shares, 1.35%∞Ω | 9,286,040 |
| | Total Investment Securities—100.0%
(Cost $194,904,219) | $278,058,090 |
| | Other Assets in Excess of Liabilities — 0.0% | 39,482 |
| | Net Assets — 100.0% | $278,097,572 |
| * | Non-income producing security. |
| ∞ | Open-End Fund. |
| Ω | Represents the 7-Day SEC yield as of June 30, 2022. |
| Portfolio Abbreviations: |
| ADR – American Depositary Receipt |
| REIT – Real Estate Investment Trust |
Other Information:
The inputs or methodology used for valuing securities may not be an indication of the risk associated with investing in those securities. For more information on valuation inputs, and their aggregation into the levels used in the table below, please refer to the security valuation section in the accompanying Notes to Financial Statements.
| Valuation Inputs at Reporting Date: |
| Description | Level 1 | Level 2 | Level 3 | Total |
| Common Stocks | $268,772,050 | $— | $— | $268,772,050 |
| Short-Term Investment Fund | 9,286,040 | — | — | 9,286,040 |
| Total | $278,058,090 | $— | $— | $278,058,090 |
See accompanying Notes to Financial Statements.
Portfolio of Investments
Touchstone Large Company Growth Fund – June 30, 2022
| Shares | | | | Market
Value |
| | Common Stocks — 92.8% | |
| | Information Technology — 40.2% | |
| 8,100 | Accenture PLC - Class A | $ 2,248,965 |
| 12,206 | Adobe, Inc.* | 4,468,128 |
| 2,700 | ASML Holding NV (Netherlands) | 1,284,876 |
| 16,490 | Automatic Data Processing, Inc. | 3,463,560 |
| 5,475 | EPAM Systems, Inc.* | 1,613,921 |
| 41,686 | Fiserv, Inc.* | 3,708,803 |
| 24,810 | FleetCor Technologies, Inc.* | 5,212,829 |
| 33,585 | Global Payments, Inc. | 3,715,844 |
| 9,143 | Intuit, Inc. | 3,524,078 |
| 9,426 | Mastercard, Inc. - Class A | 2,973,714 |
| 76,625 | Microsoft Corp. | 19,679,599 |
| 18,108 | NVIDIA Corp. | 2,744,992 |
| 37,452 | PayPal Holdings, Inc.* | 2,615,648 |
| 41,935 | Visa, Inc. - Class A | 8,256,582 |
| | | | | 65,511,539 |
| | Communication Services — 14.6% | |
| 7,217 | Alphabet, Inc. - Class A* | 15,727,719 |
| 49,664 | Meta Platforms, Inc. - Class A* | 8,008,320 |
| | | | | 23,736,039 |
| | Health Care — 12.6% | |
| 63,175 | AstraZeneca PLC (United Kingdom) ADR | 4,173,972 |
| 160,681 | Boston Scientific Corp.* | 5,988,581 |
| 37,409 | Neurocrine Biosciences, Inc.* | 3,646,629 |
| 12,998 | UnitedHealth Group, Inc. | 6,676,163 |
| | | | | 20,485,345 |
| | Financials — 8.3% | |
| 12,828 | Aon PLC - Class A | 3,459,455 |
| 159,288 | Charles Schwab Corp. (The) | 10,063,816 |
| | | | | 13,523,271 |
| | Consumer Discretionary — 7.5% | |
| 83,495 | Amazon.com, Inc.* | 8,868,004 |
| 5,350 | O'Reilly Automotive, Inc.* | 3,379,916 |
| | | | | 12,247,920 |
| | Consumer Staples — 5.0% | |
| 132,030 | Keurig Dr Pepper, Inc. | 4,672,542 |
| 37,860 | Monster Beverage Corp.* | 3,509,622 |
| | | | | 8,182,164 |
| Shares | | | | Market
Value |
| | | |
| | Materials — 3.0% | |
| 17,219 | Linde PLC (United Kingdom) | $ 4,950,979 |
| | Industrials — 1.6% | |
| 13,868 | United Parcel Service, Inc. - Class B | 2,531,465 |
| | Total Common Stocks | $151,168,722 |
| | Short-Term Investment Fund — 7.6% | |
| 12,350,433 | Dreyfus Government Cash Management, Institutional Shares, 1.35%∞Ω | 12,350,433 |
| | Total Investment Securities—100.4%
(Cost $127,838,041) | $163,519,155 |
| | Liabilities in Excess of Other Assets — (0.4%) | (666,251) |
| | Net Assets — 100.0% | $162,852,904 |
| * | Non-income producing security. |
| ∞ | Open-End Fund. |
| Ω | Represents the 7-Day SEC yield as of June 30, 2022. |
| Portfolio Abbreviations: |
| ADR – American Depositary Receipt |
| PLC – Public Limited Company |
Other Information:
The inputs or methodology used for valuing securities may not be an indication of the risk associated with investing in those securities. For more information on valuation inputs, and their aggregation into the levels used in the table below, please refer to the security valuation section in the accompanying Notes to Financial Statements.
| Valuation Inputs at Reporting Date: |
| Description | Level 1 | Level 2 | Level 3 | Total |
| Common Stocks | $151,168,722 | $— | $— | $151,168,722 |
| Short-Term Investment Fund | 12,350,433 | — | — | 12,350,433 |
| Total | $163,519,155 | $— | $— | $163,519,155 |
See accompanying Notes to Financial Statements.
Portfolio of Investments
Touchstone Small Company Fund – June 30, 2022
| Shares | | | | Market
Value |
| | Common Stocks — 98.9% | |
| | Industrials — 19.3% | |
| 96,021 | ASGN, Inc.* | $ 8,665,895 |
| 200,726 | Clean Harbors, Inc. * | 17,597,648 |
| 196,000 | Crane Holdings Co. | 17,161,760 |
| 82,468 | Curtiss-Wright Corp. | 10,890,724 |
| 155,450 | ESCO Technologies, Inc. | 10,628,117 |
| 284,640 | Federal Signal Corp. | 10,133,184 |
| 89,772 | Forward Air Corp. | 8,255,433 |
| 725,197 | Great Lakes Dredge & Dock Corp.* | 9,507,333 |
| 156,557 | ITT, Inc. | 10,526,893 |
| 358,639 | KBR, Inc. | 17,354,541 |
| 76,726 | Quanta Services, Inc. | 9,616,837 |
| 68,108 | Regal Rexnord Corp. | 7,731,620 |
| 356,483 | Zurn Water Solutions Corp. | 9,710,597 |
| | | | | 147,780,582 |
| | Health Care — 18.1% | |
| 660,460 | Allscripts Healthcare Solutions, Inc.* | 9,794,622 |
| 405,636 | Anika Therapeutics, Inc.* | 9,053,796 |
| 26,618 | Bio-Techne Corp. | 9,226,863 |
| 21,080 | Chemed Corp. | 9,894,740 |
| 141,571 | Encompass Health Corp. | 7,935,055 |
| 134,257 | Ensign Group, Inc. (The) | 9,863,862 |
| 181,940 | Globus Medical, Inc. - Class A* | 10,214,112 |
| 181,897 | Integra LifeSciences Holdings Corp.* | 9,827,895 |
| 339,983 | NuVasive, Inc.* | 16,713,564 |
| 86,553 | Omnicell, Inc.* | 9,845,404 |
| 431,872 | Premier, Inc. - Class A | 15,409,193 |
| 363,270 | Progyny, Inc.* | 10,552,993 |
| 405,140 | Vericel Corp.* | 10,201,425 |
| | | | | 138,533,524 |
| | Information Technology — 17.5% | |
| 627,928 | 8x8, Inc.* | 3,233,829 |
| 146,104 | Advanced Energy Industries, Inc. | 10,662,670 |
| 711,960 | Box, Inc. - Class A* | 17,898,674 |
| 173,871 | CommVault Systems, Inc.* | 10,936,486 |
| 450,034 | Digi International, Inc.* | 10,899,824 |
| 74,371 | ExlService Holdings, Inc.* | 10,957,079 |
| 608,927 | KnowBe4, Inc. - Class A* | 9,511,440 |
| 174,780 | MAXIMUS, Inc. | 10,925,498 |
| 236,382 | Onto Innovation, Inc.* | 16,485,281 |
| 89,647 | SPS Commerce, Inc.* | 10,134,593 |
| 257,228 | Verint Systems, Inc.* | 10,893,606 |
| 147,722 | WNS Holdings Ltd. (India) ADR* | 11,025,970 |
| | | | | 133,564,950 |
| | Consumer Discretionary — 16.1% | |
| 681,212 | American Eagle Outfitters, Inc. | 7,615,950 |
| 280,358 | Aritzia, Inc. (Canada)* | 7,590,488 |
| 103,508 | Fox Factory Holding Corp.* | 8,336,534 |
| 276,554 | Frontdoor, Inc.* | 6,659,420 |
| 102,846 | Grand Canyon Education, Inc.* | 9,687,065 |
| 529,590 | Leslie's, Inc.*† | 8,039,176 |
| 332,746 | Malibu Boats, Inc. - Class A* | 17,539,042 |
| 96,236 | Oxford Industries, Inc. | 8,539,983 |
| 206,301 | Skyline Champion Corp.* | 9,782,794 |
| 494,811 | Steven Madden Ltd. | 15,937,862 |
| 108,816 | Texas Roadhouse, Inc. | 7,965,331 |
| 43,951 | TopBuild Corp.* | 7,346,849 |
| 303,545 | Zumiez, Inc.* | 7,892,170 |
| | | | | 122,932,664 |
| Shares | | | | Market
Value |
| | | |
| | Financials — 10.5% | |
| 93,882 | Evercore, Inc. - Class A | $ 8,788,294 |
| 979,289 | FNB Corp. | 10,635,079 |
| 483,830 | Home BancShares, Inc. | 10,049,149 |
| 269,210 | Pacific Premier Bancorp, Inc. | 7,871,700 |
| 125,723 | Pinnacle Financial Partners, Inc. | 9,091,030 |
| 718,868 | Valley National Bancorp | 7,483,416 |
| 405,420 | Webster Financial Corp. | 17,088,453 |
| 129,020 | Western Alliance Bancorp | 9,108,812 |
| | | | | 80,115,933 |
| | Real Estate — 6.7% | |
| 149,850 | Agree Realty Corp. REIT | 10,808,681 |
| 836,301 | Corporate Office Properties Trust REIT | 21,902,723 |
| 348,958 | Healthcare Realty Trust, Inc. REIT | 9,491,658 |
| 297,071 | STAG Industrial, Inc. REIT | 9,173,552 |
| | | | | 51,376,614 |
| | Materials — 5.7% | |
| 102,773 | Ashland Global Holdings, Inc. | 10,590,758 |
| 396,629 | Axalta Coating Systems Ltd. * | 8,769,467 |
| 66,903 | Eagle Materials, Inc. | 7,355,316 |
| 418,112 | Silgan Holdings, Inc. | 17,288,931 |
| | | | | 44,004,472 |
| | Communication Services — 3.7% | |
| 449,777 | Cargurus, Inc.* | 9,665,708 |
| 736,350 | QuinStreet, Inc.* | 7,407,681 |
| 154,425 | Ziff Davis, Inc.* | 11,509,295 |
| | | | | 28,582,684 |
| | Energy — 1.3% | |
| 495,570 | ChampionX Corp. | 9,837,064 |
| | Total Common Stocks | $756,728,487 |
| | Short-Term Investment Funds — 2.2% | |
| 12,149,546 | Dreyfus Government Cash Management, Institutional Shares, 1.35%∞Ω | 12,149,546 |
| 4,695,000 | Invesco Government & Agency Portfolio, Institutional Class, 1.38%∞Ω** | 4,695,000 |
| | Total Short-Term Investment Funds | $16,844,546 |
| | Total Investment Securities—101.1%
(Cost $697,205,040) | $773,573,033 |
| | Liabilities in Excess of Other Assets — (1.1%) | (8,167,602) |
| | Net Assets — 100.0% | $765,405,431 |
| * | Non-income producing security. |
| ** | Represents collateral for securities loaned. |
| † | All or a portion of the security is on loan. The total market value of the securities on loan as of June 30, 2022 was $4,554,000. |
| ∞ | Open-End Fund. |
| Ω | Represents the 7-Day SEC yield as of June 30, 2022. |
| Portfolio Abbreviations: |
| ADR – American Depositary Receipt |
| REIT – Real Estate Investment Trust |
Touchstone Small Company Fund (Continued)
Other Information:
The inputs or methodology used for valuing securities may not be an indication of the risk associated with investing in those securities. For more information on valuation inputs, and their aggregation into the levels used in the table below, please refer to the security valuation section in the accompanying Notes to Financial Statements.
| Valuation Inputs at Reporting Date: |
| Description | Level 1 | Level 2 | Level 3 | Total |
| Common Stocks | $756,728,487 | $— | $— | $756,728,487 |
| Short-Term Investment Funds | 16,844,546 | — | — | 16,844,546 |
| Total | $773,573,033 | $— | $— | $773,573,033 |
See accompanying Notes to Financial Statements.
Portfolio of Investments
Touchstone Value Fund – June 30, 2022
| Shares | | | | Market
Value |
| | Common Stocks — 98.0% | |
| | Health Care — 16.9% | |
| 122,557 | CVS Health Corp. | $ 11,356,132 |
| 38,132 | Elevance Health, Inc. | 18,401,741 |
| 98,643 | Medtronic PLC | 8,853,209 |
| 207,996 | Merck & Co., Inc. | 18,962,995 |
| 291,705 | Perrigo Co. PLC | 11,834,472 |
| 29,908 | UnitedHealth Group, Inc. | 15,361,646 |
| | | | | 84,770,195 |
| | Financials — 16.1% | |
| 51,167 | American Express Co. | 7,092,769 |
| 194,478 | American International Group, Inc. | 9,943,660 |
| 85,976 | M&T Bank Corp. | 13,703,715 |
| 101,501 | Northern Trust Corp. | 9,792,816 |
| 80,697 | The Allstate Corp. | 10,226,731 |
| 153,138 | US Bancorp | 7,047,411 |
| 349,222 | Wells Fargo & Co. | 13,679,026 |
| 46,803 | Willis Towers Watson PLC | 9,238,444 |
| | | | | 80,724,572 |
| | Consumer Discretionary — 11.5% | |
| 72,223 | Advance Auto Parts, Inc. | 12,501,079 |
| 317,765 | Aramark | 9,733,142 |
| 72,185 | Dollar General Corp. | 17,717,086 |
| 260,505 | Las Vegas Sands Corp.* | 8,750,363 |
| 17,660 | Lithia Motors, Inc. | 4,853,145 |
| 24,178 | Lowe's Cos., Inc. | 4,223,171 |
| | | | | 57,777,986 |
| | Energy — 11.5% | |
| 160,572 | Halliburton Co. | 5,035,538 |
| 176,093 | Hess Corp. | 18,655,292 |
| 203,295 | Phillips 66 | 16,668,157 |
| 55,146 | Pioneer Natural Resources | 12,301,970 |
| 47,537 | Valero Energy Corp. | 5,052,232 |
| | | | | 57,713,189 |
| | Materials — 9.8% | |
| 65,471 | Air Products & Chemicals, Inc. | 15,744,466 |
| 327,211 | Axalta Coating Systems Ltd. * | 7,234,635 |
| 121,567 | Corteva, Inc. | 6,581,637 |
| 118,511 | DuPont de Nemours, Inc. | 6,586,842 |
| 109,376 | International Flavors & Fragrances, Inc. | 13,028,869 |
| | | | | 49,176,449 |
| | Industrials — 9.6% | |
| 127,181 | AECOM | 8,294,745 |
| 38,021 | Deere & Co. | 11,386,149 |
| 88,746 | JB Hunt Transport Services, Inc. | 13,974,832 |
| 80,667 | Stanley Black & Decker, Inc. | 8,458,742 |
| 744,939 | Vertiv Holdings Co. | 6,123,398 |
| | | | | 48,237,866 |
| | Information Technology — 8.6% | |
| 25,248 | Broadcom, Inc. | 12,265,731 |
| 124,430 | Cognizant Technology Solutions Corp. - Class A | 8,397,781 |
| Shares | | | | Market
Value |
| | | |
| | Information Technology — (Continued) | |
| 127,607 | Fidelity National Information Services, Inc. | $ 11,697,733 |
| 72,798 | Oracle Corp. | 5,086,396 |
| 45,075 | QUALCOMM, Inc. | 5,757,881 |
| | | | | 43,205,522 |
| | Communication Services — 6.2% | |
| 347,784 | Altice USA, Inc. - Class A* | 3,217,002 |
| 267,153 | Comcast Corp. - Class A | 10,483,084 |
| 64,148 | Electronic Arts, Inc. | 7,803,604 |
| 70,092 | T-Mobile US, Inc.* | 9,430,178 |
| | | | | 30,933,868 |
| | Consumer Staples — 3.2% | |
| 186,556 | Coca-Cola Europacific Partners PLC (United Kingdom) | 9,628,155 |
| 67,237 | Philip Morris International, Inc. | 6,638,981 |
| | | | | 16,267,136 |
| | Real Estate — 2.7% | |
| 454,897 | VICI Properties, Inc. REIT | 13,551,382 |
| | Utilities — 1.9% | |
| 130,123 | Pinnacle West Capital Corp. | 9,514,594 |
| | Total Common Stocks | $491,872,759 |
| | Short-Term Investment Fund — 1.2% | |
| 5,896,150 | Dreyfus Government Cash Management, Institutional Shares, 1.35%∞Ω | 5,896,150 |
| | Total Investment Securities—99.2%
(Cost $448,195,795) | $497,768,909 |
| | Other Assets in Excess of Liabilities — 0.8% | 4,190,928 |
| | Net Assets — 100.0% | $501,959,837 |
| * | Non-income producing security. |
| ∞ | Open-End Fund. |
| Ω | Represents the 7-Day SEC yield as of June 30, 2022. |
| Portfolio Abbreviations: |
| PLC – Public Limited Company |
| REIT – Real Estate Investment Trust |
Other Information:
The inputs or methodology used for valuing securities may not be an indication of the risk associated with investing in those securities. For more information on valuation inputs, and their aggregation into the levels used in the table below, please refer to the security valuation section in the accompanying Notes to Financial Statements.
| Valuation Inputs at Reporting Date: |
| Description | Level 1 | Level 2 | Level 3 | Total |
| Common Stocks | $491,872,759 | $— | $— | $491,872,759 |
| Short-Term Investment Fund | 5,896,150 | — | — | 5,896,150 |
| Total | $497,768,909 | $— | $— | $497,768,909 |
See accompanying Notes to Financial Statements.
Statements of Assets and Liabilities
June 30, 2022
| | Touchstone
Balanced
Fund | Touchstone
Core Municipal
Bond
Fund | Touchstone
International
Equity
Fund | Touchstone
International
Growth
Fund | Touchstone
Large Cap
Focused
Fund | Touchstone
Large Cap
Fund |
| Assets | | | | | | |
| Investments, at cost | $694,430,587 | $63,345,880 | $105,860,648 | $71,822,774 | $1,771,486,471 | $194,904,219 |
| Investments, at market value * | $754,105,772 | $60,662,099 | $100,280,778 | $65,734,853 | $2,500,490,194 | $278,058,090 |
| Cash | 12 | — | — | — | — | — |
| Cash deposits held at prime broker (A) | 90,400 | — | — | — | — | — |
| Foreign currency † | 1,030 | — | 20,095 | 19,095 | — | — |
| Dividends and interest receivable | 2,015,934 | 499,650 | 178,660 | 47,309 | 1,473,877 | 465,247 |
| Receivable for capital shares sold | 1,168,946 | 783 | 3,723 | 1,521 | 910,302 | 71,898 |
| Receivable for investments sold | 435,113 | 477,624 | 3,635,394 | — | 2,509,810 | — |
| Receivable for variation margin on futures contracts | 23,806 | — | — | — | — | — |
| Receivable for securities lending income | 301 | — | 611 | 3,236 | — | — |
| Tax reclaim receivable | 4,063 | — | 481,679 | 151,998 | 360,768 | — |
| Other assets | 2,468 | 205 | 568 | 2,681 | 10,484 | 1,236 |
| Total Assets | 757,847,845 | 61,640,361 | 104,601,508 | 65,960,693 | 2,505,755,435 | 278,596,471 |
| |
| Liabilities | | | | | | |
| Dividends payable | — | 8,041 | — | — | — | — |
| Payable for return of collateral for securities on loan | 1,732,824 | — | — | 4,804,762 | — | — |
| Payable for capital shares redeemed | 722,820 | 58,473 | 152,247 | 10,035 | 3,875,282 | 245,515 |
| Payable for investments purchased | 3,327,132 | 3,039,993 | 1,468,406 | — | 1,255,417 | — |
| Payable to Investment Advisor | 392,627 | — | 58,091 | 860 | 1,095,633 | 96,562 |
| Payable to other affiliates | 259,873 | 1,090 | 20,680 | 7,494 | 703,865 | 32,957 |
| Payable to Trustees | 14,298 | 14,298 | 14,298 | 14,298 | 14,298 | 14,298 |
| Payable for professional services | 39,846 | 26,426 | 40,339 | 39,403 | 61,302 | 26,292 |
| Payable for reports to shareholders | 15,418 | 2,650 | 6,290 | 11,230 | 28,556 | 6,233 |
| Payable for transfer agent services | 201,184 | 4,604 | 55,480 | 36,494 | 485,305 | 57,864 |
| Other accrued expenses and liabilities | 32,729 | 7,009 | 13,894 | 7,986 | 60,816 | 19,178 |
| Total Liabilities | 6,738,751 | 3,162,584 | 1,829,725 | 4,932,562 | 7,580,474 | 498,899 |
| Net Assets | $751,109,094 | $58,477,777 | $102,771,783 | $61,028,131 | $2,498,174,961 | $278,097,572 |
| Net assets consist of: | | | | | | |
| Paid-in capital | 693,495,358 | 61,197,708 | 176,225,930 | 73,711,367 | 1,730,792,744 | 184,392,495 |
| Distributable earnings (deficit) | 57,613,736 | (2,719,931) | (73,454,147) | (12,683,236) | 767,382,217 | 93,705,077 |
| Net Assets | $751,109,094 | $58,477,777 | $102,771,783 | $61,028,131 | $2,498,174,961 | $278,097,572 |
| *Includes market value of securities on loan of: | $1,695,572 | $— | $— | $4,456,197 | $— | $— |
| †Cost of foreign currency: | $1,018 | $— | $19,961 | $18,820 | $— | $— |
| (A) | Represents segregated cash for futures contracts. |
See accompanying Notes to Financial Statements.
Statements of Assets and Liabilities (Continued)
Touchstone
Large Company
Growth
Fund | Touchstone
Small
Company
Fund | Touchstone
Value
Fund |
| | | |
| $127,838,041 | $697,205,040 | $448,195,795 |
| $163,519,155 | $773,573,033 | $497,768,909 |
| — | — | 8,968 |
| — | — | — |
| — | — | — |
| 42,630 | 568,656 | 1,093,562 |
| 190 | 212,642 | 165,566 |
| — | — | 6,408,244 |
| — | — | — |
| — | 2,105 | — |
| — | — | — |
| 927 | 3,062 | 1,934 |
| 163,562,902 | 774,359,498 | 505,447,183 |
| |
| | | |
| — | — | — |
| — | 4,695,000 | — |
| 552,378 | 3,354,933 | 929,767 |
| — | — | 2,101,418 |
| 65,877 | 423,921 | 199,647 |
| 19,672 | 208,113 | 72,574 |
| 14,298 | 14,298 | 14,298 |
| 24,661 | 34,345 | 30,460 |
| 3,260 | 20,441 | 12,817 |
| 15,195 | 179,830 | 94,249 |
| 14,657 | 23,186 | 32,116 |
| 709,998 | 8,954,067 | 3,487,346 |
| $162,852,904 | $765,405,431 | $501,959,837 |
| | | |
| 122,453,792 | 684,323,113 | 429,027,588 |
| 40,399,112 | 81,082,318 | 72,932,249 |
| $162,852,904 | $765,405,431 | $501,959,837 |
| $— | $4,554,000 | $— |
| $— | $— | $— |
Statements of Assets and Liabilities (Continued)
| | Touchstone
Balanced
Fund | Touchstone
Core Municipal
Bond
Fund | Touchstone
International
Equity
Fund | Touchstone
International
Growth
Fund | Touchstone
Large Cap
Focused
Fund | Touchstone
Large Cap
Fund |
| Pricing of Class A Shares | | | | | | |
| Net assets applicable to Class A shares | $521,933,028 | $25,101,075 | $76,670,565 | $1,172,380 | $1,736,899,862 | $4,510,218 |
Shares of beneficial interest outstanding
(unlimited number of shares authorized, no par value) | 24,301,776 | 2,340,518 | 5,766,066 | 111,639 | 36,800,973 | 293,082 |
| Net asset value price per share* | $21.48 | $10.72 | $13.30 | $10.50 | $47.20 | $15.39 |
| Maximum sales charge - Class A shares | 5.00% | 3.25% | 5.00% | 5.00% | 5.00% | 5.00% |
Maximum offering price per share
(100%/(100%-maximum sales charge) of net asset value adjusted to the nearest cent) - Class A shares | $22.61 | $11.08 | $14.00 | $11.05 | $49.68 | $16.20 |
| |
| Pricing of Class C Shares | | | | | | |
| Net assets applicable to Class C shares | $73,905,847 | $942,853 | $2,398,603 | $786,606 | $49,114,840 | $2,995,388 |
Shares of beneficial interest outstanding
(unlimited number of shares authorized, no par value) | 3,436,170 | 87,878 | 196,879 | 78,215 | 1,152,330 | 198,734 |
| Net asset value and offering price per share** | $21.51 | $10.73 | $12.18 | $10.06 | $42.62 | $15.07 |
| |
| Pricing of Class Y Shares | | | | | | |
| Net assets applicable to Class Y shares | $155,158,616 | $2,739,711 | $20,429,580 | $47,844,685 | $493,825,299 | $202,912,756 |
Shares of beneficial interest outstanding
(unlimited number of shares authorized, no par value) | 7,292,176 | 255,118 | 1,557,833 | 4,423,784 | 10,474,833 | 13,162,906 |
| Net asset value, offering price and redemption price per share | $21.28 | $10.74 | $13.11 | $10.82 | $47.14 | $15.42 |
| |
| Pricing of Institutional Class Shares | | | | | | |
| Net assets applicable to Institutional Class shares | $— | $29,694,138 | $3,273,035 | $11,224,460 | $217,531,313 | $67,679,210 |
Shares of beneficial interest outstanding
(unlimited number of shares authorized, no par value) | — | 2,765,942 | 250,107 | 1,029,051 | 4,605,774 | 4,383,744 |
| Net asset value, offering price and redemption price per share | $— | $10.74 | $13.09 | $10.91 | $47.23 | $15.44 |
| |
| Pricing of Class R6 Shares | | | | | | |
| Net assets applicable to Class R6 shares | $111,603 | $— | $— | $— | $803,647 | $— |
Shares of beneficial interest outstanding
(unlimited number of shares authorized, no par value) | 5,248 | — | — | — | 17,008 | — |
| Net asset value, offering price and redemption price per share | $21.27 | $— | $— | $— | $47.25 | $— |
| * | There is no sales load on subscriptions of $1 million or more for all funds except for Core Municipal Bond Fund. There is no sales load on subscriptions of $500,000 or more for Core Municipal Bond Fund. Redemptions that were part of a $500,000 or $1 million or more subscription, as applicable, may be subject to a contingent deferred sales load if redeemed within a one-year period from the date of purchase. |
| ** | Redemption price per share varies by length of time shares are held due to the terms of the contingent deferred sales charge. |
See accompanying Notes to Financial Statements.
Statements of Assets and Liabilities (Continued)
Touchstone
Large Company
Growth
Fund | Touchstone
Small
Company
Fund | Touchstone
Value
Fund |
| | | |
| $3,289,756 | $451,080,564 | $156,947,118 |
| 90,978 | 99,009,476 | 15,826,900 |
| $36.16 | $4.56 | $9.92 |
| 5.00% | 5.00% | 5.00% |
| $38.06 | $4.80 | $10.44 |
| |
| | | |
| $205,986 | $17,385,224 | $5,721,844 |
| 6,072 | 10,091,412 | 578,990 |
| $33.92 | $1.72 | $9.88 |
| |
| | | |
| $13,916,535 | $222,140,874 | $86,614,576 |
| 377,043 | 42,613,241 | 8,690,225 |
| $36.91 | $5.21 | $9.97 |
| |
| | | |
| $145,440,627 | $21,298,787 | $252,280,872 |
| 3,907,081 | 4,086,128 | 25,399,494 |
| $37.22 | $5.21 | $9.93 |
| |
| | | |
| $— | $53,499,982 | $395,427 |
| — | 11,219,188 | 39,804 |
| $— | $4.77 | $9.93 |
Statements of Operations For the Year Ended June 30, 2022
| | Touchstone
Balanced
Fund | Touchstone
Core Municipal
Bond
Fund | Touchstone
International
Equity
Fund | Touchstone
International
Growth
Fund | Touchstone
Large Cap
Focused
Fund | Touchstone
Large Cap
Fund |
| Investment Income | | | | | | |
| Dividends* | $7,435,212 | $— | $3,071,702 | $797,618 | $33,929,885 | $5,498,874 |
| Interest | 6,472,943 | 1,435,938 | — | — | — | — |
| Income from securities loaned | 4,171 | — | 13,047 | 6,860 | 436 | — |
| Total Investment Income | 13,912,326 | 1,435,938 | 3,084,749 | 804,478 | 33,930,321 | 5,498,874 |
| Expenses | | | | | | |
| Investment advisory fees | 4,379,676 | 280,517 | 884,634 | 663,906 | 15,751,675 | 2,118,536 |
| Administration fees | 1,176,158 | 83,978 | 163,913 | 107,484 | 3,925,334 | 458,025 |
| Compliance fees and expenses | 3,200 | 3,201 | 3,200 | 3,200 | 3,200 | 3,200 |
| Custody fees | 59,927 | 6,838 | 31,190 | 19,046 | 39,808 | 17,433 |
| Professional fees | 59,651 | 47,725 | 44,619 | 36,309 | 125,137 | 33,255 |
| Transfer Agent fees, Class A | 459,340 | 13,702 | 124,285 | 4,022 | 1,149,260 | 4,085 |
| Transfer Agent fees, Class C | 58,473 | 506 | 5,657 | 1,847 | 51,676 | 1,282 |
| Transfer Agent fees, Class Y | 187,103 | 3,167 | 28,188 | 93,368 | 590,238 | 182,703 |
| Transfer Agent fees, Institutional Class | — | 660 | 167 | 13,992 | 96,813 | 6,426 |
| Transfer Agent fees, Class R6 | 15 | — | — | — | 26 | — |
| Registration Fees, Class A | 25,498 | 9,595 | 21,349 | 11,689 | 36,703 | 13,627 |
| Registration Fees, Class C | 17,058 | 4,645 | 11,190 | 8,685 | 16,193 | 7,936 |
| Registration Fees, Class Y | 24,477 | 6,240 | 15,498 | 15,840 | 47,519 | 34,123 |
| Registration Fees, Institutional Class | — | 4,127 | 10,708 | 15,761 | 16,171 | 14,794 |
| Registration Fees, Class R6 | 3,371 | — | — | — | 3,625 | — |
| Reports to Shareholders, Class A | 56,372 | 3,716 | 11,583 | 5,658 | 71,764 | 3,159 |
| Reports to Shareholders, Class C | 7,701 | 3,339 | 5,842 | 5,308 | 6,994 | 3,398 |
| Reports to Shareholders, Class Y | 15,477 | 3,010 | 4,258 | 12,889 | 27,089 | 18,044 |
| Reports to Shareholders, Institutional Class | — | 2,913 | 2,926 | 5,850 | 8,337 | 3,078 |
| Reports to Shareholders, Class R6 | 1,041 | — | — | — | 1,096 | — |
| Distribution expenses, Class A | 1,518,530 | 72,232 | 238,930 | 4,267 | 5,262,773 | 11,916 |
| Distribution and shareholder servicing expenses, Class C | 837,364 | 11,516 | 31,408 | 10,525 | 609,096 | 37,723 |
| Trustee fees | 28,238 | 28,238 | 28,238 | 28,238 | 28,238 | 28,238 |
| Other expenses | 220,667 | 23,753 | 90,075 | 68,168 | 669,169 | 117,424 |
| Total Expenses | 9,139,337 | 613,618 | 1,757,858 | 1,136,052 | 28,537,934 | 3,118,405 |
| Fees waived and/or reimbursed by the Advisor and/or Affiliates(A) | (4,428) | (182,428) | (125,153) | (316,924) | (413,437) | (345,465) |
| Fees recouped by the Advisor(A) | 81,985 | — | — | — | — | — |
| Net Expenses | 9,216,894 | 431,190 | 1,632,705 | 819,128 | 28,124,497 | 2,772,940 |
| Net Investment Income (Loss) | 4,695,432 | 1,004,748 | 1,452,044 | (14,650) | 5,805,824 | 2,725,934 |
| Realized and Unrealized Gains (Losses) on Investments | | | | | | |
| Net realized gains (losses) on investments(B)(C) | 33,471,525 | (24,917) | 7,954,770 | (2,615,573) | 254,979,759 | 22,912,067 |
| Net realized gains on futures contracts | 823,799 | — | — | — | — | — |
| Net realized losses on foreign currency transactions | — | — | (149,770) | (31,372) | — | — |
| Net change in unrealized appreciation (depreciation) on investments(D) | (163,247,426) | (6,539,645) | (34,295,050) | (26,798,310) | (674,276,909) | (58,860,797) |
| Net change in unrealized appreciation (depreciation) on futures contracts | 313 | — | — | — | — | — |
| Net change in unrealized appreciation (depreciation) on foreign currency transactions | (37) | — | (20,263) | (16,885) | — | — |
| Net Realized and Unrealized Gains (Losses) on Investments | (128,951,826) | (6,564,562) | (26,510,313) | (29,462,140) | (419,297,150) | (35,948,730) |
| Change in Net Assets Resulting from Operations | $(124,256,394) | $(5,559,814) | $(25,058,269) | $(29,476,790) | $(413,491,326) | $(33,222,796) |
| *Net of foreign tax withholding of: | $177 | $— | $346,574 | $95,881 | $— | $39,999 |
| (A) | See Note 4 in Notes to Financial Statements. |
| (B) | Includes foreign capital gains taxes paid of $155,752 and $65,228 for the International Equity Fund and the International Growth Fund, respectively. |
| (C) | For the year ended June 30, 2022, the Balanced Fund, the Large Cap Focused Fund, the Large Cap Fund, the Large Company Growth Fund and the Small Company Fund had a redemption-in-kind of securities in the amount of $20,471,881, $133,840,394, $21,000,498, $25,368,539 and $56,618,499, respectively. Net realized gains (losses) on investments includes the realized gain on the transactions of $14,901,474, $68,381,811, $9,406,419, $13,920,625 and $21,352,219, respectively, which will not be recognized by the Fund for tax purposes. |
| (D) | Change in unrealized appreciation (depreciation) does not include net appreciation of $18,402,967, $5,530,353, $209,596,258 and $15,906,544 for the Touchstone Balanced Fund, the Touchstone International Equity Fund, the Touchstone Large Cap Focused Fund and the Touchstone Value Fund, respectively, in connection with the Funds' reorganization. See Note 9 in the Notes to Financial Statements. |
See accompanying Notes to Financial Statements.
Statements of Operations (Continued)
Touchstone
Large Company
Growth
Fund | Touchstone
Small
Company
Fund | Touchstone
Value
Fund |
| | | |
| $1,071,998 | $8,068,446 | $11,992,633 |
| — | — | — |
| 1,876 | 8,229 | — |
| 1,073,874 | 8,076,675 | 11,992,633 |
| | | |
| 1,420,452 | 6,300,401 | 3,391,345 |
| 306,409 | 1,223,024 | 739,648 |
| 3,201 | 3,200 | 3,200 |
| 12,400 | 34,134 | 20,496 |
| 30,032 | 51,979 | 65,268 |
| 3,308 | 405,498 | 159,033 |
| 332 | 23,453 | 4,969 |
| 23,977 | 295,683 | 98,584 |
| 69,016 | 10,351 | 118,027 |
| — | 205 | 10 |
| 12,453 | 25,829 | 18,076 |
| 6,275 | 13,258 | 9,585 |
| 12,647 | 22,210 | 16,089 |
| 21,770 | 10,466 | 72,532 |
| — | 12,423 | 3,348 |
| 3,566 | 25,870 | 19,556 |
| 2,889 | 4,478 | 3,374 |
| 3,146 | 22,867 | 7,914 |
| 4,008 | 4,302 | 16,643 |
| — | 3,623 | 1,040 |
| 9,023 | 1,419,419 | 424,856 |
| 3,897 | 228,140 | 56,870 |
| 28,238 | 28,238 | 28,238 |
| 80,439 | 252,629 | 82,046 |
| 2,057,478 | 10,421,680 | 5,360,747 |
| (321,996) | (241,834) | (591,195) |
| — | — | — |
| 1,735,482 | 10,179,846 | 4,769,552 |
| (661,608) | (2,103,171) | 7,223,081 |
| | | |
| 52,866,635 | 72,654,827 | 53,432,153 |
| — | — | — |
| — | (2,521) | — |
| (106,678,470) | (239,902,157) | (84,024,306) |
| — | — | — |
| — | — | — |
| (53,811,835) | (167,249,851) | (30,592,153) |
| $(54,473,443) | $(169,353,022) | $(23,369,072) |
| $— | $— | $— |
Statements of Changes in Net Assets
| | Touchstone
Balanced Fund | Touchstone
Core Municipal
Bond Fund | Touchstone
International Equity
Fund |
| | For the
Year Ended
June 30,
2022 | For the
Year Ended
June 30,
2021 | For the
Year Ended
June 30,
2022 | For the
Year Ended
June 30,
2021 | For the
Year Ended
June 30,
2022 | For the
Year Ended
June 30,
2021 |
| From Operations | | | | | | |
| Net investment income (loss) | $4,695,432 | $3,124,533 | $1,004,748 | $1,211,675 | $1,452,044 | $811,340 |
| Net realized gains (losses) on investments, futures contracts and foreign currency transactions | 34,295,324 | 32,138,897 | (24,917) | 61,169 | 7,805,000 | 13,205,169 |
| Net change in unrealized appreciation (depreciation) on investments, futures contracts and foreign currency transactions | (163,247,150) | 78,354,237 | (6,539,645) | 179,252 | (34,315,313) | 23,636,169 |
| Change in Net Assets from Operations | (124,256,394) | 113,617,667 | (5,559,814) | 1,452,096 | (25,058,269) | 37,652,678 |
| |
| Distributions to Shareholders: | | | | | | |
| Distributed earnings, Class A | (18,683,622) | (20,171,816) | (422,124) | (759,648) | (12,810,410) | (394,252) |
| Distributed earnings, Class C | (2,017,932) | (3,376,561) | (8,006) | (20,387) | (443,920) | (503) |
| Distributed earnings, Class Y | (7,153,486) | (10,441,301) | (56,450) | (72,530) | (3,217,018) | (151,009) |
| Distributed earnings, Institutional Class | — | — | (551,274) | (359,126) | (555,566) | (102,145) |
| Distributed earnings, Class R6 | (430) | — | — | — | — | — |
| Total Distributions | (27,855,470) | (33,989,678) | (1,037,854) | (1,211,691) | (17,026,914) | (647,909) |
| Change in Net Assets from Share Transactions(A) | 317,880,186 | 116,319,904 | 15,095,708 | 229,658 | 22,502,489 | (32,507,841) |
| |
| Total Increase (Decrease) in Net Assets | 165,768,322 | 195,947,893 | 8,498,040 | 470,063 | (19,582,694) | 4,496,928 |
| |
| Net Assets | | | | | | |
| Beginning of period | 585,340,772 | 389,392,879 | 49,979,737 | 49,509,674 | 122,354,477 | 117,857,549 |
| End of period | $751,109,094 | $585,340,772 | $58,477,777 | $49,979,737 | $102,771,783 | $122,354,477 |
| (A) | For details on share transactions by class, see Statements of Changes in Net Assets - Capital Stock Activity on pages 66 to 69. |
See accompanying Notes to Financial Statements.
Statements of Changes in Net Assets (Continued)
Touchstone
International
Growth
Fund | Touchstone
Large Cap
Focused Fund | Touchstone
Large Cap Fund | Touchstone
Large Company
Growth Fund |
For the
Year Ended
June 30,
2022 | For the
Year Ended
June 30,
2021 | For the
Year Ended
June 30,
2022 | For the
Year Ended
June 30,
2021 | For the
Year Ended
June 30,
2022 | For the
Year Ended
June 30,
2021 | For the
Year Ended
June 30,
2022 | For the
Year Ended
June 30,
2021 |
| | | | | | | | |
| $(14,650) | $(324,122) | $5,805,824 | $4,381,657 | $2,725,934 | $3,265,990 | $(661,608) | $(955,947) |
| (2,646,945) | 21,844,022 | 254,979,759 | 223,307,044 | 22,912,067 | 14,682,457 | 52,866,635 | 46,369,147 |
| (26,815,195) | (2,303,009) | (674,276,909) | 516,360,601 | (58,860,797) | 85,403,699 | (106,678,470) | 34,594,589 |
| (29,476,790) | 19,216,891 | (413,491,326) | 744,049,302 | (33,222,796) | 103,352,146 | (54,473,443) | 80,007,789 |
| |
| | | | | | | | |
| — | — | (144,110,933) | (72,232,394) | (138,543) | (27,980) | (686,500) | (322,644) |
| — | — | (4,540,418) | (2,013,341) | (84,629) | — | (91,216) | (75,536) |
| — | — | (46,283,019) | (23,353,681) | (7,855,117) | (2,756,697) | (4,818,063) | (3,492,139) |
| (362) | (29,001) | (15,167,079) | (8,585,123) | (2,885,087) | (904,834) | (42,296,250) | (26,267,865) |
| — | — | (165) | — | — | — | — | — |
| (362) | (29,001) | (210,101,614) | (106,184,539) | (10,963,376) | (3,689,511) | (47,892,029) | (30,158,184) |
| (10,868,501) | 50,853,513 | 756,668,107 | 89,413,334 | (46,985,624) | (5,958,798) | 2,486,868 | (13,485,397) |
| |
| (40,345,653) | 70,041,403 | 133,075,167 | 727,278,097 | (91,171,796) | 93,703,837 | (99,878,604) | 36,364,208 |
| |
| | �� | | | | | | |
| 101,373,784 | 31,332,381 | 2,365,099,794 | 1,637,821,697 | 369,269,368 | 275,565,531 | 262,731,508 | 226,367,300 |
| $61,028,131 | $101,373,784 | $2,498,174,961 | $2,365,099,794 | $278,097,572 | $369,269,368 | $162,852,904 | $262,731,508 |
Statements of Changes in Net Assets (Continued)
| | Touchstone
Small Company Fund | Touchstone
Value Fund |
| | For the
Year Ended
June 30,
2022 | For the
Year Ended
June 30,
2021 | For the
Year Ended
June 30,
2022 | For the
Year Ended
June 30,
2021 |
| From Operations | | | | |
| Net investment income (loss) | $(2,103,171) | $(3,042,778) | $7,223,081 | $4,453,429 |
| Net realized gains (losses) on investments and foreign currency transactions | 72,652,306 | 201,596,566 | 53,432,153 | 21,403,643 |
| Net change in unrealized appreciation (depreciation) on investments | (239,902,157) | 208,112,135 | (84,024,306) | 95,152,352 |
| Change in Net Assets from Operations | (169,353,022) | 406,665,923 | (23,369,072) | 121,009,424 |
| |
| Distributions to Shareholders: | | | | |
| Distributed earnings, Class A | (100,933,144) | (526,115) | (14,640,827) | (776,520) |
| Distributed earnings, Class C | (8,485,889) | (48,748) | (442,410) | (34,628) |
| Distributed earnings, Class Y | (42,208,035) | (196,776) | (8,719,641) | (2,368,580) |
| Distributed earnings, Institutional Class | (2,833,076) | (13,108) | (25,683,573) | (6,305,785) |
| Distributed earnings, Class R6 | (10,437,867) | (57,850) | (1,961) | — |
| Total Distributions | (164,898,011) | (842,597) | (49,488,412) | (9,485,513) |
| Change in Net Assets from Share Transactions(A) | 100,055,548 | (113,421,577) | 150,160,610 | 57,417,338 |
| |
| Total Increase (Decrease) in Net Assets | (234,195,485) | 292,401,749 | 77,303,126 | 168,941,249 |
| |
| Net Assets | | | | |
| Beginning of period | 999,600,916 | 707,199,167 | 424,656,711 | 255,715,462 |
| End of period | $765,405,431 | $999,600,916 | $501,959,837 | $424,656,711 |
| (A) | For details on share transactions by class, see Statements of Changes in Net Assets - Capital Stock Activity on pages 69 to 70. |
See accompanying Notes to Financial Statements.
This page intentionally left blank.
Statements of Changes in Net Assets - Capital Stock Activity
| | Touchstone
Balanced Fund | Touchstone
Core Municipal
Bond Fund |
| | For the Year
Ended
June 30, 2022(A) | For the Year
Ended
June 30, 2021 | For the Year
Ended
June 30, 2022 | For the Year
Ended
June 30, 2021 |
| | Shares | Dollars | Shares | Dollars | Shares | Dollars | Shares | Dollars |
| Class A(B) | | | | | | | | |
| Proceeds from Shares issued | 2,071,514 | $51,804,611 | 1,466,609 | $34,722,660 | 82,130 | $942,504 | 117,818 | $1,400,793 |
| Proceeds from Shares issued in connection with reorganization(C) | 12,703,235 | 326,253,191 | — | — | — | — | — | — |
| Net shares increase due to stock split | — | — | — | — | — | — | — | — |
| Reinvestment of distributions | 695,294 | 17,702,007 | 833,000 | 19,264,341 | 29,811 | 342,750 | 50,202 | 596,606 |
| Cost of Shares redeemed | (3,788,521) | (94,469,765) | (1,260,991) | (30,118,012) | (367,762) | (4,187,142) | (281,021) | (3,336,930) |
| Change from Class A Share Transactions | 11,681,522 | 301,290,044 | 1,038,618 | 23,868,989 | (255,821) | (2,901,888) | (113,001) | (1,339,531) |
| Class C | | | | | | | | |
| Proceeds from Shares issued | 894,829 | 22,824,368 | 1,079,296 | 25,816,477 | 33,277 | 366,528 | 6,947 | 82,902 |
| Proceeds from Shares issued in connection with reorganization(C) | 721,908 | 18,587,124 | — | — | — | — | — | — |
| Net shares increase due to stock split | — | — | — | — | — | — | — | — |
| Reinvestment of distributions | 77,652 | 2,003,428 | 141,948 | 3,289,385 | 689 | 7,946 | 1,669 | 19,873 |
| Cost of Shares redeemed | (816,261) | (20,385,578) | (696,913) | (16,339,915) | (45,123) | (494,884) | (82,503) | (982,412) |
| Change from Class C Share Transactions | 878,128 | 23,029,342 | 524,331 | 12,765,947 | (11,157) | (120,410) | (73,887) | (879,637) |
| Class Y(D) | | | | | | | | |
| Proceeds from Shares issued | 4,190,499 | 102,045,837 | 4,074,596 | 95,993,587 | 79,167 | 908,797 | 134,759 | 1,602,926 |
| Proceeds from Shares issued in connection with reorganization(C) | — | — | — | — | — | — | — | — |
| Net shares increase due to stock split | — | — | — | — | — | — | — | — |
| Reinvestment of distributions | 283,307 | 7,147,940 | 454,002 | 10,425,611 | 3,831 | 44,150 | 4,722 | 56,160 |
| Cost of Shares redeemed | (5,008,449) | (115,748,212) | (1,131,521) | (26,734,230) | (117,610) | (1,328,373) | (70,525) | (839,958) |
| Change from Class Y Share Transactions | (534,643) | (6,554,435) | 3,397,077 | 79,684,968 | (34,612) | (375,426) | 68,956 | 819,128 |
| Institutional Class | | | | | | | | |
| Proceeds from Shares issued | — | — | — | — | 1,731,152 | 20,620,289 | 146,972 | 1,743,284 |
| Proceeds from Shares issued in connection with reorganization(C) | — | — | — | — | — | — | — | — |
| Net shares increase due to stock split | — | — | — | — | — | — | — | — |
| Reinvestment of distributions | — | — | — | — | 47,679 | 547,245 | 29,346 | 349,022 |
| Cost of Shares redeemed | — | — | — | — | (229,859) | (2,674,102) | (38,939) | (462,608) |
| Change from Institutional Class Share Transactions | — | — | — | — | 1,548,972 | 18,493,432 | 137,379 | 1,629,698 |
| Class R6 | | | | | | | | |
| Proceeds from Shares issued | 5,228 | 114,805 | — | — | — | — | — | — |
| Reinvestment of distributions | 20 | 430 | — | — | — | — | — | — |
| Change from Class R6 Share Transactions | 5,248 | 115,235 | — | — | — | — | — | — |
| Change from Share Transactions | 12,030,255 | $317,880,186 | 4,960,026 | $116,319,904 | 1,247,382 | $15,095,708 | 19,447 | $229,658 |
| (A) | Represents the period from commencement of operations (October 28, 2021) through June 30, 2022 for Class R6. |
| (B) | Effective July 16, 2021, Class B shares of the AIG Active Allocation Fund and AIG Multi-Asset Allocation Fund were reorganized into Class A shares of the Touchstone Balanced Fund. |
| (C) | See Note 9 in Notes to Financial Statements. |
| (D) | Effective July 16, 2021, Class W shares of the AIG International Dividend Strategy Fund were reorganized into Class Y shares of the Touchstone International Equity Fund. |
See accompanying Notes to Financial Statements.
Statements of Changes in Net Assets - Capital Stock Activity (Continued)
Touchstone
International Equity
Fund | Touchstone
International
Growth
Fund |
For the Year
Ended
June 30, 2022 | For the Year
Ended
June 30, 2021 | For the Year
Ended
June 30, 2022 | For the Year
Ended
June 30, 2021 |
| Shares | Dollars | Shares | Dollars | Shares | Dollars | Shares | Dollars |
| | | | | | | | |
| 469,378 | $8,288,140 | 207,265 | $3,466,458 | 25,427 | $341,175 | 17,989 | $289,648 |
| 2,291,115 | 43,002,245 | — | — | — | — | 97,100 | 1,290,678 |
| — | — | — | — | — | — | 32,844 | — |
| 811,352 | 12,465,621 | 21,556 | 369,692 | — | — | — | — |
| (2,467,086) | (43,314,837) | (1,149,415) | (18,959,641) | (58,165) | (773,559) | (38,276) | (564,950) |
| 1,104,759 | 20,441,169 | (920,594) | (15,123,491) | (32,738) | (432,384) | 109,657 | 1,015,376 |
| | | | | | | | |
| 29,057 | 424,401 | 11,590 | 194,768 | 9,141 | 112,674 | 29,320 | 430,015 |
| 122,778 | 2,140,804 | — | — | — | — | 48,931 | 631,074 |
| — | — | — | — | — | — | 16,544 | — |
| 30,546 | 429,513 | 30 | 491 | — | — | — | — |
| (106,024) | (1,641,566) | (50,705) | (745,214) | (19,774) | (254,521) | (24,564) | (372,108) |
| 76,357 | 1,353,152 | (39,085) | (549,955) | (10,633) | (141,847) | 70,231 | 688,981 |
| | | | | | | | |
| 348,174 | 5,357,930 | 349,073 | 6,178,013 | 117,736 | 1,738,578 | 77,402 | 1,153,585 |
| 53,869 | 998,993 | — | — | — | — | 5,338,452 | 72,719,437 |
| — | — | — | — | — | — | 33,230 | — |
| 209,605 | 3,180,484 | 8,826 | 149,244 | — | — | — | — |
| (549,548) | (9,100,100) | (597,691) | (9,525,838) | (418,756) | (5,776,915) | (762,790) | (11,389,617) |
| 62,100 | 437,307 | (239,792) | (3,198,581) | (301,020) | (4,038,337) | 4,686,294 | 62,483,405 |
| | | | | | | | |
| 716 | 12,694 | 326,028 | 5,389,374 | 89,919 | 1,315,535 | 134,196 | 2,022,011 |
| — | — | — | — | — | — | 282,595 | 3,877,901 |
| — | — | — | — | — | — | 1,095,088 | — |
| 36,664 | 555,566 | 6,055 | 102,145 | 25 | 360 | 1,123 | 28,917 |
| (18,960) | (297,399) | (1,136,788) | (19,127,333) | (529,482) | (7,571,828) | (1,338,444) | (19,263,078) |
| 18,420 | 270,861 | (804,705) | (13,635,814) | (439,538) | (6,255,933) | 174,558 | (13,334,249) |
| | | | | | | | |
| — | — | — | — | — | — | — | — |
| — | — | — | — | — | — | — | — |
| — | — | — | — | — | — | — | — |
| 1,261,636 | $22,502,489 | (2,004,176) | $(32,507,841) | (783,929) | $(10,868,501) | 5,040,740 | $50,853,513 |
Statements of Changes in Net Assets - Capital Stock Activity (Continued)
| | Touchstone
Large Cap
Focused Fund | Touchstone
Large Cap Fund |
| | For the Year
Ended
June 30, 2022(A) | For the Year
Ended
June 30, 2021 | For the Year
Ended
June 30, 2022 | For the Year
Ended
June 30, 2021 |
| | Shares | Dollars | Shares | Dollars | Shares | Dollars | Shares | Dollars |
| Class A | | | | | | | | |
| Proceeds from Shares issued | 1,340,013 | $77,295,565 | 1,524,656 | $76,745,640 | 78,046 | $1,363,874 | 104,007 | $1,512,734 |
| Proceeds from Shares issued in connection with reorganization(B) | 11,569,461 | 681,748,263 | — | — | — | — | — | — |
| Reinvestment of distributions | 2,295,540 | 133,285,514 | 1,343,599 | 65,769,214 | 6,281 | 118,085 | 1,558 | 24,185 |
| Cost of Shares redeemed | (4,668,669) | (265,221,706) | (3,086,035) | (155,866,155) | (30,720) | (525,957) | (95,257) | (1,367,690) |
| Change from Class A Share Transactions | 10,536,345 | 627,107,636 | (217,780) | (13,351,301) | 53,607 | 956,002 | 10,308 | 169,229 |
| Class C | | | | | | | | |
| Proceeds from Shares issued | 224,240 | 11,852,311 | 166,455 | 8,057,729 | 10,943 | 175,780 | 1,416 | 20,032 |
| Proceeds from Shares issued in connection with reorganization(B) | 446,479 | 24,084,368 | — | — | — | — | — | — |
| Reinvestment of distributions | 85,678 | 4,508,375 | 44,113 | 1,981,119 | 4,613 | 84,323 | — | — |
| Cost of Shares redeemed | (379,100) | (19,674,805) | (391,914) | (17,295,180) | (63,742) | (1,113,651) | (174,814) | (2,535,160) |
| Change from Class C Share Transactions | 377,297 | 20,770,249 | (181,346) | (7,256,332) | (48,186) | (853,548) | (173,398) | (2,515,128) |
| Class Y(C) | | | | | | | | |
| Proceeds from Shares issued | 4,114,587 | 236,829,946 | 3,821,151 | 200,689,582 | 1,150,810 | 20,630,434 | 1,169,625 | 18,630,577 |
| Proceeds from Shares issued in connection with reorganization(B) | 681,058 | 40,068,287 | — | — | — | — | — | — |
| Reinvestment of distributions | 747,215 | 43,376,695 | 437,489 | 21,384,607 | 406,710 | 7,668,528 | 173,509 | 2,691,115 |
| Cost of Shares redeemed | (4,885,257) | (274,179,208) | (2,789,494) | (139,140,516) | (3,509,211) | (63,649,856) | (2,051,020) | (32,393,077) |
| Change from Class Y Share Transactions | 657,603 | 46,095,720 | 1,469,146 | 82,933,673 | (1,951,691) | (35,350,894) | (707,886) | (11,071,385) |
| Institutional Class | | | | | | | | |
| Proceeds from Shares issued | 4,978,600 | 278,659,299 | 3,340,243 | 166,343,316 | 2,165,174 | 39,064,241 | 2,119,773 | 34,538,882 |
| Reinvestment of distributions | 258,156 | 15,015,301 | 173,680 | 8,505,633 | 134,812 | 2,547,446 | 56,203 | 872,839 |
| Cost of Shares redeemed | (4,162,961) | (231,872,423) | (3,011,062) | (147,761,655) | (2,961,832) | (53,348,871) | (1,743,984) | (27,953,235) |
| Change from Institutional Class Share Transactions | 1,073,795 | 61,802,177 | 502,861 | 27,087,294 | (661,846) | (11,737,184) | 431,992 | 7,458,486 |
| Class R6 | | | | | | | | |
| Proceeds from Shares issued | 18,091 | 948,609 | — | — | — | — | — | — |
| Reinvestment of distributions | 3 | 165 | — | — | — | — | — | — |
| Cost of Shares redeemed | (1,086) | (56,449) | — | — | — | — | — | — |
| Change from Class R6 Share Transactions | 17,008 | 892,325 | — | — | — | — | — | — |
| Change from Share Transactions | 12,662,048 | $756,668,107 | 1,572,881 | $89,413,334 | (2,608,116) | $(46,985,624) | (438,984) | $(5,958,798) |
| (A) | Represents the period from commencement of operations (October 28, 2021) through June 30, 2022 for Class R6. |
| (B) | See Note 9 in Notes to Financial Statements. |
| (C) | Effective July 16, 2021, Class W shares of the AIG Focused Alpha Large-Cap Fund were reorganized into Class Y shares of the Touchstone Large Cap Focused Fund. |
See accompanying Notes to Financial Statements.
Statements of Changes in Net Assets - Capital Stock Activity (Continued)
Touchstone
Large Company
Growth Fund | Touchstone
Small Company Fund |
For the Year
Ended
June 30, 2022 | For the Year
Ended
June 30, 2021 | For the Year
Ended
June 30, 2022 | For the Year
Ended
June 30, 2021 |
| Shares | Dollars | Shares | Dollars | Shares | Dollars | Shares | Dollars |
| | | | | | | | |
| 23,624 | $1,073,254 | 30,562 | $1,579,939 | 3,089,369 | $18,264,217 | 3,075,590 | $17,218,868 |
| — | — | — | — | — | — | — | — |
| 14,010 | 686,500 | 6,746 | 322,644 | 16,920,322 | 96,615,036 | 93,455 | 505,592 |
| (9,825) | (486,656) | (18,633) | (968,868) | (12,245,547) | (70,525,090) | (15,524,699) | (80,974,108) |
| 27,809 | 1,273,098 | 18,675 | 933,715 | 7,764,144 | 44,354,163 | (12,355,654) | (63,249,648) |
| | | | | | | | |
| 1,391 | 59,787 | 1,658 | 82,710 | 807,350 | 1,898,466 | 628,972 | 1,798,689 |
| — | — | — | — | — | — | — | — |
| 1,916 | 88,481 | 1,612 | 73,982 | 3,878,624 | 8,416,613 | 18,373 | 48,323 |
| (5,874) | (246,977) | (7,524) | (386,344) | (2,673,571) | (6,546,227) | (3,241,901) | (8,058,123) |
| (2,567) | (98,709) | (4,254) | (229,652) | 2,012,403 | 3,768,852 | (2,594,556) | (6,211,111) |
| | | | | | | | |
| 27,974 | 1,444,993 | 150,337 | 7,767,761 | 9,325,160 | 60,109,420 | 8,997,577 | 57,602,814 |
| — | — | — | — | — | — | — | — |
| 96,442 | 4,817,277 | 72,037 | 3,491,645 | 6,441,959 | 42,001,576 | 32,470 | 195,796 |
| (245,654) | (11,562,989) | (225,751) | (11,468,545) | (11,049,942) | (71,888,664) | (12,972,512) | (71,392,653) |
| (121,238) | (5,300,719) | (3,377) | (209,139) | 4,717,177 | 30,222,332 | (3,942,465) | (13,594,043) |
| | | | | | | | |
| 1,440,464 | 70,878,080 | 998,459 | 53,254,493 | 1,642,193 | 10,324,078 | 551,770 | 3,508,683 |
| 791,411 | 39,847,570 | 503,639 | 24,547,358 | 405,783 | 2,645,704 | 2,177 | 13,108 |
| (2,253,830) | (104,112,452) | (1,715,936) | (91,782,172) | (483,053) | (3,305,409) | (528,096) | (3,157,833) |
| (21,955) | 6,613,198 | (213,838) | (13,980,321) | 1,564,923 | 9,664,373 | 25,851 | 363,958 |
| | | | | | | | |
| — | — | — | — | 14,482,860 | 87,457,173 | 21,970,125 | 114,262,491 |
| — | — | — | — | 1,747,162 | 10,413,085 | 10,144 | 56,706 |
| — | — | — | — | (14,245,220) | (85,824,430) | (28,152,157) | (145,049,930) |
| — | — | — | — | 1,984,802 | 12,045,828 | (6,171,888) | (30,730,733) |
| (117,951) | $2,486,868 | (202,794) | $(13,485,397) | 18,043,449 | $100,055,548 | (25,038,712) | $(113,421,577) |
Statements of Changes in Net Assets - Capital Stock Activity (Continued)
| | Touchstone
Value Fund |
| | For the Year
Ended
June 30, 2022(A) | For the Year
Ended
June 30, 2021 |
| | Shares | Dollars | Shares | Dollars |
| Class A | | | | |
| Proceeds from Shares issued | 711,431 | $7,911,031 | 294,009 | $2,988,202 |
| Proceeds from Shares issued in connection with reorganization(B) | 16,002,448 | 178,897,865 | — | — |
| Reinvestment of distributions | 1,283,854 | 13,979,764 | 74,853 | 722,633 |
| Cost of Shares redeemed | (5,066,703) | (55,887,177) | (563,236) | (5,436,299) |
| Change from Class A Share Transactions | 12,931,030 | 144,901,483 | (194,374) | (1,725,464) |
| Class C | | | | |
| Proceeds from Shares issued | 155,614 | 1,684,614 | 43,137 | 463,857 |
| Proceeds from Shares issued in connection with reorganization(B) | 454,230 | 5,060,481 | — | — |
| Reinvestment of distributions | 40,098 | 434,249 | 3,629 | 34,591 |
| Cost of Shares redeemed | (241,736) | (2,688,461) | (150,389) | (1,401,306) |
| Change from Class C Share Transactions | 408,206 | 4,490,883 | (103,623) | (902,858) |
| Class Y(C) | | | | |
| Proceeds from Shares issued | 1,271,629 | 14,268,625 | 2,240,371 | 23,194,008 |
| Proceeds from Shares issued in connection with reorganization(B) | 493,844 | 5,545,569 | — | — |
| Reinvestment of distributions | 779,077 | 8,531,614 | 238,204 | 2,317,284 |
| Cost of Shares redeemed | (2,625,149) | (29,423,662) | (3,105,283) | (28,962,292) |
| Change from Class Y Share Transactions | (80,599) | (1,077,854) | (626,708) | (3,451,000) |
| Institutional Class | | | | |
| Proceeds from Shares issued | 5,463,546 | 60,984,321 | 12,763,089 | 135,117,333 |
| Reinvestment of distributions | 1,915,258 | 20,913,854 | 587,454 | 5,736,439 |
| Cost of Shares redeemed | (7,279,817) | (80,473,980) | (7,394,847) | (77,357,112) |
| Change from Institutional Class Share Transactions | 98,987 | 1,424,195 | 5,955,696 | 63,496,660 |
| Class R6 | | | | |
| Proceeds from Shares issued | 39,612 | 419,942 | — | — |
| Reinvestment of distributions | 192 | 1,961 | — | — |
| Change from Class R6 Share Transactions | 39,804 | 421,903 | — | — |
| Change from Share Transactions | 13,397,428 | $150,160,610 | 5,030,991 | $57,417,338 |
| (A) | Represents the period from commencement of operations (October 28, 2021) through June 30, 2022 for Class R6. |
| (B) | See Note 9 in Notes to Financial Statements. |
| (C) | Effective July 16, 2021, Class W shares of the AIG Strategic Value Fund were reorganized into Class Y shares of the Touchstone Value Fund. |
See accompanying Notes to Financial Statements.
| Touchstone Balanced Fund |
| Period ended | | Net
asset
value at
beginning
of period | | Net
investment
income
(loss) | | Net
realized
and
unrealized
gains (losses)
on investments | | Total from
investment
operations | | Distributions
from net
investment
income | | Distributions
from realized
capital
gains | | Total
distributions | | Net
asset
value
at end of
period | | Total
return(1) | | Net
assets
at end
of period
(000's) | | Ratio of
net expenses
to average
net assets | | Ratio of
gross expenses
to average
net assets | | Ratio
of net
investment
income (loss)
to average
net assets | | Portfolio
turnover
rate |
| Class A |
| 11/30/17 | | $19.68 | | $0.21 | | $2.89 | | $3.10 | | $(0.25) | | $ (0.13) | | $(0.38) | | $22.40 | | 15.95% | | $258,279 | | 1.03% | | 1.04% | | 0.99% | | 46% |
| 06/30/18(2)(3) | | 22.40 | | 0.16 | | 0.22 | | 0.38 | | (0.18) | | (1.06) | | (1.24) | | 21.54 | | 1.72(4) | | 239,056 | | 1.01(5) | | 1.07(5) | | 1.24(5) | | 119(4) |
| 06/30/19 | | 21.54 | | 0.32 | | 1.73 | | 2.05 | | (0.34) | | (1.07) | | (1.41) | | 22.18 | | 10.13 | | 244,037 | | 1.01 | | 1.09 | | 1.49 | | 81 |
| 06/30/20 | | 22.18 | | 0.27 | | 1.85 | | 2.12 | | (0.28) | | (2.41) | | (2.69) | | 21.61 | | 10.09 | | 250,298 | | 1.01 | | 1.07 | | 1.25 | | 135 |
| 06/30/21 | | 21.61 | | 0.16(6) | | 5.47 | | 5.63 | | (0.15) | | (1.57) | | (1.72) | | 25.52 | | 26.92 | | 322,009 | | 1.01 | | 1.03 | | 0.66 | | 60 |
| 06/30/22 | | 25.52 | | 0.14(6) | | (3.42) | | (3.28) | | (0.15) | | (0.61) | | (0.76) | | 21.48 | | (13.32) | | 521,933 | | 0.99 | | 0.99 | | 0.54 | | 92(7)(8) |
| Class C |
| 11/30/17 | | $19.73 | | $0.04 | | $2.91 | | $2.95 | | $(0.09) | | $ (0.13) | | $(0.22) | | $22.46 | | 15.09% | | $42,800 | | 1.79% | | 1.81% | | 0.23% | | 46% |
| 06/30/18(2)(3) | | 22.46 | | 0.06 | | 0.22 | | 0.28 | | (0.05) | | (1.06) | | (1.11) | | 21.63 | | 1.25(4) | | 39,769 | | 1.78(5) | | 1.86(5) | | 0.47(5) | | 119(4) |
| 06/30/19 | | 21.63 | | 0.15 | | 1.75 | | 1.90 | | (0.17) | | (1.07) | | (1.24) | | 22.29 | | 9.33 | | 34,380 | | 1.78 | | 1.89 | | 0.72 | | 81 |
| 06/30/20 | | 22.29 | | 0.11 | | 1.86 | | 1.97 | | (0.13) | | (2.41) | | (2.54) | | 21.72 | | 9.23 | | 44,174 | | 1.78 | | 1.88 | | 0.48 | | 135 |
| 06/30/21 | | 21.72 | | (0.03)(6) | | 5.49 | | 5.46 | | (0.02) | | (1.57) | | (1.59) | | 25.59 | | 25.93 | | 65,455 | | 1.78 | | 1.81 | | (0.11) | | 60 |
| 06/30/22 | | 25.59 | | (0.05)(6) | | (3.42) | | (3.47) | | — | | (0.61) | | (0.61) | | 21.51 | | (13.96) | | 73,906 | | 1.75 | | 1.75 | | (0.22) | | 92(7)(8) |
| Class Y |
| 11/30/17(9) | | $19.57 | | $0.28 | | $2.84 | | $3.12 | | $(0.30) | | $ (0.13) | | $(0.43) | | $22.26 | | 16.20% | | $31,215 | | 0.78% | | 0.80% | | 1.25% | | 46% |
| 06/30/18(2)(3) | | 22.26 | | 0.19 | | 0.22 | | 0.41 | | (0.22) | | (1.06) | | (1.28) | | 21.39 | | 1.86(4) | | 30,612 | | 0.81(5) | | 0.90(5) | | 1.44(5) | | 119(4) |
| 06/30/19 | | 21.39 | | 0.35 | | 1.72 | | 2.07 | | (0.38) | | (1.07) | | (1.45) | | 22.01 | | 10.33 | | 60,638 | | 0.81 | | 0.88 | | 1.69 | | 81 |
| 06/30/20 | | 22.01 | | 0.32 | | 1.84 | | 2.16 | | (0.33) | | (2.41) | | (2.74) | | 21.43 | | 10.35 | | 94,921 | | 0.81 | | 0.87 | | 1.45 | | 135 |
| 06/30/21 | | 21.43 | | 0.20(6) | | 5.41 | | 5.61 | | (0.19) | | (1.57) | | (1.76) | | 25.28 | | 27.12 | | 197,877 | | 0.81 | | 0.81 | | 0.86 | | 60 |
| 06/30/22 | | 25.28 | | 0.18(6) | | (3.38) | | (3.20) | | (0.19) | | (0.61) | | (0.80) | | 21.28 | | (13.13) | | 155,159 | | 0.79(10) | | 0.75 | | 0.74 | | 92(7)(8) |
| Class R6 |
| 06/30/22(11) | | $26.15 | | $0.13(6) | | $(4.22) | | $(4.09) | | $(0.18) | | $ (0.61) | | $(0.79) | | $21.27 | | (16.08)%(4) | | $112 | | 0.64%(5) | | 33.98%(5) | | 0.89%(5) | | 92%(7)(8) |
| (1) | Total returns shown exclude the effect of applicable sales loads and fees. If these charges were included, the returns would be lower. |
| (2) | Represents the seven months ended June 30, 2018. |
| (3) | The Fund changed its fiscal year end from November 30 to June 30. |
| (4) | Not annualized. |
| (5) | Annualized. |
| (6) | The net investment income per share was based on average shares outstanding for the period. |
| (7) | Portfolio turnover excludes securities delivered from processing redemptions-in-kind. |
| (8) | Portfolio turnover excludes the purchases and sales of securities by the AIG Asset Allocation Fund and AIG Multi-Asset Allocation Fund acquired on July 16, 2021 (See Note 9 in the Notes to Financial Statements). If these transactions were included, portfolio turnover would have been higher. |
| (9) | Effective October 28, 2017, Class I shares of the Sentinel Balanced Fund (the “Predecessor Fund”) were reorganized into Class Y shares of the Fund. |
| (10) | Net expenses include amounts recouped by the Advisor. |
| (11) | Represents the period from commencement of operations (October 28, 2021) through June 30, 2022 for Class R6. |
See accompanying Notes to Financial Statements.
Financial Highlights (Continued)
| Touchstone Core Municipal Bond Fund |
| Period ended | | Net
asset
value at
beginning
of period | | Net
investment
income | | Net
realized
and
unrealized
gains (losses)
on investments | | Total from
investment
operations | | Distributions
from net
investment
income | | Distributions
from realized
capital
gains | | Total
distributions | | Net
asset
value
at end of
period | | Total
return(1) | | Net
assets
at end
of period
(000's) | | Ratio of
net expenses
to average
net assets | | Ratio of
gross expenses
to average
net assets | | Ratio
of net
investment
income (loss)
to average
net assets | | Portfolio
turnover
rate |
| Class A |
| 06/30/18 | | $11.55 | | $0.33 | | $(0.22) | | $0.11 | | $(0.33) | | $ — | | $(0.33) | | $11.33 | | 0.99% | | $35,728 | | 0.85% | | 1.13% | | 2.91% | | 47% |
| 06/30/19 | | 11.33 | | 0.32 | | 0.30 | | 0.62 | | (0.32) | | — | | (0.32) | | 11.63 | | 5.60 | | 33,515 | | 0.85 | | 1.15 | | 2.85 | | 53 |
| 06/30/20 | | 11.63 | | 0.30 | | 0.21 | | 0.51 | | (0.30) | | (0.01) | | (0.31) | | 11.83 | | 4.38 | | 32,060 | | 0.85 | | 1.18 | | 2.53 | | 33 |
| 06/30/21 | | 11.83 | | 0.28 | | 0.06 | | 0.34 | | (0.28) | | — | | (0.28) | | 11.89 | | 2.90 | | 30,870 | | 0.85 | | 1.15 | | 2.35 | | 21 |
| 06/30/22 | | 11.89 | | 0.16 | | (1.16) | | (1.00) | | (0.16) | | (0.01) | | (0.17) | | 10.72 | | (8.43) | | 25,101 | | 0.82 | | 1.08 | | 1.40 | | 157 |
| Class C |
| 06/30/18 | | $11.57 | | $0.25 | | $(0.24) | | $0.01 | | $(0.25) | | $ — | | $(0.25) | | $11.33 | | 0.06% | | $5,363 | | 1.60% | | 2.01% | | 2.16% | | 47% |
| 06/30/19 | | 11.33 | | 0.23 | | 0.33 | | 0.56 | | (0.24) | | — | | (0.24) | | 11.65 | | 4.97 | | 2,756 | | 1.60 | | 2.08 | | 2.10 | | 53 |
| 06/30/20 | | 11.65 | | 0.21 | | 0.21 | | 0.42 | | (0.21) | | (0.01) | | (0.22) | | 11.85 | | 3.61 | | 2,050 | | 1.60 | | 2.32 | | 1.78 | | 33 |
| 06/30/21 | | 11.85 | | 0.18 | | 0.07 | | 0.25 | | (0.19) | | — | | (0.19) | | 11.91 | | 2.13 | | 1,180 | | 1.60 | | 2.27 | | 1.60 | | 21 |
| 06/30/22 | | 11.91 | | 0.08 | | (1.17) | | (1.09) | | (0.08) | | (0.01) | | (0.09) | | 10.73 | | (9.27) | | 943 | | 1.57 | | 2.47 | | 0.65 | | 157 |
| Class Y |
| 06/30/18 | | $11.56 | | $0.29 | | $(0.16) | | $0.13 | | $(0.36) | | $ — | | $(0.36) | | $11.33 | | 1.15% | | $4,596 | | 0.60% | | 1.16% | | 3.16% | | 47% |
| 06/30/19 | | 11.33 | | 0.35 | | 0.31 | | 0.66 | | (0.35) | | — | | (0.35) | | 11.64 | | 5.96 | | 3,031 | | 0.60 | | 1.05 | | 3.10 | | 53 |
| 06/30/20 | | 11.64 | | 0.33 | | 0.22 | | 0.55 | | (0.33) | | (0.01) | | (0.34) | | 11.85 | | 4.73 | | 2,616 | | 0.60 | | 1.31 | | 2.78 | | 33 |
| 06/30/21 | | 11.85 | | 0.31 | | 0.05 | | 0.36 | | (0.31) | | — | | (0.31) | | 11.90 | | 3.07 | | 3,449 | | 0.60 | | 1.25 | | 2.60 | | 21 |
| 06/30/22 | | 11.90 | | 0.19 | | (1.15) | | (0.96) | | (0.19) | | (0.01) | | (0.20) | | 10.74 | | (8.19) | | 2,740 | | 0.57 | | 1.11 | | 1.65 | | 157 |
| Institutional Class |
| 06/30/18 | | $11.56 | | $0.30 | | $(0.16) | | $0.14 | | $(0.37) | | $ — | | $(0.37) | | $11.33 | | 1.18% | | $560 | | 0.55% | | 2.54% | | 3.21% | | 47% |
| 06/30/19 | | 11.33 | | 0.36 | | 0.31 | | 0.67 | | (0.36) | | — | | (0.36) | | 11.64 | | 6.05 | | 7,913 | | 0.55 | | 0.96 | | 3.15 | | 53 |
| 06/30/20 | | 11.64 | | 0.33 | | 0.21 | | 0.54 | | (0.33) | | (0.01) | | (0.34) | | 11.84 | | 4.69 | | 12,785 | | 0.55 | | 0.91 | | 2.83 | | 33 |
| 06/30/21 | | 11.84 | | 0.32 | | 0.06 | | 0.38 | | (0.32) | | — | | (0.32) | | 11.90 | | 3.20 | | 14,481 | | 0.55 | | 0.85 | | 2.65 | | 21 |
| 06/30/22 | | 11.90 | | 0.20 | | (1.15) | | (0.95) | | (0.20) | | (0.01) | | (0.21) | | 10.74 | | (8.13) | | 29,694 | | 0.50 | | 0.75 | | 1.72 | | 157 |
| (1) | Total returns shown exclude the effect of applicable sales loads and fees. If these charges were included, the returns would be lower. |
See accompanying Notes to Financial Statements.
Financial Highlights (Continued)
| Touchstone International Equity Fund |
| Period ended | | Net
asset
value at
beginning
of period | | Net
investment
income
(loss) | | Net
realized
and
unrealized
gains (losses)
on investments | | Total from
investment
operations | | Distributions
from net
investment
income | | Distributions
from realized
capital
gains | | Total
distributions | | Net
asset
value
at end of
period | | Total
return(1) | | Net
assets
at end
of period
(000's) | | Ratio of
net expenses
to average
net assets | | Ratio of
gross expenses
to average
net assets | | Ratio
of net
investment
income (loss)
to average
net assets | | Portfolio
turnover
rate |
| Class A |
| 11/30/17 | | $15.52 | | $0.17 | | $4.05 | | $4.22 | | $(0.10) | | $ — | | $(0.10) | | $19.64 | | 27.39% | | $129,139 | | 1.37% | | 1.39% | | 0.92% | | 37% |
| 06/30/18(2)(3) | | 19.64 | | 0.36(4) | | (0.94) | | (0.58) | | (0.21) | | (0.70) | | (0.91) | | 18.15 | | (3.23)(5) | | 118,391 | | 1.23(6) | | 1.30(6) | | 3.22(4)(6) | | 26(5) |
| 06/30/19 | | 18.15 | | 0.20(7) | | (0.57) | | (0.37) | | (0.26) | | (1.87) | | (2.13) | | 15.65 | | (0.78) | | 106,870 | | 1.30 | | 1.37 | | 1.26 | | 43 |
| 06/30/20 | | 15.65 | | 0.08(7) | | (0.98) | | (0.90) | | (0.19) | | (0.63) | | (0.82) | | 13.93 | | (6.28) | | 77,744 | | 1.29 | | 1.40 | | 0.57 | | 45 |
| 06/30/21 | | 13.93 | | 0.09(7) | | 4.94 | | 5.03 | | (0.08) | | — | | (0.08) | | 18.88 | | 36.16 | | 88,022 | | 1.36 | | 1.37 | | 0.56 | | 31 |
| 06/30/22 | | 18.88 | | 0.18(7) | | (3.44) | | (3.26) | | (0.08) | | (2.24) | | (2.32) | | 13.30 | | (18.87) | | 76,671 | | 1.36 | | 1.40 | | 1.08 | | 45(8) |
| Class C |
| 11/30/17 | | $14.66 | | $(0.06) | | $3.86 | | $3.80 | | $— | | $ — | | $— | | $18.46 | | 25.92% | | $6,924 | | 2.45% | | 2.49% | | (0.16)% | | 37% |
| 06/30/18(2)(3) | | 18.46 | | 0.26(4) | | (0.90) | | (0.64) | | — | | (0.70) | | (0.70) | | 17.12 | | (3.72)(5) | | 6,737 | | 2.18(6) | | 2.25(6) | | 2.27(4)(6) | | 26(5) |
| 06/30/19 | | 17.12 | | 0.03(7) | | (0.54) | | (0.51) | | (0.10) | | (1.87) | | (1.97) | | 14.64 | | (1.87) | | 3,783 | | 2.34 | | 2.42 | | 0.21 | | 43 |
| 06/30/20 | | 14.64 | | (0.09)(7) | | (0.93) | | (1.02) | | — | | (0.63) | | (0.63) | | 12.99 | | (7.41) | | 2,073 | | 2.49 | | 2.74 | | (0.63) | | 45 |
| 06/30/21 | | 12.99 | | (0.04)(7) | | 4.60 | | 4.56 | | (—)(9) | | — | | (—)(9) | | 17.55 | | 35.14 | | 2,115 | | 2.15 | | 2.90 | | (0.24) | | 31 |
| 06/30/22 | | 17.55 | | 0.07(7) | | (3.18) | | (3.11) | | (0.02) | | (2.24) | | (2.26) | | 12.18 | | (19.45) | | 2,399 | | 1.99 | | 2.71 | | 0.45 | | 45(8) |
| Class Y |
| 11/30/17(10) | | $15.40 | | $0.25 | | $3.98 | | $4.23 | | $(0.18) | | $ — | | $(0.18) | | $19.45 | | 27.78% | | $63,320 | | 1.01% | | 1.03% | | 1.28% | | 37% |
| 06/30/18(2)(3) | | 19.45 | | 0.40(4) | | (0.93) | | (0.53) | | (0.29) | | (0.70) | | (0.99) | | 17.93 | | (3.05)(5) | | 57,438 | | 0.99(6) | | 1.09(6) | | 3.47(4)(6) | | 26(5) |
| 06/30/19 | | 17.93 | | 0.25(7) | | (0.57) | | (0.32) | | (0.30) | | (1.87) | | (2.17) | | 15.44 | | (0.47) | | 42,120 | | 0.99 | | 1.12 | | 1.57 | | 43 |
| 06/30/20 | | 15.44 | | 0.13(7) | | (0.97) | | (0.84) | | (0.24) | | (0.63) | | (0.87) | | 13.73 | | (6.03) | | 23,835 | | 0.99 | | 1.15 | | 0.87 | | 45 |
| 06/30/21 | | 13.73 | | 0.15(7) | | 4.88 | | 5.03 | | (0.11) | | — | | (0.11) | | 18.65 | | 36.71 | | 27,903 | | 0.99 | | 1.19 | | 0.93 | | 31 |
| 06/30/22 | | 18.65 | | 0.23(7) | | (3.40) | | (3.17) | | (0.13) | | (2.24) | | (2.37) | | 13.11 | | (18.61) | | 20,430 | | 0.99 | | 1.19 | | 1.45 | | 45(8) |
| Institutional Class |
| 11/30/17(11) | | $18.91 | | $0.02 | | $0.53 | | $0.55 | | $— | | $ — | | $— | | $19.46 | | 2.91%(5) | | $3 | | 0.89%(6) | | 1,921.18%(6) | | 1.40%(6) | | 37% |
| 06/30/18(2)(3) | | 19.46 | | 0.56(4) | | (1.09) | | (0.53) | | (0.31) | | (0.70) | | (1.01) | | 17.92 | | (3.02)(5) | | 2,260 | | 0.89(6) | | 1.63(6) | | 3.57(4)(6) | | 26(5) |
| 06/30/19 | | 17.92 | | 0.26(7) | | (0.57) | | (0.31) | | (0.32) | | (1.87) | | (2.19) | | 15.42 | | (0.39) | | 2,592 | | 0.89 | | 1.38 | | 1.67 | | 43 |
| 06/30/20 | | 15.42 | | 0.14(7) | | (0.95) | | (0.81) | | (0.27) | | (0.63) | | (0.90) | | 13.71 | | (5.89) | | 14,205 | | 0.89 | | 1.12 | | 0.97 | | 45 |
| 06/30/21 | | 13.71 | | 0.16(7) | | 4.88 | | 5.04 | | (0.12) | | — | | (0.12) | | 18.63 | | 36.83 | | 4,315 | | 0.89 | | 1.06 | | 1.03 | | 31 |
| 06/30/22 | | 18.63 | | 0.25(7) | | (3.40) | | (3.15) | | (0.15) | | (2.24) | | (2.39) | | 13.09 | | (18.52) | | 3,273 | | 0.89 | | 1.34 | | 1.55 | | 45(8) |
| (1) | Total returns shown exclude the effect of applicable sales loads and fees. If these charges were included, the returns would be lower. |
| (2) | Represents the seven months ended June 30, 2018. |
| (3) | The Fund changed its fiscal year end from November 30 to June 30. |
| (4) | Reflects the impact of a special dividend that resulted in a one-time increase to net investment income. If the special dividend had not occurred, the ratio of net investment income to average net assets would have been lower by 1.54% for Class A, Class C, Class Y and Institutional Class shares and the net investment income per share would have been lower by $0.17, $0.16, $0.17 and $0.16 for Class A, Class C, Class Y and Institutional Class shares, respectively. |
| (5) | Not annualized. |
| (6) | Annualized. |
| (7) | The net investment income per share was based on average shares outstanding for the period. |
| (8) | Portfolio turnover excludes the purchases and sales of securities by the AIG International Dividend Strategy Fund acquired on July 16, 2021 (See Note 9 in the Notes to Financial Statements). If these transactions were included, portfolio turnover would have been higher. |
| (9) | Less than $0.005 per share. |
| (10) | Effective October 28, 2017, Class I shares of the Sentinel Balanced Fund (the “Predecessor Fund”) were reorganized into Class Y shares of the Fund. |
| (11) | Represents the period from commencement of operations (October 30, 2017) through November 30, 2017. |
See accompanying Notes to Financial Statements.
Financial Highlights (Continued)
| Touchstone International Growth Fund |
| Period ended | | Net
asset
value at
beginning
of period | | Net
investment
income
(loss) | | Net
realized
and
unrealized
gains (losses)
on investments | | Total from
investment
operations | | Distributions
from net
investment
income | | Distributions
from realized
capital
gains | | Total
distributions | | Net
asset
value
at end of
period | | Total
return(1) | | Net
assets
at end
of period
(000's) | | Ratio of
net expenses
to average
net assets | | Ratio of
gross expenses
to average
net assets | | Ratio
of net
investment
income (loss)
to average
net assets | | Portfolio
turnover
rate |
| Class A |
| 06/30/18(2) | | $11.61 | | $(0.01) | | $1.75 | | $1.74 | | $— | | $ (0.24) | | $(0.24) | | $13.11 | | 15.00% | | $918 | | 1.36% | | 3.75% | | (0.05)% | | 109% |
| 06/30/19(2) | | 13.11 | | (0.04)(3) | | (0.47) | | (0.51) | | — | | (1.49) | | (1.49) | | 11.11 | | (1.78) | | 760 | | 1.24 | | 4.36 | | (0.31) | | 103 |
| 06/30/20(2) | | 11.11 | | (0.03)(3) | | 0.60 | | 0.57 | | — | | — | | — | | 11.68 | | 5.07 | | 777 | | 1.24 | | 4.17 | | (0.26) | | 74 |
| 06/30/21(2) | | 11.68 | | (0.10)(3) | | 3.77 | | 3.67 | | — | | — | | — | | 15.35 | | 31.51 | | 2,216 | | 1.24 | | 2.31 | | (0.63) | | 116(4) |
| 06/30/22 | | 15.35 | | (0.04) | | (4.81) | | (4.85) | | — | | — | | — | | 10.50 | | (31.60) | | 1,172 | | 1.24 | | 2.62 | | (0.27) | | 49 |
| Class C |
| 06/30/18(2) | | $11.57 | | $(0.05) | | $1.69 | | $1.64 | | $— | | $ (0.24) | | $(0.24) | | $12.97 | | 14.14% | | $436 | | 2.10% | | 5.06% | | (0.79)% | | 109% |
| 06/30/19(2) | | 12.97 | | (0.12)(3) | | (0.48) | | (0.60) | | — | | (1.49) | | (1.49) | | 10.88 | | (2.52) | | 185 | | 1.99 | | 6.35 | | (1.06) | | 103 |
| 06/30/20(2) | | 10.88 | | (0.11)(3) | | 0.57 | | 0.46 | | — | | — | | — | | 11.34 | | 4.28 | | 403 | | 1.99 | | 5.96 | | (1.01) | | 74 |
| 06/30/21(2) | | 11.34 | | (0.20)(3) | | 3.67 | | 3.47 | | — | | — | | — | | 14.81 | | 30.55 | | 1,316 | | 1.99 | | 3.43 | | (1.38) | | 116(4) |
| 06/30/22 | | 14.81 | | (0.14) | | (4.61) | | (4.75) | | — | | — | | — | | 10.06 | | (32.07) | | 787 | | 1.99 | | 3.62 | | (1.02) | | 49 |
| Class Y |
| 06/30/18(2) | | $11.81 | | $0.01 | | $1.79 | | $1.80 | | $— | | $ (0.24) | | $(0.24) | | $13.37 | | 15.32% | | $4,553 | | 1.03% | | 1.81% | | 0.28% | | 109% |
| 06/30/19(2) | | 13.37 | | (0.01)(3) | | (0.49) | | (0.50) | | (0.01) | | (1.51) | | (1.52) | | 11.35 | | (1.53) | | 2,341 | | 0.99 | | 1.89 | | (0.06) | | 103 |
| 06/30/20(2) | | 11.35 | | (—)(3)(5) | | 0.60 | | 0.60 | | — | | — | | — | | 11.95 | | 5.28 | | 867 | | 0.99 | | 2.50 | | (0.01) | | 74 |
| 06/30/21(2) | | 11.95 | | (0.06)(3) | | 3.88 | | 3.82 | | — | | — | | — | | 15.77 | | 31.88 | | 74,507 | | 0.99 | | 1.25 | | (0.38) | | 116(4) |
| 06/30/22 | | 15.77 | | (—)(5) | | (4.95) | | (4.95) | | — | | — | | — | | 10.82 | | (31.39) | | 47,845 | | 0.99 | | 1.31 | | (0.02) | | 49 |
| Institutional Class |
| 06/30/18(2) | | $11.88 | | $0.04 | | $1.78 | | $1.82 | | $— | | $ (0.24) | | $(0.24) | | $13.46 | | 15.42% | | $28,159 | | 1.02% | | 1.31% | | 0.28% | | 109% |
| 06/30/19(2) | | 13.46 | | 0.01(3) | | (0.50) | | (0.49) | | (0.02) | | (1.52) | | (1.54) | | 11.43 | | (1.46) | | 31,435 | | 0.89 | | 1.30 | | 0.04 | | 103 |
| 06/30/20(2) | | 11.43 | | 0.01(3) | | 0.61 | | 0.62 | | (—)(5) | | — | | (—)(5) | | 12.05 | | 5.46 | | 29,285 | | 0.89 | | 1.35 | | 0.09 | | 74 |
| 06/30/21(2) | | 12.05 | | (0.05)(3) | | 3.91 | | 3.86 | | (0.02) | | — | | (0.02) | | 15.89 | | 32.00 | | 23,334 | | 0.89 | | 1.20 | | (0.28) | | 116(4) |
| 06/30/22 | | 15.89 | | 0.03 | | (5.01) | | (4.98) | | (— )(5) | | — | | (— )(5) | | 10.91 | | (31.34) | | 11,224 | | 0.89 | | 1.32 | | 0.08 | | 49 |
| (1) | Total returns shown exclude the effect of applicable sales loads and fees. If these charges were included, the returns would be lower. |
| (2) | During the year ended June 30, 2021, the Fund effected the following stock split effective the close of business September 11, 2020: 1.9160 for 1 for Class A shares, 1.9095 for 1 for Class C shares, 1.8839 for 1 for Class Y shares and 1.8777 for 1 for Institutional Class shares. All historical per share information has been retroactively adjusted to reflect this stock split. |
| (3) | The net investment income (loss) per share was based on average shares outstanding for the period. |
| (4) | Portfolio turnover excludes the purchases and sales of securities of the International Small Cap Fund acquired on September 11, 2020. If these transactions were included, portfolio turnover would have been higher. |
| (5) | Less than $0.005 per share. |
See accompanying Notes to Financial Statements.
Financial Highlights (Continued)
| Touchstone Large Cap Focused Fund |
| Period ended | | Net
asset
value at
beginning
of period | | Net
investment
income
(loss) | | Net
realized
and
unrealized
gains (losses)
on investments | | Total from
investment
operations | | Distributions
from net
investment
income | | Distributions
from realized
capital
gains | | Total
distributions | | Net
asset
value
at end of
period | | Total
return(1) | | Net
assets
at end
of period
(000's) | | Ratio of
net expenses
to average
net assets(2) | | Ratio of
gross expenses
to average
net assets(3) | | Ratio
of net
investment
income (loss)
to average
net assets | | Portfolio
turnover
rate |
| Class A |
| 11/30/17 | | $42.28 | | $0.45 | | $8.99 | | $9.44 | | $(0.51) | | $ (2.46) | | $(2.97) | | $48.75 | | 23.67% | | $1,321,506 | | 1.02% | | 1.02% | | 0.98% | | 12%(4) |
| 06/30/18(5)(6) | | 48.75 | | 0.23 | | 1.85 | | 2.08 | | (0.07) | | (6.96) | | (7.03) | | 43.80 | | 4.74(7) | | 1,218,721 | | 0.97(8) | | 1.09(8) | | 0.88(8) | | 9(4)(7) |
| 06/30/19 | | 43.80 | | 0.38(9) | | 3.72 | | 4.10 | | (0.27) | | (4.26) | | (4.53) | | 43.37 | | 10.51 | | 1,170,490 | | 0.97 | | 1.09 | | 0.88 | | 15(4) |
| 06/30/20 | | 43.37 | | 0.27 | | 3.78 | | 4.05 | | (0.27) | | (4.85) | | (5.12) | | 42.30 | | 9.54 | | 1,120,305 | | 1.01 | | 1.10 | | 0.66 | | 29(4) |
| 06/30/21 | | 42.30 | | 0.08(9) | | 19.10 | | 19.18 | | (0.09) | | (2.71) | | (2.80) | | 58.68 | | 46.68 | | 1,541,127 | | 1.01 | | 1.05 | | 0.15 | | 16(4) |
| 06/30/22 | | 58.68 | | 0.04 | | (7.56) | | (7.52) | | (0.05) | | (3.91) | | (3.96) | | 47.20 | | (14.07) | | 1,736,900 | | 0.99 | | 0.99 | | 0.13 | | 27(4)(10) |
| Class C |
| 11/30/17 | | $40.44 | | $—(11) | | $8.67 | | $8.67 | | $(0.17) | | $ (2.46) | | $(2.63) | | $46.48 | | 22.69% | | $74,122 | | 1.82% | | 1.82% | | 0.18% | | 12%(4) |
| 06/30/18(5)(6) | | 46.48 | | 0.03 | | 1.74 | | 1.77 | | — | | (6.96) | | (6.96) | | 41.29 | | 4.24(7) | | 67,599 | | 1.78(8) | | 1.89(8) | | 0.07(8) | | 9(4)(7) |
| 06/30/19 | | 41.29 | | 0.03(9) | | 3.50 | | 3.53 | | — | | (4.26) | | (4.26) | | 40.56 | | 9.61 | | 47,838 | | 1.79 | | 1.90 | | 0.07 | | 15(4) |
| 06/30/20 | | 40.56 | | (0.19) | | 3.64 | | 3.45 | | — | | (4.85) | | (4.85) | | 39.16 | | 8.69 | | 37,450 | | 1.82 | | 1.94 | | (0.15) | | 29(4) |
| 06/30/21 | | 39.16 | | (0.30)(9) | | 17.58 | | 17.28 | | — | | (2.71) | | (2.71) | | 53.73 | | 45.49 | | 41,645 | | 1.80 | | 1.88 | | (0.64) | | 16(4) |
| 06/30/22 | | 53.73 | | (0.02) | | (7.18) | | (7.20) | | — | | (3.91) | | (3.91) | | 42.62 | | (14.78) | | 49,115 | | 1.80 | | 1.80 | | (0.68) | | 27(4)(10) |
| Class Y |
| 11/30/17(12) | | $42.26 | | $0.56 | | $8.99 | | $9.55 | | $(0.63) | | $ (2.46) | | $(3.09) | | $48.72 | | 24.03% | | $438,732 | | 0.74% | | 0.75% | | 1.26% | | 12%(4) |
| 06/30/18(5)(6) | | 48.72 | | 0.29 | | 1.84 | | 2.13 | | (0.21) | | (6.96) | | (7.17) | | 43.68 | | 4.85(7) | | 394,077 | | 0.74(8) | | 0.90(8) | | 1.11(8) | | 9(4)(7) |
| 06/30/19 | | 43.68 | | 0.48(9) | | 3.71 | | 4.19 | | (0.37) | | (4.26) | | (4.63) | | 43.24 | | 10.81 | | 413,137 | | 0.73 | | 0.89 | | 1.13 | | 15(4) |
| 06/30/20 | | 43.24 | | 0.40 | | 3.76 | | 4.16 | | (0.37) | | (4.85) | | (5.22) | | 42.18 | | 9.84 | | 352,103 | | 0.75 | | 0.91 | | 0.92 | | 29(4) |
| 06/30/21 | | 42.18 | | 0.22(9) | | 19.05 | | 19.27 | | (0.16) | | (2.71) | | (2.87) | | 58.58 | | 47.07 | | 575,053 | | 0.73 | | 0.86 | | 0.43 | | 16(4) |
| 06/30/22 | | 58.58 | | 0.20 | | (7.57) | | (7.37) | | (0.16) | | (3.91) | | (4.07) | | 47.14 | | (13.86) | | 493,825 | | 0.73 | | 0.78 | | 0.39 | | 27(4)(10) |
| Institutional Class |
| 11/30/17(13) | | $42.32 | | $0.61 | | $9.01 | | $9.62 | | $(0.67) | | $ (2.46) | | $(3.13) | | $48.81 | | 24.14% | | $44,738 | | 0.68% | | 0.70% | | 1.32% | | 12%(4) |
| 06/30/18(5)(6) | | 48.81 | | 0.34 | | 1.80 | | 2.14 | | (0.24) | | (6.96) | | (7.20) | | 43.75 | | 4.93(7) | | 46,683 | | 0.67(8) | | 0.88(8) | | 1.18(8) | | 9(4)(7) |
| 06/30/19 | | 43.75 | | 0.51(9) | | 3.71 | | 4.22 | | (0.40) | | (4.26) | | (4.66) | | 43.31 | | 10.87 | | 100,473 | | 0.66 | | 0.85 | | 1.20 | | 15(4) |
| 06/30/20 | | 43.31 | | 0.35 | | 3.83 | | 4.18 | | (0.40) | | (4.85) | | (5.25) | | 42.24 | | 9.87 | | 127,963 | | 0.71 | | 0.88 | | 0.96 | | 29(4) |
| 06/30/21 | | 42.24 | | 0.23(9) | | 19.10 | | 19.33 | | (0.17) | | (2.71) | | (2.88) | | 58.69 | | 47.14 | | 207,274 | | 0.70 | | 0.81 | | 0.46 | | 16(4) |
| 06/30/22 | | 58.69 | | 0.26 | | (7.63) | | (7.37) | | (0.18) | | (3.91) | | (4.09) | | 47.23 | | (13.85) | | 217,531 | | 0.70 | | 0.73 | | 0.42 | | 27(4)(10) |
| Class R6 |
| 06/30/22(14) | | $61.99 | | $0.22 | | $(10.89) | | $(10.67) | | $(0.16) | | $ (3.91) | | $(4.07) | | $47.25 | | (18.43)%(7) | | $804 | | 0.66%(8) | | 3.02%(8) | | 0.47%(8) | | 27%(4)(10) |
| (1) | Total returns shown exclude the effect of applicable sales loads and fees. If these charges were included, the returns would be lower. |
| (2) | The ratios shown include liquidity provider expenses. The ratio of net expenses to average net assets excluding liquidity provider expenses for Class A shares was 0.98%, 1.00%, 0.98%, 0.96%, 0.95% and 1.02%; for Class C shares was 1.79%, 1.79%, 1.79%, 1.78%, 1.76% and 1.82%; for Class Y shares was 0.72%, 0.72%, 0.72%, 0.72%, 0.72% and 0.74%; for Institutional Class shares was 0.69%, 0.69%, 0.68%, 0.65%, 0.65% and 0.68% for the years ended June 30, 2022, 2021, 2020 and 2019, the seven months ended June 30, 2018 and the year ended November 30, 2017, respectively; and for Class R6 shares was 0.65% for the period ended June 30, 2022. |
| (3) | The ratios shown include liquidity provider expenses. The ratio of gross expenses to average net assets excluding liquidity provider expenses for Class A shares was 0.98%, 1.04%, 1.07%, 1.08%, 1.07% and 1.02%; for Class C shares was 1.79%, 1.87%, 1.91%, 1.89%, 1.87% and 1.82%; for Class Y shares was 0.77%, 0.85%, 0.88%, 0.88%, 0.88% and 0.75%; for Institutional Class shares was 0.72%, 0.80%, 0.85%, 0.84%, 0.86% and 0.70% for the years ended June 30, 2022, 2021, 2020 and 2019, the seven months ended June 30, 2018 and the year ended November 30, 2017, respectively; and for Class R6 shares was 3.01% for the period ended June 30, 2022. |
| (4) | Portfolio turnover excludes securities delivered from processing redemptions-in-kind. |
| (5) | Represents the seven months ended June 30, 2018. |
| (6) | The Fund changed its fiscal year end from November 30 to June 30. |
| (7) | Not annualized. |
| (8) | Annualized. |
| (9) | The net investment income (loss) per share was based on average shares outstanding for the period. |
| (10) | Portfolio turnover excludes the purchases and sales of securities of the AIG Focused Alpha Large-Cap Fund acquired on July 16, 2021 (See Note 9 in the Notes to Financial Statements). If these transactions were included, portfolio turnover would have been higher. |
| (11) | Less than $0.005 per share. |
| (12) | Effective October 28, 2017, Class I shares of the Sentinel International Equity Fund (the “Predecessor Fund”) were reorganized into Class Y shares of the Fund. |
| (13) | Effective October 30, 2017, Class R6 shares of the Predecessor Fund were reorganized into Institutional Class shares of the Fund. |
| (14) | Represents the period from commencement of operations (October 28, 2021) through June 30, 2022 for Class R6. |
See accompanying Notes to Financial Statements.
Financial Highlights (Continued)
| Touchstone Large Cap Fund |
| Period ended | | Net
asset
value at
beginning
of period | | Net
investment
income
(loss) | | Net
realized
and
unrealized
gains (losses)
on investments | | Total from
investment
operations | | Distributions
from net
investment
income | | Distributions
from realized
capital
gains | | Total
distributions | | Net
asset
value
at end of
period | | Total
return(1) | | Net
assets
at end
of period
(000's) | | Ratio of
net expenses
to average
net assets(2) | | Ratio of
gross expenses
to average
net assets(3) | | Ratio
of net
investment
income (loss)
to average
net assets | | Portfolio
turnover
rate |
| Class A |
| 06/30/18 | | $11.96 | | $0.09 | | $1.27 | | $1.36 | | $(0.05) | | $ — | | $(0.05) | | $13.27 | | 11.35% | | $2,975 | | 1.12% | | 1.50% | | 0.48% | | 10% |
| 06/30/19 | | 13.27 | | 0.09(4) | | 0.83 | | 0.92 | | (0.08) | | — | | (0.08) | | 14.11 | | 7.04 | | 4,067 | | 1.11 | | 1.67 | | 0.63 | | 19(5) |
| 06/30/20 | | 14.11 | | 0.15 | | (0.24) | | (0.09) | | (0.11) | | (0.87) | | (0.98) | | 13.04 | | (1.18) | | 2,989 | | 1.03 | | 1.91 | | 1.03 | | 20 |
| 06/30/21 | | 13.04 | | 0.11 | | 4.83 | | 4.94 | | (0.12) | | — | | (0.12) | | 17.86 | | 38.06 | | 4,278 | | 1.04 | | 1.53 | | 0.75 | | 15(5) |
| 06/30/22 | | 17.86 | | 0.08 | | (2.03) | | (1.95) | | (0.12) | | (0.40) | | (0.52) | | 15.39 | | (11.44) | | 4,510 | | 1.05 | | 1.48 | | 0.51 | | 12(5) |
| Class C |
| 06/30/18 | | $11.80 | | $(0.04) | | $1.28 | | $1.24 | | $— | | $ — | | $— | | $13.04 | | 10.51% | | $7,849 | | 1.87% | | 2.12% | | (0.27)% | | 10% |
| 06/30/19 | | 13.04 | | (0.02)(4) | | 0.83 | | 0.81 | | — | | — | | — | | 13.85 | | 6.21 | | 7,372 | | 1.86 | | 2.13 | | (0.12) | | 19(5) |
| 06/30/20 | | 13.85 | | 0.01 | | (0.20) | | (0.19) | | — | | (0.87) | | (0.87) | | 12.79 | | (1.89) | | 5,376 | | 1.78 | | 2.09 | | 0.27 | | 20 |
| 06/30/21 | | 12.79 | | (0.10) | | 4.84 | | 4.74 | | — | | — | | — | | 17.53 | | 37.06 | | 4,328 | | 1.79 | | 2.03 | | (—)(6) | | 15(5) |
| 06/30/22 | | 17.53 | | (0.10) | | (1.96) | | (2.06) | | — | | (0.40) | | (0.40) | | 15.07 | | (12.15) | | 2,995 | | 1.80 | | 2.12 | | (0.24) | | 12(5) |
| Class Y |
| 06/30/18 | | $12.00 | | $0.10 | | $1.30 | | $1.40 | | $(0.09) | | $ — | | $(0.09) | | $13.31 | | 11.62% | | $231,984 | | 0.87% | | 0.99% | | 0.73% | | 10% |
| 06/30/19 | | 13.31 | | 0.12(4) | | 0.84 | | 0.96 | | (0.13) | | — | | (0.13) | | 14.14 | | 7.31 | | 213,650 | | 0.86 | | 0.99 | | 0.88 | | 19(5) |
| 06/30/20 | | 14.14 | | 0.17 | | (0.22) | | (0.05) | | (0.15) | | (0.87) | | (1.02) | | 13.07 | | (0.93) | | 206,798 | | 0.78 | | 0.90 | | 1.28 | | 20 |
| 06/30/21 | | 13.07 | | 0.16 | | 4.83 | | 4.99 | | (0.18) | | — | | (0.18) | | 17.88 | | 38.39 | | 270,305 | | 0.79 | | 0.88 | | 1.00 | | 15(5) |
| 06/30/22 | | 17.88 | | 0.15 | | (2.05) | | (1.90) | | (0.16) | | (0.40) | | (0.56) | | 15.42 | | (11.20) | | 202,913 | | 0.80 | | 0.88 | | 0.76 | | 12(5) |
| Institutional Class |
| 06/30/18 | | $12.02 | | $0.10 | | $1.31 | | $1.41 | | $(0.10) | | $ — | | $(0.10) | | $13.33 | | 11.70% | | $124,759 | | 0.77% | | 0.91% | | 0.83% | | 10% |
| 06/30/19 | | 13.33 | | 0.14(4) | | 0.83 | | 0.97 | | (0.14) | | — | | (0.14) | | 14.16 | | 7.43 | | 59,211 | | 0.77 | | 0.92 | | 0.98 | | 19(5) |
| 06/30/20 | | 14.16 | | 0.15 | | (0.19) | | (0.04) | | (0.16) | | (0.87) | | (1.03) | | 13.09 | | (0.83) | | 60,402 | | 0.68 | | 0.84 | | 1.38 | | 20 |
| 06/30/21 | | 13.09 | | 0.16 | | 4.86 | | 5.02 | | (0.20) | | — | | (0.20) | | 17.91 | | 38.59 | | 90,358 | | 0.69 | | 0.82 | | 1.10 | | 15(5) |
| 06/30/22 | | 17.91 | | 0.18 | | (2.08) | | (1.90) | | (0.17) | | (0.40) | | (0.57) | | 15.44 | | (11.15) | | 67,679 | | 0.70 | | 0.82 | | 0.86 | | 12(5) |
| (1) | Total returns shown exclude the effect of applicable sales loads and fees. If these charges were included, the returns would be lower. |
| (2) | The ratios shown include liquidity provider expenses. The ratio of net expenses to average net assets excluding liquidity provider expenses for Class A shares was 1.03% and 1.03%; for Class C shares was 1.78% and 1.78%; for Class Y shares was 0.78% and 0.78%; and for Institutional Class shares was 0.68% and 0.68% for the years ended June 30, 2022 and 2021, respectively. |
| (3) | The ratios shown include liquidity provider expenses. The ratio of gross expenses to average net assets excluding liquidity provider expenses for Class A shares was 1.46% and 1.52%; for Class C shares was 2.10% and 2.02%; for Class Y shares was 0.86% and 0.87%; and for Institutional Class shares was 0.80% and 0.81% for the years ended June 30, 2022 and 2021, respectively. |
| (4) | The net investment income per share was based on average shares outstanding for the period. |
| (5) | Portfolio turnover excludes securities delivered from processing redemptions-in-kind. |
| (6) | Less than 0.005%. |
See accompanying Notes to Financial Statements.
Financial Highlights (Continued)
| Touchstone Large Company Growth Fund |
| Period ended | | Net
asset
value at
beginning
of period | | Net
investment
loss | | Net
realized
and
unrealized
gains (losses)
on investments | | Total from
investment
operations | | Distributions
from realized
capital
gains | | Total
distributions | | Net
asset
value
at end of
period | | Total
return(1) | | Net
assets
at end
of period
(000's) | | Ratio of
net expenses
to average
net assets(2) | | Ratio of
gross expenses
to average
net assets(3) | | Ratio
of net
investment
income (loss)
to average
net assets | | Portfolio
turnover
rate |
| Class A |
| 06/30/18 | | $35.52 | | $(0.24) | | $7.19 | | $6.95 | | $ (1.14) | | $(1.14) | | $41.33 | | 19.75% | | $3,417 | | 1.23% | | 1.67% | | (0.63)% | | 44% |
| 06/30/19 | | 41.33 | | (0.56) | | 4.42 | | 3.86 | | (2.69) | | (2.69) | | 42.50 | | 10.39 | | 1,425 | | 1.23 | | 2.01 | | (0.59) | | 41 |
| 06/30/20 | | 42.50 | | (0.08) | | 8.19 | | 8.11 | | (3.15) | | (3.15) | | 47.46 | | 20.07 | | 2,112 | | 1.07 | | 2.28 | | 0.60 | | 30 |
| 06/30/21 | | 47.46 | | (0.15) | | 16.56 | | 16.41 | | (6.61) | | (6.61) | | 57.26 | | 37.33 | | 3,617 | | 1.06 | | 1.59 | | (0.71) | | 36(4) |
| 06/30/22 | | 57.26 | | (0.18) | | (10.40) | | (10.58) | | (10.52) | | (10.52) | | 36.16 | | (23.29) | | 3,290 | | 1.07 | | 1.58 | | (0.61) | | 41(4) |
| Class C |
| 06/30/18 | | $35.29 | | $(0.30) | | $6.89 | | $6.59 | | $ (1.14) | | $(1.14) | | $40.74 | | 18.88% | | $236 | | 1.98% | | 8.12% | | (1.38)% | | 44% |
| 06/30/19 | | 40.74 | | (0.40) | | 3.87 | | 3.47 | | (2.69) | | (2.69) | | 41.52 | | 9.55 | | 396 | | 1.98 | | 4.38 | | (1.34) | | 41 |
| 06/30/20 | | 41.52 | | (0.31) | | 7.87 | | 7.56 | | (3.15) | | (3.15) | | 45.93 | | 19.19 | | 592 | | 1.82 | | 4.64 | | (1.35) | | 30 |
| 06/30/21 | | 45.93 | | (1.42) | | 16.81 | | 15.39 | | (6.61) | | (6.61) | | 54.71 | | 36.28 | | 473 | | 1.81 | | 3.39 | | (1.46) | | 36(4) |
| 06/30/22 | | 54.71 | | (1.24) | | (9.03) | | (10.27) | | (10.52) | | (10.52) | | 33.92 | | (23.87) | | 206 | | 1.82 | | 4.24 | | (1.36) | | 41(4) |
| Class Y |
| 06/30/18 | | $35.60 | | $(0.13) | | $7.20 | | $7.07 | | $ (1.14) | | $(1.14) | | $41.53 | | 20.02% | | $15,961 | | 0.98% | | 1.12% | | (0.38)% | | 44% |
| 06/30/19 | | 41.53 | | (0.12) | | 4.10 | | 3.98 | | (2.69) | | (2.69) | | 42.82 | | 10.66 | | 19,580 | | 0.98 | | 1.16 | | (0.34) | | 41 |
| 06/30/20 | | 42.82 | | (0.12) | | 8.42 | | 8.30 | | (3.15) | | (3.15) | | 47.97 | | 20.38 | | 24,062 | | 0.82 | | 1.04 | | (0.35) | | 30 |
| 06/30/21 | | 47.97 | | (0.26) | | 17.00 | | 16.74 | | (6.61) | | (6.61) | | 58.10 | | 37.64 | | 28,952 | | 0.81 | | 0.96 | | (0.46) | | 36(4) |
| 06/30/22 | | 58.10 | | (0.18) | | (10.49) | | (10.67) | | (10.52) | | (10.52) | | 36.91 | | (23.09) | | 13,917 | | 0.82 | | 0.97 | | (0.36) | | 41(4) |
| Institutional Class |
| 06/30/18 | | $35.63 | | $(0.11) | | $7.23 | | $7.12 | | $ (1.14) | | $(1.14) | | $41.61 | | 20.17% | | $224,379 | | 0.88% | | 0.98% | | (0.28)% | | 44% |
| 06/30/19 | | 41.61 | | (0.10) | | 4.13 | | 4.03 | | (2.69) | | (2.69) | | 42.95 | | 10.74 | | 204,391 | | 0.88 | | 0.99 | | (0.24) | | 41 |
| 06/30/20 | | 42.95 | | (0.12) | | 8.50 | | 8.38 | | (3.15) | | (3.15) | | 48.18 | | 20.51 | | 199,601 | | 0.73 | | 0.86 | | (0.25) | | 30 |
| 06/30/21 | | 48.18 | | (0.21) | | 17.10 | | 16.89 | | (6.61) | | (6.61) | | 58.46 | | 37.80 | | 229,690 | | 0.71 | | 0.85 | | (0.36) | | 36(4) |
| 06/30/22 | | 58.46 | | (0.14) | | (10.58) | | (10.72) | | (10.52) | | (10.52) | | 37.22 | | (23.03) | | 145,441 | | 0.72 | | 0.84 | | (0.26) | | 41(4) |
| (1) | Total returns shown exclude the effect of applicable sales loads and fees. If these charges were included, the returns would be lower. |
| (2) | The ratios shown include liquidity provider expenses. The ratio of net expenses to average net assets excluding liquidity provider expenses for Class A shares was 1.04% and 1.04%; for Class C shares was 1.79% and 1.79%; for Class Y shares was 0.79% and 0.79%; and for Institutional Class shares was 0.69% and 0.69% for the years ended June 30, 2022 and 2021, respectively. |
| (3) | The ratios shown include liquidity provider expenses. The ratio of gross expenses to average net assets excluding liquidity provider expenses for Class A shares was 1.55% and 1.57%; for Class C shares was 4.21% and 3.37%; for Class Y shares was 0.94% and 0.94%; and for Institutional Class shares was 0.81% and 0.83% for the years ended June 30, 2022 and 2021, respectively. |
| (4) | Portfolio turnover excludes securities delivered from processing redemptions-in-kind. |
See accompanying Notes to Financial Statements.
Financial Highlights (Continued)
| Touchstone Small Company Fund |
| Period ended | | Net
asset
value at
beginning
of period | | Net
investment
income
(loss) | | Net
realized
and
unrealized
gains (losses)
on investments | | Total from
investment
operations | | Distributions
from net
investment
income | | Distributions
from realized
capital
gains | | Total
distributions | | Net
asset
value
at end of
period | | Total
return(1) | | Net
assets
at end
of period
(000's) | | Ratio of
net expenses
to average
net assets(2) | | Ratio of
gross expenses
to average
net assets(3) | | Ratio
of net
investment
income (loss)
to average
net assets | | Portfolio
turnover
rate |
| Class A |
| 11/30/17 | | $5.19 | | $(0.02) | | $0.89 | | $0.87 | | $— | | $ (0.42) | | $(0.42) | | $5.64 | | 17.95% | | $677,055 | | 1.18% | | 1.18% | | (0.49)% | | 82% |
| 06/30/18(4)(5) | | 5.64 | | (0.01) | | 0.37 | | 0.36 | | — | | (0.47) | | (0.47) | | 5.53 | | 6.89(6) | | 661,866 | | 1.10(7) | | 1.18(7) | | (0.26)(7) | | 30(6) |
| 06/30/19 | | 5.53 | | (0.01) | | (0.07) | | (0.08) | | — | | (0.62) | | (0.62) | | 4.83 | | (0.73) | | 589,664 | | 1.12 | | 1.20 | | (0.26) | | 94(8)(9) |
| 06/30/20 | | 4.83 | | (0.02) | | (0.47) | | (0.49) | | — | | (0.28) | | (0.28) | | 4.06 | | (10.82) | | 420,822 | | 1.15 | | 1.24 | | (0.32) | | 81 |
| 06/30/21 | | 4.06 | | (0.03) | | 2.65 | | 2.62 | | — | | (0.01) | | (0.01) | | 6.67 | | 64.45 | | 608,513 | | 1.20 | | 1.20 | | (0.45) | | 80(8) |
| 06/30/22 | | 6.67 | | (0.02)(10) | | (0.95) | | (0.97) | | — | | (1.14) | | (1.14) | | 4.56 | | (17.95) | | 451,081 | | 1.17 | | 1.17 | | (0.31) | | 70(8) |
| Class C |
| 11/30/17 | | $3.39 | | $(0.10) | | $0.63 | | $0.53 | | $— | | $ (0.42) | | $(0.42) | | $3.50 | | 17.36% | | $104,051 | | 1.92% | | 1.92% | | (1.23)% | | 82% |
| 06/30/18(4)(5) | | 3.50 | | (0.02) | | 0.22 | | 0.20 | | — | | (0.47) | | (0.47) | | 3.23 | | 6.51(6) | | 97,136 | | 1.85(7) | | 1.93(7) | | (1.02)(7) | | 30(6) |
| 06/30/19 | | 3.23 | | (0.05) | | (0.04) | | (0.09) | | — | | (0.62) | | (0.62) | | 2.52 | | (1.65) | | 39,390 | | 1.88 | | 1.96 | | (1.01) | | 94(8)(9) |
| 06/30/20 | | 2.52 | | (0.05) | | (0.20) | | (0.25) | | — | | (0.28) | | (0.28) | | 1.99 | | (11.22) | | 21,204 | | 1.95 | | 2.07 | | (1.12) | | 81 |
| 06/30/21 | | 1.99 | | (0.04) | | 1.29 | | 1.25 | | — | | (0.01) | | (0.01) | | 3.23 | | 62.65 | | 26,123 | | 1.97 | | 2.05 | | (1.22) | | 80(8) |
| 06/30/22 | | 3.23 | | (0.03)(10) | | (0.34) | | (0.37) | | — | | (1.14) | | (1.14) | | 1.72 | | (18.70) | | 17,385 | | 1.97 | | 2.02 | | (1.11) | | 70(8) |
| Class Y |
| 11/30/17(11) | | $5.56 | | $(0.06) | | $1.02 | | $0.96 | | $— | | $ (0.42) | | $(0.42) | | $6.10 | | 18.41% | | $388,404 | | 0.85% | | 0.85% | | (0.16)% | | 82% |
| 06/30/18(4)(5) | | 6.10 | | (—)(12) | | 0.41 | | 0.41 | | — | | (0.47) | | (0.47) | | 6.04 | | 7.21(6) | | 383,050 | | 0.84(7) | | 0.92(7) | | (0.01)(7) | | 30(6) |
| 06/30/19 | | 6.04 | | (—)(12) | | (0.09) | | (0.09) | | (—)(12) | | (0.62) | | (0.62) | | 5.33 | | (0.79) | | 326,021 | | 0.87 | | 0.95 | | —(12) | | 94(8)(9) |
| 06/30/20 | | 5.33 | | (—)(12) | | (0.52) | | (0.52) | | — | | (0.28) | | (0.28) | | 4.53 | | (10.35) | | 189,336 | | 0.89 | | 0.98 | | (0.06) | | 81 |
| 06/30/21 | | 4.53 | | (0.01) | | 2.94 | | 2.93 | | (—)(12) | | (0.01) | | (0.01) | | 7.45 | | 64.61 | | 282,428 | | 0.91 | | 0.99 | | (0.16) | | 80(8) |
| 06/30/22 | | 7.45 | | (—)(10) | | (1.10) | | (1.10) | | — | | (1.14) | | (1.14) | | 5.21 | | (17.81) | | 222,141 | | 0.91 | | 0.97 | | (0.05) | | 70(8) |
| Institutional Class |
| 11/30/17(13) | | $5.80 | | $(—)(12) | | $0.30 | | $0.30 | | $— | | $ — | | $— | | $6.10 | | 5.17%(6) | | $3 | | 0.79%(7) | | 2,069.15%(7) | | (0.70)%(7) | | 82% |
| 06/30/18(4)(5) | | 6.10 | | —(12) | | 0.41 | | 0.41 | | — | | (0.47) | | (0.47) | | 6.04 | | 7.21(6) | | 8 | | 0.79(7) | | 275.86(7) | | 0.05(7) | | 30(6) |
| 06/30/19 | | 6.04 | | —(12) | | (0.10) | | (0.10) | | (—)(12) | | (0.62) | | (0.62) | | 5.32 | | (0.91) | | 2,216 | | 0.79 | | 2.52 | | 0.08 | | 94(8)(9) |
| 06/30/20 | | 5.32 | | —(12) | | (0.52) | | (0.52) | | — | | (0.28) | | (0.28) | | 4.52 | | (10.37) | | 11,269 | | 0.79 | | 1.13 | | 0.05 | | 81 |
| 06/30/21 | | 4.52 | | (—)(12) | | 2.93 | | 2.93 | | (—)(12) | | (0.01) | | (0.01) | | 7.44 | | 64.75 | | 18,770 | | 0.81 | | 0.99 | | (0.06) | | 80(8) |
| 06/30/22 | | 7.44 | | —(10) | | (1.09) | | (1.09) | | — | | (1.14) | | (1.14) | | 5.21 | | (17.70) | | 21,299 | | 0.81 | | 0.96 | | 0.05 | | 70(8) |
| Class R6 |
| 11/30/17 | | $5.24 | | $(0.03) | | $0.94 | | $0.91 | | $— | | $ (0.42) | | $(0.42) | | $5.73 | | 18.58% | | $67,052 | | 0.75% | | 0.77% | | (0.07)% | | 82% |
| 06/30/18(4)(5) | | 5.73 | | —(12) | | 0.39 | | 0.39 | | — | | (0.47) | | (0.47) | | 5.65 | | 7.33(6) | | 76,246 | | 0.73(7) | | 0.84(7) | | 0.10(7) | | 30(6) |
| 06/30/19 | | 5.65 | | 0.01 | | (0.08) | | (0.07) | | (0.01) | | (0.62) | | (0.63) | | 4.95 | | (0.59) | | 137,585 | | 0.73 | | 0.84 | | 0.14 | | 94(8)(9) |
| 06/30/20 | | 4.95 | | 0.01 | | (0.49) | | (0.48) | | — | | (0.28) | | (0.28) | | 4.19 | | (10.35) | | 64,567 | | 0.76 | | 0.88 | | 0.07 | | 81 |
| 06/30/21 | | 4.19 | | (—)(12) | | 2.73 | | 2.73 | | (—)(12) | | (0.01) | | (0.01) | | 6.91 | | 65.08 | | 63,766 | | 0.81 | | 0.89 | | (0.06) | | 80(8) |
| 06/30/22 | | 6.91 | | — (10)(12) | | (1.00) | | (1.00) | | — | | (1.14) | | (1.14) | | 4.77 | | (17.73) | | 53,500 | | 0.81 | | 0.87 | | 0.05 | | 70(8) |
| (1) | Total returns shown exclude the effect of applicable sales loads and fees. If these charges were included, the returns would be lower. |
| (2) | The ratios shown include liquidity provider expenses. The ratio of net expenses to average net assets excluding liquidity provider expenses for Class A shares was 1.15% and 1.18%; for Class C shares was 1.95% and 1.95%; for Class Y shares was 0.89% and 0.89%; for Institutional Class shares was 0.79% and 0.79%; and for Class R6 shares was 0.79% and 0.79% for the years ended June 30, 2022 and 2021, respectively. |
| (3) | The ratios shown include liquidity provider expenses. The ratio of gross expenses to average net assets excluding liquidity provider expenses for Class A shares was 1.15% and 1.18%; for Class C shares was 2.00% and 2.03%; for Class Y shares was 0.95% and 0.97%; for Institutional Class shares was 0.94% and 0.97%; and for Class R6 shares was 0.85% and 0.87% for the years ended June 30, 2022 and 2021, respectively. |
| (4) | Represents the seven months ended June 30, 2018. |
| (5) | The Fund changed its fiscal year end from November 30 to June 30. |
| (6) | Not annualized. |
| (7) | Annualized. |
| (8) | Portfolio turnover excludes securities delivered from processing redemptions-in-kind. |
| (9) | Portfolio turnover excludes the purchases and sales of securities by the Touchstone Small Cap Growth Fund acquired on September 21, 2018. If these transactions were included, portfolio turnover would have been higher. |
| (10) | The net investment income per share was based on average shares outstanding for the period. |
| (11) | Effective October 28, 2017, Class I shares of the Sentinel Small Company Fund (the “Predecessor Fund”) were reorganized into Class Y shares of the Fund. |
| (12) | Less than $0.005 per share or 0.005%. |
| (13) | Represents the period from commencement of operations (October 30, 2017) through November 30, 2017. |
See accompanying Notes to Financial Statements.
Financial Highlights (Continued)
| Touchstone Value Fund |
| Period ended | | Net
asset
value at
beginning
of period | | Net
investment
income | | Net
realized
and
unrealized
gains (losses)
on investments | | Total from
investment
operations | | Distributions
from net
investment
income | | Distributions
from realized
capital
gains | | Total
distributions | | Net
asset
value
at end of
period | | Total
return(1) | | Net
assets
at end
of period
(000's) | | Ratio of
net expenses
to average
net assets | | Ratio of
gross expenses
to average
net assets | | Ratio
of net
investment
income (loss)
to average
net assets | | Portfolio
turnover
rate |
| Class A |
| 06/30/18 | | $10.13 | | $0.14 | | $0.55 | | $0.69 | | $(0.14) | | $ (0.76) | | $(0.90) | | $9.92 | | 6.92% | | $36,968 | | 1.08% | | 1.26% | | 1.42% | | 24% |
| 06/30/19 | | 9.92 | | 0.16 | | 0.57 | | 0.73 | | (0.16) | | (1.08) | | (1.24) | | 9.41 | | 8.53 | | 32,964 | | 1.08 | | 1.26 | | 1.67 | | 37(2) |
| 06/30/20 | | 9.41 | | 0.13 | | (0.98) | | (0.85) | | (0.12) | | (0.49) | | (0.61) | | 7.95 | | (9.83) | | 24,567 | | 1.08 | | 1.26 | | 1.37 | | 57 |
| 06/30/21 | | 7.95 | | 0.10 | | 3.62 | | 3.72 | | (0.10) | | (0.16) | | (0.26) | | 11.41 | | 47.49 | | 33,052 | | 1.08 | | 1.24 | | 1.08 | | 37 |
| 06/30/22 | | 11.41 | | 0.11 | | (0.63) | | (0.52) | | (0.12) | | (0.85) | | (0.97) | | 9.92 | | (5.30) | | 156,947 | | 1.08 | | 1.13 | | 1.03 | | 63(3) |
| Class C |
| 06/30/18 | | $10.10 | | $0.08 | | $0.54 | | $0.62 | | $(0.07) | | $ (0.76) | | $(0.83) | | $9.89 | | 6.12% | | $3,654 | | 1.83% | | 2.21% | | 0.68% | | 24% |
| 06/30/19 | | 9.89 | | 0.09 | | 0.56 | | 0.65 | | (0.08) | | (1.08) | | (1.16) | | 9.38 | | 7.72 | | 3,175 | | 1.83 | | 2.35 | | 0.92 | | 37(2) |
| 06/30/20 | | 9.38 | | 0.06 | | (0.97) | | (0.91) | | (0.05) | | (0.49) | | (0.54) | | 7.93 | | (10.49) | | 2,175 | | 1.83 | | 2.43 | | 0.62 | | 57 |
| 06/30/21 | | 7.93 | | 0.03 | | 3.61 | | 3.64 | | (0.03) | | (0.16) | | (0.19) | | 11.38 | | 46.40 | | 1,943 | | 1.83 | | 2.46 | | 0.33 | | 37 |
| 06/30/22 | | 11.38 | | 0.02 | | (0.64) | | (0.62) | | (0.03) | | (0.85) | | (0.88) | | 9.88 | | (6.11) | | 5,722 | | 1.83 | | 2.08 | | 0.28 | | 63(3) |
| Class Y |
| 06/30/18 | | $10.17 | | $0.17 | | $0.55 | | $0.72 | | $(0.17) | | $ (0.76) | | $(0.93) | | $9.96 | | 7.19% | | $81,988 | | 0.81% | | 0.95% | | 1.70% | | 24% |
| 06/30/19 | | 9.96 | | 0.19 | | 0.57 | | 0.76 | | (0.19) | | (1.08) | | (1.27) | | 9.45 | | 8.82 | | 92,928 | | 0.79 | | 0.94 | | 1.96 | | 37(2) |
| 06/30/20 | | 9.45 | | 0.15 | | (0.98) | | (0.83) | | (0.15) | | (0.49) | | (0.64) | | 7.98 | | (9.64) | | 75,028 | | 0.80 | | 0.96 | | 1.64 | | 57 |
| 06/30/21 | | 7.98 | | 0.13 | | 3.64 | | 3.77 | | (0.13) | | (0.16) | | (0.29) | | 11.46 | | 47.93 | | 100,542 | | 0.83 | | 0.95 | | 1.33 | | 37 |
| 06/30/22 | | 11.46 | | 0.14 | | (0.64) | | (0.50) | | (0.14) | | (0.85) | | (0.99) | | 9.97 | | (5.06) | | 86,615 | | 0.83 | | 0.88 | | 1.28 | | 63(3) |
| Institutional Class |
| 06/30/18 | | $10.14 | | $0.19 | | $0.55 | | $0.74 | | $(0.19) | | $ (0.76) | | $(0.95) | | $9.93 | | 7.34% | | $262,467 | | 0.68% | | 0.87% | | 1.82% | | 24% |
| 06/30/19 | | 9.93 | | 0.20 | | 0.57 | | 0.77 | | (0.20) | | (1.08) | | (1.28) | | 9.42 | | 8.96 | | 208,686 | | 0.68 | | 0.89 | | 2.07 | | 37(2) |
| 06/30/20 | | 9.42 | | 0.16 | | (0.97) | | (0.81) | | (0.16) | | (0.49) | | (0.65) | | 7.96 | | (9.43) | | 153,945 | | 0.68 | | 0.90 | | 1.77 | | 57 |
| 06/30/21 | | 7.96 | | 0.14 | | 3.63 | | 3.77 | | (0.14) | | (0.16) | | (0.30) | | 11.43 | | 48.12 | | 289,120 | | 0.68 | | 0.88 | | 1.48 | | 37 |
| 06/30/22 | | 11.43 | | 0.16 | | (0.65) | | (0.49) | | (0.16) | | (0.85) | | (1.01) | | 9.93 | | (5.02) | | 252,281 | | 0.68 | | 0.83 | | 1.43 | | 63(3) |
| Class R6 |
| 06/30/22(4) | | $11.91 | | $0.11 | | $(1.11) | | $(1.00) | | $(0.13) | | $ (0.85) | | $(0.98) | | $9.93 | | (9.10)%(5) | | $395 | | 0.63%(6) | | 8.11%(6) | | 1.47%(6) | | 63%(3) |
| (1) | Total returns shown exclude the effect of applicable sales loads and fees. If these charges were included, the returns would be lower. |
| (2) | Portfolio turnover excludes securities delivered from processing redemptions-in-kind. |
| (3) | Portfolio turnover excludes the purchases and sales of securities of the AIG Strategic Value Fund acquired on July 16, 2021 (See Note 9 in the Notes to Financial Statements). If these transactions were included, portfolio turnover would have been higher. |
| (4) | Represents the period from commencement of operations (October 28, 2021) through June 30, 2022 for Class R6. |
| (5) | Not annualized. |
| (6) | Annualized. |
See accompanying Notes to Financial Statements.
Notes to Financial Statements
June 30, 2022
1. Organization
The Touchstone Strategic Trust (the “Trust”) is registered under the Investment Company Act of 1940, as amended (the “1940 Act”), as an open-end management investment company. The Trust was established as a Massachusetts business trust pursuant to an Agreement and Declaration of Trust dated November 18, 1982. The Trust consists of consists of nineteen funds, including the following nine funds (individually, a “Fund”, and collectively, the “Funds”):
| Touchstone Balanced Fund ("Balanced Fund”) |
| Touchstone Core Municipal Bond Fund (formerly Touchstone Ohio Tax-Free Bond Fund) ("Core Municipal Bond Fund”) |
| Touchstone International Equity Fund ("International Equity Fund”) |
| Touchstone International Growth Fund ("International Growth Fund”) |
| Touchstone Large Cap Focused Fund ("Large Cap Focused Fund”) |
| Touchstone Large Cap Fund ("Large Cap Fund”) |
| Touchstone Large Company Growth Fund ("Large Company Growth Fund”) |
| Touchstone Small Company Fund ("Small Company Fund”) |
| Touchstone Value Fund ("Value Fund”) |
Each Fund is diversified, with the exception of the Large Cap Focused Fund, the Large Cap Fund and the Large Company Growth Fund, which are non-diversified.
The Agreement and Declaration of Trust permits the Trust to issue an unlimited number of shares of beneficial interest of each Fund. The table below indicates the classes of shares that each Fund is registered to offer:
| | Class A | Class C | Class Y | Institutional Class | Class R6 |
| Balanced Fund | X | X | X | | X |
| Core Municipal Bond Fund | X | X | X | X | |
| International Equity Fund | X | X | X | X | |
| International Growth Fund | X | X | X | X | |
| Large Cap Focused Fund | X | X | X | X | X |
| Large Cap Fund | X | X | X | X | |
| Large Company Growth Fund | X | X | X | X | |
| Small Company Fund | X | X | X | X | X |
| Value Fund | X | X | X | X | X |
The assets of each Fund are segregated, and a shareholder’s interest is limited to the Fund in which shares are held. The Funds’ prospectus provides a description of each Fund’s investment goal, policies, and strategies along with information on the classes of shares currently being offered.
2. Significant Accounting Policies
The following is a summary of the Funds’ significant accounting policies:
Each Fund is an investment company that follows the accounting and reporting guidance of Accounting Standards Codification Topic 946 applicable to investment companies.
Security valuation and fair value measurements — U.S. generally accepted accounting principles (“U.S. GAAP”) defines fair value as the price the Funds would receive to sell an asset or pay to transfer a liability in an orderly transaction between market participants at the measurement date. All investments in securities are recorded at their fair value. The Funds define the term “market value”, as used throughout this report, as the estimated fair value. The Funds use various methods to measure fair value of their portfolio securities on a recurring basis. U.S. GAAP fair value measurement standards require disclosure of a hierarchy that prioritizes inputs to valuation methods. These inputs are summarized in the three broad levels listed below:
• Level 1 − quoted prices in active markets for identical securities
• Level 2 − other significant observable inputs (including quoted prices for similar securities, interest rates, prepayment speeds, credit risk, etc.)
• Level 3 − significant unobservable inputs (including a Fund’s own assumptions in determining the fair value of investments)
The inputs or methodology used for valuing securities are not necessarily an indication of the risk associated with investing in those securities.
The aggregate value by input level, as of June 30, 2022, for each Fund’s investments, is included in each Fund’s Portfolio of Investments, which also includes a breakdown of the Fund’s investments by geographic, portfolio or sector allocation. The Funds did not hold or transfer any Level 3 categorized securities during the year ended June 30, 2022.
Notes to Financial Statements (Continued)
Changes in valuation techniques may result in transfers into or out of an investment’s assigned level within the hierarchy.
The Funds' portfolio securities are valued as of the close of the regular session of trading on the New York Stock Exchange (“NYSE”) (currently 4:00 p.m., Eastern Time or at the time as of which the NYSE establishes official closing prices). Portfolio securities traded on stock exchanges are valued at the last reported sale price, official close price, or last bid price if no sales are reported. Portfolio securities quoted by NASDAQ are valued at the NASDAQ Official Closing Price (“NOCP”) or from the primary exchange on which the security trades. To the extent these securities are actively traded, they are categorized in Level 1 of the fair value hierarchy. Options and futures are valued at the last quoted sales price. If there is no such reported sale on the valuation date, long option positions are valued at the most recent bid price, and short option positions are valued at the most recent ask price on the valuation date and are categorized in Level 1. Shares of mutual funds in which the Funds invest are valued at their respective net asset value (“NAV”) as reported by the underlying funds (the “Underlying Funds”) and are categorized in Level 1.
Debt securities held by the Funds are valued at their evaluated bid by an independent pricing service or at their last broker-quoted bid prices as obtained from one or more of the major market makers for such securities. Independent pricing services use information provided by market makers or estimates of market values through accepted market modeling conventions. Observable inputs to the models may include prepayment speeds, pricing spread, yield, trade information, dealer quotes, market color, cash flow models, the securities’ terms and conditions, among others, and are generally categorized in Level 2. Investments in asset-backed and mortgage-backed securities are valued by independent pricing services using models that consider estimated cash flows of each tranche of the security, establish a benchmark yield and develop an estimated tranche specific spread to the benchmark yield based on the unique attributes of the tranche, and are generally categorized in Level 2. Debt securities with remaining maturities of 60 days or less may be valued at amortized cost, provided such amount approximates market value and are categorized in Level 2. While this method provides consistency in valuation (and may only be used if it approximates market value), it may result in periods during which fair value, as determined by amortized cost, is higher or lower than the price that would be received if the Fund sold the investment.
Securities mainly traded on a non-U.S. exchange or denominated in foreign currencies are generally valued according to the preceding closing values on that exchange, translated to U.S. dollars using currency exchange rates as of the close of regular trading on the NYSE, and are generally categorized in Level 1. However, if an event that may change the value of a security occurs after the time that the closing value on the non-U.S. exchange was determined, but before the close of regular trading on the NYSE, the security may be priced based on fair value and is generally categorized in Level 2. This may cause the value of the security, if held on the books of a Fund, to be different from the closing value on the non-U.S. exchange and may affect the calculation of that Fund’s NAV. The Funds may use fair value pricing under the following circumstances, among others:
• If the value of a security has been materially affected by events occurring before the Funds' pricing time but after the close of the primary markets on which the security is traded.
• If the exchange on which a portfolio security is principally traded closes early or if trading in a particular portfolio security was halted during the day and did not resume prior to the Funds' NAV calculation.
• If a security is so thinly traded that reliable market quotations are unavailable due to infrequent trading.
• If the validity of market quotations is not reliable.
Securities held by the Funds that do not have readily available market quotations, significant observable inputs, or securities for which the available market quotations are not reliable, are priced at their estimated fair value using procedures approved by the Funds' Board of Trustees (the “Board”) and are generally categorized in Level 3.
Collateralized Loan Obligations — The Balanced Fund may invest in collateralized loan obligations (“CLOs”). CLOs are types of asset-backed securities. A CLO is an entity that is backed by syndicated bank loans. The cash flows of the CLO can be split into multiple segments, called “tranches,” which will vary in risk profile and yield. The riskiest segment is the subordinated or “equity” tranche. This tranche bears the greatest risk of defaults from the underlying assets in the CLO and serves to protect the other, more senior, tranches from default in all but the most severe circumstances. Since it is shielded from defaults by the more junior tranches, a “senior” tranche will typically have higher credit ratings and lower yields than their underlying securities, and often receive higher ratings from one or more of the nationally recognized rating agencies. Despite the protection from the more junior tranches, senior tranches can experience substantial losses due to actual defaults, increased sensitivity to future defaults and the disappearance of one or more protecting tranches as a result of changes in the credit profile of the underlying pool of assets.
Investment companies — The Funds may invest in securities of other investment companies, including exchange-traded funds (“ETFs”), open-end funds and closed-end funds. Open-end funds are investment companies that issue new shares continuously and redeem shares daily. Closed-end funds are investment companies that typically issue a fixed number of shares that trade on a securities exchange or over-the-counter (“OTC”). An ETF is an investment company that typically seeks to track the performance of an index by holding in its portfolio shares of all the companies, or a representative sample of the companies, that are components of a particular index. ETF shares are traded on a securities exchange based on their market value. The risks of investment in other
Notes to Financial Statements (Continued)
investment companies typically reflect the risks of the types of securities in which the other investment companies invest. Investments in ETFs and closed-end funds are subject to the additional risk that their shares may trade at a premium or discount to their NAV. When a Fund invests in another investment company, shareholders of the Fund indirectly bear their proportionate share of the other investment company’s fees and expenses, including operating, registration, trustee, licensing, and marketing, as well as their share of the Fund’s fees and expenses.
Futures Contracts — The Balanced Fund may buy and sell futures contracts and related options to manage its exposure to changing interest rates and securities prices. Some strategies reduce the Fund’s exposure to price fluctuations, while others tend to increase its market exposure. Futures and options on futures can be volatile instruments and involve certain risks that could negatively impact the Fund’s return. In order to avoid leveraging and related risks, when the Fund purchases futures contracts, it will collateralize its position by depositing an amount of cash or liquid securities, equal to the market value of the futures positions held, less margin deposits, in a segregated account with its custodian or otherwise “cover” its position in a manner consistent with the 1940 Act or the rules of the Securities and Exchange Commission (the “SEC”) or interpretations thereunder. Collateral equal to the current fair value of the futures position will be determined on a daily basis.
When the contract is closed, the Fund records a realized gain or loss equal to the difference between the proceeds from (or cost of) the closing transactions and the Fund’s basis in the contract. Risks of entering into futures contracts include the possibility that a change in the value of the contract may not correlate with the changes in the value of the underlying instruments. Second, it is possible that a lack of liquidity for futures contracts could exist in the secondary market resulting in an inability to close a futures position prior to its maturity date. Third, the purchase of a futures contract involves the risk that the Fund could lose more than the original margin deposit required to initiate the futures transaction. Finally, the risk exists that losses could exceed amounts disclosed on the Statements of Assets and Liabilities. There is minimal counterparty credit risk involved in entering into futures contracts since they are exchange-traded instruments and the exchange’s clearinghouse, as counterparty to all exchange-traded futures, guarantees the futures against default.
As of June 30, 2022, the Balanced Fund did not hold any futures contracts.
Foreign currency translation — The books and records of the Funds are maintained in U.S. dollars and translated into U.S. dollars on the following basis:
| (1) | market value of investment securities, assets and liabilities at the current rate of exchange on the valuation date; and |
| (2) | purchases and sales of investment securities, income, and expenses at the relevant rates of exchange prevailing on the respective dates of such transactions. |
The Funds do not isolate that portion of gains and losses on investments in equity securities that is due to changes in the foreign exchange rates from that which is due to changes in market prices of equity securities.
Real Estate Investment Trusts — The Funds may invest in real estate investment trusts (“REITs”) that involve risks not associated with investing in stocks. Risks associated with investments in REITs include declines in the value of real estate, general and economic conditions, changes in the value of the underlying property and defaults by borrowers. The value of assets in the real estate industry may go through cycles of relative underperformance and outperformance in comparison to equity securities markets in general. Dividend income is recorded using management’s estimate of the income included in distributions received from REIT investments. The actual amounts of income, return of capital and capital gains are only determined by each REIT after its fiscal year-end and may differ from the estimated amount. Estimates of income are adjusted in the Funds to the actual amounts when the amounts are determined.
Derivative instruments and hedging activities — The Balanced Fund may enter into an International Swaps and Derivatives Association, Inc. Master Agreement (“ISDA Master Agreement” or “MNA”) or similar agreement with certain counterparties. An ISDA Master Agreement is a bilateral agreement between a Fund and a counterparty that governs OTC derivatives and foreign exchange contracts, and typically contains, among other things, collateral posting terms and master netting provisions in the event of a default or termination. Under an ISDA Master Agreement, a party may, under certain circumstances, offset with the counterparty certain derivative financial instruments’ payables or receivables with collateral held or posted and create one single net payment. The provisions of the ISDA Master Agreement typically permit a single net payment in the event of default (close-out netting). These default events include bankruptcy or insolvency of the counterparty. Note, however, that bankruptcy or insolvency laws of a particular jurisdiction may impose restrictions on or prohibitions against the right of offset.
When entering into a derivative transaction, a Fund may be required to post and maintain collateral or margin (including both initial and maintenance margin). Collateral and margin requirements differ by type of derivative. Margin requirements are established by the broker or clearing house for exchange-traded and centrally cleared derivatives (financial futures contracts, options, and centrally cleared swaps). Brokers can ask for margining in excess of the clearing house’s minimum in certain circumstances. Collateral terms are contract specific for OTC derivatives (forward foreign currency contracts, options, and swaps). For derivatives traded under an ISDA Master Agreement, the collateral requirements are typically calculated by netting the
Notes to Financial Statements (Continued)
marked-to-market amount for each transaction under such agreement and comparing that amount to the value of any collateral currently pledged by the Fund and the counterparty. For financial reporting purposes, cash collateral that has been pledged to cover obligations of the Fund and cash collateral received from the counterparty, if any, are reported separately on the Statements of Assets and Liabilities as cash deposits held at prime broker and due to prime broker, respectively. Non-cash collateral pledged by the Fund, if any, is noted in the Portfolio of Investments. To the extent amounts due to the Fund from its counterparties are not fully collateralized, contractually or otherwise, the Fund bears the risk of loss from counterparty non-performance.
Certain ISDA Master Agreements allow counterparties to OTC derivatives transactions to terminate derivative contracts prior to maturity in the event a Fund’s net assets decline by a stated percentage or the Fund fails to meet the terms of its ISDA Master Agreement, which would cause the Fund (counterparty) to accelerate payment of any net liability owed to the counterparty (Fund).
For financial reporting purposes, the Balanced Fund does not offset derivative assets and derivative liabilities that are subject to netting arrangements in the Statements of Assets and Liabilities.
As of June 30, 2022, the Balanced Fund did not hold any assets and liabilities that were subject to a MNA in the Statement of Assets and Liabilities.
The following table sets forth the effect of the Balanced Fund's derivative financial instruments by primary risk exposure on the Statements of Operations for the year ended June 30, 2022:
| Fund | Derivatives not accounted for as hedging
instruments under ASC 815 | Realized Gains
(Losses)
on Derivatives | Change in
Unrealized
Appreciation
(Depreciation)
on Derivatives |
| Balanced Fund | Futures - Interest Rate Contracts* | $823,799 | $313 |
| * | Statements of Operations Location: Net realized gains on futures contracts and net change in unrealized appreciation (depreciation) on futures contracts, respectively. |
For the year ended June 30, 2022, the average quarterly balances of outstanding derivative financial instruments was as follows:
| | Balanced Fund |
| Interest Rate Contracts: | |
| Futures Contracts - Notional Value | $13,652,934 |
Portfolio securities loaned — The Funds may lend their portfolio securities. Lending portfolio securities exposes the Funds to the risk that the borrower may fail to return the loaned securities or may not be able to provide additional collateral or that the Funds may experience delays in recovery of the loaned securities or loss of rights in the collateral if the borrower fails financially. To minimize these risks, the borrower must agree to maintain cash collateral with the Funds' custodian. The loaned securities are secured by collateral valued at least equal, at all times, to the market value of the loaned securities plus accrued interest, if any. When the collateral falls below specified amounts, the lending agent will use its best effort to obtain additional collateral on the next business day to meet required amounts under the security lending agreement. The cash collateral is reinvested by the Funds' custodian into an approved short-term investment vehicle. The approved short-term investment vehicle is subject to market risk.
As of June 30, 2022, the following Funds loaned securities and received collateral as follows:
| Fund | Security Type | Market Value of
Securities Loaned* | Market Value of
Collateral Received** | Net
Amount*** |
| Balanced Fund | Corporate Bonds | $831,137 | $848,250 | $17,113 |
| | Preferred Stocks | 864,435 | 884,574 | 20,139 |
| Total Balanced Fund | | 1,695,572 | 1,732,824 | 37,252 |
| International Growth Fund | Common Stocks | 4,456,197 | 4,804,762 | 348,565 |
| Small Company Fund | Common Stocks | 4,554,000 | 4,695,000 | 141,000 |
| * | The remaining contractual maturity is overnight for all securities. |
| ** | Gross amount of recognized liabilities for securities lending included in the Statements of Assets and Liabilities. |
| *** | Net amount represents the net amount payable due to (receive from) the borrower in the event of default. |
All cash collateral is received, held, and administered by the Funds' custodian for the benefit of the lending Fund in its custody account or other account established for the purpose of holding collateral in cash equivalents.
Funds participating in securities lending receive compensation in the form of fees. Securities lending income is derived from lending long securities from the Funds to creditworthy approved borrowers at rates that are determined based on daily trading volumes, float, short-term interest rates and market liquidity and is shown net of fees on the Statements of Operations. When a
Notes to Financial Statements (Continued)
Fund lends securities, it retains the interest or dividends on the investment of any cash received as collateral, and the Fund continues to receive interest or dividends on the loaned securities.
Unrealized gain or loss on the market value of the loaned securities that may occur during the term of the loan is recognized by the Fund. The Fund has the right under the lending agreement to recover any loaned securities from the borrower on demand.
When-issued or delayed delivery transactions — Each Fund may purchase or sell securities on a when-issued or delayed delivery basis. These transactions involve a commitment by the Fund to purchase or sell securities for a predetermined price or yield, with payment and delivery taking place beyond the customary settlement period. When delayed delivery purchases are outstanding, the Fund will set aside liquid assets in an amount sufficient to meet the purchase price. When purchasing a security on a delayed delivery basis, the Fund assumes the rights and risks of ownership of the security, including the risk of price and yield fluctuations, and takes such fluctuations into account when determining NAV. The Fund may dispose of or renegotiate a delayed delivery transaction after it is entered into, and may sell when-issued securities before they are delivered, which may result in a capital gain or loss. When the Fund has sold a security on a delayed delivery basis, the Fund does not participate in future gains and losses with respect to the security.
Share valuation — The NAV per share of each class of shares of each Fund is calculated daily by dividing the total value of a Fund’s assets attributable to that class, less liabilities attributable to that class, by the number of outstanding shares of that class.
The maximum offering price per share of Class A shares of the equity funds (all of the Funds except the Core Municipal Bond Fund) is equal to the NAV per share plus a sales load equal to 5.26% of the NAV (or 5.00% of the offering price). The maximum offering price per share of Class A shares of the Core Municipal Bond Fund is equal to the NAV per share plus a sales load equal to 3.36% of the NAV (or 3.25% of the offering price). There is no sales load on equity or fixed income fund purchases when aggregate purchases in all Touchstone funds equal at least $1 million or $500,000, respectively. The maximum offering price per share of Classes C, Y, Institutional Class and R6 shares of the Funds is equal to the NAV per share.
The redemption price per share of each class of shares of the Funds is generally equal to the NAV per share. However, Class A redemptions that were part of a no-load purchase due to the aggregate purchase amount in all Touchstone Funds equaling at least the maximum breakpoint where a Finder’s Fee was paid may be subject to a contingent deferred sales charge (“CDSC”) of up to 1.00% or 0.50% for equity or fixed income funds, respectively, if redeemed within a one-year period from the date of purchase. Additionally, purchases of Class C shares of the Funds are subject to a CDSC of 1.00% if redeemed within a one-year period from the date of purchase. The CDSC will be assessed on an amount equal to the lesser of (1) the NAV at the time of purchase of the shares being redeemed or (2) the NAV of such shares being redeemed.
Investment income — Dividend income from securities is recognized on the ex-dividend date, net of foreign withholding taxes, if any, which are reduced by any amounts reclaimable by the Funds, where applicable. Interest income from securities is recorded on the basis of interest accrued, premium amortized and discount accreted. Realized gains and losses resulting from principal pay downs on mortgage-backed and asset-backed securities are included in interest income. Market discounts, original issue discounts and market premiums on debt securities are accreted/amortized to interest income over the life of the security or to the appropriate call date, as applicable, with a corresponding adjustment in the cost basis of that security. In addition, it is the Funds’ policy to accrue for foreign capital gains taxes, if applicable, on certain foreign securities held by the Funds. An estimated foreign capital gains tax is recorded daily on net unrealized gains on these securities and is payable upon the sale of such securities when a gain is realized.
Distributions to shareholders — Each Fund intends to distribute to its shareholders substantially all of its income and capital gains. Each Fund, except the Balanced Fund, the Core Municipal Bond Fund and the Value Fund, declares and distributes net investment income, if any, annually, as a dividend to shareholders. The Balanced Fund and Value Fund declare and distribute net investment income, if any quarterly, as a dividend to shareholders. The Core Municipal Bond Fund declares distributions from net investment income on a daily basis and distributes as a dividend to shareholders on a monthly basis. Each Fund makes distributions of capital gains, if any, at least annually, net of applicable capital loss carryforwards. Income distributions and capital gain distributions are determined in accordance with income tax regulations. Recognition of the Funds' net investment income from investments in Underlying Funds is affected by the timing of dividend declarations by the Underlying Funds.
Allocations — Investment income earned, realized capital gains and losses, and unrealized appreciation and depreciation for a Fund are allocated daily to each class of shares based upon its proportionate share of total net assets of the Fund. Class-specific expenses are charged directly to the class incurring the expense. Common expenses, which are not attributable to a specific class, are allocated daily to each class of shares based upon their proportionate share of total net assets of the Fund. Expenses not directly billed to a Fund are allocated proportionally among all Funds in the Trust, and, if applicable, Touchstone Funds Group Trust and Touchstone Variable Series Trust (collectively with the Trust, “Touchstone Fund Complex”), daily in relation to net assets of each Fund or another reasonable measure.
Security transactions — Security transactions are reflected for financial reporting purposes as of the trade date. Realized gains and losses on sales of portfolio securities are calculated using the identified cost basis.
Notes to Financial Statements (Continued)
Estimates — The preparation of financial statements in conformity with U.S. GAAP requires management to make estimates and assumptions that affect the reported amounts of assets and liabilities and disclosure of contingent assets and liabilities at the date of the financial statements and the reported amounts of income and expenses during the reporting period. Actual results could differ from those estimates.
LIBOR Transition — Many debt securities, derivatives and other financial instruments in which the Funds may invest, as well as any borrowings made by the Funds from banks or from other lenders, utilize the London Interbank Offered Rate (“LIBOR”) as the reference or benchmark index for interest rate calculations. LIBOR is a measure of the average interest rate at which major global banks can borrow from one another. Plans are underway to phase out the use of LIBOR by June 30, 2023. The ICE Benchmark Administration Limited, the administrator of LIBOR, ceased publishing most LIBOR maturities, including some U.S. LIBOR maturities, on December 31, 2021, and is expected to cease publishing the remaining and most liquid U.S. LIBOR maturities on June 30, 2023. Before then, it is expected that market participants have or will transition to the use of different reference or benchmark indices. However, there is currently no definitive information regarding the future utilization of LIBOR or of any particular replacement index. As such, the potential effect of a transition away from LIBOR on the Funds’ investments cannot yet be determined.
3. Investment Transactions
Investment transactions (excluding short-term investments and U.S. Government securities) were as follows for the year ended June 30, 2022:
| | Balanced
Fund* | Core
Municipal
Bond
Fund | International
Equity
Fund | International
Growth
Fund |
| Purchases of investment securities | $424,429,775 | $108,929,964 | $52,998,473 | $39,592,039 |
| Proceeds from sales and maturities | $343,979,039 | $95,031,231 | $87,665,688 | $54,346,818 |
| | Large Cap
Focused
Fund* | Large Cap
Fund* | Large
Company
Growth
Fund* | Small
Company
Fund* | Value
Fund |
| Purchases of investment securities | $773,683,167 | $40,667,930 | $93,494,841 | $659,524,759 | $343,619,262 |
| Proceeds from sales and maturities | $841,812,442 | $79,139,683 | $120,719,988 | $645,981,882 | $420,094,757 |
| * | Balanced Fund, Large Cap Focused Fund, Large Cap Fund, Large Company Growth Fund and Small Company Fund had a redemption-in-kind out of the Fund of $21,938,249, $168,998,235, $28,554,517, $30,606,093 and $70,196,559, respectively. The redemptions were comprised of securities of $20,471,881, $133,840,394, $21,000,498, $25,368,539 and $56,618,499 which are excluded from the proceeds from sales and maturities and cash in the amount of $1,466,368, $35,157,841, $7,554,019, $5,237,554 and $13,578,060 for the Balanced Fund, Large Cap Focused Fund, Large Cap Fund, Large Company Growth Fund and Small Company Fund, respectively. |
For the year ended June 30, 2022, purchases and proceeds from sales and maturities in U.S. Government Securities were $461,281,529 and $455,278,073, respectively, for the Balanced Fund. There were no purchases or proceeds from sales and maturities of U.S. Government securities by the other Funds for the year ended June 30, 2022.
4. Transactions with Affiliates and Other Related Parties
Certain officers of the Trust are also officers of Touchstone Advisors, Inc. (the “Advisor”), Touchstone Securities, Inc. (the “Underwriter”), or The Bank of New York Mellon (“BNY Mellon”), the Sub-Administrator to the Funds. Such officers receive no compensation from the Trust. The Advisor and the Underwriter are each wholly-owned subsidiaries of Western & Southern Financial Group, Inc. ("Western & Southern").
On behalf of the Funds, the Advisor pays each Independent Trustee a quarterly retainer plus additional retainers to the Lead Independent Trustee and the chairs of each standing committee. Interested Trustees do not receive compensation from the Funds. Each Independent Trustee also receives compensation for each Board meeting and committee meeting attended. Each standing committee chair receives additional compensation for each committee meeting that he or she oversees. The Advisor is reimbursed by the Funds for the Independent Trustees’ compensation and out-of-pocket expenses relating to their services. The Funds accrued Trustee-related expenses of $254,142 for the Funds’ Board for the year ended June 30, 2022.
Notes to Financial Statements (Continued)
MANAGEMENT & EXPENSE LIMITATION AGREEMENTS
The Advisor provides general investment supervisory services for the Funds, under the terms of an advisory agreement (the “Advisory Agreement”). Under the Advisory Agreement, each Fund pays the Advisor a fee, which is computed and accrued daily and paid monthly, at an annual rate based on average daily net assets of each Fund as shown in the table below.
| Balanced Fund | 0.55% on the first $200 million
0.50% on the next $200 million
0.45% on the next $600 million
0.40% on the next $1 billion
0.35% on such assets over $2 billion |
| Core Municipal Bond Fund* | 0.40% on the first $300 million
0.30% on such assets over $300 million |
| International Equity Fund | 0.70% on the first $500 million
0.65% on the next $300 million
0.60% on the next $200 million
0.50% on the next $1 billion
0.40% on such assets over $2 billion |
| International Growth Fund | 0.80% on the first $1 billion
0.75% on the next $500 million
0.70% on the next $500 million
0.65% on such assets over $2 billion |
| Large Cap Focused Fund | 0.70% on the first $500 million
0.65% on the next $300 million
0.60% on the next $200 million
0.50% on the next $1 billion
0.40% on such assets over $2 billion |
| Large Cap Fund | 0.60% on the first $500 million
0.54% on the next $500 million
0.50% on such assets over $1 billion |
| Large Company Growth Fund | 0.60% on all assets |
| Small Company Fund | 0.70% on the first $500 million
0.65% on the next $300 million
0.60% on the next $200 million
0.50% on the next $1 billion
0.40% on such assets over $2 billion |
| Value Fund** | 0.65% on the first $200 million
0.55% on such assets over $200 million |
| * | Prior to October 28, 2021, the Fund paid 0.50% on the first $100 million, 0.45% on the next $100 million, 0.40% on the next $100 million and 0.375% on assets over $300 million. |
| ** | Prior to September 1, 2021, the Fund paid 0.65% on all assets. |
The Advisor has entered into investment sub-advisory agreements with the following parties (each, a “Sub-Advisor”):
| Barrow, Hanley, Mewhinney & Strauss, LLC | London Company of Virginia d/b/a The London Company |
| Value Fund | Large Cap Fund |
| DSM Capital Partners LLC | Fort Washington Investment Advisors, Inc.* |
| International Growth Fund | Balanced Fund |
| Large Company Growth Fund | International Equity Fund |
| Sage Advisory Services, Ltd Co. | Large Cap Focused Fund |
| Core Municipal Bond Fund** | Small Company Fund |
* Affiliate of the Advisor and wholly-owned subsidiary of Western & Southern.
** Prior to October 28, 2021, Fort Washington Investment Advisors, Inc. was the sub-advisor to the Fund.
The Advisor pays sub-advisory fees to each Sub-Advisor from its advisory fee.
The Advisor entered into an expense limitation agreement (the “Expense Limitation Agreement”) to contractually limit the annual operating expenses of the Funds, excluding: dividend and interest expenses relating to short sales; interest; taxes; brokerage commissions and other transaction costs; portfolio transaction and investment related expenses, including expenses associated with the Funds’ liquidity providers; other expenditures which are capitalized in accordance with U.S. GAAP; the cost of “Acquired Fund
Notes to Financial Statements (Continued)
Fees and Expenses”, if any; and other extraordinary expenses not incurred in the ordinary course of business. The maximum annual operating expense limit in any year with respect to the Funds is based on a percentage of the average daily net assets of the Funds. The Advisor has agreed to waive a portion of its fees, and to reimburse certain fund expenses in order to maintain the following expense limitations for the Funds:
| | Class A | Class C | Class Y | Institutional
Class | Class R6 | Termination Date |
| Balanced Fund* | 1.01% | 1.78% | 0.81% | — | 0.64% | July 29, 2023 |
| Core Municipal Bond Fund** | 0.80% | 1.55% | 0.55% | 0.48% | — | October 29 , 2022 |
| International Equity Fund | 1.36% | 1.99% | 0.99% | 0.89% | — | July 29, 2023 |
| International Growth Fund | 1.24% | 1.99% | 0.99% | 0.89% | — | October 29, 2022 |
| Large Cap Focused Fund* | 1.00% | 1.79% | 0.72% | 0.69% | 0.65% | July 29, 2023 |
| Large Cap Fund | 1.03% | 1.78% | 0.78% | 0.68% | — | October 29, 2022 |
| Large Company Growth Fund | 1.04% | 1.79% | 0.79% | 0.69% | — | October 29, 2022 |
| Small Company Fund | 1.22% | 1.95% | 0.89% | 0.79% | 0.79% | October 29, 2022 |
| Value Fund* | 1.08% | 1.83% | 0.83% | 0.68% | 0.63% | July 29, 2023 |
| * | The termination date for Class R6 shares is October 29, 2022. |
| ** | Prior to October 28, 2021, the expense limitation for Class A shares, Class C shares, Class Y and Institutional Class were 0.85%, 1.60%, 0.60% and 0.55%, respectively. |
The Expense Limitation Agreement can be terminated by a vote of the Funds’ Board if it deems the termination to be beneficial to the Funds’ shareholders.
During the year ended June 30, 2022, the Advisor or its affiliates waived investment advisory fees, administration fees or other operating expenses, including distribution fees of the Funds, as follows:
| Fund | Investment
Advisory
Fees Waived | Administration
Fees Waived | Other Operating
Expenses
Reimbursed/
Waived | Total |
| Balanced Fund | $— | $2 | $4,426 | $4,428 |
| Core Municipal Bond Fund | — | 44,979 | 137,449 | 182,428 |
| International Equity Fund | — | 3,723 | 121,430 | 125,153 |
| International Growth Fund | — | 101,712 | 215,212 | 316,924 |
| Large Cap Focused Fund | — | 47 | 413,390 | 413,437 |
| Large Cap Fund | — | 79,185 | 266,280 | 345,465 |
| Large Company Growth Fund | — | 164,598 | 157,398 | 321,996 |
| Small Company Fund | — | 27,811 | 214,023 | 241,834 |
| Value Fund | — | 235,068 | 356,127 | 591,195 |
Under the terms of the Expense Limitation Agreement, the Advisor is entitled to recover, subject to approval by the Funds’ Board, such amounts waived or reimbursed for a period of up to three years from the date on which the Advisor reduced its compensation or assumed expenses for the Funds. A Fund will make repayments to the Advisor only if such repayment does not cause the Fund's operating expenses (after the repayment is taken into account) to exceed the Fund's expense limit in place when such amounts were waived or reimbursed by the Advisor and the Fund's current expense limitation.
As of June 30, 2022, the Advisor may seek recoupment of previously waived fees and reimbursed expenses as follows:
| Fund | Expires on
or before
June 30, 2023 | Expires on
or before
June 30, 2024 | Expires on
or before
June 30, 2025 | Total |
| Balanced Fund | $— | $— | $4,428 | $4,428 |
| Core Municipal Bond Fund | 157,632 | 73,030 | 99,819 | 330,481 |
| International Equity Fund | 174,004 | 67,613 | 64,511 | 306,128 |
| International Growth Fund | 193,290 | 255,371 | 302,133 | 750,794 |
| Large Cap Focused Fund | 1,851,991 | 757,813 | 413,033 | 3,022,837 |
| Large Cap Fund | 393,233 | 338,365 | 321,303 | 1,052,901 |
| Large Company Growth Fund | 326,338 | 357,163 | 309,075 | 992,576 |
| Small Company Fund | 818,548 | 262,375 | 229,745 | 1,310,668 |
| Value Fund | 606,669 | 515,267 | 498,918 | 1,620,854 |
For the year ended June 30, 2022, the Advisor recouped previously waived fees or reimbursed expenses from the Balanced Fund of $81,985.
Notes to Financial Statements (Continued)
ADMINISTRATION AGREEMENT
The Advisor entered into an Administration Agreement with the Trust, whereby the Advisor is responsible for: supplying executive and regulatory compliance services; supervising the preparation of tax returns; coordinating the preparation of reports to shareholders and reports to and filings with the SEC and state securities authorities, as well as materials for meetings of the Board; calculating the daily NAV per share; and maintaining the financial books and records of each Fund.
For its services, the Advisor’s annual administrative fee is:
0.145% on the first $20 billion of the aggregate average daily net assets;
0.11% on the next $10 billion of aggregate average daily net assets;
0.09% on the next $10 billion of aggregate average daily net assets; and
0.07% on the aggregate average daily net assets over $40 billion.
The fee is computed and allocated among the Touchstone Fund Complex on the basis of relative daily net assets.
The Advisor has engaged BNY Mellon as the Sub-Administrator to the Trust. BNY Mellon provides administrative and accounting services to the Trust and is compensated directly by the Advisor, not the Trust.
TRANSFER AGENT AGREEMENT
Under the terms of the Transfer Agent Agreement between the Trust and BNY Mellon Investment Servicing (U.S.) Inc. ("Transfer Agent"), the Transfer Agent to the Funds maintains the records of each shareholder’s account, answers shareholders’ inquiries concerning their accounts, processes purchases and redemptions of each Fund’s shares, acts as dividend and distribution disbursing agent, and performs other shareholder service functions. For these services, the Transfer Agent receives a monthly fee from each Fund. In addition, each Fund pays out-of-pocket expenses incurred by the Transfer Agent, including, but not limited to, postage and supplies.
The Funds may reimburse the Advisor for fees paid to intermediaries such as banks, broker-dealers, financial advisors or other financial institutions for sub-transfer agency, sub-administration and other services provided to investors whose shares of record are held in omnibus, other group accounts, retirement plans or accounts traded through registered securities clearing agents. These fees, which are included in Transfer Agent fees in the Statements of Operations, may vary based on, for example, the nature of services provided, but generally range up to 0.15% of the assets of the class serviced or maintained by the intermediary or up to $22 per sub-account maintained by the intermediary.
PLANS OF DISTRIBUTION AND SHAREHOLDER SERVICING FEE ARRANGEMENTS
The Trust has adopted distribution plans pursuant to Rule 12b-1 under the 1940 Act for each class of shares it offers that is subject to 12b-1 distribution fees. The plans allow each Fund to pay distribution and other fees for the sale and distribution of its shares and for services provided to shareholders. The fees charged to the Funds are limited to the actual expenses incurred. Under the Class A plan, each Fund offering Class A shares pays an annual fee not to exceed 0.25% of average daily net assets that are attributable to Class A shares. Under the Class C plan, each Fund offering Class C shares pays an annual fee not to exceed 1.00% of average daily net assets that are attributable to Class C shares (of which up to 0.75% is a distribution fee and up to 0.25% is a shareholder servicing fee).
UNDERWRITING AGREEMENT
The Underwriter is the Funds’ principal underwriter and, as such, acts as exclusive agent for distribution of the Funds’ shares. Under the terms of the Underwriting Agreement between the Trust and the Underwriter, the Underwriter earned underwriting and broker commissions on the sale of Class A shares of the Funds. W&S Brokerage Services, Inc., an affiliate of the Underwriter and the Advisor, also earned broker commissions on the sale of Class A shares of the Funds. Listed below are the total underwriting and broker commissions earned by the Underwriter and its affiliate during the year ended June 30, 2022:
| Fund | Amount |
| Balanced Fund | $ 56,755 |
| Core Municipal Bond Fund | 1,866 |
| International Equity Fund | 3,789 |
| International Growth Fund | 703 |
| Large Cap Focused Fund | 38,288 |
| Large Cap Fund | 658 |
| Large Company Growth Fund | 1,399 |
| Small Company Fund | 14,996 |
| Value Fund | 7,592 |
Notes to Financial Statements (Continued)
In addition, the Underwriter collected CDSC on the redemption of Class A and Class C shares of the Funds listed below during the year ended June 30, 2022:
| Fund | Class A | Class C |
| Balanced Fund | $ 285 | $ 2,935 |
| International Equity Fund | — | 44 |
| Large Cap Focused Fund | 350 | 1,057 |
| Small Company Fund | 119 | 63 |
| Value Fund | — | 80 |
INTERFUND TRANSACTIONS
Pursuant to Rule 17a-7 under the 1940 Act, the Funds may engage in purchase and sale transactions with funds that have a common investment advisor (or affiliated investment advisors), common Trustees and/or common Officers. During the year ended June 30, 2022, the Funds did not engage in any Rule 17a-7 transactions.
5. Liquidity
ReFlow Fund LLC — The Funds may participate in the ReFlow Fund LLC liquidity program (“ReFlow”), which is designed to provide an alternative liquidity source for funds experiencing redemptions. In order to pay cash to shareholders who redeem their shares on a given day, a fund typically must hold cash in its portfolio, liquidate portfolio securities, or borrow money. ReFlow provides participating funds with another source of cash by standing ready to purchase shares from a fund up to the amount of the fund’s net redemptions on a given day, cumulatively limited to 3% of the outstanding voting shares of a Fund. ReFlow then generally redeems those shares (in cash or in-kind) when the Fund experiences net sales, at the end of a maximum holding period determined by ReFlow, or at other times at ReFlow’s discretion. In return for this service, the Fund will pay a fee to ReFlow at a rate determined by a daily auction with other participating mutual funds.
During the year ended June 30, 2022, the following Funds utilized ReFlow. The shares ReFlow subscribed to and redemptions-in-kind were as follows:
| Fund | Shares ReFlow
Subscribed to | Redemptions-in-kind |
| Balanced Fund | 1,016,494 | $ 20,471,881 |
| Large Cap Focused Fund | 3,066,329 | 133,840,394 |
| Large Cap Fund | 1,481,736 | 21,000,498 |
| Large Company Growth Fund | 644,886 | 25,368,539 |
| Small Company Fund | 11,667,038 | 56,618,499 |
Interfund Lending — Pursuant to an Exemptive Order issued by the SEC on March 28, 2017, the Funds, along with certain other funds in the Touchstone Fund Complex, may participate in an interfund lending program. The interfund lending program provides an alternate credit facility that allows the Funds to lend to or borrow from other participating funds in the Touchstone Fund Complex, subject to the conditions of the Exemptive Order. The Funds may not borrow under the facility for leverage purposes and the loans’ duration may be no more than 7 days.
During the year ended June 30, 2022, the following Funds participated as borrowers in the interfund lending program. The daily average amount borrowed, weighted average interest rate and interest expense were as follows:
| Fund | Daily Average
Amount Borrowed | Weighted Average
Interest Rate | Interest
Expense* |
| International Equity Fund | $ 43,441 | 0.68% | $ 300 |
| International Growth Fund | $ 8,857 | 0.68% | $ 61 |
| Large Cap Fund | $ 406,115 | 0.80% | $ 3,439 |
| Large Company Growth Fund | $ 26,394 | 0.68% | $ 181 |
| * | Included in Other expenses in the Statements of Operations. |
6. Federal Tax Information
Federal Income Tax — It is each Fund’s policy to continue to comply with the special provisions of the Internal Revenue Code applicable to regulated investment companies. As provided therein, in any fiscal year in which a Fund so qualifies and distributes at least 90% of its investment company taxable income, the Fund (but not the shareholders) will be relieved of federal income tax on the income distributed. It is each Fund’s policy to distribute all of its taxable and tax-exempt income and accordingly, no provision for income taxes has been made.
Notes to Financial Statements (Continued)
In order to avoid imposition of the excise tax applicable to regulated investment companies, it is also each Fund’s intention to declare and pay as dividends in each calendar year at least 98% of its investment company taxable income (earned during the calendar year) and 98.2% of its net realized capital gains (earned during the twelve months ending October 31) plus undistributed amounts from prior years.
The tax character of distributions paid for the years ended June 30, 2022 and June 30, 2021 are as follows:
| | Balanced Fund | Core Municipal Bond Fund | International Equity Fund |
| | Year Ended
June 30,
2022 | Year Ended
June 30,
2021 | Year Ended
June 30,
2022 | Year Ended
June 30,
2021 | Year Ended
June 30,
2022 | Year Ended
June 30,
2021 |
| From ordinary income | $7,937,924 | $7,630,981 | $— | $— | $6,873,595 | $647,909 |
| From tax-exempt income | — | — | 1,004,748 | 1,211,675 | — | — |
| From long-term capital gains | 19,917,546 | 26,358,697 | 37,471 | 5,224 | 10,153,319 | — |
| Total distributions | $27,855,470 | $33,989,678 | $1,042,219 | $1,216,899 | $17,026,914 | $647,909 |
| | International Growth Fund | Large Cap Focused Fund | Large Cap Fund |
| | Year Ended
June 30,
2022 | Year Ended
June 30,
2021 | Year Ended
June 30,
2022 | Year Ended
June 30,
2021 | Year Ended
June 30,
2022 | Year Ended
June 30,
2021 |
| From ordinary income | $362 | $— | $39,814,540 | $12,163,638 | $3,996,630 | $3,689,511 |
| From long-term capital gains | — | — | 170,287,074 | 94,020,901 | 6,966,746 | — |
| Total distributions | $362 | $— | $210,101,614 | $106,184,539 | $10,963,376 | $3,689,511 |
| | Large Company Growth Fund | Small Company Fund | Value Fund |
| | Year Ended
June 30,
2022 | Year Ended
June 30,
2021 | Year Ended
June 30,
2022 | Year Ended
June 30,
2021 | Year Ended
June 30,
2022 | Year Ended
June 30,
2021 |
| From ordinary income | $2,681,389 | $1,164,162 | $48,143,409 | $842,597 | $15,794,980 | $4,536,512 |
| From long-term capital gains | 45,210,640 | 28,994,022 | 116,754,602 | — | 33,693,432 | 4,949,001 |
| Total distributions | $47,892,029 | $30,158,184 | $164,898,011 | $842,597 | $49,488,412 | $9,485,513 |
The following information is computed on a tax basis for each item as of June 30, 2022:
| | Balanced
Fund | Core
Municipal
Bond
Fund | International
Equity
Fund | International
Growth
Fund | Large
Cap
Focused
Fund |
| Tax cost of portfolio investments | $694,848,526 | $63,345,880 | $106,498,868 | $72,019,027 | $1,772,160,498 |
| Gross unrealized appreciation on investments | 131,765,907 | 230,106 | 13,697,620 | 6,502,668 | 850,074,984 |
| Gross unrealized depreciation on investments | (72,508,661) | (2,913,887) | (19,915,710) | (12,786,842) | (121,745,288) |
| Net unrealized appreciation (depreciation) on investments | 59,257,246 | (2,683,781) | (6,218,090) | (6,284,174) | 728,329,696 |
| Gross unrealized appreciation on foreign currency transactions | 13 | — | 2,748 | 278 | — |
| Gross unrealized depreciation on foreign currency transactions | — | — | (7,500) | (12,589) | — |
| Net unrealized appreciation (depreciation) on foreign currency transactions | 13 | — | (4,752) | (12,311) | — |
| Capital loss carryforwards | — | — | (65,508,598) | (6,386,751) | — |
| Late year ordinary losses deferrals | (1,639,566) | (28,109) | (1,722,707) | — | — |
| Undistributed ordinary income | — | — | — | — | 12,237,564 |
| Undistributed capital gains | — | — | — | — | 26,814,957 |
| Other temporary differences | (3,957) | (8,041) | — | — | — |
| Accumulated earnings (deficit) | $57,613,736 | $(2,719,931) | $(73,454,147) | $(12,683,236) | $767,382,217 |
Notes to Financial Statements (Continued)
| | Large
Cap
Fund | Large
Company
Growth
Fund | Small Company
Fund | Value
Fund |
| Tax cost of portfolio investments | $195,229,568 | $127,910,277 | $709,210,198 | $451,217,867 |
| Gross unrealized appreciation on investments | 94,149,687 | 43,178,848 | 127,289,870 | 87,497,177 |
| Gross unrealized depreciation on investments | (11,321,165) | (7,569,970) | (62,927,035) | (40,946,135) |
| Net unrealized appreciation (depreciation) on investments | 82,828,522 | 35,608,878 | 64,362,835 | 46,551,042 |
| Late year ordinary losses deferrals | — | (174,283) | (890,599) | — |
| Undistributed ordinary income | 1,812,304 | — | — | 3,069,694 |
| Undistributed capital gains | 9,064,251 | 4,964,517 | 17,610,082 | 23,311,513 |
| Accumulated earnings (deficit) | $93,705,077 | $40,399,112 | $81,082,318 | $72,932,249 |
The difference between the tax cost of portfolio investments and the financial statement cost is primarily due to wash sale loss deferrals, investments in passive foreign investment company (“PFIC”) adjustments, basis adjustments on securities no longer treated as PFICs, callable bonds and nontaxable distribution basis outstanding.
As of June 30, 2022, the International Equity Fund and International Growth Fund had the following capital loss carryforwards for federal income tax purposes:
| Fund | No Expiration
Short Term | No Expiration
Long Term | Total |
| International Equity Fund* | $ 34,975,398 | $ 30,533,200 | $ 65,508,598 |
| International Growth Fund* | 6,386,751 | — | 6,386,751 |
| * | Future utilization may be limited under current tax laws. |
The capital loss carryforwards may be utilized in future years to offset net realized capital gains, if any, prior to distributing such gains to shareholders.
During the year ended June 30, 2022, the following Fund utilized capital loss carryforwards:
| Fund | Utilized |
| International Equity Fund | $ 721,485 |
Under current laws, certain capital losses realized after October 31 and ordinary losses realized after December 31 may be deferred (and certain ordinary losses after October and/or December 31 may be deferred) and treated as occurring on the first day of the following fiscal year. For the year ended June 30, 2022, the following Funds elected to defer the following losses:
| Fund | Realized
Capital Losses | Ordinary
Losses | Total |
| Balanced Fund | $ 1,639,566 | $ — | $ 1,639,566 |
| Core Municipal Bond Fund | 28,109 | — | 28,109 |
| International Equity Fund | 1,722,707 | — | 1,722,707 |
| Large Company Growth Fund | — | 174,283 | 174,283 |
| Small Company Fund | — | 890,599 | 890,599 |
The Funds have analyzed their tax positions taken or to be taken on federal income tax returns for all open tax years (tax years ended June 30, 2019 through 2022) and have concluded that no provision for income tax is required in their financial statements.
Certain reclassifications, the result of permanent differences between financial statement and income tax reporting requirements, have been made to the components of capital as presented on the Statements of Assets and Liabilities. These reclassifications have no impact on the net assets or NAV per share of the Funds. The following reclassifications, which are primarily attributed to the tax treatment of net operating loss, redemptions in-kind, deemed distributions on shareholder redemptions, differing tax and GAAP distribution requirements, acquired capital loss carryforwards and different tax treatment of the mergers, and acquired wash sales from mergers have been made to the following Funds for the year ended June 30, 2022:
| Fund | Paid-In
Capital | Distributable
Earnings |
| Balanced Fund | $ 19,929,136 | $ (19,929,136) |
| Core Municipal Bond Fund | (4,388) | 4,388 |
| International Equity Fund | 66,422,508 | (66,422,508) |
| International Growth Fund | (218,706) | 218,706 |
Notes to Financial Statements (Continued)
| Fund | Paid-In
Capital | Distributable
Earnings |
| Large Cap Focused Fund | $86,420,740 | $(86,420,740) |
| Large Cap Fund | 11,486,481 | (11,486,481) |
| Large Company Growth Fund | 21,350,111 | (21,350,111) |
| Small Company Fund | 19,056,071 | (19,056,071) |
| Value Fund | 6,058,231 | (6,058,231) |
7. Commitments and Contingencies
The Funds indemnify the Trust’s officers and Trustees for certain liabilities that might arise from their performance of their duties to the Funds. Additionally, in the normal course of business, the Funds enter into contracts that contain a variety of representations and warranties and which provide general indemnifications. The Funds' maximum exposure under these arrangements is unknown, as this would involve future claims that may be made against the Funds.
8. Principal Risks
Risks Associated with Foreign Investments – Some of the Funds may invest in the securities of foreign issuers. Investing in securities issued by companies whose principal business activities are outside the U.S. may involve significant risks not present in domestic investments. For example, there is generally less publicly available information about foreign companies, particularly those not subject to the disclosure and reporting requirements of the U.S. securities laws. Foreign issuers are generally not bound by uniform accounting, auditing, and financial reporting requirements and standards of practice comparable to those applicable to domestic issuers. Investments in foreign securities also involve the risk of possible adverse changes in investment or exchange control regulations, expropriation or confiscatory taxation, limitations on the removal of funds or other assets of a Fund, political or financial instability or diplomatic and other developments which could affect such investments. Political and military events, including in North Korea, Venezuela, Russia, Ukraine, Iran, Syria, and other areas of the Middle East, and nationalist unrest in Europe and South America, may cause market disruptions. Foreign stock markets, while growing in volume and sophistication, are generally not as developed as those in the U.S., and securities of some foreign issuers (particularly those located in developing countries) may be less liquid and more volatile than securities of comparable U.S. companies. In general, there is less overall governmental supervision and regulation of foreign securities markets, broker-dealers, and issuers than in the U.S.
Risks Associated with Sector Concentration – Certain Funds may invest a high percentage of their assets in specific sectors of the market in order to achieve a potentially greater investment return. As a result, these Funds may be more susceptible to economic, political, and regulatory developments in a particular sector of the market, positive or negative, and may experience increased volatility in the Funds' NAVs and magnified effect on the total return.
Risks Associated with Credit – An issuer may be unable to make timely payments of either principal or interest. This may cause the issuer’s securities to decline in value. Credit risk is particularly relevant to those Funds that invest a significant amount of their assets in junk bonds or lower-rated securities.
Risks Associated with Cyber Security - With the increased use of technologies, such as mobile devices and "cloud"-based service offerings and the dependence on the Internet and computer systems to perform necessary business functions, the Funds' service providers are susceptible to cyber security risks that could result in losses to a Fund and its shareholders. Cyber security breaches are either intentional or unintentional events that allow an unauthorized party to gain access to Fund assets, customer data, or proprietary information, or cause a Fund or Fund service provider to suffer data corruption or lose operational functionality. A cyber security breach could result in the loss or theft of customer data or funds, loss or theft of proprietary information or corporate data, physical damage to a computer or network system, or costs associated with system repairs, any of which could have a substantial impact on a Fund. Cyber security incidents could cause a Fund, the Advisor, a Sub-Advisor, or other service provider to incur regulatory penalties, reputational damage, compliance costs associated with corrective measures, litigation costs, or financial loss. They may also result in violations of applicable privacy and other laws. In addition, such incidents could affect issuers in which a Fund invests, thereby causing the Fund’s investments to lose value.
Risks Associated with Interest Rate Changes – The price of debt securities is generally linked to the prevailing market interest rates. In general, when interest rates rise, the price of debt securities falls, and when interest rates fall, the price of debt securities rises. The price volatility of a debt security also depends on its maturity. Longer-term securities are generally more volatile, so the longer the average maturity or duration of these securities, the greater their price risk. Duration is a measure of the expected life, taking into account any prepayment or call features of the security, that is used to determine the price sensitivity of the security for a given change in interest rates. Specifically, duration is the change in the value of a fixed-income security that will result from a 1% change in interest rates, and generally is stated in years. For example, as a general rule a 1% rise in interest rates means a 1% fall in
Notes to Financial Statements (Continued)
value for every year of duration. Maturity, on the other hand, is the date on which a fixed-income security becomes due for payment of principal. The negative impact on fixed income securities if interest rates increase as a result could negatively impact a Fund’s NAV.
Risks Associated with Health Crises – An outbreak of respiratory disease caused by COVID-19 was first detected in China in December 2019 and subsequently spread internationally. As of the date of issuance of these financial statements, COVID-19 has resulted in closing borders, enhanced health screenings, disruptions to healthcare service preparation and delivery, quarantines, cancellations, disruptions to supply chains and customer activity, as well as general concern and uncertainty. The impact of COVID-19 may be short term or may last for an extended period of time and has resulted in a substantial economic downturn. Health crises caused by outbreaks, such as the coronavirus outbreak, may exacerbate other pre-existing political, social and economic risks. The impact of this outbreak, and other epidemics and pandemics that may arise in the future, has and could continue to negatively affect the worldwide economy, as well as the economies of individual countries, individual companies, including certain Fund service providers and issuers of the Fund's investments, and the market in general in significant and unforeseen ways. Any such impact could adversely affect a Fund’s performance, the performance of the securities in which a Fund invests and may lead to losses on your investment in a Fund.
Please see the Funds’ prospectus and statement of additional information for a complete discussion of these and other risks.
9. Fund Reorganizations
Balanced Fund:
The shareholders of the AIG Active Allocation Fund and AIG Multi-Asset Allocation Fund, each a series of SunAmerica Series, Inc., approved an Agreement and Plan of Reorganization providing for the transfer of all assets and liabilities of the AIG Active Allocation Fund and AIG Multi-Asset Allocation Fund to the Touchstone Balanced Fund. The tax-free reorganizations took place on July 16, 2021.
The following is a summary of shares outstanding, net assets, net asset value per share and unrealized appreciation immediately before and after the tax-free reorganizations.
| | Before Reorganization | After
Reorganization |
| | AIG Active Allocation Fund | AIG Multi-Asset Allocation Fund | Touchstone Balanced Fund | Touchstone Balanced Fund |
| Class A | | | | |
| Shares | 4,274,242(A) | 7,806,800(D) | 12,619,656 | 25,322,891 |
| Net Assets | $109,774,276 | $200,499,312 | $324,106,590 | $650,359,781 |
| Net Assets Value | $25.68(A) | $25.68(D) | $25.68 | $25.68 |
| Class B* | | | | |
| Shares | 225,143(B) | 397,050(E) | — | — |
| Net Assets | $5,782,265 | $10,197,338 | $— | $— |
| Net Asset Value | $25.68(B) | $25.68(E) | $— | $— |
| Class C | | | | |
| Shares | 359,911(C) | 361,997(F) | 2,574,613 | 3,296,521 |
| Net Assets | $9,266,692 | $9,320,432 | $66,289,088 | $84,876,212 |
| Net Asset Value | $25.75(C) | $25.75(F) | $25.75 | $25.75 |
| Class Y | | | | |
| Shares | — | — | 7,978,792 | 7,978,792 |
| Net Assets | $— | $— | $203,060,748 | $203,060,748 |
| Net Asset Value | $— | $— | $25.45 | $25.45 |
| Fund Total | | | | |
| Shares Outstanding | 4,859,296 | 8,565,847 | 23,173,061 | 36,598,204 |
| Net Assets | $124,823,233 | $220,017,082 | $593,456,426 | $938,296,741 |
| Unrealized Appreciation (Depreciation) | $7,087,346 | $11,315,621 | $206,862,646 | $225,265,613 |
| (A) | Reflects a 0.6343:1 stock split which occurred on the date of the reorganization, July 16, 2021. |
| (B) | Reflects a 0.6271:1 stock split which occurred on the date of the reorganization, July 16, 2021. |
| (C) | Reflects a 0.6288:1 stock split which occurred on the date of the reorganization, July 16, 2021. |
| (D) | Reflects a 0.6818:1 stock split which occurred on the date of the reorganization, July 16, 2021. |
| (E) | Reflects a 0.6813:1 stock split which occurred on the date of the reorganization, July 16, 2021. |
Notes to Financial Statements (Continued)
| (F) | Reflects a 0.6799:1 stock split which occurred on the date of the reorganization, July 16, 2021. |
| * | Class B shares of the AIG Active Allocation Fund and AIG Multi-Asset Allocation Fund were exchanged for Class A shares of the Touchstone Balanced Fund. |
Assuming the reorganization had been completed on July 1, 2021, the Balanced Fund’s results of operations for the year ended June 30, 2022 would have been as follows:
| Net investment income | $6,606,731 |
| Net realized and unrealized gain(loss) on investments | $(131,576,289) |
| Net decrease in net assets resulting from operations | $(124,969,558) |
Because the combined investment portfolios have been managed as a single portfolio since the reorganization was completed, it is not practical to separate the amounts of revenue and earnings to the Balanced Fund that have been included in its statement of operations since the reorganization.
International Equity Fund:
The shareholders of the AIG International Dividend Strategy Fund, a series of SunAmerica Equity Funds, approved an Agreement and Plan of Reorganization providing for the transfer of all assets and liabilities of the AIG International Dividend Strategy Fund to the Touchstone International Equity Fund. The tax-free reorganization took place on July 16, 2021.
The following is a summary of shares outstanding, net assets, net asset value per share and unrealized appreciation immediately before and after the tax-free reorganization.
| | Before Reorganization | After
Reorganization |
| | AIG International Dividend Strategy Fund | Touchstone International Equity Fund | Touchstone International Equity Fund |
| Class A | | | |
| Shares | 2,291,115(A) | 4,643,460 | 6,934,575 |
| Net Assets | $43,002,245 | $87,153,955 | $130,156,200 |
| Net Assets Value | $18.77(A) | $18.77 | $18.77 |
| Class C | | | |
| Shares | 122,778(B) | 120,180 | 242,958 |
| Net Assets | $2,140,804 | $2,095,495 | $4,236,299 |
| Net Asset Value | $17.44(B) | $17.44 | $17.44 |
| Class Y* | | | |
| Shares | 53,869(C) | 1,489,950 | 1,543,819 |
| Net Assets | $998,993 | $27,630,867 | $28,629,860 |
| Net Asset Value | $18.54(C) | $18.54 | $18.54 |
| Institutional Class | | | |
| Shares | — | 231,167 | 231,167 |
| Net Assets | $— | $4,280,368 | $4,280,368 |
| Net Asset Value | $— | $18.52 | $18.52 |
| Fund Total | | | |
| Shares Outstanding | 2,467,762 | 6,484,757 | 8,952,519 |
| Net Assets | $46,142,042 | $121,160,685 | $167,302,727 |
| Unrealized Appreciation (Depreciation) | $5,530,353 | $22,166,220 | $27,696,573 |
| (A) | Reflects a 0.4563:1 stock split which occurred on the date of the reorganization, July 16, 2021. |
| (B) | Reflects a 0.4439:1 stock split which occurred on the date of the reorganization, July 16, 2021. |
| (C) | Reflects a 0.4629:1 stock split which occurred on the date of the reorganization, July 16, 2021. |
| * | Class W shares of the AIG International Dividend Strategy Fund were exchanged for Class Y shares of the Touchstone International Equity Fund. |
Assuming the reorganization had been completed on July 1, 2021, the International Equity Fund’s results of operations for the year ended June 30, 2022 would have been as follows:
| Net investment income | $1,403,181 |
| Net realized and unrealized gain(loss) on investments | $(26,674,240) |
| Net decrease in net assets resulting from operations | $(25,271,059) |
Notes to Financial Statements (Continued)
Because the combined investment portfolios have been managed as a single portfolio since the reorganization was completed, it is not practical to separate the amounts of revenue and earnings to the International Equity Fund that have been included in its statement of operations since the reorganization.
Large Cap Focused Fund:
The shareholders of the AIG Focused Alpha Large-Cap Fund, a series of SunAmerica Specialty Series, approved an Agreement and Plan of Reorganization providing for the transfer of all assets and liabilities of the AIG Focused Alpha Large-Cap Fund to the Touchstone Large Cap Focused Fund. The tax-free reorganization took place on July 16, 2021.
The following is a summary of shares outstanding, net assets, net asset value per share and unrealized appreciation immediately before and after the tax-free reorganization.
| | Before Reorganization | After Reorganization |
| | AIG Focused Alpha Large-Cap Fund | Touchstone Large Cap Focused Fund | Touchstone Large Cap Focused Fund |
| Class A | | | |
| Shares | 11,569,461(A) | 26,160,413 | 37,729,874 |
| Net Assets | $681,748,263 | $1,541,543,849 | $2,223,292,112 |
| Net Assets Value | $58.93(A) | $58.93 | $58.93 |
| Class C | | | |
| Shares | 446,479(B) | 755,828 | 1,202,307 |
| Net Assets | $24,084,368 | $40,771,490 | $64,855,858 |
| Net Asset Value | $53.94(B) | $53.94 | $53.94 |
| Class Y* | | | |
| Shares | 681,058(C) | 9,911,830 | 10,592,888 |
| Net Assets | $40,068,287 | $583,136,903 | $623,205,190 |
| Net Asset Value | $58.83(C) | $58.83 | $58.83 |
| Institutional Class | | | |
| Shares | — | 3,557,114 | 3,557,114 |
| Net Assets | $— | $209,666,312 | $209,666,312 |
| Net Asset Value | $— | $58.94 | $58.94 |
| Fund Total | | | |
| Shares Outstanding | 12,696,998 | 40,385,185 | 53,082,183 |
| Net Assets | $745,900,918 | $2,375,118,554 | $3,121,019,472 |
| Unrealized Appreciation (Depreciation) | $209,596,258 | $1,195,911,973 | $1,405,508,231 |
(A) Reflects a 0.5096:1 stock split which occurred on the date of the reorganization, July 16, 2021.
(B) Reflects a 0.4983:1 stock split which occurred on the date of the reorganization, July 16, 2021.
(C) Reflects a 0.5241:1 stock split which occurred on the date of the reorganization, July 16, 2021.
* Class W shares of the AIG Focused Alpha Large-Cap Fund were exchanged for Class Y shares of the Touchstone Large Cap Focused Fund.
Assuming the reorganization had been completed on July 1, 2021, the Large Cap Focused Fund’s results of operations for the year ended June 30, 2022 would have been as follows:
| Net investment income | $5,386,420 |
| Net realized and unrealized gain(loss) on investments | $(412,243,408) |
| Net decrease in net assets resulting from operations | $(406,856,988) |
Because the combined investment portfolios have been managed as a single portfolio since the reorganization was completed, it is not practical to separate the amounts of revenue and earnings to the Large Cap Focused Fund that have been included in its statement of operations since the reorganization.
Value Fund:
The shareholders of the AIG Strategic Value Fund, a series of SunAmerica Series, Inc., approved an Agreement and Plan of Reorganization providing for the transfer of all assets and liabilities of the AIG Strategic Value Fund to the Touchstone Value Fund. The tax-free reorganization took place on July 16, 2021.
Notes to Financial Statements (Continued)
The following is a summary of shares outstanding, net assets, net asset value per share and unrealized appreciation immediately before and after the tax-free reorganization.
| | Before Reorganization | After
Reorganization |
| | AIG Strategic Value Fund | Touchstone Value Fund | Touchstone Value Fund |
| Class A | | | |
| Shares | 16,002,448(A) | 2,901,429 | 18,903,877 |
| Net Assets | $178,897,865 | $32,436,111 | $211,333,976 |
| Net Assets Value | $11.18(A) | $11.18 | $11.18 |
| Class C | | | |
| Shares | 454,230(B) | 171,151 | 625,381 |
| Net Assets | $5,060,481 | $1,906,760 | $6,967,241 |
| Net Asset Value | $11.14(B) | $11.14 | $11.14 |
| Class Y* | | | |
| Shares | 493,844(C) | 8,718,150 | 9,211,994 |
| Net Assets | $5,545,569 | $97,899,575 | $103,445,144 |
| Net Asset Value | $11.23(C) | $11.23 | $11.23 |
| Institutional Class | | | |
| Shares | — | 25,628,393 | 25,628,393 |
| Net Assets | $— | $286,911,947 | $286,911,947 |
| Net Asset Value | $— | $11.20 | $11.20 |
| Fund Total | | | |
| Shares Outstanding | 16,950,522 | 37,419,123 | 54,369,645 |
| Net Assets | $189,503,915 | $419,154,393 | $608,658,308 |
| Unrealized Appreciation (Depreciation) | $15,906,544 | $108,838,306 | $124,744,850 |
(A)Reflects a 2.5478:1 stock split which occurred on the date of the reorganization, July 16, 2021.
(B)Reflects a 2.2942:1 stock split which occurred on the date of the reorganization, July 16, 2021.
(C)Reflects a 2.5348:1 stock split which occurred on the date of the reorganization, July 16, 2021.
* Class W shares of the AIG Strategic Value Fund were exchanged for Class Y shares of the Touchstone Value Fund.
Assuming the reorganization had been completed on July 1, 2021, the Value Fund’s results of operations for the year ended June 30, 2022 would have been as follows:
| Net investment income | $7,276,890 |
| Net realized and unrealized gain(loss) on investments | $(33,394,576) |
| Net decrease in net assets resulting from operations | $(26,117,686) |
Because the combined investment portfolios have been managed as a single portfolio since the reorganization was completed, it is not practical to separate the amounts of revenue and earnings to the Value Fund that have been included in its statement of operations since the reorganization.
10. Subsequent Events
Subsequent events occurring after the date of this report have been evaluated for potential impact to this report through the date the financial statements were issued.
At a meeting of the Board held on August 18, 2022, the Advisor proposed, and the Board approved, a reverse stock split of the Small Company Fund's issued and outstanding Class C shares (the “Reverse Stock Split”). The Reverse Stock Split will be completed after the close of business on or about October 14, 2022 (the "Effective Date"). As a result of the Reverse Stock Split, for each Class C share of the Fund that a shareholder owns as of the Effective Date, the shareholder will receive a proportional number of Class C shares of the Fund with the same aggregate dollar value. Thus, the total dollar value of an investment in the Fund will be unchanged and each shareholder will continue to own the same percentage (by value) of the Fund immediately following the Reverse Stock Split as the shareholder did immediately prior to the Reverse Stock Split. The Reverse Stock Split will not be a taxable event, nor does it have an impact on the Fund's holdings or its performance. The Reverse Stock Split will be carried out in accordance with a stock split ratio calculated to result in a net asset value per share that better aligns the share class prices of the Fund.
There were no other subsequent events that necessitated recognition or disclosure in the Funds’ financial statements.
Report of Independent Registered Public Accounting Firm
To the Shareholders of Touchstone Balanced Fund, Touchstone Core Municipal Bond Fund (formerly Touchstone Ohio Tax-Free Bond Fund), Touchstone International Equity Fund, Touchstone International Growth Fund, Touchstone Large Cap Focused Fund, Touchstone Large Cap Fund, Touchstone Large Company Growth Fund, Touchstone Small Company Fund and Touchstone Value Fund and the Board of Trustees of Touchstone Strategic Trust.
Opinion on the Financial Statements
We have audited the accompanying statements of assets and liabilities of Touchstone Balanced Fund, Touchstone Core Municipal Bond Fund (formerly Touchstone Ohio Tax-Free Bond Fund), Touchstone International Equity Fund, Touchstone International Growth Fund, Touchstone Large Cap Focused Fund, Touchstone Large Cap Fund, Touchstone Large Company Growth Fund, Touchstone Small Company Fund and Touchstone Value Fund (collectively referred to as the “Funds”), (nine of the funds constituting Touchstone Strategic Trust (the “Trust”)), including the portfolios of investments, as of June 30, 2022, and the related statements of operations and changes in net assets, and the financial highlights for each of the periods indicated in the table below and the related notes (collectively referred to as the “financial statements”). In our opinion, the financial statements present fairly, in all material respects, the financial position of each of the Funds (nine of the funds constituting Touchstone Strategic Trust) at June 30, 2022, and the results of their operations, changes in net assets and financial highlights for each of the periods indicated in the table below, in conformity with U.S. generally accepted accounting principles.
Individual funds constituting
Touchstone Strategic Trust | Statement of
operations | Statements of
changes in net assets | Financial highlights |
Touchstone Balanced Fund
Touchstone International Equity Fund
Touchstone Large Cap Focused Fund
Touchstone Small Company Fund | For the year ended
June 30, 2022 | For each of the two years in the
period ended June 30, 2022 | For each of the four years in the
period ended June 30, 2022, the
the period from December 1, 2017
through June 30, 2018 and the
period from December 1, 2016 to
November 30, 2017 |
Touchstone Core Municipal Bond Fund (formerly Touchstone Ohio Tax-Free Bond Fund)
Touchstone International Growth Fund
Touchstone Large Cap Fund
Touchstone Large Company Growth Fund
Touchstone Value Fund | For the year ended
June 30, 2022 | For each of the two years in the
period ended June 30, 2022 | For each of the five years in the
period ended June 30, 2022 |
Basis for Opinion
These financial statements are the responsibility of the Trust’s management. Our responsibility is to express an opinion on each of the Funds’ financial statements based on our audits. We are a public accounting firm registered with the Public Company Accounting Oversight Board (United States) ("PCAOB") and are required to be independent with respect to the Trust in accordance with the U.S. federal securities laws and the applicable rules and regulations of the Securities and Exchange Commission and the PCAOB.
We conducted our audits in accordance with the standards of the PCAOB. Those standards require that we plan and perform the audit to obtain reasonable assurance about whether the financial statements are free of material misstatement, whether due to error or fraud. The Trust is not required to have, nor were we engaged to perform, an audit of the Trust’s internal control over financial reporting. As part of our audits, we are required to obtain an understanding of internal control over financial reporting but not for the purpose of expressing an opinion on the effectiveness of the Trust’s internal control over financial reporting. Accordingly, we express no such opinion.
Report of Independent Registered Public Accounting Firm (Continued)
Our audits included performing procedures to assess the risks of material misstatement of the financial statements, whether due to error or fraud, and performing procedures that respond to those risks. Such procedures included examining, on a test basis, evidence regarding the amounts and disclosures in the financial statements. Our procedures included confirmation of securities owned as of June 30, 2022, by correspondence with the custodian and brokers or by other appropriate auditing procedures where replies from brokers were not received. Our audits also included evaluating the accounting principles used and significant estimates made by management, as well as evaluating the overall presentation of the financial statements. We believe that our audits provide a reasonable basis for our opinion.
We have served as the auditor of one or more Touchstone Investments’ investment companies since 1999.
Cincinnati, Ohio
August 19, 2022
Qualified Dividend Income
Under the Jobs and Growth Tax Relief Reconciliation Act of 2003 (the “Act”), the following percentages of ordinary dividends paid during the fiscal year ended June 30, 2022 are designated as “qualified dividend income,” as defined in the Act, and are subject to reduced tax rates. The Funds intend to pass through the maximum allowable percentage for Form 1099 Div.
| Balanced Fund | 89.27 % |
| International Equity Fund | 69.06 % |
| Large Cap Focused Fund | 74.26 % |
| Large Cap Fund | 100.00 % |
| Value Fund | 79.08 % |
Dividend Received Deduction
For corporate shareholders, the following ordinary distributions paid during the fiscal year ended June 30, 2022 qualify for the corporate dividends received deduction. The Funds intend to pass through the maximum allowable percentage.
| Balanced Fund | 87.64 % |
| Large Cap Focused Fund | 72.80 % |
| Large Cap Fund | 100.00 % |
| Value Fund | 72.23 % |
For the fiscal year ended June 30, 2022, the Funds designated long-term capital gains as follows:
| Balanced Fund | $ 19,917,546 |
| Core Municipal Bond Fund | $ 37,471 |
| International Equity Fund | $ 10,153,319 |
| Large Cap Focused Fund | $ 188,274,619 |
| Large Cap Fund | $ 13,373,992 |
| Large Company Growth Fund | $ 53,153,985 |
| Small Company Fund | $ 116,754,602 |
| Value Fund | $ 47,319,920 |
Of the dividends paid from net investment income during the most-recent fiscal year, 100% was designated as exempt interest dividends for federal income tax purposes for the Core Municipal Bond Fund.
Foreign Tax Income & Foreign Tax Credit
The International Equity Fund intends to pass through a foreign tax credit to the shareholders. For the fiscal year ended June 30, 2022, the total amount of foreign source income is $3,345,176 or $0.43 per share. The total amount of foreign taxes to be paid is $424,779 or $0.05 per share per share. Shareholder’s allocable share of the foreign tax credit will be reported on Form 1099 Div.
Proxy Voting Guidelines and Proxy Voting Records
The Sub-Advisors are responsible for exercising the voting rights associated with the securities purchased and held by the Funds. A description of the policies and procedures that the Sub-Advisors use in fulfilling this responsibility is available as an appendix to the most recent Statement of Additional Information, which can be obtained without charge by calling toll free 1.800.543.0407 or by visiting the Touchstone website at TouchstoneInvestments.com or on the Securities and Exchange Commission’s (the “Commission”) website sec.gov. Information regarding how those proxies were voted during the most recent twelve-month period ended June 30, which will be filed by August 31 of that year, is also available without charge by calling toll free 1.800.543.0407 or on the Commission’s website at sec.gov.
Quarterly Portfolio Disclosure
Each Fund’s holdings as of the end of the third month of every fiscal quarter will be disclosed on Form N-PORT within 60 days of the end of the fiscal quarter. The complete listing of each Fund’s portfolio holdings is available on the Commission’s website and will be made available to shareholders upon request by calling 1.800.543.0407.
Other Items (Unaudited) (Continued)
Schedule of Shareholder Expenses
As a shareholder of the Funds, you incur two types of costs: (1) transaction costs, including sales charges (loads) and (2) ongoing costs, including investment advisory fees; shareholder servicing fees; and other Fund expenses. This example is intended to help you understand your ongoing costs (in dollars) of investing in the Funds and to compare these costs with the ongoing costs of investing in other mutual funds.
The example is based on an investment of $1,000 invested at the beginning of the period and held for the entire period (January 1, 2022 through June 30, 2022).
Actual Expenses
The first line for each share class of a Fund in the table below provides information about actual account values and actual expenses. You may use the information in this line, together with the amount you invested, to estimate the expenses that you paid over the period. Simply divide your account value by $1,000 (for example, an $8,600 account value divided by $1,000 = 8.6), then multiply the result by the number in the first line under the heading entitled “Expenses Paid During the Six Months Ended June 30, 2022” to estimate the expenses you paid on your account during this period.
Hypothetical Example for Comparison Purposes
The second line for each share class of a Fund in the table below provides information about hypothetical account values and hypothetical expenses based on the Funds’ actual expense ratio and an assumed rate of return of 5% per year before expenses, which is not the Funds’ actual return. The hypothetical account values and expenses may not be used to estimate the actual ending account balance or expenses you paid for the period. You may use this information to compare the ongoing costs of investing in the Funds and other funds. To do so, compare this 5% hypothetical example with the 5% hypothetical examples that appear in the shareholder reports of the other funds.
Please note that the expenses shown in the table below are meant to highlight your ongoing costs only and do not reflect any transactional costs, such as sales charges (loads). Therefore, the second line for each share class of a Fund in the table below is useful in comparing ongoing costs only, and will not help you determine the relative total costs of owning different funds. In addition, if these transactional costs were included, your costs would have been higher.
| | | Net Expense
Ratio
Annualized
June 30,
2022 | Beginning
Account
Value
January 1,
2022 | Ending
Account
Value
June 30,
2022 | Expenses
Paid During
the Six Months
Ended
June 30,
2022* |
| Balanced Fund | | | | | |
| Class A | Actual | 1.04% | $1,000.00 | $829.70 | $4.72** |
| Class A | Hypothetical | 1.04% | $1,000.00 | $1,019.64 | $5.21** |
| Class C | Actual | 1.79% | $1,000.00 | $826.70 | $8.11** |
| Class C | Hypothetical | 1.79% | $1,000.00 | $1,015.92 | $8.95** |
| Class Y | Actual | 0.80% | $1,000.00 | $830.70 | $3.63** |
| Class Y | Hypothetical | 0.80% | $1,000.00 | $1,020.83 | $4.01** |
| Class R6 | Actual | 0.65% | $1,000.00 | $831.10 | $2.95** |
| Class R6 | Hypothetical | 0.65% | $1,000.00 | $1,021.57 | $3.26** |
| Core Municipal Bond Fund | | | | | |
| Class A | Actual | 0.80% | $1,000.00 | $911.60 | $3.79 |
| Class A | Hypothetical | 0.80% | $1,000.00 | $1,020.83 | $4.01 |
| Class C | Actual | 1.55% | $1,000.00 | $906.70 | $7.33 |
| Class C | Hypothetical | 1.55% | $1,000.00 | $1,017.11 | $7.75 |
| Class Y | Actual | 0.55% | $1,000.00 | $912.80 | $2.61 |
| Class Y | Hypothetical | 0.55% | $1,000.00 | $1,022.07 | $2.76 |
| Institutional Class | Actual | 0.48% | $1,000.00 | $913.10 | $2.28 |
| Institutional Class | Hypothetical | 0.48% | $1,000.00 | $1,022.41 | $2.41 |
| International Equity Fund | | | | | |
| Class A | Actual | 1.38% | $1,000.00 | $857.50 | $6.36 |
| Class A | Hypothetical | 1.38% | $1,000.00 | $1,017.95 | $6.90 |
| Class C | Actual | 1.99% | $1,000.00 | $854.70 | $9.15 |
| Class C | Hypothetical | 1.99% | $1,000.00 | $1,014.93 | $9.94 |
| Class Y | Actual | 0.99% | $1,000.00 | $859.10 | $4.56 |
Other Items (Unaudited) (Continued)
| | | Net Expense
Ratio
Annualized
June 30,
2022 | Beginning
Account
Value
January 1,
2022 | Ending
Account
Value
June 30,
2022 | Expenses
Paid During
the Six Months
Ended
June 30,
2022* |
| Class Y | Hypothetical | 0.99% | $1,000.00 | $1,019.89 | $4.96 |
| Institutional Class | Actual | 0.89% | $1,000.00 | $860.00 | $4.10 |
| Institutional Class | Hypothetical | 0.89% | $1,000.00 | $1,020.38 | $4.46 |
| International Growth Fund | | | | | |
| Class A | Actual | 1.24% | $1,000.00 | $750.50 | $5.38 |
| Class A | Hypothetical | 1.24% | $1,000.00 | $1,018.65 | $6.21 |
| Class C | Actual | 1.99% | $1,000.00 | $748.50 | $8.63 |
| Class C | Hypothetical | 1.99% | $1,000.00 | $1,014.93 | $9.94 |
| Class Y | Actual | 0.99% | $1,000.00 | $751.90 | $4.30 |
| Class Y | Hypothetical | 0.99% | $1,000.00 | $1,019.89 | $4.96 |
| Institutional Class | Actual | 0.89% | $1,000.00 | $752.40 | $3.87 |
| Institutional Class | Hypothetical | 0.89% | $1,000.00 | $1,020.38 | $4.46 |
| Large Cap Focused Fund | | | | | |
| Class A | Actual | 0.98% | $1,000.00 | $803.40 | $4.38*** |
| Class A | Hypothetical | 0.98% | $1,000.00 | $1,019.93 | $4.91*** |
| Class C | Actual | 1.79% | $1,000.00 | $800.10 | $7.99*** |
| Class C | Hypothetical | 1.79% | $1,000.00 | $1,015.92 | $8.95*** |
| Class Y | Actual | 0.72% | $1,000.00 | $804.40 | $3.22*** |
| Class Y | Hypothetical | 0.72% | $1,000.00 | $1,021.22 | $3.61*** |
| Institutional Class | Actual | 0.69% | $1,000.00 | $804.60 | $3.09*** |
| Institutional Class | Hypothetical | 0.69% | $1,000.00 | $1,021.37 | $3.46*** |
| Class R6 | Actual | 0.65% | $1,000.00 | $804.70 | $2.91*** |
| Class R6 | Hypothetical | 0.65% | $1,000.00 | $1,021.57 | $3.26*** |
| Large Cap Fund | | | | | |
| Class A | Actual | 1.05% | $1,000.00 | $806.20 | $4.70**** |
| Class A | Hypothetical | 1.05% | $1,000.00 | $1,019.59 | $5.26**** |
| Class C | Actual | 1.80% | $1,000.00 | $803.30 | $8.05**** |
| Class C | Hypothetical | 1.80% | $1,000.00 | $1,015.87 | $9.00**** |
| Class Y | Actual | 0.80% | $1,000.00 | $807.70 | $3.59**** |
| Class Y | Hypothetical | 0.80% | $1,000.00 | $1,020.83 | $4.01**** |
| Institutional Class | Actual | 0.70% | $1,000.00 | $808.00 | $3.14**** |
| Institutional Class | Hypothetical | 0.70% | $1,000.00 | $1,021.32 | $3.51**** |
| Large Company Growth Fund | | | | | |
| Class A | Actual | 1.08% | $1,000.00 | $736.80 | $4.65***** |
| Class A | Hypothetical | 1.08% | $1,000.00 | $1,019.44 | $5.41***** |
| Class C | Actual | 1.84% | $1,000.00 | $733.90 | $7.91***** |
| Class C | Hypothetical | 1.84% | $1,000.00 | $1,015.67 | $9.20***** |
| Class Y | Actual | 0.84% | $1,000.00 | $737.60 | $3.62***** |
| Class Y | Hypothetical | 0.84% | $1,000.00 | $1,020.63 | $4.21***** |
| Institutional Class | Actual | 0.73% | $1,000.00 | $737.90 | $3.15***** |
| Institutional Class | Hypothetical | 0.73% | $1,000.00 | $1,021.17 | $3.66***** |
| Small Company Fund | | | | | |
| Class A | Actual | 1.18% | $1,000.00 | $786.20 | $5.23****** |
| Class A | Hypothetical | 1.18% | $1,000.00 | $1,018.94 | $5.91****** |
| Class C | Actual | 1.97% | $1,000.00 | $781.80 | $8.70****** |
| Class C | Hypothetical | 1.97% | $1,000.00 | $1,015.03 | $9.84****** |
| Class Y | Actual | 0.90% | $1,000.00 | $785.80 | $3.99****** |
| Class Y | Hypothetical | 0.90% | $1,000.00 | $1,020.33 | $4.51****** |
| Institutional Class | Actual | 0.80% | $1,000.00 | $785.80 | $3.54****** |
| Institutional Class | Hypothetical | 0.80% | $1,000.00 | $1,020.83 | $4.01****** |
| Class R6 | Actual | 0.80% | $1,000.00 | $787.10 | $3.54****** |
| Class R6 | Hypothetical | 0.80% | $1,000.00 | $1,020.83 | $4.01****** |
| Value Fund | | | | | |
| Class A | Actual | 1.08% | $1,000.00 | $897.50 | $5.08 |
| Class A | Hypothetical | 1.08% | $1,000.00 | $1,019.44 | $5.41 |
| Class C | Actual | 1.83% | $1,000.00 | $893.90 | $8.59 |
| Class C | Hypothetical | 1.83% | $1,000.00 | $1,015.72 | $9.15 |
| Class Y | Actual | 0.83% | $1,000.00 | $899.00 | $3.91 |
| Class Y | Hypothetical | 0.83% | $1,000.00 | $1,020.68 | $4.16 |
Other Items (Unaudited) (Continued)
| | | Net Expense
Ratio
Annualized
June 30,
2022 | Beginning
Account
Value
January 1,
2022 | Ending
Account
Value
June 30,
2022 | Expenses
Paid During
the Six Months
Ended
June 30,
2022* |
| Institutional Class | Actual | 0.68% | $1,000.00 | $898.60 | $3.20 |
| Institutional Class | Hypothetical | 0.68% | $1,000.00 | $1,021.42 | $3.41 |
| Class R6 | Actual | 0.63% | $1,000.00 | $898.70 | $2.97 |
| Class R6 | Hypothetical | 0.63% | $1,000.00 | $1,021.67 | $3.16 |
| * | Expenses are equal to the Fund’s annualized expense ratio, multiplied by the average account value over the period, multiplied by 181/365 (to reflect one-half year period). |
| ** | Excluding liquidity provider expenses, your actual cost of investment in Class A, Class C, Class Y and Class R6 would be $4.67, $8.06, $3.59 and $2.91, respectively, and your hypothetical cost of investment in Class A, Class C, Class Y and Class R6 would be $5.16, $8.90, $3.96 and $3.21, respectively. |
| *** | Excluding liquidity provider expenses, your actual cost of investment in Class A, Class C, Class Y, Institutional Class and Class R6 would be $4.34, $7.94, $3.18, $3.04 and $2.86, respectively, and your hypothetical cost of investment in Class A, Class C, Class Y, Institutional Class and Class R6 would be $4.86, $8.90, $3.56, $3.41 and $3.21, respectively. |
| **** | Excluding liquidity provider expenses, your actual cost of investment in Class A, Class C, Class Y and Institutional Class would be $4.61, $7.96, $3.50 and $3.05, respectively, and your hypothetical cost of investment in Class A, Class C, Class Y and Institutional Class would be $5.16, $8.90, $3.91 and $3.41, respectively. |
| ***** | Excluding liquidity provider expenses, your actual cost of investment in Class A, Class C, Class Y and Institutional Class would be $4.48, $7.74, $3.45 and $2.97, respectively, and your hypothetical cost of investment in Class A, Class C, Class Y and Institutional Class would be $5.21, $9.00, $4.01 and $3.46, respectively. |
| ****** | Excluding liquidity provider expenses, your actual cost of investment in Class A, Class C, Class Y, Institutional Class and Class R6 would be $5.18, $8.66, $3.94, $3.50 and $3.50, respectively, and your hypothetical cost of investment in Class A, Class C, Class Y, Institutional Class and Class R6 would be $5.86, $9.79, $4.46, $3.96 and $3.96, respectively. |
Liquidity Risk Management
The Funds have adopted and implemented a written liquidity risk management program (the “LRM Program”) as required by Rule 22e-4 under the Investment Company Act of 1940. Rule 22e-4 requires that each Fund adopt a program that is reasonably designed to assess and manage the Funds’ liquidity risk, which is the risk that a Fund could not meet redemption requests without significant dilution of remaining investors’ interests in a Fund.
Assessment and management of a Fund’s liquidity risk under the LRM Program takes into consideration certain factors, such as a Fund’s investment strategy and the liquidity of its portfolio investments during normal and reasonably foreseeable stressed conditions, its short- and long-term cash-flow projections during both normal and reasonably foreseeable stressed conditions, and its cash and cash-equivalent holdings and access to other funding sources. As required by the rule, the LRM Program includes policies and procedures for classification of Fund portfolio holdings in four liquidity categories, maintaining certain levels of highly liquid investments, and limiting holdings of illiquid investments.
The Board of Trustees of the Trust approved the appointment of a LRM Program administrator responsible for administering the LRM Program and for carrying out the specific responsibilities set forth in the LRM Program, including reporting to the Board on at least an annual basis regarding the LRM Program’s operation, its adequacy, and the effectiveness of its implementation for the past year (the “Program Administrator Report”). The Board has reviewed the Program Administrator Report covering the period from May 15, 2021 through May 12, 2022 (the “Review Period”). The Program Administrator Report stated that during the Review Period the LRM Program operated adequately and effectively in promoting effective liquidity risk management for the Funds.
Management of the Trust (Unaudited)
Listed below is required information regarding the Trustees and principal officers of the Trust. The Trust’s Statement of Additional Information includes additional information about the Trustees and is available, without charge, upon request by calling 1.800.543.0407 or by visiting the Touchstone website at TouchstoneInvestments.com.
| Interested Trustees1: |
Name
Address
Year of Birth | Position
Held with
Trust | Term of
Office And
Length of
Time Served | Principal Occupation(s)
During Past 5 Years | Number
of Funds
Overseen
in the
Touchstone
Fund
Complex2 | Other
Directorships
Held During Past 5 Years3 |
Jill T. McGruder
Touchstone Advisors, Inc.
303 Broadway
Suite 1100
Cincinnati, Ohio 45202
Year of Birth: 1955 | Trustee | Until retirement at age 75 or until she resigns or is removed
Trustee since 1999 | President of Touchstone Funds from 1999 to 2020; Director and CEO of IFS Financial Services, Inc. (a holding company) since 1999; and Senior Vice President and Chief Marketing Officer of Western & Southern Financial Group, Inc. (a financial services company) since 2016. | 36 | Director, Integrity Life Insurance Co. and National Integrity Life Insurance Co. since 2005; Director, Touchstone Securities (the Distributor) since 1999; Director, Touchstone Advisors (the Advisor) since 1999; Director, W&S Brokerage Services, Inc. since 1999; Director, W&S Financial Group Distributors, Inc. since 1999; Director, Insurance Profillment Solutions LLC since 2014; Director, Columbus Life Insurance Co. since 2016; Director, The Lafayette Life Insurance Co. since 2016; Director, Gerber Life Insurance Company since 2019; Director, Western & Southern Agency, Inc. since 2018; and Director, LL Global, Inc. (not-for-profit trade organization with operating divisions LIMRA and LOMA) since 2016. |
E. Blake Moore, Jr.
Touchstone Advisors, Inc.
303 Broadway
Suite 1100
Cincinnati, Ohio 45202
Year of Birth: 1958 | President and Trustee | Until retirement at age 75 or until he resigns or is removed
Trustee since 2021 | President, Touchstone Funds since 2021; Chief Executive Officer of Touchstone Advisors, Inc. and Touchstone Securities, Inc. since 2020; President, Foresters Investment Management Company, Inc. from 2018 to 2020; President, North American Asset Management at Foresters Financial from 2018 to 2020; Managing Director, Head of Americas at UBS Asset Management from 2015 to 2017; and Executive Vice President, Head of Distribution at Mackenzie Investments from 2011 to 2014. | 36 | Trustee, College of Wooster since 2008; and Director, UBS Funds from 2015 to 2017. |
| Independent Trustees: |
Karen Carnahan
c/o Touchstone Advisors, Inc.
303 Broadway
Suite 1100
Cincinnati, Ohio 45202
Year of Birth: 1954 | Trustee | Until retirement at age 75 or until she resigns or is removed
Trustee since 2019 | Retired; formerly Chief Operating Officer of Shred-it (a business services company) from 2014 to 2015; formerly President & Chief Operating Officer of the document management division of Cintas Corporation (a business services company) from 2008 to 2014. | 36 | Director, Cintas Corporation since 2019; Director, Boys & Girls Club of West Chester/Liberty since 2016; and Board of Advisors, Best Upon Request from 2020 to 2021. |
William C. Gale
c/o Touchstone Advisors, Inc.
303 Broadway
Suite 1100
Cincinnati, Ohio 45202
Year of Birth: 1952 | Trustee | Until retirement at age 75 or until he resigns or is removed
Trustee since 2013 | Retired; formerly Senior Vice President and Chief Financial Officer of Cintas Corporation (a business services company) from 1995 to 2015. | 36 | None. |
Management of the Trust (Unaudited) (Continued)
| Independent Trustees (Continued): |
Name
Address
Year of Birth | Position
Held with
Trust | Term of
Office And
Length of
Time Served | Principal Occupation(s)
During Past 5 Years | Number
of Funds
Overseen
in the
Touchstone
Fund
Complex2 | Other
Directorships
Held During Past 5 Years3 |
Susan J. Hickenlooper, CFA4
c/o Touchstone Advisors, Inc.
303 Broadway
Suite 1100
Cincinnati, Ohio 45202
Year of Birth: 1946 | Trustee | Until retirement at age 75 or until she resigns or is removed
Trustee since 2009 | Retired from investment management. | 36 | Trustee, Episcopal Diocese of Southern Ohio from 2014 to 2018. |
Susan M. King
c/o Touchstone Advisors, Inc.
303 Broadway
Suite 1100
Cincinnati, Ohio 45202
Year of Birth: 1963 | Trustee | Until retirement at age 75 or until she resigns or is removed
Trustee since 2021 | Formerly, Partner of ID Fund LLC (2020 to 2021); formerly, Senior Vice President, Head of Product and Marketing Strategy of Foresters Financial (2018 to 2020); formerly, Managing Director, Head of Sales Strategy and Marketing, Americas of UBS Asset Management (2015 to 2017); formerly, Director, Allianz Funds, Allianz Funds Multi-Strategy Trust and AllianzGI Institutional Multi-Series Trust (2014 to 2015); and formerly, Director, Alliance Capital Cash Management Offshore Funds (2003 to 2005). | 36 | Trustee, Claremont McKenna College since 2017; Trustee, Israel Cancer Research Fund since 2019; and Board Member of WHAM! (Women's Health Access Matters) since 2021. |
Kevin A. Robie
c/o Touchstone Advisors, Inc.
303 Broadway
Suite 1100
Cincinnati, Ohio 45202
Year of Birth: 1956 | Trustee | Until retirement at age 75 or until he resigns or is removed
Trustee since 2013 | Retired; formerly Vice President of Portfolio Management at Soin LLC (private multinational holding company and family office) from 2004 to 2020. | 36 | Director, SaverSystems, Inc. since 2015; Director, Buckeye EcoCare, Inc. from 2013 to 2018; Director, Turner Property Services Group, Inc. since 2017; Trustee, Dayton Region New Market Fund, LLC (private fund) since 2010; and Trustee, Entrepreneurs Center, Inc. (business incubator) since 2006. |
William H. Zimmer III
c/o Touchstone Advisors, Inc.
303 Broadway
Suite 1100
Cincinnati, Ohio 45202
Year of Birth: 1953 | Trustee | Until retirement at age 75 or until he resigns or is removed
Trustee since 2019 | Independent Treasury Consultant since 2014. | 36 | Director, Deaconess Associations, Inc. (healthcare) since 2001; Trustee, Huntington Funds (mutual funds) from 2006 to 2015; and Director, National Association of Corporate Treasurers from 2011 to 2015. |
1 Ms. McGruder, as a director of the Advisor and the Distributor, and an officer of affiliates of the Advisor and the Distributor, is an “interested person” of the Trust within the meaning of Section 2(a)(19) of the 1940 Act. Mr. Moore, as an officer of the Advisor and the Distributor, is an “interested person” of the Trust within the meaning of Section 2(a)(19) of the 1940 Act.
2 As of June 30, 2022, the Touchstone Fund Complex consisted of 19 series of the Trust, 13 series of Touchstone Funds Group Trust and 4 variable annuity series of Touchstone Variable Series Trust.
3 Each Trustee is also a Trustee of Touchstone ETF Trust, Touchstone Funds Group Trust and Touchstone Variable Series Trust.
4 Upon the recommendation of the Governance Committee, the Board extended the mandatory retirement age for Ms. Hickenlooper for a one-year period to allow her to remain a Trustee of the Trust through December 31, 2022.
Management of the Trust (Unaudited) (Continued)
| Principal Officers: |
Name
Address
Year of Birth | Position(s)
Held with
Trust1 | Term of
Office And
Length of
Time Served | Principal Occupation(s)
During Past 5 Years |
E. Blake Moore, Jr.
Touchstone Advisors, Inc.
303 Broadway
Suite 1100
Cincinnati, Ohio 45202
Year of Birth: 1958 | President and Trustee | Until resignation, removal or disqualification
President since January 2021 | See biography above. |
Timothy D. Paulin
Touchstone Advisors, Inc.
303 Broadway
Suite 1100
Cincinnati, Ohio 45202
Year of Birth: 1963 | Vice President | Until resignation, removal or disqualification
Vice President since 2010 | Senior Vice President of Investment Research and Product Management of Touchstone Advisors, Inc. |
Timothy S. Stearns
Touchstone Advisors, Inc.
303 Broadway
Suite 1100
Cincinnati, Ohio 45202
Year of Birth: 1963 | Chief Compliance Officer | Until resignation, removal or disqualification
Chief Compliance Officer since 2013 | Chief Compliance Officer of Touchstone Advisors, Inc. and Touchstone Securities, Inc. |
Terrie A. Wiedenheft
Touchstone Advisors, Inc.
303 Broadway
Suite 1100
Cincinnati, Ohio 45202
Year of Birth: 1962 | Controller and Treasurer | Until resignation, removal or disqualification
Controller and Treasurer since 2006 | Senior Vice President and Chief Administration Officer within the Office of the Chief Marketing Officer of Western & Southern Financial Group (since 2021); and Senior Vice President, Chief Financial Officer, and Chief Operations Officer of IFS Financial Services, Inc. (a holding company). |
Meredyth A. Whitford-Schultz
Western & Southern
Financial Group
400 Broadway
Cincinnati, Ohio 45202
Year of Birth: 1981 | Secretary | Until resignation, removal or disqualification
Secretary since 2018 | Senior Counsel - Securities/Mutual Funds of Western & Southern Financial Group (2015 to present); Associate at Morgan Lewis & Bockius LLP (law firm) (2014 to 2015); Associate at Bingham McCutchen LLP (law firm) (2008 to 2014). |
(1) Each officer also holds the same office with Touchstone ETF Trust, Touchstone Funds Group Trust and Touchstone Variable Series Trust.
This page intentionally left blank.
PRIVACY PROTECTION POLICY
We Respect Your Privacy
Thank you for your decision to invest with us. Touchstone and its affiliates have always placed a high value on the trust and confidence our clients place in us. We believe that confidence must be earned and validated through time. In today’s world, when technology allows the sharing of information at light speeds, trust must be reinforced by our sincere pledge to take the steps necessary to ensure that the information you share with us is treated with respect and confidentiality.
Our Pledge to Our Clients
• We collect only the information we need to service your account and administer our business.
• We are committed to keeping your information confidential and we place strict limits and controls on the use and sharing of your information.
• We make every effort to ensure the accuracy of your information.
We Collect the Following Nonpublic Personal Information About You:
• Information we receive from you on or in applications or other forms, correspondence, or conversations, including, but not limited to, your name, address, phone number, social security number, assets, income and date of birth; and
• Information about your transactions with us, our affiliates, or others, including, but not limited to, your account number and balance, payment history, parties to transactions, cost basis information, and other financial information.
Categories of Information We Disclose and Parties to Whom We Disclose
We do not disclose any nonpublic personal information about our current or former clients to nonaffiliated third parties, except as required or permitted by law.
We Place Strict Limits and Controls on the Use and Sharing of Your Information
• We restrict access to nonpublic personal information about you to authorized employees who need the information to administer your business.
• We maintain physical, electronic and procedural safeguards that comply with federal standards to protect this information.
• We do not disclose any nonpublic personal information about our current or former clients to anyone, except as required or permitted by law or as described in this document.
• We will not sell your personal information to anyone.
We May Provide Information to Service Your Account
Sometimes it is necessary to provide information about you to various companies such as transfer agents, custodians, broker-dealers and marketing service firms to facilitate the servicing of your account. These organizations have a legitimate business need to see some of your personal information in order for us to provide service to you. We may disclose to these various companies the information that we collect as described above. We require that these companies, including our own subsidiaries and affiliates, strictly maintain the confidentiality of this information and abide by all applicable laws. Companies within our corporate family that may receive this information are financial service providers and insurance companies. We do not permit these associated companies to sell the information for their own purposes, and we never sell our customer information.
This policy is applicable to the following affiliated companies: Touchstone Funds Group Trust, Touchstone Strategic Trust, Touchstone Variable Series Trust, Touchstone Securities, Inc.,* and W&S Brokerage Services, Inc.
*Touchstone Securities, Inc. serves as the underwriter to the Touchstone Funds.
A Member of Western & Southern Financial Group®
The Privacy Protection Policy is not part of the Annual Report.
Touchstone Investments
Distributor
Touchstone Securities, Inc.*
303 Broadway
Cincinnati, Ohio 45202-4203
800.638.8194
www.touchstoneinvestments.com
Investment Advisor
Touchstone Advisors, Inc.*
303 Broadway
Cincinnati, Ohio 45202-4203
Transfer Agent
BNY Mellon Investment Servicing (US) Inc.
4400 Computer Drive
Westborough, Massachusetts 01581
Shareholder Service
800.543.0407
* A Member of Western & Southern Financial Group
Item 2. Code of Ethics.
| (a) | The registrant, as of the end of the period covered by this report, has adopted a code of ethics that applies to the registrant’s principal executive officer, principal financial officer, principal accounting officer or controller, or persons performing similar functions, regardless of whether these individuals are employed by the registrant or a third party. |
| (c) | There have been no amendments, during the period covered by this report, to a provision of the code of ethics that applies to the registrant’s principal executive officer, principal financial officer, principal accounting officer or controller, or persons performing similar functions, regardless of whether these individuals are employed by the registrant or a third party, and that relates to any element of the code of ethics description. |
| (d) | The registrant has not granted any waivers, including an implicit waiver, from a provision of the code of ethics that applies to the registrant’s principal executive officer, principal financial officer, principal accounting officer or controller, or persons performing similar functions, regardless of whether these individuals are employed by the registrant or a third party, that relates to one or more of the items set forth in paragraph (b) of this Item’s instructions. |
| (f) | A copy of the code of ethics is attached hereto as Exhibit 13(a)(1). |
Item 3. Audit Committee Financial Expert.
The registrant’s Board of Trustees has determined that the registrant has at least one audit committee financial expert serving on its audit committee. Ms. Karen Carnahan is the registrant’s audit committee financial expert and is an independent trustee within the meaning of the Investment Company Act of 1940, as amended (the “1940 Act”).
Item 4. Principal Accountant Fees and Services.
Audit Fees
| (a) | Audit fees for Touchstone Strategic Trust (June Funds) totaled $171,300 and $171,300 for the fiscal years ended June 30, 2022 and June 30, 2021, respectively including fees associated with the annual audits and filings of Form N-1A and Form N-CEN. |
Audit-Related Fees
The aggregate fees billed in each of the last two fiscal years for assurance and related services by the principal accountant that are reasonably related to the performance of the audit of the registrant's financial statements and are not reported under paragraph (a) of this Item are $17,200 and $10,000 for the fiscal years ended June 30, 2022 and June 30, 2021, respectively. The fees for the June 30, 2022 and June 30, 2021 fiscal years relate to the review of Form N-14 and N-1A filings.
Tax Fees
| (c) | The aggregate fees billed in each of the last two fiscal years for professional services rendered by the principal accountant for tax compliance, tax advice, and tax planning were $69,430 and $49,570 for the fiscal years ended June 30, 2022 and June 30, 2021, respectively. The fees relate to the preparation of federal income and excise tax returns, review of capital gains distribution calculations and tax agent services. |
All Other Fees
| (d) | The aggregate fees billed in each of the last two fiscal years for products and services provided by the principal accountant, other than the services reported in paragraphs (a) through (c) of this Item are $18,512 and $26,999 for the fiscal years ended June 30, 2022 and June 30, 2021, respectively. The fees relate to the PFIC Analyzer and Global Withholding Tax Reporter subscriptions. |
| (e)(1) | Disclose the audit committee's pre-approval policies and procedures described in paragraph (c)(7) of Rule 2-01 of Regulation S-X. |
The Audit Committee’s pre-approval policies describe the types of audit, audit-related, tax and other services that have the general pre-approval of the Audit Committee. The pre-approval policies provide that annual audit service fees, tax services not specifically granted pre-approval, services exceeding pre-approved cost levels and other services that have not received general pre-approval will be subject to specific pre-approval by the Audit Committee. The pre-approval policies further provide that the Committee may grant general pre-approval to other audit services (statutory audits and services associated with SEC registration statements, periodic reports and other documents filed with the SEC or other documents issued in connection with securities offerings), audit-related services (accounting consultations related to accounting, financial reporting or disclosure matters not classified as “audit services,” assistance with understanding and implementing new accounting and financial reporting guidance from rulemaking authorities, agreed-upon or expanded audit procedures related to accounting and/or billing records required to respond to or comply with financial, accounting or regulatory reporting matters and assistance with internal control reporting requirements under Form N-CSR), tax services that have historically been provided by the auditor that the Committee believes would not impair the independence of the auditor and are consistent with the SEC’s rules on auditor independence and permissible non-audit services classified as “all other services” that are routine and recurring services.
| (e)(2) | All services described in paragraphs (b) through (d) of Item 4 were approved by the audit committee. |
| (f) | The percentage of hours expended on the principal accountant's engagement to audit the registrant's financial statements for the most recent fiscal year that were attributed to work performed by persons other than the principal accountant's full-time, permanent employees was less than fifty percent. |
| (g) | The aggregate non-audit fees for Touchstone Strategic Trust (June Funds) and certain entities*, totaled approximately $551,319 and $499,534 for the fiscal years ended June 30, 2022 and June 30, 2021, respectively. |
* These include the advisors (excluding sub-advisors) and any entity controlling, controlled by or under common control with the advisors that provides ongoing services to the registrant (Funds).
| (h) | The registrant's audit committee of the Board of Trustees has considered whether the provision of non-audit services that were rendered to the registrant's investment adviser (not including any sub-adviser whose role is primarily portfolio management and is subcontracted with or overseen by another investment adviser), and any entity controlling, controlled by, or under common control with the investment adviser that provides ongoing services to the registrant that were not pre-approved pursuant to paragraph (c)(7)(ii) of Rule 2-01 of Regulation S-X is compatible with maintaining the principal accountant's independence. |
Item 5. Audit Committee of Listed Registrants.
Not applicable.
Item 6. Investments.
| (a) | Schedule of Investments in securities of unaffiliated issuers as of the close of the reporting period is included as part of the report to shareholders filed under Item 1(a) of this form. |
Item 7. Disclosure of Proxy Voting Policies and Procedures for Closed-End Management Investment Companies.
Not applicable.
Item 8. Portfolio Managers of Closed-End Management Investment Companies.
Not applicable.
Item 9. Purchases of Equity Securities by Closed-End Management Investment Company and Affiliated Purchasers.
Not applicable.
Item 10. Submission of Matters to a Vote of Security Holders.
There have been no material changes to the procedures by which the shareholders may recommend nominees to the registrant’s board of trustees, where those changes were implemented after the registrant last provided disclosure in response to the requirements of Item 407(c)(2)(iv) of Regulation S-K (17 CFR 229.407) (as required by Item 22(b)(15) of Schedule 14A (17 CFR 240.14a-101)), or this Item.
Item 11. Controls and Procedures.
| (a) | The registrant’s principal executive and principal financial officers, or persons performing similar functions, have concluded that the registrant’s disclosure controls and procedures (as defined in Rule 30a-3(c) under the Investment Company Act of 1940, as amended (the “1940 Act”) (17 CFR 270.30a-3(c))) are effective, as of a date within 90 days of the filing date of the report that includes the disclosure required by this paragraph, based on their evaluation of these controls and procedures required by Rule 30a-3(b) under the 1940 Act (17 CFR 270.30a-3(b)) and Rules 13a-15(b) or 15d-15(b) under the Securities Exchange Act of 1934, as amended (17 CFR 240.13a-15(b) or 240.15d-15(b)). |
| (b) | There were no changes in the registrant’s internal control over financial reporting (as defined in Rule 30a-3(d) under the 1940 Act (17 CFR 270.30a-3(d))) that occurred during the period covered by this report that has materially affected, or is reasonably likely to materially affect, the registrant’s internal control over financial reporting. |
Item 12. Disclosure of Securities Lending Activities for Closed-End Management Investment Companies.
Not applicable.
Item 13. Exhibits.
SIGNATURES
Pursuant to the requirements of the Securities Exchange Act of 1934 and the Investment Company Act of 1940, the registrant has duly caused this report to be signed on its behalf by the undersigned, thereunto duly authorized.
| (Registrant) | Touchstone Strategic Trust | |
| By (Signature and Title)* | /s/ E. Blake Moore, Jr. | |
| | E. Blake Moore, Jr., President | |
| | (principal executive officer) | |
Pursuant to the requirements of the Securities Exchange Act of 1934 and the Investment Company Act of 1940, this report has been signed below by the following persons on behalf of the registrant and in the capacities and on the dates indicated.
| By (Signature and Title)* | /s/ E. Blake Moore, Jr. | |
| | E. Blake Moore, Jr., President | |
| | (principal executive officer) | |
| By (Signature and Title)* | /s/ Terrie A. Wiedenheft | |
| | Terrie A. Wiedenheft, Controller and Treasurer | |
| | (principal financial officer) | |
* Print the name and title of each signing officer under his or her signature.