UNITED STATES
SECURITIES AND EXCHANGE COMMISSION
Washington, D.C. 20549
FORM N-CSR
CERTIFIED SHAREHOLDER REPORT OF REGISTERED
MANAGEMENT INVESTMENT COMPANIES
| | |
Investment Company Act file number: | | 811-03623 |
| |
Exact name of registrant as specified in charter: | | The Prudential Series Fund, Inc. |
| |
Address of principal executive offices: | | Gateway Center 3, |
| | | 100 Mulberry Street, |
| | | Newark, New Jersey 07102 |
| |
Name and address of agent for service: | | Jonathan D. Shain |
| | | Gateway Center 3, |
| | | 100 Mulberry Street, |
| | | Newark, New Jersey 07102 |
| |
Registrant’s telephone number, including area code: | | 973-802-6469 |
| |
Date of fiscal year end: | | 12/31/2004 |
| |
Date of reporting period: | | 12/31/2004 |
Item 1 – Reports to Stockholders – [ INSERT REPORT ]
ANNUAL REPORT
DECEMBER 31, 2004
The Prudential Series Fund, Inc.

| | n | Conservative Balanced Portfolio |
| | n | Diversified Bond Portfolio |
| | n | Flexible Managed Portfolio |
| | n | Government Income Portfolio |
| | n | High Yield Bond Portfolio |
| | n | Natural Resources Portfolio |
| | n | Small Capitalization Stock Portfolio |
| | n | Zero Coupon Bond Portfolio 2005 |
The Prudential Insurance Company of America
751 Broad Street, Newark, NJ 07102-3777
Pruco Life Insurance Company
Pruco Life Insurance Company of New Jersey
213 Washington Street, Newark, NJ 07102-3777
Pruco Life Insurance Company is not licensed to do business in New York.
IFS-2005-A094581

T | his report is one of several that provide financial information about certain investment choices available on variable life insurance and variable annuity contracts. Based on the variable contract you own or the portfolios you invested in, you may receive additional reports that provide financial information on those investment choices. Please refer to your variable life insurance or variable annuity contract prospectus to determine which portfolios are available to you. A list of the variable contracts that this report supports is located on the inside back cover. |
This report must be preceded or accompanied by the current Monthly Performance Review (MPR) for the applicable product and the current prospectuses for the Prudential Series Fund portfolios and the applicable variable life or annuity contract. The prospectuses contain information on the investment objectives, risks, and charges and expenses and should be read carefully.
The contract’s prospectus contains hypothetical performance illustrations that show the effect of various assumptions regarding the cost of insurance protection. You may also obtain a personalized illustration of historical performance that reflects the cost of your policy’s insurance protection. The MPR shows historical investment performance after the deduction of investment management fees, investment-related expenses, and the product’s mortality and expense risk charges. For variable life insurance products, additional contract charges include the cost of insurance, administrative, sales, and any applicable withdrawal or surrender charges, which will reduce the rates of return shown. For variable annuity products, returns are net of all contract charges, including applicable surrender or withdrawal charges.
DISCOVER THE BENEFITS OF E-DELIVERY
| n | | Eliminate receiving printed reports. |
| n | | View documents on-line as they become available. |
| n | | Download and store e-reports on your PC. |
| n | | Help the environment by using less paper. |
To receive your semiannual/annual reports on-line, go to www.icsdelivery.com/prudential and enroll. Instead of receiving printed reports, you will receive notification via e-mail when new materials are available for your review. You can cancel your enrollment or change your e-mail address at any time by clicking on the change/cancel enrollment option at the icsdelivery website.
A description of the Fund’s proxy voting policies and procedures is available, without charge, upon request. Owners of variable annuity contracts should call 888-778-2888 and owners of variable life insurance contracts should call 800-778-2255 to obtain descriptions of the Fund’s proxy voting policies and procedures. The description is also available on the website of the Securities and Exchange Commission (the “Commission”) at www.sec.gov. Information regarding how the Fund voted proxies relating to portfolio securities during the most recent 12-month period ended December 31, 2004 is available on the website of the Commission at www.sec.gov and on the Fund’s website at www.irrc.com/prudential.
The Fund files with the Commission a complete listing of portfolio holdings as of its first and third quarter-end on Form N-Q. Form N-Q is available on the Commission’s website at www.sec.gov or by visiting the Commission’s Public Reference Room. For more information on the Commission’s Public Reference Room, please visit the Commission’s website or call 1-800-SEC-0330. Form N-Q is also available on the Fund’s website at www.prudential.com or by calling the telephone numbers referenced above.

GLOSSARY OF BENCHMARK DEFINITIONS
Aggressive Growth Asset Allocation Custom Blended Index consists of Russell 3000 Index (80%), and MSCI EAFE Index (20%).
Balanced Asset Allocation Custom Blended Index consists of Russell 3000 Index (48%), Lehman Brothers U.S. Aggregate Bond lndex(40%) and MSCI EAFE Index (12%).
Conservative Asset Allocation Custom Blended Index consists of Russell 3000 Index (32%), Lehman Brothers U.S. Aggregate Bond lndex(60%) and MSCI EAFE Index (8%).
Conservative Balanced Custom Blended Index consists of a blend of the S&P 500 Index (50%), the Lehman Brothers Aggregate Bond Index (40%), and the 3-Month T-Bill (10%).
Diversified Conservative Growth Custom Blended Index consists of S&P 500 Barra Value Index (15%), S&P 500 Barra Growth Index (15%), Russell 2000 Value Index (5%), Russell 2000 Growth Index (5%), Lehman Brothers Aggregate Bond Index (40%), and Lehman Brothers High Yield Bond Index (20%).
Flexible Managed Custom Blended Index consists of a blend of the S&P 500 Index (60%), the Lehman Brothers Aggregate Bond Index (35%), and the 3-Month T-Bill (5%).
Growth Asset Allocation Custom Blended Index consists of consists of Russell 3000 Index (64%), Lehman Brothers U.S. Aggregate Bond lndex(20%) and MSCI EAFE Index (16%).
Lehman Brothers U.S. Aggregate Bond Index is an unmanaged index comprised of more than 5,000 government and corporate bonds.
Lehman Brothers U.S. Corporate High Yield Index is an unmanaged index of fixed-rate, non-investment-grade debt securities with at least one year remaining to maturity. It gives a broad look at how high yield (“junk”) bonds have performed.
Lehman Brothers Government Bond Index is an unmanaged index comprised of securities issued or backed by the U.S. government, its agencies, and instrumentalities with a remaining maturity of 1 to 30 years.
Lehman Brothers Intermediate BB Corporate Bond Index is an unmanaged index comprised of various fixed income securities rated BB.
The Lipper Variable Insurance Products (VIP) Funds Averages are calculated by Lipper Analytical Services, Inc., and reflect the investment return of certain portfolios underlying variable life and annuity products. These returns are net of investment fees and fund expenses, but not product charges.
| | | | |
| Balanced Funds Average | | International Growth Funds Average | | Multi-Cap Value Funds Average |
| Corporate Debt Funds BBB-Rated Average | | Large-Cap Core Funds Average | | Natural Resources Funds Average |
| Flexible Portfolio Funds Average | | Large-Cap Growth Funds Average | | S&P 500 Index Funds Average |
| General U.S. Government Funds Average | | Large-Cap Value Funds Average | | Small-Cap Core Funds Average |
| Global Funds Average | | Mid-Cap Growth Funds Average | | Small-Cap Growth Funds Average |
| High Current Yield Funds Average | | Mid-Cap Value Funds Average | | Small-Cap Value Funds Average |
| Income Funds Average | | Money Market Funds Average | | Specialty/Miscellaneous Funds Average |
| Intermediate Investment-Grade Debt Funds Average | | Multi-Cap Core Funds Average | | Target Maturity Funds Average |
| International Value Funds Average | | Multi-Cap Growth Funds Average | | |
Merrill Lynch U.S. High Yield Master II BB-B Rated Index is a broad high yield index including high yield bonds across the maturity spectrum, within the BB-B rated credit quality spectrum, included in the below-investment-grade universe.
Morgan Stanley Capital International Europe, Australasia, and the Far East (MSCI EAFE) Index is a weighted, unmanaged index that reflects stock performance in Europe, Australasia, and the Far East.
Morgan Stanley Capital International (MSCI) World Index is an unmanaged index comprised of approximately 1,500 companies listed on the stock exchanges of Australasia, Canada, Europe, the Far East, and the United States.
Russell 1000 Growth Index is a market cap-weighted index that measures the performance of those Russell 1000 companies with higher price-to-book ratios and higher forecasted growth values.
Russell 1000 Index is a market cap-weighted index that measures the performance of the 1,000 largest companies in the Russell 3000 Index, which represents approximately 92% of the total market.
Russell 1000 Value Index is a market cap-weighted index that measures the performance of those Russell 1000 companies with lower price-to-book ratios and lower forecasted growth values.
Russell 2000 Growth Index is a market cap-weighted index that measures the performance of those Russell 2000 companies with higher price-to-book ratios and higher forecasted growth values.
Russell 2000 Index measures the performance of the 2,000 smallest companies in the Russell 3000 Index, which represents approximately 8% of the total market capitalization of the Russell 3000 Index.
Russell 2500 Growth Index is a market cap-weighted index that measures the performance of those Russell 2500™ companies with higher price-to-book ratios and higher forecasted growth values.
Russell 2500 Index is a market cap-weighted index that measures the performance of the 2,500 smallest companies in the Russell 3000 Index, which represents approximately 17% of the total market capitalization of the Russell 3000 Index.
Russell 2500 Value Index is a market cap-weighted index that measures the performance of those Russell 2500™ companies with lower price-to-book ratios and lower forecasted growth values.
Russell Midcap Growth Index is a market cap-weighted index that measures the performance of those Russell MidCap companies with higher price-to-book ratios and higher forecasted growth values.
Russell Midcap Index is a market cap-weighted index that measures the performance of the 800 smallest companies in the Russell 1000 Index, which represents approximately 25% of the total market.
S&P 500 Index is an unmanaged, market value-weighted index of 500 stocks generally representative of the broad stock market.
S&P MidCap 400 Index is a widely accepted, unmanaged total return index of 400 domestic stocks measuring the performance of the midsize company segment of the U.S. stock market.
S&P SmallCap 600 Index is an unmanaged index representing the aggregate market value of the common equity of 600 small-company stocks.
S&P SuperComposite Information Technology Index measures the performance of the technology components of the S&P SuperComposite 1500, which is a combination of the S&P 500, S&P MidCap 400, and S&P SmallCap 600 indexes, and provides a broad representation of the entire U.S. market, representing 87% of total U.S. equity market capitalization.
This page may include certain benchmarks not applicable to the portfolios available in this particular report. Investors cannot invest directly in a market index or average.
The Prudential Series Fund, Inc.
Annual Report
DECEMBER 31, 2004
Table of Contents
Letter to Contract Owners
| | n | THE PRUDENTIAL SERIES FUND, INC. PORTFOLIOS |
Conservative Balanced Portfolio
Diversified Bond Portfolio
Equity Portfolio
Flexible Managed Portfolio
Global Portfolio
Government Income Portfolio
High Yield Bond Portfolio
Jennison Portfolio
Money Market Portfolio
Natural Resources Portfolio
Small Capitalization Stock Portfolio
Stock Index Portfolio
Value Portfolio
Zero Coupon Portfolio 2005
| | B1 | Schedule of Investments |
| | C1 | Notes to Financial Statements |
| | E1 | Report of Independent Registered Accounting Firm |
| | F1 | Management of the Prudential Series Fund, Inc. |
This report may include financial information pertaining to certain portfolios that are not available through the variable life insurance policy or variable annuity contract that you have chosen. Please refer to your variable life insurance or variable annuity prospectus to determine which portfolios are available to you.
The Prudential Series Fund, Inc.
Annual Report
DECEMBER 31, 2004
Letter to Contract Owners
We hope that you find the annual report for the Prudential Series Fund to be a valuable source of information about your investments. Your success is important to us.
As the New Year begins, we are taking this opportunity to remind you of the importance of asset allocation, a strategy that takes a long-term, disciplined approach and can help minimize risk through a diversified portfolio. Investing in a strategic mix of assets can help you avoid the negative impact of a downturn in one asset class and can help better position your investments as asset classes rotate in and out of favor.
Your investment professional can help you create a diversified investment plan that considers your reasons for investing, personal investment horizon and risk tolerance. A carefully chosen and broad mix of assets—reviewed periodically over time—can help you stay focused on meeting your long-term objectives, despite fluctuations in the market.
At Prudential, we are committed to helping you grow and protect your wealth by providing financial solutions that meet your needs—today and in the future. We look forward to continuing our relationship with you and thank you for your confidence in our products.
Sincerely,

David R. Odenath, Jr.
President,
The Prudential Series Fund, Inc. | January 31, 2005 |

PRESIDENT
DAVID R. ODENATH, JR.
| | | | |
The Prudential Series Fund, Inc. | | Annual Report | | December 31, 2004 |
Conservative Balanced Portfolio
| n | MANAGED BY: PRUDENTIAL INVESTMENT MANAGEMENT, INC. AND QUANTITATIVE MANAGEMENT ASSOCIATES LLC |
Past performance does not guarantee future returns. Portfolio performance is net of investment fees and fund expenses, but not product charges, which, if included, would significantly lower the performance quoted. The investment return and principal value of an investment will fluctuate, so that an investor’s shares, when redeemed, may be worth more or less than their original cost. Current performance may be lower or higher than the past performance data quoted.
| n | PERFORMANCE SUMMARY - As of December 31, 2004 |
| | | | | | | | | |
Average Annual Total Return Percentages
| | 1-Year
| | | 5-Year
| | | 10-Year
| |
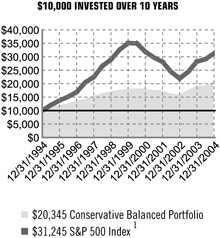
Conservative Balanced Portfolio | | 8.04 | % | | 2.64 | % | | 7.36 | % |
S&P 500 Index1 | | 10.87 | % | | -2.30 | % | | 12.07 | % |
Conservative Balanced Custom Blended Index1 | | 7.33 | % | | 2.49 | % | | 9.84 | % |
Lipper (VIP) Balanced Funds Average1 | | 8.55 | % | | 2.96 | % | | 9.27 | % |
Conservative Balanced Portfolio inception date: 5/13/1983. The Conservative Balanced Custom Blended Index consists of a blend of the S &P 500 Index (50%), the Lehman Brothers U.S. Aggregate Bond Index (40%), and the T-Bill 3-Month Blend (10%).
The Portfolio may invest in foreign securities, which are subject to the risks of currency fluctuation and the impact of social, political, and economic change. The Portfolio may also invest in derivative securities, which may carry market, credit, and liquidity risks. These risks may result in greater share price volatility.
| | | | |
| | | Portfolio
| | SP500
|
31-Dec-94 | | 10,000.0000 | | 10,000.00 |
30-Jun-95 | | 10,983.6870 | | 12,018.58 |
31-Dec-95 | | 11,727.1566 | | 13,753.37 |
30-Jun-96 | | 12,318.4790 | | 15,140.96 |
31-Dec-96 | | 13,207.8573 | | 16,909.09 |
30-Jun-97 | | 14,237.4208 | | 20,391.89 |
31-Dec-97 | | 14,984.7911 | | 22,548.44 |
30-Jun-98 | | 16,186.6397 | | 26,544.46 |
31-Dec-98 | | 16,743.2711 | | 28,997.04 |
30-Jun-99 | | 17,419.6260 | | 32,582.91 |
31-Dec-99 | | 17,863.9119 | | 35,096.05 |
30-Jun-00 | | 18,112.5990 | | 34,946.30 |
31-Dec-00 | | 17,777.7174 | | 31,901.68 |
30-Jun-01 | | 17,601.5328 | | 29,766.54 |
31-Dec-01 | | 17,418.9643 | | 28,113.01 |
30-Jun-02 | | 16,378.3997 | | 24,415.89 |
31-Dec-02 | | 15,855.4134 | | 21,902.19 |
30-Jun-03 | | 17,255.4071 | | 24,476.09 |
31-Dec-03 | | 18,831.2434 | | 28,180.94 |
30-Jun-04 | | 19,199.6913 | | 29,150.84 |
31-Dec-04 | | 20,344.9361 | | 31,245.36 |
“For the year ended December 31, 2004, the Conservative Balanced Portfolio had a total return of 8.04% compared with the return of 10.87% for the unmanaged S&P 500 Index, 7.33% for the unmanaged Conservative Balanced Custom Blended Index, and 8.55% for the Lipper (VIP) Balanced Funds Average.
The 10.87% return of the S&P 500 Index came almost entirely in the last few months of the year as the U.S. election settled the political uncertainty and the price of oil declined somewhat. Within the S&P 500 Index, value stocks and stocks of companies with small capitalizations tended to perform better. Although the threat of rising interest rates clouded the bond markets, a series of small actions by the Federal Reserve (the Fed) primarily affected short-term securities, while longer-term bonds actually declined moderately. Continued economic strength and investors’ search for higher yield continued to benefit more credit-sensitive issues.
While the Portfolio’s return trailed the Lipper (VIP) Balanced Funds Average, the Portfolio outperformed its custom benchmark. As a conservatively managed portfolio, it normally holds approximately 50% of its assets in stocks, while the remainder is in bonds and cash. This is a lower equity allocation than that of most balanced accounts, which normally hold about 60% in equities. Consequently, when stocks outperformed bonds, the Portfolio was hurt relative to its competitors by having a more conservative targeted equity exposure. Fortunately, our favorable view of stocks in 2004 led us to overweight them relative to our normal allocation, so we outperformed our 50% stock, 40% bond, and 10% cash benchmark. The stock segment of the Portfolio is managed to track the return of the S&P 500 Index, while the bond segment is actively managed.
The fixed income segment outperformed the Lehman Brothers Aggregate U.S. Bond Index. The segment emphasized intermediate-maturity bonds in lieu of the shorter-maturity securities, which were most affected by the rise in the Fed actions. The segment continued to overweight corporate bonds in the BBB ratings category and, to a lesser extent, high yield corporate bonds. Both sectors performed better than more highly rated corporate bonds and U.S. Treasury securities. Emphasizing commercial mortgage-backed and other asset-backed securities also contributed as they generally outperformed U.S. Treasurys. Issue selection in corporate bonds and mortgage-backed securities benefited performance.”
| 1 | For average and index definitions, refer to the Glossary of Benchmark Definitions page. Investors cannot invest directly in a market index or average. |
For a complete list of holdings, refer to the Schedule of Investments section of this report.
| | | | |
The Prudential Series Fund, Inc. | | Annual Report | | December 31, 2004 |
Diversified Bond Portfolio
| n | MANAGED BY: PRUDENTIAL INVESTMENT MANAGEMENT, INC. |
Past performance does not guarantee future returns. Portfolio performance is net of investment fees and fund expenses, but not product charges, which, if included, would significantly lower the performance quoted. The investment return and principal value of an investment will fluctuate so that an investor’s shares, when redeemed, may be worth more or less than their original cost. Current performance may be lower or higher than the past performance data quoted.
| n | PERFORMANCE SUMMARY - As of December 31, 2004 |
| | | | | | | | | |
Average Annual Total Return Percentages
| | 1-Year
| | | 5-Year
| | | 10-Year
| |
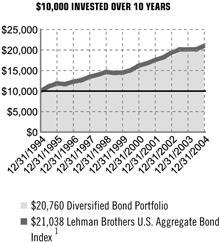
Diversified Bond Portfolio | | 5.59 | % | | 7.36 | % | | 7.58 | % |
Lehman Brothers U.S. Aggregate Bond Index1 | | 4.34 | % | | 7.71 | % | | 7.72 | % |
Lipper (VIP) Corporate Debt Funds BBB-Rated Funds Average1 | | 5.18 | % | | 7.70 | % | | 7.86 | % |
Diversified Bond Portfolio inception date: 5/13/1983.
The Portfolio may invest in foreign securities, which are subject to the risks of currency fluctuation and the impact of social, political, and economic change. The Portfolio may also invest in derivative securities, which may carry market, credit, and liquidity risks. These risks may result in greater share price volatility.
| | | | |
| | | Portfolio
| | LBAB
|
31-Dec-94 | | 10,000.0000 | | 10,000.00 |
30-Jun-95 | | 11,208.1841 | | 11,144.43 |
31-Dec-95 | | 12,073.2114 | | 11,847.46 |
30-Jun-96 | | 11,887.8679 | | 11,703.51 |
31-Dec-96 | | 12,604.1341 | | 12,277.55 |
30-Jun-97 | | 13,121.8322 | | 12,657.35 |
31-Dec-97 | | 13,684.0671 | | 13,462.89 |
30-Jun-98 | | 14,291.1644 | | 13,991.68 |
31-Dec-98 | | 14,663.1060 | | 14,632.39 |
30-Jun-99 | | 14,422.2987 | | 14,431.87 |
31-Dec-99 | | 14,555.2231 | | 14,512.11 |
30-Jun-00 | | 14,963.3377 | | 15,090.68 |
31-Dec-00 | | 15,970.6378 | | 16,199.26 |
30-Jun-01 | | 16,816.1082 | | 16,785.14 |
31-Dec-01 | | 17,084.9577 | | 17,567.19 |
30-Jun-02 | | 17,331.5785 | | 18,233.13 |
31-Dec-02 | | 18,292.3646 | | 19,368.69 |
30-Jun-03 | | 19,386.5834 | | 20,129.50 |
31-Dec-03 | | 19,661.5621 | | 20,163.61 |
30-Jun-04 | | 19,694.8328 | | 20,193.90 |
31-Dec-04 | | 20,759.9553 | | 21,038.43 |
“For the year ended December 31, 2004, the Diversified Bond Portfolio returned 5.59%, outperforming the Lehman Brothers U.S. Aggregate Bond Index that rose 4.34% and the Lipper (VIP) Corporate Debt Funds BBB-Rated Funds Average that gained 5.18%.
The Portfolio benefited from a U.S. bond market that was resilient, even as the Federal Reserve (the Fed) raised the federal funds rate—the rate banks charge each other on overnight loans—by a quarter percentage point five times. The combined moves lifted the key rate from 1.00% to 2.25%. Increasing borrowing costs enabled the Fed to reduce monetary stimulus in the economy.
Despite its resilience, the bond market was somewhat volatile during the year. Anticipation of the trend toward higher short-term rates had initially prompted a sharp selloff in the U.S. bond market during the second quarter of 2004. At that time strong job growth and rising inflationary pressures suggested the Fed would move aggressively to slow economic growth. Prospects for higher rates weighed on the fixed income market as bond prices move inversely to interest rates. However, as 2004 continued, the bond market recovered amid economic conditions that were more favorable for bonds. Job growth was uneven and inflation surprisingly mild despite sharply higher oil prices. These were welcomed developments, particularly as inflation erodes the value of bonds’ fixed interest payments.
In an environment of moderate inflation and still-low interest rates, many investors turned to bonds that yielded more than U.S. Treasury securities, particularly high yield bonds (commonly called “junk” bonds) and emerging-market bonds. The Portfolio benefited from its exposure to these higher-yielding assets, which dramatically outperformed Treasurys in 2004. Among high yield bonds held by the Portfolio, debt securities of Citizen Communications and CenterPointEnergy performed well, while bonds of HCA, Inc. and Continental Airlines Equipment Trust Certificates did not perform well. Among its emerging-market bonds, debt securities of Russia, Brazil, Poland, and Turkey performed well.
The Portfolio also benefited from its exposure to investment-grade corporate bonds, which also outperformed Treasurys in 2004. The search for attractive yields and a favorable supply/demand balance were supportive. The Portfolio’s return was enhanced by its holdings in the telecommunications sector (AT&T and Sprint) and the financial sector (Citigroup and Goldman Sachs). However, the Portfolio held bonds in the auto sector (General Motors) and the communications sector (Clear Channel) that did not perform well.”
| 1 | For average and index definitions, refer to the Glossary of Benchmark Definitions page. Investors cannot invest directly in a market index or average. |
For a complete list of holdings, refer to the Schedule of Investments section of this report.
The Prudential Series Fund, Inc.
Annual Report
December 31, 2004
Equity Portfolio
n MANAGED BY: GE ASSET MANAGEMENT; JENNISON ASSOCIATES LLC; and SALOMON BROTHERS ASSET MANAGEMENT
Past performance does not guarantee future returns. Portfolio performance is net of investment fees and fund expenses, but not product charges, which, if included, would significantly lower the performance quoted. The investment return and principal value of an investment will fluctuate, so that an investor’s shares, when redeemed, may be worth more or less than their original cost. Current performance may be lower or higher than the past performance data quoted.
n PERFORMANCE SUMMARY* - As of December 31, 2004
| | | | | | | | | |
| | | | |
| Average Annual Total Return Percentages | | 1-Year | | | 5-Year | | | 10-Year | |
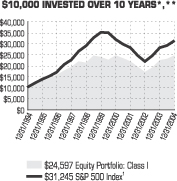
Equity Portfolio: Class I | | 9.93 | % | | 0.61 | % | | 9.42 | % |
Equity Portfolio: Class II | | 9.51 | % | | 0.20 | % | | N/A† | |
S&P 500 Index1 | | 10.87 | % | | –2.30 | % | | 12.07 | % |
Russell 1000 Index1 | | 11.40 | % | | –1.76 | % | | 12.16 | % |
Lipper (VIP) Large-Cap Core Funds Average1 | | 8.59 | % | | –2.88 | % | | 9.72 | % |
Equity Portfolio (Class I) inception date: 5/13/1983. Equity Portfolio (Class II) inception date: 5/4/1999. † The since inception return for the Class II shares was 0.06%.
The Portfolio may invest in foreign securities, which are subject to the risks of currency fluctuation and the impact of social, political, and economic change.
| | | | |
| | | Equity
| | SP500
|
31-Dec-1994 | | 10,000.00 | | 10,000.00 |
30-Jun-1995 | | 11,658.43 | | 12,018.58 |
31-Dec-1995 | | 13,129.03 | | 13,753.37 |
30-Jun-1996 | | 14,089.19 | | 15,140.96 |
31-Dec-1996 | | 15,560.47 | | 16,909.09 |
30-Jun-1997 | | 17,624.41 | | 20,391.89 |
31-Dec-1997 | | 19,397.39 | | 22,548.44 |
30-Jun-1998 | | 21,816.29 | | 26,544.46 |
31-Dec-1998 | | 21,209.10 | | 28,997.04 |
30-Jun-1999 | | 24,490.78 | | 32,582.91 |
31-Dec-1999 | | 23,858.10 | | 35,096.05 |
30-Jun-2000 | | 22,553.48 | | 34,946.30 |
31-Dec-2000 | | 24,641.60 | | 31,901.68 |
30-Jun-2001 | | 23,250.66 | | 29,766.54 |
31-Dec-2001 | | 21,886.04 | | 28,113.01 |
30-Jun-2002 | | 19,316.26 | | 24,415.89 |
31-Dec-2002 | | 16,996.63 | | 21,902.19 |
30-Jun-2003 | | 19,055.70 | | 24,476.09 |
31-Dec-2003 | | 22,375.85 | | 28,180.94 |
30-Jun-2004 | | 22,998.11 | | 29,150.84 |
31-Dec-2004 | | 24,596.68 | | 31,245.36 |
n PERFORMANCE REVIEW
“For the year ended December 31, 2004, the Equity Portfolio (Class I) had a total return of 9.93% compared with the return of 10.87% for the unmanaged S&P 500 Index, 11.40% for the Russell 1000 Index, and 8.59% for the Lipper (VIP) Large-Cap Core Funds Average. Jennison manages 50% of the Portfolio while Salomon and GE each manage 25%.
Jennison’s segment outperformed the S&P 500 Index, led by holdings in the healthcare, consumer staples, energy, and financials sectors. Positions in the information technology, materials, industrials, and consumer discretionary sectors generated positive returns, but underperformed the Index. The drug company Sepracor and Internet and catalog retail stock eBay were among the largest contributors to the segment’s return. Oil and natural gas supply constraints, coupled with rising demand, pushed up oil prices and benefited the segment’s energy holdings. In technology, Yahoo! and Marvell Technology helped performance, but Intel, Cisco, and Texas Instruments declined. Cisco’s inventories increased when they were expected to fall, disappointing investors. However, Cisco claimed that the rise was linked to quicker responses to its customers’ needs. Jennison is monitoring the position.
Salomon’s segment trailed the S&P 500 Index. Overall stock selection in the healthcare, consumer staples, and telecommunications sectors helped performance during the year. Selection in the technology, consumer discretionary, and materials sectors hurt. The segment benefited from takeovers of several holdings and from the impact of above-expectation earnings on its defense stocks. However, a position in Nortel declined because of questions about its accounting policies.
GE’s segment trailed the S&P 500 Index. Its underperformance was broad, but the greatest impact was in the information technology, healthcare, consumer discretionary, and materials sectors. The segment’s utility holdings performed in line with the benchmark. GE’s price discipline proved costly in technology, where the more seasoned firms GE preferred were outperformed by more speculative stocks.”
*Unless noted otherwise, Lipper Average and Index returns reflect performance beginning the closest month-end date to the Portfolio’s inception (Class I).
**The graph is based on the performance of Class I shares. Performance of Class II shares will be lower due to differences in the fee structure. Class II shares have associated 12b-1 and administrative fees at an annual rate of 0.25% and 0.15% respectively of the average daily net assets of the Class II shares.
1For average and index definitions, refer to the Glossary of Benchmark Definitions page. Investors cannot invest directly in a market index or average.
For a complete list of holdings, refer to the Schedule of Investments section of this report.
| | | | |
The Prudential Series Fund, Inc. | | Annual Report | | December 31, 2004 |
Flexible Managed Portfolio
| n | MANAGED BY: PRUDENTIAL INVESTMENT MANAGEMENT, INC. AND QUANTITATIVE MANAGEMENT ASSOCIATES LLC |
Past performance does not guarantee future returns. Portfolio performance is net of investment fees and fund expenses, but not product charges, which, if included, would significantly lower the performance quoted. The investment return and principal value of an investment will fluctuate, so that an investor’s shares, when redeemed, may be worth more or less than their original cost. Current performance may be lower or higher than the past performance data quoted.
| n | PERFORMANCE SUMMARY - As of December 31, 2004 |
| | | | | | | | | |
Average Annual Total Return Percentages
| | 1-Year
| | | 5-Year
| | | 10-Year
| |
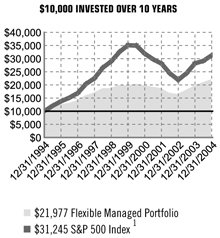
Flexible Managed Portfolio | | 10.74 | % | | 2.14 | % | | 8.19 | % |
S&P 500 Index1 | | 10.87 | % | | -2.30 | % | | 12.07 | % |
Flexible Managed Custom Blended Index1 | | 8.14 | % | | 1.73 | % | | 10.46 | % |
Lipper (VIP) Flexible Portfolio Funds Average1 | | 8.25 | % | | 3.04 | % | | 10.00 | % |
Flexible Managed Portfolio inception date: 5/13/1983. The Flexible Managed Custom Blended Index consists of a blend of the S&P 500 Index (60%), the Lehman Brothers U.S. Aggregate Bond Funds Average (35%), and the T-Bill 3-Month Blend (5%).
The Portfolio may invest in foreign securities, which are subject to the risks of currency fluctuation and the impact of social, political, and economic change. The Portfolio may also invest in derivative securities, which may carry market, credit, and liquidity risks. These risks may result in greater share price volatility.
| | | | |
| | | Portfolio
| | SP500
|
31-Dec-94 | | 10,000.0000 | | 10,000.00 |
30-Jun-95 | | 11,216.0510 | | 12,018.58 |
31-Dec-95 | | 12,413.5937 | | 13,753.37 |
30-Jun-96 | | 13,047.0578 | | 15,140.96 |
31-Dec-96 | | 14,105.8099 | | 16,909.09 |
30-Jun-97 | | 15,534.6227 | | 20,391.89 |
31-Dec-97 | | 16,639.7032 | | 22,548.44 |
30-Jun-98 | | 18,234.4269 | | 26,544.46 |
31-Dec-98 | | 18,342.9215 | | 28,997.04 |
30-Jun-99 | | 19,545.1087 | | 32,582.91 |
31-Dec-99 | | 19,769.1214 | | 35,096.05 |
30-Jun-00 | | 19,896.3958 | | 34,946.30 |
31-Dec-00 | | 19,484.0433 | | 31,901.68 |
30-Jun-01 | | 18,992.0377 | | 29,766.54 |
31-Dec-01 | | 18,376.4576 | | 28,113.01 |
30-Jun-02 | | 17,070.4340 | | 24,415.89 |
31-Dec-02 | | 16,035.4750 | | 21,902.19 |
30-Jun-03 | | 17,755.2586 | | 24,476.09 |
31-Dec-03 | | 19,845.6496 | | 28,180.94 |
30-Jun-04 | | 20,505.8402 | | 29,150.84 |
31-Dec-04 | | 21,977.1707 | | 31,245.36 |
“For the year ended December 31, 2004, the Flexible Managed Portfolio had a total return of 10.74% compared with the return of 10.87% for the unmanaged S&P 500 Index, 8.14% for the Flexible Managed Custom Blended Index, and 8.25% for the Lipper (VIP) Flexible Portfolio Funds Average.
All three elements of active management contributed positively in 2004, as the asset allocation and the underlying security selections in the stock and bond segments were good. Throughout the year the Portfolio had a consistent underweighting in bonds and overweighting in stocks, which benefited the Portfolio because stocks outperformed for the year.
The 10.87% return of the S&P 500 Index came almost entirely in the last few months of the year as the U.S. election settled the political uncertainty and the price of oil declined somewhat. Within the S&P 500 Index, value stocks and stocks of companies with small capitalizations tended to perform better. Although the threat of rising interest rates clouded the bond markets, a series of small actions by the Federal Reserve (the Fed) primarily affected short-term securities, while longer-term bonds actually declined moderately. Continued economic strength and investors’ search for higher yield continued to benefit more credit-sensitive issues.
The stock segment outperformed the S&P 500 Index by almost three percentage points. Its individual security emphases among those of rapidly growing companies were particularly helpful. Overweightings in Taser International ( + 361%) and Nucor ( + 89%) made significant contributions. Relative performance was also helped by having a larger exposure to smaller-cap stocks than the benchmark.
The fixed income segment outperformed the Lehman Aggregate Index. The segment emphasized intermediate-maturity bonds in lieu of the shorter-maturity securities that were most affected by the rise in the Fed actions. The segment continued to overweight corporate bonds in the BBB ratings category and, to a lesser extent, high yield corporate bonds. Both sectors performed better than more highly rated corporate bonds and U.S. Treasury securities. Emphasizing commercial mortgage-backed and other asset-backed securities also contributed as they generally outperformed U.S. Treasurys. Issue selection in corporate bonds and mortgage-backed securities benefited performance.”
| 1 | For average and index definitions, refer to the Glossary of Benchmark Definitions page. Investors cannot invest directly in a market index or average. |
For a complete list of holdings, refer to the Schedule of Investments section of this report.
| | | | |
The Prudential Series Fund, Inc. | | Annual Report | | December 31, 2004 |
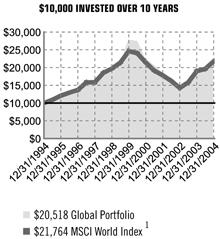
Global Portfolio
| n | MANAGED BY: JENNISON ASSOCIATES LLC |
Past performance does not guarantee future returns. Portfolio performance is net of investment fees and fund expenses, but not product charges, which, if included, would significantly lower the performance quoted. The investment return and principal value of an investment will fluctuate, so that an investor’s shares, when redeemed, may be worth more or less than their original cost. Current performance may be lower or higher than the past performance data quoted.
| n | PERFORMANCE SUMMARY - As of December 31, 2004 |
| | | | | | | | | |
Average Annual Total Return Percentages
| | 1-Year
| | | 5-Year
| | | 10-Year
| |
Global Portfolio | | 9.59 | % | | -5.70 | % | | 7.45 | % |
MSCI World Index1 | | 14.72 | % | | -2.45 | % | | 8.09 | % |
Lipper (VIP) Global Growth Funds Average1 | | 15.69 | % | | -1.81 | % | | 9.62 | % |
Global Portfolio inception date: 9/19/1988.
Foreign investments are subject to the risks of currency fluctuation and the impact of social, political, and economic change, which may result in greater share price volatility.
| | | | |
| | | Portfolio
| | MSCIWI
|
31-Dec-94 | | 10,000.0000 | | 10,000.00 |
30-Jun-95 | | 10,945.0921 | | 10,914.45 |
31-Dec-95 | | 11,587.7288 | | 12,072.03 |
30-Jun-96 | | 12,775.3886 | | 12,927.20 |
31-Dec-96 | | 13,869.6754 | | 13,699.20 |
30-Jun-97 | | 15,601.2286 | | 15,806.53 |
31-Dec-97 | | 14,837.3316 | | 15,858.66 |
30-Jun-98 | | 17,706.5131 | | 18,498.25 |
31-Dec-98 | | 18,558.2690 | | 19,718.35 |
30-Jun-99 | | 20,366.1355 | | 21,396.54 |
31-Dec-99 | | 27,516.0435 | | 24,635.09 |
30-Jun-00 | | 27,244.0513 | | 24,005.46 |
31-Dec-00 | | 22,651.6490 | | 21,388.59 |
30-Jun-01 | | 20,695.8472 | | 19,133.16 |
31-Dec-01 | | 18,656.3646 | | 17,790.19 |
30-Jun-02 | | 16,095.7567 | | 16,221.87 |
31-Dec-02 | | 13,965.2548 | | 14,252.42 |
30-Jun-03 | | 16,026.7942 | | 15,836.74 |
31-Dec-03 | | 18,722.6592 | | 18,970.91 |
30-Jun-04 | | 18,844.5209 | | 19,638.08 |
31-Dec-04 | | 20,517.9243 | | 21,763.60 |
“For the year ended December 31, 2004, the Global Portfolio had a total return of 9.59% compared with the return of 14.72% for the unmanaged MSCI World Index and 15.69% for the Lipper (VIP) Global Growth Funds Average
Most of the Portfolio’s underperformance of the MSCI World Index occurred in the second quarter of 2004. Jennison had a more positive view of the global economy than the average analyst because of a stream of better-than-expected earnings reports in the first quarter and conversations with a wide range of company managements. Consequently, the Portfolio emphasized companies they believed were best able to deliver above-average earnings growth.
However, investors began to fear that interest-rate increases, potential problems in China, and high oil prices would ultimately dampen the economic expansion, and consequently earnings growth. These fears pulled down global markets as a whole, and the Portfolio’s most aggressive positions suffered more than most. Jennison recognized this and pulled back from its earlier stance during the quarter.
During the second half of 2004 they reoriented the Portfolio toward areas of greater economic and market strength, trimming or eliminating exposure to underperforming stocks. To reduce volatility, the size of the Portfolio’s largest positions and its exposure to companies with smaller market capitalization were reduced. These changes improved performance relative to the Portfolio’s benchmark over the last few months of the year.
Information technology holdings were the key drivers of the Portfolio’s return over the full reporting period, significantly outperforming the benchmark’s information technology sector. Holdings in the financials, energy, materials, and consumer staples sectors also improved performance. Apple Computer, Sumitomo Realty & Development, Monsanto, and Marvell Technology Group were among the top performers. IAC/InterActiveCorp, a provider of on-line travel and entertainment services, was the primary detractor. Concerns about its prospects for earnings growth, diminishing margins, and recent quarterly disappointments continued to pressure its shares. However, the stock strengthened in December after the company announced that it would spin its travel business into a new company, which may provide a clearer view into its earnings prospects. Other detractors included UFJ Holdings and Taisei Corp., both of which were sold.”
| 1 | For average and index definitions, refer to the Glossary of Benchmark Definitions page. Investors cannot invest directly in a market index or average. |
For a complete list of holdings, refer to the Schedule of Investments section of this report.
| | | | |
The Prudential Series Fund, Inc. | | Annual Report | | December 31, 2004 |
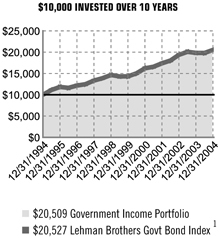
Government Income Portfolio
| n | MANAGED BY: PRUDENTIAL INVESTMENT MANAGEMENT, INC. |
Past performance does not guarantee future returns. Portfolio performance is net of investment fees and fund expenses, but not product charges, which, if included, would significantly lower the performance quoted. The investment return and principal value of an investment will fluctuate, so that an investor’s shares, when redeemed, may be worth more or less than their original cost. Current performance may be lower or higher than the past performance data quoted.
| n | PERFORMANCE SUMMARY - As of December 31, 2004 |
| | | | | | | | | |
Average Annual Total Return Percentages
| | 1-Year
| | | 5-Year
| | | 10-Year
| |
Government Income Portfolio | | 3.12 | % | | 7.61 | % | | 7.45 | % |
Lehman Brothers Govt Bond Index1 | | 3.48 | % | | 7.48 | % | | 7.46 | % |
Lipper (VIP) General U.S. Govt Funds Average1 | | 3.92 | % | | 7.02 | % | | 6.88 | % |
Government Income Portfolio inception date: 5/1/1989.
The Portfolio may invest in derivative securities, which may carry market, credit, and liquidity risks. These risks may result in greater share price volatility. The guarantee on U.S. government securities applies only to the underlying securities of the Portfolio, and not to the value of the Portfolio’s shares.
| | | | |
| | | Portfolio
| | LBGB
|
31-Dec-94 | | 10,000.0000 | | 10,000.00 |
30-Jun-95 | | 11,197.5795 | | 11,119.97 |
31-Dec-95 | | 11,947.5106 | | 11,834.08 |
30-Jun-96 | | 11,657.2212 | | 11,621.76 |
31-Dec-96 | | 12,212.4028 | | 12,162.04 |
30-Jun-97 | | 12,533.7047 | | 12,481.43 |
31-Dec-97 | | 13,393.1802 | | 13,328.17 |
30-Jun-98 | | 13,921.3377 | | 13,885.60 |
31-Dec-98 | | 14,609.9554 | | 14,641.21 |
30-Jun-99 | | 14,227.6669 | | 14,309.04 |
31-Dec-99 | | 14,215.3592 | | 14,314.16 |
30-Jun-00 | | 14,845.0679 | | 15,025.26 |
31-Dec-00 | | 16,032.0824 | | 16,209.89 |
30-Jun-01 | | 16,379.4197 | | 16,577.85 |
31-Dec-01 | | 17,324.0568 | | 17,382.03 |
30-Jun-02 | | 18,084.6506 | | 18,038.55 |
31-Dec-02 | | 19,411.0271 | | 19,380.17 |
30-Jun-03 | | 20,003.9202 | | 20,083.30 |
31-Dec-03 | | 19,888.8188 | | 19,836.84 |
30-Jun-04 | | 19,871.3514 | | 19,811.13 |
31-Dec-04 | | 20,509.3099 | | 20,526.60 |
“For the year ended December 31, 2004, the Government Income Portfolio returned 3.12%, while the Lehman Brothers U.S. Government Bond Index rose 3.48% and the Lipper (VIP) General U.S. Government Funds Average gained 3.92%.
All sectors of the investment-grade U.S. bond market posted positive returns in 2004, although the Federal Reserve (the Fed) increased the federal funds rate—the rate banks charge each other on overnight loans—by a quarter percentage point five times. This was done to reduce the monetary stimulus in the economy. The combined moves raised the key rate from 1.00% to 2.25%.
Anticipation of the trend toward higher short-term rates had initially prompted a sharp selloff in the U.S. bond market during the second quarter of 2004. At that time strong job growth and rising inflationary pressures suggested the Fed would soon begin a new round of rate hikes, which weighed on bond prices as they move in the opposite direction of interest rates. However, as 2004 continued, economic conditions proved more favorable for bonds. Job growth was uneven and inflation surprisingly mild despite sharply higher oil prices. These were welcomed developments for bond prices, particularly as inflation erodes the value of bonds’ fixed interest payments. The Portfolio’s short duration (a measure of its sensitivity to changes in interest rates) prevented it from benefiting fully as bond prices rebounded during the third quarter of 2004, driving long-term interest rates lower. However, positioning the Portfolio for a flatter yield curve in the fourth quarter of 2004 helped the Portfolio’s performance.
In an environment of moderate inflation and still-low interest rates, many participants in the investment-grade bond market turned to bonds that yielded more than U.S. Treasury securities, such as federal agency securities, mortgage-backed securities, and investment-grade corporate bonds. The Portfolio had an underweight exposure to mortgage-backed securities through the third quarter of 2004 because valuations in that market had become expensive on a historical basis. However, our strategy detracted from the Portfolio’s performance as mortgage-backed securities performed relatively well in 2004.
Meanwhile, good security selection among asset-backed securities and commercial mortgage-backed securities contributed positively to the Portfolio’s performance in 2004. The Portfolio also benefited from its exposure to federal agency securities, which performed well despite the accounting issues at the Federal National Mortgage Association.”
| 1 | For average and index definitions, refer to the Glossary of Benchmark Definitions page. Investors cannot invest directly in a market index or average. |
For a complete list of holdings, refer to the Schedule of Investments section of this report.
| | | | |
The Prudential Series Fund, Inc. | | Annual Report | | December 31, 2004 |
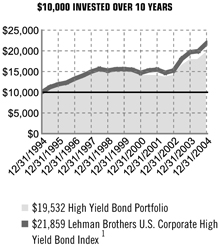
High Yield Bond Portfolio
| n | MANAGED BY: PRUDENTIAL INVESTMENT MANAGEMENT, INC. |
Past performance does not guarantee future returns. Portfolio performance is net of investment fees and fund expenses, but not product charges, which, if included, would significantly lower the performance quoted. The investment return and principal value of an investment will fluctuate, so that an investor’s shares, when redeemed, may be worth more or less than their original cost. Current performance may be lower or higher than the past performance data quoted.
| n | PERFORMANCE SUMMARY - As of December 31, 2004 |
| | | | | | | | | |
Average Annual Total Return Percentages
| | 1-Year
| | | 5-Year
| | | 10-Year
| |
High Yield Bond Portfolio | | 10.30 | % | | 5.12 | % | | 6.92 | % |
Lehman Brothers U.S. Corporate High Yield Bond Index1 | | 11.13 | % | | 6.97 | % | | 8.13 | % |
Lipper (VIP) High Current Yield Funds Average1 | | 9.84 | % | | 4.78 | % | | 6.95 | % |
High Yield Bond Portfolio inception date: 2/23/1987.
The Portfolio may invest in foreign securities, which are subject to the risks of currency fluctuation and the impact of social, political, and economic change. High yield bonds, also known as “junk” bonds, are subject to great credit and market liquidity risks, which may result in greater share price volatility.
| | | | |
| | | Portfolio
| | LBCHYB
|
31-Dec-94 | | 10,000.0000 | | 10,000.00 |
30-Jun-95 | | 10,953.3854 | | 11,241.12 |
31-Dec-95 | | 11,756.3736 | | 11,917.37 |
30-Jun-96 | | 12,318.9016 | | 12,329.38 |
31-Dec-96 | | 13,095.3690 | | 13,270.16 |
30-Jun-97 | | 13,864.7626 | | 14,042.17 |
31-Dec-97 | | 14,900.4272 | | 14,963.92 |
30-Jun-98 | | 15,675.0927 | | 15,637.33 |
31-Dec-98 | | 14,549.2904 | | 15,243.22 |
30-Jun-99 | | 15,058.0886 | | 15,578.51 |
31-Dec-99 | | 15,220.0036 | | 15,607.77 |
30-Jun-00 | | 14,931.2955 | | 15,418.82 |
31-Dec-00 | | 14,015.4771 | | 14,693.41 |
30-Jun-01 | | 14,142.9531 | | 15,270.22 |
31-Dec-01 | | 13,953.5731 | | 15,469.11 |
30-Jun-02 | | 13,652.2272 | | 14,720.12 |
31-Dec-02 | | 14,162.4453 | | 15,251.46 |
30-Jun-03 | | 16,324.9430 | | 18,070.98 |
31-Dec-03 | | 17,708.7725 | | 19,669.83 |
30-Jun-04 | | 17,917.4565 | | 19,936.92 |
31-Dec-04 | | 19,532.1540 | | 21,858.84 |
“For the year ended December 31, 2004, the High Yield Bond Portfolio returned 10.30%, underperforming the Lehman Brothers U.S. Corporate High Yield Bond Index (the Index) that rose 11.13% but outperforming the Lipper (VIP) High Current Yield Funds Average that gained 9.84%.
The U.S. high yield bond market enjoyed another banner year in 2004. Although the Federal Reserve (the Fed) raised short-term interest rates by a quarter of a percentage point five times to reduce monetary stimulus in the economy, the general level of interest rates was still low. Therefore investors bought high yield bonds for the extra yield. Improving corporate balance sheets and a low high yield bond default rate also enncouraged investment in high yield bonds, which outperformed other sectors of the U.S. debt market in 2004. Lower-quality high yield bonds (the Caa and Ca-D rating categories) performed better than higher-quality high yield bonds. Having a smaller exposure to lower-quality high yield bonds than the Index affected the Portfolio’s relative performance in 2004.
The high yield market was somewhat volatile in 2004 despite its impressive double-digit return. Anticipation of the trend toward higher short-term rates initially prompted a sharp selloff in the U.S. debt market, including high yield bonds, during the second quarter of 2004. At that time strong job growth and rising inflationary pressures suggested the Fed would act aggressively to slow economic growth. Prospects for higher rates weighed on the fixed income market as bond prices move inversely to interest rates. However, as 2004 continued, the bond market began to recover amid economic conditions that were more favorable for bonds. Job growth was uneven and inflation surprisingly mild, despite sharply higher oil prices. These were welcomed developments, particularly as inflation erodes the value of bonds’ fixed interest payments.
We positioned the Portfolio to benefit from a surge in commodities prices that occurred partly due to strong demand from China The Portfolio held bonds in the chemicals sector (Rhodia SA, Huntsman LLC, and IMC Global, Inc.), the metals sector (AK Steel Corp. and Ispat Inland ULC), and the paper sector (Georgia-Pacific Corp.) that performed well. The Portfolio’s exposure to emerging-market bonds was another positive. The search for attractive yields and improving credit quality in Brazil, Russia, and certain other nations helped fuel a rally in the bonds of developing countries in 2004.
The Portfolio held bonds of Ampex Corp. that gained sharply in value. Ampex Corp announced it would redeem some of the bonds ahead of schedule with monies it received from a settlement involving its digital video patents. The bonds were retired in December 2004.”
| 1 | For average and index definitions, refer to the Glossary of Benchmark Definitions page. Investors cannot invest directly in a market index or average. |
For a complete list of holdings, refer to the Schedule of Investments section of this report.
| | | | |
The Prudential Series Fund, Inc. | | Annual Report | | December 31, 2004 |
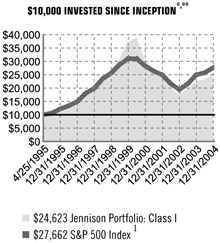
Jennison Portfolio
| n | MANAGED BY: JENNISON ASSOCIATES LLC |
Past performance does not guarantee future returns. Portfolio performance is net of investment fees and fund expenses, but not product charges, which, if included, would significantly lower the performance quoted. The investment return and principal value of an investment will fluctuate, so that an investor’s shares, when redeemed, may be worth more or less than their original cost. Current performance may be lower or higher than the past performance data quoted.
| n | PERFORMANCE SUMMARY* - As of December 31, 2004 |
| | | | | | | | | |
Average Annual Total Return Percentages
| | 1-Year
| | | 5-Year
| | | Since
Inception
| |
Jennison Portfolio: Class I | | 9.63 | % | | -7.81 | % | | 9.75 | % |
Jennison Portfolio: Class II | | 9.22 | % | | N/A | | | -9.39 | % |
S&P 500 Index1 | | 10.87 | % | | -2.30 | % | | 11.10 | % |
Russell 1000 Growth Index1 | | 6.30 | % | | -9.29 | % | | 8.67 | % |
Lipper (VIP) Large-Cap Growth Funds Average1 | | 8.04 | % | | -7.58 | % | | 8.65 | % |
Jennison Portfolio (Class I) inception date: 4/25/1995. Jennison Portfolio (Class II) inception date: 2/10/2000.
The Portfolio may invest in foreign securities, which are subject to the risks of currency fluctuation and the impact of social, political, and economic change.
| | | | |
| | | Portfolio
| | SP500
|
25-Apr-95 | | 10,000.0000 | | 10,000.00 |
30-Jun-95 | | 11,275.6908 | | 10,640.20 |
31-Dec-95 | | 12,556.3372 | | 12,176.03 |
30-Jun-96 | | 13,494.3537 | | 13,404.49 |
31-Dec-96 | | 14,361.8032 | | 14,969.83 |
30-Jun-97 | | 16,800.9715 | | 18,053.20 |
31-Dec-97 | | 18,916.0961 | | 19,962.42 |
30-Jun-98 | | 22,840.7999 | | 23,500.14 |
31-Dec-98 | | 26,001.6052 | | 25,671.45 |
30-Jun-99 | | 29,972.2871 | | 28,846.06 |
31-Dec-99 | | 36,974.9648 | | 31,070.98 |
30-Jun-00 | | 38,446.6227 | | 30,938.40 |
31-Dec-00 | | 30,549.1449 | | 28,242.96 |
30-Jun-01 | | 26,595.3238 | | 26,352.70 |
31-Dec-01 | | 24,972.4693 | | 24,888.80 |
30-Jun-02 | | 20,281.5007 | | 21,615.70 |
31-Dec-02 | | 17,243.3089 | | 19,390.29 |
30-Jun-03 | | 19,359.9622 | | 21,669.00 |
31-Dec-03 | | 22,459.2567 | | 24,948.94 |
30-Jun-04 | | 23,189.1146 | | 25,807.62 |
31-Dec-04 | | 24,622.9132 | | 27,661.91 |
“For the year ended December 31, 2004, the Jennison Portfolio (Class I) had a total return of 9.63% compared with the return of 10.87% for the unmanaged S&P 500 Index, 6.30% for the unmanaged Russell 1000 Growth Index, and 8.04% for the Lipper (VIP) Large-Cap Growth Funds Average.
Information technology, the largest sector component of the Portfolio, made the largest contribution to its total return despite a challenging environment for stocks in this sector. There was weakness in many semiconductor stocks, and several holdings, including Intel and Texas Instruments, produced negative returns for the year. After a positive beginning to the year, demand for semiconductors slowed suddenly in the summer, leading to excess inventories. However, other technology holdings more than offset this weakness. Internet-related companies, such as Google and Yahoo!, benefited from explosive growth in Internet advertising revenue. Apple was a stellar performer due to very strong consumer demand for its iPod and digital lifestyle businesses. Marvell, a semiconductor company benefiting from a strong product cycle, overcame a dismal industry environment and was one of the Portfolio’s strongest performing positions.
The energy sector produced the highest returns in the broad equity markets. This helped the Portfolio, which was positioned to benefit from a strong cyclic move in the prices of energy commodities. This exposure was reduced toward the end of the year after a considerable rise in share prices in the sector. It is not a traditional area of opportunity for the Portfolio’s growth strategy, but it continues to hold companies that can benefit from a long-term supply/demand imbalance. The return on the Portfolio’s consumer staples positions was more than double the returns of sector components of the benchmark indexes. This relative strength was driven by superior returns from Whole Foods, a natural and organic supermarket chain; Costco, a membership warehouse retailer; and Avon, a personal beauty products company.
The Portfolio’s underweight in industrials and its unfavorable stock selection among financials hurt its performance as compared with its benchmarks, although no individual holdings stand out as particularly weak performers.”
| * | Unless noted otherwise, Lipper Average and Index returns reflect performance beginning the closest month-end date to the Portfolio’s inception (Class I). |
| ** | The graph is based on the performance of Class I shares. Performance of Class II shares will be lower due to differences in the fee structure. Class II shares have associated 12b-1 and administrative fees at an annual rate of 0.25% and 0.15% respectively of the average daily net assets of the Class II shares. |
| 1 | For average and index definitions, refer to the Glossary of Benchmark Definitions page. Investors cannot invest directly in a market index or average. |
For a complete list of holdings, refer to the Schedule of Investments section of this report.
| | | | |
The Prudential Series Fund, Inc. | | Annual Report | | December 31, 2004 |
Money Market Portfolio
| n | MANAGED BY: PRUDENTIAL INVESTMENT MANAGEMENT, INC. |
Past performance does not guarantee future returns. Portfolio performance is net of investment fees and fund expenses, but not product charges, which, if included, would significantly lower the performance quoted. The investment return and principal value of an investment will fluctuate, so that an investor’s shares, when redeemed, may be worth more or less than their original cost. Current performance may be lower or higher than the past performance data quoted.
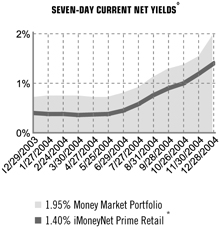
| n | PERFORMANCE SUMMARY — MONEY MARKET PORTFOLIO’S 7-DAY CURRENT NET YIELD : 1.95% |
| | | | | | | | | |
Average Annual Total Return Percentages
| | 1-Year
| | | 5-Year
| | | 10-Year
| |
Money Market Portfolio | | 1.01 | % | | 2.71 | % | | 4.03 | % |
Lipper (VIP) Money Market Funds Average1 | | 0.83 | % | | 2.49 | % | | 3.82 | % |
Money Market Portfolio inception date: 5/13/1983.
The yield quotation more closely reflects the current earnings of the Portfolio than the total return quotation. An investment in the Prudential Series Fund Money Market Portfolio is neither insured nor guaranteed by the Federal Deposit Insurance Corporation or any other government agency. Although the Portfolio seeks to preserve the value of your investment at $10.00 per share, it is possible to lose money by investing in the Portfolio.
| | | | |
| | | Portfolio
| | MNPR
|
12/29/03 | | 0.72 | | 0.40 |
01/06/04 | | 0.72 | | 0.40 |
01/13/04 | | 0.75 | | 0.39 |
01/20/04 | | 0.75 | | 0.38 |
01/27/04 | | 0.74 | | 0.38 |
02/03/04 | | 0.73 | | 0.38 |
02/10/04 | | 0.74 | | 0.38 |
02/17/04 | | 0.74 | | 0.38 |
02/24/04 | | 0.73 | | 0.38 |
03/02/04 | | 0.73 | | 0.38 |
03/09/04 | | 0.74 | | 0.37 |
03/16/04 | | 0.73 | | 0.37 |
03/23/04 | | 0.73 | | 0.37 |
03/30/04 | | 0.74 | | 0.36 |
04/06/04 | | 0.74 | | 0.36 |
04/13/04 | | 0.75 | | 0.37 |
04/20/04 | | 0.71 | | 0.37 |
04/27/04 | | 0.71 | | 0.37 |
05/04/04 | | 0.70 | | 0.38 |
05/11/04 | | 0.69 | | 0.38 |
05/18/04 | | 0.70 | | 0.38 |
05/25/04 | | 0.70 | | 0.38 |
06/01/04 | | 0.67 | | 0.39 |
06/08/04 | | 0.67 | | 0.39 |
06/15/04 | | 0.72 | | 0.40 |
06/22/04 | | 0.80 | | 0.42 |
06/29/04 | | 0.80 | | 0.45 |
07/06/04 | | 0.91 | | 0.51 |
07/13/04 | | 0.88 | | 0.53 |
07/20/04 | | 0.91 | | 0.56 |
07/27/04 | | 0.92 | | 0.58 |
08/03/04 | | 0.93 | | 0.61 |
08/10/04 | | 1.00 | | 0.64 |
08/17/04 | | 1.07 | | 0.70 |
08/24/04 | | 1.09 | | 0.72 |
08/31/04 | | 1.12 | | 0.76 |
09/07/04 | | 1.15 | | 0.77 |
09/14/04 | | 1.18 | | 0.80 |
09/21/04 | | 1.22 | | 0.84 |
09/28/04 | | 1.28 | | 0.90 |
10/05/04 | | 1.31 | | 0.93 |
10/12/04 | | 1.32 | | 0.95 |
10/19/04 | | 1.34 | | 0.98 |
10/26/04 | | 1.36 | | 1.00 |
11/02/04 | | 1.38 | | 1.03 |
11/09/04 | | 1.39 | | 1.05 |
11/16/04 | | 1.46 | | 1.11 |
11/23/04 | | 1.52 | | 1.16 |
11/30/04 | | 1.54 | | 1.19 |
12/07/04 | | 1.57 | | 1.23 |
12/14/04 | | 1.63 | | 1.28 |
12/21/04 | | 1.91 | | 1.37 |
12/28/04 | | 1.95 | | 1.40 |
“On December 31, 2004, the Money Market Portfolio’s 7-day current net yield was 1.95%, up from 0.74% on June 30, 2004. The Portfolio returned 1.01% in 2004, while the Lipper (VIP) Money Market Funds Average was 0.83%.
Yields on money market securities finally began to rise from very low levels, one of the most significant developments in the money markets in 2004. Our strategy aimed to provide the Portfolio with the flexibility to take advantage of attractive investment opportunities that occurred as yields moved progressively higher. Yields initially hovered at low levels in the first three months of 2004. Weaker-than-expected job data released during those months suggested the Federal Reserve (the Fed) would leave short-term interest rates unchanged at low levels for the time being. In this market environment, we favored debt securities that matured in six months to one year, which positioned the Portfolio’s weighted average maturity (WAM) longer than its competitive average. (WAM is expressed in days, and takes into account the maturity and quantity of each security held in a fund. It indicates a fund’s sensitivity to changes in interest rates.)
Eventually yields began to rise in early April after the outlook for monetary policy changed. Data showing improvement in the job market suggested the Fed would soon begin to raise rates to reduce monetary stimulus in the economy. Yields headed higher in May and June amid further signs of a stronger job market and rising inflation. This change in outlook altered our strategy, to one which would now emphasize debt securities that came due in three months or less, particularly those that matured near the time of the Fed’s meeting at the end of June. Our purchases caused the Portfolio’s WAM to decline over time until it was comparable with its competitive average. This allowed us to reinvest its assets more frequently at higher yields as short-term rates rose.
On June 30, 2004, the federal funds rate—the overnight bank lending rate—was increased to 1.25% from 1.00%. Proceeds of some of the Portfolio’s debt securities that matured near the end of June were reinvested in debt securities that came due in August when the federal funds rate was raised to 1.50% from 1.25%. For the remainder of 2004 we continued to reinvest the bulk of the Portfolio’s available assets in debt securities that matured around the time of successive Fed meetings in September, November, and December. In those months, the key rate was increased to 1.75%, 2.00%, and 2.25% respectively.”
| * | Source: iMoneyNet, Inc., based on 374 funds in the iMoneyNet Prime Retail universe. Weekly 7-day current net yields of the Money Market Portfolio and the iMoneyNet Prime Retail universe as of 12/28/2004. Prudential Investments LLC is the source for Money Market Portfolio information. |
| 1 | For average and index definitions, refer to the Glossary of Benchmark Definitions page. Investors cannot invest directly in a market index or average. |
For a complete list of holdings, refer to the Schedule of Investments section of this report.
| | | | |
The Prudential Series Fund, Inc. | | Annual Report | | December 31, 2004 |
Natural Resources Portfolio
| n | MANAGED BY: JENNISON ASSOCIATES LLC |
Past performance does not guarantee future returns. Portfolio performance is net of investment fees and fund expenses, but not product charges, which, if included, would significantly lower the performance quoted. The investment return and principal value of an investment will fluctuate, so that an investor’s shares, when redeemed, may be worth more or less than their original cost. Current performance may be lower or higher than the past performance data quoted.
| n | PERFORMANCE SUMMARY - As of December 31, 2004 |
| | | | | | | | | |
Average Annual Total Return Percentages
| | 1-Year
| | | 5-Year
| | | 10-Year
| |
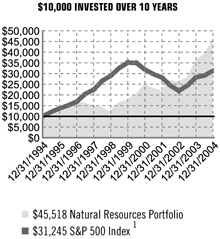
Natural Resources Portfolio | | 25.17 | % | | 20.69 | % | | 16.36 | % |
S&P 500 Index1 | | 10.87 | % | | -2.30 | % | | 12.07 | % |
Lipper (VIP) Natural Resources Funds Average1 | | 20.32 | % | | 12.73 | % | | 9.98 | % |
Natural Resources Portfolio inception date: 5/1/1988.
The Portfolio may invest in foreign securities, which are subject to the risks of currency fluctuation and the impact of social, political, and economic change. Natural resources companies are affected by numerous factors, including events of nature, inflationary pressures, and international politics. Sector funds may experience greater short-term price volatility than more diversified equity funds, and are most suitable for the aggressive portion of an investment portfolio.
The Portfolio is not diversified and may not be appropriate for all investors. Investment in a nondiversified portfolio involves greater risks than a diversified investment because a loss resulting from a particular security will have a greater impact on the Portfolio’s overall return. The Portfolio may actively and frequently trade its portfolio securities. High portfolio turnover results in higher transaction costs and can affect the Portfolio’s performance.
| | | | |
| | | Portfolio
| | SP500
|
31-Dec-94 | | 10,000.0000 | | 10,000.00 |
30-Jun-95 | | 11,598.4846 | | 12,018.58 |
31-Dec-95 | | 12,691.9423 | | 13,753.37 |
30-Jun-96 | | 15,159.3102 | | 15,140.96 |
31-Dec-96 | | 16,610.7677 | | 16,909.09 |
30-Jun-97 | | 16,364.2880 | | 20,391.89 |
31-Dec-97 | | 14,685.6324 | | 22,548.44 |
30-Jun-98 | | 13,975.7763 | | 26,544.46 |
31-Dec-98 | | 12,174.5385 | | 28,997.04 |
30-Jun-99 | | 16,222.3197 | | 32,582.91 |
31-Dec-99 | | 17,773.5741 | | 35,096.05 |
30-Jun-00 | | 20,583.0819 | | 34,946.30 |
31-Dec-00 | | 24,467.3369 | | 31,901.68 |
30-Jun-01 | | 23,283.7631 | | 29,766.54 |
31-Dec-01 | | 22,000.0560 | | 28,113.01 |
30-Jun-02 | | 26,922.3334 | | 24,415.89 |
31-Dec-02 | | 26,161.4849 | | 21,902.19 |
30-Jun-03 | | 28,228.6438 | | 24,476.09 |
31-Dec-03 | | 36,363.8903 | | 28,180.94 |
30-Jun-04 | | 38,436.2111 | | 29,150.84 |
31-Dec-04 | | 45,518.0688 | | 31,245.36 |
“For the year ended December 31, 2004, the Natural Resources Portfolio had a total return of 25.17% compared with the return of 10.87% for the unmanaged S&P 500 Index and 20.32% for the Lipper (VIP) Natural Resources Funds Average.
All of the Portfolio’s key areas of exposure made significant positive contributions to its performance, with particular strength coming from its oil & gas, oil services, and metals & mining holdings. Select holdings in these areas did detract from performance minimally. Supply and demand imbalances, coupled with occasional supply disruptions, drove oil prices to new highs. Natural gas prices also rose steadily, reflecting growing demand and tightening supply. The Portfolio’s metals & mining holdings benefited from rising base (nonprecious) metal prices, which reflected supply limitations and strong Chinese demand. Jennison expects these trends to continue. Cheniere Energy, Smith International, Phelps Dodge, and Western Gas Resources made particularly significant contributions to the Portfolio’s return. Russian oil producer Yukos was the primary detractor. Its shares fell sharply after the Russian government announced that it would auction off Yukos’ core asset, the Yugansk oil field, which produces about 1 million barrels of oil a day. This action was taken as the result of Yukos’ failure to pay back taxes. The Portfolio’s position, which was very small, was sold. Its impact on the return, while negative, was marginal.
With non-OPEC oil production nearing its peak, OPEC operating close to 100% capacity, and continued strong demand, Jennison believes that oil prices will remain higher than most analysts expect. It also remains bullish on natural gas. Despite periodic pullbacks in the gold and silver markets, the prospects for precious metals remain good. The Portfolio continues to be positioned to benefit from increases in the price of copper.”
| 1 | For average and index definitions, refer to the Glossary of Benchmark Definitions page. Investors cannot invest directly in a market index or average. |
For a complete list of holdings, refer to the Schedule of Investments section of this report.
| | | | |
The Prudential Series Fund, Inc. | | Annual Report | | December 31, 2004 |
Small Capitalization Stock Portfolio
| n | MANAGED BY: QUANTITATIVE MANAGEMENT ASSOCIATES LLC |
Past performance does not guarantee future returns. Portfolio performance is net of investment fees and fund expenses, but not product charges, which, if included, would significantly lower the performance quoted. The investment return and principal value of an investment will fluctuate, so that an investor’s shares, when redeemed, may be worth more or less than their original cost. Current performance may be lower or higher than the past performance data quoted.
| n | PERFORMANCE SUMMARY* - As of December 31, 2004 |
| | | | | | | | | |
Average Annual Total Return Percentages
| | 1-Year
| | | 5-Year
| | | Since
Inception
| |
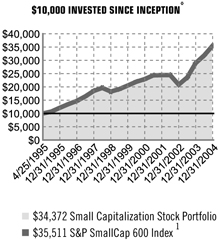
Small Capitalization Stock Portfolio | | 22.04 | % | | 11.32 | % | | 13.59 | % |
S&P SmallCap 600 Index1 | | 22.65 | % | | 11.60 | % | | 14.01 | % |
Lipper (VIP) Small-Cap Core Funds Average1 | | 17.47 | % | | 7.82 | % | | 12.61 | % |
Small Capitalization Stock Portfolio inception date: 4/25/1995.
Small and midsize companies may have limited marketability, and may be subject to more erratic or abrupt market movements than large-cap stocks.
| | | | |
| | | Portfolio
| | SPSC600
|
25-Apr-95 | | 10,000.0000 | | 10,000.00 |
30-Jun-95 | | 10,681.2446 | | 10,713.15 |
31-Dec-95 | | 11,995.5430 | | 12,138.01 |
30-Jun-96 | | 13,223.8043 | | 13,500.07 |
31-Dec-96 | | 14,367.3706 | | 14,725.86 |
30-Jun-97 | | 16,021.6951 | | 16,427.55 |
31-Dec-97 | | 17,983.4248 | | 18,493.27 |
30-Jun-98 | | 19,037.1493 | | 19,624.27 |
31-Dec-98 | | 17,845.9143 | | 18,251.83 |
30-Jun-99 | | 18,772.7651 | | 19,170.82 |
31-Dec-99 | | 20,109.2573 | | 20,515.83 |
30-Jun-00 | | 21,613.1053 | | 21,928.59 |
31-Dec-00 | | 22,685.9455 | | 22,936.46 |
30-Jun-01 | | 23,911.7877 | | 24,366.08 |
31-Dec-01 | | 23,941.4216 | | 24,436.08 |
30-Jun-02 | | 23,863.0887 | | 24,432.33 |
31-Dec-02 | | 20,369.5707 | | 20,861.30 |
30-Jun-03 | | 22,967.2089 | | 23,557.77 |
31-Dec-03 | | 28,164.3463 | | 28,953.16 |
30-Jun-04 | | 30,903.3496 | | 31,862.47 |
31-Dec-04 | | 34,372.1626 | | 35,510.89 |
“For the year ended December 31, 2004, the Small Capitalization Stock Portfolio had a total return of 22.04% compared with the return of 22.65% for the S&P SmallCap 600 Index and 17.47% for the Lipper (VIP) Small-Cap Core Funds Average.
The Portfolio reflected the return of the S&P SmallCap 600 Index, which had a strong performance in 2004. Out of 24 industry groups, only two, automobiles & components and semiconductors & semiconductor equipment, had negative returns, while 20 groups had double-digit returns. However, the Index fluctuated within a narrow trading range for more than half the year. At that time investor confidence was weakened by concerns about the economic recovery. Uncertainty about the U.S. election, geopolitical threats, the availability and price of oil, job growth, rising interest rates, and the threat of inflation also weighed on the markets.
By about midyear the economic recovery appeared to be well established, although slowing from the swift pace of the last half of 2003. The Federal Reserve (the Fed) began a very gradual tightening of interest-rate policy. Some investors may have feared that rising interest rates and commodity prices, particularly oil, would choke off the recovery. Although the S&P SmallCap 600 Index declined, the fall was relatively modest, and growth stocks performed only slightly worse than value stocks. The Index reached its low for the year on August 12 and began a steep rise that lasted the remainder of the year.
All of the 10 broad economic sectors in the S&P SmallCap 600 Index had positive returns for the year. Three leading sectors were linked to the demand for rising raw materials and to overall economic growth: energy, materials, and industrials. The slowest sector was information technology. It included the semiconductor & semiconductor equipment industry group, which fell 21.51% (one of only two out of 24 industry groups to fall), and the technology hardware & equipment group, among the slower-growing small-cap industry groups. This slower-growing group returned 11.39%, nonetheless, illustrating the size and breadth of the market gains in the capitalization range of the S&P SmallCap 600 Index in 2004.”
| * | Unless noted otherwise, Lipper Average and Index returns reflect performance beginning the closest month-end date to the Portfolio’s inception. |
| 1 | For average and index definitions, refer to the Glossary of Benchmark Definitions page. Investors cannot invest directly in a market index or average. |
For a complete list of holdings, refer to the Schedule of Investments section of this report.
| | | | |
The Prudential Series Fund, Inc. | | Annual Report | | December 31, 2004 |
Stock Index Portfolio
| n | MANAGED BY: QUANTITATIVE MANAGEMENT ASSOCIATES LLC |
Past performance does not guarantee future returns. Portfolio performance is net of investment fees and fund expenses, but not product charges, which, if included, would significantly lower the performance quoted. The investment return and principal value of an investment will fluctuate, so that an investor’s shares, when redeemed, may be worth more or less than their original cost. Current performance may be lower or higher than the past performance data quoted.
| n | PERFORMANCE SUMMARY - As of December 31, 2004 |
| | | | | | | | | |
Average Annual Total Return Percentages
| | 1-Year
| | | 5-Year
| | | 10-Year
| |
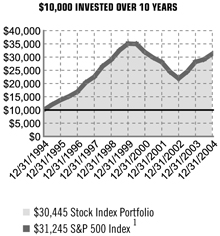
Stock Index Portfolio | | 10.45 | % | | -2.50 | % | | 11.78 | % |
S&P 500 Index1 | | 10.87 | % | | -2.30 | % | | 12.07 | % |
Lipper (VIP) S&P 500 Index Objective Funds Average1 | | 10.35 | % | | -2.64 | % | | 11.69 | % |
Stock Index Portfolio inception date: 10/19/1987.
The Portfolio consists primarily of the 500 stocks that comprise the Standard & Poor’s S&P 500 Index in approximately the same proportions they represent in the Index.
| | | | |
| | | Portfolio
| | SP500
|
31-Dec-94 | | 10,000.0000 | | 10,000.00 |
30-Jun-95 | | 11,996.7112 | | 12,018.58 |
31-Dec-95 | | 13,706.7328 | | 13,753.37 |
30-Jun-96 | | 15,070.0976 | | 15,140.96 |
31-Dec-96 | | 16,799.7099 | | 16,909.09 |
30-Jun-97 | | 20,212.6184 | | 20,391.89 |
31-Dec-97 | | 22,315.3951 | | 22,548.44 |
30-Jun-98 | | 26,215.0828 | | 26,544.46 |
31-Dec-98 | | 28,658.1719 | | 28,997.04 |
30-Jun-99 | | 32,123.9223 | | 32,582.91 |
31-Dec-99 | | 34,545.4531 | | 35,096.05 |
30-Jun-00 | | 34,358.1141 | | 34,946.30 |
31-Dec-00 | | 31,425.7011 | | 31,901.68 |
30-Jun-01 | | 29,299.6668 | | 29,766.54 |
31-Dec-01 | | 27,637.8652 | | 28,113.01 |
30-Jun-02 | | 23,974.0042 | | 24,415.89 |
31-Dec-02 | | 21,504.2612 | | 21,902.19 |
30-Jun-03 | | 23,995.4156 | | 24,476.09 |
31-Dec-03 | | 27,564.9672 | | 28,180.94 |
30-Jun-04 | | 28,454.8601 | | 29,150.84 |
31-Dec-04 | | 30,445.3091 | | 31,245.36 |
“For the year ended December 31, 2004, the Stock Index Portfolio had a total return of 10.45% compared with the return of 10.87% for the S&P 500 Index (the Index) and 10.87% for the Lipper (VIP) S&P 500 Index Objective Funds Average. The Index fluctuated within a narrow trading range for almost the first half of the year. At that time confidence was weakened by concerns about whether the economic recovery was well rooted, and also about the U.S. election, geopolitical threats, the availability and price of oil, job growth, rising interest rates, and the threat of inflation.
By about midyear the economic recovery appeared to be well established, although slowing from the swift pace of the last half of 2003. The Federal Reserve (the Fed) began a very gradual tightening of interest-rate policy. Some investors may have feared that rising interest rates and commodity prices, particularly oil, would choke off the recovery. The Index declined in July and during part of August. Growth stocks (those that are expected to have above-average profit growth and whose prices often include a premium for future earnings) fell furthest. As the economy continued to grow, the Index rallied, accelerating into a steep climb as the U.S. presidential election removed one source of investors’ uncertainty. In addition, during the last months of the year China raised its interest rates, a good sign for future oil and commodity prices because it could slow the growth of demand; oil prices declined somewhat, insurance brokers and insurers addressed their legal issues with New York Attorney General Eliot Spitzer, and the Fed indicated that it would not raise interest rates precipitously. However, growth stocks generally did not make up the performance gap that opened during the summer.
Most of the market had strong full-year returns, but there were pockets of poor performance. At the broad level of 10 economic sectors, all were positive (although the healthcare sector only barely), and six were in double digits. Gains were concentrated in value stocks (those with low share prices in relation to earnings and book value). Even at the narrower level of 24 industry groups, only four declined: semiconductors & semiconductor equipment, automobiles & components, media, and pharmaceuticals & biotechnology. The latter group itself makes up almost 8% of the entire S&P 500 Index. It was affected by concerns about the drug companies’ development pipelines and by negative news about the potential side effects of several major drugs. Energy was the leading sector by a substantial margin, driven by the high price of oil and by large upward revisions in estimates of energy company profits. According to Thomson First Call, at the beginning of 2004 analysts expected profits in the sector to fall significantly because they had risen so much in 2003. Instead, by the end of 2004 analysts estimated that energy profits had risen approximately 48% over 2003 levels. Such earnings surprises often contribute to positive share price movements.”
| 1 | For average and index definitions, refer to the Glossary of Benchmark Definitions page. Investors cannot invest directly in a market index or average. |
For a complete list of holdings, refer to the Schedule of Investments section of this report.
The Prudential Series Fund, Inc.
Annual Report
December 31, 2004
Value Portfolio
n MANAGED BY: JENNISON ASSOCIATES LLC
Past performance does not guarantee future returns. Portfolio performance is net of investment fees and fund expenses, but not product charges, which, if included, would significantly lower the performance quoted. The investment return and principal value of an investment will fluctuate, so that an investor’s shares, when redeemed, may be worth more or less than their original cost. Current performance may be lower or higher than the past performance data quoted.
n PERFORMANCE SUMMARY* - As of December 31, 2004
| | | | | | | | | |
| | | | |
| Average Annual Total Return Percentages | | 1-Year | | | 5-Year | | | 10-Year | |
Value Portfolio: Class I | | 16.31 | % | | 5.64 | % | | 11.33 | % |
Value Portfolio: Class II | | 15.83 | % | | N/A | | | N/A† | |
S&P 500 Index1 | | 10.87 | % | | –2.30 | % | | 12.07 | % |
Russell 1000 Value Index1 | | 16.49 | % | | 5.27 | % | | 13.83 | % |
Lipper (VIP) Large-Cap Value Funds Average1 | | 11.53 | % | | 4.00 | % | | 11.20 | % |
Lipper (VIP) Multi-Cap Value Funds Average1 | | 14.62 | % | | 5.42 | % | | 11.18 | % |
Value Portfolio (Class I) inception date: 2/19/1988. Value Portfolio (Class II) inception date: 5/14/2001. † The since inception return for class II shares was 3.61%.
The Portfolio may invest in foreign securities, which are subject to the risks of currency fluctuation and the impact of social, political, and economic change.
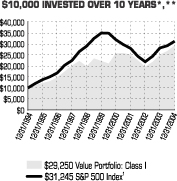
| | | | |
| | | Portfolio
| | SP500
|
31-Dec-1994 | | 10,000.00 | | 10,000.00 |
30-Jun-1995 | | 11,411.35 | | 12,018.58 |
31-Dec-1995 | | 12,170.34 | | 13,753.37 |
30-Jun-1996 | | 13,028.31 | | 15,140.96 |
31-Dec-1996 | | 14,815.91 | | 16,909.09 |
30-Jun-1997 | | 17,404.44 | | 20,391.89 |
31-Dec-1997 | | 20,239.67 | | 22,548.44 |
30-Jun-1998 | | 22,242.68 | | 26,544.46 |
31-Dec-1998 | | 19,757.47 | | 28,997.04 |
30-Jun-1999 | | 23,367.77 | | 32,582.91 |
31-Dec-1999 | | 22,231.87 | | 35,096.05 |
30-Jun-2000 | | 21,051.17 | | 34,946.30 |
31-Dec-2000 | | 25,697.84 | | 31,901.68 |
30-Jun-2001 | | 25,908.32 | | 29,766.54 |
31-Dec-2001 | | 25,164.08 | | 28,113.01 |
30-Jun-2002 | | 22,483.60 | | 24,415.89 |
31-Dec-2002 | | 19,636.23 | | 21,902.19 |
30-Jun-2003 | | 21,722.74 | | 24,476.09 |
31-Dec-2003 | | 25,148.01 | | 28,180.94 |
30-Jun-2004 | | 26,669.06 | | 29,150.84 |
31-Dec-2004 | | 29,250.08 | | 31,245.36 |
n PERFORMANCE REVIEW
“For the year ended December 31, 2004, the Value Portfolio (Class I) had a total return of 16.31% compared with the return of 10.87% for the unmanaged S&P 500 Index, 16.49% for the unmanaged Russell 1000 Value Index, 11.53% for the Lipper (VIP) Large-Cap Value Funds Average, and 14.62% for the Lipper (VIP) Multi-Cap Value Funds Average.
The Portfolio’s energy holdings led its absolute returns by a large margin. Oil and natural gas supply constraints coupled with rising demand pushed up oil prices. This had a significant impact on the share prices of many of the companies involved in supporting the search for new resources, including Portfolio holdings Halliburton and GlobalSantaFe. Exploration and production companies Occidental Petroleum and Suncor Energy also benefited from the high oil prices.
Utilities holdings also made a strong contribution to the Portfolio’s performance. TXU had the greatest impact. Its new CEO, John Wilder, crafted a plan to create an integrated energy merchant with superior earnings growth potential, free cash flow, financial flexibility, and senior management. The restructuring improved its earnings more than even the most bullish analysts expected.
Although the Portfolio’s financials holdings had a positive return, they underperformed the respective sector of the Russell 1000 Value Index. Insurance holding St. Paul Travelers Companies detracted from return. It continued to strengthen its reserves (reducing its reported earnings) after a recent merger. Investors’ opinion of management soured.
The information technology sector was the only Portfolio sector with a negative return. Semiconductor holding Agere Systems was the biggest disappointment. After it was spun out from Lucent in 2002, we expected it to win additional contracts from customers with which it previously was unable to do business. This didn’t happen. There were other disappointments as well, so we sold the position. Nortel Networks also hurt performance."
*Unless noted otherwise, Lipper Average and Index returns reflect performance beginning the closest month-end date to the Portfolio’s inception (Class I).
**The graph is based on the performance of Class I shares. Performance of Class II shares will be lower due to differences in the fee structure. Class II shares have associated 12b-1 and administrative fees at an annual rate of 0.25% and 0.15% respectively of the average daily net assets of the Class II shares.
1For average and index definitions, refer to the Glossary of Benchmark Definitions page. Investors cannot invest directly in a market index or average.
For a complete list of holdings, refer to the Schedule of Investments section of this report.
| | | | |
The Prudential Series Fund, Inc. | | Annual Report | | December 31, 2004 |
Zero Coupon Bond Portfolio 2005
| n | MANAGED BY: PRUDENTIAL INVESTMENT MANAGEMENT, INC. |
Past performance does not guarantee future returns. Portfolio performance is net of investment fees and fund expenses, but not product charges, which, if included, would significantly lower the performance quoted. The investment return and principal value of an investment will fluctuate, so that an investor’s shares, when redeemed, may be worth more or less than their original cost. Current performance may be lower or higher than the past performance data quoted.
| n | PERFORMANCE SUMMARY - As of December 31, 2004 |
| | | | | | | | | |
Average Annual Total Return Percentages
| | 1-Year
| | | 5-Year
| | | 10-Year
| |
Zero Coupon Bond Portfolio 2005 | | 0.57 | % | | 6.83 | % | | 7.90 | % |
Lehman Brothers Govt Bond Index1 | | 3.48 | % | | 7.48 | % | | 7.46 | % |
Lipper (VIP) Target Maturity Funds Average1 | | 3.05 | % | | 8.94 | % | | 8.95 | % |
Zero Coupon Bond Portfolio 2005 inception date: 5/1/1989.
The values in this Portfolio will also fluctuate as interest rates rise and fall, since zero coupon bonds are very interest-rate sensitive.
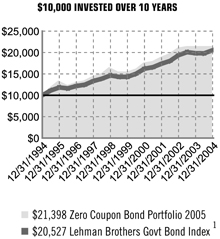
| | | | |
| | | Portfolio
| | LBGB
|
31-Dec-94 | | 10,000.0000 | | 10,000.00 |
30-Jun-95 | | 11,999.4892 | | 11,119.97 |
31-Dec-95 | | 13,184.8245 | | 11,834.08 |
30-Jun-96 | | 12,279.1054 | | 11,621.76 |
31-Dec-96 | | 13,051.3553 | | 12,162.04 |
30-Jun-97 | | 13,308.7070 | | 12,481.43 |
31-Dec-97 | | 14,510.1958 | | 13,328.17 |
30-Jun-98 | | 15,152.4204 | | 13,885.60 |
31-Dec-98 | | 16,302.4320 | | 14,641.21 |
30-Jun-99 | | 15,476.9387 | | 14,309.04 |
31-Dec-99 | | 15,379.9046 | | 14,314.16 |
30-Jun-00 | | 16,083.9776 | | 15,025.26 |
31-Dec-00 | | 17,495.7752 | | 16,209.89 |
30-Jun-01 | | 17,985.5244 | | 16,577.85 |
31-Dec-01 | | 18,914.1423 | | 17,382.03 |
30-Jun-02 | | 19,647.7101 | | 18,038.55 |
31-Dec-02 | | 20,881.0528 | | 19,380.17 |
30-Jun-03 | | 21,331.8575 | | 20,083.30 |
31-Dec-03 | | 21,276.9696 | | 19,836.84 |
30-Jun-04 | | 21,242.8319 | | 19,811.13 |
31-Dec-04 | | 21,398.3593 | | 20,526.60 |
“For the year ended December 31, 2004, the Zero Coupon Bond Portfolio 2005 returned 0.57% while the Lehman Brothers U.S. Government Bond Index rose 3.48% and the Lipper (VIP) Target Maturity Funds Average gained 3.05%.
Both U.S. Treasury and federal agency securities posted positive returns for the year, even though the Federal Reserve (the Fed) increased short-term interest rates five times. The federal funds rate—the rate banks charge each other on overnight loans—was raised by a quarter percentage point in June, August, September, November, and December. The combined moves increased the key rate from 1.00% to 2.25%. Gradually increasing short-term rates lessened the monetary stimulus in the U.S. economy as it expanded at a moderate pace in 2004.
Anticipation of the trend toward higher short-term rates initially prompted a sharp selloff in the U.S. bond market during the second quarter of 2004. At that time strong job growth and rising inflationary pressures suggested the Fed would soon begin a new round of rate hikes, which weighed on bond prices as they move in the opposite direction of interest rates. However, as 2004 continued, economic conditions proved more favorable for bonds. Job growth was uneven and inflation surprisingly mild despite sharply higher oil prices. These were welcomed developments for bond prices, particularly as inflation erodes the value of bonds’ fixed interest payments.
In the U.S. Treasury market, the slope of the yield curve flattened in 2004, which means the gap between yields on short- and long-term Treasurys narrowed. Specifically, yields rose on short-term Treasurys as they are more sensitive to changes in monetary policy, while the yield on 10-year Treasury notes declined slightly and the yield on 30-year Treasury bonds fell by a moderate amount. Thus, short-term Treasurys underperformed longer-term Treasurys in 2004. We believe the Portfolio lagged its Lipper Average in 2004 because its anticipated liquidation date of November 15, 2005, prevented us from investing in the better-performing, slightly longer-term bonds purchased by some funds in its peer group. Nevertheless, the Portfolio still benefited from emphasizing zero coupon bonds of federal agencies rather than Treasurys. Federal agency zero coupon bonds performed better than comparable Treasurys amid solid demand for bonds with higher yields than Treasurys.”
| 1 | For average and index definitions, refer to the Glossary of Benchmark Definitions page. Investors cannot invest directly in a market index or average. |
For a complete list of holdings, refer to the Schedule of Investments section of this report.
Fees and Expenses (Unaudited)
As a contract owner investing in Portfolios of the Fund through a variable annuity or variable life contract, you incur ongoing costs, including management fees, distribution and service (12b-1) fees, and other Portfolio expenses. This example is intended to help you understand your ongoing costs (in dollars) of investing in the Fund and to compare these costs with the ongoing costs of investing in other investment options. This example does not reflect fees and charges under your variable annuity or variable life contract. If contract charges were included, the costs shown below would be higher. Please consult the prospectus for your contract for more information about contract fees and charges.
The example is based on an investment of $1,000 invested at the beginning of the period and held for the entire period July 1, 2004 through December 31, 2004.
Actual Expenses
The first line of the table below provides information about actual account values and actual expenses. You may use this information, together with the amount you invested, to estimate the Portfolio expenses that you paid over the period. Simply divide your account value by $1,000 (for example, an $8,600 account value divided by $1,000 = 8.6), then multiply the result by the number in the first line under the heading entitled “Expenses Paid During Period” to estimate the Portfolio expenses you paid on your account during this period. As noted above, the table does not reflect variable contract fees and charges.
Hypothetical Example for Comparison Purposes
The second line of the table below provides information about hypothetical account values and hypothetical expenses based on the Portfolio’s actual expense ratio and an assumed rate of return of 5% per year before expenses, which is not the Portfolio’s actual return. The hypothetical account values and expenses may not be used to estimate the actual ending account balance or expenses you paid for the period. You may use this information to compare the ongoing costs of investing in the Portfolio and other investment options. To do so, compare this 5% hypothetical example with the 5% hypothetical examples that appear in the shareholder reports of the other investment options.
Please note that the expenses shown in the table are meant to highlight your ongoing Portfolio costs only and do not reflect any contract fees and charges, such as sales charges (loads), insurance charges or administrative charges. Therefore the second line of the table is useful to compare ongoing investment option costs only, and will not help you determine the relative total costs of owning different contracts. In addition, if these contract fee and charges were included, your costs would have been higher.
| | | | | | | | | | | | | | |
| Prudential Series Fund Portfolios | | Beginning Portfolio Value July 1, 2004 | | Ending Portfolio
Value December 31, 2004 | | Annualized Expense Ratio
Based on the
Six-Month Period | | | Expenses Paid
During the Six-
Month Period* |
| | | | | | | | | | | | | | | |
| Conservative Balanced (Class I) | | Actual | | $ | 1,000 | | $ | 1,060 | | 0.59 | % | | $ | 3.06 |
| | Hypothetical | | $ | 1,000 | | $ | 1,022 | | 0.59 | % | | $ | 3.00 |
| | | | | | | | | | | | | | | |
| Diversified Bond (Class I) | | Actual | | $ | 1,000 | | $ | 1,054 | | 0.45 | % | | $ | 2.32 |
| | Hypothetical | | $ | 1,000 | | $ | 1,023 | | 0.45 | % | | $ | 2.29 |
| | | | | | | | | | | | | | | |
| Equity Portfolio (Class I) | | Actual | | $ | 1,000 | | $ | 1,069 | | 0.49 | % | | $ | 2.55 |
| | Hypothetical | | $ | 1,000 | | $ | 1,023 | | 0.49 | % | | $ | 2.49 |
| | | | | | | | | | | | | | | |
| Equity Portfolio (Class II) | | Actual | | $ | 1,000 | | $ | 1,068 | | 0.89 | % | | $ | 4.63 |
| | Hypothetical | | $ | 1,000 | | $ | 1,021 | | 0.89 | % | | $ | 4.52 |
| | | | | | | | | | | | | | | |
| Flexible Managed (Class I) | | Actual | | $ | 1,000 | | $ | 1,072 | | 0.63 | % | | $ | 3.28 |
| | Hypothetical | | $ | 1,000 | | $ | 1,022 | | 0.63 | % | | $ | 3.20 |
| | | | | | | | | | | | | | | |
| Global Portfolio (Class I) | | Actual | | $ | 1,000 | | $ | 1,089 | | 0.83 | % | | $ | 4.36 |
| | Hypothetical | | $ | 1,000 | | $ | 1,021 | | 0.83 | % | | $ | 4.22 |
| | | | | | | | | | | | | | | |
| Government Income (Class I) | | Actual | | $ | 1,000 | | $ | 1,032 | | 0.47 | % | | $ | 2.40 |
| | Hypothetical | | $ | 1,000 | | $ | 1,023 | | 0.47 | % | | $ | 2.39 |
| | | | | | | | | | | | | | | |
| High Yield Portfolio (Class I) | | Actual | | $ | 1,000 | | $ | 1,090 | | 0.60 | % | | $ | 3.15 |
| | Hypothetical | | $ | 1,000 | | $ | 1,022 | | 0.60 | % | | $ | 3.05 |
| | | | | | | | | | | | | | | |
| Jennison Portfolio (Class I) | | Actual | | $ | 1,000 | | $ | 1,062 | | 0.64 | % | | $ | 3.32 |
| | Hypothetical | | $ | 1,000 | | $ | 1,022 | | 0.64 | % | | $ | 3.25 |
| | | | | | | | | | | | | | |
| Prudential Series Fund Portfolios | | Beginning Portfolio Value July 1, 2004 | | Ending Portfolio
Value December 31, 2004 | | Annualized Expense Ratio
Based on the
Six-Month Period | | | Expenses Paid
During the Six-
Month Period* |
| | | | | | | | | | | | | | | |
| Jennison Portfolio (Class II) | | Actual | | $ | 1,000 | | $ | 1,060 | | 1.04 | % | | $ | 5.39 |
| | Hypothetical | | $ | 1,000 | | $ | 1,020 | | 1.04 | % | | $ | 5.28 |
| | | | | | | | | | | | | | | |
| Money Market (Class I) | | Actual | | $ | 1,000 | | $ | 1,006 | | 0.45 | % | | $ | 2.27 |
| | Hypothetical | | $ | 1,000 | | $ | 1,023 | | 0.45 | % | | $ | 2.29 |
| | | | | | | | | | | | | | | |
| Natural Resources (Class I) | | Actual | | $ | 1,000 | | $ | 1,184 | | 0.51 | % | | $ | 2.80 |
| | Hypothetical | | $ | 1,000 | | $ | 1,023 | | 0.51 | % | | $ | 2.59 |
| | | | | | | | | | | | | | | |
| Small Capitalization (Class I) | | Actual | | $ | 1,000 | | $ | 1,112 | | 0.48 | % | | $ | 2.55 |
| | Hypothetical | | $ | 1,000 | | $ | 1,023 | | 0.48 | % | | $ | 2.44 |
| | | | | | | | | | | | | | | |
| Stock Index (Class I) | | Actual | | $ | 1,000 | | $ | 1,070 | | 0.39 | % | | $ | 2.03 |
| | Hypothetical | | $ | 1,000 | | $ | 1,023 | | 0.39 | % | | $ | 1.98 |
| | | | | | | | | | | | | | | |
| Value Portfolio (Class I) | | Actual | | $ | 1,000 | | $ | 1,097 | | 0.44 | % | | $ | 2.32 |
| | Hypothetical | | $ | 1,000 | | $ | 1,023 | | 0.44 | % | | $ | 2.24 |
| | | | | | | | | | | | | | | |
| Value Portfolio (Class II) | | Actual | | $ | 1,000 | | $ | 1,094 | | 0.84 | % | | $ | 4.42 |
| | Hypothetical | | $ | 1,000 | | $ | 1,021 | | 0.84 | % | | $ | 4.27 |
| | | | | | | | | | | | | | | |
| Zero Coupon Bond (Class I) | | Actual | | $ | 1,000 | | $ | 1,007 | | 0.62 | % | | $ | 3.13 |
| | Hypothetical | | $ | 1,000 | | $ | 1,022 | | 0.62 | % | | $ | 3.15 |
* Fund expenses for each share class are equal to the annualized expense ratio for each share class (provided in the table), multiplied by the average account value over the period, multiplied by the 184 days in the six-month period ended December 31, 2004, and divided by the 366 days in the Fund’s fiscal year ended December 31, 2004 (to reflect the six-month period).
| | | | |
| | | CONSERVATIVE BALANCED PORTFOLIO | | |
STATEMENT OF ASSETS AND LIABILITIES
December 31, 2004
| | | |
| ASSETS | | | |
Investments, at value including securities on loan of $454,023,289 (cost $3,362,687,601) | | $ | 3,472,546,424 |
Cash | | | 7,563 |
Dividends and interest receivable | | | 10,658,882 |
Receivable for investments sold | | | 719,334 |
Receivable for capital stock sold | | | 122,642 |
Prepaid expenses | | | 50,568 |
| | |
|
|
Total Assets | | | 3,484,105,413 |
| | |
|
|
| LIABILITIES | | | |
Collateral for securities on loan | | | 469,946,326 |
Payable for investments purchased | | | 118,541,866 |
Management fee payable | | | 1,340,969 |
Accrued expenses and other liabilities | | | 347,116 |
Payable for capital stock repurchased | | | 229,208 |
Due to broker-variation margin | | | 136,872 |
| | |
|
|
Total Liabilities | | | 590,542,357 |
| | |
|
|
| NET ASSETS | | $ | 2,893,563,056 |
| | |
|
|
Net assets were comprised of: | | | |
Common stock, at $0.01 par value | | $ | 1,916,883 |
Paid-in capital in excess of par | | | 2,688,619,581 |
| | |
|
|
| | | | 2,690,536,464 |
Undistributed net investment income | | | 65,771,642 |
Accumulated net realized gain on investments | | | 25,880,404 |
Net unrealized appreciation on investments | | | 111,374,546 |
| | |
|
|
Net assets, December 31, 2004 | | $ | 2,893,563,056 |
| | |
|
|
Net asset value and redemption price per share, $2,893,563,056 / 191,688,308 outstanding shares of common stock (authorized 525,000,000 shares) | | $ | 15.10 |
| | |
|
|
STATEMENT OF OPERATIONS
Year Ended December 31, 2004
| | | | |
| INVESTMENT INCOME | | | | |
Interest | | $ | 43,125,954 | |
Dividends (net of $8,426 foreign withholding tax) | | | 37,348,782 | |
Income from securities lending, net | | | 670,340 | |
| | |
|
|
|
| | | | 81,145,076 | |
| | |
|
|
|
| EXPENSES | | | | |
Management fee | | | 15,644,479 | |
Custodian’s fees and expenses | | | 519,000 | |
Shareholders’ reports | | | 310,000 | |
Insurance expenses | | | 62,000 | |
Directors’ fees | | | 47,000 | |
Commitment fee on syndicated credit agreement | | | 34,000 | |
Audit fee | | | 20,000 | |
Legal fees and expenses | | | 11,000 | |
Transfer agent’s fees and expenses | | | 2,000 | |
Miscellaneous | | | 11,666 | |
| | |
|
|
|
Total expenses | | | 16,661,145 | |
Less: custodian fee credit | | | (11,115 | ) |
| | |
|
|
|
Net expenses | | | 16,650,030 | |
| | |
|
|
|
| NET INVESTMENT INCOME | | | 64,495,046 | |
| | |
|
|
|
| NET REALIZED AND UNREALIZED GAIN ON INVESTMENTS | | | | |
Net realized gain on: | | | | |
Investments | | | 20,845,709 | |
Futures transactions | | | 13,818,853 | |
| | |
|
|
|
| | | | 34,664,562 | |
| | |
|
|
|
Net change in unrealized appreciation (depreciation) on: | | | | |
Investments | | | 125,188,913 | |
Futures | | | (5,160,666 | ) |
| | |
|
|
|
| | | | 120,028,247 | |
| | |
|
|
|
| NET GAIN ON INVESTMENTS | | | 154,692,809 | |
| | |
|
|
|
| NET INCREASE IN NET ASSETS RESULTING FROM OPERATIONS | | $ | 219,187,855 | |
| | |
|
|
|
STATEMENT OF CHANGES IN NET ASSETS
| | | | | | | | |
| | | Year Ended
December 31, 2004
| | | Year Ended
December 31, 2003
| |
| INCREASE (DECREASE) IN NET ASSETS | | | | | | | | |
| OPERATIONS: | | | | | | | | |
Net investment income | | $ | 64,495,046 | | | $ | 54,829,681 | |
Net realized gain on investments | | | 34,664,562 | | | | 77,165,130 | |
Net change in unrealized appreciation (depreciation) on investments | | | 120,028,247 | | | | 337,526,752 | |
| | |
|
|
| |
|
|
|
NET INCREASE IN NET ASSETS RESULTING FROM OPERATIONS | | | 219,187,855 | | | | 469,521,563 | |
| | |
|
|
| |
|
|
|
| DIVIDENDS AND DISTRIBUTIONS: | | | | | | | | |
Dividends from net investment income | | | (55,941,153 | ) | | | (73,725,917 | ) |
Distributions from net realized capital gains | | | (16,740,774 | ) | | | — | |
| | |
|
|
| |
|
|
|
TOTAL DIVIDENDS AND DISTRIBUTIONS | | | (72,681,927 | ) | | | (73,725,917 | ) |
| | |
|
|
| |
|
|
|
| CAPITAL STOCK TRANSACTIONS: | | | | | | | | |
Capital stock sold [2,640,900 and 3,313,419 shares, respectively] | | | 37,781,509 | | | | 43,720,032 | |
Capital stock issued in reinvestment of dividends and distributions [5,151,093 and 6,123,415 shares, respectively] | | | 72,681,927 | | | | 73,725,917 | |
Capital stock repurchased [17,999,367 and 21,565,238 shares, respectively] | | | (258,377,816 | ) | | | (278,564,074 | ) |
| | |
|
|
| |
|
|
|
NET DECREASE IN NET ASSETS RESULTING FROM CAPITAL STOCK TRANSACTIONS | | | (147,914,380 | ) | | | (161,118,125 | ) |
| | |
|
|
| |
|
|
|
| TOTAL INCREASE (DECREASE) IN NET ASSETS | | | (1,408,452 | ) | | | 234,677,521 | |
| NET ASSETS: | | | | | | | | |
Beginning of year | | | 2,894,971,508 | | | | 2,660,293,987 | |
| | |
|
|
| |
|
|
|
End of year (a) | | $ | 2,893,563,056 | | | $ | 2,894,971,508 | |
| | |
|
|
| |
|
|
|
(a) Includes undistributed net investment income of: | | $ | 65,771,642 | | | $ | 55,941,153 | |
| | |
|
|
| |
|
|
|
SEE NOTES TO FINANCIAL STATEMENTS.
A1
| | | | |
| | | DIVERSIFIED BOND PORTFOLIO | | |
STATEMENT OF ASSETS AND LIABILITIES
December 31, 2004
| | | |
| ASSETS | | | |
Investments, at value including securities on loan of $89,419,407 (cost $1,375,302,499) | | $ | 1,404,413,003 |
Foreign currency, at value (cost $554,117) | | | 560,258 |
Interest receivable | | | 12,955,764 |
Receivable for investments sold | | | 2,589,961 |
Unrealized appreciation on swaps | | | 317,459 |
Due from broker-variation margin | | | 305,668 |
Receivable for capital stock sold | | | 99,066 |
Prepaid expenses | | | 24,047 |
Interest receivable on swap agreement | | | 8,413 |
Unrealized appreciation on forward foreign currency contracts | | | 403,936 |
| | |
|
|
Total Assets | | | 1,421,677,575 |
| | |
|
|
| LIABILITIES | | | |
Collateral for securities on loan | | | 92,354,003 |
Payable for investments purchased | | | 43,805,323 |
Unrealized depreciation on forward foreign currency contracts | | | 928,412 |
Management fee payable | | | 439,396 |
Payable for capital stock repurchased | | | 227,226 |
Accrued expenses and other liabilities | | | 209,920 |
Payable to custodian | | | 35,343 |
Deferred directors’ fees | | | 8,385 |
| | |
|
|
Total Liabilities | | | 138,008,008 |
| | |
|
|
| NET ASSETS | | $ | 1,283,669,567 |
| | |
|
|
Net assets were comprised of: | | | |
Common stock, at $0.01 par value | | $ | 1,137,956 |
Paid-in capital in excess of par | | | 1,240,048,191 |
| | |
|
|
| | | | 1,241,186,147 |
Undistributed net investment income | | | 4,711,091 |
Accumulated net realized gain on investments | | | 7,721,573 |
Net unrealized appreciation on investments and foreign currencies | | | 30,050,756 |
| | |
|
|
Net assets, December 31, 2004 | | $ | 1,283,669,567 |
| | |
|
|
Net asset value and redemption price per share, $1,283,669,567 / 113,795,573 outstanding shares of common stock (authorized 275,000,000 shares) | | $ | 11.28 |
| | |
|
|
STATEMENT OF OPERATIONS
Year Ended December 31, 2004
| | | | |
| INVESTMENT INCOME | | | | |
Interest | | $ | 66,444,270 | |
Dividends | | | 1,761,507 | |
Income from securities lending, net | | | 285,992 | |
| | |
|
|
|
| | | | 68,491,769 | |
| | |
|
|
|
| EXPENSES | | | | |
Management fees | | | 5,461,750 | |
Custodian’s fees and expenses | | | 274,000 | |
Shareholders’ reports | | | 250,000 | |
Directors’ fees | | | 40,000 | |
Insurance expenses | | | 31,000 | |
Audit fee | | | 20,000 | |
Commitment fee on syndicated credit agreement | | | 16,000 | |
Legal fees and expenses | | | 14,000 | |
Transfer agent’s fees and expenses | | | 2,600 | |
Miscellaneous | | | 5,937 | |
| | |
|
|
|
Total expenses | | | 6,115,287 | |
Less: custodian fee credit | | | (11,757 | ) |
| | |
|
|
|
Net expenses | | | 6,103,530 | |
| | |
|
|
|
| NET INVESTMENT INCOME | | | 62,388,239 | |
| | |
|
|
|
| NET REALIZED AND UNREALIZED GAIN (LOSS) ON INVESTMENTS AND FOREIGN CURRENCIES | | | | |
Net realized gain (loss) on: | | | | |
Investments | | | 24,105,804 | |
Futures transactions | | | 2,157,047 | |
Foreign currency transactions | | | (2,756,103 | ) |
Swaps | | | 130,039 | |
| | |
|
|
|
| | | | 23,636,787 | |
| | |
|
|
|
Net change in unrealized appreciation (depreciation) on: | | | | |
Investments | | | (14,396,847 | ) |
Futures | | | 1,379,677 | |
Foreign currencies | | | 219,802 | |
Swaps | | | 317,459 | |
| | |
|
|
|
| | | | (12,479,909 | ) |
| | |
|
|
|
| NET GAIN ON INVESTMENTS AND FOREIGN CURRENCIES | | | 11,156,878 | |
| | |
|
|
|
| NET INCREASE IN NET ASSETS RESULTING FROM OPERATIONS | | $ | 73,545,117 | |
| | |
|
|
|
STATEMENT OF CHANGES IN NET ASSETS
| | | | | | | | |
| | | Year Ended
December 31, 2004
| | | Year Ended
December 31, 2003
| |
| INCREASE (DECREASE) IN NET ASSETS | | | | | | | | |
| OPERATIONS: | | | | | | | | |
Net investment income | | $ | 62,388,239 | | | $ | 56,823,816 | |
Net realized gain on investments and foreign currencies | | | 23,636,787 | | | | 33,989,526 | |
Net change in unrealized appreciation (depreciation) on investments and foreign currencies | | | (12,479,909 | ) | | | 12,539,296 | |
| | |
|
|
| |
|
|
|
NET INCREASE IN NET ASSETS RESULTING FROM OPERATIONS | | | 73,545,117 | | | | 103,352,638 | |
| | |
|
|
| |
|
|
|
| DIVIDENDS: | | | | | | | | |
Dividends from net investment income | | | (59,934,775 | ) | | | (57,232,060 | ) |
| | |
|
|
| |
|
|
|
| CAPITAL STOCK TRANSACTIONS: | | | | | | | | |
Capital stock sold [4,067,619 and 18,720,228 shares, respectively] | | | 45,699,435 | | | | 205,756,877 | |
Capital stock issued in reinvestment of dividends and distributions [5,347,081 and 5,149,986 shares, respectively] | | | 59,934,775 | | | | 57,232,060 | |
Capital stock repurchased [22,539,459 and 23,581,158 shares, respectively] | | | (253,550,802 | ) | | | (261,397,152 | ) |
| | |
|
|
| |
|
|
|
NET INCREASE (DECREASE) IN NET ASSETS RESULTING FROM CAPITAL STOCK TRANSACTIONS | | | (147,916,592 | ) | | | 1,591,785 | |
| | |
|
|
| |
|
|
|
| TOTAL INCREASE (DECREASE) IN NET ASSETS | | | (134,306,250 | ) | | | 47,712,363 | |
| NET ASSETS: | | | | | | | | |
Beginning of year | | | 1,417,975,817 | | | | 1,370,263,454 | |
| | |
|
|
| |
|
|
|
End of year (a) | | $ | 1,283,669,567 | | | $ | 1,417,975,817 | |
| | |
|
|
| |
|
|
|
(a) Includes undistributed net investment income of: | | $ | 4,711,091 | | | $ | 180,286 | |
| | |
|
|
| |
|
|
|
SEE NOTES TO FINANCIAL STATEMENTS.
A2
STATEMENT OF ASSETS AND LIABILITIES
December 31, 2004
| | | | |
| ASSETS | | | | |
Investments, at value including securities on loan of $442,278,355 (cost $3,884,278,933) | | $ | 4,602,906,460 | |
Foreign currency, at value (cost $51,079) | | | 51,079 | |
Receivable for investments sold | | | 8,004,161 | |
Dividends and interest receivable | | | 3,616,505 | |
Receivable for capital stock sold | | | 228,206 | |
Tax reclaim receivable | | | 20,601 | |
Prepaid expenses | | | 71,054 | |
| | |
|
|
|
Total Assets | | | 4,614,898,066 | |
| | |
|
|
|
| LIABILITIES | | | | |
Collateral for securities on loan | | | 458,644,678 | |
Payable for investments purchased | | | 16,551,415 | |
Management fee payable | | | 1,557,445 | |
Accrued expenses and other liabilities | | | 659,386 | |
Payable for capital stock repurchased | | | 620,242 | |
Due to broker-variation margin | | | 11,000 | |
Distribution fee payable | | | 236 | |
Administration fee payable | | | 141 | |
| | |
|
|
|
Total Liabilities | | | 478,044,543 | |
| | |
|
|
|
| NET ASSETS | | $ | 4,136,853,523 | |
| | |
|
|
|
Net assets were comprised of: | | | | |
Common stock, at $0.01 par value | | $ | 1,854,143 | |
Paid-in capital in excess of par | | | 4,208,415,259 | |
| | |
|
|
|
| | | | 4,210,269,402 | |
Undistributed net investment income | | | 900,629 | |
Accumulated net realized loss on investments | | | (792,940,053 | ) |
Net unrealized appreciation on investments and foreign currencies | | | 718,623,545 | |
| | |
|
|
|
Net assets, December 31, 2004 | | $ | 4,136,853,523 | |
| | |
|
|
|
| Class I: | | | | |
Net asset value and redemption price per share, $4,135,721,053 / 185,363,594 outstanding shares of common stock (authorized 525,000,000 shares) | | $ | 22.31 | |
| | |
|
|
|
| Class II: | | | | |
Net asset value and redemption price per share, $1,132,470 / 50,698 outstanding shares of common stock (authorized 50,000,000 shares) | | $ | 22.34 | |
| | |
|
|
|
STATEMENT OF OPERATIONS
Year Ended December 31, 2004
| | | | |
| INVESTMENT INCOME | | | | |
Dividends (net of $969,281 foreign withholding tax) | | $ | 69,240,182 | |
Interest | | | 361,612 | |
Income from securities loaned, net | | | 607,716 | |
| | |
|
|
|
| | | | 70,209,510 | |
| | |
|
|
|
| EXPENSES | | | | |
Management fee | | | 17,841,307 | |
Distribution fee—Class II | | | 2,648 | |
Administration fee—Class II | | | 1,589 | |
Shareholders’ reports | | | 668,000 | |
Custodian’s fees and expenses | | | 419,000 | |
Insurance expenses | | | 84,000 | |
Directors’ fees | | | 57,000 | |
Commitment fee on syndicated credit agreement | | | 47,000 | |
Legal fees and expenses | | | 23,000 | |
Audit fee | | | 18,000 | |
Transfer agent’s fees and expenses | | | 5,300 | |
Miscellaneous | | | 15,916 | |
| | |
|
|
|
Total operating expenses | | | 19,182,760 | |
Loan interest expense (Note 8) | | | 162 | |
Less: custodian fee credit | | | (2,340 | ) |
| | |
|
|
|
Net expenses | | | 19,180,582 | |
| | |
|
|
|
| NET INVESTMENT INCOME | | | 51,028,928 | |
| | |
|
|
|
| NET REALIZED AND UNREALIZED GAIN (LOSS) ON INVESTMENTS AND FOREIGN CURRENCIES | | | | |
Net realized gain on: | | | | |
Investments | | | 135,779,542 | |
Futures transactions | | | 1,578,779 | |
Foreign currency transactions | | | 8,597 | |
| | |
|
|
|
| | | | 137,366,918 | |
| | |
|
|
|
Net change in unrealized appreciation (depreciation) on: | | | | |
Investments | | | 189,431,907 | |
Futures | | | (522,400 | ) |
Foreign currencies | | | (4,255 | ) |
| | |
|
|
|
| | | | 188,905,252 | |
| | |
|
|
|
| NET GAIN ON INVESTMENTS AND FOREIGN CURRENCIES | | | 326,272,170 | |
| | |
|
|
|
| NET INCREASE IN NET ASSETS RESULTING FROM OPERATIONS | | $ | 377,301,098 | |
| | |
|
|
|
STATEMENT OF CHANGES IN NET ASSETS
| | | | | | | | |
| | | Year Ended
December 31, 2004
| | | Year Ended
December 31, 2003
| |
| INCREASE (DECREASE) IN NET ASSETS | | | | | | | | |
| OPERATIONS: | | | | | | | | |
Net investment income | | $ | 51,028,928 | | | $ | 33,670,503 | |
Net realized gain (loss) on investments and foreign currencies | | | 137,366,918 | | | | (183,886,765 | ) |
Net change in unrealized appreciation (depreciation) on investments and foreign currencies | | | 188,905,252 | | | | 1,131,897,112 | |
| | |
|
|
| |
|
|
|
NET INCREASE IN NET ASSETS RESULTING FROM OPERATIONS | | | 377,301,098 | | | | 981,680,850 | |
| | |
|
|
| |
|
|
|
| DIVIDENDS: | | | | | | | | |
Dividends from net investment income | | | | | | | | |
Class I | | | (50,405,570 | ) | | | (34,653,868 | ) |
Class II | | | (9,198 | ) | | | (3,532 | ) |
| | |
|
|
| |
|
|
|
TOTAL DIVIDENDS | | | (50,414,768 | ) | | | (34,657,400 | ) |
| | |
|
|
| |
|
|
|
| CAPITAL STOCK TRANSACTIONS (Note 7): | | | | | | | | |
Capital stock sold [4,902,308 and 5,749,045 shares, respectively] | | | 102,414,548 | | | | 101,063,434 | |
Capital stock issued in reinvestment of dividends [2,300,828 and 1,744,973 shares, respectively] | | | 50,414,768 | | | | 34,657,400 | |
Capital stock repurchased [17,031,464 and 20,110,903 shares, respectively] | | | (356,013,098 | ) | | | (343,584,774 | ) |
| | |
|
|
| |
|
|
|
NET DECREASE IN NET ASSETS RESULTING FROM CAPITAL STOCK TRANSACTIONS | | | (203,183,782 | ) | | | (207,863,940 | ) |
| | |
|
|
| |
|
|
|
| TOTAL INCREASE IN NET ASSETS | | | 123,702,548 | | | | 739,159,510 | |
| NET ASSETS: | | | | | | | | |
Beginning of year | | | 4,013,150,975 | | | | 3,273,991,465 | |
| | |
|
|
| |
|
|
|
End of year (a) | | $ | 4,136,853,523 | | | $ | 4,013,150,975 | |
| | |
|
|
| |
|
|
|
(a) Includes undistributed net investment income of: | | $ | 900,629 | | | $ | 277,872 | |
| | |
|
|
| |
|
|
|
SEE NOTES TO FINANCIAL STATEMENTS.
A3
| | | | |
| | | FLEXIBLE MANAGED PORTFOLIO | | |
STATEMENT OF ASSETS AND LIABILITIES
December 31, 2004
| | | | |
| ASSETS | | | | |
Investments, at value including securities on loan of $718,584,562 (cost $4,376,061,484) | | $ | 4,712,371,365 | |
Cash | | | 5,455 | |
Dividends and interest receivable | | | 11,568,410 | |
Due from broker-variation margin | | | 129,238 | |
Receivable for capital stock sold | | | 118,478 | |
Prepaid expenses | | | 65,911 | |
| | |
|
|
|
Total Assets | | | 4,724,258,857 | |
| | |
|
|
|
| LIABILITIES | | | | |
Collateral for securities on loan | | | 746,870,215 | |
Payable for investments purchased | | | 91,031,444 | |
Management fee payable | | | 1,957,931 | |
Payable for capital stock repurchased | | | 512,194 | |
Accrued expenses and other liabilities | | | 406,571 | |
| | |
|
|
|
Total Liabilities | | | 840,778,355 | |
| | |
|
|
|
| NET ASSETS | | $ | 3,883,480,502 | |
| | |
|
|
|
Net assets were comprised of: | | | | |
Common stock, at $0.01 par value | | $ | 2,341,952 | |
Paid-in capital in excess of par | | | 3,631,162,966 | |
| | |
|
|
|
| | | | 3,633,504,918 | |
Undistributed net investment income | | | 68,680,004 | |
Accumulated net realized loss on investments | | | (158,671,520 | ) |
Net unrealized appreciation on investments | | | 339,967,100 | |
| | |
|
|
|
Net assets, December 31, 2004 | | $ | 3,883,480,502 | |
| | |
|
|
|
Net asset value and redemption price per share, $3,883,480,502 / 234,195,220 outstanding shares of common stock (authorized 600,000,000 shares) | | $ | 16.58 | |
| | |
|
|
|
STATEMENT OF OPERATIONS
Year Ended December 31, 2004
| | | | |
| INVESTMENT INCOME | | | | |
Dividends (net of $32,511 foreign withholding tax) | | $ | 55,441,610 | |
Interest (net of $221 foreign withholding tax) | | | 34,279,883 | |
Income from securities loaned, net | | | 1,099,284 | |
| | |
|
|
|
| | | | 90,820,777 | |
| | |
|
|
|
| EXPENSES | | | | |
Management fee | | | 22,218,623 | |
Custodian’s fees and expenses | | | 552,000 | |
Shareholders’ reports | | | 137,000 | |
Insurance expenses | | | 79,000 | |
Directors’ fees | | | 56,000 | |
Commitment fee on syndicated credit agreement | | | 37,000 | |
Legal fees and expenses | | | 22,000 | |
Audit fee | | | 20,000 | |
Transfer agent’s fees and expenses | | | 1,900 | |
Miscellaneous | | | 20,613 | |
| | |
|
|
|
Total expenses | | | 23,144,136 | |
Less: custodian fee credit | | | (15,757 | ) |
| | |
|
|
|
Net expenses | | | 23,128,379 | |
| | |
|
|
|
| NET INVESTMENT INCOME | | | 67,692,398 | |
| | |
|
|
|
| NET REALIZED AND UNREALIZED GAIN (LOSS) ON INVESTMENTS | | | | |
Net realized gain on: | | | | |
Investments | | | 247,215,346 | |
Futures transactions | | | 30,619,098 | |
| | |
|
|
|
| | | | 277,834,444 | |
| | |
|
|
|
Net change in unrealized appreciation (depreciation) on: | | | | |
Investments | | | 45,961,426 | |
Futures | | | (8,088,485 | ) |
| | |
|
|
|
| | | | 37,872,941 | |
| | |
|
|
|
| NET GAIN ON INVESTMENTS | | | 315,707,385 | |
| | |
|
|
|
| NET INCREASE IN NET ASSETS RESULTING FROM OPERATIONS | | $ | 383,399,783 | |
| | |
|
|
|
STATEMENT OF CHANGES IN NET ASSETS
| | | | | | | | |
| | | Year Ended
December 31, 2004
| | | Year Ended
December 31, 2003
| |
| INCREASE (DECREASE) IN NET ASSETS | | | | | | | | |
| OPERATIONS: | | | | | | | | |
Net investment income | | $ | 67,692,398 | | | $ | 52,024,319 | |
Net realized gain on investments | | | 277,834,444 | | | | 39,518,773 | |
Net change in unrealized appreciation (depreciation) on investments | | | 37,872,941 | | | | 629,700,770 | |
| | |
|
|
| |
|
|
|
NET INCREASE IN NET ASSETS RESULTING FROM OPERATIONS | | | 383,399,783 | | | | 721,243,862 | |
| | |
|
|
| |
|
|
|
| DIVIDENDS: | | | | | | | | |
Dividends from net investment income | | | (52,897,054 | ) | | | (68,283,392 | ) |
| | |
|
|
| |
|
|
|
| CAPITAL STOCK TRANSACTIONS: | | | | | | | | |
Capital stock sold [2,576,492 and 3,981,685 shares, respectively] | | | 39,870,970 | | | | 54,389,704 | |
Capital stock issued in reinvestment of dividends and distributions [3,496,170 and 5,574,154 shares, respectively] | | | 52,897,054 | | | | 68,283,392 | |
Capital stock repurchased [15,095,754 and 19,797,358 shares, respectively] | | | (233,366,733 | ) | | | (263,069,457 | ) |
| | |
|
|
| |
|
|
|
NET DECREASE IN NET ASSETS RESULTING FROM CAPITAL STOCK TRANSACTIONS | | | (140,598,709 | ) | | | (140,396,361 | ) |
| | |
|
|
| |
|
|
|
| TOTAL INCREASE IN NET ASSETS | | | 189,904,020 | | | | 512,564,109 | |
| NET ASSETS: | | | | | | | | |
Beginning of year | | | 3,693,576,482 | | | | 3,181,012,373 | |
| | |
|
|
| |
|
|
|
End of year (a) | | $ | 3,883,480,502 | | | $ | 3,693,576,482 | |
| | |
|
|
| |
|
|
|
(a) Includes undistributed net investment income of: | | $ | 68,680,004 | | | $ | 52,897,055 | |
| | |
|
|
| |
|
|
|
SEE NOTES TO FINANCIAL STATEMENTS.
A4
STATEMENT OF ASSETS AND LIABILITIES
December 31, 2004
| | | | |
| ASSETS | | | | |
Investments, at value including securities on loan of $65,091,647 (cost $650,015,713) | | $ | 752,013,703 | |
Foreign currency, at value (cost $7,946,198) | | | 8,205,569 | |
Receivable for investments sold | | | 520,997 | |
Dividends receivable | | | 447,999 | |
Foreign tax reclaim receivable | | | 140,924 | |
Receivable for capital stock sold | | | 122,042 | |
Unrealized appreciation on forward foreign currency contracts | | | 16,623 | |
Prepaid expenses | | | 11,647 | |
| | |
|
|
|
Total Assets | | | 761,479,504 | |
| | |
|
|
|
| LIABILITIES | | | | |
Collateral for securities on loan | | | 68,128,773 | |
Payable for investments purchased | | | 1,094,358 | |
Payable for capital stock repurchased | | | 510,545 | |
Management fee payable | | | 431,894 | |
Accrued expenses and other liabilities | | | 227,220 | |
| | |
|
|
|
Total Liabilities | | | 70,392,790 | |
| | |
|
|
|
| NET ASSETS | | $ | 691,086,714 | |
| | |
|
|
|
Net assets were comprised of: | | | | |
Common stock, at $0.01 par value | | $ | 420,534 | |
Paid-in capital in excess of par | | | 808,296,007 | |
| | |
|
|
|
| | | | 808,716,541 | |
Undistributed net investment income | | | 4,450,477 | |
Accumulated net realized loss on investments | | | (224,376,354 | ) |
Net unrealized appreciation on investments and foreign currencies | | | 102,296,050 | |
| | |
|
|
|
Net assets, December 31, 2004 | | $ | 691,086,714 | |
| | |
|
|
|
Net asset value and redemption price per share, $691,086,714 / 42,053,373 outstanding shares of common stock (authorized 125,000,000 shares) | | $ | 16.43 | |
| | |
|
|
|
STATEMENT OF OPERATIONS
Year Ended December 31, 2004
| | | | |
| INVESTMENT INCOME | | | | |
Dividends (net of $802,622 foreign withholding tax) | | $ | 9,608,128 | |
Interest | | | 8,088 | |
Income from securities loaned, net | | | 317,468 | |
| | |
|
|
|
| | | | 9,933,684 | |
| | |
|
|
|
| EXPENSES | | | | |
Management fee | | | 4,916,113 | |
Custodian’s fees and expenses | | | 376,000 | |
Shareholders’ reports | | | 150,000 | |
Directors’ fees | | | 21,000 | |
Audit fee | | | 15,000 | |
Insurance expenses | | | 14,000 | |
Legal fees and expenses | | | 7,500 | |
Commitment fee on syndicated credit agreement | | | 6,600 | |
Transfer agent’s fees and expenses | | | 5,000 | |
Miscellaneous | | | 7,647 | |
| | |
|
|
|
Total operating expenses | | | 5,518,860 | |
Loan interest expense (Note 8) | | | 136 | |
Less: custodian fee credit | | | (1,749 | ) |
| | |
|
|
|
Net expenses | | | 5,517,247 | |
| | |
|
|
|
| NET INVESTMENT INCOME | | | 4,416,437 | |
| | |
|
|
|
| NET REALIZED AND UNREALIZED GAIN (LOSS) ON INVESTMENTS AND FOREIGN CURRENCIES | | | | |
Net realized gain (loss) on: | | | | |
Investments | | | 49,440,460 | |
Foreign currency transactions | | | (14,388 | ) |
| | |
|
|
|
| | | | 49,426,072 | |
| | |
|
|
|
Net change in unrealized appreciation (depreciation) on: | | | | |
Investments | | | 6,631,540 | |
Foreign currencies | | | 121,753 | |
| | |
|
|
|
| | | | 6,753,293 | |
| | |
|
|
|
| NET GAIN ON INVESTMENTS AND FOREIGN CURRENCIES | | | 56,179,365 | |
| | |
|
|
|
| NET INCREASE IN NET ASSETS RESULTING FROM OPERATIONS | | $ | 60,595,802 | |
| | |
|
|
|
STATEMENT OF CHANGES IN NET ASSETS
| | | | | | | | |
| | | Year Ended
December 31, 2004
| | | Year Ended
December 31, 2003
| |
| INCREASE (DECREASE) IN NET ASSETS | | | | | | | | |
| OPERATIONS: | | | | | | | | |
Net investment income | | $ | 4,416,437 | | | $ | 4,453,078 | |
Net realized gain on investments and foreign currencies | | | 49,426,072 | | | | 11,664,997 | |
Net change in unrealized appreciation (depreciation) on investments and foreign currencies | | | 6,753,293 | | | | 154,048,178 | |
| | |
|
|
| |
|
|
|
NET INCREASE IN NET ASSETS RESULTING FROM OPERATIONS | | | 60,595,802 | | | | 170,166,253 | |
| | |
|
|
| |
|
|
|
| DIVIDENDS: | | | | | | | | |
Dividends from net investment income | | | (6,503,370 | ) | | | (2,077,796 | ) |
| | |
|
|
| |
|
|
|
| CAPITAL STOCK TRANSACTIONS: | | | | | | | | |
Capital stock sold [4,388,836 and 17,778,589 shares, respectively] | | | 67,022,905 | | | | 225,317,636 | |
Capital stock issued in reinvestment of dividends [428,700 and 184,202 shares, respectively] | | | 6,503,370 | | | | 2,077,796 | |
Capital stock repurchased [6,721,998 and 19,392,533 shares, respectively] | | | (102,162,355 | ) | | | (244,784,313 | ) |
| | |
|
|
| |
|
|
|
NET DECREASE IN NET ASSETS RESULTING FROM CAPITAL STOCK TRANSACTIONS | | | (28,636,080 | ) | | | (17,388,881 | ) |
| | |
|
|
| |
|
|
|
| TOTAL INCREASE IN NET ASSETS | | | 25,456,352 | | | | 150,699,576 | |
| NET ASSETS: | | | | | | | | |
Beginning of year | | | 665,630,362 | | | | 514,930,786 | |
| | |
|
|
| |
|
|
|
End of year (a) | | $ | 691,086,714 | | | $ | 665,630,362 | |
| | |
|
|
| |
|
|
|
(a) Includes undistributed net investment income of: | | $ | 4,450,477 | | | $ | 6,551,798 | |
| | |
|
|
| |
|
|
|
SEE NOTES TO FINANCIAL STATEMENTS.
A5
| | | | |
| | | GOVERNMENT INCOME PORTFOLIO | | |
STATEMENT OF ASSETS AND LIABILITIES
December 31, 2004
| | | | |
| ASSETS | | | | |
Investments, at value including securities on loan of $60,640,603 (cost $524,928,788) | | $ | 529,939,925 | |
Interest receivable | | | 3,492,016 | |
Receivable for capital stock sold | | | 16,480 | |
Due from broker-variation margin | | | 6,266 | |
Prepaid assets | | | 7,588 | |
| | |
|
|
|
Total Assets | | | 533,462,275 | |
| | |
|
|
|
| LIABILITIES | | | | |
Collateral for securities on loan | | | 62,279,071 | |
Payable for investments purchased | | | 50,684,656 | |
Management fee payable | | | 142,611 | |
Payable for capital stock repurchased | | | 136,128 | |
Accrued expenses and other liabilities | | | 59,562 | |
Deferred directors’ fees | | | 3,623 | |
| | |
|
|
|
Total Liabilities | | | 113,305,651 | |
| | |
|
|
|
| NET ASSETS | | $ | 420,156,624 | |
| | |
|
|
|
Net assets were comprised of: | | | | |
Common stock, at $0.01 par value | | $ | 360,655 | |
Paid-in capital in excess of par | | | 416,001,336 | |
| | |
|
|
|
| | | | 416,361,991 | |
Undistributed net investment income | | | 2,209,085 | |
Accumulated net realized loss on investments | | | (3,562,299 | ) |
Net unrealized appreciation on investments | | | 5,147,847 | |
| | |
|
|
|
Net assets, December 31, 2004 | | $ | 420,156,624 | |
| | |
|
|
|
Net asset value and redemption price per share, $420,156,624 / 36,065,518 outstanding shares of common stock (authorized 100,000,000 shares) | | $ | 11.65 | |
| | |
|
|
|
STATEMENT OF OPERATIONS
Year Ended December 31, 2004
| | | | |
| INVESTMENT INCOME | | | | |
Interest | | $ | 18,680,093 | |
Dividends | | | 783,377 | |
Income from securities loaned, net | | | 176,285 | |
| | |
|
|
|
| | | | 19,639,755 | |
| | |
|
|
|
| EXPENSES | | | | |
Management fee | | | 1,730,251 | |
Custodian’s fees and expenses | | | 149,000 | |
Shareholders’ reports | | | 73,000 | |
Audit fee | | | 20,000 | |
Directors’ fees | | | 17,000 | |
Legal fees and expenses | | | 10,000 | |
Insurance expenses | | | 10,000 | |
Commitment fee on syndicated credit agreement | | | 6,000 | |
Transfer agent’s fees and expenses | | | 1,200 | |
Miscellaneous | | | 4,723 | |
| | |
|
|
|
Total expenses | | | 2,021,174 | |
Less: custodian fee credit | | | (7,775 | ) |
| | |
|
|
|
Net expenses | | | 2,013,399 | |
| | |
|
|
|
| NET INVESTMENT INCOME | | | 17,626,356 | |
| | |
|
|
|
| NET REALIZED AND UNREALIZED GAIN (LOSS) ON INVESTMENTS | | | | |
Net realized gain (loss) on: | | | | |
Investments | | | 2,690,068 | |
Options written | | | 21,833 | |
Futures transactions | | | (4,534,529 | ) |
| | |
|
|
|
| | | | (1,822,628 | ) |
| | |
|
|
|
Net change in unrealized appreciation (depreciation) on: | | | | |
Investments | | | (3,806,041 | ) |
Futures | | | 1,145,261 | |
| | |
|
|
|
| | | | (2,660,780 | ) |
| | |
|
|
|
| NET LOSS ON INVESTMENTS | | | (4,483,408 | ) |
| | |
|
|
|
| NET INCREASE IN NET ASSETS RESULTING FROM OPERATIONS | | $ | 13,142,948 | |
| | |
|
|
|
STATEMENT OF CHANGES IN NET ASSETS
| | | | | | | | |
| | | Year Ended
December 31, 2004
| | | Year Ended
December 31, 2003
| |
| INCREASE (DECREASE) IN NET ASSETS | | | | | | | | |
| OPERATIONS: | | | | | | | | |
Net investment income | | $ | 17,626,356 | | | $ | 18,651,561 | |
Net realized gain (loss) on investments | | | (1,822,628 | ) | | | 7,593,248 | |
Net change in unrealized appreciation (depreciation) on investments | | | (2,660,780 | ) | | | (14,198,522 | ) |
| | |
|
|
| |
|
|
|
NET INCREASE IN NET ASSETS RESULTING FROM OPERATIONS | | | 13,142,948 | | | | 12,046,287 | |
| | |
|
|
| |
|
|
|
| DIVIDENDS AND DISTRIBUTIONS: | | | | | | | | |
Dividends from net investment income | | | (17,811,600 | ) | | | (18,674,043 | ) |
Distributions from net realized capital gains | | | (5,359,384 | ) | | | (17,308,742 | ) |
| | |
|
|
| |
|
|
|
TOTAL DIVIDENDS AND DISTRIBUTIONS | | | (23,170,984 | ) | | | (35,982,785 | ) |
| | |
|
|
| |
|
|
|
| CAPITAL STOCK TRANSACTIONS: | | | | | | | | |
Capital stock sold [1,721,076 and 5,718,477 shares, respectively] | | | 20,315,715 | | | | 70,040,168 | |
Capital stock issued in reinvestment of dividends and distributions [1,976,013 and 2,987,413 shares, respectively] | | | 23,170,984 | | | | 35,982,785 | |
Capital stock repurchased [6,350,224 and 8,715,550 shares, respectively] | | | (74,818,441 | ) | | | (104,847,327 | ) |
| | |
|
|
| |
|
|
|
NET INCREASE (DECREASE) IN NET ASSETS RESULTING FROM CAPITAL STOCK TRANSACTIONS | | | (31,331,742 | ) | | | 1,175,626 | |
| | |
|
|
| |
|
|
|
| TOTAL DECREASE IN NET ASSETS | | | (41,359,778 | ) | | | (22,760,872 | ) |
| NET ASSETS: | | | | | | | | |
Beginning of year | | | 461,516,402 | | | | 484,277,274 | |
| | |
|
|
| |
|
|
|
End of year (a) | | $ | 420,156,624 | | | $ | 461,516,402 | |
| | |
|
|
| |
|
|
|
(a) Includes undistributed net investment income of: | | $ | 2,209,085 | | | $ | 1,641,908 | |
| | |
|
|
| |
|
|
|
SEE NOTES TO FINANCIAL STATEMENTS.
A6
| | | | |
| | | HIGH YIELD BOND PORTFOLIO | | |
STATEMENT OF ASSETS AND LIABILITIES
as of December 31, 2004
| | | | |
| ASSETS | | | | |
Investments, at value including securities on loan of $276,149,778 (cost $1,792,450,947) | | $ | 1,856,350,243 | |
Cash | | | 5,626,822 | |
Foreign currency, at value (cost: $50,147) | | | 54,312 | |
Dividends and interest receivable | | | 26,274,804 | |
Receivable for capital stock sold | | | 91,063 | |
Prepaid expenses | | | 25,311 | |
| | |
|
|
|
Total Assets | | | 1,888,422,555 | |
| | |
|
|
|
| LIABILITIES | | | | |
Collateral for securities on loan | | | 291,013,237 | |
Management fee payable | | | 735,021 | |
Payable for investments purchased | | | 651,291 | |
Accrued expenses and other liabilities | | | 196,992 | |
Payable for capital stock repurchased | | | 137,199 | |
Deferred director’s fee payable | | | 5,387 | |
| | |
|
|
|
Total Liabilities | | | 292,739,127 | |
| | |
|
|
|
| NET ASSETS | | $ | 1,595,683,428 | |
| | |
|
|
|
Net assets were comprised of: | | | | |
Common stock, at $0.01 par value | | $ | 2,944,179 | |
Paid-in capital in excess of par | | | 1,790,395,815 | |
| | |
|
|
|
| | | | 1,793,339,994 | |
Undistributed net investment income | | | 171,280 | |
Accumulated net realized loss on investments | | | (261,731,307 | ) |
Net unrealized appreciation on investments and foreign currency | | | 63,903,461 | |
| | |
|
|
|
Net assets December 31, 2004 | | $ | 1,595,683,428 | |
| | |
|
|
|
Net asset value and redemption price per share, $1,595,683,428 / 294,417,949 outstanding shares of common stock (authorized 600,000,000 shares) | | $ | 5.42 | |
| | |
|
|
|
STATEMENT OF OPERATIONS
Year Ended December 31, 2004
| | | | |
| INVESTMENT INCOME | | | | |
Interest | | $ | 113,534,541 | |
Dividends | | | 3,447,527 | |
Income from securities loaned, net | | | 803,323 | |
| | |
|
|
|
| | | | 117,785,391 | |
| | |
|
|
|
| EXPENSES | | | | |
Management fee | | | 8,083,755 | |
Custodian’s fees and expenses | | | 308,000 | |
Shareholders’ reports | | | 212,000 | |
Directors’ fees | | | 36,000 | |
Insurance expenses | | | 30,000 | |
Audit fee | | | 20,000 | |
Commitment fee on syndicated credit agreement | | | 18,000 | |
Legal fees and expenses | | | 14,000 | |
Transfer agent’s fees and expenses | | | 2,500 | |
Miscellaneous | | | 10,253 | |
| | |
|
|
|
Total expenses | | | 8,734,508 | |
Less: custodian fee credit | | | (18,079 | ) |
| | |
|
|
|
Net expenses | | | 8,716,429 | |
| | |
|
|
|
| NET INVESTMENT INCOME | | | 109,068,962 | |
| | |
|
|
|
| NET REALIZED AND UNREALIZED GAIN (LOSS) ON INVESTMENTS AND FOREIGN CURRENCIES | | | | |
Net realized gain (loss) on: | | | | |
Investments | | | 33,156,472 | |
Foreign currency transactions | | | (80,146 | ) |
| | |
|
|
|
| | | | 33,076,326 | |
| | |
|
|
|
Net change in unrealized appreciation (depreciation) on: | | | | |
Investments | | | 2,653,050 | |
Foreign currencies | | | 4,166 | |
| | |
|
|
|
| | | | 2,657,216 | |
| | |
|
|
|
| NET GAIN ON INVESTMENTS AND FOREIGN CURRENCIES | | | 35,733,542 | |
| | |
|
|
|
| NET INCREASE IN NET ASSETS RESULTING FROM OPERATIONS | | $ | 144,802,504 | |
| | |
|
|
|
STATEMENT OF CHANGES IN NET ASSETS
| | | | | | | | |
| | | Year Ended
December 31, 2004
| | | Year Ended
December 31, 2003
| |
| INCREASE IN NET ASSETS | | | | | | | | |
| OPERATIONS: | | | | | | | | |
Net investment income | | $ | 109,068,962 | | | $ | 104,322,351 | |
Net realized gain on investments and foreign currencies | | | 33,076,326 | | | | 6,319,986 | |
Net change in unrealized appreciation (depreciation) on investments | | | 2,657,216 | | | | 179,026,505 | |
| | |
|
|
| |
|
|
|
NET INCREASE IN NET ASSETS RESULTING FROM OPERATIONS | | | 144,802,504 | | | | 289,668,842 | |
| | |
|
|
| |
|
|
|
| DIVIDENDS: | | | | | | | | |
Dividends from net investment income | | | (108,509,679 | ) | | | (108,990,863 | ) |
| | |
|
|
| |
|
|
|
| CAPITAL STOCK TRANSACTIONS: | | | | | | | | |
Capital stock sold [22,843,297 and 36,334,558 shares, respectively] | | | 123,128,055 | | | | 183,598,701 | |
Capital stock issued in reinvestment of dividends [20,556,258 and 21,686,510 shares, respectively] | | | 108,509,679 | | | | 108,990,863 | |
Capital stock repurchased [26,189,434 and 26,825,205 shares, respectively] | | | (138,934,319 | ) | | | (135,167,810 | ) |
| | |
|
|
| |
|
|
|
NET INCREASE IN NET ASSETS RESULTING FROM CAPITAL STOCK TRANSACTIONS | | | 92,703,415 | | | | 157,421,754 | |
| | |
|
|
| |
|
|
|
| TOTAL INCREASE IN NET ASSETS | | | 128,996,240 | | | | 338,099,733 | |
| NET ASSETS: | | | | | | | | |
Beginning of year | | | 1,466,687,188 | | | | 1,128,587,455 | |
| | |
|
|
| |
|
|
|
End of year (a) | | $ | 1,595,683,428 | | | $ | 1,466,687,188 | |
| | |
|
|
| |
|
|
|
(a) Includes undistributed net investment income of: | | $ | 171,280 | | | $ | — | |
| | |
|
|
| |
|
|
|
SEE NOTES TO FINANCIAL STATEMENTS.
A7
STATEMENT OF ASSETS AND LIABILITIES
December 31, 2004
| | | | |
| ASSETS | | | | |
Investments, at value including securities on loan of $426,459,186 (cost $2,174,031,930) | | $ | 2,561,611,845 | |
Foreign currency, at value (cost: $23,307) | | | 23,909 | |
Receivable for investments sold | | | 11,556,940 | |
Dividends and interest receivable | | | 783,731 | |
Receivable for capital stock sold | | | 741,687 | |
Prepaid expenses | | | 35,456 | |
| | |
|
|
|
| | | | 2,574,753,568 | |
| | |
|
|
|
| LIABILITIES | | | | |
Collateral for securities on loan | | | 443,274,394 | |
Management fee payable | | | 1,070,608 | |
Payable for capital stock repurchased | | | 1,012,444 | |
Accrued expenses and other liabilities | | | 311,377 | |
Payable to custodian | | | 25,737 | |
Distribution fee payable | | | 17,796 | |
Administration fee payable | | | 10,677 | |
| | |
|
|
|
| | | | 445,723,033 | |
| | |
|
|
|
| NET ASSETS | | $ | 2,129,030,535 | |
| | |
|
|
|
Net assets were comprised of: | | | | |
Common stock, at $0.01 par value | | $ | 1,174,320 | |
Paid-in capital in excess of par | | | 2,895,447,116 | |
| | |
|
|
|
| | | | 2,896,621,436 | |
Undistributed net investment income | | | 348,010 | |
Accumulated net realized loss on investments | | | (1,155,522,486 | ) |
Net unrealized appreciation on investments and foreign currencies | | | 387,583,575 | |
| | |
|
|
|
Net assets, December 31, 2004 | | $ | 2,129,030,535 | |
| | |
|
|
|
| Class I: | | | | |
Net asset value and redemption price per share, $2,044,111,469 / 112,705,877 outstanding shares of common stock (authorized 275,000,000 shares) | | $ | 18.14 | |
| | |
|
|
|
| Class II: | | | | |
Net asset value and redemption price per share, $84,919,066 / 4,726,138 outstanding shares of common stock (authorized 75,000,000 shares) | | $ | 17.97 | |
| | |
|
|
|
STATEMENT OF OPERATIONS
Year Ended December 31, 2004
| | | | |
| INVESTMENT INCOME | | | | |
Dividends (net of $418,663 foreign withholding tax) | | $ | 21,673,529 | |
Interest | | | 448 | |
Income from securities lending, net | | | 499,586 | |
| | |
|
|
|
| | | | 22,173,563 | |
| | |
|
|
|
| EXPENSES | | | | |
Management fee | | | 11,650,035 | |
Distribution fee—Class II | | | 192,240 | |
Administration fee—Class II | | | 115,344 | |
Shareholders’ reports | | | 330,000 | |
Custodian’s fees and expenses | | | 265,000 | |
Insurance expenses | | | 40,000 | |
Directors’ fees | | | 33,000 | |
Commitment fee on syndicated credit agreement | | | 21,000 | |
Audit fee | | | 15,000 | |
Legal fees and expenses | | | 11,000 | |
Transfer agent’s fees and expenses | | | 6,500 | |
Miscellaneous | | | 10,146 | |
| | |
|
|
|
Total operating expenses | | | 12,689,265 | |
Loan interest expense (Note 8) | | | 395 | |
Less: custodian fee credit | | | (1,701 | ) |
| | |
|
|
|
Net expenses | | | 12,687,959 | |
| | |
|
|
|
| NET INVESTMENT INCOME | | | 9,485,604 | |
| | |
|
|
|
| NET REALIZED AND UNREALIZED GAIN (LOSS) ON INVESTMENTS AND FOREIGN CURRENCIES | | | | |
Net realized gain (loss) on: | | | | |
Investments | | | 43,467,535 | |
Foreign currency transactions | | | (137,594 | ) |
| | |
|
|
|
| | | | 43,329,941 | |
| | |
|
|
|
Net change in unrealized appreciation (depreciation) on: | | | | |
Investments | | | 133,576,557 | |
Foreign currencies | | | (4,714 | ) |
| | |
|
|
|
| | | | 133,571,843 | |
| | |
|
|
|
| NET GAIN ON INVESTMENTS AND FOREIGN CURRENCIES | | | 176,901,784 | |
| | |
|
|
|
| NET INCREASE IN NET ASSETS RESULTING FROM OPERATIONS | | $ | 186,387,388 | |
| | |
|
|
|
STATEMENT OF CHANGES IN NET ASSETS
| | | | | | | | |
| | | Year Ended
December 31, 2004
| | | Year Ended
December 31, 2003
| |
| INCREASE IN NET ASSETS | | | | | | | | |
| OPERATIONS: | | | | | | | | |
Net investment income | | $ | 9,485,604 | | | $ | 4,219,386 | |
Net realized gain (loss) on investments and foreign currencies | | | 43,329,941 | | | | (65,648,829 | ) |
Net change in unrealized appreciation (depreciation) on investments and foreign currencies | | | 133,571,843 | | | | 482,870,934 | |
| | |
|
|
| |
|
|
|
NET INCREASE IN NET ASSETS RESULTING FROM OPERATIONS | | | 186,387,388 | | | | 421,441,491 | |
| | |
|
|
| |
|
|
|
| DIVIDENDS: | | | | | | | | |
Dividends from net investment income | | | | | | | | |
Class I | | | (8,976,218 | ) | | | (4,049,114 | ) |
Class II | | | (34,040 | ) | | | — | |
| | |
|
|
| |
|
|
|
| | | | (9,010,258 | ) | | | (4,049,114 | ) |
| | |
|
|
| |
|
|
|
| CAPITAL STOCK TRANSACTIONS (Note 7): | | | | | | | | |
Capital stock sold [20,281,543 and 16,084,536 shares, respectively] | | | 339,856,220 | | | | 232,921,690 | |
Capital stock issued in reinvestment of dividends [504,275 and 248,870 shares, respectively] | | | 9,010,258 | | | | 4,049,114 | |
Capital stock repurchased [14,520,484 and 17,502,721 shares, respectively] | | | (243,917,708 | ) | | | (244,549,890 | ) |
| | |
|
|
| |
|
|
|
NET INCREASE (DECREASE) IN NET ASSETS RESULTING FROM CAPITAL STOCK TRANSACTIONS | | | 104,948,770 | | | | (7,579,086 | ) |
| | |
|
|
| |
|
|
|
| TOTAL INCREASE IN NET ASSETS | | | 282,325,900 | | | | 409,813,291 | |
| NET ASSETS: | | | | | | | | |
Beginning of year | | | 1,846,704,635 | | | | 1,436,891,344 | |
| | |
|
|
| |
|
|
|
End of year (a) | | $ | 2,129,030,535 | | | $ | 1,846,704,635 | |
| | |
|
|
| |
|
|
|
(a) Includes undistributed net investment income of: | | $ | 348,010 | | | $ | 10,258 | |
| | |
|
|
| |
|
|
|
SEE NOTES TO FINANCIAL STATEMENTS.
A8
STATEMENT OF ASSETS AND LIABILITIES
December 31, 2004
| | | |
| ASSETS | | | |
Investments, at value (amortized cost $884,208,596) | | $ | 884,208,596 |
Cash | | | 174 |
Interest receivable | | | 1,437,719 |
Receivable for capital stock sold | | | 870,468 |
Prepaid expenses | | | 16,943 |
| | |
|
|
Total Assets | | | 886,533,900 |
| | |
|
|
| LIABILITIES | | | |
Payable for capital stock repurchased | | | 644,104 |
Management fee payable | | | 300,972 |
Accrued expenses | | | 233,077 |
| | |
|
|
Total Liabilities | | | 1,178,153 |
| | |
|
|
| NET ASSETS | | $ | 885,355,747 |
| | |
|
|
Net assets were comprised of: | | | |
Common stock, at $0.01 par value | | $ | 885,356 |
Paid-in capital in excess of par | | | 884,470,391 |
| | |
|
|
Net assets, December 31, 2004 | | $ | 885,355,747 |
| | |
|
|
Net asset value and redemption price per share, $885,355,747 / 88,535,575 outstanding shares of common stock (authorized 275,000,000 shares) | | $ | 10.00 |
| | |
|
|
STATEMENT OF OPERATIONS
Year Ended December 31, 2004
| | | | |
| INVESTMENT INCOME | | | | |
Interest | | $ | 13,463,153 | |
| | |
|
|
|
| EXPENSES | | | | |
Management fee | | | 3,683,849 | |
Shareholders’ reports | | | 245,000 | |
Custodian’s fees and expenses | | | 106,000 | |
Directors’ fees | | | 28,000 | |
Audit fee | | | 14,000 | |
Insurance expenses | | | 24,000 | |
Legal fees and expenses | | | 10,000 | |
Transfer agent’s fees and expenses | | | 5,500 | |
Miscellaneous | | | 7,431 | |
| | |
|
|
|
Total expenses | | | 4,123,780 | |
Less: custodian fee credit | | | (1,237 | ) |
| | |
|
|
|
Net expenses | | | 4,122,543 | |
| | |
|
|
|
| NET INVESTMENT INCOME | | | 9,340,610 | |
| NET REALIZED GAIN ON INVESTMENTS | | | 24,915 | |
| | |
|
|
|
| NET INCREASE IN NET ASSETS RESULTING FROM OPERATIONS | | $ | 9,365,525 | |
| | |
|
|
|
STATEMENT OF CHANGES IN NET ASSETS
| | | | | | | | |
| | | Year Ended
December 31, 2004
| | | Year Ended
December 31, 2003
| |
| INCREASE (DECREASE) IN NET ASSETS | | | | | | | | |
| OPERATIONS: | | | | | | | | |
Net investment income | | $ | 9,340,610 | | | $ | 10,058,336 | |
Net realized gain on investments | | | 24,915 | | | | 5,631 | |
| | |
|
|
| |
|
|
|
NET INCREASE IN NET ASSETS RESULTING FROM OPERATIONS | | | 9,365,525 | | | | 10,063,967 | |
| | |
|
|
| |
|
|
|
| DIVIDENDS AND DISTRIBUTIONS: | | | | | | | | |
Dividends from net investment income | | | (9,340,610 | ) | | | (10,058,336 | ) |
Distributions from net realized capital gains | | | (24,915 | ) | | | (5,631 | ) |
| | |
|
|
| |
|
|
|
TOTAL DIVIDENDS AND DISTRIBUTIONS | | | (9,365,525 | ) | | | (10,063,967 | ) |
| | |
|
|
| |
|
|
|
| CAPITAL STOCK TRANSACTIONS: | | | | | | | | |
Capital stock sold [50,222,414 and 79,403,786 shares, respectively] | | | 502,224,143 | | | | 794,037,861 | |
Capital stock issued in reinvestment of dividends and distributions [936,553 and 1,006,397 shares, respectively] | | | 9,365,526 | | | | 10,063,967 | |
Capital stock repurchased [55,988,466 and 123,701,580 shares, respectively] | | | (559,884,661 | ) | | | (1,237,015,795 | ) |
| | |
|
|
| |
|
|
|
NET DECREASE IN NET ASSETS RESULTING FROM CAPITAL STOCK TRANSACTIONS | | | (48,294,992 | ) | | | (432,913,967 | ) |
| | |
|
|
| |
|
|
|
| TOTAL DECREASE IN NET ASSETS | | | (48,294,992 | ) | | | (432,913,967 | ) |
| NET ASSETS: | | | | | | | | |
Beginning of year | | | 933,650,739 | | | | 1,366,564,706 | |
| | |
|
|
| |
|
|
|
End of year | | $ | 885,355,747 | | | $ | 933,650,739 | |
| | |
|
|
| |
|
|
|
SEE NOTES TO FINANCIAL STATEMENTS.
A9
| | | | |
| | | NATURAL RESOURCES PORTFOLIO | | |
STATEMENT OF ASSETS AND LIABILITIES
December 31, 2004
| | | | |
| ASSETS | | | | |
Investments, at value including securities on loan of $131,878,496 (cost $520,358,652) | | $ | 763,350,339 | |
Dividends and interest receivable | | | 348,197 | |
Receivable for capital stock sold | | | 71,749 | |
Prepaid expenses | | | 9,512 | |
| | |
|
|
|
Total Assets | | | 763,779,797 | |
| | |
|
|
|
| LIABILITIES | | | | |
Collateral for securities on loan | | | 139,284,543 | |
Payable for investments purchased | | | 1,445,496 | |
Management fee payable | | | 233,098 | |
Accrued expenses and other liabilities | | | 106,510 | |
Payable for capital stock repurchased | | | 100,713 | |
Payable to custodian | | | 54,504 | |
| | |
|
|
|
Total Liabilities | | | 141,224,864 | |
| | |
|
|
|
| NET ASSETS | | $ | 622,554,933 | |
| | |
|
|
|
Net assets were comprised of: | | | | |
Common stock, at $0.01 par value | | $ | 195,309 | |
Paid-in capital in excess of par | | | 334,240,153 | |
| | |
|
|
|
| | | | 334,435,462 | |
Distributions in excess of net investment income | | | (14,843,794 | ) |
Accumulated net realized gain on investments | | | 59,971,508 | |
Net unrealized appreciation on investments and foreign currencies | | | 242,991,757 | |
| | |
|
|
|
Net assets, December 31, 2004 | | $ | 622,554,933 | |
| | |
|
|
|
Net asset value and redemption price per share, $622,554,933 / 19,530,900 outstanding shares of common stock (authorized 100,000,000 shares) | | $ | 31.88 | |
| | |
|
|
|
STATEMENT OF OPERATIONS
Year Ended December 31, 2004
| | | | |
| INVESTMENT INCOME | | | | |
Dividends (net of $434,508 foreign withholding tax) | | $ | 4,886,488 | |
Interest | | | 1,857 | |
Income from securities lending, net | | | 554,083 | |
| | |
|
|
|
| | | | 5,442,428 | |
| | |
|
|
|
| EXPENSES | | | | |
Management fee | | | 2,446,574 | |
Custodian’s fees and expenses | | | 212,000 | |
Shareholders’ reports | | | 60,000 | |
Directors’ fees | | | 16,000 | |
Audit fee | | | 16,000 | |
Insurance expenses | | | 10,000 | |
Legal fees and expenses | | | 8,500 | |
Commitment fee on syndicated credit agreement | | | 6,100 | |
Transfer agent’s fees and expenses | | | 1,300 | |
Miscellaneous | | | 7,195 | |
| | |
|
|
|
Total expenses | | | 2,783,669 | |
Less: custodian fee credit | | | (973 | ) |
| | |
|
|
|
Net expenses | | | 2,782,696 | |
| | |
|
|
|
| NET INVESTMENT INCOME | | | 2,659,732 | |
| | |
|
|
|
| NET REALIZED AND UNREALIZED GAIN (LOSS) ON INVESTMENTS AND FOREIGN CURRENCIES | | | | |
Net realized gain (loss) on: | | | | |
Investments | | | 61,249,467 | |
Foreign currency transactions | | | (66,195 | ) |
| | |
|
|
|
| | | | 61,183,272 | |
| | |
|
|
|
Net change in unrealized appreciation (depreciation) on: | | | | |
Investments | | | 61,165,647 | |
Foreign currencies | | | (2,838 | ) |
| | |
|
|
|
| | | | 61,162,809 | |
| | |
|
|
|
| NET GAIN ON INVESTMENTS AND FOREIGN CURRENCIES | | | 122,346,081 | |
| | |
|
|
|
| NET INCREASE IN NET ASSETS RESULTING FROM OPERATIONS | | $ | 125,005,813 | |
| | |
|
|
|
STATEMENT OF CHANGES IN NET ASSETS
| | | | | | | | |
| | | Year Ended
December 31, 2004
| | | Year Ended
December 31, 2003
| |
| INCREASE (DECREASE) IN NET ASSETS | | | | | | | | |
| OPERATIONS: | | | | | | | | |
Net investment income | | $ | 2,659,732 | | | $ | 3,234,760 | |
Net realized gain on investments and foreign currencies | | | 61,183,272 | | | | 34,228,780 | |
Net change in unrealized appreciation (depreciation) on investments and foreign currencies | | | 61,162,809 | | | | 104,149,291 | |
| | |
|
|
| |
|
|
|
NET INCREASE IN NET ASSETS RESULTING FROM OPERATIONS | | | 125,005,813 | | | | 141,612,831 | |
| | |
|
|
| |
|
|
|
| DIVIDENDS AND DISTRIBUTIONS: | | | | | | | | |
Dividends from net investment income | | | (18,430,595 | ) | | | (16,566,539 | ) |
Distributions from net realized capital gains | | | (19,967,025 | ) | | | (25,527,524 | ) |
| | |
|
|
| |
|
|
|
TOTAL DIVIDENDS AND DISTRIBUTIONS | | | (38,397,620 | ) | | | (42,094,063 | ) |
| | |
|
|
| |
|
|
|
| CAPITAL STOCK TRANSACTIONS: | | | | | | | | |
Capital stock sold [1,401,282 and 1,216,643 shares, respectively] | | | 39,851,530 | | | | 27,391,981 | |
Capital stock issued in reinvestment of dividends and distributions [1,462,209 and 2,200,422 shares, respectively] | | | 38,397,620 | | | | 42,094,063 | |
Capital stock repurchased [1,476,976 and 2,238,450 shares, respectively] | | | (41,027,681 | ) | | | (49,471,579 | ) |
| | |
|
|
| |
|
|
|
NET INCREASE IN NET ASSETS RESULTING FROM CAPITAL STOCK TRANSACTIONS | | | 37,221,469 | | | | 20,014,465 | |
| | |
|
|
| |
|
|
|
| TOTAL INCREASE IN NET ASSETS | | | 123,829,662 | | | | 119,533,233 | |
| NET ASSETS: | | | | | | | | |
Beginning of year | | | 498,725,271 | | | | 379,192,038 | |
| | |
|
|
| |
|
|
|
End of year | | $ | 622,554,933 | | | $ | 498,725,271 | |
| | |
|
|
| |
|
|
|
SEE NOTES TO FINANCIAL STATEMENTS.
A10
| | | | |
| | | SMALL CAPITALIZATION STOCK PORTFOLIO | | |
STATEMENT OF ASSETS AND LIABILITIES
December 31, 2004
| | | |
| ASSETS | | | |
Investments, at value including securities on loan of $147,253,475 (cost $689,786,033) | | $ | 890,948,559 |
Cash | | | 6 |
Receivable for investments sold | | | 603,789 |
Dividends and interest receivable | | | 544,088 |
Receivable for capital stock sold | | | 389,554 |
Prepaid expenses | | | 11,954 |
Due from broker-variation margin | | | 2,775 |
| | |
|
|
Total Assets | | | 892,500,725 |
| | |
|
|
| LIABILITIES | | | |
Collateral for securities on loan | | | 148,305,322 |
Payable for investments purchased | | | 548,845 |
Management fee payable | | | 248,348 |
Accrued expenses and other liabilities | | | 163,294 |
Payable for capital stock repurchased | | | 5,108 |
| | |
|
|
Total Liabilities | | | 149,270,917 |
| | |
|
|
| NET ASSETS | | $ | 743,229,808 |
| | |
|
|
Net assets were comprised of: | | | |
Common stock, at $0.01 par value | | $ | 348,463 |
Paid-in capital in excess of par | | | 502,153,472 |
| | |
|
|
| | | | 502,501,935 |
Undistributed net investment income | | | 178,755 |
Accumulated net realized gain on investments | | | 39,379,817 |
Net unrealized appreciation on investments | | | 201,169,301 |
| | |
|
|
Net assets, December 31, 2004 | | $ | 743,229,808 |
| | |
|
|
Net asset value and redemption price per share, $743,229,808 / 34,846,303 outstanding shares of common stock (authorized 100,000,000 shares) | | $ | 21.33 |
| | |
|
|
STATEMENT OF OPERATIONS
Year Ended December 31, 2004
| | | | |
| INVESTMENT INCOME | | | | |
Dividends (net of $2,620 foreign withholding tax) | | $ | 6,737,731 | |
Interest | | | 8,765 | |
Income from securities lending, net | | | 433,039 | |
| | |
|
|
|
| | | | 7,179,535 | |
| | |
|
|
|
| EXPENSES | | | | |
Management fee | | | 2,638,921 | |
Custodian’s fees and expenses | | | 238,000 | |
Shareholders’ reports | | | 102,000 | |
Directors’ fees | | | 17,000 | |
Audit fee | | | 16,000 | |
Insurance expenses | | | 13,000 | |
Legal fees and expenses | | | 8,000 | |
Commitment fee on syndicated credit agreement | | | 7,500 | |
Transfer agent’s fees and expenses | | | 1,700 | |
Miscellaneous | | | 61,150 | |
| | |
|
|
|
Total operating expenses | | | 3,103,271 | |
Loan interest expense (Note 8) | | | 68 | |
Less: custodian fee credit | | | (2,559 | ) |
| | |
|
|
|
Net expenses | | | 3,100,780 | |
| | |
|
|
|
| NET INVESTMENT INCOME | | | 4,078,755 | |
| | |
|
|
|
| NET REALIZED AND UNREALIZED GAIN ON INVESTMENTS | | | | |
Net realized gain on: | | | | |
Investments | | | 43,155,168 | |
Futures transactions | | | 110,788 | |
| | |
|
|
|
| | | | 43,265,956 | |
| | |
|
|
|
Net change in unrealized appreciation (depreciation) on: | | | | |
Investments | | | 87,678,730 | |
Futures | | | (137,700 | ) |
| | |
|
|
|
| | | | 87,541,030 | |
| | |
|
|
|
| NET GAIN ON INVESTMENTS | | | 130,806,986 | |
| | |
|
|
|
| NET INCREASE IN NET ASSETS RESULTING FROM OPERATIONS | | $ | 134,885,741 | |
| | |
|
|
|
STATEMENT OF CHANGES IN NET ASSETS
| | | | | | | | |
| | | Year Ended
December 31, 2004
| | | Year Ended
December 31, 2003
| |
| INCREASE (DECREASE) IN NET ASSETS | | | | | | | | |
| OPERATIONS: | | | | | | | | |
Net investment income | | $ | 4,078,755 | | | $ | 2,382,260 | |
Net realized gain on investments | | | 43,265,956 | | | | 6,054,498 | |
Net change in unrealized appreciation (depreciation) on investments | | | 87,541,030 | | | | 161,178,295 | |
| | |
|
|
| |
|
|
|
NET INCREASE IN NET ASSETS RESULTING FROM OPERATIONS | | | 134,885,741 | | | | 169,615,053 | |
| | |
|
|
| |
|
|
|
| DIVIDENDS AND DISTRIBUTIONS: | | | | | | | | |
Dividends from net investment income | | | (3,949,770 | ) | | | (2,476,478 | ) |
Distributions from net realized capital gains | | | (2,458,828 | ) | | | (3,294,388 | ) |
| | |
|
|
| |
|
|
|
TOTAL DIVIDENDS AND DISTRIBUTIONS | | | (6,408,598 | ) | | | (5,770,866 | ) |
| | |
|
|
| |
|
|
|
| CAPITAL STOCK TRANSACTIONS: | | | | | | | | |
Capital stock sold [2,655,531 and 3,617,854 shares, respectively] | | | 49,733,501 | | | | 55,220,782 | |
Capital stock issued in reinvestment of dividends and distributions [324,158 and 416,271 shares, respectively] | | | 6,408,598 | | | | 5,770,866 | |
Capital stock repurchased [3,284,891 and 5,077,773 shares, respectively] | | | (61,288,177 | ) | | | (72,352,327 | ) |
| | |
|
|
| |
|
|
|
NET INCREASE IN NET ASSETS RESULTING FROM CAPITAL STOCK TRANSACTIONS | | | (5,146,078 | ) | | | (11,360,679 | ) |
| | |
|
|
| |
|
|
|
| TOTAL INCREASE IN NET ASSETS | | | 123,331,065 | | | | 152,483,508 | |
| NET ASSETS: | | | | | | | | |
Beginning of year | | | 619,898,743 | | | | 467,415,235 | |
| | |
|
|
| |
|
|
|
End of year (a) | | $ | 743,229,808 | | | $ | 619,898,743 | |
| | |
|
|
| |
|
|
|
(a) Includes undistributed net investment income of: | | $ | 178,755 | | | $ | 49,770 | |
| | |
|
|
| |
|
|
|
SEE NOTES TO FINANCIAL STATEMENTS.
A11
STATEMENT OF ASSETS AND LIABILITIES
December 31, 2004
| | | |
| ASSETS | | | |
Investments, at value including securities on loan of $597,200,348 (cost $2,894,812,300) | | $ | 3,714,037,390 |
Cash | | | 36 |
Dividends receivable | | | 3,989,493 |
Receivable for investments sold | | | 2,085,724 |
Receivable for capital stock sold | | | 303,645 |
Prepaid expenses | | | 52,552 |
| | |
|
|
Total Assets | | | 3,720,468,840 |
| | |
|
|
| LIABILITIES | | | |
Collateral for securities on loan | | | 621,001,370 |
Payable for investments purchased | | | 2,577,408 |
Management fee payable | | | 907,905 |
Payable for capital stock repurchased | | | 868,820 |
Accrued expenses | | | 383,140 |
Due to broker-variation margin | | | 57,186 |
| | |
|
|
Total Liabilities | | | 625,795,829 |
| | |
|
|
| NET ASSETS | | $ | 3,094,673,011 |
| | |
|
|
Net assets were comprised of: | | | |
Common stock, at $0.01 par value | | $ | 989,123 |
Paid-in capital in excess of par | | | 2,193,675,955 |
| | |
|
|
| | | | 2,194,665,078 |
Undistributed net investment income | | | 1,589,801 |
Accumulated net realized gain on investments | | | 78,621,754 |
Net unrealized appreciation on investments | | | 819,796,378 |
| | |
|
|
Net assets, December 31, 2004 | | $ | 3,094,673,011 |
| | |
|
|
Net asset value and redemption price per share, $3,094,673,011 / 98,912,253 outstanding shares of common stock (authorized 275,000,000 shares) | | $ | 31.29 |
| | |
|
|
STATEMENT OF OPERATIONS
Year Ended December 31, 2004
| | | | |
| INVESTMENT INCOME | | | | |
Dividends | | $ | 59,081,758 | |
Interest | | | 77,537 | |
Income from securities loaned, net | | | 563,553 | |
| | |
|
|
|
| | | | 59,722,848 | |
| | |
|
|
|
| EXPENSES | | | | |
Management fee | | | 10,304,686 | |
Custodian’s fees and expenses | | | 415,000 | |
Shareholders’ reports | | | 379,000 | |
Insurance expenses | | | 62,000 | |
Directors’ fees | | | 48,000 | |
Commitment fee on syndicated credit agreement | | | 32,000 | |
Audit fee | | | 16,000 | |
Legal fees and expenses | | | 15,000 | |
Transfer agent’s fees and expenses | | | 5,400 | |
Miscellaneous | | | 14,864 | |
| | |
|
|
|
Total expenses | | | 11,291,950 | |
Less: custodian fee credit | | | (1,109 | ) |
| | |
|
|
|
Net expenses | | | 11,290,841 | |
| | |
|
|
|
| NET INVESTMENT INCOME | | | 48,432,007 | |
| | |
|
|
|
| NET REALIZED AND UNREALIZED GAIN ON INVESTMENTS | | | | |
Net realized gain on: | | | | |
Investments | | | 72,490,484 | |
Futures transactions | | | 9,809,212 | |
| | |
|
|
|
| | | | 82,299,696 | |
| | |
|
|
|
Net change in unrealized appreciation (depreciation) on: | | | | |
Investments | | | 168,179,418 | |
Futures | | | (2,381,036 | ) |
| | |
|
|
|
| | | | 165,798,382 | |
| | |
|
|
|
| NET GAIN ON INVESTMENTS | | | 248,098,078 | |
| | |
|
|
|
| NET INCREASE IN NET ASSETS RESULTING FROM OPERATIONS | | $ | 296,530,085 | |
| | |
|
|
|
STATEMENT OF CHANGES IN NET ASSETS
| | | | | | | | |
| | | Year Ended
December 31, 2004
| | | Year Ended
December 31, 2003
| |
| INCREASE (DECREASE) IN NET ASSETS | | | | | | | | |
| OPERATIONS: | | | | | | | | |
Net investment income | | $ | 48,432,007 | | | $ | 36,066,618 | |
Net realized gain on investments | | | 82,299,696 | | | | 52,416,302 | |
Net change in unrealized appreciation (depreciation) on investments | | | 165,798,382 | | | | 557,511,864 | |
| | |
|
|
| |
|
|
|
NET INCREASE IN NET ASSETS RESULTING FROM OPERATIONS | | | 296,530,085 | | | | 645,994,784 | |
| | |
|
|
| |
|
|
|
| DIVIDENDS AND DISTRIBUTIONS: | | | | | | | | |
Dividends from net investment income | | | (47,984,184 | ) | | | (36,873,448 | ) |
Distributions from net realized capital gains | | | (50,558,478 | ) | | | (88,278,910 | ) |
| | |
|
|
| |
|
|
|
TOTAL DIVIDENDS AND DISTRIBUTIONS | | | (98,542,662 | ) | | | (125,152,358 | ) |
| | |
|
|
| |
|
|
|
| CAPITAL STOCK TRANSACTIONS: | | | | | | | | |
Capital stock sold [9,453,913 and 11,323,413 shares, respectively] | | | 278,172,758 | | | | 289,984,229 | |
Capital stock issued in reinvestment of dividends and distributions [3,317,515 and 5,178,990 shares, respectively] | | | 98,542,662 | | | | 125,152,358 | |
Capital stock repurchased [14,255,340 and 13,763,310 shares, respectively] | | | (420,932,471 | ) | | | (347,327,411 | ) |
| | |
|
|
| |
|
|
|
NET INCREASE (DECREASE) IN NET ASSETS RESULTING FROM CAPITAL STOCK TRANSACTIONS | | | (44,217,051 | ) | | | 67,809,176 | |
| | |
|
|
| |
|
|
|
| TOTAL INCREASE IN NET ASSETS | | | 153,770,372 | | | | 588,651,602 | |
| NET ASSETS: | | | | | | | | |
Beginning of year | | | 2,940,902,639 | | | | 2,352,251,037 | |
| | |
|
|
| |
|
|
|
End of year (a) | | $ | 3,094,673,011 | | | $ | 2,940,902,639 | |
| | |
|
|
| |
|
|
|
(a) Includes undistributed net investment income of: | | $ | 1,589,801 | | | $ | 1,141,978 | |
| | |
|
|
| |
|
|
|
SEE NOTES TO FINANCIAL STATEMENTS.
A12
STATEMENT OF ASSETS AND LIABILITIES
December 31, 2004
| | | | |
| ASSETS | | | | |
Investments, at value including securities on loan of $224,320,778 (cost $1,487,075,337) | | $ | 1,819,623,676 | |
Receivable for investments sold | | | 11,489,428 | |
Dividends and interest receivable | | | 2,498,589 | |
Receivable for capital stock sold | | | 138,647 | |
Prepaid expenses | | | 26,819 | |
| | |
|
|
|
Total Assets | | | 1,833,777,159 | |
| | |
|
|
|
| LIABILITIES | | | | |
Collateral for securities on loan | | | 233,693,985 | |
Management fee payable | | | 534,865 | |
Payable for capital stock repurchased | | | 394,991 | |
Accrued expenses and other liabilities | | | 576,420 | |
Distribution fee payable | | | 625 | |
Administration fee payable | | | 375 | |
Payable to custodian | | | 139 | |
| | |
|
|
|
Total Liabilities | | | 235,201,400 | |
| | |
|
|
|
| NET ASSETS | | $ | 1,598,575,759 | |
| | |
|
|
|
Net assets were comprised of: | | | | |
Common stock, at $0.01 par value | | $ | 802,162 | |
Paid-in capital in excess of par | | | 1,406,616,371 | |
| | |
|
|
|
| | | | 1,407,418,533 | |
Undistributed net investment income | | | 1,623,087 | |
Accumulated net realized loss on investments and foreign currencies | | | (143,015,210 | ) |
Net unrealized appreciation on investments and foreign currencies | | | 332,549,349 | |
| | |
|
|
|
Net assets, December 31, 2004 | | $ | 1,598,575,759 | |
| | |
|
|
|
| Class I: | | | | |
Net asset value and redemption price per share $1,595,583,559 / 80,066,164 outstanding shares of common stock (authorized 275,000,000 shares) | | $ | 19.93 | |
| | |
|
|
|
| Class II: | | | | |
Net asset value and redemption price per share, $2,992,200 / 150,068 outstanding shares of common stock (authorized 50,000,000 shares) | | $ | 19.94 | |
| | |
|
|
|
STATEMENT OF OPERATIONS
Year Ended December 31, 2004
| | | | |
| INVESTMENT INCOME | | | | |
Dividends (net of $410,436 foreign withholding tax) | | $ | 28,260,618 | |
Income from securities lending, net | | | 382,187 | |
| | |
|
|
|
| | | | 28,642,805 | |
| | |
|
|
|
| EXPENSES | | | | |
Management fee | | | 5,967,723 | |
Distribution fee—Class II | | | 6,989 | |
Administration fee—Class II | | | 4,193 | |
Shareholders’ reports | | | 287,000 | |
Custodian’s fees and expenses | | | 201,000 | |
Insurance expenses | | | 31,000 | |
Directors’ fees | | | 30,000 | |
Commitment fee on syndicated credit agreement | | | 15,000 | |
Audit fee | | | 15,000 | |
Legal fees and expenses | | | 12,000 | |
Transfer agent’s fees and expenses | | | 6,000 | |
Miscellaneous | | | 9,277 | |
| | |
|
|
|
Total expenses | | | 6,585,182 | |
Loan interest expense (Note 8) | | | 20 | |
Less: custodian fee credit | | | (3,322 | ) |
| | |
|
|
|
Net expenses | | | 6,581,880 | |
| | |
|
|
|
| NET INVESTMENT INCOME | | | 22,060,925 | |
| | |
|
|
|
| NET REALIZED AND UNREALIZED GAIN ON INVESTMENTS AND FOREIGN CURRENCIES | | | | |
Net realized gain on: | | | | |
Investments | | | 77,061,070 | |
Foreign currency transactions | | | 1,171 | |
| | |
|
|
|
| | | | 77,062,241 | |
| | |
|
|
|
Net change in unrealized appreciation (depreciation) on: | | | | |
Investments | | | 129,043,342 | |
Foreign currencies | | | 1,010 | |
| | |
|
|
|
| | | | 129,044,352 | |
| | |
|
|
|
| NET GAIN ON INVESTMENTS AND FOREIGN CURRENCIES | | | 206,106,593 | |
| | |
|
|
|
| NET INCREASE IN NET ASSETS RESULTING FROM OPERATIONS | | $ | 228,167,518 | |
| | |
|
|
|
STATEMENT OF CHANGES IN NET ASSETS
| | | | | | | | |
| | | Year Ended
December 31, 2004
| | | Year Ended
December 31, 2003
| |
| INCREASE (DECREASE) IN NET ASSETS | | | | | | | | |
| OPERATIONS: | | | | | | | | |
Net investment income | | $ | 22,060,925 | | | $ | 19,114,150 | |
Net realized gain on investments | | | 77,062,241 | | | | 4,156,849 | |
Net change in unrealized appreciation (depreciation) on investments | | | 129,044,352 | | | | 302,547,646 | |
| | |
|
|
| |
|
|
|
NET INCREASE IN NET ASSETS RESULTING FROM OPERATIONS | | | 228,167,518 | | | | 325,818,645 | |
| | |
|
|
| |
|
|
|
| DIVIDENDS AND DISTRIBUTIONS: | | | | | | | | |
Dividends from net investment income | | | | | | | | |
Class I | | | (20,412,598 | ) | | | (19,922,456 | ) |
Class II | | | (26,411 | ) | | | (26,543 | ) |
| | |
|
|
| |
|
|
|
| | | | (20,439,009 | ) | | | (19,948,999 | ) |
| | |
|
|
| |
|
|
|
Tax return of capital | | | | | | | | |
Class I | | | — | | | | (111,957 | ) |
Class II | | | — | | | | (149 | ) |
| | |
|
|
| |
|
|
|
| | | | — | | | | (112,106 | ) |
| | |
|
|
| |
|
|
|
TOTAL DIVIDENDS AND DISTRIBUTIONS | | | (20,439,009 | ) | | | (20,061,105 | ) |
| | |
|
|
| |
|
|
|
| CAPITAL STOCK TRANSACTIONS (Note 7): | | | | | | | | |
Capital stock sold [3,961,436 and 5,751,364 shares, respectively] | | | 72,300,449 | | | | 85,572,556 | |
Capital stock issued in reinvestment of dividends [1,041,743 and 1,195,581 shares, respectively] | | | 20,439,009 | | | | 20,061,105 | |
Capital stock repurchased [8,812,231 and 13,737,343 shares, respectively] | | | (160,915,601 | ) | | | (200,934,074 | ) |
| | |
|
|
| |
|
|
|
NET DECREASE IN NET ASSETS RESULTING FROM CAPITAL STOCK TRANSACTIONS | | | (68,176,143 | ) | | | (95,300,413 | ) |
| | |
|
|
| |
|
|
|
| TOTAL INCREASE IN NET ASSETS | | | 139,552,366 | | | | 210,457,127 | |
| NET ASSETS: | | | | | | | | |
Beginning of year | | | 1,459,023,393 | | | | 1,248,566,266 | |
| | |
|
|
| |
|
|
|
End of year (a) | | $ | 1,598,575,759 | | | $ | 1,459,023,393 | |
| | |
|
|
| |
|
|
|
(a) Includes undistributed net investment income of: | | $ | 1,623,087 | | | $ | — | |
| | |
|
|
| |
|
|
|
SEE NOTES TO FINANCIAL STATEMENTS.
A13
| | | | |
| | | ZERO COUPON BOND PORTFOLIO 2005 | | |
STATEMENT OF ASSETS AND LIABILITIES
December 31, 2004
| | | |
| ASSETS | | | |
Investments, at value (cost $59,525,441) | | $ | 60,630,438 |
Receivable for capital stock sold | | | 1,744 |
Prepaid expenses | | | 1,100 |
Interest receivable | | | 67 |
| | |
|
|
Total Assets | | | 60,633,349 |
| | |
|
|
| LIABILITIES | | | |
Accrued expenses and other liabilities | | | 36,120 |
Management fee payable | | | 20,538 |
Payable for capital stock repurchased | | | 6,977 |
| | |
|
|
Total Liabilities | | | 63,635 |
| | |
|
|
| NET ASSETS | | $ | 60,569,714 |
| | |
|
|
Net assets were comprised of: | | | |
Common stock, at $0.01 par value | | $ | 48,114 |
Paid-in capital in excess of par | | | 59,020,881 |
| | |
|
|
| | | | 59,068,995 |
Accumulated net realized gain on investments | | | 395,722 |
Net unrealized appreciation on investments | | | 1,104,997 |
| | |
|
|
Net assets, December 31, 2004 | | $ | 60,569,714 |
| | |
|
|
Net asset value and redemption price per share, $60,569,714 / 4,811,350 outstanding shares of common stock (authorized 100,000,000 shares) | | $ | 12.59 |
| | |
|
|
STATEMENT OF OPERATIONS
Year Ended December 31, 2004
| | | | |
| INVESTMENT INCOME | | | | |
Interest | | $ | 2,963,434 | |
Dividends | | | 22,228 | |
| | |
|
|
|
| | | | 2,985,662 | |
| | |
|
|
|
| EXPENSES | | | | |
Management fee | | | 248,196 | |
Custodian’s fees and expenses | | | 90,000 | |
Audit fee | | | 21,000 | |
Directors’ fees | | | 11,000 | |
Legal fees and expenses | | | 8,000 | |
Shareholders’ reports | | | 7,000 | |
Insurance expenses | | | 1,400 | |
Transfer agent’s fees and expenses | | | 500 | |
Miscellaneous | | | 1,442 | |
| | |
|
|
|
Total expenses | | | 388,538 | |
Less: custodian fee credit | | | (20 | ) |
| | |
|
|
|
Net expenses | | | 388,518 | |
| | |
|
|
|
| NET INVESTMENT INCOME | | | 2,597,144 | |
| | |
|
|
|
| NET REALIZED AND UNREALIZED GAIN (LOSS) ON INVESTMENTS | | | | |
Net realized gain on investments | | | 396,206 | |
Net change in unrealized appreciation (depreciation) on investments | | | (2,663,265 | ) |
| | |
|
|
|
| NET LOSS ON INVESTMENTS | | | (2,267,059 | ) |
| | |
|
|
|
| NET INCREASE IN NET ASSETS RESULTING FROM OPERATIONS | | $ | 330,085 | |
| | |
|
|
|
STATEMENT OF CHANGES IN NET ASSETS
| | | | | | | | |
| | | Year Ended
December 31, 2004
| | | Year Ended
December 31, 2003
| |
| INCREASE (DECREASE) IN NET ASSETS | | | | | | | | |
| OPERATIONS: | | | | | | | | |
Net investment income | | $ | 2,597,144 | | | $ | 2,875,037 | |
Net realized gain on investments | | | 396,206 | | | | 1,511,352 | |
Net change in unrealized appreciation (depreciation) on investments | | | (2,663,265 | ) | | | (3,113,046 | ) |
| | |
|
|
| |
|
|
|
NET INCREASE IN NET ASSETS RESULTING FROM OPERATIONS | | | 330,085 | | | | 1,273,343 | |
| | |
|
|
| |
|
|
|
| DIVIDENDS AND DISTRIBUTIONS: | | | | | | | | |
Dividends from net investment income | | | (2,597,144 | ) | | | (2,875,037 | ) |
Distributions from net realized capital gains | | | (1,497,906 | ) | | | (57,155 | ) |
| | |
|
|
| |
|
|
|
TOTAL DIVIDENDS AND DISTRIBUTIONS | | | (4,095,050 | ) | | | (2,932,192 | ) |
| | |
|
|
| |
|
|
|
| CAPITAL STOCK TRANSACTIONS: | | | | | | | | |
Capital stock sold [120,558 and 433,990 shares, respectively] | | | 1,573,155 | | | | 5,978,323 | |
Capital stock issued in reinvestment of dividends and distributions [318,012 and 216,114 shares, respectively] | | | 4,095,050 | | | | 2,932,192 | |
Capital stock repurchased [401,001 and 745,055 shares, respectively] | | | (5,230,079 | ) | | | (10,203,192 | ) |
| | |
|
|
| |
|
|
|
NET INCREASE (DECREASE) IN NET ASSETS RESULTING FROM CAPITAL STOCK TRANSACTIONS | | | 438,126 | | | | (1,292,677 | ) |
| | |
|
|
| |
|
|
|
| TOTAL DECREASE IN NET ASSETS | | | (3,326,839 | ) | | | (2,951,526 | ) |
| NET ASSETS: | | | | | | | | |
Beginning of year | | | 63,896,553 | | | | 66,848,079 | |
| | |
|
|
| |
|
|
|
End of year | | $ | 60,569,714 | | | $ | 63,896,553 | |
| | |
|
|
| |
|
|
|
SEE NOTES TO FINANCIAL STATEMENTS.
A14
| | | | |
| | | CONSERVATIVE BALANCED PORTFOLIO | | |
SCHEDULE OF INVESTMENTS | December 31, 2004 |
| | | | | |
| LONG-TERM INVESTMENTS — 95.4% | | Value (Note 2)
|
| COMMON STOCKS — 59.4% | | Shares
| |
Aerospace — 1.1% | | | | | |
Boeing Co. | | 127,600 | | $ | 6,605,852 |
General Dynamics Corp. | | 31,100 | | | 3,253,060 |
Honeywell International, Inc. | | 132,512 | | | 4,692,250 |
Lockheed Martin Corp. | | 67,200 | | | 3,732,960 |
Northrop Grumman Corp.(b) | | 57,162 | | | 3,107,326 |
Raytheon Co. | | 67,100 | | | 2,605,493 |
Rockwell Collins, Inc.(b) | | 29,100 | | | 1,147,704 |
United Technologies Corp. | | 78,500 | | | 8,112,975 |
| | | | |
|
|
| | | | | | 33,257,620 |
| | | | |
|
|
Airlines — 0.1% | | | | | |
Delta Airlines, Inc.(a)(b) | | 20,600 | | | 154,088 |
Southwest Airlines Co. | | 117,300 | | | 1,909,644 |
| | | | |
|
|
| | | | | | 2,063,732 |
| | | | |
|
|
Apparel — 0.3% | | | | | |
Cintas Corp.(b) | | 24,000 | | | 1,052,640 |
Coach, Inc.(a) | | 28,100 | | | 1,584,840 |
Jones Apparel Group, Inc. | | 19,100 | | | 698,487 |
Nike, Inc. (Class “B” Stock) | | 40,100 | | | 3,636,669 |
Reebok International Ltd.(b) | | 10,200 | | | 448,800 |
| | | | |
|
|
| | | | | | 7,421,436 |
| | | | |
|
|
Autos – Cars & Trucks — 0.5% | | | | | |
Cummins Engine, Inc. | | 7,200 | | | 603,288 |
Dana Corp. | | 25,000 | | | 433,250 |
Delphi Automotive Systems Corp. | | 86,252 | | | 777,993 |
Ford Motor Co.(b) | | 279,695 | | | 4,094,735 |
General Motors Corp.(b) | | 85,191 | | | 3,412,751 |
Genuine Parts Co. | | 26,100 | | | 1,149,966 |
Navistar International Corp.(a)(b) | | 9,700 | | | 426,606 |
PACCAR, Inc. | | 28,275 | | | 2,275,572 |
Visteon Corp.(b) | | 24,811 | | | 242,404 |
| | | | |
|
|
| | | | | | 13,416,565 |
| | | | |
|
|
Banks & Savings & Loans — 4.5% | | | | | |
AmSouth Bancorporation(b) | | 53,900 | | | 1,396,010 |
Bank of New York Co., Inc. (The) | | 115,500 | | | 3,860,010 |
BankAmerica Corp. | | 620,566 | | | 29,160,396 |
BB&T Corp.(b) | | 84,900 | | | 3,570,045 |
Comerica, Inc.(b) | | 26,100 | | | 1,592,622 |
Compass Bancshares, Inc. | | 9,700 | | | 472,099 |
First Horizon National Corp. | | 17,000 | | | 732,870 |
Golden West Financial Corp. | | 48,000 | | | 2,948,160 |
Huntington Bancshares, Inc.(b) | | 37,836 | | | 937,576 |
J.P. Morgan & Chase Co. | | 541,801 | | | 21,135,657 |
KeyCorp Ltd. | | 65,300 | | | 2,213,670 |
M&T Bank Corp.(b) | | 17,500 | | | 1,887,200 |
Mellon Financial Corp. | | 65,900 | | | 2,050,149 |
National City Corp. | | 98,900 | | | 3,713,695 |
North Fork Bancorporation, Inc. | | 71,100 | | | 2,051,235 |
Northern Trust Corp.(b) | | 32,600 | | | 1,583,708 |
PNC Financial Services Group, Inc. (The) | | 42,700 | | | 2,452,688 |
Providian Financial Corp.(a)(b) | | 43,100 | | | 709,857 |
Regions Financial Corp. | | 74,035 | | | 2,634,906 |
Sovereign Bancorp, Inc. | | 47,800 | | | 1,077,890 |
SunTrust Banks, Inc.(b) | | 53,800 | | | 3,974,744 |
U.S. Bancorp | | 289,285 | | | 9,060,406 |
| | | | | |
| COMMON STOCKS | | Value (Note 2)
|
| (Continued) | | Shares
| |
Banks & Savings & Loans (cont’d.) | | | | | |
Wachovia Corp.(b) | | 246,180 | | $ | 12,949,068 |
Wells Fargo & Co. | | 257,200 | | | 15,984,980 |
Zions Bancorp | | 12,500 | | | 850,375 |
| | | | |
|
|
| | | | | | 129,000,016 |
| | | | |
|
|
Business Services — 0.2% | | | | | |
Fiserv, Inc.(a) | | 27,500 | | | 1,105,225 |
Omnicom Group, Inc.(b) | | 29,100 | | | 2,453,712 |
Robert-Half International, Inc. | | 26,600 | | | 782,838 |
| | | | |
|
|
| | | | | | 4,341,775 |
| | | | |
|
|
Chemicals — 0.8% | | | | | |
Air Products & Chemicals, Inc. | | 34,700 | | | 2,011,559 |
Dow Chemical Co. | | 142,731 | | | 7,066,612 |
Du Pont E.I. de Nemours & Co.(b) | | 152,320 | | | 7,471,296 |
Eastman Chemical Co. | | 11,400 | | | 658,122 |
Engelhard Corp. | | 18,100 | | | 555,127 |
Great Lakes Chemical Corp. | | 9,700 | | | 276,353 |
Hercules, Inc.(a) | | 17,500 | | | 259,875 |
Praxair, Inc. | | 48,100 | | | 2,123,615 |
Rohm & Haas Co. | | 33,511 | | | 1,482,191 |
Sigma-Aldrich Corp.(b) | | 12,100 | | | 731,566 |
| | | | |
|
|
| | | | | | 22,636,316 |
| | | | |
|
|
Commercial Services | | | | | |
Convergys Corp.(a) | | 22,000 | | | 329,780 |
| | | | |
|
|
Computers — 0.8% | | | | | |
Apple Computer, Inc.(a) | | 59,000 | | | 3,799,600 |
Dell, Inc.(a) | | 380,800 | | | 16,046,912 |
Gateway, Inc.(a) | | 48,800 | | | 293,288 |
NCR Corp.(a) | | 14,700 | | | 1,017,681 |
Sun Microsystems, Inc.(a) | | 493,000 | | | 2,652,340 |
| | | | |
|
|
| | | | | | 23,809,821 |
| | | | |
|
|
Computer Services — 4.3% | | | | | |
Adobe Systems, Inc. | | 37,200 | | | 2,333,928 |
Affiliated Computer Services, Inc.(a)(b) | | 19,900 | | | 1,197,781 |
Autodesk, Inc.(b) | | 36,600 | | | 1,388,970 |
Automatic Data Processing, Inc. | | 93,000 | | | 4,124,550 |
BMC Software, Inc.(a) | | 37,900 | | | 704,940 |
Cisco Systems, Inc.(a) | | 1,021,400 | | | 19,713,020 |
Citrix Systems, Inc.(a) | | 24,200 | | | 593,626 |
Computer Associates International, Inc.(b) | | 87,900 | | | 2,730,174 |
Computer Sciences Corp.(a)(b) | | 28,800 | | | 1,623,456 |
Compuware Corp.(a) | | 59,000 | | | 381,730 |
Comverse Technology, Inc.(a)(b) | | 28,800 | | | 704,160 |
Electronic Arts, Inc.(a) | | 43,200 | | | 2,664,576 |
Electronic Data Systems Corp.(b) | | 76,100 | | | 1,757,910 |
EMC Corp.(a)(b) | | 376,750 | | | 5,602,273 |
First Data Corp. | | 132,710 | | | 5,645,483 |
Intuit, Inc.(a)(b) | | 33,000 | | | 1,452,330 |
Mercury Interactive Corp.(a)(b) | | 13,000 | | | 592,150 |
Microsoft Corp. | | 1,655,800 | | | 44,226,418 |
Network Appliance, Inc.(a)(b) | | 54,500 | | | 1,810,490 |
Novell, Inc.(a)(b) | | 55,200 | | | 372,600 |
Oracle Corp.(a) | | 789,400 | | | 10,830,568 |
Parametric Technology Corp.(a) | | 49,200 | | | 289,788 |
SEE NOTES TO FINANCIAL STATEMENTS.
B1
| | | | |
| | | CONSERVATIVE BALANCED PORTFOLIO (Continued) | | |
SCHEDULE OF INVESTMENTS | December 31, 2004 |
| | | | | |
| COMMON STOCKS | | Value (Note 2)
|
| (Continued) | | Shares
| |
Computer Services (cont’d.) | | | | | |
Siebel Systems, Inc.(a) | | 66,800 | | $ | 701,400 |
SunGard Data Systems, Inc.(a) | | 40,000 | | | 1,133,200 |
Symantec Corp.(a) | | 92,000 | | | 2,369,920 |
Symbol Technologies, Inc. | | 39,800 | | | 688,540 |
Unisys Corp.(a) | | 49,200 | | | 500,856 |
VERITAS Software Corp.(a) | | 63,048 | | | 1,800,020 |
Yahoo!, Inc.(a) | | 206,500 | | | 7,780,920 |
| | | | |
|
|
| | | | | | 125,715,777 |
| | | | |
|
|
Construction — 0.2% | | | | | |
Centex Corp. | | 18,400 | | | 1,096,272 |
Fluor Corp.(b) | | 11,300 | | | 615,963 |
KB Home(b) | | 7,200 | | | 751,680 |
Pulte Homes, Inc.(b) | | 18,200 | | | 1,161,160 |
Vulcan Materials Co. | | 16,400 | | | 895,604 |
| | | | |
|
|
| | | | | | 4,520,679 |
| | | | |
|
|
Containers — 0.1% | | | | | |
Ball Corp. | | 17,600 | | | 774,048 |
Bemis Co., Inc. | | 14,400 | | | 418,896 |
Pactiv Corp.(a) | | 26,200 | | | 662,598 |
Sealed Air Corp.(a)(b) | | 12,500 | | | 665,875 |
| | | | |
|
|
| | | | | | 2,521,417 |
| | | | |
|
|
Cosmetics & Soaps — 1.3% | | | | | |
Alberto-Culver Co. (Class “B” Stock) | | 11,850 | | | 575,555 |
Avon Products, Inc. | | 71,200 | | | 2,755,440 |
Colgate-Palmolive Co. | | 81,000 | | | 4,143,960 |
Gillette Co.(b) | | 152,800 | | | 6,842,384 |
International Flavors & Fragrances, Inc. | | 15,100 | | | 646,884 |
Procter & Gamble Co. (The) | | 388,900 | | | 21,420,612 |
| | | | |
|
|
| | | | | | 36,384,835 |
| | | | |
|
|
Diversified Consumer Products — 0.8% | | | |
Altria Group, Inc. | | 311,600 | | | 19,038,760 |
Eastman Kodak Co.(b) | | 42,200 | | | 1,360,950 |
Fortune Brands, Inc. | | 22,600 | | | 1,744,268 |
| | | | |
|
|
| | | | | | 22,143,978 |
| | | | |
|
|
Diversified Office Equipment — 0.2% | | | | | |
Avery Dennison Corp.
(Class “A” Stock) | | 15,500 | | | 929,535 |
Lexmark International, Inc.(a) | | 19,433 | | | 1,651,805 |
Pitney Bowes, Inc. | | 33,400 | | | 1,545,752 |
Xerox Corp.(a)(b) | | 139,400 | | | 2,371,194 |
| | | | |
|
|
| | | | | | 6,498,286 |
| | | | |
|
|
Diversified Operations — 2.2% | | | | | |
Cendant Corp. | | 154,600 | | | 3,614,548 |
General Electric Co. | | 1,606,100 | | | 58,622,650 |
| | | | |
|
|
| | | | | | 62,237,198 |
| | | | |
|
|
Drugs & Medical Supplies — 6.5% | | | | | |
Abbott Laboratories | | 238,600 | | | 11,130,690 |
Allergan, Inc.(b) | | 19,700 | | | 1,597,079 |
AmerisourceBergen Corp. | | 15,700 | | | 921,276 |
Amgen, Inc.(a) | | 195,760 | | | 12,558,004 |
Bard (C.R.), Inc. | | 15,400 | | | 985,292 |
Bausch & Lomb, Inc.(b) | | 8,900 | | | 573,694 |
| | | | | |
| COMMON STOCKS | | Value (Note 2)
|
| (Continued) | | Shares
| |
Drugs & Medical Supplies (cont’d.) | | | | | |
Baxter International, Inc. | | 92,800 | | $ | 3,205,312 |
Becton Dickinson & Co. | | 37,600 | | | 2,135,680 |
Biogen Idec, Inc.(a) | | 51,690 | | | 3,443,071 |
Biomet, Inc.(b) | | 40,100 | | | 1,739,939 |
Boston Scientific Corp.(a) | | 124,600 | | | 4,429,530 |
Bristol-Myers Squibb Co.(b) | | 296,300 | | | 7,591,206 |
Cardinal Health, Inc.(b) | | 67,050 | | | 3,898,958 |
Caremark Rx, Inc.(a) | | 70,800 | | | 2,791,644 |
Chiron Corp.(a)(b) | | 28,500 | | | 949,905 |
Eli Lilly & Co. | | 170,900 | | | 9,698,575 |
Express Scripts, Inc.(a)(b) | | 11,200 | | | 856,128 |
Fisher Scientific International, Inc.(a)(b) | | 16,800 | | | 1,047,984 |
Forest Laboratories, Inc.(a)(b) | | 56,200 | | | 2,521,132 |
Genzyme Corp.(a)(b) | | 34,200 | | | 1,985,994 |
Gilead Sciences, Inc.(a) | | 65,400 | | | 2,288,346 |
Guidant Corp. | | 47,700 | | | 3,439,170 |
Hospira, Inc.(a) | | 23,860 | | | 799,310 |
Johnson & Johnson | | 452,848 | | | 28,719,620 |
King Pharmaceuticals, Inc.(a) | | 33,666 | | | 417,458 |
Laboratory Corp. of America Holdings(a) | | 20,300 | | | 1,011,346 |
Medco Health Solutions, Inc.(a) | | 42,149 | | | 1,753,398 |
MedImmune, Inc.(a) | | 37,700 | | | 1,022,047 |
Medtronic, Inc.(b) | | 184,000 | | | 9,139,280 |
Merck & Co., Inc. | | 336,100 | | | 10,802,254 |
Mylan Laboratories, Inc.(b) | | 32,900 | | | 581,672 |
Pfizer, Inc. | | 1,155,645 | | | 31,075,294 |
Quest Diagnostics, Inc.(b) | | 15,000 | | | 1,433,250 |
Schering-Plough Corp.(b) | | 223,000 | | | 4,656,240 |
St. Jude Medical, Inc.(a) | | 54,600 | | | 2,289,378 |
Stryker Corp.(b) | | 61,400 | | | 2,962,550 |
Watson Pharmaceuticals, Inc.(a) | | 15,900 | | | 521,679 |
Wyeth | | 203,500 | | | 8,667,065 |
Zimmer Holdings, Inc.(a)(b) | | 39,200 | | | 3,140,704 |
| | | | |
|
|
| | | | | | 188,781,154 |
| | | | |
|
|
Education — 0.1% | | | | | |
Apollo Group, Inc.
(Class "A" Stock)(a)(b) | | 29,400 | | | 2,372,874 |
| | | | |
|
|
Electronics — 2.2% | | | | | |
Advanced Micro Devices, Inc.(a)(b) | | 51,400 | | | 1,131,828 |
Altera Corp.(a) | | 58,000 | | | 1,200,600 |
Analog Devices, Inc.(b) | | 56,700 | | | 2,093,364 |
Applied Materials, Inc.(a) | | 259,500 | | | 4,437,450 |
Applied Micro Circuits Corp.(a)(b) | | 40,000 | | | 168,400 |
Broadcom Corp.
(Class “A” Stock)(a)(b) | | 46,000 | | | 1,484,880 |
Emerson Electric Co. | | 63,800 | | | 4,472,380 |
Freescale Semiconductor, Inc.
(Class “B” Stock)(a) | | 48,030 | | | 881,831 |
Intel Corp. | | 979,400 | | | 22,908,166 |
Jabil Circuit, Inc.(a)(b) | | 29,000 | | | 741,820 |
KLA-Tencor Corp.(a)(b) | | 29,300 | | | 1,364,794 |
L-3 Communications Holdings, Inc. | | 15,300 | | | 1,120,572 |
Linear Technology Corp.(b) | | 52,100 | | | 2,019,396 |
LSI Logic Corp.(a) | | 57,200 | | | 313,456 |
SEE NOTES TO FINANCIAL STATEMENTS.
B2
| | | | |
| | | CONSERVATIVE BALANCED PORTFOLIO (Continued) | | |
SCHEDULE OF INVESTMENTS | December 31, 2004 |
| | | | | |
| COMMON STOCKS | | Value (Note 2)
|
| (Continued) | | Shares
| |
Electronics (cont’d.) | | | | | |
Maxim Integrated Products, Inc. | | 52,300 | | $ | 2,216,997 |
Micron Technology, Inc.(a) | | 89,800 | | | 1,109,030 |
Molex, Inc.(b) | | 30,800 | | | 924,000 |
National Semiconductor Corp.(b) | | 58,000 | | | 1,041,100 |
Novellus Systems, Inc.(a)(b) | | 22,000 | | | 613,580 |
NVIDIA Corp.(a) | | 24,000 | | | 565,440 |
PMC-Sierra, Inc.(a) | | 25,000 | | | 281,250 |
QLogic Corp.(a)(b) | | 13,800 | | | 506,874 |
Rockwell Automation, Inc. | | 29,100 | | | 1,441,905 |
Sanmina-SCI Corp.(a) | | 71,700 | | | 607,299 |
Solectron Corp.(a)(b) | | 141,600 | | | 754,728 |
Tektronix, Inc. | | 14,500 | | | 438,045 |
Teradyne, Inc.(a)(b) | | 27,300 | | | 466,011 |
Texas Instruments, Inc.(b) | | 263,400 | | | 6,484,908 |
Xilinx, Inc.(b) | | 52,300 | | | 1,550,695 |
| | | | |
|
|
| | | | | | 63,340,799 |
| | | | |
|
|
Financial Services — 5.1% | | | | | |
Ambac Financial Group, Inc. | | 15,900 | | | 1,305,867 |
American Express Co.(b) | | 194,300 | | | 10,952,691 |
Bear, Stearns & Co., Inc.(b) | | 16,016 | | | 1,638,597 |
Capital One Financial, Inc.(b) | | 35,700 | | | 3,006,297 |
Charles Schwab Corp. (The) | | 201,350 | | | 2,408,146 |
CIT Group, Inc. | | 31,500 | | | 1,443,330 |
Citigroup, Inc. | | 788,658 | | | 37,997,542 |
Countrywide Financial Corp. | | 85,400 | | | 3,160,654 |
E*TRADE Financial Corp.(a) | | 51,000 | | | 762,450 |
Equifax, Inc. | | 24,500 | | | 688,450 |
Fannie Mae(b) | | 146,800 | | | 10,453,628 |
Federated Investors, Inc.
(Class “B” Stock) | | 14,400 | | | 437,760 |
Fifth Third Bancorp(b) | | 85,221 | | | 4,029,249 |
Franklin Resources, Inc.(b) | | 37,000 | | | 2,577,050 |
Freddie Mac | | 106,400 | | | 7,841,680 |
Goldman Sachs Group, Inc. (The) | | 73,100 | | | 7,605,324 |
H&R Block, Inc.(b) | | 27,400 | | | 1,342,600 |
Janus Capital Group, Inc.(b) | | 38,400 | | | 645,504 |
Lehman Brothers Holdings, Inc. | | 41,300 | | | 3,612,924 |
Marshall & Ilsley Corp. | | 34,600 | | | 1,529,320 |
MBNA Corp. | | 193,625 | | | 5,458,289 |
Merrill Lynch & Co., Inc. | | 146,200 | | | 8,738,374 |
Moody’s Corp.(b) | | 22,500 | | | 1,954,125 |
Morgan Stanley | | 167,280 | | | 9,287,385 |
Paychex, Inc. | | 58,300 | | | 1,986,864 |
Principal Financial Group, Inc. | | 51,000 | | | 2,087,940 |
SLM Corp.(b) | | 70,300 | | | 3,753,317 |
State Street Corp.(b) | | 50,400 | | | 2,475,648 |
Synovus Financial Corp. | | 48,250 | | | 1,378,985 |
T. Rowe Price Group, Inc. | | 19,400 | | | 1,206,680 |
Washington Mutual, Inc. | | 135,817 | | | 5,742,343 |
| | | | |
|
|
| | | | | | 147,509,013 |
| | | | |
|
|
Food & Beverage — 2.2% | | | | | |
Adolph Coors Co. (Class “B” Stock) | | 6,600 | | | 499,422 |
Anheuser-Busch Companies, Inc. | | 123,100 | | | 6,244,863 |
Archer Daniels Midland Co. | | 101,026 | | | 2,253,890 |
Brown-Forman Corp. (Class “B” Stock) | | 17,800 | | | 866,504 |
Campbell Soup Co.(b) | | 64,200 | | | 1,918,938 |
Coca-Cola Co. | | 370,300 | | | 15,415,589 |
| | | | | |
| COMMON STOCKS | | Value (Note 2)
|
| (Continued) | | Shares
| |
Food & Beverage (cont’d.) | | | | | |
Coca-Cola Enterprises, Inc.(b) | | 72,100 | | $ | 1,503,285 |
ConAgra Foods, Inc.(b) | | 79,400 | | | 2,338,330 |
General Mills, Inc.(b) | | 56,900 | | | 2,828,499 |
H.J. Heinz & Co. | | 53,600 | | | 2,089,864 |
Hershey Foods Corp. | | 38,400 | | | 2,132,736 |
Kellogg Co. | | 63,200 | | | 2,822,512 |
McCormick & Co., Inc.(b) | | 18,000 | | | 694,800 |
Pepsi Bottling Group, Inc.(b) | | 40,000 | | | 1,081,600 |
PepsiCo, Inc. | | 257,030 | | | 13,416,966 |
Sara Lee Corp. | | 121,400 | | | 2,930,596 |
Sysco Corp.(b) | | 96,700 | | | 3,691,039 |
Wrigley (William) Jr., Co. | | 33,100 | | | 2,290,189 |
| | | | |
|
|
| | | | | | 65,019,622 |
| | | | |
|
|
Forest Products — 0.2% | | | | | |
Georgia-Pacific Corp. | | 39,295 | | | 1,472,777 |
Louisiana-Pacific Corp. | | 14,500 | | | 387,730 |
MeadWestvaco Corp. | | 32,814 | | | 1,112,066 |
Plum Creek Timber Co., Inc. | | 27,500 | | | 1,057,100 |
Temple-Inland, Inc. | | 10,500 | | | 718,200 |
Weyerhaeuser Co. | | 35,400 | | | 2,379,588 |
| | | | |
|
|
| | | | | | 7,127,461 |
| | | | |
|
|
Gas Pipelines — 0.2% | | | | | |
Dynegy, Inc. (Class “A” Stock)(a) | | 54,100 | | | 249,942 |
Kinder Morgan, Inc. | | 19,100 | | | 1,396,783 |
People’s Energy Corp. | | 6,400 | | | 281,280 |
Sempra Energy(b) | | 34,719 | | | 1,273,493 |
Williams Companies, Inc. (The) | | 76,700 | | | 1,249,443 |
| | | | |
|
|
| | | | | | 4,450,941 |
| | | | |
|
|
Hospitals/Hospital Management — 0.8% | | | | | |
HCA, Inc. | | 69,100 | | | 2,761,236 |
Health Management Associates, Inc.
(Class “A” Stock)(b) | | 38,100 | | | 865,632 |
Humana, Inc.(a) | | 22,500 | | | 668,025 |
IMS Health, Inc. | | 38,600 | | | 895,906 |
Manor Care, Inc. | | 15,000 | | | 531,450 |
McKesson Corp. | | 44,530 | | | 1,400,914 |
Tenet Healthcare Corp.(a) | | 71,000 | | | 779,580 |
UnitedHealth Group, Inc.(b) | | 101,200 | | | 8,908,636 |
WellPoint, Inc.(a) | | 44,800 | | | 5,152,000 |
| | | | |
|
|
| | | | | | 21,963,379 |
| | | | |
|
|
Household Products & Personal Care — 0.3% | | | |
Clorox Co.(b) | | 26,100 | | | 1,538,073 |
Kimberly-Clark Corp. | | 76,200 | | | 5,014,722 |
Leggett & Platt, Inc.(b) | | 30,400 | | | 864,272 |
| | | | |
|
|
| | | | | | 7,417,067 |
| | | | |
|
|
Housing Related — 0.4% | | | | | |
Lowe’s Companies, Inc. | | 121,700 | | | 7,008,703 |
Masco Corp.(b) | | 69,800 | | | 2,549,794 |
Maytag Corp. | | 13,600 | | | 286,960 |
Newell Rubbermaid, Inc. | | 38,314 | | | 926,816 |
Stanley Works (The)(b) | | 13,200 | | | 646,668 |
Whirlpool Corp. | | 9,100 | | | 629,811 |
| | | | |
|
|
| | | | | | 12,048,752 |
| | | | |
|
|
SEE NOTES TO FINANCIAL STATEMENTS.
B3
| | | | |
| | | CONSERVATIVE BALANCED PORTFOLIO (Continued) | | |
SCHEDULE OF INVESTMENTS | December 31, 2004 |
| | | | | |
| COMMON STOCKS | | Value (Note 2)
|
| (Continued) | | Shares
| |
Instrument – Controls — 0.2% | | | | | |
Agilent Technologies, Inc.(a) | | 72,593 | | $ | 1,749,491 |
Applera Corp.-Applied Biosystems Group | | 33,000 | | | 690,030 |
Johnson Controls, Inc. | | 29,000 | | | 1,839,760 |
PerkinElmer, Inc. | | 18,500 | | | 416,065 |
Thermo Electron Corp.(a) | | 27,800 | | | 839,282 |
Waters Corp. (Bermuda)(a) | | 18,000 | | | 842,220 |
| | | | |
|
|
| | | | | | 6,376,848 |
| | | | |
|
|
Insurance — 2.5% | | | | | |
ACE Ltd. (Bermuda) | | 43,300 | | | 1,851,075 |
Aetna, Inc. | | 23,100 | | | 2,881,725 |
AFLAC, Inc. | | 78,300 | | | 3,119,472 |
Allstate Corp. | | 106,300 | | | 5,497,836 |
American International Group, Inc. | | 395,888 | | | 25,997,965 |
Aon Corp.(b) | | 42,600 | | | 1,016,436 |
Chubb Corp. (The)(b) | | 28,600 | | | 2,199,340 |
CIGNA Corp. | | 23,000 | | | 1,876,110 |
Cincinnati Financial Corp.(b) | | 28,350 | | | 1,254,771 |
Hartford Financial Services Group, Inc. (The) | | 43,900 | | | 3,042,709 |
Jefferson-Pilot Corp. | | 21,000 | | | 1,091,160 |
Lincoln National Corp. | | 27,200 | | | 1,269,696 |
Loews Corp. | | 28,100 | | | 1,975,430 |
Marsh & McLennan Companies., Inc. | | 80,500 | | | 2,648,450 |
MBIA, Inc.(b) | | 23,250 | | | 1,471,260 |
MetLife, Inc. | | 116,700 | | | 4,727,517 |
MGIC Investment Corp. | | 14,500 | | | 999,195 |
Progressive Corp. | | 31,300 | | | 2,655,492 |
SAFECO Corp.(b) | | 20,300 | | | 1,060,472 |
St. Paul Companies, Inc. | | 98,035 | | | 3,634,158 |
Torchmark Corp. | | 17,200 | | | 982,808 |
UnumProvident Corp.(b) | | 43,110 | | | 773,393 |
XL Capital Ltd. (Class "A" Stock) (Cayman Islands)(b) | | 20,500 | | | 1,591,825 |
| | | | |
|
|
| | | | | | 73,618,295 |
| | | | |
|
|
Internet Services — 0.4% | | | | | |
eBay, Inc.(a)(b) | | 99,600 | | | 11,581,488 |
Monster Worldwide, Inc.(a) | | 18,000 | | | 605,520 |
| | | | |
|
|
| | | | | | 12,187,008 |
| | | | |
|
|
Leisure — 0.8% | | | | | |
Brunswick Corp. | | 16,900 | | | 836,550 |
Carnival Corp. | | 94,400 | | | 5,440,272 |
Harrah’s Entertainment, Inc. | | 17,700 | | | 1,183,953 |
Hilton Hotels Corp. | | 57,500 | | | 1,307,550 |
International Game Technology Corp.(b) | | 50,000 | | | 1,719,000 |
Marriott International, Inc.
(Class "A" Stock) | | 36,200 | | | 2,279,876 |
Starwood Hotels & Resorts | | | | | |
Worldwide, Inc.(b) | | 27,700 | | | 1,617,680 |
Walt Disney Co. (The) | | 311,600 | | | 8,662,480 |
| | | | |
|
|
| | | | | | 23,047,361 |
| | | | |
|
|
Machinery — 0.5% | | | | | |
American Power Conversion Corp. | | 29,000 | | | 620,600 |
Caterpillar, Inc. | | 53,100 | | | 5,177,781 |
| | | | | |
| COMMON STOCKS | | Value (Note 2)
|
| (Continued) | | Shares
| |
Machinery (cont’d.) | | | | | |
Deere & Co. | | 36,900 | | $ | 2,745,360 |
Dover Corp. | | 31,300 | | | 1,312,722 |
Eaton Corp.(b) | | 23,000 | | | 1,664,280 |
Ingersoll-Rand Co.
(Class “A” Stock)(Bermuda) | | 26,600 | | | 2,135,980 |
Parker Hannifin Corp.(b) | | 17,210 | | | 1,303,485 |
Snap-On, Inc. | | 8,900 | | | 305,804 |
| | | | |
|
|
| | | | | | 15,266,012 |
| | | | |
|
|
Manufacturing — 0.6% | | | | | |
American Standard Co., Inc.(a) | | 31,800 | | | 1,313,976 |
Cooper Industries, Ltd.
(Class “A” Stock) | | 14,900 | | | 1,011,561 |
Illinois Tool Works, Inc.(b) | | 47,200 | | | 4,374,496 |
Power-One, Inc.(a) | | 5,000 | | | 44,600 |
Tyco International Ltd. (Bermuda) | | 303,661 | | | 10,852,844 |
| | | | |
|
|
| | | | | | 17,597,477 |
| | | | |
|
|
Media — 2.0% | | | | | |
Clear Channel Communications, Inc. | | 92,100 | | | 3,084,429 |
Comcast Corp. (Class “A” Stock)(a)(b) | | 339,960 | | | 11,313,869 |
Dow Jones & Co., Inc.(b) | | 13,100 | | | 564,086 |
Gannett Co., Inc.(b) | | 40,700 | | | 3,325,190 |
Interpublic Group of Companies, Inc. (The)(a)(b) | | 57,200 | | | 766,480 |
Knight-Ridder, Inc. | | 11,500 | | | 769,810 |
McGraw Hill Companies, Inc. (The) | | 28,800 | | | 2,636,352 |
Meredith Corp. | | 7,000 | | | 379,400 |
New York Times Co. (The)
(Class “A” Stock) | | 22,100 | | | 901,680 |
News Corp. (Class “A” Stock) | | 363,700 | | | 6,786,642 |
R.R. Donnelley & Sons Co. | | 32,600 | | | 1,150,454 |
Time Warner, Inc.(a)(b) | | 699,300 | | | 13,594,392 |
Tribune Co.(b) | | 49,150 | | | 2,071,181 |
Univision Communications, Inc.(a) | | 47,000 | | | 1,375,690 |
Viacom, Inc. (Class “B” Stock) | | 261,669 | | | 9,522,135 |
| | | | |
|
|
| | | | | | 58,241,790 |
| | | | |
|
|
Metals – Ferrous — 0.1% | | | | | |
Allegheny Technologies, Inc.(b) | | 14,200 | | | 307,714 |
Nucor Corp.(b) | | 25,400 | | | 1,329,436 |
United States Steel Corp. | | 17,800 | | | 912,250 |
| | | | |
|
|
| | | | | | 2,549,400 |
| | | | |
|
|
Metals – Non Ferrous — 0.1% | | | | | |
Alcoa, Inc. | | 133,840 | | | 4,205,253 |
| | | | |
|
|
Mineral Resources — 0.1% | | | | | |
Phelps Dodge Corp. | | 14,893 | | | 1,473,216 |
| | | | |
|
|
Miscellaneous Basic Industry — 0.5% | | | | | |
AES Corp.(a) | | 96,200 | | | 1,315,054 |
Danaher Corp. | | 47,600 | | | 2,732,716 |
Ecolab, Inc.(b) | | 40,800 | | | 1,433,304 |
ITT Industries, Inc. | | 13,600 | | | 1,148,520 |
Millipore Corp.(a) | | 8,200 | | | 408,442 |
Monsanto Co. | | 38,597 | | | 2,144,063 |
Pall Corp. | | 19,000 | | | 550,050 |
PPG Industries, Inc. | | 26,100 | | | 1,778,976 |
Textron, Inc. | | 21,100 | | | 1,557,180 |
W.W. Grainger, Inc. | | 13,100 | | | 872,722 |
| | | | |
|
|
| | | | | | 13,941,027 |
| | | | |
|
|
SEE NOTES TO FINANCIAL STATEMENTS.
B4
| | | | |
| | | CONSERVATIVE BALANCED PORTFOLIO (Continued) | | |
SCHEDULE OF INVESTMENTS | December 31, 2004 |
| | | | | |
| COMMON STOCKS | | Value (Note 2)
|
| (Continued) | | Shares
| |
Miscellaneous – Consumer Growth/Staple — 0.4% | | | |
3M Co. | | 119,400 | | $ | 9,799,158 |
Black & Decker Corp.(b) | | 12,500 | | | 1,104,125 |
| | | | |
|
|
| | | | | | 10,903,283 |
| | | | |
|
|
Motorcycles — 0.1% | | | | | |
Harley-Davidson, Inc.(b) | | 44,400 | | | 2,697,300 |
| | | | |
|
|
Oil & Gas — 3.2% | | | | | |
Amerada Hess Corp. | | 15,100 | | | 1,243,938 |
Anadarko Petroleum Corp.(b) | | 38,727 | | | 2,509,897 |
Ashland, Inc. | | 10,600 | | | 618,828 |
BJ Services Co. | | 25,000 | | | 1,163,500 |
ChevronTexaco Corp.(b) | | 326,072 | | | 17,122,041 |
ConocoPhillips | | 103,825 | | | 9,015,125 |
EOG Resources, Inc.(b) | | 17,500 | | | 1,248,800 |
Exxon Mobil Corp. | | 986,740 | | | 50,580,292 |
Kerr-McGee Corp. | | 22,925 | | | 1,324,836 |
KeySpan Corp. | | 24,700 | | | 974,415 |
Nabors Industries, Ltd. (Barbados)(a) | | 22,400 | | | 1,148,896 |
NICOR, Inc. | | 7,100 | | | 262,274 |
Sunoco, Inc. | | 12,900 | | | 1,054,059 |
Unocal Corp.(b) | | 40,100 | | | 1,733,924 |
Valero Energy Corp. | | 40,800 | | | 1,852,320 |
| | | | |
|
|
| | | | | | 91,853,145 |
| | | | |
|
|
Oil & Gas Exploration & Production — 0.5% | | | |
Burlington Resources, Inc.(b) | | 62,600 | | | 2,723,100 |
Devon Energy Corp. | | 71,600 | | | 2,786,672 |
Marathon Oil Corp. | | 52,700 | | | 1,982,047 |
Occidental Petroleum Corp. | | 59,900 | | | 3,495,764 |
Transocean, Inc.(a) | | 48,397 | | | 2,051,549 |
XTO Energy, Inc. | | 20,000 | | | 707,600 |
| | | | |
|
|
| | | | | | 13,746,732 |
| | | | |
|
|
Oil & Gas Services — 0.5% | | | | | |
Apache Corp. | | 48,914 | | | 2,473,581 |
Baker Hughes, Inc.(b) | | 51,950 | | | 2,216,707 |
El Paso Corp.(b) | | 93,236 | | | 969,654 |
Halliburton Co.(b) | | 65,500 | | | 2,570,220 |
Noble Corp.(a)(b) | | 20,400 | | | 1,014,696 |
Rowan Companies, Inc.(a)(b) | | 15,400 | | | 398,860 |
Schlumberger Ltd. | | 91,000 | | | 6,092,450 |
| | | | |
|
|
| | | | | | 15,736,168 |
| | | | |
|
|
Paper — 0.1% | | | | | |
International Paper Co. | | 72,073 | | | 3,027,066 |
| | | | |
|
|
Precious Metals — 0.1% | | | | | |
Freeport-McMoRan Copper & Gold, Inc. (Class “B” Stock) | | 26,000 | | | 993,980 |
Newmont Mining Corp.(b) | | 66,700 | | | 2,962,147 |
| | | | |
|
|
| | | | | | 3,956,127 |
| | | | |
|
|
Railroads — 0.3% | | | | | |
Burlington Northern Santa Fe Corp. | | 58,500 | | | 2,767,635 |
CSX Corp. | | 34,800 | | | 1,394,784 |
Norfolk Southern Corp. | | 57,000 | | | 2,062,830 |
Union Pacific Corp. | | 37,800 | | | 2,542,050 |
| | | | |
|
|
| | | | | | 8,767,299 |
| | | | |
|
|
| | | | | |
| COMMON STOCKS | | Value (Note 2)
|
| (Continued) | | Shares
| |
Real Estate Investment Trust — 0.3% | | | | | |
Apartment Investment & Management Co. (Class “A” Stock)(b) | | 13,300 | | $ | 512,582 |
Archstone-Smith Trust | | 15,000 | | | 574,500 |
Equity Office Properties Trust | | 62,300 | | | 1,814,176 |
Equity Residential Properties Trust | | 41,600 | | | 1,505,088 |
ProLogis | | 27,600 | | | 1,195,908 |
Simon Property Group, Inc. | | 34,500 | | | 2,231,115 |
| | | | |
|
|
| | | | | | 7,833,369 |
| | | | |
|
|
Restaurants — 0.5% | | | | | |
Darden Restaurants, Inc. | | 30,150 | | | 836,361 |
McDonald's Corp. | | 191,700 | | | 6,145,902 |
Starbucks Corp.(a) | | 60,500 | | | 3,772,780 |
Wendy's International, Inc. | | 18,400 | | | 722,384 |
Yum! Brands, Inc. | | 43,300 | | | 2,042,894 |
| | | | |
|
|
| | | | | | 13,520,321 |
| | | | |
|
|
Retail — 3.6% | | | | | |
Albertson’s, Inc.(b) | | 55,166 | | | 1,317,364 |
AutoNation, Inc.(a) | | 35,000 | | | 672,350 |
AutoZone, Inc.(a)(b) | | 14,400 | | | 1,314,864 |
Bed Bath & Beyond, Inc.(a) | | 45,700 | | | 1,820,231 |
Best Buy Co., Inc.(b) | | 47,750 | | | 2,837,305 |
Big Lots, Inc.(a) | | 20,100 | | | 243,813 |
Circuit City Stores, Inc. | | 33,100 | | | 517,684 |
Costco Wholesale Corp.(b) | | 68,100 | | | 3,296,721 |
CVS Corp. | | 59,500 | | | 2,681,665 |
Dillard's, Inc.(b) | | 12,600 | | | 338,562 |
Dollar General Corp. | | 49,456 | | | 1,027,201 |
Family Dollar Stores, Inc. | | 23,000 | | | 718,290 |
Federated Department Stores, Inc. | | 30,000 | | | 1,733,700 |
Gap, Inc. (The)(b) | | 133,400 | | | 2,817,408 |
Home Depot, Inc. | | 340,250 | | | 14,542,285 |
J.C. Penney Corp., Inc. | | 47,900 | | | 1,983,060 |
Kohl’s Corp.(a)(b) | | 51,300 | | | 2,522,421 |
Kroger Co. (The),(a) | | 116,746 | | | 2,047,725 |
Limited Brands, Inc. | | 68,506 | | | 1,577,008 |
Liz Claiborne, Inc. | | 16,800 | | | 709,128 |
May Department Stores Co.(b) | | 44,100 | | | 1,296,540 |
Nordstrom, Inc. | | 21,800 | | | 1,018,714 |
Office Depot, Inc.(a) | | 53,200 | | | 923,552 |
OfficeMax, Inc. | | 12,200 | | | 382,836 |
RadioShack Corp. | | 27,300 | | | 897,624 |
Sears, Roebuck & Co.(b) | | 32,300 | | | 1,648,269 |
Sherwin-Williams Co. | | 20,800 | | | 928,304 |
Staples, Inc.(b) | | 74,900 | | | 2,524,879 |
SUPERVALU, Inc.(b) | | 18,400 | | | 635,168 |
Target Corp. | | 137,400 | | | 7,135,182 |
Tiffany & Co. | | 20,000 | | | 639,400 |
TJX Companies, Inc. (The)(b) | | 77,200 | | | 1,940,036 |
Toys ‘R’ Us, Inc.(a) | | 34,900 | | | 714,403 |
Wal-Mart Stores, Inc. | | 649,000 | | | 34,280,180 |
Walgreen Co.(b) | | 153,300 | | | 5,882,121 |
| | | | |
|
|
| | | | | | 105,565,993 |
| | | | |
|
|
Rubber | | | | | |
B.F. Goodrich Co.(b) | | 16,200 | | | 528,768 |
Cooper Tire & Rubber Co.(b) | | 11,200 | | | 241,360 |
Goodyear Tire & Rubber Co. (The)(a)(b) | | 24,500 | | | 359,170 |
| | | | |
|
|
| | | | | | 1,129,298 |
| | | | |
|
|
SEE NOTES TO FINANCIAL STATEMENTS.
B5
| | | | |
| | | CONSERVATIVE BALANCED PORTFOLIO (Continued) | | |
SCHEDULE OF INVESTMENTS | December 31, 2004 |
| | | | | |
| COMMON STOCKS | | Value (Note 2)
|
| (Continued) | | Shares
| |
Supermarkets | | | | | |
Safeway, Inc.(a)(b) | | 69,000 | | $ | 1,362,060 |
| | | | |
|
|
Technology — 1.2% | | | | | |
Hewlett-Packard Co.(b) | | 465,148 | | | 9,754,154 |
International Business Machines Corp. | | 257,200 | | | 25,354,776 |
| | | | |
|
|
| | | | | | 35,108,930 |
| | | | |
|
|
Telecommunications — 2.8% | | | | | |
ADC Telecommunications, Inc.(a) | | 103,400 | | | 277,112 |
ALLTEL Corp. | | 47,400 | | | 2,785,224 |
Andrew Corp.(a) | | 27,700 | | | 377,551 |
AT&T Corp.(b) | | 123,304 | | | 2,350,174 |
Avaya, Inc.(a) | | 68,970 | | | 1,186,284 |
BellSouth Corp.(b) | | 279,100 | | | 7,756,189 |
CenturyTel, Inc.(b) | | 22,400 | | | 794,528 |
CIENA Corp.(a) | | 64,000 | | | 213,760 |
Citizens Communications Co. | | 40,000 | | | 551,600 |
Corning, Inc.(a)(b) | | 219,300 | | | 2,581,161 |
JDS Uniphase Corp.(a)(b) | | 215,000 | | | 681,550 |
Lucent Technologies, Inc.(a) | | 639,855 | | | 2,405,855 |
Motorola, Inc. | | 359,825 | | | 6,188,990 |
Nextel Communications, Inc.
(Class “A” Stock)(a)(b) | | 170,400 | | | 5,112,000 |
QUALCOMM, Inc. | | 247,700 | | | 10,502,480 |
Qwest Communications International, Inc.(a) | | 257,357 | | | 1,142,665 |
SBC Communications, Inc.(b) | | 501,808 | | | 12,931,592 |
Scientific-Atlanta, Inc. | | 24,100 | | | 795,541 |
Sprint Corp.(b) | | 221,000 | | | 5,491,850 |
Tellabs, Inc.(a)(b) | | 66,600 | | | 572,094 |
Verizon Communications, Inc. | | 421,076 | | | 17,057,789 |
| | | | |
|
|
| | | | | | 81,755,989 |
| | | | |
|
|
Textiles | | | | | |
VF Corp.(b) | | 15,600 | | | 863,928 |
| | | | |
|
|
Tobacco — 0.1% | | | | | |
Reynolds American, Inc.(b) | | 22,500 | | | 1,768,500 |
UST, Inc.(b) | | 26,100 | | | 1,255,671 |
| | | | |
|
|
| | | | | | 3,024,171 |
| | | | |
|
|
Toys — 0.1% | | | | | |
Hasbro, Inc.(b) | | 30,700 | | | 594,966 |
Mattel, Inc.(b) | | 64,951 | | | 1,265,895 |
| | | | |
|
|
| | | | | | 1,860,861 |
| | | | |
|
|
Travel Services | | | | | |
Sabre Holdings Corp.(b) | | 23,526 | | | 521,336 |
| | | | |
|
|
Trucking/Shipping — 0.7% | | | | | |
FedEx Corp. | | 45,700 | | | 4,500,993 |
Ryder System, Inc. | | 9,500 | | | 453,815 |
United Parcel Service, Inc.(b) | | 171,800 | | | 14,682,028 |
| | | | |
|
|
| | | | | | 19,636,836 |
| | | | |
|
|
Utilities – Electric & Gas — 1.6% | | | | | |
Allegheny Energy, Inc.(a)(b) | | 15,000 | | | 295,650 |
Ameren Corp. | | 29,600 | | | 1,484,144 |
American Electric Power Co., Inc.(b) | | 59,160 | | | 2,031,554 |
Calpine Corp.(a)(b) | | 67,200 | | | 264,768 |
CenterPoint Energy, Inc. | | 46,200 | | | 522,060 |
| | | | | |
| COMMON STOCKS | | Value (Note 2)
|
| (Continued) | | Shares
| |
Utilities – Electric & Gas (cont’d.) | | | | | |
Cinergy Corp. | | 27,300 | | $ | 1,136,499 |
CMS Energy Corp.(a) | | 25,000 | | | 261,250 |
Consolidated Edison, Inc. | | 36,300 | | | 1,588,125 |
Constellation Energy Group | | 25,900 | | | 1,132,089 |
Dominion Resources, Inc. | | 50,216 | | | 3,401,632 |
DTE Energy Co.(b) | | 27,600 | | | 1,190,388 |
Duke Energy Co.(b) | | 142,000 | | | 3,596,860 |
Edison International(b) | | 48,300 | | | 1,547,049 |
Entergy Corp.(b) | | 35,400 | | | 2,392,686 |
Exelon Corp. | | 100,574 | | | 4,432,296 |
FirstEnergy Corp. | | 50,101 | | | 1,979,491 |
FPL Group, Inc. | | 27,700 | | | 2,070,575 |
NiSource, Inc. | | 38,200 | | | 870,196 |
PG&E Corp.(a) | | 64,900 | | | 2,159,872 |
Pinnacle West Capital Corp. | | 14,000 | | | 621,740 |
PPL Corp. | | 29,200 | | | 1,555,776 |
Progress Energy, Inc.(b) | | 37,583 | | | 1,700,255 |
Public Service Enterprise Group, Inc. | | 35,600 | | | 1,843,012 |
Southern Co.(b) | | 111,500 | | | 3,737,480 |
TECO Energy, Inc.(b) | | 32,600 | | | 500,084 |
TXU Corp.(b) | | 41,500 | | | 2,679,240 |
Xcel Energy, Inc.(b) | | 61,910 | | | 1,126,762 |
| | | | |
|
|
| | | | | | 46,121,533 |
| | | | |
|
|
Waste Management — 0.1% | | | | | |
Allied Waste Industries, Inc.(a) | | 45,700 | | | 424,096 |
Waste Management, Inc. | | 87,942 | | | 2,632,983 |
| | | | |
|
|
| | | | | | 3,057,079 |
| | | | |
|
|
TOTAL COMMON STOCKS
(cost $1,625,758,874) | | | | | 1,716,882,804 |
| | | | |
|
|
| | | | | | | | | |
Interest
Rate
| | Maturity
Date
| | Moody’s
Rating
(Unaudited)
| | Principal
Amount
(000)
| | |
| LONG-TERM BONDS — 36.0% | | |
Aerospace — 0.3% | | |
Boeing Capital Corp. | | |
| 6.10% | | 03/01/11 | | A3 | | $ | 1,125 | | 1,227,106 |
Goodrich Corp. | | |
| 7.625% | | 12/15/12 | | Baa3 | | | 1,340 | | 1,588,924 |
Lockheed Martin Corp. | | |
| 8.50% | | 12/01/29 | | Baa2 | | | 770 | | 1,053,572 |
Northrop Grumman Corp. | | |
| 7.125% | | 02/15/11(b) | | Baa2 | | | 2,125 | | 2,438,678 |
Raytheon Co. | | |
| 4.50% | | 11/15/07 | | Baa3 | | | 194 | | 198,487 |
| 5.50% | | 11/15/12 | | Baa3 | | | 775 | | 818,246 |
| 6.55% | | 03/15/10(b) | | Baa3 | | | 1,150 | | 1,265,441 |
| 8.30% | | 03/01/10 | | Baa3 | | | 700 | | 829,495 |
| | | | | | | | | |
|
| | | | | | | | | | 9,419,949 |
| | | | | | | | | |
|
Airlines — 0.2% | | |
Continental Airlines, Inc., | | |
Series 1998-1, Class A | | |
| 6.65% | | 09/15/17 | | Baa3 | | | 829 | | 805,118 |
Series 2000-1, Class A-1 | | |
| 8.048% | | 11/01/20 | | Baa3 | | | 198 | | 200,446 |
SEE NOTES TO FINANCIAL STATEMENTS.
B6
| | | | |
| | | CONSERVATIVE BALANCED PORTFOLIO (Continued) | | |
SCHEDULE OF INVESTMENTS | December 31, 2004 |
| | | | | | | | | | |
Interest
Rate
| | Maturity
Date
| | Moody’s
Rating
(Unaudited)
| | Principal
Amount
(000)
| | Value (Note 2)
|
| LONG-TERM BONDS (Continued) | | | |
Airlines (cont’d.) | | | |
Continental Airlines, Inc. | | | |
Series 2004-RJ | | | |
| 9.558% | | 09/01/19(b) | | Ba2 | | $ | 1,192 | | $ | 1,201,179 |
Southwest Airlines Co. | | | |
| 5.25% | | 10/01/14(b) | | Baa1 | | | 800 | | | 802,939 |
| 6.50% | | 03/01/12 | | Baa1 | | | 1,290 | | | 1,417,723 |
| | | | | | | | | |
|
|
| | | | | | | | | | | 4,427,405 |
| | | | | | | | | |
|
|
Asset Backed Securities — 1.0% | | | |
American Express Credit Account Master Trust I, (cost $1,510,000; purchased 8/6/04) | | | |
Series 2004-4, Class C | | | |
| 2.873% | | 03/15/12(h)(j)(k) | | Baa2 | | | 1,510 | | | 1,514,660 |
Series 2004-C, Class C | | | |
| 2.902% | | 02/15/12(h) | | Baa2 | | | 1,940 | | | 1,942,842 |
Bank One Issuance Trust | | | |
Series 2003-C1, Class C1 | | | |
| 4.54% | | 09/15/10 | | Baa2 | | | 2,445 | | | 2,481,155 |
Citibank Credit Card Issuance Trust I, | | | |
Series 2003-C3, Class C3 | | | |
| 4.45% | | 04/07/10 | | Baa2 | | | 1,700 | | | 1,720,012 |
Equity One ABS, Inc. | | | |
Series 2004-3, Class M1 | | | |
| 5.70% | | 07/25/34 | | Aa2 | | | 1,660 | | | 1,686,339 |
Household Mortgage Loan Trust | | | |
Series 2003-HC2, Class M | | | |
| 3.01% | | 06/20/33(h) | | Aa2 | | | 1,475 | | | 1,476,704 |
Series 2004-HC1, Class M | | | |
| 2.91% | | 02/20/34(h) | | Aa2 | | | 1,097 | | | 1,097,012 |
Hyundai Auto Receivables Trust | | | |
Series 2003-A, Class A4 | | | |
| 3.02% | | 10/15/10 | | Aaa | | | 2,700 | | | 2,669,591 |
MBNA Master Credit Card Trust, | | | |
Series 1999-J, Class A | | | |
| 7.00% | | 02/15/12 | | Aaa | | | 2,370 | | | 2,669,575 |
Series 2000-E, Class A | | | |
| 7.80% | | 10/15/12 | | Aaa | | | 3,810 | | | 4,487,515 |
Prestige Auto Receivables Trust, | | | |
Series 2004-1, Class A2 | | | |
(cost $2,199,692; purchased 6/23/04) | | | |
| 3.69% | | 06/15/11(j)(k) | | Aaa | | | 2,200 | | | 2,203,630 |
Residential Asset Mortgage Products, Inc. | | | |
Series 2004-RS12, Class MII1 | | | |
| 3.027% | | 12/25/34 | | Aa1 | | | 1,755 | | | 1,755,000 |
WFS Financial Owner Trust | | | |
Series 2004-4, Class D | | | |
| 3.58% | | 05/17/12 | | Baa2 | | | 1,810 | | | 1,805,075 |
| | | | | | | | | |
|
|
| | | | | | | | | | | 27,509,110 |
| | | | | | | | | |
|
|
Automobiles — 0.6% | | | |
Auburn Hills Trust, Inc. | | | |
| 12.375% | | 05/01/20 | | A3 | | | 1,410 | | | 2,211,537 |
DaimlerChrysler North America Holding Corp. | | | |
| 6.50% | | 11/15/13 | | A3 | | | 590 | | | 639,923 |
Equus Cayman Finance Ltd. (Cayman Islands) | | | |
| 5.50% | | 09/12/08(j) | | Baa3 | | | 410 | | | 425,065 |
Ford Motor Co. | | | |
| 7.45% | | 07/16/31(b) | | A3 | | | 995 | | | 1,000,709 |
Ford Motor Credit Co. | | | |
| 5.70% | | 01/15/10 | | A3 | | | 850 | | | 857,737 |
| | | | | | | | | | |
Interest
Rate
| | Maturity
Date
| | Moody’s
Rating
(Unaudited)
| | Principal
Amount
(000)
| | Value (Note 2)
|
| LONG-TERM BONDS (Continued) | | | |
Automobiles (cont’d.) | | | |
Ford Motor Credit Co. | | | |
| 7.00% | | 10/01/13(b) | | A3 | | $ | 1,180 | | $ | 1,250,956 |
| 7.375% | | 02/01/11 | | A3 | | | 3,225 | | | 3,475,747 |
General Motors Acceptance Corp. | | | |
| 6.125% | | 01/22/08 | | Baa1 | | | 1,500 | | | 1,543,992 |
| 6.75% | | 12/01/14 | | Baa1 | | | 1,965 | | | 1,967,686 |
| 6.875% | | 09/15/11 | | Baa1 | | | 2,365 | | | 2,423,636 |
General Motors Corp. | | | |
| 7.20% | | 01/15/11(b) | | Baa2 | | | 800 | | | 820,514 |
Hyundai Motor Manufacturing LLC | | | |
| 5.30% | | 12/19/08(j) | | Baa3 | | | 650 | | | 669,657 |
| | | | | | | | | |
|
|
| | | | | | | | | | | 17,287,159 |
| | | | | | | | | |
|
|
Banks & Savings & Loans — 1.1% | | | |
Bank of America Corp. | | | |
| 5.375% | | 06/15/14 | | Aa2 | | | 2,740 | | | 2,859,395 |
Bank One Corp. | | | |
| 7.875% | | 08/01/10 | | A1 | | | 2,500 | | | 2,916,072 |
Capital One Bank, | | | |
| 6.50% | | 06/13/13(g) | | Baa3 | | | 10 | | | 10,927 |
| 6.875% | | 02/01/06 | | Baa2 | | | 2,040 | | | 2,116,255 |
Citigroup, Inc., | | | |
| 5.00% | | 09/15/14(j) | | Aa2 | | | 513 | | | 515,475 |
| 5.625% | | 08/27/12 | | Aa2 | | | 1,900 | | | 2,023,386 |
| 6.00% | | 10/31/33 | | Aa2 | | | 985 | | | 1,019,368 |
| 6.625% | | 06/15/32(b) | | Aa2 | | | 1,290 | | | 1,444,811 |
Export-Import Bank of Korea (The) (South Korea) | | | |
| 4.125% | | 02/10/09(j) | | A3 | | | 1,120 | | | 1,116,956 |
HBOS PLC, (United Kingdom) | | | |
| 6.00% | | 11/01/33(j) | | Aa3 | | | 215 | | | 223,931 |
J.P. Morgan & Chase Co. | | | |
| 4.50% | | 11/15/10 | | Aa3 | | | 1,005 | | | 1,018,884 |
| 5.25% | | 05/30/07 | | Aa3 | | | 660 | | | 686,132 |
| 6.50% | | 01/15/09 | | A1 | | | 1,100 | | | 1,197,294 |
Korea Development Bank (South Korea) | | | |
| 4.75% | | 07/20/09(b) | | A3 | | | 1,530 | | | 1,558,925 |
Mellon Bank NA | | | |
| 4.75% | | 12/15/14 | | A1 | | | 775 | | | 768,382 |
Mizuho Finance Group (Cayman Islands) | | | |
| 5.79% | | 04/15/14(j) | | A2 | | | 1,060 | | | 1,113,423 |
Roper Industries Bank Loan
(cost $1,650,000; purchased 12/2/04) | | | |
| 3.72% | | 12/13/09(k) | | Ba2 | | | 1,650 | | | 1,655,156 |
Santander Central Hispano Issuances Ltd. (Cayman Islands) |
| 7.625% | | 09/14/10 | | A1 | | | 1,005 | | | 1,171,224 |
Wachovia Corp. | | | |
| 5.25% | | 08/01/14 | | A1 | | | 220 | | | 225,479 |
| 7.80% | | 08/18/10 | | Aa3 | | | 2,400 | | | 2,818,709 |
Washington Mutual, Inc., | | | |
| 5.125% | | 01/15/15 | | A3 | | | 635 | | | 630,686 |
Wells Fargo Bank | | | |
| 5.125% | | 09/15/16 | | Aa2 | | | 1,485 | | | 1,491,868 |
| 6.45% | | 02/01/11 | | Aa1 | | | 2,300 | | | 2,557,747 |
| | | | | | | | | |
|
|
| | | | | | | | | | | 31,140,485 |
| | | | | | | | | |
|
|
Brokerage — 0.4% | | | |
Goldman Sachs Group, Inc. (The), | | | |
| 5.00% | | 10/01/14 | | Aa3 | | | 1,165 | | | 1,163,355 |
| 6.345% | | 02/15/34 | | A1 | | | 1,250 | | | 1,301,630 |
SEE NOTES TO FINANCIAL STATEMENTS.
B7
| | | | |
| | | CONSERVATIVE BALANCED PORTFOLIO (Continued) | | |
SCHEDULE OF INVESTMENTS | December 31, 2004 |
| | | | | | | | | | |
Interest
Rate
| | Maturity
Date
| | Moody’s
Rating
(Unaudited)
| | Principal
Amount
(000)
| | Value (Note 2)
|
| LONG-TERM BONDS (Continued) | | | |
Brokerage (cont’d.) | | | |
Lehman Brothers Holdings, Inc. | | | |
| 4.80% | | 03/13/14 | | A1 | | $ | 220 | | $ | 217,000 |
| 6.625% | | 01/18/12 | | A1 | | | 1,800 | | | 2,012,738 |
Merrill Lynch & Co., Inc. | | | |
| 5.00% | | 01/15/15 | | Aa3 | | | 1,700 | | | 1,693,338 |
| 5.45% | | 07/15/14 | | Aa3 | | | 685 | | | 708,648 |
Morgan Stanley, | | | |
| 4.00% | | 01/15/10(b) | | Aa3 | | | 1,660 | | | 1,641,143 |
| 4.75% | | 04/01/14 | | A1 | | | 1,510 | | | 1,471,356 |
| | | | | | | | | |
|
|
| | | | | | | | | | | 10,209,208 |
| | | | | | | | | |
|
|
Building Materials — 0.1% | | | |
American Standard, Inc. | | | |
| 7.625% | | 02/15/10 | | Baa3 | | | 1,000 | | | 1,143,278 |
CRH America, Inc. | | | |
| 6.40% | | 10/15/33 | | Baa1 | | | 640 | | | 699,076 |
Hanson PLC, (United Kingdom) | | | |
| 7.875% | | 09/27/10 | | Baa1 | | | 1,000 | | | 1,161,687 |
| | | | | | | | | |
|
|
| | | | | | | | | | | 3,004,041 |
| | | | | | | | | |
|
|
Cable & Pay Television Systems — 0.2% | | | |
Cox Communications, Inc. | | | |
| 4.625% | | 01/15/10(j) | | Baa3 | | | 1,535 | | | 1,531,460 |
| 5.45% | | 12/15/14(j) | | Baa3 | | | 830 | | | 829,969 |
Tele-Communications, Inc. | | | |
| 9.875% | | 06/15/22 | | Baa3 | | | 1,440 | | | 2,044,196 |
| | | | | | | | | |
|
|
| | | | | | | | | | | 4,405,625 |
| | | | | | | | | |
|
|
Chemicals — 0.3% | | | |
Dow Chemical Co., | | | |
| 5.75% | | 11/15/09 | | A3 | | | 495 | | | 529,495 |
| 5.97% | | 01/15/09 | | A3 | | | 430 | | | 461,035 |
| 6.00% | | 10/01/12 | | A3 | | | 876 | | | 957,070 |
| 6.125% | | 02/01/11 | | A3 | | | 890 | | | 974,830 |
Eastman Chemical Co., | | | |
| 3.25% | | 06/15/08 | | Baa2 | | | 920 | | | 897,867 |
| 7.00% | | 04/15/12(b) | | Baa2 | | | 575 | | | 655,335 |
ICI Wilmington, Inc. | | | |
| 5.625% | | 12/01/13 | | Baa3 | | | 1,905 | | | 1,972,993 |
Lubrizol Corp. | | | |
| 4.625% | | 10/01/09 | | Baa3 | | | 1,090 | | | 1,088,318 |
| 5.50% | | 10/01/14 | | Baa3 | | | 790 | | | 794,655 |
| | | | | | | | | |
|
|
| | | | | | | | | | | 8,331,598 |
| | | | | | | | | |
|
|
Collateralized Mortgage Obligations — 0.4% | | | |
Countrywide Alternative Loan Trust
Series 2004-18CB, Class 3A1 | | | |
| 5.25% | | 09/25/19 | | Aaa | | | 3,652 | | | 3,657,134 |
Master Alternative Loans Trust,
Series 2004-4, Class 4A1 | | | |
| 5.00% | | 04/25/19 | | Aaa | | | 2,736 | | | 2,772,434 |
Structured Adjustable Rate Mortgage Loan, | | | |
Ser. 2004-1, Class 4A3 | | | |
| 4.17% | | 02/25/34(h) | | Aaa | | | 3,476 | | | 3,488,973 |
Washington Mutual, Inc., | | | |
Series 2002-AR15, Class A5 | | | |
| 4.38% | | 12/25/32(h) | | Aaa | | | 1,391 | | | 1,398,587 |
Series 2002-AR4, Class A7 | | | | | | |
| 5.502% | | 04/26/32(h) | | Aaa | | | 813 | | | 812,290 |
| | | | | | | | | |
|
|
| | | | | | | | | | | 12,129,418 |
| | | | | | | | | |
|
|
| | | | | | | | | | |
Interest
Rate
| | Maturity
Date
| | Moody’s
Rating
(Unaudited)
| | Principal
Amount
(000)
| | Value (Note 2)
|
| LONG-TERM BONDS (Continued) | | | |
Commercial Mortgage Backed Securities — 3.0% |
Banc of America Commercial Mortgage, Inc. | | | |
Series 2004-2, Class A4 | | | |
| 4.153% | | 11/10/38 | | Aaa | | $ | 3,680 | | $ | 3,623,985 |
Series 2003-2, Class A3 | | | |
| 4.873% | | 03/11/41 | | AAA(d) | | | 3,350 | | | 3,424,197 |
Chase Commercial Mortgage Securities Corp., Series 1997-1, Class A2 | | | |
| 7.37% | | 06/19/29 | | AAA(d) | | | 4,872 | | | 5,145,545 |
Commercial Mortgage Pass-Through Certificate, |
Series 2004-LB2, Class X2 | | | |
| 1.117% | | 03/10/39(j) | | Aaa | | | 18,895 | | | 805,720 |
Credit Suisse First Boston Mortgage Securities Corp.
Series 2004-C3, Class A4 |
| 4.835% | | 07/15/36 | | Aaa | | | 5,500 | | | 5,586,501 |
Series 2004-C4, Class A4 | | | |
| 4.283% | | 10/15/39 | | Aaa | | | 1,500 | | | 1,486,355 |
DLJ Commercial Mortgage Corp.
Series 2000-CF1, Class A1B | | | |
| 7.62% | | 06/10/33 | | AAA(d) | | | 3,200 | | | 3,668,450 |
GE Commercial Mortgage Corp., | | | |
Series 2004-C1, Class A3 | | | |
| 0.704% | | 03/10/40(h) | | Aaa | | | 33,935 | | | 997,510 |
Series 2004-C2, Class X2 | | | |
| 4.596% | | 11/10/38 | | Aaa | | | 1,800 | | | 1,780,960 |
Greenwich Capital Commercial Funding Corp., | | | |
Series 2003-C2, Class A2 | | | |
| 4.022% | | 01/05/36 | | Aaa | | | 6,600 | | | 6,590,058 |
Series 2003-C1, Class A4 | | | |
| 4.111% | | 07/05/35 | | Aaa | | | 10,000 | | | 9,649,596 |
Series 2003-C2, Class A3 | | | |
| 4.533% | | 01/05/36 | | Aaa | | | 3,570 | | | 3,595,235 |
J.P. Morgan Commercial Mortgage Finance Corp., | | | |
Series 2000-C10, Class A2 | | | |
| 7.371% | | 08/15/32 | | Aaa | | | 6,500 | | | 7,374,938 |
Keycorp. | | | |
Series 2000-C1, Class A2 | | | |
| 7.727% | | 05/17/32 | | Aaa | | | 11,180 | | | 12,805,225 |
Merrill Lynch Mortgage Trust
Series 2004-2, Class A3 | | | |
| 4.615% | | 08/12/39 | | Aaa | | | 1,900 | | | 1,899,766 |
PNC Mortgage Acceptance Corp., | | | |
Series 1999-CM1, Class A1B | | | |
| 7.33% | | 12/10/32 | | AAA(d) | | | 3,860 | | | 4,362,887 |
UBS Commercial Mortgage Trust, | | | |
Series 2004-C6, Class A5 | | | |
| 4.826% | | 08/15/29(h) | | AAA(d) | | | 5,000 | | | 5,066,385 |
Series 2003-C8, Class A3 | | | |
| 4.83% | | 11/15/27 | | Aaa | | | 2,720 | | | 2,773,636 |
Series 2004-C8, Class A6 | | | |
| 4.799% | | 12/15/29(h) | | Aaa | | | 3,600 | | | 3,598,545 |
Wachovia Bank Commercial Mortgage Trust, | | | |
Series 2002-C2, Class A4 | | | |
| 4.98% | | 11/15/34 | | Aaa | | | 1,700 | | | 1,739,210 |
| | | | | | | | | |
|
|
| | | | | | | | | | | 85,974,704 |
| | | | | | | | | |
|
|
Consumer Products — 0.1% | | | |
Clorox Co. (The) | | | |
| 5.00% | | 01/15/15(j) | | A3 | | | 1,930 | | | 1,963,262 |
| | | | | | | | | |
|
|
SEE NOTES TO FINANCIAL STATEMENTS.
B8
| | | | |
| | | CONSERVATIVE BALANCED PORTFOLIO (Continued) | | |
SCHEDULE OF INVESTMENTS | December 31, 2004 |
| | | | | | | | | | |
Interest
Rate
| | Maturity
Date
| | Moody’s
Rating
(Unaudited)
| | Principal
Amount
(000)
| | Value (Note 2)
|
| LONG-TERM BONDS (Continued) | | | |
Consumer Services — 0.2% | | | |
Cendant Corp., | | | |
| 6.25% | | 01/15/08 | | Baa1 | | | 1,010 | | | 1,077,890 |
| 6.875% | | 08/15/06 | | Baa1 | | | 1,715 | | | 1,804,292 |
| 7.375% | | 01/15/13 | | Baa1 | | | 1,375 | | | 1,590,645 |
| | | | | | | | | |
|
|
| | | | | | | | | | | 4,472,827 |
| | | | | | | | | |
|
|
Diversified Manufacturing — 0.2% | | | |
Cooper Cameron Corp. | | | |
| 2.65% | | 04/15/07 | | Baa1 | | | 425 | | | 413,875 |
Honeywell International, Inc. | | | |
| 6.125% | | 11/01/11 | | A2 | | | 1,420 | | | 1,564,025 |
Hutchison Whampoa International Ltd. (Cayman Islands) |
| 5.45% | | 11/24/10(j) | | A3 | | $ | 1,090 | | $ | 1,128,890 |
Tyco International Group SA (Luxembourg) | | | |
| 6.00% | | 11/15/13 | | Baa3 | | | 1,640 | | | 1,786,716 |
United Technologies Corp. | | | |
| 6.35% | | 03/01/11(f) | | A2 | | | 990 | | | 1,102,917 |
| 8.875% | | 11/15/19 | | A2 | | | 640 | | | 870,379 |
| | | | | | | | | |
|
|
| | | | | | | | | | | 6,866,802 |
| | | | | | | | | |
|
|
Entertainment — 0.2% | | | |
AOL Time Warner, Inc. | | | |
| 7.70% | | 05/01/32 | | Baa1 | | | 1,420 | | | 1,736,828 |
Time Warner, Inc. | | | |
| 7.25% | | 10/15/17 | | Baa1 | | | 1,040 | | | 1,210,885 |
Viacom, Inc. | | | |
| 7.875% | | 07/30/30 | | A3 | | | 475 | | | 610,073 |
Walt Disney Co. (The), | | | |
| 5.375% | | 06/01/07 | | Baa1 | | | 300 | | | 311,852 |
| 6.75% | | 03/30/06 | | Baa1 | | | 1,365 | | | 1,422,214 |
| | | | | | | | | |
|
|
| | | | | | | | | | | 5,291,852 |
| | | | | | | | | |
|
|
Environmental | | | |
Waste Management, Inc. | | | |
| 7.75% | | 05/15/32 | | Baa3 | | | 680 | | | 842,117 |
| | | | | | | | | |
|
|
Financial Services — 0.5% | | | |
CIT Group, Inc. | | | |
| 5.50% | | 11/30/07 | | A2 | | | 1,285 | | | 1,345,165 |
Credit Suisse First Boston USA, Inc. | | | |
| 4.875% | | 01/15/15 | | Aa3 | | | 1,820 | | | 1,797,447 |
General Electric Capital Corp., | | | |
| 4.75% | | 09/15/14 | | Aaa | | | 515 | | | 513,339 |
| 5.875% | | 02/15/12 | | Aaa | | | 510 | | | 551,829 |
| 6.125% | | 02/22/11 | | Aaa | | | 2,865 | | | 3,138,292 |
| 6.75% | | 03/15/32 | | Aaa | | | 2,700 | | | 3,160,215 |
Household Finance Corp., | | | |
| 4.75% | | 05/15/09 | | A1 | | | 640 | | | 656,273 |
| 6.375% | | 11/27/12(f) | | A1 | | | 225 | | | 248,599 |
| 7.00% | | 05/15/12 | | A1 | | | 1,770 | | | 2,021,299 |
HSBC Finance Corp. | | | |
| 6.75% | | 05/15/11 | | A1 | | | 570 | | | 639,666 |
International Lease Finance Corp. | | | |
| 3.50% | | 04/01/09 | | A1 | | | 750 | | | 730,292 |
| | | | | | | | | |
|
|
| | | | | | | | | | | 14,802,416 |
| | | | | | | | | |
|
|
| | | | | | | | | | |
Interest
Rate
| | Maturity
Date
| | Moody’s
Rating
(Unaudited)
| | Principal
Amount
(000)
| | Value (Note 2)
|
| LONG-TERM BONDS (Continued) | | | |
Food & Beverage — 0.7% | | | |
Archer Daniels Midland Co. | | | |
| 8.125% | | 06/01/12 | | A2 | | | 395 | | | 487,032 |
Bunge Ltd. Finance Corp. | | | |
| 5.875% | | 05/15/13 | | Baa3 | | | 1,195 | | | 1,268,588 |
Cadbury Schweppes American Finance, Inc. | | | |
| 3.875% | | 10/01/08(j) | | Baa2 | | | 1,050 | | | 1,046,321 |
Cargill, Inc., | | | |
| 3.625% | | 03/04/09(j) | | A2 | | | 2,430 | | | 2,394,376 |
ConAgra Foods, Inc. | | | |
| 7.875% | | 09/15/10 | | Baa1 | | | 865 | | | 1,016,154 |
General Mills, Inc. | | | |
| 5.125% | | 02/15/07 | | Baa2 | | | 500 | | | 513,359 |
Kellogg Co. | | | |
| 6.60% | | 04/01/11 | | Baa1 | | $ | 2,435 | | $ | 2,727,746 |
Kraft Foods, Inc., | | | |
| 4.625% | | 11/01/06 | | A3 | | | 3,405 | | | 3,475,204 |
| 5.25% | | 06/01/07 | | A3 | | | 400 | | | 414,351 |
| 5.625% | | 11/01/11 | | A3 | | | 3,150 | | | 3,335,667 |
Miller Brewing Co., | | | |
| 5.50% | | 08/15/13(j) | | Baa1 | | | 1,010 | | | 1,055,699 |
Tate & Lyle International Finance PLC (United Kingdom) |
| 5.00% | | 11/15/14(j) | | Baa2 | | | 2,560 | | | 2,534,917 |
Tyson Foods, Inc., | | | |
| 6.625% | | 10/17/05 | | Baa3 | | | 485 | | | 496,363 |
| 7.25% | | 10/01/06 | | Baa3 | | | 525 | | | 556,612 |
| 8.25% | | 10/01/11 | | Baa3 | | | 110 | | | 130,620 |
| | | | | | | | | |
|
|
| | | | | | | | | | | 21,453,009 |
| | | | | | | | | |
|
|
Gaming | | | |
Harrah’s Operating Co., Inc., | | | |
| 5.50% | | 07/01/10 | | Baa3 | | | 970 | | | 1,004,071 |
| 7.125% | | 06/01/07 | | Baa3 | | | 365 | | | 390,998 |
| | | | | | | | | |
|
|
| | | | | | | | | | | 1,395,069 |
| | | | | | | | | |
|
|
Gas Distribution — 0.1% | | | |
Atmos Energy Corp. | | | |
| 4.00% | | 10/15/09 | | Baa3 | | | 1,605 | | | 1,586,570 |
| | | | | | | | | |
|
|
Healthcare — 0.2% | | | |
HCA, Inc. | | | |
| 7.875% | | 02/01/11(b) | | Ba2 | | | 1,185 | | | 1,305,279 |
Hospira, Inc. | | | |
| 5.90% | | 06/15/14 | | Baa3 | | | 950 | | | 998,362 |
WellPoint, Inc. | | | |
| 3.50% | | 09/01/07 | | Baa1 | | | 1,970 | | | 1,959,076 |
| 5.00% | | 12/15/14(j) | | Baa1 | | | 1,085 | | | 1,081,584 |
| 5.95% | | 12/15/34(j) | | Baa1 | | | 990 | | | 999,639 |
| | | | | | | | | |
|
|
| | | | | | | | | | | 6,343,940 |
| | | | | | | | | |
|
|
Home Construction — 0.1% | | | |
D.R. Horton, Inc. | | | |
| 5.625% | | 09/15/14(b) | | Ba1 | | | 1,550 | | | 1,546,125 |
Ryland Group, Inc. | | | |
| 5.375% | | 06/01/08 | | Baa3 | | | 575 | | | 598,000 |
| | | | | | | | | |
|
|
| | | | | | | | | | | 2,144,125 |
| | | | | | | | | |
|
|
SEE NOTES TO FINANCIAL STATEMENTS.
B9
| | | | |
| | | CONSERVATIVE BALANCED PORTFOLIO (Continued) | | |
SCHEDULE OF INVESTMENTS | December 31, 2004 |
| | | | | | | | | | |
Interest
Rate
| | Maturity
Date
| | Moody’s
Rating
(Unaudited)
| | Principal
Amount
(000)
| | Value (Note 2)
|
| LONG-TERM BONDS (Continued) | | | |
Independent Energy — 0.5% | | | |
Chesapeake Energy Corp. | | | |
| 8.125% | | 04/01/11 | | Ba3 | | | 1 | | | 1,081 |
Devon Energy Corp. | | | |
| 2.75% | | 08/01/06 | | Baa2 | | | 2,810 | | | 2,777,073 |
Devon Financing Corp. | | | |
| 6.875% | | 09/30/11 | | Baa2 | | | 60 | | | 67,953 |
EnCana Corp. (Canada) | | | |
| 6.50% | | 08/15/34 | | Baa2 | | | 1,085 | | | 1,191,115 |
Kerr-McGee Corp., | | | |
| 5.875% | | 09/15/06 | | Baa3 | | | 1,305 | | | 1,353,930 |
| 6.875% | | 09/15/11 | | Baa3 | | | 560 | | | 630,602 |
| 6.95% | | 07/01/24 | | Baa3 | | | 500 | | | 552,918 |
Occidental Petroleum Corp. | | | |
| 6.75% | | 01/15/12(b) | | Baa1 | | $ | 1,655 | | $ | 1,878,708 |
| 7.65% | | 02/15/06 | | Baa1 | | | 1,615 | | | 1,690,666 |
Ocean Energy, Inc. | | | |
| 7.25% | | 10/01/11 | | Baa3 | | | 240 | | | 273,534 |
Parker & Parsley Petroleum Co. | | | |
| 8.875% | | 04/15/05 | | Baa3 | | | 1,375 | | | 1,396,142 |
Pioneer Natural Resource | | | |
| 5.875% | | 07/15/16 | | Baa3 | | | 760 | | | 793,981 |
Union Oil Co. of California | | | |
| 7.35% | | 06/15/09 | | Baa2 | | | 820 | | | 925,897 |
Woodside Petroleum Ltd. (Australia) | | | |
| 5.00% | | 11/15/13(j) | | Baa1 | | | 1,800 | | | 1,820,605 |
| | | | | | | | | |
|
|
| | | | | | | | | | | 15,354,205 |
| | | | | | | | | |
|
|
Insurance — 0.2% | | | |
Aon Corp. | | | |
| 8.65% | | 05/15/05 | | Baa2 | | | 965 | | | 983,606 |
Axa (France) | | | |
| 8.60% | | 12/15/30 | | A3 | | | 230 | | | 302,066 |
Everest Reinsurance Holdings (Bermuda) | | | |
| 5.40% | | 10/15/14 | | A3 | | | 780 | | | 782,134 |
Hartford Financial Services Group, Inc. (The) | | | |
| 4.75% | | 03/01/14 | | A3 | | | 660 | | | 643,103 |
Marsh & McLennan Companies., Inc. | | | |
| 5.375% | | 07/15/14 | | Baa2 | | | 290 | | | 283,349 |
MetLife, Inc. | | | |
| 6.125% | | 12/01/11 | | A2 | | | 435 | | | 472,748 |
| 6.375% | | 06/15/34 | | A2 | | | 935 | | | 1,004,382 |
Phoenix Life Insurance Co. | | | |
| 7.15% | | 12/15/34(j) | | Baa2 | | | 550 | | | 548,616 |
W.R. Berkley Corp. | | | |
| 6.15% | | 08/15/19 | | Baa2 | | | 575 | | | 577,946 |
XL Capital Ltd. (Cayman Islands) | | | |
| 5.25% | | 09/15/14 | | A2 | | | 110 | | | 110,236 |
| | | | | | | | | |
|
|
| | | | | | | | | | | 5,708,186 |
| | | | | | | | | |
|
|
Integrated Energy — 0.2% | | | |
Conoco, Inc. | | | |
| 6.95% | | 04/15/29 | | A3 | | | 755 | | | 891,545 |
ConocoPhillips | | | |
| 8.75% | | 05/25/10 | | A3 | | | 1,900 | | | 2,318,709 |
Marathon Oil Corp. | | | |
| 6.125% | | 03/15/12 | | Baa1 | | | 990 | | | 1,078,737 |
Suncor Energy, Inc. (Canada) | | | |
| 5.95% | | 12/01/34(b) | | A3 | | | 580 | | | 608,048 |
| | | | | | | | | |
|
|
| | | | | | | | | | | 4,897,039 |
| | | | | | | | | |
|
|
| | | | | | | | | | |
Interest
Rate
| | Maturity
Date
| | Moody’s
Rating
(Unaudited)
| | Principal
Amount
(000)
| | Value (Note 2)
|
| LONG-TERM BONDS (Continued) | | | |
Lodging — 0.3% | | | |
Carnival Corp. (Panama) | | | |
| 3.75% | | 11/15/07 | | A3 | | | 2,845 | | | 2,848,351 |
Carnival PLC (United Kingdom) | | | |
| 7.30% | | 06/01/07 | | A3 | | | 345 | | | 372,113 |
Hilton Hotels Corp. | | | |
| 7.625% | | 12/01/12 | | Baa3 | | | 880 | | | 1,029,093 |
Host Marriott LP | | | |
| 7.00% | | 08/15/12(j) | | Ba3 | | | 1,500 | | | 1,586,250 |
La Quinta Inns, Inc., | | | |
| 7.40% | | 09/15/05 | | Ba3 | | | 2,200 | | | 2,238,500 |
| | | | | | | | | |
|
|
| | | | | | | | | | | 8,074,307 |
| | | | | | | | | |
|
|
Machinery | | | |
Caterpillar, Inc. | | | |
| 7.25% | | 09/15/09 | | A2 | | $ | 1,000 | | $ | 1,131,299 |
| | | | | | | | | |
|
|
Media — 0.3% | | | |
British Sky Broadcasting Group PLC (United Kingdom) |
| 7.30% | | 10/15/06 | | Baa2 | | | 785 | | | 833,909 |
Clear Channel Communications, Inc., | | | |
| 4.40% | | 05/15/11 | | Baa3 | | | 1,200 | | | 1,165,121 |
| 7.65% | | 09/15/10 | | Baa3 | | | 600 | | | 682,692 |
| 8.00% | | 11/01/08 | | Baa3 | | | 745 | | | 836,475 |
News America Holdings, Inc. | | | |
| 5.30% | | 12/15/14(b)(j) | | Baa3 | | | 1,800 | | | 1,821,238 |
| 7.625% | | 11/30/28 | | Baa3 | | | 1,360 | | | 1,614,976 |
| 8.50% | | 02/15/05 | | Baa3 | | | 1,800 | | | 1,809,383 |
| | | | | | | | | |
|
|
| | | | | | | | | | | 8,763,794 |
| | | | | | | | | |
|
|
Metals — 0.1% | | | |
Alcan, Inc. (Canada) | | | |
| 5.20% | | 01/15/14 | | Baa1 | | | 500 | | | 513,029 |
| 6.125% | | 12/15/33 | | Baa1 | | | 1,170 | | | 1,238,313 |
| | | | | | | | | |
|
|
| | | | | | | | | | | 1,751,342 |
| | | | | | | | | |
|
|
Municipals — 0.2% | | | |
Illinois St. Taxable Pension, G.O. | | | |
| 5.10% | | 06/01/33 | | Aa3 | | | 5,300 | | | 5,117,097 |
| | | | | | | | | |
|
|
Oil Field Services — 0.2% | | | |
BJ Services Co. | | | |
| 7.00% | | 02/01/06 | | Baa2 | | | 4,000 | | | 4,131,956 |
Halliburton Co. | | | |
| 5.50% | | 10/15/10 | | Baa2 | | | 200 | | | 210,656 |
Precision Drilling Corp. (Canada) | | | |
| 5.625% | | 06/01/14 | | BBB+(d) | | | 500 | | | 520,643 |
Transocean, Inc. (Cayman Islands) | | | |
| 7.50% | | 04/15/31 | | Baa2 | | | 185 | | | 227,709 |
| | | | | | | | | |
|
|
| | | | | | | | | | | 5,090,964 |
| | | | | | | | | |
|
|
Paper — 0.1% | | | |
Georgia-Pacific Corp. | | | |
| 8.875% | | 05/15/31 | | Ba3 | | | 750 | | | 937,500 |
International Paper Co. | | | |
| 5.25% | | 04/01/16(b) | | Baa2 | | | 625 | | | 623,897 |
MeadWestvaco Corp. | | | |
| 2.75% | | 12/01/05 | | Baa2 | | | 1,310 | | | 1,305,810 |
| 6.80% | | 11/15/32 | | Baa2 | | | 150 | | | 163,970 |
Weyerhaeuser Co., | | | |
| 5.50% | | 03/15/05 | | Baa2 | | | 255 | | | 256,174 |
| 7.375% | | 03/15/32 | | Baa2 | | | 445 | | | 527,702 |
| | | | | | | | | |
|
|
| | | | | | | | | | | 3,815,053 |
| | | | | | | | | |
|
|
SEE NOTES TO FINANCIAL STATEMENTS.
B10
| | | | |
| | | CONSERVATIVE BALANCED PORTFOLIO (Continued) | | |
SCHEDULE OF INVESTMENTS | December 31, 2004 |
| | | | | | | | | | |
Interest
Rate
| | Maturity
Date
| | Moody’s
Rating
(Unaudited)
| | Principal
Amount
(000)
| | Value (Note 2)
|
| LONG-TERM BONDS (Continued) | | | |
Pharmaceuticals — 0.1% | | | |
Bristol-Myers Squibb Co. | | | |
| 5.75% | | 10/01/11 | | A1 | | | 760 | | | 813,943 |
GlaxoSmithKline Capital, Inc. | | | |
| 4.375% | | 04/15/14 | | Aa2 | | | 330 | | | 321,507 |
Merck & Co., Inc. | | | |
| 5.95% | | 12/01/28 | | Aa2 | | | 205 | | | 212,177 |
Pharmacia Corp. | | | |
| 6.60% | | 12/01/28 | | Aaa | | | 1,150 | | | 1,322,086 |
| 6.75% | | 12/15/27 | | Aaa | | | 785 | | | 913,121 |
Wyeth | | | |
| 6.45% | | 02/01/24(f) | | Baa1 | | $ | 615 | | $ | 654,109 |
| | | | | | | | | |
|
|
| | | | | | | | | | | 4,236,943 |
| | | | | | | | | |
|
|
Pipelines — 0.1% | | | |
Enterprise Products Operating LP | | | |
| 4.00% | | 10/15/07(j) | | Baa3 | | | 1,000 | | | 997,559 |
| 6.375% | | 02/01/13 | | Baa3 | | | 930 | | | 996,798 |
Magellan Midstream Partners LP | | | |
| 5.65% | | 10/15/16 | | Ba1 | | | 770 | | | 778,510 |
| | | | | | | | | |
|
|
| | | | | | | | | | | 2,772,867 |
| | | | | | | | | |
|
|
Railroads — 0.1% | | | |
Norfolk Southern Corp. | | | |
| 7.80% | | 05/15/27 | | Baa1 | | | 645 | | | 807,889 |
Union Pacific Corp., | | | |
| 6.625% | | 02/01/08 | | Baa2 | | | 1,755 | | | 1,906,709 |
| | | | | | | | | |
|
|
| | | | | | | | | | | 2,714,598 |
| | | | | | | | | |
|
|
Real Estate Investment Trust — 0.4% | | | |
ERP Operating LP | | | |
| 6.63% | | 04/13/15 | | Baa1 | | | 5,000 | | | 5,050,845 |
Simon Debartolo Group, Inc. | | | |
| 6.75% | | 06/15/05 | | Baa2 | | | 5,000 | | | 5,079,455 |
| | | | | | | | | |
|
|
| | | | | | | | | | | 10,130,300 |
| | | | | | | | | |
|
|
Refining | | | |
Valero Energy Corp. | | | |
| 6.875% | | 04/15/12 | | Baa3 | | | 410 | | | 465,040 |
| 7.50% | | 04/15/32 | | Baa3 | | | 800 | | | 964,945 |
| | | | | | | | | |
|
|
| | | | | | | | | | | 1,429,985 |
| | | | | | | | | |
|
|
Restaurants | | | |
Tricon Global Restaurants, Inc. | | | |
| 8.875% | | 04/15/11 | | Baa3 | | | 475 | | | 586,872 |
| | | | | | | | | |
|
|
Retail — 0.1% | | | |
CVS Corp. | | | |
| 4.875% | | 09/15/14 | | A3 | | | 820 | | | 820,256 |
May Department Stores Co. | | | |
| 8.50% | | 06/01/19 | | Baa2 | | | 550 | | | 676,673 |
Target Corp., | | | |
| 7.50% | | 08/15/10 | | A2 | | | 855 | | | 999,602 |
| | | | | | | | | |
|
|
| | | | | | | | | | | 2,496,531 |
| | | | | | | | | |
|
|
Sovereign — 0.4% | | | |
Pemex Project Funding Master Trust (Mexico) | | | |
| 7.875% | | 02/01/09 | | Baa1 | | | 2,275 | | | 2,555,963 |
| 8.50% | | 02/15/08 | | Baa1 | | | 1,100 | | | 1,240,250 |
| 9.50% | | 09/15/27 | | Baa1 | | | 3,025 | | | 3,811,500 |
| | | | | | | | | | |
Interest
Rate
| | Maturity
Date
| | Moody’s
Rating
(Unaudited)
| | Principal
Amount
(000)
| | Value (Note 2)
|
| LONG-TERM BONDS (Continued) | | | |
Sovereign — 0.4% (cont’d.) | | | |
Republic of Italy (Italy) | | | |
| 5.375% | | 06/15/33 | | AA-(d) | | | 1,080 | | | 1,080,119 |
| 6.00% | | 02/22/11 | | AA-(d) | | | 430 | | | 470,771 |
Republic of South Africa (South Africa) | | | |
| 6.50% | | 06/02/14 | | Baa2 | | | 620 | | | 678,900 |
United Mexican States (Mexico) | | | |
| 7.50% | | 01/14/12 | | Baa2 | | | 2,100 | | | 2,381,400 |
| | | | | | | | | |
|
|
| | | | | | | | | | | 12,218,903 |
| | | | | | | | | |
|
|
Supermarkets — 0.2% | | | |
Albertson’s, Inc. | | | |
| 8.00% | | 05/01/31 | | Baa2 | | $ | 910 | | $ | 1,136,428 |
Kroger Co. (The), | | | |
| 6.75% | | 04/15/12 | | Baa2 | | | 1,560 | | | 1,761,338 |
| 6.80% | | 04/01/11 | | Baa2 | | | 575 | | | 648,006 |
Safeway, Inc. | | | |
| 2.50% | | 11/01/05 | | Baa2 | | | 1,800 | | | 1,789,825 |
| 4.95% | | 08/16/10(b) | | Baa2 | | | 1,600 | | | 1,628,734 |
| | | | | | | | | |
|
|
| | | | | | | | | | | 6,964,331 |
| | | | | | | | | |
|
|
Technology — 0.4% | | | |
Computer Associates International, Inc. | | | |
| 4.75% | | 12/01/09 | | Ba1 | | | 1,450 | | | 1,460,609 |
(cost $805,600; purchased 5/29/03) | | | |
| 6.375% | | 04/15/05(j)(k) | | Ba1 | | | 760 | | | 766,968 |
Computer Sciences Corp. | | | |
| 6.75% | | 06/15/06 | | A3 | | | 395 | | | 413,585 |
Equifax, Inc. | | | |
| 4.95% | | 11/01/07 | | Baa1 | | | 475 | | | 491,292 |
First Data Corp. | | | |
| 4.85% | | 10/01/14 | | A1 | | | 2,380 | | | 2,389,413 |
Hewlett-Packard Co. | | | |
| 7.15% | | 06/15/05 | | A3 | | | 320 | | | 326,091 |
International Business Machines Corp. | | | |
| 5.875% | | 11/29/32(b) | | A1 | | | 1,475 | | | 1,559,879 |
Jabil Circuit, Inc. | | | |
| 5.875% | | 07/15/10(b) | | Baa3 | | | 1,000 | | | 1,052,622 |
Motorola, Inc. | | | |
| 4.608% | | 11/16/07 | | Baa3 | | | 1,220 | | | 1,244,080 |
| 7.625% | | 11/15/10 | | Baa3 | | | 975 | | | 1,130,964 |
SunGard Data Systems, Inc. | | | |
| 3.75% | | 01/15/09 | | Baa2 | | | 900 | | | 874,102 |
| 4.875% | | 01/15/14 | | Baa2 | | | 455 | | | 442,216 |
| | | | | | | | | |
|
|
| | | | | | | | | | | 12,151,821 |
| | | | | | | | | |
|
|
Telecommunications — 1.6% | | | |
AT&T Wireless Services, Inc., | | | |
| 7.35% | | 03/01/06 | | Baa2 | | | 2,245 | | | 2,348,582 |
| 8.125% | | 05/01/12 | | Baa2 | | | 800 | | | 967,075 |
| 8.75% | | 03/01/31 | | Baa2 | | | 705 | | | 950,561 |
BellSouth Corp. | | | |
| 4.20% | | 09/15/09 | | A2 | | | 1,365 | | | 1,368,565 |
| 5.20% | | 09/15/14 | | A2 | | | 1,630 | | | 1,661,332 |
| 6.55% | | 06/15/34(b) | | A2 | | | 1,040 | | | 1,133,231 |
British Telecommunications PLC, (United Kingdom) |
| 1.00% | | 12/15/30(f) | | Baa1 | | | 1,720 | | | 2,303,116 |
| 7.00% | | 05/23/07 | | Baa1 | | | 1,400 | | | 1,500,100 |
SEE NOTES TO FINANCIAL STATEMENTS.
B11
| | | | |
| | | CONSERVATIVE BALANCED PORTFOLIO (Continued) | | |
SCHEDULE OF INVESTMENTS | December 31, 2004 |
| | | | | | | | | | |
Interest
Rate
| | Maturity
Date
| | Moody’s
Rating
(Unaudited)
| | Principal
Amount
(000)
| | Value (Note 2)
|
| LONG-TERM BONDS (Continued) | | | |
Telecommunications (cont’d.) | | | |
CenturyTel, Inc. | | | |
| 7.875% | | 08/15/12 | | Baa2 | | | 165 | | | 194,174 |
Citizens Communications Co.,
(cost $1,540,700; purchased 3/23/04) | | | |
| 7.60% | | 06/01/06(k) | | Ba3 | | | 1,420 | | | 1,501,650 |
Deutsche Telekom International Finance BV, (Netherlands) |
| 8.75% | | 06/15/30(f) | | Baa1 | | | 460 | | | 607,411 |
| 9.25% | | 06/01/32(f) | | Baa1 | | | 910 | | | 1,295,008 |
Pacific Bell | | | |
| 7.25% | | 11/01/27 | | A2 | | $ | 500 | | $ | 542,548 |
Royal KPN N.V. (Netherlands) | | | |
| 8.00% | | 10/01/10 | | Baa1 | | | 2,330 | | | 2,750,190 |
SBC Communications, Inc. | | | |
| 4.125% | | 09/15/09 | | A2 | | | 1,335 | | | 1,332,564 |
| 5.10% | | 09/15/14 | | A2 | | | 835 | | | 842,760 |
| 6.15% | | 09/15/34 | | A2 | | | 665 | | | 684,871 |
| 6.45% | | 06/15/34 | | A2 | | | 460 | | | 492,829 |
Sprint Capital Corp. | | | |
| 6.875% | | 11/15/28(b) | | Baa3 | | | 2,950 | | | 3,229,622 |
| 8.75% | | 03/15/32 | | Baa3 | | | 220 | | | 293,108 |
Telecom de Puerto Rico, Inc. (Puerto Rico) | | | |
| 6.65% | | 05/15/06 | | Baa1 | | | 4,500 | | | 4,666,828 |
| 6.80% | | 05/15/09 | | Baa1 | | | 2,220 | | | 2,363,319 |
Telecom Italia Finance (Luxembourg) | | | |
| 5.25% | | 11/15/13 | | Baa2 | | | 1,010 | | | 1,020,843 |
| 4.95% | | 09/30/14(j) | | Baa2 | | | 2,520 | | | 2,468,942 |
| 6.00% | | 09/30/34(j) | | Baa2 | | | 2,690 | | | 2,629,892 |
Telefonica Europe BV (Netherlands) | | | |
| 7.75% | | 09/15/10 | | A3 | | | 1,490 | | | 1,747,308 |
Telus Corp. (Canada) | | | |
| 8.00% | | 06/01/11 | | Baa3 | | | 1,600 | | | 1,896,128 |
Verizon Global Funding Corp. | | | |
| 7.75% | | 12/01/30 | | A2 | | | 565 | | | 702,479 |
Verizon, Inc. | | | |
| 7.375% | | 04/01/32(b) | | Baa2 | | | 1,125 | | | 1,290,439 |
Vodafone Group PLC (United Kingdom) | | | |
| 5.375% | | 01/30/15 | | A2 | | | 200 | | | 207,843 |
| 7.75% | | 02/15/10 | | A2 | | | 1,100 | | | 1,276,503 |
| | | | | | | | | |
|
|
| | | | | | | | | | | 46,269,821 |
| | | | | | | | | |
|
|
Tobacco | | �� | |
Altria Group, Inc. | | | |
| 7.65% | | 07/01/08(b) | | Baa2 | | | 765 | | | 841,449 |
Philip Morris Cos., Inc. | | | |
| 7.00% | | 07/15/05 | | Baa2 | | | 485 | | | 492,512 |
| | | | | | | | | |
|
|
| | | | | | | | | | | 1,333,961 |
| | | | | | | | | |
|
|
Transportation Services — 0.1% | | | |
Erac USA Finance Co. | | | |
| 6.70% | | 06/01/34(j) | | Baa1 | | | 1,160 | | | 1,259,839 |
Fedex Corp. | | | |
| 2.65% | | 04/01/07 | | Baa2 | | | 2,100 | | | 2,056,797 |
| | | | | | | | | |
|
|
| | | | | | | | | | | 3,316,636 |
| | | | | | | | | |
|
|
| | | | | | | | | | |
Interest
Rate
| | Maturity
Date
| | Moody’s
Rating
(Unaudited)
| | Principal
Amount
(000)
| | Value (Note 2)
|
| LONG-TERM BONDS (Continued) | | | |
Utilities — 1.1% | | | |
Arizona Public Service Co. | | | |
| 7.625% | | 08/01/05 | | Baa1 | | | 5,000 | | | 5,129,970 |
Boston Edison Co. | | | |
| 4.875% | | 04/15/14 | | A1 | | | 730 | | | 739,631 |
CenterPoint Energy Houston Electric LLC | | | |
| 5.70% | | 03/15/13 | | Baa2 | | | 1,070 | | | 1,134,005 |
| 6.95% | | 03/15/33 | | Baa2 | | | 800 | | | 937,611 |
Consolidated Edison Co. of New York | | | |
| 5.70% | | 02/01/34 | | A1 | | | 550 | | | 564,710 |
Consumers Energy Co. | | | |
| 5.375% | | 04/15/13 | | Baa3 | | $ | 435 | | $ | 449,875 |
Dominion Resources, Inc. | | | |
| 5.125% | | 12/15/09 | | Baa1 | | | 1,255 | | | 1,298,554 |
Duke Capital LLC | | | |
| 4.331% | | 11/16/06 | | Baa3 | | | 920 | | | 931,542 |
| 6.25% | | 02/15/13 | | Baa3 | | | 305 | | | 329,638 |
| 8.00% | | 10/01/19 | | Baa3 | | | 280 | | | 341,695 |
Energy East Corp. | | | |
| 6.75% | | 09/15/33 | | Baa2 | | | 805 | | | 902,160 |
FirstEnergy Corp. | | | |
| 7.375% | | 11/15/31 | | Baa3 | | | 960 | | | 1,096,305 |
Florida Power & Light Co. | | | |
| 5.95% | | 10/01/33 | | Aa3 | | | 790 | | | 846,462 |
Indiana Michigan Power Co. | | | |
| 5.05% | | 11/15/14 | | Baa2 | | | 575 | | | 574,654 |
National Rural Utilities Cooperative Finance Corp. | | | |
| 7.25% | | 03/01/12 | | A2 | | | 900 | | | 1,038,785 |
NiSource Finance Corp. | | | |
| 7.625% | | 11/15/05 | | Baa3 | | | 750 | | | 777,321 |
Oncor Electric Delivery Co. | | | |
| 6.375% | | 01/15/15 | | Baa1 | | | 465 | | | 512,350 |
| 7.00% | | 09/01/22 | | Baa2 | | | 545 | | | 621,579 |
| 7.25% | | 01/15/33 | | Baa1 | | | 340 | | | 403,916 |
Pacific Gas & Electric Co. | | | |
| 6.05% | | 03/01/34 | | Baa2 | | | 2,500 | | | 2,596,540 |
PacifiCorp. | | | |
| 5.45% | | 09/15/13 | | A3 | | | 385 | | | 402,951 |
Pepco Holdings, Inc. | | | |
| 5.50% | | 08/15/07 | | Baa2 | | | 735 | | | 764,339 |
PPL Electric Utilities Corp. | | | |
| 6.25% | | 08/15/09 | | Baa1 | | | 1,900 | | | 2,065,207 |
Progress Energy, Inc. | | | |
| 6.75% | | 03/01/06 | | Baa2 | | | 1,825 | | | 1,893,722 |
Southern California Edison Co. | | | |
| 4.65% | | 04/01/15 | | A3 | | | 610 | | | 598,419 |
| 5.75% | | 04/01/35 | | A3 | | | 310 | | | 317,901 |
| 8.00% | | 02/15/07 | | A3 | | | 1,810 | | | 1,971,056 |
TXU Corp.(b)(j) | | | |
| 6.50% | | 11/15/24 | | Ba1 | | | 1,815 | | | 1,818,029 |
Westar Energy, Inc. | | | |
| 6.00% | | 07/01/14 | | Ba1 | | | 720 | | | 774,037 |
Xcel Energy, Inc. | | | |
| 3.40% | | 07/01/08 | | Baa1 | | | 785 | | | 769,626 |
| 7.00% | | 12/01/10 | | Baa1 | | | 250 | | | 281,807 |
| | | | | | | | | |
|
|
| | | | | | | | | | | 32,884,397 |
| | | | | | | | | |
|
|
SEE NOTES TO FINANCIAL STATEMENTS.
B12
| | | | |
| | | CONSERVATIVE BALANCED PORTFOLIO (Continued) | | |
SCHEDULE OF INVESTMENTS | December 31, 2004 |
| | | | | | | | |
Interest
Rate
| | Maturity
Date
| | Moody’s
Rating
(Unaudited)
| | Principal
Amount
(000)
| | Value (Note 2)
|
| LONG-TERM BONDS (Continued) | | |
Foreign Local Government Bonds — 0.1% | | |
Hydro-Quebec (Canada) | | |
| 7.50% | | 04/01/16 | | A1 | | 665 | | 820,345 |
| 8.00% | | 02/01/13 | | A1 | | 1,900 | | 2,344,847 |
Quebec Province of Canada (Canada) | | |
| 4.875% | | 05/05/14 | | A1 | | 1,000 | | 1,016,288 |
| | | | | | | | |
|
| | | | | | | | | 4,181,480 |
| | | | | | | | |
|
| | | | | | | | |
Interest
Rate
| | Maturity
Date
| | Principal
Amount
(000)
| | Value (Note 2)
|
U.S. Government & Agency Obligations — 6.0% |
Federal Farm Credit Bank |
| 3.00% | | 12/17/07(b) | | $ | 16,450 | | $ | 16,284,529 |
Federal Home Loan Bank |
| 3.75% | | 08/18/09 | | | 3,935 | | | 3,926,674 |
| 3.875% | | 01/15/10 | | | 7,100 | | | 7,079,793 |
| 4.50% | | 05/13/11 | | | 5,455 | | | 5,548,897 |
Federal Home Loan Mortgage Corp., |
| 2.75% | | 10/15/06(b) | | | 14,055 | | | 13,943,811 |
| 2.875% | | 05/15/07(b) | | | 2,145 | | | 2,123,117 |
| 7.00% | | 03/15/10 | | | 560 | | | 639,544 |
Federal National Mortgage Association, |
| 3.25% | | 08/15/08 | | | 5,885 | | | 5,807,436 |
| 4.25% | | 05/15/09(b) | | | 7,560 | | | 7,692,209 |
| 5.25% | | 08/01/12 | | | 8,475 | | | 8,793,914 |
| 5.50% | | 07/18/12 | | | 8,200 | | | 8,298,843 |
| 7.125% | | 06/15/10 | | | 18,665 | | | 21,453,962 |
United States Treasury Bonds, |
| 5.375% | | 02/15/31(b) | | | 5,871 | | | 6,348,477 |
| 6.00% | | 02/15/26(b) | | | 4,630 | | | 5,303,702 |
| 9.00% | | 11/15/18(b) | | | 7,072 | | | 10,243,629 |
| 9.125% | | 05/15/18(b) | | | 4,202 | | | 6,111,612 |
| 9.25% | | 02/15/16 | | | 170 | | | 242,668 |
United States Treasury Notes, |
| 1.625% | | 09/30/05(b) | | | 500 | | | 496,309 |
| 1.875% | | 12/31/05 | | | 1,000 | | | 991,328 |
| 2.50% | | 10/31/06(b) | | | 11,435 | | | 11,328,243 |
| 3.125% | | 05/15/07(b) | | | 11,970 | | | 11,963,919 |
United States Treasury Strips, I/O |
| Zero | | 05/15/18 | | | 7,325 | | | 3,855,264 |
| Zero | | 05/15/19(b) | | | 23,515 | | | 11,648,132 |
| Zero | | 05/15/25(b) | | | 7,750 | | | 2,740,431 |
| | | | | | | |
|
|
| | | | | | | | | 172,866,443 |
| | | | | | | |
|
|
Mortgage Backed Securities — 13.3% |
Federal Home Loan Mortgage Corp., |
| 4.50% | | 11/01/18-06/01/19 | | | 8,141 | | | 8,124,156 |
| 5.00% | | 06/01/18-05/01/34 | | | 18,566 | | | 18,782,957 |
| 5.50% | | 12/01/33-07/01/34 | | | 19,118 | | | 19,436,693 |
| 6.00% | | 12/01/33 | | | 2,563 | | | 2,653,102 |
| 6.001% | | TBA | | | 10,000 | | | 10,328,120 |
| 6.50% | | 05/01/14-04/01/15 | | | 1,572 | | | 1,665,941 |
| 7.00% | | 05/01/31-09/01/33 | | | 14,332 | | | 15,190,470 |
Federal National Mortgage Association, |
| 4.00% | | 06/01/19 | | | 3,827 | | | 3,734,994 |
| 4.50% | | 01/01/19-10/01/33 | | | 18,466 | | | 18,257,444 |
| 5.00% | | 10/01/18-04/01/34 | | | 42,027 | | | 41,933,385 |
| 5.001% | | TBA | | | 28,000 | | | 27,950,625 |
| | | | | | | | | |
Interest
Rate
| | Maturity
Date
| | Principal
Amount
(000)
| | Value (Note 2)
| |
| LONG-TERM BONDS (Continued) | | | | |
Mortgage Backed Securities — 13.3% (cont’d.) | |
Federal National Mortgage Association, | |
| 5.054% | | 07/01/33(h) | | | 2,948 | | | 3,022,222 | |
| 5.50% | | 03/01/16-04/01/34 | | | 70,498 | | | 71,678,577 | |
| 5.501% | | TBA | | | 27,500 | | | 28,193,437 | |
| 6.00% | | 04/01/13-03/01/34 | | | 18,707 | | | 19,426,500 | |
| 6.001% | | TBA | | | 43,000 | | | 44,581,875 | |
| 6.50% | | 07/01/17-09/01/34 | | | 11,170 | | | 11,736,569 | |
| 6.501% | | TBA | | | 5,500 | | | 5,766,409 | |
| 7.00% | | 08/01/11-07/01/32 | | | 3,526 | | | 3,744,801 | |
| 7.50% | | 05/01/12-05/01/32 | | | 2,933 | | | 3,126,286 | |
Government National Mortgage Association, | |
| 5.50% | | 08/15/33-03/15/34 | | $ | 3,240 | | $ | 3,311,863 | |
| 6.00% | | 04/15/33-06/20/34 | | | 6,216 | | | 6,443,523 | |
| 6.50% | | 10/15/23-08/15/32 | | | 14,234 | | | 15,024,213 | |
| 7.00% | | 09/15/31 | | | 525 | | | 558,417 | |
| 8.00% | | 01/15/24-04/15/25 | | | 485 | | | 529,028 | |
| | | | | | | |
|
|
|
| | | | | | | | | 385,201,607 | |
| | | | | | | |
|
|
|
TOTAL LONG-TERM BONDS
(cost $1,023,726,580) | | | 1,042,461,473 | |
| | | | | | | |
|
|
|
TOTAL LONG-TERM INVESTMENTS
(cost $2,649,485,454) | | | 2,759,344,277 | |
| | | | | | | |
|
|
|
| SHORT-TERM INVESTMENTS — 24.6% | |
Corporate Bonds — 1.8% | |
EL Sevier Finance(i) | |
| 2.38% | | 02/01/05 | | | 20,000 | | | 19,959,011 | |
| 2.40% | | 02/04/05 | | | 22,500 | | | 22,449,000 | |
| 2.48% | | 01/24/05 | | | 10,000 | | | 9,984,156 | |
| | | | | | | |
|
|
|
TOTAL CORPORATE BONDS
(cost $ 52,392,167; Note 4) | | | 52,392,167 | |
| | | | | | | |
|
|
|
U.S. Government & Agency Obligations — 0.2% | |
United States Treasury Bills | |
| 2.17% | | 03/17/05(c)(g) | | | 6,500 | | | 6,470,682 | |
| | | | | | | |
|
|
|
Mutual Fund — 22.6% | |
Dryden Core Investment Fund —
Taxable Money Market Series(i) | | | 654,339,298 | | | 654,339,298 | |
| | | | | | | |
|
|
|
TOTAL SHORT-TERM INVESTMENTS
(cost $713,202,147) | | | 713,202,147 | |
| | | | | | | |
|
|
|
TOTAL INVESTMENTS — 120.0%
(cost $3,362,687,601; Note 6) | | | 3,472,546,424 | |
VARIATION MARGIN ON OPEN FUTURES CONTRACTS, NET(l) | | | (136,872 | ) |
LIABILITIES IN EXCESS OF OTHER
ASSETS — (20.0)% | | | (578,846,496 | ) |
| | | | | | | |
|
|
|
TOTAL NET ASSETS — 100% | | $ | 2,893,563,056 | |
| | | | | | | |
|
|
|
The following abbreviations are used in portfolio descriptions:
| | |
| G.O. | | General Obligation |
| I/O | | Interest Only |
| LP | | Limited Partnership |
| M.T.N. | | Medium Term Note |
| NR | | Not Rated |
| TBA | | Securities purchased on a forward commitment basis |
| (a) | Non-Income producing security. |
SEE NOTES TO FINANCIAL STATEMENTS.
B13
| | | | |
| | | CONSERVATIVE BALANCED PORTFOLIO (Continued) | | |
SCHEDULE OF INVESTMENTS | December 31, 2004 |
| (b) | Portion of securities on loan with an aggregate market value of $454,023,289; cash collateral of $469,946,326 was received with which the portfolio purchased securities. |
| (c) | Security segregated as collateral for futures contracts. |
| (d) | Standard & Poor’s rating. |
| (e) | Indicates a fair valued security. |
| (f) | Increase/decrease in rate variable upon increase/decrease in Moody’s or Standard & Poor’s rating. |
| (g) | Rate quoted represents yield-to-Maturity as of purchase date. |
| (h) | Indicates variable rate security. |
| (i) | Represents security, or a portion thereof, purchased with cash collateral for securities on loan. |
| (j) | Security was purchased pursuant to Rule 144A under the Securities Act of 1933 and may not be resold subject to that rule except to qualified institutional buyers, unless otherwise noted 144A securities are deemed to be liquid. |
| (k) | Indicates a security that has been deemed illiquid. The aggregate cost of illiquid security of $7,705,992. The aggregate value, $8,335,705 represents 0.3% of the net assets. |
| (l) | Open futures contracts as of December 31, 2004 were as follows: |
| | | | | | | | | | | | | | |
Number of
Contracts
| | Type
| | Expiration
Date
| | Value at
Trade Date
| | Value at
December 31, 2004
| | Unrealized
Appreciation/
(Depreciation)
| |
| Long Positions: | | | | | | | | | | | | | | |
| 87 | | Eurodollar Futures | | Sep. 05 | | $ | 20,998,790 | | $ | 21,012,675 | | $ | 13,885 | |
| 120 | | S&P 500 Index | | Mar. 05 | | | 36,115,550 | | | 36,411,000 | | | 295,450 | |
| 134 | | S&P 500 Index | | Mar. 05 | | | 39,570,200 | | | 40,658,950 | | | 1,088,750 | |
| 160 | | U.S. Treasury 5Yr Notes | | Mar. 05 | | | 17,419,371 | | | 17,525,000 | | | 105,629 | |
| | | | | | | | | | | | |
|
|
|
| | | | | | | | | | | | | | 1,503,714 | |
| | | | | | | | | | | | |
|
|
|
| Short Positions: | | | | | | | | | | | | |
| 148 | | U.S. Treasury 10Yr Notes | | Mar. 05 | | | 16,524,135 | | | 16,566,750 | | | (42,615 | ) |
| 58 | | U.S. Treasury Bonds | | Mar. 05 | | | 6,536,278 | | | 6,525,000 | | | 11,278 | |
| 147 | | U.S. Treasury 2Yr Notes | | Mar. 05 | | | 30,853,627 | | | 30,810,281 | | | 43,346 | |
| | | | | | | | | | | | |
|
|
|
| | | | | | | | | | | | | | 12,009 | |
| | | | | | | | | | | | |
|
|
|
| | | | | | | | | | | | | $ | 1,515,723 | |
| | | | | | | | | | | | |
|
|
|
The industry classification of portfolio holdings and liabilities in excess of other assets shown as a percentage of net assets as of December 31, 2004 was as follows:
| | | |
Mutual Fund | | 22.6 | % |
Mortgage Backed Securities | | 13.3 | |
Drugs & Medical Supplies | | 6.5 | |
U.S. Government & Agency Obligations | | 6.2 | |
Financial Services | | 5.6 | |
Banks & Savings & Loans | | 5.6 | |
Computer Services | | 4.3 | |
Retail | | 3.7 | |
Oil & Gas | | 3.2 | |
Commercial Mortgage Backed Securities | | 3.0 | |
Food & Beverage | | 2.9 | |
Telecommunications | | 2.8 | |
Insurance | | 2.7 | |
Media | | 2.3 | |
Diversified Operations | | 2.2 | |
Electronics | | 2.2 | |
Corporate Bonds | | 1.8 | |
Technology | | 1.6 | |
Utilities — Electric & Gas | | 1.6 | |
Aerospace | | 1.4 | |
Telecommunications — Wirelines | | 1.4 | |
Cosmetics & Soaps | | 1.3 | |
| | |
Chemicals | | 1.1 |
Utilities | | 1.1 |
Asset Backed Securities | | 1.0 |
Computers | | 0.8 |
Diversified Consumer Products | | 0.8 |
Hospitals/Hospital Management | | 0.8 |
Leisure | | 0.8 |
Real Estate Investment Trust | | 0.7 |
Trucking/Shipping | | 0.7 |
Automobiles | | 0.6 |
Manufacturing | | 0.6 |
Autos — Cars & Trucks | | 0.5 |
Independent Energy | | 0.5 |
Machinery | | 0.5 |
Miscellaneous Basic Industry | | 0.5 |
Oil & Gas Exploration & Production | | 0.5 |
Oil & Gas Services | | 0.5 |
Restaurants | | 0.5 |
Brokerage | | 0.4 |
Collateralized Mortgage Obligations | | 0.4 |
Housing Related | | 0.4 |
Internet Services | | 0.4 |
Miscellaneous — Consumer Growth/Staple | | 0.4 |
Railroads | | 0.4 |
Sovereign | | 0.4 |
Airlines | | 0.3 |
SEE NOTES TO FINANCIAL STATEMENTS.
B14
| | | | |
| | | CONSERVATIVE BALANCED PORTFOLIO (Continued) | | |
SCHEDULE OF INVESTMENTS | December 31, 2004 |
| | | |
Apparel | | 0.3 | |
Household Products & Personal Care | | 0.3 | |
Lodging | | 0.3 | |
Business Services | | 0.2 | |
Cable & Pay Television Systems | | 0.2 | |
Construction | | 0.2 | |
Consumer Services | | 0.2 | |
Diversified Manufacturing | | 0.2 | |
Diversified Office Equipment | | 0.2 | |
Entertainment | | 0.2 | |
Forest Products | | 0.2 | |
Gas Pipelines | | 0.2 | |
Healthcare | | 0.2 | |
Instrument — Controls | | 0.2 | |
Integrated Energy | | 0.2 | |
Municipals | | 0.2 | |
Oil Field Services | | 0.2 | |
Paper | | 0.2 | |
Supermarkets | | 0.2 | |
Telecommunications — Wireless | | 0.2 | |
Building Materials | | 0.1 | |
Consumer Products | | 0.1 | |
Containers | | 0.1 | |
Education | | 0.1 | |
Gas Distribution | | 0.1 | |
Home Construction | | 0.1 | |
Metals | | 0.1 | |
Metals — Ferrous | | 0.1 | |
Metals — Non Ferrous | | 0.1 | |
Mineral Resources | | 0.1 | |
Motorcycles | | 0.1 | |
Pharmaceuticals | | 0.1 | |
Pipelines | | 0.1 | |
Precious Metals | | 0.1 | |
Tobacco | | 0.1 | |
Toys | | 0.1 | |
Transportation Services | | 0.1 | |
Waste Management | | 0.1 | |
Foreign Local Government Bonds | | 0.1 | |
Commercial Services | | 0.0 | |
Environmental | | 0.0 | |
Gaming | | 0.0 | |
Refining | | 0.0 | |
Rubber | | 0.0 | |
Textiles | | 0.0 | |
Travel Services | | 0.0 | |
| | |
|
|
| | | 120.0 | |
Liabilities in excess of other assets | | (20.0 | ) |
| | |
|
|
| | | 100.0 | % |
| | |
|
|
SEE NOTES TO FINANCIAL STATEMENTS.
B15
| | | | |
| | | DIVERSIFIED BOND PORTFOLIO | | |
SCHEDULE OF INVESTMENTS | December 31, 2004 |
| | | | | | | | | | | | |
LONG-TERM INVESTMENTS — 98.8%
LONG-TERM BONDS | | Moody’s
Rating
(Unaudited)
| | Interest
Rate
| | Maturity
Date
| | Principal
Amount
(000)
| | Value
(Note 2)
|
Aerospace/Defense — 0.3% | | | | | | | | | | | | |
L-3 Communications Corp. | | Ba3 | | 6.125% | | 01/15/14 | | $ | 1,385 | | $ | 1,426,550 |
Raytheon Co. | | Baa3 | | 4.50% | | 11/15/07 | | | 335 | | | 342,748 |
Raytheon Co.(a) | | Baa3 | | 6.55% | | 03/15/10 | | | 1,175 | | | 1,292,951 |
Raytheon Co. | | Baa3 | | 8.30% | | 03/01/10 | | | 725 | | | 859,120 |
| | | | | | | | | | | |
|
|
| | | | | | | | | | | | | 3,921,369 |
| | | | | | | | | | | |
|
|
Airlines — 0.7% | | | | | | | | | | | | |
Continental Airlines, Inc., Series 2000-1, Class A-1(a) | | Baa3 | | 8.048% | | 11/01/20 | | | 3,789 | | | 3,838,327 |
Continental Airlines, Inc., Series RJ04, Class B(a) | | Ba2 | | 9.558% | | 09/01/19 | | | 2,165 | | | 2,180,828 |
Southwest Airlines Co.(a) | | Baa1 | | 5.25% | | 10/01/14 | | | 2,550 | | | 2,559,369 |
| | | | | | | | | | | |
|
|
| | | | | | | | | | | | | 8,578,524 |
| | | | | | | | | | | |
|
|
Asset Backed Securities — 2.9% | | | | | | | | | | | | |
American Express Credit Account Master Trust, Series 2004-C, Class C(f) | | Baa2 | | 2.902% | | 02/15/12 | | | 2,450 | | | 2,453,589 |
Bank One Issuance Trust, Series 2003-C1, Class C1 | | Baa2 | | 4.54% | | 09/15/10 | | | 2,980 | | | 3,024,066 |
Citibank Credit Card Master Trust, Series 1996-3 | | Aaa | | 6.10% | | 05/15/08 | | | 8,400 | | | 8,717,441 |
CS First Boston Mortgage Securities Corp., Series 2000-HE1, Class B(f) | | Baa3 | | 4.753% | | 12/15/30 | | | 2,750 | | | 2,756,002 |
Equity One ABS, Inc., Series 2004-3, Class M1 | | Aa2 | | 5.70% | | 07/25/34 | | | 2,100 | | | 2,133,320 |
MBNA Master Credit Card Trust, Series 1999-J, Class A | | Aaa | | 7.00% | | 02/15/12 | | | 14,300 | | | 16,107,560 |
Residential Asset Mortgage Products, Inc., Series 2004-RS12, Class MII2(f) | | Aa3 | | 3.217% | | 12/25/34 | | | 2,100 | | | 2,100,000 |
| | | | | | | | | | | |
|
|
| | | | | | | | | | | | | 37,291,978 |
| | | | | | | | | | | |
|
|
Automotive — 2.0% | | | | | | | | | | | | |
Auburn Hills Trust, Inc. | | A3 | | 12.375% | | 05/01/20 | | | 1,900 | | | 2,980,085 |
Daimlerchrysler North America Holding Corp. | | A3 | | 8.50% | | 01/18/31 | | | 1,580 | | | 1,974,134 |
Equus Cayman Finance, Ltd., (Cayman Islands), 144A(g) | | Baa3 | | 5.50% | | 09/12/08 | | | 830 | | | 860,498 |
Ford Motor Credit Co. | | A3 | | 6.875% | | 02/01/06 | | | 555 | | | 571,761 |
Ford Motor Credit Co.(a) | | A3 | | 7.00% | | 10/01/13 | | | 5,305 | | | 5,624,000 |
Ford Motor Credit Co.(a) | | A3 | | 7.75% | | 03/15/05 | | | 3,500 | | | 3,532,855 |
General Motors Acceptance Corp. | | Baa1 | | 6.15% | | 04/05/07 | | | 3,710 | | | 3,812,663 |
General Motors Acceptance Corp. | | Baa1 | | 6.75% | | 12/01/14 | | | 770 | | | 771,053 |
Hyundai Motor Manufacturing LLC, 144A(g) | | Baa3 | | 5.30% | | 12/19/08 | | | 1,820 | | | 1,875,039 |
Lear Corp.(a) | | Baa3 | | 7.96% | | 05/15/05 | | | 3,040 | | | 3,088,546 |
| | | | | | | | | | | |
|
|
| | | | | | | | | | | | | 25,090,634 |
| | | | | | | | | | | |
|
|
Banking — 3.4% | | | | | | | | | | | | |
Cho Hung Bank, (South Korea), 144A(f)(g) | | Baa2 | | 11.50% | | 04/01/10 | | | 1,335 | | | 1,362,741 |
Cho Hung Bank, (South Korea), 144A(f)(g) | | Baa2 | | 11.875% | | 04/01/10 | | | 1,190 | | | 1,215,585 |
Citigroup, Inc.(a) | | Aa2 | | 6.625% | | 06/15/32 | | | 980 | | | 1,097,609 |
Hanvit Bank, (South Korea), 144A(f)(g) | | Baa2 | | 12.75% | | 03/01/10 | | | 100 | | | 101,530 |
HSBC Bank USA | | Aa3 | | 5.875% | | 11/01/34 | | | 2,550 | | | 2,582,125 |
HSBC Holdings PLC, (United Kingdom) | | Aa3 | | 5.25% | | 12/12/12 | | | 3,100 | | | 3,213,665 |
JP Morgan Chase & Co. | | A1 | | 6.75% | | 02/01/11 | | | 1,260 | | | 1,415,493 |
Kasikornbank Public Co., Ltd., (Thailand), 144A(g) | | Baa2 | | 8.25% | | 08/21/16 | | | 1,710 | | | 2,064,317 |
Kazkommerts International BV, (Netherlands), 144A(a)(g) | | Baa2 | | 7.875% | | 04/07/14 | | | 4,150 | | | 4,150,000 |
KBC Bank Funding Trust III, 144A(f)(g) | | A2 | | 9.86% | | 11/29/49 | | | 5,000 | | | 6,134,340 |
Mizuho Financial Group, (Cayman Islands), 144A(g) | | A2 | | 5.79% | | 04/15/14 | | | 1,880 | | | 1,974,750 |
PNC Funding Corp. | | A3 | | 7.50% | | 11/01/09 | | | 1,090 | | | 1,241,294 |
Rabobank Capital Funding Trust III, 144A(f)(g) | | Aa2 | | 5.254% | | 12/29/49 | | | 1,225 | | | 1,218,342 |
Santander Central Hispano Issuances, (Cayman Islands)(d) | | A1 | | 7.625% | | 09/14/10 | | | 1,200 | | | 1,398,476 |
Washington Mutual, Inc. | | A3 | | 7.50% | | 08/15/06 | | | 10,000 | | | 10,623,480 |
Wells Fargo & Co. | | Aa2 | | 5.125% | | 09/15/16 | | | 3,800 | | | 3,817,575 |
| | | | | | | | | | | |
|
|
| | | | | | | | | | | | | 43,611,322 |
| | | | | | | | | | | |
|
|
SEE NOTES TO FINANCIAL STATEMENTS.
B16
| | | | |
| | | DIVERSIFIED BOND PORTFOLIO (Continued) | | |
SCHEDULE OF INVESTMENTS | December 31, 2004 |
| | | | | | | | | | | | |
| LONG-TERM BONDS (Continued) | | Moody’s
Rating
(Unaudited)
| | Interest
Rate
| | Maturity
Date
| | Principal
Amount
(000)
| | Value
(Note 2)
|
Brokerage — 1.1% | | | | | | | | | | | | |
Goldman Sachs Group, Inc. | | A1 | | 6.345% | | 02/15/34 | | $ | 5,180 | | $ | 5,393,955 |
Lehman Brothers Holdings, Inc. | | A1 | | 6.625% | | 02/05/06 | | | 3,685 | | | 3,817,137 |
Merrill Lynch & Co., Inc. | | Aa3 | | 5.00% | | 01/15/15 | | | 4,475 | | | 4,457,462 |
| | | | | | | | | | | |
|
|
| | | | | | | | | | | | | 13,668,554 |
| | | | | | | | | | | |
|
|
Building Materials & Construction — 1.4% | | | | | | | | | | | | |
American Standard, Inc. | | Baa3 | | 7.625% | | 02/15/10 | | | 3,800 | | | 4,344,456 |
D.R. Horton, Inc.(a) | | Ba1 | | 5.625% | | 09/15/14 | | | 5,335 | | | 5,321,663 |
RPM International, Inc. | | Baa3 | | 6.25% | | 12/15/13 | | | 1,690 | | | 1,757,938 |
RPM International, Inc., 144A(g) | | Baa3 | | 4.45% | | 10/15/09 | | | 5,150 | | | 5,049,776 |
Ryland Group, Inc. | | Baa3 | | 5.375% | | 06/01/08 | | | 1,900 | | | 1,976,000 |
| | | | | | | | | | | |
|
|
| | | | | | | | | | | | | 18,449,833 |
| | | | | | | | | | | |
|
|
Cable — 0.7% | | | | | | | | | | | | |
Comcast Cable Communications, Inc. | | Baa3 | | 6.375% | | 01/30/06 | | | 650 | | | 671,412 |
Comcast Corp., Class A | | Baa3 | | 7.05% | | 03/15/33 | | | 255 | | | 291,778 |
CSC Holdings, Inc. | | B1 | | 7.875% | | 12/15/07 | | | 3,800 | | | 4,075,500 |
Rogers Cablesystems, Inc., (Canada) | | Ba3 | | 10.00% | | 03/15/05 | | | 3,500 | | | 3,548,125 |
TCI Communications, Inc. | | Baa3 | | 7.875% | | 02/15/26 | | | 750 | | | 921,019 |
| | | | | | | | | | | |
|
|
| | | | | | | | | | | | | 9,507,834 |
| | | | | | | | | | | |
|
|
Capital Goods — 2.6% | | | | | | | | | | | | |
Briggs & Stratton Corp. | | Ba1 | | 8.875% | | 03/15/11 | | | 3,905 | | | 4,695,762 |
FedEx Corp.(f) | | Baa2 | | 2.286% | | 04/01/05 | | | 3,800 | | | 3,801,980 |
FedEx Corp. | | Baa2 | | 2.65% | | 04/01/07 | | | 7,550 | | | 7,394,674 |
Rockwell Automation, Inc. | | A3 | | 5.20% | | 01/15/98 | | | 6,500 | | | 5,627,388 |
Roper Industries Bank Loan | | B1 | | 3.72% | | 12/13/09 | | | 3,000 | | | 3,009,375 |
Tyco International Group SA, (Luxembourg) | | Baa3 | | 6.00% | | 11/15/13 | | | 200 | | | 217,892 |
Tyco International Group SA, (Luxembourg) | | Baa3 | | 6.75% | | 02/15/11 | | | 805 | | | 902,235 |
United Technologies Corp. | | A2 | | 7.125% | | 11/15/10 | | | 575 | | | 660,543 |
Waste Management, Inc. | | Baa3 | | 7.125% | | 10/01/07 | | | 1,550 | | | 1,683,450 |
Waste Management, Inc. | | Baa3 | | 7.65% | | 03/15/11 | | | 2,100 | | | 2,400,407 |
Waste Management, Inc. | | Baa3 | | 7.75% | | 05/15/32 | | | 2,500 | | | 3,096,020 |
| | | | | | | | | | | |
|
|
| | | | | | | | | | | | | 33,489,726 |
| | | | | | | | | | | |
|
|
Chemicals — 1.9% | | | | | | | | | | | | |
Dow Chemical Co. | | A3 | | 5.97% | | 01/15/09 | | | 1,490 | | | 1,597,539 |
Dow Chemical Co. | | A3 | | 6.125% | | 02/01/11 | | | 4,100 | | | 4,490,788 |
Dow Chemical Co. | | A3 | | 9.00% | | 04/01/21 | | | 1,000 | | | 1,339,900 |
Eastman Chemicals Co.(a) | | Baa2 | | 7.00% | | 04/15/12 | | | 775 | | | 883,278 |
Hercules, Inc. | | Ba3 | | 6.75% | | 10/15/29 | | | 2,125 | | | 2,194,062 |
ICI Wilmington, Inc. | | Baa3 | | 4.375% | | 12/01/08 | | | 2,040 | | | 2,051,514 |
ICI Wilmington, Inc. | | Baa3 | | 5.625% | | 12/01/13 | | | 2,930 | | | 3,034,577 |
IMC Global, Inc., (cost $2,032,968; purchased 5/25/04)(a)(h) | | B2 | | 6.875% | | 07/15/07 | | | 2,000 | | | 2,080,000 |
Lubrizol Corp. | | Baa3 | | 4.625% | | 10/01/09 | | | 5,600 | | | 5,591,359 |
Lubrizol Corp. | | Baa3 | | 5.875% | | 12/01/08 | | | 550 | | | 577,857 |
| | | | | | | | | | | |
|
|
| | | | | | | | | | | | | 23,840,874 |
| | | | | | | | | | | |
|
|
Collateralized Mortgage Obligations — 1.6% | | | | | | | | | | | | |
Countrywide Alternative Loan Trust, Series 2004-18CB, Class 3A1 | | Aaa | | 5.25% | | 09/25/19 | | | 4,518 | | | 4,523,298 |
Master Alternative Loans Trust, Series 2004-4, Class 4A1 | | Aaa | | 5.00% | | 04/25/19 | | | 3,648 | | | 3,696,578 |
Structured Adjustable Rate Mortgage Loan, Series 2004-1, Class 4A3(f) | | Aaa | | 4.17% | | 02/25/34 | | | 9,733 | | | 9,769,124 |
Washington Mutual, Series 2002-AR15, Class A5(f) | | Aaa | | 4.38% | | 12/25/32 | | | 3,005 | | | 3,020,947 |
| | | | | | | | | | | |
|
|
| | | | | | | | | | | | | 21,009,947 |
| | | | | | | | | | | |
|
|
Commercial Mortgage Backed Securities — 6.7% | | | | | | | | | | | | |
Bear Stearns Commercial Mortgage Securities, Inc., Series 2003-T10, Class X2(f) | | AAA(e) | | 1.269% | | 03/13/40 | | | 43,638 | | | 2,351,848 |
Chase Commercial Mortgage Securities Corp., Series 1997-1, Class A2 | | AAA(e) | | 7.37% | | 06/19/29 | | | 3,787 | | | 3,998,823 |
GMAC Commercial Mortgage Securities, Inc., Series 2002-C3, Class A2 | | Aaa | | 4.93% | | 07/10/39 | | | 8,500 | | | 8,688,492 |
SEE NOTES TO FINANCIAL STATEMENTS.
B17
| | | | |
| | | DIVERSIFIED BOND PORTFOLIO (Continued) | | |
SCHEDULE OF INVESTMENTS | December 31, 2004 |
| | | | | | | | | | | | |
| LONG-TERM BONDS (Continued) | | Moody’s
Rating
(Unaudited)
| | Interest
Rate
| | Maturity
Date
| | Principal
Amount
(000)
| | Value
(Note 2)
|
Commercial Mortgage Backed Securities (cont’d.) | | | | | | | | | | | | |
Greenwich Capital Commercial Funding Corp., Series 2003-C1, Class A4 | | Aaa | | 4.111% | | 07/05/35 | | $ | 12,700 | | $ | 12,254,987 |
Greenwich Capital Commercial Funding Corp., Series 2003-C2, Class A3 | | Aaa | | 4.533% | | 01/05/36 | | | 4,750 | | | 4,783,576 |
JP Morgan Chase Commercial Mortgage Securities, Series 2003-ML 1A, Class A2 | | Aaa | | 4.767% | | 03/12/39 | | | 4,969 | | | 5,003,400 |
LB-UBS Commercial Mortgage Trust, Series 2003-C8, Class A3 | | Aaa | | 4.83% | | 11/15/27 | | | 3,375 | | | 3,441,552 |
LB-UBS Commercial Mortgage Trust, Series 2004-C8, Class A6(f) | | Aaa | | 4.799% | | 12/15/29 | | | 4,200 | | | 4,198,302 |
Morgan Stanley Capital I, Inc., Series 2004-IQ7, Class A4(f) | | AAA(e) | | 5.434% | | 06/15/38 | | | 12,000 | | | 12,598,613 |
Morgan Stanley Dean Witter Capital I, Series 2000-PRIN, Class A3 | | Aaa | | 7.36% | | 02/23/34 | | | 2,530 | | | 2,747,771 |
PNC Mortgage Acceptance Corp., Series 1999-CM1, Class A1B | | AAA(e) | | 7.33% | | 12/10/32 | | | 4,800 | | | 5,425,352 |
PNC Mortgage Acceptance Corp., Series 2001-C1, Class A1 | | Aaa | | 5.91% | | 03/12/34 | | | 5,945 | | | 6,248,368 |
Wachovia Bank Commercial Mortgage Trust, Series 2002-C2, Class A4 | | Aaa | | 4.98% | | 11/15/34 | | | 2,500 | | | 2,557,661 |
Wachovia Bank Commercial Mortgage Trust, Series 2003-C3, Class A2 | | AAA(e) | | 4.867% | | 02/15/35 | | | 7,330 | | | 7,420,250 |
Wachovia Bank Commercial Mortgage Trust, Series 2003-C9, Class A3 | | AAA(e) | | 4.608% | | 12/15/35 | | | 4,750 | | | 4,799,447 |
| | | | | | | | | | | |
|
|
| | | | | | | | | | | | | 86,518,442 |
| | | | | | | | | | | |
|
|
Consumer Services — 0.2% | | | | | | | | | | | | |
Propex Fabrics, Inc., 144A(g) | | Caa1 | | 10.00% | | 12/01/12 | | | 2,000 | | | 2,075,000 |
| | | | | | | | | | | |
|
|
Electric — 5.9% | | | | | | | | | | | | |
CenterPoint Energy Houston Electric LLC | | Baa2 | | 5.70% | | 03/15/13 | | | 2,950 | | | 3,126,463 |
Commonwealth Edison Co. | | Baa1 | | 7.625% | | 01/15/07 | | | 7,525 | | | 8,114,682 |
Consumers Energy Co. | | Baa3 | | 5.375% | | 04/15/13 | | | 1,000 | | | 1,034,195 |
Consumers Energy Co. | | Baa3 | | 6.25% | | 09/15/06 | | | 2,300 | | | 2,401,336 |
Consumers Energy Co., 144A(g) | | Baa3 | | 5.00% | | 02/15/12 | | | 1,000 | | | 1,017,968 |
Dominion Resources, Inc. | | Baa1 | | 2.80% | | 02/15/05 | | | 5,000 | | | 5,001,731 |
Duke Capital LLC | | Baa3 | | 4.331% | | 11/16/06 | | | 650 | | | 658,154 |
Empresa Nacional de Electricidad SA, (Chile)(a) | | Ba2 | | 8.35% | | 08/01/13 | | | 625 | | | 724,226 |
Energy East Corp. | | Baa2 | | 6.75% | | 06/15/12 | | | 750 | | | 840,765 |
Energy East Corp. | | Baa2 | | 6.75% | | 09/15/33 | | | 1,150 | | | 1,288,799 |
Enersis SA, (Chile) | | Ba2 | | 7.375% | | 01/15/14 | | | 3,700 | | | 4,032,534 |
FirstEnergy Corp. | | Baa3 | | 5.50% | | 11/15/06 | | | 1,700 | | | 1,754,958 |
FirstEnergy Corp. | | Baa3 | | 6.45% | | 11/15/11 | | | 3,030 | | | 3,292,004 |
FirstEnergy Corp. | | Baa3 | | 7.375% | | 11/15/31 | | | 1,125 | | | 1,284,732 |
Korea East-West Power Co., Ltd., (South Korea), 144A(g) | | A3 | | 4.875% | | 04/21/11 | | | 1,700 | | | 1,714,088 |
MidAmerican Energy Holdings Co. | | Baa3 | | 7.23% | | 09/15/05 | | | 5,000 | | | 5,142,110 |
Midland Funding II, Series B (cost $4,369,591; purchased 8/4/03)(h) | | Ba3 | | 13.25% | | 07/23/06 | | | 4,000 | | | 4,412,380 |
NISource Finance Corp. | | Baa3 | | 7.875% | | 11/15/10 | | | 3,000 | | | 3,526,737 |
Northern States Power Co. | | A2 | | 8.00% | | 08/28/12 | | | 2,800 | | | 3,412,427 |
Oncor Electric Delivery Co. | | Baa2 | | 7.00% | | 09/01/22 | | | 300 | | | 342,154 |
Pacific Gas & Electric Co. | | Baa2 | | 6.05% | | 03/01/34 | | | 4,695 | | | 4,876,302 |
Southern California Edison Co. | | Baa1 | | 6.375% | | 01/15/06 | | | 1,250 | | | 1,289,233 |
Southern California Edison Co. | | Baa1 | | 7.625% | | 01/15/10 | | | 1,100 | | | 1,265,652 |
Southern California Edison Co. | | A3 | | 8.00% | | 02/15/07 | | | 3,823 | | | 4,163,174 |
Texas Genco LLC, 144A(a)(g) | | B1 | | 6.875% | | 12/15/14 | | | 2,725 | | | 2,816,969 |
TXU Corp.(a) | | Ba1 | | 4.446% | | 11/16/06 | | | 100 | | | 101,004 |
TXU Corp., 144A(g) | | Ba1 | | 6.50% | | 11/15/24 | | | 3,400 | | | 3,405,675 |
Westar Energy, Inc. | | Ba1 | | 6.00% | | 07/01/14 | | | 1,250 | | | 1,343,815 |
Xcel Energy, Inc. | | Baa1 | | 3.40% | | 07/01/08 | | | 1,330 | | | 1,303,952 |
Xcel Energy, Inc. | | Baa1 | | 7.00% | | 12/01/10 | | | 1,850 | | | 2,085,375 |
| | | | | | | | | | | |
|
|
| | | | | | | | | | | | | 75,773,594 |
| | | | | | | | | | | |
|
|
Energy – Integrated — 1.4% | | | | | | | | | | | | |
Conoco Funding Co., (Canada) | | A3 | | 6.35% | | 10/15/11 | | | 2,480 | | | 2,768,119 |
ConocoPhillips | | A3 | | 6.375% | | 03/30/09 | | | 3,075 | | | 3,359,090 |
Marathon Oil Corp. | | Baa1 | | 6.80% | | 03/15/32 | | | 1,800 | | | 2,017,870 |
Petronas Capital, Ltd., (Malaysia), 144A(g) | | A2 | | 7.00% | | 05/22/12 | | | 7,300 | | | 8,362,362 |
Tosco Corp. | | A3 | | 7.25% | | 01/01/07 | | | 1,500 | | | 1,600,158 |
| | | | | | | | | | | |
|
|
| | | | | | | | | | | | | 18,107,599 |
| | | | | | | | | | | |
|
|
SEE NOTES TO FINANCIAL STATEMENTS.
B18
| | | | |
| | | DIVERSIFIED BOND PORTFOLIO (Continued) | | |
SCHEDULE OF INVESTMENTS | December 31, 2004 |
| | | | | | | | | | | | |
| LONG-TERM BONDS (Continued) | | Moody’s
Rating
(Unaudited)
| | Interest
Rate
| | Maturity
Date
| | Principal
Amount
(000)
| | Value
(Note 2)
|
Energy – Other — 1.5% | | | | | | | | | | | | |
B.J. Services Co. | | Baa2 | | 7.00% | | 02/01/06 | | $ | 5,000 | | $ | 5,164,945 |
Burlington Resources Finance, (Canada) | | Baa1 | | 6.50% | | 12/01/11 | | | 510 | | | 570,940 |
Canadian Natural Resources Ltd., (Canada) | | Baa1 | | 4.90% | | 12/01/14 | | | 1,000 | | | 994,762 |
Chesapeake Energy Corp. | | Ba3 | | 8.125% | | 04/01/11 | | | 1 | | | 773 |
Devon Financing Corp. | | Baa2 | | 6.875% | | 09/30/11 | | | 820 | | | 928,697 |
EnCana Corp., (Canada) | | Baa2 | | 6.50% | | 08/15/34 | | | 465 | | | 510,478 |
Halliburton Co. | | Baa2 | | 5.50% | | 10/15/10 | | | 625 | | | 658,299 |
Occidental Petroleum | | Baa1 | | 4.25% | | 03/15/10 | | | 3,250 | | | 3,254,579 |
Ocean Energy, Inc. | | Baa3 | | 7.25% | | 10/01/11 | | | 500 | | | 569,863 |
Parker & Parsley Petroleum Co. | | Baa3 | | 8.875% | | 04/15/05 | | | 4,995 | | | 5,071,803 |
Pioneer Natural Resources Co. | | Baa3 | | 5.875% | | 07/15/16 | | | 1,310 | | | 1,368,573 |
Transocean, Inc., (Cayman Islands) | | Baa2 | | 7.50% | | 04/15/31 | | | 255 | | | 313,869 |
Valero Energy Corp. | | Baa3 | | 7.50% | | 04/15/32 | | | 200 | | | 241,236 |
| | | | | | | | | | | |
|
|
| | | | | | | | | | | | | 19,648,817 |
| | | | | | | | | | | |
|
|
Foods — 2.0% | | | | | | | | | | | | |
Albertson’s, Inc. | | Baa2 | | 8.00% | | 05/01/31 | | | 1,905 | | | 2,379,006 |
Cadbury Schweppes US Finance, 144A(g) | | Baa2 | | 3.875% | | 10/01/08 | | | 2,600 | | | 2,590,889 |
ConAgra Foods, Inc. | | Baa1 | | 6.00% | | 09/15/06 | | | 1,600 | | | 1,665,920 |
Kraft Foods, Inc. | | A3 | | 5.25% | | 06/01/07 | | | 650 | | | 673,320 |
Kraft Foods, Inc. | | A3 | | 5.625% | | 11/01/11 | | | 2,630 | | | 2,785,018 |
Kraft Foods, Inc. | | A3 | | 6.25% | | 06/01/12 | | | 1,425 | | | 1,564,315 |
Miller Brewing Co., 144A(g) | | Baa1 | | 5.50% | | 08/15/13 | | | 1,215 | | | 1,269,974 |
Safeway, Inc.(a) | | Baa2 | | 4.95% | | 08/16/10 | | | 3,850 | | | 3,919,142 |
The Kroger Co. | | Baa2 | | 6.75% | | 04/15/12 | | | 1,375 | | | 1,552,462 |
Tricon Global Restaurants, Inc. | | Baa3 | | 8.875% | | 04/15/11 | | | 3,415 | | | 4,219,297 |
Tyson Foods, Inc. | | Baa3 | | 6.625% | | 10/17/05 | | | 1,025 | | | 1,049,015 |
Tyson Foods, Inc. | | Baa3 | | 7.25% | | 10/01/06 | | | 1,250 | | | 1,325,267 |
| | | | | | | | | | | |
|
|
| | | | | | | | | | | | | 24,993,625 |
| | | | | | | | | | | |
|
|
Gaming — 1.0% | | | | | | | | | | | | |
Harrah’s Operating Co., Inc. | | Ba1 | | 7.875% | | 12/15/05 | | | 5,375 | | | 5,590,000 |
MGM Mirage, Inc. | | Ba1 | | 6.00% | | 10/01/09 | | | 3,900 | | | 3,997,500 |
Park Place Entertainment Corp. | | Ba2 | | 7.875% | | 12/15/05 | | | 2,450 | | | 2,541,875 |
| | | | | | | | | | | |
|
|
| | | | | | | | | | | | | 12,129,375 |
| | | | | | | | | | | |
|
|
Health Care & Pharmaceutical — 1.8% | | | | | | | | | | | | |
Bristol-Myers Squibb Co. | | A1 | | 5.75% | | 10/01/11 | | | 1,025 | | | 1,097,751 |
HCA, Inc.(a) | | Ba2 | | 6.375% | | 01/15/15 | | | 2,750 | | | 2,761,135 |
HCA, Inc. | | Ba2 | | 7.125% | | 06/01/06 | | | 7,000 | | | 7,265,972 |
Magellan Health Services, Inc. | | B3 | | 9.375% | | 11/15/08 | | | 1,300 | | | 1,415,375 |
Merck & Co., Inc. | | Aa2 | | 5.95% | | 12/01/28 | | | 255 | | | 263,927 |
Pharmacia Corp. | | Aaa | | 6.50% | | 12/01/18 | | | 1,015 | | | 1,153,045 |
Quest Diagnostics, Inc.(a) | | Baa2 | | 6.75% | | 07/12/06 | | | 5,775 | | | 6,056,156 |
WellPoint, Inc., 144A(g) | | Baa1 | | 5.00% | | 12/15/14 | | | 1,310 | | | 1,305,876 |
WellPoint, Inc., 144A(g) | | Baa1 | | 5.95% | | 12/15/34 | | | 1,000 | | | 1,009,736 |
Wyeth(b) | | Baa1 | | 5.25% | | 03/15/13 | | | 1,250 | | | 1,299,154 |
| | | | | | | | | | | |
|
|
| | | | | | | | | | | | | 23,628,127 |
| | | | | | | | | | | |
|
|
Insurance — 0.5% | | | | | | | | | | | | |
Everest Reinsurance Holdings | | A3 | | 5.40% | | 10/15/14 | | | 1,900 | | | 1,905,198 |
Hartford Financial Services Group, Inc. | | A3 | | 2.375% | | 06/01/06 | | | 1,400 | | | 1,374,407 |
Hartford Financial Services Group, Inc. | | A3 | | 4.75% | | 03/01/14 | | | 890 | | | 867,214 |
Marsh & McLennan Cos., Inc. | | Baa2 | | 5.375% | | 07/15/14 | | | 2,115 | | | 2,066,490 |
XL Capital Ltd., Class A (Cayman Islands) | | A2 | | 5.25% | | 09/15/14 | | | 140 | | | 140,301 |
| | | | | | | | | | | |
|
|
| | | | | | | | | | | | | 6,353,610 |
| | | | | | | | | | | |
|
|
Lodging — 1.0% | | | | | | | | | | | | |
Carnival Corp., (Panama) | | A3 | | 3.75% | | 11/15/07 | | | 3,600 | | | 3,604,241 |
Carnival PLC, (United Kingdom) | | A3 | | 7.30% | | 06/01/07 | | | 825 | | | 889,835 |
SEE NOTES TO FINANCIAL STATEMENTS.
B19
| | | | |
| | | DIVERSIFIED BOND PORTFOLIO (Continued) | | |
SCHEDULE OF INVESTMENTS | December 31, 2004 |
| | | | | | | | | | | | |
| LONG-TERM BONDS (Continued) | | Moody’s
Rating
(Unaudited)
| | Interest
Rate
| | Maturity
Date
| | Principal
Amount
(000)
| | Value
(Note 2)
|
Lodging (cont’d.) | | | | | | | | | | | | |
Hilton Hotels Corp. | | Baa3 | | 7.625% | | 12/01/12 | | $ | 1,000 | | $ | 1,169,424 |
Host Marriott LP | | Ba3 | | 8.375% | | 02/15/06 | | | 2,000 | | | 2,090,000 |
Host Marriott LP, 144A(g) | | Ba3 | | 7.00% | | 08/15/12 | | | 1,900 | | | 2,009,250 |
Starwood Hotels & Resorts Worldwide, Inc. | | Ba1 | | 7.375% | | 05/01/07 | | | 3,000 | | | 3,198,750 |
| | | | | | | | | | | |
|
|
| | | | | | | | | | | | | 12,961,500 |
| | | | | | | | | | | |
|
|
Media & Entertainment — 1.7% | | | | | | | | | | | | |
Chancellor Media Corp. | | Baa3 | | 8.00% | | 11/01/08 | | | 4,720 | | | 5,299,545 |
Clear Channel Communications, Inc. | | Baa3 | | 4.40% | | 05/15/11 | | | 700 | | | 679,654 |
News America, Inc., 144A(a)(g) | | Baa3 | | 5.30% | | 12/15/14 | | | 6,230 | | | 6,303,508 |
Thomson Corp., (Canada) | | A3 | | 5.75% | | 02/01/08 | | | 2,750 | | | 2,896,195 |
Time Warner, Inc. | | Baa1 | | 5.625% | | 05/01/05 | | | 500 | | | 504,605 |
Time Warner, Inc.(a) | | Baa1 | | 6.875% | | 05/01/12 | | | 3,000 | | | 3,416,568 |
Time Warner, Inc. | | Baa1 | | 7.70% | | 05/01/32 | | | 950 | | | 1,161,962 |
Viacom, Inc., Class B | | A3 | | 7.625% | | 01/15/16 | | | 1,000 | | | 1,204,980 |
| | | | | | | | | | | |
|
|
| | | | | | | | | | | | | 21,467,017 |
| | | | | | | | | | | |
|
|
Metals — 0.3% | | | | | | | | | | | | |
Alcan, Inc., (Canada) | | Baa1 | | 5.20% | | 01/15/14 | | | 2,400 | | | 2,462,539 |
Alcan, Inc., (Canada) | | Baa1 | | 6.125% | | 12/15/33 | | | 1,820 | | | 1,926,265 |
| | | | | | | | | | | |
|
|
| | | | | | | | | | | | | 4,388,804 |
| | | | | | | | | | | |
|
|
Non Captive Finance — 0.8% | | | | | | | | | | | | |
Capital One Bank | | Baa2 | | 6.875% | | 02/01/06 | | | 4,250 | | | 4,408,865 |
CIT Group, Inc. | | A2 | | 5.50% | | 11/30/07 | | | 235 | | | 246,003 |
General Electric Capital Corp. | | Aaa | | 4.75% | | 09/15/14 | | | 1,760 | | | 1,754,322 |
Household Finance Corp.(b) | | A1 | | 4.625% | | 01/15/08 | | | 740 | | | 757,709 |
HSBC Finance Corp. | | A1 | | 6.75% | | 05/15/11 | | | 550 | | | 617,222 |
International Lease Finance Corp. | | A1 | | 2.95% | | 05/23/06 | | | 1,940 | | | 1,922,265 |
| | | | | | | | | | | |
|
|
| | | | | | | | | | | | | 9,706,386 |
| | | | | | | | | | | |
|
|
Non-Corporate Foreign Agency — 0.6% | | | | | | | | | | | | |
Pemex Project Funding Master Trust, (Mexico) | | Baa1 | | 8.85% | | 09/15/07 | | | 4,450 | | | 4,999,575 |
Pemex Project Funding Master Trust, (Mexico), 144A(g) | | Baa1 | | 9.50% | | 09/15/27 | | | 2,000 | | | 2,520,000 |
| | | | | | | | | | | |
|
|
| | | | | | | | | | | | | 7,519,575 |
| | | | | | | | | | | |
|
|
Packaging — 0.7% | | | | | | | | | | | | |
Crown Cork & Seal Finance PLC, (United Kingdom) | | B3 | | 7.00% | | 12/15/06 | | | 3,500 | | | 3,675,000 |
Pactiv Corp. | | Baa2 | | 7.20% | | 12/15/05 | | | 2,450 | | | 2,531,945 |
Pactiv Corp. | | Baa2 | | 8.125% | | 06/15/17 | | | 2,360 | | | 2,946,644 |
| | | | | | | | | | | |
|
|
| | | | | | | | | | | | | 9,153,589 |
| | | | | | | | | | | |
|
|
Paper — 0.3% | | | | | | | | | | | | |
Georgia-Pacific Corp. | | Ba3 | | 8.875% | | 05/15/31 | | | 2,200 | | | 2,750,000 |
International Paper Co.(a) | | Baa2 | | 5.25% | | 04/01/16 | | | 585 | | | 583,967 |
Weyerhaeuser Co. | | Baa2 | | 7.375% | | 03/15/32 | | | 800 | | | 948,677 |
| | | | | | | | | | | |
|
|
| | | | | | | | | | | | | 4,282,644 |
| | | | | | | | | | | |
|
|
Pipelines & Other — 2.3% | | | | | | | | | | | | |
Atmos Energy Corp. | | Baa3 | | 4.00% | | 10/15/09 | | | 5,300 | | | 5,239,140 |
Aventine Renewable Energy, 144A(f)(g) | | B3 | | 8.501% | | 12/15/11 | | | 2,400 | | | 2,424,000 |
Duke Energy Field Services | | Baa2 | | 7.50% | | 08/16/05 | | | 12,000 | | | 12,317,052 |
Enterprise Products Operating LP, 144A(g) | | Baa3 | | 4.00% | | 10/15/07 | | | 4,000 | | | 3,990,236 |
Enterprise Products Operating LP, 144A(g) | | Baa3 | | 5.60% | | 10/15/14 | | | 2,100 | | | 2,118,627 |
Gazprom OAO, (Germany) | | BB-(e) | | 10.50% | | 10/21/09 | | | 1,685 | | | 2,003,971 |
Magellan Midstream Partners LP | | Ba1 | | 5.65% | | 10/15/16 | | | 1,870 | | | 1,890,667 |
| | | | | | | | | | | |
|
|
| | | | | | | | | | | | | 29,983,693 |
| | | | | | | | | | | |
|
|
SEE NOTES TO FINANCIAL STATEMENTS.
B20
| | | | |
| | | DIVERSIFIED BOND PORTFOLIO (Continued) | | |
SCHEDULE OF INVESTMENTS | December 31, 2004 |
| | | | | | | | | | | | |
| LONG-TERM BONDS (Continued) | | Moody’s
Rating
(Unaudited)
| | Interest
Rate
| | Maturity
Date
| | Principal
Amount
(000)
| | Value
(Note 2)
|
Real Estate Investment Trusts — 0.6% | | | | | | | | | | | | |
Equity One, Inc. | | Baa3 | | 3.875% | | 04/15/09 | | $ | 1,450 | | $ | 1,407,112 |
ERP Operating LP(d) | | Baa1 | | 6.63% | | 04/13/15 | | | 3,900 | | | 3,939,659 |
iStar Financial, Inc.(a) | | Baa3 | | 5.125% | | 04/01/11 | | | 2,225 | | | 2,248,732 |
| | | | | | | | | | | |
|
|
| | | | | | | | | | | | | 7,595,503 |
| | | | | | | | | | | |
|
|
Retailers — 0.7% | | | | | | | | | | | | |
JC Penney Co., Inc. | | Ba2 | | 7.375% | | 08/15/08 | | | 2,000 | | | 2,195,000 |
May Department Stores Co. | | Baa2 | | 8.50% | | 06/01/19 | | | 550 | | | 676,673 |
Target Corp. | | A2 | | 6.35% | | 01/15/11 | | | 1,400 | | | 1,560,668 |
The Gap, Inc. | | Ba1 | | 6.90% | | 09/15/07 | | | 4,675 | | | 5,025,625 |
| | | | | | | | | | | |
|
|
| | | | | | | | | | | | | 9,457,966 |
| | | | | | | | | | | |
|
|
Structured Notes — 1.2% | | | | | | | | | | | | |
DJ CDX NA HY, 144A(a)(g) | | Ba3 | | 6.375% | | 12/29/09 | | | 3,750 | | | 3,839,062 |
DJ CDX NA HY, 144A(a)(g) | | B3 | | 7.75% | | 12/29/09 | | | 6,000 | | | 6,168,750 |
DJ CDX NA HY3, 144A(a)(g) | | B3 | | 8.00% | | 12/29/09 | | | 1,500 | | | 1,538,438 |
Preferred Term Securities X, Class A-1 (cost $3,900,000; purchased 6/16/03), 144A(f)(g)(h) | | Aaa | | 2.67% | | 07/03/33 | | | 3,900 | | | 3,904,875 |
| | | | | | | | | | | |
|
|
| | | | | | | | | | | | | 15,451,125 |
| | | | | | | | | | | |
|
|
Technology — 1.9% | | | | | | | | | | | | |
Certegy, Inc. | | Baa2 | | 4.75% | | 09/15/08 | | | 1,900 | | | 1,943,689 |
Computer Associates International, Inc., (cost $2,023,793; purchased 5/29/03)(h) | | Ba1 | | 6.375% | | 04/15/05 | | | 2,005 | | | 2,023,382 |
Computer Sciences Corp. | | A3 | | 6.75% | | 06/15/06 | | | 495 | | | 518,291 |
Equifax, Inc. | | Baa1 | | 4.95% | | 11/01/07 | | | 1,340 | | | 1,385,959 |
Hewlett-Packard Co. | | A3 | | 7.15% | | 06/15/05 | | | 400 | | | 407,613 |
International Business Machines Corp. | | A1 | | 8.375% | | 11/01/19 | | | 575 | | | 753,468 |
Jabil Circuit, Inc.(a) | | Baa3 | | 5.875% | | 07/15/10 | | | 2,000 | | | 2,105,244 |
Motorola, Inc. | | Baa3 | | 4.608% | | 11/16/07 | | | 2,870 | | | 2,926,648 |
Motorola, Inc. | | Baa3 | | 7.625% | | 11/15/10 | | | 915 | | | 1,061,366 |
Sun Microsystems, Inc. | | Baa3 | | 7.50% | | 08/15/06 | | | 5,835 | | | 6,168,062 |
SunGard Data Systems, Inc. | | Baa2 | | 3.75% | | 01/15/09 | | | 1,100 | | | 1,068,348 |
SunGard Data Systems, Inc. | | Baa2 | | 4.875% | | 01/15/14 | | | 2,350 | | | 2,283,972 |
Unisys Corp. | | Ba1 | | 8.125% | | 06/01/06 | | | 1,650 | | | 1,736,625 |
| | | | | | | | | | | |
|
|
| | | | | | | | | | | | | 24,382,667 |
| | | | | | | | | | | |
|
|
Telecommunications — 7.3% | | | | | | | | | | | | |
America Movil SA de CV, (Mexico), 144A(g) | | Baa1 | | 5.75% | | 01/15/15 | | | 1,000 | | | 997,719 |
AT&T Wireless Services, Inc. | | Baa2 | | 8.125% | | 05/01/12 | | | 1,815 | | | 2,194,052 |
AT&T Wireless Services, Inc. | | Baa2 | | 8.75% | | 03/01/31 | | | 2,375 | | | 3,202,243 |
BellSouth Corp. | | A2 | | 4.20% | | 09/15/09 | | | 6,025 | | | 6,040,737 |
BellSouth Corp.(a) | | A2 | | 6.55% | | 06/15/34 | | | 2,950 | | | 3,214,453 |
British Telecommunications PLC, (United Kingdom)(b) | | Baa1 | | 8.875% | | 12/15/30 | | | 3,085 | | | 4,130,880 |
CenturyTel, Inc. | | Baa2 | | 6.55% | | 12/01/05 | | | 4,000 | | | 4,113,292 |
Citizens Communications Co., (cost $1,594,221; purchased 3/23/04)(h) | | Ba3 | | 7.60% | | 06/01/06 | | | 1,510 | | | 1,596,825 |
Deutsche Telekom International Finance BV, (Netherlands)(b) | | Baa1 | | 8.25% | | 06/15/05 | | | 1,425 | | | 1,458,208 |
Deutsche Telekom International Finance BV, (Netherlands)(b) | | Baa1 | | 8.75% | | 06/15/30 | | | 865 | | | 1,142,196 |
Deutsche Telekom International Finance BV, (Netherlands)(b) | | Baa1 | | 9.25% | | 06/01/32 | | | 970 | | | 1,380,394 |
LCI International, Inc., (cost $6,720,556; purchased 7/21/98-1/24/00)(h) | | NR | | 7.25% | | 06/15/07 | | | 6,675 | | | 6,491,437 |
SBC Communications, Inc.(a) | | A2 | | 4.125% | | 09/15/09 | | | 4,150 | | | 4,142,426 |
SBC Communications, Inc. | | A2 | | 5.10% | | 09/15/14 | | | 1,000 | | | 1,009,294 |
SBC Communications, Inc. | | A2 | | 6.45% | | 06/15/34 | | | 905 | | | 969,587 |
Sprint Capital Corp. | | Baa3 | | 4.78% | | 08/17/06 | | | 6,665 | | | 6,792,741 |
Sprint Capital Corp. | | Baa3 | | 6.90% | | 05/01/19 | | | 2,800 | | | 3,132,332 |
Sprint Capital Corp. | | Baa3 | | 8.75% | | 03/15/32 | | | 2,215 | | | 2,951,065 |
Telecom de Puerto Rico, (Puerto Rico) | | Baa1 | | 6.65% | | 05/15/06 | | | 6,800 | | | 7,052,096 |
Telecom de Puerto Rico, (Puerto Rico) | | Baa1 | | 6.80% | | 05/15/09 | | | 4,365 | | | 4,646,796 |
Telecom Italia Capital, (Luxembourg), 144A(g) | | Baa2 | | 4.95% | | 09/30/14 | | | 2,200 | | | 2,155,426 |
SEE NOTES TO FINANCIAL STATEMENTS.
B21
| | | | |
| | | DIVERSIFIED BOND PORTFOLIO (Continued) | | |
SCHEDULE OF INVESTMENTS | December 31, 2004 |
| | | | | | | | | | | | |
| LONG-TERM BONDS (Continued) | | Moody’s
Rating
(Unaudited)
| | Interest
Rate
| | Maturity Date
| | Principal
Amount
(000)
| | Value
(Note 2)
|
Telecommunications (cont’d.) | | | | | | | | | | | | |
Telecom Italia Capital, (Luxembourg), 144A(g) | | Baa2 | | 6.00% | | 09/30/34 | | $ | 4,380 | | $ | 4,282,129 |
TeleCorp PCS, Inc., Class A | | Baa2 | | 10.625% | | 07/15/10 | | | 5,940 | | | 6,474,077 |
TELUS Corp., (Canada) | | Baa3 | | 7.50% | | 06/01/07 | | | 6,250 | | | 6,790,625 |
TELUS Corp., (Canada) | | Baa3 | | 8.00% | | 06/01/11 | | | 150 | | | 177,762 |
Verizon New York, Inc.(a) | | Baa2 | | 7.375% | | 04/01/32 | | | 805 | | | 923,381 |
Verizon Wireless Capital, Inc. | | A3 | | 5.375% | | 12/15/06 | | | 5,900 | | | 6,111,250 |
| | | | | | | | | | | |
|
|
| | | | | | | | | | | | | 93,573,423 |
| | | | | | | | | | | |
|
|
Tobacco — 0.2% | | | | | | | | | | | | |
Altria Group, Inc. | | Baa2 | | 7.00% | | 07/15/05 | | | 1,750 | | | 1,777,104 |
Altria Group, Inc.(a) | | Baa2 | | 7.65% | | 07/01/08 | | | 1,100 | | | 1,209,927 |
| | | | | | | | | | | |
|
|
| | | | | | | | | | | | | 2,987,031 |
| | | | | | | | | | | |
|
|
Foreign Government Bonds — 6.1% | | | | | | | | | | | | |
Federal Republic of Brazil, (Brazil)(a) | | B2 | | 8.00% | | 04/15/14 | | | 3,398 | | | 3,478,971 |
Federal Republic of Brazil, (Brazil) | | B1 | | 9.25% | | 10/22/10 | | | 5,325 | | | 5,953,350 |
Federal Republic of Brazil, (Brazil) | | B1 | | 11.25% | | 07/26/07 | | | 565 | | | 649,750 |
Government of New Zealand, (New Zealand) | | Aaa | | 7.00% | | 07/15/09 | | | NZD22,465 | | | 16,846,243 |
Queensland Treasury Corp., (Australia) | | Aaa | | 6.50% | | 06/14/05 | | | AUD15,940 | | | 12,564,090 |
Republic of Colombia, (Colombia) | | Ba2 | | 10.00% | | 01/23/12 | | $ | 2,780 | | | 3,210,900 |
Republic of Peru, (Peru) | | Ba3 | | 4.50% | | 03/07/17 | | | 750 | | | 701,250 |
Republic of Peru, (Peru) | | Ba3 | | 9.875% | | 02/06/15 | | | 1,635 | | | 2,002,875 |
Republic of Philippines, (Philippines)(a) | | Ba2 | | 9.875% | | 03/16/10 | | | 530 | | | 576,375 |
Republic of Philippines, (Philippines)(a) | | Ba2 | | 10.625% | | 03/16/25 | | | 2,215 | | | 2,364,513 |
Republic of Turkey, (Turkey) | | B1 | | 11.75% | | 06/15/10 | | | 2,270 | | | 2,848,850 |
Republic of Uruguay, (Uruguay) | | B3 | | 7.25% | | 02/15/11 | | | 1,310 | | | 1,296,900 |
Russian Federation, (Russia), 144A(g) | | Baa3 | | 5.00% | | 03/31/30 | | | 1,260 | | | 1,297,800 |
United Mexican States, (Mexico) | | Baa1 | | 8.00% | | 12/23/10 | | | MXP154,380 | | | 12,975,565 |
United Mexican States, (Mexico) | | Baa2 | | 8.125% | | 12/30/19 | | $ | 1,395 | | | 1,637,032 |
United Mexican States, (Mexico)(a) | | Baa2 | | 8.375% | | 01/14/11 | | | 8,000 | | | 9,396,000 |
| | | | | | | | | | | |
|
|
| | | | | | | | | | | | | 77,800,464 |
| | | | | | | | | | | |
|
|
U.S. Government & Agency Obligations — 0.6% | | | | | | | | | | | | |
Federal Farm Credit Bank | | | | 4.15% | | 05/15/13 | | | 1,600 | | | 1,567,208 |
Federal Home Loan Mortgage Corp. | | | | 4.875% | | 11/15/13 | | | 515 | | | 529,586 |
Federal National Mortgage Association | | | | 6.625% | | 11/15/30 | | | 170 | | | 202,583 |
United States Treasury Bonds(a) | | | | 5.375% | | 02/15/31 | | | 4,850 | | | 5,244,441 |
| | | | | | | | | | | |
|
|
| | | | | | | | | | | | | 7,543,818 |
| | | | | | | | | | | |
|
|
U.S. Government Mortgage Backed Securities — 32.9% | | | | | | | | | | | | |
Federal Home Loan Mortgage Corp. | | | | 4.50% | | 11/01/18-06/01/19 | | | 22,723 | | | 22,669,488 |
Federal Home Loan Mortgage Corp. | | | | 5.00% | | 01/01/19-10/01/33 | | | 8,336 | | | 8,414,256 |
Federal Home Loan Mortgage Corp. | | | | 5.00% | | TBA | | | 6,000 | | | 6,090,000 |
Federal Home Loan Mortgage Corp. | | | | 5.50% | | 10/01/33-06/01/34 | | | 8,752 | | | 8,922,639 |
Federal Home Loan Mortgage Corp. | | | | 6.00% | | 11/01/33-06/01/34 | | | 10,141 | | | 10,480,623 |
Federal Home Loan Mortgage Corp. | | | | 6.00% | | TBA | | | 4,500 | | | 4,647,654 |
Federal Home Loan Mortgage Corp. | | | | 6.50% | | 07/01/32-09/01/32 | | | 5,511 | | | 5,787,126 |
Federal Home Loan Mortgage Corp. | | | | 7.00% | | 10/01/32-11/01/33 | | | 13,677 | | | 14,495,888 |
Federal National Mortgage Association | | | | 4.00% | | 05/01/19-06/01/19 | | | 10,549 | | | 10,296,050 |
Federal National Mortgage Association | | | | 4.50% | | 06/01/18-08/01/33 | | | 41,148 | | | 40,788,482 |
Federal National Mortgage Association | | | | 5.00% | | 01/01/19-04/01/34 | | | 66,557 | | | 66,401,510 |
Federal National Mortgage Association | | | | 5.00% | | TBA | | | 15,500 | | | 15,374,063 |
Federal National Mortgage Association | | | | 5.50% | | 12/01/16-02/01/34 | | | 106,863 | | | 108,878,673 |
Federal National Mortgage Association | | | | 6.00% | | 09/01/17-03/01/34 | | | 15,723 | | | 16,328,605 |
Federal National Mortgage Association | | | | 6.00% | | TBA | | | 14,000 | | | 14,472,500 |
Federal National Mortgage Association | | | | 6.50% | | 11/01/09-11/01/33 | | | 18,357 | | | 19,311,625 |
Federal National Mortgage Association | | | | 6.50% | | TBA | | | 500 | | | 524,219 |
Federal National Mortgage Association | | | | 7.00% | | 03/01/32-06/01/32 | | | 2,605 | | | 2,761,619 |
Federal National Mortgage Association | | | | 9.00% | | 10/01/16-09/01/21 | | | 63 | | | 66,965 |
SEE NOTES TO FINANCIAL STATEMENTS.
B22
| | | | |
| | | DIVERSIFIED BOND PORTFOLIO (Continued) | | |
SCHEDULE OF INVESTMENTS | December 31, 2004 |
| | | | | | | | | | | | | |
| LONG-TERM BONDS (Continued) | | | | Interest
Rate
| | Maturity Date
| | Principal
Amount
(000)
| | Value
(Note 2)
| |
U.S. Government Mortgage Backed Securities (cont’d.) | | | | | | | | | | | | | |
Government National Mortgage Association | | | | 5.50% | | 05/15/33-04/20/34 | | $ | 14,029 | | $ | 14,329,482 | |
Government National Mortgage Association | | | | 6.00% | | 12/15/32-11/15/34 | | | 18,800 | | | 19,496,609 | |
Government National Mortgage Association | | | | 6.50% | | 09/15/32-11/15/33 | | | 10,849 | | | 11,428,753 | |
Government National Mortgage Association | | | | 7.50% | | 10/15/25-02/15/26 | | | 366 | | | 394,287 | |
| | | | | | | | | | | |
|
|
|
| | | | | | | | | | | | | 422,361,116 | |
| | | | | | | | | | | |
|
|
|
TOTAL LONG-TERM BONDS
(cost $1,239,194,601) | | | 1,268,305,105 | |
| | | | | | | | | | | |
|
|
|
SHORT-TERM INVESTMENT — 10.6%
Mutual Fund — 10.6% | | | | | | | | Shares
| | | |
Dryden Core Investment Fund — Taxable Money Market Fund
Series (Note 4)(c) (cost $136,107,898) | | | 136,107,898 | | | 136,107,898 | |
| | | | | | | | | | | |
|
|
|
TOTAL INVESTMENTS — 109.4%
(cost $1,375,302,499; Note 6) | | | 1,404,413,003 | |
UNREALIZED DEPRECIATION ON FORWARD FOREIGN CURRENCY CONTRACTS(j) | | | (524,476 | ) |
VARIATION MARGIN ON OPEN FUTURES CONTRACTS, NET(i) | | | 305,668 | |
LIABILITIES IN EXCESS OF OTHER ASSETS — (9.4)% | | | (120,524,628 | ) |
| | |
|
|
|
TOTAL NET ASSETS — 100.0% | | $ | 1,283,669,567 | |
| | | | | | | | | | | |
|
|
|
The following abbreviations are used in portfolio descriptions:
| | |
| AUD | | Australian Dollar |
| MXP | | Mexican Peso |
| NZD | | New Zealand Dollar |
| NR | | Not Rated by Moody’s or Standard & Poors |
| TBA | | Securities purchased on a forward commitment basis. |
| (a) | Portion of securities on loan with an aggregate market value of $89,419,407; cash collateral of $92,354,003 was received with which the portfolio purchased highly liquid short-term securities. |
| (b) | Increase/decrease in rate variable upon increase/decrease in Moody’s or Standard & Poor’s rating. |
| (c) | Represents security, or portion thereof, purchased with cash collateral received for securities on loan. |
| (d) | Security segregated as collateral for futures contracts. |
| (e) | Standard & Poor’s rating. |
| (f) | Indicates a variable rate security. The maturity date presented for these instruments is the latter of the next date on which the security can be redeemed at par or the next date on which the rate of interest is adjusted. The interest rate shown reflects the rate in effect at December 31, 2004. |
| (g) | Security was purchased pursuant to Rule 144A under the securities Act of 1933 and may not be resold subject to that rule except to qualified institutional buyers. Unless otherwise noted 144A securities are deemed to be liquid. |
| (h) | Indicates a security that has been deemed illiquid. The aggregate cost of the illiquid securities is $20,641,129 The aggregate value $20,508,899 represents 1.6% of net assets. |
SEE NOTES TO FINANCIAL STATEMENTS.
B23
| | | | |
| | | DIVERSIFIED BOND PORTFOLIO (Continued) | | |
SCHEDULE OF INVESTMENTS | December 31, 2004 |
| (i) | Open futures contracts as of December 31, 2004 were as follows: |
| | | | | | | | | | | | | | |
Number of Contracts
| | Type
| | Expiration
Date
| | Value at
Trade Date
| | Value at
December 31, 2004
| | Unrealized
Appreciation/
(Depreciation)
| |
| Long Positions: | | | | | | | | | | | | | | |
| 99 | | Germany Fed. Rep. Bonds | | Mar 05 | | $ | 15,251,907 | | $ | 15,192,470 | | $ | (59,437 | ) |
| 256 | | Eurodollar Futures | | Sep 05 | | | 61,789,542 | | | 61,830,400 | | | 40,858 | |
| 171 | | U.S. Treasury 10 Yr Notes | | Mar 05 | | | 18,995,147 | | | 19,141,313 | | | 146,166 | |
| 669 | | U.S. Treasury Bonds | | Mar 05 | | | 74,119,096 | | | 75,262,500 | | | 1,143,404 | |
| | | | | | | | | | | | |
|
|
|
| | | | | | | | | | | | | | 1,270,991 | |
| | | | | | | | | | | | |
|
|
|
| Short Position: | | | | | | | | | | | | | | |
| 406 | | U.S. Treasury 5 Yr Notes | | Mar 05 | | | 44,513,011 | | | 44,469,687 | | | 43,324 | |
| 1,510 | | U.S. Treasury 2 Yr Notes | | Mar 05 | | | 316,301,459 | | | 316,486,563 | | | (185,104 | ) |
| | | | | | | | | | | | |
|
|
|
| | | | | | | | | | | | | | (141,780 | ) |
| | | | | | | | | | | | |
|
|
|
| | | | | | | | | | | | | $ | 1,129,211 | |
| | | | | | | | | | | | |
|
|
|
| (j) | Outstanding forward foreign currency contracts as of December 31, 2004 were as follows: |
| | | | | | | | | | |
Foreign Currency Contract
| | Value at
Settlement Date
| | Current
Value
| | Unrealized
Appreciation/
(Depreciation)
| |
Purchased: | | | | | | | | | | |
Australian Dollar expiring 1/20/05 | | $ | 6,785,562 | | $ | 6,987,840 | | $ | 202,278 | |
Mexican Peso expiring 1/10/05 | | | 6,823,847 | | | 6,922,007 | | | 98,160 | |
New Zealand Dollar expiring 1/20/05 | | | 17,206,651 | | | 17,310,149 | | | 103,498 | |
| | |
|
| |
|
| |
|
|
|
| | | | 30,816,060 | | | 31,219,996 | | | 403,936 | |
| | |
|
| |
|
| |
|
|
|
Sold: | | | | | | | | | | |
Australian Dollar expiring 1/20/05 | | | 12,831,932 | | | 13,110,512 | | | (278,580 | ) |
Mexican Peso expiring 1/10/05 | | | 13,485,900 | | | 13,605,792 | | | (119,892 | ) |
New Zealand Dollar expiring 1/20/05 | | | 16,780,209 | | | 17,310,149 | | | (529,940 | ) |
| | |
|
| |
|
| |
|
|
|
| | | | 43,098,041 | | | 44,026,453 | | | (928,412 | ) |
| | |
|
| |
|
| |
|
|
|
| | | | | | | | | $ | (524,476 | ) |
| | | | | | | | |
|
|
|
SEE NOTES TO FINANCIAL STATEMENTS.
B24
| | | | |
| | | DIVERSIFIED BOND PORTFOLIO (Continued) | | |
SCHEDULE OF INVESTMENTS | December 31, 2004 |
The industry classification of portfolio holdings and liabilities in excess of other assets shown as a percentage of net assets as of December 31, 2004 was as follows:
| | | |
U.S. Government Mortgage Backed Securities | | 32.9 | % |
Telecommunications | | 7.3 | |
Commercial Mortgage Backed Securities | | 6.7 | |
Foreign Government Bonds | | 6.1 | |
Electric | | 5.9 | |
Banking | | 3.4 | |
Asset Backed Securities | | 2.9 | |
Capital Goods | | 2.6 | |
Pipelines & Other | | 2.3 | |
Automotive | | 2.0 | |
Foods | | 2.0 | |
Technology | | 1.9 | |
Chemicals | | 1.9 | |
Health Care & Pharmaceutical | | 1.8 | |
Media & Entertainment | | 1.7 | |
Collateralized Mortgage Obligations | | 1.6 | |
Energy — Other | | 1.5 | |
Building Materials & Construction | | 1.4 | |
Energy — Integrated | | 1.4 | |
Structured Notes | | 1.2 | |
Brokerage | | 1.1 | |
Lodging | | 1.0 | |
Gaming | | 1.0 | |
Non-Captive Finance | | 0.8 | |
Cable | | 0.7 | |
Retailers | | 0.7 | |
Packaging | | 0.7 | |
Airlines | | 0.7 | |
Real Estate Investment Trust | | 0.6 | |
Non-Corporate Foreign Agency | | 0.6 | |
U.S. Government & Agency Obligations | | 0.6 | |
Insurance | | 0.5 | |
Metals | | 0.3 | |
Paper | | 0.3 | |
Aerospace/Defense | | 0.3 | |
Tobacco | | 0.2 | |
Consumer Services | | 0.2 | |
Mutual Fund | | 10.6 | |
| | |
|
|
| | | 109.4 | |
Liabilities in excess of other assets | | (9.4 | ) |
| | |
|
|
| | | 100.0 | % |
| | |
|
|
SEE NOTES TO FINANCIAL STATEMENTS.
B25
SCHEDULE OF INVESTMENTS | December 31, 2004 |
| | | | | |
| LONG-TERM INVESTMENTS — 98.6% | | Value (Note 2)
|
| COMMON STOCKS | | Shares
| |
Aerospace/Defense — 2.5% | | | | | |
Boeing Co. | | 476,822 | | $ | 24,685,075 |
General Dynamics Corp. | | 18,873 | | | 1,974,116 |
Honeywell International, Inc. | | 329,605 | | | 11,671,313 |
ITT Industries, Inc. | | 56,530 | | | 4,773,958 |
L-3 Communications Holdings, Inc. | | 8,802 | | | 644,658 |
Lockheed Martin Corp.(b) | | 560,442 | | | 31,132,553 |
Northrop Grumman Corp. | | 44,886 | | | 2,440,003 |
Raytheon Co. | | 399,200 | | | 15,500,936 |
United Technologies Corp. | | 92,842 | | | 9,595,221 |
| | | | |
|
|
| | | | | | 102,417,833 |
| | | | |
|
|
Air Freight & Logistics — 1.1% | | | | | |
United Parcel Service, Inc. (Class “B” Stock)(b) | | 517,970 | | | 44,265,716 |
| | | | |
|
|
Automobiles — 0.1% | | | | | |
Ford Motor Co. | | 68,188 | | | 998,272 |
General Motors Corp. | | 41,001 | | | 1,642,500 |
Harley-Davidson, Inc. | | 52,477 | | | 3,187,978 |
| | | | |
|
|
| | | | | | 5,828,750 |
| | | | |
|
|
Beverages — 1.2% | | | | | |
Anheuser-Busch Cos., Inc. | | 18,190 | | | 922,779 |
Coca-Cola Co. | | 278,543 | | | 11,595,745 |
PepsiCo, Inc. | | 646,279 | | | 33,735,764 |
The Pepsi Bottling Group, Inc. | | 55,709 | | | 1,506,371 |
| | | | |
|
|
| | | | | | 47,760,659 |
| | | | |
|
|
Biotechnology — 3.2% | | | | | |
Amgen, Inc.(a) | | 870,931 | | | 55,870,224 |
Biogen Idec, Inc.(a) | | 36,768 | | | 2,449,116 |
Genentech, Inc.(a) | | 282,900 | | | 15,401,076 |
Genzyme Corp.(a) | | 19,498 | | | 1,132,249 |
Gilead Sciences, Inc.(a) | | 825,244 | | | 28,875,288 |
MedImmune, Inc.(a)(b) | | 633,700 | | | 17,179,607 |
OSI Pharmaceuticals, Inc.(a) | | 133,500 | | | 9,992,475 |
| | | | |
|
|
| | | | | | 130,900,035 |
| | | | |
|
|
Building & Building Products — 0.3% | | | | | |
American Standard Cos., Inc.(a) | | 290,100 | | | 11,986,932 |
KB HOME | | 3,844 | | | 401,313 |
Pulte Homes, Inc. | | 9,471 | | | 604,250 |
| | | | |
|
|
| | | | | | 12,992,495 |
| | | | |
|
|
Capital Markets — 3.7% | | | | | |
Goldman Sachs Group, Inc.(b) | | 437,782 | | | 45,546,839 |
Legg Mason, Inc. | | 39,200 | | | 2,871,792 |
Lehman Brothers Holdings, Inc. | | 37,771 | | | 3,304,207 |
Merrill Lynch & Co., Inc. | | 1,001,113 | | | 59,836,524 |
The Bank of New York Co., Inc. | | 805,881 | | | 26,932,543 |
The Charles Schwab Corp.(b) | | 1,221,800 | | | 14,612,728 |
| | | | |
|
|
| | | | | | 153,104,633 |
| | | | |
|
|
Chemicals — 1.0% | | | | | |
Air Products & Chemicals, Inc. | | 29,800 | | | 1,727,506 |
Dow Chemical Co. | | 89,077 | | | 4,410,202 |
E.I. du Pont de Nemours & Co.(b) | | 589,257 | | | 28,903,056 |
Monsanto Co. | | 39,209 | | | 2,178,060 |
PPG Industries, Inc. | | 10,072 | | | 686,508 |
Praxair, Inc. | | 43,898 | | | 1,938,097 |
| | | | | |
| COMMON STOCKS | | Value (Note 2)
|
| (Continued) | | Shares
| |
Chemicals (cont’d.) | | | | | |
Rohm & Haas Co. | | 14,810 | | $ | 655,046 |
| | | | |
|
|
| | | | | | 40,498,475 |
| | | | |
|
|
Commercial Banks — 3.2% | | | | | |
Bank of America Corp. | | 1,024,657 | | | 48,148,632 |
Comerica, Inc. | | 135,600 | | | 8,274,312 |
Mellon Financial Corp. | | 132,258 | | | 4,114,546 |
North Fork Bancorporation, Inc. | | 41,233 | | | 1,189,572 |
U.S. Bancorp | | 352,295 | | | 11,033,879 |
Wachovia Corp. | | 430,946 | | | 22,667,760 |
Washington Mutual, Inc. | | 116,153 | | | 4,910,949 |
Wells Fargo & Co. | | 515,392 | | | 32,031,613 |
| | | | |
|
|
| | | | | | 132,371,263 |
| | | | |
|
|
Commercial Services & Supplies — 1.1% | | | |
Avery Dennison Corp. | | 177,000 | | | 10,614,690 |
Cendant Corp. | | 105,512 | | | 2,466,871 |
Certegy, Inc. | | 28,456 | | | 1,011,042 |
Corinthian Colleges, Inc.(a) | | 75,540 | | | 1,423,551 |
Fiserv, Inc.(a) | | 41,391 | | | 1,663,504 |
Iron Mountain, Inc.(a) | | 57,973 | | | 1,767,597 |
Paychex, Inc. | | 522,516 | | | 17,807,345 |
Waste Management, Inc. | | 332,216 | | | 9,946,547 |
| | | | |
|
|
| | | | | | 46,701,147 |
| | | | |
|
|
Communications Equipment — 3.2% | | | | | |
ADC Telecommunications, Inc.(a) | | 4,994,000 | | | 13,383,920 |
Avaya, Inc.(a) | | 76,750 | | | 1,320,100 |
Cisco Systems, Inc.(a) | | 2,643,555 | | | 51,020,611 |
Comverse Technology, Inc.(a) | | 22,283 | | | 544,819 |
Corning, Inc.(a) | | 181,345 | | | 2,134,431 |
Lucent Technologies, Inc.(a) | | 330,631 | | | 1,243,173 |
Motorola, Inc. | | 179,435 | | | 3,086,282 |
Nortel Networks Corp.(a) | | 3,931,600 | | | 13,721,284 |
Polycom, Inc.(a) | | 213,100 | | | 4,969,492 |
QUALCOMM, Inc. | | 478,128 | | | 20,272,627 |
Research In Motion Ltd.(a) | | 254,000 | | | 20,934,680 |
| | | | |
|
|
| | | | | | 132,631,419 |
| | | | |
|
|
Computers & Peripherals — 2.8% | | | | | |
Dell, Inc.(a) | | 690,394 | | | 29,093,203 |
EMC Corp.(a) | | 385,643 | | | 5,734,512 |
Hewlett-Packard Co. | | 198,433 | | | 4,161,140 |
International Business Machines Corp. | | 667,540 | | | 65,806,093 |
Lexmark International, Inc.(a) | | 136,885 | | | 11,635,225 |
Sun Microsystems, Inc.(a) | | 244,132 | | | 1,313,430 |
| | | | |
|
|
| | | | | | 117,743,603 |
| | | | |
|
|
Consumer Finance — 1.6% | | | | | |
American Express Co.(b) | | 1,099,474 | | | 61,977,350 |
SLM Corp. | | 78,716 | | | 4,202,647 |
| | | | |
|
|
| | | | | | 66,179,997 |
| | | | |
|
|
Containers & Packaging — 0.1% | | | | | |
Smurfit-Stone Container Corp.(a) | | 291,200 | | | 5,439,616 |
| | | | |
|
|
Diversified Financial Services — 5.2% | | | | | |
Capital One Financial Corp. | | 161,198 | | | 13,574,483 |
CIT Group, Inc. | | 58,494 | | | 2,680,195 |
Citigroup, Inc. | | 598,160 | | | 28,819,349 |
SEE NOTES TO FINANCIAL STATEMENTS.
B26
| | | | |
| | | EQUITY PORTFOLIO (Continued) | | |
SCHEDULE OF INVESTMENTS | December 31, 2004 |
| | | | | |
| COMMON STOCKS | | Value (Note 2)
|
| (Continued) | | Shares
| |
Diversified Financial Services (cont’d.) | | | | | |
Fannie Mae | | 127,684 | | $ | 9,092,378 |
Franklin Resources, Inc. | | 46,517 | | | 3,239,909 |
Freddie Mac | | 252,691 | | | 18,623,327 |
J.P. Morgan Chase & Co. | | 1,952,542 | | | 76,168,663 |
MBNA Corp. | | 318,807 | | | 8,987,169 |
Morgan Stanley | | 134,395 | | | 7,461,610 |
Principal Financial Group, Inc. | | 943,820 | | | 38,639,991 |
State Street Corp. | | 137,959 | | | 6,776,546 |
T. Rowe Price Group, Inc. | | 38,773 | | | 2,411,681 |
| | | | |
|
|
| | | | | | 216,475,301 |
| | | | |
|
|
Diversified Telecommunication Services — 1.1% | | | |
BellSouth Corp. | | 118,102 | | | 3,282,055 |
Qwest Communications International, Inc.(a) | | 115,380 | | | 512,287 |
SBC Communications, Inc. | | 1,081,306 | | | 27,865,256 |
Sprint Corp. | | 216,894 | | | 5,389,816 |
Verizon Communications, Inc. | | 221,944 | | | 8,990,951 |
| | | | |
|
|
| | | | | | 46,040,365 |
| | | | |
|
|
Electric Utilities — 1.3% | | | | | |
AES Corp.(a) | | 51,196 | | | 699,849 |
Ameren Corp. | | 11,368 | | | 569,992 |
American Electric Power Co., Inc. | | 41,391 | | | 1,421,367 |
Cinergy Corp. | | 21,170 | | | 881,307 |
Consolidated Edison, Inc. | | 13,310 | | | 582,313 |
Constellation Energy Group, Inc. | | 25,459 | | | 1,112,813 |
Dominion Resources, Inc. | | 31,309 | | | 2,120,872 |
DTE Energy Co. | | 16,955 | | | 731,269 |
Edison International | | 37,436 | | | 1,199,075 |
Entergy Corp. | | 26,573 | | | 1,796,069 |
Exelon Corp. | | 666,045 | | | 29,352,603 |
FirstEnergy Corp. | | 125,140 | | | 4,944,281 |
FPL Group, Inc. | | 14,446 | | | 1,079,839 |
PG&E Corp.(a) | | 50,973 | | | 1,696,381 |
Pinnacle West Capital Corp. | | 6,852 | | | 304,297 |
PPL Corp. | | 25,649 | | | 1,366,579 |
Progress Energy, Inc. | | 9,359 | | | 423,401 |
Public Service Enterprise Group, Inc. | | 9,964 | | | 515,836 |
Southern Co. | | 71,530 | | | 2,397,686 |
TXU Corp. | | 24,639 | | | 1,590,694 |
| | | | |
|
|
| | | | | | 54,786,523 |
| | | | |
|
|
Electrical Equipment — 0.1% | | | | | |
Molex, Inc. (Class “A” Stock) | | 89,696 | | | 2,390,398 |
| | | | |
|
|
Electronic Equipment & Instruments — 0.7% | | | |
Agilent Technologies, Inc.(a) | | 1,132,385 | | | 27,290,478 |
Sanmina-SCI Corp.(a) | | 165,459 | | | 1,401,438 |
Waters Corp.(a) | | 11,728 | | | 548,753 |
| | | | |
|
|
| | | | | | 29,240,669 |
| | | | |
|
|
Energy Equipment & Services — 3.5% | | | | | |
BJ Services Co. | | 861,700 | | | 40,103,518 |
ENSCO International, Inc. | | 253,900 | | | 8,058,786 |
GlobalSantaFe Corp.
(Cayman Islands). | | 863,400 | | | 28,587,174 |
Halliburton Co. | | 110,916 | | | 4,352,344 |
Schlumberger, Ltd.(b) | | 666,900 | | | 44,648,955 |
| | | | | |
| COMMON STOCKS | | Value (Note 2)
|
| (Continued) | | Shares
| |
Energy Equipment & Services (cont’d.) | | | | | |
Weatherford International, Ltd.(a)(b) | | 348,600 | | $ | 17,883,180 |
| | | | |
|
|
| | | | | | 143,633,957 |
| | | | |
|
|
Food & Staples Retailing — 2.3% | | | | | |
Costco Wholesale Corp. | | 199,835 | | | 9,674,013 |
Kroger Co.(a) | | 1,386,200 | | | 24,313,948 |
Wal-Mart Stores, Inc.(e) | | 405,417 | | | 21,414,126 |
Walgreen Co. | | 20,909 | | | 802,278 |
Whole Foods Market, Inc.(b) | | 401,300 | | | 38,263,955 |
| | | | |
|
|
| | | | | | 94,468,320 |
| | | | |
|
|
Food Products — 1.3% | | | | | |
Cadbury Schweppes PLC ADR
(United Kingdom)(b) | | 572,700 | | | 21,590,790 |
Hershey Foods Corp. | | 44,382 | | | 2,464,976 |
Kellogg Co. | | 372,047 | | | 16,615,619 |
McCormick & Co., Inc. | | 5,580 | | | 215,388 |
Sara Lee Corp. | | 573,884 | | | 13,853,560 |
| | | | |
|
|
| | | | | | 54,740,333 |
| | | | |
|
|
Gas Utilities — 0.5% | | | | | |
El Paso Corp. | | 1,284,100 | | | 13,354,640 |
Kinder Morgan, Inc. | | 13,053 | | | 954,566 |
Sempra Energy | | 162,332 | | | 5,954,338 |
| | | | |
|
|
| | | | | | 20,263,544 |
| | | | |
|
|
Health Care Equipment & Supplies — 0.7% | | | |
Boston Scientific Corp.(a) | | 103,061 | | | 3,663,818 |
Fisher Scientific International, Inc.(a) | | 172,000 | | | 10,729,360 |
Guidant Corp. | | 22,283 | | | 1,606,604 |
Medtronic, Inc. | | 130,916 | | | 6,502,598 |
Smith & Nephew PLC, ADR
(United Kingdom) | | 38,996 | | | 2,018,433 |
Zimmer Holdings, Inc.(a) | | 37,882 | | | 3,035,106 |
| | | | |
|
|
| | | | | | 27,555,919 |
| | | | |
|
|
Health Care Providers & Services — 1.9% | | | |
Aetna, Inc. | | 27,854 | | | 3,474,787 |
Cardinal Health, Inc. | | 11,142 | | | 647,907 |
Caremark Rx, Inc.(a) | | 803,400 | | | 31,678,062 |
Coventry Heath Care, Inc.(a) | | 147,500 | | | 7,829,300 |
UnitedHealth Group, Inc. | | 91,914 | | | 8,091,189 |
WellPoint, Inc.(a) | | 220,771 | | | 25,388,665 |
| | | | |
|
|
| | | | | | 77,109,910 |
| | | | |
|
|
Hotels, Restaurants & Leisure — 1.1% | | | | | |
Carnival Corp. | | 53,480 | | | 3,082,052 |
Ctrip.com International Ltd. ADR (Cayman Islands)(a) | | 18,300 | | | 842,166 |
International Game Technology | | 28,523 | | | 980,621 |
Marriott International, Inc.
(Class “A” Stock) | | 20,389 | | | 1,284,099 |
McDonald’s Corp. | | 368,433 | | | 11,811,962 |
Starbucks Corp.(a) | | 432,500 | | | 26,970,700 |
| | | | |
|
|
| | | | | | 44,971,600 |
| | | | |
|
|
Household Durables — 0.4% | | | | | |
Black & Decker Corp. | | 6,964 | | | 615,130 |
Centex Corp. | | 9,136 | | | 544,323 |
Fortune Brands, Inc. | | 12,312 | | | 950,240 |
Leggett & Platt, Inc. | | 15,933 | | | 452,975 |
SEE NOTES TO FINANCIAL STATEMENTS.
B27
| | | | |
| | | EQUITY PORTFOLIO (Continued) | | |
SCHEDULE OF INVESTMENTS | December 31, 2004 |
| | | | | |
| COMMON STOCKS | | Value (Note 2)
|
| (Continued) | | Shares
| |
Household Durables (cont’d.) | | | | | |
Maytag Corp. | | 6,239 | | $ | 131,643 |
Newell Rubbermaid, Inc. | | 469,559 | | | 11,358,632 |
Snap-on, Inc. | | 4,902 | | | 168,433 |
Stanley Works | | 7,131 | | | 349,348 |
Whirlpool Corp. | | 5,404 | | | 374,011 |
| | | | |
|
|
| | | | | | 14,944,735 |
| | | | |
|
|
Household Products — 1.4% | | | | | |
Clorox Co. | | 80,777 | | | 4,760,189 |
Colgate-Palmolive Co. | | 103,084 | | | 5,273,777 |
Kimberly-Clark Corp. | | 251,831 | | | 16,572,998 |
Procter & Gamble Co. | | 587,144 | | | 32,339,892 |
| | | | |
|
|
| | | | | | 58,946,856 |
| | | | |
|
|
Industrial Conglomerates — 4.2% | | | | | |
3M Co. | | 104,190 | | | 8,550,873 |
General Electric Co. | | 2,956,700 | | | 107,919,550 |
Tyco International, Ltd.(b) | | 1,632,428 | | | 58,342,977 |
| | | | |
|
|
| | | | | | 174,813,400 |
| | | | |
|
|
Insurance — 3.2% | | | | | |
Allstate Corp. | | 125,233 | | | 6,477,051 |
American International Group, Inc. | | 963,478 | | | 63,271,600 |
Berkshire Hathaway, Inc. (Class “A” Stock)(a) | | 122 | | | 10,723,800 |
Chubb Corp. | | 177,431 | | | 13,644,444 |
Loews Corp. | | 424,500 | | | 29,842,350 |
MetLife, Inc. | | 197,745 | | | 8,010,650 |
SAFECO Corp. | | 44,121 | | | 2,304,881 |
| | | | |
|
|
| | | | | | 134,274,776 |
| | | | |
|
|
Internet & Catalog Retail — 1.3% | | | | | |
eBay, Inc.(a)(b) | | 472,756 | | | 54,972,067 |
InterActiveCorp(a) | | 4,277 | | | 118,131 |
| | | | |
|
|
| | | | | | 55,090,198 |
| | | | |
|
|
Internet Software & Services — 2.1% | | | | | |
Google, Inc. (Class “A” Stock)(a)(b) | | 117,800 | | | 22,747,180 |
GTECH Holdings Corp. | | 11,142 | | | 289,135 |
SINA Corp. (Cayman Islands)(a) | | 22,600 | | | 724,556 |
Yahoo!, Inc.(a)(b) | | 1,726,563 | | | 65,056,894 |
| | | | |
|
|
| | | | | | 88,817,765 |
| | | | |
|
|
IT Consulting & Services — 0.2% | | | | | |
Accenture, Ltd. (Class “A” Stock) (Bermuda)(a) | | 50,639 | | | 1,367,253 |
Affiliated Computer Services, Inc. (Class “A” Stock)(a) | | 21,245 | | | 1,278,737 |
First Data Corp. | | 137,015 | | | 5,828,618 |
| | | | |
|
|
| | | | | | 8,474,608 |
| | | | |
|
|
Leisure Equipment & Products — 0.3% | | | | | |
Mattel, Inc. | | 688,600 | | | 13,420,814 |
| | | | |
|
|
Machinery — 1.5% | | | | | |
Caterpillar, Inc. | | 48,411 | | | 4,720,557 |
Danaher Corp. | | 122,335 | | | 7,023,252 |
Deere & Co. | | 334,762 | | | 24,906,293 |
Dover Corp. | | 74,802 | | | 3,137,196 |
Eaton Corp. | | 102,721 | | | 7,432,892 |
Illinois Tool Works, Inc. | | 24,898 | | | 2,307,547 |
| | | | | |
| COMMON STOCKS | | Value (Note 2)
|
| (Continued) | | Shares
| |
Machinery (cont’d.) | | | | | |
Ingersoll-Rand Co. (Class “A” Stock) (Bermuda) | | 26,768 | | $ | 2,149,470 |
Navistar International Corp.(a) | | 179,100 | | | 7,876,818 |
PACCAR, Inc. | | 34,009 | | | 2,737,044 |
| | | | |
|
|
| | | | | | 62,291,069 |
| | | | |
|
|
Media — 3.0% | | | | | |
Clear Channel Communications, Inc. | | 57,826 | | | 1,936,593 |
Comcast Corp. (Class “A” Stock)(a) | | 444,690 | | | 14,799,283 |
Comcast Corp. (Special Class “A” Stock)(a) | | 238,326 | | | 7,826,626 |
DreamWorks Animation SKG, Inc. (Class “A” Stock)(a)(b) | | 26,300 | | | 986,513 |
Gannett Co., Inc. | | 18,969 | | | 1,549,767 |
Liberty Media Corp.
(Class “A” Stock)(a) | | 1,056,168 | | | 11,596,725 |
Liberty Media International, Inc.
(Class “A” Stock)(a) | | 8,227 | | | 380,334 |
McGraw Hill, Inc. | | 12,646 | | | 1,157,615 |
New York Times Co.
(Class “A” Stock) | | 21,225 | | | 865,980 |
News Corp. (Class “A” Stock) | | 841,703 | | | 15,706,178 |
Omnicom Group, Inc. | | 32,500 | | | 2,740,400 |
Time Warner, Inc.(a) | | 896,378 | | | 17,425,588 |
Tribune Co. | | 28,969 | | | 1,220,754 |
Univision Communications, Inc.
(Class “A” Stock)(a)(b) | | 767,000 | | | 22,450,090 |
Viacom, Inc. (Class “B” Stock) | | 549,058 | | | 19,980,220 |
Walt Disney Co. | | 115,261 | | | 3,204,256 |
| | | | |
|
|
| | | | | | 123,826,922 |
| | | | |
|
|
Metals & Mining — 4.5% | | | | | |
Alcan, Inc. (Canada) | | 11,554 | | | 566,608 |
Alcoa, Inc. | | 69,285 | | | 2,176,935 |
Alumina, Ltd. ADR (Australia) | | 1,554,300 | | | 28,816,722 |
Barrick Gold Corp. (Canada) | | 780,158 | | | 18,895,427 |
Companhia Vale do Rio Doce, ADR (Brazil)(b) | | 2,023,400 | | | 58,698,834 |
Freeport-McMoRan Copper & Gold, Inc. (Class “B” Stock)(b) | | 1,152,480 | | | 44,059,310 |
Newmont Mining Corp.(b) | | 557,615 | | | 24,763,682 |
Phelps Dodge Corp. | | 19,052 | | | 1,884,624 |
Placer Dome, Inc. | | 229,200 | | | 4,322,712 |
| | | | |
|
|
| | | | | | 184,184,854 |
| | | | |
|
|
Multi-line Retail — 1.2% | | | | | |
Family Dollar Stores, Inc. | | 112,987 | | | 3,528,584 |
Federated Department Stores, Inc. | | 22,867 | | | 1,321,484 |
J.C. Penney Co., Inc. | | 194,500 | | | 8,052,300 |
Kohl’s Corp.(a) | | 34,577 | | | 1,700,151 |
Target Corp.(b) | | 708,536 | | | 36,794,274 |
| | | | |
|
|
| | | | | | 51,396,793 |
| | | | |
|
|
Multi-Utilities — 0.1% | | | | | |
Duke Energy Corp. | | 85,235 | | | 2,159,003 |
| | | | |
|
|
Office Electronics — 0.6% | | | | | |
Xerox Corp.(a)(b) | | 1,472,300 | | | 25,043,823 |
| | | | |
|
|
Oil & Gas — 6.8% | | | | | |
Amerada Hess Corp. | | 23,398 | | | 1,927,527 |
Apache Corp. | | 545,560 | | | 27,588,969 |
SEE NOTES TO FINANCIAL STATEMENTS.
B28
| | | | |
| | | EQUITY PORTFOLIO (Continued) | | |
SCHEDULE OF INVESTMENTS | December 31, 2004 |
| | | | | |
| COMMON STOCKS | | Value (Note 2)
|
| (Continued) | | Shares
| |
Oil & Gas (cont’d.) | | | | | |
Burlington Resources, Inc. | | 92,208 | | $ | 4,011,048 |
ChevronTexaco Corp. | | 359,278 | | | 18,865,688 |
ConocoPhillips, Inc. | | 51,586 | | | 4,479,212 |
EOG Resources, Inc. | | 27,353 | | | 1,951,910 |
ExxonMobil Corp.(e) | | 1,063,061 | | | 54,492,507 |
Kerr-McGee Corp. | | 328,600 | | | 18,989,794 |
Nexen, Inc. (Canada) | | 631,600 | | | 25,674,540 |
Occidental Petroleum Corp. | | 62,596 | | | 3,653,103 |
Suncor Energy, Inc. (Canada) | | 1,381,200 | | | 48,877,753 |
Total SA, ADR (France) | | 633,000 | | | 69,528,720 |
Transocean, Inc.(a) | | 26,105 | | | 1,106,591 |
| | | | |
|
|
| | | | | | 281,147,362 |
| | | | |
|
|
Paper & Forest Products — 0.4% | | | | | |
International Paper Co. | | 344,463 | | | 14,467,446 |
Neenah Paper, Inc.(a) | | 2,419 | | | 78,859 |
Weyerhaeuser Co. | | 24,289 | | | 1,632,707 |
| | | | |
|
|
| | | | | | 16,179,012 |
| | | | |
|
|
Personal Products — 0.4% | | | | | |
Alberto-Culver Co. | | 8,614 | | | 418,382 |
Avon Products, Inc. | | 77,692 | | | 3,006,680 |
Estee Lauder Cos., Inc.
(Class “A” Stock) | | 241,300 | | | 11,044,301 |
Gillette Co. | | 19,411 | | | 869,225 |
| | | | |
|
|
| | | | | | 15,338,588 |
| | | | |
|
|
Pharmaceuticals — 8.1% | | | | | |
Abbott Laboratories | | 172,697 | | | 8,056,315 |
Allergan, Inc.(b) | | 313,300 | | | 25,399,231 |
Barr Pharmaceuticals, Inc.(a) | | 42,183 | | | 1,921,014 |
Eli Lilly & Co. | | 814,305 | | | 46,211,809 |
Forest Laboratories, Inc.(a) | | 45,681 | | | 2,049,250 |
GlaxoSmithKline PLC, ADR
(United Kingdom) | | 328,800 | | | 15,581,832 |
Johnson & Johnson | | 304,581 | | | 19,316,527 |
Medco Health Solutions, Inc.(a) | | 38,996 | | | 1,622,234 |
Merck & Co., Inc. | | 893,545 | | | 28,718,536 |
Novartis AG, ADR (Switzerland) | | 608,300 | | | 30,743,482 |
Pfizer, Inc.(e) | | 1,220,487 | | | 32,818,895 |
Roche Holdings AG, ADR (Switzerland). | | 310,000 | | | 35,686,394 |
Sepracor, Inc.(a)(b) | | 786,700 | | | 46,706,379 |
Teva Pharmaceutical Industries, Ltd., ADR (Israel) | | 723,309 | | | 21,598,007 |
Wyeth | | 483,345 | | | 20,585,663 |
| | | | |
|
|
| | | | | | 337,015,568 |
| | | | |
|
|
Road & Rail — 0.1% | | | | | |
Burlington Northern Santa Fe Corp. | | 41,224 | | | 1,950,307 |
| | | | |
|
|
Semiconductors & Semiconductor Equipment — 2.5% |
Analog Devices, Inc. | | 78,400 | | | 2,894,528 |
Intel Corp. | | 830,298 | | | 19,420,670 |
KLA-Tencor Corp.(a) | | 30,361 | | | 1,414,215 |
Linear Technology Corp. | | 45,236 | | | 1,753,347 |
Marvell Technology Group Ltd. (Bermuda)(a)(b) | | 816,300 | | | 28,954,161 |
| | | | | |
| COMMON STOCKS | | Value (Note 2)
|
| (Continued) | | Shares
| |
Semiconductors & Semiconductor Equipment (cont’d.) |
Maxim Integrated Products, Inc. | | 436,400 | | $ | 18,498,996 |
Microchip Technology, Inc. | | 39,386 | | | 1,050,031 |
National Semiconductor Corp. | | 105,847 | | | 1,899,954 |
Novellus Systems, Inc.(a) | | 51,308 | | | 1,430,980 |
Texas Instruments, Inc.(b) | | 685,016 | | | 16,865,094 |
Xilinx, Inc. | | 264,584 | | | 7,844,916 |
| | | | |
|
|
| | | | | | 102,026,892 |
| | | | |
|
|
Software — 7.9% | | | | | |
Adobe Systems, Inc. | | 327,300 | | | 20,534,802 |
BMC Software, Inc.(a) | | 467,100 | | | 8,688,060 |
Electronic Arts, Inc.(a)(b) | | 753,400 | | | 46,469,712 |
Intuit, Inc.(a) | | 48,314 | | | 2,126,299 |
Mercury Interactive Corp.(a) | | 517,300 | | | 23,563,015 |
Microsoft Corp. | | 4,746,998 | | | 126,792,317 |
NAVTEQ Corp.(a) | | 313,200 | | | 14,519,952 |
Novell, Inc.(a) | | 173,406 | | | 1,170,490 |
Oracle Corp.(a) | | 1,076,185 | | | 14,765,258 |
SAP AG, ADR (Germany) | | 844,800 | | | 37,348,608 |
Siebel Systems, Inc.(a) | | 110,083 | | | 1,155,872 |
Symantec Corp.(a)(b) | | 635,700 | | | 16,375,632 |
VERITAS Software Corp.(a) | | 480,400 | | | 13,715,420 |
| | | | |
|
|
| | | | | | 327,225,437 |
| | | | |
|
|
Specialty Retail — 1.6% | | | | | |
Bed Bath & Beyond, Inc.(a) | | 737,191 | | | 29,362,318 |
Best Buy Co., Inc. | | 306,231 | | | 18,196,246 |
Home Depot, Inc. | | 212,798 | | | 9,094,986 |
Lowe’s Cos., Inc. | | 118,050 | | | 6,798,499 |
Ross Stores, Inc. | | 54,093 | | | 1,561,665 |
Staples, Inc. | | 22,091 | | | 744,688 |
The Gap, Inc. | | 21,789 | | | 460,184 |
Tiffany & Co. | | 5,571 | | | 178,105 |
| | | | |
|
|
| | | | | | 66,396,691 |
| | | | |
|
|
Textiles & Apparel — 0.0% | | | | | |
NIKE, Inc. (Class “B” Stock) | | 19,943 | | | 1,808,631 |
| | | | |
|
|
Tobacco — 0.8% | | | | | |
Altria Group, Inc. | | 510,199 | | | 31,173,159 |
| | | | |
|
|
Wireless Telecommunication Services — 1.2% | | | |
Nextel Communications, Inc.
(Class “A” Stock)(a) | | 1,510,072 | | | 45,302,160 |
Vodafone Group PLC, ADR
(United Kingdom) | | 122,079 | | | 3,342,523 |
| | | | |
|
|
| | | | | | 48,644,683 |
| | | | |
|
|
TOTAL LONG-TERM INVESTMENTS | | | |
(cost $3,358,476,899) | | | 4,077,104,426 |
| | | | |
|
|
| SHORT-TERM INVESTMENTS — 12.7% | | |
Mutual Fund — 11.3% | | | | | |
Dryden Core Investment Fund —Taxable Money Market Series (Note 4)(c) | | 468,331,153 | | | 468,331,153 |
| | | | |
|
|
SEE NOTES TO FINANCIAL STATEMENTS.
B29
| | | | |
| | | EQUITY PORTFOLIO (Continued) | | |
SCHEDULE OF INVESTMENTS | December 31, 2004 |
| | | | | | | |
SHORT-TERM INVESTMENTS (Continued) | | Principal Amount (000)
| | Value (Note 2)
| |
Repurchase Agreement — 1.4% | | | | | | | |
State Street Bank & Trust Co., 1.75%, 01/03/05(d) | | $ | 57,470 | | $ | 57,470,881 | |
| | | | | |
|
|
|
TOTAL SHORT-TERM INVESTMENTS
(cost $525,802,034) | | | 525,802,034 | |
| | | | | |
|
|
|
TOTAL INVESTMENTS — 111.3%
(cost $3,884,278,933; Note 6) | | | 4,602,906,460 | |
| | | | | |
|
|
|
VARIATION MARGIN ON OPEN FUTURES CONTRACTS, NET(f) | | | (11,000 | ) |
LIABILITIES IN EXCESS OF OTHER
ASSETS — (11.3)% | | | (466,041,937 | ) |
| | | | | |
|
|
|
NET ASSETS — 100% | | $ | 4,136,853,523 | |
| | | | | |
|
|
|
The industry classification of portfolio holdings and liabilities in excess of other assets shown as a percentage of net assets as of December 31, 2004 was as follows:
| | | |
Mutual Fund | | 11.3 | % |
Pharmaceuticals | | 8.1 | |
Software | | 7.9 | |
Oil & Gas | | 6.8 | |
Diversified Financial Services | | 5.2 | |
Metals & Mining | | 4.5 | |
Industrial Conglomerates | | 4.2 | |
Capital Markets | | 3.7 | |
Energy Equipment & Services | | 3.5 | |
Communications Equipment | | 3.2 | |
Commercial Banks | | 3.2 | |
Biotechnology | | 3.2 | |
Insurance | | 3.2 | |
Media | | 3.0 | |
Computers & Peripherals | | 2.8 | |
Aerospace/Defense | | 2.5 | |
Semiconductors & Semiconductor Equipment | | 2.5 | |
Food & Staples Retailing | | 2.3 | |
| | | |
Internet Software & Services | | 2.1 | % |
Health Care Providers & Services | | 1.9 | |
Specialty Retail | | 1.6 | |
Consumer Finance | | 1.6 | |
Machinery | | 1.5 | |
Household Products | | 1.4 | |
Repurchase Agreement | | 1.4 | |
Internet & Catalog Retail | | 1.3 | |
Electric Utilities | | 1.3 | |
Food Products | | 1.3 | |
Multi-line Retail | | 1.2 | |
Wireless Telecommunication Services | | 1.2 | |
Beverages | | 1.2 | |
Commercial Services & Supplies | | 1.1 | |
Diversified Telecommunication Services | | 1.1 | |
Hotels, Restaurants & Leisure | | 1.1 | |
Air Freight & Logistics | | 1.1 | |
Chemicals | | 1.0 | |
Tobacco | | 0.8 | |
Electronic Equipment & Instruments | | 0.7 | |
Health Care Equipment & Supplies | | 0.7 | |
Office Electronics | | 0.6 | |
Gas Utilities | | 0.5 | |
Paper & Forest Products | | 0.4 | |
Household Durables | | 0.4 | |
Personal Products | | 0.4 | |
Leisure Equipment & Products | | 0.3 | |
Building & Building Products | | 0.3 | |
IT Consulting & Services | | 0.2 | |
Automobiles | | 0.1 | |
Containers & Packaging | | 0.1 | |
Electrical Equipment | | 0.1 | |
Multi-Utilities | | 0.1 | |
Road & Rail | | 0.1 | |
Textiles & Apparel | | 0.0 | |
| | |
|
|
| | | 111.3 | |
Liabilities in excess of other assets | | (11.3 | ) |
| | |
|
|
| | | 100.0 | % |
| | |
|
|
The following abbreviations are used in portfolio descriptions:
| | |
| ADR | | American Depositary Receipt |
| (a) | Non-income producing security. |
| (b) | Portion of securities on loan with an aggregate market value of $442,278,355; cash collateral $458,644,678 was received with which the portfolio purchased securities. |
| (c) | Represents security purchased with cash collateral received for securities on loan. |
| (d) | State Street Bank & Trust Company Repurchase Agreement, repurchase price $57,479,262 due 01/03/2005. The value of the collateral including accrued interest was $59,291,665. Collateralized by United States Treasury or federal agency obligations. |
| (e) | Security segregated as collateral for futures contracts. |
| (f) | Open futures contracts as of December 31, 2004 were as follows: |
| | | | | | | | | | | | | | |
Number of Contracts
| | Type
| | Expiration
Date
| | Value at
Trade Date
| | Value at December 31, 2004
| | Unrealized Depreciation
| |
Long Positions: | | | | | | | | | | | | | | |
44 | | S&P 500 Index | | Mar 05 | | $ | 13,355,650 | | $ | 13,350,700 | | $ | (4,950 | ) |
| | | | | | | | | | | | |
|
|
|
SEE NOTES TO FINANCIAL STATEMENTS.
B30
| | | | |
| | | FLEXIBLE MANAGED PORTFOLIO | | |
SCHEDULE OF INVESTMENTS | December 31, 2004 |
| | | | | |
| LONG-TERM INVESTMENTS — 92.7% | | Value (Note 2)
|
| COMMON STOCKS — 71.1% | | Shares
| |
Aerospace/Defense — 1.9% | | | | | |
Alliant Techsystems, Inc.(a) | | 2,300 | | $ | 150,374 |
Armor Holdings, Inc.(a)(b) | | 19,500 | | | 916,890 |
General Dynamics Corp. | | 122,400 | | | 12,803,040 |
Lockheed Martin Corp.(b) | | 227,400 | | | 12,632,070 |
Northrop Grumman Corp.(b) | | 309,400 | | | 16,818,984 |
The Boeing Co.(b) | | 109,300 | | | 5,658,461 |
United Technologies Corp. | | 242,500 | | | 25,062,375 |
| | | | |
|
|
| | | | | | 74,042,194 |
| | | | |
|
|
Apparel — 0.3% | | | | | |
Liz Claiborne, Inc. | | 91,900 | | | 3,879,099 |
NIKE, Inc. (Class “B” Stock) | | 24,900 | | | 2,258,181 |
Quiksilver, Inc.(a)(b) | | 39,300 | | | 1,170,747 |
The Timberland Co. (Class “A” Stock)(a) | | 31,300 | | | 1,961,571 |
V.F. Corp.(b) | | 47,800 | | | 2,647,164 |
| | | | |
|
|
| | | | | | 11,916,762 |
| | | | |
|
|
Autos – Cars & Trucks — 0.9% | | | | | |
American Axle & Manufacturing Holdings, Inc. | | 52,000 | | | 1,594,320 |
Dana Corp. | | 120,600 | | | 2,089,998 |
Ford Motor Co.(b) | | 1,328,200 | | | 19,444,848 |
Navistar International Corp.(a) | | 30,100 | | | 1,323,798 |
PACCAR, Inc. | | 130,300 | | | 10,486,544 |
Winnebago Industries, Inc.(b) | | 34,200 | | | 1,335,852 |
| | | | |
|
|
| | | | | | 36,275,360 |
| | | | |
|
|
Banks & Savings & Loans — 4.7% | | | | | |
AmSouth Bancorporation(b) | | 50,800 | | | 1,315,720 |
Bank of America Corp. | | 851,882 | | | 40,029,935 |
BB&T Corp.(b) | | 216,000 | | | 9,082,800 |
CapitalSource, Inc.(a) | | 33,400 | | | 857,378 |
Comerica, Inc.(b) | | 125,700 | | | 7,670,214 |
Commerce Bancorp, Inc.(b) | | 75,200 | | | 4,842,880 |
First Horizon National Corp.(b) | | 94,500 | | | 4,073,895 |
Golden West Financial Corp. | | 22,800 | | | 1,400,376 |
Huntington Bancshares, Inc.(b) | | 124,100 | | | 3,075,198 |
KeyCorp(b) | | 228,600 | | | 7,749,540 |
National City Corp.(b) | | 225,500 | | | 8,467,525 |
New York Community Bancorp, Inc.(b) | | 136,300 | | | 2,803,691 |
Popular, Inc. | | 54,200 | | | 1,562,586 |
Regions Financial Corp. | | 19,236 | | | 684,609 |
Sovereign Bancorp, Inc. | | 86,000 | | | 1,939,300 |
SunTrust Banks, Inc.(b) | | 146,100 | | | 10,793,868 |
U.S. Bancorp(b) | | 872,032 | | | 27,312,043 |
Wachovia Corp. | | 379,300 | | | 19,951,180 |
Wells Fargo & Co. | | 421,500 | | | 26,196,225 |
Zions Bancorp | | 13,800 | | | 938,814 |
| | | | |
|
|
| | | | | | 180,747,777 |
| | | | |
|
|
Chemicals — 0.8% | | | | | |
Cabot Microelectronics Corp.(a)(b) | | 80,400 | | | 3,220,020 |
Cytec Industries, Inc.(b) | | 17,900 | | | 920,418 |
Eastman Chemical Co. | | 17,000 | | | 981,410 |
Engelhard Corp. | | 72,600 | | | 2,226,642 |
FMC Corp.(a) | | 22,100 | | | 1,067,430 |
Lubrizol Corp. | | 36,700 | | | 1,352,762 |
| | | | | |
COMMON STOCKS
(Continued) | | Shares
| | Value (Note 2)
|
Chemicals (cont’d.) | | | |
Lyondell Chemical Co. | | 14,300 | | $ | 413,556 |
MacDermid, Inc. | | 8,800 | | | 317,680 |
Olin Corp. | | 15,600 | | | 343,512 |
OM Group, Inc.(a) | | 27,500 | | | 891,550 |
PPG Industries, Inc. | | 13,400 | | | 913,344 |
RPM, Inc. | | 28,100 | | | 552,446 |
Sigma-Aldrich Corp.(b) | | 30,700 | | | 1,856,122 |
The Dow Chemical Co. | | 302,500 | | | 14,976,775 |
The Mosaic Co.(a)(b) | | 72,500 | | | 1,183,200 |
| | | | |
|
|
| | | | | | 31,216,867 |
| | | | |
|
|
Commercial Services — 0.3% | | | | | |
Banta Corp. | | 2,700 | | | 120,852 |
Convergys Corp.(a) | | 101,300 | | | 1,518,487 |
Deluxe Corp.(b) | | 41,700 | | | 1,556,661 |
Paychex, Inc. | | 70,500 | | | 2,402,640 |
Polycom, Inc.(a)(b) | | 142,700 | | | 3,327,764 |
Robert Half International, Inc. | | 73,800 | | | 2,171,934 |
SOURCECORP, Inc.(a) | | 2,400 | | | 45,864 |
| | | | |
|
|
| | | | | | 11,144,202 |
| | | | |
|
|
Computers — 2.1% | | | | | |
Dell, Inc.(a) | | 247,500 | | | 10,429,650 |
Hewlett-Packard Co.(b) | | 851,765 | | | 17,861,512 |
International Business Machines Corp. | | 549,500 | | | 54,169,710 |
PalmOne, Inc.(a)(b) | | 15,500 | | | 489,025 |
| | | | |
|
|
| | | | | | 82,949,897 |
| | | | |
|
|
Computer Services — 5.5% | | | | | |
Adobe Systems, Inc. | | 8,900 | | | 558,386 |
Automatic Data Processing, Inc. | | 27,600 | | | 1,224,060 |
Cisco Systems, Inc.(a) | | 2,364,300 | | | 45,630,990 |
Citrix Systems, Inc.(a) | | 12,300 | | | 301,719 |
Computer Sciences Corp.(a)(b) | | 4,200 | | | 236,754 |
Electronic Data Systems Corp.(b) | | 83,100 | | | 1,919,610 |
EMC Corp.(a)(b) | | 1,591,700 | | | 23,668,579 |
Intuit, Inc.(a)(b) | | 219,300 | | | 9,651,393 |
Lexmark International, Inc.(a) | | 37,800 | | | 3,213,000 |
Microsoft Corp. | | 3,169,800 | | | 84,665,358 |
NCR Corp.(a) | | 34,900 | | | 2,416,127 |
Network Appliance, Inc.(a)(b) | | 482,000 | | | 16,012,040 |
Oracle Corp.(a) | | 1,834,200 | | | 25,165,224 |
| | | | |
|
|
| | | | | | 214,663,240 |
| | | | |
|
|
Construction — 0.8% | | | | | |
D.R. Horton, Inc. | | 59,900 | | | 2,414,569 |
KB HOME(b) | | 77,300 | | | 8,070,120 |
M.D.C. Holdings, Inc. | | 22,720 | | | 1,963,917 |
Masco Corp.(b) | | 398,000 | | | 14,538,940 |
NVR, Inc.(a)(b) | | 2,000 | | | 1,538,800 |
Standard Pacific Corp. | | 59,000 | | | 3,784,260 |
| | | | |
|
|
| | | | | | 32,310,606 |
| | | | |
|
|
Consumer Products — 0.3% | | | | | |
Coach, Inc.(a) | | 194,600 | | | 10,975,440 |
NBTY, Inc.(a) | | 17,500 | | | 420,175 |
Yankee Candle, Inc.(a) | | 38,000 | | | 1,260,840 |
| | | | |
|
|
| | | | | | 12,656,455 |
| | | | |
|
|
SEE NOTES TO FINANCIAL STATEMENTS.
B31
| | | | |
| | | FLEXIBLE MANAGED PORTFOLIO (Continued) | | |
SCHEDULE OF INVESTMENTS | December 31, 2004 |
| | | | | |
COMMON STOCKS
(Continued) | | Shares
| | Value (Note 2)
|
Containers & Packaging — 0.2% | | | | | |
Ball Corp. | | 101,200 | | $ | 4,450,776 |
Pactiv Corp.(a) | | 75,600 | | | 1,911,924 |
| | | | |
|
|
| | | | | | 6,362,700 |
| | | | |
|
|
Cosmetics & Soaps — 1.3% | | | | | |
Avon Products, Inc.(b) | | 106,600 | | | 4,125,420 |
Gillette Co.(b) | | 340,500 | | | 15,247,590 |
Nu Skin Enterprises, Inc.
(Class “A” Stock) | | 41,100 | | | 1,043,118 |
Procter & Gamble Co. | | 533,000 | | | 29,357,640 |
| | | | |
|
|
| | | | | | 49,773,768 |
| | | | |
|
|
Distribution/Wholesale — 0.1% | | | | | |
W.W. Grainger, Inc. | | 56,700 | | | 3,777,354 |
| | | | |
|
|
Diversified Operations — 3.7% | | | | | |
3M Co.(b) | | 145,200 | | | 11,916,564 |
Carlisle Cos., Inc. | | 7,900 | | | 512,868 |
Cooper Industries, Ltd.
(Class “A” Stock) (Bermuda) | | 67,500 | | | 4,582,575 |
Eaton Corp.(b) | | 90,500 | | | 6,548,580 |
General Electric Co. | | 2,043,700 | | | 74,595,050 |
Illinois Tool Works, Inc.(b) | | 85,500 | | | 7,924,140 |
Ingersoll-Rand Co.
(Class “A” Stock) | | 154,900 | | | 12,438,470 |
Tyco International Ltd.(b) | | 719,650 | | | 25,720,291 |
| | | | |
|
|
| | | | | | 144,238,538 |
| | | | |
|
|
Drugs & Medical Supplies — 6.4% | | | | | |
Abbott Laboratories | | 258,700 | | | 12,068,355 |
American Medical Systems Holdings, Inc.(a) | | 10,200 | | | 426,462 |
Amgen, Inc.(a) | | 98,208 | | | 6,300,043 |
Applera Corp. – Applied Biosystems Group | | 124,100 | | | 2,594,931 |
Bausch & Lomb, Inc.(b) | | 68,100 | | | 4,389,726 |
Becton, Dickinson & Co. | | 175,700 | | | 9,979,760 |
Biogen Idec, Inc.(a) | | 38,300 | | | 2,551,163 |
Biomet, Inc.(b) | | 6,100 | | | 264,679 |
Biosite, Inc.(a)(b) | | 25,600 | | | 1,575,424 |
C.R. Bard, Inc. | | 85,400 | | | 5,463,892 |
Cephalon, Inc.(a)(b) | | 91,200 | | | 4,640,256 |
Charles River Laboratories International, Inc.(a) | | 10,400 | | | 478,504 |
Dade Behring Holdings, Inc.(a) | | 27,400 | | | 1,534,400 |
Edwards Lifesciences Corp.(a)(b) | | 37,700 | | | 1,555,502 |
Fisher Scientific International, Inc.(a)(b) | | 76,432 | | | 4,767,828 |
Guidant Corp. | | 23,600 | | | 1,701,560 |
Hospira, Inc.(a) | | 16,320 | | | 546,720 |
Immucor Corp.(a) | | 19,050 | | | 447,866 |
Invitrogen Corp.(a) | | 85,800 | | | 5,759,754 |
Johnson & Johnson | | 816,998 | | | 51,814,013 |
Kensey Nash Corp.(a) | | 18,100 | | | 624,993 |
Lilly (Eli) & Co. | | 33,800 | | | 1,918,150 |
Medtronic, Inc.(b) | | 388,300 | | | 19,286,861 |
Merck & Co., Inc. | | 1,017,000 | | | 32,686,380 |
Pfizer, Inc. | | 2,357,065 | | | 63,381,478 |
Respironics, Inc.(a) | | 5,900 | | | 320,724 |
Stryker Corp.(b) | | 88,600 | | | 4,274,950 |
| | | | | |
COMMON STOCKS
(Continued) | | Shares
| | Value (Note 2)
|
Drugs & Medical Supplies (cont’d.) | | | | | |
Techne Corp.(a) | | 24,000 | | $ | 933,600 |
Varian Medical Systems, Inc.(a)(b) | | 107,000 | | | 4,626,680 |
Ventana Medical Systems, Inc.(a)(b) | | 12,600 | | | 806,274 |
Zimmer Holdings, Inc.(a) | | 12,100 | | | 969,452 |
| | | | |
|
|
| | | | | | 248,690,380 |
| | | | |
|
|
Electronics — 1.3% | | | | | |
Amphenol Corp. (Class “A” Stock)(a) | | 60,400 | | | 2,219,096 |
Cree, Inc.(a)(b) | | 273,800 | | | 10,973,904 |
Emerson Electric Co. | | 202,600 | | | 14,202,260 |
IDEXX Laboratories, Inc.(a) | | 22,000 | | | 1,200,980 |
PerkinElmer, Inc. | | 108,700 | | | 2,444,663 |
Taser International, Inc.(a)(b) | | 438,000 | | | 13,836,420 |
Tech Data Corp.(a) | | 56,700 | | | 2,574,180 |
Waters Corp.(a) | | 41,000 | | | 1,918,390 |
| | | | |
|
|
| | | | | | 49,369,893 |
| | | | |
|
|
Financial Services — 6.4% | | | | | |
A.G. Edwards, Inc. | | 25,100 | | | 1,084,571 |
American Express Co. | | 96,300 | | | 5,428,431 |
Ameritrade Holding Corp.(a) | | 260,400 | | | 3,702,888 |
Bear, Stearns & Co., Inc.(b) | | 95,200 | | | 9,739,912 |
CIT Group, Inc. | | 98,600 | | | 4,517,852 |
Citigroup, Inc. | | 1,553,962 | | | 74,869,889 |
Countrywide Credit Industries, Inc. | | 223,300 | | | 8,264,333 |
Fannie Mae(b) | | 72,800 | | | 5,184,088 |
Goldman Sachs Group, Inc. | | 202,500 | | | 21,068,100 |
J.P. Morgan Chase & Co. | | 536,094 | | | 20,913,027 |
Lehman Brothers Holdings, Inc. | | 233,200 | | | 20,400,336 |
Marshall & Ilsley Corp. | | 22,200 | | | 981,240 |
MBNA Corp. | | 91,650 | | | 2,583,613 |
Merrill Lynch & Co., Inc. | | 290,200 | | | 17,345,254 |
Moody’s Corp.(b) | | 54,900 | | | 4,768,065 |
Morgan Stanley | | 299,590 | | | 16,633,237 |
PNC Financial Services Corp. | | 194,600 | | | 11,177,824 |
Providian Financial Corp.(a)(b) | | 213,700 | | | 3,519,639 |
SLM Corp.(b) | | 171,100 | | | 9,135,029 |
Washington Mutual, Inc.(b) | | 204,500 | | | 8,646,260 |
| | | | |
|
|
| | | | | | 249,963,588 |
| | | | |
|
|
Food & Beverage — 2.7% | | | | | |
Adolph Coors Co. (Class “B” Stock) | | 23,100 | | | 1,747,977 |
Anheuser Busch Cos., Inc. | | 300,900 | | | 15,264,657 |
Archer-Daniels-Midland Co. | | 347,779 | | | 7,758,950 |
Chiquita Brands International, Inc. | | 26,400 | | | 582,384 |
Coca-Cola Co. | | 830,200 | | | 34,561,226 |
Coca-Cola Enterprises Inc.(b) | | 272,400 | | | 5,679,540 |
Dean Foods Co.(a) | | 43,500 | | | 1,433,325 |
Del Monte Foods Co.(a) | | 33,500 | | | 369,170 |
General Mills, Inc.(b) | | 10,700 | | | 531,897 |
H.J. Heinz Co. | | 40,700 | | | 1,586,893 |
Kellogg Co. | | 13,600 | | | 607,376 |
Pepsi Bottling Group, Inc.(b) | | 210,200 | | | 5,683,808 |
PepsiAmericas, Inc. | | 2,900 | | | 61,596 |
PepsiCo, Inc. | | 148,720 | | | 7,763,184 |
Pilgrim’s Pride Corp.(b) | | 46,800 | | | 1,435,824 |
Sanderson Farms, Inc.(b) | | 25,700 | | | 1,112,296 |
Sara Lee Corp. | | 63,600 | | | 1,535,304 |
SEE NOTES TO FINANCIAL STATEMENTS.
B32
| | | | |
| | | FLEXIBLE MANAGED PORTFOLIO (Continued) | | |
SCHEDULE OF INVESTMENTS | December 31, 2004 |
| | | | | |
COMMON STOCKS
(Continued) | | Shares
| | Value (Note 2)
|
Food & Beverage (cont’d.) | | | | | |
Smithfield Foods, Inc.(a) | | 63,900 | | $ | 1,890,801 |
SUPERVALU, Inc.(b) | | 114,800 | | | 3,962,896 |
The Kroger Co.(a) | | 484,000 | | | 8,489,360 |
Tyson Foods, Inc. (Class “A” Stock)(b) | | 160,843 | | | 2,959,511 |
| | | | |
|
|
| | | | | | 105,017,975 |
| | | | |
|
|
Forest Products — 0.4% | | | | | |
Georgia-Pacific Corp. | | 200,200 | | | 7,503,496 |
Louisiana-Pacific Corp.(b) | | 145,000 | | | 3,877,300 |
Temple-Inland, Inc. | | 37,000 | | | 2,530,800 |
Weyerhaeuser Co. | | 20,200 | | | 1,357,844 |
| | | | |
|
|
| | | | | | 15,269,440 |
| | | | |
|
|
Gas Pipelines — 0.2% | | | | | |
Sempra Energy | | 169,573 | | | 6,219,938 |
| | | | |
|
|
Healthcare — 1.1% | | | | | |
Aetna, Inc. | | 69,600 | | | 8,682,600 |
Express Scripts, Inc.(a)(b) | | 66,300 | | | 5,067,972 |
Manor Care, Inc. | | 59,900 | | | 2,122,257 |
Select Medical Corp. | | 60,100 | | | 1,057,760 |
UnitedHealth Group, Inc. | | 3,500 | | | 308,105 |
WellChoice, Inc.(a) | | 9,000 | | | 480,600 |
WellPoint, Inc.(a) | | 210,900 | | | 24,253,500 |
| | | | |
|
|
| | | | | | 41,972,794 |
| | | | |
|
|
Hospital Management — 0.1% | | | | | |
AmSurg Corp.(a) | | 10,600 | | | 313,124 |
HCA, Inc. | | 52,800 | | | 2,109,888 |
Humana, Inc.(a) | | 70,900 | | | 2,105,021 |
Pediatrix Medical Group, Inc.(a) | | 14,400 | | | 922,320 |
| | | | |
|
|
| | | | | | 5,450,353 |
| | | | |
|
|
Household & Personal Care Products — 0.3% | | | |
Kimberly-Clark Corp. | | 140,200 | | | 9,226,562 |
USANA Health Sciences, Inc.(a)(b) | | 19,500 | | | 666,900 |
| | | | |
|
|
| | | | | | 9,893,462 |
| | | | |
|
|
Insurance — 2.8% | | | | | |
ACE, Ltd. | | 198,000 | | | 8,464,500 |
Allmerica Financial Corp.(a) | | 10,700 | | | 351,281 |
Allstate Corp. | | 288,100 | | | 14,900,532 |
American Financial Group, Inc. | | 27,600 | | | 864,156 |
American International Group, Inc. | | 420,835 | | | 27,636,234 |
AmerUs Group Co. | | 12,900 | | | 584,370 |
Assurant, Inc. | | 25,900 | | | 791,245 |
CIGNA Corp. | | 36,700 | | | 2,993,619 |
Everest Re Group Ltd. (Bermuda) | | 21,400 | | | 1,916,584 |
Genworth Financial, Inc.
(Class “A” Stock) | | 91,300 | | | 2,465,100 |
LandAmerica Financial Group, Inc.(b) | | 26,600 | | | 1,434,538 |
Lincoln National Corp. | | 6,500 | | | 303,420 |
Loews Corp. | | 66,900 | | | 4,703,070 |
MetLife, Inc.(b) | | 260,700 | | | 10,560,957 |
MGIC Investment Corp. | | 63,200 | | | 4,355,112 |
Odyssey Re Holdings Corp.(b) | | 12,200 | | | 307,562 |
Principal Financial Group, Inc. | | 52,400 | | | 2,145,256 |
SAFECO Corp.(b) | | 24,300 | | | 1,269,432 |
The Chubb Corp.(b) | | 109,300 | | | 8,405,170 |
The Hartford Financial Services Group, Inc. | | 47,200 | | | 3,271,432 |
UnumProvident Corp.(b) | | 341,570 | | | 6,127,766 |
| | | | | |
COMMON STOCKS
(Continued) | | Shares
| | Value (Note 2)
|
Insurance (cont’d.) | | | | | |
XL Capital Ltd. (Class “A” Stock)(b) | | 47,000 | | $ | 3,649,550 |
| | | | |
|
|
| | | | | | 107,500,886 |
| | | | |
|
|
Internet Software & Services — 0.6% | | | |
EarthLink, Inc.(a) | | 174,800 | | | 2,013,696 |
Internet Security Systems, Inc.(a) | | 85,400 | | | 1,985,550 |
Overstock.com, Inc.(a)(b) | | 116,600 | | | 8,045,400 |
Priceline.com, Inc.(a)(b) | | 35,800 | | | 844,522 |
Yahoo!, Inc.(a)(b) | | 276,000 | | | 10,399,680 |
| | | | |
|
|
| | | | | | 23,288,848 |
| | | | |
|
|
Leisure — 0.2% | | | | | |
Brunswick Corp. | | 71,600 | | | 3,544,200 |
Harrah’s Entertainment, Inc. | | 5,200 | | | 347,828 |
Marvel Enterprises, Inc.(a) | | 86,600 | | | 1,773,568 |
Sabre Holdings Corp.
(Class “A” Stock)(b) | | 144,400 | | | 3,199,904 |
| | | | |
|
|
| | | | | | 8,865,500 |
| | | | |
|
|
Machinery — 0.6% | | | | | |
Caterpillar, Inc. | | 58,900 | | | 5,743,339 |
Cummins, Inc.(b) | | 22,300 | | | 1,868,517 |
Deere & Co. | | 200,600 | | | 14,924,640 |
Zebra Technologies Corp.
(Class “A” Stock)(a) | | 16,300 | | | 917,364 |
| | | | |
|
|
| | | | | | 23,453,860 |
| | | | |
|
|
Manufacturing — 0.3% | | | | | |
CARBO Ceramics, Inc. | | 11,800 | | | 814,200 |
Dover Corp. | | 2,300 | | | 96,462 |
Grant Prideco, Inc.(a) | | 70,300 | | | 1,409,515 |
Harman International Industries, Inc. | | 400 | | | 50,800 |
Hasbro, Inc.(b) | | 140,800 | | | 2,728,704 |
Maverick Tube Corp.(a) | | 22,900 | | | 693,870 |
Parker Hannifin Corp.(b) | | 13,400 | | | 1,014,916 |
Terex Corp.(a) | | 4,900 | | | 233,485 |
Thermo Electron Corp.(a) | | 109,200 | | | 3,296,748 |
| | | | |
|
|
| | | | | | 10,338,700 |
| | | | |
|
|
Media — 2.2% | | | | | |
Clear Channel Communications, Inc.(b) | | 509,500 | | | 17,063,155 |
Comcast Corp.
(Special Class “A” Stock)(a) | | 89,782 | | | 2,987,945 |
EchoStar Communications Corp.
(Class “A” Stock) | | 84,800 | | | 2,818,752 |
Gannett Co., Inc.(b) | | 164,200 | | | 13,415,140 |
Knight-Ridder, Inc.(b) | | 33,000 | | | 2,209,020 |
Liberty Media Corp.
(Class “A” Stock)(a) | | 669,200 | | | 7,347,816 |
Time Warner, Inc.(a) | | 1,898,450 | | | 36,905,868 |
Walt Disney Co. | | 81,500 | | | 2,265,700 |
| | | | |
|
|
| | | | | | 85,013,396 |
| | | | |
|
|
Media & Entertainment | | | | | |
Viacom, Inc. (Class “B” Stock) | | 49,738 | | | 1,809,966 |
| | | | |
|
|
Metals – Non Ferrous — 0.1% | | | | | |
Century Aluminum Co.(a) | | 15,900 | | | 417,534 |
Mueller Industries, Inc. | | 30,600 | | | 985,320 |
Phelps Dodge Corp. | | 16,700 | | | 1,651,964 |
| | | | |
|
|
| | | | | | 3,054,818 |
| | | | |
|
|
SEE NOTES TO FINANCIAL STATEMENTS.
B33
| | | | |
| | | FLEXIBLE MANAGED PORTFOLIO (Continued) | | |
SCHEDULE OF INVESTMENTS | December 31, 2004 |
| | | | | |
COMMON STOCKS
(Continued) | | Shares
| | Value (Note 2)
|
Metal – Steel — 1.1% | | | | | |
Commercial Metals Co.(b) | | 13,800 | | $ | 697,728 |
International Steel Group, Inc.(a)(b) | | 52,700 | | | 2,137,512 |
Nucor Corp.(b) | | 341,700 | | | 17,884,578 |
Reliance Steel & Aluminum Co. | | 25,000 | | | 974,000 |
Steel Dynamics, Inc.(b) | | 28,900 | | | 1,094,732 |
United States Steel Corp.(b) | | 352,300 | | | 18,055,375 |
| | | | |
|
|
| | | | | | 40,843,925 |
| | | | |
|
|
Miscellaneous Consumer Growth — 0.1% | | | |
Energizer Holdings, Inc.(a)(b) | | 52,400 | | | 2,603,756 |
| | | | |
|
|
Office Equipment & Supplies — 0.2% | | | | | |
Office Depot, Inc.(a) | | 34,100 | | | 591,976 |
Xerox Corp.(a)(b) | | 510,200 | | | 8,678,502 |
| | | | |
|
|
| | | | | | 9,270,478 |
| | | | |
|
|
Oil & Gas — 5.5% | | | | | |
Amerada Hess Corp. | | 41,900 | | | 3,451,722 |
Anadarko Petroleum Corp.(b) | | 100,300 | | | 6,500,443 |
Apache Corp. | | 320,600 | | | 16,212,742 |
Atwood Oceanics, Inc.(a) | | 13,900 | | | 724,190 |
Burlington Resources, Inc. | | 18,700 | | | 813,450 |
Cal Dive International, Inc.(a) | | 18,100 | | | 737,575 |
Chesapeake Energy Corp. | | 96,000 | | | 1,584,000 |
ChevronTexaco Corp. | | 393,556 | | | 20,665,625 |
Conoco, Inc. (Class “B” Stock) | | 333,767 | | | 28,980,989 |
Devon Energy Corp. | | 338,824 | | | 13,187,030 |
Diamond Offshore Drilling, Inc.(b) | | 153,600 | | | 6,151,680 |
Exxon Mobil Corp. | | 1,269,616 | | | 65,080,516 |
Houston Exploration Co.(a) | | 3,700 | | | 208,347 |
Marathon Oil Corp. | | 52,000 | | | 1,955,720 |
Newfield Exploration Co.(a) | | 36,700 | | | 2,167,135 |
Noble Corp.(a)(b) | | 39,700 | | | 1,974,678 |
Occidental Petroleum Corp. | | 206,900 | | | 12,074,684 |
Pogo Producing Co. | | 47,100 | | | 2,283,879 |
Pride International, Inc.(a) | | 26,600 | | | 546,364 |
Schlumberger Ltd. | | 358,200 | | | 23,981,490 |
Smith International, Inc.(a) | | 24,200 | | | 1,316,722 |
Todco (Class “A” Stock)(a) | | 33,300 | | | 613,386 |
Unit Corp.(a) | | 30,200 | | | 1,153,942 |
Weatherford International Ltd.(a) | | 29,200 | | | 1,497,960 |
| | | | |
|
|
| | | | | | 213,864,269 |
| | | | |
|
|
Pharmaceuticals — 1.0% | | | | | |
Bristol-Myers Squibb Co.(b) | | 296,800 | | | 7,604,016 |
First Horizon Pharmaceutical Corp.(a)(b) | | 69,900 | | | 1,600,011 |
Gilead Sciences, Inc.(a) | | 53,900 | | | 1,885,961 |
Medicis Pharmaceutical Corp.
(Class “A” Stock)(b) | | 51,200 | | | 1,797,632 |
Pharmion Corp.(a) | | 44,600 | | | 1,882,566 |
United Therapeutics Corp.(a)(b) | | 51,300 | | | 2,316,195 |
Wyeth | | 514,000 | | | 21,891,260 |
| | | | |
|
|
| | | | | | 38,977,641 |
| | | | |
|
|
Photography | | | | | |
Eastman Kodak Co.(b) | | 57,000 | | | 1,838,250 |
| | | | |
|
|
Railroads | | | | | |
Norfolk Southern Corp. | | 24,400 | | | 883,036 |
| | | | |
|
|
| | | | | |
COMMON STOCKS
(Continued) | | Shares
| | Value (Note 2)
|
Real Estate Investment Trust — 0.3% | | | | | |
American Home Mortgage Investment Corp. | | 7,300 | | $ | 250,025 |
Boykin Lodging Co.(a) | | 9,800 | | | 89,768 |
Equity Office Properties Trust | | 10,500 | | | 305,760 |
General Growth Properties, Inc. | | 88,300 | | | 3,192,928 |
New Century Financial Corp. | | 54,749 | | | 3,499,009 |
Simon Property Group, Inc. | | 72,000 | | | 4,656,240 |
Sizeler Property Investors, Inc. | | 4,000 | | | 47,120 |
Thornburg Mortgage, Inc.(b) | | 33,000 | | | 955,680 |
| | | | |
|
|
| | | | | | 12,996,530 |
| | | | |
|
|
Restaurants — 1.1% | | | | | |
CEC Entertainment, Inc.(a) | | 36,150 | | | 1,444,915 |
Darden Restaurants, Inc. | | 142,600 | | | 3,955,724 |
Jack in the Box, Inc.(a)(b) | | 23,300 | | | 859,071 |
McDonald’s Corp. | | 577,400 | | | 18,511,444 |
Ruby Tuesday, Inc.(b) | | 24,000 | | | 625,920 |
Starbucks Corp.(a) | | 210,100 | | | 13,101,836 |
Yum! Brands, Inc. | | 68,200 | | | 3,217,676 |
| | | | |
|
|
| | | | | | 41,716,586 |
| | | | |
|
|
Retail — 5.1% | | | | | |
Albertson’s, Inc.(b) | | 126,700 | | | 3,025,596 |
American Eagle Outfitters, Inc. | | 58,100 | | | 2,736,510 |
AutoZone, Inc.(a)(b) | | 65,000 | | | 5,935,150 |
Bed Bath & Beyond, Inc.(a) | | 101,700 | | | 4,050,711 |
Best Buy Co., Inc.(b) | | 55,600 | | | 3,303,752 |
Circuit City Stores, Inc. | | 119,800 | | | 1,873,672 |
Electronics Boutique Holdings Corp.(a) | | 38,200 | | | 1,640,308 |
Federated Department Stores, Inc. | | 107,900 | | | 6,235,541 |
GameStop Corp.
(Class “A” Stock)(a)(b) | | 12,900 | | | 288,444 |
Home Depot, Inc.(b) | | 685,250 | | | 29,287,585 |
J. C. Penney Co., Inc. | | 408,500 | | | 16,911,900 |
Jones Apparel Group, Inc.(b) | | 121,100 | | | 4,428,627 |
Kmart Holding Corp.(a)(b) | | 42,400 | | | 4,195,480 |
Limited Brands | | 304,600 | | | 7,011,892 |
Lowe’s Cos., Inc. | | 429,100 | | | 24,711,869 |
Nordstrom, Inc. | | 19,400 | | | 906,562 |
Pacific Sunwear of California, Inc.(a) | | 199,300 | | | 4,436,418 |
RadioShack Corp. | | 26,900 | | | 884,472 |
Reebok International Ltd.(b) | | 73,700 | | | 3,242,800 |
Safeway, Inc.(a)(b) | | 331,100 | | | 6,535,914 |
Wal-Mart Stores, Inc.(b) | | 1,250,000 | | | 66,025,000 |
| | | | |
|
|
| | | | | | 197,668,203 |
| | | | |
|
|
Schools — 0.5% | | | | | |
Apollo Group, Inc.
(Class “A” Stock)(a)(b) | | 255,683 | | | 20,636,175 |
| | | | |
|
|
Semiconductors — 1.9% | | | | | |
Intel Corp.(b) | | 2,182,000 | | | 51,036,980 |
Linear Technology Corp.(b) | | 436,600 | | | 16,922,616 |
MEMC Electronic Materials, Inc.(a) | | 32,100 | | | 425,325 |
Sigmatel, Inc.(a) | | 76,700 | | | 2,725,151 |
Skyworks Solutions, Inc.(a)(b) | | 285,200 | | | 2,689,436 |
Tektronix, Inc. | | 63,300 | | | 1,912,293 |
| | | | |
|
|
| | | | | | 75,711,801 |
| | | | |
|
|
SEE NOTES TO FINANCIAL STATEMENTS.
B34
| | | | |
| | | FLEXIBLE MANAGED PORTFOLIO (Continued) | | |
SCHEDULE OF INVESTMENTS | December 31, 2004 |
| | | | | |
COMMON STOCKS
(Continued) | | Shares
| | Value (Note 2)
|
Software — 0.2% | | | | | |
First Data Corp. | | 44,000 | | $ | 1,871,760 |
Mercury Interactive Corp.(a) | | 71,600 | | | 3,261,380 |
The Dun & Bradstreet Corp.(a) | | 21,300 | | | 1,270,545 |
| | | | |
|
|
| | | | | | 6,403,685 |
| | | | |
|
|
Telecommunications — 2.5% | | | | | |
ALLTEL Corp. | | 73,600 | | | 4,324,736 |
AT&T Corp.(b) | | 650,100 | | | 12,390,906 |
Avaya, Inc.(a) | | 299,500 | | | 5,151,400 |
BellSouth Corp.(b) | | 239,900 | | | 6,666,821 |
CenturyTel, Inc.(b) | | 142,300 | | | 5,047,381 |
Corning, Inc.(a)(b) | | 576,100 | | | 6,780,697 |
Crown Castle International Corp.(a) | | 99,400 | | | 1,654,016 |
Motorola, Inc. | | 219,400 | | | 3,773,680 |
QUALCOMM, Inc. | | 88,700 | | | 3,760,880 |
SBC Communications, Inc. | | 283,550 | | | 7,307,083 |
Scientific–Atlanta, Inc. | | 78,100 | | | 2,578,081 |
Tellabs, Inc.(a)(b) | | 419,800 | | | 3,606,082 |
Verizon Communications | | 766,488 | | | 31,050,429 |
Western Wireless Corp.(a) | | 53,800 | | | 1,576,340 |
| | | | |
|
|
| | | | | | 95,668,532 |
| | | | |
|
|
Tobacco — 0.7% | | | | | |
Altria Group, Inc. | | 255,700 | | | 15,623,270 |
Reynolds American, Inc.(b) | | 150,900 | | | 11,860,740 |
UST, Inc.(b) | | 9,500 | | | 457,045 |
| | | | |
|
|
| | | | | | 27,941,055 |
| | | | |
|
|
Trucking & Shipping — 0.9% | | | | | |
CNF, Inc. | | 12,300 | | | 616,230 |
EGL, Inc.(a) | | 16,400 | | | 490,196 |
FedEx Corp. | | 74,500 | | | 7,337,505 |
J.B. Hunt Transport Services, Inc.(b) | | 82,100 | | | 3,682,185 |
Knight Transportation, Inc. | | 20,900 | | | 518,320 |
Overseas Shipholding Group, Inc. | | 20,900 | | | 1,153,680 |
Ryder System, Inc. | | 7,000 | | | 334,390 |
Swift Transportation Co., Inc.(a)(b) | | 99,400 | | | 2,135,112 |
United Parcel Service, Inc.
(Class “B” Stock)(b) | | 221,300 | | | 18,912,298 |
| | | | |
|
|
| | | | | | 35,179,916 |
| | | | |
|
|
Utilities – Electric — 1.4% | | | | | |
Alliant Energy Corp. | | 22,000 | | | 629,200 |
American Electric Power Co., Inc.(b) | | 3,900 | | | 133,926 |
CMS Energy Corp.(a) | | 93,100 | | | 972,895 |
Constellation Energy Group, Inc. | | 113,000 | | | 4,939,230 |
Dominion Resources, Inc. | | 86,400 | | | 5,852,736 |
Exelon Corp. | | 131,900 | | | 5,812,833 |
FirstEnergy Corp. | | 36,300 | | | 1,434,213 |
NiSource, Inc.(b) | | 172,500 | | | 3,929,550 |
PPL Corp.(b) | | 78,100 | | | 4,161,168 |
Progress Energy, Inc.(b) | | 119,100 | | | 5,388,084 |
TXU Corp.(b) | | 281,300 | | | 18,160,728 |
Xcel Energy, Inc.(b) | | 189,900 | | | 3,456,180 |
| | | | |
|
|
| | | | | | 54,870,743 |
| | | | |
|
|
TOTAL COMMON STOCKS
(cost $2,441,914,081) | | | | | 2,764,324,098 |
| | | | |
|
|
| | | | | | | | | | |
Interest Rate
| | Maturity Date
| | Moody’s Rating (Unaudited)
| | Principal Amount (000)
| | Value (Note 2)
|
| LONG-TERM BONDS — 21.6% | | | |
Aerospace/Defense — 0.2% | | | |
Boeing Capital Corp., | | | |
Sr. Notes | | | |
| 6.10% | | 03/01/11 | | A3 | | $ | 925 | | $ | 1,008,954 |
Goodrich Corp., | | | |
Notes | | | |
| 7.625% | | 12/15/12 | | Baa3 | | | 970 | | | 1,150,191 |
Lockheed Martin Corp., | | | |
Bonds | | | |
| 8.50% | | 12/01/29 | | Baa2 | | | 120 | | | 164,193 |
Northrop Grumman Corp., | | | |
Notes | | | |
| 7.125% | | 02/15/11(b) | | Baa2 | | | 3,500 | | | 4,016,645 |
Raytheon Co., | | | |
Notes | | | |
| 4.50% | | 11/15/07 | | Baa3 | | | 177 | | | 181,094 |
| 5.50% | | 11/15/12 | | Baa3 | | | 595 | | | 628,202 |
| 6.55% | | 03/15/10 | | Baa3 | | | 870 | | | 957,334 |
| 8.30% | | 03/01/10 | | Baa3 | | | 530 | | | 628,046 |
| | | | | | | | | |
|
|
| | | | | | | | | | | 8,734,659 |
| | | | | | | | | |
|
|
Airlines — 0.1% | | | |
Continental Airlines, Inc., | | | |
Pass-thru Certs. | | | |
| 6.648% | | 09/15/17 | | Baa3 | | | 503 | | | 488,822 |
| 9.558% | | 09/01/19(b) | | Ba2 | | | 925 | | | 931,420 |
Southwest Airlines Co., | | | |
Notes | | | |
| 5.25% | | 10/01/14(b) | | Baa1 | | | 650 | | | 652,388 |
| 6.50% | | 03/01/12 | | Baa1 | | | 1,005 | | | 1,104,505 |
| | | | | | | | | |
|
|
| | | | | | | | | | | 3,177,135 |
| | | | | | | | | |
|
|
Asset Backed Securities — 0.5% | | | |
American Express Credit Account Master Trust, | | | |
Ser. 2004-4, Class C, 144A (cost $1,170,000; purchased 8/6/04)(i) | | | |
| 2.873% | | 03/15/12(g) | | Baa2 | | | 1,170 | | | 1,173,610 |
Ser. 2004-C, Class C | | | |
| 2.902% | | 02/15/12(g) | | Baa2 | | | 1,490 | | | 1,492,183 |
Bank One Issuance Trust, | | | |
Ser. 2003-C1, Class C1 | | | |
| 4.54% | | 09/15/10 | | Baa2 | | | 1,820 | | | 1,846,913 |
Citibank Credit Card Issurance Trust, | | | |
Ser. 2003-C3, Class C3 | | | |
| 4.45% | | 04/07/10 | | Baa2 | | | 1,300 | | | 1,315,303 |
Equity One Abs, Inc., | | | |
Ser. 2004-3, Class M1 | | | |
| 5.70% | | 07/25/34 | | Aa2 | | | 1,280 | | | 1,300,309 |
Household Mortgage Loan Trust, | | | |
Ser. 2003-HC2, Class M | | | |
| 3.01% | | 06/20/33(g) | | Aa2 | | | 1,229 | | | 1,230,587 |
Ser. 2004-HC1, Class M | | | |
| 2.91% | | 02/20/34(g) | | Aa2 | | | 872 | | | 872,623 |
Hyundai Auto Receivables Trust, | | | |
Ser. 2003-A, Class A4 | | | |
| 3.02% | | 10/15/10 | | Aaa | | | 2,000 | | | 1,977,475 |
MBNA Master Credit Card Trust, | | | |
Ser. 1999-J, Cl. A | | | |
| 7.00% | | 02/15/12 | | Aaa | | | 1,830 | | | 2,061,317 |
SEE NOTES TO FINANCIAL STATEMENTS.
B35
| | | | |
| | | FLEXIBLE MANAGED PORTFOLIO (Continued) | | |
SCHEDULE OF INVESTMENTS | December 31, 2004 |
| | | | | | | | | | |
Interest Rate
| | Maturity Date
| | Moody’s Rating (Unaudited)
| | Principal Amount (000)
| | Value (Note 2)
|
| LONG-TERM BONDS (Continued) | | | |
Asset Backed Securities (cont’d.) | | | |
Ser. 2000-E, Cl. A | | | |
| 7.80% | | 10/15/12 | | Aaa | | $ | 2,940 | | $ | 3,462,807 |
Prestige Auto Receivables Trust, | | | |
Ser. 2004-1, Class A2, 144A | | | |
| 3.69% | | 06/15/11(j) | | Aaa | | | 1,730 | | | 1,732,855 |
Residential Asset Mortgage Products, Inc., | | | |
Ser. 2004-RS11, Class MII1 | | | |
| 2.98% | | 12/25/34(g) | | Aa1 | | | 1,400 | | | 1,400,000 |
WFS Financial Owner Trust, | | | |
Ser. 2004-4, Class D | | | |
| 3.58% | | 05/17/12 | | Baa2 | | | 1,440 | | | 1,436,082 |
| | | | | | | | | |
|
|
| | | | | | | | | | | 21,302,064 |
| | | | | | | | | |
|
|
Automotive — 0.3% | | | |
Auburn Hills Trust, | | | |
Debs. | | | |
| 12.375% | | 05/01/20 | | A3 | | | 1,080 | | | 1,693,943 |
DaimlerChrysler NA Holdings Corp., | | | |
Notes | | | |
| 6.50% | | 11/15/13 | | A3 | | | 460 | | | 498,923 |
Equus Cayman Finance Ltd. | | | |
144A, (Cayman Islands), Notes | | | |
| 5.50% | | 09/12/08(j) | | Baa3 | | | 315 | | | 326,575 |
Ford Motor Co., | | | |
Notes | | | |
| 7.45% | | 07/16/31(b) | | Baa1 | | | 2,225 | | | 2,237,767 |
Ford Motor Credit Co., | | | |
Notes | | | |
| 5.70% | | 01/15/10 | | A3 | | | 560 | | | 565,098 |
| 7.00% | | 10/01/13(b) | | A3 | | | 755 | | | 800,399 |
General Motors Acceptance Corp., | | | |
Notes | | | |
| 6.75% | | 12/01/14 | | Baa1 | | | 1,860 | | | 1,862,543 |
Sr. Unsub. Notes | | | |
| 5.85% | | 01/14/09 | | Baa1 | | | 2,800 | | | 2,836,870 |
| 6.125% | | 01/22/08 | | Baa1 | | | 575 | | | 591,864 |
General Motors Corp., | | | |
Notes | | | |
| 7.20% | | 01/15/11(b) | | Baa2 | | | 580 | | | 594,872 |
Hyundai Motor Manufacturing LLC, | | | |
Gtd. Notes, 144A | | | |
| 5.30% | | 12/19/08(j) | | Baa3 | | | 500 | | | 515,121 |
| | | | | | | | | |
|
|
| | | | | | | | | | | 12,523,975 |
| | | | | | | | | |
|
|
Banking — 0.5% | | | |
Bank of America Corp., | | | |
Sr. Notes | | | |
| 5.375% | | 06/15/14 | | Aa2 | | | 2,100 | | | 2,191,507 |
Bank One Corp., | | | |
Sub. Notes | | | |
| 7.875% | | 08/01/10 | | A1 | | | 2,250 | | | 2,624,465 |
Citigroup, Inc., | | | |
Notes | | | |
| 5.625% | | 08/27/12 | | Aa2 | | | 2,800 | | | 2,981,832 |
| 6.00% | | 10/31/33 | | Aa2 | | | 935 | | | 967,623 |
| 6.625% | | 06/15/32 | | Aa2 | | | 515 | | | 576,805 |
Sub. Notes, 144A | | | |
| 5.00% | | 09/15/14(j) | | Aa2 | | | 454 | | | 456,190 |
| | | | | | | | | | |
Interest Rate
| | Maturity Date
| | Moody’s Rating (Unaudited)
| | Principal Amount (000)
| | Value (Note 2)
|
| LONG-TERM BONDS (Continued) | | | |
Banking (cont’d.) | | | |
HBOS PLC (United Kingdom), | | | |
Sub. Notes, 144A | | | |
| 6.00% | | 11/01/33(j) | | Aa3 | | $ | 170 | | $ | 177,061 |
J.P. Morgan Chase & Co., | | | |
Sr. Notes | | | |
| 4.50% | | 11/15/10 | | Aa3 | | | 740 | | | 750,223 |
| 5.25% | | 05/30/07 | | Aa3 | | | 210 | | | 218,315 |
Sub. Notes | | | |
| 6.50% | | 01/15/09 | | A1 | | | 1,100 | | | 1,197,294 |
Mellon Bank NA, | | | |
Sub. Notes | | | |
| 4.75% | | 12/15/14 | | A1 | | | 615 | | | 609,749 |
Mizuho Financial Ltd. | | | |
144A, (Cayman Islands), Bank Gtd. | | | |
Notes | | | |
| 5.79% | | 04/15/14(j) | | A2 | | | 815 | | | 856,075 |
Santander Central Hispano Issuances, | | | |
Bank Gtd. Notes | | | |
| 7.625% | | 09/14/10 | | A1 | | | 695 | | | 809,951 |
Wachovia Bank NA, | | | |
Sub. Notes | | | |
| 7.80% | | 08/18/10 | | Aa3 | | | 2,100 | | | 2,466,370 |
Wachovia Corp., | | | |
Sub. Notes | | | |
| 5.25% | | 08/01/14 | | A1 | | | 155 | | | 158,860 |
Washington Mutual Bank, | | | |
Sub. Notes | | | |
| 5.125% | | 01/15/15 | | A3 | | | 500 | | | 496,603 |
Wells Fargo & Co., | | | |
Sub. Notes | | | |
| 5.125% | | 09/15/16 | | Aa2 | | | 1,060 | | | 1,064,903 |
Wells Fargo Bank, | | | |
Sub. Notes | | | |
| 6.45% | | 02/01/11 | | Aa1 | | | 2,000 | | | 2,224,128 |
| | | | | | | | | |
|
|
| | | | | | | | | | | 20,827,954 |
| | | | | | | | | |
|
|
Brokerage — 0.3% | | | |
Credit Suisse First Boston USA, Inc., | | | |
Notes | | | |
| 4.875% | | 01/15/15 | | Aa3 | | | 1,445 | | | 1,427,094 |
Goldman Sachs Group LP, | | | |
Notes | | | |
| 5.00% | | 10/01/14 | | Aa3 | | | 965 | | | 963,637 |
Lehman Brothers Holdings, Inc., | | | |
Notes | | | |
| 6.625% | | 01/18/12 | | A1 | | | 1,670 | | | 1,867,374 |
Merrill Lynch & Co., Inc., | | | |
Notes | | | |
| 5.00% | | 01/15/15 | | Aa3 | | | 1,375 | | | 1,369,612 |
| 5.45% | | 07/15/14 | | Aa3 | | | 515 | | | 532,779 |
Morgan Stanley, | | | |
Notes | | | |
| 4.00% | | 01/15/10(b) | | Aa3 | | | 1,365 | | | 1,349,494 |
Sub. Notes | | | |
| 4.75% | | 04/01/14 | | A1 | | | 1,170 | | | 1,140,057 |
The Goldman Sachs Group, Inc., | | | |
Sub. Notes | | | |
| 6.345% | | 02/15/34 | | A1 | | | 970 | | | 1,010,065 |
| | | | | | | | | |
|
|
| | | | | | | | | | | 9,660,112 |
| | | | | | | | | |
|
|
SEE NOTES TO FINANCIAL STATEMENTS.
B36
| | | | |
| | | FLEXIBLE MANAGED PORTFOLIO (Continued) | | |
SCHEDULE OF INVESTMENTS | December 31, 2004 |
| | | | | | | | | | |
Interest Rate
| | Maturity Date
| | Moody’s Rating (Unaudited)
| | Principal Amount (000)
| | Value (Note 2)
|
| LONG-TERM BONDS (Continued) | | | |
Building Materials & Construction — 0.1% | | | |
American Standard, Inc., | | | |
Gtd. Notes | | | |
| 7.625% | | 02/15/10 | | Baa3 | | $ | 770 | | $ | 880,324 |
CRH America, Inc., | | | |
Gtd. Notes | | | |
| 6.40% | | 10/15/33 | | Baa1 | | | 500 | | | 546,153 |
D.R. Horton, Inc., | | | |
Sr. Notes | | | |
| 5.625% | | 09/15/14(b) | | Ba1 | | | 1,230 | | | 1,226,925 |
Hanson PLC, | | | |
Sr. Unsub. | | | |
| 7.875% | | 09/27/10 | | Baa1 | | | 800 | | | 929,350 |
The Ryland Group, Inc., | | | |
Sr. Notes | | | | | | | | |
| 5.375% | | 06/01/08 | | Baa3 | | | 440 | | | 457,600 |
| | | | | | | | | |
|
|
| | | | | | | | | | | 4,040,352 |
| | | | | | | | | |
|
|
Cable — 0.2% | | | | | | | | |
Comcast Corp., | | | | | | | | |
Notes | | | | | | | | | | |
| 7.05% | | 03/15/33 | | Baa3 | | | 325 | | | 371,874 |
Continental Cablevision, Inc., | | | |
Sr. Notes | | | | | | | | |
| 8.30% | | 05/15/06 | | Baa3 | | | 4,000 | | | 4,249,236 |
Cox Communications, Inc., | | | |
Class A, Notes, 144A | | | |
| 4.625% | | 01/15/10(j) | | Baa3 | | | 1,220 | | | 1,217,187 |
| 5.45% | | 12/15/14(j) | | Baa3 | | | 660 | | | 659,975 |
Rogers Cablesystems, Inc. | | | |
(Canada), Sr. Notes | | | |
| 10.00% | | 03/15/05 | | Ba3 | | | 1,750 | | | 1,774,062 |
| | | | | | | | | |
|
|
| | | | | | | | | | | 8,272,334 |
| | | | | | | | | |
|
|
Capital Goods — 0.3% | | | |
Caterpillar, Inc., | | | | | | | | |
Debs. | | | | | | | | |
| 7.25% | | 09/15/09 | | A2 | | | 700 | | | 791,909 |
Cooper Cameron Corp., | | | |
Sr. Notes | | | | | | | | |
| 2.65% | | 04/15/07 | | Baa1 | | | 330 | | | 321,362 |
Erac USA Finance Co., | | | |
Notes, 144A | | | | | | | | |
| 6.70% | | 06/01/34(j) | | Baa1 | | | 900 | | | 977,461 |
FedEx Corp., | | | | | | | | |
Notes | | | | | | | | | | |
| 2.65% | | 04/01/07 | | Baa2 | | | 1,600 | | | 1,567,083 |
Honeywell International, Inc., | | | |
Bonds | | | | | | | | | | |
| 6.125% | | 11/01/11 | | A2 | | | 1,095 | | | 1,206,062 |
Hutchison Whampoa International Ltd., | | | |
Gtd. Notes, 144A | | | | | | | | |
| 5.45% | | 11/24/10(j) | | A3 | | | 825 | | | 854,435 |
Roper Industries Bank Loan, | | | |
| 3.72% | | 12/13/09 | | Ba2 | | | 1,350 | | | 1,354,219 |
Tyco International Group SA, | | | |
Gtd. Notes | | | | | | | | |
| 6.00% | | 11/15/13 | | Baa3 | | | 1,265 | | | 1,378,168 |
| | | | | | | | | | |
Interest Rate
| | Maturity Date
| | Moody’s Rating (Unaudited)
| | Principal Amount (000)
| | Value (Note 2)
|
| LONG-TERM BONDS (Continued) | | | |
Capital Goods (cont’d.) | | | |
United Technologies Corp., | | | |
Debs. | | | | | | | | | | |
| 8.875% | | 11/15/19 | | A2 | | $ | 460 | | $ | 625,585 |
Notes | | | | | | | | | | |
| 6.35% | | 03/01/11 | | A2 | | | 825 | | | 919,097 |
Waste Management, Inc., | | | |
Gtd. Notes | | | | | | | | |
| 7.75% | | 05/15/32 | | Baa3 | | | 540 | | | 668,740 |
| | | | | | | | | |
|
|
| | | | | | | | | | | 10,664,121 |
| | | | | | | | | |
|
|
Chemicals — 0.2% | | | | | | | | |
Eastman Chemical Co., | | | |
Notes | | | | | | | | | | |
| 3.25% | | 06/15/08 | | Baa2 | | | 710 | | | 692,919 |
| 7.00% | | 04/15/12(b) | | Baa2 | | | 445 | | | 507,172 |
ICI Wilmington, Inc., | | | |
Gtd. Notes | | | | | | | | |
| 5.625% | | 12/01/13 | | Baa3 | | | 1,470 | | | 1,522,467 |
Lubrizol Corp., | | | | | | | | |
Sr. Notes | | | | | | | | |
| 4.625% | | 10/01/09 | | Baa3 | | | 860 | | | 858,673 |
| 5.50% | | 10/01/14 | | Baa3 | | | 630 | | | 633,713 |
The Dow Chemical Co., | | | |
Notes | | | | | | | | | | |
| 5.75% | | 11/15/09 | | A3 | | | 300 | | | 320,906 |
| 5.97% | | 01/15/09 | | A3 | | | 390 | | | 418,148 |
| 6.00% | | 10/01/12 | | A3 | | | 700 | | | 764,782 |
| 6.125% | | 02/01/11 | | A3 | | | 685 | | | 750,290 |
| | | | | | | | | |
|
|
| | | | | | | | | | | 6,469,070 |
| | | | | | | | | |
|
|
Collateralized Mortgage Obligations — 0.2% | | | |
Countrywide Alternative Loan Trust, | | | |
Ser. 2004-18CB, Class 3A1 | | | |
| 5.25% | | 09/25/19 | | Aaa | | | 2,884 | | | 2,887,212 |
Master Alternative Loans Trust | | | |
| 5.00% | | 04/25/19 | | Aaa | | | 1,824 | | | 1,848,289 |
Structured Adjustable Rate Mortgage Loan | | | |
| 4.17% | | 02/25/34(g) | | Aaa | | | 2,781 | | | 2,791,178 |
Washington Mutual, Inc. | | | |
| 4.38% | | 12/25/32(g) | | Aaa | | | 1,113 | | | 1,118,869 |
| 5.502% | | 04/26/32(g) | | Aaa | | | 625 | | | 624,839 |
| | | | | | | | | |
|
|
| | | | | | | | | | | 9,270,387 |
| | | | | | | | | |
|
|
Commercial Mortgage Backed Securities — 1.7% |
Bank of America Commercial Mortgage, Inc. | | | |
| 4.153% | | 11/10/38 | | Aaa | | | 2,800 | | | 2,757,380 |
| 4.873% | | 03/11/41 | | AAA(e) | | | 2,500 | | | 2,555,371 |
Commercial Mortgage Pass-Through Certificate | | | |
144A | | | | | | | | | | |
| 1.117% | | 03/10/39(j) | | Aaa | | | 14,519 | | | 619,105 |
CS First Boston Mortgage Securities Corp., | | | |
Ser. 2004-C3, Class A4 | | | |
| 4.835% | | 07/15/36 | | Aaa | | | 4,280 | | | 4,347,314 |
Ser. 2004-C4, Class A4 | | | |
| 4.283% | | 10/15/39 | | Aaa | | | 1,400 | | | 1,387,265 |
DLJ Commercial Mortgage Corp., | | | |
Ser. 2000-CF1, Class A1B | | | |
| 7.62% | | 06/10/33 | | AAA(e) | | | 2,710 | | | 3,106,719 |
SEE NOTES TO FINANCIAL STATEMENTS.
B37
| | | | |
| | | FLEXIBLE MANAGED PORTFOLIO (Continued) | | |
SCHEDULE OF INVESTMENTS | December 31, 2004 |
| | | | | | | | | | |
Interest Rate
| | Maturity Date
| | Moody’s Rating (Unaudited)
| | Principal Amount (000)
| | Value (Note 2)
|
| LONG-TERM BONDS (Continued) | | | |
Commercial Mortgage Backed Securities (cont’d.) |
General Electric Capital Commercial Mortgage Corp. |
| 0.704% | | 03/10/40(g) | | Aaa | | $ | 26,400 | | $ | 776,020 |
Greenwich Capital Commercial Funding Corp. | | | |
| 4.022% | | 01/05/36 | | Aaa | | | 5,000 | | | 4,992,468 |
| 4.111% | | 07/05/35 | | Aaa | | | 7,700 | | | 7,430,189 |
| 4.533% | | 01/05/36 | | Aaa | | | 2,750 | | | 2,769,439 |
J.P. Morgan Commercial Mortgage Finance Corp. | | | |
| 5.255% | | 07/12/37 | | Aaa | | | 2,100 | | | 2,184,792 |
| 7.371% | | 08/15/32 | | Aaa | | | 8,250 | | | 9,360,498 |
KeyCorp | | | | | | | | | | |
| 7.727% | | 05/17/32 | | Aaa | | | 9,000 | | | 10,308,321 |
LB-UBS Commercial Mortgage Trust | | | |
| 4.826% | | 08/15/29(g) | | AAA(e) | | | 3,910 | | | 3,961,913 |
| 4.83% | | 11/15/27 | | Aaa | | | 1,460 | | | 1,488,790 |
LB-UBS Commercial Mortgage Trust, | | | |
Ser. 2004-C8, Class A6 | | | |
| 4.799% | | 12/15/29(g) | | Aaa | | | 4,260 | | | 4,258,278 |
Merrill Lynch Mortgage Trust, | | | |
Sr. 2004-KEY2, Class A3 | | | |
| 4.615% | | 08/12/39 | | Aaa | | | 2,000 | | | 1,999,753 |
PNC Mortgage Acceptance Corp. | | | |
| 7.33% | | 12/10/32 | | AAA(e) | | | 2,100 | | | 2,373,591 |
| | | | | | | | | |
|
|
| | | | | | | | | | | 66,677,206 |
| | | | | | | | | |
|
|
Consumer — 0.1% | | | |
Cendant Corp., | | | |
Notes | | | | | | | | | | |
| 6.875% | | 08/15/06 | | Baa1 | | | 1,320 | | | 1,388,726 |
Sr. Notes | | | |
| 6.25% | | 01/15/08 | | Baa1 | | | 885 | | | 944,488 |
| 7.375% | | 01/15/13 | | Baa1 | | | 1,065 | | | 1,232,027 |
The Clorox Co. | | | |
Notes, 144A | | | | | | | | |
| 5.00% | | 01/15/15(j) | | A3 | | | 1,530 | | | 1,556,368 |
| | | | | | | | | |
|
|
| | | | | | | | | | | 5,121,609 |
| | | | | | | | | |
|
|
Electric — 0.7% | | | | | | | | |
Arizona Public Service Co., | | | |
Notes | | | | | | | | | | |
| 7.625% | | 08/01/05 | | Baa1 | | | 5,000 | | | 5,129,970 |
Boston Edison Co., | | | |
Debs. | | | |
| 4.875% | | 04/15/14 | | A1 | | | 565 | | | 572,454 |
CenterPoint Energy Houston Electric LLC, | | | |
Mtge. Bonds, Ser. J2 | | | |
| 5.70% | | 03/15/13 | | Baa2 | | | 740 | | | 784,266 |
Mtge. Bonds, Ser. K2 | | | |
| 6.95% | | 03/15/33 | | Baa2 | | | 590 | | | 691,488 |
Consolidated Edison Co. of NY, | | | |
Debs. | | | | | | | | |
| 5.70% | | 02/01/34 | | A1 | | | 425 | | | 436,367 |
Consumers Energy Co., | | | |
First Mtge. Bonds, Ser. B | | | |
| 5.375% | | 04/15/13 | | Baa3 | | | 325 | | | 336,113 |
Dominion Resources, Inc., | | | |
Sr. Notes | | | |
| 5.125% | | 12/15/09 | | Baa1 | | | 970 | | | 1,003,663 |
| | | | | | | | | | |
Interest Rate
| | Maturity Date
| | Moody’s Rating (Unaudited)
| | Principal Amount (000)
| | Value (Note 2)
|
| LONG-TERM BONDS (Continued) | | | |
Electric (cont’d.) |
Duke Capital LLC, | | | |
Sr. Notes | | | |
| 4.331% | | 11/16/06 | | Baa3 | | $ | 700 | | $ | 708,781 |
| 6.25% | | 02/15/13 | | Baa3 | | | 235 | | | 253,984 |
| 8.00% | | 10/01/19 | | Baa3 | | | 215 | | | 262,373 |
Energy East Corp., | | | |
Notes | | | |
| 6.75% | | 09/15/33 | | Baa2 | | | 630 | | | 706,038 |
FirstEnergy Corp., | | | |
Notes | | | |
| 7.375% | | 11/15/31 | | Baa3 | | | 735 | | | 839,358 |
Florida Power & Light Co., | | | |
| 5.95% | | 10/01/33 | | Aa3 | | | 610 | | | 653,597 |
Indiana Michigan Power Co., | | | |
Sr. Notes | | | |
| 5.05% | | 11/15/14 | | Baa2 | | | 460 | | | 459,723 |
National Rural Utilities Cooperative Finance Corp., | | | |
Notes | | | |
| 7.25% | | 03/01/12 | | A2 | | | 715 | | | 825,257 |
NiSource Finance Corp., | | | |
Gtd. Notes | | | |
| 7.625% | | 11/15/05 | | Baa3 | | | 600 | | | 621,857 |
Oncor Electric Delivery Co., | | | |
Debs. | | | |
| 6.375% | | 01/15/15 | | Baa1 | | | 345 | | | 380,131 |
| 7.00% | | 09/01/22 | | Baa2 | | | 475 | | | 541,743 |
| 7.25% | | 01/15/33 | | Baa1 | | | 250 | | | 296,997 |
Pacific Gas & Electric Co., | | | | | | |
First Mtge. | | | | | | |
| 6.05% | | 03/01/34 | | Baa2 | | | 1,930 | | | 2,004,529 |
PacifiCorp, | | | | | | | | |
First Mtge. | | | | | | |
| 5.45% | | 09/15/13 | | A3 | | | 300 | | | 313,988 |
Pepco Holdings, Inc., | | | | | | |
Notes | | | | | | | | | | |
| 5.50% | | 08/15/07 | | Baa2 | | | 565 | | | 587,553 |
PPL Electric Utilities, | | | | | | |
Second Mtge. | | | | | | | | |
| 6.25% | | 08/15/09 | | Baa1 | | | 1,500 | | | 1,630,426 |
Progress Energy, Inc., | | | | | | |
Sr. Notes | | | | | | |
| 6.75% | | 03/01/06 | | Baa2 | | | 1,410 | | | 1,463,095 |
Southern California Edison Co., | | | | | | |
First Mtge. | | | | | | |
| 4.65% | | 04/01/15 | | A3 | | | 470 | | | 461,077 |
| 5.75% | | 04/01/35 | | A3 | | | 250 | | | 256,372 |
| 8.00% | | 02/15/07 | | A3 | | | 1,395 | | | 1,519,128 |
TXU Corp., | | | | | | |
Notes, 144A | | | | | | | | |
| 6.50% | | 11/15/24(j) | | Ba1 | | | 1,415 | | | 1,417,362 |
Westar Energy, Inc., | | | | | | |
First Mtge. | | | | | | |
| 6.00% | | 07/01/14 | | Ba1 | | | 550 | | | 591,279 |
Xcel Energy, Inc., | | | | | | | | |
Sr. Notes | | | | | | | | |
| 3.40% | | 07/01/08 | | Baa1 | | | 605 | | | 593,151 |
| 7.00% | | 12/01/10 | | Baa1 | | | 190 | | | 214,174 |
| | | | | | | | | |
|
|
| | | | | | | | | | | 26,556,294 |
| | | | | | | | | |
|
|
SEE NOTES TO FINANCIAL STATEMENTS.
B38
| | | | |
| | | FLEXIBLE MANAGED PORTFOLIO (Continued) | | |
SCHEDULE OF INVESTMENTS | December 31, 2004 |
| | | | | | | | | | |
Interest Rate
| | Maturity Date
| | Moody’s Rating (Unaudited)
| | Principal Amount (000)
| | Value (Note 2)
|
| LONG-TERM BONDS (Continued) | | | |
Energy – Integrated — 0.1% | | | | | | |
Conoco, Inc., | | | | | | | | |
Sr. Notes | | | | | | | | |
| 6.95% | | 04/15/29 | | A3 | | $ | 570 | | $ | 673,087 |
ConocoPhillips, | | | | | | | | | | |
Notes | | | | | | | | | | |
| 8.75% | | 05/25/10 | | A3 | | | 1,505 | | | 1,836,662 |
Marathon Oil Corp., | | | | | | | | |
Notes | | | | | | | | | | |
| 6.125% | | 03/15/12 | | Baa1 | | | 765 | | | 833,569 |
Suncor Energy, Inc., | | | | | | | | |
Bonds | | | | | | | | | | |
| 5.95% | | 12/01/34(b) | | A3 | | | 445 | | | 466,520 |
| | | | | | | | | |
|
|
| | | | | | | | | | | 3,809,838 |
| | | | | | | | | |
|
|
Energy – Other — 0.5% | | | | | | |
B.J. Services Co., | | | | | | | | |
Sr. Notes | | | | | | | | |
| 7.00% | | 02/01/06 | | Baa2 | | | 4,000 | | | 4,131,956 |
Chesapeake Energy Corp., | | | | | | |
Gtd. Notes | | | | | | | | |
| 8.125% | | 04/01/11 | | Ba3 | | | 1 | | | 618 |
Devon Energy Corp., | | | | | | |
Sr. Notes | | | | | | | | |
| 2.75% | | 08/01/06(d) | | Baa2 | | | 2,390 | | | 2,361,994 |
Devon Financing Corp., | | | | | | |
Gtd. Notes | | | | | | | | |
| 6.875% | | 09/30/11 | | Baa2 | | | 195 | | | 220,849 |
EnCana Corp. (Canada), | | | | | | |
Bonds | | | | | | | | | | |
| 6.50% | | 08/15/34 | | Baa2 | | | 840 | | | 922,154 |
Halliburton Co., | | | | | | | | |
Notes | | | | | | | | | | |
| 5.50% | | 10/15/10 | | Baa2 | | | 150 | | | 157,992 |
Kerr-McGee Corp., | | | | | | | | |
Gtd. Notes | | | | | | | | |
| 5.875% | | 09/15/06 | | Baa3 | | | 930 | | | 964,869 |
| 6.875% | | 09/15/11 | | Baa3 | | | 460 | | | 517,995 |
| 6.95% | | 07/01/24 | | Baa3 | | | 400 | | | 442,334 |
Occidental Petroleum Corp., | | | | | | |
Sr. Notes | | | | | | | | |
| 6.75% | | 01/15/12(b) | | Baa1 | | | 735 | | | 834,351 |
| 7.65% | | 02/15/06 | | Baa1 | | | 2,800 | | | 2,931,185 |
Parker & Parsley Petroleum Co., | | | |
Sr. Notes | | | | | | | | |
| 8.875% | | 04/15/05 | | Baa3 | | | 2,725 | | | 2,766,899 |
Pioneer Natural Resources Co., | | | |
Sr. Notes | | | | | | | | |
| 5.875% | | 07/15/16 | | Baa3 | | | 340 | | | 355,202 |
Precision Drilling Corp. (Canada), | | | |
Notes | | | | | | | | | | |
| 5.625% | | 06/01/14 | | Baa2 | | | 390 | | | 406,102 |
Transocean, Inc., | | | | | | | | |
Notes | | | | | | | | | | |
| 7.50% | | 04/15/31 | | Baa2 | | | 145 | | | 178,474 |
Union Oil Co., | | | | | | | | |
Gtd. Notes | | | | | | | | |
| 7.35% | | 06/15/09 | | Baa2 | | | 650 | | | 733,943 |
| | | | | | | | | | |
Interest Rate
| | Maturity Date
| | Moody’s Rating (Unaudited)
| | Principal Amount (000)
| | Value (Note 2)
|
| LONG-TERM BONDS (Continued) | | | |
Energy – Other (cont’d.) | | | | | | |
Valero Energy Corp., | | | | | | |
Notes | | | | | | | | | | |
| 6.875% | | 04/15/12 | | Baa3 | | $ | 315 | | $ | 357,287 |
| 7.50% | | 04/15/32 | | Baa3 | | | 645 | | | 777,987 |
Woodside Petroleum Ltd., | | | | | | |
Notes, 144A | | | | | | | | |
| 5.00% | | 11/15/13(j) | | Baa1 | | | 1,400 | | | 1,416,026 |
| | | | | | | | | |
|
|
| | | | | | | | | | | 20,478,217 |
| | | | | | | | | |
|
|
Foods — 0.6% | | | |
Albertson’s, Inc., | | | |
Debs. | | | |
| 8.00% | | 05/01/31 | | Baa2 | | | 700 | | | 874,175 |
Archer-Daniels-Midland Co., | | | |
Debs. | | | |
| 8.125% | | 06/01/12 | | A2 | | | 300 | | | 369,898 |
Bunge Ltd. Finance Corp., | | | |
Notes | | | |
| 5.875% | | 05/15/13 | | Baa3 | | | 920 | | | 976,654 |
Cadbury Schweppes US Finance, | | | |
Notes, 144A | | | |
| 3.875% | | 10/01/08(j) | | Baa2 | | | 810 | | | 807,162 |
Cargill, Inc., | | | |
Notes, 144A | | | |
| 3.625% | | 03/04/09(j) | | A2 | | | 1,875 | | | 1,847,513 |
ConAgra Foods, Inc., | | | |
Notes | | | |
| 7.875% | | 09/15/10 | | Baa1 | | | 650 | | | 763,584 |
General Mills, Inc., | | | |
Notes | | | |
| 5.125% | | 02/15/07 | | Baa2 | | | 350 | | | 359,351 |
Kellogg Co., | | | |
Notes | | | |
| 6.60% | | 04/01/11 | | Baa1 | | | 1,875 | | | 2,100,420 |
Kraft Foods, Inc., | | | |
Notes | | | |
| 4.625% | | 11/01/06 | | A3 | | | 2,700 | | | 2,755,669 |
| 5.25% | | 06/01/07 | | A3 | | | 300 | | | 310,763 |
| 5.625% | | 11/01/11 | | A3 | | | 2,400 | | | 2,541,461 |
Miller Brewing Co., | | | |
Notes, 144A | | | |
| 5.50% | | 08/15/13(j) | | Baa1 | | | 655 | | | 684,636 |
Safeway, Inc., | | | |
Notes | | | |
| 2.50% | | 11/01/05 | | Baa2 | | | 1,400 | | | 1,392,086 |
| 4.95% | | 08/16/10(b) | | Baa2 | | | 1,375 | | | 1,399,693 |
Tate & Lyle International Finance PLC
(United Kingdom) | | | |
Notes, 144A | | | |
| 5.00% | | 11/15/14(j) | | Baa2 | | | 2,040 | | | 2,020,012 |
The Kroger Co., | | | |
Gtd. Notes | | | |
| 6.75% | | 04/15/12 | | Baa2 | | | 1,830 | | | 2,066,185 |
| 6.80% | | 04/01/11 | | Baa2 | | | 670 | | | 755,068 |
Tyson Foods, Inc., | | | |
Notes | | | |
| 6.625% | | 10/17/05 | | Baa3 | | | 375 | | | 383,786 |
SEE NOTES TO FINANCIAL STATEMENTS.
B39
| | | | |
| | | FLEXIBLE MANAGED PORTFOLIO (Continued) | | |
SCHEDULE OF INVESTMENTS | December 31, 2004 |
| | | | | | | | | | |
Interest Rate
| | Maturity Date
| | Moody’s Rating (Unaudited)
| | Principal Amount (000)
| | Value (Note 2)
|
| LONG-TERM BONDS (Continued) | | | |
Foods (cont’d.) | | | |
| 7.25% | | 10/01/06 | | Baa3 | | $ | 405 | | $ | 429,386 |
| 8.25% | | 10/01/11 | | Baa3 | | | 95 | | | 112,808 |
Yum! Brands, Inc., | | | |
Sr. Notes | | | |
| 8.875% | | 04/15/11 | | Baa3 | | | 365 | | | 450,964 |
| | | | | | | | | |
|
|
| | | | | | | | | | | 23,401,274 |
| | | | | | | | | |
|
|
Foreign Agencies — 0.1% | | | |
Korea Development Bank, | | | |
Notes | | | |
| 4.75% | | 07/20/09 | | A3 | | | 1,180 | | | 1,202,308 |
The Export-Import Bank of Korea, | | | |
Notes, 144A | | | |
| 4.125% | | 02/10/09(j) | | A3 | | | 860 | | | 857,663 |
| | | | | | | | | |
|
|
| | | | | | | | | | | 2,059,971 |
| | | | | | | | | |
|
|
Gaming | | | |
Harrah’s Casinos Co., Inc., | | | |
Gtd. Notes | | | |
| 7.875% | | 12/15/05 | | Ba1 | | | 975 | | | 1,014,000 |
Harrah’s Operating Co., Inc., | | | |
Gtd. Notes | | | |
| 5.50% | | 07/01/10 | | Baa3 | | | 625 | | | 646,953 |
| | | | | | | | | |
|
|
| | | | | | | | | | | 1,660,953 |
| | | | | | | | | |
|
|
Health Care & Pharmaceutical — 0.2% | | | |
Bristol-Myers Squibb Co., | | | |
Notes | | | |
| 5.75% | | 10/01/11 | | A1 | | | 555 | | | 594,392 |
Glaxosmithkline Capital, Inc., | | | |
Gtd. Notes | | | |
| 4.375% | | 04/15/14 | | Aa2 | | | 255 | | | 248,438 |
Hospira, Inc., | | | |
Notes | | | |
| 5.90% | | 06/15/14 | | Baa3 | | | 755 | | | 793,435 |
Merck & Co., Inc., | | | |
Debs. | | | |
| 5.95% | | 12/01/28 | | Aa2 | | | 165 | | | 170,776 |
Pharmacia Corp., | | | |
Debs. | | | |
| 6.50% | | 12/01/18 | | Aaa | | | 1,550 | | | 1,760,808 |
| 6.75% | | 12/15/27 | | Aaa | | | 915 | | | 1,064,339 |
WellPoint, Inc., | | | |
Bonds, 144A | | | |
| 5.95% | | 12/15/34(j) | | Baa1 | | | 785 | | | 792,643 |
Notes | | | |
| 3.50% | | 09/01/07 | | Baa1 | | | 1,560 | | | 1,551,350 |
Notes, 144A | | | |
| 5.00% | | 12/15/14(j) | | Baa1 | | | 860 | | | 857,292 |
Wyeth, | | | | | | | | |
Notes | | | | | | | | | | |
| 6.45% | | 02/01/24 | | Baa1 | | | 475 | | | 505,206 |
| | | | | | | | | |
|
|
| | | | | | | | | | | 8,338,679 |
| | | | | | | | | |
|
|
Insurance — 0.1% | | | | | | | | |
Axa (France), | | | | | | | | |
Sub. Notes | | | | | | | | |
| 8.60% | | 12/15/30 | | A3 | | | 155 | | | 203,566 |
| | | | | | | | | | |
Interest Rate
| | Maturity Date
| | Moody’s Rating (Unaudited)
| | Principal Amount (000)
| | Value (Note 2)
|
| LONG-TERM BONDS (Continued) | | | |
Insurance (cont’d.) | | | | | | |
Everest Reinsurance Holdings | | | | | | |
(Bermuda), Notes | | | | | | |
| 5.40% | | 10/15/14 | | A3 | | $ | 615 | | $ | 616,683 |
Marsh & McLennan Cos., Inc., | | | | | | |
Notes | | | | | | | | | | |
| 5.375% | | 07/15/14 | | Baa2 | | | 230 | | | 224,725 |
MetLife, Inc., | | | | | | | | |
Notes | | | | | | | | | | |
| 6.125% | | 12/01/11 | | A2 | | | 335 | | | 364,070 |
Sr. Notes | | | | | | | | |
| 6.375% | | 06/15/34 | | A2 | | | 745 | | | 800,283 |
Phoenix Life Insurance Co., | | | | | | |
Notes, 144A | | | | | | | | |
| 7.15% | | 12/15/34(j) | | Baa2 | | | 430 | | | 428,918 |
The Hartford Financial Services Group, Inc., | | | |
Sr. Notes | | | | | | | | |
| 4.75% | | 03/01/14 | | A3 | | | 500 | | | 487,199 |
W. R. Berkley Corp., | | | | | | |
Sr. Notes | | | | | | | | |
| 6.15% | | 08/15/19 | | Baa2 | | | 460 | | | 462,356 |
XL Capital Ltd., | | | | | | |
Sr. Notes | | | | | | | | |
| 5.25% | | 09/15/14 | | A2 | | | 85 | | | 85,183 |
| | | | | | | | | |
|
|
| | | | | | | | | | | 3,672,983 |
| | | | | | | | | |
|
|
Lodging — 0.2% | | | | | | |
Carnival Corp., | | | | | | | | |
Gtd. Notes | | | | | | | | |
| 3.75% | | 11/15/07 | | A3 | | | 2,205 | | | 2,207,597 |
Carnival PLC, | | | | | | | | |
Gtd. Notes | | | | | | | | |
| 7.30% | | 06/01/07 | | A3 | | | 260 | | | 280,433 |
Hilton Hotels Corp., | | | | | | |
Notes | | | | | | | | | | |
| 7.625% | | 12/01/12 | | Baa3 | | | 650 | | | 760,126 |
Host Marriott LP, | | | | | | |
Sr. Notes, 144A | | | | | | | | |
| 7.00% | | 08/15/12(j) | | Ba3 | | | 1,150 | | | 1,216,125 |
La Quinta Inns, Inc., | | | | | | |
Sr. Notes | | | | | | | | |
| 7.40% | | 09/15/05 | | Ba3 | | | 1,700 | | | 1,729,750 |
| | | | | | | | | |
|
|
| | | | | | | | | | | 6,194,031 |
| | | | | | | | | |
|
|
Media & Entertainment — 0.3% | | | |
British Sky Broadcasting Group PLC (United Kingdom), |
Gtd. Notes | | | | | | | | |
| 7.30% | | 10/15/06 | | Baa2 | | | 660 | | | 701,121 |
Clear Channel Communications, Inc., | | | |
Sr. Notes | | | | | | | | |
| 4.40% | | 05/15/11 | | Baa3 | | | 910 | | | 883,550 |
| 7.65% | | 09/15/10 | | Baa3 | | | 450 | | | 512,019 |
| 8.00% | | 11/01/08 | | Baa3 | | | 575 | | | 645,601 |
News America Holdings, Inc., | | | | | | |
Gtd. Notes | | | | | | | | |
| 8.50% | | 02/15/05 | | Baa3 | | | 1,350 | | | 1,357,038 |
News America, Inc., | | | | | | |
Gtd. Notes | | | | | | | | |
| 7.625% | | 11/30/28 | | Baa3 | | | 1,050 | | | 1,246,856 |
SEE NOTES TO FINANCIAL STATEMENTS.
B40
| | | | |
| | | FLEXIBLE MANAGED PORTFOLIO (Continued) | | |
SCHEDULE OF INVESTMENTS | December 31, 2004 |
| | | | | | | | | | |
Interest Rate
| | Maturity Date
| | Moody’s Rating (Unaudited)
| | Principal Amount (000)
| | Value (Note 2)
|
| LONG-TERM BONDS (Continued) | | | |
Media & Entertainment (cont.d) | | | |
Notes, 144A | | | | | | | | |
| 5.30% | | 12/15/14(b)(j) | | Baa3 | | $ | 1,380 | | $ | 1,396,283 |
Time Warner Cos., Inc., | | | | | | |
Debs. | | | | | | | | | | |
| 7.25% | | 10/15/17 | | Baa1 | | | 790 | | | 919,807 |
Time Warner, Inc., | | | | | | |
Gtd. Notes | | | | | | | | |
| 7.70% | | 05/01/32 | | Baa1 | | | 1,100 | | | 1,345,430 |
Viacom, Inc., | | | | | | |
Gtd. Notes | | | | | | | | |
| 7.875% | | 07/30/30 | | A3 | | | 375 | | | 481,637 |
Walt Disney Co., | | | | | | |
Sr. Notes | | | | | | | | |
| 5.375% | | 06/01/07 | | Baa1 | | | 225 | | | 233,889 |
| 6.75% | | 03/30/06 | | Baa1 | | | 1,016 | | | 1,058,585 |
| | | | | | | | | |
|
|
| | | | | | | | | | | 10,781,816 |
| | | | | | | | | |
|
|
Metals | | | | | | |
Alcan, Inc., | | | | | | |
Notes | | | | | | | | | | |
| 5.20% | | 01/15/14 | | Baa1 | | | 390 | | | 400,163 |
| 6.125% | | 12/15/33 | | Baa1 | | | 900 | | | 952,548 |
| | | | | | | | | |
|
|
| | | | | | | | | | | 1,352,711 |
| | | | | | | | | |
|
|
Municipals — 0.1% | | | | | | |
Illinois St., Taxable Pension, G.O. | | | |
| 5.10% | | 06/01/33 | | Aa3 | | | 4,880 | | | 4,711,591 |
| | | | | | | | | |
|
|
Non Captive Finance — 0.3% | | | |
Capital One Bank Corp., | | | |
Notes | | | | | | | | | | |
| 6.50% | | 06/13/13 | | Baa3 | | | 20 | | | 21,854 |
| 6.875% | | 02/01/06 | | Baa2 | | | 1,540 | | | 1,597,565 |
CIT Group, Inc., | | | |
Sr. Notes | | | |
| 5.50% | | 11/30/07 | | A2 | | | 990 | | | 1,036,353 |
General Electric Capital Corp., | | | |
Notes | | | | | | | | | | |
| 4.75% | | 09/15/14 | | Aaa | | | 205 | | | 204,338 |
| 5.875% | | 02/15/12 | | Aaa | | | 160 | | | 173,123 |
| 6.125% | | 02/22/11 | | Aaa | | | 3,230 | | | 3,538,110 |
| 6.75% | | 03/15/32 | | Aaa | | | 2,100 | | | 2,457,945 |
Household Finance Corp., | | | |
Notes | | | | | | | | | | |
| 4.75% | | 05/15/09 | | A1 | | | 640 | | | 656,273 |
| 6.375% | | 11/27/12 | | A1 | | | 155 | | | 171,257 |
| 7.00% | | 05/15/12 | | A1 | | | 1,300 | | | 1,484,570 |
HSBC Finance Corp., | | | |
Notes | | | | | | | | | | |
| 6.75% | | 05/15/11 | | A1 | | | 430 | | | 482,555 |
International Lease Finance Corp., | | | |
Notes | | | | | | | | | | |
| 3.50% | | 04/01/09 | | A1 | | | 580 | | | 564,759 |
| | | | | | | | | |
|
|
| | | | | | | | | | | 12,388,702 |
| | | | | | | | | |
|
|
Non-Corporate — 0.2% | | | |
Pemex Project Funding Master Trust, | | | |
Gtd. Notes | | | | | | | | |
| 9.50% | | 09/15/27 | | NR | | | 2,200 | | | 2,772,000 |
| | | | | | | | | | |
Interest Rate
| | Maturity Date
| | Moody’s Rating (Unaudited)
| | Principal Amount (000)
| | Value (Note 2)
|
| LONG-TERM BONDS (Continued) | | | |
Non-Corporate (cont’d.) | | | |
Notes | | | | | | | | | | |
| 7.875% | | 02/01/09 | | Baa1 | | $ | 1,750 | | $ | 1,966,125 |
| 8.50% | | 02/15/08 | | Baa1 | | | 1,430 | | | 1,612,325 |
| | | | | | | | | |
|
|
| | | | | | | | | | | 6,350,450 |
| | | | | | | | | |
|
|
Paper — 0.1% | | | |
Georgia-Pacific Corp., | | | |
Notes | | | | | | | | | | |
| 8.875% | | 05/15/31 | | Ba3 | | | 550 | | | 687,500 |
International Paper Co., | | | |
Notes | | | | | | | | | | |
| 5.25% | | 04/01/16(b) | | Baa2 | | | 480 | | | 479,153 |
MeadWestvaco Corp., | | | |
Gtd. Notes | | | |
| 6.80% | | 11/15/32 | | Baa2 | | | 120 | | | 131,176 |
Notes | | | | | | | | | | |
| 2.75% | | 12/01/05 | | Baa2 | | | 1,010 | | | 1,006,770 |
Weyerhaeuser Co., | | | |
Notes | | | | | | | | | | |
| 5.50% | | 03/15/05 | | Baa2 | | | 198 | | | 198,911 |
| 7.375% | | 03/15/32 | | Baa2 | | | 345 | | | 409,117 |
| | | | | | | | | |
|
|
| | | | | | | | | | | 2,912,627 |
| | | | | | | | | |
|
|
Pipelines & Other — 0.1% | | | |
Atmos Energy Corp., | | | |
Notes | | | | | | | | | | |
| 4.00% | | 10/15/09 | | Baa3 | | | 1,270 | | | 1,255,416 |
Enterprise Products Operating LP, | | | |
Sr. Gtd. Notes | | | |
| 6.375% | | 02/01/13 | | Baa3 | | | 720 | | | 771,715 |
Sr. Notes, 144A | | | |
| 4.00% | | 10/15/07(j) | | Baa3 | | | 780 | | | 778,096 |
Magellan Midstream Partners LP, | | | |
Unsub. Notes | | | |
| 5.65% | | 10/15/16 | | Ba1 | | | 610 | | | 616,742 |
| | | | | | | | | |
|
|
| | | | | | | | | | | 3,421,969 |
| | | | | | | | | |
|
|
Railroads — 0.1% | | | |
Norfolk Southern Corp., | | | |
Bonds | | | | | | | | | | |
| 7.80% | | 05/15/27 | | Baa1 | | | 495 | | | 620,008 |
Union Pacific Corp., | | | |
Notes | | | | | | | | | | |
| 6.625% | | 02/01/08 | | Baa2 | | | 1,390 | | | 1,510,157 |
| | | | | | | | | |
|
|
| | | | | | | | | | | 2,130,165 |
| | | | | | | | | |
|
|
Real Estate Investment Trust — 0.2% | | | |
ERP Operating LP, | | | |
Notes | | | | | | | | | | |
| 6.63% | | 04/13/15 | | Baa1 | | | 1,650 | | | 1,666,779 |
Simon Debartolo Group, Inc., | | | |
Notes | | | | | | | | | | |
| 6.75% | | 06/15/05 | | Baa2 | | | 5,000 | | | 5,079,455 |
| | | | | | | | | |
|
|
| | | | | | | | | | | 6,746,234 |
| | | | | | | | | |
|
|
Retailers — 0.1% | | | |
CVS Corp., | | | |
Notes | | | | | | | | | | |
| 4.875% | | 09/15/14 | | A3 | | | 650 | | | 650,203 |
SEE NOTES TO FINANCIAL STATEMENTS.
B41
| | | | |
| | | FLEXIBLE MANAGED PORTFOLIO (Continued) | | |
SCHEDULE OF INVESTMENTS | December 31, 2004 |
| | | | | | | | | | |
Interest Rate
| | Maturity Date
| | Moody’s Rating (Unaudited)
| | Principal Amount (000)
| | Value (Note 2)
|
| LONG-TERM BONDS (Continued) | | | |
Retailers (cont’d.) | | | |
May Department Stores Co., | | | |
Gtd. Notes | | | |
| 8.50% | | 06/01/19 | | Baa2 | | $ | 435 | | $ | 535,187 |
Target Corp., | | | |
Notes | | | | | | | | | | |
| 5.95% | | 05/15/06 | | A2 | | | 1,000 | | | 1,037,345 |
| 7.50% | | 07/15/06 | | A2 | | | 1,150 | | | 1,220,715 |
| | | | | | | | | |
|
|
| | | | | | | | | | | 3,443,450 |
| | | | | | | | | |
|
|
Technology — 0.2% | | | | | | |
Computer Associates International, Inc., | | | |
Sr. Notes | | | |
| 6.375% | | 04/15/05 | | Ba1 | | | 575 | | | 580,272 |
Sr. Notes, 144A | | | | | | | | |
| 4.75% | | 12/01/09(j) | | Ba1 | | | 1,175 | | | 1,183,597 |
Computer Sciences Corp., | | | |
Notes | | | | | | | | | | |
| 6.75% | | 06/15/06 | | A3 | | | 290 | | | 303,645 |
Equifax, Inc., | | | |
Notes | | | | | | | | | | |
| 4.95% | | 11/01/07 | | Baa1 | | | 320 | | | 330,975 |
First Data Corp., | | | | | | |
Notes | | | | | | | | | | |
| 4.85% | | 10/01/14 | | A1 | | | 1,885 | | | 1,892,455 |
Hewlett-Packard Co., | | | |
Notes | | | | | | | | | | |
| 7.15% | | 06/15/05 | | A3 | | | 240 | | | 244,568 |
International Business Machines Corp., | | | |
Debs. | | | | | | | | | | |
| 5.875% | | 11/29/32(b) | | A1 | | | 1,150 | | | 1,216,177 |
Jabil Circuit, Inc., | | | |
St. Notes | | | | | | | | |
| 5.875% | | 07/15/10(b) | | Baa3 | | | 770 | | | 810,519 |
Motorola, Inc., | | | |
Notes | | | | | | | | | | |
| 4.608% | | 11/16/07 | | Baa3 | | | 950 | | | 968,751 |
| 7.625% | | 11/15/10 | | Baa3 | | | 750 | | | 869,972 |
SunGard Data Systems, Inc., | | | |
Bonds | | | | | | | | | | |
| 4.875% | | 01/15/14 | | Baa2 | | | 370 | | | 359,604 |
Notes | | | | | | | | | | |
| 3.75% | | 01/15/09 | | Baa2 | | | 700 | | | 679,858 |
| | | | | | | | | |
|
|
| | | | | | | | | | | 9,440,393 |
| | | | | | | | | |
|
|
Telecommunications — 0.9% | | | |
AT&T Wireless Services, Inc., | | | |
Notes | | | | | | | | | | |
| 8.125% | | 05/01/12 | | Baa2 | | | 640 | | | 773,660 |
Sr. Notes | | | | | | | | |
| 7.35% | | 03/01/06 | | Baa2 | | | 1,756 | | | 1,837,020 |
| 8.75% | | 03/01/31 | | Baa2 | | | 539 | | | 726,741 |
BellSouth Corp., | | | |
Bonds | | | | | | | | | | |
| 5.20% | | 09/15/14 | | A2 | | | 1,290 | | | 1,314,796 |
| 6.55% | | 06/15/34(b) | | A2 | | | 795 | | | 866,268 |
Notes | | | | | | | | | | |
| 4.20% | | 09/15/09 | | A2 | | | 1,175 | | | 1,178,069 |
| | | | | | | | | | |
Interest Rate
| | Maturity Date
| | Moody’s Rating (Unaudited)
| | Principal Amount (000)
| | Value (Note 2)
|
| LONG-TERM BONDS (Continued) | | | |
Telecommunications (cont’d.) | | | |
British Telecom PLC (United Kingdom), | | | |
Bonds | | | | | | | | | | |
| 7.00% | | 05/23/07 | | NR | | $ | 1,265 | | $ | 1,355,448 |
| 8.875% | | 12/15/30 | | Baa1 | | | 1,305 | | | 1,747,422 |
CenturyTel, Inc., | | | |
Sr. Notes | | | | | | | | |
| 7.875% | | 08/15/12 | | Baa2 | | | 130 | | | 152,986 |
Citizens Communications Co., | | | |
Debs. | | | | | | | | | | |
| 7.60% | | 06/01/06 | | Ba3 | | | 1,100 | | | 1,163,250 |
Deutsche Telekom International Finance BV (Netherlands), | | | |
Gtd. Notes | | | | | | | | |
| 8.75% | | 06/15/30 | | Baa1 | | | 340 | | | 448,956 |
| 9.25% | | 06/01/32 | | Baa1 | | | 745 | | | 1,060,199 |
Koninlijke (Royal) KPN NV (Netherlands), | | | |
Sr. Notes | | | | | | | | |
| 8.00% | | 10/01/10 | | Baa1 | | | 1,720 | | | 2,030,183 |
Pacific Bell, | | | |
Notes | | | | | | | | | | |
| 7.25% | | 11/01/27 | | A2 | | | 380 | | | 412,336 |
SBC Communications, Inc., | | | |
Bonds | | | | | | | | | | |
| 6.45% | | 06/15/34 | | A2 | | | 370 | | | 396,406 |
Notes | | | | | | | | | | |
| 4.125% | | 09/15/09(b) | | A2 | | | 1,070 | | | 1,068,047 |
| 5.10% | | 09/15/14 | | A2 | | | 670 | | | 676,227 |
| 6.15% | | 09/15/34 | | A2 | | | 530 | | | 545,837 |
Sprint Capital Corp., | | | |
Gtd. Notes | | | | | | | | |
| 6.875% | | 11/15/28(b) | | Baa3 | | | 2,195 | | | 2,403,058 |
| 8.75% | | 03/15/32 | | Baa3 | | | 230 | | | 306,431 |
Telecom de Puerto Rico, | | | |
Gtd. Notes | | | | | | | | |
| 6.65% | | 05/15/06 | | Baa1 | | | 2,700 | | | 2,800,097 |
| 6.80% | | 05/15/09 | | Baa1 | | | 3,065 | | | 3,262,870 |
Telecom Italia Capital, | | | |
Gtd. Notes | | | | | | | | |
| 5.25% | | 11/15/13 | | Baa2 | | | 775 | | | 783,320 |
Gtd. Notes, 144A | | | | | | | | |
| 4.95% | | 09/30/14(j) | | Baa2 | | | 2,070 | | | 2,028,060 |
| 6.00% | | 09/30/34(j) | | Baa2 | | | 2,140 | | | 2,092,181 |
Telefonica Europe BV (Netherlands), | | | |
Gtd. Notes | | | | | | | | |
| 7.75% | | 09/15/10 | | A3 | | | 1,150 | | | 1,348,594 |
Telus Corp., | | | |
Notes | | | | | | | | | | |
| 8.00% | | 06/01/11 | | Baa3 | | | 1,255 | | | 1,487,275 |
Verizon Global Funding Corp., | | | |
Notes | | | | | | | | | | |
| 7.75% | | 12/01/30 | | A2 | | | 320 | | | 397,864 |
Verizon New York, Inc., | | | |
Debs. | | | | | | | | | | |
| 7.375% | | 04/01/32(b) | | Baa2 | | | 875 | | | 1,003,675 |
Vondafone Group PLC (United Kingdom), | | | |
Notes | | | | | | | | | | |
| 5.375% | | 01/30/15 | | A2 | | | 205 | | | 213,039 |
SEE NOTES TO FINANCIAL STATEMENTS.
B42
| | | | |
| | | FLEXIBLE MANAGED PORTFOLIO (Continued) | | |
SCHEDULE OF INVESTMENTS | December 31, 2004 |
| | | | | | | | | | |
Interest Rate
| | Maturity Date
| | Moody’s Rating (Unaudited)
| | Principal Amount (000)
| | Value (Note 2)
|
| LONG-TERM BONDS (Continued) | | | |
Telecommunications (cont’d.) | | | |
| 7.75% | | 02/15/10 | | A2 | | $ | 800 | | $ | 928,366 |
| | | | | | | | | |
|
|
| | | | | | | | | | | 36,808,681 |
| | | | | | | | | |
|
|
Tobacco | | | | | | | | | | |
Altria Group, Inc., | | | |
Notes | | | | | | | | | | |
| 7.00% | | 07/15/05 | | Baa2 | | | 460 | | | 467,125 |
| 7.65% | | 07/01/08(b) | | Baa2 | | | 590 | | | 648,961 |
| | | | | | | | | |
|
|
| | | | | | | | | | | 1,116,086 |
| | | | | | | | | |
|
|
Foreign Government Bonds — 0.2% | | | |
Hydro-Quebec (Canada) | | | | | | |
| 7.50% | | 04/01/16 | | A1 | | | 600 | | | 740,161 |
| 8.00% | | 02/01/13 | | A1 | | | 1,500 | | | 1,851,195 |
Quebec Province (Canada), | | | |
Debs. | | | | | | | | | | |
| 5.75% | | 02/15/09 | | A1 | | | 500 | | | 535,643 |
Republic of Italy (Italy) | | | |
| 5.375% | | 06/15/33 | | AA-(e) | | | 800 | | | 800,088 |
| 6.00% | | 02/22/11 | | Aa2 | | | 390 | | | 426,979 |
Republic of South Africa (South Africa) | | | |
| 6.50% | | 06/02/14 | | Baa2 | | | 475 | | | 520,125 |
United Mexican States | | | |
(Mexico), Notes | | | | | | |
| 7.50% | | 01/14/12 | | Baa2 | | | 1,500 | | | 1,701,000 |
| | | | | | | | | |
|
|
| | | | | | | | | | | 6,575,191 |
| | | | | | | | | |
|
|
Mortgage Backed Securities — 7.8% | | | |
Federal Home Loan Mortgage Corp. | | | |
| 4.50% | | 11/01/18-06/01/19(h) | | | 5,988 | | | 5,972,333 |
| 5.00% | | 06/01/18-05/01/34(h) | | | 15,486 | | | 15,651,789 |
| 5.001% | | TBA | | | | | 4,000 | | | 4,060,000 |
| 5.50% | | 12/01/33-06/01/34(h) | | | 14,889 | | | 15,135,849 |
| 6.00% | | 12/01/33(h) | | | | | 2,563 | | | 2,653,101 |
| 6.001% | | TBA | | | | | 8,000 | | | 8,262,496 |
| 6.50% | | 05/01/14-09/01/14(h) | | | 849 | | | 900,013 |
| 7.00% | | 01/01/31-11/01/33(h) | | | 10,762 | | | 11,406,411 |
Federal National Mortgage Assn. | | | |
| 4.00% | | 06/01/19(h) | | | | | 2,870 | | | 2,801,246 |
| 4.50% | | 01/01/19-03/01/34(h) | | | 15,579 | | | 15,396,373 |
| 5.00% | | 10/01/18-04/01/34(h) | | | 31,330 | | | 31,256,714 |
| 5.001% | | TBA | | | | | 7,000 | | | 7,109,375 |
| 5.001% | | TBA | | | | | 14,000 | | | 13,886,250 |
| 5.054% | | 07/01/33(h) | | | | | 2,215 | | | 2,271,276 |
| 5.50% | | 03/01/16-04/01/34(h) | | | 53,809 | | | 54,718,314 |
| 5.501% | | TBA | | | | | 9,000 | | | 9,298,125 |
| 5.501% | | TBA | | | | | 16,000 | | | 16,240,000 |
| 6.00% | | 04/01/13-03/01/34(h) | | | 14,757 | | | 15,334,238 |
| 6.001% | | TBA | | | | | 3,500 | | | 3,666,250 |
| 6.001% | | TBA | | | | | 23,800 | | | 24,603,250 |
| 6.50% | | 07/01/17-09/01/34(h) | | | 8,303 | | | 8,724,532 |
| 6.501% | | TBA | | | | | 3,500 | | | 3,669,533 |
| 7.00% | | 08/01/11-07/01/32(h) | | | 3,115 | | | 3,308,537 |
| 7.50% | | 06/01/12-05/01/32(h) | | | 2,932 | | | 3,125,254 |
Government National Mortgage Assn. | | | |
| 5.50% | | 08/15/33-02/15/34 | | | 2,385 | | | 2,437,628 |
| 6.00% | | 02/15/33-06/20/34 | | | 5,248 | | | 5,440,113 |
| 6.50% | | 10/15/23-08/15/32 | | | 12,657 | | | 13,361,336 |
| | | | | | | | | | |
Interest Rate
| | Maturity Date
| | Moody’s Rating (Unaudited)
| | Principal Amount (000)
| | Value (Note 2)
|
| LONG-TERM BONDS (Continued) | | | |
Mortgage Backed Securities (cont’d.) | | | |
| 8.00% | | 01/15/24-04/15/25 | | $ | 542 | | $ | 591,819 |
| | | | | | | | | |
|
|
| | | | | | | | | | | 301,282,155 |
| | | | | | | | | |
|
|
U.S. Government Agency Obligations — 3.8% | | | |
Federal Farm Credit Bank, | | | |
| 3.00% | | 12/17/07(b) | | | | | 10,180 | | | 10,077,599 |
Federal Home Loan Bank | | | |
| 3.75% | | 08/18/09 | | | | | 1,895 | | | 1,890,990 |
| 3.875% | | 01/15/10(b) | | | | | 6,800 | | | 6,780,647 |
| 4.50% | | 05/13/11 | | | | | 4,515 | | | 4,592,717 |
Federal Home Loan Mortgage Corp. | | | |
| 2.75% | | 10/15/06(b) | | | | | 12,500 | | | 12,401,113 |
| 2.875% | | 05/15/07(b) | | | | | 1,910 | | | 1,890,514 |
| 4.875% | | 11/15/13 | | | | | 225 | | | 231,372 |
| 7.00% | | 03/15/10 | | | | | 2,505 | | | 2,860,820 |
Federal National Mortgage Assn. | | | |
| 3.25% | | 08/15/08 | | | | | 2,250 | | | 2,220,345 |
| 4.25% | | 05/15/09(b) | | | | | 6,045 | | | 6,150,715 |
| 5.25% | | 08/01/12 | | | | | 6,535 | | | 6,780,912 |
| 5.50% | | 07/18/12 | | | | | 7,200 | | | 7,286,789 |
| 7.125% | | 06/15/10 | | | | | 13,185 | | | 15,155,129 |
United States Treasury Bonds | | | |
| 5.375% | | 02/15/31(b) | | | | | 8,068 | | | 8,724,154 |
| 6.00% | | 02/15/26(b) | | | | | 1,885 | | | 2,159,283 |
| 6.25% | | 08/15/23 | | | | | 2,500 | | | 2,926,855 |
| 8.875% | | 08/15/17 | | | | | 1,950 | | | 2,763,362 |
| 8.875% | | 02/15/19(b) | | | | | 6,050 | | | 8,703,730 |
| 9.00% | | 11/15/18(b) | | | | | 5,727 | | | 8,295,428 |
| 9.125% | | 05/15/18(b) | | | | | 3,995 | | | 5,810,540 |
| 9.25% | | 02/15/16 | | | | | 1,647 | | | 2,351,028 |
United States Treasury Notes | | | |
| 1.625% | | 09/30/05(b) | | | | | 5,000 | | | 4,963,085 |
| 2.50% | | 10/31/06(b) | | | | | 8,580 | | | 8,499,897 |
| 2.75% | | 08/15/07(b) | | | | | 8,465 | | | 8,372,080 |
| 3.125% | | 05/15/07(b) | | | | | 2,104 | | | 2,102,931 |
| 4.75% | | 05/15/14 | | | | | 435 | | | 453,318 |
United States Treasury Strips, I/O | | | |
| Zero | | 05/15/18 | | | | | 1,248 | | | 656,843 |
| Zero | | 05/15/25(b) | | | | | 1,969 | | | 696,246 |
| | | | | | | | | |
|
|
| | | | | | | | | | | 145,798,442 |
| | | | | | | | | |
|
|
TOTAL LONG-TERM BONDS
(cost $824,274,017) | | | 838,173,881 |
| | | | | | | | | |
|
|
TOTAL LONG-TERM INVESTMENTS
(cost $3,266,188,098) | | | 3,602,497,979 |
| | | | | | | | | |
|
|
| SHORT-TERM INVESTMENTS — 28.6% |
Corporate Bonds — 1.3% | | | |
EL Sevier Finance | | | |
| 2.38% | | 02/01/05 | | | | | 25,000 | | | 24,948,764 |
| 2.40% | | 02/01/05 | | | | | 16,000 | | | 15,966,933 |
| 2.47% | | 01/19/05 | | | | | 10,000 | | | 9,987,650 |
| | | | | | | | | |
|
|
| | | | | | | | | | | 50,903,347 |
| | | | | | | | | |
|
|
U.S. Government Agency Obligations — 0.3% | | | |
United States Treasury Bills | | | |
| 2.18% | | 03/17/05(d) | | | | | 10,000 | | | 9,954,896 |
| | | | | | | | | |
|
|
SEE NOTES TO FINANCIAL STATEMENTS.
B43
| | | | |
| | | FLEXIBLE MANAGED PORTFOLIO (Continued) | | |
SCHEDULE OF INVESTMENTS | December 31, 2004 |
| | | | | | |
SHORT-TERM
INVESTMENTS (Continued) | | Shares
| | Value (Note 2)
| |
| | | | | | | |
Mutual Fund — 27.0% | | | | | | |
Dryden Core Investment Fund —Taxable Money Market Series (cost $1,049,015,143; Note 4)(c) | | 1,049,015,143 | | $ | 1,049,015,143 | |
| | | | |
|
|
|
TOTAL SHORT-TERM INVESTMENTS
(cost $1,109,873,386) | | | 1,109,873,386 | |
| | | | |
|
|
|
TOTAL INVESTMENTS — 121.3%
(cost $4,376,061,484; Note 6) | | | 4,712,371,365 | |
VARIATION MARGIN ON OPEN FUTURES CONTRACTS, NET(k) | | | 129,238 | |
LIABILITIES IN EXCESS OF
OTHER ASSETS — (21.3)% | | | (829,020,101 | ) |
| | | | |
|
|
|
TOTAL NET ASSETS — 100% | | $ | 3,883,480,502 | |
| | | | |
|
|
|
The following abbreviations are used in portfolio descriptions:
| | |
| G.O. | | General Obligation |
| I/O | | Interest Only |
| NR | | Not rated by Moody’s or Standard and Poor’s. |
| TBA | | Securities purchased on a forward commitment basis. |
| (a) | Non-income producing security. |
| (b) | Portion of securities on loan with an aggregate market value of $718,584,562; cash collateral $746,870,215 was received with which the portfolio purchased securities. |
| (c) | Represents security, or portion thereof, purchased with cash collateral for securities on loan. |
| (d) | Security segregated as collateral for futures contracts. |
| (e) | Standard & Poor’s rating. |
| (f) | Indicates a fair valued security. |
| (g) | Indicates a variable rate security. |
| (h) | Security segregated as collateral for TBA’s. |
| (i) | Indicates a security that has been deemed illiquid. The aggregate cost of the illiquid security is $1,170,000. The aggregate value, $1,173,610 represents .03% of the net assets. |
| (j) | Securities were purchased pursuant to Rule 144A under the Securities Act of 1933 and may not be resold subject to that rule except to qualified institutional buyers unless otherwise noted 144A securities are deemed to be liquid. |
| (k) | Open futures contracts as of December 31, 2004 were as follows: |
| | | | | | | | | | | | | | |
Number of
Contracts
| | Type
| | Expiration
Date
| | Value at
Trade Date
| | Value at
December 31, 2004
| | Unrealized
Appreciation
(Depreciation)
| |
| Long Positions: | | | | | | | | | | | | | | |
| 68 | | Eurodollar | | Sept 05 | | $ | 16,412,847 | | $ | 16,423,700 | | $ | 10,853 | |
| 289 | | S&P 500 Index | | Mar 05 | | | 85,341,700 | | | 87,689,825 | | | 2,348,125 | |
| 117 | | S&P MidCap 400 Index | | Mar 05 | | | 37,741,275 | | | 38,922,975 | | | 1,181,700 | |
| 917 | | U.S. Treasury 5 YR Notes | | Mar 05 | | | 100,354,188 | | | 100,440,156 | | | 85,968 | |
| 76 | | U.S. Treasury 5 YR Notes | | Mar 05 | | | 8,314,825 | | | 8,324,375 | | | 9,550 | |
| | | | | | | | | | | | |
|
|
|
| | | | | | | | | | | | | | 3,636,196 | |
| | | | | | | | | | | | |
|
|
|
| Short Positions: | | | | | | | | | | | | | | |
| 104 | | U.S. Treasury 10 YR Notes | | Mar 05 | | | 11,611,512 | | | 11,641,500 | | | (29,988 | ) |
| 2 | | U.S. Treasury Bonds | | Mar 05 | | | 224,871 | | | 225,000 | | | (129 | ) |
| 165 | | U.S. Treasury 2 YR Notes | | Mar 05 | | | 34,634,109 | | | 34,582,969 | | | 51,140 | |
| | | | | | | | | | | | |
|
|
|
| | | | | | | | | | | | | | 21,023 | |
| | | | | | | | | | | | |
|
|
|
| | | | | | | | | | | | | $ | 3,657,219 | |
| | | | | | | | | | | | |
|
|
|
SEE NOTES TO FINANCIAL STATEMENTS.
B44
| | | | |
| | | FLEXIBLE MANAGED PORTFOLIO (Continued) | | |
SCHEDULE OF INVESTMENTS | December 31, 2004 |
The industry classification of portfolio holdings and liabilities in excess of other assets shown as a percentage of net assets as of December 31, 2004 was as follows:
| | | |
Mutual Fund | | 27.0 | % |
Mortgage Backed Securities | | 9.5 | |
Financial Services | | 6.4 | |
Drugs & Medical Supplies | | 6.4 | |
Oil & Gas | | 5.5 | |
Computer Services | | 5.5 | |
Retail | | 5.2 | |
Banks & Savings & Loans | | 4.7 | |
U.S. Government Agency Obligations | | 4.1 | |
Diversified Operations | | 3.7 | |
Telecommunications | | 3.4 | |
Food & Beverage | | 3.3 | |
Insurance | | 2.9 | |
Media | | 2.5 | |
Computers | | 2.1 | |
Aerospace/Defense | | 2.1 | |
Semiconductors | | 1.9 | |
Utilities — Electric | | 1.4 | |
Corporate Bonds | | 1.3 | |
Cosmetics & Soaps | | 1.3 | |
Electronics | | 1.3 | |
Healthcare | | 1.3 | |
Restaurants | | 1.1 | |
Metal — Steel | | 1.1 | |
Pharmaceuticals | | 1.0 | |
Chemicals | | 1.0 | |
Autos — Cars & Trucks | | 0.9 | |
Trucking & Shipping | | 0.9 | |
Construction | | 0.8 | |
Tobacco | | 0.7 | |
Electric | | 0.7 | |
Machinery | | 0.6 | |
Internet Software & Services | | 0.6 | |
Asset Backed Securities | | 0.5 | |
Schools | | 0.5 | |
Real Estate Investment Trust | | 0.5 | |
Banking | | 0.5 | |
Energy — Other | | 0.5 | |
Forest Products | | 0.4 | |
Consumer Products | | 0.3 | |
Apparel | | 0.3 | |
Commercial Services | | 0.3 | |
Manufacturing | | 0.3 | |
Household & Personal Care Products | | 0.3 | |
Automobiles & Automotives | | 0.3 | |
Non-Captive Finance | | 0.3 | |
Capital Goods | | 0.3 | |
Brokerage | | 0.3 | |
Technology | | 0.2 | |
Office Equipment & Supplies | | 0.2 | |
Collateralized Mortgage Obligations | | 0.2 | |
Leisure | | 0.2 | |
Cable | | 0.2 | |
Foreign Government Bonds | | 0.2 | |
Software | | 0.2 | |
Containers & Packaging | | 0.2 | |
Gas Pipelines | | 0.2 | |
Lodging | | 0.2 | |
| | | |
Non-Corporate | | 0.2 | % |
Hospital Management | | 0.1 | |
Consumer Services | | 0.1 | |
Municipals | | 0.1 | |
Energy — Integrated | | 0.1 | |
Distribution/Wholesale | | 0.1 | |
Pipelines & Other | | 0.1 | |
Airlines | | 0.1 | |
Metals — Non Ferrous | | 0.1 | |
Railroads | | 0.1 | |
Paper | | 0.1 | |
Miscellaneous Consumer Growth | | 0.1 | |
Foreign Agencies | | 0.1 | |
Building Materials & Construction | | 0.1 | |
| | |
|
|
| | | 121.3 | |
Liabilities in excess of other assets | | (21.3 | ) |
| | |
|
|
| | | 100.0 | % |
| | |
|
|
SEE NOTES TO FINANCIAL STATEMENTS.
B45
SCHEDULE OF INVESTMENTS | December 31, 2004 |
| | | | | |
| LONG-TERM INVESTMENTS — 98.5% | | Value (Note 2)
|
| COMMON STOCKS | | Shares
| |
Austria — 0.5% | | | | | |
Erste Bank der Oesterreichischen Sparkassen AG | | 69,300 | | $ | 3,701,903 |
| | | | |
|
|
Bermuda — 2.3% | | | | | |
Marvell Technology Group, Ltd.(a) | | 276,500 | | | 9,807,455 |
Tyco International, Ltd.(b) | | 170,900 | | | 6,107,966 |
| | | | |
|
|
| | | | | | 15,915,421 |
| | | | |
|
|
Canada — 1.6% | | | | | |
Research In Motion Ltd.(a) | | 49,200 | | | 4,055,064 |
Suncor Energy, Inc. | | 198,700 | | | 7,033,980 |
| | | | |
|
|
| | | | | | 11,089,044 |
| | | | |
|
|
France — 4.1% | | | | | |
Schneider Electric SA | | 114,200 | | | 7,947,587 |
Total SA | | 92,882 | | | 20,288,348 |
| | | | |
|
|
| | | | | | 28,235,935 |
| | | | |
|
|
Republic of Germany — 5.5% | | | | | |
Deutsche Telekom AG(a) | | 449,100 | | | 10,163,810 |
Metro AG | | 189,300 | | | 10,418,318 |
RWE AG | | 61,300 | | | 3,391,206 |
SAP AG, ADR | | 175,600 | | | 7,763,276 |
Siemens AG | | 73,800 | | | 6,257,502 |
| | | | |
|
|
| | | | | | 37,994,112 |
| | | | |
|
|
Hong Kong — 1.8% | | | | | |
Cheung Kong Holdings, Ltd. | | 360,100 | | | 3,602,066 |
Cosco Pacific, Ltd. | | 3,494,000 | | | 7,282,257 |
Esprit Holdings, Ltd. | | 245,000 | | | 1,481,467 |
| | | | |
|
|
| | | | | | 12,365,790 |
| | | | |
|
|
Ireland — 1.3% | | | | | |
Anglo Irish Bank Corp., PLC | | 364,100 | | | 8,824,117 |
| | | | |
|
|
Italy — 3.8% | | | | | |
Enel SpA | | 895,100 | | | 8,796,484 |
Eni SpA | | 226,386 | | | 5,668,112 |
Riunione Adriatica di Sicurta SpA | | 528,843 | | | 11,961,326 |
| | | | |
|
|
| | | | | | 26,425,922 |
| | | | |
|
|
Japan — 11.1% | | | | | |
Asahi Glass Co., Ltd.(b) | | 821,000 | | | 9,053,674 |
Cannon, Inc. | | 124,100 | | | 6,697,307 |
JFE Holdings, Inc. | | 362,200 | | | 10,338,977 |
Mitsubishi Corp.(b) | | 543,000 | | | 7,016,024 |
Mitsubishi Estate Co., Ltd.(b) | | 943,000 | | | 11,043,232 |
Mitsui & Co., Ltd. | | 1,045,000 | | | 9,372,060 |
Nidec Corp. | | 80,100 | | | 9,763,336 |
Nissan Motor Co., Ltd. | | 491,300 | | | 5,341,155 |
Sumitomo Realty & Development Co., Ltd. | | 636,000 | | | 8,292,144 |
| | | | |
|
|
| | | | | | 76,917,909 |
| | | | |
|
|
Spain — 2.7% | | | | | |
Banco Bilbao Vizcaya Argentaria, S.A.(b) | | 517,665 | | | 9,182,450 |
Telefonica SA | | 487,382 | | | 9,181,887 |
| | | | |
|
|
| | | | | | 18,364,337 |
| | | | |
|
|
Switzerland — 6.9% | | | | | |
Alcon, Inc. | | 110,400 | | | 8,898,240 |
| | | | | |
COMMON STOCKS
(Continued) | | Shares
| | Value (Note 2)
|
Switzerland (cont’d.) | | | | | |
Novartis AG, ADR | | 212,900 | | $ | 10,759,966 |
Roche Holding AG, ADR | | 124,200 | | | 14,297,581 |
UBS AG — Registered | | 166,200 | | | 13,936,479 |
| | | | |
|
|
| | | | | | 47,892,266 |
| | | | |
|
|
United Kingdom — 7.4% | | | | | |
BHP Billiton PLC | | 307,100 | | | 3,599,519 |
Cadbury Schweppes PLC | | 626,500 | | | 5,833,669 |
Exel PLC | | 525,102 | | | 7,288,883 |
Royal Bank of Scotland Group PLC | | 388,582 | | | 13,070,608 |
Tesco PLC | | 2,274,500 | | | 14,050,232 |
Vodafone Group PLC | | 2,581,154 | | | 6,999,731 |
| | | | |
|
|
| | | | | | 50,842,642 |
| | | | |
|
|
United States — 49.5% | | | | | |
Activision, Inc.(a) | | 246,850 | | | 4,981,433 |
Agilent Technologies, Inc.(a) | | 211,500 | | | 5,097,150 |
American Express Co. | | 159,200 | | | 8,974,104 |
American International Group, Inc. | | 91,300 | | | 5,995,671 |
Amgen, Inc.(a) | | 160,400 | | | 10,289,660 |
Apple Computer, Inc.(a) | | 178,300 | | | 11,482,520 |
Bank of New York Co., Inc. (The) | | 203,000 | | | 6,784,260 |
Bed Bath & Beyond, Inc.(a) | | 232,800 | | | 9,272,424 |
BJ Services Co. | | 125,300 | | | 5,831,462 |
Cendant Corp. | | 213,900 | | | 5,000,982 |
Charles Schwab Corp. (The) | | 370,700 | | | 4,433,572 |
Chico’s FAS, Inc.(a)(b) | | 165,600 | | | 7,539,768 |
Cisco Systems, Inc.(a) | | 312,600 | | | 6,033,180 |
Costco Wholesale Corp.(b) | | 126,500 | | | 6,123,865 |
Dell, Inc.(a) | | 183,600 | | | 7,736,904 |
eBay, Inc.(a) | | 31,500 | | | 3,662,820 |
Electronic Arts, Inc.(a)(b) | | 146,200 | | | 9,017,616 |
Eli Lilly & Co. | | 157,100 | | | 8,915,425 |
ENSCO International, Inc. | | 244,600 | | | 7,763,604 |
General Electric Co. | | 342,400 | | | 12,497,600 |
Gilead Sciences, Inc.(a) | | 296,750 | | | 10,383,282 |
Google, Inc. (Class “A” Stock)(a)(b) | | 11,500 | | | 2,220,650 |
IAC / InterActiveCorp.(a)(b) | | 302,100 | | | 8,344,002 |
J. P. Morgan Chase & Co. | | 324,200 | | | 12,647,042 |
Kroger Co. (The)(a) | | 348,700 | | | 6,116,198 |
Lehman Brothers Holdings, Inc. | | 59,800 | | | 5,231,304 |
Lowe’s Cos., Inc. | | 176,800 | | | 10,181,912 |
MedImmune, Inc.(a) | | 15,100 | | | 409,361 |
Mercury Interactive Corp.(a)(b) | | 152,100 | | | 6,928,155 |
Microsoft Corp. | | 349,100 | | | 9,324,461 |
Monsanto Co. | | 232,400 | | | 12,909,820 |
Nextel Communications, Inc. (Class “A” Stock)(a)(b) | | 228,100 | | | 6,843,000 |
P.F. Chang’s China Bistro, Inc.(a)(b) | | 82,300 | | | 4,637,605 |
PETsMART, Inc. | | 114,600 | | | 4,071,738 |
Phelps Dodge Corp. | | 94,300 | | | 9,328,156 |
Praxair, Inc. | | 181,600 | | | 8,017,640 |
Procter & Gamble Co. | | 164,100 | | | 9,038,628 |
QUALCOMM, Inc. | | 218,100 | | | 9,247,440 |
Schlumberger, Ltd. | | 183,000 | | | 12,251,850 |
Sirius Satellite Radio, Inc.(a)(b) | | 130,200 | | | 996,030 |
Smith International, Inc.(a) | | 108,000 | | | 5,876,280 |
Target Corp. | | 155,600 | | | 8,080,308 |
SEE NOTES TO FINANCIAL STATEMENTS.
B46
| | | | |
| | | GLOBAL PORTFOLIO (Continued) | | |
SCHEDULE OF INVESTMENTS | December 31, 2004 |
| | | | | | |
COMMON STOCKS
(Continued) | | Shares
| | Value (Note 2)
| |
United States (cont’d.) | | | | | | |
UnitedHealth Group, Inc. | | 95,100 | | $ | 8,371,653 | |
Univision Communications, Inc.
(Class “A” Stock)(a)(b) | | 254,000 | | | 7,434,580 | |
WellPoint, Inc.(a) | | 29,200 | | | 3,358,000 | |
Williams-Sonoma, Inc.(a)(b) | | 126,700 | | | 4,439,568 | |
XM Satellite Radio Holdings, Inc.
(Class “A” Stock)(a)(b) | | 56,400 | | | 2,121,768 | |
Yahoo! Inc.(a) | | 162,400 | | | 6,119,232 | |
| | | | |
|
|
|
| | | | | | 342,363,683 | |
| | | | |
|
|
|
TOTAL LONG-TERM INVESTMENTS (cost $578,935,091) | | | | | 680,933,081 | |
| | | | |
|
|
|
SHORT-TERM INVESTMENT — 10.3% | | | | |
Mutual Fund | | | | | | |
Dryden Core Investment Fund –Taxable Money Market Series
(cost $71,080,622; Note 4)(c) | | 71,080,622 | | | 71,080,622 | |
| | | | |
|
|
|
TOTAL INVESTMENTS — 108.8%
(cost $650,015,713; Note 6) | | | | | 752,013,703 | |
UNREALIZED APPRECIATION ON FORWARD FOREIGN CURRENCY CONTRACTS, NET(d) | | | 16,623 | |
LIABILITIES IN EXCESS OF
OTHER ASSETS — (8.8)% | | | (60,943,612 | ) |
| | | | |
|
|
|
NET ASSETS — 100.0% | | $ | 691,086,714 | |
| | | | |
|
|
|
The industry classification of portfolio holdings and liabilities in excess of other assets shown as a percentage of net assets as of December 31, 2004 was as follows:
| | | |
Mutual Fund | | 10.3 | % |
Software | | 5.5 | |
Specialty Retail | | 5.3 | |
Food & Staples Retailing | | 5.3 | |
Commercial Banks | | 5.0 | |
Pharmaceuticals | | 4.9 | |
Industrial Conglomerates | | 4.9 | |
Oil & Gas | | 4.7 | |
Energy Equipment & Services | | 4.6 | |
Capital Markets | | 4.4 | |
Real Estate | | 3.3 | |
Biotechnology | | 3.1 | |
Chemicals | | 3.0 | |
Diversified Telecommunication Services | | 2.8 | |
Communications Equipment | | 2.8 | |
Computers & Peripherals | | 2.8 | |
Insurance | | 2.6 | |
Trading Companies & Distributors | | 2.4 | |
Electronic Equipment & Instruments | | 2.2 | |
Metals & Mining | | 2.0 | |
Wireless Telecommunication Services | | 2.0 | |
Diversified Financial Services | | 1.8 | |
Internet & Catalog Retail | | 1.7 | |
Health Care Providers & Services | | 1.7 | |
Media | | 1.5 | |
Semiconductors & Semiconductor Equipment | | 1.4 | |
Household Products | | 1.3 | |
Building Products | | 1.3 | |
Consumer Finance | | 1.3 | |
Health Care Equipment & Supplies | | 1.3 | |
Electric Utilities | | 1.3 | |
Internet Software & Services | | 1.2 | |
Multiline Retail | | 1.2 | |
Electrical Equipment | | 1.2 | |
Air Freight & Logistics | | 1.1 | |
Transportation Infrastructure | | 1.1 | |
Office Electronics | | 1.0 | |
Food Products | | 0.8 | |
Automobiles | | 0.8 | |
Commercial Services & Supplies | | 0.7 | |
Hotels Restaurants & Leisure | | 0.7 | |
Multi-Utilities & Unregulated Power | | 0.5 | |
| | |
|
|
| | | 108.8 | |
Liabilities in excess of other assets | | (8.8 | ) |
| | |
|
|
| | | 100.0 | % |
| | |
|
|
The following abbreviation is used in portfolio descriptions:
| | |
| ADR | | American Depositary Receipt |
| (a) | Non-income producing security. |
| (b) | Portion of securities on loan with an aggregate market value of $65,091,647; cash collateral of $68,128,773 was received with which the portfolio purchased highly liquid short-term investments. |
| (c) | Represents security, or a portion thereof, purchased with cash collateral received for securities on loan. |
| (d) | Outstanding forward foreign currency contract as of December 31, 2004 was as follows: |
| | | | | | | | | |
Forward Foreign Currency Contracts
| | Value at
Settlement Date
| | Value at
December 31, 2004
| | Unrealized
Appreciation
|
Purchased: | | | | | | | | | |
Japanese Yen, expiring 1/4/05 | | $ | 1,078,051 | | $ | 1,094,674 | | $ | 16,623 |
| | | | | | | | |
|
|
SEE NOTES TO FINANCIAL STATEMENTS.
B47
| | | | |
| | | GOVERNMENT INCOME PORTFOLIO | | |
SCHEDULE OF INVESTMENTS | December 31, 2004 |
| | | | | | | | | | |
| LONG-TERM INVESTMENTS — 92.9% | | Interest
Rate
| | Maturity
Date
| | Principal
Amount
(000)
| | Value
(Note 2)
|
Asset Backed Securities — 0.9% | | | | | | | | | | |
MBNA Master Credit Card Trust, Series 1999-J, Class A | | 7.00% | | 02/15/12 | | $ | 3,200 | | $ | 3,604,489 |
| | | | | | | | | |
|
|
Collateralized Mortgage Obligations — 6.5% | | | | | | | | | | |
Federal Home Loan Mortgage Corp., Series 2496, Class PM | | 5.50% | | 09/15/17 | | | 2,819 | | | 2,899,230 |
Federal Home Loan Mortgage Corp., Series 2501, Class MC | | 5.50% | | 09/15/17 | | | 2,000 | | | 2,080,968 |
Federal Home Loan Mortgage Corp., Series 2513, Class HC | | 5.00% | | 10/15/17 | | | 2,339 | | | 2,352,992 |
Federal Home Loan Mortgage Corp., Series 2518, Class PV | | 5.50% | | 06/15/19 | | | 1,920 | | | 1,970,623 |
Federal National Mortgage Association, Series 1993-29, Class PH | | 6.50% | | 01/25/23 | | | 1,358 | | | 1,390,034 |
Federal National Mortgage Association, Series 2002-18, Class PC | | 5.50% | | 04/25/17 | | | 5,000 | | | 5,237,964 |
Federal National Mortgage Association, Series 2002-57, Class ND | | 5.50% | | 09/25/17 | | | 2,600 | | | 2,703,104 |
Federal National Mortgage Association, Series 2002-94, Class HQ | | 4.50% | | 01/25/18 | | | 6,419 | | | 6,334,190 |
Structured Adjustable Rate Mortgage Loan, Ser. 2004-1, Class 4A3 | | 4.17% | | 02/25/34 | | | 1,599 | | | 1,604,927 |
Washington Mutual, Series 2002-AR4, Class A7 | | 5.502% | | 04/26/32 | | | 250 | | | 249,936 |
Westpac Securitization Trust Limited, Series 1998-1G, Class A (Australia)(c)(d) | | 2.21% | | 07/19/29 | | | 694 | | | 694,350 |
| | | | | | | | | |
|
|
| | | | | | | | | | | 27,518,318 |
| | | | | | | | | |
|
|
Commercial Mortgage Backed Securities — 6.4% | | | | | | | | | | |
Bear Stearns Commercial Mortgage, Series 2004-T16, Class A5 | | 4.60% | | 02/13/46 | | | 4,200 | | | 4,164,727 |
Bear Stearns Commercial Mortgage, Series 2000-WF1, Class A1 | | 7.64% | | 02/15/32 | | | 1,526 | | | 1,630,957 |
First Union National Bank Commercial Mortgage Trust, Series 2000-C1, Class A1 | | 7.739% | | 05/17/32 | | | 1,691 | | | 1,836,608 |
First Union National Bank Commercial Mortgage Trust, Series 2000-C2, Class A1 | | 6.94% | | 10/15/32 | | | 1,978 | | | 2,096,069 |
First Union-Lehman Brothers Commercial Mortgage Trust, Series 1997-C1, Class A3 | | 7.38% | | 04/18/29 | | | 4,146 | | | 4,411,752 |
GS Mortgage Securities Corp. II, Series 2003-C1, Class A3 | | 4.608% | | 01/10/40 | | | 6,800 | | | 6,786,444 |
KeyCorp., Series 2000-C1, Class A2 | | 7.727% | | 05/17/32 | | | 3,000 | | | 3,436,107 |
Merrill Lynch Mortgage Investors, Inc., Series 1996-C1, Class A3 | | 7.42% | | 04/25/28 | | | 65 | | | 65,069 |
Morgan Stanley Chase Capital, Inc., Series 2001-TOP1, Class A2 | | 6.32% | | 02/15/33 | | | 2,366 | | | 2,494,090 |
| | | | | | | | | |
|
|
| | | | | | | | | | | 26,921,823 |
| | | | | | | | | |
|
|
Mortgage Backed Securities — 35.9% | | | | | | | | | | |
Federal Home Loan Mortgage Corp. | | 5.00% | | 06/01/33 | | | 6,239 | | | 6,208,675 |
Federal Home Loan Mortgage Corp. | | 5.00% | | TBA | | | 500 | | | 496,406 |
Federal Home Loan Mortgage Corp. | | 6.00% | | 09/01/34 | | | 879 | | | 908,656 |
Federal Home Loan Mortgage Corp. | | 6.00% | | TBA | | | 3,000 | | | 3,098,436 |
Federal Home Loan Mortgage Corp. | | 6.50% | | 06/01/08-09/01/32 | | | 2,428 | | | 2,563,609 |
Federal Home Loan Mortgage Corp. | | 7.00% | | 06/01/08-10/01/32 | | | 3,600 | | | 3,788,201 |
Federal National Mortgage Association(d) | | 4.073% | | 08/01/33 | | | 7,505 | | | 7,372,318 |
Federal National Mortgage Association(d) | | 4.278% | | 04/01/34 | | | 3,860 | | | 3,877,603 |
Federal National Mortgage Association(d) | | 4.455% | | 06/01/34 | | | 3,883 | | | 3,907,776 |
Federal National Mortgage Association(d) | | 4.903% | | 10/01/34 | | | 3,983 | | | 4,023,636 |
Federal National Mortgage Association | | 5.00% | | 07/01/18-03/01/34 | | | 23,364 | | | 23,497,999 |
Federal National Mortgage Association | | 5.01% | | TBA | | | 38,000 | | | 37,691,250 |
Federal National Mortgage Association | | 5.50% | | 01/01/17-11/01/18 | | | 2,971 | | | 3,074,071 |
Federal National Mortgage Association | | 5.51% | | TBA | | | 1,000 | | | 1,033,125 |
Federal National Mortgage Association | | 5.51% | | TBA | | | 4,000 | | | 4,060,000 |
Federal National Mortgage Association | | 6.00% | | 11/01/14 | | | 1,346 | | | 1,413,234 |
Federal National Mortgage Association | | 6.00% | | TBA | | | 4,000 | | | 4,135,000 |
Federal National Mortgage Association | | 6.30% | | 03/01/11 | | | 1,911 | | | 2,091,659 |
Federal National Mortgage Association | | 6.50% | | 11/01/09-10/01/32 | | | 8,541 | | | 8,972,258 |
Federal National Mortgage Association | | 7.00% | | 02/01/12-02/01/34 | | | 7,848 | | | 8,318,012 |
Federal National Mortgage Association | | 7.50% | | 12/01/05-10/01/12 | | | 1,102 | | | 1,158,433 |
Federal National Mortgage Association | | 8.00% | | 03/01/22-05/01/26 | | | 106 | | | 115,714 |
Federal National Mortgage Association | | 9.00% | | 02/01/25-04/01/25 | | | 473 | | | 526,191 |
Government National Mortgage Association | | 5.00% | | 07/15/33-04/15/34 | | | 10,087 | | | 10,107,069 |
Government National Mortgage Association | | 6.50% | | 07/15/32-08/15/32 | | | 1,823 | | | 1,920,405 |
Government National Mortgage Association | | 7.00% | | 03/15/23-08/15/28 | | | 4,140 | | | 4,419,407 |
Government National Mortgage Association | | 7.50% | | 12/15/25-02/15/26 | | | 960 | | | 1,035,010 |
Government National Mortgage Association | | 8.50% | | 09/15/24-04/15/25 | | | 976 | | | 1,070,574 |
| | | | | | | | | |
|
|
| | | | | | | | | | | 150,884,727 |
| | | | | | | | | |
|
|
SEE NOTES TO FINANCIAL STATEMENTS.
B48
| | | | |
| | | GOVERNMENT INCOME PORTFOLIO (Continued) | | |
SCHEDULE OF INVESTMENTS | December 31, 2004 |
| | | | | | | | | | | | |
| LONG-TERM INVESTMENTS (Continued) | | Interest
Rate
| | | Maturity
Date
| | Principal
Amount
(000)
| | Value
(Note 2)
| |
Municipal Bond — 0.8% | | | | | | | | | | | | |
New Jersey Economic Development Authority State Pension Funding, Series B | | 4.83% | (f) | | 02/15/12 | | $ | 4,609 | | $ | 3,316,636 | |
| | | | | | | | | | |
|
|
|
U.S. Government & Agency Obligations — 42.4% | | | | | | | | | | | | |
Federal Farm Credit Bank | | 5.90% | | | 01/10/05 | | | 5,000 | | | 5,004,910 | |
Federal Home Loan Bank | | 3.875% | | | 01/15/10 | | | 17,985 | | | 17,933,815 | |
Federal Home Loan Bank | | 4.75% | | | 08/13/10 | | | 10,755 | | | 11,127,241 | |
Federal Home Loan Bank(a) | | 5.25% | | | 06/18/14 | | | 4,375 | | | 4,613,122 | |
Federal Home Loan Bank(d) | | 6.43% | | | 02/20/07 | | | 2,000 | | | 2,116,180 | |
Federal Home Loan Mortgage Corp. | | 4.00% | | | 12/15/09 | | | 11,095 | | | 11,143,918 | |
Federal Home Loan Mortgage Corp.(b) | | 4.125% | | | 09/01/09 | | | 15,965 | | | 15,918,973 | |
Federal National Mortgage Association(a) | | 4.625% | | | 10/15/13 | | | 6,050 | | | 6,106,325 | |
Federal National Mortgage Association | | 7.25% | | | 01/15/10 | | | 23,435 | | | 26,933,869 | |
Small Business Administration Participation Certificates, Series 1988-J20 | | 6.00% | | | 09/01/18 | | | 4,246 | | | 4,473,559 | |
Small Business Administration Participation Certificates, Series 1996-J20 | | 7.20% | | | 10/01/16 | | | 7,120 | | | 7,619,503 | |
Small Business Administration Participation Certificates, Series 1997-A20 | | 7.15% | | | 01/01/17 | | | 7,504 | | | 8,027,736 | |
Small Business Administration Participation Certificates, Series 1997-G20 | | 6.85% | | | 07/01/17 | | | 2,070 | | | 2,210,918 | |
United States Treasury Bonds(a) | | 5.25% | | | 11/15/28 | | | 4,200 | | | 4,402,125 | |
United States Treasury Bonds(a) | | 5.375% | | | 02/15/31 | | | 12,280 | | | 13,278,708 | |
United States Treasury Bonds | | 5.50% | | | 08/15/28 | | | 4,420 | | | 4,783,960 | |
United States Treasury Bonds(a) | | 13.25% | | | 05/15/14 | | | 5,600 | | | 7,781,374 | |
United States Treasury Notes(a) | | 3.50% | | | 12/15/09 | | | 1,120 | | | 1,114,575 | |
United States Treasury Notes(a) | | 3.875% | | | 05/15/09 | | | 10,220 | | | 10,370,510 | |
United States Treasury Notes(a) | | 4.25% | | | 11/15/14 | | | 12,940 | | | 12,973,864 | |
United States Treasury Strips, P/O | | 6.125% | | | 11/15/27 | | | 505 | | | 158,232 | |
| | | | | | | | | | |
|
|
|
| | | | | | | | | | | | 178,093,417 | |
| | | | | | | | | | |
|
|
|
TOTAL LONG-TERM INVESTMENTS
(cost $385,328,273) | | | | | | | | | | | 390,339,410 | |
| | | | | | | | | | |
|
|
|
| SHORT-TERM INVESTMENTS — 33.2% | | | | | | | Shares
| | | |
Mutual Fund | | | | | | | | | | | | |
Dryden Core Investment Fund — Taxable Money Market Series(e)
(cost $139,600,515) | | | | | | | | 139,600,515 | | | 139,600,515 | |
| | |
|
|
|
TOTAL INVESTMENTS — 126.1% | | | | |
(cost $ 524,928,788) | | | 529,939,925 | |
VARIATION MARGIN ON OPEN FUTURES CONTRACTS | | | 6,266 | |
LIABILITIES IN EXCESS OF OTHER ASSETS — (26.1)% | | | (109,789,567 | ) |
| | |
|
|
|
TOTAL NET ASSETS — 100.0% | | $ | 420,156,624 | |
| | |
|
|
|
The following abbreviations are used in portfolio descriptions:
| | |
| P/O | | Principal Only |
| TBA | | Securities purchased on a forward commitment basis |
| (a) | All or a portion of securities on loan with an aggregate market value of $60,640,603; cash collateral of $62,279,071 was received with which the portfolio purchased securities. |
| (b) | Security segregated as collateral for futures contracts. |
| (c) | US$ Denominated Foreign Bonds. |
| (d) | Indicates a variable rate security. The maturity date presented for these instruments is the later of the next date on which the security can be redeemed at par or the next date on which the rate of interest is adjusted. The interest rate shown reflects the rate in effect at December 31, 2004. |
| (e) | Represents security, or a portion thereof, purchased with cash collateral received for securities on loan. |
| (f) | Represents yield to maturity as of December 31, 2004. |
SEE NOTES TO FINANCIAL STATEMENTS.
B49
| | | | |
| | | GOVERNMENT INCOME PORTFOLIO (Continued) | | |
SCHEDULE OF INVESTMENTS | December 31, 2004 |
| (g) | Open futures contracts as of December 31, 2004 were as follows: |
| | | | | | | | | | | | | | |
Number of
Contracts
| | Type
| | Expiration
Date
| | Value at
Trade Date
| | Value at
December 31, 2004
| | Unrealized
Appreciation/
(Depreciation)
| |
| Long Positions: | | | | | | | | | | | | | | |
| 135 | | Eurodollar Futures | | Sep 05 | | $ | 32,584,329 | | $ | 32,605,875 | | $ | 21,546 | |
| 165 | | U.S. Treasury Bonds | | Mar 05 | | | 18,357,619 | | | 18,562,500 | | | 204,881 | |
| Short Positions: | | | | | | | | | | | | | | |
| 275 | | U.S. Treasury 10Yr Notes | | Mar 05 | | $ | 30,706,147 | | $ | 30,782,812 | | | (76,665 | ) |
| 82 | | U.S. Treasury 5Yr Notes | | Mar 05 | | | 8,945,546 | | | 8,981,563 | | | (36,017 | ) |
| 318 | | U.S. Treasury 2Yr Notes | | Mar 05 | | | 66,673,778 | | | 66,650,813 | | | 22,965 | |
| | | | | | | | | | | | |
|
|
|
| | | | | | | | | | | | | | $136,710 | |
| | | | | | | | | | | | |
|
|
|
The asset category classification of portfolio holdings and liabilities in excess of assets shown as a percentage of net assets as of December 31, 2004 was as follows:
| | | |
U.S Government & Agency Obligations | | 42.4 | % |
Mortgage Backed Securities | | 35.9 | |
Mutual Fund | | 33.2 | |
Collateralized Mortgage Obligations | | 6.5 | |
Commercial Mortgage Backed Securities | | 6.4 | |
Asset Backed Securities | | 0.9 | |
Municipal Bond | | 0.8 | |
| | |
|
|
| | | 126.1 | |
Liabilities in excess of other assets | | (26.1 | ) |
| | |
|
|
| | | 100 | % |
| | |
|
|
SEE NOTES TO FINANCIAL STATEMENTS.
B50
| | | | |
| | | HIGH YIELD BOND PORTFOLIO | | |
SCHEDULE OF INVESTMENTS | December 31, 2004 |
| | | | | | | | | | | | |
LONG-TERM INVESTMENTS — 90.8%
CORPORATE BONDS — 87.0% | | Moody’s Rating (Unaudited)
| | Interest Rate
| | Maturity Date
| | Principal Amount
(000)
| | Value (Note 2)
|
Aerospace/Defense — 2.1% | | | | | | | | | | | | |
Alliant Techsystems, Inc., Sr. Sub. Notes | | B2 | | 8.50% | | 05/15/11 | | $ | 2,750 | | $ | 3,011,250 |
Argo Tech Corp., Sr. Notes(b) | | B3 | | 9.25% | | 06/01/11 | | | 915 | | | 1,004,213 |
BE Aerospace, Inc., Sr. Sub Notes(b) | | Caa3 | | 8.875% | | 05/01/11 | | | 3,485 | | | 3,641,825 |
BE Aerospace, Inc., Sr. Sub Notes, Ser. B | | Caa3 | | 8.00% | | 03/01/08 | | | 1,150 | | | 1,151,437 |
Esterline Technologies Corp., Sr. Sub Notes | | B1 | | 7.75% | | 06/15/13 | | | 4,500 | | | 4,916,250 |
K&F Industry, Inc., (cost $4,947,911, purchased 11/17/04)(f) | | B2 | | 4.70% | | 11/05/12 | | | 4,948 | | | 5,024,199 |
K&F Industry, Inc., Sr. Sub. Notes 144A | | Caa1 | | 7.75% | | 11/15/14 | | | 2,600 | | | 2,684,500 |
L-3 Communications Corp., Sr. Sub. Notes | | Ba3 | | 7.625% | | 06/15/12 | | | 4,750 | | | 5,213,125 |
Sequa Corp., Sr. Notes | | B1 | | 8.875% | | 04/01/08 | | | 2,575 | | | 2,819,625 |
Standard Aero Holdings, Inc., Sr. Sub Notes 144A | | Caa1 | | 8.25% | | 09/01/14 | | | 2,050 | | | 2,214,000 |
TransDigm, Inc. | | B3 | | 8.375% | | 07/15/11 | | | 1,500 | | | 1,608,750 |
| | | | | | | | | | | |
|
|
| | | | | | | | | | | | | 33,289,174 |
| | | | | | | | | | | |
|
|
Airlines — 0.9% | | | | | | | | | | | | |
American Airline Bank Loan, Term B (cost $2,000,000; purchased 12/17/04)(f)(h) | | B2 | | 9.50% | | 12/17/10 | | | 2,000 | | | 2,031,876 |
AMR Corp., Deb. Notes | | Caa2 | | 10.00% | | 04/15/21 | | | 1,695 | | | 1,245,825 |
AMR Corp., M.T.N. | | NR | | 10.40% | | 03/15/11 | | | 1,000 | | | 765,000 |
AMR Corp., M.T.N. | | NR | | 10.55% | | 03/12/21 | | | 1,425 | | | 1,011,750 |
AMR Corp., Notes, M.T.N. | | NR | | 10.40% | | 03/10/11 | | | 1,000 | | | 765,000 |
Calair Capital Corp., Gtd. Notes | | Caa2 | | 8.125% | | 04/01/08 | | | 1,978 | | | 1,612,070 |
Continental Airlines, Inc., Pass-thru Certs., Ser. 01-1, Class B | | Ba1 | | 7.373% | | 06/15/17 | | | 1,169 | | | 987,246 |
Continental Airlines, Inc., Pass-thru Certs., Ser. 98-1, Class B | | Ba2 | | 6.748% | | 03/15/17 | | | 1,743 | | | 1,422,748 |
Continental Airlines, Inc., Pass-thru Certs., Ser. 99-1, Class B | | Ba2 | | 6.795% | | 08/02/18 | | | 931 | | | 813,906 |
Continental Airlines, Inc., Pass-thru Certs., Ser. 99-2, Class B | | Ba2 | | 7.566% | | 03/15/20 | | | 1,364 | | | 1,151,496 |
Delta Air Lines, Inc., Pass-thru Certs., Ser. 93, Class A-2 | | Caa2 | | 10.50% | | 04/30/16 | | | 2,000 | | | 1,311,580 |
Delta Air Lines, Inc., Sr. Notes | | Ca | | 8.30% | | 12/15/29 | | | 1,130 | | | 548,050 |
Delta Air Lines, Inc., Sr. Notes(b) | | C(g) | | 10.00% | | 08/15/08 | | | 995 | | | 733,813 |
| | | | | | | | | | | |
|
|
| | | | | | | | | | | | | 14,400,360 |
| | | | | | | | | | | |
|
|
Automotive — 1.6% | | | | | | | | | | | | |
ArvinMeritor, Inc., Notes(b) | | Ba1 | | 8.75% | | 03/01/12 | | | 7,245 | | | 8,367,975 |
Collins & Aikman Products Co., Sr. Notes(b) | | B2 | | 10.75% | | 12/31/11 | | | 925 | | | 943,500 |
Collins & Aikman Products Co., Sr. Sub. Notes144A(b) | | B3 | | 12.875% | | 08/15/12 | | | 535 | | | 462,106 |
Cooper Standard Automotive, Inc., Notes144A(b) | | B3 | | 8.375% | | 12/15/14 | | | 1,600 | | | 1,596,000 |
Navistar International Corp., Sr. Notes(b) | | Ba3 | | 7.50% | | 06/15/11 | | | 615 | | | 659,588 |
Navistar International Corp., Sr. Notes, Ser. B | | Ba3 | | 9.375% | | 06/01/06 | | | 1,300 | | | 1,391,000 |
Tenneco Automotive, Inc., Sr. Sub. Notes 144A(b) | | B3 | | 8.625% | | 11/15/14 | | | 3,025 | | | 3,146,000 |
TRW Automotive, Inc., Sr. Notes | | Ba3 | | 9.375% | | 02/15/13 | | | 2,409 | | | 2,794,440 |
TRW Automotive, Inc., Sr. Sub. Notes(b) | | B1 | | 11.00% | | 02/15/13 | | | 975 | | | 1,174,875 |
Visteon Corp., Notes(b) | | Ba1 | | 7.00% | | 03/10/14 | | | 2,185 | | | 2,086,675 |
Visteon Corp., Sr. Notes(b) | | Ba1 | | 8.25% | | 08/01/10 | | | 2,475 | | | 2,592,562 |
| | | | | | | | | | | |
|
|
| | | | | | | | | | | | | 25,214,721 |
| | | | | | | | | | | |
|
|
Banking — 0.4% | | | | | | | | | | | | |
Halyk Savings Bank of Kazakhstan, Notes 144A (Kazakhstan) | | Baa2 | | 8.125% | | 10/07/09 | | | 1,305 | | | 1,353,938 |
Kazkommerts International BV, Gtd. Notes 144A (Netherlands) | | Baa2 | | 7.00% | | 11/03/09 | | | 1,685 | | | 1,693,425 |
Kazkommerts International BV, Gtd. Notes 144A (Netherlands) | | Baa2 | | 8.50% | | 04/16/13 | | | 3,360 | | | 3,511,200 |
| | | | | | | | | | | |
|
|
| | | | | | | | | | | | | 6,558,563 |
| | | | | | | | | | | |
|
|
Building Materials & Construction — 2.1% | | | | | | | | | | | | |
American Standard, Inc., Gtd. Notes (cost $3,021,988; purchased 03/17/03)(f) | | Baa3 | | 7.375% | | 04/15/05 | | | 3,000 | | | 3,036,306 |
Beazer Homes USA, Inc., Sr. Notes | | Ba1 | | 8.625% | | 05/15/11 | | | 1,820 | | | 1,983,800 |
D.R. Horton, Inc., Gtd. Notes | | Ba1 | | 8.00% | | 02/01/09 | | | 3,000 | | | 3,356,250 |
D.R. Horton, Inc., Sr. Notes | | Ba1 | | 8.50% | | 04/15/12 | | | 3,250 | | | 3,623,750 |
Goodman Global Holdings Co., Inc., Sr. Notes 144A(h) | | B3 | | 5.76% | | 06/15/12 | | | 2,900 | | | 2,943,500 |
K Hovnanian Enterprises, Inc., Gtd. Notes 144A | | Ba2 | | 6.25% | | 01/15/15 | | | 3,500 | | | 3,438,750 |
KB HOME, Notes | | Ba1 | | 6.375% | | 08/15/11 | | | 700 | | | 735,000 |
SEE NOTES TO FINANCIAL STATEMENTS.
B51
| | | | |
| | | HIGH YIELD BOND PORTFOLIO (Continued) | | |
SCHEDULE OF INVESTMENTS | December 31, 2004 |
| | | | | | | | | | | | | | |
| CORPORATE BONDS (Continued) | | Moody’s Rating (Unaudited)
| | Interest Rate
| | | Maturity Date
| | Principal Amount
(000)
| | | Value (Note 2)
|
Building Materials & Construction (cont’d.) | | | | | | | | | | | | |
KB HOME, Sr. Sub. Notes(b) | | Ba2 | | 8.625% | | | 12/15/08 | | $ | 2,800 | | | $ | 3,164,000 |
New Millenium Homes LLC, Sr. Notes (cost $2,827,810; purchased 9/25/00)(f) | | NR | | 0.00% | | | 12/31/07 | | | 2,781 | | | | 1,668,600 |
Nortek Inc., Sr. Sub. Notes 144A | | B3 | | 8.50% | | | 09/01/14 | | | 3,375 | | | | 3,526,875 |
Toll Corp., Sr. Sub. Notes(b) | | Ba2 | | 8.25% | | | 02/01/11 | | | 4,150 | | | | 4,482,000 |
WCI Communities, Inc., Gtd. Notes | | Ba3 | | 9.125% | | | 05/01/12 | | | 2,000 | | | | 2,220,000 |
| | | | | | | | | | | | | |
|
|
| | | | | | | | | | | | | | | 34,178,831 |
| | | | | | | | | | | | | |
|
|
Cable — 3.8% | | | | | | | | | | | | | | |
AT&T Broadband Corp., Notes | | Baa3 | | 8.375% | | | 03/15/13 | | | 100 | (i) | | | 123 |
Avalon Cable Holdings, Sr. Disc. Notes | | Caa1 | | 11.875% | | | 12/01/08 | | | 1,891 | | | | 1,973,345 |
Callahan Nordhein-Westfalen, Sr. Disc. Notes, Zero Coupon (until 07/15/05) (Germany)(cost $3,863,565; purchased 06/29/00)(c)(f) | | NR | | 11.00% | (j) | | 07/15/10 | | | 7,000 | | | | 280,000 |
Charter Communications Bank, (cost $7,910,000; purchased 12/3/04)(f) | | B2 | | 5.17% | | | 04/27/10 | | | 8,000 | | | | 7,948,336 |
Charter Communciations Operating Charter, Sr. Notes 144A(b) | | B2 | | 8.375% | | | 04/30/14 | | | 3,000 | | | | 3,165,000 |
Charter Communications Holdings, Sr. Disc. Notes | | Ca | | 1.00% | | | 01/15/10 | | | 700 | | | | 652,750 |
Charter Communications Holdings, Sr. Disc. Notes(b), Zero coupon
(until 1/15/06) | | Ca | | 13.50% | (j) | | 01/15/11 | | | 1,000 | | | | 840,000 |
Charter Communications Holdings, Sr. Disc. Notes, Zero Coupon
(until 05/15/06) | | Ca | | 11.75% | (j) | | 05/15/11 | | | 3,150 | | | | 2,315,250 |
Charter Communications Holdings, Sr. Notes(b) | | Ca | | 8.625% | | | 04/01/09 | | | 2,675 | | | | 2,320,563 |
Charter Communications Holdings, Sr. Notes(b) | | Ca | | 9.625% | | | 11/15/09 | | | 1,150 | | | | 1,009,125 |
Charter Communications Holdings, Sr. Notes(b) | | Ca | | 10.00% | | | 05/15/11 | | | 9,109 | | | | 7,788,195 |
Charter Communications Holdings, Sr. Notes(b) | | Ca | | 10.25% | | | 01/15/10 | | | 360 | | | | 315,900 |
Charter Communications Holdings, Sr. Notes | | Ca | | 10.75% | | | 10/01/09 | | | 1,700 | | | | 1,547,000 |
Charter Communications Holdings, Sr. Notes(b) | | Ca | | 11.125% | | | 01/15/11 | | | 3,075 | | | | 2,782,875 |
Charter Communications Holdings II, Sr. Notes(b) | | Caa1 | | 10.25% | | | 09/15/10 | | | 3,725 | | | | 3,948,500 |
CSC Holdings, Inc., Sr. Debs.(b) | | B1 | | 7.625% | | | 07/15/18 | | | 1,250 | | | | 1,321,875 |
CSC Holdings, Inc., Sr. Notes, Ser. B(b) | | B1 | | 8.125% | | | 07/15/09 | | | 1,500 | | | | 1,640,625 |
CSC Holdings. Inc., Sr. Notes | | B1 | | 7.875% | | | 12/15/07 | | | 2,650 | | | | 2,842,125 |
Kabel Deutschland GMBH, Sr. Notes 144A (Germany) | | B2 | | 10.625% | | | 07/01/14 | | | 3,295 | | | | 3,789,250 |
Rogers Cable, Inc., Gtd. Debs. (Canada) | | B2 | | 11.00% | | | 12/01/15 | | | 4,500 | | | | 5,017,500 |
Rogers Cablesystems Ltd., Sec’d. (Canada) | | Ba3 | | 6.75% | | | 03/15/15 | | | 800 | | | | 818,000 |
UPC Distribution Holdings Bank, (cost $5,000,000; purchased 11/22/04)(f)(h) | | B1 | | 5.98% | | | 11/04/11 | | | 5,000 | | | | 5,054,690 |
Videotron Ltee, Sr. Notes 144A (Canada) | | Ba3 | | 6.875% | | | 01/15/14 | | | 3,000 | | | | 3,101,250 |
| | | | | | | | | | | | | |
|
|
| | | | | | | | | | | | | | | 60,472,277 |
| | | | | | | | | | | | | |
|
|
Capital Goods — 5.5% | | | | | | | | | | | | | | |
Allied Waste of North America, Inc., Sr. Notes | | B2 | | 5.75% | | | 02/15/11 | | | 5,320 | | | | 5,000,800 |
Allied Waste of North America, Inc., Sr. Notes | | B2 | | 7.625% | | | 01/01/06 | | | 1,250 | | | | 1,287,500 |
Allied Waste of North America, Inc., Sr. Notes | | B2 | | 7.875% | | | 04/15/13 | | | 675 | | | | 691,875 |
Allied Waste of North America, Inc., Sr. Notes(b) | | B2 | | 8.50% | | | 12/01/08 | | | 8,200 | | | | 8,692,000 |
AMSTED Industries, Inc., Sr. Notes 144A (cost $2,560,000; purchased 8/8/03)(f) | | B3 | | 10.25% | | | 10/15/11 | | | 2,550 | | | | 2,881,500 |
Case New Holland, Inc., Sr. Notes 144A | | Ba3 | | 9.25% | | | 08/01/11 | | | 5,555 | | | | 6,179,937 |
Flowserve Corp., Gtd. Notes | | B2 | | 12.25% | | | 08/15/10 | | | 1,725 | | | | 1,906,125 |
Great Lakes Dredge & Dock Corp., Sr. Sub. Notes(b) | | Caa2 | | 7.75% | | | 12/15/13 | | | 2,010 | | | | 1,829,100 |
Holt Group, Inc., Sr. Notes (cost $800,000; purchased 01/15/98)(c)(f) | | NR | | 9.75% | | | 01/15/06 | | | 800 | | | | 2,000 |
Invensys PLC, Sr. Notes (United Kingdom) 144A | | B3 | | 9.875% | | | 03/15/11 | | | 3,415 | | | | 3,671,125 |
Johnsondiversey, Inc., Gtd. Notes | | B2 | | 9.625% | | | 05/15/12 | | | 725 | | | | 810,188 |
Johnsondiversey, Inc., Sr. Disc. Notes, Zero Coupon (until 5/15/07)
(cost $3,664,180; purchased 2/25/04-12/7/04)(b)(f) | | B3 | | 10.67% | (j) | | 05/15/13 | | | 4,575 | | | | 3,957,375 |
Joy Global, Inc., Gtd. Notes, Ser. B | | B1 | | 8.75% | | | 03/15/12 | | | 6,110 | | | | 6,843,200 |
Manitowoc Co., Inc., Sr. Sub. Notes | | B2 | | 10.50% | | | 08/01/12 | | | 6,800 | | | | 7,820,000 |
Motors & Gears, Inc., Sr. Notes | | Caa1 | | 10.75% | | | 11/15/06 | | | 165 | | | | 161,288 |
Mueller Group, Inc., Sr. Sub. Notes | | Caa1 | | 10.00% | | | 05/01/12 | | | 1,835 | | | | 2,000,150 |
Noteco Ltd., Notes (United Kingdom)(h) | | NR | | 1.00% | | | 06/30/25 | | | 1,264 | | | | 2,608,762 |
Rexnord Corp., Gtd. Notes (cost $3,575,000; purchased 11/19/02)(f) | | B3 | | 10.125% | | | 12/15/12 | | | 3,575 | | | | 4,039,750 |
SEE NOTES TO FINANCIAL STATEMENTS.
B52
| | | | |
| | | HIGH YIELD BOND PORTFOLIO (Continued) | | |
SCHEDULE OF INVESTMENTS | December 31, 2004 |
| | | | | | | | | | | | |
| CORPORATE BONDS (Continued) | | Moody’s Rating (Unaudited)
| | Interest Rate
| | Maturity Date
| | Principal Amount
(000)
| | Value (Note 2)
|
Capital Goods (cont’d.) | | | | | | | | | | | | |
Sensus Metering Systems Inc., Sr. Sub. Notes | | Caa1 | | 8.625% | | 12/15/13 | | $ | 2,175 | | $ | 2,229,375 |
SPX Corp., Sr. Notes | | Ba3 | | 7.50% | | 01/01/13 | | | 1,070 | | | 1,160,950 |
Stena AB, Sr. Notes (Sweden) | | Ba3 | | 7.50% | | 11/01/13 | | | 3,175 | | | 3,325,813 |
Stena AB, Sr. Notes (Sweden) | | Ba3 | | 9.625% | | 12/01/12 | | | 1,600 | | | 1,808,000 |
Terex Corp., Gtd. Notes 144A | | B3 | | 7.375% | | 01/15/14 | | | 650 | | | 697,125 |
Terex Corp., Sr. Sub. Notes | | B3 | | 9.25% | | 07/15/11 | | | 2,825 | | | 3,171,062 |
Terex Corp., Sr. Sub. Notes(b) | | B3 | | 10.375% | | 04/01/11 | | | 5,534 | | | 6,198,080 |
Thermadyne Holdings Corp., Sr. Notes | | Caa1 | | 9.25% | | 02/01/14 | | | 2,825 | | | 2,754,375 |
Trism, Inc., Gtd. Notes (cost $1,572,399; purchased 03/01/00)(c)(f) | | NR | | 12.00% | | 02/15/05 | | | 1,305 | | | 3,262 |
Tyco International Group SA, Notes (Luxembourg) | | Baa3 | | 6.375% | | 10/15/11 | | | 790 | | | 872,204 |
United Rentals North America, Inc., Gtd. Notes | | B1 | | 6.50% | | 02/15/12 | | | 1,300 | | | 1,267,500 |
United Rentals North America, Inc., Gtd. Notes(b) | | B2 | | 7.75% | | 11/15/13 | | | 3,150 | | | 3,087,000 |
| | | | | | | | | | | |
|
|
| | | | | | | | | | | | | 86,957,421 |
| | | | | | | | | | | |
|
|
Chemicals — 4.0% | | | | | | | | | | | | |
BCP Caylux Holdings, Sr. Sub. Notes 144A (Luxembourg) | | B3 | | 9.625% | | 06/15/14 | | | 800 | | | 902,000 |
Borden United States Finance Corp., Sr. Sec’d. Notes 144A | | B3 | | 6.82% | | 07/15/10 | | | 1,500 | | | 1,567,500 |
Borden United States Finance Corp., Sr. Sec’d. Notes 144A(b) | | B3 | | 9.00% | | 07/15/14 | | | 2,750 | | | 3,052,500 |
Equistar Chemicals LP, Gtd. Notes(b) | | B2 | | 10.125% | | 09/01/08 | | | 2,320 | | | 2,673,800 |
Equistar Chemicals LP, Sr. Notes(b) | | B2 | | 10.625% | | 05/01/11 | | | 2,185 | | | 2,534,600 |
Hercules, Inc., Gtd. Notes | | Ba3 | | 6.75% | | 10/15/29 | | | 2,955 | | | 3,051,038 |
HMP Equity Holdings Corp., Sr. Sec’d. Notes | | CCC+(g) | | 0.00% | | 05/15/08 | | | 2,000 | | | 1,322,500 |
Huntsman Advanced Materials LLC, Sr. Sec’d. Notes 144A, Zero coupon | | B2 | | 11.00% | | 07/15/10 | | | 1,150 | | | 1,368,500 |
Huntsman ICI Chemical, Sr. Sub. Notes (k) | | Caa1 | | 10.125% | | 07/01/09 | | | 842 | | | 886,205 |
Huntsman International Holdings LLC, Sr. Disc. Notes, Zero Coupon (b) | | Caa2 | | 0.00% | | 12/31/09 | | | 1,750 | | | 980,000 |
IMC Global, Inc., Debs. (cost $2,541,210; purchased 5/25/04)(b)(f) | | B2 | | 6.875% | | 07/15/07 | | | 2,500 | | | 2,600,000 |
IMC Global, Inc., Gtd. Notes, Ser. B | | B1 | | 10.875% | | 06/01/08 | | | 2,943 | | | 3,531,600 |
IMC Global, Inc., Gtd. Notes, Ser. B | | B1 | | 11.25% | | 06/01/11 | | | 499 | | | 576,345 |
IMC Global, Inc., Gtd. Notes, Ser. B | | B1 | | 11.25% | | 06/01/11 | | | 1,100 | | | 1,270,500 |
ISP Chemco, Inc., Gtd. Notes, Ser. B | | B1 | | 10.25% | | 07/01/11 | | | 5,685 | | | 6,424,050 |
Koppers, Inc., Gtd. Notes | | B2 | | 9.875% | | 10/15/13 | | | 650 | | | 741,000 |
Lyondell Chemical Co., Sec’d. Notes, Ser. B | | B1 | | 9.875% | | 05/01/07 | | | 3,559 | | | 3,728,052 |
Millennium America, Inc., Gtd. Notes | | B1 | | 9.25% | | 06/15/08 | | | 93 | | | 105,814 |
Nalco Co., Sr. Sub. Notes(b) | | Caa1 | | 8.875% | | 11/15/13 | | | 6,500 | | | 7,133,750 |
OM Group, Inc., Sr. Sub. Notes | | Caa1 | | 9.25% | | 12/15/11 | | | 2,740 | | | 2,918,100 |
Rhodia SA, Sr. Notes (France)(b) | | B3 | | 10.25% | | 06/01/10 | | | 5,630 | | | 6,333,750 |
Rhodia SA, Sr. Sub. Notes (France)(b) | | Caa1 | | 8.875% | | 06/01/11 | | | 4,585 | | | 4,619,387 |
Rockwood Specialties, Inc., Sr. Sub. Notes (cost $2,782,789 purchased 7/9/03-4/26/04)(b)(f) | | B3 | | 10.625% | | 05/15/11 | | | 2,715 | | | 3,122,250 |
Westlake Chemical Corp., Gtd. Notes | | Ba2 | | 8.75% | | 07/15/11 | | | 2,600 | | | 2,938,000 |
| | | | | | | | | | | |
|
|
| | | | | | | | | | | | | 64,381,241 |
| | | | | | | | | | | |
|
|
Consumer — 1.6% | | | | | | | | | | | | |
Alderwoods Group, Inc., Sr. Notes 144A(b) | | B2 | | 7.75% | | 09/15/12 | | | 3,475 | | | 3,753,000 |
Coinmach Corp., Sr. Notes | | B3 | | 9.00% | | 02/01/10 | | | 1,967 | | | 2,055,515 |
Levi Strauss & Co., Sr. Notes 144A(b) | | Ca | | 9.75% | | 01/15/15 | | | 4,425 | | | 4,380,750 |
Levi Strauss & Co., Sr. Notes(b) | | Ca | | 12.25% | | 12/15/12 | | | 4,720 | | | 5,251,000 |
Propex Fabrics, Inc., Sr. Notes 144A | | Caa1 | | 10.00% | | 12/01/12 | | | 4,000 | | | 4,150,000 |
Rayovac Corp., Sr. Sub. Notes | | B3 | | 8.50% | | 10/01/13 | | | 1,355 | | | 1,504,050 |
Service Corp. International, Debs.(b) | | Ba3 | | 7.875% | | 02/01/13 | | | 2,000 | | | 2,175,000 |
Service Corp. International, Notes | | Ba3 | | 6.00% | | 12/15/05 | | | 473 | | | 481,278 |
Service Corp. International, Notes | | Ba3 | | 6.50% | | 03/15/08 | | | 2,000 | | | 2,065,000 |
| | | | | | | | | | | |
|
|
| | | | | | | | | | | | | 25,815,593 |
| | | | | | | | | | | |
|
|
Electric — 9.1% | | | | | | | | | | | | |
AES Corp., Sec’d. Notes 144A(b) | | B1 | | 8.75% | | 05/15/13 | | | 2,695 | | | 3,062,194 |
AES Corp., Sr. Notes(b) | | B2 | | 9.375% | | 09/15/10 | | | 9,200 | | | 10,695,000 |
AES Corp., Sr. Notes(b) | | B2 | | 9.50% | | 06/01/09 | | | 1,325 | | | 1,507,187 |
SEE NOTES TO FINANCIAL STATEMENTS.
B53
| | | | |
| | | HIGH YIELD BOND PORTFOLIO (Continued) | | |
SCHEDULE OF INVESTMENTS | December 31, 2004 |
| | | | | | | | | | | | |
| CORPORATE BONDS (Continued) | | Moody’s Rating (Unaudited)
| | Interest Rate
| | Maturity Date
| | Principal Amount
(000)
| | Value (Note 2)
|
Electric (cont’d.) | | | | | | | | | | | | |
AES Eastern Energy LP, Ser. 99-A | | Ba1 | | 9.00% | | 01/02/17 | | $ | 3,067 | | $ | 3,481,066 |
Allegheny Energy Supply Co., LLC, Notes 144A(b) | | B3 | | 8.25% | | 04/15/12 | | | 1,555 | | | 1,737,713 |
Aquila, Inc., Sr. Notes(b) | | B2 | | 9.95% | | 02/01/11 | | | 5,250 | | | 5,945,625 |
Beaver Valley II Funding Corp., Debs. | | Ba1 | | 9.00% | | 06/01/17 | | | 4,000 | | | 4,730,760 |
Calpine Canada Energy Finance, Gtd. Notes (Canada)(b) | | Caa1 | | 8.50% | | 05/01/08 | | | 2,500 | | | 2,050,000 |
Calpine Corp., Sr. Notes(b) | | Caa1 | | 8.50% | | 02/15/11 | | | 758 | | | 577,975 |
Calpine Corp., Sr. Notes(b) | | Caa1 | | 8.75% | | 07/15/07 | | | 5,000 | | | 4,375,000 |
Calpine Corp., Sr. Sec’d. Notes 144A(b) | | B(g) | | 8.75% | | 07/15/13 | | | 5,260 | | | 4,339,500 |
CMS Energy Corp., Sr. Notes(b) | | B1 | | 7.50% | | 01/15/09 | | | 3,290 | | | 3,503,850 |
CMS Energy Corp., Sr. Notes | | B1 | | 8.50% | | 04/15/11 | | | 1,910 | | | 2,170,238 |
CMS Energy Corp., Sr. Notes | | B1 | | 9.875% | | 10/15/07 | | | 4,725 | | | 5,280,187 |
Dynegy Holdings, Inc., Debs. | | Caa2 | | 7.125% | | 05/15/18 | | | 675 | | | 601,594 |
Dynegy Holdings, Inc., Debs. | | Caa2 | | 7.625% | | 10/15/26 | | | 1,425 | | | 1,237,968 |
Dynegy Holdings, Inc., Sr. Notes(b) | | Caa2 | | 6.875% | | 04/01/11 | | | 1,210 | | | 1,164,625 |
Dynegy Holdings, Inc., Sr. Sec’d. Notes 144A | | B3 | | 10.125% | | 07/15/13 | | | 6,520 | | | 7,465,400 |
Edison Mission Energy, Sr. Notes(b) | | B1 | | 7.73% | | 06/15/09 | | | 6,140 | | | 6,600,500 |
Edison Mission Energy, Sr. Notes(b) | | B1 | | 9.875% | | 04/15/11 | | | 720 | | | 853,200 |
Empresa Nacional de Electricidad SA, Notes (Chile)(b) | | Ba2 | | 8.35% | | 08/01/13 | | | 5,650 | | | 6,547,005 |
Empresa Nacional de Electricidad SA, Notes (Chile) | | Ba2 | | 8.625% | | 08/01/15 | | | 4,700 | | | 5,627,841 |
Homer City Funding LLC, Gtd. Notes | | Ba2 | | 8.137% | | 10/01/19 | | | 1,593 | | | 1,803,506 |
Inergy LP, Sr. Notes 144A(b) | | B1 | | 6.875% | | 12/15/14 | | | 3,000 | | | 3,015,000 |
Midland Funding II Corp., Debs. | | Ba3 | | 11.75% | | 07/23/05 | | | 1,996 | | | 2,072,561 |
Midland Funding II Corp., Debs. (cost $1,652,309; purchased 9/7/00-9/26/00)(f) | | Ba3 | | 13.25% | | 07/23/06 | | | 1,585 | | | 1,748,406 |
Midwest Generation LLC, Pass-thru Certs., Ser. A (cost $3,309,978; purchased 11/20/03-9/17/04)(f) | | B1 | | 8.30% | | 07/02/09 | | | 3,225 | | | 3,466,875 |
Midwest Generation LLC, Pass-thru Certs., Ser. B | | B1 | | 8.56% | | 01/02/16 | | | 1,320 | | | 1,465,200 |
Midwest Generation LLC, Sec’d. Notes | | B1 | | 8.75% | | 05/01/34 | | | 4,625 | | | 5,249,375 |
Mirant Corp., Sr. Notes 144A(c) | | NR | | 7.40% | | 07/15/04 | | | 1,825 | | | 1,341,375 |
Mission Energy Holding Co., Sr. Sec’d. Notes | | B3 | | 13.50% | | 07/15/08 | | | 1,925 | | | 2,401,438 |
Nevada Power Co.(b) | | Ba2 | | 8.25% | | 06/01/11 | | | 1,675 | | | 1,924,156 |
Nevada Power Co. | | Ba2 | | 10.875% | | 10/15/09 | | | 265 | | | 306,075 |
NRG Energy, Inc. 144A | | B1 | | 8.00% | | 12/15/13 | | | 9,030 | | | 9,842,700 |
Orion Power Holdings, Inc., Sr. Notes | | B2 | | 12.00% | | 05/01/10 | | | 5,055 | | | 6,419,850 |
Reliant Energy Mid-Atlantic Power, Pass-thru Certs., Ser. B
(cost $1,860,170; purchased 07/24/03)(f) | | B1 | | 9.237% | | 07/02/17 | | | 1,791 | | | 2,059,119 |
Reliant Energy Mid-Atlantic Power, Pass-thru Certs., Ser. C | | B1 | | 9.681% | | 07/02/26 | | | 250 | | | 271,906 |
Reliant Energy, Inc., Sec. Notes(b) | | B1 | | 9.50% | | 07/15/13 | | | 6,110 | | | 6,942,488 |
Sierra Pacific Power Co., Gen. Ref. Mtge. Notes, Ser. A | | Ba2 | | 8.00% | | 06/01/08 | | | 1,505 | | | 1,647,975 |
Sierra Pacific Resources, Inc., Sr. Notes(b) | | B2 | | 8.625% | | 03/15/14 | | | 1,530 | | | 1,728,900 |
TECO Energy, Inc., Sr. Notes(b) | | Ba2 | | 7.50% | | 06/15/10 | | | 3,800 | | | 4,199,000 |
Texas Genco Holdings Bank, (cost $1,576,811; purchased 12/10/04)(f)(h) | | Ba2 | | 4.48% | | 12/14/11 | | | 1,577 | | | 1,597,366 |
Texas Genco Holdings Bank, (cost $651,291; purchased 12/8/04)(f)(h) | | Ba2 | | 1.25% | | 12/14/11 | | | 651 | | | 659,665 |
Utilicorp, Gtd. Notes (Canada) | | B2 | | 7.75% | | 06/15/11 | | | 625 | | | 649,219 |
York Power Funding, Sr. Sec’d. Notes 144A (Cayman Islands)
(cost $539,993; purchased 07/31/98)(c)(f) | | D(g) | | 12.00% | | 10/30/07 | | | 540 | | | 46,709 |
| | | | | | | | | | | |
|
|
| | | | | | | | | | | | | 144,413,292 |
| | | | | | | | | | | |
|
|
Energy – Other — 3.0% | | | | | | | | | | | | |
Chesapeake Energy Corp., Gtd. Notes | | Ba3 | | 7.75% | | 01/15/15 | | | 3,054 | | | 3,321,225 |
Chesapeake Energy Corp., Sr. Notes 144A(b) | | Ba3 | | 6.375% | | 06/15/15 | | | 3,025 | | | 3,108,187 |
Chesapeake Energy Corp., Sr. Notes | | Ba3 | | 7.00% | | 08/15/14 | | | 2,350 | | | 2,502,750 |
Encore Acquisition Co., Sr. Sub. Notes (cost $1,500,000; purchased 03/30/04)(f) | | B2 | | 6.25% | | 04/15/14 | | | 1,500 | | | 1,507,500 |
Forest Oil Corp., Sr. Notes | | Ba3 | | 8.00% | | 06/15/08 | | | 440 | | | 485,650 |
Hanover Compressor Co., Sr. Notes | | B3 | | 8.625% | | 12/15/10 | | | 2,125 | | | 2,321,563 |
Hanover Equipment Trust, Sec’d. Notes(b) | | B2 | | 8.50% | | 09/01/08 | | | 2,110 | | | 2,268,250 |
Hanover Equipment Trust, Sec’d. Notes(b) | | B2 | | 8.75% | | 09/01/11 | | | 2,170 | | | 2,354,450 |
SEE NOTES TO FINANCIAL STATEMENTS.
B54
| | | | |
| | | HIGH YIELD BOND PORTFOLIO (Continued) | | |
SCHEDULE OF INVESTMENTS | December 31, 2004 |
| | | | | | | | | | | | |
| CORPORATE BONDS (Continued) | | Moody’s Rating (Unaudited)
| | Interest Rate
| | Maturity Date
| | Principal Amount
(000)
| | Value (Note 2)
|
Energy – Other (cont’d.) | | | | | | | | | | | | |
Houston Exploration Corp., Sr. Sub. Notes | | B2 | | 7.00% | | 06/15/13 | | $ | 1,625 | | $ | 1,722,500 |
Magnum Hunter Resources, Sr. Notes | | B2 | | 9.60% | | 03/15/12 | | | 341 | | | 387,035 |
Newfield Exploration Co., Sr. Sub. Notes | | Ba3 | | 8.375% | | 08/15/12 | | | 6,235 | | | 6,983,200 |
Parker and Parsley, Sr. Notes | | Baa3 | | 8.875% | | 04/15/05 | | | 1,000 | | | 1,015,376 |
Parker Drilling Co., Gtd. Notes, Ser B | | B2 | | 10.125% | | 11/15/09 | | | 1,021 | | | 1,072,050 |
Parker Drilling Co., Sr. Notes | | B2 | | 9.625% | | 10/01/13 | | | 1,480 | | | 1,661,300 |
Premcor Refining Group, Inc., Gtd. Notes | | Ba3 | | 6.75% | | 05/01/14 | | | 1,635 | | | 1,737,188 |
Premcor Refining Group, Inc., Sr. Notes | | Ba3 | | 6.75% | | 02/01/11 | | | 1,600 | | | 1,724,000 |
Premcor Refining Group, Inc., Sr. Notes | | Ba3 | | 7.50% | | 06/15/15 | | | 675 | | | 730,687 |
Premcor Refining Group, Inc., Sr. Notes | | Ba3 | | 9.50% | | 02/01/13 | | | 3,055 | | | 3,543,800 |
Premcor Refining Group, Inc., Sr. Sub. Notes(b) | | B2 | | 7.75% | | 02/01/12 | | | 1,925 | | | 2,122,312 |
Stone Energy Corp., Sr. Sub. Notes | | B2 | | 8.25% | | 12/15/11 | | | 6,875 | | | 7,425,000 |
| | | | | | | | | | | |
|
|
| | | | | | | | | | | | | 47,994,023 |
| | | | | | | | | | | |
|
|
Foods — 2.2% | | | | | | | | | | | | |
Agrilink Foods, Inc., Sr. Gtd. Notes (cost $434,772; purchased 04/11/00)(f) | | B3 | | 11.875% | | 11/01/08 | | | 465 | | | 484,181 |
Ahold Finance USA, Inc., Notes | | Ba3 | | 8.25% | | 07/15/10 | | | 1,120 | | | 1,268,400 |
Del Monte Corp., Gtd. Notes, Ser. B | | B2 | | 9.25% | | 05/15/11 | | | 2,120 | | | 2,321,400 |
Del Monte Corp., Sr. Sub. Notes | | B2 | | 8.625% | | 12/15/12 | | | 2,700 | | | 3,024,000 |
Delhaize America, Inc., Gtd. Notes | | Ba1 | | 8.125% | | 04/15/11 | | | 7,260 | | | 8,463,156 |
Dole Food Co., Inc., Sr. Notes | | B2 | | 7.25% | | 06/15/10 | | | 1,760 | | | 1,808,400 |
Dole Food Co., Inc., Sr. Notes | | B2 | | 8.625% | | 05/01/09 | | | 2,400 | | | 2,610,000 |
Dole Food Co., Inc., Sr. Notes(b) | | B2 | | 8.875% | | 03/15/11 | | | 1,995 | | | 2,169,562 |
Dominos, Inc., Sr. Sub. Notes | | B2 | | 8.25% | | 07/01/11 | | | 1,276 | | | 1,394,030 |
Pathmark Stores, Inc., Gtd. Notes | | Caa1 | | 8.75% | | 02/01/12 | | | 4,280 | | | 4,087,400 |
Smithfield Foods, Inc., Notes | | Ba2 | | 7.75% | | 05/15/13 | | | 900 | | | 1,001,250 |
Smithfield Foods, Inc., Sr. Notes 144A | | Ba2 | | 7.00% | | 08/01/11 | | | 2,770 | | | 2,956,975 |
Smithfield Foods, Inc., Sr. Notes | | Ba2 | | 8.00% | | 10/15/09 | | | 2,040 | | | 2,259,300 |
Stater Brothers Holdings, Inc., Sr. Notes(b) | | B1 | | 8.125% | | 06/15/12 | | | 1,265 | | | 1,337,738 |
| | | | | | | | | | | |
|
|
| | | | | | | | | | | | | 35,185,792 |
| | | | | | | | | | | |
|
|
Gaming — 5.4% | | | | | | | | | | | | |
Argosy Gaming Co., Sr. Sub. Notes | | B1 | | 7.00% | | 01/15/14 | | | 4,175 | | | 4,613,375 |
Argosy Gaming Co., Sr. Sub. Notes | | Ba3 | | 9.00% | | 09/01/11 | | | 810 | | | 903,150 |
Aztar Corp., Sr. Sub. Notes | | Ba3 | | 7.875% | | 06/15/14 | | | 3,575 | | | 3,941,438 |
Boyd Gaming Corp., Sr. Sub. Notes | | B1 | | 6.75% | | 04/15/14 | | | 1,875 | | | 1,964,063 |
Boyd Gaming Corp., Sr. Sub. Notes | | B1 | | 8.75% | | 04/15/12 | | | 1,500 | | | 1,668,750 |
Caesars Entertainment, Inc., Sr. Notes(b) | | Ba1 | | 7.50% | | 09/01/09 | | | 5,700 | | | 6,341,250 |
Caesars Entertainment, Inc., Sr. Sub. Notes | | Ba2 | | 7.875% | | 12/15/05 | | | 3,500 | | | 3,631,250 |
Caesars Entertainment, Inc., Sr. Sub. Notes | | Ba2 | | 7.875% | | 03/15/10 | | | 700 | | | 788,375 |
Caesars Entertainment, Inc., Sr. Sub. Notes(b) | | Ba2 | | 8.125% | | 05/15/11 | | | 1,530 | | | 1,767,150 |
Caesars Entertainment, Inc., Sr. Sub. Notes | | Ba2 | | 9.375% | | 02/15/07 | | | 355 | | | 391,387 |
Circus Enterprises, Inc., Sr. Notes | | Ba2 | | 6.45% | | 02/01/06 | | | 1,220 | | | 1,247,450 |
Isle of Capri Casinos, Inc., Sr. Sub. Notes | | B2 | | 7.00% | | 03/01/14 | | | 950 | | | 969,000 |
Isle of Capri Casinos, Inc., Sr. Sub. Notes | | B2 | | 9.00% | | 03/15/12 | | | 1,430 | | | 1,576,575 |
Mandalay Resort Group, Sr. Notes | | Ba2 | | 9.50% | | 08/01/08 | | | 2,250 | | | 2,570,625 |
MGM Grand, Inc., Gtd. Notes | | Ba2 | | 9.75% | | 06/01/07 | | | 9,051 | | | 10,046,610 |
MGM Mirage, Inc., Gtd. Notes | | Ba1 | | 6.00% | | 10/01/09 | | | 13,000 | | | 13,325,000 |
Mohegan Tribal Gaming Authority, Sr. Sub. Notes(b) | | Ba3 | | 6.375% | | 07/15/09 | | | 2,585 | | | 2,656,087 |
Mohegan Tribal Gaming Authority, Sr. Sub. Notes | | Ba3 | | 7.125% | | 08/15/14 | | | 900 | | | 947,250 |
Mohegan Tribal Gaming Authority, Sr. Sub. Notes | | Ba3 | | 8.00% | | 04/01/12 | | | 2,845 | | | 3,086,825 |
Station Casinos, Inc., Sr. Notes | | Ba3 | | 6.00% | | 04/01/12 | | | 3,250 | | | 3,310,938 |
Sun International Hotels, Ltd., Sr. Sub. Notes (Bahamas) | | B2 | | 8.875% | | 08/15/11 | | | 5,240 | | | 5,724,700 |
Venetian Casino Resort LLC, Second Mtge. Notes | | B2 | | 11.00% | | 06/15/10 | | | 7,930 | | | 9,050,112 |
Wynn Las Vegas LLC, First Mortgage 144A(b) | | B2 | | 6.625% | | 12/01/14 | | | 4,950 | | | 4,900,500 |
| | | | | | | | | | | |
|
|
| | | | | | | | | | | | | 85,421,860 |
| | | | | | | | | | | |
|
|
Health Care & Pharmaceutical — 7.3% | | | | | | | | | | | | |
Alliance Imaging, Inc., Sr. Sub. Notes 144A(b) | | B3 | | 7.25% | | 12/15/12 | | | 1,675 | | | 1,704,313 |
Bio-Rad Laboratories, Inc., Sr. Sub. Notes | | Ba3 | | 7.50% | | 08/15/13 | | | 1,575 | | | 1,732,500 |
SEE NOTES TO FINANCIAL STATEMENTS.
B55
| | | | |
| | | HIGH YIELD BOND PORTFOLIO (Continued) | | |
SCHEDULE OF INVESTMENTS | December 31, 2004 |
| | | | | | | | | | | | |
| CORPORATE BONDS (Continued) | | Moody’s Rating (Unaudited)
| | Interest Rate
| | Maturity Date
| | Principal Amount
(000)
| | Value (Note 2)
|
Health Care & Pharmaceutical (cont’d.) | | | | | | | | | | | | |
Columbia/HCA Healthcare Corp., Debs. | | Ba2 | | 7.50% | | 12/15/23 | | $ | 600 | | $ | 609,083 |
Columbia/HCA Healthcare Corp., M.T.N. | | Ba2 | | 8.70% | | 02/10/10 | | | 1,800 | | | 2,038,100 |
Columbia/HCA Healthcare Corp., M.T.N. | | Ba2 | | 8.85% | | 01/01/07 | | | 259 | | | 279,356 |
Columbia/HCA Healthcare Corp., Notes | | Ba2 | | 9.00% | | 12/15/14 | | | 4,100 | | | 4,841,731 |
Columbia/HCA Healthcare Corp., Sr. Notes | | Ba2 | | 8.36% | | 04/15/24 | | | 2,000 | | | 2,184,268 |
Concentra Operating Corp., Gtd. Notes 144A | | B3 | | 9.125% | | 06/01/12 | | | 3,625 | | | 4,096,250 |
Coventry Health Care, Inc., Sr. Notes | | Ba1 | | 8.125% | | 02/15/12 | | | 2,375 | | | 2,600,625 |
Elan Finance PLC, Sr. Notes 144A (Ireland)(b) | | B3 | | 7.75% | | 11/15/11 | | | 3,150 | | | 3,354,750 |
Elan Finance PLC, Sr. Notes 144A (Ireland)(h) | | B3 | | 6.51% | | 11/15/11 | | | 1,700 | | | 1,789,250 |
HCA, Inc., Notes | | Ba2 | | 5.25% | | 11/06/08 | | | 2,000 | | | 2,011,654 |
HCA, Inc., Notes | | Ba2 | | 5.50% | | 12/01/09 | | | 5,000 | | | 5,001,635 |
HCA, Inc., Notes(b) | | Ba2 | | 6.375% | | 01/15/15 | | | 4,000 | | | 4,016,196 |
HCA, Inc., Notes | | Ba2 | | 7.125% | | 06/01/06 | | | 3,830 | | | 3,975,525 |
HCA, Inc., Notes(b) | | Ba2 | | 7.50% | | 11/06/33 | | | 1,000 | | | 1,020,133 |
HCA, Inc., Notes | | Ba2 | | 8.75% | | 09/01/10 | | | 2,200 | | | 2,514,787 |
HEALTHSOUTH Corp., Notes(b) | | NR | | 7.625% | | 06/01/12 | | | 9,675 | | | 9,723,375 |
HEALTHSOUTH Corp., Sr. Notes | | NR | | 6.875% | | 06/15/05 | | | 1,200 | | | 1,207,500 |
HEALTHSOUTH Corp., Sr. Notes(b) | | NR | | 7.375% | | 10/01/06 | | | 750 | | | 766,875 |
HEALTHSOUTH Corp., Sr. Notes(b) | | NR | | 8.50% | | 02/01/08 | | | 3,600 | | | 3,735,000 |
Iasis Healthcare LLC, Sr. Sub. Notes | | B3 | | 8.75% | | 06/15/14 | | | 1,400 | | | 1,526,000 |
Inverness Medical Innovations, Inc., Sr. Sub Notes 144A | | Caa1 | | 8.75% | | 02/15/12 | | | 2,655 | | | 2,774,475 |
Magellan Health Services, Inc., Sr. Notes, Ser. A | | B3 | | 9.375% | | 11/15/08 | | | 6,414 | | | 6,983,505 |
Medco Health Solutions, Inc., Sr. Notes | | Ba1 | | 7.25% | | 08/15/13 | | | 3,855 | | | 4,312,392 |
Medical Device Manufacturing, Inc., Gtd. Notes 144A | | Caa1 | | 10.00% | | 07/15/12 | | | 3,785 | | | 4,078,337 |
MedQuest, Inc., Sr. Sub. Notes | | B3 | | 11.875% | | 08/15/12 | | | 4,050 | | | 4,758,750 |
NeighborCare Inc., Sr. Sub. Notes | | Ba3 | | 6.875% | | 11/15/13 | | | 1,425 | | | 1,492,688 |
Res-Care, Inc., Sr. Notes | | B2 | | 10.625% | | 11/15/08 | | | 6,650 | | | 7,331,625 |
Select Medical Corp., Sr. Sub. Notes | | B2 | | 9.50% | | 06/15/09 | | | 2,415 | | | 2,590,087 |
Senior Housing Properties Trust, Sr. Notes | | Ba2 | | 8.625% | | 01/15/12 | | | 2,730 | | | 3,119,025 |
Tenet Healthcare Corp., Sr. Notes | | B3 | | 6.375% | | 12/01/11 | | | 810 | | | 751,275 |
Tenet Healthcare Corp., Sr. Notes | | B3 | | 6.50% | | 06/01/12 | | | 3,300 | | | 3,052,500 |
Tenet Healthcare Corp., Sr. Notes 144A(b) | | B3 | | 9.875% | | 07/01/14 | | | 2,000 | | | 2,180,000 |
Vanguard Health Holding Co. II LLC, Sr. Sub Notes 144A | | Caa1 | | 9.00% | | 10/01/14 | | | 4,000 | | | 4,280,000 |
Ventas Realty LP, Sr. Notes | | Ba3 | | 8.75% | | 05/01/09 | | | 2,000 | | | 2,242,500 |
Ventas Realty LP, Sr. Notes | | Ba3 | | 9.00% | | 05/01/12 | | | 4,348 | | | 5,070,855 |
| | | | | | | | | | | |
|
|
| | | | | | | | | | | | | 115,746,920 |
| | | | | | | | | | | |
|
|
Lodging — 3.9% | | | | | | | | | | | | |
Felcor Lodging LP, Gtd. Notes(b) | | B1 | | 9.00% | | 06/01/11 | | | 4,900 | | | 5,549,250 |
Felcor Lodging LP, Sr. Notes | | B1 | | 6.874% | | 06/01/11 | | | 1,875 | | | 1,968,750 |
Felcor Suites LP, Gtd. Notes | | B1 | | 7.625% | | 10/01/07 | | | 950 | | | 1,002,250 |
HMH Properties, Inc., Sr. Gtd. Notes, Ser. B | | Ba3 | | 7.875% | | 08/01/08 | | | 1,416 | | | 1,454,940 |
Host Marriott LP, Sr. Notes 144A | | Ba3 | | 7.00% | | 08/15/12 | | | 7,000 | | | 7,402,500 |
Host Marriott LP, Sr. Notes | | Ba3 | | 7.125% | | 11/01/13 | | | 1,250 | | | 1,335,937 |
Host Marriott LP, Sr. Notes | | Ba3 | | 9.50% | | 01/15/07 | | | 6,815 | | | 7,462,425 |
Host Marriott LP, Sr. Notes, Ser. E | | Ba3 | | 8.375% | | 02/15/06 | | | 5,175 | | | 5,407,875 |
ITT Corp., Debs(b) | | Ba1 | | 6.75% | | 11/15/05 | | | 3,030 | | | 3,113,325 |
ITT Corp., Sr. Sub. Notes, Ser. B | | Ba1 | | 7.375% | | 11/15/15 | | | 2,850 | | | 3,170,625 |
La Quinta Inns, Inc., Sr. Notes | | Ba3 | | 7.40% | | 09/15/05 | | | 1,000 | | | 1,017,500 |
La Quinta Properties, Inc. | | Ba3 | | 8.875% | | 03/15/11 | | | 3,725 | | | 4,153,375 |
La Quinta Properties, Inc., Sr. Notes | | Ba3 | | 7.00% | | 08/15/12 | | | 1,775 | | | 1,877,063 |
Royal Caribbean Cruises, Ltd., Sr. Notes (Liberia) | | Ba2 | | 6.875% | | 12/01/13 | | | 6,275 | | | 6,777,000 |
Royal Caribbean Cruises, Ltd., Sr. Notes (Liberia) | | Ba2 | | 8.75% | | 02/02/11 | | | 1,150 | | | 1,358,438 |
Starwood Hotels & Resorts Worldwide, Inc., Notes | | Ba1 | | 7.375% | | 05/01/07 | | | 5,900 | | | 6,290,875 |
Starwood Hotels & Resorts Worldwide, Inc., Notes | | Ba1 | | 7.875% | | 05/01/12 | | | 2,235 | | | 2,553,487 |
| | | | | | | | | | | |
|
|
| | | | | | | | | | | | | 61,895,615 |
| | | | | | | | | | | |
|
|
SEE NOTES TO FINANCIAL STATEMENTS.
B56
| | | | |
| | | HIGH YIELD BOND PORTFOLIO (Continued) | | |
SCHEDULE OF INVESTMENTS | December 31, 2004 |
| | | | | | | | | | | | | |
| CORPORATE BONDS (Continued) | | Moody’s Rating (Unaudited)
| | Interest Rate
| | | Maturity Date
| | Principal Amount
(000)
| | Value (Note 2)
|
Media & Entertainment — 6.9% | | | | | | | | | | | | | |
Advertising Directory Solution, (cost $2,750,000; purchased 11/4/04)(f)(h) | | B3 | | 6.15% | | | 05/09/12 | | $ | 2,750 | | $ | 2,802,250 |
AMC Entertainment, Inc., Sr. Sub. Notes | | B3 | | 8.00% | | | 03/01/14 | | | 675 | | | 671,625 |
AMC Entertainment, Inc., Sr. Notes 144A(b) | | B2 | | 8.625% | | | 08/15/12 | | | 2,125 | | | 2,348,125 |
American Color Graphics, Inc., Sr. Notes | | Caa1 | | 10.00% | | | 06/15/10 | | | 3,325 | | | 2,805,469 |
American Media Operations, Inc., Gtd. Notes, Ser. B | | B3 | | 10.25% | | | 05/01/09 | | | 160 | | | 168,600 |
CanWest Media, Inc., Sr. Notes (Canada)(b) | | Ba3 | | 7.625% | | | 04/15/13 | | | 1,500 | | | 1,633,125 |
CanWest Media, Inc., Sr. Sub. Notes (Canada) | | B2 | | 10.625% | | | 05/15/11 | | | 3,000 | | | 3,367,500 |
Cinemark USA, Inc., Sr. Sub. Notes | | B3 | | 9.00% | | | 02/01/13 | | | 850 | | | 970,063 |
Cinemark, Inc., Sr. Disc. Notes, Zero Coupon (until 3/15/09) | | Caa1 | | 9.75% | (j) | | 03/15/14 | | | 1,400 | | | 1,057,000 |
Dex Media East LLC, Sr. Sub. Notes(b) | | B2 | | 12.125% | | | 11/15/12 | | | 5,328 | | | 6,493,500 |
Dex Media West LLC, Sr. Sub Notes | | B2 | | 9.875% | | | 08/15/13 | | | 8,945 | | | 10,309,112 |
Dex Media, Inc., Notes | | B3 | | 8.00% | | | 11/15/13 | | | 2,825 | | | 3,058,062 |
DirecTV Holdings, Sr. Notes(b) | | B1 | | 8.375% | | | 03/15/13 | | | 5,505 | | | 6,172,481 |
Echostar DBS Corp., Sr. Notes 144A | | Ba3 | | 6.625% | | | 10/01/14 | | | 2,800 | | | 2,835,000 |
Echostar DBS Corp., Sr. Notes | | Ba3 | | 9.125% | | | 01/15/09 | | | 5,174 | | | 5,691,400 |
Entercom Radio LLC, Gtd. Notes | | Ba2 | | 7.625% | | | 03/01/14 | | | 1,005 | | | 1,081,631 |
Granite Broadcasting, Sec’d. Notes(b) | | B3 | | 9.75% | | | 12/01/10 | | | 1,735 | | | 1,656,925 |
Gray Television, Inc., Sr. Sub. Notes | | B2 | | 9.25% | | | 12/15/11 | | | 4,605 | | | 5,157,600 |
Intrawest Corp., Sr. Notes 144A (Canada) | | B1 | | 7.50% | | | 10/15/13 | | | 2,250 | | | 2,393,438 |
Medianews Group, Inc., Sr. Sub. Notes 144A(b) | | B2 | | 6.375% | | | 04/01/14 | | | 2,375 | | | 2,351,250 |
Medianews Group, Inc., Sr. Sub. Notes | | B2 | | 6.875% | | | 10/01/13 | | | 1,375 | | | 1,409,375 |
Morris Publishing Group LLC, Gtd. Notes | | Ba3 | | 7.00% | | | 08/01/13 | | | 1,050 | | | 1,071,000 |
New Skies Satellites NV, Sr. Notes 144A (Netherlands)(b)(h) | | B3 | | 7.438% | | | 11/01/11 | | | 1,325 | | | 1,364,750 |
New Skies Satellites NV, Sr. Sub. Notes 144A (Netherlands)(b) | | Caa1 | | 9.125% | | | 11/01/12 | | | 1,425 | | | 1,453,500 |
Phoenix Color Corp., Sr. Sub. Notes | | Caa2 | | 10.375% | | | 02/01/09 | | | 4,000 | | | 3,485,000 |
PRIMEDIA, Inc., Sr. Notes | | B3 | | 7.665% | | | 05/15/10 | | | 2,145 | | | 2,273,700 |
PRIMEDIA, Inc., Sr. Notes | | B3 | | 8.875% | | | 05/15/11 | | | 2,000 | | | 2,115,000 |
Quebecor Media, Inc., Sr. Disc. Notes, Zero Coupon (until 07/15/06) (Canada) | | B2 | | 13.75% | (j) | | 07/15/11 | | | 3,125 | | | 3,093,750 |
Quebecor Media, Inc., Sr. Notes (Canada) | | B2 | | 11.125% | | | 07/15/11 | | | 4,700 | | | 5,369,750 |
R.H. Donnelley Finance Corp., Gtd. Notes | | B2 | | 10.875% | | | 12/15/12 | | | 800 | | | 950,000 |
R.H. Donnelley Finance Corp., Sr. Sub. Notes 144A | | B2 | | 10.875% | | | 12/15/12 | | | 2,995 | | | 3,556,562 |
Sinclair Broadcast Group, Inc., Gtd. Notes | | B2 | | 8.75% | | | 12/15/11 | | | 2,500 | | | 2,721,875 |
Six Flags, Inc., Sr. Notes(b) | | Caa1 | | 9.625% | | | 06/01/14 | | | 2,775 | | | 2,788,875 |
Susquehanna Media Co., Sr. Sub. Notes | | B1 | | 7.375% | | | 04/15/13 | | | 900 | | | 963,000 |
Universal City Florida Holding Co., Sr. Notes 144A(b) | | B3 | | 8.375% | | | 05/01/10 | | | 4,050 | | | 4,201,875 |
Vail Resorts, Inc., Sr. Sub Notes | | B2 | | 6.75% | | | 02/15/14 | | | 2,295 | | | 2,335,163 |
Vertis, Inc., Gtd. Notes, Ser. B | | B3 | | 10.875% | | | 06/15/09 | | | 1,700 | | | 1,844,500 |
Vertis, Inc., Sec’d. Notes | | B2 | | 9.75% | | | 04/01/09 | | | 4,500 | | | 4,882,500 |
WDAC Subsidiary Corp., Sr. Notes 144A | | B2 | | 8.375% | | | 12/01/14 | | | 1,720 | | | 1,696,350 |
| | | | | | | | | | | | |
|
|
| | | | | | | | | | | | | | 110,600,681 |
| | | | | | | | | | | | |
|
|
Metals — 2.6% | | | | | | | | | | | | | |
AK Steel Corp., Notes | | B3 | | 7.75% | | | 06/15/12 | | | 3,320 | | | 3,419,600 |
AK Steel Corp., Sr. Notes | | B3 | | 7.875% | | | 02/15/09 | | | 5,927 | | | 6,038,131 |
Arch Western Finance LLC, Sr. Notes | | Ba3 | | 6.75% | | | 07/01/13 | | | 1,385 | | | 1,430,012 |
Arch Western Finance LLC, Sr. Notes 144A | | Ba3 | | 6.75% | | | 07/01/13 | | | 2,100 | | | 2,168,250 |
Century Aluminum Co., Sr. Notes 144A | | B1 | | 7.50% | | | 08/15/14 | | | 3,600 | | | 3,834,000 |
CSN Islands VII Corp., Gtd. Notes 144A (Cayman Islands) (cost $5,002,949; purchased 9/5/03-4/22/04)(f) | | B1 | | 10.75% | | | 09/12/08 | | | 4,945 | | | 5,618,756 |
Ispat Inland ULC, Sec’d. Notes (Canada) | | B3 | | 9.75% | | | 04/01/14 | | | 5,941 | | | 7,337,135 |
Massey Energy Co., Sr. Notes | | Ba3 | | 6.625% | | | 11/15/10 | | | 250 | | | 261,250 |
Oregon Steel Mills, Inc., Gtd. Notes(b) | | B2 | | 10.00% | | | 07/15/09 | | | 2,075 | | | 2,308,438 |
Peabody Energy Corp., Sr. Notes | | Ba3 | | 5.875% | | | 04/15/16 | | | 1,450 | | | 1,442,750 |
Russel Metals, Inc., Sr. Notes (Canada)(b) | | Ba3 | | 6.375% | | | 03/01/14 | | | 1,000 | | | 1,015,000 |
Ryerson Tull, Inc., Sr. Notes 144A(b) | | B2 | | 8.25% | | | 12/15/11 | | | 2,575 | | | 2,600,750 |
United States Steel Corp., Sr. Notes | | Ba2 | | 10.75% | | | 08/01/08 | | | 3,000 | | | 3,532,500 |
| | | | | | | | | | | | |
|
|
| | | | | | | | | | | | | | 41,006,572 |
| | | | | | | | | | | | |
|
|
SEE NOTES TO FINANCIAL STATEMENTS.
B57
| | | | |
| | | HIGH YIELD BOND PORTFOLIO (Continued) | | |
SCHEDULE OF INVESTMENTS | December 31, 2004 |
| | | | | | | | | | | | | |
| CORPORATE BONDS (Continued) | | Moody’s Rating (Unaudited)
| | Interest Rate
| | Maturity Date
| | Principal Amount
(000)
| | | Value (Note 2)
|
Packaging — 3.0% | | | | | | | | | | | | | |
Anchor Glass Container Corp., Sr. Sec’d. Notes | | B2 | | 11.00% | | 02/15/13 | | $ | 4,450 | | | $ | 4,761,500 |
Berry Plastics Corp., Gtd. Notes | | B3 | | 10.75% | | 07/15/12 | | | 4,720 | | | | 5,404,400 |
Crown Cork & Seal PLC, Notes (United Kingdom) | | B3 | | 7.00% | | 12/15/06 | | | 7,525 | | | | 7,901,250 |
Crown European Holdings SA, Sr. Sec’d. Notes (France)(b) | | B1 | | 9.50% | | 03/01/11 | | | 3,750 | | | | 4,275,000 |
Graham Packaging 144A | | Caa1 | | 8.50% | | 10/15/12 | | | 2,200 | | | | 2,310,000 |
Graham Packaging 144A(b) | | Caa2 | | 9.875% | | 10/15/14 | | | 3,050 | | | | 3,255,875 |
Graham Packaging, (cost $1,000,000, purchased 10/1/04)(f)(h) | | B3 | | 6.813% | | 04/07/12 | | | 1,000 | | | | 1,024,500 |
Greif Brothers Corp., Sr. Sub. Notes | | B1 | | 8.875% | | 08/01/12 | | | 6,200 | | | | 6,897,500 |
Owens-Brockway, Sr. Sec’d. Notes(b) | | B1 | | 7.75% | | 05/15/11 | | | 5,410 | | | | 5,856,325 |
Owens-Brockway, Sr. Sec’d. Notes(b) | | B1 | | 8.75% | | 11/15/12 | | | 3,495 | | | | 3,940,612 |
Portola Packaging, Inc., Sr. Notes | | Caa1 | | 8.25% | | 02/01/12 | | | 950 | | | | 750,500 |
Silgan Holdings, Inc., Sr. Sub Notes | | B1 | | 6.75% | | 11/15/13 | | | 1,575 | | | | 1,638,000 |
| | | | | | | | | | | | |
|
|
| | | | | | | | | | | | | | 48,015,462 |
| | | | | | | | | | | | |
|
|
Paper — 3.4% | | | | | | | | | | | | | |
Abitibi Consolidated, Inc., Deb. Notes (Canada) | | Ba3 | | 8.85% | | 08/01/30 | | | 1,500 | | | | 1,507,500 |
Abitibi Consolidated, Inc., Gtd. Notes (Canada)(b) | | Ba3 | | 5.25% | | 06/20/08 | | | 1,200 | | | | 1,174,500 |
Abitibi Consolidated, Inc., Gtd. Notes (Canada) | | Ba3 | | 6.95% | | 12/15/06 | | | 600 | | | | 622,500 |
Abitibi-Consolidated, Inc., Gtd. Notes (Canada)(b) | | Ba3 | | 6.00% | | 06/20/13 | | | 2,345 | | | | 2,236,544 |
Ainsworth Lumber, Sr. Notes (Canada)(b) | | B2 | | 6.75% | | 03/15/14 | | | 4,985 | | | | 4,879,069 |
Ainsworth Lumber, Sr. Notes (Canada) 144A | | B2 | | 6.30% | | 10/01/10 | | | 1,100 | | | | 1,122,000 |
Ainsworth Lumber, Sr. Notes (Canada) 144A | | B2 | | 7.25% | | 10/01/12 | | | 100 | (i) | | | 101,750 |
Boise Cascade LLC, Sr. Notes 144A(h) | | B1 | | 5.005% | | 10/15/12 | | | 2,000 | | | | 2,075,000 |
Bowater Finance Corp., Gtd. Notes (Canada) | | Ba3 | | 7.95% | | 11/15/11 | | | 650 | | | | 700,422 |
Caraustar Industries, Inc., Sec. 144A(b) | | Caa1 | | 9.875% | | 04/01/11 | | | 2,100 | | | | 2,278,500 |
Cascades, Inc., Sr. Notes (Canada) | | Ba3 | | 7.25% | | 02/15/13 | | | 1,600 | | | | 1,696,000 |
Cascades, Inc., Sr. Notes (Canada) 144A | | Ba3 | | 7.25% | | 02/15/13 | | | 3,000 | | | | 3,180,000 |
Cellu Tissue Holdings, Inc., Sr. Sec’d. Notes | | B2 | | 9.75% | | 03/15/10 | | | 3,000 | | | | 3,112,500 |
Georgia-Pacific Corp., Debs. | | Ba3 | | 7.375% | | 12/01/25 | | | 1,000 | | | | 1,092,500 |
Georgia-Pacific Corp., Debs.(b) | | Ba3 | | 7.70% | | 06/15/15 | | | 1,000 | | | | 1,142,500 |
Georgia-Pacific Corp., Debs. | | Ba3 | | 7.75% | | 11/15/29 | | | 200 | | | | 224,000 |
Georgia-Pacific Corp., Debs. (cost $3,767,237; purchased 5/13/04)(f) | | Ba3 | | 7.50% | | 05/15/06 | | | 3,650 | | | | 3,823,375 |
Georgia-Pacific Corp., Notes | | Ba3 | | 8.875% | | 05/15/31 | | | 2,780 | | | | 3,475,000 |
Georgia-Pacific Corp., Sr. Notes(b) | | Ba2 | | 9.375% | | 02/01/13 | | | 6,210 | | | | 7,234,650 |
Millar Western Forest Products Ltd., Sr. Notes (Canada) | | B2 | | 7.75% | | 11/15/13 | | | 2,670 | | | | 2,856,900 |
Norampac, Inc., (Canada) | | Ba2 | | 6.75% | | 06/01/13 | | | 1,000 | | | | 1,052,500 |
Stone Container Finance Co., Gtd. Notes (Canada)(b) | | B2 | | 7.375% | | 07/15/14 | | | 1,920 | | | | 2,044,800 |
Tembec Industries, Inc., Gtd. Notes (Canada) | | Ba3 | | 8.50% | | 02/01/11 | | | 400 | | | | 402,000 |
Tembec Industries, Inc., Gtd. Notes (Canada)(b) | | Ba3 | | 8.625% | | 06/30/09 | | | 1,525 | | | | 1,532,625 |
Tembec Industries, Inc., Sr. Notes (Canada) | | Ba3 | | 7.75% | | 03/15/12 | | | 5,265 | | | | 5,093,887 |
| | | | | | | | | | | | |
|
|
| | | | | | | | | | | | | | 54,661,022 |
| | | | | | | | | | | | |
|
|
Pipelines & Other — 4.5% | | | | | | | | | | | | | |
AmeriGas Partners LP, Sr. Notes, Ser. C | | B2 | | 8.875% | | 05/20/11 | | | 2,950 | | | | 3,215,500 |
El Paso Corp., (cost $2,250,000; purchased 11/19/04)(f)(h) | | B3 | | 5.265% | | 11/23/09 | | | 2,250 | | | | 2,264,414 |
El Paso Corp., (cost $3,750,000; purchased 11/19/04)(f)(h) | | B3 | | 5.1875% | | 11/23/09 | | | 3,750 | | | | 3,779,167 |
El Paso Corp., Sr. Notes(b) | | Caa1 | | 7.00% | | 05/15/11 | | | 8,505 | | | | 8,600,681 |
El Paso Production Holdings Corp., Sr. Notes | | B3 | | 7.75% | | 06/01/13 | | | 4,640 | | | | 4,860,400 |
Enterprise Products Operating LP, Sr. Notes 144A | | Baa3 | | 5.60% | | 10/15/14 | | | 3,600 | | | | 3,631,932 |
Ferrellgas Partners LP, Sr. Notes | | Ba3 | | 6.75% | | 05/01/14 | | | 1,175 | | | | 1,207,313 |
Ferrellgas Partners LP, Sr. Notes | | B2 | | 8.75% | | 06/15/12 | | | 1,400 | | | | 1,526,000 |
Gazprom OAO, Notes 144A | | BB-(g) | | 9.625% | | 03/01/13 | | | 3,750 | | | | 4,425,000 |
Gazprom OAO, Sec’d. Notes (cost $1,956,256; purchased 02/21/03) (Russia)(f) | | BB-(g) | | 10.50% | | 10/21/09 | | | 1,720 | | | | 2,045,596 |
Markwest Energy Partners LP, Sr. Notes 144A | | B1 | | 6.875% | | 11/01/14 | | | 2,000 | | | | 2,030,000 |
Pacific Energy Partners LP, Sr. Notes | | Ba2 | | 7.125% | | 06/15/14 | | | 1,975 | | | | 2,103,375 |
Plains All American Pipeline LP, Sr. Notes | �� | Baa3 | | 7.75% | | 10/15/12 | | | 4,620 | | | | 5,404,227 |
Southern Natural Gas Co., Sr. Notes | | B1 | | 8.875% | | 03/15/10 | | | 2,900 | | | | 3,248,000 |
Tennessee Gas Pipeline Co., Debs.(b) | | B1 | | 7.00% | | 10/15/28 | | | 2,125 | | | | 2,130,313 |
SEE NOTES TO FINANCIAL STATEMENTS.
B58
| | | | |
| | | HIGH YIELD BOND PORTFOLIO (Continued) | | |
SCHEDULE OF INVESTMENTS | December 31, 2004 |
| | | | | | | | | | | | |
| CORPORATE BONDS (Continued) | | Moody’s Rating (Unaudited)
| | Interest Rate
| | Maturity Date
| | Principal Amount
(000)
| | Value (Note 2)
|
Pipelines & Other (cont’d.) | | | | | | | | | | | | |
Tennessee Gas Pipeline Co., Debs.(b) | | B1 | | 7.625% | | 04/01/37 | | $ | 4,615 | | $ | 4,839,981 |
Tennessee Gas Pipeline Co., Debs. (cost $3,079,298 purchased 12/3/02-2/25/03)(f) | | B1 | | 7.00% | | 03/15/27 | | | 3,530 | | | 3,705,878 |
TransMontaigne, Inc., Sr. Sub. Notes | | B3 | | 9.125% | | 06/01/10 | | | 1,385 | | | 1,502,725 |
Williams Cos., Inc., Notes(b) | | B1 | | 7.125% | | 09/01/11 | | | 4,475 | | | 4,888,937 |
Williams Cos., Inc., Notes(b) | | B1 | | 8.125% | | 03/15/12 | | | 5,045 | | | 5,826,975 |
| | | | | | | | | | | |
|
|
| | | | | | | | | | | | | 71,236,414 |
| | | | | | | | | | | |
|
|
Railroads — 0.2% | | | | | | | | | | | | |
Kansas City Southern Railway, Sr. Notes | | B2 | | 7.50% | | 06/15/09 | | | 2,750 | | | 2,887,500 |
| | | | | | | | | | | |
|
|
Real Estate Investment Trusts — 0.4% | | | | | | | | | | | | |
OMEGA Healthcare Investors, Inc., Notes | | B1 | | 6.95% | | 08/01/07 | | | 3,700 | | | 3,838,750 |
OMEGA Healthcare Investors, Inc., Sr. Notes | | B1 | | 7.00% | | 04/01/14 | | | 2,600 | | | 2,671,500 |
| | | | | | | | | | | |
|
|
| | | | | | | | | | | | | 6,510,250 |
| | | | | | | | | | | |
|
|
Retailers — 2.0% | | | | | | | | | | | | |
Asbury Automotive Group, Inc., Sr. Sub. Notes 144A(b) | | B3 | | 8.00% | | 03/15/14 | | | 1,800 | | | 1,782,000 |
AutoNation, Inc., Gtd. Notes | | Ba2 | | 9.00% | | 08/01/08 | | | 375 | | | 428,438 |
General Nutrition Center, Inc., Sr. Sub. Notes | | Caa1 | | 8.50% | | 12/01/10 | | | 2,300 | | | 2,173,500 |
JC Penney Co., Inc., Deb. Notes | | Ba2 | | 8.00% | | 03/01/10 | | | 2,350 | | | 2,684,875 |
JC Penney Co., Inc., Debs.(b) | | Ba2 | | 7.125% | | 11/15/23 | | | 3,625 | | | 3,860,625 |
JC Penney Co., Inc., Debs. | | Ba2 | | 7.65% | | 08/15/16 | | | 675 | | | 772,875 |
JC Penney Co., Inc., Notes | | Ba2 | | 6.875% | | 10/15/15 | | | 225 | | | 243,563 |
JC Penney Co., Inc., Notes | | Ba2 | | 9.00% | | 08/01/12 | | | 525 | | | 647,062 |
Jean Coutu Group PJC Inc., Sr. Notes 144A (Canada) | | B2 | | 7.625% | | 08/01/12 | | | 200 | | | 211,500 |
Jean Coutu Group PJC Inc., Sr. Sub. Notes 144 (Canada)(b) | | B3 | | 8.50% | | 08/01/14 | | | 4,185 | | | 4,289,625 |
Pantry, Inc., Sr. Sub Notes | | B3 | | 7.75% | | 02/15/14 | | | 3,025 | | | 3,221,625 |
Rite Aid Corp., Sr. Sec’d. Notes(b) | | B2 | | 8.125% | | 05/01/10 | | | 2,720 | | | 2,876,400 |
Saks, Inc., Gtd. Notes(b) | | Ba3 | | 7.00% | | 12/01/13 | | | 1,500 | | | 1,531,875 |
Saks, Inc., Gtd. Notes | | Ba3 | | 7.375% | | 02/15/19 | | | 3,425 | | | 3,390,750 |
Sonic Automotive Inc, Sr. Sub. Notes | | B2 | | 8.625% | | 08/15/13 | | | 1,810 | | | 1,929,913 |
Toys “R” Us, Inc., Notes(b) | | Ba2 | | 7.875% | | 04/15/13 | | | 2,675 | | | 2,654,937 |
| | | | | | | | | | | |
|
|
| | | | | | | | | | | | | 32,699,563 |
| | | | | | | | | | | |
|
|
Structured Notes — 0.6% | | | | | | | | | | | | |
Dow Jones CDX, Pass-thru Certs., Ser. 3-1,144A(b) | | B3 | | 7.75% | | 12/29/09 | | | 1,650 | | | 1,696,406 |
TRAINS HY-2004-1, (cost $8,252,807 purchased 10/1/04-10/20/04) 144A(f)(h) | | B1 | | 7.955% | | 08/01/15 | | | 7,628 | | | 8,343,100 |
| | | | | | | | | | | |
|
|
| | | | | | | | | | | | | 10,039,506 |
| | | | | | | | | | | |
|
|
Technology — 2.5% | | | | | | | | | | | | |
Amkor Technology, Inc., Sr. Notes(b) | | B3 | | 7.125% | | 03/15/11 | | | 800 | | | 752,000 |
Amkor Technology, Inc., Sr. Sub. Notes(b) | | Caa1 | | 10.50% | | 05/01/09 | | | 955 | | | 955,000 |
Ampex Corp., Sec’d. Notes (cost $1,771,972; purchased 8/16/02-8/15/04)(f) | | NR | | 12.00% | | 08/15/08 | | | 1,772 | | | 442,993 |
Celestica, Inc., Sr. Sub. Notes (Canada) | | Ba3 | | 7.875% | | 07/01/11 | | | 2,700 | | | 2,895,750 |
Flextronics International, Ltd., Sr. Sub. Notes (Singapore) 144A | | Ba2 | | 6.25% | | 11/15/14 | | | 1,700 | | | 1,683,000 |
Flextronics International, Ltd., Sr. Sub. Notes (Singapore)(b) | | Ba2 | | 6.50% | | 05/15/13 | | | 3,200 | | | 3,280,000 |
Freescale Semiconductor, Inc., Sr. Notes | | Ba2 | | 7.125% | | 07/15/14 | | | 1,040 | | | 1,128,400 |
Iron Mountain, Inc., Gtd. Notes | | Caa1 | | 8.625% | | 04/01/13 | | | 3,875 | | | 4,117,188 |
Nortel Networks, Ltd., Notes (Canada) | | B3 | | 6.125% | | 02/15/06 | | | 2,220 | | | 2,258,850 |
Sanmina-SCI Corp., Sr. Notes | | Ba2 | | 10.375% | | 01/15/10 | | | 2,810 | | | 3,224,475 |
Seagate Technology International, Sr. Notes (Cayman Islands) | | Ba2 | | 8.00% | | 05/15/09 | | | 1,625 | | | 1,755,000 |
STATS ChipPAC Ltd., Sr. Notes (Singapore) 144A | | Ba2 | | 6.75% | | 11/15/11 | | | 1,925 | | | 1,905,750 |
UGS Corp. 144A | | B3 | | 10.00% | | 06/01/12 | | | 1,500 | | | 1,706,250 |
Unisys Corp., Sr. Notes(b) | | Ba1 | | 7.25% | | 01/15/05 | | | 4,100 | | | 4,102,460 |
Unisys Corp., Sr. Notes | | Ba1 | | 8.125% | | 06/01/06 | | | 795 | | | 836,738 |
Xerox Corp. | | Ba2 | | 6.875% | | 08/15/11 | | | 4,450 | | | 4,739,250 |
Xerox Corp., Sr. Notes | | Ba2 | | 7.625% | | 06/15/13 | | | 3,525 | | | 3,868,687 |
Xerox Corp., Sr. Notes | | Ba2 | | 9.75% | | 01/15/09 | | | 590 | | | 693,250 |
| | | | | | | | | | | |
|
|
| | | | | | | | | | | | | 40,345,041 |
| | | | | | | | | | | |
|
|
SEE NOTES TO FINANCIAL STATEMENTS.
B59
| | | | |
| | | HIGH YIELD BOND PORTFOLIO (Continued) | | |
SCHEDULE OF INVESTMENTS | December 31, 2004 |
| | | | | | | | | | | | | |
| CORPORATE BONDS (Continued) | | Moody’s Rating (Unaudited)
| | Interest Rate
| | | Maturity Date
| | Principal Amount
(000)
| | Value (Note 2)
|
Telecommunications — 7.9% | | | | | | | | | | | | | |
Alamosa Delaware, Inc., Gtd. Notes | | Caa1 | | 11.00% | | | 07/31/10 | | $ | 2,650 | | $ | 3,120,375 |
Alamosa Delaware, Inc., Sr. Notes | | Caa1 | | 8.50% | | | 01/31/12 | | | 3,650 | | | 3,987,625 |
American Tower Corp., Sr. Notes | | B3 | | 9.375% | | | 02/01/09 | | | 2,143 | | | 2,266,223 |
AT&T Corp., Sr. Notes | | Ba1 | | 9.05% | | | 11/15/11 | | | 4,975 | | | 5,727,469 |
AT&T Corp., Sr. Notes | | Ba1 | | 9.75% | | | 11/15/31 | | | 1,500 | | | 1,790,625 |
Bestel SA de CV, Sr. Disc. Notes (Mexico)(cost $891,606; purchased
5/13/98-7/9/98)(c)(f) | | NR | | 12.75% | | | 05/15/05 | | | 900 | | | 108,000 |
Centennial Communications Corp., Sr. Notes(b) | | Caa1 | | 8.125% | | | 02/01/14 | | | 4,350 | | | 4,469,625 |
Cincinnati Bell, Inc.(b) | | B3 | | 8.375% | | | 01/15/14 | | | 2,860 | | | 2,895,750 |
Citizens Communications Co., Notes | | Ba3 | | 9.25% | | | 05/15/11 | | | 2,855 | | | 3,340,350 |
Citizens Communications Co., Sr. Notes | | Ba3 | | 6.25% | | | 01/15/13 | | | 5,850 | | | 5,893,875 |
Crown Castle International Corp., Sr. Notes | | B3 | | 7.50% | | | 12/01/13 | | | 4,250 | | | 4,568,750 |
Crown Castle International Corp., Sr. Notes | | B3 | | 9.375% | | | 08/01/11 | | | 1,325 | | | 1,484,000 |
Crown Castle International Corp., Sr. Notes | | B3 | | 10.75% | | | 08/01/11 | | | 5,390 | | | 5,848,150 |
Crown Castle International Corp., Sr. Notes, Ser. B | | B3 | | 7.50% | | | 12/01/13 | | | 1,000 | | | 1,075,000 |
Dobson Cellular Systems, Inc., Sec’d. Notes 144A(h) | | B2 | | 6.96% | | | 11/01/11 | | | 1,650 | | | 1,707,750 |
Dobson Cellular Systems, Inc., Sec’d. Notes 144A(b) | | B2 | | 8.375% | | | 11/01/11 | | | 1,175 | | | 1,213,188 |
Eircom Funding, Sr. Sub. Notes (Ireland) | | B1 | | 8.25% | | | 08/15/13 | | | 2,815 | | | 3,110,575 |
MCI, Inc., Sr. Notes | | B2 | | 6.908% | | | 05/01/07 | | | 3,516 | | | 3,599,505 |
MCI, Inc., Sr. Notes | | B2 | | 7.688% | | | 05/01/09 | | | 4,041 | | | 4,182,435 |
MCI, Inc., Sr. Notes | | B2 | | 8.735% | | | 05/01/14 | | | 4,113 | | | 4,421,475 |
New Skies Satellites NV, (Netherlands) (cost $1,250,000; purchased 11/1/04)(f) | | B1 | | 5.87% | | | 05/02/11 | | | 1,250 | | | 1,266,146 |
Nextel Communications, Inc., Sr. Notes | | Ba3 | | 5.95% | | | 03/15/14 | | | 1,200 | | | 1,242,000 |
Nextel Communications, Inc., Sr. Notes | | Ba3 | | 7.375% | | | 08/01/15 | | | 10,550 | | | 11,605,000 |
Nextel Partners, Inc., Sr. Notes(b) | | B3 | | 8.125% | | | 07/01/11 | | | 5,875 | | | 6,521,250 |
Qwest Services Corp., Sr. Notes, 144A | | Ba3 | | 7.875% | | | 09/01/11 | | | 700 | | | 759,500 |
Qwest Services Corp., Sr. Sec’d. Notes, 144A | | Caa1 | | 14.00% | | | 12/15/10 | | | 20,135 | | | 24,212,337 |
Rogers Wireless Communications, Inc., Sec’d. Notes (Canada) | | Ba3 | | 6.375% | | | 03/01/14 | | | 4,000 | | | 3,960,000 |
Rogers Wireless Communications, Inc., Sec’d. Notes (Canada) | | Ba3 | | 9.625% | | | 05/01/11 | | | 1,300 | | | 1,524,250 |
Rogers Wireless Communications, Inc., Sr. Sub. Notes, 144A (Canada) | | B2 | | 8.00% | | | 12/15/12 | | | 425 | | | 449,437 |
Triton PCS, Inc., Gtd. Notes | | Caa1 | | 8.50% | | | 06/01/13 | | | 1,570 | | | 1,515,050 |
U.S. Unwired, Inc., Sec’d. Notes(h) | | B2 | | 6.74% | | | 06/15/10 | | | 1,275 | | | 1,319,625 |
U.S. West Communications, Inc., Debs. | | Ba3 | | 7.50% | | | 06/15/23 | | | 2,000 | | | 1,990,000 |
Ubiquitel Operating Co. 144A(b) | | Caa1 | | 9.875% | | | 03/01/11 | | | 3,275 | | | 3,676,187 |
Ubiquitel Operating Co., Sr. Notes | | Caa1 | | 9.875% | | | 03/01/11 | | | 1,025 | | | 1,150,563 |
| | | | | | | | | | | | |
|
|
| | | | | | | | | | | | | | 126,002,090 |
| | | | | | | | | | | | |
|
|
Tobacco — 0.1% | | | | | | | | | | | | | |
DIMON, Inc., Gtd. Notes, Ser. B | | B1 | | 9.625% | | | 10/15/11 | | | 850 | | | 930,750 |
North Atlantic Holding Inc., Sr. Dis. Notes, Zero Coupon (until 3/1/09) | | Caa1 | | 12.25% | | | 03/01/14 | | | 2,275 | | | 932,750 |
| | | | | | | | | | | | |
|
|
| | | | | | | | | | | | | | 1,863,500 |
| | | | | | | | | | | | |
|
|
TOTAL CORPORATE BONDS
(cost $1,308,689,261) | | | | | | | | | | | | | 1,387,793,284 |
| | | | | | | | | | | | |
|
|
| CONVERTIBLE BONDS — 0.3% | | | | | | | | | | | | | |
Nortel Networks Corp., (Canada) | | B3 | | 4.25% | | | 09/01/08 | | | 2,175 | | | 2,115,188 |
Tyco International Group SA (Luxembourg)144A(b) | | Baa3 | | 3.125% | | | 01/15/23 | | | 1,650 | | | 2,772,000 |
| | | | | | | | | | | | |
|
|
TOTAL CONVERTIBLE BONDS
(cost $3,412,795) | | | | | | | | | | | | | 4,887,188 |
| | | | | | | | | | | | |
|
|
| FOREIGN GOVERNMENT OBLIGATIONS — 1.7% | | | | | | | | | | | | | |
Federal Republic of Argentina, (Argentina)(h) | | Caa1 | | 1.98% | | | 08/03/12 | | | 8,500 | | | 7,225,000 |
Federal Republic of Brazil, (Brazil)(b) | | B1 | | 8.25% | | | 01/20/34 | | | 1,560 | | | 1,518,660 |
Federal Republic of Brazil, (Brazil)(b)(h) | | B1 | | 8.299% | | | 06/29/09 | | | 1,200 | | | 1,413,000 |
Federal Republic of Brazil, (Brazil) | | B1 | | 10.00% | | | 08/07/11 | | | 1,920 | | | 2,225,280 |
Federal Republic of Colombia, (Colombia)(b) | | Ba2 | | 10.00% | | | 01/23/12 | | | 3,352 | | | 3,871,560 |
Federal Republic of Peru, (Peru) | | Ba3 | | 8.375% | | | 05/03/16 | | | 3,330 | | | 3,729,600 |
Federal Republic of Philippines, (Phillippines) | | Ba2 | | 9.375% | | | 01/18/17 | | | 4,115 | | | 4,274,456 |
Federal Republic of Venezuela, (Venezuela) | | B2 | | 9.25% | | | 09/15/27 | | | 3,315 | | | 3,497,325 |
| | | | | | | | | | | | |
|
|
TOTAL FOREIGN GOVERNMENT OBLIGATIONS
(cost $25,936,173) | | | | | | | | | | | | | 27,754,881 |
| | | | | | | | | | | | |
|
|
SEE NOTES TO FINANCIAL STATEMENTS.
B60
| | | | |
| | | HIGH YIELD BOND PORTFOLIO (Continued) | | |
SCHEDULE OF INVESTMENTS | December 31, 2004 |
| | | | | | | | | | | |
| COMMON STOCKS — 0.6% | | | | | | | | Shares
| | Value (Note 2)
|
Adelphia Business Solutions, Inc., (cost $127,579; purchased 06/29/01)(Class “B” Stock)(a)(e)(f) | | | | 25,755 | | $ | 424,957 |
Birch Telecom, Inc., (cost $2,500,000; purchased 06/18/98)(a)(f) | | | | 15,652 | | | 157 |
Classic Communications, Inc., (cost $0; purchased 07/21/98)(a)(f) | | | | 6,000 | | | 60 |
GenTek, Inc.(a) | | | | 6,444 | | | 288,369 |
IMPSAT Fiber Networks, Inc., (Argentina)(a) | | | | 29,831 | | | 171,528 |
Kaiser Group Holdings, Inc.(a) | | | | 47,054 | | | 1,246,931 |
Netia SA, (Poland)(a) | | | | 302,168 | | | 449,913 |
NTL, Inc.(a)(b) | | | | 12,930 | | | 943,373 |
PSF Group Holdings, Inc., (cost $374,377; purchased 9/17/96)(a)(f) | | | | 220 | | | 374,425 |
RCN Corp.(a) | | | | 156 | | | 3 |
Samuels Jewelers, Inc., (cost $624,993; purchased 10/28/98)(a)(f) | | | | 36,825 | | | 552 |
Systems Holding, Inc., (cost $0; purchased 2/15/02)(a)(e)(f) | | | | 29,402 | | | 294 |
Telewest Global, Inc., (United Kingdom)(a) | | | | 189,591 | | | 3,333,010 |
Trism, Inc., (cost $0; purchased 03/01/00)(a)(f) | | | | 82,628 | | | 1,033 |
UnitedGlobalCom, Inc., (Class “A” Stock)(a)(b) | | | | 212,736 | | | 2,055,030 |
York Research Corp., (cost $0; purchased 11/14/02)(a)(e)(f) | | | | 4,155 | | | 0 |
| | | | | | | | | | |
|
|
TOTAL COMMON STOCKS
(cost $15,795,889) | | | | | | | | | | | 9,289,635 |
| | | | | | | | | | |
|
|
| PREFERRED STOCKS — 1.1% | | | | | | | | | | | |
Adelphia Communications Corp., PIK, 13.00% (cost $481,250; purchased 7/2/97-8/8/01)(f) | | | | 5,000 | | | 5,000 |
AmeriKing, Inc., PIK, 13.00% (cost $745,569; purchased 9/29/97-8/22/02)(c)(f) | | | | 36,672 | | | 37 |
Dobson Communications Corp., PIK, 13.00% (cost $2,869,322; purchased 4/29/99-4/13/04)(f) | | | | 3,143 | | | 1,351,490 |
Eagle-Picher Holdings, Inc., 11.75% (cost $969,758; purchased 2/19/98-2/26/98)(f) | | | | 170 | | | 1,483,250 |
Electronic Retailing Systems International, (cost $0; purchased 06/20/00)(e)(f) | | | | 1,046 | | | 10 |
Kaiser Group Holdings, Inc., 7.00% | | | | 19,034 | | | 1,075,421 |
McLeodUSA, Inc., 2.50% | | | | 18,063 | | | 67,556 |
New Millenium Homes, 10.00% (cost $0; purchased 9/25/00)(f) | | | | 3,000 | | | 30 |
Paxon Communications, Inc., PIK, 14.25% | | | | 1,186 | | | 8,746,750 |
PRIMEDIA, Inc., 10.00% | | | | 20,918 | | | 2,091,800 |
PTV, Inc., Ser. A, 10.00% | | | | 13 | | | 56 |
World Access, Inc., 13.25%, (cost $2,000,000; purchased 02/11/00-9/20/00)(f) | | | | 1,435 | | | 1 |
Xerox Corp., 6.25% | | | | 16,920 | | | 2,499,930 |
| | | | | | | | | | |
|
|
TOTAL PREFERRED STOCKS
(cost $26,777,429) | | | | | | | | | | | 17,321,331 |
| | | | | | | | | | |
|
|
| | | | | |
| WARRANTS(a) — 0.1% | | | | | | Expiration Date
| | Units
| | |
Allegiance Telecommunications, Inc., (cost $0; purchased 1/29/98-2/25/98)(f) | | 02/03/08 | | 3,800 | | | 0 |
Asia Pulp & Paper, Ltd., 144A (cost $0; purchased 03/09/00)(f) | | 03/15/05 | | 1,295 | | | 0 |
Bell Technology Group, Ltd., (cost $0; purchased 04/24/98)(f) | | 05/01/05 | | 1,250 | | | 0 |
Bestel SA de CV, (Mexico) (cost $0; purchased 5/13/98-7/9/98)(f) | | 05/15/05 | | 2,500 | | | 0 |
GenTek, Inc., (cost $455, purchased 11/10/03)(f) | | 10/31/10 | | 3,670 | | | 7,340 |
GenTek, Inc., (cost $931, purchased 11/10/03)(f) | | 10/31/08 | | 7,516 | | | 15,032 |
GT Group Telecommunication, Inc., (Canada) 144A (cost $0, purchased 1/27/00)(f) | | 02/01/10 | | 3,050 | | | 3 |
HF Holdings, Inc., (cost $1,958,758; purchased 9/27/99-9/29/99)(f) | | 09/27/09 | | 18,093 | | | 18 |
ICG Communications, Inc., (cost $0; purchased 8/4/95-8/8/95)(f) | | 09/15/05 | | 20,790 | | | 208 |
McLeodUSA, Inc. | | 04/16/07 | | 40,027 | | | 9,607 |
Price Communications Corp., (cost $0; purchased 07/31/97)(f) | | 08/01/07 | | 6,880 | | | 354,093 |
Star Choice Communications, Inc., (cost $0; purchased 1/28/97)(f) | | 12/15/05 | | 69,480 | | | 475,070 |
Sterling Chemical Holdings, Inc., (cost $0; purchased 08/16/96)(f) | | 08/15/08 | | 560 | | | 0 |
Tellus Corp. | | 09/15/05 | | 42,866 | | | 811,882 |
TVN Entertainment, (cost $1,215,008; purchased 10/30/01-3/15/04)(e)(f) | | 08/12/11 | | 9,347 | | | 5,421 |
Verado Holdings, Inc., Ser. B 144A | | 04/18/08 | | 1,175 | | | 743 |
Versatel Telecommunications, (cost $0; purchased 05/21/98)(f) | | 05/15/08 | | 2,000 | | | 0 |
Viasystems Group, Inc., (cost $1,039,826; purchased 01/31/03)(f) | | 01/31/10 | | 45,109 | | | 5 |
Wam!Net, Inc., (cost $0; purchased 02/26/98)(f) | | 03/15/05 | | 3,000 | | | 30 |
XM Satellite Radio, Inc., 144A(cost $0, purchased 3/10/00-7/11/00)(f) | | 03/03/10 | | 5,005 | | | 50 |
| | | | | | | | | | |
|
|
TOTAL WARRANTS
(cost $4,214,978) | | | | | | | | | | | 1,679,502 |
| | | | | | | | | | |
|
|
TOTAL LONG-TERM INVESTMENTS
(cost $1,384,826,525) | | | 1,448,725,821 |
| | | | | | | | | | |
|
|
SEE NOTES TO FINANCIAL STATEMENTS.
B61
| | | | |
| | | HIGH YIELD BOND PORTFOLIO (Continued) | | |
SCHEDULE OF INVESTMENTS | December 31, 2004 |
| | | | |
| SHORT-TERM INVESTMENT — 25.5% | | Value (Note 2)
| |
Mutual Fund | | | | |
Dryden Core Investment Fund — Taxable Money Market Series(d) (cost $407,624,422; Note 4) | | $ | 407,624,422 | |
| | |
|
|
|
TOTAL INVESTMENTS — 116.3%
(cost $1,792,450,947; Note 6) | | | 1,856,350,243 | |
LIABILITIES IN EXCESS OF OTHER ASSETS — (16.3)% | | | (260,666,815 | ) |
| | |
|
|
|
TOTAL NET ASSETS — 100.0% | | $ | 1,595,683,428 | |
| | |
|
|
|
The following abbreviations are used in portfolio descriptions:
| | |
| LLC | | Limited Liability Company |
| LP | | Limited Partnership |
| M.T.N. | | Medium Term Note |
| NR | | Not Rated by Moody’s or Standard & Poor’s |
| PIK | | Payment-in-kind |
| 144A | | Securities were purchased pursuant to Rule 144A under the Securities Act of 1933 and may not be subject to that rule except to qualified institutional buyers. Unless otherwise noted 144A securities are deemed to be liquid. |
| (a) | Non-income producing security. |
| (b) | Portion of securities on loan with an aggregate market value of $276,149,778; cash collateral of $291,013,237 was received with which the portfolio purchased highly liquid short-term investments. |
| (c) | Represents issuer in default on interest payments, non-income producing security. |
| (d) | Represents security, or a portion thereof, purchased with cash collateral received for securities on loan. |
| (e) | Indicates a fair valued security. |
| (f) | Indicates a security that has been deemed illiquid; the aggregate cost of the illiquid securities is $109,222,127. The aggregate value, $92,942,706 is approximately 5.8% of net assets. |
| (g) | Standard & Poor’s rating. |
| (h) | Indicates a variable rate security. The maturity date presented for these instruments is the latter of the next date on which the security can be redeemed at par or the next date on which the rate of interest is adjusted. The interest rate shown reflects the rate in effect at December 31, 2004. |
| (i) | Amount is actual; not rounded to thousands. |
| (j) | Interest rate reflected represents the rate that would be in effect from the date the bond steps up from zero to an interest paying bond. |
SEE NOTES TO FINANCIAL STATEMENTS.
B62
| | | | |
| | | HIGH YIELD BOND PORTFOLIO (Continued) | | |
SCHEDULE OF INVESTMENTS | December 31, 2004 |
The industry classification of portfolio holdings and liabilities in excess of other assets shown as a percentage of net assets as of December 31, 2004 was as follows:
| | | |
Mutual Fund | | 25.5 | % |
Electric | | 9.1 | |
Telecommunications | | 7.9 | |
Health Care & Pharmaceutical | | 7.3 | |
Media & Entertainment | | 6.8 | |
Capital Goods | | 5.4 | |
Gaming | | 5.4 | |
Pipelines & Other | | 4.5 | |
Chemicals | | 4.0 | |
Lodging | | 3.9 | |
Paper | | 3.4 | |
Cable | | 3.0 | |
Energy — Other | | 3.0 | |
Packaging | | 3.0 | |
Metals | | 2.6 | |
Technology | | 2.5 | |
Foods | | 2.2 | |
Aerospace/Defense | | 2.1 | |
Building Materials & Construction | | 2.1 | |
Retailers | | 2.0 | |
Foreign Government Obligations | | 1.7 | |
Automotive | | 1.6 | |
Consumer | | 1.6 | |
Banking | | 1.4 | |
Preferred Stocks | | 1.1 | |
Airlines | | 0.9 | |
Common Stocks | | 0.6 | |
Structured Notes | | 0.5 | |
Real Estate Investment Trusts | | 0.4 | |
Convertible Bonds | | 0.3 | |
Railroads | | 0.2 | |
Special Purpose Entity | | 0.1 | |
Tobacco | | 0.1 | |
Warrants | | 0.1 | |
| | |
|
|
| | | 116.3 | |
Liabilities in excess of other assets | | (16.3 | ) |
| | |
|
|
| | | 100.0 | % |
| | |
|
|
SEE NOTES TO FINANCIAL STATEMENTS.
B63
SCHEDULE OF INVESTMENTS | December 31, 2004 |
| | | | | |
| LONG-TERM INVESTMENTS — 98.2% | | Value
(Note 2)
|
| COMMON STOCKS — 98.2% | | Shares
| |
Air Freight & Logistics — 1.8% | | | | | |
United Parcel Service, Inc.
(Class “B” Stock)(b) | | 441,300 | | $ | 37,713,498 |
| | | | |
|
|
Biotechnology — 6.2% | | | | | |
Amgen, Inc.(a) | | 667,300 | | | 42,807,295 |
Genentech, Inc.(a)(b) | | 833,800 | | | 45,392,072 |
Gilead Sciences, Inc.(a) | | 899,900 | | | 31,487,501 |
MedImmune, Inc.(a)(b) | | 434,000 | | | 11,765,740 |
| | | | |
|
|
| | | | 131,452,608 |
| | | | |
|
|
Capital Markets — 4.1% | | | | | |
Charles Schwab Corp. (The)(b) | | 953,500 | | | 11,403,860 |
Goldman Sachs Group, Inc. (The) | | 318,700 | | | 33,157,548 |
Merrill Lynch & Co., Inc. | | 712,100 | | | 42,562,217 |
| | | | |
|
|
| | | | | | 87,123,625 |
| | | | |
|
|
Commercial Services & Supplies — 0.5% | | | |
Paychex, Inc. | | 342,300 | | | 11,665,584 |
| | | | |
|
|
Communications Equipment — 4.9% | | | |
Cisco Systems, Inc.(a) | | 1,543,600 | | | 29,791,480 |
QUALCOMM, Inc.(b) | | 1,049,900 | | | 44,515,760 |
Research In Motion Ltd. (Canada)(a) | | 355,600 | | | 29,308,552 |
| | | | |
|
|
| | | | 103,615,792 |
| | | | |
|
|
Computers & Peripherals — 6.3% |
Apple Computer, Inc.(a) | | 688,300 | | | 44,326,520 |
Dell, Inc.(a) | | 1,112,600 | | | 46,884,964 |
International Business Machines Corp.(b) | | 271,500 | | | 26,764,470 |
Lexmark International, Inc.
(Class “A” Stock)(a) | | 193,500 | | | 16,447,500 |
| | | | |
|
|
| | | | 134,423,454 |
| | | | |
|
|
Consumer Finance — 2.4% | | | | | |
American Express Co. | | 915,100 | | | 51,584,187 |
| | | | |
|
|
Diversified Financial Services — 2.4% | | | |
J.P. Morgan Chase & Co. | | 1,288,000 | | | 50,244,880 |
| | | | |
|
|
Electronic Equipment & Instruments — 1.5% | | | |
Agilent Technologies, Inc.(a) | | 1,307,600 | | | 31,513,160 |
| | | | |
|
|
Energy Equipment & Services — 2.7% | | | |
Schlumberger Ltd.(b) | | 848,100 | | | 56,780,295 |
| | | | |
|
|
Food Products — 0.8% | | | | | |
Cadbury Schweppes PLC
(United Kingdom) | | 1,911,800 | | | 17,801,770 |
| | | | |
|
|
Food & Staples Retailing — 3.0% | | | | | |
Costco Wholesale Corp.(b) | | 414,500 | | | 20,065,945 |
Whole Foods Market, Inc.(b) | | 460,600 | | | 43,918,210 |
| | | | |
|
|
| | | | | | 63,984,155 |
| | | | |
|
|
Health Care Equipment & Supplies — 1.1% | | | |
Alcon, Inc. (Switzerland) | | 278,700 | | | 22,463,220 |
| | | | |
|
|
Health Care Providers & Services — 3.8% | | | |
Caremark Rx, Inc.(a) | | 727,200 | | | 28,673,496 |
UnitedHealth Group, Inc. | | 297,600 | | | 26,197,728 |
WellPoint, Inc.(a) | | 218,700 | | | 25,150,500 |
| | | | |
|
|
| | | | | | 80,021,724 |
| | | | |
|
|
| | | | | |
COMMON STOCKS
(Continued) | | Shares
| | Value
(Note 2)
|
Hotels Restaurants & Leisure — 2.7% | | | |
Starbucks Corp.(a)(b) | | 929,500 | | $ | 57,963,620 |
| | | | |
|
|
Household Durables — 1.3% | | | | | |
Harman International Industries, Inc.(b) | | 179,400 | | | 22,783,800 |
Lennar Corp. (Class “A” Stock)(b) | | 83,100 | | | 4,710,108 |
| | | | |
|
|
| | | | | | 27,493,908 |
| | | | |
|
|
Household Products — 1.3% | | | | | |
Procter & Gamble Co. (The) | | 502,000 | | | 27,650,160 |
| | | | |
|
|
Industrial Conglomerates — 3.8% | | | |
General Electric Co. | | 2,216,800 | | | 80,913,200 |
| | | | |
|
|
Insurance — 1.4% | | | | | |
American International Group, Inc. | | 454,637 | | | 29,856,012 |
| | | | |
|
|
Internet & Catalog Retail — 4.1% | | | | | |
eBay, Inc.(a)(b) | | 753,700 | | | 87,640,236 |
| | | | |
|
|
Internet Software & Services — 6.0% | | | | | |
Google, Inc.
(Class “A” Stock)(a)(b) | | 284,700 | | | 54,975,570 |
Yahoo!, Inc.(a)(b) | | 1,950,000 | | | 73,476,000 |
| | | | |
|
|
| | | | | | 128,451,570 |
| | | | |
|
|
Media — 2.1% | | | | | |
DreamWorks Animation SKG, Inc.
(Class “A” Stock)(a)(b) | | 36,200 | | | 1,357,862 |
Sirius Satellite Radio, Inc.(a)(b) | | 1,033,400 | | | 7,905,510 |
Univision Communications, Inc.
(Class “A” Stock)(a)(b) | | 778,700 | | | 22,792,549 |
XM Satellite Radio Holdings, Inc. (Class “A” Stock)(a)(b) | | 311,000 | | | 11,699,820 |
| | | | |
|
|
| | | | | | 43,755,741 |
| | | | |
|
|
Multiline Retail — 2.4% | | | | | |
Target Corp. | | 997,400 | | | 51,794,982 |
| | | | |
|
|
Oil & Gas — 2.3% | | | | | |
Suncor Energy, Inc. (Canada) | | 561,700 | | | 19,884,180 |
Total SA (France) | | 138,120 | | | 30,169,748 |
| | | | |
|
|
| | | | | | 50,053,928 |
| | | | |
|
|
Personal Products — 1.2% | | | | | |
Estee Lauder Companies, Inc. (The) (Class “A” Stock)(b) | | 544,700 | | | 24,930,919 |
| | | | |
|
|
Pharmaceuticals — 6.9% | | | | | |
Allergan, Inc.(b) | | 350,500 | | | 28,415,035 |
Eli Lilly & Co. | | 701,800 | | | 39,827,150 |
Novartis AG, ADR (Switzerland) | | 765,700 | | | 38,698,478 |
Roche Holdings Group, ADR (Switzerland) | | 340,200 | | | 39,162,939 |
| | | | |
|
|
| | | | | | 146,103,602 |
| | | | |
|
|
Semiconductors & Semiconductor Equipment — 3.0% |
Marvell Technology Group Ltd. (Bermuda)(a)(b) | | 1,062,600 | | | 37,690,422 |
Maxim Integrated Products, Inc. | | 630,200 | | | 26,714,178 |
| | | | |
|
|
| | | | | | 64,404,600 |
| | | | |
|
|
Software — 10.3% | | | | | |
Adobe Systems, Inc. | | 257,600 | | | 16,161,824 |
Electronic Arts, Inc.(a)(b) | | 995,100 | | | 61,377,768 |
SEE NOTES TO FINANCIAL STATEMENTS.
B64
| | | | |
| | | JENNISON PORTFOLIO (Continued) | | |
SCHEDULE OF INVESTMENTS | December 31, 2004 |
| | | | | | | |
COMMON STOCKS
(Continued) | | Shares
| | Value
(Note 2)
| |
Software (cont’d.) | | | | |
Mercury Interactive Corp.(a)(b) | | | 544,600 | | $ | 24,806,530 | |
Microsoft Corp. | | | 2,358,100 | | | 62,984,851 | |
NAVTEQ(a) | | | 312,700 | | | 14,496,772 | |
SAP AG, ADR (Germany) | | | 911,600 | | | 40,301,836 | |
| | | | | |
|
|
|
| | | | | | | 220,129,581 | |
| | | | | |
|
|
|
Specialty Retail — 5.4% | | | | | | | |
Bed Bath & Beyond, Inc.(a) | | | 930,900 | | | 37,077,747 | |
Chico’s FAS, Inc.(a)(b) | | | 825,300 | | | 37,575,909 | |
Lowe’s Companies, Inc. (The)(b) | | | 467,300 | | | 26,911,807 | |
Williams-Sonoma, Inc.(a)(b) | | | 373,700 | | | 13,094,448 | |
| | | | | |
|
|
|
| | | | | | | 114,659,911 | |
| | | | | |
|
|
|
Textiles, Apparel & Luxury Goods — 1.0% | | | | |
Coach, Inc.(a) | | | 383,600 | | | 21,635,040 | |
| | | | | |
|
|
|
Wireless Telecommunication Services — 1.5% | |
Nextel Communications, Inc.
(Class “A” Stock)(a)(b) | | | 1,066,700 | | | 32,001,000 | |
| | | | | |
|
|
|
TOTAL COMMON STOCKS
(cost $1,702,259,667) | | | | | | 2,089,825,962 | |
| | | | | |
|
|
|
| | | Units
| | | |
| WARRANTS(a) | | | | | | | |
Communications Equipment | | | | | | | |
Lucent Technologies, Inc.,
expiring 12/10/07
(cost $0) | | | 8,620 | | | 13,620 | |
| | | | | |
|
|
|
TOTAL LONG-TERM INVESTMENTS
(cost $1,702,259,667) | | | | | | 2,089,839,582 | |
| | | | | |
|
|
|
| SHORT-TERM INVESTMENTS — 22.1% | | | | |
| | | Shares
| | | |
Mutual Fund — 22.1% | | | | | | | |
Dryden Core Investment Fund — Taxable Money Market Series (cost $471,742,022; Note 4)(c) | | | 471,742,022 | | | 471,742,022 | |
| | | | | |
|
|
|
| | | Principal
Amount
(000)
| | | |
Repurchase Agreement | | | | | | | |
State Street Bank & Trust Co.
1.75%, 1/3/05(d)
(cost $30,241) | | $ | 30 | | | 30,241 | |
| | | | | |
|
|
|
TOTAL SHORT-TERM INVESTMENTS
(cost $471,772,263) | | | | | | 471,772,263 | |
| | | | | |
|
|
|
TOTAL INVESTMENTS — 120.3%
(cost $2,174,031,930; Note 6) | | | | | | 2,561,611,845 | |
LIABILITIES IN EXCESS OF
OTHER ASSETS — (20.3)% | | | | | | (432,581,310 | ) |
| | | | | |
|
|
|
NET ASSETS — 100% | | | | | $ | 2,129,030,535 | |
| | | | | |
|
|
|
The industry classification of portfolio holdings and liabilities in excess of other assets shown as a percentage of net assets as of December 31, 2004 was as follows:
| | | |
Mutual Fund | | 22.1 | % |
Software | | 10.3 | |
Pharmaceuticals | | 6.9 | |
Computers & Peripherals | | 6.3 | |
Biotechnology | | 6.2 | |
Internet Software & Services | | 6.0 | |
Specialty Retail | | 5.4 | |
Communications Equipment | | 4.9 | |
Internet & Catalog Retail | | 4.1 | |
Capital Markets | | 4.1 | |
Industrial Conglomerates | | 3.8 | |
Health Care Providers & Services | | 3.8 | |
Food & Staples Retailing | | 3.0 | |
Semiconductors & Semiconductor Equipment | | 3.0 | |
Hotels Restaurants & Leisure | | 2.7 | |
Energy Equipment & Services | | 2.7 | |
Multiline Retail | | 2.4 | |
Consumer Finance | | 2.4 | |
Diversified Financial Services | | 2.4 | |
Oil & Gas | | 2.3 | |
Media | | 2.1 | |
Air Freight & Logistics | | 1.8 | |
Wireless Telecommunication Services | | 1.5 | |
Electronic Equipment & Instruments | | 1.5 | |
Insurance | | 1.4 | |
Household Products | | 1.3 | |
Household Durables | | 1.3 | |
Personal Products | | 1.2 | |
Health Care Equipment & Supplies | | 1.1 | |
Textiles, Apparel & Luxury Goods | | 1.0 | |
Food Products | | 0.8 | |
Commercial Services & Supplies | | 0.5 | |
| | |
|
|
| | | 120.3 | |
| | | (20.30 | ) |
| | |
|
|
| | | 100.00 | % |
| | |
|
|
The following abbreviations are used in portfolio descriptions:
| | |
| ADR | | American Depositary Receipt |
| (a) | Non-income producing security. |
| (b) | Portion of securities on loan with an aggregate market value of $426,459,186; cash collateral of $443,274,394 was received with which the portfolio purchased securities. |
| (c) | Represents security, or a portion thereof, purchased with cash collateral for securities on loan. |
| (d) | State Street Bank & Trust Company Repurchase Agreement, repurchase price $30,245 due 1/03/05. The value of the collateral including accrued interest was $31,752 Collateralized by United States Treasury or federal agency obligations. |
SEE NOTES TO FINANCIAL STATEMENTS.
B65
SCHEDULE OF INVESTMENTS | December 31, 2004 |
| | | | | | | | | | |
| | | Interest Rate
| | Maturity Date
| | Principal Amount (000)
| | Value (Note 2)
|
Certificates of Deposit — 30.1% | | | | | | | | | | |
Bank of New York(a) | | 2.345% | | 01/31/05 | | $ | 25,000 | | $ | 24,993,756 |
Barclays Bank PLC New York(a) | | 2.342% | | 01/25/05 | | | 20,000 | | | 19,997,608 |
BNP Paribas SA | | 1.25% | | 01/27/05 | | | 4,000 | | | 3,999,957 |
BNP Paribas SA(a) | | 2.365% | | 03/09/05 | | | 19,000 | | | 18,994,578 |
Credit Suisse First Boston NY | | 2.21% | | 01/18/05 | | | 30,000 | | | 29,998,974 |
Landesbank Hessen Thuringen | | 1.40% | | 02/02/05 | | | 43,000 | | | 43,000,777 |
Nordea Bank Finland PLC New York Branch | | 2.39% | | 03/07/05 | | | 19,000 | | | 19,000,000 |
Societe Generale North America, Inc. | | 2.415% | | 03/11/05 | | | 26,000 | | | 25,999,752 |
Toronto Dominion Bank NY | | 2.32% | | 02/02/05 | | | 9,000 | | | 9,000,000 |
Toronto Dominion Bank NY | | 2.44% | | 03/14/05 | | | 10,000 | | | 10,000,000 |
Toronto Dominion Bank NY | | 3.03% | | 12/30/05 | | | 10,000 | | | 10,000,000 |
Unicredito Italiano SpA | | 2.30% | | 02/02/05 | | | 25,000 | | | 24,999,990 |
Wells Fargo Bank NA | | 2.35% | | 01/27/05 | | | 26,718 | | | 26,718,000 |
| | | | | | | | | |
|
|
| | | | | | | | | | | 266,703,392 |
| | | | | | | | | |
|
|
Commercial Paper — 30.0% | | | | | | | | | | |
Allianz Finance Corp. 144A(d) | | 2.31% | | 02/07/05 | | | 18,000 | | | 17,957,265 |
Amsterdam Funding Corp. 144A(d) | | 2.34% | | 02/02/05 | | | 44,000 | | | 43,908,480 |
Banco Santander Central Hispano | | 2.21% | | 02/04/05 | | | 6,633 | | | 6,619,155 |
Barton Capital Corp. 144A(d) | | 2.245% | | 02/09/05 | | | 10,000 | | | 9,975,679 |
Barton Capital Corp. 144A(d) | | 2.24% | | 02/10/05 | | | 10,000 | | | 9,975,111 |
Cafco LLC 144A(d) | | 2.35% | | 01/31/05 | | | 6,300 | | | 6,287,662 |
HBOS Treasury Services PLC | | 2.34% | | 01/31/05 | | | 10,000 | | | 9,980,500 |
HBOS Treasury Services PLC | | 2.21% | | 02/02/05 | | | 9,400 | | | 9,381,534 |
HSBC Finance Corp. | | 2.35% | | 02/02/05 | | | 15,000 | | | 14,968,667 |
New Center Asset Trust | | 2.40% | | 02/08/05 | | | 10,000 | | | 9,974,667 |
Three Pillars Funding Corp. 144A(d) | | 2.36% | | 01/20/05 | | | 20,000 | | | 19,975,089 |
Three Pillars Funding Corp. 144A(d) | | 2.35% | | 01/25/05 | | | 24,000 | | | 23,962,400 |
Triple A One Funding Corp. 144A(d) | | 2.35% | | 01/21/05 | | | 8,000 | | | 7,989,556 |
Tulip Funding Corp. 144A(d) | | 2.40% | | 01/28/05 | | | 44,000 | | | 43,920,800 |
Westpac Capital Corp. M.T.N. | | 2.41% | | 03/10/05 | | | 31,000 | | | 30,858,881 |
| | | | | | | | | |
|
|
| | | | | | | | | | | 265,735,446 |
| | | | | | | | | |
|
|
Other Corporate Obligations — 29.7% | | | | | | | | | | |
American Express Credit Corp. M.T.N.(a) | | 2.381% | | 01/05/05 | | | 8,000 | | | 8,000,000 |
Bank of Nova Scotia(a) | | 2.357% | | 01/28/05 | | | 15,000 | | | 14,999,521 |
Bank of Nova Scotia(a) | | 2.357% | | 01/31/05 | | | 10,000 | | | 9,999,639 |
GE Capital Assurances Co. (cost $11,000,000; purchased 7/21/2004)(a)(b) | | 2.493% | | 01/24/05 | | | 11,000 | | | 11,000,000 |
General Electric Capital Corp.(a) | | 2.46% | | 01/10/05 | | | 11,750 | | | 11,750,000 |
General Electric Capital Corp. M.T.N.(a) | | 2.51% | | 01/18/05 | | | 21,000 | | | 21,000,000 |
Goldman Sachs Group, Inc. M.T.N. 144A(a)(d) | | 2.64% | | 03/15/05 | | | 42,000 | | | 42,000,000 |
Irish Life and Permanent PLC M.T.N. 144A(a)(d) | | 2.413% | | 01/21/05 | | | 25,000 | | | 24,996,628 |
Merrill Lynch & Co., Inc. M.T.N.(a) | | 2.54% | | 01/11/05 | | | 34,000 | | | 34,016,571 |
Metropolitan Life Insurance (cost $10,000,000; purchased 9/30/2004)(a)(b) | | 2.36% | | 01/03/05 | | | 10,000 | | | 10,000,000 |
Metropolitan Life Insurance (cost $9,000,000; purchased 2/03/2004)(a)(b) | | 2.24% | | 02/09/05 | | | 9,000 | | | 9,000,000 |
Morgan Stanley, Inc. M.T.N.(a) | | 2.522% | | 01/18/05 | | | 25,000 | | | 25,000,000 |
National City Bank of Indiana M.T.N.(a) | | 2.365% | | 01/10/05 | | | 10,000 | | | 10,001,768 |
Pacific Life Insurance (cost $7,000,000; purchased 3/15/2004)(a)(b) | | 2.62% | | 03/16/05 | | | 7,000 | | | 7,000,000 |
Royal Bank of Canada M.T.N.(a) | | 2.38% | | 01/10/05 | | | 5,000 | | | 5,000,000 |
Travellers Insurance Co. (cost $6,000,000; purchased 7/7/04)(a)(b) | | 2.43% | | 01/10/05 | | | 6,000 | | | 6,000,000 |
Westpac Banking Corp.(a) | | 2.45% | | 03/11/05 | | | 13,000 | | | 12,999,803 |
| | | | | | | | | |
|
|
| | | | | | | | | | | 262,763,930 |
| | | | | | | | | |
|
|
U.S. Government Obligations — 8.5% | | | | | | | | | | |
Federal Home Loan Bank | | 1.47% | | 02/28/05 | | | 15,000 | | | 15,000,000 |
Federal National Mortgage Association(a) | | 2.288% | | 01/18/05 | | | 30,000 | | | 29,999,828 |
Federal National Mortgage Association(a) | | 1.65% | | 02/08/05 | | | 15,000 | | | 15,000,000 |
Federal National Mortgage Association | | 1.40% | | 03/29/05 | | | 15,000 | | | 15,000,000 |
| | | | | | | | | |
|
|
| | | | | | | | | | | 74,999,828 |
| | | | | | | | | |
|
|
SEE NOTES TO FINANCIAL STATEMENTS.
B66
| | | | |
| | | MONEY MARKET PORTFOLIO (Continued) | | |
SCHEDULE OF INVESTMENTS | December 31, 2004 |
| | | | | | | | | | |
| | | Interest Rate
| | Maturity Date
| | Principal Amount (000)
| | Value (Note 2)
|
Repurchase Agreements — 1.6% | | | | | | | | | | |
Greenwich Capital Management(c) | | 2.29% | | 01/03/05 | | $ | 14,006 | | $ | 14,006,000 |
| | | | | | | | | |
|
|
TOTAL INVESTMENTS — 99.9%
(amortized cost $884,208,596(e)) | | | 884,208,596 |
| | | | | | | | | |
|
|
OTHER ASSETS IN EXCESS OF LIABILITIES — 0.1% | | | | | | | | | | 1,147,151 |
| | | | | | | | | |
|
|
NET ASSETS — 100.0% | | $ | 885,355,747 |
| | | | | | | | | |
|
|
The industry classification of portfolio holdings and other assets in excess of liabilities shown as a percentage of net assets as of December 31, 2004 was as follows:
| | | |
Commercial Banks | | 47.9 | % |
Life Insurance | | 19.9 | % |
Asset Backed Securities | | 19.9 | % |
Federal Credit Agences | | 8.5 | % |
Short Term Business Credit | | 3.7 | % |
| | |
|
|
| | | 99.9 | % |
Other assets in excess of liabilities | | 0.1 | % |
| | |
|
|
| | | 100.0 | % |
| | |
|
|
| (a) | Indicates a variable rate security. The maturity date presented for these instruments is the later of the next date on which the security can be redeemed at par or the next date on which the rate of interest is adjusted. The interest rate shown reflects the rate in effect at December 31, 2004. |
| (b) | Indicates a restricted security and deemed illiquid. The aggregate cost and value of restricted securities is $43,000,000, and represents 4.9% of net assets. |
| (c) | Greenwich Capital Management Repurchase Agreement, repurchase price $14,008,673 due 1/3/05. The value of the collateral including accrued interest was $14,286,127. Collateralized by United States Treasury or federal agency obligations. |
| (d) | Securities were purchased pursuant to Rule 144A under the Securities Act of 1933 and may not be subject to that rule except to qualified institutional buyers unless otherwise noted. 144A securities are deemed to be liquid. |
| (e) | Federal income tax basis is the same as for financial reporting purposes. |
SEE NOTES TO FINANCIAL STATEMENTS.
B67
| | | | |
| | | NATURAL RESOURCES PORTFOLIO | | |
SCHEDULE OF INVESTMENTS | December 31, 2004 |
| | | | | |
| LONG-TERM INVESTMENTS — 99.5% | | Value (Note 2)
|
| COMMON STOCKS — 97.6% | | Shares
| |
Chemicals — 0.2% | | | | | |
Hokko Chemical Industry Co., Ltd. (Japan) | | 450,900 | | $ | 1,588,513 |
Construction Materials — 0.7% | | | | | |
Anhui Conch Cement Co., Ltd.
(Class“H” Stock) (China) | | 4,200,000 | | | 4,565,981 |
Energy Equipment & Services — 31.7% | | | | | |
B.J. Services Co.(b) | | 663,700 | | | 30,888,598 |
CARBO Ceramics, Inc. | | 53,900 | | | 3,719,100 |
Cooper Cameron Corp.(a) | | 72,700 | | | 3,911,987 |
ENSCO International, Inc. | | 294,900 | | | 9,360,126 |
FMC Technologies, Inc.(a)(b) | | 195,261 | | | 6,287,404 |
GlobalSantaFe Corp.
(Cayman Islands) | | 63,600 | | | 2,105,796 |
Grant Prideco, Inc.(a) | | 213,400 | | | 4,278,670 |
Grey Wolf, Inc.(a)(b) | | 326,000 | | | 1,718,020 |
Hydril Co.(a) | | 96,200 | | | 4,378,062 |
Maverick Tube Corp.(a) | | 272,500 | | | 8,256,750 |
Nabors Industries, Ltd. (Barbados)(a) | | 180,300 | | | 9,247,587 |
National-Oilwell, Inc.(a)(b) | | 361,600 | | | 12,760,864 |
Oil States International, Inc.(a) | | 478,700 | | | 9,234,123 |
OPTI Canada, Inc. (Canada)(a) | | 1,378,574 | | | 22,355,876 |
Rowan Cos., Inc.(a)(b) | | 166,500 | | | 4,312,350 |
Smith International, Inc.(a) | | 529,500 | | | 28,810,095 |
Todco (Class “A” Stock)(a) | | 206,400 | | | 3,801,888 |
Transocean, Inc.(a)(b) | | 279,600 | | | 11,852,244 |
W-H Energy Services, Inc.(a) | | 168,800 | | | 3,774,368 |
Weatherford International, Ltd.(a) | | 312,800 | | | 16,046,640 |
| | | | |
|
|
| | | | | | 197,100,548 |
| | | | |
|
|
Food Products — 0.7% | | | | | |
Cresud SA, ADR (Argentina)(b) | | 287,800 | | | 4,288,220 |
Household Durables — 0.5% | | | | | |
Blout International, Inc.(a) | | 171,000 | | | 2,978,820 |
Industrial Conglomerates — 3.6% | | | | | |
Phelps Dodge Corp.(b) | | 225,700 | | | 22,326,244 |
Machinery — 0.3% | | | | | |
Railpower Technologies Corp. (Canada)(a)(b) | | 354,500 | | | 1,843,287 |
Metals & Mining — 27.3% | | | | | |
Alumina, Ltd. (Australia) | | 1,989,400 | | | 9,263,374 |
Aluminum Corp. of China, Ltd., ADR (China)(b) | | 70,300 | | | 4,116,065 |
Anglo American Platinum, Ltd., ADR (South Africa) | | 86,669 | | | 3,184,462 |
AngloGold, Ltd., ADR (Canada)(b) | | 155,476 | | | 5,651,553 |
Aquarius Platinum, Ltd. (Australia) | | 517,725 | | | 2,049,515 |
AXMIN, Inc. (Canada)(a) | | 1,289,500 | | | 731,845 |
Bema Gold Corp. (Canada)(a)(b) | | 494,200 | | | 1,512,252 |
Canico Resource Corp. (Canada)(a) | | 248,389 | | | 3,006,001 |
Coeur d’Alene Mines Corp.(a) | | 243,825 | | | 958,232 |
Companhia Vale do Rio Doce, ADR (Brazil)(b) | | 641,700 | | | 18,615,717 |
Crystallex International Corp. (Canada)(a) | | 2,111,000 | | | 7,578,490 |
DRDGOLD, Ltd., ADR (South Africa)(a)(b) | | 830,600 | | | 1,279,124 |
European Goldfields, Ltd.(a) | | 38,400 | | | 85,572 |
First Quantum Minerals, Ltd.(a) | | 221,700 | | | 3,450,908 |
| | | | | |
| COMMON STOCKS | | Value (Note 2)
|
| (Continued) | | Shares
| |
Metals & Mining (Cont’d.) | | | | | |
FNX Mining Co., Inc. (Canada)(a) | | 230,600 | | $ | 996,960 |
Freeport-McMoRan Copper & Gold, Inc. (Class “B” Stock)(b) | | 314,400 | | | 12,019,512 |
Gabriel Resources, Ltd.(a) | | 749,800 | | | 976,245 |
Gold Fields, Ltd., ADR
(South Africa)(b) | | 426,000 | | | 5,316,480 |
Gold Reserve, Inc. (Canada)(a) | | 121,200 | | | 538,150 |
Golden Star Resources, Ltd.(a)(b) | | 238,700 | | | 957,187 |
Harmony Gold Mining Co., Ltd.
(South Africa) | | 156,400 | | | 1,421,376 |
Harmony Gold Mining Co., Ltd., ADR (South Africa)(b) | | 491,900 | | | 4,559,913 |
Impala Platinum Holdings, Ltd., ADR (South Africa) | | 200,800 | | | 4,268,165 |
Ivanhoe Mines, Ltd.(a) | | 576,300 | | | 4,160,577 |
Kinross Gold Corp. (Canada)(a) | | 625,965 | | | 4,414,643 |
Kinross Gold Corp.(a) | | 17,401 | | | 122,503 |
Lihir Gold, Ltd. (Australia)(a) | | 6,154,600 | | | 5,596,525 |
Massey Energy Co.(b) | | 327,300 | | | 11,439,135 |
Meridian Gold, Inc.(a) | | 274,000 | | | 5,200,317 |
Miramar Mining Corp.(a)(b) | | 234,000 | | | 269,100 |
Miramar Mining Corp. (Canada)(a) | | 336,000 | | | 384,192 |
Nelson Resources, Ltd. (Canada)(a) | | 841,500 | | | 1,580,249 |
Nevsun Resources, Ltd. (Canada)(a) | | 351,300 | | | 645,044 |
Newcrest Mining, Ltd. (Australia) | | 498,200 | | | 6,814,905 |
Newmont Mining Corp.(b) | | 248,100 | | | 11,018,121 |
Orezone Resources, Inc. (Canada)(a)(b) | | 988,500 | | | 1,237,533 |
Oxus Gold PLC (United Kingdom)(a) | | 432,500 | | | 450,469 |
Pan American Silver Corp.
(Canada)(a) . | | 97,572 | | | 1,566,005 |
Peru Copper, Inc. (Canada)(a) | | 656,200 | | | 755,795 |
Placer Dome, Inc. (Canada) | | 430,400 | | | 8,117,344 |
Platinum Group Metals, Ltd. (Canada)(a) | | 1,186,700 | | | 1,032,428 |
Randgold Resources, Ltd., ADR (Channel Islands)(a) | | 227,600 | | | 2,594,640 |
Southern Peru Copper Corp.(b) | | 94,200 | | | 4,447,182 |
Southern Platinum Corp. (Canada)(a) | | 858,600 | | | 1,512,036 |
SouthernEra Diamonds, Inc. (Class “A”Stock) (Canada)(a) | | 858,600 | | | 358,302 |
Stornoway Diamond Corp.
(Canada)(a) | | 357,800 | | | 537,529 |
Western Silver Corp. (Canada)(a) | | 343,600 | | | 3,106,144 |
| | | | |
|
|
| | | | | | 169,897,816 |
| | | | |
|
|
Oil & Gas — 32.1% | | | | | |
Apache Corp. | | 128,366 | | | 6,491,469 |
Bill Barrett Corp.(a) | | 700 | | | 22,393 |
BPI Industries, Inc. (Canada) (cost $1,368,745, purchased 12/31/04) (a)(d)(e) | | 1,200,000 | | | 1,474,774 |
Carrizo Oil & Gas, Inc.(a) | | 132,100 | | | 1,492,730 |
Cheniere Energy, Inc.(a)(b) | | 137,900 | | | 8,784,230 |
Denbury Resources, Inc.(a) | | 342,700 | | | 9,407,115 |
Encore Acquisition Co.(a) | | 272,100 | | | 9,499,011 |
Endeavour International Corp.(a)(b) | | 374,800 | | | 1,570,412 |
Eni SpA, ADR (Italy) | | 136,600 | | | 17,189,744 |
Galaxy Energy Corp.(a)(b) | | 631,700 | | | 792,784 |
SEE NOTES TO FINANCIAL STATEMENTS.
B68
| | | | |
| | | NATURAL RESOURCES PORTFOLIO (Continued) | | |
SCHEDULE OF INVESTMENTS | December 31, 2004 |
| | | | | | |
| COMMON STOCKS | | Value (Note 2)
|
| (Continued) | | Shares
| |
Oil & Gas (cont’d.) | | | | | | |
Gasco Energy, Inc.(a)(b) | | | 632,600 | | $ | 2,694,876 |
Genoil, Inc. (Canada)(a) | | | 493,267 | | | 167,711 |
Houston Exploration Co.(a) | | | 47,000 | | | 2,646,570 |
KCS Energy, Inc.(a) | | | 296,972 | | | 4,389,246 |
McMoRan Exploration Co.(a)(b) | | | 227,500 | | | 4,254,250 |
Noble Energy, Inc.(b) | | | 105,600 | | | 6,511,296 |
Petroleo Brasileiro SA, ADR (Brazil)(b) | | | 210,600 | | | 8,377,668 |
Quicksilver Resources, Inc.(a)(b) | | | 277,000 | | | 10,188,060 |
Range Resources Corp. | | | 304,200 | | | 6,223,932 |
Sibneft, ADR (Russia)(a)(b) | | | 49,100 | | | 1,485,275 |
Southwestern Energy Co.(a) | | | 282,800 | | | 14,335,132 |
St. Mary Land & Exploration Co.(b) | | | 140,200 | | | 5,851,948 |
Suncor Energy, Inc. (Canada) | | | 486,500 | | | 17,222,100 |
Surgutneftegaz, ADR (Russia)(b) | | | 76,100 | | | 2,846,140 |
Total SA, ADR (France) | | | 222,700 | | | 24,461,368 |
Trident Resources Corp. (Canada) (cost $4,402,178, purchased 12/04/03)(a)(d)(e) | | | 412,657 | | | 5,682,795 |
UTS Energy Corp. (Canada)(a) | | | 2,107,000 | | | 1,670,617 |
Warren Resources, Inc.(a) | | | 340,500 | | | 3,098,550 |
Western Gas Resources, Inc. | | | 452,100 | | | 13,223,925 |
Western Oil Sands, Inc. (Canada)(a) | | | 233,200 | | | 8,145,407 |
| | | | | |
|
|
| | | | | | | 200,201,528 |
| | | | | |
|
|
Real Estate — 0.5% | | | | | | |
IRSA Inversiones y Representaciones SA, GDR (Argentina)(a)(b) | | | 264,300 | | | 2,973,375 |
| | | | | |
|
|
TOTAL COMMON STOCKS (cost $366,723,737) | | | 607,764,332 |
| | | | | |
|
|
| | |
| LINKED NOTE(a)(d)(e) — 1.1% | | Principal Amount (000)
| | |
USD Palladium Linked Bank Note 7/13/07 (cost $7,000,001, purchased 6/30/03) | | $ | 7,000 | | | 6,760,631 |
| | | | | |
|
|
| | |
| PREFERRED STOCK — 0.7% | | Shares
| | |
Oil & Gas | | | | | | |
Surgutneftegaz, ADR (Russia)
(cost $2,445,104) | | | 79,300 | | | 4,321,850 |
| | | | | |
|
|
| | |
| WARRANTS(a) — 0.1% | | Units
| | |
Oil & Gas | | | | | | |
BPI Industries, Inc. (Canada), expiring 12/31/06 (cost $131,255, purchased 12/31/04)(d)(e) | | | 600,000 | | | 154,814 |
| | | | | |
|
|
Metals & Mining — 0.1% | | | | | | |
Pan American Silver Corp., expiring 2/20/08 | | | 49,786 | | | 395,163 |
Peru Copper, Inc. (Canada), expiring 3/18/06 | | | 328,100 | | | 60,245 |
| | | | | |
|
|
| | | | | | | 455,408 |
| | | | | |
|
|
TOTAL WARRANTS
(cost $296,506) | | | | | | 610,222 |
| | | | | |
|
|
TOTAL LONG-TERM INVESTMENTS
(cost $376,465,348) | | | | | | 619,457,035 |
| | | | | |
|
|
| | | | | | |
SHORT-TERM
INVESTMENT — 23.1% | | Shares
| | Value (Note 2)
| |
Mutual Fund | | | | | | |
Dryden Core Investment Fund — Taxable Money Market Series
(cost $143,893,304; Note 4)(c) | | 143,893,304 | | $ | 143,893,304 | |
| | | | |
|
|
|
TOTAL INVESTMENTS — 122.6%
(cost $520,358,652; Note 6) | | | | | 763,350,339 | |
| | | | |
|
|
|
LIABILITIES IN EXCESS OF OTHER ASSETS — (22.6)% | | | | | (140,795,406 | ) |
| | | | |
|
|
|
NET ASSETS — 100% | | | | $ | 622,554,933 | |
| | | | |
|
|
|
The industry classification of long-term portfolio holdings, short-term investments and liabilities in excess of other assets shown as a percentage of net assets as of December 31, 2004 was as follows:
| | | |
Oil & Gas | | 32.8 | % |
Energy Equipment & Services | | 31.7 | |
Metals & Mining | | 28.5 | |
Industrial Conglomerates | | 3.6 | |
Construction Materials | | 0.7 | |
Food Products | | 0.7 | |
Household Durables | | 0.5 | |
Real Estate | | 0.5 | |
Machinery | | 0.3 | |
Chemicals | | 0.2 | |
Mutual Fund | | 23.1 | |
| | |
|
|
| | | 122.6 | |
Liabilities in excess of other assets | | (22.6 | ) |
| | |
|
|
| | | 100.0 | % |
| | |
|
|
The following abbreviations are used in portfolio descriptions:
| | |
| ADR | | American Depositary Receipt |
| GDR | | Global Depositary Receipt |
| (a) | Non-income producing security. |
| (b) | All or portion of securities on loan with an aggregate value of $131,878,496; cash collateral of $139,284,543 was received with which the portfolio purchased short-term, highly liquid securities. |
| (c) | Represents security, or portion thereof, purchased with cash collateral for securities on loan. |
| (d) | Indicates a fair valued security. |
| (e) | Indicates a restricted security and deemed illiquid, See Note 1. The aggregate cost of such securities is $12,902,179. The aggregate value of $14,073,014 at December 31, 2004 is approximately 2.26% of net assets. |
SEE NOTES TO FINANCIAL STATEMENTS.
B69
| | | | |
| | | SMALL CAPITALIZATION STOCK PORTFOLIO | | |
SCHEDULE OF INVESTMENTS | December 31, 2004 |
| | | | | |
| LONG-TERM INVESTMENTS — 99.9% | | Value
(Note 2)
|
| COMMON STOCKS | | Shares
| |
Advertising — 0.2% | | | | | |
ADVO, Inc. | | 41,783 | | $ | 1,489,564 |
| | | | |
|
|
Aerospace — 1.4% | | | | | |
AAR Corp.(a) | | 44,056 | | | 600,043 |
Curtiss-Wright Corp. | | 29,375 | | | 1,686,419 |
DRS Technologies, Inc.(a) | | 37,241 | | | 1,590,563 |
GenCorp, Inc.(b) | | 72,392 | | | 1,344,319 |
Kaman Corp. (Class “A” Stock) | | 31,055 | | | 392,846 |
Moog, Inc. (Class “A” Stock)(a) | | 35,176 | | | 1,595,232 |
Trimble Navigation, Ltd.(a) | | 70,912 | | | 2,342,932 |
Triumph Group, Inc.(a) | | 21,761 | | | 859,559 |
| | | | |
|
|
| | | | | | 10,411,913 |
| | | | |
|
|
Agricultural Products & Services — 0.2% | | | | | |
Delta & Pine Land Co. | | 52,707 | | | 1,437,847 |
| | | | |
|
|
Airlines — 0.3% | | | | | |
Frontier Airlines, Inc.(a) | | 48,687 | | | 555,519 |
Mesa Air Group, Inc.(a)(b) | | 43,212 | | | 343,103 |
SkyWest, Inc. | | 78,542 | | | 1,575,553 |
| | | | |
|
|
| | | | | | 2,474,175 |
| | | | |
|
|
Apparel — 1.0% | | | | | |
Fossil, Inc.(a) | | 97,281 | | | 2,494,285 |
Genesco, Inc.(a) | | 30,184 | | | 939,930 |
Phillips-Van Heusen Corp. | | 42,405 | | | 1,144,935 |
Russell Corp. | | 44,676 | | | 870,288 |
Wolverine World Wide, Inc. | | 52,367 | | | 1,645,371 |
| | | | |
|
|
| | | | | | 7,094,809 |
| | | | |
|
|
Appliances & Home Furnishings | | | | | |
Applica, Inc.(a) | | 32,873 | | | 198,882 |
Fedders Corp. | | 41,431 | | | 149,980 |
| | | | |
|
|
| | | | | | 348,862 |
| | | | |
|
|
Autos – Cars & Trucks — 0.8% | | | | | |
Midas, Inc.(a) | | 21,544 | | | 430,880 |
Myers Industries, Inc. | | 47,112 | | | 603,033 |
Sonic Automative, Inc. | | 56,600 | | | 1,403,680 |
Standard Motor Products, Inc. | | 27,012 | | | 426,790 |
Superior Industries International, Inc.(b) | | 33,500 | | | 973,175 |
TBC Corp.(a) | | 30,421 | | | 845,704 |
Wabash National Corp.(a) | | 41,476 | | | 1,116,949 |
| | | | |
|
|
| | | | | | 5,800,211 |
| | | | |
|
|
Banks & Savings & Loans — 7.1% | | | | | |
Anchor BanCorp Wisconsin, Inc. | | 31,370 | | | 914,436 |
BankAtlantic Bancorp, Inc. (Class “A” Stock) | | 81,960 | | | 1,631,004 |
BankUnited Financial Corp. (Class “A” Stock)(a) | | 41,051 | | | 1,311,579 |
Boston Private Financial Holdings, Inc. | | 37,718 | | | 1,062,516 |
Brookline Bancorp, Inc. | | 80,921 | | | 1,320,631 |
Chittenden Corp.(b) | | 63,375 | | | 1,820,764 |
Commercial Federal Corp. | | 53,894 | | | 1,601,191 |
Community Bank System, Inc. | | 41,831 | | | 1,181,726 |
Dime Community Bancshares | | 50,939 | | | 912,317 |
Downey Financial Corp. | | 38,098 | | | 2,171,586 |
East West Bancorp, Inc. | | 71,666 | | | 3,007,105 |
First Bancorp/Puerto Rico | | 55,237 | | | 3,508,102 |
First Midwest Bancorp, Inc. | | 63,500 | | | 2,304,415 |
| | | | | |
COMMON STOCKS
(Continued) | | Shares
| | Value
(Note 2)
|
Banks & Savings & Loans (cont’d.) | | | | | |
First Republic Bank | | 22,435 | | $ | 1,189,055 |
FirstFed Financial Corp.(a) | | 22,495 | | | 1,166,816 |
Flagstar Bancorp, Inc.(b) | | 83,963 | | | 1,897,564 |
Gold Banc Corp., Inc. | | 54,936 | | | 803,164 |
Nara Bancorp, Inc. | | 31,900 | | | 678,513 |
PrivateBancorp, Inc. | | 27,778 | | | 895,285 |
Provident Bankshares Corp.(b) | | 45,280 | | | 1,646,834 |
Republic Bancorp, Inc. | | 96,399 | | | 1,472,977 |
Riggs National Corp. | | 43,271 | | | 919,941 |
Southwest Bancorporation of Texas, Inc.(b) | | 95,862 | | | 2,232,626 |
Sterling Bancshares, Inc. | | 61,474 | | | 877,234 |
Sterling Financial Corp.(a) | | 31,185 | | | 1,224,323 |
Susquehanna Bancshares, Inc. | | 63,592 | | | 1,586,620 |
TrustCo Bank Corp. | | 101,696 | | | 1,402,388 |
UCBH Holdings, Inc.(b) | | 62,286 | | | 2,853,945 |
Umpqua Holdings Corp. | | 61,105 | | | 1,540,457 |
United Bankshares, Inc. | | 58,996 | | | 2,250,697 |
Waypoint Financial Corp. | | 45,861 | | | 1,300,159 |
Whitney Holding Corp. | | 57,510 | | | 2,587,375 |
Wintrust Financial Corp.(b) | | 29,527 | | | 1,681,858 |
| | | | |
|
|
| | | | | | 52,955,203 |
| | | | |
|
|
Chemicals — 1.7% | | | | | |
A. Schulman, Inc. | | 41,758 | | | 894,039 |
Arch Chemicals, Inc. | | 32,148 | | | 925,220 |
Cambrex Corp. | | 35,763 | | | 969,177 |
Georgia Gulf Corp. | | 45,863 | | | 2,283,977 |
H.B. Fuller Co. | | 39,155 | | | 1,116,309 |
MacDermid, Inc. | | 41,440 | | | 1,495,984 |
OM Group, Inc.(a) | | 38,758 | | | 1,256,534 |
Omnova Solutions, Inc.(a) | | 55,095 | | | 309,634 |
Penford Corp. | | 11,997 | | | 188,713 |
PolyOne Corp.(a) | | 125,300 | | | 1,135,218 |
Quaker Chemical Corp. | | 13,192 | | | 327,689 |
TETRA Technologies, Inc.(a) | | 30,622 | | | 866,603 |
WD-40 Co. | | 22,674 | | | 644,168 |
Wellman, Inc. | | 43,804 | | | 468,265 |
| | | | |
|
|
| | | | | | 12,881,530 |
| | | | |
|
|
Collectibles & Gifts — 0.3% | | | | | |
Action Performance Cos., Inc. | | 25,083 | | | 275,662 |
Department 56, Inc.(a) | | 18,484 | | | 307,759 |
Enesco Group, Inc.(a) | | 19,606 | | | 158,416 |
Lennox International, Inc. | | 82,405 | | | 1,676,942 |
| | | | |
|
|
| | | | | | 2,418,779 |
| | | | |
|
|
Commercial Services — 3.5% | | | | | |
ABM Industries, Inc. | | 66,392 | | | 1,309,250 |
Arbitron, Inc.(a) | | 42,434 | | | 1,662,564 |
Bowne & Co., Inc. | | 48,998 | | | 796,708 |
Central Parking Corp.(b) | | 49,960 | | | 756,894 |
Chemed Corp. | | 17,057 | | | 1,144,695 |
Coinstar, Inc.(a)(b) | | 33,649 | | | 902,803 |
Consolidated Graphics, Inc.(a) | | 18,712 | | | 858,881 |
CPI Corp. | | 10,536 | | | 143,184 |
Dendrite International, Inc.(a) | | 57,081 | | | 1,107,372 |
eFunds Corp.(a) | | 66,818 | | | 1,604,300 |
FindWhat.com(a) | | 41,378 | | | 733,632 |
SEE NOTES TO FINANCIAL STATEMENTS.
B70
| | | | |
| | | SMALL CAPITALIZATION STOCK PORTFOLIO (Continued) | | |
SCHEDULE OF INVESTMENTS | December 31, 2004 |
| | | | | |
COMMON STOCKS
(Continued) | | Shares
| | Value
(Note 2)
|
Commercial Services (cont’d.) | | | | | |
Global Payments, Inc. | | 52,619 | | $ | 3,080,316 |
Hooper Holmes, Inc. | | 88,914 | | | 526,371 |
Insurance Auto Auctions, Inc.(a) | | 15,795 | | | 354,124 |
John H. Harland Co. | | 38,012 | | | 1,372,233 |
Labor Ready, Inc.(a)(b) | | 57,385 | | | 970,954 |
MAXIMUS, Inc.(a) | | 29,648 | | | 922,646 |
Mobile Mini, Inc.(a) | | 19,981 | | | 660,172 |
NCO Group, Inc.(a) | | 43,825 | | | 1,132,876 |
Nelson Thomas, Inc. | | 20,159 | | | 455,593 |
On Assignment, Inc.(a) | | 34,516 | | | 179,138 |
PAREXEL International Corp.(a) | | 35,530 | | | 721,259 |
Pre-Paid Legal Services, Inc.(b) | | 21,211 | | | 796,473 |
Rewards Network, Inc.(a)(b) | | 33,895 | | | 237,265 |
SOURCECORP, Inc.(a) | | 21,533 | | | 411,496 |
Sovran Self Storage, Inc. | | 21,660 | | | 912,752 |
Startek, Inc. | | 19,795 | | | 563,168 |
Vertrue, Inc.(a)(b) | | 13,674 | | | 516,467 |
Viad Corp. | | 30,335 | | | 864,244 |
Volt Information Sciences, Inc.(a) | | 20,828 | | | 612,135 |
| | | | |
|
|
| | | | | | 26,309,965 |
| | | | |
|
|
Computer Services — 3.9% | | | | | |
Actel Corp.(a) | | 34,635 | | | 607,498 |
Adaptec, Inc.(a) | | 152,066 | | | 1,154,181 |
Agilysys, Inc. | | 44,079 | | | 755,514 |
Avid Technology, Inc.(a)(b) | | 46,537 | | | 2,873,660 |
Black Box Corp. | | 23,722 | | | 1,139,130 |
Brooktrout, Inc.(a) | | 17,354 | | | 208,421 |
CACI International, Inc. (Class “A” Stock)(a)(b) | | 40,018 | | | 2,726,426 |
Carreker Corp.(a) | | 33,875 | | | 291,325 |
Cerner Corp.(a)(b) | | 49,700 | | | 2,642,549 |
Ciber, Inc.(a) | | 85,364 | | | 822,909 |
FactSet Research Systems, Inc.(b) | | 42,699 | | | 2,495,330 |
FileNet Corp.(a)(b) | | 53,999 | | | 1,391,014 |
Hutchinson Technology, Inc.(a) | | 35,712 | | | 1,234,564 |
Insight Enterprises, Inc.(a) | | 66,636 | | | 1,367,371 |
Manhattan Associates, Inc.(a) | | 41,080 | | | 980,990 |
Mercury Computer Systems, Inc.(a)(b) | | 28,838 | | | 855,912 |
MTS Systems Corp. | | 28,000 | | | 946,680 |
NYFIX, Inc.(a) | | 44,312 | | | 274,291 |
Phoenix Technology, Ltd.(a) | | 33,537 | | | 277,016 |
Pinnacle Systems, Inc.(a) | | 94,854 | | | 578,609 |
Progress Software Corp.(a) | | 49,387 | | | 1,153,186 |
Radiant Systems, Inc.(a) | | 36,131 | | | 235,213 |
RadiSys Corp.(a) | | 26,178 | | | 511,780 |
Standard Microsystems Corp.(a) | | 25,273 | | | 450,618 |
Synaptics, Inc.(a) | | 34,996 | | | 1,070,178 |
TALX Corp. | | 18,782 | | | 484,388 |
Teledyne Technologies, Inc.(a) | | 44,675 | | | 1,314,785 |
| | | | |
|
|
| | | | | | 28,843,538 |
| | | | |
|
|
Construction — 3.5% | | | | | |
Coachmen Industries, Inc. | | 21,503 | | | 373,292 |
ElkCorp | | 27,155 | | | 929,244 |
Florida Rock Industries, Inc. | | 59,359 | | | 3,533,641 |
Insituform Technologies, Inc. (Class “A” Stock)(a) | | 36,573 | | | 829,110 |
| | | | | |
COMMON STOCKS
(Continued) | | Shares
| | Value
(Note 2)
|
Construction (cont’d.) | | | | | |
M.D.C. Holdings, Inc. | | 44,075 | | $ | 3,809,843 |
Meritage Corp.(a) | | 17,611 | | | 1,984,760 |
NVR, Inc.(a)(b) | | 8,725 | | | 6,713,015 |
Shaw Group, Inc.(a)(b) | | 87,596 | | | 1,563,589 |
Simpson Manufacturing Co., Inc. | | 65,286 | | | 2,278,481 |
Standard Pacific Corp. | | 45,764 | | | 2,935,303 |
Thomas Industries, Inc. | | 24,199 | | | 966,024 |
| | | | |
|
|
| | | | | | 25,916,302 |
| | | | |
|
|
Consumer Cyclical — 0.1% | | | | | |
JAKKS Pacific, Inc.(a) | | 35,830 | | | 792,201 |
| | | | |
|
|
Containers — 0.3% | | | | | |
AptarGroup, Inc. | | 48,959 | | | 2,584,056 |
| | | | |
|
|
Cosmetics & Soaps — 0.1% | | | | | |
Nature’s Sunshine Products, Inc. | | 21,053 | | | 428,639 |
| | | | |
|
|
Distribution/Wholesalers — 0.9% | | | | | |
Advanced Marketing Services, Inc. | | 26,041 | | | 261,973 |
Bell Microproducts, Inc. (Class “B” Stock)(a) | | 38,747 | | | 372,746 |
Castle (A.M.) & Co.(a) | | 21,610 | | | 258,023 |
ScanSource, Inc.(a) | | 17,327 | | | 1,077,046 |
SCP Pool Corp. | | 71,390 | | | 2,277,341 |
United Stationers, Inc.(a) | | 45,249 | | | 2,090,504 |
| | | | |
|
|
| | | | | | 6,337,633 |
| | | | |
|
|
Diversified Manufacturing Operations — 1.7% | | | |
Acuity Brands, Inc. | | 58,016 | | | 1,844,909 |
Barnes Group, Inc. | | 31,687 | | | 840,022 |
Ceradyne, Inc.(a)(b) | | 22,300 | | | 1,275,783 |
CLARCOR, Inc. | | 35,049 | | | 1,919,634 |
CUNO, Inc.(a) | | 23,259 | | | 1,381,585 |
Griffon Corp.(a) | | 40,177 | | | 1,084,779 |
Lydall, Inc.(a) | | 22,033 | | | 261,311 |
MascoTech, Inc.(a) | | 64,600 | | | 0 |
Mueller Industries, Inc. | | 49,783 | | | 1,603,012 |
Smith (A.O.) Corp. | | 40,304 | | | 1,206,702 |
Standex International Corp. | | 16,837 | | | 479,686 |
Valmont Industries, Inc. | | 32,770 | | | 822,855 |
| | | | |
|
|
| | | | | | 12,720,278 |
| | | | |
|
|
Drugs & Medical Supplies — 5.6% | | | | | |
Advanced Medical Optics, Inc.(a)(b) | | 50,245 | | | 2,067,079 |
American Medical Systems Holdings, Inc.(a) | | 46,107 | | | 1,927,734 |
ArthroCare Corp.(a)(b) | | 32,247 | | | 1,033,839 |
Coherent, Inc.(a) | | 41,482 | | | 1,262,712 |
CONMED Corp.(a) | | 40,874 | | | 1,161,639 |
CryoLife, Inc.(a)(b) | | 31,865 | | | 225,286 |
Cyberonics, Inc.(a)(b) | | 32,706 | | | 677,668 |
Diagnostic Products Corp. | | 39,962 | | | 2,199,908 |
Enzo Biochem, Inc.(a) | | 44,316 | | | 862,833 |
Haemonetics Corp.(a) | | 34,822 | | | 1,260,905 |
Hologic, Inc.(a) | | 28,071 | | | 771,110 |
ICU Medical, Inc.(a)(b) | | 18,596 | | | 508,415 |
IDEXX Laboratories, Inc.(a) | | 46,036 | | | 2,513,105 |
Integra LifeSciences Holdings(a)(b) | | 39,475 | | | 1,457,812 |
Invacare Corp.(b) | | 42,788 | | | 1,979,373 |
SEE NOTES TO FINANCIAL STATEMENTS.
B71
| | | | |
| | | SMALL CAPITALIZATION STOCK PORTFOLIO (Continued) | | |
SCHEDULE OF INVESTMENTS | December 31, 2004 |
| | | | | |
COMMON STOCKS
(Continued) | | Shares
| | Value
(Note 2)
|
Drugs & Medical Supplies (cont’d.) | | | | | |
Medicis Pharmaceutical Corp. (Class “A” Stock)(b) | | 74,901 | | $ | 2,629,774 |
NBTY, Inc.(a) | | 91,535 | | | 2,197,755 |
Noven Pharmaceuticals, Inc.(a) | | 32,065 | | | 547,029 |
Osteotech, Inc.(a) | | 23,429 | | | 128,860 |
Owens & Minor, Inc. | | 53,995 | | | 1,521,039 |
PolyMedica Corp. | | 37,566 | | | 1,400,836 |
Possis Medical, Inc.(a) | | 24,798 | | | 334,277 |
Priority Healthcare Corp.(a) | | 59,555 | | | 1,296,512 |
Regeneron Pharmaceuticals, Inc.(a)(b) | | 76,186 | | | 701,673 |
ResMed, Inc.(a) | | 46,464 | | | 2,374,310 |
Respironics, Inc.(a) | | 48,145 | | | 2,617,162 |
Savient Pharmaceuticals, Inc.(a) | | 82,671 | | | 224,038 |
SFBC International, Inc.(a) | | 20,200 | | | 797,900 |
SurModics, Inc.(a)(b) | | 24,006 | | | 780,435 |
Sybron Dental Specialties, Inc.(a) | | 53,262 | | | 1,884,410 |
Viasys Healthcare, Inc.(a) | | 42,420 | | | 805,980 |
Vital Signs, Inc. | | 17,403 | | | 677,325 |
Wilson Greatbatch Technologies, Inc.(a) | | 29,236 | | | 655,471 |
| | | | |
|
|
| | | | | | 41,484,204 |
| | | | |
|
|
Electrical Equipment — 1.0% | | | | | |
ALLETE, Inc. | | 40,431 | | | 1,485,839 |
Anixter International, Inc.(a) | | 50,978 | | | 1,834,698 |
Baldor Electric Co. | | 45,110 | | | 1,241,878 |
C&D Technologies, Inc. | | 34,645 | | | 590,351 |
Kulicke & Soffa Industries, Inc.(a) | | 69,869 | | | 602,271 |
MagneTek, Inc.(a) | | 38,972 | | | 268,907 |
Technitrol, Inc.(a) | | 55,272 | | | 1,005,950 |
Vicor Corp. | | 57,507 | | | 753,917 |
| | | | |
|
|
| | | | | | 7,783,811 |
| | | | |
|
|
Electronics — 2.6% | | | | | |
Analogic Corp. | | 18,731 | | | 838,962 |
Artesyn Technologies, Inc.(a) | | 53,658 | | | 606,335 |
Audiovox Corp.(a) | | 31,447 | | | 496,234 |
Belden, Inc.(b) | | 64,190 | | | 1,489,208 |
Benchmark Electronics, Inc.(a)(b) | | 56,558 | | | 1,928,628 |
Checkpoint Systems, Inc.(a) | | 51,439 | | | 928,474 |
CTS Corp. | | 49,062 | | | 652,034 |
Dionex Corp.(a)(b) | | 28,576 | | | 1,619,402 |
EDO Corp. | | 27,398 | | | 869,887 |
Electro Scientific Industries, Inc.(a) | | 38,907 | | | 768,802 |
Esterline Technologies, Inc.(a) | | 33,602 | | | 1,097,105 |
Helix Technology Corp. | | 35,696 | | | 620,753 |
Intermagnetics General Corp.(a) | | 34,906 | | | 886,961 |
Itron, Inc.(a) | | 28,950 | | | 692,195 |
Keithley Instruments, Inc. | | 22,187 | | | 437,084 |
Littelfuse, Inc.(a) | | 30,495 | | | 1,041,709 |
Methode Electronics, Inc.
(Class “A” Stock) | | 48,946 | | | 628,956 |
Park Electrochemical Corp. | | 27,257 | | | 590,932 |
Photronics, Inc.(a) | | 44,609 | | | 736,049 |
SBS Technologies, Inc.(a) | | 21,197 | | | 295,910 |
Sonic Solutions(a)(b) | | 32,035 | | | 718,865 |
Ultratech Stepper, Inc.(a) | | 32,573 | | | 614,001 |
X-Rite, Inc. | | 28,490 | | | 456,125 |
| | | | |
|
|
| | | | | | 19,014,611 |
| | | | |
|
|
| | | | | |
COMMON STOCKS
(Continued) | | Shares
| | Value
(Note 2)
|
Electronic Components — 1.7% | | | | | |
Alliance Semiconductor Corp.(a) | | 48,490 | | $ | 179,413 |
Bel Fuse, Inc. (Class “B” Stock) | | 15,267 | | | 515,872 |
Cohu, Inc. | | 29,487 | | | 547,279 |
Cubic Corp. | | 36,563 | | | 920,291 |
Cymer, Inc.(a) | | 50,567 | | | 1,493,749 |
Daktronics, Inc.(a) | | 25,901 | | | 644,676 |
DSP Group, Inc.(a) | | 38,279 | | | 854,770 |
FLIR Systems, Inc.(a)(b) | | 46,769 | | | 2,983,394 |
Microsemi Corp.(a)(b) | | 81,535 | | | 1,415,447 |
Planar Systems, Inc.(a) | | 19,995 | | | 224,544 |
Rayovac Corp.(a) | | 47,364 | | | 1,447,444 |
Rogers Corp.(a) | | 22,919 | | | 987,809 |
Supertex, Inc.(a) | | 17,843 | | | 387,193 |
| | | | |
|
|
| | | | | | 12,601,881 |
| | | | |
|
|
Energy — 0.9% | | | | | |
Advanced Energy Industries, Inc.(a) | | 44,717 | | | 408,266 |
Headwaters, Inc.(a) | | 46,002 | | | 1,311,057 |
UGI Corp. | | 69,768 | | | 2,854,209 |
Unisource Energy Corp. | | 46,845 | | | 1,129,433 |
Veritas DGC, Inc.(a)(b) | | 45,734 | | | 1,024,899 |
| | | | |
|
|
| | | | | | 6,727,864 |
| | | | |
|
|
Engineering — 0.7% | | | | | |
EMCOR Group, Inc.(a) | | 20,748 | | | 937,394 |
Engineered Support Systems, Inc. | | 36,467 | | | 2,159,576 |
URS Corp.(a) | | 59,500 | | | 1,909,950 |
| | | | |
|
|
| | | | | | 5,006,920 |
| | | | |
|
|
Environmental Services — 0.7% | | | | | |
Ionics, Inc.(a)(b) | | 31,127 | | | 1,349,044 |
Tetra Tech, Inc.(a) | | 76,895 | | | 1,287,222 |
Waste Connections, Inc.(a) | | 65,622 | | | 2,247,554 |
| | | | |
|
|
| | | | | | 4,883,820 |
| | | | |
|
|
Exchange Traded Funds — 2.6% | | | | | |
iShares S&P SmallCap 600 Index Fund(b) | | 119,440 | | | 19,434,082 |
| | | | |
|
|
Financial Services — 2.1% | | | | | |
Financial Federal Corp. | | 23,746 | | | 930,843 |
Hudson United Bancorp | | 61,512 | | | 2,422,343 |
Investment Technology Group, Inc.(a)(b) | | 57,344 | | | 1,146,880 |
Irwin Financial Corp. | | 38,800 | | | 1,101,532 |
MAF Bancorp, Inc. | | 45,989 | | | 2,061,227 |
Piper Jaffray Cos., Inc.(a) | | 27,183 | | | 1,303,425 |
PRG-Schultz International, Inc.(a)(b) | | 84,683 | | | 425,956 |
South Financial Group, Inc. | | 97,292 | | | 3,164,909 |
SWS Group, Inc. | | 23,609 | | | 517,509 |
UICI | | 62,618 | | | 2,122,750 |
World Acceptance Corp.(a) | | 25,669 | | | 706,154 |
| | | | |
|
|
| | | | | | 15,903,528 |
| | | | |
|
|
Food & Beverage — 1.9% | | | | | |
American Italian Pasta Co. (Class “A” Stock)(b) | | 24,720 | | | 574,740 |
Corn Products International, Inc. | | 49,675 | | | 2,660,593 |
Flowers Foods, Inc. | | 59,128 | | | 1,867,262 |
Hain Celestial Group, Inc.(a) | | 49,905 | | | 1,031,536 |
J & J Snack Foods Corp. | | 12,359 | | | 605,962 |
SEE NOTES TO FINANCIAL STATEMENTS.
B72
| | | | |
| | | SMALL CAPITALIZATION STOCK PORTFOLIO (Continued) | | |
SCHEDULE OF INVESTMENTS | December 31, 2004 |
| | | | | |
COMMON STOCKS
(Continued) | | Shares
| | Value
(Note 2)
|
Food & Beverage (cont’d.) | | | | | |
Lance, Inc. | | 40,434 | | $ | 769,459 |
Nash-Finch Co. | | 17,148 | | | 647,509 |
Performance Food Group Co.(a) | | 63,954 | | | 1,721,002 |
Ralcorp Holdings, Inc. | | 40,079 | | | 1,680,512 |
Sanderson Farms, Inc.(b) | | 27,283 | | | 1,180,808 |
United Natural Foods, Inc.(a) | | 54,676 | | | 1,700,424 |
| | | | |
|
|
| | | | | | 14,439,807 |
| | | | |
|
|
Furniture — 0.8% | | | | | |
Aaron Rents, Inc. | | 68,077 | | | 1,701,925 |
Bassett Furniture Industries, Inc. | | 15,960 | | | 313,215 |
Ethan Allen Interiors, Inc.(b) | | 49,243 | | | 1,970,705 |
Interface, Inc.(a) | | 71,201 | | | 709,874 |
La-Z-Boy, Inc. | | 71,275 | | | 1,095,497 |
| | | | |
|
|
| | | | | | 5,791,216 |
| | | | |
|
|
Healthcare — 2.7% | | | | | |
Amedisys, Inc.(a) | | 20,900 | | | 676,951 |
American Healthways, Inc.(a)(b) | | 45,148 | | | 1,491,690 |
ArQule, Inc.(a) | | 39,528 | | | 228,867 |
BioLase Technology, Inc.(b) | | 33,368 | | | 362,710 |
Cooper Cos., Inc.(b) | | 44,771 | | | 3,160,385 |
Datascope Corp. | | 20,273 | | | 804,635 |
Immucor, Inc.(a) | | 61,394 | | | 1,443,373 |
LabOne, Inc.(a) | | 23,492 | | | 752,684 |
LCA-Vision, Inc. | | 41,350 | | | 967,177 |
Mentor Corp.(b) | | 58,537 | | | 1,975,038 |
Merit Medical Systems, Inc.(a) | | 36,135 | | | 552,143 |
NDCHealth Corp. | | 49,178 | | | 914,219 |
Pharmaceutical Product Development, Inc.(a)(b) | | 77,388 | | | 3,195,351 |
Sierra Health Services, Inc.(a) | | 36,111 | | | 1,990,077 |
Sola International, Inc.(a) | | 44,061 | | | 1,213,440 |
Theragenics Corp(a) | | 41,005 | | | 166,480 |
| | | | |
|
|
| | | | | | 19,895,220 |
| | | | |
|
|
Hospitals/Healthcare Management — 2.4% | | | |
Accredo Health, Inc.(a) | | 66,933 | | | 1,855,383 |
AMERIGROUP Corp.(a)(b) | | 34,291 | | | 2,594,457 |
AmSurg Corp.(a) | | 40,067 | | | 1,183,579 |
Biosite, Inc.(a)(b) | | 22,187 | | | 1,365,388 |
Centene Corp.(a) | | 56,198 | | | 1,593,213 |
Curative Health Services, Inc.(a) | | 17,618 | | | 120,683 |
DJ Orthopedics, Inc.(a) | | 29,364 | | | 628,977 |
Kensey Nash Corp.(a) | | 15,508 | | | 535,491 |
OCA, Inc.(a)(b) | | 68,485 | | | 434,880 |
Odyssey Healthcare, Inc.(a)(b) | | 50,199 | | | 686,722 |
Pediatrix Medical Group, Inc.(a) | | 30,582 | | | 1,958,777 |
Province Healthcare Co.(a) | | 68,081 | | | 1,521,610 |
RehabCare Group, Inc.(a) | | 22,454 | | | 628,488 |
Sunrise Assisted Living, Inc.(a)(b) | | 27,876 | | | 1,292,332 |
United Surgical Partners International, Inc.(a) | | 38,975 | | | 1,625,258 |
| | | | |
|
|
| | | | | | 18,025,238 |
| | | | |
|
|
Housing Related — 0.4% | | | | | |
Champion Enterprises, Inc.(a) | | 97,940 | | | 1,157,651 |
Fleetwood Enterprises, Inc.(a) | | 75,850 | | | 1,020,941 |
| | | | | |
COMMON STOCKS
(Continued) | | Shares
| | Value
(Note 2)
|
Housing Related (cont’d.) | | | | | |
National Presto Industries, Inc. | | 9,302 | | $ | 423,241 |
Skyline Corp. | | 11,520 | | | 470,016 |
| | | | |
|
|
| | | | | | 3,071,849 |
| | | | |
|
|
Human Resources — 0.6% | | | | | |
Administaff, Inc.(a)(b) | | 34,767 | | | 438,412 |
CDI Corp. | | 26,930 | | | 575,763 |
Cross Country Healthcare, Inc.(a) | | 43,862 | | | 793,025 |
Heidrick & Struggles International, Inc.(a) | | 26,244 | | | 899,382 |
Spherion Corp.(a) | | 83,446 | | | 700,947 |
Watson Wyatt & Co. Holdings | | 44,414 | | | 1,196,957 |
| | | | |
|
|
| | | | | | 4,604,486 |
| | | | |
|
|
Instrument – Controls — 0.4% | | | | | |
BEI Technologies, Inc. | | 20,216 | | | 624,270 |
FEI Co.(a) | | 45,505 | | | 955,605 |
Woodward Governor Co. | | 15,480 | | | 1,108,523 |
| | | | |
|
|
| | | | | | 2,688,398 |
| | | | |
|
|
Insurance — 2.4% | | | | | |
Delphi Financial Group, Inc. | | 43,343 | | | 2,000,279 |
Fremont General Corp.(b) | | 105,432 | | | 2,654,778 |
Hilb, Rogal & Hamilton Co.(b) | | 49,243 | | | 1,784,566 |
LandAmerica Financial Group, Inc.(b) | | 24,408 | | | 1,316,323 |
Philadelphia Consolidated Holding Corp.(a) | | 30,477 | | | 2,015,749 |
Presidential Life Corp. | | 40,101 | | | 680,113 |
ProAssurance Corp.(a)(b) | | 39,948 | | | 1,562,366 |
RLI Corp. | | 34,615 | | | 1,438,946 |
SCPIE Holdings, Inc.(a) | | 13,504 | | | 133,690 |
Selective Insurance Group, Inc. | | 38,062 | | | 1,683,863 |
Stewart Information Services Corp. | | 24,828 | | | 1,034,086 |
Zenith National Insurance Corp.(b) | | 26,405 | | | 1,316,025 |
| | | | |
|
|
| | | | | | 17,620,784 |
| | | | |
|
|
Internet — 0.6% | | | | | |
Digital Insight Corp.(a) | | 48,807 | | | 898,049 |
Internet Security Systems, Inc.(a) | | 62,768 | | | 1,459,356 |
Napster, Inc.(a)(b) | | 47,537 | | | 446,848 |
Websense, Inc.(a)(b) | | 32,007 | | | 1,623,395 |
| | | | |
|
|
| | | | | | 4,427,648 |
| | | | |
|
|
Leisure — 2.4% | | | | | |
Argosy Gaming Co.(a) | | 40,360 | | | 1,884,812 |
Aztar Corp.(a) | | 47,479 | | | 1,657,967 |
Bally Total Fitness Holding Corp.(a) | | 46,547 | | | 197,359 |
K2, Inc.(a) | | 63,885 | | | 1,014,494 |
Marcus Corp. | | 41,199 | | | 1,035,743 |
Multimedia Games, Inc.(a)(b) | | 38,335 | | | 604,160 |
Pinnacle Entertainment, Inc.(a) | | 54,396 | | | 1,075,953 |
Polaris Industries, Inc. | | 58,622 | | | 3,987,468 |
Shuffle Master, Inc.(a)(b) | | 31,713 | | | 1,493,682 |
Sturm Ruger & Co., Inc. | | 36,796 | | | 332,268 |
The Nautilus Group, Inc.(b) | | 44,918 | | | 1,085,668 |
Winnebago Industries, Inc.(b) | | 46,003 | | | 1,796,877 |
WMS Industries, Inc.(a)(b) | | 41,830 | | | 1,402,978 |
| | | | |
|
|
| | | | | | 17,569,429 |
| | | | |
|
|
SEE NOTES TO FINANCIAL STATEMENTS.
B73
| | | | |
| | | SMALL CAPITALIZATION STOCK PORTFOLIO (Continued) | | |
SCHEDULE OF INVESTMENTS | December 31, 2004 |
| | | | | |
COMMON STOCKS
(Continued) | | Shares
| | Value
(Note 2)
|
Machinery — 3.5% | | | | | |
Albany International Corp. (Class “A” Stock) | | 43,389 | | $ | 1,525,557 |
Applied Industrial Technologies, Inc. | | 40,554 | | | 1,111,180 |
Astec Industries, Inc.(a) | | 27,335 | | | 470,435 |
Cognex Corp. | | 63,033 | | | 1,758,621 |
Dril-Quip, Inc.(a) | | 23,695 | | | 574,841 |
Gardner Denver, Inc.(a) | | 27,205 | | | 987,269 |
IDEX Corp. | | 69,256 | | | 2,804,868 |
JLG Industries, Inc. | | 60,925 | | | 1,195,958 |
Lindsay Manufacturing Co. | | 16,084 | | | 416,254 |
Manitowoc Co., Inc. | | 40,425 | | | 1,522,001 |
Milacron, Inc.(a) | | 66,409 | | | 225,126 |
Paxar Corp.(a) | | 54,211 | | | 1,201,858 |
Photon Dynamics, Inc.(a) | | 23,004 | | | 558,537 |
Regal-Beloit Corp. | | 33,418 | | | 955,755 |
Robbins & Myers, Inc. | | 19,837 | | | 472,716 |
Roper Industries, Inc. | | 57,680 | | | 3,505,214 |
Stewart & Stevenson Services, Inc. | | 39,332 | | | 795,686 |
Timken Co. | | 123,530 | | | 3,214,251 |
Toro Co. | | 31,255 | | | 2,542,594 |
| | | | |
|
|
| | | | | | 25,838,721 |
| | | | |
|
|
Media — 0.1% | | | | | |
4Kids Entertainment, Inc.(a) | | 18,267 | | | 383,972 |
| | | | |
|
|
Metals – Ferrous — 1.9% | | | | | |
Aleris International, Inc.(a) | | 39,429 | | | 667,139 |
Carpenter Technology Corp. | | 32,804 | | | 1,917,722 |
Century Aluminum Co.(a) | | 43,798 | | | 1,150,135 |
Cleveland-Cliffs, Inc.(b) | | 14,763 | | | 1,533,285 |
Commercial Metals Co.(b) | | 40,209 | | | 2,032,967 |
Kaydon Corp. | | 38,641 | | | 1,275,926 |
Material Sciences Corp.(a) | | 19,666 | | | 353,791 |
Maverick Tube Corp.(a) | | 58,323 | | | 1,767,187 |
Quanex Corp. | | 22,657 | | | 1,553,590 |
Reliance Steel & Aluminum Co. | | 44,673 | | | 1,740,460 |
Steel Technologies, Inc. | | 17,501 | | | 481,453 |
| | | | |
|
|
| | | | | | 14,473,655 |
| | | | |
|
|
Metals – Non Ferrous — 0.3% | | | | | |
Brush Engineered Materials, Inc.(a) | | 26,197 | | | 484,644 |
RTI International Metals, Inc.(a) | | 29,605 | | | 608,087 |
Ryerson Tull, Inc.(b) | | 34,202 | | | 538,681 |
Wolverine Tube, Inc.(a) | | 20,315 | | | 262,267 |
| | | | |
|
|
| | | | | | 1,893,679 |
| | | | |
|
|
Mineral Resources — 0.6% | | | | | |
AMCOL International Corp. | | 40,135 | | | 806,312 |
Massey Energy Co. | | 104,044 | | | 3,636,338 |
| | | | |
|
|
| | | | | | 4,442,650 |
| | | | |
|
|
Miscellaneous Basic Industry — 1.7% | | | | | |
Apogee Enterprises, Inc. | | 37,304 | | | 500,247 |
Armor Holdings, Inc.(a)(b) | | 45,410 | | | 2,135,178 |
Briggs & Stratton Corp. | | 70,508 | | | 2,931,723 |
Lawson Products, Inc. | | 12,780 | | | 644,495 |
Libbey, Inc. | | 18,879 | | | 419,303 |
Meade Instruments Corp.(a) | | 27,339 | | | 93,773 |
Texas Industries, Inc. | | 29,643 | | | 1,849,130 |
Tredegar Industries, Inc. | | 52,796 | | | 1,067,007 |
| | | | | |
COMMON STOCKS
(Continued) | | Shares
| | Value
(Note 2)
|
Miscellaneous Basic Industry (cont’d.) | | | | | |
Watsco, Inc. | | 36,515 | | $ | 1,286,058 |
Watts Water Technologies (Class “A” Stock) | | 44,304 | | | 1,428,361 |
| | | | |
|
|
| | | | | | 12,355,275 |
| | | | |
|
|
Miscellaneous – Consumer Growth/Staple — 0.5% | | | |
DIMON, Inc. | | 61,739 | | | 414,886 |
Hughes Supply, Inc. | | 90,356 | | | 2,923,017 |
| | | | |
|
|
| | | | | | 3,337,903 |
| | | | |
|
|
Networking — 0.2% | | | | | |
Aeroflex, Inc.(a) | | 101,904 | | | 1,235,077 |
C-COR.net Corp.(a) | | 58,960 | | | 548,328 |
| | | | |
|
|
| | | | | | 1,783,405 |
| | | | |
|
|
Office Equipment & Supplies — 0.3% | | | | | |
Global Imaging Systems, Inc.(a)(b) | | 31,746 | | | 1,253,967 |
Imagistics International, Inc.(a) | | 22,310 | | | 750,955 |
Standard Register Co. | | 38,967 | | | 550,214 |
| | | | |
|
|
| | | | | | 2,555,136 |
| | | | |
|
|
Oil & Gas — 3.3% | | | | | |
Cabot Oil & Gas Corp. (Class “A” Stock) | | 45,307 | | | 2,004,835 |
Cascade Natural Gas Corp. | | 15,393 | | | 326,332 |
Cimarex Energy Co.(a) | | 56,913 | | | 2,157,003 |
Frontier Oil Corp. | | 36,829 | | | 981,861 |
Laclede Group, Inc. | | 28,715 | | | 894,472 |
Lone Star Technologies, Inc.(a) | | 39,783 | | | 1,331,139 |
Northwest Natural Gas Co. | | 37,536 | | | 1,266,465 |
Petroleum Development Corp.(a) | | 22,630 | | | 872,839 |
Piedmont Natural Gas Co., Inc.(b) | | 104,929 | | | 2,438,550 |
Remington Oil and Gas Corp.(a)(b) | | 38,011 | | | 1,035,800 |
Southern Union Co.(a)(b) | | 112,720 | | | 2,703,025 |
Southwest Gas Corp. | | 49,310 | | | 1,252,474 |
Spinnaker Exploration Co.(a) | | 46,423 | | | 1,628,055 |
Swift Energy Co.(a)(b) | | 38,331 | | | 1,109,299 |
Unit Corp.(a) | | 62,559 | | | 2,390,379 |
Vintage Petroleum, Inc.(b) | | 89,919 | | | 2,040,262 |
| | | | |
|
|
| | | | | | 24,432,790 |
| | | | |
|
|
Oil & Gas Services — 3.5% | | | | | |
Atwood Oceanics, Inc.(a) | | 20,646 | | | 1,075,657 |
Cal Dive International, Inc.(a)(b) | | 52,552 | | | 2,141,494 |
CARBO Ceramics, Inc. | | 21,896 | | | 1,510,824 |
Energen Corp. | | 49,851 | | | 2,938,716 |
Hydril Co.(a) | | 31,769 | | | 1,445,807 |
Input/Output, Inc.(a) | | 106,016 | | | 937,181 |
New Jersey Resources Corp. | | 38,129 | | | 1,652,511 |
Oceaneering International, Inc.(a) | | 35,130 | | | 1,311,052 |
Offshore Logistics, Inc.(a) | | 31,871 | | | 1,034,851 |
Patina Oil & Gas Corp. | | 96,637 | | | 3,623,888 |
SEACOR SMIT, Inc.(a) | | 25,072 | | | 1,338,845 |
Southwestern Energy Co.(a) | | 49,663 | | | 2,517,417 |
St. Mary Land & Exploration Co.(b) | | 39,216 | | | 1,636,876 |
Stone Energy Corp.(a)(b) | | 36,492 | | | 1,645,424 |
W-H Energy Services, Inc.(a) | | 37,963 | | | 848,853 |
| | | | |
|
|
| | | | | | 25,659,396 |
| | | | |
|
|
Paper & Forest Products — 1.2% | | | | | |
Brady (W.H.) Co. (Class “A” Stock) | | 33,056 | | | 2,068,314 |
Buckeye Technologies, Inc.(a) | | 51,001 | | | 663,523 |
SEE NOTES TO FINANCIAL STATEMENTS.
B74
| | | | |
| | | SMALL CAPITALIZATION STOCK PORTFOLIO (Continued) | | |
SCHEDULE OF INVESTMENTS | December 31, 2004 |
| | | | | |
COMMON STOCKS
(Continued) | | Shares
| | Value
(Note 2)
|
Paper & Forest Products (cont’d.) | | | | | |
Caraustar Industries, Inc.(a) | | 38,986 | | $ | 655,745 |
Chesapeake Corp. | | 26,678 | | | 724,574 |
Neenah Paper, Inc.(a) | | 20,500 | | | 668,300 |
Pope & Talbot, Inc. | | 22,199 | | | 379,825 |
Rock-Tenn Co. (Class “A” Stock) | | 48,699 | | | 738,277 |
Schweitzer-Mauduit Int’l, Inc. | | 20,272 | | | 688,234 |
Universal Forest Products, Inc. | | 24,499 | | | 1,063,257 |
Wausau-Mosinee Paper Corp. | | 70,734 | | | 1,263,309 |
| | | | |
|
|
| | | | | | 8,913,358 |
| | | | |
|
|
Pharmaceuticals — 0.7% | | | | | |
Alpharma, Inc. (Class “A” Stock) | | 72,073 | | | 1,221,637 |
Bradley Pharmaceuticals, Inc.(a)(b) | | 21,606 | | | 419,156 |
Gentiva Health Services, Inc.(a) | | 32,870 | | | 549,587 |
MGI Pharma, Inc.(a) | | 97,010 | | | 2,717,250 |
| | | | |
|
|
| | | | | | 4,907,630 |
| | | | |
|
|
Real Estate Investment Trust — 3.2% | | | | | |
Capital Automotive REIT(b) | | 58,893 | | | 2,092,174 |
Colonial Properties Trust | | 37,510 | | | 1,473,018 |
Commercial Net Lease Realty | | 71,081 | | | 1,464,269 |
CRT Properties, Inc. | | 42,600 | | | 1,016,436 |
Entertainment Properties Trust | | 34,756 | | | 1,548,380 |
Essex Property Trust, Inc.(b) | | 31,410 | | | 2,632,158 |
Gables Residential Trust | | 40,081 | | | 1,434,499 |
Glenborough Realty Trust, Inc. | | 43,705 | | | 930,042 |
Kilroy Realty Corp. | | 39,005 | | | 1,667,464 |
Lexington Corporate Properties Trust | | 66,323 | | | 1,497,573 |
New Century Financial Corp. | | 74,699 | | | 4,774,013 |
Parkway Properties, Inc. | | 15,700 | | | 796,775 |
Shurgard Storage Centers, Inc. (Class “A” Stock) | | 63,642 | | | 2,800,884 |
| | | | |
|
|
| | | | | | 24,127,685 |
| | | | |
|
|
Restaurants — 2.3% | | | | | |
CEC Entertainment, Inc.(a) | | 49,695 | | | 1,986,309 |
IHOP Corp.(b) | | 27,285 | | | 1,142,969 |
Jack in the Box, Inc.(a) | | 50,340 | | | 1,856,036 |
Landry’s Restaurants, Inc. | | 36,218 | | | 1,052,495 |
Lone Star Steakhouse & Saloon, Inc. | | 27,842 | | | 779,576 |
O’Charley’s, Inc.(a) | | 29,203 | | | 570,919 |
P.F. Chang’s China Bistro, Inc.(a)(b) | | 35,404 | | | 1,995,015 |
Papa John’s International, Inc.(a) | | 22,936 | | | 789,916 |
RARE Hospitality International, Inc.(a) | | 46,562 | | | 1,483,465 |
Ryan’s Restaurant Group, Inc.(a) | | 57,036 | | | 879,495 |
Sonic Corp.(a) | | 82,291 | | | 2,509,875 |
The Steak’N Shake Co.(a) | | 37,750 | | | 758,020 |
Triarc Cos., Inc. (Class “A” Stock)(b) | | 88,164 | | | 1,080,891 |
| | | | |
|
|
| | | | | | 16,884,981 |
| | | | |
|
|
Retail — 6.2% | | | | | |
Arctic Cat, Inc. | | 27,848 | | | 738,529 |
Brown Shoe Co., Inc. | | 24,925 | | | 743,513 |
Building Materials Corp. | | 18,745 | | | 717,746 |
Burlington Coat Factory Warehouse Corp. | | 61,084 | | | 1,386,607 |
Caseys Gen. Stores, Inc. | | 68,444 | | | 1,242,259 |
Cash America International, Inc. | | 39,131 | | | 1,163,365 |
| | | | | |
COMMON STOCKS
(Continued) | | Shares
| | Value
(Note 2)
|
Retail (cont’d.) | | | | | |
Cato Corp. (Class “A” Stock) | | 28,379 | | $ | 817,883 |
Christopher & Banks Corp. | | 48,838 | | | 901,061 |
Cost Plus, Inc.(a)(b) | | 29,848 | | | 959,016 |
Dress Barn, Inc.(a)(b) | | 40,715 | | | 716,584 |
Electronics Boutique Holdings Corp.(a) | | 33,189 | | | 1,425,136 |
Fred’s, Inc.(b) | | 53,745 | | | 935,163 |
GameStop Corp. (Class “B” Stock)(a) | | 69,400 | | | 1,555,254 |
Goody’s Family Clothing, Inc. | | 44,866 | | | 410,075 |
Great Atlantic & Pacific Tea Co., Inc.(a) | | 52,696 | | | 540,134 |
Group 1 Automotive, Inc.(a) | | 31,658 | | | 997,227 |
Guitar Center, Inc.(a) | | 34,698 | | | 1,828,238 |
Hancock Fabrics, Inc. | | 25,867 | | | 268,241 |
Haverty Furniture Cos., Inc. | | 30,870 | | | 571,095 |
Hibbett Sporting Goods, Inc.(a) | | 32,085 | | | 853,782 |
Hot Topic, Inc.(a) | | 63,519 | | | 1,091,892 |
J. Jill Group, Inc.(a) | | 27,467 | | | 408,984 |
Jo-Ann Stores, Inc. (Class “A” Stock)(a) | | 30,951 | | | 852,390 |
K-Swiss, Inc. (Class “A” Stock) | | 46,852 | | | 1,364,330 |
Linens ‘n Things, Inc.(a)(b) | | 61,775 | | | 1,532,020 |
Longs Drug Stores Corp.(b) | | 51,597 | | | 1,422,529 |
Movie Gallery, Inc. | | 42,452 | | | 809,560 |
Panera Bread Co. (Class “A” Stock)(a)(b) | | 41,485 | | | 1,672,675 |
Pep Boys-Manny, Moe & Jack | | 78,164 | | | 1,334,259 |
Quiksilver, Inc.(a) | | 77,821 | | | 2,318,288 |
Russ Berrie & Co., Inc. | | 28,519 | | | 651,374 |
School Specialty, Inc.(a) | | 31,076 | | | 1,198,290 |
Select Comfort Corp.(a) | | 50,526 | | | 906,436 |
Shopko Stores, Inc.(a) | | 40,268 | | | 752,206 |
Stage Stores, Inc.(a) | | 24,400 | | | 1,013,088 |
Stein Mart, Inc.(a) | | 58,068 | | | 990,640 |
Stride Rite Corp. | | 50,264 | | | 561,449 |
The Childrens Place Retail Stores, Inc.(a) | | 36,890 | | | 1,366,037 |
The Gymboree Corp.(a) | | 42,076 | | | 539,414 |
The Men’s Wearhouse, Inc.(a) | | 49,010 | | | 1,566,360 |
Too, Inc.(a) | | 47,198 | | | 1,154,463 |
Tractor Supply Co.(a) | | 52,433 | | | 1,951,032 |
Zale Corp.(a)(b) | | 70,982 | | | 2,120,232 |
| | | | |
|
|
| | | | | | 46,348,856 |
| | | | |
|
|
Semiconductors — 1.6% | | | | | |
ATMI, Inc.(a) | | 42,999 | | | 968,767 |
Axcelis Technologies, Inc.(a) | | 136,785 | | | 1,112,062 |
Brooks Automation, Inc.(a) | | 60,920 | | | 1,049,042 |
DuPont Photomasks, Inc.(a) | | 25,360 | | | 669,758 |
ESS Technology, Inc.(a) | | 54,145 | | | 384,971 |
Exar Corp.(a)(b) | | 56,964 | | | 808,319 |
Kopin Corp.(a) | | 95,745 | | | 370,533 |
Pericom Semiconductor Corp.(a) | | 36,259 | | | 341,922 |
Power Integrations, Inc.(a)(b) | | 42,470 | | | 840,057 |
Rudolph Technologies, Inc.(a) | | 22,990 | | | 394,738 |
Skyworks Solutions, Inc.(a)(b) | | 212,809 | | | 2,006,789 |
Varian Semiconductor Equipment Associates, Inc.(a) | | 49,770 | | | 1,834,025 |
Veeco Instruments, Inc.(a)(b) | | 40,700 | | | 857,549 |
| | | | |
|
|
| | | | | | 11,638,532 |
| | | | |
|
|
SEE NOTES TO FINANCIAL STATEMENTS.
B75
| | | | |
| | | SMALL CAPITALIZATION STOCK PORTFOLIO (Continued) | | |
SCHEDULE OF INVESTMENTS | December 31, 2004 |
| | | | | |
COMMON STOCKS
(Continued) | | Shares
| | Value
(Note 2)
|
Software — 2.5% | | | | | |
Altiris, Inc.(a) | | 36,900 | | $ | 1,307,367 |
ANSYS, Inc.(a) | | 42,798 | | | 1,372,104 |
Captaris, Inc.(a) | | 41,498 | | | 214,130 |
Catapult Communications Corp.(a) | | 19,905 | | | 480,905 |
Concord Communications, Inc.(a) | | 24,980 | | | 276,778 |
EPIQ Systems, Inc.(a) | | 24,393 | | | 357,114 |
Gerber Scientific, Inc.(a) | | 30,445 | | | 231,686 |
Hyperion Solutions Corp.(a)(b) | | 53,384 | | | 2,488,762 |
JDA Software Group, Inc.(a) | | 39,766 | | | 541,613 |
ManTech International Corp. (Class “A” Stock)(a) | | 44,271 | | | 1,050,994 |
Mapinfo Corp.(a) | | 27,810 | | | 333,164 |
MICROS Systems, Inc.(a) | | 25,378 | | | 1,981,007 |
MRO Software, Inc.(a) | | 34,117 | | | 444,203 |
PC-Tel, Inc.(a) | | 28,343 | | | 224,760 |
SERENA Software, Inc.(a)(b) | | 59,582 | | | 1,289,354 |
SPSS, Inc.(a) | | 23,996 | | | 375,297 |
Take-Two Interactive Software, Inc.(a)(b) | | 61,753 | | | 2,148,387 |
THQ, Inc.(a)(b) | | 53,243 | | | 1,221,394 |
Verity, Inc.(a) | | 51,118 | | | 670,668 |
Webex Communications, Inc.(a)(b) | | 61,092 | | | 1,452,768 |
Zixit Corp.(a)(b) | | 43,993 | | | 226,564 |
| | | | |
|
|
| | | | | | 18,689,019 |
| | | | |
|
|
Supermarkets — 0.3% | | | | | |
Kronos, Inc.(a) | | 42,641 | | | 2,180,234 |
| | | | |
|
|
Telecommunications — 1.2% | | | | | |
Applied Signal Technology, Inc. | | 15,307 | | | 539,572 |
Boston Communications Group, Inc.(a) | | 23,951 | | | 221,307 |
Commonwealth Telephone Enterprises, Inc.(a)(b) | | 28,743 | | | 1,427,377 |
Digi International, Inc.(a) | | 29,620 | | | 509,168 |
General Communication, Inc.(a) | | 79,447 | | | 877,095 |
Harmonic, Inc.(a) | | 98,853 | | | 824,434 |
Intermediate Telephone, Inc. | | 35,389 | | | 968,951 |
Intrado, Inc.(a) | | 23,777 | | | 287,702 |
J2 Global Communications, Inc.(a) | | 32,188 | | | 1,110,486 |
Network Equipment Technologies, Inc.(a) | | 33,417 | | | 328,155 |
Symmetricom, Inc.(a) | | 61,977 | | | 601,796 |
Tollgrade Communications, Inc.(a) | | 17,916 | | | 219,292 |
ViaSat, Inc.(a) | | 36,573 | | | 887,627 |
| | | | |
|
|
| | | | | | 8,802,962 |
| | | | |
|
|
Textiles — 0.6% | | | | | |
Angelica Corp. | | 12,240 | | | 331,092 |
Ashworth, Inc.(a) | | 18,387 | | | 200,234 |
G & K Services, Inc. (Class “A” Stock) | | 28,699 | | | 1,246,111 |
Haggar Corp. | | 9,812 | | | 230,376 |
Kellwood Co.(b) | | 37,858 | | | 1,306,101 |
Oshkosh B’Gosh, Inc. (Class “A” Stock) | | 16,037 | | | 343,192 |
Oxford Industries, Inc. | | 22,925 | | | 946,802 |
| | | | |
|
|
| | | | | | 4,603,908 |
| | | | |
|
|
Timber — 0.1% | | | | | |
Deltic Timber Corp. | | 16,699 | | | 708,873 |
| | | | |
|
|
Transportation — 0.7% | | | | | |
EGL, Inc.(a)(b) | | 70,189 | | | 2,097,949 |
| | | | | | |
COMMON STOCKS
(Continued) | | Shares
| | Value
(Note 2)
| |
Transportation (cont’d.) | | | | | | |
Kansas City Southern(a)(b) | | 85,772 | | $ | 1,520,737 | |
Pegasus Systems, Inc.(a) | | 29,703 | | | 374,258 | |
USF Corp. | | 38,327 | | | 1,454,510 | |
| | | | |
|
|
|
| | | | | | 5,447,454 | |
| | | | |
|
|
|
Trucking/Shipping — 2.6% | | | | | | |
Arkansas Best Corp. | | 34,462 | | | 1,546,999 | |
Forward Air Corp.(a) | | 29,385 | | | 1,313,510 | |
Heartland Express, Inc. | | 102,579 | | | 2,304,950 | |
Kirby Corp.(a) | | 33,928 | | | 1,505,725 | |
Knight Transportation, Inc. | | 77,343 | | | 1,918,106 | |
Landstar Systems, Inc.(a) | | 41,547 | | | 3,059,521 | |
Monaco Coach Corp. | | 40,178 | | | 826,461 | |
Oshkosh Truck Corp.(b) | | 49,020 | | | 3,351,988 | |
Yellow Roadway Corp.(a) | | 66,516 | | | 3,705,606 | |
| | | | |
|
|
|
| | | | | | 19,532,866 | |
| | | | |
|
|
|
Utility – Electric — 1.2% | | | | | | |
Atmos Energy Corp. | | 104,726 | | | 2,864,256 | |
Avista Corp. | | 66,208 | | | 1,169,895 | |
Central Vermont Public Service Corp. | | 16,646 | | | 387,186 | |
CH Energy Group, Inc. | | 21,594 | | | 1,037,592 | |
Cleco Corp. | | 66,837 | | | 1,354,118 | |
El Paso Electric Co.(a) | | 64,792 | | | 1,227,161 | |
Green Mountain Power Corp. | | 7,036 | | | 202,848 | |
UIL Holdings Corp. | | 19,988 | | | 1,025,384 | |
| | | | |
|
|
|
| | | | | | 9,268,440 | |
| | | | |
|
|
|
Utility – Water — 0.1% | | | | | | |
American States Water Co. | | 22,820 | | | 593,320 | |
| | | | |
|
|
|
TOTAL LONG-TERM INVESTMENTS
(cost $540,862,475) | | | 742,025,001 | |
| | | | |
|
|
|
| SHORT-TERM INVESTMENTS — 20.0% | | | | |
U.S. Government Agency Obligation | | | | |
United States Treasury Bills(d)(e)
2.18%, 3/17/05 (cost $248,872) | | 250,000 | | | 248,872 | |
| | | | |
|
|
|
Mutual Fund — 20.0% | | | | | | |
Dryden Core Investment Fund — Taxable Money Market Series
(cost $148,674,686; Note 4)(c) | | 148,674,686 | | | 148,674,686 | |
| | | | |
|
|
|
TOTAL SHORT-TERM INVESTMENTS
(cost $148,923,558) | | | 148,923,558 | |
| | | | |
|
|
|
TOTAL INVESTMENTS — 119.9%
(cost $689,786,033; Note 6) | | | 890,948,559 | |
| | | | |
|
|
|
VARIATION MARGIN ON OPEN FUTURES CONTRACTS, NET(f) | | | 2,775 | |
LIABILITIES IN EXCESS OF
OTHER ASSETS — (19.9)% | | | (147,721,526 | ) |
| | | | |
|
|
|
NET ASSETS — 100% | | $ | 743,229,808 | |
| | | | |
|
|
|
| (a) | Non-income producing security. |
| (b) | Portion of securities on loan with an aggregate market value of $147,253,475; cash collateral $148,305,322 was received with which the portfolio purchased securities. |
SEE NOTES TO FINANCIAL STATEMENTS.
B76
| | | | |
| | | SMALL CAPITALIZATION STOCK PORTFOLIO (Continued) | | |
SCHEDULE OF INVESTMENTS | December 31, 2004 |
| (c) | Represents security, or a portion thereof, purchased with cash collateral received for securities on loan. |
| (d) | Security segregated as collateral for futures contracts. |
| (e) | Rate quoted represents yield-to-maturity as of purchase date. |
| (f) | Open futures contracts as of December 31, 2004 were as follows: |
| | | | | | | | | | | | | |
Number of
Contracts
| | Type
| | Expiration
Date
| | Value at
Trade Date
| | Value at
Dec 31, 2004
| | Unrealized
Appreciation
|
Long Positions: | | | | | | | | | | | | | |
3 | | S&P MidCap 400 Index | | Mar 05 | | $ | 991,250 | | $ | 998,025 | | $ | 6,775 |
| | | | | | | | | | | | |
|
|
The industry classification of portfolio holdings and liabilities in excess of other assets shown as a percentage of net assets as of December 31, 2004 was as follows:
| | | |
Mutual Fund | | 20.0 | % |
Banks and Savings & Loans | | 7.1 | |
Retail | | 6.2 | |
Drugs & Medical Supplies | | 5.6 | |
Computer Services | | 3.9 | |
Commercial Services | | 3.5 | |
Construction | | 3.5 | |
Machinery | | 3.5 | |
Oil & Gas Services | | 3.5 | |
Oil & Gas | | 3.3 | |
Real Estate Investment Trust | | 3.2 | |
Healthcare | | 2.7 | |
Trucking/Shipping | | 2.6 | |
Exchange Traded Funds | | 2.6 | |
Electronics | | 2.6 | |
Software | | 2.5 | |
Hospitals/Healthcare Management | | 2.4 | |
Insurance | | 2.4 | |
Leisure | | 2.4 | |
Restaurants | | 2.3 | |
Financial Services | | 2.1 | |
Metals — Ferrous | | 1.9 | |
Food & Beverage | | 1.9 | |
Chemicals | | 1.7 | |
Diversified Manufacturing Operations | | 1.7 | |
Electronic Components | | 1.7 | |
Miscellaneous Basic Industry | | 1.7 | |
Semiconductors | | 1.6 | |
Aerospace | | 1.4 | |
Utility — Electric | | 1.2 | |
Paper & Forest Products | | 1.2 | |
Telecommunications | | 1.2 | |
Electrical Equipment | | 1.0 | |
| | | |
Apparel | | 1.0 | % |
Energy | | 0.9 | |
Distribution/Wholesalers | | 0.9 | |
Autos — Cars & Trucks | | 0.8 | |
Furniture | | 0.8 | |
Transportation | | 0.7 | |
Engineering | | 0.7 | |
Pharmaceuticals | | 0.7 | |
Environmental Services | | 0.7 | |
Human Resources | | 0.6 | |
Textiles | | 0.6 | |
Mineral Resources | | 0.6 | |
Internet | | 0.6 | |
Miscellaneous — Consumer Growth/Staple | | 0.5 | |
Housing Related | | 0.4 | |
Instrument — Controls | | 0.4 | |
Containers | | 0.3 | |
Office Equipment & Supplies | | 0.3 | |
Airlines | | 0.3 | |
Collectibles & Gifts | | 0.3 | |
Supermarkets | | 0.3 | |
Metals — Non Ferrous | | 0.3 | |
Networking | | 0.2 | |
Advertising | | 0.2 | |
Agricultural Products & Services | | 0.2 | |
Consumer Cyclical | | 0.1 | |
Timber | | 0.1 | |
Utility — Water | | 0.1 | |
Cosmetics & Soaps | | 0.1 | |
Media | | 0.1 | |
| | |
|
|
| | | 119.9 | |
Liabilities in excess of other assets | | (19.9 | ) |
| | |
|
|
| | | 100.0 | % |
| | |
|
|
SEE NOTES TO FINANCIAL STATEMENTS.
B77
SCHEDULE OF INVESTMENTS | December 31, 2004 |
| | | | | |
| LONG-TERM INVESTMENTS — 97.7% | | Value
(Note 2)
|
| COMMON STOCKS | | Shares
| |
Advertising — 0.1% | | | | | |
Omnicom Group, Inc.(b) | | 52,700 | | $ | 4,443,664 |
| | | | |
|
|
Aerospace — 1.8% | | | | | |
Boeing Co.(b) | | 231,036 | | | 11,960,734 |
General Dynamics Corp. | | 53,400 | | | 5,585,640 |
L-3 Communications Holdings, Inc. | | 26,900 | | | 1,970,156 |
Lockheed Martin Corp.(b) | | 121,498 | | | 6,749,214 |
Northrop Grumman Corp.(b) | | 102,326 | | | 5,562,441 |
Raytheon Co.(b) | | 116,918 | | | 4,539,926 |
Rockwell Automation, Inc. | | 48,200 | | | 2,388,310 |
Rockwell Collins, Inc. | | 44,500 | | | 1,755,080 |
United Technologies Corp. | | 138,700 | | | 14,334,645 |
| | | | |
|
|
| | | | | | 54,846,146 |
| | | | |
|
|
Airlines — 0.1% | | | | | |
Delta Airlines, Inc.(a)(b) | | 33,000 | | | 246,840 |
Southwest Airlines Co. | | 214,837 | | | 3,497,546 |
| | | | |
|
|
| | | | | | 3,744,386 |
| | | | |
|
|
Apparel — 0.3% | | | | | |
Jones Apparel Group, Inc.(b) | | 30,700 | | | 1,122,699 |
Nike, Inc. (Class “B” Stock)(b) | | 72,000 | | | 6,529,680 |
Reebok International, Ltd.(b) | | 17,000 | | | 748,000 |
| | | | |
|
|
| | | | | | 8,400,379 |
| | | | |
|
|
Autos – Cars & Trucks — 1.0% | | | | | |
Cummins Engine Co., Inc.(b) | | 12,400 | | | 1,038,996 |
Dana Corp. | | 37,894 | | | 656,703 |
Delphi Automotive Systems Corp. | | 154,044 | | | 1,389,477 |
Ford Motor Co.(b) | | 485,745 | | | 7,111,307 |
General Motors Corp.(b) | | 154,700 | | | 6,197,282 |
Genuine Parts Co. | | 49,225 | | | 2,168,853 |
Harley-Davidson, Inc.(b) | | 77,800 | | | 4,726,350 |
Johnson Controls, Inc. | | 50,400 | | | 3,197,376 |
Navistar International Corp.(a)(b) | | 18,900 | | | 831,222 |
PACCAR, Inc. | | 48,435 | | | 3,898,049 |
Visteon Corp.(b) | | 42,964 | | | 419,758 |
| | | | |
|
|
| | | | | | 31,635,373 |
| | | | |
|
|
Banks and Savings & Loans — 6.5% | | | |
AmSouth Bancorporation(b) | | 95,500 | | | 2,473,450 |
Bank of New York Co., Inc. | | 208,500 | | | 6,968,070 |
BankAmerica Corp. | | 1,091,412 | | | 51,285,450 |
Capital One Financial Corp.(b) | | 63,000 | | | 5,305,230 |
Comerica, Inc. | | 46,050 | | | 2,809,971 |
Compass Bancshares, Inc. | | 22,000 | | | 1,070,740 |
Fifth Third Bancorp(b) | | 149,849 | | | 7,084,861 |
First Horizon National Corp. | | 30,900 | | | 1,332,099 |
Golden West Financial Corp. | | 82,000 | | | 5,036,440 |
Huntington Bancshares, Inc.(b) | | 60,875 | | | 1,508,482 |
KeyCorp | | 115,900 | | | 3,929,010 |
M&T Bank Corp.(b) | | 31,400 | | | 3,386,176 |
Mellon Financial Corp. | | 116,100 | | | 3,611,871 |
National City Corp.(b) | | 177,100 | | | 6,650,105 |
North Fork Bancorporation, Inc. | | 126,350 | | | 3,645,197 |
Northern Trust Corp. | | 57,100 | | | 2,773,918 |
PNC Financial Services Group | | 76,900 | | | 4,417,136 |
Providian Financial Corp.(a)(b) | | 86,200 | | | 1,419,714 |
Regions Financial Corp. | | 122,737 | | | 4,368,210 |
| | | | | |
COMMON STOCKS
(Continued) | | Shares
| | Value
(Note 2)
|
Banks and Savings & Loans (cont’d.) | | | |
Sovereign Bancorp, Inc. | | 80,700 | | $ | 1,819,785 |
State Street Corp.(b) | | 87,800 | | | 4,312,736 |
Suntrust Banks, Inc.(b) | | 94,300 | | | 6,966,884 |
U.S. Bancorp(b) | | 504,181 | | | 15,790,949 |
Wachovia Corp.(b) | | 430,385 | | | 22,638,251 |
Wells Fargo & Co. | | 454,760 | | | 28,263,334 |
Zions Bancorporation | | 23,400 | | | 1,591,902 |
| | | | |
|
|
| | | | | | 200,459,971 |
| | | | |
|
|
Chemicals — 1.3% | | | | | |
Air Products & Chemicals, Inc. | | 60,900 | | | 3,530,373 |
Dow Chemical Co. | | 254,461 | | | 12,598,364 |
Du Pont (E.I.) de Nemours & Co. | | 264,891 | | | 12,992,904 |
Eastman Chemical Co. | | 22,400 | | | 1,293,152 |
Engelhard Corp. | | 32,375 | | | 992,941 |
Great Lakes Chemical Corp. | | 13,500 | | | 384,615 |
Hercules, Inc.(a) | | 27,900 | | | 414,315 |
Praxair, Inc. | | 89,400 | | | 3,947,010 |
Rohm & Haas Co. | | 60,600 | | | 2,680,338 |
Sigma-Aldrich Corp.(b) | | 19,200 | | | 1,160,832 |
| | | | |
|
|
| | | | | | 39,994,844 |
| | | | |
|
|
Commercial Services — 1.0% | | | | | |
Cendant Corp. | | 268,318 | | | 6,273,275 |
Cintas Corp.(b) | | 44,600 | | | 1,956,156 |
Convergys Corp.(a) | | 43,900 | | | 658,061 |
eBay, Inc.(a)(b) | | 176,500 | | | 20,523,420 |
Fiserv, Inc.(a) | | 51,800 | | | 2,081,842 |
Monster Worldwide, Inc.(a) | | 25,400 | | | 854,456 |
| | | | |
|
|
| | | | | | 32,347,210 |
| | | | |
|
|
Computers — 3.4% | | | | | |
Apple Computer, Inc.(a) | | 101,200 | | | 6,517,280 |
Citrix Systems, Inc.(a) | | 46,800 | | | 1,148,004 |
Comverse Technology, Inc.(a)(b) | | 52,000 | | | 1,271,400 |
Dell, Inc.(a) | | 668,300 | | | 28,162,162 |
Hewlett-Packard Co.(b) | | 822,116 | | | 17,239,773 |
International Business Machines Corp. | | 451,900 | | | 44,548,302 |
Sun Microsystems, Inc.(a) | | 902,900 | | | 4,857,602 |
| | | | |
|
|
| | | | | | 103,744,523 |
| | | | |
|
|
Computer Services — 7.2% | | | | | |
Adobe Systems, Inc. | | 62,600 | | | 3,927,524 |
Affiliated Computer Services, Inc. (Class “A” Stock)(a)(b) | | 33,500 | | | 2,016,365 |
Autodesk, Inc.(b) | | 61,700 | | | 2,341,515 |
Automatic Data Processing, Inc. | | 159,600 | | | 7,078,260 |
Avaya, Inc.(a) | | 119,908 | | | 2,062,418 |
BMC Software, Inc.(a) | | 63,300 | | | 1,177,380 |
Cisco Systems, Inc.(a) | | 1,793,800 | | | 34,620,340 |
Computer Associates International, Inc.(b) | | 159,243 | | | 4,946,088 |
Computer Sciences Corp.(a)(b) | | 49,200 | | | 2,773,404 |
Compuware Corp.(a) | | 108,600 | | | 702,642 |
EMC Corp.(a)(b) | | 646,974 | | | 9,620,503 |
First Data Corp. | | 231,004 | | | 9,826,910 |
Gateway, Inc.(a) | | 106,800 | | | 641,868 |
SEE NOTES TO FINANCIAL STATEMENTS.
B78
| | | | |
| | | STOCK INDEX PORTFOLIO (Continued) | | |
SCHEDULE OF INVESTMENTS | December 31, 2004 |
| | | | | |
COMMON STOCKS
(Continued) | | Shares
| | Value
(Note 2)
|
Computer Services (cont’d.) | | | | | |
Intuit, Inc.(a)(b) | | 51,100 | | $ | 2,248,911 |
Lexmark International, Inc.(a) | | 34,614 | | | 2,942,190 |
Mercury Interactive Corp.(a) | | 25,000 | | | 1,138,750 |
Micron Technology, Inc.(a) | | 170,700 | | | 2,108,145 |
Microsoft Corp. | | 2,920,500 | | | 78,006,555 |
NCR Corp.(a) | | 25,900 | | | 1,793,057 |
Network Appliance, Inc.(a)(b) | | 92,400 | | | 3,069,528 |
Novell, Inc.(a) | | 106,100 | | | 716,175 |
NVIDIA Corp.(a) | | 44,000 | | | 1,036,640 |
Oracle Corp.(a) | | 1,396,620 | | | 19,161,626 |
Parametric Technology Corp.(a) | | 81,800 | | | 481,802 |
Siebel Systems, Inc.(a) | | 134,900 | | | 1,416,450 |
SunGuard Data Systems, Inc.(a) | | 75,500 | | | 2,138,915 |
Symantec Corp.(a) | | 168,400 | | | 4,337,984 |
Symbol Technologies, Inc. | | 67,400 | | | 1,166,020 |
Unisys Corp.(a) | | 83,000 | | | 844,940 |
VERITAS Software Corp.(a) | | 115,559 | | | 3,299,210 |
Yahoo!, Inc.(a)(b) | | 359,900 | | | 13,561,032 |
| | | | |
|
|
| | | | | | 221,203,147 |
| | | | |
|
|
Construction — 0.3% | | | | | |
Centex Corp. | | 33,000 | | | 1,966,140 |
Fluor Corp.(b) | | 23,500 | | | 1,280,985 |
KB HOME(b) | | 14,166 | | | 1,478,930 |
Pulte Corp. | | 32,200 | | | 2,054,360 |
Vulcan Materials Co. | | 28,200 | | | 1,540,002 |
| | | | |
|
|
| | | | | | 8,320,417 |
| | | | |
|
|
Containers — 0.1% | | | | | |
Ball Corp. | | 28,200 | | | 1,240,236 |
Bemis Co., Inc. | | 25,900 | | | 753,431 |
Pactiv Corp.(a) | | 43,900 | | | 1,110,231 |
| | | | |
|
|
| | | | | | 3,103,898 |
| | | | |
|
|
Cosmetics & Soaps — 2.2% | | | | | |
Alberto-Culver Co. (Class “B” Stock) | | 22,800 | | | 1,107,396 |
Avon Products, Inc. | | 128,600 | | | 4,976,820 |
Clorox Co.(b) | | 42,700 | | | 2,516,311 |
Colgate-Palmolive Co. | | 142,800 | | | 7,305,648 |
Gillette Co.(b) | | 269,800 | | | 12,081,644 |
International Flavors & Fragrances, Inc. | | 22,100 | | | 946,764 |
Procter & Gamble Co. | | 685,008 | | | 37,730,241 |
| | | | |
|
|
| | | | | | 66,664,824 |
| | | | |
|
|
Diversified Consumer Products — 1.2% | | | |
Altria Group, Inc. | | 553,300 | | | 33,806,630 |
Eastman Kodak Co.(b) | | 74,700 | | | 2,409,075 |
| | | | |
|
|
| | | | | | 36,215,705 |
| | | | |
|
|
Diversified Manufacturing Operations — 3.5% | | | |
American Standard Cos., Inc.(a) | | 55,800 | | | 2,305,656 |
Cooper Industries, Ltd.
(Class “A” Stock) | | 25,000 | | | 1,697,250 |
General Electric Co. | | 2,837,100 | | | 103,554,150 |
| | | | |
|
|
| | | | | | 107,557,056 |
| | | | |
|
|
Diversified Office Equipment — 0.3% | | | | | |
Avery Dennison Corp. | | 28,000 | | | 1,679,160 |
Pitney Bowes, Inc. | | 60,800 | | | 2,813,824 |
Xerox Corp.(a)(b) | | 226,192 | | | 3,847,526 |
| | | | |
|
|
| | | | | | 8,340,510 |
| | | | |
|
|
| | | | | |
COMMON STOCKS
(Continued) | | Shares
| | Value
(Note 2)
|
Diversified Operations — 0.1% | | | | | |
Corning, Inc.(a) | | 369,100 | | $ | 4,344,307 |
| | | | |
|
|
Drugs & Medical Supplies — 9.3% | | | | | |
Abbott Laboratories | | 422,200 | | | 19,695,630 |
Allergan, Inc. | | 34,900 | | | 2,829,343 |
AmerisourceBergen Corp. | | 31,200 | | | 1,830,816 |
Bard, (C.R.), Inc. | | 26,600 | | | 1,701,868 |
Bausch & Lomb, Inc.(b) | | 13,100 | | | 844,426 |
Baxter International, Inc. | | 164,000 | | | 5,664,560 |
Becton Dickinson & Co. | | 67,300 | | | 3,822,640 |
Biogen Idec, Inc.(a)(b) | | 88,925 | | | 5,923,294 |
Biomet, Inc.(b) | | 67,525 | | | 2,929,910 |
Boston Scientific Corp.(a) | | 219,600 | | | 7,806,780 |
Bristol-Myers Squibb Co.(b) | | 521,060 | | | 13,349,557 |
Cardinal Health, Inc.(b) | | 114,475 | | | 6,656,721 |
Genzyme Corp.(a)(b) | | 62,300 | | | 3,617,761 |
Guidant Corp. | | 83,700 | | | 6,034,770 |
Hospira, Inc.(a) | | 42,820 | | | 1,434,470 |
Johnson & Johnson | | 800,871 | | | 50,791,239 |
King Pharmaceuticals, Inc.(a) | | 71,633 | | | 888,249 |
Laboratory Corp. of America Holdings(a) | | 37,600 | | | 1,873,232 |
Lilly (Eli) & Co. | | 303,000 | | | 17,195,250 |
Medtronic, Inc.(b) | | 324,800 | | | 16,132,816 |
Merck & Co., Inc. | | 599,400 | | | 19,264,716 |
Mylan Laboratories, Inc.(b) | | 73,000 | | | 1,290,640 |
Pfizer, Inc. | | 2,039,408 | | | 54,839,681 |
Quest Diagnostics, Inc.(b) | | 27,200 | | | 2,598,960 |
Schering-Plough Corp.(b) | | 384,000 | | | 8,017,920 |
St. Jude Medical, Inc.(a) | | 94,200 | | | 3,949,806 |
Stryker Corp.(b) | | 110,000 | | | 5,307,500 |
Watson Pharmaceuticals, Inc.(a) | | 31,400 | | | 1,030,234 |
Wyeth | | 361,700 | | | 15,404,803 |
Zimmer Holdings, Inc.(a)(b) | | 64,186 | | | 5,142,583 |
| | | | |
|
|
| | | | | | 287,870,175 |
| | | | |
|
|
Education — 0.1% | | | | | |
Apollo Group, Inc.
(Class “A” Stock)(a)(b) | | 49,300 | | | 3,979,003 |
| | | | |
|
|
Electrical Services — 0.3% | | | | | |
American Power Conversion(b) | | 57,700 | | | 1,234,780 |
Power-One, Inc.(a) | | 20,000 | | | 178,400 |
TXU Corp.(b) | | 69,506 | | | 4,487,307 |
Xcel Energy, Inc.(b) | | 109,495 | | | 1,992,809 |
| | | | |
|
|
| | | | | | 7,893,296 |
| | | | |
|
|
Electronics — 3.9% | | | | | |
Advanced Micro Devices, Inc.(a)(b) | | 92,900 | | | 2,045,658 |
Altera Corp.(a)(b) | | 96,100 | | | 1,989,270 |
Analog Devices, Inc.(b) | | 99,800 | | | 3,684,616 |
Applied Materials, Inc.(a) | | 452,300 | | | 7,734,330 |
Applied Micro Circuits Corp.(a)(b) | | 97,000 | | | 408,370 |
Broadcom Corp.(a)(b) | | 77,900 | | | 2,514,612 |
Electronic Arts, Inc.(a) | | 76,700 | | | 4,730,856 |
Electronic Data Systems Corp. | | 128,300 | | | 2,963,730 |
Emerson Electric Co. | | 115,700 | | | 8,110,570 |
Fisher Scientific International, Inc.(a)(b) | | 30,900 | | | 1,927,542 |
Freescale Semiconductor, Inc.
(Class “B” Stock)(a) | | 77,746 | | | 1,427,416 |
SEE NOTES TO FINANCIAL STATEMENTS.
B79
| | | | |
| | | STOCK INDEX PORTFOLIO (Continued) | | |
SCHEDULE OF INVESTMENTS | December 31, 2004 |
| | | | | |
COMMON STOCKS
(Continued) | | Shares
| | Value
(Note 2)
|
Electronics (cont’d.) | | | | | |
Intel Corp. | | 1,719,600 | | $ | 40,221,444 |
Jabil Circuit, Inc.(a)(b) | | 54,600 | | | 1,396,668 |
JDS Uniphase Corp.(a)(b) | | 410,100 | | | 1,300,017 |
KLA-Tencor Corp.(a)(b) | | 51,400 | | | 2,394,212 |
Linear Technology Corp.(b) | | 88,100 | | | 3,414,756 |
LSI Logic Corp.(a) | | 110,800 | | | 607,184 |
Maxim Integrated Products, Inc. | | 85,800 | | | 3,637,062 |
Molex, Inc.(b) | | 50,500 | | | 1,515,000 |
National Semiconductor Corp.(b) | | 101,600 | | | 1,823,720 |
Novellus Systems, Inc.(a)(b) | | 40,000 | | | 1,115,600 |
Perkin Elmer, Inc. | | 36,000 | | | 809,640 |
Pinnacle West Capital Corp. | | 26,000 | | | 1,154,660 |
PMC-Sierra, Inc.(a) | | 48,800 | | | 549,000 |
PPL Corp. | | 47,000 | | | 2,504,160 |
QLogic Corp.(a)(b) | | 25,900 | | | 951,307 |
RadioShack Corp. | | 43,660 | | | 1,435,541 |
Sanmina Corp.(a) | | 150,600 | | | 1,275,582 |
Solectron Corp.(a)(b) | | 247,000 | | | 1,316,510 |
Tektronix, Inc. | | 22,700 | | | 685,767 |
Teradyne, Inc.(a)(b) | | 46,600 | | | 795,462 |
Texas Instruments, Inc.(b) | | 468,400 | | | 11,532,008 |
Waters Corp.(a) | | 32,100 | | | 1,501,959 |
Xilinx, Inc.(b) | | 90,900 | | | 2,695,185 |
| | | | |
|
|
| | | | | | 122,169,414 |
| | | | |
|
|
Financial Services — 9.0% | | | | | |
Ambac Financial Group, Inc.(b) | | 30,000 | | | 2,463,900 |
American Express Co. | | 341,800 | | | 19,267,266 |
Bear Stearns Cos., Inc.(b) | | 27,010 | | | 2,763,393 |
CIT Group, Inc. | | 56,700 | | | 2,597,994 |
Citigroup, Inc. | | 1,395,176 | | | 67,219,580 |
Countrywide Credit Industries, Inc. | | 150,798 | | | 5,581,034 |
E*TRADE Financial Corp.(a) | | 90,600 | | | 1,354,470 |
Equifax, Inc. | | 41,300 | | | 1,160,530 |
Fannie Mae(b) | | 260,000 | | | 18,514,600 |
Federated Investors, Inc.
(Class “B” Stock) | | 26,500 | | | 805,600 |
Franklin Resources, Inc.(b) | | 67,800 | | | 4,722,270 |
Freddie Mac | | 181,600 | | | 13,383,920 |
Goldman Sachs Group, Inc.(b) | | 133,900 | | | 13,930,956 |
H&R Block, Inc.(b) | | 46,300 | | | 2,268,700 |
J.P. Morgan Chase & Co. | | 957,085 | | | 37,335,886 |
Janus Capital Group, Inc.(b) | | 62,600 | | | 1,052,306 |
Lehman Brothers Holdings, Inc. | | 75,100 | | | 6,569,748 |
Marshall & Ilsley Corp. | | 62,400 | | | 2,758,080 |
MBNA Corp. | | 346,152 | | | 9,758,025 |
Merrill Lynch & Co., Inc. | | 252,800 | | | 15,109,856 |
Moody’s Corp. | | 41,760 | | | 3,626,856 |
Morgan Stanley | | 297,510 | | | 16,517,755 |
Paychex, Inc. | | 103,650 | | | 3,532,392 |
Schwab (Charles) Corp. | | 374,100 | | | 4,474,236 |
SLM Corp. | | 115,300 | | | 6,155,867 |
Synovus Financial Corp. | | 85,100 | | | 2,432,158 |
T. Rowe Price Group, Inc. | | 36,000 | | | 2,239,200 |
Washington Mutual, Inc.(b) | | 231,222 | | | 9,776,066 |
| | | | |
|
|
| | | | | | 277,372,644 |
| | | | |
|
|
| | | | | |
COMMON STOCKS
(Continued) | | Shares
| | Value
(Note 2)
|
Food & Beverage — 3.8% | | | | | |
Adolph Coors Co. | | 10,800 | | $ | 817,236 |
Anheuser-Busch Cos., Inc. | | 215,100 | | | 10,912,023 |
Archer-Daniels-Midland Co. | | 172,438 | | | 3,847,092 |
Brown-Forman Corp. (Class “B” Stock) | | 32,600 | | | 1,586,968 |
Campbell Soup Co.(b) | | 111,800 | | | 3,341,702 |
Coca-Cola Co. | | 648,200 | | | 26,984,566 |
Coca-Cola Enterprises, Inc.(b) | | 123,000 | | | 2,564,550 |
ConAgra Foods, Inc.(b) | | 137,700 | | | 4,055,265 |
General Mills, Inc.(b) | | 95,500 | | | 4,747,305 |
Heinz (H.J.) & Co. | | 94,850 | | | 3,698,201 |
Hershey Foods Corp. | | 67,400 | | | 3,743,396 |
Kellogg Co.(b) | | 108,200 | | | 4,832,212 |
McCormick & Co., Inc.(b) | | 36,300 | | | 1,401,180 |
Monsanto Co. | | 69,298 | | | 3,849,504 |
Pepsi Bottling Group, Inc.(b) | | 70,400 | | | 1,903,616 |
PepsiCo, Inc. | | 450,340 | | | 23,507,748 |
Sara Lee Corp. | | 215,800 | | | 5,209,412 |
Sysco Corp.(b) | | 172,100 | | | 6,569,057 |
Wrigley (William) Jr. Co.(b) | | 58,600 | | | 4,054,534 |
| | | | |
|
|
| | | | | | 117,625,567 |
| | | | |
|
|
Forest Products — 0.6% | | | | | |
Georgia-Pacific Corp. | | 68,039 | | | 2,550,102 |
International Paper Co. | | 131,467 | | | 5,521,614 |
Louisiana-Pacific Corp. | | 31,000 | | | 828,940 |
MeadWestvaco Corp. | | 57,289 | | | 1,941,524 |
Plum Creek Timber Co., Inc. | | 46,500 | | | 1,787,460 |
Temple-Inland, Inc. | | 16,000 | | | 1,094,400 |
Weyerhaeuser Co. | | 64,400 | | | 4,328,968 |
| | | | |
|
|
| | | | | | 18,053,008 |
| | | | |
|
|
Gas Pipelines — 0.2% | | | | | |
Cinergy Corp. | | 48,339 | | | 2,012,352 |
Peoples Energy Corp. | | 11,400 | | | 501,030 |
Sempra Energy | | 63,054 | | | 2,312,821 |
Williams Cos., Inc. | | 133,400 | | | 2,173,086 |
| | | | |
|
|
| | | | | | 6,999,289 |
| | | | |
|
|
Hospitals/Healthcare Management — 2.9% | | | |
Aetna, Inc. | | 41,012 | | | 5,116,247 |
Agilent Technologies, Inc.(a) | | 127,913 | | | 3,082,703 |
Amgen, Inc.(a) | | 340,464 | | | 21,840,766 |
Applera Corp.-Applied Biosystems Group | | 60,000 | | | 1,254,600 |
Caremark Rx, Inc.(a) | | 124,000 | | | 4,889,320 |
Chiron Corp.(a)(b) | | 51,600 | | | 1,719,828 |
Express Scripts, Inc.(a)(b) | | 21,200 | | | 1,620,528 |
Forest Laboratories, Inc.(a)(b) | | 100,800 | | | 4,521,888 |
Gilead Sciences, Inc.(a) | | 115,800 | | | 4,051,842 |
HCA, Inc. | | 116,598 | | | 4,659,256 |
Health Management Associates, Inc. (Class “A” Stock)(b) | | 66,300 | | | 1,506,336 |
Humana, Inc.(a) | | 46,100 | | | 1,368,709 |
IMS Health, Inc. | | 60,120 | | | 1,395,385 |
Manor Care, Inc. | | 22,950 | | | 813,119 |
McKesson Corp. | | 81,107 | | | 2,551,626 |
Medco Health Solutions, Inc.(a) | | 74,796 | | | 3,111,514 |
MedImmune, Inc.(a) | | 68,200 | | | 1,848,902 |
Tenet Healthcare Corp.(a) | | 127,100 | | | 1,395,558 |
SEE NOTES TO FINANCIAL STATEMENTS.
B80
| | | | |
| | | STOCK INDEX PORTFOLIO (Continued) | | |
SCHEDULE OF INVESTMENTS | December 31, 2004 |
| | | | | |
COMMON STOCKS
(Continued) | | Shares
| | Value
(Note 2)
|
Hospitals/Healthcare Management (cont’d.) | | | |
UnitedHealth Group, Inc.(b) | | 174,600 | | $ | 15,370,038 |
WellPoint, Inc.(a) | | 79,200 | | | 9,108,000 |
| | | | |
|
|
| | | | | | 91,226,165 |
| | | | |
|
|
Household Products & Personal Care — 0.3% | | | |
Kimberly-Clark Corp. | | 129,988 | | | 8,554,510 |
Leggett & Platt, Inc.(b) | | 47,000 | | | 1,336,210 |
| | | | |
|
|
| | | | | | 9,890,720 |
| | | | |
|
|
Housing Related — 0.3% | | | | | |
Masco Corp.(b) | | 124,400 | | | 4,544,332 |
Maytag Corp.(b) | | 21,800 | | | 459,980 |
Newell Rubbermaid, Inc. | | 72,249 | | | 1,747,703 |
Stanley Works(b) | | 19,800 | | | 970,002 |
Whirlpool Corp. | | 19,300 | | | 1,335,753 |
| | | | |
|
|
| | | | | | 9,057,770 |
| | | | |
|
|
Human Resources | | | | | |
Robert Half International, Inc. | | 41,900 | | | 1,233,117 |
| | | | |
|
|
Insurance — 4.1% | | | | | |
ACE, Ltd. | | 75,200 | | | 3,214,800 |
AFLAC, Inc. | | 135,600 | | | 5,402,304 |
Allstate Corp. | | 188,288 | | | 9,738,255 |
American International Group, Inc.(b) | | 699,587 | | | 45,941,878 |
Aon Corp.(b) | | 81,325 | | | 1,940,415 |
Chubb Corp.(b) | | 49,700 | | | 3,821,930 |
CIGNA Corp. | | 36,700 | | | 2,993,619 |
Cincinnati Financial Corp.(b) | | 45,360 | | | 2,007,634 |
Hartford Financial Services Group, Inc. | | 80,400 | | | 5,572,524 |
Jefferson-Pilot Corp. | | 38,418 | | | 1,996,199 |
Lincoln National Corp. | | 47,700 | | | 2,226,636 |
Loews Corp. | | 48,400 | | | 3,402,520 |
Marsh & McLennan Cos., Inc. | | 133,800 | | | 4,402,020 |
MBIA, Inc.(b) | | 37,550 | | | 2,376,164 |
MetLife, Inc. | | 202,000 | | | 8,183,020 |
MGIC Investment Corp. | | 27,900 | | | 1,922,589 |
Principal Financial Group, Inc. | | 84,800 | | | 3,471,712 |
Progressive Corp. | | 53,500 | | | 4,538,940 |
SAFECO Corp.(b) | | 33,000 | | | 1,723,920 |
St. Paul Cos., Inc. | | 179,298 | | | 6,646,577 |
Torchmark Corp. | | 27,300 | | | 1,559,922 |
UnumProvident Corp.(b) | | 80,456 | | | 1,443,381 |
XL Capital, Ltd. (Bermuda) (Class “A” Stock) | | 38,000 | | | 2,950,700 |
| | | | |
|
|
| | | | | | 127,477,659 |
| | | | |
|
|
Leisure — 1.3% | | | | | |
Brunswick Corp. | | 26,400 | | | 1,306,800 |
Carnival Corp.(b) | | 168,700 | | | 9,722,181 |
Disney (Walt) Co. | | 553,001 | | | 15,373,428 |
Harrah’s Entertainment, Inc. | | 29,750 | | | 1,989,977 |
Hilton Hotels Corp. | | 104,800 | | | 2,383,152 |
Marriott International, Inc. (Class “A” Stock) | | 63,600 | | | 4,005,528 |
Sabre Group Holdings, Inc. (Class “A” Stock)(b) | | 42,419 | | | 940,005 |
Starwood Hotels & Resorts Worldwide, Inc.(b) | | 54,200 | | | 3,165,280 |
| | | | |
|
|
| | | | | | 38,886,351 |
| | | | |
|
|
| | | | | |
COMMON STOCKS
(Continued) | | Shares
| | Value
(Note 2)
|
Machinery — 0.9% | | | | | |
Caterpillar, Inc. | | 91,700 | | $ | 8,941,667 |
Deere & Co. | | 67,400 | | | 5,014,560 |
Dover Corp. | | 53,900 | | | 2,260,566 |
Eaton Corp. | | 39,200 | | | 2,836,512 |
Ingersoll-Rand Co. (Class “A” Stock) | | 46,250 | | | 3,713,875 |
Parker Hannifin Corp.(b) | | 32,325 | | | 2,448,296 |
Snap-on, Inc. | | 14,300 | | | 491,348 |
Thermo Electron Corp.(a) | | 46,400 | | | 1,400,816 |
| | | | |
|
|
| | | | | | 27,107,640 |
| | | | |
|
|
Media — 3.3% | | | | | |
Clear Channel Communications, Inc.(b) | | 161,400 | | | 5,405,286 |
Comcast Corp. (Class “A” Stock)(a) | | 594,130 | | | 19,772,646 |
Dow Jones & Co., Inc.(b) | | 22,800 | | | 981,768 |
Gannett Co., Inc.(b) | | 72,600 | | | 5,931,420 |
Interpublic Group of Cos., Inc.(a)(b) | | 116,200 | | | 1,557,080 |
Knight-Ridder, Inc. | | 19,400 | | | 1,298,636 |
McGraw Hill, Inc. | | 50,800 | | | 4,650,232 |
Meredith Corp. | | 13,800 | | | 747,960 |
New York Times Co.
(Class “A” Stock) | | 41,500 | | | 1,693,200 |
News Corp. (Class “A” Stock) | | 658,000 | | | 12,278,280 |
R.R. Donnelley & Sons, Co. | | 56,900 | | | 2,008,001 |
Time Warner, Inc.(a)(b) | | 1,226,420 | | | 23,841,605 |
Tribune Co.(b) | | 85,700 | | | 3,611,398 |
Univision Communications, Inc. (Class “A” Stock)(a)(b) | | 84,400 | | | 2,470,388 |
Viacom, Inc. (Class “B” Stock) | | 456,036 | | | 16,595,150 |
| | | | |
|
|
| | | | | | 102,843,050 |
| | | | |
|
|
Metals – Ferrous — 0.1% | | | | | |
Allegheny Technologies, Inc.(b) | | 21,940 | | | 475,440 |
Nucor Corp.(b) | | 43,600 | | | 2,282,024 |
United States Steel Corp. | | 31,540 | | | 1,616,425 |
| | | | |
|
|
| | | | | | 4,373,889 |
| | | | |
|
|
Metals – Non Ferrous — 0.2% | | | | | |
Alcoa, Inc. | | 230,176 | | | 7,232,130 |
| | | | |
|
|
Mineral Resources — 0.2% | | | | | |
Burlington Resources, Inc.(b) | | 106,834 | | | 4,647,279 |
Phelps Dodge Corp. | | 23,528 | | | 2,327,390 |
| | | | |
|
|
| | | | | | 6,974,669 |
| | | | |
|
|
Miscellaneous – Basic Industry — 2.2% | | | | | |
AES Corp.(a) | | 161,700 | | | 2,210,439 |
BB&T Corp.(b) | | 148,100 | | | 6,227,605 |
Danaher Corp.(b) | | 82,800 | | | 4,753,548 |
Ecolab, Inc.(b) | | 65,200 | | | 2,290,476 |
Fortune Brands, Inc. | | 38,100 | | | 2,940,558 |
Honeywell, Inc. | | 233,550 | | | 8,270,005 |
Illinois Tool Works, Inc.(b) | | 83,100 | | | 7,701,708 |
International Game Technology(b) | | 92,200 | | | 3,169,836 |
ITT Industries, Inc. | | 25,000 | | | 2,111,250 |
Millipore Corp.(a) | | 14,200 | | | 707,302 |
Pall Corp. | | 36,000 | | | 1,042,200 |
PPG Industries, Inc. | | 46,600 | | | 3,176,256 |
Sealed Air Corp.(a) | | 22,910 | | | 1,220,416 |
Textron, Inc. | | 38,100 | | | 2,811,780 |
SEE NOTES TO FINANCIAL STATEMENTS.
B81
| | | | |
| | | STOCK INDEX PORTFOLIO (Continued) | | |
SCHEDULE OF INVESTMENTS | December 31, 2004 |
| | | | | |
COMMON STOCKS
(Continued) | | Shares
| | Value
(Note 2)
|
Miscellaneous – Basic Industry (cont’d.) | | | |
Tyco International, Ltd.(b) | | 539,043 | | $ | 19,265,397 |
W.W. Grainger, Inc. | | 23,200 | | | 1,545,584 |
| | | | |
|
|
| | | | | | 69,444,360 |
| | | | |
|
|
Miscellaneous – Consumer Growth/Staple — 0.6% | | | |
3M Co.(b) | | 208,200 | | | 17,086,974 |
Black & Decker Corp.(b) | | 21,200 | | | 1,872,596 |
| | | | |
|
|
| | | | | | 18,959,570 |
| | | | |
|
|
Oil & Gas — 4.6% | | | | | |
Amerada Hess Corp. | | 25,500 | | | 2,100,690 |
Anadarko Petroleum Corp.(b) | | 68,063 | | | 4,411,163 |
Ashland, Inc. | | 18,600 | | | 1,085,868 |
ChevronTexaco Corp. | | 574,322 | | | 30,157,648 |
El Paso Corp.(b) | | 176,311 | | | 1,833,634 |
EOG Resources, Inc.(b) | | 27,700 | | | 1,976,672 |
Exxon Mobil Corp. | | 1,731,270 | | | 88,744,900 |
Kerr-McGee Corp. | | 38,426 | | | 2,220,639 |
Marathon Oil Corp. | | 94,300 | | | 3,546,623 |
NICOR, Inc. | | 14,200 | | | 524,548 |
Sunoco, Inc. | | 18,500 | | | 1,511,635 |
Unocal Corp.(b) | | 71,200 | | | 3,078,688 |
| | | | |
|
|
| | | | | | 141,192,708 |
| | | | |
|
|
Oil & Gas Exploration/Production — 0.9% | | | |
ConocoPhillips | | 186,897 | | | 16,228,267 |
Devon Energy Corp. | | 126,800 | | | 4,935,056 |
Occidental Petroleum Corp. | | 103,800 | | | 6,057,768 |
XTO Energy, Inc. | | 38,000 | | | 1,344,440 |
| | | | |
|
|
| | | | | | 28,565,531 |
| | | | |
|
|
Oil & Gas Services — 1.4% | | | | | |
Apache Corp. | | 88,850 | | | 4,493,144 |
Baker Hughes, Inc.(b) | | 88,330 | | | 3,769,041 |
BJ Services Co. | | 43,700 | | | 2,033,798 |
Halliburton Co.(b) | | 118,300 | | | 4,642,092 |
Kinder Morgan, Inc. | | 32,100 | | | 2,347,473 |
Nabors Industries, Ltd. (Barbados)(a) | | 39,500 | | | 2,025,955 |
Noble Corp.(a)(b) | | 40,600 | | | 2,019,444 |
PG&E Corp.(a) | | 112,500 | | | 3,744,000 |
Rowan Cos., Inc.(a) | | 28,700 | | | 743,330 |
Schlumberger, Ltd. | | 161,700 | | | 10,825,815 |
Transocean Sedco Forex, Inc.(a) | | 86,633 | | | 3,672,373 |
Valero Energy Corp. | | 69,200 | | | 3,141,680 |
| | | | |
|
|
| | | | | | 43,458,145 |
| | | | |
|
|
Precious Metals — 0.2% | | | | | |
Freeport-McMoRan Copper & Gold, Inc. (Class “B” Stock)(b) | | 49,800 | | | 1,903,854 |
Newmont Mining Corp.(b) | | 118,403 | | | 5,258,277 |
| | | | |
|
|
| | | | | | 7,162,131 |
| | | | |
|
|
Railroads — 0.5% | | | | | |
Burlington Northern Santa Fe Corp. | | 100,126 | | | 4,736,961 |
CSX Corp. | | 57,412 | | | 2,301,073 |
Norfolk Southern Corp. | | 100,100 | | | 3,622,619 |
Union Pacific Corp. | | 71,700 | | | 4,821,825 |
| | | | |
|
|
| | | | | | 15,482,478 |
| | | | |
|
|
| | | | | |
COMMON STOCKS
(Continued) | | Shares
| | Value
(Note 2)
|
Real Estate Investment Trust — 0.4% | | | | | |
Apartment Investment & Management Co. (Class “A” Stock)(b) | | 22,000 | | $ | 847,880 |
Archstone-Smith Trust | | 35,600 | | | 1,363,480 |
Equity Office Properties Trust | | 109,400 | | | 3,185,728 |
Equity Residential Properties Trust | | 71,600 | | | 2,590,488 |
ProLogis | | 51,200 | | | 2,218,496 |
Simon Property Group, Inc. | | 56,500 | | | 3,653,855 |
| | | | |
|
|
| | | | | | 13,859,927 |
| | | | |
|
|
Restaurants — 0.6% | | | | | |
Darden Restaurants, Inc.(b) | | 47,750 | | | 1,324,585 |
McDonald’s Corp. | | 341,100 | | | 10,935,666 |
Wendy’s International, Inc. | | 30,700 | | | 1,205,282 |
Yum! Brands, Inc. | | 76,100 | | | 3,590,398 |
| | | | |
|
|
| | | | | | 17,055,931 |
| | | | |
|
|
Retail — 6.7% | | | | | |
Albertson’s, Inc.(b) | | 97,944 | | | 2,338,903 |
AutoNation, Inc.(a) | | 63,400 | | | 1,217,914 |
AutoZone, Inc.(a)(b) | | 20,900 | | | 1,908,379 |
Bed Bath & Beyond, Inc.(a) | | 82,200 | | | 3,274,026 |
Best Buy Co., Inc.(b) | | 86,650 | | | 5,148,743 |
Big Lots, Inc.(a) | | 35,200 | | | 426,976 |
Circuit City Stores, Inc. | | 55,200 | | | 863,328 |
Coach, Inc.(a) | | 49,300 | | | 2,780,520 |
Costco Wholesale Corp.(b) | | 122,832 | | | 5,946,297 |
CVS Corp.(b) | | 109,800 | | | 4,948,686 |
Dillard’s, Inc. (Class “A” Stock)(b) | | 25,750 | | | 691,903 |
Dollar General Corp. | | 90,203 | | | 1,873,516 |
Family Dollar Stores, Inc. | | 45,600 | | | 1,424,088 |
Federated Department Stores, Inc. | | 48,100 | | | 2,779,699 |
Gap, Inc.(b) | | 234,087 | | | 4,943,917 |
Home Depot, Inc.(b) | | 594,919 | | | 25,426,838 |
J.C. Penney Co., Inc. | | 76,600 | | | 3,171,240 |
Kohl’s Corp.(a)(b) | | 89,100 | | | 4,381,047 |
Kroger Co.(a) | | 198,400 | | | 3,479,936 |
Limited Brands | | 118,696 | | | 2,732,382 |
Liz Claiborne, Inc.(b) | | 31,800 | | | 1,342,278 |
Lowe’s Cos., Inc.(b) | | 210,500 | | | 12,122,695 |
May Department Stores Co.(b) | | 79,600 | | | 2,340,240 |
Nordstrom, Inc. | | 38,300 | | | 1,789,759 |
Office Depot, Inc.(a) | | 89,000 | | | 1,545,040 |
OfficeMax, Inc.(b) | | 19,886 | | | 624,023 |
Safeway, Inc.(a)(b) | | 113,700 | | | 2,244,438 |
Sears, Roebuck & Co.(b) | | 54,300 | | | 2,770,929 |
Sherwin-Williams Co. | | 39,700 | | | 1,771,811 |
Staples, Inc.(b) | | 136,800 | | | 4,611,528 |
Starbucks Corp.(a)(b) | | 104,900 | | | 6,541,564 |
Supervalu, Inc.(b) | | 39,000 | | | 1,346,280 |
Target Corp. | | 241,468 | | | 12,539,433 |
Tiffany & Co. | | 39,300 | | | 1,256,421 |
TJX Cos., Inc.(b) | | 121,900 | | | 3,063,347 |
Toys ‘R’ Us, Inc.(a) | | 61,250 | | | 1,253,787 |
Wal-Mart Stores, Inc.(b) | | 1,136,500 | | | 60,029,930 |
Walgreen Co.(b) | | 273,000 | | | 10,475,010 |
| | | | |
|
|
| | | | | | 207,426,851 |
| | | | |
|
|
SEE NOTES TO FINANCIAL STATEMENTS.
B82
| | | | |
| | | STOCK INDEX PORTFOLIO (Continued) | | |
SCHEDULE OF INVESTMENTS | December 31, 2004 |
| | | | | |
COMMON STOCKS
(Continued) | | Shares
| | Value
(Note 2)
|
Rubber — 0.1% | | | | | |
B.F. Goodrich Co.(b) | | 31,800 | | $ | 1,037,952 |
Cooper Tire & Rubber Co.(b) | | 23,800 | | | 512,890 |
Goodyear Tire & Rubber Co.(a)(b) | | 49,200 | | | 721,272 |
| | | | |
|
|
| | | | | | 2,272,114 |
| | | | |
|
|
Telecommunications — 4.4% | | | | | |
ADC Telecommunications, Inc.(a) | | 232,400 | | | 622,832 |
Alltel Corp. | | 84,500 | | | 4,965,220 |
Andrew Corp.(a) | | 36,112 | | | 492,207 |
AT&T Corp.(b) | | 219,073 | | | 4,175,531 |
BellSouth Corp.(b) | | 492,700 | | | 13,692,133 |
CenturyTel, Inc.(b) | | 40,100 | | | 1,422,347 |
CIENA Corp.(a)(b) | | 115,000 | | | 384,100 |
Citizens Communications Co. | | 74,000 | | | 1,020,460 |
Lucent Technologies, Inc.(a) | | 1,160,305 | | | 4,362,747 |
Motorola, Inc. | | 635,295 | | | 10,927,074 |
Nextel Communications, Inc.
(Class “A” Stock)(a)(b) | | 299,900 | | | 8,997,000 |
QUALCOMM, Inc. | | 436,100 | | | 18,490,640 |
Qwest Communications International, Inc.(a) | | 473,947 | | | 2,104,325 |
SBC Communications, Inc.(b) | | 894,574 | | | 23,053,172 |
Scientific-Atlanta, Inc. | | 39,200 | | | 1,293,992 |
Sprint Corp.(b) | | 390,800 | | | 9,711,380 |
Tellabs, Inc.(a)(b) | | 116,000 | | | 996,440 |
Verizon Communications, Inc. | | 743,038 | | | 30,100,469 |
| | | | |
|
|
| | | | | | 136,812,069 |
| | | | |
|
|
Textiles — 0.1% | | | | | |
VF Corp.(b) | | 29,836 | | | 1,652,318 |
| | | | |
|
|
Tobacco — 0.2% | | | | | |
Reynolds American, Inc.(b) | | 38,700 | | | 3,041,820 |
UST, Inc.(b) | | 43,700 | | | 2,102,407 |
| | | | |
|
|
| | | | | | 5,144,227 |
| | | | |
|
|
Toy Manufacturer — 0.1% | | | | | |
Hasbro, Inc.(b) | | 47,650 | | | 923,457 |
Mattel, Inc.(b) | | 120,281 | | | 2,344,277 |
| | | | |
|
|
| | | | | | 3,267,734 |
| | | | |
|
|
Trucking & Shipping — 1.1% | | | | | |
FedEx Corp. | | 80,840 | | | 7,961,932 |
Ryder System, Inc. | | 17,600 | | | 840,752 |
United Parcel Service, Inc.
(Class “B” Stock)(b) | | 302,800 | | | 25,877,288 |
| | | | |
|
|
| | | | | | 34,679,972 |
| | | | |
|
|
Utilities – Electric & Gas — 0.5% | | | | | |
Dynegy, Inc. (Class “A” Stock)(a) | | 113,300 | | | 523,446 |
Exelon Corp. | | 174,850 | | | 7,705,640 |
KeySpan Corp. | | 43,400 | | | 1,712,130 |
NiSource, Inc. | | 73,000 | | | 1,662,940 |
Progress Energy, Inc.(b) | | 65,214 | | | 2,950,281 |
| | | | |
|
|
| | | | | | 14,554,437 |
| | | | |
|
|
Utilities – Electric — 1.7% | | | | | |
Allegheny Energy, Inc.(a)(b) | | 35,200 | | | 693,792 |
Ameren Corp. | | 48,200 | | | 2,416,748 |
American Electric Power Co., Inc. | | 107,940 | | | 3,706,660 |
Calpine Corp.(a)(b) | | 95,000 | | | 374,300 |
| | | | | | | |
COMMON STOCKS
(Continued) | | Shares
| | Value
(Note 2)
| |
Utilities – Electric (cont’d.) | | | | | | | |
CenterPoint Energy, Inc. | | | 90,610 | | $ | 1,023,893 | |
CMS Energy Corp.(a) | | | 43,100 | | | 450,395 | |
Consolidated Edison, Inc. | | | 62,700 | | | 2,743,125 | |
Constellation Energy Group | | | 46,850 | | | 2,047,814 | |
Dominion Resources, Inc. | | | 86,142 | | | 5,835,259 | |
DTE Energy Co.(b) | | | 48,600 | | | 2,096,118 | |
Duke Energy Co.(b) | | | 249,262 | | | 6,313,806 | |
Edison International(b) | | | 85,100 | | | 2,725,753 | |
Entergy Corp.(b) | | | 63,200 | | | 4,271,688 | |
FirstEnergy Corp. | | | 91,236 | | | 3,604,734 | |
FPL Group, Inc.(b) | | | 50,700 | | | 3,789,825 | |
Public Service Enterprise Group, Inc. | | | 63,700 | | | 3,297,749 | |
Southern Co.(b) | | | 199,300 | | | 6,680,536 | |
TECO Energy, Inc. | | | 49,700 | | | 762,398 | |
| | | | | |
|
|
|
| | | | | | | 52,834,593 | |
| | | | | |
|
|
|
Waste Management — 0.2% | | | | | | | |
Allied Waste Industries, Inc.(a)(b) | | | 90,200 | | | 837,056 | |
Waste Management, Inc. | | | 147,830 | | | 4,426,030 | |
| | | | | |
|
|
|
| | | | | | | 5,263,086 | |
| | | | | |
|
|
|
TOTAL LONG-TERM INVESTMENTS (cost $2,203,496,340) | | | | | | 3,022,720,098 | |
| | | | | |
|
|
|
| SHORT-TERM INVESTMENTS — 22.3% | | | | |
Mutual Fund — 22.2% | | | | | | | |
Dryden Core Investment Fund —Taxable Money Market Series
(Note 4)(c) | | | 686,338,512 | | | 686,338,512 | |
| | | | | |
|
|
|
| | | Principal
Amount
(000)
| | | |
U.S. Government Obligation — 0.1% | | | | |
United States Treasury Bills(d)(e) 2.18%, 3/17/05 | | $ | 5,000 | | | 4,978,780 | |
| | | | | |
|
|
|
TOTAL SHORT-TERM INVESTMENTS
(cost $691,315,960) | | | 691,317,292 | |
| | | | | |
|
|
|
TOTAL INVESTMENTS — 120.0%
(cost $2,894,812,300; Note 6) | | | 3,714,037,390 | |
| | | | | |
|
|
|
VARIATION MARGIN ON OPEN FUTURES CONTRACTS, NET(f) | | | (57,186 | ) |
OTHER LIABILITIES IN EXCESS OF OTHER
ASSETS — (20.0)% | | | (619,307,193 | ) |
| | | | | |
|
|
|
NET ASSETS — 100% | | $ | 3,094,673,011 | |
| | | | | |
|
|
|
| (a) | Non-income producing security. |
| (b) | Portion of securities on loan with an aggregate market value of $597,200,348; cash collateral of $621,001,370 was received with which the portfolio purchased highly liquid short-term investments. |
| (c) | Represents security, or portion thereof, purchased with cash collateral received for securities on loan. |
| (d) | Security segregated as collateral for futures contracts. |
| (e) | Rate quoted represents yield-to-maturity at purchase date. |
SEE NOTES TO FINANCIAL STATEMENTS.
B83
| | | | |
| | | STOCK INDEX PORTFOLIO (Continued) | | |
SCHEDULE OF INVESTMENTS | December 31, 2004 |
| (f) | Open futures contracts as of December 31, 2004 were as follows: |
| | | | | | | | | | | | | |
Number of
Contracts
| | Type
| | Expiration
Date
| | Value at
Trade Date
| | Value at
December 31, 2004
| | Unrealized
Appreciation
|
| Long Positions: | | | | | | | | | | | | | |
| 230 | | S&P 500 Index | | Mar 05 | | $ | 69,216,462 | | $ | 69,787,750 | | $ | 571,288 |
| | | | | | | | | | | | |
|
|
The industry classification of portfolio holdings and liabilities in excess of other assets shown as a percentage of net assets as of December 31, 2004 was as follows:
| | | |
Mutual Fund | | 22.2 | % |
Drugs & Medical Supplies | | 9.3 | |
Financial Services | | 9.0 | |
Computer Services | | 7.2 | |
Retail | | 6.7 | |
Banks & Savings & Loans | | 6.5 | |
Oil & Gas | | 4.6 | |
Telecommunications | | 4.4 | |
Insurance | | 4.1 | |
Electronics | | 3.9 | |
Food & Beverage | | 3.8 | |
Diversified Manufacturing Operations | | 3.5 | |
Computers | | 3.4 | |
Media | | 3.3 | |
Hospitals/Healthcare Management | | 2.9 | |
Cosmetics & Soaps | | 2.2 | |
Miscellaneous — Basic Industry | | 2.2 | |
Aerospace | | 1.8 | |
Utilities — Electric | | 1.7 | |
Oil & Gas Services | | 1.4 | |
Chemicals | | 1.3 | |
Leisure | | 1.3 | |
Diversified Consumer Products | | 1.2 | |
Trucking & Shipping | | 1.1 | |
Autos — Cars & Trucks | | 1.0 | |
Commercial Services | | 1.0 | |
Machinery | | 0.9 | |
Oil & Gas Exploration/Production | | 0.9 | |
Forest Products | | 0.6 | |
| | | |
Miscellaneous — Consumer Growth/Staple | | 0.6 | % |
Restaurants | | 0.6 | |
Railroads | | 0.5 | |
Utilities — Electric & Gas | | 0.5 | |
Real Estate Investment Trust | | 0.4 | |
Apparel | | 0.3 | |
Construction | | 0.3 | |
Diversified Office Equipment | | 0.3 | |
Electrical Services | | 0.3 | |
Household Products & Personal Care | | 0.3 | |
Housing Related | | 0.3 | |
Gas Pipelines | | 0.2 | |
Metals — Non Ferrous | | 0.2 | |
Mineral Resources | | 0.2 | |
Precious Metals | | 0.2 | |
Tobacco | | 0.2 | |
Waste Management | | 0.2 | |
Advertising | | 0.1 | |
Airlines | | 0.1 | |
Containers | | 0.1 | |
Diversified Operations | | 0.1 | |
Education | | 0.1 | |
Metals — Ferrous | | 0.1 | |
Rubber | | 0.1 | |
Textiles | | 0.1 | |
Toy Manufacturer | | 0.1 | |
U.S. Government Obligation | | 0.1 | |
| | |
|
|
| | | 120.0 | |
Liabilities in excess of other assets | | (20.0 | ) |
| | |
|
|
| | | 100 | % |
| | |
|
|
SEE NOTES TO FINANCIAL STATEMENTS.
B84
SCHEDULE OF INVESTMENTS | December 31, 2004 |
| | | | | |
| LONG-TERM INVESTMENTS — 98.0% | | Value
(Note 2)
|
| COMMON STOCKS | | Shares
| |
Aerospace & Defense — 2.3% | | | | | |
Lockheed Martin Corp.(b) | | 390,100 | | $ | 21,670,055 |
Northrop Grumman Corp. | | 271,700 | | | 14,769,612 |
| | | | |
|
|
| | | | | | 36,439,667 |
| | | | |
|
|
Biotechnology — 0.6% | | | | | |
MedImmune, Inc.(a)(b) | | 376,800 | | | 10,215,048 |
| | | | |
|
|
Capital Markets — 6.2% | | | | | |
Bank of New York Co., Inc. (The) | | 959,300 | | | 32,059,806 |
Lehman Brothers Holdings, Inc. | | 347,900 | | | 30,434,292 |
Mellon Financial Corp. | | 408,300 | | | 12,702,213 |
Merrill Lynch & Co., Inc. | | 396,800 | | | 23,716,736 |
| | | | |
|
|
| | | | | | 98,913,047 |
| | | | |
|
|
Chemicals — 2.4% | | | | | |
E.I. du Pont de Nemours & Co. | | 368,300 | | | 18,065,115 |
Mosaic Co. (The)(a)(b) | | 1,283,600 | | | 20,948,352 |
| | | | |
|
|
| | | | | | 39,013,467 |
| | | | |
|
|
Commercial Banks — 2.3% | | | | | |
Bank of America Corp. | | 778,084 | | | 36,562,167 |
| | | | |
|
|
Commercial Services & Supplies — 2.5% | | | |
Cendant Corp. | | 715,200 | | | 16,721,376 |
Waste Management, Inc. | | 752,000 | | | 22,514,880 |
| | | | |
|
|
| | | | | | 39,236,256 |
| | | | |
|
|
Communications Equipment — 0.9% | | | | | |
Nortel Networks Corp. (Canada)(a) | | 4,346,900 | | | 15,170,681 |
| | | | |
|
|
Computers & Peripherals — 0.8% | | | | | |
Hewlett-Packard Co. | | 587,250 | | | 12,314,633 |
| | | | |
|
|
Consumer Finance — 1.8% | | | | | |
American Express Services Co. | | 207,800 | | | 11,713,686 |
MBNA Corp. | | 597,800 | | | 16,851,982 |
| | | | |
|
|
| | | | | | 28,565,668 |
| | | | |
|
|
Diversified Financial Services — 6.2% | | | | | |
Citigroup, Inc. | | 1,010,300 | | | 48,676,254 |
J.P. Morgan Chase & Co. | | 633,800 | | | 24,724,538 |
Principal Financial Group, Inc. (The) | | 636,800 | | | 26,070,592 |
| | | | |
|
|
| | | | | | 99,471,384 |
| | | | |
|
|
Diversified Telecommunication Services — 4.0% | | | |
ALLTEL Corp. | | 268,300 | | | 15,765,308 |
SBC Communications, Inc. | | 1,306,600 | | | 33,671,082 |
Verizon Communications, Inc. | | 377,500 | | | 15,292,525 |
| | | | |
|
|
| | | | | | 64,728,915 |
| | | | |
|
|
Electric Utilities — 5.0% | | | | | |
E.ON AG, ADR (Germany) | | 135,500 | | | 12,330,500 |
Exelon Corp. | | 410,500 | | | 18,090,735 |
PG&E Corp.(a) | | 378,500 | | | 12,596,480 |
TXU Corp.(b) | | 579,300 | | | 37,399,608 |
| | | | |
|
|
| | | | | | 80,417,323 |
| | | | |
|
|
Electronic Equipment & Instruments — 0.8% | | | |
Agilent Technologies, Inc.(a) | | 519,600 | | | 12,522,360 |
| | | | |
|
|
Energy Equipment & Services — 4.2% | | | | | |
ENSCO International, Inc. | | 222,500 | | | 7,062,150 |
GlobalSantaFe Corp.(b) | | 794,100 | | | 26,292,651 |
Halliburton Co.(b) | | 504,500 | | | 19,796,580 |
| | | | | |
COMMON STOCKS
(Continued) | | Shares
| | Value
(Note 2)
|
| | |
Energy Equipment & Services (cont’d.) | | | | | |
Schlumberger Ltd. | | 199,300 | | $ | 13,343,135 |
| | | | |
|
|
| | | | | | 66,494,516 |
| | | | |
|
|
Food Products — 1.0% | | | | | |
Cadbury Schweppes PLC, ADR
(United Kingdom) | | 432,200 | | | 16,293,940 |
| | | | |
|
|
Food & Staples Retailing — 2.1% | | | | | |
Kroger Co. (The)(a) | | 1,901,600 | | | 33,354,064 |
| | | | |
|
|
Healthcare Providers & Services — 4.5% | | | |
CIGNA Corp.(b) | | 329,200 | | | 26,852,844 |
Express Scripts, Inc.(a)(b) | | 378,800 | | | 28,955,472 |
Medco Health Solutions, Inc.(a) | | 368,404 | | | 15,325,606 |
| | | | |
|
|
| | | | | | 71,133,922 |
| | | | |
|
|
Hotels, Restaurants & Leisure — 1.0% | | | | | |
McDonald’s Corp. | | 518,000 | | | 16,607,080 |
| | | | |
|
|
Household Products — 1.3% | | | | | |
Kimberly-Clark Corp. | | 327,200 | | | 21,533,032 |
| | | | |
|
|
Industrial Conglomerates — 5.2% | | | | | |
General Electric Co. | | 865,100 | | | 31,576,150 |
Phelps Dodge Corp.(b) | | 207,300 | | | 20,506,116 |
Tyco International Ltd.
(Bermuda)(b) | | 876,600 | | | 31,329,684 |
| | | | |
|
|
| | | | | | 83,411,950 |
| | | | |
|
|
Insurance — 7.9% | | | | | |
Allstate Corp. | | 305,300 | | | 15,790,116 |
Genworth Financial, Inc.
(Class “A” Stock)(b) | | 593,500 | | | 16,024,500 |
Loews Corp. | | 364,300 | | | 25,610,290 |
MBIA, Inc.(b) | | 250,200 | | | 15,832,656 |
St. Paul Travelers Companies, Inc. (The) | | 589,763 | | | 21,862,514 |
XL Capital, Ltd. (Class “A” Stock)
(Cayman Islands)(b) | | 411,300 | | | 31,937,445 |
| | | | |
|
|
| | | | | | 127,057,521 |
| | | | |
|
|
IT Services — 1.2% | | | | | |
Accenture Ltd. (Class “A” Stock) (Bermuda)(a)(b) | | 720,200 | | | 19,445,400 |
| | | | |
|
|
Machinery — 1.1% | | | | | |
Deere & Co. | | 226,500 | | | 16,851,600 |
| | | | |
|
|
Media — 2.1% | | | | | |
DIRECTV Group, Inc. (The)(a) | | 133,800 | | | 2,239,812 |
News Corp. (Class “A” Stock)(b) | | 926,602 | | | 17,290,394 |
Viacom, Inc. (Class “B” Stock) | | 369,629 | | | 13,450,799 |
| | | | |
|
|
| | | | | | 32,981,005 |
| | | | |
|
|
Metals & Mining — 0.9% | | | | | |
Inco Ltd. (Canada)(a) | | 405,400 | | | 14,910,612 |
| | | | |
|
|
Multi-Utilities & Unregulated Power — 2.9% | | | |
Dominion Resources, Inc. | | 308,600 | | | 20,904,564 |
Sempra Energy | | 692,600 | | | 25,404,568 |
| | | | |
|
|
| | | | | | 46,309,132 |
| | | | |
|
|
Office Electronics — 2.4% | | | | | |
Xerox Corp.(a)(b) | | 2,290,200 | | | 38,956,302 |
| | | | |
|
|
SEE NOTES TO FINANCIAL STATEMENTS.
B85
| | | | |
| | | VALUE PORTFOLIO (Continued) | | |
SCHEDULE OF INVESTMENTS | December 31, 2004 |
| | | | | | |
COMMON STOCKS
(Continued) | | Shares
| | Value
(Note 2)
| |
Oil & Gas — 10.5% | | | | | | |
Eni S.p.A., ADR (Italy) | | 219,700 | | $ | 27,647,048 | |
ExxonMobil Corp. | | 239,600 | | | 12,281,896 | |
Kerr-McGee Corp. | | 280,200 | | | 16,192,758 | |
Nexen, Inc. (Canada) | | 608,100 | | | 24,719,265 | |
Occidental Petroleum Corp. | | 505,200 | | | 29,483,472 | |
Suncor Energy, Inc. (Canada) | | 884,500 | | | 31,311,300 | |
Total SA, ADR (France) | | 235,900 | | | 25,911,256 | |
| | | | |
|
|
|
| | | | | | 167,546,995 | |
| | | | |
|
|
|
Paper & Forest Products — 2.3% | | | | | | |
Georgia-Pacific Corp. | | 566,900 | | | 21,247,412 | |
International Paper Co.(b) | | 363,100 | | | 15,250,200 | |
| | | | |
|
|
|
| | | | | | 36,497,612 | |
| | | | |
|
|
|
Pharmaceuticals — 4.5% | | | | | | |
Eli Lilly & Co. | | 280,000 | | | 15,890,000 | |
Merck & Co., Inc. | | 587,600 | | | 18,885,464 | |
Novartis AG, ADR (Switzerland) | | 507,000 | | | 25,623,780 | |
Wyeth | | 269,942 | | | 11,496,830 | |
| | | | |
|
|
|
| | | | | | 71,896,074 | |
| | | | |
|
|
|
Software — 0.9% | | | | | | |
Microsoft Corp. | | 523,900 | | | 13,993,369 | |
| | | | |
|
|
|
Specialty Retail — 1.5% | | | | | | |
Toys “R” Us, Inc.(a) | | 1,149,600 | | | 23,532,312 | |
| | | | |
|
|
|
Thrifts & Mortgage Finance — 1.0% | | | | | | |
Freddie Mac | | 218,200 | | | 16,081,340 | |
| | | | |
|
|
|
Tobacco — 2.4% | | | | | | |
Altria Group, Inc. | | 622,900 | | | 38,059,190 | |
| | | | |
|
|
|
Wireless Telecommunication Services — 1.3% | | | | |
Nextel Communications, Inc.
(Class “A” Stock)(a) | | 666,300 | | | 19,989,000 | |
| | | | |
|
|
|
TOTAL LONG-TERM INVESTMENTS
(cost $1,233,958,245) | | | 1,566,506,584 | |
| | | | |
|
|
|
| SHORT-TERM INVESTMENT — 15.8% | | | | |
Mutual Fund | | | | | | |
Dryden Core Investment Fund-Taxable Money Market Series, (cost $253,117,092)(c) | | 253,117,092 | | | 253,117,092 | |
| | | | |
|
|
|
TOTAL INVESTMENTS — 113.8%
(cost $1,487,075,337; Note 6) | | | 1,819,623,676 | |
LIABILITIES IN EXCESS OF OTHER
ASSETS — (13.8)% | | | (221,047,917 | ) |
| | | | |
|
|
|
NET ASSETS — 100% | | $ | 1,598,575,759 | |
| | | | |
|
|
|
The industry classification of portfolio of holdings and liabilities in excess of other assets shown as a percentage of net assets as of December 31, 2004 was as follows:
| | | |
Mutual Fund | | 15.8 | % |
Oil & Gas | | 10.5 | |
Insurance | | 7.9 | |
Capital Markets | | 6.2 | |
Diversified Financial Services | | 6.2 | |
Industrial Conglomerates | | 5.2 | |
Electric Utilities | | 5.0 | |
Healthcare Providers & Services | | 4.5 | |
Pharmaceuticals | | 4.5 | |
Energy Equipment & Services | | 4.2 | |
Diversified Telecommunication Services | | 4.0 | |
Multi-Utilities & Unregulated Power | | 2.9 | |
Commercial Services & Supplies | | 2.5 | |
Chemicals | | 2.4 | |
Office Electronics | | 2.4 | |
Tobacco | | 2.4 | |
Aerospace & Defense | | 2.3 | |
Commercial Banks | | 2.3 | |
Paper & Forest Products | | 2.3 | |
Food & Staples Retailing | | 2.1 | |
Media | | 2.1 | |
Consumer Finance | | 1.8 | |
Specialty Retail | | 1.5 | |
Household Products | | 1.3 | |
Wireless Telecommunication Services | | 1.3 | |
IT Services | | 1.2 | |
Machinery | | 1.1 | |
Hotels, Restaurants & Leisure | | 1.0 | |
Food Products | | 1.0 | |
Thrifts & Mortgage Finance | | 1.0 | |
Communications Equipment | | 0.9 | |
Metals & Mining | | 0.9 | |
Software | | 0.9 | |
Computers & Peripherals | | 0.8 | |
Electronic Equipment & Instruments | | 0.8 | |
Biotechnology | | 0.6 | |
| | |
|
|
| | | 113.8 | |
Liabilities in excess of other assets | | (13.8 | ) |
| | |
|
|
| | | 100.0 | % |
| | |
|
|
The following abbreviations are used in portfolio descriptions:
| | |
| ADR | | American Depositary Receipt |
| (a) | Non-income producing security. |
| (b) | All or a portion of securities on loan with an aggregate market value of $224,320,778; cash collateral $233,693,985 was received with which the portfolio purchased securities. |
| (c) | Represents security, or portion thereof, purchased with cash collateral for securities on loan. |
SEE NOTES TO FINANCIAL STATEMENTS.
B86
| | | | |
| | | ZERO COUPON BOND PORTFOLIO 2005 | | |
SCHEDULE OF INVESTMENTS | December 31, 2004 |
| | | | | | | | | |
| | | Maturity
Date
| | Principal
Amount
(000)
| | Value
(Note 2)
| |
LONG-TERM INVESTMENTS — 98.3% | | | | |
U.S. GOVERNMENT & AGENCY OBLIGATIONS | | | | | | | |
Federal National Mortgage Association | | 01/24/05 | | $ | 1,400 | | $ | 1,397,984 | |
Federal National Mortgage Association | | 01/24/06 | | | 2,320 | | | 2,248,270 | |
Financing Corp. | | 02/08/05 | | | 688 | | | 686,561 | |
Financing Corp. | | 11/11/05 | | | 425 | | | 414,520 | |
Financing Corp. | | 08/08/07 | | | 2,070 | | | 1,893,360 | |
United States Treasury Strip | | 08/15/05 | | | 41,095 | | | 40,445,535 | |
United States Treasury Strip | | 02/15/06 | | | 7,970 | | | 7,727,186 | |
United States Treasury Strip | | 08/15/07 | | | 5,150 | | | 4,738,252 | |
| | | | | | | |
|
|
|
TOTAL LONG-TERM INVESTMENTS
(cost $58,446,671) | | | | | | | | 59,551,668 | |
| | | | | | | |
|
|
|
SHORT-TERM INVESTMENT — 1.8%
MUTUAL FUND | | | | Shares
| | | |
Dryden Core Investment Fund-Taxable Money Market Series
(cost $1,078,770; Note 4) | | | | | 1,078,770 | | | 1,078,770 | |
| | | | | | | |
|
|
|
TOTAL INVESTMENTS — 100.1%
(cost $59,525,441; Note 6) | | | | | | | | 60,630,438 | |
LIABILITIES IN EXCESS OF OTHER ASSETS — (0.1)% | | | | | | | | (60,724 | ) |
| | | | | | | |
|
|
|
NET ASSETS — 100.0% | | | | | | | $ | 60,569,714 | |
| | | | | | | |
|
|
|
The sector classification of portfolio holdings and liabilities in excess of other assets shown as a percentage of net assets as of December 31, 2004 was as follows:
| | | |
U.S. Government Treasuries | | 87.4 | % |
U.S. Government Agencies | | 10.9 | |
Mutual Fund | | 1.8 | |
| | |
|
|
| | | 100.1 | |
Liabilities in excess of other assets | | (0.1 | ) |
| | |
|
|
| | | 100.0 | % |
| | |
|
|
SEE NOTES TO FINANCIAL STATEMENTS.
B87
NOTES TO THE FINANCIAL STATEMENTS OF
THE PRUDENTIAL SERIES FUND, INC.
The Prudential Series Fund, Inc. (“Series Fund”), a Maryland corporation, organized on November 15, 1982, is a diversified open-end management investment company registered under the Investment Company Act of 1940, as amended. The Series Fund is composed of thirty-six Portfolios (“Portfolio” or “Portfolios”), each with a separate series of capital stock. The information presented in these financial statements pertains to fourteen Portfolios: Conservative Balanced Portfolio, Diversified Bond Portfolio, Equity Portfolio, Flexible Managed Portfolio, Global Portfolio, Government Income Portfolio, High Yield Bond Portfolio, Jennison Portfolio, Money Market Portfolio, Natural Resources Portfolio, Small Capitalization Stock Portfolio, Stock Index Portfolio, Value Portfolio and Zero Coupon Bond Portfolio 2005.
The Portfolios of the Series Fund have the following as investment objectives:
Conservative Balanced Portfolio: Total investment return consistent with a conservatively managed diversified portfolio by investing in a mix of equity-related securities, debt obligations and money market instruments.
Diversified Bond Portfolio: High level of income over a longer term while providing reasonable safety of capital by investing in intermediate and long-term debt obligations that are rated investment grade and high quality money market instruments. The types of debt obligations in which the Portfolio can invest include U.S. government securities, mortgage-related securities and corporate bonds.
Equity Portfolio: Capital appreciation by investing primarily in stocks of major, established corporations as well as small companies.
Flexible Managed Portfolio: High total return consistent with an aggressively managed diversified portfolio by investing in a mix of equity and equity-related securities, debt obligations and money market instruments.
Global Portfolio: Long-term growth of capital by investing primarily in equity and equity-related securities of foreign and U.S. companies.
Government Income Portfolio: High level of income over the long-term consistent with the preservation of capital by investing primarily in intermediate and long-term U.S. government securities, including U.S. Treasuries and agencies and mortgage-related securities.
High Yield Bond Portfolio: High total return by investing primarily in medium to lower rated debt securities.
Jennison Portfolio: Long-term growth of capital by investing primarily in equity securities of established companies that the Portfolio manager believes offer above-average growth prospects.
Money Market Portfolio: Maximum current income consistent with the stability of capital and maintenance of liquidity by investing in high quality short-term money market securities issued by the U.S government and its agencies, as well as commercial paper, asset backed securities, certificates of deposit and other obligations issued by banks, corporations and other companies, that generally mature in 13 months or less.
Natural Resources Portfolio: Long-term growth of capital by investing primarily in stocks of companies that operate within, or do business with, the natural resources sector of the economy.
Small Capitalization Stock Portfolio: Long-term growth of capital that corresponds to the price and yield performance of the Standard & Poor’s Small Capitalization Stock Index (the “S&P 600 SmallCap Index”) by investing primarily in stocks of the S&P 600 SmallCap Index.
Stock Index Portfolio: Investment results that generally correspond to the price and yield performance of the S&P 500 Index by investing primarily in stocks in the S&P 500 Index.
Value Portfolio: Capital appreciation by investing in equity and equity-related securities that are undervalued.
Zero Coupon Bond Portfolio 2005: Highest predictable compound investment for a specific period of time, consistent with safety of invested capital by investing primarily in debt obligations of the U.S. Treasury and corporations, issued without interest coupons or stripped of their interest coupons.
C1
The ability of issuers of debt securities (other than those issued or guaranteed by the U.S. Government) held by the Portfolios to meet their obligations may be affected by the economic or political developments in a specific industry, region or country.
| Note 2: | | Accounting Policies |
The following is a summary of significant accounting policies followed by the Series Fund and the Portfolios in preparation of their financial statements.
Securities Valuation: Securities listed on a securities exchange are valued at the last sale price on such exchange on the day of valuation or, if there was no sale on such day, at the mean between the last reported bid and asked prices, or at the last bid price on such day in the absence of an asked price. Securities traded via NASDAQ are valued at the official closing price provided by NASDAQ. Securities that are actively traded in the over-the-counter market, including listed securities for which the primary market is believed by Prudential Investments LLC (“PI” or “Manager”) in consultation with the subadvisor, to be over-the-counter, are valued at market value using prices provided by an independent pricing agent or principal market maker. Options on securities and indices traded on an exchange are valued at the last sale price as of the close of trading on the applicable exchange or, if there was no sale, at the mean between the most recently quoted bid and asked prices on such exchange, or at the last bid price in the absence of an asked price. Futures contracts and options thereon traded on a commodities exchange or board of trade are valued at the last sale price at the close of trading on such exchange or board of trade or, if there was no sale on the applicable commodities exchange or board of trade on such day, at the mean between the most recently quoted bid and asked prices on such exchange or board of trade or at the last bid price in the absence of an asked price. Prices may be obtained from independent pricing services which use information provided by market makers or estimates of market values obtained from yield data relating to investments or securities with similar characteristics. Securities for which reliable market quotations are not readily available, or whose values have been affected by events occurring after the close of the security’s foreign market and before the Series fund’s normal pricing time, are valued at fair value in accordance with Board of Directors’ approved fair valuation procedures. Using fair value to price securities may result in a value that is different from a security’s most recent closing price and from the price used by other mutual funds to calculate their net asset values. As of December 31, 2004 there were no foreign securities whose value required adjustment in accordance with such procedures.
Investments in mutual funds are valued at their net asset value as of the close of the New York Stock Exchange on the date of valuation.
The Money Market, Conservative Balanced and Flexible Managed Portfolios use amortized cost to value short-term securities. Short-term securities that are held in the other Portfolios which mature in more than 60 days are valued at current market quotations and those short-term securities which mature in 60 days or less are valued at amortized cost which approximates market value. The amortized cost method values a security at its cost at the time of purchase and there after assumes a constant amortization to maturity of any discount or premium.
The High Yield Bond and Natural Resources Portfolios may hold up to 15% of their net assets in illiquid securities, including those which are restricted as to disposition under securities law (“restricted securities”). Certain issues of restricted securities held by these portfolios at December 31, 2004 include registration rights, under which the portfolios may demand registration by the issuer, of which the portfolios may bear the cost of such registration. Restricted securities, sometimes referred to as private placements, are valued pursuant to the valuation procedures noted above.
Repurchase Agreements: In connection with transactions in repurchase agreements with United States financial institutions, it is the Series Fund’s policy that its custodian or designated subcustodians, as the case may be, under triparty repurchase agreements, take possession of the underlying collateral securities, the value of which exceeds the principal amount of the repurchase transaction, including accrued interest. To the extent that any repurchase transaction exceeds one business day, the value of the collateral is marked to market on a daily basis to ensure the adequacy of the collateral. If the seller defaults or the value of the collateral declines, or if bankruptcy proceedings are commenced with respect to the seller of the security, realization of the collateral by the Series Fund may by delayed or limited.
C2
Foreign Currency Translation: The books and records of the Series Fund are maintained in U.S. dollars. Foreign currency amounts are translated into U.S. dollars on the following basis:
(i) market value of investment securities, other assets and liabilities – at the current daily rates of exchange.
(ii) purchases and sales of investment securities, income and expenses – at the rates of exchange prevailing on the respective dates of such transactions.
Although the net assets of the Series Fund are presented at the foreign exchange rates and market values at the close of the year, the Series Fund does not isolate that portion of the results of operations arising as a result of changes in the foreign exchange rates from the fluctuations arising from changes in the market prices of securities held at the end of the year. Similarly, the Series Fund does not isolate the effect of changes in foreign exchange rates from the fluctuations arising from changes in the market prices of portfolio securities sold during the year. Accordingly, these realized foreign currency gains (losses) are included in the reported net realized gains (losses) on investment transactions.
Net realized gains (losses) on foreign currency transactions represent net foreign exchange gains (losses) from the holding of foreign currencies, currency gains (losses) realized between the trade date and settlement date on securities transactions, and the difference between the amounts of dividends, interest and foreign withholding taxes recorded on the Series Fund’s books and the U.S. dollar equivalent amounts actually received or paid. Net unrealized currency gains (losses) from valuing foreign currency denominated assets and liabilities (other than investments) at year end exchange rates are reflected as a component of net unrealized appreciation (depreciation) on investments and foreign currencies.
Foreign security and currency transactions may involve certain considerations and risks not typically associated with those of domestic origin as a result of, among other factors, the possibility of political and economic instability or the level of governmental supervision and regulation of foreign securities markets.
Forward Currency Contracts: A forward currency contract is a commitment to purchase or sell a foreign currency at a future date at a negotiated forward rate. Certain Portfolios of the Series Fund may enter into forward currency contracts in order to hedge their exposure to changes in foreign currency exchange rates on their foreign portfolio holdings or on specific receivables and payables denominated in a foreign currency. The contracts are valued daily at current exchange rates and any unrealized gain (loss) is included in net unrealized appreciation (depreciation) on investments and foreign currencies. Gain (loss) is realized on the settlement date of the contract equal to the difference between the settlement value of the original and renegotiated forward contracts. This gain (loss), if any, is included in net realized gain (loss) on foreign currency transactions. Risks may arise upon entering into these contracts from the potential inability of the counterparties to meet the terms of their contracts.
Short Sales: Certain portfolios of the Series Fund may sell a security it does not own in anticipation of a decline in the market value of that security (short sale). When a Portfolio makes a short sale, it must borrow the security sold short and deliver it to the broker-dealer through which it made the short sale as collateral for its obligation to deliver the security upon conclusion of the transaction. The Portfolio may have to pay a fee to borrow the particular security and may be obligated to remit any interest or dividends received on such borrowed securities. A gain, limited to the price at which the Portfolio sold the security short, or a loss, unlimited in magnitude, will be recognized upon the termination of a short sale if the market price at termination is less than or greater than, respectively, the proceeds originally received.
Loan Participations: The High Yield Bond Portfolio may invest in loan participations. When the Portfolio purchases a loan participation, the Portfolio typically enters into a contractual relationship with the lender or third party selling such participations (“Selling Participant”), but not the borrower. As a result, the Portfolio assumes the credit risk of the borrower, the Selling Participant and any other persons interpositioned between the Portfolio and the borrower. The Portfolio may not directly benefit from the collateral supporting the senior loan in which it has purchased the loan participant.
Options: The Series Fund may either purchase or write options in order to hedge against adverse market movements or fluctuations in value caused by changes in prevailing interest rates or foreign currency exchange rates or currencies with respect to securities which the Series Fund currently owns or intends to purchase. The Series Fund’s principal reason for writing options is to realize, through receipt of premiums, a greater current return than would be realized on the underlying security alone. When the Series Fund purchases an option, it pays a premium and an amount equal to that premium is recorded as an asset. When
C3
the Series Fund writes an option, it receives a premium and an amount equal to that premium is recorded as a liability. The asset or liability is adjusted daily to reflect the current market value of the option. If an option expires unexercised, the Series Fund realizes a gain (loss) to the extent of the premium received or paid. If an option is exercised, the premium received or paid is recorded as an adjustment to the proceeds from the sale or the cost basis of the purchase in determining whether the Series Fund has realized a gain (loss). The difference between the premium and the amount received or paid on effecting a closing purchase or sale transaction is also treated as a realized gain (loss). Gains (losses) on purchased options are included in net realized gains (losses) on investment transactions. Gains (losses) on written options are presented separately as a net realized gains (losses) on written option transactions.
The Series Fund, as writer of an option, may have no control over whether the contract may be exercised. As a result, the Series Fund bears the market risk of an unfavorable change in the price of the security underlying the written option. The Series Fund, as purchaser of an option, bears the risk of the potential inability of the counterparties to meet the terms of their contracts.
Financial Futures Contracts: A financial futures contract is an agreement to purchase (long) or sell (short) an agreed amount of securities at a set price for delivery on a future date. Upon entering into a financial futures contract, the Series Fund is required to pledge to the broker an amount of cash and/or other assets equal to a certain percentage of the contract amount. This amount is known as the “initial margin”. Subsequent payments, known as “variation margin”, are made or received by the Series Fund each day, depending on the daily fluctuations in the value of the underlying security. Such variation margin is recorded for financial statement purposes on a daily basis as unrealized gain (loss). When the contract expires or is closed, the gain (loss) is realized and is presented in the Statement of Operations as net realized gain (loss) on financial futures contracts.
The Series Fund invests in financial futures contracts in order to hedge its existing portfolio securities, or securities the Series Fund intends to purchase, against fluctuations in value caused by changes in prevailing rates or market conditions. Under a variety of circumstances, the Series Fund may not achieve the anticipated benefits of the financial futures contracts and may realize a loss. The use of futures transactions involves the risk of imperfect correlation in movements in the price of futures contracts and the underlying hedged assets.
Swaps: Certain portfolios of the Series Fund may enter into swap agreements. A swap agreement is an agreement to exchange the return generated by one instrument for the return generated by another instrument. The Portfolios enter into interest rate, forward swap spread lock and credit default swap agreements to manage its exposure to interest rates and credit risk. Interest rate swap agreements involve the exchange by the Portfolios with another party of their respective commitments to pay or receive interest. Forward spread lock swap agreements involve commitments to pay or receive a settlement amount calculated as the difference between the swap spread and a fixed spread, multiplied by the notional amount times the duration of the swap. The swap spread is the difference between the benchmark swap rate (Market rate) and the specific Treasury rate. In a credit default swap, one party makes a stream of payments to another party in exchange for the right to receive a specified return in the event of a default by a third party, typically corporate issues or sovereign issues of an emerging country, on its obligation. Dividends and interest on the securities in the swap are included in the value of the exchange. The swaps are valued daily at current market value and any unrealized gain or loss is included in the Statement of Assets and Liabilities. Gains (losses) are realized on the termination date of the swap and is equal to the difference between a Portfolio’s basis in the swap and the proceeds of the closing transaction, including any fees. During the period that the swap agreement is open, the Portfolios may be subject to risk from the potential inability of the counterparty to meet the terms of the agreement.
Forward currency contracts, written options, short sales, swaps and financial futures contracts involve elements of both market and credit risk in excess of the amounts reflected on the Statement of Assets and Liabilities.
Securities Lending: The Series Fund may lend its portfolio securities to broker-dealers. The loans are secured by collateral at least equal at all times to the market value of the securities loaned. Loans are subject to termination at the option of the borrower or the Series Fund. Upon termination of the loan, the borrower will return to the lender securities identical to the loaned securities. Should the borrower of the securities fail financially, the Series has the right to repurchase the securities using the collateral in the open market. The Series Fund recognizes income, net of any rebate and securities lending agent fees, for lending its securities in the form of fees or interest on the investment of any cash received as collateral. The Series Fund also
C4
continues to receive interest and dividends or amounts equivalent thereto on the securities loaned and recognizes any unrealized gain or loss in the market price of the securities loaned that may occur during the term of the loan.
When-Issued/Delayed Delivery Securities: Securities purchased or sold on a when-issued or delayed-delivery basis may be settled a month or more after trade date; interest income is not accrued until settlement date. At the time a Portfolio enters into such transactions, it instructs the custodian to segregate assets with a current value at least equal to the amount of its when-issued or delayed-delivery purchase commitments.
Securities Transactions and Net Investment Income: Securities transactions are recorded on the trade date. Realized gains (losses) on sales of securities are calculated on the identified cost basis. Dividend income is recorded on the ex-dividend date; interest income, which is comprised of four elements: stated coupon, original issue discount, market discount and market premium, is recorded on the accrual basis. Expenses are recorded on the accrual basis. The Series Fund’s expenses are allocated to the respective Portfolios on the basis of relative net assets except for Portfolio specific expenses which are attributable directly to a Portfolio or class level.
For Portfolios with multiple classes of shares, net investment income (loss) (other than administration and distribution fees, which are charged to the respective class) and unrealized and realized gains (losses) are allocated daily to each class of shares based upon the relative proportion of net assets of each class at the beginning of the day.
Custody Fee Credits: The Series Fund has an arrangement with its custodian bank, whereby uninvested monies earn credits which reduce the fees charged by the custodian. Such custody fee credits are presented as a reduction of gross expenses in the accompanying Statements of Operations.
Taxes: For federal income tax purposes, each Portfolio in the Series Fund is treated as a separate taxpaying entity. It is each Portfolio’s policy to continue to meet the requirements of the Internal Revenue Code applicable to regulated investment companies and to distribute all of its taxable net income and capital gains, if any, to shareholders. Therefore, no federal income tax provision is required.
Withholding taxes on foreign dividends, interest and capital gains have been provided for in accordance with the Series Fund’s understanding of the applicable country’s tax rules and regulations.
Dividends and Distributions: Dividends and distributions of each Portfolio are declared in cash and automatically reinvested in additional shares of the same Portfolio. The Money Market Portfolio will declare and reinvest dividends from net investment income and net realized capital gains daily. The Diversified Bond, Government Income, High Yield Bond and Zero Coupon Bond 2005 Portfolios will declare and distribute dividends from net investment income, if any, quarterly and distributions from net capital gains, if any, at least annually. All other Portfolios will declare and distribute dividends from net investment income and distributions from net capital gains, if any, at least annually. Dividends and distributions are recorded on the ex-dividend date.
Dividends and capital gain distributions are determined in accordance with income tax regulations which may differ from generally accepted accounting principles. Permanent book/tax differences relating to income and gains are reclassified amongst undistributed net investment income, accumulated net realized gain or loss and paid in capital in excess of par, as appropriate.
Estimates: The preparation of financial statements requires management to make estimates and assumptions that affect the reported amounts and disclosures in the financial statements. Actual results could differ from these estimates.
The Series Fund has a management agreement with PI. Pursuant to this agreement PI has responsibility for all investment advisory services and supervises the subadvisers’ performance of such services. PI has entered into subadvisory agreements with Prudential Investment Management, Inc. (“PIM”), Jennison Associates LLC (“Jennison”), GE Asset Management (“GEAM”), and Salomon Brothers Asset Management (“Salomon”) (collectively, the “Subadvisers”), under which each provides investment advisory services for certain Portfolios of the Series Fund. PI pays for the services of the Subadvisers, compensation of officers of the Series Fund, occupancy and certain clerical and administrative expenses of the Series Fund. The Series Fund bears all other costs and expenses.
C5
The management fee paid to PI is computed daily and payable monthly, at the annual rates specified below, of the value of each of the Portfolio’s average daily net assets.
| | | | | |
Portfolio
| | Management Fee
| | Effective Management Fee
| |
Conservative Balanced Portfolio | | 0.55% | | 0.55 | % |
Diversified Bond Portfolio | | 0.40 | | 0.40 | |
Equity Portfolio | | 0.45 | | 0.45 | |
Flexible Managed Portfolio | | 0.60 | | 0.60 | |
Global Portfolio | | 0.75 | | 0.75 | |
Government Income Portfolio | | 0.40 | | 0.40 | |
High Yield Bond Portfolio | | 0.55 | | 0.55 | |
Jennison Portfolio | | 0.60 | | 0.60 | |
Money Market Portfolio | | 0.40 | | 0.40 | |
Natural Resources Portfolio | | 0.45 | | 0.45 | |
Small Capitalization Stock Portfolio | | 0.40 | | 0.40 | |
Stock Index Portfolio | | 0.35% up to $4 billion
0.30% over $4 billion | | 0.35 | |
Value Portfolio | | 0.40 | | 0.40 | |
Zero Coupon Bond 2005 Portfolio | | 0.40 | | 0.40 | |
The Subadvisers provide investment advisory services to the Portfolios as follows. Where more than one Subadviser is listed, each Subadviser provides services to a segment of the Portfolio:
| | |
Portfolio
| | Subadviser(s)
|
Conservative Balanced Portfolio | | PIM |
Diversified Bond Portfolio | | PIM |
Equity Portfolio | | Jennison, GEAM, Salomon |
Flexible Managed Portfolio | | PIM |
Global Portfolio | | Jennison |
Government Income Portfolio | | PIM |
High Yield Bond Portfolio | | PIM |
Jennison Portfolio | | Jennison |
Money Market Portfolio | | PIM |
Natural Resources Portfolio | | Jennison |
Small Capitalization Stock Portfolio | | PIM |
Stock Index Portfolio | | PIM |
Value Portfolio | | Jennison |
Zero Coupon Bond Portfolio 2005 | | PIM |
The Series Fund has a distribution agreement with Prudential Investment Management Services LLC (“PIMS”) which acts as the distributor of the Class I and Class II shares of the Series Fund. The Series Fund compensates PIMS for distributing and servicing the Series Fund’s Class II shares pursuant to a plan of distribution (the “Class II Plan”), regardless of expenses actually incurred by PIMS. The distribution fees are accrued daily and payable monthly. No distribution or service fees are paid to PIMS as distributor of the Class I shares of the Series Fund. Pursuant to the Class II Plan, the Class II shares of each Portfolio compensate PIMS for distribution-related activities at an annual rate of 0.25% of the average daily net assets of the Class II shares.
The Series Fund has an administration agreement with PI which acts as the administrator of the Class II shares of the Series Fund. The administration fee paid to PI is accrued daily and payable monthly, at the annual rate of 0.15% of the average daily net assets of the Class II shares.
PI has agreed to reimburse each Portfolio the portion of the management fee for that Portfolio equal to the amount that the aggregate annual ordinary operating expenses (excluding interest, taxes, and brokerage commissions) exceeded the percentage stated below, of the Portfolio’s average daily net assets.
C6
| | | | | | |
Portfolio
| | Class I
Expense limit
| | | Class II
Expense limit
| |
Conservative Balanced Portfolio | | 0.75 | % | | N/A | |
Diversified Bond Portfolio | | 0.75 | | | N/A | |
Equity Portfolio | | 0.75 | | | 1.15 | % |
Flexible Managed Portfolio | | 0.75 | | | N/A | |
Government Income Portfolio | | 0.75 | | | N/A | |
High Yield Bond Portfolio | | 0.75 | | | N/A | |
Jennison Portfolio | | 0.75 | | | 1.15 | |
Money Market Portfolio | | 0.75 | | | N/A | |
Natural Resources Portfolio | | 0.75 | | | N/A | |
Small Capitalization Stock Portfolio | | 0.75 | | | N/A | |
Stock Index Portfolio | | 0.75 | | | N/A | |
Value Portfolio | | 0.75 | | | 1.15 | |
Zero Coupon Bond Portfolio 2005 | | 0.75 | | | N/A | |
N/A – Not applicable – Portfolio does not currently have Class II shares.
PIMS, PI, PIM and Jennison are indirect, wholly-owned subsidiaries of Prudential Financial, Inc. (“Prudential”).
| Note 4: | | Other Transactions with Affiliates |
Prudential Mutual Fund Services LLC (“PMFS”), an affiliate of PI and an indirect, wholly-owned subsidiary of Prudential, serves as the Series Fund’s transfer agent. Transfer agent fees and expenses in the Statements of Operations include certain out-of-pocket expense paid to nonaffiliates, where applicable. During the year ended December 31, 2004, the Series Fund incurred fees for the services of PMFS and as of December 31, 2004 fees were due to PMFS as follows:
| | | | | | |
Portfolio
| | Amount Incurred for the Year Ended December 31, 2004
| | Amount Due as of December 31, 2004
|
Conservative Balanced Portfolio | | $ | 1,900 | | $ | 200 |
Diversified Bond Portfolio | | | 2,600 | | | 200 |
Equity Portfolio | | | 5,100 | | | 400 |
Flexible Managed Portfolio | | | 1,900 | | | 200 |
Global Portfolio | | | 4,900 | | | 400 |
Government Income Portfolio | | | 1,200 | | | 100 |
High Yield Bond Portfolio | | | 2,400 | | | 200 |
Jennison Portfolio | | | 6,200 | | | 500 |
Money Market Portfolio | | | 5,300 | | | 400 |
Natural Resources Portfolio | | | 1,200 | | | 100 |
Small Capitalization Stock Portfolio | | | 1,700 | | | 100 |
Stock Index Portfolio | | | 5,300 | | | 400 |
Value Portfolio | | | 5,200 | | | 400 |
Zero Coupon Bond Portfolio 2005 | | | 400 | | | 30 |
Prudential Investment Management, Inc. (“PIM”), an indirect, wholly-owned subsidiary of Prudential, is the Series Fund’s securities lending agent. For the year ended December 31, 2004, PIM was compensated as follows for these services by the Series Fund Portfolios:
| | | |
| | | PIM
|
Conservative Balanced Portfolio | | $ | 232,778 |
Diversified Bond Portfolio | | | 99,084 |
Equity Portfolio | | | 210,792 |
Flexible Managed Portfolio | | | 335,188 |
Global Portfolio | | | 103,239 |
Government Income Portfolio | | | 61,073 |
High Yield Bond Portfolio | | | 248,962 |
Jennison Portfolio | | | 166,528 |
Natural Resources Portfolio | | | 184,269 |
Small Capitalization Stock Portfolio | | | 146,275 |
Stock Index Portfolio | | | 187,851 |
Value Portfolio | | | 129,280 |
C7
For the year ended December 31, 2004, Prudential Equity Group, LLC, an indirect wholly-owned subsidiary of Prudential, and Wachovia Securities, LLC an affiliate of PI, earned brokerage commissions from transactions executed on behalf of the Series Fund Portfolios as follows:
| | | | | | |
Portfolio
| | Prudential Equity
Group
| | Wachovia
|
Equity Portfolio | | $ | 44,455 | | $ | 51,388 |
Global Portfolio | | | 24,666 | | | 425 |
Jennison Portfolio | | | 28,003 | | | 35,870 |
Value Portfolio | | | 49,038 | | | 83,775 |
Certain Portfolios invest in the Taxable Money Market Series (the “Series”), a portfolio of Dryden Core Investment Fund, pursuant to an exemptive order received from the Securities and Exchange Commission. The Series is a money market mutual fund registered under the Investment Company Act of 1940, as amended, and managed by PI. During the year ended December 31, 2004, the following Portfolios earned income from the Series by investing their excess cash and collateral from securities lending. See Note 2 relating to Securities Lending:
| | | | | | |
Portfolio
| | Excess Cash
Investment
| | Securities Lending Cash Collateral Investment
|
Conservative Balanced Portfolio | | $ | 4,723,277 | | $ | 670,340 |
Diversified Bond Portfolio | | | 1,761,507 | | | 285,992 |
Equity Portfolio | | | 787,650 | | | 607,716 |
Flexible Managed Portfolio | | | 6,021,340 | | | 1,099,284 |
Global Portfolio | | | 113,466 | | | 317,468 |
Government Income Portfolio | | | 783,377 | | | 176,285 |
High Yield Bond Portfolio | | | 1,099,112 | | | 803,323 |
Jennison Portfolio | | | 529,746 | | | 499,586 |
Natural Resources Portfolio | | | 56,415 | | | 554,083 |
Small Capitalization Stock Portfolio | | | 109,880 | | | 433,039 |
Stock Index Portfolio | | | 1,049,854 | | | 563,553 |
Value Portfolio | | | 484,178 | | | 382,187 |
Zero Coupon Bond 2005 Portfolio | | | 22,228 | | | — |
| Note 5: | | Portfolio Securities |
The aggregate cost of purchases and the proceeds from the sales of securities (excluding government securities and short-term issues) for the year ended December 31, 2004 were as follows:
Cost of Purchases:
| | | |
Portfolio
| | |
Conservative Balanced Portfolio | | $ | 498,655,559 |
Diversified Bond Portfolio | | | 1,104,097,572 |
Equity Portfolio | | | 1,929,866,743 |
Flexible Managed Portfolio | | | 2,509,810,032 |
Global Portfolio | | | 815,095,951 |
Government Income Portfolio | | | 30,555,326 |
High Yield Bond Portfolio | | | 933,075,758 |
Jennison Portfolio | | | 1,529,136,237 |
Natural Resources Portfolio | | | 144,110,523 |
Small Capitalization Stock Portfolio | | | 120,580,024 |
Stock Index Portfolio | | | 81,760,616 |
Value Portfolio | | | 755,280,389 |
Zero Coupon Bond 2005 Portfolio | | | — |
C8
Proceeds from Sales:
| | | |
Portfolio
| | |
Conservative Balanced Portfolio | | $ | 402,219,586 |
Diversified Bond Portfolio | | | 1,065,382,961 |
Equity Portfolio | | | 2,007,143,040 |
Flexible Managed Portfolio | | | 2,412,911,407 |
Global Portfolio | | | 827,145,795 |
Government Income Portfolio | | | 24,058,676 |
High Yield Bond Portfolio | | | 902,038,456 |
Jennison Portfolio | | | 1,423,980,377 |
Natural Resources Portfolio | | | 130,832,992 |
Small Capitalization Stock Portfolio | | | 117,954,551 |
Stock Index Portfolio | | | 137,864,680 |
Value Portfolio | | | 784,622,033 |
Zero Coupon Bond 2005 Portfolio | | | — |
The Government Income Portfolio’s written options activity for the year ended December 31, 2004 was as follows:
| | | | | | | |
| Government Income Portfolio | | Contracts
| | | Premiums
| |
Balance as of December 31, 2003 | | — | | | $ | — | |
Options written | | 1,680 | | | | 614,618 | |
Options terminated in closing purchase transactions | | (840 | ) | | | (335,062 | ) |
Options exercised | | (420 | ) | | | (188,997 | ) |
Options expired | | (420 | ) | | | (90,559 | ) |
| | |
|
| |
|
|
|
Balance as of December 31, 2004 | | — | | | $ | — | |
| | |
|
| |
|
|
|
The Diversified Bond Portfolio entered into credit default swap agreements during the year ended December 31, 2004. Details of the swap agreements outstanding as of December 31, 2004 were as follows:
| | | | | | | | | | | | | |
Diversified Bond Portfolio: | | | | | | |
Counterparty(a)
| | Termination
Date
| | Notional
Amount
(000)
| | Fixed
Rate
| | | Underlying
Bond
| | Unrealized
Appreciation
|
Morgan Stanley Capital Services, Inc. | | 6/20/09 | | $ | 4,000 | | 0.82 | % | | Tyco International Group SA, 6.00%, due 11/15/13 | | $ | 89,122 |
Morgan Stanley Capital Services, Inc. | | 12/20/14 | | | 5,500 | | 1.17 | % | | Nextel Communications, Inc., 7.375%, due 8/1/15 | | | 124,471 |
Morgan Stanley Capital Services, Inc. | | 9/20/09 | | | 8,000 | | 0.60 | % | | EnCana Corp., 4.75%, due 10/15/13 | | | 103,866 |
| | | | | | | | | | | | |
|
|
| | | | | | | | | | | | | $ | 317,459 |
| | | | | | | | | | | | |
|
|
| (a) | The Portfolio receives the fixed rate and pays the counterparty par in the event that the underlying bond defaults. |
| Note 6: | | Distributions and Tax Information |
In order to present undistributed net investment income and accumulated net realized capital gains (losses) on the statement of assets and liabilities that more closely represent their tax character, certain adjustments have been made to undistributed net investment income and accumulated net realized gain (loss) on investments.
C9
For the year ended December 31, 2004 the adjustments were as follows:
| | | | | | | | | | | |
Portfolio
| | Undistributed Net
Investment Income
| | | Accumulated
Net Realized
Gain (Loss)
| | | Paid-in
Capital
|
Conservative Balanced Portfolio (b) | | $ | 1,276,596 | | | $ | (1,276,596 | ) | | | — |
Diversified Bond Portfolio (a),(b),(f) | | | 2,077,341 | | | | (2,077,341 | ) | | | — |
Equity Portfolio (a) | | | 8,597 | | | | (8,597 | ) | | | — |
Flexible Managed Portfolio (b),(e) | | | 987,605 | | | | (987,606 | ) | | $ | 1 |
Global Portfolio (a) | | | (14,388 | ) | | | 14,388 | | | | — |
Government Income Portfolio (b) | | | 752,421 | | | | (752,421 | ) | | | — |
High Yield Bond Portfolio (a),(b),(c) | | | 484,895 | | | | (484,895 | ) | | | — |
Jennison Portfolio (a) | | | (137,594 | ) | | | 137,594 | | | | — |
Natural Resources Portfolio (a),(d) | | | 1,170,279 | | | | (1,170,279 | ) | | | — |
Value Portfolio (a) | | | 1,171 | | | | (1,171 | ) | | | — |
| (a) | Reclassification of net foreign currency gain (loss). |
| (b) | Reclassification of paydown losses. |
| (c) | Reclassification of income on defaulted securities. |
| (d) | Reclassification of book to tax differences due to the sale of passive foreign investment companies. |
| (e) | Reclassification of other tax adjustments. |
| (f) | Reclassification of swap income. |
The tax character of distributions paid during the year ended December 31, 2004 were as follows:
| | | | | | | | | |
Portfolio
| | Ordinary
Income
| | Long-Term
Capital Gains
| | Total
Distributions
|
Conservative Balanced Portfolio | | $ | 62,958,425 | | $ | 9,723,502 | | $ | 72,681,927 |
Diversified Bond Portfolio | | | 59,934,775 | | | — | | | 59,934,775 |
Equity Portfolio | | | 50,414,768 | | | — | | | 50,414,768 |
Flexible Managed Portfolio | | | 52,897,054 | | | — | | | 52,897,054 |
Global Portfolio | | | 6,503,370 | | | — | | | 6,503,370 |
Government Income Portfolio | | | 23,161,432 | | | 9,552 | | | 23,170,984 |
High Yield Bond Portfolio | | | 108,509,679 | | | — | | | 108,509,679 |
Jennison Portfolio | | | 9,010,258 | | | — | | | 9,010,258 |
Money Market Portfolio | | | 9,344,369 | | | 21,156 | | | 9,365,525 |
Natural Resources Portfolio | | | 21,498,787 | | | 16,898,833 | | | 38,397,620 |
Small Capitalization Stock Portfolio | | | 4,033,462 | | | 2,375,136 | | | 6,408,598 |
Stock Index Portfolio | | | 55,156,437 | | | 43,386,225 | | | 98,542,662 |
Value Portfolio | | | 20,439,009 | | | — | | | 20,439,009 |
Zero Coupon Bond Portfolio 2005 | | | 2,597,144 | | | 1,497,906 | | | 4,095,050 |
The tax character of distributions paid during the year ended December 31, 2003 were as follows:
| | | | | | | | | | | | |
Portfolio
| | Ordinary
Income
| | Long-Term
Capital Gains
| | Tax Return
of Capital
| | Total
Distributions
|
Conservative Balanced Portfolio | | $ | 73,725,917 | | | — | | | — | | $ | 73,725,917 |
Diversified Bond Portfolio | | | 57,232,060 | | | — | | | — | | | 57,232,060 |
Equity Portfolio | | | 34,657,400 | | | — | | | — | | | 34,657,400 |
Flexible Managed Portfolio | | | 68,283,392 | | | — | | | — | | | 68,283,392 |
Global Portfolio | | | 2,077,796 | | | — | | | — | | | 2,077,796 |
Government Income Portfolio | | | 31,212,695 | | $ | 4,770,090 | | | — | | | 35,982,785 |
High Yield Bond Portfolio | | | 108,990,863 | | | — | | | — | | | 108,990,863 |
Jennison Portfolio | | | 4,049,114 | | | — | | | — | | | 4,049,114 |
Money Market Portfolio | | | 10,061,179 | | | 2,788 | | | — | | | 10,063,967 |
Natural Resources Portfolio | | | 17,617,482 | | | 24,476,581 | | | — | | | 42,094,063 |
Small Capitalization Stock Portfolio | | | 2,476,478 | | | 3,294,388 | | | — | | | 5,770,866 |
Stock Index Portfolio | | | 36,873,448 | | | 88,278,910 | | | — | | | 125,152,358 |
Value Portfolio | | | 19,948,999 | | | — | | $ | 112,106 | | | 20,061,105 |
Zero Coupon Bond Portfolio 2005 | | | 2,875,037 | | | 57,155 | | | — | | | 2,932,192 |
C10
At December 31, 2004, the components of distributable earnings on a tax basis and approximate capital loss carryforwards were as follows:
| | | | | | | | | | | | | | | | | | | | | | | | | |
Portfolio
| | Accumulated
Ordinary
Income
| | Accumulated
Long-Term
Capital Gains
| | Approximate
Capital Loss
Carryforward(a)
| | | Expiration
|
| | | | | 2007
| | 2008
| | 2009
| | 2010
| | 2011
|
Conservative Balanced Portfolio | | $ | 75,600,623 | | $ | 18,446,572 | | | — | | | | — | | | — | | | — | | | — | | | — |
Diversified Bond Portfolio | | | 7,309,626 | | | 6,446,465 | | | — | (b) | | | — | | | — | | | — | | | — | | | — |
Equity Portfolio | | | 901,423 | | | — | | $ | 747,785,000 | (c) | | | — | | | — | | $ | 16,370,000 | | $ | 525,994,000 | | $ | 205,421,000 |
Flexible Managed Portfolio | | | 68,680,004 | | | — | | | 140,450,000 | (d) | | | — | | | — | | | — | | | 140,450,000 | | | — |
Global Portfolio | | | 4,467,100 | | | — | | | 217,927,000 | (e) | | | — | | | — | | | 67,079,000 | | | 145,175,000 | | | 5,673,000 |
Government Income Portfolio | | | 2,212,711 | | | — | | | 3,257,000 | (f) | | | — | | | — | | | — | | | — | | | — |
High Yield Bond Portfolio | | | 1,115,307 | | | — | | | 260,499,000 | (g) | | $ | 18,627,000 | | $ | 59,264,000 | | | 80,595,000 | | | 102,013,000 | | | — |
Jennison Portfolio | | | 429,383 | | | — | | | 1,141,208,000 | (h) | | | — | | | — | | | 512,257,000 | | | 508,642,000 | | | 120,309,000 |
Natural Resources Portfolio | | | 771,086 | | | 59,265,774 | | | — | | | | — | | | — | | | — | | | — | | | — |
Small Capitalization Stock Portfolio | | | 1,105,211 | | | 41,694,638 | | | — | | | | — | | | — | | | — | | | — | | | — |
Stock Index Portfolio | | | 4,783,446 | | | 77,233,581 | | | — | | | | — | | | — | | | — | | | — | | | — |
Value Portfolio | | | 1,624,516 | | | — | | | 138,535,000 | (i) | | | — | | | — | | | — | | | 94,300,000 | | | 44,235,000 |
Zero Coupon Bond 2005 Portfolio | | | — | | | 395,722 | | | — | | | | — | | | — | | | — | | | — | | | — |
| | (a) | Accordingly, no capital gain distribution is expected to be paid to shareholders until net gains have been realized in excess of such carryforwards. |
| | (b) | Approximately $13,322,000 of its capital loss carryforward was used to offset net taxable gains realized in the fiscal year ended December 31, 2004. |
| | (c) | Approximately $133,982,000 of the Fund’s capital loss carryforward was used to offset net taxable gains realized in the fiscal year ended December 31, 2004. |
| | (d) | Approximately $254,991,000 of its capital loss carryforward was used to offset net taxable gains realized in the fiscal year ended December 31, 2004. |
| | (e) | Approximately $52,466,000 of its capital loss carryforward was used to offset net taxable gains realized in the fiscal year ended December 31, 2004. |
| | (f) | Approximately $3,257,000 expiring in 2012. |
| | (g) | Approximately $24,840,000 of its capital loss carryforward was used to offset net taxable gains realized in the fiscal year ended December 31, 2004. |
| | (h) | Approximately $31,214,000 of its capital loss carryforward was used to offset net taxable gains realized in the fiscal year ended December 31, 2004. |
| | (i) | Approximately $74,429,000 of its capital loss carryforward was used to offset net taxable gains realized in the fiscal year ended December 31, 2004. |
As of December 31, 2004, the Money Market Portfolio had no distributable earnings.
The difference between book and tax basis is primarily cost basis adjustments and post-October losses (the Portfolios have elected to treat losses incurred in the period November 1, 2004 through December 31, 2004 as having been incurred in the following fiscal year) which are presented below:
| | | | | | |
| | | Approximate
Post October Losses
|
Portfolio
| | Currency
| | Capital
|
Diversified Bond Portfolio | | $ | 114,500 | | | — |
Equity Portfolio | | | 800 | | | — |
Global Portfolio | | | — | | $ | 230,456 |
High Yield Portfolio | | | 2,068 | | | — |
Jennison Portfolio | | | 81,400 | | | — |
Natural Resources Portfolio | | | 44,200 | | | — |
Value Portfolio | | | 1,400 | | | — |
C11
The United States federal income tax basis and unrealized appreciation (depreciation) of the Series Fund’s investments and the total net unrealized appreciation (depreciation) as of December 31, 2004 were as follows:
| | | | | | | | | | | | | | | | | | |
Portfolio
| | Tax Basis
| | Appreciation
| | Depreciation
| | Net
| | Other Cost
Basis
Adjustment
| | Total Net
Unrealized
|
Conservative Balanced Portfolio | | $ | 3,363,567,025 | | $ | 401,687,824 | | $ | 292,708,425 | | $ | 108,979,399 | | | — | | $ | 108,979,399 |
Diversified Bond Portfolio | | | 1,375,359,443 | | | 32,532,026 | | | 3,478,466 | | | 29,053,560 | | $ | 276,082 | | | 29,329,642 |
Equity Portfolio | | | 3,929,439,219 | | | 782,941,664 | | | 109,474,423 | | | 673,467,241 | | | 968 | | | 673,468,209 |
Flexible Managed Portfolio | | | 4,390,625,745 | | | 399,237,180 | | | 77,491,560 | | | 321,745,620 | | | — | | | 321,745,620 |
Global Portfolio | | | 656,234,660 | | | 104,727,257 | | | 8,948,214 | | | 95,779,043 | | | 281,438 | | | 96,060,481 |
Government Income Portfolio | | | 525,097,773 | | | 5,914,480 | | | 1,072,328 | | | 4,842,152 | | | — | | | 4,842,152 |
High Yield Bond Portfolio | | | 1,794,619,490 | | | 105,195,128 | | | 43,464,375 | | | 61,730,753 | | | 4,166 | | | 61,734,919 |
Jennison Portfolio | | | 2,185,346,768 | | | 401,149,560 | | | 24,884,483 | | | 376,265,077 | | | 3,661 | | | 376,268,738 |
Natural Resources Portfolio | | | 535,223,551 | | | 241,847,894 | | | 13,721,106 | | | 228,126,788 | | | — | | | 228,126,788 |
Small Capitalization Stock Portfolio | | | 693,020,534 | | | 251,754,801 | | | 53,826,776 | | | 197,928,025 | | | — | | | 197,928,025 |
Stock Index Portfolio | | | 2,896,046,486 | | | 1,113,802,162 | | | 295,811,258 | | | 817,990,904 | | | — | | | 817,990,904 |
Value Portfolio | | | 1,491,555,694 | | | 337,379,445 | | | 9,311,463 | | | 328,067,982 | | | 1,010 | | | 328,068,992 |
Zero Coupon Bond 2005 Portfolio | | | 59,525,441 | | | 1,129,772 | | | 24,775 | | | 1,104,997 | | | — | | | 1,104,997 |
The differences between book basis and tax basis of investments are primarily attributable to deferred losses on wash sales and mark to market on passive foreign investments companies. The other cost basis adjustments are primarily attributable to appreciation (depreciation) of foreign currency and mark to market of receivables and payables.
The Series Fund offers Class I and Class II shares. Neither Class I nor Class II shares of a Portfolio are subject to any sales charge or redemption charge and are sold at the net asset value of the Portfolio. Class I shares are sold only to certain separate accounts of Prudential to fund benefits under certain variable life insurance and variable annuity contracts (“contracts”). Class II shares are sold only to separate accounts of non-Prudential insurance companies as investment options under certain contracts. The separate accounts invest in shares of the Series Fund through subaccounts that correspond to the Portfolios. The separate accounts will redeem shares of the Series Fund to the extent necessary to provide benefits under the contracts or for such other purposes as may be consistent with the contracts. As of December 31, 2004, the Equity, Jennison, and Value Portfolios have Class II shares outstanding.
Transactions in shares of common stock of the Equity, Jennison and Value Portfolios were as follows:
| | | | | | | |
| Equity Portfolio: | | | | | | | |
Class I
| | Shares
| | | Amount
| |
Year ended December 31, 2004: | | | | | | | |
Capital stock sold | | 4,880,675 | | | $ | 101,956,955 | |
Capital stock issued in reinvestment of dividends and distributions | | 2,300,409 | | | | 50,405,570 | |
Capital stock repurchased | | (17,020,123 | ) | | | (355,777,280 | ) |
| | |
|
| |
|
|
|
Net increase (decrease) in shares outstanding | | (9,839,039 | ) | | $ | (203,414,755 | ) |
| | |
|
| |
|
|
|
Year ended December 31, 2003: | | | | | | | |
Capital stock sold | | 5,720,088 | | | $ | 100,538,375 | |
Capital stock issued in reinvestment of dividends and distributions | | 1,744,798 | | | | 34,653,868 | |
Capital stock repurchased | | (20,096,637 | ) | | | (343,330,924 | ) |
| | |
|
| |
|
|
|
Net increase (decrease) in shares outstanding | | (12,631,751 | ) | | $ | (208,138,681 | ) |
| | |
|
| |
|
|
|
| | |
Class II
| | | | | | |
Year ended December 31, 2004: | | | | | | | |
Capital stock sold | | 21,633 | | | $ | 457,593 | |
Capital stock issued in reinvestment of dividends and distributions | | 419 | | | | 9,198 | |
Capital stock repurchased | | (11,341 | ) | | | (235,818 | ) |
| | |
|
| |
|
|
|
Net increase (decrease) in shares outstanding | | 10,711 | | | $ | 230,973 | |
| | |
|
| |
|
|
|
Year ended December 31, 2003: | | | | | | | |
Capital stock sold | | 28,957 | | | $ | 525,059 | |
Capital stock issued in reinvestment of dividends and distributions | | 175 | | | | 3,532 | |
Capital stock repurchased | | (14,266 | ) | | | (253,850 | ) |
| | |
|
| |
|
|
|
Net increase (decrease) in shares outstanding | | 14,866 | | | $ | 274,741 | |
| | |
|
| |
|
|
|
C12
| | | | | | | |
| | |
| Jennison Portfolio: | | | | | | | |
Class I
| | Shares
| | | Amount
| |
Year ended December 31, 2004: | | | | | | | |
Capital stock sold | | 19,266,794 | | | $ | 323,093,604 | |
Capital stock issued in reinvestment of dividends and distributions | | 502,353 | | | | 8,976,218 | |
Capital stock repurchased | | (13,717,853 | ) | | | (230,738,958 | ) |
| | |
|
| |
|
|
|
Net increase (decrease) in shares outstanding | | 6,051,294 | | | $ | 101,330,864 | |
| | |
|
| |
|
|
|
Year ended December 31, 2003: | | | | | | | |
Capital stock sold | | 14,265,473 | | | $ | 207,272,223 | |
Capital stock issued in reinvestment of dividends and distributions | | 248,870 | | | | 4,049,114 | |
Capital stock repurchased | | (16,408,586 | ) | | | (229,354,175 | ) |
| | |
|
| |
|
|
|
Net increase (decrease) in shares outstanding | | (1,894,243 | ) | | $ | (18,032,838 | ) |
| | |
|
| |
|
|
|
Class II
| | Shares
| | | Amount
| |
Year ended December 31, 2004: | | | | | | | |
Capital stock sold | | 1,014,749 | | | $ | 16,762,616 | |
Capital stock issued in reinvestment of dividends and distributions | | 1,922 | | | | 34,040 | |
Capital stock repurchased | | (802,631 | ) | | | (13,178,750 | ) |
| | |
|
| |
|
|
|
Net increase (decrease) in shares outstanding | | 214,040 | | | $ | 3,617,906 | |
| | |
|
| |
|
|
|
Year ended December 31, 2003: | | | | | | | |
Capital stock sold | | 1,819,063 | | | $ | 25,649,467 | |
Capital stock repurchased | | (1,094,135 | ) | | | (15,195,715 | ) |
| | |
|
| |
|
|
|
Net increase (decrease) in shares outstanding | | 724,928 | | | $ | 10,453,752 | |
| | |
|
| |
|
|
|
| | |
| Value Portfolio: | | | | | | | |
Class I
| | Shares
| | | Amount
| |
Year ended December 31, 2004: | | | | | | | |
Capital stock sold | | 3,957,617 | | | $ | 72,230,270 | |
Capital stock issued in reinvestment of dividends and distributions | | 1,040,398 | | | | 20,412,598 | |
Capital stock repurchased | | (8,791,625 | ) | | | (160,544,530 | ) |
| | |
|
| |
|
|
|
Net increase (decrease) in shares outstanding | | (3,793,610 | ) | | $ | (67,901,662 | ) |
| | |
|
| |
|
|
|
Year ended December 31, 2003: | | | | | | | |
Capital stock sold | | 5,673,401 | | | $ | 84,460,988 | |
Capital stock issued in reinvestment of dividends and distributions | | 1,194,010 | | | | 20,034,413 | |
Capital stock repurchased | | (13,710,924 | ) | | | (200,548,356 | ) |
| | |
|
| |
|
|
|
Net increase (decrease) in shares outstanding | | (6,843,513 | ) | | $ | (96,052,955 | ) |
| | |
|
| |
|
|
|
| | |
Class II
| | | | | | |
Year ended December 31, 2004: | | | | | | | |
Capital stock sold | | 3,819 | | | $ | 70,179 | |
Capital stock issued in reinvestment of dividends and distributions | | 1,345 | | | | 26,411 | |
Capital stock repurchased | | (20,606 | ) | | | (371,071 | ) |
| | |
|
| |
|
|
|
Net increase (decrease) in shares outstanding | | (15,442 | ) | | $ | (274,481 | ) |
| | |
|
| |
|
|
|
Year ended December 31, 2003: | | | | | | | |
Capital stock sold | | 77,963 | | | $ | 1,111,568 | |
Capital stock issued in reinvestment of dividends and distributions | | 1,571 | | | | 26,692 | |
Capital stock repurchased | | (26,419 | ) | | | (385,718 | ) |
| | |
|
| |
|
|
|
Net increase (decrease) in shares outstanding | | 53,115 | | | $ | 752,542 | |
| | |
|
| |
|
|
|
C13
The Series Fund (excluding the Money Market Portfolio), along with other affiliated registered investment companies (the “Funds”), is a party to a syndicated credit agreement (“SCA”) with a group of banks. For the period January 1, 2004 through April 30, 2004, the SCA provided for a commitment of $800 million and allowed the Funds to increase the commitment to $1 billion, if necessary. Effective May 1, 2004, the SCA provided for a commitment of $500 million. Interest on any borrowings under the SCA would be incurred at market rates. The Funds paid a commitment fee of .08 of 1% of the unused portion of the SCA. The commitment fee is accrued daily and paid quarterly and is allocated to the Funds pro rata, based on net assets. The purpose of the SCA is to serve as an alternative source of funding for capital share redemptions. The expiration date of the SCA was October 29, 2004. Effective October 29, 2004, the Funds entered into a revised credit agreement with two banks. The commitment under the revised credit agreement continues to be $500 million. The Funds pay a commitment fee of .075 of 1% of the unused portion of the revised credit agreement. The expiration date of the revised credit agreement is October 28, 2005.
The following Portfolios utilized the line of credit during the year ended December 31, 2004. The average balance is for the number of days the Portfolio had an outstanding balance.
| | | | | | | | |
Portfolio
| | Average Balance
Outstanding
| | Number of Days
Outstanding
| | Weighted Average
Interest Rates
| |
Equity Portfolio | | $ | 461,833 | | 6 | | 2.11 | % |
Global Portfolio | | | 790,000 | | 4 | | 1.55 | |
Jennison Portfolio | | | 228,458 | | 44 | | 1.87 | |
Small Capitalization Stock Portfolio | | | 898,500 | | 1 | | 2.73 | |
Value Portfolio | | | 154,000 | | 3 | | 1.57 | |
| Note 9: | | Change in Independent Registered Public Accounting Firm (Unaudited) |
PricewaterhouseCoopers LLP was previously the independent registered public accounting firm for the Series Fund. The decision to change the independent registered public accounting firm was approved by the Audit Committee and by the Board of Directors in a meeting help on September 2, 2003, resulting in KPMG LLP’s appointment as the independent registered public accounting firm of the Series Fund. The reports on the financial statements of the Series Fund audited by PricewaterhouseCoopers LLP through the year ended December 31, 2003 did not contain an adverse opinion or disclaimer of opinion, and were not qualified or modified as to uncertainty, audit scope or accounting principles. There were no disagreements between the Series Fund and PricewaterhouseCoopers LLP on any matter of accounting principles or practices, financial statement disclosure, or auditing scope or procedures.
The Zero Coupon Bond Portfolio 2005 will liquidate as of November 15, 2005. On the liquidation date, all of the securities held by the Portfolio will be sold and all outstanding shares of the Portfolio will be redeemed.
| Note 11: | | Subsequent Events |
On November 18, 2004, the Board of Directors of the Series Fund approved an Agreement and Plan of Reorganization (the “Plan”) which provides for the transfer of all the assets of the Class I shares of the following funds for like shares of the acquiring funds and the assumption of the liabilities of the funds.
| | |
Fund
| | Acquiring Fund
|
SP MFS Capital Opportunities Portfolio | | Equity Portfolio |
As of December 31, 2004, all of Class I shares of each Portfolio were owned of record by the Prudential Insurance Company of America (“PICA”) on behalf of the owners of the variable insurance products issued by PICA.
C14
Financial Highlights
| | | | | | | | | | | | | | | | | | | | |
| | | Conservative Balanced Portfolio
| |
| | | Year Ended
December 31,
| |
| | | 2004
| | | 2003
| | | 2002
| | | 2001
| | | 2000
| |
Per Share Operating Performance: | | | | | | | | | | | | | | | | | | | | |
Net Asset Value, beginning of year | | $ | 14.34 | | | $ | 12.43 | | | $ | 13.69 | | | $ | 14.63 | | | $ | 15.36 | |
| | |
|
|
| |
|
|
| |
|
|
| |
|
|
| |
|
|
|
Income (Loss) From Investment Operations: | | | | | | | | | | | | | | | | | | | | |
Net investment income | | | 0.34 | | | | 0.28 | | | | 0.34 | | | | 0.44 | | | | 0.59 | |
Net realized and unrealized gains (losses) on investments | | | 0.78 | | | | 1.99 | | | | (1.57 | ) | | | (0.75 | ) | | | (0.65 | ) |
| | |
|
|
| |
|
|
| |
|
|
| |
|
|
| |
|
|
|
Total from investment operations | | | 1.12 | | | | 2.27 | | | | (1.23 | ) | | | (0.31 | ) | | | (0.06 | ) |
| | |
|
|
| |
|
|
| |
|
|
| |
|
|
| |
|
|
|
Less Distributions: | | | | | | | | | | | | | | | | | | | | |
Dividends from net investment income | | | (0.28 | ) | | | (0.36 | ) | | | — | | | | (0.48 | ) | | | (0.56 | ) |
Distributions from net realized gains | | | (0.08 | ) | | | — | | | | (0.03 | ) | | | (0.15 | ) | | | (0.11 | ) |
Distributions in excess of net realized gains | | | — | | | | — | | | | — | | | | — | | | | — | |
| | |
|
|
| |
|
|
| |
|
|
| |
|
|
| |
|
|
|
Total distributions | | | (0.36 | ) | | | (0.36 | ) | | | (0.03 | ) | | | (0.63 | ) | | | (0.67 | ) |
| | |
|
|
| |
|
|
| |
|
|
| |
|
|
| |
|
|
|
Net Asset Value, end of year | | $ | 15.10 | | | $ | 14.34 | | | $ | 12.43 | | | $ | 13.69 | | | $ | 14.63 | |
| | |
|
|
| |
|
|
| |
|
|
| |
|
|
| |
|
|
|
Total Investment Return(a) | | | 8.04 | % | | | 18.77 | % | | | (8.98 | )% | | | (2.02 | )% | | | (0.48 | )% |
Ratios/Supplemental Data: | | | | | | | | | | | | | | | | | | | | |
Net assets, end of year (in millions) | | $ | 2,893.6 | | | $ | 2,895.0 | | | $ | 2,660.3 | | | $ | 3,259.7 | | | $ | 3,714.3 | |
Ratios to average net assets: | | | | | | | | | | | | | | | | | | | | |
Expenses | | | 0.59 | % | | | 0.58 | % | | | 0.58 | % | | | 0.58 | % | | | 0.60 | % |
Net investment income | | | 2.27 | % | | | 2.02 | % | | | 2.49 | % | | | 3.05 | % | | | 3.79 | % |
Portfolio turnover rate | | | 153 | % | | | 248 | % | | | 260 | % | | | 239 | % | | | 85 | % |
| (a) | Total investment return is calculated assuming a purchase of shares on the first day and a sale on the last day of each year reported and includes reinvestment of dividends and distributions and does not reflect the effect of insurance contract charges. |
| | | | | | | | | | | | | | | | | | | | |
| | | Diversified Bond Portfolio
| |
| | | Year Ended
December 31,
| |
| | | 2004
| | | 2003
| | | 2002
| | | 2001
| | | 2000
| |
Per Share Operating Performance: | | | | | | | | | | | | | | | | | | | | |
Net Asset Value, beginning of year | | $ | 11.17 | | | $ | 10.82 | | | $ | 11.36 | | | $ | 11.28 | | | $ | 10.95 | |
| | |
|
|
| |
|
|
| |
|
|
| |
|
|
| |
|
|
|
Income (Loss) From Investment Operations: | | | | | | | | | | | | | | | | | | | | |
Net investment income | | | 0.52 | | | | 0.45 | | | | 0.57 | | | | 0.67 | | | | 0.77 | |
Net realized and unrealized gains on investments | | | 0.09 | | | | 0.35 | | | | 0.17 | | | | 0.12 | | | | 0.26 | |
| | |
|
|
| |
|
|
| |
|
|
| |
|
|
| |
|
|
|
Total from investment operations | | | 0.61 | | | | 0.80 | | | | 0.74 | | | | 0.79 | | | | 1.03 | |
| | |
|
|
| |
|
|
| |
|
|
| |
|
|
| |
|
|
|
Less Dividends and Distributions: | | | | | | | | | | | | | | | | | | | | |
Dividends from net investment income | | | (0.50 | ) | | | (0.45 | ) | | | (1.27 | ) | | | (0.71 | ) | | | (0.70 | ) |
Distributions from net realized gains | | | — | | | | — | | | | — | | | | — | | | | — | (b) |
Tax return of capital distributions | | | — | | | | — | | | | (0.01 | ) | | | — | | | | — | |
| | |
|
|
| |
|
|
| |
|
|
| |
|
|
| |
|
|
|
Total dividends and distributions | | | (0.50 | ) | | | (0.45 | ) | | | (1.28 | ) | | | (0.71 | ) | | | (0.70 | ) |
| | |
|
|
| |
|
|
| |
|
|
| |
|
|
| |
|
|
|
Net Asset Value, end of year | | $ | 11.28 | | | $ | 11.17 | | | $ | 10.82 | | | $ | 11.36 | | | $ | 11.28 | |
| | |
|
|
| |
|
|
| |
|
|
| |
|
|
| |
|
|
|
Total Investment Return(a) | | | 5.59 | % | | | 7.49 | % | | | 7.07 | % | | | 6.98 | % | | | 9.72 | % |
Ratios/Supplemental Data: | | | | | | | | | | | | | | | | | | | | |
Net assets, end of year (in millions) | | $ | 1,283.7 | | | $ | 1,418.0 | | | $ | 1,370.3 | | | $ | 1,400.7 | | | $ | 1,269.8 | |
Ratios to average net assets: | | | | | | | | | | | | | | | | | | | | |
Expenses | | | 0.45 | % | | | 0.44 | % | | | 0.44 | % | | | 0.44 | % | | | 0.45 | % |
Net investment income | | | 4.57 | % | | | 4.02 | % | | | 5.25 | % | | | 6.35 | % | | | 6.83 | % |
Portfolio turnover rate | | | 382 | % | | | 706 | % | | | 595 | % | | | 257 | % | | | 139 | % |
| (a) | Total investment return is calculated assuming a purchase of shares on the first day and a sale on the last day of each year reported and includes reinvestment of dividends and distributions and does not reflect the effect of insurance contract charges. |
| (b) | Less than $0.005 per share. |
SEE NOTES TO FINANCIAL STATEMENTS.
D1
Financial Highlights
| | | | | | | | | | | | | | | | | | | | |
| | | Equity Portfolio
| |
| | | Class I
| |
| | | Year Ended
December 31,
| |
| | | 2004
| | | 2003
| | | 2002
| | | 2001
| | | 2000
| |
Per Share Operating Performance: | | | | | | | | | | | | | | | | | | | | |
Net Asset Value, beginning of year | | $ | 20.55 | | | $ | 15.75 | | | $ | 20.49 | | | $ | 24.50 | | | $ | 28.90 | |
| | |
|
|
| |
|
|
| |
|
|
| |
|
|
| |
|
|
|
Income (Loss) From Investment Operations: | | | | | | | | | | | | | | | | | | | | |
Net investment income | | | 0.28 | | | | 0.17 | | | | 0.17 | | | | 0.18 | | | | 0.51 | |
Net realized and unrealized gains (losses) on investments | | | 1.75 | | | | 4.81 | | | | (4.75 | ) | | | (2.83 | ) | | | 0.26 | |
| | |
|
|
| |
|
|
| |
|
|
| |
|
|
| |
|
|
|
Total from investment operations | | | 2.03 | | | | 4.98 | | | | (4.58 | ) | | | (2.65 | ) | | | 0.77 | |
| | |
|
|
| |
|
|
| |
|
|
| |
|
|
| |
|
|
|
Less Distributions: | | | | | | | | | | | | | | | | | | | | |
Dividends from net investment income | | | (0.27 | ) | | | (0.18 | ) | | | (0.16 | ) | | | (0.18 | ) | | | (0.51 | ) |
Distributions in excess of net investment income | | | — | | | | — | | | | — | | | | — | | | | (0.02 | ) |
Distributions from net realized gains | | | — | | | | — | | | | — | | | | (1.18 | ) | | | (4.64 | ) |
| | |
|
|
| |
|
|
| |
|
|
| |
|
|
| |
|
|
|
Total dividends and distributions | | | (0.27 | ) | | | (0.18 | ) | | | (0.16 | ) | | | (1.36 | ) | | | (5.17 | ) |
| | |
|
|
| |
|
|
| |
|
|
| |
|
|
| |
|
|
|
Net Asset Value, end of year | | $ | 22.31 | | | $ | 20.55 | | | $ | 15.75 | | | $ | 20.49 | | | $ | 24.50 | |
| | |
|
|
| |
|
|
| |
|
|
| |
|
|
| |
|
|
|
Total Investment Return(a) | | | 9.93 | % | | | 31.65 | % | | | (22.34 | )% | | | (11.18 | )% | | | 3.28 | % |
Ratios/Supplemental Data: | | | | | | | | | | | | | | | | | | | | |
Net assets, end of year (in millions) | | $ | 4,135.7 | | | $ | 4,012.3 | | | $ | 3,273.6 | | | $ | 4,615.9 | | | $ | 5,652.7 | |
Ratios to average net assets: | | | | | | | | | | | | | | | | | | | | |
Expenses | | | 0.48 | % | | | 0.49 | % | | | 0.48 | % | | | 0.49 | % | | | 0.49 | % |
Net investment income | | | 1.29 | % | | | 0.96 | % | | | 0.88 | % | | | 0.84 | % | | | 1.75 | % |
Portfolio turnover rate | | | 50 | % | | | 54 | % | | | 54 | % | | | 153 | % | | | 78 | % |
| (a) | Total investment return is calculated assuming a purchase of shares on the first day and a sale on the last day of each year reported and includes reinvestment of dividends and distributions and does not reflect the effect of insurance contract charges. |
| | | | | | | | | | | | | | | | | | | | |
| | | Equity Portfolio
| |
| | | Class II
| |
| | | Year Ended
December 31,
| |
| | | 2004
| | | 2003
| | | 2002
| | | 2001
| | | 2000
| |
Per Share Operating Performance: | | | | | | | | | | | | | | | | | | | | |
Net Asset Value, beginning of year | | $ | 20.58 | | | $ | 15.76 | | | $ | 20.49 | | | $ | 24.51 | | | $ | 28.92 | |
| | |
|
|
| |
|
|
| |
|
|
| |
|
|
| |
|
|
|
Income (Loss) From Investment Operations: | | | | | | | | | | | | | | | | | | | | |
Net investment income | | | 0.20 | | | | 0.08 | | | | 0.09 | | | | 0.09 | | | | 0.39 | |
Net realized and unrealized gains (losses) on investments | | | 1.74 | | | | 4.83 | | | | (4.72 | ) | | | (2.83 | ) | | | 0.26 | |
| | |
|
|
| |
|
|
| |
|
|
| |
|
|
| |
|
|
|
Total from investment operations | | | 1.94 | | | | 4.91 | | | | (4.63 | ) | | | (2.74 | ) | | | 0.65 | |
| | |
|
|
| |
|
|
| |
|
|
| |
|
|
| |
|
|
|
Less distributions: | | | | | | | | | | | | | | | | | | | | |
Dividends from net investment income | | | (0.18 | ) | | | (0.09 | ) | | | (0.10 | ) | | | (0.10 | ) | | | (0.40 | ) |
Distributions in excess of net investment income | | | — | | | | — | | | | — | | | | — | | | | (0.02 | ) |
Distributions from net realized gains | | | — | | | | — | | | | — | | | | (1.18 | ) | | | (4.64 | ) |
| | |
|
|
| |
|
|
| |
|
|
| |
|
|
| |
|
|
|
Total dividends and distributions | | | (0.18 | ) | | | (0.09 | ) | | | (0.10 | ) | | | (1.28 | ) | | | (5.06 | ) |
| | |
|
|
| |
|
|
| |
|
|
| |
|
|
| |
|
|
|
Net Asset Value, end of year | | $ | 22.34 | | | $ | 20.58 | | | $ | 15.76 | | | $ | 20.49 | | | $ | 24.51 | |
| | |
|
|
| |
|
|
| |
|
|
| |
|
|
| |
|
|
|
Total Investment Return(a) | | | 9.51 | % | | | 31.11 | % | | | (22.62 | )% | | | (11.57 | )% | | | 2.83 | % |
Ratios/Supplemental Data: | | | | | | | | | | | | | | | | | | | | |
Net assets, end of year (in millions) | | $ | 1.1 | | | $ | 0.8 | | | $ | 0.4 | | | $ | 1.1 | | | $ | 1.8 | |
Ratios to average net assets: | | | | | | | | | | | | | | | | | | | | |
Expenses | | | 0.88 | % | | | 0.89 | % | | | 0.88 | % | | | 0.89 | % | | | 0.91 | % |
Net investment income | | | 0.91 | % | | | 0.54 | % | | | 0.46 | % | | | 0.45 | % | | | 1.26 | % |
Portfolio turnover rate | | | 50 | % | | | 54 | % | | | 54 | % | | | 153 | % | | | 78 | % |
| (a) | Total investment return is calculated assuming a purchase of shares on the first day and a sale on the last day of each year reported and includes reinvestment of dividends and distributions and does not reflect the effect of insurance contract charges. |
SEE NOTES TO FINANCIAL STATEMENTS.
D2
Financial Highlights
| | | | | | | | | | | | | | | | | | | | |
| | | Flexible Managed Portfolio
| |
| | | Year Ended
December 31,
| |
| | | 2004
| | | 2003
| | | 2002
| | | 2001
| | | 2000
| |
Per Share Operating Performance: | | | | | | | | | | | | | | | | | | | | |
Net Asset Value, beginning of year | | $ | 15.19 | | | $ | 12.55 | | | $ | 14.79 | | | $ | 16.53 | | | $ | 17.64 | |
| | |
|
|
| |
|
|
| |
|
|
| |
|
|
| |
|
|
|
Income (Loss) From Investment Operations: | | | | | | | | | | | | | | | | | | | | |
Net investment income | | | 0.29 | | | | 0.22 | | | | 0.27 | | | | 0.42 | | | | 0.61 | |
Net realized and unrealized gains (losses) on investments | | | 1.32 | | | | 2.70 | | | | (2.10 | ) | | | (1.35 | ) | | | (0.86 | ) |
| | |
|
|
| |
|
|
| |
|
|
| |
|
|
| |
|
|
|
Total from investment operations | | | 1.61 | | | | 2.92 | | | | (1.83 | ) | | | (0.93 | ) | | | (0.25 | ) |
| | |
|
|
| |
|
|
| |
|
|
| |
|
|
| |
|
|
|
Less Dividends and Distributions: | | | | | | | | | | | | | | | | | | | | |
Dividends from net investment income | | | (0.22 | ) | | | (0.28 | ) | | | (0.41 | ) | | | (0.58 | ) | | | (0.62 | ) |
Distributions from net realized gains | | | — | | | | — | | | | — | | | | (0.23 | ) | | | (0.24 | ) |
| | |
|
|
| |
|
|
| |
|
|
| |
|
|
| |
|
|
|
Total dividends and distributions | | | (0.22 | ) | | | (0.28 | ) | | | (0.41 | ) | | | (0.81 | ) | | | (0.86 | ) |
| | |
|
|
| |
|
|
| |
|
|
| |
|
|
| |
|
|
|
Net Asset Value, end of year | | $ | 16.58 | | | $ | 15.19 | | | $ | 12.55 | | | $ | 14.79 | | | $ | 16.53 | |
| | |
|
|
| |
|
|
| |
|
|
| |
|
|
| |
|
|
|
Total Investment Return(a) | | | 10.74 | % | | | 23.76 | % | | | (12.74 | )% | | | (5.68 | )% | | | (1.44 | )% |
Ratios/Supplemental Data: | | | | | | | | | | | | | | | | | | | | |
Net assets, end of year (in millions) | | $ | 3,883.5 | | | $ | 3,693.6 | | | $ | 3,181.0 | | | $ | 3,896.6 | | | $ | 4,463.8 | |
Ratios to average net assets: | | | | | | | | | | | | | | | | | | | | |
Expenses | | | 0.62 | % | | | 0.62 | % | | | 0.63 | % | | | 0.64 | % | | | 0.64 | % |
Net investment income | | | 1.83 | % | | | 1.55 | % | | | 1.92 | % | | | 2.61 | % | | | 3.22 | % |
Portfolio turnover rate | | | 150 | % | | | 204 | % | | | 238 | % | | | 236 | % | | | 132 | % |
| (a) | Total investment return is calculated assuming a purchase of shares on the first day and a sale on the last day of each year reported and includes reinvestment of dividends and distributions and does not reflect the effect of insurance contract charges. |
| | | | | | | | | | | | | | | | | | | | |
| | | Global Portfolio
| |
| | | Year Ended
December 31,
| |
| | | 2004
| | | 2003
| | | 2002
| | | 2001
| | | 2000
| |
Per Share Operating Performance: | | | | | | | | | | | | | | | | | | | | |
Net Asset Value, beginning of year | | $ | 15.14 | | | $ | 11.35 | | | $ | 15.29 | | | $ | 23.61 | | | $ | 30.98 | |
| | |
|
|
| |
|
|
| |
|
|
| |
|
|
| |
|
|
|
Income (Loss) From Investment Operations: | | | | | | | | | | | | | | | | | | | | |
Net investment income | | | 0.11 | | | | 0.10 | | | | 0.07 | | | | 0.09 | | | | 0.07 | |
Net realized and unrealized gains (losses) on investments | | | 1.33 | | | | 3.74 | | | | (3.87 | ) | | | (3.58 | ) | | | (5.30 | ) |
| | |
|
|
| |
|
|
| |
|
|
| |
|
|
| |
|
|
|
Total from investment operations | | | 1.44 | | | | 3.84 | | | | (3.80 | ) | | | (3.49 | ) | | | (5.23 | ) |
| | |
|
|
| |
|
|
| |
|
|
| |
|
|
| |
|
|
|
Less Dividends and Distributions: | | | | | | | | | | | | | | | | | | | | |
Dividends from net investment income | | | (0.15 | ) | | | (0.05 | ) | | | (0.14 | ) | | | (0.06 | ) | | | (0.07 | ) |
Distributions in excess of net investment income | | | — | | | | — | | | | — | | | | — | | | | (0.13 | ) |
Distributions from net realized gains | | | — | | | | — | | | | — | | | | (4.77 | ) | | | (1.94 | ) |
| | |
|
|
| |
|
|
| |
|
|
| |
|
|
| |
|
|
|
Total dividends and distributions | | | (0.15 | ) | | | (0.05 | ) | | | (0.14 | ) | | | (4.83 | ) | | | (2.14 | ) |
| | |
|
|
| |
|
|
| |
|
|
| |
|
|
| |
|
|
|
Net Asset Value, end of year | | $ | 16.43 | | | $ | 15.14 | | | $ | 11.35 | | | $ | 15.29 | | | $ | 23.61 | |
| | |
|
|
| |
|
|
| |
|
|
| |
|
|
| |
|
|
|
Total Investment Return(a) | | | 9.59 | % | | | 34.07 | % | | | (25.14 | )% | | | (17.64 | )% | | | (17.68 | )% |
Ratios/Supplemental Data: | | | | | | | | | | | | | | | | | | | | |
Net assets, end of year (in millions) | | $ | 691.1 | | | $ | 665.6 | | | $ | 514.9 | | | $ | 885.0 | | | $ | 1,182.1 | |
Ratios to average net assets: | | | | | | | | | | | | | | | | | | | | |
Expenses | | | 0.84 | % | | | 0.87 | % | | | 0.82 | % | | | 0.84 | % | | | 0.85 | % |
Net investment income | | | 0.67 | % | | | 0.78 | % | | | 0.47 | % | | | 0.58 | % | | | 0.25 | % |
Portfolio turnover rate | | | 128 | % | | | 88 | % | | | 75 | % | | | 67 | % | | | 95 | % |
| (a) | Total investment return is calculated assuming a purchase of shares on the first day and a sale on the last day of each year reported and includes reinvestment of dividends and distributions and does not reflect the effect of insurance contract charges. |
SEE NOTES TO FINANCIAL STATEMENTS.
D3
Financial Highlights
| | | | | | | | | | | | | | | | | | | | |
| | | Government Income Portfolio
| |
| | | Year Ended
December 31,
| |
| | | 2004
| | | 2003
| | | 2002
| | | 2001
| | | 2000
| |
Per Share Operating Performance: | | | | | | | | | | | | | | | | | | | | |
Net Asset Value, beginning of year | | $ | 11.92 | | | $ | 12.50 | | | $ | 12.26 | | | $ | 12.02 | | | $ | 11.55 | |
| | |
|
|
| |
|
|
| |
|
|
| |
|
|
| |
|
|
|
Income (Loss) From Investment Operations: | | | | | | | | | | | | | | | | | | | | |
Net investment income | | | 0.49 | | | | 0.46 | | | | 0.38 | | | | 0.65 | | | | 0.89 | |
Net realized and unrealized gain (losses) on investment | | | (0.13 | ) | | | (0.15 | ) | | | 1.00 | | | | 0.31 | | | | 0.52 | |
| | |
|
|
| |
|
|
| |
|
|
| |
|
|
| |
|
|
|
Total from investment operations | | | 0.36 | | | | 0.31 | | | | 1.38 | | | | 0.96 | | | | 1.41 | |
| | |
|
|
| |
|
|
| |
|
|
| |
|
|
| |
|
|
|
Less Dividends and Distributions: | | | | | | | | | | | | | | | | | | | | |
Dividends from net investment income | | | (0.44 | ) | | | (0.46 | ) | | | (1.06 | ) | | | (0.72 | ) | | | (0.91 | ) |
Distributions from net realized gains | | | (0.19 | ) | | | (0.43 | ) | | | (0.08 | ) | | | — | | | | (0.03 | ) |
| | |
|
|
| |
|
|
| |
|
|
| |
|
|
| |
|
|
|
Total dividends and distributions | | | (0.63 | ) | | | (0.89 | ) | | | (1.14 | ) | | | (0.72 | ) | | | (0.94 | ) |
| | |
|
|
| |
|
|
| |
|
|
| |
|
|
| |
|
|
|
Net Asset Value, end of year | | $ | 11.65 | | | $ | 11.92 | | | $ | 12.50 | | | $ | 12.26 | | | $ | 12.02 | |
| | |
|
|
| |
|
|
| |
|
|
| |
|
|
| |
|
|
|
Total Investment Return(a) | | | 3.12 | % | | | 2.46 | % | | | 12.05 | % | | | 8.06 | % | | | 12.78 | % |
Ratios/Supplemental Data: | | | | | | | | | | | | | | | | | | | | |
Net assets, end of year (in millions) | | $ | 420.2 | | | $ | 461.5 | | | $ | 484.3 | | | $ | 311.0 | | | $ | 291.5 | |
Ratios to average net assets: | | | | | | | | | | | | | | | | | | | | |
Expenses | | | 0.47 | % | | | 0.46 | % | | | 0.44 | % | | | 0.47 | % | | | 0.47 | % |
Net investment income | | | 4.07 | % | | | 3.76 | % | | | 4.29 | % | | | 5.53 | % | | | 6.03 | % |
Portfolio turnover rate | | | 617 | % | | | 695 | % | | | 508 | % | | | 361 | % | | | 184 | % |
| (a) | Total investment return is calculated assuming a purchase of shares on the first day and a sale on the last day of each year reported and includes reinvestment of dividends and distributions and does not reflect the effect of insurance contract charges. |
| | | | | | | | | | | | | | | | | | | | |
| | | High Yield Bond Portfolio
| |
| | | Year Ended December 31,
| |
| | | 2004
| | | 2003
| | | 2002
| | | 2001
| | | 2000
| |
Per Share Operating Performance: | | | | | | | | | | | | | | | | | | | | |
Net Asset Value, beginning of year | | $ | 5.29 | | | $ | 4.59 | | | $ | 5.40 | | | $ | 6.14 | | | $ | 7.52 | |
| | |
|
|
| |
|
|
| |
|
|
| |
|
|
| |
|
|
|
Income (Loss) From Investment Operations: | | | | | | | | | | | | | | | | | | | | |
Net investment income | | | 0.39 | | | | 0.41 | | | | 0.29 | | | | 0.58 | | | | 0.74 | |
Net realized and unrealized gains (losses) on investments | | | 0.13 | | | | 0.71 | | | | (0.21 | ) | | | (0.62 | ) | | | (1.30 | ) |
| | |
|
|
| |
|
|
| |
|
|
| |
|
|
| |
|
|
|
Total from investment operations | | | 0.52 | | | | 1.12 | | | | 0.08 | | | | (0.04 | ) | | | (0.56 | ) |
| | |
|
|
| |
|
|
| |
|
|
| |
|
|
| |
|
|
|
Less Dividends: | | | | | | | | | | | | | | | | | | | | |
Dividends from net investment income | | | (0.39 | ) | | | (0.42 | ) | | | (0.89 | ) | | | (0.70 | ) | | | (0.82 | ) |
| | |
|
|
| |
|
|
| |
|
|
| |
|
|
| |
|
|
|
Net Asset Value, end of year | | $ | 5.42 | | | $ | 5.29 | | | $ | 4.59 | | | $ | 5.40 | | | $ | 6.14 | |
| | |
|
|
| |
|
|
| |
|
|
| |
|
|
| |
|
|
|
Total Investment Return(a) | | | 10.30 | % | | | 25.04 | % | | | 1.50 | % | | | (0.44 | )% | | | (7.91 | )% |
Ratios/Supplement Data: | | | | | | | | | | | | | | | | | | | | |
Net assets, end of year (in millions) | | $ | 1,595.7 | | | $ | 1,466.7 | | | $ | 1,128.6 | | | $ | 655.8 | | | $ | 661.3 | |
Ratios to average net assets: | | | | | | | | | | | | | | | | | | | | |
Expenses | | | 0.59 | % | | | 0.60 | % | | | 0.58 | % | | | 0.60 | % | | | 0.60 | % |
Net investment income | | | 7.42 | % | | | 8.11 | % | | | 9.36 | % | | | 10.93 | % | | | 10.47 | % |
Portfolio turnover rate | | | 65 | % | | | 93 | % | | | 77 | % | | | 84 | % | | | 76 | % |
| (a) | Total investment return is calculated assuming a purchase of shares on the first day and a sale on the last day of each year reported and includes reinvestment of dividends and distributions and does not reflect the effect of insurance contract charges. |
SEE NOTES TO FINANCIAL STATEMENTS.
D4
Financial Highlights
| | | | | | | | | | | | | | | | | | | | |
| | | Jennison Portfolio
| |
| | | Class I
| |
| | | Year Ended
December 31,
| |
| | | 2004
| | | 2003
| | | 2002
| | | 2001
| | | 2000
| |
Per Share Operating Performance: | | | | | | | | | | | | | | | | | | | | |
Net Asset Value, beginning of year | | $ | 16.62 | | | $ | 12.79 | | | $ | 18.57 | | | $ | 22.97 | | | $ | 32.39 | |
| | |
|
|
| |
|
|
| |
|
|
| |
|
|
| |
|
|
|
Income (Loss) From Investment Operations: | | | | | | | | | | | | | | | | | | | | |
Net investment income | | | 0.08 | | | | 0.04 | | | | 0.03 | | | | 0.04 | | | | 0.01 | |
Net realized and unrealized gains (losses) on investments | | | 1.52 | | | | 3.83 | | | | (5.78 | ) | | | (4.22 | ) | | | (5.61 | ) |
| | |
|
|
| |
|
|
| |
|
|
| |
|
|
| |
|
|
|
Total from investment operations | | | 1.60 | | | | 3.87 | | | | (5.75 | ) | | | (4.18 | ) | | | (5.60 | ) |
| | |
|
|
| |
|
|
| |
|
|
| |
|
|
| |
|
|
|
Less Dividends and Distributions: | | | | | | | | | | | | | | | | | | | | |
Dividends from net investment income | | | (0.08 | ) | | | (0.04 | ) | | | (0.03 | ) | | | (0.03 | ) | | | — | (b) |
Distributions from net realized gains | | | — | | | | — | | | | — | | | | (0.19 | ) | | | (3.82 | ) |
| | |
|
|
| |
|
|
| |
|
|
| |
|
|
| |
|
|
|
Total dividends and distributions | | | (0.08 | ) | | | (0.04 | ) | | | (0.03 | ) | | | (0.22 | ) | | | (3.82 | ) |
| | |
|
|
| |
|
|
| |
|
|
| |
|
|
| |
|
|
|
Net Asset Value, end of year | | $ | 18.14 | | | $ | 16.62 | | | $ | 12.79 | | | $ | 18.57 | | | $ | 22.97 | |
| | |
|
|
| |
|
|
| |
|
|
| |
|
|
| |
|
|
|
Total Investment Return(a) | | | 9.63 | % | | | 30.25 | % | | | (30.95 | )% | | | (18.25 | )% | | | (17.38 | )% |
Ratios/Supplement Data: | | | | | | | | | | | | | | | | | | | | |
Net assets, end of year (in millions) | | $ | 2,044.1 | | | $ | 1,772.4 | | | $ | 1,388.8 | | | $ | 2,186.9 | | | $ | 2,892.7 | |
Ratios to average net assets: | | | | | | | | | | | | | | | | | | | | |
Expenses | | | 0.64 | % | | | 0.64 | % | | | 0.61 | % | | | 0.64 | % | | | 0.64 | % |
Net investment income | | | 0.50 | % | | | 0.28 | % | | | 0.21 | % | | | 0.18 | % | | | 0.02 | % |
Portfolio turnover rate | | | 74 | % | | | 69 | % | | | 74 | % | | | 86 | % | | | 89 | % |
| (a) | Total investment return is calculated assuming a purchase of shares on the first day and a sale on the last day of each year reported and includes reinvestment of dividends and distributions and does not reflect the effect of insurance contract charges. |
| (b) | Less than $0.005 per share. |
| | | | | | | | | | | | | | | | | | | | |
| | | Jennison Portfolio
| |
| | | Class II
| |
| | | Year Ended December 31,
| | | February 10, 2000(e)
through
December 31,
2000
| |
| | | 2004
| | | 2003
| | | 2002
| | | 2001
| | |
Per Share Operating Performance: | | | | | | | | | | | | | | | | | | | | |
Net Asset Value, beginning of year | | $ | 16.46 | | | $ | 12.70 | | | $ | 18.45 | | | $ | 22.88 | | | $ | 34.25 | |
| | |
|
|
| |
|
|
| |
|
|
| |
|
|
| |
|
|
|
Income (Loss) From Investment Operations: | | | | | | | | | | | | | | | | | | | | |
Net investment income (loss) | | | 0.02 | | | | (0.01 | ) | | | (0.02 | ) | | | 0.01 | | | | (0.03 | ) |
Net realized and unrealized gains (losses) on investments | | | 1.50 | | | | 3.77 | | | | (5.73 | ) | | | (4.25 | ) | | | (7.54 | ) |
| | |
|
|
| |
|
|
| |
|
|
| |
|
|
| |
|
|
|
Total from investment operations | | | 1.52 | | | | 3.76 | | | | (5.75 | ) | | | (4.24 | ) | | | (7.57 | ) |
| | |
|
|
| |
|
|
| |
|
|
| |
|
|
| |
|
|
|
Less Distributions: | | | | | | | | | | | | | | | | | | | | |
Dividends from net investment income | | | (0.01 | ) | | | — | | | | — | | | | — | (d) | | | — | (d) |
Distributions from net realized gains | | | — | | | | — | | | | — | | | | (0.19 | ) | | | (3.80 | ) |
| | |
|
|
| |
|
|
| |
|
|
| |
|
|
| |
|
|
|
Total distributions | | | (0.01 | ) | | | — | | | | — | | | | (0.19 | ) | | | (3.80 | ) |
| | |
|
|
| |
|
|
| |
|
|
| |
|
|
| |
|
|
|
Net Asset Value, end of year | | $ | 17.97 | | | $ | 16.46 | | | $ | 12.70 | | | $ | 18.45 | | | $ | 22.88 | |
| | |
|
|
| |
|
|
| |
|
|
| |
|
|
| |
|
|
|
Total Investment Return(a) | | | 9.22 | % | | | 29.61 | % | | | (31.17 | )% | | | (18.60 | )% | | | (22.19 | )% |
Ratios/Supplement Data: | | | | | | | | | | | | | | | | | | | | |
Net assets, end of year (in millions) | | $ | 84.9 | | | $ | 74.3 | | | $ | 48.1 | | | $ | 59.6 | | | $ | 13.3 | |
Ratios to average net assets: | | | | | | | | | | | | | | | | | | | | |
Expenses | | | 1.04 | % | | | 1.04 | % | | | 1.01 | % | | | 1.04 | % | | | 1.04 | %(b) |
Net investment income (loss) | | | 0.11 | % | | | (0.13 | )% | | | (0.19 | )% | | | (0.19 | )% | | | (0.39 | )%(b) |
Portfolio turnover rate | | | 74 | % | | | 69 | % | | | 74 | % | | | 86 | % | | | 89 | %(c) |
| (a) | Total investment return is calculated assuming a purchase of shares on the first day and a sale on the last day of each year reported and includes reinvestment of dividends and distributions and does not reflect the effect of insurance contract charges. Total investment returns for periods less than one full year are not annualized. |
| (d) | Less than $0.005 per share. |
| (e) | Commencement of offering of Class II Shares. |
SEE NOTES TO FINANCIAL STATEMENTS.
D5
Financial Highlights
| | | | | | | | | | | | | | | | | | | | |
| | | Money Market Portfolio
| |
| | | Year Ended December 31,
| |
| | | 2004
| | | 2003
| | | 2002
| | | 2001
| | | 2000
| |
Per Share Operating Performance: | | | | | | | | | | | | | | | | | | | | |
Net Asset Value, beginning of year | | $ | 10.00 | | | $ | 10.00 | | | $ | 10.00 | | | $ | 10.00 | | | $ | 10.00 | |
| | |
|
|
| |
|
|
| |
|
|
| |
|
|
| |
|
|
|
Income (Loss) From Investment Operations: | | | | | | | | | | | | | | | | | | | | |
Net investment income and realized and unrealized gains | | | 0.01 | | | | 0.08 | | | | 0.15 | | | | 0.41 | | | | 0.60 | |
Dividend and distributions | | | (0.01 | ) | | | (0.08 | ) | | | (0.15 | ) | | | (0.41 | ) | | | (0.60 | ) |
| | |
|
|
| |
|
|
| |
|
|
| |
|
|
| |
|
|
|
Net Asset Value, end of year | | $ | 10.00 | | | $ | 10.00 | | | $ | 10.00 | | | $ | 10.00 | | | $ | 10.00 | |
| | |
|
|
| |
|
|
| |
|
|
| |
|
|
| |
|
|
|
Total Investment Return(a) | | | 1.01 | % | | | 0.84 | % | | | 1.52 | % | | | 4.22 | % | | | 6.20 | % |
Ratios/Supplemental Data: | | | | | | | | | | | | | | | | | | | | |
Net assets, end of year (in millions) | | $ | 885.4 | | | $ | 933.7 | | | $ | 1,366.6 | | | $ | 1,501.9 | | | $ | 1,238.2 | |
Ratios to average net assets: | | | | | | | | | | | | | | | | | | | | |
Expenses | | | 0.45 | % | | | 0.44 | % | | | 0.43 | % | | | 0.43 | % | | | 0.44 | % |
Net investment income | | | 1.01 | % | | | 0.84 | % | | | 1.52 | % | | | 3.86 | % | | | 6.03 | % |
| (a) | Total investment return is calculated assuming a purchase of shares on the first day and a sale on the last day of each year reported and includes reinvestment of dividends and distributions and does not reflect the effect of insurance contract charges. |
| | | | | | | | | | | | | | | | | | | | |
| | | Natural Resources Portfolio
| |
| | | Year Ended December 31,
| |
| | | 2004
| | | 2003
| | | 2002
| | | 2001
| | | 2000
| |
Per Share Operating Performance: | | | | | | | | | | | | | | | | | | | | |
Net Asset Value, beginning of year | | $ | 27.49 | | | $ | 22.35 | | | $ | 19.11 | | | $ | 23.59 | | | $ | 17.38 | |
| | |
|
|
| |
|
|
| |
|
|
| |
|
|
| |
|
|
|
Income (Loss) From Investment Operations: | | | | | | | | | | | | | | | | | | | | |
Net investment income | | | 0.19 | | | | 0.25 | | | | 0.09 | | | | 0.43 | | | | 0.13 | |
Net realized and unrealized gains (losses) on investments | | | 6.28 | | | | 7.38 | | | | 3.52 | | | | (2.89 | ) | | | 6.36 | |
| | |
|
|
| |
|
|
| |
|
|
| |
|
|
| |
|
|
|
Total from investment operations | | | 6.47 | | | | 7.63 | | | | 3.61 | | | | (2.46 | ) | | | 6.49 | |
| | |
|
|
| |
|
|
| |
|
|
| |
|
|
| |
|
|
|
Less Dividends and Distributions: | | | | | | | | | | | | | | | | | | | | |
Dividends from net investment income | | | (1.00 | ) | | | (0.98 | ) | | | (0.12 | ) | | | (0.55 | ) | | | (0.16 | ) |
Distributions in excess of net investment income | | | — | | | | — | | | | — | | | | — | | | | (0.09 | ) |
Distributions from net realized gains | | | (1.08 | ) | | | (1.51 | ) | | | (0.25 | ) | | | (1.47 | ) | | | (0.03 | ) |
| | |
|
|
| |
|
|
| |
|
|
| |
|
|
| |
|
|
|
Total dividends and distributions | | | (2.08 | ) | | | (2.49 | ) | | | (0.37 | ) | | | (2.02 | ) | | | (0.28 | ) |
| | |
|
|
| |
|
|
| |
|
|
| |
|
|
| |
|
|
|
Net Asset Value, end of year | | $ | 31.88 | | | $ | 27.49 | | | $ | 22.35 | | | $ | 19.11 | | | $ | 23.59 | |
| | |
|
|
| |
|
|
| |
|
|
| |
|
|
| |
|
|
|
Total Investment Return(a) | | | 25.17 | % | | | 39.00 | % | | | 18.92 | % | | | (10.08 | )% | | | 37.66 | % |
Ratios/Supplemental Data: | | | | | | | | | | | | | | | | | | | | |
Net assets, end of year (in millions) | | $ | 622.6 | | | $ | 498.7 | | | $ | 379.2 | | | $ | 336.1 | | | $ | 393.2 | |
Ratios to average net assets: | | | | | | | | | | | | | | | | | | | | |
Expenses | | | 0.51 | % | | | 0.51 | % | | | 0.50 | % | | | 0.52 | % | | | 0.58 | % |
Net investment income | | | 0.49 | % | | | 0.80 | % | | | 0.47 | % | | | 1.94 | % | | | 0.67 | % |
Portfolio turnover rate | | | 24 | % | | | 24 | % | | | 37 | % | | | 23 | % | | | 30 | % |
| (a) | Total investment return is calculated assuming a purchase of shares on the first day and a sale on the last day of each year reported and includes reinvestment of dividends and distributions and does not reflect the effect of insurance contract charges. |
SEE NOTES TO FINANCIAL STATEMENTS.
D6
Financial Highlights
| | | | | | | | | | | | | | | | | | | | |
| | | Small Capitalization Stock Portfolio
| |
| | | Year Ended
December 31,
| |
| | | 2004
| | | 2003
| | | 2002
| | | 2001
| | | 2000
| |
Per Share Operating Performance: | | | | | | | | | | | | | | | | | | | | |
Net Asset Value, beginning of year | | $ | 17.64 | | | $ | 12.91 | | | $ | 15.48 | | | $ | 17.11 | | | $ | 16.25 | |
| | |
|
|
| |
|
|
| |
|
|
| |
|
|
| |
|
|
|
Income (Loss) From Investment Operations: | | | | | | | | | | | | | | | | | | | | |
Net investment income | | | 0.12 | | | | 0.07 | | | | 0.06 | | | | 0.06 | | | | 0.07 | |
Net realized and unrealized gains (losses) on investments | | | 3.75 | | | | 4.82 | | | | (2.31 | ) | | | 0.67 | | | | 1.81 | |
| | |
|
|
| |
|
|
| |
|
|
| |
|
|
| |
|
|
|
Total from investment operations | | | 3.87 | | | | 4.89 | | | | (2.25 | ) | | | 0.73 | | | | 1.88 | |
| | |
|
|
| |
|
|
| |
|
|
| |
|
|
| |
|
|
|
Less Distributions: | | | | | | | | | | | | | | | | | | | | |
Dividends from net investment income | | | (0.11 | ) | | | (0.07 | ) | | | (0.13 | ) | | | (0.08 | ) | | | (0.08 | ) |
Distributions from net realized gains | | | (0.07 | ) | | | (0.09 | ) | | | (0.19 | ) | | | (2.28 | ) | | | (0.94 | ) |
| | |
|
|
| |
|
|
| |
|
|
| |
|
|
| |
|
|
|
Total distributions | | | (0.18 | ) | | | (0.16 | ) | | | (0.32 | ) | | | (2.36 | ) | | | (1.02 | ) |
| | |
|
|
| |
|
|
| |
|
|
| |
|
|
| |
|
|
|
Net Asset Value, end of year | | $ | 21.33 | | | $ | 17.64 | | | $ | 12.91 | | | $ | 15.48 | | | $ | 17.11 | |
| | |
|
|
| |
|
|
| |
|
|
| |
|
|
| |
|
|
|
Total Investment Return(a) | | | 22.04 | % | | | 38.27 | % | | | (14.92 | )% | | | 5.53 | % | | | 12.81 | % |
Ratios/Supplemental Data: | | | | | | | | | | | | | | | | | | | | |
Net assets, end of year (in millions) | | $ | 743.2 | | | $ | 619.9 | | | $ | 467.4 | | | $ | 611.1 | | | $ | 568.3 | |
Ratios to average net assets: | | | | | | | | | | | | | | | | | | | | |
Expenses | | | 0.47 | % | | | 0.48 | % | | | 0.46 | % | | | 0.48 | % | | | 0.48 | % |
Net investment income | | | 0.62 | % | | | 0.47 | % | | | 0.40 | % | | | 0.52 | % | | | 0.59 | % |
Portfolio turnover rate | | | 18 | % | | | 15 | % | | | 17 | % | | | 23 | % | | | 29 | % |
| (a) | Total investment return is calculated assuming a purchase of shares on the first day and a sale on the last day of each year reported and includes reinvestment of dividends and distributions and does not reflect the effect of insurance contract charges. |
| | | | | | | | | | | | | | | | | | | | |
| | | Stock Index Portfolio
| |
| | | Year Ended
December 31,
| |
| | | 2004
| | | 2003
| | | 2002
| | | 2001
| | | 2000
| |
Per Share Operating Performance: | | | | | | | | | | | | | | | | | | | | |
Net Asset Value, beginning of year | | $ | 29.29 | | | $ | 24.09 | | | $ | 31.64 | | | $ | 38.66 | | | $ | 44.45 | |
| | |
|
|
| |
|
|
| |
|
|
| |
|
|
| |
|
|
|
Income (Loss) From Investment Operations: | | | | | | | | | | | | | | | | | | | | |
Net investment income | | | 0.50 | | | | 0.36 | | | | 0.37 | | | | 0.36 | | | | 0.36 | |
Net realized and unrealized gains (losses) on investments | | | 2.50 | | | | 6.14 | | | | (7.34 | ) | | | (5.05 | ) | | | (4.37 | ) |
| | |
|
|
| |
|
|
| |
|
|
| |
|
|
| |
|
|
|
Total from investment operations | | | 3.00 | | | | 6.50 | | | | (6.97 | ) | | | (4.69 | ) | | | (4.01 | ) |
| | |
|
|
| |
|
|
| |
|
|
| |
|
|
| |
|
|
|
Less Dividends & Distributions: | | | | | | | | | | | | | | | | | | | | |
Dividends from net investment income | | | (0.49 | ) | | | (0.37 | ) | | | (0.36 | ) | | | (0.35 | ) | | | (0.37 | ) |
Distributions from net realized gains | | | (0.51 | ) | | | (0.93 | ) | | | (0.22 | ) | | | (1.98 | ) | | | (1.41 | ) |
| | |
|
|
| |
|
|
| |
|
|
| |
|
|
| |
|
|
|
Total distributions | | | (1.00 | ) | | | (1.30 | ) | | | (0.58 | ) | | | (2.33 | ) | | | (1.78 | ) |
| | |
|
|
| |
|
|
| |
|
|
| |
|
|
| |
|
|
|
Net Asset Value, end of year | | $ | 31.29 | | | $ | 29.29 | | | $ | 24.09 | | | $ | 31.64 | | | $ | 38.66 | |
| | |
|
|
| |
|
|
| |
|
|
| |
|
|
| |
|
|
|
Total Investment Return(a) | | | 10.45 | % | | | 28.18 | % | | | (22.19 | )% | | | (12.05 | )% | | | (9.03 | )% |
Ratios/Supplemental Data: | | | | | | | | | | | | | | | | | | | | |
Net assets, end of year (in millions) | | $ | 3,094.7 | | | $ | 2,940.9 | | | $ | 2,352.3 | | | $ | 3,394.1 | | | $ | 4,186.0 | |
Ratios to average net assets: | | | | | | | | | | | | | | | | | | | | |
Expenses | | | 0.38 | % | | | 0.37 | % | | | 0.37 | % | | | 0.39 | % | | | 0.39 | % |
Net investment income | | | 1.64 | % | | | 1.42 | % | | | 1.25 | % | | | 1.02 | % | | | 0.83 | % |
Portfolio turnover rate | | | 3 | % | | | 2 | % | | | 4 | % | | | 3 | % | | | 7 | % |
| (a) | Total investment return is calculated assuming a purchase of shares on the first day and a sale on the last day of each year reported and includes reinvestment of dividends and distributions and does not reflect the effect of insurance contract charges. |
SEE NOTES TO FINANCIAL STATEMENTS.
D7
Financial Highlights
| | | | | | | | | | | | | | | | | | | | |
| | | Value Portfolio
| |
| | | Class I
| |
| | | Year Ended
December 31,
| |
| | | 2004
| | | 2003
| | | 2002(b)
| | | 2001
| | | 2000
| |
Per Share Operating Performance: | | | | | | | | | | | | | | | | | | | | |
Net Asset Value, beginning of year | | $ | 17.36 | | | $ | 13.75 | | | $ | 17.91 | | | $ | 20.46 | | | $ | 19.52 | |
| | |
|
|
| |
|
|
| |
|
|
| |
|
|
| |
|
|
|
Income (Loss) From Investment Operations: | | | | | | | | | | | | | | | | | | | | |
Net investment income | | | 0.28 | | | | 0.23 | | | | 0.22 | | | | 0.25 | | | | 0.46 | |
Net realized and unrealized gains (losses) on investments | | | 2.55 | | | | 3.62 | | | | (4.15 | ) | | | (0.69 | ) | | | 2.45 | |
| | |
|
|
| |
|
|
| |
|
|
| |
|
|
| |
|
|
|
Total from investment operations | | | 2.83 | | | | 3.85 | | | | (3.93 | ) | | | (0.44 | ) | | | 2.91 | |
| | |
|
|
| |
|
|
| |
|
|
| |
|
|
| |
|
|
|
Less Distributions: | | | | | | | | | | | | | | | | | | | | |
Dividends from net investment income | | | (0.26 | ) | | | (0.24 | ) | | | (0.23 | ) | | | (0.30 | ) | | | (0.44 | ) |
Distributions from net realized gains | | | — | | | | — | | | | — | | | | (1.81 | ) | | | (1.53 | ) |
Tax return of capital distributions | | | — | | | | — | (c) | | | — | | | | — | | | | — | |
| | |
|
|
| |
|
|
| |
|
|
| |
|
|
| |
|
|
|
Total distributions | | | (0.26 | ) | | | (0.24 | ) | | | (0.23 | ) | | | (2.11 | ) | | | (1.97 | ) |
| | |
|
|
| |
|
|
| |
|
|
| |
|
|
| |
|
|
|
Net asset value, end of year | | $ | 19.93 | | | $ | 17.36 | | | $ | 13.75 | | | $ | 17.91 | | | $ | 20.46 | |
| | |
|
|
| |
|
|
| |
|
|
| |
|
|
| |
|
|
|
Total Investment Return(a) | | | 16.31 | % | | | 28.07 | % | | | (21.97 | )% | | | (2.08 | )% | | | 15.59 | % |
Ratios/Supplement Data: | | | | | | | | | | | | | | | | | | | | |
Net assets, end of year (in millions) | | $ | 1,595.6 | | | $ | 1,456.1 | | | $ | 1,247.0 | | | $ | 1,801.4 | | | $ | 1,975.3 | |
Ratios to average net assets: | | | | | | | | | | | | | | | | | | | | |
Expenses | | | 0.44 | % | | | 0.44 | % | | | 0.43 | % | | | 0.44 | % | | | 0.45 | % |
Net investment income | | | 1.48 | % | | | 1.49 | % | | | 1.39 | % | | | 1.32 | % | | | 2.31 | % |
Portfolio turnover rate | | | 52 | % | | | 72 | % | | | 94 | % | | | 175 | % | | | 85 | % |
| (a) | Total investment return is calculated assuming a purchase of shares on the first day and a sale on the last day of each year reported and includes reinvestment of dividends and distributions and does not reflect the effect of insurance contract charges. |
| (b) | Calculated based upon weighted average shares outstanding during the year. |
| (c) | Less than .005 per share. |
| | | | | | | | | | | | | | | | |
| | | Value Portfolio
| |
| | | Class II
| |
| | | Year Ended December 31,
| | | May 14, 2001(d) through December 31, | |
| | | 2004
| | | 2003(e)
| | | 2002(e)
| | | 2001
| |
Per Share Operating Performance: | | | | | | | | | | | | | | | | |
Net Asset Value, beginning of period | | $ | 17.37 | | | $ | 13.75 | | | $ | 17.91 | | | $ | 19.79 | |
| | |
|
|
| |
|
|
| |
|
|
| |
|
|
|
Income (Loss) From Investment Operations: | | | | | | | | | | | | | | | | |
Net investment income | | | 0.20 | | | | 0.16 | | | | 0.16 | | | | 0.12 | |
Net realized and unrealized gains (losses) on investments | | | 2.55 | | | | 3.62 | | | | (4.15 | ) | | | (1.01 | ) |
| | |
|
|
| |
|
|
| |
|
|
| |
|
|
|
Total from investment operations | | | 2.75 | | | | 3.78 | | | | (3.99 | ) | | | (0.89 | ) |
| | |
|
|
| |
|
|
| |
|
|
| |
|
|
|
Less Distributions: | | | | | | | | | | | | | | | | |
Dividends from net investment income | | | (0.18 | ) | | | (0.16 | ) | | | (0.17 | ) | | | (0.14 | ) |
Distributions from net realized gains | | | — | | | | — | | | | — | | | | (0.85 | ) |
Tax return of capital distributions | | | — | | | | — | (f) | | | — | | | | — | |
| | |
|
|
| |
|
|
| |
|
|
| |
|
|
|
Total distributions | | | (0.18 | ) | | | (0.16 | ) | | | (0.17 | ) | | | (0.99 | ) |
| | |
|
|
| |
|
|
| |
|
|
| |
|
|
|
Net Asset Value, end of period | | $ | 19.94 | | | $ | 17.37 | | | $ | 13.75 | | | $ | 17.91 | |
| | |
|
|
| |
|
|
| |
|
|
| |
|
|
|
Total Investment Return(a) | | | 15.83 | % | | | 27.63 | % | | | (22.35 | )% | | | (4.34 | )% |
Ratios/Supplemental Data: | | | | | | | | | | | | | | | | |
Net assets, end of period (in millions) | | $ | 3.0 | | | $ | 2.9 | | | $ | 1.5 | | | $ | 1.1 | |
Ratios to average net assets: | | | | | | | | | | | | | | | | |
Expenses | | | 0.84 | % | | | 0.84 | % | | | 0.83 | % | | | 0.84 | %(b) |
Net investment income | | | 1.08 | % | | | 1.10 | % | | | 1.04 | % | | | 0.94 | %(b) |
Portfolio turnover rate | | | 52 | % | | | 72 | % | | | 94 | % | | | 175 | %(c) |
| (a) | Total investment return is calculated assuming a purchase of shares on the first day and a sale on the last day of each period reported and includes reinvestment of dividends and distributions and does not reflect the effect of insurance contract charges. Total investment returns for periods of less than one full year are not annualized. |
| (d) | Commencement of offering of Class II shares. |
| (e) | Calculated based upon weighted average shares outstanding during the year. |
| (f) | Less than .005 per share. |
SEE NOTES TO FINANCIAL STATEMENTS.
D8
Financial Highlights
| | | | | | | | | | | | | | | | | | | | |
| | | Zero Coupon Bond Portfolio 2005
| |
| | | Year Ended
December 31,
| |
| | | 2004
| | | 2003
| | | 2002
| | | 2001
| | | 2000
| |
Per Share Operating Performance: | | | | | | | | | | | | | | | | | | | | |
Net Asset Value, beginning of year | | $ | 13.38 | | | $ | 13.73 | | | $ | 13.77 | | | $ | 13.38 | | | $ | 12.68 | |
| | |
|
|
| |
|
|
| |
|
|
| |
|
|
| |
|
|
|
Income (Loss) From Investment Operations: | | | | | | | | | | | | | | | | | | | | |
Net investment income | | | 0.55 | | | | 0.60 | | | | 0.59 | | | | 0.65 | | | | 0.65 | |
Net realized and unrealized gains (losses) on investments | | | (0.47 | ) | | | (0.34 | ) | | | 0.75 | | | | 0.42 | | | | 1.02 | |
| | |
|
|
| |
|
|
| |
|
|
| |
|
|
| |
|
|
|
Total from investment operations | | | 0.08 | | | | 0.26 | | | | 1.34 | | | | 1.07 | | | | 1.67 | |
| | |
|
|
| |
|
|
| |
|
|
| |
|
|
| |
|
|
|
Less Dividends and Distributions: | | | | | | | | | | | | | | | | | | | | |
Dividends from net investment income | | | (0.55 | ) | | | (0.60 | ) | | | (1.25 | ) | | | (0.64 | ) | | | (0.67 | ) |
Distributions from net realized gains | | | (0.32 | ) | | | (0.01 | ) | | | (0.13 | ) | | | (0.04 | ) | | | (0.30 | ) |
| | |
|
|
| |
|
|
| |
|
|
| |
|
|
| |
|
|
|
Total dividends and distributions | | | (0.87 | ) | | | (0.61 | ) | | | (1.38 | ) | | | (0.68 | ) | | | (0.97 | ) |
| | |
|
|
| |
|
|
| |
|
|
| |
|
|
| |
|
|
|
Net Asset Value, end of year | | $ | 12.59 | | | $ | 13.38 | | | $ | 13.73 | | | $ | 13.77 | | | $ | 13.38 | |
| | |
|
|
| |
|
|
| |
|
|
| |
|
|
| |
|
|
|
Total Investment Return(a) | | | 0.57 | % | | | 1.90 | % | | | 10.40 | % | | | 8.11 | % | | | 13.76 | % |
Ratios/Supplemental Data: | | | | | | | | | | | | | | | | | | | | |
Net assets, end of year (in millions) | | $ | 60.6 | | | $ | 63.9 | | | $ | 66.8 | | | $ | 55.0 | | | $ | 49.8 | |
Ratios to average net assets: | | | | | | | | | | | | | | | | | | | | |
Expenses | | | 0.63 | % | | | 0.66 | % | | | 0.63 | % | | | 0.63 | % | | | 0.65 | % |
Net investment income | | | 4.19 | % | | | 4.33 | % | | | 4.64 | % | | | 5.05 | % | | | 5.26 | % |
Portfolio turnover rate | | | 9 | % | | | 8 | % | | | 1 | % | | | 10 | % | | | 67 | % |
| (a) | Total investment return is calculated assuming a purchase of shares on the first day and a sale on the last day of each period reported and includes reinvestment of dividends and distributions and does not reflect the effect of insurance contract charges. |
SEE NOTES TO FINANCIAL STATEMENTS.
D9
Report of Independent Registered Public Accounting Firm
The Board of Directors and Shareholders of
The Prudential Series Fund, Inc.
We have audited the accompanying statements of assets and liabilities of The Prudential Series Fund, Inc., (comprised of Conservative Balanced Portfolio, Diversified Bond Portfolio, Equity Portfolio, Flexible Managed Portfolio, Global Portfolio, Government Income Portfolio, High Yield Bond Portfolio, Jennison Portfolio, Money Market Portfolio, Natural Resources Portfolio, Small Capitalization Stock Portfolio, Stock Index Portfolio, Value Portfolio and Zero Coupon Bond 2005 Portfolio) (hereafter referred to as the “Fund”), including the portfolios of investments, as of December 31, 2004, and the related statements of operations, the statements of changes in net assets, and the financial highlights for the year then ended. These financial statements and financial highlights are the responsibility of the Fund’s management. Our responsibility is to express an opinion on these financial statements and financial highlights based on our audit. The statements of changes in net assets for the year ended December 31, 2003 and the financial highlights for the periods presented prior to December 31, 2004, were audited by another independent registered public accounting firm, whose report dated, February 13, 2004, expressed an unqualified opinion thereon.
We conducted our audit in accordance with the standards of the Public Company Accounting Oversight Board (United States). Those standards require that we plan and perform the audit to obtain reasonable assurance about whether the financial statements and financial highlights are free of material misstatement. An audit includes examining, on a test basis, evidence supporting the amounts and disclosures in the financial statements. Our procedures included confirmation of securities owned as of December 31, 2004, by correspondence with the custodian and brokers or by other appropriate auditing procedures where replies from brokers were not received. As to securities purchased or sold but not yet received or delivered, we performed other appropriate auditing procedures. An audit also includes assessing the accounting principles used and significant estimates made by management, as well as evaluating the overall financial statement presentation. We believe that our audit provides a reasonable basis for our opinion.
In our opinion, the financial statements and financial highlights referred to above present fairly, in all material respects, the financial position of the Fund as of December 31, 2004, and the results of its operations, the changes in its net assets, and the financial highlights for the year then ended, in conformity with U.S. generally accepted accounting principles.

New York, New York
February 9, 2005
E1
Tax Information
(Unaudited)
Although we understand that the vast majority, if not all, of the shareholders/contract holders of the Series Fund currently maintain a tax deferred status, we are nevertheless required by the Internal Revenue Code to advise you within 60 days of the Series Fund's fiscal year end (December 31, 2004) as to the federal tax status of dividends paid by the Series Fund during such fiscal year. Accordingly, we are advising you that in 2004, the Series Fund paid dividends as follows:
| | | | | | | | | | |
| | | Ordinary Dividends
| | Long-Term Capital Gains
| | | Total Distributions
|
Conservative Balanced Portfolio | | $ | 0.318 | | $ | 0.049 | | | $ | 0.367 |
Diversified Bond Portfolio | | | 0.502 | | | — | | | | 0.502 |
Equity Portfolio (Class I) | | | 0.275 | | | — | | | | 0.275 |
Equity Portfolio (Class II) | | | 0.184 | | | — | | | | 0.184 |
Flexible Managed Portfolio | | | 0.220 | | | — | | | | 0.220 |
Global Portfolio | | | 0.149 | | | — | | | | 0.149 |
Government Income Portfolio | | | 0.634 | | | — | (a) | | | 0.634 |
High Yield Bond Portfolio | | | 0.393 | | | — | | | | 0.393 |
Jennison Portfolio (Class I) | | | 0.080 | | | — | | | | 0.080 |
Jennison Portfolio (Class II) | | | 0.007 | | | — | | | | 0.007 |
Money Market Portfolio | | | 0.010 | | | — | (a) | | | 0.010 |
Natural Resources Portfolio | | | 1.162 | | | 0.923 | | | | 2.085 |
Small Capitalization Stock Portfolio | | | 0.116 | | | 0.067 | | | | 0.183 |
Stock Index Portfolio | | | 0.564 | | | 0.435 | | | | 0.999 |
Value Portfolio (Class I) | | | 0.258 | | | — | | | | 0.258 |
Value Portfolio (Class II) | | | 0.177 | | | — | | | | 0.177 |
Zero Coupon Bond 2005 Portfolio | | | 0.547 | | | 0.320 | | | | 0.867 |
| (a) | Less than $0.005 per share |
Pursuant to Section 854 of the Internal Revenue Code, the following percentages of distributions from ordinary income for the year ended December 31, 2004 have been designated as being eligible for the dividends received deduction available to corporate shareholders:
| | | |
| | | Corporate Dividend Received Deduction
| |
Conservative Balanced Portfolio | | 40.64 | % |
Equity Portfolio | | 100.00 | % |
Flexible Managed Portfolio | | 80.26 | % |
Global Portfolio | | 43.81 | % |
High Yield Bond Portfolio | | 3.14 | % |
Jennison Portfolio | | 100.00 | % |
Natural Resources Portfolio | | 58.27 | % |
Small Capitalization Stock Portfolio | | 100.00 | % |
Stock Index Portfolio | | 100.00 | % |
Value Portfolio | | 100.00 | % |
E2
This report contains financial information about certain investment choices that may be available on the variable life insurance and variable annuity contracts listed below. You may receive additional reports and should refer to your variable life insurance or variable annuity contract prospectus to determine which portfolios are available to you.
VARIABLE LIFE INSURANCE
| n | | Prudential’s Variable Appreciable Life® |
| n | | Pruco Life’s Variable Appreciable Life® |
| n | | Pruco Life of New Jersey’s Variable Appreciable Life® |
| n | | Prudential’s Custom VALSM |
| n | | Pruco Life’s Discovery® Life Plus |
| n | | Pruco Life of New Jersey’s Discovery® Life Plus |
| n | | Pruco Life’s Variable Life Insurance |
| n | | Pruco Life of New Jersey’s Variable Life Insurance |
| n | | Pruco Life’s PRUviderSM |
| n | | Pruco Life of New Jersey’s PRUviderSM |
| n | | Prudential’s Survivorship Preferred® |
| n | | Prudential’s Variable Universal Life |
| n | | Pruco Life’s Variable Universal Life® |
| n | | Pruco Life’s Survivorship Variable Universal Life |
| n | | Pruco Life of New Jersey’s Survivorship Variable Universal Life |
| n | | Pruco Life’s Pruselect ISM |
| n | | Pruco Life’s Pruselect IISM |
| n | | Pruco Life’s PruLife® Custom Premier |
| n | | Pruco Life of New Jersey’s PruLife® Custom Premier |
| n | | Pruco Life’s PruSelectSM III |
| n | | Pruco Life of New Jersey’s PruSelectSM III |
| n | | Pruco Life’s MPremier VUL |
VARIABLE ANNUITIES
| n | | Prudential’s Discovery® Plus |
| n | | Pruco Life’s Discovery® Plus |
| n | | Pruco Life of New Jersey’s Discovery® Plus |
| n | | Pruco Life’s Discovery Preferred® |
| n | | Prudential’s Variable Investment Plan® |
| n | | Prudential’s Qualified Variable Investment Plan® |
| n | | Pruco Life’s Discovery Select® |
| n | | Pruco Life of New Jersey’s Discovery Select® |
| n | | Pruco Life’s Discovery Choice® |
| n | | Pruco Life of NewJersey’s Discovery Choice® |
| n | | Pruco Life’s Strategic Partners Annuity One |
| n | | Pruco Life of New Jersey’s Strategic Partners Annuity One |
| n | | Pruco Life’s Strategic Partners Select |
| n | | Pruco Life of New Jersey’s Strategic Partners Select |
| n | | Pruco Life’s Strategic Partners Advisor |
| n | | Pruco Life of New Jersey’s Strategic Partners Advisor |
| n | | Pruco Life’s Strategic Partners FlexElite |
| n | | Pruco Life of New Jersey’s Strategic Partners FlexElite |
| n | | Pruco Life’s Strategic Partners Plus |
| n | | Pruco Life of New Jersey’s Strategic Partners Plus |
Variable life insurance is distributed by Pruco Securities LLC, member SIPC, 751 Broad Street, Newark, NJ 07102-3777. Variable annuities are distributed through Prudential Investment Management Services LLC (PIMS), member SIPC, Gateway Center Three, 14th Floor, Newark, NJ 07102-4077. Variable life insurance and variable annuities are issued by The Prudential Insurance Company of America, Pruco Life Insurance Company, or in New York, Pruco Life Insurance Company of New Jersey. All are Prudential Financial companies. Each is solely responsible for its own financial condition and contractual obligations. Guarantees are based on the claims-paying ability of the issuing company.
| | | | | | |
| Variable Contracts: | | ARE NOT FDIC INSURED | | ARE NOT BANK GUARANTEED | | MAY LOSE VALUE |
The 2004 Audited Financial Statements of Pruco Life Insurance Company, Pruco Life Insurance Company of New Jersey, and The Prudential Insurance Company of America will be available commencing April 30, 2005. You may call (888) 778-2888 to obtain a free copy of the audited financial statements of the insurance company that issued your contract.
To reduce costs, we now generally send only a single copy of prospectuses and shareholder reports to each household (“householding”) in lieu of sending a copy to each Contract Owner who resides in the household. You should be aware that by calling (877) 778-5008, you can revoke or “opt out” of householding at any time.
Prudential Financial and the Rock logo are registered service marks of The Prudential Insurance Company of America, Newark, NJ, and its affiliates.
Presorted
Standard
U.S. Postage
PAID
Prudential
IFS-2005-AO94581 PFS-AR-A Ed. 01/31/2005

ANNUAL REPORT
DECEMBER 31, 2004
The Prudential Series Fund, Inc.

| | n | | SP Aggressive Growth Asset Allocation Portfolio |
| | n | | SP AIM Aggressive Growth Portfolio |
| | n | | SP AIM Core Equity Portfolio |
| | n | | SP Alliance Large Cap Growth Portfolio |
| | n | | SP Balanced Asset Allocation Portfolio |
| | n | | SP Conservative Asset Allocation Portfolio |
| | n | | SP Davis Value Portfolio |
| | n | | SP Goldman Sachs Small Cap Value Portfolio |
| | n | | SP Growth Asset Allocation Portfolio |
| | n | | SP Large Cap Value Portfolio |
| | n | | SP LSV International Value Portfolio |
| | n | | SP MFS Capital Opportunities Portfolio |
| | n | | SP Mid Cap Growth Portfolio |
| | n | | SP PIMCO High Yield Portfolio |
| | n | | SP PIMCO Total Return Portfolio |
| | n | | SP Prudential U.S. Emerging Growth Portfolio |
| | n | | SP State Street Research Small Cap Growth Portfolio |
| | n | | SP Strategic Partners Focused Growth Portfolio |
| | n | | SP Technology Portfolio |
| | n | | SP William Blair International Growth Portfolio |
The Prudential Insurance Company of America
751 Broad Street, Newark, NJ 07102-3777
Pruco Life Insurance Company
Pruco Life Insurance Company of New Jersey
213 Washington Street, Newark, NJ 07102-2992
Pruco Life Insurance Company is not licensed to do business in New York.
IFS-2005-A094682

T | his report is one of several that provide financial information about certain investment choices available on variable life insurance and variable annuity contracts. Based on the variable contract you own or the portfolios you invested in, you may receive additional reports that provide financial information on those investment choices. Please refer to your variable life insurance or variable annuity contract prospectus to determine which portfolios are available to you. A list of the variable contracts that this report supports is located on the inside back cover. |
This report must be preceded or accompanied by the current Monthly Performance Review (MPR) for the applicable product and the current prospectuses for the Prudential Series Fund portfolios and the applicable variable life or annuity contract. The prospectuses contain information on the investment objectives, risks, and charges and expenses and should be read carefully.
The contract’s prospectus contains hypothetical performance illustrations that show the effect of various assumptions regarding the cost of insurance protection. You may also obtain a personalized illustration of historical performance that reflects the cost of your policy’s insurance protection. The MPR shows historical investment performance after the deduction of investment management fees, investment-related expenses, and the product’s mortality and expense risk charges. For variable life insurance products, additional contract charges include the cost of insurance, administrative, sales, and any applicable withdrawal or surrender charges, which will reduce the rates of return shown. For variable annuity products, returns are net of all contract charges, including applicable surrender or withdrawal charges.
DISCOVER THE BENEFITS OF E-DELIVERY
| n | | Eliminate receiving printed reports. |
| n | | View documents on-line as they become available. |
| n | | Download and store e-reports on your PC. |
| n | | Help the environment by using less paper. |
To receive your semiannual/annual reports on-line, go to www.icsdelivery.com/prudential and enroll. Instead of receiving printed reports, you will receive notification via e-mail when new materials are available for your review. You can cancel your enrollment or change your e-mail address at any time by clicking on the change/cancel enrollment option at the icsdelivery website.
A description of the Fund’s proxy voting policies and procedures is available, without charge, upon request. Owners of variable annuity contracts should call 888-778-2888 and owners of variable life insurance contracts should call 800-778-2255 to obtain descriptions of the Fund’s proxy voting policies and procedures. The description is also available on the website of the Securities and Exchange Commission (the “Commission”) at www.sec.gov. Information regarding how the Fund voted proxies relating to portfolio securities during the most recent 12-month period ended December 31, 2004 is available on the website of the Commission at www.sec.gov and on the Fund’s website at www.irrc.com/prudential.
The Fund files with the Commission a complete listing of portfolio holdings as of its first and third quarter-end on Form N-Q. Form N-Q is available on the Commission’s website at www.sec.gov or by visiting the Commission’s Public Reference Room. For more information on the Commission’s Public Reference Room, please visit the Commission’s website or call 800-SEC-0330. Form N-Q is also available on the Fund’s website at www.prudential.com or by calling the telephone numbers referenced above.

The Prudential Series Fund, Inc.
Annual Report
DECEMBER 31, 2004
Table of Contents
Letter to Contract Owners
| | n | | THE PRUDENTIAL SERIES FUND, INC. PORTFOLIOS |
SP Aggressive Growth Asset Allocation Portfolio
SP AIM Aggressive Growth Portfolio
SP AIM Core Equity Portfolio
SP Alliance Large Cap Growth Portfolio
SP Balanced Asset Allocation Portfolio
SP Conservative Asset Allocation Portfolio
SP Davis Value Portfolio
SP Goldman Sachs Small Cap Value Portfolio
SP Growth Asset Allocation Portfolio
SP Large Cap Value Portfolio
SP LSV International Value Portfolio
SP MFS Capital Opportunities Portfolio
SP Mid Cap Growth Portfolio
SP PIMCO High Yield Portfolio
SP PIMCO Total Return Portfolio
SP Prudential U.S. Emerging Growth Portfolio
SP State Street Research Small Cap Growth Portfolio
SP Strategic Partners Focused Growth Portfolio
SP Technology Portfolio
SP William Blair International Growth Portfolio
A1 Financial Statements
B1 Schedule of Investments
C1 Notes to Financial Statements
D1 Financial Highlights
E1 Report of Independent Registered Accounting Firm
F1 Management of the Prudential Series Fund, Inc.
This report may include financial information pertaining to certain portfolios that are not available through the variable life insurance policy or variable annuity contract that you have chosen. Please refer to your variable life insurance or variable annuity prospectus to determine which portfolios are available to you.
| | | | |
The Prudential Series Fund, Inc. | | Annual Report | | December 31, 2004 |
SP Aggressive Growth Asset Allocation Portfolio
| n | MANAGED BY: PRUDENTIAL INVESTMENTS LLC |
Past performance does not guarantee future returns. Portfolio performance is net of investment fees and fund expenses, but not product charges, which, if included, would significantly lower the performance quoted. The investment return and principal value of an investment will fluctuate, so that an investor’s shares, when redeemed, may be worth more or less than their original cost. Current performance may be lower or higher than the past performance data quoted.
| n | PERFORMANCE SUMMARY* - As of December 31, 2004 |
| | | | | | | | | |
Average Annual Total Return Percentages
| | 1-Year
| | | 3-Year
| | | Since
Inception
| |
SP Aggressive Growth Asset Allocation Portfolio | | 14.76 | % | | 5.85 | % | | -2.21 | % |
S&P 500 Index1 | | 10.87 | % | | 3.58 | % | | -2.38 | % |
Aggressive Growth AA Custom Blended Index1 | | 13.57 | % | | 6.22 | % | | -1.05 | % |
Lipper (VIP) Multi-Cap Core Funds Average1 | | 12.06 | % | | 4.40 | % | | -1.11 | % |
SP Aggressive Growth Asset Allocation Portfolio inception date: 9/22/2000.
The Portfolio may invest in foreign securities, which are subject to the risks of currency fluctuation and the impact of social, political, and economic change. Small and mid-size companies may have limited marketability, and may be subject to more erratic or abrupt market movements than large-cap stocks.
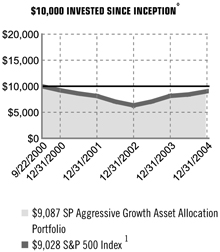
| | | | |
| | | Portfolio
| | SP500
|
22-Sep-00 | | 10,000.0000 | | 10,000.00 |
31-Dec-00 | | 9,335.3157 | | 9,218.11 |
30-Jun-01 | | 8,333.9065 | | 8,601.15 |
31-Dec-01 | | 7,662.2350 | | 8,123.36 |
30-Jun-02 | | 6,904.0983 | | 7,055.06 |
31-Dec-02 | | 5,964.0087 | | 6,328.72 |
30-Jun-03 | | 6,674.4447 | | 7,072.46 |
31-Dec-03 | | 7,918.3185 | | 8,142.99 |
30-Jun-04 | | 8,267.1341 | | 8,423.24 |
31-Dec-04 | | 9,086.7643 | | 9,028.46 |
“For the year ended December 31, 2004, the SP Aggressive Growth Asset Allocation Portfolio had a total return of 14.76%, compared with a return of 10.87% for the unmanaged S&P 500 Index, 13.57% for the Aggressive Growth AA Custom-Blended Index (80% Russell 3000 Index and 20% MSCI EAFE Index), and 12.06% for the Lipper (VIP) Multi-Cap Core Funds Average.
All of the Portfolio’s segments posted positive returns in 2004. Nonetheless, asset allocation proved to be a dominant factor in determining the Portfolio return because small caps and international stocks significantly outperformed stocks of larger U.S. companies. What’s more, value stocks outperformed growth stocks in both domestic and foreign markets, in large-caps and small-cap stocks. Stocks had a strong year. Analysts estimated that the earnings of companies in the S&P 500 Index grew more than 19% over 2003 levels, driving share prices up.
Bonds performed better than had been expected, particularly high-yield bonds. High-yield bonds are issued by companies whose lower credit ratings require them to pay higher interest rates. Investors turned to them in search of a better return in the generally low-yield environment. They also benefited from the strong global economy, which reduced the premium that less credit-worthy companies had to pay and so increased the value of their bonds.
Asset allocation decisions contributed to performance. An overweight in large-cap value versus large-cap growth had a positive impact on relative performance. The Portfolio’s large cap growth and value managers both outperformed their respective benchmarks for the year. The Portfolio’s small cap growth allocation underperformed the Russell 2000 Growth significantly and was the largest detractor from relative performance.”
| * | Unless noted otherwise, Lipper Average and Index returns reflect performance beginning the closest month-end date to the Portfolio’s inception. |
| 1 | For average and index definitions, refer to the Glossary of Benchmark Definitions page. Investors cannot invest directly in a market index or average. |
For a complete list of holdings, refer to the Schedule of Investments section of this report.
| | | | |
The Prudential Series Fund, Inc. | | Annual Report | | December 31, 2004 |
SP AIM Aggressive Growth Portfolio
| n | MANAGED BY: AIM ADVISORS |
Past performance does not guarantee future returns. Portfolio performance is net of investment fees and fund expenses, but not product charges, which, if included, would significantly lower the performance quoted. The investment return and principal value of an investment will fluctuate, so that an investor’s shares, when redeemed, may be worth more or less than their original cost. Current performance may be lower or higher than the past performance data quoted.
| n | PERFORMANCE SUMMARY* - As of December 31, 2004 |
| | | | | | | | | |
Average Annual Total Return Percentages
| | 1-Year
| | | 3-Year
| | | Since
Inception
| |
SP AIM Aggressive Growth Portfolio | | 11.86 | % | | 3.81 | % | | -7.21 | % |
Russell 2500 Index1 | | 18.29 | % | | 12.27 | % | | 7.87 | % |
Russell 2500 Growth Index1 | | 14.59 | % | | 5.93 | % | | -3.62 | % |
Lipper (VIP) Mid-Cap Growth Funds Average1 | | 14.75 | % | | 3.54 | % | | -7.35 | % |
SP AIM Aggressive Growth Portfolio inception date: 9/22/2000. A portion of the expenses of the Portfolio is subsidized. Absent such expense absorption, the performance quoted would be lower. Expense absorption may be discontinued at any time.
The Portfolio may invest in foreign securities, which are subject to the risks of currency fluctuation and the impact of social, political, and economic change. Small and mid-size companies may have limited marketability, and may be subject to more erratic or abrupt market movements than large-cap stocks.
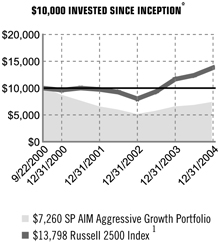
| | | | |
| | | Portfolio
| | r2500
|
22-Sep-00 | | 10,000.0000 | | 10,000.00 |
31-Dec-00 | | 8,600.0000 | | 9,633.63 |
30-Jun-01 | | 7,490.0000 | | 10,003.89 |
31-Dec-01 | | 6,490.0000 | | 9,751.16 |
30-Jun-02 | | 5,840.0000 | | 9,242.26 |
31-Dec-02 | | 5,130.0000 | | 8,015.93 |
30-Jun-03 | | 5,570.0000 | | 9,372.41 |
31-Dec-03 | | 6,490.0000 | | 11,663.92 |
30-Jun-04 | | 6,840.0000 | | 12,391.62 |
31-Dec-04 | | 7,260.0000 | | 13,797.71 |
“For the year ended December 31, 2004, the SP AIM Aggressive Growth Portfolio had a total return of 11.86%, compared with a total return of 18.29% for the unmanaged Russell 2500 Index, 14.59% for the unmanaged Russell 2500 Growth Index, and 14.75% for the Lipper (VIP) Mid-Cap Growth Funds Average.
The Portfolio’s underperformance of the Russell 2500 Growth Index came primarily in the first quarter of 2004, largely due to stock selection in the consumer discretionary and the information technology sectors. By the end of the second quarter, however, as the market began to favor quality technology stocks, performance in the sector improved significantly.
The Portfolio’s technology holdings led its sector contributions for the remainder of the year. Within the sector, the semiconductor industry added most to relative performance. The Portfolio’s financials also strengthened its performance relative to the Russell 2500 Growth Index, particularly its capital markets holdings.
AIM positioned the Portfolio with a balanced exposure to more aggressive, cyclically-sensitive stocks and high quality, less aggressive ones. They applied a combination of quantitative and fundamental analysis to seek quality companies that exhibit sustainable, above average, earnings growth potential. As 2005 begins, they are cautiously optimistic about the economic expansion and continue to seek quality names that can outperform over a longer period of time.”
| * | Unless noted otherwise, Lipper Average and Index returns reflect performance beginning the closest month-end date to the Portfolio’s inception. |
| 1 | For average and index definitions, refer to the Glossary of Benchmark Definitions page. Investors cannot invest directly in a market index or average. |
For a complete list of holdings, refer to the Schedule of Investments section of this report.
| | | | |
The Prudential Series Fund, Inc. | | Annual Report | | December 31, 2004 |
SP AIM Core Equity Portfolio
| n | MANAGED BY: AIM ADVISORS |
Past performance does not guarantee future returns. Portfolio performance is net of investment fees and fund expenses, but not product charges, which, if included, would significantly lower the performance quoted. The investment return and principal value of an investment will fluctuate, so that an investor’s shares, when redeemed, may be worth more or less than their original cost. Current performance may be lower or higher than the past performance data quoted.
| n | PERFORMANCE SUMMARY* - As of December 31, 2004 |
| | | | | | | | | |
Average Annual Total Return Percentages
| | 1-Year
| | | 3-Year
| | | Since
Inception
| |
SP AIM Core Equity Portfolio | | 8.79 | % | | 4.50 | % | | -6.70 | % |
S&P 500 Index1 | | 10.87 | % | | 3.58 | % | | -2.38 | % |
Russell 1000 Index1 | | 11.40 | % | | 4.27 | % | | -2.40 | % |
Lipper (VIP) Large-Cap Core Funds Average1 | | 8.59 | % | | 1.93 | % | | -3.75 | % |
SP AIM Core Equity Portfolio inception date: 9/22/2000. A portion of the expenses of the Portfolio is subsidized. Absent such expense absorption, the performance quoted would be lower. Expense absorption may be discontinued at any time.
The Portfolio may invest in foreign securities, which are subject to the risks of currency fluctuation and the impact of social, political, and economic change. The Portfolio may invest in derivative securities, which may carry market, credit, and liquidity risks. These risks may result in greater share price volatility.
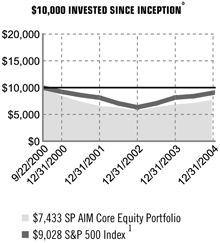
| | | | |
| | | Portfolio
| | SP500
|
22-Sep-00 | | 10,000.0000 | | 10,000.00 |
31-Dec-00 | | 8,425.7981 | | 9,218.11 |
30-Jun-01 | | 7,244.9855 | | 8,601.15 |
31-Dec-01 | | 6,514.4828 | | 8,123.36 |
30-Jun-02 | | 6,064.1730 | | 7,055.06 |
31-Dec-02 | | 5,523.8011 | | 6,328.72 |
30-Jun-03 | | 6,038.7639 | | 7,072.46 |
31-Dec-03 | | 6,832.5449 | | 8,142.99 |
30-Jun-04 | | 7,110.0372 | | 8,423.24 |
31-Dec-04 | | 7,433.2207 | | 9,028.46 |
“For the year ended December 31, 2004, the SP AIM Core Equity Portfolio had a total return of 8.79%, compared with a total return of 10.87% for the unmanaged S&P 500 Index, 11.40% for the unmanaged Russell 1000 Index, and 8.59% for the Lipper (VIP) Large-Cap Core Funds Average.
Underweights in the financials and consumer discretionary sectors were primarily responsible for the Portfolio’s underperformance, although stock selection in the consumer discretionary sector also detracted slightly from relative performance. This occurred in the second and fourth quarters of the year, when the Portfolio’s media holdings trailed those in the S&P 500 Index.
Performance was helped by the significant overall outperformance of the Portfolio’s industrial holdings. The building products industry made the largest contribution to the sector’s performance compared to its benchmark. Selection among information technology stocks also added to performance relative to the benchmark, particularly holdings in the office electronics industry.”
| * | Unless noted otherwise, Lipper Average and Index returns reflect performance beginning the closest month-end date to the Portfolio’s inception. |
| 1 | For average and index definitions, refer to the Glossary of Benchmark Definitions page. Investors cannot invest directly in a market index or average. |
For a complete list of holdings, refer to the Schedule of Investments section of this report.
| | | | |
The Prudential Series Fund, Inc. | | Annual Report | | December 31, 2004 |
SP Alliance Large Cap Growth Portfolio
| n | MANAGED BY: ALLIANCE CAPITAL MANAGEMENT, LP |
Past performance does not guarantee future returns. Portfolio performance is net of investment fees and fund expenses, but not product charges, which, if included, would significantly lower the performance quoted. The investment return and principal value of an investment will fluctuate, so that an investor’s shares, when redeemed, may be worth more or less than their original cost. Current performance may be lower or higher than the past performance data quoted.
| n | PERFORMANCE SUMMARY* - As of December 31, 2004 |
| | | | | | | | | |
Average Annual Total Return Percentages
| | 1-Year
| | | 3-Year
| | | Since
Inception
| |
SP Alliance Large Cap Growth Portfolio | | 6.10 | % | | -3.30 | % | | -9.20 | % |
Russell 1000 Index1 | | 11.40 | % | | 4.27 | % | | -2.40 | % |
Russell 1000 Growth Index1 | | 6.30 | % | | -0.18 | % | | -10.55 | % |
Lipper (VIP) Large-Cap Growth Funds Average1 | | 8.04 | % | | -0.14 | % | | -9.53 | % |
SP Alliance Large Cap Growth Portfolio inception date: 9/22/2000.
The Portfolio may invest in foreign securities, which are subject to the risks of currency fluctuation and the impact of social, political, and economic change.
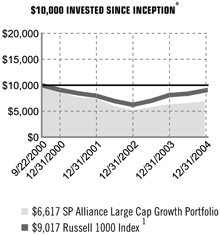
| | | | |
| | | Portfolio
| | r1000
|
22-Sep-00 | | 10,000.0000 | | 10,000.00 |
31-Dec-00 | | 8,556.2900 | | 9,084.57 |
30-Jun-01 | | 7,678.6222 | | 8,444.20 |
31-Dec-01 | | 7,318.2175 | | 7,953.58 |
30-Jun-02 | | 5,826.5425 | | 6,934.12 |
31-Dec-02 | | 5,035.6545 | | 6,231.42 |
30-Jun-03 | | 5,546.2278 | | 7,000.12 |
31-Dec-03 | | 6,237.0034 | | 8,094.04 |
30-Jun-04 | | 6,397.1833 | | 8,363.88 |
31-Dec-04 | | 6,617.4306 | | 9,017.14 |
“For the year ended December 31, 2004, the SP Alliance Large Cap Growth Portfolio had a total return of 6.10%, compared with a total return of 11.40% for the unmanaged Russell 1000 Index, 6.30% for the unmanaged Russell 1000 Growth Index, and 8.04% for the Lipper (VIP) Large-Cap Growth Funds Average.
Stock selection in the healthcare sector had the largest negative impact on the Portfolio’s performance compared with the Russell 1000 Growth Index. A mid-sized position in Forest Laboratories (-27.4%) detracted most. Overweighting the strong consumer discretionary sector and good stock selection within the sector made the greatest positive impact. Large positions in eBay (+80.1%) and Yahoo! (+67.4%) accounted for most of the outperformance.
The Portfolio also strengthened its relative performance in the technology sector. A mid-size position in Marvell Technology Group (+87.0%) contributed most. The Portfolio gained a little ground from good stock selection in the financial services sector, where a small position in Franklin Resources (+34.6%) accounted for most of the outperformance.
Alliance believes that investors are underestimating the outlook for the U.S. economy and corporate profitability, providing an unusual opportunity to buy superior growth companies at little valuation premium. In an environment that seems conducive to further economic and earnings expansion, the premium for growth stocks relative to the broad market is as low as it has been in the past 25 years.”
| * | Unless noted otherwise, Lipper Average and Index returns reflect performance beginning the closest month-end date to the Portfolio’s inception. |
| 1 | For average and index definitions, refer to the Glossary of Benchmark Definitions page. Investors cannot invest directly in a market index or average. |
For a complete list of holdings, refer to the Schedule of Investments section of this report.
| | | | |
The Prudential Series Fund, Inc. | | Annual Report | | December 31, 2004 |
SP Balanced Asset Allocation Portfolio
| n | MANAGED BY: PRUDENTIAL INVESTMENTS LLC |
Past performance does not guarantee future returns. Portfolio performance is net of investment fees and fund expenses, but not product charges, which, if included, would significantly lower the performance quoted. The investment return and principal value of an investment will fluctuate, so that an investor’s shares, when redeemed, may be worth more or less than their original cost. Current performance may be lower or higher than the past performance data quoted.
| n | PERFORMANCE SUMMARY* - As of December 31, 2004 |
| | | | | | | | | |
Average Annual Total Return Percentages
| | 1-Year
| | | 3-Year
| | | Since
Inception
| |
SP Balanced Asset Allocation Portfolio | | 11.09 | % | | 6.43 | % | | 2.63 | % |
S&P 500 Index1 | | 10.87 | % | | 3.58 | % | | -2.38 | % |
Balanced AA Custom Blended Index1 | | 9.89 | % | | 6.57 | % | | 2.65 | % |
Lipper (VIP) Balanced Funds Average1 | | 8.55 | % | | 5.28 | % | | 2.59 | % |
SP Balanced Asset Allocation Portfolio inception date: 9/22/2000.
The Portfolio may invest in foreign securities, which are subject to the risks of currency fluctuation and the impact of social, political, and economic change. The Portfolio may invest in derivative securities, which may carry market, credit, and liquidity risks. These risks may result in greater share price volatility.
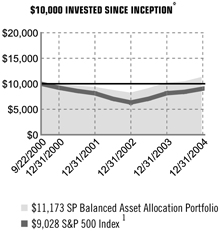
| | | | |
| | | Portfolio
| | SP500
|
22-Sep-00 | | 10,000.0000 | | 10,000.00 |
31-Dec-00 | | 9,857.5257 | | 9,218.11 |
30-Jun-01 | | 9,459.4586 | | 8,601.15 |
31-Dec-01 | | 9,267.4618 | | 8,123.36 |
30-Jun-02 | | 8,607.1148 | | 7,055.06 |
31-Dec-02 | | 8,185.4998 | | 6,328.72 |
30-Jun-03 | | 9,058.0529 | | 7,072.46 |
31-Dec-03 | | 10,057.5621 | | 8,142.99 |
30-Jun-04 | | 10,332.1492 | | 8,423.24 |
31-Dec-04 | | 11,173.0158 | | 9,028.46 |
“For the year ended December 31, 2004, the SP Balanced Asset Allocation Portfolio had a total return of 11.09%, compared with a return of 10.87% for the unmanaged S&P 500 Index, 9.89% for the Balanced AA Custom-Blended Index (48% Russell 3000 Index, 40% Lehman Brothers Aggregate Bond Index, and 12% MSCI EAFE Index), and 8.55% for the Lipper (VIP) Balanced Funds Average.
All of the Portfolio’s segments posted positive returns in 2004. Nonetheless, asset allocation proved to be a dominant factor in determining the Portfolio return because small caps and international stocks significantly outperformed stocks of larger U.S. companies. What’s more, value stocks outperformed growth stocks in both domestic and foreign markets, in large-caps and small-cap stocks. Stocks had a strong year. Analysts estimated that the earnings of companies in the S&P 500 Index grew more than 19% over 2003 levels, driving share prices up.
Bonds performed better than had been expected, particularly high-yield bonds. High-yield bonds are issued by companies whose lower credit ratings require them to pay higher interest rates. Investors turned to them in search of a better return in the generally low-yield environment. They also benefited from the strong global economy, which reduced the premium that less credit-worthy companies had to pay and so increased the value of their bonds.
An overweight in large-cap value versus large-cap growth stocks aided relative performance. Similarly, an allocation to the SP PIMCO High Yield Portfolio aided performance relative to the Lehman Aggregate Index. The Portfolio’s large-cap growth and value managers both outperformed their respective benchmarks for the year, as did the SP PIMCO Total Return Bond Portfolio, which comprises the core fixed income allocation. The Portfolio’s small cap growth allocation underperformed the Russell 2000 Growth Index significantly and was the top detractor from relative performance.”
| * | Unless noted otherwise, Lipper Average and Index returns reflect performance beginning the closest month-end date to the Portfolio’s inception. |
| 1 | For average and index definitions, refer to the Glossary of Benchmark Definitions page. Investors cannot invest directly in a market index or average. |
For a complete list of holdings, refer to the Schedule of Investments section of this report.
| | | | |
The Prudential Series Fund, Inc. | | Annual Report | | December 31, 2004 |
SP Conservative Asset Allocation Portfolio
| n | MANAGED BY: PRUDENTIAL INVESTMENTS LLC |
Past performance does not guarantee future returns. Portfolio performance is net of investment fees and fund expenses, but not product charges, which, if included, would significantly lower the performance quoted. The investment return and principal value of an investment will fluctuate, so that an investor’s shares, when redeemed, may be worth more or less than their original cost. Current performance may be lower or higher than the past performance data quoted.
| n | PERFORMANCE SUMMARY* - As of December 31, 2004 |
| | | | | | | | | |
Average Annual Total Return Percentages
| | 1-Year
| | | 3-Year
| | | Since
Inception
| |
SP Conservative Asset Allocation Portfolio | | 8.89 | % | | 6.09 | % | | 4.38 | % |
S&P 500 Index1 | | 10.87 | % | | 3.58 | % | | -2.38 | % |
Conservative AA Custom Blended Index1 | | 8.04 | % | | 6.56 | % | | 4.34 | % |
Lipper (VIP) Income Funds Average1 | | 8.47 | % | | 6.62 | % | | 4.28 | % |
SP Conservative Asset Allocation Portfolio inception date: 9/22/2000.
The Portfolio may invest in foreign securities, which are subject to the risks of currency fluctuation and the impact of social, political, and economic change. Small and mid-size companies may have limited marketability, and may be subject to more erratic or abrupt market movements than large-cap stocks.
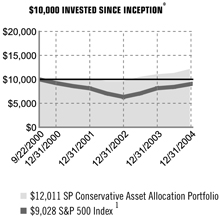
| | | | |
| | | Portfolio
| | SP500
|
22-Sep-00 | | 10,000.0000 | | 10,000.00 |
31-Dec-00 | | 10,083.5468 | | 9,218.11 |
30-Jun-01 | | 9,984.5440 | | 8,601.15 |
31-Dec-01 | | 10,060.4041 | | 8,123.36 |
30-Jun-02 | | 9,551.7901 | | 7,055.06 |
31-Dec-02 | | 9,469.0906 | | 6,328.72 |
30-Jun-03 | | 10,377.9580 | | 7,072.46 |
31-Dec-03 | | 11,030.5274 | | 8,142.99 |
30-Jun-04 | | 11,218.2671 | | 8,423.24 |
31-Dec-04 | | 12,011.1532 | | 9,028.46 |
“For the year ended December 31, 2004, the SP Conservative Asset Allocation Portfolio had a total return of 8.89%, compared with a return of 10.87% for the unmanaged S&P 500 Index, 8.04% for the Conservative AA Custom-Blended Index (32% Russell 3000 Index, 60% Lehman Brothers Aggregate Bond Index, and 8% MSCI EAFE Index), and 8.47% for the Lipper (VIP) Income Funds Average.
The Portfolio uses specialty managers to invest assets in a broad array of stocks and bonds. This diversification among asset classes and styles helped performance in 2004 over a portfolio of primarily large-cap stocks. Small cap and international stocks outperformed stocks of larger U.S. companies significantly. This exposure helped performance, as did our slight overweight of value stocks over growth stocks. Overall, stocks had a strong year. Analysts estimated that earnings of companies in the S&P 500 Index grew more than 19% over 2003 levels, driving share prices up.
Bonds performed better than expected, particularly high-yield. High yield bonds are issued by companies whose lower credit ratings require them to pay higher interest rates. Investors turned to them in search of a better return in the generally low-yielding environments. These bonds also benefited from the strong global economy, which reduced the premium that less credit-worthy companies had to pay and so increased the value of their bonds.
The Portfolio’s large-cap growth and value managers both outperformed their respective benchmarks for the year, as did the SP PIMCO Total Return Bond Portfolio, comprising the core fixed income segment. The Portfolio’s small cap growth allocation underperformed the Russell 2000 Growth Index significantly and was the largest detractor from relative performance.”
| * | Unless noted otherwise, Lipper Average and Index returns reflect performance beginning the closest month-end date to the Portfolio’s inception. |
| 1 | For average and index definitions, refer to the Glossary of Benchmark Definitions page. Investors cannot invest directly in a market index or average. |
For a complete list of holdings, refer to the Schedule of Investments section of this report.
| | | | |
The Prudential Series Fund, Inc. | | Annual Report | | December 31, 2004 |
SP Davis Value Portfolio
| n | MANAGED BY: DAVIS ADVISORS LP |
Past performance does not guarantee future returns. Portfolio performance is net of investment fees and fund expenses, but not product charges, which, if included, would significantly lower the performance quoted. The investment return and principal value of an investment will fluctuate, so that an investor’s shares, when redeemed, may be worth more or less than their original cost. Current performance may be lower or higher than the past performance data quoted.
| n | PERFORMANCE SUMMARY* - As of December 31, 2004 |
| | | | | | | | | |
Average Annual Total Return Percentages
| | 1-Year
| | | 3-Year
| | | Since
Inception
| |
SP Davis Value Portfolio | | 12.53 | % | | 7.07 | % | | 2.64 | % |
S&P 500 Index1 | | 10.87 | % | | 3.58 | % | | -2.38 | % |
Russell 1000 Value Index1 | | 16.49 | % | | 8.57 | % | | 5.42 | % |
Lipper (VIP) Multi-Cap Value Funds Average1 | | 14.62 | % | | 6.62 | % | | 5.01 | % |
Lipper (VIP) Large-Cap Value Funds Average1 | | 11.53 | % | | 4.68 | % | | 3.85 | % |
SP Davis Value Portfolio inception date: 9/22/2000. Although Upper classifies the Portfolio within the Multi-Cap Value Funds Average, the returns for the Large-Cap Value Funds Average are also shown, because the management of the portfolios included in the Large-Cap Value Funds Average is more consistent with the management of the Portfolio.
The Portfolio is not diversified and may not be appropriate for all investors. Investment in a nondiversified portfolio involves greater risks than a diversified investment, because a loss resulting from a particular security will have a greater impact on the Portfolio’s overall return. The Portfolio may actively and frequently trade its portfolio securities. High portfolio turnover results in higher transaction costs and can affect the Portfolio’s performance.

| | | | |
| | | Portfolio
| | SP500
|
22-Sep-00 | | 10,000.0000 | | 10,000.00 |
31-Dec-00 | | 10,168.9094 | | 9,218.11 |
30-Jun-01 | | 9,534.1315 | | 8,601.15 |
31-Dec-01 | | 9,105.4984 | | 8,123.36 |
30-Jun-02 | | 8,250.2292 | | 7,055.06 |
31-Dec-02 | | 7,676.0374 | | 6,328.72 |
30-Jun-03 | | 8,554.6847 | | 7,072.46 |
31-Dec-03 | | 9,933.1647 | | 8,142.99 |
30-Jun-04 | | 10,424.0828 | | 8,423.24 |
31-Dec-04 | | 11,177.3856 | | 9,028.46 |
“For the year ended December 31, 2004, the SP Davis Value Portfolio had a total return of 12.53%, compared with the return of 10.87% for the unmanaged S&P 500 Index, 16.49% for the unmanaged Russell 1000 Value Index, 14.62% for the Lipper (VIP) Multi-Cap Value Funds Average, and 11.53% for the Lipper (VIP) Large-Cap Value Funds Average.
All of the Portfolio’s holdings in the consumer staples sector performed well particularly Altria Group (+18.38%) and Costco Wholesale (+31.15%). However, a number of positions in the financial services sector pulled down performance, including Fifth Third Bancorp (-17.93%), Marsh & McLennan (-25.80% since being added to the Portfolio in June), and Transatlantic Holdings (-3.77%). Other holdings in the financial services sector turned in strong performances, notably American Express (+17.60%), CenterPoint Properties (+32.93%), and Loews (+43.59%). Overall, the Portfolio’s substantial holdings in the sector trailed the S&P 500 Index by a small margin. The Portfolio benefited from having only limited exposure to information technology companies, which generally underperformed the broader market in 2004. The largest positive contribution to the Portfolio’s performance in the sector came from Lexmark International (+8.09%). The largest detractor was Iron Mountain (-8.74%) since being purchased in September. Other important contributors to performance included industrials company Tyco International (+35.41%) and energy company ConocoPhillips (+35.60%). Important detractors included two healthcare companies, Pfizer (-24.68%) before being sold in December) and Eli Lilly (+17.55%).
Davis has built a portfolio that is quite different in composition from the S&P 500 Index. Its strategy is to perform extensive research, to buy companies with expanding earnings at value prices, and the to hold them for the long term.”
| * | Unless noted otherwise, Lipper Average and Index returns reflect performance beginning the closest month-end date to the Portfolio’s inception. |
| 1 | For average and index definitions, refer to the Glossary of Benchmark Definitions page. Investors cannot invest directly in a market index or average. |
For a complete list of holdings, refer to the Schedule of Investments section of this report.
| | | | |
.The Prudential Series Fund, Inc. | | Annual Report | | December 31, 2004 |
SP Goldman Sachs Small Cap Value Portfolio1
| n | MANAGED BY: GOLDMAN SACHS ASSET MANAGEMENT, LP |
Past performance does not guarantee future returns. Portfolio performance is net of investment fees and fund expenses, but not product charges, which, if included, would significantly lower the performance quoted. The investment return and principal value of an investment will fluctuate, so that an investor’s shares, when redeemed, may be worth more or less than their original cost. Current performance may be lower or higher than the past performance data quoted.
| n | PERFORMANCE SUMMARY* - As of December 31, 2004 |
| | | | | | | | | |
Average Annual Total Return Percentages
| | 1-Year
| | | 3-Year
| | | Since
Inception
| |
SP Goldman Sachs Small Cap Value Portfolio1 | | 20.69 | % | | 11.21 | % | | 11.27 | % |
Russell 2500 Index2 | | 18.29 | % | | 12.27 | % | | 7.87 | % |
Lipper (VIP) Small-Cap Value Funds Average2 | | 20.64 | % | | 15.40 | % | | 15.97 | % |
SP Goldman Sachs Small Cap Value Portfolio inception date: 9/22/2000. Although Lipper classifies the Portfolio in the Mid-Cap Value Funds Average, the returns for the Small-Cap Value Funds Average are shown because the management of the portfolios in the Small-Cap Value Funds Average is more consistent with the management of the Portfolio.
The Portfolio may invest in foreign securities, which are subject to the risks of currency fluctuation and the impact of social, political, and economic change. Small and mid-size companies may have limited marketability, and may be subject to more erratic or abrupt market movements than large-cap stocks.
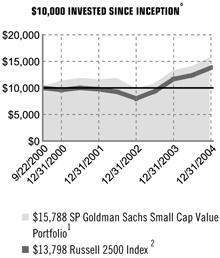
| | | | |
| | | Portfolio
| | r2500
|
22-Sep-00 | | 10,000.0000 | | 10,000.00 |
31-Dec-00 | | 11,132.9148 | | 9,633.63 |
30-Jun-01 | | 11,644.0610 | | 10,003.89 |
31-Dec-01 | | 11,479,0707 | | 9,751.16 |
30-Jun-02 | | 11,802.4248 | | 9,242.26 |
31-Dec-02 | | 9,828.2680 | | 8,015.93 |
30-Jun-03 | | 10,705.3703 | | 9,372.41 |
31-Dec-03 | | 13,082.0844 | | 11,663.92 |
30-Jun-04 | | 13,874.4624 | | 12,391.62 |
31-Dec-04 | | 15,788.1813 | | 13,797.71 |
“For the year ended December 31, 2004, the SP Goldman Sachs Small Cap Value (formerly SP Small/Midcap Value) Portfolio had a total return of 20.69%, compared with a return of 22.25% for the unmanaged Russell 2000 Value Index, 18.29% for the unmanaged Russell 2500 Index, and 20.64% for the Lipper (VIP) Small-Cap Value Funds Average. Goldman Sachs assumed management of the Portfolio from Fidelity Investments on January 20, 2004.
During the period Goldman Sachs managed the Portfolio, the Portfolio posted strong positive results and outperformed the Russell 2000 Value Index. Stock selection was mixed as transportation, financials, and energy holdings contributed positively to returns, while industrials and consumer cyclicals detracted. In energy, Range Resources, an explorer and developer of oil and gas properties, emerged as a top contributor after it announced the purchase of Appalachian oil and gas properties. In financials, Accredited Home Lenders made a significant contribution after it issued a better-than-expected outlook for 2005. The California-based mortgage bank cited its exposure to less-volatile loan origination markets, internal cost discipline, and portfolio growth as key drivers to its success in a variety of market conditions. Among transportation holdings, oil tanker company OMI was a top performer. It has been expanding its double-hulled fleet. It announced substantially higher revenues through 2004, benefiting from increased world oil demand that has sustained high freight rates.
Among industrials, GrafTech International, a synthetic and natural graphite and carbon manufacturer, detracted from performance. Its shares declined when earnings estimates were reduced on expectations that the price increase on graphite electrodes would not be as significant as was believed initially. Consumer cyclicals such as Gymboree and Concord Camera were also a drag on results. Gymboree, a specialty retailer of children’s apparel, reported weaker-than-expected earnings. Delays in product introductions caused Concord Camera, an image capture manufacturer, to lose market share. The position in Concord Camera was sold on concerns that this might be a longer term issue for the company.”
| * | Unless noted otherwise, Lipper Average and Index returns reflect performance beginning the closest month-end date to the Portfolio’s inception. |
| 1 | Prior to 1/20/04, the SP Goldman Sachs Small Cap Value Portfolio was known as the SP Small/Mid Cap Value Portfolio and Fidelity Investments served as Sub-Advisor to the Portfolio. Performance information shown reflects Fidelity Investments’ management of the Portfolio. |
| 2 | For average and index definitions, refer to the Glossary of Benchmark Definitions page. Investors cannot invest directly in a market index or average. |
For a complete list of holdings, refer to the Schedule of Investments section of this report.
| | | | |
The Prudential Series Fund, Inc. | | Annual Report | | December 31, 2004 |
SP Growth Asset Allocation Portfolio
| n | MANAGED BY: PRUDENTIAL INVESTMENTS LLC |
Past performance does not guarantee future returns. Portfolio performance is net of investment fees and fund expenses, but not product charges, which, if included, would significantly lower the performance quoted. The investment return and principal value of an investment will fluctuate, so that an investor’s shares, when redeemed, may be worth more or less than their original cost. Current performance may be lower or higher than the past performance data quoted.
| n | PERFORMANCE SUMMARY* - As of December 31, 2004 |
| | | | | | | | | |
Average Annual Total Return Percentages
| | 1-Year
| | | 3-Year
| | | Since
Inception
| |
SP Growth Asset Allocation Portfolio | | 13.05 | % | | 6.26 | % | | 0.24 | % |
S&P 500 Index1 | | 10.87 | % | | 3.58 | % | | -2.38 | % |
Growth AA Custom Blended Index1 | | 11.73 | % | | 6.45 | % | | 0.85 | % |
Lipper (VIP) Multi-Cap Core Funds Average1 | | 12.06 | % | | 4.40 | % | | -1.11 | % |
SP Growth Asset Allocation Portfolio inception date: 9/22/2000.
The Portfolio may invest in foreign securities, which are subject to the risks of currency fluctuation and the impact of social, political, and economic change. Small and mid-size companies may have limited marketability, and may be subject to more erratic or abrupt market movements than large-cap stocks.
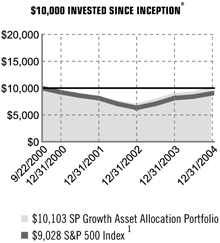
| | | | |
| | | Portfolio
| | SP500
|
22-Sep-00 | | 10,000.0000 | | 10,000.00 |
31-Dec-00 | | 9,544.4085 | | 9,218.11 |
30-Jun-01 | | 8,840.3122 | | 8,601.15 |
31-Dec-01 | | 8,420.7449 | | 8,123.36 |
30-Jun-02 | | 7,659.6866 | | 7,055.06 |
31-Dec-02 | | 6,967.0554 | | 6,328.72 |
30-Jun-03 | | 7,767.1814 | | 7,072.46 |
31-Dec-03 | | 8,936.8759 | | 8,142.99 |
30-Jun-04 | | 9,247.4716 | | 8,423.24 |
31-Dec-04 | | 10,103.1462 | | 9,028.46 |
“For the year ended December 31, 2004, the SP Growth Asset Allocation Portfolio had a total return of 13.05%, compared with a return of 10.87% for the unmanaged S&P 500 Index, 11.73% for the Growth AA Custom-Blended Index (64% Russell 3000 Index, 20% Lehman Brothers Aggregate Bond Index, and 16% MSCI EAFE Index), and 12.06% for the Lipper (VIP) Multi-Cap Core Funds Average.
All of the Portfolio’s segments posted positive returns in 2004. Nonetheless, asset allocation proved to be a dominant factor in determining the Portfolio return because small caps and international stocks significantly outperformed stocks of larger U.S. companies. What’s more, value stocks outperformed growth stocks in both domestic and foreign markets, in large-caps and small-cap stocks. Stocks had a strong year. Analysts estimated that the earnings of companies in the S&P 500 Index grew more than 19% over 2003 levels, driving share prices up.
Bonds performed better than had been expected, particularly high-yield bonds. High-yield bonds are issued by companies whose lower credit ratings require them to pay higher interest rates. Investors turned to them in search of a better return in the generally low-yield environment. They also benefited from the strong global economy, which reduced the premium that less credit-worthy companies had to pay and so increased the value of their bonds.
An overweight in large-cap value versus large-cap growth aided relative performance. Similarly, an allocation to the SP PIMCO High Yield Portfolio aided performance relative to the Lehman Aggregate Index. The Portfolio’s large-cap growth and value managers both outperformed their respective benchmarks for the year, as did the SP PIMCO Total Return Bond portfolio, which comprises the core fixed income allocation. The Portfolio’s small cap growth allocation underperformed the Russell 2000 Growth Index significantly and was the top detractor from relative performance.”
| * | Unless noted otherwise, Lipper Average and Index returns reflect performance beginning the closest month-end date to the Portfolio’s inception. |
| 1 | For average and index definitions, refer to the Glossary of Benchmark Definitions page. Investors cannot invest directly in a market index or average. |
For a complete list of holdings, refer to the Schedule of Investments section of this report.
| | | | |
The Prudential Series Fund, Inc. | | Annual Report | | December 31, 2004 |
SP Large Cap Value Portfolio
| n | MANAGED BY: JP MORGAN FLEMING ASSET MANAGEMENT; and HOTCHKIS AND WILEY CAPITAL MANAGEMENT LLC |
Past performance does not guarantee future returns. Portfolio performance is net of investment fees and fund expenses, but not product charges, which, if included, would significantly lower the performance quoted. The investment return and principal value of an investment will fluctuate, so that an investor’s shares, when redeemed, may be worth more or less than their original cost. Current performance may be lower or higher than the past performance data quoted.
| n | PERFORMANCE SUMMARY* - As of December 31, 2004 |
| | | | | | | | | |
Average Annual Total Return Percentages
| | 1-Year
| | | 3-Year
| | | Since
Inception
| |
SP Large Cap Value Portfolio | | 17.75 | % | | 7.67 | % | | 4.26 | % |
Russell 1000 Index1 | | 11.40 | % | | 4.27 | % | | -2.40 | % |
Russell 1000 Value Index1 | | 16.49 | % | | 8.57 | % | | 5.42 | % |
Lipper (VIP) Large-Cap Value Funds Average1 | | 11.53 | % | | 4.68 | % | | 3.85 | % |
Lipper (VIP) Multi-Cap Value Funds Average1 | | 14.62 | % | | 6.62 | % | | 5.01 | % |
SP Large Cap Value Portfolio inception date: 9/22/2000.
The Portfolio may invest in foreign securities, which are subject to the risks of currency fluctuation and the impact of social, political, and economic change.
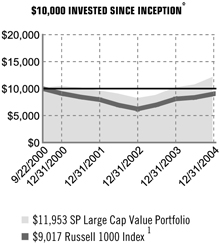
| | | | |
| | | Portfolio
| | r1000
|
22-Sep-00 | | 10,000.0000 | | 10,000.00 |
31-Dec-00 | | 10,481.9578 | | 9,084.57 |
30-Jun-01 | | 10,099.2644 | | 8,444.20 |
31-Dec-01 | | 9,575.5006 | | 7,953.58 |
30-Jun-02 | | 9,068.3237 | | 6,934.12 |
31-Dec-02 | | 8,008.3516 | | 6,231.42 |
30-Jun-03 | | 8,756.8916 | | 7,000.12 |
31-Dec-03 | | 10,151.4317 | | 8,094.04 |
30-Jun-04 | | 10,598.7995 | | 8,363.88 |
31-Dec-04 | | 11,953.3778 | | 9,017.14 |
“For the year ended December 31, 2004, the SP Large Cap Value Portfolio had a total return of 17.75%, compared with 11.40% for the unmanaged Russell 1000 Index, 16.49% for the unmanaged Russell 1000 Value Index, 11.53% for the Lipper (VIP) Large-Cap Value Funds Average, and 14.62% for the Lipper (VIP) Multi-Cap Value Funds Average. Management of the Portfolio was assumed by JPMorgan Fleming Asset Management and Hotchkis and Wiley Capital Management on January 20, 2004.
During the period JPMorgan Fleming managed their segment of the Portfolio, it performed essentially in line with the Russell 1000 Value Index. On JPMorgan Fleming’s proprietary 20-sector model, stock selection improved its performance relative to the Index in the pharmaceutical/medical technology, industrial cyclical and capital market sectors, while selection in consumer staples, media, and energy had a negative impact. At the security level, the Portfolio was helped by overweights relative to the Index in Sepracor, TXU, and Norfolk, while overweights in Coca-Cola and Viacom and an underweight in Apple detracted from performance.
During the period Hotchkis and Wiley managed its segment of the Portfolio, it benefited from their stock selection within the consumer discretionary sector. J.C. Penney and Mandalay Resort Group were the strongest performers, posting double-digit gains. J.C. Penney gained on news that sale of the company’s troubled Eckerd division was finalized; Mandalay Resort Group benefited from a buyout offer from one of its rivals as well as an overall increase in travel.
In addition, stock selection within the financials sector helped performance as MetLife and UnumProvident made solid gains. Weakness in the segment was primarily due to stock selection within the materials sector. Alcoa, the segment’s largest detractor from performance, declined as analysts lowered their earnings forecasts for the company. At the same time, investors appeared concerned about the impact of slower Chinese demand for commodities in general.”
| * | Unless noted otherwise, Lipper Average and Index returns reflect performance beginning the closest month-end date to the Portfolio’s inception. |
| 1 | For average and index definitions, refer to the Glossary of Benchmark Definitions page. Investors cannot invest directly in a market index or average. |
For a complete list of holdings, refer to the Schedule of Investments section of this report.
| | | | |
The Prudential Series Fund, Inc. | | Annual Report | | December 31, 2004 |
SP LSV International Value Portfolio
| n | MANAGED BY: LSV ASSET MANAGEMENT |
Past performance does not guarantee future returns. Portfolio performance is net of investment fees and fund expenses, but not product charges, which, if included, would significantly lower the performance quoted. The investment return and principal value of an investment will fluctuate, so that an investor’s shares, when redeemed, may be worth more or less than their original cost. Current performance may be lower or higher than the past performance data quoted.
| n | PERFORMANCE SUMMARY* - As of December 31, 2004 |
| | | | | | | | | |
Average Annual Total Return Percentages
| | 1-Year
| | | 3-Year
| | | Since
Inception
| |
SP LSV International Value Portfolio | | 15.80 | % | | 6.90 | % | | -2.37 | % |
MSCI EAFE Index1 | | 20.25 | % | | 11.89 | % | | 1.63 | % |
Lipper (VIP) International Value Funds Average1 | | 20.75 | % | | 13.12 | % | | 4.22 | % |
SP LSV International Value Portfolio inception date: 9/22/2000. A portion of the expenses of the Portfolio is subsidized. Absent such expense absorption, the performance quoted would be lower. Expense absorption may be discontinued at any time.
Foreign investments are subject to the risks of currency fluctuation and the impact of social, political, and economic change, which may result in greater share price volatility.
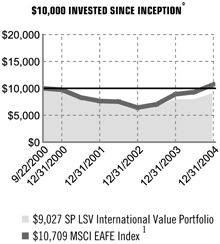
| | | | |
| | | Portfolio
| | MSCIEI
|
22-Sep-00 | | 10,000.0000 | | 10,000.00 |
31-Dec-00 | | 9,480.0000 | | 9,731.66 |
30-Jun-01 | | 8,199.1699 | | 8,309.94 |
31-Dec-01 | | 7,388.2124 | | 7,644.93 |
30-Jun-02 | | 7,307.6869 | | 7,520.94 |
31-Dec-02 | | 6,119.9361 | | 6,426.33 |
30-Jun-03 | | 6,439.4755 | | 7,035.06 |
31-Dec-03 | | 7,794.8083 | | 8,905.98 |
30-Jun-04 | | 7,934.0549 | | 9,312.40 |
31-Dec-04 | | 9,026.6467 | | 10,709.18 |
“For the year ended December 31, 2004, the SP LSV International Value Portfolio (formerly SP Deutsche International Equity Portfolio) had a total return of 15.80%, trailing the return of 20.25% for the unmanaged MSCI EAFE Index and 20.75% for the Lipper (VIP) International Value Funds Average. Management of the Portfolio was transferred from Deutsche to LSV on November 19, 2004.
During the period Deutsche managed the Portfolio, which covered most of the year, the Portfolio had a positive return, but trailed the total return of the EAFE Index. Stock selection in the consumer discretionary, healthcare, and consumer staples sectors detracted most from performance. Disappointing Japanese domestic demand as well as concerns about the U.S. consumer hurt consumer electronics holdings Philips Electronics and Sharp. Consumer staples positions Nestle and Henkel were affected by higher costs and competitive pressures on their margins, while William Morrison Supermarkets had difficulty improving the profitability of Safeway, which it acquired in March. Healthcare holdings were generally weak, primarily because of investor concerns about product pipelines and pricing regulation in large-cap pharmaceuticals. The largest positive factors in performance were overweights in the technology, materials, and energy sectors as compared with the EAFE Index. Stock selection in technology benefited from positions in Ericsson, Samsung, and Hoya China’s build-out of its infrastructure helped the Portfolio’s materials holdings BHP Billiton and CVRD, as well as its steel producer Nippon Steel. Although the Portfolio had a position in Yukos for part of the period, the negative impact on its energy return was largely offset by gains on ENI, Lukoil, Total, and Statoil.
For the brief part of 2004 that LSV managed the Portfolio, it modestly outperformed the EAFE Index during a time when the Index itself rose substantially. The Portfolio’s value orientation was beneficial, as were several large positions, particularly European financials, two European utilities, and two auto-related stocks, Toyota and Michelin. LSV seeks to buy undervalued companies that appear to be emerging from extended periods of poor financial and stock price performance. The Portfolio is broadly diversified by country, sector, and industry to mitigate the volatility associated with concentration. At the end of 2004, it had exposure to twenty countries and was most heavily invested in the United Kingdom and Japan. It was invested in all 10 economic sectors, with emphases in the financials, consumer discretionary, and utility sectors.”
| * | Unless noted otherwise, Lipper Average and Index returns reflect performance beginning the closest month-end date to the Portfolio’s inception. |
| 1 | For average and index definitions, refer to the Glossary of Benchmark Definitions page. Investors cannot invest directly in a market index or average. |
For a complete list of holdings, refer to the Schedule of Investments section of this report.
| | | | |
The Prudential Series Fund, Inc. | | Annual Report | | December 31, 2004 |
SP MFS Capital Opportunities Portfolio
| n | MANAGED BY: MASSACHUSETTS FINANCIAL SERVICES COMPANY [MFS] |
Past performance does not guarantee future returns. Portfolio performance is net of investment fees and fund expenses, but not product charges, which, if included, would significantly lower the performance quoted. The investment return and principal value of an investment will fluctuate, so that an investor’s shares, when redeemed, may be worth more or less than their original cost. Current performance may be lower or higher than the past performance data quoted.
| n | PERFORMANCE SUMMARY* - As of December 31, 2004 |
| | | | | | | | | |
Average Annual Total Return Percentages
| | 1-Year
| | | 3-Year
| | | Since
Inception
| |
SP MFS Capital Opportunities Portfolio | | 12.39 | % | | 0.55 | % | | -7.57 | % |
S&P 500 Index1 | | 10.87 | % | | 3.58 | % | | -2.38 | % |
Russell 1000 Index1 | | 11.40 | % | | 4.27 | % | | -2.40 | % |
Lipper (VIP) Large-Cap Core Funds Average1 | | 8.59 | % | | 1.93 | % | | -3.75 | % |
Lipper (VIP) Multi-Cap Core Funds Average1 | | 12.06 | % | | 4.40 | % | | -1.11 | % |
SP MFS Capital Opportunities Portfolio inception date: 9/22/2000. Although Lipper classifies the Portfolio within the Multi-Cap Core Funds Average, the returns for the Large-Cap Core Funds Average are also shown, because the management of the portfolios included in the Large-Cap Core Funds Average is more consistent with the management of the Portfolio. A portion of the expenses of the Portfolio is subsidized. Absent such expense absorption, the performance quoted would be lower. Expense absorption may be discontinued at any time.
The Portfolio may invest in foreign securities, which are subject to the risks of currency fluctuation and the impact of social, political, and economic change. The Portfolio may actively and frequently trade its portfolio securities. High portfolio turnover results in higher transaction costs and can affect the Portfolio’s performance.
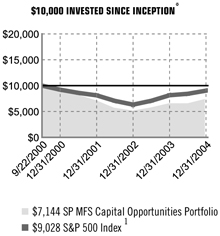
| | | | |
| | | Portfolio
| | SP500
|
22-Sep-00 | | 10,000.0000 | | 10,000.00 |
31-Dec-00 | | 9,160.5597 | | 9,218.11 |
30-Jun-01 | | 8,050.7420 | | 8,601.15 |
31-Dec-01 | | 7,027.8513 | | 8,123.36 |
30-Jun-02 | | 5,674.4135 | | 7,055.06 |
31-Dec-02 | | 5,012.7327 | | 6,328.72 |
30-Jun-03 | | 5,673.4607 | | 7,072.46 |
31-Dec-03 | | 6,356.2843 | | 8,142.99 |
30-Jun-04 | | 6,570.3574 | | 8,423.24 |
31-Dec-04 | | 7,143.8802 | | 9,028.46 |
“For the year ended December 31, 2004, the SP MFS Capital Opportunities Portfolio had a total return of 12.39%, compared with the return of 10.87% for the unmanaged S&P 500 Index, 11.40% for the unmanaged Russell 1000 Index, and 12.06% for the Lipper (VIP) Multi-Cap Core Funds Average.
Holdings in the utilities and communications, basic materials, and healthcare sectors were the strongest contributors to the Portfolio’s outperformance of the S&P 500 Index. Stock selection in the utilities and communications sector contributed most. (MFS uses a proprietary 13-sector classification.) AT&T Wireless was the Portfolio’s strongest relative performer. A position in Sprint also was among the larger contributors. In the basic materials sector, Owens-Illinois, a manufacturer of packaging products, helped boost relative return, as did a position the Brazilian mining company Companhia Vale do Rio Doce, a stock not in the S&P 500. The Portfolio’s relative performance was also helped by the fact it had no position in semiconductor giant Intel and an underweight position in the large pharmaceutical company Pfizer. Both are companies with large capitalizations (the total value of a company’s outstanding stock). Their steep declines in 2004 pulled down the capitalization-weighted S&P 500 Index. As of period end AT&T Wireless was no longer in the portfolio.
The Portfolio’s weakest performance was in its leisure and technology exposure. Selection among leisure stocks was poor. To a smaller extent, the Portfolio’s overweight in the leisure sector also hurt its relative performance. Its overweight in media giant Viacom was the largest single detractor. In the technology sector, both stock selection and an overweight hurt performance. An overweight position in the semiconductor company PMC-Sierra hurt results when the company’s profits fell in a general slowdown in the semiconductor chip industry. Positions in Nortel Networks, a global maker of telecommunications equipment, and Linux software provider Red Hat (neither of which is in the S&P 500) also reduced the Portfolio’s relative performance. As of period-end Red Hat was no longer a holding.”
| * | Unless noted otherwise, Lipper Average and Index returns reflect performance beginning the closest month-end date to the Portfolio’s inception. |
| 1 | For average and index definitions, refer to the Glossary of Benchmark Definitions page. Investors cannot invest directly in a market index or average. |
For a complete list of holdings, refer to the Schedule of Investments section of this report.
| | | | |
The Prudential Series Fund, Inc. | | Annual Report | | December 31, 2004 |
SP Mid Cap Growth Portfolio
| n | MANAGED BY: CALAMOS ADVISORS LLC |
Past performance does not guarantee future returns. Portfolio performance is net of investment fees and fund expenses, but not product charges, which, if included, would significantly lower the performance quoted. The investment return and principal value of an investment will fluctuate, so that an investor’s shares, when redeemed, may be worth more or less than their original cost. Current performance may be lower or higher than the past performance data quoted.
| n | PERFORMANCE SUMMARY* - As of December 31, 2004 |
| | | | | | | | | |
Average Annual Total Return Percentages
| | 1-Year
| | | 3-Year
| | | Since
Inception
| |
SP Mid Cap Growth Portfolio | | 19.55 | % | | -3.49 | % | | -8.16 | % |
Russell Midcap Index1 | | 20.22 | % | | 12.17 | % | | 6.06 | % |
Russell Midcap Growth Index1 | | 15.48 | % | | 6.16 | % | | -7.04 | % |
Lipper (VIP) Mid-Cap Growth Funds Average1 | | 14.75 | % | | 3.54 | % | | -7.35 | % |
Lipper (VIP) Multi-Cap Growth Funds Average1 | | 10.40 | % | | 1.86 | % | | -9.73 | % |
SP Mid Cap Growth Portfolio inception date: 9/22/2000. Although Upper classifies the Portfolio in the Multi-Cap Growth Funds Average, the returns for the Mid-Gap Growth Funds Average is also shown because the management of the portfolios in the Mid-Cap Growth Funds Average is more consistent with the management of the Portfolio. A portion of the expenses of the Portfolio is subsidized. Absent such expense absorption, the performance quoted would be lower. Expense absorption may be discontinued at any time.
Small and mid-size companies may have limited marketability, and may be subject to more erratic or abrupt market movements than large-cap stocks. The Portfolio is not diversified and may not be appropriate for all investors. Investment in a nondiversified portfolio involves greater risks than a diversified investment, because a loss resulting from a particular security will have a greater impact on the Portfolio’s overall return.
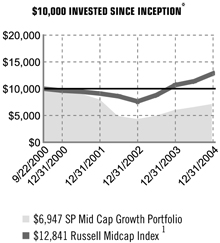
| | | | |
| | | Portfolio
| | rsmci
|
22-Sep-00 | | 10,000.0000 | | 10,000.00 |
31-Dec-00 | | 9,773.7902 | | 9,641.34 |
30-Jun-01 | | 9,046.6227 | | 9,452.27 |
31-Dec-01 | | 7,728.1687 | | 9,099.12 |
30-Jun-02 | | 4,746.4343 | | 8,579.85 |
31-Dec-02 | | 4,148.0590 | | 7,626.42 |
30-Jun-03 | | 4,847.8538 | | 8,805.90 |
31-Dec-03 | | 5,811.3394 | | 10,681.50 |
30-Jun-04 | | 6,348.8630 | | 11,393.61 |
31-Dec-04 | | 6,947.2382 | | 12,841.06 |
“For the year ended December 31, 2004, the SP Mid Cap Growth Portfolio had a total return of 19.55%, compared with 20.22% for the unmanaged Russell Midcap Index, 15.48% for the unmanaged Russell Midcap Growth Index, 14.75% for the Lipper (VIP) Mid-Cap Growth Funds Average, and 10.40% for the Lipper (VIP) Multi-Cap Growth Funds Average.
Calamos’ top-down strategy was to take advantage of more cyclical industries (those whose earnings usually reflect the pace of the overall economy) while remaining invested in high quality, strong cash flow-generating companies that benefit from productivity gains and from increasing capital expenditures. Accordingly, the Portfolio emphasized the information technology, consumer discretionary, and telecommunication services sectors, and underweighted the industrials, materials, consumer staples, and financials sectors as compared with the Russell Midcap Growth Index. The underweight in financials was primarily due to Calamos’ concerns about the impact of rising interest rates. While technology was a poor sector for the indexes in 2004, the Portfolio’s emphasis on this sector was positive in both absolute terms and relative to the indexes due to Calamos’ strong bottom-up security selection within the sector. Stocks such as Apple Computer, Research in Motion, and Autodesk were among the best performers for the year. Consumer discretionary stocks performed well both in the Russell Midcap Growth Index and the Portfolio. The Portfolio’s consumer discretionary stocks had its highest sector return because of positions in companies such as Harman International, XM Satellite Radio, and Coach. Healthcare and energy were two sectors where Calamos attempted to have a more neutral weight relative to the benchmark throughout the year. Both sectors turned in strong performances in 2004. Valero Energy and Sepracor were among the Portfolio’s better-performing positions in these sectors. Some holdings disappointed, detracting from the Portfolio’s return and hurting its performance relative to its benchmarks. Among those were Martek Bioscience, Ameritrade Holding, Broadcom, and Sandisk.”
| * | Unless noted otherwise, Lipper Average and Index returns reflect performance beginning the closest month-end date to the Portfolio’s inception. |
| 1 | For average and index definitions, refer to the Glossary of Benchmark Definitions page. Investors cannot invest directly in a market index or average. |
For a complete list of holdings, refer to the Schedule of Investments section of this report.
| | | | |
The Prudential Series Fund, Inc. | | Annual Report | | December 31, 2004 |
SP PIMCO High Yield Portfolio
| n | MANAGED BY: PACIFIC INVESTMENT MANAGEMENT COMPANY LLC |
Past performance does not guarantee future returns. Portfolio performance is net of investment fees and fund expenses, but not product charges, which, if included, would significantly lower the performance quoted. The investment return and principal value of an investment will fluctuate, so that an investor’s shares, when redeemed, may be worth more or less than their original cost. Current performance may be lower or higher than the past performance data quoted.
| n | PERFORMANCE SUMMARY* - As of December 31, 2004 |
| | | | | | | | | |
Average Annual Total Return Percentages
| | 1-Year
| | | 3-Year
| | | Since
Inception
| |
SP PIMCO High Yield Portfolio | | 9.32 | % | | 10.26 | % | | 8.55 | % |
M-L U.S. High Yield Master II BB-B Rated Index1 | | 9.93 | % | | 10.09 | % | | 7.36 | % |
Lehman Intermediate BB Corp. Index1 | | 8.55 | % | | 8.25 | % | | 8.18 | % |
Lipper (VIP) High Current Yield Funds Average1 | | 9.84 | % | | 10.63 | % | | 6.04 | % |
SP PIMCO High Yield Portfolio inception date 9/22/2000.
The Portfolio may invest in foreign securities, which are subject to the risks of currency fluctuation and the impact of social, political, and economic change. High yield bonds, also known as “junk” bonds, are subject to great credit and market liquidity risks, which may result in greater share price volatility.
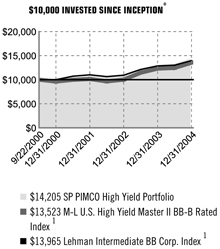
| | | | | | |
| | | Portfolio
| | Lehman Brothers
Intermediate BB Corp.
| | Merrill Lynch US High Yld
Master II BB-B Rated Index
|
22-Sep-00 | | 10,000.0000 | | 10,000.00 | | 10,000.00 |
31-Dec-00 | | 10,193.6066 | | 9,993.68 | | 9,617.15 |
30-Jun-01 | | 10,245.9459 | | 10,727.24 | | 9,970.20 |
31-Dec-01 | | 10,598.1825 | | 11,009.74 | | 10,136.44 |
30-Jun-02 | | 10,254.4164 | | 10,639.80 | | 9,667.80 |
31-Dec-02 | | 10,614.1930 | | 10,932.46 | | 10,005.25 |
30-Jun-03 | | 12,165.5221 | | 12,125.80 | | 11,454.00 |
31-Dec-03 | | 12,993.3381 | | 12,864.99 | | 12,301.30 |
30-Jun-04 | | 13,020.6689 | | 13,019.86 | | 12446.95136 |
31-Dec-04 | | 14,204.7076 | | 13,965.11 | | 13522.95884 |
“Throughout the reporting period, volatility in the high yield bond market remained low, especially in contrast to the amplified price movement experienced by high yield investors over the past few years. Technical factors continued to provide a tailwind to the high yield market as investors globally looked to the asset class to provide additional yield in their portfolios in an environment in which few fixed income sectors could fill this void. Improving fundamentals also drove high yield returns in 2004 as corporations continued to shore-up their balance sheets and the default rate fell to levels not seen in nearly seven years.
The Portfolio lagged its benchmark during the reporting period. Allocations to BBB-rated issues detracted from returns as lower quality bonds outperformed during the year. An overweight in the utility and energy sector was a strong contributor to performance as energy prices benefited from the rising tide of a commodities bull market throughout most of 2004. Given the highly indebted position of the US consumer, we maintained an underweight to consumer cyclicals, which contributed to performance as this sector lagged the broader high yield market. Additionally, positive security selection partially offset the negative effects of an overweight to the cable/pay TV sector. As equipment bonds outperformed, led by diversified capital goods, an underweight to the sector was a slight detriment to relative performance.
With respectable technicals and an improving credit environment balanced by tight spreads, yield is likely to be the driving factor for performance in 2005. The Portfolio is expected to maintain shorter than index duration and deploy, where feasible, into intermediate maturities where lower correlation to Treasurys exists. The outlook is still negative on consumer cyclical sectors as monetary and fiscal stimulus decline. The utility and energy sectors continue to offer attractive value, especially among secured issues, due to strong asset quality. Significant balance sheet improvement and potential ratings upgrades result in attractive total return opportunities in the pipeline sector. The turnaround in the telecommunications and cable sectors will likely continue and valuations remain attractive. Finally, the Portfolio is expeced to maintain out-of-index allocations to emerging markets and Euro high yield, where attractive opportunities exist to complement traditional high yield bonds.”
| * | Unless noted otherwise, Lipper Average and Index returns reflect performance beginning the closest month-end date to the Portfolio’s inception. |
| 1 | For average and index definitions, refer to the Glossary of Benchmark Definitions page. Investors cannot invest directly in a market index or average. |
| For | a complete list of holdings, refer to the Schedule of Investments section of this report. |
| | | | |
The Prudential Series Fund, Inc. | | Annual Report | | December 31, 2004 |
SP PIMCO Total Return Portfolio
| n | MANAGED BY: PACIFIC INVESTMENT MANAGEMENT COMPANY LLC |
Past performance does not guarantee future returns. Portfolio performance is net of investment fees and fund expenses, but not product charges, which, if included, would significantly lower the performance quoted. The investment return and principal value of an investment will fluctuate, so that an investor’s shares, when redeemed, may be worth more or less than their original cost. Current performance may be lower or higher than the past performance data quoted.
| n | PERFORMANCE SUMMARY* - As of December 31, 2004 |
| | | | | | | | | |
Average Annual Total Return Percentages
| | 1-Year
| | | 3-Year
| | | Since
Inception
| |
SP PIMCO Total Return Portfolio | | 5.28 | % | | 6.83 | % | | 8.06 | % |
Lehman Brothers U.S. Aggregate Bond Index1 | | 4.34 | % | | 6.19 | % | | 7.38 | % |
Lipper (VIP) Intermediate Investment-Grade Debt Funds Average1 | | 4.22 | % | | 5.97 | % | | 7.05 | % |
SP PIMCO Total Return Portfolio inception date: 9/22/2000.
The Portfolio may invest in foreign securities, which are subject to the risks of currency fluctuation and the impact of social, political, and economic change. High yield bonds, also known as “junk” bonds, are subject to great credit and market liquidity risks, which may result in greater share price volatility.
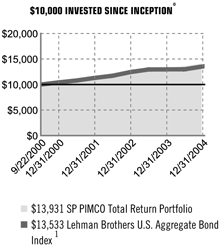
| | | | |
| | | Portfolio
| | Lehman
Brothers US
Aggregate
Bond
|
22-Sep-00 | | 10,000.0000 | | 10,000.00 |
31-Dec-00 | | 10,517.7478 | | 10,420.55 |
30-Jun-01 | | 10,847.7482 | | 10,797.43 |
31-Dec-01 | | 11,428.1201 | | 11,300.50 |
30-Jun-02 | | 11,779.5975 | | 11,728.88 |
31-Dec-02 | | 12,501.1182 | | 12,459.36 |
30-Jun-03 | | 13,156.8262 | | 12,948.77 |
31-Dec-03 | | 13,232.8254 | | 12,970.71 |
30-Jun-04 | | 13,319.3736 | | 12,990.19 |
31-Dec-04 | | 13,931.3602 | | 13,533.46 |
“During the early part of the year, concern about the durability of the U.S. economic recovery pushed interest rates lower and in addition demand for relatively safe assets also rose amid renewed fears of terrorist attacks after the Madrid bombing. However, from April through June, U.S. employment reports showed strength, which convinced markets that the Federal Reserve (the Fed) would soon begin a tightening campaign. On June 30th, the Fed met market expectations with a 25 basis point increase in the federal funds rate and raised rates a total of five times in 2004 to end the year at 2.25%. Signs of rising inflation had fueled anxiety that central banks may need to move aggressively to combat it. Inflation concerns were driven by higher oil prices as well as slower productivity growth. The Fed helped to calm markets by commenting that it would raise rates gradually. Economic data releases suggested moderate economic growth, as job numbers, inflation, and consumer confidence all fell short of analysts’ expectations.
The Portfolio outperformed its benchmark during the reporting period. Diversifying beyond core index sectors helped protect the Portfolio during difficult market periods and also added to returns in sectors where interest rates actually fell. Overall, below index U.S. duration was positive for returns as short- and intermediate-term rates rose in the U.S. Additionally, Euroland duration contributed to returns as intermediate- and long-term rates fell. Active management across a variety of strategies, including “rolling down” a steep yield curve, active security selection of mortgage-backed securities and corporate bonds, exposure to Treasury Inflation Protected Securities (TIPS), Euroland exposure, and emerging market exposure all contributed to the Portfolio’s performance during the year.
The investment strategy will remain defensive as interest rates are near historical lows and core bond sectors become even more expensive. The Portfolio will target U.S. duration below-index to limit risk from higher rates but take exposure to intermediate maturities in Europe, where growth pressures will be more muted. The Portfolio will also continue to underweight mortgage-backed securities and corporate bonds as investors stretching for yield have bid valuations up to frothy levels. Exposure to TIPS will be retained as a substitute for nominal Treasurys as the Fed seeks to keep real yields low to stimulate the economy. Out of index exposure to emerging-market bonds will also be maintained as the issuing countries continue to be upgraded amid growing trade surpluses and ample currency reserves.”
| * | Unless noted otherwise, Lipper Average and Index returns reflect performance beginning the closest month-end date to the Portfolio’s inception. |
| 1 | For average and index definitions, refer to the Glossary of Benchmark Definitions page. Investors cannot invest directly in a market index or average. |
| For | a complete list of holdings, refer to the Schedule of Investments section of this report. |
| | | | |
The Prudential Series Fund, Inc. | | Annual Report | | December 31, 2004 |
SP Prudential U.S. Emerging Growth Portfolio
| n | MANAGED BY: JENNISON ASSOCIATES LLC |
Past performance does not guarantee future returns. Portfolio performance is net of investment fees and fund expenses, but not product charges, which, if included, would significantly lower the performance quoted. The investment return and principal value of an investment will fluctuate, so that an investor’s shares, when redeemed, may be worth more or less than their original cost. Current performance may be lower or higher than the past performance data quoted.
| n | PERFORMANCE SUMMARY* - As of December 31, 2004 |
| | | | | | | | | |
Average Annual Total Return Percentages
| | 1-Year
| | | 3-Year
| | | Since
Inception
| |
SP Prudential U.S. Emerging Growth Portfolio: Class I | | 21.39 | % | | 5.42 | % | | -4.86 | % |
SP Prudential U.S. Emerging Growth Portfolio: Class II | | 21.01 | % | | 4.99 | % | | 1.50 | % |
S&P MidCap 400 Index1 | | 16.48 | % | | 10.53 | % | | 6.19 | % |
Russell Midcap Growth Index1 | | 15.48 | % | | 6.16 | % | | -7.04 | % |
Lipper (VIP) Mid-Cap Growth Funds Average1 | | 14.75 | % | | 3.54 | % | | -7.35 | % |
SP Prudential U.S. Emerging Growth Portfolio Class I inception date: 9/22/2000. SP Prudential U.S. Emerging Growth Portfolio Class II inception date: 7/9/2001.
Small and mid-size companies may have limited marketability, and may be subject to more erratic or abrupt market movements than large-cap stocks. The Portfolio may actively and frequently trade its portfolio securities. High portfolio turnover results in higher transaction costs and can affect the Portfolio’s performance.
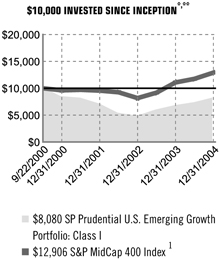
| | | | |
| | | Portfolio
| | SP400
|
22-Sep-00 | | 10,000.0000 | | 10,000.00 |
31-Dec-00 | | 8,388.5468 | | 9,614.94 |
30-Jun-01 | | 8,018.1695 | | 9,707.97 |
31-Dec-01 | | 6,897.0272 | | 9,556.86 |
30-Jun-02 | | 5,255.3545 | | 9,249.99 |
31-Dec-02 | | 4,684.7732 | | 8,169.92 |
30-Jun-03 | | 5,775.8849 | | 9,184.01 |
31-Dec-03 | | 6,656.7824 | | 11,079.94 |
30-Jun-04 | | 7,379.5551 | | 11,754.13 |
31-Dec-04 | | 8,080.4626 | | 12,906.35 |
“For the year ended December 31, 2004, the SP U.S. Emerging Growth Portfolio (Class I) had a total return of 21.39%, compared with the return of 16.48% for the unmanaged S&P Midcap 400 Index, 15.48% for the unmanaged Russell Midcap Growth Index, and 14.75% for the Lipper (VIP) Mid-Cap Growth Funds Average.
The Portfolio’s information technology holdings were, by a large margin, the primary contributors to its return and its outperformance of the Russell Midcap Growth Index. Healthcare and industrials holdings were also important contributors. Satellite radio broadcaster Sirius Satellite Radio was the Portfolio’s leading absolute and relative performer, as increasing confidence about its long-term growth prospects led shares higher. A position in Apple Computer also improved performance, as its share price reflected the continued strength of iPod sales. In healthcare, pharmaceutical company Sepracor was a leading contributor to the Portfolio’s return. The company’s shares jumped on the FDA’s approval of its Lunesta (formerly Estorra) insomnia drug.
Semiconductor holdings International Rectifier and National Semiconductor detracted from the Portfolio’s return. After a strong 2003, semiconductor stocks fell early in 2004 when investors began to be concerned about their valuations. Although the outlook for business spending on semiconductors was building momentum as we entered the summer, lower-than-expected current demand for semiconductors and a seasonal slowdown led to excess inventories. This hurt semiconductor stocks. The Portfolio’s shares of the pharmaceutical company Impax Laboratories fell on news of accounting irregularities and it was sold from the Portfolio.”
| * | Unless noted otherwise, Lipper Average and Index returns reflect performance beginning the closest month-end date to the Portfolio’s inception (Class I). |
| ** | The graph is based on the performance of Class I shares. Performance of Class II shares will be lower due to differences in the fee structure. Class II shares have associated 12b-l and administrative fees at an annual rate of 0.25% and 0.15%, respectively, of the average daily net assets of the Class II shares. |
| 1 | For average and index definitions, refer to the Glossary of Benchmark Definitions page. Investors cannot invest directly in a market index or average. |
For a complete list of holdings, refer to the Schedule of Investments section of this report.
| | | | |
The Prudential Series Fund, Inc. | | Annual Report | | December 31, 2004 |
SP State Street Research Small Cap Growth Portfolio
| n | MANAGED BY: STATE STREET RESEARCH AND MANAGEMENT COMPANY |
Past performance does not guarantee future returns. Portfolio performance is net of investment fees and fund expenses, but not product charges, which, if included, would significantly lower the performance quoted. The investment return and principal value of an investment will fluctuate, so that an investor’s shares, when redeemed, may be worth more or less than their original cost. Current performance may be lower or higher than the past performance data quoted.
| n | PERFORMANCE SUMMARY * - As of December 31, 2004 |
| | | | | | | | | |
Average Annual Total Return Percentages
| | 1-Year
| | | 3-Year
| | | Since
Inception
| |
SP State Street Research Small Cap Growth Portfolio | | -0.92 | % | | -2.36 | % | | -9.71 | % |
Russell 2000 Index1 | | 18.33 | % | | 11.48 | % | | 6.79 | % |
Russell 2000 Growth Index1 | | 14.31 | % | | 5.79 | % | | -3.55 | % |
Lipper (VIP) Small-Cap Growth Funds Average1 | | 11.71 | % | | 3.60 | % | | -4.23 | % |
SP State Street Research Small Cap Growth Portfolio inception date: 9/22/2000.
The Portfolio may invest in foreign securities, which are subject to the risks of currency fluctuation and the impact of social, political, and economic change. Small and mid-size companies may have limited marketability, and may be subject to more erratic or abrupt market movements than large-cap stocks.
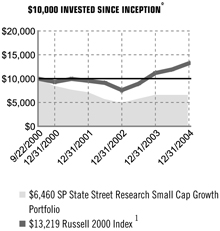
| | | | |
| | | Portfolio
| | R2000
|
22-Sep-00 | | 10,000.0000 | | 10,000.00 |
31-Dec-00 | | 8,380.0000 | | 9,309.17 |
30-Jun-01 | | 7,510.0000 | | 9,947.13 |
31-Dec-01 | | 6,940.0000 | | 9,540.61 |
30-Jun-02 | | 5,690.0000 | | 9,092.07 |
31-Dec-02 | | 4,840.0000 | | 7,586.35 |
30-Jun-03 | | 5,500.0000 | | 8,942.86 |
31-Dec-03 | | 6,520.0000 | | 11,171.19 |
30-Jun-04 | | 6,540.0000 | | 11,926.70 |
31-Dec-04 | | 6,460.0000 | | 13,218.80 |
“For the year ended December 31, 2004, the SP State Street Research Small Company Growth (formerly SP INVESCO Small Company Growth) Portfolio had a total return of -0.92%, compared with the return of 18.33% for the unmanaged Russell 2000 Index, 14.31% for the Russell 2000 Growth Index, and 11.71% for the Lipper (VIP) Small-Cap Growth Funds Average. Management of the Portfolio was transferred from INVESCO to State Street Research (SSR) on May 3, 2004. The fund’s underperformance relative to the Indices occurred primarily under State Street Research.
During the period INVESCO managed the Portfolio, it underperformed the Russell 2000 Growth Index. The underperformance occurred in the first three months of the year and was due to the Portfolio’s holdings in the information technology and financials sectors. Stock selection in the technology sector was the primary reason. The financials sector trailed due to a combination of stock selection and a slight underweight. Performance was relatively strong during April, when the benchmark dropped sharply and the Portfolio held up better.
During the period SSR managed the Portfolio it substantially underperformed its benchmarks. Several positions fell sharply. Alliance Gaming missed its earnings target. Although SSR eliminated the position, investors’ frustrations were already reflected in the stock’s price. The Portfolio’s holdings in education services providers Corinthian Colleges and Career Education, as well as the related eCollege.com, posted significant declines. Disappointing estimates of future earnings by Corinthian Colleges weighed heavily on the industry, and SSR sold the Career Education and Corinthian positions. In the healthcare sector, Nektar Therapeutics declined significantly after indications from European drug regulators that Exubera, its inhaled insulin product, would not be approved. On this news, SSR eliminated the position. Although small-cap growth stocks rebounded in the fourth quarter, certain consumer discretionary holdings generated disappointing returns. Autobytel’s share-price declined after the company announced it would have to restate 2004 earnings and retract its 2005 earnings forecast. SSR eliminated the position. Internet search provider Ask Jeeves also declined as investor sentiment turned negative following the company’s third quarter earnings release. Although Ask Jeeves’ earnings continued to grow, investors had expected faster growth because of the excitement about Internet search and were disappointed by the company’s conservative forecasts for fourth-quarter sales. The Portfolio’s energy and producer durables holdings also lagged.”
| * | Unless noted otherwise, Lipper Average and Index returns reflect performance beginning the closest month-end date to the Portfolio’s inception. |
| 1 | For average and index definitions, refer to the Glossary of Benchmark Definitions page. Investors cannot invest directly in a market index or average. |
For a complete list of holdings, refer to the Schedule of Investments section of this report.
| | | | |
The Prudential Series Fund, Inc. | | Annual Report | | December 31, 2004 |
SP Strategic Partners Focused Growth Portfolio
| n | MANAGED BY: JENNISON ASSOCIATES LLC; and ALLIANCE CAPITAL |
Past performance does not guarantee future returns. Portfolio performance is net of investment fees and fund expenses, but not product charges, which, if included, would significantly lower the performance quoted. The investment return and principal value of an investment will fluctuate, so that an investor’s shares, when redeemed, may be worth more or less than their original cost. Current performance may be lower or higher than the past performance data quoted.
| n | PERFORMANCE SUMMARY* - As of December 31, 2004 |
| | | | | | | | | |
Average Annual Total Return Percentages
| | 1-Year
| | | 3-Year
| | | Since
Inception
| |
SP Strategic Partners Focused Growth Portfolio: Class I | | 10.58 | % | | 1.32 | % | | -7.99 | % |
SP Strategic Partners Focused Growth Portfolio: Class II | | 9.90 | % | | 0.89 | % | | -5.07 | % |
S&P 500 Index1 | | 10.87 | % | | 3.58 | % | | -2.38 | % |
Russell 1000 Growth Index1 | | 6.30 | % | | -0.18 | % | | -10.55 | % |
Lipper (VIP) Large-Cap Growth Funds Average1 | | 8.04 | % | | -0.14 | % | | -9.53 | % |
SP Strategic Partners Focused Growth Portfolio Class I inception date: 9/22/2000. SP Strategic Partners Focused Growth Portfolio Class II inception date: 1/12/2001. A portion of the expenses of the Portfolio is subsidized. Absent such expense absorption, the performance quoted would be lower. Expense absorption may be discontinued at any time.
The Portfolio may invest in foreign securities, which are subject to the risks of currency fluctuation and the impact of social, political, and economic change. The Portfolio may actively and frequently trade its portfolio securities. High portfolio turnover results in higher transaction costs and can affect the Portfolio’s performance.
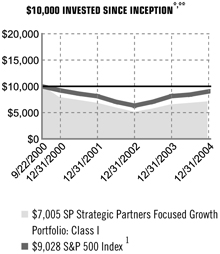
| | | | |
| | | Portfolio
| | SP500
|
22-Sep-00 | | 10,000.0000 | | 10,000.00 |
31-Dec-00 | | 7,953.4130 | | 9,218.11 |
30-Jun-01 | | 7,345.4752 | | 8,601.15 |
31-Dec-01 | | 6,735.0202 | | 8,123.36 |
30-Jun-02 | | 5,754.2892 | | 7,055.06 |
31-Dec-02 | | 5,033.7521 | | 6,328.72 |
30-Jun-03 | | 5,494.0952 | | 7,072.46 |
31-Dec-03 | | 6,334.7218 | | 8,142.99 |
30-Jun-04 | | 6,584.9083 | | 8,423.24 |
31-Dec-04 | | 7,005.2216 | | 9,028.46 |
“For the year ended December 31, 2004, the SP Focused Growth Portfolio (Class I) had a total return of 10.58%, compared with the return of 10.87% for the unmanaged S&P 500 Index, 6.30% for the unmanaged Russell 1000 Growth Index, and 8.04% for the Lipper (VIP) Large-Cap Growth Funds Average.
Jennison’s segment of the Portfolio far outperformed the Russell 1000 Growth Index. Information technology, the segment’s largest sector, made the largest contribution to its total return despite a challenging environment for some of its holdings. Semiconductor stocks were weak, and several positions, including Intel and Texas Instruments, had negative returns. However, Marvell Technology, a semiconductor company benefiting from a strong product cycle, was one of the segment’s strongest-performing positions. In addition, other industries in the sector more than offset the semiconductor weakness. Internet-related companies such as Yahoo! benefited from explosive growth in Internet advertising revenue. Apple was a stellar performer due to very strong consumer demand for its iPod and digital lifestyle businesses. Consumer discretionary holdings contributed substantially, primarily because of superb returns from eBay and Starbucks. On the other hand, the segment’s relative performance was hurt by its underweight in industrials and by unfavorable stock selection in financials, although no individual holding stands out as particularly weak. Alliance’s segment outperformed the Russell 1000 Growth Index, with particular strength in the consumer discretionary sector. Not only was stock selection excellent, but the segment overweighted this outperforming sector. Its average exposure was approximately 30% versus approximately 18% in the Index. Large positions in eBay and Yahoo accounted for most of the outperformance. The segment also beat the Index in the healthcare sector, with large positions in UnitedHealth Group and Alcon. However the segment trailed the Index in technology, primarily because it held Broadcom. Subpar stock selection in the financial services sector also detracted from relative performance. A small position in Lehman Brothers and a large position in Citigroup detracted most.”
| * | Unless noted otherwise, Lipper Average and Index returns reflect performance beginning the closest month-end date to the Portfolio’s inception (Class I). |
| ** | The graph is based on the performance of Class I shares. Performance of Class II shares will be lower due to differences in the fee structure. Class II shares have associated 12b-l and administrative fees at an annual rate of 0.25% and 0.15%, respectively, of the average daily net assets of the Class II shares. |
| 1 | For average and index definitions, refer to the Glossary of Benchmark Definitions page. Investors cannot invest directly in a market index or average. |
For a complete list of holdings, refer to the Schedule of Investments section of this report.
| | | | |
The Prudential Series Fund, Inc. | | Annual Report | | December 31, 2004 |
SP Technology Portfolio
| n | MANAGED BY: THE DREYFUS CORPORATION |
Past performance does not guarantee future returns. Portfolio performance is net of investment fees and fund expenses, but not product charges, which, if included, would significantly lower the performance quoted. The investment return and principal value of an investment will fluctuate, so that an investor’s shares, when redeemed, may be worth more or less than their original cost. Current performance may be lower or higher than the past performance data quoted.
| n | PERFORMANCE SUMMARY* - As of December 31, 2004 |
| | | | | | | | | |
Average Annual Total Return Percentages
| | 1-Year
| | | 3-Year
| | | Since
Inception
| |
SP Technology Portfolio | | 0.00 | % | | -5.82 | % | | -15.87 | % |
S&P 500 Index1 | | 10.87 | % | | 3.58 | % | | -2.38 | % |
S&P SuperComposite Information Technology Index1 | | 2.24 | % | | -1.87 | % | | -15.41 | % |
Lipper (VIP) Specialty/Misc. Funds Average1 | | 7.82 | % | | 0.67 | % | | -11.43 | % |
SP Technology Portfolio inception date: 9/22/2000. A portion of the expenses of the Portfolio is subsidized. Absent such expense absorption, the performance quoted would be lower. Expense absorption may be discontinued at any time.
The Portfolio may invest in foreign securities, which are subject to the risks of currency fluctuation and the impact of social, political, and economic change. The Portfolio focuses its investments in the technology sector, thereby increasing its vulnerability to any single economic, political, or regulatory development.
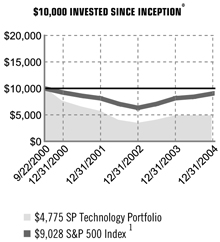
| | | | |
| | | Portfolio
| | SP500
|
22-Sep-00 | | 10,000.0000 | | 10,000.00 |
31-Dec-00 | | 7,628.5256 | | 9,218.11 |
30-Jun-01 | | 6,517.2837 | | 8,601.15 |
31-Dec-01 | | 5,716.3886 | | 8,123.36 |
30-Jun-02 | | 4,054.5313 | | 7,055.06 |
31-Dec-02 | | 3,353.7481 | | 6,328.72 |
30-Jun-03 | | 3,924.3859 | | 7,072.46 |
31-Dec-03 | | 4,775.3369 | | 8,142.99 |
30-Jun-04 | | 4.685.2362 | | 8,423.24 |
31-Dec-04 | | 4,775.3369 | | 9,028.46 |
“For the year ended December 31, 2004, the SP Technology Portfolio’s total return was flat at 0.00%, compared with the return of 10.87% for the unmanaged S&P 500 Index, 2.24% for the unmanaged S&P SuperComposite Technology Index, and 7.82% for the Lipper (VIP) Specialty/Miscellaneous Funds Average. Management of the Portfolio passed from Alliance to Dreyfus on January 20, 2004.
During the period Dreyfus managed the Portfolio, almost all of the reporting period, many of its packaged software stocks performed well because the sales and earnings in the industry continued strong growth. Some, such as digital document manager Adobe, are in the midst of new product cycles, and are seeing sales to large enterprises improve. The Internet continued the business momentum it established in 2003. Although the overall competitive landscape remains difficult, there are fewer players and several with solid business models such as Portfolio holdings Yahoo! and, eBay. In addition, the Internet remains one of the fastest growing advertising markets. Security for consumers and enterprises alike is a major concern, providing a good market for companies with security-oriented products such as Symantec and VeriSign.
The largest detractors from the Portfolio’s performance were in the semiconductor, semiconductor capital equipment, and computer communications industries. The semiconductor and related industries came under increasing pressure as 2004 progressed. They had a strong year in 2003, but as we moved past the peak in sales and earnings, inventories rose and semiconductor shares gave back some of their gains. Semiconductor spending is highly cyclical; we feel the current cycle matured in the early part of 2004 and now appears to be in a downturn. Holdings, Intel and UMC experienced share declines, as did several related companies in the semiconductor capital equipment industry. The Portfolio’s computer communications firms had mixed performance. Several companies with new product introductions and leverage to specific areas of spending, such as Juniper, performed well. On the other hand, companies such as Cisco, Emulex, and Qlogic suffered from the overall slowness of demand and aggressive competition.”
| * | Unless noted otherwise, Lipper Average and Index returns reflect performance beginning the closest month-end date to the Portfolio’s inception. |
| 1 | For average and index definitions, refer to the Glossary of Benchmark Definitions page. Investors cannot invest directly in a market index or average. |
For a complete list of holdings, refer to the Schedule of Investments section of this report.
| | | | |
The Prudential Series Fund, Inc. | | Annual Report | | December 31, 2004 |
SP William Blair International Growth Portfolio
| n | MANAGED BY: WILLIAM BLAIR & COMPANY, LLC |
Past performance does not guarantee future returns. Portfolio performance is net of investment fees and fund expenses, but not product charges, which, if included, would significantly lower the performance quoted. The investment return and principal value of an investment will fluctuate, so that an investor’s shares, when redeemed, may be worth more or less than their original cost. Current performance may be lower or higher than the past performance data quoted.
| n | PERFORMANCE SUMMARY* - As of December 31, 2004 |
| | | | | | | | | |
Average Annual Total Return Percentages
| | 1-Year
| | | 3-Year
| | | Since
Inception
| |
SP William Blair International Growth Portfolio: Class I | | 16.54 | % | | 7.99 | % | | -8.35 | % |
SP William Blair International Growth Portfolio: Class II | | 16.12 | % | | 7.63 | % | | -8.29 | % |
MSCI EAFE Index1 | | 20.25 | % | | 11.89 | % | | 1.63 | % |
Lipper (VIP) International Growth Funds Average1 | | 17.36 | % | | 8.83 | % | | -3.37 | % |
SP William Blair International Growth Portfolio Class I inception date: 9/22/2000. SP William Blair International Growth Portfolio Class II inception date: 10/04/2000.
Foreign investments are subject to the risks of currency fluctuation and the impact of social, political, and economic change, which may result in greater share price volatility.
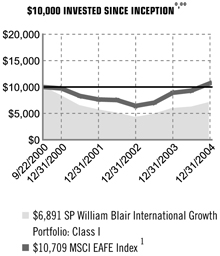
| | | | |
| | | Portfolio
| | MSCIEI
|
22-Sep-00 | | 10,000.0000 | | 10,000.00 |
31-Dec-00 | | 8,500.0000 | | 9,731.66 |
30-Jun-01 | | 6,327.7040 | | 8,309.94 |
31-Dec-01 | | 5,471.0001 | | 7,644.93 |
30-Jun-02 | | 5,169.8442 | | 7,520.94 |
31-Dec-02 | | 4,236.2607 | | 6,426.33 |
30-Jun-03 | | 4,748.2258 | | 7,035.06 |
31-Dec-03 | | 5,912.6956 | | 8,905.98 |
30-Jun-04 | | 6,116.1039 | | 9,312.40 |
31-Dec-04 | | 6,890.6763 | | 10,709.18 |
“For the year ended December 31, 2004, the SP William Blair International Growth Portfolio Class I (formerly SP Jennison International Growth Portfolio) had a total return of 16.54%, compared with the return of 20.25% for the unmanaged MSCI EAFE Index and 17.36% for the Lipper (VIP) International Funds Average. Management of the Portfolio was transferred from Jennison to William Blair on May 1, 2004.
During the period Jennison managed the Portfolio, it delivered modest positive absolute performance, and also outperformed its benchmark, the MSCI EAFE Index. Jennison’s holdings in the financials sector were the principal source of absolute and relative performance, with Japanese commercial bank Sumitomo Trust and Banking Co. as the leading contributor. Healthcare was another area of strength, led by Switzerland-based dental implant manufacturer Nobel Biocare Holding AG. On the other hand, Jennison’s telecommunications holdings detracted from both absolute and relative performance. France Telecom was the poorest performing holding in this area, and was also the primary detractor.
During the period William Blair managed the Portfolio, its performance was hampered by Blair’s focus on quality growth stocks. This strategy was not rewarded in the value-led market, as investors became concerned about the prospects of slowing global growth coupled with high energy prices. The EAFE Growth Index trailed its value counterpart by 6.8% between May 1 and the end of the year. As a result, the Portfolio’s focus on Asian cyclical stocks, such as technology and consumer stocks, rather than European value stocks was the largest factor in the underperformance. In contrast, holdings in emerging market countries and Canada strengthened its relative performance. Blair’s stock selection within most economic sectors added value, except in materials and healthcare.
Blair believes the likeliest scenario for global stocks in 2005 is a steady slowdown in economic and earnings growth toward a pace that can be sustained over the long run. It sees no clear basis for anticipating the slowdown to intensify or for volatility to increase in the near term.”
| * | Unless noted otherwise, Lipper Average and Index returns reflect performance beginning the closest month-end date to the ** Portfolio’s inception. |
| ** | The graph is based on the performance of Class I shares. Performance of Class II shares will be lower due to differences in the fee structure. Class II shares have associated 12b-l and administrative fees at an annual rate of 0.25% and 0.15%, respectively, of the average daily net assets of the Class II shares. |
| 1 | For average and index definitions, refer to the Glossary of Benchmark Definitions page. Investors cannot invest directly in a market index or average. |
For a complete list of holdings, refer to the Schedule of Investments section of this report.
Fees and Expenses (Unaudited)
As a contract owner investing in Portfolios of the Fund through a variable annuity or variable life contract, you incur ongoing costs, including management fees, [distribution and service (12b-1) fees,] and other Portfolio expenses. This example is intended to help you understand your ongoing costs (in dollars) of investing in the Fund and to compare these costs with the ongoing costs of investing in other investment options. This example does not reflect fees and charges under your variable annuity or variable life contract. If contract charges were included, the costs shown below would be higher. Please consult the prospectus for your contract for more information about contract fees and charges.
The example is based on an investment of $1,000 invested at the beginning of the period and held for the entire period July 1, 2004 through December 31, 2004.
Actual Expenses
The first line of the table below provides information about actual account values and actual expenses. You may use this information, together with the amount you invested, to estimate the Portfolio expenses that you paid over the period. Simply divide your account value by $1,000 (for example, an $8,600 account value divided by $1,000 = 8.6), then multiply the result by the number in the first line under the heading entitled “Expenses Paid During Period” to estimate the Portfolio expenses you paid on your account during this period. As noted above, the table does not reflect variable contract fees and charges.
Hypothetical Example for Comparison Purposes
The second line of the table below provides information about hypothetical account values and hypothetical expenses based on the Portfolio’s actual expense ratio and an assumed rate of return of 5% per year before expenses, which is not the Portfolio’s actual return. The hypothetical account values and expenses may not be used to estimate the actual ending account balance or expenses you paid for the period. You may use this information to compare the ongoing costs of investing in the Portfolio and other investment options. To do so, compare this 5% hypothetical example with the 5% hypothetical examples that appear in the shareholder reports of the other investment options.
Please note that the expenses shown in the table are meant to highlight your ongoing Portfolio costs only and do not reflect any contract fees and charges, such as sales charges (loads), insurance charges or administrative charges. Therefore the second line of the table is useful to compare ongoing investment option costs only, and will not help you determine the relative total costs of owning different contracts. In addition, if these contract fee and charges were included, your costs would have been higher.
| | | | | | | | | | | | | | |
| Prudential Series Fund Portfolios | | Beginning Portfolio Value July 1, 2004 | | Ending Portfolio
Value December 31, 2004 | | Annualized Expense Ratio
Based on the
Six-Month Period | | | Expenses Paid
During the Six-
Month Period* |
| | | | | | | | | | | | | | | |
| SP Aggressive Growth Asset Allocation (Class I) | | Actual | | $ | 1,000 | | $ | 1,099 | | 0.05 | % | | $ | 0.26 |
| | Hypothetical | | $ | 1,000 | | $ | 1,025 | | 0.05 | % | | $ | 0.25 |
| | | | | | | | | | | | | | | |
| SP AIM Aggressive Growth (Class I) | | Actual | | $ | 1,000 | | $ | 1,061 | | 1.07 | % | | $ | 5.54 |
| | Hypothetical | | $ | 1,000 | | $ | 1,020 | | 1.07 | % | | $ | 5.43 |
| | | | | | | | | | | | | | | |
| SP AIM Core Equity (Class I) | | Actual | | $ | 1,000 | | $ | 1,045 | | 1.00 | % | | $ | 5.14 |
| | Hypothetical | | $ | 1,000 | | $ | 1,020 | | 1.00 | % | | $ | 5.08 |
| | | | | | | | | | | | | | | |
| SP Alliance Large Cap Growth (Class I) | | Actual | | $ | 1,000 | | $ | 1,034 | | 1.17 | % | | $ | 5.98 |
| | Hypothetical | | $ | 1,000 | | $ | 1,019 | | 1.17 | % | | $ | 5.94 |
| | | | | | | | | | | | | | | |
| SP Balanced Asset Allocation (Class I) | | Actual | | $ | 1,000 | | $ | 1,081 | | 0.05 | % | | $ | 0.26 |
| | Hypothetical | | $ | 1,000 | | $ | 1,025 | | 0.05 | % | | $ | 0.25 |
| | | | | | | | | | | | | | | |
| SP Conservative Asset Allocation (Class I) | | Actual | | $ | 1,000 | | $ | 1,071 | | 0.05 | % | | $ | 0.26 |
| | Hypothetical | | $ | 1,000 | | $ | 1,025 | | 0.05 | % | | $ | 0.25 |
| | | | | | | | | | | | | | | |
| SP Davis Value (Class I) | | Actual | | $ | 1,000 | | $ | 1,072 | | 0.86 | % | | $ | 4.48 |
| | Hypothetical | | $ | 1,000 | | $ | 1,021 | | 0.86 | % | | $ | 4.37 |
| | | | | | | | | | | | | | | |
| SP Goldman Sachs Small Cap Value (Class I) | | Actual | | $ | 1,000 | | $ | 1,138 | | 0.96 | % | | $ | 5.16 |
| | Hypothetical | | $ | 1,000 | | $ | 1,020 | | 0.96 | % | | $ | 4.87 |
| | | | | | | | | | | | | | | |
| SP Growth Asset Allocation (Class I) | | Actual | | $ | 1,000 | | $ | 1,093 | | 0.05 | % | | $ | 0.26 |
| | Hypothetical | | $ | 1,000 | | $ | 1,025 | | 0.05 | % | | $ | 0.25 |
| | | | | | | | | | | | | | |
| Prudential Series Fund Portfolios | | Beginning Portfolio Value July 1, 2004 | | Ending Portfolio
Value December 31, 2004 | | Annualized Expense Ratio
Based on the
Six-Month Period | | | Expenses Paid
During the Six-
Month Period* |
| | | | | | | | | | | | | | | |
| SP Large Cap Value (Class I) | | Actual | | $ | 1,000 | | $ | 1,128 | | 0.84 | % | | $ | 4.49 |
| | Hypothetical | | $ | 1,000 | | $ | 1,021 | | 0.84 | % | | $ | 4.27 |
| | | | | | | | | | | | | | | |
| SP LSV International Value (Class I) | | Actual | | $ | 1,000 | | $ | 1,138 | | 1.10 | % | | $ | 5.91 |
| | Hypothetical | | $ | 1,000 | | $ | 1,020 | | 1.10 | % | | $ | 5.59 |
| | | | | | | | | | | | | | | |
| SP MFS Capital Opportunities (Class I) | | Actual | | $ | 1,000 | | $ | 1,087 | | 1.00 | % | | $ | 5.25 |
| | Hypothetical | | $ | 1,000 | | $ | 1,020 | | 1.00 | % | | $ | 5.08 |
| | | | | | | | | | | | | | | |
| SP Mid Cap Growth (Class I) | | Actual | | $ | 1,000 | | $ | 1,094 | | 1.00 | % | | $ | 5.26 |
| | Hypothetical | | $ | 1,000 | | $ | 1,020 | | 1.00 | % | | $ | 5.08 |
| | | | | | | | | | | | | | | |
| SP PIMCO High Yield (Class I) | | Actual | | $ | 1,000 | | $ | 1,091 | | 0.68 | % | | $ | 3.57 |
| | Hypothetical | | $ | 1,000 | | $ | 1,022 | | 0.68 | % | | $ | 3.46 |
| | | | | | | | | | | | | | | |
| SP PIMCO Total Return (Class I) | | Actual | | $ | 1,000 | | $ | 1,046 | | 0.65 | % | | $ | 3.34 |
| | Hypothetical | | $ | 1,000 | | $ | 1,022 | | 0.65 | % | | $ | 3.30 |
| | | | | | | | | | | | | | | |
| SP Prudential US Emerging Growth Portfolio (Class I) | | Actual | | $ | 1,000 | | $ | 1,095 | | 0.87 | % | | $ | 4.58 |
| | Hypothetical | | $ | 1,000 | | $ | 1,021 | | 0.87 | % | | $ | 4.42 |
| | | | | | | | | | | | | | | |
| SP Prudential US Emerging Growth Portfolio (Class II) | | Actual | | $ | 1,000 | | $ | 1,093 | | 1.27 | % | | $ | 6.68 |
| | Hypothetical | | $ | 1,000 | | $ | 1,019 | | 1.27 | % | | $ | 6.45 |
| | | | | | | | | | | | | | | |
| SP State Street Research Small Cap Growth Portfolio (Class I) | | Actual | | $ | 1,000 | | $ | 988 | | 1.06 | % | | $ | 5.30 |
| | Hypothetical | | $ | 1,000 | | $ | 1,020 | | 1.06 | % | | $ | 5.38 |
| | | | | | | | | | | | | | | |
| SP Strategic Partners Focused Growth Portfolio (Class I) | | Actual | | $ | 1,000 | | $ | 1,064 | | 1.01 | % | | $ | 5.24 |
| | Hypothetical | | $ | 1,000 | | $ | 1,020 | | 1.01 | % | | $ | 5.13 |
| | | | | | | | | | | | | | | |
| SP Strategic Partners Focused Growth Portfolio (Class II) | | Actual | | $ | 1,000 | | $ | 1,060 | | 1.41 | % | | $ | 7.30 |
| | Hypothetical | | $ | 1,000 | | $ | 1,018 | | 1.41 | % | | $ | 7.15 |
| | | | | | | | | | | | | | | |
| SP Technology (Class I) | | Actual | | $ | 1,000 | | $ | 1,019 | | 1.30 | % | | $ | 6.60 |
| | Hypothetical | | $ | 1,000 | | $ | 1,019 | | 1.30 | % | | $ | 6.60 |
| | | | | | | | | | | | | | | |
| SP William Blair International Growth Portfolio (Class I) | | Actual | | $ | 1,000 | | $ | 1,127 | | 1.04 | % | | $ | 5.56 |
| | Hypothetical | | $ | 1,000 | | $ | 1,020 | | 1.04 | % | | $ | 5.28 |
| | | | | | | | | | | | | | | |
| SP William Blair International Growth Portfolio (Class II) | | Actual | | $ | 1,000 | | $ | 1,126 | | 1.44 | % | | $ | 7.70 |
| | Hypothetical | | $ | 1,000 | | $ | 1,018 | | 1.44 | % | | $ | 7.30 |
| * | Fund expenses for each share class are equal to the annualized expense ratio for each share class (provided in the table), multiplied by the average account value over the period, multiplied by the 184 days in the six-month period ended December 31, 2004, and divided by the 366 days in the Fund’s fiscal year ended December 31, 2004 (to reflect the six-month period). |
| | | | |
| | | SP AGGRESSIVE GROWTH ASSET ALLOCATION PORTFOLIO | | |
STATEMENT OF ASSETS AND LIABILITIES
December 31, 2004
| | | |
| ASSETS | | | |
Investments, at value (cost $121,496,431) | | $ | 136,913,811 |
Receivable for capital stock sold | | | 117,328 |
| | |
|
|
Total assets | | | 137,031,139 |
| | |
|
|
| LIABILITIES | | | |
Payable for investments purchased | | | 113,929 |
Management fee payable | | | 5,518 |
Payable for capital stock repurchased | | | 3,378 |
Deferred directors’ fee | | | 851 |
| | |
|
|
Total liabilities | | | 123,676 |
| | |
|
|
| NET ASSETS | | $ | 136,907,463 |
| | |
|
|
Net assets were comprised of: | | | |
Common stock, at $0.01 par value | | $ | 152,504 |
Paid-in capital in excess of par | | | 115,747,729 |
| | |
|
|
| | | | 115,900,233 |
Undistributed net investment income | | | 254,403 |
Accumulated net realized gain on investments | | | 5,335,447 |
Net unrealized appreciation on investments | | | 15,417,380 |
| | |
|
|
Net assets, December 31, 2004 | | $ | 136,907,463 |
| | |
|
|
Net asset value and redemption price per share, $136,907,463 / 15,250,379 outstanding shares of common stock (authorized 100,000,000 shares) | | $ | 8.98 |
| | |
|
|
STATEMENT OF OPERATIONS
Year Ended December 31, 2004
| | | |
| INVESTMENT INCOME | | | |
Dividends | | $ | 301,393 |
| | |
|
|
| EXPENSES | | | |
Management fee | | | 46,990 |
| | |
|
|
| NET INVESTMENT INCOME | | | 254,403 |
| | |
|
|
| NET REALIZED AND UNREALIZED GAIN ON INVESTMENTS | | | |
Net realized gain on investments | | | 7,391,663 |
Net change in unrealized appreciation (depreciation) on investments | | | 7,628,625 |
| | |
|
|
| NET GAIN ON INVESTMENTS | | | 15,020,288 |
| | |
|
|
| NET INCREASE IN NET ASSETS RESULTING FROM OPERATIONS | | $ | 15,274,691 |
| | |
|
|
STATEMENT OF CHANGES IN NET ASSETS
| | | | | | | | |
| | | Year Ended
December 31, 2004
| | | Year Ended
December 31, 2003
| |
| INCREASE (DECREASE) IN NET ASSETS | | | | | | | | |
| OPERATIONS: | | | | | | | | |
Net investment income | | $ | 254,403 | | | $ | 47,387 | |
Net realized gain (loss) on investments | | | 7,391,663 | | | | (794,845 | ) |
Net change in unrealized appreciation (depreciation) on investments | | | 7,628,625 | | | | 10,099,333 | |
| | |
|
|
| |
|
|
|
NET INCREASE IN NET ASSETS RESULTING FROM OPERATIONS | | | 15,274,691 | | | | 9,351,875 | |
| | |
|
|
| |
|
|
|
| DIVIDENDS: | | | | | | | | |
Dividends from net investment income | | | (47,387 | ) | | | (7,077 | ) |
| | |
|
|
| |
|
|
|
| CAPITAL STOCK TRANSACTIONS: | | | | | | | | |
Capital stock sold [8,837,254 and 6,301,640 shares, respectively] | | | 71,795,086 | | | | 43,779,270 | |
Capital stock issued in reinvestment of dividends [5,953 and 1,239 shares, respectively] | | | 47,387 | | | | 7,077 | |
Capital stock repurchased [1,332,326 and 1,117,894 shares, respectively] | | | (10,751,075 | ) | | | (7,614,148 | ) |
| | |
|
|
| |
|
|
|
NET INCREASE IN NET ASSETS RESULTING FROM CAPITAL STOCK TRANSACTIONS | | | 61,091,398 | | | | 36,172,199 | |
| | |
|
|
| |
|
|
|
| TOTAL INCREASE IN NET ASSETS | | | 76,318,702 | | | | 45,516,997 | |
| NET ASSETS: | | | | | | | | |
Beginning of year | | | 60,588,761 | | | | 15,071,764 | |
| | |
|
|
| |
|
|
|
End of year (a) | | $ | 136,907,463 | | | $ | 60,588,761 | |
| | |
|
|
| |
|
|
|
(a) Includes undistributed net investment income of: | | $ | 254,403 | | | $ | 47,387 | |
| | |
|
|
| |
|
|
|
SEE NOTES TO FINANCIAL STATEMENTS.
A1
| | | | |
| | | SP AIM AGGRESSIVE GROWTH PORTFOLIO | | |
STATEMENT OF ASSETS AND LIABILITIES
December 31, 2004
| | | | |
| ASSETS | | | | |
Investments, at value (cost $30,214,441) | | $ | 33,037,020 | |
Receivable for investments sold | | | 57,557 | |
Receivable for capital stock sold | | | 23,078 | |
Dividends and interest receivable | | | 11,997 | |
Prepaid expenses | | | 479 | |
| | |
|
|
|
Total assets | | | 33,130,131 | |
| | |
|
|
|
| LIABILITIES | | | | |
Payable for investments purchased | | | 190,083 | |
Accrued expenses and other liabilities | | | 35,573 | |
Outstanding options written (premium received $27,077) | | | 33,370 | |
Management fee payable | | | 25,636 | |
Payable for capital stock repurchased | | | 2,462 | |
Deferred directors’ fees | | | 2,243 | |
| | |
|
|
|
Total liabilities | | | 289,367 | |
| | |
|
|
|
| NET ASSETS | | $ | 32,840,764 | |
| | |
|
|
|
Net assets were comprised of: | | | | |
Common stock, at $0.01 par value | | $ | 45,242 | |
Paid-in capital in excess of par | | | 28,827,052 | |
| | |
|
|
|
| | | | 28,872,294 | |
Accumulated net investment loss | | | (2,243 | ) |
Accumulated net realized gain on investments | | | 1,154,427 | |
Net unrealized appreciation on investments | | | 2,816,286 | |
| | |
|
|
|
Net assets, December 31, 2004 | | $ | 32,840,764 | |
| | |
|
|
|
Net asset value and redemption price per share,
$32,840,764 / 4,524,246 outstanding shares of
common stock (authorized 100,000,000 shares) | | $ | 7.26 | |
| | |
|
|
|
STATEMENT OF OPERATIONS
Year Ended December 31, 2004
| | | | |
| INVESTMENT LOSS | | | | |
Dividends | | $ | 108,029 | |
Interest | | | 23,265 | |
| | |
|
|
|
| | | | 131,294 | |
| | |
|
|
|
| EXPENSES | | | | |
Management fee | | | 253,180 | |
Custodian’s fees and expenses | | | 100,000 | |
Audit fee | | | 16,000 | |
Shareholders’ reports | | | 10,000 | |
Directors’ fees | | | 8,700 | |
Legal fees and expenses | | | 7,000 | |
Transfer agent’s fees and expenses | | | 3,500 | |
Commitment fee on syndicated credit agreement | | | 350 | |
Miscellaneous | | | 7,455 | |
| | |
|
|
|
Total expenses | | | 406,185 | |
Less: custodian fee credit | | | (33 | ) |
expense subsidy | | | (120,987 | ) |
| | |
|
|
|
Net expenses | | | 285,165 | |
| | |
|
|
|
| NET INVESTMENT LOSS | | | (153,871 | ) |
| | |
|
|
|
| NET REALIZED AND UNREALIZED GAIN ON INVESTMENTS | | | | |
Net realized gain on: | | | | |
Investments | | | 3,888,282 | |
Options written | | | 14,336 | |
| | |
|
|
|
| | | | 3,902,618 | |
| | |
|
|
|
Net change in unrealized appreciation (depreciation) on: | | | | |
Investments | | | (429,820 | ) |
Options written | | | (6,293 | ) |
| | |
|
|
|
| | | | (436,113 | ) |
| | |
|
|
|
| NET GAIN ON INVESTMENTS | | | 3,466,505 | |
| | |
|
|
|
| NET INCREASE IN NET ASSETS RESULTING FROM OPERATIONS | | $ | 3,312,634 | |
| | |
|
|
|
STATEMENT OF CHANGES IN NET ASSETS
| | | | | | | | |
| | | Year Ended
December 31, 2004
| | | Year Ended
December 31, 2003
| |
| INCREASE IN NET ASSETS | | | | | | | | |
| OPERATIONS: | | | | | | | | |
Net investment loss | | $ | (153,871 | ) | | $ | (104,209 | ) |
Net realized gain on investments | | | 3,902,618 | | | | 474,950 | |
Net change in unrealized appreciation (depreciation) on investments | | | (436,113 | ) | | | 3,391,777 | |
| | |
|
|
| |
|
|
|
NET INCREASE IN NET ASSETS RESULTING FROM OPERATIONS | | | 3,312,634 | | | | 3,762,518 | |
| | |
|
|
| |
|
|
|
| CAPITAL STOCK TRANSACTIONS: | | | | | | | | |
Capital stock sold [1,879,309 and 2,164,971 shares, respectively] | | | 12,515,556 | | | | 12,388,756 | |
Capital stock repurchased [803,337 and 538,571 shares, respectively] | | | (5,377,013 | ) | | | (3,103,409 | ) |
| | |
|
|
| |
|
|
|
NET INCREASE IN NET ASSETS RESULTING FROM CAPITAL STOCK TRANSACTIONS | | | 7,138,543 | | | | 9,285,347 | |
| | |
|
|
| |
|
|
|
| TOTAL INCREASE IN NET ASSETS | | | 10,451,177 | | | | 13,047,865 | |
| NET ASSETS: | | | | | | | | |
Beginning of year | | | 22,389,587 | | | | 9,341,722 | |
| | |
|
|
| |
|
|
|
End of year | | $ | 32,840,764 | | | $ | 22,389,587 | |
| | |
|
|
| |
|
|
|
SEE NOTES TO FINANCIAL STATEMENTS.
A2
| | | | |
| | | SP AIM CORE EQUITY PORTFOLIO | | |
STATEMENT OF ASSETS AND LIABILITIES
December 31, 2004
| | | | |
| ASSETS | | | | |
Investments, at value (cost $29,558,507) | | $ | 31,865,751 | |
Cash | | | 30 | |
Dividends and interest receivable | | | 46,468 | |
Receivable for investments sold | | | 18,586 | |
Receivable for capital stock sold | | | 6,298 | |
Prepaid expenses | | | 458 | |
| | |
|
|
|
Total assets | | | 31,937,591 | |
| | |
|
|
|
| LIABILITIES | | | | |
Accrued expenses and other liabilities | | | 48,630 | |
Payable for investments purchased | | | 33,961 | |
Management fee payable | | | 10,797 | |
Deferred directors’ fees | | | 2,246 | |
Payable for capital stock repurchased | | | 1,361 | |
| | |
|
|
|
Total liabilities | | | 96,995 | |
| | |
|
|
|
| NET ASSETS | | $ | 31,840,596 | |
| | |
|
|
|
Net assets were comprised of: | | | | |
Common stock, at $0.01 par value | | $ | 43,268 | |
Paid-in capital in excess of par | | | 29,628,037 | |
| | |
|
|
|
| | | | 29,671,305 | |
Undistributed net investment income | | | 335,369 | |
Accumulated net realized loss on investments | | | (473,322 | ) |
Net unrealized appreciation on investments | | | 2,307,244 | |
| | |
|
|
|
Net assets, December 31, 2004 | | $ | 31,840,596 | |
| | |
|
|
|
Net asset value and redemption price per share, $31,840,596 / 4,326,778 outstanding shares of common stock (authorized 100,000,000 shares) | | $ | 7.36 | |
| | |
|
|
|
STATEMENT OF OPERATIONS
Year Ended December 31, 2004
| | | | |
| INVESTMENT INCOME | | | | |
Dividends (net of $4,462 foreign withholding tax) | | $ | 569,964 | |
Interest | | | 29,367 | |
| | |
|
|
|
| | | | 599,331 | |
| | |
|
|
|
| EXPENSES | | | | |
Management fee | | | 224,337 | |
Custodian’s fees and expenses | | | 102,000 | |
Shareholders’ reports | | | 20,000 | |
Audit fee | | | 17,000 | |
Directors’ fees | | | 9,000 | |
Legal fees and expenses | | | 8,000 | |
Transfer agent’s fees and expenses | | | 3,400 | |
Commitment fee on syndicated credit agreement | | | 300 | |
Miscellaneous | | | 6,778 | |
| | |
|
|
|
Total expenses | | | 390,815 | |
Less: custodian fee credit | | | (1 | ) |
expense subsidy | | | (126,852 | ) |
| | |
|
|
|
Net expenses | | | 263,962 | |
| | |
|
|
|
| NET INVESTMENT INCOME | | | 335,369 | |
| | |
|
|
|
| NET REALIZED AND UNREALIZED GAIN ON INVESTMENTS | | | | |
Net realized gain on investments | | | 1,939,651 | |
Net change in unrealized appreciation (depreciation) on investments | | | 129,902 | |
| | |
|
|
|
| NET GAIN ON INVESTMENTS | | | 2,069,553 | |
| | |
|
|
|
| NET INCREASE IN NET ASSETS RESULTING FROM OPERATIONS | | $ | 2,404,922 | |
| | |
|
|
|
STATEMENT OF CHANGES IN NET ASSETS
| | | | | | | | |
| | | Year Ended
December 31, 2004
| | | Year Ended
December 31, 2003
| |
| INCREASE (DECREASE) IN NET ASSETS | | | | | | | | |
| OPERATIONS: | | | | | | | | |
Net investment income | | $ | 335,369 | | | $ | 121,766 | |
Net realized gain on investments | | | 1,939,651 | | | | 24,833 | |
Net change in unrealized appreciation (depreciation) on investments | | | 129,902 | | | | 3,787,179 | |
| | |
|
|
| |
|
|
|
NET INCREASE IN NET ASSETS RESULTING FROM OPERATIONS | | | 2,404,922 | | | | 3,933,778 | |
| | |
|
|
| |
|
|
|
| DIVIDENDS: | | | | | | | | |
Dividends from net investment income | | | (121,766 | ) | | | (56,574 | ) |
| | |
|
|
| |
|
|
|
| CAPITAL STOCK TRANSACTIONS: | | | | | | | | |
Capital stock sold [1,615,797 and 1,344,519 shares, respectively] | | | 11,192,718 | | | | 8,030,198 | |
Capital stock issued in reinvestment of dividends [18,228 and 10,654 shares, respectively] | | | 121,766 | | | | 56,574 | |
Capital stock repurchased [659,162 and 522,105 shares, respectively] | | | (4,557,603 | ) | | | (3,078,682 | ) |
| | |
|
|
| |
|
|
|
NET INCREASE IN NET ASSETS RESULTING FROM CAPITAL STOCK TRANSACTIONS | | | 6,756,881 | | | | 5,008,090 | |
| | |
|
|
| |
|
|
|
| TOTAL INCREASE IN NET ASSETS | | | 9,040,037 | | | | 8,885,294 | |
| NET ASSETS: | | | | | | | | |
Beginning of year | | | 22,800,559 | | | | 13,915,265 | |
| | |
|
|
| |
|
|
|
End of year (a) | | $ | 31,840,596 | | | $ | 22,800,559 | |
| | |
|
|
| |
|
|
|
(a) Includes undistributed net investment income of: | | $ | 335,369 | | | $ | 121,766 | |
| | |
|
|
| |
|
|
|
SEE NOTES TO FINANCIAL STATEMENTS.
A3
| | | | |
| | | SP ALLIANCE LARGE CAP GROWTH PORTFOLIO | | |
STATEMENT OF ASSETS AND LIABILITIES
December 31, 2004
| | | | |
| ASSETS | | | | |
Investments, at value (cost $59,664,525) | | $ | 65,922,445 | |
Receivable for investments sold | | | 1,081,102 | |
Receivable for capital stock sold | | | 39,532 | |
Dividends and interest receivable | | | 28,198 | |
Prepaid expenses | | | 1,196 | |
| | |
|
|
|
Total assets | | | 67,072,473 | |
| | |
|
|
|
| LIABILITIES | | | | |
Payable for investments purchased | | | 1,272,777 | |
Management fee payable | | | 49,373 | |
Accrued expenses and other liabilities | | | 40,616 | |
Deferred directors’ fees | | | 2,453 | |
Payable for capital stock repurchased | | | 1,973 | |
| | |
|
|
|
Total liabilities | | | 1,367,192 | |
| | |
|
|
|
| NET ASSETS | | $ | 65,705,281 | |
| | |
|
|
|
Net assets were comprised of: | | | | |
Common stock, at $0.01 par value | | $ | 99,440 | |
Paid-in capital in excess of par | | | 62,572,773 | |
| | |
|
|
|
| | | | 62,672,213 | |
Accumulated net investment loss | | | (2,453 | ) |
Accumulated net realized loss on investments | | | (3,222,399 | ) |
Net unrealized appreciation on investments | | | 6,257,920 | |
| | |
|
|
|
Net assets, December 31, 2004 | | $ | 65,705,281 | |
| | |
|
|
|
Net asset value and redemption price per share,
$65,705,281 / 9,944,019 outstanding shares of
common stock (authorized 100,000,000 shares) | | $ | 6.61 | |
| | |
|
|
|
STATEMENT OF OPERATIONS
Year Ended December 31, 2004
| | | | |
| INVESTMENT INCOME | | | | |
Dividends (net of $15,590 foreign withholding tax) | | $ | 872,982 | |
Interest | | | 7,578 | |
| | |
|
|
|
| | | | 880,560 | |
| | |
|
|
|
| EXPENSES | | | | |
Management fee | | | 849,105 | |
Custodian’s fees and expenses | | | 99,000 | |
Shareholders’ reports | | | 20,000 | |
Audit fee | | | 16,000 | |
Directors’ fees | | | 11,000 | |
Legal fees and expenses | | | 5,000 | |
Transfer agent’s fees and expenses | | | 4,000 | |
Commitment fee on syndicated credit agreement | | | 1,100 | |
Miscellaneous | | | 6,675 | |
| | |
|
|
|
Total expenses | | | 1,011,880 | |
Loan interest expense (Note 8) | | | 13 | |
Less: custodian fee credit | | | (336 | ) |
| | |
|
|
|
Net expenses | | | 1,011,557 | |
| | |
|
|
|
| NET INVESTMENT LOSS | | | (130,997 | ) |
| | |
|
|
|
| NET REALIZED AND UNREALIZED GAIN (LOSS) ON INVESTMENTS | | | | |
Net realized gain on investments | | | 10,375,124 | |
Net change in unrealized appreciation (depreciation) on investments | | | (8,138,530 | ) |
| | |
|
|
|
| NET GAIN ON INVESTMENTS | | | 2,236,594 | |
| | |
|
|
|
| NET INCREASE IN NET ASSETS RESULTING FROM OPERATIONS | | $ | 2,105,597 | |
| | |
|
|
|
STATEMENT OF CHANGES IN NET ASSETS
| | | | | | | | |
| | | Year Ended
December 31, 2004
| | | Year Ended
December 31, 2003
| |
| INCREASE (DECREASE) IN NET ASSETS | | | | | | | | |
| OPERATIONS: | | | | | | | | |
Net investment loss | | $ | (130,997 | ) | | $ | (95,435 | ) |
Net realized gain (loss) on investments | | | 10,375,124 | | | | (3,144,957 | ) |
Net change in unrealized appreciation (depreciation) on investments | | | (8,138,530 | ) | | | 23,187,464 | |
| | |
|
|
| |
|
|
|
NET INCREASE IN NET ASSETS RESULTING FROM OPERATIONS | | | 2,105,597 | | | | 19,947,072 | |
| | |
|
|
| |
|
|
|
| CAPITAL STOCK TRANSACTIONS: | | | | | | | | |
Capital stock sold [8,646,319 and 14,823,256 shares, respectively] | | | 54,050,476 | | | | 84,014,440 | |
Capital stock repurchased [22,224,721 and 2,766,899 shares, respectively] | | | (136,920,541 | ) | | | (15,141,794 | ) |
| | |
|
|
| |
|
|
|
NET INCREASE (DECREASE) IN NET ASSETS RESULTING FROM CAPITAL STOCK TRANSACTIONS | | | (82,870,065 | ) | | | 68,872,646 | |
| | |
|
|
| |
|
|
|
| TOTAL INCREASE (DECREASE) IN NET ASSETS | | | (80,764,468 | ) | | | 88,819,718 | |
| NET ASSETS: | | | | | | | | |
Beginning of year | | | 146,469,749 | | | | 57,650,031 | |
| | |
|
|
| |
|
|
|
End of year | | $ | 65,705,281 | | | $ | 146,469,749 | |
| | |
|
|
| |
|
|
|
SEE NOTES TO FINANCIAL STATEMENTS.
A4
| | | | |
| | | SP BALANCED ASSET ALLOCATION PORTFOLIO | | |
STATEMENT OF ASSETS AND LIABILITIES
as of December 31, 2004
| | | |
| ASSETS | | | |
Investments, at value (cost $762,250,484) | | $ | 837,027,641 |
Receivable for capital stock sold | | | 956,889 |
Dividends and interest receivable | | | 1,730 |
| | |
|
|
Total assets | | | 837,986,260 |
| | |
|
|
| LIABILITIES | | | |
Payable for investments purchased | | | 847,451 |
Payable for capital stock repurchased | | | 111,143 |
Management fee payable | | | 34,582 |
Deferred directors’ fees | | | 1,018 |
| | |
|
|
Total liabilities | | | 994,194 |
| | |
|
|
| NET ASSETS | | $ | 836,992,066 |
| | |
|
|
Net assets were comprised of: | | | |
Common stock, at $0.01 par value | | $ | 787,623 |
Paid-in capital in excess of par | | | 723,952,678 |
| | |
|
|
| | | | 724,740,301 |
Undistributed net investment income | | | 8,722,666 |
Accumulated net realized gain on investments | | | 28,751,942 |
Net unrealized appreciation on investments | | | 74,777,157 |
| | |
|
|
Net assets, December 31, 2004 | | $ | 836,992,066 |
| | |
|
|
Net asset value and redemption price per share, $836,992,066 / 78,762,266 outstanding shares of common stock (authorized 225,000,000 shares) | | $ | 10.63 |
| | |
|
|
STATEMENT OF OPERATIONS
Year Ended December 31, 2004
| | | |
| INVESTMENT INCOME | | | |
Dividends | | $ | 9,041,352 |
| | |
|
|
| EXPENSES | | | |
Management fee | | | 318,686 |
| | |
|
|
| NET INVESTMENT INCOME | | | 8,722,666 |
| | |
|
|
| NET REALIZED AND UNREALIZED GAIN ON INVESTMENTS | | | |
Net realized gain on investments | | | 33,580,255 |
Net change in unrealized appreciation (depreciation) on investments | | | 33,450,837 |
| | |
|
|
| NET GAIN ON INVESTMENTS | | | 67,031,092 |
| | |
|
|
| NET INCREASE IN NET ASSETS RESULTING FROM OPERATIONS | | $ | 75,753,758 |
| | |
|
|
STATEMENT OF CHANGES IN NET ASSETS
| | | | | | | | |
| | | Year Ended
December 31, 2004
| | | Year Ended
December 31, 2003
| |
| INCREASE (DECREASE) IN NET ASSETS | | | | | | | | |
| OPERATIONS: | | | | | | | | |
Net investment income | | $ | 8,722,666 | | | $ | 4,764,898 | |
Net realized gain (loss) on investments | | | 33,580,255 | | | | (825,056 | ) |
Net change in unrealized appreciation (depreciation) on investments | | | 33,450,837 | | | | 53,400,233 | |
| | |
|
|
| |
|
|
|
NET INCREASE IN NET ASSETS RESULTING FROM OPERATIONS | | | 75,753,758 | | | | 57,340,075 | |
| | |
|
|
| |
|
|
|
| DIVIDENDS AND DISTRIBUTIONS: | | | | | | | | |
Dividends from net investment income | | | (4,764,898 | ) | | | (2,105,869 | ) |
Distributions from net realized capital gains | | | (418,285 | ) | | | — | |
| | |
|
|
| |
|
|
|
TOTAL DIVIDENDS AND DISTRIBUTIONS | | | (5,183,183 | ) | | | (2,105,869 | ) |
| | |
|
|
| |
|
|
|
| CAPITAL STOCK TRANSACTIONS: | | | | | | | | |
Capital stock sold [36,761,733 and 30,930,294 shares, respectively] | | | 361,570,484 | | | | 272,487,635 | |
Capital stock issued in reinvestment of dividends and distributions [532,701 and 267,922 shares, respectively] | | | 5,183,183 | | | | 2,105,869 | |
Capital stock repurchased [5,099,733 and 3,147,944 shares, respectively] | | | (50,288,089 | ) | | | (27,212,619 | ) |
| | |
|
|
| |
|
|
|
NET INCREASE IN NET ASSETS RESULTING FROM CAPITAL STOCK TRANSACTIONS | | | 316,465,578 | | | | 247,380,885 | |
| | |
|
|
| |
|
|
|
| TOTAL INCREASE IN NET ASSETS | | | 387,036,153 | | | | 302,615,091 | |
| NET ASSETS: | | | | | | | | |
Beginning of year | | | 449,955,913 | | | | 147,340,822 | |
| | |
|
|
| |
|
|
|
End of year (a) | | $ | 836,992,066 | | | $ | 449,955,913 | |
| | |
|
|
| |
|
|
|
(a) Includes undistributed net investment income of: | | $ | 8,722,666 | | | $ | 4,764,898 | |
| | |
|
|
| |
|
|
|
SEE NOTES TO FINANCIAL STATEMENTS.
A5
| | | | |
| | | SP CONSERVATIVE ASSET ALLOCATION PORTFOLIO | | |
STATEMENT OF ASSETS AND LIABILITIES
December 31, 2004
| | | |
| ASSETS | | | |
Investments, at value (cost $431,474,651) | | $ | 459,887,745 |
Receivable for capital stock sold | | | 577,546 |
Dividends receivable | | | 1,643 |
| | |
|
|
Total assets | | | 460,466,934 |
| | |
|
|
| LIABILITIES | | | |
Payable for investments purchased | | | 409,814 |
Payable for capital stock repurchased | | | 169,375 |
Management fee payable | | | 19,048 |
Deferred directors’ fees | | | 1,029 |
| | |
|
|
Total liabilities | | | 599,266 |
| | |
|
|
| NET ASSETS | | $ | 459,867,668 |
| | |
|
|
Net assets were comprised of: | | | |
Common stock, at $0.01 par value | | $ | 410,556 |
Paid-in capital in excess of par | | | 408,708,122 |
| | |
|
|
| | | | 409,118,678 |
Undistributed net investment income | | | 6,842,945 |
Accumulated net realized gain on investments | | | 15,492,951 |
Net unrealized appreciation on investments | | | 28,413,094 |
| | |
|
|
Net assets, December 31, 2004 | | $ | 459,867,668 |
| | |
|
|
Net asset value and redemption price per share, $459,867,668 / 41,055,629 outstanding shares of common stock (authorized 140,000,000 shares) | | $ | 11.20 |
| | |
|
|
STATEMENT OF OPERATIONS
Year Ended December 31, 2004
| | | |
| INVESTMENT INCOME | | | |
Dividends | | $ | 7,027,136 |
| | |
|
|
| EXPENSES | | | |
Management fee | | | 184,191 |
| | |
|
|
| NET INVESTMENT INCOME | | | 6,842,945 |
| | |
|
|
| NET REALIZED AND UNREALIZED GAIN ON INVESTMENTS | | | |
Net realized gain on investments | | | 18,584,956 |
Net change in unrealized appreciation (depreciation) on investments | | | 8,656,289 |
| | |
|
|
| NET GAIN ON INVESTMENTS | | | 27,241,245 |
| | |
|
|
| NET INCREASE IN NET ASSETS RESULTING FROM OPERATIONS | | $ | 34,084,190 |
| | |
|
|
STATEMENT OF CHANGES IN NET ASSETS
| | | | | | | | |
| | | Year Ended
December 31, 2004
| | | Year Ended
December 31, 2003
| |
| INCREASE (DECREASE) IN NET ASSETS | | | | | | | | |
| OPERATIONS: | | | | | | | | |
Net investment income | | $ | 6,842,945 | | | $ | 4,871,869 | |
Net realized gain on investments | | | 18,584,956 | | | | 4,191 | |
Net change in unrealized appreciation (depreciation) on investments | | | 8,656,289 | | | | 24,067,294 | |
| | |
|
|
| |
|
|
|
NET INCREASE IN NET ASSETS RESULTING FROM OPERATIONS | | | 34,084,190 | | | | 28,943,354 | |
| | |
|
|
| |
|
|
|
| DIVIDENDS AND DISTRIBUTIONS: | | | | | | | | |
Dividends from net investment income | | | (4,871,869 | ) | | | (2,222,861 | ) |
Distributions from net realized capital gains | | | (945,835 | ) | | | (264,006 | ) |
| | |
|
|
| |
|
|
|
TOTAL DIVIDENDS AND DISTRIBUTIONS | | | (5,817,704 | ) | | | (2,486,867 | ) |
| | |
|
|
| |
|
|
|
| CAPITAL STOCK TRANSACTIONS: | | | | | | | | |
Capital stock sold [17,606,534 and 16,487,104 shares, respectively] | | | 185,977,577 | | | | 161,815,520 | |
Capital stock issued in reinvestment of dividends and distributions [554,595 and 272,384 shares, respectively] | | | 5,817,704 | | | | 2,486,867 | |
Capital stock repurchased [3,928,230 and 2,766,434 shares, respectively] | | | (41,403,704 | ) | | | (27,085,414 | ) |
| | |
|
|
| |
|
|
|
NET INCREASE IN NET ASSETS RESULTING FROM CAPITAL STOCK TRANSACTIONS | | | 150,391,577 | | | | 137,216,973 | |
| | |
|
|
| |
|
|
|
| TOTAL INCREASE IN NET ASSETS | | | 178,658,063 | | | | 163,673,460 | |
| NET ASSETS: | | | | | | | | |
Beginning of year | | | 281,209,605 | | | | 117,536,145 | |
| | |
|
|
| |
|
|
|
End of year (a) | | $ | 459,867,668 | | | $ | 281,209,605 | |
| | |
|
|
| |
|
|
|
(a) Includes undistributed net investment income of: | | $ | 6,842,945 | | | $ | 4,871,869 | |
| | |
|
|
| |
|
|
|
SEE NOTES TO FINANCIAL STATEMENTS.
A6
STATEMENT OF ASSETS AND LIABILITIES
December 31, 2004
| | | |
| ASSETS | | | |
Investments, excluding repurchase agreement, at value (cost $236,556,974) | | $ | 285,977,285 |
Foreign currency, at value (cost $2,385) | | | 2,405 |
Cash | | | 120,292 |
Dividends and interest receivable | | | 410,060 |
Receivable for capital stock sold | | | 272,936 |
Tax reclaim receivable | | | 7,739 |
Prepaid expenses | | | 4,551 |
| | |
|
|
Total assets | | | 286,795,268 |
| | |
|
|
| LIABILITIES | | | |
Payable for investments purchased | | | 1,069,627 |
Management fee payable | | | 177,466 |
Accrued expenses and other liabilities | | | 61,789 |
Payable for capital stock repurchased | | | 12,239 |
Deferred directors’ fees | | | 2,852 |
| | |
|
|
Total liabilities | | | 1,323,973 |
| | |
|
|
| NET ASSETS | | $ | 285,471,295 |
| | |
|
|
Net assets were comprised of: | | | |
Common stock, at $0.01 par value | | $ | 260,063 |
Paid-in capital in excess of par | | | 204,762,708 |
| | |
|
|
| | | | 205,022,771 |
Undistributed net investment income | | | 2,691,920 |
Accumulated net realized gain on investments | | | 28,335,483 |
Net unrealized appreciation on investments | | | 49,421,121 |
| | |
|
|
Net assets, December 31, 2004 | | $ | 285,471,295 |
| | |
|
|
Net asset value and redemption price per share, $285,471,295 / 26,006,274 outstanding shares of common stock (authorized 225,000,000 shares) | | $ | 10.98 |
| | |
|
|
STATEMENT OF OPERATIONS
Year Ended December 31, 2004
| | | | |
| INVESTMENT INCOME | | | | |
Dividends (net of $142,109 foreign withholding tax) | | $ | 5,092,965 | |
Interest | | | 259,693 | |
| | |
|
|
|
| | | | 5,352,658 | |
| | |
|
|
|
| EXPENSES | | | | |
Management fee | | | 2,345,285 | |
Custodian’s fees and expenses | | | 134,000 | |
Shareholders’ reports | | | 39,000 | |
Audit fee | | | 17,000 | |
Directors’ fees | | | 14,000 | |
Legal fees and expenses | | | 9,000 | |
Transfer agent’s fees and expenses | | | 5,000 | |
Commitment fee on syndicated credit agreement | | | 4,000 | |
Miscellaneous | | | 11,531 | |
| | |
|
|
|
Total expenses | | | 2,578,816 | |
Less: custodian fee credit | | | (125 | ) |
| | |
|
|
|
Net expenses | | | 2,578,691 | |
| | |
|
|
|
| NET INVESTMENT INCOME | | | 2,773,967 | |
| | |
|
|
|
| NET REALIZED AND UNREALIZED GAIN (LOSS) ON INVESTMENTS AND FOREIGN CURRENCIES | | | | |
Net realized gain (loss) on: | | | | |
Investments | | | 35,470,827 | |
Foreign currency transactions | | | (37,876 | ) |
| | |
|
|
|
| | | | 35,432,951 | |
| | |
|
|
|
Net change in unrealized appreciation (depreciation) on: | |
Investments | | | (2,603,810 | ) |
Foreign currencies | | | 810 | |
| | |
|
|
|
| | | | (2,603,000 | ) |
| | |
|
|
|
| NET GAIN ON INVESTMENTS AND FOREIGN CURRENCIES | | | 32,829,951 | |
| | |
|
|
|
| NET INCREASE IN NET ASSETS RESULTING FROM OPERATIONS | | $ | 35,603,918 | |
| | |
|
|
|
STATEMENT OF CHANGES IN NET ASSETS
| | | | | | | | |
| | | Year Ended
December 31, 2004
| | | Year Ended
December 31, 2003
| |
| INCREASE (DECREASE) IN NET ASSETS | | | | | | | | |
| OPERATIONS: | | | | | | | | |
Net investment income | | $ | 2,773,967 | | | $ | 1,956,738 | |
Net gain (loss) on investments and foreign currencies | | | 35,432,951 | | | | (1,290,464 | ) |
Net change in unrealized appreciation (depreciation) on investments | | | (2,603,000 | ) | | | 70,408,319 | |
| | |
|
|
| |
|
|
|
NET INCREASE IN NET ASSETS RESULTING FROM OPERATIONS | | | 35,603,918 | | | | 71,074,593 | |
| | |
|
|
| |
|
|
|
| DIVIDENDS: | | | | | | | | |
Dividends from net investment income | | | (1,941,811 | ) | | | (1,086,448 | ) |
| | |
|
|
| |
|
|
|
| CAPITAL STOCK TRANSACTIONS: | | | | | | | | |
Capital stock sold [13,018,059 and 22,745,942 shares, respectively] | | | 132,163,329 | | | | 193,625,269 | |
Capital stock issued in reinvestment of dividends [194,961 and 148,219 shares, respectively] | | | 1,941,811 | | | | 1,086,448 | |
Capital stock repurchased [27,136,196 and 4,601,620 shares, respectively] | | | (273,492,422 | ) | | | (38,456,775 | ) |
| | |
|
|
| |
|
|
|
NET INCREASE (DECREASE) IN NET ASSETS RESULTING FROM CAPITAL STOCK TRANSACTIONS | | | (139,387,282 | ) | | | 156,254,942 | |
| | |
|
|
| |
|
|
|
| TOTAL INCREASE (DECREASE) IN NET ASSETS | | | (105,725,175 | ) | | | 226,243,087 | |
| NET ASSETS: | | | | | | | | |
Beginning of year | | | 391,196,470 | | | | 164,953,383 | |
| | |
|
|
| |
|
|
|
End of year (a) | | $ | 285,471,295 | | | $ | 391,196,470 | |
| | |
|
|
| |
|
|
|
(a) Includes undistributed net investment income of: | | $ | 2,691,920 | | | $ | 1,897,640 | |
| | |
|
|
| |
|
|
|
SEE NOTES TO FINANCIAL STATEMENTS.
A7
| | | | |
| | | SP GOLDMAN SACHS SMALL CAP VALUE PORTFOLIO | | |
STATEMENT OF ASSETS AND LIABILITIES
December 31, 2004
| | | |
| ASSETS | | | |
Investments, at value (cost $342,435,171) | | $ | 392,882,873 |
Dividends and interest receivable | | | 423,710 |
Receivable for capital stock sold | | | 366,592 |
Receivable for investments sold | | | 332,817 |
Prepaid expenses | | | 5,284 |
| | |
|
|
Total assets | | | 394,011,276 |
| | |
|
|
| LIABILITIES | | | |
Management fee payable | | | 292,106 |
Payable for investments purchased | | | 186,241 |
Payable for capital stock repurchased | | | 165,520 |
Accrued expenses and other liabilities | | | 56,201 |
Deferred directors’ fees | | | 2,492 |
| | |
|
|
Total liabilities | | | 702,560 |
| | |
|
|
| NET ASSETS | | $ | 393,308,716 |
| | |
|
|
Net assets were comprised of: | | | |
Common stock, at $0.01 par value | | $ | 253,546 |
Paid-in capital in excess of par | | | 294,238,612 |
| | |
|
|
| | | | 294,492,158 |
Undistributed net investment income | | | 2,138,010 |
Accumulated net realized gain on investments | | | 46,230,846 |
Net unrealized appreciation on investments | | | 50,447,702 |
| | |
|
|
Net assets, December 31, 2004 | | $ | 393,308,716 |
| | |
|
|
Net asset value and redemption price per share, $393,308,716 / 25,354,646 outstanding shares of common stock (authorized 100,000,000 shares) | | $ | 15.51 |
| | |
|
|
STATEMENT OF OPERATIONS
Year Ended December 31, 2004
| | | | |
| INVESTMENT INCOME | | | | |
Dividends (net of $5,132 foreign withholding tax) | | $ | 4,996,008 | |
Interest | | | 102,138 | |
| | |
|
|
|
| | | | 5,098,146 | |
| | |
|
|
|
| EXPENSES | | | | |
Management fee | | | 2,765,394 | |
Custodian’s fees and expenses | | | 128,000 | |
Shareholders’ reports | | | 15,000 | |
Audit fee | | | 15,000 | |
Directors’ fees | | | 12,000 | |
Legal fees and expenses | | | 8,600 | |
Transfer agent’s fees and expenses | | | 4,600 | |
Commitment fee on syndicated credit agreement | | | 3,800 | |
Miscellaneous | | | 9,226 | |
| | |
|
|
|
Total expenses | | | 2,961,620 | |
Less: custodian fee credit | | | (1,484 | ) |
| | |
|
|
|
Net expenses | | | 2,960,136 | |
| | |
|
|
|
| NET INVESTMENT INCOME | | | 2,138,010 | |
| | |
|
|
|
| NET REALIZED AND UNREALIZED GAIN ON INVESTMENTS | | | | |
Net realized gain on investments | | | 46,403,552 | |
Net change in unrealized appreciation (depreciation) on investments | | | 14,582,023 | |
| | |
|
|
|
| NET GAIN ON INVESTMENTS | | | 60,985,575 | |
| | |
|
|
|
| NET INCREASE IN NET ASSETS RESULTING FROM OPERATIONS | | $ | 63,123,585 | |
| | |
|
|
|
STATEMENT OF CHANGES IN NET ASSETS
| | | | | | | | |
| | | Year Ended
December 31, 2004
| | | Year Ended
December 31, 2003
| |
| INCREASE (DECREASE) IN NET ASSETS | | | | | | | | |
| OPERATIONS: | | | | | | | | |
Net investment income | | $ | 2,138,010 | | | $ | 553,282 | |
Net realized gain on investments | | | 46,403,552 | | | | 5,661,627 | |
Net change in unrealized appreciation (depreciation) on investments | | | 14,582,023 | | | | 43,300,041 | |
| | |
|
|
| |
|
|
|
NET INCREASE IN NET ASSETS RESULTING FROM OPERATIONS | | | 63,123,585 | | | | 49,514,950 | |
| | |
|
|
| |
|
|
|
| DIVIDENDS AND DISTRIBUTIONS: | | | | | | | | |
Dividends from net investment income | | | (553,326 | ) | | | (37,628 | ) |
Distributions from net realized capital gains | | | (93,547 | ) | | | — | |
| | |
|
|
| |
|
|
|
TOTAL DIVIDENDS AND DISTRIBUTIONS | | | (646,873 | ) | | | (37,628 | ) |
| | |
|
|
| |
|
|
|
| CAPITAL STOCK TRANSACTIONS: | | | | | | | | |
Capital stock sold [11,394,458 and 12,296,185 shares, respectively] | | | 153,984,132 | | | | 135,021,387 | |
Capital stock issued in reinvestment of dividends [49,229 and 4,099 shares, respectively] | | | 646,873 | | | | 37,628 | |
Capital stock repurchased [5,544,868 and 3,095,968 shares, respectively] | | | (74,374,100 | ) | | | (33,154,796 | ) |
| | |
|
|
| |
|
|
|
NET INCREASE IN NET ASSETS RESULTING FROM CAPITAL STOCK TRANSACTIONS | | | 80,256,905 | | | | 101,904,219 | |
| | |
|
|
| |
|
|
|
| TOTAL INCREASE IN NET ASSETS | | | 142,733,617 | | | | 151,381,541 | |
| NET ASSETS: | | | | | | | | |
Beginning of year | | | 250,575,099 | | | | 99,193,558 | |
| | |
|
|
| |
|
|
|
End of year (a) | | $ | 393,308,716 | | | $ | 250,575,099 | |
| | |
|
|
| |
|
|
|
(a) Includes undistributed net investment income of: | | $ | 2,138,010 | | | $ | 553,326 | |
| | |
|
|
| |
|
|
|
SEE NOTES TO FINANCIAL STATEMENTS.
A8
| | | | |
| | | SP GROWTH ASSET ALLOCATION PORTFOLIO | | |
STATEMENT OF ASSETS AND LIABILITIES
December 31, 2004
| | | |
| ASSETS | | | |
Investments, at value (cost $591,684,631) | | $ | 662,700,386 |
Receivable for capital stock sold | | | 1,516,634 |
| | |
|
|
Total assets | | | 664,217,020 |
| | |
|
|
| LIABILITIES | | | |
Payable for investments purchased | | | 1,401,040 |
Payable for capital stock repurchased | | | 115,569 |
Management fee payable | | | 27,097 |
Deferred directors’ fees | | | 1,070 |
| | |
|
|
Total liabilities | | | 1,544,776 |
| | |
|
|
| NET ASSETS | | $ | 662,672,244 |
| | |
|
|
Net assets were comprised of: | | | |
Common stock, at $0.01 par value | | $ | 675,996 |
Paid-in capital in excess of par | | | 562,835,492 |
| | |
|
|
| | | | 563,511,488 |
Undistributed net investment income | | | 4,573,235 |
Accumulated net realized gain on investments | | | 23,571,766 |
Net unrealized appreciation on investments | | | 71,015,755 |
| | |
|
|
Net assets, December 31, 2004 | | $ | 662,672,244 |
| | |
|
|
Net asset value and redemption price per share, $662,672,244 / 67,599,591 outstanding shares of common stock (authorized 150,000,000 shares) | | $ | 9.80 |
| | |
|
|
STATEMENT OF OPERATIONS
Year Ended December 31, 2004
| | | |
| INVESTMENT INCOME | | | |
Dividends | | $ | 4,815,924 |
| | |
|
|
| EXPENSES | | | |
Management fee | | | 242,689 |
| | |
|
|
| NET INVESTMENT INCOME | | | 4,573,235 |
| | |
|
|
| NET REALIZED AND UNREALIZED GAIN ON INVESTMENTS | | | |
Net realized gain on investments | | | 31,270,135 |
Net change in unrealized appreciation (depreciation) on investments | | | 32,882,645 |
| | |
|
|
| NET GAIN ON INVESTMENTS | | | 64,152,780 |
| | |
|
|
| NET INCREASE IN NET ASSETS RESULTING FROM OPERATIONS | | $ | 68,726,015 |
| | |
|
|
STATEMENT OF CHANGES IN NET ASSETS
| | | | | | | | |
| | | Year Ended
December 31, 2004
| | | Year Ended
December 31, 2003
| |
| INCREASE (DECREASE) IN NET ASSETS | | | | | | | | |
| OPERATIONS: | | | | | | | | |
Net investment income | | $ | 4,573,235 | | | $ | 1,930,590 | |
Net realized gain (loss) on investments | | | 31,270,135 | | | | (3,529,031 | ) |
Net change in unrealized appreciation (depreciation) on investments | | | 32,882,645 | | | | 49,477,044 | |
| | |
|
|
| |
|
|
|
NET INCREASE IN NET ASSETS RESULTING FROM OPERATIONS | | | 68,726,015 | | | | 47,878,603 | |
| | |
|
|
| |
|
|
|
| DIVIDENDS | | | | | | | | |
Dividends from net investment income | | | (1,930,590 | ) | | | (797,294 | ) |
| | |
|
|
| |
|
|
|
| CAPITAL STOCK TRANSACTIONS: | | | | | | | | |
Capital stock sold [33,790,622 and 26,204,344 shares, respectively] | | | 302,317,165 | | | | 204,273,702 | |
Capital stock issued in reinvestment of dividends [219,136 and 118,999 shares, respectively] | | | 1,930,590 | | | | 797,294 | |
Capital stock repurchased [3,934,729 and 2,895,071 shares, respectively] | | | (35,076,687 | ) | | | (21,817,431 | ) |
| | |
|
|
| |
|
|
|
NET INCREASE IN NET ASSETS RESULTING FROM CAPITAL STOCK TRANSACTIONS | | | 269,171,068 | | | | 183,253,565 | |
| | |
|
|
| |
|
|
|
| TOTAL INCREASE IN NET ASSETS | | | 335,966,493 | | | | 230,334,874 | |
| NET ASSETS: | | | | | | | | |
Beginning of year | | | 326,705,751 | | | | 96,370,877 | |
| | |
|
|
| |
|
|
|
End of year (a) | | $ | 662,672,244 | | | $ | 326,705,751 | |
| | |
|
|
| |
|
|
|
(a) Includes undistributed net investment income of: | | $ | 4,573,235 | | | $ | 1,930,590 | |
| | |
|
|
| |
|
|
|
SEE NOTES TO FINANCIAL STATEMENTS.
A9
| | | | |
| | | SP LARGE CAP VALUE PORTFOLIO | | |
STATEMENT OF ASSETS AND LIABILITIES
December 31, 2004
| | | |
| ASSETS | | | |
Investments, at value (cost $539,636,309) | | $ | 606,033,287 |
Receivable for capital stock sold | | | 929,732 |
Dividends and interest receivable | | | 912,489 |
Receivable for investments sold | | | 647,298 |
Prepaid expenses | | | 7,624 |
| | |
|
|
Total assets | | | 608,530,430 |
| | |
|
|
| LIABILITIES | | | |
Payable for investments purchased | | | 6,567,561 |
Management fee payable | | | 396,457 |
Payable for capital stock repurchased | | | 99,755 |
Accrued expenses and other liabilities | | | 58,459 |
Deferred directors’ fees | | | 2,281 |
| | |
|
|
Total liabilities | | | 7,124,513 |
| | |
|
|
| NET ASSETS | | $ | 601,405,917 |
| | |
|
|
Net assets were comprised of: | | | |
Common stock, at $0.01 par value | | $ | 520,205 |
Paid-in capital in excess of par | | | 514,697,398 |
| | |
|
|
| | | | 515,217,603 |
Undistributed net investment income | | | 5,479,674 |
Accumulated net realized gain on investments | | | 14,311,662 |
Net unrealized appreciation on investments | | | 66,396,978 |
| | |
|
|
Net assets, December 31, 2004 | | $ | 601,405,917 |
| | |
|
|
Net asset value and redemption price per share, $601,405,917 / 52,020,523 outstanding shares of common stock (authorized 100,000,000 shares) | | $ | 11.56 |
| | |
|
|
STATEMENT OF OPERATIONS
Year Ended December 31, 2004
| | | | |
| INVESTMENT INCOME | | | | |
Dividends (net of $4,506 foreign withholding tax) | | $ | 8,468,602 | |
Interest | | | 85,225 | |
| | |
|
|
|
| | | | 8,553,827 | |
| | |
|
|
|
| EXPENSES | | | | |
Management fee | | | 2,870,992 | |
Custodian’s fees and expenses | | | 139,000 | |
Audit fee | | | 16,000 | |
Shareholders’ reports | | | 15,000 | |
Directors’ fees | | | 9,800 | |
Legal fees and expenses | | | 6,500 | |
Transfer agent’s fees and expenses | | | 4,200 | |
Commitment fee on syndicated credit agreement | | | 3,400 | |
Miscellaneous | | | 10,340 | |
| | |
|
|
|
Total expenses | | | 3,075,232 | |
Less: custodian fee credit | | | (1,079 | ) |
| | |
|
|
|
Net expenses | | | 3,074,153 | |
| | |
|
|
|
| NET INVESTMENT INCOME | | | 5,479,674 | |
| | |
|
|
|
| NET REALIZED AND UNREALIZED GAIN ON INVESTMENTS | | | | |
Net realized gain on investments | | | 17,224,937 | |
Net change in unrealized appreciation (depreciation) on investments | | | 57,876,808 | |
| | |
|
|
|
| NET GAIN ON INVESTMENTS | | | 75,101,745 | |
| | |
|
|
|
| NET INCREASE IN NET ASSETS RESULTING FROM OPERATIONS | | $ | 80,581,419 | |
| | |
|
|
|
STATEMENT OF CHANGES IN NET ASSETS
| | | | | | | | |
| | | Year Ended December 31, 2004
| | | Year Ended December 31, 2003
| |
| INCREASE (DECREASE) IN NET ASSETS | | | | | | | | |
| OPERATIONS: | | | | | | | | |
Net investment income | | $ | 5,479,674 | | | $ | 674,049 | |
Net realized gain (loss) on investments | | | 17,224,937 | | | | (194,061 | ) |
Net change in unrealized appreciation (depreciation) on investments | | | 57,876,808 | | | | 12,923,618 | |
| | |
|
|
| |
|
|
|
NET INCREASE IN NET ASSETS RESULTING FROM OPERATIONS | | | 80,581,419 | | | | 13,403,606 | |
| | |
|
|
| |
|
|
|
| DIVIDENDS: | | | | | | | | |
Dividends from net investment income | | | (674,049 | ) | | | — | |
| | |
|
|
| |
|
|
|
| CAPITAL STOCK TRANSACTIONS: | | | | | | | | |
Capital stock sold [49,406,222 and 4,233,763 shares, respectively] | | | 498,844,480 | | | | 36,308,863 | |
Capital stock issued in reinvestment of dividends [67,744 and 0 shares, respectively] | | | 674,049 | | | | — | |
Capital stock repurchased [4,817,105 and 1,778,946 shares, respectively] | | | (50,902,662 | ) | | | (15,149,223 | ) |
| | |
|
|
| |
|
|
|
NET INCREASE IN NET ASSETS RESULTING FROM CAPITAL STOCK TRANSACTIONS | | | 448,615,867 | | | | 21,159,640 | |
| | |
|
|
| |
|
|
|
| TOTAL INCREASE IN NET ASSETS | | | 528,523,237 | | | | 34,563,246 | |
| NET ASSETS: | | | | | | | | |
Beginning of year | | | 72,882,680 | | | | 38,319,434 | |
| | |
|
|
| |
|
|
|
End of year (a) | | $ | 601,405,917 | | | $ | 72,882,680 | |
| | |
|
|
| |
|
|
|
(a) Includes undistributed net investment income of: | | $ | 5,479,674 | | | $ | 674,049 | |
| | |
|
|
| |
|
|
|
SEE NOTES TO FINANCIAL STATEMENTS.
A10
| | | | |
| | | SP LSV INTERNATIONAL VALUE PORTFOLIO | | |
STATEMENT OF ASSETS AND LIABILITIES
December 31, 2004
| | | |
| ASSETS | | | |
Investments, at value (cost $220,412,097) | | $ | 239,115,152 |
Foreign currency, at value (cost $943,936) | | | 966,567 |
Receivable for capital stock sold | | | 320,806 |
Dividends and interest receivable | | | 254,059 |
Tax reclaim receivable | | | 138,378 |
Due from manager | | | 20,750 |
Prepaid expenses | | | 3,171 |
| | |
|
|
Total assets | | | 240,818,883 |
| | |
|
|
| LIABILITIES | | | |
Accrued expenses and other liabilities | | | 89,056 |
Payable for capital stock repurchased | | | 26,448 |
| | |
|
|
Total liabilities | | | 115,504 |
| | |
|
|
| NET ASSETS | | $ | 240,703,379 |
| | |
|
|
Net assets were comprised of: | | | |
Common stock, at $0.01 par value | | $ | 272,210 |
Paid-in capital in excess of par | | | 197,610,021 |
| | |
|
|
| | | | 197,882,231 |
Undistributed net investment income | | | 1,010,556 |
Accumulated net realized gain on investments | | | 23,065,703 |
Net unrealized appreciation on investments and foreign currencies | | | 18,744,889 |
| | |
|
|
Net assets, December 31, 2004 | | $ | 240,703,379 |
| | |
|
|
Net asset value and redemption price per share, $240,703,379 / 27,221,002 outstanding shares of common stock (authorized 100,000,000 shares) | | $ | 8.84 |
| | |
|
|
STATEMENT OF OPERATIONS
Year Ended December 31, 2004
| | | | |
| INVESTMENT INCOME | | | | |
Dividends (net of $368,690 foreign withholding tax) | | $ | 3,101,222 | |
Interest | | | 56,021 | |
| | |
|
|
|
| | | | 3,157,243 | |
| | |
|
|
|
| EXPENSES | | | | |
Management fee | | | 1,589,386 | |
Custodian’s fees and expenses | | | 375,000 | |
Shareholders’ reports | | | 154,000 | |
Audit fee | | | 20,000 | |
Directors’ fees | | | 12,000 | |
Legal fees and expenses | | | 6,500 | |
Transfer agent’s fees and expenses | | | 4,600 | |
Commitment fee on syndicated credit agreement | | | 2,200 | |
Miscellaneous | | | 16,287 | |
| | |
|
|
|
Total expenses | | | 2,179,973 | |
Less: custodian fee credit | | | (21 | ) |
expense subsidy | | | (237,390 | ) |
| | |
|
|
|
Net expenses | | | 1,942,562 | |
| | |
|
|
|
| NET INVESTMENT INCOME | | | 1,214,681 | |
| | |
|
|
|
| NET REALIZED AND UNREALIZED GAIN (LOSS) ON INVESTMENTS AND FOREIGN CURRENCIES | | | | |
Net realized gain on: | | | | |
Investments (net of $22,731 Thailand capital gains tax) | | | 30,330,305 | |
Foreign currency transactions | | | (169,065 | ) |
| | |
|
|
|
| | | | 30,161,240 | |
| | |
|
|
|
Net change in unrealized appreciation (depreciation) on: | |
Investments | | | (437,642 | ) |
Foreign currencies | | | 29,427 | |
| | |
|
|
|
| | | | (408,215 | ) |
| | |
|
|
|
| NET GAIN ON INVESTMENTS AND FOREIGN CURRENCIES | | | 29,753,025 | |
| | |
|
|
|
| NET INCREASE IN NET ASSETS RESULTING FROM OPERATIONS | | $ | 30,967,706 | |
| | |
|
|
|
STATEMENT OF CHANGES IN NET ASSETS
| | | | | | | | |
| | | Year Ended
December 31, 2004
| | | Year Ended
December 31, 2003
| |
| INCREASE (DECREASE) IN NET ASSETS | | | | | | | | |
| OPERATIONS: | | | | | | | | |
Net investment income | | $ | 1,214,681 | | | $ | 642,658 | |
Net realized gain (loss) on investments and foreign currencies | | | 30,161,240 | | | | (209,164 | ) |
Net change in unrealized appreciation (depreciation) on investments and foreign currencies | | | (408,215 | ) | | | 21,592,977 | |
| | |
|
|
| |
|
|
|
NET INCREASE IN NET ASSETS RESULTING FROM OPERATIONS | | | 30,967,706 | | | | 22,026,471 | |
| | |
|
|
| |
|
|
|
| DIVIDENDS: | | | | | | | | |
Dividends from net investment income | | | (662,879 | ) | | | (499,019 | ) |
| | |
|
|
| |
|
|
|
| CAPITAL STOCK TRANSACTIONS: | | | | | | | | |
Capital stock sold [15,630,900 and 18,868,658 shares, respectively] | | | 122,280,619 | | | | 119,338,463 | |
Capital stock issued in reinvestment of dividends [85,422 and 87,490 shares, respectively] | | | 662,879 | | | | 499,019 | |
Capital stock repurchased [4,118,400 and 10,962,639 shares, respectively] | | | (32,402,675 | ) | | | (67,886,396 | ) |
| | |
|
|
| |
|
|
|
NET INCREASE IN NET ASSETS RESULTING FROM CAPITAL STOCK TRANSACTIONS | | | 90,540,823 | | | | 51,951,086 | |
| | |
|
|
| |
|
|
|
| TOTAL INCREASE IN NET ASSETS | | | 120,845,650 | | | | 73,478,538 | |
| NET ASSETS: | | | | | | | | |
Beginning of year | | | 119,857,729 | | | | 46,379,191 | |
| | |
|
|
| |
|
|
|
End of year (a) | | $ | 240,703,379 | | | $ | 119,857,729 | |
| | |
|
|
| |
|
|
|
(a) Includes undistributed net investment income of: | | $ | 1,010,556 | | | $ | 650,550 | |
| | |
|
|
| |
|
|
|
SEE NOTES TO FINANCIAL STATEMENTS.
A11
| | | | |
| | | SP MFS CAPITAL OPPORTUNITIES PORTFOLIO | | |
STATEMENT OF ASSETS AND LIABILITIES
December 31, 2004
| | | | |
| ASSETS | | | | |
Investments, at value (cost $24,859,573) | | $ | 27,830,193 | |
Dividends and interest receivable | | | 28,898 | |
Receivable for investments sold | | | 9,105 | |
Receivable for capital stock sold | | | 3,727 | |
Prepaid expenses | | | 418 | |
| | |
|
|
|
Total assets | | | 27,872,341 | |
| | |
|
|
|
| LIABILITIES | | | | |
Accrued expenses and other liabilities | | | 60,186 | |
Payable for investments purchased | | | 20,585 | |
Management fee payable | | | 17,254 | |
Payable for capital stock repurchased | | | 2,697 | |
Deferred directors’ fees | | | 2,244 | |
| | |
|
|
|
Total liabilities | | | 102,966 | |
| | |
|
|
|
| NET ASSETS | | $ | 27,769,375 | |
| | |
|
|
|
Net assets were comprised of: | | | | |
Common stock, at $0.01 par value | | $ | 39,112 | |
Paid-in capital in excess of par | | | 26,419,100 | |
| | |
|
|
|
| | | | 26,458,212 | |
Undistributed net investment income | | | 151,056 | |
Accumulated net realized loss on investments | | | (1,810,513 | ) |
Net unrealized appreciation on investments and foreign currencies | | | 2,970,620 | |
| | |
|
|
|
Net assets December 31, 2004 | | $ | 27,769,375 | |
| | |
|
|
|
Net asset value and redemption price per share, $27,769,375 / 3,911,177 outstanding shares of common stock (authorized 100,000,000 shares) | | $ | 7.10 | |
| | |
|
|
|
STATEMENT OF OPERATIONS
Year Ended December 31, 2004
| | | | |
| INVESTMENT INCOME | | | | |
Dividends (net of $1,531 foreign withholding tax) | | $ | 379,237 | |
Interest | | | 6,460 | |
| | |
|
|
|
| | | | 385,697 | |
| | |
|
|
|
| EXPENSES | | | | |
Management fee | | | 175,963 | |
Custodian’s fees and expenses | | | 104,000 | |
Shareholders’ reports | | | 20,000 | |
Audit fee | | | 15,000 | |
Directors’ fees | | | 8,500 | |
Legal fees and expenses | | | 7,800 | |
Transfer agent’s fees and expenses | | | 3,500 | |
Commitment fee on syndicated credit agreement | | | 300 | |
Miscellaneous | | | 5,798 | |
| | |
|
|
|
Total expenses | | | 340,861 | |
Less: expense subsidy | | | (106,207 | ) |
custodian fee credit | | | (12 | ) |
| | |
|
|
|
Net expenses | | | 234,642 | |
| | |
|
|
|
| NET INVESTMENT INCOME | | | 151,055 | |
| | |
|
|
|
| NET REALIZED AND UNREALIZED GAIN (LOSS) ON INVESTMENTS | | | | |
Net realized gain on Investments | | | 2,239,747 | |
| | |
|
|
|
Net change in unrealized appreciation (depreciation) on investments | | | 546,409 | |
| | |
|
|
|
| NET GAIN ON INVESTMENTS | | | 2,786,156 | |
| | |
|
|
|
| NET INCREASE IN NET ASSETS RESULTING FROM OPERATIONS | | $ | 2,937,211 | |
| | |
|
|
|
STATEMENT OF CHANGES IN NET ASSETS
| | | | | | | | |
| | | Year Ended
December 31, 2004
| | | Year Ended
December 31, 2003
| |
| INCREASE IN NET ASSETS | | | | | | | | |
| OPERATIONS: | | | | | | | | |
Net investment income | | $ | 151,055 | | | $ | 43,900 | |
Net realized gain on investments and foreign currencies | | | 2,239,747 | | | | 699,563 | |
Net change in unrealized appreciation (depreciation) on investments and foreign currencies | | | 546,409 | | | | 2,517,285 | |
| | |
|
|
| |
|
|
|
NET INCREASE IN NET ASSETS RESULTING FROM OPERATIONS | | | 2,937,211 | | | | 3,260,748 | |
| | |
|
|
| |
|
|
|
| DIVIDENDS: | | | | | | | | |
Dividends from net investment income | | | (43,843 | ) | | | (14,769 | ) |
| | |
|
|
| |
|
|
|
| CAPITAL STOCK TRANSACTIONS: | | | | | | | | |
Capital stock sold [1,316,690 and 1,965,303 shares, respectively] | | | 8,563,365 | | | | 11,160,163 | |
Capital stock issued in reinvestment of dividends [6,959 and 3,026 shares, respectively] | | | 43,843 | | | | 14,769 | |
Capital stock repurchased [624,517 and 625,563 shares, respectively] | | | (4,048,590 | ) | | | (3,444,184 | ) |
| | |
|
|
| |
|
|
|
NET INCREASE IN NET ASSETS RESULTING FROM CAPITAL STOCK TRANSACTIONS | | | 4,558,618 | | | | 7,730,748 | |
| | |
|
|
| |
|
|
|
| TOTAL INCREASE IN NET ASSETS | | | 7,451,986 | | | | 10,976,727 | |
| NET ASSETS: | | | | | | | | |
Beginning of year | | | 20,317,389 | | | | 9,340,662 | |
| | |
|
|
| |
|
|
|
End of year (a) | | $ | 27,769,375 | | | $ | 20,317,389 | |
| | |
|
|
| |
|
|
|
(a) Includes undistributed net investment income of: | | $ | 151,056 | | | $ | 43,844 | |
| | |
|
|
| |
|
|
|
SEE NOTES TO FINANCIAL STATEMENTS.
A12
| | | | |
| | | SP MID-CAP GROWTH PORTFOLIO | | |
STATEMENT OF ASSETS AND LIABILITIES
December 31, 2004
| | | | |
| ASSETS | | | | |
Investments, at value (cost $86,617,486) | | $ | 107,547,030 | |
Receivable for capital stock sold | | | 132,526 | |
Dividends and interest receivable | | | 13,423 | |
Prepaid expenses | | | 1,421 | |
| | |
|
|
|
Total assets | | | 107,694,400 | |
| | |
|
|
|
| LIABILITIES | | | | |
Accrued expenses and other liabilities | | | 91,077 | |
Management fee payable | | | 70,367 | |
Payable for capital stock repurchased | | | 19,884 | |
Deferred directors’ fees | | | 2,271 | |
| | |
|
|
|
Total liabilities | | | 183,599 | |
| | |
|
|
|
| NET ASSETS | | $ | 107,510,801 | |
| | |
|
|
|
Net assets were comprised of: | | | | |
Common stock, at $0.01 par value | | $ | 156,872 | |
Paid-in capital in excess of par | | | 91,736,434 | |
| | |
|
|
|
| | | | 91,893,306 | |
Accumulated net investment loss | | | (2,271 | ) |
Accumulated net realized loss on investments and foreign currencies | | | (5,309,778 | ) |
Net unrealized appreciation on investments | | | 20,929,544 | |
| | |
|
|
|
Net assets, December 31, 2004 | | $ | 107,510,801 | |
| | |
|
|
|
Net asset value and redemption price per share, $107,510,801 / 15,687,192 outstanding shares of common stock (authorized 100,000,000 shares) | | $ | 6.85 | |
| | |
|
|
|
STATEMENT OF OPERATIONS
Year Ended December 31, 2004
| | | | |
| INVESTMENT INCOME | | | | |
Dividends (net of $351 foreign withholding tax) | | $ | 223,654 | |
Interest | | | 22,464 | |
| | |
|
|
|
| | | | 246,118 | |
| | |
|
|
|
| EXPENSES | | | | |
Management fee | | | 625,848 | |
Custodian’s fees and expenses | | | 97,000 | |
Shareholders’ reports | | | 58,000 | |
Audit fee | | | 18,000 | |
Legal fees and expenses | | | 11,000 | |
Directors’ fees | | | 10,000 | |
Transfer agent’s fees and expenses | | | 4,500 | |
Commitment fee on syndicated credit agreement | | | 700 | |
Miscellaneous | | | 9,117 | |
| | |
|
|
|
Total expenses | | | 834,165 | |
Less: custodian fee credit | | | (86 | ) |
expense subsidy | | | (51,812 | ) |
| | |
|
|
|
Net expenses | | | 782,267 | |
| | |
|
|
|
| NET INVESTMENT LOSS | | | (536,149 | ) |
| | |
|
|
|
| NET REALIZED AND UNREALIZED GAIN (LOSS) ON INVESTMENTS | | | | |
Net realized gain on investments | | | 5,342,999 | |
Net change in unrealized appreciation (depreciation) on investments | | | 11,075,571 | |
| | |
|
|
|
| NET GAIN ON INVESTMENTS | | | 16,418,570 | |
| | |
|
|
|
| NET INCREASE IN NET ASSETS RESULTING FROM OPERATIONS | | $ | 15,882,421 | |
| | |
|
|
|
STATEMENT OF CHANGES IN NET ASSETS
| | | | | | | | |
| | | Year Ended
December 31, 2004
| | | Year Ended
December 31, 2003
| |
| INCREASE (DECREASE) IN NET ASSETS | | | | | | | | |
| OPERATIONS: | | | | | | | | |
Net investment loss | | $ | (536,149 | ) | | $ | (243,009 | ) |
Net realized gain on investments and foreign currencies | | | 5,342,999 | | | | 998,920 | |
Net change in unrealized appreciation (depreciation) on investments and foreign currencies | | | 11,075,571 | | | | 10,267,488 | |
| | |
|
|
| |
|
|
|
NET INCREASE IN NET ASSETS RESULTING FROM OPERATIONS | | | 15,882,421 | | | | 11,023,399 | |
| | |
|
|
| |
|
|
|
| CAPITAL STOCK TRANSACTIONS: | | | | | | | | |
Capital stock sold [7,647,553 and 8,725,545 shares, respectively] | | | 46,088,129 | | | | 44,431,608 | |
Capital stock repurchased [2,246,630 and 2,903,968 shares, respectively] | | | (13,367,426 | ) | | | (14,817,541 | ) |
| | |
|
|
| |
|
|
|
NET INCREASE IN NET ASSETS RESULTING FROM CAPITAL STOCK TRANSACTIONS | | | 32,720,703 | | | | 29,614,067 | |
| | |
|
|
| |
|
|
|
| TOTAL INCREASE IN NET ASSETS | | | 48,603,124 | | | | 40,637,466 | |
| NET ASSETS: | | | | | | | | |
Beginning of year | | | 58,907,677 | | | | 18,270,211 | |
| | |
|
|
| |
|
|
|
End of year | | $ | 107,510,801 | | | $ | 58,907,677 | |
| | |
|
|
| |
|
|
|
SEE NOTES TO FINANCIAL STATEMENTS.
A13
| | | | |
| | | SP PIMCO HIGH YIELD PORTFOLIO | | |
STATEMENT OF ASSETS AND LIABILITIES
December 31, 2004
| | | |
| ASSETS | | | |
Investments, at value (cost $293,322,796) | | $ | 308,112,180 |
Foreign currency, at value (cost $7,251) | | | 7,342 |
Cash | | | 132,811 |
Dividends and interest receivable | | | 5,530,771 |
Receivable for capital stock sold | | | 463,625 |
Receivable for investments sold | | | 65,672 |
Interest receivable on swap agreements | | | 12,698 |
Due from broker-variation margin | | | 11,725 |
Prepaid expenses | | | 4,480 |
Unrealized appreciation on swaps | | | 19,489 |
| | |
|
|
Total assets | | | 314,360,793 |
| | |
|
|
| LIABILITIES | | | |
Payable for investments purchased | | | 1,587,263 |
Management fee payable | | | 155,662 |
Accrued expenses and other liabilities | | | 57,095 |
Unrealized depreciation on forward foreign currency contracts | | | 19,040 |
Unrealized depreciation on swaps | | | 17,215 |
Payable for capital stock repurchased | | | 5,715 |
Deferred directors’ fee | | | 2,378 |
| | |
|
|
Total liabilities | | | 1,844,368 |
| | |
|
|
| NET ASSETS | | $ | 312,516,425 |
| | |
|
|
Net assets were comprised of: | | | |
Common stock, at $0.01 par value | | $ | 292,877 |
Paid-in capital in excess of par | | | 293,072,609 |
| | |
|
|
| | | | 293,365,486 |
Undistributed net investment income | | | 566,869 |
Accumulated net realized gain on investments | | | 3,945,326 |
Net unrealized appreciation on investments | | | 14,638,744 |
| | |
|
|
Net assets, December 31, 2004 | | $ | 312,516,425 |
| | |
|
|
Net asset value and redemption price per share, $312,516,425 / 29,287,729 outstanding shares of common stock (authorized 100,000,000 shares) | | $ | 10.67 |
| | |
|
|
STATEMENT OF OPERATIONS
Year Ended December 31, 2004
| | | | |
| INVESTMENT INCOME | | | | |
Interest | | $ | 20,081,193 | |
Dividends | | | 1,607 | |
| | |
|
|
|
| | | | 20,082,800 | |
| | |
|
|
|
| EXPENSES | | | | |
Management fee | | | 1,638,357 | |
Custodian’s fees and expenses | | | 139,000 | |
Shareholders’ reports | | | 25,000 | |
Audit fee | | | 20,000 | |
Directors’ fees | | | 15,000 | |
Legal fees and expenses | | | 7,500 | |
Transfer agent’s fees and expenses | | | 4,200 | |
Commitment fee on syndicated credit agreement | | | 3,200 | |
Miscellaneous | | | 9,405 | |
| | |
|
|
|
Total expenses | | | 1,861,662 | |
Less: custodian fee credit | | | (4,724 | ) |
| | |
|
|
|
Net expenses | | | 1,856,938 | |
| | |
|
|
|
| NET INVESTMENT INCOME | | | 18,225,862 | |
| | |
|
|
|
| NET REALIZED AND UNREALIZED GAIN (LOSS) ON INVESTMENTS AND FOREIGN CURRENCIES | | | | |
Net realized gain (loss) on: | | | | |
Investments | | | 4,475,998 | |
Options written | | | 201,553 | |
Futures transactions | | | 52,938 | |
Foreign currency transactions | | | (146,302 | ) |
Interest rate swaps | | | 11,832 | |
| | |
|
|
|
| | | | 4,596,019 | |
| | |
|
|
|
Net change in unrealized appreciation (depreciation) on: | | | | |
Investments | | | 1,799,539 | |
Futures | | | (147,334 | ) |
Foreign currencies | | | (18,278 | ) |
Interest rate swaps | | | 14,972 | |
| | |
|
|
|
| | | | 1,648,899 | |
| | |
|
|
|
| NET GAIN ON INVESTMENTS AND FOREIGN CURRENCIES | | | 6,244,918 | |
| | |
|
|
|
| NET INCREASE IN NET ASSETS RESULTING FROM OPERATIONS | | $ | 24,470,780 | |
| | |
|
|
|
STATEMENT OF CHANGES IN NET ASSETS
| | | | | | | | |
| | | Year Ended December 31, 2004
| | | Year Ended December 31, 2003
| |
| INCREASE (DECREASE) IN NET ASSETS | | | | | | | | |
| OPERATIONS: | | | | | | | | |
Net investment income | | $ | 18,225,862 | | | $ | 11,335,484 | |
Net realized gain on investments and foreign currencies | | | 4,596,019 | | | | 5,908,435 | |
Net change in unrealized appreciation (depreciation) on investments and foreign currencies | | | 1,648,899 | | | | 15,178,982 | |
| | |
|
|
| |
|
|
|
NET INCREASE IN NET ASSETS RESULTING FROM OPERATIONS | | | 24,470,780 | | | | 32,422,901 | |
| | |
|
|
| |
|
|
|
| DIVIDENDS AND DISTRIBUTIONS: | | | | | | | | |
Dividends from net investment income | | | (18,437,315 | ) | | | (11,263,009 | ) |
Distributions from net realized capital gains | | | (2,719,931 | ) | | | — | |
| | |
|
|
| |
|
|
|
TOTAL DIVIDENDS AND DISTRIBUTIONS | | | (21,157,246 | ) | | | (11,263,009 | ) |
| | |
|
|
| |
|
|
|
| CAPITAL STOCK TRANSACTIONS: | | | | | | | | |
Capital stock sold [12,666,692 and 20,514,138 shares, respectively] | | | 133,099,782 | | | | 207,016,868 | |
Capital stock issued in reinvestment of dividends [2,033,225 and 1,111,648 shares, respectively] | | | 21,157,246 | | | | 11,263,009 | |
Capital stock repurchased [8,990,655 and 10,279,132 shares, respectively] | | | (93,304,039 | ) | | | (103,413,348 | ) |
| | |
|
|
| |
|
|
|
NET INCREASE IN NET ASSETS RESULTING FROM CAPITAL STOCK TRANSACTIONS | | | 60,952,989 | | | | 114,866,529 | |
| | |
|
|
| |
|
|
|
| TOTAL INCREASE IN NET ASSETS | | | 64,266,523 | | | | 136,026,421 | |
| NET ASSETS: | | | | | | | | |
Beginning of year | | | 248,249,902 | | | | 112,223,481 | |
| | |
|
|
| |
|
|
|
End of year (a) | | $ | 312,516,425 | | | $ | 248,249,902 | |
| | |
|
|
| |
|
|
|
(a) Includes undistributed net investment income of: | | $ | 566,869 | | | $ | 166,131 | |
| | |
|
|
| |
|
|
|
SEE NOTES TO FINANCIAL STATEMENTS.
A14
| | | | |
| | | SP PIMCO TOTAL RETURN PORTFOLIO | | |
STATEMENT OF ASSETS AND LIABILITIES
December 31, 2004
| | | |
| ASSETS | | | |
Investments, at value (cost $1,144,228,664) | | $ | 1,155,606,341 |
Foreign currency, at value (cost $3,053,207) | | | 3,125,826 |
Cash | | | 2,315,739 |
Receivable for investments sold | | | 273,477,101 |
Interest receivable | | | 10,254,908 |
Unrealized appreciation on swaps | | | 3,108,901 |
Due from broker-variation margin | | | 1,300,844 |
Premium for swaps purchased | | | 1,119,921 |
Receivable for capital stock sold | | | 995,276 |
Interest receivable on swap agreements | | | 622,918 |
Unrealized appreciation on forward foreign currency contracts | | | 140,035 |
Prepaid expenses | | | 16,609 |
| | |
|
|
Total assets | | | 1,452,084,419 |
| | |
|
|
| LIABILITIES | | | |
Investments sold short, at value (proceeds received $189,767,078) | | | 190,311,850 |
Payable for investments purchased | | | 141,348,342 |
Premium for swaps written | | | 8,482,617 |
Unrealized depreciation swaps | | | 6,736,622 |
Interest payable on investments sold short | | | 1,867,446 |
Outstanding options written (premium received $4,600,694) | | | 1,853,109 |
Interest payable on swap agreements | | | 1,032,665 |
Unrealized depreciation on forward foreign currency contracts | | | 783,750 |
Management fee payable | | | 548,707 |
Accrued expenses | | | 85,073 |
Payable for capital stock repurchased | | | 37,166 |
Deferred directors’ fees | | | 2,730 |
| | |
|
|
Total liabilities | | | 353,090,077 |
| | |
|
|
| NET ASSETS | | $ | 1,098,994,342 |
| | |
|
|
Net assets were comprised of: | | | |
Common stock, at $0.01 par value | | $ | 940,837 |
Paid-in capital in excess of par | | | 1,059,328,019 |
| | |
|
|
| | | | 1,060,268,856 |
Undistributed net investment income | | | 14,907,720 |
Accumulated net realized gain on investments | | | 14,854,308 |
Net unrealized appreciation on investments and foreign currencies | | | 8,963,458 |
| | |
|
|
Net assets, December 31, 2004 | | $ | 1,098,994,342 |
| | |
|
|
Net asset value and redemption price per share, $1,098,994,342 / 94,083,695 outstanding shares of common stock (authorized 225,000,000 shares) | | $ | 11.68 |
| | |
|
|
STATEMENT OF OPERATIONS
Year Ended December 31, 2004
| | | | |
| INVESTMENT INCOME | | | | |
Interest | | $ | 25,453,776 | |
Dividends | | | 18,900 | |
| | |
|
|
|
| | | | 25,472,676 | |
| | |
|
|
|
| EXPENSES | | | | |
Management fee | | | 5,734,119 | |
Custodian’s fees and expenses | | | 276,000 | |
Shareholders’ reports | | | 71,000 | |
Interest expense—short sales | | | 63,070 | |
Directors’ fees | | | 25,000 | |
Audit fee | | | 20,000 | |
Insurance expenses | | | 18,000 | |
Commitment fee on syndicated credit agreement | | | 10,000 | |
Legal fees and expenses | | | 7,500 | |
Transfer agent’s fees and expenses | | | 5,000 | |
Miscellaneous | | | 5,020 | |
| | |
|
|
|
Total expenses | | | 6,234,709 | |
Less: custodian fee credit | | | (2,797 | ) |
| | |
|
|
|
Net expenses | | | 6,231,912 | |
| | |
|
|
|
| NET INVESTMENT INCOME | | | 19,240,764 | |
| | |
|
|
|
| NET REALIZED AND UNREALIZED GAIN (LOSS) ON INVESTMENTS AND FOREIGN CURRENCIES | | | | |
Net realized gain (loss) on: | | | | |
Investments | | | 15,428,615 | |
Options written | | | 2,531,837 | |
Futures | | | 15,899,851 | |
Foreign currency | | | (4,397,861 | ) |
Swaps | | | 7,481,130 | |
Short sales | | | (7,238,275 | ) |
| | |
|
|
|
| | | | 29,705,297 | |
| | |
|
|
|
Net change in unrealized appreciation (depreciation) on: | | | | |
Investments | | | 4,251,987 | |
Options written | | | 1,641,547 | |
Futures | | | (4,345,938 | ) |
Foreign currencies | | | 921,444 | |
Swaps | | | (3,940,023 | ) |
Short sales | | | 762,524 | |
| | |
|
|
|
| | | | (708,459 | ) |
| | |
|
|
|
| NET GAIN ON INVESTMENTS AND FOREIGN CURRENCIES | | | 28,996,838 | |
| | |
|
|
|
| NET INCREASE IN NET ASSETS RESULTING FROM OPERATIONS | | $ | 48,237,602 | |
| | |
|
|
|
STATEMENT OF CHANGES IN NET ASSETS
| | | | | | | | |
| | | Year Ended
December 31, 2004
| | | Year Ended
December 31, 2003
| |
| INCREASE (DECREASE) IN NET ASSETS | | | | | | | | |
| OPERATIONS: | | | | | | | | |
Net investment income | | $ | 19,240,764 | | | $ | 14,662,767 | |
Net realized gain on investments and foreign currencies | | | 29,705,297 | | | | 19,177,690 | |
Net change in unrealized appreciation (depreciation) on investments and foreign currencies | | | (708,459 | ) | | | 2,132,613 | |
| | |
|
|
| |
|
|
|
NET INCREASE IN NET ASSETS RESULTING FROM OPERATIONS | | | 48,237,602 | | | | 35,973,070 | |
| | |
|
|
| |
|
|
|
| DIVIDENDS AND DISTRIBUTIONS: | | | | | | | | |
Dividends from net investment income | | | (18,784,427 | ) | | | (16,698,108 | ) |
Distributions from net realized capital gains | | | (16,595,819 | ) | | | (12,318,942 | ) |
| | |
|
|
| |
|
|
|
TOTAL DIVIDENDS AND DISTRIBUTIONS | | | (35,380,246 | ) | | | (29,017,050 | ) |
| | |
|
|
| |
|
|
|
| CAPITAL STOCK TRANSACTIONS: | | | | | | | | |
Capital stock sold [33,233,895 and 40,628,530 shares, respectively] | | | 382,917,441 | | | | 466,437,561 | |
Capital stock issued in reinvestment of dividends and distributions [3,069,432 and 2,550,340 shares, respectively] | | | 35,380,246 | | | | 29,017,050 | |
Capital stock repurchased [14,954,106 and 11,794,598 shares, respectively] | | | (171,285,273 | ) | | | (134,952,839 | ) |
| | |
|
|
| |
|
|
|
NET INCREASE IN NET ASSETS RESULTING FROM CAPITAL STOCK TRANSACTIONS | | | 247,012,414 | | | | 360,501,772 | |
| | |
|
|
| |
|
|
|
| TOTAL INCREASE IN NET ASSETS | | | 259,869,770 | | | | 367,457,792 | |
| NET ASSETS: | | | | | | | | |
Beginning of year | | | 839,124,572 | | | | 471,666,780 | |
| | |
|
|
| |
|
|
|
End of year (a) | | $ | 1,098,994,342 | | | $ | 839,124,572 | |
| | |
|
|
| |
|
|
|
(a) Includes undistributed net investment income of: | | $ | 14,907,720 | | | $ | 3,547,759 | |
| | |
|
|
| |
|
|
|
SEE NOTES TO FINANCIAL STATEMENTS.
A15
| | | | |
| | | SP PRUDENTIAL U.S. EMERGING GROWTH PORTFOLIO | | |
STATEMENT OF ASSETS AND LIABILITIES
December 31, 2004
| | | |
| ASSETS | | | |
Investments, at value including securities on loan of $44,398,773 (cost $155,771,381) | | $ | 175,394,065 |
Receivable for capital stock sold | | | 103,783 |
Receivable for investments sold | | | 70,145 |
Dividends receivable | | | 18,894 |
Prepaid expenses | | | 1,986 |
| | |
|
|
Total assets | | | 175,588,873 |
| | |
|
|
| LIABILITIES | | | |
Collateral for securities on loan | | | 46,313,348 |
Payable for investments purchased | | | 222,619 |
Outstanding options written (premium received $38,320) | | | 123,450 |
Accrued expenses and other liabilities | | | 108,589 |
Management fee payable | | | 63,180 |
Payable for capital stock repurchased | | | 47,603 |
Distribution fee payable | | | 76 |
Administration fee payable | | | 45 |
Payable to custodian | | | 16 |
| | |
|
|
Total liabilities | | | 46,878,926 |
| | |
|
|
| NET ASSETS | | $ | 128,709,947 |
| | |
|
|
Net assets were comprised of: | | | |
Common stock, at $0.01 par value | | $ | 159,444 |
Paid-in capital in excess of par | | | 87,181,260 |
| | |
|
|
| | | | 87,340,704 |
Undistributed net investment income | | | 169 |
Accumulated net realized gain on investments | | | 21,831,444 |
Net unrealized appreciation on investments and foreign currencies | | | 19,537,630 |
| | |
|
|
Net assets, December 31, 2004 | | $ | 128,709,947 |
| | |
|
|
| Class I: | | | |
Net asset value and redemption price per share, $128,344,648 / 15,898,521 outstanding shares of common stock (authorized 100,000,000 shares) | | $ | 8.07 |
| | |
|
|
| Class II: | | | |
Net asset value and redemption price per share, $365,299 / 45,870 outstanding shares of common stock (authorized 60,000,000 shares) | | $ | 7.96 |
| | |
|
|
STATEMENT OF OPERATIONS
Year Ended December 31, 2004
| | | | |
| INVESTMENT LOSS | | | | |
Dividends (net of $2,883 foreign withholding tax) | | $ | 266,622 | |
Interest | | | 438 | |
Income from securities loaned, net | | | 62,077 | |
| | |
|
|
|
| | | | 329,137 | |
| | |
|
|
|
| EXPENSES | | | | |
Management fee | | | 815,744 | |
Distribution fee—Class II | | | 836 | |
Administration fee—Class II | | | 501 | |
Custodian’s fees and expenses | | | 131,000 | |
Shareholders’ reports | | | 35,000 | |
Audit fee | | | 15,000 | |
Directors’ fees | | | 12,000 | |
Legal fees and expenses | | | 8,000 | |
Transfer agent’s fees and expenses | | | 4,600 | |
Commitment fee on syndicated credit agreement | | | 1,600 | |
Miscellaneous | | | 32,751 | |
| | |
|
|
|
Total expenses | | | 1,057,032 | |
Less: custodian fee credit | | | (166 | ) |
| | |
|
|
|
Net expenses | | | 1,056,866 | |
| | |
|
|
|
| NET INVESTMENT LOSS | | | (727,729 | ) |
| | |
|
|
|
| NET REALIZED AND UNREALIZED GAIN (LOSS) ON INVESTMENTS AND FOREIGN CURRENCIES | | | | |
Net realized gain on: | | | | |
Investments | | | 23,028,485 | |
Foreign currency transactions | | | 170 | |
Options written | | | 51,154 | |
| | |
|
|
|
| | | | 23,079,809 | |
| | |
|
|
|
Net change in unrealized appreciation (depreciation) on: | | | | |
Investments | | | 4,487,544 | |
Options written | | | (85,130 | ) |
Foreign currencies | | | (47 | ) |
| | |
|
|
|
| | | | 4,402,367 | |
| | |
|
|
|
| NET GAIN ON INVESTMENTS AND FOREIGN CURRENCIES | | | 27,482,176 | |
| | |
|
|
|
| NET INCREASE IN NET ASSETS RESULTING FROM OPERATIONS | | $ | 26,754,447 | |
| | |
|
|
|
STATEMENT OF CHANGES IN NET ASSETS
| | | | | | | | |
| | | Year Ended
December 31, 2004
| | | Year Ended
December 31, 2003
| |
| INCREASE (DECREASE) IN NET ASSETS | | | | | | | | |
| OPERATIONS: | | | | | | | | |
Net investment loss | | $ | (727,729 | ) | | $ | (540,051 | ) |
Net realized gain on investments and foreign currencies | | | 23,079,809 | | | | 15,663,844 | |
Net change in unrealized appreciation (depreciation) on investments and foreign currencies | | | 4,402,367 | | | | 15,314,960 | |
| | |
|
|
| |
|
|
|
NET INCREASE IN NET ASSETS RESULTING FROM OPERATIONS | | | 26,754,447 | | | | 30,438,753 | |
| | |
|
|
| |
|
|
|
| DIVIDENDS AND DISTRIBUTIONS: | | | | | | | | |
Distributions from net realized capital gains | | | | | | | | |
Class I | | | (56,557 | ) | | | — | |
Class II | | | (96 | ) | | | — | |
| | |
|
|
| |
|
|
|
TOTAL DIVIDENDS AND DISTRIBUTIONS | | | (56,653 | ) | | | — | |
| | |
|
|
| |
|
|
|
| CAPITAL STOCK TRANSACTIONS (Note 7): | | | | | | | | |
Capital stock sold [11,301,550 and 19,310,787 shares, respectively] | | | 79,126,894 | | | | 114,911,354 | |
Capital stock issued in reinvestment of dividends and distributions [8,331 and 0 shares, respectively] | | | 56,653 | | | | — | |
Capital stock repurchased [20,993,725 and 4,638,713 shares, respectively] | | | (147,512,432 | ) | | | (26,241,240 | ) |
| | |
|
|
| |
|
|
|
NET INCREASE (DECREASE) IN NET ASSETS RESULTING FROM CAPITAL STOCK TRANSACTIONS | | | (68,328,885 | ) | | | 88,670,114 | |
| | |
|
|
| |
|
|
|
| TOTAL INCREASE (DECREASE) IN NET ASSETS | | | (41,631,091 | ) | | | 119,108,867 | |
| NET ASSETS: | | | | | | | | |
Beginning of year | | | 170,341,038 | | | | 51,232,171 | |
| | |
|
|
| |
|
|
|
End of year (a) | | $ | 128,709,947 | | | $ | 170,341,038 | |
| | |
|
|
| |
|
|
|
(a) Includes undistributed net investment income of: | | $ | 169 | | | $ | — | |
| | |
|
|
| |
|
|
|
SEE NOTES TO FINANCIAL STATEMENTS.
A16
| | | | |
| | | SP STATE STREET RESEARCH SMALL CAP GROWTH PORTFOLIO | | |
STATEMENT OF ASSETS AND LIABILITIES
December 31, 2004
| | | | |
| ASSETS | | | | |
Investments, at value (cost $162,543,090) | | $ | 184,976,401 | |
Cash | | | 167,888 | |
Receivable for capital stock sold | | | 223,597 | |
Receivable for investments sold | | | 20,853 | |
Dividends and interest receivable | | | 7,564 | |
Prepaid expenses | | | 2,465 | |
| | |
|
|
|
Total assets | | | 185,398,768 | |
| | |
|
|
|
| LIABILITIES | | | | |
Payable for investments purchased | | | 1,108,807 | |
Management fee payable | | | 144,522 | |
Accrued expenses and other liabilities | | | 56,360 | |
Payable for capital stock repurchased | | | 14,418 | |
Deferred directors’ fees | | | 2,245 | |
| | |
|
|
|
Total liabilities | | | 1,326,352 | |
| | |
|
|
|
| NET ASSETS | | $ | 184,072,416 | |
| | |
|
|
|
Net assets were comprised of: | | | | |
Common stock, at $0.01 par value | | $ | 284,888 | |
Paid-in capital in excess of par | | | 181,363,005 | |
| | |
|
|
|
| | | | 181,647,893 | |
Accumulated net investment loss | | | (2,245 | ) |
Accumulated net realized loss on investments | | | (20,006,543 | ) |
Net unrealized appreciation on investments | | | 22,433,311 | |
| | |
|
|
|
Net assets, December 31, 2004 | | $ | 184,072,416 | |
| | |
|
|
|
Net asset value and redemption price per share, $184,072,416 / 28,488,795 outstanding shares of common stock (authorized 100,000,000 shares) | | $ | 6.46 | |
| | |
|
|
|
STATEMENT OF OPERATIONS
Year Ended December 31, 2004
| | | | |
| INVESTMENT INCOME | | | | |
Dividends | | $ | 218,681 | |
Interest | | | 79,953 | |
| | |
|
|
|
| | | | 298,634 | |
| | |
|
|
|
| EXPENSES | | | | |
Management fee | | | 1,090,179 | |
Custodian’s fees and expenses | | | 102,000 | |
Audit fee | | | 16,000 | |
Shareholders’ reports | | | 15,000 | |
Directors’ fees | | | 9,400 | |
Legal fees and expenses | | | 7,000 | |
Transfer agent's fees and expenses | | | 4,200 | |
Commitment fee on syndicated credit agreement | | | 1,200 | |
Miscellaneous | | | 5,339 | |
| | |
|
|
|
Total expenses | | | 1,250,318 | |
Less: custodian fee credit | | | (2,200 | ) |
| | |
|
|
|
Net expenses | | | 1,248,118 | |
| | |
|
|
|
| NET INVESTMENT LOSS | | | (949,484 | ) |
| | |
|
|
|
| NET REALIZED AND UNREALIZED GAIN (LOSS) ON INVESTMENTS | | | | |
Net realized loss on investments | | | (16,711,867 | ) |
Net change in unrealized appreciation (depreciation) on investments | | | 18,224,820 | |
| | |
|
|
|
| NET GAIN ON INVESTMENTS | | | 1,512,953 | |
| | |
|
|
|
| NET INCREASE IN NET ASSETS RESULTING FROM OPERATIONS | | $ | 563,469 | |
| | |
|
|
|
STATEMENT OF CHANGES IN NET ASSETS
| | | | | | | | |
| | | Year Ended
December 31, 2004
| | | Year Ended
December 31, 2003
| |
| INCREASE (DECREASE) IN NET ASSETS | | | | | | | | |
| OPERATIONS: | | | | | | | | |
Net investment loss | | $ | (949,484 | ) | | $ | (148,909 | ) |
Net realized gain (loss) on investments | | | (16,711,867 | ) | | | 1,829,830 | |
Net change in unrealized appreciation (depreciation) on investments | | | 18,224,820 | | | | 4,451,430 | |
| | |
|
|
| |
|
|
|
NET INCREASE IN NET ASSETS RESULTING FROM OPERATIONS | | | 563,469 | | | | 6,132,351 | |
| | |
|
|
| |
|
|
|
| CAPITAL STOCK TRANSACTIONS: | | | | | | | | |
Capital stock sold [26,969,916 and 6,256,852 shares, respectively] | | | 173,200,231 | | | | 37,240,835 | |
Capital stock repurchased [3,851,078 and 3,473,309 shares, respectively] | | | (24,710,400 | ) | | | (20,867,128 | ) |
| | |
|
|
| |
|
|
|
NET INCREASE IN NET ASSETS RESULTING FROM CAPITAL STOCK TRANSACTIONS | | | 148,489,831 | | | | 16,373,707 | |
| | |
|
|
| |
|
|
|
| TOTAL INCREASE IN NET ASSETS | | | 149,053,300 | | | | 22,506,058 | |
| NET ASSETS: | | | | | | | | |
Beginning of year | | | 35,019,116 | | | | 12,513,058 | |
| | |
|
|
| |
|
|
|
End of year | | $ | 184,072,416 | | | $ | 35,019,116 | |
| | |
|
|
| |
|
|
|
SEE NOTES TO FINANCIAL STATEMENTS.
A17
| | | | |
| | | SP STRATEGIC PARTNERS FOCUSED GROWTH PORTFOLIO | | |
STATEMENT OF ASSETS AND LIABILITIES
December 31, 2004
| | | | |
| ASSETS | | | | |
Investments, at value (cost $53,383,236) | | $ | 62,597,865 | |
Dividends and interest receivable | | | 27,170 | |
Receivable for investments sold | | | 12,637 | |
Receivable for capital stock sold | | | 7,190 | |
Prepaid expenses | | | 772 | |
| | |
|
|
|
Total assets | | | 62,645,634 | |
| | |
|
|
|
| LIABILITIES | | | | |
Payable for investments purchased | | | 376,778 | |
Accrued expenses and other liabilities | | | 58,335 | |
Management fee payable | | | 45,776 | |
Distribution fee payable | | | 6,433 | |
Administration fee payable | | | 3,860 | |
Deferred directors’ fees | | | 2,271 | |
Payable for capital stock repurchased | | | 1,200 | |
| | |
|
|
|
Total liabilities | | | 494,653 | |
| | |
|
|
|
| NET ASSETS | | $ | 62,150,981 | |
| | |
|
|
|
Net assets were comprised of: | | | | |
Common stock, at $0.01 par value | | $ | 89,581 | |
Paid-in capital in excess of par | | | 56,548,087 | |
| | |
|
|
|
| | | | 56,637,668 | |
Accumulated net investment loss | | | (2,271 | ) |
Accumulated net realized loss on investments | | | (3,699,045 | ) |
Net unrealized appreciation on investments | | | 9,214,629 | |
| | |
|
|
|
Net assets, December 31, 2004 | | $ | 62,150,981 | |
| | |
|
|
|
| Class I: | | | | |
Net asset value and redemption price per share, $30,086,112 / 4,300,654 outstanding shares of common stock (authorized 100,000,000 shares) | | $ | 7.00 | |
| | |
|
|
|
| Class II: | | | | |
Net asset value and redemption price per share, $32,064,869 / 4,657,483 outstanding shares of common stock (authorized 60,000,000 shares) | | $ | 6.88 | |
| | |
|
|
|
STATEMENT OF OPERATIONS
Year Ended December 31, 2004
| | | | |
| INVESTMENT INCOME | | | | |
Dividends (net of $5,779 foreign withholding tax) | | $ | 468,820 | |
Interest | | | 4,266 | |
| | |
|
|
|
| | | | 473,086 | |
| | |
|
|
|
| EXPENSES | | | | |
Management fee | | | 412,271 | |
Distribution fee—Class II | | | 50,442 | |
Administration fee—Class II | | | 30,265 | |
Custodian’s fees and expenses | | | 110,000 | |
Shareholders’ reports | | | 18,000 | |
Audit fee | | | 16,000 | |
Directors’ fees and expenses | | | 10,000 | |
Legal fees and expenses | | | 9,000 | |
Transfer agent's fees and expenses | | | 3,700 | |
Commitment fee on syndicated credit agreement | | | 900 | |
Miscellaneous | | | 6,825 | |
| | |
|
|
|
Total expenses | | | 667,403 | |
Loan interest expense (Note 8) | | | 32 | |
Less: custodian fee credit | | | (116 | ) |
expense subsidy | | | (123,982 | ) |
| | |
|
|
|
Net expenses | | | 543,337 | |
| | |
|
|
|
| NET INVESTMENT LOSS | | | (70,251 | ) |
| | |
|
|
|
| NET REALIZED AND UNREALIZED GAIN ON INVESTMENTS | | | | |
Net realized gain on investments | | | 920,465 | |
Net change in unrealized appreciation (depreciation) on investments | | | 4,744,770 | |
| | |
|
|
|
| NET GAIN ON INVESTMENTS | | | 5,665,235 | |
| | |
|
|
|
| NET INCREASE IN NET ASSETS RESULTING FROM OPERATIONS | | $ | 5,594,984 | |
| | |
|
|
|
STATEMENT OF CHANGES IN NET ASSETS
| | | | | | | | |
| | | Year Ended
December 31, 2004
| | | Year Ended
December 31, 2003
| |
| INCREASE (DECREASE) IN NET ASSETS | | | | | | | | |
| OPERATIONS: | | | | | | | | |
Net investment loss | | $ | (70,251 | ) | | $ | (110,283 | ) |
Net realized gain on investments | | | 920,465 | | | | 453,290 | |
Net change in unrealized appreciation (depreciation) on investments | | | 4,744,770 | | | | 5,735,988 | |
| | |
|
|
| |
|
|
|
NET INCREASE IN NET ASSETS RESULTING FROM OPERATIONS | | | 5,594,984 | | | | 6,078,995 | |
| | |
|
|
| |
|
|
|
| CAPITAL STOCK TRANSACTIONS (Note 7): | | | | | | | | |
Capital stock sold [4,453,940 and 3,613,901 shares, respectively] | | | 28,204,223 | | | | 20,091,224 | |
Capital stock repurchased [1,186,253 and 1,382,835 shares, respectively] | | | (7,525,789 | ) | | | (7,637,169 | ) |
| | |
|
|
| |
|
|
|
NET INCREASE IN NET ASSETS RESULTING FROM CAPITAL STOCK TRANSACTIONS | | | 20,678,434 | | | | 12,454,055 | |
| | |
|
|
| |
|
|
|
| TOTAL INCREASE IN NET ASSETS | | | 26,273,418 | | | | 18,533,050 | |
| NET ASSETS: | | | | | | | | |
Beginning of year | | | 35,877,563 | | | | 17,344,513 | |
| | |
|
|
| |
|
|
|
End of year | | $ | 62,150,981 | | | $ | 35,877,563 | |
| | |
|
|
| |
|
|
|
SEE NOTES TO FINANCIAL STATEMENTS.
A18
STATEMENT OF ASSETS AND LIABILITIES
December 31, 2004
| | | | |
| ASSETS | | | | |
Investments, at value (cost $27,174,510) | | $ | 29,110,348 | |
Foreign currency, at value (cost: $21,780) | | | 23,447 | |
Receivable for capital stock sold | | | 12,870 | |
Dividends and interest receivable | | | 6,125 | |
Prepaid expenses | | | 427 | |
| | |
|
|
|
Total assets | | | 29,153,217 | |
| | |
|
|
|
| LIABILITIES | | | | |
Accrued expenses and other liabilities | | | 61,637 | |
Payable for investments purchased | | | 29,463 | |
Management fee payable | | | 26,654 | |
Payable for capital stock repurchased | | | 2,660 | |
Deferred directors’ fees | | | 2,243 | |
| | |
|
|
|
Total liabilities | | | 122,657 | |
| | |
|
|
|
| NET ASSETS | | $ | 29,030,560 | |
| | |
|
|
|
Net assets were comprised of: | | | | |
Common stock, at $0.01 par value | | $ | 60,874 | |
Paid-in capital in excess of par | | | 31,152,490 | |
| | |
|
|
|
| | | | 31,213,364 | |
Accumulated net investment loss | | | (2,243 | ) |
Accumulated net realized loss on investments | | | (4,118,066 | ) |
Net unrealized appreciation on investments and foreign currencies | | | 1,937,505 | |
| | |
|
|
|
Net assets, December 31, 2004 | | $ | 29,030,560 | |
| | |
|
|
|
Net asset value and redemption price per share, $29,030,560 / 6,087,362 outstanding shares of common stock (authorized 100,000,000 shares) | | $ | 4.77 | |
| | |
|
|
|
STATEMENT OF OPERATIONS
Year Ended December 31, 2004
| | | | |
| INVESTMENT INCOME | | | | |
Dividends (net of $9,991 foreign withholding tax) | | $ | 170,846 | |
Interest | | | 13,810 | |
| | |
|
|
|
| | | | 184,656 | |
| | |
|
|
|
| EXPENSES | | | | |
Management fee | | | 276,435 | |
Custodian’s fees and expenses | | | 95,000 | |
Shareholders’ reports | | | 16,000 | |
Audit fee | | | 16,000 | |
Legal fees | | | 9,300 | |
Directors’ fees | | | 9,000 | |
Transfer agent’s fees and expenses | | | 3,500 | |
Commitment fee on syndicated credit agreement | | | 300 | |
Miscellaneous | | | 5,031 | |
| | |
|
|
|
Total expenses | | | 430,566 | |
Less: custodian fee credit | | | (62 | ) |
expense subsidy | | | (118,037 | ) |
| | |
|
|
|
Net expenses | | | 312,467 | |
| | |
|
|
|
| NET INVESTMENT LOSS | | | (127,811 | ) |
| | |
|
|
|
| NET REALIZED AND UNREALIZED GAIN (LOSS) ON INVESTMENTS AND FOREIGN CURRENCIES | | | | |
Net realized gain on: | | | | |
Investments | | | 1,283,734 | |
Foreign currency transactions | | | 3,597 | |
| | |
|
|
|
| | | | 1,287,331 | |
| | |
|
|
|
Net change in unrealized appreciation (depreciation) on: | | | | |
Investments | | | (910,259 | ) |
Foreign currencies | | | 1,204 | |
| | |
|
|
|
| | | | (909,055 | ) |
| | |
|
|
|
| NET GAIN ON INVESTMENTS | | | 378,276 | |
| | |
|
|
|
| NET INCREASE IN NET ASSETS RESULTING FROM OPERATIONS | | $ | 250,465 | |
| | |
|
|
|
STATEMENT OF CHANGES IN NET ASSETS
| | | | | | | | |
| | | Year Ended
December 31, 2004
| | | Year Ended
December 31, 2003
| |
| INCREASE (DECREASE) IN NET ASSETS | | | | | | | | |
| OPERATIONS: | | | | | | | | |
Net investment loss | | $ | (127,811 | ) | | $ | (122,118 | ) |
Net realized gain on investments and foreign currencies | | | 1,287,331 | | | | 48,938 | |
Net change in unrealized appreciation (depreciation) on investments and foreign currencies | | | (909,055 | ) | | | 3,937,245 | |
| | |
|
|
| |
|
|
|
NET INCREASE IN NET ASSETS RESULTING FROM OPERATIONS | | | 250,465 | | | | 3,864,065 | |
| | |
|
|
| |
|
|
|
| CAPITAL STOCK TRANSACTIONS: | | | | | | | | |
Capital stock sold [3,745,186 and 3,893,739 shares, respectively] | | | 17,297,839 | | | | 16,576,777 | |
Capital stock repurchased [1,850,749 and 1,654,394 shares, respectively] | | | (8,532,718 | ) | | | (6,966,079 | ) |
| | |
|
|
| |
|
|
|
NET INCREASE IN NET ASSETS RESULTING FROM CAPITAL STOCK TRANSACTIONS | | | 8,765,121 | | | | 9,610,698 | |
| | |
|
|
| |
|
|
|
| TOTAL INCREASE (DECREASE) IN NET ASSETS | | | 9,015,586 | | | | 13,474,763 | |
| NET ASSETS: | | | | | | | | |
Beginning of year | | | 20,014,974 | | | | 6,540,211 | |
| | |
|
|
| |
|
|
|
End of year | | $ | 29,030,560 | | | $ | 20,014,974 | |
| | |
|
|
| |
|
|
|
SEE NOTES TO FINANCIAL STATEMENTS.
A19
| | | | |
| | | SP WILLIAM BLAIR INTERNATIONAL GROWTH PORTFOLIO | | |
STATEMENT OF ASSETS AND LIABILITIES
December 31, 2004
| | | |
| ASSETS | | | |
Investments, at value (cost $328,513,549) | | $ | 385,241,858 |
Foreign currency, at value (cost $3,235,471) | | | 3,242,661 |
Cash | | | 10,623 |
Receivable for investments sold | | | 3,867,292 |
Receivable for capital stock sold | | | 335,918 |
Dividends and interest receivable | | | 219,724 |
Tax reclaim receivable | | | 88,880 |
Unrealized appreciation on forward foreign currency contracts | | | 13,844 |
Prepaid expenses | | | 5,288 |
| | |
|
|
Total assets | | | 393,026,088 |
| | |
|
|
| LIABILITIES | | | |
Payable for investments purchased | | | 3,573,564 |
Payable for capital stock repurchased | | | 943,250 |
Management fee payable | | | 267,814 |
Accrued expenses and other liabilities | | | 108,886 |
Distribution fee payable | | | 29,859 |
Administration fee payable | | | 17,915 |
Unrealized depreciation on forward foreign currency contracts | | | 8,751 |
| | |
|
|
Total liabilities | | | 4,950,039 |
| | |
|
|
| NET ASSETS | | $ | 388,076,049 |
| | |
|
|
Net assets were comprised of: | | | |
Common stock, at $0.01 par value | | $ | 568,802 |
Paid-in capital, in excess of par | | | 311,649,262 |
| | |
|
|
| | | | 312,218,064 |
Undistributed net investment income | | | 889,002 |
Accumulated net realized gain on investments | | | 18,248,227 |
Net unrealized appreciation on investments and foreign currencies | | | 56,720,756 |
| | |
|
|
Net assets, December 31, 2004 | | $ | 388,076,049 |
| | |
|
|
| Class I: | | | |
Net asset value and redemption price per share, $249,062,306 / 36,339,574 outstanding shares of common stock (authorized 100,000,000 shares) | | $ | 6.85 |
| | |
|
|
| Class II: | | | |
Net asset value and redemption price per share, $139,013,743 / 20,540,674 outstanding shares of common stock (authorized 150,000,000 shares) | | $ | 6.77 |
| | |
|
|
STATEMENT OF OPERATIONS
Year Ended December 31, 2004
| | | | |
| INVESTMENT INCOME | | | | |
Dividends (net of $476,121 foreign withholding tax) | | $ | 4,607,222 | |
Income from securities lending, net | | | 74,866 | |
| | |
|
|
|
| | | | 4,682,088 | |
| | |
|
|
|
| EXPENSES | | | | |
Management fee | | | 2,535,914 | |
Distribution fee—Class II | | | 333,030 | |
Administration fee—Class II | | | 199,818 | |
Custodian’s fees and expenses | | | 365,000 | |
Shareholders’ reports | | | 69,000 | |
Audit fee | | | 20,000 | |
Directors’ fees | | | 13,000 | |
Legal fees and expenses | | | 10,000 | |
Transfer agent’s fees and expenses | | | 5,000 | |
Commitment fee on syndicated credit agreement | | | 3,000 | |
Miscellaneous | | | 13,811 | |
| | |
|
|
|
Total expenses | | | 3,567,573 | |
Loan interest expense (Note 8) | | | 124 | |
| | |
|
|
|
Net expenses | | | 3,567,697 | |
| | |
|
|
|
| NET INVESTMENT INCOME | | | 1,114,391 | |
| | |
|
|
|
| NET REALIZED AND UNREALIZED GAIN (LOSS) ON INVESTMENTS AND FOREIGN CURRENCIES | | | | |
Net realized gain (loss) on: | | | | |
Investments (net of Thailand capital gains taxes of $13,951) | | | 28,632,439 | |
Foreign currency transactions | | | (243,024 | ) |
| | |
|
|
|
| | | | 28,389,415 | |
| | |
|
|
|
Net change in unrealized appreciation (depreciation) on: | | | | |
Investments | | | 20,675,439 | |
Foreign currencies | | | (311,049 | ) |
| | |
|
|
|
| | | | 20,364,390 | |
| | |
|
|
|
| NET GAIN ON INVESTMENTS AND FOREIGN CURRENCIES | | | 48,753,805 | |
| | |
|
|
|
| NET INCREASE IN NET ASSETS RESULTING FROM OPERATIONS | | $ | 49,868,196 | |
| | |
|
|
|
STATEMENT OF CHANGES IN NET ASSETS
| | | | | | | | |
| | | Year Ended
December 31, 2004
| | | Year Ended
December 31, 2003
| |
| INCREASE (DECREASE) IN NET ASSETS | | | | | | | | |
| OPERATIONS: | | | | | | | | |
Net investment income | | $ | 1,114,391 | | | $ | 347,599 | |
Net realized gain on investments and foreign currencies | | | 28,389,415 | | | | 3,650,438 | |
Net change in unrealized appreciation (depreciation) on investments and foreign currencies | | | 20,364,390 | | | | 39,155,909 | |
| | |
|
|
| |
|
|
|
NET INCREASE IN NET ASSETS RESULTING FROM OPERATIONS | | | 49,868,196 | | | | 43,153,946 | |
| | |
|
|
| |
|
|
|
| DIVIDENDS AND DISTRIBUTIONS: | | | | | | | | |
Dividends from net investment income | | | | | | | | |
Class I | | | (268,170 | ) | | | — | |
Class II | | | — | | | | — | |
| | |
|
|
| |
|
|
|
TOTAL DIVIDENDS AND DISTRIBUTIONS | | | (268,170 | ) | | | — | |
| | |
|
|
| |
|
|
|
| CAPITAL STOCK TRANSACTIONS (Note 7): | | | | | | | | |
Capital stock sold [41,429,271 and 67,706,358 shares, respectively] | | | 251,906,575 | | | | 323,300,178 | |
Capital stock issued in reinvestment of dividends and distributions [44,253 and 0 shares, respectively] | | | 268,170 | | | | — | |
Capital stock repurchased [22,043,280 and 44,166,056 shares, respectively] | | | (132,966,714 | ) | | | (205,761,119 | ) |
| | |
|
|
| |
|
|
|
NET INCREASE IN NET ASSETS RESULTING FROM CAPITAL STOCK TRANSACTIONS | | | 119,208,031 | | | | 117,539,059 | |
| | |
|
|
| |
|
|
|
| TOTAL INCREASE IN NET ASSETS | | | 168,808,057 | | | | 160,693,005 | |
| NET ASSETS: | | | | | | | | |
Beginning of year | | | 219,267,992 | | | | 58,574,987 | |
| | |
|
|
| |
|
|
|
End of year (a) | | $ | 388,076,049 | | | $ | 219,267,992 | |
| | |
|
|
| |
|
|
|
(a) Includes undistributed net investment income of: | | $ | 889,002 | | | $ | 268,170 | |
| | |
|
|
| |
|
|
|
SEE NOTES TO FINANCIAL STATEMENTS.
A20
| | | | |
| | | SP AGGRESSIVE GROWTH ASSET ALLOCATION PORTFOLIO | | |
SCHEDULE OF INVESTMENTS | December 31, 2004 |
| | | | | | |
| LONG-TERM INVESTMENTS — 100.0% | |
| MUTUAL FUNDS | | Shares
| | Value
(Note 2)
| |
Jennison Portfolio (Class I) | | 1,775,031 | | $ | 32,199,057 | |
SP Goldman Sachs Small Cap Value Portfolio | | 886,949 | | | 13,756,576 | |
SP Large Cap Value Portfolio | | 4,069,502 | | | 47,043,439 | |
SP LSV International Value Portfolio | | 1,707,074 | | | 15,090,533 | |
SP State Street Research Small Cap Growth Portfolio | | 2,145,181 | | | 13,857,869 | |
SP William Blair International Growth Portfolio (Class I) | | 2,184,867 | | | 14,966,337 | |
| | | | |
|
|
|
TOTAL INVESTMENTS — 100.0%
(cost $121,496,431; Note 6) | | | 136,913,811 | |
LIABILITIES IN EXCESS OF OTHER ASSETS | | | (6,348 | ) |
| | | | |
|
|
|
NET ASSETS — 100.0% | | $ | 136,907,463 | |
| | | | |
|
|
|
The industry classification of portfolio holdings and liabilities in excess of other assets shown as a percentage of net assets as of December 31, 2004 was as follows:
| | | |
Mutual Funds | | 100.0 | % |
Liabilities in excess of other assets | | — | (a) |
| | |
|
|
| | | 100.0 | % |
| | |
|
|
SEE NOTES TO FINANCIAL STATEMENTS.
B1
| | | | |
| | | SP AIM AGGRESSIVE GROWTH PORTFOLIO | | |
SCHEDULE OF INVESTMENTS | December 31, 2004 |
| | | | | |
| LONG-TERM INVESTMENTS — 91.8% | | Value
(Note 2)
|
| COMMON STOCKS | | Shares
| |
Advertising — 1.5% | | | | | |
Lamar Advertising Co.(a) | | 5,500 | | $ | 235,290 |
Omnicom Group, Inc. | | 3,200 | | | 269,824 |
| | | | |
|
|
| | | | | | 505,114 |
| | | | |
|
|
Airlines — 0.8% | | | | | |
Southwest Airlines Co. | | 16,000 | | | 260,480 |
| | | | |
|
|
Bank and Savings & Loans — 1.4% | | | | | |
New York Community Bancorp, Inc. | | 11,969 | | | 246,202 |
North Fork Bancorporation, Inc. | | 7,900 | | | 227,915 |
| | | | |
|
|
| | | | | | 474,117 |
| | | | |
|
|
Chemicals — 1.0% | | | | | |
PerkinElmer, Inc. | | 8,000 | | | 179,920 |
Valspar Corp. (The) | | 3,200 | | | 160,032 |
| | | | |
|
|
| | | | | | 339,952 |
| | | | |
|
|
Commercial Services — 8.3% | | | | | |
Acxiom Corp. | | 7,900 | | | 207,770 |
Cintas Corp. | | 12,000 | | | 526,320 |
CoStar Group, Inc.(a) | | 3,900 | | | 180,102 |
Fiserv, Inc.(a) | | 18,000 | | | 723,420 |
Iron Mountain, Inc.(a) | | 12,000 | | | 365,880 |
Nalco Holding Co.(a) | | 16,400 | | | 320,128 |
Paychex, Inc. | | 12,060 | | | 411,005 |
| | | | |
|
|
| | | | | | 2,734,625 |
| | | | |
|
|
Computer Services — 2.4% | | | | | |
Electronics for Imaging, Inc.(a) | | 6,200 | | | 107,942 |
SunGuard Data Systems, Inc.(a) | | 24,040 | | | 681,053 |
| | | | |
|
|
| | | | | | 788,995 |
| | | | |
|
|
Distribution/Wholesale — 1.0% | | | | | |
CDW Corp. | | 4,850 | | | 321,798 |
| | | | |
|
|
Diversified Operations — 1.7% | | | | | |
ARAMARK Corp. (Class “B” Stock) | | 7,200 | | | 190,872 |
Blount International, Inc.(a) | | 20,200 | | | 351,884 |
| | | | |
|
|
| | | | | | 542,756 |
| | | | |
|
|
Drugs & Medical Supplies — 13.4% | | | | | |
Advanced Medical Optics, Inc.(a) | | 4,300 | | | 176,902 |
Amylin Pharmaceuticals, Inc.(a) | | 10,800 | | | 252,288 |
Barr Pharmaceuticals, Inc.(a) | | 4,200 | | | 191,268 |
Cytyc Corp.(a) | | 7,600 | | | 209,532 |
Endo Pharmaceuticals Holdings, Inc.(a) . | | 5,500 | | | 115,610 |
Eon Labs, Inc.(a) | | 9,300 | | | 251,100 |
Express Scripts, Inc.(a) | | 2,300 | | | 175,812 |
Eyetech Pharmaceuticals, Inc.(a) | | 4,600 | | | 209,300 |
Fisher Scientific International, Inc.(a) | | 12,000 | | | 748,560 |
Impax Laboratories, Inc.(a) | | 10,200 | | | 161,976 |
Invitrogen Corp.(a) | | 4,800 | | | 322,224 |
IVAX Corp.(a) | | 15,050 | | | 238,091 |
Medco Health Solutions, Inc.(a) | | 7,200 | | | 299,520 |
MGI Pharma, Inc.(a) | | 8,000 | | | 224,080 |
Neurocrine Biosciences, Inc.(a) | | 2,700 | | | 133,110 |
OSI Pharmaceuticals, Inc.(a) | | 3,150 | | | 235,777 |
QLT, Inc. (Canada)(a) | | 16,100 | | | 258,888 |
Valeant Pharmaceuticals International | | 7,000 | | | 184,450 |
| | | | |
|
|
| | | | | | 4,388,488 |
| | | | |
|
|
| | | | | |
| COMMON STOCKS | | Value
(Note 2)
|
| (Continued) | | Shares
| |
Electronics — 8.1% | | | | | |
Agilent Technologies, Inc.(a) | | 12,000 | | $ | 289,200 |
Akamai Technologies, Inc.(a) | | 16,000 | | | 208,480 |
Alliance Data Systems Corp.(a) | | 10,400 | | | 493,792 |
DPL, Inc. | | 6,500 | | | 163,215 |
Littelfuse, Inc.(a) | | 3,900 | | | 133,224 |
Microchip Technology, Inc. | | 24,055 | | | 641,306 |
Molex, Inc. | | 5,500 | | | 165,000 |
Polycom, Inc.(a) | | 8,000 | | | 186,560 |
Synopsys, Inc.(a) | | 12,800 | | | 251,136 |
Xilinx, Inc. | | 4,400 | | | 130,460 |
| | | | |
|
|
| | | | | | 2,662,373 |
| | | | |
|
|
Financial Services — 4.0% | | | | | |
Affiliated Managers Group, Inc.(a) | | 3,950 | | | 267,573 |
Investors Financial Services Corp. | | 17,660 | | | 882,647 |
Legg Mason, Inc. | | 2,405 | | | 176,190 |
| | | | |
|
|
| | | | | | 1,326,410 |
| | | | |
|
|
Food & Beverage — 0.8% | | | | | |
Coca-Cola Enterprises, Inc. | | 12,000 | | | 250,200 |
| | | | |
|
|
Hospitals/Healthcare Management — 4.2% | | | | | |
Caremark Rx, Inc.(a) | | 14,900 | | | 587,507 |
DaVita, Inc.(a) | | 7,200 | | | 284,616 |
LifePoint Hospitals, Inc.(a) | | 5,500 | | | 191,510 |
Triad Hospitals, Inc.(a) | | 8,000 | | | 297,680 |
| | | | |
|
|
| | | | | | 1,361,313 |
| | | | |
|
|
Human Resources — 1.7% | | | | | |
Robert Half International, Inc. | | 19,100 | | | 562,113 |
| | | | |
|
|
Internet Content — 0.8% | | | | | |
Symantec Corp.(a) | | 9,600 | | | 247,296 |
| | | | |
|
|
Leisure — 3.2% | | | | | |
Brunswick Corp. | | 4,800 | | | 237,600 |
La Quinta Corp.(a) | | 23,500 | | | 213,615 |
Regal Entertainment Group
(Class “A” Stock) | | 14,600 | | | 302,950 |
Royal Caribbean Cruises Ltd. | | 5,600 | | | 304,864 |
| | | | |
|
|
| | | | | | 1,059,029 |
| | | | |
|
|
Machinery — 0.5% | | | | | |
Joy Global, Inc. | | 4,100 | | | 178,063 |
| | | | |
|
|
Manufacturing — 7.3% | | | | | |
American Standard Co., Inc.(a) | | 16,000 | | | 661,120 |
Bowater, Inc. | | 8,400 | | | 369,348 |
Cooper Industries, Ltd. (Class “A” Stock) | | 4,100 | | | 278,349 |
EnerSys(a) | | 17,600 | | | 268,400 |
Sappi Ltd. ADR(South Africa) | | 15,700 | | | 227,650 |
Tektronix, Inc. | | 6,300 | | | 190,323 |
Textron, Inc. | | 5,600 | | | 413,280 |
| | | | |
|
|
| | | | | | 2,408,470 |
| | | | |
|
|
Media — 2.9% | | | | | |
Radio One, Inc. (Class “D” Stock)(a) | | 19,200 | | | 309,504 |
Univision Communications, Inc.
(Class “A” Stock)(a) | | 22,002 | | | 643,999 |
| | | | |
|
|
| | | | | | 953,503 |
| | | | |
|
|
SEE NOTES TO FINANCIAL STATEMENTS.
B2
| | | | |
| | | SP AIM AGGRESSIVE GROWTH PORTFOLIO (Continued) | | |
SCHEDULE OF INVESTMENTS | December 31, 2004 |
| | | | | |
| COMMON STOCKS | | Value
(Note 2)
|
| (Continued) | | Shares
| |
Oil & Gas Services — 4.4% | | | | | |
BJ Services Co. | | 9,600 | | $ | 446,784 |
Cooper Cameron Corp.(a) | | 6,400 | | | 344,384 |
ENSCO International, Inc. | | 12,000 | | | 380,880 |
Patterson-UTI Energy, Inc. | | 9,400 | | | 182,830 |
Pride International, Inc.(a) | | 4,700 | | | 96,538 |
| | | | |
|
|
| | | | | | 1,451,416 |
| | | | |
|
|
Real Estate — 1.0% | | | | | |
CB Richard Ellis Group, Inc.
(Class “A” Stock)(a) | | 9,600 | | | 322,080 |
| | | | |
|
|
Restaurants — 3.0% | | | | | |
Brinker International, Inc.(a) | | 12,000 | | | 420,840 |
Ruby Tuesday, Inc. | | 12,000 | | | 312,960 |
Wendy’s International, Inc. | | 6,300 | | | 247,338 |
| | | | |
|
|
| | | | | | 981,138 |
| | | | |
|
|
Retail — 7.3% | | | | | |
Aeropostale, Inc.(a) | | 4,650 | | | 136,850 |
Family Dollar Stores, Inc. | | 8,000 | | | 249,840 |
Foot Locker, Inc. | | 6,000 | | | 161,580 |
Hot Topic, Inc.(a) | | 700 | | | 12,033 |
Linens ‘n Things, Inc.(a) | | 12,000 | | | 297,600 |
MSC Industrial Direct Co., Inc.
(Class “A” Stock) | | 8,000 | | | 287,840 |
OfficeMax, Inc. | | 12,000 | | | 376,560 |
Pacific Sunwear of California, Inc.(a) | | 9,650 | | | 214,809 |
Staples, Inc. | | 4,700 | | | 158,437 |
Tiffany & Co. | | 8,000 | | | 255,760 |
Tractor Supply Co.(a) | | 6,400 | | | 238,144 |
| | | | |
|
|
| | | | | | 2,389,453 |
| | | | |
|
|
Semiconductors & Semiconductor Equipment — 3.8% |
Altera Corp.(a) | | 7,800 | | | 161,460 |
AMIS Holdings, Inc.(a) | | 14,000 | | | 231,280 |
ATI Technologies, Inc. (Canada)(a) | | 5,100 | | | 98,889 |
Intersil Corp. (Class “A” Stock) | | 7,800 | | | 130,572 |
Maxim Integrated Products, Inc. | | 7,200 | | | 305,208 |
Novellus Systems, Inc.(a) | | 12,000 | | | 334,680 |
| | | | |
|
|
| | | | | | 1,262,089 |
| | | | |
|
|
Software — 0.9% | | | | | |
Cognos, Inc. (Canada)(a) | | 3,200 | | | 140,992 |
Mercury Interactive Corp.(a) | | 3,100 | | | 141,205 |
| | | | |
|
|
| | | | | | 282,197 |
| | | | |
|
|
Telecommunication Equipment — 0.8% | | | | | |
ADTRAN, Inc. | | 12,800 | | | 244,992 |
| | | | |
|
|
Telecommunications — 3.4% | | | | | |
Amdocs Ltd. (United Kingdom)(a) | | 10,000 | | | 262,500 |
Avaya, Inc.(a) | | 16,000 | | | 275,200 |
Comverse Technology, Inc.(a) | | 9,600 | | | 234,720 |
Plantronics, Inc. | | 8,500 | | | 352,495 |
| | | | |
|
|
| | | | | | 1,124,915 |
| | | | |
|
|
| | | | | | | |
| COMMON STOCKS | | Value
(Note 2)
| |
| (Continued) | | Shares
| |
Trucking & Shipping — 1.4% | | | | | | | |
Sirva, Inc.(a) | | | 24,000 | | $ | 461,280 | |
| | | | | |
|
|
|
Waste Management — 0.8% | | | | | | | |
Stericycle, Inc.(a) | | | 6,000 | | | 275,700 | |
| | | | | |
|
|
|
TOTAL LONG-TERM INVESTMENTS
(cost $27,337,776) | | | 30,160,355 | |
| | | | | |
|
|
|
| | |
SHORT-TERM
INVESTMENT — 8.8% | | Principal
Amount
(000)
| | | |
Repurchase Agreement | | | | | | | |
State Street Bank & Trust Co., 2.10%, 1/3/05(b)
(cost $2,876,665) | | $ | 2,877 | | | 2,876,665 | |
TOTAL INVESTMENTS, BEFORE OUTSTANDING OPTIONS WRITTEN — 100.6%
(cost $30,214,441) | | | 33,037,020 | |
| | | | | |
|
|
|
| | |
OUTSTANDING OPTIONS
WRITTEN(a) — (0.1%) | | Contracts
| | | |
Call Options | | | | | | | |
Alliance Data Systems Corp.,
expiring 2/19/05 @ $50 | | | 38 | | | (2,945 | ) |
Caremark Rx Inc.,
expiring 2/19/05 @ $40 | | | 49 | | | (7,105 | ) |
Eon Labs, Inc.,
expiring 1/22/05 @ $ 30 | | | 30 | | | (750 | ) |
Impax Laboratories, Inc.,
expiring 2/19/05 @ $ 17.50 | | | 51 | | | (3,060 | ) |
Investors Financial Services Corp.,
expiring 2/19/05 @ $ 50 | | | 46 | | | (10,350 | ) |
Joy Global, Inc.,
expiring 2/19/05 @ $45 | | | 31 | | | (4,960 | ) |
OSI Pharmaceuticals, Inc.,
expiring 2/19/05 @ $ 80 | | | 15 | | | (4,200 | ) |
| | | | | |
|
|
|
TOTAL OUTSTANDING OPTIONS WRITTEN
(premium received $27,077) | | | (33,370 | ) |
| | | | | |
|
|
|
TOTAL INVESTMENTS, NET OF OUTSTANDING OPTIONS WRITTEN — 100.5%
(cost $ 30,187,364; Note 6) | | | 33,003,650 | |
LIABILITIES IN EXCESS OF OTHER ASSETS — (0.5)% | | | (162,886 | ) |
| | | | | |
|
|
|
NET ASSETS —��100% | | $ | 32,840,764 | |
| | | | | |
|
|
|
| (a) | Non-income producing security. |
| (b) | State Street Bank & Trust Company Repurchase Agreement, repurchase price $2,877,168 due 1/3/05. The value of the collateral including accrued interest was $2,940,438. Collaterized by United States Treasury or federal agency obligations. |
SEE NOTES TO FINANCIAL STATEMENTS.
B3
| | | | |
| | | SP AIM AGGRESSIVE GROWTH PORTFOLIO (Continued) | | |
SCHEDULE OF INVESTMENTS | December 31, 2004 |
The industry classification of portfolio holdings and liabilities in excess of other assets shown as a percentage of net assets as of December 31, 2004 was as follows:
| | | |
Drugs & Medical Supplies | | 13.4 | % |
Repurchase Agreement | | 8.8 | |
Commercial Services | | 8.3 | |
Electronics | | 8.1 | |
Manufacturing | | 7.3 | |
Retail | | 7.3 | |
Hospitals/Healthcare Management | | 4.2 | |
Financial Services | | 4.0 | |
Semiconductors & Semiconductor Equipment | | 3.8 | |
Telecommunications | | 3.4 | |
Oil & Gas Services | | 3.3 | |
Leisure | | 3.2 | |
Restaurants | | 3.0 | |
Media | | 2.9 | |
Computer Services | | 2.4 | |
Diversified Operations | | 1.7 | |
Human Resources | | 1.7 | |
Advertising | | 1.5 | |
Banks & Savings & Loans | | 1.4 | |
Trucking & Shipping | | 1.4 | |
Chemicals | | 1.0 | |
Distribution/Wholesale | | 1.0 | |
Real Estate | | 1.0 | |
Software | | 0.9 | |
Airlines | | 0.8 | |
Biotechnology | | 0.8 | |
Food & Beverage | | 0.8 | |
Internet Content | | 0.8 | |
Waste Management | | 0.8 | |
Telecommunication Equipment | | 0.8 | |
Machinery | | 0.5 | |
Call Options Written | | (0.1 | ) |
| | |
|
|
| | | 100.5 | |
Liabilities in excess of other assets | | (0.5 | ) |
| | |
|
|
| | | 100.0 | % |
| | |
|
|
SEE NOTES TO FINANCIAL STATEMENTS.
B4
| | | | |
| | | SP AIM CORE EQUITY PORTFOLIO | | |
SCHEDULE OF INVESTMENTS | December 31, 2004 |
| | | | | |
| LONG-TERM INVESTMENTS — 90.2% | | Value
(Note 2)
|
| COMMON STOCKS | | Shares
| |
Aerospace — 1.3% | | | | | |
Northrop Grumman Corp. | | 7,700 | | $ | 418,572 |
| | | | |
|
|
Banks and Savings & Loans — 4.5% | | | | | |
Bank of America Corp. | | 11,000 | | | 516,890 |
BB&T Corp. | | 7,550 | | | 317,478 |
SunTrust Banks, Inc. | | 3,750 | | | 277,050 |
Wachovia Corp. | | 5,950 | | | 312,970 |
| | | | |
|
|
| | | | | | 1,424,388 |
| | | | |
|
|
Building & Construction — 1.0% | | | | | |
Masco Corp. | | 8,700 | | | 317,811 |
| | | | |
|
|
Chemicals — 1.3% | | | | | |
Dow Chemical Co. | | 8,300 | | | 410,933 |
| | | | |
|
|
Commercial Services — 2.7% | | | | | |
Accenture Ltd.(a) | | 17,500 | | | 472,500 |
IAC/InterActiveCorp.(a) | | 14,500 | | | 400,490 |
| | | | |
|
|
| | | | | | 872,990 |
| | | | |
|
|
Communications Equipment — 1.2% | | | | | |
Nokia Oyj, ADR (Finland) | | 24,600 | | | 385,482 |
| | | | |
|
|
Computers — 1.5% | | | | | |
International Business Machines Corp. | | 4,700 | | | 463,326 |
| | | | |
|
|
Computer Services — 1.0% | | | | | |
First Data Corp. | | 7,300 | | | 310,542 |
| | | | |
|
|
Computer Software & Services — 4.4% | | | | | |
Computer Associates International, Inc. | | 14,700 | | | 456,582 |
Microsoft Corp. | | 35,700 | | | 953,547 |
| | | | |
|
|
| | | | | | 1,410,129 |
| | | | |
|
|
Cosmetics & Soaps — 1.1% | | | | | |
Kimberly-Clark Corp. | | 5,500 | | | 361,955 |
| | | | |
|
|
Diversified Manufacturing Operations — 3.7% | | | |
General Electric Co. | | 15,500 | | | 565,750 |
Tyco International, Ltd. (Bermuda) | | 17,200 | | | 614,728 |
| | | | |
|
|
| | | | | | 1,180,478 |
| | | | |
|
|
Drugs & Medical Supplies — 13.0% | | | | | |
Bristol-Myers Squibb Co. | | 19,900 | | | 509,838 |
Forest Laboratories, Inc.(a) | | 14,900 | | | 668,414 |
GlaxoSmithKline PLC, ADR (United Kingdom) | | 15,500 | | | 734,545 |
Johnson & Johnson | | 6,400 | | | 405,888 |
Merck & Co., Inc. | | 27,100 | | | 870,994 |
Teva Pharmaceutical Industries, Ltd.,
ADR (Israel) | | 16,500 | | | 492,690 |
Wyeth | | 10,800 | | | 459,972 |
| | | | |
|
|
| | | | | | 4,142,341 |
| | | | |
|
|
Electronics — 3.4% | | | | | |
Analog Devices, Inc. | | 8,000 | | | 295,360 |
Emerson Electric Co. | | 4,500 | | | 315,450 |
Intel Corp. | | 20,400 | | | 477,156 |
| | | | |
|
|
| | | | | | 1,087,966 |
| | | | |
|
|
Financial Services — 3.7% | | | | | |
Citigroup, Inc. | | 7,200 | | | 346,896 |
Morgan Stanley | | 9,000 | | | 499,680 |
Washington Mutual, Inc. | | 7,840 | | | 331,475 |
| | | | |
|
|
| | | | | | 1,178,051 |
| | | | |
|
|
| | | | | |
| COMMON STOCKS | | Value
(Note 2)
|
| (Continued) | | Shares
| |
Food & Beverage — 10.2% | | | | | |
Campbell Soup Co. | | 16,300 | | $ | 487,207 |
Coca-Cola Co. | | 7,500 | | | 312,225 |
General Mills, Inc. | | 20,600 | | | 1,024,026 |
Kraft Foods, Inc. (Class “A” Stock) | | 12,700 | | | 452,247 |
Kroger Co. (The)(a) | | 37,400 | | | 655,996 |
Sara Lee Corp. | | 13,500 | | | 325,890 |
| | | | |
|
|
| | | | | | 3,257,591 |
| | | | |
|
|
Insurance — 3.5% | | | | | |
ACE, Ltd. (Cayman Islands) | | 11,000 | | | 470,250 |
Chubb Corp. (The) | | 4,300 | | | 330,670 |
St. Paul Travelers Cos., Inc. (The) | | 8,829 | | | 327,291 |
| | | | |
|
|
| | | | | | 1,128,211 |
| | | | |
|
|
Machinery — 1.4% | | | | | |
Dover Corp. | | 10,500 | | | 440,370 |
| | | | |
|
|
Media — 3.6% | | | | | |
Gannett Co., Inc. | | 5,000 | | | 408,500 |
New York Times Co. (The) (Class “A” Stock) | | 7,700 | | | 314,160 |
Tribune Co. | | 9,800 | | | 412,972 |
| | | | |
|
|
| | | | | | 1,135,632 |
| | | | |
|
|
Office Electronics — 1.8% | | | | | |
Xerox Corp.(a) | | 34,100 | | | 580,041 |
| | | | |
|
|
Oil & Gas Exploration & Production — 4.6% | | | |
Amerada Hess Corp. | | 5,545 | | | 456,797 |
GlobalSantaFe Corp. (Cayman Islands). | | 11,000 | | | 364,210 |
Murphy Oil Corp. | | 4,025 | | | 323,811 |
Nabors Industries, Ltd. (Bermuda)(a) | | 6,300 | | | 323,127 |
| | | | |
|
|
| | | | | | 1,467,945 |
| | | | |
|
|
Oil & Gas Services — 8.7% | | | | | |
Baker Hughes, Inc. | | 10,450 | | | 445,901 |
BJ Services Co. | | 6,800 | | | 316,472 |
BP PLC, ADR (United Kingdom) | | 13,625 | | | 795,700 |
ChevronTexaco Corp. | | 5,970 | | | 313,485 |
Exxon Mobil Corp. | | 12,050 | | | 617,683 |
Smith International, Inc.(a) | | 5,400 | | | 293,814 |
| | | | |
|
|
| | | | | | 2,783,055 |
| | | | |
|
|
Paper & Forest Products — 1.4% | | | | | |
Georgia-Pacific Corp. | | 11,800 | | | 442,264 |
Neenah Paper, Inc. | | 157 | | | 5,118 |
| | | | |
|
|
| | | | | | 447,382 |
| | | | |
|
|
Railroads — 2.3% | | | | | |
Norfolk Southern Corp. | | 9,100 | | | 329,329 |
Union Pacific Corp. | | 5,750 | | | 386,688 |
| | | | |
|
|
| | | | | | 716,017 |
| | | | |
|
|
Retail — 1.8% | | | | | |
Kohl’s Corp.(a) | | 11,800 | | | 580,206 |
| | | | |
|
|
Semiconductors — 2.0% | | | | | |
National Semiconductor Corp. | | 18,900 | | | 339,255 |
Xilinx, Inc. | | 9,800 | | | 290,570 |
| | | | |
|
|
| | | | | | 629,825 |
| | | | |
|
|
Telecommunications — 1.0% | | | | | |
ALLTEL Corp. | | 5,500 | | | 323,180 |
| | | | |
|
|
SEE NOTES TO FINANCIAL STATEMENTS.
B5
| | | | |
| | | SP AIM CORE EQUITY PORTFOLIO (Continued) | | |
SCHEDULE OF INVESTMENTS | December 31, 2004 |
| | | | | | | |
| COMMON STOCKS | | Value
(Note 2)
| |
| (Continued) | | Shares
| |
Utility – Electric — 2.0% | | | | | | | |
Dominion Resources, Inc. | | | 4,400 | | $ | 298,056 | |
FPL Group, Inc. | | | 4,300 | | | 321,425 | |
| | | | | |
|
|
|
| | | | | | | 619,481 | |
| | | | | |
|
|
|
Waste Management — 2.1% | | | | | | | |
Waste Management, Inc. | | | 21,800 | | | 652,692 | |
| | | | | |
|
|
|
TOTAL LONG-TERM INVESTMENTS
(cost $26,419,348) | | | 28,726,592 | |
| | | | | |
|
|
|
| | |
SHORT-TERM
INVESTMENT — 9.9% | | Principal
Amount
(000)
| | | |
Repurchase Agreement | | | | | | | |
State Street Bank & Trust Co., 2.10%, 1/3/05(b)
(cost $3,139,159) | | $ | 3,139 | | | 3,139,159 | |
| | | | | |
|
|
|
| |
TOTAL INVESTMENTS — 100.1%
(cost $29,558,507; Note 6) | | | 31,865,751 | |
LIABILITIES IN EXCESS OF
OTHER ASSETS — (0.1)% | | | (25,155 | ) |
| | | | | |
|
|
|
NET ASSETS — 100% | | $ | 31,840,596 | |
| | | | | |
|
|
|
The following abbreviation is used in portfolio descriptions:
| | |
| ADR | | American Depositary Receipt |
| (a) | Non-income producing security. |
| (b) | State Street Bank & Trust Company Repurchase Agreement, repurchase price $3,139,708 due 1/03/05. The value of the collateral including accrued interest was $3,258,054. Collaterized by United States Treasury or federal agency obligations. |
The industry classification of portfolio holdings and liabilities in excess of other assets shown as a percentage of net assets as of December 31, 2004 was as follows:
| | | |
Drugs & Medical Supplies | | 13.0 | % |
Food & Beverage | | 10.2 | |
Repurchase Agreement | | 9.9 | |
Oil & Gas Services | | 8.7 | |
Oil & Gas Exploration & Production | | 4.6 | |
Banks and Savings & Loans | | 4.5 | |
Computer Software & Services | | 4.4 | |
Diversified Manufacturing Operations | | 3.7 | |
Financial Services | | 3.7 | |
Media | | 3.6 | |
Insurance | | 3.5 | |
Electronics | | 3.4 | |
Commercial Services | | 2.7 | |
Railroads | | 2.3 | |
Waste Management | | 2.1 | |
Semiconductors | | 2.0 | |
Utility – Electric | | 2.0 | |
Retail | | 1.8 | |
Office Electronics | | 1.8 | |
Computers | | 1.5 | |
Paper & Forest Products | | 1.4 | |
Machinery | | 1.4 | |
Aerospace | | 1.3 | |
Chemicals | | 1.3 | |
Communications Equipment | | 1.2 | |
Cosmetics & Soaps | | 1.1 | |
Telecommunications | | 1.0 | |
Building & Construction | | 1.0 | |
Computer Services | | 1.0 | |
| | |
|
|
| | | 100.1 | |
Liabilities in excess of other assets | | (0.1 | ) |
| | |
|
|
| | | 100.0 | % |
| | |
|
|
SEE NOTES TO FINANCIAL STATEMENTS.
B6
| | | | |
| | | SP ALLIANCE LARGE CAP GROWTH PORTFOLIO | | |
SCHEDULE OF INVESTMENTS | December 31, 2004 |
| | | | | |
| LONG-TERM INVESTMENTS — 99.8% | | Value
(Note 2)
|
| COMMON STOCKS | | Shares
| |
Building & Construction — 0.8% | | | | | |
Lennar Corp. (Class “A” Stock) | | 4,000 | | $ | 226,720 |
Pulte Homes, Inc. | | 4,300 | | | 274,340 |
| | | | |
|
|
| | | | | | 501,060 |
| | | | |
|
|
Computers — 6.5% | | | | | |
Apple Computer, Inc.(a) | | 12,200 | | | 785,680 |
Dell, Inc.(a) | | 72,800 | | | 3,067,792 |
Research In Motion Ltd. (Canada)(a) | | 5,400 | | | 445,068 |
| | | | |
|
|
| | | | | | 4,298,540 |
| | | | |
|
|
Computer Software & Services — 10.9% | | | | | |
Cisco Systems, Inc.(a) | | 65,200 | | | 1,258,360 |
Electronic Arts, Inc.(a) | | 37,800 | | | 2,331,504 |
EMC Corp.(a) | | 8,900 | | | 132,343 |
Microsoft Corp. | | 67,100 | | | 1,792,241 |
Network Appliance, Inc.(a) | | 22,600 | | | 750,772 |
SAP AG, ADR (Germany) | | 20,000 | | | 884,200 |
| | | | |
|
|
| | | | | | 7,149,420 |
| | | | |
|
|
Cosmetics & Soaps — 3.4% | | | | | |
Avon Products, Inc. | | 36,500 | | | 1,412,550 |
Procter & Gamble Co. | | 15,600 | | | 859,248 |
| | | | |
|
|
| | | | | | 2,271,798 |
| | | | |
|
|
Diversified Operations — 4.1% | | | | | |
General Electric Co. | | 51,900 | | | 1,894,350 |
Tyco International Ltd. (Bermuda) | | 22,300 | | | 797,002 |
| | | | |
|
|
| | | | | | 2,691,352 |
| | | | |
|
|
Drugs & Medical Supplies — 14.3% | | | | | |
Alcon, Inc. (Switzerland) | | 15,400 | | | 1,241,240 |
Amgen, Inc.(a) | | 31,700 | | | 2,033,555 |
Boston Scientific Corp.(a) | | 46,800 | | | 1,663,740 |
Gilead Sciences, Inc.(a) | | 7,200 | | | 251,928 |
Pfizer, Inc. | | 26,100 | | | 701,829 |
St. Jude Medical, Inc.(a) | | 38,400 | | | 1,610,112 |
Teva Pharmaceutical Industries Ltd.,
ADR (Israel) | | 39,400 | | | 1,176,484 |
Zimmer Holdings, Inc.(a) | | 8,800 | | | 705,056 |
| | | | |
|
|
| | | | | | 9,383,944 |
| | | | |
|
|
Electronics — 6.3% | | | | | |
Altera Corp.(a) | | 14,900 | | | 308,430 |
Broadcom Corp. (Class “A” Stock)(a) | | 35,000 | | | 1,129,800 |
Intel Corp. | | 5,700 | | | 133,323 |
Marvell Technology Group Ltd. (Bermuda)(a) | | 38,600 | | | 1,369,142 |
Taiwan Semiconductor Manufacturing Co., Ltd., ADR (Taiwan) | | 142,800 | | | 1,212,372 |
| | | | |
|
|
| | | | | | 4,153,067 |
| | | | |
|
|
Energy Equipment & Services — 1.0% | | | | | |
Baker Hughes, Inc. | | 15,500 | | | 661,385 |
| | | | |
|
|
Financial Services — 10.1% | | | | | |
Charles Schwab Corp. | | 85,800 | | | 1,026,168 |
Citigroup, Inc. | | 33,600 | | | 1,618,848 |
Franklin Resources, Inc. | | 13,900 | | | 968,135 |
J. P. Morgan Chase & Co. | | 28,200 | | | 1,100,082 |
Legg Mason, Inc. | | 2,500 | | | 183,150 |
MBNA Corp. | | 62,100 | | | 1,750,599 |
| | | | |
|
|
| | | | | | 6,646,982 |
| | | | |
|
|
| | | | | | | |
| COMMON STOCKS | | Value
(Note 2)
| |
| (Continued) | | Shares
| |
Food & Beverage — 0.5% | | | | | | | |
Whole Foods Market, Inc. | | | 3,500 | | $ | 333,725 | |
| | | | | |
|
|
|
Health Care Services — 2.2% | | | | | | | |
UnitedHealth Group, Inc. | | | 10,500 | | | 924,315 | |
WellPoint, Inc.(a) | | | 4,600 | | | 529,000 | |
| | | | | |
|
|
|
| | | | | | | 1,453,315 | |
| | | | | |
|
|
|
Insurance — 3.7% | | | | | | | |
AFLAC, Inc. | | | 16,800 | | | 669,312 | |
American International Group, Inc. | | | 26,600 | | | 1,746,822 | |
| | | | | |
|
|
|
| | | | | | | 2,416,134 | |
| | | | | |
|
|
|
Internet — 11.3% | | | | | | | |
eBay, Inc.(a) | | | 25,500 | | | 2,965,140 | |
Google, Inc. (Class “A” Stock)(a) | | | 3,400 | | | 656,540 | |
Symantec Corp.(a) | | | 23,900 | | | 615,664 | |
Yahoo!, Inc.(a) | | | 84,600 | | | 3,187,728 | |
| | | | | |
|
|
|
| | | | | | | 7,425,072 | |
| | | | | |
|
|
|
Leisure — 2.3% | | | | | | | |
Carnival Corp. | | | 26,000 | | | 1,498,380 | |
| | | | | |
|
|
|
Media — 2.9% | | | | | | | |
E.W. Scripps Co. (Class “A” Stock) | | | 25,900 | | | 1,250,452 | |
Time Warner, Inc.(a) | | | 34,500 | | | 670,680 | |
| | | | | |
|
|
|
| | | | | | | 1,921,132 | |
| | | | | |
|
|
|
Oil & Gas Services — 3.1% | | | | | | | |
Halliburton Co. | | | 23,000 | | | 902,520 | |
Nabors Industries Ltd.(a) | | | 21,800 | | | 1,118,122 | |
XTO Energy, Inc. | | | 1,100 | | | 38,918 | |
| | | | | |
|
|
|
| | | | | | | 2,059,560 | |
| | | | | |
|
|
|
Retail — 6.1% | | | | | | | |
Lowe’s Cos., Inc. | | | 38,200 | | | 2,199,938 | |
Starbucks Corp.(a) | | | 5,600 | | | 349,216 | |
Target Corp. | | | 27,600 | | | 1,433,268 | |
| | | | | |
|
|
|
| | | | | | | 3,982,422 | |
| | | | | |
|
|
|
Telecommunications — 9.5% | | | | | | | |
Corning, Inc.(a) | | | 179,100 | | | 2,108,007 | |
Juniper Networks, Inc.(a) | | | 68,200 | | | 1,854,358 | |
QUALCOMM, Inc. | | | 53,900 | | | 2,285,360 | |
| | | | | |
|
|
|
| | | | | | | 6,247,725 | |
| | | | | |
|
|
|
Transportation/Shipping — 0.8% | | | | | | | |
United Parcel Service, Inc. (Class “B” Stock) | | | 6,000 | | | 512,760 | |
| | | | | |
|
|
|
TOTAL LONG-TERM INVESTMENTS
(cost $59,349,853) | | | 65,607,773 | |
| | | | | |
|
|
|
SHORT-TERM
INVESTMENT — 0.5% | | Principal
Amount
(000)
| | | |
Repurchase Agreement | | | | | | | |
State Street Bank & Trust Co., 1.75%, 1/3/05(b)
(Cost $314,672) | | $ | 315 | | | 314,672 | |
| | | | | |
|
|
|
TOTAL INVESTMENTS — 100.3%
(cost $59,664,525; Note 6) | | | 65,922,445 | |
LIABILITIES IN EXCESS OF
OTHER ASSETS — (0.3)% | | | (217,164 | ) |
| | | | | |
|
|
|
NET ASSETS — 100% | | $ | 65,705,281 | |
| | | | | |
|
|
|
SEE NOTES TO FINANCIAL STATEMENTS.
B7
| | | | |
| | | SP ALLIANCE LARGE CAP GROWTH PORTFOLIO (Continued) | | |
SCHEDULE OF INVESTMENTS December 31, 2004 | |
The following abbreviation is used in portfolio descriptions:
| | |
| ADR | | American Depositary Receipt |
| (a) | Non-Income producing security. |
| (b) | State Street Bank & Trust Company Repurchase Agreement, repurchase price $314,718 due 1/03/05. The value of the collateral including accrued interest was $322,797. Collateralized by United States Treasury or federal agency obligations. |
The industry classification of portfolio holdings and liabilities in excess of other assets shown as a percentage of net assets as of December 31, 2004 was as follows:
| | | |
Drugs & Medical Supplies | | 14.3 | % |
Internet | | 11.3 | |
Computer Software & Services | | 10.9 | |
Financial Services | | 10.1 | |
Telecommunications | | 9.5 | |
Computers | | 6.5 | |
Electronics | | 6.3 | |
Retail | | 6.1 | |
Diversified Operations | | 4.1 | |
Insurance | | 3.7 | |
Cosmetics & Soaps | | 3.4 | |
Oil & Gas Services | | 3.1 | |
Media | | 2.9 | |
Leisure | | 2.3 | |
Health Care Services | | 2.2 | |
Energy Equipment & Services | | 1.0 | |
Transportation/Shipping | | 0.8 | |
Building & Construction | | 0.8 | |
Food & Beverage | | 0.5 | |
Repurchase Agreement | | 0.5 | |
| | |
|
|
| | | 100.3 | |
Liabilities in excess of other assets | | (0.3 | ) |
| | |
|
|
| | | 100.0 | % |
| | |
|
|
SEE NOTES TO FINANCIAL STATEMENTS.
B8
| | | | |
| | | SP BALANCED ASSET ALLOCATION PORTFOLIO | | |
SCHEDULE OF INVESTMENTS | December 31, 2004 |
| | | | | | |
| LONG-TERM INVESTMENTS — 100.0% | | Value
(Note 2)
| |
| MUTUAL FUNDS | | Shares
| |
Jennison Portfolio (Class I) | | 6,935,055 | | $ | 125,801,895 | |
Money Market Portfolio | | 3,325,318 | | | 33,253,178 | |
SP Goldman Sachs Small Cap Value Portfolio | | 3,239,308 | | | 50,241,670 | |
SP Large Cap Value Portfolio | | 15,908,408 | | | 183,901,196 | |
SP LSV International Value Portfolio | | 6,753,908 | | | 59,704,550 | |
SP PIMCO High Yield Portfolio | | 3,897,020 | | | 41,581,206 | |
SP PIMCO Total Return Portfolio | | 19,901,076 | | | 232,444,571 | |
SP State Street Research Small Cap Growth Portfolio | | 7,826,016 | | | 50,556,062 | |
SP William Blair International Growth Portfolio (Class I) | | 8,692,454 | | | 59,543,313 | |
| | | | |
|
|
|
TOTAL INVESTMENTS — 100.0%
(cost $762,250,484; Note 6) | | | 837,027,641 | |
LIABILITIES IN EXCESS OF OTHER ASSETS | | | (35,575 | ) |
| | | | |
|
|
|
NET ASSETS — 100.0% | | $ | 836,992,066 | |
| | | | |
|
|
|
The industry classification of portfolio holdings and liabilities in excess of other assets shown as a percentage of net assets as of December 31, 2004 was as follows:
| | | |
Mutual Funds | | 100.0 | % |
Liabilities in excess of other assets | | — | (a) |
| | |
|
|
| | | 100.0 | % |
| | |
|
|
SEE NOTES TO FINANCIAL STATEMENTS.
B9
| | | | |
| | | SP CONSERVATIVE ASSET ALLOCATION PORTFOLIO | | |
SCHEDULE OF INVESTMENTS | December 31, 2004 |
| | | | | | |
| LONG-TERM INVESTMENTS — 100.0% | | Value
(Note 2)
| |
| MUTUAL FUNDS | | Shares
| |
Jennison Portfolio (Class I) | | 2,546,498 | | $ | 46,193,468 | |
Money Market Portfolio | | 3,205,124 | | | 32,051,240 | |
SP Goldman Sachs Small Cap Value Portfolio | | 1,189,442 | | | 18,448,238 | |
SP Large Cap Value Portfolio | | 5,974,205 | | | 69,061,815 | |
SP LSV International Value Portfolio | | 2,657,169 | | | 23,489,374 | |
SP PIMCO High Yield Portfolio | | 2,146,377 | | | 22,901,841 | |
SP PIMCO Total Return Portfolio | | 17,615,790 | | | 205,752,431 | |
SP State Street Research Small Cap Growth Portfolio | | 2,873,666 | | | 18,563,884 | |
SP William Blair International Growth Portfolio (Class I) | | 3,419,774 | | | 23,425,454 | |
| | | | |
|
|
|
TOTAL INVESTMENTS — 100.0%
(cost $431,474,651; Note 6) | | | 459,887,745 | |
LIABILITIES IN EXCESS OF OTHER ASSETS | | | (20,077 | ) |
| | | | |
|
|
|
NET ASSETS — 100.0% | | $ | 459,867,668 | |
| | | | |
|
|
|
SEE NOTES TO FINANCIAL STATEMENTS.
B10
The industry classification of portfolio holdings and liabilities in excess of other assets shown as a percentage of net assets as of December 31, 2004 was as follows:
| | | |
Mutual Funds | | 100.0 | % |
Liabilities in excess of other assets | | — | (a) |
| | |
|
|
| | | 100.0 | % |
| | |
|
|
SCHEDULE OF INVESTMENTS | December 31, 2004 |
| | | | | |
| LONG-TERM INVESTMENTS — 93.8% | | Value
(Note 2)
|
| COMMON STOCKS | | Shares
| |
Banks — 8.7% | | | | | |
Fifth Third Bancorp | | 74,300 | | $ | 3,512,904 |
Golden West Financial Corp. | | 123,800 | | | 7,603,796 |
HSBC Holdings PLC (United Kingdom) | | 676,748 | | | 11,420,756 |
Lloyds TSB Group PLC, ADR
(United Kingdom) | | 63,500 | | | 2,336,165 |
| | | | |
|
|
| | | | | | 24,873,621 |
| | | | |
|
|
Beverages — 1.3% | | | | | |
Heineken Holding NV (Class “A” Stock) (Netherlands) | | 127,250 | | | 3,848,461 |
| | | | |
|
|
Business Services — 2.2% | | | | | |
D&B Corp.(a) | | 42,600 | | | 2,541,090 |
Iron Mountain, Inc.(a) | | 85,600 | | | 2,609,944 |
Rentokil Initial PLC (United Kingdom)(a) | | 382,100 | | | 1,083,886 |
| | | | |
|
|
| | | | | | 6,234,920 |
| | | | |
|
|
Construction & Housing — 1.4% | | | | | |
Hunter Douglas NV (Netherlands) | | 800 | | | 42,680 |
Martin Marietta Materials, Inc. | | 35,600 | | | 1,910,296 |
Vulcan Materials Co. | | 35,200 | | | 1,922,272 |
| | | | |
|
|
| | | | | | 3,875,248 |
| | | | |
|
|
Containers & Packaging — 2.6% | | | | | |
Sealed Air Corp.(a) | | 139,100 | | | 7,409,857 |
| | | | |
|
|
Diversified Consumer Products — 1.5% | | | | | |
Lexmark International, Inc.
(Class “A” Stock)(a) | | 49,000 | | | 4,165,000 |
| | | | |
|
|
Diversified Manufacturing — 4.0% | | | | | |
Tyco International Ltd. | | 315,852 | | | 11,288,550 |
| | | | |
|
|
Drugs & Medical Supplies — 1.4% | | | | | |
Eli Lilly & Co. | | 47,100 | | | 2,672,925 |
Novartis AG Registered (Switzerland) | | 29,000 | | | 1,461,349 |
| | | | |
|
|
| | | | | | 4,134,274 |
| | | | |
|
|
Financial Services — 16.7% | | | | | |
American Express Co. | | 317,700 | | | 17,908,749 |
H&R Block, Inc. | | 88,600 | | | 4,341,400 |
J.P.Morgan Chase & Co. | | 229,916 | | | 8,969,023 |
Moody’s Corp. | | 39,600 | | | 3,439,260 |
Providian Financial Corp.(a) | | 72,700 | | | 1,197,369 |
State Street Corp. | | 13,000 | | | 638,560 |
Takefuji Corp. (Japan) | | 35,620 | | | 2,408,965 |
Wells Fargo & Co. | | 142,700 | | | 8,868,805 |
| | | | |
|
|
| | | | | | 47,772,131 |
| | | | |
|
|
Foods — 2.2% | | | | | |
Diageo PLC, ADR (United Kingdom) | | 65,500 | | | 3,791,140 |
Hershey Foods Corp. | | 44,200 | | | 2,454,868 |
| | | | |
|
|
| | | | | | 6,246,008 |
| | | | |
|
|
Healthcare Providers & Services — 2.5% | | | | | |
Cardinal Health, Inc. | | 60,200 | | | 3,500,630 |
HCA, Inc. | | 89,400 | | | 3,572,424 |
| | | | |
|
|
| | | | | | 7,073,054 |
| | | | |
|
|
Insurance — 17.3% | | | | | |
American International Group, Inc. | | 192,500 | | | 12,641,475 |
Aon Corp. | | 81,000 | | | 1,932,660 |
| | | | | |
| COMMON STOCKS | | Value
(Note 2)
|
| (Continued) | | Shares
| |
Insurance (cont’d.) | | | | | |
Berkshire Hathaway, Inc.
(Class “A” Stock)(a) | | 125 | | $ | 10,987,500 |
Chubb Corp. | | 9,900 | | | 761,310 |
Loews Corp. | | 73,100 | | | 5,138,930 |
Markel Corp.(a) | | 700 | | | 254,800 |
Marsh & McLennan Companies, Inc. | | 90,300 | | | 2,970,870 |
Principal Financial Group, Inc. | | 25,000 | | | 1,023,500 |
Progressive Corp. | | 99,400 | | | 8,433,096 |
Sun Life Financial, Inc. (Canada) | | 15,300 | | | 513,162 |
Transatlantic Holdings, Inc. | | 77,475 | | | 4,790,279 |
| | | | |
|
|
| | | | | | 49,447,582 |
| | | | |
|
|
Investment Firms — 4.7% | | | | | |
Citigroup, Inc. | | 231,100 | | | 11,134,398 |
Morgan Stanley | | 41,400 | | | 2,298,528 |
| | | | |
|
|
| | | | | | 13,432,926 |
| | | | |
|
|
Internet — 0.5% | | | | | |
IAC/InterActiveCorp(a) | | 56,100 | | | 1,549,482 |
| | | | |
|
|
Media — 5.7% | | | | | |
Comcast Corp. (Class “A” Stock)(a) | | 297,900 | | | 9,783,036 |
Gannett Co., Inc. | | 18,800 | | | 1,535,960 |
Lagardere SCA (France) | | 55,600 | | | 4,012,994 |
WPP Group, ADR (United Kingdom) | | 17,200 | | | 939,980 |
| | | | |
|
|
| | | | | | 16,271,970 |
| | | | |
|
|
Oil & Gas — 7.6% | | | | | |
ConocoPhillips | | 71,020 | | | 6,166,667 |
Devon Energy Corp. | | 127,600 | | | 4,966,192 |
EOG Resources, Inc. | | 45,000 | | | 3,211,200 |
Occidental Petroleum Corp. | | 94,100 | | | 5,491,676 |
Transocean, Inc.(a) | | 45,200 | | | 1,916,028 |
| | | | |
|
|
| | | | | | 21,751,763 |
| | | | |
|
|
Real Estate Investment Trust — 2.3% | | | | | |
CenterPoint Properties Trust | | 138,400 | | | 6,627,976 |
| | | | |
|
|
Retail — 3.7% | | | | | |
AutoZone, Inc.(a) | | 23,700 | | | 2,164,047 |
Costco Wholesale Corp. | | 170,900 | | | 8,273,269 |
| | | | |
|
|
| | | | | | 10,437,316 |
| | | | |
|
|
Software — 1.0% | | | | | |
Microsoft Corp. | | 104,900 | | | 2,801,879 |
| | | | |
|
|
Telecommunications – Wireless — 0.8% | | | | | |
Nokia Oyj, ADR (Finland) | | 59,500 | | | 932,365 |
SK Telecom Co. Ltd., ADR (South Korea) | | 59,600 | | | 1,326,100 |
| | | | |
|
|
| | | | | | 2,258,465 |
| | | | |
|
|
Tobacco — 4.9% | | | | | |
Altria Group, Inc. | | 231,100 | | | 14,120,210 |
| | | | |
|
|
Transportation/Shipping — 0.8% | | | | | |
United Parcel Service, Inc.
(Class “B” Stock) | | 25,200 | | | 2,153,592 |
| | | | |
|
|
TOTAL LONG-TERM INVESTMENTS
(cost $218,353,974) | | | 267,774,285 |
| | | | |
|
|
SEE NOTES TO FINANCIAL STATEMENTS.
B11
| | | | |
| | | SP DAVIS VALUE PORTFOLIO (Continued) | | |
SCHEDULE OF INVESTMENTS | December 31, 2004 |
| | | | | | | |
SHORT-TERM
INVESTMENT — 6.4% | | Principal
Amount
(000)
| | Value
(Note 2)
| |
Repurchase Agreement | | | | | | | |
State Street Bank & Trust Co.
Repurchase Agreement, 2.17%, 1/3/05
(cost $18,203,000)(b) | | $ | 18,203 | | $ | 18,203,000 | |
| | | | | |
|
|
|
TOTAL INVESTMENTS — 100.2%
(cost $236,556,974; Note 6) | | | 285,977,285 | |
LIABILITIES IN EXCESS OF
OTHER ASSETS — (0.2)% | | | (505,990 | ) |
| | | | | |
|
|
|
NET ASSETS — 100% | | $ | 285,471,295 | |
| | | | | |
|
|
|
The following abbreviation is used in portfolio descriptions:
| | |
| ADR | | American Depositary Receipt |
| (a) | Non-Income producing security. |
| (b) | State Street Bank & Trust Company Repurchase Agreement, repurchase price $18,206,292 due 1/3/05. The value of the collateral including accrued interest was $18,834,784, collaterized by United States Treasury or federal agency obligations. |
The industry classification of portfolio holdings and liabilities in excess of other assets shown as a percentage of net assets as of December 31, 2004 was as follows:
| | | |
Insurance | | 17.3 | % |
Financial Services | | 16.7 | |
Banks | | 8.7 | |
Oil & Gas | | 7.6 | |
Repurchase Agreement | | 6.4 | |
Media | | 5.7 | |
Tobacco | | 4.9 | |
Investment Firms | | 4.7 | |
Diversified Manufacturing | | 4.0 | |
Retail | | 3.7 | |
Containers & Packaging | | 2.6 | |
Healthcare Providers & Services | | 2.5 | |
Real Estate Investment Trust | | 2.3 | |
Foods | | 2.2 | |
Business Services | | 2.2 | |
Diversified Consumer Products | | 1.5 | |
Drugs & Medical Supplies | | 1.4 | |
Construction & Housing | | 1.4 | |
Beverages | | 1.3 | |
Software | | 1.0 | |
Telecommunications – Wireless | | 0.8 | |
Transportation/Shipping | | 0.8 | |
Internet | | 0.5 | |
| | |
|
|
| | | 100.2 | |
Liabilities in excess of other assets | | (0.2 | ) |
| | |
|
|
| | | 100.0 | % |
| | |
|
|
SEE NOTES TO FINANCIAL STATEMENTS.
B12
| | | | |
| | | SP GOLDMAN SACHS SMALL CAP VALUE PORTFOLIO | | |
SCHEDULE OF INVESTMENTS | December 31, 2004 |
| | | | | |
| LONG-TERM INVESTMENTS — 96.3% | | Value (Note 2)
|
| | | Shares
| |
| | |
| COMMON STOCKS — 96.2% | | | | |
Aerospace/Defense — 0.9% | | | | | |
Ducommun, Inc.(a) | | 55,344 | | $ | 1,153,922 |
EDO Corp. | | 46,698 | | | 1,482,662 |
Rockwell Collins, Inc. | | 27,790 | | | 1,096,038 |
| | | | |
|
|
| | | | | | 3,732,622 |
| | | | |
|
|
Airlines — 0.4% | | | | | |
AirTran Holdings, Inc.(a) | | 138,742 | | | 1,484,539 |
Frontier Airlines, Inc.(a) | | 13,451 | | | 153,476 |
| | | | |
|
|
| | | | | | 1,638,015 |
| | | | |
|
|
Biotechnology — 1.1% | | | | | |
Cell Therapeutics, Inc.(a) | | 143,814 | | | 1,170,646 |
MedImmune, Inc.(a) | | 32,758 | | | 888,069 |
Nabi Biopharmaceuticals(a) | | 22,178 | | | 324,908 |
Renovis, Inc.(a) | | 46,280 | | | 665,507 |
United Therapeutics Corp.(a) | | 28,214 | | | 1,273,862 |
| | | | |
|
|
| | | | | | 4,322,992 |
| | | | |
|
|
Brokers — 0.6% | | | | | |
Knight Trading Group, Inc.
(Class “A” Stock)(a) | | 157,468 | | | 1,724,274 |
The Bear Stearns Cos., Inc. | | 7,919 | | | 810,193 |
| | | | |
|
|
| | | | | | 2,534,467 |
| | | | |
|
|
Chemicals — 2.8% | | | | | |
Agrium, Inc. (Canada) | | 252,553 | | | 4,255,518 |
Albemarle Corp. | | 63,085 | | | 2,442,020 |
Minerals Technologies, Inc. | | 34,978 | | | 2,333,033 |
NuCo2, Inc.(a) | | 20,491 | | | 454,695 |
Penford Corp. | | 26,023 | | | 409,342 |
Rohm and Haas Co. | | 27,100 | | | 1,198,633 |
| | | | |
|
|
| | | | | | 11,093,241 |
| | | | |
|
|
Computer Hardware — 0.7% | | | | | |
CDW Corp. | | 11,311 | | | 750,485 |
Hutchinson Technology, Inc.(a) | | 54,737 | | | 1,892,258 |
MTS Systems Corp. | | 3,477 | | | 117,557 |
| | | | |
|
|
| | | | | | 2,760,300 |
| | | | |
|
|
Computer Software — 2.1% | | | | | |
Activision, Inc.(a) | | 80,776 | | | 1,630,060 |
Atari, Inc.(a) | | 24,043 | | | 70,446 |
Citadel Security Software, Inc.(a) | | 189,761 | | | 493,379 |
OPNET Technologies, Inc.(a) | | 139,062 | | | 1,170,902 |
Take-Two Interactive Software, Inc.(a) | | 70,940 | | | 2,468,003 |
Ultimate Software Group, Inc.(a) | | 46,708 | | | 592,257 |
Viisage Technology, Inc.(a) | | 184,749 | | | 1,664,588 |
| | | | |
|
|
| | | | | | 8,089,635 |
| | | | |
|
|
Construction — 2.3% | | | | | |
Beazer Homes USA, Inc. | | 14,064 | | | 2,056,297 |
ElkCorp. | | 31,671 | | | 1,083,781 |
Lennar Corp. (Class “A” Stock) | | 29,669 | | | 1,681,639 |
Lennox International, Inc. | | 59,102 | | | 1,202,726 |
Standard Pacific Corp. | | 25,513 | | | 1,636,404 |
Texas Industries, Inc. | | 13,568 | | | 846,372 |
WCI Communities, Inc.(a) | | 18,930 | | | 556,542 |
| | | | |
|
|
| | | | | | 9,063,761 |
| | | | |
|
|
| | | | | |
COMMON STOCKS
(Continued) | | Value (Note 2)
|
| | | Shares
| |
Consumer Durables — 0.6% | | | | | |
Mohawk Industries, Inc.(a) | | 7,190 | | $ | 656,087 |
Select Comfort Corp.(a) | | 54,951 | | | 985,821 |
The Stanley Works | | 12,445 | | | 609,681 |
| | | | |
|
|
| | | | | | 2,251,589 |
| | | | |
|
|
Diversified — 1.8% | | | | | |
GrafTech International Ltd.(a) | | 292,130 | | | 2,763,550 |
Lydall, Inc.(a) | | 130,236 | | | 1,544,599 |
Mueller Industries, Inc. | | 83,891 | | | 2,701,290 |
| | | | |
|
|
| | | | | | 7,009,439 |
| | | | |
|
|
Diversified Energy — 0.7% | | | | | |
The Williams Companies, Inc. | | 114,617 | | | 1,867,111 |
Western Gas Resources, Inc. | | 31,310 | | | 915,817 |
| | | | |
|
|
| | | | | | 2,782,928 |
| | | | |
|
|
Drugs — 0.5% | | | | | |
Charles River Laboratories
International, Inc.(a) | | 11,787 | | | 542,320 |
PAREXEL International Corp.(a) | | 33,340 | | | 676,802 |
Watson Pharmaceuticals, Inc.(a) | | 18,733 | | | 614,630 |
| | | | |
|
|
| | | | | | 1,833,752 |
| | | | |
|
|
Electrical Equipment — 0.8% | | | | | |
Amphenol Corp. (Class “A” Stock)(a) | | 16,159 | | | 593,682 |
Baldor Electric Co. | | 20,370 | | | 560,786 |
Cummins, Inc. | | 10,430 | | | 873,930 |
Franklin Electric Co., Inc. | | 29,516 | | | 1,247,346 |
| | | | |
|
|
| | | | | | 3,275,744 |
| | | | |
|
|
Electrical Utilities — 3.8% | | | | | |
Avista Corp. | | 27,980 | | | 494,407 |
Central Vermont Public Service Corp. | | 10,847 | | | 252,301 |
Edison International | | 12,556 | | | 402,169 |
El Paso Electric Co.(a) | | 162,532 | | | 3,078,356 |
Entergy Corp. | | 13,387 | | | 904,827 |
FirstEnergy Corp. | | 26,270 | | | 1,037,928 |
MGE Energy, Inc. | | 5,644 | | | 203,353 |
PG&E Corp.(a) | | 33,679 | | | 1,120,837 |
Pinnacle West Capital Corp. | | 7,290 | | | 323,749 |
PNM Resources, Inc. | | 84,304 | | | 2,132,048 |
PPL Corp. | | 43,998 | | | 2,344,214 |
Southern Union Co.(a) | | 41,513 | | | 995,482 |
Westar Energy, Inc. | | 42,952 | | | 982,312 |
Wisconsin Energy Corp. | | 15,027 | | | 506,560 |
| | | | |
|
|
| | | | | | 14,778,543 |
| | | | |
|
|
Energy Resources — 3.3% | | | | | |
EOG Resources, Inc. | | 23,391 | | | 1,669,182 |
Parallel Petroleum Corp.(a) | | 52,501 | | | 283,505 |
Patina Oil & Gas Corp. | | 69,877 | | | 2,620,388 |
Range Resources Corp. | | 287,772 | | | 5,887,815 |
Whiting Petroleum Corp.(a) | | 89,107 | | | 2,695,487 |
| | | | |
|
|
| | | | | | 13,156,377 |
| | | | |
|
|
Environmental & Other Services — 0.6% | | | | | |
Republic Services, Inc. | | 23,979 | | $ | 804,256 |
TRC Cos., Inc.(a) | | 24,930 | | | 423,810 |
Waste Connections, Inc.(a) | | 29,988 | | | 1,027,089 |
| | | | |
|
|
| | | | | | 2,255,155 |
| | | | |
|
|
SEE NOTES TO FINANCIAL STATEMENTS.
B13
| | | | |
| | | SP GOLDMAN SACHS SMALL CAP VALUE PORTFOLIO (Continued) | | |
SCHEDULE OF INVESTMENTS | December 31, 2004 |
| | | | | |
COMMON STOCKS (Continued) | | Shares
| | Value (Note 2)
|
Food & Beverage — 1.7% | | | | | |
American Italian Pasta Co.
(Class “A” Stock) | | 40,422 | | $ | 939,812 |
Archer-Daniels-Midland Co. | | 31,553 | | | 703,947 |
Hain Celestial Group, Inc.(a) | | 53,817 | | | 1,112,397 |
Sensient Technologies Corp. | | 146,147 | | | 3,506,067 |
The Pepsi Bottling Group, Inc. | | 12,222 | | | 330,483 |
| | | | |
|
|
| | | | | | 6,592,706 |
| | | | |
|
|
Forest — 2.2% | | | | | |
Caraustar Industries, Inc.(a) | | 318,578 | | | 5,358,482 |
Packaging Corp. of America | | 41,750 | | | 983,212 |
Universal Forest Products, Inc. | | 42,476 | | | 1,843,458 |
Wausau-Mosinee Paper Corp. | | 16,474 | | | 294,226 |
| | | | |
|
|
| | | | | | 8,479,378 |
| | | | |
|
|
Gas Utilities — 2.7% | | | | | |
AGL Resources, Inc. | | 110,038 | | | 3,657,663 |
Atmos Energy Corp. | | 40,226 | | | 1,100,181 |
Energen Corp. | | 17,905 | | | 1,055,500 |
Northwest Natural Gas Co. | | 67,064 | | | 2,262,739 |
Piedmont Natural Gas, Inc. | | 21,905 | | | 509,072 |
South Jersey Industries, Inc. | | 14,208 | | | 746,773 |
WGL Holdings, Inc. | | 36,757 | | | 1,133,586 |
| | | | |
|
|
| | | | | | 10,465,514 |
| | | | |
|
|
Health Insurance — 0.4% | | | | | |
Health Net, Inc.(a) | | 51,339 | | | 1,482,157 |
| | | | |
|
|
Home Products — 1.9% | | | | | |
Elizabeth Arden, Inc.(a) | | 117,944 | | | 2,799,991 |
Helen of Troy Ltd. (Bermuda)(a) | | 57,981 | | | 1,948,741 |
Jarden Corp.(a) | | 15,105 | | | 656,161 |
Oneida Ltd.(a) | | 125,317 | | | 383,470 |
The Clorox Co. | | 21,862 | | | 1,288,328 |
The Estee Lauder Cos., Inc.
(Class “A” Stock) | | 7,740 | | | 354,260 |
| | | | |
|
|
| | | | | | 7,430,951 |
| | | | |
|
|
Hotel & Leisure — 2.1% | | | | | |
Argosy Gaming Co.(a) | | 51,717 | | | 2,415,184 |
Fossil, Inc.(a) | | 47,931 | | | 1,228,951 |
Harrah’s Entertainment, Inc. | | 12,750 | | | 852,848 |
Hilton Hotels Corp. | | 29,072 | | | 661,097 |
JAKKS Pacific, Inc.(a) | | 61,999 | | | 1,370,798 |
K2, Inc.(a) | | 100,739 | | | 1,599,735 |
RC2 Corp.(a) | | 10,139 | | | 330,531 |
| | | | |
|
|
| | | | | | 8,459,144 |
| | | | |
|
|
Industrial Components — 3.6% | | | | | |
Actuant Corp. (Class “A” Stock)(a) | | 55,053 | | | 2,871,014 |
American Standard Cos., Inc.(a) | | 14,501 | | | 599,181 |
Applied Industrial Technologies, Inc. | | 17,187 | | | 470,924 |
Eaton Corp. | | 17,579 | | | 1,272,017 |
Hughes Supply, Inc. | | 71,954 | | | 2,327,712 |
| | | | |
Lindsay Manufacturing Co. | | 9,931 | | | 257,014 |
Tech Data Corp.(a) | | 18,430 | | | 836,722 |
Wabash National Corp.(a) | | 201,023 | | | 5,413,549 |
| | | | |
|
|
| | | | | |
COMMON STOCKS (Continued) | | Shares
| | Value (Note 2)
|
Industrial Services — 1.7% | | | | | |
Harsco Corp. | | 14,178 | | $ | 790,282 |
Infrasource Services, Inc.(a) | | 53,111 | | | 690,443 |
ITT Educational Services, Inc.(a) | | 32,035 | | | 1,523,264 |
Medical Staffing Network
Holdings, Inc.(a) | | 135,097 | | | 1,106,444 |
PRG-Shultz International, Inc.(a) | | 247,953 | | | 1,247,204 |
School Specialty, Inc.(a) | | 26,064 | | | 1,005,028 |
WebMD Corp.(a) | | 62,489 | | | 509,910 |
| | | | |
|
|
| | | | | | 6,872,575 |
| | | | |
|
|
Information Services — 1.7% | | | | | |
BearingPoint, Inc.(a) | | 69,600 | | | 558,888 |
LECG Corp.(a) | | 33,579 | | | 626,248 |
Lionbridge Technologies, Inc.(a) | | 472,378 | | | 3,174,380 |
MTC Technologies, Inc.(a) | | 72,855 | | | 2,445,743 |
| | | | |
|
|
| | | | | | 6,805,259 |
| | | | |
|
|
Internet — 0.4% | | | | | |
Autobytel, Inc.(a) | | 259,702 | | | 1,568,600 |
| | | | |
|
|
Life Insurance — 0.7% | | | | | |
StanCorp Financial Group, Inc. | | 25,935 | | | 2,139,638 |
Torchmark Corp. | | 13,144 | | | 751,048 |
| | | | |
|
|
| | | | | | 2,890,686 |
| | | | |
|
|
Machinery — 0.5% | | | | | |
Terex Corp.(a) | | 42,989 | | | 2,048,426 |
| | | | |
|
|
Media — 1.0% | | | | | |
ADVO, Inc. | | 40,701 | | | 1,450,991 |
Emmis Communications Corp.
(Class “A” Stock)(a) | | 44,236 | | | 848,889 |
Lamar Advertising Co.
(Class “A” Stock)(a) | | 21,366 | | | 914,037 |
Regent Communications, Inc.(a) | | 173,417 | | | 919,110 |
| | | | |
|
|
| | | | | | 4,133,027 |
| | | | |
|
|
Medical Products — 1.6% | | | | | |
Abaxis, Inc.(a) | | 52,353 | | | 758,595 |
Conceptus, Inc.(a) | | 146,653 | | | 1,190,089 |
Hillenbrand Industries, Inc. | | 4,700 | | | 261,038 |
NDCHealth Corp. | | 85,332 | | | 1,586,322 |
PSS World Medical, Inc.(a) | | 104,140 | | | 1,303,312 |
ThermoGenesis Corp.(a) | | 192,145 | | | 1,218,199 |
| | | | |
|
|
| | | | | | 6,317,555 |
| | | | |
|
|
Medical Providers — 0.9% | | | | | |
Psychiatric Solutions, Inc.(a) | | 13,891 | | | 507,855 |
Radiologix, Inc.(a) | | 242,360 | | | 1,066,384 |
Symbion, Inc.(a) | | 24,125 | | | 532,680 |
United Surgical Partners
International, Inc.(a) | | 30,742 | | | 1,281,941 |
| | | | |
|
|
| | | | | | 3,388,860 |
| | | | |
|
|
Mining — 2.3% | | | | | |
Commercial Metals Co. | | 85,663 | | | 4,331,121 |
Maverick Tube Corp.(a) | | 65,407 | | | 1,981,832 |
Nucor Corp. | | 14,885 | | | 779,081 |
Oregon Steel Mills, Inc.(a) | | 56,794 | | | 1,152,350 |
Peabody Energy Corp. | | 4,900 | | | 396,459 |
Schnitzer Steel Industries, Inc.
(Class “A” Stock) | | 11,753 | | | 398,780 |
| | | | |
|
|
| | | | | | 9,039,623 |
| | | | |
|
|
SEE NOTES TO FINANCIAL STATEMENTS.
B14
| | | | |
| | | SP GOLDMAN SACHS SMALL CAP VALUE PORTFOLIO (Continued) | | |
SCHEDULE OF INVESTMENTS | December 31, 2004 |
| | | | | |
COMMON STOCKS (Continued) | | Shares
| | Value (Note 2)
|
Mortgage — 0.4% | | | | | |
MFA Mortgage Investments, Inc. | | 159,778 | | $ | 1,409,242 |
| | | | |
|
|
Motor Vehicle — 2.1% | | | | | |
American Axle & Manufacturing Holdings, Inc. | | 64,969 | | | 1,991,949 |
ArvinMeritor, Inc. | | 60,426 | | | 1,351,730 |
Autoliv, Inc. (Sweden) | | 11,100 | | | 536,130 |
Lear Corp. | | 11,929 | | | 727,788 |
LoJack Corp.(a) | | 55,475 | | | 672,912 |
Methode Eletronics, Inc. | | 41,742 | | | 536,385 |
Monaco Coach Corp. | | 27,829 | | | 572,442 |
Tenneco Automotive, Inc.(a) | | 101,532 | | | 1,750,412 |
| | | | |
|
|
| | | | | | 8,139,748 |
| | | | |
|
|
Oil Refining — 0.5% | | | | | |
Frontier Oil Corp. | | 80,318 | | | 2,141,278 |
| | | | |
|
|
Oil Services — 0.9% | | | | | |
Hydril(a) | | 14,216 | | | 646,970 |
Patterson-UTI Energy, Inc. | | 70,883 | | | 1,378,674 |
Petroleum Development Corp.(a) | | 11,586 | | | 446,872 |
W-H Energy Services, Inc.(a) | | 12,841 | | | 287,125 |
Willbros Group, Inc. (Panama)(a) | | 33,099 | | | 762,932 |
| | | | |
|
|
| | | | | | 3,522,573 |
| | | | |
|
|
Other Financial Services — 3.6% | | | | | |
iShares Russell 2000 Value Index Fund, Inc. | | 73,000 | | | 14,086,080 |
| | | | |
|
|
Property Insurance — 4.0% | | | | | |
Ambac Financial Group, Inc. | | 9,367 | | | 769,312 |
Donegal Group, Inc. (Class “A” Stock) | | 20,489 | | | 469,813 |
Everest Re Group Ltd. (Barbados) | | 13,222 | | | 1,184,162 |
Hub International Ltd. (Canada) | | 35,820 | | | 659,446 |
NYMAGIC, Inc. | | 21,507 | | | 544,127 |
PartnerRe Ltd. (Bermuda) | | 18,662 | | | 1,155,924 |
ProAssurance Corp.(a) | | 52,471 | | | 2,052,141 |
ProCentury Corp. | | 90,133 | | | 1,117,649 |
PXRE Group Ltd. (Bermuda) | | 57,283 | | | 1,444,105 |
RenaissanceRe Holdings Ltd. (Bermuda) | | 25,230 | | | 1,313,978 |
RLI Corp. | | 53,825 | | | 2,237,505 |
The Navigators Group, Inc.(a) | | 30,190 | | | 909,021 |
The PMI Group, Inc. | | 9,400 | | | 392,450 |
Willis Group Holdings Ltd. (United Kingdom) | | 32,370 | | | 1,332,673 |
| | | | |
|
|
| | | | | | 15,582,306 |
| | | | |
|
|
| | | | |
Publishing — 0.4% | | | | | |
Belo Corp. (Class “A” Stock) | | 24,090 | | | 632,122 |
Journal Register Co.(a) | | 52,729 | | | 1,019,251 |
| | | | |
|
|
| | | | | | 1,651,373 |
| | | | |
|
|
Real Estate Investment Trust — 9.3% | | | | | |
Acadia Realty Trust | | 52,706 | | | 859,108 |
Affordable Residential Communities | | 43,434 | | | 623,278 |
Agree Realty Corp. | | 33,338 | | | 1,056,481 |
AmeriVest Properties, Inc. | | 42,912 | | | 274,637 |
Apartment Investment & Management Co (Class “A” Stock) | | 32,500 | | | 1,252,550 |
BioMed Reality Trust, Inc. | | 46,057 | | | 1,022,926 |
Brandywine Realty Trust | | 31,128 | | | 914,852 |
| | | | | |
COMMON STOCKS (Continued) | | Shares
| | Value (Note 2)
|
Real Estate Investment Trust (cont’d.) | | | | | |
Capital Automotive REIT | | 65,188 | | $ | 2,315,804 |
Commercial Net Lease Realty | | 97,538 | | | 2,009,283 |
Corporate Office Properties Trust | | 10,278 | | | 301,659 |
Correctional Properties Trust | | 69,278 | | | 2,000,749 |
Developers Diversified Reality Corp. | | 24,505 | | | 1,087,287 |
Entertainment Properties Trust | | 34,298 | | | 1,527,976 |
Gables Residential Trust | | 20,546 | | | 735,341 |
iStar Financial, Inc. | | 51,031 | | | 2,309,663 |
LaSalle Hotel Properties | | 47,618 | | | 1,515,681 |
Lexington Corporate Properties Trust | | 83,340 | | | 1,881,817 |
OMEGA Healthcare Investors, Inc. | | 26,443 | | | 312,027 |
Parkway Properties, Inc. | | 54,823 | | | 2,782,267 |
Plum Creek Timber Co., Inc. | | 25,510 | | | 980,604 |
Post Properties, Inc. | | 22,532 | | | 786,367 |
Prentiss Properties Trust | | 75,195 | | | 2,872,449 |
RAIT Investment Trust | | 95,013 | | | 2,657,514 |
Spirit Finance Corp.(a) | | 31,493 | | | 398,386 |
Summit Properties, Inc. | | 102,955 | | | 3,352,215 |
U-Store-It Trust | | 34,548 | | | 599,408 |
| | | | |
|
|
| | | | | | 36,430,329 |
| | | | |
|
|
Regional Banks — 9.0% | | | | | |
Alabama National BanCorp. | | 33,424 | | | 2,155,848 |
Alliance Bankshares Corp.(a) | | 22,361 | | | 347,714 |
Berkshire Hills Bancorp, Inc. | | 25,125 | | | 933,394 |
Brookline Bancorp, Inc. | | 95,687 | | | 1,561,612 |
Cardinal Financial Corp.(a) | | 59,820 | | | 666,993 |
Citizens Banking Corp. | | 96,901 | | | 3,328,549 |
Commerce Bancshares, Inc. | | 11,736 | | | 589,147 |
First Community Bancorp | | 43,081 | | | 1,839,559 |
First Niagara Financial Group, Inc. | | 178,312 | | | 2,487,452 |
First Oak Brook Bancshares, Inc. | | 16,852 | | | 546,173 |
FirstMerit Corp. | | 39,796 | | | 1,133,788 |
IBERIABANK Corp. | | 32,040 | | | 2,126,174 |
Interchange Financial Services Corp. | | 8,545 | | | 221,486 |
KeyCorp | | 22,075 | | | 748,343 |
M&T Bank Corp. | | 14,298 | | | 1,541,896 |
Main Street Banks, Inc. | | 47,709 | | | 1,666,475 |
Millennium Bankshares Corp.(a) | | 58,678 | | | 528,102 |
Northern Trust Corp. | | 14,200 | | | 689,836 |
Pacific Continental Corp. | | 762 | | | 12,002 |
PFF Bancorp, Inc. | | 87,846 | | | 4,069,905 |
Placer Sierra Bancshares | | 37,522 | | | 1,067,126 |
Prosperity Bancshares, Inc. | | 19,302 | | | 563,811 |
Regions Financial Corp. | | 49,314 | | | 1,755,085 |
Republic Bancorp, Inc. | | 1 | | | 15 |
Southcoast Financial Corp.(a) | | 23,295 | | | 604,133 |
Sterling Bancorp | | 22,998 | | | 649,694 |
Sun Bancorp, Inc.(a) | | 10,245 | | | 255,920 |
Texas United Bancshares, Inc. | | 25,411 | | | 501,867 |
The Bancorp, Inc.(a) | | 93,270 | | | 1,492,314 |
United Community Banks, Inc. | | 45,691 | | | 1,230,459 |
West Coast Bancorp | | 5,588 | | | 141,991 |
| | | | |
|
|
| | | | | | 35,456,863 |
| | | | |
|
|
Restaurants — 0.9% | | | | | |
Buca, Inc.(a) | | 139,470 | | | 970,711 |
California Pizza Kitchen, Inc.(a) | | 46,306 | | | 1,065,038 |
Total Entertainment Restaurant Corp.(a) | | 76,987 | | | 917,685 |
Yum! Brands, Inc. | | 16,921 | | | 798,333 |
| | | | |
|
|
| | | | | | 3,751,767 |
| | | | |
|
|
SEE NOTES TO FINANCIAL STATEMENTS.
B15
| | | | |
| | | SP GOLDMAN SACHS SMALL CAP VALUE PORTFOLIO (Continued) | | |
SCHEDULE OF INVESTMENTS | December 31, 2004 |
| | | | | |
COMMON STOCKS (Continued) | | Shares
| | Value (Note 2)
|
Retail – Apparel — 4.9% | | | | | |
Aaron Rents, Inc. | | 133,166 | | $ | 3,329,150 |
Abercrombie & Fitch Co.
(Class “A” Stock) | | 43,998 | | | 2,065,706 |
Brookstone, Inc.(a) | | 108,387 | | | 2,118,966 |
Charlotte Russe Holding, Inc.(a) | | 48,291 | | | 487,739 |
Federated Department Stores, Inc. | | 21,336 | | | 1,233,008 |
J.C. Penney Co., Inc. | | 24,710 | | | 1,022,994 |
K-Swiss, Inc. (Class “A” Stock) | | 35,707 | | | 1,039,788 |
Kellwood Co. | | 52,606 | | | 1,814,907 |
OshKosh B’Gosh, Inc.
(Class “A” Stock) | | 14,986 | | | 320,700 |
Ross Stores, Inc. | | 19,250 | | | 555,748 |
Sharper Image Corp.(a) | | 34,405 | | | 648,534 |
The Gymboree Corp.(a) | | 211,948 | | | 2,717,173 |
Too, Inc.(a) | | 21,843 | | | 534,280 |
Zale Corp.(a) | | 49,428 | | | 1,476,414 |
| | | | |
|
|
| | | | | | 19,365,107 |
| | | | |
|
|
Semiconductors — 0.8% | | | | | |
Power Integrations, Inc.(a) | | 20,810 | | | 411,622 |
Tessera Technologies, Inc.(a) | | 69,292 | | | 2,578,355 |
| | | | |
|
|
| | | | | | 2,989,977 |
| | | | |
|
|
Specialty Financials — 3.2% | | | | | |
Accredited Home Lenders Holding Co.(a) | | 108,174 | | | 5,374,084 |
Affiliated Managers Group, Inc.(a) | | 34,397 | | | 2,330,053 |
American Capital Strategies Ltd. | | 26,328 | | | 878,039 |
CIT Group, Inc. | | 31,168 | | | 1,428,118 |
Financial Federal Corp. | | 63,853 | | | 2,503,037 |
| | | | |
|
|
| | | | | | 12,513,331 |
| | | | |
|
|
Supply Chain — 0.5% | | | | | |
Insight Enterprises, Inc.(a) | | 87,254 | | | 1,790,452 |
ScanSource, Inc.(a) | | 3,371 | | | 209,541 |
| | | | |
|
|
| | | | | | 1,999,993 |
| | | | |
|
|
| | | | |
Telephones — 1.6% | | | | | |
CenturyTel, Inc. | | 15,625 | | | 554,219 |
Cincinnati Bell, Inc.(a) | | 220,921 | | | 916,822 |
Iowa Telecommunication Services, Inc. | | 32,536 | | | 701,801 |
West Corp.(a) | | 119,289 | | | 3,949,659 |
| | | | |
|
|
| | | | | | 6,122,501 |
| | | | |
|
|
Thrifts — 2.4% | | | | | |
BankUnited Financial Corp.
(Class “A” Stock)(a) | | 81,179 | | | 2,593,669 |
Fidelity Bankshares, Inc. | | 52,336 | | | 2,237,888 |
IndyMac Bancorp, Inc. | | 64,896 | | | 2,235,667 |
Irwin Financial Corp. | | 43,430 | | | 1,232,978 |
NetBank, Inc. | | 116,730 | | | 1,215,159 |
| | | | |
|
|
| | | | | | 9,515,361 |
| | | | |
|
|
Tobacco — 0.1% | | | | | |
Reynolds American, Inc. | | 7,595 | | | 596,967 |
| | | | |
|
|
Transportation — 1.9% | | | | | |
Forward Air Corp.(a) | | 3,293 | | | 147,197 |
Heartland Express, Inc. | | 55,585 | | | 1,248,995 |
OMI Corp. (Marshall Islands) | | 166,197 | | | 2,800,419 |
SCS Transportation, Inc.(a) | | 88,645 | | | 2,071,634 |
| | | | | |
COMMON STOCKS (Continued) | | Shares
| | Value (Note 2)
|
Transportation (cont’d.) | | | | | |
Teekay Shipping Corp. (Bahamas) | | 14,379 | | $ | 605,500 |
Yellow Roadway Corp.(a) | | 12,799 | | | 713,032 |
| | | | |
|
|
| | | | | | 7,586,777 |
| | | | |
|
|
Trust/Processors — 0.3% | | | | | |
Apollo Investment Corp. | | 72,558 | | | 1,095,626 |
| | | | |
|
|
Wireless — 1.0% | | | | | |
Ditech Communications Corp.(a) | | 208,283 | | | 3,113,831 |
EFJ, Inc.(a) | | 74,091 | | | 714,978 |
| | | | |
|
|
| | | | | | 3,828,809 |
| | | | |
|
|
TOTAL COMMON STOCKS
(cost $327,939,342) | | | 378,387,162 |
| | | | |
|
|
| | | | | | | | |
| | | |
CORPORATE
BONDS — 0.1% | | Moody’s
Rating
| | Principal
Amount
(000)
| | |
Diversified | | | |
Mueller Industries, Inc.
6.00%, 11/1/14
(cost $425,438) | | NR | | $ | 434 | | | 425,320 |
| | | | | | | |
|
|
TOTAL LONG-TERM INVESTMENTS
(cost $328,364,780) | | | 378,812,482 |
| | | | | | | |
|
|
SHORT-TERM INVESTMENT — 3.6% | | | | | | |
Repurchase Agreement | | | | | | | | |
State Street Bank & Trust Company
1.75%, 1/3/05
(cost $14,070,391)(b) | | | 14,070 | | | 14,070,391 |
| | | | | | | |
|
|
TOTAL INVESTMENTS — 99.9%
(cost $342,435,171; Note 6) | | | 392,882,873 |
OTHER ASSETS IN EXCESS OF
LIABILITIES — 0.1% | | | 425,843 |
| | | | | | | |
|
|
NET ASSETS — 100% | | $ | 393,308,716 |
| | | | | | | |
|
|
The following abbreviations are used in portfolio description:
| | |
| NR | | Not rated |
| REIT | | Real Estate Investment Trust |
| (a) | Non-Income producing security. |
| (b) | State Street Bank & Trust Company Repurchase Agreement, repurchase price $14,072,443 due 1/03/05. The value of the collateral including accrued interest was $14,353,012. Collateralized by United States Treasury or federal agency obligations. |
SEE NOTES TO FINANCIAL STATEMENTS.
B16
| | | | |
| | | SP GOLDMAN SACHS SMALL CAP VALUE PORTFOLIO (Continued) | | |
SCHEDULE OF INVESTMENTS | December 31, 2004 |
The industry classification of portfolio holdings and other assets in excess of liabilities shown as a percentage of net assets as of December 31, 2004 was as follows:
| | | |
Real Estate Investment Trusts | | 9.3 | % |
Regionals | | 9.0 | |
Retail – Apparel | | 4.9 | |
Property Insurance | | 4.0 | |
Electrical Utilities | | 3.8 | |
Industrial Components | | 3.6 | |
Other Financial Services | | 3.6 | |
Repurchase Agreement | | 3.6 | |
Energy Resources | | 3.3 | |
Specialty Financials | | 3.2 | |
Chemicals | | 2.8 | |
Gas Utilities | | 2.7 | |
Thrifts | | 2.4 | |
Construction | | 2.3 | |
Mining | | 2.3 | |
Forest | | 2.2 | |
Computer Software | | 2.1 | |
Hotel & Leisure | | 2.1 | |
Motor Vehicle | | 2.1 | |
Home Products | | 1.9 | |
Transportation | | 1.9 | |
Diversified | | 1.8 | |
Food & Beverage | | 1.7 | |
Industrial Services | | 1.7 | |
Information Services | | 1.7 | |
Medical Products | | 1.6 | |
Telephones | | 1.6 | |
Biotechnology | | 1.1 | |
Media | | 1.0 | |
Wireless | | 1.0 | |
Aerospace/Defense | | 0.9 | |
Medical Providers | | 0.9 | |
Oil Services | | 0.9 | |
Restaurants | | 0.9 | |
Electrical Equipment | | 0.8 | |
Semiconductors | | 0.8 | |
Computer Hardware | | 0.7 | |
Diversified Energy | | 0.7 | |
Life Insurance | | 0.7 | |
Brokers | | 0.6 | |
Consumer Durables | | 0.6 | |
Environmental & Other Services | | 0.6 | |
Drugs | | 0.5 | |
Machinery | | 0.5 | |
Oil Refining | | 0.5 | |
Supply Chain | | 0.5 | |
Airlines | | 0.4 | |
Health Insurance | | 0.4 | |
Internet | | 0.4 | |
Mortgage | | 0.4 | |
Publishing | | 0.4 | |
Trust/Processors | | 0.3 | |
Metals | | 0.1 | |
Tobacco | | 0.1 | |
| | |
|
|
| | | 99.9 | |
Other assets in excess of liabilities | | 0.1 | |
| | |
|
|
| | | 100.0 | % |
| | |
|
|
SEE NOTES TO FINANCIAL STATEMENTS.
B17
| | | | |
| | | SP GROWTH ASSET ALLOCATION PORTFOLIO | | |
SCHEDULE OF INVESTMENTS | December 31, 2004 |
| | | | | | |
LONG-TERM
INVESTMENTS — 100.0% | | Shares
| | Value
(Note 2)
| |
| | |
Mutual Funds | | | | | | |
Jennison Portfolio (Class I) | | 7,303,704 | | $ | 132,489,192 | |
SP Goldman Sachs Small Cap Value Portfolio | | 2,985,097 | | | 46,298,858 | |
SP Large Cap Value Portfolio | | 16,563,869 | | | 191,478,326 | |
SP LSV International Value Portfolio | | 6,858,524 | | | 60,629,355 | |
SP PIMCO High Yield Portfolio | | 3,078,320 | | | 32,845,678 | |
SP PIMCO Total Return Portfolio | | 7,298,737 | | | 85,249,252 | |
SP State Street Research Small Cap Growth Portfolio | | 8,241,883 | | | 53,242,563 | |
SP William Blair International Growth Portfolio (Class I) | | 8,827,323 | | | 60,467,162 | |
| | | | |
|
|
|
TOTAL INVESTMENTS — 100.0%
(cost $591,684,631; Note 6) | | | 662,700,386 | |
LIABILITIES IN EXCESS OF
OTHER ASSETS | | | (28,142 | ) |
| | | | |
|
|
|
NET ASSETS — 100.0% | | $ | 662,672,244 | |
| | | | |
|
|
|
SEE NOTES TO FINANCIAL STATEMENTS.
B18
The industry classification of portfolio holdings and liabilities in excess of other assets shown as a percentage of net assets as of December 31, 2004 was as follows:
| | | |
Mutual Funds | | 100.0 | % |
Liabilities in excess of other assets | | — | (a) |
| | |
|
|
| | | 100.0 | % |
| | |
|
|
| | | | |
| | | SP LARGE CAP VALUE PORTFOLIO | | |
SCHEDULE OF INVESTMENTS | December 31, 2004 |
| | | | | |
| LONG-TERM INVESTMENTS — 98.5% | | Value (Note 2)
|
| COMMON STOCKS | | Shares
| |
| | | | |
Aerospace/Defense — 3.2% | | | | | |
Lockheed Martin Corp. | | 152,600 | | $ | 8,476,930 |
Northrop Grumman Corp. | | 48,600 | | | 2,641,896 |
Raytheon Co. | | 148,900 | | | 5,781,787 |
United Technologies Corp. | | 22,900 | | | 2,366,715 |
| | | | |
|
|
| | | | | | 19,267,328 |
| | | | |
|
|
Air Freight & Couriers — 0.0% | | | | | |
FedEx Corp. | | 2,000 | | | 196,980 |
| | | | |
|
|
Auto Components — 1.1% | | | | | |
Dana Corp. | | 3,600 | | | 62,388 |
Delphi Corp. | | 339,400 | | | 3,061,388 |
Lear Corp. | | 58,900 | | | 3,593,489 |
| | | | |
|
|
| | | | | | 6,717,265 |
| | | | |
|
|
Automobiles — 0.6% | | | | | |
Ford Motor Co. | | 140,400 | | | 2,055,456 |
General Motors Corp. | | 44,900 | | | 1,798,694 |
| | | | |
|
|
| | | | | | 3,854,150 |
| | | | |
|
|
Beverages — 0.8% | | | | | |
Anheuser Busch Cos., Inc. | | 4,600 | | | 233,358 |
Coca-Cola Co. | | 80,200 | | | 3,338,726 |
PepsiCo, Inc. | | 19,600 | | | 1,023,120 |
| | | | |
|
|
| | | | | | 4,595,204 |
| | | | |
|
|
Biotechnology — 0.1% | | | | | |
Gilead Sciences, Inc.(a) | | 13,200 | | | 461,868 |
| | | | |
|
|
Chemicals — 1.4% | | | | | |
Air Products & Chemicals, Inc. | | 37,000 | | | 2,144,890 |
Dow Chemical Co. (The) | | 35,600 | | | 1,762,556 |
PPG Industries, Inc. | | 14,700 | | | 1,001,952 |
Praxair, Inc. | | 56,900 | | | 2,512,135 |
Rohm & Haas Co. | | 27,800 | | | 1,229,594 |
| | | | |
|
|
| | | | | | 8,651,127 |
| | | | |
|
|
Commercial Banks — 5.9% | | | | | |
Astoria Financial Corp. | | 11,300 | | | 451,661 |
Bank of America Corp. | | 192,700 | | | 9,054,973 |
Bank of New York Co., Inc. | | 52,000 | | | 1,737,840 |
BB&T Corp. | | 17,100 | | | 719,055 |
First Horizon National Corp. | | 23,600 | | | 1,017,396 |
FirstMerit Corp. | | 19,800 | | | 564,102 |
KeyCorp | | 126,500 | | | 4,288,350 |
Marshall & Ilsley Corp. | | 18,600 | | | 822,120 |
Mellon Financial Corp. | | 38,400 | | | 1,194,624 |
North Fork Bancorporation, Inc. | | 112,800 | | | 3,254,280 |
PNC Financial Services Group | | 5,700 | | | 327,408 |
UnionBanCal Corp. | | 57,800 | | | 3,726,944 |
Wachovia Corp. | | 41,300 | | | 2,172,380 |
Wells Fargo & Co. | | 83,700 | | | 5,201,955 |
Zions Bancorporation | | 16,300 | | | 1,108,889 |
| | | | |
|
|
| | | | | | 35,641,977 |
| | | | |
|
|
Commercial Services & Supplies — 2.3% | | | | | |
Cendant Corp. | | 276,800 | | | 6,471,584 |
Nalco Holding Co.(a) | | 60,900 | | | 1,188,768 |
Waste Management, Inc. | | 203,500 | | | 6,092,790 |
| | | | |
|
|
| | | | | | 13,753,142 |
| | | | |
|
|
| | | | | |
COMMON STOCKS (Continued) | | Shares
| | Value (Note 2)
|
| | | | |
Communications Equipment — 0.4% | | | | | |
Corning, Inc.(a) | | 80,200 | | $ | 943,954 |
Juniper Networks, Inc.(a) | | 16,100 | | | 437,759 |
Lucent Technologies, Inc.(a) | | 121,600 | | | 457,216 |
QUALCOMM, Inc. | | 8,700 | | | 368,880 |
| | | | |
|
|
| | | | | | 2,207,809 |
| | | | |
|
|
Computers & Peripherals — 1.3% | | | | | |
Dell, Inc.(a) | | 43,100 | | | 1,816,234 |
EMC Corp.(a) | | 32,300 | | | 480,301 |
Hewlett-Packard Co. | | 96,900 | | | 2,031,993 |
International Business Machines Corp. (IBM) | | 29,200 | | | 2,878,536 |
Lexmark International, Inc.
(Class “A” Stock)(a) | | 5,300 | | | 450,500 |
NCR Corp.(a) | | 2,600 | | | 179,998 |
Sun Microsystems, Inc.(a) | | 29,300 | | | 157,634 |
| | | | |
|
|
| | | | | | 7,995,196 |
| | | | |
|
|
Containers & Packaging — 0.1% | | | | | |
Smurfit-Stone Container Corp.(a) | | 4,100 | | | 76,588 |
Temple-Inland, Inc. | | 6,200 | | | 424,080 |
| | | | |
|
|
| | | | | | 500,668 |
| | | | |
|
|
Diversified Financial Services — 8.6% | | | | | |
Capital One Financial Corp. | | 100 | | | 8,421 |
Charles Schwab Corp. | | 144,500 | | | 1,728,220 |
CIT Group, Inc. | | 184,900 | | | 8,472,118 |
Citigroup, Inc. | | 299,200 | | | 14,415,456 |
Countrywide Financial Corp. | | 43,300 | | | 1,602,533 |
Doral Financial Corp. | | 10,000 | | | 492,500 |
E*TRADE Financial Corp.(a) | | 500 | | | 7,475 |
Goldman Sachs Group, Inc. | | 34,900 | | | 3,630,996 |
Legg Mason, Inc. | | 3,600 | | | 263,736 |
MBNA Corp. | | 69,900 | | | 1,970,481 |
Morgan Stanley | | 97,500 | | | 5,413,200 |
Principal Financial Group, Inc. | | 205,600 | | | 8,417,264 |
State Street Corp. | | 44,000 | | | 2,161,280 |
U.S. Bancorp | | 92,100 | | | 2,884,572 |
| | | | |
|
|
| | | | | | 51,468,252 |
| | | | |
|
|
Diversified Telecommunication Services — 2.3% | | | |
BellSouth Corp. | | 61,400 | | | 1,706,306 |
SBC Communications, Inc. | | 174,700 | | | 4,502,019 |
Sprint Corp. | | 51,400 | | | 1,277,290 |
Verizon Communications, Inc. | | 156,600 | | | 6,343,866 |
| | | | |
|
|
| | | | | | 13,829,481 |
| | | | |
|
|
Electric Utilities — 6.9% | | | | | |
Alliant Energy Corp. | | 98,400 | | | 2,814,240 |
CMS Energy Corp.(a) | | 11,500 | | | 120,175 |
Consolidated Edison, Inc. | | 40,100 | | | 1,754,375 |
Constellation Energy Group | | 8,800 | | | 384,648 |
Dominion Resources, Inc. | | 51,600 | | | 3,495,384 |
Edison International | | 60,200 | | | 1,928,206 |
Entergy Corp. | | 83,200 | | | 5,623,488 |
FirstEnergy Corp. | | 182,300 | | | 7,202,673 |
FPL Group, Inc. | | 175,600 | | | 13,126,100 |
Northeast Utilities | | 31,100 | | | 586,235 |
Pepco Holdings, Inc. | | 4,600 | | | 98,072 |
SEE NOTES TO FINANCIAL STATEMENTS.
B19
| | | | |
| | | SP LARGE CAP VALUE PORTFOLIO (Continued) | | |
SCHEDULE OF INVESTMENTS | December 31, 2004 |
| | | | | |
COMMON STOCKS (Continued) | | Shares
| | Value (Note 2)
|
| | | | |
Electric Utilities (cont’d.) | | | | | |
PG&E Corp.(a) | | 19,400 | | $ | 645,632 |
Pinnacle West Capital Corp. | | 11,900 | | | 528,479 |
PPL Corp. | | 30,500 | | | 1,625,040 |
Wisconsin Energy Corp. | | 14,500 | | | 488,795 |
Xcel Energy, Inc. | | 56,900 | | | 1,035,580 |
| | | | |
|
|
| | | | | | 41,457,122 |
| | | | |
|
|
Electrical Equipment — 0.0% | | | | | |
Cooper Industries, Ltd.
(Class “A” Stock) | | 100 | | | 6,789 |
| | | | |
|
|
Electronic Equipment & Instruments — 0.0% | | | |
Intersil Corp. (Class “A” Stock) | | 13,400 | | | 224,316 |
| | | | |
|
|
Energy Equipment & Services — 0.2% | | | | | |
Baker Hughes, Inc. | | 21,600 | | | 921,672 |
| | | | |
|
|
Food & Staples Retailing — 2.0% | | | | | |
Albertson’s, Inc. | | 318,500 | | | 7,605,780 |
Sysco Corp. | | 7,000 | | | 267,190 |
Unilever PLC ADR (United Kingdom) | | 97,600 | | | 3,857,152 |
| | | | |
|
|
| | | | | | 11,730,122 |
| | | | |
|
|
Food Products — 1.0% | | | | | |
H.J. Heinz Co. | | 500 | | | 19,495 |
Kraft Foods, Inc. (Class “A” Stock) | | 87,700 | | | 3,122,997 |
Sara Lee Corp. | | 128,900 | | | 3,111,646 |
| | | | |
|
|
| | | | | | 6,254,138 |
| | | | |
|
|
Gas Utilities — 0.0% | | | | | |
El Paso Corp. | | 1,500 | | | 15,600 |
| | | | |
|
|
Healthcare Equipment & Supplies — 0.1% | | | | | |
Guidant Corp. | | 6,600 | | | 475,860 |
| | | | |
|
|
Healthcare Providers & Services — 3.6% | | | | | |
Aetna, Inc. | | 77,500 | | | 9,668,125 |
HCA, Inc. | | 94,500 | | | 3,776,220 |
Tenet Healthcare Corp.(a) | | 570,700 | | | 6,266,286 |
WellPoint, Inc.(a) | | 18,800 | | | 2,162,000 |
| | | | |
|
|
| | | | | | 21,872,631 |
| | | | |
|
|
Hotels, Restaurants & Leisure — 3.5% | | | | | |
Caesars Entertainment, Inc.(a) | | 312,500 | | | 6,293,750 |
Carnival Corp. (Panama) | | 10,000 | | | 576,300 |
Hilton Hotels Corp. | | 46,000 | | | 1,046,040 |
International Game Technology | | 32,000 | | | 1,100,160 |
Marriott International, Inc.
(Class “A” Stock) | | 13,000 | | | 818,740 |
McDonald’s Corp. | | 103,900 | | | 3,331,034 |
Starwood Hotels & Resorts Worldwide, Inc. | | 15,300 | | | 893,520 |
Wendy’s International, Inc. | | 7,900 | | | 310,154 |
Yum! Brands, Inc. | | 135,900 | | | 6,411,762 |
| | | | |
|
|
| | | | | | 20,781,460 |
| | | | |
|
|
Household Durables — 2.4% | | | | | |
D.R. Horton, Inc. | | 18,200 | | | 733,642 |
Lennar Corp. (Class “A” Stock) | | 237,100 | | | 13,438,828 |
Pulte Homes, Inc. | | 3,300 | | | 210,540 |
| | | | |
|
|
| | | | | | 14,383,010 |
| | | | |
|
|
Household Products — 0.3% | | | | | |
Procter & Gamble Co. | | 36,500 | | | 2,010,420 |
| | | | |
|
|
| | | | | |
COMMON STOCKS (Continued) | | Shares
| | Value (Note 2)
|
| | | | |
Index Fund — 0.3% | | | | | |
iShares Russell 1000 Value Index Fund | | 27,350 | | $ | 1,815,220 |
| | | | |
|
|
Industrial Conglomerates — 4.5% | | | | | |
3M Co. | | 14,000 | | | 1,148,980 |
General Electric Co. | | 441,900 | | | 16,129,350 |
Honeywell International, Inc. | | 7,600 | | | 269,116 |
Tyco International, Ltd. (Bermuda) | | 259,700 | | | 9,281,678 |
| | | | |
|
|
| | | | | | 26,829,124 |
| | | | |
|
|
Insurance — 10.2% | | | | | |
AFLAC, Inc. | | 47,800 | | | 1,904,352 |
Allmerica Financial Corp.(a) | | 115,300 | | | 3,785,299 |
Allstate Corp. (The) | | 126,400 | | | 6,537,408 |
AMBAC Financial Group, Inc. | | 19,000 | | | 1,560,470 |
Assurant, Inc. | | 17,400 | | | 531,570 |
Chubb Corp. (The) | | 5,100 | | | 392,190 |
CIGNA Corp. | | 300 | | | 24,471 |
Genworth Financial, Inc.
(Class “A” Stock) | | 58,400 | | | 1,576,800 |
Hartford Financial Services Group, Inc. | | 32,300 | | | 2,238,713 |
MBIA, Inc. | | 11,800 | | | 746,704 |
MetLife, Inc. | | 362,600 | | | 14,688,926 |
Progressive Corp. | | 5,700 | | | 483,588 |
Protective Life Corp. | | 11,200 | | | 478,128 |
St. Paul Travelers Cos., Inc. (The) | | 387,600 | | | 14,368,332 |
Torchmark Corp. | | 18,300 | | | 1,045,662 |
UnumProvident Corp. | | 589,200 | | | 10,570,248 |
W. R. Berkley Corp. | | 14,900 | | | 702,833 |
| | | | |
|
|
| | | | | | 61,635,694 |
| | | | |
|
|
IT Consulting & Services — 0.1% | | | | | |
Automatic Data Processing, Inc. | | 6,000 | | | 266,100 |
Computer Sciences Corp.(a) | | 4,300 | | | 242,391 |
SunGuard Data Systems, Inc.(a) | | 1,000 | | | 28,330 |
| | | | |
|
|
| | | | | | 536,821 |
| | | | |
|
|
IT Services — 2.5% | | | | | |
Electronic Data Systems Corp. | | 655,600 | | | 15,144,360 |
| | | | |
|
|
Leisure Equipment & Products — 1.2% | | | | | |
Eastman Kodak Co. | | 181,700 | | | 5,859,825 |
Hasbro, Inc. | | 28,000 | | | 542,640 |
Mattel, Inc. | | 54,000 | | | 1,052,460 |
| | | | |
|
|
| | | | | | 7,454,925 |
| | | | |
|
|
Machinery — 1.3% | | | | | |
Caterpillar, Inc. | | 8,600 | | | 838,586 |
Deere & Co. | | 31,600 | | | 2,351,040 |
Eaton Corp. | | 19,800 | | | 1,432,728 |
ITT Industries, Inc. | | 1,000 | | | 84,450 |
SPX Corp. | | 82,400 | | | 3,300,944 |
| | | | |
|
|
| | | | | | 8,007,748 |
| | | | |
|
|
Media — 2.6% | | | | | |
Comcast Corp.
(Special Class “A” Stock)(a) | | 6,800 | | | 223,312 |
E.W. Scripps Co. (The)
(Class “A” Stock) | | 11,400 | | | 550,392 |
EchoStar Communications Corp.
(Class “A” Stock)(a) | | 18,100 | | | 601,644 |
SEE NOTES TO FINANCIAL STATEMENTS.
B20
| | | | |
| | | SP LARGE CAP VALUE PORTFOLIO (Continued) | | |
SCHEDULE OF INVESTMENTS | December 31, 2004 |
| | | | | |
COMMON STOCKS (Continued) | | Shares
| | Value (Note 2)
|
| | | | |
Media (cont’d.) | | | | | |
Fox Entertainment Group, Inc.
(Class “A” Stock)(a) | | 56,900 | | $ | 1,778,694 |
Gannett Co., Inc. | | 44,100 | | | 3,602,970 |
Knight-Ridder, Inc. | | 5,600 | | | 374,864 |
Liberty Media Corp. (Class “A” Stock)(a) | | 17,900 | | | 196,542 |
News Corp. (Class “B” Stock) | | 8,000 | | | 149,280 |
Time Warner, Inc.(a) | | 179,700 | | | 3,493,368 |
Tribune Co. | | 1,300 | | | 54,782 |
Viacom, Inc. (Class “B” Stock) | | 116,600 | | | 4,243,074 |
Walt Disney Co. (The) | | 6,500 | | | 180,700 |
| | | | |
|
|
| | | | | | 15,449,622 |
| | | | |
|
|
Metal & Mining — 1.0% | | | | | |
Alcoa, Inc. | | 186,200 | | | 5,850,404 |
United States Steel Corp. | | 8,400 | | | 430,500 |
| | | | |
|
|
| | | | | | 6,280,904 |
| | | | |
|
|
Multiline Retail — 2.9% | | | | | |
Costco Wholesale Corp. | | 5,000 | | | 242,050 |
Federated Department Stores, Inc. | | 23,800 | | | 1,375,402 |
Kohl’s Corp.(a) | | 11,800 | | | 580,206 |
Limited Brands, Inc. | | 1,700 | | | 39,134 |
May Department Stores Co. | | 13,500 | | | 396,900 |
Sears, Roebuck & Co. | | 283,400 | | | 14,461,902 |
Target Corp. | | 1,300 | | | 67,509 |
| | | | |
|
|
| | | | | | 17,163,103 |
| | | | |
|
|
Multi-Utilities — 0.3% | | | | | |
Dynegy, Inc. (Class “A” Stock)(a) | | 25,400 | | | 117,348 |
NiSource, Inc. | | 35,100 | | | 799,578 |
SCANA Corp. | | 26,800 | | | 1,055,920 |
Williams Cos., Inc. | | 1,000 | | | 16,290 |
| | | | |
|
|
| | | | | | 1,989,136 |
| | | | |
|
|
Oil & Gas — 6.6% | | | | | |
Anadarko Petroleum Corp. | | 16,600 | | | 1,075,846 |
Apache Corp. | | 13,500 | | | 682,695 |
Chesapeake Energy Corp. | | 35,100 | | | 579,150 |
ChevronTexaco Corp. | | 90,900 | | | 4,773,159 |
ConocoPhillips | | 47,700 | | | 4,141,791 |
Devon Energy Corp. | | 50,600 | | | 1,969,352 |
Exxon Mobil Corp. | | 325,400 | | | 16,680,004 |
Sunoco, Inc. | | 73,000 | | | 5,964,830 |
Teekay Shipping Corp. | | 27,200 | | | 1,145,392 |
Unocal Corp. | | 45,100 | | | 1,950,124 |
Valero Energy Corp. | | 19,000 | | | 862,600 |
| | | | |
|
|
| | | | | | 39,824,943 |
| | | | |
|
|
Paper & Forest Products — 1.1% | | | | | |
Bowater, Inc. | | 8,500 | | | 373,745 |
Georgia-Pacific Corp. | | 13,400 | | | 502,232 |
International Paper Co. | | 45,300 | | | 1,902,600 |
Weyerhaeuser Co. | | 57,200 | | | 3,844,984 |
| | | | |
|
|
| | | | | | 6,623,561 |
| | | | |
|
|
Personal Products — 0.0% | | | | | |
Gillette Co. | | 5,300 | | | 237,334 |
| | | | |
|
|
| | | | | |
COMMON STOCKS (Continued) | | Shares
| | Value (Note 2)
|
| | | | |
Pharmaceuticals — 0.9% | | | | | |
Bristol-Myers Squibb Co. | | 17,000 | | $ | 435,540 |
Eli Lilly & Co. | | 8,800 | | | 499,400 |
Forest Laboratories, Inc.(a) | | 26,600 | | | 1,193,276 |
Medicis Pharmaceutical Corp.
(Class “A” Stock) | | 2,700 | | | 94,797 |
OSI Pharmaceuticals, Inc.(a) | | 14,800 | | | 1,107,780 |
Sepracor, Inc.(a) | | 12,000 | | | 712,440 |
Watson Pharmaceuticals, Inc.(a) | | 20,600 | | | 675,886 |
Wyeth | | 12,200 | | | 519,598 |
| | | | |
|
|
| | | | | | 5,238,717 |
| | | | |
|
|
Real Estate Investment Trust — 2.9% | | | | | |
Apartment Investment & Management Co. (Class “A” Stock) | | 103,000 | | | 3,969,620 |
Camden Property Trust | | 7,700 | | | 392,700 |
CarrAmerica Realty Corp. | | 13,200 | | | 435,600 |
CenterPoint Properties Trust | | 6,000 | | | 287,340 |
Duke Realty Corp. | | 12,900 | | | 440,406 |
Equity Office Properties Trust | | 83,800 | | | 2,440,256 |
General Growth Properties, Inc. | | 3,100 | | | 112,096 |
Host Marriott Corp. | | 7,400 | | | 128,020 |
Kimco Realty Corp. | | 10,500 | | | 608,895 |
Liberty Property Trust | | 5,700 | | | 246,240 |
Mack-Cali Realty Corp. | | 9,900 | | | 455,697 |
New Century Financial Corp. | | 57,400 | | | 3,668,434 |
Plum Creek Timber Co., Inc. | | 76,200 | | | 2,929,128 |
ProLogis | | 32,900 | | | 1,425,557 |
| | | | |
|
|
| | | | | | 17,539,989 |
| | | | |
|
|
Road & Rail — 0.9% | | | | | |
CSX Corp. | | 14,200 | | | 569,136 |
Norfolk Southern Corp. | | 42,500 | | | 1,538,075 |
Union Pacific Corp. | | 45,900 | | | 3,086,775 |
| | | | |
|
|
| | | | | | 5,193,986 |
| | | | |
|
|
Semiconductor Equipment & Products — 0.1% | | | |
Analog Devices, Inc. | | 8,900 | | | 328,588 |
QLogic Corp.(a) | | 1,900 | | | 69,787 |
| | | | |
|
|
| | | | | | 398,375 |
| | | | |
|
|
Software — 2.8% | | | | | |
Computer Associates International, Inc. | | 390,600 | | | 12,132,036 |
Microsoft Corp. | | 102,600 | | | 2,740,446 |
Oracle Corp.(a) | | 131,900 | | | 1,809,668 |
Take-Two Interactive Software, Inc.(a) | | 3,600 | | | 125,244 |
| | | | |
|
|
| | | | | | 16,807,394 |
| | | | |
|
|
Specialty Retail — 0.5% | | | | | |
Abercrombie & Fitch Co.
(Class “A” Stock) | | 7,000 | | | 328,650 |
Foot Locker, Inc. | | 7,200 | | | 193,896 |
Home Depot, Inc. | | 21,900 | | | 936,006 |
Lowe’s Cos., Inc. | | 18,100 | | | 1,042,379 |
Nordstrom, Inc. | | 6,100 | | | 285,053 |
Ross Stores, Inc. | | 2,600 | | | 75,062 |
Staples, Inc. | | 10,700 | | | 360,697 |
| | | | |
|
|
| | | | | | 3,221,743 |
| | | | |
|
|
SEE NOTES TO FINANCIAL STATEMENTS.
B21
| | | | |
| | | SP LARGE CAP VALUE PORTFOLIO (Continued) | | |
SCHEDULE OF INVESTMENTS | December 31, 2004 |
| | | | | | | |
COMMON STOCKS (Continued) | | Shares
| | Value (Note 2)
| |
| | | | | |
Textiles, Apparel & Luxury Goods — 0.9% | | | | | | | |
Jones Apparel Group, Inc. | | | 92,000 | | $ | 3,364,440 | |
NIKE, Inc. (Class “B” Stock) | | | 21,300 | | | 1,931,697 | |
| | | | | |
|
|
|
| | | | | | | 5,296,137 | |
| | | | | |
|
|
|
Thrifts & Mortgage Finance — 2.8% | | | | | | | |
Freddie Mac | | | 108,400 | | | 7,989,080 | |
Washington Mutual, Inc. | | | 204,500 | | | 8,646,260 | |
| | | | | |
|
|
|
| | | | | | | 16,635,340 | |
| | | | | |
|
|
|
Tobacco — 3.6% | | | | | | | |
Altria Group, Inc. | | | 352,000 | | | 21,507,200 | |
| | | | | |
|
|
|
Trading Companies & Distributors — 0.1% | | | | | | | |
W.W. Grainger, Inc. | | | 4,700 | | | 313,114 | |
| | | | | |
|
|
|
Wireless Telecommunication Services — 0.3% | | | | |
Nextel Communications, Inc.
(Class “A” Stock)(a) | | | 58,300 | | | 1,749,000 | |
| | | | | |
|
|
|
TOTAL LONG-TERM INVESTMENTS
(cost $525,770,099) | | | 592,167,077 | |
| | | | | |
|
|
|
SHORT-TERM INVESTMENT — 2.3% | | | | | | | |
| | |
| | | Principal
Amount
(000)
| | | |
Repurchase Agreement | | | | | | | |
State Street Bank & Trust Co. 1.75%, 1/3/05(b) (cost $13,866,210) | | $ | 13,866 | | | 13,866,210 | |
| | | | | |
|
|
|
TOTAL INVESTMENTS — 100.8%
(cost $539,636,309; Note 6) | | | 606,033,287 | |
LIABILITIES IN EXCESS OF
OTHER ASSETS — (0.8)% | | | (4,627,370 | ) |
| | | | | |
|
|
|
NET ASSETS — 100% | | $ | 601,405,917 | |
| | | | | |
|
|
|
The following abbreviation is used in portfolio descriptions:
| | |
| ADR | | American Depositary Receipt |
| (a) | Non-income producing security. |
| (b) | State Street Bank & Trust Company Repurchase Agreement, repurchase price $13,868,232 due 1/3/05. The value of the collateral including accrued interest was $14,237,156. Collateralized by United States Treasury or federal agency obligations. |
The industry classification of long-term portfolio holdings, short-term investments and liabilities in excess of other assets shown as a percentage of net assets as of December 31, 2004 was as follows:
| | | |
Insurance | | 10.2 | % |
Diversified Financial Services | | 8.6 | |
Electric Utilities | | 6.9 | |
Oil & Gas | | 6.6 | |
Commercial Banks | | 5.9 | |
Industrial Conglomerates | | 4.5 | |
Healthcare Providers & Services | | 3.6 | |
Tobacco | | 3.6 | |
Hotels, Restaurants & Leisure | | 3.5 | |
Aerospace/Defense | | 3.2 | |
Real Estate Investment Trust | | 2.9 | |
Multiline Retail | | 2.9 | |
Software | | 2.8 | |
Thrifts & Mortgage Finance | | 2.8 | |
Media | | 2.6 | |
IT Services | | 2.5 | |
Household Durables | | 2.4 | |
Diversified Telecommunication Services | | 2.3 | |
Commercial Services & Supplies | | 2.3 | |
Food & Staples Retailing | | 2.0 | |
Chemicals | | 1.4 | |
Machinery | | 1.3 | |
Computers & Peripherals | | 1.3 | |
Leisure Equipment & Products | | 1.2 | |
Auto Components | | 1.1 | |
Paper & Forest Products | | 1.1 | |
Metal & Mining | | 1.0 | |
Food Products | | 1.0 | |
Textiles, Apparel & Luxury Goods | | 0.9 | |
Pharmaceuticals | | 0.9 | |
Road & Rail | | 0.9 | |
Beverages | | 0.8 | |
Automobiles | | 0.6 | |
Specialty Retail | | 0.5 | |
Communications Equipment | | 0.4 | |
Household Products | | 0.3 | |
Multi-Utilities | | 0.3 | |
Index Fund | | 0.3 | |
Wireless Telecommunication Services | | 0.3 | |
Energy Equipment & Services | | 0.2 | |
IT Consulting & Services | | 0.1 | |
Containers & Packaging | | 0.1 | |
Healthcare Equipment & Supplies | | 0.1 | |
Biotechnology | | 0.1 | |
Semiconductor Equipment & Products | | 0.1 | |
Trading Companies & Distributors | | 0.1 | |
Personal Products | | — | |
Electronic Equipment & Instruments | | — | |
Air Freight & Couriers | | — | |
Gas Utilities | | — | |
Electrical Equipment | | — | |
Short-term Investment | | 2.3 | |
| | |
|
|
| | | 100.8 | |
Liabilities in excess of other assets | | (0.8 | ) |
| | |
|
|
| | | 100.0 | % |
| | |
|
|
SEE NOTES TO FINANCIAL STATEMENTS.
B22
| | | | |
| | | SP LSV INTERNATIONAL VALUE PORTFOLIO | | |
SCHEDULE OF INVESTMENTS | December 31,2004 |
| | | | | |
| LONG-TERM INVESTMENTS — 96.8% | | Value
(Note 2)
|
| COMMON STOCKS — 96.0% | | Shares
| |
Australia — 4.1% | | | | | |
BlueScope Steel Ltd. | | 256,900 | | $ | 1,661,417 |
CSR, Ltd. | | 661,000 | | | 1,378,300 |
David Jones Ltd. | | 732,200 | | | 1,274,217 |
Santos, Ltd. | | 266,100 | | | 1,768,892 |
Suncorp-Metway Ltd. | | 119,700 | | | 1,630,814 |
Telstra Corp. Ltd. | | 556,800 | | | 2,143,095 |
| | | | |
|
|
| | | | | | 9,856,735 |
| | | | |
|
|
Austria — 0.6% | | | | | |
Boehler-Uddeholm AG | | 11,500 | | | 1,453,405 |
| | | | |
|
|
Belgium — 1.3% | | | | | |
Dexia | | 136,000 | | | 3,127,797 |
| | | | |
|
|
Denmark — 1.0% | | | | | |
Danisco A/S | | 15,200 | | | 927,684 |
Danske Bank A/S | | 50,200 | | | 1,538,780 |
| | | | |
|
|
| | | | | | 2,466,464 |
| | | | |
|
|
Finland — 1.3% | | | | | |
Rautaruukki Oyj | | 102,200 | | | 1,214,120 |
Sampo Oyj (Series “A” Shares) | | 134,300 | | | 1,854,680 |
| | | | |
|
|
| | | | | | 3,068,800 |
| | | | |
|
|
France — 9.2% | | | | | |
BNP Paribas SA | | 56,500 | | | 4,093,313 |
Bouygues SA | | 51,900 | | | 2,398,532 |
Ciments Francais SA | | 10,300 | | | 963,219 |
CNP Assurances | | 31,500 | | | 2,256,422 |
Compagnie Generale des Establissements Michelen
(Series “B” Shares) | | 38,300 | | | 2,456,677 |
Natexis Banques Populaires | | 6,900 | | | 944,447 |
Peugeot SA | | 36,400 | | | 2,310,561 |
Renault SA | | 27,000 | | | 2,258,869 |
Suez SA | | 127,900 | | | 3,410,899 |
Total SA | | 4,200 | | | 917,412 |
| | | | |
|
|
| | | | | | 22,010,351 |
| | | | |
|
|
Germany — 5.9% | | | | | |
BASF AG | | 52,000 | | | 3,746,092 |
Deutsche Bank AG | | 43,700 | | | 3,879,956 |
MAN AG | | 44,200 | | | 1,702,634 |
Salzgitter AG | | 68,900 | | | 1,334,545 |
Schering AG | | 16,600 | | | 1,241,221 |
ThyssenKrupp AG | | 104,900 | | | 2,309,882 |
| | | | |
|
|
| | | | | | 14,214,330 |
| | | | |
|
|
Greece — 0.4% | | | | | |
National Bank of Greece SA | | 29,500 | | | 973,576 |
| | | | |
|
|
Hong Kong — 1.7% | | | | | |
Chaoda Modern Agriculture Holdings Ltd. | | 2,419,000 | | | 894,750 |
CNOOC Ltd. | | 1,651,000 | | | 886,812 |
Orient Overseas International Ltd. | | 339,448 | | | 1,290,503 |
Shanghai Industrial Holdings Ltd. | | 450,000 | | | 961,056 |
| | | | |
|
|
| | | | | | 4,033,121 |
| | | | |
|
|
Ireland — 1.1% | | | | | |
Allied Irish Banks PLC | | 129,000 | | | 2,691,518 |
| | | | |
|
|
| | | | | |
| COMMON STOCKS | | Value
(Note 2)
|
| (Continued) | | Shares
| |
Italy — 4.2% | | | | | |
Benetton Group SpA | | 74,900 | | $ | 990,590 |
Enel SpA | | 263,300 | | | 2,587,548 |
ENI SpA | | 167,900 | | | 4,203,776 |
Riunione Adriatica di Sicurta SpA | | 102,200 | | | 2,311,551 |
| | | | |
|
|
| | | | | | 10,093,465 |
| | | | |
|
|
Japan — 19.5% | | | | | |
Alpine Electronics, Inc. | | 78,300 | | | 1,052,966 |
ALPS Electric Co. Ltd. | | 99,000 | | | 1,475,290 |
Asahi Breweries Ltd. | | 68,700 | | | 850,789 |
CMK Corp. | | 59,000 | | | 835,454 |
Cosmo Oil Co. Ltd. | | 357,000 | | | 1,055,636 |
Denki Kagaku Kogyo Kabushiki Kaisha | | 352,000 | | | 1,171,387 |
Hitachi Koki Co. Ltd. | | 136,000 | | | 1,202,459 |
Hitachi Ltd. | | 423,000 | | | 2,930,907 |
Hokkaido Electric Power Co., Inc. | | 62,200 | | | 1,223,119 |
Hokuetsu Paper Mills Ltd. | | 192,000 | | | 1,083,010 |
Honda Motor Co. Ltd. | | 47,500 | | | 2,461,452 |
Hosiden Corp. | | 102,900 | | | 1,139,763 |
Japan Securities Finance Co. Ltd. | | 120,000 | | | 781,107 |
JS Group Corp. | | 44,600 | | | 809,999 |
Kaken Pharmaceutical Co. Ltd. | | 145,000 | | | 955,158 |
Marubeni Corp. | | 545,000 | | | 1,510,491 |
Mitsubishi Chemical Corp. | | 498,000 | | | 1,516,307 |
Nippon Telegraph & Telephone Corp. | | 616 | | | 2,765,297 |
Nipro Corp. | | 65,000 | | | 1,089,148 |
Nissan Motor Co. Ltd. | | 289,700 | | | 3,149,466 |
NSK, Ltd. | | 307,000 | | | 1,542,939 |
Okasan Holdings, Inc. | | 205,000 | | | 1,142,334 |
Osaka Gas Co. Ltd. | | 512,000 | | | 1,598,907 |
Rengo Co. Ltd. | | 231,000 | | | 1,036,986 |
Sumitomo Osaka Cement Co. Ltd. | | 509,000 | | | 1,246,794 |
Sumitomo Trust & Banking Co. Ltd. | | 116,000 | | | 838,841 |
Taiheiyo Cement Corp. | | 351,000 | | | 873,475 |
Takefuji Corp. | | 29,390 | | | 1,987,632 |
Tanabe Seiyaku Co. Ltd. | | 115,000 | | | 1,185,127 |
Toyota Motor Corp. | | 140,300 | | | 5,709,486 |
UNY Co. Ltd. | | 71,000 | | | 811,369 |
| | | | |
|
|
| | | | | | 47,033,095 |
| | | | |
|
|
Liechtenstein — 0.5% | | | | | |
Verwaltungs-Und Privat-Bank AG | | 7,900 | | | 1,299,182 |
| | | | |
|
|
Netherlands — 4.9% | | | | | |
ABN AMRO Holding NV | | 97,700 | | | 2,588,247 |
ING Groep NV | | 138,100 | | | 4,178,478 |
Koninklijke (Royal) KPN NV | | 171,700 | | | 1,631,348 |
Royal Dutch Petroleum Co. | | 59,900 | | | 3,448,097 |
| | | | |
|
|
| | | | | | 11,846,170 |
| | | | |
|
|
Norway — 0.9% | | | | | |
Norsk Hydro ASA | | 25,700 | | | 2,024,040 |
| | | | |
|
|
Portugal — 0.6% | | | | | |
EDP Energias de Portugal SA | | 460,200 | | | 1,394,924 |
| | | | |
|
|
Singapore — 0.7% | | | | | |
MobileOne Ltd. | | 744,000 | | | 829,503 |
Singapore Telecommunications Ltd. | | 613,000 | | | 893,739 |
| | | | |
|
|
| | | | | | 1,723,242 |
| | | | |
|
|
SEE NOTES TO FINANCIAL STATEMENTS.
B23
| | | | |
| | | SP LSV INTERNATIONAL VALUE PORTFOLIO (Continued) | | |
SCHEDULE OF INVESTMENTS December 31,2004 | |
| | | | | |
| COMMON STOCKS | | Value
(Note 2)
|
| (Continued) | | Shares
| |
Spain — 3.6% | | | | | |
Banco Santander Central Hispano SA | | 114,300 | | $ | 1,418,457 |
Compania Espanola de Petroleos SA | | 24,000 | | | 968,873 |
Endesa SA | | 141,600 | | | 3,327,802 |
Repsol YPF SA | | 53,600 | | | 1,395,917 |
Union Fenosa SA | | 61,800 | | | 1,625,432 |
| | | | |
|
|
| | | | | | 8,736,481 |
| | | | |
|
|
Sweden — 2.7% | | | | | |
Billerud Aktiebolag | | 74,900 | | | 1,335,608 |
Nordea Bank AB | | 326,600 | | | 3,292,834 |
Skanska AB (Series “B” Shares) | | 146,100 | | | 1,753,314 |
| | | | |
|
|
| | | | | | 6,381,756 |
| | | | |
|
|
Switzerland — 6.1% | | | | | |
Ciba Specialty Chemicals AG | | 23,700 | | | 1,802,876 |
Georg Fischer AG | | 4,300 | | | 1,113,666 |
Rieter Holding AG | | 4,400 | | | 1,276,933 |
Sulzer AG | | 3,500 | | | 1,392,028 |
Swisscom AG | | 2,300 | | | 906,165 |
UBS AG | | 69,600 | | | 5,836,215 |
Zurich Financial Services AG | | 14,500 | | | 2,417,729 |
| | | | |
|
|
| | | | | | 14,745,612 |
| | | | |
|
|
United Kingdom — 25.7% | | | | | |
Arriva PLC | | 144,200 | | | 1,494,989 |
Aviva PLC | | 284,800 | | | 3,433,829 |
Barclays PLC | | 402,800 | | | 4,531,751 |
Big Food Group PLC | | 515,500 | | | 930,327 |
Boots Group PLC | | 186,300 | | | 2,344,577 |
Bradford & Bingley PLC | | 293,400 | | | 1,891,277 |
Britannic Group PLC | | 164,800 | | | 1,442,783 |
British Aerospace PLC | | 515,700 | | | 2,282,165 |
British Vita PLC | | 249,300 | | | 1,292,305 |
BT Group PLC | | 887,800 | | | 3,460,112 |
Dixons Group PLC | | 558,500 | | | 1,629,843 |
FirstGroup PLC | | 208,900 | | | 1,398,723 |
GlaxoSmithKline PLC | | 59,500 | | | 1,395,941 |
HBOS PLC | | 284,700 | | | 4,635,134 |
Kelda Group PLC | | 170,000 | | | 2,064,374 |
Lloyds TSB Group PLC | | 457,400 | | | 4,153,711 |
Mitchells & Butlers PLC | | 301,700 | | | 1,969,397 |
Northern Foods PLC | | 417,900 | | | 1,373,985 |
Northumbrian Water Group PLC | | 450,000 | | | 1,524,882 |
Old Mutual PLC | | 875,400 | | | 2,226,904 |
Pilkington PLC | | 666,900 | | | 1,408,421 |
Prudential PLC | | 634 | | | 5,514 |
Scottish Power PLC | | 327,400 | | | 2,534,732 |
Severn Trent PLC | | 105,400 | | | 1,956,799 |
Shanks Group PLC | | 501,400 | | | 1,338,068 |
Shell Transport & Trading Co. | | 560,100 | | | 4,774,496 |
Tate & Lyle PLC | | 189,000 | | | 1,715,427 |
TT Electronics PLC | | 327,500 | | | 1,213,522 |
Viridian Group PLC | | 102,100 | | | 1,430,960 |
| | | | |
|
|
| | | | | | 61,854,948 |
| | | | |
|
|
TOTAL COMMON STOCKS
(cost $212,373,748) | | | 231,029,012 |
| | | | |
|
|
| | | | | | |
| PREFERRED STOCKS — 0.8% | | Shares
| | Value
(Note 2)
|
Germany | | | | | | |
Fresenius AG | | | 12,000 | | $ | 1,122,686 |
Rheinmetall AG | | | 18,300 | | | 955,172 |
| | | | | |
|
|
TOTAL PREFERRED STOCKS
(cost $2,030,067) | | | 2,077,858 |
| | | | | |
|
|
TOTAL LONG-TERM INVESTMENTS
(cost $214,403,815) | | | 233,106,870 |
| | | | | |
|
|
| | |
SHORT-TERM
INVESTMENT — 2.5% | | Principal
Amount
(000)
| | |
Repurchase Agreement | | | | | | |
State Street Bank & Trust Co.,(a)
1.75%, 1/3/05
(cost $6,008,282) | | $ | 6,008 | | | 6,008,282 |
| | | | | |
|
|
TOTAL INVESTMENTS — 99.3%
(cost $220,412,097; Note 6) | | | 239,115,152 |
| |
OTHER ASSETS IN EXCESS OF
LIABILITIES — 0.7% | | | 1,588,227 |
| | | | | |
|
|
TOTAL NET ASSETS — 100.0% | | $ | 240,703,379 |
| | | | | |
|
|
The industry classification of portfolio holdings and other assets in excess of liabilities shown as a percentage of net assets as of December 31, 2004 was as follows:
| | | |
Banks | | 20.2 | % |
Utilities | | 10.3 | % |
Oil & Gas | | 8.9 | % |
Automobiles & Manufacturing | | 7.6 | % |
Insurance | | 6.6 | % |
Telecommunications | | 6.2 | % |
Chemicals | | 4.0 | % |
Food & Beverage | | 3.8 | % |
Financial Services | | 3.7 | % |
Building & Construction | | 3.5 | % |
Metals & Mining | | 3.3 | % |
Electronic Equipment & Instruments | | 3.2 | % |
Machinery | | 2.9 | % |
Repurchase Agreement | | 2.5 | % |
Pharmaceuticals | | 2.0 | % |
Retail | | 2.0 | % |
Transportation | | 1.8 | % |
Containers | | 1.0 | % |
Aerospace & Defense | | 0.9 | % |
Healthcare | | 0.9 | % |
Household Durables | | 0.9 | % |
Hotels Restaurants & Leisure | | 0.8 | % |
Industrial Conglomerates | | 0.8 | % |
Commercial Services | | 0.6 | % |
Marine | | 0.5 | % |
Paper & Forest Products | | 0.4 | % |
| | |
|
|
| | | 99.3 | % |
Other assets in excess of liabilities | | 0.7 | % |
| | |
|
|
| | | 100.0 | % |
| | |
|
|
| (a) | State Street Bank & Trust Company Repurchase Agreement, repurchase price $6,009,158 due 1/3/05. The value of the collateral including accrued interest was $6,128,579. Collateralized by United States Treasury or federal agency obligations. |
SEE NOTES TO FINANCIAL STATEMENTS.
B24
| | | | |
| | | SP MFS CAPITAL OPPORTUNITIES PORTFOLIO | | |
SCHEDULE OF INVESTMENTS | December 31, 2004 |
| | | | | |
| LONG-TERM INVESTMENTS — 97.7% | | Value (Note 2)
|
| COMMON STOCKS | | Shares
| |
| | | | |
Advertising — 0.7% | | | | | |
Getty Images, Inc.(a) | | 650 | | $ | 44,753 |
Interpublic Group of Cos., Inc. (The)(a) | | 7,200 | | | 96,480 |
Lamar Advertising Co.
(Class “A” Stock)(a) | | 940 | | | 40,213 |
| | | | |
|
|
| | | | | | 181,446 |
| | | | |
|
|
Aerospace/Defense — 1.4% | | | | | |
Lockheed Martin Corp. | | 6,830 | | | 379,406 |
| | | | |
|
|
Air Freight & Couriers — 0.2% | | | | | |
Expeditors International of
Washington, Inc. | | 1,050 | | | 58,674 |
| | | | |
|
|
Airlines — 0.3% | | | | | |
Southwest Airlines Co. | | 4,810 | | | 78,307 |
| | | | |
|
|
Banks and Savings & Loans — 1.8% | | | | | |
Bank of America Corp. | | 4,298 | | | 201,963 |
PNC Financial Services Group | | 5,180 | | | 297,539 |
| | | | |
|
|
| | | | | | 499,502 |
| | | | |
|
|
Chemicals — 0.6% | | | | | |
E.I. du Pont de Nemours & Co. | | 3,480 | | | 170,694 |
| | | | |
|
|
Computers — 1.9% | | | | | |
Dell, Inc.(a) | | 9,360 | | | 394,430 |
International Business Machines Corp. | | 1,370 | | | 135,055 |
| | | | |
|
|
| | | | | | 529,485 |
| | | | |
|
|
Computer Services — 1.4% | | | | | |
Accenture Ltd.
(Class “A” Stock) (Bermuda)(a) | | 8,010 | | | 216,270 |
EMC Corp.(a) | | 12,380 | | | 184,091 |
| | | | |
|
|
| | | | | | 400,361 |
| | | | |
|
|
Consumer Discretionary — 2.2% | | | | | |
ComCast Corp. (Class “A” Stock)(a) | | 18,820 | | | 618,049 |
| | | | |
|
|
Containers & Packaging — 2.0% | | | | | |
Owens-Illinois, Inc.(a) | | 20,770 | | | 470,441 |
Smurfit-Stone Container Corp.(a) | | 5,130 | | | 95,828 |
| | | | |
|
|
| | | | | | 566,269 |
| | | | |
|
|
Cosmetics/Toiletries — 1.3% | | | | | |
Avon Products, Inc. | | 3,030 | | | 117,261 |
Procter & Gamble Co. | | 4,650 | | | 256,122 |
| | | | |
|
|
| | | | | | 373,383 |
| | | | |
|
|
Diversified Manufacturing Operations — 2.4% | | | |
General Electric Co. | | 12,020 | | | 438,730 |
Tyco International Ltd. | | 6,194 | | | 221,374 |
| | | | |
|
|
| | | | | | 660,104 |
| | | | |
|
|
Drugs & Medical Supplies — 16.0% | | | | | |
Abbott Laboratories | | 10,440 | | | 487,026 |
Allergan, Inc. | | 1,080 | | | 87,556 |
Amgen, Inc.(a) | | 2,760 | | | 177,054 |
Apria Healthcare Group, Inc.(a) | | 6,030 | | | 198,688 |
Elan Corp. PLC ADR (Ireland)(a) | | 740 | | | 20,165 |
Eli Lilly & Co. | | 2,140 | | | 121,445 |
Fisher Scientific International, Inc.(a) | | 1,350 | | | 84,213 |
Genentech, Inc.(a) | | 1,350 | | | 73,494 |
| | | | | |
COMMON STOCKS
(Continued) | | Shares
| | Value (Note 2)
|
| | | | |
Drugs & Medical Supplies (cont’d.) | | | | | |
Genzyme Corp.(a) | | 4,369 | | $ | 253,708 |
Gilead Sciences, Inc.(a) | | 2,680 | | | 93,773 |
Guidant Corp. | | 1,240 | | | 89,404 |
ImClone Systems, Inc.(a) | | 2,660 | | | 122,573 |
Johnson & Johnson | | 12,890 | | | 817,484 |
MedImmune, Inc.(a) | | 8,240 | | | 223,386 |
Medtronic, Inc. | | 4,810 | | | 238,913 |
Merck & Co., Inc. | | 16,380 | | | 526,453 |
Pfizer, Inc. | | 1,158 | | | 31,139 |
Wyeth | | 18,650 | | | 794,303 |
| | | | |
|
|
| | | | | | 4,440,777 |
| | | | |
|
|
Electronic Components — 0.1% | | | | | |
Amphenol Corp. (Class “A” Stock)(a) | | 1,060 | | | 38,944 |
| | | | |
|
|
Energy — 2.2% | | | | | |
GlobalSantaFe Corp. | | 9,880 | | | 327,127 |
Noble Corp. (Cayman Islands)(a) | | 5,840 | | | 290,481 |
| | | | |
|
|
| | | | | | 617,608 |
| | | | |
|
|
Financial Services — 8.9% | | | | | |
American Express Co. | | 3,890 | | | 219,279 |
Citigroup, Inc. | | 4,665 | | | 224,760 |
Fiserv, Inc.(a) | | 3,180 | | | 127,804 |
Freddie Mac | | 4,800 | | | 353,760 |
Goldman Sachs Group, Inc. (The) | | 340 | | | 35,374 |
J.P. Morgan Chase & Co. | | 13,390 | | | 522,344 |
MBNA Corp. | | 2,960 | | | 83,442 |
Mellon Financial Corp. | | 13,160 | | | 409,408 |
Merrill Lynch & Co., Inc. | | 6,560 | | | 392,091 |
Northern Trust Corp. | | 1,960 | | | 95,217 |
| | | | |
|
|
| | | | | | 2,463,479 |
| | | | |
|
|
Food & Beverage — 2.7% | | | | | |
General Mills, Inc. | | 5,210 | | | 258,989 |
PepsiCo, Inc. | | 7,490 | | | 390,978 |
Sysco Corp. | | 2,970 | | | 113,365 |
| | | | |
|
|
| | | | | | 763,332 |
| | | | |
|
|
Healthcare — 0.2% | | | | | |
Waters Corp.(a) | | 1,380 | | | 64,570 |
| | | | |
|
|
Hospital Management — 1.2% | | | | �� | |
HCA Inc. | | 2,620 | | | 104,695 |
Tenet Healthcare Corp.(a) | | 21,150 | | | 232,227 |
| | | | |
|
|
| | | | | | 336,922 |
| | | | |
|
|
Insurance — 3.8% | | | | | |
Allstate Corp. | | 6,510 | | | 336,697 |
American International Group, Inc. | | 1,750 | | | 114,923 |
Conseco, Inc.(a) | | 16,460 | | | 328,377 |
Hartford Financial Services
Group, Inc. (The) | | 3,810 | | | 264,071 |
| | | | |
|
|
| | | | | | 1,044,068 |
| | | | |
|
|
Internet — 2.4% | | | | | |
Akamai Technologies, Inc.(a) | | 4,860 | | | 63,326 |
Check Point Software Technologies Ltd. (Israel)(a) | | 2,400 | | | 59,112 |
eBay, Inc.(a) | | 1,150 | | | 133,722 |
IAC/InterActiveCorp(a) | | 4,410 | | | 121,804 |
SEE NOTES TO FINANCIAL STATEMENTS.
B25
| | | | |
| | | SP MFS CAPITAL OPPORTUNITIES PORTFOLIO (Continued) | | |
SCHEDULE OF INVESTMENTS | December 31, 2004 |
| | | | | |
COMMON STOCKS
(Continued) | | Shares
| | Value (Note 2)
|
| | | | |
Internet (cont’d.) | | | | | |
Monster Worldwide, Inc.(a) | | 2,150 | | $ | 72,326 |
Yahoo!, Inc.(a) | | 5,740 | | | 216,283 |
| | | | |
|
|
| | | | | | 666,573 |
| | | | |
|
|
Leisure — 1.6% | | | | | |
Carnival Corp. | | 2,820 | | | 162,516 |
Mattel, Inc. | | 10,330 | | | 201,332 |
Royal Caribbean Cruises Ltd. | | 1,540 | | | 83,838 |
| | | | |
|
|
| | | | | | 447,686 |
| | | | |
|
|
Media — 6.4% | | | | | |
Clear Channel Communications, Inc. | | 730 | | | 24,448 |
Cox Radio, Inc. (Class “A” Stock)(a) | | 1,420 | | | 23,402 |
Entercom Communications Corp.(a) | | 720 | | | 25,841 |
Fox Entertainment Group, Inc.
(Class “A” Stock)(a) | | 20 | | | 625 |
Grupo Televisa, SA ADR (Mexico) | | 1,220 | | | 73,810 |
News Corp. (Class “A” Stock) | | 7,790 | | | 145,361 |
Time Warner, Inc.(a) | | 6,400 | | | 124,416 |
Univision Communications, Inc.
(Class “A” Stock)(a) | | 2,370 | | | 69,370 |
Viacom, Inc. (Class “B” Stock) | | 20,855 | | | 758,913 |
Walt Disney Co. (The) | | 16,150 | | | 448,970 |
Westwood One, Inc.(a) | | 2,990 | | | 80,521 |
| | | | |
|
|
| | | | | | 1,775,677 |
| | | | |
|
|
Metals — 0.6% | | | | | |
Companhia Vale do Rio Doce ADR (Brazil)(a) | | 5,920 | | | 171,739 |
| | | | |
|
|
Multi – Industry — 0.8% | | | | | |
Cooper Industries Ltd.
(Class “A” Stock) | | 1,530 | | | 103,872 |
Emerson Electric Co. | | 960 | | | 67,296 |
Illinois Tool Works, Inc. | | 550 | | | 50,974 |
| | | | |
|
|
| | | | | | 222,142 |
| | | | |
|
|
Networking Products — 1.5% | | | | | |
Cisco Systems, Inc.(a) | | 21,150 | | | 408,195 |
| | | | |
|
|
Oil – Exploration & Production — 0.8% | | | | | |
Devon Energy Corp. | | 5,500 | | | 214,060 |
| | | | |
|
|
Oil & Gas Services — 1.4% | | | | | |
BJ Services Co. | | 3,300 | | | 153,582 |
Cooper Cameron Corp.(a) | | 4,400 | | | 236,764 |
| | | | |
|
|
| | | | | | 390,346 |
| | | | |
|
|
Paper & Forest Products — 0.9% | | | | | |
Bowater, Inc. (Canada) | | 5,470 | | | 240,516 |
| | | | |
|
|
Restaurants — 0.1% | | | | | |
Cheesecake Factory, Inc. (The)(a) | | 1,145 | | | 37,178 |
| | | | |
|
|
Retail — 6.1% | | | | | |
Best Buy Co., Inc. | | 1,740 | | | 103,391 |
CVS Corp. | | 3,020 | | | 136,111 |
Gap, Inc. (The) | | 10,940 | | | 231,053 |
Home Depot, Inc. | | 3,940 | | | 168,396 |
Hot Topic, Inc.(a) | | 1,040 | | | 17,878 |
Kohl’s Corp.(a) | | 3,150 | | | 154,885 |
Lowe’s Cos., Inc. | | 2,260 | | | 130,153 |
Nordstrom, Inc. | | 760 | | | 35,515 |
| | | | | |
COMMON STOCKS
(Continued) | | Shares
| | Value (Note 2)
|
| | | | |
Retail (cont’d.) | | | | | |
Reebok International Ltd. | | 3,360 | | $ | 147,840 |
Rite Aid Corp.(a) | | 39,110 | | | 143,143 |
Staples, Inc. | | 1,960 | | | 66,072 |
Target Corp. | | 4,480 | | | 232,646 |
Tiffany & Co. | | 1,230 | | | 39,323 |
Wal-Mart Stores, Inc. | | 1,710 | | | 90,322 |
| | | | |
|
|
| | | | | | 1,696,728 |
| | | | |
|
|
Schools — 0.1% | | | | | |
Career Education Corp.(a) | | 450 | | | 18,000 |
| | | | |
|
|
Semiconductors — 2.2% | | | | | |
Analog Devices, Inc. | | 4,030 | | | 148,788 |
Linear Technology Corp. | | 1,230 | | | 47,675 |
Marvell Technology Group Ltd. (Bermuda)(a) | | 2,050 | | | 72,713 |
Maxim Integrated Products, Inc. | | 1,120 | | | 47,477 |
PMC-Sierra, Inc.(a) | | 8,620 | | | 96,975 |
Texas Instruments, Inc. | | 2,850 | | | 70,167 |
Xilinx, Inc. | | 4,070 | | | 120,675 |
| | | | |
|
|
| | | | | | 604,470 |
| | | | |
|
|
Software — 7.6% | | | | | |
Activision, Inc.(a) | | 1,680 | | | 33,902 |
Ascential Software Corp.(a) | | 1,730 | | | 28,216 |
Citrix Systems, Inc.(a) | | 3,730 | | | 91,497 |
Computer Associates International, Inc. | | 7,980 | | | 247,859 |
Electronic Arts, Inc.(a) | | 2,110 | | | 130,145 |
Mercury Interactive Corp.(a) | | 4,400 | | | 200,420 |
Microsoft Corp. | | 30,536 | | | 815,617 |
Network Appliance, Inc.(a) | | 3,760 | | | 124,907 |
Oracle Corp.(a) | | 15,189 | | | 208,393 |
VERITAS Software Corp.(a) | | 7,776 | | | 222,005 |
| | | | |
|
|
| | | | | | 2,102,961 |
| | | | |
|
|
Technology — 0.6% | | | | | |
Applied Materials, Inc.(a) | | 3,760 | | | 64,296 |
KLA-Tencor Corp.(a) | | 1,080 | | | 50,306 |
Novellus Systems, Inc.(a) | | 2,020 | | | 56,338 |
| | | | |
|
|
| | | | | | 170,940 |
| | | | |
|
|
Telecommunications — 11.3% | | | | | |
ADTRAN, Inc. | | 2,220 | | | 42,491 |
Amdocs Ltd. (Israel)(a) | | 3,300 | | | 86,625 |
America Movil SA de CV ADR (Mexico) | | 2,650 | | | 138,728 |
Comverse Technology, Inc.(a) | | 1,670 | | | 40,832 |
Nokia Oyj, ADR (Finland) | | 32,350 | | | 506,924 |
Nortel Networks Corp. (Canada)(a) | | 136,170 | | | 475,233 |
Sprint Corp. (FON Group) | | 29,710 | | | 738,293 |
Telefonaktiebolaget LM Ericsson ADR (Sweden)(a) | | 1,510 | | | 47,550 |
Verizon Communications, Inc. | | 16,150 | | | 654,236 |
Vodafone Group PLC ADR
(United Kingdom) | | 14,444 | | | 395,477 |
| | | | |
|
|
| | | | | | 3,126,389 |
| | | | |
|
|
Trucking/Shipping — 1.1% | | | | | |
FedEx Corp. | | 1,330 | | | 130,992 |
United Parcel Service, Inc.
(Class “B” Stock) | | 1,940 | | | 165,792 |
| | | | |
|
|
| | | | | | 296,784 |
| | | | |
|
|
SEE NOTES TO FINANCIAL STATEMENTS.
B26
| | | | |
| | | SP MFS CAPITAL OPPORTUNITIES PORTFOLIO (Continued) | | |
SCHEDULE OF INVESTMENTS | December 31, 2004 |
| | | | | | | |
COMMON STOCKS
(Continued) | | Shares
| | Value (Note 2)
| |
| | | | | |
Utilities — 0.9% | | | | | | | |
Calpine Corp.(a) | | | 65,850 | | $ | 259,449 | |
| | | | | |
|
|
|
TOTAL LONG-TERM INVESTMENTS
(cost $24,164,593) | | | 27,135,213 | |
| | | | | |
|
|
|
| SHORT-TERM INVESTMENT — 2.5% | | | |
| | |
| | | Principal
Amount
(000)
| | | |
Repurchase Agreement | | | | | | | |
State Street Bank & Trust Co.
1.75%, 1/3/05
(cost $ 694,980)(b) | | $ | 695 | | | 694,980 | |
| | | | | |
|
|
|
TOTAL INVESTMENTS — 100.2%
(cost $24,859,573; Note 6) | | | 27,830,193 | |
LIABILITIES IN EXCESS OF
OTHER ASSETS — (0.2)% | | | (60,818 | ) |
| | | | | |
|
|
|
NET ASSETS — 100% | | $ | 27,769,375 | |
| | | | | |
|
|
|
The following abbreviation is used in portfolio description:
| | |
| ADR | | American Depository Receipt |
| (a) | Non-income producing security. |
| (b) | State Street Bank & Trust Company Repurchase Agreement, repurchase price $695,081 due 1/3/05. The value of the collateral including accrued interest was $714,491. Collateralized by United States Treasury or Federal Agency obligations. |
| (c) | Indicates a fair valued security. |
The industry classification of long-term portfolio holdings, short-term investments and liabilites in excess of other assets shown as a percentage of net assets as of December 31, 2004 was as follows:
| | | |
Drugs & Medical Supplies | | 16.0 | % |
Telecommunications | | 11.3 | |
Financial Services | | 8.9 | |
Software | | 7.6 | |
Media | | 6.4 | |
Retail | | 6.1 | |
Insurance | | 3.8 | |
Food & Beverage | | 2.7 | |
Internet | | 2.4 | |
Diversified Manufacturing Operations | | 2.4 | |
Consumer Discretionary | | 2.2 | |
Energy | | 2.2 | |
Semiconductors | | 2.2 | |
Containers & Packaging | | 2.0 | |
Computers | | 1.9 | |
Banks and Savings & Loans | | 1.8 | |
Leisure | | 1.6 | |
Networking Products | | 1.5 | |
Computer Services | | 1.4 | |
Oil & Gas Services | | 1.4 | |
Aerospace/Defense | | 1.4 | |
Cosmetics/Toiletries | | 1.3 | |
Hospital Management | | 1.2 | |
Trucking/Shipping | | 1.1 | |
Utilities | | 0.9 | |
Paper & Forest Products | | 0.9 | |
Multi—Industry | | 0.8 | |
Oil—Exploration & Production | | 0.8 | |
Advertising | | 0.7 | |
Metals | | 0.6 | |
Technology | | 0.6 | |
Chemicals | | 0.6 | |
Airlines | | 0.3 | |
Healthcare | | 0.2 | |
Air Freight & Couriers | | 0.2 | |
Electronic Components | | 0.1 | |
Restaurants | | 0.1 | |
Schools | | 0.1 | |
Short-Term Investment | | 2.5 | |
| | |
|
|
| | | 100.2 | |
Liabilities in excess of other assets | | (0.2 | ) |
| | |
|
|
| | | 100.0 | % |
| | |
|
|
SEE NOTES TO FINANCIAL STATEMENTS.
B27
| | | | |
| | | SP MID-CAP GROWTH PORTFOLIO | | |
SCHEDULE OF INVESTMENTS | December 31, 2004 |
| | | | | |
| LONG-TERM INVESTMENTS — 98.1% | | Value
(Note 2)
|
| COMMON STOCKS | | Shares
| |
Aerospace/Defense — 2.8% | | | | | |
Alliant Techsystems, Inc.(a) | | 14,400 | | $ | 941,472 |
Armor Holdings, Inc.(a) | | 22,000 | | | 1,034,440 |
Precision Castparts Corp. | | 16,500 | | | 1,083,720 |
| | | | |
|
|
| | | | | | 3,059,632 |
| | | | |
|
|
Apparel — 2.3% | | | | | |
Coach, Inc.(a) | | 44,500 | | | 2,509,800 |
| | | | |
|
|
Automobiles & Trucks — 1.0% | | | | | |
Oshkosh Truck Corp. | | 16,500 | | | 1,128,270 |
| | | | |
|
|
Banks — 1.0% | | | | | |
UnionBanCal Corp. | | 16,000 | | | 1,031,680 |
| | | | |
|
|
Building & Construction — 4.8% | | | | | |
American Standard Cos., Inc.(a) | | 47,500 | | | 1,962,700 |
Centex Corp. | | 35,000 | | | 2,085,300 |
Toll Brothers, Inc.(a) | | 17,000 | | | 1,166,370 |
| | | | |
|
|
| | | | | | 5,214,370 |
| | | | |
|
|
Casinos — 3.3% | | | | | |
Scientific Games Corp.
(Class “A” Stock)(a) | | 44,000 | | | 1,048,960 |
Station Casinos, Inc. | | 24,000 | | | 1,312,320 |
Wynn Resorts Ltd.(a) | | 17,700 | | | 1,184,484 |
| | | | |
|
|
| | | | | | 3,545,764 |
| | | | |
|
|
Computers — 3.2% | | | | | |
Apple Computer, Inc.(a) | | 39,300 | | | 2,530,920 |
PalmOne, Inc.(a) | | 27,300 | | | 861,315 |
| | | | |
|
|
| | | | | | 3,392,235 |
| | | | |
|
|
Computer Services — 1.3% | | | | | |
Research In Motion Ltd.(a) | | 16,800 | | | 1,384,656 |
| | | | |
|
|
Diversified Financial Services — 3.2% | | | | | |
Chicago Merchantile Exchange (The) | | 10,000 | | | 2,287,000 |
Doral Financial Corp. | | 23,500 | | | 1,157,375 |
| | | | |
|
|
| | | | | | 3,444,375 |
| | | | |
|
|
Diversified Manufacturing Operations — 3.9% | | | |
Eastman Kodak Co. | | 66,000 | | | 2,128,500 |
Eaton Corp. | | 13,200 | | | 955,152 |
Terex Corp.(a) | | 22,200 | | | 1,057,830 |
| | | | |
|
|
| | | | | | 4,141,482 |
| | | | |
|
|
Drugs & Medical Supplies — 8.6% | | | | | |
C.R. Bard, Inc. | | 15,500 | | | 991,690 |
Dade Behring Holdings, Inc.(a) | | 20,500 | | | 1,148,000 |
Gen-Probe, Inc.(a) | | 30,000 | | | 1,356,300 |
Sepracor, Inc.(a) | | 41,600 | | | 2,469,792 |
St. Jude Medical, Inc.(a) | | 48,800 | | | 2,046,184 |
Zimmer Holdings, Inc.(a) | | 15,000 | | | 1,201,800 |
| | | | |
|
|
| | | | | | 9,213,766 |
| | | | |
|
|
Electronics — 7.4% | | | | | |
Alliance Data Systems Corp.(a) | | 45,500 | | | 2,160,340 |
Black & Decker Corp. (The) | | 11,500 | | | 1,015,795 |
FLIR Systems, Inc.(a) | | 19,000 | | | 1,212,010 |
Garmin Ltd. | | 18,300 | | | 1,113,372 |
| | | | | |
COMMON STOCKS
(Continued) | | Shares
| | Value
(Note 2)
|
Electronics (cont’d.) | | | | | |
Harman International Industries, Inc. | | 11,000 | | $ | 1,397,000 |
Trimble Navigation Ltd.(a) | | 31,400 | | | 1,037,456 |
| | | | |
|
|
| | | | | | 7,935,973 |
| | | | |
|
|
Financial Services — 2.7% | | | | | |
AmeriCredit Corp.(a) | | 76,000 | | | 1,858,200 |
CIT Group, Inc. | | 23,000 | | | 1,053,860 |
| | | | |
|
|
| | | | | | 2,912,060 |
| | | | |
|
|
Healthcare Services — 4.0% | | | | | |
Laboratory Corp. of America Holdings(a) | | 22,000 | | | 1,096,040 |
Quest Diagnostics, Inc. | | 10,700 | | | 1,022,385 |
Sierra Health Services, Inc.(a) | | 40,100 | | | 2,209,911 |
| | | | |
|
|
| | | | | | 4,328,336 |
| | | | |
|
|
Hotels, Restaurants & Leisure — 2.0% | | | | | |
Hilton Hotels Corp. | | 92,800 | | | 2,110,272 |
| | | | |
|
|
Human Resources — 0.9% | | | | | |
Robert Half Int’l, Inc. | | 33,000 | | | 971,190 |
| | | | |
|
|
Internet — 13.0% | | | | | |
Akamai Technologies, Inc.(a) | | 63,500 | | | 827,405 |
Ask Jeeves, Inc.(a) | | 24,000 | | | 642,000 |
Digital River, Inc.(a) | | 28,000 | | | 1,165,080 |
F5 Networks, Inc.(a) | | 43,000 | | | 2,094,960 |
Overstock.com, Inc.(a) | | 35,500 | | | 2,449,500 |
Sapient Corp.(a) | | 104,000 | | | 822,640 |
Symantec Corp.(a) | | 74,000 | | | 1,906,240 |
VeriSign, Inc.(a) | | 52,200 | | | 1,749,744 |
Yahoo!, Inc.(a) | | 61,200 | | | 2,306,016 |
| | | | |
|
|
| | | | | | 13,963,585 |
| | | | |
|
|
Networking Products — 2.3% | | | | | |
Juniper Networks, Inc.(a) | | 92,500 | | | 2,515,075 |
| | | | |
|
|
Oil & Gas Exploration & Production — 6.9% | | | |
Amerada Hess Corp. | | 13,000 | | | 1,070,940 |
Nabors Industries Ltd. (Bermuda)(a) | | 19,800 | | | 1,015,542 |
Smith International, Inc.(a) | | 34,400 | | | 1,871,704 |
Ultra Petroleum Corp. (Canada)(a) | | 18,500 | | | 890,405 |
Valero Energy Corp. | | 26,200 | | | 1,189,480 |
XTO Energy, Inc. | | 39,000 | | | 1,379,820 |
| | | | |
|
|
| | | | | | 7,417,891 |
| | | | |
|
|
Radio & Television — 2.5% | | | | | |
XM Satellite Radio Holdings, Inc.
(Class “A” Stock)(a) | | 71,000 | | | 2,671,020 |
| | | | |
|
|
Real Estate Investment Trusts — 0.9% | | | | | |
General Growth Properties, Inc. | | 27,500 | | | 994,400 |
| | | | |
|
|
Retail — 4.4% | | | | | |
Aeropostale, Inc.(a) | | 30,000 | | | 882,900 |
Amazon.com, Inc.(a) | | 55,000 | | | 2,435,950 |
Foot Locker, Inc. | | 34,500 | | | 929,085 |
United Natural Foods, Inc.(a) | | 17,000 | | | 528,700 |
| | | | |
|
|
| | | | | | 4,776,635 |
| | | | |
|
|
Semiconductors — 3.8% | | | | | |
Advanced Micro Devices, Inc.(a) | | 99,000 | | | 2,179,980 |
ATI Technologies, Inc.(a) | | 35,000 | | | 678,650 |
Marvell Technology Group Ltd. (Bermuda)(a) | | 33,500 | | | 1,188,245 |
| | | | |
|
|
| | | | | | 4,046,875 |
| | | | |
|
|
SEE NOTES TO FINANCIAL STATEMENTS.
B28
| | | | |
| | | SP MID-CAP GROWTH PORTFOLIO (Continued) | | |
SCHEDULE OF INVESTMENTS | December 31, 2004 |
| | | | | | | |
COMMON STOCKS
(Continued) | | Shares
| | Value
(Note 2)
| |
Software — 4.4% | | | | | | | |
Activision, Inc.(a) | | | 57,000 | | $ | 1,150,260 | |
Autodesk, Inc. | | | 30,600 | | | 1,161,270 | |
Electronic Arts, Inc.(a) | | | 39,700 | | | 2,448,696 | |
| | | | | |
|
|
|
| | | | | | | 4,760,226 | |
| | | | | |
|
|
|
Telecommunications — 5.7% | | | | | | | |
America Movil SA de CV ADR (Mexico) | | | 13,400 | | | 701,490 | |
Avaya, Inc.(a) | | | 122,000 | | | 2,098,400 | |
CenturyTel, Inc. | | | 42,300 | | | 1,500,381 | |
Corning, Inc.(a) | | | 151,000 | | | 1,777,270 | |
| | | | | |
|
|
|
| | | | | | | 6,077,541 | |
| | | | | |
|
|
|
Toys — 0.8% | | | | | | | |
Marvel Enterprises, Inc.(a) | | | 41,500 | | | 849,920 | |
| | | | | |
|
|
|
Transport Services — 1.0% | | | | | | | |
Landstar System, Inc.(a) | | | 14,500 | | | 1,067,780 | |
| | | | | |
|
|
|
TOTAL LONG-TERM INVESTMENTS
(cost $84,535,265) | | | 105,464,809 | |
| | | | | |
|
|
|
| SHORT-TERM INVESTMENTS — 1.9% | | | |
| | |
| | | Principal
Amount
(000)
| | | |
Repurchase Agreement | | | | | | | |
State Street Bank & Trust Co.
Repurchase Agreement,(b)
(cost $2,082,221) 1.75%, 1/3/04 | | $ | 2,082 | | | 2,082,221 | |
| | | | | |
|
|
|
TOTAL INVESTMENTS — 100.0%
(cost $86,617,486; Note 6) | | | 107,547,030 | |
LIABILITIES IN EXCESS OF
OTHER ASSETS | | | (36,229 | ) |
| | | | | |
|
|
|
NET ASSETS — 100% | | $ | 107,510,801 | |
| | | | | |
|
|
|
The following abbreviation is used in the portfolio descriptions:
| | |
| ADR | | American Depositary Receipt |
| (a) | Non-income producing security. |
| (b) | State Street Bank & Trust Company Repurchase Agreement, repurchase price $2,082,525 due 1/3/05. The value of the collateral including accrued interest was $2,141,371. Collateralized by United States Treasury or federal agency obligations. |
The industry classification of long-term portfolio holdings and short-term investments shown as a percentage of net assets as of December 31, 2004 was as follows:
| | | |
Internet | | 13.0 | % |
Drugs & Medical Supplies | | 8.6 | |
Electronics | | 7.4 | |
Oil & Gas Exploration & Production | | 6.9 | |
Telecommunications | | 5.7 | |
Building & Construction | | 4.8 | |
Retail | | 4.4 | |
Software | | 4.4 | |
Healthcare Services | | 4.0 | |
Diversified Manufacturing Operations | | 3.9 | |
Semiconductors | | 3.8 | |
Casinos | | 3.3 | |
Diversified Financial Services | | 3.2 | |
Computers | | 3.2 | |
Aerospace/Defense | | 2.8 | |
Financial Services | | 2.7 | |
Radio & Television | | 2.5 | |
Networking Products | | 2.3 | |
Apparel | | 2.3 | |
Hotel, Restaurants & Leisure | | 2.0 | |
Computer Services | | 1.3 | |
Automobiles & Trucks | | 1.0 | |
Transport Services | | 1.0 | |
Banks | | 1.0 | |
Real Estate Investment Trusts | | 0.9 | |
Human Resources | | 0.9 | |
Toys | | 0.8 | |
Short-term investments | | 1.9 | |
| | |
|
|
| | | 100.0 | % |
| | |
|
|
SEE NOTES TO FINANCIAL STATEMENTS.
B29
| | | | |
| | | SP PIMCO HIGH YIELD PORTFOLIO | | |
SCHEDULE OF INVESTMENTS | December 31, 2004 |
| | | | | | | | | | | | |
LONG-TERM INVESTMENTS — 92.4%
LONG-TERM BONDS — 92.4% | | Moody’s
Rating
(Unaudited)
| | Interest
Rate
| | Maturity
Date
| | Principal
Amount
(000)
| | Value
(Note 2)
|
CORPORATE BONDS — 85.5% | | | | | | | | | | | | |
Aerospace & Defense — 1.5% | | | | | | | | | | | | |
Armor Holdings, Inc., Sr. Sub. Notes | | B1 | | 8.25% | | 08/15/13 | | $ | 1,000 | | $ | 1,120,000 |
Continental Airlines, Inc., Pass-Through Certs., Ser. 01-1 | | Ba1 | | 7.373% | | 12/15/15 | | | 156 | | | 131,633 |
Continental Airlines, Inc., Pass-Through Certs., Ser. 99-1A | | Baa3 | | 6.545% | | 02/02/19 | | | 1,054 | | | 1,047,113 |
Delta Air Lines, Inc., Pass-Through Certs., Ser. 00-1 | | Ba1 | | 7.379% | | 05/18/10 | | | 411 | | | 406,284 |
Delta Air Lines, Inc., Pass-Through Certs., Ser. 00-1 | | Ba1 | | 7.57% | | 11/18/10 | | | 500 | | | 493,202 |
Northwest Airlines Corp., Pass-Through Certs., 99-1A | | Baa3 | | 6.81% | | 02/01/20 | | | 468 | | | 437,398 |
Northwest Airlines Corp., Pass-Through Certs., 99-2A | | Baa2 | | 7.575% | | 03/01/19 | | | 256 | | | 264,653 |
United Air Lines, Inc., Pass-Through Certs., Ser. 00-1(a) | | NR | | 7.73% | | 07/01/10 | | | 550 | | | 488,713 |
United Air Lines, Inc., Pass-Through Certs., Ser. 01-1(a) | | NR | | 6.201% | | 09/01/08 | | | 100 | | | 90,964 |
United Air Lines, Inc., Pass-Through Certs., Ser. 01-1(a) | | NR | | 6.602% | | 09/01/13 | | | 350 | | | 329,073 |
| | | | | | | | | | | |
|
|
| | | | | | | | | | | | | 4,809,033 |
| | | | | | | | | | | |
|
|
Asset Backed Securities — 1.6% | | | | | | | | | | | | |
Cedar Brakes II LLC, Sr. Sec’d Bond, | | Baa2 | | 9.875% | | 09/01/13 | | | 176 | | | 210,368 |
Jet Equipment Trust (Class A), 144A (cost $68,544;
purchased 10/18/01)(a)(j)(k) | | NR | | 7.63% | | 08/15/12 | | | 81 | | | 55,630 |
Midwest Generation LLC, Pass-Through Certs., Ser. A | | B1 | | 8.30% | | 07/02/09 | | | 800 | | | 860,000 |
Midwest Generation LLC, Pass-Through Certs., Ser. B | | B1 | | 8.56% | | 01/02/16 | | | 2,325 | | | 2,580,750 |
Midwest Generation LLC, Sr. Sec’d. Notes | | B1 | | 8.75% | | 05/01/34 | | | 1,000 | | | 1,135,000 |
| | | | | | | | | | | |
|
|
| | | | | | | | | | | | | 4,841,748 |
| | | | | | | | | | | |
|
|
Autos – Cars & Trucks — 2.2% | | | | | | | | | | | | |
Arvin Capital I, Gtd. Notes | | Ba2 | | 9.50% | | 02/01/27 | | | 750 | | | 776,250 |
ArvinMeritor, Inc., Notes | | Ba1 | | 6.625% | | 06/15/07 | | | 650 | | | 679,250 |
ArvinMeritor, Inc., Notes | | Ba1 | | 8.75% | | 03/01/12 | | | 300 | | | 346,500 |
Dura Operating Corp., Gtd. Notes, Ser. B | | B2 | | 8.625% | | 04/15/12 | | | 1,000 | | | 1,040,000 |
Tenneco Automotive, Inc., Sec’d. Notes | | B2 | | 10.25% | | 07/15/13 | | | 1,175 | | | 1,386,500 |
Tenneco Automotive, Inc., Sr. Sub. Notes 144A(j) | | B3 | | 8.625% | | 11/15/14 | | | 375 | | | 390,000 |
Transmontaigne, Inc., Ser. B | | B3 | | 9.125% | | 06/01/10 | | | 700 | | | 759,500 |
TRW Automotive, Sr. Notes | | Ba3 | | 9.375% | | 02/15/13 | | | 1,315 | | | 1,525,400 |
| | | | | | | | | | | |
|
|
| | | | | | | | | | | | | 6,903,400 |
| | | | | | | | | | | |
|
|
Broadcasting & Other Media — 1.6% | | | | | | | | | | | | |
Lighthouse International Co. SA, Sr. Notes | | B3 | | 8.00% | | 04/30/14 | | | 1,320 | | | 1,840,859 |
Quebecor Media, Inc., Sr. Notes (Canada) | | B2 | | 11.125% | | 07/15/11 | | | 1,050 | | | 1,199,625 |
Sinclair Broadcast Group, Inc. | | B2 | | 8.00% | | 03/15/12 | | | 1,100 | | | 1,168,750 |
Young Broadcasting, Inc., Gtd. Notes | | Caa1 | | 10.00% | | 03/01/11 | | | 400 | | | 427,000 |
Young Broadcasting, Inc., Sr. Notes | | B2 | | 8.50% | | 12/15/08 | | | 375 | | | 401,250 |
| | | | | | | | | | | |
|
|
| | | | | | | | | | | | | 5,037,484 |
| | | | | | | | | | | |
|
|
Cable — 4.7% | | | | | | | | | | | | |
Cablevision Systems Corp., Sr Notes 144A(j) | | B3 | | 8.00% | | 04/15/12 | | | 250 | | | 266,875 |
CanWest Media, Inc., Sr. Sub. Notes (Canada) | | B2 | | 10.625% | | 05/15/11 | | | 1,650 | | | 1,852,125 |
CCO Holdings LLC, Sr. Notes | | B3 | | 8.75% | | 11/15/13 | | | 1,570 | | | 1,621,025 |
CF Cable TV, Inc., Sr. Notes (Canada) | | Ba3 | | 9.125% | | 07/15/07 | | | 500 | | | 513,763 |
Charter Communications Operating LLC, Sr. Notes 144A(j) | | B2 | | 8.00% | | 04/30/12 | | | 550 | | | 572,000 |
Charter Communications Operating LLC, Sr. Notes 144A(j) | | B2 | | 8.375% | | 04/30/14 | | | 665 | | | 701,575 |
CSC Holdings, Inc., Debs., Ser. B | | B1 | | 8.125% | | 08/15/09 | | | 500 | | | 546,875 |
CSC Holdings, Inc., Sr. Notes | | B1 | | 7.25% | | 07/15/08 | | | 225 | | | 237,375 |
CSC Holdings, Inc., Sr. Notes | | B1 | | 7.875% | | 12/15/07 | | | 200 | | | 214,500 |
CSC Holdings, Inc., Sr. Notes 144A(j) | | B1 | | 6.75% | | 04/15/12 | | | 100 | | | 103,000 |
CSC Holdings, Inc., Sr. Notes, Ser. B | | B1 | | 7.625% | | 04/01/11 | | | 2,875 | | | 3,097,812 |
DirecTV Holdings LLC, Sr. Notes | | Ba2 | | 8.375% | | 03/15/13 | | | 1,450 | | | 1,625,812 |
Echostar DBS Corp., Sr. Notes | | Ba3 | | 5.75% | | 10/01/08 | | | 1,400 | | | 1,417,500 |
Mediacom Broadband LLC, Gtd. Notes | | B2 | | 11.00% | | 07/15/13 | | | 1,650 | | | 1,773,750 |
Rogers Cable, Inc., Sec’d. Notes 144A (Canada)(j) | | Ba3 | | 6.75% | | 03/15/15 | | | 175 | | | 178,938 |
Rogers Cablesystems, Ltd., Sr. Notes, Ser. B (Canada) | | Ba3 | | 10.00% | | 03/15/05 | | | 110 | | | 111,513 |
| | | | | | | | | | | |
|
|
| | | | | | | | | | | | | 14,834,438 |
| | | | | | | | | | | |
|
|
SEE NOTES TO FINANCIAL STATEMENTS.
B30
| | | | |
| | | SP PIMCO HIGH YIELD PORTFOLIO (Continued) | | |
SCHEDULE OF INVESTMENTS | December 31, 2004 |
| | | | | | | | | | | | |
| LONG-TERM BONDS (Continued) | | Moody’s
Rating
(Unaudited)
| | Interest
Rate
| | Maturity
Date
| | Principal
Amount
(000)
| | Value
(Note 2)
|
Chemicals — 3.3% | | | | | | | | | | | | |
Brenntag Tag Term B2, (cost $1,509,937; purchased 03/17/04)(f)(k) | | B1 | | 4.73% | | 02/28/12 | | $ | 1,500 | | $ | 1,508,688 |
Equistar Chemicals LP | | B2 | | 8.75% | | 02/15/09 | | | 2,025 | | | 2,268,000 |
Equistar Chemicals LP, Gtd. Notes | | B2 | | 10.125% | | 09/01/08 | | | 500 | | | 576,250 |
ISP Chemco, Inc., Ser. B | | B1 | | 10.25% | | 07/01/11 | | | 1,200 | | | 1,356,000 |
ISP Holdings, Inc., Sr. Sec’d. Note, Ser. B | | B2 | | 10.625% | | 12/15/09 | | | 300 | | | 332,250 |
Kraton Polymers LLC., Sr. Sub. Notes 144A(j) | | Caa1 | | 8.125% | | 01/15/14 | | | 1,175 | | | 1,224,937 |
Lyondell Chemical Co., Sr. Sec’d. Notes | | B1 | | 9.875% | | 05/01/07 | | | 105 | | | 109,988 |
Nalco Co., Sr. Notes | | B2 | | 7.75% | | 11/15/11 | | | 1,200 | | | 1,296,000 |
Nalco Co., Sr. Sub. Notes | | Caa1 | | 8.875% | | 11/15/13 | | | 850 | | | 932,875 |
Westlake Chemical Corp., Gtd. Notes | | Ba2 | | 8.75% | | 07/15/11 | | | 650 | | | 734,500 |
| | | | | | | | | | | |
|
|
| | | | | | | | | | | | | 10,339,488 |
| | | | | | | | | | | |
|
|
Construction — 0.4% | | | | | | | | | | | | |
North America Energy Partners, Inc., Sr. Notes (Canada) | | B2 | | 8.75% | | 12/01/11 | | | 300 | | | 306,000 |
Universal City Dev Partners, Sr. Notes | | B2 | | 11.75% | | 04/01/10 | | | 825 | | | 974,531 |
| | | | | | | | | | | |
|
|
| | | | | | | | | | | | | 1,280,531 |
| | | | | | | | | | | |
|
|
Containers — 3.4% | | | | | | | | | | | | |
Crown European Holdings SA, Sec’d. Notes (France) | | B1 | | 9.50% | | 03/01/11 | | | 2,050 | | | 2,337,000 |
Greif, Inc., Gtd. Notes | | B1 | | 8.875% | | 08/01/12 | | | 500 | | | 556,250 |
Jefferson Smurfit Corp., Gtd. Notes | | B2 | | 7.50% | | 06/01/13 | | | 800 | | | 854,000 |
Kappa Beheer BV, Gtd. Notes (Netherlands) | | B2 | | 10.625% | | 07/15/09 | | | 1,275 | | | 1,351,500 |
Norampac, Inc., Sr. Notes (Canada) | | Ba2 | | 6.75% | | 06/01/13 | | | 900 | | | 947,250 |
Owens-Brockway, Gtd. Notes | | B1 | | 7.75% | | 05/15/11 | | | 300 | | | 324,750 |
Owens-Brockway, Gtd. Notes | | B2 | | 8.25% | | 05/15/13 | | | 600 | | | 660,000 |
Owens-Brockway, Gtd. Notes | | B1 | | 8.875% | | 02/15/09 | | | 650 | | | 706,062 |
Owens-Brockway, Sec’d. Notes | | B1 | | 8.75% | | 11/15/12 | | | 1,200 | | | 1,353,000 |
Owens-Brockway, Sr. Notes 144A(j) | | B2 | | 6.75% | | 12/01/14 | | | 600 | | | 606,000 |
Stone Container Corp., Gtd. Notes (Canada) | | B2 | | 7.375% | | 07/15/14 | | | 150 | | | 159,750 |
Stone Container Corp., Sr. Notes (Canada) | | B2 | | 9.75% | | 02/01/11 | | | 700 | | | 766,500 |
| | | | | | | | | | | |
|
|
| | | | | | | | | | | | | 10,622,062 |
| | | | | | | | | | | |
|
|
Cosmetics & Toiletries — 0.3% | | | | | | | | | | | | |
JohnsonDiversey, Inc., Sr. Sub. Notes | | B2 | | 9.625% | | 05/15/12 | | | 800 | | | 894,000 |
| | | | | | | | | | | |
|
|
Distribution/Wholesale — 0.3% | | | | | | | | | | | | |
Aviall, Inc., Sr. Notes | | B1 | | 7.625% | | 07/01/11 | | | 875 | | | 931,875 |
| | | | | | | | | | | |
|
|
Diversified Operations — 1.4% | | | | | | | | | | | | |
Bombardier, Inc., (cost $1,389,885; purchased 12/15/03)(c)(f)(k) | | B1 | | 4.97% | | 12/17/10 | | | 1,386 | | | 1,406,357 |
Bombardier, Inc., (cost $595,992; purchased 12/15/03)(c)(f)(k) | | B1 | | 4.97% | | 12/18/10 | | | 594 | | | 602,725 |
PanAmSat Corp., Term A1 (cost $1,021,104; purchased 12/13/04)(f)(k) | | NR | | 1.00% | | 08/20/09 | | | 1,014 | | | 1,017,303 |
PanAmSat Corp., Term A2 (cost $490,146; purchased 12/13/04)(f)(k) | | NR | | 1.00% | | 08/20/09 | | | 486 | | | 488,322 |
Trinity Industries, Inc., Sr. Notes | | Ba3 | | 6.50% | | 03/15/14 | | | 1,000 | | | 1,000,000 |
| | | | | | | | | | | |
|
|
| | | | | | | | | | | | | 4,514,707 |
| | | | | | | | | | | |
|
|
Drugs & Health Care — 2.7% | | | | | | | | | | | | |
Fisher Scientific International, Inc., Sr. Sub. Notes | | Ba3 | | 8.00% | | 09/01/13 | | | 1,000 | | | 1,135,000 |
Fresenius Medical Care Capital Trust II, Gtd. Notes | | Ba2 | | 7.875% | | 02/01/08 | | | 1,250 | | | 1,359,375 |
Fresenius Medical Care Capital Trust IV, Gtd. Notes | | Ba2 | | 7.875% | | 06/15/11 | | | 1,925 | | | 2,146,375 |
PacifiCare Health Systems, Inc., Gtd. Notes | | Ba3 | | 10.75% | | 06/01/09 | | | 292 | | | 337,260 |
Rotech Healthcare, Inc., Sr. Sub. Notes | | B2 | | 9.50% | | 04/01/12 | | | 1,775 | | | 1,952,500 |
VMR International, Sr. Notes 144A(j) | | B3 | | 6.875% | | 04/15/12 | | | 1,300 | | | 1,358,500 |
| | | | | | | | | | | |
|
|
| | | | | | | | | | | | | 8,289,010 |
| | | | | | | | | | | |
|
|
Entertainment — 1.9% | | | | | | | | | | | | |
Park Place Entertainment Corp., Sr. Notes | | Ba1 | | 7.00% | | 04/15/13 | | | 1,175 | | | 1,295,438 |
Park Place Entertainment Corp., Sr. Sub. Notes | | Ba2 | | 7.875% | | 03/15/10 | | | 950 | | | 1,069,937 |
Park Place Entertainment Corp., Sr. Sub. Notes | | Ba2 | | 8.875% | | 09/15/08 | | | 300 | | | 339,750 |
Park Place Entertainment Corp., Sr. Sub. Notes | | Ba2 | | 9.375% | | 02/15/07 | | | 600 | | | 661,500 |
Royal Caribbean Cruises Ltd., Sr. Notes (Liberia) | | Ba2 | | 8.00% | | 05/15/10 | | | 700 | | | 791,000 |
SEE NOTES TO FINANCIAL STATEMENTS.
B31
| | | | |
| | | SP PIMCO HIGH YIELD PORTFOLIO (Continued) | | |
SCHEDULE OF INVESTMENTS | December 31, 2004 |
| | | | | | | | | | | | |
| LONG-TERM BONDS (Continued) | | Moody’s
Rating
(Unaudited)
| | Interest
Rate
| | Maturity
Date
| | Principal
Amount
(000)
| | Value
(Note 2)
|
Entertainment (Cont’d.) | | | | | | | | | | | | |
Royal Caribbean Cruises Ltd., Sr. Notes (Liberia) | | Ba2 | | 8.75% | | 02/02/11 | | $ | 775 | | $ | 915,469 |
Six Flags, Inc. | | Caa1 | | 9.75% | | 04/15/13 | | | 765 | | | 776,475 |
| | | | | | | | | | | |
|
|
| | | | | | | | | | | | | 5,849,569 |
| | | | | | | | | | | |
|
|
Financials — 4.6% | | | | | | | | | | | | |
AES Red Oak LLC, Sec’d. Notes, Ser. A | | B2 | | 8.54% | | 11/30/19 | | | 94 | | | 105,301 |
Ahold Finance Usa Inc., Notes | | Ba3 | | 8.25% | | 07/15/10 | | | 1,300 | | | 1,472,250 |
Bcp Caylux Holdings SCA, Sr. Sub. Notes 144A (Luxembourg)(j) | | B3 | | 9.625% | | 06/15/14 | | | 2,175 | | | 2,452,312 |
Bluewater Finance, Ltd., Gtd. Notes (Cayman Islands) | | B1 | | 10.25% | | 02/15/12 | | | 1,300 | | | 1,420,250 |
Eircom Funding, Sr. Sub. Notes (Ireland) | | B1 | | 8.25% | | 08/15/13 | | | 1,200 | | | 1,326,000 |
Jet Equipment Trust, Ser. 1995-A 144A (cost $245,524;
purchased 03/04/02)(a)(j)(k) | | NR | | 10.00% | | 06/15/12 | | | 300 | | | 201,000 |
MDP Acquisitions PLC, Sr. Notes (Ireland) | | B3 | | 9.625% | | 10/01/12 | | | 1,700 | | | 1,895,500 |
Mizuho JGB Investment, Ser. A 144A(c)(j) | | Baa1 | | 9.87% | | 12/29/49 | | | 1,775 | | | 2,076,485 |
Refco Finance Holdings LLC, Sr. Sub. Notes 144A(j) | | B3 | | 9.00% | | 08/01/12 | | | 600 | | | 657,000 |
Riggs Capital Trust, 144A(j) | | Caa1 | | 8.625% | | 12/31/26 | | | 750 | | | 765,000 |
Riggs Capital Trust, Gtd. Notes | | Caa1 | | 8.625% | | 12/31/26 | | | 1,050 | | | 1,071,000 |
Riggs Capital Trust, Gtd. Notes | | Caa1 | | 8.875% | | 03/15/27 | | | 100 | | | 102,000 |
Volkswagen Insurance Co., (cost $915,333; purchased 04/05/04)(f)(k) | | B1 | | 3.60% | | 04/07/11 | | | 915 | | | 930,208 |
| | | | | | | | | | | |
|
|
| | | | | | | | | | | | | 14,474,306 |
| | | | | | | | | | | |
|
|
Food & Beverage — 1.9% | | | | | | | | | | | | |
Borden United States Finance Corp., Sr. Sec’d. Notes 144A(j) | | B3 | | 9.00% | | 07/15/14 | | | 150 | | | 166,500 |
Delhaize America Inc., Gtd. Notes | | Ba1 | | 8.125% | | 04/15/11 | | | 1,500 | | | 1,748,586 |
Ingles Markets, Inc., Gtd. Notes | | Ba3 | | 8.875% | | 12/01/11 | | | 1,050 | | | 1,123,500 |
Reddy Ice Group, Inc., Sr. Sub. Notes | | B3 | | 8.875% | | 08/01/11 | | | 1,000 | | | 1,080,000 |
Roundy’s, Inc., Sr. Sub. Notes, Ser. B | | B2 | | 8.875% | | 06/15/12 | | | 1,500 | | | 1,638,750 |
UGS Corp., Sr. Sub. Notes 144A(j) | | B3 | | 10.00% | | 06/01/12 | | | 275 | | | 312,813 |
| | | | | | | | | | | |
|
|
| | | | | | | | | | | | | 6,070,149 |
| | | | | | | | | | | |
|
|
Forest & Paper — 2.7% | | | | | | | | | | | | |
Abitibi Consolidated, Inc., Notes (Canada) | | Ba3 | | 7.875% | | 08/01/09 | | | 400 | | | 423,000 |
Abitibi-Consolidated, Inc., (Canada) | | Ba3 | | 8.55% | | 08/01/10 | | | 1,750 | | | 1,896,563 |
Abitibi-Consolidated, Inc., Debs. (Canada) | | Ba3 | | 8.85% | | 08/01/30 | | | 260 | | | 261,300 |
Abitibi-Consolidated, Inc., Notes (Canada) | | Ba3 | | 5.25% | | 06/20/08 | | | 375 | | | 367,031 |
Boise Cascade Corp., Sr. Notes | | Baa2 | | 7.00% | | 11/01/13 | | | 700 | | | 809,808 |
Boise Cascade LLC, Sr. Sub. Notes 144A(j) | | B2 | | 7.125% | | 10/15/14 | | | 150 | | | 158,625 |
Georgia-Pacific Corp., Debs. | | Ba3 | | 7.25% | | 06/01/28 | | | 750 | | | 802,500 |
Georgia-Pacific Corp., Sr. Notes | | Ba2 | | 8.00% | | 01/15/14 | | | 100 | | | 113,750 |
Georgia-Pacific Corp., Sr. Notes | | Ba3 | | 8.00% | | 01/15/24 | | | 3,000 | | | 3,480,000 |
| | | | | | | | | | | |
|
|
| | | | | | | | | | | | | 8,312,577 |
| | | | | | | | | | | |
|
|
Funeral Services — 0.1% | | | | | | | | | | | | |
Alderwoods Group, Inc., Sr. Notes 144A(j) | | B2 | | 7.75% | | 09/15/12 | | | 275 | | | 297,000 |
| | | | | | | | | | | |
|
|
Gaming — 2.9% | | | | | | | | | | | | |
Boyd Gaming Corp., Sr. Sub. Notes | | B1 | | 7.75% | | 12/15/12 | | | 500 | | | 545,625 |
Choctaw Resort Development Enterprise (The), Sr. Notes 144A(j) | | B1 | | 7.25% | | 11/15/19 | | | 575 | | | 580,750 |
Mandalay Resort Group, Sr. Notes | | Ba2 | | 6.375% | | 12/15/11 | | | 500 | | | 522,500 |
Mandalay Resort Group, Sr. Notes | | Ba2 | | 6.50% | | 07/31/09 | | | 1,000 | | | 1,055,000 |
Mandalay Resort Group, Sr. Sub. Deb. | | Ba3 | | 7.625% | | 07/15/13 | | | 980 | | | 1,073,100 |
Mandalay Resort Group, Sr. Sub. Notes | | Ba3 | | 9.375% | | 02/15/10 | | | 75 | | | 87,375 |
MGM Mirage, Inc., Gtd. Notes | | Ba1 | | 6.00% | | 10/01/09 | | | 1,500 | | | 1,537,500 |
MGM Mirage, Inc., Gtd. Notes | | Ba2 | | 8.375% | | 02/01/11 | | | 1,150 | | | 1,296,625 |
Seneca Gaming Corp., Sr. Notes | | B2 | | 7.25% | | 05/01/12 | | | 610 | | | 642,025 |
Station Casinos, Inc., Sr. Notes | | Ba3 | | 6.00% | | 04/01/12 | | | 700 | | | 713,125 |
Station Casinos, Inc., Sr. Sub. Notes | | B1 | | 6.50% | | 02/01/14 | | | 225 | | | 231,187 |
Wynn Las Vegas LLC, 1st. Mortgage 144A(j) | | B2 | | 6.625% | | 12/01/14 | | | 825 | | | 816,750 |
| | | | | | | | | | | |
|
|
| | | | | | | | | | | | | 9,101,562 |
| | | | | | | | | | | |
|
|
SEE NOTES TO FINANCIAL STATEMENTS.
B32
| | | | |
| | | SP PIMCO HIGH YIELD PORTFOLIO (Continued) | | |
SCHEDULE OF INVESTMENTS | December 31, 2004 |
| | | | | | | | | | | | |
| LONG-TERM BONDS (Continued) | | Moody’s
Rating
(Unaudited)
| | Interest
Rate
| | Maturity
Date
| | Principal
Amount
(000)
| | Value
(Note 2)
|
Hospitals/Hospital Management — 3.5% | | | | | | | | | | | | |
Community Health Systems, Inc., Sr. Sub. Notes 144A(j) | | B3 | | 6.50% | | 12/15/12 | | $ | 1,000 | | $ | 1,007,500 |
Extendicare Health Services, Inc., Gtd. Notes | | B1 | | 9.50% | | 07/01/10 | | | 1,000 | | | 1,120,000 |
HCA, Inc., Notes | | Ba2 | | 5.50% | | 12/01/09 | | | 75 | | | 75,025 |
HCA, Inc., Notes | | Ba2 | | 6.25% | | 02/15/13 | | | 900 | | | 907,891 |
HCA, Inc., Notes | | Ba2 | | 6.30% | | 10/01/12 | | | 300 | | | 304,261 |
HCA, Inc., Notes | | Ba2 | | 6.375% | | 01/15/15 | | | 300 | | | 301,215 |
HCA, Inc., Notes | | Ba2 | | 6.75% | | 07/15/13 | | | 2,100 | | | 2,182,582 |
HCA, Inc., Sr. Notes | | Ba2 | | 7.875% | | 02/01/11 | | | 650 | | | 715,976 |
Tenet Healthcare Corp., Sr. Notes | | B3 | | 6.375% | | 12/01/11 | | | 555 | | | 514,763 |
Tenet Healthcare Corp., Sr. Notes | | B3 | | 6.50% | | 06/01/12 | | | 600 | | | 555,000 |
Tenet Healthcare Corp., Sr. Notes | | B3 | | 7.375% | | 02/01/13 | | | 1,875 | | | 1,818,750 |
Tenet Healthcare Corp., Sr. Notes 144A(j) | | B3 | | 9.875% | | 07/01/14 | | | 475 | | | 517,750 |
Triad Hospitals, Inc., Sr. Sub. Notes | | B3 | | 7.00% | | 11/15/13 | | | 950 | | | 971,375 |
| | | | | | | | | | | |
|
|
| | | | | | | | | | | | | 10,992,088 |
| | | | | | | | | | | |
|
|
Industrial — 0.8% | | | | | | | | | | | | |
Airgas, Inc., Sr. Sub. Notes | | Ba2 | | 6.25% | | 07/15/14 | | | 950 | | | 969,000 |
FIMEP SA, Sr. Notes (France) | | B1 | | 10.50% | | 02/15/13 | | | 850 | | | 1,007,250 |
Freescale Semiconductor, Inc., Sr. Notes(c) | | Ba2 | | 4.82% | | 07/15/09 | | | 275 | | | 286,344 |
Freescale Semiconductor, Inc., Sr. Notes | | Ba2 | | 7.125% | | 07/15/14 | | | 175 | | | 189,875 |
| | | | | | | | | | | |
|
|
| | | | | | | | | | | | | 2,452,469 |
| | | | | | | | | | | |
|
|
Lodging — 1.2% | | | | | | | | | | | | |
Host Marriott Corp., Gtd. Notes, Ser. B | | Ba3 | | 7.875% | | 08/01/08 | | | 38 | | | 39,045 |
Host Marriott LP, Gtd. Notes, Ser. G | | Ba3 | | 9.25% | | 10/01/07 | | | 300 | | | 334,500 |
Host Marriott LP, Gtd. Notes, Ser. I | | Ba3 | | 9.50% | | 01/15/07 | | | 225 | | | 246,375 |
Host Marriott LP, Sr. Notes | | Ba3 | | 7.125% | | 11/01/13 | | | 525 | | | 561,094 |
Host Marriott LP, Sr. Notes, Ser. E | | Ba3 | | 8.375% | | 02/15/06 | | | 650 | | | 679,250 |
ITT Corp., Debs. | | Ba1 | | 7.375% | | 11/15/15 | | | 200 | | | 222,500 |
Starwood Hotels & Resorts Worldwide, Inc., Gtd. Notes | | Ba1 | | 7.875% | | 05/01/12 | | | 1,575 | | | 1,799,437 |
| | | | | | | | | | | |
|
|
| | | | | | | | | | | | | 3,882,201 |
| | | | | | | | | | | |
|
|
Manufacturing — 1.0% | | | | | | | | | | | | |
Dresser, Inc., Gtd. Notes | | B2 | | 9.375% | | 04/15/11 | | | 1,490 | | | 1,631,550 |
Dresser, Inc., Sr. Sub. Notes 144A(j) | | B3 | | 7.375% | | 11/01/14 | | | 350 | | | 357,000 |
SPX Corp., Sr. Notes | | Ba3 | | 6.25% | | 06/15/11 | | | 600 | | | 633,000 |
SPX Corp., Sr. Notes | | Ba3 | | 7.50% | | 01/01/13 | | | 500 | | | 542,500 |
| | | | | | | | | | | |
|
|
| | | | | | | | | | | | | 3,164,050 |
| | | | | | | | | | | |
|
|
Marine — 0.2% | | | | | | | | | | | | |
Horizon Lines LLC., Notes 144A(j) | | B3 | | 9.00% | | 11/01/12 | | | 620 | | | 666,500 |
| | | | | | | | | | | |
|
|
Oil & Gas Exploration & Production — 10.3% | | | | | | | | | | | | |
Chesapeake Energy Corp., Gtd. Notes | | Ba3 | | 8.125% | | 04/01/11 | | | 151 | | | 163,920 |
Chesapeake Energy Corp., Sr. Notes | | Ba3 | | 7.50% | | 09/15/13 | | | 700 | | | 762,125 |
Chesapeake Energy Corp., Sr. Notes | | Ba3 | | 7.50% | | 06/15/14 | | | 450 | | | 491,625 |
Chesapeake Energy Corp., Sr. Notes 144A(j) | | Ba3 | | 6.375% | | 06/15/15 | | | 500 | | | 513,750 |
Coastal Corp., Notes | | Caa1 | | 6.375% | | 02/01/09 | | | 700 | | | 697,375 |
Coastal Corp., Notes | | Caa1 | | 7.75% | | 06/15/10 | | | 150 | | | 156,750 |
Coastal Corp., Sr. Debs. | | Caa1 | | 7.75% | | 10/15/35 | | | 400 | | | 373,000 |
Dynegy-Roseton Danskammer, Gtd. Notes | | Caa2 | | 7.27% | | 11/08/10 | | | 2,800 | | | 2,828,000 |
El Paso CGP Co., Debs. | | Caa1 | | 6.50% | | 06/01/08 | | | 500 | | | 506,250 |
El Paso CGP Co., Notes | | Caa1 | | 7.625% | | 09/01/08 | | | 2,400 | | | 2,508,000 |
El Paso Corp., (cost $375,000; purchased 11/19/04)(f)(k) | | B3 | | 5.265% | | 03/14/05 | | | 375 | | | 377,402 |
El Paso Corp., Notes | | Caa1 | | 7.875% | | 06/15/12 | | | 150 | | | 156,938 |
El Paso Corp., Sr. Notes | | Caa1 | | 7.80% | | 08/01/31 | | | 675 | | | 648,000 |
El Paso Corp., Term B (cost $625,000; purchased 11/19/04)(f)(k) | | B3 | | 5.188% | | 11/22/09 | | | 625 | | | 629,861 |
El Paso Energy, Sr. Notes | | Caa1 | | 7.375% | | 12/15/12 | | | 1,750 | | | 1,771,875 |
El Paso Natural Gas Co., Sr. Notes | | B1 | | 7.625% | | 08/01/10 | | | 750 | | | 821,250 |
El Paso Production Holding Co., Gtd. Notes | | B3 | | 7.75% | | 06/01/13 | | | 2,175 | | | 2,278,313 |
SEE NOTES TO FINANCIAL STATEMENTS.
B33
| | | | |
| | | SP PIMCO HIGH YIELD PORTFOLIO (Continued) | | |
SCHEDULE OF INVESTMENTS | December 31, 2004 |
| | | | | | | | | | | | |
| LONG-TERM BONDS (Continued) | | Moody’s
Rating
(Unaudited)
| | Interest
Rate
| | Maturity
Date
| | Principal
Amount
(000)
| | Value
(Note 2)
|
Oil & Gas Exploration & Production (Cont’d.) | | | | | | | | | | | | |
Encore Acquisition Co., Sr. Sub. Notes | | B2 | | 6.25% | | 04/15/14 | | $ | 950 | | $ | 954,750 |
Evergreen Resources, Inc., Sr. Sub. Notes | | Baa3 | | 5.875% | | 03/15/12 | | | 225 | | | 235,094 |
Foundation Coal Co., Sr. Notes 144A(j) | | B1 | | 7.25% | | 08/01/14 | | | 135 | | | 143,775 |
Gaz Capital SA, Notes (Luxembourg) 144A(j) | | Ba2 | | 8.625% | | 04/28/34 | | | 100 | | | 117,000 |
Hanover Equipment Trust, Sec’d. Notes, Ser. A | | B2 | | 8.50% | | 09/01/08 | | | 1,850 | | | 1,988,750 |
MSW Energy Holdings Finance LLC, Sr. Sec’d. Notes, Ser. B | | Ba2 | | 7.375% | | 09/01/10 | | | 500 | | | 525,000 |
Newpark Resources, Inc., Gtd. Notes, Ser. B | | B2 | | 8.625% | | 12/15/07 | | | 875 | | | 888,125 |
NRG Energy, Inc., Sr. Sub Notes 144A(f)(j) | | B1 | | 8.00% | | 12/15/13 | | | 1,975 | | | 2,152,750 |
PEMEX Project Funding Master Trust, Notes | | Baa1 | | 7.375% | | 12/15/14 | | | 250 | | | 277,875 |
Plains E&P Co., Sr. Notes | | Ba2 | | 7.125% | | 06/15/14 | | | 500 | | | 545,000 |
Premcor Refining Group, Inc., Gtd. Notes | | Ba3 | | 6.75% | | 05/01/14 | | | 300 | | | 318,750 |
Sesi LLC, Gtd. Notes | | B1 | | 8.875% | | 05/15/11 | | | 900 | | | 985,500 |
Sonat, Inc., Notes | | Caa1 | | 7.625% | | 07/15/11 | | | 300 | | | 310,500 |
The Williams Cos., Inc. | | B1 | | 8.75% | | 03/15/32 | | | 600 | | | 689,250 |
The Williams Cos., Inc., Notes | | B1 | | 7.625% | | 07/15/19 | | | 50 | | | 55,000 |
The Williams Cos., Inc., Notes | | B1 | | 7.875% | | 09/01/21 | | | 1,925 | | | 2,146,375 |
The Williams Cos., Inc., Notes | | B1 | | 8.125% | | 03/15/12 | | | 2,300 | | | 2,656,500 |
Vintage Petroleum, Inc., Sr. Notes | | Ba3 | | 8.25% | | 05/01/12 | | | 250 | | | 275,625 |
Vintage Petroleum, Inc., Sr. Sub. Notes | | B1 | | 7.875% | | 05/15/11 | | | 1,135 | | | 1,208,775 |
| | | | | | | | | | | |
|
|
| | | | | | | | | | | | | 32,158,828 |
| | | | | | | | | | | |
|
|
Printing & Publishing — 1.9% | | | | | | | | | | | | |
American Media Operations, Inc., Gtd. Notes, Ser. B | | B3 | | 10.25% | | 05/01/09 | | | 1,225 | | | 1,290,844 |
Dex Media West LLC, Sr. Notes | | B1 | | 8.50% | | 08/15/10 | | | 975 | | | 1,084,687 |
Dex Media West LLC, Sr. Sub. Notes | | B2 | | 9.875% | | 08/15/13 | | | 1,422 | | | 1,638,855 |
Mail-Well I Corp., Gtd. Notes | | B1 | | 9.625% | | 03/15/12 | | | 760 | | | 834,100 |
PRIMEDIA, Inc., Sr. Notes(c) | | B3 | | 7.665% | | 05/15/10 | | | 125 | | | 132,500 |
PRIMEDIA, Inc., Sr. Notes | | B3 | | 8.00% | | 05/15/13 | | | 860 | | | 884,725 |
| | | | | | | | | | | |
|
|
| | | | | | | | | | | | | 5,865,711 |
| | | | | | | | | | | |
|
|
Real Estate Investment Trust — 1.7% | | | | | | | | | | | | |
Forest City Enterprises, Inc., Sr. Notes | | Ba3 | | 7.625% | | 06/01/15 | | | 1,000 | | | 1,060,000 |
General Growth Properties, Inc., (cost $1,497,531;
purchased 11/16/04-12/07/04)(f)(k) | | NR | | 4.53% | | 11/12/08 | | | 1,500 | | | 1,503,750 |
La Quinta Properties, Inc. | | Ba3 | | 8.875% | | 03/15/11 | | | 950 | | | 1,059,250 |
Ventas Realty LP, Sr. Notes | | Ba3 | | 8.75% | | 05/01/09 | | | 1,450 | | | 1,625,813 |
| | | | | | | | | | | |
|
|
| | | | | | | | | | | | | 5,248,813 |
| | | | | | | | | | | |
|
|
Retail — 1.7% | | | | | | | | | | | | |
AmeriGas Partners LP, Sr. Notes | | B2 | | 10.00% | | 04/15/06 | | | 200 | | | 215,000 |
AmeriGas Partners LP, Sr. Notes (cost $153,231; purchased 04/17/02)(f)(k) | | Ba3 | | 8.83% | | 04/19/10 | | | 150 | | | 180,124 |
AmeriGas Partners LP, Sr. Notes, Ser. B | | B2 | | 8.875% | | 05/20/11 | | | 550 | | | 599,500 |
Ferrellgas Partners LP | | Ba3 | | 6.75% | | 05/01/14 | | | 900 | | | 924,750 |
Ferrellgas Partners LP, Sr. Notes | | B2 | | 8.75% | | 06/15/12 | | | 575 | | | 626,750 |
J.C. Penney Co., Inc., Notes | | Ba2 | | 8.00% | | 03/01/10 | | | 700 | | | 799,750 |
Suburban Propane Partners LP, Sr. Notes | | B1 | | 6.875% | | 12/15/13 | | | 725 | | | 739,500 |
Toys “R” Us, Inc., Notes | | Ba2 | | 7.625% | | 08/01/11 | | | 750 | | | 746,250 |
Toys “R” Us, Inc., Notes | | Ba2 | | 7.875% | | 04/15/13 | | | 400 | | | 397,000 |
| | | | | | | | | | | |
|
|
| | | | | | | | | | | | | 5,228,624 |
| | | | | | | | | | | |
|
|
Telecommunications — 13.4% | | | | | | | | | | | | |
American Cellular Corp., Sr. Notes | | Caa1 | | 10.00% | | 08/01/11 | | | 1,650 | | | 1,414,875 |
American Tower Corp., Sr. Notes, Cl. A 144A(j) | | B3 | | 7.125% | | 10/15/12 | | | 1,200 | | | 1,227,000 |
American Towers, Inc., Gtd. Notes | | B2 | | 7.25% | | 12/01/11 | | | 290 | | | 307,400 |
AT&T Corp., Sr. Notes | | Ba1 | | 7.30% | | 11/15/11 | | | 2,500 | | | 2,878,125 |
AT&T Corp., Sr. Notes(b) | | Ba1 | | 8.00% | | 11/15/31 | | | 475 | | | 567,031 |
Cincinnati Bell, Inc., Gtd. Notes | | B2 | | 7.25% | | 07/15/13 | | | 1,340 | | | 1,376,850 |
Cincinnati Bell, Inc., Sr. Sub. Notes | | B3 | | 8.375% | | 01/15/14 | | | 700 | | | 708,750 |
Citizens Communications Co., Sr. Notes | | Ba3 | | 6.25% | | 01/15/13 | | | 1,500 | | | 1,511,250 |
SEE NOTES TO FINANCIAL STATEMENTS.
B34
| | | | |
| | | SP PIMCO HIGH YIELD PORTFOLIO (Continued) | | |
SCHEDULE OF INVESTMENTS | December 31, 2004 |
| | | | | | | | | | | | |
| LONG-TERM BONDS (Continued) | | Moody’s
Rating
(Unaudited)
| | Interest
Rate
| | Maturity
Date
| | Principal
Amount
(000)
| | Value
(Note 2)
|
Telecommunications (Cont’d.) | | | | | | | | | | | | |
Crown Castle International Corp., Sr. Notes | | B3 | | 9.375% | | 08/01/11 | | $ | 1,200 | | $ | 1,344,000 |
Crown Castle International Corp., Sr. Notes | | B3 | | 10.75% | | 08/01/11 | | | 125 | | | 135,625 |
Inmarsat Ventures PLC, (cost $693,221; purchased 03/23/04)(c)(f)(k) | | NR | | 4.8286% | | 10/10/10 | | | 688 | | | 690,198 |
Inmarsat Ventures PLC, (cost $694,945; purchased 03/23/04)(c)(f)(k) | | NR | | 5.3286% | | 10/10/11 | | | 689 | | | 693,974 |
Insight Midwest LP, Sr. Notes | | B2 | | 9.75% | | 10/01/09 | | | 550 | | | 576,125 |
Insight Midwest LP, Sr. Notes | | B2 | | 10.50% | | 11/01/10 | | | 1,340 | | | 1,467,300 |
MCI, Inc., Sr. Notes | | B2 | | 6.908% | | 05/01/07 | | | 150 | | | 153,562 |
MCI, Inc., Sr. Notes | | B2 | | 7.688% | | 05/01/09 | | | 3,756 | | | 3,887,460 |
MCI, Inc., Sr. Notes | | B2 | | 8.735% | | 05/01/14 | | | 700 | | | 752,500 |
Nextel Communications, Inc., Cl. A 144A(j) | | Ba3 | | 5.25% | | 01/15/10 | | | 250 | | | 255,938 |
Nextel Communications, Inc., Sr. Notes | | Ba3 | | 6.875% | | 10/31/13 | | | 3,765 | | | 4,085,025 |
Nextel Communications, Inc., Sr. Notes | | Ba3 | | 7.375% | | 08/01/15 | | | 400 | | | 440,000 |
Nextel Communications, Inc., Sr. Notes | | Ba3 | | 9.50% | | 02/01/11 | | | 166 | | | 184,771 |
Nextel Communications, Inc., Sr. Notes, Cl. A | | Ba3 | | 5.95% | | 03/15/14 | | | 500 | | | 517,500 |
Northwestern Bell Telephone Co., Deb. Notes | | Ba3 | | 6.25% | | 01/01/07 | | | 300 | | | 311,250 |
Northwestern Bell Telephone Co., Deb. Notes | | Ba3 | | 7.75% | | 05/01/30 | | | 750 | | | 746,250 |
Qwest Capital Funding, Inc., Gtd. Notes | | Caa2 | | 7.25% | | 02/15/11 | | | 1,275 | | | 1,249,500 |
Qwest Capital Funding, Inc., Gtd. Notes | | Caa2 | | 7.75% | | 02/15/31 | | | 75 | | | 65,438 |
Qwest Capital Funding, Inc., Gtd. Notes (cost $1,113,397;
purchased 01/25/02 — 08/17/04)(k) | | Caa2 | | 7.90% | | 08/15/10 | | | 1,250 | | | 1,262,500 |
Qwest Communications International, Inc., Sr. Notes 144A(j) | | B3 | | 7.25% | | 02/15/11 | | | 2,000 | | | 2,050,000 |
Qwest Communications International, Inc., Sr. Notes 144A(j) | | B3 | | 7.50% | | 02/15/14 | | | 2,730 | | | 2,757,300 |
Qwest Corp., Notes(f) | | NR | | 6.95% | | 06/30/10 | | | 1,250 | | | 1,278,750 |
Qwest Corp., Notes 144A(j) | | Caa1 | | 13.50% | | 12/15/10 | | | 1,000 | | | 1,202,500 |
Qwest Corp., Notes 144A (j) | | Ba3 | | 8.875% | | 03/15/12 | | | 1,350 | | | 1,559,250 |
Rogers Wireless Communications, Inc., Sec’d. Notes (Canada) 144A(j) | | Ba3 | | 7.25% | | 12/15/12 | | | 100 | | | 106,000 |
Rogers Wireless Communications, Inc., Sec’d. Notes (Canada) 144A(j) | | Ba3 | | 7.50% | | 03/15/15 | | | 275 | | | 290,125 |
Rogers Wireless Communications, Inc., Sr. Sec’d. Notes (Canada) | | Ba3 | | 6.375% | | 03/01/14 | | | 650 | | | 643,500 |
Rogers Wireless Communications, Inc., Sr. Sub. Notes (Canada) 144A(j) | | B2 | | 8.00% | | 12/15/12 | | | 500 | | | 528,750 |
Rural Cellular Corp., Sec’d. Notes, Cl. A | | B2 | | 8.25% | | 03/15/12 | | | 725 | | | 766,688 |
Time Warner Telecom LLC, Sr. Notes | | B3 | | 9.75% | | 07/15/08 | | | 600 | | | 607,500 |
Time Warner Telecom, Inc., Sr. Notes(c) | | B1 | | 6.29% | | 02/15/11 | | | 200 | | | 202,500 |
Time Warner Telecom, Inc., Sr. Notes | | B3 | | 10.125% | | 02/01/11 | | | 600 | | | 589,500 |
Triton PCS, Inc., Gtd. Notes | | Caa1 | | 8.50% | | 06/01/13 | | | 570 | | | 550,050 |
| | | | | | | | | | | |
|
|
| | | | | | | | | | | | | 41,942,610 |
| | | | | | | | | | | |
|
|
Tobacco — 1.2% | | | | | | | | | | | | |
Commonwealth Brands, Inc., Sec’d. Notes 144A
(cost $1,158,268; purchased 08/23/04 — 09/09/04)(j)(k) | | B3 | | 10.625% | | 09/01/08 | | | 1,100 | | | 1,155,000 |
DIMON, Inc., Gtd. Notes, Ser. B | | B1 | | 9.625% | | 10/15/11 | | | 610 | | | 667,950 |
DIMON, Inc., Sr. Notes | | B1 | | 7.75% | | 06/01/13 | | | 655 | | | 687,750 |
North Atlantic Trading Co., Sr. Notes | | B2 | | 9.25% | | 03/01/12 | | | 1,500 | | | 1,267,500 |
| | | | | | | | | | | |
|
|
| | | | | | | | | | | | | 3,778,200 |
| | | | | | | | | | | |
|
|
Utilities — 10.2% | | | | | | | | | | | | |
AES Corp., Sr. Notes | | B2 | | 8.875% | | 02/15/11 | | | 1,150 | | | 1,313,875 |
AES Corp., Sr. Sec’d. Notes 144A(j) | | B1 | | 8.75% | | 05/15/13 | | | 2,445 | | | 2,778,131 |
AES Ironwood LLC, Sec’d. Notes | | B2 | | 8.857% | | 11/30/25 | | | 1,484 | | | 1,684,637 |
Allegheny Energy Supply Co. LLC, Term B (cost $940,973;
purchased 10/24/04)(f)(k) | | NR | | 5.16% | | 03/08/11 | | | 941 | | | 956,264 |
CMS Energy Corp. | | B1 | | 2.875% | | 12/01/24 | | | 1,500 | | | 1,503,750 |
CMS Energy Corp., Sr. Notes | | B1 | | 7.50% | | 01/15/09 | | | 1,400 | | | 1,491,000 |
CMS Energy Corp., Sr. Notes | | B1 | | 7.75% | | 08/01/10 | | | 150 | | | 164,063 |
CMS Energy Corp., Sr. Notes | | B1 | | 8.90% | | 07/15/08 | | | 1,000 | | | 1,103,750 |
CMS Energy Corp., Sr. Notes | | B1 | | 9.875% | | 10/15/07 | | | 250 | | | 279,375 |
Exco Resources, Inc., Gtd. Notes | | B2 | | 7.25% | | 01/15/11 | | | 1,300 | | | 1,391,000 |
Hanover Compressor Co., Sr. Notes | | B3 | | 9.00% | | 06/01/14 | | | 200 | | | 222,500 |
Headwaters, Inc., Term B (cost $972,159; purchased 12/06/04)(f)(k) | | NR | | 5.33% | | 04/30/11 | | | 958 | | | 969,365 |
SEE NOTES TO FINANCIAL STATEMENTS.
B35
| | | | |
| | | SP PIMCO HIGH YIELD PORTFOLIO (Continued) | | |
SCHEDULE OF INVESTMENTS | December 31, 2004 |
| | | | | | | | | | | | |
| LONG-TERM BONDS (Continued) | | Moody’s
Rating
(Unaudited)
| | Interest
Rate
| | Maturity
Date
| | Principal
Amount
(000)
| | Value
(Note 2)
|
Utilities (Cont’d.) | | | | | | | | | | | | |
Homer City Funding LLC., Gtd. Notes | | Ba2 | | 8.734% | | 10/01/26 | | $ | 1,498 | | $ | 1,745,578 |
Invensys PLC, Second Lien Loan (United Kingdom) (cost $501,651;
purchased 03/22/04)(c)(f)(k) | | NR | | 6.76% | | 12/30/09 | | | 500 | | | 513,125 |
Invensys PLC, Sr. Notes (United Kingdom) 144A(j) | | B3 | | 9.875% | | 03/15/11 | | | 500 | | | 537,500 |
IPALCO Enterprises, Inc., Sec’d. Notes | | Ba1 | | 8.375% | | 11/14/08 | | | 750 | | | 843,750 |
IPALCO Enterprises, Inc., Sec’d. Notes | | Ba1 | | 8.625% | | 11/14/11 | | | 350 | | | 392,000 |
K2, Inc., Sr. Notes 144A(j) | | Ba3 | | 7.375% | | 07/01/14 | | | 100 | | | 109,500 |
Nevada Power Co., Gen. Ref. Mtge. | | Ba2 | | 6.50% | | 04/15/12 | | | 150 | | | 158,625 |
Nevada Power Co., Gen. Ref. Mtge. 144A(j) | | Ba2 | | 5.875% | | 01/15/15 | | | 150 | | | 151,125 |
Peabody Energy Corp., Gtd. Notes | | Ba3 | | 6.875% | | 03/15/13 | | | 1,775 | | | 1,921,438 |
PSE&G Energy Holdings LLC, Notes | | Ba3 | | 7.75% | | 04/16/07 | | | 1,625 | | | 1,718,437 |
PSE&G Energy Holdings LLC, Sr. Notes | | Ba3 | | 8.50% | | 06/15/11 | | | 950 | | | 1,084,188 |
PSE&G Energy Holdings LLC, Sr. Notes | | Ba3 | | 8.625% | | 02/15/08 | | | 550 | | | 603,625 |
Rayovac Corp., Sr. Sub. Notes | | B3 | | 8.50% | | 10/01/13 | | | 350 | | | 388,500 |
Reliant Energy, Inc., Pass-Through Certs, Ser. B | | B1 | | 9.237% | | 07/02/17 | | | 394 | | | 453,384 |
Reliant Energy, Inc., Sec’d Notes | | B1 | | 9.25% | | 07/15/10 | | | 650 | | | 724,750 |
Reliant Energy, Inc., Sec’d. Notes | | B1 | | 6.75% | | 12/15/14 | | | 775 | | | 770,156 |
Reliant Resources, Inc., Sec’d Notes | | B1 | | 9.50% | | 07/15/13 | | | 725 | | | 823,781 |
Sierra Pacific Power Co., Gen, Ref. Mtge. | | Ba2 | | 6.25% | | 04/15/12 | | | 875 | | | 913,281 |
South Point Energy Center LLC, Gtd. Notes 144A(j) | | B2 | | 8.40% | | 05/30/12 | | | 1,082 | | | 1,022,087 |
TECO Energy, Inc., Sr. Notes | | Ba2 | | 7.50% | | 06/15/10 | | | 1,250 | | | 1,381,250 |
TECO Energy, Inc., Sr. Notes | | Ba2 | | 10.50% | | 12/01/07 | | | 1,000 | | | 1,152,500 |
Texas Genco LLC, Sr. Notes 144A(j) | | B1 | | 6.875% | | 12/15/14 | | | 500 | | | 516,875 |
| | | | | | | | | | | |
|
|
| | | | | | | | | | | | | 31,783,165 |
| | | | | | | | | | | |
|
|
Waste Management — 0.9% | | | | | | | | | | | | |
Allied Waste North America, Inc., Gtd. Notes, Ser. B | | B2 | | 8.50% | | 12/01/08 | | | 835 | | | 885,100 |
Allied Waste North America, Inc., Gtd. Notes, Ser. B | | B2 | | 8.875% | | 04/01/08 | | | 585 | | | 625,950 |
Allied Waste North America, Inc., Gtd. Notes, Ser. B | | B2 | | 9.25% | | 09/01/12 | | | 325 | | | 351,813 |
Allied Waste North America, Inc., Sr. Notes | | B2 | | 6.375% | | 04/15/11 | | | 750 | | | 725,625 |
Allied Waste North America, Inc., Sr. Notes | | B2 | | 7.875% | | 04/15/13 | | | 125 | | | 128,125 |
| | | | | | | | | | | |
|
|
| | | | | | | | | | | | | 2,716,613 |
| | | | | | | | | | | |
|
|
TOTAL CORPORATE BONDS
(cost $ 254,088,096) | | | 267,282,811 |
| | | | | | | | | | | |
|
|
FOREIGN GOVERNMENT OBLIGATIONS — 6.9% | | | | | | | | | | | | |
Cabinet Ministers Ukraine, 144A (Ukraine)(j) | | B1 | | 6.875% | | 03/04/11 | | | 300 | | | 306,000 |
Republic of Brazil, (Brazil) | | B1 | | 2.125% | | 04/15/12 | | | 88 | | | 84,160 |
Republic of Brazil, (Brazil) | | B1 | | 10.00% | | 08/07/11 | | | 75 | | | 86,925 |
Republic of Brazil, Ser. R (Brazil) | | B2 | | 8.00% | | 04/15/14 | | | 9,030 | | | 9,244,938 |
Republic of Guatemala, Notes (Guatemala) | | Ba2 | | 9.25% | | 08/01/13 | | | 500 | | | 560,000 |
Republic of Panama (Panama) | | Ba1 | | 8.875% | | 09/30/27 | | | 1,100 | | | 1,210,000 |
Republic of Panama (Panama) | | Ba1 | | 9.375% | | 07/23/12 | | | 1,350 | | | 1,599,750 |
Republic of Peru (Peru) | | Ba3 | | 5.00% | | 03/07/17 | | | 88 | | | 84,154 |
Republic of Peru (Peru) | | Ba3 | | 9.125% | | 02/21/12 | | | 2,700 | | | 3,152,250 |
Republic of Ukraine, (Ukraine) | | B1 | | 6.875% | | 03/04/11 | | | 450 | | | 459,675 |
Republic of Ukraine, Sr. Notes (Ukraine) | | B1 | | 11.00% | | 03/15/07 | | | 350 | | | 374,406 |
Russian Federation (Russia) | | Baa3 | | 5.00% | | 03/31/30 | | | 2,875 | | | 2,951,187 |
Russian Federation (Russia) | | Ba2 | | 11.00% | | 07/24/18 | | | 1,000 | | | 1,387,500 |
| | | | | | | | | | | |
|
|
TOTAL FOREIGN GOVERNMENT OBLIGATIONS
(cost $19,906,256) | | | 21,500,945 |
| | | | | | | | | | | |
|
|
TOTAL LONG-TERM BONDS
(cost $ 273,994,352) | | | 288,783,756 |
| | | | | | | | | | | |
|
|
| CERTIFICATES OF BENEFICIAL INTEREST | | | | | | | | Units
| | |
Aircraft Statutory Trust(e) (cost $0) | | | 1,181 | | | 11 |
| | | | | | | | | | | |
|
|
TOTAL LONG-TERM INVESTMENTS
(cost $ 273,994,352) | | | 288,783,767 |
| | | | | | | | | | | |
|
|
SEE NOTES TO FINANCIAL STATEMENTS.
B36
| | | | |
| | | SP PIMCO HIGH YIELD PORTFOLIO (Continued) | | |
SCHEDULE OF INVESTMENTS | December 31, 2004 |
| | | | | | | | | | | | | |
| SHORT-TERM INVESTMENTS — 6.2% | | Moody’s
Rating
(Unaudited)
| | Interest
Rate
| | Maturity
Date
| | Principal
Amount
(000)
| | Value
(Note 2)
| |
COMMERCIAL PAPER — 3.5% | | | | | | | | | | | | | |
ABN-Amro Bank NA | | NR | | 1.945% | | 01/31/05 | | $ | 1,200 | | $ | 1,198,055 | |
Rabobank USA Financial Corp. | | PRIM1 | | 2.17% | | 01/03/05 | | | 2,900 | | | 2,899,476 | |
UBS AG | | PRIM1 | | 1.94% | | 01/25/05 | | | 2,600 | | | 2,596,637 | |
UBS AG | | PRIM1 | | 2.39% | | 01/05/05 | | | 4,200 | | | 4,198,885 | |
| | | | | | | | | | | |
|
|
|
| | | | | | | | | | | | | 10,893,053 | |
| | | | | | | | | | | |
|
|
|
REPURCHASE AGREEMENT — 0.3% | | | | | | | | | | | | | |
State Street Bank & Trust Co.(b) | | | | 1.75% | | 01/03/05 | | | 1,042 | | | 1,041,914 | |
| | | | | | | | | | | |
|
|
|
U.S. GOVERNMENT & AGENCY OBLIGATIONS — 2.4% | | | | | | | | | | | | | |
Federal National Mortgage Association, Disc. Notes(d) | | PRIM1 | | Zero | | 01/26/05 | | | 400 | | | 399,389 | |
Federal National Mortgage Association, Disc. Notes(d) | | PRIM1 | | 2.064% | | 01/07/05 | | | 500 | | | 499,822 | |
Federal National Mortgage Association, Disc. Notes(d) | | PRIM1 | | 2.16% | | 02/09/05 | | | 3,000 | | | 2,992,931 | |
Federal National Mortgage Association, Disc. Notes(d) | | PRIM1 | | 2.197% | | 02/16/05 | | | 400 | | | 398,863 | |
Federal National Mortgage Association, Disc. Notes(d) | | PRIM1 | | 2.23% | | 02/23/05 | | | 1,100 | | | 1,096,389 | |
Federal National Mortgage Association, Disc. Notes(d) | | PRIM1 | | 2.23% | | 03/15/05 | | | 1,300 | | | 1,294,121 | |
Federal National Mortgage Association, Disc. Notes(d) | | PRIM1 | | 2.302% | | 03/09/05 | | | 300 | | | 298,694 | |
United States Treasury Bill(i) | | Aaa | | 2.205% | | 03/17/05 | | | 415 | | | 413,237 | |
| | | | | | | | | | | |
|
|
|
| | | | | | | | | | | 7,393,446 | |
| | | | | | | | | | | |
|
|
|
TOTAL SHORT-TERM INVESTMENTS
(cost $ 19,328,444) | | | 19,328,413 | |
| | | | | | | | | | | |
|
|
|
TOTAL INVESTMENTS — 98.6%
(cost $293,322,796; Note 6) | | | 308,112,180 | |
| | | | | | | | | | | |
|
|
|
UNREALIZED DEPRECIATION ON FORWARD FOREIGN CURRENCY CONTRACTS(g) | | | (19,040 | ) |
VARIATION MARGIN ON OPEN FUTURES CONTRACTS, NET(h) | | | 11,725 | |
OTHER ASSETS IN EXCESS OF OTHER LIABILITIES — 1.4% | | | 4,411,560 | |
| | | | | | | | | | | |
|
|
|
TOTAL NET ASSETS — 100.0% | | $ | 312,516,425 | |
| | | | | | | | | | | |
|
|
|
The following abbreviation is used in portfolio descriptions:
| | |
| NR | | Not Rated by Moody’s or Standard & Poor’s |
| (a) | Represents issuer in default on interest payments, non-income producing security. |
| (b) | State Street Bank & Trust Company Repurchase Agreement, repurchase price $1,042,066 due 1/03/05. The value of the collateral including accrued interest was $1,065,566. Collateralized by United States Treasury or federal agency obligations. |
| (c) | Indicates a variable rate security. The maturity date presented for these instruments is the latter of the next date on which the security can be redeemed at par or the next date on which the rate of interest is adjusted. The interest rate shown reflects the rate in effect at December 31, 2004. |
| (d) | Rate quoted represents yield-to-maturity as of purchase date. |
| (e) | Non-income producing security. |
| (f) | Loan Participation Agreements. |
| (g) | Outstanding forward foreign currency contract as of December 31, 2004 was as follows: |
| | | | | | | | | | |
Forward Foreign Currency Contract
| | Value at
Settlement Date
| | Value at
December 31, 2004
| | Unrealized
Depreciation
| |
Sold: | | | | | | | | | | |
Euro expiring 1/10/05 | | $ | 1,517,018 | | $ | 1,536,058 | | $ | (19,040 | ) |
| | | | | | | | |
|
|
|
| (h) | Open futures contracts as of December 31, 2004 were as follows: |
| | | | | | | | | | | | | | |
Number of
Contracts
| | Type
| | Expiration
Date
| | Value at
Trade Date
| | Value at
December 31, 2004
| | Unrealized
Depreciation
| |
| Long Positions: | | | | | | | | | | | | | | |
| 134 | | Eurodollars | | Sep 05 | | $ | 32,511,684 | | $ | 32,364,350 | | $ | (147,334 | ) |
| | | | | | | | | | | | |
|
|
|
| (i) | Security segregated as collateral for futures contracts. |
| (j) | Security was purchased pursuant to Rule 144A under the Securities Act of 1933 and may not be resold subject to that rule except to qualified institutional buyers. Unless otherwise noted 144A securities are deemed to be liquid. |
| (k) | Indicates a security that has been deemed illiquid. The aggregate cost of the illiquid securities is $14,961,841. The aggregate value $15,141,796 represents 4.8% of net assets. |
SEE NOTES TO FINANCIAL STATEMENTS.
B37
| | | | |
| | | SP PIMCO HIGH YIELD PORTFOLIO (Continued) | | |
SCHEDULE OF INVESTMENTS | December 31, 2004 |
The industry classification of portfolio holdings and other assets in excess of liabilities shown as a percentage of net assets as of December 31, 2004 was as follows:
| | | |
Telecommunications | | 13.4 | % |
Oil & Gas Exploration & Production | | 10.3 | |
Utilities | | 10.2 | |
Foreign Government Obligations | | 6.9 | |
Cable | | 4.7 | |
Financials | | 4.6 | |
Hospitals/Hospital Management | | 3.5 | |
Commercial Paper | | 3.5 | |
Containers | | 3.4 | |
Chemicals | | 3.3 | |
Gaming | | 2.9 | |
Drugs & Health Care | | 2.7 | |
Forest & Paper | | 2.7 | |
US Government & Agency Obligations | | 2.4 | |
Autos — Cars & Trucks | | 2.2 | |
Entertainment | | 1.9 | |
Food & Beverage | | 1.9 | |
Printing & Publishing | | 1.9 | |
Real Estate Investment Trust | | 1.7 | |
Retail | | 1.7 | |
Asset Backed Securities | | 1.6 | |
Broadcasting & Other Media | | 1.6 | |
Aerospace & Defense | | 1.5 | |
Diversified Operations | | 1.4 | |
Lodging | | 1.2 | |
Tobacco | | 1.2 | |
Manufacturing | | 1.0 | |
Waste Management | | 0.9 | |
Industrial | | 0.8 | |
Construction | | 0.4 | |
Cosmetics & Toiletries | | 0.3 | |
Distribution/Wholesale | | 0.3 | |
Repurchase Agreement | | 0.3 | |
Marine | | 0.2 | |
Funeral Services | | 0.1 | |
| | |
|
|
| | | 98.6 | |
Other assets in excess of liabilities | | 1.4 | |
| | |
|
|
| | | 100.0 | % |
| | |
|
|
SEE NOTES TO FINANCIAL STATEMENTS.
B38
| | | | |
| | | SP PIMCO TOTAL RETURN PORTFOLIO | | |
SCHEDULE OF INVESTMENTS | December 31, 2004 |
| | | | | | | | | | | | |
LONG-TERM INVESTMENTS — 67.3% LONG-TERM BONDS — 67.3% | | Moody’s
Rating
(Unaudited)
| | Interest
Rate
| | Maturity
Date
| | Principal
Amount
(000)
| | Value
(Note 2)
|
ASSET BACKED SECURITIES — 0.3% | | | | | | | | | | | | |
AmeriQuest Mortgage Securities, Inc., Series 2004-X2, Cl. A1, 144A(b)(k) | | Aaa | | 2.98% | | 06/25/34 | | $ | 3,274 | | $ | 3,270,837 |
Block Mortgage Finance, Inc., Series 1998-2(b) | | Aaa | | 2.60% | | 08/25/28 | | | 25 | | | 24,809 |
Brazos Student Loan Finance Corp., Series 1998-A(b) | | Aaa | | 2.80% | | 06/01/23 | | | 217 | | | 219,373 |
First Nationwide Trust, Series 2001-4 | | AAA(c) | | 8.50% | | 09/25/31 | | | 13 | | | 13,187 |
| | | | | | | | | | | |
|
|
| | | | | | | | | | | | | 3,528,206 |
| | | | | | | | | | | |
|
|
COLLATERALIZED MORTGAGE OBLIGATIONS — 3.0% | | | | | | | | | | | | |
Banc of America Mortgage Securities, Series 2004-2 | | Aaa | | 6.50% | | 10/25/31 | | | 574 | | | 579,897 |
Bear Stearns Adjustable Rate Mortgage Trust, Series 2002-05(b) | | Aaa | | 5.94% | | 06/25/32 | | | 453 | | | 459,443 |
Bear Stearns Adjustable Rate Mortgage Trust, Series 2002-11(b) | | Aaa | | 5.63% | | 02/25/33 | | | 826 | | | 824,938 |
Citibank Omni Master Trust, Series 2002-4, Cl. A(b) | | Aaa | | 2.53% | | 08/18/09 | | | 1,300 | | | 1,300,976 |
Federal National Mortgage Association, Series 2001-29 | | Aaa | | 6.50% | | 07/25/31 | | | 376 | | | 397,960 |
Government Lease Trust, Series 1999-C1A, 144A(k) | | A(c) | | 4.00% | | 05/18/11 | | | 1,500 | | | 1,435,850 |
Government National Mortgage Association, Series 2000-14(b) | | Aaa | | 3.06% | | 02/16/30 | | | 45 | | | 45,409 |
Homeside Mortgage Securities Trust, Series 2001-1(b) | | Aaa | | 2.27% | | 01/20/27 | | | 92 | | | 90,700 |
Indymac Adjustable Rate Mortgage Trust, Series 2001-H2(b) | | Aaa | | 3.87% | | 01/25/32 | | | 26 | | | 25,940 |
Master Asset Securitization Trust, Series 2003-7 | | AAA(c) | | 5.50% | | 09/25/33 | | | 3,877 | | | 3,904,019 |
Mellon Residental Funding Corp., Series 1999-TBC2(b) | | AAA(c) | | 2.86% | | 07/25/29 | | | 68 | | | 68,789 |
ML CLO, Series A-1X | | NR | | 2.86% | | 06/23/10 | | | 883 | | | 874,065 |
Mortgage Capital Funding, Inc., Series 1996-MC1 | | AAA(c) | | 7.90% | | 02/15/06 | | | 135 | | | 140,458 |
Residential Funding Mortgage Securities I, Series 2003-S9 | | Aaa | | 6.50% | | 03/25/32 | | | 1,245 | | | 1,281,922 |
Structured Asset Mortgage Investments, Inc., Series 1999-1(b) | | AAA(c) | | 6.45% | | 06/25/29 | | | 26 | | | 26,479 |
Washington Mutual, Inc., Series 2002-AR2(b) | | Aaa | | 3.18% | | 02/27/34 | | | 1,774 | | | 1,776,686 |
Washington Mutual, Inc., Series 2003-AR1(b) | | Aaa | | 5.40% | | 02/25/33 | | | 557 | | | 563,390 |
Washington Mutual, Inc., Series 2003-R1, Class A1(b) | | Aaa | | 2.69% | | 12/25/27 | | | 19,233 | | | 19,212,581 |
| | | | | | | | | | | |
|
|
| | | | | | | | | | | | | 33,009,502 |
| | | | | | | | | | | |
|
|
CORPORATE BONDS — 8.8% | | | | | | | | | | | | |
Airlines | | | | | | | | | | | | |
United Air Lines, Inc., Pass-Through Certs., Series A-4
(cost $143,145; purchased 12/28/01)(a)(l) | | NR | | 9.21% | | 01/21/24 | | | 200 | | | 90,000 |
| | | | | | | | | | | |
|
|
Auto – Cars & Trucks — 0.3% | | | | | | | | | | | | |
DaimlerChrysler North America Holdings | | A3 | | 7.40% | | 01/20/05 | | | 3,480 | | | 3,488,509 |
| | | | | | | | | | | |
|
|
Financial Services — 5.8% | | | | | | | | | | | | |
AIG Sunamerica, M.T.N. | | Aaa | | 1.20% | | 01/26/05 | | | JPY652,000 | | | 6,369,201 |
Ford Motor Credit Co. | | A3 | | 6.875% | | 02/01/06 | | | 2,000 | | | 2,060,400 |
General Motors Acceptance Corp. | | Baa1 | | 6.875% | | 09/15/11 | | | 2,500 | | | 2,561,983 |
General Motors Acceptance Corp. | | Baa1 | | 7.50% | | 07/15/05 | | | 1,900 | | | 1,939,140 |
General Motors Acceptance Corp., M.T.N.(b) | | Baa1 | | 3.185% | | 05/18/06 | | | 3,000 | | | 2,986,122 |
General Motors Acceptance Corp., M.T.N.(b) | | Baa1 | | 3.33% | | 10/20/05 | | | 5,500 | | | 5,520,273 |
General Motors Acceptance Corp., M.T.N.(b) | | Baa1 | | 4.23% | | 05/19/05 | | | 3,100 | | | 3,114,548 |
HSBC Bank USA(b) | | Aa2 | | 2.59% | | 09/21/07 | | | 4,300 | | | 4,301,823 |
Morgan Stanley Warehouse Facilities, (cost $29,800,000; purchased 6/28/04)(l) | | NR | | 2.30% | | 07/06/05 | | | 29,800 | | | 29,678,210 |
PEMEX Master Trust | | Baa1 | | 7.375% | | 12/15/14 | | | 300 | | | 333,450 |
PEMEX Master Trust | | Baa1 | | 8.625% | | 02/01/22 | | | 500 | | | 581,750 |
PEMEX Master Trust | | Baa1 | | 9.125% | | 10/13/10 | | | 2,000 | | | 2,398,000 |
Pemex Project Funding Master Trust, 144A(k) | | Baa1 | | 9.25% | | 03/30/18 | | | 1,700 | | | 2,108,000 |
| | | | | | | | | | | |
|
|
| | | | | | | | | | | | | 63,952,900 |
| | | | | | | | | | | |
|
|
Oil & Gas — 0.3% | | | | | | | | | | | | |
El Paso Corp. | | Caa1 | | 7.00% | | 05/15/11 | | | 200 | | | 202,250 |
El Paso Energy Corp., M.T.N. | | Caa1 | | 7.75% | | 01/15/32 | | | 2,240 | | | 2,144,800 |
El Paso Energy Corp., M.T.N. | | Caa1 | | 7.80% | | 08/01/31 | | | 1,250 | | | 1,200,000 |
| | | | | | | | | | | |
|
|
| | | | | | | | | | | | | 3,547,050 |
| | | | | | | | | | | |
|
|
SEE NOTES TO FINANCIAL STATEMENTS.
B39
| | | | |
| | | SP PIMCO TOTAL RETURN PORTFOLIO (Continued) | | |
SCHEDULE OF INVESTMENTS | December 31, 2004 |
| | | | | | | | | | | | |
| LONG-TERM BONDS (Continued) | | Moody’s
Rating
(Unaudited)
| | Interest
Rate
| | Maturity
Date
| | Principal
Amount
(000)
| | Value
(Note 2)
|
Telecommunications — 1.1% | | | | | | | | | | | | |
AT&T Corp.(f) | | Ba1 | | 8.05% | | 11/15/11 | | $ | 500 | | $ | 575,625 |
Qwest Capital Funding, Inc. | | Caa2 | | 7.25% | | 02/15/11 | | | 200 | | | 196,000 |
Qwest Corp., 144A(k) | | Ba3 | | 1.00% | | 03/15/12 | | | 1,650 | | | 1,905,750 |
SBC Communications, Inc., 144A(k) | | A2 | | 4.25% | | 06/05/21 | | | 9,100 | | | 9,152,325 |
| | | | | | | | | | | |
|
|
| | | | | | | | | | | | | 11,829,700 |
| | | | | | | | | | | |
|
|
Utility – Electric — 1.0% | | | | | | | | | | | | |
Pacific Gas & Electric Corp.(b) | | Baa2 | | 2.72% | | 04/03/06 | | | 3,025 | | | 3,027,486 |
PP&L Capital Funding, Inc., Series C, M.T.N. | | Baa3 | | 7.75% | | 04/15/05 | | | 2,300 | | | 2,327,522 |
PPL Capital Funding, Inc., Trust I | | Ba1 | | 7.29% | | 05/18/06 | | | 4,400 | | | 4,590,168 |
TXU Energy Co. LLC., 144A(b)(k) | | Baa2 | | 2.84% | | 01/17/06 | | | 1,100 | | | 1,103,013 |
| | | | | | | | | | | |
|
|
| | | | | | | | | | | | | 11,048,189 |
| | | | | | | | | | | |
|
|
Waste Management — 0.3% | | | | | | | | | | | | |
Waste Management, Inc. | | Baa3 | | 7.00% | | 10/15/06 | | | 2,775 | | | 2,939,036 |
| | | | | | | | | | | |
|
|
TOTAL CORPORATE BONDS
(cost $ 95,381,660) | | | 96,895,384 |
| | | | | | | | | | | |
|
|
FOREIGN GOVERNMENT BONDS — 12.6% | | | | | | | | | | | | |
Federal Republic of Brazil, (Brazil) | | B1 | | 3.06% | | 04/15/06 | | | 840 | | | 840,000 |
Federal Republic of Brazil, (Brazil) | | B1 | | 3.125% | | 04/15/09 | | | 185 | | | 183,451 |
Federal Republic of Brazil, (Brazil) | | B1 | | 8.00% | | 04/15/14 | | | 11,810 | | | 12,090,866 |
Federal Republic of France, (France) | | Aaa | | 5.00% | | 04/25/12 | | | EUR5,700 | | | 8,537,991 |
Federal Republic of Germany, (Germany) | | Aaa | | 3.75% | | 01/04/09 | | | EUR3,700 | | | 5,190,159 |
Federal Republic of Germany, (Germany) | | Aaa | | 5.25% | | 01/04/11 | | | EUR25,000 | | | 37,719,179 |
Federal Republic of Germany, (Germany) | | Aaa | | 5.625% | | 01/04/28 | | | EUR7,100 | | | 11,614,585 |
Federal Republic of Germany, (Germany) | | Aaa | | 6.50% | | 07/04/27 | | | EUR1,100 | | | 1,987,835 |
Federal Republic of Italy, (Italy) | | Aa2 | | 3.75% | | 06/08/05 | | | JPY333,000 | | | 3,300,102 |
Federal Republic of Panama, (Panama) | | Ba1 | | 8.25% | | 04/22/08 | | | 1,800 | | | 1,998,000 |
Federal Republic of Panama, (Panama) | | Ba1 | | 8.875% | | 09/30/27 | | | 750 | | | 825,000 |
Federal Republic of Peru, (Peru) | | Ba3 | | 9.125% | | 01/15/08 | | | 500 | | | 568,750 |
Federal Republic of Peru, (Peru) | | Ba3 | | 9.875% | | 02/06/15 | | | 2,500 | | | 3,062,500 |
Russian Federation, (Russia) | | Baa3 | | 5.00% | | 03/31/30 | | | 16,700 | | | 17,142,550 |
United Kingdom Treasury Stock, (United Kingdom) | | Aaa | | 5.00% | | 09/07/14 | | | GBP10,300 | | | 20,486,887 |
United Kingdom Treasury Stock, (United Kingdom) | | Aaa | | 5.75% | | 12/07/09 | | | GBP4,100 | | | 8,304,535 |
United Mexican States, (Mexico) | | Baa2 | | 5.875% | | 01/15/14 | | | 3,875 | | | 3,969,938 |
| | | | | | | | | | | |
|
|
| | | | | | | | | | | | | 137,822,328 |
| | | | | | | | | | | |
|
|
MUNICIPAL BONDS — 3.2% | | | | | | | | | | | | |
Chicago, IlI., G.O., Proj. & Ref., Ser. A, M.B.I.A. | | Aaa | | 5.00% | | 01/01/41 | | | 300 | | | 303,621 |
Clark Cnty. Nev., Bond Bank, G.O., M.B.I.A. | | Aaa | | 5.00% | | 06/01/32 | | | 3,000 | | | 3,061,200 |
Dallas, TX Indpt. Sch. Dist. | | Aaa | | 5.00% | | 02/15/21 | | | 2,000 | | | 2,116,200 |
Georgia St., Rd. & Thrwy. Auth. Rev. | | Aaa | | 5.00% | | 03/01/21 | | | 700 | | | 753,277 |
Golden St. Tobacco Securitization Corp., Ser. 2003-A-1 | | Baa3 | | 6.25% | | 06/01/33 | | | 2,500 | | | 2,501,450 |
Golden St. Tobacco Securitization Corp., Ser. 2003-A-1 | | Baa3 | | 6.75% | | 06/01/39 | | | 2,000 | | | 2,001,120 |
Honolulu Hawaii City & Cnty., G.O., Ser. A, M.B.I.A. | | Aaa | | 5.00% | | 07/01/23 | | | 3,075 | | | 3,256,179 |
Massachusetts St. Wtr. Res. Auth., Ser. J, F.S.A. | | Aaa | | 5.00% | | 08/01/32 | | | 2,500 | | | 2,553,350 |
New Jersey Econ. Dev. Auth. Rev., Ser. I, F.G.I.C., T.C.R.S. | | AAA(c) | | 5.00% | | 09/01/26 | | | 2,890 | | | 3,015,917 |
North East Indpt. Sch. Dist., Texas, G.O. | | Aaa | | 5.00% | | 08/01/29 | | | 1,000 | | | 1,026,000 |
Pierce Cnty. Washington Sch. Dist., G.O., F.S.A. | | Aaa | | 5.00% | | 12/01/23 | | | 3,000 | | | 3,163,470 |
Salt River Proj., Ariz., Agricultural Impvt. & Pwr. Dist. Elec. Sys. Rev.,
Ser. B | | Aa2 | | 4.75% | | 01/01/32 | | | 2,000 | | | 2,005,280 |
South Carolina St. Hwy., Ser. B | | Aaa | | 5.00% | | 04/01/17 | | | 2,000 | | | 2,155,620 |
Tobacco Settlement Fin. Corp., NJ | | Baa3 | | 6.375% | | 06/01/32 | | | 2,000 | | | 1,923,600 |
Tobacco Settlement Fin. Corp., NY, Asset Bkd., Ser. A-1 | | A2 | | 5.50% | | 06/01/15 | | | 2,000 | | | 2,187,500 |
Tobacco Settlement Fin. Corp., RI, Asset Bkd., Ser. A | | Baa3 | | 6.25% | | 06/01/42 | | | 400 | | | 371,284 |
Tobacco Settlement Fin. Corp., RI, Ser. A | | Baa3 | | 6.125% | | 06/01/32 | | | 1,205 | | | 1,132,809 |
Triborough Bridge & Tunnel Auth., NY, Rev., Rfdg., Ser. B | | Aa3 | | 5.00% | | 11/15/32 | | | 1,860 | | | 1,898,725 |
| | | | | | | | | | | |
|
|
| | | | | | | | | | | | | 35,426,602 |
| | | | | | | | | | | |
|
|
SEE NOTES TO FINANCIAL STATEMENTS.
B40
| | | | |
| | | SP PIMCO TOTAL RETURN PORTFOLIO (Continued) | | |
SCHEDULE OF INVESTMENTS | December 31, 2004 |
| | | | | | | | | | | | |
| LONG-TERM BONDS (Continued) | | Moody’s
Rating
(Unaudited)
| | Interest
Rate
| | Maturity Date
| | Principal
Amount
(000)
| | Value
(Note 2)
|
U.S. GOVERNMENT & AGENCY OBLIGATIONS — 33.5% | | | | | | | | | | | | |
United States Treasury Bonds | | | | 2.375% | | 01/15/25 | | $ | 4,658 | | $ | 4,980,826 |
United States Treasury Bonds | | | | 6.00% | | 02/15/26 | | | 14,000 | | | 16,037,112 |
United States Treasury Bonds | | | | 6.25% | | 02/15/07-08/15/23 | | | 17,500 | | | 19,424,315 |
United States Treasury Bonds | | | | 8.125% | | 08/15/19 | | | 150 | | | 204,738 |
United States Treasury Bonds | | | | 9.125% | | 05/15/18 | | | 1,800 | | | 2,618,016 |
United States Treasury Notes | | | | 0.875% | | 04/15/10 | | | 8,665 | | | 8,580,306 |
United States Treasury Notes | | | | 1.625% | | 04/30/05 | | | 15,300 | | | 15,262,347 |
United States Treasury Notes | | | | 2.00% | | 01/15/14 | | | 20,556 | | | 21,275,773 |
United States Treasury Notes | | | | 2.50% | | 10/31/06 | | | 10,000 | | | 9,906,640 |
United States Treasury Notes | | | | 2.75% | | 08/15/07 | | | 20,000 | | | 19,780,460 |
United States Treasury Notes(e) | | | | 3.375% | | 01/15/07-10/15/09 | | | 8,179 | | | 8,434,910 |
United States Treasury Notes | | | | 3.625% | | 01/15/08 | | | 36,861 | | | 40,151,061 |
United States Treasury Notes | | | | 3.875% | | 05/15/09 | | | 1,500 | | | 1,522,090 |
United States Treasury Notes | | | | 4.00% | | 02/15/14 | | | 11,850 | | | 11,686,600 |
United States Treasury Notes | | | | 4.875% | | 02/15/12 | | | 63,300 | | | 66,905,125 |
United States Treasury Notes | | | | 5.00% | | 08/15/11 | | | 95,770 | | | 101,953,869 |
United States Treasury Strip I/O(b) | | | | 7.25% | | 02/15/22 | | | 7,000 | | | 2,956,198 |
United States Treasury Strip I/O(b) | | | | 7.50% | | 11/15/16 | | | 1,300 | | | 748,207 |
United States Treasury Strip I/O(b) | | | | 8.75% | | 05/15/20 | | | 32,600 | | | 15,240,044 |
United States Treasury Strip I/O(b) | | | | 11.25% | | 02/15/15 | | | 1,050 | | | 670,035 |
| | | | | | | | | | | |
|
|
| | | | | | | | | | | | | 368,338,672 |
| | | | | | | | | | | |
|
|
U.S. GOVERNMENT MORTGAGE BACKED SECURITIES — 5.9% | | | | | | | | | | |
Federal National Mortgage Association(b) | | | | 4.15% | | 05/01/36 | | | 152 | | | 154,878 |
Federal National Mortgage Association | | | | 4.50% | | 06/01/33-09/01/33 | | | 10,792 | | | 10,449,138 |
Federal National Mortgage Association | | | | 4.50% | | TBA | | | 45,500 | | | 43,964,375 |
Federal National Mortgage Association(b) | | | | 4.80% | | 12/01/36 | | | 3,600 | | | 3,659,630 |
Federal National Mortgage Association | | | | 5.00% | | 12/01/18-02/01/19 | | | 882 | | | 896,929 |
Federal National Mortgage Association(i) | | | | 5.94% | | 11/01/11 | | | 967 | | | 1,045,620 |
Federal National Mortgage Association | | | | 6.00% | | 04/01/16-01/01/23 | | | 3,468 | | | 3,631,719 |
Government National Mortgage Association(b) | | | | 1.00% | | 08/20/24 | | | 45 | | | 45,389 |
Government National Mortgage Association(b) | | | | 3.375% | | 04/20/25-05/20/25 | | | 105 | | | 106,480 |
Government National Mortgage Association(b) | | | | 3.75% | | 07/20/25-08/20/27 | | | 265 | | | 269,590 |
Government National Mortgage Association | | | | 4.50% | | 09/15/33 | | | 57 | | | 56,014 |
Government National Mortgage Association | | | | 9.00% | | 07/15/30-10/15/30 | | | 9 | | | 9,730 |
| | | | | | | | | | | |
|
|
| | | | | | | | | | | | | 64,289,492 |
| | | | | | | | | | | |
|
|
TOTAL LONG-TERM BONDS | | | 739,310,186 |
| | | | | | | | | | | |
|
|
| | | | | |
| | | | | | | Expiration Date
| | Shares
| | |
WARRANTS(j) | | | | | | | | | | | | |
Mexico United Mexican States | | | | | | 06/30/06 | | | 1,000 | | | 25,500 |
Mexico Value, Ser. D | | | | | | 06/30/06 | | | 1,000 | | | 13,500 |
Mexico Value, Ser. E | | | | | | 06/01/07 | | | 1,000 | | | 22,500 |
| | | | | | | | | | | |
|
|
TOTAL WARRANTS | | | 61,500 |
| | | | | | | | | | | |
|
|
TOTAL LONG-TERM INVESTMENTS
(cost $728,222,750) | | | 739,371,686 |
| | | | | | | | | | | |
|
|
| | | | | |
| SHORT-TERM INVESTMENTS — 37.9% | | | | | | Maturity
Date
| | Principal
Amount
| | |
CORPORATE OBLIGATIONS — 16.6% | | | | | | | | | | | | |
ABN-Amro Bank NA | | PRIM1 | | 1.94% | | 01/31/05 | | $ | 22,900 | | | 22,862,978 |
Bank of America NA | | PRIM1 | | 2.44% | | 03/23/05-03/28/05 | | | 27,100 | | | 27,100,000 |
Citibank New York N.A. | | NR | | 2.465% | | 03/29/05 | | | 26,900 | | | 26,900,000 |
Ford Motor Credit Corp. | | PRIM1 | | 2.52% | | 04/07/05 | | | 2,700 | | | 2,681,856 |
General Electric Capital Corp. | | PRIM1 | | 2.32% | | 02/24/05 | | | 800 | | | 797,216 |
General Electric Capital Corp. | | PRIM1 | | 2.34% | | 03/22/05 | | | 4,100 | | | 4,078,680 |
General Electric Capital Corp. | | PRIM1 | | 2.42% | | 03/15/05 | | | 27,400 | | | 27,265,542 |
SEE NOTES TO FINANCIAL STATEMENTS.
B41
| | | | |
| | | SP PIMCO TOTAL RETURN PORTFOLIO (Continued) | | |
SCHEDULE OF INVESTMENTS | December 31, 2004 |
| | | | | | | | | | | | | |
| SHORT-TERM INVESTMENTS (Continued) | | Moody’s
Rating
(Unaudited)
| | Interest
Rate
| | Maturity
Date
| | Principal
Amount
(000)
| | Value (Note 2)
| |
CORPORATE OBLIGATIONS (Cont’d.) | | | | | | | | | | | | | |
General Motors Acceptance Corp. | | PRIM1 | | 2.36% | | 03/21/05 | | $ | 1,500 | | $ | 1,492,225 | |
General Motors Acceptance Corp. | | PRIM1 | | 2.495% | | 04/05/05 | | | 3,500 | | | 3,477,198 | |
General Motors Acceptance Corp. | | PRIM1 | | 2.535% | | 04/05/05 | | | 1,000 | | | 993,381 | |
HBOS Treasury Services PLC | | PRIM1 | | 1.955% | | 01/25/05 | | | 100 | | | 99,870 | |
Rabobank USA Financial Corp. | | PRIM1 | | 1.95% | | 01/26/05 | | | 9,200 | | | 9,187,541 | |
Rabobank USA Financial Corp. | | PRIM1 | | 1.97% | | 01/27/05 | | | 7,300 | | | 7,289,614 | |
Spintab Swedmortgage | | PRIM1 | | 1.96% | | 01/26/05 | | | 27,500 | | | 27,462,570 | |
UBS Finance, Inc. | | PRIM1 | | 1.93% | | 01/24/05 | | | 100 | | | 99,877 | |
UBS Finance, Inc. | | PRIM1 | | 1.94% | | 01/25/05 | | | 100 | | | 99,871 | |
UBS Finance, Inc. | | PRIM1 | | 2.47% | | 04/14/05 | | | 20,400 | | | 20,255,834 | |
| | | | | | | | | | | |
|
|
|
| | | | | | | | | | | | | 182,144,253 | |
| | | | | | | | | | | |
|
|
|
U.S. GOVERNMENT & AGENCY OBLIGATIONS — 19.8% | | | | | | | | | | | | | |
Federal Home Loan Mortgage Corp., Discount Notes(i) | | | | 2.10% | | 01/03/05 | | | 192,300 | | | 192,288,750 | |
United States Treasury Bills | | | | 2.13% | | 05/05/05 | | | 3,600 | | | 3,573,596 | |
United States Treasury Bills | | | | 2.15% | | 03/17/05 | | | 1,750 | | | 1,742,573 | |
United States Treasury Bills | | | | 2.16% | | 03/17/05 | | | 15 | | | 14,936 | |
United States Treasury Bills(e) | | | | 2.17% | | 03/03/05 | | | 1,810 | | | 1,803,345 | |
United States Treasury Bills | | | | 2.172% | | 03/03/05 | | | 175 | | | 174,356 | |
United States Treasury Bills | | | | 2.175% | | 03/03/05 | | | 30 | | | 29,890 | |
United States Treasury Bills | | | | 2.18% | | 03/03/05 | | | 520 | | | 518,079 | |
United States Treasury Bills(e) | | | | 2.195% | | 03/03/05-03/17/05 | | | 8,750 | | | 8,713,390 | |
United States Treasury Bills | | | | 2.205% | | 03/17/05 | | | 7,810 | | | 7,776,854 | |
United States Treasury Bills | | | | 2.21% | | 03/17/05 | | | 350 | | | 348,515 | |
| | | | | | | | | | | |
|
|
|
| | | | | | | | | | | | | 216,984,284 | |
| | | | | | | | | | | |
|
|
|
REPURCHASE AGREEMENT — 1.3% | | | | | | | | | | | | | |
State Street Bank & Trust Co. (d) (cost $14,671,969) | | | | 1.75% | | 01/03/05 | | | 14,672 | | | 14,671,969 | |
| | | | | | | | | | | |
|
|
|
| | | | | |
| | | | | | | | | Contracts/ Notional (000)
| | | |
OUTSTANDING OPTIONS PURCHASED — 0.2% | | | | |
Call Options — 0.1% | | | | | | | | | | | | | |
Swap Option, expiring 4/27/09 @ $5.75 | | | | | | | | | 9,800 | | | 855,276 | |
Swap Option 3 month LIBOR, expiring 5/2/08 @ $5.75 | | | | | | | | | 7,800 | | | 682,328 | |
| | | | | | | | | | | |
|
|
|
| | | | 1,537,604 | |
| | | | | | | | | | | |
|
|
|
Put Options — 0.1% | | | | | | | | | | | | | |
Euro Futures, expiring 3/14/05 @ $93.25 | | | | | | | | | 350 | | | 0 | |
Euro Futures, expiring 9/19/05 @ $93.75 | | | | | | | | | 750 | | | 1,875 | |
Swap Option, expiring 4/27/09 @ $6.25 | | | | | | | | | 13,100 | | | 686,728 | |
Swap Option 3 month LIBOR, expiring 2/18/05 @ $4.9 | | | | | | | | | 13,300 | | | 8,858 | |
Swap Option 3 month LIBOR, expiring 5/2/08 @ $6.25 | | | | | | | | | 4,500 | | | 199,084 | |
| | | | | | | | | | | |
|
|
|
| | | | | | | | | | | | | 896,545 | |
| | | | | | | | | | | |
|
|
|
TOTAL OUTSTANDING OPTIONS PURCHASED
(cost $2,211,238) | | | 2,434,149 | |
| | | | | | | | | | | |
|
|
|
TOTAL SHORT-TERM INVESTMENTS
(cost $416,005,914) | | | 416,234,655 | |
| | | | | | | | | | | |
|
|
|
TOTAL INVESTMENTS, BEFORE OUTSTANDING OPTIONS WRITTEN AND INVESTMENTS SOLD SHORT
(cost $1,144,228,664; Note 6) | | | 1,155,606,341 | |
| | | | | | | | | | | |
|
|
|
OUTSTANDING OPTIONS WRITTEN(j) — (0.2%) | | | | |
Call Options — (0.1%) | | | | | | | | | | | | | |
Swap Option 3 month LIBOR, expiring 1/7/05 @ $5.0 | | | | | | | | | 11,500 | | | (474,812 | ) |
Swap Option 3 month LIBOR, expiring 7/3/06 @ $4.0 | | | | | | | | | 35,300 | | | (347,458 | ) |
Swap Option 3 month LIBOR, expiring 9/23/05 @ $4.0 | | | | | | | | | 59,200 | | | (417,715 | ) |
United States Treasury 10 Yr. Notes, expiring 2/18/05 @ $113.0 | | | | | | | | | 159 | | | (79,500 | ) |
United States Treasury 10 Yr. Notes, expiring 2/18/05 @ $114.0 | | | | | | | | | 583 | | | (136,641 | ) |
| | | | | | | | | | | |
|
|
|
| | | | | | | | | | | | | (1,456,126 | ) |
| | | | | | | | | | | |
|
|
|
SEE NOTES TO FINANCIAL STATEMENTS.
B42
| | | | |
| | | SP PIMCO TOTAL RETURN PORTFOLIO (Continued) | | |
SCHEDULE OF INVESTMENTS | December 31, 2004 |
| | | | | | | | | | | | | |
| | | Moody’s
Rating
(Unaudited)
| | Interest
Rate
| | Maturity Date
| | Principal
Amount
(000)
| | | Value
(Note 2)
| |
Put Options — (0.1%) | | | | | | | | | | | | | |
Swap Option, expiring 9/23/05 @ $7.0 | | | | | | | | 59,200 | | | $ | (19,536 | ) |
Swap Option 3 month LIBOR, expiring 7/3/06 @ $6.0 | | | | | | | | 35,300 | | | | (321,760 | ) |
Swap Option 3 month LIBOR, expiring 1/7/05 @ $7.0 | | | | | | | | 3,500 | | | | 0 | |
Swap Option 3 month LIBOR, expiring 1/7/05 @ $7.0 | | | | | | | | 8,000 | | | | 0 | |
United States Treasury 10 Yr. Notes, expiring 2/18/05 @ $108.0 | | | | | | | | 594 | | | | (55,687 | ) |
| | | | | | | | | | | |
|
|
|
| | | | | | | | | | | | | (396,983 | ) |
| | | | | | | | | | | |
|
|
|
TOTAL OUTSTANDING OPTIONS WRITTEN
(premium received $4,600,694) | | | | (1,853,109 | ) |
| | | | | | | | | | | |
|
|
|
INVESTMENTS SOLD SHORT — (17.3%) | | | | | | | | | | | | | |
U.S. Government & Agency Obligations | | | | | | | | | | | | | |
Federal National Mortgage Association | | | | 5.00% | | TBA | | (1,500 | ) | | | (1,487,812 | ) |
Federal National Mortgage Association | | | | 5.50% | | TBA | | (13,200 | ) | | | (13,637,250 | ) |
Federal National Mortgage Association | | | | 6.00% | | TBA | | (2,500 | ) | | | (2,584,375 | ) |
United States Treasury Notes | | | | 3.00% | | 11/15/07 | | (6,300 | ) | | | (6,261,116 | ) |
United States Treasury Notes | | | | 3.625% | | 05/15/13 | | (62,400 | ) | | | (60,467,035 | ) |
United States Treasury Notes | | | | 3.875% | | 02/15/13 | | (26,600 | ) | | | (26,244,651 | ) |
United States Treasury Notes | | | | 4.00% | | 11/15/12 | | (27,900 | ) | | | (27,853,128 | ) |
United States Treasury Notes | | | | 4.25% | | 08/15/14 | | (20,000 | ) | | | (20,044,540 | ) |
United States Treasury Notes | | | | 4.375% | | 05/15/07-08/15/12 | | (25,500 | ) | | | (26,130,092 | ) |
United States Treasury Notes | | | | 4.875% | | 02/12/15 | | (5,300 | ) | | | (5,601,851 | ) |
| | | | | | | | | | | |
|
|
|
TOTAL INVESTMENTS SOLD SHORT
(proceeds received $189,767,078) | | | | (190,311,850 | ) |
| | | | | | | | | | | |
|
|
|
TOTAL INVESTMENTS, NET OF OUTSTANDING OPTIONS WRITTEN AND INVESTMENTS SOLD SHORT — 87.7%
(cost $949,860,892; Note 6) | | | | 963,441,382 | |
| | | | | | | | | | | |
|
|
|
VARIATION MARGIN ON OPEN FUTURES CONTRACTS(g) | | | | 1,300,844 | |
UNREALIZED DEPRECIATION ON FORWARD FOREIGN CURRENCY CONTRACTS(h) | | | | (643,715 | ) |
OTHER ASSETS IN EXCESS OF OTHER LIABILITIES — 12.3% | | | | 134,895,831 | |
| | | | | | | | | | | |
|
|
|
TOTAL NET ASSETS — 100.0% | | | $ | 1,098,994,342 | |
| | | | | | | | | | | |
|
|
|
The following abbreviations are used in portfolio descriptions:
| | |
| F.G.I.C | | Financial Guaranty Insurance Company |
| F.S.A. | | Financial Security Assurance |
| G.O. | | General Obligation |
| I/O | | Interest Only |
| M.B.I.A. | | Municipal Bond Insurance Association |
| M.T.N. | | Medium Term Note |
| NR | | Not Rated by Moody’s or Standard & Poor’s |
| TBA | | To Be Announced |
| T.C.R.S. | | Transferable Custodial Receipts |
| (a) | Represents issuer in default on interest payments, non-income producing security. |
| (b) | Rate shown reflects current rate on variable rate instrument. |
| (c) | Standard & Poor’s rating. |
| (d) | State Street Bank & Trust Company Repurchase Agreement, repurchase price $14,674,109 due 1/3/05. The value of the collateral including accrued interest was $15,042,478. The collateral consists of United States Treasury or Federal Agency Obligations. |
| (e) | Security segregated as collateral for futures contracts. |
| (f) | Increase/decrease in rate variable upon increase/decrease in Moody’s or Standard & Poor’s rating. |
| (g) | Open futures contracts as of December 31, 2004 were as follows: |
SEE NOTES TO FINANCIAL STATEMENTS.
B43
| | | | |
| | | SP PIMCO TOTAL RETURN PORTFOLIO (Continued) | | |
SCHEDULE OF INVESTMENTS | December 31, 2004 |
| | | | | | | | | | | | | | |
Number of
Contracts
| | Type
| | Expiration
Date
| | Value at
Trade Date
| | Value at
December 31, 2004
| | Unrealized
Appreciation/
(Depreciation)
| |
| Long Positions: | | | | | | | | | | | | | | |
| 25 | | Euribor | | Jun 05 | | $ | 424 | | $ | 0 | | $ | (424 | ) |
| 86 | | LIBOR | | Dec 05 | | | 19,659,025 | | | 19,658,593 | | | (432 | ) |
| 60 | | LIBOR | | Mar 05 | | | 13,871,986 | | | 13,699,459 | | | (172,527 | ) |
| 66 | | UK Treasury Bonds | | Mar 05 | | | 14,040,068 | | | 14,136,159 | | | 96,091 | |
| 11 | | Japan 10 Yr Fed Bonds | | Mar 05 | | | 14,811,457 | | | 14,852,737 | | | 41,280 | |
| 593 | | Eurodollars | | Jun 05 | | | 144,064,660 | | | 143,543,063 | | | (521,597 | ) |
| 162 | | Eurodollars | | Mar 05 | | | 39,336,493 | | | 39,323,475 | | | (13,018 | ) |
| 417 | | Eurodollars | | Sep 05 | | | 101,120,677 | | | 100,715,925 | | | (404,752 | ) |
| 55 | | U.S. Treasury 5 Yr Notes | | Mar 05 | | | 6,046,563 | | | 6,024,219 | | | (22,344 | ) |
| 158 | | U.S. Treasury Bonds | | Mar 05 | | | 17,816,750 | | | 17,775,000 | | | (41,750 | ) |
| 2,753 | | U.S. Treasury 10 Yr Notes | | Mar 05 | | | 306,966,559 | | | 308,163,937 | | | 1,197,378 | |
| | | | | | | | | | | | |
|
|
|
| | | | | | | | | | | | | | 157,905 | |
| | | | | | | | | | | | |
|
|
|
| Short Positions: | | | | | | | | | | | | | | |
| 45 | | LIBOR | | Dec 05 | | | 37,798 | | | 3,240 | | | 34,558 | |
| 86 | | Eurodollars | | Jun 05 | | | 20,787,268 | | | 20,817,375 | | | (30,107 | ) |
| | | | | | | | | | | | |
|
|
|
| | | | | | | | | | | | | | 4,451 | |
| | | | | | | | | | | | |
|
|
|
| | | | | | | | | | | | | $ | 162,356 | |
| | | | | | | | | | | | |
|
|
|
| (h) | Outstanding forward foreign currency contracts as of December 31, 2004 were as follows: |
| | | | | | | | | | |
Forward Foreign Currency Contract
| | Value at
Settlement Date
| | Value at
December 31, 2004
| | Unrealized
Appreciation/
Depreciation
| |
Bought: | | | | | | | | | | |
Eurodollars expiring 1/10/05 | | $ | 2,485,440 | | $ | 2,543,930 | | $ | 58,490 | |
Pound Sterling expiring 1/13/05 | | | 345,114 | | | 345,258 | | | 144 | |
Japanese Yen expiring 1/27/05 | | | 3,851,259 | | | 3,927,214 | | | 75,955 | |
Japanese Yen expiring 1/6/05 | | | 190,501 | | | 195,947 | | | 5,446 | |
| | | | | | | | |
|
|
|
| | | | | | | | | | 140,035 | |
| | | | | | | | |
|
|
|
Sold: | | | | | | | | | | |
Eurodollars expiring 1/10/05 | | | 45,619,538 | | | 46,244,872 | | | (625,334 | ) |
Pound Sterling expiring 1/13/05 | | | 8,403,326 | | | 8,410,860 | | | (7,534 | ) |
Japanese Yen expiring 1/27/05 | | | 3,980,194 | | | 4,131,076 | | | (150,882 | ) |
| | | | | | | | |
|
|
|
| | | | | | | | | | (783,750 | ) |
| | | | | | | | |
|
|
|
| | | | | | | | | $ | (643,715 | ) |
| | | | | | | | |
|
|
|
| (i) | Rate quoted represents yield-to-maturity as of purchase date. |
| (j) | Non-income producing security. |
| (k) | Securities were purchased pursuant to Rule 144A under the securities Act of 1933 and may not be resold subject to that rule except to qualified institutional buyers. Unless otherwise noted 144A securities are deemed to be liquid. |
| (l) | Indicates a security that has been deemed illiquid. The aggregate cost of the illiquid securities is $29,943,145. The aggregate value $29,768,210 represents 2.7% of net assets. |
SEE NOTES TO FINANCIAL STATEMENTS.
B44
| | | | |
| | | SP PIMCO TOTAL RETURN PORTFOLIO (Continued) | | |
SCHEDULE OF INVESTMENTS | December 31, 2004 |
The industry classification of portfolio holdings and other assets in excess of other liabilities shown as a percentage of net assets as of December 31, 2004 was as follows:
| | | |
U.S. Government & Agency Obligations | | 53.3 | % |
Other Corporate Obligations | | 16.6 | |
Foreign Government Bonds | | 12.6 | |
U.S. Government Mortgage Backed Securities | | 5.9 | |
Financial Services | | 5.8 | |
Municipal Bonds | | 3.2 | |
Collateralized Mortgage Obligations | | 3.0 | |
Repurchase Agreement | | 1.3 | |
Telecommunications | | 1.1 | |
Utility — Electric | | 1.0 | |
Oil & Gas | | 0.3 | |
Asset Backed Securities | | 0.3 | |
Auto — Cars & Trucks | | 0.3 | |
Waste Management | | 0.3 | |
Investments Sold Short | | (17.3 | ) |
| | |
|
|
| | | 87.7 | |
Other assets in excess of other liabilities | | 12.3 | |
| | |
|
|
| | | 100.0 | % |
| | |
|
|
SEE NOTES TO FINANCIAL STATEMENTS.
B45
| | | | |
| | | SP PRUDENTIAL U.S. EMERGING GROWTH PORTFOLIO | | |
SCHEDULE OF INVESTMENTS | December 31, 2004 |
| | | | | |
| LONG-TERM INVESTMENTS — 95.5% | | Value (Note 2)
|
| COMMON STOCKS | | Shares
| |
Air Freight & Logistics — 2.6% | | | | | |
Expeditors International of
Washington, Inc. | | 41,000 | | $ | 2,291,080 |
UTI Worldwide, Inc. (Virgin Islands) | | 16,000 | | | 1,088,320 |
| | | | |
|
|
| | | | | | 3,379,400 |
| | | | |
|
|
Biotechnology — 4.0% | | | | | |
Celgene Corp.(a)(b) | | 40,200 | | | 1,066,506 |
Gilead Sciences, Inc.(a) | | 32,000 | | | 1,119,680 |
ImClone Systems, Inc.(a) | | 29,500 | | | 1,359,360 |
Martek Biosciences Corp.(a)(b) | | 18,000 | | | 921,600 |
MedImmune, Inc.(a) | | 22,600 | | | 612,686 |
| | | | |
|
|
| | | | | | 5,079,832 |
| | | | |
|
|
Capital Markets — 3.1% | | | | | |
Ameritrade Holding Corp.(a)(b) | | 175,300 | | | 2,492,766 |
Legg Mason, Inc.(b) | | 19,650 | | | 1,439,559 |
| | | | |
|
|
| | | | | | 3,932,325 |
| | | | |
|
|
Chemicals — 1.6% | | | | | |
Monsanto Co. | | 36,800 | | | 2,044,240 |
| | | | |
|
|
Commercial Services & Supplies — 5.1% | | | | | |
CoStar Group, Inc.(a) | | 28,300 | | | 1,306,894 |
Monster Worldwide, Inc.(a)(b) | | 86,600 | | | 2,913,224 |
Robert Half International, Inc. | | 47,700 | | | 1,403,811 |
Strayer Education, Inc. | | 9,000 | | | 988,110 |
| | | | |
|
|
| | | | | | 6,612,039 |
| | | | |
|
|
Communications Equipment — 5.8% | | | | | |
ADC Telecommunications, Inc.(a) | | 468,900 | | | 1,256,652 |
Comverse Technology, Inc.(a)(b) | | 103,500 | | | 2,530,575 |
Juniper Networks, Inc.(a) | | 50,500 | | | 1,373,095 |
Qualcomm, Inc. | | 32,100 | | | 1,361,040 |
Research In Motion Limited(a) | | 11,900 | | | 980,798 |
| | | | |
|
|
| | | | | | 7,502,160 |
| | | | |
|
|
Computers & Peripherals — 5.4% | | | | | |
Apple Computer, Inc.(a) | | 33,900 | | | 2,183,160 |
Diebold, Inc.(b) | | 45,400 | | | 2,530,142 |
Lexmark International, Inc.
(Class “A” Stock)(a) | | 9,300 | | | 790,500 |
NCR Corp.(a) | | 21,100 | | | 1,460,753 |
| | | | |
|
|
| | | | | | 6,964,555 |
| | | | |
|
|
Diversified Financial Services — 0.8% | | | | | |
Chicago Merchantile Exchange (The) | | 4,500 | | | 1,029,150 |
| | | | |
|
|
Electronic Equipment & Instruments — 3.1% | | | |
Agilent Technologies, Inc.(a) | | 23,700 | | | 571,170 |
Amphenol Corp. (Class “A” Stock)(a) | | 33,100 | | | 1,216,094 |
Symbol Technologies, Inc. | | 130,300 | | | 2,254,190 |
| | | | |
|
|
| | | | | | 4,041,454 |
| | | | |
|
|
Energy Equipment & Services — 2.9% | | | | | |
BJ Services Co. | | 18,300 | | | 851,682 |
ENSCO International, Inc. | | 38,700 | | | 1,228,338 |
National-Oilwell, Inc.(a)(b) | | 29,100 | | | 1,026,939 |
Todco(a) | | 33,800 | | | 622,596 |
| | | | |
|
|
| | | | | | 3,729,555 |
| | | | |
|
|
| | | | | |
COMMON STOCKS
(Continued) | | Shares
| | Value (Note 2)
|
Healthcare Equipment & Supplies — 5.9% | | | | | |
Alcon, Inc.(b) | | 12,100 | | $ | 975,260 |
INAMED Corp.(a) | | 10,150 | | | 641,987 |
Kinetic Concepts Inc.(a) | | 28,400 | | | 2,166,920 |
Millipore Corp.(a) | | 25,200 | | | 1,255,212 |
Waters Corp.(a) | | 53,700 | | | 2,512,623 |
| | | | |
|
|
| | | | | | 7,552,002 |
| | | | |
|
|
Healthcare Providers & Services — 4.4% | | | | | |
Caremark Rx, Inc.(a) | | 26,400 | | | 1,040,952 |
Cerner Corp.(a)(b) | | 53,500 | | | 2,844,595 |
WebMD Corp.(a)(b) | | 223,900 | | | 1,827,024 |
| | | | |
|
|
| | | | | | 5,712,571 |
| | | | |
|
|
Hotels, Restaurants & Leisure — 6.0% | | | | | |
Gaylord Entertainment Co.(a)(b) | | 34,600 | | | 1,436,938 |
Great Wolf Resorts, Inc.(a) | | 17,800 | | | 397,652 |
GTECH Holdings Corp. | | 48,700 | | | 1,263,765 |
MGM Mirage(a) | | 32,700 | | | 2,378,598 |
Wynn Resorts, Ltd.(a)(b) | | 34,100 | | | 2,281,972 |
| | | | |
|
|
| | | | | | 7,758,925 |
| | | | |
|
|
Household Durables — 1.0% | | | | | |
Harman International Industries, Inc.(b) | | 10,100 | | | 1,282,700 |
| | | | |
|
|
Internet & Catalog Retail — 0.8% | | | | | |
IAC/InterActiveCorp(a)(b) | | 36,100 | | | 997,082 |
| | | | |
|
|
Internet Software & Services — 10.0% | | | | | |
Akamai Technologies, Inc.(a) | | 312,900 | | | 4,077,087 |
Ask Jeeves, Inc.(a)(b) | | 121,600 | | | 3,252,800 |
Google, Inc.(a)(b) | | 1,400 | | | 270,340 |
VeriSign, Inc.(a)(b) | | 87,800 | | | 2,943,056 |
Yahoo!, Inc.(a) | | 62,600 | | | 2,358,768 |
| | | | |
|
|
| | | | | | 12,902,051 |
| | | | |
|
|
IT Services — 3.1% | | | | | |
CheckFree Corp.(a)(b) | | 73,600 | | | 2,802,688 |
CSG Systems International, Inc.(a) | | 63,100 | | | 1,179,970 |
| | | | |
|
|
| | | | | | 3,982,658 |
| | | | |
|
|
Media — 2.4% | | | | | |
DreamWorks Animation SKG, Inc.
(Class “A” Stock)(a)(b) | | 4,100 | | | 153,791 |
Sirius Satellite Radio, Inc.(a)(b) | | 291,500 | | | 2,229,975 |
XM Satellite Radio Holdings, Inc.
(Class “A” Stock)(a)(b) | | 19,100 | | | 718,542 |
| | | | |
|
|
| | | | | | 3,102,308 |
| | | | |
|
|
Metals & Mining — 0.8% | | | | | |
Placer Dome, Inc. (Canada) | | 54,600 | | | 1,029,756 |
| | | | |
|
|
Oil & Gas — 1.7% | | | | | |
Southwestern Energy Co.(a) | | 26,100 | | | 1,323,009 |
Suncor Energy, Inc. | | 23,200 | | | 821,280 |
| | | | |
|
|
| | | | | | 2,144,289 |
| | | | |
|
|
Personal Products — 1.4% | | | | | |
Estee Lauder Cos., Inc. | | 39,100 | | | 1,789,607 |
| | | | |
|
|
Pharmaceuticals — 4.0% | | | | | |
Allergan, Inc. | | 15,800 | | | 1,280,906 |
Elan Corp. PLC, ADR (Ireland)(a) | | 33,800 | | | 921,050 |
SEE NOTES TO FINANCIAL STATEMENTS.
B46
| | | | |
| | | SP PRUDENTIAL U.S. EMERGING GROWTH PORTFOLIO (Continued) | | |
SCHEDULE OF INVESTMENTS | December 31, 2004 |
| | | | | | |
COMMON STOCKS
(Continued) | | Shares
| | Value (Note 2)
| |
Pharmaceuticals (cont’d.) | | | | | | |
Sepracor, Inc.(a)(b) | | 26,200 | | $ | 1,555,494 | |
Watson Pharmaceuticals, Inc.(a) | | 43,100 | | | 1,414,111 | |
| | | | |
|
|
|
| | | | | | 5,171,561 | |
| | | | |
|
|
|
Semiconductors & Semiconductor Equipment — 2.9% | |
Altera Corp.(a)(b) | | 62,500 | | | 1,293,750 | |
Marvell Technology Group, Ltd.(a) | | 33,500 | | | 1,188,245 | |
Maxim Integrated Products, Inc. | | 29,500 | | | 1,250,505 | |
| | | | |
|
|
|
| | | | | | 3,732,500 | |
| | | | |
|
|
|
Software — 10.5% | | | | | | |
Amdocs, Ltd. (United Kingdom)(a) | | 131,000 | | | 3,438,750 | |
Business Objects SA ADR(France)(a)(b) | | 60,700 | | | 1,538,138 | |
Cognos, Inc.(a) | | 31,900 | | | 1,405,514 | |
Electronic Arts, Inc.(a)(b) | | 39,800 | | | 2,454,864 | |
Intuit, Inc.(a)(b) | | 43,100 | | | 1,896,831 | |
Mercury Interactive Corp.(a)(b) | | 44,300 | | | 2,017,865 | |
NAVTEQ Corp.(a) | | 16,900 | | | 783,484 | |
| | | | |
|
|
|
| | | | | | 13,535,446 | |
| | | | |
|
|
|
Specialty Retail — 3.1% | | | | | | |
Chico’s FAS, Inc.(a) | | 46,100 | | | 2,098,933 | |
PETCO Animal Supplies, Inc.(a) | | 25,100 | | | 990,948 | |
Williams-Sonoma, Inc.(a)(b) | | 23,800 | | | 833,952 | |
| | | | |
|
|
|
| | | | | | 3,923,833 | |
| | | | |
|
|
|
Trading Companies & Distributors — 0.7% | | | | |
MSC Industrial Direct Co., Inc.(b) | | 24,600 | | | 885,108 | |
| | | | |
|
|
|
Wireless Telecommunication Services — 2.4% | | | | |
Alamosa Holdings, Inc.(a)(b) | | 108,100 | | | 1,348,007 | |
Nextel Partners, Inc.
(Class “A” Stock)(a) | | 86,300 | | | 1,686,302 | |
| | | | |
|
|
|
| | | | | | 3,034,309 | |
| | | | |
|
|
|
TOTAL LONG-TERM INVESTMENTS
(cost $ 103,228,732) | | | 122,851,416 | |
| | | | |
|
|
|
| SHORT-TERM INVESTMENTS — 40.8% | | | |
Mutual Fund | | | | | | |
Dryden Core Investment Fund — Taxable Money Market Series(c)
(cost $52,542,649; Note 4) | | 52,542,649 | | | 52,542,649 | |
| | | | |
|
|
|
TOTAL INVESTMENTS, BEFORE OUTSTANDING OPTIONS WRITTEN — 136.3%
(cost $155,771,381; Note 6) | | | 175,394,065 | |
| | | | |
|
|
|
| | |
OUTSTANDING OPTIONS WRITTEN(a) — (0.1%) | | Contracts
| | | | |
Call Options | | | | | | |
Akamai Technologies, Inc.
expiring 5/21/05 @$15.0 | | 134 | | | (16,750 | ) |
Apple Computer, Inc.
expiring 1/22/05 @$42.5 | | 46 | | | (100,740 | ) |
Apple Computer, Inc.,
expiring 1/22/05 @$70.0 | | 29 | | | (4,640 | ) |
Intuit, Inc., expiring 1/22/05 @$ 45.0 | | 24 | | | (1,320 | ) |
| | | | |
|
|
|
TOTAL OUTSTANDING OPTIONS WRITTEN
(premium received $38,320) | | | (123,450 | ) |
| | | | |
|
|
|
| | | | | | |
SHORT-TERM INVESTMENTS
(Continued) | |
| | Value (Note 2)
| |
TOTAL INVESTMENTS, NET OF OUTSTANDING OPTIONS WRITTEN — 136.2%
(cost $155,733,061) | | $ | 175,270,615 | |
| | | | |
|
|
|
LIABILITIES IN EXCESS OF
OTHER ASSETS — (36.2)% | | | (46,560,668 | ) |
| | | | |
|
|
|
NET ASSETS — 100.0% | | $ | 128,709,947 | |
| | | | |
|
|
|
The following abbreviation is used in the portfolio descriptions:
| | |
| ADR | | American Depositary Receipt |
| (a) | Non-income producing security. |
| (b) | Portion of securities on loan with an aggregate market value of $44,398,773; cash collateral of $46,313,348 was received with which the portfolio purchased securities. |
| (c) | Represents security, or portion thereof, purchased with cash collateral for securities on loan. |
The industry classification of portfolio holdings and liabilities in excess of other assets shown as a percentage of net assets as of December 31, 2004 was as follows:
| | | |
Mutual Fund | | 40.8 | % |
Software | | 10.5 | |
Internet Software & Services | | 10.0 | |
Hotels, Restaurants & Leisure | | 6.0 | |
Healthcare Equipment & Supplies | | 5.9 | |
Communications Equipment | | 5.8 | |
Computers & Peripherals | | 5.4 | |
Commercial Services & Supplies | | 5.1 | |
Healthcare Providers & Services | | 4.4 | |
Biotechnology | | 4.0 | |
Pharmaceuticals | | 4.0 | |
Capital Markets | | 3.1 | |
Electronic Equipment & Instruments | | 3.1 | |
IT Services | | 3.1 | |
Specialty Retail | | 3.1 | |
Energy Equipment & Services | | 2.9 | |
Semiconductors & Semiconductor Equipment | | 2.9 | |
Air Freight & Logistics | | 2.6 | |
Media | | 2.4 | |
Wireless Telecommunication Services | | 2.4 | |
Oil & Gas | | 1.7 | |
Chemicals | | 1.6 | |
Personal Products | | 1.4 | |
Household Durables | | 1.0 | |
Diversified Financial Services | | 0.8 | |
Internet & Catalog Retail | | 0.8 | |
Metals & Mining | | 0.8 | |
Trading Companies & Distributors | | 0.7 | |
Call Options Written | | (0.1 | ) |
| | |
|
|
| | | 136.2 | |
Liabilities in excess of other assets | | (36.2 | ) |
| | |
|
|
| | | 100.0 | % |
| | |
|
|
SEE NOTES TO FINANCIAL STATEMENTS.
B47
| | | | |
| | | SP STATE STREET RESEARCH SMALL CAP GROWTH PORTFOLIO | | |
SCHEDULE OF INVESTMENTS | December 31, 2004 |
| | | | | |
| LONG-TERM INVESTMENTS — 98.4% | | Value (Note 2)
|
| COMMON STOCKS | | Shares
| |
Apparel — 0.7% | | | | | |
Aeropostale, Inc.(a) | | 43,100 | | $ | 1,268,433 |
| | | | |
|
|
Banking — 6.1% | | | | | |
CapitalSource, Inc.(a) | | 133,700 | | | 3,432,079 |
East West Bancorp, Inc. | | 37,600 | | | 1,577,696 |
Southwest Bancorp of Texas, Inc. | | 125,900 | | | 2,932,211 |
UCBH Holdings, Inc. | | 73,500 | | | 3,367,770 |
| | | | |
|
|
| | | | | | 11,309,756 |
| | | | |
|
|
Computer Software & Services — 10.1% | | | | | |
Anteon International Corp.(a) | | 97,900 | | | 4,098,094 |
BEA Systems, Inc.(a) | | 260,400 | | | 2,307,144 |
CACI International, Inc.(a) | | 48,700 | | | 3,317,931 |
Epicor Software Corp.(a) | | 82,000 | | | 1,155,380 |
Hyperion Solutions Corp.(a) | | 57,200 | | | 2,666,664 |
Mobility Electronics, Inc.(a) | | 156,100 | | | 1,339,338 |
Quest Software, Inc.(a) | | 66,800 | | | 1,065,460 |
Sybase, Inc.(a) | | 130,500 | | | 2,603,475 |
| | | | |
|
|
| | | | | | 18,553,486 |
| | | | |
|
|
Consulting — 3.6% | | | | | |
Advisory Board Co. (The)(a) | | 30,000 | | | 1,106,400 |
Corporate Executive Board Co. (The) | | 41,800 | | | 2,798,092 |
LECG Corp.(a) | | 142,700 | | | 2,661,355 |
| | | | |
|
|
| | | | | | 6,565,847 |
| | | | |
|
|
Diversified Manufacturing Operations — 0.5% | | | |
ESCO Technologies, Inc.(a) | | 11,900 | | | 912,135 |
| | | | |
|
|
Education — 1.6% | | | | | |
Laureate Education, Inc.(a) | | 66,900 | | | 2,949,621 |
| | | | |
|
|
Electronics — 4.1% | | | | | |
Aeroflex, Inc.(a) | | 111,400 | | | 1,350,168 |
Avocent Corp.(a) | | 32,300 | | | 1,308,796 |
Harman International Industries, Inc. | | 38,400 | | | 4,876,800 |
| | | | |
|
|
| | | | | | 7,535,764 |
| | | | |
|
|
Electronic Components — 4.4% | | | | | |
Cree, Inc.(a) | | 27,900 | | | 1,118,232 |
Cymer, Inc.(a) | | 94,700 | | | 2,797,438 |
Microsemi Corp.(a) | | 155,800 | | | 2,704,688 |
NVIDIA Corp.(a) | | 64,700 | | | 1,524,332 |
| | | | |
|
|
| | | | | | 8,144,690 |
| | | | |
|
|
Financial Services — 3.6% | | | | | |
Affiliated Managers Group, Inc.(a) | | 75,100 | | | 5,087,274 |
Collegiate Funding Services, Inc.(a) | | 110,800 | | | 1,561,172 |
| | | | |
|
|
| | | | | | 6,648,446 |
| | | | |
|
|
Gaming — 8.0% | | | | | |
Boyd Gaming Corp. | | 123,700 | | | 5,152,105 |
Pinnacle Entertainment, Inc.(a) | | 207,400 | | | 4,102,372 |
Shuffle Master, Inc.(a) | | 43,300 | | | 2,039,430 |
Station Casinos, Inc. | | 61,500 | | | 3,362,820 |
| | | | |
|
|
| | | | | | 14,656,727 |
| | | | |
|
|
Health Services — 5.4% | | | | | |
AmSurg Corp.(a) | | 37,600 | | | 1,110,704 |
Community Health Systems, Inc.(a) | | 89,700 | | | 2,500,836 |
LifePoint Hospitals, Inc.(a) | | 74,900 | | | 2,608,018 |
United Surgical Partners International, Inc.(a) | | 88,400 | | | 3,686,280 |
| | | | |
|
|
| | | | | | 9,905,838 |
| | | | |
|
|
| | | | | |
COMMON STOCKS
(Continued) | | Shares
| | Value (Note 2)
|
Human Resources — 2.6% | | | | | |
Resources Connection, Inc.(a) | | 89,100 | | $ | 4,839,021 |
| | | | |
|
|
Insurance — 1.1% | | | | | |
Bristol West Holdings, Inc. | | 105,800 | | | 2,116,000 |
| | | | |
|
|
Internet Services — 1.8% | | | | | |
Ask Jeeves, Inc.(a) | | 85,400 | | | 2,284,450 |
Jupitermedia Corp.(a) | | 40,900 | | | 972,602 |
| | | | |
|
|
| | | | | | 3,257,052 |
| | | | |
|
|
Media — 1.3% | | | | | |
Citadel Broadcasting Corp.(a) | | 105,100 | | | 1,700,518 |
Entravision Communications Corp. (Class “A” Stock)(a) | | 82,000 | | | 684,700 |
| | | | |
|
|
| | | | | | 2,385,218 |
| | | | |
|
|
Medical Products — 15.6% | | | | | |
Abgenix, Inc.(a) | | 101,200 | | | 1,046,408 |
Advanced Medical Optics, Inc.(a) | | 80,100 | | | 3,295,314 |
Alkermes, Inc.(a) | | 126,400 | | | 1,780,976 |
Animas Corp.(a) | | 77,600 | | | 1,212,888 |
Cooper Cos., Inc. (The) | | 26,300 | | | 1,856,517 |
Covance, Inc.(a) | | 52,200 | | | 2,022,750 |
Cutera, Inc.(a) | | 110,650 | | | 1,380,912 |
ICOS Corp.(a) | | 52,000 | | | 1,470,560 |
INAMED Corp.(a) | | 54,900 | | | 3,472,425 |
Invitrogen Corp.(a) | | 32,300 | | | 2,168,299 |
LCA-Vision, Inc. | | 67,300 | | | 1,574,147 |
Martek Biosciences Corp.(a) | | 64,000 | | | 3,276,800 |
MGI Pharma, Inc.(a) | | 45,500 | | | 1,274,455 |
Protein Design Labs, Inc.(a) | | 90,300 | | | 1,865,598 |
Wright Medical Group, Inc.(a) | | 36,800 | | | 1,048,800 |
| | | | |
|
|
| | | | | | 28,746,849 |
| | | | |
|
|
Metals & Mining — 1.5% | | | | | |
AK Steel Holding Corp.(a) | | 67,700 | | | 979,619 |
CONSOL Energy, Inc. | | 41,200 | | | 1,691,260 |
| | | | |
|
|
| | | | | | 2,670,879 |
| | | | |
|
|
Oil & Gas Equipment & Services — 1.4% | | | |
Newpark Resources, Inc.(a) | | 297,900 | | | 1,534,185 |
Tidewater, Inc. | | 29,300 | | | 1,043,373 |
| | | | |
|
|
| | | | | | 2,577,558 |
| | | | |
|
|
Oil & Gas Exploration & Production — 2.5% | | | |
Cabot Oil & Gas Corp. | | 20,600 | | | 911,550 |
Patterson-UTI Energy, Inc. | | 65,400 | | | 1,272,030 |
Pride International, Inc.(a) | | 117,800 | | | 2,419,612 |
| | | | |
|
|
| | | | | | 4,603,192 |
| | | | |
|
|
Retail — 7.3% | | | | | |
Aaron Rents, Inc. | | 109,700 | | | 2,742,500 |
Applebee’s International, Inc. | | 45,900 | | | 1,214,055 |
Cost Plus, Inc.(a) | | 24,600 | | | 790,398 |
Guitar Center, Inc.(a) | | 57,500 | | | 3,029,675 |
RARE Hospitality International, Inc.(a) | | 91,600 | | | 2,918,376 |
West Marine, Inc.(a) | | 107,300 | | | 2,655,675 |
| | | | |
|
|
| | | | | | 13,350,679 |
| | | | |
|
|
SEE NOTES TO FINANCIAL STATEMENTS.
B48
| | | | |
| | | SP STATE STREET RESEARCH SMALL CAP GROWTH PORTFOLIO (Continued) | | |
SCHEDULE OF INVESTMENTS | December 31, 2004 |
| | | | | | | |
COMMON STOCKS
(Continued) | | Shares
| | Value (Note 2)
| |
Semiconductor Equipment — 4.7% | | | | | | | |
02Micro International Ltd.
(Cayman Islands)(a) | | | 99,700 | | $ | 1,140,568 | |
ATMI, Inc.(a) | | | 51,800 | | | 1,167,054 | |
Essex Corp.(a) | | | 33,000 | | | 668,250 | |
Genesis Microchip, Incorp.(a) | | | 68,300 | | | 1,107,826 | |
Helix Technology Corp. | | | 81,800 | | | 1,422,502 | |
Mattson Technology, Inc.(a) | | | 96,900 | | | 1,091,094 | |
Micrel, Inc.(a) | | | 97,800 | | | 1,077,756 | |
Teradyne, Inc.(a) | | | 62,000 | | | 1,058,340 | |
| | | | | |
|
|
|
| | | | | | | 8,733,390 | |
| | | | | |
|
|
|
Telecommunication Equipment — 10.5% | | | | |
American Tower Corp.
(Class “A” Stock)(a) | | | 285,400 | | | 5,251,360 | |
Anaren, Inc.(a) | | | 106,900 | | | 1,385,424 | |
Andrew Corp.(a) | | | 83,100 | | | 1,132,653 | |
Ditech Communications Corp.(a) | | | 66,400 | | | 992,680 | |
Polycom, Inc.(a) | | | 224,700 | | | 5,240,004 | |
Scientific-Atlanta, Inc. | | | 47,700 | | | 1,574,577 | |
SpectraLink Corp. | | | 180,800 | | | 2,563,744 | |
SpectraSite, Inc.(a) | | | 21,500 | | | 1,244,850 | |
| | | | | |
|
|
|
| | | | | | | 19,385,292 | |
| | | | | |
|
|
|
TOTAL LONG-TERM INVESTMENTS
(cost $158,682,562) | | | 181,115,873 | |
| | |
|
|
|
| SHORT-TERM INVESTMENT — 2.1% | | | | |
| | |
| | | Principal
Amount
(000)
| | | |
| COMMERCIAL PAPER | | | | | | | |
UBS Finance, Inc. 2.20%, 1/3/05 | | $ | 3,861 | | | 3,860,528 | |
| | |
|
|
|
(cost $3,860,528) | | | | | | | |
TOTAL INVESTMENTS — 100.5%
(cost $162,543,090; Note 6) | | | 184,976,401 | |
LIABILITIES IN EXCESS OF
OTHER ASSETS — (0.5)% | | | (903,985 | ) |
| | | | | |
|
|
|
NET ASSETS — 100% | | $ | 184,072,416 | |
| | | | | |
|
|
|
| (a) | Non-income producing security. |
The industry classification of portfolio holdings and liabilities in excess of other assets shown as a percentage of net assets as of December 31, 2004 was as follows:
| | | |
Medical Products | | 15.6 | % |
Telecommunication Equipment | | 10.5 | |
Computer Software & Services | | 10.1 | |
Gaming | | 8.0 | |
Retail | | 7.3 | |
Banking | | 6.1 | |
Health Services | | 5.4 | |
Semiconductor Equipment | | 4.7 | |
Electronic Components | | 4.4 | |
Electronics | | 4.1 | |
Consulting | | 3.6 | |
Financial Services | | 3.6 | |
Human Resources | | 2.6 | |
Oil & Gas Exploration & Production | | 2.5 | |
Commercial Paper | | 2.1 | |
Internet Services | | 1.8 | |
Education | | 1.6 | |
Metals & Mining | | 1.5 | |
Oil & Gas Equipment & Services | | 1.4 | |
Media | | 1.3 | |
Insurance | | 1.1 | |
Apparel | | 0.7 | |
Diversified Manufacturing Operations | | 0.5 | |
| | |
|
|
| | | 100.5 | |
Liabilities in excess of other assets | | (0.5 | ) |
| | |
|
|
| | | 100.0 | % |
| | |
|
|
SEE NOTES TO FINANCIAL STATEMENTS.
B49
| | | | |
| | | SP STRATEGIC PARTNERS FOCUSED GROWTH PORTFOLIO (Continued) | | |
SCHEDULE OF INVESTMENTS | December 31, 2004 |
| | | | | |
| LONG-TERM INVESTMENTS — 98.2% | | Value (Note 2)
|
| COMMON STOCKS | | Shares
| |
Biotechnology — 6.2% | | | | | |
Amgen, Inc.(a) | | 15,500 | | $ | 994,325 |
Genentech, Inc.(a) | | 37,100 | | | 2,019,724 |
Gilead Sciences, Inc.(a) | | 24,300 | | | 850,257 |
| | | | |
|
|
| | | | | | 3,864,306 |
| | | | |
|
|
Capital Markets — 2.6% | | | | | |
Merrill Lynch & Co., Inc. | | 27,400 | | | 1,637,698 |
| | | | |
|
|
Communications Equipment — 5.7% | | | | | |
Corning, Inc.(a) | | 88,400 | | | 1,040,468 |
Juniper Networks, Inc.(a) | | 41,000 | | | 1,114,790 |
QUALCOMM, Inc. | | 32,500 | | | 1,378,000 |
| | | | |
|
|
| | | | | | 3,533,258 |
| | | | |
|
|
Computers & Peripherals — 5.3% | | | | | |
Apple Computer, Inc.(a) | | 25,100 | | | 1,616,440 |
Dell, Inc.(a) | | 39,450 | | | 1,662,423 |
| | | | |
|
|
| | | | | | 3,278,863 |
| | | | |
|
|
Consumer Finance — 2.6% | | | | | |
American Express Co. | | 29,000 | | | 1,634,730 |
| | | | |
|
|
Cosmetics & Toiletries — 1.3% | | | | | |
Avon Products, Inc. | | 20,800 | | | 804,960 |
| | | | |
|
|
Diversified Financial Services — 6.2% | | | | | |
Citigroup, Inc. | | 19,150 | | | 922,647 |
J.P. Morgan Chase & Co. | | 41,900 | | | 1,634,519 |
MBNA Corp. | | 45,200 | | | 1,274,188 |
| | | | |
|
|
| | | | | | 3,831,354 |
| | | | |
|
|
Electronic Equipment & Instruments — 3.8% | | | | | |
Agilent Technologies, Inc.(a) | | 67,800 | | | 1,633,980 |
Broadcom Corp.(a) | | 22,300 | | | 719,844 |
| | | | |
|
|
| | | | | | 2,353,824 |
| | | | |
|
|
Food & Staples Retailing — 2.7% | | | | | |
Whole Foods Market, Inc. | | 17,300 | | | 1,649,555 |
| | | | |
|
|
Health Care Equipment & Supplies — 2.9% | | | | | |
Boston Scientific Corp.(a) | | 17,000 | | | 604,350 |
Zimmer Holdings, Inc.(a) | | 15,200 | | | 1,217,824 |
| | | | |
|
|
| | | | | | 1,822,174 |
| | | | |
|
|
Health Care Providers & Services — 2.5% | | | | | |
UnitedHealth Group, Inc. | | 17,800 | | | 1,566,934 |
| | | | |
|
|
Hotels, Restaurants & Leisure — 2.8% | | | | | |
Starbucks Corp.(a) | | 28,000 | | | 1,746,080 |
| | | | |
|
|
Industrial Conglomerates — 5.4% | | | | | |
General Electric Co. | | 92,600 | | | 3,379,900 |
| | | | |
|
|
Insurance — 2.6% | | | | | |
American International Group, Inc. | | 24,700 | | | 1,622,049 |
| | | | |
|
|
Internet & Catalog Retail — 6.6% | | | | | |
eBay, Inc.(a) | | 35,025 | | | 4,072,707 |
| | | | |
|
|
Internet Software & Services — 8.7% | | | | | |
Google, Inc. (Class “A” Stock)(a) | | 9,000 | | | 1,737,900 |
Yahoo!, Inc.(a) | | 96,900 | | | 3,651,192 |
| | | | |
|
|
| | | | | | 5,389,092 |
| | | | |
|
|
Media — 1.5% | | | | | |
E.W. Scripps Co. (Class “A” Stock) | | 19,650 | | | 948,702 |
| | | | |
|
|
| | | | | | |
COMMON STOCKS
(Continued) | | Shares
| | Value (Note 2)
| |
Multiline Retail — 4.6% | | | | | | |
Target Corp. | | 54,500 | | $ | 2,830,185 | |
| | | | |
|
|
|
Oil & Gas Drilling — 1.6% | | | | | | |
Nabors Industries, Ltd. (Barbados)(a) | | 19,850 | | | 1,018,107 | |
| | | | |
|
|
|
Personal Products — 2.3% | | | | | | |
Estee Lauder Cos, Inc. | | 31,000 | | | 1,418,870 | |
| | | | |
|
|
|
Pharmaceuticals — 4.9% | | | | | | |
Alcon, Inc. | | 16,500 | | | 1,329,900 | |
Eli Lilly & Co. | | 20,100 | | | 1,140,675 | |
Pfizer, Inc. | | 21,560 | | | 579,479 | |
| | | | |
|
|
|
| | | | | | 3,050,054 | |
| | | | |
|
|
|
Semiconductors & Semiconductor Equipment — 1.8% | |
Marvell Technology Group Ltd. (Bermuda)(a) | | 31,600 | | | 1,120,852 | |
| | | | |
|
|
|
Software — 9.3% | | | | | | |
Electronic Arts, Inc.(a) | | 51,600 | | | 3,182,688 | |
Microsoft Corp. | | 59,600 | | | 1,591,916 | |
Symantec Corp.(a) | | 40,100 | | | 1,032,976 | |
| | | | |
|
|
|
| | | | | | 5,807,580 | |
| | | | |
|
|
|
Specialty Retail — 2.7% | | | | | | |
Lowe’s Cos., Inc. | | 29,200 | | | 1,681,628 | |
| | | | |
|
|
|
Wireless Telecommunication Services — 1.6% | | | | |
Nextel Communications, Inc.
(Class “A” Stock)(a) | | 32,800 | | | 984,000 | |
| | | | |
|
|
|
TOTAL LONG-TERM INVESTMENTS
(cost $51,832,833) | | | | | 61,047,462 | |
| | | | |
|
|
|
| SHORT-TERM INVESTMENTS — 2.5% | | | | |
Mutual Fund — 2.0% | | | | | | |
Dryden Core Investment Fund — Taxable Money Market Series
(cost $1,250,083 Note 4) | | 1,250,083 | | | 1,250,083 | |
| | | | |
|
|
|
| | |
| | | Principal Amount (000)
| | | |
Repurchase Agreement — 0.5% | | | | | | |
State Street Bank & Trust Co.,
1.75%, 1/3/05(b) (cost $300,320) | | $300 | | | 300,320 | |
| | | | |
|
|
|
TOTAL SHORT-TERM INVESTMENTS
(cost $1,550,403) | | | 1,550,403 | |
| | | | |
|
|
|
TOTAL INVESTMENTS — 100.7%
(cost $53,383,236; Note 6) | | | 62,597,865 | |
LIABILITIES IN EXCESS OF
OTHER ASSETS — (0.7)% | | | (446,884 | ) |
| | | | |
|
|
|
NET ASSETS — 100% | | $ | 62,150,981 | |
| | | | |
|
|
|
| (a) | Non-income producing security. |
| (b) | State Street Bank & Trust Company Repurchase Agreement, repurchase price $300,364 due 1/03/05. The value of the collateral including accrued interest was $312,473. Collateralized by United States Treasury or Federal Agency obligations. |
SEE NOTES TO FINANCIAL STATEMENTS.
B50
| | | | |
| | | SP STRATEGIC PARTNERS FOCUSED GROWTH PORTFOLIO (Continued) | | |
SCHEDULE OF INVESTMENTS | December 31, 2004 |
The industry classification of portfolio holdings and liabilities in excess of other assets shown as a percentage of net assets as of December 31, 2004 was as follows:
| | | |
Software | | 9.3 | % |
Internet Software & Services | | 8.7 | |
Internet & Catalog Retail | | 6.6 | |
Biotechnology | | 6.2 | |
Diversified Financial Services | | 6.2 | |
Communications Equipment | | 5.7 | |
Industrial Conglomerates | | 5.4 | |
Computers & Peripherals | | 5.3 | |
Pharmaceuticals | | 4.9 | |
Multiline Retail | | 4.6 | |
Electronic Equipment & Instruments | | 3.8 | |
Health Care Equipment & Supplies | | 2.9 | |
Hotels, Restaurants & Leisure | | 2.8 | |
Food & Staples Retailing | | 2.7 | |
Specialty Retail | | 2.7 | |
Capital Markets | | 2.6 | |
Consumer Finance | | 2.6 | |
Insurance | | 2.6 | |
Health Care Providers & Services | | 2.5 | |
Personal Products | | 2.3 | |
Mutual Fund | | 2.0 | |
Semiconductors & Semiconductor Equipment | | 1.8 | |
Oil & Gas Drilling | | 1.6 | |
Wireless Telecommunication Services | | 1.6 | |
Media | | 1.5 | |
Cosmetics & Toiletries | | 1.3 | |
Repurchase Agreement | | 0.5 | |
| | |
|
|
| | | 100.7 | |
Liabilities in excess of other assets | | (0.7 | ) |
| | |
|
|
| | | 100.0 | % |
| | |
|
|
SEE NOTES TO FINANCIAL STATEMENTS.
B51
SCHEDULE OF INVESTMENTS | December 31, 2004 |
| | | | | |
| LONG-TERM INVESTMENTS — 98.1% | | Value
(Note 2)
|
| COMMON STOCKS | | Shares
| |
Communications Equipment — 14.2% | | | |
Cisco Systems, Inc.(a) | | 45,000 | | $ | 868,500 |
Corning, Inc.(a) | | 68,000 | | | 800,360 |
Juniper Networks, Inc.(a) | | 30,000 | | | 815,700 |
Motorola, Inc. | | 41,500 | | | 713,800 |
QUALCOMM, Inc. | | 22,000 | | | 932,800 |
| | | | |
|
|
| | | | | | 4,131,160 |
| | | | |
|
|
Computer Hardware — 10.9% | | | | | |
Dell, Inc.(a) | | 31,500 | | | 1,327,410 |
EMC Corp.(a) | | 44,500 | | | 661,715 |
Network Appliance, Inc.(a) | | 35,000 | | | 1,162,700 |
| | | | |
|
|
| | | | | | 3,151,825 |
| | | | |
|
|
Computer Services — 4.2% | | | | | |
Automatic Data Processing, Inc. | | 17,500 | | | 776,125 |
Cognizant Technology Solutions Corp. (Class “A” Stock)(a) | | 10,500 | | | 444,465 |
| | | | |
|
|
| | | | | | 1,220,590 |
| | | | |
|
|
Consulting Services — 2.6% | | | | | |
Accenture Ltd. (Class “A” Stock) (Bermuda)(a) | | 28,000 | | | 756,000 |
| | | | |
|
|
Education — 2.6% | | | | | |
Apollo Group, Inc. (Class “A” Stock)(a) | | 9,300 | | | 750,603 |
| | | | |
|
|
Electronic Components — 4.8% | | | | | |
Microchip Technology, Inc. | | 24,000 | | | 639,840 |
Xilinx, Inc. | | 25,000 | | | 741,250 |
| | | | |
|
|
| | | | | | 1,381,090 |
| | | | |
|
|
Internet Content — 8.0% | | | | | |
eBay, Inc.(a) | | 11,000 | | | 1,279,080 |
Yahoo!, Inc.(a) | | 28,000 | | | 1,055,040 |
| | | | |
|
|
| | | | | | 2,334,120 |
| | | | |
|
|
Internet Services — 4.2% | | | | | |
Check Point Software Technologies Ltd.(a) | | 23,500 | | | 578,805 |
VeriSign, Inc.(a) | | 19,200 | | | 643,584 |
| | | | |
|
|
| | | | | | 1,222,389 |
| | | | |
|
|
Medical Products — 2.8% | | | | | |
Zimmer Holdings, Inc.(a) | | 10,000 | | | 801,200 |
| | | | |
|
|
Medical Technology — 6.9% | | | | | |
Amgen, Inc.(a) | | 10,500 | | | 673,575 |
Genentech, Inc.(a) | | 12,200 | | | 664,168 |
Teva Pharmaceutical Industries Ltd. ADR (Israel) | | 22,500 | | | 671,850 |
| | | | |
|
|
| | | | | | 2,009,593 |
| | | | |
|
|
Semiconductor Components — 10.2% | | | |
Intel Corp. | | 22,000 | | | 514,580 |
Linear Technology Corp. | | 17,500 | | | 678,300 |
Taiwan Semiconductor Manufacturing Co. Ltd. ADR (Taiwan) | | 95,500 | | | 810,795 |
Texas Instruments, Inc. | | 17,000 | | | 418,540 |
United Microelectronics Corp. ADR (Taiwan)(a) | | 150,000 | | | 529,500 |
| | | | |
|
|
| | | | | | 2,951,715 |
| | | | |
|
|
| | | | | | | |
| COMMON STOCKS | | Value
(Note 2)
| |
| (Continued) | | Shares
| |
Software — 17.4% | | | | | | | |
Adobe Systems, Inc. | | | 14,500 | | $ | 909,730 | |
Cognos, Inc. (Canada)(a) | | | 12,000 | | | 528,720 | |
Electronic Arts, Inc.(a) | | | 7,000 | | | 431,760 | |
Mercury Interactive Corp.(a) | | | 11,000 | | | 501,050 | |
Microsoft Corp. | | | 33,500 | | | 894,785 | |
Oracle Corp.(a) | | | 40,500 | | | 555,660 | |
SAP AG, ADR (Germany) | | | 18,500 | | | 817,885 | |
Symantec Corp.(a) | | | 14,500 | | | 373,520 | |
TIBCO Software, Inc.(a) | | | 2,200 | | | 29,348 | |
| | | | | |
|
|
|
| | | | | | | 5,042,458 | |
| | | | | |
|
|
|
Telecommunication Equipment — 4.8% | | | | |
Avaya, Inc.(a) | | | 47,000 | | | 808,400 | |
Comverse Technology, Inc.(a) | | | 24,300 | | | 594,135 | |
| | | | | |
|
|
|
| | | | | | | 1,402,535 | |
| | | | | |
|
|
|
Telecommunication Services — 4.5% | | | | |
Amdocs Ltd. (Israel)(a) | | | 30,000 | | | 787,500 | |
Verizon Communications, Inc. | | | 13,000 | | | 526,630 | |
| | | | | |
|
|
|
| | | | | | | 1,314,130 | |
| | | | | |
|
|
|
TOTAL LONG-TERM INVESTMENTS
(cost $26,533,570) | | | 28,469,408 | |
| | | | | |
|
|
|
| | |
SHORT-TERM
INVESTMENT — 2.2% | | Principal
Amount
(000)
| | | |
Repurchase Agreement | | | | | | | |
State Street Bank & Trust Co., 1.75%, 1/3/05(b)
(cost $640,940) | | $ | 641 | | | 640,940 | |
| | | | | |
|
|
|
| |
TOTAL INVESTMENTS — 100.3%
(cost $27,174,510; Note 6) | | | 29,110,348 | |
LIABILITIES IN EXCESS OF
OTHER ASSETS — (0.3)% | | | (79,788 | ) |
| | | | | |
|
|
|
NET ASSETS — 100% | | $ | 29,030,560 | |
| | | | | |
|
|
|
The following abbreviation is used in portfolio descriptions:
| | |
| ADR | | American Depositary Receipt |
| (a) | Non-income producing security. |
| (b) | State Street Bank & Trust Company Repurchase Agreement, repurchase price $641,033 due 1/3/05. The value of the collateral including accrued interest was $658,748. Collateralized by United States Treasury or Federal Agency obligations. |
SEE NOTES TO FINANCIAL STATEMENTS.
B52
| | | | |
| | | SP TECHNOLOGY PORTFOLIO (Continued) | | |
SCHEDULE OF INVESTMENTS | December 31, 2004 |
The industry classification of portfolio holdings and liabilities in excess of other assets shown as a percentage of net assets as of December 31, 2004 was as follows:
| | | |
Software | | 17.4 | % |
Communications Equipment | | 14.2 | |
Computer Hardware | | 10.9 | |
Semiconductor Components | | 10.2 | |
Internet Content | | 8.0 | |
Medical Technology | | 6.9 | |
Telecommunication Equipment | | 4.8 | |
Electronic Components | | 4.8 | |
Telecommunication Services | | 4.5 | |
Internet Services | | 4.2 | |
Computer Services | | 4.2 | |
Medical Products | | 2.8 | |
Consulting Services | | 2.6 | |
Education | | 2.6 | |
Repurchase Agreement | | 2.2 | |
| | |
|
|
| | | 100.3 | |
Liabilities in excess of other assets | | (0.3 | ) |
| | |
|
|
| | | 100.0 | % |
| | |
|
|
SEE NOTES TO FINANCIAL STATEMENTS.
B53
| | | | |
| | | SP WILLIAM BLAIR INTERNATIONAL GROWTH PORTFOLIO | | |
SCHEDULE OF INVESTMENTS | December 31, 2004 |
| | | | | |
| LONG-TERM INVESTMENTS — 94.6% | | Value (Note 2)
|
| COMMON STOCKS — 93.4% | | Shares
| |
Australia — 4.2% | | | | | |
Macquarie Bank Ltd. | | 196,800 | | $ | 7,173,625 |
Toll Holdings Ltd. | | 312,900 | | | 3,137,160 |
Wesfarmers Ltd. | | 196,100 | | | 6,118,167 |
| | | | |
|
|
| | | | | | 16,428,952 |
| | | | |
|
|
Austria — 2.1% | | | | | |
Erste Bank der Oesterreichischen Sparkassen AG | | 151,400 | | | 8,087,563 |
| | | | |
|
|
Bermuda — 1.9% | | | | | |
Accenture Ltd.
(Class “A” Stock)(a) | | 275,800 | | | 7,446,600 |
| | | | |
|
|
Canada — 6.1% | | | | | |
Alimentation Couche-Tard, Inc.(a) | | 56,300 | | | 1,668,113 |
Canadian National Railway Co. | | 63,200 | | | 3,854,295 |
Manulife Financial Corp. | | 84,500 | | | 3,907,107 |
Precision Drilling Corp.(a) | | 42,600 | | | 2,685,100 |
Research In Motion Ltd.(a) | | 56,500 | | | 4,658,073 |
Shoppers Drug Mart Corp.(a) | | 72,200 | | | 2,245,874 |
Suncor Energy, Inc. | | 136,300 | | | 4,823,369 |
| | | | |
|
|
| | | | | | 23,841,931 |
| | | | |
|
|
China — 1.4% | | | | | |
CNOOC Ltd. | | 9,861,000 | | | 5,296,702 |
| | | | |
|
|
France — 7.1% | | | | | |
Dassault Systemes SA | | 76,400 | | | 3,852,712 |
Essilor International SA | | 52,700 | | | 4,129,611 |
Hermes International | | 9,100 | | | 1,815,794 |
JC Decaux SA(a) | | 80,600 | | | 2,353,253 |
LVMH Moet Hennessy Louis Vuitton SA | | 25,300 | | | 1,937,821 |
Sanofi-Synthelabo SA | | 167,500 | | | 13,387,250 |
| | | | |
|
|
| | | | | | 27,476,441 |
| | | | |
|
|
Germany — 10.0% | | | | | |
Celesio AG | | 97,000 | | | 7,889,738 |
Continental AG | | 95,700 | | | 6,078,647 |
E.ON AG(a) | | 105,700 | | | 9,634,691 |
Puma AG Rudolf Dassler Sport | | 10,400 | | | 2,859,753 |
SAP AG | | 69,800 | | | 12,466,657 |
| | | | |
|
|
| | | | | | 38,929,486 |
| | | | |
|
|
Greece — 2.6% | | | | | |
Coco-Cola Hellenic Bottling Co. SA | | 98,700 | | | 2,414,843 |
EFG Eurobank Ergasias | | 115,000 | | | 3,948,485 |
National Bank Of Greece SA | | 118,170 | | | 3,899,915 |
| | | | |
|
|
| | | | | | 10,263,243 |
| | | | |
|
|
| | | | |
Hong Kong — 4.8% | | | | |
Esprit Holdings Ltd. | | 649,300 | | 3,926,190 |
Standard Chartered PLC | | 569,200 | | 10,583,846 |
Techtronic Industries Co. Ltd. | | 1,807,800 | | 3,953,916 |
| | | | |
|
| | | | | 18,463,952 |
| | | | |
|
India — 1.8% | | | | |
HDFC Bank Ltd., ADR | | 47,200 | | 2,140,992 |
Infosys Technologies Ltd., ADR | | 71,600 | | 4,962,596 |
| | | | |
|
| | | | | 7,103,588 |
| | | | |
|
| | | | | |
COMMON STOCKS
(Continued) | | Shares
| | Value (Note 2)
|
Ireland — 1.0% | | | | | |
Anglo Irish Bank Corp., PLC | | 157,300 | | $ | 3,812,232 |
| | | | |
|
|
Italy — 1.5% | | | | | |
Banco Popolare di Verona e Novara S.c.r.l | | 293,100 | | | 5,960,005 |
| | | | |
|
|
Japan — 19.5% | | | | | |
ASKUL Corp. | | 24,700 | | | 1,518,591 |
Canon, Inc. | | 216,700 | | | 11,694,652 |
Denso Corp. | | 330,000 | | | 8,840,148 |
Fast Retailing Co. Ltd. | | 51,700 | | | 3,935,396 |
Hino Motors Ltd. | | 570,000 | | | 4,233,141 |
Hoya Corp. | | 49,200 | | | 5,555,226 |
Keyence Corp. | | 16,900 | | | 3,786,708 |
Nidec Corp. | | 31,900 | | | 3,888,270 |
ORIX Corp. | | 42,900 | | | 5,827,735 |
Sharp Corp. | | 528,000 | | | 8,620,513 |
Shinsei Bank Ltd. | | 569,000 | | | 3,875,886 |
SMC Corp. | | 34,400 | | | 3,937,855 |
Sumitomo Trust and
Banking Co. Ltd. (The) | | 815,000 | | | 5,893,579 |
TOTO Ltd. | | 163,000 | | | 1,555,714 |
Yamada Denki Co. Ltd. | | 60,000 | | | 2,570,508 |
| | | | |
|
|
| | | | | | 75,733,922 |
| | | | |
|
|
Mexico — 2.0% | | | | | |
America Movil SA de CV, Ser. L | | 1,612,100 | | | 4,235,975 |
Wal-Mart de Mexico SA
de CV, Ser. V | | 1,071,500 | | | 3,681,569 |
| | | | |
|
|
| | | | | | 7,917,544 |
| | | | |
|
|
Norway — 2.0% | | | | | |
Statoil ASA | | 488,600 | | | 7,663,808 |
| | | | |
|
|
Russia — 0.4% | | | | | |
Mobile TeleSystems OJSC, ADR | | 11,600 | | | 1,606,716 |
| | | | |
|
|
South Africa — 1.1% | | | | | |
Standard Bank Group Ltd. | | 367,393 | | | 4,291,007 |
| | | | |
|
|
South Korea — 4.2% | | | | | |
Hyundai Motor Co. | | 129,700 | | | 6,953,584 |
Samsung Electronics Co. Ltd. | | 21,100 | | | 9,182,332 |
| | | | |
|
|
| | | | | | 16,135,916 |
| | | | |
|
|
Spain — 0.9% | | | | | |
Grupo Ferrovial SA | | 64,600 | | | 3,452,592 |
| | | | |
|
|
Sweden — 2.3% | | | | | |
Telefonaktiebolaget LM Ericsson(a) | | 2,737,500 | | | 8,733,109 |
| | | | |
|
|
Switzerland — 2.6% | | | | | |
Serono SA (Class “B” Stock) | | 5,300 | | | 3,491,074 |
UBS AG | | 79,340 | | | 6,652,949 |
| | | | |
|
|
| | | | | | 10,144,023 |
| | | | |
|
|
United Kingdom — 13.9% | | | | | |
BG Group PLC | | 1,611,500 | | | 10,952,483 |
Capital Group PLC | | 674,300 | | | 4,734,962 |
Carnival PLC | | 160,400 | | | 9,786,722 |
SEE NOTES TO FINANCIAL STATEMENTS.
B54
| | | | |
| | | SP WILLIAM BLAIR INTERNATIONAL GROWTH PORTFOLIO (Continued) | | |
SCHEDULE OF INVESTMENTS | December 31, 2004 |
| | | | | |
COMMON STOCKS
(Continued) | | Shares
| | Value (Note 2)
|
United Kingdom (cont’d.) | | | | | |
Man Group PLC | | 66,300 | | $ | 1,873,701 |
Next PLC | | 120,600 | | | 3,820,412 |
Reckitt Benckiser PLC | | 319,400 | | | 9,652,029 |
Smith & Nephew PLC | | 69,600 | | | 712,222 |
Tesco PLC | | 1,995,200 | | | 12,324,917 |
| | | | |
|
|
| | | | | | 53,857,448 |
| | | | |
|
|
TOTAL COMMON STOCKS
(cost $308,065,969) | | | 362,646,780 |
| | | | |
|
|
| PREFERRED STOCK — 1.2% | | | | | |
Brazil | | | | | |
Banco Itau Holding Financeira SA (cost $2,440,251)(a) | | 30,539 | | | 4,587,749 |
| | | | |
|
|
TOTAL LONG-TERM INVESTMENTS
(cost $ 310,506,220) | | | 367,234,529 |
| | | | |
|
|
| | | | | |
COMMON STOCKS
(Continued) | | Shares
| | Value (Note 2)
|
| SHORT-TERM INVESTMENT — 4.7% | | | |
MUTUAL FUND | | | | | |
Dryden Core Investment Fund – Taxable Money Market Series
(cost $18,007,329) (Note 4) | | 18,007,329 | | $ | 18,007,329 |
| | | | |
|
|
TOTAL INVESTMENTS — 99.3%
(cost $328,513,549; Note 6) | | | 385,241,858 |
| | | | |
|
|
UNREALIZED APPRECIATION ON FORWARD FOREIGN CURRENCY CONTRACTS, NET (b) | | | 5,093 |
OTHER ASSETS IN EXCESS
OF LIABILITIES — 0.7% | | | 2,829,098 |
| | | | |
|
|
NET ASSETS — 100.0% | | $ | 388,076,049 |
| | | | |
|
|
The following abbreviation is used in the portfolio descriptions:
| | |
| ADR | | American Depositary Receipt |
| (a) | Non-income producing security. |
| (b) | Outstanding forward foreign currency contracts as of December 31, 2004 were as follows: |
| | | | | | | | | | |
Foreign Currency Contracts
| | Value at
Settlement Date
| | Current
Value
| | Unrealized
Appreciation/
(Depreciation)
| |
Purchased: | | | | | | | | | | |
Canadian Dollar, | | | | | | | | | | |
expiring 1/04/05 | | $ | 497,423 | | $ | 499,425 | | $ | 2,002 | |
Canadian Dollar, | | | | | | | | | | |
expiring 1/05/05 | | | 973,997 | | | 974,171 | | | 174 | |
Euros, | | | | | | | | | | |
expiring 1/03/05 | | | 111,802 | | | 111,825 | | | 23 | |
Euros, | | | | | | | | | | |
expiring 1/04/05 | | | 364,382 | | | 362,591 | | | (1,791 | ) |
Pound Sterling, | | | | | | | | | | |
expiring 1/04/05 | | | 1,321,062 | | | 1,315,133 | | | (5,929 | ) |
Hong Kong Dollar, | | | | | | | | | | |
expiring 1/03/05 | | | 118,801 | | | 118,919 | | | 118 | |
| | |
|
| |
|
| |
|
|
|
| | | | 3,387,467 | | | 3,382,064 | | | (5,403 | ) |
| | |
|
| |
|
| |
|
|
|
Sold: | | | | | | | | | | |
Euros, | | | | | | | | | | |
expiring 1/03/05 | | | 226,536 | | | 226,749 | | | (213 | ) |
Euros, | | | | | | | | | | |
expiring 1/04/05 | | | 95,686 | | | 95,286 | | | 400 | |
Pound Sterling, | | | | | | | | | | |
expiring 1/04/05 | | | 485,186 | | | 483,009 | | | 2,177 | |
Norwegian Krona, | | | | | | | | | | |
expiring 1/03/05 | | | 128,301 | | | 129,119 | | | (818 | ) |
Swedish Krona, | | | | | | | | | | |
expiring 1/03/05 | | | 2,942,033 | | | 2,933,083 | | | 8,950 | |
| | |
|
| |
|
| |
|
|
|
| | | | 3,877,742 | | | 3,867,246 | | | 10,496 | |
| | |
|
| |
|
| |
|
|
|
| | | | | | | | | $ | 5,093 | |
| | | | | | | | |
|
|
|
SEE NOTES TO FINANCIAL STATEMENTS.
B55
| | | | |
| | | SP WILLIAM BLAIR INTERNATIONAL GROWTH PORTFOLIO (Continued) | | |
SCHEDULE OF INVESTMENTS | December 31, 2004 |
The industry classification of portfolio holdings and other assets in excess of liabilities shown as a percentage of net assets as of December 31, 2004 was as follows:
| | | |
Commercial Banks | | 14.9 | % |
Oil & Gas | | 7.4 | |
Mutual Fund | | 4.7 | |
Software | | 4.2 | |
Food & Staples Retailing | | 4.2 | |
Auto Components | | 3.9 | |
Capital Markets | | 3.7 | |
Pharmaceuticals | | 3.5 | |
Electronic Equipment & Instruments | | 3.4 | |
Household Durables | | 3.2 | |
IT Consulting & Services | | 3.2 | |
Office Electronics | | 3.0 | |
Wireless Telecommunication Services | | 2.7 | |
Specialty Retail | | 2.7 | |
Hotels Restaurants & Leisure | | 2.5 | |
Household Products | | 2.5 | |
Electric Utilities | | 2.5 | |
Semiconductors & Semiconductor Equipment | | 2.4 | |
Communications Equipment | | 2.3 | |
Machinery | | 2.1 | |
Health Care Providers & Services | | 2.0 | |
Multiline Retail | | 1.9 | |
Road & Rail | | 1.8 | |
Automobiles | | 1.8 | |
Textiles, Apparel And Luxury Goods | | 1.7 | |
Industrial Conglomerates | | 1.6 | |
Consumer Finance | | 1.5 | |
Health Care Equipment & Supplies | | 1.3 | |
Commercial Services & Supplies | | 1.2 | |
Insurance | | 1.0 | |
Biotechnology | | 0.9 | |
Construction & Engineering | | 0.9 | |
Energy Equipment & Services | | 0.7 | |
Beverages | | 0.6 | |
Media | | 0.6 | |
Building Products | | 0.4 | |
Internet & Catalog Retail | | 0.4 | |
| | |
|
|
| | | 99.3 | |
Other assets in excess of liabilities | | 0.7 | |
| | |
|
|
| | | 100 | % |
| | |
|
|
SEE NOTES TO FINANCIAL STATEMENTS.
B56
NOTES TO THE FINANCIAL STATEMENTS OF
THE PRUDENTIAL SERIES FUND, INC.
The Prudential Series Fund, Inc. (“Series Fund”), a Maryland corporation, organized on November 15, 1982, is a diversified open-end management investment company registered under the Investment Company Act of 1940, as amended. The Series Fund is composed of thirty-six Portfolios (“Portfolio” or “Portfolios”), each with a separate series of capital stock. The information presented in these financial statements pertains to twenty Portfolios: SP Aggressive Growth Asset Allocation Portfolio, SP AIM Aggressive Growth Portfolio, SP AIM Core Equity Portfolio, SP Alliance Large Cap Growth Portfolio, SP Balanced Asset Allocation Portfolio, SP Conservative Asset Allocation Portfolio, SP Davis Value Portfolio, SP Goldman Sachs Small Cap Value Portfolio, SP Growth Asset Allocation Portfolio, SP Large Cap Value Portfolio, SP LSV International Value Portfolio (formerly SP Deutsche International Equity Portfolio), SP MFS Capital Opportunities Portfolio, SP Mid-Cap Growth Portfolio, SP PIMCO High Yield Portfolio, SP PIMCO Total Return Portfolio, SP Prudential U.S. Emerging Growth Portfolio, SP State Street Research Small Cap Growth Portfolio, SP Strategic Partners Focused Growth Portfolio, SP Technology Portfolio and SP William Blair International Growth Portfolio.
The Portfolios of the Series Fund have the following as investment objectives:
SP Aggressive Growth Asset Allocation Portfolio: Capital appreciation by investing primarily in large cap equity portfolios, international portfolios, and small/mid cap equity portfolios. The Portfolio will achieve this by investing in other Series Fund Portfolios.
SP AIM Aggressive Growth Portfolio: Long-term growth of capital by investing primarily in the common stock of companies whose earnings the Portfolio’s managers expect to grow more than 15% per year.
SP AIM Core Equity Portfolio: Growth of capital with a secondary objective of current income by investing primarily in securities of established companies that have long-term above-average growth in earnings and dividends, and growth companies that the Portfolio managers believe have the potential for above-average growth in earnings and dividends.
SP Alliance Large Cap Growth Portfolio: Growth of capital by pursuing aggressive investment policies. The Portfolio invests primarily in stocks of companies considered to have large capitalizations (those with market capitalizations similar to companies in the Standard & Poor’s 500 Composite Index or the Russell 1000 Index).
SP Balanced Asset Allocation Portfolio: Provide a balance between current income and growth of capital by investing in fixed income portfolios, large cap equity portfolios, small/mid cap equity portfolios, and international equity Portfolios. The Portfolio will achieve this by investing in other Series Fund Portfolios.
SP Conservative Asset Allocation Portfolio: Provide current income with low to moderate capital appreciation by investing in fixed income portfolios, large cap equity portfolios, and small/mid cap equity portfolios. The Portfolio will achieve this by investing in other Series Fund Portfolios.
SP Davis Value Portfolio: Capital growth through investments primarily in common stock of U.S. companies with market capitalization of at least $5 billion.
SP Goldman Sachs Small Cap Value Portfolio: Long-term growth of capital by investing primarily in common stocks of companies with small to medium market capitalization.
SP Growth Asset Allocation Portfolio: Provide long-term growth of capital with consideration also given to current income by investing in large-cap equity portfolios, fixed income portfolios, international equity portfolios and small/mid-cap equity portfolios. The Portfolio will achieve this by investing in other Series Fund Portfolios.
SP Large Cap Value Portfolio: Long-term growth of capital by investing primarily in common stocks of companies with large market capitalization (those with market capitalizations similar to companies in the Standard & Poor’s 500 Composite Index or the Russell 1000 Index).
SP LSV International Value Portfolio: Long-term capital appreciation by investing primarily in the stocks and other equity securities of companies in developed countries outside the United States.
SP MFS Capital Opportunities Portfolio: Capital appreciation by investing primarily in common stocks and related securities, such as preferred stocks, convertible securities and depository receipts for those securities.
C1
SP Mid-Cap Growth Portfolio: Long-term growth of capital by investing primarily in common stocks and related securities, such as preferred stocks, convertible securities and depository receipts for those securities.
SP PIMCO High Yield Portfolio: Maximum total return, consistent with preservation of capital and prudent investment management by investing primarily in a diversified portfolio of high yield/high risk securities rated below investment grade but rated at least B by Moody’s or S&P, or, if unrated, determined by Pacific Investment Management Company (“PIMCO”) to be of comparable quality.
SP PIMCO Total Return Portfolio: Maximum total return, consistent with preservation of capital and prudent investment management by investing primarily in a diversified portfolio of fixed income instruments of varying maturities.
SP Prudential U.S. Emerging Growth Portfolio: Long-term capital appreciation by investing primarily in equity securities of small and medium-sized U.S. companies that the Portfolio manager believes have the potential for above-average growth.
SP State Street Research Small Cap Growth Portfolio: Long-term capital growth by investing mostly in small-capitalization companies which are included in the Russell 2000 Growth Index at the time of purchase, or if not with market capitalizations under $2.5 billion.
SP Strategic Partners Focused Growth Portfolio: Long-term capital growth by investing primarily in equity-related securities of U.S. companies that the adviser believes to have strong capital appreciation potential.
SP Technology Portfolio: Growth of capital by investing primarily in securities of companies that use technology extensively in the development of new or improved products and processes.
SP William Blair International Growth Portfolio: Long-term growth of capital by investing primarily in equity-related securities of foreign issuers.
The ability of issuers of debt securities (other than those issued or guaranteed by the U.S. Government) held by the Portfolios to meet their obligations may be affected by the economic or political developments in a specific industry, region or country.
| Note 2: | | Accounting Policies |
The following is a summary of significant accounting policies followed by the Series Fund and the Portfolios in preparation of their financial statements.
Securities Valuation: Securities listed on a securities exchange are valued at the last sale price on such exchange on the day of valuation or, if there was no sale on such day, at the mean between the last reported bid and asked prices, or at the last bid price on such day in the absence of an asked price. Securities traded via NASDAQ are valued at the official closing price provided by NASDAQ. Securities that are actively traded in the over-the-counter market, including listed securities for which the primary market is believed by Prudential Investments LLC (“PI” or “Manager”) in consultation with the subadvisor, to be over-the-counter, are valued at market value using prices provided by an independent pricing agent or principal market maker. Options on securities and indices traded on an exchange are valued at the last sale price as of the close of trading on the applicable exchange or, if there was no sale, at the mean between the most recently quoted bid and asked prices on such exchange or at the last bid price in absence of an asked price. Futures contracts and options thereon traded on a commodities exchange or board of trade are valued at the last sale price at the close of trading on such exchange or board of trade or, if there was no sale on the applicable commodities exchange or board of trade on such day, at the mean between the most recently quoted bid and asked prices on such exchange or board of trade or at the last bid price in the absence of an asked price. Prices may be obtained from independent pricing services which use information provided by market makers or estimates of market values obtained from yield data relating to investments or securities with similar characteristics. Securities for which reliable market quotations are not readily available, or whose values have been affected by events occurring after the close of the security’s foreign market and before the Series fund’s normal pricing time, are valued at fair value in accordance with Board of Directors’ approved fair valuation procedures. Using fair value to price securities may result in a value that is different from a security’s most recent closing price and from the price used by other mutual funds to calculate their net asset values. As of December 31, 2004 there were no foreign securities whose value required adjustment in accordance with such procedures.
C2
Investments in mutual funds are valued at their net asset value as of the close of the New York Stock Exchange on the date of valuation.
Short-term securities that are held in the Portfolios which mature in more than 60 days are valued at current market quotations and those short-term securities which mature in 60 days or less are valued at amortized cost which approximates market value. The amortized cost method values a security at its cost at the time of purchase and there after assumes a constant amortization to maturity of any discount or premium.
The SP PIMCO High Yield Portfolio and the SP PIMCO Total Return Portfolio may hold up to 15% of their net assets in illiquid securities, including those which are restricted as to disposition under securities law (“restricted securities”). Certain issues of restricted securities held by the SP PIMCO High Yield Portfolio and the SP PIMCO Total Return Portfolio at December 31, 2004 include registration rights, under which the Portfolios may demand registration by the issuer, of which the Portfolio may bear the cost of such registration. Restricted securities, sometimes referred to as private placements, are valued pursuant to the valuation procedures noted above.
Repurchase Agreements: In connection with transactions in repurchase agreements with United States financial institutions, it is the Series Fund’s policy that its custodian or designated subcustodians, as the case may be, under triparty repurchase agreements, take possession of the underlying collateral securities, the value of which exceeds the principal amount of the repurchase transaction, including accrued interest. To the extent that any repurchase transaction exceeds one business day, the value of the collateral is marked to market on a daily basis to ensure the adequacy of the collateral. If the seller defaults or the value of the collateral declines, or if bankruptcy proceedings are commenced with respect to the seller of the security, realization of the collateral by the Series Fund may by delayed or limited.
Foreign Currency Translation: The books and records of the Series Fund are maintained in U.S. dollars. Foreign currency amounts are translated into U.S. dollars on the following basis:
(i) market value of investment securities, other assets and liabilities – at the current daily rates of exchange.
(ii) purchases and sales of investment securities, income and expenses – at the rates of exchange prevailing on the respective dates of such transactions.
Although the net assets of the Series Fund are presented at the foreign exchange rates and market values at the close of the year, the Series Fund does not isolate that portion of the results of operations arising as a result of changes in the foreign exchange rates from the fluctuations arising from changes in the market prices of securities held at the end of the year. Similarly, the Series Fund does not isolate the effect of changes in foreign exchange rates from the fluctuations arising from changes in the market prices of portfolio securities sold during the year. Accordingly, these realized foreign currency gains (losses) are included in the reported net realized gains (losses) on investment transactions.
Net realized gains (losses) on foreign currency transactions represent net foreign exchange gains (losses) from the holding of foreign currencies, currency gains (losses) realized between the trade date and settlement date on securities transactions, and the difference between the amounts of dividends, interest and foreign withholding taxes recorded on the Series Fund’s books and the U.S. dollar equivalent amounts actually received or paid. Net unrealized currency gains (losses) from valuing foreign currency denominated assets and liabilities (other than investments) at year end exchange rates are reflected as a component of net unrealized appreciation (depreciation) on investments and foreign currencies.
Foreign security and currency transactions may involve certain considerations and risks not typically associated with those of domestic origin as a result of, among other factors, the possibility of political and economic instability or the level of governmental supervision and regulation of foreign securities markets.
Forward Currency Contracts: A forward currency contract is a commitment to purchase or sell a foreign currency at a future date at a negotiated forward rate. Certain Portfolios of the Series Fund may enter into forward currency contracts in order to hedge their exposure to changes in foreign currency exchange rates on their foreign portfolio holdings or on specific receivables and payables denominated in a foreign currency. The contracts are valued daily at current exchange rates and any unrealized gain (loss) is included in net unrealized appreciation (depreciation) on investments and foreign currencies. Gain (loss) is realized on the settlement date of the contract equal to the difference between the settlement value of the original and
C3
negotiated forward contracts. This gain (loss), if any, is included in net realized gain (loss) on foreign currency transactions. Risks may arise upon entering into these contracts from the potential inability of the counterparties to meet the terms of their contracts.
Short Sales: Certain portfolios of the Series Fund may sell a security it does not own in anticipation of a decline in the market value of that security (short sale). When a Portfolio makes a short sale, it must borrow the security sold short and deliver it to the broker-dealer through which it made the short sale as collateral for its obligation to deliver the security upon conclusion of the transaction. The Portfolio may have to pay a fee to borrow the particular security and may be obligated to remit any interest or dividends received on such borrowed securities. Dividends declared on short positions open on record date are recorded on the ex-date as an expense. A gain, limited to the price at which the Portfolio sold the security short, or a loss, unlimited in magnitude, will be recognized upon the termination of a short sale if the market price at termination is less than or greater than, respectively, the proceeds originally received. The portfolio maintains a segregated account of securities or other liquid assets, the dollar value of which is at least equal to its obligation with respect to short sales.
Loan Participations: The SP PIMCO High Yield Portfolio may invest in loan participations. When the Portfolio purchases a loan participation, the Portfolio typically enters into a contractual relationship with the lender or third party selling such participations (“Selling Participant”), but not the borrower. As a result, the Portfolio assumes the credit risk of the borrower, the Selling Participant and any other persons interpositioned between the Portfolio and the borrower. The Portfolio may not directly benefit from the collateral supporting the senior loan in which it has purchased the loan participant.
Options: The Series Fund may either purchase or write options in order to hedge against adverse market movements or fluctuations in value caused by changes in prevailing interest rates or foreign currency exchange rates or currencies with respect to securities which the Series Fund currently owns or intends to purchase. The Series Fund’s principal reason for writing options is to realize, through receipt of premiums, a greater current return than would be realized on the underlying security alone. When the Series Fund purchases an option, it pays a premium and an amount equal to that premium is recorded as an asset. When the Series Fund writes an option, it receives a premium and an amount equal to that premium is recorded as a liability. The asset or liability is adjusted daily to reflect the current market value of the option. If an option expires unexercised, the Series Fund realizes a gain (loss) to the extent of the premium received or paid. If an option is exercised, the premium received or paid is recorded as an adjustment to the proceeds from the sale or the cost basis of the purchase in determining whether the Series Fund has realized a gain (loss). The difference between the premium and the amount received or paid on effecting a closing purchase or sale transaction is also treated as a realized gain (loss). Gains (losses) on purchased options is included in net realized gains (losses) on investment transactions. Gains (losses) on written options is presented separately as net realized gains (losses) on written option transactions.
The Series Fund, as writer of an option, may have no control over whether the contract may be exercised. As a result, the Series Fund bears the market risk of an unfavorable change in the price of the security underlying the written option. The Series Fund, as purchaser of an option, bears the risk of the potential inability of the counterparties to meet the terms of their contracts.
Financial Futures Contracts: A financial futures contract is an agreement to purchase (long) or sell (short) an agreed amount of securities at a set price for delivery on a future date. Upon entering into a financial futures contract, the Series Fund is required to pledge to the broker an amount of cash and/or other assets equal to a certain percentage of the contract amount. This amount is known as the “initial margin”. Subsequent payments, known as “variation margin”, are made or received by the Series Fund each day, depending on the daily fluctuations in the value of the underlying security. Such variation margin is recorded for financial statement purposes on a daily basis as unrealized gain (loss). When the contract expires or is closed, the gain (loss) is realized and is presented in the Statement of Operations as net realized gain (loss) on financial futures contracts.
The Series Fund invests in financial futures contracts in order to hedge its existing portfolio securities, or securities the Series Fund intends to purchase, against fluctuations in value caused by changes in prevailing rates or market conditions. Under a variety of circumstances, the Series Fund may not achieve the anticipated benefits of the financial futures contracts and may realize a loss. The use of futures transactions involves the risk of imperfect correlation in movements in the price of futures contracts and the underlying hedged assets.
Swaps: Certain portfolios of the Series Fund may enter into swap agreements. A swap agreement is an agreement to exchange the return generated by one instrument for the return generated by another
C4
instrument. The Portfolios enter into interest rate, forward swap spread lock and credit default swap agreements to manage its exposure to interest rates and credit risk. Interest rate swap agreements involve the exchange by the Portfolios with another party of their respective commitments to pay or receive interest. Forward spread lock swap agreements involve commitments to pay or receive a settlement amount calculated as the difference between the swap spread and a fixed spread, multiplied by the notional amount times the duration of the swap. The swap spread is the difference between the benchmark swap rate (Market rate) and the specific Treasury rate. In a credit default swap, one party makes a stream of payments to another party in exchange for the right to receive a specified return in the event of a default by a third party, typically corporate issues or sovereign issues of an emerging country, on its obligation. Dividends and interest on the securities in the swap are included in the value of the exchange. The swaps are valued daily at current market value and any unrealized gain or loss is included in the Statement of Assets and Liabilities. Gains (losses) are realized on the termination date of the swap and is equal to the difference between a Portfolio’s basis in the swap and the proceeds of the closing transaction, including any fees. During the period that the swap agreement is open, the Portfolios may be subject to risk from the potential inability of the counterparty to meet the terms of the agreement.
Forward currency contracts, written options, short sales, swaps and financial futures contracts involve elements of both market and credit risk in excess of the amounts reflected on the Statement of Assets and Liabilities.
Securities Lending: The Series Fund may lend its portfolio securities to broker-dealers. The loans are secured by collateral at least equal at all times to the market value of the securities loaned. Loans are subject to termination at the option of the borrower or the Series Fund. Upon termination of the loan, the borrower will return to the lender securities identical to the loaned securities. Should the borrower of the securities fail financially, the Series has the right to repurchase the securities using the collateral in the open market. The Series Fund recognizes income, net of any rebate and securities lending agent fees, for lending its securities in the form of fees or interest on the investment of any cash received as collateral. The Series Fund also continues to receive interest and dividends or amounts equivalent thereto on the securities loaned and recognizes any unrealized gain or loss in the market price of the securities loaned that may occur during the term of the loan.
When-Issued/Delayed Delivery Securities: Securities purchased or sold on a when-issued or delayed-delivery basis may be settled a month or more after trade date; interest income is not accrued until settlement date. At the time a Portfolio enters into such transactions, it instructs the custodian to segregate assets with a current value at least equal to the amount of its when-issued or delayed-delivery purchase commitments.
Securities Transactions and Net Investment Income: Securities transactions are recorded on the trade date. Realized gains (losses) on sales of securities are calculated on the identified cost basis. Dividend income is recorded on the ex-dividend date; interest income, which is comprised of four elements: stated coupon, original issue discount, market discount and market premium, is recorded on the accrual basis. Expenses are recorded on the accrual basis. The Series Fund’s expenses are allocated to the respective Portfolios on the basis of relative net assets except for Portfolio specific expenses which are attributable directly to a Portfolio or class level. The only expense charged to SP Aggressive Growth Asset Allocation Portfolio, SP Balanced Asset Allocation Portfolio, SP Conservative Asset Allocation Portfolio, and SP Growth Allocation Portfolio is a management fee. All other expenses attributable to these Portfolios are borne by PI, the Portfolios’ investment advisor (see Note 3).
For Portfolios with multiple classes of shares, net investment income (loss) (other than administration and distribution fees, which are charged to the respective class) and unrealized and realized gains (losses) are allocated daily to each class of shares based upon the relative proportion of net assets of each class at the beginning of the day.
Custody Fee Credits: The Series Fund has an arrangement with its custodian bank, whereby uninvested monies earn credits which reduce the fees charged by the custodian. Such custody fee credits are presented as a reduction of gross expenses in the accompanying Statements of Operations.
Taxes: For federal income tax purposes, each Portfolio in the Series Fund is treated as a separate taxpaying entity. It is each Portfolio’s policy to continue to meet the requirements of the Internal Revenue Code applicable to regulated investment companies and to distribute all of its taxable net income and capital gains, if any, to shareholders. Therefore, no federal income tax provision is required.
C5
Withholding taxes on foreign dividends, interest and capital gains have been provided for in accordance with the Series Fund’s understanding of the applicable country’s tax rules and regulations.
Dividends and Distributions: Dividends and distributions of each Portfolio are declared in cash and automatically reinvested in additional shares of the same Portfolio. The SP PIMCO High Yield and SP PIMCO Total Return Portfolios will declare and distribute dividends from net investment income, if any, quarterly and distributions from net capital gains, if any, at least annually. All other Portfolios will declare and distribute dividends from net investment income and distributions from net capital gains, if any, at least annually. Dividends and distributions are recorded on the ex-dividend date.
Dividends and capital gain distributions are determined in accordance with income tax regulations which may differ from generally accepted accounting principles. Permanent book/tax differences relating to income and gains are reclassified amongst undistributed net investment income, accumulated net realized gain or loss and paid in capital in excess of par, as appropriate.
Estimates: The preparation of financial statements requires management to make estimates and assumptions that affect the reported amounts and disclosures in the financial statements. Actual results could differ from these estimates.
The Series Fund has a management agreement with PI. Pursuant to this agreement PI has responsibility for all investment advisory services and supervises the subadvisers’ performance of such services. PI has entered into subadvisory agreements with Jennison Associates LLC (“Jennison”), AIM Capital Management, Inc. (“AIM”), Alliance Capital Management, LP (“Alliance”), Davis Selected Advisers, LP (“Davis”), Calamos Investments (“Calamos”), Deutsche Asset Management, Inc. (“Deutsche”), Hotchkis and Wiley Capital Management LLC (“Hotchkis and Wiley”), Dreyfus Corporation (“Dreyfus”), Goldman Sachs Asset Management, L.P. (“GSAM”), J.P. Morgan Investment Management, Inc. (“J.P. Morgan”), LSV Asset Management (“LSV”), State Street Research and Management Company (“State Street Research”), William Blair & Company LLC (“William Blair”), Massachusetts Financial Services Company (“MFS”), and Pacific Investment Management Company LLC (“PIMCO”) (collectively, the “Subadvisers”), under which each provides investment advisory services for certain Portfolios of the Series Fund. PI pays for the services of the Subadvisers, compensation of officers of the Series Fund, occupancy and certain clerical and administrative expenses of the Series Fund. The Series Fund bears all other costs and expenses.
The management fee paid to PI is computed daily and payable monthly, at the annual rates specified below, of the value of each of the Portfolio’s average daily net assets.
| | | | | | |
Portfolio
| | Management
Fee
| | | Effective
Management
Fee
| |
SP Aggressive Growth Asset Allocation Portfolio | | 0.05 | % | | 0.05 | % |
SP AIM Aggressive Growth Portfolio | | 0.95 | | | 0.95 | |
SP AIM Core Equity Portfolio | | 0.85 | | | 0.85 | |
SP Alliance Large Cap Growth Portfolio | | 0.90 | | | 0.90 | |
SP Balanced Asset Allocation Portfolio | | 0.05 | | | 0.05 | |
SP Conservative Asset Allocation Portfolio | | 0.05 | | | 0.05 | |
SP Davis Value Portfolio | | 0.75 | | | 0.75 | |
SP Goldman Sachs Small Cap Value Portfolio | | 0.90 | | | 0.90 | |
SP Growth Asset Allocation Portfolio | | 0.05 | | | 0.05 | |
SP Large Cap Value Portfolio | | 0.80 | | | 0.80 | |
SP LSV International Value Portfolio | | 0.90 | | | 0.90 | |
SP MFS Capital Opportunities Portfolio | | 0.75 | | | 0.75 | |
SP Mid-Cap Growth Portfolio | | 0.80 | | | 0.80 | |
SP PIMCO High Yield Portfolio | | 0.60 | | | 0.60 | |
SP PIMCO Total Return Portfolio | | 0.60 | | | 0.60 | |
SP Prudential U.S. Emerging Growth Portfolio | | 0.60 | | | 0.60 | |
SP State Street Research Small Cap Growth Portfolio | | 0.95 | | | 0.95 | |
SP Strategic Partners Focused Growth Portfolio | | 0.90 | | | 0.90 | |
SP Technology Portfolio | | 1.15 | | | 1.15 | |
SP William Blair International Growth Portfolio | | 0.85 | | | 0.85 | |
C6
The Subadvisers provide investment advisory services to the Portfolios as follows. Where more than one Subadviser is listed, each Subadviser provides services to a segment of the Portfolio:
| | |
Portfolio
| | Subadviser(s)
|
SP AIM Aggressive Growth Portfolio | | AIM |
SP AIM Core Equity Portfolio | | AIM |
SP Alliance Large Cap Growth Portfolio | | Alliance |
SP Davis Value Portfolio | | Davis |
SP Goldman Sachs Small Cap Value Portfolio (a) | | GSAM |
SP Large Cap Value Portfolio (b) | | Hotchkis and Wiley, J.P. Morgan |
SP LSV International Value Portfolio (f) | | LSV |
SP MFS Capital Opportunities Portfolio | | MFS |
SP Mid-Cap Growth Portfolio | | Calamos |
SP PIMCO High Yield Portfolio | | PIMCO |
SP PIMCO Total Return Portfolio | | PIMCO |
SP Prudential U.S. Emerging Growth Portfolio | | Jennison |
SP State Street Research Small Cap Growth Portfolio (c) | | State Street Research |
SP Strategic Partners Focused Growth Portfolio | | Alliance, Jennison |
SP Technology Portfolio (d) | | Dreyfus |
SP William Blair International Growth Portfolio (e) | | William Blair |
| | (a) | Effective January 20, 2004, SP Goldman Sachs Small Cap Value Portfolio is managed by GSAM replacing Fidelity Management & Research Company. This was approved by the Series Fund’s Board of Directors on November 19, 2003. |
| | (b) | Effective January 20, 2004, SP Large Cap Value Portfolio is managed by Hotchkis & Wiley and J.P. Morgan replacing Fidelity Management & Research Company. This was approved by the Series Fund’s Board of Directors on November 19, 2003. |
| | (c) | Effective May 3, 2004, SP State Street Research Small Cap Growth Portfolio is managed by State Street Research replacing INVESCO Funds Group, Inc. This was approved by the Series Fund’s Board of Directors on February 27, 2004. |
| | (d) | Effective January 20, 2004, SP Technology Portfolio is managed by Dreyfus replacing Alliance. This was approved by the Series Fund’s Board of Directors on November 19, 2003. |
| | (e) | Effective May 3, 2004, SP William Blair International Growth Portfolio is managed by William Blair replacing Jennison. This was approved by the Series Fund’s Board of Directors on February 27, 2004. |
| | (f) | Effective November 18, 2004, SP LSV International Value Portfolio is managed by LSV replacing Deutsche. This was approved by the Series Fund’s Board of Directors on August 31, 2004. |
The Series Fund has a distribution agreement with Prudential Investment Management Services LLC (“PIMS”) which acts as the distributor of the Class I and Class II shares of the Series Fund. The Series Fund compensates PIMS for distributing and servicing the Series Fund’s Class II shares pursuant to a plan of distribution (the “Class II Plan”), regardless of expenses actually incurred by PIMS. The distribution fees are accrued daily and payable monthly. No distribution or service fees are paid to PIMS as distributor of the Class I shares of the Series Fund. Pursuant to the Class II Plan, the Class II shares of each Portfolio compensate PIMS for distribution-related activities at an annual rate of 0.25% of the average daily net assets of the Class II shares.
The Series Fund has an administration agreement with PI which acts as the administrator of the Class II shares of the Series Fund. The administration fee paid to PI is accrued daily and payable monthly, at the annual rate of 0.15% of the average daily net assets of the Class II shares.
C7
PI has agreed to reimburse each Portfolio (other than SP Aggressive Growth Asset Allocation, SP Balanced Asset Allocation, SP Conservative Asset Allocation and SP Growth Asset Allocation Portfolios) the portion of the management fee for that Portfolio equal to the amount that the aggregate annual ordinary operating expenses (excluding interest, taxes, and brokerage commissions) exceeded the percentage stated below, of the Portfolio’s average daily net assets.
| | | | | | |
Portfolio
| | Class I Expense limit
| | | Class II Expense limit
| |
SP AIM Aggressive Growth Portfolio | | 1.07 | % | | N/A | |
SP AIM Core Equity Portfolio | | 1.00 | | | N/A | |
SP Alliance Large Cap Growth Portfolio | | 1.10 | | | N/A | |
SP Davis Value Portfolio | | 0.83 | | | N/A | |
SP Goldman Sachs Small Cap Value Portfolio | | 1.05 | | | N/A | |
SP Large Cap Value Portfolio | | 0.90 | | | N/A | |
SP LSV International Value Portfolio | | 1.10 | | | N/A | |
SP MFS Capital Opportunities Portfolio | | 1.00 | | | N/A | |
SP Mid-Cap Growth Portfolio | | 1.00 | | | N/A | |
SP PIMCO High Yield Portfolio | | 0.82 | | | N/A | |
SP PIMCO Total Return Portfolio | | 0.76 | | | N/A | |
SP Prudential U.S. Emerging Growth Portfolio | | 0.90 | | | 1.30 | % |
SP State Street Research Small Cap Growth Portfolio | | 1.15 | | | N/A | |
SP Strategic Partners Focused Growth Portfolio | | 1.01 | | | 1.41 | |
SP Technology Portfolio | | 1.30 | | | N/A | |
SP William Blair International Growth Portfolio | | 1.24 | | | 1.64 | |
N/A – Not applicable – Portfolio does not currently have Class II shares.
PIMS, PI, PIM and Jennison are indirect, wholly-owned subsidiaries of Prudential Financial, Inc. (“Prudential”).
| Note 4: | | Other Transactions with Affiliates |
Prudential Mutual Fund Services LLC (“PMFS”), an affiliate of PI and an indirect, wholly-owned subsidiary of Prudential, serves as the Series Fund’s transfer agent. Transfer agent fees and expenses in the Statements of Operations include certain out-of-pocket expense paid to nonaffiliates, where applicable. During the year ended December 31, 2004, the Series Fund incurred fees for the services of PMFS and as of December 31, 2004 fees were due to PMFS as follows:
| | | | | | |
Portfolio
| | Amount Incurred for the Year Ended December 31, 2004
| | Amount Due as of December 31, 2004
|
SP AIM Aggressive Growth Portfolio | | $ | 3,300 | | $ | 280 |
SP AIM Core Equity Portfolio | | | 3,200 | | | 270 |
SP Alliance Large Cap Growth Portfolio | | | 3,700 | | | 320 |
SP Davis Value Portfolio | | | 4,200 | | | 340 |
SP Goldman Sachs Small Cap Value Portfolio | | | 4,400 | | | 360 |
SP Large Cap Value Portfolio | | | 4,000 | | | 350 |
SP LSV International Value Portfolio | | | 3,900 | | | 330 |
SP MFS Capital Opportunities Portfolio | | | 3,400 | | | 290 |
SP Mid-Cap Growth Portfolio | | | 4,100 | | | 340 |
SP PIMCO High Yield Portfolio | | | 4,000 | | | 330 |
SP PIMCO Total Return Portfolio | | | 4,500 | | | 370 |
SP Prudential U.S. Emerging Growth Portfolio | | | 4,300 | | | 360 |
SP State Street Research Small Cap Growth Portfolio | | | 4,000 | | | 340 |
SP Strategic Partners Focused Growth Portfolio | | | 3,600 | | | 310 |
SP Technology Portfolio | | | 3,300 | | | 290 |
SP William Blair International Growth Portfolio | | | 4,900 | | | 420 |
C8
Prudential Investment Management, Inc. (“PIM”), an indirect, wholly-owned subsidiary of Prudential, is the Series Fund’s securities lending agent. For the year ended December 31, 2004, PIM was compensated as follows for these services by the Series Fund Portfolios:
| | | |
| | | PIM
|
SP Prudential U.S. Emerging Growth Portfolio | | $ | 17,819 |
SP William Blair International Growth Portfolio | | | 24,955 |
For the year ended December 31, 2004, Prudential Equity Group, LLC, an indirect wholly-owned subsidiary of Prudential and Wachovia Securities, LLC, an affiliate of PI, earned brokerage commissions from transactions executed on behalf of the Series Fund Portfolios as follows:
| | | | | | |
Portfolio
| | Prudential
Equity
Group
| | Wachovia
|
SP AIM Aggressive Growth Portfolio | | $ | 125 | | $ | 635 |
SP AIM Core Equity Portfolio | | | — | | | 25 |
SP Alliance Large Cap Growth Portfolio | | | — | | | 508 |
SP Davis Value Portfolio | | | 296 | | | — |
SP Goldman Sachs Small Cap Value Portfolio | | | 215 | | | 559 |
SP Large Cap Value Portfolio | | | 2,485 | | | 2,951 |
SP Prudential U.S. Emerging Growth Portfolio | | | 1,265 | | | 6,595 |
SP State Street Research Small Cap Growth Portfolio | | | — | | | 17,680 |
SP Strategic Partners Focused Growth Portfolio | | | 1,065 | | | 265 |
SP Technology Portfolio | | | 1,303 | | | 3,470 |
Certain Portfolios invest in the Taxable Money Market Series (the “Series”), a portfolio of Dryden Core Investment Fund, pursuant to an exemptive order received from the Securities and Exchange Commission. The Series is a money market mutual fund registered under the Investment Company Act of 1940, as amended, and managed by PI. During the year ended December 31, 2004, the following Portfolio earned income from the Series by investing their excess cash and collateral from securities lending. See Note 2 relating to Securities Lending:
| | | | | | |
Portfolio
| | Excess Cash Investment
| | Securities Lending
Cash Collateral
Investment
|
SP Prudential U.S. Emerging Growth Portfolio | | $ | 94,399 | | $ | 62,077 |
SP William Blair International Growth Portfolio | | | 347,634 | | | 74,866 |
C9
| Note 5: | | Portfolio Securities |
The aggregate cost of purchases and the proceeds from the sales of securities (excluding government securities and short-term issues) for the year ended December 31, 2004 were as follows:
Cost of Purchases:
| | | |
Portfolio
| | |
SP Aggressive Growth Asset Allocation Portfolio | | $ | 118,584,686 |
SP AIM Aggressive Growth Portfolio | | | 44,559,371 |
SP AIM Core Equity Portfolio | | | 22,516,733 |
SP Alliance Large Cap Growth Portfolio | | | 110,419,297 |
SP Balanced Asset Allocation Portfolio | | | 628,780,612 |
SP Conservative Asset Allocation Portfolio | | | 327,860,593 |
SP Davis Value Portfolio | | | 98,710,546 |
SP Goldman Sachs Small Cap Value Portfolio | | | 450,970,513 |
SP Growth Asset Allocation Portfolio | | | 532,178,674 |
SP Large Cap Value Portfolio | | | 714,152,979 |
SP LSV International Value Portfolio | | | 360,718,741 |
SP MFS Capital Opportunities Portfolio | | | 19,976,137 |
SP Mid-Cap Growth Portfolio | | | 91,020,332 |
SP PIMCO High Yield Portfolio | | | 198,673,428 |
SP PIMCO Total Return Portfolio | | | 1,206,432,345 |
SP Prudential U.S. Emerging Growth Portfolio | | | 268,369,664 |
SP State Street Research Small Cap Growth Portfolio | | | 403,709,084 |
SP Strategic Partners Focused Growth Portfolio | | | 58,183,908 |
SP Technology Portfolio | | | 35,478,855 |
SP William Blair International Growth Portfolio | | | 510,806,269 |
Proceeds from Sales:
| | | |
Portfolio
| | |
SP Aggressive Growth Asset Allocation Portfolio | | $ | 57,274,917 |
SP AIM Aggressive Growth Portfolio | | | 39,478,459 |
SP AIM Core Equity Portfolio | | | 16,725,957 |
SP Alliance Large Cap Growth Portfolio | | | 192,326,404 |
SP Balanced Asset Allocation Portfolio | | | 306,611,293 |
SP Conservative Asset Allocation Portfolio | | | 174,212,249 |
SP Davis Value Portfolio | | | 220,504,507 |
SP Goldman Sachs Small Cap Value Portfolio | | | 380,752,172 |
SP Growth Asset Allocation Portfolio | | | 259,646,619 |
SP Large Cap Value Portfolio | | | 269,007,686 |
SP LSV International Value Portfolio | | | 271,618,140 |
SP MFS Capital Opportunities Portfolio | | | 15,135,882 |
SP Mid-Cap Growth Portfolio | | | 60,945,901 |
SP PIMCO High Yield Portfolio | | | 133,262,871 |
SP PIMCO Total Return Portfolio | | | 1,020,409,706 |
SP Prudential U.S. Emerging Growth Portfolio | | | 327,944,174 |
SP State Street Research Small Cap Growth Portfolio | | | 256,430,746 |
SP Strategic Partners Focused Growth Portfolio | | | 37,719,386 |
SP Technology Portfolio | | | 27,018,890 |
SP William Blair International Growth Portfolio | | | 374,170,742 |
C10
The SP AIM Aggressive Growth, SP PIMCO High Yield, SP PIMCO Total Return and the SP Prudential U.S. Emerging Growth Portfolios’ written options activity for the year ended December 31, 2004 was as follows:
| | | | | | | |
| | |
| SP AIM Aggressive Growth Portfolio | | | | | | | |
| | | Contracts
| | | Premiums
| |
Balance as of December 31, 2003 | | — | | | $ | — | |
Options written | | 693 | | | | 57,925 | |
Options terminated in closing purchase transactions | | (30 | ) | | | (2,724 | ) |
Options exercised | | (164 | ) | | | (15,061 | ) |
Options expired | | (239 | ) | | | (13,063 | ) |
| | |
|
| |
|
|
|
Balance as of December 31, 2004 | | 260 | | | $ | 27,077 | |
| | |
|
| |
|
|
|
| | |
| SP PIMCO High Yield Portfolio | | | | | | | |
| | | Contracts
| | | Premiums
| |
Balance as of December 31, 2003 | | — | | | $ | — | |
Options written | | 301 | | | | 204,910 | |
Options terminated in closing purchase transactions | | (41 | ) | | | (34,440 | ) |
Options expired | | (260 | ) | | | (170,470 | ) |
| | |
|
| |
|
|
|
Balance as of December 31, 2004 | | — | | | $ | — | |
| | |
|
| |
|
|
|
| | |
| SP PIMCO Total Return Portfolio | | | | | | | |
| | | Contracts/ Notional (000)
| | | Premiums
| |
Balance as of December 31, 2003 | | 249,200 | | | $ | 4,862,208 | |
Options written | | 29,168 | | | | 2,317,658 | |
Options terminated in closing purchase transactions | | (102 | ) | | | (58,493 | ) |
Options exercised | | (117 | ) | | | (41,608 | ) |
Options expired | | (64,813 | ) | | | (2,479,071 | ) |
| | |
|
| |
|
|
|
Balance as of December 31, 2004 | | 213,336 | | | $ | 4,600,694 | |
| | |
|
| |
|
|
|
| | |
| SP Prudential U.S. Emerging Growth Portfolio | | | | | | | |
| | | Contracts
| | | Premiums
| |
Balance as of December 31, 2003 | | — | | | $ | — | |
Options written | | 913 | | | | 158,294 | |
Options terminated in closing purchase transactions | | (107 | ) | | | (20,464 | ) |
Options exercised | | (289 | ) | | | (66,284 | ) |
Options expired | | (284 | ) | | | (33,226 | ) |
| | |
|
| |
|
|
|
Balance as of December 31, 2004 | | 233 | | | $ | 38,320 | |
| | |
|
| |
|
|
|
C11
The SP PIMCO Total Return Portfolio entered into interest rate swap agreements during the year. Details of the swap agreements outstanding as of December 31, 2004 were as follows:
| | | | | | | | | | | | | |
| | | | |
| SP PIMCO Total Return Portfolio: | | | | | | | | | | | |
Counterparty
| | Termination Date
| | Notional Amount
(000)
| | Fixed Rate
| | | Floating Rate
| | Unrealized
Appreciation (Depreciation)
| |
Lehman Brothers (a) | | 12/15/31 | | EUR 3,000 | | 5.50 | % | | 6 month Euribor | | $ | (688,558 | ) |
Citibank N.A. London (a) | | 6/17/12 | | EUR 5,600 | | 5.00 | % | | 6 month Euribor | | | (830,197 | ) |
J.P. Morgan (a) | | 12/17/05 | | $13,500 | | 4.00 | % | | 3 month LIBOR | | | 242,600 | |
J.P. Morgan (b) | | 3/17/05 | | GBP 13,500 | | 4.00 | % | | 6 month LIBOR | | | 17,592 | |
UBS Warburg (a) | | 12/15/14 | | EUR 34,100 | | 5.00 | % | | 6 month Euribor | | | (3,821,766 | ) |
UBS Warburg (a) | | 6/18/34 | | GBP 200 | | 5.00 | % | | 6 month LIBOR | | | (9,792 | ) |
J.P. Morgan (b) | | 6/18/34 | | EUR 8,100 | | 6.00 | % | | 6 month Euribor | | | 686,287 | |
Morgan Stanley Capital Services (a) | | 6/15/12 | | JPY 790,000 | | 2.00 | % | | 6 month LIBOR | | | (278,841 | ) |
Barclays Capital (b) | | 6/18/34 | | GBP 4,000 | | 5.00 | % | | 6 month LIBOR | | | (217,813 | ) |
UBS Warburg (a) | | 6/15/12 | | JPY 375,000 | | 2.00 | % | | 6 month LIBOR | | | (159,293 | ) |
Barclays Capital (b) | | 6/15/08 | | GBP 2,000 | | 5.00 | % | | 6 month LIBOR | | | 49,905 | |
UBS Warburg (a) | | 6/18/34 | | GBP 1,000 | | 5.00 | % | | 6 month LIBOR | | | (43,417 | ) |
Goldman Sachs & Co. (a) | | 6/15/2012 | | JPY 130,000 | | 2.00 | % | | 6 month LIBOR | | | (55,488 | ) |
Goldman Sachs & Co. (a) | | 6/15/2012 | | JPY 129,100 | | 2.00 | % | | 6 month LIBOR | | | (34,147 | ) |
Barclays Capital (a) | | 3/15/2032 | | GBP 8,100 | | 5.00 | % | | 6 month LIBOR | | | (223,307 | ) |
J.P. Morgan (a) | | 3/15/2032 | | EUR 9,700 | | 6.00 | % | | 6 month Euribor | | | 483,749 | |
J.P. Morgan (a) | | 6/15/2008 | | GBP 43,800 | | 5.00 | % | | 6 month LIBOR | | | 550,318 | |
UBS Warburg (b) | | 12/16/2014 | | $21,200 | | 5.00 | % | | 3 month LIBOR | | | 12,279 | |
UBS Warburg (b) | | 12/16/2019 | | $26,400 | | 6.00 | % | | 3 month LIBOR | | | 39,506 | |
UBS Warburg (a) | | 6/15/10 | | $18,200 | | 6.00 | % | | 3 month LIBOR | | | (63,568 | ) |
RBS Greenwich Capital | | 12/15/2024 | | $115,100 | | 4.00 | % | | 3 month LIBOR | | | 638,704 | |
Barclays Capital (b) | | 6/15/2007 | | $9,950 | | 4.00 | % | | 3 month LIBOR | | | 16,791 | |
Lehman Brothers (a) | | 6/15/2015 | | $55,600 | | 5.00 | % | | 3 month LIBOR | | | 275,609 | |
Bank of America Securities LLC (a) | | 6/15/2025 | | $9,200 | | 6.00 | % | | 3 month LIBOR | | | 38,042 | |
UBS Warburg (b) | | 9/15/2005 | | $3,700 | | 3.25 | % | | 3 month LIBOR | | | (13,802 | ) |
| | | | | | | | | | | |
|
|
|
| | | | | | | | | | | | $ | (3,388,607 | ) |
| | | | | | | | | | | |
|
|
|
| | (a) | Portfolio pays the fixed rate and receives the floating rate. |
| | (b) | Portfolio pays the floating rate and receives the fixed rate. |
C12
The SP PIMCO High Yield and SP PIMCO Total Return Portfolios entered into credit default swap agreements during the year ended December 31, 2004. Details of the swap agreements outstanding as of December 31, 2004 were as follows:
| | | | | | | | | | | | | | |
| | | | |
| SP PIMCO High Yield Portfolio: | | | | | | | | | | | | |
Counterparty(a)
| | Termination
Date
| | Notional
Amount
(000)
| | Fixed
Rate
| | | Underlying Bond
| | Unrealized
Appreciation
(Depreciation)
| |
Goldman Sachs International | | 9/20/05
| | $
| 800
| | 1.75
| %
| |
MCI Inc.,
6.688%, due 5/1/09 | | $ | 7,401 | |
Goldman Sachs International | | 9/20/05
| |
| 1,300
| | 1.75
| %
| |
MCI Inc.,
6.688%, due 5/1/09 | | | 12,027 | |
Lehman Brothers Special Financing, Inc. | | 12/20/05 | | | 2,000 | | 0.82 | % | | General Motors Corp., 7.10%, due 3/15/06 | | | (2,846 | ) |
Morgan Stanley Capital
Services, Inc. | | 12/20/05 | | | 2,000 | | 2.00 | % | | Bombardier, Inc.,
6.75%, due 5/1/12 | | | (14,369 | ) |
Merrill Lynch International | | 1/7/05 | | | 1,500 | | 1.04 | % | | Russian Federation,
5.0%, due 3/31/30 | | | 61 | |
| | | | | | | | | | | | |
|
|
|
| | | | | | | | | | | | | $ | 2,274 | |
| | | | | | | | | | | | |
|
|
|
| | | | | |
| SP PIMCO Total Return Portfolio: | | | | | | | | | | | | | | |
Counterparty(a)
| | Termination
Date
| | Notional
Amount
(000)
| | Fixed
Rate
| | | Underlying Bond
| | Unrealized
Appreciation
(Depreciation)
| |
Morgan Stanley | | 12/20/08 | | $ | 2,700 | | 0.26 | % | | Allstate Corp., 6.125%, due 2/15/12 | | $ | (10,128 | ) |
Merrill Lynch | | 12/20/08 | | | 200 | | 0.32 | % | | Ingersoll-Rand Co., 6.48%, due 6/1/25 | | | (913 | ) |
Lehman Brothers | | 12/20/08 | | | 2,100 | | 0.11 | % | | Johnson & Johnson, 3.80%, due 5/15/13 | | | (1,587 | ) |
Lehman Brothers | | 12/20/08 | | | 1,100 | | 0.29 | % | | Whirlpool Corp., 8.60%, due 5/1/10 | | | (3,377 | ) |
Citibank, N.A., London | | 12/20/08 | | | 2,200 | | 0.28 | % | | Eaton Corp., 5.75%, due 7/15/12 | | | (11,559 | ) |
Merrill Lynch | | 12/20/08 | | | 100 | | 0.22 | % | | Gannett Co., Inc., 6.375%, due 4/1/12 | | | (576 | ) |
Lehman Brothers | | 12/20/08 | | | 2,200 | | 0.12 | % | | The Home Depot, Inc., 5.375%, due 4/1/06 | | | (2,500 | ) |
Citibank, N.A., London | | 12/20/08 | | | 1,700 | | 0.29 | % | | FedEx Corp., 7.25%, due 2/15/11 | | | (7,007 | ) |
Bear Stearns | | 12/20/08 | | | 2,200 | | 0.32 | % | | Hewlett Packard Co., 6.50%, due 7/1/12 | | | (14,838 | ) |
Bank of America | | 12/20/08 | | | 1,700 | | 0.13 | % | | E.I. Du Pont De Nemours, 6.875%, due 10/15/09 | | | (3,188 | ) |
Merrill Lynch | | 12/20/08 | | | 1,200 | | 0.32 | % | | Ingersoll-Rand Co., 6.48%, due 6/1/25 | | | (5,872 | ) |
Morgan Stanley | | 12/20/08 | | | 1,600 | | 0.21 | % | | Emerson Electric Co., 4.625%, due 10/15/12 | | | (3,034 | ) |
Citibank, N.A., London | | 12/20/08 | | | 3,600 | | 0.14 | % | | Wal-Mart Stores, Inc., 6.875%, due 8/10/09 | | | (10,756 | ) |
UBS | | 12/20/08 | | | 3,200 | | 0.35 | % | | AutoZone, Inc., 5.875, due 10/15/12 | | | 34,922 | |
Lehman Brothers | | 12/20/08 | | | 700 | | 0.24 | % | | Costco Wholesales Corp., 5.50%, due 5/15/04 | | | (2,888 | ) |
C13
| | | | | | | | | | | | | | |
Counterparty(a)
| | Termination
Date
| | Notional
Amount
(000)
| | Fixed
Rate
| | | Underlying Bond
| | Unrealized
Appreciation
(Depreciation)
| |
Lehman Brothers | | 12/20/08 | | $ | 1,200 | | 0.35 | % | | RadioShack Corp., 7.375%, due 5/15/11 | | $ | (5,858 | ) |
Lehman Brothers | | 12/20/08 | | | 1,200 | | 0.30 | % | | Masco Corp., 5.875%, due 7/15/12 | | | (3,655 | ) |
Barclays | | 12/20/08 | | | 900 | | 0.67 | % | | The Walt Disney Co.,
6.375%, due 3/1/12 | | | (16,144 | ) |
Lehman Brothers | | 12/20/08 | | | 900 | | 0.53 | % | | Lockheed Martin Corp., 8.20%, due 12/1/09 | | | (10,807 | ) |
Bear Stearns | | 12/20/08 | | | 400 | | 1.09 | % | | Capital One Bank, 4.875%, due 5/15/08 | | | (8,468 | ) |
Bear Stearns | | 12/20/08 | | | 300 | | 0.32 | % | | Hewlett Packard Co., 6.50%, due 7/1/12 | | | (1,633 | ) |
Lehman Brothers | | 12/20/08 | | | 900 | | 0.97 | % | | Goodrich Corp., 7.625%, due 12/15/12 | | | (22,207 | ) |
Lehman Brothers | | 12/20/08 | | | 900 | | 0.48 | % | | Northrop Grumman Corp., 7.125%, due 2/15/11 | | | (8,425 | ) |
Morgan Stanley | | 12/20/08 | | | 800 | | 0.53 | % | | Kroger Co. (The), 4.75%, due 4/15/12 | | | (6,873 | ) |
Merrill Lynch | | 12/20/08 | | | 1,400 | | 0.35 | % | | Devon Energy Corp.,
6.875%, due 9/30/11 | | | (5,253 | ) |
UBS | | 12/20/08 | | | 800 | | 0.37 | % | | RadioShack Corp., 7.375%, due 5/15/11 | | | (4,501 | ) |
Bear Stearns | | 12/20/08 | | | 800 | | 0.19 | % | | Caterpillar Inc., 7.250%, due 9/15/09 | | | (914 | ) |
UBS | | 12/20/08 | | | 800 | | 0.44 | % | | Carnival Corp., 6.15%, due 4/15/08 | | | (7,808 | ) |
Morgan Stanley | | 12/20/08 | | | 300 | | 0.26 | % | | Allstate Corp. (The), 6.125%, due 2/15/12 | | | (1,182 | ) |
Bear Stearns | | 12/20/08 | | | 800 | | 0.60 | % | | International Paper Co., 6.75%, due 9/1/11 | | | (8,719 | ) |
Bank of America | | 12/20/08 | | | 200 | | 0.13 | % | | E.I. Du Pont De Nemours, 6.875%, due 10/15/09 | | | (451 | ) |
UBS | | 12/20/08 | | | 800 | | 0.44 | % | | Simon Property Group, L.P., 5.45%, due 5/15/13 | | | (4,529 | ) |
Merrill Lynch | | 12/20/08 | | | 800 | | 0.28 | % | | Occidental Petroleum Corp., 6.75%, due 1/15/12 | | | (1,541 | ) |
Merrill Lynch | | 12/20/08 | | | 1,200 | | 0.85 | % | | Motorola, Inc.,
7.625%, due 11/15/10 | | | (23,772 | ) |
Merrill Lynch | | 12/20/08 | | | 800 | | 0.27 | % | | Anadarko Petroleum Corp., 5%, due 10/1/12 | | | (2,120 | ) |
Bear Stearns | | 12/20/08 | | | 1,500 | | 0.15 | % | | Wal-Mart Stores, Inc., 6.875%, due 8/10/09 | | | (5,042 | ) |
Bear Stearns | | 12/20/08 | | | 800 | | 0.24 | % | | Deere & CO.,
7.85%, due 5/15/10 | | | (2,404 | ) |
Morgan Stanley | | 12/20/08 | | | 800 | | 0.22 | % | | Emerson Electric Co., 7.125%, due 8/15/10 | | | (1,815 | ) |
Bear Stearns | | 12/20/08 | | | 100 | | 1.09 | % | | Capital One Bank,
4.875%, due 5/15/08 | | | (2,702 | ) |
Citibank, N.A., London | | 12/20/08 | | | 200 | | 0.29 | % | | FedEx Corp.,
7.25%, due 2/15/11 | | | (577 | ) |
Barclays | | 12/20/08 | | | 100 | | 0.67 | % | | The Walt Disney Co.,
6.375%, due 3/1/12 | | | (989 | ) |
Lehman Brothers | | 12/20/08 | | | 100 | | 0.97 | % | | Goodrich Corp.,
7.625%, due 12/15/12 | | | (1,501 | ) |
C14
| | | | | | | | | | | | | | |
Counterparty(a)
| | Termination
Date
| | Notional
Amount
(000)
| | Fixed
Rate
| | | Underlying Bond
| | Unrealized
Appreciation
(Depreciation)
| |
Barclays Bank PLC | | 12/20/08 | | $ | 300 | | 0.16 | % | | Eli Lilly & Co. Inc.,
6.00%, due 3/15/12 | | $ | (9 | ) |
Citibank, N.A., London | | 12/20/08 | | | 300 | | 0.28 | % | | Eaton Corp.,
5.75%, due 7/15/12 | | | (1,044 | ) |
Lehman Brothers | | 12/20/08 | | | 100 | | 0.35 | % | | RadioShack Corp.,
7.375%, due 5/15/11 | | | (836 | ) |
Lehman Brothers | | 12/20/08 | | | 100 | | 0.30 | % | | Masco Corp.,
5.875%, due 7/15/12 | | | (377 | ) |
Lehman Brothers | | 12/20/08 | | | 100 | | 0.29 | % | | Whirlpool Corp.,
8.60%, due 5/1/10 | | | (475 | ) |
Lehman Brothers | | 12/20/08 | | | 300 | | 0.11 | % | | Johnson & Johnson,
3.80%, due 5/15/13 | | | (342 | ) |
Merrill Lynch | | 12/20/08 | | | 200 | | 0.35 | % | | Devon Energy Corp.,
6.875%, due 9/30/11 | | | (1,293 | ) |
Lehman Brothers | | 12/20/08 | | | 300 | | 0.12 | % | | The Home Depot, Inc., 5.375%, due 4/1/06 | | | (1,446 | ) |
Morgan Stanley | | 12/20/08 | | | 200 | | 0.21 | % | | Emerson Electric Co., 4.625%, due 10/15/12 | | | (246 | ) |
Lehman Brothers | | 12/20/08 | | | 100 | | 0.53 | % | | Lockheed Martin Corp., 8.20%, due 12/1/09 | | | (1,301 | ) |
Lehman Brothers | | 12/20/08 | | | 100 | | 0.48 | % | | Northrop Grumman Corp., 7.125%, due 2/15/11 | | | (1,135 | ) |
Barclays Bank PLC | | 12/20/08 | | | 300 | | 0.16 | % | | Eli Lilly & Co. Inc.,
6.00%, due 5/15/12 | | | (2,613 | ) |
Merrill Lynch | | 12/20/08 | | | 500 | | 0.22 | % | | Gannett Co., Inc.,
6.375%, due 4/1/12 | | | (580 | ) |
Lehman Brothers | | 12/20/08 | | | 100 | | 0.24 | % | | Costco Wholesale Corp., 5.50%, due 3/15/07 | | | (493 | ) |
Morgan Stanley | | 12/20/08 | | | 800 | | 0.42 | % | | Countrywide Home Loans, Inc.,
5.625%, due 7/15/09 | | | (1,227 | ) |
Bear Stearns(b) | | 6/20/05 | | | 27,500 | | 0.69 | % | | General Motors Corp.,
7.125%, due 7/15/13 | | | 5,753 | |
Bear Stearns | | 6/20/05 | | | 26,250 | | 0.55 | % | | General Motors Acceptance Corp.,
6.875%, due 8/28/12 | | | 16,844 | |
Lehman Brothers | | 6/20/09 | | | 6,600 | | 0.40 | % | | People's Republic of China,
6.80%, due 5/23/11 | | | (45,103 | ) |
| | | | | | | | | | | | |
|
|
|
| | | | | | | | | | | | | $ | (239,114 | ) |
| | | | | | | | | | | | |
|
|
|
| | (a) | Portfolio pays the fixed rate and receives from the counterparty par in the event that the underlying bond defaults. |
| | (b) | The Portfolio receives the fixed rate and pays the counterparty par in the event that the underlying bond defaults. |
C15
| Note 6: | | Distributions and Tax Information |
In order to present undistributed net investment income and accumulated net realized capital gains (losses) on the statement of assets and liabilities that more closely represent their tax character, certain adjustments have been made to undistributed net investment income and accumulated net realized gain (loss) on investments.
For the year ended December 31, 2004 the adjustments were as follows:
| | | | | | | | | | | | |
Portfolio
| | Undistributed Net
Investment
Income
| | | Accumulated
Net Realized
Gain (Loss)
| | | Paid-in
Capital
| |
SP AIM Aggressive Growth Portfolio(d) | | $ | 151,628 | | | | — | | | $ | (151,628 | ) |
SP Alliance Large Cap Growth Portfolio(d) | | | 128,544 | | | | — | | | | (128,544 | ) |
SP Davis Value Portfolio(a) | | | (37,876 | ) | | $ | 37,876 | | | | — | |
SP LSV International Value Portfolio(a)(e) | | | (191,796 | ) | | | 191,796 | | | | — | |
SP Mid-Cap Growth Portfolio(d) | | | 533,878 | | | | — | | | | (533,878 | ) |
SP PIMCO High Yield Portfolio(a)(b)(f) | | | 612,191 | | | | (612,191 | ) | | | — | |
SP PIMCO Total Return Portfolio(a)(b)(f) | | | 10,903,624 | | | | (10,903,624 | ) | | | — | |
SP Prudential U.S. Emerging Growth Portfolio(a)(d) | | | 727,898 | | | | (727,898 | ) | | | — | |
SP State Street Research Small Cap Growth Portfolio(d) | | | 947,239 | | | | — | | | $ | (947,239 | ) |
SP Strategic Partners Focused Growth Portfolio(d) | | | 67,980 | | | | — | | | | (67,980 | ) |
SP Technology Portfolio(a)(d) | | | 125,568 | | | | (3,597 | ) | | | (121,971 | ) |
SP William Blair International Growth Portfolio(a)(c)(e) | | | (225,389 | ) | | | 225,389 | | | | — | |
| | (a) | Reclassification of net foreign currency gain (loss). |
| | (b) | Reclassification of paydown losses. |
| | (c) | Reclassification of income due to the sale of passive foreign investment companies. |
| | (d) | Reclassification of tax operating loss. |
| | (e) | Reclassification of Thailand capital gains taxes. |
| | (f) | Reclassification of swap income. |
The tax character of distributions paid during the year ended December 31, 2004 were as follows:
| | | | | | | | | |
Portfolio
| | Ordinary
Income
| | Long-Term
Capital Gains
| | Total
Distributions
|
SP Aggressive Growth Asset Allocation Portfolio | | $ | 47,387 | | | — | | $ | 47,387 |
SP AIM Core Equity Portfolio | | | 121,766 | | | — | | | 121,766 |
SP Balanced Asset Allocation Portfolio | | | 4,764,898 | | $ | 418,285 | | | 5,183,183 |
SP Conservative Asset Allocation Portfolio | | | 5,505,641 | | | 312,063 | | | 5,817,704 |
SP Davis Value Portfolio | | | 1,941,811 | | | — | | | 1,941,811 |
SP Goldman Sachs Small Cap Value Portfolio | | | 553,326 | | | 93,547 | | | 646,873 |
SP Growth Asset Allocation Portfolio | | | 1,930,590 | | | — | | | 1,930,590 |
SP Large Cap Value Portfolio | | | 674,049 | | | — | | | 674,049 |
SP LSV International Value Portfolio | | | 662,879 | | | — | | | 662,879 |
SP MFS Capital Opportunities Portfolio | | | 43,843 | | | — | | | 43,843 |
SP PIMCO High Yield Portfolio | | | 20,411,909 | | | 745,337 | | | 21,157,246 |
SP PIMCO Total Return Portfolio | | | 24,423,511 | | | 10,956,735 | | | 35,380,246 |
SP Prudential U.S. Emerging Growth Portfolio | | | — | | | 56,653 | | | 56,653 |
SP William Blair International Growth Portfolio | | | 268,170 | | | — | | | 268,170 |
C16
The tax character of distributions paid during the year ended December 31, 2003 were as follows:
| | | | | | | | | |
Portfolio
| | Ordinary
Income
| | Long-Term
Capital Gains
| | Total
Distributions
|
SP Aggressive Growth Asset Allocation Portfolio | | $ | 7,077 | | | — | | $ | 7,077 |
SP AIM Core Equity Portfolio | | | 56,574 | | | — | | | 56,574 |
SP Balanced Asset Allocation Portfolio | | | 2,105,869 | | | — | | | 2,105,869 |
SP Conservative Asset Allocation Portfolio | | | 2,294,484 | | $ | 192,383 | | | 2,486,867 |
SP Davis Value Portfolio | | | 1,086,448 | | | — | | | 1,086,448 |
SP Goldman Sachs Small Cap Value Portfolio | | | 37,628 | | | — | | | 37,628 |
SP Growth Asset Allocation Portfolio | | | 797,294 | | | — | | | 797,294 |
SP LSV International Value Portfolio | | | 499,019 | | | — | | | 499,019 |
SP MFS Capital Opportunities Portfolio | | | 14,769 | | | — | | | 14,769 |
SP PIMCO High Yield Portfolio | | | 11,263,009 | | | — | | | 11,263,009 |
SP PIMCO Total Return Portfolio | | | 25,070,739 | | | 3,946,311 | | | 29,017,050 |
At December 31, 2004, the components of distributable earnings on a tax basis and approximate capital loss carryforwards were as follows:
| | | | | | | | | | | | | | | | | | | |
| | | Accumulated
Ordinary
Income
| | Accumulated
Long-Term
Capital
Gains
| | Approximate
Capital Loss
Carryforward(a)
| | | 2009
| | 2010
| | 2011
|
SP Aggressive Growth Asset Allocation Portfolio | | $ | 2,784,998 | | $ | 3,220,328 | | | — | (b) | | | — | | | — | | | — |
SP AIM Aggressive Growth Portfolio | | | — | | | 1,253,513 | | | — | (c) | | | — | | | — | | | — |
SP AIM Core Equity Portfolio | | | 337,615 | | | — | | $ | 316,000 | (d) | | | — | | $ | 311,000 | | $ | 5,000 |
SP Alliance Large Cap Growth Portfolio | | | — | | | — | | | 1,099,000 | (e) | | | — | | | — | | | 1,099,000 |
SP Balanced Asset Allocation Portfolio | | | 17,685,987 | | | 22,025,487 | | | — | | | | — | | | — | | | — |
SP Conservative Asset Allocation Portfolio | | | 10,571,529 | | | 12,999,892 | | | — | | | | — | | | — | | | — |
SP Davis Value Portfolio | | | 2,694,772 | | | 29,342,603 | | | — | (f) | | | — | | | — | | | — |
SP Goldman Sachs Small Cap Value Portfolio | | | 31,804,658 | | | 17,428,304 | | | — | | | | — | | | — | | | — |
SP Growth Asset Allocation Portfolio | | | 16,999,403 | | | 13,932,075 | | | — | (g) | | | — | | | — | | | — |
SP Large Cap Value Portfolio | | | 17,688,553 | | | 4,176,180 | | | — | (h) | | | — | | | — | | | — |
SP LSV International Value Portfolio | | | 12,360,238 | | | 11,833,039 | | | — | (i) | | | — | | | — | | | — |
SP MFS Capital Opportunities Portfolio | | | 153,300 | | | — | | | 1,494,000 | (j) | | | — | | | 1,494,000 | | | — |
SP Mid-Cap Growth Portfolio | | | — | | | — | | | 5,310,000 | (k) | | | — | | | 5,310,000 | | | — |
SP PIMCO High Yield Portfolio | | | 1,835,588 | | | 3,362,054 | | | — | | | | — | | | — | | | — |
SP PIMCO Total Return Portfolio | | | 30,269,703 | | | 9,496,299 | | | — | | | | — | | | — | | | — |
SP Prudential U.S. Emerging Growth Portfolio | | | 17,879,412 | | | 4,281,058 | | | — | | | | — | | | — | | | — |
SP State Street Research Small Cap Growth Portfolio | | | — | | | — | | | 17,680,000 | | | $ | 506,000 | | | 2,530,000 | | | 14,644,000 |
SP Strategic Partners Focused Growth Portfolio | | | — | | | — | | | 3,533,000 | (L) | | | 1,008,000 | | | 2,207,000 | | | 318,000 |
SP Technology Portfolio | | | — | | | — | | | 3,799,000 | (m) | | | 507,000 | | | 2,904,000 | | | 388,000 |
SP William Blair International Growth Portfolio | | | 8,183,431 | | | 12,439,468 | | | — | (n) | | | — | | | — | | | — |
| | (a) | Accordingly, no capital gain distribution is expected to be paid to shareholders until net gains have been realized in excess of such carryforwards. |
| | (b) | Approximately $336,000 of its capital loss carryforward was used to offset net taxable gains realized in the fiscal year ended December 31, 2004. |
| | (c) | Approximately $2,653,000 of its capital loss carryforward was used to offset net taxable gains realized in the fiscal year ended December 31, 2004. |
| | (d) | Approximately $1,916,000 of its capital loss carryforward was used to offset net taxable gains realized in the fiscal year ended December 31, 2004. |
| | (e) | Approximately $11,410,000 of its capital loss carryforward was used to offset net taxable gains realized in the fiscal year ended December 31, 2004. |
C17
| | (f) | Approximately $5,776,000 of its capital loss carryforward was used to offset net taxable gains realized in the fiscal year ended December 31, 2004. |
| | (g) | Approximately $454,000 of its capital loss carryforward was used to offset net taxable gains realized in the fiscal year ended December 31, 2004. |
| | (h) | Approximately $2,709,000 of its capital loss carryforward was used to offset net taxable gains realized in the fiscal year ended December 31, 2004. |
| | (i) | Approximately $6,052,000 of its capital loss carryforward was used to offset net taxable gains realized in the fiscal year ended December 31, 2004. |
| | (j) | Approximately $1,836,000 of its capital loss carryforward was used to offset net taxable gains realized in the fiscal year ended December 31, 2004. |
| | (k) | Approximately $5,322,000 of its capital loss carryforward was used to offset net taxable gains realized in the fiscal year ended December 31, 2004. |
| | (l) | Approximately $790,000 of its capital loss carryforward was used to offset net taxable gains realized in the fiscal year ended December 31, 2004. |
| | (m) | Approximately $593,000 of its capital loss carryforward was used to offset net taxable gains realized in the fiscal year ended December 31, 2004. |
| | (n) | Approximately $9,852,000 of its capital loss carryforward was used to offset net taxable gains realized in the fiscal year ended December 31, 2004. |
The difference between book and tax basis is primarily cost basis adjustments and post-October losses (the Portfolios have elected to treat losses incurred in the period November 1, 2004 through December 31, 2004 as having been incurred in the following fiscal year) which are presented below:
| | | | | | |
| | | Approximate
Post October Losses
|
Portfolio
| | Currency
| | Capital
|
SP Alliance Large Cap Growth Portfolio | | | — | | $ | 1,090,000 |
SP Davis Value Portfolio | | | — | | | 759,000 |
SP LSV International Value Portfolio | | $ | 93,600 | | | — |
SP PIMCO High Yield Portfolio | | | 55,000 | | | 645,000 |
SP PIMCO Total Return Portfolio | | | — | | | 2,175,000 |
SP Prudential U.S. Emerging Growth Portfolio | | | 35 | | | — |
SP Technology Portfolio | | | — | | | 94,000 |
The United States federal income tax basis and unrealized appreciation (depreciation) of the Series Fund’s investments and the total net unrealized appreciation (depreciation) as of December 31, 2004 were as follows:
| | | | | | | | | | | | | | | | | | | |
| | | Tax Basis
| | Appreciation
| | Depreciation
| | Net
| | Other Cost
Basis
Adjustment
| | | Total Net
Unrealized
|
SP Aggressive Growth Asset Allocation Portfolio | | $ | 121,911,056 | | $ | 15,002,755 | | | — | | $ | 15,002,755 | | | — | | | $ | 15,002,755 |
SP AIM Aggressive Growth Portfolio | | | 30,313,527 | | | 3,069,161 | | $ | 345,668 | | | 2,723,493 | | $ | (6,293 | ) | | | 2,717,200 |
SP AIM Core Equity Portfolio | | | 29,716,294 | | | 2,435,085 | | | 285,628 | | | 2,149,457 | | | — | | | | 2,149,457 |
SP Alliance Large Cap Growth Portfolio | | | 60,698,036 | | | 6,950,084 | | | 1,725,675 | | | 5,224,409 | | | — | | | | 5,224,409 |
SP Balanced Asset Allocation Portfolio | | | 764,487,350 | | | 72,540,291 | | | — | | | 72,540,291 | | | — | | | | 72,540,291 |
SP Conservative Asset Allocation Portfolio | | | 432,709,147 | | | 27,178,598 | | | — | | | 27,178,598 | | | — | | | | 27,178,598 |
SP Davis Value Portfolio | | | 236,804,617 | | | 51,691,132 | | | 2,518,464 | | | 49,172,668 | | | 808 | | | | 49,173,476 |
SP Goldman Sachs Small Cap Value Portfolio | | | 343,296,785 | | | 58,553,594 | | | 8,967,506 | | | 49,586,088 | | | — | | | | 49,586,088 |
SP Growth Asset Allocation Portfolio | | | 594,471,107 | | | 68,229,279 | | | — | | | 68,229,279 | | | — | | | | 68,229,279 |
SP Large Cap Value Portfolio | | | 541,707,425 | | | 67,777,827 | | | 3,451,965 | | | 64,325,862 | | | — | | | | 64,325,862 |
SP LSV International Value Portfolio | | | 220,435,514 | | | 18,978,539 | | | 298,901 | | | 18,679,638 | | | 41,834 | | | | 18,721,472 |
SP MFS Capital Opportunities Portfolio | | | 25,176,585 | | | 3,277,519 | | | 623,911 | | | 2,653,608 | | | — | | | | 2,653,608 |
SP Mid-Cap Growth Portfolio | | | 86,617,486 | | | 21,417,311 | | | 487,767 | | | 20,929,544 | | | — | | | | 20,929,544 |
SP PIMCO High Yield Portfolio | | | 293,410,014 | | | 15,671,938 | | | 969,772 | | | 14,702,166 | | | 3,037 | | | | 14,705,203 |
SP PIMCO Total Return Portfolio | | | 1,152,372,923 | | | 9,767,229 | | | 6,533,811 | | | 3,233,418 | | | (2,151,375 | ) | | | 1,082,043 |
SP Prudential U.S. Emerging Growth Portfolio | | | 156,097,589 | | | 20,226,299 | | | 929,823 | | | 19,296,476 | | | (85,054 | ) | | | 19,211,422 |
C18
| | | | | | | | | | | | | | | | | | | |
| | | Tax Basis
| | Appreciation
| | Depreciation
| | Net
| | Other Cost
Basis
Adjustment
| | | Total Net
Unrealized
|
SP State Street Research Small Cap Growth Portfolio | | $ | 164,869,238 | | $ | 22,480,648 | | $ | 2,373,485 | | $ | 20,107,163 | | | — | | | $ | 20,107,163 |
SP Strategic Partners Focused Growth Portfolio | | | 53,549,392 | | | 9,608,274 | | | 559,801 | | | 9,048,473 | | | — | | | | 9,048,473 |
SP Technology Portfolio | | | 27,399,226 | | | 2,776,510 | | | 1,065,388 | | | 1,711,122 | | $ | 1,668 | | | | 1,712,790 |
SP William Blair International Growth Portfolio | | | 329,999,219 | | | 56,341,251 | | | 1,098,612 | | | 55,242,639 | | | (7,553 | ) | | | 55,235,086 |
The differences between book basis and tax basis of investments are primarily attributable to deferred losses on wash sales and mark to market on passive foreign investments companies. The other cost basis adjustments are primarily attributable to appreciation (depreciation) of foreign currency and mark to market of receivables and payables.
The Series Fund offers Class I and Class II shares. Neither Class I nor Class II shares of a Portfolio are subject to any sales charge or redemption charge and are sold at the net asset value of the Portfolio. Class I shares are sold only to certain separate accounts of Prudential to fund benefits under certain variable life insurance and variable annuity contracts (“contracts”). Class II shares are sold only to separate accounts of non-Prudential insurance companies as investment options under certain contracts. The separate accounts invest in shares of the Series Fund through subaccounts that correspond to the Portfolios. The separate accounts will redeem shares of the Series Fund to the extent necessary to provide benefits under the contracts or for such other purposes as may be consistent with the contracts. As of December 31, 2004, the SP Prudential U.S. Emerging Growth, SP Strategic Partners Focused Growth and SP William Blair International Growth Portfolios have Class II shares outstanding.
Transactions in shares of common stock of the SP Prudential U.S. Emerging Growth, SP Strategic Partners Focused Growth and SP William Blair International Growth Portfolios were as follows:
| | | | | | | |
| | |
| SP Prudential U.S. Emerging Growth Portfolio: | | | | | | | |
| | |
Class I
| | Shares
| | | Amount
| |
Year ended December 31, 2004: | | | | | | | |
Capital stock sold | | 11,300,085 | | | $ | 79,116,525 | |
Capital stock issued in reinvestment of dividends and distributions | | 8,317 | | | | 56,557 | |
Capital stock repurchased | | (20,985,809 | ) | | | (147,456,481 | ) |
| | |
|
| |
|
|
|
Net increase (decrease) in shares outstanding | | (9,677,407 | ) | | $ | (68,283,399 | ) |
| | |
|
| |
|
|
|
Year ended December 31, 2003: | | | | | | | |
Capital stock sold | | 19,306,919 | | | $ | 114,888,959 | |
Capital stock repurchased | | (4,636,097 | ) | | | (26,226,115 | ) |
| | |
|
| |
|
|
|
Net increase (decrease) in shares outstanding | | 14,670,822 | | | $ | 88,662,844 | |
| | |
|
| |
|
|
|
| | |
Class II
| | | | | | |
Year ended December 31, 2004: | | | | | | | |
Capital stock sold | | 1,465 | | | $ | 10,369 | |
Capital stock issued in reinvestment of dividends and distributions | | 14 | | | | 96 | |
Capital stock repurchased | | (7,916 | ) | | | (55,951 | ) |
| | |
|
| |
|
|
|
Net increase (decrease) in shares outstanding | | (6,437 | ) | | $ | (45,486 | ) |
| | |
|
| |
|
|
|
Year ended December 31, 2003: | | | | | | | |
Capital stock sold | | 3,868 | | | $ | 22,395 | |
Capital stock repurchased | | (2,616 | ) | | | (15,125 | ) |
| | |
|
| |
|
|
|
Net increase (decrease) in shares outstanding | | 1,252 | | | $ | 7,270 | |
| | |
|
| |
|
|
|
C19
| | | | | | | |
| | |
| SP Strategic Partners Focused Growth Portfolio: | | | | | | | |
| | |
Class I
| | Shares
| | | Amount
| |
Year ended December 31, 2004: | | | | | | | |
Capital stock sold | | 1,654,780 | | | $ | 10,560,311 | |
Capital stock repurchased | | (769,923 | ) | | | (4,935,347 | ) |
| | |
|
| |
|
|
|
Net increase (decrease) in shares outstanding | | 884,857 | | | $ | 5,624,964 | |
| | |
|
| |
|
|
|
Year ended December 31, 2003: | | | | | | | |
Capital stock sold | | 1,986,610 | | | $ | 11,273,424 | |
Capital stock repurchased | | (712,078 | ) | | | (4,051,614 | ) |
| | |
|
| |
|
|
|
Net increase (decrease) in shares outstanding | | 1,274,532 | | | $ | 7,221,810 | |
| | |
|
| |
|
|
|
| | |
Class II
| | | | | | |
Year ended December 31, 2004: | | | | | | | |
Capital stock sold | | 2,799,160 | | | $ | 17,643,912 | |
Capital stock repurchased | | (416,330 | ) | | | (2,590,442 | ) |
| | |
|
| |
|
|
|
Net increase (decrease) in shares outstanding | | 2,382,830 | | | $ | 15,053,470 | |
| | |
|
| |
|
|
|
Year ended December 31, 2003: | | | | | | | |
Capital stock sold | | 1,627,291 | | | $ | 8,817,800 | |
Capital stock repurchased | | (670,757 | ) | | | (3,585,555 | ) |
| | |
|
| |
|
|
|
Net increase (decrease) in shares outstanding | | 956,534 | | | $ | 5,232,245 | |
| | |
|
| |
|
|
|
| | |
| SP William Blair International Growth Portfolio: | | | | | | | |
| | |
Class I
| | Shares
| | | Amount
| |
Year ended December 31, 2004: | | | | | | | |
Capital stock sold | | 24,201,018 | | | $ | 148,084,849 | |
Capital stock issued in reinvestment of dividends and distributions | | 44,253 | | | | 268,170 | |
Capital stock repurchased | | (5,845,906 | ) | | | (35,656,506 | ) |
| | |
|
| |
|
|
|
Net increase (decrease) in shares outstanding | | 18,399,365 | | | $ | 112,696,513 | |
| | |
|
| |
|
|
|
Year ended December 31, 2003: | | | | | | | |
Capital stock sold | | 26,290,046 | | | $ | 124,525,584 | |
Capital stock repurchased | | (16,620,819 | ) | | | (76,743,054 | ) |
| | |
|
| |
|
|
|
Net increase (decrease) in shares outstanding | | 9,669,227 | | | $ | 47,782,530 | |
| | |
|
| |
|
|
|
| | |
Class II
| | | | | | |
Year ended December 31, 2004: | | | | | | | |
Capital stock sold | | 17,228,253 | | | $ | 103,821,726 | |
Capital stock repurchased | | (16,197,374 | ) | | | (97,310,208 | ) |
| | |
|
| |
|
|
|
Net increase (decrease) in shares outstanding | | 1,030,879 | | | $ | 6,511,518 | |
| | |
|
| |
|
|
|
Year ended December 31, 2003: | | | | | | | |
Capital stock sold | | 41,416,312 | | | $ | 198,774,594 | |
Capital stock repurchased | | (27,545,237 | ) | | | (129,018,065 | ) |
| | |
|
| |
|
|
|
Net increase (decrease) in shares outstanding | | 13,871,075 | | | $ | 69,756,529 | |
| | |
|
| |
|
|
|
The Series Fund (excluding the Money Market Portfolio), along with other affiliated registered investment companies (the “Funds”), is a party to a syndicated credit agreement (“SCA”) with a group of banks. For the period January 1, 2004 through April 30, 2004, the SCA provided for a commitment of $800 million and allowed the Funds to increase the commitment to $1 billion, if necessary. Effective May 1, 2004, the SCA provided for a commitment of $500 million. Interest on any borrowings under the SCA would be incurred at market rates. The Funds paid a commitment fee of .08 of 1% of the unused portion of the SCA. The
C20
commitment fee is accrued daily and paid quarterly and is allocated to the Funds pro rata, based on net assets. The purpose of the SCA is to serve as an alternative source of funding for capital share redemptions. The expiration date of the SCA was October 29, 2004. Effective October 29, 2004, the Funds entered into a revised credit agreement with two banks. The commitment under the revised credit agreement continues to be $500 million. The Funds pay a commitment fee of .075 of 1% of the unused portion of the revised credit agreement. The expiration date of the revised credit agreement is October 28, 2005.
The following Portfolios utilized the line of credit during the year ended December 31, 2004. The average balance is for the number of days the Portfolio had an outstanding balance.
| | | | | | | | |
Portfolio
| | Average Balance
Outstanding
| | Number of Days
Outstanding
| | Weighted Average
Interest Rates
| |
SP Alliance Large Cap Growth | | $ | 210,420 | | 1 | | 2.27 | % |
SP Strategic Partners Focused Growth Portfolio | | | 382,200 | | 2 | | 1.53 | |
SP William Blair International Growth Portfolio | | | 208,729 | | 14 | | 1.53 | |
| Note 9: | | Change in Independent Registered Public Accounting Firm (Unaudited) |
PricewaterhouseCoopers LLP was previously the independent registered public accounting firm for the Series Fund. The decision to change the independent registered public accounting firm was approved by the Audit Committee and by the Board of Directors in a meeting help on September 2, 2003, resulting in KPMG LLP’s appointment as the independent registered public accounting firm of the Series Fund. The reports on the financial statements of the Series Fund audited by PricewaterhouseCoopers LLP through the year ended December 31, 2003 did not contain an adverse opinion or disclaimer of opinion, and were not qualified or modified as to uncertainty, audit scope or accounting principles. There were no disagreements between the Series Fund and PricewaterhouseCoopers LLP on any matter of accounting principles or practices, financial statement disclosure, or auditing scope or procedures.
| Note 10: | | Subsequent Events |
On November 18, 2004, the Board of Directors of the Series Fund approved an Agreement and Plan of Reorganization (the “Plan”) which provides for the transfer of all the assets of the Class I shares of the following funds for like shares of the acquiring funds and the assumption of the liabilities of the funds.
| | |
Fund
| | Acquiring Fund
|
SP MFS Capital Opportunities Portfolio | | Equity Portfolio |
SP AIM Aggressive Growth Portfolio | | SP Mid Cap Growth Portfolio |
SP Technology Portfolio | | SP Prudential U.S. Emerging Growth Portfolio |
As of December 31, 2004, all of Class I shares of each Portfolio was owned of record by The Prudential Insurance Company of America (“PICA”) on behalf of the owners of the variable insurance products issued by PICA.
C21
Financial Highlights
| | | | | | | | | | | | | | | | | | | | |
| | | SP Aggressive Growth Asset Allocation Portfolio
| |
| | | Year Ended
December 31,
| | | September 22, 2000(a)
through December 31, 2000
| |
| | | 2004
| | | 2003
| | | 2002
| | | 2001
| | |
Per Share Operating Performance: | | | | | | | | | | | | | | | | | | | | |
Net Asset Value, beginning of period | | $ | 7.83 | | | $ | 5.90 | | | $ | 7.58 | | | $ | 9.33 | | | $ | 10.00 | |
| | |
|
|
| |
|
|
| |
|
|
| |
|
|
| |
|
|
|
Income (Loss) From Investment Operations: | | | | | | | | | | | | | | | | | | | | |
Net investment income | | | 0.02 | | | | 0.01 | | | | — | (e) | | | 0.02 | | | | 0.01 | |
Net realized and unrealized gains (losses) on investments | | | 1.13 | | | | 1.92 | | | | (1.68 | ) | | | (1.69 | ) | | | (0.67 | ) |
| | |
|
|
| |
|
|
| |
|
|
| |
|
|
| |
|
|
|
Total from investment operations | | | 1.15 | | | | 1.93 | | | | (1.68 | ) | | | (1.67 | ) | | | (0.66 | ) |
| | |
|
|
| |
|
|
| |
|
|
| |
|
|
| |
|
|
|
Less Dividends and Distributions: | | | | | | | | | | | | | | | | | | | | |
Dividends from net investment income | | | — | (e) | | | — | (e) | | | — | | | | (0.02 | ) | | | (0.01 | ) |
Distributions from net realized gains | | | — | | | | — | | | | — | | | | (0.06 | ) | | | — | |
| | |
|
|
| |
|
|
| |
|
|
| |
|
|
| |
|
|
|
Total dividends and distributions | | | — | | | | — | | | | — | | | | (0.08 | ) | | | (0.01 | ) |
| | |
|
|
| |
|
|
| |
|
|
| |
|
|
| |
|
|
|
Net Asset Value, end of period | | $ | 8.98 | | | $ | 7.83 | | | $ | 5.90 | | | $ | 7.58 | | | $ | 9.33 | |
| | |
|
|
| |
|
|
| |
|
|
| |
|
|
| |
|
|
|
Total Investment Return(b) | | | 14.76 | % | | | 32.77 | % | | | (22.16 | )% | | | (17.92 | )% | | | (6.65 | )% |
Ratios/Supplemental Data: | | | | | | | | | | | | | | | | | | | | |
Net assets, end of period (in millions) | | $ | 136.9 | | | $ | 60.6 | | | $ | 15.1 | | | $ | 7.5 | | | $ | 2.1 | |
Ratios to average net assets: | | | | | | | | | | | | | | | | | | | | |
Expenses | | | 0.05 | % | | | 0.05 | % | | | 0.05 | % | | | 0.05 | % | | | 0.05 | %(c) |
Net investment income | | | 0.27 | % | | | 0.16 | % | | | 0.06 | % | | | 0.39 | % | | | 0.36 | %(c) |
Portfolio turnover rate | | | 60 | % | | | 22 | % | | | 26 | % | | | 62 | % | | | 6 | %(d) |
| (a) | Commencement of operations. |
| (b) | Total investment return is calculated assuming a purchase of shares on the first day and a sale on the last day of each period reported and includes reinvestment of dividends and distributions and does not reflect the effect of insurance contract charges. Total investment returns for periods of less than one full year are not annualized. |
| (e) | Less than $0.005 per share. |
| | | | | | | | | | | | | | | | | | | | |
| | | SP AIM Aggressive Growth Portfolio
| |
| | | Year Ended
December 31,
| | | September 22, 2000(a)
through December 31, 2000
| |
| | | 2004
| | | 2003
| | | 2002
| | | 2001
| | |
Per Share Operating Performance: | | | | | | | | | | | | | | | | | | | | |
Net Asset Value, beginning of period | | $ | 6.49 | | | $ | 5.13 | | | $ | 6.49 | | | $ | 8.60 | | | $ | 10.00 | |
| | |
|
|
| |
|
|
| |
|
|
| |
|
|
| |
|
|
|
Income (Loss) From Investment Operations: | | | | | | | | | | | | | | | | | | | | |
Net investment loss | | | (0.03 | ) | | | (0.03 | ) | | | (0.03 | ) | | | (0.04 | ) | | | (0.01 | ) |
Net realized and unrealized gains (losses) on investments | | | 0.80 | | | | 1.39 | | | | (1.33 | ) | | | (2.07 | ) | | | (1.39 | ) |
| | |
|
|
| |
|
|
| |
|
|
| |
|
|
| |
|
|
|
Total from investment operations | | | 0.77 | | | | 1.36 | | | | (1.36 | ) | | | (2.11 | ) | | | (1.40 | ) |
| | |
|
|
| |
|
|
| |
|
|
| |
|
|
| |
|
|
|
Net Asset Value, end of period | | $ | 7.26 | | | $ | 6.49 | | | $ | 5.13 | | | $ | 6.49 | | | $ | 8.60 | |
| | |
|
|
| |
|
|
| |
|
|
| |
|
|
| |
|
|
|
Total Investment Return(b) | | | 11.86 | % | | | 26.51 | % | | | (20.96 | )% | | | (24.53 | )% | | | (14.00 | )% |
Ratios/Supplement Data: | | | | | | | | | | | | | | | | | | | | |
Net assets, end of period (in millions) | | $ | 32.8 | | | $ | 22.4 | | | $ | 9.3 | | | $ | 5.7 | | | $ | 3.9 | |
Ratios to average net assets:(d) | | | | | | | | | | | | | | | | | | | | |
Expenses | | | 1.07 | % | | | 1.07 | % | | | 1.07 | % | | | 1.07 | % | | | 1.07 | %(c) |
Net investment loss | | | (0.58 | )% | | | (0.73 | )% | | | (0.72 | )% | | | (0.73 | )% | | | (0.40 | )%(c) |
Portfolio turnover rate | | | 156 | % | | | 85 | % | | | 73 | % | | | 87 | % | | | 16 | %(e) |
| (a) | Commencement of operations. |
| (b) | Total investment return is calculated assuming a purchase of shares on the first day and a sale on the last day of each period reported and includes reinvestment of dividends and distributions and does not reflect the effect of insurance contract charges. Total investment returns for periods of less than one full year are not annualized. |
| (d) | Net of expense subsidy. If the investment advisor had not subsidized expenses, the annual expense and net investment loss ratios would have been 1.52% and (1.03)%, respectively, for the year ended December 31, 2004, 2.02% and (1.68)%, respectively, for the year ended December 31, 2003, 2.81% and (2.46)%, respectively, for the year ended December 31, 2002, 3.45% and (3.11)%, respectively, for the year ended December 31, 2001 and 5.57% and (4.90)%, respectively, for the period ended December 31, 2000. |
SEE NOTES TO FINANCIAL STATEMENTS.
D1
Financial Highlights
| | | | | | | | | | | | | | | | | | | | |
| | | SP AIM Core Equity Portfolio
| |
| | | Year Ended
December 31,
| | | September 22, 2000(a)
through
December 31,
2000
| |
| | | 2004
| | | 2003
| | | 2002
| | | 2001
| | |
Per Share Operating Performance: | | | | | | | | | | | | | | | | | | | | |
Net Asset Value, beginning of period | | $ | 6.80 | | | $ | 5.52 | | | $ | 6.51 | | | $ | 8.41 | | | $ | 10.00 | |
| | |
|
|
| |
|
|
| |
|
|
| |
|
|
| |
|
|
|
Income (Loss) From Investment Operations: | | | | | | | | | | | | | | | | | | | | |
Net investment income (loss) | | | 0.08 | | | | 0.04 | | | | 0.02 | | | | (— | )(f) | | | 0.01 | |
Net realized and unrealized gain (loss) on investments | | | 0.51 | | | | 1.26 | | | | (1.01 | ) | | | (1.90 | ) | | | (1.59 | ) |
| | |
|
|
| |
|
|
| |
|
|
| |
|
|
| |
|
|
|
Total from investment operations | | | 0.59 | | | | 1.30 | | | | (0.99 | ) | | | (1.90 | ) | | | (1.58 | ) |
| | |
|
|
| |
|
|
| |
|
|
| |
|
|
| |
|
|
|
Less Dividends: | | | | | | | | | | | | | | | | | | | | |
Dividends from net investment income | | | (0.03 | ) | | | (0.02 | ) | | | — | | | | — | | | | (0.01 | ) |
| | |
|
|
| |
|
|
| |
|
|
| |
|
|
| |
|
|
|
Net Asset Value, end of period | | $ | 7.36 | | | $ | 6.80 | | | $ | 5.52 | | | $ | 6.51 | | | $ | 8.41 | |
| | |
|
|
| |
|
|
| |
|
|
| |
|
|
| |
|
|
|
Total Investment Return(b) | | | 8.79 | % | | | 23.69 | % | | | (15.21 | )% | | | (22.68 | )% | | | (15.74 | )% |
Ratios/Supplemental Data: | | | | | | | | | | | | | | | | | | | | |
Net assets, end of period (in millions) | | $ | 31.8 | | | $ | 22.8 | | | $ | 13.9 | | | $ | 10.2 | | | $ | 4.3 | |
Ratios to average net assets:(d) | | | | | | | | | | | | | | | | | | | | |
Expenses | | | 1.00 | % | | | 1.00 | % | | | 1.00 | % | | | 1.00 | % | | | 1.00 | %(c) |
Net investment income (loss) | | | 1.27 | % | | | 0.70 | % | | | 0.45 | % | | | (0.02 | )% | | | 0.26 | %(c) |
Portfolio turnover rate | | | 68 | % | | | 37 | % | | | 116 | % | | | 65 | % | | | 15 | %(e) |
| (a) | Commencement of operations. |
| (b) | Total investment return is calculated assuming a purchase of shares on the first day and a sale on the last day of each period reported and includes reinvestment of dividends and distributions and does not reflect the effect of insurance contract charges. Total investment returns for periods of less than one full year are not annualized. |
| (d) | Net of expense subsidy. If the investment advisor had not subsidized expenses, the annual expense and net investment income (loss) ratios would have been 1.48% and 0.79%, respectively, for the year ended December 31, 2004, and 1.72% and (0.02)%, respectively for the year ended December 31, 2003, 1.79% and (0.34)%, respectively, for the year ended December 31, 2002, 2.55% and (1.57)%, respectively for the year ended December 31, 2001 and 5.53% and (4.27)%, respectively, for the period ended December 31, 2000. |
| (f) | Less than $0.005 per share. |
| | | | | | | | | | | | | | | | | | | | |
| | | SP Alliance Large Cap Growth Portfolio
| |
| | | Year Ended
December 31,
| | | September 22, 2000(a)
through
December 31,
2000
| |
| | | 2004
| | | 2003
| | | 2002
| | | 2001
| | |
Per Share Operating Performance: | | | | | | | | | | | | | | | | | | | | |
Net Asset Value, beginning of period | | $ | 6.23 | | | $ | 5.03 | | | $ | 7.31 | | | $ | 8.55 | | | $ | 10.00 | |
| | |
|
|
| |
|
|
| |
|
|
| |
|
|
| |
|
|
|
Income (Loss) From Investment Operations: | | | | | | | | | | | | | | | | | | | | |
Net investment income (loss) | | | (0.01 | ) | | | 0.00 | (f) | | | (0.01 | ) | | | (0.01 | ) | | | 0.01 | |
Net realized and unrealized gains (losses) on investments | | | 0.39 | | | | 1.20 | | | | (2.27 | ) | | | (1.23 | ) | | | (1.45 | ) |
| | |
|
|
| |
|
|
| |
|
|
| |
|
|
| |
|
|
|
Total from investment operations | | | 0.38 | | | | 1.20 | | | | (2.28 | ) | | | (1.24 | ) | | | (1.44 | ) |
| | |
|
|
| |
|
|
| |
|
|
| |
|
|
| |
|
|
|
Less Distributions: | | | | | | | | | | | | | | | | | | | | |
Dividends from net investment income | | | — | | | | — | | | | — | | | | — | | | | (0.01 | ) |
Tax return of capital distributions | | | — | | | | — | | | | — | | | | — | (f) | | | — | |
| | |
|
|
| |
|
|
| |
|
|
| |
|
|
| |
|
|
|
Total distributions | | | — | | | | — | | | | — | | | | — | (f) | | | (0.01 | ) |
| | |
|
|
| |
|
|
| |
|
|
| |
|
|
| |
|
|
|
Net Asset Value, end of period | | $ | 6.61 | | | $ | 6.23 | | | $ | 5.03 | | | $ | 7.31 | | | $ | 8.55 | |
| | |
|
|
| |
|
|
| |
|
|
| |
|
|
| |
|
|
|
Total Investment Return(b) | | | 6.10 | % | | | 23.86 | % | | | (31.19 | )% | | | (14.47 | )% | | | (14.44 | )% |
Ratios/Supplemental Data: | | | | | | | | | | | | | | | | | | | | |
Net assets, end of period (in millions) | | $ | 65.7 | | | $ | 146.5 | | | $ | 57.7 | | | $ | 35.9 | | | $ | 7.1 | |
Ratios to average net assets: | | | | | | | | | | | | | | | | | | | | |
Expenses | | | 1.07 | % | | | 1.06 | % | | | 1.10 | %(d) | | | 1.10 | %(d) | | | 1.10 | %(c)(d) |
Net investment income (loss) | | | (0.14 | )% | | | (0.11 | )% | | | (0.27 | )%(d) | | | (0.08 | )%(d) | | | 0.44 | %(c)(d) |
Portfolio turnover rate | | | 122 | % | | | 38 | % | | | 34 | % | | | 47 | % | | | 10 | %(e) |
| (a) | Commencement of operations. |
| (b) | Total investment return is calculated assuming a purchase of shares on the first day and a sale on the last day of each period reported and includes reinvestment of dividends and distributions and does not reflect the effect of insurance contract charges. Total investment returns for years of less than one full year are not annualized. |
| (d) | Net of expense subsidy. If the investment advisor had not subsidized expenses, the expense and net investment loss ratios would have been 1.19% and (0.35)%, respectively, for the year ended December 31, 2002, 1.57% and (0.55)%, respectively, for the year ended December 31, 2001 and 4.26% and (2.72)%, respectively, for the year ended December 31, 2000. |
| (f) | Less than $0.005 per share. |
SEE NOTES TO FINANCIAL STATEMENTS.
D2
Financial Highlights
| | | | | | | | | | | | | | | | | | | | |
| | | SP Balanced Assset Allocation Portfolio
| |
| | | Year Ended
December 31,
| | | September 22, 2000(a)
through
December 31,
2000
| |
| | | 2004
| | | 2003
| | | 2002
| | | 2001
| | |
Per Share Operating Performance: | | | | | | | | | | | | | | | | | | | | |
Net Asset Value, beginning of period | | $ | 9.66 | | | $ | 7.96 | | | $ | 9.02 | | | $ | 9.80 | | | $ | 10.00 | |
| | |
|
|
| |
|
|
| |
|
|
| |
|
|
| |
|
|
|
Income (Loss) From Investment Operations: | | | | | | | | | | | | | | | | | | | | |
Net investment income | | | 0.09 | | | | 0.09 | | | | 0.11 | | | | 0.14 | | | | 0.06 | |
Net realized and unrealized gain (loss) on investments | | | 0.97 | | | | 1.71 | | | | (1.16 | ) | | | (0.73 | ) | | | (0.20 | ) |
| | |
|
|
| |
|
|
| |
|
|
| |
|
|
| |
|
|
|
Total from investment operations | | | 1.06 | | | | 1.80 | | | | (1.05 | ) | | | (0.59 | ) | | | (0.14 | ) |
| | |
|
|
| |
|
|
| |
|
|
| |
|
|
| |
|
|
|
Less Dividends and Distributions: | | | | | | | | | | | | | | | | | | | | |
Dividends from net investment income | | | (0.08 | ) | | | (0.10 | ) | | | — | | | | (0.14 | ) | | | (0.06 | ) |
Distributions from net realized gains | | | (0.01 | ) | | | — | | | | (0.01 | ) | | | (0.05 | ) | | | — | |
| | |
|
|
| |
|
|
| |
|
|
| |
|
|
| |
|
|
|
Total dividends and distributions | | | (0.09 | ) | | | (0.10 | ) | | | (0.01 | ) | | | (0.19 | ) | | | (0.06 | ) |
| | |
|
|
| |
|
|
| |
|
|
| |
|
|
| |
|
|
|
Net Asset Value, end of period | | $ | 10.63 | | | $ | 9.66 | | | $ | 7.96 | | | $ | 9.02 | | | $ | 9.80 | |
| | |
|
|
| |
|
|
| |
|
|
| |
|
|
| |
|
|
|
Total Investment Return(b) | | | 11.09 | % | | | 22.87 | % | | | (11.67 | )% | | | (5.99 | )% | | | (1.42 | )% |
Ratios/Supplemental Data: | | | | | | | | | | | | | | | | | | | | |
Net assets, end of period (in millions) | | $ | 837.0 | | | $ | 449.8 | | | $ | 147.3 | | | $ | 66.1 | | | $ | 3.7 | |
Ratios to average net assets: | | | | | | | | | | | | | | | | | | | | |
Expenses | | | 0.05 | % | | | 0.05 | % | | | 0.05 | % | | | 0.05 | % | | | 0.05 | %(c) |
Net investment income | | | 1.37 | % | | | 1.83 | % | | | 1.96 | % | | | 3.26 | % | | | 4.89 | %(c) |
Portfolio turnover rate | | | 48 | % | | | 12 | % | | | 22 | % | | | 35 | % | | | 4 | %(d) |
| (a) | Commencement of operations. |
| (b) | Total investment return is calculated assuming a purchase of shares on the first day and a sale on the last day of each period reported and includes reinvestment of dividends and distributions and does not reflect the effect of insurance contract charges. Total investment returns for periods of less than one full year are not annualized. |
| | | | | | | | | | | | | | | | | | | | |
| | | SP Conservative Assset Allocation Portfolio
| |
| | | Year Ended
December 31,
| | | September 22, 2000(a)
through
December 31,
2000
| |
| | | 2004
| | | 2003
| | | 2002
| | | 2001
| | |
Per Share Operating Performance: | | | | | | | | | | | | | | | | | | | | |
Net Asset Value, beginning of period | | $ | 10.48 | | | $ | 9.16 | | | $ | 9.77 | | | $ | 10.00 | | | $ | 10.00 | |
| | |
|
|
| |
|
|
| |
|
|
| |
|
|
| |
|
|
|
Income (Loss) From Investment Operations: | | | | | | | | | | | | | | | | | | | | |
Net investment income | | | 0.14 | | | | 0.16 | | | | 0.16 | | | | 0.21 | | | | 0.08 | |
Net realized and unrealized gains (losses) on investments | | | 0.77 | | | | 1.33 | | | | (0.73 | ) | | | (0.24 | ) | | | — | (c) |
| | |
|
|
| |
|
|
| |
|
|
| |
|
|
| |
|
|
|
Total from investment operations | | | 0.91 | | | | 1.49 | | | | (0.57 | ) | | | (0.03 | ) | | | 0.08 | |
| | |
|
|
| |
|
|
| |
|
|
| |
|
|
| |
|
|
|
Less Distributions: | | | | | | | | | | | | | | | | | | | | |
Dividends from net investment income | | | (0.16 | ) | | | (0.16 | ) | | | (0.03 | ) | | | (0.16 | ) | | | (0.08 | ) |
Distributions from net realized gains | | | (0.03 | ) | | | (0.01 | ) | | | (0.01 | ) | | | (0.04 | ) | | | — | (c) |
| | |
|
|
| |
|
|
| |
|
|
| |
|
|
| |
|
|
|
Total distributions | | | (0.19 | ) | | | (0.17 | ) | | | (0.04 | ) | | | (0.20 | ) | | | (0.08 | ) |
| | |
|
|
| |
|
|
| |
|
|
| |
|
|
| |
|
|
|
Net Asset Value, end of period | | $ | 11.20 | | | $ | 10.48 | | | $ | 9.16 | | | $ | 9.77 | | | $ | 10.00 | |
| | |
|
|
| |
|
|
| |
|
|
| |
|
|
| |
|
|
|
Total Investment Return(b) | | | 8.89 | % | | | 16.49 | % | | | (5.88 | )% | | | (0.23 | )% | | | 0.84 | % |
Ratios/Supplemental Data: | | | | | | | | | | | | | | | | | | | | |
Net assets, end of period (in millions) | | $ | 459.9 | | | $ | 281.2 | | | $ | 117.5 | | | $ | 47.9 | | | $ | 1.9 | |
Ratios to average net assets: | | | | | | | | | | | | | | | | | | | | |
Expenses | | | 0.05 | % | | | 0.05 | % | | | 0.05 | % | | | 0.05 | % | | | 0.05 | %(d) |
Net investment income | | | 1.86 | % | | | 2.60 | % | | | 2.79 | % | | | 4.76 | % | | | 8.07 | %(d) |
Portfolio turnover rate | | | 47 | % | | | 22 | % | | | 25 | % | | | 29 | % | | | 4 | %(e) |
| (a) | Commencement of operations. |
| (b) | Total investment return is calculated assuming a purchase of shares on the first day and a sale on the last day of each period reported and includes reinvestment of dividends and distributions and does not reflect the effect of insurance contract charges. Total investment returns for periods of less than one full year are not annualized. |
| (c) | Less than $0.005 per share. |
SEE NOTES TO FINANCIAL STATEMENTS.
D3
Financial Highlights
| | | | | | | | | | | | | | | | | | | | |
| | | SP Davis Value Portfolio
| |
| | | Year Ended
December 31,
| | | September 22, 2000(a)
through
December 31,
2000
| |
| | | 2004
| | | 2003
| | | 2002
| | | 2001
| | |
Per Share Operating Performance: | | | | | | | | | | | | | | | | | | | | |
Net Asset Value, beginning of period | | $ | 9.80 | | | $ | 7.62 | | | $ | 9.04 | | | $ | 10.15 | | | $ | 10.00 | |
| | |
|
|
| |
|
|
| |
|
|
| |
|
|
| |
|
|
|
Income (Loss) From Investment Operations: | | | | | | | | | | | | | | | | | | | | |
Net investment income | | | 0.10 | | | | 0.05 | | | | 0.05 | | | | 0.05 | | | | 0.02 | |
Net realized and unrealized gains (losses) on investments
and foreign currencies | | | 1.12 | | | | 2.18 | | | | (1.47 | ) | | | (1.11 | ) | | | 0.15 | |
| | |
|
|
| |
|
|
| |
|
|
| |
|
|
| |
|
|
|
Total from investment operations | | | 1.22 | | | | 2.23 | | | | (1.42 | ) | | | (1.06 | ) | | | 0.17 | |
| | |
|
|
| |
|
|
| |
|
|
| |
|
|
| |
|
|
|
Less Dividends: | | | | | | | | | | | | | | | | | | | | |
Dividends from net investment income | | | (0.04 | ) | | | (0.05 | ) | | | — | (f) | | | (0.05 | ) | | | (0.02 | ) |
| | |
|
|
| |
|
|
| |
|
|
| |
|
|
| |
|
|
|
Net Asset Value, end of period | | $ | 10.98 | | | $ | 9.80 | | | $ | 7.62 | | | $ | 9.04 | | | $ | 10.15 | |
| | |
|
|
| |
|
|
| |
|
|
| |
|
|
| |
|
|
|
Total Investment Return(b) | | | 12.53 | % | | | 29.40 | % | | | (15.70 | )% | | | (10.46 | )% | | | 1.69 | % |
Ratios/Supplement Data: | | | | | | | | | | | | | | | | | | | | |
Net assets, end of period (in millions) | | $ | 285.5 | | | $ | 391.2 | | | $ | 165.0 | | | $ | 94.4 | | | $ | 12.8 | |
Ratios to average net assets: | | | | | | | | | | | | | | | | | | | | |
Expenses | | | 0.82 | % | | | 0.82 | % | | | 0.83 | %(e) | | | 0.83 | %(e) | | | 0.83 | %(c)(e) |
Net investment income | | | 0.89 | % | | | 0.80 | % | | | 0.82 | %(e) | | | 0.64 | %(e) | | | 1.48 | %(c)(e) |
Portfolio turnover rate | | | 34 | % | | | 7 | % | | | 22 | % | | | 17 | % | | | 3 | %(d) |
| (a) | Commencement of operations. |
| (b) | Total investment return is calculated assuming a purchase of shares on the first day and a sale on the last day of each period reported and included reinvestment of dividends and distributions and does not reflect the effect of insurance contract charges. Total investment returns for periods of less than one full year are not annualized. |
| (e) | Net of expense subsidy. If the investment advisor had not subsidized expenses, the annual expense and net investment income ratios would have been 0.87% and 0.78%, respectively, for the period ended December 31, 2002, 1.03% and 0.43%, respectively, for the period ended December 31, 2001, and 3.16% and (0.85)%, respectively, for the period ended December 31, 2000. |
| (f) | Less than $0.005 per share. |
| | | | | | | | | | | | | | | | | | | | |
| | | SP Goldman Sachs Small Cap Value Portfolio
| |
| | | Year Ended December 31,
| | | September 22, 2000(a)
through
December 31,
2000
| |
| | | 2004
| | | 2003
| | | 2002
| | | 2001
| | |
Per Share Operating Performance: | | | | | | | | | | | | | | | | | | | | |
Net Asset Value, beginning of period | | $ | 12.88 | | | $ | 9.68 | | | $ | 11.36 | | | $ | 11.13 | | | $ | 10.00 | |
| | |
|
|
| |
|
|
| |
|
|
| |
|
|
| |
|
|
|
Income (Loss) From Investment Operations: | | | | | | | | | | | | | | | | | | | | |
Net investment income | | | 0.08 | | | | 0.02 | | | | 0.05 | | | | 0.08 | | | | 0.03 | |
Net realized and unrealized gains (losses) on investments | | | 2.57 | | | | 3.18 | | | | (1.68 | ) | | | 0.26 | | | | 1.10 | |
| | |
|
|
| |
|
|
| |
|
|
| |
|
|
| |
|
|
|
Total from investment operations | | | 2.65 | | | | 3.20 | | | | (1.63 | ) | | | 0.34 | | | | 1.13 | |
| | |
|
|
| |
|
|
| |
|
|
| |
|
|
| |
|
|
|
Less Dividends and Distributions: | | | | | | | | | | | | | | | | | | | | |
Dividends from net investment income | | | (0.02 | ) | | | — | (b) | | | (0.05 | ) | | | (0.11 | ) | | | — | (b) |
Distributions from net realized gains | | | — | (b) | | | — | | | | — | | | | — | | | | — | |
| | |
|
|
| |
|
|
| |
|
|
| |
|
|
| |
|
|
|
Total dividends and distributions | | | (0.02 | ) | | | 0.00 | | | | (0.05 | ) | | | (0.11 | ) | | | 0.00 | |
| | |
|
|
| |
|
|
| |
|
|
| |
|
|
| |
|
|
|
Net Asset Value, end of period | | $ | 15.51 | | | $ | 12.88 | | | $ | 9.68 | | | $ | 11.36 | | | $ | 11.13 | |
| | |
|
|
| |
|
|
| |
|
|
| |
|
|
| |
|
|
|
Total Investment Return(c) | | | 20.69 | % | | | 33.11 | % | | | (14.38 | )% | | | 3.11 | % | | | 11.33 | % |
Ratios/Supplemental Data: | | | | | | | | | | | | | | | | | | | | |
Net assets, end of period (in millions) | | $ | 393.3 | | | $ | 250.6 | | | $ | 99.2 | | | $ | 47.4 | | | $ | 6.1 | |
Ratios to average net assets: | | | | | | | | | | | | | | | | | | | | |
Expenses | | | 0.96 | % | | | 1.04 | % | | | 1.05 | %(e) | | | 1.05 | %(e) | | | 1.05 | %(d)(e) |
Net investment income | | | 0.69 | % | | | 0.37 | % | | | 0.69 | %(e) | | | 1.08 | %(e) | | | 1.79 | %(d)(e) |
Portfolio turnover rate | | | 127 | % | | | 90 | % | | | 116 | % | | | 89 | % | | | 18 | %(f) |
| (a) | Commencement of operations. |
| (b) | Less than $0.005 per share. |
| (c) | Total investment return is calculated assuming a purchase of shares on the first day and a sale on the last day of each period reported and includes reinvestment of dividends and distributions and does not reflect the effect of insurance contract charges. Total investment returns for periods of less than one full year are not annualized. |
| (e) | Net of expense subsidy. If the investment advisor had not subsidized expenses, the annual expense and net investment income ratios would have been 1.10% and 0.64%, respectively, for the year ended December 31, 2002, 1.56% and 0.57%, respectively, for the year ended December 31, 2001 and 4.84% and (2.00)%, respectively, for the period ended December 31, 2000. |
SEE NOTES TO FINANCIAL STATEMENTS.
D4
Financial Highlights
| | | | | | | | | | | | | | | | | | | | |
| | | SP Growth Asset Allocation Portfolio
| |
| | | Year Ended
December 31,
| | | September 22, 2000(a)
through
December 31,
2000
| |
| | | 2004
| | | 2003
| | | 2002
| | | 2001
| | |
Per Share Operating Performance: | | | | | | | | | | | | | | | | | | | | |
Net Asset Value, beginning of period | | $ | 8.71 | | | $ | 6.84 | | | $ | 8.27 | | | $ | 9.52 | | | $ | 10.00 | |
| | |
|
|
| |
|
|
| |
|
|
| |
|
|
| |
|
|
|
Income (Loss) From Investment Operations: | | | | | | | | | | | | | | | | | | | | |
Net investment income | | | 0.06 | | | | 0.04 | | | | 0.06 | | | | 0.09 | | | | 0.03 | |
Net realized and unrealized gains (losses) on investments | | | 1.07 | | | | 1.88 | | | | (1.49 | ) | | | (1.21 | ) | | | (0.49 | ) |
| | |
|
|
| |
|
|
| |
|
|
| |
|
|
| |
|
|
|
Total from investment operations | | | 1.13 | | | | 1.92 | | | | (1.43 | ) | | | (1.12 | ) | | | (0.46 | ) |
| | |
|
|
| |
|
|
| |
|
|
| |
|
|
| |
|
|
|
Less Dividends & Distributions: | | | | | | | | | | | | | | | | | | | | |
Dividends from net investment income | | | (0.04 | ) | | | (0.05 | ) | | | — | | | | (0.08 | ) | | | (0.02 | ) |
Distributions from net realized gains | | | — | | | | — | | | | — | (e) | | | (0.05 | ) | | | — | |
| | |
|
|
| |
|
|
| |
|
|
| |
|
|
| |
|
|
|
Total dividends & distributions | | | (0.04 | ) | | | (0.05 | ) | | | — | | | | (0.13 | ) | | | (0.02 | ) |
| | |
|
|
| |
|
|
| |
|
|
| |
|
|
| |
|
|
|
Net Asset Value, end of period | | $ | 9.80 | | | $ | 8.71 | | | $ | 6.84 | | | $ | 8.27 | | | $ | 9.52 | |
| | |
|
|
| |
|
|
| |
|
|
| |
|
|
| |
|
|
|
Total Investment Return(b) | | | 13.05 | % | | | 28.27 | % | | | (17.26 | )% | | | (11.77 | )% | | | (4.56 | )% |
Ratios/Supplemental Data: | | | | | | | | | | | | | | | | | | | | |
Net assets, end of period (in millions) | | $ | 662.7 | | | $ | 326.7 | | | $ | 96.4 | | | $ | 46.8 | | | $ | 3.9 | |
Ratios to average net assets: | | | | | | | | | | | | | | | | | | | | |
Expenses | | | 0.05 | % | | | 0.05 | % | | | 0.05 | % | | | 0.05 | % | | | 0.05 | %(c) |
Net investment income | | | 0.94 | % | | | 1.10 | % | | | 1.12 | % | | | 1.71 | % | | | 2.95 | %(c) |
Portfolio turnover rate | | | 53 | % | | | 18 | % | | | 24 | % | | | 43 | % | | | 39 | %(d) |
| (a) | Commencement of operations. |
| (b) | Total investment return is calculated assuming a purchase of shares on the first day and a sale on the last day of each period reported and includes reinvestment of dividends and distributions and does not reflect the effect of insurance contract charges. Total investment returns for periods of less than one full year are not annualized. |
| (e) | Less than $0.005 per share. |
| | | | | | | | | | | | | | | | | | | | |
| | | SP Large Cap Value Portfolio
| |
| | | Year Ended
December 31,
| | | September 22, 2000(a) through
December 31,
2000
| |
| | | 2004(g)
| | | 2003
| | | 2002
| | | 2001
| | |
Per Share Operating Performance: | | | | | | | | | | | | | | | | | | | | |
Net Asset Value, beginning of period | | $ | 9.90 | | | $ | 7.81 | | | $ | 9.44 | | | $ | 10.44 | | | $ | 10.00 | |
| | |
|
|
| |
|
|
| |
|
|
| |
|
|
| |
|
|
|
Income (Loss) From Investment Operations: | | | | | | | | | | | | | | | | | | | | |
Net investment income | | | 0.16 | | | | 0.09 | | | | 0.08 | | | | 0.09 | | | | 0.04 | |
Net realized and unrealized gains (losses) on investments | | | 1.58 | | | | 2.00 | | | | (1.62 | ) | | | (0.99 | ) | | | 0.44 | |
| | |
|
|
| |
|
|
| |
|
|
| |
|
|
| |
|
|
|
Total from investment operations | | | 1.74 | | | | 2.09 | | | | (1.54 | ) | | | (0.90 | ) | | | 0.48 | |
| | |
|
|
| |
|
|
| |
|
|
| |
|
|
| |
|
|
|
Less Dividends and Distributions: | | | | | | | | | | | | | | | | | | | | |
Dividends from net investment income | | | (.08 | ) | | | — | | | | (0.09 | ) | | | (0.10 | ) | | | (0.04 | ) |
Distributions in excess of net investment income | | | — | | | | — | | | | — | | | | — | | | | — | (e) |
Tax Return of Capital | | | — | | | | — | | | | — | (e) | | | — | | | | — | |
| | |
|
|
| |
|
|
| |
|
|
| |
|
|
| |
|
|
|
Total dividends and distributions | | | (.08 | ) | | | — | | | | (0.09 | ) | | | (0.10 | ) | | | (0.04 | ) |
| | |
|
|
| |
|
|
| |
|
|
| |
|
|
| |
|
|
|
Net Asset Value, end of period | | $ | 11.56 | | | $ | 9.90 | | | $ | 7.81 | | | $ | 9.44 | | | $ | 10.44 | |
| | |
|
|
| |
|
|
| |
|
|
| |
|
|
| |
|
|
|
Total Investment Return(b) | | | 17.75 | % | | | 26.76 | % | | | (16.37 | )% | | | (8.65 | )% | | | 4.82 | % |
Ratios/Supplemental Data: | | | | | | | | | | | | | | | | | | | | |
Net assets, end of period (in millions) | | $ | 601.4 | | | $ | 72.9 | | | $ | 38.3 | | | $ | 23.7 | | | $ | 3.9 | |
Ratios to average net assets: | | | | | | | | | | | | | | | | | | | | |
Expenses | | | 0.86 | % | | | 0.90 | %(d) | | | 0.90 | %(d) | | | 0.90 | %(d) | | | 0.90 | %(c)(d) |
Net investment income | | | 1.53 | % | | | 1.32 | %(d) | | | 1.22 | %(d) | | | 1.18 | %(d) | | | 1.60 | %(c)(d) |
Portfolio turnover rate | | | 77 | % | | | 73 | % | | | 96 | % | | | 61 | % | | | 13 | %(f) |
| (a) | Commencement of operations. |
| (b) | Total investment return is calculated assuming a purchase of shares on the first day and a sale on the last day of each period reported and includes reinvestment of dividends and distributions and does not reflect the effect of insurance contract charges. Total investment returns for periods of less than one full year are not annualized. |
| (d) | Net of expense subsidy. If the investment advisor had not subsidized expenses, the annual expense and net investment income (loss) ratios would have been 1.11% and 1.11%, respectively, for the year ended December 31, 2003 and 1.31% and 0.81%, respectively, for the year ended December 31, 2002, 1.98% and 0.10%, respectively, for the year ended December 31, 2001 and 5.47% and (2.97)%, respectively, for the period ended December 31, 2000. |
| (e) | Less than $0.005 per share. |
| (g) | Calculated based upon weighted average shares outstanding during the year. |
SEE NOTES TO FINANCIAL STATEMENTS.
D5
Financial Highlights
| | | | | | | | | | | | | | | | | | | | |
| | | SP LSV International Value Portfolio
| |
| | | Year Ended
December 31,
| | | September 22, 2000(a)
through December 31,
2000
| |
| | | 2004
| | | 2003(f)
| | | 2002
| | | 2001
| | |
Per Share Operating Performance: | | | | | | | | | | | | | | | | | | | | |
Net Asset Value, beginning of period | | $ | 7.67 | | | $ | 6.08 | | | $ | 7.35 | | | $ | 9.44 | | | $ | 10.00 | |
| | |
|
|
| |
|
|
| |
|
|
| |
|
|
| |
|
|
|
Income (Loss) From Investment Operations: | | | | | | | | | | | | | | | | | | | | |
Net investment income | | | 0.04 | | | | 0.06 | | | | 0.04 | | | | 0.05 | | | | 0.01 | |
Net realized and unrealized gains (losses) on investments | | | 1.17 | | | | 1.58 | | | | (1.31 | ) | | | (2.09 | ) | | | (0.57 | ) |
| | |
|
|
| |
|
|
| |
|
|
| |
|
|
| |
|
|
|
Total from investment operations | | | 1.21 | | | | 1.64 | | | | (1.27 | ) | | | (2.04 | ) | | | (0.56 | ) |
| | |
|
|
| |
|
|
| |
|
|
| |
|
|
| |
|
|
|
Less Dividends: | | | | | | | | | | | | | | | | | | | | |
Dividends from net investment income | | | (0.04 | ) | | | (0.05 | ) | | | — | | | | (0.05 | ) | | | — | |
| | |
|
|
| |
|
|
| |
|
|
| |
|
|
| |
|
|
|
Net Asset Value, end of period | | $ | 8.84 | | | $ | 7.67 | | | $ | 6.08 | | | $ | 7.35 | | | $ | 9.44 | |
| | |
|
|
| |
|
|
| |
|
|
| |
|
|
| |
|
|
|
Total Investment Return(b) | | | 15.80 | % | | | 27.37 | % | | | (17.17 | )% | | | (22.07 | )% | | | (5.20 | )% |
Ratios/Supplemental Data: | | | | | | | | | | | | | | | | | | | | |
Net assets, end of period (in millions) | | $ | 240.7 | | | $ | 119.9 | | | $ | 46.4 | | | $ | 24.7 | | | $ | 7.8 | |
Ratios to average net assets:(e) | | | | | | | | | | | | | | | | | | | | |
Expenses | | | 1.10 | % | | | 1.10 | % | | | 1.10 | % | | | 1.10 | % | | | 1.10 | %(c) |
Net investment income | | | 0.69 | % | | | 0.89 | % | | | 0.55 | % | | | 0.61 | % | | | 0.55 | %(c) |
Portfolio turnover rate | | | 159 | % | | | 87 | % | | | 141 | % | | | 155 | % | | | 51 | %(d) |
| (a) | Commencement of operations. |
| (b) | Total investment return is calculated assuming a purchase of shares on the first day and a sale on the last day of each period reported and includes reinvestment of dividends and distributions and does not reflect the effect of insurance contract charges. Total investment returns for periods of less than one full year are not annualized. |
| (e) | Net of expense subsidy. If the investment advisor had not subsidized expenses, the annual expense and net investment income (loss) ratios would have been 1.23% and 0.55%, respectively, for the year ended December 31, 2004, 1.30% and 0.69%, respectively, for the year ended December 31, 2003, 1.77% and (0.12)%, respectively, for the year ended December 31, 2002, 3.27% and (1.56)%, respectively, for the year ended December 31, 2001, and 4.21% and (2.56)%, respectively, for the period ended December 31, 2000. |
| (f) | Calculated based upon weighted average shares outstanding during the year. |
| | | | | | | | | | | | | | | | | | | | |
| | | SP MFS Capital Opportunities Portfolio
| |
| | | Year Ended
December 31,
| | | September 22, 2000(a) through December 31,
2000
| |
| | | 2004
| | | 2003
| | | 2002
| | | 2001
| | |
Per Share Operating Performance: | | | | | | | | | | | | | | | | | | | | |
Net Asset Value, beginning of period | | $ | 6.33 | | | $ | 5.00 | | | $ | 7.01 | | | $ | 9.15 | | | $ | 10.00 | |
| | |
|
|
| |
|
|
| |
|
|
| |
|
|
| |
|
|
|
Income (Loss) From Investment Operations: | | | | | | | | | | | | | | | | | | | | |
Net investment income | | | 0.04 | | | | 0.01 | | | | 0.01 | | | | — | (f) | | | 0.01 | |
Net realized and unrealized gains (losses) on investments | | | 0.74 | | | | 1.33 | | | | (2.02 | ) | | | (2.13 | ) | | | (0.85 | ) |
| | |
|
|
| |
|
|
| |
|
|
| |
|
|
| |
|
|
|
Total from investment operations | | | 0.78 | | | | 1.34 | | | | (2.01 | ) | | | (2.13 | ) | | | (0.84 | ) |
| | |
|
|
| |
|
|
| |
|
|
| |
|
|
| |
|
|
|
Less Dividends: | | | | | | | | | | | | | | | | | | | | |
Dividends from net investment income | | | (0.01 | ) | | | (0.01 | ) | | | — | | | | (0.01 | ) | | | (0.01 | ) |
| | |
|
|
| |
|
|
| |
|
|
| |
|
|
| |
|
|
|
Net Asset Value, end of period | | $ | 7.10 | | | $ | 6.33 | | | $ | 5.00 | | | $ | 7.01 | | | $ | 9.15 | |
| | |
|
|
| |
|
|
| |
|
|
| |
|
|
| |
|
|
|
Total Return(b) | | | 12.39 | % | | | 26.80 | % | | | (28.67 | )% | | | (23.28 | )% | | | (8.39 | )% |
Ratios/Supplemental Data: | | | | | | | | | | | | | | | | | | | | |
Net assets, end of period (in millions) | | $ | 27.8 | | | $ | 20.3 | | | $ | 9.3 | | | $ | 8.2 | | | $ | 4.3 | |
Ratios to average net assets:(d) | | | | | | | | | | | | | | | | | | | | |
Expenses | | | 1.00 | % | | | 1.00 | % | | | 1.00 | % | | | 1.00 | % | | | 1.00 | %(c) |
Net investment income | | | 0.64 | % | | | 0.34 | % | | | 0.16 | % | | | (— | )%(g) | | | 0.40 | %(c) |
Portfolio turnover rate | | | 66 | % | | | 58 | % | | | 143 | % | | | 99 | % | | | 25 | %(e) |
| (a) | Commencement of operations. |
| (b) | Total investment return is calculated assuming a purchase of shares on the first day and a sale on the last day of each period reported and includes reinvestment of dividends and distributions and does not reflect the effect of insurance contract charges. Total investment returns for periods of less than one full year are not annualized. |
| (d) | Net of expense subsidy. If the investment advisor had not subsidized expenses, the annual expense and net investment loss ratios would have been 1.45% and 0.19%, respectively, for the year ended December 31, 2004, 2.02% and (0.69)%, respectively, and 2.28% and (1.12)%, respectively, for the year ended December 31, 2002, for the year ended December 31, 2003, 3.04% and (2.04)%, respectively, for the year ended December 31, 2001 and 5.48% and (4.08)%, respectively and for the period ended December 31, 2000. |
| (f) | Less than $0.005 per share. |
SEE NOTES TO FINANCIAL STATEMENTS.
D6
Financial Highlights
| | | | | | | | | | | | | | | | | | | | |
| | | SP Mid-Cap Growth Portfolio
| |
| | | Year Ended
December 31,
| | | September 22, 2000(a) through December 31,
2000
| |
| | | 2004
| | | 2003
| | | 2002
| | | 2001
| | |
Per Share Operating Performance: | | | | | | | | | | | | | | | | | | | | |
Net Asset Value, beginning of period | | $ | 5.73 | | | $ | 4.09 | | | $ | 7.62 | | | $ | 9.69 | | | $ | 10.00 | |
| | |
|
|
| |
|
|
| |
|
|
| |
|
|
| |
|
|
|
Income (Loss) From Investment Operations: | | | | | | | | | | | | | | | | | | | | |
Net investment income (loss) | | | (0.03 | ) | | | (0.02 | ) | | | (0.02 | ) | | | (0.01 | ) | | | 0.02 | |
Net realized and unrealized gain (loss) on investments | | | 1.15 | | | | 1.66 | | | | (3.51 | ) | | | (2.01 | ) | | | (0.25 | ) |
| | |
|
|
| |
|
|
| |
|
|
| |
|
|
| |
|
|
|
Total from investment operations | | | 1.12 | | | | 1.64 | | | | (3.53 | ) | | | (2.02 | ) | | | (0.23 | ) |
| | |
|
|
| |
|
|
| |
|
|
| |
|
|
| |
|
|
|
Less Dividends and Distributions: | | | | | | | | | | | | | | | | | | | | |
Dividends from net investment income | | | — | | | | — | | | | — | | | | (0.01 | ) | | | (0.02 | ) |
Distributions from net realized gains | | | — | | | | — | | | | — | | | | (0.04 | ) | | | (0.06 | ) |
| | |
|
|
| |
|
|
| |
|
|
| |
|
|
| |
|
|
|
Total dividends and distributions | | | — | | | | — | | | | — | | | | (0.05 | ) | | | (0.08 | ) |
| | |
|
|
| |
|
|
| |
|
|
| |
|
|
| |
|
|
|
Net Asset Value, end of period | | $ | 6.85 | | | $ | 5.73 | | | $ | 4.09 | | | $ | 7.62 | | | $ | 9.69 | |
| | |
|
|
| |
|
|
| |
|
|
| |
|
|
| |
|
|
|
Total Investment Return(b) | | | 19.55 | % | | | 40.10 | % | | | (46.33 | )% | | | (20.93 | )% | | | (2.26 | )% |
Ratios/Supplemental Data: | | | | | | | | | | | | | | | | | | | | |
Net assets, end of period (in millions) | | $ | 107.5 | | | $ | 58.9 | | | $ | 18.3 | | | $ | 15.9 | | | $ | 5.6 | |
Ratios to average net assets:(d) | | | | | | | | | | | | | | | | | | | | |
Expenses | | | 1.00 | % | | | 1.00 | % | | | 1.00 | % | | | 1.00 | % | | | 1.00 | %(c) |
Net investment income (loss) | | | (0.68 | )% | | | (0.73 | )% | | | (0.59 | )% | | | (0.20 | )% | | | 1.16 | %(c) |
Portfolio turnover rate | | | 79 | % | | | 73 | % | | | 255 | % | | | 93 | % | | | 27 | %(e) |
| (a) | Commencement of operations. |
| (b) | Total investment return is calculated assuming a purchase of shares on the first day and a sale on the last day of each period reported and includes reinvestment of dividends and distributions and does not reflect the effect of insurance contract charges. Total investment returns for periods of less than one full year are not annualized. |
| (d) | Net of expense subsidy. If the investment advisor had not subsidized expenses, the annual expense and net investment loss ratios would have been 1.07% and (0.75)%, respectively, for the year ended December 31, 2004, 1.34% and (1.07)%, respectively, for the year ended December 31, 2003, 1.68% and (1.27)%, respectively, for the year ended December 31, 2002, 2.11% and (1.31)%, respectively, for the year ended December 31, 2001 and 4.59% and (2.43)%, respectively, for the period ended December 31, 2000. |
| | | | | | | | | | | | | | | | | | | | |
| | | SP PIMCO High Yield Portfolio
| |
| | | Year Ended
December 31,
| | | September 22, 2000(a) through December 31,
2000
| |
| | | 2004
| | | 2003
| | | 2002
| | | 2001
| | |
Per Share Operating Performance: | | | | | | | | | | | | | | | | | | | | |
Net Asset Value, beginning of period | | $ | 10.53 | | | $ | 9.17 | | | $ | 9.81 | | | $ | 10.02 | | | $ | 10.00 | |
| | |
|
|
| |
|
|
| |
|
|
| |
|
|
| |
|
|
|
Income (Loss) From Investment Operations: | | | | | | | | | | | | | | | | | | | | |
Net investment income | | | 0.69 | | | | 0.65 | | | | 0.64 | | | | 0.59 | | | | 0.17 | |
Net realized and unrealized gains (losses) on investments | | | 0.25 | | | | 1.36 | | | | (0.64 | ) | | | (0.21 | ) | | | 0.02 | |
| | |
|
|
| |
|
|
| |
|
|
| |
|
|
| |
|
|
|
Total from investment operations | | | .94 | | | | 2.01 | | | | — | | | | 0.38 | | | | 0.19 | |
| | |
|
|
| |
|
|
| |
|
|
| |
|
|
| |
|
|
|
Less Dividends and Distributions: | | | | | | | | | | | | | | | | | | | | |
Dividends from net investment income | | | (0.70 | ) | | | (0.65 | ) | | | (0.64 | ) | | | (0.59 | ) | | | (0.16 | ) |
Distributions from net realized gains | | | (0.10 | ) | | | — | | | | — | | | | — | | | | (0.01 | ) |
Distributions in excess of net realized capital gains | | | — | | | | — | | | | — | | | | — | | | | — | (d) |
| | |
|
|
| |
|
|
| |
|
|
| |
|
|
| |
|
|
|
Total dividends and distributions | | | (0.80 | ) | | | (0.65 | ) | | | (0.64 | ) | | | (0.59 | ) | | | (0.17 | ) |
| | |
|
|
| |
|
|
| |
|
|
| |
|
|
| |
|
|
|
Net Asset Value, end of period | | $ | 10.67 | | | $ | 10.53 | | | $ | 9.17 | | | $ | 9.81 | | | $ | 10.02 | |
| | |
|
|
| |
|
|
| |
|
|
| |
|
|
| |
|
|
|
Total Investment Return(b) | | | 9.32 | % | | | 22.41 | % | | | 0.15 | % | | | 3.97 | % | | | 1.94 | % |
Ratios/Supplemental Data: | | | | | | | | | | | | | | | | | | | | |
Net assets, end of period (in millions) | | $ | 312.5 | | | $ | 248.2 | | | $ | 112.2 | | | $ | 52.0 | | | $ | 8.0 | |
Ratios to average net assets: | | | | | | | | | | | | | | | | | | | | |
Expenses | | | 0.68 | % | | | 0.72 | % | | | 0.82 | % | | | 0.82 | %(e) | | | 0.82 | %(c)(e) |
Net investment income | | | 6.68 | % | | | 6.97 | % | | | 7.79 | % | | | 7.44 | %(e) | | | 7.78 | %(c)(e) |
Portfolio turnover rate | | | 53 | % | | | 74 | % | | | 108 | % | | | 105 | % | | | 88 | %(f) |
| (a) | Commencement of operations. |
| (b) | Total investment return is calculated assuming a purchase of shares on the first day and a sale on the last day of each period reported and includes reinvestment of dividends and distributions and does not reflect the effect of insurance contract charges. Total investment returns for periods of less than one full year are not annualized. |
| (d) | Less than $0.005 per share. |
| (e) | Net of expense subsidy. If the investment advisor had not subsidized expenses, the annual expense and net investment income ratios would have been 1.08% and 7.18%, respectively, for the year ended December 31, 2001 and 3.42% and 5.18%, respectively, for the period ended December 31, 2000. |
SEE NOTES TO FINANCIAL STATEMENTS.
D7
Financial Highlights
| | | | | | | | | | | | | | | | | | | | |
| | | SP PIMCO Total Return Portfolio
| |
| | | Year Ended
December 31,
| | | September 22, 2000(a) through
December 31,
2000
| |
| | | 2004
| | | 2003
| | | 2002
| | | 2001
| | |
Per Share Operating Performance: | | | | | | | | | | | | | | | | | | | | |
Net Asset Value, beginning of period | | $ | 11.54 | | | $ | 11.41 | | | $ | 10.70 | | | $ | 10.40 | | | $ | 10.00 | |
| | |
|
|
| |
|
|
| |
|
|
| |
|
|
| |
|
|
|
Income From Investment Operations: | | | | | | | | | | | | | | | | | | | | |
Net investment income | | | 0.22 | | | | 0.23 | | | | 0.28 | | | | 0.32 | | | | 0.13 | |
Net realized and unrealized gains on investments | | | 0.36 | | | | 0.43 | | | | 0.71 | | | | 0.57 | | | | 0.39 | |
| | |
|
|
| |
|
|
| |
|
|
| |
|
|
| |
|
|
|
Total from investment operations | | | 0.58 | | | | 0.66 | | | | 0.99 | | | | 0.89 | | | | 0.52 | |
| | |
|
|
| |
|
|
| |
|
|
| |
|
|
| |
|
|
|
Less Dividends and Distributions: | | | | | | | | | | | | | | | | | | | | |
Dividends from net investment income | | | (0.23 | ) | | | (0.28 | ) | | | (0.28 | ) | | | (0.34 | ) | | | (0.11 | ) |
Distributions from net realized gains | | | (0.21 | ) | | | (0.25 | ) | | | — | (f) | | | (0.25 | ) | | | (0.01 | ) |
| | |
|
|
| |
|
|
| |
|
|
| |
|
|
| |
|
|
|
Total dividends and distributions | | | (0.44 | ) | | | (0.53 | ) | | | (0.28 | ) | | | (0.59 | ) | | | (0.12 | ) |
| | |
|
|
| |
|
|
| |
|
|
| |
|
|
| |
|
|
|
Net Asset Value, end of period | | $ | 11.68 | | | $ | 11.54 | | | $ | 11.41 | | | $ | 10.70 | | | $ | 10.40 | |
| | |
|
|
| |
|
|
| |
|
|
| |
|
|
| |
|
|
|
Total Investment Return(b) | | | 5.28 | % | | | 5.85 | % | | | 9.39 | % | | | 8.66 | % | | | 5.18 | % |
Ratios/Supplemental Data: | | | | | | | | | | | | | | | | | | | | |
Net assets, end of period (in millions) | | $ | 1,099.0 | | | $ | 839.1 | | | $ | 471.7 | | | $ | 147.0 | | | $ | 10.7 | |
Ratios to average net assets: | | | | | | | | | | | | | | | | | | | | |
Expenses | | | 0.65 | % | | | 0.65 | % | | | 0.67 | % | | | 0.76 | %(d) | | | 0.76 | %(c)(d) |
Net investment income | | | 2.01 | % | | | 2.19 | % | | | 3.02 | % | | | 3.69 | %(d) | | | 5.94 | %(c)(d) |
Portfolio turnover rate | | | 590 | % | | | 656 | % | | | 574 | % | | | 718 | % | | | 239 | %(e) |
| (a) | Commencement of operations. |
| (b) | Total investment return is calculated assuming a purchase of shares on the first day and a sale on the last day of each period reported and includes reinvestment of dividends and distributions and does not reflect the effect of insurance contract charges. Total investment returns for periods of less than one full year are not annualized. |
| (d) | Net of expense subsidy. If the investment advisor had not subsidized expenses, the annual expense and net investment income ratios would have been 0.82% and 3.63%, respectively, for the year ended December 31, 2001 and 2.73% and 3.97%, respectively, for the period ended December 31, 2000. |
| (f) | Less than $0.005 per share. |
| | | | | | | | | | | | | | | | | | | | |
| | | SP Prudential U.S. Emerging Growth Portfolio
| |
| | | Class I
| |
| | | Year Ended December 31,
| | | September 22, 2000(a)
through December 31,
2000
| |
| | | 2004
| | | 2003
| | | 2002
| | | 2001
| | |
Per Share Operating Performance: | | | | | | | | | | | | | | | | | | | | |
Net Asset Value, beginning of period | | $ | 6.65 | | | $ | 4.68 | | | $ | 6.89 | | | $ | 8.38 | | | $ | 10.00 | |
| | |
|
|
| |
|
|
| |
|
|
| |
|
|
| |
|
|
|
Income (Loss) From Investment Operations: | | | | | | | | | | | | | | | | | | | | |
Net investment income (loss) | | | (0.05 | ) | | | (0.02 | ) | | | (0.02 | ) | | | (0.01 | ) | | | 0.01 | |
Net realized and unrealized gains (losses) on investments | | | 1.47 | | | | 1.99 | | | | (2.19 | ) | | | (1.48 | ) | | | (1.62 | ) |
| | |
|
|
| |
|
|
| |
|
|
| |
|
|
| |
|
|
|
Total from investment operations | | | 1.42 | | | | 1.97 | | | | (2.21 | ) | | | (1.49 | ) | | | (1.61 | ) |
| | |
|
|
| |
|
|
| |
|
|
| |
|
|
| |
|
|
|
Less Dividends and Distributions: | | | | | | | | | | | | | | | | | | | | |
Dividends from net investment income | | | — | | | | — | | | | — | | | | — | | | | (0.01 | ) |
Distributions from net realized gains | | | — | (f) | | | — | | | | — | | | | — | | | | — | |
| | |
|
|
| |
|
|
| |
|
|
| |
|
|
| |
|
|
|
Total dividends and distributions | | | — | (f) | | | — | | | | — | | | | — | | | | (0.01 | ) |
| | |
|
|
| |
|
|
| |
|
|
| |
|
|
| |
|
|
|
Net Asset Value, end of period | | $ | 8.07 | | | $ | 6.65 | | | $ | 4.68 | | | $ | 6.89 | | | $ | 8.38 | |
| | |
|
|
| |
|
|
| |
|
|
| |
|
|
| |
|
|
|
Total Investment Return(b) | | | 21.39 | % | | | 42.09 | % | | | (32.08 | )% | | | (17.78 | )% | | | (16.11 | )% |
Ratios/Supplemental Data: | | | | | | | | | | | | | | | | | | | | |
Net assets, end of period (in millions) | | $ | 128.3 | | | $ | 170.0 | | | $ | 51.0 | | | $ | 31.2 | | | $ | 6.4 | |
Ratios to average net assets: | | | | | | | | | | | | | | | | | | | | |
Expenses | | | 0.78 | % | | | 0.80 | % | | | 0.90 | %(d) | | | 0.90 | %(d) | | | 0.90 | %(c)(d) |
Net investment income (loss) | | | (0.53 | )% | | | (0.56 | )% | | | (0.48 | )%(d) | | | (0.37 | )%(d) | | | 0.49 | %(c)(d) |
Portfolio turnover rate | | | 212 | % | | | 213 | % | | | 299 | % | | | 258 | % | | | 82 | %(e) |
| (a) | Commencement of operations. |
| (b) | Total investment return is calculated assuming a purchase of shares on the first day and a sale on the last day of each period reported and includes reinvestment of dividends and distributions and does not reflect the effect of insurance contract charges. Total investment returns for periods of less than one full year are not annualized. |
| (d) | Net of expense subsidy. If the investment advisor had not subsidized expenses, the annual expense and net investment loss ratios would have 0.98% and (0.56)%, respectively, for the year ended December 31, 2002, 1.41% and (0.88)%, respectively, for the year ended December 31, 2001 and 4.26% and (2.87)%, respectively, for the period ended December 31, 2000. |
| (f) | Less than $0.005 per share |
SEE NOTES TO FINANCIAL STATEMENTS.
D8
Financial Highlights
| | | | | | | | | | | | | | | | |
| | | SP Prudential U.S Emerging Growth Portfolio
| |
| | | Class II
| |
| | | Year Ended December 31,
| | | July 9, 2001(a)
through
December 31,
2001
| |
| | | 2004
| | | 2003
| | | 2002
| | |
Per Share Operating Performance: | | | | | | | | | | | | | | | | |
Net Asset Value, beginning of period | | $ | 6.58 | | | $ | 4.65 | | | $ | 6.88 | | | $ | 7.56 | |
| | |
|
|
| |
|
|
| |
|
|
| |
|
|
|
Income (Loss) From Investment Operations: | | | | | | | | | | | | | | | | |
Net investment income (loss) | | | (0.07 | ) | | | (0.05 | ) | | | (0.05 | ) | | | (0.01 | ) |
Net realized and unrealized gains (losses) on investments | | | 1.45 | | | | 1.98 | | | | (2.18 | ) | | | (0.67 | ) |
| | |
|
|
| |
|
|
| |
|
|
| |
|
|
|
Total from investment operations | | | 1.38 | | | | 1.93 | | | | (2.23 | ) | | | (0.68 | ) |
| | |
|
|
| |
|
|
| |
|
|
| |
|
|
|
Less Distributions: | | | | | | | | | | | | | | | | |
Distributions from net realized gains | | | — | (f) | | | — | | | | — | | | | — | |
| | |
|
|
| |
|
|
| |
|
|
| |
|
|
|
Total distributions | | | — | (f) | | | — | | | | — | | | | — | |
| | |
|
|
| |
|
|
| |
|
|
| |
|
|
|
Net Asset Value, end of period | | $ | 7.96 | | | $ | 6.58 | | | $ | 4.65 | | | $ | 6.88 | |
| | |
|
|
| |
|
|
| |
|
|
| |
|
|
|
Total Investment Return(b) | | | 21.01 | % | | | 41.51 | % | | | (32.41 | )% | | | (8.99 | )% |
Ratios/Supplemental Data: | | | | | | | | | | | | | | | | |
Net assets, end of period (in millions) | | $ | 0.4 | | | $ | 0.3 | | | $ | 0.2 | | | $ | 0.2 | |
Ratios to average net assets: | | | | | | | | | | | | | | | | |
Expenses | | | 1.18 | % | | | 1.20 | % | | | 1.30 | %(c) | | | 1.30 | %(c)(d) |
Net investment loss | | | (0.94 | )% | | | (0.97 | )% | | | (0.89 | )%(c) | | | (0.87 | )%(c)(d) |
Portfolio turnover rate | | | 212 | % | | | 213 | % | | | 299 | % | | | 258 | %(e) |
| (a) | Commencement of offering of Class II shares. |
| (b) | Total investment return is calculated assuming a purchase of shares on the first day and a sale on the last day of each period reported and includes reinvestment of dividends and distributions and does not reflect the effect of insurance contract charges. Total investment returns for periods of less than one full year are not annualized. |
| (c) | Net of expense subsidy. If the investment advisor had not subsidized expenses, the annual expense and net investment loss ratios would have been 1.38% and (0.95)%, respectively, for the year ended December 31, 2002, 1.81% and (1.38)%, respectively, for the period ended December 31, 2001. |
| (f) | Less than $0.005 per share |
| | | | | | | | | | | | | | | | | | | | |
| | | SP State Street Research Small Cap Growth Portfolio
| |
| | | Year Ended December 31,
| | | September 22, 2000(a)
through December 31,
2000
| |
| | | 2004
| | | 2003
| | | 2002
| | | 2001
| | |
Per Share Operating Performance: | | | | | | | | | | | | | | | | | | | | |
Net Asset Value, beginning of period | | $ | 6.52 | | | $ | 4.84 | | | $ | 6.94 | | | $ | 8.38 | | | $ | 10.00 | |
| | |
|
|
| |
|
|
| |
|
|
| |
|
|
| |
|
|
|
Income (Loss) From Investment Operations: | | | | | | | | | | | | | | | | | | | | |
Net investment loss | | | (0.03 | ) | | | (0.03 | ) | | | (0.03 | ) | | | (0.02 | ) | | | — | (f) |
Net realized and unrealized gains (losses) on investments | | | (0.03 | ) | | | 1.71 | | | | (2.07 | ) | | | (1.42 | ) | | | (1.62 | ) |
| | |
|
|
| |
|
|
| |
|
|
| |
|
|
| |
|
|
|
Total from investment operations | | | (0.06 | ) | | | 1.68 | | | | (2.10 | ) | | | (1.44 | ) | | | (1.62 | ) |
| | |
|
|
| |
|
|
| |
|
|
| |
|
|
| |
|
|
|
Net Asset Value, end of period | | $ | 6.46 | | | $ | 6.52 | | | $ | 4.84 | | | $ | 6.94 | | | $ | 8.38 | |
| | |
|
|
| |
|
|
| |
|
|
| |
|
|
| |
|
|
|
Total Investment Return(b) | | | (0.92 | )% | | | 34.71 | % | | | (30.26 | )% | | | (17.18 | )% | | | (16.20 | )% |
Ratios/Supplemental Data: | | | | | | | | | | | | | | | | | | | | |
Net assets, end of period (in millions) | | $ | 184.1 | | | $ | 35.0 | | | $ | 12.5 | | | $ | 8.4 | | | $ | 5.5 | |
Ratios to average net assets: | | | | | | | | | | | | | | | | | | | | |
Expenses | | | 1.09 | % | | | 1.15 | %(d) | | | 1.15 | %(d) | | | 1.15 | %(d) | | | 1.15 | %(c)(d) |
Net investment loss | | | (0.82 | )% | | | (0.72 | )%(d) | | | (0.73 | )%(d) | | | (0.28 | )%(d) | | | (0.10 | )%(c)(d) |
Portfolio turnover rate | | | 240 | % | | | 122 | % | | | 109 | % | | | 83 | % | | | 29 | %(e) |
| (a) | Commencement of operations. |
| (b) | Total investment return is calculated assuming a purchase of shares on the first day and a sale on the last day of each period reported and includes reinvestment of dividends and distributions and does not reflect the effect of insurance contract charges. Total investment returns for periods of less than one full year are not annualized. |
| (d) | Net of expense subsidy. If the investment advisor had not subsidized expenses, the annual expense and net investment loss ratios would have been 1.78% and (1.35)%, respectively for the year ended December 31, 2003, 2.30% and (1.89)%, respectively, for the year ended December 31, 2002, 2.84% and (1.97)%, respectively, for the year ended December 31, 2001 and 4.00% and (2.95)% respectively, for the period ended December 31, 2000. |
| (f) | Less than $0.005 per share. |
SEE NOTES TO FINANCIAL STATEMENTS.
D9
Financial Highlights
| | | | | | | | | | | | | | | | | | | | |
| | | SP Strategic Partners Focused Growth Portfolio
| |
| | | Class I
| | | September 22, 2000(a) | |
| | | Year Ended December 31,
| | | through December 31,
2000
| |
| | | 2004
| | | 2003
| | | 2002
| | | 2001(g)
| | |
Per Share Operating Performance: | | | | | | | | | | | | | | | | | | | | |
Net Asset Value, beginning of period | | $ | 6.33 | | | $ | 5.03 | | | $ | 6.73 | | | $ | 7.94 | | | $ | 10.00 | |
| | |
|
|
| |
|
|
| |
|
|
| |
|
|
| |
|
|
|
Income (Loss) From Investment Operations: | | | | | | | | | | | | | | | | | | | | |
Net investment income (loss) | | | — | (f) | | | (0.01 | ) | | | (0.01 | ) | | | (0.01 | ) | | | — | (f) |
Net realized and unrealized gains (losses) on investments | | | 0.67 | | | | 1.31 | | | | (1.69 | ) | | | (1.20 | ) | | | (2.06 | ) |
| | |
|
|
| |
|
|
| |
|
|
| |
|
|
| |
|
|
|
Total from investment operations | | | 0.67 | | | | 1.30 | | | | (1.70 | ) | | | (1.21 | ) | | | (2.06 | ) |
| | |
|
|
| |
|
|
| |
|
|
| |
|
|
| |
|
|
|
Net Asset Value, end of period | | $ | 7.00 | | | $ | 6.33 | | | $ | 5.03 | | | $ | 6.73 | | | $ | 7.94 | |
| | |
|
|
| |
|
|
| |
|
|
| |
|
|
| |
|
|
|
Total Investment Return(b) | | | 10.58 | % | | | 25.84 | % | | | (25.26 | )% | | | (15.32 | )% | | | (20.47 | )% |
Ratios/Supplemental Data: | | | | | | | | | | | | | | | | | | | | |
Net assets, end of period (in millions) | | $ | 30.1 | | | $ | 21.6 | | | $ | 10.8 | | | $ | 7.7 | | | $ | 5.9 | |
Ratios to average net assets:(d) | | | | | | | | | | | | | | | | | | | | |
Expenses | | | 1.01 | % | | | 1.01 | % | | | 1.01 | % | | | 1.01 | % | | | 1.01 | %(c) |
Net investment income (loss) | | | (0.01 | )% | | | (0.28 | )% | | | (0.30 | )% | | | (0.16 | )% | | | 0.18 | %(c) |
Portfolio turnover rate | | | 84 | % | | | 93 | % | | | 62 | % | | | 116 | % | | | 37 | %(e) |
| (a) | Commencement of offering of Class I shares. |
| (b) | Total investment return is calculated assuming a purchase of shares on the first day and a sale on the last day of each period reported and includes reinvestment of dividends and distributions and does not reflect the effect of insurance contract charges. Total investment returns for periods of less than one full year are not annualized. |
| (d) | Net of expense subsidy. If the investment advisor had not subsidized expenses, the annual expense and net investment loss ratios would have been 1.28% and (0.28)%, respectively, for the year ended December 31, 2004, 1.65% and (0.92)%, respectively, for the year ended December 31, 2003, 1.98% and (1.28)%, respectively for the year ended December 31, 2002, 2.61% and (1.76)%, respectively, for the year ended December 31, 2001 and 3.88% and (2.69)%, respectively, for the period ended December 31, 2000. |
| (f) | Less than $0.005 per share |
| (g) | Calculated based upon weighted average shares outstanding during the year. |
| | | | | | | | | | | | | | | | |
| | | SP Strategic Partners Focused Growth Portfolio
| |
| | | Class II
| |
| | | Year Ended
December 31,
| | | January 12, 2001(a)
through December 31,
2001(f)
| |
| | 2004
| | | 2003
| | | 2002
| | |
Per Share Operating Performance: | | | | | | | | | | | | | | | | |
Net Asset Value, beginning of period | | $ | 6.26 | | | $ | 4.99 | | | $ | 6.70 | | | $ | 8.43 | |
| | |
|
|
| |
|
|
| |
|
|
| |
|
|
|
Income (Loss) From Investment Operations: | | | | | | | | | | | | | | | | |
Net investment loss | | | (0.01 | ) | | | (0.03 | ) | | | (0.02 | ) | | | (0.03 | ) |
Net realized and unrealized gains (losses) on investments | | | 0.63 | | | | 1.30 | | | | (1.69 | ) | | | (1.70 | ) |
| | |
|
|
| |
|
|
| |
|
|
| |
|
|
|
Total from investment operations | | | 0.62 | | | | 1.27 | | | | (1.71 | ) | | | (1.73 | ) |
| | |
|
|
| |
|
|
| |
|
|
| |
|
|
|
Net Asset Value, end of period | | $ | 6.88 | | | $ | 6.26 | | | $ | 4.99 | | | $ | 6.70 | |
| | |
|
|
| |
|
|
| |
|
|
| |
|
|
|
Total Investment Return(b) | | | 9.90 | % | | | 25.45 | % | | | (25.52 | )% | | | (20.80 | )% |
Ratios/Supplemental Data: | | | | | | | | | | | | | | | | |
Net assets, end of period (in millions) | | $ | 32.1 | | | $ | 14.3 | | | $ | 6.6 | | | $ | 2.0 | |
Ratios to average net assets:(d) | | | | | | | | | | | | | | | | |
Expenses | | | 1.41 | % | | | 1.41 | % | | | 1.41 | % | | | 1.41 | %(c) |
Net investment loss | | | (0.34 | )% | | | (0.68 | )% | | | (0.68 | )% | | | (0.58 | )%(c) |
Portfolio turnover rate | | | 84 | % | | | 93 | % | | | 62 | % | | | 116 | %(e) |
| (a) | Commencement of offering of Class II shares. |
| (b) | Total investment return is calculated assuming a purchase of shares on the first day and a sale on the last day of each period reported and includes reinvestment of dividends and distributions and does not reflect the effect of insurance contract charges. Total investment returns for periods of less than one full year are not annualized. |
| (d) | Net of expense subsidy. If the investment advisor had not subsidized expenses, the annual expense and net investment loss ratios would have been 1.68% and (0.61)%, respectively, for the year ended December 31, 2004, 2.05% and (1.32)%, respectively, for the year ended December 31, 2003, 2.34% and (1.61)%, respectively, for the year ended December 31, 2002 and 3.01% and (2.18)%, respectively, for the period ended December 31, 2001. |
| (f) | Calculated based upon weighted average shares outstanding during the period. |
SEE NOTES TO FINANCIAL STATEMENTS.
D10
Financial Highlights
| | | | | | | | | | | | | | | | | | | | |
| | | SP Technology Portfolio
| |
| | | Year Ended
December 31,
| | | September 22, 2000(a)
through
December 31,
2000
| |
| | | 2004
| | | 2003
| | | 2002
| | | 2001
| | |
Per Share Operating Performance: | | | | | | | | | | | | | | | | | | | | |
Net Asset Value, beginning of period | | $ | 4.77 | | | $ | 3.35 | | | $ | 5.71 | | | $ | 7.62 | | | $ | 10.00 | |
| | |
|
|
| |
|
|
| |
|
|
| |
|
|
| |
|
|
|
Income (Loss) From Investment Operations: | | | | | | | | | | | | | | | | | | | | |
Net investment income (loss) | | | (0.02 | ) | | | (0.03 | ) | | | (0.04 | ) | | | (0.03 | ) | | | 0.01 | |
Net realized and unrealized gains (losses) on investments | | | 0.02 | | | | 1.45 | | | | (2.32 | ) | | | (1.88 | ) | | | (2.38 | ) |
| | |
|
|
| |
|
|
| |
|
|
| |
|
|
| |
|
|
|
Total from investment operations | | | — | | | | 1.42 | | | | (2.36 | ) | | | (1.91 | ) | | | (2.37 | ) |
| | |
|
|
| |
|
|
| |
|
|
| |
|
|
| |
|
|
|
Less Dividends and Distributions: | | | | | | | | | | | | | | | | | | | | |
Dividends from net investment income | | | — | | | | — | | | | — | | | | — | | | | (0.01 | ) |
Distributions in excess of net investment income | | | — | | | | — | | | | — | | | | — | | | | — | (c) |
| | |
|
|
| |
|
|
| |
|
|
| |
|
|
| |
|
|
|
Total dividends and distributions | | | — | | | | — | | | | — | | | | — | | | | (0.01 | ) |
| | |
|
|
| |
|
|
| |
|
|
| |
|
|
| |
|
|
|
Net Asset Value, end of period | | $ | 4.77 | | | $ | 4.77 | | | $ | 3.35 | | | $ | 5.71 | | | $ | 7.62 | |
| | |
|
|
| |
|
|
| |
|
|
| |
|
|
| |
|
|
|
Total Investment Return(b) | | | 0.00 | % | | | 42.39 | % | | | (41.33 | )% | | | (25.07 | )% | | | (23.71 | )% |
Ratios/Supplemental Data: | | | | | | | | | | | | | | | | | | | | |
Net assets, end of period (in millions) | | $ | 29.0 | | | $ | 20.0 | | | $ | 6.5 | | | $ | 7.7 | | | $ | 6.1 | |
Ratios to average net assets:(f) | | | | | | | | | | | | | | | | | | | | |
Expenses | | | 1.30 | % | | | 1.30 | % | | | 1.30 | % | | | 1.30 | % | | | 1.30 | %(d) |
Net investment income (loss) | | | (0.53 | )% | | | (1.05 | )% | | | (1.10 | )% | | | (0.69 | )% | | | 0.37 | %(d) |
Portfolio turnover rate | | | 118 | % | | | 88 | % | | | 81 | % | | | 47 | % | | | 23 | %(e) |
| (a) | Commencement of operations. |
| (b) | Total investment return is calculated assuming a purchase of shares on the first day and a sale on the last day of each period reported and includes reinvestment of dividends and distributions and does not reflect the effect of insurance contract charges. Total investment returns for periods of less than one full year are not annualized. |
| (c) | Less than $0.005 per share. |
| (f) | Net of expense subsidy. If the investment advisor had not subsidized expenses, the annual expense and net investment loss ratios would have been 1.79% and (1.02)%, respectively, for the year ended December 31, 2004, 2.56% and (2.31)%, respectively, for the year ended December 31, 2003, 3.00% and (2.81)%, respectively, for the year ended December 31, 2002, 3.16% and (2.53)%, respectively, for the year ended December 31, 2001 and 4.66% and (2.99)%, respectively, for the period ended December 31, 2000. |
SEE NOTES TO FINANCIAL STATEMENTS.
D11
Financial Highlights
| | | | | | | | | | | | | | | | | | | | |
| | | SP William Blair International Growth Portfolio
| |
| | | Class I
| |
| | | Year Ended
December 31,
| | | September 22, 2000(a)
through December 31,
2000
| |
| | | 2004
| | | 2003
| | | 2002
| | | 2001(f)
| | |
Per Share Operating Performance: | | | | | | | | | | | | | | | | | | | | |
Net Asset Value, beginning of period | | $ | 5.89 | | | $ | 4.22 | | | $ | 5.45 | | | $ | 8.50 | | | $ | 10.00 | |
| | |
|
|
| |
|
|
| |
|
|
| |
|
|
| |
|
|
|
Income (Loss) From Investment Operations: | | | | | | | | | | | | | | | | | | | | |
Net investment income | | | 0.02 | | | | 0.01 | | | | 0.01 | | | | 0.02 | | | | 0.01 | |
Net realized and unrealized gains (losses) on investments | | | 0.95 | | | | 1.66 | | | | (1.24 | ) | | | (3.05 | ) | | | (1.51 | ) |
| | |
|
|
| |
|
|
| |
|
|
| |
|
|
| |
|
|
|
Total from investment operations | | | 0.97 | | | | 1.67 | | | | (1.23 | ) | | | (3.03 | ) | | | (1.50 | ) |
| | |
|
|
| |
|
|
| |
|
|
| |
|
|
| |
|
|
|
Less Dividends and Distributions: | | | | | | | | | | | | | | | | | | | | |
Dividends from net investment income | | | (0.01 | ) | | | — | | | | — | | | | — | | | | — | |
Tax return of capital distributions | | | — | | | | — | | | | — | | | | (0.02 | ) | | | — | |
| | |
|
|
| |
|
|
| |
|
|
| |
|
|
| |
|
|
|
Total dividends and distributions | | | (0.01 | ) | | | — | | | | — | | | | (0.02 | ) | | | — | |
| | |
|
|
| |
|
|
| |
|
|
| |
|
|
| |
|
|
|
Net Asset Value, end of period | | $ | 6.85 | | | $ | 5.89 | | | $ | 4.22 | | | $ | 5.45 | | | $ | 8.50 | |
| | |
|
|
| |
|
|
| |
|
|
| |
|
|
| |
|
|
|
Total Investment Return(b) | | | 16.54 | % | | | 39.57 | % | | | (22.57 | )% | | | (35.64 | )% | | | (15.00 | )% |
Ratios/Supplemental Data: | | | | | | | | | | | | | | | | | | | | |
Net assets, end of period (in millions) | | $ | 249.1 | | | $ | 105.6 | | | $ | 34.9 | | | $ | 19.9 | | | $ | 7.6 | |
Ratios to average net assets | | | | | | | | | | | | | | | | | | | | |
Expenses | | | 1.02 | % | | | 1.15 | % | | | 1.24 | %(d) | | | 1.24 | %(d) | | | 1.24 | %(c)(d) |
Net investment income | | | 0.51 | % | | | 0.56 | % | | | 0.26 | %(d)(g) | | | 0.31 | %(d)(g) | | | 0.51 | %(c)(d) |
Portfolio turnover rate | | | 137 | % | | | 121 | % | | | 108 | % | | | 86 | % | | | 12 | %(e) |
| (a) | Commencement of offering of Class I shares. |
| (b) | Total investment return is calculated assuming a purchase of shares on the first day and a sale on the last day of each period reported and includes reinvestment of dividends and distributions and does not reflect the effect of insurance contract charges. Total investments returns for periods of less than one full year are not annualized. |
| (d) | Net of expense subsidy. If the investment advisor had not subsidized expenses, the annual expense and net investment income ratios would have been 1.40% and 0.10%, respectively, for the year ended December 31, 2002 and 1.86% and (0.30)%, respectively, for the year ended December 31, 2001 and 3.44% and (1.69)%, respectively, for the year ended December 31, 2000. |
| (f) | Calculated based upon weighted average shares outstanding during the year. |
| (g) | Includes custody fee credits of 0.02% and 0.12% for the year ended December 31, 2002 and the year ended December 31, 2001, respectively. If the Portfolio had not earned custodian fee credits, the annual net investment income would have been 0.24% and 0.19%, respectively for the year ended December 31, 2002 and the year ended December 31, 2001. |
SEE NOTES TO FINANCIAL STATEMENTS.
D12
Financial Highlights
| | | | | | | | | | | | | | | | | | | | |
| | | SP William Blair International Growth Portfolio
| |
| | | Class II
| |
| | | Year Ended
December 31,
| | | October 4, 2000(a)
through
December 31,
2000
| |
| | | 2004
| | | 2003
| | | 2002
| | | 2001(g)
| | |
Per Share Operating Performance: | | | | | | | | | | | | | | | | | | | | |
Net Asset Value, beginning of period | | $ | 5.83 | | | $ | 4.19 | | | $ | 5.43 | | | $ | 8.48 | | | $ | 9.79 | |
| | |
|
|
| |
|
|
| |
|
|
| |
|
|
| |
|
|
|
Income (Loss) From Investment Operations: | | | | | | | | | | | | | | | | | | | | |
Net investment income | | | 0.01 | | | | 0.01 | | | | — | (f) | | | — | (f) | | | — | (f) |
Net realized and unrealized gains (losses) on investments | | | 0.93 | | | | 1.63 | | | | (1.24 | ) | | | (3.04 | ) | | | (1.31 | ) |
| | |
|
|
| |
|
|
| |
|
|
| |
|
|
| |
|
|
|
Total from investment operations | | | 0.94 | | | | 1.64 | | | | (1.24 | ) | | | (3.04 | ) | | | (1.31 | ) |
| | |
|
|
| |
|
|
| |
|
|
| |
|
|
| |
|
|
|
Less Distributions: | | | | | | | | | | | | | | | | | | | | |
Tax return of capital distributions | | | — | | | | — | | | | — | | | | (0.01 | ) | | | — | |
| | |
|
|
| |
|
|
| |
|
|
| |
|
|
| |
|
|
|
Net Asset Value, end of period | | $ | 6.77 | | | $ | 5.83 | | | $ | 4.19 | | | $ | 5.43 | | | $ | 8.48 | |
| | |
|
|
| |
|
|
| |
|
|
| |
|
|
| |
|
|
|
Total Investment Return(b) | | | 16.12 | % | | | 39.14 | % | | | (22.84 | )% | | | (35.92 | )% | | | (13.28 | )% |
Ratios/Supplemental Data: | | | | | | | | | | | | | | | | | | | | |
Net assets, end of period (in millions) | | $ | 139.0 | | | $ | 113.6 | | | $ | 23.6 | | | $ | 14.9 | | | $ | 2.7 | |
Ratios to average net assets: | | | | | | | | | | | | | | | | | | | | |
Expenses | | | 1.42 | % | | | 1.54 | % | | | 1.64 | %(d) | | | 1.64 | %(d) | | | 1.64 | %(c)(d) |
Net investment income (loss) | | | 0.21 | % | | | 0.04 | % | | | (0.11 | )%(d)(h) | | | (0.03 | )%(d)(h) | | | — | %(c)(d) |
Portfolio turnover rate | | | 137 | % | | | 121 | % | | | 108 | % | | | 86 | % | | | 12 | %(e) |
| (a) | Commencement of offering of Class II shares. |
| (b) | Total investment return is calculated assuming a purchase of shares on the first day and a sale on the last day of each period reported and includes reinvestment of dividends and distributions and does not reflect the effect of insurance contract charges. Total investment returns for periods of less than one full year are not annualized. |
| (d) | Net of expense subsidy. If the investment advisor had not subsidized expenses, the annual expense and net investment loss ratios would have been 1.80% and (0.26)%, respectively, for the year ended December 31, 2002 and 2.26% and (0.66)%, respectively, for the year ended December 31, 2001 and 3.84% and (2.20)%, respectively, for the year ended December 31, 2000. |
| (f) | Less than $0.005 per share. |
| (g) | Calculated based upon weighted average shares outstanding during the year. |
| (h) | Includes custody fee credits of 0.02% and 0.13% for the year ended December 31, 2002 and the year ended December 31, 2001, respectively. If the Portfolio had not earned custodian fee credits, the annual net investment loss would have been (0.13)% and (0.16)%, respectively for the year ended December 31, 2002 and the year ended December 31, 2001. |
SEE NOTES TO FINANCIAL STATEMENTS.
D13
Report of Independent Registered Public Accounting Firm
The Board of Directors and Shareholders of
The Prudential Series Fund, Inc.
We have audited the accompanying statements of assets and liabilities of The Prudential Series Fund, Inc., (comprised of SP Aggressive Growth Asset Allocation Portfolio, SP AIM Aggressive Growth Portfolio, SP AIM Core Equity Portfolio, SP Alliance Large Cap Growth Portfolio, SP Balanced Asset Allocation Portfolio, SP Conservative Asset Allocation Portfolio, SP Davis Value Portfolio, SP Goldman Sachs Small Cap Value Portfolio, SP Growth Asset Allocation Portfolio, SP Large Cap Value Portfolio, SP LSV International Value Portfolio, SP MFS Capital Opportunities Portfolio, SP MFS Mid Cap Growth Portfolio, SP PIMCO High Yield Portfolio, SP PIMCO Total Return Portfolio, SP Prudential U.S. Emerging Growth Portfolio, SP State Street Research Small Cap Growth Portfolio, SP Strategic Partners Focused Growth Portfolio, SP Technology Portfolio and SP William Blair International Growth Portfolio) (hereafter referred to as the “Fund”), including the portfolios of investments, as of December 31, 2004, and the related statements of operations, the statements of changes in net assets, and the financial highlights for the year then ended. These financial statements and financial highlights are the responsibility of the Fund’s management. Our responsibility is to express an opinion on these financial statements and financial highlights based on our audit. The statements of changes in net assets for the year ended December 31, 2003 and the financial highlights for the periods presented prior to December 31, 2004, were audited by another independent registered public accounting firm, whose report dated, February 13, 2004, expressed an unqualified opinion thereon.
We conducted our audit in accordance with the standards of the Public Company Accounting Oversight Board (United States). Those standards require that we plan and perform the audit to obtain reasonable assurance about whether the financial statements and financial highlights are free of material misstatement. An audit includes examining, on a test basis, evidence supporting the amounts and disclosures in the financial statements. Our procedures included confirmation of securities owned as of December 31, 2004, by correspondence with the custodian and brokers or by other appropriate auditing procedures where replies from brokers were not received. As to securities purchased or sold but not yet received or delivered, we performed other appropriate auditing procedures. An audit also includes assessing the accounting principles used and significant estimates made by management, as well as evaluating the overall financial statement presentation. We believe that our audit provides a reasonable basis for our opinion.
In our opinion, the financial statements and financial highlights referred to above present fairly, in all material respects, the financial position of the Fund as of December 31, 2004, and the results of its operations, the changes in its net assets, and the financial highlights for the year then ended, in conformity with U.S. generally accepted accounting principles.

New York, New York
February 14, 2005
E1
Tax Information
(Unaudited)
Although we understand that the vast majority, if not all, of the shareholders/contract holders of the Series Fund currently maintain a tax deferred status, we are nevertheless required by the Internal Revenue Code to advise you within 60 days of the Series Fund's fiscal year end (December 31, 2004) as to the federal tax status of dividends paid by the Series Fund during such fiscal year. Accordingly, we are advising you that in 2004, the Series Fund paid dividends as follows:
| | | | | | | | | |
| | | Ordinary Dividends
| | Long-Term Capital Gains
| | Total Distributions
|
SP Aggressive Growth Asset Allocation Portfolio | | $ | 0.005 | | | — | | $ | 0.005 |
SP AIM Aggressive Growth Portfolio | | | — | | | — | | | — |
SP AIM Core Equity Portfolio | | | 0.034 | | | — | | | 0.034 |
SP Alliance Large Cap Growth Portfolio | | | — | | | — | | | — |
SP Balanced Asset Allocation Portfolio | | | 0.085 | | $ | 0.007 | | | 0.092 |
SP Conservative Asset Allocation Portfolio | | | 0.179 | | | 0.010 | | | 0.189 |
SP Davis Value Portfolio | | | 0.043 | | | — | | | 0.043 |
SP Goldman Sachs Small Cap Value Portfolio | | | 0.025 | | | 0.004 | | | 0.029 |
SP Growth Asset Allocation Portfolio | | | 0.042 | | | — | | | 0.042 |
SP Large Cap Value Portfolio | | | 0.084 | | | — | | | 0.084 |
SP LSV International Value Portfolio | | | 0.037 | | | — | | | 0.037 |
SP MFS Capital Opportunities Portfolio | | | 0.013 | | | — | | | 0.013 |
SP Mid Cap Growth Portfolio | | | — | | | — | | | — |
SP PIMCO High Yield Portfolio | | | 0.769 | | | 0.028 | | | 0.797 |
SP PIMCO Total Return Portfolio | | | 0.299 | | | 0.140 | | | 0.439 |
SP Prudential U.S. Emerging Growth Portfolio (Class I) | | | — | | | 0.002 | | | 0.002 |
SP Prudential U.S. Emerging Growth Portfolio (Class II) | | | — | | | 0.002 | | | 0.002 |
SP State Street Research Small Cap Growth Portfolio | | | — | | | — | | | — |
SP Strategic Partners Focused Growth Portfolio (Class I) | | | — | | | — | | | — |
SP Strategic Partners Focused Growth Portfolio (Class II) | | | — | | | — | | | — |
SP Technology Portfolio | | | — | | | — | | | — |
SP William Blair International Growth Portfolio (Class I) | | | 0.013 | | | — | | | 0.013 |
SP William Blair International Growth Portfolio (Class II) | | | — | | | — | | | — |
Pursuant to Section 854 of the Internal Revenue Code, the following percentages of distributions from ordinary income for the year ended December 31, 2004 have been designated as being eligible for the dividends received deduction available to corporate shareholders:
| | | |
| | | Corporate Dividend Received Deduction
| |
SP Aggressive Growth Asset Allocation Portfolio | | 100 | % |
SP AIM Core Equity Portfolio | | 100 | % |
SP Balanced Asset Allocation Portfolio | | 100 | % |
SP Conservative Asset Allocation Portfolio | | 90 | % |
SP Davis Value Portfolio | | 100 | % |
SP Goldman Sachs Small Cap Value Portfolio | | 100 | % |
SP Growth Asset Allocation Portfolio | | 100 | % |
SP Large Cap Value Portfolio | | 100 | % |
SP MFS Capital Opportunities Portfolio | | 100 | % |
SP William Blair International Growth Portfolio | | 100 | % |
E2
This report contains financial information about certain investment choices that may be available on the variable life insurance and variable annuity contracts listed below. You may receive additional reports and should refer to your variable life insurance or variable annuity contract prospectus to determine which portfolios are available to you.
VARIABLE LIFE INSURANCE
| n | | Prudential’s Survivorship Preferred® |
| n | | Prudential’s Variable Universal Life |
| n | | Pruco Life’s Variable Universal Life® |
| n | | Pruco Life’s Survivorship Variable Universal Life |
| n | | Pruco Life of New Jersey’s Survivorship Variable Universal Life |
| n | | Pruco Life’s PruLife® Custom Premier |
| n | | Pruco Life of New Jersey’s PruLife® Custom Premier |
| n | | Pruco Life’s PruSelectSM III |
| n | | Pruco Life of New Jersey’s PruSelectSM III |
| n | | Pruco Life’s MPremier VUL |
VARIABLE ANNUITIES
| n | | Pruco Life’s Discovery Select® |
| n | | Pruco Life of New Jersey’s Discovery Select® |
| n | | Pruco Life’s Discovery Choice® |
| n | | Pruco Life of New Jersey’s Discovery Choice® |
| n | | Pruco Life’s Strategic Partners Annuity One |
| n | | Pruco Life of New Jersey’s Strategic Partners Annuity One |
| n | | Pruco Life’s Strategic Partners Select |
| n | | Pruco Life of New Jersey’s Strategic Partners Select |
| n | | Pruco Life’s Strategic Partners Advisor |
| n | | Pruco Life of New Jersey’s Strategic Partners Advisor |
| n | | Pruco Life’s Strategic Partners FlexElite |
| n | | Pruco Life of New Jersey’s Strategic Partners FlexElite |
| n | | Pruco Life’s Strategic Partners Plus |
| n | | Pruco Life of New Jersey’s Strategic Partners Plus |
Variable life insurance is distributed by Pruco Securities LLC, member SIPC, 751 Broad Street, Newark, NJ 07102-3777. Variable annuities are distributed through Prudential Investment Management Services LLC (PIMS), member SIPC, Gateway Center Three, 14th Floor, Newark, NJ 07102-4077. Variable life insurance and variable annuities are issued by The Prudential Insurance Company of America, Pruco Life Insurance Company, or in New York, Pruco Life Insurance Company of New Jersey. All are Prudential Financial companies. Each is solely responsible for its own financial condition and contractual obligations. Guarantees are based on the claims-paying ability of the issuing Company.
| | | | | | |
| Variable Contracts: | | ARE NOT FDIC INSURED | | ARE NOT BANK GUARANTEED | | MAY LOSE VALUE |
The 2004 Audited Financial Statements of Pruco Life Insurance Company, Pruco Life Insurance Company of New Jersey, and The Prudential Insurance Company of America will be available commencing April 30, 2005. You may call (888) 778-2888 to obtain a free copy of the audited financial statements of the insurance company that issued your contract.
To reduce costs, we now generally send only a single copy of prospectuses and shareholder reports to each household (“householding”) in lieu of sending a copy to each Contract Owner who resides in the household. You should be aware that by calling (877) 778-5008, you can revoke or “opt out” of householding at any time.
Prudential Financial and the Rock logo are registered service marks of The Prudential Insurance Company of America, Newark, NJ, and its affiliates.
[LOGO] Prudential Financial
PO Box 7478
Philadelphia, PA 19101-7478
Presorted
Standard
U.S. Postage
PAID
IFS-2005-A094682 PSF-AR-B Ed. 01/31/2005

ANNUAL REPORT
DECEMBER 31, 2004
The Prudential Series Fund, Inc.

| | n | Diversified Conservative Growth Portfolio |
| | n | Jennison 20/20 Focus Portfolio |
The Prudential Insurance Company of America
751 Broad Street, Newark, NJ 07102-3777
Pruco Life Insurance Company
Pruco Life Insurance Company of New Jersey
213 Washington Street, Newark, NJ 07102-2992
Pruco Life Insurance Company is not licensed to do business in New York.
IFS-2005-A094687

T | his report is one of several that provide financial information about certain investment choices available on variable life insurance and variable annuity contracts. Based on the variable contract you own or the portfolios you invested in, you may receive additional reports that provide financial information on those investment choices. Please refer to your variable life insurance or variable annuity contract prospectus to determine which portfolios are available to you. A list of the variable contracts that this report supports is located on the inside back cover. |
This report must be preceded or accompanied by the current Monthly Performance Review (MPR) for the applicable product and the current prospectuses for the Prudential Series Fund portfolios and the applicable variable life or annuity contract. The prospectuses contains information on the investment objectives, risks, and charges and expenses and should be read carefully.
The contract’s prospectus contains hypothetical performance illustrations that show the effect of various assumptions regarding the cost of insurance protection. You may also obtain a personalized illustration of historical performance that reflects the cost of your policy’s insurance protection. The MPR shows historical investment performance after the deduction of investment management fees, investment-related expenses, and the product’s mortality and expense risk charges. For variable life insurance products, additional contract charges include the cost of insurance, administrative, sales, and any applicable withdrawal or surrender charges, which will reduce the rates of return shown. For variable annuity products, returns are net of all contract charges, including applicable surrender or withdrawal charges.
DISCOVER THE BENEFITS OF E-DELIVERY
| n | | Eliminate receiving printed reports. |
| n | | View documents on-line as they become available. |
| n | | Download and store e-reports on your PC. |
| n | | Help the environment by using less paper. |
To receive your semiannual/annual reports on-line, go to www.icsdelivery.com/prudential and enroll. Instead of receiving printed reports, you will receive notification via e-mail when new materials are available for your review. You can cancel your enrollment or change your e-mail address at any time by clicking on the change/cancel enrollment option at the icsdelivery website.
A description of the Fund’s proxy voting policies and procedures is available, without charge, upon request. Owners of variable annuity contracts should call 888-778-2888 and owners of variable life insurance contracts should call 800-778-2255 to obtain descriptions of the Fund’s proxy voting policies and procedures. The description is also available on the website of the Securities and Exchange Commission (the “Commission”) at www.sec.gov. Information regarding how the Fund voted proxies relating to portfolio securities during the most recent 12-month period ended December 31, 2004 is available on the website of the Commission at www.sec.gov and on the Fund’s website at www.irrc.com/prudential.
The Fund files with the Commission a complete listing of portfolio holdings as of its first and third quarter-end on Form N-Q. Form N-Q is available on the Commission’s website at www.sec.gov or by visiting the Commission’s Public Reference Room. For more information on the Commission’s Public Reference Room, please visit the Commission’s website or call 800-SEC-0330. Form N-Q is also available on the Fund’s website at www.prudential.com or by calling the telephone numbers referenced above.

The Prudential Series Fund, Inc.
Annual Report
DECEMBER 31, 2004
Table of Contents
Letter to Contract Owners
| | n | | THE PRUDENTIAL SERIES FUND, INC. PORTFOLIOS |
Diversified Conservative Growth Portfolio
Jennison 20/20 Focus Portfolio
A1 Financial Statements
B1 Schedule of Investments
C1 Notes to Financial Statements
D1 Financial Highlights
E1 Report of Independent Registered Accounting Firm
F1 Management of The Prudential Series Fund, Inc.
This report may include financial information pertaining to certain portfolios that are not available through the variable life insurance policy or variable annuity contract that you have chosen. Please refer to your variable life insurance or variable annuity prospectus to determine which portfolios are available to you.
| | | | |
The Prudential Series Fund, Inc. | | Annual Report | | December 31, 2004 |
Diversified Conservative Growth Portfolio
| n | MANAGED BY: PRUDENTIAL INVESTMENT MANAGEMENT, INC.; EARNEST PARTNERS, LLC; RS INVESTMENTS; JENNISON ASSOCIATES LLC; and PACIFIC INVESTMENT MANAGEMENT COMPANY LLC |
Past performance does not guarantee future returns. Portfolio performance is net of investment fees and fund expenses, but not product charges, which if included, would significantly lower the performance quoted. The investment return and principal value of an investment will fluctuate so that an investor’s shares, when redeemed, may be worth more or less than their original cost. Current performance may be lower or higher than the past performance data quoted.
| n | Performance Summary - As of December 31, 2004 |
| | | | | | | | | |
Average Annual Total Return Percentages
| | 1-Year
| | | 5-Year
| | | Since
Inception
| |
Diversified Conservative Growth Portfolio | | 9.56 | % | | 5.44 | % | | 5.89 | % |
S&P 500 Index1 | | 10.87 | % | | -2.30 | % | | -0.21 | % |
Diversified Conservative Growth Custom Blended Index1 | | 9.10 | % | | 4.89 | % | | 5.05 | % |
Lipper (VIP) Income Funds Average1 | | 8.47 | % | | 4.60 | % | | 4.10 | % |
Diversified Conservative Growth Portfolio inception date: 5/3/1999.
The Portfolio may invest in foreign securities, which are subject to the risks of currency fluctuation and the impact of social, political, and economic change. Small and mid-size companies may have limited marketability, and may be subject to more erratic or abrupt market movements than large-cap stocks.
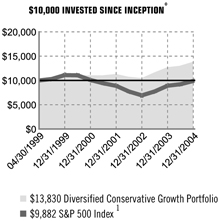
| | | | |
| | | Portfolio
| | SP500
|
04/30/1999 | | 10,000.0000 | | 10,000.00 |
06/30/1999 | | 10,060.0000 | | 10,304.53 |
12/31/1999 | | 10,609.4535 | | 11,099.32 |
06/30/2000 | | 10,842.8325 | | 11,051.96 |
12/31/2000 | | 11,011.0723 | | 10,089.08 |
06/30/2001 | | 11,044.8204 | | 9,413.83 |
12/31/2001 | | 11,176.8790 | | 8,890.90 |
06/30/2002 | | 10,621.1755 | | 7,721.66 |
12/31/2002 | | 10,383.3880 | | 6,926.69 |
06/30/2003 | | 11,469.9471 | | 7,740.70 |
12/31/2003 | | 12,622.8848 | | 8,912.38 |
06/30/2004 | | 12,922.6295 | | 9,219.12 |
12/31/2004 | | 13,829.9109 | | 9,881.52 |
“For the year ended December 31, 2004, the Diversified Conservative Growth Portfolio had a total return of 9.56%, compared with a return of 10.87% for the unmanaged S&P 500 Index, 4.34% for the unmanaged Lehman Brothers Aggregate Bond Index, 9.10% for the Diversified Conservative Customized Blend index, and 8.47% for the Lipper (VIP) Income Funds Average.
All of the Portfolio’s segments posted positive returns in 2004. Nonetheless, asset allocation proved to be a dominant factor in determining the Portfolio return because small caps and international stocks significantly outperformed stocks of larger U.S. companies. What’s more, value stocks outperformed growth stocks in both domestic and foreign markets, in large-caps and small-cap stocks. Stocks had a strong year. Analysts estimated that the earnings of companies in the S&P 500 Index grew more than 19% over 2003, driving share prices up. Bonds performed better than had been expected, particularly high-yield bonds. High-yield bonds are issued by companies whose lower credit ratings require them to pay higher interest rates. Investors turned to them in search of a better return in the generally low-yield environment. They also benefited from the strong global economy, which reduced the premium that less credit-worthy companies had to pay and so increased the value of their bonds.
Effective August 1, 2004 the Portfolio’s high yield exposure was reduced from 20% of assets to 12.5%. The additional yields on high yield bonds over investment grade bonds have narrowed significantly. The asset allocation adviser decided that they no longer offered a sufficient premium to warrant the potential risk to capital value should investors once again require a higher premium. This decision detracted from performance in 2004 as the sector continued to outperform. However, it also reduced the risk of the bond holdings. The decision to overweight large cap value versus large cap growth stocks had a positive impact on returns.
The large cap growth segment managed by Jennison and the core fixed income segment managed by PIMCO were the top contributors to relative performance. Jennison’s strong relative performance was driven by security selection. PIMCO outperformed, despite being underweight in the better-performing corporate and mortgage-backed sectors, primarily through emphasizing German government bonds instead of U.S. Treasury bonds.”
| * | Unless noted otherwise, Lipper Average and Index returns reflect performance beginning the closest month-end date to the Portfolio’s inception. |
| 1 | For average and index definitions, refer to the Glossary of Benchmark Definitions page. Investors cannot invest directly in a market index or average. |
For a complete list of holdings, refer to the Schedule of Investments section of this report.
| | | | |
The Prudential Series Fund, Inc. | | Annual Report | | December 31, 2004 |
Jennison 20/20 Focus Portfolio
| n | MANAGED BY: JENNISON ASSOCIATES LLC |
Past performance does not guarantee future returns. Portfolio performance is net of investment fees and fund expenses, but not product charges, which if included, would significantly lower the performance quoted. The investment return and principal value of an investment will fluctuate so that an investor’s shares, when redeemed, may be worth more or less than their original cost. Current performance may be lower or higher than the past performance data quoted
| n | PERFORMANCE SUMMARY* - As of December 31, 2004 |
| | | | | | | | | |
Average Annual Total Return Percentages
| | 1-Year
| | | 5-Year
| | | Since
Inception
| |
Jennison 20/20 Focus Portfolio: Class 1 | | 15.94 | % | | 1.77 | % | | 4.71 | % |
Jennison 20/20 Focus Portfolio: Class II | | 15.38 | % | | N/A | | | 2.32 | % |
S&P 500 Index1 | | 10.87 | % | | -2.30 | % | | -0.21 | % |
Russell 1000 Index1 | | 11.40 | % | | -1.76 | % | | 0.35 | % |
Lipper (VIP) Large-Cap Core Funds Average | | 8.59 | % | | -2.88 | % | | -0.62 | % |
Lipper (VIP) Multi-Cap Core Funds Average | | 12.06 | % | | 0.04 | % | | 2.29 | % |
Class I inception date: 5/3/1999. Class II inception date: 2/15/2000. Although Lipper classifies the Portfolio in the Multi-Cap Core Funds Average, the returns for the Large-Cap Core Funds Average are also shown because management of the portfolios in the Large-Cap Core funds Average is more consistent with the management of the Portfolio.
The Portfolio is not diversified and may not be appropriate for all investors. Investment in a nondiversified portfolio involves greater risks than a diversified investment, because a loss resulting from a particular security will have a greater impact on the Portfolio’s overall return. The Portfolio may actively and frequently trade its portfolio securities. High portfolio turnover results in higher transaction costs and can affect the Portfolio’s performance.
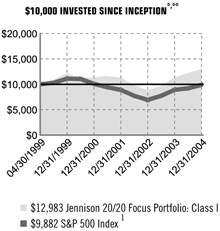
| | | | |
| | | Portfolio
| | SP500
|
04/30/1999 | | 10,000.0000 | | 10,000.00 |
06/30/1999 | | 10,550.0000 | | 10,304.53 |
12/31/1999 | | 11,894.5189 | | 11,099.32 |
06/30/2000 | | 11,239.8369 | | 11,051.96 |
12/31/2000 | | 11,251.4807 | | 10,089.08 |
06/30/2001 | | 11,545.3065 | | 9,413.83 |
12/31/2001 | | 11,137.9247 | | 8,890.90 |
06/30/2002 | | 9,842.9312 | | 7,721.66 |
12/31/2002 | | 8,660.9427 | | 6,926.69 |
06/30/2003 | | 9,499.9304 | | 7,740.70 |
12/31/2003 | | 11,198.5935 | | 8,912.38 |
06/30/2004 | | 11,902.1659 | | 9,219.12 |
12/31/2004 | | 12,983.2269 | | 9,881.52 |
“For the year ended December 31, 2004, the Jennison 20/20 Focus Portfolio (Class I) had a total return of 15.94%, compared with the return of 10.87% for the unmanaged S&P 500 Index, 11.40% for the unmanaged Russell 1000 Index, 8.59% for the Lipper (VIP) Large-Cap Core Funds Average, and 12.06% for the Lipper (VIP) Multi-Cap Core Funds Average.
The growth segment of the Portfolio solidly outperformed both the Russell 1000 Growth and S&P 500 Indexes. The consumer discretionary and information technology sectors bolstered total return and outperformed the corresponding sectors of the Russell 1000 Growth Index. Holdings in all sectors posted positive total returns and none detracted from relative return more than marginally. Although holdings in technology spanned the performance spectrum, the positive contribution to overall performance far outweighed the negative. The top contributor was Apple Computer. The largest detractors were Texas Instruments and Intel, which were not able to escape the semiconductor downdraft. Consumer discretionary holdings eBay and Starbucks were strong performers. The value segment of the Portfolio solidly outperformed both the Russell 1000 Value and S&P 500 Indexes. The energy and utilities sectors made the strongest contribution to absolute return and outpaced corresponding sectors of the Russell 1000 Value Index. Only the consumer staples sector detracted from total return and relative performance. TXU was the segment’s top performer. Its new CEO John Wilder led a dramatic corporate restructuring that had a greater impact on earnings than even the most bullish analysts expected. Oil and natural gas supply constraints coupled with rising demand pushed up oil prices. This is bullish news for energy holdings such as Schlumberger and Smith International, which support the search for new resources. Consumer staples holdings Kroger and Altria hurt performance. We believe Kroger’s fundamentals remain on track. We sold Altria from the segment.”
| * | Unless noted otherwise, Lipper Average and Index returns reflect performance beginning the closest month-end date to the Portfolio’s inception (Class I). |
| ** | The graph is based on the performance of Class I shares. Performance of Class II shares will be lower due to differences in the fee structure. Class II shares have associated 12b-l and administrative fees at an annual rate of 0.25% and 0.15%, respectively, of the average daily net assets of the Class II shares. |
| 1 | For average and index definitions, refer to the Glossary of Benchmark Definitions page. Investors cannot invest directly in a market index or average. |
For a complete list of holdings, refer to the Schedule of Investments section of this report.
Fees and Expenses (unaudited)
As a contract owner investing in Portfolios of the Fund through a variable annuity or variable life contract, you incur ongoing costs, including management fees, distribution and service (12b-1) fees, and other Portfolio expenses. This example is intended to help you understand your ongoing costs (in dollars) of investing in the Fund and to compare these costs with the ongoing costs of investing in other investment options. This example does not reflect fees and charges under your variable annuity or variable life contract. If contract charges were included, the costs shown below would be higher. Please consult the prospectus for your contract for more information about contract fees and charges.
The example is based on an investment of $1,000 invested at the beginning of the period and held for the entire period July 1, 2004 through December 31, 2004.
Actual Expenses
The first line of the table below provides information about actual account values and actual expenses. You may use this information, together with the amount you invested, to estimate the Portfolio expenses that you paid over the period. Simply divide your account value by $1,000 (for example, an $8,600 account value divided by $1,000 = 8.6), then multiply the result by the number in the first line under the heading entitled “Expenses Paid During Period” to estimate the Portfolio expenses you paid on your account during this period. As noted above, the table does not reflect variable contract fees and charges.
Hypothetical Example for Comparison Purposes
The second line of the table below provides information about hypothetical account values and hypothetical expenses based on the Portfolio’s actual expense ratio and an assumed rate of return of 5% per year before expenses, which is not the Portfolio’s actual return. The hypothetical account values and expenses may not be used to estimate the actual ending account balance or expenses you paid for the period. You may use this information to compare the ongoing costs of investing in the Portfolio and other investment options. To do so, compare this 5% hypothetical example with the 5% hypothetical examples that appear in the shareholder reports of the other investment options.
Please note that the expenses shown in the table are meant to highlight your ongoing Portfolio costs only and do not reflect any contract fees and charges, such as sales charges (loads), insurance charges or administrative charges. Therefore the second line of the table is useful to compare ongoing investment option costs only, and will not help you determine the relative total costs of owning different contracts. In addition, if these contract fee and charges were included, your costs would have been higher.
| | | | | | | | | | | | | | |
| Prudential Series Fund Portfolios | | Beginning Portfolio Value July 1, 2004 | | Ending Portfolio
Value December 31, 2004 | | Annualized Expense Ratio
Based on the
Six-Month Period | | | Expenses Paid
During the Six-
Month Period* |
| | | | | | | | | | | | | | | |
| Diversified Conservative Growth Portfolio (Class I) | | Actual | | $ | 1,000 | | $ | 1,070 | | 0.99 | % | | $ | 5.15 |
| | Hypothetical | | $ | 1,000 | | $ | 1,020 | | 0.99 | % | | $ | 5.03 |
| | | | | | | | | | | | | | | |
| Jennison 20/20 Focus (Class I) | | Actual | | $ | 1,000 | | $ | 1,091 | | 0.88 | % | | $ | 4.63 |
| | Hypothetical | | $ | 1,000 | | $ | 1,021 | | 0.88 | % | | $ | 4.47 |
| | | | | | | | | | | | | | | |
| Jennison 20/20 Focus (Class II) | | Actual | | $ | 1,000 | | $ | 1,088 | | 1.28 | % | | $ | 6.72 |
| | Hypothetical | | $ | 1,000 | | $ | 1,019 | | 1.28 | % | | $ | 6.50 |
| * | Fund expenses for each share class are equal to the annualized expense ratio for each share class (provided in the table), multiplied by the average account value over the period, multiplied by the 184 days in the six-month period ended December 31, 2004, and divided by the 366 days in the Fund’s fiscal year ended December 31, 2004 (to reflect the six-month period). |
| | | | |
| | | DIVERSIFIED CONSERVATIVE GROWTH PORTFOLIO | | |
STATEMENT OF ASSETS AND LIABILITIES
December 31, 2004
| | | | |
| ASSETS | | | | |
Investments, at value (cost $155,668,946) | | $ | 172,940,844 | |
Foreign currency, at value (cost $427,040) | | | 437,608 | |
Cash | | | 54,659 | |
Receivable for investments sold | | | 15,843,990 | |
Dividends and interest receivable | | | 1,242,611 | |
Premium for swaps purchased | | | 63,143 | |
Unrealized appreciation on swaps | | | 60,713 | |
Due from broker—variation margin | | | 37,299 | |
Interest receivable on swap agreements | | | 5,324 | |
Unrealized appreciation on forward foreign currency contracts | | | 4,145 | |
Prepaid expenses | | | 2,970 | |
| | |
|
|
|
Total Assets | | | 190,693,306 | |
| | |
|
|
|
| LIABILITIES | | | | |
Investments sold short, at value (proceeds received $12,092,228) | | | 12,149,782 | |
Payable for investments purchased | | | 10,489,423 | |
Unrealized depreciation on swaps | | | 411,186 | |
Premium for swap written | | | 179,858 | |
Interest payable on investments sold short | | | 148,719 | |
Management fee payable | | | 105,973 | |
Accrued expenses and other liabilities | | | 131,499 | |
Outstanding options written (premium received $99,789) | | | 47,980 | |
Payable for capital stock repurchased | | | 28,417 | |
Unrealized depreciation on forward foreign currency contracts | | | 16,649 | |
Interest payable on swap agreements | | | 11,209 | |
Deferred directors’ fees | | | 3,763 | |
| | |
|
|
|
Total Liabilities | | | 23,724,458 | |
| | |
|
|
|
| NET ASSETS | | $ | 166,968,848 | |
| | |
|
|
|
Net assets were comprised of: | | | | |
Common stock, at $0.01 par value | | $ | 147,999 | |
Paid-in capital in excess of par | | | 153,357,595 | |
| | |
|
|
|
| | | | 153,505,594 | |
Undistributed net investment income | | | 4,757,403 | |
Accumulated net realized loss on investments and foreign currencies | | | (8,168,198 | ) |
Net unrealized appreciation on investments and foreign currencies | | | 16,874,049 | |
| | |
|
|
|
Net assets, December 31, 2004 | | $ | 166,968,848 | |
| | |
|
|
|
Net asset value and redemption price per share, $166,968,848 / 14,799,942 outstanding shares of common stock (authorized 100,000,000 shares) | | $ | 11.28 | |
| | |
|
|
|
STATEMENT OF OPERATIONS
Year Ended December 31, 2004
| | | | |
| INVESTMENT INCOME | | | | |
Interest | | $ | 4,506,459 | |
Dividends (net of $14,080 foreign withholding tax) | | | 949,094 | |
| | |
|
|
|
| | | | 5,455,553 | |
| | |
|
|
|
| EXPENSES | | | | |
Investment advisory fee | | | 1,251,800 | |
Custodian’s fees and expenses | | | 277,000 | |
Shareholders’ reports | | | 51,000 | |
Audit fee | | | 16,000 | |
Directors’ fees | | | 11,000 | |
Legal fees and expenses | | | 7,000 | |
Interest expense—short sales | | | 4,349 | |
Insurance expenses | | | 3,600 | |
Commitment fee on syndicated credit agreement | | | 2,000 | |
Transfer agent’s fees and expenses | | | 400 | |
Miscellaneous | | | 4,355 | |
| | |
|
|
|
Total expenses | | | 1,628,504 | |
Less: custodian fee credit | | | (1,135 | ) |
| | |
|
|
|
Net expenses | | | 1,627,369 | |
| | |
|
|
|
| NET INVESTMENT INCOME | | | 3,828,184 | |
| | |
|
|
|
| NET REALIZED AND UNREALIZED GAIN (LOSS) ON INVESTMENTS AND FOREIGN CURRENCIES | | | | |
Net realized gain (loss) on: | | | | |
Investments | | | 9,657,161 | |
Options written | | | 189,071 | |
Futures transactions | | | 862,387 | |
Foreign currency transactions | | | (181,207 | ) |
Short Sales | | | (390,337 | ) |
Swaps | | | 657,717 | |
| | |
|
|
|
| | | | 10,794,792 | |
| | |
|
|
|
Net change in unrealized appreciation (depreciation) on: | | | | |
Investments | | | 1,112,182 | |
Options written | | | (85,144 | ) |
Futures | | | (273,484 | ) |
Foreign currencies | | | 13,575 | |
Short Sales | | | 1,245 | |
Swaps | | | (325,675 | ) |
| | |
|
|
|
| | | | 442,699 | |
| | |
|
|
|
| NET GAIN ON INVESTMENTS AND FOREIGN CURRENCIES | | | 11,237,491 | |
| | |
|
|
|
| NET INCREASE IN NET ASSETS RESULTING FROM OPERATIONS | | $ | 15,065,675 | |
| | |
|
|
|
| | | | | | | | |
STATEMENT OF CHANGES IN NET ASSETS | | | | | | | | |
| | | Year Ended December 31, 2004
| | | Year Ended
December 31, 2003
| |
| INCREASE (DECREASE) IN NET ASSETS | | | | | | | | |
| OPERATIONS: | | | | | | | | |
Net investment income | | $ | 3,828,184 | | | $ | 4,665,937 | |
Net realized gain on investments and foreign currencies | | | 10,794,792 | | | | 4,928,357 | |
Net change in unrealized appreciation (depreciation) on investments and foreign currencies | | | 442,699 | | | | 21,480,746 | |
| | |
|
|
| |
|
|
|
NET INCREASE IN NET ASSETS RESULTING FROM OPERATIONS | | | 15,065,675 | | | | 31,075,040 | |
| | |
|
|
| |
|
|
|
| DIVIDENDS: | | | | | | | | |
Dividends from net investment income | | | (5,196,232 | ) | | | (7,087,093 | ) |
| | |
|
|
| |
|
|
|
| CAPITAL STOCK TRANSACTIONS: | | | | | | | | |
Capital stock sold [327,219 and 419,429 shares, respectively] | | | 3,465,420 | | | | 4,040,815 | |
Capital stock issued in reinvestment of dividends [495,351 and 802,615 shares, respectively] | | | 5,196,232 | | | | 7,087,093 | |
Capital stock repurchased [1,979,656 and 2,386,946 shares, respectively] | | | (21,115,512 | ) | | | (22,629,143 | ) |
| | |
|
|
| |
|
|
|
NET DECREASE IN NET ASSETS RESULTING FROM CAPITAL STOCK TRANSACTIONS | | | (12,453,860 | ) | | | (11,501,235 | ) |
| | |
|
|
| |
|
|
|
| TOTAL INCREASE (DECREASE) IN NET ASSETS | | | (2,584,417 | ) | | | 12,486,712 | |
| NET ASSETS: | | | | | | | | |
Beginning of year | | | 169,553,265 | | | | 157,066,553 | |
| | |
|
|
| |
|
|
|
End of year (a) | | $ | 166,968,848 | | | $ | 169,553,265 | |
| | |
|
|
| |
|
|
|
(a) Includes undistributed net investment income of: | | $ | 4,757,403 | | | $ | 5,113,671 | |
| | |
|
|
| |
|
|
|
SEE NOTES TO FINANCIAL STATEMENTS.
A1
| | | | |
| | | JENNISON 20/20 FOCUS PORTFOLIO | | |
STATEMENT OF ASSETS AND LIABILITIES
December 31, 2004
| | | | |
| ASSETS | | | | |
Investments, at value (cost $141,327,752) | | $ | 170,411,156 | |
Receivable for capital stock sold | | | 221,898 | |
Dividends and interest receivable | | | 136,169 | |
Receivable for investments sold | | | 31,593 | |
Prepaid expenses | | | 2,344 | |
| | |
|
|
|
Total Assets | | | 170,803,160 | |
| | |
|
|
|
| LIABILITIES | | | | |
Payable for investments purchased | | | 1,024,516 | |
Payable for capital stock repurchased | | | 158,392 | |
Management fee payable | | | 104,262 | |
Accrued expenses and other liabilities | | | 38,627 | |
Distribution fee payable | | | 20,471 | |
Administration fee payable | | | 12,283 | |
| | |
|
|
|
Total Liabilities | | | 1,358,551 | |
| | |
|
|
|
| NET ASSETS | | $ | 169,444,609 | |
| | |
|
|
|
Net assets were comprised of: | | | | |
Common stock, at $0.01 par value | | $ | 137,905 | |
Paid-in capital in excess of par | | | 149,205,056 | |
| | |
|
|
|
| | | | 149,342,961 | |
Undistributed net investment income | | | 177,132 | |
Accumulated net realized loss on investments | | | (9,159,056 | ) |
Net unrealized appreciation on investments | | | 29,083,572 | |
| | |
|
|
|
Net assets, December 31, 2004 | | $ | 169,444,609 | |
| | |
|
|
|
| Class I: | | | | |
Net asset value and redemption price per share, $68,423,989 / 5,532,189 outstanding shares of
common stock (authorized 100,000,000 shares) | | $ | 12.37 | |
| | |
|
|
|
| Class II: | | | | |
Net asset value and redemption price per share, $101,020,620 / 8,258,268 outstanding shares of common stock (authorized 50,000,000 shares) | | $ | 12.23 | |
| | |
|
|
|
STATEMENT OF OPERATIONS
Year Ended December 31, 2004
| | | | |
| INVESTMENT INCOME | | | | |
Dividends (net of $11,427 foreign withholding tax) | | $ | 1,598,334 | |
Interest | | | 1,841 | |
| | |
|
|
|
| | | | 1,600,175 | |
| | |
|
|
|
| EXPENSES | | | | |
Management fee | | | 981,790 | |
Distribution fee—Class II | | | 166,811 | |
Administration fee—Class II | | | 100,087 | |
Custodian’s fees and expenses | | | 114,000 | |
Shareholders’ reports | | | 16,000 | |
Audit fee | | | 15,000 | |
Directors’ fees | | | 11,000 | |
Legal fees and expenses | | | 9,000 | |
Commitment fee on syndicated credit agreement | | | 1,200 | |
Transfer agent’s fees and expenses | | | 1,000 | |
Miscellaneous | | | 7,191 | |
| | |
|
|
|
Total expenses | | | 1,423,079 | |
Loan interest expense (Note 8) | | | 233 | |
Less: custodian fee credit | | | (176 | ) |
| | |
|
|
|
Net expenses | | | 1,423,136 | |
| | |
|
|
|
| NET INVESTMENT INCOME | | | 177,039 | |
| | |
|
|
|
| NET REALIZED AND UNREALIZED GAIN ON INVESTMENTS AND FOREIGN CURRENCIES | | | | |
Net realized gain on: | | | | |
Investments | | | 7,084,279 | |
Foreign currency transactions | | | 93 | |
| | |
|
|
|
| | | | 7,084,372 | |
| | |
|
|
|
Net change in unrealized appreciation (depreciation) on: | | | | |
Investments | | | 13,589,213 | |
Foreign currencies | | | 168 | |
| | |
|
|
|
| | | | 13,589,381 | |
| | |
|
|
|
| NET GAIN ON INVESTMENTS AND FOREIGN CURRENCIES | | | 20,673,753 | |
| | |
|
|
|
| NET INCREASE IN NET ASSETS RESULTING FROM OPERATIONS | | $ | 20,850,792 | |
| | |
|
|
|
STATEMENT OF CHANGES IN NET ASSETS
| | | | | | | | |
| | | Year Ended December 31, 2004
| | | Year Ended December 31, 2003
| |
| INCREASE (DECREASE) IN NET ASSETS | | | | | | | | |
| OPERATIONS: | | | | | | | | |
Net investment income | | $ | 177,039 | | | $ | 61,682 | |
Net realized gain on investments and foreign currencies | | | 7,084,372 | | | | 528,786 | |
Net change in unrealized appreciation (depreciation) on investments and foreign currencies | | | 13,589,381 | | | | 20,042,662 | |
| | |
|
|
| |
|
|
|
NET INCREASE IN NET ASSETS RESULTING FROM OPERATIONS | | | 20,850,792 | | | | 20,633,130 | |
| | |
|
|
| |
|
|
|
| DIVIDENDS: | | | | | | | | |
Dividends from net investment income | | | | | | | | |
Class I | | | (61,682 | ) | | | (127,802 | ) |
Class II | | | — | | | | — | |
| | |
|
|
| |
|
|
|
| TOTAL DIVIDENDS | | | (61,682 | ) | | | (127,802 | ) |
| | |
|
|
| |
|
|
|
| CAPITAL STOCK TRANSACTIONS: | | | | | | | | |
Capital stock sold [5,902,529 and 3,119,135 shares, respectively] | | | 65,018,127 | | | | 29,245,787 | |
Capital stock issued in reinvestment of dividends [5,765 and 15,798 shares, respectively] | | | 61,682 | | | | 127,802 | |
Capital stock repurchased [1,901,064 and 1,161,738 shares, respectively] | | | (20,614,630 | ) | | | (10,306,439 | ) |
| | |
|
|
| |
|
|
|
NET INCREASE IN NET ASSETS RESULTING FROM CAPITAL STOCK TRANSACTIONS | | | 44,465,179 | | | | 19,067,150 | |
| | |
|
|
| |
|
|
|
| TOTAL INCREASE IN NET ASSETS | | | 65,254,289 | | | | 39,572,478 | |
| NET ASSETS: | | | | | | | | |
Beginning of year | | | 104,190,320 | | | | 64,617,842 | |
| | |
|
|
| |
|
|
|
End of year (a) | | $ | 169,444,609 | | | $ | 104,190,320 | |
| | |
|
|
| |
|
|
|
(a) Includes undistributed net investment income of: | | $ | 177,132 | | | $ | 61,682 | |
| | |
|
|
| |
|
|
|
SEE NOTES TO FINANCIAL STATEMENTS.
A2
| | | | |
| | | DIVERSIFIED CONSERVATIVE GROWTH PORTFOLIO | | |
SCHEDULE OF INVESTMENTS | December 31, 2004 |
| | | | | |
| LONG-TERM INVESTMENTS — 86.1% | | Value (Note 2)
|
| COMMON STOCKS — 40.2% | | Shares
| |
Aerospace & Defense — 0.6% | | | | | |
Applied Signal Technology, Inc. | | 2,120 | | $ | 74,730 |
ARGON ST, Inc.(a) | | 300 | | | 10,635 |
DRS Technologies, Inc.(a) | | 1,950 | | | 83,285 |
Engineered Support Systems, Inc. | | 1,460 | | | 86,461 |
Lockheed Martin Corp. | | 6,100 | | | 338,855 |
Moog, Inc. (Class “A” Stock)(a) | | 2,850 | | | 129,247 |
Northrop Grumman Corp. | | 4,400 | | | 239,184 |
| | | | |
|
|
| | | | | | 962,397 |
| | | | |
|
|
Air Freight & Couriers | | | | | |
Forward Air Corp.(a) | | 1,430 | | | 63,921 |
| | | | |
|
|
Air Freight & Logistics — 0.2% | | | | | |
United Parcel Service, Inc. (Class “B” Stock) | | 4,900 | | | 418,754 |
| | | | |
|
|
Auto Components | | | | | |
IMPCO Technologies, Inc.(a) | | 500 | | | 3,775 |
| | | | |
|
|
Automobiles — 0.1% | | | | | |
Winnebago Industries, Inc. | | 2,200 | | | 85,932 |
| | | | |
|
|
Banks — 0.1% | | | | | |
Signature Bank(a) | | 2,250 | | | 72,810 |
Southwest Bancorp of Texas, Inc. | | 2,930 | | | 68,240 |
| | | | |
|
|
| | | | | | 141,050 |
| | | | |
|
|
Biotechnology — 1.5% | | | | | |
Alexion Pharmaceuticals, Inc.(a) | | 3,430 | | | 86,436 |
Amgen, Inc.(a) | | 8,500 | | | 545,275 |
Connetics Corp.(a) | | 3,280 | | | 79,671 |
Genentech, Inc.(a) | | 10,600 | | | 577,064 |
Gilead Sciences, Inc.(a) | | 11,400 | | | 398,886 |
MedImmune, Inc.(a) | | 11,100 | | | 300,921 |
Nabi Biopharmaceuticals(a) | | 11,296 | | | 165,487 |
QLT, Inc. (Canada)(a) | | 5,680 | | | 91,334 |
Rigel Pharmaceuticals, Inc.(a) | | 2,500 | | | 61,050 |
Serologicals Corp.(a) | | 5,300 | | | 117,236 |
VaxGen, Inc.(a) | | 2,450 | | | 41,650 |
| | | | |
|
|
| | | | | | 2,465,010 |
| | | | |
|
|
Building Products — 0.1% | | | | | |
Watsco, Inc. | | 3,400 | | | 119,748 |
| | | | |
|
|
Capital Markets — 1.6% | | | | | |
Bank of New York Co., Inc. | | 14,700 | | | 491,274 |
Charles Schwab Corp.(The) | | 12,600 | | | 150,696 |
Goldman Sachs Group, Inc. | | 4,000 | | | 416,160 |
Lehman Brothers Holdings, Inc. | | 5,500 | | | 481,140 |
Mellon Financial Corp. | | 7,100 | | | 220,881 |
Merrill Lynch & Co., Inc. | | 14,900 | | | 890,573 |
| | | | |
|
|
| | | | | | 2,650,724 |
| | | | |
|
|
Chemicals — 0.5% | | | | | |
E.I. du Pont de Nemours & Co. | | 6,100 | | | 299,205 |
Mosaic Co.(The)(a) | | 19,000 | | | 310,080 |
Scotts Co.(The) (Class “A” Stock)(a) | | 1,400 | | | 102,928 |
Valspar Corp.(The) | | 1,700 | | | 85,017 |
| | | | |
|
|
| | | | | | 797,230 |
| | | | |
|
|
Commercial Banks — 0.7% | | | | | |
Accredited Home Lenders Holding Co.(a) | | 3,000 | | | 149,040 |
Astoria Financial Corp. | | 2,400 | | | 95,928 |
| | | | | |
| COMMON STOCKS | | Value (Note 2)
|
| (Continued) | | Shares
| |
Commercial Banks (cont’d.) | | | | | |
Bank of America Corp. | | 12,084 | | $ | 567,827 |
BankUnited Financial Corp. (Class “A” Stock)(a) | | 5,400 | | | 172,530 |
Hibernia Corp. (Class “A” Stock) | | 1,300 | | | 38,363 |
Nara Bancorp, Inc. | | 3,900 | | | 82,953 |
PrivateBankcorp, Inc. | | 1,660 | | | 53,502 |
| | | | |
|
|
| | | | | | 1,160,143 |
| | | | |
|
|
Commercial Services & Supplies — 1.1% | | | | | |
Administaff, Inc.(a) | | 5,300 | | | 66,833 |
Allied Waste Industries, Inc.(a) | | 7,100 | | | 65,888 |
Cendant Corp. | | 12,100 | | | 282,898 |
Chemed Corp. | | 1,800 | | | 120,798 |
Global Payments, Inc. | | 2,400 | | | 140,496 |
Kelly Services, Inc. (Class “A” Stock) | | 2,300 | | | 69,414 |
Kforce, Inc.(a) | | 9,010 | | | 100,011 |
Knoll, Inc.(a) | | 3,150 | | | 55,125 |
Laureate Education, Inc.(a) | | 1,970 | | | 86,857 |
Marlin Business Services, Inc.(a) | | 3,310 | | | 62,890 |
Navigant Consulting, Inc.(a) | | 3,220 | | | 85,652 |
Paychex, Inc. | | 4,300 | | | 146,544 |
Providence Service Corp.(a) | | 3,940 | | | 82,622 |
Republic Services, Inc. | | 3,400 | | | 114,036 |
Waste Management, Inc. | | 11,500 | | | 344,310 |
| | | | |
|
|
| | | | | | 1,824,374 |
| | | | |
|
|
Communications Equipment — 1.0% | | | | | |
Cisco Systems, Inc.(a) | | 19,600 | | | 378,280 |
Harmonic, Inc.(a) | | 8,300 | | | 69,222 |
Nortel Networks Corp. (Canada)(a) | | 67,900 | | | 236,971 |
Novatel Wireless, Inc.(a) | | 2,930 | | | 56,784 |
QUALCOMM, Inc. | | 13,100 | | | 555,440 |
Research In Motion, Ltd. (Canada)(a) | | 4,400 | | | 362,648 |
Symmetricom, Inc.(a) | | 7,130 | | | 69,232 |
| | | | |
|
|
| | | | | | 1,728,577 |
| | | | |
|
|
Computers & Peripherals — 1.2% | | | | | |
Apple Computer, Inc.(a) | | 8,700 | | | 560,280 |
Dell, Inc.(a) | | 14,100 | | | 594,174 |
Hewlett-Packard Co. | | 8,855 | | | 185,689 |
International Business Machines Corp. (IBM) | | 3,400 | | | 335,172 |
Lexmark International, Inc.(a) | | 2,400 | | | 204,000 |
M-Systems Flash Disk Pioneers, Ltd. (Israel)(a) | | 3,690 | | | 72,767 |
Mercury Computer Systems, Inc.(a) | | 2,660 | | | 78,949 |
| | | | |
|
|
| | | | | | 2,031,031 |
| | | | |
|
|
Consumer Finance — 0.6% | | | | | |
American Express Co. | | 14,500 | | | 817,365 |
MBNA Corp. | | 9,100 | | | 256,529 |
| | | | |
|
|
| | | | | | 1,073,894 |
| | | | |
|
|
Distributors | | | | | |
Beacon Roofing Supply, Inc.(a) | | 4,040 | | | 80,234 |
| | | | |
|
|
Diversified Financial Services — 1.8% | | | | | |
AmeriCredit Corp.(a) | | 8,800 | | | 215,160 |
Citigroup, Inc. | | 15,200 | | | 732,336 |
Eaton Vance Corp. | | 3,300 | | | 172,095 |
EZCORP, Inc.(a) | | 4,780 | | | 73,660 |
SEE NOTES TO FINANCIAL STATEMENTS.
B1
| | | | |
| | | DIVERSIFIED CONSERVATIVE GROWTH PORTFOLIO (Continued) | | |
SCHEDULE OF INVESTMENTS | December 31, 2004 |
| | | | | |
| COMMON STOCKS | | Value (Note 2)
|
| (Continued) | | Shares
| |
Diversified Financial Services (cont’d.) | | | | | |
J.P. Morgan Chase & Co. | | 25,700 | | $ | 1,002,557 |
Jeffries Group, Inc. | | 4,600 | | | 185,288 |
Principal Financial Group, Inc. | | 9,600 | | | 393,024 |
Raymond James Financial, Inc. | | 4,650 | | | 144,057 |
Student Loan Corp. | | 400 | | | 73,600 |
| | | | |
|
|
| | | | | | 2,991,777 |
| | | | |
|
|
Diversified Telecommunication Services — 0.6% | | | |
ALLTEL Corp. | | 4,400 | | | 258,544 |
SBC Communications, Inc. | | 19,300 | | | 497,361 |
Verizon Communications, Inc. | | 5,700 | | | 230,907 |
| | | | |
|
|
| | | | | | 986,812 |
| | | | |
|
|
Electric Utilities — 0.9% | | | | | |
E.ON AG, ADR (Germany) | | 2,100 | | | 191,100 |
Exelon Corp. | | 6,700 | | | 295,269 |
PG&E Corp.(a) | | 11,500 | | | 382,720 |
PNM Resources, Inc. | | 4,300 | | | 108,747 |
TXU Corp. | | 8,900 | | | 574,584 |
| | | | |
|
|
| | | | | | 1,552,420 |
| | | | |
|
|
Electronic Equipment & Instruments — 0.8% | | | |
Agilent Technologies, Inc.(a) | | 24,500 | | | 590,450 |
Artesyn Technologies, Inc.(a) | | 8,100 | | | 91,530 |
BEI Technologies, Inc. | | 2,380 | | | 73,494 |
Checkpoint Systems, Inc.(a) | | 7,800 | | | 140,790 |
FARO Technologies, Inc.(a) | | 1,800 | | | 56,124 |
FLIR Systems, Inc.(a) | | 4,800 | | | 306,192 |
Sanmina-SCI Corp.(a) | | 11,000 | | | 93,170 |
| | | | |
|
|
| | | | | | 1,351,750 |
| | | | |
|
|
Energy Equipment & Services — 1.4% | | | | | |
Cal Dive International, Inc.(a) | | 1,780 | | | 72,535 |
ENSCO International, Inc. | | 3,400 | | | 107,916 |
GlobalSantaFe Corp. | | 12,100 | | | 400,631 |
Grey Wolf, Inc.(a) | | 14,800 | | | 77,996 |
Halliburton Co. | | 7,700 | | | 302,148 |
Key Energy Services, Inc.(a) | | 5,550 | | | 65,490 |
Maverick Tube Corp.(a) | | 2,170 | | | 65,751 |
Oil States International, Inc.(a) | | 3,930 | | | 75,810 |
Patterson-UTI Energy, Inc. | | 5,440 | | | 105,808 |
Schlumberger, Ltd. | | 13,700 | | | 917,215 |
Superior Energy Services, Inc.(a) | | 5,150 | | | 79,361 |
Unit Corp.(a) | | 1,950 | | | 74,510 |
| | | | |
|
|
| | | | | | 2,345,171 |
| | | | |
|
|
Food Products — 0.3% | | | | | |
Cadbury Schweppes PLC
(United Kingdom) | | 24,200 | | | 225,339 |
Cadbury Schweppes PLC, ADR
(United Kingdom) | | 7,200 | | | 271,440 |
| | | | |
|
|
| | | | | | 496,779 |
| | | | |
|
|
Food & Staples Retailing — 0.8% | | | | | |
Costco Wholesale Corp. | | 5,200 | | | 251,732 |
Kroger Co. (The)(a) | | 29,700 | | | 520,938 |
Whole Foods Market, Inc. | | 5,800 | | | 553,030 |
| | | | |
|
|
| | | | | | 1,325,700 |
| | | | |
|
|
| | | | | |
| COMMON STOCKS | | Value (Note 2)
|
| (Continued) | | Shares
| |
Gas Utilities — 0.1% | | | | | |
ONEOK, Inc. | | 3,900 | | $ | 110,838 |
| | | | |
|
|
Health Care Equipment & Supplies — 0.8% | | | | | |
Abaxis, Inc.(a) | | 5,100 | | | 73,899 |
Advanced Neuromodulation Systems, Inc.(a) | | 1,700 | | | 67,082 |
Alcon, Inc. | | 3,500 | | | 282,100 |
Closure Medical Corp.(a) | | 4,300 | | | 83,850 |
Cooper Cos., Inc. (The) | | 3,600 | | | 254,124 |
Encore Medical Corp.(a) | | 12,700 | | | 86,233 |
Intuitive Surgical, Inc.(a) | | 980 | | | 39,220 |
Laserscope(a) | | 1,670 | | | 59,970 |
Lifeline Systems, Inc.(a) | | 3,650 | | | 94,024 |
Orthovita, Inc.(a) | | 16,150 | | | 67,669 |
PolyMedica Corp. | | 2,370 | | | 88,377 |
Spectranetics Corp. (The)(a) | | 14,500 | | | 81,504 |
| | | | |
|
|
| | | | | | 1,278,052 |
| | | | |
|
|
Health Care Providers & Services — 1.8% | | | | | |
Accredo Health, Inc.(a) | | 4,500 | | | 124,740 |
America Service Group, Inc.(a) | | 3,585 | | | 95,970 |
American Healthways, Inc.(a) | | 4,700 | | | 155,288 |
Caremark Rx, Inc.(a) | | 9,200 | | | 362,756 |
CIGNA Corp. | | 5,100 | | | 416,007 |
Covance, Inc.(a) | | 4,400 | | | 170,500 |
Express Scripts, Inc.(a) | | 5,800 | | | 443,352 |
Kindred Healthcare, Inc.(a) | | 2,650 | | | 79,367 |
LabOne, Inc.(a) | | 3,620 | | | 115,985 |
Medco Health Solutions, Inc.(a) | | 5,616 | | | 233,626 |
Pharmaceutical Product Development, Inc.(a) | | 5,000 | | | 206,450 |
UnitedHealth Group, Inc. | | 3,100 | | | 272,893 |
WellPoint, Inc.(a) | | 2,700 | | | 310,500 |
| | | | |
|
|
| | | | | | 2,987,434 |
| | | | |
|
|
Hotels, Restaurants & Leisure — 1.1% | | | | | |
Brinker International, Inc.(a) | | 3,200 | | | 112,224 |
CEC Entertainment, Inc.(a) | | 2,500 | | | 99,925 |
Cosi, Inc.(a) | | 9,200 | | | 55,660 |
McDonald’s Corp. | | 7,700 | | | 246,862 |
Mikohn Gaming Corp.(a) | | 700 | | | 7,154 |
RARE Hospitality International, Inc.(a) | | 2,740 | | | 87,296 |
Scientific Games Corp.
(Class “A” Stock)(a) | | 6,860 | | | 163,543 |
Sonic Corp.(a) | | 3,400 | | | 103,700 |
Starbucks Corp.(a) | | 11,800 | | | 735,848 |
WMS Industries, Inc.(a) | | 4,400 | | | 147,576 |
| | | | |
|
|
| | | | | | 1,759,788 |
| | | | |
|
|
Household Durables — 1.0% | | | | | |
Harman International Industries, Inc. | | 5,900 | | | 749,300 |
Hovnanian Enterprises, Inc.
(Class “A” Stock)(a) | | 6,600 | | | 326,832 |
Lennar Corp. (Class “A” Stock) | | 1,000 | | | 56,680 |
Meritage Corp.(a) | | 1,700 | | | 191,590 |
Snap-on, Inc. | | 3,400 | | | 116,824 |
Standard Pacific Corp. | | 2,800 | | | 179,592 |
| | | | |
|
|
| | | | | | 1,620,818 |
| | | | |
|
|
SEE NOTES TO FINANCIAL STATEMENTS.
B2
| | | | |
| | | DIVERSIFIED CONSERVATIVE GROWTH PORTFOLIO (Continued) | | |
SCHEDULE OF INVESTMENTS | December 31, 2004 |
| | | | | |
| COMMON STOCKS | | Value (Note 2)
|
| (Continued) | | Shares
| |
Household Products — 0.4% | | | | | |
Kimberly-Clark Corp. | | 5,000 | | $ | 329,050 |
Procter & Gamble Co. | | 6,300 | | | 347,004 |
| | | | |
|
|
| | | | | | 676,054 |
| | | | |
|
|
Industrial Conglomerates — 1.4% | | | | | |
General Electric Co. | | 41,200 | | | 1,503,800 |
Gentek, Inc.(a) | | 380 | | | 17,005 |
Phelps Dodge Corp. | | 3,300 | | | 326,436 |
Tyco International, Ltd. (Bermuda) | | 13,700 | | | 489,638 |
| | | | |
|
|
| | | | | | 2,336,879 |
| | | | |
|
|
Insurance — 1.9% | | | | | |
Affirmative Insurance Holdings, Inc. | | 4,700 | | | 79,148 |
Allstate Corp. | | 5,100 | | | 263,772 |
American International Group, Inc. | | 5,812 | | | 381,674 |
Commerce Group, Inc. | | 2,500 | | | 152,600 |
Delphi Financial Group, Inc. | | 2,550 | | | 117,683 |
Genworth Financial, Inc. | | | | | |
(Class “A” Stock) | | 9,300 | | | 251,100 |
Infinity Property & Casualty Corp. | | 3,120 | | | 109,824 |
Loews Corp. | | 5,500 | | | 386,650 |
MBIA, Inc. | | 3,900 | | | 246,792 |
Philadelphia Consolidated Holding Corp.(a) | | 3,000 | | | 198,420 |
Protective Life Corp. | | 1,800 | | | 76,842 |
St. Travelers Paul Cos., Inc. (The) | | 9,817 | | | 363,916 |
Tower Group, Inc. | | 8,850 | | | 106,200 |
XL Capital, Ltd.
(Class “A” Stock) (Bermuda) | | 6,300 | | | 489,195 |
| | | | |
|
|
| | | | | | 3,223,816 |
| | | | |
|
|
Internet & Catalog Retail — 0.7% | | | | | |
eBay, Inc.(a) | | 9,500 | | | 1,104,660 |
School Specialty, Inc.(a) | | 2,000 | | | 77,120 |
| | | | |
|
|
| | | | | | 1,181,780 |
| | | | |
|
|
Internet Software & Services — 1.5% | | | | | |
Ask Jeeves, Inc.(a) | | 3,320 | | | 88,810 |
CNET Networks, Inc.(a) | | 6,540 | | | 73,444 |
Digitas, Inc.(a) | | 12,050 | | | 115,077 |
Equinix, Inc.(a) | | 1,920 | | | 82,061 |
Google, Inc. (Class “A” stock)(a) | | 3,600 | | | 695,160 |
InfoSpace, Inc.(a) | | 1,920 | | | 91,296 |
j2 Global Communications, Inc.(a) | | 3,040 | | | 104,880 |
Jupitermedia Corp.(a) | | 1,820 | | | 43,280 |
Keynote Systems, Inc.(a) | | 8,650 | | | 120,408 |
RADVision, Ltd. (Israel)(a) | | 5,010 | | | 67,635 |
RADWARE, Ltd.(a) | | 2,350 | | | 61,406 |
ValueClick, Inc.(a) | | 5,810 | | | 77,447 |
Yahoo!, Inc.(a) | | 24,200 | | | 911,856 |
| | | | |
|
|
| | | | | | 2,532,760 |
| | | | |
|
|
IT Consulting & Services — 0.2% | | | | | |
Accenture, Ltd.
(Class “A” Stock)(Bermuda)(a) | | 11,000 | | | 297,000 |
Infocrossing, Inc.(a) | | 4,240 | | | 71,783 |
| | | | |
|
|
| | | | | | 368,783 |
| | | | |
|
|
| | | | | |
| COMMON STOCKS | | Value (Note 2)
|
| (Continued) | | Shares
| |
Leisure Equipment & Products — 0.1% | | | | | |
K2, Inc.(a) | | 6,380 | | $ | 101,314 |
| | | | |
|
|
Machinery — 0.2% | | | | | |
Ceradyne, Inc.(a) | | 770 | | | 44,052 |
Deere & Co. | | 3,400 | | | 252,960 |
| | | | |
|
|
| | | | | | 297,012 |
| | | | |
|
|
Media — 0.8% | | | | | |
DIRECTV Group, Inc. (The)(a) | | 2,000 | | | 33,480 |
DreamWorks Animation SKG
(Class “A” Stock)(a) | | 300 | | | 11,253 |
Image Entertainment, Inc.(a) | | 5,850 | | | 34,749 |
News Corp. (Class “A” Stock) | | 13,734 | | | 256,276 |
Scholastic Corp.(a) | | 2,700 | | | 99,792 |
Sinclair Broadcast Group, Inc.
(Class “A” Stock) | | 7,000 | | | 64,470 |
Sirius Satellite Radio, Inc.(a) | | 13,100 | | | 100,215 |
UnitedGlobalCom, Inc.(a) | | 4,511 | | | 43,576 |
Univision Communications, Inc.
(Class “A” Stock)(a) | | 9,700 | | | 283,919 |
Viacom, Inc. (Class “B” Stock) | | 5,640 | | | 205,240 |
XM Satellite Radio Holding, Inc.
(Class “A” Stock)(a) | | 4,100 | | | 154,242 |
| | | | |
|
|
| | | | | | 1,287,212 |
| | | | |
|
|
Metals & Mining — 0.1% | | | | | |
Inco, Ltd. (Canada)(a) | | 6,500 | | | 239,070 |
| | | | |
|
|
Multi-line Retail — 0.4% | | | | | |
Target Corp. | | 12,700 | | | 659,511 |
| | | | |
|
|
Multi-Utilities — 0.4% | | | | | |
Dominion Resources, Inc. | | 4,700 | | | 318,378 |
Sempra Energy | | 10,600 | | | 388,808 |
| | | | |
|
|
| | | | | | 707,186 |
| | | | |
|
|
Office Electronics — 0.3% | | | | | |
Xerox Corp.(a) | | 34,300 | | | 583,443 |
| | | | |
|
|
Oil & Gas — 2.2% | | | | | |
Cabot Oil & Gas Corp. | | 5,500 | | | 243,375 |
Chesapeake Energy Corp. | | 8,700 | | | 143,550 |
Eni S.p.A. ADR (Italy) | | 3,400 | | | 427,856 |
Exxon Mobil Corp. | | 3,600 | | | 184,536 |
Kerr-McGee Corp. | | 3,500 | | | 202,265 |
Nexen, Inc. (Canada) | | 9,400 | | | 382,110 |
Occidental Petroleum Corp. | | 8,000 | | | 466,880 |
Suncor Energy, Inc. (Canada) | | 20,500 | | | 725,700 |
Swift Energy Co.(a) | | 5,100 | | | 147,594 |
Total SA (France) | | 1,750 | | | 382,255 |
Total SA ADR (France) | | 3,448 | | | 378,728 |
| | | | |
|
|
| | | | | | 3,684,849 |
| | | | |
|
|
Paper & Forest Products — 0.3% | | | | | |
Georgia-Pacific Corp. | | 8,400 | | | 314,832 |
International Paper Co. | | 5,600 | | | 235,200 |
| | | | |
|
|
| | | | | | 550,032 |
| | | | |
|
|
Personal Products — 0.3% | | | | | |
Chattem, Inc.(a) | | 4,400 | | | 145,640 |
Estee Lauder Cos., Inc. (Class “A” Stock) | | 6,900 | | | 315,813 |
| | | | |
|
|
| | | | | | 461,453 |
| | | | |
|
|
SEE NOTES TO FINANCIAL STATEMENTS.
B3
| | | | |
| | | DIVERSIFIED CONSERVATIVE GROWTH PORTFOLIO (Continued) | | |
SCHEDULE OF INVESTMENTS | December 31, 2004 |
| | | | | |
| COMMON STOCKS | | Value (Note 2)
|
| (Continued) | | Shares
| |
Pharmaceuticals — 2.1% | | | | | |
Allergan, Inc. | | 4,600 | | $ | 372,922 |
AtheroGenics, Inc.(a) | | 2,100 | | | 49,476 |
Barr Laboratories, Inc.(a) | | 1,900 | | | 86,526 |
Cypress Biosciences, Inc.(a) | | 5,020 | | | 70,581 |
Eli Lilly & Co. | | 13,200 | | | 749,100 |
Inspire Pharmaceuticals, Inc.(a) | | 4,100 | | | 68,757 |
K-V Pharmaceutical Co.
(Class “A” Stock)(a) | | 7,050 | | | 155,452 |
Merck & Co., Inc. | | 9,700 | | | 311,758 |
Novartis AG, ADR (Switzerland) | | 17,700 | | | 894,558 |
Roche Holdings, Ltd. ADR (Switzerland) | | 4,200 | | | 483,493 |
Salix Pharmaceuticals, Ltd.(a) | | 4,450 | | | 78,276 |
Wyeth | | 4,700 | | | 200,173 |
| | | | |
|
|
| | | | | | 3,521,072 |
| | | | |
|
|
Real Estate — 0.1% | | | | | |
Saxon Capital, Inc. | | 4,550 | | | 109,154 |
| | | | |
|
|
Real Estate Investment Trust — 0.2% | | | | | |
Entertainment Properties Trust | | 3,200 | | | 142,560 |
SL Green Realty Corp. | | 2,000 | | | 121,100 |
| | | | |
|
|
| | | | | | 263,660 |
| | | | |
|
|
Road & Rail — 0.1% | | | | | |
Old Dominion Freight Lines, Inc.(a) | | 2,370 | | | 82,476 |
Vitran Corp., Inc.(a) | | 5,550 | | | 94,905 |
| | | | |
|
|
| | | | | | 177,381 |
| | | | |
|
|
Semiconductors & Semiconductor Equipment — 0.7% |
02Micro International, Ltd.(a) | | 9,420 | | | 107,765 |
Marvell Technology Group, Ltd. (Bermuda)(a) | | 13,200 | | | 468,204 |
Maxim Integrated Products, Inc. | | 8,000 | | | 339,120 |
Microsemi Corp.(a) | | 2,850 | | | 49,476 |
Sigmatel, Inc.(a) | | 1,230 | | | 43,702 |
SiRF Technology Holdings, Inc.(a) | | 5,700 | | | 72,504 |
SRS Labs, Inc.(a) | | 12,750 | | | 79,700 |
Ultratech, Inc.(a) | | 3,860 | | | 72,761 |
| | | | |
|
|
| | | | | | 1,233,232 |
| | | | |
|
|
Software — 2.2% | | | | | |
Adobe Systems, Inc. | | 3,100 | | | 194,494 |
Electronic Arts, Inc.(a) | | 12,600 | | | 777,168 |
Embarcadero Technologies, Inc.(a) | | 8,550 | | | 80,456 |
Epicor Software Corp.(a) | | 5,780 | | | 81,440 |
Mercury Interactive Corp.(a) | | 6,900 | | | 314,295 |
Merge Technologies, Inc.(a) | | 2,880 | | | 64,080 |
Microsoft Corp. | | 37,600 | | | 1,004,296 |
NAVTEQ Corp.(a) | | 4,000 | | | 185,440 |
Open Solutions, Inc.(a) | | 2,140 | | | 55,554 |
SafeNet, Inc.(a) | | 3,430 | | | 126,018 |
SAP AG, ADR(Germany) | | 11,500 | | | 508,415 |
Smith Micro Software, Inc.(a) | | 6,050 | | | 54,148 |
Sonic Solutions(a) | | 3,950 | | | 88,638 |
Synplicity, Inc.(a) | | 12,050 | | | 71,336 |
THQ, Inc.(a) | | 3,650 | | | 83,731 |
| | | | |
|
|
| | | | | | 3,689,509 |
| | | | |
|
|
| | | | | |
| COMMON STOCKS | | Value (Note 2)
|
| (Continued) | | Shares
| |
Specialty Retail — 1.4% | | | | | |
Aaron Rents, Inc. | | 2,365 | | $ | 59,125 |
Bed Bath & Beyond, Inc.(a) | | 11,700 | | | 466,011 |
Charlotte Russe Holding, Inc.(a) | | 6,450 | | | 65,145 |
Chico’s FAS, Inc.(a) | | 10,500 | | | 478,065 |
Cost Plus, Inc.(a) | | 2,330 | | | 74,863 |
CSK Auto Corp.(a) | | 5,400 | | | 90,396 |
Guitar Center, Inc.(a) | | 2,070 | | | 109,068 |
Jos. A. Bank Clothiers, Inc.(a) | | 3,982 | | | 112,691 |
Lowe’s Cos., Inc. | | 5,900 | | | 339,781 |
Toys ‘R’ Us, Inc.(a) | | 17,300 | | | 354,131 |
Williams-Sonoma, Inc.(a) | | 4,500 | | | 157,680 |
| | | | |
|
|
| | | | | | 2,306,956 |
| | | | |
|
|
Telecommunications | | | | | |
NTL, Inc.(a) | | 250 | | | 18,240 |
| | | | |
|
|
Textiles, Apparel & Luxury Goods — 0.2% | | | |
Coach, Inc.(a) | | 4,700 | | | 265,080 |
| | | | |
|
|
Textiles & Apparel — 0.2% | | | | | |
Ashworth, Inc.(a) | | 9,030 | | | 98,337 |
Oxford Industries, Inc. | | 2,590 | | | 106,967 |
Phillips-Van Heusen Corp. | | 6,100 | | | 164,700 |
Stein Mart, Inc.(a) | | 1,500 | | | 25,590 |
| | | | |
|
|
| | | | | | 395,594 |
| | | | |
|
|
Thrifts & Mortgage Finance — 0.1% | | | | | |
Freddie Mac | | 3,300 | | | 243,210 |
| | | | |
|
|
Tobacco — 0.4% | | | | | |
Altria Group, Inc. | | 10,100 | | | 617,110 |
| | | | |
|
|
Wireless Telecommunication Services — 0.6% | | | |
American Tower Corp. (Class “A” Stock)(a) | | 18,500 | | | 340,400 |
Nextel Communications, Inc. (Class “A” Stock)(a) | | 23,900 | | | 717,000 |
| | | | |
|
|
| | | | | | 1,057,400 |
| | | | |
|
|
TOTAL COMMON STOCKS
(cost $52,341,109) | | | 67,202,885 |
| | | | |
|
|
| WARRANTS & RIGHTS(a) — 0.1% | | | |
Capital Goods | | | | | |
Gentek, Inc. expiring 10/31/08
(cost $57; purchased 11/10/03)(h) | | 444 | | | 888 |
Gentek, Inc. expiring 10/31/10
(cost $28; purchased 11/10/03)(h) | | 216 | | | 432 |
| | | | |
|
|
| | | | | | 1,320 |
| | | | |
|
|
Media & Entertainment | | | | | |
XM Satellite Radio, Inc. 144A expiring 03/03/10
(cost $0; purchased 07/11/00)(g)(h) | | 100 | | | 1 |
| | | | |
|
|
Telecommunications | | | | | |
Lucent Technologies, Inc. expiring 12/10/07 | | 83 | | | 131 |
McLeodUSA, Inc. expiring 04/16/07 | | 2,311 | | | 555 |
United Mexican States, expiring 06/01/07 | | 1,300,000 | | | 29,250 |
SEE NOTES TO FINANCIAL STATEMENTS.
B4
| | | | |
| | | DIVERSIFIED CONSERVATIVE GROWTH PORTFOLIO (Continued) | | |
SCHEDULE OF INVESTMENTS | December 31, 2004 |
| | | | | |
| COMMON STOCKS | | Value (Note 2)
|
| (Continued) | | Shares
| |
Telecommunications (cont’d.) | | | | | |
United Mexican States, expiring 06/30/06 | | 1,300,000 | | $ | 33,150 |
United Mexican States, expiring 06/30/06 | | 1,300,000 | | | 17,550 |
| | | | |
|
|
| | | | | | 80,636 |
| | | | |
|
|
TOTAL WARRANTS & RIGHTS
(cost $85) | | | | | 81,957 |
| | | | |
|
|
| | | | | | | | | |
| | | | |
Interest
Rate
| | Maturity
Date
| | Moody’s
Rating
(Unaudited)
| | Principal
Amount
(000)
| | |
| CORPORATE BONDS — 21.1% | | |
Aerospace/Defense — 0.4% | | |
Alliant Techsystems, Inc. | | |
Sr. Sub. Notes | | |
| 8.50% | | 05/15/11 | | B2 | | $ | 75 | | 82,125 |
Argo-Tech Corp. | | |
Sr. Notes | | |
| 9.25% | | 06/01/11 | | B3 | | | 20 | | 21,950 |
BE Aerospace, Inc. | | |
Sr. Sub. Notes | | |
| 8.875% | | 05/01/11 | | Caa3 | | | 115 | | 120,175 |
Esterline Technologies Corp | | |
Sr. Sub. Notes | | |
| 7.75% | | 06/15/13 | | B1 | | | 125 | | 136,563 |
K&F Industries, Inc. 144A | | |
Sr. Sub. Notes(g) | | |
| 7.75% | | 11/15/14 | | Caa1 | | | 50 | | 51,625 |
L-3 Communications Corp. | | |
Sr. Sub. Notes | | |
| 7.625% | | 06/15/12 | | Ba3 | | | 125 | | 137,187 |
Sequa Corp. | | |
Sr. Notes | | |
| 8.875% | | 04/01/08 | | B1 | | | 100 | | 109,500 |
Standard Aero Holdings, Inc. 144A | | |
Sr. Sub. Notes(g) | | |
| 8.25% | | 09/01/14 | | Caa1 | | | 45 | | 48,600 |
| | | | | | | | | |
|
| | | | | | | | | | 707,725 |
| | | | | | | | | |
|
Airlines — 0.2% | | |
AMR Corp. | | |
Debs. | | |
| 10.00% | | 04/15/21 | | Caa2 | | | 50 | | 36,750 |
Notes | | |
| 10.40% | | 03/10/11 | | NR | | | 100 | | 76,500 |
Continental Airlines, Inc. | | |
Pass-thru Certs., Ser. 96-C69 | | |
| 9.50% | | 10/15/13 | | B3 | | | 60 | | 45,203 |
Pass-thru Certs., Ser. 98-1B | | |
| 6.748% | | 03/15/17 | | Ba2 | | | 39 | | 31,617 |
Pass-thru. Certs., Ser. 99-1B | | |
| 6.795% | | 08/02/18 | | Ba2 | | | 70 | | 61,043 |
Delta Air Lines, Inc. | | |
Notes | | |
| 8.30% | | 12/15/29 | | Ca | | | 125 | | 60,625 |
| | | | | | | | | |
|
| | | | | | | | | | 311,738 |
| | | | | | | | | |
|
Automotive — 0.3% | | |
ArvinMeritor, Inc. | | |
Notes | | |
| 8.75% | | 03/01/12 | | Ba1 | | | 155 | | 179,025 |
| | | | | | | | | | |
Interest
Rate
| | Maturity
Date
| | Moody’s
Rating
(Unaudited)
| | Principal
Amount
(000)
| | Value (Note 2)
|
| CORPORATE BONDS (Continued) | | | |
Automotive (cont’d.) | | | |
Collins & Aikman Products Co. | | | |
Gtd. Notes | | | |
| 10.75% | | 12/31/11 | | B2 | | $ | 20 | | $ | 20,400 |
Collins & Aikman Products Co. 144A | | | |
Sr. Sub. Notes(g) | | | |
| 12.875% | | 08/15/12 | | B3 | | | 10 | | | 8,638 |
Cooper Standard Automotive, Inc. 144A | | | |
Notes(g) | | | |
| 8.375% | | 12/15/14 | | B3 | | | 25 | | | 24,938 |
Navistar International Corp. | | | |
Gtd. Notes | | | |
| 9.375% | | 06/01/06 | | Ba3 | | | 40 | | | 42,800 |
Tenneco Automotive, Inc. 144A | | | |
Sr. Sub. Notes(g) | | | |
| 8.625% | | 11/15/14 | | B3 | | | 50 | | | 52,000 |
TRW Automotive | | | |
Sr. Notes | | | |
| 9.375% | | 02/15/13 | | Ba3 | | | 58 | | | 67,280 |
Visteon Corp. | | | |
Notes | | | |
| 7.00% | | 03/10/14 | | Ba1 | | | 50 | | | 47,750 |
Sr. Notes | | | |
| 8.25% | | 08/01/10 | | Ba1 | | | 45 | | | 47,137 |
| | | | | | | | | |
|
|
| | | | | | | | | | | 489,968 |
| | | | | | | | | |
|
|
Banks — 0.1% | | | |
Kazkommerts International BV 144A (Netherland) | | | |
Gtd. Notes(g) | | | |
| 7.00% | | 11/03/09 | | Baa2 | | | 40 | | | 40,200 |
| 7.875% | | 04/07/14 | | Baa2 | | | 95 | | | 95,000 |
| | | | | | | | | |
|
|
| | | | | | | | | | | 135,200 |
| | | | | | | | | |
|
|
Building Materials & Construction — 0.4% | | | |
American Standard, Inc. | | | |
Sr. Notes
(cost $125,886; purchased 03/11/03)(h) | | | |
| 7.375% | | 04/15/05 | | Baa3 | | | 125 | | | 126,513 |
D.R. Horton, Inc. | | | |
Sr. Notes | | | |
| 7.875% | | 08/15/11 | | Ba1 | | | 200 | | | 229,000 |
Goodman Global Holdings, Inc. 144A | | | |
Sr. Notes(g) | | | |
| 5.76% | | 06/15/12(b) | | B3 | | | 50 | | | 50,750 |
K Hovnanian Enterprises, Inc. 144A | | | |
Gtd. Notes(g) | | | |
| 6.25% | | 01/15/15 | | Ba2 | | | 50 | | | 49,125 |
KB HOME | | | |
Sr. Sub. Notes | | | |
| 8.625% | | 12/15/08 | | Ba2 | | | 80 | | | 90,400 |
THL BUILDCO (Nortek, Inc.) 144A | | | |
Sr. Sub. Notes(g) | | | |
| 8.50% | | 09/01/14 | | B3 | | | 75 | | | 78,375 |
| | | | | | | | | |
|
|
| | | | | | | | | | | 624,163 |
| | | | | | | | | |
|
|
Cable — 0.7% | | | |
Callahan Nordrhein Westfalen | | | |
(German) Sr. Disc. Notes, Zero Coupon (until 7/15/05)
(cost $158,508; purchased 08/01/01)(h) | | | |
| Zero Coupon | | 07/15/10(c) | | Ca | | | 250 | | | 10,000 |
SEE NOTES TO FINANCIAL STATEMENTS.
B5
| | | | |
| | | DIVERSIFIED CONSERVATIVE GROWTH PORTFOLIO (Continued) | | |
SCHEDULE OF INVESTMENTS | December 31, 2004 |
| | | | | | | | | | |
Interest
Rate
| | Maturity
Date
| | Moody’s
Rating
(Unaudited)
| | Principal
Amount
(000)
| | Value (Note 2)
|
| CORPORATE BONDS (Continued) | | | |
Cable (cont’d.) | | | |
Charter Communications Holdings LLC | | | |
Sr. Disc. Notes, Zero Coupon (until 05/15/06) | | | |
| Zero Coupon | | 05/15/11 | | Ca | | $ | 450 | | $ | 330,750 |
Sr. Notes | | | |
| 10.25% | | 01/15/10 | | Ca | | | 175 | | | 153,562 |
Charter Community Hldgs. | | | |
Sr. Notes | | | |
| 10.25% | | 09/15/10 | | Caa1 | | | 100 | | | 106,000 |
CSC Holdings, Inc. | | | |
Sr. Notes | | | |
| 7.875% | | 12/15/07 | | B1 | | | 54 | | | 57,915 |
Sr. Notes, Ser. B | | | |
| 8.125% | | 07/15/09 | | B1 | | | 25 | | | 27,344 |
CSC Holdings, Inc. 144A | | | |
Sr. Notes(g) | | | |
| 6.75% | | 04/15/12 | | B1 | | | 100 | | | 103,000 |
Kabel Deutschland GmbH (Germany) | | | |
Sr. Notes | | | |
| 10.625% | | 07/01/14 | | B2 | | | 75 | | | 86,250 |
Rogers Cablesystems, Inc., (Canada) | | | |
Gtd. Notes | | | |
| 11.00% | | 12/01/15 | | B2 | | | 100 | | | 111,500 |
Sr. Notes | | | |
| 10.00% | | 03/15/05 | | Ba3 | | | 200 | | | 202,750 |
| | | | | | | | | |
|
|
| | | | | | | | | | | 1,189,071 |
| | | | | | | | | |
|
|
Capital Goods — 1.1% | | | |
Allied Waste North America, Inc. | | | |
Sec’d. Notes | | | |
| 5.75% | | 02/15/11 | | B2 | | | 60 | | | 56,400 |
Sr. Notes | | | |
| 7.875% | | 04/15/13 | | B2 | | | 50 | | | 51,250 |
| 8.50% | | 12/01/08 | | B2 | | | 145 | | | 153,700 |
Amsted Industries, Inc. 144A | | | |
Sr. Notes(g) | | | |
| 10.25% | | 10/15/11 | | B3 | | | 75 | | | 84,750 |
Case New Holland, Inc. 144A | | | |
Sr. Notes(g) | | | |
| 9.25% | | 08/01/11 | | Ba3 | | | 120 | | | 133,500 |
Flowserve Corp. | | | |
Gtd. Notes | | | |
| 12.25% | | 08/15/10 | | B2 | | | 50 | | | 55,250 |
Great Lakes Dredge & Dock Corp. | | | |
Sr. Sub. Notes | | | |
| 7.75% | | 12/15/13 | | Caa2 | | | 40 | | | 36,400 |
Invensys PLC 144A | | | |
Sr. Notes(g) | | | |
| 9.875% | | 03/15/11 | | B3 | | | 80 | | | 86,000 |
Johnsondiversey Holdings, Inc. | | | |
Gtd. Notes
(cost $56,960; purchased 09/08/03)(h) | | | |
| 9.625% | | 05/15/12 | | B2 | | | 35 | | | 39,112 |
Sr. Disc. Notes | | | |
| 10.67% | | 05/15/13 | | B3 | | | 75 | | | 64,875 |
Joy Global, Inc. | | | |
Gtd. Notes, Ser. B | | | |
| 8.75% | | 03/15/12 | | B1 | | | 150 | | | 168,000 |
Manitowoc, Inc. | | | |
Sr. Sub. Notes | | | |
| 10.50% | | 08/01/12 | | B2 | | | 150 | | | 172,500 |
| | | | | | | | | | |
Interest
Rate
| | Maturity
Date
| | Moody’s
Rating
(Unaudited)
| | Principal
Amount
(000)
| | Value (Note 2)
|
| CORPORATE BONDS (Continued) | | | |
Capital Goods (cont’d.) | | | |
Mueller Group, Inc. | | | |
Sr. Sub. Notes | | | |
| 10.00% | | 05/01/12 | | Caa1 | | $ | 45 | | $ | 49,050 |
Rexnord Corp. | | | |
Sr. Sub. Notes
(cost $100,000; purchased 11/19/02)(h) |
| 10.125% | | 12/15/12 | | B3 | | | 100 | | | 113,000 |
Sensus Metering Systems, Inc. | | | |
Sr. Sub. Notes | | | |
| 8.625% | | 12/15/13 | | Caa1 | | | 90 | | | 92,250 |
SPX Corp. | | | |
Sr. Notes | | | |
| 7.50% | | 01/01/13 | | Ba3 | | | 25 | | | 27,125 |
Stena AB | | | |
Sr. Notes | | | |
| 7.50% | | 11/01/13 | | Ba3 | | | 100 | | | 104,750 |
Terex Corp. | | | |
Gtd. Notes | | | |
| 10.375% | | 04/01/11 | | B3 | | | 155 | | | 173,600 |
Sr. Sub. Notes | | | |
| 9.25% | | 07/15/11 | | B3 | | | 45 | | | 50,512 |
Terex Corp. 144A | | | |
Gtd. Notes(g) | | | |
| 7.375% | | 01/15/14 | | B3 | | | 25 | | | 26,813 |
Thermadyne Holdings Corp. | | | |
Gtd. Notes | | | |
| 9.25% | | 02/01/14 | | Caa1 | | | 50 | | | 48,750 |
Tyco International Group SA | | | |
Gtd. Notes | | | |
| 6.125% | | 11/01/08 | | Baa3 | | | 25 | | | 26,935 |
United Rentals North America, Inc. | | | |
Gtd. Notes | | | |
| 6.50% | | 02/15/12 | | B1 | | | 100 | | | 97,500 |
| | | | | | | | | |
|
|
| | | | | | | | | | | 1,912,022 |
| | | | | | | | | |
|
|
Chemicals — 0.8% | | | |
Borden United States Finance Corporation / Borden 144A |
Sec’d. Notes(g) | | | |
| 9.00% | | 07/15/14 | | B3 | | | 50 | | | 55,500 |
Equistar Chemicals LP | | | |
Sr. Notes | | | |
| 10.125% | | 09/01/08 | | B2 | | | 45 | | | 51,862 |
| 10.625% | | 05/01/11 | | B2 | | | 55 | | | 63,800 |
Hercules, Inc. | | | |
Debs.
(cost $151,111; purchased 05/07/03)(h) | | | |
| 6.60% | | 08/01/27 | | Ba1 | | | 150 | | | 153,000 |
Gtd. Notes | | | |
| 6.75% | | 10/15/29 | | Ba3 | | | 25 | | | 25,812 |
Huntsman Advanced Materials 144A | | | |
Sr. Sec’d. Notes(g) | | | |
| 11.00% | | 07/15/10 | | B2 | | | 35 | | | 41,650 |
Huntsman ICI Chemicals LLC | | | |
Sr. Sub. Notes | | | |
| 10.125% | | 07/01/09 | | Caa1 | | | 11 | | | 11,578 |
IMC Global, Inc. | | | |
Debs.
(cost $101,658; purchased 05/25/04)(h) | | | |
| 6.875% | | 07/15/07 | | B2 | | | 100 | | | 104,000 |
SEE NOTES TO FINANCIAL STATEMENTS.
B6
| | | | |
| | | DIVERSIFIED CONSERVATIVE GROWTH PORTFOLIO (Continued) | | |
SCHEDULE OF INVESTMENTS | December 31, 2004 |
| | | | | | | | | | |
Interest
Rate
| | Maturity
Date
| | Moody’s
Rating
(Unaudited)
| | Principal
Amount
(000)
| | Value (Note 2)
|
| CORPORATE BONDS (Continued) | | | |
Chemicals (cont’d.) | | | |
ISP Chemco, Inc. | | | |
Gtd. Notes, Ser. B | | | |
| 10.25% | | 07/01/11 | | B1 | | $ | 75 | | $ | 84,750 |
Koppers, Inc. | | | |
Gtd. Notes | | | |
| 9.875% | | 10/15/13 | | B2 | | | 75 | | | 85,500 |
Lyondell Chemical Co. | | | |
Sec’d. Notes | | | |
| 9.875% | | 05/01/07 | | B1 | | | 35 | | | 36,663 |
| 11.125% | | 07/15/12 | | B1 | | | 50 | | | 59,375 |
Nalco Co. | | | |
Sr. Notes | | | |
| 7.75% | | 11/15/11 | | B2 | | | 125 | | | 135,000 |
Sr. Sub. Notes | | | |
| 8.875% | | 11/15/13 | | Caa1 | | | 25 | | | 27,437 |
OM Group, Inc. | | | |
Gtd. Notes | | | |
| 9.25% | | 12/15/11 | | Caa1 | | | 60 | | | 63,900 |
Rhodia SA | | | |
Sr. Notes | | | |
| 10.25% | | 06/01/10 | | B3 | | | 125 | | | 140,625 |
Sr. Sub Notes | | | |
| 8.875% | | 06/01/11 | | Caa1 | | | 100 | | | 100,750 |
Rockwood Specialties, Inc. | | | |
Sr. Sub. Notes
(cost $53,257; purchased 04/26/04)(h) | | | |
| 10.625% | | 05/15/11 | | B3 | | | 50 | | | 57,500 |
Westlake Chemical Corp. | | | |
Gtd. Notes | | | |
| 8.75% | | 07/15/11 | | Ba2 | | | 45 | | | 50,850 |
| | | | | | | | | |
|
|
| | | | | | | | | | | 1,349,552 |
| | | | | | | | | |
|
|
Consumer Services — 0.4% | | | |
Alderwoods Group Inc. 144A | | | |
Sr. Notes(g) | | | |
| 7.75% | | 09/15/12 | | B2 | | | 75 | | | 81,000 |
Coinmach Corp. | | | |
Sr. Notes | | | |
| 9.00% | | 02/01/10 | | B3 | | | 42 | | | 43,890 |
K2, Inc. 144A | | | |
Sr. Notes(g) | | | |
| 7.375% | | 07/01/14 | | Ba3 | | | 50 | | | 54,750 |
Kindercare Learning Center, Inc. | | | |
Sr. Sub. Notes
(cost $72,215; purchased 04/19/00)(h) | | | |
| 9.50% | | 02/15/09 | | B3 | | | 76 | | | 76,285 |
Levi Strauss & Co. | | | |
Sr. Notes | | | |
| 12.25% | | 12/15/12 | | Ca | | | 100 | | | 111,250 |
Propex Fabrics 144A | | | |
Sr. Notes(g) | | | |
| 10.00% | | 12/01/12 | | Caa1 | | | 100 | | | 103,750 |
Rayovac Corp. | | | |
Sr. Sub. Notes | | | |
| 8.50% | | 10/01/13 | | B3 | | | 30 | | | 33,300 |
Service Corp. International
Notes | | | |
| 6.50% | | 03/15/08 | | Ba3 | | | 75 | | | 77,438 |
| | | | | | | | | | |
Interest
Rate
| | Maturity
Date
| | Moody’s
Rating
(Unaudited)
| | Principal
Amount
(000)
| | Value (Note 2)
|
| CORPORATE BONDS (Continued) | | | |
Consumer Services (cont’d.) | | | |
Sr. Notes | | | |
| 6.00% | | 12/15/05 | | Ba3 | | $ | 10 | | $ | 10,175 |
| | | | | | | | | |
|
|
| | | | | | | | | | | 591,838 |
| | | | | | | | | |
|
|
Diversified Financials — 0.5% | | | |
General Motors Acceptance Corp.
Notes | | | |
| 6.875% | | 09/15/11 | | Baa1 | | | 750 | | | 768,595 |
Notes, M.T.N. | | | |
| 3.329% | | 10/20/05(b) | | Baa1 | | | 100 | | | 100,368 |
| | | | | | | | | |
|
|
| | | | | | | | | | | 868,963 |
| | | | | | | | | |
|
|
Electric — 2.1% | | | |
AES Corp. | | | |
Sr. Notes | | | |
| 9.375% | | 09/15/10 | | B2 | | | 275 | | | 319,687 |
| 9.50% | | 06/01/09 | | B2 | | | 25 | | | 28,438 |
AES Eastern Energy LP, Pass-thru. Certs.,
Ser. 99-A | | | |
| 9.00% | | 01/02/17 | | Ba1 | | | 38 | | | 43,378 |
Allegheny Energy Supply Co., LLC 144A
Notes(g) | | | |
| 8.25% | | 04/15/12 | | B3 | | | 30 | | | 33,525 |
Aquila, Inc. | | | |
Sr. Notes | | | |
| 9.95% | | 02/01/11 | | B2 | | | 115 | | | 130,238 |
Calpine Corp. | | | |
Sr. Notes | | | |
| 8.50% | | 02/15/11 | | Caa1 | | | 181 | | | 138,012 |
Calpine Corp. 144A | | | |
Sr. Notes(g) | | | |
| 8.75% | | 07/15/13 | | B(e) | | | 140 | | | 115,500 |
CMS Energy Corp. | | | |
Sr. Notes | | | |
| 7.50% | | 01/15/09 | | B1 | | | 125 | | | 133,125 |
| 8.50% | | 04/15/11 | | B1 | | | 50 | | | 56,812 |
Dynegy Holdings, Inc. 144A | | | |
Sr. Sec’d. Notes(g) | | | |
| 10.125% | | 07/15/13 | | B3 | | | 180 | | | 206,100 |
Edison Mission Energy | | | |
Sr. Notes | | | |
| 7.73% | | 06/15/09 | | B1 | | | 150 | | | 161,250 |
Empresa Nacional De Electricidad SA
Notes | | | |
| 8.35% | | 08/01/13 | | Ba2 | | | 210 | | | 243,340 |
| 8.625% | | 08/01/15 | | Ba2 | | | 55 | | | 65,858 |
Homer City Funding LLC
Gtd. Notes | | | |
| 8.137% | | 10/01/19 | | Ba2 | | | 49 | | | 55,493 |
Inergy LP 144A | | | |
Sr. Notes(g) | | | |
| 6.875% | | 12/15/14 | | B1 | | | 50 | | | 50,250 |
Midland Funding Corp.
| | | |
Debs.
(cost $178,774; purchased 09/26/00-06/19/02)(h) | | | |
| 13.25% | | 07/23/06 | | Ba3 | | | 175 | | | 193,042 |
SEE NOTES TO FINANCIAL STATEMENTS.
B7
| | | | |
| | | DIVERSIFIED CONSERVATIVE GROWTH PORTFOLIO (Continued) | | |
SCHEDULE OF INVESTMENTS | December 31, 2004 |
| | | | | | | | | | |
Interest
Rate
| | Maturity
Date
| | Moody’s
Rating
(Unaudited)
| | Principal
Amount
(000)
| | Value (Note 2)
|
| CORPORATE BONDS (Continued) | | | |
Electric (cont’d.) | | | |
Midwest Generation LLC | | | |
Pass-thru Certs., Ser. A
(cost $36,746; purchased 09/17/04)(h) | | | |
| 8.30% | | 07/02/09 | | B1 | | $ | 35 | | $ | 37,625 |
Pass-thru Certs., Ser. B | | | |
| 8.56% | | 01/02/16 | | B1 | | | 85 | | | 94,350 |
Sec’d Notes | | | |
| 8.75% | | 05/01/34 | | B1 | | | 75 | | | 85,125 |
Nevada Power Co. | | | |
Gen. Ref. Mtge | | | |
| 6.50% | | 04/15/12 | | Ba2 | | | 50 | | | 52,875 |
Notes | | | |
| 10.875% | | 10/15/09 | | Ba2 | | | 5 | | | 5,775 |
Noteco, Ltd. | | | |
Notes | | | |
| 1.00% | | 06/30/25(c) | | NR | | | 7 | | | 14,447 |
NRG Energy, Inc. 144A(g) | | | |
| 8.00% | | 12/15/13 | | B1 | | | 195 | | | 212,550 |
Orion Power Holdings, Inc. | | | |
Sr. Notes | | | |
| 12.00% | | 05/01/10 | | B2 | | | 140 | | | 177,800 |
Reliant Resources, Inc. | | | |
Sec’d. Notes | | | |
| 9.50% | | 07/15/13 | | B1 | | | 140 | | | 159,075 |
Sierra Pacific Resources | | | |
Notes
(cost $127,040; purchased 05/20/04)(h) | | | |
| 8.75% | | 05/15/05 | | B2 | | | 125 | | | 127,374 |
Sr. Notes | | | |
| 8.625% | | 03/15/14 | | B2 | | | 40 | | | 45,200 |
TECO Energy, Inc. | | | |
Notes | | | |
| 7.50% | | 06/15/10 | | Ba2 | | | 175 | | | 193,375 |
Texas Genco LLC 144A | | | |
Sr. Notes(g) | | | |
| 6.875% | | 12/15/14 | | B1 | | | 200 | | | 206,750 |
TNP Enterprises, Inc. | | | |
Sr. Sub. Notes | | | |
| 10.25% | | 04/01/10 | | B2 | | | 100 | | | 106,750 |
UtiliCorp Canada Finance Corp. | | | |
Gtd. Notes (Canada) | | | |
| 7.75% | | 06/15/11 | | B2 | | | 15 | | | 15,581 |
| | | | | | | | | |
|
|
| | | | | | | | | | | 3,508,700 |
| | | | | | | | | |
|
|
Electric Utilities — 0.5% | | | |
PG&E Corp. | | | |
First Mtge. Notes | | | |
| 2.838% | | 04/03/06(b) | | Baa2 | | | 206 | | | 206,169 |
PPL Capital Funding Trust I | | | |
Sub. Notes | | | |
| 7.29% | | 05/18/06 | | Ba1 | | | 275 | | | 286,886 |
Southern California Edison Co. | | | |
First Mtge. Notes | | | |
| 8.00% | | 02/15/07 | | A3 | | | 250 | | | 272,245 |
TXU Energy Co. LLC 144A(g) | | | |
| 2.838% | | 01/17/06(b) | | Baa2 | | | 50 | | | 50,137 |
| | | | | | | | | |
|
|
| | | | | | | | | | | 815,437 |
| | | | | | | | | |
|
|
| | | | | | | | | | |
Interest
Rate
| | Maturity
Date
| | Moody’s
Rating
(Unaudited)
| | Principal
Amount
(000)
| | Value (Note 2)
|
| CORPORATE BONDS (Continued) | | | |
Energy — 0.2% | | | |
El Paso Corp. | | | |
Sr. Notes, MTN | | | |
| 7.75% | | 01/15/32 | | Caa1 | | $ | 200 | | $ | 191,500 |
| 7.80% | | 08/01/31 | | Caa1 | | | 100 | | | 96,000 |
| | | | | | | | | |
|
|
| | | | | | | | | | | 287,500 |
| | | | | | | | | |
|
|
Energy – Other — 0.6% | | | |
Chesapeake Energy Corp. 144A | | | |
Sr. Notes(g) | | | |
| 6.375% | | 06/15/15 | | Ba3 | | | 50 | | | 51,375 |
Encore Acquisition Co. | | | |
Sr. Sub. Notes
(cost $25,000; purchased 03/30/04)(h) | | | |
| 6.25% | | 04/15/14 | | B2 | | | 25 | | | 25,125 |
Evergreen Resources, Inc. | | | |
Sr. Sub. Notes
(cost $84,392; purchased 03/05/04)(h) | | | |
| 5.875% | | 03/15/12 | | Baa3 | | | 85 | | | 88,813 |
Forest Oil Corp. | | | |
Sr. Notes | | | |
| 8.00% | | 06/15/08 | | Ba3 | | | 40 | | | 44,150 |
Hanover Compressor Co. | | | |
Sr. Notes | | | |
| 8.625% | | 12/15/10 | | B3 | | | 50 | | | 54,625 |
Hanover Equipment Trust | | | |
Sec’d. Notes | | | |
| 8.75% | | 09/01/11 | | B2 | | | 95 | | | 103,075 |
Houston Exploration Co. (The) | | | |
Sr. Sub. Notes | | | |
| 7.00% | | 06/15/13 | | B2 | | | 25 | | | 26,500 |
Magnum Hunter Resources, Inc. | | | |
Gtd. Notes | | | |
| 9.60% | | 03/15/12 | | B2 | | | 10 | | | 11,350 |
Newfield Exploration Co. | | | |
Sr. Sub. Notes | | | |
| 8.375% | | 08/15/12 | | Ba3 | | | 50 | | | 56,000 |
Parker Drilling Co. | | | |
Sr. Notes | | | |
| 9.625% | | 10/01/13 | | B2 | | | 175 | | | 196,437 |
Premcor Refining Group, Inc. | | | |
Gtd. Notes | | | |
| 6.75% | | 05/01/14 | | Ba3 | | | 20 | | | 21,250 |
Sr. Notes | | | |
| 9.50% | | 02/01/13 | | Ba3 | | | 100 | | | 116,000 |
Sr. Sub. Notes | | | |
| 7.75% | | 02/01/12 | | B2 | | | 50 | | | 55,125 |
Pride International, Inc. | | | |
Sr. Notes | | | |
| 7.375% | | 07/15/14 | | Ba2 | | | 25 | | | 27,313 |
Stone Energy Corp. | | | |
Sr. Sub. Notes | | | |
| 8.25% | | 12/15/11 | | B2 | | | 90 | | | 97,200 |
Vintage Petroleum, Inc. | | | |
Sr. Notes | | | |
| 8.25% | | 05/01/12 | | Ba3 | | | 50 | | | 55,125 |
| | | | | | | | | |
|
|
| | | | | | | | | | | 1,029,463 |
| | | | | | | | | |
|
|
SEE NOTES TO FINANCIAL STATEMENTS.
B8
| | | | |
| | | DIVERSIFIED CONSERVATIVE GROWTH PORTFOLIO (Continued) | | |
SCHEDULE OF INVESTMENTS | December 31, 2004 |
| | | | | | | | | | |
Interest
Rate
| | Maturity
Date
| | Moody’s
Rating
(Unaudited)
| | Principal
Amount
(000)
| | Value (Note 2)
|
| CORPORATE BONDS (Continued) | | | |
Foods — 0.5% | | | |
Agrilink Foods, Inc. | | | |
Sr. Sub. Notes
(cost $23,377; purchased 04/11/00)(h) | | | |
| 11.875% | | 11/01/08 | | B3 | | $ | 25 | | $ | 26,031 |
Ahold Finance USA, Inc. | | | |
Notes | | | |
| 8.25% | | 07/15/10 | | Ba3 | | | 25 | | | 28,312 |
Carrols Corp. 144A | | | |
Sr. Sub. Notes(g) | | | |
| 9.00% | | 01/15/13 | | B3 | | | 50 | | | 51,750 |
Del Monte Corp. | | | |
Sr. Sub. Notes | | | |
| 8.625% | | 12/15/12 | | B2 | | | 100 | | | 112,000 |
Delhaize America, Inc. | | | |
Gtd. Notes. | | | |
| 8.125% | | 04/15/11 | | Ba1 | | | 175 | | | 204,002 |
Dole Food, Inc. | | | |
Gtd. Notes | | | |
| 7.25% | | 06/15/10 | | B2 | | | 35 | | | 35,962 |
Sr. Notes | | | |
| 8.625% | | 05/01/09 | | B2 | | | 50 | | | 54,375 |
| 8.875% | | 03/15/11 | | B2 | | | 50 | | | 54,375 |
Dominos, Inc. | | | |
Sr. Sub. Notes | | | |
| 8.25% | | 07/01/11 | | B2 | | | 18 | | | 19,665 |
Pathmark Stores, Inc. | | | |
Gtd. Notes | | | |
| 8.75% | | 02/01/12 | | Caa1 | | | 90 | | | 85,950 |
Smithfield Foods, Inc. | | | |
Sr. Notes | | | |
| 8.00% | | 10/15/09 | | Ba2 | | | 70 | | | 77,525 |
Smithfield Foods, Inc. 144A | | | |
Sr. Notes(g) | | | |
| 7.00% | | 08/01/11 | | Ba2 | | | 50 | | | 53,375 |
Stater Brothers Holdings, Inc. | | | |
Sr. Notes | | | |
| 8.125% | | 06/15/12 | | B1 | | | 25 | | | 26,438 |
| | | | | | | | | |
|
|
| | | | | | | | | | | 829,760 |
| | | | | | | | | |
|
|
Gaming — 1.1% | | | |
Argosy Gaming Co. | | | |
Sr. Sub. Notes | | | |
| 7.00% | | 01/15/14 | | B1 | | | 50 | | | 55,250 |
| 9.00% | | 09/01/11 | | Ba3 | | | 50 | | | 55,750 |
Aztar Corp. | | | |
Sr. Sub. Notes | | | |
| 7.875% | | 06/15/14 | | Ba3 | | | 20 | | | 22,050 |
| 9.00% | | 08/15/11 | | Ba3 | | | 150 | | | 165,375 |
Boyd Gaming Corp. | | | |
Sr. Sub. Notes | | | |
| 8.75% | | 04/15/12 | | B1 | | | 90 | | | 100,125 |
Caesars Entertainment, Inc. | | | |
Sr. Sub. Notes | | | |
| 7.875% | | 03/15/10 | | Ba2 | | | 150 | | | 168,937 |
| 8.125% | | 05/15/11 | | Ba2 | | | 25 | | | 28,875 |
| 8.875% | | 09/15/08 | | Ba2 | | | 40 | | | 45,300 |
| 9.375% | | 02/15/07 | | Ba2 | | | 45 | | | 49,613 |
| | | | | | | | | | |
Interest
Rate
| | Maturity
Date
| | Moody’s
Rating
(Unaudited)
| | Principal
Amount
(000)
| | Value (Note 2)
|
| CORPORATE BONDS (Continued) | | | |
Gaming (cont’d.) | | | |
Isle of Capri Casinos, Inc. | | | |
Sr. Sub. Notes | | | |
| 7.00% | | 03/01/14 | | B2 | | $ | 50 | | $ | 51,000 |
Kerzner International, Ltd. (Bahamas) | | | |
Sr. Sub. Notes | | | |
| 8.875% | | 08/15/11 | | B2 | | | 125 | | | 136,562 |
MGM Mirage, Inc. | | | |
Gtd. Notes | | | |
| 6.00% | | 10/01/09 | | Ba1 | | | 275 | | | 281,875 |
| 9.75% | | 06/01/07 | | Ba2 | | | 205 | | | 227,550 |
Mohegan Tribal Gaming Authority | | | |
Sr. Sub. Notes | | | |
| 6.375% | | 07/15/09 | | Ba3 | | | 50 | | | 51,375 |
| 8.00% | | 04/01/12 | | Ba3 | | | 70 | | | 75,950 |
Station Casinos, Inc. | | | |
Sr. Notes | | | |
| 6.00% | | 04/01/12 | | Ba3 | | | 75 | | | 76,406 |
Venetian Casino Resort LLC | | | |
Notes | | | |
| 11.00% | | 06/15/10 | | B2 | | | 175 | | | 199,719 |
Wynn Las Vegas LLC 144A | | | |
1st. Mtge(g) | | | |
| 6.625% | | 12/01/14 | | B2 | | | 75 | | | 74,250 |
| | | | | | | | | |
|
|
| | | | | | | | | | | 1,865,962 |
| | | | | | | | | |
|
|
Health Care — 0.4% | | | |
AIG II 144A (Cayman Islands) | | | |
Sec’d. Notes, M.T.N.(g) | | | |
| 1.20% | | 01/26/05 | | Aaa | | | JPY 74,000 | | | 722,885 |
| | | | | | | | | |
|
|
Healthcare & Pharmaceuticals — 1.6% | | | |
Alliance Imaging, Inc. 144A | | | |
Sr. Sub. Notes(g) | | | |
| 7.25% | | 12/15/12 | | B3 | | | 25 | | | 25,438 |
Bio-Rad Laboratories, Inc. 144A | | | |
Sr. Sub. Notes(g) | | | |
| 6.125% | | 12/15/14 | | Ba3 | | | 100 | | | 100,750 |
Concentra Operating Corp. | | | |
Gtd. Notes | | | |
| 9.50% | | 08/15/10 | | B3 | | | 50 | | | 56,500 |
Concentra Operating Corp. 144A | | | |
Gtd. Notes(g) | | | |
| 9.125% | | 06/01/12 | | B3 | | | 75 | | | 84,750 |
Coventry Health Care, Inc. | | | |
Sr. Notes | | | |
| 8.125% | | 02/15/12 | | Ba1 | | | 50 | | | 54,750 |
Elan Finance PLC 144A (Ireland) | | | |
Sr. Notes(g) | | | |
| 7.75% | | 11/15/11 | | B3 | | | 75 | | | 79,875 |
HCA, Inc. | | | |
Notes | | | |
| 5.50% | | 12/01/09 | | Ba2 | | | 75 | | | 75,025 |
| 7.125% | | 06/01/06 | | Ba2 | | | 100 | | | 103,800 |
| 8.36% | | 04/15/24 | | Ba2 | | | 100 | | | 109,213 |
| 9.00% | | 12/15/14 | | Ba2 | | | 150 | | | 177,136 |
HEALTHSOUTH Corp. | | | |
Notes | | | |
| 7.625% | | 06/01/12 | | NR | | | 150 | | | 150,750 |
SEE NOTES TO FINANCIAL STATEMENTS.
B9
| | | | |
| | | DIVERSIFIED CONSERVATIVE GROWTH PORTFOLIO (Continued) | | |
SCHEDULE OF INVESTMENTS | December 31, 2004 |
| | | | | | | | | | |
Interest
Rate
| | Maturity
Date
| | Moody’s
Rating
(Unaudited)
| | Principal
Amount
(000)
| | Value (Note 2)
|
| CORPORATE BONDS (Continued) | | | |
Healthcare & Pharmaceuticals (cont’d.) | | | |
Sr. Sub. Notes | | | |
| 8.50% | | 02/01/08 | | Caa2 | | $ | 175 | | $ | 181,562 |
Iasis Healthcare LLC | | | |
Sr. Sub. Notes | | | |
| 8.75% | | 06/15/14 | | B3 | | | 40 | | | 43,600 |
Inverness Medical Innovations, Inc. 144A | | | |
Sr. Sub. Notes(g) | | | |
| 8.75% | | 02/15/12 | | Caa1 | | | 60 | | | 62,700 |
Magellan Health Services, Inc. | | | |
Sr. Notes | | | |
| 9.375% | | 11/15/08 | | B3 | | | 188 | | | 205,101 |
Medco Health Solutions, Inc. | | | |
Sr. Notes | | | |
| 7.25% | | 08/15/13 | | Ba1 | | | 55 | | | 61,526 |
Medical Device Manufacturing, Inc. 144A | | | |
Gtd. Notes(g) | | | |
| 10.00% | | 07/15/12 | | Caa1 | | | 75 | | | 80,812 |
MedQuest, Inc. | | | |
Sr. Sub. Notes | | | |
| 11.875% | | 08/15/12 | | B3 | | | 125 | | | 146,875 |
NeighborCare, Inc. | | | |
Sr. Sub. Notes | | | |
| 6.875% | | 11/15/13 | | Ba3 | | | 35 | | | 36,663 |
Res-Care, Inc. | | | |
Gtd. Notes | | | |
| 10.625% | | 11/15/08 | | B2 | | | 190 | | | 209,475 |
Select Medical Corp. | | | |
Sr. Sub. Notes | | | |
| 9.50% | | 06/15/09 | | B2 | | | 70 | | | 75,075 |
Senior Housing Properties Trust | | | |
Sr. Notes | | | |
| 8.625% | | 01/15/12 | | Ba2 | | | 50 | | | 57,125 |
Tenet Healthcare Corp. | | | |
Sr. Notes | | | |
| 5.375% | | 11/15/06 | | B3 | | | 50 | | | 50,250 |
| 6.375% | | 12/01/11 | | B3 | | | 50 | | | 46,375 |
| 6.50% | | 06/01/12 | | B3 | | | 50 | | | 46,250 |
Vanguard Health Holding Co. LLC 144A | | | |
Sr. Sub Notes(g) | | | |
| 9.00% | | 10/01/14 | | Caa1 | | | 75 | | | 80,250 |
Ventas Realty LP | | | |
Sr. Notes | | | |
| 8.75% | | 05/01/09 | | Ba3 | | | 40 | | | 44,850 |
| 9.00% | | 05/01/12 | | Ba3 | | | 85 | | | 99,131 |
Ventas Realty LP 144A | | | |
Sr. Notes(g) | | | |
| 6.625% | | 10/15/14 | | Ba3 | | | 75 | | | 76,687 |
| | | | | | | | | |
|
|
| | | | | | | | | | | 2,622,294 |
| | | | | | | | | |
|
|
Lodging — 0.8% | | | |
Felcor Lodging LP | | | |
Sr. Notes | | | |
| 6.874% | | 06/01/11(b) | | B1 | | | 50 | | | 52,500 |
| 9.00% | | 06/01/11 | | B1 | | | 50 | | | 56,625 |
Felcor Suites LP | | | |
Gtd. Sr. Notes | | | |
| 7.625% | | 10/01/07 | | B1 | | | 75 | | | 79,125 |
| | | | | | | | | | |
Interest
Rate
| | Maturity
Date
| | Moody’s
Rating
(Unaudited)
| | Principal
Amount
(000)
| | Value (Note 2)
|
| CORPORATE BONDS (Continued) | | | |
Lodging (cont’d.) | | | |
HMH Properties, Inc. | | | |
Sr. Notes, Ser. B | | | |
| 7.875% | | 08/01/08 | | Ba3 | | $ | 26 | | $ | 26,715 |
Host Marriott LP | | | |
Gtd. Notes | | | |
| 9.50% | | 01/15/07 | | Ba3 | | | 250 | | | 273,750 |
Sr. Notes | | | |
| 7.125% | | 11/01/13 | | Ba3 | | | 45 | | | 48,094 |
Host Marriott LP 144A | | | |
Sr. Notes(g) | | | |
| 7.00% | | 08/15/12 | | Ba3 | | | 100 | | | 105,750 |
ITT Corp. | | | |
Debs. | | | |
| 7.375% | | 11/15/15 | | Ba1 | | | 175 | | | 194,687 |
Notes | | | |
| 6.75% | | 11/15/05 | | Ba1 | | | 70 | | | 71,925 |
La Quinta Properties, Inc. | | | |
Sr. Notes | | | |
| 8.875% | | 03/15/11 | | Ba3 | | | 125 | | | 139,375 |
Royal Caribbean Cruises, Ltd. | | | |
Sr. Notes | | | |
| 6.875% | | 12/01/13 | | Ba2 | | | 25 | | | 27,000 |
| 8.00% | | 05/15/10 | | Ba2 | | | 100 | | | 113,000 |
Starwood Hotels & Resorts Worldwide, Inc. | | | |
Sr. Notes | | | |
| 7.375% | | 05/01/07 | | Ba1 | | | 120 | | | 127,950 |
| 7.875% | | 05/01/12 | | Ba1 | | | 55 | | | 62,838 |
| | | | | | | | | |
|
|
| | | | | | | | | | | 1,379,334 |
| | | | | | | | | |
|
|
Media & Entertainment — 1.6% | | | |
Advertising Directory Solution 144A (Canada) | | | |
Sr. Notes(g) | | | |
| 9.25% | | 11/15/12 | | Caa1 | | | 75 | | | 78,750 |
AMC Entertainment, Inc. | | | |
Sr. Sub. Notes | | | |
| 8.00% | | 03/01/14 | | B3 | | | 35 | | | 34,825 |
American Color Graphics, Inc. | | | |
Notes | | | |
| 10.00% | | 06/15/10 | | Caa1 | | | 80 | | | 67,500 |
American Media Operations, Inc. | | | |
Gtd. Notes, Ser. B | | | |
| 10.25% | | 05/01/09 | | B3 | | | 5 | | | 5,269 |
CanWest Media, Inc. (Canada) | | | |
Sr. Notes, Ser. B | | | |
| 7.625% | | 04/15/13 | | Ba3 | | | 5 | | | 5,444 |
Sr. Sub. Notes | | | |
| 10.625% | | 05/15/11 | | B2 | | | 100 | | | 112,250 |
Dex Media East LLC | | | |
Gtd. Notes | | | |
| 12.125% | | 11/15/12 | | B2 | | | 81 | | | 98,719 |
Dex Media West LLC | | | |
Sr. Sub. Notes | | | |
| 9.875% | | 08/15/13 | | B2 | | | 229 | | | 263,922 |
Dex Media, Inc. | | | |
Notes | | | |
| 8.00% | | 11/15/13 | | B3 | | | 70 | | | 75,775 |
SEE NOTES TO FINANCIAL STATEMENTS.
B10
| | | | |
| | | DIVERSIFIED CONSERVATIVE GROWTH PORTFOLIO (Continued) | | |
SCHEDULE OF INVESTMENTS | December 31, 2004 |
| | | | | | | | | | |
Interest
Rate
| | Maturity
Date
| | Moody’s
Rating
(Unaudited)
| | Principal
Amount
(000)
| | Value (Note 2)
|
| CORPORATE BONDS (Continued) | | | |
Media & Entertainment (cont’d.) | | | |
DIRECTV Holdings LLC | | | |
Sr. Notes | | | |
| 8.375% | | 03/15/13 | | B1 | | $ | 110 | | $ | 123,337 |
Echostar DBS Corp. 144A | | | |
Gtd. Note(g) | | | |
| 6.625% | | 10/01/14 | | Ba3 | | | 100 | | | 101,250 |
Entercom Radio LLC | | | |
Gtd. Notes | | | |
| 7.625% | | 03/01/14 | | Ba2 | | | 25 | | | 26,906 |
Granite Broadcasting, Corp. | | | |
Sr. Sec’d. Notes | | | |
| 9.75% | | 12/01/10 | | B3 | | | 40 | | | 38,200 |
Gray Television, Inc. | | | |
Sr. Sub. Notes | | | |
| 9.25% | | 12/15/11 | | B2 | | | 125 | | | 140,000 |
Intrawest Corp. 144A (Canada) | | | |
Sr. Notes(g) | | | |
| 7.50% | | 10/15/13 | | B1 | | | 75 | | | 79,781 |
LCE Acquisition Corp. 144A | | | |
Gtd. Notes(g) | | | |
| 9.00% | | 08/01/14 | | B3 | | | 40 | | | 43,300 |
Marquee, Inc. 144A | | | |
Sr. Notes(g) | | | |
| 8.625% | | 08/15/12 | | B2 | | | 75 | | | 82,875 |
Medianews Group, Inc. | | | |
Sr. Sub. Notes | | | |
| 6.875% | | 10/01/13 | | B2 | | | 75 | | | 76,875 |
Morris Publishing Group LLC | | | |
Gtd. Notes | | | |
| 7.00% | | 08/01/13 | | Ba3 | | | 25 | | | 25,500 |
New Skies Satellites NV 144A (Netherlands) | | | |
Sr. Notes(g) | | | |
| 7.4375% | | 11/01/11(b) | | B3 | | | 25 | | | 25,750 |
Sr. Sub. Notes(g) | | | |
| 9.125% | | 11/01/12 | | Caa1 | | | 25 | | | 25,500 |
Paxson Communications Corp. | | | |
Gtd. Notes | | | |
| 10.75% | | 07/15/08 | | Caa1 | | | 125 | | | 131,250 |
PRIMEDIA, Inc. | | | |
Sr. Notes | | | |
| 7.665% | | 05/15/10(b) | | B3 | | | 75 | | | 79,500 |
Quebecor Media, Inc. (Canada) | | | |
Sr. Disc. Notes, Zero Coupon (until 7/15/06) | | | |
| Zero | | 07/15/11 | | B2 | | | 150 | | | 148,500 |
R.H. Donnelley Corp. 144A | | | |
Sr. Sub. Notes(g) | | | |
| 10.875% | | 12/15/12 | | B2 | | | 150 | | | 178,125 |
Six Flags, Inc. | | | |
Sr. Notes | | | |
| 9.625% | | 06/01/14 | | Caa1 | | | 75 | | | 75,375 |
Sun Media Corp. (Canada) | | | |
Gtd. Notes | | | |
| 7.625% | | 02/15/13 | | Ba3 | | | 175 | | | 190,969 |
Universal City Florida Holding Co. 144A | | | |
Sr. Notes(g) | | | |
| 8.375% | | 05/01/10 | | B3 | | | 75 | | | 77,813 |
| | | | | | | | | | |
Interest
Rate
| | Maturity
Date
| | Moody’s
Rating
(Unaudited)
| | Principal
Amount
(000)
| | Value (Note 2)
|
| CORPORATE BONDS (Continued) | | | |
Media & Entertainment (cont’d.) | | | |
Vail Resorts, Inc. | | | |
Sr. Sub. Notes | | | |
| 6.75% | | 02/15/14 | | B2 | | $ | 60 | | $ | 61,050 |
Vertis, Inc. | | | |
Sec’d. Notes | | | |
| 9.75% | | 04/01/09 | | B2 | | | 145 | | | 157,325 |
WDAC Subsidiary Corp. 144A | | | |
Sr. Notes(g) | | | |
| 8.375% | | 12/01/14 | | B2 | | | 35 | | | 34,519 |
| | | | | | | | | |
|
|
| | | | | | | | | | | 2,666,154 |
| | | | | | | | | |
|
|
Metals — 0.6% | | | |
AK Steel Corp. | | | |
Gtd. Notes | | | |
| 7.75% | | 06/15/12 | | B3 | | | 70 | | | 72,100 |
| 7.875% | | 02/15/09 | | B3 | | | 150 | | | 152,812 |
Arch Western Finance LLC | | | |
Sr. Notes | | | |
| 6.75% | | 07/01/13 | | Ba3 | | | 75 | | | 77,438 |
Century Aluminum Co. 144A | | | |
Sr. Notes(g) | | | |
| 7.50% | | 08/15/14 | | B1 | | | 75 | | | 79,875 |
CSN Islands VII Corp. 144A | | | |
Gtd. Notes
(cost $79,918; purchased 09/05/03)(g)(h) | | | |
| 10.75% | | 09/12/08 | | B1 | | | 80 | | | 90,900 |
Foundation Penn. Coal Co. 144A | | | |
Sr. Notes(g) | | | |
| 7.25% | | 08/01/14 | | B1 | | | 75 | | | 79,875 |
IMCO Recycling Escrow, Inc. 144A | | | |
Sr. Notes(g) | | | |
| 9.00% | | 11/15/14 | | B3 | | | 50 | | | 52,000 |
Ispat Inland ULC | | | |
Sr. Sec’d. Notes | | | |
| 9.75% | | 04/01/14 | | B3 | | | 114 | | | 140,790 |
Oregon Steel Mills, Inc. | | | |
Gtd. Notes | | | |
| 10.00% | | 07/15/09 | | B2 | | | 25 | | | 27,813 |
Russel Metals, Inc. | | | |
Sr. Notes | | | |
| 6.375% | | 03/01/14 | | Ba3 | | | 160 | | | 162,400 |
Ryerson Tull, Inc. 144A | | | |
Sr. Notes(g) | | | |
| 8.25% | | 12/15/11 | | B2 | | | 50 | | | 50,500 |
United States Steel LLC | | | |
Sr. Notes | | | |
| 10.75% | | 08/01/08 | | Ba2 | | | 75 | | | 88,312 |
| | | | | | | | | |
|
|
| | | | | | | | | | | 1,074,815 |
| | | | | | | | | |
|
|
Oil & Gas Exploration & Production — 0.4% | | | |
Pemex Project Funding Master Trust | | | |
Gtd. Notes | | | |
| 8.625% | | 02/01/22 | | Baa1 | | | 250 | | | 290,875 |
| 9.25% | | 03/30/18(g) | | Baa1 | | | 250 | | | 310,000 |
| | | | | | | | | |
|
|
| | | | | | | | | | | 600,875 |
| | | | | | | | | |
|
|
Packaging — 0.6% | | | |
Anchor Glass Container Corp. | | | |
| 11.00% | | 02/15/13 | | B2 | | | 75 | | | 80,250 |
SEE NOTES TO FINANCIAL STATEMENTS.
B11
| | | | |
| | | DIVERSIFIED CONSERVATIVE GROWTH PORTFOLIO (Continued) | | |
SCHEDULE OF INVESTMENTS | December 31, 2004 |
| | | | | | | | | | |
Interest
Rate
| | Maturity
Date
| | Moody’s
Rating
(Unaudited)
| | Principal
Amount
(000)
| | Value (Note 2)
|
| CORPORATE BONDS (Continued) | | | |
Packaging (cont’d.) | | | |
Berry Plastics Corp. | | | |
Gtd. Notes | | | |
| 10.75% | | 07/15/12 | | B3 | | $ | 100 | | $ | 114,500 |
Crown European Holdings SA | | | |
Notes | | | |
| 9.50% | | 03/01/11 | | B1 | | | 100 | | | 114,000 |
Graham Packaging Co., Inc. 144A | | | |
Sr. Notes(g) | | | |
| 8.50% | | 10/15/12 | | Caa1 | | | 25 | | | 26,250 |
Sr. Sub. Notes(g) | | | |
| 9.875% | | 10/15/14 | | Caa2 | | | 75 | | | 80,063 |
Greif Brothers Corp. | | | |
Sr. Sub. Notes | | | |
| 8.875% | | 08/01/12 | | B1 | | | 175 | | | 194,688 |
Owens-Brockway Glass Container | | | |
Sr. Gtd. Sec’d. Notes | | | |
| 8.75% | | 11/15/12 | | B1 | | | 215 | | | 242,412 |
Portola Packaging, Inc. | | | |
Sr. Notes | | | |
| 8.25% | | 02/01/12 | | Caa1 | | | 75 | | | 59,250 |
Silgan Holdings, Inc. | | | |
Sr. Sub. Notes | | | |
| 6.75% | | 11/15/13 | | B1 | | | 50 | | | 52,000 |
| | | | | | | | | |
|
|
| | | | | | | | | | | 963,413 |
| | | | | | | | | |
|
|
Paper — 0.7% | | | |
Abitibi-Consolidated, Inc. | | | |
Bonds | | | |
| 8.30% | | 08/01/05 | | Ba3 | | | 150 | | | 153,375 |
Gtd. Notes | | | |
| 5.25% | | 06/20/08 | | Ba3 | | | 50 | | | 48,937 |
Ainsworth Lumber Co. Ltd. | | | |
Sr. Notes | | | |
| 6.75% | | 03/15/14 | | B2 | | | 130 | | | 127,238 |
Ainsworth Lumber Co. Ltd. 144A | | | |
Sr. Notes(g) | | | |
| 7.25% | | 10/01/12 | | B2 | | | 10 | | | 10,175 |
Bowater Finance Corp. (Canada) | | | |
Gtd. Notes | | | |
| 7.95% | | 11/15/11 | | Ba3 | | | 75 | | | 80,818 |
Caraustar Industries, Inc. | | | |
Sr. Sub. Notes | | | |
| 9.875% | | 04/01/11 | | Caa1 | | | 25 | | | 27,125 |
Cascades, Inc. 144A (Canada) | | | |
Sr. Notes(g) | | | |
| 7.25% | | 02/15/13 | | Ba3 | | | 70 | | | 74,200 |
| 7.25% | | 02/15/13 | | Ba3 | | | 25 | | | 26,500 |
Cellu Tissue Holdings, Inc. | | | |
Sec’d Notes | | | |
| 9.75% | | 03/15/10 | | B2 | | | 125 | | | 129,687 |
Georgia-Pacific Corp. | | | |
Notes | | | |
| 8.125% | | 05/15/11 | | Ba3 | | | 30 | | | 34,500 |
| 8.875% | | 05/15/31 | | Ba3 | | | 100 | | | 125,000 |
Notes
(cost $77,421; purchased 05/13/04)(h) | | | |
| 7.50% | | 05/15/06 | | Ba3 | | | 75 | | | 78,562 |
| | | | | | | | | | |
Interest
Rate
| | Maturity
Date
| | Moody’s
Rating
(Unaudited)
| | Principal
Amount
(000)
| | Value (Note 2)
|
| CORPORATE BONDS (Continued) | | | |
Paper (cont’d.) | | | |
Millar Western Forest Products, Ltd. | | | |
Sr. Notes | | | |
| 7.75% | | 11/15/13 | | B2 | | $ | 65 | | $ | 69,550 |
Norske Skog Canada, Ltd. | | | |
Sr. Notes | | | |
| 7.375% | | 03/01/14 | | Ba3 | | | 75 | | | 78,188 |
Tembec Industries, Inc. (Canada) | | | |
Gtd. Notes | | | |
| 7.75% | | 03/15/12 | | Ba3 | | | 80 | | | 77,400 |
| 8.50% | | 02/01/11 | | Ba3 | | | 25 | | | 25,125 |
| | | | | | | | | |
|
|
| | | | | | | | | | | 1,166,380 |
| | | | | | | | | |
|
|
Pipelines & Other — 1.0% | | | |
Amerigas Partners LP | | | |
Sr. Notes | | | |
| 8.875% | | 05/20/11 | | B2 | | | 50 | | | 54,500 |
Aventine Renewable Energy 144A | | | |
Sec’d. Notes(g) | | | |
| 8.501% | | 12/15/11(b) | | B3 | | | 100 | | | 101,000 |
El Paso Corp. | | | |
Sr. Notes | | | |
| 7.00% | | 05/15/11 | | Caa1 | | | 465 | | | 470,231 |
El Paso Production Holding Co. | | | |
Gtd. Notes | | | |
| 7.75% | | 06/01/13 | | B3 | | | 150 | | | 157,125 |
Enterprise Products Operating LP 144A | | | |
Sr. Notes(g) | | | |
| 5.60% | | 10/15/14 | | Baa3 | | | 75 | | | 75,665 |
Ferrellgas Partners LP | | | |
Sr. Notes | | | |
| 8.75% | | 06/15/12 | | B2 | | | 50 | | | 54,500 |
Markwest Energy Partners LP 144A | | | |
Sr. Notes(g) | | | |
| 6.875% | | 11/01/14 | | B1 | | | 25 | | | 25,375 |
Pacific Energy Partners Finance | | | |
Sr. Notes | | | |
| 7.125% | | 06/15/14 | | Ba2 | | | 25 | | | 26,625 |
Plains All American Pipeline LP | | | |
Sr. Notes | | | |
| 7.75% | | 10/15/12 | | Baa3 | | | 25 | | | 29,244 |
Tennessee Gas Pipeline Co. | | | |
Debs. | | | |
| 7.00% | | 10/15/28 | | B1 | | | 50 | | | 50,125 |
| 7.625% | | 04/01/37 | | B1 | | | 145 | | | 152,069 |
Debs.
(cost $78,953; purchased 12/03/02-12/09/02)(h) | | | |
| 7.00% | | 03/15/27 | | B1 | | | 90 | | | 94,484 |
TransMontaigne, Inc. | | | |
Sr. Sub. Notes | | | |
| 9.125% | | 06/01/10 | | B3 | | | 35 | | | 37,975 |
Williams Cos., Inc. | | | |
Notes | | | |
| 7.125% | | 09/01/11 | | B1 | | | 225 | | | 245,813 |
| 8.125% | | 03/15/12 | | B1 | | | 40 | | | 46,200 |
| | | | | | | | | |
|
|
| | | | | | | | | | | 1,620,931 |
| | | | | | | | | |
|
|
SEE NOTES TO FINANCIAL STATEMENTS.
B12
| | | | |
| | | DIVERSIFIED CONSERVATIVE GROWTH PORTFOLIO (Continued) | | |
SCHEDULE OF INVESTMENTS | December 31, 2004 |
| | | | | | | | | | |
Interest
Rate
| | Maturity
Date
| | Moody’s
Rating
(Unaudited)
| | Principal
Amount
(000)
| | Value (Note 2)
|
| CORPORATE BONDS (Continued) | | | |
Real Estate Investment Trust — 0.1% | | | |
OMEGA Healthcare Investors, Inc. | | | |
Notes | | | |
| 6.95% | | 08/01/07 | | B1 | | $ | 100 | | $ | 103,750 |
Sr. Notes | | | |
| 7.00% | | 04/01/14 | | B1 | | | 25 | | | 25,688 |
| | | | | | | | | |
|
|
| | | | | | | | | | | 129,438 |
| | | | | | | | | |
|
|
Retailers — 0.6% | | | |
Asbury Automotive Group, Inc. 144A | | | |
Sr. Sub. Notes(g) | | | |
| 8.00% | | 03/15/14 | | B3 | | | 25 | | | 24,750 |
AutoNation, Inc. | | | |
Gtd. Notes | | | |
| 9.00% | | 08/01/08 | | Ba2 | | | 35 | | | 39,988 |
Finlay Fine Jewelry Corp. | | | |
Sr. Notes | | | |
| 8.375% | | 06/01/12 | | B1 | | | 45 | | | 48,600 |
General Nutrition Centers, Inc. | | | |
Sr. Sub. Notes | | | |
| 8.50% | | 12/01/10 | | Caa1 | | | 50 | | | 47,250 |
Group 1 Automotive, Inc. | | | |
Sr. Sub. Notes | | | |
| 8.25% | | 08/15/13 | | B1 | | | 75 | | | 79,687 |
JC Penney Co., Inc. | | | |
Debs. | | | |
| 7.125% | | 11/15/23 | | Ba2 | | | 75 | | | 79,875 |
| 7.40% | | 04/01/37 | | Ba2 | | | 235 | | | 250,862 |
Jean Coutu Group (PJC), Inc. 144A | | | |
Sr. Notes(g) | | | |
| 7.625% | | 08/01/12 | | B2 | | | 50 | | | 52,875 |
Sr. Sub. Notes(g) | | | |
| 8.50% | | 08/01/14 | | B3 | | | 45 | | | 46,125 |
Lazydays RV Center, Inc. | | | |
Sr. Notes | | | |
| 11.75% | | 05/15/12 | | B3 | | | 120 | | | 130,500 |
Pantry, Inc. (The) | | | |
Sr. Sub. Notes | | | |
| 7.75% | | 02/15/14 | | B3 | | | 85 | | | 90,525 |
Saks, Inc. | | | |
Gtd. Notes | | | |
| 7.375% | | 02/15/19 | | Ba3 | | | 85 | | | 84,150 |
Sonic Automotive, Inc. | | | |
Sr. Sub. Notes | | | |
| 8.625% | | 08/15/13 | | B2 | | | 40 | | | 42,650 |
Toys “R” Us, Inc. | | | |
Notes | | | |
| 7.875% | | 04/15/13 | | Ba2 | | | 50 | | | 49,625 |
| | | | | | | | | |
|
|
| | | | | | | | | | | 1,067,462 |
| | | | | | | | | |
|
|
Technology — 0.8% | | | |
Amkor Technology, Inc. | | | |
Sr. Notes | | | |
| 7.125% | | 03/15/11 | | B3 | | | 25 | | | 23,500 |
Celestica Inc | | | |
Sr. Sub. Notes | | | |
| 7.875% | | 07/01/11 | | Ba3 | | | 50 | | | 53,625 |
| | | | | | | | | | |
Interest
Rate
| | Maturity
Date
| | Moody’s
Rating
(Unaudited)
| | Principal
Amount
(000)
| | Value (Note 2)
|
| CORPORATE BONDS (Continued) | | | |
Technology (cont’d.) | | | |
Fairchild Semiconductor International, Inc. | | | |
Sr. Sub. Notes | | | |
| 10.50% | | 02/01/09 | | B2 | | $ | 100 | | $ | 105,500 |
Flextronics International, Ltd. 144A (Singapore) | | | |
Sr. Sub. Notes(g) | | | |
| 6.25% | | 11/15/14 | | Ba2 | | | 50 | | | 49,500 |
Freescale Semiconductor, Inc. | | | |
Sr. Notes | | | |
| 6.875% | | 07/15/11 | | Ba2 | | | 50 | | | 53,625 |
Iron Mountain, Inc. | | | |
Gtd. Notes | | | |
| 8.625% | | 04/01/13 | | Caa1 | | | 95 | | | 100,937 |
Magnachip Semiconductor SA 144A | | | |
Sec’d. Notes(g) | | | |
| 6.875% | | 12/15/11 | | Ba3 | | | 75 | | | 77,250 |
Sr. Sub. Notes(g) | | | |
| 8.00% | | 12/15/14 | | B2 | | | 75 | | | 78,187 |
Nortel Networks Corp. | | | |
Sr. Gtd. Notes | | | |
| 4.25% | | 09/01/08 | | B3 | | | 25 | | | 24,313 |
Nortel Networks, Ltd. (Canada) | | | |
Conv. Notes | | | |
| 6.125% | | 02/15/06 | | B3 | | | 65 | | | 66,138 |
Sanmina-SCI Corp. | | | |
Gtd. Notes | | | |
| 10.375% | | 01/15/10 | | Ba2 | | | 125 | | | 143,437 |
STATS ChipPAC, Ltd. 144A | | | |
Sr. Notes(g) | | | |
| 6.75% | | 11/15/11 | | Ba2 | | | 100 | | | 99,000 |
UGS Corp. 144A | | | |
Sr. Sub. Notes(g) | | | |
| 10.00% | | 06/01/12 | | B3 | | | 150 | | | 170,625 |
Unisys Corp. | | | |
Sr. Notes | | | |
| 8.125% | | 06/01/06 | | Ba1 | | | 75 | | | 78,938 |
Xerox Corp. | | | |
Sr. Notes | | | |
| 6.875% | | 08/15/11 | | Ba2 | | | 125 | | | 133,125 |
Sr. Notes | | | |
| 7.625% | | 06/15/13 | | Ba2 | | | 75 | | | 82,312 |
| | | | | | | | | |
|
|
| | | | | | | | | | | 1,340,012 |
| | | | | | | | | |
|
|
Telecommunications — 1.9% | | | |
Alamosa Delaware, Inc. | | | |
Gtd. Notes | | | |
| 11.00% | | 07/31/10 | | Caa1 | | | 50 | | | 58,875 |
Sr. Notes | | | |
| 8.50% | | 01/31/12 | | Caa1 | | | 25 | | | 27,313 |
AT&T Corp. | | | |
Sr. Notes | | | |
| 9.05% | | 11/15/11 | | Ba1 | | | 180 | | | 207,225 |
Cincinnati Bell, Inc. | | | |
Sr. Sub. Notes | | | |
| 8.375% | | 01/15/14 | | B3 | | | 60 | | | 60,750 |
Citizens Communications Co. | | | |
Notes | | | |
| 9.25% | | 05/15/11 | | Ba3 | | | 105 | | | 122,850 |
SEE NOTES TO FINANCIAL STATEMENTS.
B13
| | | | |
| | | DIVERSIFIED CONSERVATIVE GROWTH PORTFOLIO (Continued) | | |
SCHEDULE OF INVESTMENTS | December 31, 2004 |
| | | | | | | | | | |
Interest
Rate
| | Maturity
Date
| | Moody’s
Rating
(Unaudited)
| | Principal
Amount
(000)
| | Value (Note 2)
|
| CORPORATE BONDS (Continued) | | | |
Telecommunications (cont’d.) | | | |
Sr. Notes | | | |
| 6.25% | | 01/15/13 | | Ba3 | | $ | 75 | | $ | 75,562 |
Crown Castle International Corp. | | | |
Sr. Notes | | | |
| 7.50% | | 12/01/13 | | B3 | | | 100 | | | 107,500 |
| 9.375% | | 08/01/11 | | B3 | | | 25 | | | 28,000 |
| 10.75% | | 08/01/11 | | B3 | | | 100 | | | 108,500 |
Dobson Cellular Systems, Inc. 144A | | | |
Sec’d. Notes(g) | | | |
| 6.96% | | 11/01/11(b) | | B2 | | | 25 | | | 25,875 |
| 8.375% | | 11/01/11 | | B2 | | | 25 | | | 25,813 |
Eircom Funding | | | |
Gtd. Notes (Ireland) | | | |
| 8.25% | | 08/15/13 | | B1 | | | 65 | | | 71,825 |
MCI, Inc. | | | |
Sr. Notes | | | |
| 7.688% | | 05/01/09 | | B2 | | | 225 | | | 232,875 |
| 8.735% | | 05/01/14 | | B2 | | | 55 | | | 59,125 |
Nextel Communications, Inc. | | | |
Sr. Notes | | | |
| 5.95% | | 03/15/14 | | Ba3 | | | 50 | | | 51,750 |
| 7.375% | | 08/01/15 | | Ba3 | | | 200 | | | 220,000 |
Qwest Communications International, Inc. 144A | | | |
Sr. Notes(g) | | | |
| 7.50% | | 02/15/14 | | B3 | | | 100 | | | 101,000 |
Qwest Corp. 144A | | | |
Sr. Notes(g) | | | |
| 7.875% | | 09/01/11 | | Ba3 | | | 100 | | | 108,500 |
Qwest Services Corp. 144A | | | |
Notes(g) | | | |
| 14.00% | | 12/15/10 | | Caa1 | | | 363 | | | 436,507 |
Rogers Wireless Communications, Inc. (Canada) | | | |
Sec’d. Notes | | | |
| 9.625% | | 05/01/11 | | Ba3 | | | 95 | | | 111,387 |
SBC Communications, Inc. 144A | | | |
Notes(g) | | | |
| 4.206% | | 06/05/21 | | A2 | | | 600 | | | 603,450 |
Ubiquitel Operating Co. | | | |
Sr. Note | | | |
| 9.875% | | 03/01/11 | | Caa1 | | | 25 | | | 28,063 |
Ubiquitel Operating Co. 144A | | | |
Sr. Note(g) | | | |
| 9.875% | | 03/01/11 | | Caa1 | | | 50 | | | 56,125 |
US Unwired, Inc. | | | |
Sec’d Notes | | | |
| 6.74% | | 06/15/10(b) | | B2 | | | 25 | | | 25,875 |
Verizon Wireless Capital LLC 144A(g) | | | |
| 2.415% | | 05/23/05(b) | | A3 | | | 300 | | | 299,920 |
| | | | | | | | | |
|
|
| | | | | | | | | | | 3,254,665 |
| | | | | | | | | |
|
|
Tobacco — 0.1% | | | |
DIMON, Inc. | | | |
Gtd. Notes | | | |
| 9.625% | | 10/15/11 | | B1 | | | 65 | | | 71,175 |
North Atlantic Trading Co. | | | |
Sr. Notes | | | |
| 9.25% | | 03/01/12 | | B2 | | | 25 | | | 21,125 |
| | | | | | | | | | |
Interest
Rate
| | Maturity
Date
| | Moody’s
Rating
(Unaudited)
| | Principal
Amount
(000)
| | Value (Note 2)
|
| CORPORATE BONDS (Continued) | | | |
Tobacco (cont’d.) | | | |
Standard Commercial Corp. | | | |
Sr. Notes | | | |
| 8.00% | | 04/15/12 | | Ba3 | | $ | 75 | | $ | 77,063 |
| | | | | | | | | |
|
|
| | | | | | | | | | | 169,363 |
| | | | | | | | | |
|
|
TOTAL CORPORATE BONDS
(cost $33,456,397) | | | 35,295,083 |
| | | | | | | | | |
|
|
| FOREIGN GOVERNMENT OBLIGATIONS — 3.9% |
Federal Republic of Brazil | | | |
| 8.00% | | 04/15/14 | | B1 | | | 334 | | | 342,194 |
| 8.25% | | 01/20/34 | | B1 | | | 45 | | | 43,808 |
| 12.00% | | 04/15/10 | | B1 | | | 300 | | | 370,500 |
German Government Bonds | | | |
| 5.25% | | 07/04/10 | | Aaa | | EUR | 400 | | | 601,060 |
Panamanian Government Bonds | | | |
| 9.625% | | 02/08/11 | | Ba1 | | | 250 | | | 295,000 |
Republic of Colombia | | | |
Notes | | | |
| 10.00% | | 01/23/12 | | Ba2 | | | 75 | | | 86,625 |
Russian Federation | | | |
| 5.00% | | 03/31/30 | | Baa3 | | | 1,050 | | | 1,077,825 |
United Kingdom Treasury Stock | | | |
| 5.00% | | 03/07/12 | | AAA(e) | | GBP | 500 | | | 988,269 |
| 5.00% | | 09/07/14 | | Aaa | | GBP | 1,300 | | | 2,585,724 |
United Mexican States | | | |
| 8.125% | | 12/30/19 | | Baa2 | | | 170 | | | 199,495 |
| | | | | | | | | |
|
|
TOTAL FOREIGN GOVERNMENT OBLIGATIONS
(cost $6,289,015) | | | 6,590,500 |
| | | | | | | | | |
|
|
| | |
| PREFERRED STOCKS | | Shares
| | |
Media & Entertainment | | | |
PRIMEDIA, Inc., Ser. D | | | 250 | | | 25,000 |
| | | | | | | | | |
|
|
Telecommunications | | | | | | | | |
McLeodUSA, Inc., Ser. A | | | 1,043 | | | 3,901 |
| | | | | | | | | |
|
|
TOTAL PREFERRED STOCKS
(cost $246,465) | | | 28,901 |
| | | | | | | | | |
|
|
| | | | |
| | | | | | | Principal
Amount
(000)
| | |
| CONVERTIBLE BOND — 0.1% | | | |
Capital Goods — 0.1% | | | |
Tyco International Group SA 144A(g)
(cost $50,000) | | | |
| 3.125% | | 01/15/23 | | Baa3 | | $ | 50 | | | 84,000 |
| | | | | | | | | |
|
|
COLLATERALIZED MORTGAGE
OBLIGATIONS — 0.7% |
Ocwen Mortgage Loan Asset Backed Certificates | | | |
Ser. 1998-OFS3, Cl. A | | | |
| 3.0375% | | 10/25/29(b) | | AAA(e) | | | 6 | | | 6,424 |
SEE NOTES TO FINANCIAL STATEMENTS.
B14
| | | | |
| | | DIVERSIFIED CONSERVATIVE GROWTH PORTFOLIO (Continued) | | |
SCHEDULE OF INVESTMENTS | December 31, 2004 |
| | | | | | | | | | |
Interest
Rate
| | Maturity
Date
| | Moody’s
Rating
(Unaudited)
| | Principal
Amount
(000)
| | Value (Note 2)
|
COLLATERALIZED MORTGAGE
OBLIGATIONS (Continued) |
Structured Asset Mortgage Investments, Inc. | | | |
3.438% | | 02/25/30 | | Aaa | | $ | 20 | | $ | 20,297 |
Washington Mutual, Inc. | | | |
Ser. 2003-R1, Class A1 | | | |
| 2.6875% | | 12/25/27(b) | | Aaa | | | 1,139 | | | 1,138,027 |
| | | | | | | | | |
|
|
TOTAL COLLATERALIZED MORTGAGE OBLIGATIONS
(cost $1,165,723) | | | 1,164,748 |
| | | | | | | | | |
|
|
| U.S. GOVERNMENT AGENCY OBLIGATIONS — 0.4% |
Small Business Administration | | | |
Gtd. Notes | | | |
| 7.59% | | 01/01/20 | | Aaa | | | 282 | | | 313,377 |
Small Business Investment Cos. | | | |
| 8.017% | | 02/10/10 | | Aaa | | | 268 | | | 291,612 |
| | | | | | | | | |
|
|
TOTAL U.S. GOVERNMENT AGENCY OBLIGATIONS
(cost $550,546) | | | 604,989 |
| | | | | | | | | |
|
|
| U.S. GOVERNMENT SECURITIES — 11.9% |
United States Treasury Bonds | | | |
| 2.375% | | 01/15/25 | | | | | 203 | | | 216,558 |
| 6.00% | | 02/15/26 | | | | | 300 | | | 343,652 |
| 8.875% | | 08/15/17 | | | | | 1,550 | | | 2,196,519 |
United States Treasury Notes | | | |
| 0.875% | | 04/15/10 | | | | | 907 | | | 897,939 |
| 2.00% | | 01/15/14 | | | | | 1,343 | | | 1,389,875 |
| 3.625% | | 01/15/08 | | | | | 414 | | | 450,412 |
| 4.875% | | 02/15/12 | | | | | 13,150 | | | 13,898,932 |
United States Treasury, TIPS | | | |
| 3.375% | | 01/15/07(d) | | | | | 482 | | | 510,360 |
| | | | | | | | | |
|
|
TOTAL U.S. GOVERNMENT SECURITIES
(cost $19,880,601) | | | 19,904,247 |
| | | | | | | | | |
|
|
| MORTGAGE BACKED SECURITIES — 6.1% |
Federal Home Loan Mortgage Corp. | | | |
| 2.853% | | 11/15/30(b) | | | | | 35 | | | 35,477 |
Federal National Mortgage Assn. | | | |
| 6.875% | | 08/01/09 | | | | | 951 | | | 1,044,107 |
| 4.147% | | 05/01/36(b) | | | | | 305 | | | 309,756 |
| 4.50% | | 08/01/33 | | | | | 554 | | | 536,098 |
| 4.50% | | TBA | | | | | 3,000 | | | 2,898,750 |
| 5.00% | | 01/01/19 | | | | | 197 | | | 199,905 |
| 5.00% | | TBA | | | | | 3,000 | | | 2,975,625 |
| 6.00% | | TBA | | | | | 300 | | | 310,125 |
| 6.20% | | 08/01/29(b) | | | | | 64 | | | 65,703 |
| 6.50% | | 06/01/18 | | | | | 195 | | | 205,951 |
| 6.50% | | 10/01/21 | | | | | 163 | | | 172,365 |
| 6.50% | | 11/01/21 | | | | | 140 | | | 148,196 |
| 6.50% | | 10/01/32 | | | | | 100 | | | 105,019 |
Government National Mortgage Assn. | | | |
| 3.375% | | 04/20/27(b) | | | | | 159 | | | 162,385 |
| 3.75% | | 08/20/24(b) | | | | | 12 | | | 12,658 |
| 4.00% | | 11/20/29(b) | | | | | 89 | | | 90,266 |
| 4.625% | | 10/20/27(b) | | | | | 56 | | | 56,692 |
| 7.50% | | 02/20/30 | | | | | 633 | | | 674,874 |
| 8.00% | | 08/20/31 | | | | | 30 | | | 32,055 |
| 8.50% | | 02/20/26 | | | | | 3 | | | 2,800 |
| 8.50% | | 04/20/26 | | | | | 2 | | | 2,033 |
| | | | | | | | | | |
Interest
Rate
| | Maturity
Date
| | Moody’s
Rating
(Unaudited)
| | Principal
Amount
(000)
| | Value (Note 2)
|
| MORTGAGE BACKED SECURITIES (Continued) |
| 8.50% | | 10/20/29 | | | | $ | 22 | | $ | 23,572 |
| 8.50% | | 07/15/30 | | | | | 29 | | | 32,063 |
| 8.50% | | 09/20/30 | | | | | 11 | | | 11,527 |
| 8.50% | | 04/20/31 | | | | | 14 | | | 14,759 |
| | | | | | | | | |
|
|
TOTAL MORTGAGE BACKED SECURITIES
(cost $9,948,244) | | | 10,122,761 |
| | | | | | | | | |
|
|
| MUNICIPAL BONDS — 1.6% |
Golden State Tobacco Securitization Corp. | | | |
Ser. 2003-A-1 | | | |
| 6.25% | | 06/01/33 | | Baa3 | | | 300 | | | 300,174 |
Massachusetts State Water Resources
Authority Ser. J | | | |
| 5.00% | | 08/01/32 | | Aaa | | | 250 | | | 255,335 |
Michigan St. Bldg. Auth. Rev. | | | |
| 5.25% | | 10/15/11 | | Aaa | | | 400 | | | 449,948 |
New Jersey St. Trans. Trust Fd. Auth. | | | |
| 5.00% | | 06/15/12 | | A1(e) | | | 600 | | | 656,832 |
San Antonio, Texas Water Revenue | | | |
| 5.00% | | 05/15/25 | | Aaa | | | 500 | | | 517,890 |
Tobacco Settlement Financing Corp. | | | |
| 5.875% | | 05/15/39 | | Baa3 | | | 290 | | | 260,101 |
| 6.375% | | 06/01/32 | | Baa3 | | | 250 | | | 240,450 |
| | | | | | | | | |
|
|
TOTAL MUNICIPAL BONDS
(cost $2,559,399) | | | 2,680,730 |
| | | | | | | | | |
|
|
TOTAL LONG-TERM INVESTMENTS
(cost $126,487,584) | | | 143,760,801 |
| | | | | | | | | |
|
|
| SHORT-TERM INVESTMENTS — 17.5% |
| CORPORATE BONDS — 5.0% |
Automobiles — 0.5% | | | |
Daimler Chrysler North America Holding Corp. | | | |
Gtd. Notes | | | |
| 7.40% | | 01/20/05 | | A3(e) | | | 600 | | | 601,467 |
Ford Motor Credit Co. | | | |
| 2.52% | | 04/07/05 | | NR | | | 200 | | | 198,656 |
General Motors Acceptance Corp. | | | |
| 2.495% | | 04/05/05 | | NR | | | 100 | | | 99,348 |
| | | | | | | | | |
|
|
| | | | | | | | | | | 899,471 |
| | | | | | | | | |
|
|
Consumer Products — 1.9% | | | |
Kimberly Clark Worldwide | | | |
| 2.15% | | 01/20/05 | | PRIM1 | | | 1,500 | | | 1,498,298 |
Pfizer, Inc. | | | |
| 2.24% | | 03/18/05 | | NR | | | 1,600 | | | 1,592,434 |
| | | | | | | | | |
|
|
| | | | | | | | | | | 3,090,732 |
| | | | | | | | | |
|
|
Diversified Financials — 1.6% | | | |
Bank Of America Certificate | | | |
| 2.44% | | 03/23/05 | | PRIM1 | | | 1,200 | | | 1,200,000 |
Citibank Certificate | | | |
| 2.45% | | 03/21/05 | | A1(e) | | | 1,300 | | | 1,300,000 |
| 2.465% | | 03/29/05 | | NR | | | 100 | | | 100,000 |
| | | | | | | | | |
|
|
| | | | | | | | | | | 2,600,000 |
| | | | | | | | | |
|
|
Energy — 1.0% | | | | | | | | |
General Electric Capital Corp. | | | |
| 2.28% | | 02/23/05 | | PRIM1 | | | 1,600 | | | 1,594,629 |
SEE NOTES TO FINANCIAL STATEMENTS.
B15
| | | | |
| | | DIVERSIFIED CONSERVATIVE GROWTH PORTFOLIO (Continued) | | |
SCHEDULE OF INVESTMENTS | December 31, 2004 |
| | | | | | | | | | | |
Interest
Rate
| | Maturity
Date
| | Moody’s
Rating
(Unaudited)
| | Principal
Amount
(000)
| | Value (Note 2)
| |
| CORPORATE BONDS (Continued) | |
Energy (cont’d.) | | | | | | | | | |
| 2.32% | | 02/24/05 | | PRIM1 | | $ | 100 | | $ | 99,652 | |
| | | | | | | | | |
|
|
|
| | | | | | | | | | | 1,694,281 | |
| | | | | | | | | |
|
|
|
TOTAL CORPORATE BONDS
(cost $8,284,491) | | | 8,284,484 | |
| | | | | | | | | |
|
|
|
| U.S. GOVERNMENT SECURITIES — 6.5% | |
Federal Home Loan Bank | | | | |
| 0.01% | | 01/14/05 | | PRIM1 | | | 1,700 | | | 1,698,803 | |
| 2.33% | | 03/15/05 | | PRIM1 | | | 4,000 | | | 3,981,101 | |
Federal Home Loan Mortgage Corp. | | | | |
| 2.53% | | 05/10/05 | | PRIM1 | | | 4,500 | | | 4,459,204 | |
United States Treasury Bills | | | | |
| 2.172% | | 03/03/05(d) | | Aaa | | | 10 | | | 9,963 | |
| 2.18% | | 03/03/05 | | Aaa | | | 50 | | | 49,816 | |
| 2.195% | | 03/03/05 | | Aaa | | | 250 | | | 249,070 | |
| 2.205% | | 03/17/05(d) | | Aaa | | | 315 | | | 313,663 | |
| | | | | | | | | |
|
|
|
TOTAL U.S. GOVERNMENT SECURITIES
(cost $10,761,510) | | | 10,761,620 | |
| | | | | | | | | |
|
|
|
| REPURCHASE AGREEMENT — 2.4% | | | | |
State Street Bank & Trust Co.,
1.75%, 01/03/05(f)
(cost $4,050,245) | | | 4,050 | | | 4,050,245 | |
| | | | | | | | | |
|
|
|
| | | Shares
| | | |
| MUTUAL FUND — 3.6% | | | | | | | |
Dryden Core Investment Fund —Taxable Money Market Series
(cost $6,083,036) | | | 6,083,036 | | | 6,083,036 | |
| | | | | | | | | |
|
|
|
| | | | | | | Contracts/ Notional (000)
| | | |
| OUTSTANDING OPTIONS PURCHASED(a) | |
Put Options | | | | | | | | | |
Euro Futures, expiring 12/19/05 @ $93.0 | | | 25 | | | 125 | |
Swap Option 3 month LIBOR, expiring 2/18/05 @ $4.9 | | | 800 | | | 533 | |
| | | | | | | | | |
|
|
|
TOTAL OUTSTANDING OPTIONS PURCHASED
(cost $2,080) | | | 658 | |
| | | | | | | | | |
|
|
|
TOTAL SHORT-TERM INVESTMENTS
(cost $29,181,362) | | | 29,180,043 | |
| | | | | | | | | |
|
|
|
TOTAL INVESTMENTS, BEFORE OUTSTANDING OPTIONS WRITTEN AND SHORT SALES — 103.6%
(cost $155,668,946) | | | 172,940,844 | |
| | | | | | | | | |
|
|
|
| | | | |
Interest
Rate
| | Maturity
Date
| | Moody’s
Rating
| | Principal
Amount
(000)
| | | |
| INVESTMENTS SOLD SHORT — (7.3%) | |
United States Treasury Notes | | | | | | | |
| 3.625% | | 05/15/13 | | Aaa | | | 4,800 | | | (4,651,310 | ) |
| 3.875% | | 02/15/13 | | Aaa | | | 7,600 | | | (7,498,472 | ) |
| | | | | | | | | |
|
|
|
TOTAL INVESTMENTS SOLD SHORT
(cost $(12,092,228)) | | | (12,149,782 | ) |
| | | | | | | | | |
|
|
|
| | | | | | |
OUTSTANDING OPTIONS WRITTEN(a) | | Contracts/ Notional
(000)
| | Value (Note 2)
| |
Call Options | | | | | | |
Swap Option 3 month LIBOR,
expiring 1/07/05 @ $5.0 | | 200 | | $ | (8,257) | |
Swap Option 3 month LIBOR,
expiring 9/23/05 @ $4.0 | | 2,900 | | | (20,462 | ) |
Swap Option 3 month LIBOR,
expiring 9/23/05 @ $4.0 | | 600 | | | (4,234 | ) |
United States Treasury Notes 10Yr Futures,
expiring 2/18/05 @ $113.0 | | 11 | | | (5,500 | ) |
United States Treasury Notes 10Yr Futures,
expiring 2/18/05 @ $114.0 | | 23 | | | (5,391 | ) |
| | | | |
|
|
|
| | | | | | (43,844 | ) |
| | | | |
|
|
|
Put Options | | | | | | |
Swap Option 3 month LIBOR,
expiring 1/07/05 @ $7.0 | | 200 | | | 0 | |
Swap Option,
expiring 9/23/05 @ $7.0 | | 600 | | | (198 | ) |
United States Treasury Notes 10Yr Futures,
expiring 2/18/05 @ $108.0 | | 42 | | | (3,938 | ) |
| | | | |
|
|
|
| | | | | | (4,136 | ) |
| | | | |
|
|
|
TOTAL OUTSTANDING OPTIONS WRITTEN
(premium received $99,789) | | | (47,980 | ) |
| | | | |
|
|
|
TOTAL INVESTMENTS, NET OF OUTSTANDING OPTIONS WRITTEN AND INVESTMENTS SOLD SHORT — 96.3%
(cost $143,476,929; Note 6) | | | 160,743,082 | |
| | | | |
|
|
|
UNREALIZED DEPRECIATION ON FORWARD FOREIGN CURRENCY CONTRACTS(j) | | | (12,504 | ) |
VARIATION MARGIN ON OPEN FUTURES CONTRACTS, NET(i) | | | 37,299 | |
OTHER ASSETS IN EXCESS OF OTHER
LIABILITIES — 3.7% | | | 6,200,971 | |
| | | | |
|
|
|
NET ASSETS — 100% | | $ | 166,968,848 | |
| | | | |
|
|
|
The industry classification of portfolio holdings and other assets in excess of other liabilities shown as a percentage of net assets as of December 31, 2004 was as follows:
| | | |
U.S. Government Securities | | 18.8 | % |
Mortgage Backed Securities | | 6.1 | % |
Diversified Financial Services | | 3.9 | % |
Mutual Fund | | 3.6 | % |
Foreign Government Obligations | | 3.4 | % |
Repurchase Agreement | | 2.4 | % |
Media & Entertainment | | 2.4 | % |
Software | | 2.2 | % |
Oil & Gas | | 2.2 | % |
Pharmaceuticals | | 2.1 | % |
Electric | | 2.1 | % |
Telecommunications | | 2.0 | % |
Consumer Products | | 1.9 | % |
Insurance | | 1.9 | % |
Health Care Providers & Services | | 1.8 | % |
Municipal Bonds | | 1.6 | % |
SEE NOTES TO FINANCIAL STATEMENTS.
B16
| | | | |
| | | DIVERSIFIED CONSERVATIVE GROWTH PORTFOLIO (Continued) | | |
SCHEDULE OF INVESTMENTS | December 31, 2004 |
| | | |
Food & Staples Retailing | | 1.6 | % |
Capital Markets | | 1.6 | % |
Healthcare & Pharmaceuticals | | 1.6 | % |
Internet Software & Services | | 1.5 | % |
Biotechnology | | 1.5 | % |
Specialty Retail | | 1.4 | % |
Electric Utilities | | 1.4 | % |
Energy Equipment & Services | | 1.4 | % |
Industrial Conglomerates | | 1.4 | % |
Chemicals | | 1.3 | % |
Computers & Peripherals | | 1.2 | % |
Capital Goods | | 1.2 | % |
Energy | | 1.2 | % |
Gaming | | 1.1 | % |
Commercial Services & Supplies | | 1.1 | % |
Hotels, Restaurants & Leisure | | 1.1 | % |
Communications Equipment | | 1.0 | % |
Paper & Forest Products | | 1.0 | % |
Aerospace & Defense | | 1.0 | % |
Pipelines & Other | | 1.0 | % |
Household Durables | | 1.0 | % |
Automobiles | | 0.9 | % |
Commercial Banks | | 0.9 | % |
Lodging | | 0.8 | % |
Electronic Equipment & Instruments | | 0.8 | % |
Technology | | 0.8 | % |
Metals & Mining | | 0.8 | % |
Health Care Equipment & Supplies | | 0.8 | % |
Semiconductors & Semiconductor Equipment | | 0.7 | % |
Cable | | 0.7 | % |
Internet & Catalog Retail | | 0.7 | % |
Collateralized Mortgage Obligations | | 0.7 | % |
Consumer Finance | | 0.6 | % |
Retailers | | 0.6 | % |
Wireless Telecommunication Services | | 0.6 | % |
Energy – Other | | 0.6 | % |
| | | |
Diversified Telecommunication Services | | 0.6 | % |
Packaging | | 0.6 | % |
Non-Corporate | | 0.5 | % |
Tobacco | | 0.5 | % |
Health Care | | 0.4 | % |
Multi-Utilities | | 0.4 | % |
Household Products | | 0.4 | % |
Multi-line Retail | | 0.4 | % |
Building Materials & Construction | | 0.4 | % |
Oil & Gas Exploration & Production | | 0.4 | % |
Consumer Services | | 0.4 | % |
Office Electronics | | 0.3 | % |
Air Freight Couriers & Logistics | | 0.3 | % |
Personal Products | | 0.3 | % |
Textiles & Apparel | | 0.2 | % |
Real Estate Investment Trust | | 0.2 | % |
IT Consulting & Services | | 0.2 | % |
Airlines | | 0.2 | % |
Machinery | | 0.2 | % |
Thrifts & Mortgage Finance | | 0.1 | % |
Road & Rail | | 0.1 | % |
Building Products | | 0.1 | % |
Gas Utilities | | 0.1 | % |
Real Estate | | 0.1 | % |
Leisure Equipment & Products | | 0.1 | % |
Warrants & Rights | | 0.1 | % |
Investments Sold Short | | (7.3 | )% |
| | |
|
|
| | | 96.3 | % |
Other assets in excess of other liabilities | | 3.7 | % |
| | |
|
|
| | | 100.0 | % |
| | |
|
|
The following abbreviations are used in portfolio descriptions:
| | |
| ADR | | American Depositary Receipt |
| MTN | | Medium Term Note |
| NR | | Not Rated by Moody’s or Standard & Poor’s |
| TBA | | Securities purchased on a forward commitment basis |
| TIPS | | U.S. Treasury Inflation Protected Security |
| (a) | Non-income producing security. |
| (b) | Rate shown reflects current rate of variable instruments. |
| (d) | Security segregated as collateral for futures contracts. |
| (e) | Standard & Poor’s rating. |
| (f) | State Street Repurchase Agreement, repurchase price $4,050,836 due 01/03/05. The value of the collateral including accrued interest was $4,177,197. The collateral consists of US Treasury or federal agency obligations. |
| (g) | Securities were purchased pursuant to Rule 144A under the Securities Act of 1933 and may not be resold subject to that rule except to qualified institutional buyers. Unless otherwise noted 144A securities are deemed to be liquid. |
| (h) | Indicates a security that has been deemed illiquid. The aggregate cost of the illiquid securities is $1,531,301. The aggregate value, $1,442,687 represents 0.86% of the net assets. |
SEE NOTES TO FINANCIAL STATEMENTS.
B17
| | | | |
| | | DIVERSIFIED CONSERVATIVE GROWTH PORTFOLIO (Continued) | | |
SCHEDULE OF INVESTMENTS | December 31, 2004 |
| (i) | Open futures contracts as of December 31, 2004 were as follows: |
| | | | | | | | | | | | | | |
Number of
Contracts
| | Type
| | Expiration
Date
| | Value at
Trade Date
| | Value at
December 31, 2004
| | Unrealized
Appreciation/
(Depreciation)
| |
| Long Positions: | | | | | | | | | | | | | | |
| 14 | | German 5 YR Bonds | | Mar 05 | | $ | 2,152,896 | | $ | 2,148,430 | | $ | (4,466 | ) |
| 13 | | German 10 YR Bonds | | Mar 05 | | | 2,087,859 | | | 2,095,514 | | | 7,655 | |
| 6 | | LIBOR | | Mar 05 | | | 1,387,201 | | | 1,369,946 | | | (17,255 | ) |
| 6 | | LIBOR | | Dec 05 | | | 1,371,482 | | | 1,371,530 | | | 48 | |
| 9 | | Eurodollar | | Mar 05 | | | 2,185,361 | | | 2,184,638 | | | (723 | ) |
| 18 | | Eurodollar | | Jun 05 | | | 4,374,224 | | | 4,357,125 | | | (17,099 | ) |
| 17 | | Eurodollar | | Sep 05 | | | 4,123,091 | | | 4,105,925 | | | (17,166 | ) |
| 20 | | Eurodollar | | Dec 05 | | | 4,793,500 | | | 4,822,000 | | | 28,500 | |
| 88 | | U.S. Treasury 5 YR Notes | | Mar 05 | | | 9,636,950 | | | 9,638,750 | | | 1,800 | |
| 48 | | U.S. Treasury 10 YR Notes | | Mar 05 | | | 5,393,771 | | | 5,373,000 | | | (20,771 | ) |
| 9 | | U.S. Treasury Bonds | | Mar 05 | | | 1,011,427 | | | 1,012,500 | | | 1,073 | |
| | | | | | | | | | | | |
|
|
|
| | | | | | | | | | | | | $ | (38,404 | ) |
| | | | | | | | | | | | |
|
|
|
| (j) | Outstanding forward foreign currency contracts as of December 31, 2004 were as follows: |
| | | | | | | | | | |
Forward Foreign
Currency Contract
| | Value at
Settlement Date
| | Value at
December 31, 2004
| | Unrealized
Appreciation/
(Depreciation)
| |
| Bought: | | | | | | | | | | |
| Euro expiring 01/10/05 | | $ | 50,533 | | $ | 51,655 | | $ | 1,122 | |
| Japanese Yen expiring 01/27/05 | | | 67,045 | | | 68,446 | | | 1,401 | |
| Japanese Yen expiring 01/27/05 | | | 84,748 | | | 86,370 | | | 1,622 | |
| | | | | | | | |
|
|
|
| | | | | | | | | | 4,145 | |
| | | | | | | | |
|
|
|
| Sold: | | | | | | | | | | |
| Euro expiring 01/10/05 | | | 264,633 | | | 267,791 | | | (3,158 | ) |
| Euro expiring 01/10/05 | | | 261,967 | | | 267,791 | | | (5,824 | ) |
| Pound Sterling expiring 01/13/05 | | | 2,535,371 | | | 2,537,644 | | | (2,273 | ) |
| Japanese Yen expiring 01/27/05 | | | 101,829 | | | 106,434 | | | (4,605 | ) |
| Japanese Yen expiring 01/27/05 | | | 48,101 | | | 48,890 | | | (789 | ) |
| | | | | | | | |
|
|
|
| | | | | | | | | | (16,649 | ) |
| | | | | | | | |
|
|
|
| | | | | | | | | $ | (12,504 | ) |
| | | | | | | | |
|
|
|
SEE NOTES TO FINANCIAL STATEMENTS.
B18
| | | | |
| | | JENNISON 20/20 FOCUS PORTFOLIO | | |
SCHEDULE OF INVESTMENTS | December 31, 2004 |
| | | | | |
| LONG-TERM INVESTMENTS — 96.3% | | Value (Note 2)
|
| COMMON STOCKS | | Shares
| |
Aerospace & Defense — 2.3% | | | | | |
Northrop Grumman Corp. | | 70,800 | | $ | 3,848,688 |
| | | | |
|
|
Biotechnology — 4.4% | | | | | |
Genentech, Inc.(a) | | 94,600 | | | 5,150,024 |
Gilead Sciences, Inc.(a) | | 63,700 | | | 2,228,863 |
| | | | |
|
|
| | | | | | 7,378,887 |
| | | | |
|
|
Capital Markets — 4.8% | | | | | |
Lehman Brothers Holdings, Inc. | | 38,200 | | | 3,341,736 |
Merrill Lynch & Co., Inc. | | 79,400 | | | 4,745,738 |
| | | | |
|
|
| | | | | | 8,087,474 |
| | | | |
|
|
Chemicals — 2.4% | | | | | |
E. I. du Pont de Nemours & Co. | | 84,500 | | | 4,144,725 |
| | | | |
|
|
Computers & Peripherals — 2.5% | | | | | |
Apple Computer, Inc.(a) | | 65,900 | | | 4,243,960 |
| | | | |
|
|
Consumer Finance — 2.5% | | | | | |
American Express Co. | | 75,600 | | | 4,261,572 |
| | | | |
|
|
Diversified Financial Services — 4.5% | | | | | |
J.P. Morgan Chase & Co. | | 109,400 | | | 4,267,694 |
Principal Financial Group, Inc. | | 81,200 | | | 3,324,328 |
| | | | |
|
|
| | | | | | 7,592,022 |
| | | | |
|
|
Diversified Telecommunication Services — 1.6% | | | |
SBC Communications, Inc. | | 106,400 | | | 2,741,928 |
| | | | |
|
|
Electric Utilities — 2.7% | | | | | |
TXU Corp. | | 70,300 | | | 4,538,568 |
| | | | |
|
|
Electronic Equipment & Instruments — 2.5% | | | |
Agilent Technologies, Inc.(a) | | 178,700 | | | 4,306,670 |
| | | | |
|
|
Energy Equipment & Services — 5.0% | | | | | |
Schlumberger Ltd. | | 72,200 | | | 4,833,790 |
Smith International, Inc.(a) | | 65,400 | | | 3,558,414 |
| | | | |
|
|
| | | | | | 8,392,204 |
| | | | |
|
|
Food Products — 2.4% | | | | | |
Cadbury Schweppes, ADR
(United Kingdom) | | 107,300 | | | 4,045,210 |
| | | | |
|
|
Food & Staples Retailing — 4.7% | | | | | |
Kroger Co.(a) | | 204,200 | | | 3,581,668 |
Whole Foods Market, Inc. | | 45,700 | | | 4,357,495 |
| | | | |
|
|
| | | | | | 7,939,163 |
| | | | |
|
|
Health Care Providers & Services — 2.1% | | | | | |
CIGNA Corp. | | 44,100 | | | 3,597,237 |
| | | | |
|
|
Hotels, Restaurants & Leisure — 2.7% | | | | | |
Starbucks Corp.(a) | | 72,600 | | | 4,527,336 |
| | | | |
|
|
Industrial Conglomerates — 7.3% | | | | | |
General Electric Co. | | 139,400 | | | 5,088,100 |
Phelps Dodge Corp. | | 35,900 | | | 3,551,228 |
Tyco International Ltd. (Bermuda) | | 105,200 | | | 3,759,848 |
| | | | |
|
|
| | | | | | 12,399,176 |
| | | | |
|
|
Internet & Catalog Retail — 3.3% | | | | | |
eBay, Inc.(a) | | 48,000 | | | 5,581,440 |
| | | | |
|
|
Internet Software & Services — 5.4% | | | | | |
Google, Inc. (Class “A” Stock)(a) | | 23,700 | | | 4,576,470 |
Yahoo!, Inc.(a) | | 122,900 | | | 4,630,872 |
| | | | |
|
|
| | | | | | 9,207,342 |
| | | | |
|
|
| | | | | | | |
| COMMON STOCKS | | Value (Note 2)
| |
| (Continued) | | Shares
| |
Multi-Utilities & Unregulated Power — 2.1% | | | | |
Sempra Energy | | | 98,600 | | $ | 3,616,648 | |
| | | | | |
|
|
|
Multiline Retail — 2.7% | | | | | | | |
Target Corp. | | | 87,900 | | | 4,564,647 | |
| | | | | |
|
|
|
Office Electronics — 3.7% | | | | | | | |
Xerox Corp.(a) | | | 367,700 | | | 6,254,577 | |
| | | | | |
|
|
|
Oil & Gas — 5.4% | | | | | | | |
Nexen, Inc. | | | 101,300 | | | 4,117,845 | |
Suncor Energy, Inc. (Canada) | | | 142,000 | | | 5,026,800 | |
| | | | | |
|
|
|
| | | | | | | 9,144,645 | |
| | | | | |
|
|
|
Paper & Forest Products — 2.1% | | | | | | | |
Georgia-Pacific Corp. | | | 94,400 | | | 3,538,112 | |
| | | | | |
|
|
|
Personal Products — 2.2% | | | | | | | |
Estee Lauder Companies, Inc.
(Class “A” Stock) | | | 83,100 | | | 3,803,487 | |
| | | | | |
|
|
|
Pharmaceuticals — 4.2% | | | | | | | |
Eli Lilly & Co. | | | 52,900 | | | 3,002,075 | |
Novartis AG, ADR (Switzerland) | | | 80,100 | | | 4,048,254 | |
| | | | | |
|
|
|
| | | | | | | 7,050,329 | |
| | | | | |
|
|
|
Semiconductors & Semiconductor
Equipment — 1.7% | | | | |
Marvell Technology Group Ltd. (Bermuda)(a) | | | 82,100 | | | 2,912,087 | |
| | | | | |
|
|
|
Software — 5.5% | | | | |
Electronic Arts, Inc.(a) | | | 82,400 | | | 5,082,432 | |
Microsoft Corp. | | | 157,700 | | | 4,212,167 | |
| | | | | |
|
|
|
| | | | | | | 9,294,599 | |
| | | | | |
|
|
|
Specialty Retail — 2.1% | | | | |
Toys “R” Us, Inc.(a) | | | 170,100 | | | 3,481,947 | |
| | | | | |
|
|
|
Wireless Telecommunication Services — 1.5% | | | | |
Nextel Communications, Inc.
(Class “A” Stock)(a) | | | 86,200 | | | 2,586,000 | |
| | | | | |
|
|
|
TOTAL LONG-TERM INVESTMENTS
(cost $133,997,276) | | | 163,080,680 | |
| | | | | |
|
|
|
SHORT-TERM INVESTMENTS — 4.3% | | | | |
Mutual Fund — 4.2% | | | | |
Dryden Core Investment Fund —
Taxable Money Market Series (Note 4) | | | 7,209,694 | | | 7,209,694 | |
| | | | | |
|
|
|
| | |
| Principal
Amount
(000)
| | | | |
Repurchase Agreement — 0.1% | | | | |
State Street Bank & Trust Co.,
1.75%, 1/3/05(b) | | $ | 121 | | | 120,782 | |
| | | | | |
|
|
|
TOTAL SHORT-TERM INVESTMENTS
(cost $7,330,476) | | | 7,330,476 | |
| | | | | |
|
|
|
TOTAL INVESTMENTS — 100.6%
(cost $141,327,752; Note 6) | | | 170,411,156 | |
LIABILITIES IN EXCESS OF
OTHER ASSETS — (0.6)% | | | (966,547 | ) |
| | | | | |
|
|
|
NET ASSETS — 100% | | $ | 169,444,609 | |
| | | | | |
|
|
|
SEE NOTES TO FINANCIAL STATEMENTS.
B19
| | | | |
| | | JENNISON 20/20 FOCUS PORTFOLIO (Continued) | | |
SCHEDULE OF INVESTMENTS | December 31, 2004 |
The following abbreviation is used in portfolio descriptions:
| | |
| ADR | | American Depositary Receipt |
| (a) | Non-income producing security. |
| (b) | State Street Bank & Trust Company Repurchase Agreement, repurchase price $120,800 due 1/3/05. The value of the collateral including accrued interest was $128,886. Collateralized by United States Treasury or federal agency obligations. |
The industry classification of portfolio holdings and liabilities in excess of other assets shown as a percentage of net assets as of December 31, 2004 was as follows:
| | | |
Industrial Conglomerates | | 7.3 | % |
Software | | 5.5 | |
Internet Software & Services | | 5.4 | |
Oil & Gas | | 5.4 | |
Energy Equipment & Services | | 5.0 | |
Capital Markets | | 4.8 | |
Food & Staples Retailing | | 4.7 | |
Diversified Financial Services | | 4.5 | |
Biotechnology | | 4.4 | |
Mutual Fund | | 4.2 | |
Pharmaceuticals | | 4.2 | |
Office Electronics | | 3.7 | |
Internet & Catalog Retail | | 3.3 | |
Multiline Retail | | 2.7 | |
Electric Utilities | | 2.7 | |
Hotels, Restaurants & Leisure | | 2.7 | |
Electronic Equipment & Instruments | | 2.5 | |
Consumer Finance | | 2.5 | |
Computers & Peripherals | | 2.5 | |
Food Products | | 2.4 | |
Chemicals | | 2.4 | |
Aerospace & Defense | | 2.3 | |
Personal Products | | 2.2 | |
Multi-Utilities & Unregulated Power | | 2.1 | |
Health Care Providers & Services | | 2.1 | |
Paper & Forest Products | | 2.1 | |
Specialty Retail | | 2.1 | |
Semiconductors & Semiconductor Equipment | | 1.7 | |
Diversified Telecommunication Services | | 1.6 | |
Wireless Telecommunication Services | | 1.5 | |
Repurchase Agreement | | 0.1 | |
| | |
|
|
| | | 100.6 | |
Liabilities in excess of other assets | | (0.6 | ) |
| | |
|
|
| | | 100.0 | % |
| | |
|
|
SEE NOTES TO FINANCIAL STATEMENTS.
B20
NOTES TO THE FINANCIAL STATEMENTS OF
THE PRUDENTIAL SERIES FUND, INC.
The Prudential Series Fund, Inc. (“Series Fund”), a Maryland corporation, organized on November 15, 1982, is a diversified open-end management investment company registered under the Investment Company Act of 1940, as amended. The Series Fund is composed of thirty-six Portfolios (“Portfolio” or “Portfolios”), each with a separate series of capital stock. The information presented in these financial statements pertains to two Portfolios: Diversified Conservative Growth Portfolio and Jennison 20/20 Focus Portfolio.
The Portfolios of the Series Fund have the following as investment objectives:
Diversified Conservative Growth Portfolio: Current income and a reasonable level of capital appreciation by investing primarily in a diversified portfolio of debt and equity securities.
Jennison 20/20 Focus Portfolio: Long-term growth of capital by investing primarily in up to 40 equity securities of U.S. companies that the Portfolio manager believe to have strong capital appreciation potential.
The ability of issuers of debt securities (other than those issued or guaranteed by the U.S. Government) held by the Portfolios to meet their obligations may be affected by the economic or political developments in a specific industry, region or country.
| Note 2: | | Accounting Policies |
The following is a summary of significant accounting policies followed by the Series Fund and the Portfolios in preparation of their financial statements.
Securities Valuation: Securities listed on a securities exchange are valued at the last sale price on such exchange on the day of valuation or, if there was no sale on such day, at the mean between the last reported bid and asked prices, or at the last bid price on such day in the absence of an asked price. Securities traded via NASDAQ are valued at the official closing price provided by NASDAQ. Securities that are actively traded in the over-the-counter market, including listed securities for which the primary market is believed by Prudential Investments LLC (“PI” or “Manager”) in consultation with the subadvisor, to be over-the-counter, are valued at market value using prices provided by an independent pricing agent or principal market maker. Options on securities and indices traded on an exchange are valued at the last sale price as of the close of trading on the applicable exchange or, if there was no sale, at the mean between the most recently quoted bid and asked prices on such exchange, or at the last bid price in the absence of an asked price. Futures contracts and options thereon traded on a commodities exchange or board of trade are valued at the last sale price at the close of trading on such exchange or board of trade or, if there was no sale on the applicable commodities exchange or board of trade on such day, at the mean between the most recently quoted bid and asked prices on such exchange or board of trade or at the last bid price in the absence of an asked price. Prices may be obtained from independent pricing services which use information provided by market makers or estimates of market values obtained from yield data relating to investments or securities with similar characteristics. Securities for which reliable market quotations are not readily available, or whose values have been affected by events occurring after the close of the security’s foreign market and before the Series fund’s normal pricing time, are valued at fair value in accordance with Board of Directors’ approved fair valuation procedures. Using fair value to price securities may result in a value that is different from a security’s most recent closing price and from the price used by other mutual funds to calculate their net asset values. As of December 31, 2004 there were no foreign securities whose value required adjustment in accordance with such procedures.
Investments in mutual funds are valued at their net asset value as of the close of the New York Stock Exchange on the date of valuation.
Short-term securities that are held in the Portfolios which mature in more than 60 days are valued at current market quotations and those short-term securities which mature in 60 days or less are valued at amortized cost which approximates market value. The amortized cost method values a security at its cost at the time of purchase and there after assumes a constant amortization to maturity of any discount or premium.
C1
Repurchase Agreements: In connection with transactions in repurchase agreements with United States financial institutions, it is the Series Fund’s policy that its custodian or designated subcustodians, as the case may be, under triparty repurchase agreements, take possession of the underlying collateral securities, the value of which exceeds the principal amount of the repurchase transaction, including accrued interest. To the extent that any repurchase transaction exceeds one business day, the value of the collateral is marked to market on a daily basis to ensure the adequacy of the collateral. If the seller defaults or the value of the collateral declines, or if bankruptcy proceedings are commenced with respect to the seller of the security, realization of the collateral by the Series Fund may by delayed or limited.
Foreign Currency Translation: The books and records of the Series Fund are maintained in U.S. dollars. Foreign currency amounts are translated into U.S. dollars on the following basis:
(i) market value of investment securities, other assets and liabilities – at the current daily rates of exchange.
(ii) purchases and sales of investment securities, income and expenses – at the rates of exchange prevailing on the respective dates of such transactions.
Although the net assets of the Series Fund are presented at the foreign exchange rates and market values at the close of the year, the Series Fund does not isolate that portion of the results of operations arising as a result of changes in the foreign exchange rates from the fluctuations arising from changes in the market prices of securities held at the end of the year. Similarly, the Series Fund does not isolate the effect of changes in foreign exchange rates from the fluctuations arising from changes in the market prices of portfolio securities sold during the year. Accordingly, these realized foreign currency gains (losses) are included in the reported net realized gains (losses) on investment transactions.
Net realized gains (losses) on foreign currency transactions represent net foreign exchange gains (losses) from the holding of foreign currencies, currency gains (losses) realized between the trade date and settlement date on securities transactions, and the difference between the amounts of dividends, interest and foreign withholding taxes recorded on the Series Fund’s books and the U.S. dollar equivalent amounts actually received or paid. Net unrealized currency gains (losses) from valuing foreign currency denominated assets and liabilities (other than investments) at year end exchange rates are reflected as a component of net unrealized appreciation (depreciation) on investments and foreign currencies.
Foreign security and currency transactions may involve certain considerations and risks not typically associated with those of domestic origin as a result of, among other factors, the possibility of political and economic instability or the level of governmental supervision and regulation of foreign securities markets.
Forward Currency Contracts: A forward currency contract is a commitment to purchase or sell a foreign currency at a future date at a negotiated forward rate. Certain Portfolios of the Series Fund may enter into forward currency contracts in order to hedge their exposure to changes in foreign currency exchange rates on their foreign portfolio holdings or on specific receivables and payables denominated in a foreign currency. The contracts are valued daily at current exchange rates and any unrealized gain (loss) is included in net unrealized appreciation (depreciation) on investments and foreign currencies. Gain (loss) is realized on the settlement date of the contract equal to the difference between the settlement value of the original and negotiated forward contracts. This gain (loss), if any, is included in net realized gain (loss) on foreign currency transactions. Risks may arise upon entering into these contracts from the potential inability of the counterparties to meet the terms of their contracts.
Short Sales: Certain portfolios of the Series Fund may sell a security it does not own in anticipation of a decline in the market value of that security (short sale). When a Portfolio makes a short sale, it must borrow the security sold short and deliver it to the broker-dealer through which it made the short sale as collateral for its obligation to deliver the security upon conclusion of the transaction. The Portfolio may have to pay a fee to borrow the particular security and may be obligated to remit any interest or dividends received on such borrowed securities. Dividends declared on short positions open on record date are recorded on the ex-date as an expense. A gain, limited to the price at which the Portfolio sold the security short, or a loss, unlimited in magnitude, will be recognized upon the termination of a short sale if the market price at termination is less than or greater than, respectively, the proceeds originally received. The Portfolio maintains a segregated account of securities or other liquid assets, the dollar value of which is at least equal to its obligation with respect to short sales.
Options: The Series Fund may either purchase or write options in order to hedge against adverse market movements or fluctuations in value caused by changes in prevailing interest rates or foreign currency
C2
exchange rates or currencies with respect to securities which the Series Fund currently owns or intends to purchase. The Series Fund’s principal reason for writing options is to realize, through receipt of premiums, a greater current return than would be realized on the underlying security alone. When the Series Fund purchases an option, it pays a premium and an amount equal to that premium is recorded as an asset. When the Series Fund writes an option, it receives a premium and an amount equal to that premium is recorded as a liability. The asset or liability is adjusted daily to reflect the current market value of the option. If an option expires unexercised, the Series Fund realizes a gain (loss) to the extent of the premium received or paid. If an option is exercised, the premium received or paid is recorded as an adjustment to the proceeds from the sale or the cost basis of the purchase in determining whether the Series Fund has realized a gain (loss). The difference between the premium and the amount received or paid on effecting a closing purchase or sale transaction is also treated as a realized gain (loss). Gains (losses) on purchased options are included in net realized gains (losses) on investment transactions. Gains (losses) on written options are presented separately as net realized gains (losses) on written option transactions.
The Series Fund, as writer of an option, may have no control over whether the contract may be exercised. As a result, the Series Fund bears the market risk of an unfavorable change in the price of the security underlying the written option. The Series Fund, as purchaser of an option, bears the risk of the potential inability of the counterparties to meet the terms of their contracts.
Financial Futures Contracts: A financial futures contract is an agreement to purchase (long) or sell (short) an agreed amount of securities at a set price for delivery on a future date. Upon entering into a financial futures contract, the Series Fund is required to pledge to the broker an amount of cash and/or other assets equal to a certain percentage of the contract amount. This amount is known as the “initial margin”. Subsequent payments, known as “variation margin”, are made or received by the Series Fund each day, depending on the daily fluctuations in the value of the underlying security. Such variation margin is recorded for financial statement purposes on a daily basis as unrealized gain (loss). When the contract expires or is closed, the gain (loss) is realized and is presented in the Statement of Operations as net realized gain (loss) on financial futures contracts.
The Series Fund invests in financial futures contracts in order to hedge its existing portfolio securities, or securities the Series Fund intends to purchase, against fluctuations in value caused by changes in prevailing rates or market conditions. Under a variety of circumstances, the Series Fund may not achieve the anticipated benefits of the financial futures contracts and may realize a loss. The use of futures transactions involves the risk of imperfect correlation in movements in the price of futures contracts and the underlying hedged assets.
Swaps: Certain portfolios of the Series Fund may enter into swap agreements. A swap agreement is an agreement to exchange the return generated by one instrument for the return generated by another instrument. The Portfolios enter into interest rate, forward swap spread lock and credit default swap agreements to manage its exposure to interest rates and credit risk. Interest rate swap agreements involve the exchange by the Portfolios with another party of their respective commitments to pay or receive interest. Forward spread lock swap agreements involve commitments to pay or receive a settlement amount calculated as the difference between the swap spread and a fixed spread, multiplied by the notional amount times the duration of the swap. The swap spread is the difference between the benchmark swap rate (Market rate) and the specific Treasury rate. In a credit default swap, one party makes a stream of payments to another party in exchange for the right to receive a specified return in the event of a default by a third party, typically corporate issues or sovereign issues of an emerging country, on its obligation. Dividends and interest on the securities in the swap are included in the value of the exchange. The swaps are valued daily at current market value and any unrealized gain or loss is included in the Statement of Assets and Liabilities. Gains (losses) are realized on the termination date of the swap and is equal to the difference between a Portfolio’s basis in the swap and the proceeds of the closing transaction, including any fees. During the period that the swap agreement is open, the Portfolios may be subject to risk from the potential inability of the counterparty to meet the terms of the agreement.
Forward currency contracts, written options, short sales, swaps and financial futures contracts involve elements of both market and credit risk in excess of the amounts reflected on the Statement of Assets and Liabilities.
Securities Lending: The Series Fund may lend its portfolio securities to broker-dealers. The loans are secured by collateral at least equal at all times to the market value of the securities loaned. Loans are subject to termination at the option of the borrower or the Series Fund. Upon termination of the loan, the borrower will return to the lender securities identical to the loaned securities. Should the borrower of the securities fail
C3
financially, the Series has the right to repurchase the securities using the collateral in the open market. The Series Fund recognizes income, net of any rebate and securities lending agent fees, for lending its securities in the form of fees or interest on the investment of any cash received as collateral. The Series Fund also continues to receive interest and dividends or amounts equivalent thereto on the securities loaned and recognizes any unrealized gain or loss in the market price of the securities loaned that may occur during the term of the loan.
When-Issued/Delayed Delivery Securities: Securities purchased or sold on a when-issued or delayed-delivery basis may be settled a month or more after trade date; interest income is not accrued until settlement date. At the time a Portfolio enters into such transactions, it instructs the custodian to segregate assets with a current value at least equal to the amount of its when-issued or delayed-delivery purchase commitments.
Securities Transactions and Net Investment Income: Securities transactions are recorded on the trade date. Realized gains (losses) on sales of securities are calculated on the identified cost basis. Dividend income is recorded on the ex-dividend date; interest income, which is comprised of four elements: stated coupon, original issue discount, market discount and market premium, is recorded on the accrual basis. Expenses are recorded on the accrual basis. The Series Fund’s expenses are allocated to the respective Portfolios on the basis of relative net assets except for Portfolio specific expenses which are attributable directly to a Portfolio or class level.
For Portfolios with multiple classes of shares, net investment income (loss) (other than administration and distribution fees, which are charged to the respective class) and unrealized and realized gains (losses) are allocated daily to each class of shares based upon the relative proportion of net assets of each class at the beginning of the day.
Custody Fee Credits: The Series Fund has an arrangement with its custodian bank, whereby uninvested monies earn credits which reduce the fees charged by the custodian. Such custody fee credits are presented as a reduction of gross expenses in the accompanying Statements of Operations.
Taxes: For federal income tax purposes, each Portfolio in the Series Fund is treated as a separate taxpaying entity. It is each Portfolio’s policy to continue to meet the requirements of the Internal Revenue Code applicable to regulated investment companies and to distribute all of its taxable net income and capital gains, if any, to shareholders. Therefore, no federal income tax provision is required.
Withholding taxes on foreign dividends, interest and capital gains have been provided for in accordance with the Series Fund’s understanding of the applicable country’s tax rules and regulations.
Dividends and Distributions: Dividends and distributions of each Portfolio are declared in cash and automatically reinvested in additional shares of the same Portfolio. The Portfolios will declare and distribute dividends from net investment income and distributions from net capital gains, if any, at least annually. Dividends and distributions are recorded on the ex-dividend date.
Dividends and capital gain distributions are determined in accordance with income tax regulations which may differ from generally accepted accounting principles. Permanent book/tax differences relating to income and gains are reclassified amongst undistributed net investment income, accumulated net realized gain or loss and paid in capital in excess of par, as appropriate.
Estimates: The preparation of financial statements requires management to make estimates and assumptions that affect the reported amounts and disclosures in the financial statements. Actual results could differ from these estimates.
The Series Fund has a management agreement with PI. Pursuant to this agreement PI has responsibility for all investment advisory services and supervises the subadvisers’ performance of such services. PI has entered into subadvisory agreements with Prudential Investment Management, Inc. (“PIM”), Jennison Associates LLC (“Jennison”), RS Investment Management, L.P. (“RS”), Pacific Investment Management Company LLC (“PIMCO”) and EARNEST Partners LLC (“EARNEST”) (collectively, the “Subadvisers”), under which each provides investment advisory services for certain Portfolios of the Series Fund. PI pays for the services of the Subadvisers, compensation of officers of the Series Fund, occupancy and certain clerical and administrative expenses of the Series Fund. The Series Fund bears all other costs and expenses.
C4
The management fee paid to PI is computed daily and payable monthly, at the annual rates specified below, of the value of each of the Portfolio’s average daily net assets.
| | | | | | |
Portfolio
| | Management Fee
| | | Effective
Management Fee
| |
Diversified Conservative Growth Portfolio | | 0.75 | % | | 0.75 | % |
Jennison 20/20 Focus Portfolio | | 0.75 | | | 0.75 | |
The Subadvisers provide investment advisory services to the Portfolios as follows. Where more than one Subadviser is listed, each Subadviser provides services to a segment of the Portfolio:
| | |
Portfolio
| | Subadviser(s)
|
Diversified Conservative Growth Portfolio | | EARNEST, RS, Jennison, PIMCO, PIM |
Jennison 20/20 Focus Portfolio | | Jennison |
The Series Fund has a distribution agreement with Prudential Investment Management Services LLC (“PIMS”) which acts as the distributor of the Class I and Class II shares of the Series Fund. The Series Fund compensates PIMS for distributing and servicing the Series Fund’s Class II shares pursuant to a plan of distribution (the “Class II Plan”), regardless of expenses actually incurred by PIMS. The distribution fees are accrued daily and payable monthly. No distribution or service fees are paid to PIMS as distributor of the Class I shares of the Series Fund. Pursuant to the Class II Plan, the Class II shares of each Portfolio compensate PIMS for distribution-related activities at an annual rate of 0.25% of the average daily net assets of the Class II shares.
The Series Fund has an administration agreement with PI which acts as the administrator of the Class II shares of the Series Fund. The administration fee paid to PI is accrued daily and payable monthly, at the annual rate of 0.15% of the average daily net assets of the Class II shares.
PIMS, PI, PIM and Jennison are indirect, wholly-owned subsidiaries of Prudential Financial, Inc. (“Prudential”).
| Note 4: | | Other Transactions with Affiliates |
Prudential Mutual Fund Services LLC (“PMFS”), an affiliate of PI and an indirect, wholly-owned subsidiary of Prudential, serves as the Series Fund’s transfer agent. Transfer agent fees and expenses in the Statements of Operations include certain out-of-pocket expense paid to nonaffiliates, where applicable. During the year ended December 31, 2004, the Series Fund incurred fees for the services of PMFS and as of December 31, 2004 fees were due to PMFS as follows:
| | | | | | |
Portfolio
| | Amount Incurred for the Year Ended December 31, 2004
| | Amount Due as of December 31, 2004
|
Diversified Conservative Growth Portfolio | | $ | 400 | | $ | 30 |
Jennison 20/20 Focus Portfolio | | | 1,000 | | | 100 |
For the year ended December 31, 2004, Prudential Equity Group, LLC, an indirect wholly-owned subsidiary of Prudential and Wachovia Securities, LLC, an affiliate of PI, earned brokerage commissions from transactions executed on behalf of the Series Fund Portfolios as follows:
| | | | | | |
Portfolio
| | Prudential Equity
Group
| | Wachovia
|
Diversified Conservative Growth Portfolio | | $ | 1,796 | | $ | 2,586 |
Jennison 20/20 Focus Portfolio | | | 5,648 | | | 985 |
Certain Portfolios invest in the Taxable Money Market Series (the “Series”), a portfolio of Dryden Core Investment Fund, pursuant to an exemptive order received from the Securities and Exchange Commission. The Series is a money market mutual fund registered under the Investment Company Act of 1940, as amended, and managed by PI. During the year ended December 31, 2004, the following Portfolios earned income from the Series by investing their excess cash:
| | | |
Portfolio
| | Excess Cash Investment
|
Diversified Conservative Growth Portfolio | | $ | 82,243 |
Jennison 20/20 Focus Portfolio | | | 101,669 |
C5
| Note 5: | | Portfolio Securities |
The aggregate cost of purchases and the proceeds from the sales of securities (excluding government securities and short-term issues) for the year ended December 31, 2003 were as follows:
Cost of Purchases:
| | | |
Portfolio
| | |
Diversified Conservative Growth Portfolio | | $ | 109,038,491 |
Jennison 20/20 Focus Portfolio | | | 152,115,444 |
Proceeds from Sales:
| | | |
Portfolio
| | |
Diversified Conservative Growth Portfolio | | $ | 118,092,672 |
Jennison 20/20 Focus Portfolio | | | 108,752,878 |
The Diversified Conservative Growth Portfolio’s written options activity for the year ended December 31, 2004 was as follows:
| | | | | | | |
Diversified Conservative Growth Portfolio
| | Contracts/ Notional
(000)
| | | Premiums
| |
Balance as of December 31, 2003 | | 15,200 | | | $ | 275,482 | |
Options written | | 1,809 | | | | 99,443 | |
Options expired | | (9,184 | ) | | | (220,143 | ) |
Options terminated in closing purchase transactions | | (3,200 | ) | | | (37,568 | ) |
Options exercised | | (49 | ) | | | (17,425 | ) |
| | |
|
| |
|
|
|
Balance as of December 31, 2004 | | 4,576 | | | $ | 99,789 | |
| | |
|
| |
|
|
|
The Diversified Conservative Portfolio Portfolio entered into interest rate swap agreements during the year. Details of the swap agreements outstanding as of December 31, 2004 were as follows:
| | | | | | | | | | | | | | |
| Diversified Conservative Growth Portfolio: | | | | | | | | | | | | |
Counterparty
| | Termination Date
| | Notional Amount (000)
| | Fixed Rate
| | | Floating Rate
| | Unrealized
Appreciation (Depreciation)
| |
Greenwich Capital Derivatives, Inc. (b) | | 06/15/10 | | $ | 1,600 | | 4.00 | % | | 3 month LIBOR | | $ | 8,879 | |
Lehman Brothers (b) | | 06/15/15 | | $ | 2,000 | | 5.00 | % | | 3 month LIBOR | | | 9,914 | |
Barclays (b) | | 06/15/07 | | $ | 600 | | 4.00 | % | | 3 month LIBOR | | | 1,013 | |
Morgan Stanley Capital (b) | | 06/15/15 | | $ | 1,900 | | 5.00 | % | | 3 month LIBOR | | | (2,761 | ) |
UBS Warburg (b) | | 06/17/10 | | EUR | 800 | | 4.00 | % | | 6 month Euribor | | | 27,435 | |
UBS Warburg (a) | | 12/15/14 | | EUR | 3,500 | | 5.00 | % | | 6 month Euribor | | | (392,264 | ) |
Merrill Lynch & Co. (b) | | 06/15/08 | | GBP | 400 | | 5.00 | % | | 6 month LIBOR | | | 6,338 | |
UBS Warburg (a) | | 12/16/14 | | $ | 1,400 | | 5.00 | % | | 3 month LIBOR | | | 811 | |
UBS Warburg (b) | | 12/16/19 | | $ | 1,800 | | 6.00 | % | | 3 month LIBOR | | | 2,694 | |
| | | | | | | | | | | | |
|
|
|
| | | | | | | | | | | | | $ | (337,941 | ) |
| | | | | | | | | | | | |
|
|
|
| | (a) | Portfolio pays the fixed rate and receives the floating rate. |
| | (b) | Portfolio pays the floating rate and receives the fixed rate. |
The Diversified Conservative Growth Portfolio entered into credit default swap agreements during the year ended December 31, 2004. Details of the swap agreements outstanding as of December 31, 2004 were as follows:
| | | | | | | | | | | | | | |
| Diversified Conservative Growth Portfolio: | | | | | | | | | | | | |
Counterparty(a)
| | Termination
Date
| | Notional
Amount
(000)
| | Fixed
Rate
| | | Underlying Bond
| | Unrealized
Appreciation
(Depreciation)
| |
Morgan Stanley | | 12/20/08 | | $ | 200 | | 0.26 | % | | Allstate Corp. (The), 6.125%, due 2/15/12 | | $ | (750 | ) |
UBS | | 12/20/08 | | $ | 200 | | 0.35 | % | | AutoZone, Inc., 5.875%, due 10/15/12 | | | 2,183 | |
C6
| | | | | | | | | | | | | | |
Counterparty(a)
| | Termination
Date
| | Notional
Amount
(000)
| | Fixed
Rate
| | | Underlying Bond
| | Unrealized
Appreciation
(Depreciation)
| |
Bank of America, N.A. | | 12/20/08 | | $ | 100 | | 0.13 | % | | E.I. DuPont de Nemours & Co., 6.875%, due 10/15/09 | | $ | (188 | ) |
Citigroup | | 12/20/08 | | $ | 200 | | 0.28 | % | | Eaton Corp., 5.75%, due 7/15/12 | | | (1,051 | ) |
Barclays | | 12/20/08 | | $ | 200 | | 0.16 | % | | Eli Lilly & Co., Inc., 6.00%, due 3/15/12 | | | (227 | ) |
Morgan Stanley | | 12/20/08 | | $ | 100 | | 0.21 | % | | Emerson Electric Co., 4.625%, due 10/15/12 | | | (190 | ) |
Citigroup | | 12/20/08 | | $ | 100 | | 0.29 | % | | FedEx Corp., 7.25%, due 2/15/11 | | | (412 | ) |
Bear Stearns | | 06/20/05 | | $ | 1,700 | | 0.55 | % | | General Motors Acceptance Corp., 6.875%, due 8/28/12 | | | 1,091 | |
Bear Stearns(b) | | 06/20/05 | | $ | 1,700 | | 0.69 | % | | General Motors Corp., 7.125%, due 7/15/13 | | | 356 | |
Lehman Brothers | | 12/20/08 | | $ | 100 | | 0.97 | % | | Goodrich Corp., 7.625%, due 12/15/12 | | | (2,467 | ) |
Bear Stearns | | 12/20/08 | | $ | 200 | | 0.32 | % | | Hewlett Packard Co., 6.50%, due 7/1/12 | | | (1,349 | ) |
Merrill Lynch | | 12/20/08 | | $ | 100 | | 0.32 | % | | Ingersoll-Rand Co., 6.48%, due 6/1/25 | | | (489 | ) |
Lehman Brothers | | 12/20/08 | | $ | 200 | | 0.11 | % | | Johnson & Johnson, 3.80%, due 5/15/13 | | | (151 | ) |
Lehman Brothers | | 12/20/08 | | $ | 100 | | 0.53 | % | | Lockheed Martin Corp., 8.20%, due 12/1/09 | | | (1,201 | ) |
Lehman Brothers | | 12/20/08 | | $ | 100 | | 0.30 | % | | Masco Corp., 5.875%, due 7/15/12 | | | (305 | ) |
Lehman Brothers | | 12/20/08 | | $ | 100 | | 0.48 | % | | Northrop Grumman Corp., 7.125%, due 2/15/11 | | | (936 | ) |
Lehman Brothers | | 06/20/09 | | $ | 400 | | 0.40 | % | | People’s Republic of China, 6.80%, due 5/23/11 | | | (2,734 | ) |
Lehman Brothers | | 12/20/08 | | $ | 100 | | 0.35 | % | | RadioShack Corp., 7.375%, due 5/15/11 | | | (488 | ) |
Lehman Brothers | | 12/20/08 | | $ | 200 | | 0.12 | % | | The Home Depot, Inc., 5.375%, due 4/1/06 | | | (227 | ) |
Barclays | | 12/20/08 | | $ | 100 | | 0.67 | % | | The Walt Disney Co., 6.375%, due 3/1/12 | | | (1,794 | ) |
Citigroup | | 12/20/08 | | $ | 300 | | 0.14 | % | | Wal-Mart Stores, Inc., 6.875%, due 8/10/09 | | | (896 | ) |
Lehman Brothers | | 12/20/08 | | $ | 100 | | 0.29 | % | | Whirlpool Corp., 8.60%, due 5/1/10 | | | (307 | ) |
| | | | | | | | | | | | |
|
|
|
| | | | | | | | | | | | | $ | (12,532 | ) |
| | | | | | | | | | | | |
|
|
|
| | (a) | Portfolio pays the fixed rate and receives from the counterparty par in the event that the underlying bond defaults. |
| | (b) | The portfolio receives the fixed rate and pays the counterparty par in the event that the underlying bond defaults. |
| Note 6: | | Distributions and Tax Information |
In order to present undistributed net investment income and accumulated net realized capital gains (losses) on the statement of assets and liabilities that more closely represent their tax character, certain adjustments have been made to undistributed net investment income and accumulated net realized gain (loss) on investments.
C7
For the year ended December 31, 2004 the adjustments were as follows:
| | | | | | | | | |
Portfolio
| | Undistributed
Net Investment
Income
| | Accumulated
Net Realized
Gain (Loss)
| | | Paid-in
Capital
|
Diversified Conservative Growth Portfolio(a)(b)(c)(d) | | $ | 1,011,780 | | $ | (1,011,780 | ) | | — |
Jennison 20/20 Focus Portfolio (a) | | | 93 | | | (93 | ) | | — |
| | (a) | Reclassification of net foreign currency gain (loss). |
| | (b) | Reclassification of swap income. |
| | (c) | Reclassification of paydown losses. |
| | (d) | Reclassification of income from defaulted securities. |
The tax character of distributions paid during the year ended December 31, 2004 were as follows:
| | | | | | | | | |
Portfolio
| | Ordinary
Income
| | Long-Term
Capital Gains
| | Total
Distributions
|
Diversified Conservative Growth Portfolio | | $ | 5,196,232 | | $ | — | | $ | 5,196,232 |
Jennison 20/20 Focus Portfolio | | | 61,682 | | | — | | | 61,682 |
The tax character of distributions paid during the year ended December 31, 2003 were as follows:
| | | | | | | | | |
Portfolio
| | Ordinary
Income
| | Long-Term
Capital Gains
| | Total
Distributions
|
Diversified Conservative Growth Portfolio | | $ | 7,087,093 | | $ | — | | $ | 7,087,093 |
Jennison 20/20 Focus Portfolio | | | 127,802 | | | — | | | 127,802 |
At December 31, 2004, the components of distributable earnings on a tax basis and approximate capital loss carryforwards were as follows:
| | | | | | | | | | | | | | | | | | |
Portfolio
| | Ordinary
Income
| | Long-Term
Capital Gains
| | Approximate
Capital Loss
Carryforward(a)
| | | Expiration
|
| | | | | 2009
| | 2010
| | 2011
|
Diversified Conservative Growth | | $ | 4,898,162 | | — | | $ | 7,282,000 | (b) | | $ | — | | $ | 7,282,000 | | | — |
Jennison 20/20 Focus | | | 177,361 | | — | | | 9,102,000 | (c) | | $ | 216,000 | | | 7,511,000 | | $ | 1,375,000 |
| | (a) | Accordingly, no capital gain distribution is expected to be paid to shareholders until net gains have been realized in excess of such carryforwards. |
| | (b) | Approximately $9,210,400 of its capital loss carryforward was used to offset net taxable gains realized in the fiscal year ended December 31, 2004. |
| | (c) | Approximately $5,859,000 of its capital loss carryforward was used to offset net taxable gains realized in the fiscal year ended December 31, 2004. |
The difference between book and tax basis is primarily cost basis adjustments and post-October losses (the Portfolios have elected to treat losses incurred in the period November 1, 2004 through December 31, 2004 as having been incurred in the following fiscal year) which are presented below:
| | | |
Portfolio
| | Approximate Post October
Losses
|
| | Currency
|
Jennison 20/20 Focus Portfolio | | $ | 200 |
The United States federal income tax basis and unrealized appreciation (depreciation) of the Series Fund’s investments and the total net unrealized appreciation (depreciation) as of December 31, 2004 were as follows:
| | | | | | | | | | | | | | | | | | | |
Portfolio
| | Tax Basis
| | Appreciation
| | Depreciation
| | Net Appreciation (Depreciation)
| | Other
Cost
Basis
Adjusted
| | | Total Net Unrealized Appreciation (Depreciation)
|
Diversified Conservative Growth Portfolio | | $ | 156,714,563 | | $ | 18,091,333 | | $ | 1,865,052 | | $ | 16,226,281 | | $ | (371,952 | ) | | $ | 15,854,329 |
Jennison 20/20 Focus Portfolio | | | 141,384,683 | | | 29,531,697 | | | 505,224 | | | 29,026,473 | | | 168 | | | | 29,026,641 |
C8
The differences between book basis and tax basis of investments are primarily attributable to deferred losses on wash sales and mark to market on passive foreign investments companies. The other cost basis adjustments are primarily attributable to appreciation (depreciation) of foreign currency and mark to market of receivables and payables.
The Series Fund offers Class I and Class II shares. Neither Class I nor Class II shares of a Portfolio are subject to any sales charge or redemption charge and are sold at the net asset value of the Portfolio. Class I shares are sold only to certain separate accounts of Prudential to fund benefits under certain variable life insurance and variable annuity contracts (“Contracts”). Class II shares are sold only to separate accounts of non-Prudential insurance companies as investment options under certain contracts. The separate accounts invest in shares of the Series Fund through subaccounts that correspond to the Portfolios. The separate accounts will redeem shares of the Series Fund to the extent necessary to provide benefits under the contracts or for such other purposes as may be consistent with the contracts. As of December 31, 2004, the Jennison 20/20 Focus Portfolio has Class II shares outstanding.
Transactions in shares of common stock of the Jennison 20/20 Focus were as follows:
| | | | | | | |
| Jennison 20/20 Focus Portfolio: | | | | | | | |
Class I
| | Shares
| | | Amount
| |
Year ended December 31, 2004: | | | | | | | |
Capital stock sold | | 228,915 | | | $ | 2,558,089 | |
Capital stock issued in reinvestment of dividends and distributions | | 5,765 | | | | 61,682 | |
Capital stock repurchased | | (753,278 | ) | | | (8,343,927 | ) |
| | |
|
| |
|
|
|
Net increase (decrease) in shares outstanding | | (518,598 | ) | | $ | (5,724,156 | ) |
| | |
|
| |
|
|
|
Year ended December 31, 2003: | | | | | | | |
Capital stock sold | | 196,317 | | | $ | 1,802,208 | |
Capital stock issued in reinvestment of dividends and distributions | | 15,798 | | | | 127,802 | |
Capital stock repurchased | | (1,064,818 | ) | | | (9,437,398 | ) |
| | |
|
| |
|
|
|
Net increase (decrease) in shares outstanding | | (852,703 | ) | | $ | (7,507,388 | ) |
| | |
|
| |
|
|
|
| | |
Class II
| | | | | | |
Year ended December 31, 2004: | | | | | | | |
Capital stock sold | | 5,673,614 | | | $ | 62,460,038 | |
Capital stock repurchased | | (1,147,786 | ) | | | (12,270,703 | ) |
| | |
|
| |
|
|
|
Net increase (decrease) in shares outstanding | | 4,525,828 | | | $ | 50,189,335 | |
| | |
|
| |
|
|
|
Year ended December 31, 2003: | | | | | | | |
Capital stock sold | | 2,922,818 | | | $ | 27,443,579 | |
Capital stock repurchased | | (96,920 | ) | | | (869,041 | ) |
| | |
|
| |
|
|
|
Net increase (decrease) in shares outstanding | | 2,825,898 | | | $ | 26,574,538 | |
| | |
|
| |
|
|
|
The Series Fund (excluding the Money Market Portfolio), along with other affiliated registered investment companies (the “Funds”), is a party to a syndicated credit agreement (“SCA”) with a group of banks. For the period January 1, 2004 through April 30, 2004, the SCA provided for a commitment of $800 million and allowed the Funds to increase the commitment to $1 billion, if necessary. Effective May 1, 2004, the SCA provided for a commitment of $500 million. Interest on any borrowings under the SCA would be incurred at market rates. The Funds paid a commitment fee of .08 of 1% of the unused portion of the SCA. The commitment fee is accrued daily and paid quarterly and is allocated to the Funds pro rata, based on net assets. The purpose of the SCA is to serve as an alternative source of funding for capital share redemptions. The expiration date of the SCA was October 29, 2004. Effective October 29, 2004, the Funds entered into a revised credit agreement with two banks. The commitment under the revised credit agreement continues to be $500 million. The Funds pay a commitment fee of .075 of 1% of the unused portion of the revised credit agreement. The expiration date of the revised credit agreement is October 28, 2005.
C9
The following Portfolio utilized the line of credit during the year ended December 31, 2004. The average balance is for the number of days the Portfolio had an outstanding balance.
| | | | | | | | |
Portfolio
| | Average Balance
Outstanding
| | Number of Days
Outstanding
| | Weighted Average
Interest Rates
| |
Jennison 20/20 Focus Portfolio | | $ | 289,165 | | 15 | | 1.94 | % |
| Note 9: | | Change in Independent Registered Public Accounting Firm (Unaudited) |
PricewaterhouseCoopers LLP was previously the independent registered public accounting firm for the Series Fund. The decision to change the independent registered public accounting firm was approved by the Audit Committee and by the Board of Directors in a meeting help on September 2, 2003, resulting in KPMG LLP’s appointment as the independent registered public accounting firm of the Series Fund. The reports on the financial statements of the Series Fund audited by PricewaterhouseCoopers LLP through the year ended December 31, 2003 did not contain an adverse opinion or disclaimer of opinion, and were not qualified or modified as to uncertainty, audit scope or accounting principles. There were no disagreements between the Series Fund and PricewaterhouseCoopers LLP on any matter of accounting principles or practices, financial statement disclosure, or auditing scope or procedures.
As of December 31, 2004, all of Class I shares of each Portfolio were owned of record by The Prudential Insurance Company of America (“PICA”) on behalf of the owners of the variable insurance products issued by PICA.
C10
Financial Highlights
| | | | | | | | | | | | | | | | | | | | |
| | | Diversified Conservative Growth Portfolio
| |
| | | Year Ended December 31,
| |
| | | 2004
| | | 2003
| | | 2002
| | | 2001
| | | 2000
| |
Per Share Operating Performance: | | | | | | | | | | | | | | | | | | | | |
Net Asset Value, beginning of year | | $ | 10.63 | | | $ | 9.17 | | | $ | 9.89 | | | $ | 10.16 | | | $ | 10.37 | |
| | |
|
|
| |
|
|
| |
|
|
| |
|
|
| |
|
|
|
Income (Loss) From Investment Operations: | | | | | | | | | | | | | | | | | | | | |
Net investment income | | | 0.26 | | | | 0.32 | | | | 0.38 | | | | 0.42 | | | | 0.46 | |
Net realized and unrealized gains (losses) on investments | | | 0.72 | | | | 1.58 | | | | (1.08 | ) | | | (0.28 | ) | | | (0.09 | ) |
| | |
|
|
| |
|
|
| |
|
|
| |
|
|
| |
|
|
|
Total from investment operations | | | 0.98 | | | | 1.90 | | | | (0.70 | ) | | | 0.14 | | | | 0.37 | |
| | |
|
|
| |
|
|
| |
|
|
| |
|
|
| |
|
|
|
Less Dividends and Distributions: | | | | | | | | | | | | | | | | | | | | |
Dividends from net investment income | | | (0.33 | ) | | | (0.44 | ) | | | (0.02 | ) | | | (0.41 | ) | | | (0.46 | ) |
Distributions in excess of net investment income | | | — | | | | — | | | | — | | | | — | | | | (0.01 | ) |
Distributions from net realized gains | | | — | | | | — | | | | — | | | | — | | | | (0.09 | ) |
Distributions in excess of net realized gains | | | — | | | | — | | | | — | | | | — | | | | (0.02 | ) |
| | |
|
|
| |
|
|
| |
|
|
| |
|
|
| |
|
|
|
Total dividends and distributions | | | (0.33 | ) | | | (0.44 | ) | | | (0.02 | ) | | | (0.41 | ) | | | (0.58 | ) |
| | |
|
|
| |
|
|
| |
|
|
| |
|
|
| |
|
|
|
Net Asset Value, end of year | | $ | 11.28 | | | $ | 10.63 | | | $ | 9.17 | | | $ | 9.89 | | | $ | 10.16 | |
| | |
|
|
| |
|
|
| |
|
|
| |
|
|
| |
|
|
|
Total Investment Return(a) | | | 9.56 | % | | | 21.57 | % | | | (7.10 | )% | | | 1.51 | % | | | 3.79 | % |
Ratios/Supplemental Data: | | | | | | | | | | | | | | | | | | | | |
Net assets, end of year (in millions) | | $ | 167.0 | | | $ | 169.6 | | | $ | 157.1 | | | $ | 204.1 | | | $ | 204.8 | |
Ratios to average net assets: | | | | | | | | | | | | | | | | | | | | |
Expenses | | | 0.97 | % | | | 0.98 | % | | | 0.92 | % | | | 0.94 | % | | | 0.93 | % |
Net investment income | | | 2.29 | % | | | 2.93 | % | | | 3.63 | % | | | 4.17 | % | | | 4.71 | % |
Portfolio turnover | | | 186 | % | | | 224 | % | | | 271 | % | | | 315 | % | | | 319 | % |
| (a) | Total investment return is calculated assuming a purchase of shares on the first day and a sale on the last day of each year reported and includes reinvestment of dividends and distributions and does not reflect the effect of insurance contract charges. |
| | | | | | | | | | | | | | | | | | | | |
| | | Jennison 20/20 Focus Portfolio
| |
| | | Class I
| |
| | | Year Ended December 31,
| |
| | | 2004
| | | 2003
| | | 2002
| | | 2001
| | | 2000
| |
Per Share Operating Performance: | | | | | | | | | | | | | | | | | | | | |
Net Asset Value, beginning of year | | $ | 10.68 | | | $ | 8.28 | | | $ | 10.65 | | | $ | 10.99 | | | $ | 11.88 | |
| | |
|
|
| |
|
|
| |
|
|
| |
|
|
| |
|
|
|
Income (Loss) From Investment Operations: | | | | | | | | | | | | | | | | | | | | |
Net investment income | | | 0.04 | | | | 0.02 | | | | 0.02 | | | | 0.05 | | | | 0.05 | |
Net realized and unrealized gains (losses) on investments | | | 1.66 | | | | 2.40 | | | | (2.39 | ) | | | (0.15 | ) | | | (0.71 | ) |
| | |
|
|
| |
|
|
| |
|
|
| |
|
|
| |
|
|
|
Total from investment operations | | | 1.70 | | | | 2.42 | | | | (2.37 | ) | | | (0.10 | ) | | | (0.66 | ) |
| | |
|
|
| |
|
|
| |
|
|
| |
|
|
| |
|
|
|
Less Dividends and Distributions: | | | | | | | | | | | | | | | | | | | | |
Dividends from net investment income | | | (0.01 | ) | | | (0.02 | ) | | | — | (b) | | | (0.05 | ) | | | (0.05 | ) |
Distributions from net realized gains | | | — | | | | — | | | | — | | | | (0.19 | ) | | | (0.18 | ) |
| | |
|
|
| |
|
|
| |
|
|
| |
|
|
| |
|
|
|
Total dividends and distributions | | | (0.01 | ) | | | (0.02 | ) | | | — | | | | (0.24 | ) | | | (0.23 | ) |
| | |
|
|
| |
|
|
| |
|
|
| |
|
|
| |
|
|
|
Net Asset Value, end of year | | $ | 12.37 | | | $ | 10.68 | | | $ | 8.28 | | | $ | 10.65 | | | $ | 10.99 | |
| | |
|
|
| |
|
|
| |
|
|
| |
|
|
| |
|
|
|
Total Investment Return(a): | | | 15.94 | % | | | 29.30 | % | | | (22.24 | )% | | | (1.01 | )% | | | (5.41 | )% |
Ratios Supplemental Data: | | | | | | | | | | | | | | | | | | | | |
Net assets, end of year (in millions) | | $ | 68.4 | | | $ | 64.6 | | | $ | 57.2 | | | $ | 87.8 | | | $ | 95.8 | |
Ratios to average net assets: | | | | | | | | | | | | | | | | | | | | |
Expenses | | | 0.88 | % | | | 0.95 | % | | | 0.97 | % | | | 0.93 | % | | | 0.88 | % |
Net investment income | | | 0.29 | % | | | 0.18 | % | | | 0.19 | % | | | 0.46 | % | | | 0.45 | % |
Portfolio turnover rate | | | 87 | % | | | 102 | % | | | 75 | % | | | 131 | % | | | 163 | % |
| (a) | Total investment return is calculated assuming a purchase of shares on the first day and a sale on the last day of each year reported and includes reinvestment of dividends and distributions and does not reflect the effect of insurance contract charges. |
| (b) | Less than $0.005 per share. |
SEE NOTES TO FINANCIAL STATEMENTS.
D1
Financial Highlights
| | | | | | | | | | | | | | | | | | | | |
| | | Jennison 20/20 Focus Portfolio
| |
| | | Class II
| |
| | | Year Ended
December 31,
| | | February 15, 2000(a) through December 31, 2000
| |
| | | 2004
| | | 2003
| | | 2002
| | | 2001
| | |
Per Share Operating Performance: | | | | | | | | | | | | | | | | | | | | |
Net Asset Value, beginning of period | | $ | 10.60 | | | $ | 8.23 | | | $ | 10.63 | | | $ | 10.99 | | | $ | 11.36 | |
| | |
|
|
| |
|
|
| |
|
|
| |
|
|
| |
|
|
|
Income (Loss) From Investment Operations: | | | | | | | | | | | | | | | | | | | | |
Net investment income | | | 0.01 | | | | — | (d) | | | — | (d) | | | 0.02 | | | | 0.01 | |
Net realized and unrealized gains (losses) on investments | | | 1.62 | | | | 2.37 | | | | (2.40 | ) | | | (0.15 | ) | | | (0.19 | ) |
| | |
|
|
| |
|
|
| |
|
|
| |
|
|
| |
|
|
|
Total from investment operations | | | 1.63 | | | | 2.37 | | | | (2.40 | ) | | | (0.13 | ) | | | (0.18 | ) |
| | |
|
|
| |
|
|
| |
|
|
| |
|
|
| |
|
|
|
Less Dividends and Distributions: | | | | | | | | | | | | | | | | | | | | |
Dividends from net investment income | | | — | | | | — | | | | — | | | | (0.04 | ) | | | (0.01 | ) |
Distributions from net realized gains | | | — | | | | — | | | | — | | | | (0.19 | ) | | | (0.18 | ) |
| | |
|
|
| |
|
|
| |
|
|
| |
|
|
| |
|
|
|
Total dividends and distributions | | | — | | | | — | | | | — | | | | (0.23 | ) | | | (0.19 | ) |
| | |
|
|
| |
|
|
| |
|
|
| |
|
|
| |
|
|
|
Net Asset Value, end of period | | $ | 12.23 | | | $ | 10.60 | | | $ | 8.23 | | | $ | 10.63 | | | $ | 10.99 | |
| | |
|
|
| |
|
|
| |
|
|
| |
|
|
| |
|
|
|
Total Investment Return(b): | | | 15.38 | % | | | 28.80 | % | | | (22.58 | )% | | | (1.30 | )% | | | (1.53 | )% |
Ratios Supplemental Data: | | | | | | | | | | | | | | | | | | | | |
Net assets, end of period (in millions) | | $ | 101.0 | | | $ | 39.6 | | | $ | 7.5 | | | $ | 2.0 | | | $ | 0.7 | |
Ratios to average net assets: | | | | | | | | | | | | | | | | | | | | |
Expenses | | | 1.28 | % | | | 1.35 | % | | | 1.37 | % | | | 1.33 | % | | | 1.28 | %(c) |
Net investment income (loss) | | | (0.02 | )% | | | (0.22 | )% | | | (0.21 | )% | | | 0.06 | % | | | 0.10 | %(c) |
Portfolio turnover rate | | | 87 | % | | | 102 | % | | | 75 | % | | | 131 | % | | | 163 | %(e) |
| (a) | Commencement of offering of Class II shares. |
| (b) | Total investment return is calculated assuming a purchase of shares on the first day and a sale on the last day of each period reported and includes reinvestment of dividends and distributions and does not reflect the effect of insurance contract charges. Total investment returns for periods of less than one full year are not annualized. |
| (d) | Less than $0.005 per share. |
SEE NOTES TO FINANCIAL STATEMENTS.
D2
Report of Independent Registered Public Accounting Firm
The Board of Directors and Shareholders of
The Prudential Series Fund, Inc.
We have audited the accompanying statements of assets and liabilities of The Prudential Series Fund, Inc., (comprised of Diversified Conservative Growth Portfolio and Jennison 20/20 Focus Portfolio) (hereafter referred to as the “Fund”), including the portfolios of investments, as of December 31, 2004, and the related statements of operations, the statements of changes in net assets, and the financial highlights for the year then ended. These financial statements and financial highlights are the responsibility of the Fund’s management. Our responsibility is to express an opinion on these financial statements and financial highlights based on our audit. The statements of changes in net assets for the year ended December 31, 2003 and the financial highlights for the periods presented prior to December 31, 2004, were audited by another independent registered public accounting firm, whose report dated, February 13, 2004, expressed an unqualified opinion thereon.
We conducted our audit in accordance with the standards of the Public Company Accounting Oversight Board (United States). Those standards require that we plan and perform the audit to obtain reasonable assurance about whether the financial statements and financial highlights are free of material misstatement. An audit includes examining, on a test basis, evidence supporting the amounts and disclosures in the financial statements. Our procedures included confirmation of securities owned as of December 31, 2004, by correspondence with the custodian and brokers or by other appropriate auditing procedures where replies from brokers were not received. As to securities purchased or sold but not yet received or delivered, we performed other appropriate auditing procedures. An audit also includes assessing the accounting principles used and significant estimates made by management, as well as evaluating the overall financial statement presentation. We believe that our audit provides a reasonable basis for our opinion.
In our opinion, the financial statements and financial highlights referred to above present fairly, in all material respects, the financial position of the Fund as of December 31, 2004, and the results of its operations, the changes in its net assets, and the financial highlights for the year then ended, in conformity with U.S. generally accepted accounting principles.
New York, New York
February 14, 2005
E1
Tax Information
(Unaudited)
Although we understand that the vast majority, if not all, of the shareholders/contract holders of the Series Fund currently maintain a tax deferred status, we are nevertheless required by the Internal Revenue Code to advise you within 60 days of the Series Fund's fiscal year end (December 31, 2004) as to the federal tax status of dividends paid by the Series Fund during such fiscal year. Accordingly, we are advising you that in 2004, the Series Fund paid dividends as follows:
| | | | | | | | | |
| | | Ordinary Dividends
| | Long-Term Capital Gains
| | Total Distributions
|
Diversified Conservative Growth Portfolio | | $ | 0.331 | | $ | — | | $ | 0.331 |
Jennison 20/20 Focus Portfolio (Class I) | | | 0.010 | | | — | | | 0.010 |
Jennison 20/20 Focus Portfolio (Class II) | | | — | | | — | | | — |
Pursuant to Section 854 of the Internal Revenue Code, the following percentages of distributions from ordinary income for the year ended December 31, 2004 have been designated as being eligible for the dividends received deduction available to corporate shareholders:
| | | |
| | | Corporate Dividend Received Deduction
| |
Diversified Conservative Growth Portfolio | | 16.22 | % |
Jennison 20/20 Focus Portfolio | | 100 | % |
E2
MANAGEMENT OF THE FUND
(Unaudited)
Information pertaining to the Directors of the Fund is set forth below. Directors who are not deemed to be “interested persons” of the Fund as defined in the Investment Company Act are referred to as “Independent Directors.” Directors who are deemed to be “interested persons” of the Fund are referred to as “Interested Directors.” “Fund Complex” consists of the Fund and any other investment companies managed by PI.
| | | | | | |
Name, Address**,
and Birthdate | | Position with Fund*
Term of Office***
Length of Time Served | | Number of Portfolios
In Fund Complex
Overseen by Director | | Other Directorships
Held by the Director**** |
| | | |
Saul K. Fenster, Ph.D. (3/22/33) | | Director, Since 1983 | | 74 | | Member (since 2000), Board of Directors of IDT Corporation |
|
| Principal Occupations During Past 5 Years – Currently President Emeritus of New Jersey Institute of Technology (since 2002); formerly President (1978-2002) of New Jersey Institute of Technology; Commissioner (1998-2002) of the Middle States Association Commission on Higher Education; Commissioner (1985-2002) of the New Jersey Commission on Science and Technology; Director (since 1998) of Society of Manufacturing Engineering Education Foundation, Director (since 1995) of Prosperity New Jersey; formerly a director or trustee of Liberty Science Center, Research and Development Council of New Jersey, New Jersey State Chamber of Commerce, and National Action Council for Minorities in Engineering. |
| | | |
Delayne Dedrick Gold (7/15/38) | | Director, Since 2001 | | 74 | | — |
|
| Principal Occupations During Past 5 Years – Marketing Consultant (1982-present); formerly Senior Vice President and Member of the Board of Directors, Prudential Bache Securities, Inc. |
| | | |
Julian A. Lerner (11/12/24) | | Director Emeritus
Since 2003 | | 74 | | — |
|
| Principal Occupations During Past 5 Years – Senior Vice President and Portfolio Manager (1986-1995); AIM Charter Fund and AIM Summit Fund. |
| | | |
W. Scott McDonald, Jr. (4/19/37) | | Vice Chairman and Director
Since 1983 | | 74 | | — |
|
| Principal Occupations During Past 5 Years – Of Counsel (since 2004); formerly Management Consultant (1997-2004) at Kaludis Consulting Group, Inc. (company serving higher education); Formerly principal (1995-1997), Scott McDonald & Associates, Chief Operating Officer (1991-1995), Fairleigh Dickinson University, Executive Vice President and Chief Operating Officer (1975-1991), Drew University, interim President (1988-1990), Drew University and former Director of School, College and University Underwriters Ltd. |
| | | |
Thomas T. Mooney (11/11/41) | | Chairman and Director Since 2001 | | 74 | | Director (since 1988) of The High Yield Plus Fund, Inc. |
|
| Principal Occupations During Past 5 Years – Chief Executive Officer, the Rochester Business Alliance, formerly President of the Greater Rochester Metro Chamber of Commerce, Rochester City Manager; formerly Deputy Monroe County Executive; Director of Blue Cross of Rochester and Executive Service Corps of Rochester; Director of the Rochester Individual Practice Association; Director of Rural Metro Ambulance Rochester (since 2003); Vice President and Director of Hi-tech of Rochester. |
| | | |
Thomas M. O’Brien (12/5/50) | | Director, Since 2003 | | 74 | | Director (December 1996-May 2000) of North Fork Bancorporation, Inc.; Director (since May 2000) of Atlantic Bank of New York. |
|
| Principal Occupations During Past 5 Years – President and Chief Executive Officer (since May 2000) of Atlantic Bank of New York; Vice Chairman (January 1997-April 2000) of North Fork Bank; President and Chief Executive Officer (December 1984-December 1996) of North Side Savings Bank. |
| | | |
John A. Pileski (9/2/39) | | Director, Since 2003 | | 74 | | Director (since April 2001) of New York Community Bank. |
|
| Principal Occupations During Past 5 Years – Retired since June 2000; Tax Partner (July 1974-June 2000) of KPMG, LLP. |
| | | |
F. Don Schwartz (8/14/35) | | Director, Since 2003 | | 74 | | — |
|
| Principal Occupations During Past 5 Years – Management Consultant (since April 1985). |
| | | | | | |
|
Interested Directors
|
Name, Address**,
and Birthdate | | Position with Fund*
Term of Office***
Length of Time Served | | Number of Portfolios
In Fund Complex
Overseen by Director | | Other Directorships
Held by the Director**** |
| | | |
*David R. Odenath (3/8/57) | | President and Director Since 1999 | | 74 | | — |
|
| Principal Occupations During Past 5 Years – President of Prudential Annuities (since August 2002); Executive Vice President (since May 2003) of American Skandia Investment Services, Inc; Chief Executive Officer and Director (since May 2003) of American Skandia Life Assurance Corporation, American Skandia Information Services and Technology Corporation and Skandia U.S. Inc.; President, Chief Executive Officer and Director (since May 2003) of American Skandia Marketing, Inc.; Formerly President, Chief Executive Officer, Chief Operating Officer and Officer-In-Charge (1999-2003) of PI; Senior Vice President (since June 1999) of Prudential; formerly Senior Vice President (August 1993-May 1999) of PaineWebber Group, Inc. |
F1
| | | | | | |
|
Interested Directors—(continued)
|
Name, Address**,
and Birthdate | | Position with Fund*
Term of Office***
Length of Time Served | | Number of Portfolios
In Fund Complex
Overseen by Director | | Other Directorships
Held by the Director**** |
| | | |
*Robert F. Gunia (12/15/46) | | Vice President and Director Since 2001 | | 167 | | Vice President and Director (since May 1989) and Treasurer (since 1999) of The Asia Pacific Fund, Inc. |
|
| Principal Occupations During Past 5 Years – Chief Administrative Officer (since June 1999) of Prudential Investments LLC (PI); Executive Vice President and Treasurer (since January 1996) of PI; President (since April 1999) of Prudential Investment Management Services LLC (PIMS); Corporate Vice President (since September 1997) of The Prudential Insurance Company of America (Prudential); Director, Executive Vice President and Chief Administrative Officer (since May 2003) of American Skandia Investment Services, Inc, American Skandia Advisory Services, Inc., and American Skandia Fund Services, Inc.; Executive Vice President (since March 1999) and Treasurer (since May 2000) of Prudential Mutual Fund Services LLC; formerly Senior Vice President (March 1987-May 1999) of Prudential Securities Incorporated (Prudential Securities). |
| | | | | | |
Name, Address**,
and Birthdate | | Position with Fund*
Term of Office***
Length of Time Served | | Principal Occupations During Past 5 Years |
| | |
Grace C. Torres (6/28/59) | | Treasurer and Principal Financial and Accounting Officer Since 1997 | | Senior Vice President (since January 2000) of PI; Senior Vice President and Assistant Treasurer (since
May 2003) of American Skandia Investment Services, Inc. and American Skandia Advisory Services,
Inc.; formerly First Vice President (December 1996-January 2000) of PI and First Vice President (March
1993-1999) of Prudential Securities. |
| | |
| Jonathan D. Shain (8/9/58) | | Secretary, Since 2001 | | Vice President and Corporate Counsel (since August 1998) of Prudential Insurance; Vice President and
Assistant Secretary (since May 2003) of American Skandia Investment Services, Inc. and American
Skandia Fund Services, Inc.; formerly Attorney with Fleet Bank, N.A. (January 1997-July 1998). |
| | |
William V. Healey (7/28/53) | | Chief Legal Officer Since 2004 | | Vice President and Associate General Counsel (since 1998) of Prudential; Executive Vice President and
Chief Legal Officer (since February 1999) of Prudential Investments LLC; Senior Vice President, Chief
Legal Officer and Secretary (since December 1998) of Prudential Investment Management Services
LLC; Executive Vice President and Chief Legal Officer (since February 1999) of Prudential Mutual Fund
Services LLC; Vice President and Secretary (since October 1998) of Prudential Investment
Management, Inc.; Executive Vice President and Chief Legal Officer (since May 2003) of American
Skandia Investment Services, Inc., American Skandia Fund Services, Inc. and American Skandia
Advisory Services, Inc.; Director (June 1999-June 2002 and June 2003-present) of ICI Mutual Insurance
Company; prior to August 1998, Associate General Counsel of the Dreyfus Corporation (Dreyfus), a
subsidiary of Mellon Bank, N.A. (Mellon Bank), and an officer and/or director of various affiliates of Mellon
Bank and Dreyfus; Assistant Secretary (since June 2004) of The Asia Pacific Fund, Inc. |
| | |
Edward P. Macdonald (7/4/67) | | Assistant Secretary
Since 2003 | | Vice President and Assistant Secretary (since May 2003) of American Skandia Investment Services,
Inc.; Chief Counsel, Investment Management of American Skandia, Inc. (ASI) (since July 2002); Senior
Counsel, Securities of ASI (September 2000-June 2002); Counsel of ASI (December 1999-August
2000); Senior Associate of Counsel of ASI (April 1999-December 1999); Branch Chief, Senior Counsel
and Attorney at the U.S. Securities and Exchange Commission (October 1994-April 1999). |
| | |
Lee D. Augsburger (6/7/59) | | Chief Compliance Officer
Since 2004 | | Vice President and Chief Compliance Officer (since May 2003) of PI; Vice President and Chief
Compliance Officer (since October 2000) of Prudential Investment Management, Inc.; formerly Vice
President and Chief Legal Officer-Annuities (August 1999-October 2000) of Prudential Insurance
Company of America; Vice President and Corporate Counsel (November 1997-August 1999) of
Prudential Insurance Company of America. |
| | |
Maryanne Ryan (10/12/64) | | Anti-Money Laundering Compliance Officer Since 2002 | | Vice President, Prudential (since November 1998), First Vice President Prudential Securities (March 1997-
May 1998); Anti-Money Laundering Compliance Officer (since 2003) of American Skandia Investment
Services, Inc., American Skandia Advisory Services, Inc. and American Skandia Marketing, Inc. |
| | |
Helene Gurian (10/25/53) | | Acting Anti-Money Laundering Compliance Officer Since 2004 | | Vice President, Prudential (since July 1997). Vice President, Compliance (July 1997-January 2001); Vice
President, Compliance and Risk Officer, Retail Distribution (January 2001-May 2002); Vice President,
Corporate Investigations (May 2002-present) responsible for supervision of Prudential’s fraud
investigations, anti-money laundering program and high technology investigation unit. |
* “Interested” Director, as defined in the Investment Company Act, by reason of employment with the Manager (as defined below), and/or the Distributor (as defined below).
** Unless otherwise noted, the address of the Directors and Officers is c/o: Prudential Investments LLC, Gateway Center Three, 100 Mulberry Street, Newark, New Jersey 07102.
*** There is no set term of office for Directors and Officers. The Independent Directors have adopted a retirement policy, which calls for the retirement of Directors on December 31 of the year in which they reach the age of 75. The table shows how long they have served as Director and/or Officer.
**** This column includes only directorships of companies required to register, or file reports with the SEC under the Securities Exchange Act of 1934 (i.e., “public companies”) or other investment companies registered under the Investment Company Act.
F2
This report contains financial information about certain investment choices that may be available on the variable life insurance and variable annuity contracts listed below. You may receive additional reports and should refer to your variable life insurance or variable annuity contract prospectus to determine which portfolios are available to you.
Variable Life Insurance
Variable Annuities
| n | | Pruco Life’s Discovery Select® |
| n | | Pruco Life of New Jersey’s Discovery Select® |
| n | | Pruco Life’s Discovery Choice® |
| n | | Pruco Life of New Jersey’s Discovery Choice® |
Variable life insurance is distributed by Pruco Securities LLC, member SIPC, 751 Broad Street, Newark, NJ 07102-3777. Variable annuities are distributed through Prudential Investment Management Services LLC (PIMS), member SIPC, Gateway Center Three, 14th Floor, Newark, NJ 07102-4077. Variable life insurance and variable annuities are issued by The Prudential Insurance Company of America, Pruco Life Insurance Company, or in New York, Pruco Life Insurance Company of New Jersey. All are Prudential Financial companies. Each is solely responsible for its own financial condition and contractual obligations. Guarantees are based on the claims-paying ability of the issuing company.
| | | | | | |
| Variable Contracts: | | ARE NOT FDIC INSURED | | ARE NOT BANK GUARANTEED | | MAY LOSE VALUE |
The 2004 Audited Financial Statements of Pruco Life Insurance Company, Pruco Life Insurance Company of New Jersey, and The Prudential Insurance Company of America will be available commencing April 30, 2005. You may call (888) 778-2888 to obtain a free copy of the audited financial statements of the insurance company that issued your contract.
To reduce costs, we now generally send only a single copy of prospectuses and shareholder reports to each household (“householding”) in lieu of sending a copy to each Contract Owner who resides in the household. You should be aware that by calling (877) 778-5008, you can revoke or “opt out” of householding at any time.
Prudential Financial and the Rock logo are registered service marks of The Prudential Insurance Company of America, Newark, NJ, and its affiliates.
PO Box 7478
Philadelphia, PA 19101-7478
Presorted
Standard
U.S. Postage
PAID
Prudential
IFS-2005-A094687 PSF-AR-C Ed. 01/31/2005

Item 2 – Code of Ethics — See Exhibit (a)
As of the end of the period covered by this report, the registrant has adopted a code of ethics (the “Section 406 Standards for Investment Companies – Ethical Standards for Principal Executive and Financial Officers”) that applies to the registrant’s Principal Executive Officer and Principal Financial Officer; the registrant’s Principal Financial Officer also serves as the Principal Accounting Officer.
The registrant hereby undertakes to provide any person, without charge, upon request, a copy of the code of ethics. To request a copy of the code of ethics, contact the registrant 973-802-6469, and ask for a copy of the Section 406 Standards for Investment Companies - Ethical Standards for Principal Executive and Financial Officers.
Item 3 – Audit Committee Financial Expert –
The registrant’s Board has determined that Mr. John A. Pileski, member of the Board’s Audit Committee is an “audit committee financial expert,” and that he is “independent,” for purposes of this Item.
Item 4 – Principal Accountant Fees and Services –
(a) Audit Fees
For the fiscal year ended December 31, 2004, KPMG LLP (“KPMG”), the Registrant’s principal accountant, billed the Registrant $575,500 for professional services rendered for the audit of the Registrant’s annual financial statements or services that are normally provided in connection with statutory and regulatory filings. KPMG did not serve as the Registrant’s principal accountant during fiscal year ended December 31, 2003, so no information for that fiscal year is provided.
(b) Audit-Related Fees
None.
(c) Tax Fees
None.
(d) All Other Fees
None.
(e) (1) Audit Committee Pre-Approval Policies and Procedures
THE PRUDENTIAL MUTUAL FUNDS
AUDIT COMMITTEE POLICY
on
Pre-Approval of Services Provided by the Independent Accountants
The Audit Committee of each Prudential Mutual Fund is charged with the responsibility to monitor the independence of the Fund’s independent accountants. As part of this responsibility, the Audit Committee must pre-approve any independent accounting firm’s engagement to render audit and/or permissible non-audit services, as required by law. In evaluating a proposed engagement of the independent accountants, the Audit Committee will assess the effect that the engagement might reasonably be expected to have on the accountant’s independence. The Committee’s evaluation will be based on:
| | • | | a review of the nature of the professional services expected to be provided, |
| | • | | a review of the safeguards put into place by the accounting firm to safeguard independence, and |
| | • | | periodic meetings with the accounting firm. |
Policy for Audit and Non-Audit Services Provided to the Funds
On an annual basis, the scope of audits for each Fund, audit fees and expenses, and audit-related and non-audit services (and fees proposed in respect thereof) proposed to be performed by the Fund’s independent accountants will be presented by the Treasurer and the independent accountants to the Audit Committee for review and, as appropriate, approval prior to the initiation of such services. Such presentation shall be accompanied by confirmation by both the Treasurer and the independent accountants that the proposed services will not adversely affect the independence of the independent accountants. Proposed services shall be described in sufficient detail to enable the Audit Committee to assess the appropriateness of such services and fees, and the compatibility of the provision of such services with the auditor’s independence. The Committee shall receive periodic reports on the progress of the audit and other services which are approved by the Committee or by the Committee Chair pursuant to authority delegated in this Policy.
The categories of services enumerated under “Audit Services”, “Audit-related Services”, and “Tax Services” are intended to provide guidance to the Treasurer and the independent accountants as to those categories of services which the Committee believes are generally consistent with the independence of the independent accountants and which the Committee (or the Committee Chair) would expect upon the presentation of specific proposals to pre-approve. The enumerated categories are not intended as an exclusive list of audit, audit-related or tax services which the Committee (or the Committee Chair) would consider for pre-approval.
Audit Services
The following categories of audit services are considered to be consistent with the role of the Fund’s independent accountants:
| | • | | Annual Fund financial statement audits |
| | • | | Seed audits (related to new product filings, as required) |
| | • | | SEC and regulatory filings and consents |
Audit-related Services
The following categories of audit-related services are considered to be consistent with the role of the Fund’s independent accountants:
| | • | | Accounting consultations |
| | • | | Fund merger support services |
| | • | | Agreed Upon Procedure Reports |
| | • | | Other Internal Control Reports |
Individual audit-related services that fall within one of these categories and are not presented to the Audit Committee as part of the annual pre-approval process will be subject to pre-approval by the Committee Chair (or any other Committee member on whom this responsibility has been delegated) so long as the estimated fee for those services does not exceed $50,000.
Tax Services
The following categories of tax services are considered to be consistent with the role of the Fund’s independent accountants:
| | • | | Tax compliance services related to the filing or amendment of the following: |
| | • | | Federal, state and local income tax compliance; and, |
| | • | | Sales and use tax compliance |
| | • | | Timely RIC qualification reviews |
| | • | | Tax distribution analysis and planning |
| | • | | Tax authority examination services |
| | • | | Tax appeals support services |
| | • | | Accounting methods studies |
| | • | | Fund merger support services |
| | • | | Tax consulting services and related projects |
Individual tax services that fall within one of these categories and are not presented to the Audit Committee as part of the annual pre-approval process will be subject to pre-approval by the Committee Chair (or any other Committee member on whom this responsibility has been delegated) so long as the estimated fee for those services does not exceed $50,000.
Other Non-audit Services
Certain non-audit services that the independent accountants are legally permitted to render will be subject to pre-approval by the Committee or by one or more Committee members to whom the Committee has delegated this authority and who will report to the full Committee any pre-approval decisions made pursuant to this Policy. Non-audit services presented for pre-approval
pursuant to this paragraph will be accompanied by a confirmation from both the Treasurer and the independent accountants that the proposed services will not adversely affect the independence of the independent accountants.
Proscribed Services
The Fund’s independent accountants will not render services in the following categories of non-audit services:
| | • | | Bookkeeping or other services related to the accounting records or financial statements of the Fund |
| | • | | Financial information systems design and implementation |
| | • | | Appraisal or valuation services, fairness opinions, or contribution-in-kind reports |
| | • | | Internal audit outsourcing services |
| | • | | Management functions or human resources |
| | • | | Broker or dealer, investment adviser, or investment banking services |
| | • | | Legal services and expert services unrelated to the audit |
| | • | | Any other service that the Public Company Accounting Oversight Board determines, by regulation, is impermissible. |
Pre-approval of Non-Audit Services Provided to Other Entities Within the Prudential Fund Complex
Certain non-audit services provided to Prudential Investments LLC or any of its affiliates that also provide ongoing services to the Prudential Mutual Funds will be subject to pre-approval by the Audit Committee. The only non-audit services provided to these entities that will require pre-approval are those related directly to the operations and financial reporting of the Funds. Individual projects that are not presented to the Audit Committee as part of the annual pre-approval process, will be subject to pre-approval by the Committee Chair (or any other Committee member on whom this responsibility has been delegated) so long as the estimated fee for those services does not exceed $50,000. Services presented for pre-approval pursuant to this paragraph will be accompanied by a confirmation from both the Treasurer and the independent accountants that the proposed services will not adversely affect the independence of the independent accountants.
Although the Audit Committee will not pre-approve all services provided to Prudential Investments LLC and its affiliates, the Committee will receive an annual report from the Fund’s independent accounting firm showing the aggregate fees for all services provided to Prudential Investments and its affiliates.
| (e) | (2) Percentage of services referred to in 4(b)- (4)(d) that were approved by the audit committee – |
Not applicable.
| (f) | Percentage of hours expended attributable to work performed by other than full time employees of principal accountant if greater than 50%. |
Not applicable.
Not applicable to Registrant. The aggregate non-audit fees billed by KPMG for services rendered to the registrant’s investment adviser and any entity controlling, controlled by, or under common control with the investment adviser that provides ongoing services to the registrant for the last fiscal year 2004 was $33,500. KPMG did not serve as the Registrant’s principal accountant during fiscal year 2003, so no information for that fiscal year is provided.
| (h) | Principal Accountants Independence |
Not applicable as KPMG has not provided non-audit services to the registrant’s investment adviser and any entity controlling, controlled by, or under common control with the investment adviser that provides ongoing services to the registrant that were not pre-approved pursuant to Rule 2-01(c)(7)(ii) of Regulation S-X.
Item 5 – Audit Committee of Listed Registrants – Not applicable.
Item 6 – Schedule of Investments – The schedule is included as part of the report to shareholders filed under Item 1 of this Form.
Item 7 – Disclosure of Proxy Voting Policies and Procedures for Closed-End Management Investment Companies – Not applicable.
Item 8 – Portfolio Managers of Closed-End Management Investment Companies – Not applicable.
Item 9 – Purchases of Equity Securities by Closed-End Management Investment Company and Affiliated Purchasers – Not applicable.
Item 10 – Submission of Matters to a Vote of Security Holders:
On August 30, 2004, the Board of Directors adopted the following nominations and communications policy:
Governance Committee: The Governance Committee of the Board of Directors is responsible for nominating directors and making recommendations to the Board concerning Board composition, committee structure and governance, director education, and governance practices. The Board has determined that each member of the Governance Committee is not an “interested person” as defined in the Investment Company Act of 1940.
The Governance Committee Charter is available on the Fund’s website at www.prudential.com.
Selection of Director Nominees: The Governance Committee is responsible for considering director nominees at such times as it considers electing new directors to the Board. The Governance Committee may consider recommendations by business and personal contacts of current Board members and by executive search firms which the Committee may engage from time to time and will also consider shareholder recommendations. The Governance Committee has not established specific, minimum qualifications that it believes must be met by a director nominee. In evaluating director
nominees, the Governance Committee considers, among other things, an individual’s background, skills, and experience; whether the individual is an “interested person” as defined in the Investment Company Act of 1940; and whether the individual is would be deemed an “audit committee financial expert” within the meaning of applicable SEC rules. The Governance Committee also considers whether the individual’s background, skills, and experience will complement the background, skills, and experience of other nominees and will contribute to the diversity of the Board. There are no differences in the manner in which the Governance Committee evaluates nominees for director based on whether the nominee is recommended by a shareholder.
A shareholder who wishes to recommend a director nominee should submit his or her recommendation in writing to the Chair of the Board (Mr. Thomas T. Mooney) or the Chair of the Governance Committee (Mr. Saul K. Fenster, Ph.D.), in either case c/o The Prudential Series Fund, Inc., P.O. Box 13964, Philadelphia, PA 19176. At a minimum, the recommendation should include:
| | • | | the name, address, and business, educational, and/or other pertinent background of the person being recommended; |
| | • | | a statement concerning whether the person is an “interested person” as defined in the Investment Company Act of 1940; |
| | • | | any other information that the Fund would be required to include in a proxy statement concerning the person if he or she was nominated; |
| | • | | the name and address of the person submitting the recommendation, together with the number of Fund shares held by such person and the period for which the shares have been held. |
The recommendation also can include any additional information which the person submitting it believes would assist the Governance Committee in evaluating the recommendation.
Shareholders should note that a person who owns securities issued by Prudential Financial, Inc. (the parent company of the Fund’s investment adviser) would be deemed an “interested person” under the Investment Company Act of 1940. In addition, certain other relationships with Prudential Financial, Inc. or its subsidiaries, with registered broker-dealers, or with the Fund’s outside legal counsel may cause a person to be deemed an “interested person.”
Before the Governance Committee decides to nominate an individual as a director, Committee members and other directors customarily interview the individual in person. In addition, the individual customarily is asked to complete a detailed questionnaire which is designed to elicit information which must be disclosed under SEC and stock exchange rules and to determine whether the individual is subject to any statutory disqualification from serving as a director of a registered investment company.
Shareholder Communications with Directors: Shareholders of the Fund can communicate directly with the Board of Directors by writing to the Chair of the Board, c/o The Prudential Series Fund, Inc., P.O. Box 13964, Philadelphia, PA 19176. Shareholders can communicate directly with an individual director by writing to that director at The Prudential Series Fund, Inc., P.O. Box 13964, Philadelphia, PA 19176. Such communications to the Board or individual directors are not screened before being delivered to the addressee.
Item 11 – Controls and Procedures
| | (a) | It is the conclusion of the registrant’s principal executive officer and principal financial officer that the effectiveness of the registrant’s current disclosure controls and procedures (such disclosure controls and procedures having been evaluated within 90 days of the date of this filing) provide reasonable assurance that the information required to be disclosed by the registrant has been recorded, processed, summarized and reported within the time period specified in the Commission’s rules and forms and that the information required to be disclosed by the registrant has been accumulated and communicated to the registrant’s principal executive officer and principal financial officer in order to allow timely decisions regarding required disclosure. |
| | (b) | There have been no significant changes in the registrant’s internal controls or in other factors that could significantly affect these controls subsequent to the date of their evaluation, including any corrective actions with regard to significant deficiencies and material weaknesses. |
Item 12 – Exhibits
| | (a) | Code of Ethics – Attached hereto |
| | (b) | Certifications pursuant to Section 302 and 906 of the Sarbanes-Oxley Act – Attached hereto |
SIGNATURES
Pursuant to the requirements of the Securities Exchange Act of 1934 and the Investment Company Act of 1940, the registrant has duly caused this report to be signed on its behalf by the undersigned, thereunto duly authorized.
| | |
(Registrant) | | The Prudential Series Fund, Inc. |
| | |
By (Signature and Title)* | | /s/ Jonathan D. Shain
|
| | | Jonathan D. Shain |
| | | Secretary |
Pursuant to the requirements of the Securities Exchange Act of 1934 and the Investment Company Act of 1940, this report has been signed below by the following persons on behalf of the registrant and in the capacities and on the dates indicated.
| | |
By (Signature and Title)* | | /s/ David R. Odenath
|
| | | David R. Odenath |
| | | President and Principal Executive Officer |
| | |
By (Signature and Title)* | | /s/ Grace C. Torres
|
| | | Grace C. Torres |
| | | Treasurer and Principal Financial Officer |
| * | Print the name and title of each signing officer under his or her signature. |