UNITED STATES
SECURITIES AND EXCHANGE COMMISSION
Washington, D.C. 20549
FORM N-CSR
CERTIFIED SHAREHOLDER REPORT OF REGISTERED MANAGEMENT
INVESTMENT COMPANIES
Investment Company Act file number: 811-03623
The Prudential Series Fund
Exact name of registrant as specified in charter:
Gateway Center 3,
100 Mulberry Street,
Newark, New Jersey 07102
Address of principal executive offices:
Deborah A. Docs
Gateway Center 3,
100 Mulberry Street,
Newark, New Jersey 07102
Name and address of agent for service:
Registrant’s telephone number, including area code: 973-367-7521
Date of fiscal year end: 12/31/2006
Date of reporting period: 12/31/2006
Item 1 – Reports to Stockholders
ANNUAL REPORT
DECEMBER 31, 2006
The Prudential Series Fund

| n | | Conservative Balanced Portfolio |
| n | | Diversified Bond Portfolio |
| n | | Flexible Managed Portfolio |
| n | | Government Income Portfolio |
| n | | High Yield Bond Portfolio |
| n | | Natural Resources Portfolio |
| n | | Small Capitalization Stock Portfolio |
Please note inside are Prospectus Supplements dated November 16, & December 29, 2006 and February 9, 2007.
These documents are separate from and not a part of the annual report.
The Prudential Insurance Company of America
751 Broad Street, Newark, NJ 07102-3777
Pruco Life Insurance Company
Pruco Life Insurance Company of New Jersey
213 Washington Street, Newark, NJ 07102-3777
Pruco Life Insurance Company is not licensed to do business in New York.
IFS-A114446

T | his report is one of several that provide financial information about certain investment choices available on variable life insurance and variable annuity contracts. Based on the variable contract you own or the portfolios you invested in, you may receive additional reports that provide financial information on those investment choices. Please refer to your variable life insurance or variable annuity contract prospectus to determine which portfolios are available to you. A list of the variable contracts that this report supports is located on the inside back cover. |
This report must be preceded or accompanied by the current prospectuses for the Prudential Series Fund portfolios and the applicable variable life or annuity contract. The prospectuses contain information on the investment objectives, risks, and charges and expenses and should be read carefully.
The contract’s prospectus contains hypothetical performance illustrations that show the effect of various assumptions regarding the cost of insurance protection. You may also obtain a personalized illustration of historical performance that reflects the cost of your policy’s insurance protection.
DISCOVER THE BENEFITS OF eDelivery
| n | | Eliminate receiving printed reports. |
| n | | View documents on-line as they become available. |
| n | | Download and store e-reports on your PC. |
| n | | Help the environment by using less paper. |
To receive your semiannual/annual reports on-line, go to www.prudential.com/edelivery and enroll. Instead of receiving printed reports, you will receive notification via e-mail when new materials are available for your review. You can cancel your enrollment or change your e-mail address at any time by visiting the internet address listed above.
A description of the Fund’s proxy voting policies and procedures is available, without charge, upon request. Owners of variable annuity contracts should call 888-778-2888 and owners of variable life insurance contracts should call 800-778-2255 to obtain descriptions of the Fund’s proxy voting policies and procedures. The description is also available on the website of the Securities and Exchange Commission (the “Commission”) at www.sec.gov. Information regarding how the Fund voted proxies relating to portfolio securities during the most recent 12-month period ended June 30, is available on the website of the Commission at www.sec.gov and on the Fund’s website.
The Fund files with the Commission a complete listing of portfolio holdings as of its first and third quarter-end on Form N-Q. Form N-Q is available on the Commission’s website at www.sec.gov or by visiting the Commission’s Public Reference Room. For more information on the Commission’s Public Reference Room, please visit the Commission’s website or call 1-800-SEC-0330. Form N-Q is also available on the Fund’s website at www.prudential.com or by calling the telephone numbers referenced above.
The Fund’s Statement of Additional Information contains additional information about the Fund’s Trustees and is available without charge upon request by calling 888-778-2888.

GLOSSARY OF BENCHMARK DEFINITIONS
Conservative Balanced Custom Blended Index consists of a blend of the S&P 500 Index (50%), the Lehman Brothers Aggregate Bond Index (40%), and the 3-Month T-Bill (10%).
Flexible Managed Custom Blended Index consists of a blend of the S&P 500 Index (60%), the Lehman Brothers Aggregate Bond Index (35%), and the 3-Month T-Bill (5%).
Lehman Brothers U.S. Aggregate Bond Index is an unmanaged index comprised of more than 5,000 government and corporate bonds.
Lehman Brothers U.S. Corporate High Yield Index is an unmanaged index of fixed-rate, non-investment-grade debt securities with at least one year remaining to maturity. It gives a broad look at how high yield (“junk”) bonds have performed.
Lehman Brothers U.S. Corporate High Yield 2% Issuer Capped index covers the universe of U.S. dollar denominated, non-convertible, fixed-rate, non-investment-grade debt. Issuers are capped at 2% of the Index. Index holdings must have at least one year to final maturity, at least $150 million par amount outstanding, and be publicly issued with a rating of Ba1 or lower.
Lehman Brothers Government Bond Index is an unmanaged index comprised of securities issued or backed by the U.S. government, its agencies, and instrumentalities with a remaining maturity of 1 to 30 years.
The Lipper Variable Insurance Products (VIP) Funds Averages are calculated by Lipper Analytical Services, Inc., and reflect the investment return of certain portfolios underlying variable life and annuity products. These returns are net of investment fees and fund expenses, but not product charges.
| | | | |
| General U.S. Government Funds Average | | Large-Cap Growth Funds Average | | Small-Cap Core Funds Average |
| Global Growth Funds Average | | Large-Cap Value Funds Average | | |
| High Current Yield Funds Average | | Money Market Funds Average | | |
| International Growth Funds Average | | Multi-Cap Value Funds Average | | |
| Mixed Asset Allocation. Growth Fds Average | | Natural Resources Funds Average | | |
| Mixed Asset Allocation. Moderate Fds Average | | S&P 500 Index Funds Average | | |
Morgan Stanley Capital International Europe, Australasia, and the Far East (MSCI EAFE) Index (GD & ND) – The Morgan Stanley Capital International Europe, Australasia, Far East Index is an unmanaged capitalization-weighted index generally accepted as a benchmark for major overseas markets. The ND and GD versions of the MSCI EAFE differ in that ND returns reflect the impact of the maximum withholding taxes on reinvested dividends while the GD version does not reflect the impact of withholding taxes on reinvested dividends. These returns do not include the effect of any investment management expenses. These returns would have been lower if they included the effect of these expenses.
Morgan Stanley Capital International (MSCI) World Index (GD & ND) – The Morgan Stanley Capital International World Index is an unmanaged capitalization weighted index which includes the equity markets of Australia, Austria, Belgium, Canada, Denmark, Finland, France, Germany, Hong Kong, Ireland, Italy, Japan, Malaysia, Netherlands, New Zealand, Norway, Singapore, Spain, Sweden, Switzerland, United Kingdom and United States. The ND and GD versions of the MSCI World Index differ in that ND returns reflect the impact of the maximum withholding taxes on reinvested dividends while the GD version does not reflect the impact of withholding taxes on reinvested dividends. These returns do not include the effect of any investment management expenses. These returns would have been lower if they included the effect of these expenses.
Russell 1000 Growth Index is a market cap-weighted index that measures the performance of those Russell 1000 companies with higher price-to-book ratios and higher forecasted growth values.
Russell 1000 Index is a market cap-weighted index that measures the performance of the 1,000 largest companies in the Russell 3000 Index, which represents approximately 92% of the total market.
Russell 1000 Value Index is a market cap-weighted index that measures the performance of those Russell 1000 companies with lower price-to-book ratios and lower forecasted growth values.
Russell 3000 Index is a market cap-weighted index that measures the performance of the 3,000 largest U.S. companies based on total market capitalization, which represents approximately 98% of the investable U.S. equity market.
S&P 500 Index is an unmanaged, market value-weighted index of 500 stocks generally representative of the broad stock market.
S&P SmallCap 600 Index is an unmanaged index representing the aggregate market value of the common equity of 600 small-company stocks.
This page may include certain benchmarks not applicable to the portfolios available in this particular report. Investors cannot invest directly in a market index or average.
The Prudential Series Fund
Annual Report
December 31, 2006
Table of Contents
| n | | LETTER TO CONTRACT OWNERS |
| n | | FEES AND EXPENSES TABLE |
A1 Financial Statements
B1 Schedule of Investments
C1 Notes to Financial Statements
D1 Financial Highlights
E1 Report of Independent Registered Accounting Firm
F1 Management of the Prudential Series Fund
This report may include financial information pertaining to certain portfolios that are not available through the variable life insurance policy or variable annuity contract that you have chosen. Please refer to your variable life insurance or variable annuity prospectus to determine which portfolios are available to you.
The Prudential Series Fund
Letter to Contract Owners
December 31, 2006
At Prudential, we are committed to helping you achieve and sustain financial success. We hope that you find the annual report for the Prudential Series Fund to be an informative and valuable resource.
Each year, we remind our clients about the benefits of diversification within their portfolios. A diversified portfolio helps you manage downside risk by not being overly invested in any particular asset class, and it helps better position your investments as asset classes rotate in and out of favor. Not only is diversification the best way to balance risk and return, but it can also help align your long-term goals with your risk tolerance. The result is a portfolio that may help you weather market fluctuations and more closely meet your long-term needs.
Contact your financial professional to take the first step in creating a diversified investment plan. Together you should review your reasons for investing, personal investment horizon and risk tolerance to develop a strategy that works best for you. A carefully chosen and broad mix of assets—reviewed periodically over time—can help you stay focused on meeting your long-term objectives.
Thank you for selecting our financial products. At Prudential, your financial security is our priority and we value the opportunity to help you grow and protect your wealth.
Sincerely,

David R. Odenath, Jr.
President,
The Prudential Series Fund | January 31, 2007 |

PRESIDENT
DAVID R. ODENATH, JR.
The Prudential Series Fund, Conservative Balanced Portfolio
Subadvised by: Prudential Investment Management, Inc., Quantitative Management Associates LLC
December 31, 2006
Investment Manager’s Report
Performance Summary - As of December 31, 2006
Average Annual Total Return Percentages
| | | | | | | | | |
| | | 1-Year | | | 5-Year | | | 10-Year | |
Conservative Balanced Portfolio | | 10.44 | % | | 5.93 | % | | 5.81 | % |
S&P 500 Index | | 15.78 | | | 6.18 | | | 8.42 | |
Conservative Balanced Custom Blend Index | | 10.00 | | | 5.59 | | | 7.40 | |
Lipper Mixed Asset Target Allocation Growth Funds Avg. | | 11.67 | | | 6.37 | | | 7.18 | |
Portfolio inception: 5/13/1983.
$10,000 INVESTED OVER 10 YEARS
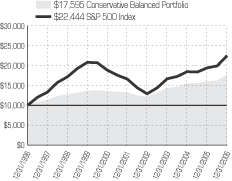
Past performance does not guarantee future returns. Portfolio performance is net of investment fees and fund expenses, but not product charges, which, if included, would significantly lower the performance quoted. The investment return and principal value of an investment will fluctuate, so that an investor’s shares, when redeemed, may be worth more or less than their original cost. Current performance may be lower or higher than the past performance data quoted.
Unless noted otherwise, Lipper Average and Index returns reflect performance beginning the closest month-end date to the Portfolio’s inception. Performance figures may reflect fee waivers and/or expense reimbursements. In the absence of such fee waivers and/or expense reimbursements, total returns would be lower.
For the year ended December 31, 2006, the Conservative Balanced Portfolio had a total return that was above its Blend Index (50% stock, 40% bond, 10% cash), but trailed the average return of its peer group.
The Portfolio’s stock holdings are managed as an index fund, with performance characteristics similar to those of the S&P 500 Index, while its bond holdings are more actively managed, focusing on high-grade bonds. Allocations to these asset classes are actively managed within a fairly wide range to take advantage of different market conditions.
The Portfolio benefited from emphasizing stocks in a year when they had exceptionally high returns. In addition, the managers added a small allocation to international stocks, which substantially outperformed the domestic market. Not only did foreign markets generally have higher returns than the United States, their returns to U.S. investors were augmented by the decline of the U.S. dollar against all major currencies except the Japanese yen. The Portfolio was underweighted in cash equivalents (very short-term securities), which added to its return in the strong markets. Its bond holdings outperformed the Lehman Aggregate Bond Index, thanks to allocations to high yield (junk) and emerging market bonds, good selection among investment grade corporate bonds, and positions in securities backed by mortgages and other assets.
Prudential Investments LLC (PI), an indirect, wholly owned subsidiary of Prudential Financial, Inc., serves as the investment manager for the Fund.
For average and index definitions, refer to the Glossary of Benchmark Definitions page. Investors cannot invest directly in a market index or average. For a complete list of holdings refer to the Schedule of Investments section of this report.
The Prudential Series Fund, Diversified Bond Portfolio
Subadvised by: Prudential Investment Management, Inc.
December 31, 2006
Investment Manager’s Report
Performance Summary - As of December 31, 2006
Average Annual Total Return Percentages
| | | | | | | | | |
| | | 1-Year | | | 5-Year | | | 10-Year | |
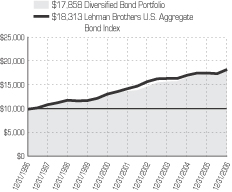
Diversified Bond Portfolio | | 4.98 | % | | 5.67 | % | | 5.97 | % |
Lehman Brothers U.S Aggregate Bond Index | | 4.33 | % | | 5.06 | % | | 6.24 | % |
Lipper VP Intermediate Investment Grade Debt Funds Avg. | | 4.14 | % | | 4.90 | % | | 5.81 | % |
Portfolio inception: 5/13/1983.
$10,000 INVESTED OVER 10 YEARS
Past performance does not guarantee future returns. Portfolio performance is net of investment fees and fund expenses, but not product charges, which, if included, would significantly lower the performance quoted. The investment return and principal value of an investment will fluctuate, so that an investor’s shares, when redeemed, may be worth more or less than their original cost. Current performance may be lower or higher than the past performance data quoted.
Unless noted otherwise, Lipper Average and Index returns reflect performance beginning the closest month-end date to the Portfolio’s inception. Performance figures may reflect fee waivers and/or expense reimbursements. In the absence of such fee waivers and/or expense reimbursements, total returns would be lower.
For the year ended December 31, 2006, the Diversified Bond Portfolio had a total return that was above its benchmark index and the average of its peer group.
In the fixed income markets, 2006 proved to be a banner year for emerging market bonds and U.S. high yield corporate bonds, commonly called “junk” bonds because they are rated below investment grade. Money from around the world flowed into these debt securities as investors sought assets that provided attractive yields. They were also drawn to the high yield market by its historically low default rate and the healthy credit fundamentals of companies, many of which generated free cash flow and carried positive cash balances on their financial statements. Investors favored emerging market bonds as the global economic expansion continued, the ratings of many emerging market bonds improved, and prudent fiscal policies resulted in lower levels of public debt in some developing nations.
Both high yield bonds and emerging market bonds significantly outperformed U.S. Treasury and federal agency securities. Exposure to high yield bonds and emerging market bonds, and favorable security selection in both areas, were key reasons that the Portfolio performed better than the benchmark index, a gauge of U.S. investment grade bonds that excludes high yield and emerging market bonds. For example, the Portfolio held General Motors Corp. bonds that rallied as the troubled auto maker cut costs by reducing its work force and raised money by selling a controlling interest in General Motors Acceptance Corp. The Portfolio’s emerging-market exposure consisted of mostly sovereign bonds and a few positions in corporate bonds.
In other areas of the U.S. fixed income market, the Portfolio had overweight exposures to investment-grade corporate bonds, commercial mortgage-backed securities, and asset-backed securities (compared to the benchmark index). This strategy worked well because these markets also outperformed U.S. Treasury and federal agency securities in 2006. Even though economic growth slowed in the United States as repeated increases in short-term interest rates by the Federal Reserve took a toll on the housing sector, corporate earnings remained strong, supporting investment-grade corporate bonds. Among the Portfolio’s holding were bonds of airlines, which benefited from falling fuel prices and higher ticket prices as conditions improved in the travel industry.
Prudential Investments LLC (PI), an indirect, wholly owned subsidiary of Prudential Financial, Inc., serves as the investment manager for the Fund.
For average and index definitions, refer to the Glossary of Benchmark Definitions page. Investors cannot invest directly in a market index or average. For a complete list of holdings refer to the Schedule of Investments section of this report.
The Prudential Series Fund, Equity Portfolio
Subadvised by: Jennison Associates LLC, ClearBridge Advisors, LLC
December 31, 2006
Investment Manager’s Report
Performance Summary - As of December 31, 2006
Average Annual Total Return Percentages
| | | | | | | | | | | |
| | | 1-Year | | | 5-Year | | | 10-Year | | | Since
Inception |
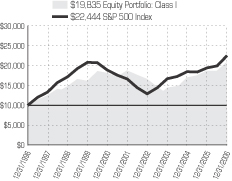
Equity Portfolio: Class I | | 12.57 | % | | 7.12 | % | | 7.09 | % | | N/A |
Equity Portfolio: Class II | | 12.13 | | | 6.70 | | | N/A | | | 2.95 |
S&P 500 Index | | 15.78 | | | 6.18 | | | 8.42 | | | 2.41 |
Russell 1000® Index | | 15.46 | | | 6.82 | | | 8.64 | | | 2.97 |
Lipper Large-Cap Core Funds Avg. | | 13.31 | | | 5.22 | | | 6.71 | | | 1.98 |
Portfolio (Class I) inception: 5/13/1983. Portfolio (Class II) inception: 5/4/1999.
$10,000 INVESTED OVER 10 YEARS1
Past performance does not guarantee future returns. Portfolio performance is net of investment fees and fund expenses, but not product charges, which, if included, would significantly lower the performance quoted. The investment return and principal value of an investment will fluctuate, so that an investor’s shares, when redeemed, may be worth more or less than their original cost. Current performance may be lower or higher than the past performance data quoted.
Unless noted otherwise, Lipper Average and Index returns reflect performance beginning the closest month-end date to the Portfolio’s inception (Class II).
The Russell 1000® Index is a trademark/service mark of the Frank Russell Company. Russell® is a trademark of the Frank Russell Company. Performance figures may reflect fee waivers and/or expense reimbursements. In the absence of such fee waivers and/or expense reimbursements, total returns would be lower.
For the year ended December 31, 2006, the Equity Portfolio had a total return that was below its benchmarks and the average return of its peer group.
Approximately half of the Portfolio was managed by Jennison Associates, a unit of Prudential Investment Management, and approximately half by ClearBridge Advisors (formerly known as Salomon Brothers Asset Management).
Stock selection, particularly in the Jennison segment and particularly in the healthcare, technology, telecommunications, consumer non-cyclical, and consumer cyclical sectors, accounted for most of the Portfolio’s underperformance. Moreover, in an investment environment that strongly favored value stocks, it suffered from a tilt to the growth style, primarily in the Jennison segment. This was manifested in above-average acceleration of its holdings’ business fundamentals and their below-average exposure to value characteristics such as low price-to-earnings and price-to-book value ratios and debt levels.
The Portfolio’s sector distribution had a positive impact on its return. It was overweight compared with its benchmark in the strong basic materials sector and underweight in the relatively weak financials and transportation sectors. However, an underweight in the high-returning telecommunications sector detracted from its relative performance. Both managers’ segments contributed to the positive sector exposures.
Prudential Investments LLC (PI), an indirect, wholly owned subsidiary of Prudential Financial, Inc., serves as the investment manager for the Fund.
| 1 | The graph is based on the performance of Class I shares. Performance of Class II shares will be lower due to differences in the fee structure. Class II shares have associated 12b-1 and administrative fees at an annual rate of 0.25% and 0.15% respectively of the average daily net assets of the Class II shares. |
For average and index definitions, refer to the Glossary of Benchmark Definitions page. Investors cannot invest directly in a market index or average. For a complete list of holdings, refer to the Schedule of Investments section of this report.
The Prudential Series Fund, Flexible Managed Portfolio
Subadvised by: Prudential Investment Management, Inc., Quantitative Management Associates, LLC
December 31, 2006
Investment Manager’s Report
Performance Summary - As of December 31, 2006
Average Annual Total Return Percentages
| | | | | | | | | |
| | | 1-Year | | | 5-Year | | | 10-Year | |
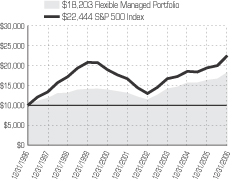
Flexible Managed Portfolio | | 12.17 | % | | 6.92 | % | | 6.17 | % |
S&P 500 Index | | 15.78 | | | 6.18 | | | 8.42 | |
Flexible Managed Custom Blended Index | | 11.13 | | | 5.84 | | | 7.74 | |
Lipper Mixed Target Allocation Growth Funds Avg. | | 11.67 | | | 6.37 | | | 7.18 | |
Portfolio inception: 5/13/1983.
$10,000 INVESTED OVER 10 YEARS
Past performance does not guarantee future returns. Portfolio performance is net of investment fees and fund expenses, but not product charges, which, if included, would significantly lower the performance quoted. The investment return and principal value of an investment will fluctuate, so that an investor’s shares, when redeemed, may be worth more or less than their original cost. Current performance may be lower or higher than the past performance data quoted.
Unless noted otherwise, Lipper Average and Index returns reflect performance beginning the closest month-end date to the Portfolio’s inception. Performance figures may reflect fee waivers and/or expense reimbursements. In the absence of such fee waivers and/or expense reimbursements, total returns would be lower.
For the year ended December 31, 2006, the Flexible Managed Portfolio had a total return that was above both its Blend Index (60% stocks, 35% bonds, 5% cash) and the average of its peer group.
The Portfolio’s stock holdings are actively managed with risk characteristics similar to those of the S&P 500 Index, while its bond holdings are more actively managed, focusing on high-grade bonds. Allocations to these asset classes are actively managed within a fairly wide range to take advantage of different market conditions.
The Portfolio benefited from emphasizing stocks in a year when they had exceptionally high returns. In addition, the managers added a small allocation to international stocks, which substantially outperformed the domestic market. Not only did foreign markets generally have higher returns than the United States, their returns to U.S. investors were augmented by the decline of the U.S. dollar against all major currencies except the Japanese yen. The Portfolio was underweighted in cash equivalents (very short-term securities), which added to its return in the strong markets. Its bond holdings outperformed the Lehman Aggregate Bond index, thanks to allocations to high yield (junk) and emerging market bonds, good selection among investment grade corporate bonds, and positions in securities backed by mortgages and other assets.
Prudential Investments LLC (PI), an indirect, wholly owned subsidiary of Prudential Financial, Inc., serves as the investment manager for the Fund.
For average and index definitions, refer to the Glossary of Benchmark Definitions page. Investors cannot invest directly in a market index or average. For a complete list of holdings refer to the Schedule of Investments section of this report.
The Prudential Series Fund, Global Portfolio
Subadvised by: William Blair & Company LLC, LSV Asset Management, Marsico Capital Management, LLC, T. Rowe Price Associates, Inc.
December 31, 2006
Investment Manager’s Report
Performance Summary - As of December 31, 2006
Average Annual Total Return Percentages
| | | | | | | | | |
| | | 1-Year | | | 5-Year | | | 10-Year | |
Global Portfolio | | 19.65 | % | | 8.84 | % | | 7.46 | % |
MSCI World Index (GD) | | 20.65 | | | 10.49 | | | 8.08 | |
MSCI World Index (ND) | | 20.07 | | | 9.97 | | | 7.64 | |
Lipper (VIP) Global Growth Funds Avg. | | 18.78 | | | 10.54 | | | 8.95 | |
Portfolio inception: 9/19/1988.
$10,000 INVESTED OVER 10 YEARS
Past performance does not guarantee future returns. Portfolio performance is net of investment fees and fund expenses, but not product charges, which, if included, would significantly lower the performance quoted. The investment return and principal value of an investment will fluctuate, so that an investor’s shares, when redeemed, may be worth more or less than their original cost. Current performance may be lower or higher than the past performance data quoted.
Unless noted otherwise, Lipper Average and Index returns reflect performance beginning the closest month-end date to the Portfolio’s inception. Performance figures may reflect fee waivers and/or expense reimbursements. In the absence of such fee waivers and/or expense reimbursements, total returns would be lower.
For the year ended December 31, 2006, the Global Portfolio had a total return that was in line with the very strong return of its benchmark and above the average of its peer group.
The Portfolio is co-managed by four specialist asset managers: Marsico Capital Management manages its large-cap domestic growth stocks; T. Rowe Price manages its large-cap domestic value stocks; William Blair & Company manages its international growth stocks; and LSV Asset Management manages its international value stocks. Each firm manages approximately a quarter of the Portfolio’s assets. We expect this diversified structure to reduce style and risk exposures so that most of the Portfolio’s variance from its benchmark will be due to its co-managers’ stock selection. The major exception is that William Blair has the flexibility to invest in emerging markets stocks, which are not part of the Portfolio’s benchmark.
During 2006, the Portfolio benefited from the geographic distribution of its holdings, particularly its underexposure to the United States. Although U.S. stocks performed well over the year, international stocks performed even better, aided by the decline of the U.S. dollar against most other major currencies. In addition, William Blair’s exposure to Mexico, China, India, and Brazil improved the Portfolio’s performance. Its distribution among economic sectors had relatively little impact because the benefit of an overweight in technology compared with the benchmark was largely offset by an underweight in the strong utilities sector and an overweight in the relatively soft industrials sector. Investment style and risk factors made a modestly positive contribution to relative performance, primarily due to an emphasis compared with the benchmark on stocks of smaller companies. These outperformed those of larger firms during 2006. The Portfolio also benefited slightly from a modest emphasis on stocks with rising price momentum.
The Portfolio’s performance was enhanced by its stock selection, particularly within the financials and consumer discretionary sectors. However, its healthcare holdings did not keep up with the corresponding sector of the benchmark.
Prudential Investments LLC (PI), an indirect, wholly owned subsidiary of Prudential Financial, Inc., serves as the investment manager for the Fund.
For average and index definitions, refer to the Glossary of Benchmark Definitions page. Investors cannot invest directly in a market index or average. For a complete list of holdings refer to the Schedule of Investments section of this report.
The Prudential Series Fund, Government Income Portfolio
Subadvised by: Prudential Investment Management, Inc.
December 31, 2006
Investment Manager’s Report
Performance Summary - As of December 31, 2006
Average Annual Total Return Percentages
| | | | | | | | | |
| | | 1-Year | | | 5-Year | | | 10-Year | |
Government Income Portfolio | | 3.74 | % | | 4.71 | % | | 5.97 | % |
Lehman Brothers Govt. Bond Index | | 3.48 | | | 4.64 | | | 6.01 | |
Lipper (VIP) General U.S. Govt. Funds Avg. | | 2.81 | | | 4.46 | | | 5.51 | |
Portfolio inception: 5/1/1989.
$10,000 INVESTED OVER 10 YEARS
Past performance does not guarantee future returns. Portfolio performance is net of investment fees and fund expenses, but not product charges, which, if included, would significantly lower the performance quoted. The investment return and principal value of an investment will fluctuate, so that an investor’s shares, when redeemed, may be worth more or less than their original cost. Current performance may be lower or higher than the past performance data quoted.
Unless noted otherwise, Lipper Average and Index returns reflect performance beginning the closest month-end date to the Portfolio’s inception. Performance figures may reflect fee waivers and/or expense reimbursements. In the absence of such fee waivers and/or expense reimbursements, total returns would be lower.
For the year ended December 31, 2006, the Government Income Portfolio had a total return that was above its benchmark index and the average of its peer group.
The investment environment for U.S. fixed income securities improved in 2006. In the first half of the year, the Federal Reserve (“the Fed”) increased the target for the federal funds rate on overnight loans between banks four times. This was part of its latest effort to slow economic growth and pull down inflation. The total rate increase from 4.25% to 5.25%, along with concern that persistent inflation might lead the Fed to continue tightening monetary policy, at times put upward pressure on bond yields, causing bond prices to fall as bond prices move inversely to yields. But in the second half of the year, the Fed left short-term rates unchanged as economic growth, which had begun to slow in the spring of 2006, continued to moderate in the second half of the year. There was even speculation that the Fed would have to cut short-term rates in 2007 to reinvigorate the economy. From time to time, this expectation of lower rates put downward pressure on bond yields, which boosts bond prices.
The Portfolio performed better than its benchmark index because some of the bonds it held were not included in its benchmark index, which is composed of U.S. Treasury and federal agency securities. In the global low interest-rate environment, investors sought assets with attractive yields, enabling bonds such as mortgage-backed securities and commercial mortgage-backed securities to outperform comparable Treasury securities in 2006. While the Portfolio held Treasury and federal agency securities, the bulk of its holdings consisted of mortgage-backed securities, commercial mortgage-backed securities and sovereign bonds issued by governments of nations, such as Germany and Norway. During the year, the Portfolio began to invest in foreign government bonds because they provide diversification away from the U.S. market, incremental yield, and potential gains from currency appreciation.
The Portfolio also performed better than its benchmark Index because it had a shorter duration. Duration measures a portfolio’s sensitivity to changes in interest rates. Having a shorter duration provided the Portfolio with some degree of protection as, on net, yields rose across the Treasury yield curve for the year.
Prudential Investments LLC (PI), an indirect, wholly owned subsidiary of Prudential Financial, Inc., serves as the investment manager for the Fund.
For average and index definitions, refer to the Glossary of Benchmark Definitions page. Investors cannot invest directly in a market index or average. For a complete list of holdings refer to the Schedule of Investments section of this report.
The Prudential Series Fund, High Yield Bond Portfolio
Subadvised by: Prudential Investment Management, Inc.
December 31, 2006
Investment Manager’s Report
Performance Summary - As of December 31, 2006
Average Annual Total Return Percentages
| | | | | | | | | |
| | | 1-Year | | | 5-Year | | | 10-Year | |
High Yield Bond Portfolio | | 10.25 | % | | 9.80 | % | | 5.45 | % |
Lehman Brothers U.S. Corp. High Yield Bond Index | | 11.85 | | | 10.18 | | | 6.59 | |
Lehman Brothers U.S. High Yield 2% Issuer Capped Index | | 10.76 | | | 10.20 | | | 6.63 | |
Lipper (VIP) High Current Yield Funds Average | | 9.96 | | | 8.94 | | | 5.35 | |
Portfolio inception: 2/23/1987.
$10,000 INVESTED OVER 10 YEARS
Past performance does not guarantee future returns. Portfolio performance is net of investment fees and fund expenses, but not product charges, which, if included, would significantly lower the performance quoted. The investment return and principal value of an investment will fluctuate, so that an investor’s shares, when redeemed, may be worth more or less than their original cost. Current performance may be lower or higher than the past performance data quoted.
Unless noted otherwise, Lipper Average and Index returns reflect performance beginning the closest month-end date to the Portfolio’s inception. Performance figures may reflect fee waivers and/or expense reimbursements. In the absence of such fee waivers and/or expense reimbursements, total returns would be lower.
For the year ended December 31, 2006, the High Yield Portfolio had a total return that was below that of its benchmark index but above the average of its peer group.
Money flowed into high yield bonds, commonly called “junk” bonds, as investors from around the world sought assets that provided attractive yields. This helped the high yield market absorb a record amount of newly issued bonds in 2006. Investors were also drawn to the market’s historically low default rate and the solid credit fundamentals of companies, many of which continued to generate free cash flow and carried positive cash balances on their financial statements. The Portfolio has to maintain a modest cash position to meet the liquidity needs of its shareholders; but in a year in which high yield bonds rallied, the cash position was a drag on its performance.
The Portfolio benefited from favorable security selection in 2006, particularly in the healthcare and pharmaceuticals sector where it held bonds of Warner Chilcot Corp. and Skilled Healthcare Group. The managers favored healthcare and pharmaceuticals, two of the more defensive industries that tend to do well even when the economy loses steam. Economic growth slowed in 2006 because the Federal Reserve repeatedly increased short-term interest rates to slow economic growth and pull back inflationary pressures. The target for the federal funds rate on overnight loans between banks was raised a total of 17 times between June 2004 and June 2006, increasing the rate from 1.00% to 5.25%. The last four increases occurred in the first half of 2006.
The troubled U.S. automotive industry posted a solid return in 2006 even though General Motors Corp. and Ford Motor Co. continued to lose market share in the United States. The Portfolio benefited from favorable security selection among bonds of auto parts suppliers. It held debt securities of Visteon Corp. and Lear Corp. but avoided bonds of Dura Automotive Systems, which filed for bankruptcy in 2006.
By contrast, exposure to bonds of packaging companies Tekni-Plex Inc. and Crown Holdings detracted from the Portfolio’s relative performance as rising commodity prices and higher input costs hurt the industry. Exposure to the paper and forest products industry also weakened the Portfolio’s relative performance. It held bonds of Ainsworth Lumber that performed poorly in part because prices of oriented strand board, which is used in residential and commercial construction, declined due to the housing slump.
Prudential Investments LLC (PI), an indirect, wholly owned subsidiary of Prudential Financial, Inc., serves as the investment manager for the Fund.
For average and index definitions, refer to the Glossary of Benchmark Definitions page. Investors cannot invest directly in a market index or average. For a complete list of holdings refer to the Schedule of Investments section of this report.
The Prudential Series Fund, Jennison Portfolio
Subadvised by: Jennison Associates LLC
December 31, 2006
Investment Manager’s Report
Performance Summary - As of December 31, 2006
Average Annual Total Return Percentages
| | | | | | | | | | | |
| | | 1-Year | | | 5-Year | | | 10-Year | | | Since
Inception |
Jennison Portfolio: Class I | | 1.79 | % | | 2.83 | % | | 7.17 | % | | N/A |
Jennison Portfolio: Class II | | 1.37 | | | 2.41 | | | N/A | | | -4.78 |
S&P 500 Index | | 15.78 | | | 6.18 | | | 8.42 | | | 1.89 |
Russell 1000® Growth Index | | 9.07 | | | 2.69 | | | 5.44 | | | -4.27 |
Lipper (VIP) Large-Cap Growth Funds Avg. | | 6.30 | | | 2.70 | | | 6.09 | | | -2.63 |
Portfolio (Class I) inception: 4/25/1995. Portfolio (Class II) inception: 2/10/2000.
$10,000 INVESTED OVER 10 YEARS1
Past performance does not guarantee future returns. Portfolio performance is net of investment fees and fund expenses, but not product charges, which, if included, would significantly lower the performance quoted. The investment return and principal value of an investment will fluctuate, so that an investor’s shares, when redeemed, may be worth more or less than their original cost. Current performance may be lower or higher than the past performance data quoted.
Unless noted otherwise, Lipper Average and Index returns reflect performance beginning the closest month-end date to the Portfolio’s inception (Class II).
The Russell® 1000 Growth Index is a trademark/service of the Frank Russell Company. Russell® is a trademark of the Frank Russell Company. Performance figures may reflect fee waivers and/or expense reimbursements. In the absence of such fee waivers and/or expense reimbursements, total returns would be lower.
For the year ended December 31, 2006, the Jennison Portfolio had a total return that was substantially below its benchmarks and the average of its peer group.
Jennison looks for companies whose earnings and/or free cash flow they project to grow faster than average, compared with both the broad market and industry peers, and that have a moderate valuation for such growth prospects. This strategy worked very poorly in 2006, particularly during the strong value-oriented market in the first seven months of the year.
The largest detractor from the Portfolio’s performance relative to the Russell 1000 Growth Index was an overweight in grocery chain Whole Foods. The stock fell after the company warned that it expected slower growth in 2007 because it would be a transitional year for the firm. Several holdings in the technology sector also detracted from the Portfolio’s return. However, stocks in the asset management and energy industries enhanced its performance compared with the comparable sectors of the benchmark.
The Portfolio’s sector positioning is a result of its selection of individual stocks, not a separate strategic decision. Overall, the positioning hurt its performance in 2006, as greater-than-benchmark exposure to technology and an underweight in consumer noncyclical sectors weakened it more than its overweight in financials helped. The Portfolio also was hurt by having stronger growth characteristics than its benchmark and greater exposure to volatile stocks, inherent characteristics of its style that fared poorly in this market.
Prudential Investments LLC (PI), an indirect, wholly owned subsidiary of Prudential Financial, Inc., serves as the investment manager for the Fund.
| 1 | The graph is based on the performance of Class I shares. Performance of Class II shares will be lower due to differences in the fee structure. Class II shares have associated 12b-1 and administrative fees at an annual rate of 0.25% and 0.15%, respectively, of the average daily net assets of the Class II shares. |
For average and index definitions, refer to the Glossary of Benchmark Definitions page. Investors cannot invest directly in a market index or average. For a complete list of holdings, refer to the Schedule of Investments section of this report.
The Prudential Series Fund, Money Market Portfolio
Subadvised by: Prudential Investment Management, Inc.
December 31, 2006
Investment Manager’s Report
Performance Summary - As of December 31, 2006
Average Annual Total Return Percentages
| | | | | | | | | | | | |
| | | 7-Day*
Current
Net Yield | | | 1-Year | | | 5-Year | | | 10-Year | |
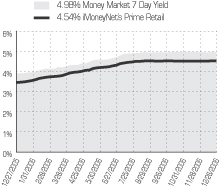
Money Market Portfolio | | 4.98 | % | | 4.74 | % | | 2.20 | % | | 3.69 | % |
Lipper (VIP) Money Market Funds Avg. | | N/A | | | 4.54 | % | | 1.99 | % | | 3.50 | % |
Portfolio inception: 5/13/1983.
SEVEN-DAY CURRENT NET YIELD *
Past performance does not guarantee future returns. Portfolio performance is net of investment fees and fund expenses, but not product charges, which, if included, would significantly lower the performance quoted. The investment return and principal value of an investment will fluctuate, so that an investor’s shares, when redeemed, may be worth more or less than their original cost. Current performance may be lower or higher than the past performance data quoted.
The yield quotation more closely reflects the current earnings of the Portfolio than the total return quotation. Unless noted otherwise, Lipper Average and Index returns reflect performance beginning the closest month-end date to the Portfolio’s inception. Performance figures may reflect fee waivers and/or expense reimbursements. In the absence of such fee waivers and/or expense reimbursements, total returns would be lower.
For the year ended December 31, 2006, the Money Market Portfolio had a total return of 4.74% that was above the average of its peer group. On December 26, 2006, the Portfolio’s 7-day current yield was 4.98%, up from 3.92% on December 27, 2005. The yield more closely reflects the current earnings of the Portfolio than the total return.
Among the most influential developments in the money markets during 2006 was the decision by the Federal Reserve (“the Fed”) to leave short-term interest rates unchanged in the second half of the year after repeatedly increasing them in the first half. In this changing investment environment, the Portfolio provided a competitive yield and ample liquidity to help shareholders meet their financial needs.
Fed policymakers, hoping to slow economic growth and bring down inflation, increased the target for the federal funds rate on overnight loans between banks 17 times from June 2004 to June 2006, raising the rate from 1.00% to 5.25%. The last four rate hikes occurred in the first half of 2006. During these months, the timing of their regularly scheduled meetings, which occur roughly every six weeks, remained a focal point of our investment strategy. We purchased short-term debt securities that matured around the time of the next meeting and reinvested their proceeds in higher yielding money market securities that became available after the Fed tightened monetary policy.
Economic growth began to slow in the spring of 2006, particularly as higher interest rates began to take a toll on the housing sector. The economy continued to lose steam in the second half of the year, allowing the Fed to leave short-term rates unchanged from July through December. Even though the Fed continued to express concern about inflation in the second half of the year (core inflation remained above the Fed’s unofficial target of 2%), many market participants expected it to cut short-term rates in 2007 to reinvigorate the economy. Under these conditions, longer-term money market yields declined to unattractive levels, and we found value in the one- to- three-month sector of the yield curve.
Throughout 2006, we maintained a large exposure to adjustable-rate money market securities that reset periodically based on formulas tied to either the one- or three-month London Interbank Offered Rates (LIBOR). Such securities were in great demand because their interest rates reset to higher levels as short-term rates rose. After the Fed stopped tightening monetary policy, and because many market participants expected the Fed to cut rates in 2007, three-month LIBOR was often the highest-yielding sector of the money market yield curve. Therefore, adjustable-rate securities based on three-month LIBOR remained a very attractive investment opportunity.
Prudential Investments LLC (PI), an indirect, wholly owned subsidiary of Prudential Financial, Inc., serves as the investment manager for the Fund.
| * | Source: iMoneyNet, Inc. based on 357 funds in the iMoneyNet Prime Retail universe. Weekly 7-day current net yields of the Money Market Portfolio and the iMoneyNet Prime Retail universe as of 12/26/06. Prudential Investment Management, Inc. is the source for Money Market Portfolio information. |
For average and index definitions, refer to the Glossary of Benchmark Definitions page. Investors cannot invest directly in a market index or average. For a complete list of holdings refer to the Schedule of Investments section of this report.
The Prudential Series Fund, Natural Resources Portfolio
Subadvised by: Jennison Associates LLC
December 31, 2006
Investment Manager’s Report
Performance Summary - As of December 31, 2006
Average Annual Total Return Percentages
| | | | | | | | | | | | |
| | | 1-Year | | | 5-Year | | | 10-Year | | | Since
Inception | |
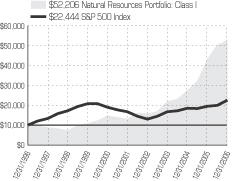
Natural Resources Portfolio: Class I | | 22.20 | % | | 31.56 | % | | 17.97 | % | | N/A | |
Natural Resources Portfolio: Class II | | 21.72% | | | N/A | | | N/A | | | 43.47 | % |
S&P 500 Index | | 15.78 | % | | 6.18 | % | | 8.42 | % | | 15.16 | % |
Lipper (VIP) Natural Resources Funds Avg. | | 19.46 | % | | 21.80 | % | | 12.70 | % | | 33.41 | % |
Portfolio (Class I) inception: 5/1/1988. Portfolio (Class II) inception: 4/28/2005.
$10,000 INVESTED OVER 10 YEARS1
Past performance does not guarantee future returns. Portfolio performance is net of investment fees and fund expenses, but not product charges, which, if included, would significantly lower the performance quoted. The investment return and principal value of an investment will fluctuate, so that an investor’s shares, when redeemed, may be worth more or less than their original cost. Current performance may be lower or higher than the past performance data quoted.
Unless noted otherwise, Lipper Average and Index returns reflect performance beginning the closest month-end date to the Portfolio’s inception (Class II). Performance figures may reflect fee waivers and/or expense reimbursements. In the absence of such fee waivers and/or expense reimbursements, total returns would be lower.
For the year ended December 31, 2006, the Natural Resources Portfolio had a total return that was higher than both its benchmark index and the average of its peer group.
The Portfolio seeks to invest in low-cost producers of natural resources using a value-driven investment style. We expect its returns to be less volatile than the majority of its peers because it is diversified across natural resource subsectors and because its value approach tends to leave less room for share price declines.
In 2006, the Portfolio particularly benefited from its holdings of metals and mining companies. The manager believes that emerging economies, especially China, will drive increased demand for metals. Global supplies, particularly of copper and iron ore, remain strained because the easiest exploited sources of these metals have long been tapped. The Portfolio focuses on the producers with the largest and most productive reserves.
The return of the Portfolio was affected by a severe sell-off in commodities in September 2006. Despite the sell-off, commodity prices remain historically high. The volatility largely reflects the impact of short-term speculation. The manager believes that over the long term, fundamentals in many commodities are strong because the costs of new production will be higher than most expectations, while demand continues to be robust.
Prudential Investments LLC (PI), an indirect, wholly owned subsidiary of Prudential Financial, Inc., serves as the investment manager for the Fund.
| 1 | The graph is based on the performance of Class I shares. Performance of Class II shares will be lower due to differences in the fee structure. Class II shares have associated 12b-1 and administrative fees at an annual rate of 0.25% and 0.15% respectively of the average daily net assets of the Class II shares. |
For average and index definitions, refer to the Glossary of Benchmark Definitions page. Investors cannot invest directly in a market index or average. For a complete list of holdings, refer to the Schedule of Investments section of this report.
The Prudential Series Fund, Small Capitalization Stock Portfolio
Subadvised by: Quantitative Management Associates LLC
December 31, 2006
Investment Manager’s Report
Performance Summary - As of December 31, 2006
Average Annual Total Return Percentages
| | | | | | | | | |
| | | 1-Year | | | 5-Year | | | 10-Year | |
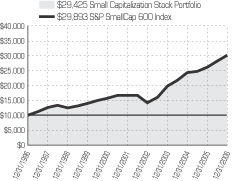
Small Capitalization Stock Portfolio | | 14.67 | % | | 12.04 | % | | 11.40 | % |
S&P SmallCap 600 Index | | 15.12 | | | 12.49 | | | 11.57 | |
Lipper (VIP) Small-Cap Core Funds Avg. | | 15.23 | | | 10.28 | | | 10.42 | |
Portfolio inception: 4/25/1995.
$10,000 INVESTED OVER 10 YEARS
Past performance does not guarantee future returns. Portfolio performance is net of investment fees and fund expenses, but not product charges, which, if included, would significantly lower the performance quoted. The investment return and principal value of an investment will fluctuate, so that an investor’s shares, when redeemed, may be worth more or less than their original cost. Current performance may be lower or higher than the past performance data quoted.
Unless noted otherwise, Lipper Average and Index returns reflect performance beginning the closest month-end date to the Portfolio’s inception. Performance figures may reflect fee waivers and/or expense reimbursements. In the absence of such fee waivers and/or expense reimbursements, total returns would be lower.
Prudential’s research group monitors and reports upon the performance of all Series fund Portfolios. In 2006, the Small Capitalization Stock Portfolio was managed by Quantitative Management Associates LLC (QMA), a unit of Prudential Investment Management. It is managed with the goal of having a return before fees and expenses that is close to that of the S&P SmallCap 600 Index (“the Index”). The Portfolio, the Index, and the Lipper (VIP) Small-Cap Core Funds Average all fell within a 0.60 percentage point range in 2006. The Lipper Average includes portfolios that have more aggressive strategies.
The Index return in 2006 was above its 10-year average and about in line with that of large-cap stocks. The foundation of its above-average return was very strong performance by the industrials sector, one of its largest. This sector includes the agricultural products group, whose return was above 50%, in part because of the rising price for corn for conversion to ethanol. The Index’s highest sector returns, however, were in the tiny telecommunication services sector, up almost 40%, and the somewhat larger materials and consumer staples sectors. The materials sector, which rose more than 30%, was driven by the metals & mining group. These industries are benefiting from the long-term rise in demand from developing economies that are building up their infrastructure. The consumer staples sector rose almost 30% on the strength of its tobacco, personal products, and beverages industries.
The financials sector, among the largest in the Index, contributed a good return although it didn’t keep up with the exceptional performance of the leading sectors. Its consumer finance group was among the strongest in the market. The energy sector was led by oil & gas refining and marketing, but its coal & consumable fuels group dropped sharply. The utilities sector had a good return, albeit not quite up with the leading sectors.
In this strong market, even the weakest sectors had returns close to 9% over the year. The technology sector, one of the two largest in this Index, was pulled down by the substantial drop of its computers & peripherals group and by information technology (IT) services. The consumer discretionary sector had several groups with negative returns, including multiline retail, distributors, catalog retail, and homebuilders. The healthcare sector was helped by its strong biotechnology group, but held back by poor performance by healthcare providers & services.
Prudential Investments LLC (PI), an indirect, wholly owned subsidiary of Prudential Financial, Inc., serves as the investment manager for the Fund.
For average and index definitions, refer to the Glossary of Benchmark Definitions page. Investors cannot invest directly in a market index or average. For a complete list of holdings refer to the Schedule of Investments section of this report.
The Prudential Series Fund, Stock Index Portfolio
Subadvised by: Quantitative Management Associates LLC
December 31, 2006
Investment Manager’s Report
Performance Summary - As of December 31, 2006
Average Annual Total Return Percentages
| | | | | | | | | |
| | | 1-Year | | | 5-Year | | | 10-Year | |
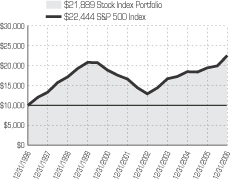
Stock Index Portfolio | | 15.54 | % | | 5.88 | % | | 8.15 | % |
S&P 500 Index | | 15.78 | | | 6.18 | | | 8.42 | |
Lipper (VIP) S&P 500 Index Objective Funds Avg. | | 15.38 | | | 5.78 | | | 8.11 | |
Portfolio inception: 10/19/1987.
$10,000 INVESTED OVER 10 YEARS
Past performance does not guarantee future returns. Portfolio performance is net of investment fees and fund expenses, but not product charges, which, if included, would significantly lower the performance quoted. The investment return and principal value of an investment will fluctuate, so that an investor’s shares, when redeemed, may be worth more or less than their original cost. Current performance may be lower or higher than the past performance data quoted.
Unless noted otherwise, Lipper Average and Index returns reflect performance beginning the closest month-end date to the Portfolio’s inception. Performance figures may reflect fee waivers and/or expense reimbursements. In the absence of such fee waivers and/or expense reimbursements, total returns would be lower.
In 2006, the Stock Index Portfolio was managed by QMA, a unit of Prudential Investment Management. The average index fund generally trails the S&P 500 Index (“the Index”) primarily because funds have fees and expenses that an index does not. The Portfolio’s return, although slightly below the Index, was above the average of similar funds.
The Index return for 2006 was above its historical average. All sectors, except health care and technology, made double-digit advances, most above 18%. The market benefited from exceptionally high corporate profits. In addition, substantial merger and acquisition activity helped prices in the real estate, utilities, telecommunications services, metals, and media industries. Investment bank stocks reflected high advising and trading income. Shares of ExxonMobil and Chevron, together composing almost 5% of the Index, had substantial gains. The aerospace and defense industry had high returns, in part because of demand for Boeing’s civilian aircraft. The impact of the slowing housing sector was mitigated by a pickup in nonresidential construction and by construction in the developing world. Demand for shares of companies producing construction materials continued to be strong. Metals stocks, particularly those of steel companies, and firms making construction machinery were in high demand. Negative returns for the managed health care and biotechnology industries contributed to making the healthcare sector the weakest in the Index.
Homebuilding stocks, which had fallen 45% from their January peak, recovered somewhat by year-end. Nonetheless, homebuilding and home improvement stocks had negative annual returns. After the U.S. Federal Reserve let its August 8 meeting pass without an interest-rate hike, the first break in two years, other industries rebounded significantly from steep losses earlier in the year. These included Internet & catalog retailers, human resource & employment services, Internet software & services, and wireless telecommunication services. Semiconductor and semiconductor equipment stocks recovered more modestly. Conversely, the rising price of corn drove agricultural products giant Archer-Daniels-Midland to give up some of a huge first-half gain.
Prudential Investments LLC (PI), an indirect, wholly owned subsidiary of Prudential Financial, Inc., serves as the investment manager for the Fund.
For average and index definitions, refer to the Glossary of Benchmark Definitions page. Investors cannot invest directly in a market index or average. For a complete list of holdings refer to the Schedule of Investments section of this report.
The Prudential Series Fund, Value Portfolio
Subadvised by: Jennison Associates LLC
December 31, 2006
Investment Manager’s Report
Performance Summary - As of December 31, 2006
Average Annual Total Return Percentages
| | | | | | | | | | | |
| | | 1-Year | | | 5-Year | | | 10-Year | | | Since
Inception |
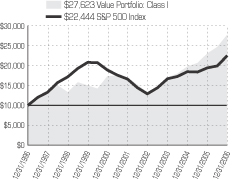
Value Portfolio: Class I | | 19.94 | % | | 10.22 | % | | 10.69 | % | | N/A |
Value Portfolio: Class II | | 19.43 | | | 9.76 | | | N/A | | | 7.77 |
S&P 500 Index | | 15.78 | | | 6.18 | | | 8.42 | | | 4.05 |
Russell 1000® Value Index | | 22.25 | | | 10.86 | | | 11.00 | | | 8.66 |
Lipper (VIP) Large Cap Value Funds Avg. | | 19.01 | | | 7.73 | | | 8.75 | | | 6.34 |
Lipper (VIP) Multi Cap Value Funds Avg. | | 17.30 | | | 8.99 | | | 9.25 | | | 7.27 |
Portfolio (Class I) inception: 2/19/1988. Portfolio (Class II) inception: 5/14/2001.
$10,000 INVESTED OVER 10 YEARS1
Past performance does not guarantee future returns. Portfolio performance is net of investment fees and fund expenses, but not product charges, which, if included, would significantly lower the performance quoted. The investment return and principal value of an investment will fluctuate, so that an investor’s shares, when redeemed, may be worth more or less than their original cost. Current performance may be lower or higher than the past performance data quoted.
Unless noted otherwise, Lipper Average and Index returns reflect performance beginning the closest month-end date to the Portfolio’s inception (Class II). Although Lipper classifies the Portfolio within the Multi-Cap Value Funds Average, the returns for the Large-Cap Value Funds Average are also shown, because the management of the portfolios included in the Large-Cap Value Funds Average is more consistent with the management of the Portfolio. The Russell 1000® Value Index is a trademark/service mark of the Frank Russell Company. Russell® is a trademark of the Frank Russell Company. Performance figures may reflect fee waivers and/or expense reimbursements. In the absence of such fee waivers and/or expense reimbursements, total returns would be lower.
For the year ended December 31, 2006, the Value Portfolio had a total return below the exceptionally high return of its style-specific benchmark index, but above the average of its peer group.
The Portfolio is managed in a relative value substyle. During this reporting period that substyle led to holding positions that varied more than the Russell 1000 Value Index. During 2006, this greater exposure to volatile stocks and the Portfolio’s less pronounced value characteristics than its benchmark both hurt its performance. Value stocks strongly outperformed growth over the first half of the year, and this environment was unfriendly to the Portfolio’s style. In fact, the Lipper Average of comparably managed funds trailed the benchmark by an even larger margin, showing that the very strong market provided few toeholds for active managers. Nonetheless, the Portfolio’s overall return was quite high by historical standards.
The Portfolio’s stock selection among large-cap value stocks eroded its return compared with its benchmark, particularly its selections within the technology and telecommunication sectors. A position in a computer software company, CA, had particularly large impact when the stock fell upon news about management turnover and a delay in filing its annual financial report with the SEC. Stock selection in the basic materials and financials sectors improved the Portfolio’s performance. It also benefited from a favorable distribution of its holdings among economic sectors. It was overweight compared with the benchmark in the very strong energy sector as well as in the above-average consumer noncyclicals and basic materials sectors, and correspondingly underweight in the financials sector, which was not among the market leaders.
Prudential Investments LLC (PI), an indirect, wholly owned subsidiary of Prudential Financial, Inc., serves as the investment manager for the Fund.
| 1 | The graph is based on the performance of Class I shares. Performance of Class II shares will be lower due to differences in the fee structure. Class II shares have associated 12b-1 and administrative fees at an annual rate of 0.25% and 0.15% respectively of the average daily net assets of the Class II shares. |
For average and index definitions, refer to the Glossary of Benchmark Definitions page. Investors cannot invest directly in a market index or average. For a complete list of holdings, refer to the Schedule of Investments section of this report.
Presentation of Portfolio Holdings for the Prudential Series Fund as of December 31, 2006 (Unaudited)
| | | | | | | | | | | | | | |
| Conservative Balanced | | | | | | Diversified Bond | | | | | | Equity | | |
| Five Largest Holdings (% Assets) of Net | | | | Five Largest Issues (% Net Assets) of | | | | Five Largest Holdings (% of Net Assets) |
Exxon Mobil Corp. | | 1.8% | | | | Federal National Mortgage Association, 5.50%, 1/01/33 | | 4.9% | | | | Microsoft Corp. | | 2.6% |
General Electric Co. | | 1.5% | | | | Federal National Mortgage Association, 5.00%, 3/01/34 | | 2.5% | | | | General Electric Co. | | 2.3% |
Citigroup, Inc. | | 1.1% | | | | Trains HY-1 2006, 7.548%, 5/01/16 | | 1.6% | | | | QUALCOMM, Inc. | | 2.1% |
Microsoft Corp. | | 1.0% | | | | Government of Hungary, 8.00%, 2/12/15 | | 1.4% | | | | Motorola, Inc. | | 2.0% |
Bank of America Corp. | | 1.0% | | | | Federal National Mortgage Association, 5.00%, 1/01/20 | | 1.3% | | | | Cisco Systems, Inc. | | 1.9% |
| | | | | | | | | | | | | | |
| Flexible Managed | | | | | | Global | | | | | | Government Income | | |
| Five Largest Holdings (% Net Assets) of | | | | Five Largest Holdings (% Net Assets) of | | | | Five Largest Issues (% Net Assets) of |
Exxon Mobil Corp. | | 1.8% | | | | UnitedHealth Group, Inc. | | 1.4% | | | | Federal National Mortgage Association, 4.875%, 4/10/08 | | 8.0% |
General Electric Co. | | 1.5% | | | | Goldman Sachs Group, Inc. | | 1.3% | | | | Federal National Mortgage Association, 5.30%, 2/22/11 | | 4.6% |
Citigroup, Inc. | | 1.2% | | | | Comcast Corp. (Class A Stock) | | 1.3% | | | | Federal National Mortgage Association, 5.00%, TBA | | 2.9% |
Federal National Mortgage Association, 5.50%, TBA | | 1.2% | | | | HBOS PLC | | 1.1% | | | | Tennessee Valley Authority, Series B, 4.375%, 6/15/15 | | 2.7% |
International Business Machines Corp. | | 1.1% | | | | Genentech, Inc. | | 1.0% | | | | United States Treasury Inflation Indexed Notes, 3.875%, 1/15/09 | | 2.4% |
| | | | | | | | | | | | | | |
| High Yield Bond | | | | | | Jennison | | | | | | Natural Resources | | |
| Five Largest Issues (% of Net Assets) | | | | Five Largest Holdings (% of Net Assets) | | | | Five Largest Holdings (% of Net Assets) |
General Motors Acceptance Corp.,
6.875%, 9/15/11 | | 1.6% | | | | Google, Inc. (Class “A” Stock) | | 4.1% | | | | Suncor Energy, Inc. | | 3.3% |
Ford Motor Credit Co., 7.875%, 6/15/10 | | 1.5% | | | | Microsoft Corp. | | 3.6% | | | | National-Oilwell Varco, Inc. | | 2.5% |
Accellent, Inc., 10.50%, 12/01/13 | | 1.0% | | | | Cisco Systems, Inc. | | 3.3% | | | | Transocean, Inc. | | 2.5% |
HCA, Inc., 8.114%, 11/14/13 | | 0.9% | | | | Adobe Systems, Inc. | | 3.2% | | | | OPTI Canada, Inc. (Canada) | | 2.4% |
Ford Motor Co., 8.36%, 12/12/13 | | 0.9% | | | | American International Group, Inc. | | 3.2% | | | | Southwestern Energy Co. | | 2.2% |
| | | | | | | | | | | | | | |
| Small Capitalization Stock | | | | | | Stock Index | | | | | | Value | | |
| Five Largest Holdings (% of Net Assets) | | | | Five Largest Holdings (% of Net Assets) | | | | Five Largest Holdings (% Net Assets) of |
Manitowac Co., Inc. | | 0.6% | | | | Exxon Mobil Corp. | | 3.5% | | | | Citigroup, Inc. | | 3.0% |
Energen Corp | | 0.6% | | | | General Electric Co. | | 3.0% | | | | American International Group, Inc. | | 2.8% |
Frontier Oil Corp. | | 0.5% | | | | Citigroup, Inc. | | 2.1% | | | | Merrill Lynch & Co., Inc. | | 2.4% |
Global Payments, Inc. | | 0.5% | | | | Microsoft Corp. | | 2.0% | | | | Altria Group, Inc. | | 2.3% |
Veritas DGC, Inc. | | 0.5% | | | | Bank of America Corp. | | 1.9% | | | | Bank of New York Co., Inc. (The) | | 2.2% |
For a complete listing of holdings, refer to the Schedule of Investments section of this report.
Holdings reflect only long-term investments. Holdings/Issues/Industries/Sectors are subject to change.
Fees and Expenses (Unaudited)
As a contract owner investing in Portfolios of the Fund through a variable annuity or variable life contract, you incur ongoing costs, including management fees, distribution and service (12b-1*) fees, and other Portfolio expenses. This example is intended to help you understand your ongoing costs (in dollars) of investing in the Fund and to compare these costs with the ongoing costs of investing in other investment options. This example does not reflect fees and charges under your variable annuity or variable life contract. If contract charges were included, the costs shown below would be higher. Please consult the prospectus for your contract for more information about contract fees and charges.
* 12b-1 fees are paid by the fund out of fund assets to cover distribution expenses and sometimes shareholder service expenses.
The example is based on an investment of $1,000 invested at the beginning of the period and held for the entire period July 1, 2006 through December 31, 2006.
Actual Expenses
The first line of the table below provides information about actual account values and actual expenses. You may use this information, together with the amount you invested, to estimate the Portfolio expenses that you paid over the period. Simply divide your account value by $1,000 (for example, an $8,600 account value divided by $1,000 = 8.6), then multiply the result by the number in the first line under the heading entitled “Expenses Paid During Period” to estimate the Portfolio expenses you paid on your account during this period. As noted above, the table does not reflect variable contract fees and charges.
Hypothetical Example for Comparison Purposes
The second line of the table below provides information about hypothetical account values and hypothetical expenses based on the Portfolio’s actual expense ratio and an assumed rate of return of 5% per year before expenses, which is not the Portfolio’s actual return. The hypothetical account values and expenses may not be used to estimate the actual ending account balance or expenses you paid for the period. You may use this information to compare the ongoing costs of investing in the Portfolio and other investment options. To do so, compare this 5% hypothetical example with the 5% hypothetical examples that appear in the shareholder reports of the other investment options.
Please note that the expenses shown in the table are meant to highlight your ongoing Portfolio costs only and do not reflect any contract fees and charges, such as sales charges (loads), insurance charges or administrative charges. Therefore the second line of the table is useful to compare ongoing investment option costs only, and will not help you determine the relative total costs of owning different contracts. In addition, if these contract fee and charges were included, your costs would have been higher.
| | | | | | | | | | | | | | |
| The Prudential Series Fund Portfolios | | Beginning Account
Value
July 1, 2006 | | Ending Account
Value
December 31, 2006 | | Annualized
Expense Ratio
Based on the
Six-Month Period | | | Expenses Paid
During the Six-
Month Period* |
| | | | | | | | | | | | | | | |
Conservative Balanced
(Class I) | | Actual | | $ | 1,000.00 | | $ | 1,090.80 | | 0.56 | % | | $ | 2.95 |
| | Hypothetical | | $ | 1,000.00 | | $ | 1,022.38 | | 0.56 | % | | $ | 2.85 |
| | | | | | | | | | | | | | | |
| Diversified Bond (Class I) | | Actual | | $ | 1,000.00 | | $ | 1,058.30 | | 0.45 | % | | $ | 2.33 |
| | Hypothetical | | $ | 1,000.00 | | $ | 1,022.94 | | 0.45 | % | | $ | 2.29 |
| | | | | | | | | | | | | | | |
| Equity (Class I) | | Actual | | $ | 1,000.00 | | $ | 1,118.80 | | 0.47 | % | | $ | 2.51 |
| | Hypothetical | | $ | 1,000.00 | | $ | 1,022.84 | | 0.47 | % | | $ | 2.40 |
| | | | | | | | | | | | | | | |
| Equity (Class II) | | Actual | | $ | 1,000.00 | | $ | 1,116.70 | | 0.87 | % | | $ | 4.64 |
| | Hypothetical | | $ | 1,000.00 | | $ | 1,020.82 | | 0.87 | % | | $ | 4.43 |
| | | | | | | | | | | | | | | |
| Flexible Managed (Class I) | | Actual | | $ | 1,000.00 | | $ | 1,100.10 | | 0.61 | % | | $ | 3.23 |
| | Hypothetical | | $ | 1,000.00 | | $ | 1,022.13 | | 0.61 | % | | $ | 3.11 |
| | | | | | | | | | | | | | | |
| Global (Class I) | | Actual | | $ | 1,000.00 | | $ | 1,129.90 | | 0.74 | % | | $ | 3.97 |
| | Hypothetical | | $ | 1,000.00 | | $ | 1,021.48 | | 0.74 | % | | $ | 3.77 |
| | | | | | | | | | | | | | | |
| Government Income (Class I) | | Actual | | $ | 1,000.00 | | $ | 1,044.00 | | 0.51 | % | | $ | 2.63 |
| | Hypothetical | | $ | 1,000.00 | | $ | 1,022.63 | | 0.51 | % | | $ | 2.60 |
| | | | | | | | | | | | | | | |
| High Yield Bond (Class I) | | Actual | | $ | 1,000.00 | | $ | 1,073.10 | | 0.57 | % | | $ | 2.98 |
| | Hypothetical | | $ | 1,000.00 | | $ | 1,022.33 | | 0.57 | % | | $ | 2.91 |
| | | | | | | | | | | | | | | |
| Jennison (Class I) | | Actual | | $ | 1,000.00 | | $ | 1,090.40 | | 0.63 | % | | $ | 3.32 |
| | Hypothetical | | $ | 1,000.00 | | $ | 1,022.03 | | 0.63 | % | | $ | 3.21 |
| | | | | | | | | | | | | | |
| The Prudential Series Fund Portfolios | | Beginning Account
Value
July 1, 2006 | | Ending Account
Value
December 31, 2006 | | Annualized
Expense Ratio
Based on the
Six-Month Period | | | Expenses Paid
During the Six-
Month Period* |
| | | | | | | | | | | | | | | |
| Jennison (Class II) | | Actual | | $ | 1,000.00 | | $ | 1,088.00 | | 1.03 | % | | $ | 5.42 |
| | Hypothetical | | $ | 1,000.00 | | $ | 1,020.01 | | 1.03 | % | | $ | 5.24 |
| | | | | | | | | | | | | | | |
| Money Market (Class I) | | Actual | | $ | 1,000.00 | | $ | 1,025.10 | | 0.42 | % | | $ | 2.14 |
| | Hypothetical | | $ | 1,000.00 | | $ | 1,023.09 | | 0.42 | % | | $ | 2.14 |
| | | | | | | | | | | | | | | |
| Natural Resources (Class I) | | Actual | | $ | 1,000.00 | | $ | 1,039.40 | | 0.50 | % | | $ | 2.57 |
| | Hypothetical | | $ | 1,000.00 | | $ | 1,022.68 | | 0.50 | % | | $ | 2.55 |
| | | | | | | | | | | | | | | |
| Natural Resources (Class II) | | Actual | | $ | 1,000.00 | | $ | 1,037.30 | | 0.90 | % | | $ | 4.62 |
| | Hypothetical | | $ | 1,000.00 | | $ | 1,020.67 | | 0.90 | % | | $ | 4.58 |
| | | | | | | | | | | | | | | |
Small Capitalization Stock
(Class I) | | Actual | | $ | 1,000.00 | | $ | 1,067.20 | | 0.44 | % | | $ | 2.29 |
| | Hypothetical | | $ | 1,000.00 | | $ | 1,022.99 | | 0.44 | % | | $ | 2.24 |
| | | | | | | | | | | | | | | |
| Stock Index (Class I) | | Actual | | $ | 1,000.00 | | $ | 1,125.80 | | 0.36 | % | | $ | 1.93 |
| | Hypothetical | | $ | 1,000.00 | | $ | 1,023.39 | | 0.36 | % | | $ | 1.84 |
| | | | | | | | | | | | | | | |
| Value (Class I) | | Actual | | $ | 1,000.00 | | $ | 1,123.80 | | 0.42 | % | | $ | 2.25 |
| | Hypothetical | | $ | 1,000.00 | | $ | 1,023.09 | | 0.42 | % | | $ | 2.14 |
| | | | | | | | | | | | | | | |
| Value (Class II) | | Actual | | $ | 1,000.00 | | $ | 1,121.30 | | 0.82 | % | | $ | 4.38 |
| | Hypothetical | | $ | 1,000.00 | | $ | 1,021.07 | | 0.82 | % | | $ | 4.18 |
| * | Portfolio expenses (net of fee waivers or subsidies, if any) for each share class are equal to the annualized expense ratio for each share class (provided in the table), multiplied by the average account value over the period, multiplied by the 184 days in the six-month period ended December 31, 2006, and divided by the 365 days in the Portfolio’s fiscal year ended December 31, 2006 (to reflect the six-month period). |
| | | | |
| | | CONSERVATIVE BALANCED PORTFOLIO | | |
STATEMENT OF ASSETS AND LIABILITIES
December 31, 2006
| | | |
| ASSETS | | | |
Investments, at value including securities on loan of $196,798,835: | | | |
Unaffiliated investments (cost $2,022,194,120) | | $ | 2,469,261,024 |
Affiliated investments (cost $546,923,952) | | | 546,988,257 |
Cash | | | 116,699 |
Foreign currency, at value (cost $26,841) | | | 27,060 |
Receivable for investments sold | | | 52,574,428 |
Dividends and interest receivable | | | 10,479,778 |
Receivable for Series shares sold | | | 46,474 |
Prepaid expenses | | | 42,886 |
Foreign tax reclaim receivable | | | 36,623 |
| | |
|
|
Total Assets | | | 3,079,573,229 |
| | |
|
|
| LIABILITIES | | | |
Collateral for securities on loan | | | 204,591,018 |
Payable for investments purchased | | | 101,997,507 |
Management fee payable | | | 1,297,142 |
Payable for Series shares repurchased | | | 608,357 |
Due to broker—variation margin | | | 246,824 |
Accrued expenses and other liabilities | | | 230,407 |
Unrealized depreciation on swaps | | | 21,669 |
Transfer agent fee payable | | | 316 |
| | |
|
|
Total Liabilities | | | 308,993,240 |
| | |
|
|
| NET ASSETS | | $ | 2,770,579,989 |
| | |
|
|
| |
Net assets were comprised of: | | | |
Paid-in capital | | $ | 2,373,220,128 |
Retained earnings | | | 397,359,861 |
| | |
|
|
Net assets, December 31, 2006 | | $ | 2,770,579,989 |
| | |
|
|
Net asset value and redemption price per share, $2,770,579,989 / 170,879,134 outstanding shares of beneficial interest (authorized 525,000,000 shares) | | $ | 16.21 |
| | |
|
|
STATEMENT OF OPERATIONS
Year Ended December 31, 2006
| | | | |
| INVESTMENT INCOME | | | | |
Interest | | $ | 50,753,367 | |
Unaffiliated dividend income (net of foreign withholding taxes of $233,535) | | | 28,950,414 | |
Affiliated dividend income | | | 16,339,321 | |
Affiliated income from securities loaned, net | | | 260,395 | |
| | |
|
|
|
| | | | 96,303,497 | |
| | |
|
|
|
| EXPENSES | | | | |
Management fee | | | 14,950,476 | |
Custodian’s fees and expenses | | | 205,000 | |
Shareholders’ reports | | | 140,000 | |
Insurance expenses | | | 71,000 | |
Trustees’ fees | | | 40,000 | |
Audit fee | | | 21,000 | |
Legal fees and expenses | | | 14,000 | |
Commitment fee on syndicated credit agreement | | | 2,000 | |
Transfer agent’s fee and expenses (including affiliated expense of $1,800) (Note 4) | | | 2,000 | |
Miscellaneous | | | 18,119 | |
| | |
|
|
|
Total expenses | | | 15,463,595 | |
| | |
|
|
|
| NET INVESTMENT INCOME | | | 80,839,902 | |
| | |
|
|
|
| |
| NET REALIZED AND UNREALIZED GAIN (LOSS) ON INVESTMENTS, SWAPS AND FOREIGN CURRENCIES | | | | |
Net realized gain (loss) on: | | | | |
Investments | | | (108,622,883 | ) |
Futures transactions | | | 3,473,671 | |
Foreign currency transactions | | | (35,133 | ) |
Options written | | | 32,695 | |
Short sales | | | (41,934 | ) |
Swaps | | | (284,957 | ) |
| | |
|
|
|
| | | | (105,478,541 | ) |
| | |
|
|
|
Net change in unrealized appreciation (depreciation) on: | | | | |
Investments | | | 296,538,582 | |
Futures | | | (1,204,348 | ) |
Foreign currencies | | | 2,278 | |
Options written | | | (25,332 | ) |
Swaps | | | (21,669 | ) |
| | |
|
|
|
| | | | 295,289,511 | |
| | |
|
|
|
| NET GAIN ON INVESTMENTS, SWAPS AND FOREIGN CURRENCIES | | | 189,810,970 | |
| | |
|
|
|
| NET INCREASE IN NET ASSETS RESULTING FROM OPERATIONS | | $ | 270,650,872 | |
| | |
|
|
|
STATEMENT OF CHANGES IN NET ASSETS
| | | | | | | | |
| | | Year Ended December 31,
| |
| | | 2006
| | | 2005
| |
| INCREASE (DECREASE) IN NET ASSETS | | | | | | | | |
| OPERATIONS: | | | | | | | | |
Net investment income | | $ | 80,839,902 | | | $ | 68,482,581 | |
Net realized loss on investments, swaps and foreign currency transactions | | | (105,478,541 | ) | | | (14,618,230 | ) |
Net change in unrealized appreciation (depreciation) on investments and foreign currencies | | | 295,289,511 | | | | 39,591,655 | |
| | |
|
|
| |
|
|
|
NET INCREASE IN NET ASSETS RESULTING FROM OPERATIONS | | | 270,650,872 | | | | 93,456,006 | |
| | |
|
|
| |
|
|
|
| DIVIDENDS AND DISTRIBUTIONS: | | | | | | | | |
Dividends from net investment income | | | — | | | | (65,771,642 | ) |
Distributions from net realized capital gains | | | — | | | | (28,275,553 | ) |
Distributions | | | (75,726,414 | ) | | | — | |
| | |
|
|
| |
|
|
|
TOTAL DIVIDENDS AND DISTRIBUTIONS | | | (75,726,414 | ) | | | (94,047,195 | ) |
| | |
|
|
| |
|
|
|
| SERIES SHARE TRANSACTIONS: | | | | | | | | |
Series shares sold [1,557,565 and 2,034,058 shares, respectively] | | | 23,668,066 | | | | 30,062,884 | |
Series shares issued in reinvestment of dividends and distributions [5,014,994 and 6,595,175 shares, respectively] | | | 75,726,414 | | | | 94,047,195 | |
Series shares repurchased [17,938,730 and 18,072,236 shares, respectively] | | | (273,531,887 | ) | | | (267,289,008 | ) |
| | |
|
|
| |
|
|
|
NET DECREASE IN NET ASSETS RESULTING FROM SERIES SHARE TRANSACTIONS | | | (174,137,407 | ) | | | (143,178,929 | ) |
| | |
|
|
| |
|
|
|
| TOTAL INCREASE (DECREASE) IN NET ASSETS | | | 20,787,051 | | | | (143,770,118 | ) |
| NET ASSETS: | | | | | | | | |
Beginning of year | | | 2,749,792,938 | | | | 2,893,563,056 | |
| | |
|
|
| |
|
|
|
End of year | | $ | 2,770,579,989 | | | $ | 2,749,792,938 | (a) |
| | |
|
|
| |
|
|
|
(a) Includes undistributed net investment income of: | | | | | | $ | 69,851,558 | |
| | | | | | |
|
|
|
SEE NOTES TO FINANCIAL STATEMENTS.
A1
| | | | |
| | | DIVERSIFIED BOND PORTFOLIO | | |
STATEMENT OF ASSETS AND LIABILITIES
December 31, 2006
| | | | |
| ASSETS | | | | |
Investments, at value including securities on loan of $52,884,013: | | | | |
Unaffiliated investments (cost $1,137,656,890) | | $ | 1,142,714,909 | |
Affiliated investments (cost $112,153,335) | | | 112,173,480 | |
Foreign currency, at value (cost $325,802) | | | 325,799 | |
Receivable for investments sold | | | 61,345,970 | |
Interest receivable | | | 12,462,570 | |
Unrealized appreciation on forward foreign currency contracts | | | 556,456 | |
Unrealized appreciation on swaps | | | 480,813 | |
Due from broker—variation margin | | | 152,383 | |
Receivable for Series shares sold | | | 133,784 | |
Prepaid expenses | | | 25,596 | |
| | |
|
|
|
Total Assets | | | 1,330,371,760 | |
| | |
|
|
|
| LIABILITIES | | | | |
Payable for investments purchased | | | 105,083,662 | |
Collateral for securities on loan | | | 54,138,631 | |
Securities sold short, at value (proceeds $19,425,000) | | | 19,287,500 | |
Accrued expenses and other liabilities | | | 407,584 | |
Management fee payable | | | 392,983 | |
Payable for Series shares repurchased | | | 297,214 | |
Unrealized depreciation on forward foreign currency contracts | | | 228,641 | |
Unrealized depreciation on swaps | | | 127,952 | |
Payable to custodian | | | 34,489 | |
Deferred trustees’ fees | | | 7,588 | |
Transfer agent fee payable | | | 436 | |
| | |
|
|
|
Total Liabilities | | | 180,006,680 | |
| | |
|
|
|
| NET ASSETS | | $ | 1,150,365,080 | |
| | |
|
|
|
| |
Net assets were comprised of: | | | | |
Paid-in capital | | $ | 1,154,116,065 | |
Retained earnings | | | (3,750,985 | ) |
| | |
|
|
|
Net assets, December 31, 2006 | | $ | 1,150,365,080 | |
| | |
|
|
|
Net asset value and redemption price per share, $1,150,365,080 / 106,044,661 outstanding shares of beneficial interest (authorized 275,000,000 shares) | | $ | 10.85 | |
| | |
|
|
|
STATEMENT OF OPERATIONS
Year Ended December 31, 2006
| | | | |
| INVESTMENT INCOME | | | | |
Interest (net of foreign withholding taxes of $155,816) | | $ | 61,039,790 | |
Affiliated dividend income | | | 4,830,425 | |
Affiliated income from securities loaned, net | | | 197,570 | |
| | |
|
|
|
| | | | 66,067,785 | |
| | |
|
|
|
| EXPENSES | | | | |
Management fee | | | 4,689,336 | |
Custodian’s fees and expenses | | | 265,000 | |
Shareholders’ reports | | | 214,000 | |
Insurance expenses | | | 42,000 | |
Trustees’ fees | | | 23,000 | |
Audit fee | | | 20,000 | |
Legal fees and expenses | | | 15,000 | |
Commitment fee on syndicated credit agreement | | | 4,000 | |
Transfer agent’s fee and expenses (including affiliated expense of $2,600) (Note 4) | | | 2,800 | |
Miscellaneous | | | 8,658 | |
| | |
|
|
|
Total expenses | | | 5,283,794 | |
| | |
|
|
|
| NET INVESTMENT INCOME | | | 60,783,991 | |
| | |
|
|
|
| |
| NET REALIZED AND UNREALIZED GAIN (LOSS) ON INVESTMENTS, SWAPS AND FOREIGN CURRENCIES | | | | |
Net realized gain (loss) on: | | | | |
Investments | | | (6,233,676 | ) |
Short sales | | | (71,504 | ) |
Futures transactions | | | (577,814 | ) |
Swaps | | | 302,013 | |
Options written | | | 68,013 | |
Foreign currency transactions | | | (3,144,587 | ) |
| | |
|
|
|
| | | | (9,657,555 | ) |
| | |
|
|
|
Net change in unrealized appreciation (depreciation) on: | | | | |
Investments | | | 5,927,207 | |
Securities sold short | | | 137,500 | |
Futures | | | (773,590 | ) |
Swaps | | | (349,449 | ) |
Options written | | | (52,694 | ) |
Foreign currencies | | | (62,272 | ) |
| | |
|
|
|
| | | | 4,826,702 | |
| | |
|
|
|
| NET LOSS ON INVESTMENTS, SWAPS AND FOREIGN CURRENCIES | | | (4,830,853 | ) |
| | |
|
|
|
| NET INCREASE IN NET ASSETS RESULTING FROM OPERATIONS | | $ | 55,953,138 | |
| | |
|
|
|
STATEMENT OF CHANGES IN NET ASSETS
| | | | | | | | |
| | | Year Ended December 31,
| |
| | | 2006
| | | 2005
| |
| INCREASE (DECREASE) IN NET ASSETS | | | | | | | | |
| OPERATIONS: | | | | | | | | |
Net investment income | | $ | 60,783,991 | | | $ | 58,610,798 | |
Net realized gain (loss) on investments, swaps and foreign currency transactions | | | (9,657,555 | ) | | | 9,146,862 | |
Net change in unrealized appreciation (depreciation) on investments, swaps and foreign currencies | | | 4,826,702 | | | | (28,627,041 | ) |
| | |
|
|
| |
|
|
|
NET INCREASE IN NET ASSETS RESULTING FROM OPERATIONS | | | 55,953,138 | | | | 39,130,619 | |
| | |
|
|
| |
|
|
|
| DIVIDENDS AND DISTRIBUTIONS: | | | | | | | | |
Dividends from net investment income | | | — | | | | (64,066,702 | ) |
Distributions from net realized capital gains | | | — | | | | (8,967,165 | ) |
Distributions | | | (68,284,295 | ) | | | — | |
| | |
|
|
| |
|
|
|
TOTAL DIVIDENDS AND DISTRIBUTIONS | | | (68,284,295 | ) | | | (73,033,867 | ) |
| | |
|
|
| |
|
|
|
| SERIES SHARE TRANSACTIONS: | | | | | | | | |
Series shares sold [3,007,043 and 13,510,338 shares, respectively] | | | 32,538,204 | | | | 149,284,047 | |
Series shares issued in reinvestment of dividends and distributions [6,373,024 and 6,639,907 shares, respectively] | | | 68,284,295 | | | | 73,033,867 | |
Series shares repurchased [15,646,812 and 21,634,412 shares, respectively] | | | (168,772,245 | ) | | | (241,438,250 | ) |
| | |
|
|
| |
|
|
|
NET DECREASE IN NET ASSETS RESULTING FROM SERIES SHARE TRANSACTIONS | | | (67,949,746 | ) | | | (19,120,336 | ) |
| | |
|
|
| |
|
|
|
| TOTAL DECREASE IN NET ASSETS | | | (80,280,903 | ) | | | (53,023,584 | ) |
| NET ASSETS: | | | | | | | | |
Beginning of year | | | 1,230,645,983 | | | | 1,283,669,567 | |
| | |
|
|
| |
|
|
|
End of year | | $ | 1,150,365,080 | | | $ | 1,230,645,983 | |
| | |
|
|
| |
|
|
|
SEE NOTES TO FINANCIAL STATEMENTS.
A2
STATEMENT OF ASSETS AND LIABILITIES
December 31, 2006
| | | |
| ASSETS | | | |
Investments, at value including securities on loan of $366,835,888: | | | |
Unaffiliated investments (cost $3,521,170,634) | | $ | 4,349,476,968 |
Affiliated investments (cost $435,213,247) | | | 435,213,247 |
Cash | | | 199,179 |
Dividends and interest receivable | | | 5,717,150 |
Receivable for investments sold | | | 712,998 |
Prepaid expenses | | | 92,317 |
Tax reclaim receivable | | | 17,041 |
Receivable for Series shares sold | | | 15,108 |
| | |
|
|
Total Assets | | | 4,791,444,008 |
| | |
|
|
| LIABILITIES | | | |
Collateral for securities on loan | | | 379,439,451 |
Payable for investments purchased | | | 4,496,794 |
Management fee payable | | | 1,683,368 |
Payable for Series shares repurchased | | | 605,883 |
Accrued expenses and other liabilities | | | 567,957 |
Deferred trustees’ fees | | | 2,030 |
Transfer agent fee payable | | | 896 |
Distribution fee payable | | | 403 |
Administration fee payable | | | 242 |
| | |
|
|
Total Liabilities | | | 386,797,024 |
| | |
|
|
| NET ASSETS | | $ | 4,404,646,984 |
| | |
|
|
| |
Net assets were comprised of: | | | |
Paid-in capital | | $ | 3,610,238,397 |
Retained earnings | | | 794,408,587 |
| | |
|
|
Net assets, December 31, 2006 | | $ | 4,404,646,984 |
| | |
|
|
| Class I: | | | |
Net asset value and redemption price per share, $4,402,742,586 / 160,390,283 outstanding shares of beneficial interest (authorized 525,000,000 shares) | | $ | 27.45 |
| | |
|
|
| Class II: | | | |
Net asset value and redemption price per share, $1,904,398 / 69,196 outstanding shares of beneficial interest (authorized 50,000,000 shares) | | $ | 27.52 |
| | |
|
|
STATEMENT OF OPERATIONS
Year Ended December 31, 2006
| | | | |
| INVESTMENT INCOME | | | | |
Unaffiliated dividend income (net of $1,248,781 foreign withholding tax) | | $ | 62,461,919 | |
Affiliated dividend income | | | 3,573,498 | |
Affiliated income from securities lending, net | | | 1,129,408 | |
Unaffiliated Interest | | | 1,330 | |
| | |
|
|
|
| | | | 67,166,155 | |
| | |
|
|
|
| EXPENSES | | | | |
Management fee | | | 19,172,602 | |
Distribution fee—Class II | | | 4,627 | |
Administration fee—Class II | | | 2,776 | |
Custodian’s fees and expenses | | | 594,000 | |
Insurance expenses | | | 126,000 | |
Shareholders’ reports | | | 120,000 | |
Trustees’ fees | | | 62,000 | |
Commitment fee on syndicated credit agreement | | | 19,000 | |
Audit fee | | | 15,000 | |
Transfer agent’s fees and expenses (including affiliated expense of $5,300) (Note 4) | | | 9,000 | |
Legal fees and expenses | | | 5,000 | |
Miscellaneous | | | 9,694 | |
| | |
|
|
|
Total expenses | | | 20,139,699 | |
| | |
|
|
|
| NET INVESTMENT INCOME | | | 47,026,456 | |
| | |
|
|
|
| |
| NET REALIZED AND UNREALIZED GAIN (LOSS) ON INVESTMENTS AND FOREIGN CURRENCIES | | | | |
Net realized gain (loss) on: | | | | |
Investment transactions | | | 333,279,341 | |
Foreign currency transactions | | | (66,838 | ) |
| | |
|
|
|
| | | | 333,212,503 | |
| | |
|
|
|
Net change in unrealized appreciation (depreciation) on: | | | | |
Investments | | | 125,859,938 | |
Foreign currencies | | | (726 | ) |
| | |
|
|
|
| | | | 125,859,212 | |
| | |
|
|
|
| NET GAIN ON INVESTMENTS AND FOREIGN CURRENCIES | | | 459,071,715 | |
| | |
|
|
|
| NET INCREASE IN NET ASSETS RESULTING FROM OPERATIONS | | $ | 506,098,171 | |
| | |
|
|
|
STATEMENT OF CHANGES IN NET ASSETS
| | | | | | | | |
| | | Year Ended December 31,
| |
| | | 2006
| | | 2005
| |
| INCREASE (DECREASE) IN NET ASSETS | | | | | | | | |
| OPERATIONS: | | | | | | | | |
Net investment income | | $ | 47,026,456 | | | $ | 41,399,720 | |
Net realized gain on investments and foreign currencies | | | 333,212,503 | | | | 423,884,584 | |
Net change in unrealized appreciation (depreciation) on investments and foreign currencies | | | 125,859,212 | | | | (16,875,093 | ) |
| | |
|
|
| |
|
|
|
NET INCREASE IN NET ASSETS RESULTING FROM OPERATIONS | | | 506,098,171 | | | | 448,409,211 | |
| | |
|
|
| |
|
|
|
| DIVIDENDS AND DISTRIBUTIONS: | | | | | | | | |
Dividends from net investment income | | | | | | | | |
Class I | | | — | | | | (39,989,141 | ) |
Class II | | | — | | | | (9,415 | ) |
Distributions | | | | | | | | |
Class I | | | (46,000,931 | ) | | | — | |
Class II | | | (11,345 | ) | | | — | |
| | |
|
|
| |
|
|
|
TOTAL DIVIDENDS AND DISTRIBUTIONS | | | (46,012,276 | ) | | | (39,998,556 | ) |
| | |
|
|
| |
|
|
|
| SERIES SHARE TRANSACTIONS (Note 7): | | | | | | | | |
Series shares sold | | | 56,539,838 | | | | 69,318,202 | |
Series shares issued in reinvestment of dividends and distributions | | | 46,012,276 | | | | 39,998,556 | |
Net asset value of shares issued in merger | | | — | | | | 28,041,417 | |
Series shares repurchased | | | (443,931,719 | ) | | | (396,681,659 | ) |
| | |
|
|
| |
|
|
|
NET DECREASE IN NET ASSETS RESULTING FROM SERIES SHARE TRANSACTIONS | | | (341,379,605 | ) | | | (259,323,484 | ) |
| | |
|
|
| |
|
|
|
| TOTAL INCREASE IN NET ASSETS | | | 118,706,290 | | | | 149,087,171 | |
| NET ASSETS: | | | | | | | | |
Beginning of year | | | 4,285,940,694 | | | | 4,136,853,523 | |
| | |
|
|
| |
|
|
|
End of year | | $ | 4,404,646,984 | | | $ | 4,285,940,694 | (a) |
| | |
|
|
| |
|
|
|
(a) Includes undistributed net investment income of | | | | | | $ | 2,150,120 | |
| | | | | | |
|
|
|
SEE NOTES TO FINANCIAL STATEMENTS.
A3
| | | | |
| | | FLEXIBLE MANAGED PORTFOLIO | | |
STATEMENT OF ASSETS AND LIABILITIES
December 31, 2006
| | | |
| ASSETS | | | |
Investments, at value including securities on loan of $293,454,272: | | | |
Unaffiliated investments (cost $3,009,764,519) | | $ | 3,420,923,312 |
Affiliated investments (cost $702,769,257) | | | 702,847,821 |
Cash | | | 2,218,393 |
Foreign currency, at value (cost $37,131) | | | 37,470 |
Receivable for investments sold | | | 48,042,849 |
Dividends and interest receivable | | | 11,704,154 |
Prepaid expenses | | | 78,126 |
Foreign tax reclaim receivable | | | 57,735 |
Receivable for Series shares sold | | | 4,420 |
| | |
|
|
Total Assets | | | 4,185,914,280 |
| | |
|
|
| LIABILITIES | | | |
Collateral for securities on loan | | | 305,547,916 |
Payable for investments purchased | | | 153,648,249 |
Management fee payable | | | 1,896,885 |
Payable for Series shares repurchased | | | 526,943 |
Accrued expenses and other liabilities | | | 381,195 |
Due to broker—variation margin | | | 339,431 |
Unrealized depreciation on swaps | | | 22,365 |
Transfer agent fee payable | | | 306 |
| | |
|
|
Total Liabilities | | | 462,363,290 |
| | |
|
|
| NET ASSETS | | $ | 3,723,550,990 |
| | |
|
|
| |
Net assets were comprised of: | | | |
Paid-in capital | | $ | 3,105,699,602 |
Retained earnings | | | 617,851,388 |
| | |
|
|
Net assets, December 31, 2006 | | $ | 3,723,550,990 |
| | |
|
|
Net asset value and redemption price per share, $3,723,550,990 / 202,776,598 outstanding shares of beneficial interest (authorized 600,000,000 shares) | | $ | 18.36 |
| | |
|
|
STATEMENT OF OPERATIONS
Year Ended December 31, 2006
| | | | |
| INVESTMENT INCOME | | | | |
Interest | | $ | 45,927,732 | |
Unaffiliated dividend income (net of foreign withholding taxes of $359,215) | | | 44,963,085 | |
Affiliated dividend income | | | 19,505,872 | |
Affiliated income from securities loaned, net | | | 398,178 | |
| | |
|
|
|
| | | | 110,794,867 | |
| | |
|
|
|
| EXPENSES | | | | |
Management fee | | | 21,482,143 | |
Shareholders’ reports | | | 175,000 | |
Custodian’s fees and expenses | | | 155,000 | |
Insurance expenses | | | 67,000 | |
Trustees’ fees | | | 60,000 | |
Commitment fee on syndicated credit agreement | | | 30,000 | |
Audit fee | | | 15,000 | |
Legal fees and expenses | | | 13,000 | |
Transfer agent’s fee and expenses (including affiliated expense of $1,800) (Note 4) | | | 1,900 | |
Miscellaneous | | | 20,171 | |
| | |
|
|
|
Total expenses | | | 22,019,214 | |
| | |
|
|
|
| NET INVESTMENT INCOME | | | 88,775,653 | |
| | |
|
|
|
| |
| NET REALIZED AND UNREALIZED GAIN (LOSS) ON INVESTMENTS, SWAPS AND FOREIGN CURRENCIES | | | | |
Net realized gain (loss) on: | | | | |
Investments | | | 137,675,925 | |
Futures transactions | | | 5,045,557 | |
Foreign currency transactions | | | (55,311 | ) |
Written options transactions | | | 25,845 | |
Swaps | | | (254,091 | ) |
Short sales | | | 51,719 | |
| | |
|
|
|
| | | | 142,489,644 | |
| | |
|
|
|
Net change in unrealized appreciation (depreciation) on: | | | | |
Investments | | | 188,413,266 | |
Futures | | | (2,129,845 | ) |
Foreign currencies | | | 3,445 | |
Written options | | | (20,027 | ) |
Swaps | | | (22,365 | ) |
| | |
|
|
|
| | | | 186,244,474 | |
| | |
|
|
|
| NET GAIN ON INVESTMENTS, SWAPS AND FOREIGN CURRENCIES | | | 328,734,118 | |
| | |
|
|
|
| NET INCREASE IN NET ASSETS RESULTING FROM OPERATIONS | | $ | 417,509,771 | |
| | |
|
|
|
STATEMENT OF CHANGES IN NET ASSETS
| | | | | | | | |
| | | Year Ended December 31,
| |
| | | 2006
| | | 2005
| |
| INCREASE (DECREASE) IN NET ASSETS | | | | | | | | |
| OPERATIONS: | | | | | | | | |
Net investment income | | $ | 88,775,653 | | | $ | 69,761,928 | |
Net realized gain on investments, swaps and foreign currency transactions | | | 142,489,644 | | | | 187,998,027 | |
Net change in unrealized appreciation (depreciation) on investments and foreign currencies | | | 186,244,474 | | | | (116,399,356 | ) |
| | |
|
|
| |
|
|
|
NET INCREASE IN NET ASSETS RESULTING FROM OPERATIONS | | | 417,509,771 | | | | 141,360,599 | |
| | |
|
|
| |
|
|
|
| DIVIDENDS AND DISTRIBUTIONS: | | | | | | | | |
Dividends from net investment income | | | — | | | | (68,680,004 | ) |
Distributions | | | (122,314,562 | ) | | | — | |
| | |
|
|
| |
|
|
|
TOTAL DIVIDENDS AND DISTRIBUTIONS | | | (122,314,562 | ) | | | (68,680,004 | ) |
| | |
|
|
| |
|
|
|
| SERIES SHARE TRANSACTIONS: | | | | | | | | |
Series shares sold [1,352,364 and 2,131,903 shares, respectively] | | | 23,240,485 | | | | 35,053,816 | |
Series shares issued in reinvestment of dividends and distributions [7,199,209 and 4,311,362 shares, respectively] | | | 122,314,562 | | | | 68,680,004 | |
Series shares repurchased [15,165,926 and 31,247,534 shares, respectively] | | | (261,128,310 | ) | | | (515,965,873 | ) |
| | |
|
|
| |
|
|
|
NET DECREASE IN NET ASSETS RESULTING FROM SERIES SHARE TRANSACTIONS | | | (115,573,263 | ) | | | (412,232,053 | ) |
| | |
|
|
| |
|
|
|
| TOTAL INCREASE (DECREASE) IN NET ASSETS | | | 179,621,946 | | | | (339,551,458 | ) |
| NET ASSETS: | | | | | | | | |
Beginning of year | | | 3,543,929,044 | | | | 3,883,480,502 | |
| | |
|
|
| |
|
|
|
End of year | | $ | 3,723,550,990 | | | $ | 3,543,929,044 | (a) |
| | |
|
|
| |
|
|
|
(a) Includes undistributed net investment income of: | | | | | | $ | 70,753,332 | |
| | | | | | |
|
|
|
SEE NOTES TO FINANCIAL STATEMENTS.
A4
STATEMENT OF ASSETS AND LIABILITIES
December 31, 2006
| | | |
| ASSETS | | | |
Investments, at value including securities on loan of $48,803,921: | | | |
Unaffiliated investments (cost $752,362,931) | | $ | 902,248,491 |
Affiliated investments (cost $70,116,659) | | | 70,116,659 |
Cash | | | 1,900 |
Foreign currency, at value (cost $8,846,990) | | | 8,989,536 |
Receivable for investments sold | | | 5,928,884 |
Dividends receivable | | | 705,361 |
Foreign tax reclaim receivable | | | 265,807 |
Receivable for Series shares sold | | | 142,605 |
Prepaid expenses | | | 13,666 |
| | |
|
|
Total Assets | | | 988,412,909 |
| | |
|
|
| LIABILITIES | | | |
Collateral for securities on loan | | | 50,850,856 |
Payable for investments purchased | | | 3,628,829 |
Management fee payable | | | 588,366 |
Accrued expenses and other liabilities | | | 251,734 |
Payable for Series shares repurchased | | | 233,807 |
Transfer agent fee payable | | | 421 |
| | |
|
|
Total Liabilities | | | 55,554,013 |
| | |
|
|
| NET ASSETS | | $ | 932,858,896 |
| | |
|
|
| |
Net assets were comprised of: | | | |
Paid-in capital | | $ | 791,374,063 |
Retained earnings | | | 141,484,833 |
| | |
|
|
Net assets, December 31, 2006 | | $ | 932,858,896 |
| | |
|
|
Net asset value and redemption price per share, $932,858,896 / 41,399,689 outstanding shares of beneficial interest (authorized 125,000,000 shares) | | $ | 22.53 |
| | |
|
|
STATEMENT OF OPERATIONS
Year Ended December 31, 2006
| | | | |
| INVESTMENT INCOME | | | | |
Unaffiliated dividend income (net of foreign withholding taxes of $1,103,800) | | $ | 16,427,605 | |
Affiliated dividend income | | | 1,280,168 | |
Affiliated income from securities loaned, net | | | 222,789 | |
Interest | | | 5,781 | |
| | |
|
|
|
| | | | 17,936,343 | |
| | |
|
|
|
| EXPENSES | | | | |
Management fee | | | 6,477,031 | |
Custodian’s fees and expenses | | | 260,000 | |
Shareholders’ reports | | | 200,000 | |
Interest expense | | | 189,169 | |
Insurance expenses | | | 20,000 | |
Trustees’ fees | | | 20,000 | |
Audit fee | | | 15,000 | |
Legal fees and expenses | | | 10,000 | |
Commitment fee on syndicated credit agreement | | | 5,000 | |
Transfer agent’s fees and expenses (including affiliated expense of $5,000 ) (Note 4) | | | 5,000 | |
Miscellaneous | | | 42,513 | |
| | |
|
|
|
Total expenses | | | 7,243,713 | |
| | |
|
|
|
| NET INVESTMENT INCOME | | | 10,692,630 | |
| | |
|
|
|
| |
| NET REALIZED AND UNREALIZED GAIN (LOSS) ON INVESTMENTS AND FOREIGN CURRENCIES | | | | |
Net realized gain (loss) on: | | | | |
Investments | | | 33,063,490 | |
Futures transactions | | | (172,946 | ) |
Foreign currency transactions | | | (450,808 | ) |
| | |
|
|
|
| | | | 32,439,736 | |
| | |
|
|
|
Net change in unrealized appreciation (depreciation) on: | | | | |
Investments | | | 112,017,163 | |
Futures | | | 159,503 | |
Foreign currencies | | | 79,622 | |
| | |
|
|
|
| | | | 112,256,288 | |
| | |
|
|
|
| NET GAIN ON INVESTMENTS AND FOREIGN CURRENCIES | | | 144,696,024 | |
| | |
|
|
|
| NET INCREASE IN NET ASSETS RESULTING FROM OPERATIONS | | $ | 155,388,654 | |
| | |
|
|
|
STATEMENT OF CHANGES IN NET ASSETS
| | | | | | | | |
| | | Year Ended December 31,
| |
| | | 2006
| | | 2005
| |
| INCREASE (DECREASE) IN NET ASSETS | | | | | | | | |
| OPERATIONS: | | | | | | | | |
Net investment income | | $ | 10,692,630 | | | $ | 5,696,521 | |
Net realized gain on investments and foreign currency transactions | | | 32,439,736 | | | | 172,527,940 | |
Net change in unrealized appreciation (depreciation) on investments, futures and foreign currencies | | | 112,256,288 | | | | (64,514,700 | ) |
| | |
|
|
| |
|
|
|
NET INCREASE IN NET ASSETS RESULTING FROM OPERATIONS | | | 155,388,654 | | | | 113,709,761 | |
| | |
|
|
| |
|
|
|
| DIVIDENDS AND DISTRIBUTIONS: | | | | | | | | |
Dividends from net investment income | | | — | | | | (4,467,100 | ) |
Distributions | | | (5,516,655 | ) | | | — | |
| | |
|
|
| |
|
|
|
| TOTAL DIVIDENDS AND DISTRIBUTIONS | | | (5,516,655 | ) | | | (4,467,100 | ) |
| | |
|
|
| |
|
|
|
| SERIES SHARE TRANSACTIONS: | | | | | | | | |
Series shares sold [2,609,905 and 5,440,330 shares, respectively] | | | 53,367,041 | | | | 90,659,307 | |
Series shares issued in reinvestment of dividends and distributions [272,832 and 279,893 shares, respectively] | | | 5,516,655 | | | | 4,467,100 | |
Series shares repurchased [4,426,740 and 4,829,904 shares, respectively] | | | (90,036,644 | ) | | | (81,315,937 | ) |
| | |
|
|
| |
|
|
|
NET INCREASE (DECREASE) IN NET ASSETS RESULTING FROM SERIES SHARE TRANSACTIONS | | | (31,152,948 | ) | | | 13,810,470 | |
| | |
|
|
| |
|
|
|
| TOTAL INCREASE IN NET ASSETS | | | 118,719,051 | | | | 123,053,131 | |
| NET ASSETS: | | | | | | | | |
Beginning of year | | | 814,139,845 | | | | 691,086,714 | |
| | |
|
|
| |
|
|
|
End of year | | $ | 932,858,896 | | | $ | 814,139,845 | (a) |
| | |
|
|
| |
|
|
|
(a) Includes undistributed net investment income of: | | | | | | $ | 4,677,915 | |
| | | | | | |
|
|
|
SEE NOTES TO FINANCIAL STATEMENTS.
A5
| | | | |
| | | GOVERNMENT INCOME PORTFOLIO | | |
STATEMENT OF ASSETS AND LIABILITIES
December 31, 2006
| | | | |
| ASSETS | | | | |
Investments, at value including securities on loan of $20,724,279: | | | | |
Unaffiliated investments (cost $333,011,098) | | $ | 330,285,965 | |
Affiliated investments (cost $83,334,583) | | | 83,347,754 | |
Cash | | | 1,790 | |
Foreign currency (cost $17) | | | 17 | |
Receivable for investments sold | | | 10,335,204 | |
Interest receivable | | | 2,473,614 | |
Receivable for Series shares sold | | | 46,254 | |
Unrealized appreciation on forward currency contracts | | | 31,647 | |
Due from broker—variation margin | | | 31,003 | |
Prepaid expenses | | | 5,736 | |
Unrealized appreciation on swaps | | | 4,555 | |
| | |
|
|
|
Total Assets | | | 426,563,539 | |
| | |
|
|
|
| LIABILITIES | | | | |
Payable for investments purchased | | | 49,902,378 | |
Collateral for securities on loan | | | 21,369,617 | |
Securities sold short, at value (proceeds $497,344) | | | 494,063 | |
Payable for Series shares repurchased | | | 202,543 | |
Accrued expenses and other liabilities | | | 132,774 | |
Management fee payable | | | 121,118 | |
Unrealized depreciation on swaps | | | 50,898 | |
Unrealized depreciation on forward currency contracts | | | 27,873 | |
Deferred trustees’ fees | | | 3,277 | |
Transfer agent fee payable | | | 213 | |
| | |
|
|
|
Total Liabilities | | | 72,304,754 | |
| | |
|
|
|
| NET ASSETS | | $ | 354,258,785 | |
| | |
|
|
|
| |
Net assets were comprised of: | | | | |
Paid-in capital | | $ | 363,090,300 | |
Retained earnings | | | (8,831,515 | ) |
| | |
|
|
|
Net assets, December 31, 2006 | | $ | 354,258,785 | |
| | |
|
|
|
Net asset value and redemption price per share, ($354,258,785 / 31,451,198 outstanding shares of
beneficial interest (authorized 100,000,000 shares) | | $ | 11.26 | |
| | |
|
|
|
STATEMENT OF OPERATIONS
Year Ended December 31, 2006
| | | | |
| INVESTMENT INCOME | | | | |
Unaffiliated interest income | | $ | 16,477,819 | |
Affiliated dividend income | | | 2,434,419 | |
Affiliated income from securities loaned, net | | | 34,508 | |
| | |
|
|
|
| | | | 18,946,746 | |
| | |
|
|
|
| EXPENSES | | | | |
Management fee | | | 1,443,993 | |
Shareholders’ reports | | | 180,000 | |
Custodian’s fees and expenses | | | 125,000 | |
Audit fee | | | 20,000 | |
Trustees’ fees | | | 15,000 | |
Insurance expenses | | | 10,000 | |
Legal fees and expenses | | | 7,000 | |
Transfer agent’s fees and expenses (including affiliated expense of $1,200) (Note 4) | | | 1,300 | |
Miscellaneous | | | 10,117 | |
| | |
|
|
|
Total expenses | | | 1,812,410 | |
| | |
|
|
|
| NET INVESTMENT INCOME | | | 17,134,336 | |
| | |
|
|
|
| |
| NET REALIZED AND UNREALIZED GAIN (LOSS) ON INVESTMENTS, SWAPS AND FOREIGN CURRENCIES | | | | |
Net realized gain (loss) on: | | | | |
Investment transactions | | | (2,290,853 | ) |
Foreign currency transactions | | | (458,252 | ) |
Futures transactions | | | 80,611 | |
Short sale transactions | | | (241,211 | ) |
Swap transactions | | | 21,961 | |
Options written transactions | | | 22,688 | |
| | |
|
|
|
| | | | (2,865,056 | ) |
| | |
|
|
|
Net change in unrealized appreciation (depreciation) on: | | | | |
Investments | | | (818,410 | ) |
Foreign currencies | | | 7,015 | |
Futures | | | (245,148 | ) |
Short sales | | | 3,281 | |
Swaps | | | (179,302 | ) |
Options written | | | (17,582 | ) |
| | |
|
|
|
| | | | (1,250,146 | ) |
| | |
|
|
|
| NET LOSS ON INVESTMENTS AND FOREIGN CURRENCIES | | | (4,115,202 | ) |
| | |
|
|
|
| NET INCREASE IN NET ASSETS RESULTING FROM OPERATIONS | | $ | 13,019,134 | |
| | |
|
|
|
STATEMENT OF CHANGES IN NET ASSETS
| | | | | | | | |
| | | Year Ended December 31,
| |
| | | 2006
| | | 2005
| |
| INCREASE (DECREASE) IN NET ASSETS | | | | | | | | |
| OPERATIONS: | | | | | | | | |
Net investment income | | $ | 17,134,336 | | | $ | 16,624,367 | |
Net realized gain (loss) on investments, swaps and foreign currency transactions | | | (2,865,056 | ) | | | 225,247 | |
Net change in unrealized appreciation (depreciation) on investments and foreign currencies | | | (1,250,146 | ) | | | (6,657,947 | ) |
| | |
|
|
| |
|
|
|
NET INCREASE IN NET ASSETS RESULTING FROM OPERATIONS | | | 13,019,134 | | | | 10,191,667 | |
| | |
|
|
| |
|
|
|
| DIVIDENDS AND DISTRIBUTIONS: | | | | | | | | |
Dividends from net investment income | | | — | | | | (18,278,784 | ) |
Distributions | | | (17,558,195 | ) | | | — | |
| | |
|
|
| |
|
|
|
TOTAL DIVIDENDS AND DISTRIBUTIONS | | | (17,558,195 | ) | | | (18,278,784 | ) |
| | |
|
|
| |
|
|
|
| SERIES SHARE TRANSACTIONS: | | | | | | | | |
Series share sold [1,318,889 and 1,193,333 shares, respectively] | | | 14,867,273 | | | | 13,825,736 | |
Series share issued in reinvestment of dividends and distributions [1,568,051 and 1,593,500 shares, respectively] | | | 17,558,195 | | | | 18,278,784 | |
Series share repurchased [4,593,356 and 5,694,737 shares, respectively] | | | (51,789,971 | ) | | | (66,011,678 | ) |
| | |
|
|
| |
|
|
|
NET DECREASE IN NET ASSETS RESULTING FROM SERIES SHARE TRANSACTIONS | | | (19,364,503 | ) | | | (33,907,158 | ) |
| | |
|
|
| |
|
|
|
| TOTAL DECREASE IN NET ASSETS | | | (23,903,564 | ) | | | (41,994,275 | ) |
| NET ASSETS: | | | | | | | | |
Beginning of year | | | 378,162,349 | | | | 420,156,624 | |
| | |
|
|
| |
|
|
|
End of year | | $ | 354,258,785 | | | $ | 378,162,349 | (a) |
| | |
|
|
| |
|
|
|
(a) Includes undistributed net investment income of: | | | | | | $ | 1,093,680 | |
| | | | | | |
|
|
|
SEE NOTES TO FINANCIAL STATEMENTS.
A6
| | | | |
| | | HIGH YIELD BOND PORTFOLIO | | |
STATEMENT OF ASSETS AND LIABILITIES
December 31, 2006
| | | | |
| ASSETS | | | | |
Investments, at value including securities on loan of $242,435,755: | | | | |
Unaffiliated investments (cost $1,576,230,433) | | $ | 1,616,116,744 | |
Affiliated investments (cost $316,291,461) | | | 316,306,419 | |
Cash | | | 170,853 | |
Foreign currency, at value (cost $1,222,149) | | | 1,357,656 | |
Dividends and interest receivable | | | 31,915,389 | |
Receivable for investments sold | | | 5,024,828 | |
Unrealized appreciation on swaps | | | 189,244 | |
Receivable for Series shares sold | | | 50,473 | |
Prepaid expenses | | | 36,125 | |
| | |
|
|
|
Total Assets | | | 1,971,167,731 | |
| | |
|
|
|
| LIABILITIES | | | | |
Collateral for securities on loan | | | 248,931,952 | |
Management fee payable | | | 800,020 | |
Accrued expenses and other liabilities | | | 190,554 | |
Payable for Series shares repurchased | | | 173,671 | |
Deferred trustees’ fees | | | 4,874 | |
Transfer agent fee payable | | | 436 | |
| | |
|
|
|
Total Liabilities | | | 250,101,507 | |
| | |
|
|
|
| NET ASSETS | | $ | 1,721,066,224 | |
| | |
|
|
|
| |
Net assets were comprised of: | | | | |
Paid-in capital | | $ | 1,941,894,528 | |
Retained earnings | | | (220,828,304 | ) |
| | |
|
|
|
Net assets, December 31, 2006 | | $ | 1,721,066,224 | |
| | |
|
|
|
Net asset value and redemption price per share, $1,721,066,224 / 322,842,834 outstanding shares of beneficial interest (authorized 600,000,000 shares) | | $ | 5.33 | |
| | |
|
|
|
STATEMENT OF OPERATIONS
Year Ended December 31, 2006
| | | |
| INVESTMENT INCOME | | | |
Interest | | $ | 126,997,349 |
Affiliated dividend income | | | 3,409,232 |
Affiliated income from securities loaned, net | | | 668,984 |
Unaffiliated dividend income (net of foreign withholding taxes of $8,094) | | | 99,507 |
| | |
|
|
Total income | | | 131,175,072 |
| | |
|
|
| EXPENSES | | | |
Management fee | | | 9,057,758 |
Custodian’s fees and expenses | | | 203,000 |
Shareholders’ reports | | | 135,000 |
Insurance expenses | | | 34,000 |
Trustees’ fees | | | 31,000 |
Audit fee | | | 20,000 |
Legal fees and expenses | | | 14,000 |
Commitment fee on syndicated credit agreement | | | 8,000 |
Transfer agent’s fee and expenses (including affiliated expense of $2,600) (Note 4) | | | 3,000 |
Miscellaneous | | | 14,723 |
| | |
|
|
Total expenses | | | 9,520,481 |
| | |
|
|
| NET INVESTMENT INCOME | | | 121,654,591 |
| | |
|
|
| |
| NET REALIZED AND UNREALIZED GAIN ON INVESTMENTS, SWAPS AND FOREIGN CURRENCIES | | | |
Net realized gain on: | | | |
Investments | | | 4,303,693 |
Swaps | | | 130,225 |
Foreign currency transactions | | | 206 |
| | |
|
|
| | | | 4,434,124 |
| | |
|
|
Net change in unrealized appreciation on: | | | |
Investments | | | 34,789,795 |
Swaps | | | 405,214 |
Foreign currencies | | | 158,205 |
| | |
|
|
| | | | 35,353,214 |
| | |
|
|
| NET GAIN ON INVESTMENTS, SWAPS AND FOREIGN CURRENCIES | | | 39,787,338 |
| | |
|
|
| NET INCREASE IN NET ASSETS RESULTING FROM OPERATIONS | | $ | 161,441,929 |
| | |
|
|
STATEMENT OF CHANGES IN NET ASSETS
| | | | | | | | |
| | | Year Ended December 31,
| |
| | | 2006
| | | 2005
| |
| INCREASE (DECREASE) IN NET ASSETS | | | | | | | | |
| OPERATIONS: | | | | | | | | |
Net investment income | | $ | 121,654,591 | | | $ | 114,505,158 | |
Net realized gain (loss) on investments, swaps and foreign currency transactions | | | 4,434,124 | | | | (711,848 | ) |
Net change in unrealized appreciation (depreciation) on investments and foreign currencies | | | 35,353,214 | | | | (59,030,655 | ) |
| | |
|
|
| |
|
|
|
NET INCREASE IN NET ASSETS RESULTING FROM OPERATIONS | | | 161,441,929 | | | | 54,762,655 | |
| | |
|
|
| |
|
|
|
| DIVIDENDS AND DISTRIBUTIONS: | | | | | | | | |
Dividends from net investment income | | | — | | | | (110,212,418 | ) |
Distributions | | | (129,163,904 | ) | | | — | |
| | |
|
|
| |
|
|
|
| TOTAL DIVIDENDS AND DISTRIBUTIONS | | | (129,163,904 | ) | | | (110,212,418 | ) |
| | |
|
|
| |
|
|
|
| SERIES SHARE TRANSACTIONS: | | | | | | | | |
Series shares sold (6,501,981 and 20,763,375 shares, respectively) | | | 34,504,776 | | | | 110,658,866 | |
Series shares issued in reinvestment of dividends and distributions (24,614,532 and 20,967,075 shares, respectively) | | | 129,163,904 | | | | 110,212,418 | |
Series shares repurchased (20,932,126 and 23,489,952 shares, respectively) | | | (110,629,621 | ) | | | (125,355,809 | ) |
| | |
|
|
| |
|
|
|
NET INCREASE IN NET ASSETS RESULTING FROM SERIES SHARE TRANSACTIONS | | | 53,039,059 | | | | 95,515,475 | |
| | |
|
|
| |
|
|
|
| TOTAL INCREASE IN NET ASSETS | | | 85,317,084 | | | | 40,065,712 | |
| NET ASSETS: | | | | | | | | |
Beginning of year | | | 1,635,749,140 | | | | 1,595,683,428 | |
| | |
|
|
| |
|
|
|
End of year | | $ | 1,721,066,224 | | | $ | 1,635,749,140 | (a) |
| | |
|
|
| |
|
|
|
(a) Includes undistributed net investment income of: | | | | | | $ | 4,914,325 | |
| | | | | | |
|
|
|
SEE NOTES TO FINANCIAL STATEMENTS.
A7
STATEMENT OF ASSETS AND LIABILITIES
December 31, 2006
| | | | |
| ASSETS | | | | |
Investments, at value including securities on loan of $191,121,962: | | | | |
Unaffiliated investments (cost $1,596,328,686) | | $ | 2,082,348,654 | |
Affiliated investments (cost $217,419,846) | | | 217,419,846 | |
Dividends and interest receivable | | | 2,142,333 | |
Foreign tax reclaim receivable | | | 195,115 | |
Receivable for Series shares sold | | | 80,332 | |
Prepaid expenses | | | 25,923 | |
| | |
|
|
|
Total Assets | | | 2,302,212,203 | |
| | |
|
|
|
| LIABILITIES | | | | |
Collateral for securities on loan | | | 198,460,608 | |
Payable for investments purchased | | | 4,831,699 | |
Management fee payable | | | 1,075,148 | |
Payable for Series shares repurchased | | | 524,812 | |
Accrued expenses | | | 313,562 | |
Payable to custodian | | | 109,637 | |
Distribution fee payable | | | 4,144 | |
Administration fee payable | | | 2,486 | |
Transfer agent fee payable | | | 1,092 | |
| | |
|
|
|
Total Liabilities | | | 205,323,188 | |
| | |
|
|
|
| NET ASSETS | | $ | 2,096,889,015 | |
| | |
|
|
|
| |
Net assets were comprised of: | | | | |
Paid-in capital | | $ | 2,543,748,174 | |
Retained earnings | | | (446,859,159 | ) |
| | |
|
|
|
Net assets, December 31, 2006 | | $ | 2,096,889,015 | |
| | |
|
|
|
| Class I: | | | | |
Net asset value and redemption price per share, $2,077,295,716 / 98,594,054 outstanding shares of beneficial interest (authorized 275,000,000 shares) | | $ | 21.07 | |
| | |
|
|
|
| Class II: | | | | |
Net asset value and redemption price per share, $19,593,299 / 943,302 outstanding shares of beneficial interest (authorized 75,000,000 shares) | | $ | 20.77 | |
| | |
|
|
|
STATEMENT OF OPERATIONS
Year Ended December 31, 2006
| | | | |
| INVESTMENT INCOME | | | | |
Unaffiliated dividend income (net of foreign withholding taxes of $772,927) | | $ | 17,480,149 | |
Affiliated dividend income | | | 1,037,775 | |
Affiliated income from securities loaned, net | | | 960,997 | |
| | |
|
|
|
| | | | 19,478,921 | |
| | |
|
|
|
| EXPENSES | | | | |
Management fee | | | 12,696,436 | |
Distribution fee—Class II | | | 44,943 | |
Administration fee—Class II | | | 26,966 | |
Shareholders’ reports | | | 250,000 | |
Custodian’s fees and expenses | | | 210,000 | |
Insurance expenses | | | 42,000 | |
Trustees’ fees | | | 40,000 | |
Loan interest expense (Note 8) | | | 38,937 | |
Audit fee | | | 15,000 | |
Legal fees and expenses | | | 10,000 | |
Interest expense | | | 8,708 | |
Transfer agent’s fees and expenses (including affiliated expense of $6,400) (Note 4) | | | 7,000 | |
Commitment fee on syndicated credit agreement | | | 5,000 | |
Miscellaneous | | | 13,194 | |
| | |
|
|
|
Total expenses | | | 13,408,184 | |
| | |
|
|
|
| NET INVESTMENT INCOME | | | 6,070,737 | |
| | |
|
|
|
| |
| NET REALIZED AND UNREALIZED GAIN (LOSS) ON INVESTMENTS AND FOREIGN CURRENCIES | | | | |
Net realized gain on: | | | | |
Investments | | | 88,296,249 | |
Foreign currency transactions | | | 6,395 | |
| | |
|
|
|
| | | | 88,302,644 | |
| | |
|
|
|
Net change in unrealized appreciation (depreciation) on investments | | | (65,722,336 | ) |
| | |
|
|
|
| NET GAIN ON INVESTMENTS AND FOREIGN CURRENCIES | | | 22,580,308 | |
| | |
|
|
|
| NET INCREASE IN NET ASSETS RESULTING FROM OPERATIONS | | $ | 28,651,045 | |
| | |
|
|
|
STATEMENT OF CHANGES IN NET ASSETS
| | | | | | | | |
| | | Year Ended December 31,
| |
| | | 2006
| | | 2005
| |
| INCREASE (DECREASE) IN NET ASSETS | | | | | | | | |
| OPERATIONS: | | | | | | | | |
Net investment income | | $ | 6,070,737 | | | $ | 1,937,182 | |
Net realized gain on investments and foreign currency transactions | | | 88,302,644 | | | | 134,204,369 | |
Net change in unrealized appreciation (depreciation) on investments | | | (65,722,336 | ) | | | 164,158,729 | |
| | |
|
|
| |
|
|
|
NET INCREASE IN NET ASSETS RESULTING FROM OPERATIONS | | | 28,651,045 | | | | 300,300,280 | |
| | |
|
|
| |
|
|
|
| DIVIDENDS AND DISTRIBUTIONS: | | | | | | | | |
Dividends from net investment income | | | | | | | | |
Class I | | | — | | | | (2,181,501 | ) |
Distributions | | | | | | | | |
Class I | | | (6,106,593 | ) | | | — | |
| | |
|
|
| |
|
|
|
| TOTAL DIVIDENDS AND DISTRIBUTIONS | | | (6,106,593 | ) | | | (2,181,501 | ) |
| | |
|
|
| |
|
|
|
| SERIES SHARE TRANSACTIONS (Note 7): | | | | | | | | |
Series shares sold [6,012,576 and 14,492,389 shares, respectively] | | | 123,017,264 | | | | 269,056,619 | |
Series shares issued in reinvestment of dividends and distributions [286,560 and 107,900 shares, respectively] | | | 6,106,593 | | | | 2,181,501 | |
Series shares repurchased [18,306,413 and 20,487,671 shares, respectively] | | | (370,019,866 | ) | | | (383,146,862 | ) |
| | |
|
|
| |
|
|
|
NET DECREASE IN NET ASSETS RESULTING FROM SERIES SHARE TRANSACTIONS | | | (240,896,009 | ) | | | (111,908,742 | ) |
| | |
|
|
| |
|
|
|
| TOTAL INCREASE (DECREASE) IN NET ASSETS | | | (218,351,557 | ) | | | 186,210,037 | |
| NET ASSETS: | | | | | | | | |
Beginning of year | | | 2,315,240,572 | | | | 2,129,030,535 | |
| | |
|
|
| |
|
|
|
End of year | | $ | 2,096,889,015 | | | $ | 2,315,240,572 | |
| | |
|
|
| |
|
|
|
SEE NOTES TO FINANCIAL STATEMENTS.
A8
STATEMENT OF ASSETS AND LIABILITIES
December 31, 2006
| | | |
| ASSETS | | | |
Investments, at value (amortized cost $1,057,655,190) | | $ | 1,057,655,190 |
Cash | | | 3,508 |
Interest receivable | | | 5,478,200 |
Receivable for Series shares sold | | | 1,168,312 |
Prepaid expenses | | | 19,057 |
| | |
|
|
Total Assets | | | 1,064,324,267 |
| | |
|
|
| LIABILITIES | | | |
Payable for Series shares repurchased | | | 3,234,408 |
Management fee payable | | | 362,091 |
Accrued expenses and other liabilities | | | 203,457 |
Transfer agent fee payable | | | 508 |
| | |
|
|
Total Liabilities | | | 3,800,464 |
| | |
|
|
| NET ASSETS | | $ | 1,060,523,803 |
| | |
|
|
| |
Net assets were comprised of: | | | |
Paid-in capital | | $ | 1,060,523,803 |
| | |
|
|
Net assets, December 31, 2006 | | $ | 1,060,523,803 |
| | |
|
|
Net asset value and redemption price per share, $1,060,523,803 / 106,052,380 outstanding shares of beneficial interest (authorized 275,000,000 shares) | | $ | 10.00 |
| | |
|
|
STATEMENT OF OPERATIONS
Year Ended December 31, 2006
| | | | |
| INVESTMENT INCOME | | | | |
Interest | | $ | 52,052,580 | |
| | |
|
|
|
| EXPENSES | | | | |
Management fee | | | 4,072,696 | |
Shareholders’ reports | | | 140,000 | |
Custodian’s fees and expenses | | | 123,000 | |
Insurance expenses | | | 30,000 | |
Trustees’ fees | | | 25,000 | |
Audit fee | | | 13,000 | |
Legal fees and expenses | | | 10,000 | |
Transfer agent’s fee and expenses (including affiliated expense of $5,500) (Note 4) | | | 6,000 | |
Miscellaneous | | | 6,439 | |
| | |
|
|
|
Total expenses | | | 4,426,135 | |
| | |
|
|
|
| NET INVESTMENT INCOME | | | 47,626,445 | |
| | |
|
|
|
| |
| NET REALIZED LOSS ON INVESTMENTS | | | (1,731 | ) |
| | |
|
|
|
| NET INCREASE IN NET ASSETS RESULTING FROM OPERATIONS | | $ | 47,624,714 | |
| | |
|
|
|
STATEMENT OF CHANGES IN NET ASSETS
| | | | | | | | |
| | | Year Ended December 31,
| |
| | | 2006
| | | 2005
| |
| INCREASE (DECREASE) IN NET ASSETS | | | | | | | | |
| OPERATIONS: | | | | | | | | |
Net investment income | | $ | 47,626,445 | | | $ | 25,832,139 | |
Net realized gain (loss) on investments | | | (1,731 | ) | | | 781 | |
| | |
|
|
| |
|
|
|
NET INCREASE IN NET ASSETS RESULTING FROM OPERATIONS | | | 47,624,714 | | | | 25,832,920 | |
| | |
|
|
| |
|
|
|
| DIVIDENDS AND DISTRIBUTIONS: | | | | | | | | |
Dividends from net investment income | | | — | | | | (25,832,139 | ) |
Distributions from net realized capital gains | | | — | | | | (781 | ) |
Distributions | | | (47,624,714 | ) | | | — | |
| | |
|
|
| |
|
|
|
TOTAL DIVIDENDS AND DISTRIBUTIONS | | | (47,624,714 | ) | | | (25,832,920 | ) |
| | |
|
|
| |
|
|
|
| SERIES SHARE TRANSACTIONS: | | | | | | | | |
Series shares sold [76,634,918 and 53,191,964 shares, respectively] | | | 766,349,174 | | | | 531,919,640 | |
Series shares issued in reinvestment of dividends and distributions [4,772,689 and 2,574,174 shares, respectively] | | | 47,726,894 | | | | 25,741,744 | |
Series shares repurchased [60,549,475 and 59,107,465 shares, respectively] | | | (605,494,752 | ) | | | (591,074,644 | ) |
| | |
|
|
| |
|
|
|
NET INCREASE (DECREASE) IN NET ASSETS RESULTING FROM SERIES SHARE TRANSACTIONS | | | 208,581,316 | | | | (33,413,260 | ) |
| | |
|
|
| |
|
|
|
| TOTAL INCREASE (DECREASE) IN NET ASSETS | | | 208,581,316 | | | | (33,413,260 | ) |
| NET ASSETS: | | | | | | | | |
Beginning of year | | | 851,942,487 | | | | 885,355,747 | |
| | |
|
|
| |
|
|
|
End of year | | $ | 1,060,523,803 | | | $ | 851,942,487 | |
| | |
|
|
| |
|
|
|
SEE NOTES TO FINANCIAL STATEMENTS.
A9
| | | | |
| | | NATURAL RESOURCES PORTFOLIO | | |
STATEMENT OF ASSETS AND LIABILITIES
December 31, 2006
| | | |
| ASSETS | | | |
Investments, at value, including securities on loan of $159,866,332: | | | |
Unaffiliated investments (cost $834,373,070) | | $ | 1,192,025,726 |
Affiliated investments (cost $189,237,193) | | | 189,237,193 |
Foreign currency, at value (cost $1,396) | | | 1,512 |
Dividends and interest receivable | | | 798,545 |
Receivable for Series shares sold | | | 318,615 |
Tax reclaims receivable | | | 46,203 |
Prepaid expenses | | | 18,801 |
| | |
|
|
Total Assets | | | 1,382,446,595 |
| | |
|
|
| LIABILITIES | | | |
Collateral for securities on loan | | | 171,369,405 |
Payable to custodian | | | 520,569 |
Management fee payable | | | 472,813 |
Accrued expenses and other liabilities | | | 141,490 |
Distribution fee payable | | | 3,588 |
Administration fee payable | | | 2,153 |
Transfer agent fee payable | | | 262 |
Payable for Series shares repurchased | | | 45 |
| | |
|
|
Total Liabilities | | | 172,510,325 |
| | |
|
|
| NET ASSETS | | $ | 1,209,936,270 |
| | |
|
|
| |
Net assets were comprised of: | | | |
Paid-in capital | | $ | 597,611,505 |
Retained earnings | | | 612,324,765 |
| | |
|
|
Net assets, December 31, 2006 | | $ | 1,209,936,270 |
| | |
|
|
| Class I: | | | |
Net asset value and redemption price per share, $1,193,032,771 / 26,121,903 outstanding shares of beneficial interest (authorized 100,000,000 shares) | | $ | 45.67 |
| | |
|
|
| Class II: | | | |
Net asset value and redemption price per share, $16,903,499 / 371,123 outstanding shares of beneficial interest (authorized 10,000,000 shares) | | $ | 45.55 |
| | |
|
|
STATEMENT OF OPERATIONS
Year Ended December 31, 2006
| | | | |
| INVESTMENT INCOME | | | | |
Unaffiliated dividend income (net of foreign withholding taxes of $296,555) | | $ | 12,349,852 | |
Affiliated dividend income | | | 1,387,556 | |
Affiliated income from securities loaned, net | | | 1,023,372 | |
Interest | | | 32,539 | |
| | |
|
|
|
| | | | 14,793,319 | |
| | |
|
|
|
| EXPENSES | | | | |
Management fee | | | 5,261,131 | |
Distribution fee—Class II | | | 36,366 | |
Administration fee—Class II | | | 21,820 | |
Shareholders’ reports | | | 210,000 | |
Custodian’s fees and expenses | | | 151,000 | |
Insurance expenses | | | 24,000 | |
Trustees’ fees | | | 20,000 | |
Audit fee | | | 16,000 | |
Transfer agent’s fee and expenses (including affiliated expense of $1,500) (Note 4) | | | 12,000 | |
Legal fees and expenses | | | 11,000 | |
Commitment fee on syndicated credit agreement | | | 4,000 | |
Miscellaneous | | | 18,675 | |
| | |
|
|
|
Total expenses | | | 5,785,992 | |
| | |
|
|
|
| NET INVESTMENT INCOME | | | 9,007,327 | |
| | |
|
|
|
| |
| NET REALIZED AND UNREALIZED GAIN (LOSS) ON INVESTMENTS AND FOREIGN CURRENCIES | | | | |
Net realized gain (loss) on: | | | | |
Investments | | | 268,376,563 | |
Foreign currency transactions | | | (183,762 | ) |
Swaps | | | (64,809 | ) |
| | |
|
|
|
| | | | 268,127,992 | |
| | |
|
|
|
Net change in unrealized appreciation (depreciation) on: | | | | |
Investments | | | (53,355,214 | ) |
Foreign currencies | | | 2,313 | |
| | |
|
|
|
| | | | (53,352,901 | ) |
| | |
|
|
|
| NET GAIN ON INVESTMENTS AND FOREIGN CURRENCIES | | | 214,775,091 | |
| | |
|
|
|
| NET INCREASE IN NET ASSETS RESULTING FROM OPERATIONS | | $ | 223,782,418 | |
| | |
|
|
|
STATEMENT OF CHANGES IN NET ASSETS
| | | | | | | | |
| | | Year Ended December 31,
| |
| | | 2006
| | | 2005
| |
| INCREASE (DECREASE) IN NET ASSETS | | | | | | | | |
| OPERATIONS: | | | | | | | | |
Net investment income | | $ | 9,007,327 | | | $ | 5,198,136 | |
Net realized gain on investments and foreign currencies | | | 268,127,992 | | | | 185,328,105 | |
Net change in unrealized appreciation (depreciation) on investments and foreign currencies | | | (53,352,901 | ) | | | 168,013,381 | |
| | |
|
|
| |
|
|
|
NET INCREASE IN NET ASSETS RESULTING FROM OPERATIONS | | | 223,782,418 | | | | 358,539,622 | |
| | |
|
|
| |
|
|
|
| DIVIDENDS AND DISTRIBUTIONS: | | | | | | | | |
Dividends from net investment income | | | | | | | | |
Class I | | | — | | | | (27,981 | ) |
Distributions from net realized capital gains | | | | | | | | |
Class I | | | — | | | | (60,008,879 | ) |
Distributions | | | | | | | | |
Class I | | | (195,926,670 | ) | | | — | |
Class II | | | (2,153,216 | ) | | | — | |
| | �� |
|
|
| |
|
|
|
TOTAL DIVIDENDS AND DISTRIBUTIONS | | | (198,079,886 | ) | | | (60,036,860 | ) |
| | |
|
|
| |
|
|
|
| SERIES SHARE TRANSACTIONS (Note 7): | | | | | | | | |
Series shares sold [2,190,005 and 2,586,211 shares, respectively] | | | 98,062,879 | | | | 96,654,278 | |
Series shares issued in reinvestment of dividends and distributions [ 4,866,801 and 1,857,002 shares, respectively] | | | 198,079,886 | | | | 60,036,860 | |
Series shares repurchased [3,033,953 and 1,503,940 shares, respectively] | | | (133,276,101 | ) | | | (56,381,759 | ) |
| | |
|
|
| |
|
|
|
NET INCREASE IN NET ASSETS RESULTING FROM SERIES SHARE TRANSACTIONS | | | 162,866,664 | | | | 100,309,379 | |
| | |
|
|
| |
|
|
|
| TOTAL INCREASE IN NET ASSETS | | | 188,569,196 | | | | 398,812,141 | |
| NET ASSETS: | | | | | | | | |
Beginning of year | | | 1,021,367,074 | | | | 622,554,933 | |
| | |
|
|
| |
|
|
|
End of year | | $ | 1,209,936,270 | | | $ | 1,021,367,074 | (a) |
| | |
|
|
| |
|
|
|
(a) Includes undistributed net investment income of: | | | | | | $ | 960,296 | |
| | | | | | |
|
|
|
SEE NOTES TO FINANCIAL STATEMENTS.
A10
| | | | |
| | | SMALL CAPITALIZATION STOCK PORTFOLIO | | |
STATEMENT OF ASSETS AND LIABILITIES
December 31, 2006
| | | |
| ASSETS | | | |
Investments, at value including securities on loan of $183,898,003: | | | |
Unaffiliated investments (cost $512,491,751) | | $ | 773,390,185 |
Affiliated investments (cost $197,654,555) | | | 197,654,555 |
Cash | | | 626,036 |
Receivable for investments sold | | | 1,412,115 |
Dividends and interest receivable | | | 770,214 |
Receivable for Series shares sold | | | 27,293 |
Prepaid expenses | | | 12,307 |
| | |
|
|
Total Assets | | | 973,892,705 |
| | |
|
|
| LIABILITIES | | | |
Collateral for securities on loan | | | 193,996,428 |
Payable for investments purchased | | | 2,285,223 |
Management fee payable | | | 265,452 |
Payable for Series shares repurchased | | | 99,362 |
Accrued expenses and other liabilities | | | 75,469 |
Due to broker—variation margin | | | 33,550 |
Transfer agent fee payable | | | 302 |
| | |
|
|
Total Liabilities | | | 196,755,786 |
| | |
|
|
| NET ASSETS | | $ | 777,136,919 |
| | |
|
|
| |
Net assets were comprised of: | | | |
Paid-in capital | | $ | 469,249,930 |
Retained earnings | | | 307,886,989 |
| | |
|
|
Net assets, December 31, 2006 | | $ | 777,136,919 |
| | |
|
|
Net asset value and redemption price per share, $777,136,919 / 33,363,859 outstanding shares of beneficial interest (authorized 100,000,000 shares) | | $ | 23.29 |
| | |
|
|
STATEMENT OF OPERATIONS
Year Ended December 31, 2006
| | | | |
| INVESTMENT INCOME | | | | |
Unaffiliated dividend income (net of foreign withholding taxes of $2,277) | | $ | 6,988,176 | |
Affiliated income from securities loaned, net | | | 552,611 | |
Affiliated dividend income | | | 364,910 | |
Interest | | | 25,175 | |
| | |
|
|
|
| | | | 7,930,872 | |
| | |
|
|
|
| EXPENSES | | | | |
Management fee | | | 3,058,143 | |
Shareholders’ reports | | | 120,000 | |
Custodian’s fees and expenses | | | 100,000 | |
Insurance expenses | | | 19,000 | |
Interest expense | | | 18,947 | |
Audit fee | | | 16,000 | |
Trustees’ fees | | | 16,000 | |
Legal fees and expenses | | | 12,000 | |
Commitment fee on syndicated credit agreement | | | 3,000 | |
Loan interest expense (Note 8) | | | 2,597 | |
Transfer agent’s fee and expenses (including affiliated expense of $1,800) (Note 4) | | | 1,800 | |
Miscellaneous | | | 74,349 | |
| | |
|
|
|
Total expenses | | | 3,441,836 | |
| | |
|
|
|
| NET INVESTMENT INCOME | | | 4,489,036 | |
| | |
|
|
|
| |
| NET REALIZED AND UNREALIZED GAIN (LOSS) ON INVESTMENTS | | | | |
Net realized gain (loss) on: | | | | |
Investments | | | 52,062,721 | |
Futures transactions | | | (946,112 | ) |
| | |
|
|
|
| | | | 51,116,609 | |
| | |
|
|
|
Net change in unrealized appreciation (depreciation) on: | | | | |
Investments | | | 48,011,178 | |
Futures | | | 74,225 | |
| | |
|
|
|
| | | | 48,085,403 | |
| | |
|
|
|
| NET GAIN ON INVESTMENTS | | | 99,202,012 | |
| | |
|
|
|
| NET INCREASE IN NET ASSETS RESULTING FROM OPERATIONS | | $ | 103,691,048 | |
| | |
|
|
|
STATEMENT OF CHANGES IN NET ASSETS
| | | | | | | | |
| | | Year Ended December 31,
| |
| | | 2006
| | | 2005
| |
| INCREASE (DECREASE) IN NET ASSETS | | | | | | | | |
| OPERATIONS: | | | | | | | | |
Net investment income | | $ | 4,489,036 | | | $ | 4,464,450 | |
Net realized gain on investments | | | 51,116,609 | | | | 34,189,019 | |
Net change in unrealized appreciation (depreciation) on investments | | | 48,085,403 | | | | 11,665,555 | |
| | |
|
|
| |
|
|
|
NET INCREASE IN NET ASSETS RESULTING FROM OPERATIONS | | | 103,691,048 | | | | 50,319,024 | |
| | |
|
|
| |
|
|
|
| DIVIDENDS AND DISTRIBUTIONS: | | | | | | | | |
Dividends from net investment income | | | — | | | | (4,346,380 | ) |
Distributions from net realized capital gains | | | — | | | | (42,621,094 | ) |
Distributions | | | (39,883,482 | ) | | | — | |
| | |
|
|
| |
|
|
|
TOTAL DIVIDENDS AND DISTRIBUTIONS | | | (39,883,482 | ) | | | (46,967,474 | ) |
| | |
|
|
| |
|
|
|
| SERIES SHARE TRANSACTIONS: | | | | | | | | |
Series shares sold [1,425,583 and 1,735,176 shares, respectively] | | | 32,193,709 | | | | 35,830,020 | |
Series shares issued in reinvestment of dividends and distributions [1,770,000 and 2,375,052 shares, respectively] | | | 39,883,482 | | | | 46,967,474 | |
Series shares repurchased [4,365,943 and 4,422,312 shares, respectively] | | | (97,080,147 | ) | | | (91,046,543 | ) |
| | |
|
|
| |
|
|
|
NET DECREASE IN NET ASSETS RESULTING FROM SERIES SHARE TRANSACTIONS | | | (25,002,956 | ) | | | (8,249,049 | ) |
| | |
|
|
| |
|
|
|
| TOTAL INCREASE (DECREASE) IN NET ASSETS | | | 38,804,610 | | | | (4,897,499 | ) |
| NET ASSETS: | | | | | | | | |
Beginning of year | | | 738,332,309 | | | | 743,229,808 | |
| | |
|
|
| |
|
|
|
End of year | | $ | 777,136,919 | | | $ | 738,332,309 | (a) |
| | |
|
|
| |
|
|
|
(a) Includes undistributed net investment income of: | | | | | | $ | 296,825 | |
| | | | | | |
|
|
|
SEE NOTES TO FINANCIAL STATEMENTS.
A11
STATEMENT OF ASSETS AND LIABILITIES
December 31, 2006
| | | |
| ASSETS | | | |
Investments, at value including securities on loan of $312,744,658: | | | |
Unaffiliated investments (cost $1,850,312,530) | | $ | 3,250,965,027 |
Affiliated investments (cost $377,537,575) | | | 377,537,575 |
Dividends receivable | | | 4,592,791 |
Receivable for investments sold | | | 4,107,723 |
Prepaid expenses | | | 49,878 |
Receivable for Series shares sold | | | 48,699 |
| | |
|
|
Total Assets | | | 3,637,301,693 |
| | |
|
|
| LIABILITIES | | | |
Collateral for securities on loan | | | 324,986,258 |
Payable for investments purchased | | | 2,864,453 |
Payable for Series shares repurchased | | | 1,249,938 |
Management fee payable | | | 981,721 |
Accrued expenses | | | 553,223 |
Due to broker-variation margin | | | 226,399 |
Payable to custodian | | | 29,817 |
Transfer agent fee payable | | | 908 |
| | |
|
|
Total Liabilities | | | 330,892,717 |
| | |
|
|
| NET ASSETS | | $ | 3,306,408,976 |
| | |
|
|
| |
Net assets were comprised of: | | | |
Paid-in capital | | $ | 1,990,761,212 |
Retained earnings | | | 1,315,647,764 |
| | |
|
|
Net assets, December 31, 2006 | | $ | 3,306,408,976 |
| | |
|
|
Net asset value and redemption price per share, $3,306,408,976 / 92,784,961 outstanding shares of beneficial interest (authorized 275,000,000 shares) | | $ | 35.64 |
| | |
|
|
STATEMENT OF OPERATIONS
Year Ended December 31, 2006
| | | | |
| INVESTMENT INCOME | | | | |
Unaffiliated dividend income | | $ | 60,380,082 | |
Affiliated dividend income | | | 2,448,969 | |
Affiliated income from securities loaned, net | | | 359,549 | |
Interest | | | 214,996 | |
| | |
|
|
|
| | | | 63,403,596 | |
| | |
|
|
|
| EXPENSES | | | | |
Management fee | | | 11,168,545 | |
Custodian’s fees and expenses | | | 260,000 | |
Shareholders’ reports | | | 250,000 | |
Insurance expenses | | | 84,000 | |
Trustees’ fees | | | 49,000 | |
Commitment fee on syndicated credit agreement | | | 18,000 | |
Audit fee | | | 15,000 | |
Legal fees and expenses | | | 10,000 | |
Transfer agent’s fee and expenses (including affiliated expense of $5,500) (Note 4) | | | 6,000 | |
Miscellaneous | | | 10,234 | |
| | |
|
|
|
Total expenses | | | 11,870,779 | |
| | |
|
|
|
| NET INVESTMENT INCOME | | | 51,532,817 | |
| | |
|
|
|
| |
| NET REALIZED AND UNREALIZED GAIN (LOSS) ON INVESTMENTS | | | | |
Net realized gain (loss) on: | | | | |
Investments | | | (71,148,376 | ) |
Futures transactions | | | 4,536,149 | |
| | |
|
|
|
| | | | (66,612,227 | ) |
| | |
|
|
|
Net change in unrealized appreciation (depreciation) on: | | | | |
Investments | | | 476,053,748 | |
Futures | | | 1,059,651 | |
| | |
|
|
|
| | | | 477,113,399 | |
| | |
|
|
|
| NET GAIN ON INVESTMENTS | | | 410,501,172 | |
| | |
|
|
|
| NET INCREASE IN NET ASSETS RESULTING FROM OPERATIONS | | $ | 462,033,989 | |
| | |
|
|
|
STATEMENT OF CHANGES IN NET ASSETS
| | | | | | | | |
| | | Year Ended December 31,
| |
| | | 2006
| | | 2005
| |
| INCREASE (DECREASE) IN NET ASSETS | | | | | | | | |
| OPERATIONS: | | | | | | | | |
Net investment income | | $ | 51,532,817 | | | $ | 48,182,909 | |
Net realized loss on investments | | | (66,612,227 | ) | | | (10,086,564 | ) |
Net change in unrealized appreciation (depreciation) on investments | | | 477,113,399 | | | | 103,847,958 | |
| | |
|
|
| |
|
|
|
NET INCREASE IN NET ASSETS RESULTING FROM OPERATIONS | | | 462,033,989 | | | | 141,944,303 | |
| | |
|
|
| |
|
|
|
| DIVIDENDS AND DISTRIBUTIONS: | | | | | | | | |
Dividends from net investment income | | | — | | | | (47,928,302 | ) |
Distributions from net realized capital gains | | | — | | | | (80,427,226 | ) |
Distributions | | | (59,982,933 | ) | | | — | |
| | |
|
|
| |
|
|
|
TOTAL DIVIDENDS AND DISTRIBUTIONS | | | (59,982,933 | ) | | | (128,355,528 | ) |
| | |
|
|
| |
|
|
|
| SERIES SHARE TRANSACTIONS: | | | | | | | | |
Series shares sold [2,413,005 and 10,979,065 shares, respectively] | | | 80,048,346 | | | | 339,642,147 | |
Series shares issued in reinvestment of dividends and distributions [1,700,891 and 4,228,580 shares, respectively] | | | 59,982,933 | | | | 128,355,528 | |
Series shares repurchased [13,622,829 and 11,826,004 shares, respectively] | | | (448,417,431 | ) | | | (363,515,389 | ) |
| | |
|
|
| |
|
|
|
NET INCREASE (DECREASE) IN NET ASSETS RESULTING FROM SERIES SHARE TRANSACTIONS | | | (308,386,152 | ) | | | 104,482,286 | |
| | |
|
|
| |
|
|
|
| TOTAL INCREASE IN NET ASSETS | | | 93,664,904 | | | | 118,071,061 | |
| NET ASSETS: | | | | | | | | |
Beginning of year | | | 3,212,744,072 | | | | 3,094,673,011 | |
| | |
|
|
| |
|
|
|
End of year | | $ | 3,306,408,976 | | | $ | 3,212,744,072 | (a) |
| | |
|
|
| |
|
|
|
(a) Includes undistributed net investment income of: | | | | | | $ | 1,844,408 | |
| | | | | | |
|
|
|
SEE NOTES TO FINANCIAL STATEMENTS.
A12
STATEMENT OF ASSETS AND LIABILITIES
December 31, 2006
| | | |
| ASSETS | | | |
Investments, at value including securities on loan of $157,993,033: | | | |
Unaffiliated investments (cost $1,476,137,639) | | $ | 1,931,925,941 |
Affiliated investments (cost $213,111,026) | | | 213,111,026 |
Cash | | | 124,298 |
Foreign currency, at value (cost $9,646) | | | 9,862 |
Dividends and interest receivable | | | 2,823,593 |
Receivable for Series shares sold | | | 336,413 |
Dividend reclaim receivable | | | 153,880 |
Prepaid expenses | | | 29,416 |
| | |
|
|
Total Assets | | | 2,148,514,429 |
| | |
|
|
| LIABILITIES | | | |
Collateral for securities on loan | | | 165,338,035 |
Payable for investments purchased | | | 2,695,321 |
Management fee payable | | | 669,002 |
Accrued expenses and other liabilities | | | 593,720 |
Payable for Series shares repurchased | | | 264,988 |
Transfer agent fee payable | | | 918 |
Distribution fee payable | | | 685 |
Administration fee payable | | | 411 |
| | |
|
|
Total Liabilities | | | 169,563,080 |
| | |
|
|
| NET ASSETS | | $ | 1,978,951,349 |
| | |
|
|
Net assets were comprised of: | | | |
Paid-in capital | | $ | 1,308,416,215 |
Retained earnings | | | 670,535,134 |
| | |
|
|
Net assets, December 31, 2006 | | $ | 1,978,951,349 |
| | |
|
|
| Class I: | | | |
Net asset value and redemption price per share, $1,975,723,941 / 75,389,736 outstanding shares of beneficial interest (authorized 275,000,000 shares) | | $ | 26.21 |
| | |
|
|
| Class II: | | | |
Net asset value and redemption price per share, $3,227,408 / 122,903 outstanding shares of beneficial interest (authorized 50,000,000 shares) | | $ | 26.26 |
| | |
|
|
STATEMENT OF OPERATIONS
Year Ended December 31, 2006
| | | | |
| INVESTMENT INCOME | | | | |
Unaffiliated dividend income (net of foreign withholding taxes of $451,053) | | $ | 32,751,838 | |
Affiliated dividend income | | | 1,623,575 | |
Affiliated income from securities loaned, net | | | 192,790 | |
Interest | | | 32,562 | |
| | |
|
|
|
| | | | 34,600,765 | |
| | |
|
|
|
| EXPENSES | | | | |
Management fee | | | 7,394,052 | |
Distribution fee—Class II | | | 7,846 | |
Administration fee—Class II | | | 4,708 | |
Shareholders’ reports | | | 200,000 | |
Custodian’s fees and expenses | | | 155,000 | |
Insurance expenses | | | 44,000 | |
Trustees’ fees | | | 34,000 | |
Audit fee | | | 16,000 | |
Legal fees and expenses | | | 10,000 | |
Transfer agent’s fee and expenses (including affiliated expense of $5,400) (Note 4) | | | 6,000 | |
Miscellaneous | | | 11,241 | |
| | |
|
|
|
Total expenses | | | 7,882,847 | |
| | |
|
|
|
| NET INVESTMENT INCOME | | | 26,717,918 | |
| | |
|
|
|
| NET REALIZED AND UNREALIZED GAIN (LOSS) ON INVESTMENTS AND FOREIGN CURRENCIES | | | | |
Net realized gain (loss) on: | | | | |
Investments | | | 215,970,472 | |
Foreign currency transactions | | | (13,826 | ) |
| | |
|
|
|
| | | | 215,956,646 | |
| | |
|
|
|
Net change in unrealized appreciation (depreciation) on: | | | | |
Investments | | | 94,559,921 | |
Foreign currencies | | | 216 | |
| | |
|
|
|
| | | | 94,560,137 | |
| | |
|
|
|
| NET GAIN ON INVESTMENTS AND FOREIGN CURRENCIES | | | 310,516,783 | |
| | |
|
|
|
| NET INCREASE IN NET ASSETS RESULTING FROM OPERATIONS | | $ | 337,234,701 | |
| | |
|
|
|
STATEMENT OF CHANGES IN NET ASSETS
| | | | | | | | |
| | | Year Ended December 31,
| |
| | | 2006
| | | 2005
| |
| INCREASE (DECREASE) IN NET ASSETS | | | | | | | | |
| OPERATIONS: | | | | | | | | |
Net investment income | | $ | 26,717,918 | | | $ | 22,164,814 | |
Net realized gain on investments and foreign currency transactions | | | 215,956,646 | | | | 205,030,786 | |
Net change in unrealized appreciation (depreciation) on investments and foreign currencies | | | 94,560,137 | | | | 28,679,032 | |
| | |
|
|
| |
|
|
|
NET INCREASE IN NET ASSETS RESULTING FROM OPERATIONS | | | 337,234,701 | | | | 255,874,632 | |
| | |
|
|
| |
|
|
|
| DIVIDENDS AND DISTRIBUTIONS: | | | | | | | | |
Dividends from net investment income | | | | | | | | |
Class I | | | — | | | | (22,610,679 | ) |
Class II | | | — | | | | (26,899 | ) |
Distributions | | | | | | | | |
Class I | | | (90,953,391 | ) | | | — | |
Class II | | | (140,456 | ) | | | — | |
| | |
|
|
| |
|
|
|
TOTAL DIVIDENDS AND DISTRIBUTIONS | | | (91,093,847 | ) | | | (22,637,578 | ) |
| | |
|
|
| |
|
|
|
| SERIES SHARE TRANSACTIONS (Note 7): | | | | | | | | |
Series shares sold [3,470,511 and 3,300,330 shares, respectively] | | | 84,008,078 | | | | 69,873,234 | |
Series shares issued in reinvestment of dividends and distributions [3,735,884 and 990,895 shares, respectively] | | | 91,093,847 | | | | 22,637,578 | |
Series shares repurchased [8,082,223 and 8,118,990 shares, respectively] | | | (195,543,964 | ) | | | (171,071,091 | ) |
| | |
|
|
| |
|
|
|
NET DECREASE IN NET ASSETS RESULTING FROM SERIES SHARE TRANSACTIONS | | | (20,442,039 | ) | | | (78,560,279 | ) |
| | |
|
|
| |
|
|
|
| TOTAL INCREASE IN NET ASSETS | | | 225,698,815 | | | | 154,676,775 | |
| NET ASSETS: | | | | | | | | |
Beginning of year | | | 1,753,252,534 | | | | 1,598,575,759 | |
| | |
|
|
| |
|
|
|
End of year | | $ | 1,978,951,349 | | | $ | 1,753,252,534 | (a) |
| | |
|
|
| |
|
|
|
(a) Includes undistributed net investment income of: | | | | | | $ | 1,224,164 | |
| | | | | | |
|
|
|
SEE NOTES TO FINANCIAL STATEMENTS.
A13
| | | | |
| | | CONSERVATIVE BALANCED PORTFOLIO | | |
SCHEDULE OF INVESTMENTS | December 31, 2006 |
| | | | | |
| LONG-TERM INVESTMENTS — 88.9% | | Value (Note 2)
|
| COMMON STOCKS — 56.1% | | Shares
| |
Aerospace & Defense — 1.2% | | | | | |
Boeing Co. | | 86,300 | | $ | 7,666,892 |
General Dynamics Corp. | | 43,000 | | | 3,197,050 |
Goodrich Corp. | | 14,300 | | | 651,365 |
Honeywell International, Inc. | | 91,512 | | | 4,140,003 |
L-3 Communications Holdings, Inc. | | 14,300 | | | 1,169,454 |
Lockheed Martin Corp. | | 39,200 | | | 3,609,144 |
Northrop Grumman Corp. | | 37,962 | | | 2,570,027 |
Raytheon Co. | | 48,200 | | | 2,544,960 |
Rockwell Collins, Inc. | | 18,100 | | | 1,145,549 |
United Technologies Corp. | | 109,100 | | | 6,820,932 |
| | | | |
|
|
| | | | | | 33,515,376 |
| | | | |
|
|
Air Freight & Logistics — 0.4% | | | | | |
FedEx Corp. | | 32,200 | | | 3,497,564 |
United Parcel Service, Inc. | | 117,000 | | | 8,772,660 |
| | | | |
|
|
| | | | | | 12,270,224 |
| | | | |
|
|
Airlines — 0.1% | | | | | |
Air France KLM (France) | | 25,467 | | | 1,072,065 |
British Airways PLC (United Kingdom)(a) | | 11,347 | | | 117,196 |
Qantas Airways Ltd. (Australia) | | 147,621 | | | 608,460 |
Southwest Airlines Co. | | 81,200 | | | 1,243,983 |
| | | | |
|
|
| | | | | | 3,041,704 |
| | | | |
|
|
Auto Components — 0.1% | | | | | |
Continental AG (Germany) | | 7,471 | | | 869,932 |
Goodyear Tire & Rubber Co. (The)(a)(b) | | 20,500 | | | 430,295 |
Johnson Controls, Inc. | | 21,300 | | | 1,830,096 |
Michelin (CDGE) “Class B” (France) | | 4,090 | | | 391,426 |
Rieter Holding AG (Switzerland) | | 412 | | | 215,552 |
Stanley Electric Co Ltd | | 11,000 | | | 219,756 |
| | | | |
|
|
| | | | | | 3,957,057 |
| | | | |
|
|
Automobiles — 0.4% | | | | | |
DaimlerChrysler AG (Germany) | | 7,932 | | | 491,385 |
Fiat SpA (Italy) | | 18,949 | | | 362,196 |
Ford Motor Co.(b) | | 192,995 | | | 1,449,392 |
General Motors Corp.(b) | | 59,991 | | | 1,842,924 |
Harley-Davidson, Inc.(b) | | 29,800 | | | 2,100,006 |
Honda Motor Co. Ltd. (Japan) | | 31,100 | | | 1,227,491 |
Renault SA (France) | | 6,703 | | | 805,192 |
Toyota Motor Corp. (Japan) | | 41,900 | | | 2,804,241 |
Volkswagen AG (Germany) | | 2,865 | | | 325,095 |
Yamaha Motor Co. Ltd. (Japan) | | 13,400 | | | 421,212 |
| | | | |
|
|
| | | | | | 11,829,134 |
| | | | |
|
|
Beverages — 1.1% | | | | | |
Anheuser-Busch Cos., Inc. | | 82,400 | | | 4,054,080 |
Brown-Forman Corp. “Class B” | | 7,700 | | | 510,048 |
Carlsberg A/S (Denmark) | | 600 | | | 59,588 |
Coca-Cola Co. (The) | | 223,100 | | | 10,764,575 |
Coca-Cola Enterprises, Inc. | | 33,500 | | | 684,070 |
Coca-Cola Hellenic Bottling Co. SA (Greece) | | 3,180 | | | 124,253 |
Constellation Brands, Inc.(a)(b) | | 19,100 | | | 554,282 |
Foster’s Group Ltd. (Australia) | | 104,496 | | | 569,836 |
InBev NV (Belgium) | | 588 | | | 38,763 |
| | | | | |
COMMON STOCKS
(Continued) | | Shares
| | Value (Note 2)
|
Beverages (cont’d.) | | | | | |
Molson Coors Brewing Co. “Class B”(a) | | 6,400 | | $ | 489,216 |
Pepsi Bottling Group, Inc. | | 16,600 | | | 513,106 |
PepsiCo, Inc. | | 178,230 | | | 11,148,287 |
SABMiller PLC (United Kingdom) | | 26,325 | | | 605,640 |
| | | | |
|
|
| | | | | | 30,115,744 |
| | | | |
|
|
Biotechnology — 0.7% | | | | | |
Amgen, Inc.(a) | | 127,260 | | | 8,693,131 |
Biogen Idec, Inc.(a)(b) | | 36,690 | | | 1,804,781 |
Celgene Corp.(a)(b) | | 39,700 | | | 2,283,941 |
Genzyme Corp.(a) | | 28,700 | | | 1,767,346 |
Gilead Sciences, Inc.(a) | | 46,700 | | | 3,032,231 |
MedImmune, Inc.(a) | | 28,000 | | | 906,360 |
| | | | |
|
|
| | | | | | 18,487,790 |
| | | | |
|
|
Building Products — 0.2% | | | | | |
American Standard Cos., Inc. | | 19,100 | | | 875,735 |
Cie de Saint-Gobain (France) | | 14,772 | | | 1,241,156 |
Geberit AG (Switzerland) | | 257 | | | 396,098 |
JS Group Corp. (Japan) | | 2,000 | | | 42,058 |
Masco Corp. | | 45,300 | | | 1,353,112 |
Nippon Sheet Glass Co. Ltd. (Japan) | | 78,000 | | | 365,275 |
Sanwa Shutter Corp. (Japan) | | 19,000 | | | 112,130 |
| | | | |
|
|
| | | | | | 4,385,564 |
| | | | |
|
|
Capital Markets — 2.2% | | | | | |
Ameriprise Financial, Inc. | | 30,620 | | | 1,668,790 |
Bank of New York Co., Inc. (The) | | 85,100 | | | 3,350,387 |
Bear Stearns Cos., Inc. (The) | | 14,616 | | | 2,379,192 |
Charles Schwab Corp. (The) | | 116,050 | | | 2,244,407 |
Credit Suisse Group (Switzerland) | | 24,488 | | | 1,713,256 |
D Carnegie AB (Sweden) | | 7,500 | | | 161,592 |
Deutsche Bank AG (Germany) | | 14,435 | | | 1,935,591 |
E*TRADE Financial Corp.(a) | | 48,300 | | | 1,082,886 |
Federated Investors, Inc. “Class B” | | 6,700 | | | 226,326 |
Franklin Resources, Inc. | | 19,700 | | | 2,170,349 |
Goldman Sachs Group, Inc. | | 48,200 | | | 9,608,670 |
Janus Capital Group, Inc.(b) | | 31,900 | | | 688,721 |
Legg Mason, Inc.(b) | | 13,500 | | | 1,283,175 |
Lehman Brothers Holdings, Inc.(b) | | 62,000 | | | 4,843,440 |
Macquarie Bank Ltd. (Australia) | | 4,918 | | | 305,681 |
Man Group PLC (United Kingdom | | 4,122 | | | 42,190 |
Mellon Financial Corp. | | 43,400 | | | 1,829,310 |
Merrill Lynch & Co., Inc.(b) | | 100,800 | | | 9,384,480 |
Morgan Stanley | | 119,580 | | | 9,737,400 |
Northern Trust Corp. | | 19,700 | | | 1,195,593 |
State Street Corp. | | 37,800 | | | 2,549,232 |
T. Rowe Price Group, Inc. | | 27,600 | | | 1,208,052 |
UBS AG (Switzerland) | | 26,580 | | | 1,615,305 |
| | | | |
|
|
| | | | | | 61,224,025 |
| | | | |
|
|
Chemicals — 1.0% | | | | | |
Air Products and Chemicals, Inc. | | 24,500 | | | 1,721,860 |
Asahi Chemical Industry Co. Ltd | | 48,000 | | | 314,699 |
Ashland, Inc. | | 8,100 | | | 560,358 |
BASF AG (Germany) | | 14,608 | | | 1,428,693 |
Denki Kagaku Kogyo K K (Japan) | | 11,000 | | | 45,647 |
Dow Chemical Co. (The) | | 102,331 | | | 4,087,100 |
SEE NOTES TO FINANCIAL STATEMENTS.
B1
| | | | |
| | | CONSERVATIVE BALANCED PORTFOLIO (Continued) | | |
SCHEDULE OF INVESTMENTS | December 31, 2006 |
| | | | | |
COMMON STOCKS
(Continued) | | Shares
| | Value (Note 2)
|
Chemicals (cont’d.) | | | | | |
Du Pont E. I. de Nemours & Co. | | 96,020 | | $ | 4,677,135 |
Eastman Chemical Co. | | 9,800 | | | 581,238 |
Ecolab, Inc. | | 21,200 | | | 958,240 |
Hercules, Inc.(a) | | 11,500 | | | 222,065 |
International Flavors & Fragrances, Inc. | | 9,100 | | | 447,356 |
Koninklijke DSM NV (Netherlands) | | 13,669 | | | 675,375 |
Mitsubishi Chemical Holdings Corp. (Japan) | | 138,000 | | | 868,962 |
Mitsubishi Gas Chemical Co., Inc. (Japan) | | 24,000 | | | 251,109 |
Mitsui Chemicals Inc. | | 63,000 | | | 484,355 |
Monsanto Co. | | 59,194 | | | 3,109,461 |
Nippon Shokubai Co. Ltd. | | 12,000 | | | 127,735 |
Orica Ltd. (Australia) | | 8,695 | | | 166,228 |
PPG Industries, Inc. | | 17,600 | | | 1,130,096 |
Praxair, Inc. | | 33,100 | | | 1,963,823 |
Rohm & Haas Co. | | 16,711 | | | 854,266 |
Sigma-Aldrich Corp. | | 7,900 | | | 613,988 |
Sumitomo Bakelite Co. Ltd. (Japan) | | 13,000 | | | 89,784 |
Sumitomo Chemical Co. Ltd. (Japan) | | 50,000 | | | 386,923 |
Teijin Ltd. (Japan) | | 67,000 | | | 412,506 |
Yara International ASA (Norway) | | 9,000 | | | 204,605 |
| | | | |
|
|
| | | | | | 26,383,607 |
| | | | |
|
|
Commercial Banks — 3.1% | | | | | |
Allied Irish Banks PLC (Ireland) | | 2,297 | | | 68,223 |
Alpha Bank (Greece) | | 4,298 | | | 129,924 |
Australia And New Zealand Banking Group Ltd. (Australia) | | 32,156 | | | 713,712 |
Banche Popolari Unite Scpa (Italy) | | 16,362 | | | 449,682 |
Banco Bilbao Vizcaya Argentaria SA (Spain) | | 74,746 | | | 1,799,706 |
Banco Comercial Portugues SA (Portugal) | | 127,436 | | | 471,019 |
Banco Espirito Santo SA (Portugal) | | 28,843 | | | 518,569 |
Banco Popolare di Verona (Italy) | | 27,020 | | | 775,771 |
Banco Popular Espanol SA (Spain) | | 14,784 | | | 267,948 |
Banco Santander Central Hispano SA (Spain) | | 127,293 | | | 2,375,979 |
Bank of Ireland (Ireland) | | 2,712 | | | 62,649 |
Barclay’s PLC (United Kingdom) | | 85,086 | | | 1,216,157 |
BB&T Corp. | | 60,600 | | | 2,662,158 |
BNP Paribas (France) | | 18,630 | | | 2,032,565 |
Comerica, Inc. | | 20,500 | | | 1,202,940 |
Commerce Bancorp, Inc. | | 16,700 | | | 589,009 |
Commerzbank AG (Germany) | | 11,366 | | | 431,354 |
Compass Bancshares, Inc. | | 12,800 | | | 763,520 |
Credit Agricole SA (France) | | 26,812 | | | 1,127,622 |
Danske Bank A/S (Denmark) | | 20,300 | | | 902,015 |
DBS Group Holdings Ltd. (Singapore) | | 46,000 | | | 675,325 |
Dexia (Belgium) | | 28,302 | | | 775,218 |
DNB NOR ASA (Norway) | | 70,000 | | | 993,553 |
Fifth Third Bancorp | | 61,521 | | | 2,518,055 |
First Horizon National Corp.(b) | | 13,600 | | | 568,208 |
Gunma Bank Ltd. (The) (Japan) | | 4,000 | | | 24,046 |
HSBC Holdings PLC (United Kingdom) | | 192,206 | | | 3,503,687 |
| | | | | |
COMMON STOCKS
(Continued) | | Shares
| | Value (Note 2)
|
Commercial Banks (cont’d.) | | | | | |
Huntington Bancshares, Inc.(b) | | 33,036 | | $ | 784,605 |
KeyCorp | | 46,600 | | | 1,772,198 |
Lloyds TSB Group PLC (United Kingdom) | | 33,095 | | | 370,329 |
M&T Bank Corp. | | 8,300 | | | 1,013,928 |
Marshall & Ilsley Corp. | | 23,700 | | | 1,140,207 |
Mitsubishi Financial Group, Inc. (Japan) | | 32 | | | 396,986 |
Mitsui Trust Holdings, Inc. (Japan) | | 63,000 | | | 719,756 |
Mizuho Financial Group, Inc. (Japan) | | 115 | | | 820,291 |
National Australia Bank Ltd. (Australia) | | 6,163 | | | 196,210 |
National City Corp.(b) | | 64,500 | | | 2,358,120 |
PNC Financial Services Group, Inc.(b) | | 35,900 | | | 2,658,036 |
Regions Financial Corp. | | 83,903 | | | 3,137,972 |
Royal Bank of Scotland Group PLC (United Kingdom) | | 34,725 | | | 1,355,059 |
Sapporo Hokuyo Holdings, Inc (Japan) | | 3 | | | 28,953 |
Shinsei Bank Ltd. (Japan) | | 111,000 | | | 652,435 |
Skandinaviska Enskilda Banken AB “A Shares” (Sweden) | | 14,600 | | | 463,851 |
Societe Generale (France) | | 9,526 | | | 1,617,113 |
SunTrust Banks, Inc.(b) | | 40,200 | | | 3,394,890 |
Svenska Handelbanken “A Shares” (Sweden) | | 7,400 | | | 223,753 |
Synovus Financial Corp. | | 35,050 | | | 1,080,592 |
U.S. Bancorp | | 194,985 | | | 7,056,506 |
UniCredito Italiano SpA (Italy) | | 198,310 | | | 1,738,207 |
Wachovia Corp.(e) | | 203,540 | | | 11,591,602 |
Wells Fargo & Co. | | 369,500 | | | 13,139,419 |
Westpac Banking Corp. (Australia) | | 31,382 | | | 598,772 |
Zions Bancorporation | | 13,250 | | | 1,092,330 |
| | | | |
|
|
| | | | | | 87,020,734 |
| | | | |
|
|
Commercial Services & Supplies — 0.3% | | | |
Allied Waste Industries, Inc.(a)(b) | | 26,400 | | | 324,456 |
Avery Dennison Corp. | | 12,300 | | | 835,539 |
Cintas Corp. | | 15,100 | | | 599,621 |
Equifax, Inc. | | 14,600 | | | 592,760 |
Michael Page International PLC (United Kingdom) | | 26,133 | | | 231,407 |
Monster Worldwide, Inc.(a) | | 13,100 | | | 610,984 |
Pitney Bowes, Inc. | | 21,600 | | | 997,704 |
Randstad Holding NV (Netherlands) | | 1,545 | | | 106,868 |
Robert Half International, Inc. | | 21,900 | | | 812,928 |
RR Donnelley & Sons Co. | | 23,000 | | | 817,420 |
SGS SA (Switzerland) | | 131 | | | 145,998 |
Waste Management, Inc. | | 56,942 | | | 2,093,757 |
| | | | |
|
|
| | | | | | 8,169,442 |
| | | | |
|
|
Communications Equipment — 1.4% | | | | | |
ADC Telecommunications, Inc.(a) | | 14,771 | | | 214,623 |
Avaya, Inc.(a) | | 49,570 | | | 692,989 |
Ciena Corp.(b) | | 9,142 | | | 253,325 |
Cisco Systems, Inc.(a) | | 658,600 | | | 17,999,537 |
Comverse Technology, Inc.(a)(b) | | 18,400 | | | 388,424 |
Corning, Inc.(a) | | 159,100 | | | 2,976,761 |
Foxconn International Holdings Ltd. (Hong Kong)(a) | | 274,000 | | | 893,669 |
SEE NOTES TO FINANCIAL STATEMENTS.
B2
| | | | |
| | | CONSERVATIVE BALANCED PORTFOLIO (Continued) | | |
SCHEDULE OF INVESTMENTS | December 31, 2006 |
| | | | | |
COMMON STOCKS
(Continued) | | Shares
| | Value (Note 2)
|
Communications Equipment (cont’d.) | | | | | |
JDS Uniphase Corp.(a) | | 11,375 | | $ | 189,508 |
Juniper Networks, Inc.(a) | | 51,600 | | | 977,304 |
Motorola, Inc. | | 266,425 | | | 5,477,698 |
Nokia Corp. (Finland) | | 12,850 | | | 262,581 |
QUALCOMM, Inc. | | 180,800 | | | 6,832,431 |
Telent PLC (United Kingdom)(a) | | 4,333 | | | 40,108 |
Tellabs, Inc.(a) | | 45,800 | | | 469,908 |
| | | | |
|
|
| | | | | | 37,668,866 |
| | | | |
|
|
Computers & Peripherals — 1.9% | | | | | |
Apple Computer, Inc.(a) | | 91,600 | | | 7,771,344 |
Dell, Inc.(a) | | 244,500 | | | 6,134,505 |
EMC Corp.(a)(b) | | 248,350 | | | 3,278,220 |
Hewlett-Packard Co. | | 302,348 | | | 12,453,714 |
International Business Machines Corp. | | 167,300 | | | 16,253,195 |
Lexmark International, Inc.(a)(b) | | 12,533 | | | 917,416 |
NCR Corp.(a) | | 20,900 | | | 893,684 |
Network Appliance, Inc.(a) | | 41,700 | | | 1,637,976 |
QLogic Corp.(a) | | 20,600 | | | 451,552 |
SanDisk Corp.(a)(b) | | 19,000 | | | 817,570 |
Sun Microsystems, Inc.(a) | | 369,400 | | | 2,002,148 |
Toshiba Corp. (Japan) | | 10,000 | | | 64,982 |
Wincor Nixdorf AG (Germany) | | 486 | | | 75,099 |
| | | | |
|
|
| | | | | | 52,751,405 |
| | | | |
|
|
Construction & Engineering — 0.1% | | | | | |
ACS Actividades de Construccion y Servicios SA (Spain) | | 6,223 | | | 350,847 |
Chiyoda Corp. (Japan) | | 5,000 | | | 97,745 |
COMSYS Holdings Corp. (Japan) | | 10,000 | | | 110,489 |
Fluor Corp. | | 9,700 | | | 792,005 |
Fomento de Construcciones Y Contratas SA (Spain) | | 821 | | | 83,666 |
Kajima Corp. (Japan) | | 31,000 | | | 135,728 |
Obayashi Corp. (Japan) | | 135,000 | | | 875,175 |
| | | | |
|
|
| | | | | | 2,445,655 |
| | | | |
|
|
Construction Materials — 0.1% | | | | | |
Cimpor Cimentos de Portugal SGPS SA (Portugal) | | 26,165 | | | 217,250 |
CRH PLC (Ireland) | | 1,105 | | | 46,006 |
Fletcher Building Ltd. (New Zealand) | | 8,419 | | | 65,521 |
Holcim Ltd. “B Shares” (Switzerland) | | 3,487 | | | 319,654 |
Italcementi SpA (Italy) | | 7,499 | | | 211,542 |
Lafarge SA (France) | | 2,544 | | | 378,468 |
Taiheiyo Cement Corp. (Japan) | | 12,000 | | | 46,996 |
Vulcan Materials Co. | | 10,600 | | | 952,623 |
| | | | |
|
|
| | | | | | 2,238,060 |
| | | | |
|
|
Consumer Finance — 0.5% | | | | | |
American Express Co. | | 132,400 | | | 8,032,708 |
Capital One Financial Corp. | | 49,661 | | | 3,814,958 |
ORIX Corp. (Japan) | | 3,080 | | | 893,176 |
SLM Corp. | | 43,200 | | | 2,106,864 |
| | | | |
|
|
| | | | | | 14,847,706 |
| | | | |
|
|
Containers & Packaging — 0.1% | | | | | |
Ball Corp. | | 12,000 | | | 523,200 |
Bemis Co. | | 11,300 | | | 383,974 |
| | | | | |
COMMON STOCKS
(Continued) | | Shares
| | Value (Note 2)
|
Containers & Packaging (cont’d.) | | | | | |
Pactiv Corp.(a) | | 15,600 | | $ | 556,764 |
Sealed Air Corp.(a) | | 9,300 | | | 603,756 |
Temple-Inland, Inc. | | 13,000 | | | 598,390 |
| | | | |
|
|
| | | | | | 2,666,084 |
| | | | |
|
|
Distributors — 0.1% | | | | | |
Genuine Parts Co. | | 18,800 | | | 891,684 |
Li & Fung Ltd. (Hong Kong) | | 130,000 | | | 403,628 |
Pacific Brands Ltd. (Australia) | | 116,210 | | | 239,057 |
| | | | |
|
|
| | | | | | 1,534,369 |
| | | | |
|
|
Diversified Consumer Services — 0.1% | | | | | |
Apollo Group, Inc.(a)(b) | | 14,800 | | | 576,756 |
H&R Block, Inc. | | 36,100 | | | 831,744 |
| | | | |
|
|
| | | | | | 1,408,500 |
| | | | |
|
|
Diversified Financial Services — 3.0% | | | | | |
Babcock & Brown Ltd. (Australia) | | 11,219 | | | 218,600 |
Bank of America Corp. | | 495,338 | | | 26,446,095 |
Challenger Financial Services Group Ltd. (Australia) | | 62,164 | | | 201,413 |
Chicago Mercantile Exchange Holdings, Inc.(b) | | 4,100 | | | 2,089,975 |
CIT Group, Inc. | | 23,500 | | | 1,310,595 |
Citigroup, Inc. | | 538,358 | | | 29,986,540 |
Fortis (Belgium) | | 32,439 | | | 1,383,973 |
ING Groep NV (Netherlands) | | 38,582 | | | 1,710,738 |
JPMorgan Chase & Co. | | 383,601 | | | 18,527,928 |
Moody’s Corp. | | 28,300 | | | 1,954,398 |
OKO Bank PLC (Finland) | | 23,100 | | | 387,262 |
Suncorp-Metway Ltd. | | 10,583 | | | 169,611 |
| | | | |
|
|
| | | | | | 84,387,128 |
| | | | |
|
|
Diversified Telecommunication Services — 1.7% | | | |
AT&T, Inc.(b) | | 424,073 | | | 15,160,610 |
Belgacom SA (Belgium) | | 15,659 | | | 689,777 |
BellSouth Corp. | | 196,600 | | | 9,261,826 |
BT Group PLC (United Kingdom) | | 126,583 | | | 747,259 |
CenturyTel, Inc. | | 14,000 | | | 611,240 |
Citizens Communications Co. | | 36,000 | | | 517,320 |
Embarq Corp.(a) | | 15,643 | | | 822,196 |
France Telecom SA (France) | | 1,419 | | | 39,242 |
Nippon Telegraph & Telephone Corp. (Japan) | | 220 | | | 1,084,927 |
Qwest Communications International, Inc.(a)(b) | | 171,257 | | | 1,433,421 |
Royal KPN NV (Netherlands) | | 43,376 | | | 616,672 |
Swisscom AG (Switzerland) | | 1,447 | | | 547,746 |
Telecom Corp. of New Zealand Ltd. (New Zealand) | | 308,025 | | | 1,041,749 |
Telecom Italia SpA (Italy) | | 295,654 | | | 750,112 |
Telefonica SA (Spain) | | 20,281 | | | 431,562 |
Telia Sonera AB (Sweden) | | 41,000 | | | 336,878 |
Verizon Communications Group Inc. | | 314,676 | | | 11,718,534 |
Windstream Corp. | | 47,457 | | | 674,839 |
| | | | |
|
|
| | | | | | 46,485,910 |
| | | | |
|
|
Electric Utilities — 1.2% | | | |
Allegheny Energy, Inc.(a) | | 16,900 | | | 775,879 |
American Electric Power Co., Inc. | | 42,660 | | | 1,816,463 |
SEE NOTES TO FINANCIAL STATEMENTS.
B3
| | | | |
| | | CONSERVATIVE BALANCED PORTFOLIO (Continued) | | |
SCHEDULE OF INVESTMENTS | December 31, 2006 |
| | | | | |
COMMON STOCKS
(Continued) | | Shares
| | Value (Note 2)
|
Electric Utilities (Cont’d.) | | | |
CLP Holdings Ltd. (Hong Kong) | | 35,500 | | $ | 262,039 |
Duke Energy Corp.(b) | | 131,324 | | | 4,361,270 |
E.ON AG (Germany) | | 14,991 | | | 2,043,984 |
Edison International | | 36,500 | | | 1,660,020 |
Endesa SA (Spain) | | 30,512 | | | 1,443,132 |
Enel SpA (Italy) | | 27,024 | | | 278,784 |
Entergy Corp. | | 21,700 | | | 2,003,344 |
Exelon Corp. | | 71,774 | | | 4,442,093 |
FirstEnergy Corp. | | 36,001 | | | 2,170,860 |
FPL Group, Inc.(b) | | 42,800 | | | 2,329,176 |
Hokkaido Electric Power Co., Inc. (Japan) | | 23,100 | | | 589,958 |
Hong Kong Electric Holdings (Hong Kong) | | 7,000 | | | 34,229 |
Kansai Electric Power Co. Inc. (The) (Japan) | | 18,700 | | | 503,405 |
Kyushu Electric Power Co. Inc. | | 15,900 | | | 419,300 |
Pinnacle West Capital Corp. | | 11,500 | | | 582,935 |
PPL Corp. | | 41,500 | | | 1,487,360 |
Progress Energy, Inc. | | 27,683 | | | 1,358,682 |
Southern Co. (The) | | 82,100 | | | 3,026,206 |
Tokyo Electric Power Co., Inc. (The) (Japan) | | 26,900 | | | 869,040 |
Union Fenosa SA (Spain) | | 5,956 | | | 294,832 |
| | | | |
|
|
| | | | | | 32,752,991 |
| | | | |
|
|
Electrical Equipment — 0.3% | | | |
ABB Ltd. (Switzerland) | | 36,137 | | | 648,004 |
American Power Conversion Corp. | | 12,100 | | | 370,139 |
Cooper Industries Ltd. | | 10,300 | | | 931,429 |
Emerson Electric Co. | | 90,200 | | | 3,976,918 |
Fujikura Ltd. (Japan) | | 25,000 | | | 219,775 |
Mitsubishi Electronics Corp. (Japan) | | 114,000 | | | 1,038,818 |
Rockwell Automation, Inc. | | 19,500 | | | 1,191,060 |
Schneider Electric SA (France) | | 2,217 | | | 246,122 |
| | | | |
|
|
| | | | | | 8,622,265 |
| | | | |
|
|
Electronic Equipment & Instruments — 0.2% | | | |
Agilent Technologies, Inc.(a) | | 54,614 | | | 1,903,299 |
Dainippon Screen Manufacturing Co. Ltd. (Japan) | | 5,000 | | | 44,842 |
Ibiden Co. Ltd. (Japan) | | 1,100 | | | 55,327 |
Jabil Circuit, Inc. | | 18,600 | | | 456,630 |
Kingboard Chemical Holdings Ltd. (Hong Kong) | | 36,500 | | | 143,329 |
Kyocera Corp. (Japan) | | 2,000 | | | 189,065 |
Molex, Inc. | | 16,700 | | | 528,221 |
Nippon Electric Glass Co., Ltd. | | 8,000 | | | 167,749 |
Sanmina-SCI Corp.(a) | | 54,200 | | | 186,990 |
Solectron Corp.(a)(b) | | 109,300 | | | 351,946 |
Symbol Technologies, Inc. | | 31,900 | | | 476,586 |
TDK Corp. (Japan) | | 600 | | | 47,772 |
Tektronix, Inc. | | 10,600 | | | 309,202 |
Venture Manufacturing (Singapore) Ltd. Corp. | | 13,000 | | | 114,021 |
Yaskawa Electric Corp. (Japan) | | 58,000 | | | 670,436 |
| | | | |
|
|
| | | | | | 5,645,415 |
| | | | |
|
|
| | | | | |
COMMON STOCKS
(Continued) | | Shares
| | Value (Note 2)
|
Energy Equipment & Services — 0.9% | | | |
Baker Hughes, Inc. | | 39,150 | | $ | 2,922,939 |
Fugro NV (Netherlands) | | 5,784 | | | 276,392 |
Halliburton Co.(b) | | 111,000 | | | 3,446,550 |
Nabors Industries Ltd. (Bermuda)(a) | | 35,300 | | | 1,051,234 |
National Oilwell Varco, Inc.(a)(b) | | 18,800 | | | 1,150,184 |
Noble Corp.(b) | | 14,800 | | | 1,127,020 |
Rowan Cos., Inc. | | 6,700 | | | 222,440 |
Schlumberger Ltd. | | 129,300 | | | 8,166,588 |
Smith International, Inc. | | 17,900 | | | 735,153 |
TGS Nopec Geophysical Co. Asa(a) (Norway) | | 11,522 | | | 238,379 |
Transocean, Inc.(a)(b) | | 35,897 | | | 2,903,708 |
Weatherford International Ltd.(a) | | 36,100 | | | 1,508,619 |
| | | | |
|
|
| | | | | | 23,749,206 |
| | | | |
|
|
Food & Staples Retailing — 1.2% | | | |
Aeon Co. Ltd. (Japan) | | 15,700 | | | 339,565 |
Casino GuichardPerrachon SA (France) | | 7,369 | | | 684,810 |
Costco Wholesale Corp. | | 52,100 | | | 2,754,527 |
CVS Corp.(b) | | 90,500 | | | 2,797,355 |
Delhaize Group (Belgium) | | 2,654 | | | 221,240 |
FamilyMart Co. Ltd. (Japan) | | 3,000 | | | 81,551 |
J. Sainsbury PLC (United Kingdom) | | 74,197 | | | 594,544 |
Koninklijke Ahold NV (Netherlands)(a) | | 51,070 | | | 543,362 |
Kroger Co. (The) | | 77,146 | | | 1,779,758 |
Safeway, Inc. | | 48,600 | | | 1,679,616 |
Supervalu, Inc. | | 20,010 | | | 715,358 |
Sysco Corp. | | 68,300 | | | 2,510,708 |
Walgreen Co.(b) | | 108,600 | | | 4,983,654 |
Wal-Mart Stores, Inc. | | 269,700 | | | 12,454,745 |
Whole Foods Market, Inc.(b) | | 14,100 | | | 661,713 |
Woolworths Ltd. (Australia) | | 10,721 | | | 201,945 |
| | | | |
|
|
| | | | | | 33,004,451 |
| | | | |
|
|
Food Products — 0.7% | | | |
Archer-Daniels-Midland Co.(b) | | 72,326 | | | 2,311,540 |
Campbell Soup Co. | | 20,500 | | | 797,245 |
ConAgra Foods, Inc. | | 57,300 | | | 1,547,100 |
Dean Foods Co.(a) | | 15,600 | | | 659,568 |
Ebro Puleva SA (Spain) | | 8,051 | | | 204,051 |
General Mills, Inc. | | 38,200 | | | 2,200,320 |
Groupe Danone (France) | | 270 | | | 40,916 |
H.J. Heinz Co. | | 35,100 | | | 1,579,851 |
Hershey Co. (The) | | 18,300 | | | 911,340 |
Kellogg Co. | | 27,400 | | | 1,371,644 |
McCormick & Co., Inc. | | 15,000 | | | 578,400 |
Nestle SA “B Shares” (Switzerland) | | 2,874 | | | 1,021,290 |
Nichirei Corp. (Japan) | | 11,000 | | | 61,608 |
Nisshin Scifon Group, Inc. (Japan) | | 11,500 | | | 118,678 |
Sara Lee Corp. | | 86,200 | | | 1,467,986 |
Suedzucker AG (Germany) | | 31,115 | | | 747,121 |
The East Asiatic Co. Ltd. (Denmark) | | 8,275 | | | 462,912 |
Tyson Foods, Inc. “Class A” | | 22,700 | | | 373,415 |
Unilever NV (Netherlands) | | 40,896 | | | 1,117,480 |
Unilever PLC (United Kingdom) | | 37,773 | | | 1,056,132 |
WM Wrigley Jr. Co. | | 23,100 | | | 1,194,732 |
Yamazaki Baking Co. Ltd. | | 14,000 | | | 135,891 |
| | | | |
|
|
| | | | | | 19,959,220 |
| | | | |
|
|
SEE NOTES TO FINANCIAL STATEMENTS.
B4
| | | | |
| | | CONSERVATIVE BALANCED PORTFOLIO (Continued) | | |
SCHEDULE OF INVESTMENTS | December 31, 2006 |
| | | | | |
COMMON STOCKS
(Continued) | | Shares
| | Value (Note 2)
|
Gas Utilities — 0.1% | | | |
Gas Natural SDG SA (Spain) | | 5,798 | | $ | 229,532 |
Gaz De France SA (France) | | 6,055 | | | 278,552 |
Nicor, Inc. | | 4,600 | | | 215,280 |
Peoples Energy Corp. | | 1,600 | | | 71,312 |
Questar Corp. | | 9,400 | | | 780,670 |
| | | | |
|
|
| | | | | | 1,575,346 |
| | | | |
|
|
Healthcare Equipment & Supplies — 0.8% | | | |
Ansell Ltd | | 8,085 | | | 71,706 |
Bard C.R., Inc. | | 10,900 | | | 904,373 |
Bausch & Lomb, Inc.(b) | | 6,700 | | | 348,802 |
Baxter International, Inc. | | 69,000 | | | 3,200,910 |
Becton Dickinson & Co. | | 27,300 | | | 1,915,095 |
Biomet, Inc. | | 26,300 | | | 1,085,401 |
Boston Scientific Corp.(a) | | 127,967 | | | 2,198,473 |
Cochlear Ltd. (Australia) | | 3,521 | | | 160,689 |
Hospira, Inc.(a) | | 16,760 | | | 562,801 |
Medtronic, Inc. | | 126,100 | | | 6,747,611 |
Phonak Holding AG (Switzerland) | | 1,432 | | | 113,996 |
St. Jude Medical, Inc.(a) | | 39,000 | | | 1,425,840 |
Stryker Corp. | | 32,600 | | | 1,796,586 |
Zimmer Holdings, Inc.(a) | | 26,900 | | | 2,108,422 |
| | | | |
|
|
| | | | | | 22,640,705 |
| | | | |
|
|
Healthcare Providers & Services — 1.3% | | | |
Aetna, Inc. | | 67,200 | | | 2,901,696 |
AmerisourceBergen Corp.(b) | | 25,000 | | | 1,124,000 |
Cardinal Health, Inc. | | 43,850 | | | 2,825,256 |
Caremark Rx, Inc. | | 50,100 | | | 2,861,211 |
Cigna Corp. | | 12,600 | | | 1,657,782 |
Coventry Health Care, Inc.(a) | | 19,750 | | | 988,488 |
Express Scripts, Inc.(a)(b) | | 17,600 | | | 1,260,160 |
Fresenius Medical Care AG (Germany) | | 583 | | | 77,782 |
Health Management Associates, Inc. “Class A” | | 28,600 | | | 603,746 |
Humana, Inc.(a) | | 17,400 | | | 962,394 |
Laboratory Corp. of America Holdings(a)(b) | | 13,100 | | | 962,457 |
Manor Care, Inc. | | 7,500 | | | 351,900 |
McKesson Corp. | | 32,130 | | | 1,628,991 |
Medco Health Solutions, Inc.(a) | | 31,549 | | | 1,685,979 |
Patterson Cos., Inc.(a) | | 10,000 | | | 355,100 |
Quest Diagnostics, Inc. | | 18,300 | | | 969,900 |
Suzuken Co. Ltd. (Japan) | | 8,400 | | | 315,821 |
Tenet Healthcare Corp.(a) | | 44,600 | | | 310,862 |
UnitedHealth Group, Inc. | | 148,300 | | | 7,968,158 |
WellPoint, Inc.(a) | | 69,800 | | | 5,492,561 |
| | | | |
|
|
| | | | | | 35,304,244 |
| | | | |
|
|
Healthcare Technology | | | |
IMS Health, Inc. | | 22,500 | | | 618,300 |
| | | | |
|
|
Hotels, Restaurants & Leisure — 0.8% | | | |
Carnival Corp.(b) | | 47,800 | | | 2,344,590 |
Carnival PLC (United Kingdom) | | 5,774 | | | 292,583 |
Darden Restaurants, Inc.(b) | | 15,150 | | | 608,576 |
Enterprise Inns PLC (United Kingdom) | | 20,592 | | | 545,513 |
Harrah’s Entertainment, Inc. | | 21,500 | | | 1,778,480 |
Hilton Hotels Corp.(b) | | 34,500 | | | 1,204,050 |
International Game Technology(b) | | 35,900 | | | 1,658,580 |
| | | | | |
COMMON STOCKS
(Continued) | | Shares
| | Value (Note 2)
|
Hotels, Restaurants & Leisure (cont’d.) | | | |
Marriott International, Inc. “Class A” | | 34,400 | | $ | 1,641,568 |
McDonald’s Corp.(b) | | 133,600 | | | 5,922,488 |
Starbucks Corp.(a)(b) | | 82,300 | | | 2,915,066 |
Starwood Hotels & Resorts Worldwide, Inc. | | 23,100 | | | 1,443,750 |
Wendy’s International, Inc. | | 9,600 | | | 317,664 |
Wyndham Worldwide Corp.(a) | | 20,420 | | | 653,848 |
Yum! Brands, Inc. | | 31,600 | | | 1,858,080 |
| | | | |
|
|
| | | | | | 23,184,836 |
| | | | |
|
|
Household Durables — 0.4% | | | |
Barratt Developments PLC (United Kingdom) | | 34,949 | | | 845,104 |
Black & Decker Corp. | | 8,700 | | | 695,739 |
Bovis Homes Group PLC (United Kingdom) | | 7,889 | | | 167,440 |
Centex Corp.(b) | | 12,300 | | | 692,121 |
D.R. Horton, Inc. | | 23,700 | | | 627,813 |
Fortune Brands, Inc.(b) | | 16,300 | | | 1,391,857 |
George Wimpey PLC (United Kingdom) | | 62,831 | | | 687,078 |
Harman International Industries, Inc. | | 8,000 | | | 799,280 |
KB Home | | 9,200 | | | 471,776 |
Leggett & Platt, Inc. | | 22,500 | | | 537,750 |
Lennar Corp. | | 16,400 | | | 860,344 |
Makita Corp. (Japan) | | 28,200 | | | 864,316 |
Matsushita Electric Industrial Co. Ltd. (Japan) | | 14,000 | | | 280,721 |
Newell Rubbermaid, Inc. | | 32,314 | | | 935,490 |
Pulte Homes, Inc. | | 17,200 | | | 569,664 |
Sekisui House Ltd. | | 8,000 | | | 116,186 |
Snap-On, Inc. | | 4,900 | | | 233,436 |
Stanley Works (The) | | 5,900 | | | 296,711 |
Taylor Woodrow PLC (United Kingdom) | | 47,224 | | | 394,127 |
Whirlpool Corp. | | 7,526 | | | 624,809 |
| | | | |
|
|
| | | | | | 12,091,762 |
| | | | |
|
|
Household Products — 1.1% | | | |
Clorox Co. | | 16,500 | | | 1,058,475 |
Colgate-Palmolive Co. | | 55,600 | | | 3,627,344 |
Kimberly-Clark Corp. | | 49,400 | | | 3,356,730 |
Procter & Gamble Co. | | 350,325 | | | 22,515,388 |
Reckitt Benckiser PLC (United Kingdom) | | 22,401 | | | 1,023,710 |
| | | | |
|
|
| | | | | | 31,581,647 |
| | | | |
|
|
Independent Power Producers & Energy Traders — 0.2% |
AES Corp. (The)(a) | | 71,700 | | | 1,580,268 |
Constellation Energy Group, Inc. | | 20,400 | | | 1,404,948 |
Dynegy, Inc. “Class A”(a) | | 37,500 | | | 271,500 |
International Power PLC (United Kingdom) | | 115,618 | | | 864,198 |
TXU Corp. | | 49,900 | | | 2,705,079 |
| | | | |
|
|
| | | | | | 6,825,993 |
| | | | |
|
|
Industrial Conglomerates — 2.1% |
3M Co. | | 81,300 | | | 6,335,709 |
Cookson Group PLC (United Kingdom) | | 16,043 | | | 197,267 |
General Electric Co. | | 1,121,600 | | | 41,734,737 |
SEE NOTES TO FINANCIAL STATEMENTS.
B5
| | | | |
| | | CONSERVATIVE BALANCED PORTFOLIO (Continued) | | |
SCHEDULE OF INVESTMENTS | December 31, 2006 |
| | | | | |
COMMON STOCKS
(Continued) | | Shares
| | Value (Note 2)
|
Industrial Conglomerates (cont’d.) |
Orkla ASA (Norway) | | 17,600 | | $ | 996,407 |
Siemens AG (Germany) | | 1,368 | | | 136,520 |
Textron, Inc. | | 13,800 | | | 1,294,026 |
Tyco International Ltd. (Bermuda) | | 219,261 | | | 6,665,534 |
| | | | |
|
|
| | | | | | 57,360,200 |
| | | | |
|
|
Insurance — 2.6% |
ACE Ltd. (Bermuda) | | 36,000 | | | 2,180,520 |
Aegon NV (Netherlands) | | 48,143 | | | 917,675 |
Aflac, Inc.(b) | | 53,800 | | | 2,474,800 |
Allianz AG (Germany) | | 8,137 | | | 1,663,920 |
Allstate Corp. (The) | | 72,600 | | | 4,726,986 |
AMBAC Financial Group, Inc. | | 11,300 | | | 1,006,491 |
American International Group, Inc. | | 282,188 | | | 20,221,592 |
AON Corp. | | 34,200 | | | 1,208,628 |
Aviva PLC (United Kingdom) | | 85,093 | | | 1,369,539 |
AXA SA (France) | | 24,363 | | | 986,355 |
Chubb Corp. | | 51,800 | | | 2,740,738 |
Cincinnati Financial Corp. | | 17,837 | | | 808,194 |
CNP Assurances (France) | | 2,118 | | | 236,529 |
Fondiaria-Sai SpA (Italy) | | 2,967 | | | 141,937 |
Genworth Financial, Inc. | | 49,500 | | | 1,693,395 |
Hartford Financial Services Group, Inc. | | 33,100 | | | 3,088,561 |
Lincoln National Corp. | | 30,917 | | | 2,052,889 |
Loews Corp. | | 45,800 | | | 1,899,326 |
Marsh & McLennan Cos., Inc. | | 61,300 | | | 1,879,458 |
MBIA, Inc.(b) | | 14,350 | | | 1,048,411 |
MetLife, Inc. | | 81,100 | | | 4,785,711 |
Muenchener Rueckversicherungs — Gesellschaft AG (Germany) | | 7,869 | | | 1,360,754 |
Principal Financial Group | | 30,700 | | | 1,802,090 |
Progressive Corp. (The) | | 83,400 | | | 2,019,948 |
Royal & Sun Alliance Insurance Group PLC (United Kingdom) | | 266,881 | | | 796,886 |
SAFECO Corp. | | 15,900 | | | 994,545 |
SCOR (France) | | 24,972 | | | 73,840 |
St. Paul Travelers Cos., Inc. (The) | | 79,035 | | | 4,243,389 |
Swiss Reinsurance (Switzerland) | | 9,365 | | | 796,236 |
Topdanmark A/S (Denmark)(a) | | 600 | | | 99,207 |
Torchmark Corp. | | 11,500 | | | 733,240 |
Unipol SpA (Italy) | | 29,919 | | | 96,959 |
UnumProvident Corp. | | 32,210 | | | 669,324 |
XL Capital Ltd. “Class A” (Bermuda) | | 18,900 | | | 1,361,178 |
Zurich Financial Services AG (Switzerland) | | 4,424 | | | 1,190,867 |
| | | | |
|
|
| | | | | | 73,370,118 |
| | | | |
|
|
Internet & Catalog Retail — 0.1% |
Amazon.com, Inc.(a)(b) | | 29,500 | | | 1,164,070 |
Experian Group Ltd. (Ireland)(a) | | 9,339 | | | 109,622 |
IAC/InterActiveCorp(a)(b) | | 19,300 | | | 717,188 |
| | | | |
|
|
| | | | | | 1,990,880 |
| | | | |
|
|
Internet Software & Services — 0.7% | | | |
eBay, Inc.(a)(b) | | 124,100 | | | 3,731,687 |
Google, Inc. “Class A”(a) | | 22,900 | | | 10,544,992 |
Verisign, Inc.(a) | | 26,500 | | | 637,325 |
Yahoo!, Inc.(a) | | 130,400 | | | 3,330,416 |
| | | | |
|
|
| | | | | | 18,244,420 |
| | | | |
|
|
| | | | | |
COMMON STOCKS
(Continued) | | Shares
| | Value (Note 2)
|
IT Services — 0.6% |
Affiliated Computer Services, Inc.(a) | | 13,700 | | $ | 669,108 |
Automatic Data Processing, Inc. | | 61,000 | | | 3,004,251 |
Cognizant Technology SolutionsCorp.(a) | | 14,900 | | | 1,149,684 |
Computer Sciences Corp.(a) | | 17,400 | | | 928,638 |
Convergys Corp.(a) | | 14,800 | | | 351,944 |
Electronic Data Systems Corp. | | 54,100 | | | 1,490,455 |
Fidelity National Information Services, Inc. | | 14,600 | | | 585,314 |
First Data Corp. | | 80,610 | | | 2,057,167 |
Fiserv, Inc.(a) | | 21,300 | | | 1,116,546 |
NTT Data Corp. (Japan) | | 181 | | | 906,122 |
Paychex, Inc. | | 36,800 | | | 1,455,072 |
Sabre Holdings Corp. | | 14,526 | | | 463,234 |
Unisys Corp.(a) | | 49,200 | | | 385,728 |
Western Union Co. | | 80,610 | | | 1,807,276 |
| | | | |
|
|
| | | | | | 16,370,539 |
| | | | |
|
|
Leisure Equipment & Products — 0.2% |
Brunswick Corp. | | 7,200 | | | 229,680 |
Eastman Kodak Co. | | 27,400 | | | 706,920 |
FUJIFILM Holdings Corp. (Japan) | | 12,700 | | | 523,089 |
Hasbro, Inc. | | 21,500 | | | 585,875 |
Mattel, Inc. | | 42,651 | | | 966,472 |
Nikon Corp. (Japan) | | 42,000 | | | 920,635 |
Yamaha Corporation (Japan) | | 16,900 | | | 358,040 |
| | | | |
|
|
| | | | | | 4,290,711 |
| | | | |
|
|
Life Sciences, Tools & Services — 0.1% |
Applera Corp. — Applied Biosystems Group | | 20,300 | | | 744,807 |
Millipore Corp.(a)(b) | | 4,700 | | | 313,020 |
PerkinElmer, Inc. | | 12,800 | | | 284,544 |
Thermo Electron Corp.(a) | | 45,100 | | | 2,042,579 |
Waters Corp.(a) | | 12,500 | | | 612,125 |
| | | | |
|
|
| | | | | | 3,997,075 |
| | | | |
|
|
Machinery — 0.9% |
Amada Co. Ltd. (Japan) | | 30,000 | | | 317,629 |
Caterpillar, Inc. | | 71,700 | | | 4,397,360 |
Cummins, Inc. | | 5,400 | | | 638,172 |
Danaher Corp. | | 24,800 | | | 1,796,512 |
Deere & Co. | | 24,800 | | | 2,357,736 |
Dover Corp. | | 22,500 | | | 1,102,950 |
Eaton Corp. | | 16,400 | | | 1,232,296 |
Illinois Tool Works, Inc. | | 44,300 | | | 2,046,217 |
Ingersoll-Rand Co. Ltd. “Class A” (Bermuda) | | 36,800 | | | 1,439,984 |
ITT Corp. | | 19,200 | | | 1,090,944 |
KCI Konecranes Oyj (Finland) | | 2,250 | | | 66,233 |
Komatsu Ltd. (Japan) | | 55,000 | | | 1,113,193 |
Komori Corp. (Japan) | | 14,000 | | | 260,745 |
Kubota Corp. (Japan) | | 59,000 | | | 546,398 |
MAN AG (Germany) | | 3,277 | | | 297,225 |
Metso Oyj (Finland) | | 6,300 | | | 318,015 |
Mitsubishi Heavy Industries Ltd. (Japan) | | 25,000 | | | 113,422 |
NSK Ltd. (Japan) | | 29,000 | | | 285,684 |
Paccar, Inc.(b) | | 26,262 | | | 1,704,404 |
Pall Corp. | | 10,000 | | | 345,500 |
Parker Hannifin Corp. | | 13,710 | | | 1,054,025 |
Terex Corp.(a) | | 7,500 | | | 484,350 |
SEE NOTES TO FINANCIAL STATEMENTS.
B6
| | | | |
| | | CONSERVATIVE BALANCED PORTFOLIO (Continued) | | |
SCHEDULE OF INVESTMENTS | December 31, 2006 |
| | | | | |
COMMON STOCKS
(Continued) | | Shares
| | Value (Note 2)
|
Machinery (cont’d.) |
Vallourec | | 3,667 | | $ | 1,066,385 |
Volvo AB “B Shares” (Sweden) | | 8,400 | | | 578,532 |
| | | | |
|
|
| | | | | | 24,653,911 |
| | | | |
|
|
Marine |
Kawasaki Kisen Kaisha Ltd. (Japan) | | 14,000 | | | 109,431 |
Mitsui O.S.K. Lines Ltd. (Japan) | | 102,000 | | | 1,007,420 |
Nippon Yusen KK (Japan) | | 6,000 | | | 43,878 |
| | | | |
|
|
| | | | | | 1,160,729 |
| | | | |
|
|
Media — 1.9% |
APN News & Media Ltd. (Australia) | | 15,016 | | | 71,582 |
CBS Corp. “Class B”(b) | | 85,434 | | | 2,663,832 |
Clear Channel Communications, Inc. | | 55,600 | | | 1,976,024 |
Comcast Corp. “Class A”(a)(b) | | 231,960 | | | 9,818,868 |
DIRECTV Group, Inc. (The)(a) | | 76,000 | | | 1,895,440 |
Dow Jones & Co., Inc.(b) | | 6,800 | | | 258,400 |
E.W. Scripps Co. | | 8,600 | | | 429,484 |
Eniro AB (Sweden) | | 13,900 | | | 183,751 |
Gannett Co., Inc. | | 25,200 | | | 1,523,592 |
Interpublic Group of Cos., Inc.(a)(b) | | 37,200 | | | 455,328 |
ITV PLC (United Kingdom) | | 110,494 | | | 230,408 |
McGraw-Hill Cos., Inc. (The) | | 38,100 | | | 2,591,562 |
Meredith Corp. | | 2,700 | | | 152,145 |
New York Times Co. (The) “Class A”(b) | | 17,800 | | | 433,608 |
News Corp. “Class A” | | 244,400 | | | 5,249,712 |
Omnicom Group, Inc. | | 18,900 | | | 1,975,806 |
Reed Elsener PLC (UK) | | 7,548 | | | 82,835 |
Reed Elsevier NV (New Zealand) | | 5,029 | | | 85,769 |
Time Warner, Inc. | | 438,800 | | | 9,557,064 |
Tokyo Broadcasting System, Inc. (Japan) | | 1,300 | | | 43,316 |
Tribune Co.(b) | | 24,250 | | | 746,415 |
Univision Communications, Inc.(a) | | 20,300 | | | 719,026 |
Viacom, Inc. “Class B”(a) | | 76,234 | | | 3,127,881 |
Vivendi (France) | | 36,265 | | | 1,417,473 |
Walt Disney Co. | | 233,300 | | | 7,995,191 |
| | | | |
|
|
| | | | | | 53,684,512 |
| | | | |
|
|
Metals & Mining — 0.8% |
Acerinox SA (Spain) | | 17,350 | | | 527,909 |
Alcoa, Inc. | | 96,240 | | | 2,888,161 |
Allegheny Technologies, Inc. | | 8,200 | | | 743,576 |
Anglo American PLC (United Kingdom) | | 30,860 | | | 1,505,145 |
BHP Billiton Ltd. (Australia) | | 31,001 | | | 616,582 |
BHP Billiton PLC (United Kingdom) | | 29,379 | | | 537,558 |
Boehler-Uddeholm AG (Austria) | | 1,268 | | | 88,880 |
Boliden AB (Sweden) | | 1,792 | | | 46,070 |
Freeport-McMoRan Copper & Gold, Inc.(b) | | 20,500 | | | 1,142,465 |
Mittal Steel Co. NV | | 4,664 | | | 196,891 |
Newmont Mining Corp. (Netherlands) | | 50,700 | | | 2,289,105 |
Nippon Light Metal Co. Ltd. (Japan) | | 43,000 | | | 110,202 |
Nippon Steel Corp. (Japan) | | 69,000 | | | 395,855 |
Nucor Corp. | | 32,200 | | | 1,760,052 |
Outokumpu Oyj “Class A” (Finland) | | 18,000 | | | 704,746 |
Phelps Dodge Corp. | | 22,586 | | | 2,703,995 |
Rio Tinto Ltd. (Australia) | | 5,753 | | | 334,932 |
| | | | | |
COMMON STOCKS
(Continued) | | Shares
| | Value (Note 2)
|
Metals & Mining (cont’d.) |
Rio Tinto PLC (United Kingdom) | | 25,934 | | $ | 1,380,154 |
Salzgitter AG (Germany) | | 1,193 | | | 157,009 |
Sumitomo Metal Industries Ltd. (Japan) | | 106,000 | | | 460,222 |
ThyssenKrupp AG (Germany) | | 16,523 | | | 779,747 |
United States Steel Corp. | | 13,300 | | | 972,762 |
Xstrata PLC. (Switzerland) | | 10,090 | | | 503,779 |
| | | | |
|
|
| | | | | | 20,845,797 |
| | | | |
|
|
Multiline Retail — 0.6% |
Big Lots, Inc.(a) | | 14,100 | | | 323,172 |
Dillard’s, Inc. | | 7,800 | | | 272,766 |
Dollar General Corp. | | 35,356 | | | 567,817 |
Family Dollar Stores, Inc. | | 18,900 | | | 554,337 |
Federated Department Stores, Inc. | | 59,074 | | | 2,252,492 |
J.C. Penney Co., Inc. | | 26,800 | | | 2,073,248 |
Kohl’s Corp.(a) | | 37,700 | | | 2,579,811 |
Marks & Spencer Group PLC (United Kingdom) | | 66,968 | | | 940,146 |
Nordstrom, Inc. | | 23,400 | | | 1,154,556 |
PPR SA (France) | | 602 | | | 89,956 |
Sears Holding Corp.(a)(b) | | 10,442 | | | 1,753,525 |
Target Corp. | | 90,400 | | | 5,157,320 |
| | | | |
|
|
| | | | | | 17,719,146 |
| | | | |
|
|
Multi-Utilities — 0.6% |
Ameren Corp.(b) | | 21,400 | | | 1,149,822 |
CenterPoint Energy, Inc.(b) | | 36,700 | | | 608,486 |
CMS Energy Corp.(a)(b) | | 25,000 | | | 417,500 |
Consolidated Edison, Inc.(b) | | 27,000 | | | 1,297,890 |
Dominion Resources, Inc.(b) | | 39,516 | | | 3,313,020 |
DTE Energy Co.(b) | | 20,000 | | | 968,200 |
KeySpan Corp. | | 18,200 | | | 749,476 |
National Grid PLC (United Kingdom) | | 93,691 | | | 1,351,992 |
NiSource, Inc. | | 29,500 | | | 710,950 |
PG&E Corp. | | 37,000 | | | 1,751,210 |
Public Service Enterprise Group, Inc. | | 27,100 | | | 1,798,898 |
RWE AG (Germany) | | 480 | | | 52,882 |
Sempra Energy | | 27,819 | | | 1,558,977 |
Suez SA (France) | | 3,029 | | | 156,858 |
TECO Energy, Inc. | | 22,300 | | | 384,229 |
Xcel Energy, Inc. | | 45,810 | | | 1,056,379 |
| | | | |
|
|
| | | | | | 17,326,769 |
| | | | |
|
|
Office Electronics — 0.1% |
Canon, Inc. (Japan) | | 20,550 | | | 1,156,968 |
Ricoh Co. Ltd. (Japan) | | 48,000 | | | 977,534 |
Xerox Corp.(a) | | 107,300 | | | 1,818,736 |
| | | | |
|
|
| | | | | | 3,953,238 |
| | | | |
|
|
Oil, Gas & Consumable Fuels — 4.6% |
Anadarko Petroleum Corp. | | 48,354 | | | 2,104,366 |
Apache Corp.(b) | | 35,214 | | | 2,342,083 |
B.J. Services Co. | | 39,000 | | | 1,143,480 |
BP PLC (United Kingdom) | | 331,078 | | | 3,678,789 |
Chesapeake Energy Corp. | | 45,600 | | | 1,324,680 |
Chevron Corp. | | 239,122 | | | 17,582,640 |
ConocoPhillips | | 178,077 | | | 12,812,640 |
CONSOL Energy, Inc.(b) | | 17,300 | | | 555,849 |
Devon Energy Corp. | | 48,700 | | | 3,266,796 |
El Paso Corp. | | 76,136 | | | 1,163,358 |
ENI SpA (Italy) | | 60,280 | | | 2,027,502 |
EOG Resources, Inc. | | 27,300 | | | 1,704,885 |
SEE NOTES TO FINANCIAL STATEMENTS.
B7
| | | | |
| | | CONSERVATIVE BALANCED PORTFOLIO (Continued) | | |
SCHEDULE OF INVESTMENTS | December 31, 2006 |
| | | | | |
COMMON STOCKS
(Continued) | | Shares
| | Value (Note 2)
|
Oil, Gas & Consumable Fuels (cont’d.) |
Exxon Mobil Corp. | | 641,240 | | $ | 49,138,220 |
Hess Corp. | | 24,800 | | | 1,229,336 |
Kinder Morgan, Inc. | | 10,800 | | | 1,142,100 |
Marathon Oil Corp. | | 38,291 | | | 3,541,918 |
Murphy Oil Corp.(b) | | 19,500 | | | 991,575 |
Neste Oil Oyj (Finland) | | 24,400 | | | 741,775 |
Nippon Oil Corp. (Japan) | | 88,000 | | | 588,495 |
Norsk Hydro ASA (Norway) | | 12,517 | | | 388,446 |
Occidental Petroleum Corp. | | 91,900 | | | 4,487,477 |
Peabody Energy Corp. | | 22,800 | | | 921,348 |
Repsol YPF SA (Spain) | | 2,165 | | | 74,877 |
Royal Dutch Shell (Netherlands) | | 34,918 | | | 1,220,383 |
Royal Dutch Shell PLC “B Shares” (Netherlands) | | 57,915 | | | 2,029,798 |
Santos Ltd. (Australia) | | 104,129 | | | 810,372 |
Sunoco, Inc.(b) | | 15,000 | | | 935,400 |
Total SA (France) | | 17,654 | | | 1,273,568 |
Valero Energy Corp. | | 65,500 | | | 3,350,980 |
Williams Cos., Inc. | | 66,300 | | | 1,731,756 |
XTO Energy, Inc. | | 40,233 | | | 1,892,963 |
| | | | |
|
|
| | | | | | 126,197,855 |
| | | | |
|
|
Paper & Forest Products — 0.2% |
International Paper Co. | | 51,373 | | | 1,751,819 |
MeadWestvaco Corp. | | 20,714 | | | 622,663 |
Svenska Cellulosa AB (SCA) “B Shares” (Sweden) | | 7,900 | | | 412,543 |
Weyerhaeuser Co. | | 24,200 | | | 1,709,730 |
| | | | |
|
|
| | | | | | 4,496,755 |
| | | | |
|
|
Personal Products — 0.1% |
Avon Products, Inc. | | 48,800 | | | 1,612,352 |
Estee Lauder Cos., Inc. (The) “Class A” | | 13,500 | | | 551,070 |
| | | | |
|
|
| | | | | | 2,163,422 |
| | | | |
|
|
Pharmaceuticals — 3.5% |
Abbott Laboratories | | 164,700 | | | 8,022,537 |
Allergan, Inc.(b) | | 16,700 | | | 1,999,658 |
Altana AG (Germany) | | 2,862 | | | 176,998 |
AstraZeneca PLC (United Kingdom) | | 34,940 | | | 1,877,222 |
Barr Pharmaceuticals, Inc.(a) | | 11,500 | | | 576,380 |
Bristol-Myers Squibb Co. | | 210,500 | | | 5,540,360 |
Daiichi Sankyo Co. Ltd. (Japan) | | 3,700 | | | 115,417 |
Eisai Co. Ltd. (Japan) | | 1,100 | | | 60,429 |
Eli Lilly & Co. | | 112,100 | | | 5,840,410 |
Forest Laboratories, Inc.(a) | | 36,000 | | | 1,821,600 |
GlaxoSmithKline PLC (United Kingdom) | | 84,951 | | | 2,235,509 |
Johnson & Johnson | | 322,448 | | | 21,288,016 |
King Pharmaceuticals, Inc.(a) | | 28,366 | | | 451,587 |
Mayne Pharma Ltd. (Australia) | | 23,343 | | | 74,903 |
Merck & Co., Inc. | | 235,500 | | | 10,267,800 |
Mylan Laboratories, Inc. | | 20,900 | | | 417,164 |
Novartis AG (Switzerland) | | 15,479 | | | 892,408 |
Pfizer, Inc. | | 790,545 | | | 20,475,115 |
Roche Holding AG (Switzerland) | | 11,467 | | | 2,056,249 |
Sanofi-Aventis (France) | | 17,248 | | | 1,592,631 |
Santen Pharmaceutical Co. Ltd. (Japan) | | 4,400 | | | 123,773 |
Schering-Plough Corp.(b) | | 159,800 | | | 3,777,672 |
| | | | | |
COMMON STOCKS
(Continued) | | Shares
| | Value (Note 2)
|
Pharmaceuticals (cont’d.) |
Takeda Pharmaceutical Co. Ltd. (Japan) | | 5,400 | | $ | 370,095 |
Tanabe Seiyaku CO Ltd | | 16,000 | | | 209,230 |
Watson Pharmaceuticals, Inc.(a) | | 12,200 | | | 317,566 |
Wyeth | | 145,200 | | | 7,393,584 |
| | | | |
|
|
| | | | | | 97,974,313 |
| | | | |
|
|
Real Estate — 0.1% |
CB Richard Ellis Group, Inc. | | 18,800 | | | 624,160 |
City Developments Ltd. (Singapore) | | 6,000 | | | 49,453 |
Immofinanz Immobilien Anlagen (Australia) | | 7,831 | | | 111,643 |
Lend Lease Corp. Ltd. (Australia) | | 19,977 | | | 290,090 |
Leopalace21 Corp. (Japan) | | 21,700 | | | 693,176 |
Realogy Corp.(a) | | 25,775 | | | 781,497 |
Sumitono Realty & Development Co. Ltd. (Japan) | | 7,000 | | | 224,415 |
Swire Pacific Ltd. (Hong Kong) | | 19,500 | | | 209,097 |
UOL Group Ltd. (Singapore) | | 77,000 | | | 217,082 |
Wharf Holdings (Hong Kong) | | 17,000 | | | 62,690 |
| | | | |
|
|
| | | | | | 3,263,303 |
| | | | |
|
|
Real Estate Investment Trust — 0.6% |
Apartment Investment & Management Co. “Class A” | | 9,000 | | | 504,180 |
Archstone-Smith Trust(b) | | 23,300 | | | 1,356,293 |
Boston Properties, Inc.(b) | | 11,800 | | | 1,320,184 |
British Land Co. PLC (United Kingdom) | | 6,336 | | | 212,635 |
Equity Office Properties Trust | | 40,500 | | | 1,950,885 |
Equity Residential | | 32,300 | | | 1,639,225 |
Hammerson PLC (United Kingdom) | | 2,513 | | | 77,595 |
Kimco Realty Corp.(b) | | 21,500 | | | 966,425 |
Mirvac Group (Australia) | | 102,795 | | | 452,157 |
Plum Creek Timber Co., Inc. | | 17,100 | | | 681,435 |
ProLogis | | 27,100 | | | 1,646,867 |
Public Storage, Inc. | | 11,400 | | | 1,111,500 |
Simon Property Group, Inc.(b) | | 22,100 | | | 2,238,509 |
Vornado Realty Trust | | 13,000 | | | 1,579,500 |
| | | | |
|
|
| | | | | | 15,737,390 |
| | | | |
|
|
Road & Rail — 0.4% |
Burlington Northern Santa Fe Corp. | | 40,300 | | | 2,974,543 |
CSX Corp. | | 52,600 | | | 1,811,018 |
Nippon Express Co. Ltd. (Japan) | | 23,000 | | | 125,841 |
Norfolk Southern Corp. | | 45,500 | | | 2,288,195 |
Ryder System, Inc. | | 6,900 | | | 352,314 |
Toll Holdings Ltd. (Australia) | | 7,390 | | | 106,444 |
Union Pacific Corp. | | 29,800 | | | 2,742,196 |
| | | | |
|
|
| | | | | | 10,400,551 |
| | | | |
|
|
Semiconductors & Semiconductor Equipment — 1.3% |
Advanced Micro Devices, Inc.(a)(b) | | 51,300 | | | 1,043,955 |
Altera Corp.(a)(b) | | 42,200 | | | 830,496 |
Analog Devices, Inc. | | 40,100 | | | 1,318,087 |
Applied Materials, Inc. | | 166,000 | | | 3,062,700 |
ASM Pacific Technology Ltd. (Hong Kong) | | 17,500 | | | 97,296 |
Broadcom Corp. “Class A”(a) | | 43,150 | | | 1,394,177 |
Elpida Memory, Inc. (Japan)(a) | | 6,400 | | | 351,490 |
SEE NOTES TO FINANCIAL STATEMENTS.
B8
| | | | |
| | | CONSERVATIVE BALANCED PORTFOLIO (Continued) | | |
SCHEDULE OF INVESTMENTS | December 31, 2006 |
| | | | | |
COMMON STOCKS
(Continued) | | Shares
| | Value (Note 2)
|
Semiconductors & Semiconductor Equipment (cont’d.) |
Intel Corp. | | 620,500 | | $ | 12,565,125 |
KLA-Tencor Corp. | | 20,500 | | | 1,019,875 |
Linear Technology Corp. | | 31,000 | | | 939,920 |
LSI Logic Corp.(a)(b) | | 47,100 | | | 423,900 |
Maxim Integrated Products, Inc. | | 27,500 | | | 842,050 |
Micron Technology, Inc.(a)(b) | | 70,400 | | | 982,784 |
National Semiconductor Corp. | | 36,500 | | | 828,550 |
Novellus Systems, Inc.(a)(b) | | 16,000 | | | 550,720 |
NVIDIA Corp.(a) | | 40,600 | | | 1,502,606 |
PMC — Sierra, Inc.(a)(b) | | 10,000 | | | 67,100 |
Sumco Corp. (Japan) | | 12,700 | | | 1,073,288 |
Teradyne, Inc.(a)(b) | | 22,100 | | | 330,616 |
Texas Instruments, Inc. | | 172,300 | | | 4,962,240 |
Tokyo Electron Ltd. (Japan) | | 13,200 | | | 1,038,280 |
Xilinx, Inc. | | 38,000 | | | 904,780 |
| | | | |
|
|
| | | | | | 36,130,035 |
| | | | |
|
|
Software — 1.7% |
Adobe Systems, Inc.(a) | | 62,000 | | | 2,549,440 |
Autodesk, Inc.(a)(b) | | 23,300 | | | 942,718 |
BMC Software, Inc.(a) | | 24,200 | | | 779,240 |
CA, Inc. | | 51,664 | | | 1,170,190 |
Citrix Systems, Inc.(a) | | 16,400 | | | 443,620 |
Compuware Corp.(a) | | 45,900 | | | 382,347 |
Electronic Arts, Inc.(a) | | 33,100 | | | 1,666,916 |
Intuit, Inc.(a) | | 38,200 | | | 1,165,482 |
Microsoft Corp. | | 949,600 | | | 28,355,056 |
Novell, Inc.(a) | | 41,200 | | | 255,440 |
Oracle Corp.(a) | | 439,000 | | | 7,524,460 |
Symantec Corp.(a) | | 108,778 | | | 2,268,021 |
| | | | |
|
|
| | | | | | 47,502,930 |
| | | | |
|
|
Specialty Retail — 1.0% |
Aoyama Trading Co. Ltd. (Japan) | | 1,600 | | | 47,998 |
Autobacs Seven Co. Ltd. (Japan) | | 1,600 | | | 58,441 |
AutoNation, Inc.(a) | | 16,974 | | | 361,886 |
AutoZone, Inc.(a) | | 4,800 | | | 554,688 |
Bed Bath & Beyond, Inc.(a) | | 29,800 | | | 1,135,380 |
Best Buy Co., Inc. | | 46,625 | | | 2,293,484 |
Circuit City Stores, Inc. | | 17,200 | | | 326,456 |
Gap, Inc. (The) | | 60,700 | | | 1,183,650 |
Home Depot, Inc. | | 222,950 | | | 8,953,672 |
Limited Brands, Inc. | | 37,506 | | | 1,085,424 |
Lowe’s Cos., Inc. | | 166,000 | | | 5,170,900 |
Office Depot, Inc.(a) | | 32,200 | | | 1,229,074 |
OfficeMax, Inc. | | 7,500 | | | 372,375 |
RadioShack Corp.(b) | | 12,700 | | | 213,106 |
Sherwin-Williams Co. (The) | | 11,800 | | | 750,244 |
Staples, Inc. | | 74,849 | | | 1,998,468 |
Tiffany & Co. | | 15,200 | | | 596,448 |
TJX Cos., Inc. (The) | | 51,700 | | | 1,474,484 |
USS Co. Ltd. (Japan) | | 2,460 | | | 160,136 |
| | | | |
|
|
| | | | | | 27,966,314 |
| | | | |
|
|
Textiles, Apparel & Luxury Goods — 0.2% |
Coach, Inc.(a) | | 44,500 | | | 1,911,720 |
Folli — Follie SA (Greece) | | 1,260 | | | 49,731 |
Jones Apparel Group, Inc. | | 12,600 | | | 421,218 |
Liz Claiborne, Inc. | | 10,900 | | | 473,714 |
| | | | | |
COMMON STOCKS
(Continued) | | Shares
| | Value (Note 2)
|
Textiles, Apparel & Luxury Goods (cont’d.) |
NIKE, Inc. “Class B” | | 20,700 | | $ | 2,049,922 |
Puma AG Rudolf Dassler Sport (Germany) | | 856 | | | 334,490 |
Swatch Group AG (Switzerland) | | 2,058 | | | 92,048 |
VF Corp. | | 10,100 | | | 829,008 |
| | | | |
|
|
| | | | | | 6,161,851 |
| | | | |
|
|
Thrifts & Mortgage Finance — 0.7% |
Countrywide Financial Corp. | | 65,100 | | | 2,763,495 |
Fannie Mae | | 104,100 | | | 6,182,500 |
Freddie Mac | | 74,000 | | | 5,024,600 |
MGIC Investment Corp.(b) | | 8,800 | | | 550,352 |
Sovereign Bancorp, Inc. | | 38,955 | | | 989,067 |
Washington Mutual, Inc. | | 102,678 | | | 4,670,822 |
| | | | |
|
|
| | | | | | 20,180,836 |
| | | | |
|
|
Tobacco — 0.9% |
Altria Group, Inc. | | 227,400 | | | 19,515,469 |
British American Tobacco (United Kingdom) | | 21,111 | | | 590,676 |
Imperial Tobacco Group (United Kingdom) | | 16,870 | | | 663,926 |
Reynolds American, Inc.(b) | | 17,400 | | | 1,139,178 |
Swedish Match AB (Sweden) | | 35,400 | | | 661,880 |
UST, Inc. | | 16,900 | | | 983,580 |
| | | | |
|
|
| | | | | | 23,554,709 |
| | | | |
|
|
Trading Companies & Distributors — 0.1% |
Itochu Corp. (Japan) | | 69,000 | | | 565,597 |
Marubeni Corp. (Japan) | | 97,000 | | | 491,447 |
Mitsubishi Corp. (Japan) | | 20,700 | | | 388,927 |
Mitsui & Co. Ltd. (Japan) | | 47,000 | | | 704,242 |
Sumitomo Corp. (Japan) | | 49,000 | | | 733,517 |
W.W. Grainger, Inc. | | 8,200 | | | 573,508 |
| | | | |
|
|
| | | | | | 3,457,238 |
| | | | |
|
|
Transportation Infrastructure |
Hopewell Holdings (Hong Kong) | | 44,000 | | | 154,026 |
Kamigumi Co. Ltd. (Japan) | | 9,000 | | | 73,659 |
Macquarie Airports Management Ltd. (Australia) | | 274,081 | | | 777,400 |
| | | | |
|
|
| | | | | | 1,005,085 |
| | | | |
|
|
Wireless Telecommunication Services — 0.4% |
Alltel Corp. | | 41,400 | | | 2,503,872 |
Mobistar SA (Belgium) | | 2,237 | | | 190,908 |
NTT DoCoMo, Inc. (Japan) | | 85 | | | 134,498 |
Sprint Nextel Corp. | | 323,477 | | | 6,110,481 |
Vodafone Group PLC (United Kingdom) | | 812,477 | | | 2,251,003 |
| | | | |
|
|
| | | | | | 11,190,762 |
| | | | |
|
|
TOTAL COMMON STOCKS
(cost $1,101,623,415) | | | 1,556,741,859 |
| | | | |
|
|
| PREFERRED STOCK | | | | | |
Automobiles | | | | | |
Porsche AG (Germany)
(cost $381,434) | | 395 | | | 504,190 |
| | | | |
|
|
SEE NOTES TO FINANCIAL STATEMENTS.
B9
| | | | |
| | | CONSERVATIVE BALANCED PORTFOLIO (Continued) | | |
SCHEDULE OF INVESTMENTS | December 31, 2006 |
| | | | | | | | | | |
Interest
Rate
| | Maturity
Date
| | Moody’s
Rating
(Unaudited)
| | Principal
Amount
(000)
| | Value
(Note 2)
|
| LONG-TERM BONDS — 32.8% | | | |
Aerospace & Defense — 0.4% | | | |
BAE Systems Holdings, Inc.(k) | | | |
| 4.75% | | 08/15/10 | | Baa2 | | $ | 2,000 | | $ | 1,946,228 |
| 5.20% | | 08/15/15 | | Baa2 | | | 1,170 | | | 1,114,472 |
Boeing Capital Corp.(b) | | | |
| 6.10% | | 03/01/11 | | A2 | | | 975 | | | 1,007,285 |
Goodrich Corp. | | | |
| 6.80% | | 07/01/36 | | Baa3 | | | 1,301 | | | 1,384,029 |
Lockheed Martin Corp. | | | |
| 6.15% | | 09/01/36 | | Baa1 | | | 670 | | | 703,928 |
Northrop Grumman Corp. | | | |
| 7.125% | | 02/15/11 | | Baa2 | | | 1,025 | | | 1,093,324 |
Raytheon Co. | | | |
| 4.50% | | 11/15/07 | | Baa2 | | | 194 | | | 192,464 |
| 5.50% | | 11/15/12 | | Baa2 | | | 625 | | | 628,922 |
| 6.55% | | 03/15/10 | | Baa2 | | | 1,150 | | | 1,191,510 |
| 8.30% | | 03/01/10 | | Baa2 | | | 700 | | | 759,973 |
| | | | | | | | | |
|
|
| | | | | | | | | | | 10,022,135 |
| | | | | | | | | |
|
|
Airlines — 0.1% | | | |
Continental Airlines, Inc. | | | |
| 6.648% | | 09/15/17 | | Baa3 | | | 365 | | | 379,178 |
| 6.703% | | 06/15/21 | | Baa3 | | | 183 | | | 188,894 |
Southwest Airlines Co. | | | |
| 6.50% | | 03/01/12 | | Baa1 | | | 1,290 | | | 1,345,052 |
| | | | | | | | | |
|
|
| | | | | | | | | | | 1,913,124 |
| | | | | | | | | |
|
|
Asset Backed Securities — 1.6% | | | |
American Express Credit Account Master Trust I,(h)(k) |
Series 2004-4, Class C | | | |
| 5.82% | | 03/15/12 | | Baa2 | | | 1,510 | | | 1,518,258 |
Series 2004-C, Class C | | | |
| 5.85% | | 02/15/12 | | Baa2 | | | 957 | | | 958,416 |
Amortizing Residential Collateral Trust, | | | |
Series 2002-BC9, Class M1(h) | | | |
| 7.00% | | 12/25/32 | | Aa2 | | | 2,664 | | | 2,701,117 |
Bank of America Credit Card Trust, | | | |
Series 2006-C5, Class C5(h) | | | |
| 5.75% | | 01/15/16 | | Baa2 | | | 4,159 | | | 4,159,853 |
Bank One Issuance Trust, | | | |
Series 2003-C1, Class C1 | | | |
| 4.54% | | 09/15/10 | | Baa2 | | | 2,445 | | | 2,421,353 |
CDC Mortgage Capital Trust,(h) | | | |
Series 2002-HE3, Class M1 | | | |
| 7.00% | | 03/25/33 | | Aa2 | | | 1,462 | | | 1,462,988 |
Series 2003-HE1, Class M2 | | | |
| 8.275% | | 08/25/33 | | A2 | | | 189 | | | 189,827 |
Centex Home Equity, | | | |
Series 2005-A, Class M2(h) | | | |
| 5.85% | | 01/25/35 | | Aa2 | | | 2,250 | | | 2,262,027 |
Chase Issuance Trust, | | | |
Series 2005-A4, Class A4 | | | |
| 4.23% | | 01/15/13 | | Aaa | | | 4,000 | | | 3,903,561 |
Citibank Credit Card Issuance Trust, | | | |
Series 2006-C1, Class C1(h) | | | |
| 5.75% | | 02/20/15 | | Baa2 | | | 1,500 | | | 1,505,016 |
| | | | | | | | | | |
Interest
Rate
| | Maturity
Date
| | Moody’s
Rating
(Unaudited)
| | Principal
Amount
(000)
| | Value
(Note 2)
|
| LONG-TERM BONDS (Continued) | | | |
Asset Backed Securities (cont’d.) | | | |
Credit-Based Asset Servicing and Securitization, | | | |
Series 2005-CB6, Class A3 | | | |
| 5.12% | | 07/25/35 | | Aaa | | $ | 1,740 | | $ | 1,725,931 |
Equity One ABS, Inc., | | | |
Series 2004-3, Class M1 | | | |
| 5.70% | | 07/25/34 | | Aa2 | | | 1,660 | | | 1,650,387 |
First Franklin Mortgage Loan Trust, | | | |
Series 2005-FFH1, Class M2(h) | | | |
| 5.87% | | 06/25/36 | | Aa2 | | | 1,800 | | | 1,814,887 |
HFC Home Equity Loan Trust, | | | |
Series 2005-2, Class M2(h) | | | |
| 5.84% | | 01/20/35 | | Aa1 | | | 911 | | | 913,919 |
Home Equity Asset Trust, | | | |
Series 2005-7, Class 2A4(h) | | | |
| 5.73% | | 01/25/36 | | Aaa | | | 1,400 | | | 1,406,787 |
MBNA Master Credit Card Trust, | | | |
Series 1999-J, Class A | | | |
| 7.00% | | 02/15/12 | | Aaa | | | 2,370 | | | 2,486,932 |
Morgan Stanley ABS Capital I, | | | |
Series 2004-NC3, Class M2(h) | | | |
| 6.45% | | 03/25/34 | | A2 | | | 1,800 | | | 1,811,268 |
Morgan Stanley Dean Witter Capital I,(h) | | | |
Series 2002-HE1, Class M1 | | | |
| 6.25% | | 07/25/32 | | Aa2 | | | 1,897 | | | 1,916,127 |
Series 2002-NC4, Class M1 | | | |
| 6.20% | | 09/25/32 | | Aaa | | | 1,879 | | | 1,920,655 |
Prestige Auto Receivables Trust, | | | |
Series 2004-1, Class A2(k) | | | |
| 3.69% | | 06/15/11 | | Aaa | | | 624 | | | 617,289 |
Saxon Asset Securities Trust, | | | |
Series 2005-2, Class M2(h) | | | |
| 5.79% | | 10/25/35 | | Aa2 | | | 1,480 | | | 1,489,024 |
Securitized Asset Backed Receivables LLC,(h) | | | |
Series 2004-OP1, Class M1 | | | |
| 5.86% | | 02/25/34 | | Aa2 | | | 1,660 | | | 1,664,284 |
Series 2006-FR3, Class A3 | | | |
| 5.576% | | 05/25/36 | | Aaa | | | 1,400 | | | 1,404,372 |
SVO VOI Mortgage Corp., | | | |
Series 2005-AA, Class A | | | |
| 5.25% | | 02/20/21 | | Aaa | | | 948 | | | 943,605 |
WFS Financial Owner Trust, | | | |
Series 2004-4, Class D | | | |
| 3.58% | | 05/17/12 | | A2 | | | 717 | | | 707,262 |
| | | | | | | | | |
|
|
| | | | | | | | | | | 43,555,145 |
| | | | | | | | | |
|
|
Automotive — 0.2% | | | | | | |
Auburn Hills Trust, Inc. | | | |
| 12.375% | | 05/01/20 | | Baa1 | | | 640 | | | 944,922 |
DaimlerChrysler NA Holding Corp. | | | |
| 8.50% | | 01/18/31 | | Baa1 | | | 231 | | | 274,990 |
Equus Cayman Finance Ltd. (Cayman Islands)(k) | | | |
| 5.50% | | 09/12/08 | | Baa3 | | | 410 | | | 408,831 |
Hyundai Motor Manufacturing LLC(k) | | | |
| 5.30% | | 12/19/08 | | Baa3 | | | 650 | | | 645,540 |
SEE NOTES TO FINANCIAL STATEMENTS.
B10
| | | | |
| | | CONSERVATIVE BALANCED PORTFOLIO (Continued) | | |
SCHEDULE OF INVESTMENTS | December 31, 2006 |
| | | | | | | | | | |
Interest
Rate
| | Maturity
Date
| | Moody’s
Rating
(Unaudited)
| | Principal
Amount
(000)
| | Value
(Note 2)
|
| LONG-TERM BONDS (Continued) | | | |
Automotive (cont’d.) | | | | | | |
Johnson Controls, Inc. | | | |
| 5.50% | | 01/15/16 | | Baa1 | | $ | 350 | | $ | 343,172 |
Oshkosh Truck Corp. Bank Loan(l) | | | |
| 7.35% | | 12/06/13 | | Ba3 | | | 2,000 | | | 2,001,876 |
| | | | | | | | | |
|
|
| | | | | | | | | | | 4,619,331 |
| | | | | | | | | |
|
|
Banking — 0.6% | | | | | | |
Banco Bradesco (Cayman Islands) | | | |
| 8.75% | | 10/24/13 | | A2 | | | 550 | | | 627,000 |
Bank of America NA | | | |
| 6.00% | | 10/15/36 | | Aa2 | | | 1,300 | | | 1,338,436 |
Bank One Corp. | | | |
| 7.875% | | 08/01/10 | | A1 | | | 2,500 | | | 2,711,778 |
Barclays Bank PLC(h)(k) | | | |
| 5.926% | | 12/15/49 | | Aa3 | | | 1,830 | | | 1,853,038 |
Citigroup, Inc. | | | |
| 5.625% | | 08/27/12 | | Aa2 | | | 1,900 | | | 1,927,491 |
| 6.125% | | 08/25/36 | | Aa2 | | | 725 | | | 754,941 |
HSBC Bank USA, Senior Notes | | | |
| 3.875% | | 09/15/09 | | Aa2 | | | 250 | | | 242,396 |
ICICI Bank Ltd. (Singapore)(k) | | | |
| 5.75% | | 11/16/10 | | Baa2 | | | 1,350 | | | 1,347,860 |
J.P. Morgan Chase & Co. | | | |
| 4.60% | | 01/17/11 | | Aa3 | | | 975 | | | 951,488 |
| 6.50% | | 01/15/09 | | A1 | | | 1,100 | | | 1,121,019 |
J.P. Morgan Chase Capital XVIII, Series R | | | |
| 6.95% | | 08/17/36 | | A2 | | | 690 | | | 746,355 |
Mizuho Finance Group Ltd. (Cayman Islands)(k) | | | |
| 5.79% | | 04/15/14 | | A2 | | | 1,060 | | | 1,066,216 |
MUFG Capital Finance Group Ltd. (Cayman Islands)(g) | | | |
| 6.346% | | 07/25/49 | | Baa2 | | | 800 | | | 812,556 |
Santander Central Hispano Issuances Ltd. (Cayman Islands) | | | |
| 7.625% | | 09/14/10 | | A1 | | | 805 | | | 869,696 |
Washington Mutual, Inc. | | | |
| 5.65% | | 08/15/14 | | A3 | | | 270 | | | 270,374 |
Wells Fargo Bank | | | |
| 6.45% | | 02/01/11 | | Aa1 | | | 90 | | | 93,988 |
| | | | | | | | | |
|
|
| | | | | | | | | | | 16,734,632 |
| | | | | | | | | |
|
|
Brokerage — 0.4% | | | | | | |
Bear Stearns Companies, Inc. (The) | | | |
| 5.30% | | 10/30/15 | | A1 | | | 550 | | | 542,720 |
Goldman Sachs Group, Inc. (The) | | | |
| 6.45% | | 05/01/36 | | A1 | | | 1,770 | | | 1,841,531 |
Lehman Brothers Holdings, Inc. | | | |
| 6.625% | | 01/18/12 | | A1 | | | 1,800 | | | 1,901,858 |
Merrill Lynch & Co., Inc. | | | |
| 4.25% | | 02/08/10 | | Aa3 | | | 1,470 | | | 1,428,412 |
| 4.79% | | 08/04/10 | | Aa3 | | | 375 | | | 369,896 |
| 5.45% | | 07/15/14 | | Aa3 | | | 200 | | | 201,068 |
| 5.77% | | 07/25/11(b) | | Aa3 | | | 355 | | | 362,838 |
Morgan Stanley Group, Inc. | | | |
| 4.75% | | 04/01/14 | | A1 | | | 1,510 | | | 1,443,752 |
| 5.375% | | 10/15/15 | | Aa3 | | | 30 | | | 29,732 |
| 5.75% | | 10/18/16 | | Aa3 | | | 1,860 | | | 1,887,294 |
| | | | | | | | | |
|
|
| | | | | | | | | | | 10,009,101 |
| | | | | | | | | |
|
|
| | | | | | | | | | |
Interest
Rate
| | Maturity
Date
| | Moody’s
Rating
(Unaudited)
| | Principal
Amount
(000)
| | Value
(Note 2)
|
| LONG-TERM BONDS (Continued) | | | |
Building Materials & Construction — 0.2% | | | |
American Standard, Inc. | | | |
| 7.625% | | 02/15/10 | | Baa3 | | $ | 1,000 | | $ | 1,048,051 |
CRH America, Inc. | | | |
| 6.00% | | 09/30/16 | | Baa1 | | | 660 | | | 666,201 |
Hanson PLC (United Kingdom) | | | |
| 7.875% | | 09/27/10 | | Baa1 | | | 1,270 | | | 1,366,493 |
Lafarge SA | | | |
| 6.15% | | 07/15/11 | | Baa2 | | | 1,100 | | | 1,125,906 |
Owens Corning Inc.(k) | | | |
| 6.50% | | 12/01/16 | | Baa3 | | | 530 | | | 538,394 |
Ryland Group, Inc. | | | |
| 5.375% | | 06/01/08 | | Baa3 | | | 575 | | | 571,149 |
| | | | | | | | | |
|
|
| | | | | | | | | | | 5,316,194 |
| | | | | | | | | |
|
|
Cable — 0.3% | | | |
AT&T Broadband | | | |
| 9.455% | | 11/15/22 | | Baa2 | | | 115 | | | 148,918 |
Comcast Corp. | | | |
| 6.45% | | 03/15/37 | | Baa2 | | | 580 | | | 580,313 |
Cox Communications, Inc. | | | |
| 6.75% | | 03/15/11 | | Baa3 | | | 1,195 | | | 1,249,272 |
| 7.875% | | 08/15/09 | | Baa2 | | | 1,160 | | | 1,227,584 |
CSC Holdings, Inc. | | | |
| 7.875% | | 12/15/07 | | B2 | | | 2,135 | | | 2,161,688 |
Tele-Communications, Inc. | | | |
| 9.875% | | 06/15/22 | | Baa2 | | | 1,440 | | | 1,894,974 |
| | | | | | | | | |
|
|
| | | | | | | | | | | 7,262,749 |
| | | | | | | | | |
|
|
Capital Goods — 0.5% | | | |
Caterpillar Financial Service Corp. | | | |
| 5.50% | | 03/15/16 | | A2 | | | 780 | | | 780,431 |
Caterpillar, Inc. | | | |
| 7.25% | | 09/15/09 | | A2 | | | 1,000 | | | 1,049,944 |
Cooper Cameron Corp. | | | |
| 2.65% | | 04/15/07 | | Baa1 | | | 425 | | | 421,546 |
Erac USA Finance Co.(k) | | | |
| 7.35% | | 06/15/08 | | Baa1 | | | 2,450 | | | 2,511,326 |
FedEx Corp. | | | |
| 2.65% | | 04/01/07 | | Baa2 | | | 2,100 | | | 2,085,737 |
| 7.25% | | 02/15/11 | | Baa2 | | | 480 | | | 511,419 |
Honeywell International, Inc. | | | |
| 6.125% | | 11/01/11 | | A2 | | | 1,120 | | | 1,160,232 |
Stena AB, Sr. Notes (Sweden) | | | |
| 7.50% | | 11/01/13 | | Ba3 | | | 1,120 | | | 1,106,000 |
Tyco International Group SA (Luxembourg) | | | |
| 6.00% | | 11/15/13 | | Baa3 | | | 1,530 | | | 1,583,051 |
United Technologies Corp.(f) | | | |
| 6.35% | | 03/01/11 | | A2 | | | 810 | | | 842,215 |
| 8.875% | | 11/15/19 | | A2 | | | 640 | | | 829,757 |
Waste Management, Inc. | | | |
| 7.75% | | 05/15/32 | | Baa3 | | | 240 | | | 283,070 |
| | | | | | | | | |
|
|
| | | | | | | | | | | 13,164,728 |
| | | | | | | | | |
|
|
Chemicals — 0.2% | | | | | | | | |
Dow Chemical Co. | | | | | | | | |
| 5.97% | | 01/15/09 | | A3 | | | 430 | | | 434,767 |
| 6.125% | | 02/01/11 | | A3 | | | 690 | | | 709,313 |
SEE NOTES TO FINANCIAL STATEMENTS.
B11
| | | | |
| | | CONSERVATIVE BALANCED PORTFOLIO (Continued) | | |
SCHEDULE OF INVESTMENTS | December 31, 2006 |
| | | | | | | | | | |
Interest
Rate
| | Maturity
Date
| | Moody’s
Rating
(Unaudited)
| | Principal
Amount
(000)
| | Value
(Note 2)
|
| LONG-TERM BONDS (Continued) | | | |
Chemicals (cont’d.) | | | | | | | | |
Huntsman International LLC | | | | | | |
| 9.875% | | 03/01/09 | | B2 | | $ | 1,344 | | $ | 1,384,319 |
ICI Wilmington, Inc. | | | | | | | | |
| 5.625% | | 12/01/13 | | Baa3 | | | 780 | | | 770,162 |
Lubrizol Corp. | | | | | | | | |
| 4.625% | | 10/01/09 | | Baa3 | | | 1,090 | | | 1,069,226 |
Monsanto Co., Series 1 | | | | | | |
| 5.50% | | 07/30/35 | | Baa1 | | | 635 | | | 598,425 |
Union Carbide Corp. | | | | | | | | |
| 7.50% | | 06/01/25 | | Ba2 | | | 500 | | | 531,766 |
| | | | | | | | | |
|
|
| | | | | | | | | | | 5,497,978 |
| | | | | | | | | |
|
|
Collateralized Mortgage Obligations — 0.5% | | | |
Bank of America Alternative Loan Trust, | | | |
Series 2005-12, Class 3CB1 | | | |
| 6.00% | | 01/25/36 | | Aaa | | | 4,460 | | | 4,462,160 |
Bank of America Mortgage Securities, Inc.,(h) | | | |
Series 2005-A, Class 2A1 | | | |
| 4.46% | | 02/25/35 | | Aaa | | | 1,462 | | | 1,427,678 |
Series 2005-B, Class 2A1 | | | |
| 4.39% | | 03/25/35 | | Aaa | | | 1,411 | | | 1,375,813 |
Countrywide Alternative Loan Trust, Pass-Thru Certificates, |
Series 2004-18CB, Class 3A1 | | | |
| 5.25% | | 09/25/19 | | Aaa | | | 2,349 | | | 2,276,715 |
Master Alternative Loans Trust, Pass-Thru Certificates, | | | |
Series 2004-4, Class 4A1 | | | |
| 5.00% | | 04/25/19 | | Aaa | | | 599 | | | 584,894 |
Structured Adjustable Rate Mortgage Loan, | | | |
Series 2004-1, Class 4A3(h) | | | |
| 4.17% | | 02/25/34 | | Aaa | | | 1,487 | | | 1,471,978 |
Washington Mutual Alternative Loan Trust, | | | |
Mortgage Pass-Thru Certificates, | | | |
Series 2005-1, Class 3A | | | |
| 5.00% | | 03/25/20 | | AAA(d) | | | 1,301 | | | 1,284,232 |
Washington Mutual, Inc., | | | | | | |
Series 2002-AR15, Class A-5(h) | | | |
| 4.38% | | 12/25/32 | | Aaa | | | 730 | | | 722,417 |
| | | | | | | | | |
|
|
| | | | | | | | | | | 13,605,887 |
| | | | | | | | | |
|
|
Commercial Mortgage Backed Securities — 3.8% |
Bank of America Commercial Mortgage, Inc., | | | |
Series 2003-2, Class A3 | | | |
| 4.873% | | 03/11/41 | | AAA(d) | | | 3,350 | | | 3,293,586 |
Series 2004-2, Class A4 | | | |
| 4.153% | | 11/10/38 | | Aaa | | | 3,680 | | | 3,526,411 |
Series 2004-3, Class A4 | | | |
| 5.176% | | 06/10/39 | | Aaa | | | 2,000 | | | 1,992,620 |
Series 2005-1, Class ASB(h) | | | |
| 4.864% | | 11/10/42 | | AAA(d) | | | 1,100 | | | 1,091,526 |
Series 2006-2 A4 | | | |
| 5.741% | | 05/10/45 | | AAA(d) | | | 4,400 | | | 4,549,819 |
Bear Stearns Commercial Mortgage Securities,(h) | | | |
Series 2004-T16, Class A6 | | | |
| 4.75% | | 02/13/46 | | AAA(d) | | | 3,500 | | | 3,377,616 |
Series 2005-T18, Class AAB | | | |
| 4.823% | | 02/13/42 | | Aaa | | | 2,250 | | | 2,194,669 |
Series 2005-T20, Class AAB | | | |
| 5.1394% | | 10/12/42 | | Aaa | | | 3,000 | | | 2,988,393 |
| | | | | | | | | | |
Interest
Rate
| | Maturity
Date
| | Moody’s
Rating
(Unaudited)
| | Principal
Amount
(000)
| | Value
(Note 2)
|
| LONG-TERM BONDS (Continued) | | | |
Commercial Mortgage Backed Securities (cont’d.) |
Citigroup Commercial Mortgage Trust, | | | |
Series 2006-C4, Class A3(h) | | | |
| 5.72% | | 03/15/49 | | Aaa | | $ | 2,190 | | $ | 2,260,899 |
Commercial Mortgage Pass-Thru Certificate, | | | |
Series 2004-LB2A, Class X2, I/O(h)(k) | | | |
| 0.98% | | 03/10/39 | | AAA(d) | | | 16,642 | | | 451,745 |
Credit Suisse First Boston Mortgage Securities Corp., |
Series 2004-C4, Class A4 | | | |
| 4.283% | | 10/15/39 | | Aaa | | | 1,500 | | | 1,439,759 |
Credit Suisse Mortgage Capital Certificates, | | | |
Series 2006-C1, Class A4(h) | | | |
| 5.557% | | 02/15/39 | | AAA(d) | | | 4,330 | | | 4,399,573 |
Series 2006-C4, Class A3 | | | |
| 5.467% | | 09/15/39 | | Aaa | | | 5,000 | | | 5,038,481 |
DLJ Commercial Mortgage Corp., | | | |
Series 2000-CF1, Class A1B | | | |
| 7.62% | | 06/10/33 | | AAA(d) | | | 3,199 | | | 3,402,378 |
GE Commercial Mortgage Corp., | | | |
Series 2004-C2, Class X2, I/O(h)(k) | | | |
| 0.597% | | 03/10/40 | | Aaa | | | 30,083 | | | 588,411 |
Greenwich Capital Commercial Funding Corp., | | | |
Series 2003-C1, Class A-4 | | | |
| 4.111% | | 07/05/35 | | Aaa | | | 5,000 | | | 4,698,361 |
Series 2003-C2, Class A3 | | | |
| 4.533% | | 01/05/36 | | Aaa | | | 3,570 | | | 3,477,628 |
J.P. Morgan Chase Commercial Mortgage Securities Corp., |
Series 2000-C10, Class A2 | | | |
| 7.371% | | 08/15/32 | | Aaa | | | 6,119 | | | 6,428,773 |
Series 2005-CB13, Class A4(h) | | | |
| 5.2943% | | 01/12/43 | | Aaa | | | 2,800 | | | 2,802,537 |
Series 2005-LDP5, Class A4(h) | | | |
| 5.1793% | | 12/15/44 | | Aaa | | | 3,630 | | | 3,616,751 |
Series 2006-CB16, Class ASB | | | |
| 5.523% | | 05/12/45 | | Aaa | | | 2,000 | | | 2,020,997 |
Series 2006-LDP6, Class X2 I/O(h) | | | |
| 0.088% | | 04/15/43 | | Aaa | | | 164,744 | | | 949,735 |
Series 2005-LDP2, Class ASB | | | |
| 4.659% | | 07/15/42 | | Aaa | | | 6,380 | | | 6,185,629 |
Series 2006-LDP8, Class ASB | | | |
| 5.37% | | 05/15/45 | | Aaa | | | 2,000 | | | 2,001,016 |
Series 2006-CB17, Class A4 | | | |
| 5.429% | | 12/12/43 | | Aaa | | | 5,100 | | | 5,125,865 |
Keycorp., | | | |
Series 2000-C1, Class A2 | | | |
| 7.727% | | 05/17/32 | | Aaa | | | 10,690 | | | 11,313,134 |
LB-UBS Commercial Mortgage Trust, | | | |
Series 2003-C8, Class A3 | | | |
| 4.83% | | 11/15/27 | | Aaa | | | 2,720 | | | 2,672,250 |
Series 2004-C6, Class A5(h) | | | |
| 4.826% | | 08/15/29 | | AAA(d) | | | 5,000 | | | 4,893,417 |
Series 2005-C3, Class A5 | | | |
| 4.739% | | 07/15/30 | | Aaa | | | 695 | | | 668,115 |
Series 2006-C3, Class A4(h) | | | |
| 5.661% | | 03/15/39 | | Aaa | | | 4,950 | | | 5,069,015 |
Merrill Lynch Mortgage Trust, | | | |
Series 2004-Key 2, Class A3 | | | |
| 4.615% | | 08/12/39 | | Aaa | | | 1,900 | | | 1,838,915 |
SEE NOTES TO FINANCIAL STATEMENTS.
B12
| | | | |
| | | CONSERVATIVE BALANCED PORTFOLIO (Continued) | | |
SCHEDULE OF INVESTMENTS | December 31, 2006 |
| | | | | | | | | | |
Interest
Rate
| | Maturity
Date
| | Moody’s
Rating
(Unaudited)
| | Principal
Amount
(000)
| | Value
(Note 2)
|
| LONG-TERM BONDS (Continued) | | | |
Commercial Mortgage Backed Securities (cont’d.) |
Merrill Lynch/Countrywide Commercial Mortgage Trust, |
Series 2006-2, Class A4(h) | | | |
| 5.9098% | | 06/12/46 | | Aaa | | $ | 2,210 | | $ | 2,309,570 |
Wachovia Bank Commercial Mortgage Trust, | | | |
Series 2002-C2, Class A4 | | | |
| 4.98% | | 11/15/34 | | Aaa | | | 1,700 | | | 1,676,493 |
| | | | | | | | | |
|
|
| | | | | | | | | | | 108,344,087 |
| | | | | | | | | |
|
|
Consumer — 0.1% | | | | | | | | |
Realogy Corp.(k) | | | |
| 6.15% | | 10/15/11 | | Baa2 | | | 950 | | | 970,766 |
Western Union Telegram Co.(k) | | | |
| 5.93% | | 10/01/16 | | A3 | | | 565 | | | 559,590 |
Whirlpool Corp. | | | |
| 6.125% | | 06/15/11 | | Baa2 | | | 1,045 | | | 1,063,829 |
| | | | | | | | | |
|
|
| | | | | | | | | | | 2,594,185 |
| | | | | | | | | |
|
|
Electric — 0.9% | | | | | | | | |
Appalachian Power Co. | | | |
| 4.40% | | 06/01/10 | | Baa2 | | | 790 | | | 763,213 |
Arizona Public Services Co. | | | |
| 6.25% | | 08/01/16 | | Baa2 | | | 1,490 | | | 1,524,583 |
Baltimore Gas & Electric(k) | | | |
| 6.35% | | 10/01/36 | | Baa2 | | | 530 | | | 541,036 |
Boston Edison Co. | | | |
| 4.875% | | 04/15/14 | | A1 | | | 730 | | | 708,922 |
Carolina Power & Light Co. | | | |
| 5.25% | | 12/15/15 | | A3 | | | 660 | | | 648,991 |
CenterPoint Energy Houston Electric LLC | | | |
| 5.70% | | 03/15/13 | | Baa2 | | | 1,070 | | | 1,077,772 |
| 6.95% | | 03/15/33 | | Baa2 | | | 300 | | | 332,471 |
Consolidated Edison, Inc. | | | |
| 5.375% | | 12/15/15 | | A1 | | | 820 | | | 814,632 |
Consumers Energy Co., First Mortgage Bonds, Series D |
| 5.375% | | 04/15/13 | | Baa2 | | | 435 | | | 430,790 |
Dominion Resources, Inc. | | | |
| 5.125% | | 12/15/09 | | Baa2 | | | 1,255 | | | 1,246,989 |
Duke Capital LLC | | | |
| 6.25% | | 02/15/13 | | Baa2 | | | 205 | | | 211,220 |
| 8.00% | | 10/01/19 | | Baa2 | | | 140 | | | 162,758 |
El Paso Electric Co. | | | |
| 6.00% | | 05/15/35 | | Baa3 | | | 845 | | | 809,999 |
Empresa Nacional de Electricidad S.A. (Chile) | | | |
| 8.50% | | 04/01/09 | | Baa3 | | | 1,350 | | | 1,433,336 |
| 8.625% | | 08/01/15 | | Baa3 | | | 310 | | | 364,851 |
Energy East Corp. | | | |
| 6.75% | | 09/15/33 | | Baa2 | | | 805 | | | 845,516 |
Exelon Corp. | | | |
| 4.90% | | 06/15/15 | | Baa2 | | | 195 | | | 183,928 |
FirstEnergy Corp. | | | |
| 7.375% | | 11/15/31 | | Baa3 | | | 720 | | | 819,962 |
Florida Power & Light Co. | | | |
| 5.95% | | 10/01/33 | | Aa3 | | | 380 | | | 390,538 |
Indiana Michigan Power Co. | | | |
| 5.05% | | 11/15/14 | | Baa2 | | | 575 | | | 549,508 |
Nevada Power Co. | | | |
| 6.50% | | 05/15/18 | | Ba1 | | | 1,180 | | | 1,223,259 |
| | | | | | | | | | |
Interest
Rate
| | Maturity
Date
| | Moody’s
Rating
(Unaudited)
| | Principal
Amount
(000)
| | Value
(Note 2)
|
| LONG-TERM BONDS (Continued) | | | |
Electric (cont’d.) | | | | | | | | |
NiSource Finance Corp. | | | |
| 5.45% | | 09/15/20 | | Baa3 | | $ | 500 | | $ | 465,674 |
Ohio Edison Co. | | | |
| 6.40% | | 07/15/16 | | Baa2 | | | 730 | | | 762,896 |
| 6.875% | | 07/15/36 | | Baa2 | | | 135 | | | 146,980 |
Oncor Electric Delivery Co. | | | |
| 6.375% | | 01/15/15 | | Baa2 | | | 465 | | | 479,311 |
| 7.00% | | 09/01/22 | | Baa2 | | | 545 | | | 586,233 |
| 7.25% | | 01/15/33 | | Baa2 | | | 240 | | | 270,486 |
Pacific Gas & Electric Co. | | | |
| 6.05% | | 03/01/34 | | Baa1 | | | 1,610 | | | 1,623,805 |
Pepco Holdings, Inc. | | | |
| 5.50% | | 08/15/07 | | Baa3 | | | 735 | | | 734,411 |
PPL Electric Utilities Corp. | | | |
| 6.25% | | 08/15/09 | | A3 | | | 1,900 | | | 1,943,762 |
Southern California Edison Co. | | | |
| 4.65% | | 04/01/15 | | A2 | | | 610 | | | 576,434 |
| 5.625% | | 02/01/36 | | A2 | | | 340 | | | 329,122 |
Xcel Energy, Inc. | | | |
| 3.40% | | 07/01/08 | | Baa1 | | | 785 | | | 762,018 |
| 6.50% | | 07/01/36 | | Baa1 | | | 445 | | | 470,163 |
| 7.00% | | 12/01/10 | | Baa1 | | | 250 | | | 263,683 |
| | | | | | | | | |
|
|
| | | | | | | | | | | 24,499,252 |
| | | | | | | | | |
|
|
Energy – Integrated — 0.2% | | | | | | |
Conoco, Inc. | | | |
| 6.95% | | 04/15/29 | | A1 | | | 270 | | | 306,687 |
ConocoPhillips Canada Funding Co. (Canada) | | | |
| 5.625% | | 10/15/16 | | A1 | | | 1,595 | | | 1,602,583 |
Phillips Petroleum Co. | | | |
| 8.75% | | 05/25/10 | | A1 | | | 1,900 | | | 2,105,349 |
TNK-BP Finance(k) | | | |
| 7.50% | | 07/18/16 | | Baa2 | | | 490 | | | 521,238 |
| | | | | | | | | |
|
|
| | | | | | | | | | | 4,535,857 |
| | | | | | | | | |
|
|
Energy – Other — 0.2% | | | | | | |
Anadarko Finance (Canada) | | | |
| 7.50% | | 05/01/31 | | Baa2 | | | 5 | | | 5,673 |
Anadarko Petroleum Corp. | | | |
| 5.95% | | 09/15/16 | | Baa2 | | | 870 | | | 871,821 |
| 6.45% | | 09/15/36 | | Baa2 | | | 450 | | | 454,723 |
Devon Energy Corp. | | | |
| 7.875% | | 09/30/31 | | Baa2 | | | 280 | | | 336,875 |
Encana Corp. (Canada) | | | |
| 6.50% | | 08/15/34 | | Baa2 | | | 255 | | | 262,801 |
Halliburton Co. | | | |
| 5.50% | | 10/15/10 | | Baa1 | | | 200 | | | 199,645 |
Talisman Energy, Inc. (Canada) | | | |
| 5.125% | | 05/15/15 | | Baa2 | | | 185 | | | 175,419 |
| 6.25% | | 02/01/38 | | Baa2 | | | 510 | | | 492,054 |
Valero Energy Corp. | | | |
| 7.50% | | 04/15/32 | | Baa3 | | | 185 | | | 211,067 |
Weatherford International, Inc. | | | |
| 6.50% | | 08/01/36 | | Baa1 | | | 575 | | | 577,225 |
Woodside Finance Ltd. (Australia)(k) | | | |
| 5.00% | | 11/15/13 | | Baa1 | | | 1,660 | | | 1,602,667 |
XTO Energy, Inc. | | | |
| 5.65% | | 04/01/16 | | Baa2 | | | 335 | | | 331,175 |
| | | | | | | | | |
|
|
| | | | | | | | | | | 5,521,145 |
| | | | | | | | | |
|
|
SEE NOTES TO FINANCIAL STATEMENTS.
B13
| | | | |
| | | CONSERVATIVE BALANCED PORTFOLIO (Continued) | | |
SCHEDULE OF INVESTMENTS | December 31, 2006 |
| | | | | | | | | | |
Interest
Rate
| | Maturity
Date
| | Moody’s
Rating
(Unaudited)
| | Principal
Amount
(000)
| | Value
(Note 2)
|
| LONG-TERM BONDS (Continued) | | | |
Foods — 0.5% | | | | | | |
Archer-Daniels-Midland Co. | | | |
| 8.125% | | 06/01/12 | | A2 | | $ | 195 | | $ | 219,704 |
Bottling Group LLC | | | |
| 5.50% | | 04/01/16 | | A3 | | | 415 | | | 413,477 |
Bunge Ltd. Finance Corp.(b) | | | |
| 5.35% | | 04/15/14 | | Baa2 | | | 1,000 | | | 961,109 |
Cadbury Schweppes American Finance, Inc.(k) | | | |
| 3.875% | | 10/01/08 | | Baa2 | | | 1,050 | | | 1,022,574 |
ConAgra Foods, Inc. | | | |
| 7.125% | | 10/01/26 | | Baa2 | | | 290 | | | 318,165 |
| 7.875% | | 09/15/10 | | Baa2 | | | 585 | | | 633,074 |
General Mills, Inc. | | | |
| 5.125% | | 02/15/07 | | Baa1 | | | 500 | | | 499,642 |
HJ Heinz Co.(k) | | | |
| 6.428% | | 12/01/08 | | Baa2 | | | 1,620 | | | 1,648,900 |
Kellogg Co. | | | |
| 6.60% | | 04/01/11 | | A3 | | | 1,285 | | | 1,347,581 |
Kraft Foods, Inc. | | | |
| 5.25% | | 06/01/07 | | A3 | | | 400 | | | 399,687 |
| 5.625% | | 11/01/11 | | A3 | | | 965 | | | 975,257 |
Kroger Co. (The) | | | |
| 6.75% | | 04/15/12 | | Baa2 | | | 310 | | | 325,288 |
| 6.80% | | 04/01/11 | | Baa2 | | | 575 | | | 601,769 |
| 7.00% | | 05/01/18 | | Baa2 | | | 530 | | | 560,092 |
Tricon Global Restaurants, Inc. | | | |
| 8.875% | | 04/15/11 | | Baa2 | | | 235 | | | 263,616 |
Tyson Foods, Inc. | | | |
| 6.85% | | 04/01/16 | | Ba1 | | | 785 | | | 806,056 |
Whitman Corp. | | | |
| 6.375% | | 05/01/09 | | Baa1 | | | 1,645 | | | 1,673,555 |
| | | | | | | | | |
|
|
| | | | | | | | | | | 12,669,546 |
| | | | | | | | | |
|
|
Foreign Government Bonds — 0.2% | | | |
Export-Import Bank of Korea (The) (South Korea)(k) | | | |
| 4.125% | | 02/10/09 | | Aa3 | | | 1,120 | | | 1,093,634 |
Korea Development Bank (South Korea) | | | |
| 4.75% | | 07/20/09 | | A3 | | | 1,530 | | | 1,510,411 |
Pemex Project Funding Master Trust | | | |
| 5.75% | | 12/15/15 | | Baa1 | | | 1,610 | | | 1,598,730 |
| 8.625% | | 12/01/23 | | Baa1 | | | 350 | | | 430,938 |
Petrobras International Finance Co. (PIFCO)
(Cayman Islands) |
| 8.375% | | 12/10/18 | | Baa2 | | | 900 | | | 1,073,250 |
| | | | | | | | | |
|
|
| | | | | | | | | | | 5,706,963 |
| | | | | | | | | |
|
|
Gaming — 0.1% | | | | | | |
Harrah’s Operating Co., Inc. | | | |
| 5.50% | | 07/01/10 | | Baa3 | | | 970 | | | 950,746 |
| 7.125% | | 06/01/07 | | Baa3 | | | 365 | | | 366,712 |
Mandalay Resort Group | | | |
| 9.375% | | 02/15/10 | | B1 | | | 12 | | | 12,840 |
Station Casinos | | | |
| 6.625% | | 03/15/18 | | Ba3 | | | 1,800 | | | 1,543,500 |
| | | | | | | | | |
|
|
| | | | | | | | | | | 2,873,798 |
| | | | | | | | | |
|
|
| | | | | | | | | | |
Interest
Rate
| | Maturity
Date
| | Moody’s
Rating
(Unaudited)
| | Principal
Amount
(000)
| | Value
(Note 2)
|
| LONG-TERM BONDS (Continued) | | | |
Health Care & Pharmaceutical — 0.7% | | | |
Abbott Laboratories | | | |
| 5.875% | | 05/15/16 | | A1 | | $ | 2,015 | | $ | 2,075,512 |
Amerisourceberger Corp. Series WI | | | |
| 5.625% | | 09/15/12 | | Ba1 | | | 915 | | | 899,513 |
Baxter International, Inc. | | | |
| 5.196% | | 02/16/08 | | Baa1 | | | 1,085 | | | 1,082,268 |
Boston Scientific | | | |
| 6.40% | | 06/15/16 | | Baa3 | | | 2,135 | | | 2,160,528 |
Cardinal Health, Inc. | | | |
| 5.85% | | 12/15/17 | | Baa3 | | | 1,475 | | | 1,466,709 |
Genentech, Inc. | | | |
| 4.75% | | 07/15/15 | | A1 | | | 270 | | | 258,480 |
HCA, Inc. | | | |
| 6.25% | | 02/15/13 | | Caa1 | | | 33 | | | 29,205 |
HCA, Inc., Bank Loan(l) | | | |
| 8.1137% | | 11/14/13 | | Ba3 | | | 2,000 | | | 2,021,924 |
Laboratory Corp. of America Holdings | | | |
| 5.625% | | 12/15/15 | | Baa3 | | | 925 | | | 909,365 |
Merck & Co., Inc. | | | |
| 5.75% | | 11/15/36 | | Aa3 | | | 900 | | | 890,332 |
| 5.95% | | 12/01/28 | | Aa3 | | | 205 | | | 206,994 |
Schering-Plough Corp. | | | |
| 5.55% | | 12/01/13 | | Baa1 | | | 1,860 | | | 1,865,388 |
Teva Pharmaceutical Finance LLC (Israel) | | | |
| 6.15% | | 02/01/36 | | Baa2 | | | 1,400 | | | 1,360,276 |
Ventas Realty LP, Sr. Notes | | | |
| 6.625% | | 10/15/14 | | Ba2 | | | 2,620 | | | 2,678,950 |
Wyeth | | | |
| 5.50% | | 03/15/13-02/01/14 | | A3 | | | 1,125 | | | 1,131,998 |
| 6.45% | | 02/01/24 | | A3 | | | 60 | | | 64,188 |
| | | | | | | | | |
|
|
| | | | | | | | | | | 19,101,630 |
| | | | | | | | | |
|
|
Healthcare Insurance — 0.3% | | | |
Aetna, Inc. | | | |
| 5.75% | | 06/15/11 | | A3 | | | 430 | | | 436,546 |
| 6.625% | | 06/15/36 | | A3 | | | 575 | | | 614,884 |
Coventry Health Care, Inc. | | | |
| 6.125% | | 01/15/15 | | Ba1 | | | 1,070 | | | 1,054,486 |
UnitedHealth Group, Inc. | | | |
| 5.25% | | 03/15/11 | | A3 | | | 1,470 | | | 1,464,963 |
| 5.375% | | 03/15/16 | | A3 | | | 695 | | | 688,240 |
Wellpoint, Inc. | | | |
| 3.50% | | 09/01/07 | | Baa1 | | | 1,970 | | | 1,943,394 |
| 5.00% | | 12/15/14 | | Baa1 | | | 1,085 | | | 1,050,443 |
| 5.25% | | 01/15/16 | | Baa1 | | | 335 | | | 328,395 |
| 5.95% | | 12/15/34 | | Baa1 | | | 210 | | | 206,620 |
| | | | | | | | | |
|
|
| | | | | | | | | | | 7,787,971 |
| | | | | | | | | |
|
|
Insurance — 0.3% | | | |
Allstate Corp. (The) | | | |
| 5.55% | | 05/09/35 | | A1 | | | 170 | | | 163,487 |
| 5.95% | | 04/01/36 | | A1 | | | 635 | | | 645,774 |
American International Group, Inc. | | | |
| 4.25% | | 05/15/13 | | Aa2 | | | 1,355 | | | 1,270,541 |
| 5.05% | | 10/01/15 | | Aa2 | | | 125 | | | 121,547 |
| 5.60% | | 10/18/16 | | Aa2 | | | 800 | | | 807,441 |
SEE NOTES TO FINANCIAL STATEMENTS.
B14
| | | | |
| | | CONSERVATIVE BALANCED PORTFOLIO (Continued) | | |
SCHEDULE OF INVESTMENTS | December 31, 2006 |
| | | | | | | | | | |
Interest
Rate
| | Maturity
Date
| | Moody’s
Rating
(Unaudited)
| | Principal
Amount
(000)
| | Value
(Note 2)
|
| LONG-TERM BONDS (Continued) | | | |
Insurance (cont’d.) | | | |
AXA SA (France)(c) | | | |
| 8.60% | | 12/15/30 | | A3 | | $ | 230 | | $ | 298,209 |
Berkshire Hathaway, Inc. | | | |
| 4.75% | | 05/15/12 | | Aaa | | | 945 | | | 926,180 |
Liberty Mutual Group(k) | | | |
| 7.00% | | 03/15/34 | | Baa3 | | | 910 | | | 936,884 |
Marsh & Mclennan Cos., Inc. | | | |
| 5.15% | | 09/15/10 | | Baa2 | | | 335 | | | 329,124 |
| 5.75% | | 09/15/15 | | Baa2 | | | 120 | | | 118,057 |
MetLife, Inc. | | | |
| 5.70% | | 06/15/35 | | A2 | | | 1,185 | | | 1,158,024 |
| 6.125% | | 12/01/11 | | A2 | | | 435 | | | 449,681 |
| 6.375% | | 06/15/34 | | A2 | | | 85 | | | 90,768 |
St. Paul Travelers | | | |
| 6.75% | | 06/20/36 | | A3 | | | 740 | | | 817,941 |
W.R. Berkley Corp. | | | |
| 5.60% | | 05/15/15 | | Baa2 | | | 705 | | | 692,504 |
| 6.15% | | 08/15/19 | | Baa2 | | | 575 | | | 572,143 |
XL Capital Ltd. (Cayman Islands) | | | |
| 5.25% | | 09/15/14 | | A3 | | | 110 | | | 107,802 |
| | | | | | | | | |
|
|
| | | | | | | | | | | 9,506,107 |
| | | | | | | | | |
|
|
Lodging | | | |
P&O Princess (United Kingdom) | | | |
| 7.30% | | 06/01/07 | | A3 | | | 345 | | | 347,421 |
| | | | | | | | | |
|
|
Media & Entertainment — 0.3% | | | |
CBS Corp. | | | |
| 7.875% | | 07/30/30 | | Baa3 | | | 345 | | | 361,536 |
Chancellor Media Corp. | | | |
| 8.00% | | 11/01/08 | | Baa3 | | | 745 | | | 774,546 |
Idearc, Inc. Bank Loan(l) | | | |
| 7.3762% | | 11/09/14 | | Ba2 | | | 1,500 | | | 1,507,500 |
Knight Ridder, Inc. | | | |
| 6.875% | | 03/15/29 | | Ba1 | | | 80 | | | 75,860 |
News America Holdings, Inc. | | | |
| 7.625% | | 11/30/28 | | Baa2 | | | 1,360 | | | 1,525,046 |
Time Warner, Inc. | | | |
| 6.50% | | 11/15/36 | | Baa2 | | | 155 | | | 154,275 |
| 6.75% | | 04/15/11 | | Baa2 | | | 725 | | | 758,936 |
| 7.25% | | 10/15/17 | | Baa2 | | | 745 | | | 813,826 |
| 9.15% | | 02/01/23 | | Baa2 | | | 625 | | | 773,179 |
Viacom, Inc. | | | |
| 6.25% | | 04/30/16 | | Baa3 | | | 710 | | | 705,082 |
| 6.875% | | 04/30/36 | | Baa3 | | | 740 | | | 731,622 |
Walt Disney Co. (The) | | | |
| 5.375% | | 06/01/07 | | A3 | | | 300 | | | 300,201 |
| | | | | | | | | |
|
|
| | | | | | | | | | | 8,481,609 |
| | | | | | | | | |
|
|
Metals — 0.2% | | | |
Alcan, Inc. (Canada) | | | |
| 4.50% | | 05/15/13 | | Baa1 | | | 255 | | | 240,042 |
| 5.00% | | 06/01/15 | | Baa1 | | | 755 | | | 718,105 |
Peabody Energy Corp. | | | |
| 7.375% | | 11/01/16 | | Ba1 | | | 1,150 | | | 1,224,750 |
Southern Copper Corp. | | | |
| 7.50% | | 07/27/35 | | Baa2 | | | 1,090 | | | 1,181,873 |
| | | | | | | | | | |
Interest
Rate
| | Maturity
Date
| | Moody’s
Rating
(Unaudited)
| | Principal
Amount
(000)
| | Value
(Note 2)
|
| LONG-TERM BONDS (Continued) | | | |
Metals (cont’d.) | | | |
Vale Overseas Ltd. (Cayman Islands) | | | |
| 6.875% | | 11/21/36 | | Baa3 | | $ | 660 | | $ | 676,926 |
| 8.25% | | 01/17/34 | | Baa3 | | | 250 | | | 296,136 |
| | | | | | | | | |
|
|
| | | | | | | | | | | 4,337,832 |
| | | | | | | | | |
|
|
Municipals | | | |
Illinois State Taxable Pension, G.O. | | | |
| 5.10% | | 06/01/33 | | Aa3 | | | 1,060 | | | 1,014,653 |
| | | | | | | | | |
|
|
Non Captive Finance — 0.3% | | | |
Capital One Bank(g) | | | |
| 6.50% | | 06/13/13 | | A3 | | | 10 | | | 10,541 |
Capital One Financial Co. | | | |
| 5.70% | | 09/15/11 | | A3 | | | 570 | | | 578,449 |
| 6.15% | | 09/01/16 | | Baa1 | | | 80 | | | 82,737 |
Capital One Financial Corp. | | | |
| 5.50% | | 06/01/15 | | A3 | | | 275 | | | 274,811 |
CIT Group, Inc. | | | |
| 4.25% | | 02/01/10 | | A2 | | | 480 | | | 464,888 |
| 5.50% | | 11/30/07 | | A2 | | | 1,285 | | | 1,287,831 |
General Electric Capital Corp., MTN | | | |
| 6.75% | | 03/15/32 | | Aaa | | | 1,785 | | | 2,044,322 |
Household Finance Corp. | | | |
| 4.75% | | 05/15/09 | | Aa3 | | | 370 | | | 365,997 |
HSBC Finance Corp. | | | |
| 5.70% | | 06/01/11 | | Aa3 | | | 585 | | | 595,109 |
International Lease Finance Corp. | | | |
| 3.50% | | 04/01/09 | | A1 | | | 750 | | | 721,442 |
Residential Capital Corp. | | | |
| 6.00% | | 02/22/11 | | Baa3 | | | 1,540 | | | 1,537,086 |
| 6.375% | | 06/30/10 | | Baa3 | | | 610 | | | 617,099 |
| | | | | | | | | |
|
|
| | | | | | | | | | | 8,580,312 |
| | | | | | | | | |
|
|
Packaging — 0.1% | | | |
Ball Corp. | | | |
| 6.625% | | 03/15/18 | | Ba1 | | | 1,900 | | | 1,890,500 |
| | | | | | | | | |
|
|
Paper | | | |
Plum Creek Timberlands | | | |
| 5.875% | | 11/15/15 | | Baa3 | | | 745 | | | 732,090 |
Weyerhaeuser Co. | | | |
| 7.375% | | 03/15/32 | | Baa2 | | | 425 | | | 443,626 |
| | | | | | | | | |
|
|
| | | | | | | | | | | 1,175,716 |
| | | | | | | | | |
|
|
Pipelines & Other — 0.3% | | | |
Atmos Energy Corp. | | | |
| 4.00% | | 10/15/09 | | Baa3 | | | 1,815 | | | 1,746,030 |
Duke Energy Field Services Corp. | | | |
| 7.875% | | 08/16/10 | | Baa2 | | | 1,830 | | | 1,968,423 |
Enterprise Products Operating LP | | | |
| 4.00% | | 10/15/07 | | Baa3 | | | 1,000 | | | 987,767 |
| 4.625% | | 10/15/09 | | Baa3 | | | 710 | | | 695,150 |
| 6.875% | | 03/01/33 | | Baa3 | | | 140 | | | 146,183 |
Kinder Morgan Finance (Canada) | | | |
| 5.70% | | 01/05/16 | | Baa2 | | | 650 | | | 596,387 |
Oneok, Inc. | | | |
| 5.51% | | 02/16/08 | | Baa2 | | | 1,630 | | | 1,628,843 |
Oneok Partners LP | | | |
| 6.65% | | 10/01/36 | | Baa2 | | | 580 | | | 593,243 |
SEE NOTES TO FINANCIAL STATEMENTS.
B15
| | | | |
| | | CONSERVATIVE BALANCED PORTFOLIO (Continued) | | |
SCHEDULE OF INVESTMENTS | December 31, 2006 |
| | | | | | | | | | |
Interest
Rate
| | Maturity
Date
| | Moody’s
Rating
(Unaudited)
| | Principal
Amount
(000)
| | Value
(Note 2)
|
| LONG-TERM BONDS (Continued) | | | |
Pipelines & Other (cont’d.) | | | |
Sempra Energy | | | |
| 4.621% | | 05/17/07 | | Baa1 | | $ | 790 | | $ | 786,986 |
| 6.00% | | 02/01/13 | | Baa1 | | | 80 | | | 81,591 |
| | | | | | | | | |
|
|
| | | | | | | | | | | 9,230,603 |
| | | | | | | | | |
|
|
Railroads — 0.2% | | | |
Burlington Northern Santa Fe Corp. | | | |
| 6.70% | | 08/01/28 | | Baa1 | | | 735 | | | 799,568 |
Norfolk Southern Corp. | | | |
| 5.64% | | 05/17/29 | | Baa1 | | | 571 | | | 551,695 |
| 7.80% | | 05/15/27 | | Baa1 | | | 24 | | | 29,349 |
Union Pacific Corp. | | | |
| 3.625% | | 06/01/10 | | Baa2 | | | 1,395 | | | 1,316,323 |
| 6.625% | | 02/01/08 | | Baa2 | | | 1,755 | | | 1,775,377 |
| 6.65% | | 01/15/11 | | Baa2 | | | 760 | | | 794,300 |
| | | | | | | | | |
|
|
| | | | | | | | | | | 5,266,612 |
| | | | | | | | | |
|
|
Real Estate Investments Trusts — 0.2% | | | |
Brandywine Operating Partnership LP | | | |
| 5.75% | | 04/01/12 | | Baa3 | | | 1,405 | | | 1,414,645 |
ERP Operating LP | | | |
| 5.125% | | 03/15/16 | | Baa1 | | | 430 | | | 417,606 |
Mack-Cali Realty Corp. | | | |
| 7.25% | | 03/15/09 | | Baa2 | | | 1,595 | | | 1,647,109 |
Post Apartment Homes LP | | | |
| 5.45% | | 06/01/12 | | Baa3 | | | 545 | | | 533,835 |
| 6.30% | | 06/01/13 | | Baa3 | | | 650 | | | 666,449 |
Simon Property Group LP | | | |
| 5.75% | | 05/01/12 | | A3 | | | 1,625 | | | 1,641,658 |
| | | | | | | | | |
|
|
| | | | | | | | | | | 6,321,302 |
| | | | | | | | | |
|
|
Retailers — 0.1% | | | |
Federated Retail Holding, Inc. | | | |
| 5.90% | | 12/01/16 | | Baa1 | | | 370 | | | 369,425 |
Gap, Inc. (The) | | | |
| 6.90% | | 09/15/07 | | Baa3 | | | 1,550 | | | 1,560,732 |
Home Depot, Inc. | | | |
| 5.40% | | 03/01/16 | | Aa3 | | | 10 | | | 9,780 |
| 5.875% | | 12/16/36 | | Aa3 | | | 680 | | | 667,300 |
May Department Stores Co. | | | |
| 6.65% | | 07/15/24 | | Baa1 | | | 730 | | | 723,278 |
Wal-Mart Stores, Inc. | | | |
| 5.25% | | 09/01/35 | | Aa2 | | | 235 | | | 215,800 |
| | | | | | | | | |
|
|
| | | | | | | | | | | 3,546,315 |
| | | | | | | | | |
|
|
Sovereign — 0.3% | | | |
Republic of Malaysia (Malaysia) | | | |
| 7.50% | | 07/15/11 | | A3 | | | 375 | | | 408,069 |
Republic of South Africa (South Africa) | | | |
| 6.50% | | 06/02/14 | | Baa1 | | | 520 | | | 546,650 |
Russian Federation(k) | | | |
| 11.00% | | 07/24/18 | | Baa2 | | | 735 | | | 1,064,831 |
United Mexican States (Mexico) | | | |
| 5.625% | | 01/15/17(b) | | Baa1 | | | 1,242 | | | 1,243,242 |
| 6.75% | | 09/27/34 | | Baa1 | | | 1,030 | | | 1,112,400 |
| 7.50% | | 01/14/12(b) | | Baa1 | | | 1,630 | | | 1,786,480 |
| 8.125% | | 12/30/19 | | Baa1 | | | 951 | | | 1,155,465 |
| | | | | | | | | |
|
|
| | | | | | | | | | | 7,317,137 |
| | | | | | | | | |
|
|
| | | | | | | | | | |
Interest
Rate
| | Maturity
Date
| | Moody’s
Rating
(Unaudited)
| | Principal
Amount
(000)
| | Value
(Note 2)
|
| LONG-TERM BONDS (Continued) | | | |
Structured Notes — 0.1% | | | |
TRAINS, Series HY-1 2006(b)(k) | | | |
| 7.548% | | 05/01/16 | | B1 | | $ | 3,168 | | $ | 3,232,881 |
| | | | | | | | | |
|
|
Technology — 0.4% | | | |
Electronic Data Systems Corp. | | | |
| 7.45% | | 10/15/29 | | Ba1 | | | 120 | | | 131,315 |
Equifax, Inc. | | | |
| 4.95% | | 11/01/07 | | Baa1 | | | 475 | | | 471,701 |
Freescale Semiconductor, Inc.(k) | | | |
| 8.875% | | 12/15/14 | | B1 | | | 1,100 | | | 1,095,875 |
International Business Machines Corp. | | | |
| 5.875% | | 11/29/32 | | A1 | | | 575 | | | 586,928 |
Jabil Circuit, Inc. | | | |
| 5.875% | | 07/15/10 | | Baa3 | | | 1,800 | | | 1,787,263 |
Motorola, Inc. | | | |
| 4.608% | | 11/16/07 | | Baa1 | | | 1,220 | | | 1,211,833 |
| 8.00% | | 11/01/11 | | Baa1 | | | 128 | | | 141,640 |
NXP Funding LLC(k) | | | |
| 7.875% | | 10/15/14 | | Ba2 | | | 2,000 | | | 2,067,501 |
Oracle Corp. | | | |
| 5.00% | | 01/15/11 | | A3 | | | 1,080 | | | 1,069,129 |
Xerox Corp. | | | |
| 6.40% | | 03/15/16 | | Baa3 | | | 1,195 | | | 1,220,394 |
| | | | | | | | | |
|
|
| | | | | | | | | | | 9,783,579 |
| | | | | | | | | |
|
|
Telecommunications — 1.0% | | | |
ALLTEL Ohio LP(k) | | | |
| 8.00% | | 08/15/10 | | A2 | | | 408 | | | 437,459 |
America Movil SA de CV (Mexico) | | | |
| 6.375% | | 03/01/35 | | A3 | | | 630 | | | 614,655 |
AT&T Corp. | | | |
| 8.00% | | 11/15/31 | | A2 | | | 570 | | | 707,186 |
AT&T Wireless Services, Inc. | | | |
| 8.125% | | 05/01/12 | | Baa1 | | | 800 | | | 900,214 |
| 8.75% | | 03/01/31 | | Baa1 | | | 705 | | | 916,193 |
BellSouth Corp. | | | |
| 4.20% | | 09/15/09 | | A2 | | | 1,365 | | | 1,326,967 |
British Telecommunications PLC (United Kingdom) | | | |
| 7.00% | | 05/23/07 | | Baa1 | | | 1,400 | | | 1,406,416 |
| 9.125% | | 12/15/30 | | Baa1 | | | 245 | | | 335,129 |
Cingular Wireless LLC | | | |
| 7.125% | | 12/15/31 | | Baa1 | | | 535 | | | 592,648 |
Deutsche Telekom International Finance BV (Netherlands)(c) | | | |
| 8.25% | | 06/15/30 | | A3 | | | 345 | | | 424,122 |
Embarq Corp. | | | |
| 7.082% | | 06/01/16 | | Baa3 | | | 350 | | | 356,307 |
| 7.995% | | 06/01/36 | | Baa3 | | | 1,035 | | | 1,077,048 |
France Telecom SA (France) | | | |
| 8.50% | | 03/01/31 | | A3 | | | 360 | | | 472,582 |
Nextel Communications, Inc. | | | |
| 5.95% | | 03/15/14 | | Baa3 | | | 1,475 | | | 1,436,379 |
Royal KPN NV (Netherlands) | | | |
| 8.00% | | 10/01/10 | | Baa2 | | | 645 | | | 695,945 |
SBC Communications, Inc. | | | |
| 4.125% | | 09/15/09(b) | | A2 | | | 1,335 | | | 1,296,624 |
| 5.30% | | 11/15/10 | | A2 | | | 1,180 | | | 1,180,163 |
SEE NOTES TO FINANCIAL STATEMENTS.
B16
| | | | |
| | | CONSERVATIVE BALANCED PORTFOLIO (Continued) | | |
SCHEDULE OF INVESTMENTS | December 31, 2006 |
| | | | | | | | | | |
Interest
Rate
| | Maturity Date
| | Moody’s
Rating
(Unaudited)
| | Principal
Amount
(000)
| | Value
(Note 2)
|
| LONG-TERM BONDS (Continued) | | | |
Telecommunications (cont’d.) | | | |
Sprint Capital Corp. | | | |
| 6.875% | | 11/15/28 | | Baa3 | | $ | 265 | | $ | 265,267 |
| 8.75% | | 03/15/32 | | Baa3 | | | 220 | | | 264,794 |
Sprint Nextel Corp. | | | |
| 6.00% | | 12/01/16 | | Baa3 | | | 1,335 | | | 1,301,127 |
Telecom Italia Finance (Luxembourg) | | | |
| 5.25% | | 11/15/13 | | Baa2 | | | 170 | | | 162,093 |
| 6.375% | | 11/15/33 | | Baa2 | | | 520 | | | 491,311 |
| 7.20% | | 07/18/36 | | Baa2 | | | 1,660 | | | 1,734,232 |
Telecomunicaciones de Puerto Rico, Inc. (Puerto Rico) | | | |
| 6.80% | | 05/15/09 | | Baa1 | | | 2,220 | | | 2,266,110 |
Telefonica Emisiones Sau (Spain) | | | |
| 6.421% | | 06/20/16 | | Baa1 | | | 630 | | | 649,919 |
| 7.045% | | 06/20/36 | | Baa1 | | | 1,375 | | | 1,460,480 |
TELUS Corp. (Cananda) | | | |
| 8.00% | | 06/01/11 | | Baa2 | | | 1,500 | | | 1,640,306 |
US Cellular Corp. | | | |
| 6.70% | | 12/15/33 | | Baa3 | | | 600 | | | 563,481 |
Verizon Global Funding Corp. | | | |
| 5.85% | | 09/15/35 | | A3 | | | 380 | | | 363,944 |
| 7.75% | | 12/01/30 | | A3 | | | 450 | | | 527,840 |
Vodafone Group PLC (United Kingdom) | | | |
| 7.75% | | 02/15/10 | | A3 | | | 950 | | | 1,012,399 |
| | | | | | | | | |
|
|
| | | | | | | | | | | 26,879,340 |
| | | | | | | | | |
|
|
Tobacco | | | |
Altria Group, Inc. | | | |
| 7.65% | | 07/01/08 | | Baa1 | | | 765 | | | 788,691 |
| 7.75% | | 01/15/27 | | Baa1 | | | 300 | | | 363,867 |
| | | | | | | | | |
|
|
| | | | | | | | | | | 1,152,558 |
| | | | | | | | | |
|
|
Mortgage Backed Securities — 11.5% | | | |
Federal Home Loan Mortgage Corp. | | | |
| 4.50% | | 02/01/19-07/01/20 | | | | | 8,654 | | | 8,348,158 |
| 5.00% | | 07/01/18-05/01/34 | | | | | 15,566 | | | 15,234,065 |
| 5.00% | | TBA 30 YR | | | | | 4,000 | | | 3,858,752 |
| 5.242% | | 12/01/35(h) | | | | | 4,441 | | | 4,426,445 |
| 5.50% | | 12/01/33-07/01/34 | | | | | 13,104 | | | 12,975,187 |
| 5.50% | | TBA 30 YR | | | | | 9,000 | | | 8,898,750 |
| 6.00% | | 03/01/32-12/01/33 | | | | | 3,778 | | | 3,819,082 |
| 6.00% | | TBA 30 YR | | | | | 14,000 | | | 14,100,631 |
| 6.50% | | 12/01/14-09/01/16 | | | | | 883 | | | 901,685 |
| 7.00% | | 05/01/31-09/01/33 | | | | | 6,824 | | | 7,019,563 |
Federal National Mortgage Association | | | |
| 4.00% | | 06/01/19 | | | | | 2,994 | | | 2,821,471 |
| 4.50% | | 11/01/18-01/01/35 | | | | | 19,196 | | | 18,390,936 |
| 4.919% | | 07/01/33(h) | | | | | 1,132 | | | 1,128,259 |
| 5.00% | | TBA 15 YR | | | | | 2,500 | | | 2,457,030 |
| 5.00% | | TBA 30 YR | | | | | 7,000 | | | 6,757,184 |
| 5.00% | | 10/01/18-03/01/34 | | | | | 46,157 | | | 44,729,014 |
| 5.50% | | 03/01/16-10/01/35 | | | | | 51,023 | | | 50,538,383 |
| 5.50% | | TBA 15 YR | | | | | 3,500 | | | 3,498,908 |
| 5.50% | | TBA 30 YR | | | | | 18,000 | | | 17,786,250 |
| 6.00% | | 04/01/13-03/01/35 | | | | | 29,678 | | | 29,936,729 |
| 6.00% | | TBA 30 YR | | | | | 13,000 | | | 13,085,305 |
| 6.50% | | TBA 30 YR | | | | | 5,000 | | | 5,093,750 |
| | | | | | | | | | |
Interest
Rate
| | Maturity Date
| | Moody’s
Rating
(Unaudited)
| | Principal
Amount
(000)
| | Value
(Note 2)
|
| LONG-TERM BONDS (Continued) | | | |
Mortgage Backed Securities (cont’d.) | | | |
| 6.50% | | 07/01/17-11/01/36 | | | | $ | 12,321 | | $ | 12,571,235 |
| 7.00% | | 08/01/11-07/01/32 | | | | | 1,804 | | | 1,859,757 |
| 7.50% | | 05/01/12-05/01/32 | | | | | 1,277 | | | 1,325,721 |
Government National Mortgage Association | | | |
| 5.50% | | 08/15/33-07/15/35 | | | | | 7,387 | | | 7,358,164 |
| 5.50% | | TBA 30 YR | | | | | 9,500 | | | 9,452,500 |
| 6.00% | | 04/15/33-06/20/34 | | | | | 3,352 | | | 3,396,912 |
| 6.50% | | 10/15/23-06/15/35 | | | | | 7,579 | | | 7,787,973 |
| 6.50% | | TBA 30 YR | | | | | 1,000 | | | 1,025,625 |
| 7.00% | | 09/15/31 | | | | | 224 | | | 230,980 |
| 8.00% | | 01/15/24-04/15/25 | | | | | 217 | | | 229,390 |
| | | | | | | | | |
|
|
| | | | | | | | | | | 321,043,794 |
| | | | | | | | | |
|
|
U.S. Government Agency Obligations — 3.5% | | | |
Federal Farm Credit Bank | | | |
| 5.125% | | 08/25/16 | | | | | 1,140 | | | 1,153,364 |
Federal Home Loan Bank | | | |
| 4.375% | | 10/03/08 | | | | | 7,925 | | | 7,828,941 |
| 4.75% | | 06/11/08-12/16/16 | | | | | 7,530 | | | 7,479,670 |
| 4.875% | | 11/18/11(b) | | | | | 3,950 | | | 3,934,299 |
| 5.00% | | 10/16/09 | | | | | 10,270 | | | 10,227,184 |
| 5.125% | | 08/08/08 | | | | | 5,130 | | | 5,133,468 |
| 5.375% | | 08/19/11 | | | | | 6,930 | | | 7,048,538 |
| 5.60% | | 01/03/08 | | | | | 18,400 | | | 18,400,091 |
Federal Home Loan Mortgage Corp. | | | |
| 4.75% | | 11/03/09 | | | | | 645 | | | 641,482 |
| 4.75% | | 01/18/11, MTN | | | | | 180 | | | 178,807 |
| 5.00% | | 12/14/18, MTN | | | | | 5,730 | | | 5,594,955 |
| 5.125% | | 10/18/16 | | | | | 100 | | | 100,856 |
| 5.25% | | 07/18/11, MTN(b) | | | | | 3,100 | | | 3,137,101 |
| 5.40% | | 02/28/11, MTN | | | | | 6,040 | | | 6,036,509 |
Federal National Mortgage Association | | | |
| 4.25% | | 07/27/07 | | | | | 6,485 | | | 6,448,457 |
| 5.00% | | 10/15/11, MTN(b) | | | | | 3,370 | | | 3,377,465 |
| 5.125% | | 04/15/11 | | | | | 4,745 | | | 4,778,932 |
| 6.125% | | 03/15/12 | | | | | 6,010 | | | 6,328,127 |
Tennessee Valley Authority, Series B | | | |
| 5.88% | | 04/01/36 | | | | | 1,305 | | | 1,434,862 |
| | | | | | | | | |
|
|
| | | | | | | | | | | 99,263,108 |
| | | | | | | | | |
|
|
U.S. Treasury Securities — 2.0% | | | |
United States Treasury Bonds | | | |
| 4.50% | | 02/15/36(b) | | | | | 2,105 | | | 2,001,724 |
| 8.125% | | 05/15/21-08/15/21(c) | | | 2,395 | | | 3,190,326 |
United States Treasury Inflation Index | | | |
| 0.875% | | 04/15/10 | | | | | 1,705 | | | 1,616,471 |
| 1.625% | | 01/15/15 | | | | | 1,168 | | | 1,099,684 |
| 1.875% | | 07/15/13-07/15/15 | | | | | 2,276 | | | 2,190,684 |
| 2.00% | | 01/15/14-01/15/26 | | | | | 4,503 | | | 4,336,070 |
| 2.375% | | 04/15/11-01/15/25 | | | | | 2,621 | | | 2,609,651 |
| 2.50% | | 07/15/16 | | | | | 989 | | | 996,948 |
| 3.00% | | 07/15/12 | | | | | 1,342 | | | 1,380,940 |
| 3.375% | | 01/15/12-04/15/32 | | | | | 705 | | | 788,278 |
| 3.50% | | 01/15/11 | | | | | 708 | | | 736,589 |
| 3.625% | | 01/15/08-04/15/28 | | | | | 2,161 | | | 2,387,439 |
| 3.875% | | 01/15/09-04/15/29 | | | | | 2,128 | | | 2,464,020 |
| 4.25% | | 01/15/10 | | | | | 720 | | | 757,408 |
SEE NOTES TO FINANCIAL STATEMENTS.
B17
| | | | |
| | | CONSERVATIVE BALANCED PORTFOLIO (Continued) | | |
SCHEDULE OF INVESTMENTS | December 31, 2006 |
| | | | | | | | | | |
Interest
Rate
| | Maturity Date
| | Moody’s
Rating
(Unaudited)
| | Principal
Amount
(000)
| | Value
(Note 2)
|
| LONG-TERM BONDS (Continued) | | | |
United States Treasury Notes | | | |
| 3.375% | | 09/15/09 | | | | $ | 420 | | $ | 405,612 |
| 4.50% | | 11/30/11 | | | | | 1,340 | | | 1,328,066 |
| 4.625% | | 09/30/08-11/15/16(b) | | | | | 12,377 | | | 12,320,948 |
| 4.875% | | 05/15/09 | | | | | 820 | | | 821,794 |
| 5.00% | | 07/31/08 | | | | | 120 | | | 120,197 |
United States Treasury Strips | | | |
| Zero | | 02/15/19-11/15/26(b) | | | | | 27,630 | | | 13,882,963 |
| | | | | | | | | |
|
|
| | | | | | | | | | | 55,435,812 |
| | | | | | | | | |
|
|
TOTAL LONG-TERM BONDS
(cost $917,317,498) | | | 909,142,629 |
| | | | | | | | | |
|
|
TOTAL LONG-TERM INVESTMENTS
(cost $2,019,322,347) | | | 2,466,388,678 |
| | | | | | | | | |
|
|
| | | | | | | |
SHORT-TERM
INVESTMENTS — 12.5% | | | | Shares
| | Value (Note 2)
|
Affiliated Mutual Funds — 12.4% | | | | | |
Dryden Core Investment Fund —Dryden Short Term Bond Series(j) | | 7,845,674 | | $ | 78,535,192 |
Dryden Core Investment Fund —Taxable Money Market Series
(cost $468,453,065; includes $204,591,018 of cash collateral received for securities on loan)(i)(j) | | 468,453,065 | | | 468,453,065 |
| | | | | | |
|
|
TOTAL AFFILIATED
MUTUAL FUNDS
(cost $546,923,952) | | | | | 546,988,257 |
| | | | | | |
|
|
| | | | | | | | |
| | | |
Interest Rate
| | Maturity
Date
| | Principal
Amount
(000)
| | | |
U.S. Government Agency Obligations — 0.1% | |
United States Treasury Bills (c)(g) | |
4.80% | | 03/15/07 | | $2,900 | | | 2,872,346 | |
| | | | | | |
|
|
|
TOTAL SHORT-TERM INVESTMENTS
(cost $549,795,725) | | | 549,860,603 | |
| | | | | | |
|
|
|
TOTAL INVESTMENTS — 101.4%
(cost $2,569,118,072) | | | 3,016,249,281 | |
LIABILITIES IN EXCESS OF
OTHER ASSETS(m) — (1.4)% | | | (245,669,292 | ) |
| | | | | | |
|
|
|
TOTAL NET ASSETS — 100.0% | | $ | 2,770,579,989 | |
| | | | | | |
|
|
|
The following abbreviations are used in portfolio descriptions:
| | |
| G.O. | | General Obligation |
| I/O | | Interest Only |
| TBA | | Securities purchased on a forward commitment basis |
| MTN | | Medium Term Note |
| (a) | Non-income producing security. |
| (b) | All or portion of security is on loan. The aggregate market value of such securities is $196,798,835; cash collateral of $204,591,018 (included in liabilities) was received with which the Portfolio purchased highly liquid short-term investments. |
| (c) | Security segregated as collateral for futures contracts. |
| (d) | Standard & Poor’s rating. |
| (e) | Indicates an affiliated security. |
| (f) | Increase/decrease in rate variable upon increase/decrease in Moody’s or Standard & Poor’s rating. |
| (g) | Rate quoted represents yield-to-maturity as of purchase date. |
| (h) | Indicates variable rate security. |
| (i) | Represents security, or a portion thereof, purchased with cash collateral for securities on loan. |
| (j) | Prudential Investments LLC, the manager of the Portfolio, also serves as manager of the Dryden Core Investment Fund — Taxable Money Market Series and Dryden Core Investment Fund — Short-Term Bond Series. |
| (k) | Security was purchased pursuant to Rule 144A under the Securities Act of 1933 and may not be resold subject to that rule except to qualified institutional buyers. Unless otherwise noted, 144A securities are deemed to be liquid. |
| (l) | Indicates a security that has been deemed illiquid. |
SEE NOTES TO FINANCIAL STATEMENTS.
B18
| | | | |
| | | CONSERVATIVE BALANCED PORTFOLIO (Continued) | | |
SCHEDULE OF INVESTMENTS | December 31, 2006 |
| (m) | Liabilities in excess of other assets include unrealized appreciation (depreciation) on financial futures, interest rate swaps and credit default swaps as follows: |
Open future contracts outstanding at December 31, 2006:
| | | | | | | | | | | | | | |
Number of
Contracts
| | Type
| | Expiration
Date
| | Value at
Trade Date
| | Value at
December 31, 2006
| | Unrealized
Appreciation
(Depreciation)
| |
| Long Positions: | | | | | | | | | | | | | | |
| 55 | | U.S. Treasury 2 Yr. Notes | | Mar. 2007 | | $ | 11,257,916 | | $ | 11,221,719 | | $ | (36,197 | ) |
| 600 | | U.S. Treasury 5 Yr. Notes | | Mar. 2007 | | | 63,600,000 | | | 63,037,500 | | | (562,500 | ) |
| 3 | | U.S. Treasury 5 Yr. Notes | | Mar. 2007 | | | 319,409 | | | 315,187 | | | (4,222 | ) |
| 390 | | U.S. Treasury 20 Yr. Bonds | | Mar. 2007 | | | 43,913,121 | | | 43,460,625 | | | (452,496 | ) |
| 58 | | S&P 500 Index | | Mar. 2007 | | | 20,619,000 | | | 20,711,800 | | | 92,800 | |
| 86 | | S&P 500 Index | | Mar. 2007 | | | 30,668,587 | | | 30,710,600 | | | 42,013 | |
| | | | | | | | | | | | |
|
|
|
| | | | | | | | | | | | | | (920,602 | ) |
| Short Positions: | | | | | | | | | | | | | | |
| 52 | | U.S. Treasury 10 Yr. Notes | | Mar. 2007 | | | 5,652,871 | | | 5,588,375 | | | 64,496 | |
| | | | | | | | | | | | |
|
|
|
| | | | | | | | | | | | | $ | (856,106 | ) |
| | | | | | | | | | | | |
|
|
|
Interest rate swap agreements outstanding at December 31, 2006:
| | | | | | | | | | | | | | |
Counterparty
| | Termination
Date
| | Notional
Amount
(000)
| | Fixed
Rate
| | | Floating
Rate
| | Unrealized
Depreciation
| |
Merrill Lynch Capital Services, Inc.(a) | | 11/2/2016 | | $ | 5,050 | | 5.151 | % | | 3 month LIBOR | | $ | (16,744 | ) |
| | | | | | | | | | | | | | | |
| (a) | Portfolio pays the floating rate and receives the fixed rate. |
Credit default swap agreements outstanding at December 31, 2006:
| | | | | | | | | | | | | | |
Counterparty
| | Termination
Date
| | Notional
Amount
(000)
| | Fixed
Rate
| | | Underlying Bond
| | Unrealized
Depreciation
| |
Deutsche Bank AG(a) | | 12/25/2009 | | $ | 1,000 | | 2.75 | % | | Fieldstone Mortgage Investment Corp., | | | (809 | ) |
| | | | | | | | | | | 7.65%, due 05/25/36 | | | | |
Deutsche Bank AG(a) | | 06/25/2036 | | | 1,000 | | 2.52 | % | | Residential Asset Securities Corp., | | | (4,116 | ) |
| | | | | | | | | | | 7.32%, 06/25/36 | | | | |
| | | | | | | | | | | | |
|
|
|
| | | | | | | | | | | | | $ | (4,925 | ) |
| | | | | | | | | | | | |
|
|
|
| (a) | The Portfolio pays the fixed rate and receives from the counterparty par in the event that the underlying bond defaults. |
SEE NOTES TO FINANCIAL STATEMENTS.
B19
| | | | |
| | | CONSERVATIVE BALANCED PORTFOLIO (Continued) | | |
SCHEDULE OF INVESTMENTS | December 31, 2006 |
The industry classification of portfolio holdings and liabilities in excess of other assets shown as a percentage of net assets as of December 31, 2006 were as follows:
| | | |
Affiliated Mutual Funds (including 7.4% of collateral received for securities on loan) | | 12.4 | % |
Mortgage Backed Securities | | 11.5 | |
Oil, Gas & Consumable Fuels | | 4.6 | |
Pharmaceuticals | | 4.2 | |
Commercial Mortgage Backed Securities | | 3.8 | |
Commercial Banks | | 3.7 | |
U.S. Government Agency Obligations | | 3.6 | |
Diversified Financial Services | | 3.0 | |
Insurance | | 2.9 | |
Capital Markets | | 2.2 | |
Electric Utilities | | 2.1 | |
Industrial Conglomerates | | 2.1 | |
U.S. Treasury Securities | | 2.0 | |
Computers & Peripherals | | 1.9 | |
Media | | 1.9 | |
Diversified Telecommunication Services | | 1.7 | |
Software | | 1.7 | |
Aerospace & Defense | | 1.6 | |
Asset Backed Securities | | 1.6 | |
Communications Equipment | | 1.4 | |
Wireless Telecommunication Services | | 1.4 | |
Healthcare Providers & Services | | 1.3 | |
Semiconductor & Semiconductor Equipment | | 1.3 | |
Chemicals | | 1.2 | |
Food & Staples Retailing | | 1.2 | |
Food Products | | 1.2 | |
Beverages | | 1.1 | |
Household Products | | 1.1 | |
Metals & Mining | | 1.0 | |
Specialty Retail | | 1.0 | |
Energy Equipment & Services | | 0.9 | |
Machinery | | 0.9 | |
Tobacco | | 0.9 | |
Healthcare Equipment & Supplies | | 0.8 | |
Hotels, Restaurants & Leisure | | 0.8 | |
Real Estate Investment Trust | | 0.8 | |
Biotechnology | | 0.7 | |
Internet Software & Services | | 0.7 | |
Thrifts & Mortgage Finance | | 0.7 | |
Automobiles | | 0.6 | |
Road & Rail | | 0.6 | |
IT Services | | 0.6 | |
Multiline Retail | | 0.6 | |
| | | |
Multi-Utilities | | 0.6 | % |
Capital Goods | | 0.5 | |
Collateralized Mortgage Obligations | | 0.5 | |
Consumer Finance | | 0.5 | |
Air Freight & Logistics | | 0.4 | |
Brokerage | | 0.4 | |
Household Durables | | 0.4 | |
Technology | | 0.4 | |
Construction Materials | | 0.3 | |
Cable | | 0.3 | |
Commercial Services & Supplies | | 0.3 | |
Electrical Equipment | | 0.3 | |
Healthcare Insurance | | 0.3 | |
Media & Entertainment | | 0.3 | |
Non Captive Finance | | 0.3 | |
Pipelines & Other | | 0.3 | |
Sovereign | | 0.3 | |
Airlines | | 0.2 | |
Building Products | | 0.2 | |
Containers & Packaging | | 0.2 | |
Electronic Equipment & Instruments | | 0.2 | |
Energy — Integrated | | 0.2 | |
Energy — Other | | 0.2 | |
Foreign Government Bonds | | 0.2 | |
Independent Power Producers & Energy Traders | | 0.2 | |
Leisure Equipment & Products | | 0.2 | |
Paper & Forest Products | | 0.2 | |
Textiles, Apparel & Luxury Goods | | 0.2 | |
Auto Components | | 0.1 | |
Construction & Engineering | | 0.1 | |
Consumer | | 0.1 | |
Distributors | | 0.1 | |
Diversified Consumer Services | | 0.1 | |
Gaming | | 0.1 | |
Gas Utilities | | 0.1 | |
Internet & Catalog Retail | | 0.1 | |
Life Sciences Tools & Services | | 0.1 | |
Office Electronics | | 0.1 | |
Personal Products | | 0.1 | |
Real Estate | | 0.1 | |
Retailers | | 0.1 | |
Structures Notes | | 0.1 | |
Trading Companies & Distributors | | 0.1 | |
| | |
|
|
| | | 101.4 | |
Liabilities in excess of other assets | | (1.4 | ) |
| | |
|
|
| | | 100.0 | % |
| | |
|
|
SEE NOTES TO FINANCIAL STATEMENTS.
B20
| | | | |
| | | DIVERSIFIED BOND PORTFOLIO | | |
SCHEDULE OF INVESTMENTS | December 31, 2006 |
| | | | | | | | | | | | |
LONG-TERM INVESTMENTS — 99.3%
LONG-TERM BONDS | | Moody’s
Rating
(Unaudited)
| | Interest
Rate
| | Maturity
Date
| | Principal
Amount
(000)#
| | Value (Note 2)
|
Aerospace/Defense — 0.8% | | | | | | | | | | | | |
BAE Systems Holdings, Inc., 144A(h) | | Baa2 | | 5.20% | | 08/15/15 | | $ | 6,850 | | $ | 6,524,899 |
DRS Technologies, Inc. | | B1 | | 6.625% | | 02/01/16 | | | 1,580 | | | 1,591,850 |
Raytheon Co. | | Baa2 | | 4.50% | | 11/15/07 | | | 335 | | | 332,347 |
Raytheon Co. | | Baa2 | | 8.30% | | 03/01/10 | | | 725 | | | 787,115 |
| | | | | | | | | | | |
|
|
| | | | | | | | | | | | | 9,236,211 |
| | | | | | | | | | | |
|
|
Airlines — 0.8% | | | | | | | | | | | | |
Continental Airlines, Inc., Series 2000-1, Class A-1 | | Baa3 | | 7.487% | | 10/02/10 | | | 7,954 | | | 8,407,378 |
Continental Airlines, Inc., Series 2000-1, Class A-1 | | Baa3 | | 6.703% | | 06/15/21 | | | 3 | | | 3,564 |
Continental Airlines, Inc., Pass-Through Certificates,
Series 2001-01, Class B | | Ba1 | | 7.373% | | 12/15/15 | | | 1,247 | | | 1,265,927 |
| | | | | | | | | | | |
|
|
| | | | | | | | | | | | | 9,676,869 |
| | | | | | | | | | | |
|
|
Asset-Backed Securities — 4.1% | | | | | | | | | | | | |
American Express Credit Account Master Trust, Series 2004-C, Class C, 144A(g)(h) | | Baa2 | | 5.85% | | 02/15/12 | | | 1,208 | | | 1,210,371 |
AmeriQuest Mortgage Securities, Inc., Series 2001-2, Class M3(g) | | Baa2 | | 8.275% | | 10/25/31 | | | 725 | | | 726,125 |
AmeriQuest Mortgage Securities, Inc., Series 2003-AR3, Class M6(g) | | Baa3 | | 8.3233% | | 10/25/33 | | | 1,600 | | | 1,599,123 |
Amortizing Residential Collateral Trust, Series 2002-BC7, Class M2(g) | | AA+(f) | | 6.70% | | 10/25/32 | | | 189 | | | 188,961 |
Bank of America Credit Card Trust, Series 2006-C5, Class C5(g) | | Baa2 | | 5.75% | | 01/15/16 | | | 5,750 | | | 5,751,179 |
Bank One Issuance Trust, Series 2003-C1, Class C1 | | Baa2 | | 4.54% | | 09/15/10 | | | 2,980 | | | 2,951,179 |
CDC Mortgage Capital Trust, Series 2002-HE3, Class M2(g) | | A2 | | 8.725% | | 03/25/33 | | | 501 | | | 500,373 |
Centex Home Equity, Series 2005-A, Class M4(g) | | A1 | | 6.15% | | 01/25/35 | | | 2,400 | | | 2,420,116 |
Citibank Credit Card Issuance Trust, Series 2003-C4, Class C-4 | | Baa2 | | 5.00% | | 06/10/15 | | | 6,500 | | | 6,321,122 |
Countrywide Asset-Backed Certificates, Series 2002-BC3, Class M2(g) | | A2 | | 6.47% | | 05/25/32 | | | 2,472 | | | 2,474,491 |
Countrywide Asset-Backed Certificates, Series 2004-12, Class MV3(g) | | Aa3 | | 6.01% | | 03/25/35 | | | 2,670 | | | 2,697,810 |
CS First Boston Mortgage Securities Corp., Series 2002-HE4, Class M2(g) | | A2 | | 7.60% | | 08/25/32 | | | 250 | | | 249,973 |
Equity One ABS, Inc., Series 2004-3, Class M1 | | Aa2 | | 5.70% | | 07/25/34 | | | 2,100 | | | 2,087,839 |
First Franklin Mortgage Loan Asset-Backed Certificates, Series 2005-FF6, Class M2(g) | | Aa2 | | 5.79% | | 05/25/36 | | | 2,575 | | | 2,593,821 |
Ford Credit Auto Owner Trust, Series 2006-B, Class C | | Baa2 | | 5.68% | | 06/15/12 | | | 2,100 | | | 2,112,847 |
Fremont Home Loan Trust, Series 2003-B, Class M2(g) | | Aa2 | | 6.05% | | 12/25/33 | | | 500 | | | 502,790 |
Home Equity Asset Trust, Series 2005-7, Class 2A4(g) | | Aaa | | 5.73% | | 01/25/36 | | | 1,500 | | | 1,507,271 |
IXIS Real Estate Capital Trust, Series 2006-HE1, Class A4(g) | | Aaa | | 5.65% | | 03/25/36 | | | 3,200 | | | 3,212,935 |
Morgan Stanley ABS Capital I, Series 2002-NC6, Class M2(g) | | A2 | | 7.45% | | 11/25/32 | | | 478 | | | 479,430 |
Morgan Stanley ABS Capital I, Series 2003-HE1, Class M1(g) | | Aa2 | | 6.15% | | 05/25/33 | | | 2,187 | | | 2,194,588 |
Residential Asset Mortgage Products, Inc., Series 2004-RS12, Class MII2(g) | | Aa3 | | 6.15% | | 12/25/34 | | | 2,100 | | | 2,122,152 |
Saxon Asset Securities Trust, Series 2002-3, Class M1(g) | | Aaa | | 6.10% | | 12/25/32 | | | 1,930 | | | 1,932,681 |
Structured Asset Securities Corp., Series 2002-HF2, Class M3(g) | | BBB(f) | | 7.35% | | 07/25/32 | | | 1,345 | | | 1,243,941 |
| | | | | | | | | | | |
|
|
| | | | | | | | | | | | | 47,081,118 |
| | | | | | | | | | | |
|
|
Automotive — 1.5% | | | | | | | | | | | | |
Auburn Hills Trust, Inc. | | Baa1 | | 12.375% | | 05/01/20 | | | 640 | | | 944,922 |
Equus Cayman Finance, Ltd. (Cayman Islands), 144A(h) | | Baa3 | | 5.50% | | 09/12/08 | | | 830 | | | 827,634 |
Ford Motor Co., Bank Loan(i) | | Ba3 | | 8.36% | | 12/12/13 | | | 3,900 | | | 3,902,437 |
Ford Motor Credit Co. | | B1 | | 6.625% | | 06/16/08 | | | 3,500 | | | 3,497,613 |
General Motors Acceptance Corp.(a) | | Caa1 | | 7.20% | | 01/15/11 | | | 2,175 | | | 2,109,750 |
Hyundai Motor Manufacturing LLC, 144A(h) | | Baa3 | | 5.30% | | 12/19/08 | | | 1,820 | | | 1,807,513 |
Johnson Controls Inc. | | Baa1 | | 5.50% | | 01/15/16 | | | 300 | | | 294,148 |
Oshkosh Truck Corp., Bank Loan(i) | | Ba3 | | 7.35% | | 12/06/13 | | | 3,675 | | | 3,678,447 |
| | | | | | | | | | | |
|
|
| | | | | | | | | | | | | 17,062,464 |
| | | | | | | | | | | |
|
|
Banking — 2.9% | | | | | | | | | | | | |
Barclays Bank PLC, 144A(g)(h) | | Aa3 | | 5.926% | | 12/15/49 | | | 900 | | | 911,330 |
Chuo Mitsui Trust & Banking Co., Ltd., (Japan), 144A(g)(h) | | Baa1 | | 5.506% | | 12/31/49 | | | 3,050 | | | 2,913,174 |
Dresdner Kleinwort Wasserstein for CJSC (The) (Ukraine) | | Ba2 | | 7.75% | | 09/23/09 | | | 1,400 | | | 1,433,180 |
ICICI Bank, Ltd. (Singapore), 144A(a)(g)(h) | | Baa2 | | 7.25% | | 12/31/49 | | | 2,380 | | | 2,459,973 |
ICICI Bank, Ltd. (Singapore), 144A(h) | | Baa2 | | 5.75% | | 11/16/10 | | | 2,500 | | | 2,496,038 |
SEE NOTES TO FINANCIAL STATEMENTS.
B21
| | | | |
| | | DIVERSIFIED BOND PORTFOLIO (Continued) | | |
SCHEDULE OF INVESTMENTS | December 31, 2006 |
| | | | | | | | | | | | |
| LONG-TERM BONDS (Continued) | | Moody’s
Rating
(Unaudited)
| | Interest
Rate
| | Maturity
Date
| | Principal
Amount
(000)#
| | Value (Note 2)
|
Banking (cont’d.) | | | | | | | | | | | | |
Kazkommerts International BV, (Netherlands) 144A(h) | | Baa1 | | 7.875% | | 04/07/14 | | $ | 4,150 | | $ | 4,310,813 |
KBC Bank Funding Trust III, 144A(g)(h) | | A2 | | 9.86% | | 12/31/49 | | | 5,000 | | | 5,562,960 |
Mizuho Finance Group (Cayman Islands), MTN, 144A(h) | | A2 | | 5.79% | | 04/15/14 | | | 1,880 | | | 1,891,024 |
Resona Bank Ltd., 144A(g)(h) | | Baa1 | | 5.85% | | 09/29/49 | | | 2,900 | | | 2,831,725 |
Russian Standard Finance Bank, SA, 144A(h) | | Ba2 | | 7.50% | | 10/07/10 | | | 3,000 | | | 2,891,250 |
Sumitomo Mitsui Banking Corp. (Japan), 144A(g)(h) | | A2 | | 5.625% | | 07/15/49 | | | 6,380 | | | 6,236,698 |
| | | | | | | | | | | |
|
|
| | | | | | | | | | | | | 33,938,165 |
| | | | | | | | | | | |
|
|
Brokerage — 0.5% | | | | | | | | | | | | |
Goldman Sachs Group, Inc. | | A1 | | 6.45% | | 05/01/36 | | | 5,575 | | | 5,800,302 |
| | | | | | | | | | | |
|
|
Building Materials & Construction — 1.0% | | | | | | | | | | | | |
American Standard, Inc. | | Baa3 | | 7.625% | | 02/15/10 | | | 3,800 | | | 3,982,594 |
CRH America, Inc. | | Baa1 | | 6.00% | | 09/30/16 | | | 805 | | | 812,563 |
RPM International, Inc. | | Baa3 | | 4.45% | | 10/15/09 | | | 5,150 | | | 4,973,056 |
Ryland Group, Inc. | | Baa3 | | 5.375% | | 06/01/08 | | | 1,900 | | | 1,887,274 |
| | | | | | | | | | | |
|
|
| | | | | | | | | | | | | 11,655,487 |
| | | | | | | | | | | |
|
|
Cable — 1.3% | | | | | | | | | | | | |
AT&T Broadband | | Baa2 | | 9.455% | | 11/15/22 | | | 1,065 | | | 1,379,107 |
Charter Communications Operating Charter, Sr. Notes, 144A(h) | | B3 | | 8.375% | | 04/30/14 | | | 1,875 | | | 1,957,031 |
Comcast Corp. | | Baa2 | | 5.875% | | 02/15/18 | | | 3,500 | | | 3,462,393 |
CSC Holdings, Inc. | | B2 | | 7.875% | | 12/15/07 | | | 3,800 | | | 3,847,499 |
Mediacom Broadband LLC, 144A(a)(h) | | B3 | | 8.50% | | 10/15/15 | | | 2,925 | | | 2,961,563 |
TCI Communications, Inc. | | Baa2 | | 7.875% | | 02/15/26 | | | 750 | | | 856,479 |
| | | | | | | | | | | |
|
|
| | | | | | | | | | | | | 14,464,072 |
| | | | | | | | | | | |
|
|
Capital Goods — 1.2% | | | | | | | | | | | | |
Caterpillar, Inc. | | A2 | | 6.05% | | 08/15/36 | | | 260 | | | 267,627 |
Clarendon Alumina Production Ltd. (Jamaica), 144A(h) | | Ba2 | | 8.50% | | 11/16/21 | | | 1,875 | | | 1,954,688 |
FedEx Corp. | | Baa2 | | 7.25% | | 02/15/11 | | | 1,750 | | | 1,864,550 |
Rockwell Automation, Inc. | | A3 | | 5.20% | | 01/15/98 | | | 6,500 | | | 5,293,307 |
Tyco International Group SA (Luxembourg) | | Baa3 | | 6.00% | | 11/15/13 | | | 200 | | | 206,935 |
Tyco International Group SA (Luxembourg) | | Baa3 | | 6.75% | | 02/15/11 | | | 805 | | | 848,794 |
Waste Management, Inc. | | Baa3 | | 7.125% | | 10/01/07 | | | 1,550 | | | 1,564,400 |
Waste Management, Inc. | | Baa3 | | 7.65% | | 03/15/11 | | | 2,100 | | | 2,262,041 |
| | | | | | | | | | | |
|
|
| | | | | | | | | | | | | 14,262,342 |
| | | | | | | | | | | |
|
|
Chemicals — 2.2% | | | | | | | | | | | | |
Dow Chemical Co. | | A3 | | 5.97% | | 01/15/09 | | | 490 | | | 495,432 |
Dow Chemical Co. | | A3 | | 7.375% | | 11/01/29 | | | 845 | | | 976,700 |
Huntsman International LLC | | B2 | | 9.875% | | 03/01/09 | | | 1,478 | | | 1,522,340 |
Huntsman International LLC | | Ba3 | | 11.625% | | 10/15/10 | | | 2,100 | | | 2,294,250 |
ICI Wilmington, Inc. | | Baa3 | | 4.375% | | 12/01/08 | | | 2,040 | | | 2,001,624 |
Lubrizol Corp. | | Baa3 | | 4.625% | | 10/01/09 | | | 5,600 | | | 5,493,274 |
Lubrizol Corp. | | Baa3 | | 5.875% | | 12/01/08 | | | 550 | | | 553,226 |
Lubrizol Corp. | | Baa3 | | 6.50% | | 10/01/34 | | | 1,380 | | | 1,388,682 |
Monsanto Co. | | Baa1 | | 5.50% | | 08/15/25 | | | 4,560 | | | 4,360,226 |
Nalco Co., Sr. Notes | | B1 | | 7.75% | | 11/15/11 | | | 2,800 | | | 2,863,000 |
Union Carbide Chemical & Plastics Co. | | Ba2 | | 7.875% | | 04/01/23 | | | 3,058 | | | 3,306,909 |
| | | | | | | | | | | |
|
|
| | | | | | | | | | | | | 25,255,663 |
| | | | | | | | | | | |
|
|
Collateralized Mortgage Obligations — 1.0% | | | | | | | | | | | | |
Countrywide Alternative Loan Trust, Series 2004-18CB, Class 3A1 | | Aaa | | 5.25% | | 09/25/19 | | | 2,905 | | | 2,815,937 |
Master Alternative Loan Trust, Series 2004-4, Class 4A1 | | Aaa | | 5.00% | | 04/25/19 | | | 599 | | | 584,894 |
Structured Adjustable Rate Mortgage Loan Trust, Series 2004-1, Class 4A3(g) | | Aaa | | 4.17% | | 02/25/34 | | | 4,164 | | | 4,121,537 |
Washington Mutual Mortgage Pass-Through Certificates, Series 2005-1, Class 3A | | AAA(f) | | 5.00% | | 03/25/20 | | | 1,996 | | | 1,970,129 |
Washington Mutual, Series 2002-AR15, Class A5(g) | | Aaa | | 4.38% | | 12/25/32 | | | 1,577 | | | 1,560,421 |
| | | | | | | | | | | |
|
|
| | | | | | | | | | | | | 11,052,918 |
| | | | | | | | | | | |
|
|
SEE NOTES TO FINANCIAL STATEMENTS.
B22
| | | | |
| | | DIVERSIFIED BOND PORTFOLIO (Continued) | | |
SCHEDULE OF INVESTMENTS | December 31, 2006 |
| | | | | | | | | | | | |
| LONG-TERM BONDS (Continued) | | Moody’s
Rating
(Unaudited)
| | Interest
Rate
| | Maturity
Date
| | Principal
Amount
(000)#
| | Value (Note 2)
|
Commercial Mortgage-Backed Securities — 8.7% | | | | | | | | | | | | |
Banc of America Commercial Mortgage, Inc., Series 2005-1, Class ASB(g) | | AAA(f) | | 4.8645% | | 11/10/42 | | $ | 5,950 | | $ | 5,904,162 |
Banc of America Commercial Mortgage, Inc., Series 2006, Class A4(g) | | AAA(f) | | 5.7405% | | 05/10/45 | | | 9,400 | | | 9,720,066 |
Bear Stearns Commercial Mortgage Securities, Inc., Series 2005-T18, Class AAB(g) | | Aaa | | 4.823% | | 02/13/42 | | | 2,475 | | | 2,414,136 |
Bear Stearns Commercial Mortgage Securities, Inc., Series 2005-T20, Class AAB(g) | | Aaa | | 5.1394% | | 10/12/42 | | | 3,400 | | | 3,386,846 |
Citigroup Commercial Mortgage Trust, 2006-C4, Class A3(g) | | Aaa | | 5.72% | | 03/15/49 | | | 2,310 | | | 2,384,784 |
GMAC Commercial Mortgage Securities, Inc., Series 2002-C3, Class A2 | | Aaa | | 4.93% | | 07/10/39 | | | 8,500 | | | 8,364,434 |
Greenwich Capital Commercial Funding Corp., Series 2003-C1, Class A4 | | Aaa | | 4.111% | | 07/05/35 | | | 12,700 | | | 11,933,836 |
JP Morgan Chase Commercial Mortgage Securities Corp., Series 2003-ML1A, Class A2 | | Aaa | | 4.767% | | 03/12/39 | | | 4,969 | | | 4,834,230 |
JP Morgan Chase Commercial Mortgage Securities Corp., Series 2005-CB13, Class A4(g) | | Aaa | | 5.2943% | | 01/12/43 | | | 3,275 | | | 3,277,967 |
JP Morgan Chase Commercial Mortgage Securities Corp., Series 2005-LDP2, Class ASB | | Aaa | | 4.659% | | 07/15/42 | | | 9,300 | | | 9,016,671 |
JP Morgan Chase Commercial Mortgage Securities Corp., Series 2005-LDP4, Class A4(g) | | Aaa | | 4.918% | | 10/15/42 | | | 3,700 | | | 3,591,999 |
LB-UBS Commercial Mortgage Trust, Series 2003-C8, Class A3 | �� | Aaa | | 4.83% | | 11/15/27 | | | 3,375 | | | 3,315,751 |
LB-UBS Commercial Mortgage Trust, Series 2004-C8, Class A6(g) | | Aaa | | 4.799% | | 12/15/29 | | | 4,200 | | | 4,064,459 |
LB-UBS Commercial Mortgage Trust, Series 2006-C4, Class A4(g) | | Aaa | | 5.8996% | | 06/15/38 | | | 6,130 | | | 6,411,982 |
Merrill Lynch/Countrywide Commercial Mortgage, Series 2006-2, Class A4(g) | | Aaa | | 5.9098% | | 06/12/46 | | | 2,325 | | | 2,429,751 |
Morgan Stanley Dean Witter Capital I, Series 2000-PRIN, Class A3 | | Aaa | | 7.36% | | 02/23/34 | | | 522 | | | 527,659 |
PNC Mortgage Acceptance Corp., Series 2001-C1, Class A1 | | Aaa | | 5.91% | | 03/12/34 | | | 3,042 | | | 3,062,585 |
Wachovia Bank Commercial Mortgage Trust, Series 2002-C2, Class A4 | | Aaa | | 4.98% | | 11/15/34 | | | 2,500 | | | 2,465,432 |
Wachovia Bank Commercial Mortgage Trust, Series 2003-C3, Class A2 | | AAA(f) | | 4.867% | | 02/15/35 | | | 7,330 | | | 7,179,528 |
Wachovia Bank Commercial Mortgage Trust, Series 2003-C9, Class A3 | | AAA(f) | | 4.608% | | 12/15/35 | | | 4,750 | | | 4,636,576 |
Wachovia Bank Commercial Mortgage Trust, Series 2005-C18, Class APB | | Aaa | | 4.807% | | 04/15/42 | | | 1,500 | | | 1,462,680 |
| | | | | | | | | | | |
|
|
| | | | | | | | | | | | | 100,385,534 |
| | | | | | | | | | | |
|
|
Consumer — 0.6% | | | | | | | | | | | | |
Playtex Products, Inc. | | Ba3 | | 8.00% | | 03/01/11 | | | 1,850 | | | 1,933,250 |
Realogy Corp., 144A(h) | | Baa2 | | 6.15% | | 10/15/11 | | | 3,000 | | | 3,065,577 |
Western Union (The) Co., 144A(h) | | A3 | | 6.20% | | 11/17/36 | | | 2,450 | | | 2,301,444 |
| | | | | | | | | | | |
|
|
| | | | | | | | | | | | | 7,300,271 |
| | | | | | | | | | | |
|
|
Electric — 3.8% | | | | | | | | | | | | |
Arizona Public Services | | Baa2 | | 6.25% | | 08/01/16 | | | 1,750 | | | 1,790,618 |
CenterPoint Energy Houston Electric LLC | | Baa2 | | 5.70% | | 03/15/13 | | | 2,950 | | | 2,971,428 |
CMS Energy Corp. | | Ba3 | | 8.90% | | 07/15/08 | | | 2,570 | | | 2,685,650 |
Consumers Energy Co. | | Baa2 | | 5.00% | | 02/15/12 | | | 1,000 | | | 975,581 |
Consumers Energy Co. | | Baa2 | | 5.375% | | 04/15/13 | | | 1,000 | | | 990,322 |
Dominion Resources Inc | | Baa2 | | 5.15% | | 07/15/15 | | | 875 | | | 847,536 |
Edison Mission Energy(a) | | B1 | | 7.73% | | 06/15/09 | | | 2,420 | | | 2,504,700 |
Edison Mission Energy(a) | | B1 | | 7.75% | | 06/15/16 | | | 2,200 | | | 2,332,000 |
El Paso Electric Co. | | Baa3 | | 6.00% | | 05/15/35 | | | 2,325 | | | 2,228,696 |
Empresa Nacional de Electricidad SA (Chile) | | Baa3 | | 8.35% | | 08/01/13 | | | 625 | | | 708,911 |
Energy East Corp. | | Baa2 | | 6.75% | | 06/15/12 | | | 750 | | | 786,599 |
Energy East Corp. | | Baa2 | | 6.75% | | 09/15/33 | | | 1,150 | | | 1,207,880 |
Enersis SA (Chile)(a) | | Baa3 | | 7.375% | | 01/15/14 | | | 3,700 | | | 3,982,017 |
Exelon Corp. | | Baa2 | | 4.90% | | 06/15/15 | | | 500 | | | 471,610 |
FirstEnergy Corp. | | Baa3 | | 7.375% | | 11/15/31 | | | 945 | | | 1,076,200 |
Korea East-West Power Co., Ltd. (South Korea), 144A(h) | | A1 | | 4.875% | | 04/21/11 | | | 1,700 | | | 1,665,808 |
NiSource Finance Corp. | | Baa3 | | 5.45% | | 09/15/20 | | | 1,345 | | | 1,252,663 |
Northern States Power Co. | | A2 | | 8.00% | | 08/28/12 | | | 2,800 | | | 3,153,863 |
NRG Energy, Inc. | | B1 | | 7.25% | | 02/01/14 | | | 1,840 | | | 1,853,800 |
SEE NOTES TO FINANCIAL STATEMENTS.
B23
| | | | |
| | | DIVERSIFIED BOND PORTFOLIO (Continued) | | |
SCHEDULE OF INVESTMENTS | December 31, 2006 |
| | | | | | | | | | | | |
| LONG-TERM BONDS (Continued) | | Moody’s
Rating
(Unaudited)
| | Interest
Rate
| | Maturity
Date
| | Principal
Amount
(000)#
| | Value (Note 2)
|
Electric (cont’d.) | | | | | | | | | | | | |
NRG Energy, Inc. | | B1 | | 7.375% | | 01/15/17 | | $ | 1,735 | | $ | 1,739,338 |
Ohio Edison Co. | | Baa2 | | 6.875% | | 07/15/36 | | | 175 | | | 190,529 |
Oncor Electric Delivery Co. | | Baa2 | | 7.00% | | 09/01/22 | | | 300 | | | 322,697 |
Orion Power Holdings, Inc., Sr. Notes | | B2 | | 12.00% | | 05/01/10 | | | 1,920 | | | 2,179,200 |
Southern California Edison Co. | | A3 | | 7.625% | | 01/15/10 | | | 1,100 | | | 1,166,209 |
Teco Energy, Inc. | | Ba2 | | 7.50% | | 06/15/10 | | | 955 | | | 1,017,075 |
Xcel Energy, Inc. | | Baa1 | | 3.40% | | 07/01/08 | | | 1,330 | | | 1,291,062 |
Xcel Energy, Inc. | | Baa1 | | 7.00% | | 12/01/10 | | | 1,850 | | | 1,951,256 |
| | | | | | | | | | | |
|
|
| | | | | | | | | | | | | 43,343,248 |
| | | | | | | | | | | |
|
|
Emerging Markets — 0.3% | | | | | | | | | | | | |
Alfa Diversified Payment Rights Finance Co., 144A(g)(h) | | Baa3 | | 6.96% | | 03/15/11 | | | 3,243 | | | 3,230,428 |
| | | | | | | | | | | |
|
|
Energy – Integrated — 0.4% | | | | | | | | | | | | |
Conocophilips Canada Funding Co. (Canada) | | A1 | | 5.625% | | 10/15/16 | | | 4,700 | | | 4,722,344 |
| | | | | | | | | | | |
|
|
Energy – Other — 1.2% | | | | | | | | | | | | |
Anadarko Petroleum Corp. | | Baa2 | | 5.95% | | 09/15/16 | | | 1,635 | | | 1,638,422 |
Anadarko Petroleum Corp. | | Baa2 | | 6.45% | | 09/15/36 | | | 575 | | | 581,035 |
GS Caltex Corp., 144A(h) | | Baa1 | | 7.75% | | 07/25/11 | | | 3,250 | | | 3,543,176 |
Halliburton Co. | | Baa1 | | 5.50% | | 10/15/10 | | | 625 | | | 623,889 |
Newfield Exploration Co. | | Ba3 | | 6.625% | | 04/15/16 | | | 1,685 | | | 1,676,575 |
Occidental Petroleum Corp., MTN | | A3 | | 4.25% | | 03/15/10 | | | 3,250 | | | 3,158,360 |
Talisman Energy, Inc. (Canada) | | Baa2 | | 6.25% | | 02/01/38 | | | 1,600 | | | 1,543,698 |
Talisman Energy, Inc., (Canada) | | Baa2 | | 5.125% | | 05/15/15 | | | 1,190 | | | 1,128,373 |
| | | | | | | | | | | |
|
|
| | | | | | | | | | | | | 13,893,528 |
| | | | | | | | | | | |
|
|
Foods — 1.5% | | | | | | | | | | | | |
Cadbury Schweppes US Finance LLC, 144A(h) | | Baa2 | | 3.875% | | 10/01/08 | | | 2,600 | | | 2,532,088 |
HJ Heinz Co., 144A(h) | | Baa2 | | 6.428% | | 12/01/08 | | | 3,550 | | | 3,613,331 |
Kraft Foods, Inc. | | A3 | | 5.625% | | 11/01/11 | | | 860 | | | 869,141 |
Supervalu, Inc., Bank Loan(i) | | Ba3 | | 6.85% | | 06/02/11 | | | 3,000 | | | 2,927,754 |
The Kroger Co. | | Baa2 | | 6.75% | | 04/15/12 | | | 1,375 | | | 1,442,811 |
Tricon Global Restaurants, Inc. | | Baa2 | | 8.875% | | 04/15/11 | | | 1,705 | | | 1,912,620 |
Tyson Foods, Inc. | | Ba1 | | 6.85% | | 04/01/16 | | | 1,000 | | | 1,026,823 |
Tyson Foods, Inc. | | Ba2 | | 8.25% | | 10/01/11 | | | 2,550 | | | 2,755,584 |
| | | | | | | | | | | |
|
|
| | | | | | | | | | | | | 17,080,152 |
| | | | | | | | | | | |
|
|
Gaming — 0.6% | | | | | | | | | | | | |
Harrah’s Operating Co., Inc. | | Baa3 | | 5.625% | | 06/01/15 | | | 2,500 | | | 2,144,120 |
Mandalay Resorts Group | | B1 | | 9.375% | | 02/15/10 | | | 33 | | | 35,310 |
MGM Mirage, Inc. | | Ba2 | | 6.875% | | 04/01/16 | | | 3,000 | | | 2,880,000 |
Station Casinos, Inc. | | Ba3 | | 6.875% | | 03/01/16 | | | 2,210 | | | 1,983,475 |
| | | | | | | | | | | |
|
|
| | | | | | | | | | | | | 7,042,905 |
| | | | | | | | | | | |
|
|
Health Care & Pharmaceutical — 2.0% | | | | | | | | | | | | |
Accellent, Inc. | | Caa1 | | 10.50% | | 12/01/13 | | | 1,570 | | | 1,628,875 |
Alliance Imaging, Inc., Sr. Sub. Notes(a) | | B3 | | 7.25% | | 12/15/12 | | | 1,500 | | | 1,425,000 |
AmerisourceBergen Corp. | | Ba1 | | 5.875% | | 09/15/15 | | | 2,325 | | | 2,273,332 |
Boston Scientific Corp. | | Baa3 | | 6.40% | | 06/15/16 | | | 1,675 | | | 1,695,028 |
Cardinal Health, Inc. | | Baa2 | | 5.85% | | 12/15/17 | | | 3,130 | | | 3,112,405 |
HCA, Inc. | | Caa1 | | 6.25% | | 02/15/13 | | | 194 | | | 171,690 |
HCA, Inc. | | Caa1 | | 7.69% | | 06/15/25 | | | 1,100 | | | 910,472 |
HCA, Inc., 144A(h) | | B2 | | 9.625% | | 11/15/16 | | | 2,200 | | | 2,365,000 |
HCA, Inc., Bank Loan(i) | | Ba3 | | 8.086% | | 11/14/13 | | | 2,500 | | | 2,527,405 |
Merck & Co., Inc. | | Aa3 | | 5.75% | | 11/15/36 | | | 2,805 | | | 2,774,869 |
Merck & Co., Inc. | | Aa3 | | 5.95% | | 12/01/28 | | | 255 | | | 257,480 |
Teva Pharmaceutical Finance LLC | | Baa2 | | 6.15% | | 02/01/36 | | | 750 | | | 728,720 |
Ventas Realty LP, Sr. Notes(a) | | Ba2 | | 6.625% | | 10/15/14 | | | 2,100 | | | 2,147,250 |
Wyeth(b) | | A3 | | 5.50% | | 03/15/13 | | | 1,250 | | | 1,258,088 |
Wyeth(b) | | A3 | | 6.45% | | 02/01/24 | | | 95 | | | 101,630 |
| | | | | | | | | | | |
|
|
| | | | | | | | | | | | | 23,377,244 |
| | | | | | | | | | | |
|
|
SEE NOTES TO FINANCIAL STATEMENTS.
B24
| | | | |
| | | DIVERSIFIED BOND PORTFOLIO (Continued) | | |
SCHEDULE OF INVESTMENTS | December 31, 2006 |
| | | | | | | | | | | | |
| LONG-TERM BONDS (Continued) | | Moody’s
Rating
(Unaudited)
| | Interest
Rate
| | Maturity
Date
| | Principal
Amount
(000)#
| | Value (Note 2)
|
Health Care Insurance — 1.0% | | | | | | | | | | | | |
Aetna, Inc. | | A3 | | 6.625% | | 06/15/36 | | $ | 2,000 | | $ | 2,138,728 |
Coventry Health Care, Inc. | | Ba1 | | 6.125% | | 01/15/15 | | | 4,025 | | | 3,966,641 |
United Healthcare Corp. | | A3 | | 5.80% | | 03/15/36 | | | 310 | | | 304,829 |
Wellpoint, Inc. | | Baa1 | | 5.00% | | 12/15/14 | | | 1,310 | | | 1,268,277 |
Wellpoint, Inc. | | Baa1 | | 5.85% | | 01/15/36 | | | 3,500 | | | 3,400,061 |
| | | | | | | | | | | |
|
|
| | | | | | | | | | | | | 11,078,536 |
| | | | | | | | | | | |
|
|
Insurance — 1.4% | | | | | | | | | | | | |
Allied World Insurance Holdings, Ltd. (Bermuda) | | Baa1 | | 7.50% | | 08/01/16 | | | 1,700 | | | 1,824,486 |
Allstate Corp. | | A1 | | 5.55% | | 05/09/35 | | | 995 | | | 956,878 |
Allstate Corp. | | A1 | | 5.95% | | 04/01/36 | | | 3,730 | | | 3,793,286 |
American International Group, Inc. | | Aa2 | | 4.25% | | 05/15/13 | | | 1,820 | | | 1,706,556 |
American International Group, Inc. | | Aa2 | | 5.05% | | 10/01/15 | | | 315 | | | 306,298 |
Axis Capital Holdings | | Baa1 | | 5.75% | | 12/01/14 | | | 3,350 | | | 3,329,243 |
Berkshire Hathaway Finance Corp. | | Aaa | | 4.75% | | 05/15/12 | | | 3,400 | | | 3,332,289 |
Marsh & Mclennan Cos., Inc. | | Baa2 | | 5.75% | | 09/15/15 | | | 500 | | | 491,906 |
XL Capital, Ltd., Class A (Cayman Islands) | | A3 | | 5.25% | | 09/15/14 | | | 140 | | | 137,203 |
| | | | | | | | | | | |
|
|
| | | | | | | | | | | | | 15,878,145 |
| | | | | | | | | | | |
|
|
Lodging — 0.5% | | | | | | | | | | |
Carnival PLC (United Kingdom) | | A3 | | 7.30% | | 06/01/07 | | | 825 | | | 830,790 |
Felcor Lodging LP, 144A(g)(h) | | Ba3 | | 7.275% | | 12/01/11 | | | 1,800 | | | 1,809,000 |
Starwood Hotels & Resorts Worldwide, Inc. | | Baa3 | | 7.375% | | 05/01/07 | | | 3,000 | | | 3,012,255 |
| | | | | | | | | | | |
|
|
| | | | | | | | | | | | | 5,652,045 |
| | | | | | | | | | | |
|
|
Media & Entertainment — 2.2% | | | | | | | | | | | | |
Clear Channel Communications, Inc. | | Baa3 | | 8.00% | | 11/01/08 | | | 4,720 | | | 4,907,191 |
Idearc, Inc., Bank Loan(i) | | Ba2 | | 7.3762% | | 11/09/14 | | | 1,750 | | | 1,758,750 |
Intelsat Bermuda Ltd. (Bermuda), 144A(h) | | B2 | | 9.25% | | 06/15/16 | | | 2,300 | | | 2,472,500 |
Quebecor World Capital Corp. (Canada), 144A(h) | | B2 | | 8.75% | | 03/15/16 | | | 1,900 | | | 1,819,250 |
RH Donnelley Corp. | | B3 | | 6.875% | | 01/15/13 | | | 1,300 | | | 1,246,375 |
Thomson Corp. (Canada) | | A3 | | 5.75% | | 02/01/08 | | | 2,750 | | | 2,758,236 |
Time Warner, Inc.(a) | | Baa2 | | 5.875% | | 11/15/16 | | | 4,615 | | | 4,603,347 |
Viacom, Inc. | | Baa3 | | 5.75% | | 04/30/11 | | | 1,300 | | | 1,300,664 |
Viacom, Inc. | | Baa3 | | 6.25% | | 04/30/16 | | | 4,100 | | | 4,071,599 |
Viacom, Inc. | | Baa3 | | 7.875% | | 07/30/30 | | | 425 | | | 445,370 |
| | | | | | | | | | | |
|
|
| | | | | | | | | | | | | 25,383,282 |
| | | | | | | | | | | |
|
|
Metals — 0.6% | | | | | | | | | | | | |
Arch Western Finance LLC, Sr. Notes | | B1 | | 6.75% | | 07/01/13 | | | 3,000 | | | 2,977,500 |
Russel Metals, Inc., Sr. Notes (Canada) | | Ba2 | | 6.375% | | 03/01/14 | | | 1,800 | | | 1,716,750 |
Southern Copper Corp. | | Baa2 | | 7.50% | | 07/27/35 | | | 1,600 | | | 1,734,859 |
| | | | | | | | | | | |
|
|
| | | | | | | | | | | | | 6,429,109 |
| | | | | | | | | | | |
|
|
Non-Captive Finance — 1.8% | | | | | | | | | | | | |
Capital One Financial Corp. | | Baa1 | | 6.15% | | 09/01/16 | | | 700 | | | 723,948 |
General Electric Capital Australia Funding | | Aaa | | 6.00% | | 04/15/15 | | | AUD 4,440 | | | 3,350,900 |
General Motors Acceptance Corp. | | Ba1 | | 6.15% | | 04/05/07 | | | 3,710 | | | 3,710,115 |
General Motors Acceptance Corp. MTN | | Ba1 | | 6.125% | | 03/15/07 | | | EUR 3,260 | | | 4,314,574 |
Preferred Term Securities X, Class A-1, 144A(g)(h)(i) | | Aaa | | 6.0906% | | 07/03/33 | | | 3,900 | | | 3,929,250 |
Residential Capital Corp. | | Baa3 | | 6.50% | | 04/17/13 | | | 3,500 | | | 3,547,023 |
Residential Capital Corp. | | Baa3 | | 6.875% | | 06/30/15 | | | 1,550 | | | 1,606,863 |
| | | | | | | | | | | |
|
|
| | | | | | | | | | | | | 21,182,673 |
| | | | | | | | | | | |
|
|
Non-Corporate Foreign Agency — 2.0% | | | | | | | | | | | | |
Credit Suisse First Boston International for CJSC (The) (Ukraine) | | Ba2 | | 6.80% | | 10/04/12 | | | 1,400 | | | 1,363,964 |
Gazprom International SA (Chile), 144A(h) | | BBB+(f) | | 7.201% | | 02/01/20 | | | 2,400 | | | 2,538,000 |
Gazprom OAO (Russia) | | BB-(f) | | 10.50% | | 10/21/09 | | | 1,685 | | | 1,904,050 |
National Power Corp. (Philippines), 144A(g)(h) | | BB-(f) | | 9.62% | | 08/23/11 | | | 1,530 | | | 1,723,892 |
National Power Corp. (Philippines) | | B1 | | 9.625% | | 05/15/28 | | | 2,095 | | | 2,540,655 |
Pemex Project Funding Master Trust (Mexico) | | Baa1 | | 8.85% | | 09/15/07 | | | 4,450 | | | 4,547,900 |
Petronas Capital, Ltd. (Malaysia), 144A(h) | | A1 | | 7.00% | | 05/22/12 | | | 7,300 | | | 7,872,393 |
| | | | | | | | | | | |
|
|
| | | | | | | | | | | | | 22,490,854 |
| | | | | | | | | | | |
|
|
SEE NOTES TO FINANCIAL STATEMENTS.
B25
| | | | |
| | | DIVERSIFIED BOND PORTFOLIO (Continued) | | |
SCHEDULE OF INVESTMENTS | December 31, 2006 |
| | | | | | | | | | | |
| LONG-TERM BONDS (Continued) | | Moody’s
Rating
(Unaudited)
| | Interest
Rate
| | Maturity
Date
| | Principal
Amount
(000)#
| | Value (Note 2)
|
Non-Corporate Sovereign — 7.7% | | | | | | | | | | | |
Deutsche Bundesrepublik (Denmark) | | Aaa | | 4.00% | | 01/04/37 | | EUR 595 | | $ | 774,195 |
Federal Republic of Argentina (Argentina)(g) | | B3 | | 3.00% | | 04/30/13 | | 2,468 | | | 1,902,443 |
Federal Republic of Argentina (Argentina)(g) | | B3 | | 5.589% | | 08/03/12 | | 2,400 | | | 2,266,043 |
Federal Republic of Brazil (Brazil)(a) | | Ba2 | | 9.25% | | 10/22/10 | | 5,325 | | | 6,017,250 |
Federal Republic of Brazil (Brazil) | | Ba2 | | 10.25% | | 06/17/13 | | 2,425 | | | 2,994,875 |
Federal Republic of Brazil (Brazil)(a) | | Ba2 | | 12.50% | | 01/05/16 | | BRL 4,750 | | | 2,523,403 |
Government of Hungary (Hungary) | | A2 | | 8.00% | | 02/12/15 | | HUF 2,893,570 | | | 16,164,121 |
Government of Japan (Japan) | | A2 | | 2.20% | | 09/20/26 | | JPY 168,250 | | | 1,442,311 |
Jamaica Government Bond (Jamaica) | | B1 | | 11.00% | | 07/27/12 | | EUR 995 | | | 1,592,552 |
Norway Government Bond (Norway) | | Aaa | | 5.00% | | 05/15/15 | | NOK 30,470 | | | 5,089,627 |
Peru Government International Bond (Peru), 144A(h) | | Ba3 | | Zero | | 05/31/18 | | 1,837 | | | 1,217,013 |
Republic of Colombia (Colombia)(g) | | Ba2 | | 7.175% | | 11/16/15 | | 2,500 | | | 2,587,500 |
Republic of Peru (Peru)(g) | | Ba3 | | 5.00% | | 03/07/17 | | 2,267 | | | 2,249,601 |
Republic of Panama (Panama) | | Ba1 | | 9.375% | | 07/23/12 | | 1,295 | | | 1,518,388 |
Republic of Panama (Panama) | | Ba1 | | 7.25% | | 03/15/15 | | 2,375 | | | 2,570,938 |
Republic of Poland (Poland) | | A2 | | 6.25% | | 10/24/15 | | PLN 36,085 | | | 13,337,951 |
Republic of Turkey (Turkey) | | Ba3 | | 9.875% | | 03/19/08 | | 1,845 | | | 1,937,250 |
Republic of Uruguay (Uruguay) | | B1 | | 7.25% | | 02/15/11 | | 660 | | | 689,700 |
Republic of Venezuela (Venezuela) | | B2 | | 10.75% | | 09/19/13 | | 2,385 | | | 2,963,363 |
Russian Government International Bond (Russia), 144A(h) | | Baa2 | | 8.25% | | 03/31/10 | | 4,037 | | | 4,218,383 |
United Mexican States (Mexico)(g) | | Baa1 | | 6.0734% | | 01/13/09 | | 2,090 | | | 2,108,810 |
United Mexican States (Mexico)(a) | | Baa1 | | 7.50% | | 01/14/12 | | 4,250 | | | 4,658,000 |
United Mexican States (Mexico) | | Baa1 | | 9.00% | | 12/20/12 | | MXP 77,200 | | | 7,709,994 |
| | | | | | | | | | |
|
|
| | | | | | | | | | | | 88,533,711 |
| | | | | | | | | | |
|
|
Paper — 1.4% | | | | | | | | | | | |
Catalyst Paper Corp. | | B2 | | 8.625% | | 06/15/11 | | 2,100 | | | 2,126,250 |
Domtar, Inc. (Canada) | | B2 | | 7.875% | | 10/15/11 | | 675 | | | 700,313 |
Domtar, Inc. (Canada) | | B2 | | 5.375% | | 12/01/13 | | 1,000 | | | 905,000 |
Graphic Packaging International, Inc. | | B2 | | 8.50% | | 08/15/11 | | 2,970 | | | 3,073,950 |
International Paper Co. | | Baa3 | | 4.00% | | 04/01/10 | | 2,815 | | | 2,701,857 |
Norampac, Inc., Sr. Notes (Canada) | | Ba3 | | 6.75% | | 06/01/13 | | 1,900 | | | 1,847,750 |
Stora Enso Oyj (Finland), 144A(a)(h) | | Baa3 | | 7.25% | | 04/15/36 | | 1,560 | | | 1,635,126 |
Weyerhaeuser Co. | | Baa2 | | 7.375% | | 03/15/32 | | 3,495 | | | 3,648,168 |
| | | | | | | | | | |
|
|
| | | | | | | | | | | | 16,638,414 |
| | | | | | | | | | |
|
|
Pipelines & Other — 1.3% | | | | | | | | | | | |
Atmos Energy Corp.(e) | | Baa3 | | 4.00% | | 10/15/09 | | 5,300 | | | 5,098,600 |
Enterprise Products Operating LP | | Baa3 | | 4.00% | | 10/15/07 | | 4,000 | | | 3,951,068 |
Oneok, Inc. | | Baa2 | | 5.51% | | 02/16/08 | | 6,000 | | | 5,995,740 |
| | | | | | | | | | |
|
|
| | | | | | | | | | | | 15,045,408 |
| | | | | | | | | | |
|
|
Real Estate Investment Trusts — 0.4% | | | | | | | | | | | |
Equity One, Inc. | | Baa3 | | 3.875% | | 04/15/09 | | 1,450 | | | 1,394,933 |
Post Apartment Homes LP | | Baa3 | | 5.45% | | 06/01/12 | | 2,300 | | | 2,252,883 |
Spieker Properties LP | | Baa2 | | 7.65% | | 12/15/10 | | 1,000 | | | 1,095,380 |
| | | | | | | | | | |
|
|
| | | | | | | | | | | | 4,743,196 |
| | | | | | | | | | |
|
|
Retailers — 1.5% | | | | | | | | | | | |
GSC Holdings Corp.(g) | | B1 | | 9.2466% | | 10/01/11 | | 3,000 | | | 3,112,500 |
Home Depot, Inc. | | Aa3 | | 5.875% | | 12/16/36 | | 4,600 | | | 4,514,090 |
May Department Stores Co. | | Baa1 | | 6.65% | | 07/15/24 | | 900 | | | 891,713 |
The Gap, Inc. | | Baa3 | | 6.90% | | 09/15/07 | | 8,875 | | | 8,936,442 |
| | | | | | | | | | |
|
|
| | | | | | | | | | | | 17,454,745 |
| | | | | | | | | | |
|
|
Structured Notes — 3.3% | | | | | | | | | | | |
Dow Jones CDX HY, 144A(h) | | B3 | | 8.25% | | 12/29/10 | | 8,500 | | | 8,786,875 |
Dow Jones CDX HY, 144A(h) | | B3 | | 8.625% | | 06/29/11 | | 10,230 | | | 10,632,039 |
Trains HY-1 2006, 144A(a)(h) | | B1 | | 7.548% | | 05/01/16 | | 18,576 | | | 18,956,436 |
| | | | | | | | | | |
|
|
| | | | | | | | | | | | 38,375,350 |
| | | | | | | | | | |
|
|
SEE NOTES TO FINANCIAL STATEMENTS.
B26
| | | | |
| | | DIVERSIFIED BOND PORTFOLIO (Continued) | | |
SCHEDULE OF INVESTMENTS | December 31, 2006 |
| | | | | | | | | | | | |
| LONG-TERM BONDS (Continued) | | Moody’s
Rating
(Unaudited)
| | Interest
Rate
| | Maturity Date
| | Principal
Amount
(000)#
| | Value (Note 2)
|
Technology — 2.0% | | | | | | | | | | | | |
Advanced Micro Devices, Inc., Bank Loan(i) | | Ba3 | | 7.62% | | 10/24/13 | | $ | 2,666 | | $ | 2,671,782 |
Certegy, Inc. | | Ba2 | | 4.75% | | 09/15/08 | | | 1,900 | | | 1,835,007 |
Equifax, Inc. | | Baa1 | | 4.95% | | 11/01/07 | | | 1,340 | | | 1,330,692 |
Freescale Semiconductor, Inc., 144A(h) | | B1 | | 9.125% | | 12/15/14 | | | 2,600 | | | 2,583,750 |
Freescale Semiconductor, Inc., 144A(h) | | B2 | | 10.125% | | 12/15/16 | | | 1,500 | | | 1,501,875 |
Jabil Circuit, Inc. | | Baa3 | | 5.875% | | 07/15/10 | | | 2,000 | | | 1,985,848 |
Motorola, Inc. | | Baa1 | | 8.00% | | 11/01/11 | | | 121 | | | 133,894 |
NXP BV/NXP Funding LLC, 144A(a)(h) | | B2 | | 9.50% | | 10/15/15 | | | 1,970 | | | 2,019,250 |
Sensata Technologies BV (Netherlands), 144A(h) | | Caa1 | | 8.25% | | 05/01/14 | | | 3,590 | | | 3,446,400 |
SunGard Data Systems, Inc. | | B3 | | 3.75% | | 01/15/09 | | | 720 | | | 680,400 |
Xerox Corp. | | Baa3 | | 6.40% | | 03/15/16 | | | 4,450 | | | 4,544,563 |
| | | | | | | | | | | |
|
|
| | | | | | | | | | | | | 22,733,461 |
| | | | | | | | | | | |
|
|
Telecommunications — 4.8% | | | | | | | | | | | | |
ALLTEL LP, 144A(h) | | A2 | | 8.00% | | 08/15/10 | | | 735 | | | 788,070 |
AT&T Corp.(a) | | A2 | | 4.125% | | 09/15/09 | | | 4,150 | | | 4,030,704 |
AT&T Corp. | | A2 | | 8.00% | | 11/15/31 | | | 2,475 | | | 3,070,678 |
AT&T Wireless Services, Inc. | | Baa1 | | 8.75% | | 03/01/31 | | | 2,375 | | | 3,086,467 |
BellSouth Corp. | | A2 | | 4.20% | | 09/15/09 | | | 2,750 | | | 2,673,377 |
Citizens Communications Co. | | Ba2 | | 7.625% | | 08/15/08 | | | 903 | | | 934,605 |
Embarq Corp. | | Baa3 | | 7.082% | | 06/01/16 | | | 5,600 | | | 5,700,912 |
LCI International, Inc. | | NR | | 7.25% | | 06/15/07 | | | 6,675 | | | 6,691,687 |
Level 3 Financing, Inc., 144A(h) | | B2 | | 9.25% | | 11/01/14 | | | 1,650 | | | 1,683,000 |
New Cingular Wireless Services, Inc. | | Baa1 | | 8.125% | | 05/01/12 | | | 1,810 | | | 2,036,735 |
Sprint Nextel Corp. | | Baa3 | | 6.00% | | 12/01/16 | | | 3,625 | | | 3,533,023 |
Telecom de Puerto Rico (Puerto Rico) | | Baa1 | | 6.80% | | 05/15/09 | | | 4,365 | | | 4,455,661 |
Telecom Italia Capital (Luxemburg) | | Baa2 | | 7.20% | | 07/18/36 | | | 2,400 | | | 2,507,323 |
Telecom Italia Capital (Luxemburg) | | Baa2 | | 4.95% | | 09/30/14 | | | 605 | | | 560,497 |
Telecom Italia Capital (Luxemburg) | | Baa2 | | 5.25% | | 10/01/15 | | | 1,355 | | | 1,265,718 |
Telefonica Emisiones SAU | | Baa1 | | 6.421% | | 06/20/16 | | | 5,500 | | | 5,673,899 |
TELUS Corp. (Canada) | | Baa2 | | 7.50% | | 06/01/07 | | | 6,250 | | | 6,296,256 |
TELUS Corp. (Canada) | | Baa2 | | 8.00% | | 06/01/11 | | | 150 | | | 164,031 |
| | | | | | | | | | | |
|
|
| | | | | | | | | | | | | 55,152,643 |
| | | | | | | | | | | |
|
|
Tobacco — 0.6% | | | | | | | | | | | | |
Altria Group, Inc. | | Baa1 | | 7.65% | | 07/01/08 | | | 1,100 | | | 1,134,066 |
Altria Group, Inc. | | Baa1 | | 7.75% | | 01/15/27 | | | 315 | | | 382,060 |
Reynolds American, Inc. | | BB(f) | | 6.50% | | 07/15/10 | | | 4,000 | | | 4,057,456 |
Reynolds American, Inc. | | Ba3 | | 7.625% | | 06/01/16 | | | 1,020 | | | 1,080,725 |
| | | | | | | | | | | |
|
|
| | | | | | | | | | | | | 6,654,307 |
| | | | | | | | | | | |
|
|
U.S. Government Agency Obligations — 0.2% | | | | | | | | | | | | |
Federal Home Loan Bank | | Aaa | | 4.75% | | 12/16/16 | | | 105 | | | 102,803 |
Federal Home Loan Mortgage Corp. | | Aaa | | 5.50% | | 07/18/16 | | | 120 | | | 124,487 |
Federal Home Loan Mortgage Corp. | | Aaa | | 5.125% | | 10/18/16 | | | 115 | | | 115,985 |
Federal National Mortgage Association | | Aaa | | 4.875% | | 12/15/16 | | | 20 | | | 19,776 |
Federal National Mortgage Association | | Aaa | | 6.625% | | 11/15/30 | | | 170 | | | 202,861 |
Tennessee Valley Authority | | Aaa | | 5.88% | | 04/01/36 | | | 1,315 | | | 1,445,857 |
| | | | | | | | | | | |
|
|
| | | | | | | | | | | | | 2,011,769 |
| | | | | | | | | | | |
|
|
U.S. Government Mortgage-Backed Securities — 29.9% | | | | | | | | | | | | |
Federal Home Loan Mortgage Corp. | | Aaa | | 4.50% | | 02/01/19-07/01/19 | | | 17,368 | | | 16,760,176 |
Federal Home Loan Mortgage Corp. | | Aaa | | 5.00% | | 07/01/19-05/01/34 | | | 8,642 | | | 8,443,933 |
Federal Home Loan Mortgage Corp. | | Aaa | | 5.00% | | TBA 30 YR | | | 8,500 | | | 8,199,848 |
Federal Home Loan Mortgage Corp. | | Aaa | | 5.50% | | 10/01/33-06/01/34 | | | 6,212 | | | 6,158,259 |
Federal Home Loan Mortgage Corp. | | Aaa | | 6.00% | | 11/01/33-06/01/34 | | | 7,104 | | | 7,164,221 |
Federal Home Loan Mortgage Corp. | | Aaa | | 6.00% | | TBA 30 YR | | | 2,500 | | | 2,517,970 |
Federal Home Loan Mortgage Corp. | | Aaa | | 6.50% | | 07/01/32-09/01/32 | | | 3,382 | | | 3,458,430 |
SEE NOTES TO FINANCIAL STATEMENTS.
B27
| | | | |
| | | DIVERSIFIED BOND PORTFOLIO (Continued) | | |
SCHEDULE OF INVESTMENTS | December 31, 2006 |
| | | | | | | | | | | | | |
| LONG-TERM BONDS (Continued) | | Moody’s
Rating
(Unaudited)
| | Interest
Rate
| | Maturity Date
| | Principal
Amount
(000)#
| | Value (Note 2)
| |
U.S. Government Mortgage-Backed Securities (cont’d.) | | | | | | | | | | | | | |
Federal Home Loan Mortgage Corp. | | Aaa | | 7.00% | | 10/01/32-11/01/33 | | $ | 6,882 | | $ | 7,078,887 | |
Federal National Mortgage Association | | Aaa | | 4.00% | | 05/01/19-06/01/19 | | | 8,263 | | | 7,787,500 | |
Federal National Mortgage Association | | Aaa | | 4.50% | | 06/01/18-02/01/35 | | | 33,720 | | | 32,395,534 | |
Federal National Mortgage Association | | Aaa | | 5.00% | | 01/01/19-03/01/34 | | | 48,578 | | | 47,111,438 | |
Federal National Mortgage Association | | Aaa | | 5.00% | | TBA 15 YR | | | 15,000 | | | 14,742,180 | |
Federal National Mortgage Association | | Aaa | | 5.00% | | TBA 30 YR | | | 3,000 | | | 2,895,936 | |
Federal National Mortgage Association(g) | | Aaa | | 5.279% | | 01/01/36 | | | 4,016 | | | 4,009,212 | |
Federal National Mortgage Association | | Aaa | | 5.50% | | TBA 30 YR | | | 56,500 | | | 55,829,063 | |
Federal National Mortgage Association | | Aaa | | 5.50% | | 12/01/16-09/01/34 | | | 39,111 | | | 38,839,179 | |
Federal National Mortgage Association | | Aaa | | 6.00% | | TBA 15 YR | | | 7,500 | | | 7,603,125 | |
Federal National Mortgage Association | | Aaa | | 6.00% | | TBA 30 YR | | | 5,500 | | | 5,536,091 | |
Federal National Mortgage Association | | Aaa | | 6.00% | | 09/01/17-02/01/35 | | | 21,421 | | | 21,623,049 | |
Federal National Mortgage Association | | Aaa | | 6.50% | | 11/01/09-11/01/33 | | | 7,856 | | | 8,039,769 | |
Federal National Mortgage Association | | Aaa | | 7.00% | | 05/01/32-06/01/32 | | | 689 | | | 708,360 | |
Federal National Mortgage Association | | Aaa | | 9.00% | | 10/01/16-05/01/17 | | | 19 | | | 19,797 | |
Government National Mortgage Association | | Aaa | | 5.50% | | TBA 30 YR | | | 250 | | | 248,750 | |
Government National Mortgage Association | | Aaa | | 5.50% | | 01/15/33-07/15/35 | | | 18,397 | | | 18,303,823 | |
Government National Mortgage Association | | Aaa | | 6.00% | | 12/15/32-11/15/34 | | | 11,430 | | | 11,587,771 | |
Government National Mortgage Association | | Aaa | | 6.50% | | 09/15/32-11/15/33 | | | 6,099 | | | 6,264,218 | |
Government National Mortgage Association | | Aaa | | 7.50% | | 10/15/25-02/15/26 | | | 200 | | | 208,667 | |
| | | | | | | | | | | |
|
|
|
| | | | | | | | | | | | | 343,535,186 | |
| | | | | | | | | | | |
|
|
|
U.S. Government Treasury Securities — 0.3% | | | | | | | | | | | | | |
United States Treasury Bonds(a) | | Aaa | | 4.50% | | 02/15/36 | | | 200 | | | 190,188 | |
United States Treasury Notes(a) | | Aaa | | 4.625% | | 11/15/16 | | | 1,285 | | | 1,276,568 | |
United States Treasury Notes(a) | | Aaa | | 4.625% | | 11/15/16 | | | 2,430 | | | 2,414,054 | |
| | | | | | | | | | | |
|
|
|
| | | | | | | | | | | | | 3,880,810 | |
| | | | | | | | | | | |
|
|
|
TOTAL LONG-TERM BONDS
(cost $1,137,656,890) | | | 1,142,714,909 | |
| | | | | | | | | | | |
|
|
|
| SHORT-TERM INVESTMENTS — 9.8% | | | | | | | | Shares
| | | |
Affiliated Money Market Mutual Funds | | | | | | | | | | | | | |
Dryden Core Investment Fund- Dryden Short-Term Bond Series(d) | | | | | | | | | 3,345,946 | | | 33,492,916 | |
Dryden Core Investment Fund-Taxable Money Market Fund Series (includes $54,138,631 of cash collateral received for securities on loan) (Note 4)(c)(d) | | | | | | | | | 78,680,564 | | | 78,680,564 | |
| | | | | | | | | | | |
|
|
|
TOTAL AFFILIATED MONEY MARKET MUTUAL FUNDS
(cost $112,153,335) | | | 112,173,480 | |
| | | | | | | | | | | |
|
|
|
TOTAL INVESTMENTS, BEFORE SECURITY SOLD SHORT — 109.1%
(cost $1,249,810,225) | | | 1,254,888,389 | |
| | | | | | | | | | | |
|
|
|
| | | | | |
| SECURITY SOLD SHORT — (1.7)% | | Moody’s
Rating
| | Interest
Rate
| | Maturity
Date
| | Principal
Amount
(000)
| | Value (Note 2)
| |
U.S. Government Mortgage-Backed Securities | | | | | | | | | | | | | |
Federal National Mortgage Association (proceeds $19,425,000) | | Aaa | | 4.50% | | TBA | | $ | 20,000 | | | (19,287,500 | ) |
| | | | | | | | | | | |
|
|
|
TOTAL INVESTMENTS, NET OF SECURITY SOLD SHORT — 107.4%
(cost $1,230,385,225) | | | | | | 1,235,600,889 | |
LIABILITIES IN EXCESS OF OTHER ASSETS(j) — (7.4%) | | | | | | (85,235,809 | ) |
| | | | | | | | | | | |
|
|
|
TOTAL NET ASSETS — 100.0% | | | | | $ | 1,150,365,080 | |
| | | | | | | | | | | |
|
|
|
SEE NOTES TO FINANCIAL STATEMENTS.
B28
| | | | |
| | | DIVERSIFIED BOND PORTFOLIO (Continued) | | |
SCHEDULE OF INVESTMENTS | December 31, 2006 |
The following abbreviations are used in portfolio descriptions:
| | |
| AUD | | Australian Dollar |
| BRL | | Brazilian Real |
| EUR | | Euro Dollar |
| HUF | | Hungarian Forint |
| JPY | | Japanese Yen |
| MTN | | Medium Term Note |
| MXP | | Mexican Peso |
| NOK | | Norwegian Krone |
| NR | | Not Rated by Moody’s or Standard & Poor’s |
| PLN | | Polish Zloty |
| TBA | | Securities purchased on a forward commitment basis |
| # | Principal amount shown in U.S. dollars unless otherwise stated. |
| (a) | All or portion of security is on loan. The aggregate market value of such securities is $52,884,013; cash collateral of $54,138,631 (included in liabilities) was received with which the Portfolio purchased highly liquid short-term investments. |
| (b) | Increase/decrease in rate variable upon increase/decrease in Moody’s or Standard & Poor’s rating. |
| (c) | Represents security, or a portion thereof, purchased with cash collateral received for securities on loan. |
| (d) | Prudential Investments LLC, the manager of the Portfolio, also serves as manager of the Dryden Core Investment Fund — Taxable Money Market Series and the Dryden Core Investment Fund — Dryden Short-Term Bond Series. |
| (e) | Security segregated as collateral for future contracts. |
| (f) | Standard & Poor’s rating. |
| (g) | Indicates a variable rate security. The maturity date presented for these instruments is the latter of the next date on which the security can be redeemed at par or the next date on which the rate of interest is adjusted. The interest rate shown reflects the rate in effect at December 31, 2006. |
| (h) | Security was purchased pursuant to Rule 144A under the Securities Act of 1933 and may not be resold subject to that rule except to qualified institutional buyers. Unless otherwise noted, 144A securities are deemed to be liquid. |
| (i) | Indicates a security that has been deemed illiquid. |
| (j) | Liabilities in excess of other assets include net unrealized appreciation (depreciation) on financial futures, interest rate swaps, credit default swaps and foreign currency contracts as follows: |
Open future contracts outstanding at December 31, 2006:
| | | | | | | | | | | | | | |
Number of
Contracts
| | Type
| | Expiration
Date
| | Value at
Trade Date
| | Value at
December 31, 2006
| | Unrealized
Appreciation
(Depreciation)
| |
| Long Positions: | | | | | | | | | | | | | | |
| 34 | | Canadian 10 Yr Bond | | Mar. 2007 | | $ | 3,352,107 | | $ | 3,318,510 | | $ | (33,597 | ) |
| 80 | | Eurodollar | | Mar. 2007 | | | 12,487,910 | | | 12,253,185 | | | (234,725 | ) |
| 41 | | U.K. 10 Yr Bond | | Mar. 2007 | | | 8,801,662 | | | 8,680,379 | | | (121,283 | ) |
| 839 | | U.S. Treasury 10 Yr. Bond | | Mar. 2007 | | | 94,836,138 | | | 93,496,063 | | | (1,340,075 | ) |
| | | | | | | | | | | | |
|
|
|
| | | | | | | | | | | | | | (1,729,680 | ) |
| | | | | | | | | | | | |
|
|
|
| Short Positions: | | | | | | | | | | | | | | |
| 169 | | U.S. Treasury 5 Yr. Notes | | Mar. 2007 | | | 17,946,770 | | | 17,755,563 | | | 191,207 | |
| 110 | | U.S. Treasury 2 Yr. Notes | | Mar. 2007 | | | 22,592,833 | | | 22,443,438 | | | 149,395 | |
| 1358 | | U.S. Treasury 10 Yr. Notes | | Mar. 2007 | | | 147,560,657 | | | 145,942,563 | | | 1,618,094 | |
| | | | | | | | | | | | |
|
|
|
| | | | | | | | | | | | | | 1,958,696 | |
| | | | | | | | | | | | |
|
|
|
| | | | | | | | | | | | | $ | 229,016 | |
| | | | | | | | | | | | |
|
|
|
SEE NOTES TO FINANCIAL STATEMENTS.
B29
| | | | |
| | | DIVERSIFIED BOND PORTFOLIO (Continued) | | |
SCHEDULE OF INVESTMENTS | December 31, 2006 |
Forward Foreign currency exchange contracts outstanding at December 31, 2006:
| | | | | | | | | | |
Foreign Currency Contract
| | Value at
Settlement Date
| | Current
Value
| | Unrealized
Appreciation/
(Depreciation)
| |
Purchased: | | | | | | | | | | |
Brazilian Real expiring 10/23/08 | | $ | 2,775,000 | | $ | 3,092,791 | | $ | 317,791 | |
Japanese Yen expiring 01/24/07 | | | 2,217,281 | | | 2,204,654 | | | (12,627 | ) |
Norwegian Krone expiring 01/22/07 | | | 3,398,888 | | | 3,401,740 | | | 2,852 | |
| | |
|
| |
|
| |
|
|
|
| | | | 8,391,169 | | | 8,699,185 | | | 308,016 | |
| | |
|
| |
|
| |
|
|
|
Sold: | | | | | | | | | | |
Australian Dollar expiring 01/19/07 | | | 3,285,773 | | | 3,298,715 | | | (12,942 | ) |
Euro expiring 01/24/07 | | | 6,690,847 | | | 6,739,742 | | | (48,895 | ) |
Hungarian Forint expiring 01/22/07 | | | 16,480,840 | | | 16,612,076 | | | (131,236 | ) |
Japanese Yen expiring 01/24/07 | | | 3,511,312 | | | 3,468,046 | | | 43,266 | |
Mexican Nuevo Peso expiring 01/18/07 | | | 6,075,507 | | | 6,098,448 | | | (22,941 | ) |
Norwegian Krone expiring 01/22/07 | | | 8,748,426 | | | 8,692,160 | | | 56,266 | |
Polish Zloty expiring 01/22/07 | | | 13,593,679 | | | 13,457,398 | | | 136,281 | |
| | |
|
| |
|
| |
|
|
|
| | | | 58,386,384 | | | 58,366,585 | | | 19,799 | |
| | |
|
| |
|
| |
|
|
|
| | | | | | | | | $ | 327,815 | |
| | | | | | | | |
|
|
|
Interest rate swap agreements outstanding at December 31, 2006:
| | | | | | | | | | | | | | |
Counterparty
| | Termination Date
| | Notional
Amount (000)
| | Fixed Rate
| | | Floating Rate
| | Unrealized
Appreciation/ (Depreciation)
| |
Merrill Lynch Capital Services, Inc.(a) | | 11/02/2016 | | $ | 12,030 | | 5.151 | % | | 3 month LIBOR | | $ | (39,888 | ) |
Morgan Stanley Capital Services(a) | | 12/22/2016 | | | 9,490 | | 6.808 | % | | 3 month NZD-BBR-FRA | | | 14,752 | |
Morgan Stanley Capital Services(a) | | 01/04/2017 | | | 4,735 | | 6.88 | % | | 3 month NZD-BBR-FRA | | | — | |
| | | | | | | | | | | | |
|
|
|
| | | | | | | | | | | | | $ | (25,136 | ) |
| | | | | | | | | | | | |
|
|
|
| (a) | Portfolio pays the floating rate and receives the fixed rate. |
Credit default swap agreements outstanding at December 31, 2006:
| | | | | | | | | | | | | | |
Counterparty
| | Termination
Date
| | Notional
Amount
(000)
| | Fixed
Rate
| | | Underlying Bond
| | Unrealized
Appreciation/
(Depreciation)
| |
Morgan Stanley Capital Services, Inc.(a) | | 06/20/2009 | | $ | 4,000 | | 0.82 | % | | Tyco International Group SA,
6.00%, due 11/15/13 | | $ | 61,130 | |
Morgan Stanley Capital Services, Inc.(b) | | 12/20/2009 | | | 3,295 | | 0.60 | % | | RPM International, Inc.,
6.25%, due 12/15/13 | | | (32,058 | ) |
Morgan Stanley Capital Services, Inc.(b) | | 12/20/2009 | | | 1,855 | | 0.75 | % | | RPM International, Inc.,
6.25%, due 12/15/13 | | | (25,925 | ) |
Merrill Lynch Capital Services, Inc.(a) | | 12/20/2009 | | | 4,000 | | 4.55 | % | | General Motors Corp.,
7.125%, 07/15/13 | | | 181,411 | |
Deutsche Bank AG(b) | | 05/25/2036 | | | 1,000 | | 2.74 | % | | Fieldstone Mortgage Investment Corp.,
Ser. 2006-1, Class M9,
7.62%, due 05/25/36 | | | (809 | ) |
Morgan Stanley Capital Services, Inc.(b) | | 06/25/2036 | | | 1,000 | | 4.25 | % | | Morgan Stanley ABS Capital I,
Ser. 2006-HE4, Class B3,
7.19%, 06/25/36 | | | (15,852 | ) |
Morgan Stanley Capital Services, Inc.(a) | | 12/20/2014 | | | 5,500 | | 1.17 | % | | Nextel Communications, Inc.,
7.375%, due 8/1/15 | | | 136,586 | |
Morgan Stanley Capital Services, Inc.(a) | | 09/20/2015 | | | 4,000 | | 0.57 | % | | Dow Chemical Co.,
6.00%, due 10/01/12 | | | 86,934 | |
SEE NOTES TO FINANCIAL STATEMENTS.
B30
| | | | |
| | | DIVERSIFIED BOND PORTFOLIO (Continued) | | |
SCHEDULE OF INVESTMENTS | December 31, 2006 |
| | | | | | | | | | | | | | |
Counterparty
| | Termination
Date
| | Notional
Amount
(000)
| | Fixed
Rate
| | | Underlying Bond
| | Unrealized
Appreciation/
(Depreciation)
| |
Deutsche Bank AG(b) | | 11/25/2035 | | $ | 1,000 | | 1.98 | % | | Residential Asset Mortgage Products,
Inc., Ser. 2005-EFC6, Class M9,
7.57%, 11/25/35 | | $ | (4,311 | ) |
Merrill Lynch Capital Services, Inc.(b) | | 12/25/2035 | | | 800 | | 2.04 | % | | Accredited Mortgage Loan Trust,
Ser. 2005-4, Class M9,
7.82%, 12/25/35 | | | (3,458 | ) |
Deutsche Bank AG(b) | | 04/25/2036 | | | 550 | | 3.05 | % | | First Franklin Mortgage Loan Asset
Backed Certificates, | | | (2,268 | ) |
Morgan Stanley Capital Services, Inc.(b) | | 04/25/2036 | | | 235 | | 3.15 | % | | First Franklin Mortgage Loan Asset
Backed Certificates,
Ser. 2006-FF5, Class M9,
7.27%, 04/25/36 | | | (973 | ) |
Citibank, NA(b) | | 05/25/2036 | | | 1,000 | | 4.55 | % | | Structured Asset Securities Corp.,
Ser. 2006-NC1, Class M9,
7.22%, 05/25/36 | | | (2,410 | ) |
| | | | | | | | | | | | |
|
|
|
| | | | | | | | | | | | | $ | 377,997 | |
| | | | | | | | | | | | |
|
|
|
| (a) | The Portfolio receives the fixed rate and pays the counterparty par in the event that the underlying bond defaults. |
| (b) | The Portfolio pays the fixed rate and receives from the counterparty par in the event that the underlying bond defaults. |
SEE NOTES TO FINANCIAL STATEMENTS.
B31
| | | | |
| | | DIVERSIFIED BOND PORTFOLIO (Continued) | | |
SCHEDULE OF INVESTMENTS | December 31, 2006 |
The industry classification of portfolio holdings and liabilities in excess of other assets shown as a percentage of net assets as of December 31, 2006 was as follows:
| | | |
U.S Government Mortgage-Backed Securities | | 29.9 | % |
Affiliated Money Market Mutual Funds (including 4.7% of collateral received for securities on loan) | | 9.8 | |
Commercial Mortgage-Backed Securities | | 8.7 | |
Non-Corporate Sovereign | | 7.7 | |
Telecommunications | | 4.8 | |
Asset-Backed Securities | | 4.1 | |
Electric | | 3.8 | |
Structured Notes | | 3.3 | |
Banking | | 2.9 | |
Chemicals | | 2.2 | |
Media & Entertainment | | 2.2 | |
Health Care & Pharmaceutical | | 2.0 | |
Non-Corporate Foreign Agency | | 2.0 | |
Technology | | 2.0 | |
Non-Captive Finance | | 1.8 | |
Automotive | | 1.5 | |
Foods | | 1.5 | |
Retailers | | 1.5 | |
Insurance | | 1.4 | |
Paper | | 1.4 | |
Cable | | 1.3 | |
Pipelines & Other | | 1.3 | |
Capital Goods | | 1.2 | |
Energy-Other | | 1.2 | |
Building Materials & Construction | | 1.0 | |
Collateralized Mortgage Obligations | | 1.0 | |
Health Care Insurance | | 1.0 | |
Aerospace/Defense | | 0.8 | |
Airlines | | 0.8 | |
Consumer | | 0.6 | |
Gaming | | 0.6 | |
Metals | | 0.6 | |
Tobacco | | 0.6 | |
Brokerage | | 0.5 | |
Lodging | | 0.5 | |
Energy-Integrated | | 0.4 | |
Real Estate Investment Trusts | | 0.4 | |
Emerging Markets | | 0.3 | |
U.S. Government Treasury Securities | | 0.3 | |
U.S. Government Agency Obligations | | 0.2 | |
| | |
|
|
| | | 109.1 | |
Securities Sold Short | | (1.7 | ) |
Liabilities in excess of other assets | | (7.4 | ) |
| | |
|
|
| | | 100.0 | % |
| | |
|
|
SEE NOTES TO FINANCIAL STATEMENTS.
B32
SCHEDULE OF INVESTMENTS | December 31, 2006 |
| | | | | |
| LONG-TERM INVESTMENTS — 98.7% | | Value (Note 2)
|
| COMMON STOCKS | | Shares
| |
Aerospace & Defense — 3.0% | | | |
Boeing Co. (The) | | 600,559 | | $ | 53,353,661 |
Honeywell International, Inc. | | 1,490,800 | | | 67,443,792 |
Lockheed Martin Corp. | | 1,326 | | | 122,085 |
Orbital Sciences Corp.*(a) | | 681,900 | | | 12,574,236 |
Raytheon Co. | | 2,400 | | | 126,720 |
| | | | |
|
|
| | | | | | 133,620,494 |
| | | | |
|
|
Air Freight & Logistics | | | | | |
United Parcel Service, Inc.
(Class B Stock) | | 1,735 | | | 130,090 |
| | | | |
|
|
Beverages — 1.7% | | | |
PepsiCo, Inc. | | 1,221,423 | | | 76,400,009 |
| | | | |
|
|
Biotechnology — 1.4% | | | |
Amgen, Inc.* | | 2,315 | | | 158,138 |
Genentech, Inc.*(a) | | 325,313 | | | 26,392,644 |
Gilead Sciences, Inc.*(a) | | 560,752 | | | 36,409,627 |
| | | | |
|
|
| | | | | | 62,960,409 |
| | | | |
|
|
Building Materials — 0.9% | | | |
Masco Corp. | | 1,360,862 | | | 40,648,948 |
| | | | |
|
|
Building Products — 0.7% | | | |
American Standard Cos., Inc.(a) | | 656,200 | | | 30,086,770 |
| | | | |
|
|
Capital Markets — 6.1% | | | |
Bank of New York Co., Inc. (The) | | 961,900 | | | 37,870,003 |
Goldman Sachs Group, Inc. | | 336,712 | | | 67,123,537 |
Lazard Ltd. (Class A Stock)(a) | | 193,400 | | | 9,155,556 |
Mellon Financial Corp.(a) | | 16,538 | | | 697,077 |
Merrill Lynch & Co., Inc.(a) | | 740,859 | | | 68,973,973 |
Schwab, (Charles) Corp. | | 1,131,700 | | | 21,887,078 |
UBS AG | | 1,017,600 | | | 61,391,808 |
| | | | |
|
|
| | | | | | 267,099,032 |
| | | | |
|
|
Chemicals — 1.8% | | | |
Air Products & Chemicals, Inc. | | 900 | | | 63,252 |
Arkema, ADR (France)* | | 70 | | | 3,593 |
E.I. Du Pont de Nemours & Co.(a) | | 1,297,914 | | | 63,221,391 |
Ecolab, Inc.(a) | | 329,528 | | | 14,894,666 |
| | | | |
|
|
| | | | | | 78,182,902 |
| | | | |
|
|
Clothing & Apparel | | | |
Cintas Corp. | | 844 | | | 33,515 |
Hanesbrands, Inc.* | | 500 | | | 11,810 |
| | | | |
|
|
| | | | | | 45,325 |
| | | | |
|
|
Commercial Banks — 2.5% | | | |
Bank of America Corp. | | 751,448 | | | 40,119,809 |
Royal Bank of Scotland Group PLC (United Kingdom) | | 525,055 | | | 20,488,998 |
Wachovia Corp. | | 1,401 | | | 79,786 |
Wells Fargo & Co. | | 1,436,614 | | | 51,085,994 |
| | | | |
|
|
| | | | | | 111,774,587 |
| | | | |
|
|
Commercial Services & Supplies — 0.7% | | | |
Waste Management, Inc. | | 883,600 | | | 32,489,972 |
| | | | |
|
|
Communication Equipment — 7.4% | | | |
Avaya, Inc.* | | 2,016,800 | | | 28,194,864 |
Cisco Systems, Inc.* | | 3,132,689 | | | 85,616,390 |
Corning, Inc.* | | 614,975 | | | 11,506,182 |
Motorola, Inc. | | 4,189,564 | | | 86,137,436 |
| | | | | |
COMMON STOCKS
(Continued) | | Shares
| | Value (Note 2)
|
Communication Equipment (cont’d.) | | | |
Nokia Corp., ADR (Finland) | | 7,542 | | $ | 153,254 |
QUALCOMM, Inc. | | 2,459,460 | | | 92,942,993 |
Research in Motion Ltd. (Canada)* | | 151,800 | | | 19,397,004 |
| | | | |
|
|
| | | | | | 323,948,123 |
| | | | |
|
|
Computers & Peripherals — 1.4% | | | |
Apple Computer, Inc.* | | 481,700 | | | 40,867,428 |
Dell, Inc.*(a) | | 10,365 | | | 260,058 |
EMC Corp.* | | 8,140 | | | 107,448 |
Hewlett-Packard Co. | | 450,100 | | | 18,539,619 |
Sun Microsystems, Inc.*(a) | | 5,400 | | | 29,268 |
| | | | |
|
|
| | | | | | 59,803,821 |
| | | | |
|
|
Conglomerates | | | |
Cooper Industries Ltd. (Bermuda) (Class A Stock) | | 410 | | | 37,076 |
| | | | |
|
|
Construction — 1.0% | | | |
Toll Brothers, Inc.*(a) | | 1,319,100 | | | 42,514,593 |
| | | | |
|
|
Consumer Finance — 1.3% | | | |
American Express Co. | | 946,646 | | | 57,433,013 |
| | | | |
|
|
Consumer Products & Services — 0.5% | | | |
Fortune Brands, Inc.(a) | | 242,700 | | | 20,724,153 |
| | | | |
|
|
Diversified Consumer Services — 1.0% | | | |
Career Education Corp.*(a) | | 679,400 | | | 16,835,532 |
H&R Block, Inc. | | 1,220,900 | | | 28,129,536 |
| | | | |
|
|
| | | | | | 44,965,068 |
| | | | |
|
|
Diversified Financial Services — 5.8% | | | |
Capital One Financial Corp. | | 438,575 | | | 33,691,331 |
Citigroup, Inc. | | 753,304 | | | 41,959,033 |
Freddie Mac(a) | | 612,790 | | | 41,608,441 |
IntercontinentalExchange, Inc.*(a) | | 216,100 | | | 23,317,190 |
JPMorgan Chase & Co. | | 1,043,247 | | | 50,388,830 |
KKR Private Equity Investors LP(c) | | 1,295,700 | | | 29,606,745 |
KKR Private Equity Investors LP, RDU (cost $7,567,532; purchased 7/18/06-8/3/06)(c)(e) | | 334,700 | | | 7,647,895 |
NYSE Group, Inc.*(a) | | 267,500 | | | 26,001,000 |
| | | | |
|
|
| | | | | | 254,220,465 |
| | | | |
|
|
Electronic Components — 1.0% | | | |
Dolby Laboratories, Inc. (Class A Stock)*(a) | | 684,158 | | | 21,222,581 |
Parker Hannifin Corp. | | 286,900 | | | 22,056,872 |
| | | | |
|
|
| | | | | | 43,279,453 |
| | | | |
|
|
Energy Equipment & Services — 1.7% | | | |
Baker Hughes, Inc. | | 362,700 | | | 27,079,182 |
BJ Services Co. | | 5,010 | | | 146,893 |
Cameron International Corp.* | | 6,490 | | | 344,295 |
GlobalSantaFe Corp. (Cayman Islands) | | 2,000 | | | 117,560 |
Halliburton Co. | | 855,500 | | | 26,563,275 |
Transocean, Inc.* | | 272,000 | | | 22,002,080 |
| | | | |
|
|
| | | | | | 76,253,285 |
| | | | |
|
|
Financial – Bank & Trust — 0.4% | | | |
Hudson City Bancorp, Inc. | | 1,363,500 | | | 18,925,380 |
PNC Financial Services Group, Inc.(a) | | 1,986 | | | 147,043 |
| | | | |
|
|
| | | | | | 19,072,423 |
| | | | |
|
|
SEE NOTES TO FINANCIAL STATEMENTS.
B33
| | | | |
| | | EQUITY PORTFOLIO (Continued) | | |
SCHEDULE OF INVESTMENTS | December 31, 2006 |
| | | | | |
COMMON STOCKS
(Continued) | | Shares
| | Value (Note 2)
|
Financial – Brokerage | | | |
Ameriprise Financial, Inc. | | 177 | | $ | 9,647 |
| | | | |
|
|
Food & Staples Retailing — 1.7% | | | | | |
Kroger Co. (The) | | 1,251,500 | | | 28,872,105 |
Wal-Mart Stores, Inc. | | 1,023,192 | | | 47,251,007 |
| | | | |
|
|
| | | | | | 76,123,112 |
| | | | |
|
|
Food Products — 2.3% | | | |
Cadbury Schweppes PLC, ADR (United Kingdom) | | 686,800 | | | 29,484,324 |
ConAgra Foods, Inc. | | 1,128,200 | | | 30,461,400 |
General Mills, Inc. | | 792 | | | 45,619 |
Kellogg Co. | | 395,315 | | | 19,789,469 |
McCormick & Co., Inc. | | 587,523 | | | 22,654,887 |
Sara Lee Corp. | | 4,000 | | | 68,120 |
| | | | |
|
|
| | | | | | 102,503,819 |
| | | | |
|
|
Healthcare Equipment & Supplies — 0.8% | | | |
Alcon, Inc.(a) | | 265,300 | | | 29,652,581 |
Baxter International, Inc. | | 88,800 | | | 4,119,432 |
Medtronic, Inc. | | 1,486 | | | 79,516 |
St. Jude Medical, Inc.*(a) | | 833 | | | 30,454 |
| | | | |
|
|
| | | | | | 33,881,983 |
| | | | |
|
|
Healthcare Providers & Services — 2.1% | | | |
Coventry Health Care, Inc.* | | 357,523 | | | 17,894,026 |
Omnicare, Inc.(a) | | 611,500 | | | 23,622,245 |
Tenet Healthcare Corp.*(a) | | 2,352 | | | 16,394 |
UnitedHealth Group, Inc. | | 497,147 | | | 26,711,708 |
WellPoint, Inc.* | | 292,800 | | | 23,040,432 |
| | | | |
|
|
| | | | | | 91,284,805 |
| | | | |
|
|
Hotels, Restaurants & Leisure — 2.2% | | | |
Marriott International, Inc. (Class A Stock) | | 539,600 | | | 25,749,712 |
McDonald’s Corp. | | 968,661 | | | 42,940,742 |
OSI Restaurant Partners, Inc. | | 560 | | | 21,952 |
Station Casinos, Inc.(a) | | 320,878 | | | 26,206,106 |
| | | | |
|
|
| | | | | | 94,918,512 |
| | | | |
|
|
Household Durables | | | |
Newell Rubbermaid, Inc. | | 2,500 | | | 72,375 |
| | | | |
|
|
Household Products — 1.0% | | | |
Kimberly-Clark Corp. | | 388,900 | | | 26,425,755 |
Procter & Gamble Co. | | 302,878 | | | 19,465,969 |
| | | | |
|
|
| | | | | | 45,891,724 |
| | | | |
|
|
Independent Power Producers & Energy Traders — 0.7% |
NRG Energy, Inc.*(a) | | 525,500 | | | 29,433,255 |
| | | | |
|
|
Industrial Conglomerates — 2.9% | | | |
General Electric Co. | | 2,741,463 | | | 102,009,838 |
Textron, Inc. | | 265,485 | | | 24,894,529 |
Tyco International Ltd. | | 16,708 | | | 507,923 |
| | | | |
|
|
| | | | | | 127,412,290 |
| | | | |
|
|
Insurance — 5.5% | | | |
AFLAC, Inc.(a) | | 668,670 | | | 30,758,820 |
Allstate Corp. (The) | | 2,922 | | | 190,251 |
American International Group, Inc. | | 1,157,110 | | | 82,918,503 |
Axis Capital Holdings Ltd. | | 644,600 | | | 21,510,302 |
| | | | | |
COMMON STOCKS
(Continued) | | Shares
| | Value (Note 2)
|
Insurance (cont’d.) | | | |
Berkshire Hathaway, Inc. (Class A Stock)* | | 207 | | $ | 22,767,930 |
Chubb Corp. | | 486,664 | | | 25,749,392 |
Conseco, Inc.* | | 2,165 | | | 43,257 |
Hartford Financial Services Group, Inc. | | 614 | | | 57,292 |
Loews Corp. | | 943,200 | | | 39,114,504 |
Marsh & McLennan Cos., Inc. | | 687,900 | | | 21,091,014 |
| | | | |
|
|
| | | | | | 244,201,265 |
| | | | |
|
|
Internet Software & Services — 1.2% | | | |
Google, Inc. (Class A Stock)* | | 109,900 | | | 50,606,752 |
Oracle Corp.* | | 10,373 | | | 177,793 |
Yahoo!, Inc.*(a) | | 1,140 | | | 29,116 |
| | | | |
|
|
| | | | | | 50,813,661 |
| | | | |
|
|
IT Services — 0.8% | | | |
Accenture Ltd. (Class A Stock) | | 2,802 | | | 103,478 |
Infosys Technologies Ltd., ADR (India)(a) | | 244,700 | | | 13,350,832 |
Paychex, Inc. | | 521,110 | | | 20,604,689 |
| | | | |
|
|
| | | | | | 34,058,999 |
| | | | |
|
|
Leisure Equipment & Products | | | |
Mattel, Inc. | | 2,812 | | | 63,720 |
| | | | |
|
|
Life Science Tools & Services | | | |
Thermo Fisher Scientific, Inc.* | | 550 | | | 24,910 |
| | | | |
|
|
Media — 4.9% | | | |
CBS Corp. (Class B Stock) | | 3,523 | | | 109,847 |
Comcast Corp. (Class A Stock)*(a) | | 655,200 | | | 27,734,616 |
Comcast Corp. (Special Class A Stock)* | | 1,045 | | | 43,764 |
EchoStar Communications Corp. (Class A Stock)*(a) | | 551,926 | | | 20,989,746 |
Liberty Global, Inc. (Class C Stock)* | | 1,022,450 | | | 28,628,600 |
News Corp. (Class A Stock) | | 1,540,026 | | | 33,079,758 |
News Corp. (Class B Stock) | | 1,313,938 | | | 29,248,260 |
Time Warner, Inc. | | 1,541,906 | | | 33,582,713 |
Univision Communications, Inc. (Class A Stock)* | | 1,102 | | | 39,033 |
Viacom, Inc. (Class B Stock)* | | 3,523 | | | 144,549 |
Walt Disney Co. (The) | | 1,248,600 | | | 42,789,522 |
| | | | |
|
|
| | | | | | 216,390,408 |
| | | | |
|
|
Metals & Mining — 1.8% | | | |
Barrick Gold Corp. (Canada)(a) | | 1,448,138 | | | 44,457,837 |
Freeport-McMoRan Copper & Gold, Inc. (Class B Stock) | | 297,100 | | | 16,557,383 |
Phelps Dodge Corp. | | 171,000 | | | 20,472,120 |
| | | | |
|
|
| | | | | | 81,487,340 |
| | | | |
|
|
Multi – Line Retail — 0.7% | | | |
J.C. Penney Co., Inc. | | 1,300 | | | 100,568 |
Kohl’s Corp.*(a) | | 530 | | | 36,268 |
Staples, Inc. | | 534,841 | | | 14,280,255 |
Target Corp. | | 322,013 | | | 18,370,841 |
| | | | |
|
|
| | | | | | 32,787,932 |
| | | | |
|
|
Multi – Utilities — 1.8% | | | |
Sempra Energy | | 1,394,046 | | | 78,058,502 |
| | | | |
|
|
SEE NOTES TO FINANCIAL STATEMENTS.
B34
| | | | |
| | | EQUITY PORTFOLIO (Continued) | | |
SCHEDULE OF INVESTMENTS | December 31, 2006 |
| | | | | |
COMMON STOCKS
(Continued) | | Shares
| | Value (Note 2)
|
Office Electronics — 0.6% | | | |
Xerox Corp.* | | 1,616,100 | | $ | 27,392,895 |
| | | | |
|
|
Oil, Gas & Consumable Fuels — 7.5% | | | |
Anadarko Petroleum Corp. | | 515,900 | | | 22,451,968 |
ConocoPhillips | | 286,986 | | | 20,648,643 |
Exxon Mobil Corp. | | 759,928 | | | 58,233,282 |
Hess Corp. | | 565,400 | | | 28,026,878 |
Nexen, Inc. | | 599,300 | | | 32,961,500 |
Occidental Petroleum Corp. | | 612,400 | | | 29,903,492 |
Petroleo Brasileiro SA, ADR (Brazil) | | 276,100 | | | 28,435,539 |
Suncor Energy, Inc. (Canada) | | 796,620 | | | 62,752,676 |
Total SA, ADR (France) | | 644,726 | | | 46,368,694 |
| | | | |
|
|
| | | | | | 329,782,672 |
| | | | |
|
|
Pharmaceuticals — 6.6% | | | |
Abbott Laboratories | | 830,655 | | | 40,461,205 |
Elan Corp. PLC, ADR (Ireland)*(a) | | 1,489,000 | | | 21,962,750 |
Eli Lilly & Co. | | 1,697 | | | 88,414 |
Johnson & Johnson | | 2,172 | | | 143,395 |
MedImmune, Inc.*(a) | | 1,986 | | | 64,287 |
Merck & Co., Inc. | | 4,000 | | | 174,400 |
Novartis AG, ADR (Switzerland) | | 748,000 | | | 42,965,120 |
Pfizer, Inc. | | 1,800 | | | 46,620 |
Roche Holdings Ltd., ADR (Switzerland) | | 476,700 | | | 42,663,601 |
Sanofi-Aventis, ADR (France) | | 698,922 | | | 32,269,229 |
Schering-Plough Corp. | | 1,956,100 | | | 46,242,204 |
Sepracor, Inc.*(a) | | 1,200 | | | 73,896 |
Wyeth | | 1,234,809 | | | 62,876,474 |
| | | | |
|
|
| | | | | | 290,031,595 |
| | | | |
|
|
Retail & Merchandising — 0.6% | | | |
Best Buy Co., Inc. | | 536,100 | | | 26,370,759 |
CVS Corp.(a) | | 1,060 | | | 32,764 |
TJX Cos., Inc. | | 1,310 | | | 37,309 |
| | | | |
|
|
| | | | | | 26,440,832 |
| | | | |
|
|
Semiconductors & Semiconductor Equipment — 1.8% |
Analog Devices, Inc. | | 1,080 | | | 35,500 |
ASML Holding NV (Netherlands)* | | 1,061,916 | | | 26,154,991 |
Broadcom Corp. (Class A Stock)*(a) | | 647,150 | | | 20,909,416 |
Intel Corp. | | 4,300 | | | 87,075 |
KLA-Tencor Corp. | | 552 | | | 27,462 |
Marvell Technology Group Ltd.* | | 1,102,310 | | | 21,153,329 |
Maxim Integrated Products, Inc.(a) | | 2,600 | | | 79,612 |
Texas Instruments, Inc. | | 443,955 | | | 12,785,904 |
Xilinx, Inc.(a) | | 1,070 | | | 25,477 |
| | | | |
|
|
| | | | | | 81,258,766 |
| | | | |
|
|
Software — 5.4% | | | |
Adobe Systems, Inc.* | | 1,622,213 | | | 66,705,399 |
Electronic Arts, Inc.* | | 675,352 | | | 34,010,727 |
Microsoft Corp. | | 3,802,995 | | | 113,557,431 |
SAP AG, ADR (Germany)(a) | | 426,600 | | | 22,652,460 |
Symantec Corp.* | | 13,210 | | | 275,428 |
| | | | |
|
|
| | | | | | 237,201,445 |
| | | | |
|
|
| | | | | | |
COMMON STOCKS
(Continued) | | Shares
| | Value (Note 2)
| |
Specialty Retail — 0.6% | | | | |
Bed Bath & Beyond, Inc.* | | 770 | | $ | 29,337 | |
Home Depot, Inc. (The) | | 1,445 | | | 58,031 | |
Lowe’s Cos., Inc.(a) | | 697,384 | | | 21,723,512 | |
Williams-Sonoma, Inc.(a) | | 78,200 | | | 2,458,608 | |
| | | | |
|
|
|
| | | | | | 24,269,488 | |
| | | | |
|
|
|
Telecommunications — 0.9% | | | | |
Alltel Corp. | | 267,948 | | | 16,205,495 | |
Comverse Technology, Inc.* | | 24,403 | | | 515,148 | |
Embarq Corp. | | 661 | | | 34,742 | |
Juniper Networks, Inc.*(a) | | 1,102,500 | | | 20,881,350 | |
Nortel Networks Corp. (Canada)* | | 1,926 | | | 51,482 | |
| | | | |
|
|
|
| | | | | | 37,688,217 | |
| | | | |
|
|
|
Textiles, Apparel & Luxury Goods — 1.3% | | | | |
Coach, Inc.* | | 827,200 | | | 35,536,512 | |
NIKE, Inc. (Class B Stock) | | 242,000 | | | 23,965,260 | |
| | | | |
|
|
|
| | | | | | 59,501,772 | |
| | | | |
|
|
|
Tobacco — 1.6% | | | | |
Altria Group, Inc. | | 830,400 | | | 71,264,928 | |
| | | | |
|
|
|
Transportation | | | | |
Expeditors International Washington, Inc. | | 566 | | | 22,923 | |
FedEx Corp. | | 250 | | | 27,155 | |
| | | | |
|
|
|
| | | | | | 50,078 | |
| | | | |
|
|
|
Wireless Telecommunication Services — 1.1% | | | | |
NII Holdings, Inc.*(a) | | 442,900 | | | 28,540,476 | |
Sprint Nextel Corp. | | 1,108,816 | | | 20,945,534 | |
| | | | |
|
|
|
| | | | | | 49,486,010 | |
| | | | |
|
|
|
TOTAL LONG-TERM INVESTMENTS
(cost $3,521,170,634) | | | 4,349,476,968 | |
| | | | |
|
|
|
| SHORT-TERM INVESTMENT — 9.9% | |
AFFILIATED MONEY MARKET MUTUAL FUND | | | | |
Dryden Core Investment Fund —Taxable Money Market Series (cost $435,213,247 includes $379,439,451 of cash collateral for securities on loan)(b)(w) (Note 4) | | 435,213,247 | | $ | 435,213,247 | |
| | | | |
|
|
|
TOTAL INVESTMENTS(d) — 108.6% (cost $3,956,383,881) | | | 4,784,690,215 | |
LIABILITIES IN EXCESS OF OTHER
ASSETS — (8.6)% | | | (380,043,231 | ) |
| | | | |
|
|
|
NET ASSETS — 100.0% | | $ | 4,404,646,984 | |
| | | | |
|
|
|
SEE NOTES TO FINANCIAL STATEMENTS.
B35
| | | | |
| | | EQUITY PORTFOLIO (Continued) | | |
SCHEDULE OF INVESTMENTS | December 31, 2006 |
The following abbreviations are used in portfolio descriptions:
| | |
| ADR | | American Depositary Receipt |
| RDU | | Restricted Depositary Receipt |
| * | Non-income producing security. |
| (a) | All or a portion of security is on loan. The aggregate market value of such securities is $366,835,888; cash collateral of $379,439,451 (included with liabilities) was received with which the portfolio purchased highly liquid short-term investments. |
| (b) | Represents security, or a portion thereof, purchased with cash collateral received for securities on loan. |
| (c) | Securities were purchased pursuant to Rule 144A under the Securities Act of 1933 and may not be resold subject to that rule except to qualified institutional buyers. Unless otherwise noted, 144A securities are deemed to be liquid. |
| (d) | As of December 31, 2006, 1 security representing $7,647,895 and 0.17% of the net assets was fair valued in accordance with the policies adopted by the Board of Trustees. |
| (e) | Indicates a security illiquid and restricted as to resale. The aggregate cost of such security was $7,567,532. The aggregate value of $7,647,895 is approximately .17% of the net assets. |
| (w) | Prudential Investments LLC, the manager of the Portfolio also serves as manager of the Dryden Core Investment Fund-Taxable Money Market Series. |
The industry classification of long-term portfolio holdings, short-term investment and liabilities in excess of other assets shown as a percentage of net assets as of December 31, 2006 were as follows:
| | | |
Industry
| |
Affiliated Money Market Mutual Fund (including 8.6% of collateral received for securities on loan) | | 9.9 | % |
Oil, Gas & Consumable Fuels | | 7.5 | |
Communication Equipment | | 7.4 | |
Pharmaceuticals | | 6.6 | |
Capital Markets | | 6.1 | |
Diversified Financial Services | | 5.8 | |
Insurance | | 5.5 | |
Software | | 5.4 | |
Media | | 4.9 | |
Aerospace & Defense | | 3.0 | |
Industrial Conglomerates | | 2.9 | |
Commercial Banks | | 2.5 | |
Food Products | | 2.3 | |
Hotels, Restaurants & Leisure | | 2.2 | |
Healthcare Providers & Services | | 2.1 | |
Metals & Mining | | 1.8 | |
Semiconductors & Semiconductor Equipment | | 1.8 | |
Chemicals | | 1.8 | |
Multi-Utilities | | 1.8 | |
Beverages | | 1.7 | |
Energy Equipment & Services | | 1.7 | |
Food & Staples Retailing | | 1.7 | |
Tobacco | | 1.6 | |
Biotechnology | | 1.4 | |
Computers & Peripherals | | 1.4 | |
Textiles, Apparel & Luxury Goods | | 1.3 | |
Consumer Finance | | 1.3 | |
Internet Software & Services | | 1.2 | |
Wireless Telecommunication Services | | 1.1 | |
Household Products | | 1.0 | |
Diversified Consumer Services | | 1.0 | |
Electronic Components | | 1.0 | |
Construction | | 1.0 | |
Building Materials | | 0.9 | |
Telecommunications | | 0.9 | |
IT Services | | 0.8 | |
Healthcare Equipment & Supplies | | 0.8 | |
Multi-Line Retail | | 0.7 | |
Commercial Services & Supplies | | 0.7 | |
| | | |
Building Products | | 0.7 | % |
Independent Power Producers & Energy Traders | | 0.7 | |
Office Electronics | | 0.6 | |
Retail & Merchandising | | 0.6 | |
Specialty Retail | | 0.6 | |
Consumer Products & Services | | 0.5 | |
Financial — Bank & Trust | | 0.4 | |
| | |
|
|
| | | 108.6 | |
Liabilities in excess of other assets | | (8.6 | ) |
| | |
|
|
| | | 100.0 | % |
| | |
|
|
SEE NOTES TO FINANCIAL STATEMENTS.
B36
| | | | |
| | | FLEXIBLE MANAGED PORTFOLIO | | |
SCHEDULE OF INVESTMENTS | December 31, 2006 |
| | | | | |
| LONG-TERM INVESTMENTS — 91.7% | | Value (Note 2)
|
| COMMON STOCKS — 66.8% | | Shares
| |
Aerospace & Defense — 1.9% | | | | | |
Boeing Co. | | 101,900 | | $ | 9,052,796 |
Ceradyne, Inc.(a)(b) | | 51,900 | | | 2,932,350 |
Honeywell International, Inc. | | 200,200 | | | 9,057,048 |
L-3 Communications Holdings, Inc. | | 122,900 | | | 10,050,762 |
Lockheed Martin Corp. | | 190,600 | | | 17,548,542 |
Northrop Grumman Corp. | | 268,400 | | | 18,170,680 |
Raytheon Co. | | 54,400 | | | 2,872,320 |
United Technologies Corp. | | 13,400 | | | 837,768 |
| | | | |
|
|
| | | | | | 70,522,266 |
| | | | |
|
|
Air Freight & Logistics — 0.4% | | | | | |
FedEx Corp. | | 89,400 | | | 9,710,628 |
HUB Group, Inc.(a) | | 21,200 | | | 584,060 |
United Parcel Service, Inc. (Class “B” Stock)(b) | | 43,800 | | | 3,284,124 |
| | | | |
|
|
| | | | | | 13,578,812 |
| | | | |
|
|
Airlines — 0.1% | | | | | |
Air France KLM (France) | | 36,941 | | | 1,555,077 |
British Airways PLC (United Kingdom)(a) | | 35,460 | | | 366,243 |
Qantas Airways Ltd. (Australia) | | 222,933 | | | 918,879 |
| | | | |
|
|
| | | | | | 2,840,199 |
| | | | |
|
|
Auto Components — 0.1% | | | | | |
Bridgestone Corp. (Japan) | | 4,000 | | | 89,265 |
Compagnie Generale des Etablissements Michelin (France) | | 6,546 | | | 626,474 |
Continental AG (Germany) | | 12,157 | | | 1,415,575 |
Rieter Holding AG (Switzerland) | | 775 | | | 405,468 |
Stanley Electric Co. Ltd. (Japan) | | 18,500 | | | 369,589 |
| | | | |
|
|
| | | | | | 2,906,371 |
| | | | |
|
|
Automobiles — 0.6% | | | | | |
DaimlerChrysler AG (Germany) | | 13,601 | | | 842,578 |
Fiat S.p.A. (Italy) | | 34,999 | | | 668,980 |
General Motors Corp.(b) | | 423,500 | | | 13,009,920 |
Harley-Davidson, Inc.(b) | | 6,000 | | | 422,820 |
Honda Motor Co. Ltd. (Japan) | | 51,100 | | | 2,016,875 |
Renault SA (France) | | 10,333 | | | 1,241,242 |
Toyota Motor Corp. (Japan) | | 66,000 | | | 4,417,182 |
Volkswagen AG (Germany) | | 4,477 | | | 508,010 |
Yamaha Motor Co. Ltd. (Japan) | | 18,000 | | | 565,807 |
| | | | |
|
|
| | | | | | 23,693,414 |
| | | | |
|
|
Beverages — 1.2% | | | | | |
Anheuser-Busch Cos., Inc.(b) | | 39,400 | | | 1,938,480 |
Carlsberg A/S (Denmark) | | 800 | | | 79,451 |
Coca-Cola Co. (The)(b) | | 349,800 | | | 16,877,850 |
Coca-Cola Enterprises, Inc. | | 227,300 | | | 4,641,466 |
Coca-Cola Hellenic Bottling Co. SA (Greece) | | 5,730 | | | 223,890 |
Foster’s Group Ltd. (Australia) | | 174,143 | | | 949,634 |
InBev NV (Belgium) | | 1,030 | | | 67,901 |
Molson Coors Brewing Co. | | 9,300 | | | 710,892 |
Pepsi Bottling Group, Inc. | | 87,000 | | | 2,689,170 |
PepsiAmericas, Inc. | | 10,600 | | | 222,388 |
PepsiCo, Inc. | | 226,020 | | | 14,137,551 |
SABMiller PLC (United Kingdom) | | 39,487 | | | 908,449 |
| | | | |
|
|
| | | | | | 43,447,122 |
| | | | |
|
|
| | | | | |
COMMON STOCKS
(Continued) | | Shares
| | Value (Note 2)
|
Biotechnology — 0.6% | | | | | |
Amgen, Inc.(a) | | 185,608 | | $ | 12,678,882 |
Biogen Idec, Inc.(a)(b) | | 161,400 | | | 7,939,266 |
ImClone Systems, Inc.(a) | | 40,100 | | | 1,073,076 |
PDL BioPharma, Inc.(a)(b) | | 53,700 | | | 1,081,518 |
United Therapeutics Corp.(a) | | 24,300 | | | 1,321,191 |
| | | | |
|
|
| | | | | | 24,093,933 |
| | | | |
|
|
Building Products — 0.1% | | | | | |
Cie de Saint-Gobain (France) | | 23,439 | | | 1,969,365 |
Geberit AG (Switzerland) | | 412 | | | 634,991 |
JS Group Corp. (Japan) | | 8,000 | | | 168,233 |
NCI Buildings Systems, Inc.(a) | | 9,800 | | | 507,150 |
Nippon Sheet Glass Co. Ltd. (Japan) | | 93,000 | | | 435,521 |
Sanwa Shutter Corp. (Japan) | | 25,000 | | | 147,539 |
| | | | |
|
|
| | | | | | 3,862,799 |
| | | | |
|
|
Capital Markets — 3.0% | | | | | |
3i Group PLC (United Kingdom) | | 8,809 | | | 174,117 |
Bear Stearns Cos., Inc. (The) | | 42,900 | | | 6,983,262 |
Credit Suisse Group (Switzerland) | | 42,315 | | | 2,960,487 |
D. Carnegie & Co. AB (Sweden) | | 10,100 | | | 217,610 |
Deutsche Bank AG (Germany) | | 22,896 | | | 3,070,128 |
Franklin Resources, Inc. | | 8,900 | | | 980,513 |
Goldman Sachs Group, Inc. | | 136,700 | | | 27,251,145 |
Janus Capital Group, Inc.(b) | | 121,100 | | | 2,614,549 |
Lehman Brothers Holdings, Inc. | | 303,000 | | | 23,670,360 |
Macquarie Bank Ltd. (Australia) | | 10,777 | | | 669,850 |
Merrill Lynch & Co.(b) | | 245,500 | | | 22,856,050 |
Morgan Stanley | | 217,290 | | | 17,693,925 |
UBS AG (Switzerland) | | 43,907 | | | 2,668,292 |
| | | | |
|
|
| | | | | | 111,810,288 |
| | | | |
|
|
Chemicals — 0.7% | | | | | |
Asahi Kasei Corp. (Japan) | | 70,000 | | | 458,936 |
Ashland, Inc. | | 11,200 | | | 774,816 |
BASF AG (Germany) | | 22,717 | | | 2,221,771 |
Ciba Specialty Chemicals AG (Switzerland) | | 2,068 | | | 137,556 |
Denki Kagaku Kogyo K K (Japan) | | 21,000 | | | 87,143 |
Dow Chemical Co. (The) | | 445,500 | | | 17,793,270 |
Koninklijke DSM NV (Netherlands) | | 20,779 | | | 1,026,675 |
Mitsubishi Chemical Holdings Corp. (Japan) | | 219,000 | | | 1,379,005 |
Mitsubishi Gas Chemical Co., Inc. (Japan) | | 46,000 | | | 481,293 |
Mitsui Chemicals, Inc. (Japan) | | 107,000 | | | 822,634 |
Nippon Shokubai Co. Ltd. (Japan) | | 17,000 | | | 180,957 |
Orica Ltd. (Australia) | | 11,759 | | | 224,805 |
Sumitomo Bakelite Co. Ltd. (Japan) | | 19,000 | | | 131,223 |
Sumitomo Chemical Co. Ltd. (Japan) | | 94,000 | | | 727,415 |
Teijin Ltd. (Japan) | | 89,000 | | | 547,956 |
Yara International ASA (Norway) | | 11,800 | | | 268,259 |
| | | | |
|
|
| | | | | | 27,263,714 |
| | | | |
|
|
Commercial Banks — 3.6% | | | | | |
Allied Irish Banks PLC (Ireland) | | 4,181 | | | 124,180 |
Alpha Credit Bank (Greece) | | 6,594 | | | 199,330 |
Australia and New Zealand Banking Group Ltd. (Australia) | | 54,366 | | | 1,206,670 |
SEE NOTES TO FINANCIAL STATEMENTS.
B37
| | | | |
| | | FLEXIBLE MANAGED PORTFOLIO (Continued) | | |
SCHEDULE OF INVESTMENTS | December 31, 2006 |
| | | | | |
COMMON STOCKS
(Continued) | | Shares
| | Value (Note 2)
|
Commercial Banks (cont’d.) | | | | | |
Banche Popolari Unite Scpa (Italy) | | 27,471 | | $ | 754,995 |
Banco Bilbao Vizcaya Argentaria SA (Spain) | | 117,790 | | | 2,836,103 |
Banco Comercial Portugues SA (Portugal) | | 176,183 | | | 651,195 |
Banco Espirito Santo SA (Portugal) | | 43,906 | | | 789,386 |
Banco Popolare di Verona e Novara Scrl (Italy) | | 43,796 | | | 1,257,426 |
Banco Popular Espanol SA (Spain) | | 18,614 | | | 337,364 |
Banco Santander Central Hispano SA (Spain) | | 202,008 | | | 3,770,567 |
Barclays PLC (United Kingdom) | | 136,015 | | | 1,944,099 |
BB&T Corp. | | 189,000 | | | 8,302,770 |
BNP Paribas (France) | | 29,560 | | | 3,225,047 |
Comerica, Inc. | | 105,800 | | | 6,208,344 |
Comerzbank AG (Germany) | | 18,415 | | | 698,873 |
Credit Agricole SA (France) | | 42,549 | | | 1,789,468 |
Danske Bank A/S (Denmark) | | 31,100 | | | 1,381,904 |
DBS Group Holdings Ltd. (Singapore) | | 73,000 | | | 1,071,712 |
Dexia (Belgium) | | 51,666 | | | 1,415,180 |
DNB NOR ASA (Norway) | | 109,600 | | | 1,555,620 |
Gunma Bank Ltd. (The) (Japan) | | 22,000 | | | 132,255 |
HSBC Holdings PLC (United Kingdom) | | 305,300 | | | 5,565,256 |
Joyo Bank Ltd. (The) (Japan) | | 17,000 | | | 93,814 |
KeyCorp | | 268,200 | | | 10,199,646 |
Lloyds TSB Group PLC (United Kingdom) | | 53,801 | | | 602,026 |
Mitsubishi UFJ Financial Group, Inc. (Japan) | | 50 | | | 620,290 |
Mitsui Trust Holdings, Inc. (Japan) | | 88,000 | | | 1,005,373 |
Mizuho Financial Group, Inc. (Japan) | | 162 | | | 1,155,541 |
National City Corp.(b) | | 321,000 | | | 11,735,760 |
Regions Financial Corp. | | 220,000 | | | 8,228,000 |
Royal Bank of Scotland Group PLC (United Kingdom) | | 52,087 | | | 2,032,569 |
Sapporo Hokuyo Holdings, Inc. (Japan) | | 7 | | | 67,557 |
Shinsei Bank Ltd. (Japan) | | 153,000 | | | 899,302 |
Skandinaviska Enskilda Banken AB (Class “A” Stock) (Sweden) | | 23,000 | | | 730,724 |
Societe Generale (France) | | 15,117 | | | 2,566,228 |
Sumitomo Mitsui Financial Group, Inc. (Japan) | | 8 | | | 81,908 |
SunTrust Banks, Inc.(b) | | 48,900 | | | 4,129,605 |
Svenska Handelbanken (Class “A” Stock) (Sweden) | | 11,200 | | | 338,653 |
Sydbank A/S (Denmark) | | 1,756 | | | 83,933 |
U.S. Bancorp | | 371,032 | | | 13,427,648 |
UniCredito Italiano S.p.A (Italy) | | 308,917 | | | 2,707,688 |
United Overseas Bank Ltd. (Singapore) | | 11,000 | | | 138,741 |
Wachovia Corp. | | 210,600 | | | 11,993,670 |
Wells Fargo & Co. | | 418,900 | | | 14,896,084 |
Westpac Banking Corp. (Australia) | | 47,410 | | | 904,588 |
Zions Bancorporation | | 21,100 | | | 1,739,484 |
| | | | |
|
|
| | | | | | 135,596,576 |
| | | | |
|
|
| | | | | |
COMMON STOCKS
(Continued) | | Shares
| | Value (Note 2)
|
Commercial Services & Supplies — 0.4% | | | |
Corporate Executive Board Co. | | 13,000 | | $ | 1,140,100 |
Hays PLC (United Kingdom) | | 18,051 | | | 56,285 |
Herman Miller, Inc. | | 84,300 | | | 3,065,148 |
John H. Harland Co.(b) | | 29,700 | | | 1,490,940 |
Michael Page International PLC (United Kingdom) | | 41,077 | | | 363,736 |
R. R. Donnelley & Sons Co. | | 74,100 | | | 2,633,514 |
Randstad Holdings NV (Netherlands) | | 2,745 | | | 189,873 |
Robert Half International, Inc. | | 34,500 | | | 1,280,640 |
Societe Generale Surveilla (Switzerland) | | 172 | | | 191,691 |
Waste Management, Inc. | | 145,600 | | | 5,353,712 |
| | | | |
|
|
| | | | | | 15,765,639 |
| | | | |
|
|
Communications Equipment — 1.2% | | | |
Andrew Corp.(a) | | 96,100 | | | 983,103 |
Cisco Systems, Inc.(a) | | 592,400 | | | 16,190,292 |
Foxconn International Holdings Ltd. (Cayman Islands)(a) | | 427,000 | | | 1,392,689 |
Harris Corp. | | 47,400 | | | 2,173,764 |
Motorola, Inc. | | 957,600 | | | 19,688,256 |
Nokia Corp. OYJ (Finland) | | 20,400 | | | 416,860 |
QUALCOMM, Inc. | | 115,000 | | | 4,345,850 |
Telent PLC (United Kingdom) | | 4,705 | | | 43,551 |
Uniden Corp. (Japan) | | 6,000 | | | 41,096 |
| | | | |
|
|
| | | | | | 45,275,461 |
| | | | |
|
|
Computers & Peripherals — 2.7% | | | |
Dell, Inc.(a) | | 327,200 | | | 8,209,448 |
Hewlett-Packard Co. | | 754,765 | | | 31,088,770 |
International Business Machines Corp. | | 438,400 | | | 42,590,560 |
Network Appliance, Inc.(a) | | 297,200 | | | 11,674,016 |
QLogic Corp.(a) | | 235,400 | | | 5,159,968 |
Western Digital Corp.(a) | | 116,300 | | | 2,379,498 |
Wincor Nixdorf AG (Germany) | | 639 | | | 98,741 |
| | | | |
|
|
| | | | | | 101,201,001 |
| | | | |
|
|
Construction & Engineering — 0.1% | | | |
ACS Actividades de Construccion y Servicios SA (Spain) | | 13,655 | | | 769,857 |
Chiyoda Corp. (Japan) | | 11,000 | | | 215,038 |
COMSYS Holdings Corp. (Japan) | | 13,000 | | | 143,635 |
Fomento de Construcciones y Contratas SA (Spain) | | 1,398 | | | 142,467 |
Kajima Corp. (Japan) | | 57,000 | | | 249,564 |
Obayashi Corp. (Japan) | | 225,000 | | | 1,458,627 |
| | | | |
|
|
| | | | | | 2,979,188 |
| | | | |
|
|
Construction Materials — 0.3% | | | |
Cimpor Cimentos de Portugal SGPS SA (Portugal) | | 31,783 | | | 263,897 |
CRH PLC (Ireland) | | 3,297 | | | 137,268 |
Eagle Materials, Inc. | | 34,000 | | | 1,469,820 |
Holcim Ltd. (Switzerland) | | 5,589 | | | 512,344 |
Italcementi S.p.A (Italy) | | 13,516 | | | 381,278 |
Lafarge SA (France) | | 4,154 | | | 617,987 |
Taiheiyo Cement Corp. (Japan) | | 28,000 | | | 109,658 |
Vulcan Materials Co. | | 84,000 | | | 7,549,080 |
| | | | |
|
|
| | | | | | 11,041,332 |
| | | | |
|
|
SEE NOTES TO FINANCIAL STATEMENTS.
B38
| | | | |
| | | FLEXIBLE MANAGED PORTFOLIO (Continued) | | |
SCHEDULE OF INVESTMENTS | December 31, 2006 |
| | | | | |
COMMON STOCKS
(Continued) | | Shares
| | Value (Note 2)
|
Consumer Finance — 0.4% | | | |
American Express Co. | | 22,500 | | $ | 1,365,075 |
AmeriCredit Corp.(a)(b) | | 127,800 | | | 3,216,726 |
First Cash Financial Services, Inc.(a) | | 53,700 | | | 1,389,219 |
ORIX Corp. (Japan) | | 4,600 | | | 1,333,964 |
SLM Corp. | | 121,900 | | | 5,945,063 |
| | | | |
|
|
| | | | | | 13,250,047 |
| | | | |
|
|
Containers & Packaging — 0.1% | | | |
Temple-Inland, Inc. | | 109,900 | | | 5,058,697 |
Distributors | | | | | |
Li & Fung Ltd. (Bermuda) | | 224,000 | | | 695,482 |
Pacific Brands Ltd. (Australia) | | 125,751 | | | 258,684 |
| | | | |
|
|
| | | | | | 6,012,863 |
| | | | |
|
|
Diversified Consumer Services — 0.1% | | | |
Bright Horizons Family Solutions, Inc.(a) | | 12,600 | | | 487,116 |
ITT Educational Services, Inc.(a)(b) | | 16,900 | | | 1,121,653 |
Jackson Hewitt Tax Service, Inc. | | 12,700 | | | 431,419 |
| | | | |
|
|
| | | | | | 2,040,188 |
| | | | |
|
|
Diversified Financial Services — 4.0% | | | |
Babcock & Brown Ltd. (Australia) | | 20,314 | | | 395,814 |
Bank of America Corp. | | 734,082 | | | 39,192,638 |
Challenger Financial Services Group Ltd. (Australia) | | 103,013 | | | 333,764 |
Chicago Mercantile Exchange Holdings, Inc.(b) | | 12,100 | | | 6,167,975 |
CIT Group, Inc. | | 3,900 | | | 217,503 |
Citigroup, Inc. | | 817,762 | | | 45,549,343 |
Fortis (Belgium) | | 51,172 | | | 2,183,195 |
Hong Kong Exchanges and Clearing Ltd. (Hong Kong) | | 8,000 | | | 87,577 |
ING Groep NV (Netherlands) | | 55,378 | | | 2,455,478 |
JPMorgan Chase & Co. | | 830,894 | | | 40,132,180 |
Moody’s Corp. | | 161,500 | | | 11,153,190 |
OKO Bank PLC (Finland) | | 36,900 | | | 618,613 |
Suncorp-Metway Ltd. (Australia) | | 24,715 | | | 396,101 |
| | | | |
|
|
| | | | | | 148,883,371 |
| | | | |
|
|
Diversified Telecommunication Services — 1.8% |
AT&T, Inc.(b) | | 746,912 | | | 26,702,104 |
Belgacom SA (Belgium) | | 21,326 | | | 939,408 |
BellSouth Corp. | | 27,800 | | | 1,309,658 |
BT Group PLC (United Kingdom) | | 214,484 | | | 1,266,167 |
CenturyTel, Inc. | | 149,300 | | | 6,518,438 |
France Telecom SA (France) | | 3,424 | | | 94,691 |
Koninklijke (Royal) KPN NV (Netherlands) | | 77,107 | | | 1,096,221 |
Nippon Telegraph & Telephone Corp. (Japan) | | 347 | | | 1,711,226 |
Swisscom AG (Switzerland) | | 2,707 | | | 1,024,706 |
Telecom Corp. of New Zealand Ltd. (New Zealand) | | 488,759 | | | 1,652,996 |
Telecom Italia S.p.A (Italy) | | 497,882 | | | 1,263,189 |
Telefonica SA (Spain) | | 25,305 | | | 538,468 |
TeliaSonera AB (Sweden) | | 54,500 | | | 447,801 |
Verizon Communications, Inc. | | 619,588 | | | 23,073,457 |
| | | | |
|
|
| | | | | | 67,638,530 |
| | | | |
|
|
| | | | | |
COMMON STOCKS
(Continued) | | Shares
| | Value (Note 2)
|
Electric Utilities — 1.1% |
Allegheny Energy, Inc.(a) | | 103,300 | | $ | 4,742,503 |
American Electric Power Co., Inc. | | 261,900 | | | 11,151,702 |
CLP Holdings Ltd. (Hong Kong) | | 54,500 | | | 402,285 |
E.On AG (Germany) | | 23,795 | | | 3,244,387 |
Endesa SA (Spain) | | 52,997 | | | 2,506,610 |
Enel S.p.A (Italy) | | 15,300 | | | 157,837 |
Exelon Corp. | | 73,200 | | | 4,530,348 |
FirstEnergy Corp. | | 131,000 | | | 7,899,300 |
Hokkaido Electric Power Co., Inc. (Japan) | | 28,400 | | | 725,316 |
Hong Kong Electric Holdings Ltd. (Hong Kong) | | 13,500 | | | 66,014 |
Kansai Electric Power Co., Inc. (The) (Japan) | | 33,700 | | | 907,205 |
Kyushu Electric Power Co., Inc. (Japan) | | 24,500 | | | 646,091 |
Pinnacle West Capital Corp. | | 32,200 | | | 1,632,218 |
Tokyo Electric Power Co., Inc. (The) (Japan) | | 52,100 | | | 1,683,160 |
Union Fenosa, SA (Spain) | | 7,205 | | | 356,660 |
| | | | |
|
|
| | | | | | 40,651,636 |
| | | | |
|
|
Electrical Equipment — 0.8% |
ABB Ltd. (Switzerland) | | 57,979 | | | 1,039,673 |
Acuity Brands, Inc.(b) | | 59,700 | | | 3,106,788 |
Cooper Industries Ltd. (Class “A” Stock) (Bermuda) | | 10,500 | | | 949,515 |
Emerson Electric Co. | | 359,200 | | | 15,837,128 |
Fujikura Ltd. (Japan) | | 39,000 | | | 342,848 |
Genlyte Group, Inc.(a) | | 10,000 | | | 781,100 |
Mitsubishi Electric Corp. (Japan) | | 168,000 | | | 1,530,889 |
Rockwell Automation, Inc. | | 46,200 | | | 2,821,896 |
Schneider Electric SA (France) | | 3,945 | | | 437,957 |
Thomas & Betts Corp.(a) | | 44,400 | | | 2,099,232 |
| | | | |
|
|
| | | | | | 28,947,026 |
| | | | |
|
|
Electronic Equipment & Instruments — 0.6% |
Agilent Technologies, Inc.(a) | | 433,700 | | | 15,114,445 |
Dainippon Screen Manufacturing Co. Ltd. (Japan) | | 10,000 | | | 89,684 |
Ibiden Co. Ltd. (Japan) | | 2,300 | | | 115,685 |
Itron, Inc.(a)(b) | | 67,100 | | | 3,478,464 |
Kingboard Chemical Holdings Ltd. (Hong Kong) | | 45,000 | | | 176,706 |
Kyocera Corp. (Japan) | | 3,400 | | | 321,411 |
Nippon Electric Glass Co. Ltd. (Japan) | | 13,000 | | | 272,592 |
TDK Corp. (Japan) | | 2,100 | | | 167,203 |
Venture Co. Ltd. (Singapore) | | 15,000 | | | 131,563 |
Yaskawa Electric Corp. (Japan) | | 87,000 | | | 1,005,655 |
| | | | |
|
|
| | | | | | 20,873,408 |
| | | | |
|
|
Energy Equipment & Services — 1.5% | | | |
B.J. Services Co. | | 239,100 | | | 7,010,412 |
Baker Hughes, Inc. | | 140,100 | | | 10,459,866 |
Fugro NV-CVA (Netherlands) | | 9,541 | | | 455,923 |
Halliburton Co.(b) | | 465,000 | | | 14,438,250 |
Nabors Industries Ltd. (Bermunda)(a)(b) | | 25,300 | | | 753,434 |
SEE NOTES TO FINANCIAL STATEMENTS.
B39
| | | | |
| | | FLEXIBLE MANAGED PORTFOLIO (Continued) | | |
SCHEDULE OF INVESTMENTS | December 31, 2006 |
| | | | | |
COMMON STOCKS
(Continued) | | Shares
| | Value (Note 2)
|
Energy Equipment & Services (cont’d.) | | | |
Schlumberger Ltd. (Netherlands Antilles) | | 182,400 | | $ | 11,520,384 |
TGS Nopec Geophysical Co. ASA (Norway)(a) | | 18,851 | | | 390,008 |
Tidewater, Inc.(b) | | 61,500 | | | 2,974,140 |
Transocean, Inc. (Cayman Islands)(a)(b) | | 85,500 | | | 6,916,095 |
| | | | |
|
|
| | | | | | 54,918,512 |
| | | | |
|
|
Food & Staples Retailing — 1.2% | | | |
Aeon Co. Ltd. (Japan) | | 20,500 | | | 443,381 |
Casino Guichard-Perrachon SA (France) | | 12,552 | | | 1,166,472 |
CVS Corp. | | 11,100 | | | 343,101 |
Delhaize Group (Belgium) | | 5,838 | | | 486,661 |
FamilyMart Co. Ltd. (Japan) | | 4,000 | | | 108,734 |
J. Sainsbury PLC (United Kingdom) | | 94,968 | | | 760,982 |
Jeronimo Martins SGPS SA (Portugal) | | 3,067 | | | 68,826 |
Koninklijke Ahold NV (Netherlands)(a) | | 102,977 | | | 1,095,630 |
Kroger Co. (The) | | 251,600 | | | 5,804,412 |
Safeway, Inc. | | 454,800 | | | 15,717,888 |
SUPERVALU, Inc. | | 60,500 | | | 2,162,875 |
Wal-Mart Stores, Inc. | | 321,200 | | | 14,833,016 |
Woolworths Ltd. (Australia) | | 22,071 | | | 415,737 |
| | | | |
|
|
| | | | | | 43,407,715 |
| | | | |
|
|
Food Products — 0.8% | | | |
Archer-Daniels-Midland Co. | | 449,300 | | | 14,359,628 |
Chiquita Brands International, Inc.(b) | | 35,100 | | | 560,547 |
ConAgra Foods, Inc. | | 101,300 | | | 2,735,100 |
Dean Foods Co.(a) | | 33,300 | | | 1,407,924 |
East Asiatic Co. Ltd. A/S (Denmark) | | 8,750 | | | 489,484 |
Ebro Puleva SA (Spain) | | 11,618 | | | 294,457 |
H.J. Heinz Co. | | 87,000 | | | 3,915,870 |
Nestle SA (Class “B” Stock) (Switzerland) | | 3,982 | | | 1,415,023 |
Nichirei Corp. (Japan) | | 19,000 | | | 106,413 |
Nisshin Seifun Group, Inc. (Japan) | | 24,000 | | | 247,675 |
Smithfield Foods, Inc.(a) | | 10,400 | | | 266,864 |
Suedzucker AG (Germany) | | 48,464 | | | 1,163,699 |
Toyo Suisan Kaisha Ltd. (Japan) | | 4,000 | | | 64,077 |
Unilever NV (Netherlands) | | 64,290 | | | 1,756,720 |
Unilever PLC (United Kingdom) | | 62,819 | | | 1,756,418 |
Yamazaki Baking Co. Ltd. (Japan) | | 20,000 | | | 194,129 |
| | | | |
|
|
| | | | | | 30,734,028 |
| | | | |
|
|
Gas Utilities | | | |
Gas Natural SDG SA (Spain) | | 6,002 | | | 237,608 |
Gaz de France (France) | | 9,751 | | | 448,581 |
| | | | |
|
|
| | | | | | 686,189 |
| | | | |
|
|
Healthcare Equipment & Supplies — 0.5% | | | |
Baxter International, Inc. | | 53,300 | | | 2,472,587 |
Becton, Dickinson & Co. | | 219,100 | | | 15,369,865 |
Cochlear Ltd. (Australia) | | 5,175 | | | 236,173 |
Mentor Corp. | | 19,800 | | | 967,626 |
Phonak Holding AG (Switzerland) | | 6,481 | | | 515,927 |
| | | | |
|
|
| | | | | | 19,562,178 |
| | | | |
|
|
| | | | | |
COMMON STOCKS
(Continued) | | Shares
| | Value (Note 2)
|
Healthcare Providers & Services — 2.0% | | | |
Aetna, Inc. | | 177,300 | | $ | 7,655,814 |
Caremark Rx, Inc.(a) | | 293,100 | | | 16,738,941 |
Express Scripts, Inc. (Class “A” Stock)(a)(b) | | 167,500 | | | 11,993,000 |
Fresenius Medical Care AG & Co. KGaA (Germany) | | 484 | | | 64,574 |
Medco Health Solutions, Inc.(a) | | 145,900 | | | 7,796,896 |
Suzuken Co. Ltd. (Japan) | | 14,100 | | | 530,128 |
UnitedHealth Group, Inc. | | 215,000 | | | 11,551,950 |
WellPoint, Inc.(a) | | 211,000 | | | 16,603,590 |
| | | | |
|
|
| | | | | | 72,934,893 |
| | | | |
|
|
Healthcare Technology | | | |
IMS Health, Inc. | | 28,800 | | | 791,424 |
| | | | |
|
|
Hotels, Restaurants & Leisure — 1.2% | | | |
Brinker International, Inc. (Australia) | | 226,650 | | | 6,835,764 |
Carnival PLC (United Kingdom) | | 8,895 | | | 450,732 |
Darden Restaurants, Inc.(b) | | 145,500 | | | 5,844,735 |
Dover Downs Gaming & Entertainment, Inc. | | 1,400 | | | 18,718 |
Enterprise Inns PLC (United Kingdom) | | 27,948 | | | 740,384 |
McDonald’s Corp. | | 384,500 | | | 17,044,885 |
Yum! Brands, Inc. | | 237,300 | | | 13,953,240 |
| | | | |
|
|
| | | | | | 44,888,458 |
| | | | |
|
|
Household Durables — 0.2% | | | |
Barratt Developments PLC (United Kingdom) | | 46,780 | | | 1,131,191 |
Bellway PLC (United Kingdom) | | 3,967 | | | 119,927 |
Bovis Homes Group PLC (United Kingdom) | | 10,253 | | | 217,615 |
George Wimpey PLC (United Kingdom) | | 98,078 | | | 1,072,515 |
Harman International Industries, Inc. | | 29,100 | | | 2,907,381 |
Makita Corp. (Japan) | | 39,500 | | | 1,210,656 |
Matsushita Electric Industrial Co. Ltd. (Japan) | | 20,000 | | | 401,030 |
Sekisui House Ltd. (Japan) | | 17,000 | | | 246,896 |
Taylor Woodrow PLC (United Kingdom) | | 80,614 | | | 672,796 |
| | | | |
|
|
| | | | | | 7,980,007 |
| | | | |
|
|
Household Products — 1.3% | | | |
Kimberly-Clark Corp. | | 245,400 | | | 16,674,930 |
Procter & Gamble Co.(b) | | 464,405 | | | 29,847,309 |
Reckitt Benckiser PLC (United Kingdom) | | 36,636 | | | 1,674,239 |
| | | | |
|
|
| | | | | | 48,196,478 |
| | | | |
|
|
Independent Power Producers & Energy Traders — 0.6% |
International Power PLC (United Kingdom) | | 167,025 | | | 1,248,444 |
NRG Energy, Inc.(a) | | 97,600 | | | 5,466,576 |
TXU Corp. | | 263,200 | | | 14,268,072 |
| | | | |
|
|
| | | | | | 20,983,092 |
| | | | |
|
|
SEE NOTES TO FINANCIAL STATEMENTS.
B40
| | | | |
| | | FLEXIBLE MANAGED PORTFOLIO (Continued) | | |
SCHEDULE OF INVESTMENTS | December 31, 2006 |
| | | | | |
COMMON STOCKS
(Continued) | | Shares
| | Value (Note 2)
|
Industrial Conglomerates — 2.0% |
3M Co. | | 69,300 | | $ | 5,400,549 |
Cookson Group PLC (United Kingdom) | | 19,042 | | | 234,143 |
General Electric Co. | | 1,498,200 | | | 55,748,022 |
Orkla ASA (Class “A” Stock) (Norway) | | 29,000 | | | 1,641,808 |
Siemens AG (Germany) | | 2,011 | | | 200,689 |
Textron, Inc. | | 19,900 | | | 1,866,023 |
Tyco International Ltd. (Bermuda) | | 339,900 | | | 10,332,960 |
| | | | |
|
|
| | | | | | 75,424,194 |
| | | | |
|
|
Insurance — 2.9% |
ACE Ltd. (Cayman Islands) | | 67,600 | | | 4,094,532 |
Aegon NV (Netherlands) | | 97,879 | | | 1,865,715 |
Allianz AG (Germany) | | 12,284 | | | 2,511,932 |
Allstate Corp. (The) | | 281,600 | | | 18,334,976 |
American International Group, Inc. | | 289,235 | | | 20,726,580 |
Aviva PLC (United Kingdom) | | 133,120 | | | 2,142,514 |
AXA SA (France) | | 36,544 | | | 1,479,512 |
Chubb Corp. (The) | | 182,200 | | | 9,640,202 |
CNP Assurances (France) | | 2,207 | | | 246,468 |
Compagnia Assicuratrice unipol S.p.A. (Italy) | | 24,175 | | | 78,344 |
Fondiaria – SAI S.p.A. (Italy) | | 3,016 | | | 144,281 |
Genworth Financial, Inc. (Class “A” Stock) | | 22,000 | | | 752,620 |
Hartford Financial Services Group, Inc. | | 71,200 | | | 6,643,672 |
MetLife, Inc. | | 54,200 | | | 3,198,342 |
Muenchener Rueckversicherungs – Gesellschaft AG (Germany) | | 12,487 | | | 2,159,325 |
QBE Insurance Group Ltd. (Australia) | | 3,606 | | | 81,816 |
Royal & Sun Alliance Insurance Group PLC (United Kingdom) | | 456,213 | | | 1,362,216 |
SAFECO Corp. | | 146,300 | | | 9,151,065 |
SCOR (France) | | 65,782 | | | 194,511 |
St. Paul Travelers Cos., Inc. (The) | | 364,600 | | | 19,575,374 |
Swiss Reinsurance (Switzerland) | | 12,986 | | | 1,104,103 |
Topdanmark A/S (Denmark)(a) | | 1,100 | | | 181,879 |
Zurich Financial Services AG (Switzerland) | | 7,136 | | | 1,920,893 |
| | | | |
|
|
| | | | | | 107,590,872 |
| | | | |
|
|
Internet & Catalog Retail — 0.2% |
Experian Group Ltd.(a) | | 20,266 | | | 237,884 |
IAC/Interactive Corp.(a)(b) | | 120,800 | | | 4,488,928 |
Priceline.com, Inc.(a)(b) | | 46,500 | | | 2,027,865 |
| | | | |
|
|
| | | | | | 6,754,677 |
| | | | |
|
|
Internet Software & Services — 0.4% |
Ariba, Inc.(a) | | 133,600 | | | 1,034,064 |
Dealertrack Holdings, Inc.(a) | | 11,300 | | | 332,446 |
Digital Insight Corp.(a) | | 28,700 | | | 1,104,663 |
eBay, Inc.(a) | | 68,900 | | | 2,071,823 |
Google, Inc. (Class “A” Stock)(a) | | 3,400 | | | 1,565,632 |
RealNetworks, Inc.(a)(b) | | 151,100 | | | 1,653,034 |
SonicWALL, Inc.(a) | | 135,800 | | | 1,143,436 |
| | | | | |
COMMON STOCKS
(Continued) | | Shares
| | Value (Note 2)
|
Internet Software & Services (cont’d.) |
Travelzoo, Inc.(a)(b) | | 73,500 | | $ | 2,201,325 |
Valueclick, Inc.(a) | | 20,000 | | | 472,600 |
Websense, Inc.(a) | | 121,000 | | | 2,762,430 |
| | | | |
|
|
| | | | | | 14,341,453 |
| | | | |
|
|
IT Services — 0.7% |
Automatic Data Processing, Inc. | | 159,000 | | | 7,830,750 |
Fiserv, Inc.(a) | | 295,600 | | | 15,495,352 |
NTT Data Corp. (Japan) | | 287 | | | 1,436,779 |
| | | | |
|
|
| | | | | | 24,762,881 |
| | | | |
|
|
Leisure Equipment & Products — 0.2% |
FUJIFILM Holdings Corp. (Japan) | | 21,400 | | | 881,426 |
Nikon Corp. (Japan) | | 56,000 | | | 1,227,514 |
Pool Corp.(b) | | 81,300 | | | 3,184,521 |
Sankyo Co. Ltd. (Japan) | | 2,100 | | | 115,929 |
Yamaha Corp. (Japan) | | 24,200 | | | 512,696 |
| | | | |
|
|
| | | | | | 5,922,086 |
| | | | |
|
|
Life Sciences, Tools & Services — 0.2% |
Charles River Laboratories International, Inc.(a) | | 31,200 | | | 1,349,400 |
Thermo Electron Corp.(a) | | 96,200 | | | 4,356,898 |
Waters Corp.(a) | | 71,100 | | | 3,481,767 |
| | | | |
|
|
| | | | | | 9,188,065 |
| | | | |
|
|
Machinery — 1.1% |
Amada Co. Ltd. (Japan) | | 51,000 | | | 539,969 |
Caterpillar, Inc. | | 176,400 | | | 10,818,612 |
Dover Corp. | | 47,300 | | | 2,318,646 |
Eaton Corp. | | 63,400 | | | 4,763,876 |
Gardner Denver, Inc.(a) | | 71,100 | | | 2,652,741 |
Ingersoll-Rand Co. (Class “A” Stock) (Bermuda) | | 263,500 | | | 10,310,755 |
Komatsu Ltd. (Japan) | | 88,000 | | | 1,781,109 |
Komori Corp. (Japan) | | 19,000 | | | 353,868 |
Kubota Corp. (Japan) | | 86,000 | | | 796,444 |
MAN AG (Germany) | | 5,446 | | | 493,954 |
Metso Oyj (Finland) | | 11,400 | | | 575,455 |
Mitsubishi Heavy Industries Ltd. (Japan) | | 35,000 | | | 158,791 |
NSK Ltd. (Japan) | | 47,000 | | | 463,005 |
PACCAR, Inc.(b) | | 33,750 | | | 2,190,375 |
Parker Hannifin Corp. | | 5,700 | | | 438,216 |
Sandvik AB (Sweden) | | 7,266 | | | 105,605 |
Vallourec SA (France) | | 5,820 | | | 1,692,490 |
Volvo AB (Class “B” Stock) (Sweden) | | 13,300 | | | 916,009 |
| | | | |
|
|
| | | | | | 41,369,920 |
| | | | |
|
|
Marine | | | |
AP Moller – Maersk A/S (Denmark) | | 6 | | | 56,508 |
Kawasaki Kisen Kaisha Ltd. (Japan) | | 17,000 | | | 132,880 |
Mitsui OSK Lines Ltd. (Japan) | | 137,000 | | | 1,353,104 |
| | | | |
|
|
| | | | | | 1,542,492 |
| | | | |
|
|
Media — 1.9% | | | |
APN News & Media Ltd. (Australia) | | 32,325 | | | 154,095 |
CBS Corp. (Class “B” Stock)(b) | | 384,419 | | | 11,986,184 |
Comcast Corp. (Class “A” Stock)(a)(b) | | 446,582 | | | 18,903,816 |
SEE NOTES TO FINANCIAL STATEMENTS.
B41
| | | | |
| | | FLEXIBLE MANAGED PORTFOLIO (Continued) | | |
SCHEDULE OF INVESTMENTS | December 31, 2006 |
| | | | | |
COMMON STOCKS
(Continued) | | Shares
| | Value (Note 2)
|
Media (cont’d.) | | | |
DIRECTV Group, Inc. (The)(a) | | 577,900 | | $ | 14,412,826 |
Emap PLC (Class “B” Stock) (United Kingdom) | | 2,615 | | | 41,345 |
Eniro AB (Sweden) | | 14,900 | | | 196,970 |
ITV PLC (United Kingdom) | | 173,353 | | | 361,484 |
McGraw-Hill Cos., Inc. (The) | | 30,700 | | | 2,088,214 |
Omnicom Group, Inc. | | 2,500 | | | 261,350 |
Reed Elsevier NV (United Kingdom) | | 8,370 | | | 142,750 |
Reed Elsevier PLC (United Kingdom) | | 15,443 | | | 169,479 |
Time Warner, Inc. | | 250,750 | | | 5,461,335 |
Viacom, Inc. (Class “B” Stock)(a) | | 219,700 | | | 9,014,291 |
Vivendi Universal SA (France) | | 57,540 | | | 2,249,039 |
Walt Disney Co. | | 139,000 | | | 4,763,530 |
| | | | |
|
|
| | | | | | 70,206,708 |
| | | | |
|
|
Metals & Mining — 0.8% | | | |
Acerinox SA (Spain) | | 27,766 | | | 844,837 |
Alcoa, Inc. | | 180,600 | | | 5,419,806 |
Anglo American PLC (United Kingdom) | | 48,896 | | | 2,384,820 |
BHP Billiton Ltd. (Australia) | | 41,980 | | | 834,945 |
BHP Billiton PLC (United Kingdom) | | 38,506 | | | 704,557 |
Boehler-Uddeholm AG (Austria) | | 1,057 | | | 74,090 |
Newmont Mining Corp. | | 108,900 | | | 4,916,835 |
Nippon Light Metal Co. Ltd. (Japan) | | 61,000 | | | 156,332 |
Nippon Steel Corp. (Japan) | | 169,000 | | | 969,558 |
OneSteel Ltd. (Australia) | | 17,774 | | | 65,543 |
Outokumpu OYJ (Finland) | | 34,000 | | | 1,331,186 |
Phelps Dodge Corp. | | 43,600 | | | 5,219,792 |
Quanex Corp. | | 31,150 | | | 1,077,479 |
Rio Tinto Ltd. (Australia) | | 10,942 | | | 637,028 |
Rio Tinto PLC (United Kingdom) | | 39,715 | | | 2,113,551 |
Salzgitter AG (Germany) | | 2,686 | | | 353,500 |
Sumitomo Metal Industries Ltd. (Japan) | | 176,000 | | | 764,143 |
Thyssenkrupp AG (Germany) | | 27,577 | | | 1,301,403 |
Wheeling-Pittsburgh Corp.(a)(b) | | 13,000 | | | 243,490 |
Xstrata PLC (United Kingdom) | | 15,625 | | | 780,133 |
| | | | |
|
|
| | | | | | 30,193,028 |
| | | | |
|
|
Multiline Retail — 1.1% | | | |
Family Dollar Stores, Inc. | | 104,500 | | | 3,064,985 |
Federated Department Stores, Inc. | | 151,000 | | | 5,757,630 |
J.C. Penney Co., Inc. | | 199,300 | | | 15,417,848 |
Kohl’s Corp.(a) | | 215,700 | | | 14,760,351 |
Marks & Spencer Group PLC
(United Kingdom) | | 113,014 | | | 1,586,573 |
Nordstrom, Inc. | | 11,000 | | | 542,740 |
Pinault Printemps Redoute SA (France) | | 471 | | | 70,381 |
| | | | |
|
|
| | | | | | 41,200,508 |
| | | | |
|
|
Multi-Utilities — 0.5% |
Ameren Corp.(b) | | 52,600 | | | 2,826,198 |
CMS Energy Corp.(a)(b) | | 10,200 | | | 170,340 |
National Grid PLC (United Kingdom) | | 150,205 | | | 2,167,507 |
Public Service Enterprise Group, Inc. | | 114,100 | | | 7,573,958 |
RWE AG (Germany) | | 751 | | | 82,738 |
| | | | | |
COMMON STOCKS
(Continued) | | Shares
| | Value (Note 2)
|
Multi-Utilities (cont’d.) |
Sempra Energy | | 97,273 | | $ | 5,451,179 |
Suez SA (France) | | 4,383 | | | 226,975 |
| | | | |
|
|
| | | | | | 18,498,895 |
| | | | |
|
|
Office Electronics — 0.4% |
Canon, Inc. (Japan) | | 34,150 | | | 1,922,650 |
Ricoh Co. Ltd. (Japan) | | 73,000 | | | 1,486,667 |
Xerox Corp.(a) | | 720,600 | | | 12,214,170 |
| | | | |
|
|
| | | | | | 15,623,487 |
| | | | |
|
|
Oil, Gas & Consumable Fuels — 5.2% | | | | | |
Anadarko Petroleum Corp. | | 201,600 | | | 8,773,632 |
BG Group PLC (United Kingdom) | | 2,761 | | | 37,463 |
BP PLC (United Kingdom) | | 525,868 | | | 5,843,207 |
Chesapeake Energy Corp. | | 382,700 | | | 11,117,435 |
Chevron Corp. | | 564,156 | | | 41,482,391 |
ConocoPhillips (Class “B” Stock) | | 167,434 | | | 12,046,876 |
ENI S.p.A (Italy) | | 95,750 | | | 3,220,527 |
Exxon Mobil Corp. | | 879,716 | | | 67,412,636 |
Marathon Oil Corp. | | 128,000 | | | 11,840,000 |
Neste Oil OYJ (Finland) | | 33,700 | | | 1,024,501 |
Nippon Oil Corp. (Japan) | | 162,000 | | | 1,083,365 |
Norsk Hydro ASA (Norway) | | 20,173 | | | 626,039 |
Occidental Petroleum Corp. | | 63,600 | | | 3,105,588 |
Repsol YPF SA (Spain) | | 5,692 | | | 196,859 |
Royal Dutch Shell PLC (Class “B” Stock) (United Kingdom) | | 90,079 | | | 3,157,077 |
Royal Dutch Shell PLC (United Kingdom) | | 55,023 | | | 1,923,052 |
Santos Ltd. (Australia) | | 136,743 | | | 1,064,186 |
Singapore Petroleum Co. Ltd. (Singapore) | | 69,000 | | | 195,898 |
Sunoco, Inc.(b) | | 88,300 | | | 5,506,388 |
Total SA (France) | | 27,472 | | | 1,981,843 |
Valero Energy Corp. | | 218,700 | | | 11,188,692 |
| | | | |
|
|
| | | | | | 192,827,655 |
| | | | |
|
|
Paper & Forest Products | | | | | |
Svenska Cellulosa AB (Sca)
(Class “B” Stock) (Sweden) | | 12,400 | | | 647,536 |
| | | | |
|
|
Personal Products — 0.1% | | | | | |
Avon Products, Inc. | | 75,700 | | | 2,501,128 |
Chattem, Inc.(a)(b) | | 9,600 | | | 480,768 |
USANA Health Sciences, Inc.(a)(b) | | 12,900 | | | 666,414 |
| | | | |
|
|
| | | | | | 3,648,310 |
| | | | |
|
|
Pharmaceuticals — 4.6% |
Abbott Laboratories | | 65,500 | | | 3,190,505 |
Altana AG (Germany) | | 4,760 | | | 294,378 |
AstraZeneca PLC (United Kingdom) | | 55,439 | | | 2,978,572 |
Daiichi Sankyo Co. Ltd. (Japan) | | 5,900 | | | 184,044 |
Eli Lilly & Co. | | 279,400 | | | 14,556,740 |
Forest Laboratories, Inc.(a) | | 56,400 | | | 2,853,840 |
GlaxoSmithKline PLC (United Kingdom) | | 136,998 | | | 3,605,140 |
Johnson & Johnson | | 625,398 | | | 41,288,776 |
King Pharmaceuticals, Inc.(a) | | 388,700 | | | 6,188,104 |
Mayne Pharma Ltd. (Australia) | | 67,052 | | | 215,157 |
SEE NOTES TO FINANCIAL STATEMENTS.
B42
| | | | |
| | | FLEXIBLE MANAGED PORTFOLIO (Continued) | | |
SCHEDULE OF INVESTMENTS | December 31, 2006 |
| | | | | |
COMMON STOCKS
(Continued) | | Shares
| | Value (Note 2)
|
Pharmaceuticals (cont’d.) |
Merck & Co., Inc. | | 570,400 | | $ | 24,869,440 |
Novartis AG (Switzerland) | | 20,548 | | | 1,184,651 |
Novo Nordisk A/S-B (Denmark) | | 3,600 | | | 299,851 |
Pfizer, Inc. | | 1,484,665 | | | 38,452,824 |
Roche Holding AG-Genusshein (Switzerland) | | 16,692 | | | 2,993,190 |
Sanofi-Aventis (France) | | 25,739 | | | 2,376,666 |
Santen Pharmaceutical Co., Ltd. (Japan) | | 7,600 | | | 213,789 |
Takeda Pharmaceutical Co. Ltd. (Japan) | | 9,900 | | | 678,507 |
Tanabe Seiyaku Co., Ltd. (Japan) | | 27,000 | | | 353,076 |
Wyeth | | 476,600 | | | 24,268,472 |
| | | | |
|
|
| | | | | | 171,045,722 |
| | | | |
|
|
Real Estate Investment Trusts — 0.3% | | | | | |
American Home Mortgage Investment Corp.(b) | | 86,400 | | | 3,034,368 |
Ashford Hospitality Trust, Inc. | | 49,600 | | | 617,520 |
British Land Co. PLC
(United Kingdom) | | 9,755 | | | 327,376 |
Corio NV (Netherlands) | | 1,109 | | | 90,617 |
FelCor Lodging Trust, Inc. | | 50,600 | | | 1,105,104 |
Hospitality Properties Trust | | 6,900 | | | 327,957 |
KKR Financial Corp. | | 69,300 | | | 1,856,547 |
Land Securities Group PLC (United Kingdom) | | 2,350 | | | 106,887 |
Luminent Mortgage Capital, Inc. | | 26,200 | | | 254,402 |
Mirvac Group (Australia) | | 153,720 | | | 676,158 |
Newcastle Investment Corp. | | 30,600 | | | 958,392 |
Thornburg Mortgage, Inc.(b) | | 30,300 | | | 761,439 |
| | | | |
|
|
| | | | | | 10,116,767 |
| | | | |
|
|
Real Estate Management & Development — 0.2% |
City Developments Ltd. | | 15,000 | | | 123,633 |
Immofinanz Immobilien Anlagen AG (Austria)(a) | | 20,519 | | | 292,529 |
Jones Lang Lasalle, Inc. | | 32,800 | | | 3,023,176 |
Lend Lease Corp. Ltd. (Australia) | | 33,660 | | | 488,784 |
Leopalace21 Corp. (Japan) | | 32,700 | | | 1,044,555 |
Sumitomo Realty & Development Co. Ltd. (Japan) | | 11,000 | | | 352,653 |
Swire Pacific Ltd. (Hong Kong) | | 29,000 | | | 310,964 |
UOL Group Ltd. (Singapore) | | 96,000 | | | 270,647 |
Wharf Holdings Ltd. (Hong Kong) | | 28,000 | | | 103,254 |
| | | | |
|
|
| | | | | | 6,010,195 |
| | | | |
|
|
Road & Rail — 0.7% |
Burlington Northern Santa Fe Corp. | | 11,800 | | | 870,958 |
CSX Corp. | | 389,400 | | | 13,407,042 |
JB Hunt Transport Services, Inc. | | 32,700 | | | 679,179 |
Nippon Express Co. Ltd. (Japan) | | 51,000 | | | 279,039 |
Norfolk Southern Corp. | | 165,500 | | | 8,322,995 |
Ryder System, Inc. | | 19,500 | | | 995,670 |
Toll Holdings Ltd. (Australia) | | 18,893 | | | 272,130 |
| | | | |
|
|
| | | | | | 24,827,013 |
| | | | |
|
|
| | | | | |
COMMON STOCKS
(Continued) | | Shares
| | Value (Note 2)
|
Semiconductors & Semiconductor Equipment — 1.5% |
Analog Devices, Inc. | | 127,200 | | $ | 4,181,064 |
Applied Materials, Inc. | | 857,600 | | | 15,822,720 |
ASM Pacific Technology Ltd. (Hong Kong) | | 10,500 | | | 58,377 |
ATMI, Inc.(a)(b) | | 82,800 | | | 2,527,884 |
Elpida Memory, Inc. (Japan)(a) | | 12,200 | | | 670,029 |
Intel Corp. | | 437,200 | | | 8,853,300 |
Lam Research Corp.(a)(b) | | 12,500 | | | 632,750 |
MEMC Electronic Materials, Inc.(a) | | 49,800 | | | 1,949,172 |
Novellus Systems, Inc.(b) | | 275,800 | | | 9,493,036 |
Sirf Technology Holdings, Inc.(a)(b) | | 17,200 | | | 438,944 |
Sumco Corp. (Japan) | | 20,100 | | | 1,698,669 |
Texas Instruments, Inc. | | 65,100 | | | 1,874,880 |
Tokyo Electron Ltd. (Japan) | | 20,900 | | | 1,643,943 |
Xilinx, Inc. | | 226,000 | | | 5,381,060 |
| | | | |
|
|
| | | | | | 55,225,828 |
| | | | |
|
|
Software — 2.3% |
BMC Software, Inc.(a) | | 50,200 | | | 1,616,440 |
Cadence Design Systems, Inc.(a)(b) | | 290,000 | | | 5,193,900 |
Fair Isaac Corp. | | 19,000 | | | 772,350 |
Intuit, Inc.(a) | | 33,200 | | | 1,012,932 |
Microsoft Corp. | | 1,221,700 | | | 36,479,962 |
MicroStrategy, Inc.
(Class “A” Stock)(a)(b) | | 85,500 | | | 9,747,855 |
Oracle Corp.(a) | | 1,015,400 | | | 17,403,956 |
Symantec Corp.(a)(b) | | 586,600 | | | 12,230,610 |
Synopsys, Inc.(a) | | 80,500 | | | 2,151,765 |
| | | | |
|
|
| | | | | | 86,609,770 |
| | | | |
|
|
Specialty Retail — 1.2% |
Aeropostale, Inc.(a) | | 113,800 | | | 3,513,006 |
AnnTaylor Stores Corp.(a) | | 18,700 | | | 614,108 |
Aoyama Trading Co. Ltd. (Japan) | | 2,200 | | | 65,998 |
Autobacs Seven Co. Ltd. (Japan) | | 1,900 | | | 69,399 |
Best Buy Co., Inc. | | 91,400 | | | 4,495,966 |
Esprit Holdings Ltd. (Hong Kong) | | 7,000 | | | 77,969 |
Group 1 Automotive, Inc. | | 13,700 | | | 708,564 |
Gymboree Corp.(a) | | 105,600 | | | 4,029,696 |
Home Depot, Inc. | | 282,050 | | | 11,327,128 |
Lowe’s Cos., Inc. | | 238,300 | | | 7,423,045 |
Nobia AB (Sweden) | | 2,622 | | | 100,921 |
Office Depot, Inc.(a) | | 142,300 | | | 5,431,591 |
Rent-A-Center, Inc.(a) | | 18,400 | | | 542,984 |
TJX Cos., Inc. | | 228,400 | | | 6,513,968 |
USS Co. Ltd. (Japan) | | 3,190 | | | 207,656 |
| | | | |
|
|
| | | | | | 45,121,999 |
| | | | |
|
|
Textiles, Apparel & Luxury Goods — 0.7% |
Coach, Inc.(a) | | 394,500 | | | 16,947,720 |
Folli – Follie SA (Greece) | | 1,750 | | | 69,071 |
Fossil, Inc.(a)(b) | | 13,100 | | | 295,798 |
Gunze Ltd. (Japan) | | 18,000 | | | 90,371 |
Jones Apparel Group, Inc. | | 140,200 | | | 4,686,886 |
Liz Claiborne, Inc. | | 66,100 | | | 2,872,706 |
Puma AG Rudolf Dassler Sport (Germany)(a) | | 1,471 | | | 574,808 |
Swatch Group AG (Switzerland) | | 4,940 | | | 220,952 |
| | | | |
|
|
| | | | | | 25,758,312 |
| | | | |
|
|
SEE NOTES TO FINANCIAL STATEMENTS.
B43
| | | | |
| | | FLEXIBLE MANAGED PORTFOLIO (Continued) | | |
SCHEDULE OF INVESTMENTS | December 31, 2006 |
| | | | | |
COMMON STOCKS
(Continued) | | Shares
| | Value (Note 2)
|
Thrifts & Mortgage Finance — 0.7% |
Countrywide Financial Corp. | | 107,000 | | $ | 4,542,150 |
Fannie Mae | | 49,400 | | | 2,933,866 |
MGIC Investment Corp.(b) | | 175,800 | | | 10,994,532 |
PMI Group, Inc. (The) | | 68,700 | | | 3,240,579 |
Radian Group, Inc.(b) | | 56,900 | | | 3,067,479 |
Washington Mutual, Inc. | | 41,300 | | | 1,878,737 |
| | | | |
|
|
| | | | | | 26,657,343 |
| | | | |
|
|
Tobacco — 1.0% |
Altria Group, Inc. | | 254,600 | | | 21,849,772 |
British American Tobacco PLC (United Kingdom) | | 32,134 | | | 899,095 |
Imperial Tobacco Group PLC (United Kingdom) | | 28,488 | | | 1,121,158 |
Reynolds American, Inc.(b) | | 196,200 | | | 12,845,214 |
Swedish Match AB (Sweden) | | 61,000 | | | 1,140,528 |
| | | | |
|
|
| | | | | | 37,855,767 |
| | | | |
|
|
Trading Companies & Distributors — 0.1% |
Itochu Corp. (Japan) | | 115,000 | | | 942,661 |
Marubeni Corp. (Japan) | | 163,000 | | | 825,834 |
Mitsubishi Corp. (Japan) | | 26,100 | | | 490,387 |
Mitsui & Co. Ltd. (Japan) | | 75,000 | | | 1,123,791 |
MSC Industrial Direct Co. | | 12,900 | | | 505,035 |
Sumitomo Corp. (Japan) | | 80,000 | | | 1,197,579 |
| | | | |
|
|
| | | | | | 5,085,287 |
| | | | |
|
|
Transportation Infrastructure |
Hopewell Holdings (Hong Kong) | | 57,000 | | | 199,533 |
Kamigumi Co. Ltd. (Japan) | | 18,000 | | | 147,319 |
Macquarie Airports Management Ltd. (Australia) | | 443,638 | | | 1,258,330 |
| | | | |
|
|
| | | | | | 1,605,182 |
| | | | |
|
|
Wireless Telecommunication Services — 0.6% |
Alltel Corp. | | 134,200 | | | 8,116,416 |
KDDI Corp. (Japan) | | 15 | | | 101,829 |
Mobistar SA (Belgium) | | 1,853 | | | 158,137 |
NTT DoCoMo, Inc. (Japan) | | 150 | | | 237,350 |
Sprint Nextel Corp. | | 631,300 | | | 11,925,257 |
Vodafone Group PLC (United Kingdom) | | 1,336,762 | | | 3,703,558 |
| | | | |
|
|
| | | | | | 24,242,547 |
| | | | |
|
|
TOTAL COMMON STOCKS
(cost $2,070,322,905) | | | 2,489,162,657 |
| | | | |
|
|
| PREFERRED STOCK | | | | | |
Automobiles | | | | | |
Porsche AG (Germany)
(cost $566,243) | | 588 | | | 750,541 |
| | | | |
|
|
| | | | | | | | | | |
Interest
Rate
| | Maturity
Date
| | Moody’s
Rating
(Unaudited)
| | Principal
Amount
(000)
| | Value
(Note 2)
|
| LONG-TERM BONDS — 24.9% | | | |
Aerospace & Defense — 0.3% | | | |
BAE Systems Holdings, Inc.,(h) | | | |
Notes, 144A | | | |
| 4.75% | | 08/15/10 | | Baa2 | | $ | 2,150 | | $ | 2,092,195 |
| 5.20% | | 08/15/15 | | Baa2 | | | 1,060 | | | 1,009,692 |
Boeing Capital Corp., | | | |
Sr. Notes | | | |
| 6.10% | | 03/01/11 | | A2 | | | 925 | | | 955,630 |
Goodrich Corp., | | | |
Notes | | | |
| 6.80% | | 07/01/36 | | Baa3 | | | 1,018 | | | 1,082,968 |
Lockheed Martin Corp., | | | |
Notes, Ser. B | | | |
| 6.15% | | 09/01/36 | | Baa1 | | | 120 | | | 126,077 |
Northrop Grumman Corp., | | | |
Gtd. Notes | | | |
| 7.125% | | 02/15/11 | | Baa2 | | | 3,500 | | | 3,733,302 |
Raytheon Co., | | | |
Notes, | | | |
| 4.50% | | 11/15/07 | | Baa2 | | | 177 | | | 175,598 |
Sr. Notes | | | |
| 5.50% | | 11/15/12 | | Baa2 | | | 595 | | | 598,734 |
| 6.55% | | 03/15/10 | | Baa2 | | | 870 | | | 901,404 |
Sr. Unsec. Notes | | | |
| 8.30% | | 03/01/10 | | Baa2 | | | 530 | | | 575,408 |
| | | | | | | | | |
|
|
| | | | | | | | | | | 11,251,008 |
| | | | | | | | | |
|
|
Airlines | | | |
Continental Airlines, Inc., | | | |
Pass-thru Certs. | | | |
| 6.648% | | 09/15/17 | | Baa3 | | | 400 | | | 415,483 |
Southwest Airlines Co., | | | |
Notes | | | |
| 6.50% | | 03/01/12 | | Baa1 | | | 1,005 | | | 1,047,889 |
| | | | | | | | | |
|
|
| | | | | | | | | | | 1,463,372 |
| | | | | | | | | |
|
|
Asset Backed Securities — 1.0% | | | |
American Express Credit Account Master Trust,(g)(h) | | | |
Ser. 2004-4, Class C, 144A | | | |
| 5.82% | | 03/15/12 | | Baa2 | | | 1,170 | | | 1,176,398 |
Ser. 2004-C, Class C, 144A | | | |
| 5.85% | | 02/15/12 | | Baa2 | | | 735 | | | 736,103 |
Amortizing Residential Collateral Trust,(g) | | | |
2002-BC7 M2 | | | |
| 6.70% | | 10/25/32 | | AA+(f) | | | 151 | | | 150,621 |
2002-BC9 M1 | | | |
| 7.00% | | 12/25/32 | | Aa2 | | | 2,498 | | | 2,532,297 |
Bank of America Credit Card Trust,(g) | | | |
Series 2006-C5, Class C5 | | | |
| 5.75% | | 01/15/16 | | Baa2 | | | 3,209 | | | 3,209,657 |
Bank One Issuance Trust, | | | |
Ser. 2003-C1, Class C1 | | | |
| 4.54% | | 09/15/10 | | Baa2 | | | 1,820 | | | 1,802,398 |
CDC Mortgage Capital Trust,(g) | | | |
Ser. 2002-HE3, Class M1 | | | |
| 7.00% | | 03/25/33 | | Aa2 | | | 1,160 | | | 1,161,247 |
SEE NOTES TO FINANCIAL STATEMENTS.
B44
| | | | |
| | | FLEXIBLE MANAGED PORTFOLIO (Continued) | | |
SCHEDULE OF INVESTMENTS | December 31, 2006 |
| | | | | | | | | | |
Interest
Rate
| | Maturity
Date
| | Moody’s
Rating
(Unaudited)
| | Principal
Amount
(000)
| | Value
(Note 2)
|
| LONG-TERM BONDS (Continued) | | | |
Asset Backed Securities (cont’d.) | | | |
Centex Home Equity,(g) | | | |
Ser. 2005-A, Class M2 | | | |
| 5.85% | | 01/25/35 | | Aa2 | | $ | 1,790 | | $ | 1,799,568 |
Chase Issuance Trust, | | | |
Ser. 2005-A4, Class A4 | | | |
| 4.23% | | 01/15/13 | | Aaa | | | 3,200 | | | 3,122,849 |
Citibank Credit Card Insurance Trust,(g) | | | |
Ser. 2006-C1, Class C1 | | | |
| 5.75% | | 02/20/15 | | Baa2 | | | 1,350 | | | 1,354,515 |
Credit-Based Asset Servicing and Securitization, | | | |
Ser. 2005-CB6, Class A3 | | | |
| 5.12% | | 07/25/35 | | Aaa | | | 1,400 | | | 1,388,680 |
Equity One ABS, Inc., | | | |
Ser. 2004-3, Class M1 | | | |
| 5.70% | | 07/25/34 | | Aa2 | | | 1,280 | | | 1,272,588 |
First Franklin Mortgage Loan Trust,(g) | | | |
Ser. 2005-FFH1, Class M2 | | | |
| 5.87% | | 06/25/36 | | Aa2 | | | 1,450 | | | 1,461,992 |
Home Equity Asset Trust,(g) | | | |
Ser. 2005-7, Class 2A4 | | | |
| 5.73% | | 01/25/36 | | Aaa | | | 1,100 | | | 1,105,332 |
Household Home Equity Loan Trust,(g) | | | |
Ser. 2005-2, Class M2 | | | |
| 5.84% | | 01/20/35 | | Aa1 | | | 736 | | | 738,165 |
MBNA Master Credit Card Trust, | | | |
Ser. 1999-J, Class A | | | |
| 7.00% | | 02/15/12 | | Aaa | | | 1,830 | | | 1,920,289 |
Morgan Stanley ABS Capital I,(g) | | | |
Ser. 2004-NC3, Class M2 | | | |
| 6.45% | | 03/25/34 | | A2 | | | 1,460 | | | 1,469,140 |
Morgan Stanley Dean Witter Capital I,(g) | | | |
Ser. 2002-HE1, Class M1 | | | |
6.25% | | 07/25/32 | | Aa2 | | | 1,747 | | | 1,764,854 |
Ser. 2002-NC2, Class M2 | | | |
| 7.675% | | 04/25/32 | | A(f) | | | 456 | | | 456,223 |
Ser. 2002-NC4, Class M1 | | | |
| 6.20% | | 09/25/32 | | Aaa | | | 1,432 | | | 1,463,356 |
Prestige Auto Receivables Trust,(g)(h) | | | |
Ser. 2004-1, Class A2, 144A | | | |
| 3.69% | | 06/15/11 | | Aaa | | | 490 | | | 485,414 |
Saxon Asset Securities Trust,(g) | | | |
Ser. 2005-2, Class M2 | | | |
| 5.79% | | 10/25/35 | | Aa2 | | | 1,170 | | | 1,177,133 |
Securitized Asset Backed Receivables LLC,(g) | | | |
Ser. 2004-OP1, Class M1 | | | |
| 5.86% | | 02/25/34 | | Aa2 | | | 1,325 | | | 1,327,634 |
Ser. 2006-FR3, Class A3 | | | |
| 5.57% | | 05/25/36 | | Aaa | | | 1,100 | | | 1,103,436 |
SVO VOI Mortgage Corp., | | | |
Ser. 2005-AA, Class A | | | |
| 5.25% | | 02/20/21 | | Aaa | | | 759 | | | 754,884 |
WFS Financial Owner Trust, | | | |
Ser. 2004-4, Class D | | | |
| 3.58% | | 05/17/12 | | A2 | | | 571 | | | 562,684 |
| | | | | | | | | |
|
|
| | | | | | | | | | | 35,497,457 |
| | | | | | | | | |
|
|
| | | | | | | | | | |
Interest
Rate
| | Maturity
Date
| | Moody’s
Rating
(Unaudited)
| | Principal
Amount
(000)
| | Value
(Note 2)
|
| LONG-TERM BONDS (Continued) | | | |
Automotive — 0.1% | | | | | | |
Auburn Hills Trust, | | | |
Debs. | | | |
| 12.375% | | 05/01/20 | | Baa1 | | $ | 510 | | $ | 752,984 |
DaimlerChrysler NA Holding Corp., | | | |
Gtd. Notes | | | |
| 8.50% | | 01/18/31 | | Baa1 | | | 279 | | | 332,131 |
Equus Cayman Finance Ltd. (Cayman Islands),(h) | | | |
Notes, 144A | | | |
| 5.50% | | 09/12/08 | | Baa3 | | | 315 | | | 314,102 |
Hyundai Motor Manufacturing LLC,(h) | | | |
Gtd. Notes, 144A | | | |
| 5.30% | | 12/19/08 | | Baa3 | | | 500 | | | 496,570 |
Johnson Controls, Inc., | | | |
Sr. Notes | | | |
| 5.50% | | 01/15/16 | | Baa1 | | | 310 | | | 303,953 |
Oshkosh Truck Corp.,(i) | | | |
Bank Loan | | | |
| 7.37% | | 12/06/13 | | Ba3 | | | 2,000 | | | 2,001,875 |
| | | | | | | | | |
|
|
| | | | | | | | | | | 4,201,615 |
| | | | | | | | | |
|
|
Banking — 0.6% | | | | | | |
Banco Bradesco (Cayman Islands), | | | |
Notes | | | |
| 8.75% | | 10/24/13 | | A2 | | | 550 | | | 627,000 |
Bank of America Corp.,(b) | | | |
Sub. Notes | | | |
| 5.75% | | 08/15/16 | | Aa3 | | | 1,775 | | | 1,811,611 |
Bank of America NA, | | | |
Sub. Notes | | | |
| 6.00% | | 10/15/36 | | Aa2 | | | 410 | | | 422,122 |
Bank One Corp., | | | |
Sub. Notes | | | |
| 7.875% | | 08/01/10 | | A1 | | | 2,250 | | | 2,440,600 |
Barclays Bank PLC (United Kingdom),(g)(h) | | | |
Notes, 144A | | | |
| 5.926% | | 12/15/49 | | Aa3 | | | 1,900 | | | 1,923,919 |
Citigroup, Inc., | | | |
Sub. Notes | | | |
| 5.00% | | 09/15/14 | | Aa2 | | | 454 | | | 443,284 |
| 5.625% | | 08/27/12 | | Aa2 | | | 2,800 | | | 2,840,513 |
| 6.125% | | 08/25/36 | | Aa2 | | | 570 | | | 593,540 |
First Union National Bank, | | | |
Sub. Notes | | | |
| 7.80% | | 08/18/10 | | Aa3 | | | 2,100 | | | 2,258,869 |
HSBC Bank USA, | | | |
Sr. Notes | | | |
| 3.875% | | 09/15/09 | | Aa2 | | | 250 | | | 242,396 |
Icici Bank Ltd. (Singapore),(h) | | | |
Notes, 144A | | | |
| 5.75% | | 11/16/10 | | Baa2 | | | 1,070 | | | 1,068,304 |
J.P. Morgan Chase & Co., | | | |
Sr. Notes | | | |
| 5.25% | | 05/30/07 | | Aa3 | | | 210 | | | 209,920 |
Sub. Notes | | | |
| 4.60% | | 01/17/11 | | Aa3 | | | 720 | | | 702,637 |
| 6.50% | | 01/15/09 | | A1 | | | 1,100 | | | 1,121,019 |
SEE NOTES TO FINANCIAL STATEMENTS.
B45
| | | | |
| | | FLEXIBLE MANAGED PORTFOLIO (Continued) | | |
SCHEDULE OF INVESTMENTS | December 31, 2006 |
| | | | | | | | | | |
Interest
Rate
| | Maturity
Date
| | Moody’s
Rating
(Unaudited)
| | Principal
Amount
(000)
| | Value
(Note 2)
|
| LONG-TERM BONDS (Continued) | | | |
Banking (cont’d.) | | | | | | |
Capital XVIII, Series R | | | |
| 6.95% | | 08/17/36 | | A2 | | $ | 690 | | $ | 746,355 |
Mizuho Finance Ltd. (Cayman Islands),(h) | | | |
Bank Gtd. Notes, 144A | | | |
| 5.79% | | 04/15/14 | | A2 | | | 815 | | | 819,779 |
MUFG Capital Finance 1 Ltd.
(Cayman Islands),(g) | | | |
Gtd. Notes | | | |
| 6.346% | | 07/25/49 | | Baa2 | | | 800 | | | 812,556 |
Santander Central Hispano Issuances (Cayman Islands), |
Bank Gtd. Notes | | | |
| 7.625% | | 09/14/10 | | A1 | | | 695 | | | 750,856 |
Washington Mutual Bank, | | | |
Sub. Notes | | | |
| 5.65% | | 08/15/14 | | A3 | | | 290 | | | 290,401 |
Wells Fargo Bank, | | | |
Sub. Notes | | | |
| 4.75% | | 02/09/15 | | Aa1 | | | 585 | | | 560,082 |
| 6.45% | | 02/01/11 | | Aa1 | | | 65 | | | 67,881 |
| | | | | | | | | |
|
|
| | | | | | | | | | | 20,753,644 |
| | | | | | | | | |
|
|
Brokerage — 0.3% | | | | | | |
Bear Stearns Co., Inc. (The), | | | |
Unsec. Notes | | | |
| 5.30% | | 10/30/15 | | A1 | | | 515 | | | 508,183 |
Goldman Sachs Group Inc. (The), | | | |
Sub. Notes | | | |
| 6.45% | | 05/01/36 | | A1 | | | 1,615 | | | 1,680,267 |
Lehman Brothers Holdings, Inc., | | | |
Notes | | | |
| 6.625% | | 01/18/12 | | A1 | | | 1,670 | | | 1,764,501 |
Merrill Lynch & Co., | | | |
Notes | | | |
| 4.79% | | 08/04/10 | | Aa3 | | | 295 | | | 290,985 |
| 5.45% | | 07/15/14 | | Aa3 | | | 160 | | | 160,854 |
Notes, Ser. M.T.N. | | | |
| 4.25% | | 02/08/10 | | Aa3 | | | 1,170 | | | 1,136,900 |
| 5.00% | | 01/15/15 | | Aa3 | | | 460 | | | 448,129 |
| 5.77%(b) | | 07/25/11 | | Aa3 | | | 520 | | | 531,482 |
Morgan Stanley, | | | |
Notes | | | |
| 5.30% | | 03/01/13 | | Aa3 | | | 845 | | | 842,472 |
| 5.375% | | 10/15/15 | | Aa3 | | | 395 | | | 391,467 |
Sub. Notes | | | |
| 4.75% | | 04/01/14 | | A1 | | | 1,170 | | | 1,118,669 |
Sr. Unsec. Notes, M.T.N. | | | |
| 5.75% | | 10/18/16 | | Aa3 | | | 1,300 | | | 1,319,076 |
| | | | | | | | | |
|
|
| | | | | | | | | | | 10,192,985 |
| | | | | | | | | |
|
|
Building Materials & Construction — 0.1% | | | |
American Standard, Inc., | | | |
Gtd. Notes | | | |
| 7.625% | | 02/15/10 | | Baa3 | | | 770 | | | 806,999 |
CRH America, Inc., | | | |
Gtd. Notes | | | |
| 6.00% | | 09/30/16 | | Baa1 | | | 720 | | | 726,764 |
| | | | | | | | | | |
Interest
Rate
| | Maturity
Date
| | Moody’s
Rating
(Unaudited)
| | Principal
Amount
(000)
| | Value
(Note 2)
|
| LONG-TERM BONDS (Continued) | | | |
Building Materials & Construction (cont’d.) | | | |
Hanson PLC (United Kingdom), | | | |
Sr. Unsub. Notes | | | |
| 7.875% | | 09/27/10 | | Baa1 | | $ | 1,000 | | $ | 1,075,980 |
Lafarge SA (France), | | | |
Notes | | | |
| 6.15% | | 07/15/11 | | Baa2 | | | 910 | | | 931,431 |
Owens Corning, Inc.,(h) | | | |
Sr. Unsec. Notes, 144A | | | |
| 6.50% | | 12/01/16 | | Baa3 | | | 550 | | | 558,711 |
Ryland Group, Inc. (The), | | | |
Sr. Notes | | | |
| 5.375% | | 06/01/08 | | Baa3 | | | 440 | | | 437,053 |
| | | | | | | | | |
|
|
| | | | | | | | | | | 4,536,938 |
| | | | | | | | | |
|
|
Cable — 0.2% | | | |
AT&T Broadband LLC | | | |
| 9.455% | | 11/15/22 | | Baa2 | | | 255 | | | 330,209 |
Comcast Corp., | | | |
Gtd. Notes | | | |
| 6.45% | | 03/15/37 | | Baa2 | | | 1,315 | | | 1,315,710 |
Sr. Unsec. Notes | | | |
| 6.50% | | 11/15/35 | | Baa2 | | | 450 | | | 453,178 |
Cox Communications, Inc., | | | |
Notes, Class A | | | |
| 6.75% | | 03/15/11 | | Baa3 | | | 950 | | | 993,145 |
| 7.875% | | 08/15/09 | | Baa3 | | | 1,275 | | | 1,349,284 |
CSC Holdings, Inc., | | | |
Sr. Notes | | | |
| 7.875% | | 12/15/07 | | B2 | | | 1,970 | | | 1,994,625 |
| | | | | | | | | |
|
|
| | | | | | | | | | | 6,436,151 |
| | | | | | | | | |
|
|
Capital Goods — 0.3% | | | |
Cameron International Corp., | | | |
Sr. Notes | | | |
| 2.65% | | 04/15/07 | | Baa1 | | | 330 | | | 327,318 |
Caterpillar Financial Services Corp., M.T.N. | | | |
| 5.50% | | 03/15/16 | | A2 | | | 825 | | | 825,456 |
Caterpillar, Inc., | | | |
| Debs. | | | | | | | | | | |
| 7.25% | | 09/15/09 | | A2 | | | 700 | | | 734,961 |
ERAC USA Finance Co.,(h) | | | |
Gtd. Notes, 144A | | | |
| 7.35% | | 06/15/08 | | Baa1 | | | 1,950 | | | 1,998,809 |
Fedex Corp., | | | |
Gtd. Notes | | | |
| 7.25% | | 02/15/11 | | Baa2 | | | 400 | | | 426,183 |
Notes | | | |
| 2.65% | | 04/01/07 | | Baa2 | | | 1,600 | | | 1,589,132 |
Honeywell International, Inc., | | | |
Sr. Unsec. Notes | | | |
| 5.70% | | 03/15/36 | | A2 | | | 140 | | | 139,198 |
Sr. Unsub. Notes | | | |
| 6.125% | | 11/01/11 | | A2 | | | 1,095 | | | 1,134,334 |
Stena AB (Sweden), | | | |
Sr. Notes | | | |
| 7.50% | | 11/01/13 | | Ba3 | | | 1,160 | | | 1,145,500 |
SEE NOTES TO FINANCIAL STATEMENTS.
B46
| | | | |
| | | FLEXIBLE MANAGED PORTFOLIO (Continued) | | |
SCHEDULE OF INVESTMENTS | December 31, 2006 |
| | | | | | | | | | |
Interest
Rate
| | Maturity
Date
| | Moody’s
Rating
(Unaudited)
| | Principal
Amount
(000)
| | Value
(Note 2)
|
| LONG-TERM BONDS (Continued) | | | |
Capital Goods (cont’d.) | | | |
Tyco International Group SA (Bermuda), | | | |
Gtd. Notes | | | |
| 6.00% | | 11/15/13 | | Baa3 | | $ | 1,265 | | $ | 1,308,863 |
United Technologies Corp., | | | |
| Debs. | | | | | | | | | | |
8.875% | | 11/15/19 | | A2 | | | 460 | | | 596,388 |
| Notes | | | | | | | | | | |
| 6.35% | | 03/01/11 | | A2 | | | 825 | | | 857,812 |
Waste Management, Inc., | | | |
Gtd. Notes | | | |
| 7.75% | | 05/15/32 | | Baa3 | | | 220 | | | 259,481 |
| | | | | | | | | |
|
|
| | | | | | | | | | | 11,343,435 |
| | | | | | | | | |
|
|
Chemicals — 0.1% | | | |
Dow Chemical Co. (The), | | | |
Debs. | | | |
| 5.97% | | 01/15/09 | | A3 | | | 390 | | | 394,323 |
Gtd. Notes | | | |
| 5.625% | | 12/01/13 | | Baa3 | | | 720 | | | 710,919 |
| 9.875% | | 03/01/09 | | B2 | | | 1,083 | | | 1,115,490 |
Sr. Notes | | | |
6.125% | | 02/01/11 | | A3 | | | 685 | | | 704,173 |
Lubrizol Corp., | | | |
Sr. Notes | | | |
| 4.625% | | 10/01/09 | | Baa3 | | | 860 | | | 843,610 |
Monsanto Co., | | | |
Sr. Unsec. Notes, Ser. 1 | | | |
| 5.50% | | 07/30/35 | | Baa1 | | | 500 | | | 471,201 |
Union Carbide Corp., | | | |
Debs. | | | |
| 7.50% | | 06/01/25 | | Ba2 | | | 460 | | | 489,224 |
| | | | | | | | | |
|
|
| | | | | | | | | | | 4,728,940 |
| | | | | | | | | |
|
|
Collateralized Mortgage Obligations — 0.3% | | | |
Banc of America Mortgage Securities,(g) | | | |
Ser. 2005-A, Class 2A1 | | | |
| 4.46% | | 02/25/35 | | Aaa | | | 1,208 | | | 1,180,214 |
Ser. 2005-B, Class 2A1 | | | |
| 4.39% | | 03/25/35 | | Aaa | | | 1,166 | | | 1,137,339 |
Bank of America Alternative Loan Trust, | | | |
Ser. 2005-12, Class 3CB1 | | | |
| 6.00% | | 01/25/36 | | Aaa | | | 4,460 | | | 4,462,158 |
Countrywide Alternative Loan Trust, | | | |
Ser. 2004-18CB, Class 3A1 | | | |
| 5.25% | | 09/25/19 | | Aaa | | | 1,854 | | | 1,797,407 |
Master Alternative Loan Trust, | | | |
Ser. 2004-4, Class 4A1 | | | |
| 5.00% | | 04/25/19 | | Aaa | | | 599 | | | 584,894 |
Structured Adjustable Rate Mortgage Loan,(g) | | | |
Ser. 2004-1, Class 4A3 | | | |
| 4.17% | | 02/25/34 | | Aaa | | | 1,190 | | | 1,177,582 |
Washington Mutual Mortgage, | | | |
Pass-Through Certificates, Ser. 2005-1, Class 3A |
| 5.00% | | 03/25/20 | | AAA(f) | | | 665 | | | 656,710 |
| | | | | | | | | | |
Interest
Rate
| | Maturity
Date
| | Moody’s
Rating
(Unaudited)
| | Principal
Amount
(000)
| | Value
(Note 2)
|
| LONG-TERM BONDS (Continued) | | | |
Collateralized Mortgage Obligations (cont’d.) | | | |
Washington Mutual, Inc.,(g) | | | |
Ser. 2002-AR15, Class A5 | | | |
| 4.38% | | 12/25/32 | | Aaa | | $ | 584 | | $ | 577,934 |
| | | | | | | | | |
|
|
| | | | | | | | | | | 11,574,238 |
| | | | | | | | | |
|
|
Commercial Mortgage Backed Securities — 3.0% |
Banc of America Commercial Mortgage, Inc.,(g) | | | |
Ser. 2003-2, Class A3 | | | |
| 4.873% | | 03/11/41 | | AAA(f) | | | 2,500 | | | 2,457,900 |
Ser. 2004-2, Class A4 | | | |
| 4.153% | | 11/10/38 | | Aaa | | | 2,800 | | | 2,683,139 |
Ser. 2005-1 , Class ASB | | | |
| 4.8645% | | 11/10/42 | | AAA(f) | | | 900 | | | 893,066 |
Ser. 2006-2, Class A4 | | | |
| 5.7405% | | 05/10/45 | | AAA(f) | | | 2,300 | | | 2,378,314 |
Bear Stearns Commercial Mortgage Securities,(g) | | | |
Ser. 2004-T16, Class A-6 | | | |
| 4.75% | | 02/13/46 | | AAA(f) | | | 4,500 | | | 4,342,649 |
Ser. 2005-T18, Class AAB | | | |
| 4.823% | | 02/13/42 | | Aaa | | | 1,775 | | | 1,731,350 |
Ser. 2005-T20, Class AAB | | | |
| 5.1394% | | 10/12/42 | | Aaa | | | 2,400 | | | 2,390,715 |
Citigroup Commercial Mortgage Trust,(g) | | | |
Ser. 2006-C4 A3 | | | |
| 5.72% | | 03/15/49 | | Aaa | | | 1,775 | | | 1,832,464 |
Commercial Mortgage Pass-Through
Certificate, I/O,(g)(h) | | | | | | |
Ser. 2004-LB2A, Class X2, 144A | | | |
| 0.978% | | 03/10/39 | | AAA(f) | | | 12,788 | | | 347,115 |
CS First Boston Mortgage Securities Corp., | | | |
Ser. 2004-C3, Class A4 | | | |
| 4.835% | | 07/15/36 | | Aaa | | | 880 | | | 862,996 |
Ser. 2004-C4, Class A4 | | | |
| 4.283% | | 10/15/39 | | Aaa | | | 1,400 | | | 1,343,775 |
CS Mortgage Capital Certificate Corp., | | | |
Ser. 2006-C1, Class A4(g) | | | |
| 5.557% | | 02/15/39 | | AAA(f) | | | 2,700 | | | 2,743,383 |
Ser. 2006-C4, Class A3 | | | |
| 5.467% | | 09/15/39 | | Aaa | | | 4,100 | | | 4,131,554 |
DLJ Commercial Mortgage Corp., | | | |
Ser. 2000-CF1, Class A1B | | | |
| 7.62% | | 06/10/33 | | AAA(f) | | | 2,709 | | | 2,881,389 |
General Electric Capital Commercial Mortgage Corp., I/O,(g) |
Ser. 2004-C2, Class X2 | | | |
| 0.597% | | 03/10/40 | | Aaa | | | 23,404 | | | 457,759 |
Greenwich Capital Commercial Funding Corp., | | | |
Ser. 2003-C1, Class A4 | | | |
| 4.111% | | 07/05/35 | | Aaa | | | 7,700 | | | 7,235,476 |
Ser. 2003-C2, Class A3 | | | |
| 4.533% | | 01/05/36 | | Aaa | | | 2,750 | | | 2,678,845 |
GS Mortgage Securities Corp. II, | | | |
Ser. 2006-GG6, Class AAB(g) | | | |
| 5.587% | | 04/10/38 | | AAA(f) | | | 6,650 | | | 6,736,145 |
J.P. Morgan Chase Commercial Mortgage Securites Corp., |
Ser. 2005-LDP2, Class ASB | | | |
| 4.659% | | 07/15/42 | | Aaa | | | 6,350 | | | 6,156,544 |
SEE NOTES TO FINANCIAL STATEMENTS.
B47
| | | | |
| | | FLEXIBLE MANAGED PORTFOLIO (Continued) | | |
SCHEDULE OF INVESTMENTS | December 31, 2006 |
| | | | | | | | | | |
Interest
Rate
| | Maturity
Date
| | Moody’s
Rating
(Unaudited)
| | Principal
Amount
(000)
| | Value
(Note 2)
|
| LONG-TERM BONDS (Continued) | | | |
Commercial Mortgage Backed Securities (cont’d.) |
Ser. 2005-LDP4, Class A4(g) | | | |
| 4.918% | | 10/15/42 | | Aaa | | $ | 2,500 | | $ | 2,427,027 |
Ser. 2006-CB16, Class ASB | | | |
| 5.523% | | 05/12/45 | | Aaa | | | 3,900 | | | 3,940,943 |
Ser. 2006-CB17, Class A4 | | | |
| 5.429% | | 12/12/43 | | Aaa | | | 4,750 | | | 4,774,091 |
Ser. 2006-LDP6, Class X2, I/O,(g) | | | |
| 0.881% | | 04/15/43 | | Aaa | | | 149,768 | | | 863,395 |
Ser. 2006-LDP8, Class ASB | | | |
| 5.37% | | 05/15/45 | | Aaa | | | 3,700 | | | 3,701,879 |
J.P. Morgan Commercial Mortgage Finance Corp., | | | |
Ser. 2000-C10, Class A2 | | | |
| 7.371% | | 08/15/32 | | Aaa | | | 7,766 | | | 8,159,598 |
Ser. 2003-CB6, Class A2 | | | |
| 5.255% | | 07/12/37 | | Aaa | | | 2,100 | | | 2,097,686 |
J.P. Morgan Chase & Co.,(g) | | | |
Ser. 2005-CB13, Class A4 | | | |
| 5.294% | | 01/12/43 | | Aaa | | | 2,340 | | | 2,342,120 |
Ser. 2005-LDP5, Class A4 | | | |
| 5.1793% | | 12/15/44 | | Aaa | | | 5,000 | | | 4,981,750 |
KeyCorp., | | | |
Ser. 2000-C1, Class A2 | | | |
| 7.727% | | 05/17/32 | | Aaa | | | 8,605 | | | 9,107,176 |
LB-UBS Commercial Mortgage Trust, | | | |
Ser. 2003-C8, Class A3 | | | |
| 4.83% | | 11/15/27 | | Aaa | | | 1,460 | | | 1,434,369 |
Ser. 2004-C6, Class A5(g) | | | |
| 4.826% | | 08/15/29 | | AAA(f) | | | 3,910 | | | 3,826,652 |
Ser. 2006-C3 A4(g) | | | |
| 5.661% | | 03/15/39 | | Aaa | | | 4,580 | | | 4,690,120 |
Merrill Lynch Mortgage Trust, | | | |
Ser. 2004-KEY2, Class A3 | | | |
| 4.615% | | 08/12/39 | | Aaa | | | 2,000 | | | 1,935,700 |
Merrill Lynch/Countrywide Commercial Mortgage,(g) |
Ser. 2006-2, Class A4 | | | |
| 5.910% | | 06/12/46 | | Aaa | | | 1,795 | | | 1,875,872 |
| | | | | | | | | |
|
|
| | | | | | | | | | | 110,442,956 |
| | | | | | | | | |
|
|
Consumer — 0.1% | | | |
Realogy Corp.,(h) | | | |
Notes, 144A | | | |
| 6.15% | | 10/15/11 | | Baa2 | | | 975 | | | 996,313 |
Western Union Co.,(h) | | | |
Notes, 144A | | | |
| 5.93% | | 10/01/16 | | A3 | | | 585 | | | 579,399 |
Whirlpool Corp., | | | |
Notes | | | |
| 6.125% | | 06/15/11 | | Baa2 | | | 965 | | | 982,387 |
| | | | | | | | | |
|
|
| | | | | | | | | | | 2,558,099 |
| | | | | | | | | |
|
|
Electric — 0.6% | | | |
Appalachian Power Co., | | | |
Sr. Notes, Ser. J | | | |
| 4.40% | | 06/01/10 | | Baa2 | | | 620 | | | 598,977 |
Arizona Public Service Co., | | | |
Unsec. Notes | | | |
| 6.25% | | 08/01/16 | | Baa2 | | | 1,490 | | | 1,524,583 |
| | | | | | | | | | |
Interest
Rate
| | Maturity
Date
| | Moody’s
Rating
(Unaudited)
| | Principal
Amount
(000)
| | Value
(Note 2)
|
| LONG-TERM BONDS (Continued) | | | |
Electric (cont’d.) | | | |
Baltimore Gas & Electric Co.,(h) | | | |
Sr. Unsec., 144A | | | |
| 6.35% | | 10/01/36 | | Baa2 | | $ | 550 | | $ | 561,453 |
Boston Edison Co., | | | |
Debs. | | | |
| 4.875% | | 04/15/14 | | A1 | | | 565 | | | 548,686 |
Carolina Power & Light Co., | | | |
First Mtge. | | | |
| 5.25% | | 12/15/15 | | A3 | | | 525 | | | 516,243 |
CenterPoint Energy Houston Electric LLC, | | | |
Mtge. Bonds, Ser. J2 | | | |
| 5.70% | | 03/15/13 | | Baa2 | | | 740 | | | 745,375 |
Mtge. Bonds, Ser. K2 | | | |
| 6.95% | | 03/15/33 | | Baa2 | | | 590 | | | 653,860 |
Con Edison Co. of New York, | | | |
Sr. Unsec. Notes | | | |
| 5.375% | | 12/15/15 | | A1 | | | 730 | | | 725,221 |
Consumers Energy Co., | | | |
First Mtge. Bonds, Ser. B | | | |
| 5.375% | | 04/15/13 | | Baa2 | | | 325 | | | 321,855 |
Dominion Resources, Inc., | | | |
Sr. Notes, Ser. D | | | |
| 5.125% | | 12/15/09 | | Baa2 | | | 970 | | | 963,809 |
Duke Capital LLC,
Sr. Notes | | | |
| 6.25% | | 02/15/13 | | Baa2 | | | 235 | | | 242,130 |
| 8.00% | | 10/01/19 | | Baa2 | | | 107 | | | 124,393 |
El Paso Electric Co., | | | |
Sr. Unsec. Notes | | | |
| 6.00% | | 05/15/35 | | Baa3 | | | 670 | | | 642,248 |
Empresa Nacional de Electricidad S.A. (Chile), | | | |
Bonds, Ser. B | | | |
| 8.50% | | 04/01/09 | | Baa3 | | | 1,070 | | | 1,136,051 |
Notes | | | |
| 8.625% | | 08/01/15 | | Baa3 | | | 360 | | | 423,698 |
Energy East Corp., | | | |
Notes | | | |
| 6.75% | | 09/15/33 | | Baa2 | | | 630 | | | 661,708 |
Exelon Corp., | | | |
Notes | | | |
| 4.90% | | 06/15/15 | | Baa2 | | | 155 | | | 146,199 |
FirstEnergy Corp., | | | |
Notes, Ser. C | | | |
| 7.375% | | 11/15/31 | | Baa3 | | | 615 | | | 700,384 |
Florida Power & Light Co., | | | |
First Mtge. | | | |
| 5.95% | | 10/01/33 | | Aa3 | | | 295 | | | 303,181 |
Indiana Michigan Power Co., | | | |
Sr. Notes | | | |
| 5.05% | | 11/15/14 | | Baa2 | | | 460 | | | 439,606 |
National Rural Utilities Cooperative Finance Corp., | | | |
Notes, Ser. C, M.T.N. | | | |
| 7.25% | | 03/01/12 | | A2 | | | 185 | | | 201,036 |
Nevada Power Co., | | | |
Mtge. Bonds, Ser. O | | | |
| 6.50% | | 05/15/18 | | Ba1 | | | 1,080 | | | 1,119,593 |
SEE NOTES TO FINANCIAL STATEMENTS.
B48
| | | | |
| | | FLEXIBLE MANAGED PORTFOLIO (Continued) | | |
SCHEDULE OF INVESTMENTS | December 31, 2006 |
| | | | | | | | | | |
Interest
Rate
| | Maturity
Date
| | Moody’s
Rating
(Unaudited)
| | Principal
Amount
(000)
| | Value
(Note 2)
|
| LONG-TERM BONDS (Continued) | | | |
Electric (cont’d.) | | | |
NiSource Finance Corp., | | | |
Gtd. Notes | | | |
| 5.25% | | 09/15/17 | | Baa3 | | $ | 245 | | $ | 229,627 |
| 5.45% | | 09/15/20 | | Baa3 | | | 350 | | | 325,972 |
Ohio Edison Co., | | | |
Sr. Unsec. Notes | | | |
6.40% | | 07/15/16 | | Baa2 | | | 775 | | | 809,924 |
6.875% | | 07/15/36 | | Baa2 | | | 115 | | | 125,205 |
Oncor Electric Delivery Co., | | | |
Debs. | | | |
| 7.00% | | 09/01/22 | | Baa2 | | | 475 | | | 510,937 |
Sec. Notes | | | |
6.375% | | 01/15/15 | | Baa2 | | | 345 | | | 355,618 |
7.25% | | 01/15/33 | | Baa2 | | | 250 | | | 281,757 |
Pacific Gas & Electric Co., | | | |
Unsec. Notes | | | |
| 6.05% | | 03/01/34 | | Baa1 | | | 1,550 | | | 1,563,292 |
Pepco Holdings, Inc., | | | |
Notes | | | |
| 5.50% | | 08/15/07 | | Baa3 | | | 565 | | | 564,547 |
PPL Electric Utilities Corp., | | | |
Sec. Notes | | | |
| 6.25% | | 08/15/09 | | A3 | | | 1,500 | | | 1,534,551 |
Southern California Edison Co., | | | |
First Mtge. | | | |
4.65% | | 04/01/15 | | A2 | | | 470 | | | 444,137 |
5.625% | | 02/01/36 | | A2 | | | 355 | | | 343,642 |
Xcel Energy, Inc., | | | |
Sr. Notes | | | |
| 3.40% | | 07/01/08 | | Baa1 | | | 605 | | | 587,287 |
| 6.50% | | 07/01/36 | | Baa1 | | | 445 | | | 470,163 |
| 7.00% | | 12/01/10 | | Baa1 | | | 190 | | | 200,399 |
| | | | | | | | | |
|
|
| | | | | | | | | | | 21,647,347 |
| | | | | | | | | |
|
|
Energy - Integrated — 0.1% | | | |
ConocoPhilips Canada Funding Co. (Canada), | | | |
Gtd. Notes | | | |
| 5.625% | | 10/15/16 | | A1 | | | 1,695 | | | 1,703,057 |
ConocoPhillips Co., | | | |
Notes | | | |
| 8.75% | | 05/25/10 | | A1 | | | 1,505 | | | 1,667,658 |
ConocoPhillips Holding Co., | | | |
Sr. Notes | | | |
| 6.95% | | 04/15/29 | | A1 | | | 375 | | | 425,954 |
Marathon Oil Corp., | | | |
Notes | | | |
| 6.125% | | 03/15/12 | | Baa1 | | | 310 | | | 319,249 |
TNK-BP Finance SA,(h) | | | |
Gtd. Notes, 144A | | | |
| 7.50% | | 07/18/16 | | Baa2 | | | 450 | | | 478,688 |
| | | | | | | | | |
|
|
| | | | | | | | | | | 4,594,606 |
| | | | | | | | | |
|
|
Energy - Other — 0.2% | | | |
Anadarko Finance Co. (Canada), | | | |
Gtd. Notes, Ser. B | | | |
| 7.50% | | 05/01/31 | | Baa2 | | | 5 | | | 5,673 |
| | | | | | | | | | |
Interest
Rate
| | Maturity
Date
| | Moody’s
Rating
(Unaudited)
| | Principal
Amount
(000)
| | Value
(Note 2)
|
| LONG-TERM BONDS (Continued) | | | |
Energy - Other (cont’d.) | | | |
Anadarko Petroleum Corp., | | | |
Sr. Unsec. Notes | | | |
| 5.95% | | 09/15/16 | | Baa2 | | $ | 905 | | $ | 906,894 |
| 6.45% | | 09/15/36 | | Baa2 | | | 460 | | | 464,828 |
Devon Financing Corp. ULC, | | | |
Gtd. Notes | | | |
| 7.875% | | 09/30/31 | | Baa2 | | | 225 | | | 270,703 |
Encana Corp. (Canada), | | | |
Bonds | | | |
| 6.50% | | 08/15/34 | | Baa2 | | | 290 | | | 298,872 |
Halliburton Co., | | | |
Sr. Unsec. Notes | | | |
| 5.50% | | 10/15/10 | | Baa1 | | | 150 | | | 149,733 |
Occidental Petroleum Corp.,(b) | | | |
Sr. Notes | | | |
| 6.75% | | 01/15/12 | | A3 | | | 735 | | | 779,784 |
Talisman Energy, Inc. (Canada), | | | |
Notes | | | |
| 5.125% | | 05/15/15 | | Baa2 | | | 170 | | | 161,196 |
Sr. Unsec. | | | |
| 6.25% | | 02/01/38 | | Baa2 | | | 545 | | | 525,822 |
Valero Energy Corp., | | | |
Sr. Unsec. Notes | | | |
| 7.50% | | 04/15/32 | | Baa3 | | | 145 | | | 165,431 |
Weatherford International Ltd. (Bermuda), | | | |
Gtd. Notes | | | |
| 6.50% | | 08/01/36 | | Baa1 | | | 575 | | | 577,225 |
Woodside Finance Ltd. (Austrailia),(h) | | | |
Gtd. Notes, 144A | | | |
| 5.00% | | 11/15/13 | | Baa1 | | | 1,315 | | | 1,269,583 |
XTO Energy Inc., | | | |
Sr. Unsec. Notes | | | |
| 5.65% | | 04/01/16 | | Baa2 | | | 325 | | | 321,289 |
| | | | | | | | | |
|
|
| | | | | | | | | | | 5,897,033 |
| | | | | | | | | |
|
|
Foods — 0.4% | | | | | | | | |
Archer-Daniels-Midland Co., | | | |
Debs. | | | |
| 8.125% | | 06/01/12 | | A2 | | | 300 | | | 338,006 |
Bottling Group LLC, | | | |
Sr. Unsec. Notes | | | |
| 5.50% | | 04/01/16 | | A3 | | | 385 | | | 383,587 |
Bunge Ltd. Finance Corp.,(b) | | | |
Notes | | | |
| 5.35% | | 04/15/14 | | Baa2 | | | 1,040 | | | 999,553 |
Cadbury Schweppes US Finance,(h) | | | |
Gtd. Notes, 144A | | | |
| 3.875% | | 10/01/08 | | Baa2 | | | 810 | | | 788,843 |
Cargill, Inc.,(h) | | | |
Notes, 144A | | | |
| 3.625% | | 03/04/09 | | A2 | | | 1,875 | | | 1,810,959 |
ConAgra Foods, Inc., | | | |
Notes | | | |
| 7.875% | | 09/15/10 | | Baa2 | | | 430 | | | 465,336 |
Sr. Notes | | | |
| 7.125% | | 10/01/26 | | Baa2 | | | 355 | | | 389,478 |
SEE NOTES TO FINANCIAL STATEMENTS.
B49
| | | | |
| | | FLEXIBLE MANAGED PORTFOLIO (Continued) | | |
SCHEDULE OF INVESTMENTS | December 31, 2006 |
| | | | | | | | | | |
Interest
Rate
| | Maturity
Date
| | Moody’s
Rating
(Unaudited)
| | Principal
Amount
(000)
| | Value
(Note 2)
|
| LONG-TERM BONDS (Continued) | | | |
Foods (cont’d.) | | | | | | | | |
General Mills, Inc., | | | |
Notes | | | |
| 5.125% | | 02/15/07 | | Baa1 | | $ | 350 | | $ | 349,750 |
Heinz Co.,(h) | | | |
Notes 144A | | | |
| 6.428% | | 12/01/08 | | Baa2 | | | 1,290 | | | 1,313,014 |
Kellogg Co., | | | |
Notes, Ser. B | | | |
| 6.60% | | 04/01/11 | | A3 | | | 1,875 | | | 1,966,313 |
Kraft Foods, Inc., | | | |
Notes | | | |
| 5.25% | | 06/01/07 | | A3 | | | 300 | | | 299,765 |
Sr. Unsec. Notes | | | |
| 5.625% | | 11/01/11 | | A3 | | | 850 | | | 859,035 |
Kroger Co., (The) | | | |
Gtd. Notes | | | |
| 6.75% | | 04/15/12 | | Baa2 | | | 45 | | | 47,219 |
| 6.80% | | 04/01/11 | | Baa2 | | | 670 | | | 701,191 |
Sr. Notes | | | | | | | | | | |
| 7.00% | | 05/01/18 | | Baa2 | | | 565 | | | 597,080 |
Tricon Global Restaurants, | | | |
Sr. Notes | | | |
| 8.875% | | 04/15/11 | | Baa2 | | | 180 | | | 201,919 |
Tyson Foods, Inc., | | | |
Sr. Unsec. Notes | | | |
| 6.85% | | 04/01/16 | | Ba1 | | | 735 | | | 754,715 |
Whitman Corp., | | | |
Notes | | | |
| 6.375% | | 05/01/09 | | Baa1 | | | 1,530 | | | 1,556,559 |
| | | | | | | | | |
|
|
| | | | | | | | | | | 13,822,322 |
| | | | | | | | | |
|
|
Gaming — 0.1% | | | |
Harrah’s Operating Co., Inc., | | | |
Gtd. Notes | | | |
| 5.50% | | 07/01/10 | | Baa3 | | | 625 | | | 612,594 |
Mandalay Resorts Group, | | | |
Sr. Sub. Notes | | | |
| 9.375% | | 02/15/10 | | B1 | | | 10 | | | 10,700 |
Station Casinos Inc., | | | |
| 6.625% | | 03/15/18 | | Ba3 | | | 1,500 | | | 1,286,250 |
| | | | | | | | | |
|
|
| | | | | | | | | | | 1,909,544 |
| | | | | | | | | |
|
|
Healthcare & Pharmaceutical — 0.5% | | | |
Abbott Laboratories, | | | |
Notes | | | |
| 5.875% | | 05/15/16 | | A1 | | | 1,965 | | | 2,024,011 |
Amerisourcebergen Corp., | | | |
Gtd. Notes | | | |
| 5.625% | | 09/15/12 | | Ba1 | | | 915 | | | 899,513 |
Baxter International, Inc., | | | |
Sr. Unsec. Notes | | | |
| 5.196% | | 02/16/08 | | Baa1 | | | 860 | | | 857,835 |
Boston Scientific Corp., | | | |
Sr. Notes | | | |
| 6.40% | | 06/15/16 | | Baa3 | | | 2,075 | | | 2,099,810 |
| | | | | | | | | | |
Interest
Rate
| | Maturity
Date
| | Moody’s
Rating
(Unaudited)
| | Principal
Amount
(000)
| | Value
(Note 2)
|
| LONG-TERM BONDS (Continued) | | | |
Healthcare & Pharmaceutical (cont’d.) | | | |
Cardinal Health, Inc., | | | |
Unsub. Notes | | | |
| 5.85% | | 12/15/17 | | Baa2 | | $ | 1,305 | | $ | 1,297,665 |
Genentech, Inc., | | | |
Sr. Notes | | | |
| 4.75% | | 07/15/15 | | A1 | | | 280 | | | 268,053 |
HCA, Inc., | | | |
Bank Loan(i) | | | |
| 8.125% | | 11/14/13 | | Ba3 | | | 2,000 | | | 2,021,924 |
Sr. Unsec. | | | |
| 6.25% | | 02/15/13 | | Caa1 | | | 30 | | | 26,550 |
Laboratory Corp. of America Holdings, | | | |
Sr. Unsec. Notes | | | |
| 5.625% | | 12/15/15 | | Baa3 | | | 730 | | | 717,661 |
Merck & Co., Inc., | | | |
Bonds | | | |
| 5.75% | | 11/15/36 | | Aa3 | | | 980 | | | 969,473 |
Debs. | | | |
| 5.95% | | 12/01/28 | | Aa3 | | | 165 | | | 166,605 |
Pharmacia Corp., | | | |
Debs. | | | |
| 6.60% | | 12/01/28 | | Aa1 | | | 185 | | | 209,439 |
Schering-Plough Corp., | | | |
Sr. Notes | | | |
| 5.55% | | 12/01/13 | | Baa1 | | | 1,580 | | | 1,584,577 |
Teva Pharmaceutical Finance LLC, | | | |
Gtd. Notes | | | |
| 6.15% | | 02/01/36 | | Baa2 | | | 1,295 | | | 1,258,256 |
Ventas Realty LP, | | | |
Sr. Notes | | | |
| 6.625% | | 10/15/14 | | Ba2 | | | 2,410 | | | 2,464,224 |
Wyeth, | | | |
Unsub. Notes | | | |
| 5.50% | | 03/15/13 | | A3 | | | 910 | | | 915,888 |
| 5.50% | | 02/01/14 | | A3 | | | 255 | | | 256,308 |
| 6.45% | | 02/01/24 | | A3 | | | 60 | | | 64,188 |
| | | | | | | | | |
|
|
| | | | | | | | | | | 18,101,980 |
| | | | | | | | | |
|
|
Healthcare Insurance — 0.2% | | | |
Aetna, Inc., | | | |
Sr. Unsub. Notes | | | |
| 5.75% | | 06/15/11 | | A3 | | | 390 | | | 395,937 |
| 6.625% | | 06/15/36 | | A3 | | | 615 | | | 657,659 |
Anthem, Inc., | | | |
Notes | | | |
| 3.50% | | 09/01/07 | | Baa1 | | | 1,560 | | | 1,538,931 |
Coventry Health Care, Inc., | | | |
Sr. Notes | | | |
| 6.125% | | 01/15/15 | | Ba1 | | | 990 | | | 975,646 |
United Health Group, Inc., | | | |
Sr. Unsec. Notes | | | |
| 5.25% | | 03/15/11 | | A3 | | | 1,350 | | | 1,345,374 |
| 5.375% | | 03/15/16 | | A3 | | | 770 | | | 762,511 |
Wellpoint, Inc., | | | |
Notes | | | |
| 5.00% | | 12/15/14 | | Baa1 | | | 860 | | | 832,609 |
| 5.95% | | 12/15/34 | | Baa1 | | | 635 | | | 624,780 |
| | | | | | | | | |
|
|
| | | | | | | | | | | 7,133,447 |
| | | | | | | | | |
|
|
SEE NOTES TO FINANCIAL STATEMENTS.
B50
| | | | |
| | | FLEXIBLE MANAGED PORTFOLIO (Continued) | | |
SCHEDULE OF INVESTMENTS | December 31, 2006 |
| | | | | | | | | | |
Interest
Rate
| | Maturity
Date
| | Moody’s
Rating
(Unaudited)
| | Principal
Amount
(000)
| | Value
(Note 2)
|
| LONG-TERM BONDS (Continued) | | | |
Insurance — 0.2% | | | |
Allstate Corp. (The), | | | |
Sr. Notes | | | |
| 5.55% | | 05/09/35 | | A1 | | $ | 145 | | $ | 139,444 |
| 5.95% | | 04/01/36 | | A1 | | | 540 | | | 549,162 |
American International Group, Inc., | | | |
Notes | | | | | | | | | | |
| 4.25% | | 05/15/13 | | Aa2 | | | 1,080 | | | 1,012,681 |
| 5.60% | | 10/18/16 | | Aa2 | | | 1,040 | | | 1,049,673 |
Sr. Notes | | | |
| 5.05% | | 10/01/15 | | Aa2 | | | 180 | | | 175,028 |
AXA SA (France), | | | |
Sub. Notes | | | |
| 8.60% | | 12/15/30 | | A3 | | | 155 | | | 200,967 |
Berkshire Hathaway Finance Corp., | | | |
Gtd. Notes | | | |
| 4.75% | | 05/15/12 | | Aaa | | | 830 | | | 813,471 |
Liberty Mutual Group, Inc.,(h) | | | |
Bonds, 144A | | | |
| 7.00% | | 03/15/34 | | Baa3 | | | 850 | | | 875,112 |
Marsh & Mclennan Cos., Inc., | | | |
Sr. Unsec. Notes | | | |
| 5.15% | | 09/15/10 | | Baa2 | | | 265 | | | 260,352 |
| 5.75% | | 09/15/15 | | Baa2 | | | 160 | | | 157,410 |
MetLife, Inc., | | | |
Sr. Notes | | | |
| 5.70% | | 06/15/35 | | A2 | | | 1,020 | | | 996,780 |
| 6.125% | | 12/01/11 | | A2 | | | 335 | | | 346,306 |
| 6.375% | | 06/15/34 | | A2 | | | 400 | | | 427,145 |
St. Paul Travelers Cos., Inc. (The), | | | |
Sr. Unsec. Notes | | | |
| 6.75% | | 06/20/36 | | A3 | | | 685 | | | 757,148 |
W.R. Berkley Corp., | | | |
Sr. Notes | | | |
| 5.60% | | 05/15/15 | | Baa2 | | | 555 | | | 545,163 |
| 6.15% | | 08/15/19 | | Baa2 | | | 460 | | | 457,714 |
XL Capital Ltd. (Cayman Islands), | | | |
Sr. Notes | | | |
| 5.25% | | 09/15/14 | | A3 | | | 85 | | | 83,302 |
| | | | | | | | | |
|
|
| | | | | | | | | | | 8,846,858 |
| | | | | | | | | |
|
|
Lodging — 0.1% | | | | | | |
Carnival Corp. (Panama), | | | |
Gtd. Notes | | | |
| 3.75% | | 11/15/07 | | A3 | | | 2,205 | | | 2,175,126 |
P&O Princess (United Kingdom), | | | |
Notes | | | |
| 7.30% | | 06/01/07 | | A3 | | | 260 | | | 261,825 |
| | | | | | | | | |
|
|
| | | | | | | | | | | 2,436,951 |
| | | | | | | | | |
|
|
Media & Entertainment — 0.2% | | | | | | |
CBS Corp., | | | |
Gtd. Notes | | | |
| 7.875% | | 07/30/30 | | Baa3 | | | 320 | | | 335,337 |
Chancellor Media Corp., | | | |
Gtd. Notes | | | |
| 8.00% | | 11/01/08 | | Baa3 | | | 575 | | | 597,804 |
| | | | | | | | | | |
Interest
Rate
| | Maturity
Date
| | Moody’s
Rating
(Unaudited)
| | Principal
Amount
(000)
| | Value
(Note 2)
|
| LONG-TERM BONDS (Continued) | | | |
Media & Entertainment (cont’d.) | | | | | | |
Idearc, Inc.,(i) | | | |
Bank Loan | | | |
| 7.3762% | | 11/09/14 | | Ba2 | | $ | 1,500 | | $ | 1,507,501 |
Knight Ridder, Inc., | | | |
Debs. | | | |
| 6.875% | | 03/15/29 | | Ba1 | | | 70 | | | 66,377 |
News America, Inc., | | | |
Gtd. Notes | | | |
| 7.625% | | 11/30/28 | | Baa2 | | | 1,050 | | | 1,177,425 |
Time Warner, Inc., | | | |
Debs. | | | |
| 9.15% | | 02/01/23 | | Baa2 | | | 505 | | | 624,729 |
Gtd. Notes | | | |
| 6.50% | | 11/15/36 | | Baa2 | | | 315 | | | 313,527 |
| 6.75% | | 04/15/11 | | Baa2 | | | 640 | | | 669,957 |
| 7.25% | | 10/15/17 | | Baa2 | | | 790 | | | 862,983 |
Viacom, Inc., | | | |
Sr. Notes, | | | |
| 6.25% | | 04/30/16 | | Baa3 | | | 650 | | | 645,497 |
| 6.875% | | 04/30/36 | | Baa3 | | | 680 | | | 672,302 |
Walt Disney Co., | | | |
Notes | | | |
| 5.375% | | 06/01/07 | | A3 | | | 225 | | | 225,151 |
| | | | | | | | | |
|
|
| | | | | | | | | | | 7,698,590 |
| | | | | | | | | |
|
|
Metals — 0.1% | | | | | | |
Alcan, Inc. (Canada), | | | |
Notes | | | |
| 4.50% | | 05/15/13 | | Baa1 | | | 115 | | | 108,254 |
| 5.00% | | 06/01/15 | | Baa1 | | | 600 | | | 570,680 |
Peabody Energy Corp., | | | |
Gtd. Notes | | | |
| 7.375% | | 11/01/16 | | Ba1 | | | 1,200 | | | 1,278,000 |
Southern Copper Corp., | | | |
Sr. Notes | | | |
| 7.50% | | 07/27/35 | | Baa2 | | | 955 | | | 1,035,494 |
Vale Overseas Ltd. (Cayman Islands), | | | |
Gtd. Notes | | | |
| 6.875% | | 11/21/36 | | Baa3 | | | 710 | | | 728,209 |
| 8.25% | | 01/17/34 | | Baa3 | | | 240 | | | 284,290 |
| | | | | | | | | |
|
|
| | | | | | | | | | | 4,004,927 |
| | | | | | | | | |
|
|
Municipals | | | | | | |
Illinois St., Taxable Pension, G.O., | | | |
| 5.10% | | 06/01/33 | | Aa3 | | | 975 | | | 933,290 |
| | | | | | | | | |
|
|
Non Captive Finance — 0.3% | | | | | | |
Capital One Bank Corp., | | | |
Sub. Notes | | | |
| 6.50% | | 06/13/13 | | A3 | | | 20 | | | 21,083 |
Capital One Financial Corp., | | | |
Notes | | | |
| 5.50% | | 06/01/15 | | A3 | | | 265 | | | 264,817 |
Sr. Notes, M.T.N. | | | |
| 5.70% | | 09/15/11 | | A3 | | | 600 | | | 608,893 |
Sub. Notes | | | |
| 6.15% | | 09/01/16 | | Baa1 | | | 80 | | | 82,737 |
SEE NOTES TO FINANCIAL STATEMENTS.
B51
| | | | |
| | | FLEXIBLE MANAGED PORTFOLIO (Continued) | | |
SCHEDULE OF INVESTMENTS | December 31, 2006 |
| | | | | | | | | | |
Interest
Rate
| | Maturity
Date
| | Moody’s
Rating
(Unaudited)
| | Principal
Amount
(000)
| | Value
(Note 2)
|
| LONG-TERM BONDS (Continued) | | | |
Non Captive Finance (cont’d.) | | | | | | |
CIT Group Funding Co. (Canada), | | | |
Gtd. Notes | | | |
| 5.20% | | 06/01/15 | | A2 | | $ | 680 | | $ | 658,636 |
CIT Group, Inc., | | | |
Sr. Notes | | | |
| 4.25% | | 02/01/10 | | A2 | | | 400 | | | 387,407 |
| 5.50% | | 11/30/07 | | A2 | | | 990 | | | 992,181 |
General Electric Capital Corp., | | | |
Notes | | | |
| 5.50% | | 04/28/11 | | Aaa | | | 2,895 | | | 2,929,204 |
Notes, M.T.N. | | | |
| 4.875% | | 10/21/10 | | Aaa | | | 1,070 | | | 1,058,744 |
Notes, Ser. A, M.T.N. | | | |
| 6.125% | | 02/22/11 | | Aaa | | | 5 | | | 5,169 |
| 6.75% | | 03/15/32 | | Aaa | | | 850 | | | 973,486 |
Household Finance Corp., | | | |
Notes | | | |
| 4.75% | | 05/15/09 | | Aa3 | | | 370 | | | 365,997 |
| 4.75% | | 07/15/13 | | Aa3 | | | 150 | | | 145,449 |
HSBC Finance Corp., | | | |
Sr. Notes | | | |
| 5.70% | | 06/01/11 | | Aa3 | | | 440 | | | 447,604 |
International Lease Finance Corp., | | | |
Unsub. Notes | | | |
| 3.50% | | 04/01/09 | | A1 | | | 580 | | | 557,915 |
Residential Capital Corp., | | | |
Gtd. Notes | | | |
| 6.00% | | 02/22/11 | | Baa3 | | | 1,630 | | | 1,626,916 |
Sr. Unsec. Notes | | | |
| 6.375% | | 06/30/10 | | Baa3 | | | 480 | | | 485,586 |
| | | | | | | | | |
|
|
| | | | | | | | | | | 11,611,824 |
| | | | | | | | | |
|
|
Packaging | | | | | | |
Ball Corp., | | | |
Gtd. Notes | | | |
| 6.625% | | 03/15/18 | | Ba1 | | | 1,900 | | | 1,890,500 |
| Paper | | | | | | | | | | |
Plum Creek Timberlands LP, | | | |
Gtd. Notes | | | |
| 5.875% | | 11/15/15 | | Baa3 | | | 690 | | | 678,043 |
Weyerhaeuser Co., | | | |
Debs. | | | |
| 7.375% | | 03/15/32 | | Baa2 | | | 390 | | | 407,092 |
| | | | | | | | | |
|
|
| | | | | | | | | | | 2,975,635 |
| | | | | | | | | |
|
|
Pipelines & Other — 0.2% | | | | | | |
Atmos Energy Corp., | | | |
Notes | | | |
| 4.00% | | 10/15/09 | | Baa3 | | | 1,680 | | | 1,616,160 |
Duke Energy Field Services LLC, | | | |
Notes | | | |
| 7.875% | | 08/16/10 | | Baa2 | | | 1,760 | | | 1,893,129 |
Enterprise Products Operating LP, | | | |
Gtd. Notes, Ser. B | | | |
| 6.875% | | 03/01/33 | | Baa3 | | | 140 | | | 146,183 |
Sr. Notes | | | |
| 4.625% | | 10/15/09 | | Baa3 | | | 740 | | | 724,522 |
| | | | | | | | | | |
Interest
Rate
| | Maturity
Date
| | Moody’s
Rating
(Unaudited)
| | Principal
Amount
(000)
| | Value
(Note 2)
|
| LONG-TERM BONDS (Continued) | | | |
Pipelines & Other(cont’d.) | | | | | | |
Sr. Notes, Ser. B | | | |
| 4.00% | | 10/15/07 | | Baa3 | | $ | 780 | | $ | 770,458 |
Kinder Morgan Finance Co. ULC (Canada), | | | |
Gtd. Notes | | | |
| 5.70% | | 01/05/16 | | Baa2 | | | 735 | | | 674,376 |
Oneok Inc., | | | |
Sr. Unsec. Notes | | | |
| 5.51% | | 02/16/08 | | Baa2 | | | 1,290 | | | 1,289,084 |
Oneok Partners LP, | | | |
Notes | | | |
| 6.65% | | 10/01/36 | | Baa2 | | | 605 | | | 618,813 |
Sempra Energy, | | | |
Sr. Notes | | | |
| 4.621% | | 05/17/07 | | Baa1 | | | 630 | | | 627,597 |
Sr. Unsec. Notes | | | |
| 6.00% | | 02/01/13 | | Baa1 | | | 90 | | | 91,790 |
| | | | | | | | | |
|
|
| | | | | | | | | | | 8,452,112 |
| | | | | | | | | |
|
|
Railroads — 0.1% | | | | | | |
Burlington Northern Santa Fe Corp.,
Debs. | | | |
| 6.70% | | 08/01/28 | | Baa1 | | | 670 | | | 728,857 |
Norfolk Southern Corp.,
Sr. Notes | | | |
| 7.80% | | 05/15/27 | | Baa1 | | | 18 | | | 22,011 |
Sr. Unsec. Notes | | | |
| 5.64% | | 05/17/29 | | Baa1 | | | 477 | | | 460,873 |
Union Pacific Corp.,
Notes | | | |
| 3.625% | | 06/01/10 | | Baa2 | | | 1,375 | | | 1,297,452 |
| 6.625% | | 02/01/08 | | Baa2 | | | 1,390 | | | 1,406,140 |
| 6.65% | | 01/15/11 | | Baa2 | | | 750 | | | 783,848 |
| | | | | | | | | |
|
|
| | | | | | | | | | | 4,699,181 |
| | | | | | | | | |
|
|
Real Estate Investment Trusts — 0.1% | | | |
Brandywine Operating Partners LP, | | | |
Gtd. Notes | | | |
| 5.75% | | 04/01/12 | | Baa3 | | | 1,295 | | | 1,303,890 |
ERP Operating LP, | | | |
Notes | | | |
| 5.125% | | 03/15/16 | | Baa1 | | | 345 | | | 335,056 |
Mack-Cali Realty LP, | | | |
Notes | | | |
| 7.25% | | 03/15/09 | | Baa2 | | | 1,270 | | | 1,311,491 |
Post Apartment Homes LP, | | | |
Notes | | | |
| 6.30% | | 06/01/13 | | Baa3 | | | 660 | | | 676,702 |
Sr. Notes | | | |
| 5.45% | | 06/01/12 | | Baa3 | | | 435 | | | 426,089 |
Simon Property Group LP, | | | |
Unsec. Notes | | | |
| 5.75% | | 05/01/12 | | A3 | | | 1,500 | | | 1,515,376 |
| | | | | | | | | |
|
|
| | | | | | | | | | | 5,568,604 |
| | | | | | | | | |
|
|
Retailers — 0.1% | | | |
Federated Retail Holdings, Inc., | | | |
Gtd. Notes | | | |
| 5.90% | | 12/01/16 | | Baa1 | | | 290 | | | 289,549 |
Gap, Inc., | | | |
Notes | | | |
| 6.90% | | 09/15/07 | | Baa3 | | | 1,230 | | | 1,238,516 |
SEE NOTES TO FINANCIAL STATEMENTS.
B52
| | | | |
| | | FLEXIBLE MANAGED PORTFOLIO (Continued) | | |
SCHEDULE OF INVESTMENTS | December 31, 2006 |
| | | | | | | | | | |
Interest
Rate
| | Maturity
Date
| | Moody’s
Rating
(Unaudited)
| | Principal
Amount
(000)
| | Value
(Note 2)
|
| LONG-TERM BONDS (Continued) | | | |
Retailers (cont’d.) | | | |
Home Depot, Inc., | | | |
Sr. Unsec. Notes | | | |
| 5.40% | | 03/01/16 | | Aa3 | | $ | 295 | | $ | 288,524 |
| 5.875% | | 12/16/36 | | Aa3 | | | 560 | | | 549,541 |
May Department Stores Co. (The), | | | |
Notes | | | |
| 6.65% | | 07/15/24 | | Baa1 | | | 830 | | | 822,357 |
Wal-Mart Stores, Inc., | | | |
Bonds | | | |
| 5.25% | | 09/01/35 | | Aa2 | | | 245 | | | 224,983 |
| | | | | | | | | |
|
|
| | | | | | | | | | | 3,413,470 |
| | | | | | | | | |
|
|
Structured Notes — 0.1% | | | |
Trains HY-1 2006,(b)(h) | | | |
Sec. Notes, 144A | | | |
| 7.548% | | 05/01/16 | | B1 | | | 2,880 | | | 2,938,982 |
| | | | | | | | | |
|
|
Technology — 0.3% | | | |
Electronic Data Systems Corp., | | | |
Notes | | | |
| 7.45% | | 10/15/29 | | Ba1 | | | 120 | | | 131,315 |
Equifax, Inc., | | | |
Notes | | | |
| 4.95% | | 11/01/07 | | Baa1 | | | 320 | | | 317,777 |
Freescale Semiconductor, Inc.,(h) | | | |
Sr. Notes, 144A | | | |
| 8.875% | | 12/15/14 | | B1 | | | 1,100 | | | 1,095,875 |
International Business Machines Corp., | | | |
Debs. | | | |
| 5.875% | | 11/29/32 | | A1 | | | 1,150 | | | 1,173,857 |
Jabil Circuit, Inc., | | | |
Sr. Notes | | | |
| 5.875% | | 07/15/10 | | Baa3 | | | 1,875 | | | 1,861,733 |
Motorola, Inc., | | | |
Notes | | | |
| 4.608% | | 11/16/07 | | Baa1 | | | 950 | | | 943,641 |
Sr. Notes | | | |
| 8.00% | | 11/01/11 | | Baa1 | | | 99 | | | 109,550 |
NXP Funding LLC,(h) | | | |
Secd. Notes, 144A | | | |
| 7.875% | | 10/15/14 | | Ba2 | | | 2,000 | | | 2,067,499 |
Oracle Corp. and Ozark Holding, Inc., | | | |
Notes | | | |
| 5.00% | | 01/15/11 | | A3 | | | 980 | | | 970,135 |
Xerox Corp., | | | |
Sr. Unsec. Notes | | | |
| 6.40% | | 03/15/16 | | Baa3 | | | 1,239 | | | 1,265,329 |
| | | | | | | | | |
|
|
| | | | | | | | | | | 9,936,711 |
| | | | | | | | | |
|
|
Telecommunications — 0.7% | | | |
ALLTEL Ohio LP,(h) | | | |
Gtd. Notes, 144A | | | |
| 8.00% | | 08/15/10 | | A2 | | | 323 | | | 346,322 |
America Movil SA de CV (Mexico), | | | |
Unsec. Notes | | | |
| 6.375% | | 03/01/35 | | A3 | | | 580 | | | 565,873 |
AT&T Corp., | | | |
Sr. Notes | | | |
| 8.00% | | 11/15/31 | | A2 | | | 615 | | | 763,017 |
| | | | | | | | | | |
Interest
Rate
| | Maturity
Date
| | Moody’s
Rating
(Unaudited)
| | Principal
Amount
(000)
| | Value
(Note 2)
|
| LONG-TERM BONDS (Continued) | | | |
Telecommunications (cont’d.) | | | |
AT&T Wireless Services, Inc., | | | |
Notes | | | |
| 8.125% | | 05/01/12 | | Baa1 | | $ | 640 | | $ | 720,172 |
Sr. Notes | | | |
| 8.75% | | 03/01/31 | | Baa1 | | | 879 | | | 1,142,318 |
AT&T, Inc., | | | |
Notes | | | |
| 4.125%(b) | | 09/15/09 | | A2 | | | 1,070 | | | 1,039,242 |
| 5.30% | | 11/15/10 | | A2 | | | 1,260 | | | 1,260,174 |
BellSouth Corp., | | | |
Notes | | | |
| 4.20% | | 09/15/09 | | A2 | | | 1,175 | | | 1,142,261 |
British Telecom PLC (United Kingdom), | | | |
| Bonds | | | | | | | | | | |
| 7.00% | | 05/23/07 | | Baa1 | | | 1,265 | | | 1,270,798 |
| 9.125% | | 12/15/30 | | Baa1 | | | 210 | | | 287,254 |
Cingular Wireless LLC, | | | |
Sr. Notes | | | |
| 7.125% | | 12/15/31 | | Baa1 | | | 505 | | | 559,415 |
Deutsche Telekom International Finance BV (Netherlands), | | | |
Gtd. Notes | | | |
| 8.25% | | 06/15/30 | | A3 | | | 295 | | | 362,655 |
Embarq Corp., | | | |
Notes | | | |
| 7.082% | | 06/01/16 | | Baa3 | | | 350 | | | 356,307 |
| 7.995% | | 06/01/36 | | Baa3 | | | 1,100 | | | 1,144,689 |
France Telecom SA (France), | | | |
Notes | | | |
| 8.50% | | 03/01/31 | | A3 | | | 375 | | | 492,273 |
Koninklijke (Royal) KPN NV (Netherlands), | | | |
Sr. Unsub. Notes | | | |
| 8.00% | | 10/01/10 | | Baa2 | | | 530 | | | 571,862 |
Nextel Communications, Inc., | | | |
Sr. Notes, Ser. F | | | |
| 5.95% | | 03/15/14 | | Baa3 | | | 1,160 | | | 1,129,627 |
Sprint Capital Corp., | | | |
Gtd. Notes | | | |
| 6.875% | | 11/15/28 | | Baa3 | | | 295 | | | 295,297 |
| 8.75% | | 03/15/32 | | Baa3 | | | 230 | | | 276,831 |
Sprint Nextel Corp. | | | |
Usec. Notes | | | |
| 6.00% | | 12/01/16 | | Baa3 | | | 1,580 | | | 1,539,911 |
Telecom Italia Capital SA, | | | |
Gtd. Notes | | | |
| 5.25% | | 11/15/13 | | Baa2 | | | 320 | | | 305,116 |
| 6.375% | | 11/15/33 | | Baa2 | | | 395 | | | 373,207 |
| 7.20% | | 07/18/36 | | Baa2 | | | 1,630 | | | 1,702,889 |
Telecomunicaciones de Puerto Rico, Inc. (Puerto Rico), | | | |
Gtd. Notes | | | |
| 6.80% | | 05/15/09 | | Baa1 | | | 3,065 | | | 3,128,659 |
Telefonica Emisiones SAU (Spain), | | | |
Gtd. Notes | | | |
| 6.421% | | 06/20/16 | | Baa1 | | | 580 | | | 598,338 |
| 7.045% | | 06/20/36 | | Baa1 | | | 1,420 | | | 1,508,277 |
SEE NOTES TO FINANCIAL STATEMENTS.
B53
| | | | |
| | | FLEXIBLE MANAGED PORTFOLIO (Continued) | | |
SCHEDULE OF INVESTMENTS | December 31, 2006 |
| | | | | | | | | | |
Interest
Rate
| | Maturity
Date
| | Moody’s
Rating
(Unaudited)
| | Principal
Amount
(000)
| | Value
(Note 2)
|
| LONG-TERM BONDS (Continued) | | | |
Telecommunications (cont’d.) | | | |
TELUS Corp. (Canada), | | | |
Notes | | | |
| 8.00% | | 06/01/11 | | Baa2 | | $ | 1,255 | | $ | 1,372,389 |
US Cellular Corp., | | | |
Sr. Notes | | | |
| 6.70% | | 12/15/33 | | Baa3 | | | 470 | | | 441,393 |
Verizon Global Funding Corp., | | | |
Notes | | | |
| 7.75% | | 12/01/30 | | A3 | | | 105 | | | 123,163 |
Sr. Notes | | | |
| 5.85% | | 09/15/35 | | A3 | | | 625 | | | 598,592 |
Vodafone Group PLC (United Kingdom), | | | |
Sr. Notes | | | |
| 7.75% | | 02/15/10 | | A3 | | | 800 | | | 852,546 |
| | | | | | | | | |
|
|
| | | | | | | | | | | 26,270,867 |
| | | | | | | | | |
|
|
Tobacco | | | | | | | | | | |
Altria Group, Inc., | | | |
Debs. | | | |
| 7.75% | | 01/15/27 | | Baa1 | | | 292 | | | 354,164 |
Notes | | | |
| 7.65% | | 07/01/08 | | Baa1 | | | 590 | | | 608,271 |
| | | | | | | | | |
|
|
| | | | | | | | | | | 962,435 |
| | | | | | | | | |
|
|
Foreign Government Bonds — 0.4% | | | |
Korea Development Bank (Korea), | | | |
Notes | | | |
| 4.75% | | 07/20/09 | | A3 | | | 1,180 | | | 1,164,892 |
Pemex Project Funding Master Trust, | | | |
Gtd. Notes | | | |
| 5.75% | | 12/15/15 | | Baa1 | | | 1,480 | | | 1,469,640 |
| 8.625% | | 12/01/23 | | Baa1 | | | 350 | | | 430,938 |
Petrobras International Finance Co.
(Cayman Islands), | | | |
Bonds | | | |
| 8.375% | | 12/10/18 | | Baa2 | | | 935 | | | 1,114,988 |
Quebec Province (Canada), | | | |
Notes(b) | | | |
| 4.60% | | 05/26/15 | | Aa2 | | | 735 | | | 706,827 |
Sr. Unsec. Notes | | | |
| 5.75% | | 02/15/09 | | Aa2 | | | 500 | | | 506,855 |
Republic of Italy (Italy), | | | |
Notes | | | |
| 5.375% | | 06/15/33 | | A+(f) | | | 800 | | | 788,862 |
Republic of Malaysia (Malaysia), | | | |
Bonds | | | |
| 7.50% | | 07/15/11 | | A3 | | | 300 | | | 326,455 |
Republic of South Africa (South Africa), | | | |
Notes | | | |
| 6.50% | | 06/02/14 | | Baa1 | | | 475 | | | 499,344 |
Russian Government International Bond (Russia),(h) | | | |
Unsub. Notes, 144A | | | |
| 11.00% | | 07/24/18 | | Baa2 | | | 735 | | | 1,064,831 |
The Export-Import Bank of Korea (Korea),(h) | | | |
Notes, 144A | | | |
| 4.125% | | 02/10/09 | | Aa3 | | | 860 | | | 839,755 |
| | | | | | | | | | |
Interest
Rate
| | Maturity
Date
| | Moody’s
Rating
(Unaudited)
| | Principal
Amount
(000)
| | Value
(Note 2)
|
| LONG-TERM BONDS (Continued) | | | |
Foreign Government Bonds (cont’d.) | | | |
United Mexican States Global Bond (Mexico), | | | |
Notes | | | |
| 5.625%(b) | | 01/15/17 | | Baa1 | | $ | 1,644 | | $ | 1,645,644 |
| 7.50%(b) | | 01/14/12 | | Baa1 | | | 1,290 | | | 1,413,840 |
| 8.125% | | 12/30/19 | | Baa1 | | | 816 | | | 991,440 |
Notes, M.T.N. | | | |
| 6.75% | | 09/27/34 | | Baa1 | | | 1,070 | | | 1,155,600 |
| | | | | | | | | |
|
|
| | | | | | | | | | | 14,119,911 |
| | | | | | | | | |
|
|
Mortgage Backed Securities — 9.2% | | | |
Federal Home Loan Mortgage Corp., | | | |
| 4.50% | | 02/01/19-07/01/20(e) | | | | | 7,367 | | | 7,105,395 |
| 5.00% | | TBA 30 YR | | | | | 6,000 | | | 5,788,128 |
| 5.00% | | 07/01/18-05/01/34(e) | | | | | 12,511 | | | 12,242,066 |
5.252%(g) | | 12/01/35(e) | | | | | 4,125 | | | 4,111,678 |
| 5.50% | | TBA 30 YR | | | | | 8,000 | | | 7,910,000 |
| 5.50% | | 12/01/33-06/01/34(e) | | | | | 10,835 | | | 10,727,327 |
| 6.00% | | TBA 30 YR | | | | | 15,000 | | | 15,107,820 |
| 6.00% | | 03/01/32-12/01/33(e) | | | | | 3,778 | | | 3,819,081 |
| 6.50% | | 12/01/14(e) | | | | | 493 | | | 503,946 |
| 7.00% | | 01/01/31-11/01/33(e) | | | | | 5,110 | | | 5,256,972 |
Federal National Mortgage Assn., | | | |
| 4.00% | | 06/01/19(e) | | | | | 2,245 | | | 2,116,103 |
| 4.50% | | 11/01/18-01/01/35(e) | | | | | 15,583 | | | 14,937,562 |
4.932%(g) | | 07/01/33(e) | | | | | 851 | | | 847,915 |
| 5.00% | | TBA 15 YR | | | | | 7,500 | | | 7,371,090 |
| 5.00% | | TBA 30 YR | | | | | 13,000 | | | 12,549,056 |
| 5.00% | | 10/01/18-07/01/35(e) | | | | | 39,832 | | | 38,582,669 |
| 5.50% | | TBA 15 YR | | | | | 7,500 | | | 7,497,660 |
| 5.50% | | TBA 30 YR | | | | | 44,000 | | | 43,477,500 |
| 5.50% | | 03/01/16-10/01/35(e) | | | | | 38,460 | | | 38,101,678 |
| 6.00% | | TBA 30 YR | | | | | 27,500 | | | 27,680,455 |
| 6.00% | | 04/01/13-02/01/35(e) | | | | | 21,211 | | | 21,401,687 |
| 6.50% | | TBA 30 YR | | | | | 12,000 | | | 12,225,000 |
| 6.50% | | 07/01/17-11/01/36(e) | | | | | 12,857 | | | 13,112,473 |
| 7.00% | | 08/01/11-07/01/32(e) | | | | | 1,625 | | | 1,675,713 |
| 7.50% | | 06/01/12-05/01/32(e) | | | | | 1,180 | | | 1,217,376 |
Government National Mortgage Assn., | | | |
| 5.50% | | TBA 30 YR | | | | | 5,500 | | | 5,472,500 |
| 5.50% | | 02/15/33-07/15/35(e) | | | | | 9,953 | | | 9,914,809 |
| 6.00% | | 02/15/33-06/20/34(e) | | | | | 2,927 | | | 2,967,807 |
| 6.50% | | 10/15/23-07/15/35(e) | | | | | 7,468 | | | 7,673,424 |
| 8.00% | | 01/15/24-04/15/25(e) | | | | | 263 | | | 278,246 |
| | | | | | | | | |
|
|
| | | | | | | | | | | 341,673,136 |
| | | | | | | | | |
|
|
U.S. Government Agency Obligations — 2.7% | | | |
Federal Farm Credit Bank, | | | |
| 5.125% | | 08/25/16 | | | | | 1,020 | | | 1,031,957 |
Federal Home Loan Bank, | | | |
| 4.375% | | 10/03/08 | | | | | 8,140 | | | 8,041,335 |
| 4.50% | | 05/13/11 | | | | | 160 | | | 157,106 |
| 4.75% | | 06/11/08-12/16/16 | | | | | 9,320 | | | 9,256,029 |
| 4.875% | | 11/18/11(b) | | | | | 4,420 | | | 4,402,431 |
| 5.00% | | 10/16/09 | | | | | 14,165 | | | 14,105,946 |
| 5.125% | | 08/08/08 | | | | | 6,280 | | | 6,284,245 |
| 5.375% | | 08/19/11(b) | | | | | 6,755 | | | 6,870,544 |
| 5.60% | | 01/03/08 | | | | | 11,400 | | | 11,400,057 |
SEE NOTES TO FINANCIAL STATEMENTS.
B54
| | | | |
| | | FLEXIBLE MANAGED PORTFOLIO (Continued) | | |
SCHEDULE OF INVESTMENTS | December 31, 2006 |
| | | | | | | | | | |
Interest
Rate
| | Maturity
Date
| | Moody’s
Rating
(Unaudited)
| | Principal
Amount
(000)
| | Value
(Note 2)
|
| LONG-TERM BONDS (Continued) | | | |
U.S. Government Agency Obligations (cont’d.) | | | |
Federal Home Loan Mortgage Corp., | | | |
| 4.75% | | 11/03/09-01/18/11 | | | | $ | 1,285 | | $ | 1,277,608 |
| 5.00% | | 12/14/18, M.T.N. | | | | | 4,420 | | | 4,315,829 |
| 5.125% | | 10/18/16 | | | | | 250 | | | 252,141 |
| 5.25% | | 07/18/11, M.T.N.(b) | | | | | 4,300 | | | 4,351,462 |
| 5.40% | | 02/28/11, M.T.N. | | | | | 8,150 | | | 8,145,289 |
Federal National Mortgage Assn., | | | |
| 4.25% | | 07/27/07 | | | | | 4,021 | | | 3,998,342 |
| 4.875% | | 12/15/16 | | | | | 25 | | | 24,720 |
| 5.00% | | 10/15/11, M.T.N.(b) | | | | | 3,510 | | | 3,517,775 |
| 5.125% | | 04/15/11(b) | | | | | 5,305 | | | 5,342,936 |
| 6.125% | | 03/15/12 | | | | | 6,260 | | | 6,591,361 |
Tennessee Valley Authority, | | | |
| 5.88% | | 04/01/36 | | | | | 990 | | | 1,088,516 |
| | | | | | | | | |
|
|
| | | | | | | | | | | 100,455,629 |
| | | | | | | | | |
|
|
U.S. Government Treasury Obligations — 1.6% | | | |
United States Treasury Bonds, | | | |
| 4.50% | | 02/15/36(b) | | | | | 2,140 | | | 2,035,007 |
| 6.00% | | 02/15/26 | | | | | 115 | | | 130,426 |
| 6.875% | | 08/15/25 | | | | | 545 | | | 674,693 |
| 8.125% | | 08/15/21 | | | | | 3,665 | | | 4,891,343 |
| 8.75% | | 08/15/20 | | | | | 1,270 | | | 1,755,775 |
| 9.00% | | 11/15/18 | | | | | 987 | | | 1,357,202 |
| 9.125% | | 05/15/18 | | | | | 730 | | | 1,004,035 |
United States Treasury Inflation Index Bonds, | | | |
| 0.875% | | 04/15/10 | | | | | 1,950 | | | 1,848,780 |
| 1.625% | | 01/15/15 | | | | | 1,390 | | | 1,308,581 |
| 1.875% | | 07/15/13-07/15/15 | | | | | 2,693 | | | 2,593,023 |
| 2.00% | | 01/15/14-01/15/26 | | | | | 5,349 | | | 5,151,474 |
| 2.375% | | 04/15/11-01/15/25 | | | | | 3,083 | | | 3,069,626 |
| 2.50% | | 07/15/16 | | | | | 1,174 | | | 1,183,223 |
| 3.00% | | 07/15/12 | | | | | 1,589 | | | 1,635,083 |
| 3.375% | | 01/15/12-04/15/32 | | | | | 824 | | | 922,227 |
| 3.50% | | 01/15/11 | | | | | 818 | | | 851,277 |
| 3.625% | | 01/15/08-04/15/28 | | | | | 2,635 | | | 2,905,027 |
| 3.875% | | 01/15/09-04/15/29 | | | | | 2,527 | | | 2,924,239 |
| 4.25% | | 01/15/10 | | | | | 792 | | | 833,149 |
| | | | | | | | | | | |
Interest
Rate
| | Maturity
Date
| | Moody’s
Rating
(Unaudited)
| | Principal
Amount
(000)
| | Value
(Note 2)
| |
United States Treasury Notes, | | | | |
| 4.00% | | 06/15/09(j) | | | | $ | 680 | | $ | 668,286 | |
| 4.50% | | 11/30/11(b) | | | | | 2,840 | | | 2,814,707 | |
| 4.625% | | 09/30/08-11/15/16(b) | | | 10,035 | | | 9,985,916 | |
| 4.875% | | 05/15/09 | | | | | 475 | | | 476,039 | |
| 5.00% | | 07/31/08 | | | | | 25 | | | 25,041 | |
United States Treasury Strips, I/O, | | | | |
Zero | | 02/15/19-05/15/19(b) | | | 18,593 | | | 10,323,571 | |
| | | | | | | | | |
|
|
|
| | | | | | | | | | | 61,367,750 | |
| | | | | | | | | |
|
|
|
TOTAL LONG-TERM BONDS (cost $934,320,145) | | | | | | 926,453,980 | |
| | | | | | | | | |
|
|
|
TOTAL LONG-TERM INVESTMENTS (cost $3,005,209,293) | | | | | | 3,416,367,178 | |
| | | | | | | | | |
|
|
|
| SHORT-TERM INVESTMENTS — 19.0% | | | | |
U.S. Government Obligations — 0.1% | | | | |
United States Treasury Bill(j)
(cost $4,555,226) | | | | |
| 4.80% | | 03/15/07 | | | | | 4,600 | | | 4,556,134 | |
| | | Shares
| | | |
Affiliated Money Market Mutual Funds — 18.9% | | | | |
Dryden Core Investment Fund —Dryden Short-Term Bond Series(d) | | | 13,906,281 | | | 139,201,877 | |
Dryden Core Investment Fund —Taxable Money Market Series (cost $563,645,944; includes $305,547,916 of cash collateral for securities on loan)
(Note 4)(c)(d) | | | 563,645,944 | | | 563,645,944 | |
| | | | | | | | | |
|
|
|
TOTAL SHORT-TERM INVESTMENTS (cost $707,324,483) | | | 707,403,955 | |
| | | | | | | | | |
|
|
|
TOTAL INVESTMENTS — 110.7% (cost $3,712,533,776) | | | 4,123,771,133 | |
| | | | | | | | | |
|
|
|
LIABILITIES IN EXCESS OF OTHER ASSETS(k) — (10.7)% | | | (400,220,143 | ) |
| | | | | | | | | |
|
|
|
TOTAL NET ASSETS — 100.0% | | $ | 3,723,550,990 | |
| | | | | | | | | |
|
|
|
SEE NOTES TO FINANCIAL STATEMENTS.
B55
| | | | |
| | | FLEXIBLE MANAGED PORTFOLIO (Continued) | | |
SCHEDULE OF INVESTMENTS | December 31, 2006 |
The following abbreviations are used in portfolio descriptions:
| | |
| G.O. | | General Obligation |
| I/O | | Interest Only |
| M.T.N. | | Medium Term Note |
| TBA | | To Be Announced Security |
| (a) | Non income-producing security. |
| (b) | All or portion of security is on loan. The aggregate market value of such securities is $293,454,272; cash collateral of $305,547,916 (included in liabilities) was received with which the Portfolio purchased highly liquid short-term investments. |
| (c) | Represents security, or portion thereof, purchased with cash collateral received for securities on loan. |
| (d) | Prudential Investments LLC, the manager of the Portfolio, also serves as manager of Dryden Core Investment Fund — Taxable Money Market Series and the Dryden Core Investment Fund — Dryden Short-Term Bond Series. |
| (e) | Securities segregated as collateral for TBAs. |
| (f) | Standard & Poor’s rating. |
| (g) | Indicates a variable rate security. |
| (h) | Securities were purchased pursuant to Rule 144A under the Securities Act of 1933 and may not be subject to that rule except to qualified institutional buyers. Unless otherwise noted, 144A securities are deemed to be liquid. |
| (i) | Indicates a security that has been deemed illiquid. |
| (j) | Security segregated as collateral for futures contracts. |
| (k) | Liabilities in excess of other assets include net unrealized appreciation (depreciation) on futures contracts and interest rate swap and credit default swap agreements as follows: |
Open futures contracts outstanding at December 31, 2006:
| | | | | | | | | | | | | | |
Number of
Contracts
| | Type
| | Expiration
Date
| | Value at
December 31, 2006
| | Value at
Trade Date
| | Unrealized
Appreciation
(Depreciation)
| |
| Long Positions: | | | | | | | | | | | | | | |
| 93 | | 2-Yr. U.S. T-Notes | | Mar. 07 | | $ | 18,974,906 | | $ | 19,036,112 | | $ | (61,206 | ) |
| 1,173 | | 5-Yr. U.S. T-Notes | | Mar. 07 | | | 123,238,313 | | | 124,338,000 | | | (1,099,687 | ) |
| 527 | | U.S. Long Bond | | Mar. 07 | | | 58,727,562 | | | 59,447,798 | | | (720,236 | ) |
| 183 | | S&P 500 Index | | Mar. 07 | | | 65,349,300 | | | 65,056,225 | | | 293,075 | |
| | | | | | | | | | | | |
|
|
|
| | | | | | | | | | | | | | (1,588,054 | ) |
| | | | | | | | | | | | |
|
|
|
| Short Positions: | | | | | | | | | | | | | | |
| 150 | | 10-Yr. U.S. T-Notes | | Mar. 07 | | | 16,120,313 | | | 16,302,148 | | | 181,835 | |
| | | | | | | | | | | | |
|
|
|
| | | | | | | | | | | | | $ | (1,406,219 | ) |
| | | | | | | | | | | | |
|
|
|
Interest rate swap agreements outstanding at December 31, 2006:
| | | | | | | | | | | | | |
Counterparty
| | Termination Date
| | Notional Amount (000)
| | Fixed Rate
| | Floating Rate
| | Unrealized (Depreciation)
| |
Merrill Lynch Capital Services, Inc.(a) | | 11/02/2016 | | $ | 5,260 | | 5.151 | | 3 month LIBOR | | $ | (17,440 | ) |
| | | | | | | | | | | |
|
|
|
| (a) | The Portfolio pays the floating rate and receives the fixed rate. |
Credit default swap agreements outstanding at December 31, 2006:
| | | | | | | | | | | | | | |
Counterparty
| | Termination
Date
| | Notional
Amount
(000)
| | Fixed
Rate
| | | Underlying Bond
| | Unrealized
(Depreciation)
| |
Deutsche Bank AG(a) | | 05/25/2036 | | $ | 1,000 | | 2.74 | % | | Fieldstone Mortgage Investment Corp.,
Ser. 2006-1, Class M9
7.62%, due 05/25/36 | | $ | (809 | ) |
Deutsche Bank AG(a) | | 06/25/2036 | | | 1,000 | | 2.52 | % | | Residential Asset Securities Corp.,
Ser. 2006-EMX4, Class M9
7.32%, 06/25/36 | | | (4,116 | ) |
| | | | | | | | | | | | |
|
|
|
| | | | | | | | | | | | | $ | (4,925 | ) |
| | | | | | | | | | | | |
|
|
|
| (a) | The Portfolio pays the fixed rate and receives from the counterparty par in the event that the underlying bond defaults. |
SEE NOTES TO FINANCIAL STATEMENTS.
B56
| | | | |
| | | FLEXIBLE MANAGED PORTFOLIO (Continued) | | |
SCHEDULE OF INVESTMENTS | December 31, 2006 |
The industry classification of portfolio holdings and liabilities in excess of other assets shown as a percentage of net assets as of December 31, 2006 was as follows:
| | | |
Affiliated Money Market Mutual Funds (including 8.2% of collateral received for securities on loan) | | 18.9 | % |
Mortgage Backed Securities | | 9.2 | |
Oil, Gas & Consumable Fuels | | 5.2 | |
Healthcare & Pharmaceutical | | 5.1 | |
Diversified Financial Services | | 4.0 | |
Commercial Banks | | 3.6 | |
Insurance | | 3.1 | |
Telecommunications | | 3.1 | |
Capital Markets | | 3.0 | |
Commercial Mortgage Backed Securities | | 3.0 | |
Computers & Peripherals | | 2.7 | |
U.S. Government Agency Obligations | | 2.7 | |
Food & Staples Retailing | | 2.4 | |
Software | | 2.3 | |
Aerospace & Defense | | 2.2 | |
Media & Entertainment | | 2.1 | |
Healthcare Providers & Services | | 2.0 | |
Industrial Conglomerates | | 2.0 | |
Energy Equipment & Services | | 1.8 | |
Electric | | 1.7 | |
U.S. Government Treasury Obligations | | 1.6 | |
Semiconductors & Semiconductor Equipment | | 1.5 | |
Electronic Equipment & Instruments | | 1.4 | |
Household Products | | 1.3 | |
Retailers | | 1.2 | |
Beverages | | 1.2 | |
Communications Equipment | | 1.2 | |
Hotels, Restaurants & Leisure | | 1.2 | |
Specialty Retail | | 1.2 | |
Internet Software & Services | | 1.1 | |
Machinery | | 1.1 | |
Asset Backed Securities | | 1.0 | |
Tobacco | | 1.0 | |
Metals & Mining | | 0.9 | |
Chemicals | | 0.8 | |
Automobiles | | 0.7 | |
Healthcare Equipment & Supplies | | 0.7 | |
Road & Rail | | 0.7 | |
Textiles, Apparel & Luxury Goods | | 0.7 | |
Thrifts & Mortgage Finance | | 0.7 | |
Banking | | 0.6 | |
Biotechnology | | 0.6 | |
Independent Power Producers & Energy Traders | | 0.6 | |
Multi-Utilities | | 0.5 | |
Air Freight & Logistics | | 0.4 | |
Commercial Services & Supplies | | 0.4 | |
Construction & Engineering | | 0.4 | |
Consumer Finance | | 0.4 | |
Foreign Government Bonds | | 0.4 | |
Office Electronics | | 0.4 | |
Real Estate Investment Trusts | | 0.4 | |
Brokerage | | 0.3 | |
Capital Goods | | 0.3 | |
Collateralized Mortgage Obligations | | 0.3 | |
Non Captive Finance | | 0.3 | |
Technology | | 0.3 | |
Building Materials & Construction | | 0.2 | |
| | | |
Cable | | 0.2 | % |
Household Durables | | 0.2 | |
Internet & Capital Retail | | 0.2 | |
Leisure Equipment & Products | | 0.2 | |
Life Sciences, Tools & Services | | 0.2 | |
Pipelines & Other | | 0.2 | |
Real Estate Management & Development | | 0.2 | |
Airlines | | 0.1 | |
Auto Components | | 0.1 | |
Consumer | | 0.1 | |
Containers & Packaging | | 0.1 | |
Diversified Consumer Services | | 0.1 | |
Gaming | | 0.1 | |
Lodging | | 0.1 | |
Personal Products | | 0.1 | |
Railroads | | 0.1 | |
Structured Notes | | 0.1 | |
Trading Companies & Distributors | | 0.1 | |
U.S. Government Obligations | | 0.1 | |
| | |
|
|
| | | 110.7 | |
Liabilities in excess of other assets | | (10.7 | ) |
| | |
|
|
| | | 100.0 | % |
| | |
|
|
SEE NOTES TO FINANCIAL STATEMENTS.
B57
SCHEDULE OF INVESTMENTS | December 31, 2006 |
| | | | | |
| LONG-TERM INVESTMENTS — 96.7% | | Value (Note 2)
|
| COMMON STOCKS | | Shares
| |
Australia — 1.8% | | | | | |
Allco Finance Group Ltd. | | 104,171 | | $ | 1,057,289 |
AWB Ltd. | | 271,500 | | | 659,873 |
BlueScope Steel Ltd. | | 251,400 | | | 1,704,796 |
Commonwealth Bank of Australia | | 61,000 | | | 2,375,467 |
CSR Ltd. | | 173,200 | | | 512,074 |
Macquarie Bank Ltd. | | 71,300 | | | 4,431,689 |
Quantas Airways Ltd. | | 515,500 | | | 2,124,773 |
Santos Ltd. | | 82,000 | | | 638,155 |
Smorgon Steel Group Ltd. | | 936,900 | | | 1,374,401 |
Telstra Corp. Ltd. | | 445,700 | | | 1,456,475 |
Zinifex Ltd. | | 30,000 | | | 442,177 |
| | | | |
|
|
| | | | | | 16,777,169 |
| | | | |
|
|
Austria — 0.7% | | | | | |
Boehler-Uddeholm AG | | 23,200 | | | 1,626,190 |
Erste Bank der Oesterreichischen Sparkassen AG | | 28,352 | | | 2,174,445 |
Raiffeisen International Bank-Holding AG | | 11,400 | | | 1,738,254 |
Voestalpine AG | | 9,500 | | | 536,354 |
| | | | |
|
|
| | | | | | 6,075,243 |
| | | | |
|
|
Belgium — 0.4% | | | | | |
Fortis | | 74,100 | | | 3,161,392 |
InBev NV | | 14,600 | | | 962,476 |
| | | | |
|
|
| | | | | | 4,123,868 |
| | | | |
|
|
Bermuda — 0.4% | | | | | |
Tyco International Ltd. | | 132,900 | | | 4,040,160 |
| | | | |
|
|
Brazil — 0.7% | | | | | |
Banco Itau Holding Financeira, ADR | | 44,600 | | | 1,612,290 |
Cia de Concessoes Rodoviarias | | 74,500 | | | 1,006,003 |
Gol Linhas Aereas Inteligentes SA, ADR(b) | | 19,800 | | | 567,666 |
Localiza Rent A Car SA | | 15,300 | | | 460,110 |
Natura Cosmeticos SA | | 82,400 | | | 1,162,818 |
Petroleo Brasilerio SA, ADR | | 20,000 | | | 1,869,599 |
| | | | |
|
|
| | | | | | 6,678,486 |
| | | | |
|
|
Canada — 0.8% | | | | | |
Manulife Financial Corp. | | 102,500 | | | 3,458,710 |
Shoppers Drug Mart Corp. | | 50,100 | | | 2,151,961 |
Suncor Energy, Inc. | | 25,400 | | | 1,999,285 |
| | | | |
|
|
| | | | | | 7,609,956 |
| | | | |
|
|
Chile — 0.1% | | | | | |
Cencosud SA, ADR, 144A | | 26,600 | | | 1,248,162 |
| | | | |
|
|
China — 0.9% | | | | | |
China Merchants Bank Co. Ltd.(a) | | 217,500 | | | 460,820 |
Focus Media Holding Ltd., ADR(a) | | 15,800 | | | 1,048,962 |
Foxconn International Holdings Ltd.(a) | | 215,000 | | | 701,237 |
Industrial & Commercial Bank of China(a) | | 9,354,000 | | | 5,808,444 |
| | | | |
|
|
| | | | | | 8,019,463 |
| | | | |
|
|
Colombia — 0.1% | | | | | |
BanColombia SA, ADR | | 32,400 | | | 1,009,260 |
| | | | |
|
|
Denmark — 0.2% | | | | | |
Danske Bank A/S | | 36,600 | | | 1,626,292 |
| | | | |
|
|
| | | | | |
| COMMON STOCKS | | Value (Note 2)
|
| (Continued) | | Shares
| |
Finland — 0.4% | | | | | |
Perlos Oyj | | 73,300 | | $ | 339,625 |
Rautaruukki Oyj | | 39,900 | | | 1,587,994 |
Stora Enso Oyj (Class R Stock) | | 88,600 | | | 1,403,472 |
| | | | |
|
|
| | | | | | 3,331,091 |
| | | | |
|
|
France — 6.8% | | | | | |
Arkema(a) | | 530 | | | 27,236 |
BNP Paribas SA | | 79,260 | | | 8,647,401 |
Capgemini SA | | 29,100 | | | 1,826,553 |
Cie Generale D’Optique Essilor International SA | | 21,500 | | | 2,311,630 |
Ciments Francais | | 5,200 | | | 998,746 |
CNP Assurances | | 10,300 | | | 1,150,261 |
Compagnie Generale des Etablissements Michelin (Class B Stock) | | 24,600 | | | 2,354,300 |
Credit Agricole SA | | 58,900 | | | 2,477,136 |
Eurazeo | | 13,945 | | | 1,991,748 |
Groupe Danone | | 39,000 | | | 5,910,105 |
Iliad SA | | 9,000 | | | 781,731 |
L’Oreal SA | | 63,400 | | | 6,352,135 |
LVMH Moet Hennessy Louis Vuitton SA | | 37,700 | | | 3,978,767 |
Natixis | | 57,000 | | | 1,601,162 |
Peugeot SA | | 26,000 | | | 1,722,923 |
Rallye SA | | 13,400 | | | 725,763 |
Renault SA | | 11,800 | | | 1,417,464 |
Schneider Electric SA | | 8,900 | | | 988,040 |
Societe Generale | | 5,300 | | | 899,716 |
Total SA | | 21,200 | | | 1,529,378 |
Total SA, ADR | | 85,000 | | | 6,113,200 |
Valeo SA | | 30,700 | | | 1,277,765 |
Veolia Environnement | | 53,900 | | | 4,155,184 |
Vinci SA | | 21,600 | | | 2,760,055 |
Vivendi Universal SA | | 31,700 | | | 1,239,043 |
| | | | |
|
|
| | | | | | 63,237,442 |
| | | | |
|
|
Germany — 2.5% | | | | | |
BASF AG | | 39,300 | | | 3,843,624 |
Bayer AG | | 21,600 | | | 1,164,185 |
Bijou Brigitte AG | | 1,900 | | | 374,708 |
DaimlerChrysler AG | | 24,800 | | | 1,536,353 |
Deutsche Bank AG | | 21,900 | | | 2,936,574 |
Deutsche Telekom AG | | 57,400 | | | 1,052,453 |
E.ON AG | | 29,600 | | | 4,035,883 |
MAN AG | | 18,200 | | | 1,650,745 |
SAP AG | | 35,800 | | | 1,906,372 |
ThyssenKrupp AG | | 60,200 | | | 2,840,935 |
TUI AG | | 45,600 | | | 914,348 |
Volkswagen AG | | 10,200 | | | 1,157,405 |
| | | | |
|
|
| | | | | | 23,413,585 |
| | | | |
|
|
Greece — 0.3% | | | | | |
Motor Oil Hellas Corinth Refineries SA | | 31,000 | | | 798,786 |
National Bank of Greece SA, ADR(b) | | 248,200 | | | 2,308,260 |
| | | | |
|
|
| | | | | | 3,107,046 |
| | | | |
|
|
Hong Kong — 1.3% | | | | | |
Chaoda Modern Agriculture | | 1,203,600 | | | 773,585 |
China Mobile Ltd. | | 407,500 | | | 3,512,630 |
SEE NOTES TO FINANCIAL STATEMENTS.
B58
| | | | |
| | | GLOBAL PORTFOLIO (Continued) | | |
SCHEDULE OF INVESTMENTS | December 31, 2006 |
| | | | | |
| COMMON STOCKS | | Value (Note 2)
|
| (Continued) | | Shares
| |
Hong Kong (cont’d.) | | | | | |
CITIC International Financial Holdings Ltd. | | 1,095,000 | | $ | 980,895 |
Citic Pacific Ltd. | | 324,500 | | | 1,115,995 |
Esprit Holdings Ltd. | | 227,500 | | | 2,534,000 |
Hopson Devolpment Holdings Ltd. | | 198,000 | | | 559,683 |
Li & Fung Ltd. | | 981,600 | | | 3,047,702 |
| | | | |
|
|
| | | | | | 12,524,490 |
| | | | |
|
|
India — 0.6% | | | | | |
HDFC Bank Ltd., ADR | | 10,200 | | | 769,896 |
Infosys Technologies Ltd., ADR | | 95,500 | | | 5,210,480 |
| | | | |
|
|
| | | | | | 5,980,376 |
| | | | |
|
|
Ireland — 0.6% | | | | | |
Anglo Irish Bank Corp. PLC (Irish Stock Exchange) | | 108,100 | | | 2,241,768 |
Anglo Irish Bank Corp. PLC (London Exchange) | | 21,100 | | | 435,899 |
IAWS Group, PLC | | 29,300 | | | 750,340 |
Irish Life & Permanent PLC | | 86,900 | | | 2,408,949 |
| | | | |
|
|
| | | | | | 5,836,956 |
| | | | |
|
|
Italy — 1.6% | | | | | |
Banche Popolari Unite Scpa | | 33,200 | | | 912,447 |
Benetton Group SpA | | 46,500 | | | 887,585 |
ENI SpA | | 121,400 | | | 4,083,258 |
Luxottica Group SpA | | 127,600 | | | 3,921,230 |
Saipem SpA | | 147,800 | | | 3,851,326 |
Sanpaolo IMI SpA | | 53,700 | | | 1,247,601 |
| | | | |
|
|
| | | | | | 14,903,447 |
| | | | |
|
|
Japan — 10.6% | | | | | |
Aeon Mall Co. Ltd. | | 28,000 | | | 1,581,073 |
Alpine Electronics, Inc. | | 41,600 | | | 621,259 |
Alps Electric Co. Ltd. | | 49,700 | | | 538,684 |
Asahi Breweries Ltd. | | 89,400 | | | 1,428,614 |
Asahi Kasei Corp. | | 226,100 | | | 1,482,363 |
Canon, Inc. | | 83,700 | | | 4,712,323 |
Capcom Co. Ltd. | | 55,200 | | | 991,149 |
Cosmo Oil Co. Ltd. | | 303,300 | | | 1,231,566 |
Daiwa Securities Group, Inc. | | 89,400 | | | 1,000,583 |
Denki Kagaku Kogyo K K | | 224,900 | | | 933,264 |
Denso Corp. | | 130,800 | | | 5,186,322 |
Fanuc Ltd. | | 24,100 | | | 2,365,216 |
Fuji Heavy Industries Ltd. | | 233,000 | | | 1,196,081 |
Hitachi Ltd. | | 202,900 | | | 1,263,842 |
Hokkaido Electric Power Co., Inc. | | 53,200 | | | 1,358,691 |
Hokuetsu Paper Mills Ltd. | | 68,900 | | | 387,301 |
Honda Motor Co. Ltd. | | 95,400 | | | 3,765,360 |
Honeys Co. Ltd. | | 14,300 | | | 531,180 |
Hosiden Corp. | | 51,900 | | | 556,946 |
Hoya Corp. | | 52,700 | | | 2,054,080 |
Jupiter Telecommunications Co.(a) | | 1,529 | | | 1,232,443 |
Kaken Pharmaceutical Co. Ltd. | | 129,500 | | | 1,009,971 |
Kansai Electric Power Co., Inc. (The) | | 126,000 | | | 3,391,924 |
Keyence Corp. | | 10,550 | | | 2,604,152 |
KK Davinci Advisors(a) | | 598 | | | 592,678 |
Komatsu Ltd. | | 113,000 | | | 2,287,105 |
Kurabo Industries Ltd. | | 173,100 | | | 447,569 |
| | | | | |
| COMMON STOCKS | | Value (Note 2)
|
| (Continued) | | Shares
| |
Japan (cont’d.) | | | | | |
Kyowa Hakko Kogyo Co. Ltd. | | 118,000 | | $ | 1,008,496 |
Kyushu Electric Power Co., Inc. | | 30,700 | | | 809,592 |
Marubeni Corp. | | 191,700 | | | 971,241 |
Mori Seiki Co. Ltd. | | 17,400 | | | 388,498 |
Nippon Oil Corp. | | 284,200 | | | 1,900,570 |
Nippon Paper Group, Inc. | | 300 | | | 1,129,735 |
Nippon Telegraph and Telephone Corp. | | 500 | | | 2,465,744 |
Nissan Motor Co. Ltd. | | 200,100 | | | 2,414,547 |
Nomura Holdings, Inc. | | 109,900 | | | 2,073,236 |
NSK Ltd. | | 110,400 | | | 1,087,570 |
NTT DoCoMo, Inc. | | 1,600 | | | 2,531,728 |
Oji Paper Co., Ltd. | | 185,000 | | | 980,106 |
Okasan Holdings, Inc. | | 63,100 | | | 403,564 |
ORIX Corp. | | 21,700 | | | 6,292,829 |
Osaka Gas Co. Ltd. | | 439,300 | | | 1,632,816 |
Promise Co., Ltd. | | 5,100 | | | 157,919 |
Rengo Co. Ltd. | | 118,900 | | | 759,115 |
Ricoh Co. Ltd. | | 95,600 | | | 1,946,923 |
Santen Pharmaceutical Co. Ltd. | | 26,700 | | | 751,074 |
Sharp Corp. | | 120,000 | | | 2,063,289 |
Sumitomo Corp. | | 83,000 | | | 1,242,488 |
Suruga Bank Ltd. | | 119,000 | | | 1,473,756 |
Takefuji Corp. | | 19,000 | | | 751,566 |
Tanabe Seiyaku Co. Ltd. | | 143,600 | | | 1,877,842 |
Tohoku Electric Power Co., Inc. | | 38,900 | | | 972,318 |
Toppan Printing Co. Ltd. | | 85,000 | | | 936,447 |
Toyota Motor Corp. | | 35,000 | | | 2,342,445 |
Toyota Motor Corp., ADR | | 59,828 | | | 8,035,500 |
Yamada Denki Co. Ltd. | | 11,500 | | | 976,135 |
Yamaha Motor Co. Ltd. | | 82,500 | | | 2,593,284 |
Yokohama Rubber Co. Ltd. (The) | | 174,300 | | | 1,050,506 |
| | | | |
|
|
| | | | | | 98,772,618 |
| | | | |
|
|
Mexico — 1.2% | | | | | |
America Movil — Ser. L, ADR | | 80,618 | | | 3,645,546 |
America Movil SA de CV | | 1,490,500 | | | 3,360,972 |
Wal-Mart de Mexico SA de CV | | 926,900 | | | 4,078,085 |
| | | | |
|
|
| | | | | | 11,084,603 |
| | | | |
|
|
Netherlands — 1.9% | | | | | |
ABN AMRO Holding NV | | 22,700 | | | 729,648 |
Aegon NV | | 108,800 | | | 2,073,886 |
Heineken NV, ADR | | 132,745 | | | 3,153,424 |
ING Groep NV | | 81,100 | | | 3,595,999 |
Royal Dutch Shell PLC, ADR | | 31,500 | | | 2,229,885 |
Royal KPN NV | | 172,200 | | | 2,448,147 |
Royal Numico NV | | 31,400 | | | 1,689,063 |
TomTom NV(a) | | 30,900 | | | 1,334,629 |
| | | | |
|
|
| | | | | | 17,254,681 |
| | | | |
|
|
New Zealand — 0.1% | | | | | |
Fisher & Paykel Appliances Holdings Ltd. | | 319,700 | | | 864,477 |
| | | | |
|
|
Norway — 0.2% | | | | | |
Norsk Hydro ASA | | 70,500 | | | 2,187,861 |
| | | | |
|
|
Portugal — 0.1% | | | | | |
Energias de Portugal SA | | 231,100 | | | 1,171,440 |
| | | | |
|
|
SEE NOTES TO FINANCIAL STATEMENTS.
B59
| | | | |
| | | GLOBAL PORTFOLIO (Continued) | | |
SCHEDULE OF INVESTMENTS | December 31, 2006 |
| | | | | |
| COMMON STOCKS | | Value (Note 2)
|
| (Continued) | | Shares
| |
Russia — 0.1% | | | | | |
CTC Media, Inc.(a) | | 18,800 | | $ | 451,388 |
| | | | |
|
|
Singapore — 0.8% | | | | | |
CapitaLand Ltd. | | 1,121,000 | | | 4,511,035 |
MobileOne Ltd. | | 433,700 | | | 606,351 |
Neptune Orient Lines Ltd. | | 432,800 | | | 587,414 |
Singapore Airlines Ltd. | | 152,000 | | | 1,730,852 |
| | | | |
|
|
| | | | | | 7,435,652 |
| | | | |
|
|
South Africa — 0.2% | | | | | |
Naspers Ltd. | | 32,200 | | | 762,157 |
Sasol Ltd. | | 21,500 | | | 793,354 |
| | | | |
|
|
| | | | | | 1,555,511 |
| | | | |
|
|
South Korea — 0.2% | | | | | |
Samsung Electronics Co. Ltd., GDR | | 5,300 | | | 1,743,700 |
| | | | |
|
|
Spain — 1.5% | | | | | |
Banco Bilbao Vizcaya Argentaria SA | | 83,800 | | | 2,017,704 |
Banco Santander Central Hispano SA | | 146,800 | | | 2,740,086 |
Inditex SA | | 80,700 | | | 4,347,393 |
Repsol YPF SA | | 93,200 | | | 3,223,338 |
Telefonica SA | | 55,700 | | | 1,185,247 |
| | | | |
|
|
| | | | | | 13,513,768 |
| | | | |
|
|
Sweden — 1.0% | | | | | |
Electrolux AB, Ser. B(a) | | 68,800 | | | 1,376,814 |
Husqvarna AB (Class B Stock) | | 68,800 | | | 1,075,322 |
Modern Times Group
(Class B Stock) | | 12,200 | | | 801,934 |
Nordea Bank AB | | 244,700 | | | 3,770,967 |
Telefonaktiebolaget LM Ericsson (Class B Stock) | | 665,000 | | | 2,685,858 |
| | | | |
|
|
| | | | | | 9,710,895 |
| | | | |
|
|
Switzerland — 4.7% | | | | | |
ABB Ltd. | | 394,900 | | | 7,081,300 |
Baloise Holding AG | | 21,900 | | | 2,189,101 |
Credit Suisse Group | | 68,700 | | | 4,806,463 |
EFG International(a) | | 35,100 | | | 1,323,632 |
Georg Fischer AG | | 2,500 | | | 1,619,819 |
Kuehne & Nagel International AG | | 24,500 | | | 1,782,458 |
Nestle SA | | 11,010 | | | 3,912,458 |
Nobel Biocare Holding AG | | 4,150 | | | 1,226,949 |
Rieter Holding AG | | 2,200 | | | 1,151,005 |
Roche Holdings AG | | 22,050 | | | 3,953,980 |
SGS SA | | 1,560 | | | 1,738,597 |
Swiss Reinsurance | | 8,000 | | | 680,181 |
Swisscom AG | | 2,900 | | | 1,097,764 |
Syngenta AG | | 8,200 | | | 1,525,597 |
UBS AG | | 19,400 | | | 1,178,966 |
UBS AG — New | | 110,336 | | | 6,656,571 |
Verwalt & Privat-Bank AG | | 2,578 | | | 687,608 |
Zurich Financial Services AG | | 5,900 | | | 1,588,182 |
| | | | |
|
|
| | | | | | 44,200,631 |
| | | | |
|
|
Taiwan — 0.4% | | | | | |
High Tech Computer Corp. GDR | | 5,300 | | | 419,641 |
HON HAI Precision Industry Co. Ltd., GDR | | 200,740 | | | 2,830,434 |
| | | | |
|
|
| | | | | | 3,250,075 |
| | | | |
|
|
| | | | | |
| COMMON STOCKS | | Value (Note 2)
|
| (Continued) | | Shares
| |
United Kingdom — 10.6% | | | | | |
Acergy SA(a) | | 55,600 | | $ | 1,070,054 |
Alliance & Leicester PLC | | 76,000 | | | 1,693,419 |
AstraZeneca PLC | | 31,100 | | | 1,670,910 |
Aviva PLC | | 60,000 | | | 965,677 |
Barclays PLC | | 299,200 | | | 4,276,545 |
BG Group PLC | | 389,700 | | | 5,287,767 |
BP PLC | | 317,700 | | | 3,530,138 |
Bradford & Bingley PLC | | 178,100 | | | 1,639,840 |
BT Group PLC | | 756,400 | | | 4,465,267 |
Cairn Energy PLC(a) | | 38,300 | | | 1,349,083 |
Capita Group PLC | | 207,000 | | | 2,460,184 |
Carphone Warehouse Group PLC | | 170,400 | | | 1,047,630 |
Davis Service Group PLC | | 900 | | | 8,881 |
DSG International PLC | | 566,000 | | | 2,122,237 |
GKN PLC | | 263,300 | | | 1,433,192 |
GlaxoSmithKline PLC | | 37,400 | | | 984,191 |
Hanson PLC | | 70,700 | | | 1,066,598 |
HBOS PLC | | 468,800 | | | 10,390,648 |
Imperial Chemical Industries PLC | | 123,100 | | | 1,089,445 |
Interserve PLC | | 174,800 | | | 1,372,443 |
Legal & General Group PLC | | 359,600 | | | 1,108,942 |
Lloyds TSB Group PLC | | 346,200 | | | 3,873,931 |
Man Group PLC | | 258,500 | | | 2,645,838 |
Northern Foods PLC | | 211,500 | | | 475,195 |
Northern Rock PLC | | 127,900 | | | 2,950,017 |
Northumbrian Water Group PLC | | 73,500 | | | 440,370 |
Old Mutual PLC | | 319,100 | | | 1,088,700 |
Reckitt Benckiser PLC | | 118,500 | | | 5,415,366 |
Rolls-Royce Group PLC, B Share entitlement(a) | | 19,021,610 | | | 0 |
Rolls-Royce Group PLC | | 516,600 | | | 4,528,961 |
Rotork PLC | | 48,800 | | | 797,838 |
Royal & Sun Alliance Insurance Group PLC | | 300,200 | | | 896,374 |
Royal Bank of Scotland Group PLC (The) | | 57,300 | | | 2,235,994 |
Royal Dutch Shell PLC
(Class B Stock) | | 195,600 | | | 6,855,363 |
Standard Chartered PLC | | 98,000 | | | 2,862,883 |
Tate & Lyle PLC | | 71,300 | | | 1,072,857 |
Taylor Woodrow PLC | | 148,300 | | | 1,237,697 |
Tesco PLC | | 776,100 | | | 6,146,740 |
Tomkins PLC | | 113,100 | | | 544,208 |
Tullow Oil PLC | | 81,300 | | | 633,552 |
Vedanta Resources PLC | | 55,500 | | | 1,326,836 |
Vodafone Group PLC | | 1,437,175 | | | 3,981,757 |
| | | | |
|
|
| | | | | | 99,043,568 |
| | | | |
|
|
United States — 42.9% | | | | | |
Alltel Corp. | | 24,100 | | | 1,457,568 |
Altria Group, Inc. | | 23,600 | | | 2,025,352 |
American Express Co. | | 36,900 | | | 2,238,723 |
American International Group, Inc. | | 47,100 | | | 3,375,186 |
Ameriprise Financial, Inc. | | 40,200 | | | 2,190,900 |
Amylin Pharmaceuticals, Inc.(a)(b) | | 69,351 | | | 2,501,491 |
Anheuser-Busch Cos., Inc.(b) | | 69,900 | | | 3,439,080 |
AT&T, Inc.(b) | | 95,200 | | | 3,403,400 |
Avon Products, Inc. | | 72,300 | | | 2,388,792 |
SEE NOTES TO FINANCIAL STATEMENTS.
B60
| | | | |
| | | GLOBAL PORTFOLIO (Continued) | | |
SCHEDULE OF INVESTMENTS | December 31, 2006 |
| | | | | |
| COMMON STOCKS | | Value (Note 2)
|
| (Continued) | | Shares
| |
United States (cont’d.) | | | | | |
Baker Hughes, Inc. | | 69,600 | | $ | 5,196,336 |
Bank of America Corp. | | 114,800 | | | 6,129,172 |
Boeing Co. | | 48,208 | | | 4,282,799 |
Boston Scientific Corp.(a) | | 75,300 | | | 1,293,654 |
Bowater, Inc. | | 34,100 | | | 767,250 |
Bristol-Myers Squibb Co. | | 44,800 | | | 1,179,136 |
Burlington Northern Santa Fe Corp. | | 104,640 | | | 7,723,478 |
Campbell Soup Co. | | 38,100 | | | 1,481,709 |
CB Richard Ellis Group, Inc.(a) | | 19,527 | | | 648,296 |
CBS Corp. (Class B Stock) | | 35,500 | | | 1,106,890 |
ChevronTexaco Corp. | | 79,700 | | | 5,860,341 |
Cisco Systems, Inc.(a) | | 259,467 | | | 7,091,233 |
Citigroup, Inc. | | 151,144 | | | 8,418,721 |
Coca-Cola Co. (The) | | 77,000 | | | 3,715,250 |
Comcast Corp. (Class A Stock)(a)(b) | | 277,261 | | | 11,736,458 |
Dow Chemical Co. (The) | | 28,900 | | | 1,154,266 |
Dow Jones & Co., Inc.(b) | | 36,900 | | | 1,402,200 |
Duke Energy Corp.(b) | | 94,700 | | | 3,144,987 |
E.I. du Pont de Nemours & Co. | | 59,100 | | | 2,878,761 |
Entergy Corp. | | 33,700 | | | 3,111,184 |
Exxon Mobil Corp. | | 78,300 | | | 6,000,129 |
Fannie Mae | | 33,800 | | | 2,007,382 |
Federated Department Stores, Inc. | | 87,364 | | | 3,331,189 |
FedEx Corp. | | 72,454 | | | 7,869,953 |
Fifth Third Bancorp | | 70,900 | | | 2,901,937 |
Genentech, Inc.(a) | | 115,170 | | | 9,343,742 |
General Dynamics Corp. | | 85,774 | | | 6,377,297 |
General Electric Co. | | 194,500 | | | 7,237,345 |
General Mills, Inc. | | 31,300 | | | 1,802,880 |
General Motors Corp.(b) | | 48,900 | | | 1,502,208 |
Genworth Financial, Inc. | | 41,200 | | | 1,409,452 |
Genzyme Corp.(a) | | 53,839 | | | 3,315,406 |
Goldman Sachs Group, Inc. | | 60,328 | | | 12,026,387 |
H&R Block, Inc. | | 75,400 | | | 1,737,216 |
Hartford Financial Services Group, Inc. | | 27,700 | | | 2,584,687 |
Home Depot, Inc. (The) | | 76,100 | | | 3,056,176 |
Honeywell International, Inc. | | 77,600 | | | 3,510,624 |
Idearc, Inc.(a) | | 3,430 | | | 98,270 |
Illinois Tool Works, Inc. | | 41,200 | | | 1,903,028 |
Intel Corp. | | 241,099 | | | 4,882,255 |
International Business Machines Corp. | | 40,000 | | | 3,886,000 |
International Paper Co. | | 96,800 | | | 3,300,880 |
Johnson & Johnson | | 53,100 | | | 3,505,662 |
JPMorgan Chase & Co. | | 146,800 | | | 7,090,440 |
KB Home | | 46,405 | | | 2,379,648 |
Las Vegas Sands Corp.(a) | | 69,310 | | | 6,201,859 |
Lehman Brothers Holdings, Inc. | | 92,040 | | | 7,190,165 |
Lennar Corp. (Class A Stock) | | 66,220 | | | 3,473,901 |
Liberty Media Holdings Corp. — Capital (Class A Stock)(a) | | 19,780 | | | 1,938,044 |
Liberty Media Holdings Corp. — Interactive (Class A Stock)(a) | | 92,000 | | | 1,984,440 |
| | | | | |
| COMMON STOCKS | | Value (Note 2)
|
| (Continued) | | Shares
| |
United States (cont’d.) | | | | | |
Lincoln National Corp. | | 27,100 | | $ | 1,799,440 |
Lockheed Martin Corp. | | 72,935 | | | 6,715,125 |
Lowe’s Cos., Inc.(b) | | 177,308 | | | 5,523,144 |
Marsh & McLennan Cos., Inc. | | 154,800 | | | 4,746,168 |
Mellon Financial Corp.(b) | | 74,200 | | | 3,127,530 |
Merck & Co., Inc. | | 99,600 | | | 4,342,560 |
Merrill Lynch & Co., Inc. | | 33,500 | | | 3,118,850 |
Microsoft Corp. | | 161,700 | | | 4,828,362 |
Monsanto Co. | | 108,571 | | | 5,703,235 |
Morgan Stanley | | 44,100 | | | 3,591,063 |
Murphy Oil Corp.(b) | | 51,600 | | | 2,623,860 |
New York Times Co. (The)
(Class A Stock)(b) | | 67,700 | | | 1,649,172 |
Newell Rubbermaid, Inc. | | 86,500 | | | 2,504,175 |
NiSource, Inc. | | 112,400 | | | 2,708,840 |
Nordstrom, Inc. | | 106,497 | | | 5,254,562 |
NRG Energy, Inc.(a)(b) | | 19,264 | | | 1,078,977 |
Nucor Corp. | | 20,700 | | | 1,131,462 |
PepsiCo, Inc. | | 14,897 | | | 931,807 |
Pfizer, Inc. | | 144,500 | | | 3,742,550 |
Praxair, Inc. | | 91,780 | | | 5,445,307 |
Procter & Gamble Co. (The) | | 136,019 | | | 8,741,941 |
Qwest Communications International, Inc.(a)(b) | | 171,400 | | | 1,434,618 |
RadioShack Corp.(b) | | 67,800 | | | 1,137,684 |
Raytheon Co. | | 49,100 | | | 2,592,480 |
Schering-Plough Corp.(b) | | 96,500 | | | 2,281,260 |
Schlumberger Ltd. | | 76,167 | | | 4,810,708 |
Sprint Nextel Corp. | | 145,000 | | | 2,739,050 |
St. Joe Co. (The)(b) | | 49,051 | | | 2,627,662 |
St. Paul Travelers Cos., Inc. (The) | | 39,700 | | | 2,131,493 |
Starbucks Corp.(a)(b) | | 83,311 | | | 2,950,876 |
State Street Corp. | | 41,000 | | | 2,765,040 |
Station Casinos, Inc. | | 43,314 | | | 3,537,454 |
Target Corp. | | 90,204 | | | 5,146,138 |
Time Warner Cos., Inc. | | 191,500 | | | 4,170,870 |
U.S. Bancorp | | 111,600 | | | 4,038,804 |
Union Pacific Corp. | | 97,444 | | | 8,966,797 |
United Technologies Corp. | | 81,039 | | | 5,066,558 |
UnitedHealth Group, Inc. | | 247,272 | | | 13,285,925 |
Verizon Communications, Inc. | | 68,600 | | | 2,554,664 |
Viacom, Inc. (Class B Stock)(a) | | 39,200 | | | 1,608,376 |
Wal-Mart Stores, Inc. | | 56,400 | | | 2,604,552 |
Walt Disney Co. | | 65,100 | | | 2,230,977 |
Waste Management, Inc. | | 82,600 | | | 3,037,202 |
Wells Fargo & Co. | | 125,405 | | | 4,459,402 |
Wyeth | | 48,100 | | | 2,449,252 |
Wynn Resorts Ltd.(b) | | 78,188 | | | 7,337,944 |
| | | | |
|
|
| | | | | | 400,465,131 |
| | | | |
|
|
TOTAL LONG-TERM INVESTMENTS
(cost $752,362,931) | | | 902,248,491 |
| | | | |
|
|
SEE NOTES TO FINANCIAL STATEMENTS.
B61
| | | | |
| | | GLOBAL PORTFOLIO (Continued) | | |
SCHEDULE OF INVESTMENTS | December 31, 2006 |
| | | | | | |
SHORT-TERM
INVESTMENT — 7.5% | | Shares
| | Value (Note 2)
| |
Affiliated Money Market Mutual Fund | | | | |
Dryden Core Investment Fund — Taxable Money Market Series (cost $70,116,659 includes $50,850,856 of cash collateral received for securities on loan) (Note 4)(c)(d) | | 70,116,659 | | $ | 70,116,659 | |
| | | | |
|
|
|
TOTAL INVESTMENTS(e) — 104.2%
(cost $822,479,590) | | | 972,365,150 | |
| | | | |
|
|
|
LIABILITIES IN EXCESS OF OTHER ASSETS — (4.2)% | | | (39,506,254 | ) |
| | | | |
|
|
|
TOTAL NET ASSETS — 100.0% | | $ | 932,858,896 | |
| | | | |
|
|
|
The following abbreviations are used in portfolio descriptions:
| | |
| ADR | | American Depositary Receipt |
| GDR | | Global Depositary Receipt |
| 144A | | Security was purchased pursuant to rule 144A under the Securities Act of 1933 and may not be resold subject to that rule except to qualified institutional buyers. Unless otherwise noted, 144A securities are deemed to be liquid. |
| (a) | Non-income producing security. |
| (b) | All or a portion of security is on loan. The aggregate market value of such securities is $48,803,921; cash collateral of $50,850,856 (included in liabilities) was received with which the Portfolio purchased highly liquid short-term investments. |
| (c) | Represents security, or a portion thereof, purchased with cash collateral for securities on loan. |
| (d) | Prudential Investments LLC, the manager of the Portfolio, also serves as manager of the Dryden Core Investment Fund — Taxable Money Market Series. |
| (e) | As of December 31, 2006, 80 securities representing $128,063,028 and 13.7% of the net assets were fair valued in accordance with policies adopted by the Board of Trustees. |
The industry classification of portfolio holdings and liabilities in excess of other assets shown as a percentage of net assets as of December 31, 2006 were as follows:
| | | |
Commercial Banks | | 9.3 | % |
Affiliated Money Market Mutual Fund (including 5.5% of collateral received for securities on loan) | | 7.5 | |
Oil, Gas & Consumable Fuels | | 7.0 | |
Capital Markets | | 6.8 | |
Telecommunications | | 4.7 | |
Automobiles | | 4.3 | |
Food & Staples Retailing | | 3.8 | |
Aerospace & Defense | | 3.6 | |
Insurance | | 3.6 | |
Media | | 3.4 | |
Diversified Financial Services | | 3.3 | |
Household Durables | | 3.3 | |
Pharmaceuticals | | 3.1 | |
Utilities | | 2.9 | |
Chemicals | | 2.7 | |
Specialty Retail | | 2.3 | |
Hotels, Restaurants & Leisure | | 2.2 | |
Electric Equipment & Instruments | | 2.1 | |
Road & Rail | | 1.8 | |
Biotechnology | | 1.6 | |
Beverages | | 1.5 | |
Multiline Retail | | 1.5 | |
Health Care Providers & Services | | 1.4 | |
Industrial Conglomerates | | 1.4 | |
Metals & Mining | | 1.4 | |
Software | | 1.4 | |
Machinery | | 1.2 | |
Communications Equipment | | 1.1 | |
Energy Equipment & Services | | 1.1 | |
Personal Products | | 1.1 | |
Real Estate Management & Development | | 1.1 | |
Consumer Finance | | 1.0 | |
Textiles, Apparel & Luxury Goods | | 1.0 | |
Commercial Services & Supplies | | 0.9 | |
Paper & Forest Products | | 0.9 | |
Air Freight & Logistics | | 0.8 | |
Office Electronics | | 0.7 | |
Semiconductors & Semiconductor Equipment | | 0.7 | |
Thrifts & Mortgage Finance | | 0.7 | |
Airlines | | 0.5 | |
Computers & Peripherals | | 0.5 | |
Distributors | | 0.5 | |
Health Care Equipment & Supplies | | 0.5 | |
Construction & Engineering | | 0.4 | |
Marine | | 0.3 | |
Construction Materials | | 0.2 | |
Diversified Consumer Services | | 0.2 | |
Internet & Catalog Retail | | 0.2 | |
IT Services | | 0.2 | |
Tobacco | | 0.2 | |
Containers & Packaging | | 0.1 | |
Independent Power Producers & Energy Traders | | 0.1 | |
Transportation Infrastructure | | 0.1 | |
| | |
|
|
| | | 104.2 | |
Liabilities in excess of other assets | | (4.2 | ) |
| | |
|
|
| | | 100.0 | % |
| | |
|
|
SEE NOTES TO FINANCIAL STATEMENTS.
B62
| | | | |
| | | GOVERNMENT INCOME PORTFOLIO | | |
SCHEDULE OF INVESTMENTS | December 31, 2006 |
| | | | | | | | | | |
| LONG-TERM INVESTMENTS — 93.2% | | Interest
Rate
| | Maturity
Date
| | Principal
Amount
(000)
| | Value
(Note 2)
|
Asset Backed Securities — 3.8% | | | | | | | | | | |
Small Business Administration Participation Certificates, | | | | | | | | | | |
Series 1996-20J, Class 1 | | 7.20% | | 10/01/16 | | $ | 4,437 | | $ | 4,607,951 |
Series 1997-20A, Class 1 | | 7.15% | | 01/01/17 | | | 4,311 | | | 4,471,480 |
Series 1997-20G, Class 1 | | 6.85% | | 07/01/17 | | | 1,376 | | | 1,422,139 |
Series 1998-20I, Class 1 | | 6.00% | | 09/01/18 | | | 2,863 | | | 2,921,201 |
| | | | | | | | | |
|
|
| | | | | | | | | | | 13,422,771 |
| | | | | | | | | |
|
|
Collateralized Mortgage Obligations — 6.6% | | | | | | | | | | |
Federal Home Loan Mortgage Corp., | | | | | | | | | | |
Series 2496, Class PM | | 5.50% | | 09/15/17 | | | 2,819 | | | 2,789,991 |
Series 2501, Class MC | | 5.50% | | 09/15/17 | | | 2,000 | | | 2,005,337 |
Series 2513, Class HC | | 5.00% | | 10/15/17 | | | 2,339 | | | 2,267,501 |
Series 2518, Class PV | | 5.50% | | 06/15/19 | | | 1,920 | | | 1,896,040 |
Federal National Mortgage Association, | | | | | | | | | | |
Series 1993-29, Class PH | | 6.50% | | 01/25/23 | | | 178 | | | 177,297 |
Series 2002-18, Class PC | | 5.50% | | 04/25/17 | | | 5,000 | | | 5,027,849 |
Series 2002-57, Class ND | | 5.50% | | 09/25/17 | | | 2,600 | | | 2,603,574 |
Series 2002-94, Class HQ | | 4.50% | | 01/25/18 | | | 6,419 | | | 6,063,051 |
Structured Adjustable Rate Mortgage Loan, Series 2004-1, Class 4A-3(a) | | 4.17% | | 02/25/34 | | | 684 | | | 677,110 |
| | | | | | | | | |
|
|
| | | | | | | | | | | 23,507,750 |
| | | | | | | | | |
|
|
Commercial Mortgage Backed Securities — 5.8% | | | | | | | | | | |
Banc of America Commercial Mortgage, Inc., Series 2005-2, Class A5(a) | | 4.857% | | 07/10/43 | | | 1,750 | | | 1,695,191 |
Bear Stearns Commercial Mortgage Securities, Inc., | | | | | | | | | | |
Series 2000-WF1, Class A1(b) | | 7.64% | | 02/15/32 | | | 683 | | | 695,331 |
Series 2004-T16, Class A5 | | 4.60% | | 02/13/46 | | | 4,200 | | | 4,045,327 |
Series 2005-PWR8, Class A4 | | 4.674% | | 06/11/41 | | | 1,750 | | | 1,675,310 |
CS First Boston Mortgage Securities Corp., Series 2005-C3, Class A4 | | 4.686% | | 07/15/37 | | | 1,750 | | | 1,674,679 |
First Union National Bank Commercial Mortgage Trust, | | | | | | | | | | |
Series 2000-C1, Class A1 | | 7.739% | | 05/17/32 | | | 386 | | | 390,016 |
Series 2000-C2, Class A1 | | 6.94% | | 10/15/32 | | | 266 | | | 265,296 |
GS Mortgage Securities Corp. II, Series 2003-C1, Class A3 | | 4.608% | | 01/10/40 | | | 6,800 | | | 6,572,978 |
Merrill Lynch Mortgage Trust, Series 2006-C1, Class ASB | | 5.66% | | 05/12/39 | | | 1,500 | | | 1,535,100 |
Morgan Stanley Capital I, Series 2005-T19, Class AAB | | 4.852% | | 06/12/47 | | | 1,375 | | | 1,346,279 |
Morgan Stanley Dean Witter I, Series 2001-TOP1, Class A2 | | 6.32% | | 02/15/33 | | | 612 | | | 614,196 |
| | | | | | | | | |
|
|
| | | | | | | | | 20,509,703 |
| | | | | | | | | |
|
|
Foreign Government Bonds — 1.6% | | | | | | | | | | |
Australian Government Bond, Series 415 | | 6.25% | | 04/15/15 | | | AUD 1,045 | | | 842,381 |
Deutsche Bundesrepublik, Series 06 | | 4.00% | | 07/04/16 | | | EUR 2,080 | | | 2,753,655 |
Japanese Government Bond, Series 90 | | 2.20% | | 09/20/26 | | | JPY 51,950 | | | 445,338 |
Norwegian Government Bonds | | 5.00% | | 05/15/15 | | | NOK 9,400 | | | 1,570,151 |
| | | | | | | | | |
|
|
| | | | | | | | | | | 5,611,525 |
| | | | | | | | | |
|
|
Mortgage Backed Securities — 43.9% | | | | | | | | | | |
Federal Home Loan Mortgage Corp. | | 5.00% | | 06/01/33-5/01/34 | | | 11,362 | | | 10,978,044 |
Federal Home Loan Mortgage Corp. | | 5.00% | | TBA 30 YR | | | 5,500 | | | 5,305,784 |
Federal Home Loan Mortgage Corp. | | 6.00% | | TBA 30 YR | | | 3,000 | | | 3,021,564 |
Federal Home Loan Mortgage Corp. | | 6.00% | | 09/01/34 | | | 731 | | | 736,882 |
Federal Home Loan Mortgage Corp. | | 6.50% | | 06/01/08-9/01/32 | | | 1,112 | | | 1,133,997 |
Federal Home Loan Mortgage Corp. | | 7.00% | | 08/01/11-10/01/32 | | | 1,272 | | | 1,294,381 |
Federal National Mortgage Association(a) | | 4.249% | | 04/01/34 | | | 2,333 | | | 2,313,991 |
Federal National Mortgage Association(a) | | 4.439% | | 06/01/34 | | | 2,297 | | | 2,268,233 |
Federal National Mortgage Association | | 4.50% | | TBA 15 YR | | | 5,000 | | | 4,821,875 |
Federal National Mortgage Association(a) | | 4.032% | | 08/01/33 | | | 3,684 | | | 3,576,331 |
Federal National Mortgage Association(a) | | 4.876% | | 10/01/34 | | | 3,043 | | | 3,006,202 |
Federal National Mortgage Association(a) | | 4.976% | | 06/01/36 | | | 4,742 | | | 4,699,684 |
Federal National Mortgage Association | | 5.00% | | 07/01/18-03/01/34 | | | 15,056 | | | 14,736,302 |
Federal National Mortgage Association | | 5.00% | | TBA 15 YR | | | 10,500 | | | 10,319,526 |
SEE NOTES TO FINANCIAL STATEMENTS.
B63
| | | | |
| | | GOVERNMENT INCOME PORTFOLIO (Continued) | | |
SCHEDULE OF INVESTMENTS | December 31, 2006 |
| | | | | | | | | | |
| LONG-TERM INVESTMENTS (Continued) | | Interest
Rate
| | Maturity
Date
| | Principal
Amount
(000)
| | Value
(Note 2)
|
Mortgage Backed Securities (cont’d.) | | | | | | | | | | |
Federal National Mortgage Association | | 5.00% | | TBA 30 YR | | $ | 4,000 | | $ | 3,861,248 |
Federal National Mortgage Association | | 5.50% | | 01/01/17-11/01/35 | | | 43,647 | | | 43,180,308 |
Federal National Mortgage Association | | 6.00% | | TBA 30 YR | | | 500 | | | 503,281 |
Federal National Mortgage Association | | 6.00% | | 11/01/14-01/01/36 | | | 9,275 | | | 9,349,293 |
Federal National Mortgage Association(a) | | 6.276% | | 03/01/11 | | | 1,269 | | | 1,311,230 |
Federal National Mortgage Association | | 6.50% | | 11/01/09-10/01/32 | | | 5,035 | | | 5,148,094 |
Federal National Mortgage Association | | 6.50% | | TBA 30 YR | | | 2,500 | | | 2,546,875 |
Federal National Mortgage Association | | 7.00% | | TBA 30 YR | | | 2,000 | | | 2,052,500 |
Federal National Mortgage Association | | 7.00% | | 02/01/12-01/01/36 | | | 2,297 | | | 2,362,271 |
Federal National Mortgage Association | | 7.50% | | 03/01/07-10/01/12 | | | 336 | | | 344,982 |
Federal National Mortgage Association | | 8.00% | | 03/01/22-05/01/26 | | | 68 | | | 71,547 |
Federal National Mortgage Association | | 9.00% | | 02/01/25-04/01/25 | | | 270 | | | 293,484 |
Government National Mortgage Association | | 5.00% | | TBA 30 YR | | | 3,000 | | | 2,916,564 |
Government National Mortgage Association | | 5.00% | | 07/15/33-04/15/34 | | | 4,571 | | | 4,450,351 |
Government National Mortgage Association | | 5.50% | | TBA 30 YR | | | 4,500 | | | 4,477,500 |
Government National Mortgage Association | | 6.50% | | 07/15/32-08/15/32 | | | 1,036 | | | 1,064,653 |
Government National Mortgage Association | | 7.00% | | 03/15/23-08/15/28 | | | 2,297 | | | 2,374,603 |
Government National Mortgage Association | | 7.50% | | 12/15/25-02/15/26 | | | 468 | | | 489,417 |
Government National Mortgage Association | | 8.50% | | 09/15/24-04/15/25 | | | 556 | | | 600,414 |
| | | | | | | | | |
|
|
| | | | | | | | | | | 155,611,411 |
| | | | | | | | | |
|
|
U.S. Government Agency Obligations — 23.4% | | | | | | | | | | |
Federal Home Loan Bank | | 4.75% | | 06/11/08-08/13/10 | | | 1,920 | | | 1,908,111 |
Federal Home Loan Bank(c) | | 4.875% | | 11/18/11 | | | 7,490 | | | 7,460,227 |
Federal Home Loan Bank | | 5.125% | | 08/08/08 | | | 450 | | | 450,304 |
Federal Home Loan Bank | | 5.375% | | 08/19/11 | | | 3,580 | | | 3,641,236 |
Federal Home Loan Bank(a) | | 9.148% | | 02/20/07 | | | 2,000 | | | 1,995,980 |
Federal Home Loan Mortgage Corp. | | 4.75% | | 01/18/11 | | | 645 | | | 640,724 |
Federal Home Loan Mortgage Corp., M.T.N. | | 5.00% | | 12/14/18 | | | 2,475 | | | 2,416,669 |
Federal National Mortgage Association | | 4.875% | | 04/10/08 | | | 28,535 | | | 28,436,926 |
Federal National Mortgage Association(c) | | 5.125% | | 04/15/11 | | | 6,920 | | | 6,969,485 |
Federal National Mortgage Association | | 5.30% | | 02/22/11 | | | 16,310 | | | 16,231,973 |
FICO Strip Principal | | Zero | | 05/11/18 | | | 4,000 | | | 2,244,916 |
Tennessee Valley Authority, Series B | | 4.375% | | 06/15/15 | | | 9,850 | | | 9,444,298 |
Tennessee Valley Authority, Series B | | 5.88% | | 04/01/36 | | | 1,090 | | | 1,198,467 |
| | | | | | | | | |
|
|
| | | | | | | | | | | 83,039,316 |
| | | | | | | | | |
|
|
U.S. Government Treasury Securities — 8.1% | | | | | | | | | | |
United States Treasury Bonds(c) | | 4.50% | | 02/15/36 | | | 1,025 | | | 974,712 |
United States Treasury Bonds(c) | | 4.625% | | 11/15/16 | | | 4,165 | | | 4,137,669 |
United States Treasury Bonds | | 8.125% | | 05/15/21 | | | 840 | | | 1,118,447 |
United States Treasury Inflation Index Notes | | 2.375% | | 04/15/11 | | | 3,040 | | | 3,028,328 |
United States Treasury Inflation Index Notes | | 3.875% | | 01/15/09 | | | 8,270 | | | 8,497,737 |
United States Treasury Notes | | 3.375% | | 09/15/09 | | | 1,860 | | | 1,796,280 |
United States Treasury Notes | | 4.875% | | 04/30/08 | | | 8 | | | 7,993 |
United States Treasury Notes | | 5.00% | | 07/31/08 | | | 15 | | | 15,025 |
United States Treasury Strip(c) | | Zero | | 02/15/12-05/15/21 | | | 15,230 | | | 9,007,298 |
| | | | | | | | | |
|
|
| | | | | | | | | | | 28,583,489 |
| | | | | | | | | |
|
|
TOTAL LONG-TERM INVESTMENTS
(cost $333,011,098) | | | 330,285,965 |
| | | | | | | | | |
|
|
| | | | |
| SHORT-TERM INVESTMENTS — 23.5% | | | | | | Shares
| | |
Affiliated Money Market Mutual Funds | | | | | | | | | | |
Dryden Core Investment Fund — Short Term Bond Series
(cost $36,554,024)(e) | | | | | | | 3,653,066 | | | 36,567,195 |
Dryden Core Investment Fund — Taxable Money Market Series
(cost $46,780,559; includes $21,369,617 of cash collateral received for securities on loan) (Note 4)(d)(e) | | | | | | | 46,780,559 | | | 46,780,559 |
| | | | | | | | | |
|
|
TOTAL SHORT-TERM INVESTMENTS
(cost $83,334,583) | | | | | | | | | | 83,347,754 |
| | | | | | | | | |
|
|
TOTAL INVESTMENTS, BEFORE SECURITIES SOLD SHORT — 116.7%
(cost $416,345,681) | | | | | | | | | | 413,633,719 |
| | | | | | | | | |
|
|
SEE NOTES TO FINANCIAL STATEMENTS.
B64
| | | | |
| | | GOVERNMENT INCOME PORTFOLIO (Continued) | | |
SCHEDULE OF INVESTMENTS | December 31, 2006 |
| | | | | | | | | | | |
| SECURITIES SOLD SHORT — (0.1)% | | Interest
Rate
| | Maturity
Date
| | Principal
Amount
(000)
| | Value
(Note 2)
| |
Mortgage Backed Securities | | | | | | | | | | | |
Federal National Mortgage Association (proceeds received $497,344) | | 5.50% | | TBA 30 YR | | $ | 500 | | $ | (494,063 | ) |
| | | | | | | | | |
|
|
|
TOTAL INVESTMENTS, NET OF SECURITIES SOLD SHORT — 116.6%
(cost $415,848,337) | | | 413,139,656 | |
OTHER LIABILITIES IN EXCESS OF OTHER ASSETS(f) — (16.6%) | | | (58,880,871 | ) |
| | | | | | | | | |
|
|
|
TOTAL NET ASSETS — 100.0% | | $ | 354,258,785 | |
| | | | | | | | | |
|
|
|
The following abbreviations are used in portfolio descriptions:
| | |
| AUD | | Australian Dollar |
| EUR | | Euro |
| FICO | | Financing Corporation |
| JPY | | Japanese Yen |
| M.T.N. | | Medium Term Note |
| NOK | | Norwegian Krone |
| NZD | | New Zealand Dollar |
| TBA | | To be announced security |
| (a) | Indicates a variable rate security. The maturity date presented for these instruments is the later of the next date on which the security can be redeemed at par or the next date on which the rate of interest is adjusted. The interest rate shown reflects the rate in effect at December 31, 2006. |
| (b) | Security segregated as collateral for futures contracts. |
| (c) | All or portion of security is on loan. The aggregate market value of such securities is $20,724,279; cash collateral of $21,369,617 (included in liabilities) was received with which the Portfolio purchased highly liquid short-term investments. |
| (d) | Represents security, or a portion thereof, purchased with cash collateral received for securities on loan. |
| (e) | Prudential Investments LLC, the manager of the Portfolio, also serves as manager of the Dryden Core Investment Fund — Taxable Money Market Series and the Dryden Core Investment Fund — Short-Term Bond Series. |
| (f) | Other liabilities in excess of other assets include net unrealized appreciation (depreciation) on financial futures contracts, forward foreign currency contracts and interest rate swap agreements as follows: |
Open futures contracts outstanding at December 31, 2006:
| | | | | | | | | | | | | | |
Number of
Contracts
| | Type
| | Expiration
Date
| | Value at
December 31, 2006
| | Value at
Trade Date
| | Unrealized
Appreciation
(Depreciation)
| |
| Long Positions: | | | | | | | | | | | | | | |
| 10 | | Canadian 10 Yr. Bond | | Mar. 07 | | $ | 976,032 | | $ | 985,914 | | $ | (9,882 | ) |
| 9 | | 10 Yr. Euro-Bund | | Mar. 07 | | | 1,378,483 | | | 1,394,757 | | | (16,274 | ) |
| 13 | | Long-Term U.K. Gilt | | Mar. 07 | | | 2,752,315 | | | 2,790,771 | | | (38,456 | ) |
| 249 | | U.S. 30 Yr. Bond | | Mar. 07 | | | 27,747,937 | | | 28,142,827 | | | (394,890 | ) |
| | | | | | | | | | | | |
|
|
|
| | | | | | | | | | | | | | (459,502 | ) |
| Short Positions: | | | | | | | | | | | | | | |
| 114 | | U.S. Treasury 2 Yr. Notes | | Mar. 07 | | | 23,259,562 | | | 23,398,622 | | | 139,060 | |
| 106 | | U.S. Treasury 5 Yr. Notes | | Mar. 07 | | | 11,136,625 | | | 11,192,473 | | | 55,848 | |
| 202 | | U.S. Treasury 10 Yr. Notes | | Mar. 07 | | | 21,708,687 | | | 21,961,044 | | | 252,357 | |
| | | | | | | | | | | | |
|
|
|
| | | | | | | | | | | | | | 447,265 | |
| | | | | | | | | | | | |
|
|
|
| | | | | | | | | | | | | $ | (12,237 | ) |
| | | | | | | | | | | | |
|
|
|
SEE NOTES TO FINANCIAL STATEMENTS.
B65
| | | | |
| | | GOVERNMENT INCOME PORTFOLIO (Continued) | | |
SCHEDULE OF INVESTMENTS | December 31, 2006 |
Open forward foreign currency exchange contracts outstanding at December 31, 2006:
| | | | | | | | | | | | |
Purchase Contracts:
| | Contracts to
Deliver
| | Payable at
Statement Date
| | Value at
December 31, 2006
| | Unrealized
Appreciation
(Depreciation)
| |
Japanese Yen expiring 01/24/07 | | JPY 80,446,708 | | $ | 682,139 | | $ | 678,254 | | $ | (3,885 | ) |
Norwegian Krone expiring 01/22/07 | | NOK 6,603,277 | | | 1,059,281 | | | 1,060,170 | | | 889 | |
| | | | | | | | | | |
|
|
|
| | | | | | | | | | | | (2,996 | ) |
| | | | | | | | | | |
|
|
|
| | | | | | | | | | | | |
Sales Contracts:
| | Contracts to
Deliver
| | Receivable at
Statement Date
| | Value at
December 31, 2006
| | Unrealized
Appreciation
(Depreciation)
| |
Australian Dollar expiring 01/19/07 | | AUD 1,097,963 | | $ | 862,813 | | $ | 866,211 | | $ | (3,398 | ) |
Euros expiring 01/24/07 | | EUR 2,147,334 | | | 2,817,495 | | | 2,838,085 | | | (20,590 | ) |
Japanese Yen expiring 01/24/07 | | JPY 126,734,619 | | | 1,081,842 | | | 1,068,512 | | | 13,330 | |
Norwegian Krone expiring 01/22/07 | | NOK 16,768,796 | | | 2,709,693 | | | 2,692,265 | | | 17,428 | |
| | | | | | | | | | |
|
|
|
| | | | | | | | | | | | 6,770 | |
| | | | | | | | | | |
|
|
|
| | | | | | | | | | | $ | 3,774 | |
| | | | | | | | | | |
|
|
|
Interest rate swap agreements outstanding at December 31, 2006:
| | | | | | | | | | | | | | |
Counterparty (1)
| | Termination
Date
| | Notional
Amount
(000)
| | Fixed
Rate
| | | Floating Rate
| | Unrealized
Appreciation
(Depreciation)
| |
Merrill Lynch Capital Services | | 11/02/16 | | $ | 4,660 | | 5.151 | % | | 3 month LIBOR | | $ | (15,451 | ) |
Merrill Lynch Capital Services | | 08/15/22 | | | 3,150 | | 5.185 | % | | 3 month LIBOR | | | (35,447 | ) |
Morgan Stanley Capital Services | | 01/04/17 | | | NZD 1,460 | | 6.880 | % | | 3 month NZD-BBR-FRA | | | — | |
Morgan Stanley Capital Services | | 12/22/16 | | | NZD 2,930 | | 6.808 | % | | 3 month NZD-BBR-FRA | | | 4,555 | |
| | | | | | | | | | | | |
|
|
|
| | | | | | | | | | | | | $ | (46,343 | ) |
| | | | | | | | | | | | |
|
|
|
| (1) | The Portfolio pays the floating rate and receives the fixed rate. |
The industry classification of portfolio holdings and other liabilities in excess of other assets shown as a percentage of net assets as of December 31, 2006 was as follows:
| | | |
Mortgage Backed Securities | | 43.9 | % |
Affiliated Money Market Mutual Funds
(including 6.0% of collateral received for securities on loan) | | 23.5 | |
U.S. Government Agency Obligations | | 23.4 | |
U.S. Government Treasury Securities | | 8.1 | |
Collateralized Mortgage Obligations | | 6.6 | |
Commercial Mortgage Backed Securities | | 5.8 | |
Asset Backed Securities | | 3.8 | |
Foreign Government Bonds | | 1.6 | |
| | |
|
|
| | | 116.7 | |
Securities Sold Short | | (0.1 | ) |
Other liabilities in excess of other assets | | (16.6 | ) |
| | |
|
|
| | | 100.0 | % |
| | |
|
|
SEE NOTES TO FINANCIAL STATEMENTS.
B66
| | | | |
| | | HIGH YIELD BOND PORTFOLIO | | |
SCHEDULE OF INVESTMENTS | December 31, 2006 |
| | | | | | | | | | | | |
LONG-TERM INVESTMENTS — 93.9% CORPORATE BONDS — 91.6% | | Moody’s
Rating (Unaudited)
| | Interest
Rate
| | Maturity
Date
| | Principal
Amount
(000)
| | Value
(Note 2)
|
Aerospace/Defense — 2.4% | | | | | | | | | | | | |
BE Aerospace, Inc., Sr. Sub Notes, Ser. B(b) | | B3 | | 8.875% | | 05/01/11 | | $ | 3,485 | | $ | 3,606,975 |
Bombardier Inc., Sr. Unsec’d (Canada)(j) | | Ba2 | | 8.00% | | 11/15/14 | | | 1,425 | | | 1,460,625 |
Bombardier, Inc., Notes (Canada)(j)(b) | | Ba2 | | 6.30% | | 05/01/14 | | | 1,000 | | | 940,000 |
DRS Technologies, Inc., Gtd. Notes | | B1 | | 6.625% | | 02/01/16 | | | 4,600 | | | 4,634,500 |
DRS Technologies, Inc., Gtd. Notes(b) | | B3 | | 7.625% | | 02/01/18 | | | 3,050 | | | 3,141,500 |
Esterline Technologies Corp., Sr. Sub. Notes | | Ba3 | | 7.75% | | 06/15/13 | | | 4,500 | | | 4,590,000 |
K&F Acquisition, Inc., Gtd. Notes | | Caa1 | | 7.75% | | 11/15/14 | | | 2,750 | | | 2,832,500 |
K&F Industry, Inc., Bank Loan(g)(i) | | B2 | | 7.35% | | 11/18/12 | | | 1,953 | | | 1,959,002 |
L-3 Communications Corp., Gtd. Notes | | Ba3 | | 7.625% | | 06/15/12 | | | 11,050 | | | 11,436,749 |
Moog, Inc., Sr. Sub. Notes | | Ba3 | | 6.25% | | 01/15/15 | | | 2,000 | | | 1,940,000 |
Sequa Corp., Sr. Notes | | B2 | | 9.00% | | 08/01/09 | | | 575 | | | 615,250 |
Sequa Corp., Sr. Notes, Ser. B | | B2 | | 8.875% | | 04/01/08 | | | 3,475 | | | 3,579,250 |
Standard Aero Holdings, Inc., Gtd. Notes | | Caa1 | | 8.25% | | 09/01/14 | | | 560 | | | 565,600 |
| | | | | | | | | | | |
|
|
| | | | | | | | | | | | | 41,301,951 |
| | | | | | | | | | | |
|
|
Airlines — 0.4% | | | | | | | | | | | | |
AMR Corp., MTN | | CCC†(f) | | 10.40% | | 03/10/11 | | | 1,000 | | | 1,001,250 |
AMR Corp., MTN | | CCC†(f) | | 10.40% | | 03/15/11 | | | 1,000 | | | 1,001,250 |
AMR Corp., MTN | | NR | | 10.55% | | 03/12/21 | | | 1,425 | | | 1,359,094 |
Calair Capital Corp., Gtd. Notes | | Caa1 | | 8.125% | | 04/01/08 | | | 1,978 | | | 1,982,945 |
Continental Airlines, Inc., Pass-thru Certs.,
Ser. 98-1, Class B(b) | | Ba2 | | 6.748% | | 09/15/18 | | | 1,575 | | | 1,559,693 |
Ser. 99-2, Class B | | Ba2 | | 7.566% | | 09/15/21 | | | 485 | | | 489,470 |
| | | | | | | | | | | |
|
|
| | | | | | | | | | | | | 7,393,702 |
| | | | | | | | | | | |
|
|
Automotive — 5.0% | | | | | | | | | | | | |
ArvinMeritor, Inc., Notes(b) | | Ba3 | | 8.75% | | 03/01/12 | | | 1,310 | | | 1,346,025 |
Ford Motor Co., Bank Loan(g)(i) | | Ba3 | | 8.36% | | 12/12/13 | | | 15,000 | | | 15,009,375 |
Ford Motor Credit Co., Sr. Unsec’d | | B1 | | 8.00% | | 12/15/16 | | | 1,330 | | | 1,314,240 |
Ford Motor Credit Co., Notes | | B1 | | 7.875% | | 06/15/10 | | | 26,380 | | | 26,599,111 |
Ford Motor Credit Co., Sr. Notes(b) | | B1 | | 9.875% | | 08/10/11 | | | 6,500 | | | 6,951,919 |
General Motors Corp., Notes(b) | | Caa1 | | 7.20% | | 01/15/11 | | | 12,305 | | | 11,935,850 |
General Motors Nova Scotia Finance Co., Gtd. Notes (Canada) | | Caa1 | | 6.85% | | 10/15/08 | | | 4,100 | | | 4,079,500 |
Lear Corp., Sr. Notes(j) | | B3 | | 8.75% | | 12/01/16 | | | 3,220 | | | 3,111,325 |
TRW Automotive, Inc., Sr. Notes | | Ba3 | | 9.375% | | 02/15/13 | | | 5,185 | | | 5,560,913 |
TRW Automotive, Inc., Sr. Sub. Notes(b) | | B1 | | 11.00% | | 02/15/13 | | | 975 | | | 1,068,844 |
Visteon Corp., Sr. Notes(b) | | Caa2 | | 7.00% | | 03/10/14 | | | 2,245 | | | 1,964,375 |
Visteon Corp., Sr. Notes(b) | | Caa2 | | 8.25% | | 08/01/10 | | | 6,905 | | | 6,732,375 |
| | | | | | | | | | | |
|
|
| | | | | | | | | | | | | 85,673,852 |
| | | | | | | | | | | |
|
|
Banking — 0.4% | | | | | | | | | | | | |
Halyk Savings Bank of Kazakhstan, Notes (Kazakhstan)(j) | | Baa1 | | 8.125% | | 10/07/09 | | | 1,305 | | | 1,370,250 |
Kazkommerts International BV, Gtd. Notes (Netherlands)(j) | | Baa1 | | 7.00% | | 11/03/09 | | | 1,685 | | | 1,706,063 |
Kazkommerts International BV, Gtd. Notes (Netherlands)(j) | | Baa1 | | 8.50% | | 04/16/13 | | | 3,360 | | | 3,607,800 |
| | | | | | | | | | | |
|
|
| | | | | | | | | | | | | 6,684,113 |
| | | | | | | | | | | |
|
|
Building Materials & Construction — 1.3% | | | | | | | | | | | | |
Beazer Homes USA, Inc., Gtd. Notes | | Ba1 | | 8.625% | | 05/15/11 | | | 1,820 | | | 1,874,600 |
D.R. Horton, Inc., Gtd. Notes | | Baa3 | | 8.00% | | 02/01/09 | | | 500 | | | 523,561 |
Goodman Global Holdings, Inc., Sr. Notes, Ser. B(i) | | B1 | | 8.36% | | 06/15/12 | | | 2,659 | | | 2,698,885 |
K Hovnanian Enterprises, Inc., Gtd. Notes | | Ba1 | | 6.25% | | 01/15/15 | | | 2,525 | | | 2,398,750 |
KB Home, Notes | | Ba1 | | 6.375% | | 08/15/11 | | | 700 | | | 688,760 |
KB Home, Sr. Sub. Notes | | Ba2 | | 8.625% | | 12/15/08 | | | 2,800 | | | 2,909,245 |
KB Home, Sr. Sub. Notes | | Ba2 | | 9.50% | | 02/15/11 | | | 250 | | | 257,500 |
Nortek, Inc., Sr. Sub. Notes(b) | | B3 | | 8.50% | | 09/01/14 | | | 6,725 | | | 6,590,499 |
Toll Corp., Sr. Sub. Notes(b) | | Ba2 | | 8.25% | | 02/01/11 | | | 4,150 | | | 4,274,500 |
| | | | | | | | | | | |
|
|
| | | | | | | | | | | | | 22,216,300 |
| | | | | | | | | | | |
|
|
SEE NOTES TO FINANCIAL STATEMENTS.
B67
| | | | |
| | | HIGH YIELD BOND PORTFOLIO (Continued) | | |
SCHEDULE OF INVESTMENTS | December 31, 2006 |
| | | | | | | | | | | | | |
CORPORATE BONDS (Continued) | | Moody’s
Rating
(Unaudited)
| | Interest
Rate
| | Maturity
Date
| | Principal
Amount
(000)
| | | Value (Note 2)
|
Cable — 4.5% | | | | | | | | | | | | | |
Cablevision Systems Corp., Sr. Notes, Ser. B | | B3 | | 8.00% | | 04/15/12 | | $ | 875 | | | $ | 859,688 |
Callahan Nordrhein-Westfalen, Sr. Disc. Notes (Germany)(c)(g) | | NR | | 16.00% | | 07/15/10 | | | 7,000 | | | | 70 |
Charter Communications Holdings I LLC, Gtd. Notes(j) | | NR | | 11.00% | | 10/01/15 | | | 3,240 | | | | 3,312,900 |
Charter Communications Holdings II LLC, Gtd. Notes(j) | | NR | | 10.25% | | 10/01/13 | | | 4,145 | | | | 4,414,425 |
Charter Communications Holdings I LLC, Gtd. Notes(b) | | Caa3 | | 10.00% | | 05/15/14 | | | 2,517 | | | | 2,174,059 |
Charter Communications Holdings I LLC, Gtd. Notes(b) | | Caa3 | | 11.125% | | 01/15/14 | | | 1,515 | | | | 1,333,200 |
Charter Communications Holdings I LLC, Gtd. Notes | | Caa3 | | 11.75% | | 05/15/14 | | | 3,150 | | | | 2,842,875 |
Charter Communications Holdings I LLC, Gtd. Notes(b) | | Caa3 | | 13.50% | | 01/15/14 | | | 1,000 | | | | 982,500 |
Charter Communications Holdings I LLC, Sec’d. Notes | | Caa2 | | 11.00% | | 10/01/15 | | | 8,928 | | | | 9,162,359 |
Charter Communications Holdings II LLC, Sr. Notes | | Caa2 | | 10.25% | | 09/15/10 | | | 3,725 | | | | 3,897,281 |
Charter Communications Holdings II LLC, Sr. Notes, Ser. B(b) | | Caa2 | | 10.25% | | 09/15/10 | | | 1,000 | | | | 1,043,750 |
Charter Communications Holdings LLC, Bank Loan(g)(i) | | B2 | | 7.995% | | 04/28/13 | | | 8,500 | | | | 8,550,736 |
Charter Communications Operating LLC, Sr. Notes(j) | | B3 | | 8.375% | | 04/30/14 | | | 4,440 | | | | 4,634,249 |
Comcast Cable Communications Holdings, Inc., Gtd Notes(j) | | Baa2 | | 8.375% | | 03/15/13 | | | 100 | (h) | | | 114 |
CSC Holdings, Inc., Debs. | | B2 | | 7.625% | | 07/15/18 | | | 3,800 | | | | 3,700,250 |
CSC Holdings, Inc., Debs. | | B2 | | 7.875% | | 02/15/18 | | | 800 | | | | 798,000 |
CSC Holdings, Inc., Debs., Ser. B | | B2 | | 8.125% | | 08/15/09 | | | 5,450 | | | | 5,647,562 |
CSC Holdings, Inc., Sr. Notes(k) | | B2 | | 7.875% | | 12/15/07 | | | 3,775 | | | | 3,822,188 |
CSC Holdings, Inc., Sr. Notes, Ser. B(b) | | B2 | | 7.625% | | 04/01/11 | | | 350 | | | | 356,563 |
CSC Holdings, Inc., Sr. Notes, Ser. B | | B2 | | 8.125% | | 07/15/09 | | | 2,410 | | | | 2,497,363 |
Mediacom Broadband LLC, Sr. Notes(j) | | B3 | | 8.50% | | 10/15/15 | | | 1,975 | | | | 1,999,688 |
Mediacom LLC, Sr. Notes | | B3 | | 9.50% | | 01/15/13 | | | 875 | | | | 901,250 |
Rogers Cable, Inc., Sr. Notes (Canada) | | Ba2 | | 6.75% | | 03/15/15 | | | 800 | | | | 824,269 |
UPC Broadbank Holdings BV, Bank Loan(g)(i) | | B1 | | 7.37% | | 03/31/13 | | | 2,500 | | | | 2,500,000 |
UPC Broadbank Holdings BV, Bank Loan(g)(i) | | B1 | | 7.37% | | 12/31/13 | | | 2,500 | | | | 2,500,000 |
Videotron Ltee, Gtd. Notes (Canada) | | Ba2 | | 6.375% | | 12/15/15 | | | 3,450 | | | | 3,372,375 |
Videotron Ltee, Gtd. Notes (Canada)(b) | | Ba2 | | 6.875% | | 01/15/14 | | | 4,570 | | | | 4,598,563 |
| | | | | | | | | | | | |
|
|
| | | | | | | | | | | | | | 76,726,277 |
| | | | | | | | | | | | |
|
|
Capital Goods — 5.4% | | | | | | | | | | | | | |
ALH Finance LLC, Sr. Sub. Notes | | B3 | | 8.50% | | 01/15/13 | | | 1,400 | | | | 1,375,500 |
Allied Waste of North America, Inc., Sec’d Notes, Ser. B(b) | | B2 | | 5.75% | | 02/15/11 | | | 5,320 | | | | 5,147,100 |
Allied Waste of North America, Inc., Sr. Notes(b) | | B2 | | 7.25% | | 03/15/15 | | | 900 | | | | 901,125 |
Allied Waste of North America, Inc., Sr. Notes | | B2 | | 7.875% | | 04/15/13 | | | 675 | | | | 696,094 |
Allied Waste of North America, Inc., Sr. Notes, Ser. B | | B2 | | 8.50% | | 12/01/08 | | | 8,200 | | | | 8,620,249 |
Aramark Services, Inc. Notes | | B2 | | 5.00% | | 06/01/12 | | | 3,425 | | | | 2,934,598 |
Ashtead Capital, Inc., Notes(b)(j) | | B3 | | 9.00% | | 08/15/16 | | | 3,270 | | | | 3,498,900 |
Avis Budget Car Rental LLC, Sr. Notes(j) | | Ba3 | | 7.625% | | 05/15/14 | | | 1,835 | | | | 1,789,125 |
Blount, Inc., Sr. Sub Notes(b) | | B2 | | 8.875% | | 08/01/12 | | | 7,825 | | | | 7,981,500 |
Case New Holland, Inc., Gtd. Notes | | Ba3 | | 9.25% | | 08/01/11 | | | 3,360 | | | | 3,557,400 |
Columbus Mckinnon Corp., Sr. Sub. Notes(b) | | B2 | | 8.875% | | 11/01/13 | | | 3,990 | | | | 4,209,450 |
Hertz Corp., Sr. Notes(j) | | B1 | | 8.875% | | 01/01/14 | | | 9,275 | | | | 9,715,562 |
Holt Group, Inc., Gtd. Notes(c)(g) | | NR | | 9.75% | | 01/15/06 | | | 800 | | | | 8 |
Invensys PLC, Sr. Notes (United Kingdom)(j) | | B2 | | 9.875% | | 03/15/11 | | | 360 | | | | 386,100 |
Johnsondiversey Holdings, Inc., Disc. Notes(b) | | Caa1 | | 10.67% | | 05/15/13 | | | 2,590 | | | | 2,499,350 |
Johnsondiversey, Inc., Gtd. Notes, Ser. B(b) | | B3 | | 9.625% | | 05/15/12 | | | 1,550 | | | | 1,623,625 |
Manitowoc Co., Inc., Gtd. Notes | | B2 | | 10.50% | | 08/01/12 | | | 6,120 | | | | 6,571,350 |
Rental Service Corp,(j) | | Caa1 | | 9.50% | | 12/01/14 | | | 3,525 | | | | 3,639,563 |
Rexnord Corp., Gtd. Notes(b)(j) | | B3 | | 9.50% | | 08/01/14 | | | 2,850 | | | | 2,964,000 |
Stena AB, Sr. Notes (Sweden)(b) | | Ba3 | | 7.50% | | 11/01/13 | | | 5,175 | | | | 5,110,313 |
Stena AB, Sr. Notes (Sweden) | | Ba3 | | 9.625% | | 12/01/12 | | | 3,375 | | | | 3,594,375 |
Terex Corp., Gtd. Notes | | B1 | | 7.375% | | 01/15/14 | | | 2,790 | | | | 2,831,850 |
Terex Corp., Gtd. Notes | | B1 | | 9.25% | | 07/15/11 | | | 2,825 | | | | 2,955,656 |
Trism, Inc., Gtd. Notes(c)(g) | | NR | | 12.00% | | 02/15/05 | | | 1,305 | | | | 13 |
United Rentals North America, Inc., Gtd. Notes(b) | | B1 | | 6.50% | | 02/15/12 | | | 1,800 | | | | 1,777,500 |
United Rentals North America, Inc., Sr. Sub. Notes(b) | | B3 | | 7.75% | | 11/15/13 | | | 3,150 | | | | 3,161,813 |
Valmont Industries, Inc., Gtd. Notes | | Ba3 | | 6.875% | | 05/01/14 | | | 4,920 | | | | 4,876,950 |
| | | | | | | | | | | | |
|
|
| | | | | | | | | | | | | | 92,419,069 |
| | | | | | | | | | | | |
|
|
SEE NOTES TO FINANCIAL STATEMENTS.
B68
| | | | |
| | | HIGH YIELD BOND PORTFOLIO (Continued) | | |
SCHEDULE OF INVESTMENTS | December 31, 2006 |
| | | | | | | | | | | | |
CORPORATE BONDS (Continued) | | Moody’s
Rating
(Unaudited)
| | Interest
Rate
| | Maturity
Date
| | Principal
Amount
(000)
| | Value
(Note 2)
|
Chemicals — 3.4% | | | | | | | | | | | | |
Equistar Chemicals LP, Gtd. Notes | | B1 | | 10.125% | | 09/01/08 | | $ | 5,420 | | $ | 5,758,750 |
Equistar Chemicals LP, Sr. Notes | | B1 | | 10.625% | | 05/01/11 | | | 2,185 | | | 2,327,025 |
Huntsman International LLC, Gtd. Notes | | B2 | | 9.875% | | 03/01/09 | | | 5,459 | | | 5,622,770 |
Huntsman International LLC, Gtd. Notes | | Ba3 | | 11.625% | | 10/15/10 | | | 5,301 | | | 5,791,342 |
Ineos Group Holdings PLC, Notes (United Kingdom)(b)(j) | | B2 | | 8.50% | | 02/15/16 | | | 1,450 | | | 1,384,750 |
Koppers, Inc., Gtd. Notes | | B2 | | 9.875% | | 10/15/13 | | | 5,417 | | | 5,890,987 |
Lyondell Chemical Co., Gtd. Notes | | Ba2 | | 10.50% | | 06/01/13 | | | 4,050 | | | 4,455,000 |
Momentive Performance Materials, Inc., Sr. Notes,(j) | | B3 | | 9.75% | | 12/01/14 | | | 4,100 | | | 4,100,000 |
Mosaic Co., Sr. Notes,(j) | | B1 | | 7.375% | | 12/01/14 | | | 2,375 | | | 2,437,344 |
Mosaic Co., Sr. Notes,(j)(b) | | B1 | | 7.625% | | 12/01/16 | | | 2,375 | | | 2,461,094 |
Nalco Co., Sr. Notes | | B1 | | 7.75% | | 11/15/11 | | | 2,450 | | | 2,505,125 |
Nalco Co., Sr. Sub. Notes | | B3 | | 8.875% | | 11/15/13 | | | 4,050 | | | 4,287,938 |
OM Group, Inc., Gtd. Notes(b) | | B3 | | 9.25% | | 12/15/11 | | | 2,140 | | | 2,238,975 |
Rhodia SA, Sr. Notes (France)(b) | | B2 | | 10.25% | | 06/01/10 | | | 1,602 | | | 1,826,280 |
Rhodia SA, Sr. Sub. Notes (France)(b) | | B3 | | 8.875% | | 06/01/11 | | | 4,338 | | | 4,576,590 |
Rockwood Specialties Group, Inc., Sr. Sub. Notes | | B3 | | 10.625% | | 05/15/11 | | | 2,633 | | | 2,804,145 |
| | | | | | | | | | | |
|
|
| | | | | | | | | | | | | 58,468,115 |
| | | | | | | | | | | |
|
|
Consumer — 2.1% | | | | | | | | | | | | |
Levi Strauss & Co., Sr. Notes | | B3 | | 8.875% | | 04/01/16 | | | 450 | | | 470,250 |
Levi Strauss & Co., Sr. Notes | | B3 | | 12.25% | | 12/15/12 | | | 4,870 | | | 5,417,875 |
Levi Strauss & Co., Sr. Unsub. Notes(i) | | B3 | | 10.1216% | | 04/01/12 | | | 950 | | | 974,938 |
Mac-Gray Corp., Sr. Notes | | B2 | | 7.625% | | 08/15/15 | | | 2,950 | | | 2,994,250 |
Playtex Products, Inc., Gtd. Notes(b) | | Caa1 | | 9.375% | | 06/01/11 | | | 6,160 | | | 6,421,799 |
Playtex Products, Inc., Sec’d Notes | | Ba3 | | 8.00% | | 03/01/11 | | | 315 | | | 329,175 |
Service Corp, Sr. Notes | | B1 | | 7.00% | | 06/15/17 | | | 2,100 | | | 2,126,250 |
Service Corp. International, Debs. | | B1 | | 7.875% | | 02/01/13 | | | 2,000 | | | 2,105,000 |
Service Corp. International, Sr. Unsec’d. Notes | | B1 | | 6.50% | | 03/15/08 | | | 2,000 | | | 2,010,000 |
Simmons Bedding Co., Sr. Sub. Notes(b) | | B3 | | 7.875% | | 01/15/14 | | | 3,375 | | | 3,417,188 |
Stewart Enterprises, Inc., Sr. Notes(b) | | B1 | | 6.25% | | 02/15/13 | | | 3,450 | | | 3,320,625 |
TDS Investor Corp., Sr. Sub. Notes(b)(j) | | Caa1 | | 11.875% | | 09/01/16 | | | 3,095 | | | 3,172,375 |
West Corp., Sr. Sub. Notes(b)(j) | | Caa1 | | 11.00% | | 10/15/16 | | | 3,025 | | | 3,055,250 |
| | | | | | | | | | | |
|
|
| | | | | | | | | | | | | 35,814,975 |
| | | | | | | | | | | |
|
|
Electric — 7.6% | | | | | | | | | | | | |
AES Corp., Sec’d Notes(j) | | Ba3 | | 9.00% | | 05/15/15 | | | 1,625 | | | 1,746,875 |
AES Corp., Sec’d. Notes(j) | | Ba3 | | 8.75% | | 05/15/13 | | | 3,195 | | | 3,422,644 |
AES Corp., Sr. Notes | | B1 | | 9.375% | | 09/15/10 | | | 9,200 | | | 9,993,499 |
AES Corp., Sr. Notes(b) | | B1 | | 9.50% | | 06/01/09 | | | 1,325 | | | 1,417,750 |
AES Eastern Energy LP, Pass-thru-Certs,
Ser. 99-B | | Ba1 | | 9.67% | | 01/02/29 | | | 2,000 | | | 2,510,000 |
Ser. 99-A | | Ba1 | | 9.00% | | 01/02/17 | | | 2,878 | | | 3,223,168 |
Aquila, Inc., Sr. Notes | | B2 | | 9.95% | | 02/01/11 | | | 204 | | | 223,441 |
CMS Energy Corp., Sr. Notes | | Ba3 | | 7.50% | | 01/15/09 | | | 3,290 | | | 3,392,813 |
CMS Energy Corp., Sr. Notes(b) | | Ba3 | | 8.50% | | 04/15/11 | | | 1,310 | | | 1,424,625 |
CMS Energy Corp., Sr. Notes | | Ba3 | | 9.875% | | 10/15/07 | | | 4,725 | | | 4,872,656 |
Dynegy Holdings, Inc., Debs. | | B2 | | 7.125% | | 05/15/18 | | | 675 | | | 658,125 |
Dynegy Holdings, Inc., Debs. | | B2 | | 7.625% | | 10/15/26 | | | 1,425 | | | 1,382,250 |
Dynegy Holdings, Inc., Sr. Notes | | B2 | | 6.875% | | 04/01/11 | | | 1,210 | | | 1,210,000 |
Dynegy Holdings, Inc., Sr. Unsec’d Notes(b) | | B2 | | 8.375% | | 05/01/16 | | | 5,875 | | | 6,168,750 |
Edison Mission Energy, Sr. Unsec’d Notes(b) | | B1 | | 7.75% | | 06/15/16 | | | 3,750 | | | 3,975,000 |
Edison Mission Energy, Sr. Notes(b) | | B1 | | 7.73% | | 06/15/09 | | | 6,615 | | | 6,846,525 |
Empresa Nacional de Electricidad S.A., Notes (Chile) | | Baa3 | | 8.625% | | 08/01/15 | | | 4,700 | | | 5,531,613 |
Empresa Nacional de Electricidad S.A., Unsub. Notes (Chile) | | Baa3 | | 8.35% | | 08/01/13 | | | 4,415 | | | 5,007,745 |
Homer City Funding LLC, Gtd. Notes | | Ba2 | | 8.137% | | 10/01/19 | | | 1,463 | | | 1,594,125 |
Midwest Generation LLC, Pass-thru Certs., Ser. A(g) | | Ba2 | | 8.30% | | 07/02/09 | | | 4,160 | | | 4,280,020 |
Midwest Generation LLC, Pass-thru Certs., Ser. B | | Ba2 | | 8.56% | | 01/02/16 | | | 1,102 | | | 1,214,884 |
Midwest Generation LLC, Sr. Sec’d. Notes | | Ba2 | | 8.75% | | 05/01/34 | | | 4,625 | | | 5,018,125 |
SEE NOTES TO FINANCIAL STATEMENTS.
B69
| | | | |
| | | HIGH YIELD BOND PORTFOLIO (Continued) | | |
SCHEDULE OF INVESTMENTS | December 31, 2006 |
| | | | | | | | | | | | |
CORPORATE BONDS (Continued) | | Moody’s
Rating
(Unaudited)
| | Interest
Rate
| | Maturity
Date
| | Principal
Amount
(000)
| | Value
(Note 2)
|
Electric (cont’d.) | | | | | | | | | | | | |
Mirant Americas Generation LLC, Sr. Notes | | Caa1 | | 8.30% | | 05/01/11 | | $ | 6,225 | | $ | 6,380,625 |
Mirant Corp., Sr. Notes(c)(g)(j) | | NR | | 7.40% | | 07/15/04 | | | 1,825 | | | 18,250 |
Mirant North America LLC, Sr. Notes | | B2 | | 7.375% | | 12/31/13 | | | 2,625 | | | 2,664,375 |
Mission Energy Holding Co., Sec’d. Notes | | B2 | | 13.50% | | 07/15/08 | | | 1,775 | | | 1,956,938 |
Nevada Power Co., Gen Ref. Mtge. Notes, Ser. A | | Ba1 | | 8.25% | | 06/01/11 | | | 1,675 | | | 1,829,748 |
NRG Energy, Inc., Gtd. Notes | | B1 | | 7.375% | | 01/15/17 | | | 5,300 | | | 5,313,250 |
NRG Energy, Inc., Gtd. Notes | | B1 | | 7.375% | | 02/01/16 | | | 11,000 | | | 11,054,999 |
Orion Power Holdings, Inc., Sr. Notes | | B2 | | 12.00% | | 05/01/10 | | | 5,055 | | | 5,737,425 |
Reliant Energy Mid-Atlantic Power Holdings LLC, Pass-thru Certs., Ser. B(g) | | Ba2 | | 9.237% | | 07/02/17 | | | 1,684 | | | 1,886,513 |
Reliant Energy Mid-Atlantic Power Holdings LLC, Pass-thru Certs., Ser. C | | Ba2 | | 9.681% | | 07/02/26 | | | 250 | | | 297,500 |
Reliant Energy, Inc., Sec. Notes | | B2 | | 9.50% | | 07/15/13 | | | 4,515 | | | 4,842,338 |
Sierra Pacific Power Co., Gen. Ref. Mtge. Notes, Ser. A | | Ba1 | | 8.00% | | 06/01/08 | | | 1,505 | | | 1,546,762 |
Sierra Pacific Resources, Inc., Sr. Notes(b) | | B1 | | 8.625% | | 03/15/14 | | | 1,530 | | | 1,642,698 |
TECO Energy, Inc., Sr. Notes | | Ba2 | | 7.50% | | 06/15/10 | | | 3,800 | | | 4,047,000 |
TXU Corp., Sr. Notes, Ser. P | | Ba1 | | 5.55% | | 11/15/14 | | | 1,200 | | | 1,139,209 |
TXU Corp., Sr. Notes, Ser. Q | | Ba1 | | 6.50% | | 11/15/24 | | | 2,825 | | | 2,661,407 |
UtiliCorp Finance, Gtd., Notes (Canada) | | B2 | | 7.75% | | 06/15/11 | | | 1,990 | | | 2,099,924 |
York Power Funding Cayman Ltd., Gtd. Notes (Cayman Islands)
(cost $539,993; purchased 7/31/98)(c)(g)(j)(l) | | D(f) | | Zero | | 10/30/07 | | | 540 | | | 60,911 |
| | | | | | | | | | | |
|
|
| | | | | | | | | | | | | 130,294,505 |
| | | | | | | | | | | |
|
|
Energy – Integrated — 0.2% | | | | | | | | | | | | |
TNK-BP Finance SA, Gtd. Notes (Luxembourg) | | Baa2 | | 7.50% | | 07/18/16 | | | 3,000 | | | 3,191,250 |
| | | | | | | | | | | |
|
|
Energy – Other — 3.1% | | | | | | | | | | | | |
Chesapeake Energy Corp., Gtd. Notes | | Ba2 | | 6.25% | | 01/15/18 | | | 1,025 | | | 986,563 |
Chesapeake Energy Corp., Gtd. Notes(b) | | Ba2 | | 6.50% | | 08/15/17 | | | 2,235 | | | 2,184,713 |
Chesapeake Energy Corp., Gtd. Notes | | Ba2 | | 7.75% | | 01/15/15 | | | 3,054 | | | 3,179,978 |
Chesapeake Energy Corp., Sr. Notes | | Ba2 | | 6.375% | | 06/15/15 | | | 3,950 | | | 3,910,500 |
Chesapeake Energy Corp., Sr. Notes | | Ba2 | | 7.00% | | 08/15/14 | | | 2,350 | | | 2,388,188 |
Chesapeake Energy Corp., Sr. Notes | | Ba2 | | 7.50% | | 06/15/14 | | | 1,000 | | | 1,038,750 |
Compton Petroleum Corp., Gtd. Notes (Canada) | | B2 | | 7.625% | | 12/01/13 | | | 2,100 | | | 2,026,500 |
Encore Acquisition Co., Sr. Sub. Notes | | B1 | | 6.00% | | 07/15/15 | | | 1,100 | | | 1,003,750 |
Encore Acquisition Co., Sr. Sub. Notes | | B1 | | 6.25% | | 04/15/14 | | | 2,400 | | | 2,250,000 |
Forest Oil Corp., Sr. Notes | | B1 | | 8.00% | | 06/15/08 | | | 440 | | | 450,450 |
Hanover Equipment Trust, Sec’d. Notes, Ser. A | | Ba3 | | 8.50% | | 09/01/08 | | | 2,053 | | | 2,078,663 |
Hanover Equipment Trust, Sec’d. Notes, Ser. B(b) | | Ba3 | | 8.75% | | 09/01/11 | | | 3,445 | | | 3,591,413 |
Houston Exploration Co., Sr. Sub. Notes | | B2 | | 7.00% | | 06/15/13 | | | 1,625 | | | 1,584,375 |
Magnum Hunter Resources, Inc., Gtd. Notes | | B1 | | 9.60% | | 03/15/12 | | | 341 | | | 358,476 |
Newfield Exploration Co., Sr. Sub. Notes | | Ba3 | | 6.625% | | 09/01/14 | | | 4,875 | | | 4,853,999 |
OPTI Canada Inc., Gtd. Notes(j) | | B1 | | 8.25% | | 12/15/14 | | | 4,075 | | | 4,187,062 |
Parker Drilling Co., Sr. Notes(b) | | B2 | | 9.625% | | 10/01/13 | | | 4,030 | | | 4,417,887 |
Petrohawk Energy Corp, Gtd. Notes | | B3 | | 9.125% | | 07/15/13 | | | 4,975 | | | 5,223,749 |
Pioneer Natural Resource Co., Bonds | | Ba1 | | 6.875% | | 05/01/18 | | | 3,550 | | | 3,432,481 |
Pioneer Natural Resource Co., Sr. Notes | | Ba1 | | 5.875% | | 07/15/16 | | | 2,150 | | | 1,982,672 |
Pogo Producing Co., Sr. Sub. Notes(b) | | B1 | | 6.875% | | 10/01/17 | | | 1,015 | | | 969,325 |
Pride International, Inc., Sr. Notes | | Ba2 | | 7.375% | | 07/15/14 | | | 320 | | | 330,400 |
Tesero Corp, Gtd. Notes | | Ba1 | | 6.25% | | 11/01/12 | | | 55 | | | 54,725 |
Tesoro Corp, Gtd. Notes | | Ba1 | | 6.625% | | 11/01/15 | | | 1,175 | | | 1,166,188 |
| | | | | | | | | | | |
|
|
| | | | | | | | | | | | | 53,650,807 |
| | | | | | | | | | | |
|
|
Foods — 2.3% | | | | | | | | | | | | |
Ahold Finance USA, Inc. Gtd. Notes | | Ba1 | | 6.875% | | 05/01/29 | | | 1,780 | | | 1,744,400 |
Ahold Finance USA, Inc., Notes(b) | | Ba1 | | 8.25% | | 07/15/10 | | | 1,120 | | | 1,213,800 |
Alberton’s LLC, Debs. | | B1 | | 7.45% | | 08/01/29 | | | 3,775 | | | 3,688,171 |
Alberton’s LLC, Debs. | | B1 | | 8.70% | | 05/01/30 | | | 2,050 | | | 2,141,164 |
Albertson’s LLC, Sr. Notes | | B1 | | 7.50% | | 02/15/11 | | | 1,900 | | | 1,974,039 |
Carrols Corp., Gtd. Notes | | Caa1 | | 9.00% | | 01/15/13 | | | 500 | | | 511,250 |
Constellation Brands, Inc., Gtd. Notes | | Ba2 | | 7.25% | | 09/01/16 | | | 3,425 | | | 3,519,188 |
SEE NOTES TO FINANCIAL STATEMENTS.
B70
| | | | |
| | | HIGH YIELD BOND PORTFOLIO (Continued) | | |
SCHEDULE OF INVESTMENTS | December 31, 2006 |
| | | | | | | | | | | | |
CORPORATE BONDS (Continued) | | Moody’s
Rating
(Unaudited)
| | Interest
Rate
| | Maturity
Date
| | Principal
Amount
(000)
| | Value
(Note 2)
|
Foods (cont’d.) | | | | | | | | | | | | |
Dean Foods Co., Gtd. Notes | | Ba2 | | 7.00% | | 06/01/16 | | $ | 2,300 | | $ | 2,323,000 |
Del Monte Corp., Sr. Sub. Notes(b) | | B2 | | 8.625% | | 12/15/12 | | | 1,830 | | | 1,930,650 |
Delhaize America, Inc., Gtd. Notes | | Ba1 | | 8.125% | | 04/15/11 | | | 3,400 | | | 3,667,770 |
Dole Food Co., Inc., Gtd. Notes | | B3 | | 7.25% | | 06/15/10 | | | 1,760 | | | 1,676,400 |
Dole Food Co., Inc., Sr. Notes | | B3 | | 8.625% | | 05/01/09 | | | 823 | | | 817,856 |
National Beef Packing Co., LLC, Sr. Notes | | Caa1 | | 10.50% | | 08/01/11 | | | 3,150 | | | 3,323,250 |
Pathmark Stores, Inc., Gtd. Notes | | Caa2 | | 8.75% | | 02/01/12 | | | 1,590 | | | 1,591,988 |
Pilgrim’s Pride Corp., Gtd. Notes | | Ba3 | | 9.625% | | 09/15/11 | | | 2,125 | | | 2,220,625 |
Smithfield Foods, Inc., Sr. Notes, Ser. B(b) | | Ba3 | | 7.75% | | 05/15/13 | | | 140 | | | 144,900 |
Smithfield Foods, Inc., Sr. Notes, Ser. B | | Ba3 | | 8.00% | | 10/15/09 | | | 2,040 | | | 2,131,800 |
Stater Brothers Holdings, Inc., Sr. Notes(b) | | B1 | | 8.125% | | 06/15/12 | | | 2,140 | | | 2,172,100 |
Supervalu Inc., Sr. Notes(b) | | B1 | | 7.50% | | 11/15/14 | | | 3,375 | | | 3,519,119 |
| | | | | | | | | | | |
|
|
| | | | | | | | | | | | | 40,311,470 |
| | | | | | | | | | | |
|
|
Foreign Agencies — 0.4% | | | | | | | | | | | | |
Gazprom OAO, Notes (Russia)(b)(j) | | A3 | | 9.625% | | 03/01/13 | | | 3,750 | | | 4,490,625 |
Gazprom OAO, Notes (Russia) | | A3 | | 10.50% | | 10/21/09 | | | 1,720 | | | 1,943,600 |
| | | | | | | | | | | |
|
|
| | | | | | | | | | | | | 6,434,225 |
| | | | | | | | | | | |
|
|
Gaming — 5.4% | | | | | | | | | | | | |
Aztar Corp., Sr. Sub. Notes(b) | | Ba3 | | 7.875% | | 06/15/14 | | | 5,800 | | | 6,300,250 |
Boyd Gaming Corp., Sr. Sub. Notes(b) | | Ba3 | | 6.75% | | 04/15/14 | | | 3,559 | | | 3,550,103 |
Boyd Gaming Corp., Sr. Sub. Notes | | Ba3 | | 8.75% | | 04/15/12 | | | 1,500 | | | 1,567,500 |
Caesars Entertainment Corp., Sr. Sub. Notes(b) | | Ba1 | | 8.125% | | 05/15/11 | | | 3,230 | | | 3,379,388 |
CCM Merger, Inc., Notes(b)(j) | | B3 | | 8.00% | | 08/01/13 | | | 7,740 | | | 7,565,849 |
Harrah’s Operating Co., Inc., Gtd. Notes | | Baa3 | | 5.625% | | 06/01/15 | | | 7,350 | | | 6,303,713 |
Harrah’s Operating Co., Inc., Gtd. Notes | | Baa3 | | 6.50% | | 06/01/16 | | | 775 | | | 693,896 |
Harrah’s Operating Co., Inc., Gtd. Notes | | Baa3 | | 5.50% | | 07/01/10 | | | 1,200 | | | 1,176,181 |
Isle of Capri Casinos, Inc., Gtd. Notes | | B1 | | 9.00% | | 03/15/12 | | | 2,530 | | | 2,643,850 |
Isle of Capri Casinos, Inc., Sr. Sub. Notes | | B1 | | 7.00% | | 03/01/14 | | | 750 | | | 746,250 |
Mandalay Resort Group, Sr. Notes | | Ba2 | | 9.50% | | 08/01/08 | | | 845 | | | 887,250 |
Mandalay Resort Group, Sr. Sub. Notes | | B1 | | 9.375% | | 02/15/10 | | | 581 | | | 621,670 |
MGM Mirage, Inc., Gtd. Notes | | Ba2 | | 7.625% | | 01/15/17 | | | 2,225 | | | 2,230,563 |
MGM Mirage, Inc., Gtd. Notes | | Ba2 | | 6.00% | | 10/01/09 | | | 6,565 | | | 6,548,587 |
MGM Mirage, Inc., Gtd. Notes(b) | | Ba2 | | 6.625% | | 07/15/15 | | | 390 | | | 371,475 |
MGM Mirage, Inc., Gtd. Notes(b) | | Ba2 | | 6.875% | | 04/01/16 | | | 5,150 | | | 4,944,000 |
MGM Mirage, Inc., Gtd. Notes | | B1 | | 8.375% | | 02/01/11 | | | 1,792 | | | 1,859,200 |
MGM Mirage, Inc., Gtd. Notes | | B1 | | 9.75% | | 06/01/07 | | | 9,051 | | | 9,164,137 |
MGM Mirage, Inc., Sr. Notes | | Ba2 | | 5.875% | | 02/27/14 | | | 2,750 | | | 2,543,750 |
Mohegan Tribal Gaming Authority, Sr. Notes | | Baa2 | | 6.125% | | 02/15/13 | | | 1,000 | | | 992,500 |
Mohegan Tribal Gaming Authority, Sr. Sub. Notes | | Ba2 | | 6.375% | | 07/15/09 | | | 1,400 | | | 1,400,000 |
Mohegan Tribal Gaming Authority, Sr. Sub. Notes | | Ba2 | | 7.125% | | 08/15/14 | | | 1,000 | | | 1,013,750 |
Mohegan Tribal Gaming Authority, Sr. Sub. Notes | | Ba2 | | 8.00% | | 04/01/12 | | | 2,845 | | | 2,962,356 |
Mohegan Tribal Gaming Authority, Sr. Sub. Notes(g) | | Ba2 | | 8.375% | | 07/01/11 | | | 400 | | | 415,000 |
Seneca Gaming Corp., Sr. Unsec’d. Notes, Ser. B | | Ba2 | | 7.25% | | 05/01/12 | | | 5,375 | | | 5,469,063 |
Station Casinos, Inc., Sr. Notes | | Ba2 | | 6.00% | | 04/01/12 | | | 4,760 | | | 4,516,050 |
Station Casinos, Inc., Sr. Sub. Notes | | Ba3 | | 6.50% | | 02/01/14 | | | 1,500 | | | 1,333,125 |
Station Casinos, Inc., Sr. Sub. Notes | | Ba3 | | 6.625% | | 03/15/18 | | | 1,300 | | | 1,114,750 |
Station Casinos, Inc., Sr. Sub. Notes | | Ba3 | | 6.875% | | 03/01/16 | | | 3,155 | | | 2,831,613 |
Station Casinos, Inc., Sr. Unsec’d Notes | | Ba2 | | 7.75% | | 08/15/16 | | | 2,375 | | | 2,392,813 |
Trump Entertainment Resorts, Inc., Sec’d. Notes(b) | | Caa1 | | 8.50% | | 06/01/15 | | | 5,195 | | | 5,169,025 |
| | | | | | | | | | | |
|
|
| | | | | | | | | | | | | 92,707,657 |
| | | | | | | | | | | |
|
|
Health Care & Pharmaceutical — 7.6% | | | | | | | | | | | | |
Accellent Inc., Gtd. Notes | | Caa1 | | 10.50% | | 12/01/13 | | | 16,563 | | | 17,184,112 |
Alliance Imaging, Inc., Sr. Sub. Notes(b) | | B3 | | 7.25% | | 12/15/12 | | | 3,775 | | | 3,586,250 |
Columbia/HCA Healthcare Corp., Debs. | | Caa1 | | 7.50% | | 12/15/23 | | | 600 | | | 488,231 |
Columbia/HCA Healthcare Corp., MTN | | Caa1 | | 8.70% | | 02/10/10 | | | 1,800 | | | 1,863,302 |
Columbia/HCA Healthcare Corp., MTN | | Caa1 | | 9.00% | | 12/15/14 | | | 4,965 | | | 4,812,684 |
SEE NOTES TO FINANCIAL STATEMENTS.
B71
| | | | |
| | | HIGH YIELD BOND PORTFOLIO (Continued) | | |
SCHEDULE OF INVESTMENTS | December 31, 2006 |
| | | | | | | | | | | | |
CORPORATE BONDS (Continued) | | Moody’s
Rating
(Unaudited)
| | Interest
Rate
| | Maturity
Date
| | Principal
Amount
(000)
| | Value
(Note 2)
|
Health Care & Pharmaceutical (cont’d.) | | | | | | | | | | | | |
Concentra Operating Corp., Gtd. Notes | | B3 | | 9.125% | | 06/01/12 | | $ | 2,275 | | $ | 2,388,750 |
Concentra Operating Corp., Gtd. Notes | | B3 | | 9.50% | | 08/15/10 | | | 200 | | | 210,000 |
Elan Finance PLC, Sr. Unsec’d, (Ireland)(j) | | B3 | | 8.875% | | 12/01/13 | | | 4,500 | | | 4,500,000 |
Elan Finance PLC, Gtd. Notes (Ireland)(b)(i) | | B3 | | 9.3737% | | 11/15/11 | | | 1,020 | | | 1,012,350 |
Fisher Scientific International Inc., Sr Sub. Notes | | Baa3 | | 6.125% | | 07/01/15 | | | 3,000 | | | 2,965,824 |
Hanger Orthopedic Group, Inc., Sr. Notes(k) | | Caa2 | | 10.25% | | 06/01/14 | | | 3,500 | | | 3,613,750 |
HCA, Inc., Sec’d Notes(j) | | B2 | | 9.625% | | 11/15/16 | | | 11,100 | | | 11,932,500 |
HCA, Inc., Bank Loan(g)(i) | | Ba3 | | 8.1137% | | 11/14/13 | | | 15,000 | | | 15,164,430 |
HCA, Inc., Sr. Unsec’d Notes(b) | | Caa1 | | 6.25% | | 02/15/13 | | | 2,700 | | | 2,389,500 |
HCA, Inc., Sr. Unsec’d Notes(k) | | Caa1 | | 8.75% | | 09/01/10 | | | 2,200 | | | 2,293,500 |
IASIS Healthcare LLC, Sr. Sub. Notes | | B3 | | 8.75% | | 06/15/14 | | | 1,025 | | | 1,037,813 |
Inverness Medical Innovations, Inc., Sr. Sub. Notes(g) | | Caa1 | | 8.75% | | 02/15/12 | | | 4,505 | | | 4,685,200 |
Medco Health Solutions, Inc., Sr. Notes | | Baa3 | | 7.25% | | 08/15/13 | | | 455 | | | 488,387 |
MedQuest, Inc., Gtd. Notes, Ser. B | | Caa1 | | 11.875% | | 08/15/12 | | | 840 | | | 693,000 |
Omnicare, Inc., Sr. Sub. Notes | | Ba3 | | 6.125% | | 06/01/13 | | | 2,500 | | | 2,393,750 |
Omnicare, Inc., Sr. Sub. Notes | | Ba3 | | 6.875% | | 12/15/15 | | | 1,800 | | | 1,777,500 |
Res-Care, Inc., Sr. Notes | | B1 | | 7.75% | | 10/15/13 | | | 4,800 | | | 4,920,000 |
Select Medical Corp., Gtd. Notes | | B2 | | 7.625% | | 02/01/15 | | | 4,125 | | | 3,423,750 |
Senior Housing Properties Trust, Sr. Notes | | Ba2 | | 7.875% | | 04/15/15 | | | 1,300 | | | 1,345,500 |
Senior Housing Properties Trust, Sr. Notes | | Ba2 | | 8.625% | | 01/15/12 | | | 3,730 | | | 4,047,050 |
Skilled Healthcare Group, Inc., Sr. Sub. Notes(j) | | Caa1 | | 11.00% | | 01/15/14 | | | 11,505 | | | 12,655,500 |
Tenet Healthcare Corp., Sr. Notes | | Caa1 | | 9.25% | | 02/01/15 | | | 2,710 | | | 2,710,000 |
Ventas Realty LP, Gtd. Notes | | Ba2 | | 7.125% | | 06/01/15 | | | 4,500 | | | 4,725,000 |
Ventas Realty LP, Gtd. Notes | | Ba2 | | 8.75% | | 05/01/09 | | | 2,000 | | | 2,125,000 |
Ventas Realty LP, Gtd. Notes | | Ba2 | | 9.00% | | 05/01/12 | | | 3,648 | | | 4,122,240 |
Ventas Realty LP, Sr. Notes(b) | | Ba2 | | 6.50% | | 06/01/16 | | | 1,000 | | | 1,025,000 |
Warner Chilcott Corp., Gtd. Notes | | Caa1 | | 8.75% | | 02/01/15 | | | 4,490 | | | 4,602,250 |
| | | | | | | | | | | |
|
|
| | | | | | | | | | | | | 131,182,123 |
| | | | | | | | | | | |
|
|
Health Care Insurance —��0.4% | | | | | | | | | | | | |
Coventry Health Care, Inc., Sr. Notes | | Ba1 | | 5.875% | | 01/15/12 | | | 2,800 | | | 2,764,572 |
Coventry Health Care, Inc., Sr. Notes | | Ba1 | | 6.125% | | 01/15/15 | | | 1,000 | | | 985,501 |
Coventry Health Care, Inc., Sr. Notes | | Ba1 | | 8.125% | | 02/15/12 | | | 2,675 | | | 2,775,312 |
| | | | | | | | | | | |
|
|
| | | | | | | | | | | | | 6,525,385 |
| | | | | | | | | | | |
|
|
Lodging — 1.7% | | | | | | | | | | | | |
Felcor Lodging LP, Gtd. Notes | | Ba3 | | 8.50% | | 06/01/11 | | | 6,275 | | | 6,682,875 |
Gaylord Entertainment Co., Sr. Notes | | B3 | | 8.00% | | 11/15/13 | | | 2,000 | | | 2,075,000 |
Hilton Hotels Corp., Notes | | Ba2 | | 7.625% | | 12/01/12 | | | 135 | | | 143,100 |
Hilton Hotels Corp., Sr. Notes | | Ba2 | | 7.50% | | 12/15/17 | | | 450 | | | 468,000 |
Host Marriott LP, Sr. Notes(j) | | Ba1 | | 6.875% | | 11/01/14 | | | 925 | | | 936,563 |
Host Marriott LP, Sr. Notes | | Ba1 | | 6.75% | | 06/01/16 | | | 4,600 | | | 4,605,750 |
Host Marriott LP, Sr. Notes(b) | | Ba1 | | 7.125% | | 11/01/13 | | | 3,890 | | | 3,977,525 |
Host Marriott LP, Sr. Notes, Ser. M | | Ba1 | | 7.00% | | 08/15/12 | | | 8,150 | | | 8,272,249 |
Royal Caribbean Cruises, Ltd., Sr. Notes (Liberia)(b) | | Ba1 | | 6.875% | | 12/01/13 | | | 1,300 | | | 1,317,740 |
Royal Caribbean Cruises, Ltd., Sr. Notes (Liberia) | | Ba1 | | 8.75% | | 02/02/11 | | | 1,150 | | | 1,256,894 |
| | | | | | | | | | | |
|
|
| | | | | | | | | | | | | 29,735,696 |
| | | | | | | | | | | |
|
|
Media & Entertainment — 6.9% | | | | | | | | | | | | |
AMC Entertainment, Inc., Gtd Notes | | B3 | | 11.00% | | 02/01/16 | | | 2,465 | | | 2,766,963 |
AMC Entertainment, Inc., Gtd. Notes, Ser. B | | Ba3 | | 8.625% | | 08/15/12 | | | 2,125 | | | 2,223,281 |
AMC Entertainment, Inc., Sr. Sub. Notes | | B3 | | 8.00% | | 03/01/14 | | | 675 | | | 669,938 |
Cinemark, Inc., Sr. Disc. Notes | | B3 | | 9.75% | | 03/15/14 | | | 3,050 | | | 2,619,188 |
Dex Media East LLC, Gtd. Notes | | B2 | | 12.125% | | 11/15/12 | | | 7,298 | | | 8,036,922 |
Dex Media West LLC, Sr. Sub. Notes, Ser. B | | B2 | | 9.875% | | 08/15/13 | | | 7,725 | | | 8,420,249 |
Dex Media, Inc., Notes | | B3 | | 8.00% | | 11/15/13 | | | 2,825 | | | 2,909,750 |
DirecTV Holdings LLC, Gtd. Notes | | Ba3 | | 6.375% | | 06/15/15 | | | 2,777 | | | 2,662,449 |
DirecTVHoldings LLC, Sr. Notes | | Ba3 | | 8.375% | | 03/15/13 | | | 425 | | | 442,000 |
Echostar DBS Corp., Gtd. Notes(b) | | BB-(f) | | 7.125% | | 02/01/16 | | | 4,875 | | | 4,875,000 |
SEE NOTES TO FINANCIAL STATEMENTS.
B72
| | | | |
| | | HIGH YIELD BOND PORTFOLIO (Continued) | | |
SCHEDULE OF INVESTMENTS | December 31, 2006 |
| | | | | | | | | | | | |
CORPORATE BONDS (Continued) | | Moody’s
Rating
(Unaudited)
| | Interest
Rate
| | Maturity
Date
| | Principal
Amount
(000)
| | Value
(Note 2)
|
Media & Entertainment (cont’d.) | | | | | | | | | | | | |
Echostar DBS Corp., Gtd. Notes | | Ba3 | | 6.625% | | 10/01/14 | | $ | 4,675 | | $ | 4,558,125 |
Gray Television, Inc., Gtd. Notes | | B1 | | 9.25% | | 12/15/11 | | | 4,605 | | | 4,817,981 |
Idearc Inc., Sr. Notes | | B2 | | 8.00% | | 11/15/16 | | | 4,125 | | | 4,186,875 |
Intelsat Bermuda Ltd., Gtd Notes (Bermuda)(b)(j) | | B2 | | 9.25% | | 06/15/16 | | | 2,900 | | | 3,117,500 |
Intelsat Bermuda, Ltd., Sr. Notes (Bermuda)(j) | | Caa1 | | 11.25% | | 06/15/16 | | | 9,275 | | | 10,179,312 |
Intelsat Subsidiary Holding Co., Ltd., Sr. Notes (Bermuda) | | B2 | | 8.25% | | 01/15/13 | | | 7,610 | | | 7,724,150 |
Medianews Group, Inc., Sr. Sub. Notes | | B2 | | 6.375% | | 04/01/14 | | | 2,375 | | | 2,042,500 |
Medianews Group, Inc., Sr. Sub. Notes | | B2 | | 6.875% | | 10/01/13 | | | 1,375 | | | 1,244,375 |
Morris Publishing Group LLC, Gtd. Notes | | B1 | | 7.00% | | 08/01/13 | | | 1,050 | | | 994,875 |
Nielsen Finance LLC, Sr. Notes(j) | | B3 | | 10.00% | | 08/01/14 | | | 2,375 | | | 2,573,906 |
PRIMEDIA, Inc., Sr. Notes | | B2 | | 8.875% | | 05/15/11 | | | 2,000 | | | 2,040,000 |
PRIMEDIA, Inc., Sr. Notes(b)(i) | | B2 | | 10.7488% | | 05/15/10 | | | 2,145 | | | 2,230,800 |
Quebecor Media, Inc. Sr. Notes (Canada)(b) | | B2 | | 7.75% | | 03/15/16 | | | 2,930 | | | 2,992,263 |
Quebecor World Capital Corp., Sr. Notes (Canada)(b)(j) | | B2 | | 8.75% | | 03/15/16 | | | 2,215 | | | 2,120,863 |
Quebecor World Capital Corp., Sr. Notes (Canada)(j)(k) | | B2 | | 9.75% | | 01/15/15 | | | 1,900 | | | 1,911,875 |
R.H. Donnelley Finance Corp I., Gtd. Notes
(cost $2,995,000; purchase 6/15/06)(j)(l) | | B2 | | 10.875% | | 12/15/12 | | | 2,995 | | | 3,264,550 |
R.H. Donnelley, Inc., Gtd. Notes | | B2 | | 10.875% | | 12/15/12 | | | 800 | | | 872,000 |
Rainbow National Services LLC, Sr. Notes(j) | | B2 | | 8.75% | | 09/01/12 | | | 2,000 | | | 2,102,500 |
Rainbow National Services LLC, Sr. Sub. Debs.(j) | | B3 | | 10.375% | | 09/01/14 | | | 325 | | | 361,156 |
RH Donnelley Corp., Sr. Disc. Notes, Ser. A-1 | | B3 | | 6.875% | | 01/15/13 | | | 1,300 | | | 1,246,375 |
RH Donnelley Corp., Sr. Disc. Notes, Ser. A-2 | | B3 | | 6.875% | | 01/15/13 | | | 7,700 | | | 7,382,375 |
RH Donnelly Corp., Sr. Notes, Series A-3(b) | | B3 | | 8.875% | | 01/15/16 | | | 1,310 | | | 1,375,500 |
Sinclair Broadcast Group, Inc., Gtd. Notes | | Ba3 | | 8.75% | | 12/15/11 | | | 2,500 | | | 2,609,375 |
Six Flags, Inc., Sr. Notes(b) | | Caa1 | | 9.625% | | 06/01/14 | | | 565 | | | 524,038 |
Universal City Florida Holding Co. I/II, Sr. Notes(b) | | B3 | | 8.375% | | 05/01/10 | | | 4,050 | | | 4,151,250 |
Vertis, Inc., Gtd. Notes, Ser. B | | Caa1 | | 10.875% | | 06/15/09 | | | 900 | | | 904,500 |
Vertis, Inc., Sec’d. Notes | | B1 | | 9.75% | | 04/01/09 | | | 3,765 | | | 3,877,950 |
Warner Music Group Sr. Sub. Notes | | B2 | | 7.375% | | 04/15/14 | | | 1,250 | | | 1,237,500 |
| | | | | | | | | | | |
|
|
| | | | | | | | | | | | | 118,270,209 |
| | | | | | | | | | | |
|
|
Metals — 4.0% | | | | | | | | | | | | |
AK Steel Corp., Gtd. Notes(b) | | B2 | | 7.75% | | 06/15/12 | | | 2,517 | | | 2,535,878 |
AK Steel Corp., Gtd. Notes(b) | | B2 | | 7.875% | | 02/15/09 | | | 712 | | | 712,000 |
Aleris International Inc., Sr. Notes(j)(b) | | B3 | | 9.00% | | 12/15/14 | | | 3,000 | | | 3,015,000 |
Aleris International Inc., Sr. Sub Notes(j) | | Caa1 | | 10.00% | | 12/15/16 | | | 2,100 | | | 2,105,250 |
Arch Western Finance LLC, Sr. Notes | | B1 | | 6.75% | | 07/01/13 | | | 3,635 | | | 3,607,738 |
Century Aluminum Co., Gtd. Notes | | B1 | | 7.50% | | 08/15/14 | | | 7,352 | | | 7,453,089 |
Chaparral Steel Co., Gtd. Notes | | B1 | | 10.00% | | 07/15/13 | | | 5,000 | | | 5,581,250 |
CSN Islands VII Corp., Gtd. Notes (Cayman Islands)(j) | | BB(f) | | 10.75% | | 09/12/08 | | | 4,945 | | | 5,340,600 |
Gerdau AmeriSteel Corp., Sr. Notes | | Ba2 | | 10.375% | | 07/15/11 | | | 4,225 | | | 4,531,313 |
Indalex Holdings Corp., Sec’d. Notes(j) | | Caa1 | | 11.50% | | 02/01/14 | | | 2,300 | | | 2,403,500 |
Ispat Inland ULC, Sec’d. Notes (Canada) | | Baa3 | | 9.75% | | 04/01/14 | | | 3,164 | | | 3,535,770 |
Massey Energy Co., Sr. Notes | | B2 | | 6.625% | | 11/15/10 | | | 250 | | | 250,000 |
Metals USA, Inc., Sec’d Notes | | B3 | | 11.125% | | 12/01/15 | | | 9,175 | | | 10,081,030 |
Novelis, Inc., Sr. Notes (Canada)(j) | | B2 | | 8.25% | | 02/15/15 | | | 5,715 | | | 5,529,263 |
PNA Group, Inc., Sr. Notes
(cost $3,700,000; purchased 8/4/06)(g)(j)(l) | | B3 | | 10.75% | | 09/01/16 | | | 3,700 | | | 3,824,875 |
Ryerson Tull, Inc., Sr. Notes(b) | | B3 | | 8.25% | | 12/15/11 | | | 2,485 | | | 2,466,363 |
Southern Copper Corp., Sr. Notes | | Baa2 | | 7.50% | | 07/27/35 | | | 3,550 | | | 3,849,219 |
United States Steel Corp., Sr. Notes | | Ba1 | | 9.75% | | 05/15/10 | | | 2,200 | | | 2,340,250 |
| | | | | | | | | | | |
|
|
| | | | | | | | | | | | | 69,162,388 |
| | | | | | | | | | | |
|
|
Non Captive Finance — 2.2% | | | | | | | | | | | | |
General Motors Acceptance Corp., Notes | | Ba1 | | 6.75% | | 12/01/14 | | | 7,790 | | | 8,001,366 |
General Motors Acceptance Corp., Notes | | Ba1 | | 6.875% | | 09/15/11 | | | 8,750 | | | 8,974,857 |
General Motors Acceptance Corp., Notes | | Ba1 | | 6.875% | | 08/28/12 | | | 17,700 | | | 18,174,785 |
Residential Capital Corp., Sr. Unsec’d. Notes | | Baa3 | | 6.375% | | 06/30/10 | | | 2,330 | | | 2,357,117 |
| | | | | | | | | | | |
|
|
| | | | | | | | | | | | | 37,508,125 |
| | | | | | | | | | | |
|
|
SEE NOTES TO FINANCIAL STATEMENTS.
B73
| | | | |
| | | HIGH YIELD BOND PORTFOLIO (Continued) | | |
SCHEDULE OF INVESTMENTS | December 31, 2006 |
| | | | | | | | | | | | |
CORPORATE BONDS (Continued) | | Moody’s
Rating
(Unaudited)
| | Interest
Rate
| | Maturity
Date
| | Principal
Amount
(000)
| | Value
(Note 2)
|
Packaging — 2.8% | | | | | | | | | | | | |
Berry Plastics Holding Corp., Sec’d Notes(b)(j) | | B2 | | 8.875% | | 09/15/14 | | $ | 3,375 | | $ | 3,425,625 |
Berry Plastics Holding Corp., Sec’d Notes(b)(i)(j) | | B2 | | 9.235% | | 09/15/14 | | | 2,025 | | | 2,050,313 |
Crown Americas LLC, Sr. Notes | | B1 | | 7.625% | | 11/15/13 | | | 8,000 | | | 8,240,000 |
Exopack Holding Corp, Sr. Notes(j) | | B3 | | 11.25% | | 02/01/14 | | | 2,675 | | | 2,815,438 |
Graham Packaging Co., Inc. Gtd. Notes(b) | | Caa1 | | 8.50% | | 10/15/12 | | | 3,600 | | | 3,636,000 |
Graham Packaging Co., Inc. Sub. Notes(b) | | Caa1 | | 9.875% | | 10/15/14 | | | 3,925 | | | 3,964,250 |
Greif Brothers Corp., Gtd. Notes | | Ba3 | | 8.875% | | 08/01/12 | | | 8,925 | | | 9,371,249 |
Owens-Brockway Glass Container, Inc., Gtd. Notes | | Ba2 | | 7.75% | | 05/15/11 | | | 4,250 | | | 4,366,875 |
Owens-Brockway Glass Container, Inc., Sr. Sec’d. Notes | | Ba2 | | 8.75% | | 11/15/12 | | | 7,755 | | | 8,220,300 |
Silgan Holdings, Inc., Sr. Sub. Notes | | B1 | | 6.75% | | 11/15/13 | | | 2,825 | | | 2,768,500 |
| | | | | | | | | | | |
|
|
| | | | | | | | | | | | | 48,858,550 |
| | | | | | | | | | | |
|
|
Paper — 3.5% | | | | | | | | | | | | |
Abitibi-Consolidated, Inc., Notes (Canada)(b) | | B2 | | 5.25% | | 06/20/08 | | | 1,617 | | | 1,552,320 |
Abitibi-Consolidated, Inc., Notes (Canada)(b) | | B2 | | 6.00% | | 06/20/13 | | | 2,270 | | | 1,816,000 |
Abitibi-Consolidated, Inc., Notes (Canada)(b) | | B2 | | 7.75% | | 06/15/11 | | | 1,780 | | | 1,597,550 |
Abitibi-Consolidated, Inc., Notes (Canada)(k) | | B2 | | 8.55% | | 08/01/10 | | | 5,500 | | | 5,225,000 |
Ainsworth Lumber Co., Ltd., Gtd. Notes (Canada)(i)(k) | | B2 | | 9.11% | | 10/01/10 | | | 1,100 | | | 929,500 |
Ainsworth Lumber Co., Ltd., Sr. Notes (Canada)(b) | | B2 | | 6.75% | | 03/15/14 | | | 3,355 | | | 2,549,800 |
Bowater Canada Finance, Gtd. Notes (Canada) | | B2 | | 7.95% | | 11/15/11 | | | 2,150 | | | 2,107,000 |
Cascades, Inc., Sr. Notes (Canada) | | Ba3 | | 7.25% | | 02/15/13 | | | 4,725 | | | 4,713,188 |
Catalyst Paper Corp., Gtd. Notes, Ser. D (Canada) | | B2 | | 8.625% | | 06/15/11 | | | 5,220 | | | 5,285,249 |
Catalyst Paper Corp., Sr. Notes (Canada) | | B2 | | 7.375% | | 03/01/14 | | | 1,000 | | | 947,500 |
Cellu Tissue Holdings, Inc., Sr. Sec’d Notes | | B2 | | 9.75% | | 03/15/10 | | | 4,000 | | | 3,950,000 |
Domtar, Inc., Notes (Canada) | | B2 | | 5.375% | | 12/01/13 | | | 1,000 | | | 905,000 |
Domtar, Inc., Notes (Canada) | | B2 | | 7.875% | | 10/15/11 | | | 1,525 | | | 1,582,188 |
Georgia-Pacific Corp., Gtd. Notes
(cost $4,800,000; purchased 12/13/060(j)(l) | | Ba3 | | 7.125% | | 01/15/17 | | | 4,800 | | | 4,788,000 |
Georgia-Pacific Corp., Debs.(b) | | B2 | | 7.375% | | 12/01/25 | | | 1,000 | | | 975,000 |
Graphic Packaging International Corp., Sr. Notes(b) | | B2 | | 8.50% | | 08/15/11 | | | 2,670 | | | 2,763,450 |
Graphic Packaging International Corp., Sr. Sub. Notes(b) | | B3 | | 9.50% | | 08/15/13 | | | 4,625 | | | 4,879,375 |
Millar Western Forest Products Ltd., Sr. Notes (Canada) | | B2 | | 7.75% | | 11/15/13 | | | 2,670 | | | 2,396,325 |
Norampac, Inc., Sr. Notes (Canada)(b) | | Ba3 | | 6.75% | | 06/01/13 | | | 2,180 | | | 2,120,050 |
Glatfelter, Gtd. Notes | | Ba1 | | 7.125% | | 05/01/16 | | | 1,450 | | | 1,457,250 |
Smurfit-Stone Container Enterprises, Inc., Sr. Notes | | B2 | | 8.375% | | 07/01/12 | | | 1,340 | | | 1,313,200 |
Stone Container Finance, Gtd. Notes. | | B2 | | 7.375% | | 07/15/14 | | | 2,025 | | | 1,883,250 |
Tembec Industries, Inc., Gtd. Notes (Canada) | | Ca | | 7.75% | | 03/15/12 | | | 3,870 | | | 2,263,950 |
Verso Paper Holdings LLC, Sec’d Notes(i)(j) | | B2 | | 9.1213% | | 08/01/14 | | | 430 | | | 436,450 |
Verso Paper Holdings LLC, Sec’d Notes(j)(k) | | B2 | | 9.125% | | 08/01/14 | | | 1,500 | | | 1,563,750 |
| | | | | | | | | | | |
|
|
| | | | | | | | | | | | | 60,000,345 |
| | | | | | | | | | | |
|
|
Pipelines & Others — 4.2% | | | | | | | | | | | | |
AmeriGas Partners LP, Sr. Notes | | B1 | | 7.125% | | 05/20/16 | | | 3,600 | | | 3,600,000 |
ANR Pipeline Co., Notes | | Ba1 | | 8.875% | | 03/15/10 | | | 50 | | | 52,455 |
El Paso Corp., Sr. Notes | | B2 | | 7.00% | | 05/15/11 | | | 8,505 | | | 8,823,937 |
El Paso Production Holding Co., Gtd. Notes(b) | | B1 | | 7.75% | | 06/01/13 | | | 12,265 | | | 12,832,255 |
Ferrellgas Partners LP, Sr. Notes | | Ba3 | | 6.75% | | 05/01/14 | | | 1,175 | | | 1,142,688 |
Inergy LP, Sr. Notes | | B1 | | 6.875% | | 12/15/14 | | | 3,000 | | | 2,947,500 |
Inergy LP/Inergy Finance Corp., Gtd. Notes | | B1 | | 8.25% | | 03/01/16 | | | 1,050 | | | 1,102,500 |
Pacific Energy Partners LP, Sr. Notes | | Baa3 | | 7.125% | | 06/15/14 | | | 1,975 | | | 2,026,765 |
Southern Natural Gas Co., Unsub. Notes | | Ba1 | | 8.875% | | 03/15/10 | | | 2,900 | | | 3,042,361 |
Targa Resources, Inc., Gtd. Notes(j) | | B3 | | 8.50% | | 11/01/13 | | | 1,475 | | | 1,486,063 |
Tennessee Gas Pipeline Co., Debs. | | Ba1 | | 7.00% | | 03/15/27 | | | 5,655 | | | 5,964,057 |
Tennessee Gas Pipeline Co., Debs. | | Ba1 | | 7.625% | | 04/01/37 | | | 4,615 | | | 5,187,463 |
Williams Cos., Inc., Notes | | Ba2 | | 8.75% | | 03/15/32 | | | 1,025 | | | 1,158,250 |
Williams Cos., Inc., Debs., Ser. A(b) | | Ba2 | | 7.50% | | 01/15/31 | | | 2,075 | | | 2,152,813 |
Williams Cos., Inc., Notes(b) | | Ba2 | | 7.125% | | 09/01/11 | | | 4,475 | | | 4,654,000 |
Williams Cos., Inc., Notes | | Ba2 | | 7.75% | | 06/15/31 | | | 1,925 | | | 2,021,250 |
SEE NOTES TO FINANCIAL STATEMENTS.
B74
| | | | |
| | | HIGH YIELD BOND PORTFOLIO (Continued) | | |
SCHEDULE OF INVESTMENTS | December 31, 2006 |
| | | | | | | | | | | | |
CORPORATE BONDS (Continued) | | Moody’s
Rating
(Unaudited)
| | Interest
Rate
| | Maturity
Date
| | Principal
Amount
(000)
| | Value
(Note 2)
|
Pipelines & Other (cont’d.) | | | | | | | | | | | | |
Williams Cos., Inc., Notes | | Ba2 | | 7.875% | | 09/01/21 | | $ | 4,955 | | $ | 5,314,238 |
Williams Cos., Inc., Sr. Notes | | Ba2 | | 7.625% | | 07/15/19 | | | 525 | | | 561,750 |
Williams Cos., Inc., Sr. Unsec’d. Notes | | Ba2 | | 8.125% | | 03/15/12 | | | 7,445 | | | 8,059,212 |
| | | | | | | | | | | |
|
|
| | | | | | | | | | | | | 72,129,557 |
| | | | | | | | | | | |
|
|
Railroads — 0.1% | | | | | | | | | | | | |
Kansas City Southern Railway, Gtd. Notes | | B3 | | 7.50% | | 06/15/09 | | | 2,750 | | | 2,774,063 |
| | | | | | | | | | | |
|
|
Retailers — 1.9% | | | | | | | | | | | | |
Asbury Automotive Group, Inc., Sr. Sub. Notes | | B3 | | 8.00% | | 03/15/14 | | | 1,100 | | | 1,116,500 |
Couche-Tard Finance Corp., Sr. Sub. Notes | | Ba2 | | 7.50% | | 12/15/13 | | | 2,475 | | | 2,530,688 |
GSC Holdings Corp., Gtd. Notes(b) | | B1 | | 8.00% | | 10/01/12 | | | 1,195 | | | 1,248,775 |
GSC Holdings Corp., Gtd. Notes(i) | | B1 | | 9.2466% | | 10/01/11 | | | 5,651 | | | 5,862,912 |
Jean Coutu Group (PJC), Inc., Sr. Notes (Canada) | | B3 | | 7.625% | | 08/01/12 | | | 800 | | | 842,000 |
Jean Coutu Group (PJC), Inc., Sr. Sub. Notes (Canada)(b) | | Caa2 | | 8.50% | | 08/01/14 | | | 2,835 | | | 2,852,719 |
Neiman Marcus Group, Inc ., Gtd. Notes(b) | | B2 | | 9.00% | | 10/15/15 | | | 3,495 | | | 3,813,919 |
Neiman Marcus Group, Inc ., Gtd. Notes | | B3 | | 10.375% | | 10/15/15 | | | 2,135 | | | 2,375,188 |
Pantry, Inc., Sr. Sub. Notes | | B3 | | 7.75% | | 02/15/14 | | | 3,025 | | | 3,043,906 |
Rite Aid Corp., Sec’d. Notes | | B2 | | 8.125% | | 05/01/10 | | | 5,595 | | | 5,713,893 |
Stripes Acquisition LLC, Sr. Notes(b)(j) | | B2 | | 10.625% | | 12/15/13 | | | 3,000 | | | 3,255,000 |
| | | | | | | | | | | |
|
|
| | | | | | | | | | | | | 32,655,500 |
| | | | | | | | | | | |
|
|
Technology — 5.5% | | | | | | | | | | | | |
Amkor Technology, Inc., Sr. Notes(b) | | Caa1 | | 7.125% | | 03/15/11 | | | 800 | | | 746,000 |
Ampex Corp., Sec’d. Notes
(cost $714,578; purchased 2/15/04-8/15/06)(c)(g)(l) | | NR | | 12.00% | | 08/15/08 | | | 715 | | | 535,933 |
Avago Technologies, Sr. Notes (Singapore)(b)(j) | | B2 | | 10.125% | | 12/01/13 | | | 5,260 | | | 5,615,050 |
Avago Technologies, Sr. Sub. Notes (Singapore)(b)(j) | | Caa1 | | 11.875% | | 12/01/15 | | | 1,360 | | | 1,489,200 |
Flextronics International, Ltd., Sr. Sub. Notes (Singapore) | | Ba2 | | 6.25% | | 11/15/14 | | | 200 | | | 193,000 |
Flextronics International, Ltd., Sr. Sub. Notes (Singapore) | | Ba2 | | 6.50% | | 05/15/13 | | | 1,990 | | | 1,965,125 |
Freescale Semiconductor Inc., Sr. Notes(j) | | B1 | | 9.125% | | 12/15/14 | | | 11,650 | | | 11,577,187 |
Freescale Semiconductor Inc., Sr. Sub. Notes(b)(j) | | B2 | | 10.125% | | 12/15/16 | | | 11,900 | | | 11,914,874 |
Freescale Semiconductor Inc., Sr. Notes(j) | | B1 | | 8.875% | | 12/15/14 | | | 1,275 | | | 1,270,219 |
Iron Mountain, Inc., Gtd. Notes | | B3 | | 8.625% | | 04/01/13 | | | 5,225 | | | 5,394,813 |
Nortel Networks Corp., Gtd. Notes (Canada) | | B3 | | 4.25% | | 09/01/08 | | | 2,175 | | | 2,104,313 |
Nortel Networks, Ltd., Gtd. Notes (Canada)(b)(j) | | B3 | | 10.125% | | 07/15/13 | | | 1,200 | | | 1,296,000 |
NXP Co., Sec’d(b)(j) | | Ba2 | | 7.875% | | 10/15/14 | | | 13,250 | | | 13,697,187 |
NXP Co, Sr. Notes(j) | | B2 | | 9.50% | | 10/15/15 | | | 6,100 | | | 6,252,500 |
Sensata Technologies BV, Sr. Notes (Netherlands)(j) | | Caa1 | | 8.25% | | 05/01/14 | | | 9,300 | | | 8,928,000 |
Serena Software, Inc., Sr. Sub. Notes | | Caa1 | | 10.375% | | 03/15/16 | | | 5,840 | | | 6,197,700 |
Spansion Inc., Sr. Notes(j) | | Caa1 | | 11.25% | | 01/15/16 | | | 5,300 | | | 5,565,000 |
STATS ChipPAC Ltd., Gtd. Notes (Singapore) | | Ba2 | | 6.75% | | 11/15/11 | | | 1,810 | | | 1,773,800 |
Sungard Data Systems, Inc., Sr. Sub. Notes | | Caa1 | | 10.25% | | 08/15/15 | | | 1,880 | | | 2,006,900 |
Sungard Data Systems, Inc., Sr. Unsec’d. Notes(b)(i) | | Caa1 | | 9.9725% | | 08/15/13 | | | 2,000 | | | 2,077,500 |
Unisys Corp., Sr. Notes | | B2 | | 6.875% | | 03/15/10 | | | 195 | | | 191,588 |
Unisys Corp., Sr. Notes | | B2 | | 8.00% | | 10/15/12 | | | 465 | | | 459,769 |
Xerox Corp., Gtd. Notes | | Baa3 | | 9.75% | | 01/15/09 | | | 590 | | | 637,200 |
Xerox Corp., Sr. Notes | | Baa3 | | 6.875% | | 08/15/11 | | | 1,350 | | | 1,419,188 |
Xerox Corp., Sr. Unsec’d. Notes | | Baa3 | | 6.40% | | 03/15/16 | | | 1,525 | | | 1,557,406 |
| | | | | | | | | | | |
|
|
| | | | | | | | | | | | | 94,865,452 |
| | | | | | | | | | | |
|
|
Telecommunications — 6.6% | | | | | | | | | | | | |
American Cellular Corp., Sr. Notes, Ser. B | | B3 | | 10.00% | | 08/01/11 | | | 1,000 | | | 1,057,500 |
Centennial Communications Corp., Sr. Notes(b) | | B2 | | 8.125% | | 02/01/14 | | | 2,875 | | | 2,950,469 |
Centennial Communications Corp., Sr. Notes | | Caa1 | | 10.00% | | 01/01/13 | | | 225 | | | 239,344 |
Cincinnati Bell, Inc., Gtd. Notes | | Ba3 | | 7.25% | | 07/15/13 | | | 1,275 | | | 1,319,625 |
Cincinnati Bell, Inc., Sr. Sub. Notes(b) | | B2 | | 8.375% | | 01/15/14 | | | 2,590 | | | 2,661,225 |
Citizens Communications Co., Notes | | Ba2 | | 9.25% | | 05/15/11 | | | 2,475 | | | 2,737,969 |
Citizens Communications Co., Sr. Notes(b) | | Ba2 | | 6.25% | | 01/15/13 | | | 4,400 | | | 4,317,500 |
Citizens Communications Co., Sr. Notes | | Ba2 | | 9.00% | | 08/15/31 | | | 1,710 | | | 1,855,350 |
SEE NOTES TO FINANCIAL STATEMENTS.
B75
| | | | |
| | | HIGH YIELD BOND PORTFOLIO (Continued) | | |
SCHEDULE OF INVESTMENTS | December 31, 2006 |
| | | | | | | | | | | | |
CORPORATE BONDS (Continued) | | Moody’s
Rating
(Unaudited)
| | Interest
Rate
| | Maturity
Date
| | Principal
Amount
(000)
| | Value
(Note 2)
|
Telecommunications (cont’d.) | | | | | | | | | | | | |
Cricket Communications Inc., Sr. Notes(b)(j) | | Caa2 | | 9.375% | | 11/01/14 | | $ | 3,525 | | $ | 3,718,875 |
Dobson Cellular Systems, Inc., Sec’d. Notes(b) | | Ba3 | | 8.375% | | 11/01/11 | | | 1,400 | | | 1,475,250 |
Dobson Communications Corp., Sr. Notes(i) | | Caa2 | | 9.6238% | | 10/15/12 | | | 975 | | | 994,500 |
Hawaiian Telcom Communications, Inc., Gtd. Notes, Ser. B(b)(i) | | B3 | | 10.8894% | | 05/01/13 | | | 3,350 | | | 3,350,000 |
Hawaiian Telcom Communications, Inc., Gtd. Notes, Ser. B(b) | | B3 | | 12.50% | | 05/01/15 | | | 2,075 | | | 2,173,563 |
Level 3 Communications Inc., Sr. Notes(b) | | CCC-(f) | | 11.50% | | 03/01/10 | | | 725 | | | 768,500 |
Level 3 Financing Inc., Sr Notes(j) | | B2 | | 9.25% | | 11/01/14 | | | 1,900 | | | 1,938,000 |
Level 3 Financing, Inc., Gtd. Notes(b) | | B2 | | 12.25% | | 03/15/13 | | | 10,950 | | | 12,400,874 |
Metropcs Wireless Inc., Sr. Notes(b)(j) | | Caa2 | | 9.25% | | 11/01/14 | | | 3,850 | | | 4,023,250 |
Nextel Partners, Inc., Sr. Notes | | NR | | 8.125% | | 07/01/11 | | | 5,875 | | | 6,117,344 |
Nordic Telephone Co., Holdings ApS, Sr. Notes, (Denmark)(j) | | B2 | | 8.875% | | 05/01/16 | | | 4,950 | | | 5,296,500 |
Qwest Communications International, Inc., Gtd. Notes, Ser. B | | Ba3 | | 7.50% | | 02/15/14 | | | 6,225 | | | 6,411,750 |
Qwest Corp., Gtd. Notes | | Ba1 | | 7.50% | | 10/01/14 | | | 3,900 | | | 4,134,000 |
Qwest Corp., Debs. | | Ba1 | | 6.875% | | 09/15/33 | | | 1,030 | | | 983,650 |
Qwest Corp., Debs. | | Ba1 | | 7.50% | | 06/15/23 | | | 500 | | | 503,750 |
Qwest Corp., Notes | | Ba1 | | 8.875% | | 03/15/12 | | | 2,375 | | | 2,645,156 |
Qwest Corp., Sr. Notes | | Ba1 | | 7.625% | | 06/15/15 | | | 10,825 | | | 11,582,750 |
Qwest Corp., Sr. Notes | | Ba1 | | 7.875% | | 09/01/11 | | | 7,710 | | | 8,211,150 |
Rogers Wireless, Inc., Debs. (Canada) | | Ba2 | | 9.75% | | 06/01/16 | | | 425 | | | 533,375 |
Rogers Wireless, Inc., Sec’d. Notes (Canada) | | Ba2 | | 6.375% | | 03/01/14 | | | 4,000 | | | 4,050,000 |
Rogers Wireless, Inc., Sec’d. Notes (Canada) | | Ba2 | | 9.625% | | 05/01/11 | | | 1,300 | | | 1,475,500 |
Rogers Wireless, Inc., Sr. Sub. Notes (Canada) | | B1 | | 8.00% | | 12/15/12 | | | 425 | | | 453,688 |
Rural Cellular Corp., Sr. Notes | | B3 | | 9.875% | | 02/01/10 | | | 20 | | | 21,275 |
Time Warner Telecom Holdings, Inc., Gtd. Notes | | B3 | | 9.25% | | 02/15/14 | | | 2,075 | | | 2,217,656 |
UbiquiTel Operating Co., Sr. Notes | | BBB+(f) | | 9.875% | | 03/01/11 | | | 4,300 | | | 4,644,000 |
Windstream Corp., Sr. Notes(j) | | Ba3 | | 8.625% | | 08/01/16 | | | 5,950 | | | 6,515,250 |
| | | | | | | | | | | |
|
|
| | | | | | | | | | | | | 113,778,588 |
| | | | | | | | | | | |
|
|
Tobacco — 0.3% | | | | | | | | | | | | |
RJ Reynolds Tobacco Holdings, Inc., Gtd. Notes | | BB(f) | | 6.50% | | 07/15/10 | | | 1,260 | | | 1,278,099 |
RJ Reynolds Tobacco Holdings, Inc., Gtd. Notes | | Ba3 | | 7.625% | | 06/01/16 | | | 3,400 | | | 3,602,415 |
| | | | | | | | | | | |
|
|
| | | | | | | | | | | | | 4,880,514 |
| | | | | | | | | | | |
|
|
TOTAL CORPORATE BONDS
(cost $1,534,011,996) | | | 1,575,614,763 |
| | | | | | | | | | | |
|
|
FOREIGN GOVERNMENT OBLIGATIONS — 1.5% | | | | | | | | | | | | |
Federal Republic of Argentina, Bonds(i) | | B3 | | 3.00% | | 04/30/13 | | | 4,589 | | | 3,538,408 |
Federal Republic of Argentina, Bonds(i) | | B3 | | 5.59% | | 08/03/12 | | | 2,685 | | | 2,535,136 |
Federal Republic of Brazil, Notes | | Ba2 | | 8.75% | | 02/04/25 | | | 3,350 | | | 4,137,250 |
Federal Republic of Brazil, Unsub. Notes | | Ba2 | | 10.00% | | 08/07/11 | | | 1,920 | | | 2,265,600 |
Federal Republic of Colombia, Notes | | Ba2 | | 10.00% | | 01/23/12 | | | 3,352 | | | 3,938,600 |
Federal Republic of Peru, Bonds(b) | | Ba3 | | 8.375% | | 05/03/16 | | | 3,330 | | | 3,954,375 |
Federal Republic of Philippines, Bonds | | B1 | | 9.375% | | 01/18/17 | | | 5,015 | | | 6,180,987 |
| | | | | | | | | | | |
|
|
TOTAL FOREIGN GOVERNMENT OBLIGATIONS
(cost $23,760,617) | | | 26,550,356 |
| | | | | | | | | | | |
|
|
COMMON STOCKS — 0.2% Cable | | | | | | | | Shares
| | |
Adelphia Business Solutions, Inc.(a)(g) | | | | | | | | | 25,755 | | | 26 |
Classic Communications, Inc.,
(cost $0; purchased 7/21/98)(a)(g)(l) | | | | | | | | | 6,000 | | | 60 |
NTL, Inc.(a) | | | | | | | | | 8,521 | | | 215,070 |
| | | | | | | | | | | |
|
|
| | | | | | | | | | | | | 215,156 |
| | | | | | | | | | | |
|
|
Capital Goods | | | | | | | | | | | | |
Trism, Inc.(a)(g) | | | | | | | | | 82,628 | | | 83 |
| | | | | | | | | | | |
|
|
SEE NOTES TO FINANCIAL STATEMENTS.
B76
| | | | |
| | | HIGH YIELD BOND PORTFOLIO (Continued) | | |
SCHEDULE OF INVESTMENTS | December 31, 2006 |
| | | | | | | |
| COMMON STOCKS (Continued) | | | | Shares
| | Value
(Note 2)
|
Electric | | | | | | | |
York Research Corp.(a)(g) | | | | 4,155 | | $ | 4 |
| | | | | | |
|
|
Food | | | | | | | |
Premium Standard Farms, Inc.,
(cost $202,333; purchased 6/13/05)(g)(l) | | | | 17,260 | | | 320,518 |
| | | | | | |
|
|
Retail | | | | | | | |
Stage Stores, Inc. | | | | 67 | | | 2,036 |
| | | | | | |
|
|
Technology — 0.2% | | | | | | | |
Xerox Corp. | | | | 137,561 | | | 2,331,659 |
| | | | | | |
|
|
Telecommunications | | | | | | | |
IMPSAT Fiber Networks, Inc. (Argentina)(a) | | | | 29,831 | | | 274,744 |
Netia SA (Poland) | | | | 238,168 | | | 414,269 |
| | | | | | |
|
|
| | | | | | | | 689,013 |
| | | | | | |
|
|
TOTAL COMMON STOCKS
(cost $3,587,935) | | | 3,558,469 |
| | | | | | |
|
|
PREFERRED STOCK(a) — 0.6% | | | | | | | |
Building Materials & Construction — 0.1% | | | | | | | |
New Millenium Homes LLC
(cost $0; purchased 7/28/05)(g)(l) | | | | 3,000 | | | 894,000 |
| | | | | | |
|
|
Cable | | | | | | | |
Adelphia Communications Corp., PIK, 13.00%(g) | | | | 5,000 | | | 5 |
PTV, Inc., Ser. A, 10.00% | | | | 13 | | | 49 |
| | | | | | |
|
|
| | | | | | | | 54 |
| | | | | | |
|
|
Food | | | | | | | |
AmeriKing, Inc., PIK, 13.00%(g) | | | | 36,672 | | | 37 |
| | | | | | |
|
|
Media & Entertainment — 0.5% | | | | | | | |
Ion Media Networks, Inc 14.25% | | | | 1,229 | | | 9,094,599 |
| | | | | | |
|
|
TOTAL PREFERRED STOCK
(cost $10,656,293) | | | 9,988,690 |
| | | | | | |
|
|
| | | |
| WARRANTS(a)(g) | | Expiration
Dates
| | Units
| | |
Cable | | | | | | | |
TVN Entertainment
(cost $1,215,008; purchased 3/30/01-3/15/04)(l) | | 8/21/11 | | 9,347 | | | 5,421 |
| | | | | | |
|
|
Chemicals | | | | | | | |
Sterling Chemical Holdings, Inc. | | 8/15/08 | | 560 | | | 1 |
| | | | | | |
|
|
Consumer | | | | | | | |
ICON Fitness Corp. | | 9/27/09 | | 18,093 | | | 181 |
| | | | | | |
|
|
Media & Entertainment | | | | | | | |
XM Satellite Radio, Inc.(j) | | 3/15/10 | | 5,005 | | | 5 |
| | | | | | |
|
|
Technology | | | | | | | |
Viasystems Group, Inc. | | 1/31/10 | | 45,109 | | | 5 |
| | | | | | |
|
|
Telecommunications | | | | | | | |
Allegiance Telecommunications, Inc. | | 2/03/08 | | 3,800 | | | 4 |
GT Group Telecommunications, Inc.,
(cost $0; purchased 1/27/00)(Canada)(j)(l) | | 2/01/10 | | 3,050 | | | 3 |
Price Communications Corp. | | 8/01/07 | | 6,880 | | | 398,083 |
Verado Holdings, Inc., Ser. B | | 4/15/08 | | 1,175 | | | 761 |
Versatel Telecommunications | | 5/15/08 | | 2,000 | | | 2 |
| | | | | | |
|
|
| | | | | | | | 398,853 |
| | | | | | |
|
|
TOTAL WARRANTS
(cost $ 4,213,592) | | | 404,466 |
| | | | | | |
|
|
TOTAL LONG-TERM INVESTMENTS
(cost $1,576,230,433) | | | 1,616,116,744 |
| | | | | | |
|
|
SEE NOTES TO FINANCIAL STATEMENTS.
B77
| | | | |
| | | HIGH YIELD BOND PORTFOLIO (Continued) | | |
SCHEDULE OF INVESTMENTS | December 31, 2006 |
| | | | | | |
SHORT-TERM INVESTMENTS — 18.4% AFFILIATED MUTUAL FUNDS | | Shares
| | Value
(Note 2)
| |
Dryden Core Investment Fund — Short Term Bond Series(e) | | 5,116,910 | | $ | 51,220,266 | |
Dryden Core Investment Fund — Taxable Money market Series
(cost $265,086,153 includes $248,931,952 of cash collateral received for securities lending)(Note 4)(d)(e) | | 265,086,153 | | | 265,086,153 | |
| | | | |
|
|
|
TOTAL SHORT-TERM INVESTMENTS
(cost $316,291,461) | | | 316,306,419 | |
| | | | |
|
|
|
TOTAL INVESTMENTS(m) — 112.3%
(cost $1,892,521,894) | | | 1,932,423,163 | |
LIABILITIES IN EXCESS OF OTHER ASSETS(n) — (12.3)% | | | (211,356,939 | ) |
| | | | |
|
|
|
NET ASSETS — 100.0% | | $ | 1,721,066,224 | |
| | | | |
|
|
|
The following abbreviations are used in portfolio descriptions:
| | |
| LLC | | Limited Liability Company |
| LP | | Limited Partnership |
| MTN | | Medium Term Note |
| NR | | Not Rated by Moody’s or Standard & Poor’s |
| PIK | | Payment-in-kind |
| (a) | Non-income producing security. |
| (b) | All or portion of security is on loan. The aggregate market value of such securities is $242,435,755; cash collateral of $248,931,952 (included in liabilities) was received with which the portfolio purchased highly liquid short-term investments. |
| (c) | Represents issuer in default on interest payments and/or principal repayment; non-income producing security. |
| (d) | Represents security, or a portion thereof, purchased with cash collateral received for securities on loan. |
| (e) | Prudential Investments LLC, the manager of the Portfolio, also serves as manager of the Dryden Core Investment Fund – Short-Term Bond Series and the Dryden Core Investment Fund – Taxable Money Market Series. |
| (f) | Standard & Poor’s rating. |
| (g) | Indicates a security that has been deemed illiquid. |
| (h) | Amount is actual; not rounded to thousands. |
| (i) | Indicates a variable rate security. The maturity date presented for these instruments is the latter of the next date on which the security can be redeemed at par or the next date on which the rate of interest is adjusted. The interest rate shown reflects the rate in effect at December 31, 2006. |
| (j) | Security was purchased pursuant to Rule 144A under the Securities Act of 1933 and may not be resold subject to that rule except to qualified institutional buyers. Unless otherwise noted, 144A securities are deemed to be liquid. |
| (k) | Interest rate reflected represents the rate that would be in effect from the date the bond steps up from zero to an interest paying bond. |
| (l) | Indicates a restricted security; the aggregate cost of such securities is $14,166,912. The aggregate value of $13,694,271 is approximately 0.8% of net assets. |
| (m) | As of December 31, 2006, nine securities representing $1,496,541 and 0.1% of the net assets were fair valued in accordance with the policies adopted by the Board of Directors. |
| (n) | Liabilities in excess of other assets include credit default swaps as follows: |
Credit default swap agreement outstanding at December 31, 2006:
| | | | | | | | | | | | | |
Counterparty (1)
| | Termination
Date
| | Notional
Amount
(000)
| | Fixed
Rate
| | | Underlying Bond
| | Unrealized
Appreciation
|
Merrill Lynch Capital Services, Inc. | | 9/20/2009 | | $ | 2,000 | | 4.65 | % | | General Motors Corp. 7.125%, 7/15/13 | | $ | 97,463 |
Morgan Stanley Capital Services, Inc. | | 9/20/2010 | | | 2,500 | | 4.20 | % | | Lear Corp., 8.11%, 5/15/08 | | | 91,781 |
| | | | | | | | | | | | |
|
|
| | | | | | | | | | | | | $ | 189,244 |
| | | | | | | | | | | | |
|
|
| (1) | The portfolio receives the fixed rate and pays the counterparty par in the event that the underlying bond defaults. |
SEE NOTES TO FINANCIAL STATEMENTS.
B78
| | | | |
| | | HIGH YIELD BOND PORTFOLIO (Continued) | | |
SCHEDULE OF INVESTMENTS | December 31, 2006 |
The industry classification of long-term portfolio holdings, short-term investments and liabilities in excess of other assets shown as a percentage of net assets as of December 31, 2006 was as follows:
| | | |
Affiliated Mutual Funds (including 14.5% of collateral received for securities on loan) | | 18.4 | % |
Electric | | 7.6 | |
Health Care & Pharmaceutical | | 7.6 | |
Media & Entertainment | | 6.9 | |
Telecommunications | | 6.6 | |
Technology | | 5.5 | |
Capital Goods | | 5.4 | |
Gaming | | 5.4 | |
Automotive | | 5.0 | |
Cable | | 4.4 | |
Pipelines & Other | | 4.3 | |
Metals | | 4.0 | |
Paper | | 3.5 | |
Chemicals | | 3.4 | |
Energy — Other | | 3.1 | |
Packaging | | 2.8 | |
Aerospace/Defense | | 2.4 | |
Foods | | 2.3 | |
Non Captive Finance | | 2.2 | |
Consumer | | 2.1 | |
Retailers | | 1.9 | |
Lodging | | 1.7 | |
Foreign Government Obligations | | 1.5 | |
Building Materials & Construction | | 1.3 | |
Preferred Stock | | 0.6 | |
Airlines | | 0.4 | |
Banking | | 0.4 | |
Foreign Agencies | | 0.4 | |
Health Care Insurance | | 0.4 | |
Tobacco | | 0.3 | |
Common Stock | | 0.2 | |
Energy — Integrated | | 0.2 | |
Railroads | | 0.1 | |
| | |
|
|
| | | 112.3 | |
Liabilities in excess of other assets | | (12.3 | ) |
| | |
|
|
| | | 100.0 | % |
| | |
|
|
SEE NOTES TO FINANCIAL STATEMENTS.
B79
SCHEDULE OF INVESTMENTS | December 31, 2006 |
| | | | | |
| LONG-TERM INVESTMENTS — 99.3% | | Value (Note 2)
|
| COMMON STOCKS | | Shares
| |
Aerospace & Defense — 3.4% | | | | | |
Boeing Co. | | 520,600 | | $ | 46,250,104 |
United Technologies Corp.(b) | | 408,300 | | | 25,526,916 |
| | | | |
|
|
| | | | | | 71,777,020 |
| | | | |
|
|
Beverages — 2.7% | | | | | |
PepsiCo, Inc. | | 919,500 | | | 57,514,725 |
| | | | |
|
|
Biotechnology — 6.0% | | | | | |
Amgen, Inc.(a) | | 306,600 | | | 20,943,846 |
Genentech, Inc.(a) | | 566,400 | | | 45,952,032 |
Gilead Sciences, Inc.(a)(b) | | 918,600 | | | 59,644,698 |
| | | | |
|
|
| | | | | | 126,540,576 |
| | | | |
|
|
Capital Markets — 7.3% | | | | | |
Charles Schwab Corp. (The) | | 1,651,700 | | | 31,943,878 |
Goldman Sachs Group, Inc. (The) | | 189,700 | | | 37,816,695 |
Merrill Lynch & Co., Inc.(b) | | 298,600 | | | 27,799,660 |
UBS AG | | 934,500 | | | 56,378,385 |
| | | | |
|
|
| | | | | | 153,938,618 |
| | | | |
|
|
Chemicals — 0.8% | | | | | |
Monsanto Co. | | 328,700 | | | 17,266,611 |
| | | | |
|
|
Communications Equipment — 8.8% | | | | | |
Cisco Systems, Inc.(a) | | 2,495,800 | | | 68,210,214 |
Corning, Inc.(a) | | 662,500 | | | 12,395,375 |
Motorola, Inc. | | 727,100 | | | 14,949,176 |
QUALCOMM, Inc. | | 1,347,500 | | | 50,922,025 |
Research In Motion Ltd.(a) | | 295,900 | | | 37,810,102 |
| | | | |
|
|
| | | | | | 184,286,892 |
| | | | |
|
|
Computers & Peripherals — 3.8% | | | | | |
Apple Computer, Inc.(a) | | 652,700 | | | 55,375,068 |
Hewlett-Packard Co. | | 604,000 | | | 24,878,760 |
| | | | |
|
|
| | | | | | 80,253,828 |
| | | | |
|
|
Consumer Finance — 1.4% | | | | | |
American Express Co. | | 483,900 | | | 29,358,213 |
| | | | |
|
|
Diversified Financial Services — 2.4% | | | | | |
IntercontinentalExchange, Inc.(a)(b) | | 158,100 | | | 17,058,990 |
NYSE Group, Inc.(a)(b) | | 335,100 | | | 32,571,720 |
| | | | |
|
|
| | | | | | 49,630,710 |
| | | | |
|
|
Energy Equipment & Services — 1.1% | | | | | |
Schlumberger Ltd. | | 349,500 | | | 22,074,420 |
| | | | |
|
|
Food & Staples Retailing — 1.0% | | | | | |
Whole Foods Market, Inc.(b) | | 430,000 | | | 20,179,900 |
| | | | |
|
|
Health Care Equipment & Supplies — 4.4% | | | |
Alcon, Inc. | | 440,900 | | | 49,279,393 |
Baxter International, Inc. | | 101,300 | | | 4,699,307 |
St. Jude Medical, Inc.(a) | | 1,068,100 | | | 39,049,736 |
| | | | |
|
|
| | | | | | 93,028,436 |
| | | | |
|
|
Health Care Providers & Services — 3.2% | | | |
UnitedHealth Group, Inc. | | 499,800 | | | 26,854,254 |
WellPoint, Inc.(a) | | 500,000 | | | 39,345,000 |
| | | | |
|
|
| | | | | | 66,199,254 |
| | | | |
|
|
Hotels, Restaurants & Leisure — 3.6% | | | | | |
Chipotle Mexican Grill, Inc.
(Class “A” Stock)(a)(b) | | 79,000 | | | 4,503,000 |
| | | | | |
| COMMON STOCKS | | Value (Note 2)
|
| (Continued) | | Shares
| |
Hotels, Restaurants & Leisure (cont’d.) | | | | | |
International Game Technology(b) | | 198,300 | | $ | 9,161,460 |
Marriott International, Inc.
(Class “A” Stock) | | 782,000 | | | 37,317,040 |
Starbucks Corp.(a)(b) | | 681,700 | | | 24,145,814 |
| | | | |
|
|
| | | | | | 75,127,314 |
| | | | |
|
|
Household Products — 1.8% | | | | | |
Procter & Gamble Co. | | 601,457 | | | 38,655,641 |
| | | | |
|
|
Industrial Conglomerates — 2.3% | | | | | |
General Electric Co. | | 1,280,700 | | | 47,654,847 |
| | | | |
|
|
Insurance — 3.2% | | | | | |
American International Group, Inc. | | 938,700 | | | 67,267,242 |
| | | | |
|
|
Internet Software & Services — 4.1% | | | | | |
Google, Inc. (Class “A” Stock)(a) | | 185,900 | | | 85,603,232 |
| | | | |
|
|
IT Services — 1.0% | | | | | |
Infosys Technologies Ltd., ADR (India) | | 396,700 | | | 21,643,952 |
| | | | |
|
|
Media — 4.7% | | | | | |
News Corp. (Class “A” Stock) | | 1,480,600 | | | 31,803,288 |
Walt Disney Co. (The) | | 1,933,400 | | | 66,257,618 |
| | | | |
|
|
| | | | | | 98,060,906 |
| | | | |
|
|
Multiline Retail — 3.4% | | | | | |
Federated Department Stores, Inc. | | 611,600 | | | 23,320,308 |
Kohl’s Corp.(a) | | 194,000 | | | 13,275,420 |
Target Corp. | | 598,700 | | | 34,155,835 |
| | | | |
|
|
| | | | | | 70,751,563 |
| | | | |
|
|
Oil, Gas & Consumable Fuels — 2.0% | | | | | |
Occidental Petroleum Corp. | | 464,200 | | | 22,666,886 |
Suncor Energy, Inc.(b) | | 243,000 | | | 19,175,130 |
| | | | |
|
|
| | | | | | 41,842,016 |
| | | | |
|
|
Pharmaceuticals — 8.1% | | | | | |
Abbott Laboratories | | 737,000 | | | 35,899,270 |
Novartis AG, ADR (Switzerland) | | 730,200 | | | 41,942,688 |
Roche Holdings Group, ADR (Switzerland) | | 715,100 | | | 63,999,877 |
Wyeth | | 529,000 | | | 26,936,680 |
| | | | |
|
|
| | | | | | 168,778,515 |
| | | | |
|
|
Semiconductors & Semiconductor Equipment — 3.1% |
Broadcom Corp.
(Class “A” Stock)(a)(b) | | 958,300 | | | 30,962,673 |
Marvell Technology Group Ltd.(a)(b) | | 1,815,600 | | | 34,841,364 |
| | | | |
|
|
| | | | | | 65,804,037 |
| | | | |
|
|
Software — 9.7% | | | | | |
Adobe Systems, Inc.(a) | | 1,639,500 | | | 67,416,240 |
Electronic Arts, Inc.(a)(b) | | 562,900 | | | 28,347,644 |
Microsoft Corp. | | 2,503,000 | | | 74,739,580 |
SAP AG, ADR (Germany)(b) | | 612,200 | | | 32,507,820 |
| | | | |
|
|
| | | | | | 203,011,284 |
| | | | |
|
|
Specialty Retail — 1.2% | | | | | |
Lowe’s Cos., Inc.(b) | | 815,200 | | | 25,393,480 |
| | | | |
|
|
SEE NOTES TO FINANCIAL STATEMENTS.
B80
| | | | |
| | | JENNISON PORTFOLIO (Continued) | | |
SCHEDULE OF INVESTMENTS | December 31, 2006 |
| | | | | | |
| COMMON STOCKS | | Value (Note 2)
| |
| (Continued) | | Shares
| |
Textiles, Apparel & Luxury Goods — 3.7% | | | | |
Coach, Inc.(a) | | 1,093,900 | | $ | 46,993,944 | |
NIKE, Inc. (Class “B” Stock) | | 299,400 | | | 29,649,582 | |
| | | | |
|
|
|
| | | | | | 76,643,526 | |
| | | | |
|
|
|
Wireless Telecommunication Services — 1.1% | | | | |
NII Holdings, Inc.(a)(b) | | 373,400 | | | 24,061,896 | |
| | | | |
|
|
|
TOTAL LONG-TERM INVESTMENTS
(cost $1,596,328,686) | | | 2,082,348,654 | |
| | | | |
|
|
|
| SHORT-TERM INVESTMENT — 10.4% | | | | |
Affiliated Money Market Mutual Fund | | | | |
Dryden Core Investment Fund —Taxable Money Market Series
(cost $217,419,846; includes $198,460,608 of cash collateral received for securities on loan) (Note 4)(c)(d) | | 217,419,846 | | | 217,419,846 | |
| | | | |
|
|
|
TOTAL INVESTMENTS — 109.7%
(cost $1,813,748,532) | | | 2,299,768,500 | |
| | | | |
|
|
|
LIABILITIES IN EXCESS OF
OTHER ASSETS — (9.7)% | | | (202,879,485 | ) |
| | | | |
|
|
|
TOTAL NET ASSETS — 100.0% | | $ | 2,096,889,015 | |
| | | | |
|
|
|
The following abbreviation is used in portfolio descriptions:
| | |
| ADR | | American Depositary Receipt |
| (a) | Non-income producing security. |
| (b) | All or portion of security is on loan. The aggregate market value of such securities is $191,121,962; cash collateral of $198,460,608 (included in liabilities) was received with which the Portfolio purchased highly liquid short-term investments. |
| (c) | Represents security, or a portion thereof, purchased with cash collateral received for securities on loan. |
| (d) | Prudential Investments LLC, the manager of the portfolio, also serves as manager of the Dryden Core Investment Fund-Taxable Money Market Series. |
The industry classification of portfolio holdings and liabilities in excess of other assets shown as a percentage of net assets as of December 31, 2006 were as follows:
| | | |
Affiliated Money Market Mutual Fund (including 9.5% of collateral received for securities on loan) | | 10.4 | % |
Software | | 9.7 | |
Communications Equipment | | 8.8 | |
Pharmaceuticals | | 8.1 | |
Capital Markets | | 7.3 | |
Biotechnology | | 6.0 | |
Media | | 4.7 | |
Health Care Equipment & Supplies | | 4.4 | |
Internet Software & Services | | 4.1 | |
Computers & Peripherals | | 3.8 | |
Textiles, Apparel & Luxury Goods | | 3.7 | |
Hotels, Restaurants & Leisure | | 3.6 | |
Aerospace & Defense | | 3.4 | |
Multiline Retail | | 3.4 | |
Health Care Providers & Services | | 3.2 | |
Insurance | | 3.2 | |
Semiconductors & Semiconductor Equipment | | 3.1 | |
Beverages | | 2.7 | |
Diversified Financial Services | | 2.4 | |
Industrial Conglomerates | | 2.3 | |
Oil, Gas & Consumable Fuels | | 2.0 | |
Household Products | | 1.8 | |
Consumer Finance | | 1.4 | |
Specialty Retail | | 1.2 | |
Energy Equipment & Services | | 1.1 | |
Wireless Telecommunication Services | | 1.1 | |
Food & Staples Retailing | | 1.0 | |
IT Services | | 1.0 | |
Chemicals | | 0.8 | |
| | |
|
|
| | | 109.7 | |
Liabilities in excess of other assets | | (9.7 | ) |
| | |
|
|
| | | 100.0 | % |
| | |
|
|
SEE NOTES TO FINANCIAL STATEMENTS.
B81
SCHEDULE OF INVESTMENTS | December 31, 2006 |
| | | | | | | | | | |
| | | Interest
Rate
| | Maturity
Date
| | Principal
Amount
(000)
| | Value
(Note 2)
|
Certificates of Deposit — 19.2% | | | | | | | | | | |
Barclays Bank PLC | | 5.295% | | 04/05/07 | | $ | 30,000 | | $ | 29,998,332 |
Branch Banking and Trust Co. | | 5.240% | | 06/08/07 | | | 25,000 | | | 25,000,000 |
HBOS Treasury Services PLC | | 5.315% | | 04/27/07 | | | 15,000 | | | 15,000,000 |
Nordea Bank AB | | 5.700% | | 06/28/07 | | | 14,000 | | | 14,000,000 |
Suntrust Banks, Inc.(a) | | 5.300% | | 02/09/07 | | | 20,000 | | | 19,999,791 |
Toronto Dominion Bank NY | | 5.405% | | 02/20/07 | | | 20,000 | | | 20,000,135 |
Unicredito Italiano New York | | 5.425% | | 02/28/07 | | | 50,000 | | | 50,000,000 |
Wells Fargo Bank NA | | 4.880% | | 02/01/07 | | | 10,000 | | | 10,000,000 |
Wells Fargo Bank NA | | 5.240% | | 04/11/07 | | | 20,000 | | | 20,000,000 |
| | | | | | | | | |
|
|
| | | | | | | | | | | 203,998,258 |
| | | | | | | | | |
|
|
Commercial Paper — 37.3% | | | | | | | | | | |
Alliance Leicester plc 144A(c)(d) | | 5.370% | | 02/26/07 | | | 25,000 | | | 24,795,639 |
Alliance Leicester plc 144A(c)(d) | | 5.370% | | 04/11/07 | | | 11,500 | | | 11,332,611 |
Amsterdam Funding Corp. 144A(c)(d) | | 5.390% | | 01/19/07 | | | 25,000 | | | 24,934,375 |
Amsterdam Funding Corp. 144A(c)(d) | | 5.390% | | 01/25/07 | | | 8,100 | | | 8,071,218 |
Barton Capital Corp. 144A(c)(d) | | 5.390% | | 02/09/07 | | | 1,500 | | | 1,491,485 |
Bear Stearns Co.(d) | | 5.350% | | 02/27/07 | | | 25,000 | | | 24,792,188 |
Bryant Park Funding 144A(c)(d) | | 5.380% | | 02/28/07 | | | 20,000 | | | 19,830,833 |
Caisse Nationale Des Caisses D’Epargne 144A(c)(d) | | 5.350% | | 02/02/07 | | | 38,000 | | | 37,823,342 |
Caisse Nationale Des Caisses D’Epargne 144A(c)(d) | | 5.360% | | 02/22/07 | | | 25,000 | | | 24,809,333 |
Citigroup Funding, Inc.(d) | | 5.350% | | 02/05/07 | | | 40,000 | | | 39,795,445 |
Countrywide Financial Corp.(d) | | 5.460% | | 01/23/07 | | | 10,000 | | | 9,967,306 |
Countrywide Financial Corp.(d) | | 5.350% | | 02/02/07 | | | 8,000 | | | 7,962,169 |
Dexia Delaware LLC(d) | | 5.360% | | 02/20/07 | | | 1,200 | | | 1,191,167 |
Edison Asset Securitization LLC 144A(c)(d) | | 5.380% | | 03/05/07 | | | 25,000 | | | 24,772,938 |
Falcon Asset Securitization Corp. 144A(c)(d) | | 5.340% | | 01/30/07 | | | 1,243 | | | 1,237,663 |
Falcon Asset Securitization Corp. 144A(c)(d) | | 5.400% | | 02/22/07 | | | 10,000 | | | 9,923,589 |
HBOS(d) | | 5.360% | | 02/20/07 | | | 3,300 | | | 3,275,708 |
Hewlett- Packard Co. 144A(c)(d) | | 5.350% | | 01/31/07 | | | 6,000 | | | 5,973,400 |
ING America Insurance Holdings(d) | | 5.360% | | 02/21/07 | | | 25,000 | | | 24,814,063 |
Jupiter Securitization Corp. 144A(c)(d) | | 5.310% | | 01/23/07 | | | 4,345 | | | 4,330,927 |
Kredietbank NA 144A(c)(d) | | 5.350% | | 03/01/07 | | | 16,000 | | | 15,862,596 |
Long Lane Master Trust 144A(c)(d) | | 5.340% | | 01/22/07 | | | 4,606 | | | 4,591,706 |
Long Lane Master Trust 144A(c)(d) | | 5.390% | | 02/05/07 | | | 4,791 | | | 4,766,266 |
Long Lane Master Trust 144A(c)(d) | | 5.400% | | 02/20/07 | | | 5,566 | | | 5,525,105 |
Old Line Funding Corp. 144A(c)(d) | | 5.390% | | 01/10/07 | | | 3,056 | | | 3,051,874 |
Old Line Funding Corp. 144A(c)(d) | | 5.390% | | 02/07/07 | | | 6,194 | | | 6,160,196 |
Old Line Funding Corp. 144A(c)(d) | | 5.390% | | 01/22/07 | | | 6,023 | | | 6,004,273 |
Prudential plc 144A(c)(d) | | 5.350% | | 01/30/07 | | | 7,000 | | | 6,970,339 |
San Paolo IMI US(d) | | 5.380% | | 04/27/07 | | | 1,000 | | | 983,083 |
Societe Generale NA(d) | | 5.360% | | 02/16/07 | | | 1,400 | | | 1,390,519 |
Swedbank Mortgage AB(d) | | 5.350% | | 01/31/07 | | | 1,050 | | | 1,045,345 |
Toyota Motor Credit Corp.(d) | | 5.380% | | 06/08/07 | | | 1,000 | | | 977,266 |
Toyota Motor Credit Corp.(d) | | 5.380% | | 06/11/07 | | | 25,000 | | | 24,420,847 |
Windmill Funding Corp. 144A(c)(d) | | 5.390% | | 01/31/07 | | | 3,000 | | | 2,986,875 |
| | | | | | | | | |
|
|
| | | | | | | | | | | 395,861,689 |
| | | | | | | | | |
|
|
Loan Participation — 1.9% | | | | | | | | | | |
Cargill Global Funding PLC(b) | | 5.350% | | 01/31/07 | | | 20,000 | | | 20,000,000 |
| | | | | | | | | |
|
|
Other Corporate Obligations — 41.3% | | | | | | | | | | |
American Express Credit Corp. M.T.N.(a) | | 5.370% | | 01/12/07 | | | 2,000 | | | 2,000,569 |
American Express Credit Corp. M.T.N.(a) | | 5.450% | | 01/04/07 | | | 27,000 | | | 27,004,966 |
BMW US Capital LLC 144A(a)(c) | | 5.330% | | 01/05/07 | | | 10,000 | | | 10,000,000 |
Caja Ahorro Monte Madrid(a) | | 5.369% | | 01/19/07 | | | 13,000 | | | 13,000,000 |
General Electric Capital Corp. M.T.N.(a) | | 5.475% | | 01/17/07 | | | 21,000 | | | 21,000,000 |
General Electric Capital Corp.(a) | | 5.475% | | 01/09/07 | | | 11,750 | | | 11,750,000 |
Genworth Life Insurance Co.(a)(b)(e)
(cost $11,000,000; purchased 12/26/06) | | 5.430% | | 01/24/07 | | | 11,000 | | | 11,000,000 |
SEE NOTES TO FINANCIAL STATEMENTS.
B82
| | | | |
| | | MONEY MARKET PORTFOLIO (Continued) | | |
SCHEDULE OF INVESTMENTS | December 31, 2006 |
| | | | | | | | | | |
| | | Interest
Rate
| | Maturity
Date
| | Principal
Amount
(000)
| | Value
(Note 2)
|
Other Corporate Obligations (cont’d.) | | | | | | | | | | |
Goldman Sachs & Co., Inc. M.T.N. | | 5.4637% | | 03/30/07 | | $ | 43,000 | | $ | 43,011,244 |
HSBC Finance Corp. M.T.N. | | 5.4144% | | 02/10/07 | | | 20,000 | | | 20,002,676 |
HSBC USA, Inc. M.T.N.(a) | | 5.350% | | 01/16/07 | | | 30,000 | | | 30,000,000 |
Irish Life and Permanent PLC M.T.N. 144A (a)(c) | | 5.390% | | 01/22/07 | | | 25,000 | | | 24,998,953 |
JPMorgan Chase & Co. M.T.N.(a) | | 5.320% | | 01/02/07 | | | 13,000 | | | 13,000,000 |
Merrill Lynch & Co., Inc. M.T.N.(a) | | 5.600% | | 01/11/07 | | | 34,000 | | | 34,003,524 |
Metropolitan Life Insurance Co.(a)(b)(e)
(cost $5,000,000; purchased 10/2/06) | | 5.4094% | | 01/02/07 | | | 5,000 | | | 5,000,000 |
Metropolitan Life Insurance Co.(a)(b)(e)
(cost $9,000,000; purchased 2/1/06) | | 5.4413% | | 02/01/07 | | | 9,000 | | | 9,000,000 |
Metropolitan Life Insurance Co. of Connecticut(a)(b)(e)
(cost $6,000,000; purchased 7/7/06) | | 5.410% | | 01/08/07 | | | 6,000 | | | 6,000,000 |
Morgan Stanley, Inc. M.T.N.(a) | | 5.370% | | 01/03/07 | | | 31,000 | | | 31,000,000 |
Nationwide Building Society 144A(a)(c) | | 5.4425% | | 03/28/07 | | | 15,000 | | | 15,006,018 |
Nordea Bank AB 144A(a)(c) | | 5.360% | | 01/11/07 | | | 20,000 | | | 20,000,000 |
Paccar Financial Corp. M.T.N(a) | | 5.330% | | 01/02/07 | | | 10,000 | | | 10,000,000 |
Pacific Life Insurance Co. (a)(b)(e)
(cost $7,000,000; purchased 6/15/06) | | 5.4806% | | 03/18/07 | | | 7,000 | | | 7,000,000 |
Royal Bank of Canada M.T.N.(a) | | 5.400% | | 01/10/07 | | | 5,000 | | | 5,000,000 |
Skandinaviska Enskilda Banken AB 144A(a)(c) | | 5.350% | | 01/18/07 | | | 36,000 | | | 36,000,000 |
Suntrust Banks, Inc.(a) | | 5.4538% | | 01/09/07 | | | 20,000 | | | 20,017,349 |
Westpac Banking Corp. M.T.N.(a) | | 5.393% | | 03/12/07 | | | 13,000 | | | 12,999,944 |
| | | | | | | | | |
|
|
| | | | | | | | | | | 437,795,243 |
| | | | | | | | | |
|
|
TOTAL INVESTMENTS — 99.7%
(amortized cost $1,057,655,190) | | | 1,057,655,190 |
OTHER ASSETS IN EXCESS OF LIABILITIES — 0.3% | | | 2,868,613 |
| | | | | | | | | |
|
|
TOTAL NET ASSETS — 100.0% | | $ | 1,060,523,803 |
| | | | | | | | | |
|
|
The industry classification of portfolio holdings and other assets in excess of liabilities shown as a percentage of nets assets as of December 31, 2006 was as follows:
| | | |
Foreign Banks | | 22.8 | % |
Commercial Banks | | 20.8 | |
Asset Backed Securities | | 12.7 | |
Security Broker & Dealers | | 12.5 | |
Finance Services | | 11.8 | |
Non Captive Finance | | 8.7 | |
Insurance | | 6.6 | |
Automotive | | 3.3 | |
Computers | | 0.5 | |
| | |
|
|
| | | 99.7 | |
Other assets in excess of liabilities | | 0.3 | |
| | |
|
|
| | | 100.0 | % |
| | |
|
|
The following abbreviation is used in portfolio descriptions:
| (a) | Indicates a variable rate security. The maturity date presented for these instruments is the later of the next date on which the security can be redeemed at par or the next date on which the rate of interest is adjusted. The interest rate shown reflects the rate in effect at December 31, 2006. |
| (b) | Indicates an illiquid security. |
| (c) | Securities were purchased pursuant to Rule 144A under the Securities Act of 1933 and may not be resold subject to that rule except to qualified institutional buyers. Unless otherwise noted, 144A securities are deemed to be liquid. |
| (d) | Rate quoted represents yield-to-maturity as of purchase date. |
| (e) | Indicates a restricted security; the aggregate cost of such securities is $38,000,000. The aggregate value of $38,000,000 is approximately 3.6% of net assets. |
SEE NOTES TO FINANCIAL STATEMENTS.
B83
| | | | |
| | | NATURAL RESOURCES PORTFOLIO | | |
SCHEDULE OF INVESTMENTS | December 31, 2006 |
| | | | | |
| LONG-TERM INVESTMENTS — 98.6% | | Value
(Note 2)
|
| COMMON STOCKS — 97.5% | | Shares
| |
All Other Basic Metals — 2.8% | | | | | |
Anhui Conch Cement Co. Ltd. (Class H) (China) | | 3,626,000 | | $ | 12,077,505 |
Cameco Corp. (Canada) | | 529,000 | | | 21,411,310 |
| | | | |
|
|
| | | | | | 33,488,815 |
| | | | |
|
|
Aluminum — 1.6% | | | | | |
Century Aluminum Co.(a)(b) | | 431,600 | | | 19,270,940 |
| | | | |
|
|
Coal — 2.2% | | | | | |
Alpha Natural Resources, Inc.(a)(b) | | 422,800 | | | 6,016,444 |
CONSOL Energy, Inc.(b) | | 647,600 | | | 20,807,388 |
| | | | |
|
|
| | | | | | 26,823,832 |
| | | | |
|
|
Copper — 7.0% | | | | | |
First Quantum Minerals Ltd. (Canada) | | 424,900 | | | 22,863,675 |
Freeport-McMoRan Copper & Gold, Inc. (Class B) | | 446,600 | | | 24,889,019 |
Peru Copper, Inc. (Canada)(a) | | 849,800 | | | 2,900,316 |
Phelps Dodge Corp. | | 207,300 | | | 24,817,956 |
Southern Copper Corp.(b) | | 183,400 | | | 9,883,426 |
| | | | |
|
|
| | | | | | 85,354,392 |
| | | | |
|
|
Diversified Exploration & Production — 7.5% |
Anadarko Petroleum Corp. | | 342,800 | | | 14,918,656 |
Apache Corp. | | 88,900 | | | 5,912,739 |
Canadian Natural Resources Ltd. | | 134,300 | | | 7,148,789 |
Denbury Resources, Inc.(a) | | 382,300 | | | 10,624,117 |
Endeavour International Corp.(a)(b) | | 744,100 | | | 1,703,989 |
McMoRan Exploration Co.(a)(b) | | 393,500 | | | 5,595,570 |
Newfield Exploration Co.(a) | | 221,900 | | | 10,196,305 |
Plains Exploration & Production Co.(a) | | 270,900 | | | 12,875,877 |
Talisman Energy, Inc. | | 605,300 | | | 10,284,047 |
Warren Resources, Inc.(a)(b) | | 995,600 | | | 11,668,432 |
| | | | |
|
|
| | | | | | 90,928,521 |
| | | | |
|
|
Diversified Metals & Mining — 1.9% | | | | | |
African Rainbow Minerals Ltd. (South Africa)(a) | | 552,800 | | | 7,961,045 |
First Uranium Corp., 144 A (South Africa)(a)(h) | | 400,000 | | | 2,776,056 |
First Uranium Corp. (South Africa)(a) | | 177,800 | | | 1,247,214 |
FNX Mining Co., Inc. (Canada)(a) | | 336,900 | | | 5,297,806 |
FNX Mining Co., Inc., 144A (Canada)(a)(h) | | 56,300 | | | 862,434 |
Northern Dynasty Minerals Ltd.(a)(b) | | 671,000 | | | 5,435,100 |
| | | | |
|
|
| | | | | | 23,579,655 |
| | | | |
|
|
Diversified Resources — 2.4% | | | | | |
Cia Vale do Rio Doce, ADR (Brazil) | | 454,000 | | | 13,501,960 |
Evergreen Solar, Inc.(a)(b) | | 134,600 | | | 1,018,922 |
SXR Uranium One, Inc. (Canada)(a)(b) | | 1,099,080 | | | 15,079,775 |
| | | | |
|
|
| | | | | | 29,600,657 |
| | | | |
|
|
| | | | | |
| COMMON STOCKS | | Value
(Note 2)
|
| (Continued) | | Shares
| |
Drillers — 7.9% | | | | | |
ENSCO International, Inc. | | 441,800 | | $ | 22,116,508 |
GlobalSantaFe Corp. | | 336,900 | | | 19,802,982 |
Noble Corp. | | 306,100 | | | 23,309,515 |
Transocean, Inc.(a) | | 369,800 | | | 29,913,122 |
| | | | |
|
|
| | | | | | 95,142,127 |
| | | | |
|
|
Energy Services — 15.4% | | | | | |
Baker Hughes, Inc. | | 168,700 | | | 12,595,142 |
Cameron International Corp.(a) | | 333,000 | | | 17,665,650 |
CARBO Ceramics, Inc.(b) | | 143,500 | | | 5,362,595 |
Grant Prideco, Inc.(a) | | 363,900 | | | 14,472,303 |
Halliburton Co. | | 785,200 | | | 24,380,460 |
Hornbeck Offshore Services, Inc.(a)(b) | | 173,300 | | | 6,186,810 |
KBR, Inc.(a)(b) | | 142,400 | | | 3,725,184 |
National-Oilwell Varco, Inc.(a) | | 496,200 | | | 30,357,517 |
Schlumberger Ltd. | | 275,400 | | | 17,394,264 |
SEACOR Holdings, Inc.(a)(b) | | 152,200 | | | 15,089,108 |
Smith International, Inc. | | 288,700 | | | 11,856,909 |
Superior Energy Services, Inc.(a) | | 458,800 | | | 14,993,584 |
Tenaris SA, ADR (Luxembourg) | | 249,500 | | | 12,447,555 |
| | | | |
|
|
| | | | | | 186,527,081 |
| | | | |
|
|
Gold — 15.2% | | | | | |
AXMIN, Inc. (Canada)(a) | | 4,169,900 | | | 3,540,026 |
Barrick Gold Corp. | | 615,494 | | | 18,895,666 |
Cia de Minas Buenaventura SA, ADR (Peru) | | 563,500 | | | 15,811,810 |
Crystallex International Corp.(a)(b) | | 2,447,300 | | | 8,859,226 |
Eldorado Gold Corp. (Canada)(a) | | 2,713,000 | | | 14,679,955 |
European Goldfields Ltd. (Canada)(a) | | 3,041,600 | | | 12,623,885 |
Gabriel Resources Ltd. (Canada)(a) | | 1,834,900 | | | 7,961,749 |
Gammon Lake Resources, Inc. (Canada)(a) | | 852,000 | | | 13,874,270 |
Gold Reserve, Inc.(a) | | 131,900 | | | 619,827 |
Goldcorp, Inc. | | 664,677 | | | 18,903,414 |
Greystar Resources Ltd. (Canada)(a) | | 587,800 | | | 4,783,452 |
Highland Gold Mining Ltd. (United Kingdom)(a) | | 974,300 | | | 3,052,259 |
IAMGOLD Corp. (Canada) | | 1,063,700 | | | 9,413,355 |
Lihir Gold Ltd., ADR
(Papua New Guinea)(a) | | 746,000 | | | 18,411,280 |
Nevsun Resources Ltd. (Canada)(a) | | 1,137,400 | | | 2,487,133 |
Newcrest Mining Ltd. (Australia) | | 1,113,691 | | | 23,064,953 |
Orezone Resources, Inc. (Canada)(a) | | 1,472,300 | | | 2,083,175 |
SEMAFO, Inc., 144A (Canada)(a)(f)(h) | | 3,216,300 | | | 4,688,685 |
| | | | |
|
|
| | | | | | 183,754,120 |
| | | | |
|
|
Integrated Oil/Domestic — 3.2% | | | | | |
Hess Corp. | | 346,800 | | | 17,190,876 |
Occidental Petroleum Corp. | | 437,200 | | | 21,348,476 |
| | | | |
|
|
| | | | | | 38,539,352 |
| | | | |
|
|
SEE NOTES TO FINANCIAL STATEMENTS.
B84
| | | | |
| | | NATURAL RESOURCES PORTFOLIO (Continued) | | |
SCHEDULE OF INVESTMENTS | December 31, 2006 |
| | | | | |
COMMON STOCKS
(Continued) | | Shares
| | Value
(Note 2)
|
Integrated Oil/International — 3.4% | | | |
Petroleo Brasileiro SA, ADR (Brazil) | | 174,400 | | $ | 17,961,456 |
Sasol Ltd., ADR (South Africa) | | 613,000 | | | 22,619,700 |
| | | | |
|
|
| | | | | | 40,581,156 |
| | | | |
|
|
Iron & Steel — 2.1% | | | | | |
Cleveland-Cliffs, Inc.(b) | | 215,300 | | | 10,429,132 |
MMX Mineracao e Metalicos SA (Brazil)(a) | | 35,000 | | | 15,071,378 |
| | | | |
|
|
| | | | | | 25,500,510 |
| | | | |
|
|
Mineral Sands — 6.7% | | | | | |
OPTI Canada, Inc. (Canada)(a) | | 1,680,148 | | | 28,498,330 |
Suncor Energy, Inc.(a) | | 501,400 | | | 39,565,474 |
UTS Energy Corp. (Canada)(a) | | 3,225,400 | | | 12,473,999 |
| | | | |
|
|
| | | | | | 80,537,803 |
| | | | |
|
|
Natural Gas Production — 9.8% | | | | | |
BPI Energy Holdings, Inc.(a) | | 2,800,000 | | | 1,456,000 |
CNX Gas Corp.(Physical)(a) | | 89,800 | | | 2,289,900 |
Compton Petroleum Corp. (Canada)(a) | | 568,500 | | | 5,191,892 |
Duvernay Oil Corp. (Canada)(a) | | 152,800 | | | 4,524,447 |
Gasco Energy, Inc.(a)(b) | | 919,300 | | | 2,252,285 |
Goodrich Petroleum Corp.(a)(b) | | 184,800 | | | 6,686,064 |
Quicksilver Resources, Inc.(a)(b) | | 318,600 | | | 11,657,574 |
Range Resources Corp. | | 684,550 | | | 18,797,743 |
Southwestern Energy Co.(a)(b) | | 754,700 | | | 26,452,235 |
Trident Resources Corp. (Canada) (Private) (cost $4,402,178; purchased 12/4/03)(a)(f)(g) | | 412,657 | | | 17,693,136 |
Ultra Petroleum Corp.(a)(b) | | 234,400 | | | 11,192,600 |
XTO Energy, Inc. | | 213,300 | | | 10,035,765 |
| | | | |
|
|
| | | | | | 118,229,641 |
| | | | |
|
|
Non-Natural Resources — 1.3% | | | | | |
NRG Energy, Inc.(a) | | 280,100 | | | 15,688,401 |
| | | | |
|
|
Oil & Gas Refining & Marketing — 1.9% | | | |
Frontier Oil Corp. | | 386,000 | | | 11,093,640 |
Sunoco, Inc. | | 183,900 | | | 11,468,004 |
| | | | |
|
|
| | | | | | 22,561,644 |
| | | | |
|
|
Paper Products — 1.0% | | | | | |
Plum Creek Timber Co., Inc. (REIT) | | 313,000 | | | 12,473,050 |
| | | | |
|
|
Platinum — 1.8% | | | | | |
Impala Platinum Holdings Ltd., ADR (South Africa)(b) | | 834,400 | | | 22,069,880 |
| | | | |
|
|
Silver — 2.4% | | | | | |
Apex Silver Mines Ltd.(a)(b) | | 448,700 | | | 7,129,843 |
Coeur d’Alene Mines Corp.(a)(b) | | 2,059,000 | | | 10,192,050 |
Pan American Silver Corp. (Canada)(a) | | 84,172 | | | 2,122,074 |
Pan American Silver Corp. (USD)(a)(b) | | 361,900 | | | 9,109,023 |
| | | | |
|
|
| | | | | | 28,552,990 |
| | | | |
|
|
TOTAL COMMON STOCKS
(cost $827,101,994) | | | | | 1,179,204,567 |
| | | | |
|
|
| | | | | | | |
| LINKED NOTE — 1.0% | | Principal
Amount
(000)
| | Value
(Note 2)
| |
All Other Basic Metals | | | | | | | |
USD Palladium Linked Bank Note 7/13/07 (Private)
(cost $7,000,000; purchased 6/30/03)(a)(f)(g) | | $ | 38,088 | | $ | 12,054,826 | |
| | | | | |
|
|
|
| | |
| WARRANTS(a) — 0.1% | | Units
| | | |
Natural Gas Production | | | | | | | |
BPI Industries, Inc., expiring 12/31/06 (Private)
(cost $131,255; purchased 12/31/04)(f)(g) | | | 600,000 | | | 1 | |
| | | | | |
|
|
|
Silver — 0.1% | | | | | | | |
Pan American Silver Corp. (Canada), expiring 2/20/08 | | | 49,786 | | | 766,332 | |
| | | | | |
|
|
|
TOTAL WARRANTS
(cost $271,076) | | | 766,333 | |
| | | | | |
|
|
|
TOTAL LONG-TERM INVESTMENTS
(cost $834,373,070) | | | 1,192,025,726 | |
| | | | | |
|
|
|
| | |
SHORT-TERM
INVESTMENTS — 15.6% | | Shares
| | | |
Affiliated Money Market Mutual Fund | | | | |
Dryden Core Investment Fund — Taxable Money Market Series (cost $189,237,193; includes $171,369,405 of cash collateral received for securities on loan)(Note 4)(c)(d) | | | 189,237,193 | | | 189,237,193 | |
| | | | | |
|
|
|
TOTAL INVESTMENTS(e) — 114.2%
(cost $1,023,610,263) | | | 1,381,262,919 | |
LIABILITIES IN EXCESS OF OTHER ASSETS — (14.2)% | | | (171,326,649 | ) |
| | | | | |
|
|
|
NET ASSETS — 100.0% | | $ | 1,209,936,270 | |
| | | | | |
|
|
|
The following abbreviations are used in portfolio descriptions:
| | |
| ADR | | American Depositary Receipt |
| USD | | United States Dollar – denominated |
| REIT | | Real Estate Investment Trust |
| (a) | Non-income producing security. |
| (b) | All or portion of security is on loan. The aggregate market value of such securities is $159,866,332; cash collateral of $171,369,405 (included in liabilities) was received with which the Portfolio purchased highly liquid short-term investments. |
| (c) | Represents security, or portion thereof, purchased with cash collateral for securities of loan. |
| (d) | Prudential Investments LLC, the manager of the Portfolio, also serves as manager of the Dryden Core Investment Fund-Taxable Money Market Series. |
| (e) | As of December 31, 2006, 5 securities representing $64,890,421 and 5.4% of the net assets were fair valued in accordance with the policies adopted by the Board of Trustees. |
SEE NOTES TO FINANCIAL STATEMENTS.
B85
| | | | |
| | | NATURAL RESOURCES PORTFOLIO (Continued) | | |
SCHEDULE OF INVESTMENTS | December 31, 2006 |
| (f) | Indicates illiquid securities. |
| (g) | Indicates a security restricted to resale. The aggregate cost of such securities was $11,533,433. The aggregate value of $29,747,963 is approximately 2.5% of the net assets. |
| (h) | Security was purchased pursuant to Rule 144A under the Securities Act of 1933 and may not be resold subject to that rule except to qualified institutional buyers. Unless otherwise noted, 144A securities are deemed to be liquid. |
The industry classification of portfolio holdings and liabilities in excess of other assets shown as a percentage of net assets as of December 31, 2006 was as follows:
| | | |
Affiliated Money Market Mutual Fund (including 14.2% of collateral received for securities on loan) | | 15.6 | % |
Energy Services | | 15.4 | |
Gold | | 15.2 | |
Natural Gas Production | | 9.8 | |
Drillers | | 7.9 | |
Diversified Exploration & Production | | 7.5 | |
Copper | | 7.0 | |
Mineral Sands | | 6.7 | |
Integrated Oil/International | | 3.4 | |
Integrated Oil/Domestic | | 3.2 | |
All Other Basic Metals | | 2.8 | |
Silver | | 2.5 | |
Diversified Resources | | 2.4 | |
Coal | | 2.2 | |
Iron & Steel | | 2.1 | |
Diversified Metals & Mining | | 1.9 | |
Oil & Gas Refining & Marketing | | 1.9 | |
Platinum | | 1.8 | |
Aluminum | | 1.6 | |
Non-Natural Resources | | 1.3 | |
Linked Note | | 1.0 | |
Paper Products | | 1.0 | |
| | |
|
|
| | | 114.2 | |
Liabilities in excess of other assets | | (14.2 | ) |
| | |
|
|
| | | 100.0 | % |
| | |
|
|
SEE NOTES TO FINANCIAL STATEMENTS.
B86
| | | | |
| | | SMALL CAPITALIZATION STOCK PORTFOLIO | | |
SCHEDULE OF INVESTMENTS | December 31, 2006 |
| | | | | |
| LONG-TERM INVESTMENTS — 99.5% | | Value
(Note 2)
|
| COMMON STOCKS | | Shares
| |
Aerospace & Defense — 2.1% | | | | | |
AAR Corp.(a)(b) | | 48,420 | | $ | 1,413,380 |
Applied Signal Technology, Inc. | | 15,589 | | | 219,181 |
Armor Holdings, Inc.(a)(b) | | 39,859 | | | 2,186,267 |
Ceradyne, Inc.(a)(b) | | 35,626 | | | 2,012,869 |
Cubic Corp. | | 20,369 | | | 442,007 |
Curtiss-Wright Corp. | | 57,880 | | | 2,146,191 |
EDO Corp. | | 21,693 | | | 514,992 |
Esterline Technologies Corp.(a) | | 33,605 | | | 1,351,929 |
GenCorp, Inc.(a)(b) | | 73,345 | | | 1,028,297 |
Moog, Inc. (Class “A” Stock)(a) | | 55,755 | | | 2,129,283 |
Teledyne Technologies, Inc.(a) | | 45,745 | | | 1,835,747 |
Triumph Group, Inc. | | 21,438 | | | 1,123,994 |
| | | | |
|
|
| | | | | | 16,404,137 |
| | | | |
|
|
Air Freight & Logistics — 0.5% | | | | | |
EGL, Inc.(a) | | 41,792 | | | 1,244,566 |
Forward Air Corp. | | 40,178 | | | 1,162,350 |
HUB Group, Inc.(a) | | 52,346 | | | 1,442,132 |
| | | | |
|
|
| | | | | | 3,849,048 |
| | | | |
|
|
Airlines — 0.4% | | | | | |
Frontier Airlines, Inc.(a)(b) | | 48,186 | | | 356,576 |
Mesa Air Group, Inc.(a) | | 47,765 | | | 409,346 |
SkyWest, Inc. | | 84,222 | | | 2,148,504 |
| | | | |
|
|
| | | | | | 2,914,426 |
| | | | |
|
|
Auto Components — 0.4% | | | | | |
Drew Industries, Inc.(a) | | 24,523 | | | 637,843 |
LKQ Corp.(a)(b) | | 59,651 | | | 1,371,377 |
Standard Motor Products, Inc. | | 15,647 | | | 234,392 |
Superior Industries International, Inc.(b) | | 30,093 | | | 579,892 |
| | | | |
|
|
| | | | | | 2,823,504 |
| | | | |
|
|
Automobiles — 0.3% | | | | | |
Coachmen Industries, Inc. | | 20,552 | | | 226,072 |
Fleetwood Enterprises, Inc.(a) | | 84,322 | | | 666,987 |
Monaco Coach Corp. | | 35,239 | | | 498,984 |
Winnebago Industries, Inc.(b) | | 41,310 | | | 1,359,512 |
| | | | |
|
|
| | | | | | 2,751,555 |
| | | | |
|
|
Biotechnology — 0.5% | | | | | |
ArQule, Inc.(a) | | 37,165 | | | 220,017 |
Digene Corp.(a) | | 31,200 | | | 1,495,104 |
Regeneron Pharmaceuticals, Inc.(a) | | 85,652 | | | 1,719,035 |
Savient Pharmaceuticals, Inc.(a) | | 61,108 | | | 685,021 |
| | | | |
|
|
| | | | | | 4,119,177 |
| | | | |
|
|
Building Products — 1.2% | | | | | |
Apogee Enterprises, Inc. | | 37,138 | | | 717,135 |
ElkCorp. | | 27,143 | | | 1,115,306 |
Griffon Corp.(a) | | 34,501 | | | 879,776 |
Lennox International, Inc. | | 76,066 | | | 2,328,380 |
NCI Building Systems, Inc.(a)(b) | | 26,159 | | | 1,353,728 |
Simpson Manufacturing Co., Inc.(b) | | 48,213 | | | 1,525,941 |
Universal Forest Products, Inc. | | 24,887 | | | 1,160,232 |
| | | | |
|
|
| | | | | | 9,080,498 |
| | | | |
|
|
Capital Markets — 0.8% | | | | | |
Investment Technology Group, Inc.(a) | | 57,489 | | | 2,465,127 |
LaBranche & Co., Inc.(a)(b) | | 69,578 | | | 683,952 |
| | | | | |
COMMON STOCKS
(Continued) | | Shares
| | Value
(Note 2)
|
Capital Markets (cont’d.) | | | | | |
Piper Jaffray Cos., Inc.(a)(b) | | 24,521 | | $ | 1,597,543 |
SWS Group, Inc. | | 21,261 | | | 759,018 |
Tradestation Group, Inc.(a) | | 33,594 | | | 461,918 |
| | | | |
|
|
| | | | | | 5,967,558 |
| | | | |
|
|
Chemicals — 1.3% | | | | | |
A. Schulman, Inc. | | 31,822 | | | 708,040 |
Arch Chemicals, Inc. | | 31,783 | | | 1,058,692 |
Georgia Gulf Corp. | | 45,034 | | | 869,607 |
H.B. Fuller Co. | | 78,619 | | | 2,029,942 |
MacDermid, Inc. | | 32,978 | | | 1,124,549 |
Material Sciences Corp.(a) | | 16,703 | | | 216,137 |
OM Group, Inc.(a) | | 38,707 | | | 1,752,652 |
Omnova Solutions, Inc.(a) | | 55,149 | | | 252,582 |
Penford Corp. | | 11,780 | | | 203,794 |
PolyOne Corp.(a) | | 122,209 | | | 916,568 |
Quaker Chemical Corp. | | 13,010 | | | 287,131 |
Tronox, Inc. (Class “B” Stock)(b) | | 54,311 | | | 857,571 |
Wellman, Inc. | | 43,084 | | | 137,438 |
| | | | |
|
|
| | | | | | 10,414,703 |
| | | | |
|
|
Commercial Banks — 5.8% | | | | | |
Boston Private Financial Holdings, Inc. | | 48,167 | | | 1,358,791 |
Cascade Bancorp(b) | | 37,100 | | | 1,151,213 |
Central Pacific Financial Corp. | | 40,401 | | | 1,565,943 |
Chittenden Corp. | | 60,618 | | | 1,860,366 |
Community Bank System, Inc. | | 39,417 | | | 906,591 |
East West Bancorp, Inc. | | 80,770 | | | 2,860,873 |
First BanCorp/Puerto Rico(b) | | 106,491 | | | 1,014,859 |
First Commonwealth Financial Corp. | | 82,706 | | | 1,110,742 |
First Financial Bancorp | | 42,600 | | | 707,586 |
First Indiana Corp. | | 17,131 | | | 434,442 |
First Midwest Bancorp, Inc. | | 65,933 | | | 2,550,288 |
First Republic Bank | | 40,738 | | | 1,592,041 |
Glacier Bancorp, Inc. | | 68,839 | | | 1,682,425 |
Hanmi Financial Corp. | | 55,548 | | | 1,251,496 |
Independent Bank Corp. | | 26,747 | | | 676,432 |
Irwin Financial Corp. | | 24,693 | | | 558,803 |
Nara Bancorp, Inc. | | 27,613 | | | 577,664 |
PrivateBancorp, Inc. | | 23,684 | | | 985,965 |
Prosperity Bancshares, Inc. | | 34,110 | | | 1,177,136 |
Provident Bankshares Corp. | | 43,155 | | | 1,536,318 |
South Financial Group, Inc. (The) | | 99,132 | | | 2,635,920 |
Sterling Bancorp | | 24,659 | | | 485,782 |
Sterling Bancshares, Inc. | | 93,564 | | | 1,218,203 |
Sterling Financial Corp. | | 55,102 | | | 1,862,999 |
Susquehanna Bancshares, Inc. | | 68,311 | | | 1,836,200 |
UCBH Holdings, Inc. | | 131,072 | | | 2,301,624 |
Umpqua Holdings Corp. | | 76,491 | | | 2,251,130 |
United Bankshares, Inc. | | 48,303 | | | 1,866,911 |
Whitney Holding Corp. | | 86,906 | | | 2,834,874 |
Wilshire Bancorp, Inc. | | 20,356 | | | 386,153 |
Wintrust Financial Corp. | | 33,831 | | | 1,624,565 |
| | | | |
|
|
| | | | | | 44,864,335 |
| | | | |
|
|
Commercial Services & Supplies — 3.5% | | | | | |
ABM Industries, Inc. | | 57,461 | | | 1,304,939 |
Administaff, Inc. | | 31,958 | | | 1,366,844 |
SEE NOTES TO FINANCIAL STATEMENTS.
B87
| | | | |
| | | SMALL CAPITALIZATION STOCK PORTFOLIO (Continued) | | |
SCHEDULE OF INVESTMENTS | December 31, 2006 |
| | | | | |
COMMON STOCKS
(Continued) | | Shares
| | Value
(Note 2)
|
Commercial Services & Supplies (cont’d.) | | | | | |
Angelica Corp. | | 12,447 | | $ | 321,133 |
Bowne & Co., Inc. | | 38,204 | | | 608,972 |
Brady Corp.(b) | | 71,083 | | | 2,649,974 |
CDI Corp. | | 17,117 | | | 426,213 |
Central Parking Corp. | | 21,515 | | | 387,270 |
Consolidated Graphics, Inc.(a) | | 15,590 | | | 920,901 |
G&K Services, Inc. (Class “ A” Stock) | | 28,200 | | | 1,096,698 |
Healthcare Services Group, Inc. | | 36,207 | | | 1,048,555 |
Heidrick & Struggles International, Inc.(a) | | 23,098 | | | 978,431 |
John H. Harland Co.(b) | | 33,707 | | | 1,692,091 |
Labor Ready, Inc.(a) | | 68,686 | | | 1,259,014 |
Mobile Mini, Inc.(a)(b) | | 47,002 | | | 1,266,234 |
On Assignment, Inc.(a) | | 43,425 | | | 510,244 |
School Specialty, Inc.(a)(b) | | 24,466 | | | 917,230 |
Spherion Corp.(a) | | 74,533 | | | 553,780 |
Standard Register Co. (The) | | 16,343 | | | 196,116 |
Tetra Tech, Inc.(a) | | 75,898 | | | 1,372,995 |
United Stationers, Inc.(a) | | 39,899 | | | 1,862,884 |
Viad Corp. | | 28,486 | | | 1,156,532 |
Volt Information Sciences, Inc.(a)(b) | | 11,360 | | | 570,386 |
Waste Connections, Inc.(a)(b) | | 59,770 | | | 2,483,444 |
Watson Wyatt Worldwide, Inc. | | 55,893 | | | 2,523,569 |
| | | | |
|
|
| | | | | | 27,474,449 |
| | | | |
|
|
Communications Equipment — 1.2% | | | | | |
Bel Fuse, Inc. (Class “B” Stock) | | 15,667 | | | 545,055 |
Black Box Corp. | | 22,912 | | | 962,075 |
Blue Coat Systems, Inc.(a)(b) | | 19,033 | | | 455,840 |
C-COR.net Corp.(a) | | 63,477 | | | 707,134 |
Comtech Telecommunications Corp.(a)(b) | | 30,399 | | | 1,157,290 |
Digi International, Inc.(a) | | 33,006 | | | 455,153 |
Ditech Communications Corp.(a) | | 42,896 | | | 296,840 |
Harmonic, Inc.(a) | | 98,405 | | | 715,404 |
Inter-Tel, Inc. | | 28,149 | | | 623,782 |
NETGEAR, Inc.(a) | | 44,433 | | | 1,166,367 |
Network Equipment Technologies, Inc.(a) | | 33,218 | | | 193,329 |
PC-Tel, Inc.(a) | | 29,403 | | | 274,918 |
Symmetricom, Inc.(a) | | 60,771 | | | 542,077 |
Tollgrade Communications, Inc.(a) | | 17,990 | | | 190,154 |
ViaSat, Inc.(a) | | 32,036 | | | 954,993 |
| | | | |
|
|
| | | | | | 9,240,411 |
| | | | |
|
|
Computers & Peripherals — 0.9% | | | | | |
Adaptec, Inc.(a)(b) | | 154,837 | | | 721,540 |
Avid Technology, Inc.(a)(b) | | 53,998 | | | 2,011,966 |
Hutchinson Technology, Inc.(a)(b) | | 34,196 | | | 806,000 |
Komag, Inc.(a)(b) | | 40,862 | | | 1,547,853 |
Neoware, Inc.(a)(b) | | 26,282 | | | 347,185 |
Novatel Wireless, Inc.(a) | | 39,454 | | | 381,520 |
Synaptics, Inc.(a)(b) | | 33,373 | | | 990,844 |
| | | | |
|
|
| | | | | | 6,806,908 |
| | | | |
|
|
Construction & Engineering — 1.3% | | | | | |
EMCOR Group, Inc.(a) | | 41,819 | | | 2,377,410 |
Insituform Technologies, Inc.
(Class “A” Stock)(a) | | 35,911 | | | 928,658 |
| | | | | |
COMMON STOCKS
(Continued) | | Shares
| | Value
(Note 2)
|
Construction & Engineering (cont’d.) | | | | | |
Shaw Group, Inc. (The)(a)(b) | | 106,065 | | $ | 3,553,178 |
URS Corp.(a) | | 68,423 | | | 2,931,926 |
| | | | |
|
|
| | | | | | 9,791,172 |
| | | | |
|
|
Construction Materials — 0.4% | | | | | |
Headwaters, Inc.(a)(b) | | 55,725 | | | 1,335,171 |
Texas Industries, Inc.(b) | | 31,636 | | | 2,031,980 |
| | | | |
|
|
| | | | | | 3,367,151 |
| | | | |
|
|
Consumer Finance — 0.5% | | | | | |
Cash America International, Inc. | | 39,085 | | | 1,833,087 |
First Cash Financial Services, Inc.(a) | | 36,200 | | | 936,494 |
Rewards Network, Inc.(a) | | 35,036 | | | 243,500 |
World Acceptance Corp.(a)(b) | | 23,123 | | | 1,085,625 |
| | | | |
|
|
| | | | | | 4,098,706 |
| | | | |
|
|
Containers & Packaging — 0.7% | | | | | |
AptarGroup, Inc. | | 45,445 | | | 2,683,073 |
Caraustar Industries, Inc.(a) | | 38,299 | | | 309,839 |
Chesapeake Corp. | | 26,086 | | | 443,984 |
Myers Industries, Inc. | | 35,549 | | | 556,697 |
Rock-Tenn Co. (Class “A” Stock) | | 43,399 | | | 1,176,547 |
| | | | |
|
|
| | | | | | 5,170,140 |
| | | | |
|
|
Distributors — 0.3% | | | | | |
Audiovox Corp.(a) | | 23,684 | | | 333,708 |
Building Materials Holding Corp. | | 38,278 | | | 945,084 |
Keystone Automotive Industries, Inc.(a) | | 21,475 | | | 729,935 |
| | | | |
|
|
| | | | | | 2,008,727 |
| | | | |
|
|
Diversified Consumer Services — 0.6% | | | | | |
Bright Horizons Family Solutions, Inc.(a)(b) | | 34,457 | | | 1,332,108 |
Coinstar, Inc.(a) | | 36,433 | | | 1,113,757 |
CPI Corp. | | 6,890 | | | 320,316 |
Pre-Paid Legal Services, Inc.(b) | | 12,417 | | | 485,877 |
Universal Technical Institute, Inc.(a)(b) | | 30,430 | | | 675,850 |
Vertrue, Inc.(a) | | 12,727 | | | 488,844 |
| | | | |
|
|
| | | | | | 4,416,752 |
| | | | |
|
|
Diversified Financial Services — 0.3% | | | | | |
Financial Federal Corp. | | 35,872 | | | 1,054,996 |
Portfolio Recovery Associates, Inc.(a)(b) | | 21,042 | | | 982,451 |
| | | | |
|
|
| | | | | | 2,037,447 |
| | | | |
|
|
Diversified Telecommunication Services — 0.3% | | | | | |
Commonwealth Telephone Enterprises, Inc. | | 27,863 | | | 1,166,345 |
CT Communications, Inc. | | 26,100 | | | 598,212 |
General Communication, Inc.
(Class “A” Stock)(a) | | 58,938 | | | 927,095 |
| | | | |
|
|
| | | | | | 2,691,652 |
| | | | |
|
|
Electric Utilities — 1.1% | | | | | |
ALLETE, Inc.(b) | | 40,061 | | | 1,864,439 |
Central Vermont Public Services Corp. | | 13,356 | | | 314,534 |
Cleco Corp. | | 75,755 | | | 1,911,299 |
El Paso Electric Co.(a) | | 61,501 | | | 1,498,779 |
Green Mountain Power Corp. | | 6,986 | | | 236,756 |
SEE NOTES TO FINANCIAL STATEMENTS.
B88
| | | | |
| | | SMALL CAPITALIZATION STOCK PORTFOLIO (Continued) | | |
SCHEDULE OF INVESTMENTS | December 31, 2006 |
| | | | | |
COMMON STOCKS
(Continued) | | Shares
| | Value
(Note 2)
|
Electric Utilities (cont’d.) | | | | | |
UIL Holdings Corp.(b) | | 32,553 | | $ | 1,373,411 |
Unisource Energy Corp.(b) | | 46,397 | | | 1,694,882 |
| | | | |
|
|
| | | | | | 8,894,100 |
| | | | |
|
|
Electrical Equipment — 1.5% | | | | | |
Acuity Brands, Inc.(b) | | 56,739 | | | 2,952,697 |
Baldor Electric Co. | | 38,327 | | | 1,280,888 |
Belden, Inc. | | 57,284 | | | 2,239,232 |
C&D Technologies, Inc.(b) | | 33,736 | | | 159,909 |
Magnetek, Inc.(a) | | 38,602 | | | 218,101 |
Regal Beloit Corp. | | 40,810 | | | 2,142,933 |
Smith (A.O.) Corp.(b) | | 29,915 | | | 1,123,607 |
Vicor Corp. | | 25,690 | | | 285,416 |
Woodward Governor Co. | | 38,753 | | | 1,538,882 |
| | | | |
|
|
| | | | | | 11,941,665 |
| | | | |
|
|
Electronic Equipment & Instruments — 4.6% | | | |
Aeroflex, Inc.(a) | | 96,907 | | | 1,135,750 |
Agilysys, Inc. | | 40,333 | | | 675,174 |
Anixter International, Inc.(a)(b) | | 44,542 | | | 2,418,631 |
Bell Microproducts, Inc.
(Class “B” Stock)(a) | | 40,047 | | | 282,331 |
Benchmark Electronics, Inc.(a)(b) | | 85,312 | | | 2,078,200 |
Brightpoint, Inc.(a) | | 66,629 | | | 896,160 |
Checkpoint Systems, Inc.(a) | | 51,753 | | | 1,045,411 |
Cognex Corp. | | 58,782 | | | 1,400,187 |
Coherent, Inc.(a) | | 41,195 | | | 1,300,526 |
CTS Corp. | | 47,163 | | | 740,459 |
Daktronics, Inc.(b) | | 41,862 | | | 1,542,615 |
Electro Scientific Industries, Inc.(a) | | 38,315 | | | 771,664 |
FLIR Systems, Inc.(a)(b) | | 86,384 | | | 2,749,603 |
Gerber Scientific, Inc.(a) | | 30,266 | | | 380,141 |
Global Imaging Systems, Inc.(a) | | 67,408 | | | 1,479,606 |
Insight Enterprises, Inc.(a) | | 63,719 | | | 1,202,378 |
Itron, Inc.(a)(b) | | 33,747 | | | 1,749,444 |
Keithley Instruments, Inc. | | 18,457 | | | 242,710 |
Littelfuse, Inc.(a) | | 29,540 | | | 941,735 |
Lojack Corp.(a) | | 23,883 | | | 407,922 |
Mercury Computer Systems, Inc.(a) | | 29,135 | | | 389,244 |
Methode Electronics, Inc.
(Class “A” Stock) | | 49,226 | | | 533,118 |
MTS Systems Corp. | | 24,009 | | | 927,228 |
Park Electrochemical Corp. | | 26,573 | | | 681,597 |
Paxar Corp.(a) | | 54,422 | | | 1,254,971 |
Photo Dynamics, Inc.(a) | | 22,407 | | | 261,938 |
Planar Systems, Inc.(a) | | 22,424 | | | 216,840 |
Radisys Corp.(a) | | 28,636 | | | 477,362 |
Rogers Corp.(a) | | 23,280 | | | 1,377,012 |
Scansource, Inc.(a) | | 33,951 | | | 1,032,110 |
Technitrol, Inc. | | 53,655 | | | 1,281,818 |
Trimble Navigation, Ltd.(a) | | 73,296 | | | 3,718,305 |
X-Rite, Inc.(a) | | 37,705 | | | 463,772 |
| | | | |
|
|
| | | | | | 36,055,962 |
| | | | |
|
|
Energy Equipment & Services — 3.7% | | | | | |
Atwood Oceanics, Inc.(a) | | 35,660 | | | 1,746,270 |
Bristow Group, Inc.(a) | | 30,923 | | | 1,116,011 |
CARBO Ceramics, Inc.(b) | | 26,679 | | | 996,994 |
| | | | | |
COMMON STOCKS
(Continued) | | Shares
| | Value
(Note 2)
|
Energy Equipment & Services (cont’d.) | | | | | |
Dril-Quip, Inc.(a)(b) | | 31,478 | | $ | 1,232,678 |
Hydril Co.(a) | | 25,354 | | | 1,906,367 |
Input/Output, Inc.(a)(b) | | 92,601 | | | 1,262,152 |
Lone Star Technologies, Inc.(a)(b) | | 40,865 | | | 1,978,275 |
Lufkin Industries, Inc. | | 20,182 | | | 1,172,171 |
Oceaneering International, Inc.(a) | | 71,475 | | | 2,837,558 |
SEACOR Holdings, Inc.(a)(b) | | 28,112 | | | 2,787,024 |
Tetra Technologies, Inc.(a) | | 94,723 | | | 2,423,014 |
Unit Corp.(a)(b) | | 61,073 | | | 2,958,987 |
Veritas DGC, Inc.(a) | | 47,761 | | | 4,089,774 |
W-H Energy Services, Inc.(a) | | 39,721 | | | 1,934,015 |
| | | | |
|
|
| | | | | | 28,441,290 |
| | | | |
|
|
Exchange Traded Fund — 0.3% | | | | | |
iShares S&P SmallCap 600 Index(b) | | 33,694 | | | 2,223,467 |
| | | | |
|
|
Food & Staples Retailing — 1.0% | | | | | |
Casey’s General Stores, Inc. | | 66,521 | | | 1,566,570 |
Great Atlantic & Pacific Tea Co., Inc.(b) | | 25,691 | | | 661,286 |
Longs Drug Stores Corp. | | 37,422 | | | 1,585,944 |
Nash-Finch Co.(b) | | 18,263 | | | 498,580 |
Performance Food Group Co.(a)(b) | | 45,937 | | | 1,269,699 |
United Natural Foods, Inc.(a)(b) | | 56,014 | | | 2,012,023 |
| | | | |
|
|
| | | | | | 7,594,102 |
| | | | |
|
|
Food Products — 1.9% | | | | | |
Corn Products International, Inc. | | 97,824 | | | 3,378,840 |
Delta & Pine Land Co. | | 48,104 | | | 1,945,806 |
Flowers Foods, Inc. | | 68,106 | | | 1,838,181 |
Hain Celestial Group, Inc.(a) | | 51,356 | | | 1,602,821 |
J&J Snack Foods Corp. | | 18,099 | | | 749,299 |
Lance, Inc. | | 40,587 | | | 814,987 |
Peet’s Coffee & Tea, Inc.(a) | | 18,278 | | | 479,615 |
Ralcorp Holdings, Inc.(a) | | 35,186 | | | 1,790,616 |
Sanderson Farms, Inc.(b) | | 20,944 | | | 634,394 |
TreeHouse Foods, Inc.(a) | | 41,118 | | | 1,282,882 |
| | | | |
|
|
| | | | | | 14,517,441 |
| | | | |
|
|
Gas Utilities — 3.4% | | | | | |
Atmos Energy Corp. | | 115,137 | | | 3,674,022 |
Cascade Natural Gas Corp. | | 15,128 | | | 392,118 |
Energen Corp.(b) | | 95,397 | | | 4,477,936 |
Laclede Group, Inc. (The) | | 28,181 | | | 987,180 |
New Jersey Resources Corp. | | 36,504 | | | 1,773,364 |
Northwest Natural Gas Co. | | 36,261 | | | 1,538,917 |
Piedmont Natural Gas Co., Inc.(b) | | 99,243 | | | 2,654,750 |
South Jersey Industries, Inc. | | 38,614 | | | 1,290,094 |
Southern Union Co. | | 141,923 | | | 3,966,748 |
Southwest Gas Corp. | | 54,711 | | | 2,099,261 |
UGI Corp. | | 139,516 | | | 3,805,996 |
| | | | |
|
|
| | | | | | 26,660,386 |
| | | | |
|
|
Health Care Equipment & Supplies — 5.1% | | | | | |
American Medical Systems Holdings, Inc.(a)(b) | | 93,488 | | | 1,731,398 |
Analogic Corp. | | 18,461 | | | 1,036,401 |
ArthroCare Corp.(a)(b) | | 35,577 | | | 1,420,234 |
Biolase Technology, Inc.(a)(b) | | 31,162 | | | 272,668 |
Biosite, Inc.(a)(b) | | 21,410 | | | 1,045,879 |
CONMED Corp.(a) | | 36,876 | | | 852,573 |
SEE NOTES TO FINANCIAL STATEMENTS.
B89
| | | | |
| | | SMALL CAPITALIZATION STOCK PORTFOLIO (Continued) | | |
SCHEDULE OF INVESTMENTS | December 31, 2006 |
| | | | | |
COMMON STOCKS
(Continued) | | Shares
| | Value
(Note 2)
|
Health Care Equipment & Supplies (cont’d.) | | | |
Cooper Companies, Inc. (The) | | 58,721 | | $ | 2,613,085 |
Cyberonics, Inc.(a) | | 28,552 | | | 589,313 |
Datascope Corp. | | 16,596 | | | 604,758 |
DJ Orthopedics, Inc.(a) | | 30,452 | | | 1,303,955 |
Haemonetics Corp.(a) | | 35,538 | | | 1,599,921 |
Hologic, Inc.(a)(b) | | 69,495 | | | 3,285,723 |
ICU Medical, Inc.(a) | | 19,385 | | | 788,582 |
IDEXX Laboratories, Inc.(a) | | 41,245 | | | 3,270,728 |
Immucor, Inc.(a)(b) | | 89,296 | | | 2,610,122 |
Integra LifeSciences Holdings Corp.(a) | | 25,972 | | | 1,106,147 |
Invacare Corp. | | 42,019 | | | 1,031,566 |
Kensey Nash Corp.(a) | | 15,411 | | | 490,070 |
Mentor Corp. | | 55,546 | | | 2,714,532 |
Meridian Bioscience, Inc. | | 28,298 | | | 694,150 |
Merit Medical Systems, Inc.(a) | | 36,065 | | | 571,270 |
Osteotech, Inc.(a) | | 22,758 | | | 128,583 |
Palomar Medical Technologies, Inc.(a)(b) | | 23,352 | | | 1,183,246 |
PolyMedica Corp. | | 29,698 | | | 1,200,096 |
Possis Medical, Inc.(a) | | 22,606 | | | 304,729 |
Respironics, Inc.(a) | | 96,182 | | | 3,630,870 |
SurModics, Inc.(a)(b) | | 21,004 | | | 653,644 |
Theragenics Corp.(a) | | 43,540 | | | 134,974 |
Viasys Healthcare, Inc.(a) | | 43,198 | | | 1,201,768 |
Vital Signs, Inc. | | 10,335 | | | 515,923 |
Wilson Greatbatch Technologies, Inc.(a) | | 28,956 | | | 779,496 |
| | | | |
|
|
| | | | | | 39,366,404 |
| | | | |
|
|
Health Care Providers & Services — 3.7% | | | | | |
Amedisys, Inc.(a) | | 33,803 | | | 1,111,105 |
AMERIGROUP Corp.(a) | | 68,656 | | | 2,464,064 |
AMN Healthcare Services, Inc.(a) | | 44,857 | | | 1,235,362 |
AmSurg Corp.(a)(b) | | 39,405 | | | 906,315 |
Centene Corp.(a) | | 56,910 | | | 1,398,279 |
Chemed Corp. | | 34,626 | | | 1,280,469 |
Cross Country Healthcare, Inc.(a) | | 28,652 | | | 625,187 |
CryoLife, Inc.(a) | | 29,460 | | | 225,369 |
Genesis Healthcare Corp.(a) | | 25,945 | | | 1,225,382 |
Gentiva Health Services, Inc.(a) | | 35,980 | | | 685,779 |
Healthways, Inc.(a)(b) | | 45,688 | | | 2,179,774 |
Hooper Holmes, Inc. | | 89,093 | | | 294,898 |
inVentiv Health, Inc.(a) | | 39,117 | | | 1,382,786 |
LCA-Vision, Inc.(b) | | 27,418 | | | 942,082 |
Matria Healthcare, Inc.(a)(b) | | 28,285 | | | 812,628 |
Odyssey Healthcare, Inc.(a)(b) | | 45,210 | | | 599,485 |
Owens & Minor, Inc. | | 52,990 | | | 1,656,997 |
Pediatrix Medical Group, Inc.(a) | | 63,918 | | | 3,125,589 |
RehabCare Group, Inc.(a) | | 22,661 | | | 336,516 |
Sierra Health Services, Inc.(a)(b) | | 75,322 | | | 2,714,605 |
Sunrise Senior Living, Inc.(a) | | 59,025 | | | 1,813,248 |
United Surgical Partners International, Inc.(a)(b) | | 58,790 | | | 1,666,697 |
| | | | |
|
|
| | | | | | 28,682,616 |
| | | | |
|
|
Health Care Technology — 1.0% | | | | | |
Allscripts Healthcare Solutions, Inc.(a)(b) | | 63,000 | | | 1,700,370 |
Cerner Corp.(a)(b) | | 85,480 | | | 3,889,339 |
Dendrite International, Inc.(a) | | 57,625 | | | 617,164 |
Per-Se Technologies, Inc.(a) | | 43,979 | | | 1,221,737 |
| | | | |
|
|
| | | | | | 7,428,610 |
| | | | |
|
|
| | | | | |
COMMON STOCKS
(Continued) | | Shares
| | Value
(Note 2)
|
Hotels, Restaurants & Leisure — 3.7% | | | | | |
Aztar Corp.(a)(b) | | 48,113 | | $ | 2,618,309 |
California Pizza Kitchen, Inc.(a) | | 25,200 | | | 839,412 |
CEC Entertainment, Inc.(a) | | 43,911 | | | 1,767,418 |
CKE Restaurants, Inc. | | 91,738 | | | 1,687,979 |
IHOP Corp. | | 20,717 | | | 1,091,786 |
Jack in the Box, Inc.(a) | | 44,309 | | | 2,704,622 |
Landry’s Restaurants, Inc.(b) | | 22,314 | | | 671,428 |
Marcus Corp. | | 28,047 | | | 717,442 |
Multimedia Games, Inc.(a)(b) | | 36,206 | | | 347,578 |
O’Charleys, Inc.(a) | | 30,753 | | | 654,424 |
P.F. Chang’s China Bistro, Inc.(a)(b) | | 35,132 | | | 1,348,366 |
Panera Bread Co. (Class “A” Stock)(a)(b) | | 41,680 | | | 2,330,329 |
Papa John’s International, Inc.(a)(b) | | 31,673 | | | 918,834 |
Pinnacle Entertainment, Inc.(a) | | 63,367 | | | 2,099,982 |
RARE Hospitality International, Inc.(a)(b) | | 44,913 | | | 1,478,985 |
Red Robin Gourmet Burgers, Inc.(a)(b) | | 21,915 | | | 785,653 |
Shuffle Master, Inc.(a)(b) | | 46,066 | | | 1,206,929 |
Sonic Corp.(a) | | 91,750 | | | 2,197,413 |
Steak n Shake Co. (The)(a) | | 37,089 | | | 652,766 |
Triarc Co., Inc. (Class “B” Stock) | | 81,990 | | | 1,639,800 |
WMS Industries, Inc.(a) | | 31,056 | | | 1,082,612 |
| | | | |
|
|
| | | | | | 28,842,067 |
| | | | |
|
|
Household Durables — 1.8% | | | | | |
Bassett Furniture Industries, Inc. | | 15,471 | | | 252,796 |
Champion Enterprises, Inc.(a) | | 100,693 | | | 942,486 |
Ethan Allen Interiors, Inc. | | 41,878 | | | 1,512,215 |
Interface, Inc.(a) | | 68,595 | | | 975,421 |
La-Z-Boy, Inc.(b) | | 67,691 | | | 803,492 |
Lenox Group, Inc.(a) | | 18,547 | | | 118,701 |
Libbey, Inc. | | 18,774 | | | 231,671 |
M/I Homes, Inc. | | 15,937 | | | 608,634 |
Meritage Home Corp.(a)(b) | | 28,920 | | | 1,380,062 |
National Presto Industries, Inc. | | 6,250 | | | 374,188 |
NVR, Inc.(a)(b) | | 6,292 | | | 4,058,340 |
Russ Berrie & Co., Inc.(a) | | 15,067 | | | 232,785 |
Skyline Corp. | | 8,994 | | | 361,739 |
Standard Pacific Corp. | | 85,081 | | | 2,279,320 |
| | | | |
|
|
| | | | | | 14,131,850 |
| | | | |
|
|
Household Products — 0.4% | | | | | |
Central Garden and Pet Co.(a)(b) | | 31,400 | | | 1,520,388 |
Spectrum Brands, Inc.(a)(b) | | 49,892 | | | 543,823 |
WD-40 Co. | | 22,461 | | | 783,215 |
| | | | |
|
|
| | | | | | 2,847,426 |
| | | | |
|
|
Industrial Conglomerates — 0.2% | | | | | |
Standex International Corp. | | 16,394 | | | 493,951 |
Tredegar Industries, Inc. | | 36,834 | | | 832,817 |
| | | | |
|
|
| | | | | | 1,326,768 |
| | | | |
|
|
Insurance — 2.9% | | | | | |
Delphi Financial Group, Inc. | | 56,921 | | | 2,303,023 |
Hilb, Rogal & Hamilton Co. | | 47,666 | | | 2,007,692 |
Infinity Property & Casualty Corp. | | 26,179 | | | 1,266,802 |
LandAmerica Financial Group, Inc.(b) | | 23,400 | | | 1,476,774 |
Philadelphia Consolidated Holding Corp.(a) | | 75,201 | | | 3,350,956 |
SEE NOTES TO FINANCIAL STATEMENTS.
B90
| | | | |
| | | SMALL CAPITALIZATION STOCK PORTFOLIO (Continued) | | |
SCHEDULE OF INVESTMENTS | December 31, 2006 |
| | | | | |
COMMON STOCKS
(Continued) | | Shares
| | Value
(Note 2)
|
Insurance (cont’d.) | | | | | |
Presidential Life Corp. | | 28,308 | | $ | 621,361 |
ProAssurance Corp.(a) | | 43,834 | | | 2,188,193 |
RLI Corp. | | 26,709 | | | 1,506,922 |
Safety Insurance Group, Inc. | | 18,844 | | | 955,579 |
SCPIE Holdings, Inc.(a) | | 13,268 | | | 346,826 |
Selective Insurance Group, Inc. | | 37,804 | | | 2,165,791 |
Stewart Information Services Corp. | | 24,048 | | | 1,042,721 |
United Fire & Casualty Co. | | 27,640 | | | 974,310 |
Zenith National Insurance Corp. | | 48,748 | | | 2,286,769 |
| | | | |
|
|
| | | | | | 22,493,719 |
| | | | |
|
|
Internet & Catalog Retail — 0.2% | | | | | |
Blue Nile, Inc.(a)(b) | | 18,400 | | | 678,776 |
PetMed Express, Inc.(a) | | 31,892 | | | 425,758 |
Stamps.com, Inc.(a) | | 25,140 | | | 395,955 |
| | | | |
|
|
| | | | | | 1,500,489 |
| | | | |
|
|
Internet Software & Services — 1.4% | | | | | |
Bankrate, Inc.(a)(b) | | 15,038 | | | 570,692 |
Digital Insight Corp.(a) | | 42,735 | | | 1,644,870 |
Digitas, Inc.(a) | | 113,948 | | | 1,528,043 |
InfoSpace, Inc.(a)(b) | | 41,348 | | | 848,047 |
j2 Global Communications, Inc.(a)(b) | | 65,466 | | | 1,783,949 |
MIVA, Inc.(a) | | 36,916 | | | 125,145 |
United Online, Inc. | | 86,341 | | | 1,146,608 |
WebEx Communications, Inc.(a)(b) | | 56,719 | | | 1,978,926 |
Websense, Inc.(a) | | 58,879 | | | 1,344,208 |
| | | | |
|
|
| | | | | | 10,970,488 |
| | | | |
|
|
IT Services — 1.8% | | | | | |
CACI International, Inc.
(Class “A” Stock)(a) | | 40,469 | | | 2,286,499 |
Carreker Corp.(a) | | 26,615 | | | 203,339 |
Ciber, Inc.(a) | | 71,585 | | | 485,346 |
eFunds Corp.(a) | | 61,746 | | | 1,698,015 |
Gevity HR, Inc. | | 33,216 | | | 786,887 |
Global Payments, Inc. | | 89,847 | | | 4,159,915 |
Keane, Inc.(a)(b) | | 58,701 | | | 699,129 |
ManTech International Corp.
(Class “A” Stock)(a) | | 24,050 | | | 885,762 |
MAXIMUS, Inc. | | 28,369 | | | 873,198 |
Startek, Inc. | | 14,828 | | | 200,771 |
Sykes Enterprises, Inc.(a) | | 38,942 | | | 686,937 |
TALX Corp. | | 41,164 | | | 1,129,952 |
| | | | |
|
|
| | | | | | 14,095,750 |
| | | | |
|
|
Leisure Equipment & Products — 1.2% | | | | | |
Arctic Cat, Inc. | | 16,368 | | | 287,913 |
JAKKS Pacific, Inc.(a) | | 36,593 | | | 799,191 |
K2, Inc.(a) | | 65,002 | | | 857,376 |
Marinemax, Inc.(a)(b) | | 24,682 | | | 640,004 |
Nautilus Group, Inc. (The)(b) | | 41,442 | | | 580,188 |
Polaris Industries, Inc.(b) | | 51,500 | | | 2,411,745 |
Pool Corp.(b) | | 66,906 | | | 2,620,709 |
RC2 Corp.(a) | | 27,585 | | | 1,213,740 |
Sturm Ruger & Co., Inc.(a) | | 24,130 | | | 231,648 |
| | | | |
|
|
| | | | | | 9,642,514 |
| | | | |
|
|
| | | | | |
COMMON STOCKS
(Continued) | | Shares
| | Value
(Note 2)
|
Life Sciences Tools & Services — 0.6% | | | | | |
Cambrex Corp. | | 35,209 | | $ | 799,948 |
Dionex Corp.(a) | | 25,396 | | | 1,440,207 |
Enzo Biochem, Inc.(a)(b) | | 39,713 | | | 566,705 |
Kendle International, Inc.(a) | | 16,172 | | | 508,609 |
PAREXEL International Corp.(a) | | 35,846 | | | 1,038,459 |
Pharmanet Development Group, Inc.(a) | | 24,226 | | | 534,668 |
| | | | |
|
|
| | | | | | 4,888,596 |
| | | | |
|
|
Machinery — 3.9% | | | | | |
Albany International Corp.
(Class “A” Stock) | | 38,414 | | | 1,264,205 |
Astec Industries, Inc.(a) | | 24,782 | | | 869,848 |
ASV, Inc.(a)(b) | | 27,005 | | | 439,371 |
Barnes Group, Inc. | | 52,212 | | | 1,135,611 |
Briggs & Stratton Corp. | | 64,960 | | | 1,750,672 |
CLARCOR, Inc. | | 67,270 | | | 2,274,399 |
Enpro Industries, Inc.(a) | | 27,921 | | | 927,256 |
Gardner Denver, Inc.(a) | | 69,243 | | | 2,583,456 |
IDEX Corp. | | 70,658 | | | 3,349,896 |
Kaydon Corp. | | 37,128 | | | 1,475,467 |
Lindsay Manufacturing Co. | | 15,281 | | | 498,925 |
Lydall, Inc.(a) | | 21,306 | | | 230,318 |
Manitowoc Co., Inc. | | 81,203 | | | 4,825,893 |
Mueller Industries, Inc. | | 48,745 | | | 1,545,217 |
Robbins & Myers, Inc. | | 22,148 | | | 1,017,036 |
Toro Co. | | 54,011 | | | 2,518,533 |
Valmont Industries, Inc. | | 22,656 | | | 1,257,181 |
Wabash National Corp. | | 41,006 | | | 619,191 |
Watts Water Technologies, Inc.
(Class “A” Stock) | | 38,361 | | | 1,577,021 |
| | | | |
|
|
| | | | | | 30,159,496 |
| | | | |
|
|
Marine — 0.3% | | | | | |
Kirby Corp.(a) | | 69,764 | | | 2,381,045 |
| | | | |
|
|
Media — 0.8% | | | | | |
4Kids Entertainment, Inc.(a) | | 17,263 | | | 314,532 |
ADVO, Inc. | | 42,007 | | | 1,369,428 |
Arbitron, Inc. | | 38,833 | | | 1,686,906 |
Live Nation, Inc.(a) | | 86,250 | | | 1,931,999 |
Radio One, Inc. (Class “D” Stock)(a) | | 101,425 | | | 683,605 |
| | | | |
|
|
| | | | | | 5,986,470 |
| | | | |
|
|
Metals & Mining — 2.2% | | | | | |
AMCOL International Corp. | | 28,737 | | | 797,164 |
Brush Engineered Materials, Inc.(a)(b) | | 26,535 | | | 896,087 |
Carpenter Technology Corp. | | 33,788 | | | 3,463,946 |
Castle (A.M.) & Co. | | 16,616 | | | 422,877 |
Century Aluminum Co.(a)(b) | | 30,395 | | | 1,357,137 |
Chaparral Steel Co.(b) | | 61,093 | | | 2,704,587 |
Cleveland-Cliffs, Inc.(b) | | 54,357 | | | 2,633,053 |
Quanex Corp.(b) | | 48,750 | | | 1,686,263 |
RTI International Metals, Inc.(a)(b) | | 30,156 | | | 2,358,802 |
Ryerson Tull, Inc.(b) | | 34,591 | | | 867,888 |
Steel Technologies, Inc. | | 15,091 | | | 264,847 |
| | | | |
|
|
| | | | | | 17,452,651 |
| | | | |
|
|
Multiline Retail — 0.2% | | | | | |
Fred’s, Inc. | | 52,735 | | | 634,930 |
Tuesday Morning Corp.(b) | | 39,224 | | | 609,933 |
| | | | |
|
|
| | | | | | 1,244,863 |
| | | | |
|
|
SEE NOTES TO FINANCIAL STATEMENTS.
B91
| | | | |
| | | SMALL CAPITALIZATION STOCK PORTFOLIO (Continued) | | |
SCHEDULE OF INVESTMENTS | December 31, 2006 |
| | | | | |
COMMON STOCKS
(Continued) | | Shares
| | Value
(Note 2)
|
Multi-Utilities — 0.3% | | | | | |
Avista Corp. | | 68,568 | | $ | 1,735,456 |
CH Energy Group, Inc. | | 17,893 | | | 944,750 |
| | | | |
|
|
| | | | | | 2,680,206 |
| | | | |
|
|
Oil, Gas & Consumable Fuels — 3.6% | | | | | |
Cabot Oil & Gas Corp.
(Class “A” Stock)(b) | | 63,188 | | | 3,832,352 |
Cimarex Energy Co.(b) | | 109,211 | | | 3,986,202 |
Frontier Oil Corp. | | 145,485 | | | 4,181,239 |
Helix Energy Solutions Group, Inc.(a)(b) | | 123,038 | | | 3,859,702 |
Massey Energy Corp. | | 105,982 | | | 2,461,962 |
Penn Virginia Corp. | | 24,653 | | | 1,726,696 |
Petroleum Development Corp.(a) | | 19,528 | | | 840,680 |
St. Mary Land & Exploration Co. | | 72,376 | | | 2,666,332 |
Stone Energy Corp.(a) | | 36,866 | | | 1,303,213 |
Swift Energy Co.(a) | | 38,921 | | | 1,744,050 |
World Fuel Services Corp. | | 37,360 | | | 1,661,026 |
| | | | |
|
|
| | | | | | 28,263,454 |
| | | | |
|
|
Paper & Forest Products — 0.5% | | | | | |
Buckeye Technologies, Inc.(a) | | 49,627 | | | 594,531 |
Deltic Timber Corp. | | 13,471 | | | 751,412 |
Neenah Paper, Inc. | | 19,521 | | | 689,482 |
Pope & Talbot, Inc.(a) | | 21,467 | | | 117,424 |
Schweitzer-Mauduit International, Inc. | | 20,370 | | | 530,639 |
Wausau-Mosinee Paper Corp. | | 58,899 | | | 882,897 |
| | | | |
|
|
| | | | | | 3,566,385 |
| | | | |
|
|
Personal Products — 0.6% | | | | | |
Mannatech, Inc.(b) | | 20,600 | | | 303,438 |
NBTY, Inc.(a) | | 74,387 | | | 3,092,267 |
Playtex Products, Inc.(a) | | 73,331 | | | 1,055,233 |
USANA Health Sciences, Inc.(a)(b) | | 11,963 | | | 618,009 |
| | | | |
|
|
| | | | | | 5,068,947 |
| | | | |
|
|
Pharmaceuticals — 0.7% | | | | | |
Alpharma, Inc. (Class “A” Stock) | | 56,394 | | | 1,359,095 |
Bradley Pharmaceuticals, Inc.(a) | | 21,664 | | | 445,845 |
MGI Pharma, Inc.(a)(b) | | 104,050 | | | 1,915,561 |
Noven Pharmaceuticals, Inc.(a) | | 32,132 | | | 817,759 |
Sciele Pharma, Inc.(a)(b) | | 38,630 | | | 927,120 |
| | | | |
|
|
| | | | | | 5,465,380 |
| | | | |
|
|
Real Estate Investment Trusts (REITs) — 4.0% | | | |
Acadia Realty Trust | | 41,819 | | | 1,046,311 |
Colonial Properties Trust | | 60,719 | | | 2,846,507 |
EastGroup Properties, Inc. | | 31,196 | | | 1,670,858 |
Entertainment Properties Trust | | 34,946 | | | 2,042,244 |
Essex Property Trust, Inc.(b) | | 30,780 | | | 3,978,316 |
Inland Real Estate Corp.(b) | | 89,313 | | | 1,671,939 |
Kilroy Realty Corp. | | 42,772 | | | 3,336,216 |
Lexington Corporate Properties Trust | | 90,660 | | | 2,032,597 |
LTC Properties, Inc. | | 27,292 | | | 745,345 |
MID-AMERICA Apartment Communities, Inc.(b) | | 32,285 | | | 1,847,993 |
National Retail Properties, Inc.(b) | | 77,810 | | | 1,785,740 |
New Century Financial Corp.(b) | | 59,194 | | | 1,869,938 |
Parkway Properties, Inc. | | 19,634 | | | 1,001,530 |
PS Business Parks, Inc. | | 21,077 | | | 1,490,355 |
Senior Housing Properties Trust | | 90,159 | | | 2,207,092 |
Sovran Self Storage, Inc. | | 26,556 | | | 1,521,128 |
| | | | |
|
|
| | | | | | 31,094,109 |
| | | | |
|
|
| | | | | |
COMMON STOCKS
(Continued) | | Shares
| | Value
(Note 2)
|
Road & Rail — 1.3% | | | | | |
Arkansas Best Corp. | | 32,858 | | $ | 1,182,888 |
Heartland Express, Inc. | | 77,646 | | | 1,166,243 |
Kansas City Southern Industries, Inc.(a)(b) | | 99,927 | | | 2,895,885 |
Knight Transportation, Inc. | | 75,906 | | | 1,294,197 |
Landstar System, Inc. | | 75,035 | | | 2,864,836 |
Old Dominion Freight Line, Inc.(a)(b) | | 36,892 | | | 887,990 |
| | | | |
|
|
| | | | | | 10,292,039 |
| | | | |
|
|
Semiconductors & Semiconductor Equipment — 3.4% |
Actel Corp.(a) | | 34,334 | | | 623,505 |
Advanced Energy Industries, Inc.(a) | | 46,644 | | | 880,172 |
ATMI, Inc.(a)(b) | | 46,053 | | | 1,405,998 |
Axcelis Technologies, Inc.(a) | | 133,523 | | | 778,439 |
Brooks Automation, Inc.(a) | | 99,314 | | | 1,430,122 |
Cabot Microelectronics Corp.(a) | | 31,619 | | | 1,073,149 |
Cohu, Inc. | | 29,737 | | | 599,498 |
Cymer, Inc.(a)(b) | | 48,956 | | | 2,151,616 |
Diodes, Inc.(a) | | 26,379 | | | 935,927 |
DSP Group, Inc.(a) | | 38,297 | | | 831,045 |
Exar Corp.(a) | | 48,420 | | | 629,460 |
FEI Co.(a) | | 33,435 | | | 881,681 |
Intevac, Inc.(a) | | 27,900 | | | 724,005 |
Kopin Corp.(a) | | 89,403 | | | 319,169 |
Kulicke & Soffa Industries, Inc.(a) | | 75,217 | | | 631,823 |
Microsemi Corp.(a) | | 93,700 | | | 1,841,205 |
MKS Instruments, Inc.(a) | | 73,500 | | | 1,659,630 |
Pericom Semiconductor Corp.(a) | | 34,389 | | | 394,442 |
Phototronics, Inc.(a) | | 54,914 | | | 897,295 |
Rudolph Technologies, Inc.(a) | | 32,756 | | | 521,476 |
Skyworks Solutions, Inc.(a)(b) | | 212,231 | | | 1,502,595 |
Standard Microsystems Corp.(a) | | 29,148 | | | 815,561 |
Supertex, Inc.(a) | | 18,057 | | | 708,737 |
Ultratech Stepper, Inc.(a) | | 30,569 | | | 381,501 |
Varian Semiconductor Equipment Associates, Inc.(a) | | 72,954 | | | 3,320,865 |
Veeco Instruments, Inc.(a)(b) | | 40,961 | | | 767,200 |
| | | | |
|
|
| | | | | | 26,706,116 |
| | | | |
|
|
Software — 3.5% | | | | | |
Altiris, Inc.(a) | | 31,921 | | | 810,155 |
ANSYS, Inc.(a) | | 50,765 | | | 2,207,770 |
Captaris, Inc.(a) | | 35,589 | | | 276,527 |
Catapult Communications Corp.(a) | | 13,856 | | | 124,427 |
Epicor Software Corp.(a) | | 76,208 | | | 1,029,570 |
EPIQ Systems, Inc.(a) | | 18,924 | | | 321,140 |
FactSet Research Systems, Inc. | | 49,766 | | | 2,810,783 |
Hyperion Solution Corp.(a) | | 77,185 | | | 2,774,029 |
JDA Software Group, Inc.(a) | | 38,601 | | | 531,536 |
Kronos, Inc.(a) | | 42,020 | | | 1,543,815 |
Manhattan Associates, Inc.(a) | | 35,893 | | | 1,079,661 |
Mapinfo Corp.(a) | | 28,058 | | | 366,157 |
MICROS Systems, Inc.(a) | | 52,173 | | | 2,749,517 |
Napster, Inc.(a) | | 59,177 | | | 214,813 |
Open Solutions, Inc.(a) | | 27,488 | | | 1,034,648 |
Phoenix Technologies, Ltd.(a) | | 33,488 | | | 150,696 |
Progress Software Corp.(a) | | 54,192 | | | 1,513,583 |
Quality Systems, Inc. | | 22,392 | | | 834,550 |
SEE NOTES TO FINANCIAL STATEMENTS.
B92
| | | | |
| | | SMALL CAPITALIZATION STOCK PORTFOLIO (Continued) | | |
SCHEDULE OF INVESTMENTS | December 31, 2006 |
| | | | | |
COMMON STOCKS
(Continued) | | Shares
| | Value
(Note 2)
|
Software (cont’d.) | | | | | |
Radiant Systems, Inc.(a) | | 34,082 | | $ | 355,816 |
Secure Computing Corp.(a) | | 85,016 | | | 557,705 |
Sonic Solutions(a) | | 34,267 | | | 558,552 |
SPSS, Inc.(a) | | 25,976 | | | 781,098 |
Take -Two Interactive Software, Inc.(a)(b) | | 95,586 | | | 1,697,607 |
THQ, Inc.(a)(b) | | 84,832 | | | 2,758,737 |
| | | | |
|
|
| | | | | | 27,082,892 |
| | | | |
|
|
Specialty Retail — 4.1% | | | | | |
Aaron Rents, Inc. | | 64,096 | | | 1,844,683 |
Cato Corp. (The) (Class “A” Stock) | | 41,491 | | | 950,559 |
Children’s Place Retail Stores, Inc. (The)(a)(b) | | 30,738 | | | 1,952,478 |
Christopher & Banks Corp. | | 50,103 | | | 934,922 |
Cost Plus, Inc.(a)(b) | | 29,037 | | | 299,081 |
Dress Barn, Inc.(a)(b) | | 60,612 | | | 1,414,078 |
Finish Line, Inc. (The) (Class “A” Stock) | | 55,007 | | | 785,500 |
Genesco, Inc.(a) | | 29,663 | | | 1,106,430 |
Group 1 Automotive, Inc. | | 31,819 | | | 1,645,679 |
Guitar Center, Inc.(a)(b) | | 38,674 | | | 1,758,120 |
Gymboree Corp. (The)(a) | | 41,721 | | | 1,592,073 |
Hancock Fabrics, Inc.(a) | | 25,198 | | | 86,681 |
Haverty Furniture Cos., Inc. | | 29,811 | | | 441,203 |
Hibbett Sporting Goods, Inc.(a) | | 41,862 | | | 1,278,047 |
Hot Topic, Inc.(a) | | 58,250 | | | 777,055 |
Jo-Ann Stores, Inc.(a) | | 32,206 | | | 792,268 |
Jos. A. Bank Clothiers, Inc.(a)(b) | | 23,744 | | | 696,886 |
Men’s Wearhouse, Inc. (The) | | 69,785 | | | 2,669,974 |
Midas, Inc.(a) | | 15,499 | | | 356,477 |
Pep Boys-Manny, Moe & Jack | | 71,628 | | | 1,064,392 |
Select Comfort Corp.(a)(b) | | 69,362 | | | 1,206,205 |
Sonic Automotive, Inc. | | 39,646 | | | 1,151,320 |
Stage Stores, Inc. | | 38,361 | | | 1,165,791 |
Stein Mart, Inc. | | 35,546 | | | 471,340 |
Tractor Supply Co.(a)(b) | | 45,599 | | | 2,038,731 |
Tween Brands Inc.(a) | | 42,202 | | | 1,685,126 |
Zale Corp.(a) | | 64,001 | | | 1,805,468 |
| | | | |
|
|
| | | | | | 31,970,567 |
| | | | |
|
|
Textiles, Apparel & Luxury Goods — 2.6% | | | | | |
Ashworth, Inc.(a) | | 19,071 | | | 138,455 |
Brown Shoe Co., Inc. | | 37,944 | | | 1,811,447 |
Crocs, Inc.(a)(b) | | 44,210 | | | 1,909,872 |
Deckers Outdoor Corp.(a)(b) | | 14,437 | | | 865,498 |
Fossil, Inc.(a)(b) | | 59,600 | | | 1,345,768 |
Kellwood Co. | | 33,184 | | | 1,079,144 |
K-Swiss, Inc. | | 34,967 | | | 1,074,886 |
Movado Group, Inc. | | 26,800 | | | 777,200 |
Oxford Industries, Inc. | | 20,093 | | | 997,617 |
Phillips-Van Heusen Corp. | | 73,225 | | | 3,673,698 |
Quiksilver, Inc.(a)(b) | | 158,596 | | | 2,497,887 |
Skechers USA, Inc.,
(Class “A” Stock)(a) | | 32,791 | | | 1,092,268 |
Stride Rite Corp. | | 47,555 | | | 717,129 |
Wolverine World Wide, Inc. | | 73,382 | | | 2,092,855 |
| | | | |
|
|
| | | | | | 20,073,724 |
| | | | |
|
|
| | | | | | | |
COMMON STOCKS
(Continued) | | Shares
| | Value
(Note 2)
| |
Thrifts & Mortgage Finance — 2.0% | | | | | | | |
Anchor BanCorp Wisconsin, Inc. | | | 23,859 | | $ | 687,616 | |
Bank Mutual Corp. | | | 79,410 | | | 961,655 | |
BankAtlantic Bancorp, Inc.
(Class “A” Stock) | | | 60,366 | | | 833,654 | |
BankUnited Financial Corp.
(Class “A” Stock) | | | 42,070 | | | 1,176,277 | |
Brookline Bancorp, Inc. | | | 81,087 | | | 1,067,916 | |
Dime Community Bancshares | | | 36,121 | | | 506,055 | |
Downey Financial Corp. | | | 25,765 | | | 1,870,025 | |
Fidelity Bankshares, Inc. | | | 28,886 | | | 1,145,908 | |
FirstFed Financial Corp.(a)(b) | | | 21,924 | | | 1,468,250 | |
Flagstar Bancorp, Inc. | | | 51,087 | | | 758,131 | |
Franklin Bank Corp.(a) | | | 31,046 | | | 637,685 | |
Fremont General Corp. | | | 89,273 | | | 1,447,115 | |
MAF Bancorp, Inc. | | | 36,826 | | | 1,645,754 | |
TrustCo Bank Corp.(b) | | | 98,851 | | | 1,099,223 | |
| | | | | |
|
|
|
| | | | | | | 15,305,264 | |
| | | | | |
|
|
|
Tobacco — 0.1% | | | | | | | |
Alliance One International, Inc.(a) | | | 115,246 | | | 813,637 | |
| | | | | |
|
|
|
Trading Companies & Distributors — 0.5% | | | | |
Applied Industrial Technologies, Inc.(b) | | | 49,154 | | | 1,293,242 | |
Kaman Corp. (Class “A” Stock) | | | 31,736 | | | 710,569 | |
Lawson Products, Inc. | | | 5,520 | | | 253,313 | |
Watsco, Inc. | | | 32,281 | | | 1,522,372 | |
| | | | | |
|
|
|
| | | | | | | 3,779,496 | |
| | | | | |
|
|
|
Water Utilities — 0.1% | | | | | | | |
American States Water Co.(b) | | | 22,479 | | | 868,139 | |
| | | | | |
|
|
|
TOTAL LONG-TERM INVESTMENTS (cost $512,194,674) | | | | | | 773,093,046 | |
| | | | | |
|
|
|
| SHORT-TERM INVESTMENTS — 25.5% | |
Affiliated Money Market Mutual Fund | | | | | | | |
Dryden Core Investment Fund —Taxable Money Market Series (cost $197,654,555; includes 193,996,428 of cash collateral received for securities on loan)
(Note 4)(c)(d) | | | 197,654,555 | | | 197,654,555 | |
| | | | | |
|
|
|
| | |
| | | Principal
Amount
(000)
| | | |
U.S. Government Obligation | | | | | | | |
U.S. Treasury Bills(e)(f)
(cost $297,077)
4.80%, 3/15/07 | | $ | 300 | | | 297,139 | |
| | | | | |
|
|
|
TOTAL SHORT-TERM INVESTMENTS
(cost $197,951,632) | | | 197,951,694 | |
| | | | | |
|
|
|
TOTAL INVESTMENTS — 125.0%
(cost $710,146,306) | | | 971,044,740 | |
LIABILTIES IN EXCESS OF
OTHER ASSETS(g) — (25.0)% | | | (193,907,821 | ) |
| | | | | |
|
|
|
NET ASSETS — 100.0% | | $ | 777,136,919 | |
| | | | | |
|
|
|
SEE NOTES TO FINANCIAL STATEMENTS.
B93
| | | | |
| | | SMALL CAPITALIZATION STOCK PORTFOLIO (Continued) | | |
SCHEDULE OF INVESTMENTS | December 31, 2006 |
The following abbreviation is used in the Portfolio descriptions:
| | |
| ADR | | American Depositary Receipt |
| (a) | Non-income producing security. |
| (b) | All or a portion of security is on loan. The aggregate market value of such securities is $183,898,003; cash collateral of $193,996,428 (included in liabilities) was received with which the Portfolio purchased highly liquid short-term investments. |
| (c) | Represents security, or a portion thereof, purchased with cash collateral received for securities on loan. |
| (d) | Prudential Investments LLC, the manager of the Portfolio, also serves as manager of the Dryden Core Investment Fund-Taxable Money Market Series. |
| (e) | Security segregated as collateral for futures contracts. |
| (f) | Rate quoted represents yield-to-maturity as of purchase date. |
| (g) | Liabilities in excess of other assets include net unrealized appreciation on financial futures as follows: |
Open future contracts outstanding at December 31, 2006:
| | | | | | | | | | | | | |
Number of
Contracts
| | Type
| | Expiration
Date
| | Value at
December 31,
2006
| | Value at
Trade Date
| | Unrealized
Appreciation
|
| Long Position: | | | | | | | | | | | | | |
| 11 | | Russell 2000 | | Mar. 07 | | $ | 4,371,950 | | $ | 4,350,125 | | $ | 21,825 |
| | | | | | | | | | | | |
|
|
SEE NOTES TO FINANCIAL STATEMENTS.
B94
| | | | |
| | | SMALL CAPITALIZATION STOCK PORTFOLIO (Continued) | | |
SCHEDULE OF INVESTMENTS | December 31, 2006 |
The industry classification of portfolio holdings and liabilities in excess of other assets shown as a percentage of net assets as of December 31, 2006 were as follows:
| | | |
Affiliated Money Market Mutual Fund (including 25.0% of collateral received for securities on loan) | | 25.5 | % |
Commercial Banks | | 5.8 | |
Health Care Equipment & Supplies | | 5.1 | |
Electronic Equipment & Instruments | | 4.6 | |
Specialty Retail | | 4.1 | |
Real Estate Investment Trusts (REITs) | | 4.0 | |
Machinery | | 3.9 | |
Energy Equipment & Services | | 3.7 | |
Health Care Providers & Services | | 3.7 | |
Hotels, Restaurants & Leisure | | 3.7 | |
Oil, Gas & Consumable Fuels | | 3.6 | |
Commercial Services & Supplies | | 3.5 | |
Software | | 3.5 | |
Gas Utilities | | 3.4 | |
Semiconductors & Semiconductor Equipment | | 3.4 | |
Insurance | | 2.9 | |
Textiles, Apparel & Luxury Goods | | 2.6 | |
Metals & Mining | | 2.2 | |
Aerospace & Defense | | 2.1 | |
Thrifts & Mortgage Finance | | 2.0 | |
Food Products | | 1.9 | |
Household Durables | | 1.8 | |
IT Services | | 1.8 | |
Electrical Equipment | | 1.5 | |
Internet Software & Services | | 1.4 | |
Chemicals | | 1.3 | |
Construction & Engineering | | 1.3 | |
Road & Rail | | 1.3 | |
Building Products | | 1.2 | |
Communications Equipment | | 1.2 | |
Leisure Equipment & Products | | 1.2 | |
| | | |
Electric Utilities | | 1.1 | % |
Food & Staples Retailing | | 1.0 | |
Health Care Technology | | 1.0 | |
Computers & Peripherals | | 0.9 | |
Capital Markets | | 0.8 | |
Media | | 0.8 | |
Containers & Packaging | | 0.7 | |
Pharmaceuticals | | 0.7 | |
Diversified Consumer Services | | 0.6 | |
Life Sciences Tools & Services | | 0.6 | |
Personal Products | | 0.6 | |
Air Freight & Logistics | | 0.5 | |
Biotechnology | | 0.5 | |
Consumer Finance | | 0.5 | |
Paper & Forest Products | | 0.5 | |
Trading Companies & Distributors | | 0.5 | |
Airlines | | 0.4 | |
Auto Components | | 0.4 | |
Construction Materials | | 0.4 | |
Household Products | | 0.4 | |
Automobiles | | 0.3 | |
Distributors | | 0.3 | |
Diversified Financial Services | | 0.3 | |
Diversified Telecommunication Services | | 0.3 | |
Exchange Traded Fund | | 0.3 | |
Marine | | 0.3 | |
Multi-Utilities | | 0.3 | |
Industrial Conglomerates | | 0.2 | |
Internet & Catalog Retail | | 0.2 | |
Multiline Retail | | 0.2 | |
Tobacco | | 0.1 | |
Water Utilities | | 0.1 | |
| | |
|
|
| | | 125.0 | |
Liabilities in excess of other assets | | (25.0 | ) |
| | |
|
|
| | | 100.0 | % |
| | |
|
|
SEE NOTES TO FINANCIAL STATEMENTS.
B95
SCHEDULE OF INVESTMENTS | December 31, 2006 |
| | | | | |
| LONG-TERM INVESTMENTS — 98.2% | | Value
(Note 2)
|
| COMMON STOCKS | | Shares
| |
Aerospace/Defense — 2.4% | | | | | |
Boeing Co. | | 204,136 | | $ | 18,135,442 |
General Dynamics Corp. | | 104,600 | | | 7,777,010 |
Goodrich Corp. | | 31,800 | | | 1,448,490 |
Honeywell International, Inc. | | 215,150 | | | 9,733,386 |
L-3 Communications Holdings, Inc. | | 32,900 | | | 2,690,562 |
Lockheed Martin Corp. | | 93,698 | | | 8,626,775 |
Northrop Grumman Corp. | | 97,226 | | | 6,582,200 |
Raytheon Co. | | 115,818 | | | 6,115,190 |
Rockwell Collins, Inc. | | 45,100 | | | 2,854,379 |
United Technologies Corp. | | 260,000 | | | 16,255,200 |
| | | | |
|
|
| | | | | | 80,218,634 |
| | | | |
|
|
Air Freight & Logistics — 0.9% | | | | | |
FedEx Corp. | | 80,740 | | | 8,769,979 |
United Parcel Service, Inc.
(Class B Stock) | | 274,800 | | | 20,604,504 |
| | | | |
|
|
| | | | | | 29,374,483 |
| | | | |
|
|
Airlines — 0.1% | | | | | |
Southwest Airlines Co. | | 176,637 | | | 2,706,079 |
| | | | |
|
|
Auto Components — 0.1% | | | | | |
Goodyear Tire & Rubber Co. (The)(a)(b) | | 49,200 | | | 1,032,708 |
Johnson Controls, Inc. | | 46,100 | | | 3,960,912 |
| | | | |
|
|
| | | | | | 4,993,620 |
| | | | |
|
|
Automobiles — 0.4% | | | | | |
Ford Motor Co.(b) | | 462,045 | | | 3,469,958 |
General Motors Corp. | | 139,100 | | | 4,273,152 |
Harley-Davidson, Inc.(b) | | 69,700 | | | 4,911,759 |
| | | | |
|
|
| | | | | | 12,654,869 |
| | | | |
|
|
Beverages — 2.1% | | | | | |
Anheuser-Busch Cos., Inc.(b) | | 204,500 | | | 10,061,400 |
Brown-Forman Corp. | | 16,200 | | | 1,073,088 |
Coca-Cola Co. (The) (Class B Stock) | | 522,700 | | | 25,220,275 |
Coca-Cola Enterprises, Inc. | | 84,700 | | | 1,729,574 |
Constellation Brands, Inc.
(Class A Stock)(a) | | 38,200 | | | 1,108,564 |
Molson Coors Brewing Co.
(Class B Stock) | | 16,000 | | | 1,223,040 |
Pepsi Bottling Group, Inc. | | 33,600 | | | 1,038,576 |
PepsiCo, Inc. | | 429,640 | | | 26,873,982 |
| | | | |
|
|
| | | | | | 68,328,499 |
| | | | |
|
|
Biotechnology — 1.3% | | | | | |
Amgen, Inc.(a) | | 303,164 | | | 20,709,133 |
Biogen Idec, Inc.(a)(b) | | 90,825 | | | 4,467,682 |
Celgene Corp.(a)(b) | | 87,200 | | | 5,016,616 |
Genzyme Corp.(a) | | 58,800 | | | 3,620,904 |
Gilead Sciences, Inc.(a) | | 109,200 | | | 7,090,356 |
MedImmune, Inc.(a) | | 61,200 | | | 1,981,044 |
| | | | |
|
|
| | | | | | 42,885,735 |
| | | | |
|
|
Building Products — 0.1% | | | | | |
American Standard Cos., Inc. | | 38,900 | | | 1,783,565 |
Masco Corp. | | 103,400 | | | 3,088,558 |
| | | | |
|
|
| | | | | | 4,872,123 |
| | | | |
|
|
| | | | | |
COMMON STOCKS
(Continued) | | Shares
| | Value
(Note 2)
|
Capital Markets — 3.8% | | | | | |
Ameriprise Financial, Inc. | | 62,300 | | $ | 3,395,350 |
Bank of New York Co., Inc. | | 199,200 | | | 7,842,504 |
Bear Stearns & Co., Inc. | | 32,110 | | | 5,226,866 |
Charles Schwab Corp. | | 275,400 | | | 5,326,236 |
E*Trade Financial Corp.(a) | | 106,800 | | | 2,394,456 |
Federated Investors, Inc.
(Class B Stock) | | 22,600 | | | 763,428 |
Franklin Resources, Inc. | | 40,400 | | | 4,450,868 |
Goldman Sachs Group, Inc. | | 113,100 | | | 22,546,485 |
Janus Capital Group, Inc. | | 55,000 | | | 1,187,450 |
Legg Mason, Inc.(b) | | 30,800 | | | 2,927,540 |
Lehman Brothers Holdings, Inc. | | 141,100 | | | 11,022,732 |
Mellon Financial Corp.(b) | | 105,700 | | | 4,455,255 |
Merrill Lynch & Co., Inc.(b) | | 234,100 | | | 21,794,710 |
Morgan Stanley | | 277,710 | | | 22,613,925 |
Northern Trust Corp. | | 48,800 | | | 2,961,672 |
State Street Corp. | | 85,600 | | | 5,772,864 |
T. Rowe Price Group, Inc. | | 59,600 | | | 2,608,692 |
| | | | |
|
|
| | | | | | 127,291,033 |
| | | | |
|
|
Chemicals — 1.5% | | | | | |
Air Products & Chemicals, Inc. | | 55,700 | | | 3,914,596 |
Ashland, Inc. | | 18,600 | | | 1,286,748 |
Dow Chemical Co. | | 259,761 | | | 10,374,854 |
Du Pont (E.I.) de Nemours & Co. | | 234,391 | | | 11,417,186 |
Eastman Chemical Co. | | 22,400 | | | 1,328,544 |
Ecolab, Inc. | | 48,800 | | | 2,205,760 |
Hercules, Inc.(a) | | 27,900 | | | 538,749 |
International Flavors & Fragrances, Inc. | | 18,700 | | | 919,292 |
Monsanto Co. | | 131,396 | | | 6,902,232 |
PPG Industries, Inc. | | 42,600 | | | 2,735,346 |
Praxair, Inc. | | 79,000 | | | 4,687,070 |
Rohm and Haas Co. | | 38,800 | | | 1,983,456 |
Sigma-Aldrich Corp. | | 12,800 | | | 994,816 |
| | | | |
|
|
| | | | | | 49,288,649 |
| | | | |
|
|
Commercial Banks — 4.1% | | | | | |
BB&T Corp. | | 140,900 | | | 6,189,737 |
Comerica, Inc. | | 44,750 | | | 2,625,930 |
Commerce Bancorp, Inc. | | 33,300 | | | 1,174,491 |
Compass Bancshares, Inc. | | 33,800 | | | 2,016,170 |
Fifth Third Bancorp | | 143,249 | | | 5,863,182 |
First Horizon National Corp.(b) | | 35,900 | | | 1,499,902 |
Huntington Bancshares, Inc.(b) | | 60,875 | | | 1,445,781 |
KeyCorp | | 106,900 | | | 4,065,407 |
M&T Bank Corp. | | 20,100 | | | 2,455,416 |
Marshall & Ilsley Corp. | | 58,700 | | | 2,824,057 |
National City Corp.(b) | | 151,500 | | | 5,538,840 |
PNC Financial Services Group, Inc.(b) | | 77,900 | | | 5,767,716 |
Regions Financial Corp. | | 196,812 | | | 7,360,769 |
SunTrust Banks, Inc. | | 90,700 | | | 7,659,615 |
Synovus Financial Corp. | | 85,100 | | | 2,623,633 |
US Bancorp | | 455,381 | | | 16,480,238 |
Wachovia Corp. | | 491,855 | | | 28,011,142 |
Wells Fargo & Co. | | 873,620 | | | 31,065,927 |
Zions Bancorporation | | 27,700 | | | 2,283,588 |
| | | | |
|
|
| | | | | | 136,951,541 |
| | | | |
|
|
SEE NOTES TO FINANCIAL STATEMENTS.
B96
| | | | |
| | | STOCK INDEX PORTFOLIO (Continued) | | |
SCHEDULE OF INVESTMENTS | December 31, 2006 |
| | | | | |
COMMON STOCKS
(Continued) | | Shares
| | Value
(Note 2)
|
Commercial Services & Supplies — 0.5% | | | |
Allied Waste Industries, Inc.(a)(b) | | 71,800 | | $ | 882,422 |
Avery Dennison Corp. | | 25,000 | | | 1,698,250 |
Cintas Corp. | | 35,800 | | | 1,421,618 |
Donnelley (R.R.) & Sons Co. | | 57,500 | | | 2,043,550 |
Equifax, Inc. | | 31,100 | | | 1,262,660 |
Monster Worldwide, Inc.(a) | | 22,900 | | | 1,068,056 |
Pitney Bowes, Inc. | | 58,300 | | | 2,692,877 |
Robert Half International, Inc. | | 45,800 | | | 1,700,096 |
Waste Management, Inc. | | 145,030 | | | 5,332,753 |
| | | | |
|
|
| | | | | | 18,102,282 |
| | | | |
|
|
Communications Equipment — 2.6% | | | | | |
ADC Telecommunications, Inc.(a) | | 27,200 | | | 395,216 |
Avaya, Inc.(a) | | 110,908 | | | 1,550,494 |
Ciena Corp.(a)(b) | | 21,657 | | | 600,115 |
Cisco Systems, Inc.(a) | | 1,577,600 | | | 43,115,808 |
Comverse Technology, Inc.(a)(b) | | 37,000 | | | 781,070 |
Corning, Inc.(a) | | 371,400 | | | 6,948,894 |
JDS Uniphase Corp.(a) | | 24,887 | | | 414,617 |
Juniper Networks, Inc.(a) | | 115,000 | | | 2,178,100 |
Motorola, Inc. | | 652,695 | | | 13,419,409 |
QUALCOMM, Inc. | | 427,200 | | | 16,143,888 |
Tellabs, Inc.(a) | | 116,000 | | | 1,190,160 |
| | | | |
|
|
| | | | | | 86,737,771 |
| | | | |
|
|
Computers & Peripherals — 3.7% | | | | | |
Apple Computer, Inc.(a) | | 213,600 | | | 18,121,824 |
Dell, Inc.(a) | | 596,100 | | | 14,956,149 |
EMC Corp.(a) | | 588,274 | | | 7,765,217 |
Hewlett-Packard Co. | | 720,616 | | | 29,682,173 |
International Business Machines Corp. | | 392,100 | | | 38,092,515 |
Lexmark International, Inc.(a)(b) | | 29,014 | | | 2,123,825 |
NCR Corp.(a) | | 46,300 | | | 1,979,788 |
Network Appliance, Inc.(a) | | 96,800 | | | 3,802,304 |
QLogic Corp.(a) | | 51,800 | | | 1,135,456 |
SanDisk Corp.(a)(b) | | 47,700 | | | 2,052,531 |
Sun Microsystems, Inc.(a) | | 808,600 | | | 4,382,612 |
| | | | |
|
|
| | | | | | 124,094,394 |
| | | | |
|
|
Construction & Engineering — 0.1% | | | | | |
Fluor Corp. | | 23,500 | | | 1,918,775 |
| | | | |
|
|
Construction Materials — 0.1% | | | | | |
Vulcan Materials Co. | | 27,000 | | | 2,426,490 |
| | | | |
|
|
Consumer Finance — 1.0% | | | | | |
American Express Co. | | 310,800 | | | 18,856,236 |
Capital One Financial Corp. | | 113,569 | | | 8,724,371 |
SLM Corp. | | 109,000 | | | 5,315,930 |
| | | | |
|
|
| | | | | | 32,896,537 |
| | | | |
|
|
Containers & Packaging — 0.2% | | | | | |
Ball Corp. | | 23,400 | | | 1,020,240 |
Bemis Co. | | 25,900 | | | 880,082 |
Pactiv Corp.(a) | | 33,000 | | | 1,177,770 |
Sealed Air Corp. | | 19,910 | | | 1,292,557 |
Temple-Inland, Inc. | | 29,600 | | | 1,362,488 |
| | | | |
|
|
| | | | | | 5,733,137 |
| | | | |
|
|
Distributors — 0.1% | | | | | |
Genuine Parts Co. | | 46,225 | | | 2,192,452 |
| | | | |
|
|
| | | | | |
COMMON STOCKS
(Continued) | | Shares
| | Value
(Note 2)
|
Diversified Consumer Services — 0.1% | | | | | |
Apollo Group, Inc. (Class A Stock)(a)(b) | | 29,800 | | $ | 1,161,306 |
H&R Block, Inc. | | 87,900 | | | 2,025,216 |
| | | | |
|
|
| | | | | | 3,186,522 |
| | | | |
|
|
Diversified Financial Services — 5.7% | | | | | |
Bank of America Corp. | | 1,164,207 | | | 62,157,011 |
Chicago Mercantile Exchange Holdings, Inc.(b) | | 8,200 | | | 4,179,950 |
CIT Group, Inc. | | 53,800 | | | 3,000,426 |
Citigroup, Inc. | | 1,260,476 | | | 70,208,512 |
JPMorgan Chase & Co. | | 903,385 | | | 43,633,496 |
Moody’s Corp. | | 65,320 | | | 4,510,999 |
| | | | |
|
|
| | | | | | 187,690,394 |
| | | | |
|
|
Diversified Telecommunication Services — 2.0% | | | |
AT&T, Inc.(b) | | 993,409 | | | 35,514,372 |
BellSouth Corp. | | 467,700 | | | 22,033,347 |
CenturyTel, Inc. | | 30,000 | | | 1,309,800 |
Citizens Communications Co. | | 90,300 | | | 1,297,611 |
Embarq Corp. | | 39,376 | | | 2,069,603 |
Qwest Communications International, Inc.(a)(b) | | 411,647 | | | 3,445,485 |
Windstream Corp. | | 102,565 | | | 1,458,474 |
| | | | |
|
|
| | | | | | 67,128,692 |
| | | | |
|
|
Electric Utilities — 1.8% | | | | | |
Allegheny Energy, Inc.(a) | | 36,200 | | | 1,661,942 |
American Electric Power Co., Inc. | | 109,940 | | | 4,681,245 |
Duke Energy Corp.(b) | | 308,482 | | | 10,244,687 |
Edison International | | 85,100 | | | 3,870,348 |
Entergy Corp. | | 52,100 | | | 4,809,872 |
Exelon Corp. | | 171,550 | | | 10,617,230 |
FirstEnergy Corp. | | 87,436 | | | 5,272,391 |
FPL Group, Inc.(b) | | 99,700 | | | 5,425,674 |
Pinnacle West Capital Corp. | | 26,000 | | | 1,317,940 |
PPL Corp. | | 95,100 | | | 3,408,384 |
Progress Energy, Inc. | | 56,714 | | | 2,783,523 |
Southern Co. | | 179,100 | | | 6,601,626 |
| | | | |
|
|
| | | | | | 60,694,862 |
| | | | |
|
|
Electrical Equipment — 0.5% | | | | | |
American Power Conversion Corp. | | 31,500 | | | 963,585 |
Cooper Industries Ltd. | | 25,000 | | | 2,260,750 |
Emerson Electric Co. | | 210,000 | | | 9,258,900 |
Rockwell Automation, Inc. | | 45,800 | | | 2,797,464 |
| | | | |
|
|
| | | | | | 15,280,699 |
| | | | |
|
|
Electronic Equipment & Instruments — 0.3% | | | |
Agilent Technologies, Inc.(a) | | 113,682 | | | 3,961,818 |
Jabil Circuit, Inc. | | 30,900 | | | 758,595 |
Molex, Inc. | | 32,600 | | | 1,031,138 |
Sanmina Corp.(a) | | 150,600 | | | 519,570 |
Solectron Corp.(a)(b) | | 261,700 | | | 842,674 |
Symbol Technologies, Inc. | | 67,400 | | | 1,006,956 |
Tektronix, Inc. | | 18,300 | | | 533,811 |
| | | | |
|
|
| | | | | | 8,654,562 |
| | | | |
|
|
Energy Equipment & Services — 1.7% | | | | | |
Baker Hughes, Inc. | | 84,630 | | | 6,318,476 |
SEE NOTES TO FINANCIAL STATEMENTS.
B97
| | | | |
| | | STOCK INDEX PORTFOLIO (Continued) | | |
SCHEDULE OF INVESTMENTS | December 31, 2006 |
| | | | | |
COMMON STOCKS
(Continued) | | Shares
| | Value
(Note 2)
|
Energy Equipment & Services (cont’d.) | | | | | |
BJ Services Co. | | 87,400 | | $ | 2,562,568 |
Halliburton Co. | | 264,200 | | | 8,203,410 |
Nabors Industries Ltd.(a)(b) | | 86,800 | | | 2,584,904 |
National-Oilwell Varco, Inc.(a) | | 43,200 | | | 2,642,976 |
Noble Corp.(b) | | 32,800 | | | 2,497,720 |
Rowan Cos., Inc. | | 12,700 | | | 421,640 |
Schlumberger Ltd. | | 308,800 | | | 19,503,808 |
Smith International Inc. | | 37,900 | | | 1,556,553 |
Transocean, Inc.(a) | | 83,133 | | | 6,724,628 |
Weatherford International Ltd.(a) | | 85,500 | | | 3,573,045 |
| | | | |
|
|
| | | | | | 56,589,728 |
| | | | |
|
|
Food & Staples Retailing — 2.2% | | | | | |
Costco Wholesale Corp. | | 123,332 | | | 6,520,563 |
CVS Corp.(b) | | 206,600 | | | 6,386,006 |
Kroger Co. | | 186,300 | | | 4,297,941 |
Safeway, Inc. | | 117,300 | | | 4,053,888 |
SUPERVALU, Inc. | | 57,208 | | | 2,045,186 |
Sysco Corp. | | 153,700 | | | 5,650,012 |
Walgreen Co.(b) | | 257,900 | | | 11,835,031 |
Wal-Mart Stores, Inc. | | 629,900 | | | 29,088,782 |
Whole Foods Market, Inc.(b) | | 31,300 | | | 1,468,909 |
| | | | |
|
|
| | | | | | 71,346,318 |
| | | | |
|
|
Food Products — 1.0% | | | | | |
Archer-Daniels-Midland Co. | | 168,138 | | | 5,373,690 |
Campbell Soup Co. | | 48,800 | | | 1,897,832 |
ConAgra Foods, Inc. | | 135,800 | | | 3,666,600 |
Dean Foods Co.(a) | | 27,200 | | | 1,150,016 |
General Mills, Inc. | | 94,300 | | | 5,431,680 |
Heinz (H.J.) & Co. | | 80,350 | | | 3,616,554 |
Hershey Foods Corp. | | 46,100 | | | 2,295,780 |
Kellogg Co. | | 66,000 | | | 3,303,960 |
McCormick & Co., Inc. | | 31,300 | | | 1,206,928 |
Sara Lee Corp. | | 185,900 | | | 3,165,877 |
Tyson Foods, Inc. (Class A Stock) | | 51,800 | | | 852,110 |
Wrigley (William) Jr. Co. | | 49,100 | | | 2,539,452 |
| | | | |
|
|
| | | | | | 34,500,479 |
| | | | |
|
|
Gas Utilities — 0.1% | | | | | |
Nicor, Inc. | | 12,200 | | | 570,960 |
Peoples Energy Corp. | | 6,000 | | | 267,420 |
Questar Corp. | | 21,900 | | | 1,818,795 |
| | | | |
|
|
| | | | | | 2,657,175 |
| | | | |
|
|
Healthcare Equipment & Supplies — 1.5% | | | |
Bausch & Lomb, Inc.(b) | | 12,100 | | | 629,926 |
Baxter International, Inc. | | 164,700 | | | 7,640,433 |
Becton Dickinson & Co. | | 68,800 | | | 4,826,320 |
Biomet, Inc. | | 46,625 | | | 1,924,214 |
Boston Scientific Corp.(a) | | 289,199 | | | 4,968,439 |
C.R. Bard, Inc. | | 26,600 | | | 2,207,002 |
Hospira, Inc.(a) | | 42,820 | | | 1,437,896 |
Medtronic, Inc. | | 294,800 | | | 15,774,748 |
St. Jude Medical, Inc.(a) | | 84,600 | | | 3,092,976 |
Stryker Corp. | | 69,500 | | | 3,830,145 |
Zimmer Holdings, Inc.(a) | | 59,286 | | | 4,646,837 |
| | | | |
|
|
| | | | | | 50,978,936 |
| | | | |
|
|
| | | | | |
COMMON STOCKS
(Continued) | | Shares
| | Value
(Note 2)
|
Healthcare Providers & Services — 2.5% | | | | | |
Aetna, Inc. | | 150,348 | | $ | 6,492,027 |
AmerisourceBergen Corp.(b) | | 58,400 | | | 2,625,664 |
Cardinal Health, Inc. | | 103,475 | | | 6,666,894 |
Caremark Rx, Inc. | | 111,400 | | | 6,362,054 |
CIGNA Corp. | | 31,200 | | | 4,104,984 |
Coventry Health Care, Inc.(a) | | 39,750 | | | 1,989,488 |
Express Scripts, Inc.(a) | | 34,700 | | | 2,484,520 |
Health Management Associates, Inc. | | 66,300 | | | 1,399,593 |
Humana, Inc.(a) | | 41,900 | | | 2,317,489 |
Laboratory Corp. of America Holdings(a)(b) | | 33,800 | | | 2,483,286 |
Manor Care, Inc. | | 12,750 | | | 598,230 |
McKesson Corp. | | 72,107 | | | 3,655,825 |
Medco Health Solutions, Inc.(a) | | 74,396 | | | 3,975,722 |
Patterson Cos., Inc.(a) | | 21,400 | | | 759,914 |
Quest Diagnostics, Inc. | | 44,300 | | | 2,347,900 |
Tenet Healthcare Corp.(a) | | 111,100 | | | 774,367 |
UnitedHealth Group, Inc. | | 349,500 | | | 18,778,635 |
Wellpoint, Inc.(a) | | 168,200 | | | 13,235,658 |
| | | | |
|
|
| | | | | | 81,052,250 |
| | | | |
|
|
Healthcare Technology | | | | | |
IMS Health, Inc. | | 51,320 | | | 1,410,274 |
| | | | |
|
|
Hotels, Restaurants & Leisure — 1.6% | | | | | |
Carnival Corp.(b) | | 106,800 | | | 5,238,540 |
Darden Restaurants, Inc. | | 38,650 | | | 1,552,571 |
Harrah’s Entertainment, Inc. | | 41,450 | | | 3,428,744 |
Hilton Hotels Corp. | | 84,000 | | | 2,931,600 |
International Game Technology(b) | | 79,000 | | | 3,649,800 |
Marriott International, Inc. (Class A Stock) | | 77,900 | | | 3,717,388 |
McDonald’s Corp.(b) | | 330,500 | | | 14,651,065 |
Starbucks Corp.(a)(b) | | 200,100 | | | 7,087,542 |
Starwood Hotels & Resorts Worldwide, Inc. | | 47,300 | | | 2,956,250 |
Wendy’s International, Inc. | | 21,700 | | | 718,053 |
Wyndham Worldwide Corp.(a) | | 42,663 | | | 1,366,069 |
Yum! Brands, Inc. | | 72,500 | | | 4,263,000 |
| | | | |
|
|
| | | | | | 51,560,622 |
| | | | |
|
|
Household Durables — 0.6% | | | | | |
Black & Decker Corp. | | 16,500 | | | 1,319,505 |
Centex Corp.(b) | | 32,000 | | | 1,800,640 |
D.R. Horton, Inc. | | 52,200 | | | 1,382,778 |
Fortune Brands, Inc.(b) | | 33,000 | | | 2,817,870 |
Harman International Industries, Inc. | | 16,700 | | | 1,668,497 |
KB Home | | 21,932 | | | 1,124,673 |
Leggett & Platt, Inc. | | 50,900 | | | 1,216,510 |
Lennar Corp. (Class A Stock) | | 29,000 | | | 1,521,340 |
Newell Rubbermaid, Inc. | | 58,249 | | | 1,686,309 |
Pulte Homes, Inc. | | 39,800 | | | 1,318,176 |
Snap-On, Inc. | | 12,300 | | | 585,972 |
Stanley Works | | 12,200 | | | 613,538 |
Whirlpool Corp.(b) | | 16,507 | | | 1,370,411 |
| | | | |
|
|
| | | | | | 18,426,219 |
| | | | |
|
|
Household Products — 2.2% | | | | | |
Clorox Co. | | 37,900 | | | 2,431,285 |
SEE NOTES TO FINANCIAL STATEMENTS.
B98
| | | | |
| | | STOCK INDEX PORTFOLIO (Continued) | | |
SCHEDULE OF INVESTMENTS | December 31, 2006 |
| | | | | |
COMMON STOCKS
(Continued) | | Shares
| | Value
(Note 2)
|
Household Products (cont’d.) | | | | | |
Colgate-Palmolive Co. | | 130,400 | | $ | 8,507,296 |
Kimberly-Clark Corp. | | 124,788 | | | 8,479,345 |
Procter & Gamble Co. | | 814,681 | | | 52,359,547 |
| | | | |
|
|
| | | | | | 71,777,473 |
| | | | |
|
|
Independent Power Producers & Energy Traders — 0.4% |
AES Corp.(a) | | 159,700 | | | 3,519,788 |
Constellation Energy Group, Inc.(b) | | 48,350 | | | 3,329,865 |
Dynegy, Inc.(a) | | 87,800 | | | 635,672 |
TXU Corp. | | 125,512 | | | 6,804,006 |
| | | | |
|
|
| | | | | | 14,289,331 |
| | | | |
|
|
Industrial Conglomerates — 4.0% |
3M Co. | | 190,000 | | | 14,806,700 |
General Electric Co. | | 2,633,800 | | | 98,003,697 |
Textron, Inc. | | 32,100 | | | 3,010,017 |
Tyco International Ltd. | | 510,543 | | | 15,520,507 |
| | | | |
|
|
| | | | | | 131,340,921 |
| | | | |
|
|
Insurance — 4.5% |
ACE Ltd. | | 87,200 | | | 5,281,704 |
AFLAC, Inc.(b) | | 121,400 | | | 5,584,400 |
Allstate Corp. | | 164,888 | | | 10,735,858 |
Ambac Financial Group, Inc. | | 28,800 | | | 2,565,216 |
American International Group, Inc. | | 667,487 | | | 47,832,118 |
Aon Corp. | | 74,725 | | | 2,640,782 |
Chubb Corp. | | 113,000 | | | 5,978,830 |
Cincinnati Financial Corp. | | 45,628 | | | 2,067,405 |
Genworth Financial, Inc. (Class A Stock) | | 106,800 | | | 3,653,628 |
Hartford Financial Services Group, Inc. | | 82,500 | | | 7,698,075 |
Lincoln National Corp. | | 71,363 | | | 4,738,503 |
Loews Corp. | | 104,300 | | | 4,325,321 |
Marsh & McLennan Cos., Inc. | | 121,800 | | | 3,734,388 |
MBIA, Inc.(b) | | 36,850 | | | 2,692,261 |
MetLife, Inc. | | 198,800 | | | 11,731,188 |
Principal Financial Group, Inc. | | 66,300 | | | 3,891,810 |
Progressive Corp. | | 195,800 | | | 4,742,276 |
SAFECO Corp. | | 35,800 | | | 2,239,290 |
St. Paul Travelers Cos., Inc. | | 181,898 | | | 9,766,104 |
Torchmark Corp. | | 24,100 | | | 1,536,616 |
UnumProvident Corp. | | 86,456 | | | 1,796,556 |
XL Capital Ltd. (Class A Stock) | | 45,300 | | | 3,262,506 |
| | | | |
|
|
| | | | | | 148,494,835 |
| | | | |
|
|
Internet & Catalog Retail — 0.1% |
Amazon.Com, Inc.(a)(b) | | 67,000 | | | 2,643,820 |
IAC/InterActiveCorp(a)(b) | | 45,200 | | | 1,679,632 |
| | | | |
|
|
| | | | | | 4,323,452 |
| | | | |
|
|
Internet Software & Services — 1.3% |
eBay, Inc.(a)(b) | | 285,300 | | | 8,578,971 |
Google, Inc. (Class A Stock)(a) | | 53,950 | | | 24,842,896 |
VeriSign, Inc.(a) | | 50,500 | | | 1,214,525 |
Yahoo!, Inc.(a)(b) | | 301,300 | | | 7,695,202 |
| | | | |
|
|
| | | | | | 42,331,594 |
| | | | |
|
|
| | | | | |
COMMON STOCKS
(Continued) | | Shares
| | Value
(Note 2)
|
IT Services — 1.1% | | | | | |
Affiliated Computer Services, Inc. (Class A Stock)(a) | | 25,300 | | $ | 1,235,652 |
Automatic Data Processing, Inc. | | 147,100 | | | 7,244,675 |
Cognizant Technology Solutions(a) | | 31,300 | | | 2,415,108 |
Computer Sciences Corp.(a) | | 47,400 | | | 2,529,738 |
Convergys Corp.(a) | | 37,600 | | | 894,128 |
Electronic Data Systems Corp. | | 123,300 | | | 3,396,915 |
Fidelity Information Services, Inc. | | 31,500 | | | 1,262,835 |
First Data Corp. | | 187,004 | | | 4,772,342 |
Fiserv, Inc.(a) | | 54,900 | | | 2,877,858 |
Paychex, Inc. | | 89,350 | | | 3,532,899 |
Sabre Holdings Corp. | | 39,619 | | | 1,263,450 |
Unisys Corp.(a) | | 67,000 | | | 525,280 |
Western Union Co. | | 192,004 | | | 4,304,730 |
| | | | |
|
|
| | | | | | 36,255,610 |
| | | | |
|
|
Leisure Equipment & Products — 0.2% | | | | | |
Brunswick Corp. | | 26,400 | | | 842,160 |
Eastman Kodak Co. | | 53,000 | | | 1,367,400 |
Hasbro, Inc. | | 42,650 | | | 1,162,213 |
Mattel, Inc. | | 98,281 | | | 2,227,047 |
| | | | |
|
|
| | | | | | 5,598,820 |
| | | | |
|
|
Life Sciences, Tools & Services — 0.3% | | | | | |
Applera Corp.-Applied Biosystems Group | | 49,100 | | | 1,801,479 |
Millipore Corp.(a) | | 10,800 | | | 719,280 |
PerkinElmer, Inc. | | 31,000 | | | 689,130 |
Thermo Electron Corp.(a) | | 104,800 | | | 4,746,392 |
Waters Corp.(a) | | 27,600 | | | 1,351,572 |
| | | | |
|
|
| | | | | | 9,307,853 |
| | | | |
|
|
Machinery — 1.4% | | | | | |
Caterpillar, Inc. | | 167,300 | | | 10,260,509 |
Cummins, Inc. | | 12,400 | | | 1,465,432 |
Danaher Corp. | | 61,500 | | | 4,455,060 |
Deere & Co. | | 57,600 | | | 5,476,032 |
Dover Corp. | | 55,100 | | | 2,701,002 |
Eaton Corp. | | 40,200 | | | 3,020,628 |
Illinois Tool Works, Inc. | | 106,600 | | | 4,923,854 |
Ingersoll-Rand Co. (Class A Stock) | | 81,800 | | | 3,200,834 |
ITT Corp. | | 50,000 | | | 2,841,000 |
PACCAR, Inc.(b) | | 60,952 | | | 3,955,785 |
Pall Corp. | | 17,600 | | | 608,080 |
Parker Hannifin Corp. | | 32,325 | | | 2,485,146 |
Terex Corp.(a) | | 17,000 | | | 1,097,860 |
| | | | |
|
|
| | | | | | 46,491,222 |
| | | | |
|
|
Media — 3.6% | | | | | |
CBS Corp. (Class B Stock) | | 212,768 | | | 6,634,106 |
Clear Channel Communications, Inc. | | 123,100 | | | 4,374,974 |
Comcast Corp. (Class A Stock)(a)(b) | | 536,430 | | | 22,707,082 |
DIRECTV Group, Inc. (The)(a) | | 176,600 | | | 4,404,404 |
Dow Jones & Co., Inc.(b) | | 17,400 | | | 661,200 |
E.W. Scripps Co. (Class A Stock) | | 16,700 | | | 833,998 |
Gannett Co., Inc. | | 59,100 | | | 3,573,186 |
Interpublic Group of Cos., Inc.(a)(b) | | 69,800 | | | 854,352 |
McGraw-Hill Cos., Inc. | | 89,800 | | | 6,108,196 |
Meredith Corp. | | 11,000 | | | 619,850 |
SEE NOTES TO FINANCIAL STATEMENTS.
B99
| | | | |
| | | STOCK INDEX PORTFOLIO (Continued) | | |
SCHEDULE OF INVESTMENTS | December 31, 2006 |
| | | | | |
COMMON STOCKS
(Continued) | | Shares
| | Value
(Note 2)
|
Media (cont’d.) | | | | | |
New York Times Co.(b) | | 41,900 | | $ | 1,020,684 |
News Corp. (Class A Stock) | | 573,100 | | | 12,310,188 |
Omnicom Group, Inc. | | 44,600 | | | 4,662,484 |
Time Warner, Inc. | | 1,037,720 | | | 22,601,542 |
Tribune Co. | | 49,000 | | | 1,508,220 |
Univision Communications, Inc. (Class A Stock)(a) | | 49,400 | | | 1,749,748 |
Viacom, Inc. (Class B Stock)(a) | | 174,468 | | | 7,158,422 |
Walt Disney Co. | | 540,301 | | | 18,516,115 |
| | | | |
|
|
| | | | | | 120,298,751 |
| | | | |
|
|
Metals & Mining — 0.9% | | | | | |
Alcoa, Inc. | | 228,376 | | | 6,853,564 |
Allegheny Technologies, Inc. | | 20,040 | | | 1,817,227 |
Freeport-McMoran Copper & Gold, Inc. | | 41,100 | | | 2,290,503 |
Newmont Mining Corp. | | 119,503 | | | 5,395,560 |
Nucor Corp. | | 78,600 | | | 4,296,276 |
Phelps Dodge Corp. | | 50,756 | | | 6,076,508 |
United States Steel Corp. | | 27,740 | | | 2,028,904 |
| | | | |
|
|
| | | | | | 28,758,542 |
| | | | |
|
|
Multiline Retail — 1.2% | | | | | |
Big Lots, Inc.(a) | | 26,200 | | | 600,504 |
Dillard’s, Inc. | | 20,750 | | | 725,628 |
Dollar General Corp. | | 78,203 | | | 1,255,940 |
Family Dollar Stores, Inc. | | 45,600 | | | 1,337,448 |
Federated Department Stores, Inc. | | 139,820 | | | 5,331,337 |
J.C. Penney Co., Inc. | | 61,900 | | | 4,788,584 |
Kohl’s Corp.(a) | | 84,700 | | | 5,796,021 |
Nordstrom, Inc. | | 56,000 | | | 2,763,040 |
Sears Holdings Corp.(a)(b) | | 20,412 | | | 3,427,787 |
Target Corp. | | 223,568 | | | 12,754,554 |
| | | | |
|
|
| | | | | | 38,780,843 |
| | | | |
|
|
Multi-Utilities — 1.1% | | | | | |
Ameren Corp.(b) | | 48,300 | | | 2,595,159 |
CenterPoint Energy, Inc.(b) | | 86,610 | | | 1,435,994 |
CMS Energy Corp.(a)(b) | | 53,000 | | | 885,100 |
Consolidated Edison, Inc.(b) | | 62,800 | | | 3,018,796 |
Dominion Resources, Inc.(b) | | 88,842 | | | 7,448,513 |
DTE Energy Co.(b) | | 37,000 | | | 1,791,170 |
KeySpan Corp. | | 33,800 | | | 1,391,884 |
NiSource, Inc. | | 73,000 | | | 1,759,300 |
PG&E Corp. | | 78,500 | | | 3,715,405 |
Public Service Enterprise Group, Inc. | | 60,300 | | | 4,002,714 |
Sempra Energy | | 70,054 | | | 3,925,826 |
TECO Energy, Inc. | | 37,900 | | | 653,017 |
Xcel Energy, Inc. | | 109,495 | | | 2,524,955 |
| | | | |
|
|
| | | | | | 35,147,833 |
| | | | |
|
|
Office Electronics — 0.1% | | | | | |
Xerox Corp.(a) | | 246,892 | | | 4,184,819 |
| | | | |
|
|
Oil, Gas & Consumable Fuels — 8.0% | | | | | |
Anadarko Petroleum Corp. | | 122,526 | | | 5,332,332 |
Apache Corp. | | 85,250 | | | 5,669,978 |
Chesapeake Energy Corp. | | 104,700 | | | 3,041,535 |
Chevron Corp. | | 561,592 | | | 41,293,860 |
ConocoPhillips | | 421,779 | | | 30,346,999 |
Consol Energy, Inc.(b) | | 28,800 | | | 925,344 |
| | | | | |
COMMON STOCKS
(Continued) | | Shares
| | Value
(Note 2)
|
Oil, Gas & Consumable Fuels (cont’d.) | | | | | |
Devon Energy Corp. | | 114,800 | | $ | 7,700,784 |
El Paso Corp. | | 176,311 | | | 2,694,032 |
EOG Resources, Inc. | | 59,700 | | | 3,728,265 |
Exxon Mobil Corp.(b) | | 1,491,970 | | | 114,329,660 |
Hess Corp. | | 66,000 | | | 3,271,620 |
Kinder Morgan, Inc. | | 22,600 | | | 2,389,950 |
Marathon Oil Corp. | | 92,997 | | | 8,602,223 |
Murphy Oil Corp.(b) | | 43,100 | | | 2,191,635 |
Occidental Petroleum Corp. | | 223,500 | | | 10,913,505 |
Peabody Energy Corp. | | 53,500 | | | 2,161,935 |
Sunoco, Inc.(b) | | 37,000 | | | 2,307,320 |
Valero Energy Corp. | | 161,700 | | | 8,272,572 |
Williams Cos., Inc. | | 150,000 | | | 3,918,000 |
XTO Energy, Inc. | | 98,200 | | | 4,620,310 |
| | | | |
|
|
| | | | | | 263,711,859 |
| | | | |
|
|
Paper & Forest Products — 0.3% | | | | | |
International Paper Co. | | 123,267 | | | 4,203,405 |
MeadWestvaco Corp. | | 48,289 | | | 1,451,567 |
Weyerhaeuser Co. | | 61,200 | | | 4,323,780 |
| | | | |
|
|
| | | | | | 9,978,752 |
| | | | |
|
|
Personal Products — 0.1% | | | | | |
Avon Products, Inc. | | 104,100 | | | 3,439,464 |
Estee Lauder Cos., Inc. (The) | | 25,500 | | | 1,040,910 |
| | | | |
|
|
| | | | | | 4,480,374 |
| | | | |
|
|
Pharmaceuticals — 6.3% | | | | | |
Abbott Laboratories | | 396,700 | | | 19,323,257 |
Allergan, Inc.(b) | | 36,300 | | | 4,346,562 |
Barr Pharmaceuticals, Inc.(a) | | 20,800 | | | 1,042,496 |
Bristol-Myers Squibb Co. | | 501,860 | | | 13,208,955 |
Forest Laboratories, Inc.(a) | | 89,700 | | | 4,538,820 |
Johnson & Johnson | | 752,371 | | | 49,671,533 |
King Pharmaceuticals, Inc.(a) | | 71,033 | | | 1,130,845 |
Lilly (Eli) & Co. | | 262,600 | | | 13,681,460 |
Merck & Co., Inc. | | 573,400 | | | 25,000,240 |
Mylan Laboratories, Inc. | | 40,900 | | | 816,364 |
Pfizer, Inc. | | 1,873,508 | | | 48,523,857 |
Schering-Plough Corp.(b) | | 381,400 | | | 9,016,296 |
Watson Pharmaceuticals, Inc.(a) | | 27,900 | | | 726,237 |
Wyeth | | 356,600 | | | 18,158,072 |
| | | | |
|
|
| | | | | | 209,184,994 |
| | | | |
|
|
Real Estate Investment Trust — 1.0% | | | |
Apartment Investment & Management Co. (Class A Stock) | | 24,700 | | | 1,383,694 |
Archstone-Smith Trust(b) | | 57,100 | | | 3,323,791 |
Boston Properties, Inc.(b) | | 25,700 | | | 2,875,316 |
Equity Office Properties Trust | | 79,100 | | | 3,810,247 |
Equity Residential Properties Trust | | 66,700 | | | 3,385,025 |
Kimco Realty Corp.(b) | | 47,700 | | | 2,144,115 |
Plum Creek Timber Co., Inc. | | 46,200 | | | 1,841,070 |
ProLogis | | 65,600 | | | 3,986,512 |
Public Storage, Inc. | | 25,500 | | | 2,486,250 |
Simon Property Group, Inc.(b) | | 56,400 | | | 5,712,756 |
Vornado Realty Trust | | 29,800 | | | 3,620,700 |
| | | | |
|
|
| | | | | | 34,569,476 |
| | | | |
|
|
SEE NOTES TO FINANCIAL STATEMENTS.
B100
| | | | |
| | | STOCK INDEX PORTFOLIO (Continued) | | |
SCHEDULE OF INVESTMENTS | December 31, 2006 |
| | | | | |
COMMON STOCKS
(Continued) | | Shares
| | Value
(Note 2)
|
Real Estate Management & Development — 0.1% | | | |
CB Richard Ellis Group Inc.(a) | | 48,500 | | $ | 1,610,200 |
Realogy Corp.(a) | | 56,254 | | | 1,705,621 |
| | | | |
|
|
| | | | | | 3,315,821 |
| | | | |
|
|
Road & Rail — 0.7% | | | |
Burlington Northern Santa Fe Corp. | | 94,726 | | | 6,991,726 |
CSX Corp. | | 117,824 | | | 4,056,680 |
Norfolk Southern Corp. | | 98,900 | | | 4,973,681 |
Ryder System, Inc. | | 17,600 | | | 898,656 |
Union Pacific Corp. | | 69,400 | | | 6,386,188 |
| | | | |
|
|
| | | | | | 23,306,931 |
| | | | |
|
|
Semiconductors & Semiconductor Equipment — 2.3% |
Advanced Micro Devices, Inc.(a)(b) | | 112,900 | | | 2,297,515 |
Altera Corp.(a)(b) | | 95,200 | | | 1,873,536 |
Analog Devices, Inc. | | 98,900 | | | 3,250,843 |
Applied Materials, Inc. | | 389,600 | | | 7,188,120 |
Broadcom Corp.(a)(b) | | 102,550 | | | 3,313,391 |
Intel Corp. | | 1,487,700 | | | 30,125,925 |
KLA-Tencor Corp. | | 43,700 | | | 2,174,075 |
Linear Technology Corp. | | 64,900 | | | 1,967,768 |
LSI Logic Corp.(a)(b) | | 110,800 | | | 997,200 |
Maxim Integrated Products, Inc. | | 64,000 | | | 1,959,680 |
Micron Technology, Inc.(a) | | 151,900 | | | 2,120,524 |
National Semiconductor Corp. | | 86,000 | | | 1,952,200 |
Novellus Systems, Inc.(a)(b) | | 40,000 | | | 1,376,800 |
NVIDIA Corp.(a) | | 80,400 | | | 2,975,604 |
PMC-Sierra, Inc.(a)(b) | | 20,000 | | | 134,200 |
Teradyne, Inc.(a)(b) | | 30,800 | | | 460,768 |
Texas Instruments, Inc. | | 397,700 | | | 11,453,760 |
Xilinx, Inc. | | 92,200 | | | 2,195,282 |
| | | | |
|
|
| | | | | | 77,817,191 |
| | | | |
|
|
Software — 3.3% | | | | | |
Adobe Systems, Inc.(a) | | 141,700 | | | 5,826,704 |
Autodesk, Inc.(a)(b) | | 46,700 | | | 1,889,482 |
BMC Software, Inc.(a) | | 57,900 | | | 1,864,380 |
CA, Inc. | | 121,673 | | | 2,755,893 |
Citrix Systems, Inc.(a) | | 27,500 | | | 743,875 |
Compuware Corp.(a) | | 108,600 | | | 904,638 |
Electronic Arts, Inc.(a) | | 74,200 | | | 3,736,712 |
Intuit, Inc.(a)(b) | | 91,600 | | | 2,794,716 |
Microsoft Corp. | | 2,226,600 | | | 66,486,275 |
Novell, Inc.(a) | | 89,100 | | | 552,420 |
Oracle Corp.(a) | | 1,019,020 | | | 17,466,003 |
Symantec Corp.(a)(b) | | 273,011 | | | 5,692,279 |
| | | | |
|
|
| | | | | | 110,713,377 |
| | | | |
|
|
Specialty Retail — 2.0% | | | | | |
AutoNation, Inc.(a) | | 40,589 | | | 865,357 |
AutoZone, Inc.(a) | | 13,600 | | | 1,571,616 |
Bed Bath & Beyond, Inc.(a) | | 57,800 | | | 2,202,180 |
Best Buy Co., Inc. | | 104,225 | | | 5,126,828 |
Circuit City Stores, Inc. | | 37,000 | | | 702,260 |
Gap, Inc. | | 133,787 | | | 2,608,847 |
Home Depot, Inc. | | 526,819 | | | 21,157,051 |
Limited Brands, Inc. | | 89,796 | | | 2,598,696 |
Lowe’s Cos., Inc.(b) | | 386,900 | | | 12,051,935 |
Office Depot, Inc.(a) | | 77,000 | | | 2,939,090 |
| | | | | | |
COMMON STOCKS
(Continued) | | Shares
| | Value
(Note 2)
|
Specialty Retail (cont’d.) | | | | | | |
OfficeMax, Inc. | | | 16,786 | | $ | 833,425 |
Radioshack Corp.(b) | | | 31,760 | | | 532,933 |
Sherwin-Williams Co. | | | 31,400 | | | 1,996,412 |
Staples, Inc. | | | 180,000 | | | 4,806,000 |
Tiffany & Co. | | | 30,300 | | | 1,188,972 |
TJX Cos., Inc. | | | 122,000 | | | 3,479,440 |
| | | | | |
|
|
| | | | | | | 64,661,042 |
| | | | | |
|
|
Textiles, Apparel & Luxury Goods — 0.4% | | | |
Coach, Inc.(a) | | | 106,400 | | | 4,570,944 |
Jones Apparel Group, Inc. | | | 28,000 | | | 936,040 |
Liz Claiborne, Inc. | | | 26,400 | | | 1,147,344 |
NIKE, Inc. (Class B Stock) | | | 47,100 | | | 4,664,313 |
V.F. Corp. | | | 24,536 | | | 2,013,915 |
| | | | | |
|
|
| | | | | | | 13,332,556 |
| | | | | |
|
|
Thrifts & Mortgage Finance — 1.5% | | | | | | |
Countrywide Financial Corp. | | | 159,498 | | | 6,770,690 |
Fannie Mae | | | 250,900 | | | 14,900,951 |
Freddie Mac | | | 176,900 | | | 12,011,510 |
MGIC Investment Corp.(b) | | | 23,600 | | | 1,475,944 |
Sovereign Bancorp, Inc. | | | 87,405 | | | 2,219,213 |
Washington Mutual, Inc. | | | 246,326 | | | 11,205,370 |
| | | | | |
|
|
| | | | | | | 48,583,678 |
| | | | | |
|
|
Tobacco — 1.6% | | | | | | |
Altria Group, Inc. | | | 536,700 | | | 46,059,594 |
Reynolds American, Inc. | | | 44,400 | | | 2,906,868 |
UST, Inc. | | | 42,200 | | | 2,456,040 |
| | | | | |
|
|
| | | | | | | 51,422,502 |
| | | | | |
|
|
Trading Companies & Distributors | | | | | | |
Grainger (W.W.), Inc. | | | 20,300 | | | 1,419,782 |
| | | | | |
|
|
Wireless Telecommunication Services — 1.5% |
Alltel Corp. | | | 99,200 | | | 5,999,616 |
Sprint Nextel Corp. | | | 763,522 | | | 14,422,931 |
Verizon Communications, Inc. | | | 748,538 | | | 27,875,555 |
| | | | | |
|
|
| | | | | | | 48,298,102 |
| | | | | |
|
|
TOTAL LONG-TERM INVESTMENTS
(cost $1,846,351,504) | | | 3,247,003,171 |
| | | | | |
|
|
SHORT-TERM
INVESTMENTS — 11.5% | | | | |
Affiliated Money Market Mutual Fund — 11.4% |
Dryden Core Investment Fund —Taxable Money Market Series (includes $324,986,258 of cash collateral received for securities on loan)(Note 4)(c)(f) | | | 377,537,575 | | | 377,537,575 |
| | | | | |
|
|
| | | Principal
Amount (000)
| | |
U. S. Government Obligation — 0.1% |
United States Treasury Bills(d)(e) 4.8%, 03/15/07 (cost $3,961,026) | | $ | 4,000 | | | 3,961,856 |
| | | | | |
|
|
SEE NOTES TO FINANCIAL STATEMENTS.
B101
| | | | |
| | | STOCK INDEX PORTFOLIO (Continued) | | |
SCHEDULE OF INVESTMENTS | December 31, 2006 |
| | | | | | |
| | | | | Value
(Note 2)
| |
TOTAL SHORT-TERM INVESTMENTS (cost $381,498,601) | | $ | 381,499,431 | |
TOTAL INVESTMENTS — 109.7% (cost $2,227,850,105) | | | 3,628,502,602 | |
LIABILITIES IN EXCESS OF
OTHER ASSETS(g) — (9.7)% | | | (322,093,626 | ) |
| | | | |
|
|
|
NET ASSETS — 100.0% | | $ | 3,306,408,976 | |
| | | | |
|
|
|
| (a) | Non income-producing security. |
| (b) | All or portion of security is on loan. The aggregate market value of such securities is $312,744,658; cash collateral of $324,986,258 (included in liabilities) was received with which the Portfolio purchased highly liquid short-term investments. |
| (c) | Represents security, or portion thereof, purchased with cash collateral received for securities on loan. |
| (d) | Security segregated as collateral for futures contracts. |
| (e) | Rate quoted represents yield-to-maturity at purchase date. |
| (f) | Prudential Investments LLC, the manager of the Portfolio, also serves as manager of the Dryden Core Investment Fund — Taxable Money Market Series. |
| (g) | Liabilities in excess of other assets include net unrealized appreciation on futures contracts as follows: |
Open futures contract outstanding at December 31, 2006:
| | | | | | | | | | | | | |
Number of
Contracts
| | Type
| | Expiration
Date
| | Value at
December 31, 2006
| | Value at
Trade Date
| | Unrealized
Appreciation
|
| Long Position: | | | | | | | | | | | | | |
| 167 | | S&P 500 Index | | Mar. 2007 | | $ | 59,635,700 | | $ | 59,530,462 | | $ | 105,238 |
SEE NOTES TO FINANCIAL STATEMENTS.
B102
| | | | |
| | | STOCK INDEX PORTFOLIO (Continued) | | |
SCHEDULE OF INVESTMENTS | December 31, 2006 |
The industry classification of portfolio holdings and liabilities in excess of other assets shown as a percentage of net assets as of December 31, 2006 was as follows:
| | | |
Affiliated Money Market Mutual Fund (including 9.8% of collateral received for securities on loan) | | 11.4 | % |
Oil, Gas & Consumable Fuels | | 8.0 | |
Pharmaceuticals | | 6.3 | |
Diversified Financial Services | | 5.7 | |
Insurance | | 4.5 | |
Commercial Banks | | 4.1 | |
Industrial Conglomerates | | 4.0 | |
Capital Markets | | 3.8 | |
Computers & Peripherals | | 3.7 | |
Media | | 3.6 | |
Software | | 3.3 | |
Communications Equipment | | 2.6 | |
Healthcare Providers & Services | | 2.5 | |
Aerospace/Defense | | 2.4 | |
Semiconductors & Semiconductor Equipment | | 2.3 | |
Food & Staples Retailing | | 2.2 | |
Household Products | | 2.2 | |
Beverages | | 2.1 | |
Diversified Telecommunication Services | | 2.0 | |
Specialty Retail | | 2.0 | |
Electric Utilities | | 1.8 | |
Energy Equipment & Services | | 1.7 | |
Hotels, Restaurants & Leisure | | 1.6 | |
Tobacco | | 1.6 | |
Chemicals | | 1.5 | |
Healthcare Equipment & Supplies | | 1.5 | |
Thrifts & Mortgage Finance | | 1.5 | |
Wireless Telecommunication Services | | 1.5 | |
Machinery | | 1.4 | |
Biotechnology | | 1.3 | |
Internet Software & Services | | 1.3 | |
Multiline Retail | | 1.2 | |
IT Services | | 1.1 | |
| | | |
Multi-Utilities | | 1.1 | % |
Consumer Finance | | 1.0 | |
Food Products | | 1.0 | |
Real Estate Investment Trust | | 1.0 | |
Air Freight & Logistics | | 0.9 | |
Metals & Mining | | 0.9 | |
Road & Rail | | 0.7 | |
Household Durables | | 0.6 | |
Commercial Services & Supplies | | 0.5 | |
Electrical Equipment | | 0.5 | |
Automobiles | | 0.4 | |
Independent Power Producers & Energy Traders | | 0.4 | |
Textiles, Apparel & Luxury Goods | | 0.4 | |
Electronic Equipment & Instruments | | 0.3 | |
Life Sciences, Tools & Services | | 0.3 | |
Paper & Forest Products | | 0.3 | |
Containers & Packaging | | 0.2 | |
Leisure Equipment & Products | | 0.2 | |
Airlines | | 0.1 | |
Auto Components | | 0.1 | |
Building Products | | 0.1 | |
Construction & Engineering | | 0.1 | |
Construction Materials | | 0.1 | |
Distributors | | 0.1 | |
Diversified Consumer Services | | 0.1 | |
Gas Utilities | | 0.1 | |
Internet & Catalog Retail | | 0.1 | |
Office Electronics | | 0.1 | |
Personal Products | | 0.1 | |
Real Estate Management & Development | | 0.1 | |
U. S. Government Obligation | | 0.1 | |
Healthcare Technology | | 0.0 | |
Trading Companies & Distributors | | 0.0 | |
| | |
|
|
| | | 109.7 | |
Liabilities in excess of other assets | | (9.7 | ) |
| | |
|
|
| | | 100.0 | % |
| | |
|
|
SEE NOTES TO FINANCIAL STATEMENTS.
B103
SCHEDULE OF INVESTMENTS | December 31, 2006 |
| | | | | |
| LONG-TERM INVESTMENTS — 97.6% | | Value
(Note 2)
|
| COMMON STOCKS | | Shares
| |
Aerospace & Defense — 2.1% | | | | | |
Honeywell International, Inc. | | 934,100 | | $ | 42,258,684 |
| | | | |
|
|
Building Products — 1.2% | | | | | |
American Standard Companies, Inc. | | 527,900 | | | 24,204,215 |
| | | | |
|
|
Capital Markets — 7.5% | | | | | |
Bank of New York Co., Inc. (The) | | 1,099,100 | | | 43,271,567 |
Mellon Financial Corp.(b) | | 399,900 | | | 16,855,785 |
Merrill Lynch & Co., Inc. | | 515,200 | | | 47,965,120 |
UBS AG | | 657,400 | | | 39,660,942 |
| | | | |
|
|
| | | | | | 147,753,414 |
| | | | |
|
|
Chemicals — 2.6% | | | | | |
E.I. du Pont de Nemours & Co. | | 575,300 | | | 28,022,863 |
Mosaic Co. (The)(a)(b) | | 1,074,600 | | | 22,953,456 |
| | | | |
|
|
| | | | | | 50,976,319 |
| | | | |
|
|
Commercial Banks — 1.4% | | | | | |
Royal Bank of Scotland Group PLC (United Kingdom) | | 697,747 | | | 27,227,885 |
| | | | |
|
|
Commercial Services & Supplies — 1.9% | | | |
Waste Management, Inc. | | 1,015,300 | | | 37,332,581 |
| | | | |
|
|
Communications Equipment — 3.1% | | | | | |
Avaya, Inc.(a) | | 2,359,000 | | | 32,978,820 |
Motorola, Inc. | | 1,377,800 | | | 28,327,568 |
| | | | |
|
|
| | | | | | 61,306,388 |
| | | | |
|
|
Computers & Peripherals — 1.1% | | | | | |
International Business Machines Corp. | | 221,500 | | | 21,518,725 |
| | | | |
|
|
Consumer Finance — 2.0% | | | | | |
American Express Co. | | 326,000 | | | 19,778,420 |
SLM Corp. | | 406,200 | | | 19,810,374 |
| | | | |
|
|
| | | | | | 39,588,794 |
| | | | |
|
|
Diversified Consumer Services — 3.0% | | | | | |
Career Education Corp.(a)(b) | | 828,400 | | | 20,527,752 |
H&R Block, Inc. | | 1,716,800 | | | 39,555,072 |
| | | | |
|
|
| | | | | | 60,082,824 |
| | | | |
|
|
Diversified Financial Services — 7.7% | | | | | |
Bank of America Corp. | | 773,972 | | | 41,322,365 |
Citigroup, Inc. | | 1,064,200 | | | 59,275,940 |
JPMorgan Chase & Co. | | 570,100 | | | 27,535,830 |
KKR Private Equity Investors LLP | | 176,100 | | | 4,023,885 |
KKR Private Equity Investors LLP, RDU, Physical, Private Placement, 144A
(cost $22,639,596; purchased 5/03/06 – 5/05/06)(e)(f)(g) | | 907,900 | | | 20,745,515 |
| | | | |
|
|
| | | | | | 152,903,535 |
| | | | |
|
|
Diversified Telecommunication Services — 1.0% | | | |
Verizon Communications, Inc. | | 533,800 | | | 19,878,712 |
| | | | |
|
|
Electric Utilities — 0.8% | | | | | |
Exelon Corp. | | 256,400 | | | 15,868,596 |
| | | | |
|
|
Energy Equipment & Services — 1.5% | | | | | |
Baker Hughes, Inc. | | 391,300 | | | 29,214,458 |
| | | | |
|
|
| | | | | |
| COMMON STOCKS | | Value
(Note 2)
|
| (Continued) | | Shares
| |
Food & Staples Retailing — 2.8% | | | | | |
Kroger Co. (The) | | 1,671,100 | | $ | 38,552,277 |
Wal-Mart Stores, Inc. | | 382,300 | | | 17,654,614 |
| | | | |
|
|
| | | | | | 56,206,891 |
| | | | |
|
|
Food Products — 3.4% | | | | | |
Cadbury Schweppes PLC ADR (United Kingdom)(b) | | 820,400 | | | 35,219,772 |
ConAgra Foods, Inc. | | 1,206,400 | | | 32,572,800 |
| | | | |
|
|
| | | | | | 67,792,572 |
| | | | |
|
|
Healthcare Equipment & Supplies — 1.0% | | | |
Boston Scientific Corp.(a) | | 1,172,800 | | | 20,148,704 |
| | | | |
|
|
Healthcare Providers & Services — 3.0% | | | | | |
CIGNA Corp. | | 204,300 | | | 26,879,751 |
Omnicare, Inc.(b) | | 819,300 | | | 31,649,559 |
| | | | |
|
|
| | | | | | 58,529,310 |
| | | | |
|
|
Hotels, Restaurants & Leisure — 1.8% | | | | | |
Hilton Hotels Corp.(b) | | 377,500 | | | 13,174,750 |
OSI Restaurant Partners, Inc. | | 570,500 | | | 22,363,600 |
| | | | |
|
|
| | | | | | 35,538,350 |
| | | | |
|
|
Household Products — 1.6% | | | | | |
Kimberly-Clark Corp. | | 479,100 | | | 32,554,845 |
| | | | |
|
|
Independent Power Producers & Energy Traders — 1.8% |
NRG Energy, Inc.(a)(b) | | 633,200 | | | 35,465,532 |
| | | | |
|
|
Industrial Conglomerates — 2.9% | | | | | |
General Electric Co. | | 743,900 | | | 27,680,519 |
Tyco International Ltd. | | 969,500 | | | 29,472,800 |
| | | | |
|
|
| | | | | | 57,153,319 |
| | | | |
|
|
Insurance — 7.8% | | | | | |
American International Group, Inc. | | 764,400 | | | 54,776,904 |
Axis Capital Holdings Ltd. | | 661,100 | | | 22,060,907 |
Genworth Financial, Inc.
(Class “A” Stock) | | 385,700 | | | 13,194,797 |
Loews Corp. | | 828,400 | | | 34,353,748 |
Montpelier Re Holdings Ltd. | | 1,559,400 | | | 29,020,434 |
| | | | |
|
|
| | | | | | 153,406,790 |
| | | | |
|
|
Internet & Catalog Retail — 0.8% | | | | | |
IAC/InterActiveCorp(a)(b) | | 446,300 | | | 16,584,508 |
| | | | |
|
|
Media — 4.7% | | | | | |
Comcast Corp.
(Class “A” Stock)(a)(b) | | 790,700 | | | 33,470,331 |
Idearc, Inc.(a) | | 26,690 | | | 764,669 |
Liberty Global, Inc., Series C(a) | | 1,093,335 | | | 30,613,380 |
Viacom, Inc. (Class “B” Stock)(a) | | 697,614 | | | 28,623,102 |
| | | | |
|
|
| | | | | | 93,471,482 |
| | | | |
|
|
Metals & Mining — 1.5% | | | | | |
Phelps Dodge Corp. | | 242,000 | | | 28,972,240 |
| | | | |
|
|
Multi-Utilities — 1.4% | | | | | |
Sempra Energy | | 494,200 | | | 27,694,968 |
| | | | |
|
|
Office Electronics — 2.1% | | | | | |
Xerox Corp.(a) | | 2,418,400 | | | 40,991,880 |
| | | | |
|
|
SEE NOTES TO FINANCIAL STATEMENTS.
B104
| | | | |
| | | VALUE PORTFOLIO (Continued) | | |
SCHEDULE OF INVESTMENTS | December 31, 2006 |
| | | | | | |
| COMMON STOCKS | | Value
(Note 2)
| |
| (Continued) | | Shares
| |
Oil, Gas & Consumable Fuels — 11.8% | | | | | | |
Anadarko Petroleum Corp. | | 518,800 | | $ | 22,578,176 | |
Hess Corp. | | 665,300 | | | 32,978,921 | |
Marathon Oil Corp. | | 215,400 | | | 19,924,500 | |
Nexen, Inc.(b) | | 523,700 | | | 28,803,500 | |
Occidental Petroleum Corp. | | 774,600 | | | 37,823,718 | |
Petroleo Brasileiro SA ADR (Brazil) | | 319,800 | | | 32,936,202 | |
Suncor Energy, Inc. | | 531,100 | | | 41,909,101 | |
Trident Resources Corp. (Canada)
(cost $16,980,633; purchased 3/11/05 — 1/05/06)(a)(e)(f) | | 404,537 | | | 17,344,981 | |
| | | | |
|
|
|
| | | | | | 234,299,099 | |
| | | | |
|
|
|
Pharmaceuticals — 2.5% | | | | | | |
Abbott Laboratories | | 465,100 | | | 22,655,021 | |
Novartis AG ADR (Switzerland) | | 467,200 | | | 26,835,968 | |
| | | | |
|
|
|
| | | | | | 49,490,989 | |
| | | | |
|
|
|
Software — 2.1% | | | | | | |
Computer Associates International, Inc.(b) | | 956,106 | | | 21,655,801 | |
Symantec Corp.(a)(b) | | 958,800 | | | 19,990,980 | |
| | | | |
|
|
|
| | | | | | 41,646,781 | |
| | | | |
|
|
|
Textiles, Apparel & Luxury Goods — 1.1% | | | | |
NIKE, Inc. (Class “B” Stock) | | 228,400 | | | 22,618,452 | |
| | | | |
|
|
|
Thrifts & Mortgage Finance — 0.7% | | | | | | |
Countrywide Financial Corp.(b) | | 324,300 | | | 13,766,535 | |
| | | | |
|
|
|
Tobacco — 2.3% | | | | | | |
Altria Group, Inc. | | 524,700 | | | 45,029,754 | |
| | | | |
|
|
|
Wireless Telecommunication Services — 3.6% | | | | |
Alltel Corp. | | 575,300 | | | 34,794,144 | |
Sprint Nextel Corp.(b) | | 1,887,436 | | | 35,653,666 | |
| | | | |
|
|
|
| | | | | | 70,447,810 | |
| | | | |
|
|
|
TOTAL LONG-TERM INVESTMENTS
(cost $1,476,137,639) | | | 1,931,925,941 | |
| | | | |
|
|
|
| SHORT-TERM INVESTMENT — 10.8% | | | | |
Affiliated Money Market Mutual Fund | | | | | | |
Dryden Core Investment Fund — Taxable Money Market Series
(cost $213,111,026 includes $165,338,035 of cash collateral for securities on loan) (Note 4)(c)(d) | | | | | 213,111,026 | |
| | | | |
|
|
|
TOTAL INVESTMENTS(h) — 108.4%
(cost $1,689,248,665) | | | 2,145,036,967 | |
| | | | |
|
|
|
LIABILITIES IN EXCESS OF
OTHER ASSETS — (8.4)% | | | (166,085,618 | ) |
| | | | |
|
|
|
NET ASSETS — 100.0% | | $ | 1,978,951,349 | |
| | | | |
|
|
|
The following abbreviations are used in portfolio descriptions:
| | |
| ADR | | American Depositary Receipt |
| RDU | | Restricted Depositary Unit |
| (a) | Non-income producing security. |
| (b) | All or a portion of security is on loan. The aggregate market value of such securities is $157,993,033; cash collateral of $165,338,035 (included in liabilities) was received with which the Portfolio purchased highly liquid short-term investments. |
| (c) | Represents security, or a portion thereof, purchased with cash collateral for securities on loan. |
| (d) | Prudential Investments LLC, the manager of the Portfolio, also serves as manager of the Dryden Core Investment Fund — Taxable Money Market Series. |
| (e) | Indicates illiquid securities. |
| (f) | Indicates securities restricted to resale. The aggregate cost of such securities was $39,620,229. The aggregate value of $38,090,496 is approximately 1.9% of the net assets. |
| (g) | Security was purchased pursuant to Rule 144A under the Securities Act of 1933 and may not be resold subject to that rule except to qualified institutional buyers. Unless otherwise noted, 144A securities are deemed to be liquid. |
| (h) | As of December 31, 2006, one security representing $17,344,981 and 0.8% of the total market value of the Portfolio were fair valued in accordance with the policies adopted by the Board of Trustees. |
The industry classification of portfolio holdings and liabilities in excess of other assets shown as a percentage of net assets as of December 31, 2006 was as follows:
| | | |
Oil, Gas & Consumable Fuels | | 11.8 | % |
Affiliated Money Market Mutual Fund (including 8.4% of collateral received for securities on loan) | | 10.8 | |
Insurance | | 7.8 | |
Diversified Financial Services | | 7.7 | |
Capital Markets | | 7.5 | |
Media | | 4.7 | |
Wireless Telecommunication Services | | 3.6 | |
Food Products | | 3.4 | |
Communications Equipment | | 3.1 | |
Diversified Consumer Services | | 3.0 | |
Healthcare Providers & Services | | 3.0 | |
Industrial Conglomerates | | 2.9 | |
Food & Staples Retailing | | 2.8 | |
Chemicals | | 2.6 | |
Pharmaceuticals | | 2.5 | |
Tobacco | | 2.3 | |
Aerospace & Defense | | 2.1 | |
Office Electronics | | 2.1 | |
Software | | 2.1 | |
Consumer Finance | | 2.0 | |
Commercial Services & Supplies | | 1.9 | |
Hotels, Restaurants & Leisure | | 1.8 | |
Independent Power Producers & Energy Traders | | 1.8 | |
Household Products | | 1.6 | |
Energy Equipment & Services | | 1.5 | |
Metals & Mining | | 1.5 | |
Commercial Banks | | 1.4 | |
Multi-Utilities | | 1.4 | |
Building Products | | 1.2 | |
Computers & Peripherals | | 1.1 | |
Textiles, Apparel & Luxury Goods | | 1.1 | |
Diversified Telecommunications Services | | 1.0 | |
Healthcare Equipment & Supplies | | 1.0 | |
Electric Utilities | | 0.8 | |
Internet & Catalog Retail | | 0.8 | |
Thrifts & Mortgage Finance | | 0.7 | |
| | |
|
|
| | | 108.4 | |
Liabilities in excess of other assets | | (8.4 | ) |
| | |
|
|
| | | 100.0 | % |
| | |
|
|
SEE NOTES TO FINANCIAL STATEMENTS.
B105
NOTES TO THE FINANCIAL STATEMENTS OF
THE PRUDENTIAL SERIES FUND
The Prudential Series Fund, Inc. (“Series Fund”), was a Maryland corporation, organized on November 15, 1982, and continues to be a diversified open-end management investment company registered under the Investment Company Act of 1940, as amended. On January 2, 2006, each Portfolio of the Fund changed its federal income tax status from a regulated investment company to a partnership. As a result of that conversion, the Series Fund was reorganized from a Maryland corporation to a Delaware statutory trust. Pursuant to this reorganization, the Fund has been renamed “The Prudential Series Fund.” The Series Fund is composed of thirty-two Portfolios (“Portfolio” or “Portfolios”), each with separate series shares. The information presented in these financial statements pertains to thirteen Portfolios: Conservative Balanced Portfolio, Diversified Bond Portfolio, Equity Portfolio, Flexible Managed Portfolio, Global Portfolio, Government Income Portfolio, High Yield Bond Portfolio, Jennison Portfolio, Money Market Portfolio, Natural Resources Portfolio, Small Capitalization Stock Portfolio, Stock Index Portfolio and Value Portfolio.
The Portfolios of the Series Fund have the following as investment objectives:
Conservative Balanced Portfolio: Total investment return consistent with a conservatively managed diversified portfolio by investing in a mix of equity-related securities, debt obligations and money market instruments.
Diversified Bond Portfolio: High level of income over a longer term while providing reasonable safety of capital by investing in intermediate and long-term debt obligations that are rated investment grade and high quality money market instruments. The types of debt obligations in which the Portfolio can invest include U.S. government securities, mortgage-related securities and corporate bonds.
Equity Portfolio: Capital appreciation by investing primarily in stocks of major, established corporations as well as small companies.
Flexible Managed Portfolio: High total return consistent with an aggressively managed diversified portfolio by investing in a mix of equity and equity-related securities, debt obligations and money market instruments.
Global Portfolio: Long-term growth of capital by investing primarily in equity and equity-related securities of foreign and U.S. companies.
Government Income Portfolio: High level of income over the long-term consistent with the preservation of capital by investing primarily in intermediate and long-term U.S. government securities, including U.S. Treasuries and agencies and mortgage-related securities.
High Yield Bond Portfolio: High total return by investing primarily in medium to lower rated debt securities.
Jennison Portfolio: Long-term growth of capital by investing primarily in equity securities of established companies that the Portfolio manager believes offer above-average growth prospects.
Money Market Portfolio: Maximum current income consistent with the stability of capital and maintenance of liquidity by investing in high quality short-term money market securities issued by the U.S. government and its agencies, as well as commercial paper, asset backed securities, certificates of deposit and other obligations issued by banks, corporations and other companies, that generally mature in 13 months or less.
Natural Resources Portfolio: Long-term growth of capital by investing primarily in stocks of companies that operate within, or do business with, the natural resources sector of the economy.
Small Capitalization Stock Portfolio: Long-term growth of capital that corresponds to the price and yield performance of the Standard & Poor’s Small Capitalization Stock Index (the “S&P 600 SmallCap Index”) by investing primarily in stocks of the S&P 600 SmallCap Index.
Stock Index Portfolio: Investment results that generally correspond to the price and yield performance of the S&P 500 Index by investing primarily in stocks in the S&P 500 Index.
Value Portfolio: Capital appreciation by investing in equity and equity-related securities that are undervalued.
C1
The ability of issuers of debt securities (other than those issued or guaranteed by the U.S. Government) held by the Portfolios to meet their obligations may be affected by the economic or political developments in a specific industry, region or country.
| Note 2: | | Accounting Policies |
The following is a summary of significant accounting policies followed by the Series Fund and the Portfolios in preparation of their financial statements.
Securities Valuation: Securities listed on a securities exchange are valued at the last sale price on such exchange on the day of valuation or, if there was no sale on such day, at the mean between the last reported bid and asked prices, or at the last bid price on such day in the absence of an asked price. Securities traded via NASDAQ are valued at the official closing price provided by NASDAQ. Securities that are actively traded in the over-the-counter market, including listed securities for which the primary market is believed by Prudential Investments LLC (“PI” or “Manager”) in consultation with the subadvisor, to be over-the-counter, are valued at market value using prices provided by an independent pricing agent or principal market maker. Options on securities and indices traded on an exchange are valued at the last sale price as of the close of trading on the applicable exchange or, if there was no sale, at the mean between the most recently quoted bid and asked prices on such exchange, or at the last bid price in the absence of an asked price. Futures contracts and options thereon traded on a commodities exchange or board of trade are valued at the last sale price at the close of trading on such exchange or board of trade or, if there was no sale on the applicable commodities exchange or board of trade on such day, at the mean between the most recently quoted bid and asked prices on such exchange or board of trade or at the last bid price in the absence of an asked price. Prices may be obtained from independent pricing services which use information provided by market makers or estimates of market values obtained from yield data relating to investments or securities with similar characteristics. Securities for which reliable market quotations are not readily available, or whose values have been affected by events occurring after the close of the security’s foreign market and before the Series Fund’s normal pricing time, are valued at fair value in accordance with Board of Trustees’ approved fair valuation procedures. When determining the fair value of securities, some of the factors influencing the valuation include, the nature of any restrictions on disposition of the securities; assessment of the general liquidity of the securities; the issuer’s financial condition and the markets in which it does business; the cost of the investment; the size of the holding and the capitalization of the issuer; the prices of any recent transactions or bids/offers for such securities or any comparable securities; any available analyst media or other reports or information deemed reliable by the investment advisor regarding the issuer or the markets or industry in which it operates. Using fair value to price securities may result in a value that is different from a security’s most recent closing price and from the price used by other mutual funds to calculate their net asset values. As of December 31, 2006, Conservative Balanced, Global, High Yield Bond and Natural Resources Portfolios held foreign securities whose value required adjustment in accordance with such procedures.
Investments in mutual funds are valued at their net asset value as of the close of the New York Stock Exchange on the date of valuation.
The Money Market, Conservative Balanced and Flexible Managed Portfolios use amortized cost to value short-term securities. Short-term securities that are held in the other Portfolios which mature in more than 60 days are valued at current market quotations and those short-term securities which mature in 60 days or less are valued at amortized cost which approximates market value. The amortized cost method values a security at its cost at the time of purchase and there after assumes a constant amortization to maturity of any discount or premium.
The Diversified Bond, High Yield Bond and Natural Resources Portfolios may hold up to 15% of their net assets in illiquid securities, including those which are restricted as to disposition under securities law (“restricted securities”). Certain issues of restricted securities held by these portfolios at December 31, 2006 include registration rights, under which the portfolios may demand registration by the issuer, of which the portfolios may bear the cost of such registration. Restricted securities, including private placements, are valued pursuant to the valuation procedures noted above.
Repurchase Agreements: In connection with transactions in repurchase agreements with United States financial institutions, it is the Series Fund’s policy that its custodian or designated subcustodians, as the case may be, under triparty repurchase agreements, take possession of the underlying collateral securities, the
C2
value of which exceeds the principal amount of the repurchase transaction, including accrued interest. To the extent that any repurchase transaction exceeds one business day, the value of the collateral is marked to market on a daily basis to ensure the adequacy of the collateral. If the seller defaults and the value of the collateral declines, or if bankruptcy proceedings are commenced with respect to the seller of the security, realization of the collateral by the Series Fund may by delayed or limited.
Foreign Currency Translation: The books and records of the Series Fund are maintained in U.S. dollars. Foreign currency amounts are translated into U.S. dollars on the following basis:
(i) market value of investment securities, other assets and liabilities – at the current daily rates of exchange.
(ii) purchases and sales of investment securities, income and expenses – at the rates of exchange prevailing on the respective dates of such transactions.
Although the net assets of the Series Fund are presented at the foreign exchange rates and market values at the close of the period, the Series Fund does not isolate that portion of the results of operations arising as a result of changes in the foreign exchange rates from the fluctuations arising from changes in the market prices of securities held at the end of the period. Similarly, the Series Fund does not isolate the effect of changes in foreign exchange rates from the fluctuations arising from changes in the market prices of portfolio securities sold during the period. Accordingly, these realized foreign currency gains (losses) are included in the reported net realized gains (losses) on investment transactions.
Net realized gains (losses) on foreign currency transactions represent net foreign exchange gains (losses) from the holding of foreign currencies, currency gains (losses) realized between the trade date and settlement date on securities transactions, and the difference between the amounts of dividends, interest and foreign withholding taxes recorded on the Series Fund’s books and the U.S. dollar equivalent amounts actually received or paid. Net unrealized currency gains (losses) from valuing foreign currency denominated assets and liabilities (other than investments) at period end exchange rates are reflected as a component of net unrealized appreciation (depreciation) on investments and foreign currencies.
Foreign security and currency transactions may involve certain considerations and risks not typically associated with those of domestic origin as a result of, among other factors, the possibility of political and economic instability or the level of governmental supervision and regulation of foreign securities markets.
Forward Currency Contracts: A forward currency contract is a commitment to purchase or sell a foreign currency at a future date at a negotiated forward rate. Certain Portfolios of the Series Fund may enter into forward currency contracts in order to hedge their exposure to changes in foreign currency exchange rates on their foreign portfolio holdings or on specific receivables and payables denominated in a foreign currency. The contracts are valued daily at current forward exchange rates and any unrealized gain (loss) is included in net unrealized appreciation (depreciation) on investments and foreign currencies. Gain (loss) is realized on the settlement date of the contract equal to the difference between the settlement value of the original and renegotiated forward contracts. This gain (loss), if any, is included in net realized gain (loss) on foreign currency transactions. Risks may arise upon entering into these contracts from the potential inability of the counterparties to meet the terms of their contracts.
Short Sales: Certain portfolios of the Series Fund may sell a security it does not own in anticipation of a decline in the market value of that security (short sale). When a Portfolio makes a short sale, it must borrow the security sold short and deliver it to the broker-dealer through which it made the short sale as collateral for its obligation to deliver the security upon conclusion of the transaction. The Portfolio may have to pay a fee to borrow the particular security and may be obligated to remit any interest or dividends received on such borrowed securities. A gain, limited to the price at which the Portfolio sold the security short, or a loss, unlimited in magnitude, will be recognized upon the termination of a short sale if the market price at termination is less than or greater than, respectively, the proceeds originally received.
Loan Participations: The High Yield Bond Portfolio may invest in loan participations. When the Portfolio purchases a loan participation, the Portfolio typically enters into a contractual relationship with the lender or third party selling such participations (“Selling Participant”), but not the borrower. As a result, the Portfolio assumes the credit risk of the borrower, the Selling Participant and any other persons interpositioned between the Portfolio and the borrower. The Portfolio may not directly benefit from the collateral supporting the senior loan in which it has purchased the loan participant.
C3
Options: The Series Fund may either purchase or write options in order to hedge against adverse market movements or fluctuations in value caused by changes in prevailing interest rates or foreign currency exchange rates or currencies with respect to securities which the Series Fund currently owns or intends to purchase. The Series Fund’s principal reason for writing options is to realize, through receipt of premiums, a greater current return than would be realized on the underlying security alone. When the Series Fund purchases an option, it pays a premium and an amount equal to that premium is recorded as an asset. When the Series Fund writes an option, it receives a premium and an amount equal to that premium is recorded as a liability. The asset or liability is adjusted daily to reflect the current market value of the option. If an option expires unexercised, the Series Fund realizes a gain (loss) to the extent of the premium received or paid. If an option is exercised, the premium received or paid is recorded as an adjustment to the proceeds from the sale or the cost basis of the purchase in determining whether the Series Fund has realized a gain (loss). The difference between the premium and the amount received or paid on effecting a closing purchase or sale transaction is also treated as a realized gain (loss). Gains (losses) on purchased options are included in net realized gains (losses) on investment transactions. Gains (losses) on written options are presented separately as net realized gains (losses) on written option transactions.
The Series Fund, as writer of an option, may have no control over whether the contract may be exercised. As a result, the Series Fund bears the market risk of an unfavorable change in the price of the security underlying the written option. The Series Fund, as purchaser of an over-the-counter option, bears the risk of the potential inability of the counterparties to meet the terms of their contracts.
Financial Futures Contracts: A financial futures contract is an agreement to purchase (long) or sell (short) an agreed amount of securities at a set price for delivery on a future date. Upon entering into a financial futures contract, the Series Fund is required to pledge to the broker an amount of cash and/or other assets equal to a certain percentage of the contract amount. This amount is known as the “initial margin”. Subsequent payments, known as “variation margin”, are made or received by the Series Fund each day, depending on the daily fluctuations in the value of the underlying security. Such variation margin is recorded for financial statement purposes on a daily basis as unrealized gain (loss). When the contract expires or is closed, the gain (loss) is realized and is presented in the Statement of Operations as net realized gain (loss) on financial futures contracts.
The Series Fund invests in financial futures contracts in order to hedge its existing portfolio securities, or securities the Series Fund intends to purchase, against fluctuations in value caused by changes in prevailing rates or market conditions. Under a variety of circumstances, the Series Fund may not achieve the anticipated benefits of the financial futures contracts and may realize a loss. The use of futures transactions involves the risk of imperfect correlation in movements in the price of futures contracts and the underlying hedged assets.
Swap Agreements: The Portfolios may enter into interest rate swap agreements, forward swap spread lock agreements, credit default swap agreements and total return swap agreements. A swap agreement is an agreement to exchange the return generated by one instrument for the return generated by another instrument. Interest rate swap agreements involve the exchange by the Portfolio with another party of their respective commitments to pay or receive interest. Forward spread lock swap agreements involve commitments to pay or receive a settlement amount calculated as the difference between the swap spread and a fixed spread, multiplied by the notional amount times the duration of the swap. The swap spread is the difference between the benchmark swap rate (market rate) and the specific Treasury rate. In a credit default swap agreement, one party (the protection buyer) makes a stream of payments to another party (the protection seller) in exchange for the right to receive a specified payment in the event of a default by a third party, typically corporate issues or sovereign issues of an emerging country, on its obligation. The maximum amount of the payment may equal the notional, at par, of the underlying index or security as a result of a default (or “credit event”). In addition to bearing the risk that the credit event will occur, the Portfolios could be exposed to market risk due to unfavorable changes in interest rates or in the price of the underlying security or index, the possibility that the fund may be unable to close out its position at the same time or at the same price as if it had purchased comparable publicly traded securities, or that the counterparty may default on it’s obligation to perform. Total return swap agreements are contracts in which one party agrees to make periodic payments based on the change in market value of the underlying assets, which may include a specified security, basket of securities or securities indices during the specified period, in return for periodic payments based on a fixed or variable interest rate or the total return from other underlying assets. Total return swap agreements may be used to obtain exposure to a security or market without owning or taking physical custody of such security or market. The swaps are valued daily at current market value and any change in value is
C4
included in net unrealized appreciation or depreciation on investments. Payments received or paid by the Portfolio are recorded as realized gains or losses. Risk of loss may exceed amounts recognized on the statements of assets and liabilities. Swap agreements outstanding at period end, if any, are listed on the Schedule of Investments.
Forward currency contracts, written options, short sales, swaps and financial futures contracts involve elements of both market and credit risk in excess of the amounts reflected on the Statement of Assets and Liabilities.
Securities Lending: The Series Fund may lend its portfolio securities to broker-dealers. The loans are secured by collateral at least equal at all times to the market value of the securities loaned. Loans are subject to termination at the option of the borrower or the Series Fund. Upon termination of the loan, the borrower will return to the lender securities identical to the loaned securities. Should the borrower of the securities fail financially, the Series has the right to repurchase the securities using the collateral in the open market. The Series Fund recognizes income, net of any rebate and securities lending agent fees, for lending its securities in the form of fees or interest on the investment of any cash received as collateral. The Series Fund also continues to receive interest and dividends or amounts equivalent thereto on the securities loaned and recognizes any unrealized gain or loss in the market price of the securities loaned that may occur during the term of the loan.
When-Issued/Delayed Delivery Securities: Securities purchased or sold on a when-issued or delayed-delivery basis may be settled a month or more after trade date; interest income is not accrued until settlement date. At the time a Portfolio enters into such transactions, it instructs the custodian to segregate assets with a current value at least equal to the amount of its when-issued or delayed-delivery purchase commitments.
Securities Transactions and Net Investment Income: Securities transactions are recorded on the trade date. Realized gains (losses) on sales of securities are calculated on the identified cost basis. Dividend income is recorded on the ex-dividend date; interest income, which is comprised of four elements: stated coupon, original issue discount, market discount and market premium, is recorded on the accrual basis. Expenses are recorded on the accrual basis. The Series Fund’s expenses are allocated to the respective Portfolios on the basis of relative net assets except for Portfolio specific expenses which are attributable directly to a Portfolio or class level.
For Portfolios with multiple classes of shares, net investment income (loss) (other than administration and distribution fees, which are charged to the respective class) and unrealized and realized gains (losses) are allocated daily to each class of shares based upon the relative proportion of net assets of each class at the beginning of the day.
Taxes: For federal income tax purposes, each Portfolio in the Series Fund is treated as a separate taxpaying entity. The Portfolios are treated as partnerships for tax purposes. No provision has been made in the financial statements for U.S. federal, state, or local taxes, as any tax liability arising from operations of the Portfolios are the responsibility of their partners. The Portfolios are not subject to tax. Partners of each Portfolio are subject to taxes on their distributive share of partnership items.
Withholding taxes on foreign dividends, interest and capital gains have been provided for in accordance with the Trust’s understanding of the applicable country’s tax rules and regulations.
Dividends and Distributions: Dividends and distributions of each Portfolio are declared in cash and automatically reinvested in additional shares of the same Portfolio. The Money Market Portfolio will declare and reinvest dividends from net investment income and net realized capital gains daily. The Diversified Bond, Government Income and High Yield Bond Portfolios will declare and distribute dividends from net investment income, if any, quarterly and distributions from net capital gains, if any, at least annually. All other Portfolios will declare and distribute dividends from net investment income and distributions from net capital gains, if any, at least annually. Dividends and distributions are recorded on the ex-dividend date.
Dividends and capital gain distributions are determined in accordance with income tax regulations which may differ from generally accepted accounting principles.
Estimates: The preparation of financial statements requires management to make estimates and assumptions that affect the reported amounts and disclosures in the financial statements. Actual results could differ from these estimates.
C5
The Series Fund has a management agreement with PI. Pursuant to this agreement PI has responsibility for all investment advisory services and supervises the subadvisors’ performance of such services. PI has entered into subadvisory agreements with Prudential Investment Management, Inc. (“PIM”), Jennison Associates LLC (“Jennison”), LSV Asset Management (“LSV”), Marsico Capital Management, LLC (“Marsico”), Quantitative Management Associates LLC (“QMA”), ClearBridge Advisors LLC (“ClearBridge”), T. Rowe Price Associates, Inc. (“T. Rowe”) and William Blair & Company, L.L.C. (“William Blair”) (collectively, the “Subadvisors”), under which each provides investment advisory services for certain Portfolios of the Series Fund. PI pays for the services of the Subadvisors, compensation of officers of the Series Fund, occupancy and certain clerical and administrative expenses of the Series Fund. The Series Fund bears all other costs and expenses.
The management fee paid to PI is computed daily and payable monthly, at the annual rates specified below, of the value of each of the Portfolio’s average daily net assets.
| | | | | |
Portfolio
| | Management Fee
| | Effective Management Fee
| |
Conservative Balanced Portfolio | | 0.55% | | 0.55 | % |
Diversified Bond Portfolio | | 0.40 | | 0.40 | |
Equity Portfolio | | 0.45 | | 0.45 | |
Flexible Managed Portfolio | | 0.60 | | 0.60 | |
Global Portfolio | | 0.75 | | 0.75 | |
Government Income Portfolio | | 0.40 | | 0.40 | |
High Yield Bond Portfolio | | 0.55 | | 0.55 | |
Jennison Portfolio | | 0.60 | | 0.60 | |
Money Market Portfolio | | 0.40 | | 0.40 | |
Natural Resources Portfolio | | 0.45 | | 0.45 | |
Small Capitalization Stock Portfolio | | 0.40 | | 0.40 | |
Stock Index Portfolio | | 0.35% up to $4 billion
0.30% over $4 billion | | 0.35 | |
Value Portfolio | | 0.40 | | 0.40 | |
At December 31, 2006 the Subadvisors that provide investment advisory services to the Portfolios are as follows. Where more than one Subadvisor is listed, each Subadvisor provides services to a segment of the Portfolio:
| | |
Portfolio
| | Subadvisor(s)
|
Conservative Balanced Portfolio | | PIM, QMA |
Diversified Bond Portfolio | | PIM |
Equity Portfolio | | Jennison, ClearBridge (Formerly Salomon) |
Flexible Managed Portfolio | | PIM, QMA |
Global Portfolio | | LSV, Marsico, T. Rowe & William Blair |
Government Income Portfolio | | PIM |
High Yield Bond Portfolio | | PIM |
Jennison Portfolio | | Jennison |
Money Market Portfolio | | PIM |
Natural Resources Portfolio | | Jennison |
Small Capitalization Stock Portfolio | | QMA |
Stock Index Portfolio | | QMA |
Value Portfolio | | Jennison |
The Series Fund has a distribution agreement with Prudential Investment Management Services LLC (“PIMS”) which acts as the distributor of the Class I and Class II shares of the Series Fund. The Series Fund compensates PIMS for distributing and servicing the Series Fund’s Class II shares pursuant to a plan of distribution (the “Class II Plan”), regardless of expenses actually incurred by PIMS. The distribution fees are accrued daily and payable monthly. No distribution or service fees are paid to PIMS as distributor of the Class I shares of the Series Fund. Pursuant to the Class II Plan, the Class II shares of each Portfolio compensate PIMS for distribution-related activities at an annual rate of 0.25% of the average daily net assets of the Class II shares.
C6
The Series Fund has an administration agreement with PI which acts as the administrator of the Class II shares of the Series Fund. The administration fee paid to PI is accrued daily and payable monthly, at the annual rate of 0.15% of the average daily net assets of the Class II shares.
PI has agreed to reimburse each Portfolio (other than Global Portfolio) the portion of the management fee for that Portfolio equal to the amount that the aggregate annual ordinary operating expenses (excluding interest, taxes, and brokerage commissions) exceeded the percentage stated below, of the Portfolio’s average daily net assets.
| | | | | | |
Portfolio
| | Class I
Expense Limit
| | | Class II
Expense Limit
| |
Conservative Balanced Portfolio | | 0.75 | % | | N/A | |
Diversified Bond Portfolio | | 0.75 | | | N/A | |
Equity Portfolio | | 0.75 | | | 1.15 | % |
Flexible Managed Portfolio | | 0.75 | | | N/A | |
Government Income Portfolio | | 0.75 | | | N/A | |
High Yield Bond Portfolio | | 0.75 | | | N/A | |
Jennison Portfolio | | 0.75 | | | 1.15 | |
Money Market Portfolio | | 0.75 | | | N/A | |
Natural Resources Portfolio | | 0.75 | | | 1.15 | |
Small Capitalization Stock Portfolio | | 0.75 | | | N/A | |
Stock Index Portfolio | | 0.75 | | | N/A | |
Value Portfolio | | 0.75 | | | 1.15 | |
N/A – Not applicable – There are no Class II shares outstanding for this portfolio.
PIMS, PI, PIM, QMA and Jennison are indirect, wholly-owned subsidiaries of Prudential Financial, Inc. (“Prudential”).
| Note 4: | | Other Transactions with Affiliates |
Prudential Mutual Fund Services LLC (“PMFS”), an affiliate of PI and an indirect, wholly-owned subsidiary of Prudential, serves as the Series Fund’s transfer agent. Transfer agent’s fees and expenses in the Statements of Operations include certain out-of-pocket expenses paid to non-affiliates, where applicable.
PIM is the Series Fund’s security lending agent. For the year ended December 31, 2006, PIM was compensated as follows for these services by the Series Fund Portfolios:
| | | |
Portfolio
| | PIM
|
Conservative Balanced Portfolio | | $ | 111,599 |
Diversified Bond Portfolio | | | 84,483 |
Equity Portfolio | | | 480,394 |
Flexible Managed Portfolio | | | 165,775 |
Global Portfolio | | | 95,240 |
Government Income Portfolio | | | 14,817 |
High Yield Bond Portfolio | | | 286,527 |
Jennison Portfolio | | | 410,250 |
Natural Resources Portfolio | | | 437,167 |
Small Capitalization Stock Portfolio | | | 235,414 |
Stock Index Portfolio | | | 154,048 |
Value Portfolio | | | 82,624 |
For the year ended December 31, 2006, Prudential Equity Group, LLC, an indirect, wholly-owned subsidiary of Prudential, and Wachovia Securities, LLC, an affiliate of PI, earned brokerage commissions from transactions executed on behalf of the Series Fund Portfolios as follows:
| | | | | | |
Portfolio
| | Prudential
Equity Group
| | Wachovia
|
Equity Portfolio | | $ | 77,388 | | $ | 48,044 |
Jennison Portfolio | | | 31,235 | | | 12,692 |
Value Portfolio | | | 48,028 | | | 15,817 |
C7
Certain Portfolios invest in the Taxable Money Market Series and Short-Term Bond Series (the “Portfolios”), portfolios of Dryden Core Investment Fund, pursuant to an exemptive order received from the Securities and Exchange Commission. The Portfolios are a money market mutual fund and a short term bond fund, respectively, registered under the Investment Company Act of 1940, as amended, and managed by PI.
Included in the realized gain/loss on investments, in the Statement of Operations of the Natural Resources Portfolio, for the year ended December 31, 2006, is an amount of approximately $139,200, reimbursed by the Subadviser in connection with a security trading error.
| Note 5: | | Portfolio Securities |
The aggregate cost of purchases and the proceeds from the sales of securities (excluding government securities and short-term issues) for the year ended December 31, 2006 were as follows:
Cost of Purchases:
| | | |
Portfolio
| | |
Conservative Balanced Portfolio | | $ | 581,674,096 |
Diversified Bond Portfolio | | | 820,395,985 |
Equity Portfolio | | | 2,525,011,169 |
Flexible Managed Portfolio | | | 2,372,555,167 |
Global Portfolio | | | 415,180,971 |
Government Income Portfolio | | | 1,800,381,464 |
High Yield Bond Portfolio | | | 816,638,309 |
Jennison Portfolio | | | 1,411,497,983 |
Natural Resources Portfolio | | | 674,867,064 |
Small Capitalization Stock Portfolio | | | 91,444,077 |
Stock Index Portfolio | | | 109,010,698 |
Value Portfolio | | | 896,503,694 |
Proceeds from Sales:
| | | |
Portfolio
| | |
Conservative Balanced Portfolio | | $ | 787,873,804 |
Diversified Bond Portfolio | | | 746,009,763 |
Equity Portfolio | | | 2,817,139,158 |
Flexible Managed Portfolio | | | 2,620,007,714 |
Global Portfolio | | | 427,602,371 |
Government Income Portfolio | | | 1,821,928,491 |
High Yield Bond Portfolio | | | 772,782,476 |
Jennison Portfolio | | | 1,646,851,602 |
Natural Resources Portfolio | | | 705,519,202 |
Small Capitalization Stock Portfolio | | | 147,452,557 |
Stock Index Portfolio | | | 413,875,700 |
Value Portfolio | | | 1,011,505,882 |
The Conservative Balanced, Diversified Bond, Flexible Managed and Government Income Portfolios’ written options activity for the year ended December 31, 2006 were as follows:
| | | | | | | |
| Conservative Balanced Portfolio | | | | | | | |
| | | Contracts
| | | Premiums
| |
Balance as of December 31, 2005 | | 62 | | | $ | 32,695 | |
Options written | | — | | | | — | |
Options terminated in closing purchase transactions | | — | | | | — | |
Options expired | | (62 | ) | | | (32,695 | ) |
| | |
|
| |
|
|
|
Balance as of December 31, 2006 | | — | | | $ | — | |
| | |
|
| |
|
|
|
C8
| | | | | | | |
| | |
| Diversified Bond Portfolio | | | | | | | |
| | | Contracts
| | | Premiums
| |
Balance as of December 31, 2005 | | 129 | | | $ | 68,013 | |
Options written | | — | | | | — | |
Options terminated in closing purchase transactions | | — | | | | — | |
Options expired | | (129 | ) | | | (68,013 | ) |
| | |
|
| |
|
|
|
Balance as of December 31, 2006 | | — | | | $ | — | |
| | |
|
| |
|
|
|
| | | | | | | |
| Flexible Managed Portfolio | | | | | | | |
| | | Contracts
| | | Premiums
| |
Balance as of December 31, 2005 | | 49 | | | $ | 25,846 | |
Options written | | — | | | | — | |
Options terminated in closing purchase transactions | | — | | | | — | |
Options expired | | (49 | ) | | | (25,846 | ) |
| | |
|
| |
|
|
|
Balance as of December 31, 2006 | | — | | | $ | — | |
| | |
|
| |
|
|
|
| | |
| Government Income Portfolio | | | | | | | |
| | | Contracts
| | | Premiums
| |
Balance as of December 31, 2005 | | 43 | | | $ | 22,688 | |
Options written | | — | | | | — | |
Options terminated in closing purchase transactions | | — | | | | — | |
Options expired | | (43 | ) | | | (22,688 | ) |
| | |
|
| |
|
|
|
Balance as of December 31, 2006 | | — | | | $ | — | |
| | |
|
| |
|
|
|
As of January 2, 2006 all portfolios are treated as partnerships for tax purposes. The character of the cash distributions paid by the partnership are generally classified as return of capital non taxable distributions. Later in 2007 each partner will receive information regarding their distributive allocable share of the partnerships’s income, gains, losses and deductions.
Prior to January 2, 2006 each Portfolio qualified as a regulated investment company under the Internal Revenue Code and distributed all of its taxable income, including any net realized gains on investments, to shareholders. Accordingly, no provision for federal income or excise tax has been made.
Income and capital gains of the Portfolios were determined in accordance with both tax regulations and accounting principles generally accepted in the United States of America. Prior to being structured as partnerships for tax purposes such determinations may have resulted in temporary and permanent differences between tax basis earnings and earnings reported for financial statement purposes.
The tax character of distributions paid during the year ended December 31, 2005 were as follows:
| | | | | | | | | |
Portfolio
| | Ordinary
Income
| | Long-Term
Capital Gains
| | Total
Distributions
|
Conservative Balanced Portfolio | | $ | 75,600,623 | | $ | 18,446,572 | | $ | 94,047,195 |
Diversified Bond Portfolio | | | 66,587,402 | | | 6,446,465 | | | 73,033,867 |
Equity Portfolio | | | 39,998,556 | | | — | | | 39,998,556 |
Flexible Managed Portfolio | | | 68,680,004 | | | — | | | 68,680,004 |
Global Portfolio | | | 4,467,100 | | | — | | | 4,467,100 |
Government Income Portfolio | | | 18,278,784 | | | — | | | 18,278,784 |
High Yield Bond Portfolio | | | 110,212,418 | | | — | | | 110,212,418 |
Jennison Portfolio | | | 2,181,501 | | | — | | | 2,181,501 |
Money Market Portfolio | | | 25,832,139 | | | 781 | | | 25,832,920 |
Natural Resources Portfolio | | | 771,086 | | | 59,265,774 | | | 60,036,860 |
Small Capitalization Stock Portfolio | | | 5,272,836 | | | 41,694,638 | | | 46,967,474 |
Stock Index Portfolio | | | 51,121,948 | | | 77,233,580 | | | 128,355,528 |
Value Portfolio | | | 22,637,578 | | | — | | | 22,637,578 |
C9
With respect to the Portfolios, book cost of assets differs from tax cost of assets as a result of each Portfolio’s adoption of a mark to market method of accounting for tax purposes. Under this method, tax cost of assets will approximate its fair market value. See Note 10 below regarding “Change in Federal Income Tax Status and Related Reorganization.”
The Series Fund offers Class I and Class II shares. Neither Class I nor Class II shares of a Portfolio are subject to any sales charge or redemption charge and are sold at the net asset value of the Portfolio. Class I shares are sold only to certain separate accounts of Prudential to fund benefits under certain variable life insurance and variable annuity contracts (“contracts”). Class II shares are sold only to separate accounts of non-Prudential insurance companies as investment options under certain contracts. The separate accounts invest in shares of the Series Fund through subaccounts that correspond to the Portfolios. The separate accounts will redeem shares of the Series Fund to the extent necessary to provide benefits under the contracts or for such other purposes as may be consistent with the contracts. As of December 31, 2006, the Equity, Jennison, Natural Resources and Value Portfolios have Class II shares outstanding.
Transactions in shares of beneficial interest of the Equity, Jennison, Natural Resources and Value Portfolios were as follows:
| | | | | | | |
| | |
| Equity Portfolio: | | | | | | | |
Class I
| | Shares
| | | Amount
| |
Year ended December 31, 2006: | | | | | | | |
Series shares sold | | 2,168,346 | | | $ | 55,202,137 | |
Series shares issued in reinvestment of dividends and distributions | | 1,669,920 | | | | 46,000,931 | |
Series shares repurchased | | (17,323,133 | ) | | | (442,264,123 | ) |
| | |
|
| |
|
|
|
Net increase (decrease) in shares outstanding | | (13,484,867 | ) | | $ | (341,061,055 | ) |
| | |
|
| |
|
|
|
Year ended December 31, 2005: | | | | | | | |
Series shares sold | | 2,989,262 | | | $ | 68,173,944 | |
Series shares issued in reinvestment of dividends and distributions | | 1,608,530 | | | | 39,989,141 | |
Series shares issued in connection with the merger | | 1,320,590 | | | | 28,041,417 | |
Series shares repurchased | | (17,406,826 | ) | | | (396,297,859 | ) |
| | |
|
| |
|
|
|
Net increase (decrease) in shares outstanding | | (11,488,444 | ) | | $ | (260,093,357 | ) |
| | |
|
| |
|
|
|
| | |
Class II
| | Shares
| | | Amount
| |
Year ended December 31, 2006: | | | | | | | |
Series shares sold | | 50,883 | | | $ | 1,337,701 | |
Series shares issued in reinvestment of dividends and distributions | | 409 | | | | 11,345 | |
Series shares repurchased | | (65,345 | ) | | | (1,667,596 | ) |
| | |
|
| |
|
|
|
Net increase (decrease) in shares outstanding | | (14,053 | ) | | $ | (318,550 | ) |
| | |
|
| |
|
|
|
Year ended December 31, 2005: | | | | | | | |
Series shares sold | | 48,657 | | | $ | 1,144,258 | |
Series shares issued in reinvestment of dividends and distributions | | 377 | | | | 9,415 | |
Series shares repurchased | | (16,483 | ) | | | (383,800 | ) |
| | |
|
| |
|
|
|
Net increase (decrease) in shares outstanding | | 32,551 | | | $ | 769,873 | |
| | |
|
| |
|
|
|
| | |
| Jennison Portfolio: | | | | | | | |
Class I
| | Shares
| | | Amount
| |
Year ended December 31, 2006: | | | | | | | |
Series shares sold | | 5,774,164 | | | $ | 118,209,162 | |
Series shares issued in reinvestment of dividends and distributions | | 286,560 | | | | 6,106,593 | |
Series shares repurchased | | (18,119,531 | ) | | | (366,233,433 | ) |
| | |
|
| |
|
|
|
Net increase (decrease) in shares outstanding | | (12,058,807 | ) | | $ | (241,917,678 | ) |
| | |
|
| |
|
|
|
Year ended December 31, 2005: | | | | | | | |
Series shares sold | | 14,164,344 | | | $ | 263,061,616 | |
Series shares issued in reinvestment of dividends and distributions | | 107,900 | | | | 2,181,501 | |
Series shares repurchased | | (16,325,260 | ) | | | (304,605,918 | ) |
| | |
|
| |
|
|
|
Net increase (decrease) in shares outstanding | | (2,053,016 | ) | | $ | (39,362,801 | ) |
| | |
|
| |
|
|
|
C10
| | | | | | | |
Class II
| | Shares
| | | Amount
| |
Year ended December 31, 2006: | | | | | | | |
Series shares sold | | 238,412 | | | $ | 4,808,102 | |
Series shares issued in reinvestment of dividends and distributions | | — | | | | — | |
Series shares repurchased | | (186,882 | ) | | | (3,786,433 | ) |
| | |
|
| |
|
|
|
Net increase (decrease) in shares outstanding | | 51,530 | | | $ | 1,021,669 | |
| | |
|
| |
|
|
|
Year ended December 31, 2005: | | | | | | | |
Series shares sold | | 328,045 | | | $ | 5,995,003 | |
Series shares issued in reinvestment of dividends and distributions | | — | | | | — | |
Series shares repurchased | | (4,162,411 | ) | | | (78,540,944 | ) |
| | |
|
| |
|
|
|
Net increase (decrease) in shares outstanding | | (3,834,366 | ) | | $ | (72,545,941 | ) |
| | |
|
| |
|
|
|
| | |
| Natural Resources Portfolio: | | | | | | | |
Class I
| | Shares
| | | Amount
| |
Year ended December 31, 2006: | | | | | | | |
Series shares sold | | 1,747,285 | | | $ | 77,626,709 | |
Series shares issued in reinvestment of dividends and distributions | | 4,813,923 | | | | 195,926,670 | |
Series shares repurchased | | (2,797,966 | ) | | | (123,046,940 | ) |
| | |
|
| |
|
|
|
Net increase (decrease) in shares outstanding | | 3,763,242 | | | $ | 150,506,439 | |
| | |
|
| |
|
|
|
Year ended December 31, 2005: | | | | | | | |
Series shares sold | | 2,361,004 | | | $ | 87,612,149 | |
Series shares issued in reinvestment of dividends and distributions | | 1,857,002 | | | | 60,036,860 | |
Series shares repurchased | | (1,390,245 | ) | | | (51,805,248 | ) |
| | |
|
| |
|
|
|
Net increase (decrease) in shares outstanding | | 2,827,761 | | | $ | 95,843,761 | |
| | |
|
| |
|
|
|
| | |
Class II
| | Shares
| | | Amount
| |
Year ended December 31, 2006: | | | | | | | |
Series shares sold | | 442,720 | | | $ | 20,436,170 | |
Series shares issued in reinvestment of dividends and distributions | | 52,878 | | | | 2,153,216 | |
Series shares repurchased | | (235,987 | ) | | | (10,229,161 | ) |
| | |
|
| |
|
|
|
Net increase (decrease) in shares outstanding | | 259,611 | | | $ | 12,360,225 | |
| | |
|
| |
|
|
|
Period ended December 31, 2005*: | | | | | | | |
Series shares sold | | 225,207 | | | $ | 9,042,129 | |
Series shares repurchased | | (113,695 | ) | | | (4,576,511 | ) |
| | |
|
| |
|
|
|
Net increase (decrease) in shares outstanding | | 111,512 | | | $ | 4,465,618 | |
| | |
|
| |
|
|
|
* Commencement of offering, April 28, 2005. | | | | | | | |
| | |
| Value Portfolio: | | | | | | | |
Class I
| | Shares
| | | Amount
| |
Year ended December 31, 2006: | | | | | | | |
Series shares sold | | 3,460,122 | | | $ | 83,754,259 | |
Series shares issued in reinvestment of dividends and distributions | | 3,730,095 | | | | 90,953,391 | |
Series shares repurchased | | (8,052,454 | ) | | | (194,820,384 | ) |
| | |
|
| |
|
|
|
Net increase (decrease) in shares outstanding | | (862,237 | ) | | $ | (20,112,734 | ) |
| | |
|
| |
|
|
|
Year ended December 31, 2005: | | | | | | | |
Series shares sold | | 3,282,027 | | | $ | 69,499,816 | |
Series shares issued in reinvestment of dividends | | 989,733 | | | | 22,610,679 | |
Series shares repurchased | | (8,085,951 | ) | | | (170,356,605 | ) |
| | |
|
| |
|
|
|
Net increase (decrease) in shares outstanding | | (3,814,191 | ) | | $ | (78,246,110 | ) |
| | |
|
| |
|
|
|
C11
| | | | | | | |
Class II
| | Shares
| | | Amount
| |
Year ended December 31, 2006: | | | | | | | |
Series shares sold | | 10,389 | | | $ | 253,819 | |
Series shares issued in reinvestment of dividends and distributions | | 5,789 | | | | 140,456 | |
Series shares repurchased | | (29,769 | ) | | | (723,580 | ) |
| | |
|
| |
|
|
|
Net increase (decrease) in shares outstanding | | (13,591 | ) | | $ | (329,305 | ) |
| | |
|
| |
|
|
|
Year ended December 31, 2005: | | | | | | | |
Series shares sold | | 18,303 | | | $ | 373,418 | |
Series shares issued in reinvestment of dividends | | 1,162 | | | | 26,899 | |
Series shares repurchased | | (33,039 | ) | | | (714,486 | ) |
| | |
|
| |
|
|
|
Net increase (decrease) in shares outstanding | | (13,574 | ) | | $ | (314,169 | ) |
| | |
|
| |
|
|
|
The Series Fund (excluding the Money Market Portfolio), along with other affiliated registered investment companies (the “Funds”), is a party to a Syndicated Credit Agreement (“SCA”) with two banks. The SCA provides for a commitment of $500 million. Interest on any borrowings under the SCA is incurred at contracted market rates and a commitment fee for the unused amount is accrued daily and paid quarterly. Effective October 27, 2006, the Funds renewed SCA with the banks. The commitment under the renewed SCA continues to be $500 million. The Series Fund pays a commitment fee of .07 of 1% of the unused portion of the renewed SCA. The expiration date of the renewed SCA will be October 26, 2007. For the period from October 29, 2005 through October 26, 2006, the Funds paid a commitment fee of .0725 of 1% of the unused portion of the agreement. The purpose of the SCA is to provide an alternative source of temporary funding for capital share redemptions.
The following Portfolio utilized the line of credit during the year ended December 31, 2006. The average balance outstanding is for the number of days the Portfolio had an outstanding balance.
| | | | | | | | |
Portfolio
| | Approximate
Average Balance
Outstanding
| | Number of
Days
Outstanding
| | Weighted
Average
Interest Rates
| |
Jennison Portfolio | | $ | 6,398,000 | | 37 | | 5.92 | % |
Small Capitalization Stock Portfolio | | | 795,000 | | 21 | | 5.60 | |
| Note 9: | | Ownership and Affiliates |
As of December 31, 2006, all of Class I shares of each Portfolio were owned of record by the Prudential Insurance Company of America (“PICA”) on behalf of the owners of the variable insurance products issued by PICA.
| Note 10: | | Change in Federal Income Tax Status and Related Reorganization |
On January 2, 2006, each portfolio of the Series Fund was reorganized from a Maryland corporation to a Delaware statutory trust. Each Portfolio of the Series Fund changed its federal income tax status from a regulated investment company to a partnership as a result of that conversion. Pursuant to this reorganization, the Series Fund has been renamed “The Prudential Series Fund.” Subsequent to January 2, 2006, each Portfolio’s income, gains, losses and credits will be allocated directly to its partners and will retain the same character for federal income tax purposes. Furthermore, subsequent to January 2, 2006 each Portfolio will not be able to realize any future benefit from any unused capital loss carryforward and other losses (if any) deferred from each Portfolio.
The investment objectives, policies, restrictions, net asset values per share, service providers, fiscal years, and investment portfolios of the Portfolios have not changed. In addition, the Series Fund obtained opinions of counsel that the change in the tax status and the related reorganization had no adverse federal income tax consequences for the Portfolios or contract owners.
C12
| Note 11: | | New Accounting Pronouncements |
On July 13, 2006, the Financial Accounting Standards Board (FASB) released FASB Interpretation No. 48 “Accounting for Uncertainty in Income Taxes” (FIN 48). FIN 48 provides guidance for how uncertain tax positions should be recognized, measured, presented and disclosed in the financial statements. FIN 48 requires the evaluation of tax positions taken or expected to be taken in the course of preparing the Portfolios’ tax returns to determine whether the tax positions are “more-likely-than-not” of being sustained by the applicable tax authority. The impact of the tax positions not deemed to meet the more-likely-than-not threshold would be recorded in the year in which they arise. On December 22, 2006 the Securities and Exchange Commission delayed the effective date until June 30, 2007. At this time, management is evaluating the implications of FIN 48 and its impact, if any, in the financial statements has not yet been determined.
On September 20, 2006, the FASB released Statement of Financial Accounting Standards No. 157 “Fair Value Measurements” (FAS 157). FAS 157 establishes an authoritative definition of fair value, sets out a framework for measuring fair value, and requires additional disclosures about fair-value measurements. The application of FAS 157 is required for fiscal years beginning after November 15, 2007 and interim periods within those fiscal years. At this time, management is evaluating the implications of FAS 157 and its impact, if any, in the financial statements has not yet been determined.
C13
Financial Highlights
| | | | | | | | | | | | | | | | | | | | |
| | | Conservative Balanced Portfolio
| |
| | | Year Ended December 31,
| |
| | | 2006
| | | 2005
| | | 2004
| | | 2003
| | | 2002
| |
Per Share Operating Performance: | | | | | | | | | | | | | | | | | | | | |
Net Asset Value, beginning of year | | $ | 15.09 | | | $ | 15.10 | | | $ | 14.34 | | | $ | 12.43 | | | $ | 13.69 | |
| | |
|
|
| |
|
|
| |
|
|
| |
|
|
| |
|
|
|
Income (Loss) From Investment Operations: | | | | | | | | | | | | | | | | | | | | |
Net investment income | | | .48 | | | | .38 | | | | .34 | | | | .28 | | | | .34 | |
Net realized and unrealized gains (losses) on investments | | | 1.06 | | | | .11 | | | | .78 | | | | 1.99 | | | | (1.57 | ) |
| | |
|
|
| |
|
|
| |
|
|
| |
|
|
| |
|
|
|
Total from investment operations | | | 1.54 | | | | .49 | | | | 1.12 | | | | 2.27 | | | | (1.23 | ) |
| | |
|
|
| |
|
|
| |
|
|
| |
|
|
| |
|
|
|
Less Dividends and Distributions: | | | | | | | | | | | | | | | | | | | | |
Dividends from net investment income | | | — | | | | (.35 | ) | | | (.28 | ) | | | (.36 | ) | | | — | |
Distributions from net realized gains | | | — | | | | (.15 | ) | | | (.08 | ) | | | — | | | | (.03 | ) |
Distributions | | | (.42 | ) | | | — | | | | — | | | | — | | | | — | |
| | |
|
|
| |
|
|
| |
|
|
| |
|
|
| |
|
|
|
Total dividends and distributions | | | (.42 | ) | | | (.50 | ) | | | (.36 | ) | | | (.36 | ) | | | (.03 | ) |
| | |
|
|
| |
|
|
| |
|
|
| |
|
|
| |
|
|
|
Net Asset Value, end of year | | $ | 16.21 | | | $ | 15.09 | | | $ | 15.10 | | | $ | 14.34 | | | $ | 12.43 | |
| | |
|
|
| |
|
|
| |
|
|
| |
|
|
| |
|
|
|
Total Investment Return(a) | | | 10.44 | % | | | 3.43 | % | | | 8.04 | % | | | 18.77 | % | | | (8.98 | )% |
Ratios/Supplemental Data: | | | | | | | | | | | | | | | | | | | | |
Net assets, end of year (in millions) | | $ | 2,770.6 | | | $ | 2,749.8 | | | $ | 2,893.6 | | | $ | 2,895.0 | | | $ | 2,660.3 | |
Ratios to average net assets: | | | | | | | | | | | | | | | | | | | | |
Expenses | | | .57 | % | | | .58 | % | | | .59 | % | | | .58 | % | | | .58 | % |
Net investment income | | | 2.97 | % | | | 2.45 | % | | | 2.27 | % | | | 2.02 | % | | | 2.49 | % |
Portfolio turnover rate | | | 114 | % | | | 110 | % | | | 153 | % | | | 248 | % | | | 260 | % |
| (a) | Total investment return is calculated assuming a purchase of shares on the first day and a sale on the last day of each year reported and includes reinvestment of dividends and distributions and does not reflect the effect of insurance contract charges. Total return does not reflect expenses associated with the separate account such as administrative fees, account charges and surrender charges which, if reflected, would reduce the total returns for all periods shown. Performance figures may reflect voluntary fee waivers and/or expense reimbursements. In the absence of voluntary fee waivers and/or expense reimbursements, the total return would be lower. Past performance is no guarantee of future results. |
| | | | | | | | | | | | | | | | | | | | |
| | | Diversified Bond Portfolio
| |
| | | Year Ended December 31,
| |
| | | 2006
| | | 2005
| | | 2004
| | | 2003
| | | 2002
| |
Per Share Operating Performance: | | | | | | | | | | | | | | | | | | | | |
Net Asset Value, beginning of year | | $ | 10.96 | | | $ | 11.28 | | | $ | 11.17 | | | $ | 10.82 | | | $ | 11.36 | |
| | |
|
|
| |
|
|
| |
|
|
| |
|
|
| |
|
|
|
Income From Investment Operations: | | | | | | | | | | | | | | | | | | | | |
Net investment income | | | .57 | | | | .55 | | | | .52 | | | | .45 | | | | .57 | |
Net realized and unrealized gains (losses) on investments | | | (.05 | ) | | | (.20 | ) | | | .09 | | | | .35 | | | | .17 | |
| | |
|
|
| |
|
|
| |
|
|
| |
|
|
| |
|
|
|
Total from investment operations | | | .52 | | | | .35 | | | | .61 | | | | .80 | | | | .74 | |
| | |
|
|
| |
|
|
| |
|
|
| |
|
|
| |
|
|
|
Less Dividends and Distributions: | | | | | | | | | | | | | | | | | | | | |
Dividends from net investment income | | | — | | | | (.59 | ) | | | (.50 | ) | | | (.45 | ) | | | (1.27 | ) |
Distributions from net realized gains | | | — | | | | (.08 | ) | | | — | | | | — | | | | — | |
Distributions | | | (.63 | ) | | | — | | | | — | | | | — | | | | — | |
Tax return of capital distributions | | | — | | | | — | | | | — | | | | — | | | | (.01 | ) |
| | |
|
|
| |
|
|
| |
|
|
| |
|
|
| |
|
|
|
Total dividends and distributions | | | (.63 | ) | | | (.67 | ) | | | (.50 | ) | | | (.45 | ) | | | (1.28 | ) |
| | |
|
|
| |
|
|
| |
|
|
| |
|
|
| |
|
|
|
Net Asset Value, end of year | | $ | 10.85 | | | $ | 10.96 | | | $ | 11.28 | | | $ | 11.17 | | | $ | 10.82 | |
| | |
|
|
| |
|
|
| |
|
|
| |
|
|
| |
|
|
|
Total Investment Return(a) | | | 4.98 | % | | | 3.28 | % | | | 5.59 | % | | | 7.49 | % | | | 7.07 | % |
Ratios/Supplemental Data: | | | | | | | | | | | | | | | | | | | | |
Net assets, end of year (in millions) | | $ | 1,150.4 | | | $ | 1,230.6 | | | $ | 1,283.7 | | | $ | 1,418.0 | | | $ | 1,370.3 | |
Ratios to average net assets: | | | | | | | | | | | | | | | | | | | | |
Expenses | | | .45 | % | | | .45 | % | | | .45 | % | | | .44 | % | | | .44 | % |
Net investment income | | | 5.18 | % | | | 4.81 | % | | | 4.57 | % | | | 4.02 | % | | | 5.25 | % |
Portfolio turnover rate | | | 393 | % | | | 278 | % | | | 382 | % | | | 706 | % | | | 595 | % |
| (a) | Total investment return is calculated assuming a purchase of shares on the first day and a sale on the last day of each year reported and includes reinvestment of dividends and distributions and does not reflect the effect of insurance contract charges. Total return does not reflect expenses associated with the separate account such as administrative fees, account charges and surrender charges which, if reflected, would reduce the total returns for all periods shown. Performance figures may reflect voluntary fee waivers and/or expense reimbursements. In the absence of voluntary fee waivers and/or expense reimbursements, the total return would be lower. Past performance is no guarantee of future results. |
SEE NOTES TO FINANCIAL STATEMENTS.
D1
Financial Highlights
| | | | | | | | | | | | | | | | | | | | |
| | | Equity Portfolio Class I
| |
| | | Year Ended December 31,
| |
| | | 2006
| | | 2005
| | | 2004
| | | 2003
| | | 2002
| |
Per Share Operating Performance: | | | | | | | | | | | | | | | | | | | | |
Net Asset Value, beginning of year | | $ | 24.64 | | | $ | 22.31 | | | $ | 20.55 | | | $ | 15.75 | | | $ | 20.49 | |
| | |
|
|
| |
|
|
| |
|
|
| |
|
|
| |
|
|
|
Income (Loss) From Investment Operations: | | | | | | | | | | | | | | | | | | | | |
Net investment income | | | .30 | | | | .24 | | | | .28 | | | | .17 | | | | .17 | |
Net realized and unrealized gain (loss) on investments | | | 2.80 | | | | 2.32 | | | | 1.75 | | | | 4.81 | | | | (4.75 | ) |
| | |
|
|
| |
|
|
| |
|
|
| |
|
|
| |
|
|
|
Total from investment operations | | | 3.10 | | | | 2.56 | | | | 2.03 | | | | 4.98 | | | | (4.58 | ) |
| | |
|
|
| |
|
|
| |
|
|
| |
|
|
| |
|
|
|
Less Dividends and Distributions: | | | | | | | | | | | | | | | | | | | | |
Dividends from net investment income | | | — | | | | (.23 | ) | | | (.27 | ) | | | (.18 | ) | | | (.16 | ) |
Distributions | | | (.29 | ) | | | — | | | | — | | | | — | | | | — | |
| | |
|
|
| |
|
|
| |
|
|
| |
|
|
| |
|
|
|
Total dividends and distributions | | | (.29 | ) | | | (.23 | ) | | | (.27 | ) | | | (.18 | ) | | | (.16 | ) |
| | |
|
|
| |
|
|
| |
|
|
| |
|
|
| |
|
|
|
Net Asset Value, end of year | | $ | 27.45 | | | $ | 24.64 | | | $ | 22.31 | | | $ | 20.55 | | | $ | 15.75 | |
| | |
|
|
| |
|
|
| |
|
|
| |
|
|
| |
|
|
|
Total Investment Return(a) | | | 12.57 | % | | | 11.47 | % | | | 9.93 | % | | | 31.65 | % | | | (22.34 | )% |
Ratios/Supplemental Data: | | | | | | | | | | | | | | | | | | | | |
Net assets, end of year (in millions) | | $ | 4,402.7 | | | $ | 4,283.9 | | | $ | 4,135.7 | | | $ | 4,012.3 | | | $ | 3,273.6 | |
Ratios to average net assets: | | | | | | | | | | | | | | | | | | | | |
Expenses | | | .47 | % | | | .47 | % | | | .48 | % | | | .49 | % | | | .48 | % |
Net investment income | | | 1.10 | % | | | 1.01 | % | | | 1.29 | % | | | .96 | % | | | .88 | % |
Portfolio turnover rate | | | 60 | % | | | 77 | % | | | 50 | % | | | 54 | % | | | 54 | % |
| (a) | Total investment return is calculated assuming a purchase of shares on the first day and a sale on the last day of each year reported and includes reinvestment of dividends and distributions and does not reflect the effect of insurance contract charges. Total return does not reflect expenses associated with the separate account such as administrative fees, account charges and surrender charges which, if reflected would reduce the total returns for all periods shown. Performance figures may reflect voluntary fee waivers and/or expense reimbursements. In the absence of voluntary fee waivers and/or expense reimbursements, the total return would be lower. Past performance is no guarantee of future results. |
| | | | | | | | | | | | | | | | | | | | |
| | | Equity Portfolio Class II
| |
| | | Year Ended December 31,
| |
| | | 2006
| | | 2005
| | | 2004
| | | 2003
| | | 2002
| |
Per Share Operating Performance: | | | | | | | | | | | | | | | | | | | | |
Net Asset Value, beginning of year | | $ | 24.69 | | | $ | 22.34 | | | $ | 20.58 | | | $ | 15.76 | | | $ | 20.49 | |
| | |
|
|
| |
|
|
| |
|
|
| |
|
|
| |
|
|
|
Income (Loss) From Investment Operations: | | | | | | | | | | | | | | | | | | | | |
Net investment income | | | .19 | | | | .12 | | | | .20 | | | | .08 | | | | .09 | |
Net realized and unrealized gain (loss) on investments | | | 2.80 | | | | 2.35 | | | | 1.74 | | | | 4.83 | | | | (4.72 | ) |
| | |
|
|
| |
|
|
| |
|
|
| |
|
|
| |
|
|
|
Total from investment operations | | | 2.99 | | | | 2.47 | | | | 1.94 | | | | 4.91 | | | | (4.63 | ) |
| | |
|
|
| |
|
|
| |
|
|
| |
|
|
| |
|
|
|
Less Dividends and Distributions: | | | | | | | | | | | | | | | | | | | | |
Dividends from net investment income | | | — | | | | (.12 | ) | | | (.18 | ) | | | (.09 | ) | | | (.10 | ) |
Distributions | | | (.16 | ) | | | — | | | | — | | | | — | | | | — | |
| | |
|
|
| |
|
|
| |
|
|
| |
|
|
| |
|
|
|
Total dividends and distributions | | | (.16 | ) | | | (.12 | ) | | | (.18 | ) | | | (.09 | ) | | | (.10 | ) |
| | |
|
|
| |
|
|
| |
|
|
| |
|
|
| |
|
|
|
Net Asset Value, end of year | | $ | 27.52 | | | $ | 24.69 | | | $ | 22.34 | | | $ | 20.58 | | | $ | 15.76 | |
| | |
|
|
| |
|
|
| |
|
|
| |
|
|
| |
|
|
|
Total Investment Return(a) | | | 12.13 | % | | | 11.04 | % | | | 9.51 | % | | | 31.11 | % | | | (22.62 | )% |
Ratios/Supplemental Data: | | | | | | | | | | | | | | | | | | | | |
Net assets, end of year (in millions) | | $ | 1.9 | | | $ | 2.1 | | | $ | 1.1 | | | $ | 0.8 | | | $ | 0.4 | |
Ratios to average net assets: | | | | | | | | | | | | | | | | | | | | |
Expenses | | | .87 | % | | | .87 | % | | | .88 | % | | | .89 | % | | | .88 | % |
Net investment income | | | .71 | % | | | .64 | % | | | .91 | % | | | .54 | % | | | .46 | % |
Portfolio turnover rate | | | 60 | % | | | 77 | % | | | 50 | % | | | 54 | % | | | 54 | % |
| (a) | Total investment return is calculated assuming a purchase of shares on the first day and a sale on the last day of each year reported and includes reinvestment of dividends and distributions and does not reflect the effect of insurance contract charges. Total return does not reflect expenses associated with the separate account such as administrative fees, account charges and surrender charges which, if reflected would reduce the total returns for all periods shown. Performance figures may reflect voluntary fee waivers and/or expense reimbursements. In the absence of voluntary fee waivers and/or expense reimbursements, the total return would be lower. Past performance is no guarantee of future results. |
SEE NOTES TO FINANCIAL STATEMENTS.
D2
Financial Highlights
| | | | | | | | | | | | | | | | | | | | |
| | | Flexible Managed Portfolio
| |
| | | Year Ended December 31,
| |
| | | 2006
| | | 2005(b)
| | | 2004
| | | 2003
| | | 2002
| |
Per Share Operating Performance: | | | | | | | | | | | | | | | | | | | | |
Net Asset Value, beginning of year | | $ | 16.92 | | | $ | 16.58 | | | $ | 15.19 | | | $ | 12.55 | | | $ | 14.79 | |
| | |
|
|
| |
|
|
| |
|
|
| |
|
|
| |
|
|
|
Income (loss) From Investment Operations: | | | | | | | | | | | | | | | | | | | | |
Net investment income | | | .44 | | | | .32 | | | | .29 | | | | .22 | | | | .27 | |
Net realized and unrealized gain (loss) on investments | | | 1.59 | | | | .34 | | | | 1.32 | | | | 2.70 | | | | (2.10 | ) |
| | |
|
|
| |
|
|
| |
|
|
| |
|
|
| |
|
|
|
Total from investment operations | | | 2.03 | | | | .66 | | | | 1.61 | | | | 2.92 | | | | (1.83 | ) |
| | |
|
|
| |
|
|
| |
|
|
| |
|
|
| |
|
|
|
Less Dividends and Distributions: | | | | | | | | | | | | | | | | | | | | |
Dividends from net investment income | | | — | | | | (.32 | ) | | | (.22 | ) | | | (.28 | ) | | | (.41 | ) |
Distributions | | | (.59 | ) | | | — | | | | — | | | | — | | | | — | |
| | |
|
|
| |
|
|
| |
|
|
| |
|
|
| |
|
|
|
Total dividends and distributions | | | (.59 | ) | | | (.32 | ) | | | (.22 | ) | | | (.28 | ) | | | (.41 | ) |
| | |
|
|
| |
|
|
| |
|
|
| |
|
|
| |
|
|
|
Net Asset Value, end of year | | $ | 18.36 | | | $ | 16.92 | | | $ | 16.58 | | | $ | 15.19 | | | $ | 12.55 | |
| | |
|
|
| |
|
|
| |
|
|
| |
|
|
| |
|
|
|
Total Investment Return(a) | | | 12.17 | % | | | 4.16 | % | | | 10.74 | % | | | 23.76 | % | | | (12.74 | )% |
Ratios/Supplemental Data: | | | | | | | | | | | | | | | | | | | | |
Net assets, end of year (000,000) | | $ | 3,723.6 | | | $ | 3,543.9 | | | $ | 3,883.5 | | | $ | 3,693.6 | | | $ | 3,181.0 | |
Ratios to average net assets: | | | | | | | | | | | | | | | | | | | | |
Expenses | | | .62 | % | | | .63 | % | | | .62 | % | | | .62 | % | | | .63 | % |
Net investment income | | | 2.48 | % | | | 1.95 | % | | | 1.83 | % | | | 1.55 | % | | | 1.92 | % |
Portfolio turnover rate | | | 153 | % | | | 126 | % | | | 150 | % | | | 204 | % | | | 238 | % |
| (a) | Total investment return is calculated assuming a purchase of shares on the first day and a sale on the last day of each year reported and includes reinvestment of dividends and distributions and does not reflect the effect of insurance contract charges. Total return does not reflect expenses associated with the separate account such as administrative fees, account charges and surrender charges which, if reflected, would reduce the total returns for all periods shown. Performance figures may reflect voluntary fee waivers and/or expense reimbursements. In the absence of voluntary fee waivers and/or expense reimbursements, the total return would be lower. Past performance is no guarantee of future results. |
| (b) | Calculated based upon average shares outstanding during the year. |
| | | | | | | | | | | | | | | | | | | | |
| | | Global Portfolio
| |
| | | Year Ended December 31,
| |
| | | 2006
| | | 2005
| | | 2004
| | | 2003
| | | 2002
| |
Per Share Operating Performance: | | | | | | | | | | | | | | | | | | | | |
Net Asset Value, beginning of year | | $ | 18.96 | | | $ | 16.43 | | | $ | 15.14 | | | $ | 11.35 | | | $ | 15.29 | |
| | |
|
|
| |
|
|
| |
|
|
| |
|
|
| |
|
|
|
Income (Loss) From Investment Operations: | | | | | | | | | | | | | | | | | | | | |
Net investment income | | | .26 | | | | .13 | | | | .11 | | | | .10 | | | | .07 | |
Net realized and unrealized gain (loss) on investments | | | 3.44 | | | | 2.50 | | | | 1.33 | | | | 3.74 | | | | (3.87 | ) |
| | |
|
|
| |
|
|
| |
|
|
| |
|
|
| |
|
|
|
Total from investment operations | | | 3.70 | | | | 2.63 | | | | 1.44 | | | | 3.84 | | | | (3.80 | ) |
| | |
|
|
| |
|
|
| |
|
|
| |
|
|
| |
|
|
|
Less Dividends and Distributions: | | | | | | | | | | | | | | | | | | | | |
Dividends from net investment income | | | — | | | | (.10 | ) | | | (.15 | ) | | | (.05 | ) | | | (.14 | ) |
Distributions | | | (.13 | ) | | | — | | | | — | | | | — | | | | — | |
| | |
|
|
| |
|
|
| |
|
|
| |
|
|
| |
|
|
|
Total dividends and distributions | | | (.13 | ) | | | (.10 | ) | | | (.15 | ) | | | (.05 | ) | | | (.14 | ) |
| | |
|
|
| |
|
|
| |
|
|
| |
|
|
| |
|
|
|
Net Asset Value, end of year | | $ | 22.53 | | | $ | 18.96 | | | $ | 16.43 | | | $ | 15.14 | | | $ | 11.35 | |
| | |
|
|
| |
|
|
| |
|
|
| |
|
|
| |
|
|
|
Total Investment Return(a) | | | 19.65 | % | | | 16.06 | % | | | 9.59 | % | | | 34.07 | % | | | (25.14 | )% |
Ratios/Supplemental Data: | | | | | | | | | | | | | | | | | | | | |
Net assets, end of year (in millions) | | $ | 932.9 | | | $ | 814.1 | | | $ | 691.1 | | | $ | 665.6 | | | $ | 514.9 | |
Ratios to average net assets: | | | | | | | | | | | | | | | | | | | | |
Expenses | | | .84 | % | | | .82 | % | | | .84 | % | | | .87 | % | | | .82 | % |
Net investment income | | | 1.24 | % | | | .77 | % | | | .67 | % | | | .78 | % | | | .47 | % |
Portfolio turnover rate | | | 50 | % | | | 155 | % | | | 128 | % | | | 88 | % | | | 75 | % |
| (a) | Total investment return is calculated assuming a purchase of shares on the first day and a sale on the last day of each year reported and includes reinvestment of dividends and distributions and does not reflect the effect of insurance contract charges. Total return does not reflect expenses associated with the separate account such as administrative fees, account charges and surrender charges which, if reflected, would reduce the total returns for all periods shown. Performance figures may reflect voluntary fee waivers and/or expense reimbursements. In the absence of voluntary fee waivers and/or expense reimbursements, the total return would be lower. Past performance is no guarantee of future results. |
SEE NOTES TO FINANCIAL STATEMENTS.
D3
Financial Highlights
| | | | | | | | | | | | | | | | | | | | |
| | | Government Income Portfolio
| |
| | | Year Ended December 31,
| |
| | | 2006
| | | 2005
| | | 2004
| | | 2003
| | | 2002
| |
Per Share Operating Performance: | | | | | | | | | | | | | | | | | | | | |
Net Asset Value, beginning of year | | $ | 11.40 | | | $ | 11.65 | | | $ | 11.92 | | | $ | 12.50 | | | $ | 12.26 | |
| | |
|
|
| |
|
|
| |
|
|
| |
|
|
| |
|
|
|
Income from investment operations: | | | | | | | | | | | | | | | | | | | | |
Net investment income | | | .54 | | | | .49 | | | | .49 | | | | .46 | | | | .38 | |
Net realized and unrealized gain (loss) on investments | | | (.13 | ) | | | (.20 | ) | | | (.13 | ) | | | (.15 | ) | | | 1.00 | |
| | |
|
|
| |
|
|
| |
|
|
| |
|
|
| |
|
|
|
Total from investment operations | | | .41 | | | | .29 | | | | .36 | | | | .31 | | | | 1.38 | |
| | |
|
|
| |
|
|
| |
|
|
| |
|
|
| |
|
|
|
Less Dividends and Distributions: | | | | | | | | | | | | | | | | | | | | |
Dividends from net investment income | | | — | | | | (.54 | ) | | | (.44 | ) | | | (.46 | ) | | | (1.06 | ) |
Distributions from net realized gains | | | — | | | | — | | | | (.19 | ) | | | (.43 | ) | | | (.08 | ) |
Distributions | | | (.55 | ) | | | — | | | | — | | | | — | | | | — | |
| | |
|
|
| |
|
|
| |
|
|
| |
|
|
| |
|
|
|
Total dividends and distributions | | | (.55 | ) | | | (.54 | ) | | | (.63 | ) | | | (.89 | ) | | | (1.14 | ) |
| | |
|
|
| |
|
|
| |
|
|
| |
|
|
| |
|
|
|
Net Asset Value, end of year | | $ | 11.26 | | | $ | 11.40 | | | $ | 11.65 | | | $ | 11.92 | | | $ | 12.50 | |
| | |
|
|
| |
|
|
| |
|
|
| |
|
|
| |
|
|
|
Total Investment Return(a) | | | 3.74 | % | | | 2.51 | % | | | 3.12 | % | | | 2.46 | % | | | 12.05 | % |
Ratios/Supplemental Data: | | | | | | | | | | | | | | | | | | | | |
Net assets, end of year (in millions) | | $ | 354.3 | | | $ | 378.2 | | | $ | 420.2 | | | $ | 461.5 | | | $ | 484.3 | |
Ratios to average net assets: | | | | | | | | | | | | | | | | | | | | |
Expenses | | | .50 | % | | | .47 | % | | | .47 | % | | | .46 | % | | | .44 | % |
Net investment income | | | 4.75 | % | | | 4.16 | % | | | 4.07 | % | | | 3.76 | % | | | 4.29 | % |
Portfolio turnover rate | | | 734 | % | | | 507 | % | | | 617 | % | | | 695 | % | | | 508 | % |
| (a) | Total investment return is calculated assuming a purchase of shares on the first day and a sale on the last day of each year reported and includes reinvestment of dividends and distributions. Total return does not reflect expenses associated with the separate account such as administrative fees, account charges and surrender charges which, if reflected, would reduce the total returns for all periods shown. Performance figures may reflect voluntary fee waivers and/or expense reimbursements. In the absence of voluntary fee waivers and /or expense reimbursements, the total return would be lower. Past performance is no guarantee of future results. |
| | | | | | | | | | | | | | | | | | | | |
| | | High Yield Bond Portfolio
| |
| | | Year Ended December 31,
| |
| | | 2006
| | | 2005
| | | 2004
| | | 2003
| | | 2002(b)
| |
Per Share Operating Performance: | | | | | | | | | | | | | | | | | | | | |
Net Asset Value, beginning of year | | $ | 5.23 | | | $ | 5.42 | | | $ | 5.29 | | | $ | 4.59 | | | $ | 5.40 | |
| | |
|
|
| |
|
|
| |
|
|
| |
|
|
| |
|
|
|
Income From Investment Operations: | | | | | | | | | | | | | | | | | | | | |
Net investment income | | | .39 | | | | .38 | | | | .39 | | | | .41 | | | | .29 | |
Net realized and unrealized gain (loss) on investments | | | .13 | | | | (.20 | ) | | | .13 | | | | .71 | | | | (.21 | ) |
| | |
|
|
| |
|
|
| |
|
|
| |
|
|
| |
|
|
|
Total from investment operations | | | .52 | | | | .18 | | | | .52 | | | | 1.12 | | | | .08 | |
| | |
|
|
| |
|
|
| |
|
|
| |
|
|
| |
|
|
|
Less Dividends and Distributions: | | | | | | | | | | | | | | | | | | | | |
Dividends from net investment income | | | — | | | | (.37 | ) | | | (.39 | ) | | | (.42 | ) | | | (.89 | ) |
Distributions | | | (.42 | ) | | | — | | | | — | | | | — | | | | — | |
| | |
|
|
| |
|
|
| |
|
|
| |
|
|
| |
|
|
|
Total dividends and distributions | | | (.42 | ) | | | (.37 | ) | | | (.39 | ) | | | (.42 | ) | | | (.89 | ) |
| | |
|
|
| |
|
|
| |
|
|
| |
|
|
| |
|
|
|
Net asset Value, end of year | | $ | 5.33 | | | $ | 5.23 | | | $ | 5.42 | | | $ | 5.29 | | | $ | 4.59 | |
| | |
|
|
| |
|
|
| |
|
|
| |
|
|
| |
|
|
|
Total Investment Return(a) | | | 10.25 | % | | | 3.41 | % | | | 10.30 | % | | | 25.04 | % | | | 1.50 | % |
Ratios/Supplemental Data: | | | | | | | | | | | | | | | | | | | | |
Net assets, end of year (in millions) | | $ | 1,721.1 | | | $ | 1,635.7 | | | $ | 1,595.7 | | | $ | 1,466.7 | | | $ | 1,128.6 | |
Ratios to average net assets: | | | | | | | | | | | | | | | | | | | | |
Expenses | | | .58 | % | | | .58 | % | | | .59 | % | | | .60 | % | | | .58 | % |
Net investment income | | | 7.39 | % | | | 7.14 | % | | | 7.42 | % | | | 8.11 | % | | | 9.36 | % |
Portfolio turnover rate | | | 49 | % | | | 56 | % | | | 65 | % | | | 93 | % | | | 77 | % |
| (a) | Total investment return is calculated assuming a purchase of shares on the first day and a sale on the last day of each year reported and includes reinvestment of dividends and distributions and does not reflect the effect of insurance contract charges. Total return does not reflect expenses associated with the separate account such as administrative fees, account charges and surrender charges which, if reflected, would reduce the total returns for all periods shown. Performance figures may reflect voluntary fee waivers and/or expense reimbursements. In the absence of voluntary fee waivers and/or expense reimbursements, the total return would be lower. Past performance is no guarantee of future results. |
| (b) | Calculated based upon average shares during the year. |
SEE NOTES TO FINANCIAL STATEMENTS.
D4
Financial Highlights
| | | | | | | | | | | | | | | | | | | | |
| | | Jennison Portfolio
| |
| | | Class I
| |
| | | Year Ended December 31,
| |
| | | 2006(b)
| | | 2005(b)
| | | 2004
| | | 2003
| | | 2002
| |
Per Share Operating Performance: | | | | | | | | | | | | | | | | | | | | |
Net Asset Value, beginning of year | | $ | 20.76 | | | $ | 18.14 | | | $ | 16.62 | | | $ | 12.79 | | | $ | 18.57 | |
| | |
|
|
| |
|
|
| |
|
|
| |
|
|
| |
|
|
|
Income (Loss) From Investment Operations: | | | | | | | | | | | | | | | | | | | | |
Net investment income | | | .06 | | | | .02 | | | | .08 | | | | .04 | | | | .03 | |
Net realized and unrealized gain (loss) on investments | | | .31 | | | | 2.62 | | | | 1.52 | | | | 3.83 | | | | (5.78 | ) |
| | |
|
|
| |
|
|
| |
|
|
| |
|
|
| |
|
|
|
Total from investment operations | | | .37 | | | | 2.64 | | | | 1.60 | | | | 3.87 | | | | (5.75 | ) |
| | |
|
|
| |
|
|
| |
|
|
| |
|
|
| |
|
|
|
Less Dividends and Distributions: | | | | | | | | | | | | | | | | | | | | |
Dividends from net investment income | | | — | | | | (.02 | ) | | | (.08 | ) | | | (.04 | ) | | | (.03 | ) |
Distributions | | | (.06 | ) | | | — | | | | — | | | | — | | | | — | |
| | |
|
|
| |
|
|
| |
|
|
| |
|
|
| |
|
|
|
Total dividends and distributions | | | (.06 | ) | | | (.02 | ) | | | (.08 | ) | | | (.04 | ) | | | (.03 | ) |
| | |
|
|
| |
|
|
| |
|
|
| |
|
|
| |
|
|
|
Net Asset Value, end of year | | $ | 21.07 | | | $ | 20.76 | | | $ | 18.14 | | | $ | 16.62 | | | $ | 12.79 | |
| | |
|
|
| |
|
|
| |
|
|
| |
|
|
| |
|
|
|
Total Investment Return(a) | | | 1.79 | % | | | 14.55 | % | | | 9.63 | % | | | 30.25 | % | | | (30.95 | )% |
Ratios/Supplemental Data: | | | | | | | | | | | | | | | | | | | | |
Net assets, end of year (in millions) | | $ | 2,077.3 | | | $ | 2,297.0 | | | $ | 2,044.1 | | | $ | 1,772.4 | | | $ | 1,388.8 | |
Ratios to average net assets: | | | | | | | | | | | | | | | | | | | | |
Expenses | | | .63 | % | | | .63 | % | | | .64 | % | | | .64 | % | | | .61 | % |
Net investment income | | | .29 | % | | | .10 | % | | | .50 | % | | | .28 | % | | | .21 | % |
Portfolio turnover rate | | | 67 | % | | | 57 | % | | | 74 | % | | | 69 | % | | | 74 | % |
| (a) | Total investment return is calculated assuming a purchase of shares on the first day and a sale on the last day of each year reported and includes reinvestment of dividends and distributions and does not reflect the effect of insurance contract charges. Total return does not reflect expenses associated with the separate account such as administrative fees, account charges and surrender charges which, if reflected, would reduce the total returns for all periods shown, Performance figures may reflect voluntary fee waivers and/or expense reimbursements. In the absence of voluntary fee waivers and/or expense reimbursements, the total return would be lower. Past performance is no guarantee of future results. |
| (b) | Calculated based upon average shares during the year. |
| | | | | | | | | | | | | | | | | | | | |
| | | Jennison Portfolio
| |
| | | Class II
| |
| | | Year Ended December 31,
| |
| | | 2006(b)
| | | 2005(b)
| | | 2004
| | | 2003
| | | 2002
| |
Per Share Operating Performance: | | | | | | | | | | | | | | | | | | | | |
Net Asset Value, beginning of year | | $ | 20.49 | | | $ | 17.97 | | | $ | 16.46 | | | $ | 12.70 | | | $ | 18.45 | |
| | |
|
|
| |
|
|
| |
|
|
| |
|
|
| |
|
|
|
Income (Loss) From Investment Operations: | | | | | | | | | | | | | | | | | | | | |
Net investment income (loss) | | | (.02 | ) | | | (.05 | ) | | | .02 | | | | (.01 | ) | | | (.02 | ) |
Net realized and unrealized gain (loss) on investments | | | .30 | | | | 2.57 | | | | 1.50 | | | | 3.77 | | | | (5.73 | ) |
| | |
|
|
| |
|
|
| |
|
|
| |
|
|
| |
|
|
|
Total from investment operations | | | .28 | | | | 2.52 | | | | 1.52 | | | | 3.76 | | | | (5.75 | ) |
| | |
|
|
| |
|
|
| |
|
|
| |
|
|
| |
|
|
|
Less Dividends: | | | | | | | | | | | | | | | | | | | | |
Dividends from net investment income | | | — | | | | — | | | | (.01 | ) | | | — | | | | — | |
| | |
|
|
| |
|
|
| |
|
|
| |
|
|
| |
|
|
|
Net Asset Value, end of year | | $ | 20.77 | | | $ | 20.49 | | | $ | 17.97 | | | $ | 16.46 | | | $ | 12.70 | |
| | |
|
|
| |
|
|
| |
|
|
| |
|
|
| |
|
|
|
Total Investment Return(a) | | | 1.37 | % | | | 14.02 | % | | | 9.22 | % | | | 29.61 | % | | | (31.17 | )% |
Ratios/Supplemental Data: | | | | | | | | | | | | | | | | | | | | |
Net assets, end of year (in millions) | | $ | 19.6 | | | $ | 18.2 | | | $ | 84.9 | | | $ | 74.3 | | | $ | 48.1 | |
Ratios to average net assets: | | | | | | | | | | | | | | | | | | | | |
Expenses | | | 1.03 | % | | | 1.03 | % | | | 1.04 | % | | | 1.04 | % | | | 1.01 | % |
Net investment income (loss) | | | (.12 | )% | | | (.27 | )% | | | .11 | % | | | (.13 | )% | | | (.19 | )% |
Portfolio turnover rate | | | 67 | % | | | 57 | % | | | 74 | % | | | 69 | % | | | 74 | % |
| (a) | Total investment return is calculated assuming a purchase of shares on the first day and a sale on the last day of each year reported and includes reinvestment of dividends and distributions and does not reflect the effect of insurance contract charges. Total return does not reflect expenses associated with the separate account such as administrative fees, account charges and surrender charges which, if reflected, would reduce the total returns for all periods shown, Performance figures may reflect voluntary fee waivers and/or expense reimbursements. In the absence of voluntary fee waivers and/or expense reimbursements, the total return would be lower. Past performance is no guarantee of future results. |
| (b) | Calculated based upon average shares during the year. |
SEE NOTES TO FINANCIAL STATEMENTS.
D5
Financial Highlights
| | | | | | | | | | | | | | | | | | | | |
| | | Money Market Portfolio
| |
| | | Year Ended December 31,
| |
| | | 2006
| | | 2005
| | | 2004
| | | 2003
| | | 2002
| |
Per Share Operating Performance: | | | | | | | | | | | | | | | | | | | | |
Net Asset Value, beginning of year | | $ | 10.00 | | | $ | 10.00 | | | $ | 10.00 | | | $ | 10.00 | | | $ | 10.00 | |
| | |
|
|
| |
|
|
| |
|
|
| |
|
|
| |
|
|
|
Income From Investment Operations: | | | | | | | | | | | | | | | | | | | | |
Net investment income and realized gains | | | .46 | | | | .28 | | | | .10 | | | | .08 | | | | .15 | |
Dividends and distributions | | | — | | | | (.28 | ) | | | (.10 | ) | | | (.08 | ) | | | (.15 | ) |
Distributions | | | (.46 | ) | | | — | | | | — | | | | — | | | | — | |
| | |
|
|
| |
|
|
| |
|
|
| |
|
|
| |
|
|
|
Net Asset Value, end of year | | $ | 10.00 | | | $ | 10.00 | | | $ | 10.00 | | | $ | 10.00 | | | $ | 10.00 | |
| | |
|
|
| |
|
|
| |
|
|
| |
|
|
| |
|
|
|
Total Investment Return(a) | | | 4.74 | % | | | 2.85 | % | | | 1.01 | % | | | .84 | % | | | 1.52 | % |
Ratios/Supplemental Data: | | | | | | | | | | | | | | | | | | | | |
Net assets, end of year (in millions) | | $ | 1,060.5 | | | $ | 851.9 | | | $ | 885.4 | | | $ | 933.7 | | | $ | 1,366.6 | |
Ratios to average net assets: | | | | | | | | | | | | | | | | | | | | |
Expenses | | | .43 | % | | | .45 | % | | | .45 | % | | | .44 | % | | | .43 | % |
Net investment income | | | 4.68 | % | | | 2.86 | % | | | 1.01 | % | | | .84 | % | | | 1.52 | % |
| (a) | Total investment return is calculated assuming a purchase of shares on the first day and a sale on the last day of each year reported and includes reinvestment of dividends and distributions. Total return does not reflect expenses associated with the separate account such as administrative fees, account charges and surrender charges which, if reflected, would reduce the total returns for all periods shown. Performance figures may reflect voluntary fee waivers and/or expense reimbursements. In the absence of voluntary fee waivers and /or expense reimbursements, the total return would be lower. Past performance is no guarantee of future results. |
| | | | | | | | | | | | | | | | | | | | |
| | | Natural Resources Portfolio
| |
| | | Class I
| |
| | | Year Ended December 31,
| |
| | | 2006(a)
| | | 2005
| | | 2004
| | | 2003
| | | 2002
| |
Per Share Operating Performance: | | | | | | | | | | | | | | | | | | | | |
Net Asset Value, beginning of year | | $ | 45.46 | | | $ | 31.88 | | | $ | 27.49 | | | $ | 22.35 | | | $ | 19.11 | |
| | |
|
|
| |
|
|
| |
|
|
| |
|
|
| |
|
|
|
Income From Investment Operations: | | | | | | | | | | | | | | | | | | | | |
Net investment income | | | .35 | | | | .33 | | | | .19 | | | | .25 | | | | .09 | |
Net realized and unrealized gain on investments | | | 8.65 | | | | 16.27 | | | | 6.28 | | | | 7.38 | | | | 3.52 | |
| | |
|
|
| |
|
|
| |
|
|
| |
|
|
| |
|
|
|
Total from investment operations | | | 9.00 | | | | 16.60 | | | | 6.47 | | | | 7.63 | | | | 3.61 | |
| | |
|
|
| |
|
|
| |
|
|
| |
|
|
| |
|
|
|
Less Dividends and Distributions: | | | | | | | | | | | | | | | | | | | | |
Dividends from net investment income | | | — | | | | — | (b) | | | (1.00 | ) | | | (.98 | ) | | | (.12 | ) |
Distributions from net realized gains | | | — | | | | (3.02 | ) | | | (1.08 | ) | | | (1.51 | ) | | | (.25 | ) |
Distributions | | | (8.79 | ) | | | — | | | | — | | | | — | | | | — | |
| | |
|
|
| |
|
|
| |
|
|
| |
|
|
| |
|
|
|
Total dividends and distributions | | | (8.79 | ) | | | (3.02 | ) | | | (2.08 | ) | | | (2.49 | ) | | | (.37 | ) |
| | |
|
|
| |
|
|
| |
|
|
| |
|
|
| |
|
|
|
Net Asset Value, end of year | | $ | 45.67 | | | $ | 45.46 | | | $ | 31.88 | | | $ | 27.49 | | | $ | 22.35 | |
| | |
|
|
| |
|
|
| |
|
|
| |
|
|
| |
|
|
|
Total Investment Return(c) | | | 22.20 | % | | | 55.91 | % | | | 25.17 | % | | | 39.00 | % | | | 18.92 | % |
Ratios/Supplemental Data: | | | | | | | | | | | | | | | | | | | | |
Net assets, end of year (in millions) | | $ | 1,193.0 | | | $ | 1,016.3 | | | $ | 622.6 | | | $ | 498.7 | | | $ | 379.2 | |
Ratios to average net assets: | | | | | | | | | | | | | | | | | | | | |
Expenses | | | .49 | % | | | .49 | % | | | .51 | % | | | .51 | % | | | .50 | % |
Net investment income | | | .78 | % | | | .66 | % | | | .49 | % | | | .80 | % | | | .47 | % |
Portfolio turnover rate | | | 58 | % | | | 59 | % | | | 24 | % | | | 24 | % | | | 37 | % |
| (a) | Calculated based upon average shares outstanding during the year. |
| (b) | Amount is less than $0.01 per share. |
| (c) | Total investment return is calculated assuming a purchase of shares on the first day and a sale on the last day of each year reported and includes reinvestment of dividends and distributions and does not reflect the effect of insurance contract charges. Total return does not reflect expenses associated with the separate account such as administrative fees, account charges and surrender charges which, if reflected, would reduce the total returns for all periods shown. Performance figures may reflect voluntary fee waivers and/or expense reimbursements. In the absence of voluntary fee waivers and/or expense reimbursements, the total return would be lower. Past performance is no guarantee of future results. |
SEE NOTES TO FINANCIAL STATEMENTS.
D6
Financial Highlights
| | | | | | | | |
| | | Natural Resources Portfolio
| |
| | | Class II
| |
| | | Year Ended
December 31, 2006(b)
| | | April 28, 2005(a)
through
December 31, 2005
| |
Per Share Operating Performance: | | | | | | | | |
Net Asset Value, beginning of period | | $ | 45.32 | | | $ | 30.10 | |
| | |
|
|
| |
|
|
|
Income From Investment Operations: | | | | | | | | |
Net investment income | | | .18 | | | | .05 | |
Net realized and unrealized gain on investments | | | 8.64 | | | | 15.17 | |
| | |
|
|
| |
|
|
|
Total from investment operations | | | 8.82 | | | | 15.22 | |
| | |
|
|
| |
|
|
|
Less Distributions: | | | | | | | | |
Distributions | | | (8.59 | ) | | | — | |
| | |
|
|
| |
|
|
|
Net Asset Value, end of period | | $ | 45.55 | | | $ | 45.32 | |
| | |
|
|
| |
|
|
|
Total Investment Return(c) | | | 21.72 | % | | | 50.56 | %(e) |
Ratios/Supplemental Data: | | | | | | | | |
Net assets, end of period (in millions) | | $ | 16.9 | | | $ | 5.1 | |
Ratios to average net assets: | | | | | | | | |
Expenses | | | .89 | % | | | .89 | %(d) |
Net investment income | | | .40 | % | | | .33 | %(d) |
Portfolio turnover rate | | | 58 | % | | | 59 | %(e) |
| (a) | Commencement of offering of Class II shares. |
| (b) | Calculated based upon average shares outstanding during the year. |
| (c) | Total investment return is calculated assuming a purchase of shares on the first day and a sale on the last day of each period reported and includes reinvestment of dividends and distributions and does not reflect the effect of insurance contract charges. Total return does not reflect expenses associated with the separate account such as administrative fees, account charges and surrender charges which, if reflected, would reduce the total returns for all periods shown. Performance figures may reflect voluntary fee waivers and/or expense reimbursements. In the absence of voluntary fee waivers and/or expense reimbursements, the total return would be lower. Past performance is no guarantee of future results. |
| | | | | | | | | | | | | | | | | | | | |
| | | Small Capitalization Stock Portfolio
| |
| | | Year Ended December 31,
| |
| | | 2006
| | | 2005
| | | 2004
| | | 2003
| | | 2002
| |
Per Share Operating Performance: | | | | | | | | | | | | | | | | | | | | |
Net Asset Value, beginning of year | | $ | 21.38 | | | $ | 21.33 | | | $ | 17.64 | | | $ | 12.91 | | | $ | 15.48 | |
| | |
|
|
| |
|
|
| |
|
|
| |
|
|
| |
|
|
|
Income (Loss) From Investment Operations: | | | | | | | | | | | | | | | | | | | | |
Net investment income | | | .14 | | | | .13 | | | | .12 | | | | .07 | | | | .06 | |
Net realized and unrealized gain (loss) on investments | | | 2.95 | | | | 1.30 | | | | 3.75 | | | | 4.82 | | | | (2.31 | ) |
| | |
|
|
| |
|
|
| |
|
|
| |
|
|
| |
|
|
|
Total from investment operations | | | 3.09 | | | | 1.43 | | | | 3.87 | | | | 4.89 | | | | (2.25 | ) |
| | |
|
|
| |
|
|
| |
|
|
| |
|
|
| |
|
|
|
Less Dividends and Distributions: | | | | | | | | | | | | | | | | | | | | |
Dividends from net investment income | | | ��� | | | | (.13 | ) | | | (.11 | ) | | | (.07 | ) | | | (.13 | ) |
Distributions from net realized gains | | | — | | | | (1.25 | ) | | | (.07 | ) | | | (.09 | ) | | | (.19 | ) |
Distributions | | | (1.18 | ) | | | — | | | | — | | | | — | | | | — | |
| | |
|
|
| |
|
|
| |
|
|
| |
|
|
| |
|
|
|
Total dividends and distributions | | | (1.18 | ) | | | (1.38 | ) | | | (.18 | ) | | | (.16 | ) | | | (.32 | ) |
| | |
|
|
| |
|
|
| |
|
|
| |
|
|
| |
|
|
|
Net Asset Value, end of year | | $ | 23.29 | | | $ | 21.38 | | | $ | 21.33 | | | $ | 17.64 | | | $ | 12.91 | |
| | |
|
|
| |
|
|
| |
|
|
| |
|
|
| |
|
|
|
Total Investment Return(a) | | | 14.67 | % | | | 7.26 | % | | | 22.04 | % | | | 38.27 | % | | | (14.92 | )% |
Ratios/Supplemental Data: | | | | | | | | | | | | | | | | | | | | |
Net assets, end of year (in millions) | | $ | 777.1 | | | $ | 738.3 | | | $ | 743.2 | | | $ | 619.9 | | | $ | 467.4 | |
Ratios to average net assets: | | | | | | | | | | | | | | | | | | | | |
Expenses | | | .45 | % | | | .46 | % | | | .47 | % | | | .48 | % | | | .46 | % |
Net investment income | | | .59 | % | | | .62 | % | | | .62 | % | | | .47 | % | | | .40 | % |
Portfolio turnover rate | | | 12 | % | | | 16 | % | | | 18 | % | | | 15 | % | | | 17 | % |
| (a) | Total investment return is calculated assuming a purchase of shares on the first day and a sale on the last day of each year reported and includes reinvestment of dividends and distributions and does not reflect the effect of insurance contract charges. Total return does not reflect expenses associated with the separate account such as administrative fees, account charges and surrender charges which, if reflected, would reduce the total returns for all periods shown. Performance figures may reflect voluntary fee waivers and/or expense reimbursements. In the absence of voluntary fee waivers and/or expense reimbursements, the total return would be lower. Past performance is no guarantee of future results. |
SEE NOTES TO FINANCIAL STATEMENTS.
D7
Financial Highlights
| | | | | | | | | | | | | | | | | | | | |
| | | Stock Index Portfolio
| |
| | | Year Ended December 31,
| |
| | | 2006
| | | 2005
| | | 2004
| | | 2003
| | | 2002
| |
Per Share Operating Performance: | | | | | | | | | | | | | | | | | | | | |
Net Asset Value, beginning of year | | $ | 31.41 | | | $ | 31.29 | | | $ | 29.29 | | | $ | 24.09 | | | $ | 31.64 | |
| | |
|
|
| |
|
|
| |
|
|
| |
|
|
| |
|
|
|
Income (Loss) From Investment Operations: | | | | | | | | | | | | | | | | | | | | |
Net investment income | | | .56 | | | | .48 | | | | .50 | | | | .36 | | | | .37 | |
Net realized and unrealized gain (loss) on investments | | | 4.31 | | | | .88 | | | | 2.50 | | | | 6.14 | | | | (7.34 | ) |
| | |
|
|
| |
|
|
| |
|
|
| |
|
|
| |
|
|
|
Total from investment operations | | | 4.87 | | | | 1.36 | | | | 3.00 | | | | 6.50 | | | | (6.97 | ) |
| | |
|
|
| |
|
|
| |
|
|
| |
|
|
| |
|
|
|
Less Dividends and Distributions: | | | | | | | | | | | | | | | | | | | | |
Dividends from net investment income | | | — | | | | (.47 | ) | | | (.49 | ) | | | (.37 | ) | | | (.36 | ) |
Distributions from net realized gains | | | — | | | | (.77 | ) | | | (.51 | ) | | | (.93 | ) | | | (.22 | ) |
Distributions | | | (.64 | ) | | | — | | | | — | | | | — | | | | — | |
| | |
|
|
| |
|
|
| |
|
|
| |
|
|
| |
|
|
|
Total dividends and distributions | | | (.64 | ) | | | (1.24 | ) | | | (1.00 | ) | | | (1.30 | ) | | | (.58 | ) |
| | |
|
|
| |
|
|
| |
|
|
| |
|
|
| |
|
|
|
Net Asset Value, end of year | | $ | 35.64 | | | $ | 31.41 | | | $ | 31.29 | | | $ | 29.29 | | | $ | 24.09 | |
| | |
|
|
| |
|
|
| |
|
|
| |
|
|
| |
|
|
|
Total Investment Return(a) | | | 15.54 | % | | | 4.54 | % | | | 10.45 | % | | | 28.18 | % | | | (22.19 | )% |
Ratios/Supplemental Data: | | | | | | | | | | | | | | | | | | | | |
Net assets, end of year (in millions) | | $ | 3,306.4 | | | $ | 3,212.7 | | | $ | 3,094.7 | | | $ | 2,940.9 | | | $ | 2,352.3 | |
Ratios to average net assets: | | | | | | | | | | | | | | | | | | | | |
Expenses | | | .37 | % | | | .38 | % | | | .38 | % | | | .37 | % | | | .37 | % |
Net investment income | | | 1.61 | % | | | 1.52 | % | | | 1.64 | % | | | 1.42 | % | | | 1.25 | % |
Portfolio turnover rate | | | 3 | % | | | 7 | % | | | 3 | % | | | 2 | % | | | 4 | % |
| (a) | Total investment return is calculated assuming a purchase of shares on the first day and a sale on the last day of each year reported and includes reinvestment of dividends and distributions and does not reflect the effect of insurance contract charges. Total return does not reflect expenses associated with the separate account such as administrative fees, account charges and surrender charges which, if reflected, would reduce the total returns for all periods shown. Performance figures may reflect voluntary fee waivers and/or expense reimbursements. In the absence of voluntary fee waivers and/or expense reimbursements, the total return would be lower. Past performance is no guarantee of future results. |
| | | | | | | | | | | | | | | | | | | | |
| | | Value Portfolio
| |
| | | Class I
| |
| | | Year Ended December 31,
| |
| | | 2006
| | | 2005
| | | 2004
| | | 2003
| | | 2002(b)
| |
Per Share Operating Performance : | | | | | | | | | | | | | | | | | | | | |
Net Asset Value, beginning of year | | $ | 22.95 | | | $ | 19.93 | | | $ | 17.36 | | | $ | 13.75 | | | $ | 17.91 | |
| | |
|
|
| |
|
|
| |
|
|
| |
|
|
| |
|
|
|
Income (Loss) From Investment Operations: | | | | | | | | | | | | | | | | | | | | |
Net investment income | | | .36 | | | | .29 | | | | .28 | | | | .23 | | | | .22 | |
Net realized and unrealized gain (loss) on investments | | | 4.11 | | | | 3.03 | | | | 2.55 | | | | 3.62 | | | | (4.15 | ) |
| | |
|
|
| |
|
|
| |
|
|
| |
|
|
| |
|
|
|
Total from investment operations | | | 4.47 | | | | 3.32 | | | | 2.83 | | | | 3.85 | | | | (3.93 | ) |
| | |
|
|
| |
|
|
| |
|
|
| |
|
|
| |
|
|
|
Less Dividends and Distributions: | | | | | | | | | | | | | | | | | | | | |
Dividends from net investment income | | | — | | | | (.30 | ) | | | (.26 | ) | | | (.24 | ) | | | (.23 | ) |
Distributions | | | (1.21 | ) | | | — | | | | — | | | | — | | | | — | |
Tax return of capital distributions | | | — | | | | — | | | | — | | | | — | (c) | | | — | |
| | |
|
|
| |
|
|
| |
|
|
| |
|
|
| |
|
|
|
Total dividends and distributions | | | (1.21 | ) | | | (.30 | ) | | | (.26 | ) | | | (.24 | ) | | | (.23 | ) |
| | |
|
|
| |
|
|
| |
|
|
| |
|
|
| |
|
|
|
Net Asset Value, end of year | | $ | 26.21 | | | $ | 22.95 | | | $ | 19.93 | | | $ | 17.36 | | | $ | 13.75 | |
| | |
|
|
| |
|
|
| |
|
|
| |
|
|
| |
|
|
|
Total Investment Return(a) | | | 19.94 | % | | | 16.66 | % | | | 16.31 | % | | | 28.07 | % | | | (21.97 | )% |
Ratios/Supplemental Data: | | | | | | | | | | | | | | | | | | | | |
Net assets, end of year (in millions) | | $ | 1,975.7 | | | $ | 1,750.1 | | | $ | 1,595.6 | | | $ | 1,456.1 | | | $ | 1,247.0 | |
Ratios to average net assets: | | | | | | | | | | | | | | | | | | | | |
Expenses | | | .43 | % | | | .43 | % | | | .44 | % | | | .44 | % | | | .43 | % |
Net investment income | | | 1.45 | % | | | 1.35 | % | | | 1.48 | % | | | 1.49 | % | | | 1.39 | % |
Portfolio turnover rate | | | 49 | % | | | 56 | % | | | 52 | % | | | 72 | % | | | 94 | % |
| (a) | Total investment return is calculated assuming a purchase of shares on the first day and a sale on the last day of each year reported and includes reinvestment of dividends and distributions and does not reflect the effect of insurance contract charges. Total investment returns for periods of less than one full year are not annualized. Total return does not reflect expenses associated with the separate account such as administrative fees, account charges and surrender charges which, if reflected, would reduce the total returns for all periods shown. Performance figures may reflect voluntary fee waivers and/or expense reimbursements. In the absence of voluntary fee waivers and/or expense reimbursements, the total return would be lower. Past performance is no guarantee of future results. |
| (b) | Calculated based upon weighted average shares outstanding during the year. |
| (c) | Less than $.005 per share. |
SEE NOTES TO FINANCIAL STATEMENTS.
D8
Financial Highlights
| | | | | | | | | | | | | | | | | | | | |
| | | Value Portfolio
| |
| | | Class II
| |
| | | Year Ended December 31,
| |
| | | 2006
| | | 2005
| | | 2004
| | | 2003(b)
| | | 2002(b)
| |
Per Share Operating Performance : | | | | | | | | | | | | | | | | | | | | |
Net Asset Value, beginning of year | | $ | 22.98 | | | $ | 19.94 | | | $ | 17.37 | | | $ | 13.75 | | | $ | 17.91 | |
| | |
|
|
| |
|
|
| |
|
|
| |
|
|
| |
|
|
|
Income (Loss) From Investment Operations: | | | | | | | | | | | | | | | | | | | | |
Net investment income | | | .27 | | | | .21 | | | | .20 | | | | .16 | | | | .16 | |
Net realized and unrealized gain (loss) on investments | | | 4.11 | | | | 3.01 | | | | 2.55 | | | | 3.62 | | | | (4.15 | ) |
| | |
|
|
| |
|
|
| |
|
|
| |
|
|
| |
|
|
|
Total from investment operations | | | 4.38 | | | | 3.22 | | | | 2.75 | | | | 3.78 | | | | (3.99 | ) |
| | |
|
|
| |
|
|
| |
|
|
| |
|
|
| |
|
|
|
Less Dividends and Distributions: | | | | | | | | | | | | | | | | | | | | |
Dividends from net investment income | | | — | | | | (.18 | ) | | | (.18 | ) | | | (.16 | ) | | | (.17 | ) |
Distributions | | | (1.10 | ) | | | — | | | | — | | | | — | | | | — | |
Tax return of capital distributions | | | — | | | | — | | | | — | | | | — | (c) | | | — | |
| | |
|
|
| |
|
|
| |
|
|
| |
|
|
| |
|
|
|
Total dividends and distributions | | | (1.10 | ) | | | (.18 | ) | | | (.18 | ) | | | (.16 | ) | | | (.17 | ) |
| | |
|
|
| |
|
|
| |
|
|
| |
|
|
| |
|
|
|
Net Asset Value, end of year | | $ | 26.26 | | | $ | 22.98 | | | $ | 19.94 | | | $ | 17.37 | | | $ | 13.75 | |
| | |
|
|
| |
|
|
| |
|
|
| |
|
|
| |
|
|
|
Total Investment Return(a) | | | 19.43 | % | | | 16.21 | % | | | 15.83 | % | | | 27.63 | % | | | (22.35 | )% |
Ratios/Supplemental Data: | | | | | | | | | | | | | | | | | | | | |
Net assets, end of year (in millions) | | $ | 3.2 | | | $ | 3.1 | | | $ | 3.0 | | | $ | 2.9 | | | $ | 1.5 | |
Ratios to average net assets: | | | | | | | | | | | | | | | | | | | | |
Expenses | | | .83 | % | | | .83 | % | | | .84 | % | | | .84 | % | | | .83 | % |
Net investment income | | | 1.04 | % | | | .95 | % | | | 1.08 | % | | | 1.10 | % | | | 1.04 | % |
Portfolio turnover rate | | | 49 | % | | | 56 | % | | | 52 | % | | | 72 | % | | | 94 | % |
| (a) | Total investment return is calculated assuming a purchase of shares on the first day and a sale on the last day of each year reported and includes reinvestment of dividends and distributions and does not reflect the effect of insurance contract charges. Total investment returns for periods of less than one full year are not annualized. Total return does not reflect expenses associated with the separate account such as administrative fees, account charges and surrender charges which, if reflected, would reduce the total returns for all periods shown. Performance figures may reflect voluntary fee waivers and/or expense reimbursements. In the absence of voluntary fee waivers and/or expense reimbursements, the total return would be lower. Past performance is no guarantee of future results. |
| (b) | Calculated based upon weighted average shares outstanding during the year. |
| (c) | Less than $.005 per share. |
SEE NOTES TO FINANCIAL STATEMENTS.
D9
Report of Independent Registered Public Accounting Firm
THE BOARD OF TRUSTEES AND SHAREHOLDERS OF THE PRUDENTIAL SERIES FUND:
We have audited the accompanying statements of assets and liabilities of The Prudential Series Fund (comprised of Conservative Balanced Portfolio, Diversified Bond Portfolio, Equity Portfolio, Flexible Managed Portfolio, Global Portfolio, Government Income Portfolio, High Yield Bond Portfolio, Jennison Portfolio, Money Market Portfolio, Natural Resources Portfolio, Small Capitalization Stock Portfolio, Stock Index Portfolio and Value Portfolio, hereafter referred to as the “Funds”), including the portfolios of investments, as of December 31, 2006, and the related statements of operations for the year then ended, the statements of changes in net assets for each of the years in the two-year period then ended, and the financial highlights for each of the years in the three-year period then ended. These financial statements and financial highlights are the responsibility of the Funds’ management. Our responsibility is to express an opinion on these financial statements and financial highlights based on our audits. The financial highlights for the years presented prior to the year ended December 31, 2004, were audited by another independent registered public accounting firm whose report dated February 13, 2004, expressed an unqualified opinion thereon.
We conducted our audits in accordance with the standards of the Public Company Accounting Oversight Board (United States). Those standards require that we plan and perform the audit to obtain reasonable assurance about whether the financial statements and financial highlights are free of material misstatement. An audit includes examining, on a test basis, evidence supporting the amounts and disclosures in the financial statements. Our procedures included confirmation of securities owned as of December 31, 2006, by correspondence with the custodian and brokers or by other appropriate auditing procedures where replies from brokers were not received. An audit also includes assessing the accounting principles used and significant estimates made by management, as well as evaluating the overall financial statement presentation. We believe that our audits provide a reasonable basis for our opinion.
In our opinion, the financial statements and financial highlights referred to above present fairly, in all material respects, the financial position of The Prudential Series Fund as of December 31, 2006, and the results of its operations for the year then ended, the changes in its net assets for each of the years in the two-year period then ended, and the financial highlights for each of the years in the three-year period then ended, in conformity with U.S. generally accepted accounting principles.
New York, New York
February 19, 2007
E1
MANAGEMENT OF THE FUND
(Unaudited)
Information pertaining to the Trustees of the Fund is set forth below. Trustees who are not deemed to be “interested persons” of the Fund as defined in the Investment Company Act are referred to as “Independent Trustees.” Trustees who are deemed to be “interested persons” of the Fund are referred to as “Interested Trustees.” “Fund Complex” consists of the Fund and any other investment companies managed by PI.
| | | | | | |
Name, Address**,
and Age | | Position with Fund*
Term of Office***
Length of Time Served | | Number of Portfolios
In Fund Complex
Overseen by Trustee | | Other Directorships
Held by the Trustee**** |
| | | |
| Saul K. Fenster, Ph.D. (73) | | Trustee, Since 1983 | | 77 | | Member (since 2006), Board of The Ridgefield Foundation and The Leir Foundation. |
|
| Principal Occupations During Past 5 Years – Currently President Emeritus of New Jersey Institute of Technology (since 2002); formerly President (1978-2002) of New Jersey Institute of Technology; Commissioner (1998-2002) of the Middle States Association Commission on Higher Education; Commissioner (1985-2002) of the New Jersey Commission on Science and Technology; formerly Director (1998-2005) of Society of Manufacturing Engineering Education Foundation; formerly Director of Prosperity New Jersey; formerly a director or trustee of Liberty Science Center, Research and Development Council of New Jersey, New Jersey State Chamber of Commerce, and National Action Council for Minorities in Engineering. |
| | | |
| Delayne Dedrick Gold (68) | | Trustee, Since 2001 | | 76 | | — |
|
| Principal Occupations During Past 5 Years – Marketing Consultant (1982-present); formerly Senior Vice President and Member of the Board of Directors, Prudential Bache Securities, Inc. |
| | | |
| W. Scott McDonald, Jr. (69) | | Vice Chairman and Trustee, Since 1983 | | 77 | | — |
|
| Principal Occupations During Past 5 Years – Formerly Management Consultant (1997-2004) and of Counsel (2004-2005) at Kaludis Consulting Group, Inc. (company serving higher education); Formerly principal (1995-1997), Scott McDonald & Associates; Chief Operating Officer (1991-1995), Fairleigh Dickinson University; Executive Vice President and Chief Operating Officer (1975-1991), Drew University; interim President (1988-1990), Drew University; formerly Director of School, College and University Underwriters Ltd. |
| | | |
| Thomas T. Mooney (65) | | Chairman and Trustee, Since 2001 | | 76 | | — |
|
| Principal Occupations During Past 5 Years – Chief Executive Officer, Excell Partners, Inc.; formerly President of the Greater Rochester Metro Chamber of Commerce, Rochester City Manager; formerly Deputy Monroe County Executive. |
| | | |
| Thomas M. O’Brien (56) | | Trustee, Since 2003 | | 76 | | Formerly Director (December 1996-May 2000) of North Fork Bancorporation, Inc.; Formerly Director (May 2000-April 2006) of Atlantic Bank of New York; Director (since November 2006) of State Bancorp, Inc. (NASDAQ: STBC) and State Bank of Long Island. |
|
| Principal Occupations During Past 5 Years – President and COO (since November 2006) of State Bancorp, Inc. and State Bank; Vice Chairman (January 1997-April 2000) of North Fork Bank; President and Chief Executive Officer (December 1984-December 1996) of North Side Savings Bank; formerly President and Chief Executive Officer (May 2000-June 2006) Atlantic Bank of New York. |
| | | |
| John A. Pileski (67) | | Trustee, Since 2003 | | 76 | | Director (since April 2001) of New York Community Bank. Director (since May 1980) of Surf Club of Quogue, Inc. |
|
| Principal Occupations During Past 5 Years – Retired since June 2000; Tax Partner (July 1974-June 2000) of KPMG, LLP. |
| | | |
| F. Don Schwartz (71) | | Trustee, Since 2003 | | 76 | | — |
|
| Principal Occupations During Past 5 Years – Management Consultant (since April 1985). |
F1
| | | | | | |
|
Interested Trustees
|
Name, Address**,
and Age | | Position with Fund*
Term of Office***
Length of Time Served | | Number of Portfolios
In Fund Complex
Overseen by Trustee | | Other Directorships
Held by the Trustee**** |
| | | |
| *David R. Odenath (49) | | President and Trustee Since 1999 | | 76 | | — |
|
| Principal Occupations During Past 5 Years – President of Prudential Annuities (since August 2002); Senior Vice President (since June 1999) of Prudential; Executive Vice President (since May 2003) of Prudential Investment Management Services LLC; President, Chief Executive Officer, Chief Operating Officer, Officer in Charge and Director (since June 2005) of American Skandia Investment Services, Inc; Formerly President, Chief Executive Officer, Chief Operating Officer and Officer-In-Charge (September 1999-February 2003) of Prudential Investments LLC. |
| | | |
| *Robert F. Gunia (60) | | Vice President and Trustee since 2001 | | 154 | | Vice President and Director (since May 1989) and Treasurer (since 1999) of The Asia Pacific Fund, Inc.; |
|
| Principal Occupations During Past 5 Years – Chief Administrative Officer (since September 1999) and Executive Vice President (since December 1996) of Prudential Investments LLC; President (since April 1999) of Prudential Investment Management Services LLC; Executive Vice President (since March 1999) and Treasurer (since May 2000) of Prudential Mutual Fund Services LLC; Chief Administrative Officer, Executive Vice President and Director (since May 2003) of American Skandia Investment Services, Inc. |
| | | | |
|
Officers
|
Name, Address**,
and Age | | Position with Fund*
Term of Office***
Length of Time Served | | Principal Occupations During Past 5 Years |
| | |
| Grace C. Torres (47) | | Treasurer and Principal Financial and Accounting Officer Since 1997 | | Assistant Treasurer (since March 1999) and Senior Vice President (since September 1999) of PI; Assistant Treasurer (since May 2003) and Vice President (since June 2005) of American Skandia Investment Services, Inc.; Senior Vice President and Assistant Treasurer (since May 2003) of American Skandia Advisory Services, Inc.; formerly Senior Vice President (May 2003-June 2005) of American Skandia Investment Services, Inc. |
| | |
| Kathryn L. Quirk (54) | | Chief Legal Officer Since 2005 | | Vice President and Corporate Counsel (since September 2004) of Prudential; Executive Vice President, Chief Legal Officer and Secretary (since July 2005) of Prudential Investments LLC and Prudential Mutual Fund Services LLC; formerly Managing Director, General Counsel, Chief Compliance Officer, Chief Risk Officer and Corporate Secretary (1997-2002) of Zurich Scudder Investments, Inc. |
| | |
| Deborah A. Docs (49) | | Secretary Since 2005 | | Vice President and Corporate Counsel (since January 2001) of Prudential; Vice President (since December 1996) and Assistant Secretary (since March 1999) of PI; formerly Vice President and Assistant Secretary (May 2003-June 2005) of American Skandia Investment Services, Inc. |
| | |
| Jonathan D. Shain (48) | | Assistant Secretary Since 2005 | | Vice President and Corporate Counsel (since August 1998) of Prudential Insurance; Vice President and Assistant Secretary (since May 2003) of American Skandia Investment Services, Inc. and American Skandia Fund Services, Inc.; formerly Attorney with Fleet Bank, N.A. (January 1997-July 1998). |
| | |
| Claudia DiGiacomo (32) | | Assistant Secretary Since 2005 | | Vice President and Corporate Counsel (since January 2005) of Prudential; Vice President and Assistant Secretary of PI (since December 2005); Associate at Sidley Austin Brown & Wood LLP (1999-2004). |
| | |
| John P. Schwartz (35) | | Assistant Secretary Since 2006 | | Vice President and Corporate Counsel (since April 2005) of Prudential; Vice President and Assistant Secretary of PI (since December 2005); Associate at Sidley Austin Brown & Wood LLP (1997-2005). |
| | |
| Lee D. Augsburger (47) | | Chief Compliance Officer Since 2004 | | Senior Vice President and Chief Compliance Officer (since April 2003) of PI; Vice President (since November 2000) and Chief Compliance Officer (since October 2000) of Prudential Investment Management, Inc.; Chief Compliance Officer and Senior Vice President (since May 2003) of American Skandia Investment Services, Inc. |
| | |
| Valerie M. Simpson (48) | | Deputy Chief Compliance Officer | | Vice President and Senior Compliance Officer (since March 2006) of PI; Vice President – Financial Reporting (since March 2006) for Prudential Life and Annuities Finance. |
F2
| | | | |
Name, Address**,
and Age | | Position with Fund*
Term of Office***
Length of Time Served | | Principal Occupations During Past 5 Years |
| | |
| M. Sadiq Peshimam (43) | | Assistant Treasurer Since 2006 | | Vice President (since 2005) and Director (2000-2005) within Prudential Mutual Fund Administration. |
| | |
| Jack Benintende (42) | | Assistant Treasurer Since 2006 | | Vice President (since June 2000) within Prudential Mutual Fund Administration; formerly Senior Manager within the investment management practice of PricewaterhouseCoopers LLP (May 1994-June 2000). |
| | |
| Alan Fu (50) | | Assistant Treasurer Since 2006 | | Vice President – Tax, The Prudential Insurance Company of America (1999-October 2003); Vice President and Corporate Counsel – Tax, Prudential Financial, Inc. (since October 2003). |
| | |
| Andrew French (44) | | Assistant Secretary Since 2006 | | Director and Corporate Counsel (since May 2006) of Prudential; formerly Senior Legal Analyst of Prudential Mutual Fund Law Department (1997-2006). |
| | |
| Noreen M. Fierro (42) | | Anti-Money Laundering Compliance Officer Since 2006 | | Vice President, Corporate Compliance Officer (since May 2006) of Prudential; formerly Corporate Vice President, Associate General Counsel (April 2002-May 2005) of UBS Financial Services, Inc., in their Money Laundering Prevention Group; Senior Manager (May 2005-May 2006) of Deloitte Financial Advisory Services, LLP, in their Forensic and Dispute Services, Anti-Money Laundering Group. |
* “Interested” Trustee, as defined in the Investment Company Act, by reason of employment with the Manager (as defined below), and/or the Distributor (as defined below).
** Unless otherwise noted, the address of the Trustees and Officers is c/o: Prudential Investments LLC, Gateway Center Three, 100 Mulberry Street, Newark, New Jersey 07102.
*** There is no set term of office for Trustees and Officers.
**** This column includes only directorships of companies required to register, or file reports with the SEC under the Securities Exchange Act of 1934 (i.e., “public companies”) or other investment companies registered under the Investment Company Act.
F3
This report contains financial information about certain investment choices that may be available on the variable life insurance and variable annuity contracts listed below. You may receive additional reports and should refer to your variable life insurance or variable annuity contract prospectus to determine which portfolios are available to you.
VARIABLE LIFE INSURANCE
| n | | Prudential’s Variable Appreciable Life® |
| n | | Pruco Life’s Variable Appreciable Life® |
| n | | Pruco Life of New Jersey’s Variable Appreciable Life® |
n | | Prudential’s Custom VALSM |
| n | | Pruco Life’s Discovery® Life Plus |
| n | | Pruco Life of New Jersey’s Discovery® Life Plus |
| n | | Pruco Life’s Variable Life Insurance |
| n | | Pruco Life of New Jersey’s Variable Life Insurance |
n | | Pruco Life’s PRUviderSM |
n | | Pruco Life of New Jersey’s PRUviderSM |
| n | | Prudential’s Survivorship Preferred® |
| n | | Prudential’s Variable Universal Life |
| n | | Pruco Life’s Variable Universal Life® |
| n | | Pruco Life’s Survivorship Variable Universal Life |
| n | | Pruco Life of New Jersey’s Survivorship Variable Universal Life |
n | | Pruco Life’s Pruselect ISM |
n | | Pruco Life’s Pruselect IISM |
| n | | Pruco Life’s PruLife® Custom Premier |
| n | | Pruco Life of New Jersey’s PruLife® Custom Premier |
n | | Pruco Life’s PruSelectSM III |
n | | Pruco Life of New Jersey’s PruSelectSM III |
n | | Pruco Life’s MPremierSM VUL |
VARIABLE ANNUITIES
| n | | Prudential’s Discovery® Plus |
| n | | Pruco Life’s Discovery® Plus |
| n | | Pruco Life of New Jersey’s Discovery® Plus |
| n | | Pruco Life’s Discovery Preferred® |
| n | | Prudential’s Variable Investment Plan® |
| n | | Prudential’s Qualified Variable Investment Plan® |
| n | | Pruco Life’s Discovery Select® |
| n | | Pruco Life of New Jersey’s Discovery Select® |
| n | | Pruco Life’s Discovery Choice® |
| n | | Pruco Life of New Jersey’s Discovery Choice® |
n | | Pruco Life’s Strategic PartnersSM Annuity One |
n | | Pruco Life of New Jersey’s Strategic PartnersSM Annuity One |
n | | Pruco Life’s Strategic PartnersSM Select |
n | | Pruco Life of New Jersey’s Strategic PartnersSM Select |
n | | Pruco Life’s Strategic PartnersSM Advisor |
n | | Pruco Life of New Jersey’s Strategic PartnersSM Advisor |
n | | Pruco Life’s Strategic PartnersSM FlexElite |
n | | Pruco Life of New Jersey’s Strategic PartnersSM FlexElite |
n | | Pruco Life’s Strategic PartnersSM Plus |
n | | Pruco Life of New Jersey’s Strategic PartnersSM Plus |
Variable life insurance is offered through Pruco Securities LLC, member SIPC, 751 Broad Street, Newark, NJ 07102-3777. Variable annuities are distributed by Prudential Investment Management Services LLC (PIMS), member SIPC, Gateway Center Three, 14th Floor, Newark, NJ 07102-4077. Variable life insurance and variable annuities are issued by The Prudential Insurance Company of America, Pruco Life Insurance Company, or in New York, Pruco Life Insurance Company of New Jersey. All are Prudential Financial companies. Each is solely responsible for its own financial condition and contractual obligations. Contract guarantees are based on the claims-paying ability of the issuing company.
The 2006 Audited Financial Statements of Pruco Life Insurance Company, Pruco Life Insurance Company of New Jersey, and The Prudential Insurance Company of America will be available commencing April 30, 2007. You may call (888) 778-2888 to obtain a free copy of the audited financial statements of the insurance company that issued your contract.
To reduce costs, we now generally send only a single copy of prospectuses and shareholder reports to each household (“householding”) in lieu of sending a copy to each Contract Owner who resides in the household. You should be aware that by calling (877) 778-5008, you can revoke or “opt out” of householding at any time.
Prudential Financial and the Rock logo are service marks of The Prudential Insurance Company of America, Newark, NJ, and its affiliates.
751 Broad Street
Newark NJ 07102-3777
Presorted
Standard
U.S. Postage
PAID
Prudential
IFS-A114446 PSF-AR-A Ed. 02/2007

ANNUAL REPORT
DECEMBER 31, 2006
The Prudential Series Fund

| n | | SP Aggressive Growth Asset Allocation Portfolio |
| n | | SP AIM Core Equity Portfolio |
| n | | SP Balanced Asset Allocation Portfolio |
| n | | SP Conservative Asset Allocation Portfolio |
| n | | SP Davis Value Portfolio |
| n | | SP Growth Asset Allocation Portfolio |
| n | | SP International Growth Portfolio |
| n | | SP International Value Portfolio |
| n | | SP Large Cap Value Portfolio |
| n | | SP Mid Cap Growth Portfolio |
| n | | SP PIMCO High Yield Portfolio |
| n | | SP PIMCO Total Return Portfolio |
| n | | SP Prudential U.S. Emerging Growth Portfolio |
| n | | SP Small Cap Growth Portfolio |
| n | | SP Small Cap Value Portfolio |
| n | | SP Strategic Partners Focused Growth Portfolio |
| n | | SP T. Rowe Price Large Cap Growth Portfolio |
Please note that inside are Prospectus supplements dated December 29, 2006, and February 13, 2007. These documents are separate from and not a part of the annual report.
The Prudential Insurance Company of America
751 Broad Street, Newark, NJ 07102-3777
Pruco Life Insurance Company
Pruco Life Insurance Company of New Jersey
213 Washington Street, Newark, NJ 07102-2992
Pruco Life Insurance Company is not licensed to do business in New York.
IFS-A114669

| | This report is one of several that provide financial information about certain investment choices available on variable life insurance and variable annuity contracts. Based on the variable contract you own or the portfolios you invested in, you may receive additional reports that provide financial information on those investment choices. Please refer to your variable life insurance or variable annuity contract prospectus to determine which portfolios are available to you. A list of the variable contracts that this report supports is located on the inside back cover. |
This report must be preceded or accompanied by the current prospectuses for the Prudential Series Fund portfolios and the applicable variable life or annuity contract. The prospectuses contain information on the investment objectives, risks, and charges and expenses and should be read carefully.
The contract’s prospectus contains hypothetical performance illustrations that show the effect of various assumptions regarding the cost of insurance protection. You may also obtain a personalized illustration of historical performance that reflects the cost of your policy’s insurance protection.
DISCOVER THE BENEFITS OF eDelivery
| n | | Eliminate receiving printed reports. |
| n | | View documents on-line as they become available. |
| n | | Download and store e-reports on your PC. |
| n | | Help the environment by using less paper. |
To receive your semiannual/annual reports on-line, go to www.prudential.com/edelivery and enroll. Instead of receiving printed reports, you will receive notification via e-mail when new materials are available for your review. You can cancel your enrollment or change your e-mail address at any time by visiting the internet address listed above.
A description of the Fund’s proxy voting policies and procedures is available, without charge, upon request. Owners of variable annuity contracts should call 888-778-2888 and owners of variable life insurance contracts should call 800-778-2255 to obtain descriptions of the Fund’s proxy voting policies and procedures. The description is also available on the website of the Securities and Exchange Commission (the “Commission”) at www.sec.gov. Information regarding how the Fund voted proxies relating to portfolio securities during the most recent 12-month period ended June 30, is available on the website of the Commission at www.sec.gov and on the Fund’s website.
The Fund files with the Commission a complete listing of portfolio holdings as of its first and third quarter-ends on Form N-Q. Form N-Q is available on the Commission’s website at www.sec.gov or by visiting the Commission’s Public Reference Room. For more information on the Commission’s Public Reference Room, please visit the Commission’s website or call 800-SEC-0330. Form N-Q is also available on the Fund’s website at www.prudential.com or by calling the telephone numbers referenced above.
The Fund’s Statement of Additional Information contains additional information about the Fund’s Trustees and is available without charge upon request by calling 888-778-2888.

GLOSSARY OF BENCHMARK DEFINITIONS
Aggressive Growth Asset Allocation Custom Blended Index (GD/ND) consists of Russell 3000 Index (80%), and MSCI EAFE Index(GD/ND) (20%).
Balanced Asset Allocation Custom Blended Index (GD/ND) consists of Russell 3000 Index (48%), Lehman Brothers U.S. Aggregate Bond Index(40%) and MSCI EAFE Index(GD /ND) (12%).
Conservative Asset Allocation Custom Blended Index (GD/ND) consists of Russell 3000 Index (32%), Lehman Brothers U.S. Aggregate Bond Index (60%) and MSCI EAFE Index (GD/ND) (8%).
Growth Asset Allocation Custom Blended Index (GD/ND) consists of consists of Russell 3000 Index (64%), Lehman Brothers U.S. Aggregate Bond Index (20%) and MSCI EAFE Index (GD/ ND) (16%).
(The ND and GD versions of the MSCI EAFE in the blended indexes above, differ in that ND returns reflect the impact of the maximum withholding taxes on reinvested dividends while the GD version does not reflect the impact of withholding taxes on reinvested dividends. These returns do not include the effect of any investment management expenses. These returns would have been lower if they included the effect of these expenses.)
Lehman Brothers U.S. Aggregate Bond Index is an unmanaged index comprised of more than 5,000 government and corporate bonds.
Lehman Brothers U.S. Corporate High Yield Index is an unmanaged index of fixed-rate, non-investment-grade debt securities with at least one year remaining to maturity. It gives a broad look at how high yield (“junk”) bonds have performed.
Lehman Brothers Government Bond Index is an unmanaged index comprised of securities issued or backed by the U.S. government, its agencies, and instrumentalities with a remaining maturity of 1 to 30 years.
Lehman Brothers Intermediate BB Corporate Bond Index is an unmanaged index comprised of various fixed income securities rated BB.
The Lipper Variable Insurance Products (VIP) Funds Averages are calculated by Lipper Analytical Services, Inc., and reflect the investment return of certain portfolios underlying variable life and annuity products. These returns are net of investment fees and fund expenses, but not product charges.
| | | | |
| High Current Yield Funds Average | | Large-Cap Value Funds Average | | Multi-Cap Value Funds Average |
| International Growth Funds Average | | Mid-Cap Growth Funds Average | | Small-Cap Core Funds Average |
| Intermediate Investment-Grade Debt | | Mixed Asset Alloc Growth Funds Average | | Small-Cap Growth Funds Average |
| International Value Funds Average | | Mixed Asset Alloc Moderate Funds Average | | Small-Cap Value Funds Average |
| Large-Cap Core Funds Average | | Multi-Cap Core Funds Average | | |
| Large-Cap Growth Funds Average | | Multi-Cap Growth Funds Average | | |
Merrill Lynch U.S. High Yield Master II BB-B Rated Index is a broad high yield index including high yield bonds across the maturity spectrum, within the BB-B rated credit quality spectrum, included in the below-investment-grade universe.
MSCI EAFE Index – The Morgan Stanley Capital International Europe, Australasia, Far East Index is an unmanaged capitalization-weighted index generally accepted as a benchmark for major overseas markets. The ND and GD versions of the MSCI EAFE differ in that ND returns reflect the impact of the maximum withholding taxes on reinvested dividends while the GD version does not reflect the impact of withholding taxes on reinvested dividends. These returns do not include the effect of any investment management expenses. These returns would have been lower if they included the effect of these expenses.
MSCI World Index – The Morgan Stanley Capital International World Index is an unmanaged capitalization weighted index which includes the equity markets of Australia, Austria, Belgium, Canada, Denmark, Finland, France, Germany, Hong Kong, Ireland, Italy, Japan, Malaysia, Netherlands, New Zealand, Norway, Singapore, Spain, Sweden, Switzerland, United Kingdom and United States. The Portfolio no longer utilizes the MSCI World Index (ND), and instead now utilizes the MSCI World Index (GD). The ND and GD versions of the MSCI World Index differ in that ND returns reflect the impact of the maximum withholding taxes on reinvested dividends while the GD version does not reflect the impact of withholding taxes on reinvested dividends. These returns do not include the effect of any investment management expenses. These returns would have been lower if they included the effect of these expenses.
Russell 1000 Growth Index is a market cap-weighted index that measures the performance of those Russell 1000 companies with higher price-to-book ratios and higher forecasted growth values.
Russell 1000 Index is a market cap-weighted index that measures the performance of the 1,000 largest companies in the Russell 3000 Index, which represents approximately 92% of the total market.
Russell 1000 Value Index is a market cap-weighted index that measures the performance of those Russell 1000 companies with lower price-to-book ratios and lower forecasted growth values.
Russell 2000 Growth Index is a market cap-weighted index that measures the performance of those Russell 2000 companies with higher price-to-book ratios and higher forecasted growth values.
Russell 2000 Index measures the performance of the 2,000 smallest companies in the Russell 3000 Index, which represents approximately 8% of the total market capitalization of the Russell 3000 Index.
Russell 2500 Growth Index is a market cap-weighted index that measures the performance of those Russell 2500TM companies with higher price-to-book ratios and higher forecasted growth values.
Russell 2500 Index is a market cap-weighted index that measures the performance of the 2,500 smallest companies in the Russell 3000 Index, which represents approximately 17% of the total market capitalization of the Russell 3000 Index.
Russell 2500 Value Index is a market cap-weighted index that measures the performance of those Russell 2500TM companies with lower price-to-book ratios and lower forecasted growth values.
Russell 3000 Index Measures the performance of the 3,000 largest U.S. companies based on total market capitalization, which represents approximately 98% of the investable U.S. equity market.
Russell Midcap Growth Index is a market cap-weighted index that measures the performance of those Russell MidCap companies with higher price-to-book ratios and higher forecasted growth values.
Russell Midcap Index is a market cap-weighted index that measures the performance of the 800 smallest companies in the Russell 1000 Index, which represents approximately 25% of the total market.
S&P 500 Index is an unmanaged, market value-weighted index of 500 stocks generally representative of the broad stock market.
S&P MidCap 400 Index is a widely accepted, unmanaged total return index of 400 domestic stocks measuring the performance of the midsize company segment of the U.S. stock market.
S&P SmallCap 600 Index is an unmanaged index representing the aggregate market value of the common equity of 600 small-company stocks.
This page may include certain benchmarks not applicable to the portfolios available in this particular report. Investors cannot invest directly in a market index or average.
The Prudential Series Fund
Annual Report
December 31, 2006
Table of Contents
| n | | LETTER TO CONTRACT OWNERS |
| n | | FEES AND EXPENSES TABLE |
A1 Financial Statements
B1 Schedule of Investments
C1 Notes to Financial Statements
D1 Financial Highlights
E1 Report of Independent Registered Accounting Firm
F1 Management of the Prudential Series Fund
This report may include financial information pertaining to certain portfolios that are not available through the variable life insurance policy or variable annuity contract that you have chosen. Please refer to your variable life insurance or variable annuity prospectus to determine which portfolios are available to you.
The Prudential Series Fund
Letter to Contract Owners
December 31, 2006
At Prudential, we are committed to helping you achieve and sustain financial success. We hope that you find the annual report for the Prudential Series Fund to be an informative and valuable resource.
Each year, we remind our clients about the benefits of diversification within their portfolios. A diversified portfolio helps you manage downside risk by not being overly invested in any particular asset class, and it helps better position your investments as asset classes rotate in and out of favor. Not only is diversification the best way to balance risk and return, but it can also help align your long-term goals with your risk tolerance. The result is a portfolio that may help you weather market fluctuations and more closely meet your long-term needs.
Contact your financial professional to take the first step in creating a diversified investment plan. Together you should review your reasons for investing, personal investment horizon and risk tolerance to develop a strategy that works best for you. A carefully chosen and broad mix of assets—reviewed periodically over time—can help you stay focused on meeting your long-term objectives.
Thank you for selecting our financial products. At Prudential, your financial security is our priority and we value the opportunity to help you grow and protect your wealth.
Sincerely,
David R. Odenath, Jr.
President,
The Prudential Series Fund | January 31, 2007 |
PRESIDENT
DAVID R. ODENATH, JR.
The Prudential Series Fund, SP Aggressive Growth Asset Allocation Portfolio
Advised by: Prudential Investments LLC
December 31, 2006
Investment Manager’s Report
Performance Summary - As of December 31, 2006
Average Annual Total Return Percentages
| | | | | | | | | |
| | | 1-Year | | | 5-Year | | | Since
Inception | |
SP Aggressive Growth Asset Allocation Portfolio | | 14.27 | % | | 8.41 | % | | 2.21 | % |
S&P 500 Index | | 15.78 | | | 6.18 | | | 1.49 | |
Aggressive Growth AA Custom Blended Index (GD) | | 17.89 | | | 8.82 | | | 3.21 | |
Aggressive Growth AA Custom Blended Index (ND) | | 17.80 | | | 8.72 | | | 3.13 | |
Lipper (VIP) Multi Cap Core Funds Avg. | | 14.45 | | | 6.69 | | | 2.83 | |
Portfolio inception: 9/22/2000.
$10,000 INVESTED SINCE INCEPTION
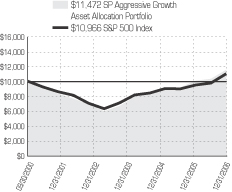
Past performance does not guarantee future returns. Portfolio performance is net of investment fees and fund expenses, but not product charges, which, if included, would significantly lower the performance quoted. The investment return and principal value of an investment will fluctuate, so that an investor’s shares, when redeemed, may be worth more or less than their original cost. Current performance may be lower or higher than the past performance data quoted.
Unless noted otherwise, Lipper Average and Index returns reflect performance beginning the closest month-end date to the Portfolio’s inception. Performance figures may reflect fee waivers and/or expense reimbursements. In the absence of such fee waivers and/or expense reimbursements, total returns would be lower.
For the year ended December 31, 2006, the Aggressive Growth Asset Allocation Portfolio had a total return that was below its benchmarks and in line with the average return of its peer group.
The Portfolio is the most aggressive of the four Strategic Partner Asset Allocation portfolios. It invests in shares of other Portfolios on the platform and attempts to outperform a blended benchmark consisting of 80% Russell 3000 Index (a measure of the broad U.S. equity market) and 20% MSCI EAFE Index (GD) (a measure of the broad developed-country international equity market). Its performance relative to this target is determined by its overweights and underweights compared to the target in different asset classes and by the performance of the Portfolios selected to invest in these asset classes.
International stocks substantially outperformed domestic stocks in 2006, aided by the decline of the U.S. dollar against most major foreign currencies except the Japanese yen. The Portfolio was overweighted in non-U.S. stocks compared with its target. Moreover a modest investment in the Natural Resources Portfolio added to its results.
Three Portfolios detracted significantly from performance relative to the Portfolio’s target. The Jennison Portfolio underperformed the Russell 1000 Growth Index primarily due to its selection of stocks in the technology, healthcare, and consumer staples sectors. The SP Large Cap Value Portfolio’s relative performance was hampered by its underexposure to a few sizeable constituents of the Russell 1000 Value Index that posted particularly strong returns in 2006. The SP International Growth Portfolio trailed the MSCI EAFE Index primarily because growth stocks trailed value stocks. Conversely, the SP International Value Portfolio benefited substantially from its deep-value investment style, which resulted in holdings with lower average price-to-earnings and price-to-book value ratios. These characteristics were rewarded in the value-favoring investing environment. It also had a smaller average capitalization level (a measure of company size) than the MSCI EAFE Index, and this characteristic was favored by the markets in 2006.
Prudential Investments LLC (PI), an indirect, wholly owned subsidiary of Prudential Financial, Inc., serves as the investment manager for the Fund.
For average and index definitions, refer to the Glossary of Benchmark Definitions page. Investors cannot invest directly in a market index or average. For a complete list of holdings, refer to the Schedule of Investments section of this report.
The Prudential Series Fund, SP AIM Core Equity Portfolio
Subadvised by: A I M Capital Management, Inc.
December 31, 2006
Investment Manager’s Report
Performance Summary - As of December 31, 2006
Average Annual Total Return Percentages
| | | | | | | | | |
| | | 1-Year | | | 5-Year | | | Since
Inception | |
SP AIM Core Equity Portfolio | | 16.05 | % | | 6.74 | % | | –1.62 | % |
S&P 500 Index | | 15.78 | | | 6.18 | | | 1.49 | |
Russell 1000® Index | | 15.46 | | | 6.82 | | | 1.63 | |
Lipper (VIP) Large Cap Core Avg. | | 13.31 | | | 5.22 | | | 0.90 | |
Portfolio inception: 9/22/2000.
$10,000 INVESTED SINCE INCEPTION
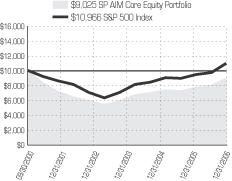
Past performance does not guarantee future returns. Portfolio performance is net of investment fees and fund expenses, but not product charges, which, if included, would significantly lower the performance quoted. The investment return and principal value of an investment will fluctuate, so that an investor’s shares, when redeemed, may be worth more or less than their original cost. Current performance may be lower or higher than the past performance data quoted.
Unless noted otherwise, Lipper Average and Index returns reflect performance beginning the closest month-end date to the Portfolio’s inception. The Russell 1000® Index is a trademark/service mark of the Frank Russell Company. Russell® is a trademark of the Frank Russell Company. Performance figures may reflect fee waivers and/or expense reimbursements. In the absence of such fee waivers and/or expense reimbursements, total returns would be lower.
For the year ended December 31, 2006, the SP AIM Core Equity Portfolio had a total return that was above its benchmark indexes and the average of its peer group.
The Portfolio’s manager prefers securities of companies that may have short-term firm-specific problems that have depressed their share price. It may emphasize sectors (over or underweight relative to the Russell 1000 Index) believed to offer compelling opportunities.
In 2006, about 15% of the Portfolio’s investments, on average, were in foreign stocks. The buoyant international stock markets strengthened its performance. Triple-digit returns on a Japanese technology company and a high return on a French energy firm made particularly significant contributions.
Although the Portfolio’s overweight compared with the Russell 1000 Index in stocks of firms with low credit quality hurt its performance in the value-favoring markets of 2006, the relatively high returns on holdings in the stocks of high credit-quality firms offset the impact. The Portfolio’s performance was weakened by its underweight compared with the Russell 1000 Index in the relatively strong financials and utilities sectors.
The Portfolio’s holdings in various sectors generally outperformed comparable sectors of the Russell 1000 Index, particularly in the utilities and technology sectors.
Prudential Investments LLC (PI), an indirect, wholly owned subsidiary of Prudential Financial, Inc., serves as the investment manager for the Fund.
For average and index definitions, refer to the Glossary of Benchmark Definitions page. Investors cannot invest directly in a market index or average. For a complete list of holdings, refer to the Schedule of Investments section of this report.
The Prudential Series Fund, SP Balanced Asset Allocation Portfolio
Advised by: Prudential Investments LLC
December 31, 2006
Investment Manager’s Report
Performance Summary - As of December 31, 2006
Average Annual Total Return Percentages
| | | | | | | | | |
| | | 1-Year | | | 5-Year | | | Since
Inception | |
SP Balanced Asset Allocation Portfolio | | 10.69 | % | | 7.50 | % | | 4.66 | % |
S&P 500 Index | | 15.78 | | | 6.18 | | | 1.49 | |
Balanced AA Custom Blended Index (GD) | | 12.35 | | | 7.55 | | | 4.66 | |
Balanced AA Custom Blended Index (ND) | | 12.29 | | | 7.50 | | | 4.61 | |
Lipper (VIP) Mixed Asset Target Allocation Growth Funds Avg. | | 11.67 | | | 6.37 | | | 3.76 | |
Portfolio inception: 9/22/2000.
$10,000 INVESTED SINCE INCEPTION
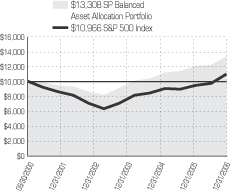
Past performance does not guarantee future returns. Portfolio performance is net of investment fees and fund expenses, but not product charges, which, if included, would significantly lower the performance quoted. The investment return and principal value of an investment will fluctuate, so that an investor’s shares, when redeemed, may be worth more or less than their original cost. Current performance may be lower or higher than the past performance data quoted.
Unless noted otherwise, Lipper Average and Index returns reflect performance beginning the closest month-end date to the Portfolio’s inception. Performance figures may reflect fee waivers and/or expense reimbursements. In the absence of such fee waivers and/or expense reimbursements, total returns would be lower.
For the year ended December 31, 2006, the SP Balanced Asset Allocation Portfolio had a total return that was below its Custom Index benchmark and the average of its peer group.
The Portfolio is one of the four Strategic Partner Asset Allocation portfolios. It invests in shares of other Portfolios on the platform and attempts to outperform a blended benchmark consisting of 48% Russell 3000 Index (a measure of the broad U.S. equity market), 12% MSCI EAFE Index (GD) (a measure of the broad developed-country international equity market), and 40% Lehman Aggregate Bonds Index (a measure of the U.S. investment-grade bond market). Its performance relative to this target is determined by its overweights and underweights compared to the target in different asset classes and by the performance of the Portfolios selected to invest in these asset classes.
An underweight in bonds and overweight in international stocks compared with the Portfolio’s blended benchmark both contributed positively to its performance. Stocks generally outperformed bonds by a significant margin and international stocks substantially outperformed domestic stocks in 2006, aided by the decline of the U.S. dollar against most major foreign currencies except the Japanese yen. The Portfolio was overweighted in non-U.S. stocks compared with its target. Moreover, a modest investment in the Natural Resources Portfolio added to its results. Within its bond allocation, holdings of high yield (junk) bonds and money market instruments, neither of which are included in the benchmark, augmented the Portfolio’s return.
Three Portfolios detracted significantly from performance relative to the Portfolio’s target. The Jennison Portfolio underperformed the Russell 1000 Growth Index primarily due to its selection of stocks in the technology, healthcare, and consumer staples sectors. The SP Large Cap Value Portfolio’s relative performance was hampered by its underexposure to a few sizeable constituents of the Russell 1000 Value Index that posted particularly strong returns in 2006. The SP International Growth Portfolio trailed the MSCI EAFE Index primarily because growth stocks trailed value stocks. Conversely, the SP International Value Portfolio benefited substantially from its deep-value investment style, which resulted in holdings with lower average price-to-earnings and price-to-book value ratios. These characteristics were rewarded in the value-favoring investing environment. It also had a smaller average capitalization level (a measure of company size) than the MSCI EAFE Index, and this characteristic was favored by the markets in 2006.
Prudential Investments LLC (PI), an indirect, wholly owned subsidiary of Prudential Financial, Inc., serves as the investment manager for the Fund.
For average and index definitions, refer to the Glossary of Benchmark Definitions page. Investors cannot invest directly in a market index or average. For a complete list of holdings, refer to the Schedule of Investments section of this report.
The Prudential Series Fund, SP Conservative Asset Allocation Portfolio
Advised by: Prudential Investments LLC
December 31, 2006
Investment Manager’s Report
Performance Summary - As of December 31, 2006
Average Annual Total Return Percentages
| | | | | | | | | |
| | | 1-Year | | | 5-Year | | | Since
Inception | |
SP Conservative Asset Allocation Portfolio | | 8.67 | % | | 6.56 | % | | 5.29 | % |
S&P 500 Index | | 15.78 | | | 6.18 | | | 1.49 | |
Conservative AA Custom Blended Index (GD) | | 9.63 | | | 6.79 | | | 5.24 | |
Conservative AA Custom Blended Index (ND) | | 9.60 | | | 6.76 | | | 5.20 | |
Lipper (VIP) Mixed Asset Target Allocation Moderate Funds Avg. | | 10.88 | | | 6.43 | | | 4.38 | |
Portfolio inception: 9/22/2000.
$10,000 INVESTED SINCE INCEPTION
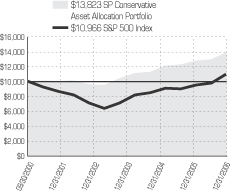
Past performance does not guarantee future returns. Portfolio performance is net of investment fees and fund expenses, but not product charges, which, if included, would significantly lower the performance quoted. The investment return and principal value of an investment will fluctuate, so that an investor’s shares, when redeemed, may be worth more or less than their original cost. Current performance may be lower or higher than the past performance data quoted.
Unless noted otherwise, Lipper Average and Index returns reflect performance beginning the closest month-end date to the Portfolio’s inception. Performance figures may reflect fee waivers and/or expense reimbursements. In the absence of such fee waivers and/or expense reimbursements, total returns would be lower.
For the year ended December 31, 2006, the SP Conservative Asset Allocation Portfolio had a total return that was below its Custom Index benchmark and the average of its peer group.
The Portfolio is the most conservative of the four Strategic Partner Asset Allocation portfolios. It invests in shares of other Portfolios on the platform and attempts to outperform a blended benchmark consisting of 32% Russell 3000 Index (a measure of the broad U.S. equity market), 8% MSCI EAFE Index (GD) (a measure of the broad developed-country international equity market), and 60% Lehman Aggregate Bonds Index (a measure of the U.S. investment-grade bond market). Its performance relative to this target is determined by its overweights and underweights compared to the target in different asset classes and by the performance of the Portfolios selected to invest in these asset classes.
An underweight in bonds and overweight in international stocks compared with the Portfolio’s blended benchmark both contributed positively to its performance. Stocks generally outperformed bonds by a significant margin and international stocks substantially outperformed domestic stocks in 2006, aided by the decline of the U.S. dollar against most major foreign currencies except the Japanese yen. The Portfolio was overweighted in non-U.S. stocks compared with its target. Moreover, a modest investment in the Natural Resources Portfolio added to its results. Within its bond allocation, holdings of high yield (junk) bonds and money market instruments, neither of which are included in the benchmark, augmented the Portfolio’s return.
Three Portfolios detracted significantly from performance relative to the Portfolio’s target. The Jennison Portfolio underperformed the Russell 1000 Growth Index primarily due to its selection of stocks in the technology, healthcare, and consumer staples sectors. The SP Large Cap Value Portfolio’s relative performance was hampered by its underexposure to a few sizeable constituents of the Russell 1000 Value Index that posted particularly strong returns in 2006. The SP International Growth Portfolio trailed the MSCI EAFE Index primarily because growth stocks trailed value stocks. Conversely, the SP International Value Portfolio benefited substantially from its deep-value investment style, which resulted in holdings with lower average price-to-earnings and price-to-book value ratios. These characteristics were rewarded in the value-favoring investing environment. It also had a smaller average capitalization level (a measure of company size) than the MSCI EAFE Index, and this characteristic was favored by the markets in 2006.
Prudential Investments LLC (PI), an indirect, wholly owned subsidiary of Prudential Financial, Inc., serves as the investment manager for the Fund.
For average and index definitions, refer to the Glossary of Benchmark Definitions page. Investors cannot invest directly in a market index or average. For a complete list of holdings, refer to the Schedule of Investments section of this report.
The Prudential Series Fund, SP Davis Value Portfolio
Subadvised by: Davis Advisors
December 31, 2006
Investment Manager’s Report
Performance Summary - As of December 31, 2006
Average Annual Total Return Percentages
| | | | | | | | | |
| | | 1-Year | | | 5-Year | | | Since
Inception | |
SP Davis Value Portfolio | | 15.02 | % | | 9.11 | % | | 5.60 | % |
S&P 500 Index | | 15.78 | | | 6.18 | | | 1.49 | |
Russell 1000® Value Index | | 22.25 | | | 10.86 | | | 8.21 | |
Lipper (VIP) Multi-Cap Value Funds Avg. | | 17.30 | | | 8.99 | | | 7.27 | |
Lipper (VIP) Large-Cap Value Funds Avg. | | 19.01 | | | 7.73 | | | 6.61 | |
Portfolio inception: 9/22/2000.
$10,000 INVESTED SINCE INCEPTION
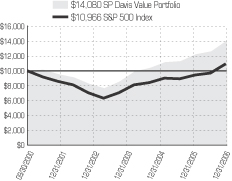
Past performance does not guarantee future returns. Portfolio performance is net of investment fees and fund expenses, but not product charges, which, if included, would significantly lower the performance quoted. The investment return and principal value of an investment will fluctuate, so that an investor’s shares, when redeemed, may be worth more or less than their original cost. Current performance may be lower or higher than the past performance data quoted.
Unless noted otherwise, Lipper Average and Index returns reflect performance beginning the closest month-end date to the Portfolio’s inception. Although Lipper classifies the Portfolio within the Multi-Cap Value Funds Average, the returns for the Large-Cap Value Funds Average are also shown, because the management of the portfolios included in the Large-Cap Value Funds Average is more consistent with the management of the Portfolio. The Russell 1000® Index is a trademark/service mark of the Frank Russell Company. Russell® is a trademark of the Frank Russell Company. Performance figures may reflect fee waivers and/or expense reimbursements. In the absence of such fee waivers and/or expense reimbursements, total returns would be lower.
For the year ended December 31, 2006, the SP Davis Value Portfolio had a total return that was below its benchmark indexes and the average of its peer group.
Davis uses a top-down analysis to select industries that it believes are likely to benefit from economic developments and a bottom-up stock selection process to identify good quality firms that can sustain their growth over full market cycles, but that are currently out of favor. It looks at both intrinsic value and value relative to similar firms. This approach gives it a distinct profile with greater representation in sectors, such as technology, that are normally considered growth sectors.
In 2006, its long-time position in The Progressive Corporation (automobile insurance) declined when Progressive had difficulty with a recent acquisition. However, the acquired company had just been upgraded by an insurance rating agency, the kind of potentially under-appreciated value Davis looks for. Positions in insurance companies American International Group (AIG) and Transatlantic Holdings, retailer Wal-Mart, and energy company EOG Resources detracted from the Portfolio’s performance relative to the Russell 1000 Value Index.
A position in cable operator Comcast and several financial services holdings offset some of the impact of the poorer performers. The Portfolio also benefited from a low exposure compared to the Russell 1000 Value Index to firms that paid dividends. This year, the market did not reward high dividend yields. The Portfolio also benefited from holding securities that were less heavily traded, a characteristic that was associated with better returns in 2006.
Prudential Investments LLC (PI), an indirect, wholly owned subsidiary of Prudential Financial, Inc., serves as the investment manager for the Fund.
For average and index definitions, refer to the Glossary of Benchmark Definitions page. Investors cannot invest directly in a market index or average. For a complete list of holdings, refer to the Schedule of Investments section of this report.
The Prudential Series Fund, SP Growth Asset Allocation Portfolio
Advised by: Prudential Investments LLC
December 31, 2006
Investment Manager’s Report
Performance Summary - As of December 31, 2006
Average Annual Total Return Percentages
| | | | | | | | | |
| | | 1-Year | | | 5-Year | | | Since
Inception | |
SP Growth Asset Allocation Portfolio | | 12.88 | % | | 8.15 | % | | 3.56 | % |
S&P 500 Index | | 15.78 | | | 6.18 | | | 1.49 | |
Growth AA Custom Blended Index (GD) | | 15.10 | | | 8.22 | | | 3.98 | |
Growth AA Custom Blended (ND) | | 15.03 | | | 8.15 | | | 3.92 | |
Lipper (VIP) Multi-Cap Core Avg. | | 14.45 | | | 6.69 | | | 2.83 | |
Portfolio inception: 9/22/2000.
$10,000 INVESTED SINCE INCEPTION
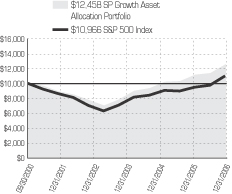
Past performance does not guarantee future returns. Portfolio performance is net of investment fees and fund expenses, but not product charges, which, if included, would significantly lower the performance quoted. The investment return and principal value of an investment will fluctuate, so that an investor’s shares, when redeemed, may be worth more or less than their original cost. Current performance may be lower or higher than the past performance data quoted.
Unless noted otherwise, Lipper Average and Index returns reflect performance beginning the closest month-end date to the Portfolio’s inception. Performance figures may reflect fee waivers and/or expense reimbursements. In the absence of such fee waivers and/or expense reimbursements, total returns would be lower.
For the year ended December 31, 2006, the SP Growth Asset Allocation Portfolio had a total return that was below its Custom Index benchmark and the average of its peer group.
The Portfolio is one of the four Strategic Partner Asset Allocation portfolios. It invests in shares of other Portfolios on the platform and attempts to outperform a blended benchmark consisting of 64% Russell 3000 Index (a measure of the broad U.S. equity market), 16% MSCI EAFE Index (GD) (a measure of the broad developed-country international equity market), and 20% Lehman Aggregate Bonds Index (a measure of the U.S. investment-grade bond market). Its performance relative to this target is determined by its overweights and underweights compared to the target in different asset classes and by the performance of the Portfolios selected to invest in these asset classes.
An underweight in bonds and overweight in international stocks compared with the Portfolio’s blended benchmark both contributed positively to its performance. Stocks generally outperformed bonds by a significant margin and international stocks substantially outperformed domestic stocks in 2006, aided by the decline of the U.S. dollar against most major foreign currencies except the Japanese yen. The Portfolio was overweighted in non-U.S. stocks compared with its target. Moreover a modest investment in the Natural Resources Portfolio added to its results. Within its bond allocation, holdings of high yield (junk) bonds and money market instruments, neither of which are included in the benchmark, augmented the Portfolio’s return.
Three Portfolios detracted significantly from performance relative to the Portfolio’s target. The Jennison Portfolio underperformed the Russell 1000 Growth Index primarily due to its selection of stocks in the technology, healthcare, and consumer staples sectors. The SP Large Cap Value Portfolio’s relative performance was hampered by its underexposure to a few sizeable constituents of the Russell 1000 Value Index that posted particularly strong returns in 2006. The SP International Growth Portfolio trailed the MSCI EAFE Index primarily because growth stocks trailed value stocks. Conversely, the SP International Value Portfolio benefited substantially from its deep-value investment style, which resulted in holdings with lower average price-to-earnings and price-to-book value ratios. These characteristics were rewarded in the value-favoring investing environment. It also had a smaller average capitalization level (a measure of company size) than the MSCI EAFE Index, and this characteristic was favored by the markets in 2006.
Prudential Investments LLC (PI), an indirect, wholly owned subsidiary of Prudential Financial, Inc., serves as the investment manager for the Fund.
For average and index definitions, refer to the Glossary of Benchmark Definitions page. Investors cannot invest directly in a market index or average. For a complete list of holdings, refer to the Schedule of Investments section of this report.
The Prudential Series Fund, SP International Growth Portfolio
Subadvised by: William Blair & Company LLC, Marsico Capital Management
December 31, 2006
Investment Manager’s Report
Performance Summary - As of December 31, 2006
Average Annual Total Return Percentages
| | | | | | | | | |
| | | 1-Year | | | 5-Year | | | Since
Inception | |
SP International Growth Portfolio: Class I | | 21.05 | % | | 12.15 | % | | –0.47 | % |
SP International Growth Portfolio: Class II | | 20.42 | | | 11.69 | | | –0.55 | |
MSCI EAFE Index (GD) | | 26.86 | | | 15.43 | | | 7.51 | |
MSCI EAFE Index (ND) | | 26.34 | | | 14.98 | | | 7.11 | |
Lipper (VIP) International Growth Funds Avg. | | 24.61 | | | 13.89 | | | 4.41 | |
Portfolio (Class I) inception: 9/22/2000. Portfolio (Class II) inception: 10/4/2000.
$10,000 INVESTED SINCE INCEPTION
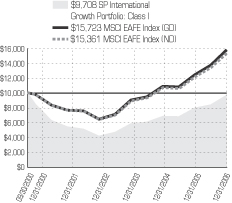
Past performance does not guarantee future returns. Portfolio performance is net of investment fees and fund expenses, but not product charges, which, if included, would significantly lower the performance quoted. The investment return and principal value of an investment will fluctuate, so that an investor’s shares, when redeemed, may be worth more or less than their original cost. Current performance may be lower or higher than the past performance data quoted.
Unless noted otherwise, Lipper Average and Index returns reflect performance beginning the closest month-end date to the Portfolio’s inception (Class I). Performance figures may reflect fee waivers and/or expense reimbursements. In the absence of such fee waivers and/or expense reimbursements, total returns would be lower.
For the year ended December 31, 2006, the SP International Growth Portfolio had a total return that was below its benchmark indexes and the average of its peer group.
International stock markets were very strong in 2006, aided by the decline of the U.S. dollar against most major currencies except the Japanese yen. The Portfolio captured most of this strength and provided an excellent return by historical standards. The major reason it underperformed its style-neutral benchmark was its growth investing style, which trailed the value style over the year by a significant amount. The Portfolio was primarily managed by William Blair & Company, L.L.C., with Marsico Capital Management assuming somewhat less than a third of the Portfolio’s assets in November 2006. The change in structure was not in place long enough to have had a significant impact on the Portfolio’s 2006 performance.
Investment style was reflected in an underexposure compared with the benchmark in value characteristics and an overexposure to more volatile stocks. The high earnings growth that Blair seeks is usually accompanied by greater share-price volatility. The Portfolio’s overweight in technology and underweight in the materials and utilities sectors, also characteristic of a growth style, hurt its relative performance. In addition, the Portfolio’s holdings generated an underexposure to the British pound and overexposure to the South African rand compared with the benchmark, which further hurt its return.
Aside from these style factors, stock selection was strong. Major contributors to the Portfolio’s return included the Spanish clothing designer-retailer Inditex (which operates the Zara chain, among others, primarily in Europe) and China Life Insurance (Hong Kong). The Portfolio was relatively light in Japan, which also helped its performance.
Prudential Investments LLC (PI), an indirect, wholly owned subsidiary of Prudential Financial, Inc., serves as the investment manager for the Fund.
| 1 | The graph is based on the performance of Class I shares. Performance of Class II shares will be lower due to differences in the fee structure. Class II shares have associated 12b-1 and administrative fees at an annual rate of 0.25% and 0.15% respectively of the average daily net assets of the Class II shares. |
For average and index definitions, refer to the Glossary of Benchmark Definitions page. Investors cannot invest directly in a market index or average. For a complete list of holdings, refer to the Schedule of Investments section of this report.
The Prudential Series Fund, SP International Value Portfolio
Subadvised by: LSV Asset Management, Thornburg Investment Management
December 31, 2006
Investment Manager’s Report
Performance Summary - As of December 31, 2006
Average Annual Total Return Percentages
| | | | | | | | | |
| | | 1-Year | | | 5-Year | | | Since
Inception | |
SP International Value Portfolio | | 29.09 | % | | 12.40 | % | | 4.60 | % |
MSCI EAFE Index (GD) | | 26.86 | | | 15.43 | | | 7.51 | |
MSCI EAFE Index (ND) | | 26.34 | | | 14.98 | | | 7.11 | |
Lipper (VIP) International Value Funds Avg. | | 26.89 | | | 15.88 | | | 9.23 | |
Portfolio inception: 9/22/2000.
$10,000 INVESTED SINCE INCEPTION
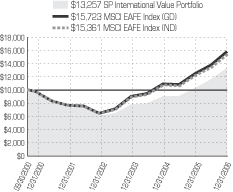
Past performance does not guarantee future returns. Portfolio performance is net of investment fees and fund expenses, but not product charges, which, if included, would significantly lower the performance quoted. The investment return and principal value of an investment will fluctuate, so that an investor’s shares, when redeemed, may be worth more or less than their original cost. Current performance may be lower or higher than the past performance data quoted.
Unless noted otherwise, Lipper Average and Index returns reflect performance beginning the closest month-end date to the Portfolio’s inception. Performance figures may reflect fee waivers and/or expense reimbursements. In the absence of such fee waivers and/or expense reimbursements, total returns would be lower.
For the year ended December 31, 2006, the SP International Value Portfolio had a total return that was above its benchmark index and the average of its peer group.
LSV Asset Management managed the Portfolio throughout the year. On November 17, 2006, Thornburg Investment Management, whose investment substyle is complementary to LSV’s, was added as co-manager. Whereas LSV is a deep-value manager, using quantitative techniques based upon studies of investors’ biases, Thornburg’s strategy is more flexible, including stocks with less-pronounced value characteristics. LSV’s methods are purely quantitative, whereas Thornburg performs fundamental research on companies to develop proprietary estimates of their intrinsic value. However, Thornburg’s addition to the Portfolio late in the year meant it had little impact on performance for 2006.
LSV’s deep-value approach characteristically leads to an emphasis on smaller firms and to more-pronounced overall value characteristics than the MSCI EAFE Index. These qualities were favored by the markets in 2006. Aside from these characteristics of the Portfolio holdings, several of its positions in the banking, business services, machine engineering, and metals industries outperformed the benchmark. Many of these firms were domiciled in Australia, Hong Kong, France, and Greece. However, LSV keeps its country distribution close to that of its index, so the geographic distribution of the Portfolio holdings were largely neutral to its relative performance.
Prudential Investments LLC (PI), an indirect, wholly owned subsidiary of Prudential Financial, Inc., serves as the investment manager for the Fund.
For average and index definitions, refer to the Glossary of Benchmark Definitions page. Investors cannot invest directly in a market index or average. For a complete list of holdings, refer to the Schedule of Investments section of this report.
The Prudential Series Fund, SP Large Cap Value Portfolio
Subadvised by: JP Morgan Asset Management, Hotchkis and Wiley Capital Management LLC, Dremen Value Management LLC
December 31, 2006
Investment Manager’s Report
Performance Summary - As of December 31, 2006
Average Annual Total Return Percentages
| | | | | | | | | |
| | | 1-Year | | | 5-Year | | | Since
Inception | |
SP Large Cap Value Portfolio | | 18.47 | % | | 9.54 | % | | 6.79 | % |
Russell 1000® Index | | 15.46 | | | 6.82 | | | 1.63 | |
Russell 1000® Value Index | | 22.25 | | | 10.86 | | | 8.21 | |
Lipper (VIP) Large-Cap Value Funds Avg. | | 19.01 | | | 7.73 | | | 6.61 | |
Lipper (VIP) Multi-Cap Value Funds Avg. | | 17.30 | | | 8.99 | | | 7.27 | |
Portfolio inception: 9/22/2000.
$10,000 INVESTED SINCE INCEPTION
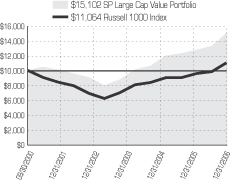
Past performance does not guarantee future returns. Portfolio performance is net of investment fees and fund expenses, but not product charges, which, if included, would significantly lower the performance quoted. The investment return and principal value of an investment will fluctuate, so that an investor’s shares, when redeemed, may be worth more or less than their original cost. Current performance may be lower or higher than the past performance data quoted.
Although Lipper classifies the Portfolio within the Multi-Cap Value Funds Average, the returns for the Large-Cap Value Funds Average are also shown because the management of the portfolios included in the Large-Cap Value Average is more consistent with the management of the Portfolio. Unless noted otherwise, Lipper Average and Index returns reflect performance beginning the closest month-end date to the Portfolio’s inception. The Russell 1000® and 1000® Value Indexes are trademarks of the Frank Russell Company. Russell® is a trademark of the Frank Russell Company. Performance figures may reflect fee waivers and/or expense reimbursements. In the absence of such fee waivers and/or expense reimbursements, total returns would be lower.
For the year ended December 31, 2006, the SP Large Cap Value Portfolio had a return that was below its style-specific benchmark, the Russell 1000 Value Index, but marginally exceeded its peer group average.
The Portfolio employs a multi-manager framework with three components: JP Morgan Asset Management is responsible for approximately half the Portfolio, managed in a relative value style that is generally sector neutral to the Russell 1000 Value Index; Dreman Value Management and Hotchkis and Wiley Capital Management separately manage the other half in more aggressive value styles. We expect the combination to produce a traditional large-cap value portfolio.
Although the Portfolio’s return was superior by historical standards, it failed to keep pace with that of its benchmark. The sub-par result was primarily attributable to stock selection in the consumer noncyclical, technology, energy, and financial sectors. The Portfolio did not hold several stocks that were in the benchmark and posted exceptionally strong returns. The negative impact on relative performance was primarily due to Hotchkis and Wiley’s holdings. A 3% average cash position dragged on performance in 2006 as stock prices surged upward. This elevated cash position was attributable to Dreman’s segment of the Portfolio.
As designed, the Portfolio exhibited more attractive value characteristics than its benchmark and had less exposure to firms with accelerating and potentially unsustainable business fundamentals (i.e., growth stocks). These style attributes helped 2006 performance, particularly during the first half of the year when investors strongly favored traditional value sectors such as energy and utilities. JP Morgan and Dreman drove this aspect of the Portfolio’s risk profile.
Prudential Investments LLC (PI), an indirect, wholly owned subsidiary of Prudential Financial, Inc., serves as the investment manager for the Fund.
For average and index definitions, refer to the Glossary of Benchmark Definitions page. Investors cannot invest directly in a market index or average. For a complete list of holdings, refer to the Schedule of Investments section of this report.
The Prudential Series Fund, SP Mid Cap Growth Portfolio
Subadvised by: Calamos Advisors LLC
December 31, 2006
Investment Manager’s Report
Performance Summary - As of December 31, 2006
Average Annual Total Return Percentages
| | | | | | | | | |
| | | 1-Year | | | 5-Year | | | Since
Inception | |
SP Mid Cap Growth Portfolio | | –1.94 | % | | –1.49 | % | | –5.16 | % |
Russell Midcap™ Index | | 15.26 | | | 12.88 | | | 8.52 | |
Russell Midcap Growth™ Index | | 10.66 | | | 8.22 | | | –1.51 | |
Lipper (VIP) Mid-Cap Growth Funds Avg. | | 8.63 | | | 6.00 | | | –2.00 | |
Lipper (VIP) Multi-Cap Growth Funds Avg. | | 7.70 | | | 4.78 | | | –3.91 | |
Portfolio inception: 9/22/2000.
$10,000 INVESTED SINCE INCEPTION
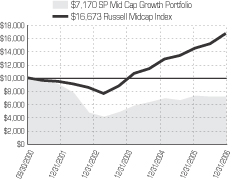
Past performance does not guarantee future returns. Portfolio performance is net of investment fees and fund expenses, but not product charges, which, if included, would significantly lower the performance quoted. The investment return and principal value of an investment will fluctuate, so that an investor’s shares, when redeemed, may be worth more or less than their original cost. Current performance may be lower or higher than the past performance data quoted.
Unless noted otherwise, Lipper Average and Index returns reflect performance beginning the closest month-end date to the Portfolio’s inception. Although Lipper classifies the Portfolio within the Multi-Cap Growth Funds Average, the returns for the Mid-Cap Growth Funds Average are also shown, because the management of the portfolios included in the Mid-Cap Growth Funds Average is more consistent with the management of the Portfolio. The Russell MidCap™ and MidCap Growth™ Indexes are trademarks/service marks of the Frank Russell Company. Russell® is a trademark of the Frank Russell Company. Performance figures may reflect fee waivers and/or expense reimbursements. In the absence of such fee waivers and/or expense reimbursements, total returns would be lower.
For the year ended December 31, 2006, the SP Mid Cap Growth Portfolio had a total return that was substantially below its benchmark indexes and the average of its peer group.
The Portfolio is managed by Calamos Asset Management with a process that is highly dependent upon its proprietary research and stock-pricing models. It uses an analysis of macroeconomic themes to set sector weights and a highly disciplined stock evaluation model focused on long-term earnings sustainability and return on invested capital.
Very little about the Portfolio’s holdings worked in its favor in 2006’s strongly value-favoring markets. Stock selection was weak, particularly in the healthcare, financials, and energy sectors. The exceptions were selections in the telecommunications and technology sectors. The Portfolio’s greater exposure than the Russell Midcap Growth Index to share-price volatility and momentum (stocks with recently rising prices) hurt its performance because investors were more value-oriented even among growth stocks. The Portfolio’s substantial emphasis on technology and underweighting of consumer services also affected its return negatively.
However, the overall Portfolio tended to move in the same direction as the Russell Midcap Growth Index, only more so. This characteristic helped its performance, particularly in the first and fourth quarters of the year.
Prudential Investments LLC (PI), an indirect, wholly owned subsidiary of Prudential Financial, Inc., serves as the investment manager for the Fund.
For average and index definitions, refer to the Glossary of Benchmark Definitions page. Investors cannot invest directly in a market index or average. For a complete list of holdings, refer to the Schedule of Investments section of this report.
The Prudential Series Fund, SP PIMCO High Yield Portfolio
Subadvised by: Pacific Investment Management Company LLC
December 31, 2006
Investment Manager’s Report
Performance Summary - As of December 31, 2006
Average Annual Total Return Percentages
| | | | | | | | | |
| | | 1-Year | | | 5-Year | | | Since
Inception | |
SP PIMCO High Yield Portfolio | | 9.51 | % | | 8.83 | % | | 7.97 | % |
M-L U.S. High Yield Master II BB-B Rated Index | | 10.72 | | | 8.83 | | | 7.23 | |
Lehman Intermediate BB Corp. Index | | 9.65 | | | 7.42 | | | 7.53 | |
Lipper (VIP) High Current Yield Funds Avg. | | 9.96 | | | 8.94 | | | 6.22 | |
Portfolio inception: 9/22/2000.
$10,000 INVESTED SINCE INCEPTION
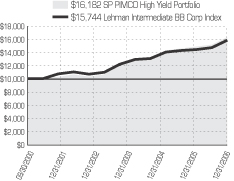
Past performance does not guarantee future returns. Portfolio performance is net of investment fees and fund expenses, but not product charges, which, if included, would significantly lower the performance quoted. The investment return and principal value of an investment will fluctuate, so that an investor’s shares, when redeemed, may be worth more or less than their original cost. Current performance may be lower or higher than the past performance data quoted.
Unless noted otherwise, Lipper Average and Index returns reflect performance beginning the closest month-end date to the Portfolio’s inception. Performance figures may reflect fee waivers and/or expense reimbursements. In the absence of such fee waivers and/or expense reimbursements, total returns would be lower.
For the year ended December 31, 2006, the SP PIMCO High Yield Portfolio had a total return that was below its benchmark index.
After increasing short-term interest rates a record 17 consecutive times, the Federal Reserve (the Fed) ended its two-year campaign to reduce the excess monetary stimulus in the U.S. economy. It left the target for the federal funds rate on overnight loans between banks unchanged at 5.25% in August 2006. As economic growth slowed, particularly in the housing and manufacturing sectors, and energy prices declined, investors anticipated the Fed might have to cut short-term rates in 2007 to reinvigorate the economy. However, the economy showed a surprising amount of resilience in late 2006, lessening rate-cut hopes.
In this investment environment, high yield bonds, which tend to be less sensitive to interest rate movements and more responsive to economic activity, benefited from a reasonable economy, moderate inflation, and a low default rate. Risk-tolerant investors searching for income in a low interest-rate environment turned to high yield bonds, enabling them to outperform the remainder of the U.S. fixed income market in 2006. Therefore, the Portfolio’s performance was hurt by its exposure to bonds rated BBB, the lowest rating category for investment-grade bonds.
The Portfolio benefited from favorable security selection. The utilities sector was a notable contributor as a focus on bonds of electric generation firms aided the Portfolio’s performance. By contrast, in the forest products and packaging industries, an emphasis on upper tier packaging companies and middle tier paper companies weighed on the Portfolio’s performance relative to its benchmark index.
The Portfolio also benefited from specific industry exposures, such as its overweight in automotive bonds. The auto industry was among the top performing industries in the high yield market in 2006 as General Motors Corp. and Ford Motor Co. appeared to make strides in restructuring their businesses even though both automakers continued to lose market share in the United States to foreign competitors. Another positive was the Portfolio’s overweight exposure to bonds of pipeline companies, an industry that outperformed the broader energy sector.
A modest exposure to sovereign (government) bonds of emerging market nations marginally added to the Portfolio’s performance relative to its benchmark index. After a sharp sell-off in May and June amidst concerns about inflation and higher interest rates, emerging markets bonds rebounded in the second half of 2006. Risk-tolerant investors were attracted to the asset class by improvement in the credit quality of some bonds and the yield advantage in a low-interest-rate environment.
Prudential Investments LLC (PI), an indirect, wholly owned subsidiary of Prudential Financial, Inc., serves as the investment manager for the Fund.
For average and index definitions, refer to the Glossary of Benchmark Definitions page. Investors cannot invest directly in a market index or average. For a complete list of holdings, refer to the Schedule of Investments section of this report.
The Prudential Series Fund, SP PIMCO Total Return Portfolio
Subadvised by: Pacific Investment Management Company LLC
December 31, 2006
Investment Manager’s Report
Performance Summary - As of December 31, 2006
Average Annual Total Return Percentages
| | | | | | | | | |
| | | 1-Year | | | 5-Year | | | Since
Inception | |
SP PIMCO Total Return Portfolio | | 3.68 | % | | 5.29 | % | | 6.43 | % |
Lehman Brothers U.S. Aggregate Bond Index | | 4.33 | | | 5.06 | | | 6.08 | |
Lipper (VIP) Intermediate Investment Grade Debt Avg. | | 4.14 | | | 4.90 | | | 5.88 | |
Portfolio inception: 9/22/2000.
$10,000 INVESTED SINCE INCEPTION
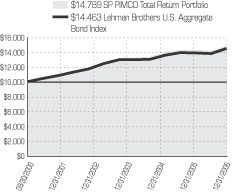
Past performance does not guarantee future returns. Portfolio performance is net of investment fees and fund expenses, but not product charges, which, if included, would significantly lower the performance quoted. The investment return and principal value of an investment will fluctuate, so that an investor’s shares, when redeemed, may be worth more or less than their original cost. Current performance may be lower or higher than the past performance data quoted.
Unless noted otherwise, Lipper Average and Index returns reflect performance beginning the closest month-end date to the Portfolio’s inception. Performance figures may reflect fee waivers and/or expense reimbursements. In the absence of such fee waivers and/or expense reimbursements, total returns would be lower.
For the year ended December 31, 2006, the SP PIMCO Total Return Portfolio had a total return that was below its benchmark index.
After increasing short-term interest rates 17 consecutive times, the Federal Reserve (the Fed) halted its two-year campaign to reduce excess monetary stimulus in the U.S. economy in 2006. It left the target for the federal funds rate on overnight loans between banks unchanged at 5.25% in August. Subsequently, with economic growth slowing, particularly in the housing and manufacturing sectors, and the Fed on hold, bond markets rallied for much of the second half of the year.
Anticipating that the Fed would move to cut short-term rates in 2007 to stimulate the economy, the Portfolio’s duration — a measure of its sensitivity to changes in interest rates — was above that of the Index. However, the economy proved surprisingly resilient in late 2006, lessening rate-cut hopes. Indeed the 10-year Treasury note yield, which began the year at 4.39%, rose to 4.70% by year-end. Because the Portfolio was more fully exposed to these rising interest rates, which pushed bond prices lower, its performance was negatively affected. The Portfolio was also positioned for the potential steepening of the yield curve. In June, the 10-year Treasury note yield fell below that of two-year Treasury notes and hovered there for much of the rest of the year. This is unusual because investors typically demand higher yields on longer-dated bonds to compensate for the risk of higher inflation later. The yield curve’s failure to steepen hurt the Portfolio’s performance.
Corporate bonds outperformed comparable Treasurys in 2006, and the Portfolio’s substantial underweight to corporate debt detracted from its performance. In contrast to the red flag of the inverted yield curve, corporate bonds traded at levels indicating a robust economy and secure corporate profits. The Portfolio’s overweight to mortgage-backed securities contributed positively to its return as that market outperformed the Treasury market on a duration-adjusted basis. Also security selection within the mortgage-backed market was strong. Despite the housing slowdown, mortgage-backed securities benefited from foreign investor demand.
A modest exposure to emerging markets bonds also boosted performance. After a sharp sell-off in May and June amidst concerns about inflation and higher interest rates, emerging market bonds rebounded in the second half of 2006. Risk-tolerant investors were attracted to the asset class by improvement in credit quality and its yield advantage in a low interest-rate environment.
On the foreign currency front, the Portfolio’s exposure to the Japanese yen detracted from its performance but was mitigated by exposure to the euro and select emerging market currencies. The Fed paused, effectively removing a source of support for the U.S. dollar, but central banks around the world had begun to tighten monetary policy. The European Central Bank raised rates five times in 2006, and backed by strong economic growth, the euro appreciated relative to the U.S. dollar. Select emerging markets currencies also strengthened after central banks in those nations tightened monetary policy. By comparison, after raising rates from 0.00% to 0.25% in July, the Bank of Japan left rates unchanged for the remainder of the year, when a hoped for economic recovery failed to materialize. The U.S. dollar gained versus the Japanese yen.
Prudential Investments LLC (PI), an indirect, wholly owned subsidiary of Prudential Financial, Inc., serves as the investment manager for the Fund.
For average and index definitions, refer to the Glossary of Benchmark Definitions page. Investors cannot invest directly in a market index or average. For a complete list of holdings, refer to the Schedule of Investments section of this report.
The Prudential Series Fund, SP Prudential U.S. Emerging Growth Portfolio
Subadvised by: Jennison Associates LLC
December 31, 2006
Investment Manager’s Report
Performance Summary - As of December 31, 2006
Average Annual Total Return Percentages
| | | | | | | | | |
| | | 1-Year | | | 5-Year | | | Since
Inception | |
SP Prudential U.S. Emerging Growth Portfolio: Class I | | 9.59 | % | | 8.62 | % | | 0.67 | % |
SP Prudential U.S. Emerging Growth Portfolio: Class II | | 9.10 | | | 8.20 | | | 5.62 | |
S&P Midcap 400 Index | | 10.32 | | | 10.89 | | | 7.84 | |
Russell Midcap Growth™ Index | | 10.66 | | | 8.22 | | | –1.51 | |
Lipper (VIP) Mid-Cap Growth Funds Avg. | | 8.63 | | | 6.00 | | | –2.00 | |
Portfolio (Class I) inception: 9/22/2000. Portfolio (Class II) inception: 7/9/2001.
$10,000 INVESTED SINCE INCEPTION
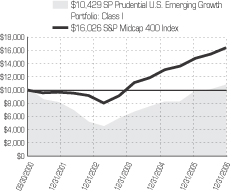
Past performance does not guarantee future returns. Portfolio performance is net of investment fees and fund expenses, but not product charges, which, if included, would significantly lower the performance quoted. The investment return and principal value of an investment will fluctuate, so that an investor’s shares, when redeemed, may be worth more or less than their original cost. Current performance may be lower or higher than the past performance data quoted.
Unless noted otherwise, Lipper Average and Index returns reflect performance beginning the closest month-end date to the Portfolio’s inception (Class I). The Russell MidCap Growth™ Index is a trademark/service mark of the Frank Russell Company. Russell® is a trademark of the Frank Russell Company. Performance figures may reflect fee waivers and/or expense reimbursements. In the absence of such fee waivers and/or expense reimbursements, total returns would be lower.
For the year ended December 31, 2006, the SP Prudential U.S. Emerging Growth Portfolio had a total return that was slightly below its style-specific Russell Midcap Growth Index benchmark but above the average of its peer group.
The Portfolio looks for rapidly growing small-cap to mid-cap growth stocks, emphasizing a company’s ability to increase its earnings faster than average. In 2006, the overall stock market shifted direction significantly in midyear, beginning a strong climb when the Federal Reserve suspended its two-year sequence of tightening interest rates at each meeting. However, the market continued to favor value stocks, albeit to a much smaller degree. Consequently, it is somewhat surprising that the Portfolio’s broad risk characteristics modestly added to its performance over the year. It had more exposure to share-price momentum and a lower overall dividend yield than its benchmark. These characteristics were rewarded. It also was more exposed to share-price volatility, and this detracted from its performance in the value-favoring markets.
Stock selection detracted from the Portfolio’s performance, particularly in the computer hardware, specialty retail, healthcare providers and IT services industries. The impact was partially offset by positions in the computer software and electronic equipment industries. The manager’s bottom-up selection process (one based upon intensive company analysis rather than forecasts of industry or sector trends) resulted in an overweight (as compared with the style-specific benchmark) in the technology sector. This hurt its performance, as technology stocks generally had another lackluster year. The impact of the technology emphasis was mitigated by an overweight in the strong telecommunications sector.
Prudential Investments LLC (PI), an indirect, wholly owned subsidiary of Prudential Financial, Inc., serves as the investment manager for the Fund.
| 1 | The graph is based on the performance of Class I shares. Performance of Class II shares will be lower due to differences in the fee structure. Class II shares have associated 12b-1 and administrative fees at an annual rate of 0.25% and 0.15% respectively of the average daily net assets of the Class II shares. |
For average and index definitions, refer to the Glossary of Benchmark Definitions page. Investors cannot invest directly in a market index or average. For a complete list of holdings, refer to the Schedule of Investments section of this report.
The Prudential Series Fund, SP Small Cap Growth Portfolio
Subadvised by: Eagle Asset Management, Neuberger Berman Management Inc.
December 31, 2006
Investment Manager’s Report
Performance Summary - As of December 31, 2006
Average Annual Total Return Percentages
| | | | | | | | | |
| | | 1-Year | | | 5-Year | | | Since
Inception | |
SP Small Cap Growth Portfolio | | 12.39 | % | | 1.40 | % | | –4.60 | % |
Russell 2000® Index | | 18.37 | | | 11.39 | | | 8.19 | |
Russell 2000® Growth Index | | 13.35 | | | 6.93 | | | 0.20 | |
Lipper (VIP) Small-Cap Growth Funds Avg. | | 11.12 | | | 5.51 | | | –0.50 | |
Portfolio inception: 9/22/2000.
$10,000 INVESTED SINCE INCEPTION
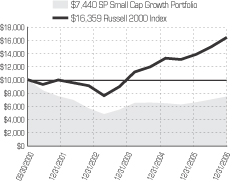
Past performance does not guarantee future returns. Portfolio performance is net of investment fees and fund expenses, but not product charges, which, if included, would significantly lower the performance quoted. The investment return and principal value of an investment will fluctuate, so that an investor’s shares, when redeemed, may be worth more or less than their original cost. Current performance may be lower or higher than the past performance data quoted.
Unless noted otherwise, Lipper Average and Index returns reflect performance beginning the closest month-end date to the Portfolio’s inception. The Russell 2000® and Russell 2000® Growth Indexes are trademarks/service marks of the Frank Russell Company. Russell® is a trademark of the Frank Russell Company. Performance figures may reflect fee waivers and/or expense reimbursements. In the absence of such fee waivers and/or expense reimbursements, total returns would be lower.
For the year ended December 31, 2006, the SP Small Cap Growth Portfolio had a total return that was below its benchmark indexes but above the average of its peer group.
Management was shared by Neuberger Berman and Eagle Asset Management. Neuberger Berman looks for small, undervalued but growing companies and tries to hold them until their value is recognized by other investors. Eagle looks for firms with rapid growth characteristics, such as accelerating but sustainable earnings growth, a positive earnings catalyst, high or expanding return on equity, and good management.
Neuberger Berman generally maintains a “beta” less than the Russell 2000 Growth Index, meaning that its holdings will tend to move in the same direction as that index, but somewhat less. Eagle’s beta, while usually low also, may or may not be less than the Index. The overall portfolio generally has a lower beta than the Russell 2000 Growth Index. This conservative approach was not favored by the markets in 2006, particularly during the first and fourth quarters of the year. When the markets rose rapidly, the Portfolio’s performance relative to the Russell 2000 Growth Index also was hurt by the cash on its balance sheet, although the amount was a reasonable consequence of managing its cash flow. The Index has no cash, but other annuity portfolios in the peer group generally do, and this factor would have affected them to varying degrees.
Aside from these general risk characteristics, the Portfolio’s stock selection was successful, particularly in the industrials and basic materials sectors. This was primarily due to Eagle, which selected well in those sectors as well as in the technology, financials, and consumer non-cyclical sectors. Neuberger Berman’s selection was weaker, particularly in the healthcare, consumer services, consumer cyclicals, technology, and financials sectors. Both managers had less exposure to volatile stocks than the Russell 2000 Growth index, and this benefited the Portfolio’s return.
Prudential Investments LLC (PI), an indirect, wholly owned subsidiary of Prudential Financial, Inc., serves as the investment manager for the Fund.
For average and index definitions, refer to the Glossary of Benchmark Definitions page. Investors cannot invest directly in a market index or average. For a complete list of holdings, refer to the Schedule of Investments section of this report.
The Prudential Series Fund, SP Small Cap Value Portfolio
Subadvised by: Goldman Sachs Asset Management L.P.
December 31, 2006
Investment Adviser’s Report
Performance Summary - As of December 31, 2006
Average Annual Total Return Percentages
| | | | | | | | | |
| | | 1-Year | | | 5-Year | | | Since
Inception | |
SP Small Cap Value Portfolio | | 14.60 | % | | 10.52 | % | | 10.70 | % |
Russell 2500™ Index | | 16.17 | | | 12.19 | | | 9.19 | |
Lipper (VIP) Small-Cap Core Funds Avg. | | 15.23 | | | 10.28 | | | 8.99 | |
Lipper (VIP) Small-Cap Value Funds Avg. | | 17.31 | | | 13.71 | | | 14.46 | |
Although Lipper classifies the Portfolio within the Small-Cap Core Funds Average, the returns for the Small-Cap Value Funds Average are also shown, because the management of the portfolios included in the Small-Cap Value Funds Average is more consistent with the management of the Portfolio.
Portfolio inception: 9/22/2000.
$10,000 INVESTED SINCE INCEPTION
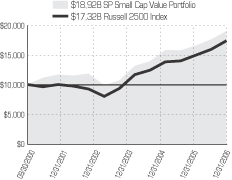
Past performance does not guarantee future returns. Portfolio performance is net of investment fees and fund expenses, but not product charges, which, if included, would significantly lower the performance quoted. The investment return and principal value of an investment will fluctuate, so that an investor’s shares, when redeemed, may be worth more or less than their original cost. Current performance may be lower or higher than the past performance data quoted.
Unless noted otherwise, Lipper Average and Index returns reflect performance beginning the closest month-end date to the Portfolio’s inception. The Russell 2500® Index is a trademark/service mark of the Frank Russell Company. Russell® is a trademark of the Frank Russell Company. Performance figures may reflect fee waivers and/or expense reimbursements. In the absence of such fee waivers and/or expense reimbursements, total returns would be lower.
For the year ended December 31, 2006, the SP Small Cap Value Portfolio had a total return that was substantially below its style-specific benchmark indexes and slightly below the average of its peer group.
Goldman Sachs and Salomon Brothers Asset Management each manage approximately half of the Portfolio. Goldman Sachs follows a traditional small-cap value strategy with an emphasis on quality, i.e., strong cash flow and balance sheets. Salomon Brothers follows a relative value approach, looking for undiscovered companies with good prospects for growth and profitability, capable management, and demand for its goods and services.
A number of the Portfolio’s holdings, particularly in the financial services, basic materials, and healthcare sectors, performed poorly in 2006. Most of the weaker positions were held by Salomon Brothers. The Portfolio’s typical emphasis on growth characteristics and higher-quality companies (i.e., low debt and consistent earnings) were punished by the markets’ strong preference for value this year. Its sector distribution also hurt its relative performance, with a slight underweight compared with the Russell 2000 Value Index in the telecommunication and financial services sectors. Both posted strong returns. The Portfolio was overweight in basic materials and transportation stocks, which were affected by falling commodity prices and concerns about slowing economic growth. These sector emphases are consistent with both managers’ investment processes, so over the long run they have been associated with good performance.
Prudential Investments LLC (PI), an indirect, wholly owned subsidiary of Prudential Financial, Inc., serves as the investment manager for the Fund.
For average and index definitions, refer to the Glossary of Benchmark Definitions page. Investors cannot invest directly in a market index or average. For a complete list of holdings, refer to the Schedule of Investments section of this report.
The Prudential Series Fund, SP Strategic Partners Focused Growth Portfolio
Subadvised by: Jennison Associates LLC, Alliance Capital
December 31, 2006
Investment Manager’s Report
Performance Summary - As of December 31, 2006
Average Annual Total Return Percentages
| | | | | | | | | |
| | | 1-Year | | | 5-Year | | | Since
Inception | |
SP Strategic Partners Focused Growth Portfolio: Class I | | –0.66 | % | | 3.54 | % | | –3.47 | % |
SP Strategic Partners Focused Growth Portfolio: Class II | | –1.07 | | | 3.13 | | | –1.32 | |
S&P 500 Index | | 15.78 | | | 6.18 | | | 1.49 | |
Russell 1000 Index® Growth Index | | 9.07 | | | 2.69 | | | –5.23 | |
Lipper (VIP) Large-Cap Growth Funds Avg. | | 6.30 | | | 2.70 | | | –4.17 | |
Portfolio (Class I) inception: 9/22/2000. Portfolio (Class II) inception: 1/12/2001.
$10,000 INVESTED SINCE INCEPTION
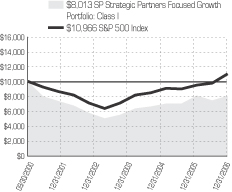
Past performance does not guarantee future returns. Portfolio performance is net of investment fees and fund expenses, but not product charges, which, if included, would significantly lower the performance quoted. The investment return and principal value of an investment will fluctuate, so that an investor’s shares, when redeemed, may be worth more or less than their original cost. Current performance may be lower or higher than the past performance data quoted.
Unless noted otherwise, Lipper Average and Index returns reflect performance beginning the closest month-end date to the Portfolio’s inception (Class I). The Russell 1000® Growth Index is a trademark/service mark of the Frank Russell Company. Russell® is a trademark of the Frank Russell Company. Performance figures may reflect fee waivers and/or expense reimbursements. In the absence of such fee waivers and/or expense reimbursements, total returns would be lower.
For the year ended December 31, 2006, the SP Strategic Partners Focused Growth Portfolio had a total return that was substantially below the style-appropriate Russell 1000® Growth Index and the average of its peer group.
Both co-managers, Jennison Associates and AllianceBernstein, trailed the Russell 1000 Growth Index, but AllianceBernstein had the more substantial underperformance. AllianceBernstein was primarily responsible via weak stock selection in the technology and healthcare sectors. A position in eBay, whose growth slowed in what appeared to be a significant change in its growth potential, and three semiconductor stocks significantly hurt the Portfolio’s relative performance. In addition, a position in UnitedHealth dropped sharply and was sold from the Portfolio before its rebound in the latter half of the year. Many of the underperformers were held by both co-managers, although at different weights.
This Portfolio typically is more exposed to earnings growth, share-price momentum, and price volatility than the Index, and these characteristics hurt its performance in a market that favored value stocks. The Portfolio’s holdings also were among the more heavily traded stocks in the Index, which reflects their popularity among institutional investors, and this was a disfavored trait in 2006. Moreover, the Portfolio’s holdings tended to move in the same direction as their benchmark, only more so. Particularly in the weak May market, this trait occasionally hurt its performance, although helping overall.
The Portfolio’s sector exposures also detracted. It was underweight in the consumer sectors and considerably overweight in the poor-performing technology sector. In particular, it was hurt by overweights in the electronic equipment, Internet, and semiconductors industries. An overweight in the very strong securities and asset management industry and a more modest emphasis on oil services companies offset some of the negative impact.
Prudential Investments LLC (PI), an indirect, wholly owned subsidiary of Prudential Financial, Inc., serves as the investment manager for the Fund.
| 1 | The graph is based on the performance of Class I shares. Performance of Class II shares will be lower due to differences in the fee structure. Class II shares have associated 12b-1 and administrative fees at an annual rate of 0.25% and 0.15% respectively of the average daily net assets of the Class II shares. |
For average and index definitions, refer to the Glossary of Benchmark Definitions page. Investors cannot invest directly in a market index or average. For a complete list of holdings, refer to the Schedule of Investments section of this report.
The Prudential Series Fund, SP T. Rowe Price Large-Cap Growth Portfolio
Subadvised by: T Rowe Price Associates Inc
December 31, 2006
Investment Manager’s Report
Performance Summary - As of December 31, 2006
Average Annual Total Return Percentages
| | | | | | | | | |
| | | 1-Year | | | 5-Year | | | Since
Inception | |
SP T. Rowe Price Large-Cap Growth | | 5.91 | % | | 2.21 | % | | –3.18 | % |
Russell 1000® Index | | 15.46 | | | 6.82 | | | 1.63 | |
Russell 1000® Growth Index | | 9.07 | | | 2.69 | | | –5.23 | |
Lipper (VIP) Large Cap Core Funds Avg. | | 6.30 | | | 2.70 | | | –4.17 | |
Portfolio inception: 9/22/2000.
$10,000 INVESTED SINCE INCEPTION
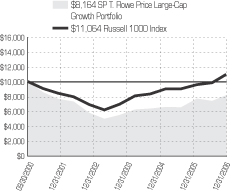
Past performance does not guarantee future returns. Portfolio performance is net of investment fees and fund expenses, but not product charges, which, if included, would significantly lower the performance quoted. The investment return and principal value of an investment will fluctuate, so that an investor’s shares, when redeemed, may be worth more or less than their original cost. Current performance may be lower or higher than the past performance data quoted.
Unless noted otherwise, Lipper Average and Index returns reflect performance beginning the closest month-end date to the Portfolio’s inception. The Russell 1000® and Russell 1000® Growth Indexes are trademarks/service marks of the Frank Russell Company. Russell® is a trademark of the Frank Russell Company. Performance figures may reflect fee waivers and/or expense reimbursements. In the absence of such fee waivers and/or expense reimbursements, total returns would be lower.
For the year ended December 31, 2006, the T. Rowe Price Large-Cap Growth Portfolio had a total return that was below its benchmark index and also below the average return of its peer group, but by a smaller margin.
The Portfolio manager looks for companies larger than $5 billion in market capitalization that are increasing their earnings by at least 10% a year. It is flexible in the valuation (share price in relation to measures of intrinsic value) it will accept, taking sector and market conditions into account. The Portfolio’s current aggressive growth posture was responsible for its underperforming its benchmark in a year that strongly favored value investors. The Portfolio’s performance was further disadvantaged by its greater weighting compared to the benchmark in highly volatile stocks, stocks with above-average acceleration of business fundamentals, and stocks with high share prices.
Stock selection hurt the Portfolio’s performance in the first quarter of 2006, but strengthening selection over the three remaining quarters of the year offset the negative impact. Overall selection was neutral, and on a rising trajectory. It was strongest in the consumer discretionary and energy sectors and weakest in the technology sector.
Prudential Investments LLC (PI), an indirect, wholly owned subsidiary of Prudential Financial, Inc., serves as the investment manager for the Fund.
For average and index definitions, refer to the Glossary of Benchmark Definitions page. Investors cannot invest directly in a market index or average. For a complete list of holdings, refer to the Schedule of Investments section of this report.
Presentation of Portfolio Holdings for the Prudential Series Fund as of December 31 2006 (Unaudited)
| | | | | | | | | | | | | | |
| SP Aggressive Growth Asset Allocation Portfolio | | | | SP AIM Core Equity Portfolio | | | | SP Balanced Asset Allocation Portfolio |
| Five Largest Holdings (% of Net Assets) | | | | Five Largest Holdings (% of Net Assets) | | | | Five Largest Holdings (% of Net Assets) |
| PSF-SP Large Cap Value Portfolio | | 32.9% | | | | Exxon Mobil Corp. | | 2.9% | | | | PSF-SP PIMCO Total Return Portfolio | | 31.5% |
| American Skandia Trust-Marsico Capital Growth Portfolio | | 18.5% | | | | Berkshire Hathaway, Inc. | | 2.6% | | | | PSF-SP Large Cap Value Portfolio | | 21.7% |
| PSF-Jennison Portfolio (Class I) | | 18.3% | | | | AT&T, Inc. | | 2.5% | | | | AST-Marsico Capital Growth Portfolio | | 12.2% |
| PSF-SP International Value Portfolio | | 11.2% | | | | Tyco International Ltd. | | 2.5% | | | | PSF-Jennison Portfolio (Class I) | | 12.1% |
| PSF-SP International Growth Portfolio (Class I) | | 11.1% | | | | Microsoft Corp. | | 2.4% | | | | PSF-SP International Value Portfolio | | 7.4% |
| | | | | | | | | | | | | | |
| SP Conservative Asset Allocation Portfolio | | | | SP Davis Value Portfolio | | | | SP Small Cap Value Portfolio |
| Five Largest Holdings (% of Net Assets) | | | | Five Largest Holdings (% of Net Assets) | | | | Five Largest Holdings (% of Net Assets) |
| PSF-SP PIMCO Total Return Portfolio | | 50.8% | | | | American Express Co. | | 4.6% | | | | iShares Russell 2000 Value Index Fund | | 2.5% |
| PSF-SP Large Cap Value Portfolio | | 14.7% | | | | ConocoPhillips | | 4.5% | | | | Lawson Software, Inc. | | 1.0% |
| American Skandia Trust-Marsico Capital Growth Portfolio | | 8.3% | | | | American International Group, Inc. | | 4.4% | | | | Foundry Networks, Inc. | | 1.0% |
| Jennison Portfolio (Class I) | | 8.2% | | | | Altria Group, Inc. | | 4.4% | | | | Central Pacific Financial Corp. | | 0.9% |
| PSF-SP International Growth Portfolio (Class I) | | 5.0% | | | | Tyco International Ltd. | | 4.2% | | | | Mueller Industries, Inc. | | 0.8% |
| | | | | | | | | | | | | | |
| SP Growth Asset Allocation Portfolio | | | | SP Large Cap Value Portfolio | | | | SP International Value Portfolio |
| Five Largest Holdings (% of Net Assets) | | | | Five Largest Holdings (% of Net Assets) | | | | Five Largest Holdings (% of Net Assets) |
| PSF-SP Large Cap Value Portfolio | | 28.5% | | | | Altria Group, Inc. | | 3.9% | | | | Eni SpA | | 2.4% |
| American Skandia Trust-Marsico Capital Growth Portfolio | | 15.9% | | | | Bank of America Corp. | | 3.4% | | | | Toyota Motor Corp. | | 1.9% |
| PSF Jennison Portfolio (Class I) | | 15.7% | | | | ConocoPhillips | | 3.3% | | | | Roche Holding AG | | 1.9% |
| PSF-SP PIMCO Total Return Portfolio | | 12.9% | | | | Exxon Mobil Corp. | | 3.0% | | | | Barclays PLC | | 1.8% |
| PSF-SP International Value Portfolio | | 9.7% | | | | Citigroup, Inc. | | 2.7% | | | | Next PLC | | 1.7% |
| | | | | | | | | | | | | | |
| SP Mid-Cap Growth Portfolio | | | | SP PIMCO High Yield Portfolio | | | | SP PIMCO Total Return Portfolio |
| Five Largest Holdings (% of Net Assets) | | | | Five Largest Issues (% of Net Assets) | | | | Five Largest Issues (% of Net Assets) |
| Apple Computer, Inc. | | 4.7% | | | | Ford Motor Credit Co. | | 2.2% | | | | Federal National Mortgage Assoc.,
6.0%, 01/11/37 | | 17.3% |
| Akamai Technologies, Inc. | | 3.3% | | | | El Paso Production Holding Co. | | 2.2% | | | | Government National Mortgage Assoc., 6.0%, 01/22/37 | | 8.7% |
| Forest Laboratories, Inc. | | 3.0% | | | | Williams Cos., Inc. | | 1.9% | | | | U.S. Treasury Notes, 4.375%, 11/15/08 | | 7.5% |
| Synopsys, Inc. | | 2.9% | | | | U.S. Treasury Bonds, 7.5%, 11/15/16 | | 1.5% | | | | Federal National Mortgage Assoc.,
5.5%, 11/01/34 | | 4.1% |
| Cognizant Technology Solutions Corp. | | 2.7% | | | | HCA, Inc. | | 1.5% | | | | U.S. Treasury Bonds,
3.375%, 01/15/07 | | 3.7% |
| | | | | | | | | | | | | | |
| SP Prudential U.S. Emerging Growth Portfolio | | | | SP Small Cap Growth Portfolio | | | | SP Strategic Partners Focused Growth Portfolio |
| Five Largest Holdings (% of Net Assets) | | | | Five Largest Holdings (% of Net Assets) | | | | Five Largest Holdings (% of Net Assets) |
| NII Holdings, Inc. | | 3.3% | | | | Bucyrus International, Inc. | | 2.6% | | | | Google, Inc. | | 6.3% |
| Eaton Vance Corp. | | 2.8% | | | | TETRA Technologies, Inc. | | 2.2% | | | | Apple Computer, Inc. | | 6.0% |
| American Tower Corp. | | 2.4% | | | | Waste Connections, Inc. | | 1.9% | | | | Gilead Sciences, Inc. | | 4.6% |
| DaVita, Inc. | | 2.2% | | | | Cash America International, Inc. | | 1.8% | | | | Goldman Sachs Group, Inc. | | 4.2% |
| Quest Diagnostics, Inc. | | 2.0% | | | | FactSet Research Systems, Inc. | | 1.6% | | | | Microsoft Corp. | | 4.1% |
| | | | | | | | |
| SP T. Rowe Price Large Cap Growth Portfolio | | | | SP International Growth Portfolio |
| Five Largest Holdings (% of Net Assets) | | | | Five Largest Holdings (% of Net Assets) |
| General Electric Co. | | 5.3% | | | | ABB Ltd. | | 2.6% |
| Microsoft Corp. | | 3.7% | | | | Tesco PLC | | 2.5% |
| American Tower Corp. | | 3.6% | | | | Roche Holding AG | | 2.4% |
| Juniper Networks, Inc. | | 2.8% | | | | Macquarie Bank Ltd. | | 2.1% |
| State Street Corp. | | 2.6% | | | | Veolia Environment | | 2.1% |
For a complete listing of holdings, refer to the Schedule of Investments section of this report. Holdings reflect only long-term investments. Holdings/Issues/Industries/Sectors are subject to change.
Fees and Expenses (Unaudited)
As a contract owner investing in Portfolios of the Fund through a variable annuity or variable life contract, you incur ongoing costs, including management fees, [distribution and service (12b-1*) fees,] and other Portfolio expenses. This example is intended to help you understand your ongoing costs (in dollars) of investing in the Fund and to compare these costs with the ongoing costs of investing in other investment options. This example does not reflect fees and charges under your variable annuity or variable life contract. If contract charges were included, the costs shown below would be higher. Please consult the prospectus for your contract for more information about contract fees and charges.
*12b-1 fees are paid by the fund out of fund assets to cover distribution expenses and sometimes shareholder service expenses.
The example is based on an investment of $1,000 invested at the beginning of the period and held for the entire period July 1, 2006 through December 31, 2006.
Actual Expenses
The first line of the table below provides information about actual account values and actual expenses. You may use this information, together with the amount you invested, to estimate the Portfolio expenses that you paid over the period. Simply divide your account value by $1,000 (for example, an $8,600 account value divided by $1,000 = 8.6), then multiply the result by the number in the first line under the heading entitled “Expenses Paid During Period” to estimate the Portfolio expenses you paid on your account during this period. As noted above, the table does not reflect variable contract fees and charges.
Hypothetical Example for Comparison Purposes
The second line of the table below provides information about hypothetical account values and hypothetical expenses based on the Portfolio’s actual expense ratio and an assumed rate of return of 5% per year before expenses, which is not the Portfolio’s actual return. The hypothetical account values and expenses may not be used to estimate the actual ending account balance or expenses you paid for the period. You may use this information to compare the ongoing costs of investing in the Portfolio and other investment options. To do so, compare this 5% hypothetical example with the 5% hypothetical examples that appear in the shareholder reports of the other investment options.
Please note that the expenses shown in the table are meant to highlight your ongoing Portfolio costs only and do not reflect any contract fees and charges, such as sales charges (loads), insurance charges or administrative charges. Therefore the second line of the table is useful to compare ongoing investment option costs only, and will not help you determine the relative total costs of owning different contracts. In addition, if these contract fee and charges were included, your costs would have been higher.
| | | | | | | | | | | | | | |
| The Prudential Series Fund Portfolios | | Beginning
Account Value
July 1, 2006 | | Ending
Account Value
December 31, 2006 | | Annualized
Expense Ratio
Based on the
Six-Month Period | | | Expenses Paid
During the Six-
Month Period |
| | | | | | | | | | | | | | | |
| SP Aggressive Growth Asset Allocation (Class I) | | Actual | | $ | 1,000.00 | | $ | 1,114.60 | | 0.05 | % | | $ | 0.27 |
| | Hypothetical | | $ | 1,000.00 | | $ | 1,024.95 | | 0.05 | % | | $ | 0.26 |
| | | | | | | | | | | | | | | |
| SP AIM Core Equity (Class I) | | Actual | | $ | 1,000.00 | | $ | 1,117.40 | | 1.02 | % | | $ | 5.44 |
| | Hypothetical | | $ | 1,000.00 | | $ | 1,020.06 | | 1.02 | % | | $ | 5.19 |
| | | | | | | | | | | | | | | |
| SP Balanced Asset Allocation (Class I) | | Actual | | $ | 1,000.00 | | $ | 1,090.30 | | 0.05 | % | | $ | 0.26 |
| | Hypothetical | | $ | 1,000.00 | | $ | 1,024.95 | | 0.05 | % | | $ | 0.26 |
| | | | | | | | | | | | | | | |
| SP Conservative Asset Allocation (Class I) | | Actual | | $ | 1,000.00 | | $ | 1,073.70 | | 0.05 | % | | $ | 0.26 |
| | Hypothetical | | $ | 1,000.00 | | $ | 1,024.95 | | 0.05 | % | | $ | 0.26 |
| | | | | | | | | | | | | | | |
| SP Davis Value (Class I) | | Actual | | $ | 1,000.00 | | $ | 1,114.30 | | 0.81 | % | | $ | 4.32 |
| | Hypothetical | | $ | 1,000.00 | | $ | 1,021.12 | | 0.81 | % | | $ | 4.13 |
| | | | | | | | | | | | | | | |
| SP Growth Asset Allocation (Class I) | | Actual | | $ | 1,000.00 | | $ | 1,105.90 | | 0.05 | % | | $ | 0.27 |
| | Hypothetical | | $ | 1,000.00 | | $ | 1,024.95 | | 0.05 | % | | $ | 0.26 |
| | | | | | | | | | | | | | | |
| SP Large Cap Value (Class I) | | Actual | | $ | 1,000.00 | | $ | 1,139.20 | | 0.84 | % | | $ | 4.53 |
| | Hypothetical | | $ | 1,000.00 | | $ | 1,020.97 | | 0.84 | % | | $ | 4.28 |
| | | | | | | | | | | | | | | |
| SP International Value (Class I) | | Actual | | $ | 1,000.00 | | $ | 1,150.40 | | 0.98 | % | | $ | 5.31 |
| | Hypothetical | | $ | 1,000.00 | | $ | 1,020.27 | | 0.98 | % | | $ | 4.99 |
| | | | | | | | | | | | | | | |
| | | | | | | | | | | | | | |
| The Prudential Series Fund Portfolios | | Beginning
Account Value
July 1, 2006 | | Ending
Account Value
December 31, 2006 | | Annualized
Expense Ratio
Based on the
Six-Month Period | | | Expenses Paid
During the Six-
Month Period |
| | | | | | | | | | | | | | | |
| SP Mid Cap Growth (Class I) | | Actual | | $ | 1,000.00 | | $ | 1,002.80 | | 0.92 | % | | $ | 4.64 |
| | Hypothetical | | $ | 1,000.00 | | $ | 1,020.57 | | 0.92 | % | | $ | 4.69 |
| | | | | | | | | | | | | | | |
| SP PIMCO High Yield (Class I) | | Actual | | $ | 1,000.00 | | $ | 1,074.90 | | 0.72 | % | | $ | 3.77 |
| | Hypothetical | | $ | 1,000.00 | | $ | 1,021.58 | | 0.72 | % | | $ | 3.67 |
| | | | | | | | | | | | | | | |
| SP PIMCO Total Return (Class I) | | Actual | | $ | 1,000.00 | | $ | 1,045.50 | | 0.68 | % | | $ | 3.51 |
| | Hypothetical | | $ | 1,000.00 | | $ | 1,021.78 | | 0.68 | % | | $ | 3.47 |
| | | | | | | | | | | | | | | |
| SP Prudential US Emerging Growth (Class I) | | Actual | | $ | 1,000.00 | | $ | 1,069.60 | | 0.62 | % | | $ | 3.23 |
| | Hypothetical | | $ | 1,000.00 | | $ | 1,022.08 | | 0.62 | % | | $ | 3.16 |
| | | | | | | | | | | | | | | |
| SP Prudential US Emerging Growth (Class II) | | Actual | | $ | 1,000.00 | | $ | 1,067.10 | | 1.02 | % | | $ | 5.31 |
| | Hypothetical | | $ | 1,000.00 | | $ | 1,020.06 | | 1.02 | % | | $ | 5.19 |
| | | | | | | | | | | | | | | |
| SP Small Cap Growth (Class I) | | Actual | | $ | 1,000.00 | | $ | 1,059.80 | | 1.21 | % | | $ | 6.28 |
| | Hypothetical | | $ | 1,000.00 | | $ | 1,019.11 | | 1.21 | % | | $ | 6.16 |
| | | | | | | | | | | | | | | |
| SP Small Cap Value (Class I) | | Actual | | $ | 1,000.00 | | $ | 1,080.60 | | 0.96 | % | | $ | 5.03 |
| | Hypothetical | | $ | 1,000.00 | | $ | 1,020.37 | | 0.96 | % | | $ | 4.89 |
| | | | | | | | | | | | | | | |
| SP Strategic Partners Focused Growth (Class I) | | Actual | | $ | 1,000.00 | | $ | 1,077.70 | | 1.24 | % | | $ | 6.49 |
| | Hypothetical | | $ | 1,000.00 | | $ | 1,018.95 | | 1.24 | % | | $ | 6.31 |
| | | | | | | | | | | | | | | |
| SP Strategic Partners Focused Growth (Class II) | | Actual | | $ | 1,000.00 | | $ | 1,076.70 | | 1.64 | % | | $ | 8.58 |
| | Hypothetical | | $ | 1,000.00 | | $ | 1,016.94 | | 1.64 | % | | $ | 8.34 |
| | | | | | | | | | | | | | | |
| SP T. Rowe Price Large-Cap Growth (Class I) | | Actual | | $ | 1,000.00 | | $ | 1,099.70 | | 1.07 | % | | $ | 5.66 |
| | Hypothetical | | $ | 1,000.00 | | $ | 1,019.81 | | 1.07 | % | | $ | 5.45 |
| | | | | | | | | | | | | | | |
| SP International Growth (Class I) | | Actual | | $ | 1,000.00 | | $ | 1,151.20 | | 1.01 | % | | $ | 5.48 |
| | Hypothetical | | $ | 1,000.00 | | $ | 1,020.11 | | 1.01 | % | | $ | 5.14 |
| | | | | | | | | | | | | | | |
| SP International Growth (Class II) | | Actual | | $ | 1,000.00 | | $ | 1,149.10 | | 1.41 | % | | $ | 7.64 |
| | Hypothetical | | $ | 1,000.00 | | $ | 1,018.10 | | 1.41 | % | | $ | 7.17 |
| * | Portfolio expenses (net of fee waivers or subsidies, if any) for each share class are equal to the annualized expense ratio for each share class (provided in the table), multiplied by the average account value over the period, multiplied by the 184 days in the six-month period ended December 31, 2006, and divided by the 365 days in the Portfolio’s fiscal year ended December 31, 2006 (to reflect the six-month period). |
| | | | |
| | | SP AGGRESSIVE GROWTH ASSET ALLOCATION PORTFOLIO | | |
STATEMENT OF ASSETS AND LIABILITIES
December 31, 2006
| | | |
| ASSETS | | | |
Affiliated investments, at value (cost $162,435,661) | | $ | 201,565,992 |
Cash | | | 7,109 |
Receivable due from manager | | | 41,722 |
Receivable for Series shares sold | | | 14,566 |
Dividends receivable | | | 1,657 |
| | |
|
|
Total Assets | | | 201,631,046 |
| | |
|
|
| LIABILITIES | | | |
Payable for Series shares repurchased | | | 16,310 |
Management fee payable | | | 8,525 |
| | |
|
|
Total Liabilities | | | 24,835 |
| | |
|
|
| NET ASSETS | | $ | 201,606,211 |
| | |
|
|
Net assets were comprised of: | | | |
Paid-in capital | | $ | 151,679,520 |
Retained earnings | | | 49,926,691 |
| | |
|
|
Net assets, December 31, 2006 | | $ | 201,606,211 |
| | |
|
|
Net asset value and redemption price per share, ($201,606,211 / 19,359,901) outstanding shares of beneficial interest (authorized 100,000,000 shares) | | $ | 10.41 |
| | |
|
|
STATEMENT OF OPERATIONS
Year Ended December 31, 2006
| | | |
| INVESTMENT INCOME | | | |
Affiliated dividend income | | $ | 2,023,720 |
| | |
|
|
| EXPENSES | | | |
Management fee | | | 96,327 |
| | |
|
|
| NET INVESTMENT INCOME | | | 1,927,393 |
| | |
|
|
NET REALIZED AND UNREALIZED GAIN ON
AFFILIATED INVESTMENTS | | | |
Net realized gain on investments | | | 2,740,379 |
Net capital gain distributions received | | | 6,434,530 |
| | |
|
|
| | | | 9,174,909 |
| | |
|
|
Net change in unrealized appreciation (depreciation) on investments | | | 14,717,473 |
| | |
|
|
| NET GAIN ON INVESTMENTS | | | 23,892,382 |
| | |
|
|
| NET INCREASE IN NET ASSETS RESULTING FROM OPERATIONS | | $ | 25,819,775 |
| | |
|
|
STATEMENT OF CHANGES IN NET ASSETS
| | | | | | | | |
| | | Year Ended December 31,
| |
| | | 2006
| | | 2005
| |
| INCREASE (DECREASE) IN NET ASSETS | | | | | | | | |
| OPERATIONS: | | | | | | | | |
Net investment income | | $ | 1,927,393 | | | $ | 3,598,888 | |
Net realized gain on investments | | | 9,174,909 | | | | 4,624,615 | |
Net change in unrealized appreciation (depreciation) on investments | | | 14,717,473 | | | | 8,995,478 | |
| | |
|
|
| |
|
|
|
NET INCREASE IN NET ASSETS RESULTING FROM OPERATIONS | | | 25,819,775 | | | | 17,218,981 | |
| | |
|
|
| |
|
|
|
| DIVIDENDS AND DISTRIBUTIONS: | | | | | | | | |
Dividends from net investment income | | | — | | | | (255,254 | ) |
Distributions from net realized capital gains | | | — | | | | (5,750,072 | ) |
Distributions | | | (8,113,969 | ) | | | — | |
| | |
|
|
| |
|
|
|
TOTAL DIVIDENDS AND DISTRIBUTIONS | | | (8,113,969 | ) | | | (6,005,326 | ) |
| | |
|
|
| |
|
|
|
| SERIES SHARE TRANSACTIONS: | | | | | | | | |
Series shares sold [2,144,659 and 6,021,182 shares, respectively] | | | 20,790,257 | | | | 53,233,551 | |
Series shares issued in reinvestment of dividends and distributions [843,448 and 720,063 shares, respectively] | | | 8,113,969 | | | | 6,005,326 | |
Series shares repurchased [3,440,817 and 2,179,013 shares, respectively] | | | (33,216,872 | ) | | | (19,146,944 | ) |
| | |
|
|
| |
|
|
|
NET INCREASE (DECREASE) IN NET ASSETS RESULTING FROM SERIES SHARE TRANSACTIONS | | | (4,312,646 | ) | | | 40,091,933 | |
| | |
|
|
| |
|
|
|
| TOTAL INCREASE IN NET ASSETS | | | 13,393,160 | | | | 51,305,588 | |
| NET ASSETS: | | | | | | | | |
Beginning of year | | | 188,213,051 | | | | 136,907,463 | |
| | |
|
|
| |
|
|
|
End of year | | $ | 201,606,211 | | | $ | 188,213,051 | (a) |
| | |
|
|
| |
|
|
|
(a) Includes undistributed net investment income of: | | | | | | $ | 3,598,037 | |
| | | | | | |
|
|
|
SEE NOTES TO FINANCIAL STATEMENTS.
A1
| | | | |
| | | SP AIM CORE EQUITY PORTFOLIO | | |
STATEMENT OF ASSETS AND LIABILITIES
December 31, 2006
| | | |
| ASSETS | | | |
Investments at value: | | | |
Unaffiliated investments (cost $28,173,897) | | $ | 33,914,285 |
Affiliated investments (cost $3,879,442) | | | 3,879,442 |
Foreign currency, at value (cost $1) | | | 1 |
Dividends and interest receivable | | | 55,372 |
Receivable for Series shares sold | | | 48,612 |
Tax reclaim receivable | | | 7,450 |
Prepaid expenses | | | 2,031 |
| | |
|
|
Total Assets | | | 37,907,193 |
| | |
|
|
| LIABILITIES | | | |
Payable for Series shares repurchased | | | 9,837 |
Management fee payable | | | 8,618 |
Payable to custodian | | | 5,069 |
Deferred trustees’ fees | | | 2,032 |
Transfer agent fee payable | | | 540 |
| | |
|
|
Total Liabilities | | | 26,096 |
| | |
|
|
| NET ASSETS | | $ | 37,881,097 |
| | |
|
|
Net assets were comprised of: | | | |
Paid-in capital | | $ | 31,487,892 |
Retained earnings | | | 6,393,205 |
| | |
|
|
Net assets, December 31, 2006 | | $ | 37,881,097 |
| | |
|
|
Net asset value and redemption price per share,
$37,881,097 / 4,577,526 outstanding shares of
beneficial interest (authorized 100,000,000 shares) | | $ | 8.28 |
| | |
|
|
STATEMENT OF OPERATIONS
Year Ended December 31, 2006
| | | | |
| INVESTMENT INCOME | | | | |
Unaffiliated dividend income (net of $15,930 foreign withholding tax) | | $ | 564,014 | |
Affiliated dividend income | | | 225,466 | |
| | |
|
|
|
| | | | 789,480 | |
| | |
|
|
|
| EXPENSES | | | | |
Management fee | | | 301,787 | |
Custodian’s fees and expenses | | | 58,000 | |
Shareholders’ reports | | | 40,000 | |
Audit fee | | | 15,000 | |
Trustees’ fees | | | 11,000 | |
Legal fees and expenses | | | 9,000 | |
Transfer agent’s fees and expenses (including
affiliated expense of $3,300) (Note 4) | | | 6,000 | |
Insurance expenses | | | 1,000 | |
Commitment fee on syndicated credit agreement | | | 150 | |
Miscellaneous | | | 16,745 | |
| | |
|
|
|
Total expenses | | | 458,682 | |
Less: advisory fee waivers and/or expense reimbursements | | | (95,795 | ) |
| | |
|
|
|
Net expenses | | | 362,887 | |
| | |
|
|
|
| NET INVESTMENT INCOME | | | 426,593 | |
| | |
|
|
|
| NET REALIZED AND UNREALIZED GAIN (LOSS) ON INVESTMENTS AND FOREIGN CURRENCIES | | | | |
Net realized gain (loss) on: | | | | |
Investment transactions | | | 389,460 | |
Options written | | | (10,131 | ) |
Foreign currency transactions | | | 718 | |
| | |
|
|
|
| | | | 380,047 | |
| | |
|
|
|
Net change in unrealized appreciation (depreciation) on: | | | | |
Investments | | | 4,440,481 | |
Options written | | | 30,696 | |
Foreign currencies | | | 374 | |
| | |
|
|
|
| | | | 4,471,551 | |
| | |
|
|
|
| NET GAIN ON INVESTMENTS AND FOREIGN CURRENCIES | | | 4,851,598 | |
| | |
|
|
|
| NET INCREASE IN NET ASSETS RESULTING FROM OPERATIONS | | $ | 5,278,191 | |
| | |
|
|
|
STATEMENT OF CHANGES IN NET ASSETS
| | | | | | | | |
| | | Year Ended December 31,
| |
| | | 2006
| | | 2005
| |
| INCREASE (DECREASE) IN NET ASSETS | | | | | | | | |
| OPERATIONS: | | | | | | | | |
Net investment income | | $ | 426,593 | | | $ | 326,716 | |
Net realized gain on investments and foreign currency transactions | | | 380,047 | | | | 2,261,732 | |
Net change in unrealized appreciation (depreciation) on investments and foreign currencies | | | 4,471,551 | | | | (1,038,048 | ) |
| | |
|
|
| |
|
|
|
NET INCREASE IN NET ASSETS RESULTING FROM OPERATIONS | | | 5,278,191 | | | | 1,550,400 | |
| | |
|
|
| |
|
|
|
| DIVIDENDS AND DISTRIBUTIONS: | | | | | | | | |
Dividends from net investment income | | | — | | | | (337,615 | ) |
Distributions | | | (2,267,062 | ) | | | — | |
| | |
|
|
| |
|
|
|
TOTAL DIVIDENDS AND DISTRIBUTIONS | | | (2,267,062 | ) | | | (337,615 | ) |
| | |
|
|
| |
|
|
|
| SERIES SHARE TRANSACTIONS (NOTE 7): | | | | | | | | |
Series shares sold [592,562 and 848,731 shares, respectively] | | | 4,594,030 | | | | 6,198,927 | |
Series shares issued in reinvestment of dividends and distributions [300,671 and 47,087 shares, respectively] | | | 2,267,062 | | | | 337,615 | |
Series shares repurchased [807,651 and 730,652 shares, respectively] | | | (6,219,674 | ) | | | (5,361,373 | ) |
| | |
|
|
| |
|
|
|
NET INCREASE IN NET ASSETS RESULTING FROM SERIES SHARE TRANSACTIONS | | | 641,418 | | | | 1,175,169 | |
| | |
|
|
| |
|
|
|
| TOTAL INCREASE IN NET ASSETS | | | 3,652,547 | | | | 2,387,954 | |
| NET ASSETS: | | | | | | | | |
Beginning of year | | | 34,228,550 | | | | 31,840,596 | |
| | |
|
|
| |
|
|
|
End of year | | $ | 37,881,097 | | | $ | 34,228,550 | (a) |
| | |
|
|
| |
|
|
|
(a) Includes undistributed net investment income of | | | | | | $ | 317,783 | |
| | | | | | |
|
|
|
SEE NOTES TO FINANCIAL STATEMENTS.
A2
| | | | |
| | | SP BALANCED ASSET ALLOCATION PORTFOLIO | | |
STATEMENT OF ASSETS AND LIABILITIES
December 31, 2006
| | | |
| ASSETS | | | |
Affiliated investments, at value (cost $1,233,204,248) | | $ | 1,406,982,913 |
Cash | | | 6,738 |
Receivable for Series shares sold | | | 155,841 |
Receivable due from manager | | | 75,142 |
Dividends receivable | | | 14,399 |
| | |
|
|
Total Assets | | | 1,407,235,033 |
| | |
|
|
| LIABILITIES | | | |
Payable for Series shares repurchased | | | 863,966 |
Management fee payable | | | 59,713 |
| | |
|
|
Total Liabilities | | | 923,679 |
| | |
|
|
| NET ASSETS | | $ | 1,406,311,354 |
| | |
|
|
Net assets were comprised of: | | | |
Paid-in capital | | $ | 1,164,789,020 |
Retained earnings | | | 241,522,334 |
| | |
|
|
Net assets, December 31, 2006 | | $ | 1,406,311,354 |
| | |
|
|
Net asset value and redemption price per share, $1,406,311,354 / 121,340,906 outstanding shares of beneficial interest (authorized 225,000,000 shares) | | $ | 11.59 |
| | |
|
|
STATEMENT OF OPERATIONS
Year Ended December 31, 2006
| | | |
| INVESTMENT INCOME | | | |
Affiliated dividend income | | $ | 31,435,078 |
| | |
|
|
| EXPENSES | | | |
Management fee | | | 690,390 |
| | |
|
|
| NET INVESTMENT INCOME | | | 30,744,688 |
| | |
|
|
NET REALIZED AND UNREALIZED GAIN ON
AFFILIATED INVESTMENTS | | | |
Net realized gain on investments | | | 9,213,914 |
Net capital gain distributions received | | | 29,251,519 |
| | |
|
|
| | | | 38,465,433 |
| | |
|
|
Net change in unrealized appreciation (depreciation) on investments | | | 70,777,842 |
| | |
|
|
| NET GAIN ON INVESTMENTS | | | 109,243,275 |
| | |
|
|
| NET INCREASE IN NET ASSETS RESULTING FROM OPERATIONS | | $ | 139,987,963 |
| | |
|
|
STATEMENT OF CHANGES IN NET ASSETS
| | | | | | | | |
| | | Year Ended December 31,
| |
| | | 2006
| | | 2005
| |
| INCREASE (DECREASE) IN NET ASSETS | | | | | | | | |
| OPERATIONS: | | | | | | | | |
Net investment income | | $ | 30,744,688 | | | $ | 35,724,076 | |
Net realized gain on investments | | | 38,465,433 | | | | 23,316,866 | |
Net change in unrealized appreciation (depreciation) on investments | | | 70,777,842 | | | | 28,223,666 | |
| | |
|
|
| |
|
|
|
NET INCREASE IN NET ASSETS RESULTING FROM OPERATIONS | | | 139,987,963 | | | | 87,264,608 | |
| | |
|
|
| |
|
|
|
| DIVIDENDS AND DISTRIBUTIONS: | | | | | | | | |
Dividends from net investment income | | | — | | | | (8,722,666 | ) |
Distributions from net realized capital gains | | | — | | | | (30,988,808 | ) |
Distributions | | | (58,270,528 | ) | | | — | |
| | |
|
|
| |
|
|
|
TOTAL DIVIDENDS AND DISTRIBUTIONS | | | (58,270,528 | ) | | | (39,711,474 | ) |
| | |
|
|
| |
|
|
|
| SERIES SHARE TRANSACTIONS: | | | | | | | | |
Series shares sold [8,743,179 and 53,729,204 shares, respectively] | | | 96,425,347 | | | | 561,157,881 | |
Series shares issued in reinvestment of dividends and distributions [5,365,610 and 3,999,141 shares, respectively] | | | 58,270,528 | | | | 39,711,474 | |
Series shares repurchased [18,390,492 and 10,868,002 shares, respectively] | | | (201,870,744 | ) | | | (113,645,767 | ) |
| | |
|
|
| |
|
|
|
NET INCREASE (DECREASE) IN NET ASSETS RESULTING FROM SERIES SHARE TRANSACTIONS | | | (47,174,869 | ) | | | 487,223,588 | |
| | |
|
|
| |
|
|
|
| TOTAL INCREASE IN NET ASSETS | | | 34,542,566 | | | | 534,776,722 | |
| NET ASSETS: | | | | | | | | |
Beginning of year | | | 1,371,768,788 | | | | 836,992,066 | |
| | |
|
|
| |
|
|
|
End of year | | $ | 1,406,311,354 | | | $ | 1,371,768,788 | (a) |
| | |
|
|
| |
|
|
|
(a) Includes undistributed net investment income of: | | | | | | $ | 35,724,076 | |
| | | | | | |
|
|
|
SEE NOTES TO FINANCIAL STATEMENTS.
A3
| | | | |
| | | SP CONSERVATIVE ASSET ALLOCATION PORTFOLIO | | |
STATEMENT OF ASSETS AND LIABILITIES
December 31, 2006
| | | |
| ASSETS | | | |
Affiliated Investments, at value (cost $582,469,620) | | $ | 633,033,549 |
Cash | | | 6,765 |
Receivables due from manager | | | 54,599 |
Receivable for Series shares sold | | | 16,756 |
Dividends receivable | | | 8,674 |
| | |
|
|
Total Assets | | | 633,120,343 |
| | |
|
|
| LIABILITIES | | | |
Payable for Series shares repurchased | | | 303,896 |
Management fee payable | | | 27,014 |
| | |
|
|
Total Liabilities | | | 330,910 |
| | |
|
|
| NET ASSETS | | $ | 632,789,433 |
| | |
|
|
Net assets were comprised of: | | | |
Paid-in capital | | $ | 550,792,343 |
Retained earnings | | | 81,997,090 |
| | |
|
|
Net assets, December 31, 2006 | | $ | 632,789,433 |
| | |
|
|
Net asset value and redemption price per share, $632,789,433 / 54,270,425 outstanding shares of beneficial interest (authorized 140,000,000 shares) | | $ | 11.66 |
| | |
|
|
STATEMENT OF OPERATIONS
Year Ended December 31, 2006
| | | |
| INVESTMENT INCOME | | | |
Affiliated dividend income | | $ | 18,968,833 |
| | |
|
|
| EXPENSES | | | |
Management fee | | | 316,953 |
| | |
|
|
| NET INVESTMENT INCOME | | | 18,651,880 |
| | |
|
|
NET REALIZED AND UNREALIZED GAIN ON
AFFILIATED INVESTMENTS | | | |
Net realized gain on investments | | | 4,133,462 |
Net capital gain distributions received | | | 9,335,160 |
| | |
|
|
| | | | 13,468,622 |
| | |
|
|
Net change in unrealized appreciation (depreciation) on investments | | | 20,212,384 |
| | |
|
|
| NET GAIN ON INVESTMENTS | | | 33,681,006 |
| | |
|
|
| NET INCREASE IN NET ASSETS RESULTING FROM OPERATIONS | | $ | 52,332,886 |
| | |
|
|
STATEMENT OF CHANGES IN NET ASSETS
| | | | | | | | |
| | | Year Ended December 31,
| |
| | | 2006
| | | 2005
| |
| INCREASE (DECREASE) IN NET ASSETS | | | | | | | | |
| OPERATIONS: | | | | | | | | |
Net investment income | | $ | 18,651,880 | | | $ | 22,043,773 | |
Net realized gain on investments | | | 13,468,622 | | | | 10,154,313 | |
Net change in unrealized appreciation (depreciation) on investments | | | 20,212,384 | | | | 1,938,451 | |
| | |
|
|
| |
|
|
|
NET INCREASE IN NET ASSETS RESULTING FROM OPERATIONS | | | 52,332,886 | | | | 34,136,537 | |
| | |
|
|
| |
|
|
|
| DIVIDENDS AND DISTRIBUTIONS: | | | | | | | | |
Dividends from net investment income | | | — | | | | (6,843,974 | ) |
Distributions from net realized capital gains | | | — | | | | (16,727,447 | ) |
Distributions | | | (31,649,902 | ) | | | — | |
| | |
|
|
| |
|
|
|
TOTAL DIVIDENDS AND DISTRIBUTIONS | | | (31,649,902 | ) | | | (23,571,421 | ) |
| | |
|
|
| |
|
|
|
| CAPITAL STOCK TRANSACTIONS: | | | | | | | | |
Series shares sold (3,731,103 and 21,064,032 shares, respectively) | | | 41,820,894 | | | | 229,842,764 | |
Series shares issued in reinvestment of dividends and distributions (2,869,438 and 2,251,330 shares, respectively) | | | 31,649,902 | | | | 23,571,421 | |
Series shares repurchased (9,218,672 and 7,482,435 shares, respectively) | | | (103,341,968 | ) | | | (81,869,348 | ) |
| | |
|
|
| |
|
|
|
NET INCREASE (DECREASE) IN NET ASSETS RESULTING FROM SERIES SHARE TRANSACTIONS | | | (29,871,172 | ) | | | 171,544,837 | |
| | |
|
|
| |
|
|
|
| TOTAL INCREASE (DECREASE) IN NET ASSETS | | | (9,188,188 | ) | | | 182,109,953 | |
| NET ASSETS: | | | | | | | | |
Beginning of year | | | 641,977,621 | | | | 459,867,668 | |
| | |
|
|
| |
|
|
|
End of year | | $ | 632,789,433 | | | $ | 641,977,621 | (a) |
| | |
|
|
| |
|
|
|
(a) Includes undistributed net investment income of: | | | | | | $ | 22,042,744 | |
| | | | | | |
|
|
|
SEE NOTES TO FINANCIAL STATEMENTS.
A4
STATEMENT OF ASSETS AND LIABILITIES
December 31, 2006
| | | |
| ASSETS | | | |
Investments at value, including securities on loan of $19,725,056: | | | |
Unaffiliated investments (cost $224,599,148) | | $ | 323,618,933 |
Affiliated investments (cost $23,596,395) | | | 23,596,395 |
Receivable for investments sold | | | 1,375,919 |
Dividends and interest receivable | | | 412,829 |
Receivable for Series shares sold | | | 25,118 |
Tax reclaim receivable | | | 24,551 |
Prepaid expenses | | | 6,833 |
| | |
|
|
Total Assets | | | 349,060,578 |
| | |
|
|
| LIABILITIES | | | |
Collateral for securities on loan | | | 20,533,022 |
Management fee payable | | | 208,670 |
Payable for investments purchased | | | 154,025 |
Payable for Series shares repurchased | | | 143,546 |
Accrued expenses and other liabilities | | | 42,307 |
Payable to custodian | | | 4,233 |
Deferred trustees’ fees | | | 2,580 |
Transfer agent fee payable | | | 750 |
| | |
|
|
Total Liabilities | | | 21,089,133 |
| | |
|
|
| NET ASSETS | | $ | 327,971,445 |
| | |
|
|
Net assets were comprised of: | | | |
Paid-in capital | | $ | 215,941,041 |
Retained earnings | | | 112,030,404 |
| | |
|
|
Net assets, December 31, 2006 | | $ | 327,971,445 |
| | |
|
|
Net asset value and redemption price per share, $327,971,445 / 27,353,372 outstanding shares of beneficial interest (authorized 225,000,000 shares) | | $ | 11.99 |
| | |
|
|
STATEMENT OF OPERATIONS
Year Ended December 31, 2006
| | | |
| INVESTMENT INCOME | | | |
Unaffiliated dividend income (net of $33,100 foreign withholding tax) | | $ | 4,839,974 |
Affiliated dividend income | | | 195,709 |
Affiliated income from securities lending, net | | | 38,605 |
Unaffiliated interest | | | 2,463 |
| | |
|
|
| | | | 5,076,751 |
| | |
|
|
| EXPENSES | | | |
Management fee | | | 2,348,026 |
Custodian’s fees and expenses | | | 91,000 |
Shareholders’ reports | | | 35,000 |
Trustees’ fees | | | 16,000 |
Audit fee | | | 15,000 |
Insurance expenses | | | 9,000 |
Legal fees and expenses | | | 8,000 |
Transfer agent’s fees and expenses (including affiliated expense of $4,000) (Note 4) | | | 4,000 |
Loan interest expense (Note 8) | | | 1,860 |
Commitment fee on syndicated credit agreement | | | 1,500 |
Miscellaneous | | | 14,491 |
| | |
|
|
Total expenses | | | 2,543,877 |
| | |
|
|
| NET INVESTMENT INCOME | | | 2,532,874 |
| | |
|
|
| NET REALIZED AND UNREALIZED GAIN (LOSS) ON INVESTMENTS AND FOREIGN CURRENCIES | | | |
Net realized gain on: | | | |
Investment transactions | | | 10,716,129 |
Foreign currency transactions | | | 377 |
| | |
|
|
| | | | 10,716,506 |
| | |
|
|
Net change in unrealized appreciation (depreciation) on: | | | |
Investments | | | 30,814,869 |
Foreign currencies | | | 2,393 |
| | |
|
|
| | | | 30,817,262 |
| | |
|
|
| NET GAIN ON INVESTMENTS AND FOREIGN CURRENCIES | | | 41,533,768 |
| | |
|
|
| NET INCREASE IN NET ASSETS RESULTING FROM OPERATIONS | | $ | 44,066,642 |
| | |
|
|
STATEMENT OF CHANGES IN NET ASSETS
| | | | | | | | |
| | | Year Ended December 31,
| |
| | | 2006
| | | 2005
| |
| INCREASE (DECREASE) IN NET ASSETS | | | | | | | | |
| OPERATIONS: | | | | | | | | |
Net investment income | | $ | 2,532,874 | | | $ | 2,559,984 | |
Net realized gain on investments and foreign currencies | | | 10,716,506 | | | | 5,920,125 | |
Net change in unrealized appreciation (depreciation) on investments and foreign currencies | | | 30,817,262 | | | | 18,783,975 | |
| | |
|
|
| |
|
|
|
NET INCREASE IN NET ASSETS RESULTING FROM OPERATIONS | | | 44,066,642 | | | | 27,264,084 | |
| | |
|
|
| |
|
|
|
| DIVIDENDS AND DISTRIBUTIONS: | | | | | | | | |
Dividends from net investment income | | | — | | | | (2,694,772 | ) |
Distributions from net realized gains | | | — | | | | (29,342,603 | ) |
Distributions | | | (7,711,471 | ) | | | — | |
| | |
|
|
| |
|
|
|
TOTAL DIVIDENDS AND DISTRIBUTIONS | | | (7,711,471 | ) | | | (32,037,375 | ) |
| | |
|
|
| |
|
|
|
| SERIES SHARE TRANSACTIONS (NOTE 7): | | | | | | | | |
Series shares sold [2,724,387 and 3,740,896 shares, respectively] | | | 29,848,117 | | | | 38,659,851 | |
Series shares issued in reinvestment of dividends and distributions [714,025 and 3,337,227 shares, respectively] | | | 7,711,471 | | | | 32,037,375 | |
Series shares repurchased [5,281,525 and 3,887,912 shares, respectively] | | | (57,687,525 | ) | | | (39,651,019 | ) |
| | |
|
|
| |
|
|
|
NET INCREASE (DECREASE) IN NET ASSETS RESULTING FROM SERIES SHARE TRANSACTIONS | | | (20,127,937 | ) | | | 31,046,207 | |
| | |
|
|
| |
|
|
|
| TOTAL INCREASE IN NET ASSETS | | | 16,227,234 | | | | 26,272,916 | |
| NET ASSETS: | | | | | | | | |
Beginning of year | | | 311,744,211 | | | | 285,471,295 | |
| | |
|
|
| |
|
|
|
End of year | | $ | 327,971,445 | | | $ | 311,744,211 | (a) |
| | |
|
|
| |
|
|
|
(a) Includes undistributed net investment income of | | | | | | $ | 2,547,146 | |
| | | | | | |
|
|
|
SEE NOTES TO FINANCIAL STATEMENTS.
A5
| | | | |
| | | SP GROWTH ASSET ALLOCATION PORTFOLIO | | |
STATEMENT OF ASSETS AND LIABILITIES
December 31, 2006
| | | |
| ASSETS | | | |
Affiliated investments, at value (cost $1,078,161,822) | | $ | 1,284,172,825 |
Cash | | | 6,615 |
Receivable for Series shares sold | | | 232,709 |
Receivable due from manager | | | 70,482 |
Dividends receivable | | | 9,649 |
| | |
|
|
Total Assets | | | 1,284,492,280 |
| | |
|
|
| LIABILITIES | | | |
Payable for Series shares repurchased | | | 538,591 |
Management fee payable | | | 54,428 |
| | |
|
|
Total Liabilities | | | 593,019 |
| | |
|
|
| NET ASSETS | | $ | 1,283,899,261 |
| | |
|
|
Net assets were comprised of: | | | |
Paid-in capital | | $ | 1,016,689,518 |
Retained earnings | | | 267,209,743 |
| | |
|
|
Net assets, December 31, 2006 | | $ | 1,283,899,261 |
| | |
|
|
Net asset value and redemption price per share, (1,283,899,261 / 114,983,569) outstanding shares of beneficial interest (authorized 150,000,000 shares) | | $ | 11.17 |
| | |
|
|
STATEMENT OF OPERATIONS
Year Ended December 31, 2006
| | | |
| INVESTMENT INCOME | | | |
Affiliated dividend income | | $ | 19,303,001 |
| | |
|
|
| EXPENSES | | | |
Management fee | | | 622,119 |
| | |
|
|
| NET INVESTMENT INCOME | | | 18,680,882 |
| | |
|
|
NET REALIZED AND UNREALIZED GAIN ON
AFFILIATED INVESTMENTS | | | |
Net realized gain on investments | | | 8,576,807 |
Net capital gain distributions received | | | 35,352,134 |
| | |
|
|
| | | | 43,928,941 |
| | |
|
|
Net change in unrealized appreciation (depreciation) on investments | | | 87,976,514 |
| | |
|
|
| NET GAIN ON INVESTMENTS | | | 131,905,455 |
| | |
|
|
| NET INCREASE IN NET ASSETS RESULTING FROM OPERATIONS | | $ | 150,586,337 |
| | |
|
|
STATEMENT OF CHANGES IN NET ASSETS
| | | | | | | | |
| | | Year Ended December 31,
| |
| | | 2006
| | | 2005
| |
| INCREASE (DECREASE) IN NET ASSETS | | | | | | | | |
| OPERATIONS: | | | | | | | | |
Net investment income | | $ | 18,680,882 | | | $ | 23,268,793 | |
Net realized gain on investments | | | 43,928,941 | | | | 19,853,371 | |
Net change in unrealized appreciation (depreciation) on investments | | | 87,976,514 | | | | 47,018,734 | |
| | |
|
|
| |
|
|
|
NET INCREASE IN NET ASSETS RESULTING FROM OPERATIONS | | | 150,586,337 | | | | 90,140,898 | |
| | |
|
|
| |
|
|
|
| DIVIDENDS AND DISTRIBUTIONS: | | | | | | | | |
Dividends from net investment income | | | — | | | | (4,573,235 | ) |
Distributions from net realized capital gains | | | — | | | | (26,358,243 | ) |
Distributions | | | (41,746,770 | ) | | | — | |
| | |
|
|
| |
|
|
|
TOTAL DIVIDENDS AND DISTRIBUTIONS | | | (41,746,770 | ) | | | (30,931,478 | ) |
| | |
|
|
| |
|
|
|
| SERIES SHARE TRANSACTIONS: | | | | | | | | |
Series shares sold [10,842,004 and 57,444,052 shares, respectively] | | | 113,640,623 | | | | 555,197,559 | |
Series shares issued in reinvestment of dividends and distributions [4,029,611 and 3,391,609 shares, respectively] | | | 41,746,770 | | | | 30,931,478 | |
Series shares repurchased [18,418,048 and 9,905,250 shares, respectively] | | | (192,330,963 | ) | | | (96,007,437 | ) |
| | |
|
|
| |
|
|
|
NET INCREASE (DECREASE) IN NET ASSETS RESULTING FROM SERIES SHARE TRANSACTIONS | | | (36,943,570 | ) | | | 490,121,600 | |
| | |
|
|
| |
|
|
|
| TOTAL INCREASE IN NET ASSETS | | | 71,895,997 | | | | 549,331,020 | |
| NET ASSETS: | | | | | | | | |
Beginning of year | | | 1,212,003,264 | | | | 662,672,244 | |
| | |
|
|
| |
|
|
|
End of year | | $ | 1,283,899,261 | | | $ | 1,212,003,264 | (a) |
| | |
|
|
| |
|
|
|
(a) Includes undistributed net investment income of: | | | | | | $ | 23,268,793 | |
| | | | | | |
|
|
|
SEE NOTES TO FINANCIAL STATEMENTS.
A6
| | | | |
| | | SP INTERNATIONAL GROWTH PORTFOLIO | | |
STATEMENT OF ASSETS AND LIABILITIES
December 31, 2006
| | | |
| ASSETS | | | |
Investments at value, including securities on loan of $4,696,799: | | | |
Unaffiliated investments (cost $371,795,349) | | $ | 473,202,675 |
Affiliated investments (cost $10,070,881) | | | 10,070,881 |
Cash | | | 1,767,237 |
Receivable for investments sold | | | 1,825,774 |
Tax reclaim receivable | | | 425,436 |
Dividends and interest receivable | | | 364,095 |
Receivable for Series shares sold | | | 125,116 |
Prepaid expenses | | | 6,286 |
Unrealized appreciation on foreign currency forward contracts | | | 66 |
| | |
|
|
Total Assets | | | 487,787,566 |
| | |
|
|
| LIABILITIES | | | |
Collateral for securities on loan | | | 4,956,944 |
Payable for investments purchased | | | 1,898,327 |
Payable for Series shares repurchased | | | 609,029 |
Management fee payable | | | 341,797 |
Accrued expenses and other liabilities | | | 155,294 |
Foreign currency, at value (cost $33,389) | | | 33,053 |
Administration fee payable | | | 6,686 |
Transfer agent fee payable | | | 842 |
| | |
|
|
Total Liabilities | | | 8,001,972 |
| | |
|
|
| NET ASSETS | | $ | 479,785,594 |
| | |
|
|
Net assets were comprised of: | | | |
Paid-in capital | | $ | 312,355,718 |
Retained earnings | | | 167,429,876 |
| | |
|
|
Net assets, December 31, 2006 | | $ | 479,785,594 |
| | |
|
|
| Class I: | | | |
Net asset value and redemption price per share,
$455,961,249 / 54,947,312 outstanding shares of
beneficial interest (authorized 100,000,000 shares) | | $ | 8.30 |
| | |
|
|
| Class II: | | | |
Net asset value and redemption price per share,
$23,824,345 / 2,915,261 outstanding shares of
beneficial interest (authorized 150,000,000 shares) | | $ | 8.17 |
| | |
|
|
STATEMENT OF OPERATIONS
Year Ended December 31, 2006
| | | | |
| INVESTMENT INCOME | | | | |
Unaffiliated dividend income (net of $802,597 foreign withholding tax) | | $ | 7,575,135 | |
Affiliated dividend income | | | 675,429 | |
Affiliated income from securities lending, net | | | 3,237 | |
| | |
|
|
|
| | | | 8,253,801 | |
| | |
|
|
|
| EXPENSES | | | | |
Management fee | | | 4,216,574 | |
Distribution fee—Class II | | | 59,592 | |
Administration fee—Class II | | | 35,755 | |
Custodian’s fees and expenses | | | 379,000 | |
Shareholders’ reports | | | 87,000 | |
Loan interest expense (Note 8) | | | 41,307 | |
Audit fee | | | 20,000 | |
Trustees’ fees | | | 18,000 | |
Transfer agent’s fees and expenses (including affiliated expense of $5,200) (Note 4) | | | 13,000 | |
Legal fees and expenses | | | 10,000 | |
Insurance expenses | | | 6,000 | |
Commitment fee on syndicated credit agreement | | | 2,500 | |
Miscellaneous | | | 32,067 | |
| | |
|
|
|
Total expenses | | | 4,920,795 | |
| | |
|
|
|
| NET INVESTMENT INCOME | | | 3,333,006 | |
| | |
|
|
|
| NET REALIZED AND UNREALIZED GAIN (LOSS) ON INVESTMENTS AND FOREIGN CURRENCIES | | | | |
Net realized gain (loss) on: | | | | |
Investment transactions | | | 73,002,654 | |
Foreign currency transactions | | | (1,482,698 | ) |
| | |
|
|
|
| | | | 71,519,956 | |
| | |
|
|
|
Net change in unrealized appreciation (depreciation) on: | | | | |
Investments | | | 16,595,234 | |
Foreign currencies | | | (34,031 | ) |
| | |
|
|
|
| | | | 16,561,203 | |
| | |
|
|
|
| NET GAIN ON INVESTMENTS AND FOREIGN CURRENCIES | | | 88,081,159 | |
| | |
|
|
|
| NET INCREASE IN NET ASSETS RESULTING FROM OPERATIONS | | $ | 91,414,165 | |
| | |
|
|
|
STATEMENT OF CHANGES IN NET ASSETS
| | | | | | | | |
| | | Year Ended December 31,
| |
| | | 2006
| | | 2005
| |
| INCREASE (DECREASE) IN NET ASSETS | | | | | | | | |
| OPERATIONS: | | | | | | | | |
Net investment income | | $ | 3,333,006 | | | $ | 2,643,486 | |
Net realized gain on investments and foreign currencies | | | 71,519,956 | | | | 37,716,469 | |
Net change in unrealized appreciation (depreciation) on investments and foreign currencies | | | 16,561,203 | | | | 28,138,819 | |
| | |
|
|
| |
|
|
|
NET INCREASE IN NET ASSETS RESULTING FROM OPERATIONS | | | 91,414,165 | | | | 68,498,774 | |
| | |
|
|
| |
|
|
|
| DIVIDENDS AND DISTRIBUTIONS: | | | | | | | | |
Dividends from net investment income | | | | | | | | |
Class I | | | — | | | | (1,667,899 | ) |
Class II | | | — | | | | (307,445 | ) |
Distributions from net realized gains | | | | | | | | |
Class I | | | — | | | | (12,334,591 | ) |
Class II | | | — | | | | (6,312,964 | ) |
Distributions | | | | | | | | |
Class I | | | (45,416,833 | ) | | | — | |
Class II | | | (2,301,316 | ) | | | — | |
| | |
|
|
| |
|
|
|
TOTAL DIVIDENDS AND DISTRIBUTIONS | | | (47,718,149 | ) | | | (20,622,899 | ) |
| | |
|
|
| |
|
|
|
| SERIES SHARE TRANSACTIONS (NOTE 7): | | | | | | | | |
Series shares sold [11,881,106 and 28,946,819 shares, respectively] | | | 90,213,315 | | | | 194,846,073 | |
Series shares issued in reinvestment of dividends and distributions [6,452,228 and 3,249,051 shares, respectively] | | | 47,718,149 | | | | 20,622,899 | |
Series shares repurchased [23,645,208 and 25,901,671 shares, respectively] | | | (178,494,583 | ) | | | (174,768,199 | ) |
| | |
|
|
| |
|
|
|
NET INCREASE (DECREASE) IN NET ASSETS RESULTING FROM SERIES SHARE TRANSACTIONS | | | (40,563,119 | ) | | | 40,700,773 | |
| | |
|
|
| |
|
|
|
| TOTAL INCREASE IN NET ASSETS | | | 3,132,897 | | �� | | 88,576,648 | |
| NET ASSETS: | | | | | | | | |
Beginning of year | | | 476,652,697 | | | | 388,076,049 | |
| | |
|
|
| |
|
|
|
End of year | | $ | 479,785,594 | | | $ | 476,652,697 | (a) |
| | |
|
|
| |
|
|
|
(a) Includes undistributed net investment income of | | | | | | $ | 1,463,921 | |
| | | | | | |
|
|
|
SEE NOTES TO FINANCIAL STATEMENTS.
A7
| | | | |
| | | SP INTERNATIONAL VALUE PORTFOLIO | | |
STATEMENT OF ASSETS AND LIABILITIES
December 31, 2006
| | | |
| ASSETS | | | |
Investments at value: | | | |
Unaffiliated investments (cost $419,593,026) | | $ | 482,845,212 |
Affiliated investments (cost $4,166,163) | | | 4,166,163 |
Foreign currency, at value (cost $3,167,647) | | | 3,184,291 |
Tax reclaim receivable | | | 456,459 |
Receivable for investments sold | | | 400,258 |
Dividends and interest receivable | | | 383,696 |
Receivable for Series shares sold | | | 148,554 |
Unrealized appreciation on forward foreign currency contracts | | | 57,458 |
Prepaid expenses | | | 3,747 |
| | |
|
|
Total Assets | | | 491,645,838 |
| | |
|
|
| LIABILITIES | | | |
Payable for investments purchased | | | 1,737,843 |
Payable to custodian | | | 1,432,601 |
Loan payable | | | 461,000 |
Management fee payable | | | 368,218 |
Accrued expenses and other liabilities | | | 176,857 |
Unrealized depreciation on forward foreign currency contracts | | | 46,858 |
Payable for Series shares repurchased | | | 35,701 |
Transfer agent fee payable | | | 754 |
| | |
|
|
Total Liabilities | | | 4,259,832 |
| | |
|
|
| NET ASSETS | | $ | 487,386,006 |
| | |
|
|
Net assets were comprised of: | | | |
Paid-in capital | | $ | 321,497,913 |
Retained earnings | | | 165,888,093 |
| | |
|
|
Net assets, December 31, 2006 | | $ | 487,386,006 |
| | |
|
|
Net asset value and redemption price per share, $487,386,006 / 42,748,019 outstanding shares of beneficial interest (authorized 100,000,000 shares) | | $ | 11.40 |
| | |
|
|
STATEMENT OF OPERATIONS
Year Ended December 31, 2006
| | | |
| INVESTMENT INCOME | | | |
Unaffiliated dividend income (net of $1,186,970 foreign withholding tax) | | $ | 14,234,949 |
Affiliated dividend income | | | 164,844 |
Unaffiliated interest | | | 27,124 |
| | |
|
|
| | | | 14,426,917 |
| | |
|
|
| EXPENSES | | | |
Management fee | | | 3,971,308 |
Custodian’s fees and expenses | | | 262,000 |
Shareholders’ reports | | | 38,000 |
Audit fee | | | 19,000 |
Trustees’ fees | | | 13,000 |
Loan interest expense (Note 8) | | | 10,112 |
Legal fees and expenses | | | 10,000 |
Transfer agent’s fees and expenses (including affiliated expense of $4,500) (Note 4) | | | 5,000 |
Commitment fee on syndicated credit agreement | | | 1,500 |
Insurance expenses | | | 1,000 |
Miscellaneous | | | 41,955 |
| | |
|
|
Total expenses | | | 4,372,875 |
| | |
|
|
| NET INVESTMENT INCOME | | | 10,054,042 |
| | |
|
|
| NET REALIZED AND UNREALIZED GAIN ON INVESTMENTS AND FOREIGN CURRENCIES | | | |
Net realized gain on: | | | |
Investment transactions | | | 92,898,029 |
Foreign currency transactions | | | 413,036 |
| | |
|
|
| | | | 93,311,065 |
| | |
|
|
Net change in unrealized appreciation (depreciation) on: | | | |
Investments | | | 12,397,150 |
Foreign currencies | | | 32,765 |
| | |
|
|
| | | | 12,429,915 |
| | |
|
|
| NET GAIN ON INVESTMENTS AND FOREIGN CURRENCIES | | | 105,740,980 |
| | |
|
|
| NET INCREASE IN NET ASSETS RESULTING FROM OPERATIONS | | $ | 115,795,022 |
| | |
|
|
STATEMENT OF CHANGES IN NET ASSETS
| | | | | | | | |
| | | Year Ended December 31,
| |
| | | 2006
| | | 2005
| |
| INCREASE (DECREASE) IN NET ASSETS | | | | | | | | |
| OPERATIONS: | | | | | | | | |
Net investment income | | $ | 10,054,042 | | | $ | 6,234,398 | |
Net realized gain on investments and foreign currencies | | | 93,311,065 | | | | 4,922,384 | |
Net change in unrealized appreciation (depreciation) on investments and foreign currencies | | | 12,429,915 | | | | 32,126,852 | |
| | |
|
|
| |
|
|
|
NET INCREASE IN NET ASSETS RESULTING FROM OPERATIONS | | | 115,795,022 | | | | 43,283,634 | |
| | |
|
|
| |
|
|
|
| DIVIDENDS AND DISTRIBUTIONS: | | | | | | | | |
Dividends from net investment income | | | — | | | | (1,104,157 | ) |
Distributions from net realized gains | | | — | | | | (23,089,120 | ) |
Distributions | | | (11,818,434 | ) | | | — | |
| | |
|
|
| |
|
|
|
TOTAL DIVIDENDS AND DISTRIBUTIONS | | | (11,818,434 | ) | | | (24,193,277 | ) |
| | |
|
|
| |
|
|
|
| SERIES SHARE TRANSACTIONS: | | | | | | | | |
Series shares sold [10,491,513 and 15,708,031 shares, respectively] | | | 104,888,014 | | | | 131,395,774 | |
Series shares issued in reinvestment of dividends and distributions [1,199,841 and 2,997,928 shares, respectively] | | | 11,818,434 | | | | 24,193,277 | |
Series shares repurchased [11,838,881 and 3,031,415 shares, respectively] | | | (122,618,454 | ) | | | (26,061,363 | ) |
| | |
|
|
| |
|
|
|
NET INCREASE (DECREASE) IN NET ASSETS RESULTING FROM SERIES SHARE TRANSACTIONS | | | (5,912,006 | ) | | | 129,527,688 | |
| | |
|
|
| |
|
|
|
| TOTAL INCREASE IN NET ASSETS | | | 98,064,582 | | | | 148,618,045 | |
| NET ASSETS: | | | | | | | | |
Beginning of year | | | 389,321,424 | | | | 240,703,379 | |
| | |
|
|
| |
|
|
|
End of year | | $ | 487,386,006 | | | $ | 389,321,424 | (a) |
| | |
|
|
| |
|
|
|
(a) Includes undistributed net investment income of | | | | | | $ | 5,753,024 | |
| | | | | | |
|
|
|
SEE NOTES TO FINANCIAL STATEMENTS.
A8
| | | | |
| | | SP LARGE CAP VALUE PORTFOLIO | | |
STATEMENT OF ASSETS AND LIABILITIES
December 31, 2006
| | | |
| ASSETS | | | |
Investments at value, including securities on loan of $66,979,156: | | | |
Unaffiliated investments (cost $786,263,180) | | $ | 934,136,040 |
Affiliated investments (cost $92,756,816) | | | 92,756,816 |
Cash | | | 3,427,357 |
Dividends and interest receivable | | | 1,726,500 |
Receivable for investments sold | | | 268,382 |
Receivable for Series shares sold | | | 13,763 |
Prepaid expenses | | | 6,224 |
| | |
|
|
Total Assets | | | 1,032,335,082 |
| | |
|
|
| LIABILITIES | | | |
Collateral for securities on loan | | | 69,954,183 |
Payable for investments purchased | | | 1,845,333 |
Management fee payable | | | 653,521 |
Payable for Series shares repurchased | | | 111,281 |
Due to broker-variation margin | | | 78,300 |
Accrued expenses and other liabilities | | | 60,955 |
Deferred trustees’ fees | | | 2,063 |
Transfer agent fee payable | | | 732 |
| | |
|
|
Total Liabilities | | | 72,706,368 |
| | |
|
|
| NET ASSETS | | $ | 959,628,714 |
| | |
|
|
Net assets were comprised of: | | | |
Paid-in capital | | $ | 744,599,626 |
Retained earnings | | | 215,029,088 |
| | |
|
|
Net assets, December 31, 2006 | | $ | 959,628,714 |
| | |
|
|
Net asset value and redemption price per share, $959,628,714 / 72,374,480 outstanding shares of beneficial interest (authorized 100,000,000 shares) | | $ | 13.26 |
| | |
|
|
STATEMENT OF OPERATIONS
Year Ended December 31, 2006
| | | |
| INVESTMENT INCOME | | | |
Unaffiliated dividend income (net of $8,174 foreign withholding tax) | | $ | 20,627,193 |
Affiliated dividend income | | | 1,251,617 |
Affiliated income from securities lending, net | | | 84,437 |
| | |
|
|
| | | | 21,963,247 |
| | |
|
|
| EXPENSES | | | |
Management fee | | | 7,094,083 |
Custodian’s fees and expenses | | | 170,000 |
Shareholders’ reports | | | 35,000 |
Trustees’ fees | | | 20,000 |
Audit fee | | | 15,000 |
Legal fees and expenses | | | 12,000 |
Transfer agent’s fees and expenses (including affiliated expense of $4,300) (Note 4) | | | 5,000 |
Insurance expenses | | | 4,000 |
Commitment fee on syndicated credit agreement | | | 2,000 |
Loan interest expense (Note 8) | | | 570 |
Miscellaneous | | | 18,469 |
| | |
|
|
Total expenses | | | 7,376,122 |
| | |
|
|
| NET INVESTMENT INCOME | | | 14,587,125 |
| | |
|
|
| NET REALIZED AND UNREALIZED GAIN ON INVESTMENTS AND FOREIGN CURRENCIES | | | |
Net realized gain on: | | | |
Investment transactions | | | 54,525,731 |
Futures transactions | | | 1,026,542 |
| | |
|
|
| | | | 55,552,273 |
| | |
|
|
Net change in unrealized appreciation (depreciation) on: | | | |
Investments | | | 83,711,088 |
Futures | | | 158,575 |
| | |
|
|
| | | | 83,869,663 |
| | |
|
|
| NET GAIN ON INVESTMENTS AND FOREIGN CURRENCIES | | | 139,421,936 |
| | |
|
|
| NET INCREASE IN NET ASSETS RESULTING FROM OPERATIONS | | $ | 154,009,061 |
| | |
|
|
STATEMENT OF CHANGES IN NET ASSETS
| | | | | | | | |
| | | Year Ended December 31,
| |
| | | 2006
| | | 2005
| |
| INCREASE (DECREASE) IN NET ASSETS | | | | | | | | |
| OPERATIONS: | | | | | | | | |
Net investment income | | $ | 14,587,125 | | | $ | 10,904,898 | |
Net realized gain on investments | | | 55,552,273 | | | | 39,671,466 | |
Net change in unrealized appreciation (depreciation) on investments | | | 83,869,663 | | | | (2,235,206 | ) |
| | |
|
|
| |
|
|
|
NET INCREASE IN NET ASSETS RESULTING FROM OPERATIONS | | | 154,009,061 | | | | 48,341,158 | |
| | |
|
|
| |
|
|
|
| DIVIDENDS AND DISTRIBUTIONS: | | | | | | | | |
Dividends from net investment income | | | — | | | | (5,481,955 | ) |
Distributions from net realized gains | | | — | | | | (16,382,778 | ) |
Distributions | | | (51,644,712 | ) | | | — | |
| | |
|
|
| |
|
|
|
TOTAL DIVIDENDS AND DISTRIBUTIONS | | | (51,644,712 | ) | | | (21,864,733 | ) |
| | |
|
|
| |
|
|
|
| SERIES SHARE TRANSACTIONS (NOTE 7): | | | | | | | | |
Series shares sold [7,084,853 and 24,086,262 shares, respectively] | | | 83,219,245 | | | | 276,899,408 | |
Series shares issued in reinvestment of dividends and distributions [4,380,383 and 1,996,779 shares, respectively] | | | 51,644,712 | | | | 21,864,733 | |
Series shares repurchased [9,098,369 and 8,095,951 shares, respectively] | | | (110,691,150 | ) | | | (93,554,925 | ) |
| | |
|
|
| |
|
|
|
NET INCREASE IN NET ASSETS RESULTING FROM SERIES SHARE TRANSACTIONS | | | 24,172,807 | | | | 205,209,216 | |
| | |
|
|
| |
|
|
|
| TOTAL INCREASE IN NET ASSETS | | | 126,537,156 | | | | 231,685,641 | |
| NET ASSETS: | | | | | | | | |
Beginning of year | | | 833,091,558 | | | | 601,405,917 | |
| | |
|
|
| |
|
|
|
End of year | | $ | 959,628,714 | | | $ | 833,091,558 | (a) |
| | |
|
|
| |
|
|
|
(a) Includes undistributed net investment income of | | | | | | $ | 10,902,617 | |
| | | | | | |
|
|
|
SEE NOTES TO FINANCIAL STATEMENTS.
A9
| | | | |
| | | SP MID-CAP GROWTH PORTFOLIO | | |
STATEMENT OF ASSETS AND LIABILITIES
December 31, 2006
| | | |
| ASSETS | | | |
Investments at value, including securities on loan of $34,940,544: | | | |
Unaffiliated investments (cost $119,507,088) | | $ | 131,918,091 |
Affiliated investments (cost $39,286,026) | | | 39,286,026 |
Receivable for investments sold | | | 480,408 |
Dividends and interest receivable | | | 32,723 |
Receivable for Series shares sold | | | 14,278 |
Prepaid expenses | | | 3,184 |
| | |
|
|
Total Assets | | | 171,734,710 |
| | |
|
|
| LIABILITIES | | | |
Collateral for securities on loan | | | 36,421,136 |
Payable for investments purchased | | | 1,864,321 |
Accrued expenses and other liabilities | | | 146,268 |
Management fee payable | | | 92,068 |
Payable for Series shares repurchased | | | 61,410 |
Payable to custodian | | | 33,896 |
Deferred trustees’ fees | | | 4,084 |
Transfer agent fee payable | | | 1,038 |
| | |
|
|
Total Liabilities | | | 38,624,221 |
| | |
|
|
| NET ASSETS | | $ | 133,110,489 |
| | |
|
|
Net assets were comprised of: | | | |
Paid-in capital | | $ | 109,574,897 |
Retained earnings | | | 23,535,592 |
| | |
|
|
Net assets, December 31, 2006 | | $ | 133,110,489 |
| | |
|
|
Net asset value and redemption price per share, $133,110,489 / 18,838,108 outstanding shares of beneficial interest (authorized 100,000,000 shares) | | $ | 7.07 |
| | |
|
|
STATEMENT OF OPERATIONS
Year Ended December 31, 2006
| | | | |
| INVESTMENT INCOME | | | | |
Unaffiliated dividend income (net of $792 foreign withholding tax) | | $ | 1,458,580 | |
Affiliated dividend income | | | 97,353 | |
Affiliated income from securities lending, net | | | 54,114 | |
| | |
|
|
|
| | | | 1,610,047 | |
| | |
|
|
|
| EXPENSES | | | | |
Management fee | | | 1,155,879 | |
Custodian’s fees and expenses | | | 54,000 | |
Shareholders’ reports | | | 45,000 | |
Audit fee | | | 15,000 | |
Trustees’ fees | | | 14,000 | |
Legal fees and expenses | | | 8,000 | |
Transfer agent’s fees and expenses (including affiliated expense of $5,700) (Note 4) | | | 6,000 | |
Insurance expenses | | | 4,000 | |
Commitment fee on syndicated credit agreement | | | 1,000 | |
Loan interest expense (Note 8) | | | 153 | |
Miscellaneous | | | 18,074 | |
| | |
|
|
|
Total expenses | | | 1,321,106 | |
| | |
|
|
|
| NET INVESTMENT INCOME | | | 288,941 | |
| | |
|
|
|
| NET REALIZED AND UNREALIZED GAIN (LOSS) ON INVESTMENTS | | | | |
Net realized gain on investment transactions | | | 13,297,303 | |
Net change in unrealized appreciation (depreciation) on investments | | | (16,566,128 | ) |
| | |
|
|
|
| NET LOSS ON INVESTMENTS | | | (3,268,825 | ) |
| | |
|
|
|
| NET DECREASE IN NET ASSETS RESULTING FROM OPERATIONS | | $ | (2,979,884 | ) |
| | |
|
|
|
STATEMENT OF CHANGES IN NET ASSETS
| | | | | | | | |
| | | Year Ended December 31,
| |
| | | 2006
| | | 2005
| |
| INCREASE (DECREASE) IN NET ASSETS | | | | | | | | |
| OPERATIONS: | | | | | | | | |
Net investment income (loss) | | $ | 288,941 | | | $ | (746,121 | ) |
Net realized gain on investments | | | 13,297,303 | | | | 2,852,382 | |
Net change in unrealized appreciation (depreciation) on investments | | | (16,566,128 | ) | | | 9,613,723 | |
| | |
|
|
| |
|
|
|
NET INCREASE (DECREASE) IN NET ASSETS RESULTING FROM OPERATIONS | | | (2,979,884 | ) | | | 11,719,984 | |
| | |
|
|
| |
|
|
|
| SERIES SHARE TRANSACTIONS: | | | | | | | | |
Series shares sold [2,145,372 and 4,215,893 shares, respectively] | | | 15,533,006 | | | | 27,851,805 | |
Net asset value of shares issued in merger [0 and 5,202,111 shares, respectively] | | | — | | | | 31,565,347 | |
Series shares repurchased [4,524,604 and 3,887,856 shares, respectively] | | | (32,351,343 | ) | | | (25,739,227 | ) |
| | |
|
|
| |
|
|
|
NET INCREASE (DECREASE) IN NET ASSETS RESULTING FROM SERIES SHARE TRANSACTIONS | | | (16,818,337 | ) | | | 33,677,925 | |
| | |
|
|
| |
|
|
|
| TOTAL INCREASE (DECREASE) IN NET ASSETS | | | (19,798,221 | ) | | | 45,397,909 | |
| NET ASSETS: | | | | | | | | |
Beginning of year | | | 152,908,710 | | | | 107,510,801 | |
| | |
|
|
| |
|
|
|
End of year | | $ | 133,110,489 | | | $ | 152,908,710 | |
| | |
|
|
| |
|
|
|
SEE NOTES TO FINANCIAL STATEMENTS.
A10
| | | | |
| | | SP PIMCO HIGH YIELD PORTFOLIO | | |
STATEMENT OF ASSETS AND LIABILITIES
December 31, 2006
| | | |
| ASSETS | | | |
Investments at value: | | | |
Unaffiliated investments (cost $266,795,888) | | $ | 272,343,302 |
Affiliated investments (cost $3,882,061) | | | 3,882,061 |
Dividends and interest receivable | | | 5,106,320 |
Foreign currency, at value (cost $279,842) | | | 287,928 |
Unrealized appreciation on swap agreements | | | 154,671 |
Unrealized appreciation on foreign currency forward contracts | | | 67,400 |
Prepaid expenses | | | 4,074 |
Receivable for Series shares sold | | | 3,893 |
| | |
|
|
Total Assets | | | 281,849,649 |
| | |
|
|
| LIABILITIES | | | |
Payable for investments purchased | | | 6,540,887 |
Unrealized depreciation on swap agreements | | | 404,771 |
Payable to custodian | | | 179,995 |
Management fee payable | | | 140,417 |
Accrued expenses and other liabilities | | | 70,406 |
Payable for Series shares repurchased | | | 30,914 |
Premium for swaps written | | | 28,639 |
Due to broker-variation margin | | | 12,450 |
Written options outstanding, at value (cost $11,577) | | | 6,906 |
Deferred trustees’ fees | | | 2,152 |
Transfer agent fee payable | | | 700 |
| | |
|
|
Total Liabilities | | | 7,418,237 |
| | |
|
|
| NET ASSETS | | $ | 274,431,412 |
| | |
|
|
Net assets were comprised of: | | | |
Paid-in capital | | $ | 265,637,405 |
Retained earnings | | | 8,794,007 |
| | |
|
|
Net assets, December 31, 2006 | | $ | 274,431,412 |
| | |
|
|
Net asset value and redemption price per share, $274,431,412 / 26,554,781 outstanding shares of beneficial interest (authorized 100,000,000 shares) | | $ | 10.33 |
| | |
|
|
STATEMENT OF OPERATIONS
Year Ended December 31, 2006
| | | | |
| INVESTMENT INCOME | | | | |
Unaffiliated interest | | $ | 21,972,619 | |
Affiliated dividend income | | | 99,224 | |
Unaffiliated dividend income | | | 98,754 | |
| | |
|
|
|
| | | | 22,170,597 | |
| | |
|
|
|
| EXPENSES | | | | |
Management fee | | | 1,738,761 | |
Custodian’s fees and expenses | | | 166,000 | |
Shareholders’ reports | | | 46,000 | |
Audit fee | | | 20,000 | |
Trustees’ fees | | | 15,000 | |
Legal fees and expenses | | | 9,000 | |
Insurance expenses | | | 8,000 | |
Transfer agent’s fees and expenses (including affiliated expense of $3,900) (Note 4) | | | 5,000 | |
Commitment fee on syndicated credit agreement | | | 1,500 | |
Loan interest expense (Note 8) | | | 659 | |
Miscellaneous | | | 10,253 | |
| | |
|
|
|
Total expenses | | | 2,020,173 | |
| | |
|
|
|
| NET INVESTMENT INCOME | | | 20,150,424 | |
| | |
|
|
|
| NET REALIZED AND UNREALIZED GAIN (LOSS) ON INVESTMENTS AND FOREIGN CURRENCIES | | | | |
Net realized gain (loss) on: | | | | |
Investment transactions | | | 3,323,620 | |
Futures transactions | | | (10,033 | ) |
Options written | | | 587,708 | |
Swap agreements | | | (96,182 | ) |
Foreign currency transactions | | | (601,210 | ) |
| | |
|
|
|
| | | | 3,203,903 | |
| | |
|
|
|
Net change in unrealized appreciation (depreciation) on: | | | | |
Investments | | | 3,372,635 | |
Futures | | | (90,150 | ) |
Options written | | | (60,813 | ) |
Swap agreements | | | (223,698 | ) |
Foreign currencies | | | 126,112 | |
| | |
|
|
|
| | | | 3,124,086 | |
| | |
|
|
|
| NET GAIN ON INVESTMENTS AND FOREIGN CURRENCIES | | | 6,327,989 | |
| | |
|
|
|
| NET INCREASE IN NET ASSETS RESULTING FROM OPERATIONS | | $ | 26,478,413 | |
| | |
|
|
|
STATEMENT OF CHANGES IN NET ASSETS
| | | | | | | | |
| | | Year Ended December 31,
| |
| | | 2006
| | | 2005
| |
| INCREASE (DECREASE) IN NET ASSETS | | | | | | | | |
| OPERATIONS: | | | | | | | | |
Net investment income | | $ | 20,150,424 | | | $ | 22,674,636 | |
Net realized gain on investments and foreign currencies | | | 3,203,903 | | | | 3,634,314 | |
Net change in unrealized appreciation (depreciation) on investments and foreign currencies | | | 3,124,086 | | | | (12,471,858 | ) |
| | |
|
|
| |
|
|
|
NET INCREASE IN NET ASSETS RESULTING FROM OPERATIONS | | | 26,478,413 | | | | 13,837,092 | |
| | |
|
|
| |
|
|
|
| DIVIDENDS AND DISTRIBUTIONS: | | | | | | | | |
Dividends from net investment income | | | — | | | | (22,462,955 | ) |
Distributions from net realized gains | | | — | | | | (4,530,597 | ) |
Distributions | | | (23,678,885 | ) | | | — | |
| | |
|
|
| |
|
|
|
TOTAL DIVIDENDS AND DISTRIBUTIONS | | | (23,678,885 | ) | | | (26,993,552 | ) |
| | |
|
|
| |
|
|
|
| SERIES SHARE TRANSACTIONS (NOTE 7): | | | | | | | | |
Series shares sold [1,758,830 and 9,213,269 shares, respectively] | | | 17,937,774 | | | | 96,076,697 | |
Series shares issued in reinvestment of dividends and distributions [2,337,450 and 2,626,070 shares, respectively] | | | 23,678,885 | | | | 26,993,552 | |
Series shares repurchased [13,506,793 and 5,161,774 shares, respectively] | | | (138,592,570 | ) | | | (53,822,419 | ) |
| | |
|
|
| |
|
|
|
NET INCREASE (DECREASE) IN NET ASSETS RESULTING FROM SERIES SHARE TRANSACTIONS | | | (96,975,911 | ) | | | 69,247,830 | |
| | |
|
|
| |
|
|
|
| TOTAL INCREASE (DECREASE) IN NET ASSETS | | | (94,176,383 | ) | | | 56,091,370 | |
| NET ASSETS: | | | | | | | | |
Beginning of year | | | 368,607,795 | | | | 312,516,425 | |
| | |
|
|
| |
|
|
|
End of year | | $ | 274,431,412 | | | $ | 368,607,795 | (a) |
| | |
|
|
| |
|
|
|
(a) Includes undistributed net investment income of | | | | | | $ | 1,462,427 | |
| | | | | | |
|
|
|
SEE NOTES TO FINANCIAL STATEMENTS.
A11
| | | | |
| | | SP PIMCO TOTAL RETURN PORTFOLIO | | |
STATEMENT OF ASSETS AND LIABILITIES
December 31, 2006
| | | | |
| ASSETS | | | | |
Investments at value: | | | | |
Unaffiliated investments (cost $2,516,802,262) | | $ | 2,508,945,628 | |
Affiliated investments (cost $45,350,561) | | | 45,350,561 | |
Foreign currency, at value (cost $18,184,573) | | | 18,620,885 | |
Cash | | | 1,432,664 | |
Receivable for investments sold | | | 1,067,979,561 | |
Dividends and interest receivable | | | 17,905,671 | |
Unrealized appreciation on swap agreements | | | 3,104,134 | |
Receivable for Series shares sold | | | 289,594 | |
Unrealized appreciation on foreign currency forward contracts | | | 207,608 | |
Prepaid expenses | | | 16,078 | |
| | |
|
|
|
Total Assets | | | 3,663,852,384 | |
| | |
|
|
|
| LIABILITIES | | | | |
Payable for investments purchased | | | 1,503,469,580 | |
Securities sold short, at value (proceeds received $555,277,750) | | | 551,774,303 | |
Payable for floating rate notes issued | | | 4,787,500 | |
Unrealized depreciation on swap agreements | | | 3,902,213 | |
Premium for swaps written | | | 2,909,625 | |
Written options outstanding, at value (cost $2,044,259) | | | 2,418,106 | |
Interest payable on investments sold short | | | 1,851,248 | |
Unrealized depreciation on foreign currency forward contracts | | | 1,130,655 | |
Management fee payable | | | 809,942 | |
Payable for Series shares repurchased | | | 367,305 | |
Due to broker-variation margin | | | 78,389 | |
Accrued expenses and other liabilities | | | 56,130 | |
Deferred trustees’ fees | | | 2,471 | |
Transfer agent fee payable | | | 856 | |
| | |
|
|
|
Total Liabilities | | | 2,073,558,323 | |
| | |
|
|
|
| NET ASSETS | | $ | 1,590,294,061 | |
| | |
|
|
|
Net assets were comprised of: | | | | |
Paid-in capital | | $ | 1,614,859,333 | |
Retained earnings | | | (24,565,272 | ) |
| | |
|
|
|
Net assets, December 31, 2006 | | $ | 1,590,294,061 | |
| | |
|
|
|
Net asset value and redemption price per share, $1,590,294,061 / 142,707,609 outstanding shares of beneficial interest (authorized 225,000,000 shares) | | $ | 11.14 | |
| | |
|
|
|
STATEMENT OF OPERATIONS
Year Ended December 31, 2006
| | | | |
| INVESTMENT INCOME | | | | |
Unaffiliated interest | | $ | 71,731,404 | |
Affiliated dividend income | | | 909,164 | |
Unaffiliated dividend income (net of $13,538 foreign withholding tax) | | | 37,537 | |
| | |
|
|
|
| | | | 72,678,105 | |
| | |
|
|
|
| EXPENSES | | | | |
Management fee | | | 9,060,229 | |
Custodian’s fees and expenses | | | 382,000 | |
Interest expense (Note 2 and 8) | | | 245,264 | |
Shareholders’ reports | | | 38,000 | |
Trustees’ fees | | | 27,000 | |
Insurance expenses | | | 24,000 | |
Audit fee | | | 20,000 | |
Legal fees and expenses | | | 10,000 | |
Transfer agent’s fees and expenses (including affiliated expense of $4,600) (Note 4) | | | 5,000 | |
Commitment fee on syndicated credit agreement | | | 4,500 | |
Miscellaneous | | | 8,224 | |
| | |
|
|
|
Total expenses | | | 9,824,217 | |
| | |
|
|
|
| NET INVESTMENT INCOME | | | 62,853,888 | |
| | |
|
|
|
| NET REALIZED AND UNREALIZED GAIN (LOSS) ON INVESTMENTS AND FOREIGN CURRENCIES | | | | |
Net realized gain (loss) on: | | | | |
Investment transactions | | | 8,022,872 | |
Futures transactions | | | (9,843,031 | ) |
Options written | | | 1,788,488 | |
Swap agreements | | | (1,839,592 | ) |
Foreign currency transactions | | | 2,346,776 | |
Short sales | | | (8,218,909 | ) |
| | |
|
|
|
| | | | (7,743,396 | ) |
| | |
|
|
|
Net change in unrealized appreciation (depreciation) on: | | | | |
Investments | | | (4,256,106 | ) |
Futures | | | (1,726,258 | ) |
Options written | | | (2,519,044 | ) |
Swap agreements | | | 1,675,905 | |
Foreign currencies | | | 1,549,162 | |
Short sales | | | 4,092,935 | |
| | |
|
|
|
| | | | (1,183,406 | ) |
| | |
|
|
|
| NET LOSS ON INVESTMENTS AND FOREIGN CURRENCIES | | | (8,926,802 | ) |
| | |
|
|
|
| NET INCREASE IN NET ASSETS RESULTING FROM OPERATIONS | | $ | 53,927,086 | |
| | |
|
|
|
STATEMENT OF CHANGES IN NET ASSETS
| | | | | | | | |
| | | Year Ended December 31,
| |
| | | 2006
| | | 2005
| |
| INCREASE (DECREASE) IN NET ASSETS | | | | | | | | |
| OPERATIONS: | | | | | | | | |
Net investment income | | $ | 62,853,888 | | | $ | 48,267,176 | |
Net realized loss on investments and foreign currencies | | | (7,743,396 | ) | | | (57,548 | ) |
Net change in unrealized appreciation (depreciation) on investments and foreign currencies | | | (1,183,406 | ) | | | (15,021,189 | ) |
| | |
|
|
| |
|
|
|
NET INCREASE IN NET ASSETS RESULTING FROM OPERATIONS | | | 53,927,086 | | | | 33,188,439 | |
| | |
|
|
| |
|
|
|
| DIVIDENDS AND DISTRIBUTIONS: | | | | | | | | |
Dividends from net investment income | | | — | | | | (65,066,623 | ) |
Distributions from net realized gains | | | — | | | | (21,522,555 | ) |
Distributions | | | (63,817,105 | ) | | | — | |
| | |
|
|
| |
|
|
|
TOTAL DIVIDENDS AND DISTRIBUTIONS | | | (63,817,105 | ) | | | (86,589,178 | ) |
| | |
|
|
| |
|
|
|
| SERIES SHARE TRANSACTIONS (NOTE 7): | | | | | | | | |
Series shares sold [18,129,452 and 45,303,572 shares, respectively] | | | 202,000,051 | | | | 518,342,360 | |
Series shares issued in reinvestment of dividends and distributions [5,773,643 and 7,727,423 shares, respectively] | | | 63,817,105 | | | | 86,589,178 | |
Series shares repurchased [18,464,240 and 9,845,936 shares, respectively] | | | (203,878,541 | ) | | | (112,279,676 | ) |
| | |
|
|
| |
|
|
|
NET INCREASE IN NET ASSETS RESULTING FROM SERIES SHARE TRANSACTIONS | | | 61,938,615 | | | | 492,651,862 | |
| | |
|
|
| |
|
|
|
| TOTAL INCREASE IN NET ASSETS | | | 52,048,596 | | | | 439,251,123 | |
| NET ASSETS: | | | | | | | | |
Beginning of year | | | 1,538,245,465 | | | | 1,098,994,342 | |
| | |
|
|
| |
|
|
|
End of year | | $ | 1,590,294,061 | | | $ | 1,538,245,465 | (a) |
| | |
|
|
| |
|
|
|
(a) Includes undistributed net investment income of | | | | | | $ | 6,657,952 | |
| | | | | | |
|
|
|
SEE NOTES TO FINANCIAL STATEMENTS.
A12
| | | | |
| | | SP PRUDENTIAL U.S. EMERGING GROWTH PORTFOLIO | | |
STATEMENT OF ASSETS AND LIABILITIES
December 31, 2006
| | | |
| ASSETS | | | |
Investments, at value including securities on loan of $41,247,597: | | | |
Unaffiliated investments (cost $162,609,364) | | $ | 194,656,933 |
Affiliated investments (cost $51,476,123) | | | 51,476,123 |
Cash | | | 121,819 |
Receivable for investments sold | | | 1,223,483 |
Dividends and interest receivable | | | 76,309 |
Receivable for Series shares sold | | | 66,759 |
Prepaid expenses | | | 3,258 |
| | |
|
|
Total Assets | | | 247,624,684 |
| | |
|
|
| LIABILITIES | | | |
Collateral for securities on loan | | | 43,193,423 |
Payable for investments purchased | | | 1,167,245 |
Accrued expenses and other liabilities | | | 138,134 |
Management fee payable | | | 104,255 |
Payable for Series shares reacquired | | | 84,091 |
Deferred trustees’ fees | | | 2,028 |
Transfer agent fee payable | | | 746 |
Distribution fee payable | | | 71 |
Administration fee payable | | | 43 |
| | |
|
|
Total Liabilities | | | 44,690,036 |
| | |
|
|
| NET ASSETS | | $ | 202,934,648 |
| | |
|
|
Net assets were comprised of: | | | |
Paid-in capital | | $ | 151,024,098 |
Retained earnings | | | 51,910,550 |
| | |
|
|
Net assets, December 31, 2006 | | $ | 202,934,648 |
| | |
|
|
| Class I: | | | |
Net asset value and redemption price per share, $202,600,965 / 25,359,935 outstanding shares of beneficial interest (authorized 100,000,000 shares) | | $ | 7.99 |
| | |
|
|
| Class II: | | | |
Net asset value and redemption price per share, $333,683 / 42,845 outstanding shares of beneficial interest (authorized 60,000,000 shares) | | $ | 7.79 |
| | |
|
|
STATEMENT OF OPERATIONS
Year Ended December 31, 2006
| | | | |
| INVESTMENT INCOME | | | | |
Unaffiliated dividend income (net of foreign withholding taxes of $4,847 ) | | $ | 1,539,688 | |
Affiliated dividend income | | | 372,258 | |
Affiliated income from securities loaned, net | | | 97,251 | |
| | |
|
|
|
| | | | 2,009,197 | |
| | |
|
|
|
| EXPENSES | | | | |
Management fee | | | 1,216,841 | |
Distribution fee—Class II | | | 867 | |
Administration fee—Class II | | | 520 | |
Shareholders’ reports | | | 43,000 | |
Custodian’s fees and expenses | | | 42,000 | |
Audit fee | | | 15,000 | |
Trustees’ fees | | | 11,000 | |
Legal fees and expenses | | | 8,000 | |
Insurance expenses | | | 5,000 | |
Transfer agent’s fee and expenses (including affiliated expense of $4,500) (Note 4) | | | 5,000 | |
Miscellaneous | | | 9,595 | |
| | |
|
|
|
Total expenses | | | 1,356,823 | |
| | |
|
|
|
| NET INVESTMENT INCOME | | | 652,374 | |
| | |
|
|
|
| NET REALIZED AND UNREALIZED GAIN (LOSS) ON | | | | |
| INVESTMENTS | | | | |
Net realized gain on investments | | | 19,588,725 | |
Net change in unrealized appreciation (depreciation) on investments | | | (2,597,586 | ) |
| | |
|
|
|
| NET GAIN ON INVESTMENTS | | | 16,991,139 | |
| | |
|
|
|
| NET INCREASE IN NET ASSETS RESULTING FROM OPERATIONS | | $ | 17,643,513 | |
| | |
|
|
|
STATEMENT OF CHANGES IN NET ASSETS
| | | | | | | | |
| | | Year Ended December 31,
| |
| | | 2006
| | | 2005
| |
| INCREASE (DECREASE) IN NET ASSETS | | | | | | | | |
| OPERATIONS: | | | | | | | | |
Net investment gain (loss) | | $ | 652,374 | | | $ | (445,292 | ) |
Net realized gain on investments and foreign currencies | | | 19,588,725 | | | | 15,864,787 | |
Net change in unrealized appreciation (depreciation) on investments and foreign currencies | | | (2,597,586 | ) | | | 15,633,719 | |
| | |
|
|
| |
|
|
|
NET INCREASE IN NET ASSETS RESULTING FROM OPERATIONS | | | 17,643,513 | | | | 31,053,214 | |
| | |
|
|
| |
|
|
|
| DIVIDENDS AND DISTRIBUTIONS: | | | | | | | | |
Dividends from net investment income | | | | | | | | |
Class I | | | — | | | | (205 | ) |
Distributions from net realized capital gains | | | | | | | | |
Class I | | | — | | | | (22,102,685 | ) |
Class II | | | — | | | | (57,580 | ) |
Distributions | | | | | | | | |
Class I | | | (15,437,758 | ) | | | — | |
Class II | | | (30,998 | ) | | | — | |
| | |
|
|
| |
|
|
|
TOTAL DIVIDENDS AND DISTRIBUTIONS | | | (15,468,756 | ) | | | (22,160,470 | ) |
| | |
|
|
| |
|
|
|
| SERIES SHARE TRANSACTIONS (Note 7): | | | | | | | | |
Series shares sold [3,604,315 and 4,400,150 shares, respectively] | | | 28,455,379 | | | | 32,192,747 | |
Net asset value, of Shares issued in connection with merger [0 and 4,037,693 shares, respectively] | | | — | | | | 24,736,435 | |
Series shares issued in reinvestment of dividends and distributions [1,978,190 and 3,425 266 shares, respectively] | | | 15,468,756 | | | | 22,160,470 | |
Series shares repurchased [4,976,168 and 3,011,057 shares, respectively] | | | (38,386,640 | ) | | | (21,469,947 | ) |
| | |
|
|
| |
|
|
|
NET INCREASE IN NET ASSETS RESULTING FROM SERIES SHARE TRANSACTIONS | | | 5,537,495 | | | | 57,619,705 | |
| | |
|
|
| |
|
|
|
| TOTAL INCREASE IN NET ASSETS | | | 7,712,252 | | | | 66,512,449 | |
| NET ASSETS: | | | | | | | | |
Beginning of year | | | 195,222,396 | | | | 128,709,947 | |
| | |
|
|
| |
|
|
|
End of year | | $ | 202,934,648 | | | $ | 195,222,396 | |
| | |
|
|
| |
|
|
|
SEE NOTES TO FINANCIAL STATEMENTS.
A13
| | | | |
| | | SP SMALL CAP GROWTH PORTFOLIO | | |
STATEMENT OF ASSETS AND LIABILITIES
December 31, 2006
| | | |
| ASSETS | | | |
Investments at value, including securities on loan of $29,027,470: | | | |
Unaffiliated investments (cost $92,095,068) | | $ | 112,500,853 |
Affiliated investments (cost $41,045,186) | | | 41,045,186 |
Receivable for investments sold | | | 113,086 |
Dividends and interest receivable | | | 50,050 |
Receivable for Series shares sold | | | 4,960 |
Prepaid expenses | | | 2,141 |
| | |
|
|
Total Assets | | | 153,716,276 |
| | |
|
|
| LIABILITIES | | | |
Collateral for securities on loan | | | 30,519,848 |
Accrued expenses and other liabilities | | | 86,402 |
Payable to custodian | | | 65,720 |
Payable for Series shares repurchased | | | 20,661 |
Management fee payable | | | 4,347 |
Deferred trustees’ fees | | | 2,032 |
Transfer agent fee payable | | | 730 |
| | |
|
|
Total Liabilities | | | 30,699,740 |
| | |
|
|
| NET ASSETS | | $ | 123,016,536 |
| | |
|
|
Net assets were comprised of: | | | |
Paid-in capital | | $ | 98,070,485 |
Retained earnings | | | 24,946,051 |
| | |
|
|
Net assets, December 31, 2006 | | $ | 123,016,536 |
| | |
|
|
Net asset value and redemption price per share, $123,016,536 / 16,534,908 outstanding shares of beneficial interest (authorized 100,000,000 shares) | | $ | 7.44 |
| | |
|
|
STATEMENT OF OPERATIONS
Year Ended December 31, 2006
| | | | |
| INVESTMENT INCOME | | | | |
Unaffiliated dividend income (net of $2,365 foreign withholding tax) | | $ | 532,363 | |
Affiliated dividend income | | | 302,778 | |
Affiliated income from securities lending, net | | | 96,360 | |
| | |
|
|
|
| | | | 931,501 | |
| | |
|
|
|
| EXPENSES | | | | |
Management fee | | | 1,316,693 | |
Custodian’s fees and expenses | | | 122,000 | |
Shareholders’ reports | | | 64,000 | |
Legal fees and expenses | | | 17,000 | |
Audit fee | | | 15,100 | |
Trustees’ fees | | | 13,000 | |
Loan interest expense (Note 8) | | | 7,946 | |
Transfer agent’s fees and expenses (including affiliated expense of $4,500) (Note 4) | | | 5,000 | |
Insurance expenses | | | 2,000 | |
Commitment fee on syndicated credit agreement | | | 1,300 | |
Miscellaneous | | | 17,690 | |
| | |
|
|
|
Total expenses | | | 1,581,729 | |
| | |
|
|
|
| NET INVESTMENT LOSS | | | (650,228 | ) |
| | |
|
|
|
| NET REALIZED AND UNREALIZED GAIN ON INVESTMENTS | | | | |
Net realized gain on investment transactions | | | 7,022,235 | |
Net change in unrealized appreciation (depreciation) on investments | | | 10,012,719 | |
| | |
|
|
|
| NET GAIN ON INVESTMENTS | | | 17,034,954 | |
| | |
|
|
|
| NET INCREASE IN NET ASSETS RESULTING FROM OPERATIONS | | $ | 16,384,726 | |
| | |
|
|
|
STATEMENT OF CHANGES IN NET ASSETS
| | | | | | | | |
| | | Year Ended December 31,
| |
| | | 2006
| | | 2005
| |
| | |
| INCREASE (DECREASE) IN NET ASSETS | | | | | | | | |
| OPERATIONS: | | | | | | | | |
Net investment loss | | $ | (650,228 | ) | | $ | (754,922 | ) |
Net realized gain on investments | | | 7,022,235 | | | | 18,176,920 | |
Net change in unrealized appreciation (depreciation) on investments | | | 10,012,719 | | | | (12,040,245 | ) |
| | |
|
|
| |
|
|
|
NET INCREASE IN NET ASSETS RESULTING FROM OPERATIONS | | | 16,384,726 | | | | 5,381,753 | |
| | |
|
|
| |
|
|
|
| SERIES SHARE TRANSACTIONS (NOTE 7): | | | | | | | | |
Series shares sold [4,157,641 and 10,844,232 shares, respectively] | | | 29,943,037 | | | | 67,879,177 | |
Series shares repurchased [8,114,496 and 18,841,264 shares, respectively] | | | (59,025,936 | ) | | | (121,618,637 | ) |
| | |
|
|
| |
|
|
|
NET DECREASE IN NET ASSETS RESULTING FROM SERIES SHARE TRANSACTIONS | | | (29,082,899 | ) | | | (53,739,460 | ) |
| | |
|
|
| |
|
|
|
| TOTAL DECREASE IN NET ASSETS | | | (12,698,173 | ) | | | (48,357,707 | ) |
| NET ASSETS: | | | | | | | | |
Beginning of year | | | 135,714,709 | | | | 184,072,416 | |
| | |
|
|
| |
|
|
|
End of year | | $ | 123,016,536 | | | $ | 135,714,709 | |
| | |
|
|
| |
|
|
|
SEE NOTES TO FINANCIAL STATEMENTS.
A14
| | | | |
| | | SP SMALL CAP VALUE PORTFOLIO | | |
STATEMENT OF ASSETS AND LIABILITIES
December 31, 2006
| | | |
| ASSETS | | | |
Investments at value, including securities on loan of $63,899,354: | | | |
Unaffiliated investments (cost $312,694,848) | | $ | 351,588,389 |
Affiliated investments (cost $90,298,035) | | | 90,298,035 |
Receivable for investments sold | | | 1,779,013 |
Dividends and interest receivable | | | 543,012 |
Receivable for Series shares sold | | | 77,525 |
Prepaid expenses | | | 7,361 |
| | |
|
|
Total Assets | | | 444,293,335 |
| | |
|
|
| LIABILITIES | | | |
Collateral for securities on loan | | | 67,120,284 |
Payable for investments purchased | | | 7,633,455 |
Management fee payable | | | 277,062 |
Payable to custodian | | | 134,651 |
Payable for Series shares repurchased | | | 129,999 |
Accrued expenses and other liabilities | | | 12,422 |
Deferred trustees’ fees | | | 2,255 |
Transfer agent fee payable | | | 776 |
| | |
|
|
Total Liabilities | | | 75,310,904 |
| | |
|
|
| NET ASSETS | | $ | 368,982,431 |
| | |
|
|
Net assets were comprised of: | | | |
Paid-in capital | | $ | 308,740,283 |
Retained earnings | | | 60,242,148 |
| | |
|
|
Net assets, December 31, 2006 | | $ | 368,982,431 |
| | |
|
|
Net asset value and redemption price per share, $368,982,431 / 26,964,003 outstanding shares of beneficial interest (authorized 100,000,000 shares) | | $ | 13.68 |
| | |
|
|
STATEMENT OF OPERATIONS
Year Ended December 31, 2006
| | | |
| INVESTMENT INCOME | | | |
Unaffiliated dividend income (net of $57 foreign withholding tax) | | $ | 4,974,419 |
Affiliated dividend income | | | 711,514 |
Affiliated income from securities lending, net | | | 272,979 |
| | |
|
|
| | | | 5,958,912 |
| | |
|
|
| EXPENSES | | | |
Management fee | | | 3,218,789 |
Custodian’s fees and expenses | | | 111,000 |
Shareholders’ reports | | | 35,000 |
Audit fee | | | 15,000 |
Trustees’ fees | | | 14,000 |
Legal fees and expenses | | | 10,000 |
Insurance expenses | | | 9,000 |
Transfer agent’s fees and expenses (including affiliated expense of $4,600) (Note 4) | | | 5,000 |
Commitment fee on syndicated credit agreement | | | 1,100 |
Miscellaneous | | | 10,739 |
| | |
|
|
Total expenses | | | 3,429,628 |
| | |
|
|
| NET INVESTMENT INCOME | | | 2,529,284 |
| | |
|
|
| NET REALIZED AND UNREALIZED GAIN ON INVESTMENTS | | | |
Net realized gain on investment transactions | | | 19,857,258 |
Net change in unrealized appreciation on investments | | | 25,400,901 |
| | |
|
|
| NET GAIN ON INVESTMENTS | | | 45,258,159 |
| | |
|
|
| NET INCREASE IN NET ASSETS RESULTING FROM OPERATIONS | | $ | 47,787,443 |
| | |
|
|
STATEMENT OF CHANGES IN NET ASSETS
| | | | | | | | |
| | | Year Ended December 31,
| |
| | | 2006
| | | 2005
| |
| INCREASE (DECREASE) IN NET ASSETS | | | | | | | | |
| OPERATIONS: | | | | | | | | |
Net investment income | | $ | 2,529,284 | | | $ | 1,888,410 | |
Net realized gain on investments | | | 19,857,258 | | | | 57,245,116 | |
Net change in unrealized appreciation (depreciation) on investments | | | 25,400,901 | | | | (36,955,062 | ) |
| | |
|
|
| |
|
|
|
NET INCREASE IN NET ASSETS RESULTING FROM OPERATIONS | | | 47,787,443 | | | | 22,178,464 | |
| | |
|
|
| |
|
|
|
| DIVIDENDS AND DISTRIBUTIONS: | | | | | | | | |
Dividends from net investment income | | | — | | | | (2,140,502 | ) |
Distributions from net realized gains | | | — | | | | (47,092,460 | ) |
Distributions | | | (59,307,355 | ) | | | — | |
| | |
|
|
| |
|
|
|
TOTAL DIVIDENDS AND DISTRIBUTIONS | | | (59,307,355 | ) | | | (49,232,962 | ) |
| | |
|
|
| |
|
|
|
| SERIES SHARE TRANSACTIONS (NOTE 7): | | | | | | | | |
Series shares sold [2,729,338 and 7,412,645 shares, respectively] | | | 36,435,016 | | | | 103,227,323 | |
Series shares issued in reinvestment of dividends and distributions [4,622,553 and 3,763,988 shares, respectively] | | | 59,307,355 | | | | 49,232,962 | |
Series shares repurchased [4,967,085 and 11,952,082 shares, respectively] | | | (65,944,369 | ) | | | (168,010,162 | ) |
| | |
|
|
| |
|
|
|
NET INCREASE (DECREASE) IN NET ASSETS RESULTING FROM SERIES SHARE TRANSACTIONS | | | 29,798,002 | | | | (15,549,877 | ) |
| | |
|
|
| |
|
|
|
| TOTAL INCREASE (DECREASE) IN NET ASSETS | | | 18,278,090 | | | | (42,604,375 | ) |
| NET ASSETS: | | | | | | | | |
Beginning of year | | | 350,704,341 | | | | 393,308,716 | |
| | |
|
|
| |
|
|
|
End of year | | $ | 368,982,431 | | | $ | 350,704,341 | (a) |
| | |
|
|
| |
|
|
|
(a) Includes undistributed net investment income of | | | | | | $ | 1,885,918 | |
| | | | | | |
|
|
|
SEE NOTES TO FINANCIAL STATEMENTS.
A15
| | | | |
| | | SP STRATEGIC PARTNERS FOCUSED GROWTH PORTFOLIO | | |
STATEMENT OF ASSETS AND LIABILITIES
December 31, 2006
| | | |
| ASSETS | | | |
Investments at value: | | | |
Unaffiliated investments (cost $59,989,190) | | $ | 68,883,546 |
Affiliated investments (cost $3,368,166) | | | 3,368,166 |
Receivable for investments sold | | | 377,504 |
Dividends and interest receivable | | | 68,627 |
Receivable for Series shares sold | | | 4,220 |
Prepaid expenses | | | 1,544 |
| | |
|
|
Total Assets | | | 72,703,607 |
| | |
|
|
| LIABILITIES | | | |
Payable for investments purchased | | | 2,470,183 |
Accrued expenses and other liabilities | | | 77,393 |
Payable to custodian | | | 76,085 |
Management fee payable | | | 47,052 |
Administration fee payable | | | 9,188 |
Payable for Series shares repurchased | | | 5,151 |
Deferred trustees’ fees | | | 2,054 |
Transfer agent fee payable | | | 650 |
| | |
|
|
Total Liabilities | | | 2,687,756 |
| | |
|
|
| NET ASSETS | | $ | 70,015,851 |
| | |
|
|
Net assets were comprised of: | | | |
Paid-in capital | | $ | 60,780,021 |
Retained earnings | | | 9,235,830 |
| | |
|
|
Net assets, December 31, 2006 | | $ | 70,015,851 |
| | |
|
|
| Class I: | | | |
Net asset value and redemption price per share, $38,686,615 / 5,165,638 outstanding shares of beneficial interest (authorized 100,000,000 shares) | | $ | 7.49 |
| | |
|
|
| Class II: | | | |
Net asset value and redemption price per share, $31,329,236 / 4,293,757 outstanding shares of beneficial interest (authorized 60,000,000 shares) | | $ | 7.30 |
| | |
|
|
STATEMENT OF OPERATIONS
Year Ended December 31, 2006
| | | | |
| INVESTMENT INCOME | | | | |
Unaffiliated dividend income (net of $29,462 foreign withholding tax) | | $ | 449,366 | |
Affiliated dividend income | | | 51,447 | |
| | |
|
|
|
| | | | 500,813 | |
| | |
|
|
|
| EXPENSES | | | | |
Management fee | | | 665,516 | |
Distribution fee—Class II | | | 89,493 | |
Administration fee—Class II | | | 53,696 | |
Custodian’s fees and expenses | | | 65,000 | |
Shareholders’ reports | | | 57,000 | |
Audit fee | | | 15,000 | |
Trustees’ fees | | | 14,000 | |
Legal fees and expenses | | | 7,000 | |
Transfer agent’s fees and expenses (including affiliated expense of $3,800) (Note 4) | | | 4,000 | |
Insurance expenses | | | 2,000 | |
Commitment fee on syndicated credit agreement | | | 500 | |
Loan interest expense (Note 8) | | | 437 | |
Miscellaneous | | | 21,049 | |
| | |
|
|
|
Total expenses | | | 994,691 | |
| | |
|
|
|
| NET INVESTMENT LOSS | | | (493,878 | ) |
| | |
|
|
|
| NET REALIZED AND UNREALIZED GAIN (LOSS) ON INVESTMENTS | | | | |
Net realized gain on investment transactions | | | 3,061,018 | |
Net change in unrealized appreciation (depreciation) on investments | | | (3,803,346 | ) |
| | |
|
|
|
| NET LOSS ON INVESTMENTS | | | (742,328 | ) |
| | |
|
|
|
| NET DECREASE IN NET ASSETS RESULTING FROM OPERATIONS | | $ | (1,236,206 | ) |
| | |
|
|
|
STATEMENT OF CHANGES IN NET ASSETS
| | | | | | | | |
| | | Year Ended December 31,
| |
| | | 2006
| | | 2005
| |
| INCREASE (DECREASE) IN NET ASSETS | | | | | | | | |
| OPERATIONS: | | | | | | | | |
Net investment loss | | $ | (493,878 | ) | | $ | (453,344 | ) |
Net realized gain on investments | | | 3,061,018 | | | | 7,252,737 | |
Net change in unrealized appreciation (depreciation) on investments | | | (3,803,346 | ) | | | 3,483,073 | |
| | |
|
|
| |
|
|
|
NET INCREASE (DECREASE) IN NET ASSETS RESULTING FROM OPERATIONS | | | (1,236,206 | ) | | | 10,282,466 | |
| | |
|
|
| |
|
|
|
| DISTRIBUTIONS: | | | | | | | | |
Distributions | | | | | | | | |
Class I | | | (2,547,235 | ) | | | — | |
Class II | | | (2,776,508 | ) | | | — | |
| | |
|
|
| |
|
|
|
TOTAL DISTRIBUTIONS | | | (5,323,743 | ) | | | — | |
| | |
|
|
| |
|
|
|
| SERIES SHARE TRANSACTIONS (NOTE 7): | | | | | | | | |
Series shares sold [1,511,971 and 3,646,345 shares, respectively] | | | 11,414,376 | | | | 25,555,392 | |
Series shares issued in reinvestment of distributions [712,648 and 0 shares, respectively] | | | 5,323,743 | | | | — | |
Series shares repurchased [2,920,808 and 2,448,898 shares, respectively] | | | (21,216,354 | ) | | | (16,934,804 | ) |
| | |
|
|
| |
|
|
|
NET INCREASE (DECREASE) IN NET ASSETS RESULTING FROM SERIES SHARE TRANSACTIONS | | | (4,478,235 | ) | | | 8,620,588 | |
| | |
|
|
| |
|
|
|
| TOTAL INCREASE (DECREASE) IN NET ASSETS | | | (11,038,184 | ) | | | 18,903,054 | |
| NET ASSETS: | | | | | | | | |
Beginning of year | | | 81,054,035 | | | | 62,150,981 | |
| | |
|
|
| |
|
|
|
End of year | | $ | 70,015,851 | | | $ | 81,054,035 | |
| | |
|
|
| |
|
|
|
SEE NOTES TO FINANCIAL STATEMENTS.
A16
| | | | |
| | | SP T. ROWE PRICE LARGE CAP GROWTH PORTFOLIO | | |
STATEMENT OF ASSETS AND LIABILITIES
December 31, 2006
| | | |
| ASSETS | | | |
Investments at value: | | | |
Unaffiliated investments (cost $66,904,775) | | $ | 76,030,713 |
Affiliated investments (cost $2,067,364) | | | 2,067,364 |
Dividends receivable | | | 72,169 |
Receivable for investments sold | | | 10,594 |
Prepaid expenses | | | 1,595 |
Receivable for Series shares sold | | | 1,092 |
| | |
|
|
Total Assets | | | 78,183,527 |
| | |
|
|
| LIABILITIES | | | |
Payable for investments purchased | | | 230,627 |
Accrued expenses and other liabilities | | | 95,398 |
Management fee payable | | | 45,930 |
Payable for Series shares repurchased | | | 51,318 |
Payable to custodian | | | 49,238 |
Deferred trustees’ fees | | | 2,220 |
Transfer agent fee payable | | | 685 |
| | |
|
|
Total Liabilities | | | 475,416 |
| | |
|
|
| NET ASSETS | | $ | 77,708,111 |
| | |
|
|
Net assets were comprised of: | | | |
Paid-in capital | | $ | 69,148,672 |
Retained earnings | | | 8,559,439 |
| | |
|
|
Net assets, December 31, 2006 | | $ | 77,708,111 |
| | |
|
|
Net asset value and redemption price per share, $77,708,111 / 10,834,366 outstanding shares of beneficial interest (authorized 100,000,000 shares) | | $ | 7.17 |
| | |
|
|
STATEMENT OF OPERATIONS
Year Ended December 31, 2006
| | | | |
| INVESTMENT INCOME | | | | |
Unaffiliated dividend income (net of $2,785 foreign withholding tax) | | $ | 888,059 | |
Affiliated dividend income | | | 91,364 | |
Unaffiliated Interest | | | 786 | |
| | |
|
|
|
| | | | 980,209 | |
| | |
|
|
|
| EXPENSES | | | | |
Management fee | | | 669,994 | |
Custodian’s fees and expenses | | | 104,000 | |
Shareholders’ reports | | | 45,000 | |
Audit fee | | | 15,000 | |
Trustees’ fees | | | 13,000 | |
Legal fees and expenses | | | 10,000 | |
Transfer agent’s fees and expenses (including affiliated expense of $5,400) (Note 4) | | | 6,000 | |
Insurance expenses | | | 2,000 | |
Commitment fee on syndicated credit agreement | | | 500 | |
Miscellaneous | | | 17,315 | |
| | |
|
|
|
Total expenses | | | 882,809 | |
Less: advisory fee waivers and expense reimbursements | | | (87,355 | ) |
| | |
|
|
|
Net expenses | | | 795,454 | |
| | |
|
|
|
| NET INVESTMENT INCOME | | | 184,755 | |
| | |
|
|
|
| NET REALIZED AND UNREALIZED GAIN (LOSS) ON INVESTMENTS | | | | |
Net realized loss on investment transactions | | | (355,223 | ) |
Net change in unrealized appreciation (depreciation) on investments | | | 4,393,070 | |
| | |
|
|
|
| NET GAIN ON INVESTMENTS | | | 4,037,847 | |
| | |
|
|
|
| NET INCREASE IN NET ASSETS RESULTING FROM OPERATIONS | | $ | 4,222,602 | |
| | |
|
|
|
STATEMENT OF CHANGES IN NET ASSETS
| | | | | | | | |
| | | Year Ended December 31,
| |
| | | 2006
| | | 2005
| |
| INCREASE (DECREASE) IN NET ASSETS | | | | | | | | |
| OPERATIONS: | | | | | | | | |
Net investment income (loss) | | $ | 184,755 | | | $ | (252,100 | ) |
Net realized gain (loss) on investments | | | (355,223 | ) | | | 12,322,519 | |
Net change in unrealized appreciation (depreciation) on investments | | | 4,393,070 | | | | (1,525,052 | ) |
| | |
|
|
| |
|
|
|
NET INCREASE IN NET ASSETS RESULTING FROM OPERATIONS | | | 4,222,602 | | | | 10,545,367 | |
| | |
|
|
| |
|
|
|
| DISTRIBUTIONS: | | | | | | | | |
Distributions | | | (9,241,598 | ) | | | — | |
| | |
|
|
| |
|
|
|
| SERIES SHARE TRANSACTIONS (NOTE 7): | | | | | | | | |
Series shares sold [1,945,894 and 1,686,574 shares, respectively] | | | 13,642,113 | | | | 11,483,234 | |
Series shares issued in reinvestment of distributions [1,335,491 and 0 shares, respectively] | | | 9,241,598 | | | | — | |
Series shares repurchased [2,021,217 and 2,056,395 shares, respectively] | | | (13,936,631 | ) | | | (13,953,855 | ) |
| | |
|
|
| |
|
|
|
NET INCREASE (DECREASE) IN NET ASSETS RESULTING FROM SERIES SHARE TRANSACTIONS | | | 8,947,080 | | | | (2,470,621 | ) |
| | |
|
|
| |
|
|
|
| TOTAL INCREASE IN NET ASSETS | | | 3,928,084 | | | | 8,074,746 | |
| NET ASSETS: | | | | | | | | |
Beginning of year | | | 73,780,027 | | | | 65,705,281 | |
| | |
|
|
| |
|
|
|
End of year | | $ | 77,708,111 | | | $ | 73,780,027 | |
| | |
|
|
| |
|
|
|
SEE NOTES TO FINANCIAL STATEMENTS.
A17
| | | | |
| | | SP AGGRESSIVE GROWTH ASSET ALLOCATION PORTFOLIO | | |
SCHEDULE OF INVESTMENTS | December 31, 2006 |
| | | | | |
| LONG-TERM INVESTMENTS — 99.4% | | Shares
| | Value
(Note 2)
|
Affiliated Mutual Funds | | | | | |
American Skandia Trust-Marsico Capital Growth Portfolio | | 1,824,509 | | $ | 37,311,207 |
The Prudential Series Fund — | | | | | |
Jennison Portfolio (Class I) | | 1,753,252 | | | 36,941,011 |
Money Market Portfolio | | 99,792 | | | 997,915 |
Natural Resources Portfolio (Class I) | | 100,892 | | | 4,607,733 |
SP International Growth Portfolio (Class I) | | 2,698,122 | | | 22,394,415 |
SP International Value Portfolio | | 1,974,451 | | | 22,508,744 |
SP Large Cap Value Portfolio | | 5,007,584 | | | 66,400,560 |
SP Small Cap Growth Portfolio(a) | | 630,085 | | | 4,687,836 |
SP Small Cap Value Portfolio | | 337,751 | | | 4,620,438 |
| | | | |
|
|
TOTAL LONG-TERM INVESTMENTS
(cost $161,339,528) | | | 200,469,859 |
| | | | |
|
|
| SHORT-TERM INVESTMENT — 0.6% | | | | | |
Affiliated Money Market Mutual Fund | | | | | |
Dryden Core Investment Fund — Taxable Money Market Series (cost $1,096,133) (Note 4) | | 1,096,133 | | | 1,096,133 |
| | | | |
|
|
TOTAL INVESTMENTS — 100.0%
(cost $162,435,661)(b) | | | 201,565,992 |
OTHER ASSETS IN EXCESS OF LIABILITIES | | | 40,219 |
| | | | |
|
|
NET ASSETS — 100.0% | | $ | 201,606,211 |
| | | | |
|
|
| (a) | Non-income producing security. |
| (b) | Prudential Investments LLC, the manager of the Portfolio, also serves as manager of the underlying funds in which the Portfolio invests. |
The investment allocation of portfolio holdings and other assets in excess of liabilities shown as a percentage of net assets as of December 31, 2006 were as follows:
| | | |
Investment Type
| | | |
Large/Mid-Cap Growth | | 36.8 | % |
Large/Mid-Cap Value | | 32.9 | |
International Value | | 11.2 | |
International Growth | | 11.1 | |
Small-Cap Growth | | 2.3 | |
Small-Cap Value | | 2.3 | |
Sector | | 2.3 | |
Money Market | | 0.5 | |
| | |
|
|
| | | 99.4 | |
Short-Term Investment | | 0.6 | |
Other assets in excess of liabilities | | — | (c) |
| | |
|
|
| | | 100.0 | % |
| | |
|
|
SEE NOTES TO FINANCIAL STATEMENTS.
B1
| | | | |
| | | SP AIM CORE EQUITY PORTFOLIO | | |
SCHEDULE OF INVESTMENTS | December 31, 2006 |
| | | | | |
| LONG-TERM INVESTMENTS — 89.5% | | Value
(Note 2)
|
| COMMON STOCKS | | Shares
| |
Aerospace — 2.1% | | | |
Northrop Grumman Corp. | | 6,106 | | $ | 413,376 |
United Technologies Corp. | | 5,914 | | | 369,743 |
| | | | |
|
|
| | | | | | 783,119 |
| | | | |
|
|
Automobiles — 1.0% | | | |
Renault SA (France) | | 3,271 | | | 392,926 |
| | | | |
|
|
Beverages — 1.3% | | | |
Heineken NV (Netherlands) | | 10,678 | | | 507,859 |
| | | | |
|
|
Biotechnology — 1.8% | | | |
Amgen, Inc.* | | 10,025 | | | 684,808 |
| | | | |
|
|
Broadcast & Cable/Satellite TV — 0.6% | | | |
Clear Channel Communications, Inc. | | 6,171 | | | 219,317 |
| | | | |
|
|
Commercial Banks — 1.3% | | | |
Barclays PLC (United Kingdom) | | 35,584 | | | 508,612 |
| | | | |
|
|
Communication Equipment — 0.8% | | | |
Corning, Inc.* | | 15,943 | | | 298,294 |
| | | | |
|
|
Computer Services & Software — 7.8% | | | |
Cisco Systems, Inc.* | | 31,365 | | | 857,206 |
EMC Corp.* | | 34,670 | | | 457,644 |
Microsoft Corp. | | 31,057 | | | 927,362 |
Symantec Corp.* | | 34,951 | | | 728,728 |
| | | | |
|
|
| | | | | | 2,970,940 |
| | | | |
|
|
Computers — 1.5% | | | |
International Business Machines Corp. | | 5,724 | | | 556,087 |
| | | | |
|
|
Computers & Peripherals — 0.9% | | | |
Seagate Technology (Cayman Islands) | | 13,300 | | | 352,450 |
| | | | |
|
|
Consumer Products & Services — 3.7% | | | |
Avon Products, Inc. | | 18,029 | | | 595,678 |
Estee Lauder Cos., Inc. (Class A Stock) | | 19,869 | | | 811,053 |
| | | | |
|
|
| | | | | | 1,406,731 |
| | | | |
|
|
Diversified Manufacturing Operations — 4.2% | | | |
General Electric Co. | | 17,425 | | | 648,384 |
Tyco International Ltd. | | 30,557 | | | 928,933 |
| | | | |
|
|
| | | | | | 1,577,317 |
| | | | |
|
|
Electronic Components — 1.1% | | | |
Koninklijke (Royal) Philips Electronics NV (Netherlands) | | 11,035 | | | 416,170 |
| | | | |
|
|
Electronics — 0.9% | | | |
Analog Devices, Inc. | | 10,859 | | | 356,935 |
| | | | |
|
|
Entertainment & Leisure — 1.2% | | | |
Nintendo Co. Ltd. (Japan) | | 1,800 | | | 466,000 |
| | | | |
|
|
Financial Services — 3.8% | | | | | |
Citigroup, Inc. | | 7,287 | | | 405,886 |
Moody’s Corp. | | 2,271 | | | 156,835 |
Morgan Stanley | | 5,427 | | | 441,921 |
UBS AG (Switzerland) | | 7,392 | | | 449,222 |
| | | | |
|
|
| | | | | | 1,453,864 |
| | | | |
|
|
Food & Beverage — 9.4% | | | |
Cadbury Schweppes PLC
(United Kingdom) | | 84,993 | | | 909,457 |
Coca-Cola Co. | | 13,560 | | | 654,270 |
General Mills, Inc. | | 7,497 | | | 431,827 |
| | | | | |
COMMON STOCKS
(Continued) | | Shares
| | Value
(Note 2)
|
Food & Beverage (cont’d.) | | | |
Kroger Co. (The) | | 17,600 | | $ | 406,032 |
Sysco Corp. | | 12,497 | | | 459,390 |
Unilever NV (Netherlands) | | 24,957 | | | 681,948 |
| | | | |
|
|
| | | | | | 3,542,924 |
| | | | |
|
|
Industrial Conglomerates — 1.0% | | | |
3M Co. | | 5,085 | | | 396,274 |
| | | | |
|
|
Insurance — 7.3% | | | |
Berkshire Hathaway, Inc. (Class A Stock)* | | 9 | | | 989,910 |
Chubb Corp. (The) | | 7,640 | | | 404,233 |
Genworth Financial, Inc. (Class A Stock) | | 13,497 | | | 461,732 |
Marsh & McLennan Cos., Inc. | | 11,406 | | | 349,708 |
XL Capital Ltd. (Class A Stock) | | 7,498 | | | 540,006 |
| | | | |
|
|
| | | | | | 2,745,589 |
| | | | |
|
|
Iron/Steel — 1.5% | | | |
Tenaris SA, ADR (Luxembourg) | | 11,590 | | | 578,225 |
| | | | |
|
|
Machinery — 1.2% | | | |
Dover Corp. | | 8,996 | | | 440,984 |
| | | | |
|
|
Media — 3.5% | | | |
Gannett Co., Inc. | | 4,612 | | | 278,842 |
McGraw-Hill Cos., Inc. | | 5,360 | | | 364,587 |
News Corp. (Class A Stock) | | 31,577 | | | 678,274 |
| | | | |
|
|
| | | | | | 1,321,703 |
| | | | |
|
|
Office Equipment — 1.6% | | | |
Xerox Corp.* | | 36,105 | | | 611,980 |
| | | | |
|
|
Oil, Gas & Consumable Fuels — 8.2% | | | |
Exxon Mobil Corp. | | 14,133 | | | 1,083,012 |
Schlumberger Ltd. | | 5,766 | | | 364,180 |
Smith International, Inc. | | 8,610 | | | 353,613 |
Total SA (France) (Class B Stock) | | 6,713 | | | 484,279 |
Weatherford International Ltd. (Bermuda)* | | 9,459 | | | 395,292 |
XTO Energy, Inc. | | 9,100 | | | 428,155 |
| | | | |
|
|
| | | | | | 3,108,531 |
| | | | |
|
|
Pharmaceuticals — 7.8% | | | |
Bristol-Myers Squibb Co. | | 23,761 | | | 625,389 |
Forest Laboratories, Inc.* | | 7,458 | | | 377,375 |
GlaxoSmithKline PLC, ADR
(United Kingdom) | | 13,228 | | | 697,909 |
Merck & Co., Inc. | | 9,128 | | | 397,981 |
Pfizer, Inc. | | 14,468 | | | 374,721 |
Teva Pharmaceutical Industries Ltd., ADR (Israel) | | 15,072 | | | 468,438 |
| | | | |
|
|
| | | | | | 2,941,813 |
| | | | |
|
|
Railroads — 1.5% | | | | | |
Union Pacific Corp. | | 6,072 | | | 558,745 |
| | | | |
|
|
Retail — 2.5% | | | | | |
Gap, Inc. (The) | | 19,304 | | | 376,428 |
Wal-Mart Stores, Inc. | | 12,425 | | | 573,786 |
| | | | |
|
|
| | | | | | 950,214 |
| | | | |
|
|
Software — 1.1% | | | | | |
Automatic Data Processing, Inc. | | 8,133 | | | 400,550 |
| | | | |
|
|
SEE NOTES TO FINANCIAL STATEMENTS.
B2
| | | | |
| | | SP AIM CORE EQUITY PORTFOLIO (Continued) | | |
SCHEDULE OF INVESTMENTS December 31, 2006 | |
| | | | | |
COMMON STOCKS
(Continued) | | Shares
| | Value
(Note 2)
|
Telecommunications — 3.8% | | | | | |
AT&T, Inc. | | 26,040 | | $ | 930,930 |
Nokia Corp., ADR (Finland) | | 24,573 | | | 499,323 |
| | | | |
|
|
| | | | | | 1,430,253 |
| | | | |
|
|
Telecommunications Wireless — 1.2% | | | | | |
SK Telecom Co. Ltd., ADR (South Korea) | | 16,897 | | | 447,433 |
| | | | |
|
|
Transportation — 0.4% | | | | | |
United Parcel Service, Inc. (Class B Stock) | | 2,230 | | | 167,205 |
| | | | |
|
|
Utilities — Electrical Utilities — 1.8% | | | | | |
FPL Group, Inc. | | 12,276 | | | 668,060 |
| | | | |
|
|
Waste Management — 1.7% | | | | | |
Waste Management, Inc. | | 17,742 | | | 652,373 |
| | | | |
|
|
TOTAL LONG-TERM INVESTMENTS
(cost $28,173,897) | | | 33,914,285 |
| | | | |
|
|
SHORT-TERM
INVESTMENT — 10.3% | | | |
Affiliated Money Market Mutual Fund |
Dryden Core Investment Fund —Taxable Money Market Series
(cost $3,879,442)(w) (Note 4) | | 3,879,442 | | | 3,879,442 |
| | | | |
|
|
TOTAL INVESTMENTS(o) — 99.8%
(cost $32,053,339) | | | 37,793,727 |
OTHER ASSETS IN EXCESS OF LIABILITIES — 0.2% | | | 87,370 |
| | | | |
|
|
NET ASSETS — 100.0% | | $ | 37,881,097 |
| | | | |
|
|
The following abbreviations are used in portfolio descriptions:
| | |
| ADR | | American Depositary Receipt |
| * | Non-income producing security. |
| (o) | As of December 31, 2006, 1 security representing $466,000 and 1.2% of the total market value was fair valued in accordance with the policies adopted by the Board of Trustees. |
| (w) | Prudential Investments LLC, the manager of the Portfolio, also serves as manager of the Dryden Core Investment Fund-Taxable Money Market Series. |
The industry classification of portfolio holdings and other assets in excess of liabilities shown as a percentage of net assets as of December 31, 2006 were as follows:
| | | |
Industry
| | | |
Affiliated Money Market Mutual Fund | | 10.3 | % |
Food & Beverage | | 9.4 | |
Oil, Gas & Consumable Fuels | | 8.2 | |
Computer Services & Software | | 7.8 | |
Pharmaceuticals | | 7.8 | |
Insurance | | 7.3 | |
Diversified Manufacturing Operations | | 4.2 | |
Financial Services | | 3.8 | |
Telecommunications | | 3.8 | |
Consumer Products & Services | | 3.7 | |
Media | | 3.5 | |
Retail | | 2.5 | |
Aerospace | | 2.1 | |
Biotechnology | | 1.8 | |
Utilities — Electrical Utilities | | 1.8 | |
Waste Management | | 1.7 | |
Office Equipment | | 1.6 | |
Computers | | 1.5 | |
Iron/Steel | | 1.5 | |
Railroads | | 1.5 | |
Beverages | | 1.3 | |
Commercial Banks | | 1.3 | |
Entertainment & Leisure | | 1.2 | |
Machinery | | 1.2 | |
Telecommunications Wireless | | 1.2 | |
Electronic Components | | 1.1 | |
Software | | 1.1 | |
Automobiles | | 1.0 | |
Industrial Conglomerates | | 1.0 | |
Computers & Peripherals | | 0.9 | |
Electronics | | 0.9 | |
Communication Equipment | | 0.8 | |
Broadcast & Cable/Satellite TV | | 0.6 | |
Transportation | | 0.4 | |
| | |
|
|
| | | 99.8 | |
Other Assets in Excess of Liabilities | | 0.2 | |
| | |
|
|
| | | 100.0 | % |
| | |
|
|
SEE NOTES TO FINANCIAL STATEMENTS.
B3
| | | | |
| | | SP BALANCED ASSET ALLOCATION PORTFOLIO | | |
SCHEDULE OF INVESTMENTS | December 31, 2006 |
| | | | | | |
| LONG-TERM INVESTMENTS — 99.4% | | Shares
| | Value
(Note 2)
| |
Affiliated Mutual Funds | | | | | | |
American Skandia Trust — Marsico Capital Growth Portfolio | | 8,406,351 | | $ | 171,909,878 | |
The Prudential Series Fund — | | | | | | |
Jennison Portfolio (Class I) | | 8,091,367 | | | 170,485,105 | |
Money Market Portfolio | | 1,346,145 | | | 13,461,450 | |
Natural Resources Portfolio (Class I) | | 457,606 | | | 20,898,861 | |
SP Large Cap Value Portfolio | | 23,042,767 | | | 305,547,092 | |
SP International Value Portfolio | | 9,083,736 | | | 103,554,594 | |
SP PIMCO High Yield Portfolio | | 2,421,145 | | | 25,010,426 | |
SP PIMCO Total Return Portfolio | | 39,785,872 | | | 443,214,613 | |
SP Small Cap Growth Portfolio(a) | | 2,813,124 | | | 20,929,640 | |
SP Small Cap Value Portfolio | | 1,544,388 | | | 21,127,222 | |
SP International Growth Portfolio (Class I) | | 12,346,996 | | | 102,480,068 | |
| | | | |
|
|
|
TOTAL LONG-TERM INVESTMENTS
(cost $1,224,840,284) | | | 1,398,618,949 | |
| | | | |
|
|
|
| SHORT-TERM INVESTMENT — 0.6% | | | | | | |
Affiliated Money Market Mutual Fund | | | | | | |
Dryden Core Investment Fund — Taxable Money Market Series (cost $8,363,964) (Note 4) | | 8,363,964 | | | 8,363,964 | |
| | | | |
|
|
|
TOTAL INVESTMENTS — 100.0%
(cost $1,233,204,248)(b) | | | 1,406,982,913 | |
LIABILITIES IN EXCESS OF OTHER ASSETS | | | (671,559 | ) |
| | | | |
|
|
|
NET ASSETS — 100.0% | | $ | 1,406,311,354 | |
| | | | |
|
|
|
| (a) | Non-income producing security. |
| (b) | Prudential Investments LLC, the manager of the Portfolio, also serves as manager of the underlying funds in which the Portfolio invests. |
The investment allocation of portfolio holdings and liabilities in excess of other assets shown as a percentage of net assets as of December 31, 2006 were as follows:
| | | |
Investment Type
| | | |
Core Bonds | | 31.5 | % |
Large/Mid-Cap Growth | | 24.3 | |
Large/Mid-Cap Value | | 21.7 | |
International Value | | 7.4 | |
International Growth | | 7.3 | |
High Yield | | 1.8 | |
Small-Cap Value | | 1.5 | |
Small-Cap Growth | | 1.5 | |
Sector | | 1.5 | |
Money Market | | 0.9 | |
| | |
|
|
| | | 99.4 | |
Short-Term Investment | | 0.6 | |
Liabilities in excess of other assets | | — | (c) |
| | |
|
|
| | | 100.0 | % |
| | |
|
|
SEE NOTES TO FINANCIAL STATEMENTS.
B4
| | | | |
| | | SP CONSERVATIVE ASSET ALLOCATION PORTFOLIO | | |
SCHEDULE OF INVESTMENTS | December 31, 2006 |
| | | | | | |
| LONG-TERM INVESTMENTS — 99.6% | | Shares
| | Value (Note 2)
| |
Affiliated Mutual Funds | | | | | | |
American Skandia Trust-Marsico Capital Growth Portfolio | | 2,568,719 | | $ | 52,530,298 | |
The Prudential Series Fund — | | | | | | |
Jennison Portfolio (Class I) | | 2,466,023 | | | 51,959,107 | |
Money Market Portfolio | | 1,215,319 | | | 12,153,187 | |
Natural Resources Portfolio (Class I) | | 139,194 | | | 6,356,989 | |
SP International Growth Portfolio (Class I) | | 3,802,090 | | | 31,557,343 | |
SP International Value Portfolio | | 2,747,677 | | | 31,323,513 | |
SP Large Cap Value Portfolio | | 7,009,295 | | | 92,943,245 | |
SP PIMCO High Yield Portfolio | | 1,625,281 | | | 16,789,154 | |
SP PIMCO Total Return Portfolio | | 28,863,938 | | | 321,544,273 | |
SP Small Cap Growth Portfolio(a) | | 865,853 | | | 6,441,948 | |
SP Small Cap Value Portfolio | | 479,225 | | | 6,555,793 | |
| | | | |
|
|
|
TOTAL LONG-TERM INVESTMENTS
(cost $579,590,921) | | | 630,154,850 | |
| | | | |
|
|
|
| SHORT-TERM INVESTMENT — 0.4% | | | | |
Affiliated Money Market Mutual Fund | | | | | | |
Dryden Core Investment Fund — Taxable Money Market Series (cost $2,878,699) (Note 4) | | 2,878,699 | | | 2,878,699 | |
| | | | |
|
|
|
TOTAL INVESTMENTS — 100.0%
(cost $582,469,620)(b) | | | 633,033,549 | |
LIABILITIES IN EXCESS OF OTHER ASSETS | | | (244,116 | ) |
| | | | |
|
|
|
NET ASSETS — 100.0% | | $ | 632,789,433 | |
| | | | |
|
|
|
| (a) | Non-income producing security. |
| (b) | Prudential Investments LLC, the manager of the Portfolio, also serves as manager of the underlying portfolios in which the Portfolio invests. |
The investment allocation of portfolio holdings and liabilities in excess of other assets shown as a percentage of net assets as of December 31, 2006 were as follows:
| | | |
Investment Type
| | | |
Core Bonds | | 50.8 | % |
Large/Mid-Cap Growth | | 16.5 | |
Large/Mid-Cap Value | | 14.7 | |
International Growth | | 5.0 | |
International Value | | 5.0 | |
High Yield | | 2.7 | |
Money Market | | 1.9 | |
Small-Cap Growth | | 1.0 | |
Sector | | 1.0 | |
Small-Cap Value | | 1.0 | |
| | |
|
|
| | | 99.6 | |
Short-Term Investment | | 0.4 | |
Liabilities in excess of other assets | | — | (c) |
| | |
|
|
| | | 100.0 | % |
| | |
|
|
SEE NOTES TO FINANCIAL STATEMENTS.
B5
SCHEDULE OF INVESTMENTS December 31, 2006 | |
| | | | | |
| LONG-TERM INVESTMENTS — 98.7% | | Value
(Note 2)
|
| COMMON STOCKS | | Shares
| |
Automobile Manufacturers — 0.3% | | | | | |
Carmax, Inc.*(a) | | 17,800 | | $ | 954,614 |
| | | | |
|
|
Beverages — 0.8% | | | | | |
Heineken Holding NV (Netherlands) | | 65,450 | | | 2,661,026 |
| | | | |
|
|
Business Services — 1.3% | | | | | |
Iron Mountain, Inc.*(a) | | 101,600 | | | 4,200,144 |
| | | | |
|
|
Commercial Banks — 0.5% | | | | | |
Mellon Financial Corp.(a) | | 35,800 | | | 1,508,970 |
| | | | |
|
|
Computers — 1.3% | | | | | |
Dell, Inc.*(a) | | 82,000 | | | 2,057,380 |
Hewlett-Packard Co. | | 52,200 | | | 2,150,118 |
| | | | |
|
|
| | | | | | 4,207,498 |
| | | | |
|
|
Construction — 0.3% | | | | | |
Hunter Douglas NV (Netherlands) | | 10,453 | | | 840,324 |
| | | | |
|
|
Consumer Services — 0.3% | | | | | |
Apollo Group, Inc. (Class A Stock)* | | 21,500 | | | 837,855 |
| | | | |
|
|
Containers & Packaging — 2.2% | | | | | |
Sealed Air Corp. | | 110,500 | | | 7,173,660 |
| | | | |
|
|
Cosmetics & Toiletries — 0.4% | | | | | |
Avon Products, Inc. | | 38,700 | | | 1,278,648 |
| | | | |
|
|
Diversified Manufacturing Operations — 4.2% | | | |
Tyco International Ltd. | | 453,752 | | | 13,794,061 |
| | | | |
|
|
Diversified Metals — 0.5% | | | | | |
BHP Billiton PLC (United Kingdom) | | 39,200 | | | 717,256 |
Rio Tinto PLC (United Kingdom) | | 14,900 | | | 792,947 |
| | | | |
|
|
| | | | | | 1,510,203 |
| | | | |
|
|
Entertainment & Leisure — 2.0% | | | | | |
Harley-Davidson, Inc.(a) | | 93,000 | | | 6,553,710 |
| | | | |
|
|
Financial — Bank & Trust — 5.2% | | | | | |
HSBC Holdings PLC (United Kingdom) | | 499,072 | | | 9,097,488 |
Wachovia Corp. | | 138,307 | | | 7,876,584 |
| | | | |
|
|
| | | | | | 16,974,072 |
| | | | |
|
|
Financial Services — 11.3% | | | | | |
American Express Co. | | 246,300 | | | 14,943,021 |
Ameriprise Financial, Inc. | | 69,760 | | | 3,801,920 |
Commerce Bancorp, Inc. | | 54,500 | | | 1,922,215 |
H&R Block, Inc. | | 144,800 | | | 3,336,192 |
Moody’s Corp.(a) | | 63,500 | | | 4,385,310 |
State Street Corp. | | 9,300 | | | 627,192 |
Wells Fargo & Co. | | 230,700 | | | 8,203,692 |
| | | | |
|
|
| | | | | | 37,219,542 |
| | | | |
|
|
Foods — 1.8% | | | | | |
Diageo PLC, ADR (United Kingdom)(a) | | 53,100 | | | 4,211,361 |
Hershey Co. | | 36,500 | | | 1,817,700 |
| | | | |
|
|
| | | | | | 6,029,061 |
| | | | |
|
|
Healthcare Providers & Services — 2.3% | | | | | |
Cardinal Health, Inc. | | 44,800 | | | 2,886,464 |
Express Scripts, Inc.* | | 17,500 | | | 1,253,000 |
UnitedHealth Group, Inc. | | 65,400 | | | 3,513,942 |
| | | | |
|
|
| | | | | | 7,653,406 |
| | | | |
|
|
Household Products — 1.1% | | | | | |
Procter & Gamble Co. | | 55,500 | | | 3,566,985 |
| | | | |
|
|
| | | | | |
COMMON STOCKS
(Continued) | | Shares
| | Value
(Note 2)
|
Insurance — 14.6% | | | | | |
Ambac Financial Group, Inc. | | 2,300 | | $ | 204,861 |
American International Group, Inc. | | 202,700 | | | 14,525,482 |
AON Corp. | | 59,200 | | | 2,092,128 |
Berkshire Hathaway, Inc. (Class A Stock)* | | 106 | | | 11,658,940 |
Chubb Corp. | | 16,000 | | | 846,560 |
Loews Corp. | | 163,900 | | | 6,796,933 |
Markel Corp.* | | 534 | | | 256,373 |
Principal Financial Group, Inc. | | 18,900 | | | 1,109,430 |
Progressive Corp. | | 285,000 | | | 6,902,700 |
Sun Life Financial, Inc. (Canada) | | 11,400 | | | 482,790 |
Transatlantic Holdings, Inc. | | 48,475 | | | 3,010,298 |
| | | | |
|
|
| | | | | | 47,886,495 |
| | | | |
|
|
Internet & Catalog Retail — 0.3% | | | | | |
Liberty Media Holding Corp. Interactive (Class A Stock)* | | 48,525 | | | 1,046,684 |
| | | | |
|
|
Internet Services — 0.4% | | | | | |
Expedia, Inc.* | | 20,550 | | | 431,139 |
IAC/InterActive Corp.* | | 20,150 | | | 748,774 |
| | | | |
|
|
| | | | | | 1,179,913 |
| | | | |
|
|
Internet Software & Services — 0.7% | | | | | |
Amazon.com, Inc.*(a) | | 55,000 | | | 2,170,300 |
| | | | |
|
|
Investment Firms — 7.1% | | | | | |
Citigroup, Inc. | | 132,200 | | | 7,363,540 |
JPMorgan Chase & Co. | | 277,916 | | | 13,423,343 |
Morgan Stanley | | 29,400 | | | 2,394,042 |
| | | | |
|
|
| | | | | | 23,180,925 |
| | | | |
|
|
Materials — 0.8% | | | | | |
Martin Marietta Materials, Inc. | | 26,300 | | | 2,732,833 |
| | | | |
|
|
Media — 6.8% | | | | | |
Comcast Corp.
(Special Class A Stock)* | | 265,100 | | | 11,102,388 |
Gannett Co., Inc.(a) | | 13,400 | | | 810,164 |
Lagardere SCA (France) | | 37,700 | | | 3,035,707 |
Liberty Media Holding Corp. Capital (Class A Stock)* | | 9,825 | | | 962,654 |
News Corp. (Class A Stock) | | 260,600 | | | 5,597,688 |
WPP Group PLC, ADR
(United Kingdom) | | 12,700 | | | 860,298 |
| | | | |
|
|
| | | | | | 22,368,899 |
| | | | |
|
|
Metals & Mining — 0.2% | | | | | |
China Coal Energy Co. (Hong Kong)* | | 1,140,700 | | | 740,590 |
| | | | |
|
|
Mining — 0.7% | | | | | |
Vulcan Materials Co. | | 25,900 | | | 2,327,633 |
| | | | |
|
|
Multi-Line Retail — 0.2% | | | | | |
Sears Holdings Corp.* | | 4,700 | | | 789,271 |
| | | | |
|
|
Oil, Gas & Consumable Fuels — 11.7% | | | | | |
Canadian Natural Resources Ltd. (Canada) | | 24,600 | | | 1,309,458 |
ConocoPhillips | | 205,740 | | | 14,802,993 |
Devon Energy Corp. | | 104,200 | | | 6,989,736 |
EOG Resources, Inc. | | 89,800 | | | 5,608,010 |
Occidental Petroleum Corp. | | 141,700 | | | 6,919,211 |
Transocean, Inc. (Cayman Islands)* | | 33,500 | | | 2,709,815 |
| | | | |
|
|
| | | | | | 38,339,223 |
| | | | |
|
|
SEE NOTES TO FINANCIAL STATEMENTS.
B6
| | | | |
| | | SP DAVIS VALUE PORTFOLIO (Continued) | | |
SCHEDULE OF INVESTMENTS December 31, 2006 | |
| | | | | | |
COMMON STOCKS
(Continued) | | Shares
| | Value
(Note 2)
| |
Pharmaceuticals — 1.3% | | | | | | |
Caremark Rx, Inc. | | 74,500 | | $ | 4,254,695 | |
| | | | |
|
|
|
Retail & Merchandising — 6.0% | | | | | | |
Bed Bath & Beyond, Inc.* | | 45,400 | | | 1,729,740 | |
Costco Wholesale Corp. | | 227,600 | | | 12,033,212 | |
Wal-Mart Stores, Inc. | | 127,200 | | | 5,874,096 | |
| | | | |
|
|
|
| | | | | | 19,637,048 | |
| | | | |
|
|
|
Software — 3.1% | | | | | | |
Dun & Bradstreet Corp.* | | 35,100 | | | 2,905,929 | |
Microsoft Corp. | | 244,300 | | | 7,294,798 | |
| | | | |
|
|
|
| | | | | | 10,200,727 | |
| | | | |
|
|
|
Specialty Retail — 0.5% | | | | | | |
Lowe’s Co., Inc. | | 52,000 | | | 1,619,800 | |
| | | | |
|
|
|
Telecommunications Wireless — 2.3% | | | | | | |
Nokia Corp. (Class A Stock), ADR (Finland) | | 37,100 | | | 753,872 | |
NTL, Inc. | | 62,517 | | | 1,577,929 | |
SK Telecom Co. Ltd., ADR
(South Korea) | | 66,000 | | | 1,747,680 | |
Sprint Nextel Corp. | | 192,000 | | | 3,626,880 | |
| | | | |
|
|
|
| | | | | | 7,706,361 | |
| | | | |
|
|
|
Tobacco — 4.4% | | | | | | |
Altria Group, Inc. | | 167,400 | | | 14,366,268 | |
| | | | |
|
|
|
Transportation — 1.1% | | | | | | |
Cosco Pacific Ltd. (Hong Kong) | | 469,200 | | | 1,101,474 | |
Kuehne & Nagel International AG (Switzerland) | | 14,945 | | | 1,087,299 | |
United Parcel Service, Inc.
(Class B Stock) | | 20,800 | | | 1,559,584 | |
| | | | |
|
|
|
| | | | | | 3,748,357 | |
| | | | |
|
|
|
Transportation/Shipping — 0.7% | | | | | | |
China Merchants Holdings International Co. Ltd. (Hong Kong) | | 576,708 | | | 2,359,132 | |
| | | | |
|
|
|
TOTAL LONG-TERM INVESTMENTS
(cost $224,599,148) | | | 323,618,933 | |
| | | | |
|
|
|
| SHORT-TERM INVESTMENT — 7.2% | | | | |
Affiliated Money Market Mutual Fund | | | | |
Dryden Core Investment Fund — Taxable Money Market Series (cost $23,596,395; includes $20,533,022 of cash collateral for securities on loan)(b)(w) (Note 4) | | 23,596,395 | | | 23,596,395 | |
| | | | |
|
|
|
TOTAL INVESTMENTS(o) — 105.9%
(cost $248,195,543) | | | 347,215,328 | |
LIABILITIES IN EXCESS OF OTHER
ASSETS — (5.9)% | | | (19,243,883 | ) |
| | | | |
|
|
|
NET ASSETS — 100.0% | | $ | 327,971,445 | |
| | | | |
|
|
|
The following abbreviations are used in portfolio descriptions:
| | |
| ADR | | American Depositary Receipt |
| * | Non-income producing security. |
| (a) | All or a portion of security is on loan. The aggregate market value of such securities is $19,725,056; cash collateral of $20,533,022 (included with liabilities) was received with which the portfolio purchased highly liquid short-term investments. |
| (b) | Represents security, or a portion thereof, purchased with cash collateral received for securities on loan. |
| (o) | As of December 31, 2006, 3 securities representing $4,201,196 and 1.21% of the total market value were fair valued in accordance with the policies adopted by the Board of Trustees. |
| (w) | Prudential Investments LLC, the manager of the Portfolio, also serves as manager of the Dryden Core Investment Fund-Taxable Money Market Series. |
The industry classification of long-term portfolio holdings, short-term investments and liabilities in excess of other assets shown as a percentage of net assets as of December 31, 2006 were as follows:
| | | |
Industry
| | | |
Insurance | | 14.6 | % |
Oil, Gas & Consumable Fuels | | 11.7 | |
Financial Services | | 11.3 | |
Affiliated Money Market Mutual Fund (including 6.3% of collateral received for securities on loan) | | 7.2 | |
Investment Firms | | 7.1 | |
Media | | 6.8 | |
Retail & Merchandising | | 6.0 | |
Financial — Bank & Trust | | 5.2 | |
Tobacco | | 4.4 | |
Diversified Manufacturing Operations | | 4.2 | |
Software | | 3.1 | |
Telecommunications Wireless | | 2.3 | |
Healthcare Providers & Services | | 2.3 | |
Containers & Packaging | | 2.2 | |
Entertainment & Leisure | | 2.0 | |
Foods | | 1.8 | |
Pharmaceuticals | | 1.3 | |
Computers | | 1.3 | |
Business Services | | 1.3 | |
Transportation | | 1.1 | |
Household Products | | 1.1 | |
Materials | | 0.8 | |
Beverages | | 0.8 | |
Transportation/Shipping | | 0.7 | |
Mining | | 0.7 | |
Internet Software & Services | | 0.7 | |
Specialty Retail | | 0.5 | |
Diversified Metals | | 0.5 | |
Commercial Banks | | 0.5 | |
Cosmetics & Toiletries | | 0.4 | |
Internet Services | | 0.4 | |
Internet & Catalog Retail | | 0.3 | |
Automobile Manufacturers | | 0.3 | |
Construction | | 0.3 | |
Consumer Services | | 0.3 | |
Multi-Line Retail | | 0.2 | |
Metals & Mining | | 0.2 | |
| | |
|
|
| | | 105.9 | |
Liabilities in Excess of Other Assets | | (5.9 | ) |
| | |
|
|
| | | 100.0 | % |
| | |
|
|
SEE NOTES TO FINANCIAL STATEMENTS.
B7
| | | | |
| | | SP GROWTH ASSET ALLOCATION PORTFOLIO | | |
SCHEDULE OF INVESTMENTS | December 31, 2006 |
| | | | | | |
| LONG-TERM INVESTMENTS — 99.5% | | Shares
| | Value
(Note 2)
| |
Affiliated Mutual Funds | | | | | | |
American Skandia Trust-Marsico Capital Growth Portfolio | | 9,957,968 | | $ | 203,640,448 | |
The Prudential Series Fund — | | | | | | |
Jennison Portfolio (Class I) | | 9,582,540 | | | 201,904,113 | |
Money Market Portfolio | | 655,269 | | | 6,552,695 | |
Natural Resources Portfolio (Class I) | | 532,614 | | | 24,324,497 | |
SP Large Cap Value Portfolio | | 27,572,631 | | | 365,613,093 | |
SP International Value Portfolio | | 10,908,779 | | | 124,360,075 | |
SP PIMCO High Yield Portfolio | | 1,228,101 | | | 12,686,283 | |
SP PIMCO Total Return Portfolio | | 14,931,803 | | | 166,340,285 | |
SP Small Cap Growth Portfolio(a) | | 3,380,217 | | | 25,148,812 | |
SP Small Cap Value Portfolio | | 1,856,046 | | | 25,390,703 | |
SP International Growth Portfolio (Class I) | | 14,691,246 | | | 121,937,340 | |
| | | | |
|
|
|
TOTAL LONG-TERM INVESTMENTS
(cost $1,071,887,341) | | | 1,277,898,344 | |
| | | | |
|
|
|
| SHORT-TERM INVESTMENT — 0.5% | | | | |
Affiliated Money Market Mutual Fund | | | | | | |
Dryden Core Investment Fund — Taxable Money Market Series (cost $6,274,481) (Note 4) | | 6,274,481 | | | 6,274,481 | |
| | | | |
|
|
|
TOTAL INVESTMENTS — 100.0%
(cost $1,078,161,822)(b) | | | 1,284,172,825 | |
LIABILITIES IN EXCESS OF OTHER ASSETS | | | (273,564 | ) |
| | | | |
|
|
|
NET ASSETS — 100.0% | | $ | 1,283,899,261 | |
| | | | |
|
|
|
| (a) | Non-income producing security. |
| (b) | Prudential Investments LLC, the manager of the Portfolio, also serves as manager of the underlying funds in which the Portfolio invests. |
The investment allocation of portfolio holdings and liabilities in excess of other assets. shown as a percentage of net assets as of December 31, 2006 were as follows:
| | | |
Investment Type
| | | |
Large/Mid-Cap Growth | | 31.6 | % |
Large/Mid-Cap Value | | 28.5 | |
Core Bonds | | 12.9 | |
International Value | | 9.7 | |
International Growth | | 9.5 | |
Small Cap Value | | 2.0 | |
Small Cap Growth | | 1.9 | |
Sector | | 1.9 | |
High Yield | | 1.0 | |
Money Market | | 0.5 | |
| | |
|
|
| | | 99.5 | |
Short-Term Investment | | 0.5 | |
Liabilities in excess of other assets | | — | (c) |
| | |
|
|
| | | 100.0 | % |
| | |
|
|
SEE NOTES TO FINANCIAL STATEMENTS.
B8
| | | | |
| | | SP INTERNATIONAL GROWTH PORTFOLIO | | |
SCHEDULE OF INVESTMENTS December 31, 2006 | |
| | | | | |
| LONG-TERM INVESTMENTS — 98.6% | | Value (Note 2)
|
| COMMON STOCKS — 98.1% | | Shares
| |
Australia — 3.0% | | | | | |
Allco Finance Group Ltd. | | 151,654 | | $ | 1,539,220 |
CSL Ltd. | | 48,557 | | | 2,499,167 |
Macquarie Bank Ltd. | | 164,437 | | | 10,220,668 |
| | | | |
|
|
| | | | | | 14,259,055 |
| | | | |
|
|
Austria — 2.1% | | | | | |
Erste Bank der Oesterreichischen Sparkassen AG | | 96,122 | | | 7,372,039 |
Raiffeisen International Bank Holding AG* | | 16,300 | | | 2,485,398 |
| | | | |
|
|
| | | | | | 9,857,437 |
| | | | |
|
|
Belgium — 0.3% | | | | | |
InBev NV | | 20,900 | | | 1,377,792 |
| | | | |
|
|
Brazil — 2.3% | | | | | |
Companhia de Concessoes Rodoviarias | | 117,700 | | | 1,589,350 |
Gafisa SA* | | 61,100 | | | 913,426 |
Gol Linhas Aereas Inteligentes SA, ADR | | 28,400 | | | 814,228 |
Localiza Rent A Car SA | | 22,100 | | | 664,603 |
Natura Cosmeticos SA | | 118,100 | | | 1,666,611 |
Petroleo Brasileiro SA | | 96,300 | | | 2,244,671 |
Unibanco — Uniao de Bancos Brasileiros, ADR | | 34,800 | | | 3,235,008 |
| | | | |
|
|
| | | | | | 11,127,897 |
| | | | |
|
|
Canada — 2.8% | | | | | |
Canadian National Railway Co. | | 31,185 | | | 1,341,890 |
Manulife Financial Corp. | | 146,900 | | | 4,956,922 |
Shoppers Drug Mart Corp. | | 104,930 | | | 4,507,091 |
Suncor Energy, Inc. | | 36,400 | | | 2,865,117 |
| | | | |
|
|
| | | | | | 13,671,020 |
| | | | |
|
|
Chile — 0.4% | | | | | |
Cencosud SA, ADR, 144A | | 38,700 | | | 1,815,936 |
| | | | |
|
|
China — 1.4% | | | | | |
Focus Media Holding Ltd., ADR* | | 23,000 | | | 1,526,970 |
Foxconn International Holding Ltd.* | | 307,000 | | | 1,001,301 |
Industrial & Commercial Bank of China (Class H Shares)* | | 6,402,000 | | | 3,975,375 |
| | | | |
|
|
| | | | | | 6,503,646 |
| | | | |
|
|
Colombia — 0.3% | | | | | |
Bancolombia SA, ADR | | 46,400 | | | 1,445,360 |
| | | | |
|
|
France — 13.3% | | | | | |
Axa SA | | 77,434 | | | 3,134,976 |
BNP Paribas SA | | 54,160 | | | 5,908,949 |
Cap Gemini SA | | 41,700 | | | 2,617,431 |
Essilor International SA | | 30,700 | | | 3,300,792 |
Eurazeo | | 20,000 | | | 2,856,577 |
Groupe Danone | | 55,800 | | | 8,455,996 |
Iliad SA | | 12,900 | | | 1,120,481 |
JC Decaux SA | | 39,769 | | | 1,138,132 |
L’Oreal SA | | 90,900 | | | 9,107,399 |
LVMH Moet Hennessy Louis Vuitton SA | | 88,684 | | | 9,359,495 |
Vallourec SA | | 9,854 | | | 2,865,601 |
| | | | | |
COMMON STOCKS
(Continued) | | Shares
| | Value (Note 2)
|
France (cont’d.) | | | | | |
Veolia Environment | | 131,349 | | $ | 10,125,776 |
Vinci SA | | 31,000 | | | 3,961,191 |
| | | | |
|
|
| | | | | | 63,952,796 |
| | | | |
|
|
Germany — 3.3% | | | | | |
Bijou Brigitte Modische Accessoires AG | | 2,700 | | | 532,658 |
Continental AG | | 40,120 | | | 4,665,794 |
E.ON AG | | 42,500 | | | 5,768,959 |
SAP AG | | 90,648 | | | 4,817,488 |
| | | | |
|
|
| | | | | | 15,784,899 |
| | | | |
|
|
Greece — 0.7% | | | | | |
National Bank of Greece SA | | 71,976 | | | 3,315,903 |
| | | | |
|
|
Hong Kong — 4.3% | | | | | |
China Mobile Ltd | | 311,500 | | | 2,685,114 |
CNOOC Ltd., ADR(a) | | 16,300 | | | 1,542,469 |
Esprit Holdings Ltd. | | 736,800 | | | 8,206,820 |
Hopson Development Holdings Ltd. | | 283,000 | | | 799,951 |
Li & Fung Ltd. | | 1,408,400 | | | 4,372,844 |
Melco PBL Entertainment (Macau) Ltd., ADR*(a) | | 65,263 | | | 1,387,491 |
Shangri-La Asia Ltd. | | 616,000 | | | 1,584,616 |
| | | | |
|
|
| | | | | | 20,579,305 |
| | | | |
|
|
India — 2.2% | | | | | |
HDFC Bank Ltd., ADR | | 15,050 | | | 1,135,974 |
ICICI Bank Ltd., ADR | | 45,053 | | | 1,880,512 |
Infosys Technologies Ltd., ADR | | 137,100 | | | 7,480,176 |
| | | | |
|
|
| | | | | | 10,496,662 |
| | | | |
|
|
Indonesia — 0.6% | | | | | |
Bank Rakyat Indonesia | | 2,823,500 | | | 1,619,573 |
PT Telekomunikasi Indonesia | | 1,250,500 | | | 1,409,424 |
| | | | |
|
|
| | | | | | 3,028,997 |
| | | | |
|
|
Ireland — 1.0% | | | | | |
Anglo Irish Bank Corp. PLC | | 185,100 | | | 3,838,586 |
IAWS Group PLC | | 42,000 | | | 1,075,573 |
| | | | |
|
|
| | | | | | 4,914,159 |
| | | | |
|
|
Italy — 3.5% | | | | | |
Banco Ambrosiano Veneto SpA | | 383,247 | | | 2,959,534 |
Luxottica Group SpA | | 182,800 | | | 5,617,562 |
Saipem SpA | | 211,800 | | | 5,519,018 |
San Paolo — IMI SpA | | 113,111 | | | 2,627,884 |
| | | | |
|
|
| | | | | | 16,723,998 |
| | | | |
|
|
Japan — 14.4% | | | | | |
Advantest Corp. | | 26,300 | | | 1,507,714 |
Aeon Mall Co. Ltd. | | 40,200 | | | 2,269,969 |
Canon, Inc. | | 120,500 | | | 6,784,169 |
Daikin Industries Ltd. | | 51,500 | | | 1,788,552 |
Denso Corp. | | 187,400 | | | 7,430,556 |
Fanuc Ltd. | | 34,500 | | | 3,385,891 |
Honeys Co. Ltd. | | 20,500 | | | 761,481 |
Hoya Corp. | | 75,500 | | | 2,942,752 |
Jupiter Telecommunications Co. Ltd.* | | 1,974 | | | 1,591,133 |
K.K. DaVinci Advisors* | | 880 | | | 872,169 |
SEE NOTES TO FINANCIAL STATEMENTS.
B9
| | | | |
| | | SP INTERNATIONAL GROWTH PORTFOLIO (Continued) | | |
SCHEDULE OF INVESTMENTS December 31, 2006 | |
| | | | | |
COMMON STOCKS
(Continued) | | Shares
| | Value (Note 2)
|
Japan (cont’d.) | | | | | |
Keyence Corp. | | 15,140 | | $ | 3,737,143 |
Komatsu Ltd. | | 161,400 | | | 3,266,715 |
Marubeni Corp. | | 382,000 | | | 1,935,389 |
Mitsui Trust Holdings, Inc. | | 192,000 | | | 2,193,541 |
Nippon Electric Glass Co. Ltd. | | 65,000 | | | 1,362,961 |
ORIX Corp. | | 31,200 | | | 9,047,754 |
Sega Sammy Holdings, Inc. | | 57,300 | | | 1,540,325 |
Sharp Corp. | | 172,000 | | | 2,957,381 |
Suruga Bank Ltd. | | 171,000 | | | 2,117,751 |
Toyota Motor Corp. | | 70,100 | | | 4,691,583 |
Yamada Denki Co. Ltd. | | 38,020 | | | 3,227,188 |
Yamaha Motor Co. Ltd | | 118,700 | | | 3,731,185 |
| | | | |
|
|
| | | | | | 69,143,302 |
| | | | |
|
|
Mexico — 4.3% | | | | | |
America Movil SA de CV, Series L | | 2,135,700 | | | 4,815,852 |
America Movil SA de CV, Series L, ADR | | 105,986 | | | 4,792,687 |
Cemex SA de CV, ADR* | | 122,645 | | | 4,149,081 |
Wal-Mart de Mexico SA de CV, Series V | | 1,525,300 | | | 6,710,868 |
| | | | |
|
|
| | | | | | 20,468,488 |
| | | | |
|
|
Netherlands — 0.9% | | | | | |
Koninklijke Numico NV | | 45,200 | | | 2,431,391 |
TomTom NV* | | 44,200 | | | 1,909,080 |
| | | | |
|
|
| | | | | | 4,340,471 |
| | | | |
|
|
Norway — 0.6% | | | | | |
Acergy SA* | | 161,900 | | | 3,115,858 |
| | | | |
|
|
Russia — 0.1% | | | | | |
CTC Media, Inc.* | | 26,900 | | | 645,869 |
| | | | |
|
|
Singapore — 1.7% | | | | | |
Capitaland Ltd. | | 1,981,000 | | | 7,971,774 |
| | | | |
|
|
South Africa — 0.5% | | | | | |
Naspers Ltd. (Class N Shares) | | 47,400 | | | 1,121,933 |
Sasol Ltd. | | 30,800 | | | 1,136,525 |
| | | | |
|
|
| | | | | | 2,258,458 |
| | | | |
|
|
South Korea — 1.3% | | | | | |
Samsung Electronics Co. Ltd. | | 3,770 | | | 2,473,152 |
Samsung Electronics Co. Ltd., GDR, 144A* | | 12,000 | | | 3,954,839 |
| | | | |
|
|
| | | | | | 6,427,991 |
| | | | |
|
|
Spain — 1.3% | | | | | |
Industria de Diseno Textil SA | | 115,700 | | | 6,232,878 |
| | | | |
|
|
Sweden — 2.0% | | | | | |
Ericsson, L.M. Telefonaktiebolaget
(Class B Shares) | | 953,000 | | | 3,849,057 |
Ericsson, L.M. Telefonaktiebolaget, ADR | | 115,507 | | | 4,646,847 |
Modern Times Group MTG AB
(Class B Shares)* | | 17,500 | | | 1,150,315 |
| | | | |
|
|
| | | | | | 9,646,219 |
| | | | |
|
|
| | | | | |
COMMON STOCKS
(Continued) | | Shares
| | Value (Note 2)
|
Switzerland — 10.5% | | | | | |
ABB Ltd. | | 693,798 | | $ | 12,441,105 |
EFG International* | | 51,100 | | | 1,926,996 |
Kuehne & Nagel International AG | | 35,100 | | | 2,553,644 |
Lonza Group AG | | 31,624 | | | 2,732,874 |
Nestle SA | | 23,719 | | | 8,428,664 |
Nobel Biocare Holding AG | | 6,000 | | | 1,773,902 |
Roche Holding AG | | 63,434 | | | 11,374,911 |
SGS Societe Generale | | 2,270 | | | 2,529,881 |
Syngenta AG* | | 12,861 | | | 2,392,769 |
UBS AG* | | 71,093 | | | 4,320,424 |
| | | | |
|
|
| | | | | | 50,475,170 |
| | | | |
|
|
Taiwan — 1.3% | | | | | |
High Tech Computer Corp. | | 14,400 | | | 284,022 |
Hon Hai Precision Industry Co. Ltd. | | 572,929 | | | 4,076,450 |
Taiwan Semiconductor Manufacturing Co. Ltd., ADR(a) | | 187,148 | | | 2,045,528 |
| | | | |
|
|
| | | | | | 6,406,000 |
| | | | |
|
|
United Kingdom — 17.7% | | | | | |
BAE Systems PLC | | 607,136 | | | 5,061,151 |
BG Group PLC | | 558,400 | | | 7,576,825 |
Cairn Energy PLC* | | 55,700 | | | 1,961,982 |
Capita Group PLC | | 298,500 | | | 3,547,657 |
Carphone Warehouse Group | | 248,900 | | | 1,530,253 |
Diageo PLC | | 145,711 | | | 2,860,127 |
HBOS PLC | | 402,900 | | | 8,930,018 |
Man Group PLC | | 749,618 | | | 7,672,602 |
Northern Rock PLC | | 282,833 | | | 6,523,550 |
Reckitt Benckiser PLC | | 217,475 | | | 9,938,454 |
Rolls-Royce Group PLC* | | 743,500 | | | 6,518,163 |
Rolls-Royce Group PLC (Class B Shares) | | 42,557,320 | | | 84,576 |
Rotork PLC | | 71,800 | | | 1,173,869 |
Royal Bank of Scotland Group PLC | | 72,709 | | | 2,837,293 |
Standard Chartered PLC | | 140,400 | | | 4,101,517 |
Tesco PLC | | 1,484,389 | | | 11,756,414 |
Tullow Oil PLC | | 119,600 | | | 932,015 |
Vedanta Resources PLC | | 80,600 | | | 1,926,901 |
| | | | |
|
|
| | | | | | 84,933,367 |
| | | | |
|
|
TOTAL COMMON STOCKS
(cost $371,284,948) | | | 470,920,707 |
| | | | |
|
|
| PREFERRED STOCK — 0.5% | | | | | |
Brazil — 0.5% | | | | | |
Banco Itau Holding Financeira SA 13.50% (cost $510,401) | | 62,990 | | | 2,281,968 |
| | | | |
|
|
TOTAL LONG-TERM INVESTMENTS
(cost $371,795,349) | | | 473,202,675 |
| | | | |
|
|
SEE NOTES TO FINANCIAL STATEMENTS.
B10
| | | | |
| | | SP INTERNATIONAL GROWTH PORTFOLIO (Continued) | | |
SCHEDULE OF INVESTMENTS December 31, 2006 | |
| | | | | | |
SHORT-TERM
INVESTMENT — 2.1% | | Shares
| | Value
(Note 2)
| |
Affiliated Money Market Mutual Fund | | | | |
Dryden Core Investment Fund — Taxable Money Market Series (cost $10,070,881; includes $4,956,944 of cash collateral for securities on loan)(b)(w)(Note 4) | | 10,070,881 | | $ | 10,070,881 | |
| | | | |
|
|
|
TOTAL INVESTMENTS(o) — 100.7%
(cost $381,866,230) | | | 483,273,556 | |
LIABILITIES IN EXCESS OF OTHER
ASSETS(x) — (0.7)% | | | (3,487,962 | ) |
| | | | |
|
|
|
NET ASSETS — 100.0% | | $ | 479,785,594 | |
| | | | |
|
|
|
The following abbreviations are used in portfolio descriptions:
| | |
| 144A | | Security was purchased pursuant to Rule 144A under the securities Act of 1933 and may not be resold subject to that rule except to qualified institutional buyers. Unless otherwise noted 144A securities are deemed to be liquid. |
| ADR | | American Depositary Receipt |
| GDR | | Global Depositary Receipt |
| * | Non-income producing security. |
| (a) | All or a portion of security is on loan. The aggregate market value of such securities is $4,696,799; cash collateral of $4,956,944 (included with liabilities) was received with which the portfolio purchased highly liquid short-term investments. |
| (b) | Represents security, or a portion thereof, purchased with cash collateral received for securities on loan. |
| (o) | As of December 31, 2006, 38 securities representing $123,862,774 and 25.82% of the total market value were fair valued in accordance with the policies adopted by the Board of Trustees. |
| (w) | Prudential Investments LLC, the manager of the Portfolio, also serves as manager of the Dryden Core Investment Fund —Taxable Money Market Series. |
| (x) | Liabilities in excess of other assets includes net unrealized appreciation on forward foreign currency contracts as follows: |
Forward foreign currency exchange contracts outstanding at December 31, 2006:
| | | | | | | | | |
Purchase Contracts
| | Value at
Settlement
Date
| | Current
Value
| | Unrealized
Appreciation
|
EUR 112,240 | | | | | | | | | |
expiring 01/04/07 | | $ | 148,096 | | $ | 148,162 | | $ | 66 |
| | | | | | | | |
|
|
The industry classification of long-term portfolio holdings, short-term investment and liabilities in excess of other assets shown as a percentage of net assets as of December 31, 2006 were as follows:
| | | |
Industry
| | | |
Financial — Bank & Trust | | 8.8 | % |
Financial Services | | 7.9 | |
Real Estate | | 5.5 | |
Oil, Gas & Consumable Fuels | | 4.9 | |
Retail & Merchandising | | 4.7 | |
Food | | 4.2 | |
| | | |
Industry
| | | |
Telecommunications | | 3.9 | % |
Commercial Banks | | 3.6 | |
Electronic Components | | 3.4 | |
Oil & Gas | | 3.2 | |
Computer Services & Software | | 3.0 | |
Pharmaceuticals | | 2.9 | |
Automotive Parts | | 2.5 | |
Foods | | 2.4 | |
Automobile Manufacturers | | 2.4 | |
Medical Supplies & Equipment | | 2.3 | |
Cosmetics & Toiletries | | 2.2 | |
Water | | 2.1 | |
Affiliated Money Market Mutual Fund (including 1.0% of collateral received for securities on loan) | | 2.1 | |
Banks | | 2.1 | |
Consumer Products & Services | | 2.1 | |
Diversified Operations | | 2.0 | |
Construction | | 1.7 | |
Insurance | | 1.7 | |
Commercial Services | | 1.6 | |
Office Equipment | | 1.4 | |
Utilities | | 1.2 | |
Chemicals | | 1.1 | |
Aerospace | | 1.0 | |
Beverages | | 0.9 | |
Computer Hardware | | 0.8 | |
Leisure Equipment | | 0.8 | |
Media | | 0.7 | |
Entertainment & Leisure | | 0.7 | |
Machinery — Construction & Mining | | 0.7 | |
Electronics | | 0.6 | |
Computers | | 0.6 | |
Electronic Components & Equipment | | 0.6 | |
Industrial Products | | 0.6 | |
Advertising | | 0.5 | |
Transportation | | 0.5 | |
Banks | | 0.5 | |
Retail | | 0.4 | |
Semiconductors | | 0.4 | |
Conglomerates | | 0.4 | |
Metals | | 0.4 | |
Building Products | | 0.4 | |
Lodging | | 0.3 | |
Diversified Financial Services | | 0.3 | |
Diversified Resources | | 0.3 | |
Instruments — Controls | | 0.2 | |
Internet | | 0.2 | |
Oil Comp-Integrated | | 0.2 | |
Building & Construction | | 0.2 | |
Business Services | | 0.2 | |
Airlines | | 0.2 | |
Clothing & Apparel | | 0.2 | |
| | |
|
|
| | | 100.7 | |
Liabilities in Excess of Other Assets | | (0.7 | ) |
| | |
|
|
| | | 100.0 | % |
| | |
|
|
SEE NOTES TO FINANCIAL STATEMENTS.
B11
| | | | |
| | | SP INTERNATIONAL VALUE PORTFOLIO | | |
SCHEDULE OF INVESTMENTS December 31, 2006 | |
| | | | | |
| LONG-TERM INVESTMENTS — 99.1% | | Value
(Note 2)
|
| COMMON STOCKS | | Shares
| |
Australia — 1.8% | | | | | |
AWB Ltd. | | 310,900 | | $ | 755,634 |
Bluescope Steel Ltd. | | 260,300 | | | 1,765,148 |
Commonwealth Bank of Australia | | 51,400 | | | 2,001,623 |
CSR Ltd. | | 253,300 | | | 748,894 |
Qantas Airways Ltd. | | 393,600 | | | 1,622,329 |
Santos Ltd. | | 72,300 | | | 562,666 |
Telestra Corp. Ltd. | | 402,800 | | | 1,316,285 |
| | | | |
|
|
| | | | | | 8,772,579 |
| | | | |
|
|
Austria — 0.4% | | | | | |
Boehler-Uddeholm AG* | | 14,200 | | | 995,340 |
voestalpine AG | | 18,800 | | | 1,061,417 |
| | | | |
|
|
| | | | | | 2,056,757 |
| | | | |
|
|
Belgium — 0.6% | | | | | |
Dexia | | 24,800 | | | 679,295 |
Fortis | | 53,200 | | | 2,269,717 |
| | | | |
|
|
| | | | | | 2,949,012 |
| | | | |
|
|
Brazil — 0.8% | | | | | |
Empresa Brasileira de Aeronautica SA, ADR | | 88,200 | | | 3,652,362 |
| | | | |
|
|
Canada — 3.1% | | | | | |
Canadian Natural Resources Ltd. | | 121,700 | | | 6,486,005 |
Rogers Communications, Inc. (Class B Stock) | | 190,600 | | | 5,671,500 |
Shaw Communications, Inc. (Class B Stock) | | 93,900 | | | 2,972,044 |
| | | | |
|
|
| | | | | | 15,129,549 |
| | | | |
|
|
China — 1.9% | | | | | |
China Merchants Holdings International Co. Ltd. | | 1,300,100 | | | 5,318,302 |
China Petroleum and Chemical Corp. (Class H Stock) | | 4,276,000 | | | 3,961,297 |
| | | | |
|
|
| | | | | | 9,279,599 |
| | | | |
|
|
Denmark — 1.5% | | | | | |
Danske Bank SA | | 28,900 | | | 1,284,149 |
Novo Nordisk SA (Class B Stock) | | 70,450 | | | 5,867,923 |
| | | | |
|
|
| | | | | | 7,152,072 |
| | | | |
|
|
Finland — 0.5% | | | | | |
Rautaruukki Oyj | | 29,600 | | | 1,178,061 |
Stora Enso Oyj | | 73,200 | | | 1,159,527 |
| | | | |
|
|
| | | | | | 2,337,588 |
| | | | |
|
|
France — 9.4% | | | | | |
Air Liquide | | 22,686 | | | 5,387,382 |
Arkema* | | 130 | | | 6,681 |
BNP Paribas SA | | 31,800 | | | 3,469,434 |
Carrefour SA | | 84,735 | | | 5,138,573 |
Ciments Francais SA* | | 4,300 | | | 825,886 |
CNP Assurances SA | | 8,000 | | | 893,406 |
Compagnie Generale des Establissements Michelin (Class B Stock) | | 25,300 | | | 2,421,292 |
Credit Agricole SA | | 62,100 | | | 2,611,717 |
France Telecom SA | | 221,467 | | | 6,124,657 |
JCDecaux SA | | 143,899 | | | 4,118,184 |
LVMH Moet Hennessy Louis Vuitton SA | | 54,935 | | | 5,797,707 |
| | | | | |
COMMON STOCKS
(Continued) | | Shares
| | Value
(Note 2)
|
France (cont’d.) | | | | | |
Natixis SA | | 30,000 | | $ | 842,717 |
PSA Peugeot Citroen SA | | 19,800 | | | 1,312,072 |
Renault SA | | 11,000 | | | 1,321,365 |
Schneider Electric SA | | 9,100 | | | 1,010,244 |
Societe Generale | | 7,000 | | | 1,188,304 |
Total SA | | 17,200 | | | 1,240,816 |
Valeo SA | | 23,100 | | | 961,445 |
Vivendi | | 29,500 | | | 1,153,053 |
| | | | |
|
|
| | | | | | 45,824,935 |
| | | | |
|
|
Germany — 7.4% | | | | | |
Adidas AG | | 111,989 | | | 5,577,645 |
Altana AG | | 12,200 | | | 756,914 |
BASF AG | | 32,100 | | | 3,129,278 |
Bayer AG | | 17,100 | | | 917,809 |
Daimler-Chrysler AG | | 15,600 | | | 963,738 |
Deutsche Bank AG | | 18,400 | | | 2,461,430 |
Deutsche Boerse AG | | 31,385 | | | 5,776,116 |
Deutsche Telekom AG | | 51,300 | | | 937,221 |
E.ON AG | | 43,400 | | | 5,891,125 |
MAN AG | | 10,600 | | | 957,925 |
SAP AG | | 71,844 | | | 3,818,150 |
ThyssenKrup AG | | 46,900 | | | 2,209,572 |
TUI AG | | 35,200 | | | 703,489 |
Volkswagen AG | | 15,000 | | | 1,700,680 |
| | | | |
|
|
| | | | | | 35,801,092 |
| | | | |
|
|
Greece — 1.1% | | | | | |
OPAP SA | | 132,666 | | | 5,127,662 |
| | | | |
|
|
Hong Kong — 5.1% | | | | | |
Chaoda Modern Agriculture Holdings Ltd. | | 1,011,000 | | | 649,796 |
China Merchants Bank* | | 2,526,500 | | | 5,352,933 |
China Mobile Ltd. | | 633,000 | | | 5,456,428 |
China Overseas Land & Investment Ltd. | | 2,478,390 | | | 3,306,424 |
CITIC International Financial Holding Ltd. | | 594,000 | | | 532,102 |
CITIC Pacific Ltd. | | 238,000 | | | 818,511 |
Hong Kong Exchanges and Clearing Ltd. | | 689,500 | | | 7,548,040 |
Orient Overseas International Ltd. | | 169,392 | | | 1,075,534 |
Solomon Systech International Ltd. | | 525,000 | | | 81,428 |
| | | | |
|
|
| | | | | | 24,821,196 |
| | | | |
|
|
Ireland — 1.5% | | | | | |
Allied Irish Banks PLC | | 200,214 | | | 5,978,273 |
Irish Life & Permanent PLC | | 45,500 | | | 1,255,297 |
| | | | |
|
|
| | | | | | 7,233,570 |
| | | | |
|
|
Israel — 2.3% | | | | | |
Amdocs Ltd.* | | 138,100 | | | 5,351,375 |
Teva Pharmaceutical Industries Ltd., ADR | | 193,000 | | | 5,998,440 |
| | | | |
|
|
| | | | | | 11,349,815 |
| | | | |
|
|
Italy — 3.3% | | | | | |
Banche Popolari Unite SpA | | 26,200 | | | 720,063 |
Banco Ambrosiano Veneto SpA | | 132,900 | | | 1,026,289 |
Banco Popolare di Verona e Novara Scrl | | 37,000 | | | 1,062,306 |
Eni SpA | | 347,738 | | | 11,696,079 |
SEE NOTES TO FINANCIAL STATEMENTS.
B12
| | | | |
| | | SP INTERNATIONAL VALUE PORTFOLIO (Continued) | | |
SCHEDULE OF INVESTMENTS December 31, 2006 | |
| | | | | |
COMMON STOCKS
(Continued) | | Shares
| | Value
(Note 2)
|
Italy (cont’d.) | | | | | |
Fondiaria SAI SpA | | 17,000 | | $ | 813,253 |
San Paolo — IMI SpA | | 41,600 | | | 966,484 |
| | | | |
|
|
| | | | | | 16,284,474 |
| | | | |
|
|
Japan — 18.0% | | | | | |
Alpine Electronics, Inc. | | 45,300 | | | 676,515 |
ALPS Electric Co. Ltd. | | 51,800 | | | 561,445 |
Asahi Breweries Ltd. | | 79,800 | | | 1,275,206 |
Asahi Kasei Corp. | | 122,000 | | | 799,860 |
Bank of Yokohama Ltd. (The) | | 689,000 | | | 5,381,091 |
Capcom Co. Ltd. | | 33,700 | | | 605,104 |
Cosmo Oil Co. Ltd. | | 149,000 | | | 605,022 |
Denki Kagaku Kogyo Kabushiki Kiasha | | 217,000 | | | 900,481 |
Fanuc Ltd. | | 31,300 | | | 3,071,837 |
Fuji Heavy Industries Ltd. | | 241,100 | | | 1,237,662 |
Hitachi Ltd. | | 165,000 | | | 1,027,767 |
Hokkaido Electric Power Co., Inc. | | 40,800 | | | 1,042,004 |
Hokuetsu Paper Mills Ltd. | | 59,000 | | | 331,651 |
Honda Motor Co. Ltd. | | 74,200 | | | 2,928,613 |
Hosiden Corp. | | 39,900 | | | 428,172 |
Kaken Pharmaceutical Co. Ltd. | | 101,000 | | | 787,700 |
Kansai Electric Power Co., Inc. (The) | | 88,500 | | | 2,382,423 |
Komatsu Ltd. | | 311,100 | | | 6,296,624 |
Kurabo Industries Ltd. | | 152,000 | | | 393,012 |
Kyowa Hakko Kogyo Co. Ltd. | | 92,000 | | | 786,285 |
Kyushu Electric Power Co., Inc. | | 28,200 | | | 743,664 |
Marubeni Corp. | | 124,600 | | | 631,281 |
Mitsubishi Chemical Holdings Corp. | | 126,000 | | | 793,400 |
New Oji Paper Co. Ltd. | | 132,000 | | | 699,319 |
Nihon Kohden Corp. | | 33,000 | | | 754,720 |
Nippon Oil Corp. | | 243,000 | | | 1,625,048 |
Nippon Telegraph and Telephone Corp. | | 400 | | | 1,972,595 |
Nippon Unipac Group, Inc. | | 700 | | | 2,636,047 |
Nipro Corp. | | 25,000 | | | 457,362 |
Nissan Motor Co. Ltd. | | 173,300 | | | 2,091,160 |
Nomura Holdings, Inc. | | 91,700 | | | 1,729,898 |
NSK Ltd. | | 63,000 | | | 620,624 |
NTT DoCoMo, Inc. | | 1,400 | | | 2,215,262 |
Okasan Holdings, Inc. | | 46,900 | | | 299,955 |
Ono Pharmaceutical Co. Ltd. | | 15,200 | | | 801,896 |
Osaka Gas Co. Ltd. | | 298,000 | | | 1,107,624 |
Promise Co. Ltd. | | 3,800 | | | 117,665 |
Rengo Co. Ltd. | | 87,000 | | | 555,450 |
Ricoh Co. Ltd. | | 59,000 | | | 1,201,553 |
Santen Pharmaceutical Co. Ltd. | | 21,200 | | | 596,359 |
Sanyo Electric Credit Co. Ltd. | | 23,000 | | | 342,334 |
Secom Co. Ltd. | | 82,500 | | | 4,271,394 |
Sharp Corp. | | 309,000 | | | 5,312,969 |
Shiseido Co. Ltd. | | 237,000 | | | 5,130,631 |
Sumitomo Corp. | | 56,000 | | | 838,305 |
Takefuji Corp. | | 15,100 | | | 597,297 |
Tanabe Seiyaku Co. Ltd. | | 112,000 | | | 1,464,612 |
Tohoku Electric Power Co., Inc. | | 30,500 | | | 762,358 |
Tokyo Electric Power Co., Inc. | | 44,400 | | | 1,434,401 |
Toppan Printing Co. Ltd. | | 64,000 | | | 705,090 |
Toyota Motor Corp. | | 140,200 | | | 9,383,166 |
Yamada Denki Co. Ltd. | | 39,740 | | | 3,373,184 |
Yokohama Rubber Co. Ltd. | | 172,000 | | | 1,036,644 |
| | | | |
|
|
| | | | | | 87,821,741 |
| | | | |
|
|
| | | | | |
COMMON STOCKS
(Continued) | | Shares
| | Value
(Note 2)
|
Mexico — 1.9% | | | | | |
America Movil SA de CV, ADR | | 116,300 | | $ | 5,259,086 |
Wal-Mart de Mexico SA de CV | | 923,600 | | | 4,063,566 |
| | | | |
|
|
| | | | | | 9,322,652 |
| | | | |
|
|
Netherlands — 1.9% | | | | | |
ABN AMRO Holding NV | | 30,700 | | | 986,793 |
Aegon NV | | 48,400 | | | 922,574 |
ING Groep NV, ADR | | 64,800 | | | 2,873,252 |
Koninklijke (Royal) KPN NV | | 104,600 | | | 1,487,086 |
Oce NV | | 58,900 | | | 963,330 |
Royal Dutch Shell (Class A Stock) | | 60,600 | | | 2,137,459 |
| | | | |
|
|
| | | | | | 9,370,494 |
| | | | |
|
|
Norway — 0.3% | | | | | |
Norsk Hydro ASA | | 40,600 | | | 1,259,960 |
| | | | |
|
|
Portugal — 0.2% | | | | | |
EDP Energias de Portugal SA* | | 229,700 | | | 1,164,343 |
| | | | |
|
|
Russia — 0.8% | | | | | |
Lukoil, ADR | | 43,437 | | | 3,820,284 |
| | | | |
|
|
Singapore — 0.5% | | | | | |
MobileOne Ltd. | | 490,000 | | | 685,064 |
Neptune Orient Lines Ltd. | | 336,000 | | | 456,033 |
Singapore Airlines Ltd. | | 131,000 | | | 1,491,721 |
| | | | |
|
|
| | | | | | 2,632,818 |
| | | | |
|
|
South Korea — 1.1% | | | | | |
iShares MSCI South Korea Index Fund | | 110,000 | | | 5,434,000 |
| | | | |
|
|
Spain — 2.0% | | | | | |
Banco Bilbao Vizcaya Argentaria SA | | 96,300 | | | 2,318,675 |
Banco Santander Central Hispano SA | | 197,100 | | | 3,678,957 |
Endesa SA | | 18,187 | | | 860,194 |
Repsol YPF SA | | 61,200 | | | 2,116,613 |
Telefonica Sa | | 41,400 | | | 880,956 |
| | | | |
|
|
| | | | | | 9,855,395 |
| | | | |
|
|
Sweden — 1.1% | | | | | |
Electrolux AB, Series B* | | 59,500 | | | 1,190,704 |
Husqvarna AB (Class B Stock)* | | 42,700 | | | 667,387 |
Nordea Bank AB | | 163,000 | | | 2,511,923 |
SSAB Svenskt Stal AB, Series B | | 45,500 | | | 1,026,848 |
| | | | |
|
|
| | | | | | 5,396,862 |
| | | | |
|
|
Switzerland — 9.8% | | | | | |
Baloise Holding | | 17,700 | | | 1,769,274 |
Ciba Specialty Chemicals AG | | 2,600 | | | 172,942 |
Credit Suisse Group* | | 50,800 | | | 3,554,124 |
Georg Fischer AG* | | 1,900 | | | 1,231,063 |
Givaudan SA | | 4,372 | | | 4,047,284 |
Novartis AG | | 119,615 | | | 6,896,146 |
Rieter Holdings AG | | 1,400 | | | 732,458 |
Roche Holding AG | | 50,685 | | | 9,088,775 |
Swiss Re | | 91,372 | | | 7,768,682 |
Swisscom AG | | 3,700 | | | 1,400,595 |
Syngenta AG* | | 7,100 | | | 1,320,944 |
UBS AG* | | 120,860 | | | 7,344,836 |
Verwaltungs und Privat Bank AG | | 2,900 | | | 773,492 |
Zurich Financial Services AG | | 5,900 | | | 1,588,182 |
| | | | |
|
|
| | | | | | 47,688,797 |
| | | | |
|
|
SEE NOTES TO FINANCIAL STATEMENTS.
B13
| | | | |
| | | SP INTERNATIONAL VALUE PORTFOLIO (Continued) | | |
SCHEDULE OF INVESTMENTS December 31, 2006 | |
| | | | | |
COMMON STOCKS
(Continued) | | Shares
| | Value
(Note 2)
|
United Kingdom — 20.0% | | | | | |
Alliance & Leicester PLC | | 41,800 | | $ | 931,381 |
Alliance Boots PLC | | 18,370 | | | 301,233 |
Anglo American PLC | | 22,700 | | | 1,107,154 |
AstraZeneca PLC | | 16,500 | | | 886,496 |
Aviva PLC | | 60,100 | | | 967,286 |
Barclays PLC | | 599,733 | | | 8,572,144 |
BP PLC | | 388,200 | | | 4,313,502 |
Bradford & Bingley PLC | | 101,000 | | | 929,948 |
BT Group PLC | | 549,700 | | | 3,245,052 |
Cadbury Schweppes PLC | | 340,020 | | | 3,638,340 |
Carnival PLC | | 101,931 | | | 5,165,105 |
Dairy Crest Group PLC | | 40,400 | | | 537,106 |
DSG International PLC | | 317,100 | | | 1,188,978 |
GKN PLC | | 203,300 | | | 1,106,600 |
GlaxoSmithKline PLC | | 23,500 | | | 618,409 |
Hanson PLC | | 54,800 | | | 826,726 |
HBOS PLC | | 142,700 | | | 3,162,853 |
Imperial Chemical Industries PLC | | 50,400 | | | 446,044 |
Interserve PLC | | 132,100 | | | 1,037,184 |
Kingfisher | | 1,192,211 | | | 5,567,371 |
Legal & General PLC | | 364,200 | | | 1,123,128 |
Lloyds TSB Group PLC | | 576,166 | | | 6,447,220 |
Next PLC | | 233,064 | | | 8,214,031 |
Northern Foods PLC | | 162,900 | | | 366,001 |
Northumbrian Water Group PLC | | 148,800 | | | 891,524 |
Old Mutual PLC | | 230,800 | | | 787,440 |
Reckitt Benckiser PLC | | 116,623 | | | 5,329,589 |
Rio Tinto PLC | | 93,909 | | | 4,997,644 |
Royal & Sun Alliance Insurance Group PLC | | 396,400 | | | 1,183,619 |
Royal Bank of Scotland Group PLC | | 56,700 | | | 2,212,580 |
Royal Dutch Shell PLC (Class B Stock) | | 103,100 | | | 3,613,436 |
SABMiller PLC* | | 243,500 | | | 5,602,030 |
Tate & Lyle PLC | | 65,200 | | | 981,070 |
Taylor Woodrow PLC | | 107,500 | | | 897,184 |
Tomkins PLC | | 125,800 | | | 605,317 |
TT Electronics PLC | | 127,500 | | | 649,071 |
Vodafone Group PLC | | 1,140,200 | | | 3,158,974 |
Vodafone Group PLC, ADR | | 218,100 | | | 6,058,818 |
| | | | |
|
|
| | | | | | 97,667,588 |
| | | | |
|
|
United States — 0.8% | | | | | |
Schlumberger Ltd. | | 57,600 | | | 3,638,016 |
| | | | |
|
|
TOTAL LONG-TERM INVESTMENTS
(cost $419,593,026) | | | 482,845,212 |
| | | | |
|
|
| SHORT-TERM INVESTMENT — 0.8% | | | |
Affiliated Money Market Mutual Fund | | | | | |
Dryden Core Investment Fund — Taxable Money Market Series
(cost $4,166,163)(w) (Note 4) | | 4,166,163 | | | 4,166,163 |
| | | | |
|
|
TOTAL INVESTMENTS(o) — 99.9%
(cost $423,759,189) | | | 487,011,375 |
OTHER ASSETS IN EXCESS OF
LIABILITIES(x) — 0.1% | | | 374,631 |
| | | | |
|
|
NET ASSETS — 100.0% | | $ | 487,386,006 |
| | | | |
|
|
The following abbreviations are used in portfolio descriptions:
| | |
| ADR | | American Depositary Receipt |
| * | Non-income producing security. |
| (o) | As of December 31, 2006, 74 securities representing $133,327,933 and 27.36% of the total market value were fair valued in accordance with the policies adopted by the Board of Trustees. |
| (w) | Prudential Investments LLC, the manager of the Portfolio, also serves as manager of the Dryden Core Investment Fund — Taxable Money Market Series. |
| (x) | Other assets in excess of liabilities include net unrealized appreciation (depreciation) on forward foreign currency contracts as follows: |
Forward foreign currency contracts outstanding at December 31, 2006:
| | | | | | | | | | |
Purchase Contracts
| | Value at
Settlement
Date
| | Current
Value
| | Unrealized
Appreciation
(Depreciation)
| |
EUR 305,546
expiring 01/04/07 | | $ | 401,043 | | $ | 403,335 | | $ | 2,292 | |
| | | | | | | | |
|
|
|
Sale Contracts
| | | | | | | |
EUR 121,600,000, expiring 04/04/07 | | $ | 16,757,244 | | $ | 16,703,104 | | $ | 54,140 | |
JPY 47,603,910 expiring 01/04/07 | | | 401,042 | | | 400,016 | | | 1,026 | |
MXP 103,000,000 expiring 06/06/07 | | | 9,415,852 | | | 9,462,710 | | | (46,858 | ) |
| | | | | | | | |
|
|
|
| | | | | | | | | $ | 8,308 | |
| | | | | | | | |
|
|
|
The industry classification of long-term portfolio holdings, short-term investments and liabilities in excess of other assets shown as a percentage of net assets as of December 31, 2006 were as follows:
| | | |
Industry
| | | |
Financial — Bank & Trust | | 15.1 | % |
Oil, Gas & Consumable Fuels | | 9.7 | |
Telecommunications | | 7.7 | |
Pharmaceuticals | | 5.8 | |
Automobile Manufacturers | | 4.4 | |
Insurance | | 4.1 | |
Chemicals | | 3.7 | |
Financial Services | | 3.4 | |
Electronic Components | | 2.7 | |
Utilities | | 2.7 | |
Retail & Merchandising | | 2.6 | |
Food Products | | 1.7 | |
Building Materials | | 1.6 | |
Diversified Operations | | 1.6 | |
Metals & Mining | | 1.5 | |
Automobiles | | 1.4 | |
Commercial Banks | | 1.4 | |
Consumer Products & Services | | 1.4 | |
Machinery — Construction & Mining | | 1.3 | |
Wireless Telecommunication Services | | 1.2 | |
Entertainment & Leisure | | 1.2 | |
Automotive Parts | | 1.2 | |
SEE NOTES TO FINANCIAL STATEMENTS.
B14
| | | | |
| | | SP INTERNATIONAL VALUE PORTFOLIO (Continued) | | |
SCHEDULE OF INVESTMENTS December 31, 2006 | |
| | | |
Industry
| | | |
Media | | 1.2 | % |
Consumer Staples — Food & Beverage | | 1.2 | |
Apparel | | 1.1 | |
Exchange Traded Funds | | 1.1 | |
Conglomerates | | 1.1 | |
Entertainment | | 1.1 | |
Cosmetics & Toiletries | | 1.0 | |
Diversified Metals | | 1.0 | |
Retail | | 0.9 | |
Semiconductors | | 0.9 | |
Affiliated Money Market Mutual Fund | | 0.8 | |
Advertising | | 0.8 | |
Computer Services & Software | | 0.8 | |
Aerospace | | 0.8 | |
Real Estate | | 0.7 | |
Airlines | | 0.6 | |
Cable Television | | 0.6 | |
Paper & Related Products | | 0.5 | |
Telecom — Cellular | | 0.5 | |
Office Equipment | | 0.4 | |
Paper & Forest Products | | 0.4 | |
Foods | | 0.4 | |
Diversified Financial Services | | 0.4 | |
Diversified | | 0.3 | |
Machinery | | 0.3 | |
Transportation | | 0.3 | |
Beverages | | 0.3 | |
Oil & Gas | | 0.3 | |
Medical Supplies & Equipment | | 0.3 | |
Insurance — Property Insurance | | 0.2 | |
Multimedia | | 0.2 | |
Steel Producers/Products | | 0.2 | |
Iron/Steel | | 0.2 | |
Electrical Equipment | | 0.2 | |
Construction | | 0.2 | |
Distribution/Wholesale | | 0.2 | |
Agriculture | | 0.2 | |
Electric | | 0.1 | |
Commercial Services | | 0.1 | |
Forest Products & Paper | | 0.1 | |
Consumer Products | | 0.1 | |
Farming & Agriculture | | 0.1 | |
Business Services | | 0.1 | |
Software | | 0.1 | |
Clothing & Apparel | | 0.1 | |
| | |
|
|
| | | 99.9 | |
Other assets in excess of liabilities | | 0.1 | |
| | |
|
|
| | | 100.0 | % |
| | |
|
|
SEE NOTES TO FINANCIAL STATEMENTS.
B15
| | | | |
| | | SP LARGE CAP VALUE PORTFOLIO | | |
SCHEDULE OF INVESTMENTS December 31, 2006 | |
| | | | | |
| LONG-TERM INVESTMENTS — 97.3% | | |
| COMMON STOCKS | | Shares
| | Value
(Note 2)
|
Aerospace/Defense — 1.4% | | | | | |
Goodrich Corp. | | 22,000 | | $ | 1,002,100 |
Lockheed Martin Corp. | | 29,000 | | | 2,670,030 |
Northrop Grumman Corp. | | 138,000 | | | 9,342,600 |
United Technologies Corp. | | 7,200 | | | 450,144 |
| | | | |
|
|
| | | | | | 13,464,874 |
| | | | |
|
|
Auto Components — 0.7% | | | | | |
Johnson Controls, Inc. | | 56,100 | | | 4,820,112 |
Magna International, Inc.
(Class A Stock) | | 21,800 | | | 1,755,990 |
| | | | |
|
|
| | | | | | 6,576,102 |
| | | | |
|
|
Automotive Parts — 0.1% | | | | | |
Advance Auto Parts, Inc. | | 12,300 | | | 437,388 |
| | | | |
|
|
Banks — 1.8% | | | | | |
Colonial BancGroup, Inc. (The) | | 23,600 | | | 607,464 |
Fannie Mae | | 226,700 | | | 13,463,713 |
First Tennessee National Corp. | | 6,900 | | | 288,282 |
KeyCorp | | 72,300 | | | 2,749,569 |
| | | | |
|
|
| | | | | | 17,109,028 |
| | | | |
|
|
Beverages — 0.2% | | | | | |
Coca-Cola Co. | | 1,100 | | | 53,075 |
Coca-Cola Enterprises, Inc. | | 83,300 | | | 1,700,986 |
| | | | |
|
|
| | | | | | 1,754,061 |
| | | | |
|
|
Chemicals — 1.7% | | | | | |
Dow Chemical Co. | | 126,700 | | | 5,060,398 |
Eastman Chemical Co. | | 97,100 | | | 5,759,001 |
Praxair, Inc. | | 21,000 | | | 1,245,930 |
Rohm & Haas Co. | | 91,300 | | | 4,667,256 |
| | | | |
|
|
| | | | | | 16,732,585 |
| | | | |
|
|
Commercial Banks — 4.0% | | | | | |
Bank of America Corp. | | 605,345 | | | 32,319,370 |
Marshall & Ilsley Corp. | | 73,000 | | | 3,512,030 |
UnionBanCal Corp. | | 30,300 | | | 1,855,875 |
Zions Bancorp | | 5,100 | | | 420,444 |
| | | | |
|
|
| | | | | | 38,107,719 |
| | | | |
|
|
Commercial Services & Supplies — 0.3% |
Avis Budget Group | | 23,460 | | | 508,847 |
Waste Management, Inc. | | 71,900 | | | 2,643,763 |
| | | | |
|
|
| | | | | | 3,152,610 |
| | | | |
|
|
Communication Equipment — 0.1% | | | | | |
QUALCOMM, Inc. | | 32,500 | | | 1,228,175 |
| | | | |
|
|
Computers & Peripherals — 0.3% | | | | | |
Hewlett-Packard Co. | | 38,800 | | | 1,598,172 |
Sun Microsystems, Inc.* | | 281,500 | | | 1,525,730 |
| | | | |
|
|
| | | | | | 3,123,902 |
| | | | |
|
|
Construction — 0.2% | | | | | |
D.R. Horton, Inc.(a) | | 31,200 | | | 826,488 |
Toll Brothers, Inc.*(a) | | 44,100 | | | 1,421,343 |
| | | | |
|
|
| | | | | | 2,247,831 |
| | | | |
|
|
Consumer Products & Services — 3.3% | | | | | |
Avon Products, Inc. | | 18,600 | | | 614,544 |
Procter & Gamble Co. | | 266,400 | | | 17,121,528 |
| | | | | |
COMMON STOCKS
(Continued) | | Shares
| | Value
(Note 2)
|
Consumer Products & Services (cont’d.) | | | | | |
UST, Inc. | | 242,400 | | $ | 14,107,680 |
| | | | |
|
|
| | | | | | 31,843,752 |
| | | | |
|
|
Containers & Packaging | | | | | |
Smurfit-Stone Container Corp.* | | 6,000 | | | 63,360 |
| | | | |
|
|
Diversified Financial Services — 10.3% | | | | | |
Bank of New York Co., Inc. (The) | | 14,400 | | | 566,928 |
Capital One Financial Corp. | | 22,398 | | | 1,720,614 |
CIT Group, Inc. | | 112,000 | | | 6,246,240 |
Citigroup, Inc. | | 462,600 | | | 25,766,820 |
Countrywide Credit Industries, Inc. | | 123,200 | | | 5,229,840 |
E*TRADE Financial Corp.* | | 17,200 | | | 385,624 |
Goldman Sachs Group, Inc. | | 4,200 | | | 837,270 |
JPMorgan Chase & Co. | | 162,500 | | | 7,848,750 |
Merrill Lynch & Co., Inc. | | 26,900 | | | 2,504,390 |
Morgan Stanley | | 154,800 | | | 12,605,364 |
State Street Corp. | | 77,800 | | | 5,246,832 |
SunTrust Banks, Inc.(a) | | 37,500 | | | 3,166,875 |
TCF Financial Corp. | | 58,900 | | | 1,615,038 |
U.S. Bancorp | | 344,200 | | | 12,456,598 |
Wells Fargo & Co. | | 340,800 | | | 12,118,848 |
| | | | |
|
|
| | | | | | 98,316,031 |
| | | | |
|
|
Diversified Financials — 0.2% | | | | | |
Franklin Resources, Inc. | | 20,300 | | | 2,236,451 |
| | | | |
|
|
Diversified Manufacturing Operations — 0.1% | | | |
Textron, Inc. | | 8,800 | | | 825,176 |
| | | | |
|
|
Diversified Telecommunication Services — 4.2% | | | |
AT&T, Inc.(a) | | 403,700 | | | 14,432,275 |
BellSouth Corp. | | 26,000 | | | 1,224,860 |
Cisco Systems, Inc.* | | 52,900 | | | 1,445,757 |
Corning, Inc.* | | 91,800 | | | 1,717,578 |
Motorola, Inc. | | 63,500 | | | 1,305,560 |
Sprint Nextel Corp. | | 203,200 | | | 3,838,448 |
Verizon Communications, Inc. | | 433,200 | | | 16,132,368 |
| | | | |
|
|
| | | | | | 40,096,846 |
| | | | |
|
|
Electric — 0.1% | | | | | |
DTE Energy Co. | | 26,000 | | | 1,258,660 |
| | | | |
|
|
Electric – Integrated — 0.2% | | | | | |
Sierra Pacific Resources* | | 139,300 | | | 2,344,419 |
| | | | |
|
|
Electric Utilities — 6.0% | | | | | |
American Electric Power Co., Inc. | | 148,500 | | | 6,323,130 |
CMS Energy Corp.*(a) | | 180,800 | | | 3,019,360 |
Dominion Resources, Inc.(a) | | 15,000 | | | 1,257,600 |
Edison International | | 135,200 | | | 6,148,896 |
Exelon Corp. | | 123,400 | | | 7,637,226 |
FPL Group, Inc. | | 99,800 | | | 5,431,116 |
General Electric Co. | | 517,500 | | | 19,256,175 |
Ingersoll-Rand Co. Ltd. (Class A Stock) | | 42,200 | | | 1,651,286 |
Northeast Utilities | | 83,200 | | | 2,342,912 |
Pinnacle West Capital Corp. | | 17,100 | | | 866,799 |
Wisconsin Energy Corp. | | 26,100 | | | 1,238,706 |
Xcel Energy, Inc. | | 121,300 | | | 2,797,178 |
| | | | |
|
|
| | | | | | 57,970,384 |
| | | | |
|
|
SEE NOTES TO FINANCIAL STATEMENTS.
B16
| | | | |
| | | SP LARGE CAP VALUE PORTFOLIO (Continued) | | |
SCHEDULE OF INVESTMENTS December 31, 2006 | |
| | | | | |
COMMON STOCKS
(Continued) | | Shares
| | Value
(Note 2)
|
Energy Equipment & Services — 0.1% | | | | | |
Weatherford International Ltd.* | | 32,300 | | $ | 1,349,817 |
| | | | |
|
|
Entertainment & Leisure — 0.1% | | | | | |
Sabre Holdings Corp. | | 30,200 | | | 963,078 |
| | | | |
|
|
Exchange Traded Fund — 0.2% | | | | | |
iShares Russell 1000 Value Index Fund | | 24,930 | | | 2,058,470 |
| | | | |
|
|
Financial – Bank & Trust — 3.6% | | | | | |
Comerica, Inc. | | 108,700 | | | 6,378,516 |
PNC Financial Services Group, Inc.(a) | | 38,000 | | | 2,813,520 |
Sovereign Bancorp, Inc.(a) | | 167,285 | | | 4,247,366 |
Wachovia Corp. | | 162,100 | | | 9,231,595 |
Washington Mutual, Inc.(a) | | 253,300 | | | 11,522,617 |
| | | | |
|
|
| | | | | | 34,193,614 |
| | | | |
|
|
Financial – Brokerage — 0.2% | | | | | |
MGIC Investment Corp.(a) | | 30,700 | | | 1,919,978 |
| | | | |
|
|
Financial Services — 1.7% | | | | | |
Freddie Mac | | 239,700 | | | 16,275,630 |
TD Ameritrade Holding Corp. | | 900 | | | 14,562 |
| | | | |
|
|
| | | | | | 16,290,192 |
| | | | |
|
|
Food & Staples Retailing — 0.7% | | | | | |
Safeway, Inc. | | 91,700 | | | 3,169,152 |
Sysco Corp. | | 14,800 | | | 544,048 |
Wal-Mart Stores, Inc. | | 57,500 | | | 2,655,350 |
| | | | |
|
|
| | | | | | 6,368,550 |
| | | | |
|
|
Food Products — 0.6% | | | | | |
H.J. Heinz Co. | | 300 | | | 13,503 |
Kellogg Co. | | 3,500 | | | 175,210 |
Kraft Foods, Inc. (Class A Stock) | | 46,600 | | | 1,663,620 |
Unilever PLC, ADR (United Kingdom) | | 138,440 | | | 3,851,401 |
| | | | |
|
|
| | | | | | 5,703,734 |
| | | | |
|
|
Healthcare Providers & Services — 2.3% | | | | | |
Aetna, Inc. | | 117,600 | | | 5,077,968 |
Tenet Healthcare Corp.*(a) | | 431,900 | | | 3,010,343 |
UnitedHealth Group, Inc. | | 171,100 | | | 9,193,203 |
WellPoint, Inc.* | | 66,100 | | | 5,201,409 |
| | | | |
|
|
| | | | | | 22,482,923 |
| | | | |
|
|
Healthcare Services — 0.2% | | | | | |
Health Care Property Investors, Inc.(a) | | 17,900 | | | 659,078 |
Quest Diagnostics, Inc. | | 14,100 | | | 747,300 |
| | | | |
|
|
| | | | | | 1,406,378 |
| | | | |
|
|
Healthcare Supplies — 0.5% | | | | | |
Amgen, Inc.* | | 34,200 | | | 2,336,202 |
Baxter International, Inc. | | 4,800 | | | 222,672 |
Zimmer Holdings, Inc.* | | 22,200 | | | 1,740,036 |
| | | | |
|
|
| | | | | | 4,298,910 |
| | | | |
|
|
Hotels & Motels | | | | | |
Starwood Hotels & Resorts Worldwide, Inc. | | 400 | | | 25,000 |
| | | | |
|
|
| | | | | |
COMMON STOCKS
(Continued) | | Shares
| | Value
(Note 2)
|
Hotels, Restaurants & Leisure — 1.0% | | | | | |
Harrah’s Entertainment, Inc. | | 35,827 | | $ | 2,963,610 |
McDonald’s Corp. | | 68,700 | | | 3,045,471 |
Wyndham Worldwide Corp* | | 47,020 | | | 1,505,580 |
Yum! Brands, Inc. | | 35,400 | | | 2,081,520 |
| | | | |
|
|
| | | | | | 9,596,181 |
| | | | |
|
|
Household Durables — 1.3% | | | | | |
Centex Corp(a) | | 42,400 | | | 2,385,848 |
Lennar Corp. (Class A Stock)(a) | | 176,400 | | | 9,253,944 |
Lennar Corp. (Class B Stock) | | 16,500 | | | 810,480 |
| | | | |
|
|
| | | | | | 12,450,272 |
| | | | |
|
|
Industrial Conglomerates — 2.4% | | | | | |
3M Co. | | 105,000 | | | 8,182,650 |
Eaton Corp. | | 36,800 | | | 2,765,152 |
Tyco International Ltd. | | 407,800 | | | 12,397,120 |
| | | | |
|
|
| | | | | | 23,344,922 |
| | | | |
|
|
Insurance — 7.8% | | | | | |
Allstate Corp. (The) | | 39,600 | | | 2,578,356 |
AMBAC Financial Group, Inc. | | 56,800 | | | 5,059,176 |
American International Group, Inc. | | 93,100 | | | 6,671,546 |
Assurant, Inc. | | 55,100 | | | 3,044,275 |
Chubb Corp. (The) | | 61,700 | | | 3,264,547 |
CIGNA Corp. | | 13,100 | | | 1,723,567 |
Genworth Financial, Inc. (Class A Stock) | | 310,800 | | | 10,632,468 |
Hanover Insurance Group, Inc. (The) | | 50,100 | | | 2,444,880 |
Hartford Financial Services Group, Inc. | | 95,100 | | | 8,873,781 |
Lincoln National Corp. | | 21,800 | | | 1,447,520 |
MBIA, Inc. | | 68,100 | | | 4,975,386 |
MetLife, Inc.(a) | | 109,200 | | | 6,443,892 |
Protective Life Corp. | | 23,700 | | | 1,125,750 |
St. Paul Travelers Cos., Inc. (The) | | 169,900 | | | 9,121,931 |
UnumProvident Corp.(a) | | 269,600 | | | 5,602,288 |
XL Capital Ltd. (Class A Stock) | | 31,300 | | | 2,254,226 |
| | | | |
|
|
| | | | | | 75,263,589 |
| | | | |
|
|
Internet Services | | | |
eBay, Inc.*(a) | | 3,900 | | | 117,273 |
| | | | |
|
|
IT Consulting & Services — 0.2% | | | | | |
International Business Machines Corp. | | 23,600 | | | 2,292,740 |
| | | | |
|
|
IT Services — 1.4% | | | | | |
Electronic Data Systems Corp. | | 471,600 | | | 12,992,580 |
| | | | |
|
|
Leisure Equipment & Products | | | | | |
Mattel, Inc. | | 5,800 | | | 131,428 |
| | | | |
|
|
Machinery — 0.4% | | | | | |
Deere & Co. | | 6,700 | | | 636,969 |
SPX Corp. | | 54,400 | | | 3,327,104 |
| | | | |
|
|
| | | | | | 3,964,073 |
| | | | |
|
|
Machinery & Equipment — 0.1% | | | | | |
Rockwell Automation, Inc. | | 15,900 | | | 971,172 |
| | | | |
|
|
Mall | | | | | |
Taubman Centers, Inc. | | 3,400 | | | 172,924 |
| | | | |
|
|
SEE NOTES TO FINANCIAL STATEMENTS.
B17
| | | | |
| | | SP LARGE CAP VALUE PORTFOLIO (Continued) | | |
SCHEDULE OF INVESTMENTS December 31, 2006 | |
| | | | | |
COMMON STOCKS
(Continued) | | Shares
| | Value
(Note 2)
|
Media — 2.5% | | | | | |
CBS Corp. (Class B Stock) | | 156,500 | | $ | 4,879,670 |
Clear Channel Communications, Inc. | | 6,100 | | | 216,794 |
Comcast Corp. (Class A Stock)*(a) | | 56,700 | | | 2,400,111 |
E.W. Scripps Co. (Class A Stock) | | 20,100 | | | 1,003,794 |
EchoStar Communications Corp. (Class A Stock)* | | 5,600 | | | 212,968 |
Gannett Co., Inc.(a) | | 69,200 | | | 4,183,832 |
Idearc, Inc.* | | 91,500 | | | 2,621,475 |
News Corp. (Class A Stock) | | 172,600 | | | 3,707,448 |
Time Warner, Inc. | | 124,900 | | | 2,720,322 |
Viacom, Inc. (Class B Stock)* | | 17,100 | | | 701,613 |
Walt Disney Co. (The) | | 40,200 | | | 1,377,654 |
| | | | |
|
|
| | | | | | 24,025,681 |
| | | | |
|
|
Medical Supplies & Equipment — 0.2% | | | | | |
Johnson & Johnson | | 29,000 | | | 1,914,580 |
| | | | |
|
|
Metals & Mining — 1.2% | | | | | |
Alcoa, Inc. | | 291,100 | | | 8,735,911 |
United States Steel Corp. | | 39,900 | | | 2,918,286 |
| | | | |
|
|
| | | | | | 11,654,197 |
| | | | |
|
|
Miscellaneous Manufacturers — 0.1% | | | | | |
Honeywell International, Inc. | | 11,400 | | | 515,736 |
| | | | |
|
|
Multi-Line Retail — 0.5% | | | | | |
Abercrombie & Fitch Co., (Class A Stock) | | 12,200 | | | 849,486 |
Kohl’s Corp.*(a) | | 17,800 | | | 1,218,054 |
Lowe’s Cos., Inc. | | 63,000 | | | 1,962,450 |
Target Corp. | | 8,300 | | | 473,515 |
| | | | |
|
|
| | | | | | 4,503,505 |
| | | | |
|
|
Multi-Utilities — 0.2% | | | | | |
Dynegy, Inc. (Class A Stock)* | | 33,600 | | | 243,264 |
SCANA Corp. | | 35,900 | | | 1,458,258 |
| | | | |
|
|
| | | | | | 1,701,522 |
| | | | |
|
|
Networking Products — 0.1% | | | | | |
Juniper Networks, Inc.* | | 28,000 | | | 530,320 |
| | | | |
|
|
Office Equipment — 0.4% | | | | | |
Staples, Inc. | | 153,200 | | | 4,090,440 |
| | | | |
|
|
Oil & Gas — 1.2% | | | | | |
Apache Corp. | | 74,700 | | | 4,968,297 |
Occidental Petroleum Corp. | | 134,900 | | | 6,587,167 |
| | | | |
|
|
| | | | | | 11,555,464 |
| | | | |
|
|
Oil, Gas & Consumable Fuels — 11.9% | | | | | |
Anadarko Petroleum Corp. | | 118,300 | | | 5,148,416 |
BJ Services Co. | | 4,800 | | | 140,736 |
ChevronTexaco Corp. | | 212,400 | | | 15,617,772 |
ConocoPhillips | | 441,301 | | | 31,751,607 |
Devon Energy Corp. | | 198,700 | | | 13,328,796 |
Ecnana Corp.(a) | | 34,000 | | | 1,562,300 |
El Paso Corp. | | 184,400 | | | 2,817,632 |
Exxon Mobil Corp. | | 380,500 | | | 29,157,715 |
Halliburton Co. | | 96,300 | | | 2,990,115 |
Marathon Oil Corp. | | 51,700 | | | 4,782,250 |
Sunoco, Inc. | | 13,700 | | | 854,332 |
Tesoro Corp. | | 44,500 | | | 2,926,765 |
| | | | | |
COMMON STOCKS
(Continued) | | Shares
| | Value
(Note 2)
|
Oil, Gas & Consumable Fuels (cont’d.) | | | | | |
Valero Energy Corp. | | 23,100 | | $ | 1,181,796 |
XTO Energy, Inc. | | 35,000 | | | 1,646,750 |
| | | | |
|
|
| | | | | | 113,906,982 |
| | | | |
|
|
Paper & Forest Products — 0.6% | | | | | |
Weyerhaeuser Co. | | 75,700 | | | 5,348,205 |
| | | | |
|
|
Pharmaceuticals — 4.9% | | | | | |
Abbott Laboratories | | 73,700 | | | 3,589,927 |
Bristol-Meyers Squibb Co. | | 84,200 | | | 2,216,144 |
Merck & Co., Inc. | | 257,800 | | | 11,240,080 |
Pfizer, Inc. | | 553,300 | | | 14,330,470 |
Schering-Plough Corp. | | 116,400 | | | 2,751,696 |
Sepracor, Inc.*(a) | | 23,500 | | | 1,447,130 |
Wyeth | | 232,700 | | | 11,849,084 |
| | | | |
|
|
| | | | | | 47,424,531 |
| | | | |
|
|
Real Estate Investment Trusts — 1.7% | | | |
Apartment Investment & Management Co. (Class A Stock) | | 51,400 | | | 2,879,428 |
Cresent Real Estate Equities Co.(a) | | 31,800 | | | 628,050 |
Global Signal, Inc. | | 600 | | | 31,602 |
Hospitality Properties Trust | | 31,200 | | | 1,482,936 |
Host Marriott Corp. | | 151,400 | | | 3,716,870 |
Mack-Cali Realty Corp.(a) | | 12,300 | | | 627,300 |
New Century Financial Corp.(a) | | 46,900 | | | 1,481,571 |
ProLogis | | 61,100 | | | 3,713,047 |
Realty Income Corp. | | 19,200 | | | 531,840 |
Simon Property Group, Inc.(a) | | 10,400 | | | 1,053,416 |
| | | | |
|
|
| | | | | | 16,146,060 |
| | | | |
|
|
Real Estate Management & Development — 0.5% |
Realogy Corp* | | 148,050 | | | 4,488,876 |
| | | | |
|
|
Retail — 0.7% | | | | | |
Borders Group, Inc. | | 160,100 | | | 3,578,235 |
Federated Department Stores, Inc. | | 91,400 | | | 3,485,082 |
| | | | |
|
|
| | | | | | 7,063,317 |
| | | | |
|
|
Retail & Merchandising | | | | | |
SUPERVALU, Inc. | | 12,000 | | | 429,000 |
| | | | |
|
|
Semiconductors — 0.1% | | | | | |
Linear Technology Corp. | | 7,800 | | | 236,496 |
Xilinx, Inc.(a) | | 32,000 | | | 761,920 |
| | | | |
|
|
| | | | | | 998,416 |
| | | | |
|
|
Software — 2.6% | | | | | |
BMC Software, Inc.* | | 109,200 | | | 3,516,240 |
CA, Inc. | | 388,015 | | | 8,788,540 |
First Data Corp. | | 27,900 | | | 712,008 |
Microsoft Corp. | | 391,300 | | | 11,684,218 |
Oracle Corp.*(a) | | 32,000 | | | 548,480 |
| | | | |
|
|
| | | | | | 25,249,486 |
| | | | |
|
|
Specialty Finance — 0.1% | | | | | |
Ventas, Inc. | | 15,600 | | | 660,192 |
| | | | |
|
|
Specialty Retail — 1.5% | | | | | |
Home Depot, Inc. | | 311,200 | | | 12,497,792 |
JC Penney Co., Inc. | | 19,700 | | | 1,523,992 |
| | | | |
|
|
| | | | | | 14,021,784 |
| | | | |
|
|
SEE NOTES TO FINANCIAL STATEMENTS.
B18
| | | | |
| | | SP LARGE CAP VALUE PORTFOLIO (Continued) | | |
SCHEDULE OF INVESTMENTS | December 31, 2006 |
| | | | | |
COMMON STOCKS
(Continued) | | Shares
| | Value
(Note 2)
|
Telecommunication Services — 0.1% | �� | | |
Crown Castle International Corp.*(a) | | 39,100 | | $ | 1,262,930 |
| | | | |
|
|
Textiles, Apparel & Luxury Goods — 0.4% | | | |
Coach, Inc.* | | 31,300 | | | 1,344,648 |
Jones Apparel Group, Inc. | | 78,900 | | | 2,637,627 |
| | | | |
|
|
| | | | | | 3,982,275 |
| | | | |
|
|
Tobacco — 4.1% | | | | | |
Altria Group, Inc. | | 432,600 | | | 37,125,732 |
Imperial Tobacco Group, ADR (United Kingdom) | | 22,700 | | | 1,793,981 |
| | | | |
|
|
| | | | | | 38,919,713 |
| | | | |
|
|
Transportation — 1.0% | | | | | |
CSX Corp. | | 80,500 | | | 2,771,615 |
FedEx Corp. | | 10,800 | | | 1,173,096 |
Norfolk Southern Corp. | | 111,400 | | | 5,602,306 |
| | | | |
|
|
| | | | | | 9,547,017 |
| | | | |
|
|
Utilities — 0.7% | | | | | |
Duke Energy Corp. | | 116,500 | | | 3,868,965 |
Illinois Tool Works, Inc. | | 14,800 | | | 683,612 |
TXU Corp. | | 44,200 | | | 2,396,082 |
| | | | |
|
|
| | | | | | 6,948,659 |
| | | | |
|
|
TOTAL LONG-TERM INVESTMENTS
(cost $786,263,180) | | | 934,136,040 |
| | | | |
|
|
| | | | | | |
SHORT-TERM
INVESTMENT — 9.7% | | Shares
| | Value
(Note 2)
| |
Affiliated Money Market Mutual Fund | | | | |
Dryden Core Investment Fund — Taxable Money Market Series (cost $92,756,816; includes $69,954,183 of cash collateral for securities on loan)(b)(w) (Note 4) | | 92,756,816 | | $ | 92,756,816 | |
| | | | |
|
|
|
TOTAL INVESTMENTS — 107.0%
(cost $879,019,996) | | | 1,026,892,856 | |
LIABILITIES IN EXCESS OF OTHER ASSETS — (7.0)% | | | (67,264,142 | ) |
| | | | |
|
|
|
NET ASSETS — 100.0% | | $ | 959,628,714 | |
| | | | |
|
|
|
The following abbreviations are used in portfolio descriptions:
| | |
| ADR | | American Depositary Receipt |
| * | Non-income producing security. |
| (a) | All or a portion of security is on loan. The aggregate market value of such securities is $66,979,156; cash collateral of $69,954,183 (included with liabilities) was received with which the portfolio purchased highly liquid short-term investments. |
| (b) | Represents security, or a portion thereof, purchased with cash collateral received for securities on loan. |
| (w) | Prudential Investments LLC, the manager of the Portfolio, also serves as manager of the Dryden Core Investment Fund — Taxable Money Market Series. |
Cash of $5,000,000 has been segregated with the custodian to cover requirements for open future contracts at December 31, 2006.
| | | | | | | | | | | | | |
Number of
Contracts
| | Type
| | Expiration
Date
| | Value at
Trade Date
| | Value at
December 31, 2006
| | Unrealized
Appreciation
|
| Long Positions: | | | | | | | | | | | | | |
| 58 | | S&P 500 | | Mar 07 | | $ | 20,553,225 | | $ | 20,711,800 | | $ | 158,575 |
| | | | | | | | | | | | |
|
|
SEE NOTES TO FINANCIAL STATEMENTS.
B19
| | | | |
| | | SP LARGE CAP VALUE PORTFOLIO (Continued) | | |
SCHEDULE OF INVESTMENTS December 31, 2006 | |
The industry classification of long-term portfolio holdings and liabilities in excess of other assets shown as a percentage of net assets as of December 31, 2006 was as follows:
| | | |
Industry
| | | |
Oil, Gas & Consumable Fuels | | 11.9 | % |
Diversified Financial Services | | 10.3 | |
Affiliated Money Market Mutual Fund (including 7.3% of collateral received from securities on loan) | | 9.7 | |
Insurance | | 7.8 | |
Electric Utilities | | 6.0 | |
Pharmaceuticals | | 4.9 | |
Diversified Telecommunication Services | | 4.2 | |
Tobacco | | 4.1 | |
Commercial Banks | | 4.0 | |
Financial — Bank & Trust | | 3.6 | |
Consumer Products & Services | | 3.3 | |
Software | | 2.6 | |
Media | | 2.5 | |
Industrial Conglomerates | | 2.4 | |
Healthcare Providers & Services | | 2.3 | |
Banks | | 1.8 | |
Chemicals | | 1.7 | |
Financial Services | | 1.7 | |
Real Estate Investment Trusts | | 1.7 | |
Specialty Retail | | 1.5 | |
Aerospace/Defense | | 1.4 | |
IT Services | | 1.4 | |
Household Durables | | 1.3 | |
Metals & Mining | | 1.2 | |
Oil & Gas | | 1.2 | |
Hotels, Restaurants & Leisure | | 1.0 | |
Transportation | | 1.0 | |
Auto Components | | 0.7 | |
Food & Staples Retailing | | 0.7 | |
Retail | | 0.7 | |
Utilities | | 0.7 | |
Food Products | | 0.6 | |
Paper & Forest Products | | 0.6 | |
| | | |
Industry
| | | |
Healthcare Supplies | | 0.5 | % |
Multi-Line Retail | | 0.5 | |
Real Estate Management & Development | | 0.5 | |
Machinery | | 0.4 | |
Office Equipment | | 0.4 | |
Textiles, Apparel & Luxury Goods | | 0.4 | |
Commercial Services & Supplies | | 0.3 | |
Computers & Peripherals | | 0.3 | |
Beverages | | 0.2 | |
Construction | | 0.2 | |
Diversified Financials | | 0.2 | |
Electric — Integrated | | 0.2 | |
Exchange Traded Fund | | 0.2 | |
Financial — Brokerage | | 0.2 | |
Healthcare Services | | 0.2 | |
IT Consulting & Services | | 0.2 | |
Medical Supplies & Equipment | | 0.2 | |
Multi-Utilities | | 0.2 | |
Automotive Parts | | 0.1 | |
Communication Equipment | | 0.1 | |
Diversified Manufacturing Operations | | 0.1 | |
Electric | | 0.1 | |
Energy Equipment & Services | | 0.1 | |
Entertainment & Leisure | | 0.1 | |
Machinery & Equipment | | 0.1 | |
Miscellaneous Manufacturers | | 0.1 | |
Networking Products | | 0.1 | |
Semiconductors | | 0.1 | |
Specialty Finance | | 0.1 | |
Telecommunication Services | | 0.1 | |
| | |
|
|
| | | 107.0 | |
Liabilities in excess of other assets | | (7.0 | ) |
| | |
|
|
| | | 100.0 | % |
| | |
|
|
SEE NOTES TO FINANCIAL STATEMENTS.
B20
| | | | |
| | | SP MID-CAP GROWTH PORTFOLIO | | |
SCHEDULE OF INVESTMENTS December 31, 2006 | |
| | | | | |
| LONG-TERM INVESTMENTS — 99.1% | | Value
(Note 2)
|
| COMMON STOCKS | | Shares
| |
Advertising — 1.0% | | | | | |
Omnicom Group, Inc.* | | 13,000 | | $ | 1,359,020 |
| | | | |
|
|
Beverages — 2.2% | | | | | |
Hansen Natural Corp.*(a) | | 85,700 | | | 2,886,376 |
| | | | |
|
|
Biotechnology — 1.6% | | | | | |
Applera Corp. Applied Biosystems Group | | 57,000 | | | 2,091,330 |
| | | | |
|
|
Business Services — 0.5% | | | | | |
Thermo Fisher Scientific, Inc.* | | 15,200 | | | 688,408 |
| | | | |
|
|
Chemicals — 1.0% | | | | | |
International Flavors & Fragrances, Inc. | | 28,000 | | | 1,376,480 |
| | | | |
|
|
Clothing & Apparel — 2.2% | | | | | |
VF Corp. | | 35,100 | | | 2,881,008 |
| | | | |
|
|
Commercial Services — 1.0% | | | | | |
Alliance Data Systems Corp.*(a) | | 17,900 | | | 1,118,213 |
Corporate Executive Board Co. (The) | | 3,200 | | | 280,640 |
| | | | |
|
|
| | | | | | 1,398,853 |
| | | | |
|
|
Commercial Services & Supplies — 4.4% | | | | | |
Corrections Corp. of America* | | 61,000 | | | 2,759,030 |
Manpower, Inc. | | 9,000 | | | 674,370 |
Sotheby`s | | 78,000 | | | 2,419,560 |
| | | | |
|
|
| | | | | | 5,852,960 |
| | | | |
|
|
Computer Hardware — 8.6% | | | | | |
Apple Computer, Inc.* | | 74,000 | | | 6,278,160 |
Brocade Communications Systems, Inc.*(a) | | 198,000 | | | 1,625,580 |
Cognizant Technology Solutions Corp. (Class A Stock)* | | 46,700 | | | 3,603,372 |
| | | | |
|
|
| | | | | | 11,507,112 |
| | | | |
|
|
Computer Services & Software — 4.2% | | | | | |
BEA Systems, Inc.* | | 256,900 | | | 3,231,802 |
BMC Software, Inc.* | | 71,300 | | | 2,295,860 |
| | | | |
|
|
| | | | | | 5,527,662 |
| | | | |
|
|
Computers — 4.9% | | | | | |
Lexmark International, Inc. (Class A Stock)*(a) | | 37,000 | | | 2,708,400 |
Synopsys, Inc.*(a) | | 144,000 | | | 3,849,120 |
| | | | |
|
|
| | | | | | 6,557,520 |
| | | | |
|
|
Distribution/Wholesale — 1.1% | | | | | |
WESCO International, Inc.* | | 24,100 | | | 1,417,321 |
| | | | |
|
|
Drugs & Healthcare — 2.2% | | | | | |
ARAMARK Corp. (Class B Stock) | | 10,700 | | | 357,915 |
IMS Health, Inc. | | 91,700 | | | 2,519,916 |
| | | | |
|
|
| | | | | | 2,877,831 |
| | | | |
|
|
Electrical Equipment — 1.0% | | | | | |
General Cable Corp.*(a) | | 30,400 | | | 1,328,784 |
| | | | |
|
|
Electronic Components — 4.3% | | | | | |
Amphenol Corp. (Class A Stock) | | 40,900 | | | 2,539,072 |
Garmin Ltd.(a) | | 57,000 | | | 3,172,620 |
| | | | |
|
|
| | | | | | 5,711,692 |
| | | | |
|
|
Entertainment & Leisure — 1.0% | | | | | |
Harley-Davidson, Inc. | | 19,600 | | | 1,381,212 |
| | | | |
|
|
| | | | | |
COMMON STOCKS
(Continued) | | Shares
| | Value
(Note 2)
|
Financial Services — 5.4% | | | | | |
Ameriprise Financial, Inc.* | | 51,325 | | $ | 2,797,212 |
Chicago Mercantile Exchange Holdings, Inc.(a) | | 3,450 | | | 1,758,638 |
Jefferies Group, Inc. | | 1,900 | | | 50,958 |
Nasdaq Stock Market, Inc.*(a) | | 84,000 | | | 2,586,360 |
| | | | |
|
|
| | | | | | 7,193,168 |
| | | | |
|
|
Financial/Business Services — 0.5% | | | | | |
Dun & Bradstreet Corp. (The)* | | 8,000 | | | 662,320 |
| | | | |
|
|
Healthcare Equipment & Supplies — 3.6% | | | | | |
Dentsply International, Inc. | | 80,825 | | | 2,412,626 |
Intuitive Surgical, Inc.*(a) | | 25,200 | | | 2,416,680 |
| | | | |
|
|
| | | | | | 4,829,306 |
| | | | |
|
|
Healthcare Services — 5.8% | | | | | |
Caremark Rx, Inc. | | 8,500 | | | 485,435 |
Davita, Inc.* | | 47,000 | | | 2,673,360 |
Laboratory Corp. of America Holdings*(a) | | 38,200 | | | 2,806,554 |
WellCare Health Plans, Inc.*(a) | | 24,600 | | | 1,694,940 |
| | | | |
|
|
| | | | | | 7,660,289 |
| | | | |
|
|
Hotels, Restaurants & Leisure — 0.2% | | | | | |
International Game Technology(a) | | 7,100 | | | 328,020 |
| | | | |
|
|
Insurance — 3.6% | | | | | |
Arch Capital Group Ltd. (Bermuda)* | | 38,600 | | | 2,609,746 |
Assurant, Inc. | | 40,200 | | | 2,221,050 |
| | | | |
|
|
| | | | | | 4,830,796 |
| | | | |
|
|
Internet Services — 3.1% | | | | | |
NutriSystem, Inc.*(a) | | 20,800 | | | 1,318,512 |
ValueClick, Inc.* | | 117,000 | | | 2,764,710 |
| | | | |
|
|
| | | | | | 4,083,222 |
| | | | |
|
|
Internet Software & Services — 5.1% | | | | | |
Akamai Technologies, Inc.*(a) | | 82,000 | | | 4,355,840 |
Oracle Corp.* | | 140,600 | | | 2,409,884 |
| | | | |
|
|
| | | | | | 6,765,724 |
| | | | |
|
|
Manufacturing — 2.2% | | | | | |
Hasbro, Inc. | | 107,200 | | | 2,921,200 |
| | | | |
|
|
Media — 1.0% | | | | | |
Comcast Corp. (Class A Stock)* | | 31,800 | | | 1,346,094 |
| | | | |
|
|
Metals & Mining — 0.9% | | | | | |
Titanium Metals Corp.* | | 39,200 | | | 1,156,792 |
| | | | |
|
|
Oil, Gas & Consumable Fuels — 5.1% | | | | | |
ENSCO International, Inc.* | | 24,800 | | | 1,241,488 |
FMC Technologies, Inc.* | | 21,400 | | | 1,318,882 |
Newfield Exploration Co.* | | 28,000 | | | 1,286,600 |
Oceaneering International, Inc.* | | 73,400 | | | 2,913,980 |
| | | | |
|
|
| | | | | | 6,760,950 |
| | | | |
|
|
Pharmaceuticals — 5.1% | | | | | |
Forest Laboratories, Inc.* | | 80,075 | | | 4,051,795 |
Herbalife Ltd.* | | 33,800 | | | 1,357,408 |
OSI Pharmaceuticals, Inc.*(a) | | 38,800 | | | 1,357,224 |
| | | | |
|
|
| | | | | | 6,766,427 |
| | | | |
|
|
Real Estate Investment Trusts — 1.1% | | | | | |
Archstone-Smith Trust(a) | | 25,000 | | | 1,455,250 |
| | | | |
|
|
SEE NOTES TO FINANCIAL STATEMENTS.
B21
| | | | |
| | | SP MID-CAP GROWTH PORTFOLIO (Continued) | | |
SCHEDULE OF INVESTMENTS December 31, 2006 | |
| | | | | | |
COMMON STOCKS
(Continued) | | Shares
| | Value
(Note 2)
| |
Retail & Merchandising — 4.8% | | | | | | |
Children’s Place Retail Stores, Inc. (The)* | | 40,000 | | $ | 2,540,800 | |
Gamestop Corp.*(a) | | 14,000 | | | 771,540 | |
Under Armour, Inc. (Class A Stock)*(a) | | 60,700 | | | 3,062,315 | |
| | | | |
|
|
|
| | | | | | 6,374,655 | |
| | | | |
|
|
|
Semiconductors — 3.1% | | | | | | |
Atmel Corp.* | | 300,000 | | | 1,815,000 | |
MEMC Electronic Materials, Inc.* | | 60,000 | | | 2,348,400 | |
| | | | |
|
|
|
| | | | | | 4,163,400 | |
| | | | |
|
|
|
Telecommunications — 2.2% | | | | | | |
Time Warner Telecom, Inc. (Class A Stock)*(a) | | 147,300 | | | 2,935,689 | |
| | | | |
|
|
|
Textiles & Apparel — 2.3% | | | | | | |
Skechers USA, Inc. (Class A Stock)* | | 92,000 | | | 3,064,520 | |
| | | | |
|
|
|
Transportation — 1.8% | | | | | | |
Expeditors International Washington, Inc. | | 60,600 | | | 2,454,300 | |
| | | | |
|
|
|
Utilities — 1.0% | | | | | | |
AES Corp. (The)* | | 60,000 | | | 1,322,400 | |
| | | | |
|
|
|
TOTAL LONG-TERM INVESTMENTS
(cost $119,507,088) | | | 131,918,091 | |
| | | | |
|
|
|
| SHORT-TERM INVESTMENT — 29.5% | | | | |
Affiliated Money Market Mutual Fund | |
Dryden Core Investment Fund — Taxable Money Market Series
(cost $39,286,026; includes $36,421,136 of cash collateral for securities on loan)(b)(w) (Note 4) | | 39,286,026 | | | 39,286,026 | |
| | | | |
|
|
|
TOTAL INVESTMENTS — 128.6%
(cost $158,793,114) | | | 171,204,117 | |
LIABILITIES IN EXCESS OF OTHER ASSETS — (28.6)% | | | (38,093,628 | ) |
| | | | |
|
|
|
NET ASSETS — 100.0% | | $ | 133,110,489 | |
| | | | |
|
|
|
| * | Non-income producing security. |
| (a) | All or a portion of security is on loan. The aggregate market value of such securities is $34,940,544; cash collateral of $36,421,136 (included with liabilities) was received with which the portfolio purchased highly liquid short-term investments. |
| (b) | Represents security, or a portion thereof, purchased with cash collateral received for securities on loan. |
| (w) | Prudential Investments LLC, the manager of the Portfolio, also serves as manager of the Dryden Core Investment Fund-Taxable Money Market Series. |
The industry classification of long-term portfolio holdings, short-term investments and liabilities in excess of other assets shown as a percentage of net assets as of December 31, 2006 were as follows:
| | | |
Industry
| | | |
Affiliated Money Market Mutual Fund (including 27.4% received for securities on loan) | | 29.5 | % |
Computer Hardware | | 8.6 | |
Healthcare Services | | 5.8 | |
Financial Services | | 5.4 | |
Pharmaceuticals | | 5.1 | |
Internet Software & Services | | 5.1 | |
Oil, Gas & Consumable Fuels | | 5.1 | |
Computers | | 4.9 | |
Retail & Merchandising | | 4.8 | |
Commercial Services & Supplies | | 4.4 | |
Electronic Components | | 4.3 | |
Computer Services & Software | | 4.2 | |
Insurance | | 3.6 | |
Healthcare Equipment & Supplies | | 3.6 | |
Semiconductors | | 3.1 | |
Internet Services | | 3.1 | |
Textiles & Apparel | | 2.3 | |
Telecommunications | | 2.2 | |
Manufacturing | | 2.2 | |
Beverages | | 2.2 | |
Clothing & Apparel | | 2.2 | |
Drugs & Healthcare | | 2.2 | |
Transportation | | 1.8 | |
Biotechnology | | 1.6 | |
Real Estate Investment Trusts | | 1.1 | |
Distribution/Wholesale | | 1.1 | |
Commercial Services | | 1.0 | |
Entertainment & Leisure | | 1.0 | |
Chemicals | | 1.0 | |
Advertising | | 1.0 | |
Media | | 1.0 | |
Electrical Equipment | | 1.0 | |
Utilities | | 1.0 | |
Metals & Mining | | 0.9 | |
Business Services | | 0.5 | |
Financial/Business Services | | 0.5 | |
Hotels, Restaurants & Leisure | | 0.2 | |
| | |
|
|
| | | 128.6 | |
Liabilities in excess of other assets | | (28.6 | ) |
| | |
|
|
| | | 100.0 | % |
| | |
|
|
SEE NOTES TO FINANCIAL STATEMENTS.
B22
| | | | |
| | | SP PIMCO HIGH YIELD PORTFOLIO | | |
SCHEDULE OF INVESTMENTS | December 31, 2006 |
| | | | | | | | | | | | |
| LONG-TERM INVESTMENTS — 97.0% | | Moody’s
Ratings
(Unaudited)
| | Interest
Rate
| | Maturity
Date
| | Principal
Amount
(000)#
| | Value
(Note 2)
|
BANK NOTES — 6.1% | | | | | | | | | | | | |
Charter Communications | | B(d) | | 8.01% | | 04/25/13 | | $ | 1,000 | | $ | 1,007,812 |
Ford Motor Co. | | NR | | 8.36% | | 11/29/13 | | | 1,000 | | | 1,000,628 |
Goodyear Tire & Rubber Co. | | NR | | 8.14% | | 04/30/10 | | | 1,500 | | | 1,520,313 |
HCA, Inc. | | NR | | 8.11% | | 11/14/13 | | | 750 | | | 758,960 |
Headwaters, Inc. | | B+(d) | | 7.38% | | 04/30/11 | | | 674 | | | 671,269 |
Healthsouth Corp. | | B(d) | | 8.62% | | 02/02/13 | | | 1,244 | | | 1,253,683 |
Hertz Corp. | | NR | | 5.37% | | 12/21/12 | | | 111 | | | 111,988 |
Hertz Corp. | | NR | | 7.35% | | 12/21/12 | | | 375 | | | 377,766 |
Hertz Corp. | | NR | | 7.62% | | 12/21/12 | | | 508 | | | 511,993 |
MGM Studios | | NR | | 8.61% | | 04/08/12 | | | 997 | | | 989,160 |
Nordic Telephone (Denmark) | | NR | | 5.94% | | 11/30/13 | | | 500 | | | 666,837 |
Nordic Telephone (Denmark) | | NR | | 6.44% | | 11/30/14 | | | 500 | | | 669,753 |
Reliant Energy | | B+(d) | | 5.22% | | 12/01/10 | | | 429 | | | 432,107 |
Reliant Energy | | B+(d) | | 7.73% | | 12/01/10 | | | 571 | | | 576,143 |
Roundy’s, Inc. | | B+(d) | | 8.36% | | 10/27/11 | | | 490 | | | 495,023 |
Roundy’s, Inc. | | B+(d) | | 8.38% | | 10/27/11 | | | 500 | | | 505,125 |
Sigmakalon (France) | | B+(d) | | 5.72% | | 06/30/12 | | | 954 | | | 1,258,704 |
Spansion LLC | | NR | | 8.38% | | 10/30/12 | | | 1,500 | | | 1,506,251 |
VNU/Nielsen Finance LLC | | B+(d) | | 8.13% | | 08/08/13 | | | 2,000 | | | 2,016,388 |
Wind Acquisitions Finance | | B-(d) | | 10.00% | | 12/21/11 | | | 300 | | | 299,812 |
| | | | | | | | | | | |
|
|
TOTAL BANK NOTES
(cost $16,300,913) | | | 16,629,715 |
| | | | | | | | | | | |
|
|
CORPORATE BONDS — 89.2% | | | | | | | | | | | | |
Advertising — 0.4% | | | | | | | | | | | | |
R.H. Donnelley Corp., Sr. Disc. Notes | | B3 | | 6.875% | | 01/15/13 | | | 175 | | | 167,781 |
R.H. Donnelley Corp., Sr. Notes | | B3 | | 8.875% | | 01/15/16 | | | 1,000 | | | 1,050,000 |
| | | | | | | | | | | |
|
|
| | | | | | | | | | | | | 1,217,781 |
| | | | | | | | | | | |
|
|
Aerospace & Defense — 1.3% | | | | | | | | | | | | |
Armor Holdings, Inc., Sr. Sub. Notes | | B1 | | 8.25% | | 08/15/13 | | | 1,000 | | | 1,040,000 |
DRS Technologies, Inc., Gtd. Notes | | B3 | | 7.625% | | 02/01/18 | | | 1,000 | | | 1,030,000 |
L-3 Communications Corp., Gtd. Notes | | Ba3 | | 7.625% | | 06/15/12 | | | 630 | | | 652,050 |
L-3 Communications Corp., Sr. Sub. Notes | | Ba3 | | 6.375% | | 10/15/15 | | | 975 | | | 965,250 |
| | | | | | | | | | | |
|
|
| | | | | | | | | | | | | 3,687,300 |
| | | | | | | | | | | |
|
|
Airlines — 0.2% | | | | | | | | | | | | |
United AirLines, Inc., Pass-Through Certs., Series 01-1 | | BBB(d) | | 6.201% | | 09/01/08 | | | 396 | | | 397,989 |
United AirLines, Inc., Pass-Through Certs., Series 01-1 | | BBB(d) | | 6.602% | | 09/01/13 | | | 233 | | | 236,178 |
| | | | | | | | | | | |
|
|
| | | | | | | | | | | | | 634,167 |
| | | | | | | | | | | |
|
|
Apparel — 0.7% | | | | | | | | | | | | |
Quiksilver, Inc., Co. Gtd. Notes | | Ba3 | | 6.875% | | 04/15/15 | | | 1,875 | | | 1,842,188 |
| | | | | | | | | | | |
|
|
Automotive — 2.7% | | | | | | | | | | | | |
Arvin Capital I, Gtd. Notes | | B1 | | 9.50% | | 02/01/27 | | | 750 | | | 762,188 |
ArvinMeritor, Inc., Notes | | Ba3 | | 8.75% | | 03/01/12 | | | 790 | | | 811,725 |
Cooper-Standard Automotive, Inc., Gtd. Notes | | B3 | | 7.00% | | 12/15/12 | | | 1,250 | | | 1,121,875 |
General Motors Corp., Debs. | | Caa1 | | 8.25% | | 07/15/23 | | | 1,500 | | | 1,395,000 |
Tenneco Automotive, Inc., Gtd. Notes | | B3 | | 8.625% | | 11/15/14 | | | 555 | | | 566,100 |
Tenneco Automotive, Inc., Sec’d. Notes | | Ba3 | | 10.25% | | 07/15/13 | | | 875 | | | 958,125 |
TRW Automotive, Inc., Sr. Notes | | Ba3 | | 9.375% | | 02/15/13 | | | 1,565 | | | 1,678,462 |
| | | | | | | | | | | |
|
|
| | | | | | | | | | | | | 7,293,475 |
| | | | | | | | | | | |
|
|
Automotive Parts — 0.3% | | | | | | | | | | | | |
Goodyear Tire & Rubber Co., Sr. Notes | | B2 | | 9.00% | | 07/01/15 | | | 850 | | | 890,375 |
| | | | | | | | | | | |
|
|
Cable — 4.5% | | | | | | | | | | | | |
CanWest Media, Inc., Gtd. Notes (Canada) | | B2 | | 8.00% | | 09/15/12 | | | 950 | | | 991,563 |
CCO Holdings LLC/CCO Holdings Capital Corp., Sr. Notes | | Caa1 | | 8.75% | | 11/15/13 | | | 2,370 | | | 2,461,838 |
Charter Communications Operating LLC, Sr. Notes, 144A | | B3 | | 8.375% | | 04/30/14 | | | 1,415 | | | 1,476,906 |
SEE NOTES TO FINANCIAL STATEMENTS.
B23
| | | | |
| | | SP PIMCO HIGH YIELD PORTFOLIO (Continued) | | |
SCHEDULE OF INVESTMENTS | December 31, 2006 |
| | | | | | | | | | | | |
| CORPORATE BONDS (Continued) | | Moody’s
Ratings
(Unaudited)
| | Interest
Rate
| | Maturity
Date
| | Principal
Amount
(000)#
| | Value
(Note 2)
|
Cable (cont’d.) | | | | | | | | | | | | |
CSC Holdings, Inc., Sr. Notes | | B2 | | 8.125% | | 07/15/09 | | $ | 800 | | $ | 829,000 |
CSC Holdings, Inc., Sr. Notes, Series. B | | B2 | | 7.625% | | 04/01/11 | | | 2,675 | | | 2,725,156 |
Echostar DBS Corp., Gtd. Notes | | Ba3 | | 6.625% | | 10/01/14 | | | 975 | | | 950,625 |
Echostar DBS Corp., Sr. Notes | | Ba3 | | 6.375% | | 10/01/11 | | | 775 | | | 770,156 |
Rogers Cable, Inc., Sec’d. Notes (Canada) | | Ba1 | | 6.75% | | 03/15/15 | | | 2,065 | | | 2,127,644 |
| | | | | | | | | | | |
|
|
| | | | | | | | | | | | | 12,332,888 |
| | | | | | | | | | | |
|
|
Capital Goods – Others — 0.1% | | | | | | | | | | | | |
Dresser-Rand Group, Inc., Gtd. Notes (Canada) | | B1 | | 7.375% | | 11/01/14 | | | 396 | | | 398,970 |
| | | | | | | | | | | |
|
|
Chemicals — 3.2% | | | | | | | | | | | | |
Ineos Group Holdings, PLC., Sr. Sub. Notes, 144A (United Kingdom) | | B2 | | 8.50% | | 02/15/16 | | | 2,250 | | | 2,148,750 |
Lyondell Chemical Co., Gtd. Notes | | B1 | | 8.00% | | 09/15/14 | | | 975 | | | 1,011,562 |
Lyondell Chemical Co., Gtd. Notes | | B1 | | 8.25% | | 09/15/16 | | | 250 | | | 262,500 |
Mosaic Co., Sr. Notes 144A | | B1 | | 7.625% | | 12/01/16 | | | 1,000 | | | 1,036,250 |
Nalco Co., Sr. Notes | | B1 | | 7.75% | | 11/15/11 | | | 475 | | | 485,688 |
Nalco Co., Sr. Sub. Notes | | B3 | | 8.875% | | 11/15/13 | | | 850 | | | 899,938 |
PQ Corp., Gtd. Notes | | B3 | | 7.50% | | 02/15/13 | | | 1,000 | | | 985,000 |
Rockwood Specialties Group, Inc., Sub. Notes | | B3 | | 7.50% | | 11/15/14 | | | 2,075 | | | 2,090,562 |
| | | | | | | | | | | |
|
|
| | | | | | | | | | | | | 8,920,250 |
| | | | | | | | | | | |
|
|
Containers — 1.7% | | | | | | | | | | | | |
Greif, Inc., Gtd. Notes | | Ba3 | | 8.875% | | 08/01/12 | | | 500 | | | 525,000 |
Jefferson Smurfit Corp. US, Gtd. Notes | | B2 | | 7.50% | | 06/01/13 | | | 800 | | | 752,000 |
Jefferson Smurfit Corp. US, Gtd. Notes | | B2 | | 8.25% | | 10/01/12 | | | 475 | | | 463,125 |
Owens-Brockway Glass Container, Inc., Gtd. Notes | | B3 | | 6.75% | | 12/01/14 | | | 1,275 | | | 1,236,750 |
Owens-Brockway Glass Container, Inc., Gtd. Notes | | Ba2 | | 7.75% | | 05/15/11 | | | 500 | | | 513,750 |
Owens-Brockway Glass Container, Inc., Sec’d. Notes | | Ba2 | | 8.75% | | 11/15/12 | | | 150 | | | 159,000 |
Smurfit-Stone Container Enterprises, Inc., Sr. Notes | | B2 | | 8.375% | | 07/01/12 | | | 100 | | | 98,000 |
Smurfit-Stone Container Enterprises, Inc., Sr. Notes | | B2 | | 9.75% | | 02/01/11 | | | 859 | | | 885,844 |
| | | | | | | | | | | |
|
|
| | | | | | | | | | | | | 4,633,469 |
| | | | | | | | | | | |
|
|
Containers & Packaging — 0.6% | | | | | | | | | | | | |
Crown Americas Inc., Gtd. Notes | | B1 | | 7.625% | | 11/15/15 | | | 350 | | | 360,500 |
Crown Americas Inc., Sr. Notes | | B1 | | 7.75% | | 11/15/15 | | | 1,125 | | | 1,167,188 |
| | | | | | | | | | | |
|
|
| | | | | | | | | | | | | 1,527,688 |
| | | | | | | | | | | |
|
|
Distribution/Wholesale — 1.1% | | | | | | | | | | | | |
Buhrmann US, Inc., Sr. Sub. Notes | | B2 | | 8.25% | | 07/01/14 | | | 1,500 | | | 1,488,750 |
VWR International, Inc., Sr. Sub. Notes | | B3 | | 8.00% | | 04/15/14 | | | 1,500 | | | 1,545,000 |
| | | | | | | | | | | |
|
|
| | | | | | | | | | | | | 3,033,750 |
| | | | | | | | | | | |
|
|
Diversified — 0.5% | | | | | | | | | | | | |
Bomardier, Inc., Sr. Unsec’d. Notes, 144A (Canada) | | Ba2 | | 7.25% | | 11/15/16 | | | 950 | | | 1,275,988 |
| | | | | | | | | | | |
|
|
Diversified Financial Services — 0.2% | | | | | | | | | | | | |
Sally Holdings LLC, Sr. Notes, 144A | | B2 | | 9.25% | | 11/15/14 | | | 600 | | | 611,250 |
| | | | | | | | | | | |
|
|
Diversified Operations — 0.3% | | | | | | | | | | | | |
Invensys PLC, Sr. Notes, 144A (United Kingdom) | | B2 | | 9.875% | | 03/15/11 | | | 61 | | | 65,423 |
Trinity Industries, Inc., Sr. Unsub. Notes | | Ba1 | | 6.50% | | 03/15/14 | | | 700 | | | 687,750 |
| | | | | | | | | | | |
|
|
| | | | | | | | | | | | | 753,173 |
| | | | | | | | | | | |
|
|
Electronic Components — 0.8% | | | | | | | | | | | | |
Celestica, Inc., Sr. Sub. Notes | | B2 | | 7.875% | | 07/01/11 | | | 300 | | | 297,000 |
Celestica, Inc., Sr. Sub. Notes (Canada) | | B2 | | 7.625% | | 07/01/13 | | | 450 | | | 438,750 |
Legrand France SA, Debs. (France) | | Baa3 | | 8.50% | | 02/15/25 | | | 500 | | | 575,000 |
Solectron Global Finance Ltd., Gtd. Notes | | B3 | | 8.00% | | 03/15/16 | | | 950 | | | 961,875 |
| | | | | | | | | | | |
|
|
| | | | | | | | | | | | | 2,272,625 |
| | | | | | | | | | | |
|
|
Entertainment — 0.2% | | | | | | | | | | | | |
Royal Caribbean Cruises Ltd., Debs. (Liberia) | | Ba1 | | 7.25% | | 03/15/18 | | | 500 | | | 505,343 |
| | | | | | | | | | | |
|
|
SEE NOTES TO FINANCIAL STATEMENTS.
B24
| | | | |
| | | SP PIMCO HIGH YIELD PORTFOLIO (Continued) | | |
SCHEDULE OF INVESTMENTS | December 31, 2006 |
| | | | | | | | | | | | |
| CORPORATE BONDS (Continued) | | Moody’s
Ratings
(Unaudited)
| | Interest
Rate
| | Maturity
Date
| | Principal
Amount
(000)#
| | Value (Note 2)
|
Financials — 10.7% | | | | | | | | | | |
AES Ironwood LLC, Sec’d. Notes, Series A | | B1 | | 8.857% | | 11/30/25 | | $ | 1,413 | | $ | 1,586,067 |
AES Red Oak LLC, Sec’d. Notes | | B1 | | 8.54% | | 11/30/19 | | | 972 | | | 1,057,186 |
BCP Crystal US Holdings Corp., Sr. Sub. Notes | | B3 | | 9.625% | | 06/15/14 | | | 1,500 | | | 1,657,500 |
Chukchansi Economic Development Authority, Sr. Notes, 144A | | B2 | | 8.00% | | 11/15/13 | | | 1,000 | | | 1,038,750 |
Ford Motor Co., Notes | | Caa1 | | 7.45% | | 07/16/31 | | | 1,075 | | | 843,875 |
Ford Motor Credit Co., Bonds | | B1 | | 7.375% | | 02/01/11 | | | 6,115 | | | 6,053,501 |
Ford Motor Credit Co., Notes | | B1 | | 7.875% | | 06/15/10 | | | 2,185 | | | 2,203,149 |
Ford Motor Credit Co., Sr. Notes | | B1 | | 7.25% | | 10/25/11 | | | 1,175 | | | 1,150,645 |
Ford Motor Credit Co., Sr. Unsec’d. Notes | | B1 | | 8.00% | | 12/15/16 | | | 100 | | | 98,815 |
General Motors Acceptance Corp., Bonds | | Ba1 | | 6.00% | | 04/01/11 | | | 990 | | | 983,634 |
General Motors Acceptance Corp., Bonds | | Ba1 | | 8.00% | | 11/01/31 | | | 325 | | | 373,122 |
General Motors Acceptance Corp., Notes | | Ba1 | | 6.875% | | 08/28/12 | | | 1,275 | | | 1,309,201 |
General Motors Acceptance Corp., Notes | | Ba1 | | 7.00% | | 02/01/12 | | | 1,600 | | | 1,650,688 |
Idearc, Inc., Sub. Notes, 144A | | B2 | | 8.00% | | 11/15/16 | | | 1,225 | | | 1,243,375 |
JET Equipment Trust, 144A(i) | | NR | | 7.628% | | 08/15/12 | | | 45 | | | 33,660 |
JET Equipment Trust, 144A | | NR | | 10.00% | | 06/15/12 | | | 300 | | | 292,875 |
JSG Funding PLC, Sr. Notes (Ireland) | | B3 | | 9.625% | | 10/01/12 | | | 3,175 | | | 3,365,500 |
KRATON Polymers LLC, Gtd. Notes | | B3 | | 8.125% | | 01/15/14 | | | 1,875 | | | 1,875,000 |
RSHB Capital NA, Sr. Notes, 144A | | A3 | | 7.175% | | 05/16/13 | | | 1,000 | | | 1,053,750 |
TNK-BP Finance SA, Gtd. Notes, 144A (Russia) | | Baa2 | | 7.50% | | 07/18/16 | | | 400 | | | 425,500 |
Universal City Florida Holding Co. I/II, Sr. Notes | | B3 | | 8.375% | | 05/01/10 | | | 950 | | | 973,750 |
Universal City Florida Holding Co. I/II, Sr. Notes(c) | | B3 | | 10.121% | | 05/01/10 | | | 50 | | | 51,625 |
| | | | | | | | | | | |
|
|
| | | | | | | | | | | | | 29,321,168 |
| | | | | | | | | | | |
|
|
Food & Beverage — 1.0% | | | | | | | | | | | | |
Delhaize America, Inc., Gtd. Notes | | Ba1 | | 9.00% | | 04/15/31 | | | 1,555 | | | 1,846,259 |
Ingles Markets, Inc., Gtd. Notes | | B3 | | 8.875% | | 12/01/11 | | | 975 | | | 1,016,438 |
| | | | | | | | | | | |
|
|
| | | | | | | | | | | | | 2,862,697 |
| | | | | | | | | | | |
|
|
Foods — 0.9% | | | | | | | | | | | | |
Albertson’s, Inc., Debs. | | B1 | | 7.45% | | 08/01/29 | | | 1,000 | | | 976,999 |
American Stores Co., Bonds | | B1 | | 8.00% | | 06/01/26 | | | 400 | | | 420,443 |
Supervalu, Inc., Sr. Notes | | B1 | | 7.50% | | 11/15/14 | | | 900 | | | 938,432 |
| | | | | | | | | | | |
|
|
| | | | | | | | | | | | | 2,335,874 |
| | | | | | | | | | | |
|
|
Forest & Paper Products — 3.7% | | | | | | | | | | | | |
Abitibi-Consolidated Co. of Canada, Gtd. Notes (Canada) | | B2 | | 8.375% | | 04/01/15 | | | 1,200 | | | 1,038,000 |
Abitibi-Consolidated, Inc., Notes (Canada) | | B2 | | 8.55% | | 08/01/10 | | | 600 | | | 570,000 |
Bowater Canada Finance Corp., Gtd. Notes (Canada) | | B2 | | 7.95% | | 11/15/11 | | | 1,125 | | | 1,102,500 |
Cascades, Inc., Sr. Notes (Canada) | | Ba3 | | 7.25% | | 02/15/13 | | | 900 | | | 897,750 |
Georgia-Pacific Corp., Debs. | | B2 | | 7.375% | | 12/01/25 | | | 3,625 | | | 3,534,375 |
Georgia-Pacific Corp., Notes | | B2 | | 7.75% | | 11/15/29 | | | 300 | | | 299,250 |
Georgia-Pacific Corp., Sr. Notes | | B2 | | 8.00% | | 01/15/24 | | | 800 | | | 812,000 |
Smurfit Capital Funding PLC, Debs. (Ireland) | | B1 | | 7.50% | | 11/20/25 | | | 700 | | | 668,500 |
Verso Paper Holdings LLC and Verson Paper, Inc., Sec’d. Notes | | B2 | | 9.125% | | 08/01/14 | | | 1,175 | | | 1,224,937 |
| | | | | | | | | | | |
|
|
| | | | | | | | | | | | | 10,147,312 |
| | | | | | | | | | | |
|
|
Gaming — 3.8% | | | | | | | | | | | | |
Boyd Gaming Corp., Sr. Sub. Notes | | Ba3 | | 7.125% | | 02/01/16 | | | 600 | | | 597,000 |
Choctaw Resort Development Enterprise, Sr. Notes, 144A | | Ba2 | | 7.25% | | 11/15/19 | | | 969 | | | 969,000 |
MGM Mirage, Inc., Gtd. Notes | | Ba2 | | 6.625% | | 07/15/15 | | | 1,525 | | | 1,452,562 |
MGM Mirage, Inc., Gtd. Notes | | Ba2 | | 6.875% | | 04/01/16 | | | 525 | | | 504,000 |
MGM Mirage, Inc., Gtd. Notes | | B1 | | 8.375% | | 02/01/11 | | | 600 | | | 622,500 |
Mirage Resorts, Inc., Debs. | | Ba2 | | 7.25% | | 08/01/17 | | | 500 | | | 501,875 |
Station Casinos, Inc., Sr. Sub. Notes | | Ba3 | | 6.50% | | 02/01/14 | | | 500 | | | 444,375 |
Station Casinos, Inc., Sr. Sub. Notes | | Ba3 | | 6.875% | | 03/01/16 | | | 800 | | | 718,000 |
Station Casinos, Inc., Sr. Unsec’d. Notes | | Ba2 | | 7.75% | | 08/15/16 | | | 1,250 | | | 1,259,375 |
Wynn Las Vegas LLC, 1st Mortgage | | B1 | | 6.625% | | 12/01/14 | | | 3,400 | | | 3,378,750 |
| | | | | | | | | | | |
|
|
| | | | | | | | | | | | | 10,447,437 |
| | | | | | | | | | | |
|
|
SEE NOTES TO FINANCIAL STATEMENTS.
B25
| | | | |
| | | SP PIMCO HIGH YIELD PORTFOLIO (Continued) | | |
SCHEDULE OF INVESTMENTS | December 31, 2006 |
| | | | | | | | | | | | |
| CORPORATE BONDS (Continued) | | Moody’s
Ratings
(Unaudited)
| | Interest
Rate
| | Maturity
Date
| | Principal
Amount
(000)#
| | Value
(Note 2)
|
Healthcare Services — 0.2% | | | | | | | | | | | | |
Service Corp. International, Sr. Notes | | B1 | | 7.375% | | 10/01/14 | | $ | 250 | | $ | 261,250 |
Service Corp. International, Sr. Notes | | B1 | | 7.625% | | 10/01/18 | | | 325 | | | 344,500 |
| | | | | | | | | | | |
|
|
| | | | | | | | | | | | | 605,750 |
| | | | | | | | | | | |
|
|
Hospitals/Hospital Management — 6.2% | | | | | | | | | | | | |
DaVita, Inc., Sr. Sub. Notes | | B3 | | 7.25% | | 03/15/15 | | | 1,805 | | | 1,841,100 |
Fresenius Medical Care Capital Trust II, Gtd. Notes | | B1 | | 7.875% | | 02/01/08 | | | 500 | | | 508,750 |
Fresenius Medical Care Capital Trust IV, Gtd. Notes | | B1 | | 7.875% | | 06/15/11 | | | 1,925 | | | 2,016,437 |
HCA, Inc., Debs. | | Caa1 | | 7.19% | | 11/15/15 | | | 200 | | | 171,547 |
HCA, Inc., Notes | | Caa1 | | 6.75% | | 07/15/13 | | | 1,725 | | | 1,548,187 |
HCA, Inc., Notes | | Caa1 | | 7.69% | | 06/15/25 | | | 681 | | | 563,665 |
HCA, Inc., Sec’d. Notes | | B2 | | 9.125% | | 11/15/14 | | | 460 | | | 491,625 |
HCA, Inc., Sec’d. Notes | | B2 | | 9.25% | | 11/15/16 | | | 3,835 | | | 4,108,244 |
HCA, Inc., Sr. Unsec’d Notes | | Caa1 | | 6.25% | | 02/15/13 | | | 275 | | | 243,375 |
Rotech Healthcare, Inc., Gtd. Notes | | Caa3 | | 9.50% | | 04/01/12 | | | 2,775 | | | 2,719,500 |
Tenet Healthcare Corp., Sr. Unsec’d. Notes | | Caa1 | | 7.375% | | 02/01/13 | | | 1,550 | | | 1,424,063 |
Triad Hospitals, Inc., Sr. Sub. Notes | | B2 | | 7.00% | | 11/15/13 | | | 1,350 | | | 1,358,438 |
| | | | | | | | | | | |
|
|
| | | | | | | | | | | | | 16,994,931 |
| | | | | | | | | | | |
|
|
Industrial — 0.1% | | | | | | | | | | | | |
Bombardier, Inc., Sr. Unsec’d. Notes, 144A | | Ba2 | | 8.00% | | 11/15/14 | | | 150 | | | 153,750 |
| | | | | | | | | | | |
|
|
Machinery — 0.6% | | | | | | | | | | | | |
Chart Industries, Inc./Pre First Reserve Fund X LP, Sr. Sub. Notes, 144A | | B3 | | 9.125% | | 10/15/15 | | | 1,000 | | | 1,055,000 |
Goodyear Tire & Rubber Corp., Sr. Notes | | B2 | | 8.625% | | 12/01/11 | | | 600 | | | 619,500 |
| | | | | | | | | | | |
|
|
| | | | | | | | | | | | | 1,674,500 |
| | | | | | | | | | | |
|
|
Media — 2.5% | | | | | | | | | | | | |
DirecTV Holdings LLC/DirecTV Financing Co., Sr. Notes | | Ba3 | | 8.375% | | 03/15/13 | | | 1,500 | | | 1,560,000 |
Echostar DBS Corp., Gtd. Notes | | Ba3 | | 7.00% | | 10/01/13 | | | 275 | | | 274,656 |
Echostar DBS Corp., Gtd. Notes | | BB-(d) | | 7.125% | | 02/01/16 | | | 1,985 | | | 1,985,000 |
Lighthouse International Co. SA, Gtd. Notes, 144A (Luxembourg) | | B2 | | 8.00% | | 04/30/14 | | | EUR 1,220 | | | 1,763,448 |
Unity Media GmbH, Sr. Notes, 144A (Germany) | | Caa2 | | 10.375% | | 02/15/15 | | | 450 | | | 437,063 |
UPC Holding BV, Sec’d. Notes (Netherlands) | | B3 | | 7.75% | | 01/15/14 | | | EUR 675 | | | 895,485 |
| | | | | | | | | | | |
|
|
| | | | | | | | | | | | | 6,915,652 |
| | | | | | | | | | | |
|
|
Metals & Mining — 1.0% | | | | | | | | | | | | |
Novelis, Inc., Sr. Notes, 144A (Canada) | | B2 | | 7.25% | | 02/15/15 | | | 850 | | | 822,375 |
Peabody Energy Corp., Gtd. Notes | | Ba1 | | 6.875% | | 03/15/13 | | | 2,000 | | | 2,050,000 |
| | | | | | | | | | | |
|
|
| | | | | | | | | | | | | 2,872,375 |
| | | | | | | | | | | |
|
|
Office Equipment — 0.5% | | | | | | | | | | | | |
Xerox Capital Trust I, Gtd. Notes | | Ba1 | | 8.00% | | 02/01/27 | | | 1,300 | | | 1,327,625 |
| | | | | | | | | | | |
|
|
Oil & Gas Exploration/Production — 9.1% | | | | | | | | | | | | |
Chesapeake Energy Corp., Gtd. Notes | | Ba2 | | 7.75% | | 01/15/15 | | | 500 | | | 520,625 |
Chesapeake Energy Corp., Sr. Notes | | Ba2 | | 6.375% | | 06/15/15 | | | 625 | | | 618,750 |
Chesapeake Energy Corp., Sr. Notes | | Ba2 | | 7.00% | | 08/15/14 | | | 800 | | | 813,000 |
Chesapeake Energy Corp., Sr. Notes | | Ba2 | | 7.50% | | 06/15/14 | | | 1,175 | | | 1,220,531 |
Complete Production Services, Inc., Sr. Notes, 144A | | B2 | | 8.00% | | 12/15/16 | | | 325 | | | 333,125 |
El Paso Corp., Sr. Notes | | B2 | | 7.75% | | 01/15/32 | | | 400 | | | 438,000 |
El Paso Production Holding Co., Gtd. Notes | | B1 | | 7.75% | | 06/01/13 | | | 5,710 | | | 5,974,087 |
Hanover Compressor Co., Sr. Notes | | B2 | | 9.00% | | 06/01/14 | | | 1,200 | | | 1,296,000 |
Hanover Equipment Trust, Sec’d. Notes | | Ba3 | | 8.50% | | 09/01/08 | | | 320 | | | 324,000 |
Naftogaz UKrainy, Bonds | | Ba2 | | 8.125% | | 09/30/09 | | | 1,000 | | | 981,874 |
OPTI Canada, Inc., Gtd. Notes, 144A | | B1 | | 8.25% | | 12/15/14 | | | 600 | | | 616,500 |
Pogo Producing Co., Sr. Sub. Notes | | B1 | | 7.875% | | 05/01/13 | | | 800 | | | 812,000 |
Roseton/Danskammer, Gtd. Notes | | Ba3 | | 7.67% | | 11/08/16 | | | 675 | | | 699,469 |
Roseton/Danskammer, Pass-Through Certs. | | Ba3 | | 7.27% | | 11/08/10 | | | 2,200 | | | 2,249,500 |
SemGroup LP, Sr. Notes, 144A | | B1 | | 8.75% | | 11/15/15 | | | 1,150 | | | 1,155,750 |
SEE NOTES TO FINANCIAL STATEMENTS.
B26
| | | | |
| | | SP PIMCO HIGH YIELD PORTFOLIO (Continued) | | |
SCHEDULE OF INVESTMENTS | December 31, 2006 |
| | | | | | | | | | | | |
| CORPORATE BONDS (Continued) | | Moody’s
Ratings
(Unaudited)
| | Interest
Rate
| | Maturity
Date
| | Principal
Amount
(000)#
| | Value
(Note 2)
|
Oil & Gas Exploration/Production (cont’d.) | | | | | | | | | | | | |
Williams Cos., Inc., Debs. | | Ba2 | | 7.50% | | 01/15/31 | | $ | 1,500 | | $ | 1,556,250 |
Williams Cos., Inc., Notes | | Ba2 | | 7.875% | | 09/01/21 | | | 4,800 | | | 5,148,000 |
Williams Partners LP/Williams Partners Finance Corp., Bonds, 144A | | Ba3 | | 7.25% | | 02/01/17 | | | 225 | | | 229,500 |
| | | | | | | | | | | |
|
|
| | | | | | | | | | | | | 24,986,961 |
| | | | | | | | | | | |
|
|
Personell Services — 0.4% | | | | | | | | | | | | |
Corrections Corp. of America, Gtd. Notes | | Ba3 | | 6.75% | | 01/31/14 | | | 1,000 | | | 1,010,000 |
| | | | | | | | | | | |
|
|
Printing & Publishing — 1.0% | | | | | | | | | | | | |
Dex Media West LLC/Dex Media Finance Co., Sr. Sub. Notes | | B2 | | 9.875% | | 08/15/13 | | | 2,397 | | | 2,612,730 |
| | | | | | | | | | | |
|
|
Real Estate Investment Trusts — 1.3% | | | | | | | | | | | | |
Host Marriott LP, Gtd. Notes | | Ba1 | | 6.75% | | 06/01/16 | | | 500 | | | 500,625 |
Host Marriott LP, Sr. Notes | | Ba1 | | 7.00% | | 08/15/12 | | | 800 | | | 812,000 |
Host Marriott LP, Sr. Notes | | Ba1 | | 7.125% | | 11/01/13 | | | 875 | | | 894,688 |
Ventas Realty LP, Gtd. Notes | | Ba2 | | 6.75% | | 04/01/17 | | | 1,325 | | | 1,368,062 |
| | | | | | | | | | | |
|
|
| | | | | | | | | | | | | 3,575,375 |
| | | | | | | | | | | |
|
|
Real Estate Management & Development — 0.4% | | | | | | | | | | | | |
Forest City Enterprises, Inc., Sr. Notes | | Ba3 | | 7.625% | | 06/01/15 | | | 1,000 | | | 1,020,000 |
| | | | | | | | | | | |
|
|
Retail — 2.7% | | | | | | | | | | | | |
Amerigas Partners LP, Sr. Unsec’d. Notes | | B1 | | 7.25% | | 05/20/15 | | | 1,850 | | | 1,873,125 |
Amerigas Partners LP/AmeriGas Eagle Finance Corp., Sr. Notes | | B1 | | 7.125% | | 05/20/16 | | | 1,025 | | | 1,025,000 |
Ferrellgas Escrow LLC/Ferrellgas Finance Escrow Corp., Sr. Notes | | Ba3 | | 6.75% | | 05/01/14 | | | 1,825 | | | 1,774,812 |
Ferrellgas Partners LP/Ferrellgas Partners Finance, Sr. Notes | | B2 | | 8.75% | | 06/15/12 | | | 1,400 | | | 1,435,000 |
Suburban Propane Partners LP, Sr. Notes | | B1 | | 6.875% | | 12/15/13 | | | 1,425 | | | 1,396,500 |
| | | | | | | | | | | |
|
|
| | | | | | | | | | | | | 7,504,437 |
| | | | | | | | | | | |
|
|
Retail & Merchandising — 0.3% | | | | | | | | | | | | |
Bon-Ton Stores, Inc., Gtd. Notes | | B3 | | 10.25% | | 03/15/14 | | | 800 | | | 818,000 |
| | | | | | | | | | | |
|
|
Semiconductors — 0.9% | | | | | | | | | | | | |
Freescale Semiconductor, Inc., Sr. Notes, 144A | | B1 | | 8.875% | | 12/15/14 | | | 525 | | | 523,031 |
Freescale Semiconductor, Inc., Sr. Notes, 144A | | B1 | | 9.125% | | 12/15/14 | | | 875 | | | 869,532 |
Sensata Technologies BV, Sr. Notes (Netherlands) | | Caa1 | | 8.00% | | 05/01/14 | | | 1,025 | | | 984,000 |
| | | | | | | | | | | |
|
|
| | | | | | | | | | | | | 2,376,563 |
| | | | | | | | | | | |
|
|
Technology — 1.0% | | | | | | | | | | | | |
Sanmina-SCI Corp., Sr. Sub. Notes | | B2 | | 8.125% | | 03/01/16 | | | 900 | | | 870,750 |
Sungard Data Systems, Inc., Gtd. Notes | | Caa1 | | 9.125% | | 08/15/13 | | | 1,750 | | | 1,837,500 |
| | | | | | | | | | | |
|
|
| | | | | | | | | | | | | 2,708,250 |
| | | | | | | | | | | |
|
|
Telecommunications — 11.5% | | | | | | | | | | | | |
American Cellular Corp., Sr. Notes | | B3 | | 10.00% | | 08/01/11 | | | 875 | | | 925,313 |
Cincinnati Bell, Inc., Sr. Sub. Notes | | B2 | | 8.375% | | 01/15/14 | | | 1,700 | | | 1,746,750 |
Citizens Communications Co., Sr. Notes | | Ba2 | | 9.00% | | 08/15/31 | | | 1,025 | | | 1,112,125 |
Citizens Communications Co., Sr. Notes, 144A | | Ba2 | | 7.875% | | 01/15/27 | | | 500 | | | 505,000 |
Hawaiian Telecom Communications, Inc., Gtd. Notes | | B3 | | 9.75% | | 05/01/13 | | | 1,300 | | | 1,303,250 |
Insight Midwest LP/Insight Capital, Inc., Sr. Notes | | B2 | | 9.75% | | 10/01/09 | | | 675 | | | 685,969 |
Intelsat Bermuda Ltd., Gtd. Notes (Bermuda) | | B2 | | 9.25% | | 06/15/16 | | | 1,075 | | | 1,155,625 |
Intelsat Corp., Gtd. Notes (Bermuda) | | B2 | | 9.00% | | 06/15/16 | | | 500 | | | 529,375 |
Intelsat Subsidiary Holding Co. Ltd., Gtd. Notes (Bermuda)(c) | | B2 | | 10.484% | | 01/15/12 | | | 800 | | | 807,000 |
Intelsat Subsidiary Holding Co. Ltd., Sr. Notes (Bermuda) | | B2 | | 8.25% | | 01/15/13 | | | 1,350 | | | 1,370,250 |
Intelsat Subsidiary Holding Co. Ltd., Sr. Notes (Bermuda) | | B2 | | 8.625% | | 01/15/15 | | | 75 | | | 78,000 |
Mobile Telesystems Finance SA, Gtd. Notes (Luxembourg) | | Ba3 | | 8.375% | | 10/14/10 | | | 500 | | | 525,350 |
Mobile Telesystems Finance SA, Gtd. Notes, 144A (Luxembourg) | | Ba3 | | 8.00% | | 01/28/12 | | | 350 | | | 366,625 |
Nordic Telephone Co. Holdings ApS, Sr. Notes, 144A (Denmark) | | B2 | | 8.875% | | 05/01/16 | | | 1,300 | | | 1,391,000 |
Nortel Networks Ltd., Gtd. Notes, 144A (United Kingdom) | | B3 | | 10.125% | | 07/15/13 | | | 500 | | | 540,000 |
Nortel Networks Ltd., Gtd. Notes, 144A (Canada) | | B3 | | 10.75% | | 07/15/16 | | | 275 | | | 300,781 |
Northwestern Bell Telephone, Debs. | | Ba1 | | 7.75% | | 05/01/30 | | | 750 | | | 759,375 |
Qwest Capital Funding, Inc., Gtd. Notes | | B1 | | 7.25% | | 02/15/11 | | | 150 | | | 153,188 |
SEE NOTES TO FINANCIAL STATEMENTS.
B27
| | | | |
| | | SP PIMCO HIGH YIELD PORTFOLIO (Continued) | | |
SCHEDULE OF INVESTMENTS | December 31, 2006 |
| | | | | | | | | | | | |
| CORPORATE BONDS (Continued) | | Moody’s
Ratings
(Unaudited)
| | Interest
Rate
| | Maturity
Date
| | Principal
Amount
(000)#
| | Value
(Note 2)
|
Telecommunications (cont’d.) | | | | | | | | | | | | |
Qwest Capital Funding, Inc., Gtd. Notes | | B1 | | 7.90% | | 08/15/10 | | $ | 500 | | $ | 520,625 |
Qwest Communications International, Inc., Gtd. Notes | | Ba3 | | 7.50% | | 02/15/14 | | | 5,430 | | | 5,592,900 |
Qwest Corp., Debs. | | Ba1 | | 7.50% | | 06/15/23 | | | 500 | | | 503,750 |
Qwest Corp., Notes | | Ba1 | | 8.875% | | 03/15/12 | | | 2,350 | | | 2,617,312 |
Qwest Corp., Sr. Notes | | Ba1 | | 7.625% | | 06/15/15 | | | 875 | | | 936,250 |
Rogers Wireless, Inc., Sec’d. Notes (Canada) | | Ba1 | | 7.50% | | 03/15/15 | | | 1,585 | | | 1,719,725 |
Rural Cellular Corp., Sr. Notes | | B3 | | 9.875% | | 02/01/10 | | | 1,450 | | | 1,542,437 |
Time Warner Telecom Holdings, Inc., Gtd. Notes | | B3 | | 9.25% | | 02/15/14 | | | 2,250 | | | 2,404,687 |
Wind Acquisition Finance SA, Gtd. Notes, 144A (Luxembourg) | | B2 | | 10.75% | | 12/01/15 | | | 600 | | | 682,500 |
Windstream Corp., Sr. Notes | | Ba3 | | 8.625% | | 08/01/16 | | | 650 | | | 711,750 |
| | | | | | | | | | | |
|
|
| | | | | | | | | | | | | 31,486,912 |
| | | | | | | | | | | |
|
|
Telecommunications – Cellular — 0.5% | | | | | | | | | | | | |
Nextel Communications, Inc., Gtd. Notes | | Baa3 | | 7.375% | | 08/01/15 | | | 1,350 | | | 1,384,324 |
| | | | | | | | | | | |
|
|
Tobacco — 0.7% | | | | | | | | | | | | |
Reynolds American, Inc., Gtd. Notes | | Ba3 | | 7.75% | | 06/01/18 | | | 1,065 | | | 1,130,553 |
Reynolds American, Inc., Gtd. Notes, 144A | | Ba3 | | 7.625% | | 06/01/16 | | | 675 | | | 715,185 |
| | | | | | | | | | | |
|
|
| | | | | | | | | | | | | 1,845,738 |
| | | | | | | | | | | |
|
|
Transportation — 1.2% | | | | | | | | | | | | |
Hertz Corp., Sr. Notes, 144A | | B1 | | 8.875% | | 01/01/14 | | | 1,575 | | | 1,649,812 |
Horizon Lines LLC, Gtd. Notes | | B3 | | 9.00% | | 11/01/12 | | | 1,671 | | | 1,754,550 |
| | | | | | | | | | | |
|
|
| | | | | | | | | | | | | 3,404,362 |
| | | | | | | | | | | |
|
|
Utilities — 7.0% | | | | | | | | | | | | |
AES Corp., Sec’d. Notes, 144A | | Ba3 | | 8.75% | | 05/15/13 | | | 1,900 | | | 2,035,375 |
CMS Energy Corp., Sr. Notes | | Ba3 | | 2.875% | | 12/01/24 | | | 325 | | | 417,219 |
CMS Energy Corp., Sr. Unsec’d. Notes | | Ba3 | | 6.875% | | 12/15/15 | | | 700 | | | 722,750 |
Homer City Funding LLC, Gtd. Notes | | Ba2 | | 8.734% | | 10/01/26 | | | 1,466 | | | 1,686,187 |
Midwest Generation LLC, Pass-Through Certs. | | Ba2 | | 8.56% | | 01/02/16 | | | 1,106 | | | 1,219,487 |
Midwest Generation LLC, Sec’d. Notes | | Ba2 | | 8.75% | | 05/01/34 | | | 1,000 | | | 1,085,000 |
NGC Corp., Debs. | | B2 | | 7.125% | | 05/15/18 | | | 500 | | | 487,500 |
NRG Energy, Inc., Gtd. Notes | | B1 | | 7.25% | | 02/01/14 | | | 725 | | | 730,437 |
NRG Energy, Inc., Gtd. Notes | | B1 | | 7.375% | | 02/01/16-01/15/17 | | | 3,375 | | | 3,390,437 |
PSE&G Energy Holdings LLC, Sr. Notes | | Ba3 | | 8.50% | | 06/15/11 | | | 1,000 | | | 1,075,000 |
Reliant Energy Mid-Atlantic Power Holdings LLC, Pass-Through Certs. | | Ba2 | | 9.237% | | 07/02/17 | | | 371 | | | 415,379 |
Reliant Energy, Inc., Sec’d. Notes | | B2 | | 6.75% | | 12/15/14 | | | 2,075 | | | 2,028,312 |
Sierra Pacific Resources, Sr. Notes | | B1 | | 6.75% | | 08/15/17 | | | 800 | | | 784,648 |
Sierra Pacific Resources, Sr. Notes | | B1 | | 8.625% | | 03/15/14 | | | 1,300 | | | 1,395,757 |
South Point Energy Center LLC/Broad River Energy LlLC/Rockgen Energy LLC, Gtd. Notes, 144A(i) | | D(d) | | 8.40% | | 05/30/12 | | | 1,030 | | | 994,013 |
Tenaska Alabama Partners LP, Sec’d. Notes, 144A | | Ba2 | | 7.00% | | 06/30/21 | | | 800 | | | 794,125 |
| | | | | | | | | | | |
|
|
| | | | | | | | | | | | | 19,261,626 |
| | | | | | | | | | | |
|
|
Waste Management — 1.2% | | | | | | | | | | | | |
Allied Waste North America, Gtd. Notes | | B2 | | 7.125% | | 05/15/16 | | | 1,125 | | | 1,113,750 |
Allied Waste North America, Sr. Notes | | B2 | | 7.25% | | 03/15/15 | | | 2,250 | | | 2,252,813 |
| | | | | | | | | | | |
|
|
| | | | | | | | | | | | | 3,366,563 |
| | | | | | | | | | | |
|
|
TOTAL CORPORATE BONDS
(cost $239,581,768) | | | 244,851,592 |
| | | | | | | | | | | |
|
|
| | | | | |
| COMMON STOCK | | | | | | | | Shares
| | |
Financial Services | | | | | | | | | | | | |
Aircraft Statutory Trust (Certificates of Benefical Interest from U.S. Airways Group, Inc., 1993 A Pass-Through Cert.)
(cost $—)(g)* | | | | | | | | | 850,554 | | | 85 |
| | | | | | | | | | | |
|
|
SEE NOTES TO FINANCIAL STATEMENTS.
B28
| | | | |
| | | SP PIMCO HIGH YIELD PORTFOLIO (Continued) | | |
SCHEDULE OF INVESTMENTS | December 31, 2006 |
| | | | | | | | | | | | | |
| PREFERRED STOCK — 0.2% | | | | | | | | Shares
| | Value
(Note 2)
| |
Oil & Gas Exploration/Production — 0.2% | | | | | | | | | | | | | |
Chesapeake Energy Corp., 4.5%, CVT
(cost $399,676) | | | | | | | | | 4,000 | | $ | 384,400 | |
| | | | | | | | | | | |
|
|
|
| | | | | |
| U.S. TREASURY OBLIGATION (k) — 1.5% | | | | Interest
Rate
| | Maturity
Date
| | Principal
Amount
(000)#
| | | |
U.S. Treasury Bonds
(cost $4,197,963) | | | | 7.50% | | 11/15/16 | | $ | 3,425 | | | 4,161,909 | |
| | | | | | | | | | | |
|
|
|
TOTAL LONG-TERM INVESTMENTS
(cost $260,480,320) | | | 266,027,701 | |
| | | | | | | | | | | |
|
|
|
| | | | | |
| SHORT-TERM INVESTMENTS — 3.7% | | | | | | | | Shares
| | | |
Affiliated Money Market Mutual Fund — 1.4% | | | | | | | | | | | | | |
Dryden Core Investment Fund — Taxable Money Market Series (cost $3,882,061)(w) (Note 4) | | | | | | | | | 3,882,061 | | | 3,882,061 | |
| | | | | | | | | | | |
|
|
|
| | | | | |
| COMMERCIAL PAPER — 1.2% | | Moody’s
Ratings
(Unaudited)
| | | | | | Principal
Amount
(000)#
| | | |
Societe Generale
(cost $3,196,737) | | A1+(d) | | 5.245% | | 01/08/07 | | $ | 3,200 | | | 3,196,746 | |
| | | | | | | | | | | |
|
|
|
| REPURCHASE AGREEMENT — 1.1% | | | | | | | | | | | |
U.S. Treasury Repurchase Agreement, repurchase price of $3,001,617, due 01/02/07 (cost $3,000,000; The value of the collateral including accrued interest was $3,060,542. The collateral consists of U.S. Treasury Notes.) | | | | 4.85% | | 01/02/07 | | | 3,000 | | | 3,000,000 | |
| | | | | | | | | | | |
|
|
|
| U.S. TREASURY OBLIGATIONS(k)(n) | | | | | | | | | | | |
U.S. Treasury Bills | | | | 4.803% | | 03/15/07 | | | 50 | | | 49,523 | |
U.S. Treasury Bills | | | | 4.805% | | 03/15/07 | | | 70 | | | 69,332 | |
| | | | | | | | | | | |
|
|
|
TOTAL U.S. TREASURY OBLIGATIONS
(cost $118,831) | | | 118,855 | |
| | | | | | | | | | | |
|
|
|
TOTAL SHORT-TERM INVESTMENTS
(cost $10,197,629) | | | 10,197,662 | |
| | | | | | | | | | | |
|
|
|
TOTAL INVESTMENTS, BEFORE OUTSTANDING OPTIONS WRITTEN — 100.7%
(cost $270,677,949; Note 6) | | | 276,225,363 | |
| | | | | | | | | | | |
|
|
|
| | | | | |
| | | | | | | | | Notional
Amount (000)
| | | |
| OUTSTANDING OPTIONS WRITTEN | | | | | | | | | | | |
Put Options | | | | | | | | | | | | | |
U.S. Treasury Note Futures, Expiring 02/23/2007, Strike Price $106 | | | | | | | | | | | | | |
(Premium received $11,577) | | | 3,400 | | | (6,906 | ) |
| | | | | | | | | | | |
|
|
|
TOTAL INVESTMENTS, NET OF OUTSTANDING OPTIONS WRITTEN — 100.7%
(cost $270,666,372; Note 6) | | | 276,218,457 | |
LIABILITIES IN EXCESS OF OTHER ASSETS(u) — (0.7)% | | | (1,787,045 | ) |
| | | | | | | | | | | |
|
|
|
NET ASSETS — 100.0% | | $ | 274,431,412 | |
| | | | | | | | | | | |
|
|
|
The following abbreviations are used in portfolio descriptions:
| | |
| 144A | | Security was purchased pursuant to Rule 144A under the Securities Act of 1933 and may not be resold subject to that rule except to qualified institutional buyers. Unless otherwise noted, 144A securities are deemed to be liquid. |
| CVT | | Convertible Security |
| NR | | Not Rated by Moody’s or Standard & Poor’s |
| EUR | | Euro |
| * | Non-income producing security. |
| # | Principal amount is shown in U.S. dollars unless otherwise stated. |
SEE NOTES TO FINANCIAL STATEMENTS.
B29
| | | | |
| | | SP PIMCO HIGH YIELD PORTFOLIO (Continued) | | |
SCHEDULE OF INVESTMENTS | December 31, 2006 |
| (c) | Indicates a variable rate security. |
| (d) | Standard & Poor’s rating. |
| (g) | Indicates a security that has been deemed illiquid. |
| (i) | Represents issuer in default on interest payments. Non-income producing security. |
| (k) | Securities segregated as collateral for futures contracts. |
| (n) | Rates shown are the effective yields at purchase date. |
| (u) | Liabilities in excess of other assets include net unrealized appreciation (depreciation) on futures contracts, forward foreign currency contracts, interest rate and credit default swap agreements as follows: |
Securities or a portion thereof with an aggregate market value of $297,132 have been segregated with the custodian to cover margin requirements for futures contracts open at December 31, 2006.
| | | | | | | | | | | | | | |
Number of
Contracts
| | Type
| | Expiration
Date
| | Value at
Trade Date
| | Value at
December 31, 2006
| | Unrealized
(Depreciation)
| |
| Long Positions: | | | | | | | | | | | | | | |
| 94 | | 90 Day Euro Dollar | | Dec 07 | | $ | 22,373,263 | | $ | 22,336,750 | | $ | (36,513 | ) |
| 62 | | 10 Year U.S. Treasury Notes | | Mar 07 | | | 6,719,250 | | | 6,663,063 | | | (56,187 | ) |
| | | | | | | | | | | | |
|
|
|
| | | | | | | | | | | | | $ | (92,700 | ) |
| | | | | | | | | | | | |
|
|
|
Forward foreign currency exchange contracts outstanding at December 31, 2006:
| | | | | | | | | |
Sale Contracts
| | Value at
Settlement Date
| | Current
Value
| | Unrealized
Appreciation
|
EUR 4,601,000
expiring 01/23/07 | | $ | 6,148,753 | | $ | 6,081,353 | | $ | 67,400 |
| | | | | | | | |
|
|
Interest rate swap agreements outstanding at December 31, 2006:
| | | | | | | | | | | | | |
Counterparty
| | Termination
Date
| | Notional
Amount
| | Fixed
Rate
| | | Floating Rate
| | Unrealized Appreciation (Depreciation)
| |
| UBS AG(1) | | 12/19/08 | | 300,000 | | 5.00 | % | | 3 month LIBOR | | $ | (275 | ) |
| Lehman Brothers, Inc.(2) | | 06/20/17 | | 1,100,000 | | 5.00 | % | | 3 month LIBOR | | | 25,252 | |
| Duetsche Bank(1) | | 12/19/08 | | 7,100,000 | | 5.00 | % | | 3 month LIBOR | | | (6,933 | ) |
Goldman Sachs(1) | | 12/19/08 | | 1,300,000 | | 5.00 | % | | 3 month LIBOR | | | (1,478 | ) |
| | | | | | | | | | | |
|
|
|
| | | | | | | | | | | | $ | 16,566 | |
| | | | | | | | | | | |
|
|
|
|
(1) Portfolio pays the floating rate and receives the fixed rate. |
(2) Portfolio pays the fixed rate and receives the floating rate. |
| |
| Credit default swap agreements outstanding at December 31, 2006: |
| | | | | | | | | | | | | |
Counterparty
| | Termination
Date
| | Notional
Amount
| | Fixed
Rate
| | | Underlying Bond
| | Unrealized
Appreciation
(Depreciation)
| |
| Bank of America(1) | | 03/20/07 | | 2,000,000 | | 2.20 | % | | Abitibi-Consolidated, Inc., 8.55%,
due 08/01/10 | | $ | 4,498 | |
| Merrill Lynch International(1) | | 06/20/07 | | 800,000 | | 0.95 | % | | AES Corp., 8.75%, due 06/15/08 | | | 2,972 | |
| Merrill Lynch International(1) | | 06/20/07 | | 400,000 | | 0.95 | % | | AES Corp., 8.75%, due 06/15/08 | | | 1,487 | |
| Bank of America(1) | | 03/20/07 | | 2,000,000 | | 2.35 | % | | ArvinMeritor, Inc., 8.75%, 03/01/12 | | | 7,408 | |
| Morgan Stanley Capital Services, Inc.(1) | | 09/20/07 | | 500,000 | | 2.45 | % | | Bombardier, Inc., 6.75%,
due 05/01/12 | | | 7,554 | |
| Credit Suisse International(2) | | 12/20/11 | | 500,000 | | 1.68 | % | | DirectTV, 8.375%, due 03/15/13 | | | 499 | |
| Bank of America(2) | | 12/20/11 | | 10,000,000 | | 3.25 | % | | Dow Jones CDX IG4 Index | | | (226,694 | ) |
| Duetsche Bank(2) | | 12/20/11 | | 7,000,000 | | 3.25 | % | | Dow Jones CDX IG4 Index | | | (154,526 | ) |
SEE NOTES TO FINANCIAL STATEMENTS.
B30
| | | | |
| | | SP PIMCO HIGH YIELD PORTFOLIO (Continued) | | |
SCHEDULE OF INVESTMENTS | December 31, 2006 |
| | | | | | | | | | | | | |
Counterparty
| | Termination
Date
| | Notional
Amount
| | Fixed
Rate
| | | Underlying Bond
| | Unrealized
Appreciation
(Depreciation)
| |
| Lehman Brothers, Inc.(2) | | 12/20/11 | | 1,000,000 | | 3.25 | % | | Dow Jones CDX NA HY7 Index | | $ | (14,865 | ) |
| JPMorgan Chase Bank, N.A.(1) | | 06/20/07 | | 2,000,000 | | 3.40 | % | | Ford Motor Credit Co., 7.00%, due 10/01/13 | | | 30,740 | |
| JPMorgan Chase Bank, N.A.(1) | | 09/20/07 | | 1,000,000 | | 2.20 | % | | Ford Motor Credit Co., 7.00%, due 10/01/13 | | | 12,649 | |
| Morgan Stanley Capital Services, Inc.(1) | | 04/20/11 | | 1,500,000 | | 1.05 | % | | JSC "GAZPROM", 9.125%,
due 04/25/07 | | | 24,314 | |
| JPMorgan Chase Bank, N.A.(1) | | 03/20/07 | | 2,000,000 | | 7.80 | % | | Lear Corp., Series B, 8.11%,
due 05/15/09 | | | 37,298 | |
| | | | | | | | | | | |
|
|
|
| | | | | | | | | | | | $ | (266,666 | ) |
| | | | | | | | | | | |
|
|
|
| (1) | Portfolio receives the fixed rate and pays the counterparty par in the event that the underlying bond defaults. |
| (2) | Portfolio pays the fixed rate and receives from the counterparty par in the event that the underlying bond defaults. |
| (w) | Prudential Investments LLC, the manager of the Portfolio, also serves as manager of the Dryden Core Investment Fund-Taxable Money Market Series. |
The industry classification of long-term portfolio holdings and liabilities in excess of other assets shown as a percentage of net assets as of December 31, 2006 was as follows:
| | | |
Industry
| | | |
Telecommunications | | 11.5 | % |
Financials | | 10.7 | |
Oil & Gas Exploration/Production | | 9.3 | |
Utilities | | 7.0 | |
Hospitals/Hospital Management | | 6.2 | |
Bank Notes | | 6.1 | |
Cable | | 4.5 | |
Gaming | | 3.8 | |
Forest & Paper Products | | 3.7 | |
Chemicals | | 3.2 | |
Retail | | 2.7 | |
Automotive | | 2.7 | |
Media | | 2.5 | |
Containers | | 1.7 | |
U.S. Treasury Obligation | | 1.5 | |
Affiliated Money Market Mutual Fund | | 1.4 | |
Aerospace & Defense | | 1.3 | |
Real Estate Investment Trusts | | 1.3 | |
Transportation | | 1.2 | |
Waste Management | | 1.2 | |
Commercial Paper | | 1.2 | |
Distribution/Wholesale | | 1.1 | |
Repurchase Agreements | | 1.1 | |
Metals & Mining | | 1.0 | |
Food & Beverage | | 1.0 | |
Technology | | 1.0 | |
Printing & Publishing | | 1.0 | |
Semiconductors | | 0.9 | |
Foods | | 0.9 | |
Electronic Components | | 0.8 | |
Tobacco | | 0.7 | |
Apparel | | 0.7 | |
Machinery | | 0.6 | |
Containers & Packaging | | 0.6 | |
Telecommunications — Cellular | | 0.5 | |
Office Equipment | | 0.5 | |
Diversified | | 0.5 | |
| | | |
Industry
| | | |
Advertising | | 0.4 | |
Real Estate Management & Development | | 0.4 | |
Personell Services | | 0.4 | |
Automotive Parts | | 0.3 | |
Retail & Merchandising | | 0.3 | |
Diversified Operations | | 0.3 | |
Airlines | | 0.2 | |
Diversified Financial Services | | 0.2 | |
Healthcare Services | | 0.2 | |
Entertainment | | 0.2 | |
Capital Goods — Others | | 0.1 | |
Industrial | | 0.1 | |
| | |
|
|
| | | 100.7 | |
Liabilities in excess of other assets | | (0.7 | ) |
| | |
|
|
| | | 100.0 | % |
| | |
|
|
SEE NOTES TO FINANCIAL STATEMENTS.
B31
| | | | |
| | | SP PIMCO TOTAL RETURN PORTFOLIO | | |
SCHEDULE OF INVESTMENTS | December 31, 2006 |
| | | | | | | | | | | | |
| LONG-TERM INVESTMENTS — 144.2% | | Moody’s
Ratings
(Unaudited)
| | Interest
Rate
| | Maturity
Date
| | Principal
Amount
(000)#
| | Value
(Note 2)
|
ASSET-BACKED SECURITIES — 3.9% | | | | | | |
Arkle Master Issuer PLC, Series 2006-1A, Class1A, 144A(c) | | Aaa | | 5.33% | | 11/19/07 | | $ | 4,500 | | $ | 4,507,759 |
Asset Backed Securities Corp. Home Equity Loan Trust, Series 2004-HE6, Class A1(c) | | Aaa | | 5.625% | | 09/25/34 | | | 2,258 | | | 2,256,622 |
Chase Credit Card Master Trust, Series 2004-2, Class A(c) | | Aaa | | 5.39% | | 09/15/09 | | | 1,295 | | | 1,295,274 |
Citibank Credit Card Issuance Trust, Series 2003-A4, Class A4(c) | | Aaa | | 5.435% | | 03/20/09 | | | 8,300 | | | 8,301,685 |
Countrywide Asset-Backed Certificates, Series 2006-SD1, Class A1, 144A | | AAA(d) | | 5.51% | | 04/25/36 | | | 2,486 | | | 2,487,042 |
Honda Auto Receivables Owner Trust, Series 2006-1, Class A2 | | Aaa | | 5.10% | | 09/18/08 | | | 13,612 | | | 13,602,832 |
Master Asset Backed Securities Trust, Series 2006-AM3, Class A1(c) | | Aaa | | 5.38% | | 10/27/36 | | | 1,721 | | | 1,720,769 |
MBNA Credit Card Master Note Trust, Series 2004-A7, Class A7(c) | | Aaa | | 5.45% | | 12/15/11 | | | 2,000 | | | 2,005,484 |
Morgan Stanley ABS Capital I, Series 2006-HE4 Class A1(c) | | Aaa | | 5.39% | | 06/25/36 | | | 824 | | | 823,528 |
Morgan Stanley IXIS Real Estate Capital Trust, Series 2006-2, Class A1(c) | | Aaa | | 5.37% | | 11/25/36 | | | 1,912 | | | 1,911,694 |
Nissan Auto Receivables Owner Trust, Series 2006-B, Class A2 | | Aaa | | 5.18% | | 11/15/11 | | | 15,300 | | | 15,291,961 |
Structured Asset Securities Corp., Series 2006-BC3, Class A2(c) | | Aaa | | 5.37% | | 10/25/36 | | | 7,051 | | | 7,048,961 |
| | | | | | | | | | | |
|
|
TOTAL ASSET-BACKED SECURITIES
(cost $61,271,959) | | | 61,253,611 |
| | | | | | | | | | | |
|
|
COLLATERALIZED MORTGAGE OBLIGATIONS — 4.2% | | | | | | |
Argent Securities, Inc., Series 2005-W3, Class A2A(c) | | Aaa | | 5.45% | | 11/25/35 | | | 804 | | | 804,228 |
Asset Backed Funding Certificates, Series 2006-OPT3, Class A3A(c) | | Aaa | | 5.38% | | 11/25/36 | | | 1,625 | | | 1,625,601 |
Banc of America Mortgage Securities, Inc., Series 2004-2, Class 5A1 | | Aaa | | 6.50% | | 10/25/31 | | | 262 | | | 263,664 |
Bear Stearns Adjustable Rate Mortgage Trust, Series 2002-11, Class 1A1 | | Aaa | | 5.63% | | 02/25/33 | | | 517 | | | 516,179 |
Bear Stearns Adjustable Rate Mortgage Trust, Series 2005-4, Class 23A2 | | Aaa | | 5.39% | | 05/25/35 | | | 3,861 | | | 3,848,188 |
Brazos Student Loan Finance Corp., Series 1998-A, Class A2(c) | | Aaa | | 5.96% | | 06/01/23 | | | 71 | | | 71,556 |
Conseco Finance Securitizations Corp., Series 2001-4, Class A3 | | Baa2 | | 6.09% | | 09/01/33 | | | 9 | | | 8,716 |
Countrywide Alternative Loan Trust, Series 2006-OA19, Class: A1A | | Aaa | | 5.53% | | 12/25/46 | | | 7,496 | | | 7,522,144 |
Countrywide Alternative Loan Trust, Series 2006-OA20, Class A1 | | Aaa | | 5.50% | | 01/25/46 | | | 5,300 | | | 5,309,138 |
Federal National Mortgage Assoc., Series 2001-29, Class Z | | Aaa | | 6.50% | | 07/25/31 | | | 312 | | | 317,120 |
Fremont Home Loan Trust, Series 2005-E, Class 2A1(c) | | Aaa | | 5.44% | | 01/25/36 | | | 1,348 | | | 1,348,744 |
Government Lease Trust, Series 1999-C1A, Class B2, 144A | | AAA(d) | | 4.00% | | 05/18/11 | | | 1,500 | | | 1,436,751 |
Government National Mortgage Assoc., Series 2000-14, Class F(c) | | Aaa | | 5.97% | | 02/16/30 | | | 24 | | | 24,036 |
Greenpoint Mortgage Funding Trust, Series 2006-AR6, Class A1A(c) | | Aaa | | 5.43% | | 10/25/46 | | | 4,371 | | | 4,372,099 |
GSR Mortgage Loan Trust, Series 2005-AR6, Class 2A1(c) | | AAA(d) | | 4.54% | | 10/25/35 | | | 6,449 | | | 6,334,580 |
Harborview Mortgage Loan Trust, Series: 2006-122 Class: A1A1(c) | | Aaa | | 5.44% | | 12/19/36 | | | 2,796 | | | 2,800,411 |
Impac Secured Assets CMN Owner Trust, Series 2006-4, Class A2A(c) | | Aaa | | 5.40% | | 12/25/36 | | | 489 | | | 489,209 |
Indymac ARM Trust, Series 2001-H2, Class A1(c) | | Aaa | | 6.511% | | 01/25/32 | | | 8 | | | 8,050 |
Master Asset Securitization Trust, Series 2003-7, Class 1A2 | | AAA(d) | | 5.50% | | 09/25/33 | | | 2,711 | | | 2,667,373 |
Mellon Residential Funding Corp., Series 1999-TBC2, Class A3(c) | | AAA(d) | | 6.406% | | 07/25/29 | | | 23 | | | 22,990 |
Merrill Lynch Floating Trust, Series 2006-1, Class A1, 144A(c) | | Aaa | | 5.42% | | 06/15/22 | | | 1,816 | | | 1,816,770 |
Quest Trust, Series 2004-X2, Class A1, 144A(c) | | Aaa | | 5.91% | | 06/25/34 | | | 390 | | | 390,862 |
Residential Funding Mortgage Securities I, Series 2003-S9, Class A1 | | Aaa | | 6.50% | | 03/25/32 | | | 641 | | | 644,382 |
Washington Mutual Series 2002-AR17, Class 1A(c) | | Aaa | | 6.03% | | 11/25/42 | | | 1,575 | | | 1,580,159 |
Washington Mutual, Inc., Series 2003-R1, Class A1(c) | | Aaa | | 5.62% | | 12/25/27 | | | 12,373 | | | 12,370,739 |
Washington Mutual, Inc., Series 2002-AR2, Class A(c) | | Aaa | | 5.60% | | 02/27/34 | | | 1,178 | | | 1,180,645 |
Washington Mutual, Inc., Series 2003-AR1, Class 2A(c) | | Aaa | | 5.381% | | 02/25/33 | | | 157 | | | 156,697 |
Washington Mutual, Inc., Series 2005-AR13, Class A1A1(c) | | Aaa | | 5.64% | | 10/25/45 | | | 5,188 | | | 5,195,270 |
Washington Mutual, Inc., Series 2006-AR17, Class 1A1A(c) | | Aaa | | 5.568% | | 12/25/46 | | | 2,797 | | | 2,806,082 |
Washington Mutual, Inc., Series 2007-AR17, Class 2A(c) | | Aaa | | 5.882% | | 12/25/46 | | | 704 | | | 709,586 |
| | | | | | | | | | | |
|
|
TOTAL COLLATERALIZED MORTGAGE OBLIGATIONS
(cost $66,717,883) | | | 66,641,969 |
| | | | | | | | | | | |
|
|
CORPORATE BONDS — 18.0% | | | | | | |
Aerospace — 0.1% | | | | | | |
Goodrich Corp., Notes | | Baa3 | | 6.29% | | 07/01/16 | | | 2,200 | | | 2,261,666 |
| | | | | | | | | | | |
|
|
Airlines | | | | | | |
United AirLines, Inc., Pass Thru Certificates(g) | | NR | | Zero | | 01/21/17 | | | 118 | | | 8,248 |
| | | | | | | | | | | |
|
|
SEE NOTES TO FINANCIAL STATEMENTS.
B32
| | | | |
| | | SP PIMCO TOTAL RETURN PORTFOLIO (Continued) | | |
SCHEDULE OF INVESTMENTS | December 31, 2006 |
| | | | | | | | | | | | |
| LONG-TERM INVESTMENTS (Continued) | | Moody’s
Ratings
(Unaudited)
| | Interest
Rate
| | Maturity
Date
| | Principal
Amount
(000)#
| | Value
(Note 2)
|
Automobile Manufacturers — 1.1% | | | | | | |
DaimlerChrysler NA Holding Corp., Gtd. Notes(c) | | Baa1 | | 5.60% | | 03/07/07 | | $ | 11,300 | | $ | 11,301,774 |
DaimlerChrysler NA Holding Corp., Gtd. Notes(c) | | Baa1 | | 5.79% | | 03/13/09 | | | 3,500 | | | 3,503,346 |
DaimlerChrysler NA Holding Corp., Notes | | Baa1 | | 5.75% | | 09/08/11 | | | 3,400 | | | 3,391,425 |
| | | | | | | | | | | |
|
|
| | | | | | | | | | | | | 18,196,545 |
| | | | | | | | | | | |
|
|
Building Materials — 0.4% | | | | | | |
Lennar Corp., Gtd. Notes | | Baa2 | | 5.95% | | 10/17/11 | | | 5,000 | | | 5,029,590 |
Pulte Homes, Inc. Sr. Unsec’d. Notes | | Baa3 | | 6.25% | | 02/15/13 | | | 600 | | | 609,046 |
| | | | | | | | | | | |
|
|
| | | | | | | | | | | | | 5,638,636 |
| | | | | | | | | | | |
|
|
Diversified — 1.7% | | | | | | |
C10 Capital SPV Ltd., Debs., 144A | | BBB-(d) | | 6.722% | | 12/31/49 | | | 5,300 | | | 5,305,811 |
General Electric Co., Unsec’d. Notes(c) | | Aaa | | 5.393% | | 12/09/08 | | | 6,832 | | | 6,836,024 |
iStar Financial, Inc., Sr Unsec’d Notes | | Baa2 | | 5.80% | | 03/15/11 | | | 1,000 | | | 1,003,498 |
Siemens Financieringsmat, Notes, 144A (Netherlands)(c) | | Aa3 | | 5.424% | | 08/14/09 | | | 14,700 | | | 14,700,324 |
| | | | | | | | | | | |
|
|
| | | | | | | | | | | | | 27,845,657 |
| | | | | | | | | | | |
|
|
Financial - Bank & Trust — 6.1% | | | | | | |
Goldman Sachs Group, Inc., Notes(c) | | Aa3 | | 5.455% | | 12/22/08 | | | 15,300 | | | 15,317,564 |
HSBC Bank USA NA, Sr. Notes(c) | | Aa2 | | 5.435% | | 09/21/07 | | | 2,300 | | | 2,302,031 |
Norddeutsche Landesbank Girozentrale, Notes (Germany) | | Aaa | | 0.45% | | 01/19/09 | | | JPY 2,456,000 | | | 20,504,221 |
NRW.Bank, Gtd. Notes (Japan) | | Aa1 | | 0.05% | | 03/20/07 | | | JPY 50,000 | | | 419,851 |
Rabobank Nederland, Notes (Netherlands) | | Aaa | | 0.20% | | 06/20/08 | | | 569,000 | | | 4,740,154 |
Rabobank Nederland, Sr. Notes, 144A (Netherlands)(c) | | Aaa | | 5.394% | | 01/15/09 | | | 6,700 | | | 6,701,059 |
Resona Bank Ltd., Notes, 144A | | Baa1 | | 5.85% | | 09/29/49 | | | 4,000 | | | 3,905,828 |
Royal Bank of Scotland Group PLC, Sr. Notes, 144A (United Kingdom)(c) | | Aa2 | | 5.365% | | 12/21/07 | | | 23,000 | | | 23,017,526 |
Santander US Debt SA Unipersonal, Gtd. Notes, 144A(c) | | Aa3 | | 5.428% | | 02/06/09 | | | 15,500 | | | 15,515,795 |
Vornado Realty LP, Sr. Unsec’d. Notes | | Baa2 | | 5.60% | | 02/15/11 | | | 1,000 | | | 997,896 |
VTB Capital SA, Sr. Notes, 144A(c) | | A2 | | 5.97% | | 08/01/08 | | | 3,700 | | | 3,701,850 |
| | | | | | | | | | | |
|
|
| | | | | | | | | | | | | 97,123,775 |
| | | | | | | | | | | |
|
|
Financial Services — 2.9% | | | | | | |
Citi Financial, Inc., Notes | | Aa1 | | 6.625% | | 06/01/15 | | | 600 | | | 644,571 |
Citigroup, Inc., Unsec’d. Notes(c) | | Aa1 | | 5.416% | | 01/30/09 | | | 2,700 | | | 2,700,891 |
General Electric Capital Corp., Sr. Unsec’d. Notes(c) | | Aaa | | 5.38% | | 10/24/08 | | | 20,300 | | | 20,306,476 |
Morgan Stanley, Sr. Notes(c) | | Aa3 | | 5.485% | | 02/09/09 | | | 15,400 | | | 15,424,393 |
Pemex Project Funding Master Trust, Gtd. Notes | | Baa1 | | 7.375% | | 12/15/14 | | | 300 | | | 330,300 |
Pemex Project Funding Master Trust, Gtd. Notes | | Baa1 | | 8.625% | | 02/01/22 | | | 500 | | | 618,000 |
Pemex Project Funding Master Trust, Gtd. Notes | | Baa1 | | 9.125% | | 10/13/10 | | | 2,000 | | | 2,243,000 |
Pemex Project Funding Master Trust, Gtd. Notes | | Baa1 | | 9.25% | | 03/30/18 | | | 1,700 | | | 2,143,700 |
Petroleum Export Ltd., Sr. Notes, 144A (Cayman Islands) | | Baa1 | | 5.265% | | 06/15/11 | | | 2,223 | | | 2,162,824 |
| | | | | | | | | | | |
|
|
| | | | | | | | | | | | | 46,574,155 |
| | | | | | | | | | | |
|
|
Gaming — 0.7% | | | | | | |
Caesars Entertainment Inc., Sr. Sub. Notes | | Ba1 | | 9.375% | | 02/15/07 | | | 5,215 | | | 5,228,038 |
Mandalay Resort Group, Sr. Sub. Notes | | B1 | | 10.25% | | 08/01/07 | | | 4,200 | | | 4,299,750 |
MGM Mirage, Inc., Gtd. Notes | | B1 | | 9.75% | | 06/01/07 | | | 1,100 | | | 1,113,750 |
| | | | | | | | | | | |
|
|
| | | | | | | | | | | | | 10,641,538 |
| | | | | | | | | | | |
|
|
Insurance — 0.5% | | | | | | |
ASIF III Jersey Ltd., Sec’d. Notes (Japan) | | Aa2 | | 0.95% | | 07/15/09 | | | JPY 875,000 | | | 7,325,898 |
| | | | | | | | | | | |
|
|
Media — 1.5% | | | | | | |
Time Warner, Inc., Gtd. Notes | | Baa2 | | 5.606% | | 11/13/09 | | | 23,200 | | | 23,215,057 |
| | | | | | | | | | | |
|
|
Oil, Gas & Consumable Fuels — 0.6% | | | | | | |
El Paso Corp., Sr. Notes | | B2 | | 7.00% | | 05/15/11 | | | 200 | | | 207,500 |
El Paso Corp., Sr. Notes | | B2 | | 7.80% | | 08/01/31 | | | 1,050 | | | 1,147,125 |
El Paso Corp., Sr. Unsec’d. Notes | | B2 | | 7.625% | | 08/16/07 | | | 100 | | | 98,125 |
Transocean, Inc., Notes | | Baa1 | | 5.566% | | 09/05/08 | | | 7,800 | | | 7,804,703 |
| | | | | | | | | | | |
|
|
| | | | | | | | | | | | | 9,257,453 |
| | | | | | | | | | | |
|
|
SEE NOTES TO FINANCIAL STATEMENTS.
B33
| | | | |
| | | SP PIMCO TOTAL RETURN PORTFOLIO (Continued) | | |
SCHEDULE OF INVESTMENTS | December 31, 2006 |
| | | | | | | | | | | | | |
| LONG-TERM INVESTMENTS (Continued) | | Moody’s
Ratings
(Unaudited)
| | Interest
Rate
| | Maturity
Date
| | Principal
Amount
(000)#
| | | Value
(Note 2)
|
Paper & Forest Products — 0.3% | | | | | | | |
Georgia-Pacific Corp., Gtd. Notes, 144A | | Ba3 | | 7.00% | | 01/15/15 | | $ | 900 | | | $ | 897,750 |
Georgia-Pacific Corp., Gtd. Notes, 144A | | Ba3 | | 7.125% | | 01/15/17 | | | 1,300 | | | | 1,296,750 |
Georgia-Pacific Corp., Notes | | B2 | | 7.75% | | 11/15/29 | | | 3,000 | | | | 2,992,500 |
| | | | | | | | | | | | |
|
|
| | | | | | | | | | | | | | 5,187,000 |
| | | | | | | | | | | | |
|
|
Retail & Merchandising — 0.2% | | | | | | | |
CVS Corp., Sr. Unsec’d Notes | | Baa2 | | 5.75% | | 08/15/11 | | | 3,700 | | | | 3,744,496 |
| | | | | | | | | | | | |
|
|
Telecom - Integrated/Services — 0.5% | | | | | | | |
BellSouth Corp., Sr. Unsec’d. Notes(c) | | A2 | | 5.474% | | 08/15/08 | | | 7,200 | | | | 7,204,190 |
| | | | | | | | | | | | |
|
|
Telecommunications — 1.1% | | | | | | | |
Nippon Telegraph & Telephone Corp., Notes (Japan) | | Aa1 | | 2.50% | | 07/25/07 | | | JPY 667,000 | | | | 5,662,738 |
Qwest Corp., Notes, 144A | | Ba1 | | 8.875% | | 03/15/12 | | | 1,650 | | | | 1,837,688 |
Qwest Corp., Sr. Notes | | Ba1 | | 7.625% | | 06/15/15 | | | 7,000 | | | | 7,490,000 |
Verizon Global Funding Corp., Sr. Notes | | A3 | | 5.85% | | 09/15/35 | | | 2,500 | | | | 2,394,367 |
| | | | | | | | | | | | |
|
|
| | | | | | | | | | | | | | 17,384,793 |
| | | | | | | | | | | | |
|
|
Tobacco — 0.3% | | | | | | | |
Reynolds American, Inc., Gtd. Notes | | Ba3 | | 7.625% | | 06/01/16 | | | 4,000 | | | | 4,238,136 |
| | | | | | | | | | | | |
|
|
TOTAL CORPORATE BONDS
(cost $284,596,881) | | | | 285,847,243 |
| | | | | | | | | | | | |
|
|
FOREIGN GOVERNMENT BONDS — 1.4% | | | | | | | |
Federal Republic of Brazil (Brazil) | | Ba2 | | 7.125% | | 01/20/37 | | | 200 | | | | 214,900 |
Federal Republic of Brazil (Brazil) | | Ba2 | | 7.875% | | 03/07/15 | | | 75 | | | | 83,550 |
Federal Republic of France (France) | | Aaa | | 4.00% | | 12/31/49 | | | EUR 1,400 | | | | 1,822,005 |
Federal Republic of Panama (Panama) | | Ba1 | | 8.875% | | 09/30/27 | | | 750 | | | | 952,500 |
Federal Republic of Peru (Peru) | | Ba3 | | 9.125% | | 01/15/08 | | | 400 | | | | 415,200 |
French Treasury Notes (France) | | Aaa | | 2.25% | | 03/12/07 | | | EUR 1,400 | | | | 1,843,129 |
Japan Bank International Corp. (Japan) | | Aaa | | 0.35% | | 03/19/08 | | | JPY 350,000 | | | | 2,930,771 |
Russian Federation (Russia) | | Baa2 | | 5.00% | | 03/31/30 | | | 10 | | | | 11,289 |
United Kingdom Treasury Stock (United Kingdom) | | Aaa | | 4.25% | | 03/07/11 | | | GBP 5,900 | | | | 11,205,680 |
United Kingdom Treasury Stock (United Kingdom) | | Aaa | | 5.75% | | 12/07/09 | | | GBP 1,700 | | | | 3,383,157 |
| | | | | | | | | | | | |
|
|
TOTAL FOREIGN GOVERNMENT BONDS
(cost $22,189,400) | | | | 22,862,181 |
| | | | | | | | | | | | |
|
|
MUNICIPAL BONDS — 1.4% | | | | | | | |
Georgia State Road & Tollway Authority | | Aaa | | 5.00% | | 03/01/21 | | | 700 | | | | 735,714 |
Golden State Tobacco Securitization Corp., Series A1 | | Baa3 | | 6.25% | | 06/01/33 | | | 2,500 | | | | 2,792,625 |
Golden State Tobacco Settlement Revenue Bonds | | Baa3 | | 6.75% | | 06/01/39 | | | 2,000 | | | | 2,289,840 |
Honolulu Hawaii City & County | | Aaa | | 5.00% | | 07/01/23 | | | 3,075 | (i) | | | 3,260,392 |
Massachusetts Water Resources Authority, Series J | | Aaa | | 5.00% | | 08/01/32 | | | 2,500 | (i) | | | 2,621,450 |
Pierce County School District No. 3 | | Aaa | | 5.00% | | 12/01/23 | | | 3,000 | (i) | | | 3,173,160 |
Salt River Project Agricultural Improvement & Power District, Series B | | Aa1 | | 4.75% | | 01/01/32 | | | 1,000 | (i) | | | 1,023,590 |
Salt River Project Agricultural Improvement & Power District, R1B, Series 1076, 144A(c) | | AA(d) | | 5.32% | | 01/01/32 | | | 500 | | | | 523,590 |
Tobacco Settlement Financing Corp. | | A1 | | 5.50% | | 06/01/15 | | | 2,000 | | | | 2,112,240 |
Tobacco Settlement Financing Corp. | | Baa3 | | 6.125% | | 06/01/32 | | | 1,205 | | | | 1,293,748 |
Tobacco Settlement Financing Corp. | | Baa3 | | 6.25% | | 06/01/42 | | | 400 | | | | 431,836 |
Tobacco Settlement Financing Corp. | | Baa3 | | 6.375% | | 06/01/32 | | | 2,000 | | | | 2,249,260 |
| | | | | | | | | | | | |
|
|
TOTAL MUNICIPAL BONDS
(cost $20,630,629) | | | | 22,507,445 |
| | | | | | | | | | | | |
|
|
U.S. GOVERNMENT MORTGAGE BACKED OBLIGATIONS — 77.3% | | | | | | | |
Federal Home Loan Mortgage Corp. | | | | 4.00% | | 09/01/18 | | | 744 | | | | 702,502 |
Federal Home Loan Mortgage Corp. | | | | 4.50% | | 11/01/35 | | | 945 | | | | 885,609 |
Federal Home Loan Mortgage Corp. | | | | 5.00% | | 09/01/35-01/01/37 | | | 57,360 | | | | 55,365,534 |
Federal National Mortgage Assoc. | | | | 4.00% | | 07/01/18 03/01/20 | | | 80,573 | | | | 75,948,803 |
Federal National Mortgage Assoc. | | | | 4.50% | | 06/01/20-06/01/36 | | | 95,533 | | | | 90,505,136 |
Federal National Mortgage Assoc. | | | | 5.00% | | 12/01/18-03/01/36 | | | 67,433 | | | | 65,134,411 |
Federal National Mortgage Assoc. | | | | 5.218% | | 06/01/35 | | | 2,401 | | | | 2,399,085 |
Federal National Mortgage Assoc. | | | | 5.50% | | 09/01/32-01/01/37 | | | 379,221 | | | | 375,032,762 |
SEE NOTES TO FINANCIAL STATEMENTS.
B34
| | | | |
| | | SP PIMCO TOTAL RETURN PORTFOLIO (Continued) | | |
SCHEDULE OF INVESTMENTS | December 31, 2006 |
| | | | | | | | | | | | |
| LONG-TERM INVESTMENTS (Continued) | | Moody’s
Ratings
(Unaudited)
| | Interest
Rate
| | Maturity
Date
| | Principal
Amount
(000)#
| | Value
(Note 2)
|
U.S. GOVERNMENT MORTGAGE BACKED OBLIGATIONS (cont’d.) | | | | | | |
Federal National Mortgage Assoc. | | | | 5.56% | | 05/01/36 | | $ | 100 | | $ | 100,312 |
Federal National Mortgage Assoc. | | | | 5.775% | | 10/01/36 | | | 367 | | | 369,548 |
Federal National Mortgage Assoc. | | | | 6.00% | | 04/01/16-01/01/37 | | | 410,727 | | | 413,461,811 |
Federal National Mortgage Assoc. | | | | 6.339% | | 12/01/36 | | | 2,296 | | | 2,319,046 |
Federal National Mortgage Assoc. | | | | 6.50% | | TBA | | | 9,000 | | | 9,168,750 |
Government National Mortgage Assoc. | | | | 6.00% | | 01/22/37 | | | 136,000 | | | 137,870,000 |
Government National Mortgage Assoc. | | | | 4.50% | | 09/15/33 | | | 42 | | | 39,346 |
Government National Mortgage Assoc. | | | | 5.375% | | 04/20/25-05/20/25 | | | 59 | | | 59,188 |
Government National Mortgage Assoc. | | | | 5.75% | | 08/20/24-08/20/27 | | | 190 | | | 192,521 |
Government National Mortgage Assoc. | | | | 9.00% | | 07/15/30-08/15/30 | | | 2 | | | 2,505 |
| | | | | | | | | | | |
|
|
TOTAL U.S. GOVERNMENT MORTGAGE BACKED OBLIGATIONS
(cost $1,238,500,487) | | | 1,229,556,869 |
| | | | | | | | | | | |
|
|
U.S. TREASURY OBLIGATIONS — 38.0% | | | | | | | | | | | | |
U.S. Treasury Inflationary Bonds, TIPS | | | | 0.875% | | 04/15/10 | | | 46,300 | | | 46,754,747 |
U.S. Treasury Inflationary Bonds, TIPS | | | | 2.00% | | 07/15/14 | | | 23,400 | | | 24,313,342 |
U.S. Treasury Inflationary Bonds, TIPS | | | | 2.00% | | 01/15/26 | | | 5,700 | | | 5,450,143 |
U.S. Treasury Inflationary Bonds, TIPS | | | | 2.375% | | 04/15/11 | | | 5,100 | | | 5,164,207 |
U.S. Treasury Bonds | | | | 3.375% | | 01/15/07 | | | 46,700 | | | 59,376,744 |
U.S. Treasury Bonds | | | | 3.625% | | 01/15/08 | | | 25,400 | | | 32,064,195 |
U.S. Treasury Bonds | | | | 4.50% | | 02/28/11 | | | 13,050 | | | 12,953,652 |
U.S. Treasury Notes | | | | 3.25% | | 01/15/09 | | | 4,300 | | | 4,172,342 |
U.S. Treasury Notes | | | | 3.375% | | 02/15/08 | | | 660 | | | 648,476 |
U.S. Treasury Notes | | | | 3.50% | | 02/15/10 | | | 3,200 | | | 3,087,501 |
U.S. Treasury Notes | | | | 3.625% | | 01/15/10 | | | 5,200 | | | 5,039,533 |
U.S. Treasury Notes | | | | 3.75% | | 05/15/08 | | | 1,100 | | | 1,083,157 |
U.S. Treasury Notes | | | | 3.875% | | 09/15/10 | | | 3,880 | | | 3,771,632 |
U.S. Treasury Notes | | | | 4.00% | | 04/15/10 | | | 1,700 | | | 1,663,477 |
U.S. Treasury Notes | | | | 4.25% | | 10/15/10-11/15/14 | | | 18,090 | | | 17,564,446 |
U.S. Treasury Notes | | | | 4.375% | | 11/15/08 | | | 120,600 | | | 119,629,532 |
U.S. Treasury Notes | | | | 4.50% | | 11/15/15 | | | 6,600 | | | 6,498,419 |
U.S. Treasury Notes | | | | 4.625% | | 11/15/16 | | | 43,900 | | | 43,611,928 |
U.S. Treasury Notes | | | | 4.75% | | 03/31/11 | | | 41,200 | | | 41,269,216 |
U.S. Treasury Notes | | | | 4.875% | | 07/31/11-08/15/16 | | | 92,900 | | | 93,721,020 |
U.S. Treasury Notes | | | | 5.125% | | 06/30/11-05/15/16 | | | 16,600 | | | 16,913,034 |
U.S. Treasury Notes | | | | 6.25% | | 05/15/30 | | | 18,100 | | | 21,561,625 |
U.S. Treasury Notes | | | | 8.125% | | 08/15/19 | | | 7,800 | | | 10,190,575 |
U.S. Treasury Strips | | | | Zero | | 05/15/14-02/15/22 | | | 42,600 | | | 27,941,361 |
| | | | | | | | | | | |
|
|
TOTAL U.S. TREASURY OBLIGATIONS
(cost $609,557,128) | | | 604,444,304 |
| | | | | | | | | | | |
|
|
| | | | | |
| WARRANTS | | | | | | Expiration
Date
| | Units
| | |
United Mexican State, Series E (Mexico)*
(cost $0) | | | | | | 06/01/07 | | | 1,000,000 | | | 14,500 |
| | | | | | | | | | | |
|
|
TOTAL LONG-TERM INVESTMENTS
(cost $2,303,464,367) | | | 2,293,128,122 |
| | | | | | | | | | | |
|
|
| | | | | |
| SHORT-TERM INVESTMENTS — 16.4% | | | | | | Maturity
Date
| | Principal
Amount
(000)#
| | |
FOREIGN GOVERNMENT SECURITIES — 6.1% | | | | | | | | | | |
Bundesobligation (Germany) | | Aaa | | 4.00% | | 02/16/07 | | $ | 37,230 | | | 49,160,997 |
Bundesrepublic Deutschland, Bonds (Germany) | | Aaa | | 6.00% | | 01/04/07 | | | 36,360 | | | 47,992,032 |
| | | | | | | | | | | |
|
|
TOTAL FOREIGN GOVERNMENT SECURITIES
(cost $94,693,858) | | | | | | | | | | | | 97,153,029 |
| | | | | | | | | | | |
|
|
FOREIGN TREASURY BILLS(n) — 5.8% | | | | | | | | | | | | |
Dutch Discount Treasury Bill (Netherlands) | | | | 3.42% | | 02/28/07 | | | EUR 60,560 | | | 79,511,031 |
French Discount Treasury Bill (France) | | | | 3.16% | | 02/01/07 | | | EUR 10,000 | | | 13,162,827 |
| | | | | | | | | | | |
|
|
TOTAL FOREIGN TREASURY BILLS
(cost $92,027,670) | | | 92,673,858 |
| | | | | | | | | | | |
|
|
SEE NOTES TO FINANCIAL STATEMENTS.
B35
| | | | |
| | | SP PIMCO TOTAL RETURN PORTFOLIO (Continued) | | |
SCHEDULE OF INVESTMENTS | December 31, 2006 |
| | | | | | | | | | | | |
| SHORT-TERM INVESTMENTS (Continued) | | Moody’s
Ratings
(Unaudited)
| | Interest
Rate
| | Maturity
Date
| | Shares
| | Value
(Note 2)
|
AFFILIATED MONEY MARKET MUTUAL FUND — 2.9% | | | | | | | | | | | | |
Dryden Core Investment Fund — Taxable Money Market Series
(cost $45,350,561)(w) | | | | | | | | | 45,350,561 | | $ | 45,350,561 |
| | | | | | | | | | | |
|
|
| | | | | |
| | | | | | | | | Principal
Amount
(000)#
| | |
COMMERCIAL PAPER (n) — 0.5% | | | | | | | | | | | | |
Time Warner, Inc.
(cost $7,871,613) | | A2 | | 5.39% | | 01/25/07 | | $ | 7,900 | | | 7,872,085 |
| | | | | | | | | | | |
|
|
CERTIFICATE OF DEPOSIT — 0.4% | | | | | | | | | | | | |
Skandinavia Enskilda BK/NY
(cost $6,598,189) | | | | 5.30% | | 10/03/07 | | | 6,600 | | | 6,598,502 |
| | | | | | | | | | | |
|
|
U.S. TREASURY OBLIGATIONS (n) — 0.3% | | | | | | | | | | | | |
U.S. Treasury Bills(k) | | | | 4.81% | | 03/15/07 | | | 500 | | | 495,232 |
U.S. Treasury Bills(k) | | | | 4.805% | | 03/15/07 | | | 5,040 | | | 4,991,939 |
U.S. Treasury Bills(k) | | | | 4.807% | | 03/15/07 | | | 50 | | | 49,523 |
| | | | | | | | | | | |
|
|
TOTAL U.S. TREASURY OBLIGATIONS
(cost $5,535,360) | | | 5,536,694 |
| | | | | | | | | | | |
|
|
| | | | | |
| | | | | | | | | Notional
Amounts
(000)
| | |
OUTSTANDING OPTIONS PURCHASED* — 0.4% | | | | | | | | | | | | |
Call Options — 0.4% | | | | | | | | | | | | |
Eurodollar Futures, expiring 09/14/2007, Strike Price$95.00 | | | | | | | | | 945,000 | | | 885,937 |
Eurodollar Futures, expiring 09/14/2007, Strike Price$95.25 | | | | | | | | | 1,647,000 | | | 1,029,375 |
Eurodollar Futures, expiring 09/17/2007, Strike Price$95.00 | | | | | | | | | 88,000 | | | 40,700 |
Swap on 3 Month LIBOR, expiring 07/02/2007 @ 4.90% | | | | | | | | | 161,900 | | | 483,522 |
Swap on 3 Month LIBOR, expiring 05/02/2008 @ 5.75% | | | | | | | | | 7,800 | | | 633,586 |
Swap on 3 Month LIBOR, expiring 04/27/2009 @ 5.75% | | | | | | | | | 9,800 | | | 872,445 |
Swap on 3 Month LIBOR, expiring 12/20/2007 @ 5.00% | | | | | | | | | 82,100 | | | 500,853 |
Swap on 3 Month LIBOR, expiring 06/15/2007 @ 5.00% | | | | | | | | | GBP 72,100 | | | 60,167 |
Swap on 3 Month LIBOR, expiring 07/02/2007 @ 5.37% | | | | | | | | | 132,100 | | | 1,039,495 |
Swap on 6 Month LIBOR, expiring 09/14/2007 @ 5.17% | | | | | | | | | GBP 17,500 | | | 45,643 |
U.S. Treasury Note Futures, expiring 02/23/2007, Strike Price$113.00 | | | | | | | | | 35,000 | | | 5,469 |
U.S. Treasury Note Futures, expiring 02/23/2007, Strike Price$115.00 | | | | | | | | | 50,000 | | | 7,813 |
| | | | | | | | | | | |
|
|
| | | | | | | | | | | | | 5,605,005 |
| | | | | | | | | | | |
|
|
Put Options | | | | | | | | | | | | |
Eurodollar Futures, expiring 03/17/2008, Strike Price$91.75 | | | | | | | | | 1,650,000 | | | 10,312 |
Eurodollar Futures, expiring 06/18/2007, Strike Price$91.25 | | | | | | | | | 707,000 | | | 4,419 |
Eurodollar Futures, expiring 09/17/2007, Strike Price$90.25 | | | | | | | | | 645,000 | | | 4,031 |
Eurodollar Futures, expiring 09/17/2007, Strike Price$90.50 | | | | | | | | | 1,614,000 | | | 10,087 |
Eurodollar Futures, expiring 12/17/2007, Strike Price$91.25 | | | | | | | | | 720,000 | | | 4,500 |
Eurodollar Futures, expiring 12/17/2007, Strike Price$91.75 | | | | | | | | | 798,000 | | | 4,988 |
FNCL, expiring 02/05/2007, Strike Price$95.50 | | | | | | | | | 65,000 | | | 1,429 |
FNCL, expiring 03/06/2007, Strike Price$90.00 | | | | | | | | | 2,000 | | | 110 |
FNCL, expiring 03/06/2007, Strike Price$91.00 | | | | | | | | | 2,000 | | | 128 |
Swap on 3 Month LIBOR, expiring 05/02/2008 @ 6.00% | | | | | | | | | 4,500 | | | 35,505 |
Swap on 3 Month LIBOR, expiring 04/27/2009 @ 6.25% | | | | | | | | | 13,100 | | | 238,918 |
U.S. Treasury Note Futures, expiring 02/23/2007, Strike Price$102.50 | | | | | | | | | 159,200 | | | 24,875 |
U.S. Treasury Note Futures, expiring 02/23/2007, Strike Price$103.00 | | | | | | | | | 124,900 | | | 39,031 |
| | | | | | | | | | | |
|
|
| | | | | | | | | | | | | 378,333 |
| | | | | | | | | | | |
|
|
TOTAL OUTSTANDING OPTIONS PURCHASED
(cost $6,611,205) | | | 5,983,338 |
| | | | | | | | | | | |
|
|
TOTAL SHORT-TERM INVESTMENTS
(cost $258,688,456) | | | 261,168,067 |
| | | | | | | | | | | |
|
|
TOTAL INVESTMENTS, BEFORE OUTSTANDING OPTIONS WRITTEN AND SECURITIES SOLD SHORT—160.6%
(cost $2,562,152,823) | | | 2,554,296,189 |
| | | | | | | | | | | |
|
|
SEE NOTES TO FINANCIAL STATEMENTS.
B36
| | | | |
| | | SP PIMCO TOTAL RETURN PORTFOLIO (Continued) | | |
SCHEDULE OF INVESTMENTS | December 31, 2006 |
| | | | | | | | | | | | | |
| INVESTMENTS SOLD SHORT — (34.7)% | | Moody’s
Ratings
(Unaudited)
| | Interest
Rate
| | Maturity
Date
| | Principal
Amount
(000)#
| | Value
(Note 2)
| |
Short Sales — (34.7)% | | | | | | | | | | | | | |
Federal National Mortgage Assoc. | | | | 5.00% | | 01/11/37 | | $ | 49,000 | | $ | (47,300,288 | ) |
Federal National Mortgage Assoc. | | | | 5.50% | | 02/12/37 | | | 377,600 | | | (372,997,811 | ) |
Federal National Mortgage Assoc. | | | | 5.50% | | 01/18/21 | | | 13,200 | | | (13,195,882 | ) |
U.S. Treasury Bonds | | | | 9.00% | | 11/15/18 | | | 950 | | | (1,306,324 | ) |
U.S. Treasury Notes | | | | 3.25% | | 01/15/09 | | | 4,300 | | | (4,172,342 | ) |
U.S. Treasury Notes | | | | 3.625% | | 05/15/13 | | | 1,800 | | | (1,696,008 | ) |
U.S. Treasury Notes | | | | 4.00% | | 02/15/14 | | | 6,600 | | | (6,317,698 | ) |
U.S. Treasury Notes | | | | 4.375% | | 08/15/12 | | | 81,700 | | | (80,525,562 | ) |
U.S. Treasury Notes | | | | 4.75% | | 05/15/14 | | | 24,200 | | | (24,262,388 | ) |
| | | | | | | | | | | |
|
|
|
TOTAL SHORT SALES
(proceeds received $555,277,750) | | | (551,774,303 | ) |
| | | | | | | | | | | |
|
|
|
| | | | | |
| | | | | | | | | Notional
Amounts
(000)
| | | |
OUTSTANDING OPTIONS WRITTEN* — (0.1)% | | | | | | | | | | | | | |
Call Options — (0.1)% | | | | | | | | | | | | | |
Swap on 3 Month LIBOR, expiring 07/05/2007 @ 5.00% | | | | | | | | | 70,600 | | | (574,205 | ) |
Swap on 3 Month LIBOR, expiring 07/02/2007 @ 5.50% | | | | | | | | | 43,300 | | | (1,156,370 | ) |
Swap on 3 Month LIBOR, expiring 12/20/2007 @ 5.15% | | | | | | | | | 35,700 | | | (542,515 | ) |
Swap on 3 Month LIBOR, expiring 06/15/2007 @ 4.85% | | | | | | GBP | | | 20,600 | | | (99,186 | ) |
Swap on 6 Month LIBOR, expiring 09/14/2007 @ 4.85% | | | | | | GBP | | | 5,000 | | | (45,830 | ) |
| | | | | | | | | | | |
|
|
|
TOTAL OUTSTANDING OPTIONS WRITTEN
(premium received $2,044,259) | | | (2,418,106 | ) |
| | | | | | | | | | | |
|
|
|
TOTAL INVESTMENTS, NET OF OUTSTANDING OPTIONS WRITTEN AND SHORT SALES — 125.8%
(cost $2,004,830,814; Note 6) | | | 2,000,103,780 | |
LIABILITIES IN EXCESS OF OTHER ASSETS (Note 1)(x) — (25.8)% | | | (409,809,719 | ) |
| | | | | | | | | | | |
|
|
|
NET ASSETS — 100.0% | | $ | 1,590,294,061 | |
| | | | | | | | | | | |
|
|
|
The following abbreviations are used in portfolio descriptions:
| | |
| 144A | | Security was purchased pursuant to Rule 144A under the Securities Act of 1933 and may not be resold subject to that rule except to qualified institutional buyers. Unless otherwise noted, 144A securities are deemed to be liquid. |
| NR | | Not Rated by Moody’s or Standard & Poor’s |
| TBA | | Securities Purchased on a Forward Commitment Basis |
| TIPS | | Treasury Inflation Protected Securities |
| EUR | | Euro |
| GBP | | British Pound |
| JPY | | Japanese Yen |
| * | Non-income producing security. |
| # | Principal amount is shown in U.S. dollars unless otherwise stated. |
| (c) | Indicates a variable rate security. |
| (d) | Standard & Poor’s rating. |
| (g) | Indicates a security that has been deemed illiquid. |
| (i) | Represents all or partial amount utilized in the Municipal Tender Option Bond transaction. The aggregated principal amount of the inverse floaters and the floating rate notes (included in liabilities) are $4,787,500 and $4,787,500, respectively. |
| (k) | Securities segregated as collateral for futures contracts. |
| (n) | Rates shown are the effective yields at purchase date. |
| (w) | Prudential Investments LLC, the manager of the Portfolio, also serves as manager of the Dryden Core Investment Fund-Taxable Money Market Series. |
| (x) | Liabilities in excess of other assets includes net unrealized appreciation (depreciation) on futures contracts, forward foreign currency contracts, interest rate and credit default swaps as follows: |
SEE NOTES TO FINANCIAL STATEMENTS.
B37
| | | | |
| | | SP PIMCO TOTAL RETURN PORTFOLIO (Continued) | | |
SCHEDULE OF INVESTMENTS | December 31, 2006 |
Securities or a portion thereof with an aggregate market value of $6,566,853 have been segregated with the custodian to cover margin requirements for future contracts open at December 31, 2006.
| | | | | | | | | | | | | | |
Number of
Contracts
| | Type
| | Expiration
Date
| | Value at
Trade Date
| | Value at
December 31, 2006
| | Unrealized
Appreciation
(Depreciation)
| |
| Long Positions: | | | | | | | | | | | | | | |
| 135 | | 90 Day Euro Dollar | | Jun 07 | | $ | 32,070,938 | | $ | 31,984,875 | | $ | (86,063 | ) |
| 3,121 | | 90 Day Euro Dollar | | Sep 07 | | | 740,927,903 | | | 740,574,288 | | | (353,615 | ) |
| 1,296 | | 90 Day Euro Dollar | | Dec 07 | | | 308,472,550 | | | 307,962,000 | | | (510,550 | ) |
| 334 | | 90 Day Euro Dollar | | Mar 08 | | | 79,538,550 | | | 79,416,850 | | | (121,700 | ) |
| 1,077 | | 90 Day Euro Dollar | | Jun 08 | | | 256,749,575 | | | 256,150,987 | | | (598,588 | ) |
| 179 | | 90 Day Euro Dollar | | Sep 08 | | | 42,673,600 | | | 42,579,625 | | | (93,975 | ) |
| 71 | | 90 Day Euro Dollar | | Dec 08 | | | 16,878,474 | | | 16,888,237 | | | 9,763 | |
| 957 | | 90 Day Euro EURIBOR | | Jun 07 | | | 303,565,869 | | | 303,014,207 | | | (551,662 | ) |
| 236 | | 90 Day Sterling | | Jun 07 | | | 54,715,528 | | | 54,583,635 | | | (131,893 | ) |
| 583 | | 90 Day Sterling | | Sep 07 | | | 135,189,043 | | | 134,854,351 | | | (334,692 | ) |
| 510 | | 90 Day Sterling | | Dec 07 | | | 118,197,579 | | | 117,981,125 | | | (216,454 | ) |
| 3,154 | | 5 Year U.S. Treasury Notes | | Mar 07 | | | 333,067,876 | | | 331,367,126 | | | (1,700,750 | ) |
| | | | | | | | | | | | |
|
|
|
| | | | | | | | | | | | | | (4,690,179 | ) |
| | | | | | | | | | | | |
|
|
|
| Short Positions: | | | | | | | | | | | | | | |
| 2,498 | | 10 Year U.S. Treasury Notes | | Mar 07 | | | 271,475,000 | | | 268,456,937 | | | 3,018,063 | |
| | | | | | | | | | | | |
|
|
|
| | | | | | | | | | | | | $ | (1,672,116 | ) |
| | | | | | | | | | | | |
|
|
|
Forward foreign currency exchange contracts outstanding at December 31, 2006:
| | | | | | | | | | |
| | | Value at
Settlement Date
| | Current
Value
| | Unrealized
Appreciation
(Depreciation)
| |
Purchase Contracts | | | | | | | | | | |
EUR 79,000, expiring 01/23/07 | | $ | 104,216 | | $ | 104,418 | | $ | 202 | |
EUR 109,000, expiring 01/23/07 | | | 142,779 | | | 144,070 | | | 1,291 | |
EUR 1,600,000, expiring 01/23/07 | | | 2,101,632 | | | 2,112,072 | | | 10,440 | |
EUR 36,360,000, expiring 01/23/07 | | | 47,824,127 | | | 47,996,832 | | | 172,705 | |
| | | | | | | | |
|
|
|
| | | | | | | | | $ | 184,638 | |
| | | | | | | | |
|
|
|
Sale Contracts | | | | | | | | | | |
EUR 36,360,000, expiring 01/04/07 | | | 47,781,222 | | | 47,996,832 | | $ | (215,610 | ) |
EUR 6,900,000, expiring 01/23/07 | | | 9,143,018 | | | 9,120,048 | | | 22,970 | |
EUR 71,022,000, expiring 01/23/07 | | | 93,184,498 | | | 93,873,046 | | | (688,548 | ) |
EUR 60,166,000, expiring 01/23/07 | | | 79,410,101 | | | 79,524,171 | | | (114,070 | ) |
GBP 12,259,000, expiring 01/11/07 | | | 23,892,793 | | | 24,005,220 | | | (112,427 | ) |
| | | | | | | | |
|
|
|
| | | | | | | | | | (1,107,685 | ) |
| | | | | | | | |
|
|
|
| | | | | | $ | (923,047 | ) |
| | | | | | | | |
|
|
|
Interest rate swap agreements outstanding at December 31, 2006:
| | | | | | | | | | | | | | |
Counterparty
| | Termination
Date
| | Notional
Amount
| | Fixed
Rate
| | | Floating Rate
| | Unrealized
Appreciation
(Depreciation)
| |
Morgan Stanley & Co.(1) | | 06/20/37 | | $ | 13,100,000 | | 5.00 | % | | 3 month LIBOR | | $ | (291,504 | ) |
Deutsche Bank(1) | | 06/20/37 | | $ | 64,000,000 | | 5.00 | % | | 3 month LIBOR | | | (1,616,975 | ) |
UBS AG(1) | | 06/18/09 | | $ | 177,000,000 | | 5.00 | % | | 3 month LIBOR | | | 417,652 | |
Bank of America, N.A.(1) | | 06/15/35 | | $ | 5,300,000 | | 6.00 | % | | 3 month LIBOR | | | 23,017 | |
Barclays Capital(2) | | 06/18/34 | | GBP | 400,000 | | 5.00 | % | | 6 month LIBOR | | | (35,096 | ) |
UBS AG(1) | | 10/15/10 | | EUR | 1,400,000 | | 2.1455 | % | | FRC - Excluding Tobacco - Non-Revised Consumer Price Index | | | 26,504 | |
Duetsche Bank(1) | | 06/15/17 | | AUD | 25,100,000 | | 6.00 | % | | 3 month Australian Bank Bill | | | (322,224 | ) |
Duetsche Bank(2) | | 06/20/17 | | $ | 32,900,000 | | 5.00 | % | | 3 month LIBOR | | | 737,880 | |
Morgan Stanley & Co.(2) | | 06/20/16 | | JPY | 830,000,000 | | 2.00 | % | | 6 month LIBOR | | | (32,003 | ) |
Barclays Capital(2) | | 06/20/16 | | JPY | 340,000,000 | | 2.00 | % | | 6 month LIBOR | | | (22,462 | ) |
Citigroup(2) | | 06/20/17 | | $ | 30,000,000 | | 5.00 | % | | 3 month LIBOR | | | 633,912 | |
UBS AG(2) | | 06/20/37 | | $ | 5,200,000 | | 5.00 | % | | 3 month LIBOR | | | (120,124 | ) |
Barclays Capital(1) | | 09/15/10 | | GBP | 8,000,000 | | 5.00 | % | | 6 month LIBOR | | | (228,697 | ) |
Goldman Sachs(2) | | 06/12/36 | | GBP | 11,600,000 | | 4.25 | % | | 6 month LIBOR | | | 981,177 | |
Goldman Sachs(1) | | 09/15/15 | | GBP | 2,000,000 | | 5.00 | % | | 6 month LIBOR | | | (46,048 | ) |
Barclays Capital(1) | | 06/15/09 | | GBP | 1,200,000 | | 5.00 | % | | 6 month LIBOR | | | (15,569 | ) |
| | | | | | | | | | | | |
|
|
|
| | | | | | | | | | | | | $ | 89,440 | |
| | | | | | | | | | | | |
|
|
|
| (1) | Portfolio pays the floating rate and receives the fixed rate. |
| (2) | Portfolio pays the fixed rate and receives the floating rate. |
SEE NOTES TO FINANCIAL STATEMENTS.
B38
| | | | |
| | | SP PIMCO TOTAL RETURN PORTFOLIO (Continued) | | |
SCHEDULE OF INVESTMENTS | December 31, 2006 |
Credit default swap agreements outstanding at December 31, 2006:
| | | | | | | | | | | | | | |
Counterparty
| | Termination
Date
| | Notional
Amount
| | Fixed
Rate
| | | Underlying Bond
| | Unrealized
Appreciation
(Depreciation)
| |
Morgan Stanley & Co.(1) | | 12/20/08 | | $ | 2,700,000 | | 0.26 | % | | Allstate Corp., 6.125%, due 02/15/12 | | $ | (10,640 | ) |
Morgan Stanley & Co.(1) | | 12/20/08 | | $ | 300,000 | | 0.26 | % | | Allstate Corp., 6.125%, due 02/15/12 | | | (1,216 | ) |
Merrill Lynch & Co.(1) | | 12/20/08 | | $ | 800,000 | | 0.27 | % | | Anadarko Petroleum Corp.,
5.00%, due 10/01/12 | | | (2,115 | ) |
UBS AG(1) | | 11/25/32 | | $ | 5,500,000 | | 2.35 | % | | Asset Backed Funding Certificate,
8.82%, due 11/25/32(3) | | | 56,007 | |
UBS AG(1) | | 12/20/08 | | $ | 3,200,000 | | 0.35 | % | | AutoZone, Inc., 5.875%, due 10/15/12 | | | (18,873 | ) |
Barclays Bank PLC(1) | | 06/28/46 | | $ | 4,000,000 | | 1.40 | % | | Camber 6A, 6.838%, due 07/12/43 | | | (30,783 | ) |
Barclays Bank PLC(1) | | 06/28/46 | | $ | 2,000,000 | | 3.30 | % | | Camber 6A, 8.758%, due 07/12/43 | | | 14,817 | |
Bear Stearns International Ltd.(1) | | 12/20/08 | | $ | 400,000 | | 1.09 | % | | Capital One Bank, 4.875%, due 05/15/08 | | | (7,908 | ) |
Bear Stearns International Ltd.(1) | | 12/20/08 | | $ | 100,000 | | 1.09 | % | | Capital One Bank, 4.875%, due 05/15/08 | | | (2,327 | ) |
UBS AG(1) | | 12/20/08 | | $ | 800,000 | | 0.44 | % | | Carnival Corp., 6.15%, due 04/15/08 | | | (6,008 | ) |
Bear Stearns International Ltd.(1) | | 12/20/08 | | $ | 800,000 | | 0.19 | % | | Caterpillar, Inc., 7.25%, due 09/15/09 | | | (2,072 | ) |
Barclays Bank PLC(1) | | 06/20/15 | | $ | 700,000 | | 0.15 | % | | Citifinancial 6.625%, due 06/01/15 | | | (13 | ) |
Lehman Brothers, Inc.(1) | | 12/20/08 | | $ | 700,000 | | 0.24 | % | | Costco Wholesale Corp., 5.50%, due 03/15/07 | | | (2,243 | ) |
Lehman Brothers, Inc.(1) | | 12/22/08 | | $ | 100,000 | | 0.24 | % | | Costco Wholesale Corp., 5.50%, due 03/15/07 | | | (368 | ) |
Morgan Stanley & Co.(1) | | 12/20/08 | | $ | 800,000 | | 0.42 | % | | Countrywide Home Loans, Inc.,
5.625%, due 07/15/09 | | | (5,138 | ) |
Morgan Stanley & Co.(1) | | 09/20/11 | | $ | 3,800,000 | | 0.24 | % | | CVS Corp., 5.75%, due 08/15/11 | | | (51 | ) |
Barclays Bank PLC(1) | | 09/20/11 | | $ | 3,400,000 | | 0.58 | % | | DaimlerChrysler NA, 5.75%, due 09/08/11 | | | (14,652 | ) |
Bear Stearns International Ltd.(1) | | 12/20/08 | | $ | 800,000 | | 0.24 | % | | Deere & Co., 7.85%, due 05/15/10 | | | (3,148 | ) |
Merrill Lynch & Co.(1) | | 12/20/08 | | $ | 1,600,000 | | 0.35 | % | | Devon Energy Corp., 6.875%, due 09/30/11 | | | (7,270 | ) |
Bank of America Securities LLC(1) | | 07/25/45 | | $ | 6,000,000 | | 0.54 | % | | Dow Jones CDX IG4 Index | | | (8,173 | ) |
Goldman Sachs(1) | | 07/25/45 | | $ | 4,500,000 | | 0.54 | % | | Dow Jones CDX IG4 Index | | | (11,531 | ) |
First Boston(1) | | 07/25/45 | | $ | 25,000,000 | | 0.54 | % | | Dow Jones CDX IG4 Index | | | (63,051 | ) |
Merrill Lynch & Co.(1) | | 07/25/45 | | $ | 9,000,000 | | 0.54 | % | | Dow Jones CDX IG4 Index | | | (28,430 | ) |
Morgan Stanley & Co.(2) | | 12/20/15 | | $ | 12,200,000 | | 0.46 | % | | Dow Jones CDX IG5 Index | | | 9,145 | |
Morgan Stanley & Co.(1) | | 12/20/12 | | $ | 17,100,000 | | 0.14 | % | | Dow Jones CDX IG5 Index | | | (7,852 | ) |
Morgan Stanley & Co.(1) | | 12/20/12 | | $ | 26,700,000 | | 0.14 | % | | Dow Jones CDX IG5 Index | | | (12,048 | ) |
Morgan Stanley & Co.(2) | | 12/20/15 | | $ | 19,000,000 | | 0.46 | % | | Dow Jones CDX IG5 Index | | | 20,690 | |
Barclays Bank PLC(1) | | 12/20/11 | | $ | 39,000,000 | | 0.75 | % | | Dow Jones CDX IG7 Index | | | (6,982 | ) |
Morgan Stanley & Co.(1) | | 12/20/16 | | $ | 29,700,000 | | 0.65 | % | | Dow Jones CDX IG7 Index | | | 24,124 | |
Goldman Sachs(1) | | 12/20/16 | | EUR | 10,600,000 | | 0.85 | % | | Dow Jones CDX iTraxx HiVol Series 6 Version 1 Index | | | 7,632 | |
Duetsche Bank(1) | | 12/20/16 | | EUR | 18,200,000 | | 0.85 | % | | Dow Jones CDX iTraxx HiVol Series 6 Version 1 Index | | | 11,301 | |
Barclays Bank PLC(1) | | 12/20/16 | | EUR | 17,400,000 | | 0.85 | % | | Dow Jones CDX iTraxx HiVol Series 6 Version 1 Index | | | 19,671 | |
Bank of America Securities LLC(1) | | 12/20/08 | | $ | 1,700,000 | | 0.13 | % | | E.I. DuPont de Nemours & Co.,
6.875%, due 10/15/09 | | | (2,383 | ) |
Bank of America Securities LLC(1) | | 12/20/08 | | $ | 200,000 | | 0.13 | % | | E.I. DuPont, 6.875%, due 10/15/09 | | | (326 | ) |
Citigroup(1) | | 12/20/08 | | $ | 2,200,000 | | 0.28 | % | | Eaton Corp., 5.75%, due 07/15/12 | | | (9,454 | ) |
Citigroup(1) | | 12/20/08 | | $ | 300,000 | | 0.28 | % | | Eaton Corp., 5.75%, due 07/15/12 | | | (970 | ) |
Barclays Bank PLC(1) | | 12/20/08 | | $ | 2,300,000 | | 0.16 | % | | Eli Lilly & Co., 6.00%, due 03/15/12 | | | (6,303 | ) |
Barclays Bank PLC(1) | | 12/20/08 | | $ | 300,000 | | 0.16 | % | | Eli Lilly & Co., 6.00%, due 03/15/12 | | | (623 | ) |
Morgan Stanley & Co.(1) | | 12/20/08 | | $ | 1,600,000 | | 0.21 | % | | Emerson Electric Co., 6.48%, due 10/15/12 | | | (4,807 | ) |
Morgan Stanley & Co.(1) | | 12/20/08 | | $ | 200,000 | | 0.21 | % | | Emerson Electric Co., 6.48%, due 10/15/12 | | | (521 | ) |
Morgan Stanley & Co.(1) | | 12/20/08 | | $ | 800,000 | | 0.22 | % | | Emerson Electric Co., 7.125%%, due 08/15/10 | | | (2,558 | ) |
Barclays Bank PLC(1) | | 06/20/07 | | $ | 16,300,000 | | 0.27 | % | | Federal Republic of Brazil, 12.25%, 03/06/30 | | | (11,276 | ) |
Bear Stearns International Ltd.(1) | | 10/05/46 | | $ | 4,300,000 | | 1.55 | % | | Federal Republic of Brazil, 12.25%, 03/06/30 | | | (14,071 | ) |
Citigroup(1) | | 12/20/08 | | $ | 1,700,000 | | 0.29 | % | | FedEx Corp. 7.25%, due 02/15/11 | | | (7,248 | ) |
Citigroup(1) | | 12/20/08 | | $ | 200,000 | | 0.29 | % | | FedEx Corp., 7.25%, due 02/15/11 | | | (704 | ) |
Merrill Lynch & Co.(1) | | 12/20/08 | | $ | 600,000 | | 0.22 | % | | Gannett Co., Inc., 6.375%, due 04/01/12 | | | (1,598 | ) |
Duetsche Bank(1) | | 09/20/16 | | $ | 2,400,000 | | 0.51 | % | | Goodrich Corp., 6.29%, due 07/01/16 | | | (13,315 | ) |
Lehman Brothers, Inc.(1) | | 12/20/08 | | $ | 900,000 | | 0.97 | % | | Goodrich Corp., 7.625%, due 12/15/12 | | | (16,142 | ) |
Lehman Brothers, Inc.(1) | | 12/20/08 | | $ | 100,000 | | 0.97 | % | | Goodrich Corp., 7.625%, due 12/15/12 | | | (1,214 | ) |
Bear Stearns International Ltd.(1) | | 12/20/08 | | $ | 2,200,000 | | 0.32 | % | | Hewlett-Packard Co., 6.50%, due 07/12/12 | | | (11,990 | ) |
Bear Stearns International Ltd.(1) | | 12/20/08 | | $ | 300,000 | | 0.32 | % | | Hewlett-Packard Co., 6.50%, due 07/12/12 | | | (1,401 | ) |
Lehman Brothers, Inc.(1) | | 12/20/08 | | $ | 2,200,000 | | 0.12 | % | | Home Depot, Inc., 5.375%, due 04/01/06 | | | (1,889 | ) |
SEE NOTES TO FINANCIAL STATEMENTS.
B39
| | | | |
| | | SP PIMCO TOTAL RETURN PORTFOLIO (Continued) | | |
SCHEDULE OF INVESTMENTS | December 31, 2006 |
| | | | | | | | | | | | | | |
Counterparty
| | Termination
Date
| | Notional
Amount
| | Fixed
Rate
| | | Underlying Bond
| | Unrealized
Appreciation
(Depreciation)
| |
Lehman Brothers, Inc.(1) | | 12/20/08 | | $ | 300,000 | | 0.12 | % | | Home Depot, Inc., 5.375%, due 04/01/06 | | | (920 | ) |
Merrill Lynch & Co.(1) | | 12/20/08 | | $ | 1,400,000 | | 0.32 | % | | Ingersoll-Rand Corp., 6.48%, due 06/01/25 | | | (2,318 | ) |
Barclays Bank PLC(1) | | 03/20/12 | | $ | 1,500,000 | | 0.17 | % | | International Lease Finance Corp.,
5.40%, due 02/15/12 | | | (1,822 | ) |
Bear Stearns International Ltd.(1) | | 12/20/08 | | $ | 800,000 | | 0.60 | % | | International Paper Co., 6.75%, due 09/01/11 | | | (7,535 | ) |
Bear Stearns International Ltd.(1) | | 08/04/46 | | $ | 5,000,000 | | 1.35 | % | | Ipswich Street CDO Ltd.,
6.71813%, due 08/04/46(3) | | | 38,062 | |
Barclays Bank PLC(1) | | 03/20/11 | | $ | 1,000,000 | | 0.37 | % | | iStar Financial, Inc., 5.80%, due 03/15/11 | | | (1,464 | ) |
Bear Stearns International Ltd.(1) | | 12/20/13 | | $ | 400,000 | | 0.56 | % | | iStar Financial, Inc., 5.95%, due 10/15/13 | | | (670 | ) |
Lehman Brothers, Inc.(1) | | 12/20/08 | | $ | 2,100,000 | | 0.11 | % | | Johnson & Johnson, 3.80%, due 05/15/13 | | | (4,064 | ) |
Lehman Brothers, Inc.(1) | | 12/20/08 | | $ | 300,000 | | 0.11 | % | | Johnson & Johnson, 3.80%, due 05/15/13 | | | (649 | ) |
Morgan Stanley & Co.(1) | | 03/20/13 | | $ | 5,000,000 | | 0.56 | % | | Kroger Co., 5.50%, due 02/01/13 | | | (31,614 | ) |
Duetsche Bank(1) | | 12/20/11 | | $ | 5,000,000 | | 0.66 | % | | Lennar Corp., 5.95%, due 10/17/11 | | | (30,490 | ) |
Lehman Brothers, Inc.(1) | | 12/20/08 | | $ | 900,000 | | 0.53 | % | | Lockheed Martin Corp., 8.20%, due 12/01/09 | | | (8,753 | ) |
Lehman Brothers, Inc.(1) | | 12/20/08 | | $ | 100,000 | | 0.53 | % | | Lockheed Martin Corp., 8.20%, due 12/01/09 | | | (1,033 | ) |
Bear Stearns International Ltd.(1) | | 03/20/16 | | $ | 3,100,000 | | 0.28 | % | | Loews Corp., 5.25%, due 03/15/16 | | | (11,788 | ) |
Merrill Lynch & Co.(2) | | 02/25/34 | | $ | 4,500,000 | | 2.25 | % | | Long Beach Mortgage Loan Trust 2004-1,
8.82% , due 02/25/34(3) | | | 29,813 | |
Goldman Sachs(1) | | 02/25/34 | | $ | 4,500,000 | | 2.00 | % | | Long Beach Mortgage Loan Trust 2004-1,
8.82% , due 02/25/34(3) | | | (1,750 | ) |
Lehman Brothers, Inc.(1) | | 12/20/08 | | $ | 1,200,000 | | 0.30 | % | | Masco Corp., 5.875%, due 07/15/12 | | | (3,289 | ) |
Lehman Brothers, Inc.(1) | | 12/20/08 | | $ | 100,000 | | 0.30 | % | | Masco Corp., 5.875%, due 07/15/12 | | | (317 | ) |
Bear Stearns International Ltd.(1) | | 10/13/46 | | $ | 5,000,000 | | 1.40 | % | | Mercury CDO, Ltd., 6.78% due 07/27/48(3) | | | (14,972 | ) |
Merrill Lynch & Co.(1) | | 12/20/08 | | $ | 1,200,000 | | 0.85 | % | | Motorola, Inc, 7.625%, due 11/15/10 | | | (18,360 | ) |
Lehman Brothers, Inc.(1) | | 12/20/08 | | $ | 900,000 | | 0.48 | % | | Northrop & Grumman Corp.,
7.125%, due 02/15/11 | | | (7,541 | ) |
Lehman Brothers, Inc.(1) | | 12/20/08 | | $ | 100,000 | | 0.48 | % | | Northrop & Grumman Corp.,
7.125%, due 02/15/11 | | | (957 | ) |
Merrill Lynch & Co.(1) | | 12/20/08 | | $ | 800,000 | | 0.28 | % | | Occidental Petroleum Corp.,
6.75%, due 01/15/12 | | | (3,409 | ) |
Lehman Brothers, Inc.(1) | | 06/20/09 | | $ | 6,600,000 | | 0.40 | % | | People’s Republic of China,
6.80%, due 05/23/11 | | | (52,619 | ) |
Barclays Bank PLC(1) | | 03/20/13 | | $ | 600,000 | | 0.72 | % | | Pulte Homes, Inc., 6.25%, due 02/15/13 | | | (4,924 | ) |
Lehman Brothers, Inc.(1) | | 12/20/08 | | $ | 1,200,000 | | 0.35 | % | | RadioShack Corp., 7.375%, due 05/15/11 | | | 12,359 | |
UBS AG(1) | | 12/20/08 | | $ | 800,000 | | 0.37 | % | | RadioShack Corp., 7.375%, due 05/15/11 | | | 7,933 | |
Lehman Brothers, Inc.(1) | | 12/20/08 | | $ | 100,000 | | 0.35 | % | | RadioShack Corp., 7.375%, due 05/15/11 | | | 821 | |
Morgan Stanley & Co.(1) | | 05/20/16 | | $ | 15,900,000 | | 0.54 | % | | Republic of Hungary, 4.75%, due 02/03/15 | | | (164,722 | ) |
JPMorgan Chase Bank(1) | | 05/20/16 | | $ | 7,100,000 | | 0.54 | % | | Republic of Hungary, 4.75%, due 02/03/15 | | | (76,203 | ) |
Lehman Brothers, Inc.(1) | | 09/20/08 | | $ | 3,000,000 | | 2.47 | % | | Republic of the Philippines,
8.25%, due 01/15/14 | | | (102,717 | ) |
Morgan Stanley & Co.(1) | | 09/20/10 | | $ | 1,700,000 | | 2.70 | % | | Republic of Turkey, 11.875%, due 01/15/30 | | | (98,117 | ) |
Lehman Brothers, Inc.(1) | | 09/20/10 | | $ | 400,000 | | 2.26 | % | | Republic of Turkey, 11.875%, due 01/15/30 | | | (16,798 | ) |
Lehman Brothers, Inc.(1) | | 10/20/10 | | $ | 2,500,000 | | 2.11 | % | | Republic of Turkey, 11.875%, due 01/15/30 | | | (86,845 | ) |
Bear Stearns International Ltd.(2) | | 03/20/07 | | $ | 4,500,000 | | 0.62 | % | | Russian Federation, 2.25%, due 03/31/30 | | | 12,726 | |
JPMorgan Chase Bank(2) | | 05/20/07 | | $ | 300,000 | | 0.77 | % | | Russian Federation, 2.25%, due 03/31/30 | | | 938 | |
JPMorgan Chase Bank(2) | | 06/20/07 | | $ | 16,300,000 | | 0.42 | % | | Russian Federation, 5.00%, due 03/31/30 | | | 17,953 | |
Morgan Stanley & Co.(1) | | 09/20/13 | | $ | 1,600,000 | | 0.58 | % | | Sealed Air Corp., 5.625%, due 07/15/13 | | | (7,627 | ) |
UBS AG(1) | | 12/20/08 | | $ | 800,000 | | 0.44 | % | | Simon Property Group, L.P.,
5.45%, due 03/15/13 | | | (6,085 | ) |
Morgan Stanley & Co.(1) | | 12/20/08 | | $ | 800,000 | | 0.53 | % | | The Kroger Co., 4.75%, due 04/15/12 | | | (6,936 | ) |
Bear Stearns International Ltd.(1) | | 03/20/11 | | $ | 1,000,000 | | 0.33 | % | | Vornado Realty, 5.6%, due 02/15/11 | | | (3,549 | ) |
Citigroup(1) | | 12/20/08 | | $ | 3,600,000 | | 0.14 | % | | Walmart Stores, Inc., 6.875%, due 08/10/09 | | | (7,791 | ) |
Bear Stearns International Ltd.(1) | | 12/20/08 | | $ | 1,500,000 | | 0.15 | % | | Walmart Stores, Inc., 6.875%, due 08/10/09 | | | (3,536 | ) |
Barclays Bank PLC(1) | | 12/20/08 | | $ | 900,000 | | 0.67 | % | | Walt Disney Co. (The), 6.375%, due 03/12/12 | | | (10,987 | ) |
Barclays Bank PLC(1) | | 12/20/08 | | $ | 100,000 | | 0.67 | % | | Walt Disney Co. (The), 6.375%, due 03/12/12 | | | (738 | ) |
Lehman Brothers, Inc.(1) | | 12/20/08 | | $ | 1,100,000 | | 0.29 | % | | Whirlpool Corp., 8.60%, due 05/01/10 | | | (2,771 | ) |
Lehman Brothers, Inc.(1) | | 12/20/08 | | $ | 100,000 | | 0.29 | % | | Whirlpool Corp., 8.60%, due 05/01/10 | | | (353 | ) |
Barclays Bank PLC(1) | | 03/20/12 | | $ | 1,300,000 | | 0.21 | % | | XL Cap Europe PLC, 6.50%, due 01/15/12 | | | (2,793 | ) |
| | | | | | | | | | | | |
|
|
|
| | | | | | | | | | | | | $ | (887,519 | ) |
| | | | | | | | | | | | |
|
|
|
SEE NOTES TO FINANCIAL STATEMENTS.
B40
| | | | |
| | | SP PIMCO TOTAL RETURN PORTFOLIO (Continued) | | |
SCHEDULE OF INVESTMENTS | December 31, 2006 |
| (1) | Portfolio pays the fixed rate and receives from the counterparty, par in the event that the underlying bond defaults. |
| (2) | Portfolio pays counterparty par in the event that the underlying bond defaults and receives the fixed rate. |
| (3) | Variable rate, displayed rate is as of 12/31/06. |
The industry classification of long-term portfolio holdings and liabilities in excess of other assets shown as a percentage of net assets as of December 31, 2006 was as follows:
| | | |
Industry
| | | |
U.S. Government Mortgage Backed Obligations | | 77.3 | % |
U.S. Treasury Obligation | | 38.3 | |
Foreign Government Securities | | 6.1 | |
Financial — Bank & Trust | | 6.1 | |
Foreign Treasury Bills | | 5.8 | |
Collateralized Mortgage Obligations | | 4.2 | |
Asset-Backed Securities | | 3.9 | |
Financial Services | | 2.9 | |
Affiliated Money Market Mutual Fund | | 2.9 | |
Diversified | | 1.7 | |
Media | | 1.5 | |
Foreign Government Bonds | | 1.4 | |
Municipal Bonds | | 1.4 | |
Automobile Manufacturers | | 1.1 | |
Telecommunications | | 1.1 | |
Gaming | | 0.7 | |
Oil, Gas & Consumable Fuels | | 0.6 | |
Commercial Paper | | 0.5 | |
Insurance | | 0.5 | |
Telecom — Integrated/Services | | 0.5 | |
Certificates of Deposit | | 0.4 | |
Outstanding Options Purchased | | 0.4 | |
Building Materials | | 0.4 | |
Paper & Forest Products | | 0.3 | |
Tobacco | | 0.3 | |
Retail & Merchandising | | 0.2 | |
Aerospace | | 0.1 | |
| | |
|
|
| | | 160.6 | |
Investments sold short | | (34.8 | ) |
Liabilities in excess of other assets | | (25.8 | ) |
| | |
|
|
| | | 100.0 | % |
| | |
|
|
SEE NOTES TO FINANCIAL STATEMENTS.
B41
| | | | |
| | | SP PRUDENTIAL US EMERGING GROWTH PORTFOLIO | | |
SCHEDULE OF INVESTMENTS December 31, 2006 | |
| | | | | |
| LONG-TERM INVESTMENTS — 95.9% | | Value
(Note 2)
|
| COMMON STOCKS | | Shares
| |
Air Freight & Logistics — 1.0% | | | | | |
UTI Worldwide, Inc. | | 68,700 | | $ | 2,054,130 |
| | | | |
|
|
Capital Markets — 6.6% | | | | | |
Eaton Vance Corp. | | 174,500 | | | 5,760,245 |
Lazard, Ltd. (Class “A” Stock)(b) | | 41,600 | | | 1,969,344 |
Nuveen Investments, Inc. (Class “A” Stock)(b) | | 62,400 | | | 3,237,312 |
TD Ameritrade Holdings Corp.(b) | | 151,800 | | | 2,456,124 |
| | | | |
|
|
| | | | | | 13,423,025 |
| | | | |
|
|
Chemicals — 4.5% | | | | | |
Ecolab, Inc. | | 56,600 | | | 2,558,320 |
Monsanto Co. | | 63,300 | | | 3,325,149 |
Nalco Holdings Co.(a) | | 161,900 | | | 3,312,474 |
| | | | |
|
|
| | | | | | 9,195,943 |
| | | | |
|
|
Commercial Services & Supplies — 7.2% | | | | | |
Allied Waste Industries, Inc.(a) | | 237,100 | | | 2,913,959 |
ChoicePoint, Inc.(a) | | 61,300 | | | 2,413,994 |
Iron Mountain, Inc.(a) | | 81,400 | | | 3,365,076 |
Paychex, Inc. | | 65,800 | | | 2,601,732 |
Stericycle, Inc.(a) | | 44,700 | | | 3,374,850 |
| | | | |
|
|
| | | | | | 14,669,611 |
| | | | |
|
|
Communications Equipment — 3.5% | | | | | |
Avaya, Inc.(a) | | 251,100 | | | 3,510,378 |
Comverse Technology, Inc.(a)(b) | | 165,400 | | | 3,491,594 |
| | | | |
|
|
| | | | | | 7,001,972 |
| | | | |
|
|
Consumer Finance — 0.6% | | | | | |
Alliance Data Systems Corp.(a) | | 19,100 | | | 1,193,177 |
| | | | |
|
|
Diversified Consumer Services — 1.8% | | | | | |
Apollo Group, Inc. (Class “A” Stock)(a)(b) | | 31,500 | | | 1,227,555 |
ServiceMaster Co. (The) | | 91,200 | | | 1,195,632 |
Weight Watchers International, Inc. | | 22,200 | | | 1,166,166 |
| | | | |
|
|
| | | | | | 3,589,353 |
| | | | |
|
|
Diversified Financial Services — 0.8% | | | | | |
KKR Private Equity Investors LLP RDU- Physical, Private Placement 144A (cost $1,847,476; purchased 5/03/06-5/05/06)(e)(f)(g) | | 74,000 | | | 1,690,900 |
| | | | |
|
|
Electrical Equipment — 2.0% | | | | | |
Ametek, Inc. | | 129,000 | | | 4,107,360 |
| | | | |
|
|
Electronic Equipment & Instruments — 2.9% | | | |
Amphenol Corp. (Class “A” Stock) | | 30,000 | | | 1,862,400 |
Insight Enterprises, Inc.(a) | | 95,800 | | | 1,807,746 |
Tektronix, Inc. | | 77,500 | | | 2,260,675 |
| | | | |
|
|
| | | | | | 5,930,821 |
| | | | |
|
|
Energy Equipment & Services — 4.3% | | | | | |
Cameron International Corp.(a) | | 43,400 | | | 2,302,370 |
FMC Technologies, Inc.(a) | | 32,800 | | | 2,021,464 |
National-Oilwell Varco, Inc.(a) | | 15,200 | | | 929,936 |
Pride International, Inc.(a) | | 118,200 | | | 3,547,182 |
| | | | |
|
|
| | | | | | 8,800,952 |
| | | | |
|
|
Food Products — 1.8% | | | | | |
ConAgra Foods, Inc. | | 134,200 | | | 3,623,400 |
| | | | |
|
|
| | | | | |
COMMON STOCKS
(Continued) | | Shares
| | Value
(Note 2)
|
Health Care Technology — 1.0% | | | | | |
Cerner Corp.(a)(b) | | 42,600 | | $ | 1,938,300 |
| | | | |
|
|
Health Care Equipment & Supplies — 4.0% | | | | | |
DENTSPLY International, Inc. | | 98,800 | | | 2,949,180 |
ResMed, Inc.(a)(b) | | 52,500 | | | 2,584,050 |
Respironics, Inc.(a) | | 67,200 | | | 2,536,800 |
| | | | |
|
|
| | | | | | 8,070,030 |
| | | | |
|
|
Health Care Providers & Services — 8.8% | | | | | |
DaVita, Inc.(a) | | 77,300 | | | 4,396,824 |
Express Scripts, Inc.(a)(b) | | 36,500 | | | 2,613,400 |
Medco Health Solutions, Inc.(a) | | 62,500 | | | 3,340,000 |
Omnicare, Inc.(b) | | 84,900 | | | 3,279,687 |
Quest Diagnostics, Inc. | | 78,000 | | | 4,134,000 |
| | | | |
|
|
| | | | | | 17,763,911 |
| | | | |
|
|
Hotels, Restaurants & Leisure — 2.0% | | | | | |
Hilton Hotels Corp. | | 78,200 | | | 2,729,180 |
Tim Hortons, Inc. | | 48,900 | | | 1,416,144 |
| | | | |
|
|
| | | | | | 4,145,324 |
| | | | |
|
|
Insurance — 0.8% | | | | | |
Axis Capital Holdings Ltd. | | 50,100 | | | 1,671,837 |
| | | | |
|
|
Internet & Catalog Retail — 0.8% | | | | | |
GSI Commerce, Inc.(a)(b) | | 89,800 | | | 1,683,750 |
| | | | |
|
|
Internet Software & Services — 2.5% | | | | | |
Digital River, Inc.(a)(b) | | 38,900 | | | 2,170,231 |
Equinix, Inc.(a)(b) | | 38,000 | | | 2,873,560 |
| | | | |
|
|
| | | | | | 5,043,791 |
| | | | |
|
|
IT Services — 1.0% | | | | | |
CheckFree Corp.(a) | | 50,400 | | | 2,024,064 |
| | | | |
|
|
Machinery — 5.8% | | | | | |
Danaher Corp. | | 44,600 | | | 3,230,824 |
IDEX Corp. | | 63,600 | | | 3,015,276 |
ITT Corp. | | 64,400 | | | 3,659,208 |
Roper Industries, Inc. | | 35,800 | | | 1,798,592 |
| | | | |
|
|
| | | | | | 11,703,900 |
| | | | |
|
|
Media — 2.5% | | | | | |
E.W. Scripps Co. (The) (Class “A” Stock) | | 28,600 | | | 1,428,284 |
Regal Entertainment Group (Class “A” Stock) | | 166,900 | | | 3,558,308 |
| | | | |
|
|
| | | | | | 4,986,592 |
| | | | |
|
|
Metals & Mining — 1.3% | | | | | |
Goldcorp, Inc. | | 94,800 | | | 2,696,112 |
| | | | |
|
|
Oil, Gas & Consumable Fuels — 4.3% | | | | | |
Noble Energy, Inc. | | 40,600 | | | 1,992,242 |
Southwestern Energy Co.(a)(b) | | 101,200 | | | 3,547,060 |
Xto Energy, Inc. | | 68,700 | | | 3,232,335 |
| | | | |
|
|
| | | | | | 8,771,637 |
| | | | |
|
|
Pharmaceuticals — 0.8% | | | | | |
Endo Pharmaceuticals Holdings, Inc.(a) | | 56,400 | | | 1,555,512 |
| | | | |
|
|
Real Estate Investment Trust (REIT) — 0.9% | | | |
Host Hotels & Resorts, Inc. | | 74,800 | | | 1,836,340 |
| | | | |
|
|
SEE NOTES TO FINANCIAL STATEMENTS.
B42
| | | | |
| | | SP PRUDENTIAL US EMERGING GROWTH PORTFOLIO (Continued) | | |
SCHEDULE OF INVESTMENTS December 31, 2006 | |
| | | | | | |
COMMON STOCKS
(Continued) | | Shares
| | Value
(Note 2)
| |
Semiconductors & Semiconductor Equipment — 6.4% | |
Broadcom Corp. (Class “A” Stock)(a) | | 65,650 | | $ | 2,121,152 | |
Integrated Device Technology, Inc.(a) | | 226,200 | | | 3,501,576 | |
Intersil Corp. (Class “A” Stock) | | 55,700 | | | 1,332,344 | |
KLA-Tencor Corp. | | 20,300 | | | 1,009,925 | |
Marvell Technology Group, Ltd.(a) | | 135,200 | | | 2,594,488 | |
Teradyne, Inc.(a)(b) | | 158,800 | | | 2,375,648 | |
| | | | |
|
|
|
| | | | | | 12,935,133 | |
| | | | |
|
|
|
Software — 7.1% | | | | | | |
Adobe Systems, Inc.(a) | | 91,228 | | | 3,751,295 | |
Amdocs Ltd.(a)(b) | | 95,100 | | | 3,685,125 | |
Autodesk, Inc.(a) | | 58,300 | | | 2,358,818 | |
BEA Systems, Inc.(a) | | 166,200 | | | 2,090,796 | |
Citrix Systems, Inc.(a) | | 93,200 | | | 2,521,060 | |
| | | | |
|
|
|
| | | | | | 14,407,094 | |
| | | | |
|
|
|
Specialty Retail — 2.8% | | | | | | |
Ltd. Brands, Inc. | | 53,200 | | | 1,539,608 | |
Ross Stores, Inc. | | 67,900 | | | 1,989,470 | |
Urban Outfitters, Inc.(a)(b) | | 94,800 | | | 2,183,244 | |
| | | | |
|
|
|
| | | | | | 5,712,322 | |
| | | | |
|
|
|
Wireless Telecommunication Services — 6.1% | | | | |
American Tower Corp. (Class “A” Stock)(a) | | 130,100 | | | 4,850,128 | |
Crown Castle International Corp.(b) | | 29,600 | | | 956,080 | |
NII Holdings, Inc.(a) | | 102,800 | | | 6,624,432 | |
| | | | |
|
|
|
| | | | | | 12,430,640 | |
| | | | |
|
|
|
TOTAL LONG-TERM INVESTMENTS
(cost $162,609,364) | | | | | 194,656,933 | |
| | | | |
|
|
|
| SHORT-TERM INVESTMENT — 25.4% | |
Affiliated Money Market Mutual Fund | |
Dryden Core Investment Fund — Taxable Money Market Series(c)(d) (cost $51,476,123 includes $43,193,423 of cash collateral received for securities on loan) (Note 4) | | 51,476,123 | | | 51,476,123 | |
| | | | |
|
|
|
TOTAL INVESTMENTS — 121.3%
(cost $214,085,487) | | | 246,133,056 | |
LIABILITIES IN EXCESS OF OTHER ASSETS — (21.3)% | | | (43,198,408 | ) |
| | | | |
|
|
|
NET ASSETS — 100.0% | | $ | 202,934,648 | |
| | | | |
|
|
|
The following abbreviations are used in the portfolio descriptions:
| | |
| RDU | | Restricted Depositary Unit |
| REIT | | Real Estate Investment Trust |
| (a) | Non-income producing security. |
| (b) | All or a portion of security is on loan. The aggregate market value of such securities is $41,247,597; cash collateral of $43,193,423 (included in liabilities) was received with which the Portfolio purchased highly liquid short-term investments. |
| (c) | Represents security, or a portion thereof, purchased with cash collateral received for securities on loan. |
| (d) | Prudential Investments LLC, the manager of the Portfolio, also serves as manager of the Dryden Core Investment Fund — Taxable Money Market Series. |
| (e) | Securities were purchased pursuant to Rule 144A under the Securities Act of 1933 and may not be resold subject to that rule except to qualified institutional buyers. Unless otherwise noted, 144A securities are deemed to be liquid. |
| (f) | Indicates a restricted security. The aggregate cost of the security is $1,847,476. The aggregate market value of $1,690,900 represents 0.8% of net assets. |
| (g) | Indicates a security that has been deemed illiquid. |
The industry classification of portfolio holdings and liabilities in excess of other assets shown as a percentage of net assets as of December 31, 2006 were as follows:
| | | |
Affiliated Money Market Mutual Fund (including 21.3% of collateral received for securities on loan) | | 25.4 | % |
Health Care Providers & Services | | 8.8 | |
Commercial Services & Supplies | | 7.2 | |
Software | | 7.1 | |
Capital Markets | | 6.6 | |
Semiconductors & Semiconductor Equipment | | 6.4 | |
Wireless Telecommunication Services | | 6.1 | |
Machinery | | 5.8 | |
Chemicals | | 4.5 | |
Energy Equipment & Services | | 4.3 | |
Oil, Gas & Consumable Fuels | | 4.3 | |
Health Care Equipment & Supplies | | 4.0 | |
Communications Equipment | | 3.5 | |
Electronic Equipment & Instruments | | 2.9 | |
Specialty Retail | | 2.8 | |
Internet Software & Services | | 2.5 | |
Media | | 2.5 | |
Electrical Equipment | | 2.0 | |
Hotels, Restaurants & Leisure | | 2.0 | |
Diversified Consumer Services | | 1.8 | |
Food Products | | 1.8 | |
Metals & Mining | | 1.3 | |
Air Freight & Logistics | | 1.0 | |
Health Care Technology | | 1.0 | |
IT Services | | 1.0 | |
Real Estate Investment Trusts (REIT) | | 0.9 | |
Diversified Financial Services | | 0.8 | |
Insurance | | 0.8 | |
Internet & Catalog Retail | | 0.8 | |
Pharmaceuticals | | 0.8 | |
Consumer Finance | | 0.6 | |
| | |
|
|
| | | 121.3 | |
Liabilities in excess of other assets | | (21.3 | ) |
| | |
|
|
| | | 100.0 | % |
| | |
|
|
SEE NOTES TO FINANCIAL STATEMENTS.
B43
| | | | |
| | | SP SMALL CAP GROWTH PORTFOLIO | | |
SCHEDULE OF INVESTMENTS December 31, 2006 | |
| | | | | |
| LONG-TERM INVESTMENTS — 91.4% | | Value
(Note 2)
|
| COMMON STOCKS | | Shares
| |
Aerospace — 0.5% | | | | | |
ARGON ST, Inc.*(a) | | 28,600 | | $ | 616,044 |
| | | | |
|
|
Apparel Manufacturers — 0.7% | | | | | |
Carter’s, Inc.* | | 34,910 | | | 890,205 |
| | | | |
|
|
Banking — 1.9% | | | | | |
Texas Capital Banshares, Inc.* | | 27,700 | | | 550,676 |
Wilshire Bancorp, Inc. | | 30,800 | | | 584,276 |
Wintrust Financial Corp.(a) | | 25,800 | | | 1,238,916 |
| | | | |
|
|
| | | | | | 2,373,868 |
| | | | |
|
|
Biotechnology — 1.0% | | | | | |
Alexion Pharmaceuticals, Inc.* | | 7,315 | | | 295,453 |
Arena Pharmaceuticals, Inc.*(a) | | 20,870 | | | 269,432 |
Ariad Pharmaceuticals, Inc.* | | 80,052 | | | 411,467 |
deCODE genetics, Inc.*(a) | | 61,333 | | | 277,838 |
| | | | |
|
|
| | | | | | 1,254,190 |
| | | | |
|
|
Building Materials — 1.8% | | | | | |
Drew Industries, Inc.*(a) | | 19,400 | | | 504,594 |
Interline Brands, Inc.* | | 31,700 | | | 712,299 |
Texas Industries, Inc.(a) | | 15,705 | | | 1,008,732 |
| | | | |
|
|
| | | | | | 2,225,625 |
| | | | |
|
|
Business Services — 0.5% | | | | | |
ICON PLC (Ireland)* | | 15,065 | | | 567,951 |
| | | | |
|
|
Capital Markets — 0.7% | | | | | |
Lazard Ltd. (Bermuda) (Class A Stock) | | 18,425 | | | 872,240 |
| | | | |
|
|
Chemicals — 3.3% | | | | | |
Cabot Microelectronics Corp.*(a) | | 20,500 | | | 695,770 |
Rockwood Holdings, Inc.* | | 29,400 | | | 742,644 |
Spartech Corp. | | 9,800 | | | 256,956 |
Terra Industries, Inc.* | | 114,325 | | | 1,369,613 |
UAP Holding Corp. | | 38,510 | | | 969,682 |
US BioEnergy Corp.* | | 170 | | | 2,890 |
| | | | |
|
|
| | | | | | 4,037,555 |
| | | | |
|
|
Clothing & Apparel — 1.2% | | | | | |
Volcom, Inc.*(a) | | 48,750 | | | 1,441,538 |
| | | | |
|
|
Commercial Services — 2.8% | | | | | |
Global Cash Access Holdings*(a) | | 80,580 | | | 1,307,813 |
Healthcare Services Group, Inc. | | 11,000 | | | 318,560 |
Healthspring, Inc.* | | 16,400 | | | 333,740 |
Korn/Ferry International* | | 31,900 | | | 732,424 |
Navigant Consulting, Inc.*(a) | | 36,300 | | | 717,288 |
| | | | |
|
|
| | | | | | 3,409,825 |
| | | | |
|
|
Commercial Services & Supplies — 2.4% | | | | | |
Advisory Board Co. (The)* | | 6,700 | | | 358,718 |
Corrections Corp. of America* | | 26,697 | | | 1,207,505 |
H&E Equipment Services, Inc.* | | 13,600 | | | 336,872 |
Rollins, Inc. | | 47,000 | | | 1,039,170 |
| | | | |
|
|
| | | | | | 2,942,265 |
| | | | |
|
|
Computer Services & Software — 5.0% | | | | | |
ANSYS, Inc.*(a) | | 31,810 | | | 1,383,417 |
Avid Technology, Inc.*(a) | | 25,900 | | | 965,034 |
FactSet Research Systems, Inc. | | 34,138 | | | 1,928,114 |
The9 Ltd., ADR (China)*(a) | | 32,140 | | | 1,035,551 |
Trident Microsystems, Inc.*(a) | | 48,225 | | | 876,730 |
| | | | |
|
|
| | | | | | 6,188,846 |
| | | | |
|
|
| | | | | |
COMMON STOCKS
(Continued) | | Shares
| | Value
(Note 2)
|
Conglomerates — 0.2% | | | | | |
Griffon Corp.* | | 11,700 | | $ | 298,350 |
| | | | |
|
|
Construction — 0.2% | | | | | |
NCI Buildings Systems, Inc.* | | 4,700 | | | 243,225 |
| | | | |
|
|
Consulting — 0.6% | | | | | |
Watson Wyatt Worldwide, Inc. (Class A Stock) | | 16,200 | | | 731,430 |
| | | | |
|
|
Consumer Products & Services — 1.3% | | | | | |
Central Garden & Pet Co.*(a) | | 17,200 | | | 832,824 |
Ritchie Bros. Auctioneers, Inc. (Canada) | | 14,100 | | | 754,914 |
| | | | |
|
|
| | | | | | 1,587,738 |
| | | | |
|
|
Distribution/Wholesale — 2.2% | | | | | |
Houston Wire & Cable*(a) | | 22,700 | | | 474,430 |
MWI Veterinary Supply, Inc.* | | 10,800 | | | 348,840 |
Owens & Minor, Inc. | | 8,300 | | | 259,541 |
Pool Corp.(a) | | 19,384 | | | 759,271 |
ScanSource, Inc.*(a) | | 27,500 | | | 836,000 |
| | | | |
|
|
| | | | | | 2,678,082 |
| | | | |
|
|
Diversified Manufacturing Operations — 2.1% |
Actuant Corp. (Class A Stock)(a) | | 37,298 | | | 1,777,250 |
CLARCOR, Inc.(a) | | 24,100 | | | 814,821 |
| | | | |
|
|
| | | | | | 2,592,071 |
| | | | |
|
|
Electrical Equipment — 1.6% | | | | | |
Advanced Energy Industries, Inc.*(a) | | 49,046 | | | 925,498 |
General Cable Corp.* | | 22,271 | | | 973,465 |
| | | | |
|
|
| | | | | | 1,898,963 |
| | | | |
|
|
Electronic Components — 2.2% | | | | | |
Eagle Test Systems, Inc.* | | 25,010 | | | 364,646 |
LoJack Corp.* | | 23,900 | | | 408,212 |
Methode Electronics, Inc. | | 31,400 | | | 340,062 |
Universal Electronics, Inc.* | | 76,544 | | | 1,608,955 |
| | | | |
|
|
| | | | | | 2,721,875 |
| | | | |
|
|
Electronics — 2.6% | | | | | |
Coherent, Inc.*(a) | | 47,595 | | | 1,502,574 |
Dolby Laboratories, Inc. (Class A Stock)* | | 54,155 | | | 1,679,888 |
| | | | |
|
|
| | | | | | 3,182,462 |
| | | | |
|
|
Entertainment — 0.7% | | | | | |
Vail Resorts, Inc.*(a) | | 19,720 | | | 883,850 |
| | | | |
|
|
Entertainment & Leisure — 0.4% | | | | | |
RC2 Corp.* | | 11,600 | | | 510,400 |
| | | | |
|
|
Financial – Brokerage — 0.6% | | | | | |
Cowen Group, Inc.* | | 36,710 | | | 776,417 |
| | | | |
|
|
Financial Services — 3.4% | | | | | |
Boston Private Financial Holdings, Inc. | | 28,505 | | | 804,126 |
Financial Federal Corp.(a) | | 24,900 | | | 732,309 |
First Mercury Financial Corp.* | | 22,485 | | | 528,847 |
Hilb Rogal & Hobbs Co. | | 14,600 | | | 614,952 |
Investment Technology Group, Inc.* | | 14,640 | | | 627,763 |
ITLA Capital Corp. | | 7,200 | | | 416,952 |
W.P. Stewart & Co. Ltd.(a) | | 27,700 | | | 438,768 |
| | | | |
|
|
| | | | | | 4,163,717 |
| | | | |
|
|
Food — 0.3% | | | | | |
Tootsie Roll Industries, Inc. | | 11,673 | | | 381,707 |
| | | | |
|
|
SEE NOTES TO FINANCIAL STATEMENTS.
B44
| | | | |
| | | SP SMALL CAP GROWTH PORTFOLIO (Continued) | | |
SCHEDULE OF INVESTMENTS December 31, 2006 | |
| | | | | |
COMMON STOCKS
(Continued) | | Shares
| | Value
(Note 2)
|
Gaming — 0.5% | | | | | |
Shuffle Master, Inc.*(a) | | 24,059 | | $ | 630,346 |
| | | | |
|
|
Health Services — 3.7% | | | | | |
Centene Corp.*(a) | | 53,815 | | | 1,322,235 |
Computer Programs & Systems, Inc. | | 22,800 | | | 774,972 |
Eclipsys Corp.* | | 73,330 | | | 1,507,665 |
Horizon Health Corp.*(a) | | 45,513 | | | 890,689 |
| | | | |
|
|
| | | | | | 4,495,561 |
| | | | |
|
|
Healthcare Equipment & Supplies — 0.4% | | | | | |
Cutera, Inc.* | | 18,275 | | | 493,425 |
| | | | |
|
|
Healthcare Providers & Services — 0.6% | | | | | |
Matria Healthcare, Inc.*(a) | | 25,910 | | | 744,394 |
| | | | |
|
|
Healthcare – Products — 0.3% | | | | | |
LCA-Vision, Inc.(a) | | 10,400 | | | 357,344 |
| | | | |
|
|
Household Products — 0.5% | | | | | |
ACCO Brands Corp.* | | 25,100 | | | 664,397 |
| | | | |
|
|
Instruments – Controls — 0.3% | | | | | |
Photon Dynamics, Inc.* | | 32,696 | | | 382,216 |
| | | | |
|
|
Insurance — 2.3% | | | | | |
American Equity Investment Life Holding Co. | | 36,700 | | | 478,201 |
American Safety Insurance Holdings Ltd.* | | 17,510 | | | 324,811 |
Amerisafe, Inc.* | | 35,400 | | | 547,284 |
Philadelphia Consolidated Holding Co.* | | 33,774 | | | 1,504,969 |
| | | | |
|
|
| | | | | | 2,855,265 |
| | | | |
|
|
Internet Services — 1.8% |
eCollege.com, Inc.*(a) | | 28,230 | | | 441,800 |
Internet Capital Group, Inc.* | | 42,266 | | | 433,649 |
j2 Global Communications, Inc.*(a) | | 40,200 | | | 1,095,450 |
Online Resources Corp.* | | 26,700 | | | 272,607 |
| | | | |
|
|
| | | | | | 2,243,506 |
| | | | |
|
|
Leisure — 0.6% | | | | | |
International Speedway Corp. (Class A Stock) | | 15,400 | | | 786,016 |
| | | | |
|
|
Machinery — 5.5% | | | | | |
Bucyrus International, Inc. (Class A Stock) | | 62,557 | | | 3,237,950 |
IDEX Corp. | | 25,100 | | | 1,189,991 |
Middleby Corp.* | | 10,500 | | | 1,099,035 |
RBC Bearings, Inc.* | | 18,800 | | | 538,808 |
Regal-Beloit Corp. | | 12,200 | | | 640,622 |
| | | | |
|
|
| | | | | | 6,706,406 |
| | | | |
|
|
Media — 1.8% | | | | | |
Entravision Communications Corp. (Class A Stock)* | | 77,545 | | | 637,420 |
Journal Communications, Inc. (Class A Stock) | | 46,900 | | | 591,409 |
Meredith Corp. | | 18,400 | | | 1,036,840 |
| | | | |
|
|
| | | | | | 2,265,669 |
| | | | |
|
|
Medical Products — 7.8% | | | | | |
American Medical Systems Holdings, Inc.*(a) | | 66,426 | | | 1,230,210 |
Arrow International, Inc. | | 31,455 | | | 1,112,878 |
| | | | | |
COMMON STOCKS
(Continued) | | Shares
| | Value
(Note 2)
|
Medical Products (cont’d.) | | | | | |
DJ Orthopedics, Inc.* | | 13,712 | | $ | 587,148 |
ICU Medical, Inc.* | | 9,600 | | | 390,528 |
K-V Pharmaceutical Co. (Class A Stock)*(a) | | 40,755 | | | 969,154 |
Landauer, Inc. | | 14,500 | | | 760,815 |
Respironics, Inc.* | | 35,539 | | | 1,341,597 |
STERIS Corp. | | 30,200 | | | 760,134 |
TECHNE Corp.* | | 13,300 | | | 737,485 |
Thoratec Corp.* | | 44,604 | | | 784,138 |
Young Innovations, Inc. | | 25,900 | | | 862,470 |
| | | | |
|
|
| | | | | | 9,536,557 |
| | | | |
|
|
Medical Supplies & Equipment — 0.9% | | | | | |
Quality Systems, Inc.(a) | | 28,350 | | | 1,056,605 |
| | | | |
|
|
Metals & Mining — 0.4% | | | | | |
Claymont Steel Holdings, Inc.* | | 28,710 | | | 527,977 |
| | | | |
|
|
Mineral Resources — 0.5% | | | | | |
AMCOL International Corp. | | 21,600 | | | 599,184 |
| | | | |
|
|
Office Equipment — 0.7% | | | | | |
School Specialty, Inc.* | | 24,085 | | | 902,947 |
| | | | |
|
|
Oil & Field Services — 0.2% | | | | | |
Cal Dive International, Inc.* | | 22,700 | | | 284,885 |
| | | | |
|
|
Oil & Gas Equipment & Services — 2.7% | | | |
CARBO Ceramics, Inc. | | 16,000 | | | 597,920 |
TETRA Technologies, Inc.* | | 103,993 | | | 2,660,141 |
| | | | |
|
|
| | | | | | 3,258,061 |
| | | | |
|
|
Oil & Gas Exploration/Production — 1.9% | | | |
Core Laboratories NV (Netherlands)* | | 9,462 | | | 766,422 |
Hydril Co.* | | 7,800 | | | 586,482 |
Unit Corp.* | | 19,823 | | | 960,424 |
| | | | |
|
|
| | | | | | 2,313,328 |
| | | | |
|
|
Oil, Gas & Consumable Fuels — 1.3% | | | | | |
Berry Petroleum Co. (Class A Stock) | | 25,100 | | | 778,351 |
Comstock Resources, Inc.* | | 9,500 | | | 295,070 |
Oceaneering International, Inc.* | | 12,555 | | | 498,434 |
| | | | |
|
|
| | | | | | 1,571,855 |
| | | | |
|
|
Personell Services | | | | | |
TALX Corp. | | 1,500 | | | 41,175 |
| | | | |
|
|
Pharmaceuticals — 0.3% | | | | | |
Cubist Pharmaceuticals, Inc.* | | 20,410 | | | 369,625 |
| | | | |
|
|
Publishing — 0.6% | | | | | |
Courier Corp. | | 17,700 | | | 689,769 |
| | | | |
|
|
Retail — 5.1% | | | | | |
Build-A-Bear Workshop, Inc.*(a) | | 35,091 | | | 983,250 |
Cash America International, Inc. | | 46,207 | | | 2,167,108 |
Genesco, Inc.*(a) | | 36,403 | | | 1,357,832 |
Red Robin Gourmet Burgers, Inc.* | | 10,900 | | | 390,765 |
Ruby Tuesday, Inc. | | 22,600 | | | 620,144 |
Steak N Shake Co. (The)* | | 44,100 | | | 776,160 |
| | | | |
|
|
| | | | | | 6,295,259 |
| | | | |
|
|
Retail & Merchandising — 0.8% | | | | | |
Guitar Center, Inc.*(a) | | 8,200 | | | 372,772 |
MSC Industrial Direct, Inc. (Class A Stock) | | 15,600 | | | 610,740 |
| | | | |
|
|
| | | | | | 983,512 |
| | | | |
|
|
SEE NOTES TO FINANCIAL STATEMENTS.
B45
| | | | |
| | | SP SMALL CAP GROWTH PORTFOLIO (Continued) | | |
SCHEDULE OF INVESTMENTS December 31, 2006 | |
| | | | | | |
COMMON STOCKS
(Continued) | | Shares
| | Value
(Note 2)
| |
Road & Rail — 0.7% | | | | | | |
Landstar System, Inc. | | 22,900 | | $ | 874,322 | |
| | | | |
|
|
|
Semiconductors & Semiconductor Equipment — 3.0% | |
Integrated Device Technology, Inc.* | | 81,412 | | | 1,260,258 | |
OYO Geospace Corp.* | | 30,348 | | | 1,762,915 | |
Supertex, Inc.* | | 15,680 | | | 615,440 | |
| | | | |
|
|
|
| | | | | | 3,638,613 | |
| | | | |
|
|
|
Software — 0.5% | | | | | | |
Netsmart Technologies, Inc.* | | 38,595 | | | 626,783 | |
| | | | |
|
|
|
Specialty Retail — 0.2% | | | | | | |
Hibbett Sporting Goods, Inc.* | | 9,800 | | | 299,194 | |
| | | | |
|
|
|
Telecommunications — 1.0% | | | | | | |
EMS Technologies, Inc.* | | 34,019 | | | 681,401 | |
Ixia* | | 58,652 | | | 563,059 | |
| | | | |
|
|
|
| | | | | | 1,244,460 | |
| | | | |
|
|
|
Transportation Services — 2.1% | | | | | | |
Bristow Group, Inc.* | | 7,800 | | | 281,502 | |
Forward Air Corp. | | 21,900 | | | 633,567 | |
Heartland Express, Inc. | | 52,366 | | | 786,537 | |
HUB Group, Inc. (Class A Stock)* | | 30,800 | | | 848,540 | |
| | | | |
|
|
|
| | | | | | 2,550,146 | |
| | | | |
|
|
|
Waste Management — 2.2% | | | | | | |
Stericycle, Inc.* | | 5,000 | | | 377,500 | |
Waste Connections, Inc.*(a) | | 56,898 | | | 2,364,112 | |
| | | | |
|
|
|
| | | | | | 2,741,612 | |
| | | | |
|
|
|
TOTAL LONG-TERM INVESTMENTS
(cost $92,095,068) | | | 112,500,853 | |
| | | | |
|
|
|
| SHORT-TERM INVESTMENT — 33.4% | |
Affiliated Money Market Mutual Fund | |
Dryden Core Investment Fund — Taxable Money Market Series (cost $41,045,186; includes $30,519,848 of cash collateral for securities on loan)(b)(w) (Note 4) | | 41,045,186 | | | 41,045,186 | |
| | | | |
|
|
|
TOTAL INVESTMENTS — 124.8%
(cost $133,140,254) | | | 153,546,039 | |
LIABILITIES IN EXCESS OF OTHER ASSETS — (24.8)% | | | (30,529,503 | ) |
| | | | |
|
|
|
NET ASSETS — 100.0% | | $ | 123,016,536 | |
| | | | |
|
|
|
The following abbreviations are used in portfolio descriptions:
| | |
| ADR | | American Depositary Receipt |
| * | Non-income producing security. |
| (a) | All or a portion of security is on loan. The aggregate market value of such securities is $29,027,470; cash collateral of $30,519,848 (included with liabilities) was received with which the portfolio purchased highly liquid short-term investments. |
| (b) | Represents security, or a portion thereof, purchased with cash collateral received for securities on loan. |
| (w) | Prudential Investments LLC, the manager of the Portfolio, also serves as manager of the Dryden Core Investment Fund-Taxable Money Market Series. |
The industry classification of long-term portfolio holdings, short-term investments and liabilities in excess of other assets shown as a percentage of net assets as of December 31, 2006 were as follows:
| | | |
Industry
| | | |
Affiliated Money Market Mutual Fund (including 24.8% of collateral received for securities on loan) | | 33.4 | % |
Medical Products | | 7.8 | |
Machinery | | 5.5 | |
Retail | | 5.1 | |
Computer Services & Software | | 5.0 | |
Health Services | | 3.7 | |
Financial Services | | 3.4 | |
Chemicals | | 3.3 | |
Semiconductors & Semiconductor Equipment | | 3.0 | |
Commercial Services | | 2.8 | |
Oil & Gas Equipment & Services | | 2.7 | |
Electronics | | 2.6 | |
Commercial Services & Supplies | | 2.4 | |
Insurance | | 2.3 | |
Waste Management | | 2.2 | |
Electronic Components | | 2.2 | |
Distribution/Wholesale | | 2.2 | |
Diversified Manufacturing Operations | | 2.1 | |
Transportation Services | | 2.1 | |
Banking | | 1.9 | |
Oil & Gas Exploration/Production | | 1.9 | |
Media | | 1.8 | |
Internet Services | | 1.8 | |
Building Materials | | 1.8 | |
Electrical Equipment | | 1.6 | |
Consumer Products & Services | | 1.3 | |
Oil, Gas & Consumable Fuels | | 1.3 | |
Clothing & Apparel | | 1.2 | |
Biotechnology | | 1.0 | |
Telecommunications | | 1.0 | |
Medical Supplies & Equipment | | 0.9 | |
Retail & Merchandising | | 0.8 | |
Office Equipment | | 0.7 | |
Apparel Manufacturers | | 0.7 | |
Entertainment | | 0.7 | |
Road & Rail | | 0.7 | |
Capital Markets | | 0.7 | |
Leisure | | 0.6 | |
Financial — Brokerage | | 0.6 | |
Healthcare Providers & Services | | 0.6 | |
Consulting | | 0.6 | |
Publishing | | 0.6 | |
Household Products | | 0.5 | |
Gaming | | 0.5 | |
Software | | 0.5 | |
Aerospace | | 0.5 | |
Mineral Resources | | 0.5 | |
Business Services | | 0.5 | |
Metals & Mining | | 0.4 | |
Entertainment & Leisure | | 0.4 | |
Healthcare Equipment & Supplies | | 0.4 | |
Instruments — Controls | | 0.3 | |
Foods | | 0.3 | |
Pharmaceuticals | | 0.3 | |
Healthcare-Products | | 0.3 | |
Specialty Retail | | 0.2 | |
Conglomerates | | 0.2 | |
Oil & Field Services | | 0.2 | |
Construction | | 0.2 | |
| | |
|
|
| | | 124.8 | |
Liabilities in excess of other assets | | (24.8 | ) |
| | |
|
|
| | | 100.0 | % |
| | |
|
|
SEE NOTES TO FINANCIAL STATEMENTS.
B46
| | | | |
| | | SP SMALL CAP VALUE PORTFOLIO | | |
SCHEDULE OF INVESTMENTS December 31, 2006 | |
| | | | | |
| LONG-TERM INVESTMENTS — 95.3% | | Value
(Note 2)
|
| COMMON STOCKS | | Shares
| |
Aerospace — 2.0% | | | | | |
DRS Technologies, Inc. | | 46,110 | | $ | 2,429,075 |
Ducommun, Inc.* | | 8,626 | | | 197,363 |
Heico Corp. (Class A Stock) | | 61,000 | | | 1,987,380 |
MTC Technologies, Inc.* | | 25,353 | | | 597,063 |
Orbital Sciences Corp.* | | 109,700 | | | 2,022,868 |
| | | | |
|
|
| | | | | | 7,233,749 |
| | | | |
|
|
Airlines — 0.9% | | | | | |
AirTran Holdings, Inc.*(a) | | 211,398 | | | 2,481,812 |
SkyWest, Inc. | | 28,200 | | | 719,382 |
| | | | |
|
|
| | | | | | 3,201,194 |
| | | | |
|
|
Auto Components — 1.4% | | | | | |
Cooper Tire & Rubber Co.(a) | | 156,500 | | | 2,237,950 |
Sauer-Danfoss, Inc. | | 49,800 | | | 1,606,050 |
Superior Industries International, Inc.(a) | | 61,360 | | | 1,182,407 |
| | | | |
|
|
| | | | | | 5,026,407 |
| | | | |
|
|
Automobile Manufacturers — 0.7% | | | | | |
Wabash National Corp. | | 178,502 | | | 2,695,380 |
| | | | |
|
|
Automotive Parts — 0.7% | | | | | |
Commercial Vehicle Group, Inc.* | | 48,844 | | | 1,064,799 |
Tenneco Automotive, Inc.* | | 65,530 | | | 1,619,902 |
| | | | |
|
|
| | | | | | 2,684,701 |
| | | | |
|
|
Banks — 0.2% | | | | | |
Sterling Financial Corp. | | 5,100 | | | 172,431 |
West Coast Bancorp | | 11,397 | | | 394,792 |
| | | | |
|
|
| | | | | | 567,223 |
| | | | |
|
|
Basic Materials – Mining — 0.1% | | | | | |
Olympic Steel Inc. | | 18,529 | | | 411,900 |
| | | | |
|
|
Biotechnology — 0.5% | | | | | |
iShares Nasdaq Biotech Index*(a) | | 24,800 | | | 1,928,448 |
| | | | |
|
|
Building Materials — 0.6% | | | | | |
Comfort Systems USA, Inc. | | 67,987 | | | 859,356 |
Trex Co., Inc.* | | 3,100 | | | 70,959 |
Universal Forest Products, Inc. | | 27,272 | | | 1,271,420 |
| | | | |
|
|
| | | | | | 2,201,735 |
| | | | |
|
|
Building Products — 1.3% | | | | | |
Goodman Global, Inc.*(a) | | 79,321 | | | 1,364,321 |
Patrick Industries, Inc.* | | 85,700 | | | 1,064,823 |
Simpson Manufacturing Co, Inc.(a) | | 78,300 | | | 2,478,195 |
| | | | |
|
|
| | | | | | 4,907,339 |
| | | | |
|
|
Business Services — 0.8% | | | | | |
efunds Corp.* | | 56,812 | | | 1,562,330 |
Macquarie Infrastucture Co. Trust | | 22,457 | | | 796,774 |
Resources Connection, Inc.* | | 22,272 | | | 709,141 |
| | | | |
|
|
| | | | | | 3,068,245 |
| | | | |
|
|
Capital Markets — 0.3% | | | | | |
Investors Financial Services Corp.(a) | | 22,200 | | | 947,274 |
| | | | |
|
|
Chemicals — 1.9% | | | | | |
Albemarle Corp. | | 22,859 | | | 1,641,276 |
American Vanguard Corp.(a) | | 10,914 | | | 173,533 |
H.B. Fuller Co.(a) | | 24,559 | | | 634,113 |
KMG Chemicals, Inc. | | 24,443 | | | 244,430 |
Minerals Technologies, Inc. | | 33,323 | | | 1,959,059 |
| | | | | |
COMMON STOCKS
(Continued) | | Shares
| | Value
(Note 2)
|
Chemicals (cont’d.) | | | | | |
NuCO2, Inc.* | | 15,410 | | $ | 378,932 |
Penford Corp. | | 16,905 | | | 292,457 |
UAP Holding Corp. | | 61,591 | | | 1,550,861 |
| | | | |
|
|
| | | | | | 6,874,661 |
| | | | |
|
|
Clothing & Apparel — 0.4% | | | | | |
Gymboree Corp.* | | 14,554 | | | 555,380 |
K-Swiss, Inc. (Class A Stock) | | 24,305 | | | 747,136 |
| | | | |
|
|
| | | | | | 1,302,516 |
| | | | |
|
|
Commercial Banks — 6.4% | | | | | |
Alabama National Bancorp | | 24,108 | | | 1,656,943 |
Alliance Bankshares Corp.* | | 15,560 | | | 243,514 |
Bancorp Bank (The)* | | 57,141 | | | 1,691,373 |
BancTrust Financial Group, Inc. | | 53,484 | | | 1,364,912 |
Capital Corp of the West | | 41,900 | | | 1,344,571 |
Cardinal Financial Corp. | | 49,860 | | | 511,065 |
Cascade Financial Corp. | | 71,725 | | | 1,224,346 |
Central Pacific Financial Corp. | | 89,967 | | | 3,487,121 |
City National Corp. | | 13,000 | | | 925,600 |
Cullen Frost Bankers, Inc. | | 29,100 | | | 1,624,362 |
First Security Group, Inc. | | 95,190 | | | 1,097,541 |
First State Bancorp | | 11,890 | | | 294,277 |
FNB Corp. | | 34,264 | | | 626,003 |
Midwest Banc Holdings, Inc. | | 103,939 | | | 2,468,551 |
PAB Bankshares, Inc. | | 17,570 | | | 375,471 |
Tompkins Trustco, Inc. | | 11,260 | | | 511,767 |
UCBH Holdings, Inc. | | 101,100 | | | 1,775,316 |
Umpqua Holdings Corp. | | 75,800 | | | 2,230,794 |
| | | | |
|
|
| | | | | | 23,453,527 |
| | | | |
|
|
Commercial Services — 0.6% | | | | | |
ITT Educational Services, Inc.* | | 7,754 | | | 514,633 |
MAXIMUS, Inc. | | 20,245 | | | 623,141 |
Providence Service Corp.*(a) | | 37,763 | | | 948,984 |
| | | | |
|
|
| | | | | | 2,086,758 |
| | | | |
|
|
Commercial Services & Supplies — 2.1% | | | | | |
Hewitt Associates, Inc. (Class A Stock)* | | 15,293 | | | 393,795 |
John H. Harland Co.(a) | | 31,900 | | | 1,601,380 |
Labor Ready, Inc.* | | 124,300 | | | 2,278,419 |
United Stationers, Inc.* | | 29,400 | | | 1,372,686 |
Watson Wyatt & Co. Holdings | | 47,500 | | | 2,144,625 |
| | | | |
|
|
| | | | | | 7,790,905 |
| | | | |
|
|
Communication Equipment — 2.1% | | | | | |
Bel Fuse, Inc. (Class B Stock) | | 16,200 | | | 563,598 |
Black Box Corp. | | 37,900 | | | 1,591,421 |
Foundry Networks, Inc.* | | 236,167 | | | 3,537,782 |
NETGEAR, Inc.*(a) | | 80,900 | | | 2,123,625 |
| | | | |
|
|
| | | | | | 7,816,426 |
| | | | |
|
|
Computer Hardware — 0.5% | | | | | |
Electronics for Imaging, Inc.* | | 50,325 | | | 1,337,639 |
MTS Systems Corp. | | 10,594 | | | 409,140 |
| | | | |
|
|
| | | | | | 1,746,779 |
| | | | |
|
|
Computer Services & Software — 1.4% | | | | | |
BISYS Group, Inc. (The)*(a) | | 42,032 | | | 542,633 |
JDA Software Group, Inc.* | | 84,259 | | | 1,160,247 |
SEE NOTES TO FINANCIAL STATEMENTS.
B47
| | | | |
| | | SP SMALL CAP VALUE PORTFOLIO (Continued) | | |
SCHEDULE OF INVESTMENTS December 31, 2006 | |
| | | | | |
COMMON STOCKS
(Continued) | | Shares
| | Value
(Note 2)
|
Computer Services & Software (cont’d.) | | | | | |
Kanbay International, Inc.*(a) | | 15,560 | | $ | 447,661 |
MICRO Systems, Inc.*(a) | | 6,868 | | | 361,944 |
Parametric Technology Corp.*(a) | | 100,971 | | | 1,819,497 |
Transactions Systems Architects, Inc.* | | 17,469 | | | 568,965 |
Witness Systems, Inc.* | | 20,641 | | | 361,837 |
| | | | |
|
|
| | | | | | 5,262,784 |
| | | | |
|
|
Computers & Peripherals — 0.2% | | | | | |
Rimage Corp.* | | 25,000 | | | 650,000 |
| | | | |
|
|
Construction — 1.2% | | | | | |
Beazer Homes USA, Inc. | | 22,413 | | | 1,053,635 |
Builders FirstSource, Inc.* | | 15,304 | | | 272,870 |
Hovnanian Enterprises, Inc. (Class A Stock)* | | 28,731 | | | 973,981 |
Infrasource Services, Inc.* | | 29,068 | | | 632,810 |
Modtech Holdings, Inc.* | | 41,966 | | | 207,732 |
Ryland Group, Inc.(a) | | 21,311 | | | 1,164,007 |
| | | | |
|
|
| | | | | | 4,305,035 |
| | | | |
|
|
Consumer Products & Services — 1.2% | | | | | |
Elizabeth Arden, Inc.* | | 68,017 | | | 1,295,724 |
Fossil, Inc.*(a) | | 60,629 | | | 1,369,003 |
Playtex Products, Inc.*(a) | | 98,731 | | | 1,420,739 |
Prestige Brands Holdings, Inc.* | | 29,059 | | | 378,348 |
| | | | |
|
|
| | | | | | 4,463,814 |
| | | | |
|
|
Containers & Packaging — 0.5% | | | | | |
AptarGroup, Inc. | | 33,200 | | | 1,960,128 |
| | | | |
|
|
Distribution/Wholesale — 0.6% | | | | | |
Owens & Minor, Inc. | | 29,137 | | | 911,114 |
Watsco, Inc. | | 29,258 | | | 1,379,807 |
| | | | |
|
|
| | | | | | 2,290,921 |
| | | | |
|
|
Diversified — 0.4% | | | | | |
Actuant Corp. (Class A Stock) | | 8,684 | | | 413,792 |
Lydall, Inc.* | | 19,380 | | | 209,498 |
Technology Investment Capital Corp. | | 43,035 | | | 694,585 |
| | | | |
|
|
| | | | | | 1,317,875 |
| | | | |
|
|
Diversified Consumer Services — 0.4% | | | | | |
Steiner Leisure Ltd.* | | 35,850 | | | 1,631,175 |
| | | | |
|
|
Diversified Financial Services — 0.6% | | | | | |
Portfolio Recovery Associates, Inc.*(a) | | 47,800 | | | 2,231,782 |
| | | | |
|
|
Diversified Machinery — 0.2% | | | | | |
Intermec, Inc.*(a) | | 25,960 | | | 630,049 |
| | | | |
|
|
Electric Utilities — 0.2% | | | | | |
MGE Energy, Inc. | | 16,038 | | | 586,670 |
| | | | |
|
|
Electronic Components — 0.8% | | | | | |
CyberOptics Corp.* | | 13,321 | | | 168,777 |
EDO Corp.(a) | | 28,776 | | | 683,142 |
Empire District Electric Co. The(a) | | 2,001 | | | 49,405 |
GrafTech International Ltd.* | | 159,857 | | | 1,106,211 |
ITC Holdings Corp. | | 2,966 | | | 118,343 |
LoJack Corp.* | | 28,434 | | | 485,653 |
Semtech Corp.* | | 36,030 | | | 470,912 |
| | | | |
|
|
| | | | | | 3,082,443 |
| | | | |
|
|
| | | | | |
COMMON STOCKS
(Continued) | | Shares
| | Value
(Note 2)
|
Electronic Equipment & Instruments — 0.5% | | | |
Tektronix, Inc. | | 67,400 | | $ | 1,966,058 |
| | | | |
|
|
Electronics — 0.3% | | | | | |
Belden CDT, Inc.(a) | | 31,588 | | | 1,234,775 |
| | | | |
|
|
Energy Equipment & Services — 1.3% | | | | | |
Input Output, Inc.*(a) | | 125,800 | | | 1,714,654 |
National-Oilwell Varco, Inc.* | | 44,100 | | | 2,698,038 |
Superior Well Services, Inc.* | | 21,000 | | | 536,760 |
| | | | |
|
|
| | | | | | 4,949,452 |
| | | | |
|
|
Engineering/Construction — 0.9% | | | | | |
EMCOR Group, Inc.* | | 35,300 | | | 2,006,805 |
Perini Corp.* | | 42,100 | | | 1,295,838 |
| | | | |
|
|
| | | | | | 3,302,643 |
| | | | |
|
|
Entertainment & Leisure — 0.4% | | | | | |
Boyd Gaming Corp. | | 21,848 | | | 989,933 |
Isle of Capri Casinos* | | 12,829 | | | 340,995 |
| | | | |
|
|
| | | | | | 1,330,928 |
| | | | |
|
|
Environmental Services — 0.4% | | | | | |
Waste Connections, Inc.* | | 35,435 | | | 1,472,324 |
| | | | |
|
|
Equipment Services — 0.3% | | | | | |
Aaron Rents, Inc. | | 33,365 | | | 960,245 |
| | | | |
|
|
Exchange Traded Fund — 2.5% | | | | | |
iShares Russell 2000 Value Index Fund(a) | | 113,540 | | | 9,085,471 |
| | | | |
|
|
Financial – Bank & Trust — 3.6% | | | | | |
Bank of The Ozarks, Inc. | | 3,101 | | | 102,519 |
Chittenden Corp. | | 18,451 | | | 566,261 |
Citizens Banking Corp.(a) | | 27,351 | | | 724,802 |
Columbia Banking System, Inc. | | 21,499 | | | 755,045 |
First Financial Bankshare, Inc. | | 5,847 | | | 244,755 |
Glacier Bancorp, Inc. | | 37,309 | | | 911,832 |
IBERIABANK Corp. | | 45,449 | | | 2,683,763 |
Irwin Financial Corp. | | 21,387 | | | 483,988 |
Millennium Bankshares Corp. | | 35,664 | | | 332,389 |
Nexity Financial Corp.* | | 14,174 | | | 170,088 |
Placer Sierra Bancshares | | 37,437 | | | 889,878 |
Prosperity Bancshares, Inc. | | 24,886 | | | 858,816 |
Signature Bank* | | 65,541 | | | 2,030,460 |
Southcoast Financial Corp.* | | 13,144 | | | 272,081 |
Sterling Bancorp | | 14,604 | | | 287,699 |
Summit State Bank | | 10,512 | | | 134,133 |
Texas United Bancshares, Inc. | | 14,110 | | | 484,537 |
United Community Banks, Inc. | | 39,642 | | | 1,281,229 |
| | | | |
|
|
| | | | | | 13,214,275 |
| | | | |
|
|
Financial Services — 3.3% | | | | | |
Accredited Home*(a) | | 67,257 | | | 1,834,771 |
Affiliated Managers Group, Inc.*(a) | | 7,256 | | | 762,823 |
Apollo Investment Corp. | | 21,498 | | | 481,555 |
Berkshire Hills Bancorp, Inc. | | 18,656 | | | 624,230 |
Brookline Bancorp, Inc. | | 53,768 | | | 708,125 |
Fidelity Bankshares, Inc. | | 23,190 | | | 919,947 |
Financial Federal Corp.(a) | | 97,622 | | | 2,871,063 |
First Niagara Financial Group, Inc. | | 61,773 | | | 917,947 |
SEE NOTES TO FINANCIAL STATEMENTS.
B48
| | | | |
| | | SP SMALL CAP VALUE PORTFOLIO (Continued) | | |
SCHEDULE OF INVESTMENTS December 31, 2006 | |
| | | | | |
COMMON STOCKS
(Continued) | | Shares
| | Value
(Note 2)
|
Financial Services (cont’d.) | | | | | |
Knight Trading Group, Inc. (Class A Stock)* | | 25,447 | | $ | 487,819 |
PFF Bancorp, Inc. | | 70,522 | | | 2,433,714 |
| | | | |
|
|
| | | | | | 12,041,994 |
| | | | |
|
|
Food Products — 1.5% | | | | | |
Del Monte Foods Co.(a) | | 238,600 | | | 2,631,758 |
Nash Finch Co.(a) | | 22,497 | | | 614,168 |
Pilgrim’s Pride Corp. | | 71,800 | | | 2,113,074 |
Sanderson Farms, Inc. | | 5,620 | | | 170,230 |
| | | | |
|
|
| | | | | | 5,529,230 |
| | | | |
|
|
Gas Utilities — 0.3% | | | | | |
New Jersey Resources Corp. | | 20,500 | | | 995,890 |
| | | | |
|
|
Healthcare Equipment & Supplies — 0.3% | | | | | |
National Dentex Corp.* | | 70,280 | | | 1,229,900 |
| | | | |
|
|
Healthcare Providers & Services — 1.6% | | | | | |
AMERIGROUP Corp.* | | 37,100 | | | 1,331,519 |
Apria Healthcare Group, Inc.* | | 55,200 | | | 1,471,080 |
Cross Country, Inc* | | 99,000 | | | 2,160,180 |
Rehabcare Group, Inc.* | | 75,200 | | | 1,116,720 |
| | | | |
|
|
| | | | | | 6,079,499 |
| | | | |
|
|
Healthcare Services | | | | | |
Amedisys, Inc.* | | 1 | | | 33 |
| | | | |
|
|
Healthcare Techology — 0.2% | | | | | |
Dendrite International, Inc.* | | 64,800 | | | 694,008 |
| | | | |
|
|
Healthcare – Products — 0.3% | | | | | |
American Medical Systems Holdings, Inc.*(a) | | 63,364 | | | 1,173,501 |
| | | | |
|
|
Hotels & Motels — 0.1% | | | | | |
Aztar Corp.* | | 9,772 | | | 531,792 |
| | | | |
|
|
Hotels, Restaurants & Leisure — 0.8% | | | | | |
Applebee’s International, Inc. | | 22,606 | | | 557,690 |
O’ Charleys, Inc.* | | 113,100 | | | 2,406,768 |
| | | | |
|
|
| | | | | | 2,964,458 |
| | | | |
|
|
Household Durables — 1.6% | | | | | |
Furniture Brands International, Inc.(a) | | 120,500 | | | 1,955,715 |
Snap-On, Inc. | | 28,700 | | | 1,367,268 |
Tupperware Corp. | | 63,400 | | | 1,433,474 |
WCI Communities, Inc.*(a) | | 69,839 | | | 1,339,512 |
| | | | |
|
|
| | | | | | 6,095,969 |
| | | | |
|
|
Industrial Products — 0.2% | | | | | |
UniFirst Corp. | | 16,007 | | | 614,829 |
| | | | |
|
|
Information Technology Services — 0.7% | | | | | |
Medquist, Inc.* | | 22,370 | | | 304,232 |
Perot Systems Corp. (Class A Stock)* | | 131,000 | | | 2,147,090 |
| | | | |
|
|
| | | | | | 2,451,322 |
| | | | |
|
|
Insurance — 3.5% | | | | | |
Allied World Assurance Holdings Ltd. | | 48,650 | | | 2,122,600 |
American Equity Investment Life Holding Co. | | 100,884 | | | 1,314,519 |
Aspen Insurance Holdings Ltd. (Bermuda) | | 28,440 | | | 749,678 |
| | | | | |
COMMON STOCKS
(Continued) | | Shares
| | Value
(Note 2)
|
Insurance (cont’d.) | | | | | |
CNA Financial Corp.* | | 75,392 | | $ | 1,620,928 |
Donegal Group, Inc. | | 21,249 | | | 416,268 |
Midland Co. (The) | | 19,373 | | | 812,697 |
National Atlantic Holdings Corp.* | | 21,488 | | | 250,550 |
Navigators Group, Inc.* | | 16,302 | | | 785,430 |
NYMAGIC, Inc. | | 14,155 | | | 518,073 |
ProAssurance Corp.*(a) | | 28,200 | | | 1,407,744 |
Procentury Corp. | | 51,803 | | | 958,356 |
RLI Corp. | | 21,369 | | | 1,205,639 |
StanCorp Financial Group, Inc. | | 16,759 | | | 754,993 |
| | | | |
|
|
| | | | | | 12,917,475 |
| | | | |
|
|
Internet Services — 0.1% | | | | | |
Vignette Corp.* | | 16,580 | | | 283,021 |
| | | | |
|
|
Leisure Equipment & Products — 1.2% | | | | | |
Callaway Gulf Co. | | 126,000 | | | 1,815,660 |
K2, Inc.*(a) | | 202,720 | | | 2,673,877 |
| | | | |
|
|
| | | | | | 4,489,537 |
| | | | |
|
|
Life Science Tools & Services — 0.2% | | | | | |
Enzo Biochem, Inc.*(a) | | 56,500 | | | 806,255 |
| | | | |
|
|
Machinery & Equipment — 5.0% | | | | | |
Albany International Corp. (Class A Stock)(a) | | 54,300 | | | 1,787,013 |
Applied Industrial Technologies, Inc.(a) | | 19,507 | | | 513,229 |
Baldor Electric Co. | | 9,913 | | | 331,292 |
Crane Co. | | 61,700 | | | 2,260,688 |
Franklin Electric Co., Inc. | | 10,081 | | | 518,063 |
IDEX Corp. | | 47,300 | | | 2,242,493 |
Kaydon Corp. | | 53,300 | | | 2,118,142 |
Kennametal, Inc. | | 32,500 | | | 1,912,625 |
Mueller Industries, Inc. | | 92,913 | | | 2,945,342 |
RBC Bearings, Inc.* | | 51,280 | | | 1,469,685 |
Tennant Co. | | 16,081 | | | 466,349 |
Wabtec Corp. | | 63,300 | | | 1,923,054 |
| | | | |
|
|
| | | | | | 18,487,975 |
| | | | |
|
|
Marine — 0.5% | | | | | |
Kirby Corp.*(a) | | 59,200 | | | 2,020,496 |
| | | | |
|
|
Medical Supplies & Equipment — 1.0% | | | | | |
Cardiac Science Corp.* | | 95,532 | | | 770,943 |
PerkinElmer, Inc. | | 69,140 | | | 1,536,982 |
Symmetry Medical, Inc.* | | 79,869 | | | 1,104,589 |
Wilson Greatbatch Technologies, Inc.* | | 3,974 | | | 106,980 |
| | | | |
|
|
| | | | | | 3,519,494 |
| | | | |
|
|
Metals & Mining — 1.2% | | | | | |
Commercial Metals Co. | | 47,851 | | | 1,234,556 |
Gibraltar Industries, Inc. | | 102,690 | | | 2,414,242 |
Meridian Gold, Inc.* | | 23,400 | | | 650,286 |
| | | | |
|
|
| | | | | | 4,299,084 |
| | | | |
|
|
Multi-Line Retail — 0.4% | | | | | |
Dillard’s, Inc. (Class A Stock) | | 47,700 | | | 1,668,069 |
| | | | |
|
|
Multi-Utilities | | | | | |
Vectren Corp. | | 2,874 | | | 81,277 |
| | | | |
|
|
Networking/Telecom Equipment | | | | | |
Aeroflex, Inc.* | | 11,573 | | | 135,636 |
| | | | |
|
|
SEE NOTES TO FINANCIAL STATEMENTS.
B49
| | | | |
| | | SP SMALL CAP VALUE PORTFOLIO (Continued) | | |
SCHEDULE OF INVESTMENTS December 31, 2006 | |
| | | | | |
COMMON STOCKS
(Continued) | | Shares
| | Value
(Note 2)
|
Oil, Gas & Consumable Fuels — 4.3% | | | | | |
Denbury Resources, Inc.* | | 77,300 | | $ | 2,148,167 |
Geomet, Inc.*(a) | | 44,761 | | | 465,514 |
Hydril Co.* | | 6,218 | | | 467,532 |
Northwest Natural Gas Co. | | 54,959 | | | 2,332,460 |
Oil States International*(a) | | 44,070 | | | 1,420,376 |
Parallel Petroleum Corp.*(a) | | 59,576 | | | 1,046,750 |
Range Resources Corp. | | 51,690 | | | 1,419,407 |
South Jersey Industries, Inc. | | 30,115 | | | 1,006,142 |
Southeastern Michigan Gas Enterprises, Inc.* | | 26,509 | | | 161,705 |
Southwest Gas Corp. | | 22,048 | | | 845,982 |
W-H Energy Services, Inc.* | | 17,770 | | | 865,221 |
Williams Partners LP | | 42,425 | | | 1,641,848 |
XTO Energy, Inc. | | 43,400 | | | 2,041,970 |
| | | | |
|
|
| | | | | | 15,863,074 |
| | | | |
|
|
Paper & Forest Products — 0.3% | | | | | |
Caraustar Industries, Inc.* | | 136,057 | | | 1,100,701 |
| | | | |
|
|
Pharmaceuticals — 0.8% | | | | | |
Bentley Pharmaceuticals, Inc.*(a) | | 120,500 | | | 1,225,485 |
Medarex, Inc.* | | 85,287 | | | 1,261,395 |
Salix Pharmaceuticals Ltd.*(a) | | 28,167 | | | 342,792 |
| | | | |
|
|
| | | | | | 2,829,672 |
| | | | |
|
|
Pipelines — 0.1% | | | | | |
Dynegy, Inc. (Class A Stock)* | | 28,302 | | | 204,906 |
| | | | |
|
|
Real Estate Investment Trust – Apartment — 0.2% |
American Campus Communities, Inc. | | 30,501 | | | 868,363 |
| | | | |
|
|
Real Estate Investment Trust – Office Industrial — 0.4% |
Brandywine Realty Trust | | 46,930 | | | 1,560,422 |
| | | | |
|
|
Real Estate Investment Trust – Other REIT — 1.7% |
Acadia Realty Trust | | 28,547 | | | 714,246 |
Agree Realty Corp. | | 7,051 | | | 242,343 |
Digital Realty Trust, Inc. | | 21,555 | | | 737,828 |
Health Care REIT, Inc. | | 96 | | | 4,130 |
Omega Healthcare Investors, Inc. | | 89,555 | | | 1,586,915 |
Spirit Finance Corp. | | 162,726 | | | 2,029,193 |
U-Store-It Trust | | 51,428 | | | 1,056,845 |
| | | | |
|
|
| | | | | | 6,371,500 |
| | | | |
|
|
Real Estate Investment Trusts — 4.6% |
American Land Lease, Inc. | | 30,100 | | | 797,951 |
Biomed Realty Trust, Inc. | | 40,520 | | | 1,158,872 |
Cogdell Spencer, Inc. | | 22,961 | | | 493,661 |
Cousins Properties, Inc. | | 51,600 | | | 1,819,932 |
Duke Realty Corp. | | 20,200 | | | 826,180 |
Entertainment Properties Trust | | 19,107 | | | 1,116,613 |
LaSalle Hotel Properties | | 60,233 | | | 2,761,683 |
Lexington Corp. Properties Trust(a) | | 51,516 | | | 1,155,504 |
Liberty Property Trust(a) | | 18,200 | | | 894,348 |
MFA Mortgage Investments, Inc. | | 152,312 | | | 1,171,279 |
National Retail Properties(a) | | 52,204 | | | 1,198,082 |
Parkway Properties, Inc. | | 38,527 | | | 1,965,262 |
RAIT Investment Trust | | 51,095 | | | 1,761,756 |
| | | | |
|
|
| | | | | | 17,121,123 |
| | | | |
|
|
| | | | | |
COMMON STOCKS
(Continued) | | Shares
| | Value
(Note 2)
|
Restaurants — 1.2% |
California Pizza Kitchen, Inc.* | | 29,622 | | $ | 986,709 |
CEC Entertainment, Inc.* | | 32,432 | | | 1,305,388 |
Rare Hospitality International, Inc.* | | 33,640 | | | 1,107,765 |
Ruby Tuesday, Inc. | | 11,952 | | | 327,963 |
Steak N Shake Co. (The)* | | 34,656 | | | 609,945 |
| | | | |
|
|
| | | | | | 4,337,770 |
| | | | |
|
|
Retail — 0.3% |
Charming Shoppes, Inc.*(a) | | 75,640 | | | 1,023,409 |
| | | | |
|
|
Retail & Merchandising — 1.6% |
Big Lots, Inc.*(a) | | 63,707 | | | 1,460,164 |
Casey’s General Stores, Inc. | | 51,722 | | | 1,218,053 |
Christopher & Banks Corp. | | 9,105 | | | 169,899 |
Hot Topic, Inc.* | | 22,772 | | | 303,779 |
Insight Enterprises, Inc.* | | 69,281 | | | 1,307,332 |
School Specialty, Inc.*(a) | | 22,992 | | | 861,970 |
Select Comfort Corp.*(a) | | 21,099 | | | 366,912 |
Sharper Image Corp.*(a) | | 5,642 | | | 52,189 |
| | | | |
|
|
| | | | | | 5,740,298 |
| | | | |
|
|
Road & Rail — 0.2% |
Arkansas Best Corp. | | 24,200 | | | 871,200 |
| | | | |
|
|
Semiconductors & Semiconductor Equipment — 4.5% |
ATMI, Inc.* | | 27,696 | | | 845,559 |
Brooks Automation, Inc.* | | 86,444 | | | 1,244,794 |
Cabot Microelectronics Corp.* | | 30,100 | | | 1,021,594 |
Emulex Corp.* | | 90,726 | | | 1,770,064 |
Entegris, Inc.*(a) | | 52,143 | | | 564,187 |
Exar Corp.* | | 127,400 | | | 1,656,200 |
Form Factor, Inc.*(a) | | 12,614 | | | 469,871 |
Intergrated Device Technology, Inc.* | | 89,910 | | | 1,391,807 |
Kulicke & Soffa Industries, Inc.*(a) | | 241,500 | | | 2,028,600 |
Omnivision Technologies, Inc.*(a) | | 131,600 | | | 1,796,340 |
ON Semiconductor Corp.* | | 15,677 | | | 118,675 |
Tessera Technologies, Inc.* | | 33,718 | | | 1,360,184 |
Verigy Ltd. (Singapore)* | | 135,500 | | | 2,405,125 |
| | | | |
|
|
| | | | | | 16,673,000 |
| | | | |
|
|
Software — 1.8% |
Blackboard, Inc.*(a) | | 18,005 | | | 540,870 |
EPIQ Systems, Inc.* | | 70,100 | | | 1,189,597 |
Lawson Software, Inc.*(a) | | 509,879 | | | 3,768,006 |
McAfee, Inc.* | | 39,500 | | | 1,121,010 |
| | | | |
|
|
| | | | | | 6,619,483 |
| | | | |
|
|
Specialty Retail — 2.0% |
Buckle, Inc. The | | 30,500 | | | 1,550,925 |
Cato Corp. (Class A Stock) | | 76,370 | | | 1,749,637 |
Deb Shops, Inc. | | 46,710 | | | 1,233,144 |
Lithia Motors, Inc. (Class A Stock) | | 39,637 | | | 1,139,960 |
West Marine, Inc.*(a) | | 109,800 | | | 1,896,246 |
| | | | |
|
|
| | | | | | 7,569,912 |
| | | | |
|
|
Telecommunications — 2.0% |
Andrew Corp.* | | 34,476 | | | 352,690 |
Anixter International, Inc.*(a) | | 11,908 | | | 646,604 |
Dobson Communications Corp. (Class A Stock)* | | 168,936 | | | 1,471,433 |
SEE NOTES TO FINANCIAL STATEMENTS.
B50
| | | | |
| | | SP SMALL CAP VALUE PORTFOLIO (Continued) | | |
SCHEDULE OF INVESTMENTS December 31, 2006 | |
| | | | | | |
COMMON STOCKS
(Continued) | | Shares
| | Value
(Note 2)
| |
Telecommunications (cont’d.) | |
Hypercom Corp.* | | 37,403 | | $ | 237,509 | |
IPG Photonics Corp.* | | 3,642 | | | 87,408 | |
Knology, Inc.* | | 25,982 | | | 276,448 | |
Premiere Global Services, Inc.* | | 147,778 | | | 1,395,024 | |
RCN Corp.* | | 51,071 | | | 1,539,791 | |
Tekelec* | | 82,877 | | | 1,229,066 | |
| | | | |
|
|
|
| | | | | | 7,235,973 | |
| | | | |
|
|
|
Textiles — 0.2% | |
G & K Services, Inc. (Class A Stock) | | 15,277 | | | 594,123 | |
| | | | |
|
|
|
Textiles, Apparel & Luxury Goods — 0.6% | |
Timberland Co. (The) (Class A Stock)* | | 75,200 | | | 2,374,816 | |
| | | | |
|
|
|
Thrifts & Mortgage Finance — 1.1% | |
City Bank/Lynnwood WA | | 25,200 | | | 902,160 | |
PMI Group, Inc. (The) | | 53,600 | | | 2,528,312 | |
Triad Guaranty, Inc.* | | 11,540 | | | 633,200 | |
| | | | |
|
|
|
| | | | | | 4,063,672 | |
| | | | |
|
|
|
Transportation — 0.3% | |
Forward Air Corp. | | 17,643 | | | 510,412 | |
Heartland Express, Inc. | | 46,905 | | | 704,513 | |
| | | | |
|
|
|
| | | | | | 1,214,925 | |
| | | | |
|
|
|
Utilities — 1.7% | |
Cleco Corp. | | 41,507 | | | 1,047,222 | |
El Paso Electric Co.* | | 111,846 | | | 2,725,687 | |
Sierra Pacific Resources* | | 72,081 | | | 1,213,123 | |
Unisource Energy Corp. | | 8,665 | | | 316,532 | |
Westar Energy, Inc. | | 40,937 | | | 1,062,725 | |
| | | | |
|
|
|
| | | | | | 6,365,289 | |
| | | | |
|
|
|
TOTAL LONG-TERM INVESTMENTS
(cost $312,694,848) | | | 351,588,389 | |
| | | | |
|
|
|
| SHORT-TERM INVESTMENT — 24.5% | |
Affiliated Money Market Mutual Fund | |
Dryden Core Investment Fund — Taxable Money Market Series (cost $90,298,035; includes $67,120,284 of cash collateral for securities on loan)(b)(w)(Note 4) | | 90,298,035 | | | 90,298,035 | |
| | | | |
|
|
|
TOTAL INVESTMENTS — 119.8%
(cost $402,992,883; Note 6) | | | 441,886,424 | |
LIABILITIES IN EXCESS OF OTHER ASSETS — (19.8)% | | | (72,903,993 | ) |
| | | | |
|
|
|
NET ASSETS — 100.0% | | $ | 368,982,431 | |
| | | | |
|
|
|
The following abbreviations are used in portfolio descriptions:
| | |
| REIT | | Real Estate Investment Trust |
| * | Non-income producing security. |
| (a) | All or a portion of security is on loan. The aggregate market value of such securities is $63,899,354; cash collateral of $67,120,284 (included with liabilities) was received with which the portfolio purchased highly liquid short-term investments. |
| (b) | Represents security, or a portion thereof, purchased with cash collateral received for securities on loan. |
| (w) | Prudential Investments LLC, the manager of the Portfolio, also serves as manager of the Dryden Core Investment Fund — Taxable Money Market Series. |
The industry classification of long-term portfolio holdings, short-term investments and liabilities in excess of other assets shown as a percentage of net assets as of December 31, 2006 were as follows:
| | | |
Industry
| | | |
Affiliated Money Market Mutual Fund (includes 18.2% of collateral received for securities on loan) | | 24.5 | % |
Commercial Banks | | 6.4 | |
Machinery & Equipment | | 5.0 | |
Real Estate Investment Trusts | | 4.6 | |
Semiconductors & Semiconductor Equipment | | 4.5 | |
Oil, Gas & Consumable Fuels | | 4.3 | |
Financial — Bank & Trust | | 3.6 | |
Insurance | | 3.5 | |
Financial Services | | 3.3 | |
Exchange Traded Funds | | 2.5 | |
Communication Equipment | | 2.1 | |
Commercial Services & Supplies | | 2.1 | |
Specialty Retail | | 2.0 | |
Telecommunications | | 2.0 | |
Aerospace | | 2.0 | |
Chemicals | | 1.9 | |
Software | | 1.8 | |
Real Estate Investment Trust — Other Reit | | 1.7 | |
Utilities | | 1.7 | |
Household Durables | | 1.6 | |
Healthcare Providers & Services | | 1.6 | |
Retail & Merchandising | | 1.6 | |
Food Products | | 1.5 | |
Computer Services & Software | | 1.4 | |
Auto Components | | 1.4 | |
Energy Equipment & Services | | 1.3 | |
Building Products | | 1.3 | |
Leisure Equipment & Products | | 1.2 | |
Consumer Products & Services | | 1.2 | |
Restaurants | | 1.2 | |
Construction | | 1.2 | |
Metals & Mining | | 1.2 | |
Thrifts & Mortgage Finance | | 1.1 | |
Medical Supplies & Equipment | | 1.0 | |
Engineering/Construction | | 0.9 | |
Airlines | | 0.9 | |
Electronic Components | | 0.8 | |
Business Services | | 0.8 | |
Hotels, Restaurants & Leisure | | 0.8 | |
Pharmaceuticals | | 0.8 | |
Automobile Manufacturers | | 0.7 | |
Automotive Parts | | 0.7 | |
Information Technology Services | | 0.7 | |
Textiles, Apparel & Luxury Goods | | 0.6 | |
Distribution/Wholesale | | 0.6 | |
Diversified Financial Services | | 0.6 | |
Building Materials | | 0.6 | |
Commercial Services | | 0.6 | |
Marine | | 0.5 | |
SEE NOTES TO FINANCIAL STATEMENTS.
B51
| | | | |
| | | SP SMALL CAP VALUE PORTFOLIO (Continued) | | |
SCHEDULE OF INVESTMENTS December 31, 2006 | |
| | | |
Industry
| | | |
Electronic Equipment & Instruments | | 0.5 | % |
Containers & Packaging | | 0.5 | |
Biotechnology | | 0.5 | |
Computer Hardware | | 0.5 | |
Multi-Line Retail | | 0.4 | |
Diversified Consumer Services | | 0.4 | |
Real Estate Investment Trust — Office Industrial | | 0.4 | |
Environmental Services | | 0.4 | |
Entertainment & Leisure | | 0.4 | |
Diversified | | 0.4 | |
Clothing & Apparel | | 0.4 | |
Electronics | | 0.3 | |
Healthcare Equipment & Supplies | | 0.3 | |
Transportation | | 0.3 | |
Healthcare-Products | | 0.3 | |
Paper & Forest Products | | 0.3 | |
Retail | | 0.3 | |
Gas Utilities | | 0.3 | |
Equipment Services | | 0.3 | |
Capital Markets | | 0.3 | |
Road & Rail | | 0.2 | |
Real Estate Investment Trust — Apartment | | 0.2 | |
Life Science Tools & Services | | 0.2 | |
Healthcare Techology | | 0.2 | |
Computers & Peripherals | | 0.2 | |
Diversified Machinery | | 0.2 | |
Industrial Products | | 0.2 | |
Textiles | | 0.2 | |
Electric Utilities | | 0.2 | |
Banks | | 0.2 | |
Hotels & Motels | | 0.1 | |
Basic Materials — Mining | | 0.1 | |
Internet Services | | 0.1 | |
Pipelines | | 0.1 | |
| | |
|
|
| | | 119.8 | |
Liabilities in excess of other assets | | (19.8 | ) |
| | |
|
|
| | | 100.0 | % |
| | |
|
|
SEE NOTES TO FINANCIAL STATEMENTS.
B52
| | | | |
| | | SP STRATEGIC PARTNERS FOCUSED GROWTH PORTFOLIO | | |
SCHEDULE OF INVESTMENTS December 31, 2006 | |
| | | | | |
| LONG-TERM INVESTMENTS — 98.4% | | Value
(Note 2)
|
| COMMON STOCKS | | Shares
| |
Aerospace — 2.2% | | | | | |
Boeing Co. (The) | | 17,300 | | $ | 1,536,932 |
| | | | |
|
|
Beverages — 3.2% | | | | | |
PepsiCo, Inc. | | 35,500 | | | 2,220,525 |
| | | | |
|
|
Biotechnology — 8.5% | | | | | |
Genentech, Inc.* | | 33,300 | | | 2,701,629 |
Gilead Sciences, Inc.* | | 49,500 | | | 3,214,035 |
| | | | |
|
|
| | | | | | 5,915,664 |
| | | | |
|
|
Capital Markets — 2.0% |
Lazard Ltd. (Class A Stock) (Bermuda) | | 28,900 | | | 1,368,126 |
| | | | |
|
|
Communication Equipment — 5.2% |
QUALCOMM, Inc. | | 58,700 | | | 2,218,273 |
Research in Motion Ltd. (Canada)* | | 11,000 | | | 1,405,580 |
| | | | |
|
|
| | | | | | 3,623,853 |
| | | | |
|
|
Computer Hardware — 0.8% |
Advanced Mirco Devices, Inc.* | | 27,500 | | | 559,625 |
| | | | |
|
|
Computers & Peripherals — 9.4% |
Apple Computer, Inc.* | | 49,200 | | | 4,174,128 |
Hewlett-Packard Co. | | 58,400 | | | 2,405,496 |
| | | | |
|
|
| | | | | | 6,579,624 |
| | | | |
|
|
Consumer Products & Services — 2.2% |
Procter & Gamble Co. | | 23,500 | | | 1,510,345 |
| | | | |
|
|
Diversified Financial Services — 9.2% |
Goldman Sachs Group, Inc. | | 14,700 | | | 2,930,445 |
JPMorgan Chase & Co. | | 26,300 | | | 1,270,290 |
NYSE Group, Inc.* | | 23,300 | | | 2,264,760 |
| | | | |
|
|
| | | | | | 6,465,495 |
| | | | |
|
|
Farming & Agriculture — 1.3% |
Monsanto Co. | | 17,900 | | | 940,287 |
| | | | |
|
|
Financial Services — 4.4% |
Chicago Mercantile Exchange Holdings, Inc. | | 1,220 | | | 621,895 |
Credit Suisse Group, ADR (Switzerland) | | 19,900 | | | 1,390,015 |
Legg Mason, Inc. | | 11,400 | | | 1,083,570 |
| | | | |
|
|
| | | | | | 3,095,480 |
| | | | |
|
|
Healthcare Services — 3.2% |
WellPoint, Inc.* | | 28,200 | | | 2,219,058 |
| | | | |
|
|
Hotels & Motels — 1.4% |
Starwood Hotels & Resorts Worldwide, Inc. | | 16,100 | | | 1,006,250 |
| | | | |
|
|
Insurance — 3.3% |
American International Group, Inc. | | 32,700 | | | 2,343,282 |
| | | | |
|
|
Internet Software & Services — 6.3% |
Google, Inc. (Class A Stock)* | | 9,620 | | | 4,429,817 |
| | | | |
|
|
Media — 5.0% |
Time Warner, Inc. | | 53,500 | | | 1,165,230 |
Walt Disney Co. (The) | | 68,200 | | | 2,337,214 |
| | | | |
|
|
| | | | | | 3,502,444 |
| | | | |
|
|
Oil, Gas & Consumable Fuels — 2.1% |
Halliburton Co. | | 46,400 | | | 1,440,720 |
| | | | |
|
|
| | | | | | |
COMMON STOCKS
(Continued) | | Shares
| | Value
(Note 2)
| |
Pharmaceuticals — 9.1% | |
Alcon, Inc. (Switzerland) | | 10,300 | | $ | 1,151,231 | |
Merck & Co., Inc. | | 24,500 | | | 1,068,200 | |
Novartis AG, ADR (Switzerland) | | 31,200 | | | 1,792,128 | |
Roche Holdings, Ltd., ADR (Switzerland) | | 26,500 | | | 2,371,692 | |
| | | | |
|
|
|
| | | | | | 6,383,251 | |
| | | | |
|
|
|
Retail & Merchandising — 1.6% | |
Kohl’s Corp.* | | 16,800 | | | 1,149,624 | |
| | | | |
|
|
|
Semiconductors — 1.3% | |
Broadcom Corp., (Class A Stock)* | | 27,200 | | | 878,832 | |
| | | | |
|
|
|
Semiconductors & Semiconductor Equipment — 2.3% | |
Marvell Technology Group Ltd.* | | 83,600 | | | 1,604,284 | |
| | | | |
|
|
|
Software — 10.0% | |
Adobe Systems, Inc.* | | 61,300 | | | 2,520,656 | |
Electronic Arts, Inc.* | | 31,200 | | | 1,571,232 | |
Microsoft Corp. | | 97,200 | | | 2,902,392 | |
| | | | |
|
|
|
| | | | | | 6,994,280 | |
| | | | |
|
|
|
Specialty Retail — 2.6% | |
Lowe’s Cos., Inc. | | 58,700 | | | 1,828,505 | |
| | | | |
|
|
|
Telecommunications — 1.8% | |
Cisco Systems, Inc.* | | 47,100 | | | 1,287,243 | |
| | | | |
|
|
|
TOTAL LONG-TERM INVESTMENTS
(cost $59,989,190) | | | 68,883,546 | |
| | | | |
|
|
|
| SHORT-TERM INVESTMENT — 4.8% | |
Affiliated Money Market Mutual Fund | |
Dryden Core Investment Fund — Taxable Money Market Series
(cost $3,368,166)(w) | | 3,368,166 | | | 3,368,166 | |
| | | | |
|
|
|
TOTAL INVESTMENTS — 103.2%
(cost $63,357,356) | | | 72,251,712 | |
LIABILITIES IN EXCESS OF OTHER ASSETS — (3.2)% | | | (2,235,861 | ) |
| | | | |
|
|
|
NET ASSETS — 100.0% | | $ | 70,015,851 | |
| | | | |
|
|
|
The following abbreviations are used in portfolio descriptions:
| | |
| ADR | | American Depositary Receipt |
| * | Non-income producing security. |
| (w) | Prudential Investments LLC, the manager of the Portfolio, also serves as manager of the Dryden Core Investment Fund-Taxable Money Market Series. |
The industry classification of long-term portfolio holdings, short-term investments and liabilities in excess of other assets shown as a percentage of net assets as of December 31, 2006 were as follows:
| | | |
Industry
| | | |
Software | | 10.0 | % |
Computers & Peripherals | | 9.4 | |
Diversified Financial Services | | 9.2 | |
Pharmaceuticals | | 9.1 | |
Biotechnology | | 8.5 | |
Internet Software & Services | | 6.3 | |
SEE NOTES TO FINANCIAL STATEMENTS.
B53
| | | | |
| | | SP STRATEGIC PARTNERS FOCUSED GROWTH PORTFOLIO (Continued) | | |
SCHEDULE OF INVESTMENTS December 31, 2006 | |
| | | |
Industry
| | | |
Communication Equipment | | 5.2 | % |
Media | | 5.0 | |
Affiliated Money Market Mutual Fund | | 4.8 | |
Financial Services | | 4.4 | |
Insurance | | 3.3 | |
Beverages | | 3.2 | |
Healthcare Services | | 3.2 | |
Specialty Retail | | 2.6 | |
Semiconductors & Semiconductor Equipment | | 2.3 | |
Aerospace | | 2.2 | |
Consumer Products & Services | | 2.2 | |
Oil, Gas & Consumable Fuels | | 2.1 | |
Capital Markets | | 2.0 | |
Telecommunications | | 1.8 | |
Retail & Merchandising | | 1.6 | |
Hotels & Motels | | 1.4 | |
Farming & Agriculture | | 1.3 | |
Semiconductors | | 1.3 | |
Computer Hardware | | 0.8 | |
| | |
|
|
| | | 103.2 | |
Liabilities in excess of other assets | | (3.2 | ) |
| | |
|
|
| | | 100.0 | % |
| | |
|
|
SEE NOTES TO FINANCIAL STATEMENTS.
B54
| | | | |
| | | SP T. ROWE PRICE LARGE CAP GROWTH PORTFOLIO | | |
SCHEDULE OF INVESTMENTS December 31, 2006 | |
| | | | | |
| LONG-TERM INVESTMENTS — 97.8% | | Value
(Note 2)
|
| COMMON STOCKS | | Shares
| |
Advertising — 2.3% |
Lamar Advertising Co.* | | 26,900 | | $ | 1,758,991 |
| | | | |
|
|
Airlines — 1.8% |
Southwest Airlines Co. | | 89,500 | | | 1,371,140 |
| | | | |
|
|
Biotechnology Healthcare — 0.9% |
Celgene Corp.* | | 11,600 | | | 667,348 |
| | | | |
|
|
Commercial Services & Supplies — 0.9% |
Monster Worldwide, Inc.* | | 15,200 | | | 708,928 |
| | | | |
|
|
Communication Equipment — 0.7% |
QUALCOMM, Inc. | | 13,500 | | | 510,165 |
| | | | |
|
|
Computer Hardware — 1.3% |
Apple Computer, Inc.* | | 11,700 | | | 992,628 |
| | | | |
|
|
Computer Services & Software — 8.2% |
Autodesk, Inc.* | | 18,600 | | | 752,556 |
Automatic Data Processing, Inc. | | 22,300 | | | 1,098,275 |
Microsoft Corp. | | 96,800 | | | 2,890,448 |
NAVTEQ Corp.* | | 25,300 | | | 884,741 |
Red Hat, Inc.* | | 31,900 | | | 733,700 |
| | | | |
|
|
| | | | | | 6,359,720 |
| | | | |
|
|
Consumer Products & Services — 1.8% |
Accenture Ltd. (Class A Stock) | | 38,200 | | | 1,410,726 |
| | | | |
|
|
Diversified Financial Services — 3.2% |
E*trade Financial Corp.* | | 50,900 | | | 1,141,178 |
Morgan Stanley | | 16,800 | | | 1,368,024 |
| | | | |
|
|
| | | | | | 2,509,202 |
| | | | |
|
|
Drugs & Medicine — 9.4% |
Amgen, Inc.* | | 19,200 | | | 1,311,552 |
Caremark Rx, Inc. | | 26,900 | | | 1,536,259 |
Genentech, Inc.* | | 12,100 | | | 981,673 |
Gilead Sciences, Inc.* | | 25,300 | | | 1,642,729 |
St. Jude Medical, Inc.* | | 20,700 | | | 756,792 |
WellPoint, Inc.* | | 14,000 | | | 1,101,660 |
| | | | |
|
|
| | | | | | 7,330,665 |
| | | | |
|
|
Electronic Components — 1.7% |
Harman International Industries, Inc. | | 13,000 | | | 1,298,830 |
| | | | |
|
|
Farming & Agriculture — 1.0% |
Monsanto Co. | | 14,500 | | | 761,685 |
| | | | |
|
|
Financial – Bank & Trust — 2.6% |
State Street Corp. | | 30,300 | | | 2,043,432 |
| | | | |
|
|
Financial Services — 4.5% |
Chicago Mercantile Exchange Holdings, Inc. | | 1,000 | | | 509,750 |
Franklin Resources, Inc. | | 12,500 | | | 1,377,125 |
Legg Mason, Inc. | | 8,900 | | | 845,945 |
SLM Corp. | | 15,700 | | | 765,689 |
| | | | |
|
|
| | | | | | 3,498,509 |
| | | | |
|
|
Food & Staples Retailing — 3.0% |
Sysco Corp. | | 32,100 | | | 1,179,996 |
Wal-Mart Stores, Inc. | | 24,600 | | | 1,136,028 |
| | | | |
|
|
| | | | | | 2,316,024 |
| | | | |
|
|
Healthcare Providers & Services — 2.3% |
UnitedHealth Group, Inc. | | 33,500 | | | 1,799,955 |
| | | | |
|
|
| | | | | |
COMMON STOCKS
(Continued) | | Shares
| | Value
(Note 2)
|
Hotels, Restaurants & Leisure — 4.7% |
International Game Technology | | 37,700 | | $ | 1,741,740 |
Marriott International, Inc. (Class A Stock) | | 16,800 | | | 801,696 |
Wynn Resorts Ltd.* | | 11,600 | | | 1,088,660 |
| | | | |
|
|
| | | | | | 3,632,096 |
| | | | |
|
|
Internet Services — 5.6% |
Amazon.com, Inc.* | | 40,400 | | | 1,594,184 |
Google, Inc. (Class A Stock)* | | 4,400 | | | 2,026,112 |
Yahoo!, Inc.* | | 29,800 | | | 761,092 |
| | | | |
|
|
| | | | | | 4,381,388 |
| | | | |
|
|
Manufacturing — 2.0% |
Danaher Corp. | | 21,200 | | | 1,535,728 |
| | | | |
|
|
Media — 1.2% |
EchoStar Communications Corp. (Class A Stock)* | | 25,400 | | | 965,962 |
| | | | |
|
|
Medical Supplies & Equipment — 3.4% |
Medtronic, Inc. | | 27,100 | | | 1,450,121 |
Sepracor, Inc.* | | 19,400 | | | 1,194,652 |
| | | | |
|
|
| | | | | | 2,644,773 |
| | | | |
|
|
Oil, Gas & Consumable Fuels — 1.9% |
Schlumberger Ltd. | | 11,900 | | | 751,604 |
Transocean, Inc. (Cayman Islands)* | | 8,800 | | | 711,832 |
| | | | |
|
|
| | | | | | 1,463,436 |
| | | | |
|
|
Pharmaceuticals — 1.1% |
Cephalon, Inc.* | | 5,500 | | | 387,255 |
Medco Health Solutions, Inc.* | | 8,500 | | | 454,240 |
| | | | |
|
|
| | | | | | 841,495 |
| | | | |
|
|
Retail & Merchandising — 5.5% |
Kohl’s Corp.* | | 24,200 | | | 1,656,006 |
Target Corp. | | 24,300 | | | 1,386,315 |
Walgreen Co. | | 26,800 | | | 1,229,852 |
| | | | |
|
|
| | | | | | 4,272,173 |
| | | | |
|
|
Semiconductors — 11.8% |
Analog Devices, Inc. | | 42,600 | | | 1,400,262 |
Applied Materials, Inc. | | 85,600 | | | 1,579,320 |
Broadcom Corp. (Class A Stock)* | | 19,100 | | | 617,121 |
Intel Corp. | | 47,000 | | | 951,750 |
Marvell Technology Group Ltd. (Bermuda)* | | 90,500 | | | 1,736,695 |
Maxim Integrated Products, Inc. | | 52,300 | | | 1,601,426 |
Xilinx, Inc. | | 55,200 | | | 1,314,312 |
| | | | |
|
|
| | | | | | 9,200,886 |
| | | | |
|
|
Software — 1.3% |
Adobe Systems, Inc.* | | 24,900 | | | 1,023,888 |
| | | | |
|
|
Telecommunications — 7.4% |
American Tower Corp., (Class A Stock)* | | 75,400 | | | 2,810,912 |
Ericsson LM Telephone, ADR (Sweden) | | 20,400 | | | 820,692 |
Juniper Networks, Inc.* | | 113,600 | | | 2,151,584 |
| | | | |
|
|
| | | | | | 5,783,188 |
| | | | |
|
|
Transportation — 1.0% |
Expeditors International Washington, Inc. | | 20,000 | | | 810,000 |
| | | | |
|
|
SEE NOTES TO FINANCIAL STATEMENTS.
B55
| | | | |
| | | SP T. ROWE PRICE LARGE CAP GROWTH PORTFOLIO (Continued) | | |
SCHEDULE OF INVESTMENTS December 31, 2006 | |
| | | | | | |
COMMON STOCKS
(Continued) | | Shares
| | Value
(Note 2)
| |
Utilities — 5.3% | |
General Electric Co. | | 111,200 | | $ | 4,137,752 | |
| | | | |
|
|
|
TOTAL LONG-TERM INVESTMENTS
(cost $66,904,775) | | | 76,030,713 | |
| | | | |
|
|
|
| SHORT-TERM INVESTMENT — 2.7% | |
Affiliated Money Market Mutual Fund | |
Dryden Core Investment Fund — Taxable Money Market Series (cost $2,067,364)(w) (Note 4) | | 2,067,364 | | | 2,067,364 | |
| | | | |
|
|
|
TOTAL INVESTMENTS — 100.5%
(cost $68,972,139) | | | 78,098,077 | |
LIABILITIES IN EXCESS OF OTHER
ASSETS — (0.5)% | | | (389,966 | ) |
| | | | |
|
|
|
NET ASSETS — 100.0% | | $ | 77,708,111 | |
| | | | |
|
|
|
The following abbreviations are used in portfolio descriptions:
| | |
| ADR | | American Depositary Receipt |
| * | Non-income producing security. |
| (w) | Prudential Investments LLC, the manager of the Portfolio, also serves as manager of the Dryden Core Investment Fund-Taxable Money Market Series. |
The industry classification of long-term portfolio holdings, short-term investments and liabilities in excess of other assets shown as a percentage of net assets as of December 31, 2006 were as follows:
| | | |
Industry
| | | |
Semiconductors | | 11.8 | % |
Drugs & Medicine | | 9.4 | |
Computer Services & Software | | 8.2 | |
Telecommunications | | 7.4 | |
Internet Services | | 5.6 | |
Retail & Merchandising | | 5.5 | |
Utilities | | 5.3 | |
Hotels, Restaurants & Leisure | | 4.7 | |
Financial Services | | 4.5 | |
Medical Supplies & Equipment | | 3.4 | |
Diversified Financial Services | | 3.2 | |
Food & Staples Retailing | | 3.0 | |
Affiliated Money Market Mutual Fund | | 2.7 | |
Financial — Bank & Trust | | 2.6 | |
Healthcare Providers & Services | | 2.3 | |
Advertising | | 2.3 | |
Manufacturing | | 2.0 | |
Oil, Gas & Consumable Fuels | | 1.9 | |
Consumer Products & Services | | 1.8 | |
Airlines | | 1.8 | |
Electronic Components | | 1.7 | |
Software | | 1.3 | |
Computer Hardware | | 1.3 | |
Media | | 1.2 | |
Pharmaceuticals | | 1.1 | |
Transportation | | 1.0 | |
Farming & Agriculture | | 1.0 | |
Commercial Services & Supplies | | 0.9 | |
Biotechnology Healthcare | | 0.9 | |
Communication Equipment | | 0.7 | |
| | |
|
|
| | | 100.5 | |
Liabilities in excess of other assets | | (0.5 | ) |
| | |
|
|
| | | 100.0 | % |
| | |
|
|
SEE NOTES TO FINANCIAL STATEMENTS.
B56
NOTES TO THE FINANCIAL STATEMENTS OF
THE PRUDENTIAL SERIES FUND
The Prudential Series Fund, Inc. (“Series Fund”), was a Maryland corporation, organized on November 15, 1982, and continues to be a diversified open-end management investment company registered under the Investment Company Act of 1940, as amended. On January 2, 2006, each Portfolio of the Fund changed its federal income tax status from a regulated investment company to a partnership. As a result of that conversion, the Series Fund was reorganized from a Maryland corporation to a Delaware statutory trust. Pursuant to this reorganization, the Fund has been renamed “The Prudential Series Fund.” The Series Fund is composed of thirty-two Portfolios (“Portfolio” or “Portfolios”), each with a separate series of shares. The information presented in these financial statements pertains to seventeen Portfolios: SP Aggressive Growth Asset Allocation Portfolio, SP AIM Core Equity Portfolio, SP Balanced Asset Allocation Portfolio, SP Conservative Asset Allocation Portfolio, SP Davis Value Portfolio, SP Growth Asset Allocation Portfolio, SP International Growth Portfolio, SP International Value Portfolio, SP Large Cap Value Portfolio, SP Mid-Cap Growth Portfolio, SP PIMCO High Yield Portfolio, SP PIMCO Total Return Portfolio, SP Prudential U.S. Emerging Growth Portfolio, SP Small Cap Growth Portfolio, SP Small Cap Value Portfolio, SP Strategic Partners Focused Growth Portfolio, and SP T. Rowe Price Large Cap Growth Portfolio.
The Portfolios of the Series Fund have the following as investment objectives:
SP Aggressive Growth Asset Allocation Portfolio: Capital appreciation by investing primarily in large cap equity portfolios, international portfolios, and small/mid cap equity portfolios. The Portfolio will achieve this by investing in certain other Series Fund Portfolios and American Skandia Trust Portfolios.
SP AIM Core Equity Portfolio: Growth of capital with a secondary objective of current income by investing primarily in securities of established companies that have long-term above-average growth in earnings and dividends, and growth companies that the Portfolio managers believe have the potential for above-average growth in earnings and dividends.
SP Balanced Asset Allocation Portfolio: Provide a balance between current income and growth of capital by investing in fixed income portfolios, large cap equity portfolios, small/mid cap equity portfolios, and international equity portfolios. The Portfolio will achieve this by investing in certain other Series Fund Portfolios and American Skandia Trust Portfolios.
SP Conservative Asset Allocation Portfolio: Provide current income with low to moderate capital appreciation by investing in fixed income portfolios, large cap equity portfolios, and small/mid cap equity portfolios. The Portfolio will achieve this by investing in certain other Series Fund and American Skandia Trust Portfolios.
SP Davis Value Portfolio: Capital growth through investments primarily in common stock of U.S. companies with market capitalization of at least $5 billion.
SP Growth Asset Allocation Portfolio: Provide long-term growth of capital with consideration also given to current income by investing in large-cap equity portfolios, fixed income portfolios, international equity portfolios and small/mid-cap equity portfolios. The Portfolio will achieve this by investing in certain other Series Fund Portfolios and American Skandia Trust Portfolios.
SP International Growth Portfolio, formerly known as SP William Blair International Growth Portfolio: Long-term growth of capital by investing primarily in equity-related securities of foreign issuers.
SP International Value Portfolio, formerly known as SP LSV International Value Portfolio: Long-term capital appreciation by investing primarily in the stocks and other equity securities of companies in developed countries outside the United States.
SP Large Cap Value Portfolio: Long-term growth of capital by investing primarily in common stocks of companies with large market capitalization (those with market capitalizations similar to companies in the Standard & Poor’s 500 Composite Index or the Russell 100 Index).
SP Mid-Cap Growth Portfolio: Long-term growth of capital by investing primarily in common stocks and related securities, such as preferred stocks, convertible securities and depository receipts for those securities.
C1
SP PIMCO High Yield Portfolio: Maximum total return, consistent with preservation of capital and prudent investment management by investing primarily in a diversified portfolio of high yield/high risk securities rated below investment grade but rated at least B by Moody’s or S&P, or, if unrated, determined by Pacific Investment Management Company LLC (“PIMCO”) to be of comparable quality.
SP PIMCO Total Return Portfolio: Maximum total return, consistent with preservation of capital and prudent investment management by investing primarily in a diversified portfolio of fixed income instruments of varying maturities.
SP Prudential U.S. Emerging Growth Portfolio: Long-term capital appreciation by investing primarily in equity securities of small and medium-sized U.S. companies that the Portfolio manager believes have the potential for above-average growth.
SP Small Cap Growth Portfolio: Long-term capital growth by investing mostly in small-capitalization companies which are included in the Russell 2000 Growth Index at the time of purchase, or if not with market capitalizations under $2.5 billion.
SP Small Cap Value Portfolio: Long-term growth of capital by investing primarily in common stocks of companies with small to medium market capitalization.
SP Strategic Partners Focused Growth Portfolio: Long-term capital growth by investing primarily in equity-related securities of U.S. companies that the Portfolio manager believes to have strong capital appreciation potential.
SP T. Rowe Price Large Cap Growth Portfolio: Growth of capital by pursuing aggressive investment policies. The Portfolio invests primarily in stocks of companies considered to have large capitalizations.
The ability of issuers of debt securities (other than those issued or guaranteed by the U.S. Government) held by the Portfolios to meet their obligations may be affected by the economic or political developments in a specific industry, region or country.
| Note 2: | | Accounting Policies |
The following is a summary of significant accounting policies followed by the Series Fund and the Portfolios in preparation of their financial statements.
Securities Valuation: Securities listed on a securities exchange are valued at the last sale price on such exchange on the day of valuation or, if there was no sale on such day, at the mean between the last reported bid and asked prices, or at the last bid price on such day in the absence of an asked price. Securities traded via NASDAQ are valued at the official closing price provided by NASDAQ. Securities that are actively traded in the over-the-counter market, including listed securities for which the primary market is believed by Prudential Investments LLC (“PI” or “Manager”) in consultation with the subadviser, to be over-the-counter, are valued at market value using prices provided by an independent pricing agent or principal market maker. Options on securities and indices traded on an exchange are valued at the last sale price as of the close of trading on the applicable exchange or, if there was no sale, at the mean between the most recently quoted bid and asked prices on such exchange or at the last bid price in absence of an asked price. Futures contracts and options thereon traded on a commodities exchange or board of trade are valued at the last sale price at the close of trading on such exchange or board of trade or, if there was no sale on the applicable commodities exchange or board of trade on such day, at the mean between the most recently quoted bid and asked prices on such exchange or board of trade or at the last bid price in the absence of an asked price. Prices may be obtained from independent pricing services which use information provided by market makers or estimates of market values obtained from yield data relating to investments or securities with similar characteristics. Securities for which reliable market quotations are not readily available, or whose values have been affected by events occurring after the close of the security’s foreign market and before the Series Fund’s normal pricing time, are valued at fair value in accordance with Board of Trustees’ approved fair valuation procedures. When determining the fair valuation of securities, some of the factors influencing the valuation include, the nature of any restrictions on disposition of the securities; assessment of the general liquidity of the securities; the issuer’s financial condition and the markets in which it does business; the cost of the investment; the size of the holding and the capitalization of the issuer; the prices of any recent transactions or bids/offers for such securities or any comparable securities; any available analyst media or other reports or information deemed
C2
reliable by the investment adviser regarding the issuer or the markets or industry in which it operates. Using fair value to price securities may result in a value that is different from a security’s most recent closing price and from the price used by other mutual funds to calculate their net asset values. As of December 31, 2006, the SP AIM Core Equity Portfolio, SP Davis Value Portfolio, SP International Growth Portfolio, and SP International Value Portfolio held foreign securities whose value required adjustment in accordance with such procedures.
Investments in mutual funds are valued at their net asset value as of the close of the New York Stock Exchange on the date of valuation.
Short-term securities that are held in the other Portfolios which mature in more than 60 days are valued at current market quotations and those short-term securities which mature in 60 days or less are valued at amortized cost which approximates market value. The amortized cost method values a security at its cost at the time of purchase and there after assumes a constant amortization to maturity of any discount or premium.
The SP PIMCO High Yield Portfolio and the SP PIMCO Total Return Portfolio may hold up to 15% of their net assets in illiquid securities, including those which are restricted as to disposition under securities law (“restricted securities”). Certain issues of restricted securities held by the SP PIMCO High Yield Portfolio and the SP PIMCO Total Return Portfolio at December 31, 2006 include registration rights, under which the Portfolios may demand registration by the issuer, of which the Portfolio may bear the cost of such registration. Restricted securities, sometimes referred to as private placements, are valued pursuant to the valuation procedures noted above. Certain restricted securities were deemed liquid by procedures adopted by the Board of Trustees.
Repurchase Agreements: In connection with transactions in repurchase agreements with United States financial institutions, it is the Series Fund’s policy that its custodian or designated subcustodians, as the case may be, under triparty repurchase agreements, take possession of the underlying collateral securities, the value of which exceeds the principal amount of the repurchase transaction, including accrued interest. To the extent that any repurchase transaction exceeds one business day, the value of the collateral is marked to market on a daily basis to ensure the adequacy of the collateral. If the seller defaults or the value of the collateral declines, or if bankruptcy proceedings are commenced with respect to the seller of the security, realization of the collateral by the Series Fund may by delayed or limited.
Foreign Currency Translation: The books and records of the Series Fund are maintained in U.S. dollars. Foreign currency amounts are translated into U.S. dollars on the following basis:
(i) market value of investment securities, other assets and liabilities – at the current daily rates of exchange.
(ii) purchases and sales of investment securities, income and expenses – at the rates of exchange prevailing on the respective dates of such transactions.
Although the net assets of the Series Fund are presented at the foreign exchange rates and market values at the close of the period, the Series Fund does not isolate that portion of the results of operations arising as a result of changes in the foreign exchange rates from the fluctuations arising from changes in the market prices of securities held at the end of the period. Similarly, the Series Fund does not isolate the effect of changes in foreign exchange rates from the fluctuations arising from changes in the market prices of portfolio securities sold during the period. Accordingly, these realized foreign currency gains (losses) are included in the reported net realized gains (losses) on investment transactions.
Net realized gains (losses) on foreign currency transactions represent net foreign exchange gains (losses) from the holding of foreign currencies, currency gains (losses) realized between the trade date and settlement date on securities transactions, and the difference between the amounts of dividends, interest and foreign withholding taxes recorded on the Series Fund’s books and the U.S. dollar equivalent amounts actually received or paid. Net unrealized currency gains (losses) from valuing foreign currency denominated assets and liabilities (other than investments) at period end exchange rates are reflected as a component of net unrealized appreciation (depreciation) on investments and foreign currencies.
Foreign security and currency transactions may involve certain considerations and risks not typically associated with those of domestic origin as a result of, among other factors, the possibility of political and economic instability or the level of governmental supervision and regulation of foreign securities markets.
C3
Forward Currency Contracts: A forward currency contract is a commitment to purchase or sell a foreign currency at a future date at a negotiated forward rate. Certain Portfolios of the Series Fund may enter into forward currency contracts in order to hedge their exposure to changes in foreign currency exchange rates on their foreign portfolio holdings or on specific receivables and payables denominated in a foreign currency. The contracts are valued daily at current forward exchange rates and any unrealized gain (loss) is included in assets and liabilities in the financial statements. Gain (loss) is realized on the settlement date of the contract equal to the difference between the settlement value of the original and negotiated forward contracts. This gain (loss), if any, is included in net realized gain (loss) on foreign currency transactions. Risks may arise upon entering into these contracts from the potential inability of the counterparties to meet the terms of their contracts.
Short Sales: Certain portfolios of the Series Fund may sell a security it does not own in anticipation of a decline in the market value of that security (short sale). When a Portfolio makes a short sale, it must borrow the security sold short and deliver it to the broker-dealer through which it made the short sale as collateral for its obligation to deliver the security upon conclusion of the transaction. The Portfolio may have to pay a fee to borrow the particular security and may be obligated to remit any interest or dividends received on such borrowed securities. Dividends declared on short positions open on record date are recorded on the ex-date as an expense. A gain, limited to the price at which the Portfolio sold the security short, or a loss, unlimited in magnitude, will be recognized upon the termination of a short sale if the market price at termination is less than or greater than, respectively, the proceeds originally received. The portfolio maintains a segregated account of securities or other liquid assets, the dollar value of which is at least equal to its obligation with respect to short sales.
Loan Participations: The SP PIMCO High Yield Portfolio may invest in loan participations. When the Portfolio purchases a loan participation, the Portfolio typically enters into a contractual relationship with the lender or third party selling such participations (“Selling Participant”), but not the borrower. As a result, the Portfolio assumes the credit risk of the borrower, the Selling Participant and any other persons interpositioned between the Portfolio and the borrower. The Portfolio may not directly benefit from the collateral supporting the senior loan in which it has purchased the loan participant.
Options: The Series Fund may either purchase or write options in order to hedge against adverse market movements or fluctuations in value caused by changes in prevailing interest rates or foreign currency exchange rates or currencies with respect to securities which the Series Fund currently owns or intends to purchase. The Series Fund’s principal reason for writing options is to realize, through receipt of premiums, a greater current return than would be realized on the underlying security alone. When the Series Fund purchases an option, it pays a premium and an amount equal to that premium is recorded as an asset. When the Series Fund writes an option, it receives a premium and an amount equal to that premium is recorded as a liability. The asset or liability is adjusted daily to reflect the current market value of the option. If an option expires unexercised, the Series Fund realizes a gain (loss) to the extent of the premium received or paid. If an option is exercised, the premium received or paid is recorded as an adjustment to the proceeds from the sale or the cost basis of the purchase in determining whether the Series Fund has realized a gain (loss). The difference between the premium and the amount received or paid on effecting a closing purchase or sale transaction is also treated as a realized gain (loss). Gains (losses) on purchased options are included in net realized gains (losses) on investment transactions. Gains (losses) on written options are presented separately as net realized gain (loss) on written option transactions.
The Series Fund, as writer of an option, may have no control over whether the contract may be exercised. As a result, the Series Fund bears the market risk of an unfavorable change in the price of the security underlying the written option. The Series Fund, as purchaser of an over-the-counter option, bears the risk of the potential inability of the counterparties to meet the terms of their contracts.
Financial Futures Contracts: A financial futures contract is an agreement to purchase (long) or sell (short) an agreed amount of securities at a set price for delivery on a future date. Upon entering into a financial futures contract, the Series Fund is required to pledge to the broker an amount of cash and/or other assets equal to a certain percentage of the contract amount. This amount is known as the “initial margin”. Subsequent payments, known as “variation margin”, are made or received by the Series Fund each day, depending on the daily fluctuations in the value of the underlying security. Such variation margin is recorded for financial statement purposes on a daily basis as unrealized gain (loss). When the contract expires or is closed, the gain (loss) is realized and is presented in the Statement of Operations as net realized gain (loss) on financial futures contracts.
C4
The Series Fund invests in financial futures contracts in order to hedge its existing portfolio securities, or securities the Series Fund intends to purchase, against fluctuations in value caused by changes in prevailing rates or market conditions. Under a variety of circumstances, the Series Fund may not achieve the anticipated benefits of the financial futures contracts and may realize a loss. The use of futures transactions involves the risk of imperfect correlation in movements in the price of futures contracts and the underlying hedged assets.
Swap Agreements: The Portfolios may enter into interest rate swap agreements, forward swap spread lock agreements, and credit default swap agreements. A swap agreement is an agreement to exchange the return generated by one instrument for the return generated by another instrument. Interest rate swap agreements involve the exchange by the Portfolio with another party of their respective commitments to pay or receive interest. Forward spread lock swap agreements involve commitments to pay or receive a settlement amount calculated as the difference between the swap spread and a fixed spread, multiplied by the notional amount times the duration of the swap. The swap spread is the difference between the benchmark swap rate (market rate) and the specific Treasury rate. In a credit default swap agreement, one party (the protection buyer) makes a stream of payments to another party (the protection seller) in exchange for the right to receive a specified payment in the event of a default by a third party, typically corporate issues or sovereign issues of an emerging country, on its obligation. The maximum amount of the payment may equal the notional, at par, of the underlying index or security as a result of a default (or “credit event”). In addition to bearing the risk that the credit event will occur, the Portfolios could be exposed to market risk due to unfavorable changes in interest rates or in the price of the underlying security or index, the possibility that the fund may be unable to close out its position at the same time or at the same price as if it had purchased comparable publicly traded securities, or that the counterparty may default on it’s obligation to perform. The Portfolios may enter into swap agreements as either the protection buyer or seller. The swaps are valued daily at current market value and any change in value is included in net unrealized appreciation or depreciation on investments. Payments received or paid by the Portfolio are recorded as realized gains or losses. Risk of loss may exceed amounts recognized on the statements of assets and liabilities. Swap agreements outstanding at period end, if any, are listed on the Schedule of Investments.
Forward currency contracts, written options, short sales, swaps and financial futures contracts involve elements of both market and credit risk in excess of the amounts reflected on the Statement of Assets and Liabilities.
Floating Rate Notes Issued in Conjunction with Securities Held: The Portfolios invest in inverse floating rate securities (“inverse floaters”) that pay interest at a rate that varies inversely with short-term interest rates. Certain of these securities may be leveraged, whereby the interest rate varies inversely at a multiple of the change in short-term rates. As interest rates rise, inverse floaters produce less current income. The price of such securities is more volatile than comparable fixed rate securities.
When the Portfolios enter into agreements to create inverse floaters and floater note securities (also known as Tender Option Bond Transactions), the Portfolios transfer a fixed rate bond to a broker for cash. At the same time the Portfolios buy (receive) a residual interest in the assets and cash flows at the trust (the “trust”) set up by the broker, often referred to as an inverse floating rate obligation (“inverse floaters”). Generally, the broker deposits a fixed rate bond (the “fixed rate bond”) into the trust with the same CUSIP number as the fixed rate bond sold (transferred) to the broker by the Portfolio. The trust also issues floating-rate notes (“floating rate notes”) which are sold to third-parties. The floating rate notes have interest rates that reset weekly. The inverse floater held by the Portfolio gives the Portfolio the right (1) to cause the holders of the floating rate notes to tender (redeem) their notes at par, and (2) to have the broker transfer the fixed rate bond held by the trust to the Portfolio thereby collapsing the trust. In accordance with FAS Statement No. 140, the Portfolio’s account for the transaction described above as funded leverage by including the fixed rate bond in its Portfolio of Investments, and accounts for the floating rate notes as a liability under the caption “payable for floating rate notes issued” in the Portfolio’s “Statement of Assets and Liabilities”.
The Portfolio’s investment policies and restrictions permit investments in inverse floating rate securities. Inverse floaters held by the Portfolio are securities exempt from registration under Rules 144A of the Securities Act of 1933.
Securities Lending: The Series Fund may lend its portfolio securities to broker-dealers. The loans are secured by collateral at least equal at all times to the market value of the securities loaned. Loans are subject to termination at the option of the borrower or the Series Fund. Upon termination of the loan, the borrower will return to the lender securities identical to the loaned securities. Should the borrower of the securities fail
C5
financially, the Series Fund has the right to repurchase the securities using the collateral in the open market. The Series Fund recognizes income, net of any rebate and securities lending agent fees, for lending its securities in the form of fees or interest on the investment of any cash received as collateral. The Series Fund also continues to receive interest and dividends or amounts equivalent thereto on the securities loaned and recognizes any unrealized gain or loss in the market price of the securities loaned that may occur during the term of the loan.
When-Issued/Delayed Delivery Securities: Securities purchased or sold on a when-issued or delayed-delivery basis may be settled a month or more after trade date; interest income is not accrued until settlement date. At the time a Portfolio enters into such transactions, it instructs the custodian to segregate assets with a current value at least equal to the amount of its when-issued or delayed-delivery purchase commitments.
Securities Transactions and Net Investment Income: Securities transactions are recorded on the trade date. Realized gains (losses) on sales of securities are calculated on the identified cost basis. Dividend income is recorded on the ex-dividend date; interest income, which is comprised of four elements: stated coupon, original issue discount, market discount and market premium, is recorded on the accrual basis. Expenses are recorded on the accrual basis. The Series Fund’s expenses are allocated to the respective Portfolios on the basis of relative net assets except for Portfolio specific expenses which are attributable directly to a Portfolio or class level.
For Portfolios with multiple classes of shares, net investment income (loss) (other than administration and distribution fees, which are charged to the respective class) and unrealized and realized gains (losses) are allocated daily to each class of shares based upon the relative proportion of net assets of each class at the beginning of the day.
Custody Fee Credits: The Series Fund has an arrangement with its custodian bank, whereby uninvested monies earn credits which reduce the fees charged by the custodian. Such custody fee credits are presented as a reduction of gross expenses in the accompanying Statements of Operations.
Taxes: For federal income tax purposes, each Portfolio in the Series Fund is treated as a separate taxpaying entity. The Portfolios are treated as partnerships for tax purposes. No provision has been made in the financial statements for U.S. federal, state, or local taxes, as any tax liability arising from operations of the Portfolios are the responsibility of their partners. The Portfolios are not subject to tax. Partners of each Portfolio are subject to taxes on their distributive share of partnership items.
Withholding taxes on foreign dividends, interest and capital gains have been provided for in accordance with the Series Trust’s understanding of the applicable country’s tax rules and regulations.
Dividends and Distributions: Dividends and distributions of each Portfolio are declared in cash and automatically reinvested in additional shares of the same Portfolio. The SP PIMCO High Yield and SP PIMCO Total Return Portfolios will declare and distribute dividends from net investment income, if any, quarterly and distributions from net capital gains, if any, at least annually. All other Portfolios will declare and distribute dividends from net investment income and distributions from net capital gains, if any, at least annually. Dividends and distributions are recorded on the ex-dividend date.
Dividends and capital gain distributions are determined in accordance with income tax regulations which may differ from generally accepted accounting principles.
Estimates: The preparation of financial statements requires management to make estimates and assumptions that affect the reported amounts and disclosures in the financial statements. Actual results could differ from these estimates.
The Series Fund has a management agreement with PI. Pursuant to this agreement PI has responsibility for all investment advisory services and supervises the subadvisers’ performance of such services. PI has
C6
entered into subadvisory agreements with Jennison Associates LLC (“Jennison”), AIM Capital Management, Inc. (“AIM”), Alliance Capital Management, LP (“Alliance”), Davis Selected Advisers, LP (“Davis”), Calamos Investments (“Calamos”), Hotchkis and Wiley Capital Management LLC (“Hotchkis and Wiley”), Goldman Sachs Asset Management, L.P. (“GSAM”), J.P. Morgan Investment Management, Inc. (“J.P. Morgan”), LSV Asset Management (“LSV”), Marsico (“Marsico”), Neuberger Berman Management, Inc. (“Neuberger Berman”), T. Rowe Price Associates, Inc. (“T. Rowe”), William Blair & Company LLC (“William Blair”), Eagle Asset Management (“Eagle”), Pacific Investment Management Company LLC (“PIMCO”), Thornburg (“Thornburg”), and ClearBridge Advisors LLC (“ClearBridge”) (collectively, the “Subadvisers”), under which each provides investment advisory services for certain Portfolios of the Series Fund. PI pays for the services of the Subadvisers, compensation of officers of the Series Fund, occupancy and certain clerical and administrative expenses of the Series Fund. The Series Fund bears all other costs and expenses.
The management fee paid to PI is computed daily and payable monthly, at the annual rates specified below, of the value of each of the Portfolio’s average daily net assets.
| | | | | | |
Portfolio
| | Management Fee
| | | Effective
Management Fee
| |
SP Aggressive Growth Asset Allocation Portfolio | | 0.05 | % | | 0.05 | % |
SP AIM Core Equity Portfolio | | 0.85 | | | 0.85 | |
SP Balanced Asset Allocation Portfolio | | 0.05 | | | 0.05 | |
SP Conservative Asset Allocation Portfolio | | 0.05 | | | 0.05 | |
SP Davis Value Portfolio | | 0.75 | | | 0.75 | |
SP Growth Asset Allocation Portfolio | | 0.05 | | | 0.05 | |
SP International Growth Portfolio | | 0.85 | | | 0.85 | |
SP International Value Portfolio | | 0.90 | | | 0.90 | |
SP Large Cap Value Portfolio | | 0.80 | | | 0.80 | |
SP Mid-Cap Growth Portfolio | | 0.80 | | | 0.80 | |
SP PIMCO High Yield Portfolio | | 0.60 | | | 0.60 | |
SP PIMCO Total Return Portfolio | | 0.60 | | | 0.60 | |
SP Prudential U.S. Emerging Growth Portfolio | | 0.60 | | | 0.60 | |
SP Small Cap Growth Portfolio | | 0.95 | | | 0.95 | |
SP Small Cap Value Portfolio | | 0.90 | | | 0.90 | |
SP Strategic Partners Focused Growth Portfolio | | 0.90 | | | 0.90 | |
SP T. Rowe Price Large Cap Growth Portfolio | | 0.90 | | | 0.78 | |
At December 31, 2006 the Subadvisers that provide investment advisory services to the Portfolios are as follows. Where more than one Subadviser is listed, each Subadviser provides services to a segment of the Portfolio:
| | |
Portfolio
| | Subadviser(s)
|
SP AIM Core Equity Portfolio | | AIM |
SP Davis Value Portfolio | | Davis |
SP International Growth Portfolio | | William Blair, Marsico* |
SP International Value Portfolio | | LSV, Thornburg* |
SP Large Cap Value Portfolio | | Hotchkis and Wiley, J.P. Morgan, Dreman |
SP Mid-Cap Growth Portfolio | | Calamos |
SP PIMCO High Yield Portfolio | | PIMCO |
SP PIMCO Total Return Portfolio | | PIMCO |
SP Prudential U.S. Emerging Growth Portfolio | | Jennison |
SP Small Cap Growth Portfolio | | Neuberger Berman, Eagle |
SP Small Cap Value Portfolio | | GSAM, ClearBridge (formerly Salomon) |
SP Strategic Partners Focused Growth Portfolio | | Alliance, Jennison |
SP T. Rowe Price Large Cap Growth Portfolio | | T. Rowe |
| | * | Effective as of the close of business November 17, 2006. |
The Series Fund has a distribution agreement with Prudential Investment Management Services LLC (“PIMS”) which acts as the distributor of the Class I and Class II shares of the Series Fund. The Series Fund compensates PIMS for distributing and servicing the Series Fund’s Class II shares pursuant to a plan of distribution (the “Class II Plan”), regardless of expenses actually incurred by PIMS. The distribution fees are accrued daily and payable monthly. No distribution or service fees are paid to PIMS as distributor of the Class
C7
I shares of the Series Fund. Pursuant to the Class II Plan, the Class II shares of each Portfolio compensate PIMS for distribution-related activities at an annual rate of 0.25% of the average daily net assets of the Class II shares.
The Series Fund has an administration agreement with PI which acts as the administrator of the Class II shares of the Series Fund. The administration fee paid to PI is accrued daily and payable monthly, at the annual rate of 0.15% of the average daily net assets of the Class II shares.
PI has agreed to waive management fees and/or reimburse expenses of each Portfolio (other than the SP Aggressive Growth Asset Allocation, SP Balanced Asset Allocation, SP Conservative Asset Allocation and SP Growth Asset Allocation Portfolios) for the amount that the aggregate annual ordinary operating expenses (excluding interest, taxes, and brokerage commissions) exceeded the percentage stated below, of the Portfolio’s average daily net assets.
| | | | | | |
Portfolio
| | Class I
Expense limit
| | | Class II
Expense limit
| |
SP AIM Core Equity Portfolio | | 1.00 | % | | N/A | |
SP Davis Value Portfolio | | 0.83 | * | | N/A | |
SP International Growth Portfolio | | 1.24 | | | 1.64 | % |
SP International Value Portfolio | | 1.10 | ** | | N/A | |
SP Large Cap Value Portfolio | | 0.90 | | | N/A | |
SP Mid-Cap Growth Portfolio | | 1.00 | | | N/A | |
SP PIMCO High Yield Portfolio | | 0.82 | | | N/A | |
SP PIMCO Total Return Portfolio | | 0.76 | | | N/A | |
SP Prudential U.S. Emerging Growth Portfolio | | 0.90 | | | 1.30 | |
SP Small Cap Growth Portfolio | | 1.15 | | | N/A | |
SP Small Cap Value Portfolio | | 1.05 | | | N/A | |
SP Strategic Partners Focused Growth Portfolio | | 1.25 | | | 1.65 | |
SP T. Rowe Price Large Cap Growth Portfolio | | 1.06 | | | N/A | |
N/A – Not applicable – Portfolio does not currently have Class II shares.
PIMS, PI and Jennison are indirect, wholly-owned subsidiaries of Prudential Financial, Inc. (“Prudential”).
| | * | Effective July 1, 2006, the expense limitation for SP Davis Value was removed. |
| | ** | Effective July 1, 2006, the limit has been reduced to 1.00%. |
| Note 4: | | Other Transactions with Affiliates |
Prudential Mutual Fund Services LLC (“PMFS”), an affiliate of PI and an indirect, wholly-owned subsidiary of Prudential, serves as the Series Fund’s transfer agent. Transfer agent fees and expenses in the Statements of Operations include certain out-of-pocket expenses paid to non-affiliates, where applicable.
Prudential Investment Management, Inc. (“PIM”), an indirect, wholly-owned subsidiary of Prudential, is the Series Fund’s security lending agent. For the year ended December 31, 2006, PIM was compensated as follows for these services by the Series Fund Portfolios:
| | | |
| | | PIM
|
SP Davis Portfolio | | $ | 16,594 |
SP International Growth Portfolio | | | 1,842 |
SP Large Cap Value Portfolio | | | 38,928 |
SP Mid-Cap Growth Portfolio | | | 23,130 |
SP Prudential U.S. Emerging Growth Portfolio . | | | 41,679 |
SP Small Cap Growth Portfolio | | | 42,083 |
SP Small Cap Value Portfolio | | | 117,201 |
C8
For the year ended December 31, 2006, Prudential Equity Group, LLC, an indirect wholly-owned subsidiary of Prudential and Wachovia Securities, LLC, affiliates of PI, earned brokerage commissions from transactions executed on behalf of the Series Fund Portfolios as follows:
| | | | | | |
Portfolio
| | Prudential
Equity Group
| | Wachovia
|
SP AIM Core Equity Portfolio | | $ | 297 | | | — |
SP Large Cap Value Portfolio | | | 13,618 | | $ | 1,319 |
SP Prudential U.S. Emerging Growth Portfolio | | | 802 | | | — |
SP Small Cap Growth Portfolio | | | — | | | 5,499 |
SP Small Cap Value Portfolio | | | — | | | 681 |
SP Strategic Partners Focused Growth Portfolio | | | 769 | | | — |
Certain Portfolios invest in the Taxable Money Market Series and Short-Term Bond Series (the “Portfolios”), portfolios of Dryden Core Investment Fund, pursuant to an exemptive order received from the Securities and Exchange Commission. The Portfolios are a money market mutual fund and short term bond fund, respectively, registered under the Investment Company Act of 1940, as amended, and managed by PI.
| Note 5: | | Portfolio Securities |
The aggregate cost of purchases and the proceeds from the sales of securities (excluding government securities and short-term issues) for the year ended December 31, 2006 were as follows:
Cost of Purchases:
| | | |
Portfolio
| | |
SP Aggressive Growth Asset Allocation Portfolio | | $ | 53,276,558 |
SP AIM Core Equity Portfolio | | | 11,897,113 |
SP Balanced Asset Allocation Portfolio | | | 390,538,407 |
SP Conservative Asset Allocation Portfolio | | | 200,190,178 |
SP Davis Value Portfolio | | | 44,592,571 |
SP Growth Asset Allocation Portfolio | | | 321,194,581 |
SP International Growth Portfolio | | | 535,517,443 |
SP International Value Portfolio | | | 489,121,700 |
SP Large Cap Value Portfolio | | | 612,960,224 |
SP Mid-Cap Growth Portfolio | | | 153,147,571 |
SP PIMCO High Yield Portfolio | | | 147,766,353 |
SP PIMCO Total Return Portfolio | | | 1,756,826,014 |
SP Prudential U.S. Emerging Growth Portfolio | | | 137,857,265 |
SP Small Cap Growth Portfolio | | | 69,429,408 |
SP Small Cap Value Portfolio | | | 188,436,804 |
SP Strategic Partners Focused Growth Portfolio | | | 103,701,768 |
SP T. Rowe Price Large Cap Growth Portfolio | | | 42,613,437 |
C9
Proceeds from Sales:
| | | |
Portfolio
| | |
SP Aggressive Growth Asset Allocation Portfolio | | $ | 53,051,000 |
SP AIM Core Equity Portfolio | | | 16,073,086 |
SP Balanced Asset Allocation Portfolio | | | 350,175,000 |
SP Conservative Asset Allocation Portfolio | | | 195,269,000 |
SP Davis Value Portfolio | | | 61,729,649 |
SP Growth Asset Allocation Portfolio | | | 298,870,000 |
SP International Growth Portfolio | | | 605,362,856 |
SP International Value Portfolio | | | 490,279,371 |
SP Large Cap Value Portfolio | | | 623,245,288 |
SP Mid-Cap Growth Portfolio | | | 169,164,680 |
SP PIMCO High Yield Portfolio | | | 240,341,796 |
SP PIMCO Total Return Portfolio | | | 269,234,837 |
SP Prudential U.S. Emerging Growth Portfolio | | | 148,097,313 |
SP Small Cap Growth Portfolio | | | 100,384,438 |
SP Small Cap Value Portfolio | | | 201,852,950 |
SP Strategic Partners Focused Growth Portfolio | | | 114,188,169 |
SP T. Rowe Price Large Cap Growth Portfolio | | | 42,185,758 |
The SP PIMCO High Yield, SP PIMCO Total Return and the SP AIM Core Equity Portfolios’ written options activity for the year ended December 31, 2006 were as follows:
| | | | | | | | | | | | | | |
| | | SP PIMCO High Yield
| | | SP PIMCO Total Return
| |
| | | Number of
Contracts/
Swap Notional
Amount $(000)
| | | Premium
| | | Number of
Contracts/
Swap Notional
Amount $(000)
| | | Premium
| |
Balance at beginning of year | | 678 | | | $ | 192,765 | | | 259,801,998 | | | $ | 3,719,339 | |
Written options | | 9,936 | | | | 512,289 | | | 23,302,780 | | | | 107,810 | |
Written swap options | | — | | | | — | | | 175,525 | | | | 2,363,125 | |
Expired options | | (2,560 | ) | | | (35,902 | ) | | (5,093 | ) | | | (618,483 | ) |
Expired Swap options | | — | | | | — | | | (223,000,000 | ) | | | (3,082,239 | ) |
Exercised options | | — | | | | — | | | — | | | | — | |
Closed options | | (4,654 | ) | | | (657,575 | ) | | (10 | ) | | | (9,811 | ) |
Closed Swap options | | — | | | | — | | | (60,100,000 | ) | | | (435,482 | ) |
| | |
|
| |
|
|
| |
|
| |
|
|
|
Balance at end of year | | 3,400 | | | $ | 11,577 | | | 175,200 | | | $ | 2,044,259 | |
| | |
|
| |
|
|
| |
|
| |
|
|
|
| | | |
| | | SP AIM Core Equity
| | | | | | | |
| | | Number of
Contracts/
Swap Notional
Amount $(000)
| | | Premium
| | | | | | | |
Balance at beginning of year | | 180 | | | $ | 20,604 | | | | | | | | |
Written options | | — | | | | — | | | | | | | | |
Expired options | | (180 | ) | | | (20,604 | ) | | | | | | | |
Expired Swap options | | — | | | | — | | | | | | | | |
Exercised options | | — | | | | — | | | | | | | | |
Closed options | | — | | | | — | | | | | | | | |
Closed Swap options | | — | | | | — | | | | | | | | |
| | |
|
| |
|
|
| | | | | | | |
Balance at end of year | | — | | | $ | — | | | | | | | | |
| | |
|
| |
|
|
| | | | | | | |
As of January 2, 2006 all Portfolios are treated as partnerships for tax purposes. The character of the cash distributions paid by the partnership are generally classified as return of capital non taxable distributions. Later in 2007 each partner will receive information regarding their distributive allocable share of the partnership’s income, gains, losses and deductions.
C10
Prior to January 2, 2006, each Portfolio qualified as a regulated investment company under the Internal Revenue Code and distributed all of its taxable income, including any net realized gains on investments, to shareholders. Accordingly, no provision for federal income or excise tax has been made.
Income and capital gains of the Portfolios were determined in accordance with both tax regulations and accounting principles generally accepted in the United States of America. Prior to being structured as partnerships for tax purposes such determinations may have resulted in temporary and permanent differences between tax basis earnings and earnings reported for financial statement purposes.
The tax character of distributions paid during the year ended December 31, 2005, were as follows:
| | | | | | | | | |
Portfolio
| | Ordinary
Income
| | Long-Term
Capital Gains
| | Total
Distributions
|
SP Aggressive Growth Asset Allocation Portfolio | | $ | 2,784,998 | | $ | 3,220,328 | | $ | 6,005,326 |
SP AIM Core Equity Portfolio | | | 337,615 | | | — | | | 337,615 |
SP Balanced Asset Allocation Portfolio | | | 17,685,987 | | | 22,025,487 | | | 39,711,474 |
SP Conservative Asset Allocation Portfolio | | | 10,571,529 | | | 12,999,892 | | | 23,571,421 |
SP Davis Value Portfolio | | | 2,694,772 | | | 29,342,603 | | | 32,037,375 |
SP Growth Asset Allocation Portfolio | | | 16,999,403 | | | 13,932,075 | | | 30,931,478 |
SP International Growth Portfolio | | | 8,183,431 | | | 12,439,468 | | | 20,622,899 |
SP International Value Portfolio | | | 12,360,238 | | | 11,833,039 | | | 24,193,277 |
SP Large Cap Value Portfolio | | | 17,688,553 | | | 4,176,180 | | | 21,864,733 |
SP PIMCO High Yield Portfolio | | | 23,631,498 | | | 3,362,054 | | | 26,993,552 |
SP PIMCO Total Return Portfolio | | | 77,092,879 | | | 9,496,299 | | | 86,589,178 |
SP Prudential U.S. Emerging Growth Portfolio | | | 17,879,412 | | | 4,281,058 | | | 22,160,470 |
SP Small Cap Value Portfolio | | | 31,804,658 | | | 17,428,304 | | | 49,232,962 |
With respect to the Portfolios, book cost of assets differs from tax cost of assets as a result of each Portfolio’s adoption of a mark to market method of accounting for tax purposes. Under this method, tax cost of assets will approximate its fair market value. See Note 10 below regarding “Change in Federal Income Tax Status and Related Reorganization”.
The Series Fund offers Class I and Class II shares. Neither Class I nor Class II shares of a Portfolio are subject to any sales charge or redemption charge and are sold at the net asset value of the Portfolio. Class I shares are sold only to certain separate accounts of Prudential to fund benefits under certain variable life insurance and variable annuity contracts (“contracts”). Class II shares are sold only to separate accounts of non-Prudential insurance companies as investment options under certain contracts. The separate accounts invest in shares of the Series Fund through subaccounts that correspond to the Portfolios. The separate accounts will redeem shares of the Series Fund to the extent necessary to provide benefits under the contracts or for such other purposes as may be consistent with the contracts. As of December 31, 2006, the SP Prudential U.S. Emerging Growth, SP Strategic Partners Focused Growth and SP International Growth Portfolios have Class II shares outstanding.
Transactions in shares of common stock of the SP Prudential U.S. Emerging Growth, SP Strategic Partners Focused Growth and SP International Growth Portfolios were as follows:
| | | | | | | |
| | |
| SP Prudential U.S. Emerging Growth Portfolio: | | | | | | | |
Class I
| | Shares
| | | Amount
| |
Year ended December 31, 2006: | | | | | | | |
Capital stock sold | | 3,604,315 | | | $ | 28,455,379 | |
Capital stock issued in reinvestment of dividends and distributions | | 1,974,138 | | | | 15,437,758 | |
Capital stock repurchased | | (4,964,683 | ) | | | (38,298,965 | ) |
| | |
|
| |
|
|
|
Net increase in shares outstanding | | 613,770 | | | $ | 5,594,172 | |
| | |
|
| |
|
|
|
Year ended December 31, 2005: | | | | | | | |
Capital stock sold | | 4,400,150 | | | $ | 32,192,743 | |
Capital stock issued in connection with the merger | | 4,037,693 | | | | 24,736,435 | |
Capital stock issued in reinvestment of dividends and distributions | | 3,416,212 | | | | 22,102,890 | |
Capital stock repurchased | | (3,006,411 | ) | | | (21,435,346 | ) |
| | |
|
| |
|
|
|
Net increase in shares outstanding | | 8,847,644 | | | $ | 57,596,722 | |
| | |
|
| |
|
|
|
C11
| | | | | | | |
Class II
| | Shares
| | | Amount
| |
Year ended December 31, 2006: | | | | | | | |
Capital stock issued in reinvestment of dividends and distributions | | 4,052 | | | $ | 30,998 | |
Capital stock repurchased | | (11,485 | ) | | | (87,675 | ) |
| | |
|
| |
|
|
|
Net decrease in shares outstanding | | (7,433 | ) | | $ | (56,677 | ) |
| | |
|
| |
|
|
|
Year ended December 31, 2005: | | | | | | | |
Capital stock sold | | — | (a) | | $ | 4 | |
Capital stock issued in reinvestment of dividends and distributions | | 9,054 | | | | 57,580 | |
Capital stock repurchased | | (4,646 | ) | | | (34,601 | ) |
| | |
|
| |
|
|
|
Net increase in shares outstanding | | 4,408 | | | $ | 22,983 | |
| | |
|
| |
|
|
|
(a) Less than 0.5 Shares. | | | | | | | |
| | | | | | | |
| | |
| SP Strategic Partners Focused Growth Portfolio: | | | | | | | |
Class I
| | Shares
| | | Amount
| |
Year ended December 31, 2006: | | | | | | | |
Capital stock sold | | 1,132,903 | | | $ | 8,574,353 | |
Capital stock issued in reinvestment of dividends and distributions | | 336,936 | | | | 2,547,235 | |
Capital stock repurchased | | (1,051,192 | ) | | | (7,751,637 | ) |
| | |
|
| |
|
|
|
Net increase in shares outstanding | | 418,647 | | | $ | 3,369,951 | |
| | |
|
| |
|
|
|
Year ended December 31, 2005: | | | | | | | |
Capital stock sold | | 1,314,274 | | | $ | 9,555,363 | |
Capital stock repurchased | | (867,937 | ) | | | (6,268,773 | ) |
| | |
|
| |
|
|
|
Net increase in shares outstanding | | 446,337 | | | $ | 3,286,590 | |
| | |
|
| |
|
|
|
| | |
Class II
| | | | | | |
Year ended December 31, 2006: | | | | | | | |
Capital stock sold | | 379,068 | | | $ | 2,840,023 | |
Capital stock issued in reinvestment of dividends and distributions | | 375,712 | | | | 2,776,508 | |
Capital stock repurchased | | (1,869,616 | ) | | | (13,464,717 | ) |
| | |
|
| |
|
|
|
Net decrease in shares outstanding | | (1,114,836 | ) | | $ | (7,848,186 | ) |
| | |
|
| |
|
|
|
Year ended December 31, 2005: | | | | | | | |
Capital stock sold | | 2,332,071 | | | $ | 16,000,029 | |
Capital stock repurchased | | (1,580,961 | ) | | | (10,666,031 | ) |
| | |
|
| |
|
|
|
Net increase in shares outstanding | | 751,110 | | | $ | 5,333,998 | |
| | |
|
| |
|
|
|
| | |
| SP International Growth Portfolio: | | | | | | | |
Class I
| | Shares
| | | Amount
| |
Year ended December 31, 2006: | | | | | | | |
Capital stock sold | | 11,447,164 | | | $ | 86,938,831 | |
Capital stock issued in reinvestment of dividends and distributions | | 6,137,410 | | | | 45,416,833 | |
Capital stock repurchased | | (22,713,601 | ) | | | (171,563,955 | ) |
| | |
|
| |
|
|
|
Net decrease in shares outstanding | | (5,129,027 | ) | | $ | (39,208,291 | ) |
| | |
|
| |
|
|
|
Year ended December 31, 2005: | | | | | | | |
Capital stock sold | | 26,170,510 | | | $ | 176,617,874 | |
Capital stock issued in reinvestment of dividends and distributions | | 2,198,193 | | | | 14,002,490 | |
Capital stock repurchased | | (4,631,938 | ) | | | (31,184,958 | ) |
| | |
|
| |
|
|
|
Net increase in shares outstanding | | 23,736,765 | | | $ | 159,435,406 | |
| | |
|
| |
|
|
|
C12
| | | | | | | |
Class II
| | Shares
| | | Amount
| |
Year ended December 31, 2006: | | | | | | | |
Capital stock sold | | 433,942 | | | $ | 3,274,484 | |
Capital stock issued in reinvestment of dividends and distributions | | 314,818 | | | | 2,301,316 | |
Capital stock repurchased | | (931,607 | ) | | | (6,930,628 | ) |
| | |
|
| |
|
|
|
Net decrease in shares outstanding | | (182,847 | ) | | $ | (1,354,828 | ) |
| | |
|
| |
|
|
|
Year ended December 31, 2005: | | | | | | | |
Capital stock sold | | 2,776,309 | | | $ | 18,228,199 | |
Capital stock issued in reinvestment of dividends and distributions | | 1,050,858 | | | | 6,620,409 | |
Capital stock repurchased | | (21,269,733 | ) | | | (143,583,241 | ) |
| | |
|
| |
|
|
|
Net decrease in shares outstanding | | (17,442,566 | ) | | $ | (118,734,633 | ) |
| | |
|
| |
|
|
|
The Series Fund (excluding the Money Market Portfolio), along with other affiliated registered investment companies (the “Funds”), is a party to a Syndicated Credit Agreement (“SCA”) with two banks. The SCA provides for a commitment of $500 million. Interest on any borrowings under the SCA is incurred at contracted market rates and a commitment fee for the unused amount is accrued daily and paid quarterly. Effective October 27, 2006, the Funds renewed SCA with the banks. The commitment under the renewed SCA continues to be $500 million. The Series Fund pays a commitment fee of .07 of 1% of the unused portion of the renewed SCA. The expiration date of the renewed SCA will be October 26, 2007. For the period from October 29, 2005 through October 26, 2006, the Funds paid a commitment fee of .0725 of 1% of the unused portion of the agreement. The purpose of the SCA is to provide an alternative source of temporary funding for capital share redemptions.
The following Portfolios utilized the line of credit during the year ended December 31, 2006. The average balance is for the number of days the Portfolios had an outstanding balance.
| | | | | | | | | | | |
Portfolio
| | Approximate
Average
Balance
Outstanding
| | Number of Days
Outstanding
| | Weighted
Average
Interest
Rates
| | | Outstanding
Borrowings
at December 31, 2006
|
SP Davis Value Portfolio | | $ | 1,140,909 | | 11 | | 5.33 | % | | | — |
SP Large Cap Value Portfolio | | | 4,100,000 | | 1 | | 4.95 | | | | — |
SP International Value Portfolio | | | 1,382,125 | | 48 | | 5.49 | | | $ | 461,000 |
SP Mid-Cap Growth Portfolio | | | 1,000,000 | | 1 | | 5.51 | | | | — |
SP PIMCO High Yield Portfolio | | | 1,200,000 | | 4 | | 4.91 | | | | — |
SP PIMCO Total Return Portfolio | | | 13,100,000 | | 5 | | 5.79 | | | | — |
SP Small Cap Growth Portfolio | | | 16,598,667 | | 3 | | 5.72 | | | | — |
SP Strategic Partners Focused Growth Portfolio | | | 738,000 | | 4 | | 5.33 | | | | — |
SP International Growth Portfolio | | | 13,673,684 | | 19 | | 5.72 | | | | — |
| Note 9: | | Ownership and Affiliates |
As of December 31, 2006, all of Class I shares of each Portfolio were owned of record by The Prudential Insurance Company of America (“PICA”) on behalf of the owners of the variable insurance products issued by PICA.
| Note 10: | | Change in Federal Income Tax Status and Related Reorganization |
On January 2, 2006, each portfolio of the Series Fund was reorganized from a Maryland corporation to a Delaware statutory trust. Each Portfolio of the Series Fund changed its federal income tax status from a regulated investment company to a partnership as a result of that conversion. Pursuant to this reorganization, the Series Fund has been renamed “The Prudential Series Fund.” Subsequent to January 2, 2006, each Portfolio’s income, gains, losses and credits will be allocated directly to its partners and will retain the same character for federal income tax purposes. Furthermore, subsequent to January 2, 2006 each Portfolio will not be able to realize any future benefit from any unused capital loss carryforward and other losses (if any) deferred from each Portfolio.
C13
The investment objectives, policies, restrictions, net asset values per share, service providers, fiscal years, and investment portfolios of the Portfolios have not changed. In addition, the Series Fund obtained opinions of counsel that the change in the tax status and the related reorganization had no adverse federal income tax consequences for the Portfolios or contract owners.
| Note 11: | | New Accounting Pronouncements |
On July 13, 2006, the Financial Accounting Standards Board (FASB) released FASB Interpretation No. 48 “Accounting for Uncertainty in Income Taxes” (FIN 48). FIN 48 provides guidance for how uncertain tax positions should be recognized, measured, presented and disclosed in the financial statements. FIN 48 requires the evaluation of tax positions taken or expected to be taken in the course of preparing the Portfolios’ tax returns to determine whether the tax positions are “more-likely-than-not” of being sustained by the applicable tax authority. The impact of the tax positions not deemed to meet the more-likely-than-not threshold would be recorded in the year in which they arise. On December 22, 2006 the Securities and Exchange Commission delayed the effective date until June 30, 2007. At this time, management is evaluating the implications of FIN 48 and its impact, if any, in the financial statements has not yet been determined.
On September 20, 2006, the FASB released Statement of Financial Accounting Standards No. 157 “Fair Value Measurements” (FAS 157). FAS 157 establishes an authoritative definition of fair value, sets out a framework for measuring fair value, and requires additional disclosures about fair-value measurements. The application of FAS 157 is required for fiscal years beginning after November 15, 2007 and interim periods within those fiscal years. At this time, management is evaluating the implications of FAS 157 and its impact, if any, in the financial statements has not yet been determined.
C14
Financial Highlights
| | | | | | | | | | | | | | | | | | | | |
| | | SP Aggressive Growth Asset Allocation Portfolio
| |
| | | Year Ended December 31,
| |
| | | 2006
| | | 2005
| | | 2004
| | | 2003
| | | 2002
| |
Per Share Operating Performance : | | | | | | | | | | | | | | | | | | | | |
Net Asset Value, beginning of year | | $ | 9.50 | | | $ | 8.98 | | | $ | 7.83 | | | $ | 5.90 | | | $ | 7.58 | |
| | |
|
|
| |
|
|
| |
|
|
| |
|
|
| |
|
|
|
Income (Loss) From Investment Operations: | | | | | | | | | | | | | | | | | | | | |
Net investment income | | | .10 | | | | .18 | | | | .02 | | | | .01 | | | | — | (b) |
Net realized and unrealized gain (loss) on investments | | | 1.22 | | | | .71 | | | | 1.13 | | | | 1.92 | | | | (1.68 | ) |
| | |
|
|
| |
|
|
| |
|
|
| |
|
|
| |
|
|
|
Total from investment operations | | | 1.32 | | | | .89 | | | | 1.15 | | | | 1.93 | | | | (1.68 | ) |
| | |
|
|
| |
|
|
| |
|
|
| |
|
|
| |
|
|
|
Less Dividends and Distributions: | | | | | | | | | | | | | | | | | | | | |
Dividends from net investment income | | | — | | | | (.02 | ) | | | — | (b) | | | — | (b) | | | — | |
Distributions from net realized gains | | | — | | | | (.35 | ) | | | — | | | | — | | | | — | |
Distributions | | | (.41 | ) | | | — | | | | — | | | | — | | | | — | |
| | |
|
|
| |
|
|
| |
|
|
| |
|
|
| |
|
|
|
Total dividends and distributions | | | (.41 | ) | | | (.37 | ) | | | — | | | | — | | | | — | |
| | |
|
|
| |
|
|
| |
|
|
| |
|
|
| |
|
|
|
Net Asset Value, end of year | | $ | 10.41 | | | $ | 9.50 | | | $ | 8.98 | | | $ | 7.83 | | | $ | 5.90 | |
| | |
|
|
| |
|
|
| |
|
|
| |
|
|
| |
|
|
|
Total Investment Return(a) | | | 14.27 | % | | | 10.48 | % | | | 14.76 | % | | | 32.77 | % | | | (22.16 | )% |
Ratios/Supplemental Data: | | | | | | | | | | | | | | | | | | | | |
Net assets, end of year (in millions) | | $ | 201.6 | | | $ | 188.2 | | | $ | 136.9 | | | $ | 60.6 | | | $ | 15.1 | |
Ratios to average net assets: | | | | | | | | | | | | | | | | | | | | |
Expenses | | | .05 | % | | | .05 | % | | | .05 | % | | | .05 | % | | | .05 | % |
Net investment income | | | 1.00 | % | | | 2.29 | % | | | .27 | % | | | .16 | % | | | .06 | % |
Portfolio turnover rate | | | 28 | % | | | 26 | % | | | 60 | % | | | 22 | % | | | 26 | % |
| (a) | Total investment return is calculated assuming a purchase of shares on the first day and a sale on the last day of each year reported and includes reinvestment of dividends and distributions. Total return does not reflect expenses associated with the separate account such as administrative fees, account charges and surrender charges which, if reflected, would reduce the total returns for all periods shown. Performance figures may reflect voluntary fee waivers and/or expense reimbursements. In the absence of voluntary fee waivers and/or expense reimbursements, the total return would be lower. Past performance is no guarantee of future results. |
| (b) | Less than $.005 per share. |
| | | | | | | | | | | | | | | | | | | | |
| | | SP AIM Core Equity Portfolio
| |
| | | Year Ended December 31,
| |
| | | 2006
| | | 2005
| | | 2004
| | | 2003
| | | 2002
| |
Per Share Operating Performance: | | | | | | | | | | | | | | | | | | | | |
Net Asset Value, beginning of year | | $ | 7.62 | | | $ | 7.36 | | | $ | 6.80 | | | $ | 5.52 | | | $ | 6.51 | |
| | |
|
|
| |
|
|
| |
|
|
| |
|
|
| |
|
|
|
Income From Investment Operations: | | | | | | | | | | | | | | | | | | | | |
Net investment income | | | .09 | | | | .07 | | | | .08 | | | | .04 | | | | .02 | |
Net realized and unrealized gain (loss) on investments | | | 1.08 | | | | .27 | | | | .51 | | | | 1.26 | | | | (1.01 | ) |
| | |
|
|
| |
|
|
| |
|
|
| |
|
|
| |
|
|
|
Total from investment operations | | | 1.17 | | | | .34 | | | | .59 | | | | 1.30 | | | | (.99 | ) |
| | |
|
|
| |
|
|
| |
|
|
| |
|
|
| |
|
|
|
Less Dividends and Distributions: | | | | | | | | | | | | | | | | | | | | |
Dividends from net investment income | | | — | | | | (.08 | ) | | | (.03 | ) | | | (.02 | ) | | | — | |
Distributions | | | (.51 | ) | | | — | | | | — | | | | — | | | | — | |
| | |
|
|
| |
|
|
| |
|
|
| |
|
|
| |
|
|
|
Total dividends and distributions | | | (.51 | ) | | | (.08 | ) | | | (.03 | ) | | | (.02 | ) | | | — | |
| | |
|
|
| |
|
|
| |
|
|
| |
|
|
| |
|
|
|
Net Asset Value, end of year | | $ | 8.28 | | | $ | 7.62 | | | $ | 7.36 | | | $ | 6.80 | | | $ | 5.52 | |
| | |
|
|
| |
|
|
| |
|
|
| |
|
|
| |
|
|
|
Total Investment Return(a) | | | 16.05 | % | | | 4.63 | % | | | 8.79 | % | | | 23.69 | % | | | (15.21 | )% |
Ratios/Supplemental Data: | | | | | | | | | | | | | | | | | | | | |
Net assets, end of year (in millions) | | $ | 37.9 | | | $ | 34.2 | | | $ | 31.8 | | | $ | 22.8 | | | $ | 13.9 | |
Ratios to average net assets: | | | | | | | | | | | | | | | | | | | | |
Expenses | | | 1.02 | %(b) | | | 1.00 | %(b) | | | 1.00 | %(b) | | | 1.00 | %(b) | | | 1.00 | %(b) |
Net investment income | | | 1.20 | %(b) | | | .98 | %(b) | | | 1.27 | %(b) | | | .70 | %(b) | | | .45 | %(b) |
Portfolio turnover rate | | | 38 | % | | | 69 | % | | | 68 | % | | | 37 | % | | | 116 | % |
| (a) | Total investment return is calculated assuming a purchase of shares on the first day and a sale on the last day of each year reported and includes reinvestment of dividends and distributions. Total return does not reflect expenses associated with the separate account such as administrative fees, account charges and surrender charges which, if reflected, would reduce the total returns for all periods shown. Performance figures may reflect voluntary fee waivers and/or expense reimbursements. In the absence of voluntary fee waivers and/or expense reimbursements, the total return would be lower. Past performance is no guarantee of future results. |
| (b) | Net of expense reimbursement. If the investment advisor had not reimbursed expenses, the annual expense and net investment income ratios would have been 1.29% and .93%, respectively, for year ended December 31, 2006, 1.28% and .70%, respectively, for the year ended December 31, 2005, 1.48% and .79%, respectively, for the year ended December 31, 2004, 1.72% and (.02)%, respectively for the year ended December 31, 2003, and 1.79% and (.34)%, respectively, for the year ended December 31, 2002. |
SEE NOTES TO FINANCIAL STATEMENTS.
D1
Financial Highlights
| | | | | | | | | | | | | | | | | | | | |
| | | SP Balanced Asset Allocation Portfolio
| |
| | | Year Ended December 31,
| |
| | | 2006
| | | 2005
| | | 2004
| | | 2003
| | | 2002
| |
Per Share Operating Performance: | | | | | | | | | | | | | | | | | | | | |
Net Asset Value, beginning of year | | $ | 10.92 | | | $ | 10.63 | | | $ | 9.66 | | | $ | 7.96 | | | $ | 9.02 | |
| | |
|
|
| |
|
|
| |
|
|
| |
|
|
| |
|
|
|
Income (Loss) From Investment Operations: | | | | | | | | | | | | | | | | | | | | |
Net investment income | | | .25 | | | | .27 | | | | .09 | | | | .09 | | | | .11 | |
Net realized and unrealized gain (loss) on investments | | | .89 | | | | .49 | | | | .97 | | | | 1.71 | | | | (1.16 | ) |
| | |
|
|
| |
|
|
| |
|
|
| |
|
|
| |
|
|
|
Total from investment operations | | | 1.14 | | | | .76 | | | | 1.06 | | | | 1.80 | | | | (1.05 | ) |
| | |
|
|
| |
|
|
| |
|
|
| |
|
|
| |
|
|
|
Less Dividends and Distributions: | | | | | | | | | | | | | | | | | | | | |
Dividends from net investment income | | | — | | | | (.10 | ) | | | (.08 | ) | | | (.10 | ) | | | — | |
Distributions from net realized gains | | | — | | | | (.37 | ) | | | (.01 | ) | | | — | | | | (.01 | ) |
Distributions | | | (.47 | ) | | | — | | | | — | | | | — | | | | — | |
| | |
|
|
| |
|
|
| |
|
|
| |
|
|
| |
|
|
|
Total dividends and distributions | | | (.47 | ) | | | (.47 | ) | | | (.09 | ) | | | (.10 | ) | | | (.01 | ) |
| | |
|
|
| |
|
|
| |
|
|
| |
|
|
| |
|
|
|
Net Asset Value, end of year | | $ | 11.59 | | | $ | 10.92 | | | $ | 10.63 | | | $ | 9.66 | | | $ | 7.96 | |
| | |
|
|
| |
|
|
| |
|
|
| |
|
|
| |
|
|
|
Total Investment Return(a) | | | 10.69 | % | | | 7.60 | % | | | 11.09 | % | | | 22.87 | % | | | (11.67 | )% |
Ratios/Supplemental Data: | | | | | | | | | | | | | | | | | | | | |
Net assets, end of year (in millions) | | $ | 1,406.3 | | | $ | 1,372.0 | | | $ | 837.0 | | | $ | 449.8 | | | $ | 147.3 | |
Ratios to average net assets: | | | | | | | | | | | | | | | | | | | | |
Expenses | | | .05 | % | | | .05 | % | | | .05 | % | | | .05 | % | | | .05 | % |
Net investment income | | | 2.23 | % | | | 3.40 | % | | | 1.37 | % | | | 1.83 | % | | | 1.96 | % |
Portfolio turnover rate | | | 27 | % | | | 21 | % | | | 48 | % | | | 12 | % | | | 22 | % |
| (a) | Total investment return is calculated assuming a purchase of shares on the first day and a sale on the last day of each year reported and includes reinvestment of dividends and distributions. Total return does not reflect expenses associated with the separate account such as administrative fees, account charges and surrender charges which, if reflected, would reduce the total returns for all periods shown. Performance figures may reflect voluntary fee waivers and/or expense reimbursements. In the absence of voluntary fee waivers and/or expense reimbursements, the total return would be lower. Past performance is no guarantee of future results. |
| | | | | | | | | | | | | | | | | | | | |
| | | SP Conservative Asset Allocation Portfolio
| |
| | | Year Ended December 31,
| |
| | | 2006
| | | 2005
| | | 2004
| | | 2003
| | | 2002
| |
Per Share Operating Performance : | | | | | | | | | | | | | | | | | | | | |
Net Asset Value, beginning of year | | $ | 11.28 | | | $ | 11.20 | | | $ | 10.48 | | | $ | 9.16 | | | $ | 9.77 | |
| | |
|
|
| |
|
|
| |
|
|
| |
|
|
| |
|
|
|
Income (Loss) From Investment Operations: | | | | | | | | | | | | | | | | | | | | |
Net investment income | | | .35 | | | | .38 | | | | .14 | | | | .16 | | | | .16 | |
Net realized and unrealized gain (loss) on investments | | | .59 | | | | .25 | | | | .77 | | | | 1.33 | | | | (.73 | ) |
| | |
|
|
| |
|
|
| |
|
|
| |
|
|
| |
|
|
|
Total from investment operations | | | .94 | | | | .63 | | | | .91 | | | | 1.49 | | | | (.57 | ) |
| | |
|
|
| |
|
|
| |
|
|
| |
|
|
| |
|
|
|
Less Dividends and Distributions: | | | | | | | | | | | | | | | | | | | | |
Dividends from net investment income | | | — | | | | (.16 | ) | | | (.16 | ) | | | (.16 | ) | | | (.03 | ) |
Distributions from net realized gains | | | — | | | | (.39 | ) | | | (.03 | ) | | | (.01 | ) | | | (.01 | ) |
Distributions | | | (.56 | ) | | | — | | | | — | | | | — | | | | — | |
| | |
|
|
| |
|
|
| |
|
|
| |
|
|
| |
|
|
|
Total dividends and distributions | | | (.56 | ) | | | (.55 | ) | | | (.19 | ) | | | (.17 | ) | | | (.04 | ) |
| | |
|
|
| |
|
|
| |
|
|
| |
|
|
| |
|
|
|
Net Asset Value, end of year | | $ | 11.66 | | | $ | 11.28 | | | $ | 11.20 | | | $ | 10.48 | | | $ | 9.16 | |
| | |
|
|
| |
|
|
| |
|
|
| |
|
|
| |
|
|
|
Total Investment Return(a): | | | 8.67 | % | | | 5.91 | % | | | 8.89 | % | | | 16.49 | % | | | (5.88 | )% |
Ratios/Supplemental Data: | | | | | | | | | | | | | | | | | | | | |
Net assets, end of year (in millions) | | $ | 632.8 | | | $ | 642.0 | | | $ | 459.9 | | | $ | 281.2 | | | $ | 117.5 | |
Ratios to average net assets: | | | | | | | | | | | | | | | | | | | | |
Expenses | | | .05 | % | | | .05 | % | | | .05 | % | | | .05 | % | | | .05 | % |
Net investment income | | | 2.94 | % | | | 4.10 | % | | | 1.86 | % | | | 2.60 | % | | | 2.79 | % |
Portfolio turnover rate | | | 33 | % | | | 24 | % | | | 47 | % | | | 22 | % | | | 25 | % |
| (a) | Total investment return is calculated assuming a purchase of shares on the first day and a sale on the last day of each year reported and includes reinvestment of dividends and distributions. Total return does not reflect expenses associated with the separate account such as administrative fees, account charges and surrender charges which, if reflected, would reduce the total returns for all periods shown. Performance figures may reflect voluntary fee waivers and/or expense reimbursements. In the absence of voluntary fee waivers and/or expense reimbursements, the total return would be lower. Past performance is no guarantee of future results. |
SEE NOTES TO FINANCIAL STATEMENTS.
D2
Financial Highlights
| | | | | | | | | | | | | | | | | | | | |
| | | SP Davis Value Portfolio
| |
| | | Year Ended December 31,
| |
| | | 2006
| | | 2005
| | | 2004
| | | 2003
| | | 2002
| |
Per Share Operating Performance: | | | | | | | | | | | | | | | | | | | | |
Net Asset Value, beginning of year | | $ | 10.68 | | | $ | 10.98 | | | $ | 9.80 | | | $ | 7.62 | | | $ | 9.04 | |
| | |
|
|
| |
|
|
| |
|
|
| |
|
|
| |
|
|
|
Income (Loss) From Investment Operations: | | | | | | | | | | | | | | | | | | | | |
Net investment income | | | .09 | | | | .09 | | | | .10 | | | | .05 | | | | .05 | |
Net realized and unrealized gain (loss) on investments | | | 1.49 | | | | .82 | | | | 1.12 | | | | 2.18 | | | | (1.47 | ) |
| | |
|
|
| |
|
|
| |
|
|
| |
|
|
| |
|
|
|
Total from investment operations | | | 1.58 | | | | .91 | | | | 1.22 | | | | 2.23 | | | | (1.42 | ) |
| | |
|
|
| |
|
|
| |
|
|
| |
|
|
| |
|
|
|
Less Dividends and Distributions: | | | | | | | | | | | | | | | | | | | | |
Dividends from net investment income | | | — | | | | (.10 | ) | | | (.04 | ) | | | (.05 | ) | | | — | (c) |
Distributions from net realized gains | | | — | | | | (1.11 | ) | | | — | | | | — | | | | — | |
Distributions | | | (.27 | ) | | | — | | | | — | | | | — | | | | — | |
| | |
|
|
| |
|
|
| |
|
|
| |
|
|
| |
|
|
|
Total dividends and distributions | | | (.27 | ) | | | (1.21 | ) | | | (.04 | ) | | | (.05 | ) | | | — | (c) |
| | |
|
|
| |
|
|
| |
|
|
| |
|
|
| |
|
|
|
Net Asset Value, end of year | | $ | 11.99 | | | $ | 10.68 | | | $ | 10.98 | | | $ | 9.80 | | | $ | 7.62 | |
| | |
|
|
| |
|
|
| |
|
|
| |
|
|
| |
|
|
|
Total Investment Return(a) | | | 15.02 | % | | | 9.52 | % | | | 12.53 | % | | | 29.40 | % | | | (15.70 | )% |
Ratios/Supplemental Data: | | | | | | | | | | | | | | | | | | | | |
Net assets, end of year (in millions) | | $ | 328.0 | | | $ | 311.7 | | | $ | 285.5 | | | $ | 391.2 | | | $ | 165.0 | |
Ratios to average net assets: | | | | | | | | | | | | | | | | | | | | |
Expenses | | | .81 | % | | | .82 | % | | | .82 | % | | | .82 | % | | | .83 | %(b) |
Net investment income | | | .81 | % | | | .87 | % | | | .89 | % | | | .80 | % | | | .82 | %(b) |
Portfolio turnover rate | | | 14 | % | | | 14 | % | | | 34 | % | | | 7 | % | | | 22 | % |
| (a) | Total investment return is calculated assuming a purchase of shares on the first day and a sale on the last day of each year reported and includes reinvestment of dividends and distributions. Total return does not reflect expenses associated with the separate account such as administrative fees, account charges and surrender charges which, if reflected, would reduce the total returns for all periods shown. Performance figures may reflect voluntary fee waivers and/or expense reimbursements. In the absence of voluntary fee waivers and/or expense reimbursements, the total return would be lower. Past performance is no guarantee of future results. |
| (b) | Net of expense reimbursement. If the investment advisor had not reimbursed expenses, the annual expense and net investment income ratios would have been .87% and .78%, respectively, for the year ended December 31, 2002. |
| (c) | Less than $.005 per share. |
| | | | | | | | | | | | | | | | | | | | |
| | | SP Growth Asset Allocation Portfolio
| |
| | | Year Ended December 31,
| |
| | | 2006
| | | 2005
| | | 2004
| | | 2003
| | | 2002
| |
Per Share Operating Performance : | | | | | | | | | | | | | | | | | | | | |
Net Asset Value, beginning of year | | $ | 10.23 | | | $ | 9.80 | | | $ | 8.71 | | | $ | 6.84 | | | $ | 8.27 | |
| | |
|
|
| |
|
|
| |
|
|
| |
|
|
| |
|
|
|
Income (Loss) From Investment Operations: | | | | | | | | | | | | | | | | | | | | |
Net investment income | | | .16 | | | | .19 | | | | .06 | | | | .04 | | | | .06 | |
Net realized and unrealized gain (loss) on investments | | | 1.13 | | | | .66 | | | | 1.07 | | | | 1.88 | | | | (1.49 | ) |
| | |
|
|
| |
|
|
| |
|
|
| |
|
|
| |
|
|
|
Total from investment operations | | | 1.29 | | | | .85 | | | | 1.13 | | | | 1.92 | | | | (1.43 | ) |
| | |
|
|
| |
|
|
| |
|
|
| |
|
|
| |
|
|
|
Less Dividends and Distributions: | | | | | | | | | | | | | | | | | | | | |
Dividends from net investment income | | | — | | | | (.06 | ) | | | (.04 | ) | | | (.05 | ) | | | — | |
Distributions from net realized gains | | | — | | | | (.36 | ) | | | — | | | | — | | | | — | |
Distributions | | | (.35 | ) | | | — | | | | — | | | | — | | | | — | |
| | |
|
|
| |
|
|
| |
|
|
| |
|
|
| |
|
|
|
Total dividends and distributions | | | (.35 | ) | | | (.42 | ) | | | (.04 | ) | | | (.05 | ) | | | — | (b) |
| | |
|
|
| |
|
|
| |
|
|
| |
|
|
| |
|
|
|
Net Asset Value, end of year | | $ | 11.17 | | | $ | 10.23 | | | $ | 9.80 | | | $ | 8.71 | | | $ | 6.84 | |
| | |
|
|
| |
|
|
| |
|
|
| |
|
|
| |
|
|
|
Total Investment Return(a) | | | 12.88 | % | | | 9.24 | % | | | 13.05 | % | | | 28.27 | % | | | (17.26 | )% |
Ratios/Supplemental Data: | | | | | | | | | | | | | | | | | | | | |
Net assets, end of year (in millions) | | $ | 1,283.9 | | | $ | 1,212.0 | | | $ | 662.7 | | | $ | 326.7 | | | $ | 96.4 | |
Ratios to average net assets: | | | | | | | | | | | | | | | | | | | | |
Expenses | | | .05 | % | | | .05 | % | | | .05 | % | | | .05 | % | | | .05 | % |
Net investment income | | | 1.50 | % | | | 2.65 | % | | | .94 | % | | | 1.10 | % | | | 1.12 | % |
Portfolio turnover rate | | | 25 | % | | | 18 | % | | | 53 | % | | | 18 | % | | | 24 | % |
| (a) | Total investment return is calculated assuming a purchase of shares on the first day and a sale on the last day of each year reported and includes reinvestment of dividends and distributions. Total return does not reflect expenses associated with the separate account such as administrative fees, account charges and surrender charges which, if reflected, would reduce the total returns for all periods shown. Performance figures may reflect voluntary fee waivers and/or expense reimbursements. In the absence of voluntary fee waivers and/or expense reimbursements, the total return would be lower. Past performance is no guarantee of future results. |
| (b) | Less than $.005 per share. |
SEE NOTES TO FINANCIAL STATEMENTS.
D3
Financial Highlights
| | | | | | | | | | | | | | | | | | | | |
| | | SP International Growth Portfolio
| |
| | | Class I
| |
| | | Year Ended December 31,
| |
| | | 2006
| | | 2005
| | | 2004
| | | 2003
| | | 2002
| |
Per Share Operating Performance: | | | | | | | | | | | | | | | | | | | | |
Net Asset Value, beginning of year | | $ | 7.55 | | | $ | 6.85 | | | $ | 5.89 | | | $ | 4.22 | | | $ | 5.45 | |
| | |
|
|
| |
|
|
| |
|
|
| |
|
|
| |
|
|
|
Income (Loss) From Investment Operations: | | | | | | | | | | | | | | | | | | | | |
Net investment income | | | .05 | | | | .04 | | | | .02 | | | | .01 | | | | .01 | |
Net realized and unrealized gain (loss) on investments | | | 1.45 | | | | 1.01 | | | | .95 | | | | 1.66 | | | | (1.24 | ) |
| | |
|
|
| |
|
|
| |
|
|
| |
|
|
| |
|
|
|
Total from investment operations | | | 1.50 | | | | 1.05 | | | | .97 | | | | 1.67 | | | | (1.23 | ) |
| | |
|
|
| |
|
|
| |
|
|
| |
|
|
| |
|
|
|
Less Dividends and Distributions: | | | | | | | | | | | | | | | | | | | | |
Dividends from net investment income | | | — | | | | (.04 | ) | | | (.01 | ) | | | — | | | | — | |
Distributions from net realized gains | | | — | | | | (.31 | ) | | | — | | | | — | | | | — | |
Distributions | | | (.75 | ) | | | — | | | | — | | | | — | | | | — | |
| | |
|
|
| |
|
|
| |
|
|
| |
|
|
| |
|
|
|
Total dividends and distributions | | | (.75 | ) | | | (.35 | ) | | | (.01 | ) | | | — | | | | — | |
| | |
|
|
| |
|
|
| |
|
|
| |
|
|
| |
|
|
|
Net Asset Value, end of year | | $ | 8.30 | | | $ | 7.55 | | | $ | 6.85 | | | $ | 5.89 | | | $ | 4.22 | |
| | |
|
|
| |
|
|
| |
|
|
| |
|
|
| |
|
|
|
Total Investment Return(a) | | | 21.05 | % | | | 16.39 | % | | | 16.54 | % | | | 39.57 | % | | | (22.57 | )% |
Ratios/Supplemental Data: | | | | | | | | | | | | | | | | | | | | |
Net assets, end of year (in millions) | | $ | 456.0 | | | $ | 453.6 | | | $ | 249.1 | | | $ | 105.6 | | | $ | 34.9 | |
Ratios to average net assets: | | | | | | | | | | | | | | | | | | | | |
Expenses | | | .97 | % | | | .98 | % | | | 1.02 | % | | | 1.15 | % | | | 1.24 | %(b) |
Net investment income | | | .69 | % | | | .64 | % | | | .50 | % | | | .56 | % | | | .26 | %(b)(c) |
Portfolio turnover rate | | | 111 | % | | | 99 | % | | | 137 | % | | | 121 | % | | | 108 | % |
| (a) | Total investment return is calculated assuming a purchase of shares on the first day and a sale on the last day of each year reported and includes reinvestment of dividends and distributions. Total return does not reflect expenses associated with the separate account such as administrative fees, account charges and surrender charges which, if reflected, would reduce the total returns for all periods shown. Performance figures may reflect voluntary fee waivers and/or expense reimbursements. In the absence of voluntary fee waivers and/or expense reimbursements, the total return would be lower. Past performance is no guarantee of future results. |
| (b) | Net of expense reimbursement. If the investment advisor had not reimbursed expenses, the annual expense and net investment income ratios would have been 1.40% and .10%, respectively, for the year ended December 31, 2002. |
| (c) | Includes custody fee credits of .02% for the year ended December 31, 2002. If the Portfolio had not earned custodian fee credits, the annual net investment income would have been .24% for the year ended December 31, 2002. |
| | | | | | | | | | | | | | | | | | | | |
| | | SP International Growth Portfolio
| |
| | | Class II
| |
| | | Year Ended December 31,
| |
| | | 2006
| | | 2005
| | | 2004
| | | 2003
| | | 2002
| |
Per Share Operating Performance: | | | | | | | | | | | | | | | | | | | | |
Net Asset Value, beginning of year | | $ | 7.45 | | | $ | 6.77 | | | $ | 5.83 | | | $ | 4.19 | | | $ | 5.43 | |
| | |
|
|
| |
|
|
| |
|
|
| |
|
|
| |
|
|
|
Income (Loss) From Investment Operations: | | | | | | | | | | | | | | | | | | | | |
Net investment income | | | .02 | | | | .03 | | | | .01 | | | | .01 | | | | — | (d) |
Net realized and unrealized gain (loss) on investments | | | 1.42 | | | | .98 | | | | .93 | | | | 1.63 | | | | (1.24 | ) |
| | |
|
|
| |
|
|
| |
|
|
| |
|
|
| |
|
|
|
Total from investment operations | | | 1.44 | | | | 1.01 | | | | .94 | | | | 1.64 | | | | (1.24 | ) |
| | |
|
|
| |
|
|
| |
|
|
| |
|
|
| |
|
|
|
Less Dividends and Distributions: | | | | | | | | | | | | | | | | | | | | |
Dividends from net investment income | | | — | | | | (.02 | ) | | | — | | | | — | | | | — | |
Distributions from net realized gains | | | — | | | | (.31 | ) | | | — | | | | — | | | | — | |
Distributions | | | (.72 | ) | | | — | | | | — | | | | — | | | | — | |
| | |
|
|
| |
|
|
| |
|
|
| |
|
|
| |
|
|
|
Total dividends and distributions | | | (.72 | ) | | | (.33 | ) | | | — | | | | — | | | | — | |
| | |
|
|
| |
|
|
| |
|
|
| |
|
|
| |
|
|
|
Net Asset Value, end of year | | $ | 8.17 | | | $ | 7.45 | | | $ | 6.77 | | | $ | 5.83 | | | $ | 4.19 | |
| | |
|
|
| |
|
|
| |
|
|
| |
|
|
| |
|
|
|
Total Investment Return(a) | | | 20.42 | % | | | 15.79 | % | | | 16.12 | % | | | 39.14 | % | | | (22.84 | )% |
Ratios/Supplemental Data: | | | | | | | | | | | | | | | | | | | | |
Net assets, end of year (in millions) | | $ | 23.8 | | | $ | 23.1 | | | $ | 139.0 | | | $ | 113.6 | | | $ | 23.6 | |
Ratios to average net assets: | | | | | | | | | | | | | | | | | | | | |
Expenses | | | 1.37 | % | | | 1.38 | % | | | 1.41 | % | | | 1.54 | % | | | 1.64 | %(b) |
Net investment income (loss) | | | .28 | % | | | .56 | % | | | .21 | % | | | .04 | % | | | (.11 | )%(b)(c) |
Portfolio turnover rate | | | 111 | % | | | 99 | % | | | 137 | % | | | 121 | % | | | 108 | % |
| (a) | Total investment return is calculated assuming a purchase of shares on the first day and a sale on the last day of each year reported and includes reinvestment of dividends and distributions. Total return does not reflect expenses associated with the separate account such as administrative fees, account charges and surrender charges which, if reflected, would reduce the total returns for all periods shown. Performance figures may reflect voluntary fee waivers and/or expense reimbursements. In the absence of voluntary fee waivers and/or expense reimbursements, the total return would be lower. Past performance is no guarantee of future results. |
| (b) | Net of expense reimbursement. If the investment advisor had not reimbursed expenses, the annual expense and net investment loss ratios would have been 1.80% and (.26)%, respectively, for the year ended December 31, 2002. |
| (c) | Includes custody fee credits of .02% for the year ended December 31, 2002. If the Portfolio had not earned custodian fee credits, the annual net investment loss would have been (.13)% for the year ended December 31, 2002. |
| (d) | Less than $.005 per share. |
SEE NOTES TO FINANCIAL STATEMENTS.
D4
Financial Highlights
| | | | | | | | | | | | | | | | | | | | |
| | | SP International Value Portfolio
| |
| | | Year Ended December 31,
| |
| | | 2006
| | | 2005(c)
| | | 2004
| | | 2003(c)
| | | 2002
| |
Per Share Operating Performance: | | | | | | | | | | | | | | | | | | | | |
Net Asset Value, beginning of year | | $ | 9.08 | | | $ | 8.84 | | | $ | 7.67 | | | $ | 6.08 | | | $ | 7.35 | |
| | |
|
|
| |
|
|
| |
|
|
| |
|
|
| |
|
|
|
Income (Loss) From Investment Operations: | | | | | | | | | | | | | | | | | | | | |
Net investment income | | | .24 | | | | .17 | | | | .04 | | | | .06 | | | | .04 | |
Net realized and unrealized gain (loss) on investments | | | 2.35 | | | | .94 | | | | 1.17 | | | | 1.58 | | | | (1.31 | ) |
| | |
|
|
| |
|
|
| |
|
|
| |
|
|
| |
|
|
|
Total from investment operations | | | 2.59 | | | | 1.11 | | | | 1.21 | | | | 1.64 | | | | (1.27 | ) |
| | |
|
|
| |
|
|
| |
|
|
| |
|
|
| |
|
|
|
Less Dividends and Distributions: | | | | | | | | | | | | | | | | | | | | |
Dividends from net investment income | | | — | | | | (.04 | ) | | | (.04 | ) | | | (.05 | ) | | | — | |
Distributions from net realized gains | | | — | | | | (.83 | ) | | | — | | | | — | | | | — | |
Distributions | | | (.27 | ) | | | — | | | | — | | | | — | | | | — | |
| | |
|
|
| |
|
|
| |
|
|
| |
|
|
| |
|
|
|
Total dividends and distributions | | | (.27 | ) | | | (.87 | ) | | | (.04 | ) | | | (.05 | ) | | | — | |
| | |
|
|
| |
|
|
| |
|
|
| |
|
|
| |
|
|
|
Net Asset Value, end of year | | $ | 11.40 | | | $ | 9.08 | | | $ | 8.84 | | | $ | 7.67 | | | $ | 6.08 | |
| | |
|
|
| |
|
|
| |
|
|
| |
|
|
| |
|
|
|
Total Investment Return(a) | | | 29.09 | % | | | 13.77 | % | | | 15.80 | % | | | 27.37 | % | | | (17.17 | )% |
Ratios/Supplemental Data: | | | | | | | | | | | | | | | | | | | | |
Net assets, end of year (in millions) | | $ | 487.4 | | | $ | 389.3 | | | $ | 240.7 | | | $ | 119.9 | | | $ | 46.4 | |
Ratios to average net assets: | | | | | | | | | | | | | | | | | | | | |
Expenses | | | .99 | % | | | 1.06 | % | | | 1.10 | %(b) | | | 1.10 | %(b) | | | 1.10 | %(b) |
Net investment income | | | 2.28 | % | | | 2.08 | % | | | .69 | %(b) | | | .89 | %(b) | | | .55 | %(b) |
Portfolio turnover rate | | | 113 | % | | | 18 | % | | | 159 | % | | | 87 | % | | | 141 | % |
| (a) | Total investment return is calculated assuming a purchase of shares on the first day and a sale on the last day of each year reported and includes reinvestment of dividends and distributions. Total return does not reflect expenses associated with the separate account such as administrative fees, account charges and surrender charges which, if reflected, would reduce the total returns for all periods shown. Performance figures may reflect voluntary fee waivers and/or expense reimbursements. In the absence of voluntary fee waivers and/or expense reimbursements, the total return would be lower. Past performance is no guarantee of future results. |
| (b) | Net of expense reimbursement. If the investment advisor had not reimbursed expenses, the annual expense and net investment income (loss) ratios would have been 1.23% and .55%, respectively, for the year ended December 31, 2004, 1.30% and .69%, respectively for the year ended December 31, 2003, and 1.77% and (.12)%, respectively, for the year ended December 31, 2002. |
| (c) | Calculated based upon weighted average shares outstanding during the fiscal year. |
| | | | | | | | | | | | | | | | | | | | |
| | | SP Large Cap Value Portfolio
| |
| | | Year Ended December 31,
| |
| | | 2006
| | | 2005
| | | 2004(d)
| | | 2003
| | | 2002
| |
Per Share Operating Performance: | | | | | | | | | | | | | | | | | | | | |
Net Asset Value, beginning of year | | $ | 11.90 | | | $ | 11.56 | | | $ | 9.90 | | | $ | 7.81 | | | $ | 9.44 | |
| | |
|
|
| |
|
|
| |
|
|
| |
|
|
| |
|
|
|
Income (Loss) From Investment Operations: | | | | | | | | | | | | | | | | | | | | |
Net investment income | | | .20 | | | | .16 | | | | .16 | | | | .09 | | | | .08 | |
Net realized and unrealized gain (loss) on investments | | | 1.91 | | | | .58 | | | | 1.58 | | | | 2.00 | | | | (1.62 | ) |
| | |
|
|
| |
|
|
| |
|
|
| |
|
|
| |
|
|
|
Total from investment operations | | | 2.11 | | | | .74 | | | | 1.74 | | | | 2.09 | | | | (1.54 | ) |
| | |
|
|
| |
|
|
| |
|
|
| |
|
|
| |
|
|
|
Less Dividends and Distributions: | | | | | | | | | | | | | | | | | | | | |
Dividends from net investment income | | | — | | | | (.10 | ) | | | (.08 | ) | | | — | | | | (.09 | ) |
Distributions from net realized gains | | | — | | | | (.30 | ) | | | — | | | | — | | | | — | |
Distributions | | | (.75 | ) | | | — | | | | — | | | | — | | | | — | |
Tax Return of Capital | | | — | | | | — | | | | — | | | | — | | | | — | (c) |
| | |
|
|
| |
|
|
| |
|
|
| |
|
|
| |
|
|
|
Total dividends and distributions | | | (.75 | ) | | | (.40 | ) | | | (.08 | ) | | | — | | | | (.09 | ) |
| | |
|
|
| |
|
|
| |
|
|
| |
|
|
| |
|
|
|
Net Asset Value, end of year | | $ | 13.26 | | | $ | 11.90 | | | $ | 11.56 | | | $ | 9.90 | | | $ | 7.81 | |
| | |
|
|
| |
|
|
| |
|
|
| |
|
|
| |
|
|
|
Total Investment Return(a) | | | 18.47 | % | | | 6.64 | % | | | 17.75 | % | | | 26.76 | % | | | (16.37 | )% |
Ratios/Supplemental Data: | | | | | | | | | | | | | | | | | | | | |
Net assets, end of year (in millions) | | $ | 959.6 | | | $ | 833.1 | | | $ | 601.4 | | | $ | 72.9 | | | $ | 38.3 | |
Ratios to average net assets: | | | | | | | | | | | | | | | | | | | | |
Expenses | | | .83 | % | | | .83 | % | | | .86 | % | | | .90 | %(b) | | | .90 | %(b) |
Net investment income | | | 1.64 | % | | | 1.53 | % | | | 1.53 | % | | | 1.32 | %(b) | | | 1.22 | %(b) |
Portfolio turnover rate | | | 71 | % | | | 62 | % | | | 77 | % | | | 73 | % | | | 96 | % |
| (a) | Total investment return is calculated assuming a purchase of shares on the first day and a sale on the last day of each year reported and includes reinvestment of dividends and distributions. Total return does not reflect expenses associated with the separate account such as administrative fees, account charges and surrender charges which, if reflected, would reduce the total returns for all periods shown. Performance figures may reflect voluntary fee waivers and/or expense reimbursements. In the absence of voluntary fee waivers and/or expense reimbursements, the total return would be lower. Past performance is no guarantee of future results. |
| (b) | Net of expense reimbursement. If the investment advisor had not reimbursed expenses, the annual expense and net investment income ratios would have been 1.11% and 1.11%, respectively for the year ended December 31, 2003, and 1.31% and .81%, respectively, for the year ended December 31, 2002. |
| (c) | Less than $.005 per share. |
| (d) | Calculated based upon weighted average share outstanding during the year. |
SEE NOTES TO FINANCIAL STATEMENTS.
D5
Financial Highlights
| | | | | | | | | | | | | | | | | | | | |
| | | SP Mid-Cap Growth Portfolio
| |
| | | Year Ended December 31,
| |
| | | 2006
| | | 2005
| | | 2004
| | | 2003
| | | 2002
| |
Per Share Operating Performance: | | | | | | | | | | | | | | | | | | | | |
Net Asset Value, beginning of year | | $ | 7.21 | | | $ | 6.85 | | | $ | 5.73 | | | $ | 4.09 | | | $ | 7.62 | |
| | |
|
|
| |
|
|
| |
|
|
| |
|
|
| |
|
|
|
Income (Loss) From Investment Operations: | | | | | | | | | | | | | | | | | | | | |
Net investment income (loss) | | | .02 | | | | (.03 | ) | | | (.03 | ) | | | (.02 | ) | | | (.02 | ) |
Net realized and unrealized gain (loss) on investments | | | (.16 | ) | | | .39 | | | | 1.15 | | | | 1.66 | | | | (3.51 | ) |
| | |
|
|
| |
|
|
| |
|
|
| |
|
|
| |
|
|
|
Total from investment operations | | | (.14 | ) | | | .36 | | | | 1.12 | | | | 1.64 | | | | (3.53 | ) |
| | |
|
|
| |
|
|
| |
|
|
| |
|
|
| |
|
|
|
Net Asset Value, end of year | | $ | 7.07 | | | $ | 7.21 | | | $ | 6.85 | | | $ | 5.73 | | | $ | 4.09 | |
| | |
|
|
| |
|
|
| |
|
|
| |
|
|
| |
|
|
|
Total Investment Return(a) | | | (1.94 | )% | | | 5.26 | % | | | 19.55 | % | | | 40.10 | % | | | (46.33 | )% |
Ratios/Supplemental Data: | | | | | | | | | | | | | | | | | | | | |
Net assets, end of year (in millions) | | $ | 133.1 | | | $ | 152.9 | | | $ | 107.5 | | | $ | 58.9 | | | $ | 18.3 | |
Ratios to average net assets: | | | | | | | | | | | | | | | | | | | | |
Expenses | | | .91 | % | | | 1.00 | %(b) | | | 1.00 | %(b) | | | 1.00 | %(b) | | | 1.00 | %(b) |
Net investment income (loss) | | | .20 | % | | | (.56 | )%(b) | | | (.68 | )%(b) | | | (.73 | )%(b) | | | (.59 | )%(b) |
Portfolio turnover rate | | | 107 | % | | | 94 | % | | | 79 | % | | | 73 | % | | | 255 | % |
| (a) | Total investment return is calculated assuming a purchase of shares on the first day and a sale on the last day of each year reported and includes reinvestment of dividends and distributions. Total return does not reflect expenses associated with the separate account such as administrative fees, account charges and surrender charges which, if reflected, would reduce the total returns for all periods shown. Performance figures may reflect voluntary fee waivers and/or expense reimbursements. In the absence of voluntary fee waivers and/or expense reimbursements, the total return would be lower. Past performance is no guarantee of future results. |
| (b) | Net of expense reimbursement. If the investment advisor had not reimbursed expenses, the annual expense and net investment loss ratios would have been 1.02% and (.58)%, respectively, for the year ended December 31, 2005, 1.07% and (.75)%, respectively, for the year ended December 31, 2004, 1.34% and (1.07)%, respectively for the year ended December 31, 2003, and 1.68% and (1.27)%, respectively, for the year ended December 31, 2002. |
| | | | | | | | | | | | | | | | | | | | |
| | | SP PIMCO High Yield Portfolio
| |
| | | Year Ended December 31,
| |
| | | 2006
| | | 2005
| | | 2004
| | | 2003
| | | 2002
| |
Per Share Operating Performance: | | | | | | | | | | | | | | | | | | | | |
Net Asset Value, beginning of year | | $ | 10.25 | | | $ | 10.67 | | | $ | 10.53 | | | $ | 9.17 | | | $ | 9.81 | |
| | |
|
|
| |
|
|
| |
|
|
| |
|
|
| |
|
|
|
Income From Investment Operations: | | | | | | | | | | | | | | | | | | | | |
Net investment income | | | .75 | | | | .68 | | | | .69 | | | | .65 | | | | .64 | |
Net realized and unrealized gain (loss) on investments | | | .18 | | | | (.27 | ) | | | .25 | | | | 1.36 | | | | (.64 | ) |
| | |
|
|
| |
|
|
| |
|
|
| |
|
|
| |
|
|
|
Total from investment operations | | | .93 | | | | .41 | | | | .94 | | | | 2.01 | | | | — | |
| | |
|
|
| |
|
|
| |
|
|
| |
|
|
| |
|
|
|
Less Dividends and Distributions: | | | | | | | | | | | | | | | | | | | | |
Dividends from net investment income | | | — | | | | (.68 | ) | | | (.70 | ) | | | (.65 | ) | | | (.64 | ) |
Distributions from net realized gains | | | — | | | | (.15 | ) | | | (.10 | ) | | | — | | | | — | |
Distributions | | | (.85 | ) | | | — | | | | — | | | | — | | | | — | |
| | |
|
|
| |
|
|
| |
|
|
| |
|
|
| |
|
|
|
Total dividends and distributions | | | (.85 | ) | | | (.83 | ) | | | (.80 | ) | | | (.65 | ) | | | (.64 | ) |
| | |
|
|
| |
|
|
| |
|
|
| |
|
|
| |
|
|
|
Net Asset Value, end of year | | $ | 10.33 | | | $ | 10.25 | | | $ | 10.67 | | | $ | 10.53 | | | $ | 9.17 | |
| | |
|
|
| |
|
|
| |
|
|
| |
|
|
| |
|
|
|
Total Investment Return(a) | | | 9.51 | % | | | 4.03 | % | | | 9.32 | % | | | 22.41 | % | | | .15 | % |
Ratios/Supplemental Data: | | | | | | | | | | | | | | | | | | | | |
Net assets, end of year (in millions) | | $ | 274.4 | | | $ | 368.6 | | | $ | 312.5 | | | $ | 248.2 | | | $ | 112.2 | |
Ratios to average net assets: | | | | | | | | | | | | | | | | | | | | |
Expenses | | | .70 | % | | | .67 | % | | | .68 | % | | | .72 | % | | | .82 | % |
Net investment income | | | 6.95 | % | | | 6.65 | % | | | 6.68 | % | | | 6.97 | % | | | 7.79 | % |
Portfolio turnover rate | | | 59 | % | | | 89 | % | | | 53 | % | | | 74 | % | | | 108 | % |
| (a) | Total investment return is calculated assuming a purchase of shares on the first day and a sale on the last day of each year reported and includes reinvestment of dividends and distributions. Total return does not reflect expenses associated with the separate account such as administrative fees, account charges and surrender charges which, if reflected, would reduce the total returns for all periods shown. Performance figures may reflect voluntary fee waivers and/or expense reimbursements. In the absence of voluntary fee waivers and/or expense reimbursements, the total return would be lower. Past performance is no guarantee of future results. |
SEE NOTES TO FINANCIAL STATEMENTS.
D6
Financial Highlights
| | | | | | | | | | | | | | | | | | | | |
| | | SP PIMCO Total Return Portfolio
| |
| | | Year Ended December 31,
| |
| | | 2006
| | | 2005
| | | 2004
| | | 2003
| | | 2002
| |
Per Share Operating Performance: | | | | | | | | | | | | | | | | | | | | |
Net Asset Value, beginning of year | | $ | 11.21 | | | $ | 11.68 | | | $ | 11.54 | | | $ | 11.41 | | | $ | 10.70 | |
| | |
|
|
| |
|
|
| |
|
|
| |
|
|
| |
|
|
|
Income From Investment Operations: | | | | | | | | | | | | | | | | | | | | |
Net investment income | | | .45 | | | | .37 | | | | .22 | | | | .23 | | | | .28 | |
Net realized and unrealized gain (loss) on investments | | | (.05 | ) | | | (.10 | ) | | | .36 | | | | .43 | | | | .71 | |
| | |
|
|
| |
|
|
| |
|
|
| |
|
|
| |
|
|
|
Total from investment operations | | | .40 | | | | .27 | | | | .58 | | | | .66 | | | | .99 | |
| | |
|
|
| |
|
|
| |
|
|
| |
|
|
| |
|
|
|
Less Dividends and Distributions: | | | | | | | | | | | | | | | | | | | | |
Dividends from net investment income | | | — | | | | (.54 | ) | | | (.23 | ) | | | (.28 | ) | | | (.28 | ) |
Distributions from net realized gains | | | — | | | | (.20 | ) | | | (.21 | ) | | | (.25 | ) | | | — | (b) |
Distributions | | | (.47 | ) | | | — | | | | — | | | | — | | | | — | |
| | |
|
|
| |
|
|
| |
|
|
| |
|
|
| |
|
|
|
Total dividends and distributions | | | (.47 | ) | | | (.74 | ) | | | (.44 | ) | | | (.53 | ) | | | (.28 | ) |
| | |
|
|
| |
|
|
| |
|
|
| |
|
|
| |
|
|
|
Net Asset Value, end of year | | $ | 11.14 | | | $ | 11.21 | | | $ | 11.68 | | | $ | 11.54 | | | $ | 11.41 | |
| | |
|
|
| |
|
|
| |
|
|
| |
|
|
| |
|
|
|
Total Investment Return(a) | | | 3.68 | % | | | 2.39 | % | | | 5.28 | % | | | 5.85 | % | | | 9.39 | % |
Ratios/Supplemental Data: | | | | | | | | | | | | | | | | | | | | |
Net assets, end of year (in millions) | | $ | 1,590.3 | | | $ | 1,538.2 | | | $ | 1,099.0 | | | $ | 839.1 | | | $ | 471.7 | |
Ratios to average net assets: | | | | | | | | | | | | | | | | | | | | |
Expenses | | | .66 | %(c) | | | .62 | % | | | .65 | % | | | .65 | % | | | .67 | % |
Net investment income | | | 4.16 | % | | | 3.62 | % | | | 2.01 | % | | | 2.19 | % | | | 3.02 | % |
Portfolio turnover rate | | | 539 | % | | | 590 | % | | | 590 | % | | | 656 | % | | | 574 | % |
| (a) | Total investment return is calculated assuming a purchase of shares on the first day and a sale on the last day of each year reported and includes reinvestment of dividends and distributions. Total return does not reflect expenses associated with the separate account such as administrative fees, account charges and surrender charges which, if reflected, would reduce the total returns for all periods shown. Performance figures may reflect voluntary fee waivers and/or expense reimbursements. In the absence of voluntary fee waivers and/or expense reimbursements, the total return would be lower. Past performance is no guarantee of future results. |
| (b) | Less than $.005 per share. |
| (c) | The expense ratio reflects the interest and fee expenses related to the liability for the floating rate notes issued in conjunction with the inverse floater securities. The total expense ratio excluding interest and fees is .64%. |
| | | | | | | | | | | | | | | | | | | | |
| | | SP Prudential U.S. Emerging Growth Portfolio
| |
| | | Class I
| |
| | | Year Ended December 31,
| |
| | | 2006
| | | 2005
| | | 2004
| | | 2003
| | | 2002
| |
Per Share Operating Performance : | | | | | | | | | | | | | | | | | | | | |
Net Asset Value, beginning of year | | $ | 7.87 | | | $ | 8.07 | | | $ | 6.65 | | | $ | 4.68 | | | $ | 6.89 | |
| | |
|
|
| |
|
|
| |
|
|
| |
|
|
| |
|
|
|
Income (Loss) From Investment Operations: | | | | | | | | | | | | | | | | | | | | |
Net investment income (loss) | | | .03 | | | | (.02 | ) | | | (.05 | ) | | | (.02 | ) | | | (.02 | ) |
Net realized and unrealized gain (loss) on investments | | | .71 | | | | 1.16 | | | | 1.47 | | | | 1.99 | | | | (2.19 | ) |
| | |
|
|
| |
|
|
| |
|
|
| |
|
|
| |
|
|
|
Total from investment operations | | | .74 | | | | 1.14 | | | | 1.42 | | | | 1.97 | | | | (2.21 | ) |
| | |
|
|
| |
|
|
| |
|
|
| |
|
|
| |
|
|
|
Less Dividends and Distributions: | | | | | | | | | | | | | | | | | | | | |
Dividends from net investment income | | | — | | | | — | (c) | | | — | | | | — | | | | — | |
Distributions from net realized gains | | | — | | | | (1.34 | ) | | | — | (c) | | | — | | | | — | |
Distributions | | | (.62 | ) | | | — | | | | — | | | | — | | | | — | |
| | |
|
|
| |
|
|
| |
|
|
| |
|
|
| |
|
|
|
Total dividends and distributions | | | (.62 | ) | | | (1.34 | ) | | | — | (c) | | | — | | | | — | |
| | |
|
|
| |
|
|
| |
|
|
| |
|
|
| |
|
|
|
Net Asset Value, end of year | | $ | 7.99 | | | $ | 7.87 | | | $ | 8.07 | | | $ | 6.65 | | | $ | 4.68 | |
| | |
|
|
| |
|
|
| |
|
|
| |
|
|
| |
|
|
|
Total Investment Return(a) | | | 9.59 | % | | | 17.77 | % | | | 21.39 | % | | | 42.09 | % | | | (32.08 | )% |
Ratios/Supplemental Data: | | | | | | | | | | | | | | | | | | | | |
Net assets, end of year (in millions) | | $ | 202.6 | | | $ | 194.8 | | | $ | 128.3 | | | $ | 170.0 | | | $ | 51.0 | |
Ratios to average net assets: | | | | | | | | | | | | | | | | | | | | |
Expenses | | | .67 | % | | | .80 | % | | | .78 | % | | | .80 | % | | | .90 | %(b) |
Net investment income (loss) | | | .32 | % | | | (.28 | )% | | | (.53 | )% | | | (.56 | )% | | | (.48 | )%(b) |
Portfolio turnover rate | | | 70 | % | | | 142 | % | | | 212 | % | | | 213 | % | | | 299 | % |
| (a) | Total investment return is calculated assuming a purchase of shares on the first day and a sale on the last day of each period reported and includes reinvestment of dividends and distributions. Total return does not reflect expenses associated with the separate account such as administrative fees, account charges and surrender charges which, if reflected, would reduce the total returns for all periods shown. Performance figures may reflect voluntary fee waivers and/or expense reimbursements. In the absence of voluntary fee waivers and/or expense reimbursements, the total return would be lower. Past performance is no guarantee of future results. |
| (b) | Net of expense reimbursement. If the investment advisor had not reimbursed expenses, the annual expense and net investment loss ratios would have been .98% and (.56)%, respectively, for the year ended December 31, 2002. |
| (c) | Less than $.005 per share. |
SEE NOTES TO FINANCIAL STATEMENTS.
D7
Financial Highlights
| | | | | | | | | | | | | | | | | | | | |
| | | SP Prudential U.S. Emerging Growth Portfolio
| |
| | | Class II
| |
| | | Year Ended December 31,
| |
| | | 2006
| | | 2005
| | | 2004
| | | 2003
| | | 2002
| |
Per Share Operating Performance : | | | | | | | | | | | | | | | | | | | | |
Net Asset Value, beginning of year | | $ | 7.72 | | | $ | 7.96 | | | $ | 6.58 | | | $ | 4.65 | | | $ | 6.88 | |
| | |
|
|
| |
|
|
| |
|
|
| |
|
|
| |
|
|
|
Income (Loss) From Investment Operations: | | | | | | | | | | | | | | | | | | | | |
Net investment loss | | | (.01 | ) | | | (.05 | ) | | | (.07 | ) | | | (.05 | ) | | | (.05 | ) |
Net realized and unrealized gain (loss) on investments | | | .70 | | | | 1.15 | | | | 1.45 | | | | 1.98 | | | | (2.18 | ) |
| | |
|
|
| |
|
|
| |
|
|
| |
|
|
| |
|
|
|
Total from investment operations | | | .69 | | | | 1.10 | | | | 1.38 | | | | 1.93 | | | | (2.23 | ) |
| | |
|
|
| |
|
|
| |
|
|
| |
|
|
| |
|
|
|
Less Distributions: | | | | | | | | | | | | | | | | | | | | |
Distributions from net realized gains | | | — | | | | (1.34 | ) | | | — | (c) | | | — | | | | — | |
Distributions | | | (.62 | ) | | | — | | | | — | | | | — | | | | — | |
| | |
|
|
| |
|
|
| |
|
|
| |
|
|
| |
|
|
|
Total distributions | | | (.62 | ) | | | (1.34 | ) | | | — | (c) | | | — | | | | — | |
| | |
|
|
| |
|
|
| |
|
|
| |
|
|
| |
|
|
|
Net Asset Value, end of year | | $ | 7.79 | | | $ | 7.72 | | | $ | 7.96 | | | $ | 6.58 | | | $ | 4.65 | |
| | |
|
|
| |
|
|
| |
|
|
| |
|
|
| |
|
|
|
Total Investment Return(a): | | | 9.10 | % | | | 17.47 | % | | | 21.01 | % | | | 41.51 | % | | | (32.41 | )% |
Ratios/Supplemental Data: | | | | | | | | | | | | | | | | | | | | |
Net assets, end of year (in millions) | | $ | 0.3 | | | $ | 0.3 | | | $ | 0.4 | | | $ | 0.3 | | | $ | 0.2 | |
Ratios to average net assets: | | | | | | | | | | | | | | | | | | | | |
Expenses | | | 1.07 | % | | | 1.20 | % | | | 1.18 | % | | | 1.20 | % | | | 1.30 | %(b) |
Net investment loss | | | (.04 | )% | | | (.70 | )% | | | (.94 | )% | | | (.97 | )% | | | (.89 | )%(b) |
Portfolio turnover rate | | | 70 | % | | | 142 | % | | | 212 | % | | | 213 | % | | | 299 | % |
| (a) | Total investment return is calculated assuming a purchase of shares on the first day and a sale on the last day of each period reported and includes reinvestment of dividends and distributions. Total return does not reflect expenses associated with the separate account such as administrative fees, account charges and surrender charges which, if reflected, would reduce the total returns for all periods shown. Performance figures may reflect voluntary fee waivers and/or expense reimbursements. In the absence of voluntary fee waivers and/or expense reimbursements, the total return would be lower. Past performance is no guarantee of future results. |
| (b) | Net of expense reimbursement. If the investment advisor had not reimbursed expenses, the annual expense and net investment loss ratios would have been 1.38% and (.95)%, respectively, for the year ended December 31, 2002. |
| (c) | Less than $.005 per share. |
| | | | | | | | | | | | | | | | | | | | |
| | | SP Small Cap Growth Portfolio
| |
| | | Year Ended December 31,
| |
| | | 2006
| | | 2005
| | | 2004
| | | 2003
| | | 2002
| |
Per Share Operating Performance: | | | | | | | | | | | | | | | | | | | | |
Net Asset Value, beginning of year | | $ | 6.62 | | | $ | 6.46 | | | $ | 6.52 | | | $ | 4.84 | | | $ | 6.94 | |
| | |
|
|
| |
|
|
| |
|
|
| |
|
|
| |
|
|
|
Income (Loss) From Investment Operations: | | | | | | | | | | | | | | | | | | | | |
Net investment loss | | | (.04 | ) | | | (.04 | ) | | | (.03 | ) | | | (.03 | ) | | | (.03 | ) |
Net realized and unrealized gain (loss) on investments | | | .86 | | | | .20 | | | | (.03 | ) | | | 1.71 | | | | (2.07 | ) |
| | |
|
|
| |
|
|
| |
|
|
| |
|
|
| |
|
|
|
Total from investment operations | | | .82 | | | | .16 | | | | (.06 | ) | | | 1.68 | | | | (2.10 | ) |
| | |
|
|
| |
|
|
| |
|
|
| |
|
|
| |
|
|
|
Net Asset Value, end of year | | $ | 7.44 | | | $ | 6.62 | | | $ | 6.46 | | | $ | 6.52 | | | $ | 4.84 | |
| | |
|
|
| |
|
|
| |
|
|
| |
|
|
| |
|
|
|
Total Investment Return(a) | | | 12.39 | % | | | 2.48 | % | | | (.92 | )% | | | 34.71 | % | | | (30.26 | )% |
Ratios/Supplemental Data: | | | | | | | | | | | | | | | | | | | | |
Net assets, end of year (in millions) | | $ | 123.0 | | | $ | 135.7 | | | $ | 184.1 | | | $ | 35.0 | | | $ | 12.5 | |
Ratios to average net assets: | | | | | | | | | | | | | | | | | | | | |
Expenses | | | 1.14 | % | | | 1.05 | % | | | 1.09 | % | | | 1.15 | %(b) | | | 1.15 | %(b) |
Net investment loss | | | (.47 | )% | | | (.44 | )% | | | (.82 | )% | | | (.72 | )%(b) | | | (.73 | )%(b) |
Portfolio turnover rate | | | 53 | % | | | 192 | % | | | 240 | % | | | 122 | % | | | 109 | % |
| (a) | Total investment return is calculated assuming a purchase of shares on the first day and a sale on the last day of each year reported and includes reinvestment of dividends and distributions. Total return does not reflect expenses associated with the separate account such as administrative fees, account charges and surrender charges which, if reflected, would reduce the total returns for all periods shown. Performance figures may reflect voluntary fee waivers and/or expense reimbursements. In the absence of voluntary fee waivers and/or expense reimbursements, the total return would be lower. Past performance is no guarantee of future results. |
| (b) | Net of expense reimbursement. If the investment advisor had not reimbursed expenses, the annual expense and net investment loss ratios would have been 1.78% and (1.35)%, respectively, for the year ended December 31, 2003, and 2.30% and (1.89)%, respectively, for the year ended December 31, 2002. |
SEE NOTES TO FINANCIAL STATEMENTS.
D8
Financial Highlights
| | | | | | | | | | | | | | | | | | | | |
| | | SP Small Cap Value Portfolio
| |
| | | Year Ended December 31,
| |
| | | 2006
| | | 2005
| | | 2004
| | | 2003
| | | 2002
| |
Per Share Operating Performance: | | | | | | | | | | | | | | | | | | | | |
Net Asset Value, beginning of year | | $ | 14.27 | | | $ | 15.51 | | | $ | 12.88 | | | $ | 9.68 | | | $ | 11.36 | |
| | |
|
|
| |
|
|
| |
|
|
| |
|
|
| |
|
|
|
Income (Loss) From Investment Operations: | | | | | | | | | | | | | | | | | | | | |
Net investment income | | | .10 | | | | .07 | | | | .08 | | | | .02 | | | | .05 | |
Net realized and unrealized gain (loss) on investments | | | 1.78 | | | | .52 | | | | 2.57 | | | | 3.18 | | | | (1.68 | ) |
| | |
|
|
| |
|
|
| |
|
|
| |
|
|
| |
|
|
|
Total from investment operations | | | 1.88 | | | | .59 | | | | 2.65 | | | | 3.20 | | | | (1.63 | ) |
| | |
|
|
| |
|
|
| |
|
|
| |
|
|
| |
|
|
|
Less Dividends and Distributions: | | | | | | | | | | | | | | | | | | | | |
Dividends from net investment income | | | — | | | | (.08 | ) | | | (.02 | ) | | | — | (c) | | | (.05 | ) |
Distributions from net realized gains | | | — | | | | (1.75 | ) | | | — | (c) | | | — | | | | — | |
Distributions | | | (2.47 | ) | | | — | | | | — | | | | — | | | | — | |
| | |
|
|
| |
|
|
| |
|
|
| |
|
|
| |
|
|
|
Total dividends and distributions | | | (2.47 | ) | | | (1.83 | ) | | | (.02 | ) | | | — | (c) | | | (.05 | ) |
| | |
|
|
| |
|
|
| |
|
|
| |
|
|
| |
|
|
|
Net Asset Value, end of year | | $ | 13.68 | | | $ | 14.27 | | | $ | 15.51 | | | $ | 12.88 | | | $ | 9.68 | |
| | |
|
|
| |
|
|
| |
|
|
| |
|
|
| |
|
|
|
Total Investment Return(a) | | | 14.60 | % | | | 4.61 | % | | | 20.69 | % | | | 33.11 | % | | | (14.38 | )% |
Ratios/Supplemental Data: | | | | | | | | | | | | | | | | | | | | |
Net assets, end of year (in millions) | | $ | 369.0 | | | $ | 350.7 | | | $ | 393.3 | | | $ | 250.6 | | | $ | 99.2 | |
Ratios to average net assets: | | | | | | | | | | | | | | | | | | | | |
Expenses | | | .96 | % | | | .97 | % | | | .96 | % | | | 1.04 | % | | | 1.05 | %(b) |
Net investment income | | | .71 | % | | | .49 | % | | | .69 | % | | | .37 | % | | | .69 | %(b) |
Portfolio turnover rate | | | 55 | % | | | 119 | % | | | 127 | % | | | 90 | % | | | 116 | % |
| (a) | Total investment return is calculated assuming a purchase of shares on the first day and a sale on the last day of each year reported and includes reinvestment of dividends and distributions. Total return does not reflect expenses associated with the separate account such as administrative fees, account charges and surrender charges which, if reflected, would reduce the total returns for all periods shown. Performance figures may reflect voluntary fee waivers and/or expense reimbursements. In the absence of voluntary fee waivers and/or expense reimbursements, the total return would be lower. Past performance is no guarantee of future results. |
| (b) | Net of expense reimbursement. If the investment advisor had not reimbursed expenses, the annual expense and net investment loss ratios would have been 1.10% and .64%, respectively, for the year ended December 31, 2002. |
| (c) | Less than $.005 per share. |
| | | | | | | | | | | | | | | | | | | | |
| | | SP Strategic Partners Focused Growth Portfolio
| |
| | | Class I
| |
| | | Year Ended December 31,
| |
| | | 2006
| | | 2005
| | | 2004
| | | 2003
| | | 2002
| |
Per Share Operating Performance: | | | | | | | | | | | | | | | | | | | | |
Net Asset Value, beginning of year | | $ | 8.07 | | | $ | 7.00 | | | $ | 6.33 | | | $ | 5.03 | | | $ | 6.73 | |
| | |
|
|
| |
|
|
| |
|
|
| |
|
|
| |
|
|
|
Income (Loss) From Investment Operations: | | | | | | | | | | | | | | | | | | | | |
Net investment loss | | | (.04 | ) | | | (.03 | ) | | | — | (b) | | | (.01 | ) | | | (.01 | ) |
Net realized and unrealized gain (loss) on investments | | | (.02 | ) | | | 1.10 | | | | .67 | | | | 1.31 | | | | (1.69 | ) |
| | |
|
|
| |
|
|
| |
|
|
| |
|
|
| |
|
|
|
Total from investment operations | | | (.06 | ) | | | 1.07 | | | | .67 | | | | 1.30 | | | | (1.70 | ) |
| | |
|
|
| |
|
|
| |
|
|
| |
|
|
| |
|
|
|
Less Distributions: | | | | | | | | | | | | | | | | | | | | |
Distributions | | | (.52 | ) | | | — | | | | — | | | | — | | | | — | |
| | |
|
|
| |
|
|
| |
|
|
| |
|
|
| |
|
|
|
Net Asset Value, end of year | | $ | 7.49 | | | $ | 8.07 | | | $ | 7.00 | | | $ | 6.33 | | | $ | 5.03 | |
| | |
|
|
| |
|
|
| |
|
|
| |
|
|
| |
|
|
|
Total Investment Return(a) | | | (.66 | )% | | | 15.29 | % | | | 10.58 | % | | | 25.84 | % | | | (25.26 | )% |
Ratios/Supplemental Data: | | | | | | | | | | | | | | | | | | | | |
Net assets, end of year (in millions) | | $ | 38.7 | | | $ | 38.3 | | | $ | 30.1 | | | $ | 21.6 | | | $ | 10.8 | |
Ratios to average net assets: | | | | | | | | | | | | | | | | | | | | |
Expenses | | | 1.15 | % | | | 1.07 | %(c) | | | 1.01 | %(c) | | | 1.01 | %(c) | | | 1.01 | %(c) |
Net investment loss | | | (.47 | )% | | | (.44 | )%(c) | | | (.01 | )%(c) | | | (.28 | )%(c) | | | (.30 | )%(c) |
Portfolio turnover rate | | | 142 | % | | | 110 | % | | | 84 | % | | | 93 | % | | | 62 | % |
| (a) | Total investment return is calculated assuming a purchase of shares on the first day and a sale on the last day of each year reported and includes reinvestment of dividends and distributions. Total return does not reflect expenses associated with the separate account such as administrative fees, account charges and surrender charges which, if reflected, would reduce the total returns for all periods shown. Performance figures may reflect voluntary fee waivers and/or expense reimbursements. In the absence of voluntary fee waivers and/or expense reimbursements, the total return would be lower. Past performance is no guarantee of future results. |
| (b) | Less than $.005 per share. |
| (c) | Net of expense reimbursement. If the investment advisor had not reimbursed expenses, the annual expense and net investment loss ratios would have been 1.14% and (.51)%, respectively, for the year ended December 31, 2005, 1.28% and (.28)%, respectively, for the year ended December 31, 2004, 1.65% and (.92)%, respectively for the year ended December 31, 2003, and 1.98% and (1.28)%, respectively, for the year ended December 31, 2002. |
SEE NOTES TO FINANCIAL STATEMENTS.
D9
Financial Highlights
| | | | | | | | | | | | | | | | | | | | |
| | | SP Strategic Partners Focused Growth Portfolio
| |
| | | Class II
| |
| | | Year Ended December 31,
| |
| | | 2006
| | | 2005
| | | 2004
| | | 2003
| | | 2002
| |
Per Share Operating Performance: | | | | | | | | | | | | | | | | | | | | |
Net Asset Value, beginning of year | | $ | 7.91 | | | $ | 6.88 | | | $ | 6.26 | | | $ | 4.99 | | | $ | 6.70 | |
| | |
|
|
| |
|
|
| |
|
|
| |
|
|
| |
|
|
|
Income (Loss) From Investment Operations: | | | | | | | | | | | | | | | | | | | | |
Net investment loss | | | (.08 | ) | | | (.06 | ) | | | (.01 | ) | | | (.03 | ) | | | (.02 | ) |
Net realized and unrealized gain (loss) on investments | | | (.01 | ) | | | 1.09 | | | | .63 | | | | 1.30 | | | | (1.69 | ) |
| | |
|
|
| |
|
|
| |
|
|
| |
|
|
| |
|
|
|
Total from investment operations | | | (.09 | ) | | | 1.03 | | | | .62 | | | | 1.27 | | | | (1.71 | ) |
| | |
|
|
| |
|
|
| |
|
|
| |
|
|
| |
|
|
|
Less Distributions: | | | | | | | | | | | | | | | | | | | | |
Distributions | | | (.52 | ) | | | — | | | | — | | | | — | | | | — | |
| | |
|
|
| |
|
|
| |
|
|
| |
|
|
| |
|
|
|
Net Asset Value, end of year | | | 7.30 | | | $ | 7.91 | | | $ | 6.88 | | | $ | 6.26 | | | $ | 4.99 | |
| | |
|
|
| |
|
|
| |
|
|
| |
|
|
| |
|
|
|
Total Investment Return(a) | | | (1.07 | )% | | | 14.97 | % | | | 9.90 | % | | | 25.45 | % | | | (25.52 | )% |
Ratios/Supplemental Data: | | | | | | | | | | | | | | | | | | | | |
Net assets, end of year (in millions) | | $ | 31.3 | | | $ | 42.8 | | | $ | 32.1 | | | $ | 14.3 | | | $ | 6.6 | |
Ratios to average net assets: | | | | | | | | | | | | | | | | | | | | |
Expenses | | | 1.55 | % | | | 1.47 | %(b) | | | 1.41 | %(b) | | | 1.41 | %(b) | | | 1.41 | %(b) |
Net investment loss | | | (.88 | )% | | | (.84 | )%(b) | | | (.34 | )%(b) | | | (.68 | )%(b) | | | (.68 | )%(b) |
Portfolio turnover rate | | | 142 | % | | | 110 | % | | | 84 | % | | | 93 | % | | | 62 | % |
| (a) | Total investment return is calculated assuming a purchase of shares on the first day and a sale on the last day of each year reported and includes reinvestment of dividends and distributions. Total return does not reflect expenses associated with the separate account such as administrative fees, account charges and surrender charges which, if reflected, would reduce the total returns for all periods shown. Performance figures may reflect voluntary fee waivers and/or expense reimbursements. In the absence of voluntary fee waivers and/or expense reimbursements, the total return would be lower. Past performance is no guarantee of future results. |
| (b) | Net of expense reimbursement. If the investment advisor had not reimbursed expenses, the annual expense and net investment loss ratios would have been 1.54% and (.91)%, respectively, for the year ended December 31, 2005, 1.68% and (.61)%, respectively, for the year ended December 31, 2004, 2.05% and (1.32)%, respectively, for the year ended December 31, 2003, and 2.34% and (1.61)%, respectively, for the year ended December 31, 2002. |
| | | | | | | | | | | | | | | | | | | | |
| | | SP T.Rowe Price Large Cap Growth Portfolio
| |
| | | Year Ended December 31,
| |
| | | 2006
| | | 2005
| | | 2004
| | | 2003
| | | 2002
| |
Per Share Operating Performance: | | | | | | | | | | | | | | | | | | | | |
Net Asset Value, beginning of year | | $ | 7.71 | | | $ | 6.61 | | | $ | 6.23 | | | $ | 5.03 | | | $ | 7.31 | |
| | |
|
|
| |
|
|
| |
|
|
| |
|
|
| |
|
|
|
Income (Loss) From Investment Operations: | | | | | | | | | | | | | | | | | | | | |
Net investment income (loss) | | | .02 | | | | (.03 | ) | | | (.01 | ) | | | — | (c) | | | (.01 | ) |
Net realized and unrealized gain (loss) on investments | | | .39 | | | | 1.13 | | | | .39 | | | | 1.20 | | | | (2.27 | ) |
| | |
|
|
| |
|
|
| |
|
|
| |
|
|
| |
|
|
|
Total from investment operations | | | .41 | | | | 1.10 | | | | .38 | | | | 1.20 | | | | (2.28 | ) |
| | |
|
|
| |
|
|
| |
|
|
| |
|
|
| |
|
|
|
Less Distributions: | | | | | | | | | | | | | | | | | | | | |
Distributions | | | (.95 | ) | | | — | | | | — | | | | — | | | | — | |
| | |
|
|
| |
|
|
| |
|
|
| |
|
|
| |
|
|
|
Net Asset Value, end of year | | $ | 7.17 | | | $ | 7.71 | | | $ | 6.61 | | | $ | 6.23 | | | $ | 5.03 | |
| | |
|
|
| |
|
|
| |
|
|
| |
|
|
| |
|
|
|
Total Investment Return(a) | | | 5.91 | % | | | 16.64 | % | | | 6.10 | % | | | 23.86 | % | | | (31.19 | )% |
Ratios/Supplemental Data: | | | | | | | | | | | | | | | | | | | | |
Net assets, end of year (in millions) | | $ | 77.7 | | | $ | 73.8 | | | $ | 65.7 | | | $ | 146.5 | | | $ | 57.7 | |
Ratios to average net assets: | | | | | | | | | | | | | | | | | | | | |
Expenses | | | 1.06 | %(b) | | | 1.06 | %(b) | | | 1.08 | % | | | 1.06 | % | | | 1.10 | %(b) |
Net investment income (loss) | | | .25 | %(b) | | | (.38 | )%(b) | | | (.14 | )% | | | (.11 | )% | | | (.27 | )%(b) |
Portfolio turnover rate | | | 58 | % | | | 144 | % | | | 122 | % | | | 38 | % | | | 34 | % |
| (a) | Total investment return is calculated assuming a purchase of shares on the first day and a sale on the last day of each year reported and includes reinvestment of dividends and distributions. Total return does not reflect expenses associated with the separate account such as administrative fees, account charges and surrender charges which, if reflected, would reduce the total returns for all periods shown. Performance figures may reflect voluntary fee waivers and/or expense reimbursements. In the absence of voluntary fee waivers and/or expense reimbursements, the total return would be lower. Past performance is no guarantee of future results. |
| (b) | Net of expense reimbursement. If the investment advisor had not reimbursed expenses, the annual expense and net investment income (loss) ratios would have been 1.19% and .13%, respectively, for the year ended December 31, 2006, 1.16% and (.48)%, respectively, for the year ended December 31, 2005, and 1.19% and (.35)%, respectively, for the year ended December 31, 2002. |
| (c) | Less than $.005 per share. |
SEE NOTES TO FINANCIAL STATEMENTS.
D10
REPORT OF INDEPENDENT REGISTERED PUBLIC ACCOUNTING FIRM
THE BOARD OF TRUSTEES AND SHAREHOLDERS OF THE PRUDENTIAL SERIES FUND:
We have audited the accompanying statements of assets and liabilities of The Prudential Series Fund (comprised of SP Aggressive Growth Asset Allocation Portfolio, SP AIM Core Equity Portfolio, SP Balanced Asset Allocation Portfolio, SP Conservative Asset Allocation Portfolio, SP Davis Value Portfolio, SP Growth Asset Allocation Portfolio, SP International Growth Portfolio, SP International Value Portfolio, SP Large Cap Value Portfolio, SP Mid-Cap Growth Portfolio, SP PIMCO High Yield Portfolio, SP PIMCO Total Return Portfolio, SP Prudential U.S. Emerging Growth Portfolio, SP Small Cap Growth Portfolio, SP Small Cap Value Portfolio, SP Strategic Partners Focused Growth Portfolio, SP T. Rowe Price Large Cap Growth Portfolio, hereafter referred to as the “Funds”), including the portfolios of investments, as of December 31, 2006, and the related statements of operations for the year then ended, the statements of changes in net assets for each of the years in the two-year period then ended, and the financial highlights for each of the years in the three-year period then ended. These financial statements and financial highlights are the responsibility of the Funds’ management. Our responsibility is to express an opinion on these financial statements and financial highlights based on our audits. The financial highlights for the years presented prior to the year ended December 31, 2004, were audited by another independent registered public accounting firm whose report dated February 20, 2004, expressed an unqualified opinion thereon.
We conducted our audits in accordance with the standards of the Public Company Accounting Oversight Board (United States). Those standards require that we plan and perform the audit to obtain reasonable assurance about whether the financial statements and financial highlights are free of material misstatement. An audit includes examining, on a test basis, evidence supporting the amounts and disclosures in the financial statements. Our procedures included confirmation of securities owned as of December 31, 2006, by correspondence with the custodian and brokers or by other appropriate auditing procedures where replies from brokers were not received. An audit also includes assessing the accounting principles used and significant estimates made by management, as well as evaluating the overall financial statement presentation. We believe that our audits provide a reasonable basis for our opinion.
In our opinion, the financial statements and financial highlights referred to above present fairly, in all material respects, the financial position of The Prudential Series Fund as of December 31, 2006, and the results of its operations for the year then ended, the changes in its net assets for each of the years in the two-year period then ended, and the financial highlights for each of the years in the three-year period then ended, in conformity with U.S. generally accepted accounting principles.

New York, New York
February 19, 2007
E1
MANAGEMENT OF THE FUND
(Unaudited)
Information pertaining to the Trustees of the Fund is set forth below. Trustees who are not deemed to be “interested persons” of the Fund as defined in the Investment Company Act are referred to as “Independent Trustees.” Trustees who are deemed to be “interested persons” of the Fund are referred to as “Interested Trustees.” “Fund Complex” consists of the Fund and any other investment companies managed by PI.
| | | | | | |
Name, Address**,
and Age | | Position with Fund*
Term of Office***
Length of Time Served | | Number of Portfolios
In Fund Complex
Overseen by Trustee | | Other Directorships
Held by the Trustee**** |
| | | |
| Saul K. Fenster, Ph.D. (73) | | Trustee, Since 1983 | | 77 | | Member (since 2006), Board of The Ridgefield Foundation and The Leir Foundation. |
|
| Principal Occupations During Past 5 Years – Currently President Emeritus of New Jersey Institute of Technology (since 2002); formerly President (1978-2002) of New Jersey Institute of Technology; Commissioner (1998-2002) of the Middle States Association Commission on Higher Education; Commissioner (1985-2002) of the New Jersey Commission on Science and Technology; formerly Director (1998-2005) of Society of Manufacturing Engineering Education Foundation; formerly Director of Prosperity New Jersey; formerly a director or trustee of Liberty Science Center, Research and Development Council of New Jersey, New Jersey State Chamber of Commerce, and National Action Council for Minorities in Engineering. |
| | | |
| Delayne Dedrick Gold (68) | | Trustee, Since 2001 | | 76 | | — |
|
| Principal Occupations During Past 5 Years – Marketing Consultant (1982-present); formerly Senior Vice President and Member of the Board of Directors, Prudential Bache Securities, Inc. |
| | | |
| W. Scott McDonald, Jr. (69) | | Vice Chairman and Trustee, Since 1983 | | 77 | | — |
|
| Principal Occupations During Past 5 Years – Formerly Management Consultant (1997-2004) and of Counsel (2004-2005) at Kaludis Consulting Group, Inc. (company serving higher education); Formerly principal (1995-1997), Scott McDonald & Associates; Chief Operating Officer (1991-1995), Fairleigh Dickinson University; Executive Vice President and Chief Operating Officer (1975-1991), Drew University; interim President (1988-1990), Drew University; formerly Director of School, College and University Underwriters Ltd. |
| | | |
| Thomas T. Mooney (65) | | Chairman and Trustee, Since 2001 | | 76 | | — |
|
| Principal Occupations During Past 5 Years – Chief Executive Officer, Excell Partners, Inc.; formerly President of the Greater Rochester Metro Chamber of Commerce, Rochester City Manager; formerly Deputy Monroe County Executive. |
| | | |
| Thomas M. O’Brien (56) | | Trustee, Since 2003 | | 76 | | Formerly Director (December 1996-May 2000) of North Fork Bancorporation, Inc.; Formerly Director (May 2000-April 2006) of Atlantic Bank of New York; Director (since November 2006) of State Bancorp, Inc. (NASDAQ: STBC) and State Bank of Long Island. |
|
| Principal Occupations During Past 5 Years – President and COO (since November 2006) of State Bancorp, Inc. and State Bank; Vice Chairman (January 1997-April 2000) of North Fork Bank; President and Chief Executive Officer (December 1984-December 1996) of North Side Savings Bank; formerly President and Chief Executive Officer (May 2000-June 2006) Atlantic Bank of New York. |
| | | |
| John A. Pileski (67) | | Trustee, Since 2003 | | 76 | | Director (since April 2001) of New York Community Bank. Director (since May 1980) of Surf Club of Quogue, Inc. |
|
| Principal Occupations During Past 5 Years – Retired since June 2000; Tax Partner (July 1974-June 2000) of KPMG, LLP. |
| | | |
| F. Don Schwartz (71) | | Trustee, Since 2003 | | 76 | | — |
|
| Principal Occupations During Past 5 Years – Management Consultant (since April 1985). |
F1
| | | | | | |
|
Interested Trustees
|
Name, Address**,
and Age | | Position with Fund*
Term of Office***
Length of Time Served | | Number of Portfolios
In Fund Complex
Overseen by Trustee | | Other Directorships
Held by the Trustee**** |
| | | |
| *David R. Odenath (49) | | President and Trustee Since 1999 | | 76 | | — |
|
| Principal Occupations During Past 5 Years – President of Prudential Annuities (since August 2002); Senior Vice President (since June 1999) of Prudential; Executive Vice President (since May 2003) of Prudential Investment Management Services LLC; President, Chief Executive Officer, Chief Operating Officer, Officer in Charge and Director (since June 2005) of American Skandia Investment Services, Inc; Formerly President, Chief Executive Officer, Chief Operating Officer and Officer-In-Charge (September 1999-February 2003) of Prudential Investments LLC. |
| | | |
| *Robert F. Gunia (60) | | Vice President and Trustee since 2001 | | 154 | | Vice President and Director (since May 1989) and Treasurer (since 1999) of The Asia Pacific Fund, Inc.; |
|
| Principal Occupations During Past 5 Years – Chief Administrative Officer (since September 1999) and Executive Vice President (since December 1996) of Prudential Investments LLC; President (since April 1999) of Prudential Investment Management Services LLC; Executive Vice President (since March 1999) and Treasurer (since May 2000) of Prudential Mutual Fund Services LLC; Chief Administrative Officer, Executive Vice President and Director (since May 2003) of American Skandia Investment Services, Inc. |
| | | | |
|
Officers
|
Name, Address**,
and Age | | Position with Fund*
Term of Office***
Length of Time Served | | Principal Occupations During Past 5 Years |
| | |
| Grace C. Torres (47) | | Treasurer and Principal Financial and Accounting Officer Since 1997 | | Assistant Treasurer (since March 1999) and Senior Vice President (since September 1999) of PI; Assistant Treasurer (since May 2003) and Vice President (since June 2005) of American Skandia Investment Services, Inc.; Senior Vice President and Assistant Treasurer (since May 2003) of American Skandia Advisory Services, Inc.; formerly Senior Vice President (May 2003-June 2005) of American Skandia Investment Services, Inc. |
| | |
| Kathryn L. Quirk (54) | | Chief Legal Officer Since 2005 | | Vice President and Corporate Counsel (since September 2004) of Prudential; Executive Vice President, Chief Legal Officer and Secretary (since July 2005) of Prudential Investments LLC and Prudential Mutual Fund Services LLC; formerly Managing Director, General Counsel, Chief Compliance Officer, Chief Risk Officer and Corporate Secretary (1997-2002) of Zurich Scudder Investments, Inc. |
| | |
| Deborah A. Docs (49) | | Secretary Since 2005 | | Vice President and Corporate Counsel (since January 2001) of Prudential; Vice President (since December 1996) and Assistant Secretary (since March 1999) of PI; formerly Vice President and Assistant Secretary (May 2003-June 2005) of American Skandia Investment Services, Inc. |
| | |
| Jonathan D. Shain (48) | | Assistant Secretary Since 2005 | | Vice President and Corporate Counsel (since August 1998) of Prudential Insurance; Vice President and Assistant Secretary (since May 2003) of American Skandia Investment Services, Inc. and American Skandia Fund Services, Inc.; formerly Attorney with Fleet Bank, N.A. (January 1997-July 1998). |
| | |
| Claudia DiGiacomo (32) | | Assistant Secretary Since 2005 | | Vice President and Corporate Counsel (since January 2005) of Prudential; Vice President and Assistant Secretary of PI (since December 2005); Associate at Sidley Austin Brown & Wood LLP (1999-2004). |
| | |
| John P. Schwartz (35) | | Assistant Secretary Since 2006 | | Vice President and Corporate Counsel (since April 2005) of Prudential; Vice President and Assistant Secretary of PI (since December 2005); Associate at Sidley Austin Brown & Wood LLP (1997-2005). |
| | |
| Lee D. Augsburger (47) | | Chief Compliance Officer Since 2004 | | Senior Vice President and Chief Compliance Officer (since April 2003) of PI; Vice President (since November 2000) and Chief Compliance Officer (since October 2000) of Prudential Investment Management, Inc.; Chief Compliance Officer and Senior Vice President (since May 2003) of American Skandia Investment Services, Inc. |
| | |
| Valerie M. Simpson (48) | | Deputy Chief Compliance Officer | | Vice President and Senior Compliance Officer (since March 2006) of PI; Vice President – Financial Reporting (since March 2006) for Prudential Life and Annuities Finance. |
F2
| | | | |
Name, Address**,
and Age | | Position with Fund*
Term of Office***
Length of Time Served | | Principal Occupations During Past 5 Years |
| | |
| M. Sadiq Peshimam (43) | | Assistant Treasurer Since 2006 | | Vice President (since 2005) and Director (2000-2005) within Prudential Mutual Fund Administration. |
| | |
| Jack Benintende (42) | | Assistant Treasurer Since 2006 | | Vice President (since June 2000) within Prudential Mutual Fund Administration; formerly Senior Manager within the investment management practice of PricewaterhouseCoopers LLP (May 1994-June 2000). |
| | |
| Alan Fu (50) | | Assistant Treasurer Since 2006 | | Vice President – Tax, The Prudential Insurance Company of America (1999-October 2003); Vice President and Corporate Counsel – Tax, Prudential Financial, Inc. (since October 2003). |
| | |
| Andrew French (44) | | Assistant Secretary Since 2006 | | Director and Corporate Counsel (since May 2006) of Prudential; formerly Senior Legal Analyst of Prudential Mutual Fund Law Department (1997-2006). |
| | |
| Noreen M. Fierro (42) | | Anti-Money Laundering Compliance Officer Since 2006 | | Vice President, Corporate Compliance Officer (since May 2006) of Prudential; formerly Corporate Vice President, Associate General Counsel (April 2002-May 2005) of UBS Financial Services, Inc., in their Money Laundering Prevention Group; Senior Manager (May 2005-May 2006) of Deloitte Financial Advisory Services, LLP, in their Forensic and Dispute Services, Anti-Money Laundering Group. |
* “Interested” Trustee, as defined in the Investment Company Act, by reason of employment with the Manager (as defined below), and/or the Distributor (as defined below).
** Unless otherwise noted, the address of the Trustees and Officers is c/o: Prudential Investments LLC, Gateway Center Three, 100 Mulberry Street, Newark, New Jersey 07102.
*** There is no set term of office for Trustees and Officers.
**** This column includes only directorships of companies required to register, or file reports with the SEC under the Securities Exchange Act of 1934 (i.e., “public companies”) or other investment companies registered under the Investment Company Act.
F3
This report contains financial information about certain investment choices that may be available on the variable life insurance and variable annuity contracts listed below. You may receive additional reports and should refer to your variable life insurance or variable annuity contract prospectus to determine which portfolios are available to you.
VARIABLE LIFE INSURANCE
| n | | Prudential’s Survivorship Preferred® |
| n | | Prudential’s Variable Universal Life |
| n | | Pruco Life’s Variable Universal Life® |
| n | | Pruco Life’s Survivorship Variable Universal Life |
| n | | Pruco Life of New Jersey’s Survivorship Variable Universal Life |
| n | | Pruco Life’s PruLife® Custom Premier |
| n | | Pruco Life of New Jersey’s PruLife® Custom Premier |
n | | Pruco Life’s PruSelectSM III |
n | | Pruco Life of New Jersey’s PruSelectSM III |
n | | Pruco Life’s MPremierSM VUL |
VARIABLE ANNUITIES
| n | | Pruco Life’s Discovery Select® |
| n | | Pruco Life of New Jersey’s Discovery Select® |
| n | | Pruco Life’s Discovery Choice® |
| n | | Pruco Life of New Jersey’s Discovery Choice® |
n | | Pruco Life’s Strategic PartnersSM Annuity One |
n | | Pruco Life of New Jersey’s Strategic PartnersSM Annuity One |
n | | Pruco Life’s Strategic PartnersSM Select |
n | | Pruco Life of New Jersey’s Strategic PartnersSM Select |
n | | Pruco Life’s Strategic PartnersSM Advisor |
n | | Pruco Life of New Jersey’s Strategic PartnersSM Advisor |
n | | Pruco Life’s Strategic PartnersSM FlexElite |
n | | Pruco Life of New Jersey’s Strategic PartnersSM FlexElite |
n | | Pruco Life’s Strategic PartnersSM Plus |
n | | Pruco Life of New Jersey’s Strategic PartnersSM Plus |
Variable life insurance is offered through Pruco Securities LLC, member SIPC, 751 Broad Street, Newark, NJ 07102-3777. Variable annuities are distributed by Prudential Investment Management Services LLC (PIMS), member SIPC, Gateway Center Three, 14th Floor, Newark, NJ 07102-4077. Variable life insurance and variable annuities are issued by The Prudential Insurance Company of America, Pruco Life Insurance Company, or in New York, Pruco Life Insurance Company of New Jersey. All are Prudential Financial companies. Each is solely responsible for its own financial condition and contractual obligations. Contract guarantees are based on the claims-paying ability of the issuing Company.
The 2006 Audited Financial Statements of Pruco Life Insurance Company, Pruco Life Insurance Company of New Jersey, and The Prudential Insurance Company of America will be available commencing on April 30, 2007. You may call (888) 778-2888 to obtain a free copy of the audited financial statements of the insurance company that issued your contract.
To reduce costs, we now generally send only a single copy of prospectuses and shareholder reports to each household (“householding”) in lieu of sending a copy to each Contract Owner who resides in the household. You should be aware that by calling (877) 778-5008, you can revoke or “opt out” of householding at any time.
Prudential Financial and the Rock logo are service marks of The Prudential Insurance Company of America, Newark, NJ, and its affiliates.
751 Broad Street
Newark NJ 07102-3777
Presorted
Standard
U.S. Postage
PAID
Prudential
IFS-A114669 PSF-AR-B Ed. 02/2007

ANNUAL REPORT
DECEMBER 31, 2006
The Prudential Series Fund

| n | | Diversified Conservative Growth Portfolio |
| n | | Jennison 20/20 Focus Portfolio |
Please note that inside are the Prospectus Supplements dated February 1, and February 13, 2007. This document is separate from and not a part of the annual report.

The Prudential Insurance Company of America
751 Broad Street, Newark, NJ 07102-3777
Pruco Life Insurance Company
Pruco Life Insurance Company of New Jersey
213 Washington Street, Newark, NJ 07102-2992
Pruco Life Insurance Company is not licensed to do business in New York.
IFS-A114743
| | This report is one of several that provide financial information about certain investment choices available on variable life insurance and variable annuity contracts. Based on the variable contract you own or the portfolios you invested in, you may receive additional reports that provide financial information on those investment choices. Please refer to your variable life insurance or variable annuity contract prospectus to determine which portfolios are available to you. A list of the variable contracts that this report supports is located on the inside back cover. |
This report must be preceded or accompanied by the current prospectuses for the Prudential Series Fund portfolios and the applicable variable life or annuity contract. The prospectuses contains information on the investment objectives, risks, and charges and expenses and should be read carefully.
The contract’s prospectus contains hypothetical performance illustrations that show the effect of various assumptions regarding the cost of insurance protection. You may also obtain a personalized illustration of historical performance that reflects the cost of your policy’s insurance protection.
DISCOVER THE BENEFITS OF eDelivery
| n | | Eliminate receiving printed reports. |
| n | | View documents on-line as they become available. |
| n | | Download and store e-reports on your PC. |
| n | | Help the environment by using less paper. |
To receive your semiannual/annual reports on-line, go to www.prudential.com/edelivery and enroll. Instead of receiving printed reports, you will receive notification via e-mail when new materials are available for your review. You can cancel your enrollment or change your e-mail address at any time by visiting the internet address listed above.
A description of the Fund’s proxy voting policies and procedures is available, without charge, upon request. Owners of variable annuity contracts should call 888-778-2888 and owners of variable life insurance contracts should call 800-778-2255 to obtain descriptions of the Fund’s proxy voting policies and procedures. The description is also available on the website of the Securities and Exchange Commission (the “Commission”) at www.sec.gov. Information regarding how the Fund voted proxies relating to portfolio securities during the most recent 12-month period ended June 30, is available on the website of the Commission at www.sec.gov and on the Fund’s website.
The Fund files with the Commission a complete listing of portfolio holdings as of its first and third quarter-end on Form N-Q. Form N-Q is available on the Commission’s website at www.sec.gov or by visiting the Commission’s Public Reference Room. For more information on the Commission’s Public Reference Room, please visit the Commission’s website or call 800-SEC-0330. Form N-Q is also available on the Fund’s website at www.prudential.com or by calling the telephone numbers referenced above.
The Fund’s Statement of Additional Information contains additional information about the Fund’s Trustees and is available without charge upon request by calling (888) 778-2888.

GLOSSARY OF BENCHMARK DEFINITIONS
The Diversified Conservative Growth Custom Blended Index consists of the Russell 3000 Index (40%)Lehman Brothers Aggregate Bond Index (60%),
The Lehman U.S. Aggregate Bond Index is an unmanaged index comprised of more than 5,000 government and corporate bonds.
The Lipper Variable Insurance Products (VIP) Funds Averages are calculated by Lipper Analytical Services, Inc., and reflect the investment return of certain portfolios underlying variable life and annuity products. These returns are net of investment fees and fund expenses, but not product charges.
Mixed Asset Allocation Moderate Funds Average
Large-Cap Core Funds Average
Multi-Cap Core Funds Average
The Russell 1000 Index is an unmanaged index that consists of the 1,000 largest securities in the Russell 3000® Index.
The Russell 3000 Index Measures the performance of the 3,000 largest U.S. companies based on total market capitalization, which represents approximately 98% of the investable U.S. equity market.
The Standard & Poor’s 500 Composite Stock Price Index (S&P 500 Index) is an unmanaged index of 500 stocks of large U.S. public companies. It gives a broad look at how stock prices in the United States have performed.
This page may include certain benchmarks not applicable to the portfolios available in this particular report. Investors cannot invest directly in a market index or average.
The Prudential Series Fund
Annual Report
December 31, 2006
Table of Contents
| n | | LETTER TO CONTRACT OWNERS |
| n | | FEES AND EXPENSES TABLE |
A1 Financial Statements
B1 Schedule of Investments
C1 Notes to Financial Statements
D1 Financial Highlights
E1 Report of Independent Registered Accounting Firm
F1 Management of The Prudential Series Fund
This report may include financial information pertaining to certain portfolios that are not available through the variable life insurance policy or variable annuity contract that you have chosen. Please refer to your variable life insurance or variable annuity prospectus to determine which portfolios are available to you.
The Prudential Series Fund
Letter to Contract Owners
December 31, 2006
At Prudential, we are committed to helping you achieve and sustain financial success. We hope that you find the annual report for the Prudential Series Fund to be an informative and valuable resource.
Each year, we remind our clients about the benefits of diversification within their portfolios. A diversified portfolio helps you manage downside risk by not being overly invested in any particular asset class, and it helps better position your investments as asset classes rotate in and out of favor. Not only is diversification the best way to balance risk and return, but it can also help align your long-term goals with your risk tolerance. The result is a portfolio that may help you weather market fluctuations and more closely meet your long-term needs.
Contact your financial professional to take the first step in creating a diversified investment plan. Together you should review your reasons for investing, personal investment horizon and risk tolerance to develop a strategy that works best for you. A carefully chosen and broad mix of assets—reviewed periodically over time—can help you stay focused on meeting your long-term objectives.
Thank you for selecting our financial products. At Prudential, your financial security is our priority and we value the opportunity to help you grow and protect your wealth.
Sincerely,
David R. Odenath, Jr.
President,
The Prudential Series Fund | January 31, 2007 |
PRESIDENT
DAVID R. ODENATH, JR.
The Prudential Series Fund, Diversified Conservative Growth Portfolio
Subadvised by: EARNEST Partners, RS Investment Management Co. LLC, Jennison Associates LLC, Prudential Investment Management, Inc., Pacific Investment Management Company LLC
December 31, 2006
Investment Manager’s Report
Performance Summary - As of December 31, 2006
Average Annual Total Return Percentages
| | | | | | | | | |
| | | 1-Year | | | 5-Year | | | Since
Inception | |
Diversified Conservative Growth Portfolio | | 6.92 | % | | 7.21 | % | | 6.17 | % |
S&P 500 Index | | 15.78 | | | 6.18 | | | 2.41 | |
Diversified Conservative Growth Custom Blended Index | | 8.81 | | | 6.15 | | | 5.15 | |
Lipper Mixed Asset Allocation Moderate Funds Avg. | | 10.88 | | | 6.43 | | | 4.38 | |
Portfolio inception: 5/3/1999.
$10,000 INVESTED SINCE INCEPTION

Past performance does not guarantee future returns. Portfolio performance is net of investment fees and fund expenses, but not product charges, which, if included, would significantly lower the performance quoted. The investment return and principal value of an investment will fluctuate, so that an investor’s shares, when redeemed, may be worth more or less than their original cost. Current performance may be lower or higher than the past performance data quoted.
Unless noted otherwise, Lipper Average and Index returns reflect performance beginning the closest month-end date to the Portfolio’s inception. Performance figures may reflect fee waivers and/or expense reimbursements. In the absence of such fee waivers and/or expense reimbursements, total returns would be lower.
For the year ended December 31, 2006, the Diversified Conservative Growth Portfolio had a total return that was substantially below its Custom Index benchmark and the average return of its peer group.
The Portfolio is managed in six segments by five institutional investment managers. In direct contrast to 2005, when all segments of the Portfolio outperformed their individual benchmarks, the four equity segments underperformed to various degrees in 2006, driving the poor Portfolio return. The large cap growth stock segment, managed by Jennison Associates, had the largest impact. A position in grocery chain Whole Foods and several technology holdings pulled down its performance. In addition, an overweight compared with the Russell 1000 Growth Index in the relatively weak technology sector and an underweight in the better-performing consumer noncyclicals sector hurt relative performance, as did exposures to companies with above-benchmark earnings growth and share price volatility. In itself, faster earnings growth would be a good thing, but in a strongly value-favoring market, it went largely unrewarded. A similar exposure was a factor in the underperformance of EARNEST Partners’ small cap value segment of the Portfolio. EARNEST Partners’ characteristic style biases in favor of strong earnings growth and balance sheets were weaknesses in this market. Stock selection in the homebuilding industry also hurt its segment, as did overweights compared with the Russell 2000 Value Index in the healthcare and consumer cyclicals sectors and underweights in basic materials, consumer staples, and telecommunications services.
The other two underperforming segments had less impact. RS Investments small-cap growth segment was hurt by its stock selection in technology, while Jennison’s large cap value segment had more exposure to share price volatility and less pronounced value characteristics than the Russell 1000 Value Index. These are typical of its style, but were out of favor in 2006. The segment also was hurt by its selection of technology stocks.
Prudential Investments LLC (PI), an indirect, wholly owned subsidiary of Prudential Financial, Inc., serves as the investment manager for the Fund.
For average and index definitions, refer to the Glossary of Benchmark Definitions page. Investors cannot invest directly in a market index or average. For a complete list of holdings, refer to the Schedule of Investments section of this report.
The Prudential Series Fund, Jennison 20/20 Focus Portfolio
Subadvised by: Jennison Associates LLC
December 31, 2006
Investment Manager’s Report
Performance Summary - As of December 31, 2006
Average Annual Total Return Percentages
| | | | | | | | | |
| | | 1-Year | | | 5-Year | | | Since
Inception | |
Jennison 20/20 Focus Portfolio: Class I | | 14.13 | % | | 10.10 | % | | 7.98 | % |
Jennison 20/20 Focus Portfolio: Class II | | 13.61 | | | 9.65 | | | 6.48 | |
S&P 500 Index | | 15.78 | | | 6.18 | | | 2.41 | |
Russell 1000® Index | | 15.46 | | | 6.82 | | | 2.97 | |
Lipper (VIP) Large Cap Core Funds Avg. | | 13.31 | | | 5.22 | | | 1.98 | |
Lipper (VIP) Multi Cap Core Funds Avg. | | 14.45 | | | 6.69 | | | 4.43 | |
Portfolio Class I inception: 5/3/1999. Portfolio Class II inception: 2/15/2000
$10,000 INVESTED SINCE INCEPTION
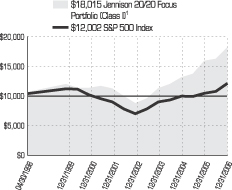
Past performance does not guarantee future returns. Portfolio performance is net of investment fees and fund expenses, but not product charges, which, if included, would significantly lower the performance quoted. The investment return and principal value of an investment will fluctuate, so that an investor’s shares, when redeemed, may be worth more or less than their original cost. Current performance may be lower or higher than the past performance data quoted.
Unless noted otherwise, Lipper Average and Index returns reflect performance beginning the closest month-end date to the Portfolio’s inception (Class I). Although Lipper classifies the Portfolio within the Multi-Cap Core Funds Average, the returns for the Large-Cap Core Funds Average are also shown, because the management of the portfolios included in the Large-Cap Core Funds Average is more consistent with the management of the Portfolio. The Russell 1000® Index is a trademark/service mark of the Frank Russell Company. Russell® is a trademark of the Frank Russell Company. Performance figures may reflect fee waivers and/or expense reimbursements. In the absence of such fee waivers and/or expense reimbursements, total returns would be lower.
For the year ended December 31, 2006, the Jennison 20/20 Focus Portfolio had a total return that was slightly below that of its benchmark and in line with the average of its peer group.
The Portfolio is a combination of a concentrated growth segment managed by Sig Segalas and a concentrated value segment managed by David Kiefer, both of Jennison Associates. Portfolio holdings broadly provided solid gains for the year as the Portfolio posted a double-digit return. Positions in the financial and technology sectors were among the top contributors to the Portfolio’s return. A position in NYSE Group, which operates the New York Stock Exchange, rose sharply amid growing optimism that it will gain regulatory and shareholder approval for a merger with a European stock exchange.
The Portfolio was held back somewhat by having more pronounced growth characteristics than its benchmark in a market that strongly favored value investing. It also was more exposed to volatile stocks, a characteristic that hindered performance during the period.
Prudential Investments LLC (PI), an indirect, wholly owned subsidiary of Prudential Financial, Inc., serves as the investment manager for the Fund.
| 1 | The graph is based on the performance of Class I shares. Performance of Class II shares will be lower due to differences in the fee structure. Class II shares have associated 12b-1 and administrative fees at an annual rate of 0.25% and 0.15% respectively of the average daily net assets of the Class II shares. |
For average and index definitions, refer to the Glossary of Benchmark Definitions page. Investors cannot invest directly in a market index or average. For a complete list of holdings, refer to the Schedule of Investments section of this report.
Presentation of Portfolio Holdings for the Prudential Series Fund as of December 31, 2006 (Unaudited)
| | | | | | | | |
| Diversified Conservative Growth | | | | Jennison 20/20 |
| Five Largest Holdings (% of Net Assets) | | | | Five Largest Holdings (% of Net Assets) |
| U.S. Treasury Notes, 4.875%, 07/31/11 | | 4.5% | | | | American International Group, Inc. | | 5.5% |
| FNMA, 6.0%, 01/01/37 | | 3.6% | | | | ConAgra Foods, Inc. | | 3.0% |
| FNMA, 5.50%, 02/01/35 | | 3.2% | | | | Bank of New York Co., Inc. (The) | | 2.9% |
| FNMA, 6.50%, 01/11/37 | | 2.9% | | | | Alltel Corp. | | 2.9% |
| U.S. Inflation Index Bonds, 3.375%, 01/15/07 | | 2.5% | | | | Honeywell International, Inc. | | 2.9% |
For a complete listing of holdings, refer to the Schedule of Investments section of this report.
Holdings reflect only long-term investments. Holdings/Issues/Industries/Sectors are subject to change.
Fees and Expenses (unaudited)
As a contract owner investing in Portfolios of the Fund through a variable annuity or variable life contract, you incur ongoing costs, including management fees, distribution and service (12b-1*) fees, and other Portfolio expenses. This example is intended to help you understand your ongoing costs (in dollars) of investing in the Fund and to compare these costs with the ongoing costs of investing in other investment options. This example does not reflect fees and charges under your variable annuity or variable life contract. If contract charges were included, the costs shown below would be higher. Please consult the prospectus for your contract for more information about contract fees and charges.
| * | 12b-1 fees are paid by the fund out of fund assets to cover distribution expenses and sometimes shareholder service expenses. |
The example is based on an investment of $1,000 invested at the beginning of the period and held for the entire period July 1, 2006 through December 31, 2006.
Actual Expenses
The first line of the table below provides information about actual account values and actual expenses. You may use this information, together with the amount you invested, to estimate the Portfolio expenses that you paid over the period. Simply divide your account value by $1,000 (for example, an $8,600 account value divided by $1,000 = 8.6), then multiply the result by the number in the first line under the heading entitled “Expenses Paid During Period” to estimate the Portfolio expenses you paid on your account during this period. As noted above, the table does not reflect variable contract fees and charges.
Hypothetical Example for Comparison Purposes
The second line of the table below provides information about hypothetical account values and hypothetical expenses based on the Portfolio’s actual expense ratio and an assumed rate of return of 5% per year before expenses, which is not the Portfolio’s actual return. The hypothetical account values and expenses may not be used to estimate the actual ending account balance or expenses you paid for the period. You may use this information to compare the ongoing costs of investing in the Portfolio and other investment options. To do so, compare this 5% hypothetical example with the 5% hypothetical examples that appear in the shareholder reports of the other investment options.
Please note that the expenses shown in the table are meant to highlight your ongoing Portfolio costs only and do not reflect any contract fees and charges, such as sales charges (loads), insurance charges or administrative charges. Therefore the second line of the table is useful to compare ongoing investment option costs only, and will not help you determine the relative total costs of owning different contracts. In addition, if these contract fee and charges were included, your costs would have been higher.
| | | | | | | | | | | | | | |
| The Prudential Series Fund Portfolios | | Beginning Account Value July 1, 2006 | | Ending Account
Value December 31, 2006 | | Annualized Expense Ratio Based on the Six-Month Period | | | Expenses Paid
During the Six-
Month Period* |
| | | | | | | | | | | | | | | |
Diversified Conservative
Growth (Class I) | | Actual | | $ | 1,000.00 | | $ | 1,068.20 | | 1.11 | % | | $ | 5.79 |
| | Hypothetical | | $ | 1,000.00 | | $ | 1,019.61 | | 1.11 | % | | $ | 5.65 |
| | | | | | | | | | | | | | | |
Jennison 20/20 Focus (Class I) | | Actual | | $ | 1,000.00 | | $ | 1,120.40 | | 0.81 | % | | $ | 4.33 |
| | Hypothetical | | $ | 1,000.00 | | $ | 1,021.12 | | 0.81 | % | | $ | 4.13 |
| | | | | | | | | | | | | | | |
Jennison 20/20 Focus (Class II) | | Actual | | $ | 1,000.00 | | $ | 1,118.10 | | 1.21 | % | | $ | 6.46 |
| | Hypothetical | | $ | 1,000.00 | | $ | 1,019.11 | | 1.21 | % | | $ | 6.16 |
| * | Portfolio expenses (net of fee waivers or subsidies, if any) for each share class are equal to the annualized expense ratio for each share class (provided in the table), multiplied by the average account value over the period, multiplied by the 184 days in the six-month period ended December 31, 2006, and divided by the 365 days in the Portfolio's fiscal year ended December 31, 2006 (to reflect the six-month period). |
| | | | |
| | | DIVERSIFIED CONSERVATIVE GROWTH PORTFOLIO | | |
STATEMENT OF ASSETS AND LIABILITIES
December 31, 2006
| | | |
| ASSETS | | | |
Investments at value: | | | |
Unaffiliated investments (cost $149,374,449) | | $ | 164,205,676 |
Affiliated investments (cost $6,520,740) | | | 6,520,740 |
Foreign currency, at value (cost $1,699,991) | | | 1,709,559 |
Receivable for investments sold | | | 15,792,509 |
Dividends and interest receivable | | | 1,248,378 |
Unrealized appreciation on swap agreements | | | 31,018 |
Receivable for Series shares sold | | | 29,531 |
Due from broker-variation margin | | | 2,926 |
Prepaid expenses | | | 2,791 |
Tax reclaim receivable | | | 1,159 |
Unrealized appreciation on foreign currency forward contracts | | | 256 |
| | |
|
|
Total Assets | | | 189,544,543 |
| | |
|
|
| LIABILITIES | | | |
Payable for investments purchased | | | 35,401,067 |
Securities sold short, at value (proceeds received $13,211,224) | | | 13,137,257 |
Payable to custodian | | | 309,426 |
Unrealized depreciation on swap agreements | | | 169,735 |
Premium for swaps written | | | 149,888 |
Accrued expenses and other liabilities | | | 143,319 |
Payable for floating rate notes issued | | | 125,000 |
Management fee payable | | | 124,166 |
Written options outstanding, at value (cost $66,952) | | | 86,650 |
Interest payable on securities sold short | | | 84,434 |
Unrealized depreciation on foreign currency forward contracts | | | 28,344 |
Deferred trustees’ fees | | | 3,405 |
Interest expense and fees payable | | | 2,036 |
| | |
|
|
Total Liabilities | | | 49,764,727 |
| | |
|
|
| NET ASSETS | | $ | 139,779,816 |
| | |
|
|
Net assets were comprised of: | | | |
Paid-in capital | | $ | 116,571,825 |
Retained earnings | | | 23,207,991 |
| | |
|
|
Net assets, December 31, 2006 | | $ | 139,779,816 |
| | |
|
|
Net asset value and redemption price per share, $139,779,816 / 11,587,600 outstanding shares of beneficial interest (authorized 100,000,000 shares) | | $ | 12.06 |
| | |
|
|
STATEMENT OF OPERATIONS
Year Ended December 31, 2006
| | | | |
| INVESTMENT INCOME | | | | |
Unaffiliated interest | | $ | 4,805,110 | |
Unaffiliated dividend income (net of $20,752 foreign withholding tax) | | | 724,719 | |
Affiliated dividend income | | | 303,697 | |
| | |
|
|
|
| | | | 5,833,526 | |
| | |
|
|
|
| EXPENSES | | | | |
Management fee | | | 1,084,633 | |
Custodian’s fees and expenses | | | 247,000 | |
Audit fee | | | 16,000 | |
Trustees’ fees | | | 13,000 | |
Shareholders’ reports | | | 12,000 | |
Legal fees and expenses | | | 10,000 | |
Interest expense and fees | | | 7,679 | |
Commitment fee on syndicated credit agreement | | | 1,332 | |
Insurance expenses | | | 1,000 | |
Transfer agent’s fees and expenses (including affiliated expense of $1,000) (Note 4) | | | 1,000 | |
Loan interest expense (Note 8) | | | 445 | |
Miscellaneous | | | 26,174 | |
| | |
|
|
|
Total expenses | | | 1,420,263 | |
| | |
|
|
|
| NET INVESTMENT INCOME | | | 4,413,263 | |
| | |
|
|
|
| NET REALIZED AND UNREALIZED GAIN (LOSS) ON INVESTMENTS AND FOREIGN CURRENCIES | | | | |
Net realized gain (loss) on: | | | | |
Investment transactions | | | 5,550,060 | |
Futures transactions | | | (367,258 | ) |
Options written | | | (4,838 | ) |
Swap agreements | | | (68,801 | ) |
Foreign currency transactions | | | (187,016 | ) |
| | |
|
|
|
| | | | 4,922,147 | |
| | |
|
|
|
Net change in unrealized appreciation (depreciation) on: | | | | |
Investments | | | 651,838 | |
Futures | | | 45,676 | |
Options written | | | (33,412 | ) |
Swap agreements | | | (31,344 | ) |
Foreign currencies | | | (99,118 | ) |
Short sales | | | 110,105 | |
| | |
|
|
|
| | | | 643,745 | |
| | |
|
|
|
| NET GAIN ON INVESTMENTS AND FOREIGN CURRENCIES | | | 5,565,892 | |
| | |
|
|
|
| NET INCREASE IN NET ASSETS RESULTING FROM OPERATIONS | | $ | 9,979,155 | |
| | |
|
|
|
STATEMENT OF CHANGES IN NET ASSETS
| | | | | | | | |
| | | Year Ended December 31,
| |
| | | 2006
| | | 2005
| |
| INCREASE (DECREASE) IN NET ASSETS | | | | | | | | |
| OPERATIONS: | | | | | | | | |
Net investment income | | $ | 4,413,263 | | | $ | 4,318,613 | |
Net realized gain on investments and foreign currency transactions | | | 4,922,147 | | | | 8,592,437 | |
Net change in unrealized appreciation (depreciation) on investments and foreign currencies | | | 643,745 | | | | (2,829,878 | ) |
| | |
|
|
| |
|
|
|
NET INCREASE IN NET ASSETS RESULTING FROM OPERATIONS | | | 9,979,155 | | | | 10,081,172 | |
| | |
|
|
| |
|
|
|
| DIVIDENDS AND DISTRIBUTIONS: | | | | | | | | |
Dividends from net investment income | | | — | | | | (4,898,162 | ) |
Distributions | | | (5,417,428 | ) | | | — | |
| | |
|
|
| |
|
|
|
TOTAL DIVIDENDS AND DISTRIBUTIONS | | | (5,417,428 | ) | | | (4,898,162 | ) |
| | |
|
|
| |
|
|
|
| SERIES SHARE TRANSACTIONS: | | | | | | | | |
Series shares sold [205,401 and 125,832 shares, respectively] | | | 2,385,357 | | | | 1,403,725 | |
Series shares issued in reinvestment of dividends and distributions [469,855 and 456,918 shares, respectively] | | | 5,417,428 | | | | 4,898,162 | |
Series shares repurchased [2,063,447 and 2,406,901 shares, respectively] | | | (24,021,598 | ) | | | (27,016,843 | ) |
| | |
|
|
| |
|
|
|
NET DECREASE IN NET ASSETS RESULTING FROM SERIES SHARE TRANSACTIONS | | | (16,218,813 | ) | | | (20,714,956 | ) |
| | |
|
|
| |
|
|
|
| TOTAL DECREASE IN NET ASSETS | | | (11,657,086 | ) | | | (15,531,946 | ) |
| NET ASSETS: | | | | | | | | |
Beginning of year | | | 151,436,902 | | | | 166,968,848 | |
| | |
|
|
| |
|
|
|
End of year | | $ | 139,779,816 | | | $ | 151,436,902 | (a) |
| | |
|
|
| |
|
|
|
(a) Includes undistributed net investment income of | | | | | | $ | 4,737,256 | |
| | | | | | |
|
|
|
SEE NOTES TO FINANCIAL STATEMENTS.
A1
| | | | |
| | | JENNISON 20/20 FOCUS PORTFOLIO | | |
STATEMENT OF ASSETS AND LIABILITIES
December 31, 2006
| | | |
| ASSETS | | | |
Investments, at value including securities on loan of $51,660,586: | | | |
Unaffiliated investments (cost $253,924,505) | | $ | 297,891,142 |
Affiliated investments (cost $77,379,540) | | | 77,379,540 |
Cash | | | 682,681 |
Dividends receivable | | | 336,231 |
Receivable for Series shares sold | | | 226,466 |
Foreign tax reclaim receivable | | | 51,019 |
Prepaid expenses | | | 4,072 |
| | |
|
|
Total Assets | | | 376,571,151 |
| | |
|
|
| LIABILITIES | | | |
Collateral for securities on loan | | | 53,718,962 |
Payable for investments purchased | | | 10,961,457 |
Management fee payable | | | 197,553 |
Accrued expenses | | | 93,096 |
Payable for Series shares repurchased | | | 51,395 |
Distribution fee payable | | | 45,926 |
Administration fee payable | | | 27,560 |
Transfer agent fee payable | | | 180 |
| | |
|
|
Total Liabilities | | | 65,096,129 |
| | |
|
|
| NET ASSETS | | $ | 311,475,022 |
| | |
|
|
Net assets were comprised of: | | | |
Paid-in capital | | $ | 232,025,234 |
Retained earnings | | | 79,449,788 |
| | |
|
|
Net assets, December 31, 2006 | | $ | 311,475,022 |
| | |
|
|
| Class I: | | | |
Net asset value and redemption price per share, $93,097,737 / 5,814,995 outstanding shares of beneficial interest (authorized 100,000,000 shares) | | $ | 16.01 |
| | |
|
|
| Class II: | | | |
Net asset value and redemption price per share, $218,377,285 / 13,815,795 outstanding shares of beneficial interest (authorized 50,000,000 shares) | | $ | 15.81 |
| | |
|
|
STATEMENT OF OPERATIONS
Year Ended December 31, 2006
| | | | |
| INVESTMENT INCOME | | | | |
Unaffiliated dividend income (net of foreign withholding taxes of $66,101) | | $ | 3,285,750 | |
Affiliated dividend income | | | 358,429 | |
Affiliated income from securities loaned, net | | | 135,406 | |
| | |
|
|
|
| | | | 3,779,585 | |
| | |
|
|
|
| EXPENSES | | | | |
Management fee | | | 2,015,018 | |
Distribution fee—Class II | | | 448,016 | |
Administration fee—Class II | | | 268,809 | |
Shareholders’ reports | | | 68,000 | |
Custodian’s fees and expenses | | | 62,000 | |
Audit fee | | | 15,000 | |
Trustees’ fees | | | 11,000 | |
Legal fees and expenses | | | 10,000 | |
Insurance expenses | | | 6,000 | |
Loan interest expense (Note 8) | | | 4,000 | |
Commitment fee on syndicated credit agreement | | | 2,000 | |
Transfer agent’s fee and expenses (including affiliated expense of $1,100) (Note 4) | | | 1,100 | |
Miscellaneous | | | 10,647 | |
| | |
|
|
|
Total expenses | | | 2,921,590 | |
| | |
|
|
|
| NET INVESTMENT INCOME | | | 857,995 | |
| | |
|
|
|
| NET REALIZED AND UNREALIZED GAIN (LOSS) ON INVESTMENTS | | | | |
Net realized gain on investments | | | 34,706,334 | |
Net change in unrealized appreciation (depreciation) on investments and foreign currencies | | | (791,103 | ) |
| | |
|
|
|
| NET GAIN ON INVESTMENTS | | | 33,915,231 | |
| | |
|
|
|
| NET INCREASE IN NET ASSETS RESULTING FROM OPERATIONS | | $ | 34,773,226 | |
| | |
|
|
|
STATEMENT OF CHANGES IN NET ASSETS
| | | | | | | | |
| | | Year Ended December 31,
| |
| | | 2006
| | | 2005
| |
| INCREASE (DECREASE) IN NET ASSETS | | | | | | | | |
| OPERATIONS: | | | | | | | | |
Net investment income | | $ | 857,995 | | | $ | 358,683 | |
Net realized gain on investment transactions | | | 34,706,334 | | | | 25,481,477 | |
Net change in unrealized appreciation (depreciation) on investments and foreign currencies | | | (791,103 | ) | | | 15,674,168 | |
| | |
|
|
| |
|
|
|
NET INCREASE IN NET ASSETS RESULTING FROM OPERATIONS | | | 34,773,226 | | | | 41,514,328 | |
| | |
|
|
| |
|
|
|
| DIVIDENDS AND DISTRIBUTIONS: | | | | | | | | |
Dividends from net investment income | | | | | | | | |
Class I | | | — | | | | (177,361 | ) |
Distributions | | | | | | | | |
Class I | | | (5,908,325 | ) | | | — | |
Class II | | | (10,853,728 | ) | | | — | |
| | |
|
|
| |
|
|
|
TOTAL DIVIDENDS AND DISTRIBUTIONS | | | (16,762,053 | ) | | | (177,361 | ) |
| | |
|
|
| |
|
|
|
| SERIES SHARE TRANSACTIONS (Note 7): | | | | | | | | |
Series shares sold | | | 82,524,252 | | | | 59,933,620 | |
Series shares issued in reinvestment of dividends and distributions | | | 16,762,053 | | | | 177,361 | |
Series shares repurchased | | | (48,978,942 | ) | | | (27,736,071 | ) |
| | |
|
|
| |
|
|
|
NET INCREASE IN NET ASSETS RESULTING FROM SERIES SHARE TRANSACTIONS | | | 50,307,363 | | | | 32,374,910 | |
| | |
|
|
| |
|
|
|
| TOTAL INCREASE IN NET ASSETS | | | 68,318,536 | | | | 73,711,877 | |
| NET ASSETS: | | | | | | | | |
Beginning of year | | | 243,156,486 | | | | 169,444,609 | |
| | |
|
|
| |
|
|
|
End of year | | $ | 311,475,022 | | | $ | 243,156,486 | (a) |
| | |
|
|
| |
|
|
|
(a) Includes undistributed net investment income of: | | | | | | $ | 358,681 | |
| | | | | | |
|
|
|
SEE NOTES TO FINANCIAL STATEMENTS.
A2
| | | | |
| | | DIVERSIFIED CONSERVATIVE GROWTH PORTFOLIO | | |
SCHEDULE OF INVESTMENTS | December 31, 2006 |
| | | | | |
| LONG-TERM INVESTMENTS — 112.2% | | Value (Note 2)
|
| COMMON STOCKS — 39.9% | | Shares
| |
Aerospace — 0.1% | | | | | |
Aegean Marine Petroleum Network, Inc.* | | 3,630 | | $ | 59,532 |
BE Aerospace, Inc.* | | 4,070 | | | 104,518 |
| | | | |
|
|
| | | | | | 164,050 |
| | | | |
|
|
Aerospace & Defense — 1.0% | | | | | |
Boeing Co. | | 5,300 | | | 470,852 |
HEICO Corp. | | 1,070 | | | 41,548 |
Honeywell International, Inc. | | 10,300 | | | 465,972 |
Moog, Inc. (Class A Stock)* | | 2,575 | | | 98,339 |
United Technologies Corp. | | 4,300 | | | 268,836 |
| | | | |
|
|
| | | | | | 1,345,547 |
| | | | |
|
|
Apparel Manufacturers | | | | | |
Carter’s, Inc.* | | 2,360 | | | 60,180 |
| | | | |
|
|
Automobiles | | | | | |
Winnebago Industries, Inc. | | 1,000 | | | 32,910 |
| | | | |
|
|
Automotive Parts — 0.1% | | | | | |
Midas, Inc.* | | 3,980 | | | 91,540 |
| | | | |
|
|
Banks — 0.1% | | | | | |
Pacific Capital Bancorp | | 2,800 | | | 94,024 |
| | | | |
|
|
Beverages — 0.5% | | | | | |
Central European Distribution Corp.* | | 2,010 | | | 59,697 |
PepsiCo, Inc. | | 9,500 | | | 594,225 |
| | | | |
|
|
| | | | | | 653,922 |
| | | | |
|
|
Biotechnology — 0.9% | | | | | |
Amgen, Inc.* | | 3,200 | | | 218,592 |
Genentech, Inc.* | | 5,800 | | | 470,554 |
Gilead Sciences, Inc.* | | 9,500 | | | 616,835 |
| | | | |
|
|
| | | | | | 1,305,981 |
| | | | |
|
|
Building & Construction — 0.1% | | | | | |
Standard Pacific Corp. | | 4,000 | | | 107,160 |
| | | | |
|
|
Building Materials — 0.1% | | | | | |
Ceradyne, Inc.* | | 1,660 | | | 93,790 |
| | | | |
|
|
Building Products — 0.2% | | | | | |
American Standard Cos., Inc. | | 5,800 | | | 265,930 |
Watsco, Inc. | | 1,400 | | | 66,024 |
| | | | |
|
|
| | | | | | 331,954 |
| | | | |
|
|
Business Services — 0.1% | | | | | |
Perficient, Inc.* | | 3,620 | | | 59,404 |
URS Corp.* | | 2,200 | | | 94,270 |
| | | | |
|
|
| | | | | | 153,674 |
| | | | |
|
|
Capital Goods — 0.1% | | | | | |
Joy Global, Inc. | | 3,200 | | | 154,688 |
| | | | |
|
|
Capital Markets — 2.4% | | | | | |
Bank of New York Co., Inc. (The) | | 12,200 | | | 480,314 |
Goldman Sachs Group, Inc. | | 2,000 | | | 398,700 |
Jefferies Group, Inc. | | 5,000 | | | 134,100 |
Mellon Financial Corp. | | 4,300 | | | 181,245 |
Merrill Lynch & Co., Inc. | | 8,800 | | | 819,280 |
Schwab, (Charles) Corp. | | 17,200 | | | 332,648 |
UBS AG | | 16,400 | | | 989,412 |
| | | | |
|
|
| | | | | | 3,335,699 |
| | | | |
|
|
Chemicals — 0.6% | | | | | |
E.I. Du Pont de Nemours & Co. | | 6,300 | | | 306,873 |
Monsanto Co. | | 3,200 | | | 168,096 |
| | | | | |
COMMON STOCKS
(Continued) | | Shares
| | Value (Note 2)
|
Chemicals (cont’d.) | | | | | |
Mosaic Co. (The)* | | 11,600 | | $ | 247,776 |
Scotts Co. (The) (Class A Stock) | | 1,800 | | | 92,970 |
Valspar Corp. (The) | | 1,600 | | | 44,224 |
| | | | |
|
|
| | | | | | 859,939 |
| | | | |
|
|
Clothing & Apparel — 0.1% | | | | | |
Iconix Brand Group, Inc.* | | 4,480 | | | 86,867 |
| | | | |
|
|
Commercial Banks — 0.4% | | | | | |
Accredited Home Lenders Holding Co.* | | 1,400 | | | 38,192 |
Astoria Financial Corp. | | 4,350 | | | 131,196 |
BankUnited Financial Corp. (Class A Stock) | | 1,700 | | | 47,532 |
Royal Bank of Scotland Group PLC (United Kingdom) | | 8,094 | | | 315,849 |
| | | | |
|
|
| | | | | | 532,769 |
| | | | |
|
|
Commercial Services | | | | | |
HMS Holdings Corp.* | | 4,240 | | | 64,236 |
| | | | |
|
|
Commercial Services & Supplies — 0.9% | | | | | |
Administaff, Inc. | | 1,500 | | | 64,155 |
Allied Waste Industries, Inc.* | | 8,000 | | | 98,320 |
Barrett Business Services, Inc. | | 3,790 | | | 88,762 |
FirstService Corp. (Canada)* | | 5,210 | | | 120,351 |
Global Payments, Inc. | | 2,900 | | | 134,270 |
PrivateBancorp, Inc. | | 1,060 | | | 44,128 |
Rollins, Inc. | | 4,700 | | | 103,917 |
Steiner Leisure Ltd.* | | 2,050 | | | 93,275 |
Team, Inc.* | | 3,220 | | | 112,152 |
Waste Management, Inc. | | 11,100 | | | 408,147 |
| | | | |
|
|
| | | | | | 1,267,477 |
| | | | |
|
|
Communication Equipment — 1.9% | | | | | |
Avaya, Inc.* | | 25,600 | | | 357,888 |
Cisco Systems, Inc.* | | 26,000 | | | 710,580 |
Corning, Inc.* | | 6,900 | | | 129,099 |
Motorola, Inc. | | 22,800 | | | 468,768 |
QUALCOMM, Inc. | | 14,000 | | | 529,060 |
Research in Motion Ltd.* | | 3,100 | | | 396,118 |
| | | | |
|
|
| | | | | | 2,591,513 |
| | | | |
|
|
Computer Hardware | | | | | |
Cray, Inc.* | | 5,190 | | | 61,657 |
| | | | |
|
|
Computer Networking | | | | | |
Atheros Communications, Inc.* | | 3,120 | | | 66,518 |
| | | | |
|
|
Computer Services & Software — 0.2% | | | | | |
Advent Software, Inc.* | | 2,770 | | | 97,754 |
American Reprographics Co.* | | 2,120 | | | 70,617 |
The9 Ltd., ADR (China)* | | 3,400 | | | 109,548 |
| | | | |
|
|
| | | | | | 277,919 |
| | | | |
|
|
Computers & Peripherals — 0.7% | | | | | |
Apple Computer, Inc.* | | 6,800 | | | 576,912 |
Hewlett-Packard Co. | | 5,400 | | | 222,426 |
International Business Machines Corp. | | 2,400 | | | 233,160 |
| | | | |
|
|
| | | | | | 1,032,498 |
| | | | |
|
|
Consumer Finance — 0.5% | | | | | |
American Express Co. | | 8,900 | | | 539,963 |
SLM Corp. | | 4,500 | | | 219,465 |
| | | | |
|
|
| | | | | | 759,428 |
| | | | |
|
|
SEE NOTES TO FINANCIAL STATEMENTS.
B1
| | | | |
| | | DIVERSIFIED CONSERVATIVE GROWTH PORTFOLIO (Continued) | | |
SCHEDULE OF INVESTMENTS | December 31, 2006 |
| | | | | |
COMMON STOCKS
(Continued) | | Shares
| | Value (Note 2)
|
Consumer Products & Services — 0.1% | | | | | |
Central Garden & Pet Co.* | | 1,910 | | $ | 92,482 |
| | | | |
|
|
Diversified Consumer Services — 0.5% | | | | | |
Career Education Corp.* | | 9,500 | | | 235,410 |
H&R Block, Inc. | | 19,100 | | | 440,064 |
| | | | |
|
|
| | | | | | 675,474 |
| | | | |
|
|
Diversified Financial Services — 2.0% | | | | | |
Bank of America Corp. | | 8,690 | | | 463,959 |
Citigroup, Inc. | | 11,900 | | | 662,830 |
Eaton Vance Corp. | | 4,000 | | | 132,040 |
Intercontinental Exchange, Inc.* | | 1,700 | | | 183,430 |
JPMorgan Chase & Co. | | 6,000 | | | 289,800 |
KKR Private Equity Investors LLP | | 11,200 | | | 255,920 |
KKR Private Equity Investors LLP, RDU-144A (g) (purchased 08/03/06, cost $41,122) | | 1,800 | | | 41,130 |
NYSE Group, Inc.* | | 3,900 | | | 379,080 |
Oriental Financial Group (Puerto Rico) | | 1,300 | | | 16,835 |
Portfolio Recovery Associates, Inc.* | | 2,190 | | | 102,251 |
Raymond James Financial, Inc. | | 4,475 | | | 135,637 |
Sterling Financial Corp. (WA) | | 2,300 | | | 77,763 |
Student Loan Corp. (The) | | 500 | | | 103,650 |
| | | | |
|
|
| | | | | | 2,844,325 |
| | | | |
|
|
Diversified Telecommunication Services — 0.2% | | | |
Verizon Communications, Inc. | | 5,900 | | | 219,716 |
| | | | |
|
|
Electric Utilities — 0.1% | | | |
Exelon Corp. | | 2,800 | | | 173,292 |
| | | | |
|
|
Electronic Equipment & Instruments — 0.2% | | | |
Checkpoint Systems, Inc.* | | 4,000 | | | 80,800 |
FLIR Systems, Inc.* | | 4,700 | | | 149,601 |
Itron, Inc.* | | 360 | | | 18,662 |
Regal-Beloit Corp. | | 970 | | | 50,935 |
| | | | |
|
|
| | | | | | 299,998 |
| | | | |
|
|
Electronics — 0.1% | | | |
Benchmark Electronics, Inc.* | | 2,900 | | | 70,644 |
PNM Resources, Inc. | | 2,500 | | | 77,750 |
| | | | |
|
|
| | | | | | 148,394 |
| | | | |
|
|
Energy — 0.1% | | | |
Headwaters, Inc.* | | 3,469 | | | 83,117 |
| | | | |
|
|
Energy Equipment & Services — 0.5% | | | | | |
Baker Hughes, Inc. | | 4,300 | | | 321,038 |
Oil States International, Inc.* | | 3,200 | | | 103,136 |
Schlumberger Ltd. | | 3,700 | | | 233,692 |
| | | | |
|
|
| | | | | | 657,866 |
| | | | |
|
|
Entertainment & Leisure — 0.1% | | | |
Life Time Fitness, Inc.* | | 1,780 | | | 86,348 |
Pinnacle Entertainment, Inc.* | | 1,460 | | | 48,384 |
| | | | |
|
|
| | | | | | 134,732 |
| | | | |
|
|
Financial – Brokerage | | | |
TradeStation Group, Inc.* | | 4,190 | | | 57,613 |
| | | | |
|
|
Financial Services — 0.4% | | | |
Asset Acceptance Capital Corp.* | | 3,400 | | | 57,188 |
Calamos Asset Management, Inc. | | 2,234 | | | 59,938 |
First Mercury Financial Corp.* | | 3,340 | | | 78,557 |
| | | | | |
COMMON STOCKS
(Continued) | | Shares
| | Value (Note 2)
|
Financial Services (cont’d.) | | | |
Greenhill & Co., Inc. | | 1,000 | | $ | 73,800 |
International Securities Exchange, Inc. | | 730 | | | 34,157 |
Investment Technology Group, Inc.* | | 3,040 | | | 130,355 |
Moneygram International, Inc. | | 3,000 | | | 94,080 |
NewStar Financial, Inc.* | | 3,090 | | | 57,011 |
Optionsxpress Holding, Inc. | | 1,760 | | | 39,934 |
| | | | |
|
|
| | | | | | 625,020 |
| | | | |
|
|
Food & Staples Retailing — 0.6% | | | |
Kroger Co. (The) | | 18,500 | | | 426,795 |
SunOpta, Inc.* | | 7,840 | | | 68,992 |
Wal-Mart Stores, Inc. | | 4,200 | | | 193,956 |
Whole Foods Market, Inc. | | 4,500 | | | 211,185 |
| | | | |
|
|
| | | | | | 900,928 |
| | | | |
|
|
Food Products — 0.5% | | | |
Cadbury Schweppes PLC, ADR (United Kingdom) | | 9,200 | | | 394,956 |
ConAgra Foods, Inc. | | 13,200 | | | 356,400 |
| | | | |
|
|
| | | | | | 751,356 |
| | | | |
|
|
Gaming — 0.1% | | | |
Century Casinos, Inc.* | | 9,880 | | | 110,261 |
| | | | |
|
|
Healthcare Equipment & Supplies — 1.3% | | | |
Alcon, Inc. | | 4,300 | | | 480,611 |
AngioDynamics, Inc.* | | 5,040 | | | 108,310 |
ArthroCare Corp.* | | 1,440 | | | 57,485 |
Baxter International, Inc. | | 900 | | | 41,751 |
Boston Scientific Corp.* | | 13,000 | | | 223,340 |
Cutera, Inc.* | | 2,810 | | | 75,870 |
Kyphon, Inc.* | | 1,230 | | | 49,692 |
NuVasive, Inc.* | | 2,590 | | | 59,829 |
Orthovita, Inc.* | | 15,010 | | | 54,486 |
PolyMedica Corp. | | 2,761 | | | 111,572 |
Spectranetics Corp. (The)* | | 9,450 | | | 106,690 |
St. Jude Medical, Inc.* | | 10,200 | | | 372,912 |
The Cooper Cos., Inc. | | 2,200 | | | 97,900 |
| | | | |
|
|
| | | | | | 1,840,448 |
| | | | |
|
|
Healthcare Providers & Services — 1.6% | | | |
AMERIGROUP Corp.* | | 3,300 | | | 118,437 |
AMN Healthcare Services, Inc.* | | 2,560 | | | 70,502 |
Cigna Corp. | | 2,200 | | | 289,454 |
Covance, Inc.* | | 2,700 | | | 159,057 |
Five Star Quality Care, Inc.* | | 11,900 | | | 132,685 |
Healthways, Inc.* | | 2,500 | | | 119,275 |
Omnicare, Inc. | | 9,000 | | | 347,670 |
Pharmaceutical Product Development, Inc. | | 5,700 | | | 183,654 |
Solexa, Inc.* | | 6,040 | | | 79,426 |
Sunrise Senior Living, Inc.* | | 2,900 | | | 89,088 |
Systems Xcellence, Inc.* | | 1,700 | | | 34,289 |
UnitedHealth Group, Inc. | | 5,200 | | | 279,396 |
WellPoint, Inc.* | | 5,100 | | | 401,319 |
| | | | |
|
|
| | | | | | 2,304,252 |
| | | | |
|
|
Healthcare Services — 0.1% | | | | | |
Centene Corp.* | | 3,000 | | | 73,710 |
| | | | |
|
|
Hotels, Restaurants & Leisure — 1.1% | | | | | |
Brinker International, Inc. | | 3,100 | | | 93,496 |
SEE NOTES TO FINANCIAL STATEMENTS.
B2
| | | | |
| | | DIVERSIFIED CONSERVATIVE GROWTH PORTFOLIO (Continued) | | |
SCHEDULE OF INVESTMENTS | December 31, 2006 |
| | | | | |
COMMON STOCKS
(Continued) | | Shares
| | Value (Note 2)
|
Hotels, Restaurants & Leisure (cont’d.) | | | | | |
Chipotle Mexican Grill, Inc. (Class A Stock)* | | 800 | | $ | 45,600 |
Hilton Hotels Corp. | | 4,000 | | | 139,600 |
International Game Technology | | 1,700 | | | 78,540 |
Marriott International, Inc. (Class A Stock) | | 7,800 | | | 372,216 |
OSI Restaurant Partners, Inc. | | 6,300 | | | 246,960 |
Scientific Games Corp. (Class A Stock)* | | 4,370 | | | 132,105 |
Sonic Corp.* | | 3,900 | | | 93,405 |
Starbucks Corp.* | | 7,900 | | | 279,818 |
| | | | |
|
|
| | | | | | 1,481,740 |
| | | | |
|
|
Household Durables — 0.3% | | | | | |
Harman International Industries, Inc. | | 1,500 | | | 149,865 |
Meritage Homes Corp.* | | 2,100 | | | 100,212 |
Snap-On, Inc. | | 2,100 | | | 100,044 |
| | | | |
|
|
| | | | | | 350,121 |
| | | | |
|
|
Household Products — 0.5% | | | | | |
Kimberly-Clark Corp. | | 5,400 | | | 366,930 |
Procter & Gamble Co. | | 6,187 | | | 397,639 |
| | | | |
|
|
| | | | | | 764,569 |
| | | | |
|
|
Independent Power Producers & Energy Traders — 0.3% |
NRG Energy, Inc.* | | 7,100 | | | 397,671 |
| | | | |
|
|
Industrial Conglomerates — 0.8% | | | | | |
General Electric Co. | | 21,700 | | | 807,457 |
Tyco International Ltd. | | 10,700 | | | 325,280 |
| | | | |
|
|
| | | | | | 1,132,737 |
| | | | |
|
|
Insurance — 2.3% |
American International Group, Inc. | | 18,100 | | | 1,297,046 |
Amerisafe, Inc.* | | 7,210 | | | 111,467 |
Amtrust Financial Services | | 7,160 | | | 61,218 |
Axis Capital Holdings Ltd. | | 7,300 | | | 243,601 |
Delphi Financial Group, Inc. (Class A Stock) | | 2,625 | | | 106,207 |
Genworth Financial, Inc. (Class A Stock) | | 4,300 | | | 147,103 |
Loews Corp. | | 9,100 | | | 377,377 |
Montpelier Re Holdings Ltd. | | 17,100 | | | 318,231 |
Philadelphia Consolidated Holding Corp.* | | 3,900 | | | 173,784 |
Protective Life Corp. | | 1,200 | | | 57,000 |
Security Capital Assurance Ltd. | | 3,660 | | | 101,858 |
State Auto Financial Corp. | | 2,800 | | | 97,244 |
United Fire & Casualty Co. | | 1,600 | | | 56,400 |
| | | | |
|
|
| | | | | | 3,148,536 |
| | | | |
|
|
Internet — 0.1% |
Ctrip.com International Ltd., ADR (China) | | 560 | | | 34,989 |
Equinix, Inc.* | | 715 | | | 54,068 |
| | | | |
|
|
| | | | | | 89,057 |
| | | | |
|
|
Internet & Catalog Retail — 0.1% |
IAC/InterActiveCorp* | | 4,900 | | | 182,084 |
| | | | |
|
|
Internet Software & Services — 1.0% | | | | | |
Dealer-Trade Holdings, Inc.* | | 2,220 | | | 65,313 |
Google, Inc. (Class A Stock)* | | 2,000 | | | 920,960 |
j2 Global Communications, Inc.* | | 3,860 | | | 105,185 |
Nutri System, Inc.* | | 1,670 | | | 105,861 |
| | | | | |
COMMON STOCKS
(Continued) | | Shares
| | Value (Note 2)
|
Internet Software & Services (cont’d.) | | | | | |
Online Resources Corp.* | | 8,710 | | $ | 88,929 |
RADVision Ltd. (Israel)* | | 3,140 | | | 63,051 |
WebEx Communications, Inc.* | | 2,150 | | | 75,014 |
| | | | |
|
|
| | | | | | 1,424,313 |
| | | | |
|
|
IT Services — 0.2% |
Infosys Technologies Ltd., ADR (India) | | 4,200 | | | 229,152 |
| | | | |
|
|
Machinery — 0.2% |
Bucyrus International, Inc. (Class A Stock) | | 2,500 | | | 129,400 |
Flow International Corp.* | | 7,750 | | | 85,405 |
| | | | |
|
|
| | | | | | 214,805 |
| | | | |
|
|
Manufacturing — 0.2% |
Harsco Corp. | | 1,500 | | | 114,150 |
Hexel Corp.* | | 6,100 | | | 106,201 |
| | | | |
|
|
| | | | | | 220,351 |
| | | | |
|
|
Media — 1.5% |
Comcast Corp. (Class A Stock)* | | 8,700 | | | 368,271 |
Idearc, Inc.* | | 315 | | | 9,025 |
Liberty Global, Inc.* | | 11,983 | | | 335,524 |
Marchex, Inc. (Class B Stock)* | | 5,590 | | | 74,794 |
News Corp. (Class A Stock) | | 15,200 | | | 326,496 |
Viacom, Inc. (Class B Stock)* | | 7,720 | | | 316,752 |
Walt Disney Co. (The) | | 20,000 | | | 685,400 |
| | | | |
|
|
| | | | | | 2,116,262 |
| | | | |
|
|
Medical Supplies & Equipment — 0.2% |
Micrus Endovascular Corp.* | | 4,450 | | | 84,906 |
NovaMed, Inc.* | | 7,800 | | | 59,046 |
ResMed, Inc.* | | 1,620 | | | 79,736 |
Vital Images, Inc.* | | 1,730 | | | 60,204 |
| | | | |
|
|
| | | | | | 283,892 |
| | | | |
|
|
Metals & Mining — 0.3% |
Phelps Dodge Corp. | | 2,700 | | | 323,244 |
Timken Co. | | 3,300 | | | 96,294 |
| | | | |
|
|
| | | | | | 419,538 |
| | | | |
|
|
Multi-Line Retail — 0.5% | | | | | |
Federated Department Stores, Inc. | | 6,300 | | | 240,219 |
Kohl’s Corp.* | | 2,000 | | | 136,860 |
Target Corp. | | 6,000 | | | 342,300 |
| | | | |
|
|
| | | | | | 719,379 |
| | | | |
|
|
Multi-Utilities — 0.2% | | | | | |
Sempra Energy | | 5,400 | | | 302,238 |
| | | | |
|
|
Office Electronics — 0.3% | | | | | |
Xerox Corp.* | | 26,500 | | | 449,175 |
| | | | |
|
|
Office Equipment — 0.1% | | | | | |
Cymer, Inc.* | | 1,250 | | | 54,938 |
School Specialty, Inc.* | | 1,800 | | | 67,482 |
| | | | |
|
|
| | | | | | 122,420 |
| | | | |
|
|
Oil & Gas Exploration/Production | | | | | |
Core Laboratories NV (Netherlands)* | | 390 | | | 31,590 |
| | | | |
|
|
Oil, Gas & Consumable Fuels — 2.7% | | | | | |
Anadarko Petroleum Corp. | | 5,900 | | | 256,768 |
Cabot Oil & Gas Corp. | | 4,000 | | | 242,600 |
SEE NOTES TO FINANCIAL STATEMENTS.
B3
| | | | |
| | | DIVERSIFIED CONSERVATIVE GROWTH PORTFOLIO (Continued) | | |
SCHEDULE OF INVESTMENTS | December 31, 2006 |
| | | | | |
COMMON STOCKS
(Continued) | | Shares
| | Value (Note 2)
|
Oil, Gas & Consumable Fuels (cont’d.) | | | | | |
Hess Corp. | | 7,300 | | $ | 361,861 |
Houston Exploration Co. (The)* | | 1,800 | | | 93,204 |
Marathon Oil Corp. | | 2,400 | | | 222,000 |
Nexen, Inc. | | 5,900 | | | 324,500 |
Occidental Petroleum Corp. | | 14,900 | | | 727,567 |
Oceaneering International, Inc.* | | 3,676 | | | 145,937 |
Petroleo Brasileiro SA, ADR (Brazil) | | 3,800 | | | 391,362 |
Suncor Energy, Inc. | | 9,800 | | | 773,318 |
Superior Energy Services, Inc.* | | 3,170 | | | 103,596 |
Swift Energy Co.* | | 2,200 | | | 98,582 |
| | | | |
|
|
| | | | | | 3,741,295 |
| | | | |
|
|
Pharmaceuticals — 1.8% | | | | | |
Abbott Laboratories | | 12,700 | | | 618,617 |
American Medical Systems Holdings, Inc.* | | 5,950 | | | 110,194 |
Barr Pharmaceuticals, Inc.* | | 1,300 | | | 65,156 |
KV Pharmaceutical Co. (Class A Stock)* | | 1,430 | | | 34,005 |
LeMaitre Vascular, Inc.* | | 9,500 | | | 57,000 |
Novartis AG, ADR (Switzerland) | | 12,900 | | | 740,976 |
Roche Holdings Ltd., ADR (Switzerland) | | 7,300 | | | 653,334 |
Vital Signs, Inc. | | 290 | | | 14,477 |
Wyeth | | 5,500 | | | 280,060 |
| | | | |
|
|
| | | | | | 2,573,819 |
| | | | |
|
|
Railroads — 0.1% | | | | | |
American Railcar Industries, Inc. | | 2,880 | | | 98,035 |
| | | | |
|
|
Real Estate Investment Trusts — 0.2% | | | | | |
Hovnanian Enterprises, Inc. (Class A Stock)* | | 2,700 | | | 91,530 |
KKR Financial Corp. | | 3,920 | | | 105,017 |
SL Green Realty Corp. | | 1,100 | | | 146,058 |
| | | | |
|
|
| | | | | | 342,605 |
| | | | |
|
|
Semiconductors — 0.1% | | | | | |
Silicon Image, Inc.* | | 5,190 | | | 66,017 |
Sillicon Motion Technology Corp., ADR (Taiwan)* | | 4,630 | | | 73,478 |
| | | | |
|
|
| | | | | | 139,495 |
| | | | |
|
|
Semiconductors & Semiconductor Equipment — 0.5% |
Broadcom Corp. (Class A Stock)* | | 9,950 | | | 321,484 |
Marvell Technology Group Ltd.* | | 19,000 | | | 364,610 |
SRS Labs, Inc.* | | 3,890 | | | 42,090 |
| | | | |
|
|
| | | | | | 728,184 |
| | | | |
|
|
Software — 1.9% | | | | | |
Adobe Systems, Inc.* | | 16,500 | | | 678,480 |
CA, Inc. | | 10,527 | | | 238,437 |
Concur Technologies, Inc.* | | 5,450 | | | 87,418 |
Electronic Arts, Inc.* | | 5,700 | | | 287,052 |
Microsoft Corp. | | 25,800 | | | 770,388 |
SAP AG, ADR (Germany) | | 5,900 | | | 313,290 |
Symantec Corp.* | | 10,600 | | | 221,010 |
| | | | |
|
|
| | | | | | 2,596,075 |
| | | | |
|
|
| | | | | |
COMMON STOCKS
(Continued) | | Shares
| | Value (Note 2)
|
Specialty Retail — 0.3% | | | | | |
Aaron Rents, Inc. | | 3,100 | | $ | 89,218 |
Lowe’s Cos., Inc. | | 8,400 | | | 261,660 |
Williams-Sonoma, Inc. | | 1,300 | | | 40,872 |
| | | | |
|
|
| | | | | | 391,750 |
| | | | |
|
|
Technology | | | | | |
Sanmina – SCI Corp.* | | 18,300 | | | 63,135 |
| | | | |
|
|
Telecommunications — 0.2% | | | | | |
Dril-Quip, Inc.* | | 1,840 | | | 72,054 |
Occam Networks, Inc.* | | 3,190 | | | 52,635 |
Oplink Communications, Inc.* | | 3,060 | | | 62,914 |
Time Warner Telecom, Inc.
(Class A Stock)* | | 3,850 | | | 76,731 |
| | | | |
|
|
| | | | | | 264,334 |
| | | | |
|
|
Textiles, Apparel & Luxury Goods — 1.0% | | | | | |
Cache, Inc.* | | 4,060 | | | 102,474 |
Coach, Inc.* | | 11,200 | | | 481,152 |
Jos. A. Bank Clothiers, Inc.* | | 2,840 | | | 83,354 |
NIKE, Inc. (Class B Stock) | | 5,700 | | | 564,471 |
Phillips-Van Heusen Corp. | | 3,200 | | | 160,544 |
Stein Mart, Inc. | | 3,400 | | | 45,084 |
| | | | |
|
|
| | | | | | 1,437,079 |
| | | | |
|
|
Thrifts & Mortgage Finance — 0.1% | | | | | |
Countrywide Financial Corp. | | 3,300 | | | 140,085 |
| | | | |
|
|
Tobacco — 0.4% | | | | | |
Altria Group, Inc. | | 5,800 | | | 497,756 |
| | | | |
|
|
Utilities — 0.1% | | | | | |
Oneok, Inc. | | 2,300 | | | 99,176 |
| | | | |
|
|
Wireless Telecommunication Services — 0.8% | | | |
Alltel Corp. | | 6,400 | | | 387,072 |
NII Holdings, Inc.* | | 4,600 | | | 296,424 |
Sprint Nextel Corp. | | 21,426 | | | 404,737 |
| | | | |
|
|
| | | | | | 1,088,233 |
| | | | |
|
|
TOTAL COMMON STOCKS
(cost $42,068,094) | | | 55,799,610 |
| | | | |
|
|
| | |
| RIGHTS* | | Units
| | |
United Mexican States,
expiring 06/30/07 (Mexico)
(cost $0) | | 1,300,000 | | | 18,850 |
| | | | |
|
|
| WARRANTS* | | | | | |
Media | | | |
XM Satellite Radio, Inc., 144A
(cost $0) | | 100 | | | — |
| | | | |
|
|
SEE NOTES TO FINANCIAL STATEMENTS.
B4
| | | | |
| | | DIVERSIFIED CONSERVATIVE GROWTH PORTFOLIO (Continued) | | |
SCHEDULE OF INVESTMENTS | December 31, 2006 |
| | | | | | | | | | |
Interest
Rate
| | Maturity
Date
| | Moody’s
Ratings
(Unaudited)
| | Principal
Amount
(000)#
| | Value
(Note 2)
|
| CORPORATE BONDS — 23.4% | | | |
Aerospace & Defense — 0.5% | | | | | | |
BE Aerospace, Inc., | | | | | | |
Sr. Sub. Notes | | | | | | | | |
| 8.875% | | 05/01/11 | | B3 | | $ | 115 | | $ | 119,025 |
DRS Technologies, Inc., | | | | | | |
Gtd. Notes | | | | | | | | |
| 6.625% | | 02/01/16 | | B1 | | | 75 | | | 75,563 |
| 7.625% | | 02/01/18 | | B3 | | | 50 | | | 51,500 |
Esterline Technologies Corp., | | | |
Sr. Sub. Notes | | | | | | | | |
| 7.75% | | 06/15/13 | | Ba3 | | | 125 | | | 127,500 |
K&F Acquisition, Inc., | | | | | | |
Gtd. Notes | | | | | | | | |
| 7.75% | | 11/15/14 | | Caa1 | | | 50 | | | 51,500 |
L-3 Communications Corp., | | | |
Sr. Notes | | | | | | | | |
| 7.625% | | 06/15/12 | | Ba3 | | | 175 | | | 181,125 |
Moog, Inc., | | | | | | |
Sr. Sub. Notes | | | | | | | | |
| 6.25% | | 01/15/15 | | Ba3 | | | 100 | | | 97,000 |
Sequa Corp., | | | | | | |
Sr. Notes. | | | | | | | | |
| 9.00% | | 08/01/09 | | B2 | | | 50 | | | 53,500 |
| | | | | | | | | |
|
|
| | | | | | | | | | | 756,713 |
| | | | | | | | | |
|
|
Airlines — 0.1% | | | | | | |
AMR Corp., | | | | | | |
Notes | | | | | | | | |
| 10.40% | | 03/10/11 | | CCC(d) | | | 100 | | | 100,125 |
Continental Airlines, Inc., | | | |
Pass Through Certificates | | | |
| 6.748% | | 03/15/17 | | Ba2 | | | 35 | | | 34,660 |
| | | | | | | | | |
|
|
| | | | | | | | | | | 134,785 |
| | | | | | | | | |
|
|
Automobile Manufacturers — 0.5% | | | |
DaimlerChrysler NA Holding Corp., | | | | | | |
Gtd. Notes | | | | | | | | |
| 5.60% | | 03/07/07 | | A3 | | | 600 | | | 600,094 |
Notes | | | | | | | | |
| 5.75% | | 09/08/11 | | A3 | | | 100 | | | 99,748 |
| | | | | | | | | |
|
|
| | | | | | | | | | | 699,842 |
| | | | | | | | | |
|
|
Automotive — 1.3% | | | | | | |
Arvinmeritor, Inc., | | | | | | |
Notes | | | | | | | | |
| 8.75% | | 03/01/12 | | Ba3 | | | 20 | | | 20,550 |
Ford Motor Credit Co., | | | | | | |
Notes | | | | | | | | |
| 7.875% | | 06/15/10 | | B1 | | | 470 | | | 473,904 |
Sr. Notes | | | | | | | | |
| 9.875% | | 08/10/11 | | B1 | | | 100 | | | 106,953 |
General Motors Acceptance Corp., | | | | | | |
Notes | | | | | | | | |
| 6.75% | | 12/01/14 | | Caa1 | | | 155 | | | 159,206 |
| 6.875% | | 09/15/11 | | Caa1 | | | 225 | | | 230,782 |
| 6.875% | | 08/28/12 | | Caa1 | | | 235 | | | 241,304 |
| | | | | | | | | | |
Interest
Rate
| | Maturity
Date
| | Moody’s
Ratings
(Unaudited)
| | Principal
Amount
(000)#
| | Value
(Note 2)
|
| CORPORATE BONDS (Continued) | | | |
Automotive (cont’d.) | | | | | | |
General Motors Corp., | | | | | | |
Notes | | | | | | | | |
| 7.20% | | 01/15/11 | | Caa2 | | $ | 220 | | $ | 213,400 |
General Motors Nova Scotia Finance Co., | | | |
Gtd. Notes (Canada) | | | | | | |
| 6.85% | | 10/15/08 | | Caa1 | | | 75 | | | 74,625 |
Lear Corp., | | | | | | |
Sr. Notes | | | | | | | | |
| 8.75% | | 12/01/16 | | B3 | | | 50 | | | 48,312 |
TRW Automotive, Inc., | | | | | | |
Sr. Notes | | | | | | | | |
| 9.375% | | 02/15/13 | | Ba3 | | | 113 | | | 121,192 |
Visteon Corp., | | | | | | |
Sr. Notes | | | | | | | | |
| 7.00% | | 03/10/14 | | Caa2 | | | 35 | | | 30,625 |
| 8.25% | | 08/01/10 | | Caa2 | | | 115 | | | 112,125 |
| | | | | | | | | |
|
|
| | | | | | | | | | | 1,832,978 |
| | | | | | | | | |
|
|
Banks — 0.1% | | | | | | |
Kazkommerts International BV, (Netherlands) | | | |
Bank Gtd. Notes, 144A | | | | | | |
| 7.00% | | 11/03/09 | | Baa1 | | | 40 | | | 40,500 |
| 7.875% | | 04/07/14 | | Baa1 | | | 95 | | | 98,681 |
| | | | | | | | | |
|
|
| | | | | | | | | | | 139,181 |
| | | | | | | | | |
|
|
Building Materials & Construction — 0.2% | | | |
Goodman Global Holdings, Inc., | | | |
Sr. Notes | | | | | | | | |
| 8.36% | | 06/15/12 | | B1 | | | 45 | | | 45,675 |
K Hovnanian Enterprises, Inc., | | | |
Gtd. Notes | | | | | | | | |
| 7.50% | | 05/15/16 | | Ba1 | | | 50 | | | 50,250 |
KB Home, | | | |
Sr. Sub. Notes | | | | | | | | |
| 8.625% | | 12/15/08 | | Ba2 | | | 80 | | | 83,121 |
Nortek, Inc., | | | |
Sr. Sub. Notes | | | | | | | | |
| 8.50% | | 09/01/14 | | B3 | | | 120 | | | 117,600 |
| | | | | | | | | |
|
|
| | | | | | | | | | | 296,646 |
| | | | | | | | | |
|
|
Cable — 0.7% | | | |
Callahan Nordrhein-Westfalen GMBH, | | | |
Sr. Disc. Notes (Germany)(i) | | | | | | |
| 16.00% | | 07/15/10 | | NR | | | 250 | | | 3 |
Charter Communications Holdings I LLC, | | | |
Sec’d. Notes | | | | | | | | |
| 11.00% | | 10/01/15 | | Caa2 | | | 173 | | | 177,530 |
Charter Communications Holdings II LLC, | | | |
Gtd. Notes | | | | | | | | |
| 10.25% | | 10/01/13 | | Caa2 | | | 44 | | | 46,860 |
| 11.75% | | 05/15/14 | | Ca | | | 150 | | | 135,375 |
Sr. Notes | | | | | | | | |
| 10.25% | | 09/15/10 | | Caa2 | | | 175 | | | 182,906 |
Charter Communications Operating LLC, | | | |
Sr. Notes, 144A | | | | | | | | |
| 8.00% | | 04/30/12 | | B3 | | | 20 | | | 20,775 |
SEE NOTES TO FINANCIAL STATEMENTS.
B5
| | | | |
| | | DIVERSIFIED CONSERVATIVE GROWTH PORTFOLIO (Continued) | | |
SCHEDULE OF INVESTMENTS | December 31, 2006 |
| | | | | | | | | | |
Interest
Rate
| | Maturity
Date
| | Moody’s
Ratings
(Unaudited)
| | Principal
Amount
(000)#
| | Value
(Note 2)
|
| CORPORATE BONDS (Continued) | | | |
Cable (cont’d.) | | | |
CSC Holdings, Inc., | | | |
Debs. | | | | | | | | |
| 7.625% | | 07/15/18 | | B2 | | $ | 25 | | $ | 24,344 |
Sr. Notes | | | | | | | | |
| 7.875% | | 12/15/07 | | B2 | | | 24 | | | 24,300 |
| 8.00% | | 04/15/12 | | B3 | | | 25 | | | 24,563 |
| 8.125% | | 07/15/09-08/15/09 | | B2 | | | 200 | | | 207,249 |
Sr. Notes, 144A | | | | | | | | |
| 6.75% | | 04/15/12 | | B2 | | | 50 | | | 48,750 |
Mediacom Broadband LLC, | | | |
Sr. Notes. | | | | | | | | |
| 8.50% | | 10/15/15 | | B3 | | | 25 | | | 25,312 |
NTL Cable PLC, | | | |
Sr. Notes | | | | | | | | |
| 9.125% | | 08/15/16 | | B2 | | | 100 | | | 105,625 |
| | | | | | | | | |
|
|
| | | | | | | | | | | 1,023,592 |
| | | | | | | | | |
|
|
Capital Goods — 1.2% | | | |
ALH Finance LLC, | | | |
Sr. Sub. Notes | | | | | | | | |
| 8.50% | | 01/15/13 | | B3 | | | 25 | | | 24,563 |
Allied Waste North America, Inc., | | | |
Sec’d. Notes | | | | | | | | |
| 5.75% | | 02/15/11 | | B2 | | | 60 | | | 58,050 |
Sr. Notes | | | | | | | | |
| 7.875% | | 04/15/13 | | B2 | | | 50 | | | 51,563 |
| 8.50% | | 12/01/08 | | B2 | | | 145 | | | 152,431 |
Aramark Services, Inc., | | | |
Notes | | | | | | | | |
| 5.00% | | 06/01/12 | | B2 | | | 50 | | | 42,841 |
Ashtead Capital, Inc., | | | |
Notes | | | | | | | | |
| 9.00% | | 08/15/16 | | B3 | | | 55 | | | 58,850 |
Avis Budget Car Rental LLC, | | | |
Sr. Notes | | | | | | | | |
| 7.625% | | 05/15/14 | | Ba3 | | | 30 | | | 29,250 |
Blount, Inc., | | | |
Sr. Sub. Notes | | | | | | | | |
| 8.875% | | 08/01/12 | | B2 | | | 150 | | | 153,000 |
Columbus Mckinnon Corp., | | | |
Sr. Sub. Notes | | | | | | | | |
| 8.875% | | 11/01/13 | | B2 | | | 50 | | | 52,750 |
Hertz Corp., | | | |
Sr. Notes, 144A | | | | | | | | |
| 8.875% | | 01/01/14 | | B1 | | | 155 | | | 162,362 |
Invensys PLC, | | | |
Sr. Notes, 144A (United Kingdom) | | | |
| 9.875% | | 03/15/11 | | B2 | | | 7 | | | 7,508 |
Johnson Diversified Holdings, Inc., | | | |
Disc. Notes, Zero Coupon (until 05/15/07) | | | | | | | | |
| 10.67%(v) | | 05/15/13 | | Caa1 | | | 75 | | | 72,375 |
Johnson Diversified, Inc., | | | |
Gtd. Notes | | | | | | | | |
| 9.625% | | 05/15/12 | | B3 | | | 30 | | | 31,425 |
| | | | | | | | | | |
Interest
Rate
| | Maturity
Date
| | Moody’s
Ratings
(Unaudited)
| | Principal
Amount
(000)#
| | Value
(Note 2)
|
| CORPORATE BONDS (Continued) | | | |
Capital Goods (cont’d.) | | | |
Manitowoc Co., Inc., | | | |
Gtd. Notes | | | | | | | | |
| 10.50% | | 08/01/12 | | B2 | | $ | 97 | | $ | 104,154 |
RBS Global, Inc.,/Rexnord Corp., | | | |
Notes, 144A | | | | | | | | |
| 9.50% | | 08/01/14 | | B3 | | | 50 | | | 52,000 |
Rental Service Corp., | | | |
Bonds | | | | | | | | |
| 9.50% | | 12/01/14 | | Caa1 | | | 50 | | | 51,625 |
Stena AB, (Sweden) | | | |
Sr. Notes | | | | | | | | |
| 7.50% | | 11/01/13 | | Ba3 | | | 125 | | | 123,437 |
| 9.625% | | 12/01/12 | | Ba3 | | | 25 | | | 26,625 |
Terex Corp., | | | |
Gtd. Notes | | | | | | | | |
| 7.375% | | 01/15/14 | | B1 | | | 75 | | | 76,125 |
| 9.25% | | 07/15/11 | | B1 | | | 45 | | | 47,081 |
United Rentals North America, Inc., | | | |
Gtd. Notes | | | | | | | | |
| 6.50% | | 02/15/12 | | B1 | | | 100 | | | 98,750 |
Sr. Sub. Notes | | | | | | | | |
| 7.75% | | 11/15/13 | | B3 | | | 40 | | | 40,150 |
Valmont Industries, Inc., | | | |
Gtd. Notes | | | | | | | | |
| 6.875% | | 05/01/14 | | Ba3 | | | 125 | | | 123,906 |
| | | | | | | | | |
|
|
| | | | | | | | | | | 1,640,821 |
| | | | | | | | | |
|
|
Chemicals — 0.7% | | | |
Equistar Chemical Funding, | | | |
Sr. Notes | | | | | | | | |
| 10.625% | | 05/01/11 | | B1 | | | 55 | | | 58,575 |
Equistar Chemicals LP, | | | |
Gtd. Notes | | | | | | | | |
| 10.125% | | 09/01/08 | | B1 | | | 95 | | | 100,938 |
Huntsman LLC, | | | |
Gtd. Notes | | | | | | | | |
| 11.625% | | 10/15/10 | | Ba3 | | | 150 | | | 163,875 |
Koppers, Inc., | | | |
Gtd. Notes | | | | | | | | |
| 9.875% | | 10/15/13 | | B2 | | | 102 | | | 110,925 |
Lyondell Chemical Co., | | | |
Gtd. Notes | | | | | | | | |
| 10.50% | | 06/01/13 | | B2 | | | 75 | | | 82,500 |
Sec’d. Notes | | | | | | | | |
| 11.125% | | 07/15/12 | | B2 | | | 50 | | | 53,750 |
Mosaic Co. (The), | | | |
Sr. Notes | | | | | | | | |
| 7.375% | | 12/01/14 | | B1 | | | 25 | | | 25,656 |
| 7.625% | | 12/01/16 | | B1 | | | 25 | | | 25,906 |
Nalco Co., | | | |
Sr. Notes | | | | | | | | |
| 7.75% | | 11/15/11 | | B1 | | | 130 | | | 132,925 |
Sr. Sub. Notes | | | | | | | | |
| 8.875% | | 11/15/13 | | B3 | | | 15 | | | 15,881 |
OM Group, Inc., | | | |
Gtd. Notes | | | | | | | | |
| 9.25% | | 12/15/11 | | B3 | | | 35 | | | 36,619 |
SEE NOTES TO FINANCIAL STATEMENTS.
B6
| | | | |
| | | DIVERSIFIED CONSERVATIVE GROWTH PORTFOLIO (Continued) | | |
SCHEDULE OF INVESTMENTS | December 31, 2006 |
| | | | | | | | | | |
Interest
Rate
| | Maturity
Date
| | Moody’s
Ratings
(Unaudited)
| | Principal
Amount
(000)#
| | Value
(Note 2)
|
| CORPORATE BONDS (Continued) | | | |
Chemicals (cont’d.) | | | |
Rhodia SA, | | | |
Sr. Sub. Notes (France) | | | |
| 8.875% | | 06/01/11 | | B3 | | $ | 78 | | $ | 82,290 |
Rockwood Specialties, Inc., | | | |
Sr. Sub. Notes | | | | | | | | |
| 10.625% | | 05/15/11 | | B3 | | | 36 | | | 38,340 |
| | | | | | | | | |
|
|
| | | | | | | | | | | 928,180 |
| | | | | | | | | |
|
|
Consumers — 0.2% | | | |
Levi Strauss & Co., | | | |
Gtd. Notes | | | | | | | | |
| 12.25% | | 12/15/12 | | B3 | | | 75 | | | 83,437 |
Mac-Gray Corp., | | | |
Sr. Notes | | | | | | | | |
| 7.625% | | 08/15/15 | | B2 | | | 50 | | | 50,750 |
Playtex Products, Inc., | | | |
Gtd. Notes | | | | | | | | |
| 9.375% | | 06/01/11 | | Caa1 | | | 100 | | | 104,250 |
Simmons Bedding Co., | | | |
Sr. Sub. Notes | | | | | | | | |
| 7.875% | | 01/15/14 | | B3 | | | 75 | | | 75,938 |
TDS Investor Corp., | | | |
Sr. Sub. Notes, 144A | | | |
| 11.875% | | 09/01/16 | | Caa1 | | | 30 | | | 30,750 |
| | | | | | | | | |
|
|
| | | | | | | | | | | 345,125 |
| | | | | | | | | |
|
|
Diversified — 0.1% | | | |
Istar Financial, Inc., | | | |
Sr. Unsec’d. Notes | | | |
| 5.80% | | 03/15/11 | | Baa2 | | | 100 | | | 100,350 |
| | | | | | | | | |
|
|
Diversified Financial Services — 0.2% | | | |
Petroleum Export Ltd., (Cayman Islands) | | | |
Sr. Notes, 144A | | | | | | | | |
| 4.623% | | 06/15/10 | | Aaa | | | 78 | | | 76,532 |
| 4.633% | | 06/15/10 | | Aaa | | | 156 | | | 153,065 |
| | | | | | | | | |
|
|
| | | | | | | | | | | 229,597 |
| | | | | | | | | |
|
|
Electric — 1.7% | | | |
AES Corp., | | | |
Sr. Notes | | | |
| 9.375% | | 09/15/10 | | B1 | | | 275 | | | 298,719 |
| 9.50% | | 06/01/09 | | B1 | | | 25 | | | 26,750 |
AES Eastern Energy LP, | | | |
Pass Through Certificates | | | |
| 9.00% | | 01/02/17 | | Ba1 | | | 36 | | | 40,164 |
Allegheny Energy Supply, | | | |
Sr. Unsec’d. Notes, 144A | | | |
| 8.25% | | 04/15/12 | | Ba3 | | | 50 | | | 54,875 |
Aquila Canada Finance Corp., | | | |
Gtd. Notes (Canada) | | | |
| 7.75% | | 06/15/11 | | B2 | | | 40 | | | 42,209 |
Aquila, Inc., | | | |
Sr. Notes | | | | | | | | |
| 9.95% | | 02/01/11 | | B2 | | | 3 | | | 3,286 |
CMS Energy Corp., | | | |
Sr. Notes | | | |
| 7.50% | | 01/15/09 | | B1 | | | 70 | | | 72,187 |
| 8.50% | | 04/15/11 | | B1 | | | 50 | | | 54,375 |
| | | | | | | | | | |
Interest
Rate
| | Maturity
Date
| | Moody’s
Ratings
(Unaudited)
| | Principal
Amount
(000)#
| | Value
(Note 2)
|
| CORPORATE BONDS (Continued) | | | |
Electric (cont’d.) | | | |
Dynegy Holdings, Inc., | | | |
Sr. Unsec’d. Notes | | | | | | | | |
| 8.375% | | 05/01/16 | | B2 | | $ | 155 | | $ | 162,750 |
Edison Mission Energy, | | | |
Sr. Notes | | | |
| 7.73% | | 06/15/09 | | B1 | | | 50 | | | 51,750 |
Sr. Unsec’d. Notes | | | |
| 7.75% | | 06/15/16 | | B1 | | | 50 | | | 53,000 |
Empresa Nacional de Electricidad SA, (Chile) | | | |
Notes | | | | | | | | | | |
| 8.625% | | 08/01/15 | | Baa3 | | | 55 | | | 64,732 |
Unsub. Notes | | | |
| 8.35% | | 08/01/13 | | Baa3 | | | 110 | | | 124,768 |
Homer City Funding LLC, | | | |
Gtd. Notes | | | | | | | | |
| 8.137% | | 10/01/19 | | Ba2 | | | 45 | | | 49,050 |
Midwest Generation LLC, | | | |
Pass Through Certificates | | | |
| 8.30% | | 07/02/09 | | Ba2 | | | 134 | | | 137,736 |
| 8.56% | | 01/02/16 | | Ba2 | | | 71 | | | 78,232 |
Sec’d. Notes | | | |
| 8.75% | | 05/01/34 | | Ba2 | | | 75 | | | 81,375 |
Mirant North America LLC, | | | |
Gtd. Notes | | | | | | | | |
| 7.375% | | 12/31/13 | | B2 | | | 125 | | | 126,875 |
Nevada Power Co., | | | |
General Refinance Mortgage | | | |
| 6.50% | | 04/15/12 | | Ba1 | | | 50 | | | 51,329 |
NRG Energy, Inc., | | | |
Gtd. Notes | | | | | | | | |
| 7.375% | | 02/01/16-01/15/17 | | B1 | | | 260 | | | 261,112 |
Orion Power Holdings, Inc., | | | |
Sr. Notes | | | | | | | | |
| 12.00% | | 05/01/10 | | B2 | | | 40 | | | 45,400 |
Reliant Energy, Inc., | | | |
Sec’d. Notes | | | | | | | | |
| 9.50% | | 07/15/13 | | B2 | | | 140 | | | 150,150 |
Sierra Pacific Resources, | | | |
Sr. Notes | | | | | | | | |
| 8.625% | | 03/15/14 | | B1 | | | 40 | | | 42,946 |
TECO Energy, Inc., | | | |
Sr. Notes | | | | | | | | |
| 7.50% | | 06/15/10 | | Ba2 | | | 175 | | | 186,375 |
TXU Corp., | | | |
Sr. Notes | | | | | | | | |
| 6.50% | | 11/15/24 | | Ba1 | | | 50 | | | 47,105 |
| | | | | | | | | |
|
|
| | | | | | | | | | | 2,307,250 |
| | | | | | | | | |
|
|
Energy — 0.7% | | | |
Chesapeake Energy Corp., | | | |
Gtd. Notes | | | |
| 6.50% | | 08/15/17 | | Ba2 | | | 50 | | | 48,875 |
Sr. Notes | | | |
| 6.375% | | 06/15/15 | | Ba2 | | | 200 | | | 198,000 |
Compton Petroleum Finance Corp., | | | |
Gtd. Notes | | | | | | | | |
| 7.625% | | 12/01/13 | | B2 | | | 25 | | | 24,125 |
SEE NOTES TO FINANCIAL STATEMENTS.
B7
| | | | |
| | | DIVERSIFIED CONSERVATIVE GROWTH PORTFOLIO (Continued) | | |
SCHEDULE OF INVESTMENTS | December 31, 2006 |
| | | | | | | | | | |
Interest
Rate
| | Maturity
Date
| | Moody’s
Ratings
(Unaudited)
| | Principal
Amount
(000)#
| | Value
(Note 2)
|
| CORPORATE BONDS (Continued) | | | |
Energy (cont’d.) | | | |
Encore Acquisition Corp., | | | |
Sr. Sub. Notes | | | | | | | | |
| 6.25% | | 04/15/14 | | B1 | | $ | 50 | | $ | 46,875 |
Forest Oil Corp., | | | |
Sr. Notes | | | | | | | | |
| 8.00% | | 06/15/08 | | B1 | | | 40 | | | 40,950 |
Hanover Compressor Co., | | | |
Gtd. Notes | | | | | | | | |
| 7.50% | | 04/15/13 | | B2 | | | 100 | | | 101,000 |
Houston Exploration Co., | | | |
Sr. Sub. Notes | | | | | | | | |
| 7.00% | | 06/15/13 | | B2 | | | 25 | | | 24,375 |
Magnum Hunter Resources, Inc., | | | |
Gtd. Notes | | | | | | | | |
| 9.60% | | 03/15/12 | | B1 | | | 10 | | | 10,512 |
Newfield Exploration Co., | | | |
Sr. Sub. Notes | | | | | | | | |
| 6.625% | | 04/15/16 | | Ba3 | | | 125 | | | 124,375 |
OPTI Canada, Inc., | | | |
Gtd. Notes | | | | | | | | |
| 8.25% | | 12/15/14 | | B1 | | | 50 | | | 51,375 |
Parker Drilling Co., | | | |
Sr. Notes | | | | | | | | |
| 9.625% | | 10/01/13 | | B2 | | | 175 | | | 191,844 |
Pioneer Natural Resources Co., | | | |
Sr. Notes | | | | | | | | |
| 5.875% | | 07/15/16 | | Ba1 | | | 100 | | | 92,217 |
Pogo Producing Co., | | | |
Sr. Sub. Notes | | | | | | | | |
| 6.875% | | 10/01/17 | | B1 | | | 15 | | | 14,325 |
Pride International, Inc., | | | |
Sr. Notes | | | | | | | | |
| 7.375% | | 07/15/14 | | Ba2 | | | 5 | | | 5,163 |
| | | | | | | | | |
|
|
| | | | | | | | | | | 974,011 |
| | | | | | | | | |
|
|
Energy – Other — 0.1% | | | |
Petrohawk Energy Corp., | | | |
Gtd. Notes | | | | | | | | |
| 9.125% | | 07/15/13 | | B3 | | | 75 | | | 78,750 |
Tesoro Corp., | | | |
Sec’d. Notes | | | | | | | | |
| 6.625% | | 11/01/15 | | Ba1 | | | 25 | | | 24,813 |
| | | | | | | | | |
|
|
| | | | | | | | | | | 103,563 |
| | | | | | | | | |
|
|
Financial – Bank & Trust — 1.0% | | | |
Export-Import Bank of Korea, | | | |
Notes, 144A(g) | | | | | | | | |
| 5.592% | | 10/04/11 | | A3 | | | 200 | | | 199,956 |
Rabobank Nederland, | | | |
Notes (Japan) | | | | | | | | |
| 0.20% | | 06/20/08 | | Aaa | | | 137,000 | | | 1,143,048 |
VTB Capital SA, | | | |
Sr. Notes (Luxembourg) | | | |
| 5.976% | | 08/01/08 | | A2 | | | 100 | | | 100,050 |
| | | | | | | | | |
|
|
| | | | | | | | | | | 1,443,054 |
| | | | | | | | | |
|
|
| | | | | | | | | | |
Interest
Rate
| | Maturity
Date
| | Moody’s
Ratings
(Unaudited)
| | Principal
Amount
(000)#
| | Value
(Note 2)
|
| CORPORATE BONDS (Continued) | | | |
Financial Services — 0.6% | | | |
Bank of America Corp., | | | |
Sr. Notes | | | | | | | | |
| 5.64% | | 10/14/16 | | Aa2 | | $ | 400 | | $ | 401,633 |
CitiFinancial, Inc., | | | |
Notes | | | | | | | | |
| 6.625% | | 06/01/15 | | Aa1 | | | 100 | | | 107,429 |
Momentive Performance Materials, Inc., | | | |
Sr. Notes | | | | | | | | |
| 9.75% | | 12/01/14 | | B3 | | | 75 | | | 75,000 |
Pemex Project Funding Master Trust, | | | |
Gtd. Notes | | | | | | | | |
| 9.25% | | 03/30/18 | | Baa1 | | | 250 | | | 315,250 |
| | | | | | | | | |
|
|
| | | | | | | | | | | 899,312 |
| | | | | | | | | |
|
|
Food — 0.5% | | | |
Ahold Finance USA, Inc., | | | |
Gtd. Notes | | | |
| 6.875% | | 05/01/29 | | Ba1 | | | 20 | | | 19,600 |
Notes | | | | | | | | | | |
| 8.25% | | 07/15/10 | | Ba1 | | | 25 | | | 27,094 |
Albertson’s, Inc., | | | |
Debs. | | | | | | | | | | |
| 7.45% | | 08/01/29 | | B1 | | | 75 | | | 73,275 |
| 8.70% | | 05/01/30 | | B1 | | | 25 | | | 26,112 |
Notes | | | | | | | | |
| 7.50% | | 02/15/11 | | B1 | | | 25 | | | 25,974 |
Carrols Corp., | | | | | | | | |
Gtd. Notes | | | | | | | | |
| 9.00% | | 01/15/13 | | Caa1 | | | 50 | | | 51,125 |
Constellation Brands, Inc., | | | | | | |
Gtd. Notes | | | | | | | | |
| 7.25% | | 09/01/16 | | Ba2 | | | 50 | | | 51,375 |
Dean Foods Co., | | | | | | |
Gtd. Notes | | | | | | | | |
| 7.00% | | 06/01/16 | | Ba2 | | | 25 | | | 25,250 |
Del Monte Corp., | | | | | | |
Sr. Sub. Notes | | | | | | | | |
| 8.625% | | 12/15/12 | | B2 | | | 35 | | | 36,925 |
Delhaize America, Inc., | | | | | | |
Gtd. Notes | | | | | | | | |
| 8.125% | | 04/15/11 | | Ba1 | | | 80 | | | 86,300 |
Dole Foods Co., Inc., | | | | | | |
Gtd. Notes | | | |
| 7.25% | | 06/15/10 | | B3 | | | 35 | | | 33,338 |
Sr. Notes | | | |
| 8.625% | | 05/01/09 | | B3 | | | 8 | | | 7,950 |
National Beef Packaging Co. LLC, | | | |
Sr. Notes | | | | | | | | |
| 10.50% | | 08/01/11 | | Caa1 | | | 50 | | | 52,750 |
Smithfield Foods, Inc., | | | |
Sr. Notes | | | | | | | | |
| 8.00% | | 10/15/09 | | Ba3 | | | 70 | | | 73,150 |
Stater Brothers Holdings, | | | |
Sr. Notes | | | | | | | | |
| 8.125% | | 06/15/12 | | B1 | | | 25 | | | 25,375 |
SEE NOTES TO FINANCIAL STATEMENTS.
B8
| | | | |
| | | DIVERSIFIED CONSERVATIVE GROWTH PORTFOLIO (Continued) | | |
SCHEDULE OF INVESTMENTS | December 31, 2006 |
| | | | | | | | | | |
Interest
Rate
| | Maturity
Date
| | Moody’s
Ratings
(Unaudited)
| | Principal
Amount
(000)#
| | Value
(Note 2)
|
| CORPORATE BONDS (Continued) | | | |
Food (cont’d.) | | | |
Supervalu, Inc., | | | |
Sr. Notes | | | | | | | | |
| 7.50% | | 11/15/14 | | B1 | | $ | 50 | | $ | 52,135 |
| | | | | | | | | |
|
|
| | | | | | | | | | | 667,728 |
| | | | | | | | | |
|
|
Gaming — 1.4% | | | |
Aztar Corp., | | | |
Sr. Sub. Notes | | | | | | | | |
| 7.875% | | 06/15/14 | | Ba3 | | | 95 | | | 103,194 |
Boyd Gaming Corp., | | | |
Sr. Sub. Notes | | | | | | | | |
| 6.75% | | 04/15/14 | | Ba3 | | | 20 | | | 19,950 |
| 8.75% | | 04/15/12 | | Ba3 | | | 90 | | | 94,050 |
CCM Merger, Inc., | | | |
Notes, 144A | | | | | | | | |
| 8.00% | | 08/01/13 | | B3 | | | 75 | | | 73,312 |
Harrahs Operating Co., Inc., | | | |
Gtd. Notes | | | | | | |
| 5.50% | | 07/01/10 | | Baa3 | | | 50 | | | 49,008 |
| 5.625% | | 06/01/15 | | Baa3 | | | 100 | | | 85,765 |
Notes | | | | | | | | | | |
| 6.50% | | 06/01/16 | | Baa3 | | | 25 | | | 22,384 |
Mandalay Resort Group,
Sr. Sub. Notes | | | |
| 10.25% | | 08/01/07 | | B1 | | | 300 | | | 307,125 |
MGM Mirage, | | | |
Gtd. Notes | | | | | | | | |
| 6.00% | | 10/01/09 | | Ba2 | | | 155 | | | 154,612 |
| 6.625% | | 07/15/15 | | Ba2 | | | 140 | | | 133,350 |
| 6.875% | | 04/01/16 | | Ba2 | | | 50 | | | 48,000 |
| 9.75% | | 06/01/07 | | B1 | | | 105 | | | 106,312 |
Mohegan Tribal Gaming Authority, | | | |
Sr. Sub. Notes | | | | | | | | |
| 6.375% | | 07/15/09 | | Ba2 | | | 50 | | | 50,000 |
| 8.00% | | 04/01/12 | | Ba2 | | | 70 | | | 72,888 |
Park Place Entertainment Corp., | | | |
Sr. Sub. Notes | | | | | | | | |
| 8.125% | | 05/15/11 | | Ba1 | | | 5 | | | 5,231 |
| 9.375% | | 02/15/07 | | Ba1 | | | 300 | | | 300,750 |
Station Casinos, Inc., | | | |
Sr. Notes | | | | | | | | |
| 6.00% | | 04/01/12 | | Ba2 | | | 170 | | | 161,287 |
Sr. Sub. Notes | | | | | | | | |
| 6.625% | | 03/15/18 | | Ba3 | | | 25 | | | 21,438 |
Trump Entertainment Resorts, Inc., | | | |
Sec’d. Notes | | | | | | | | |
| 8.50% | | 06/01/15 | | Caa1 | | | 80 | | | 79,600 |
| | | | | | | | | |
|
|
| | | | | | | | | | | 1,888,256 |
| | | | | | | | | |
|
|
Healthcare & Pharmaceuticals — 1.2% | | | |
Accellant, Inc., | | | |
Gtd. Notes | | | | | | | | |
| 10.50% | | 12/01/13 | | Caa1 | | | 175 | | | 181,562 |
Alliance Imaging, Inc., | | | |
Sr. Sub. Notes | | | | | | | | |
| 7.25% | | 12/15/12 | | B3 | | | 75 | | | 71,250 |
| | | | | | | | | |
Interest
Rate
| | Maturity
Date
| | Moody’s
Ratings
(Unaudited)
| | Principal
Amount
(000)#
| | Value
(Note 2)
|
| CORPORATE BONDS (Continued) | | | |
Healthcare & Pharmaceuticals (cont’d.) | | | |
Concentra Operating Corp., | | | |
Gtd. Notes | | | | | | | |
| 9.125% | | 06/01/12 | | B3 | | $ 50 | | $ | 52,500 |
| 9.50% | | 08/15/10 | | B3 | | 50 | | | 52,500 |
Coventry Health Care, Inc., | | | |
Sr. Notes | | | | | | | |
| 8.125% | | 02/15/12 | | Ba1 | | 75 | | | 77,813 |
Elan Finance PLC, | | | |
Gtd. Notes (Ireland) | | | |
| 9.374% | | 11/15/11 | | B3 | | 30 | | | 29,775 |
Fresenius Medical Care Capital Trust II, | | | |
Gtd. Notes | | | | | | | |
| 7.875% | | 02/01/08 | | B1 | | 150 | | | 152,625 |
Hanger Orthopedic Group, Inc., | | | |
Gtd. Notes | | | | | | | |
| 10.25% | | 06/01/14 | | Caa2 | | 75 | | | 77,438 |
HCA, Inc., | | | |
Notes | | | | | | | |
| 9.00% | | 12/15/14 | | Caa1 | | 50 | | | 48,466 |
Sec’d. Notes | | | | | | | |
| 9.625% | | 11/15/16 | | B2 | | 175 | | | 188,125 |
Inverness Medical Innovations, Inc., | | | |
Sr. Sub. Notes | | | | | | | |
| 8.75% | | 02/15/12 | | Caa1 | | 75 | | | 78,000 |
MedQuest, Inc., | | | |
Gtd. Notes | | | | | | | |
| 11.875% | | 08/15/12 | | Caa1 | | 15 | | | 12,375 |
Res-Care, Inc., | | | |
Sr. Notes | | | | | | | |
| 7.75% | | 10/15/13 | | B1 | | 100 | | | 102,500 |
Select Medical Corp., | | | |
Gtd. Notes | | | | | | | |
| 7.625% | | 02/01/15 | | B2 | | 60 | | | 49,800 |
Senior Housing Properties Trust, | | | |
Sr. Notes | | | |
| 7.875% | | 04/15/15 | | Ba2 | | 33 | | | 34,155 |
| 8.625% | | 01/15/12 | | Ba2 | | 50 | | | 54,250 |
Skilled Health Care Group, Inc., | | | |
Sr. Sub. Notes, 144A | | | | | |
| 11.00% | | 01/15/14 | | Caa1 | | 190 | | | 209,000 |
Tenet Healthcare Corp., | | | |
Sr. Notes | | | | | | | |
| 9.25% | | 02/01/15 | | Caa1 | | 25 | | | 25,000 |
Ventas Realty LP, | | | |
Gtd. Notes | | | |
| 7.125% | | 06/01/15 | | Ba2 | | 75 | | | 78,750 |
Sr. Notes | | | |
| 6.50% | | 06/01/16 | | Ba2 | | 50 | | | 51,250 |
Warner Chilcott Corp., | | | |
Gtd. Notes | | | | | | | |
| 8.75% | | 02/01/15 | | Caa1 | | 81 | | | 83,025 |
| | | | | | | | |
|
|
| | | | | | | | | | 1,710,159 |
| | | | | | | | |
|
|
Insurance — 0.4% | | | |
ASIF III Jersey Ltd., | | | |
Sec’d. Notes (Japan) | | | |
| 0.95% | | 07/15/09 | | Aa2 | | JPY 60,000 | | | 502,347 |
| | | | | | | | |
|
|
SEE NOTES TO FINANCIAL STATEMENTS.
B9
| | | | |
| | | DIVERSIFIED CONSERVATIVE GROWTH PORTFOLIO (Continued) | | |
SCHEDULE OF INVESTMENTS | December 31, 2006 |
| | | | | | | | | | |
Interest
Rate
| | Maturity
Date
| | Moody’s
Ratings
(Unaudited)
| | Principal
Amount
(000)#
| | Value
(Note 2)
|
| CORPORATE BONDS (Continued) | | | |
Lodging — 0.3% | | | |
Felcor Lodging LP, | | | |
Gtd. Notes | | | | | | | | |
| 8.50% | | 06/01/11 | | Ba3 | | $ | 50 | | $ | 53,250 |
Gaylord Entertainment Co., | | | |
Sr. Notes | | | | | | | | |
| 8.00% | | 11/15/13 | | B3 | | | 25 | | | 25,938 |
Hilton Hotels Corp., | | | |
Notes | | | | | | | | |
| 7.625% | | 12/01/12 | | Ba2 | | | 10 | | | 10,600 |
Host Marriott LP, | | | |
Gtd. Notes | | | |
| 6.625% | | 06/01/16 | | Ba1 | | | 75 | | | 75,094 |
Sr. Notes | | | |
| 7.00% | | 08/15/12 | | Ba1 | | | 100 | | | 101,500 |
| 7.125% | | 11/01/13 | | Ba1 | | | 85 | | | 86,912 |
Royal Caribbean Cruises Ltd., (Liberia) | | | |
Debs. | | | |
| 7.25% | | 03/15/18 | | Ba1 | | | 45 | | | 45,481 |
Sr. Notes | | | |
| 8.00% | | 05/15/10 | | Ba1 | | | 50 | | | 53,069 |
| | | | | | | | | |
|
|
| | | | | | | | | | | 451,844 |
| | | | | | | | | |
|
|
Media — 0.8% | | | |
Echostar DBS Corp., | | | |
Gtd. Notes | | | |
| 6.625% | | 10/01/14 | | Ba3 | | | 50 | | | 48,750 |
| 7.125% | | 02/01/16 | | BB- | | | 100 | | | 100,000 |
Idearc, Inc., | | | | | | | | |
Sr. Notes | | | | | | | | |
| 8.00% | | 11/15/16 | | B2 | | | 50 | | | 50,750 |
Lamar Media Corp., | | | | | | | | |
Sr. Sub. Notes | | | | | | | | |
| 6.625% | | 08/15/15 | | Ba3 | | | 125 | | | 123,906 |
Quebecor World Cap Corp. | | | |
Sr. Notes | | | | | | | | |
| 8.75% | | 03/15/16 | | B2 | | | 25 | | | 23,938 |
Quebecor World, Inc., | | | |
| 9.75% | | 01/15/15 | | B2 | | | 25 | | | 25,156 |
Time Warner, Inc., | | | |
Gtd. Notes | | | | | | | | |
| 5.606% | | 11/13/09 | | Baa2 | | | 800 | | | 800,519 |
| | | | | | | | | |
|
|
| | | | | | | | | | | 1,173,019 |
| | | | | | | | | |
|
|
Media & Entertainment — 1.3% | | | |
AMC Entertainment, Inc., | | | |
Gtd. Notes | | | |
| 8.625% | | 08/15/12 | | Ba3 | | | 75 | | | 78,469 |
| 11.00% | | 02/01/16 | | B3 | | | 35 | | | 39,287 |
Sr. Sub. Notes | | | |
| 8.00% | | 03/01/14 | | B3 | | | 35 | | | 34,738 |
Cinemark, Inc., | | | |
Sr. Disc. Notes, Zero Coupon
(until 03/15/09) | | | |
| 9.75%(v) | | 03/15/14 | | Ba3 | | | 75 | | | 64,406 |
Dex Media West LLC, | | | |
Sr. Sub. Notes | | | | | | | | |
| 9.875% | | 08/15/13 | | B2 | | | 159 | | | 173,310 |
| | | | | | | | | | |
Interest
Rate
| | Maturity
Date
| | Moody’s
Ratings
(Unaudited)
| | Principal
Amount
(000)#
| | Value
(Note 2)
|
| CORPORATE BONDS (Continued) | | | |
Media & Entertainment (cont’d.) | | | |
Dex Media, Inc., | | | |
Notes | | | | | | | | |
| 8.00% | | 11/15/13 | | B3 | | $ | 70 | | $ | 72,100 |
DirecTV Holdings LLC, | | | |
Gtd. Notes | | | | | | | | |
| 6.375% | | 06/15/15 | | Ba3 | | | 52 | | | 49,855 |
Gray Television, Inc., | | | |
Gtd. Notes | | | | | | | | |
| 9.25% | | 12/15/11 | | B1 | | | 125 | | | 130,781 |
Intelsat Bermuda Ltd., (Bermuda) | | | |
Gtd. Notes | | | |
| 9.25% | | 06/15/16 | | B2 | | | 25 | | | 26,875 |
Sr. Notes | | | |
| 11.25% | | 06/15/16 | | Caa1 | | | 225 | | | 246,937 |
Intelsat Subsidiary Holding Co. Ltd., | | | |
Sr. Notes (Bermuda) | | | |
| 8.25% | | 01/15/13 | | B2 | | | 140 | | | 142,100 |
Medianews Group, Inc., | | | |
Sr. Sub. Notes | | | | | | | | |
| 6.875% | | 10/01/13 | | B2 | | | 75 | | | 67,875 |
Morris Publishing Group LLC, | | | |
Gtd. Notes | | | | | | | | |
| 7.00% | | 08/01/13 | | B1 | | | 25 | | | 23,688 |
Nielsen Finance LLC, | | | |
Sr. Notes, 144A | | | | | | | | |
| 10.00% | | 08/01/14 | | B3 | | | 25 | | | 27,094 |
Primedia, Inc., | | | |
Sr. Notes | | | | | | | | |
| 10.749% | | 05/15/10 | | B2 | | | 75 | | | 78,000 |
R.H. Donnelley Corp., | | | |
Sr. Notes | | | | | | | | |
| 8.875% | | 01/15/16 | | B3 | | | 75 | | | 78,750 |
R.H. Donnelley Finance Corp., | | | |
Sr. Sub. Notes, 144A | | | |
| 10.875% | | 12/15/12 | | B2 | | | 150 | | | 163,500 |
Sun Media Corp., | | | |
Gtd. Notes (Canada) | | | |
| 7.625% | | 02/15/13 | | Ba2 | | | 175 | | | 177,406 |
Universal City Florida Holding Co., | | | |
Sr. Notes | | | | | | | | |
| 8.375% | | 05/01/10 | | B3 | | | 75 | | | 76,875 |
Vertis, Inc., | | | |
Notes | | | | | | | | |
| 9.75% | | 04/01/09 | | B1 | | | 105 | | | 108,150 |
| | | | | | | | | |
|
|
| | | | | | | | | | | 1,860,196 |
| | | | | | | | | |
|
|
Metals — 0.8% | | | |
AK Steel Corp., | | | |
Gtd. Notes | | | | | | | | |
| 7.75% | | 06/15/12 | | B2 | | | 60 | | | 60,450 |
Aleris International, Inc., | | | |
Sr. Notes | | | |
| 9.00% | | 12/15/14 | | B3 | | | 25 | | | 25,125 |
Sr. Sub. Notes | | | |
| 10.00% | | 12/15/16 | | Caa1 | | | 50 | | | 50,125 |
SEE NOTES TO FINANCIAL STATEMENTS.
B10
| | | | |
| | | DIVERSIFIED CONSERVATIVE GROWTH PORTFOLIO (Continued) | | |
SCHEDULE OF INVESTMENTS | December 31, 2006 |
| | | | | | | | | | |
Interest
Rate
| | Maturity
Date
| | Moody’s
Ratings
(Unaudited)
| | Principal
Amount
(000)#
| | Value
(Note 2)
|
| CORPORATE BONDS (Continued) | | | |
Metals (cont’d.) | | | |
Arch Western Finance LLC, | | | |
Sec’d. Notes | | | | | | | | |
| 6.75% | | 07/01/13 | | B1 | | $ | 80 | | $ | 79,400 |
Century Aluminum Co., | | | |
Gtd. Notes | | | | | | | | |
| 7.50% | | 08/15/14 | | B1 | | | 75 | | | 76,031 |
Chaparral Steel Co., | | | |
Gtd. Notes | | | | | | | | |
| 10.00% | | 07/15/13 | | B1 | | | 130 | | | 145,112 |
CSN Islands VII Corp., | | | |
Gtd. Notes, 144A | | | | | | | | |
| 10.75% | | 09/12/08 | | BB-(d) | | | 80 | | | 86,400 |
Gerdau Ameristeel Corp., | | | |
Sr. Notes (Canada) | | | | | | | | |
| 10.375% | | 07/15/11 | | Ba2 | | | 100 | | | 107,250 |
Indalex Holding Corp., | | | |
Sec’d. Notes, 144A | | | | | | | | |
| 11.50% | | 02/01/14 | | Caa1 | | | 20 | | | 20,900 |
Ispat Inland ULC, | | | |
Notes (Canada) | | | | | | | | |
| 9.75% | | 04/01/14 | | Baa3 | | | 49 | | | 54,757 |
Metals USA, Inc., | | | |
Sec’d. Notes | | | | | | | | |
| 11.125% | | 12/01/15 | | B3 | | | 125 | | | 137,344 |
Novelis, Inc., | | | |
Sr. Notes, 144A (Canada) | | | |
| 8.25% | | 02/15/15 | | B2 | | | 100 | | | 96,750 |
PNA Group, Inc., | | | |
Sr. Notes, 144A | | | | | | | | |
| 10.75% | | 09/01/16 | | B3 | | | 75 | | | 77,531 |
Ryerson Tull, Inc., | | | |
Sr. Notes | | | | | | | | |
| 8.25% | | 12/15/11 | | B3 | | | 45 | | | 44,663 |
United States Steel Corp., | | | |
Sr. Notes | | | | | | | | |
| 9.75% | | 05/15/10 | | Ba1 | | | 50 | | | 53,188 |
| | | | | | | | | |
|
|
| | | | | | | | | | | 1,115,026 |
| | | | | | | | | |
|
|
Packaging — 0.5% | | | |
Berry Plastics Holding Corp., | | | |
Sec’d. Notes | | | | | | | | |
| 8.875% | | 09/15/14 | | B2 | | | 100 | | | 101,500 |
Crown Americas LLC, | | | |
Gtd. Notes | | | | | | | | |
| 7.625% | | 11/15/13 | | B1 | | | 100 | | | 103,000 |
Exopac Holding Corp., | | | |
Sr. Notes | | | | | | | | |
| 11.25% | | 02/01/14 | | B3 | | | 50 | | | 52,625 |
Graham Packaging Co., Inc., | | | |
Gtd. Notes | | | |
| 8.50% | | 10/15/12 | | Caa1 | | | 60 | | | 60,600 |
Sub. Notes | | | |
| 9.875% | | 10/15/14 | | Caa1 | | | 25 | | | 25,250 |
Greif, Inc., | | | |
Gtd. Notes | | | | | | | | |
| 8.875% | | 08/01/12 | | Ba3 | | | 175 | | | 183,750 |
| | | | | | | | | | |
Interest
Rate
| | Maturity
Date
| | Moody’s
Ratings
(Unaudited)
| | Principal
Amount
(000)#
| | Value
(Note 2)
|
| CORPORATE BONDS (Continued) | | | |
Packaging (cont’d.) | | | |
Owens Brockway Glass Container, Inc., |
Sec’d. Notes | | | | | | | | |
| 8.75% | | 11/15/12 | | Ba1 | | $ | 115 | | $ | 121,900 |
Silgan Holdings, Inc., | | | |
Sr. Sub. Notes | | | | | | | | |
| 6.75% | | 11/15/13 | | B1 | | | 90 | | | 88,200 |
| | | | | | | | | |
|
|
| | | | | | | | | | | 736,825 |
| | | | | | | | | |
|
|
Paper — 0.6% | | | |
Abitibi-Consolidated, Inc., (Canada) | | | |
Notes | | | |
| 5.25% | | 06/20/08 | | B2 | | | 50 | | | 48,000 |
| 7.75% | | 06/15/11 | | B2 | | | 35 | | | 31,412 |
Ainsworth Lumber Co. Ltd., | | | |
Sr. Notes (Canada) | | | |
| 6.75% | | 03/15/14 | | B2 | | | 25 | | | 19,000 |
Bowater Canada Finance, | | | |
Gtd. Notes (Canada) | | | |
| 7.95% | | 11/15/11 | | B2 | | | 25 | | | 24,500 |
Cascades, Inc., | | | |
Sr. Notes (Canada) | | | |
| 7.25% | | 02/15/13 | | Ba3 | | | 85 | | | 84,787 |
Catalyst Paper Corp., (Canada) | | | |
Gtd. Notes | | | |
| 8.625% | | 06/15/11 | | B2 | | | 50 | | | 50,625 |
Sr. Notes | | | |
| 7.375% | | 03/01/14 | | B2 | | | 25 | | | 23,688 |
Cellu Tissue Holdings, Inc., | | | |
Sec’d. Notes | | | | | | | | |
| 9.75% | | 03/15/10 | | B2 | | | 125 | | | 123,437 |
Domtar, Inc., | | | |
Notes | | | | | | | | |
| 7.875% | | 10/15/11 | | B2 | | | 25 | | | 25,938 |
Georgia-Pacific Corp., | | | |
Gtd. Notes | | | |
| 7.125% | | 01/15/17 | | Ba3 | | | 50 | | | 49,875 |
Notes | | | |
| 8.125% | | 05/15/11 | | B2 | | | 30 | | | 31,500 |
Graphic Packaging International Corp., | | | |
Sr. Notes | | | |
| 8.50% | | 08/15/11 | | B2 | | | 50 | | | 51,750 |
Sr. Sub. Notes | | | |
| 9.50% | | 08/15/13 | | B3 | | | 50 | | | 52,750 |
Millar Western Forest Products Ltd., |
Sr. Notes (Canada) | | | |
| 7.75% | | 11/15/13 | | B2 | | | 55 | | | 49,362 |
Norampac, Inc., |
Sr. Notes (Canada) | | | |
| 6.75% | | 06/01/13 | | Ba3 | | | 30 | | | 29,175 |
Smurfit-Stone Container Enterprises, Inc., |
Sr. Notes | | | | | | | | |
| 9.75% | | 02/01/11 | | B2 | | | 22 | | | 22,688 |
Tembec Industries, Inc., |
Gtd. Notes (Canada) | | | |
| 7.75% | | 03/15/12 | | Ca | | | 70 | | | 40,950 |
SEE NOTES TO FINANCIAL STATEMENTS.
B11
| | | | |
| | | DIVERSIFIED CONSERVATIVE GROWTH PORTFOLIO (Continued) | | |
SCHEDULE OF INVESTMENTS | December 31, 2006 |
| | | | | | | | | | |
Interest
Rate
| | Maturity
Date
| | Moody’s
Ratings
(Unaudited)
| | Principal
Amount
(000)#
| | Value
(Note 2)
|
| CORPORATE BONDS (Continued) | | | |
Paper (cont’d.) | | | |
Verso Paper Holdings LLC, |
Sec’d. Notes, 144A | | | |
| 9.121% | | 08/01/14 | | B2 | | $ | 25 | | $ | 25,375 |
| 9.125% | | 08/01/14 | | B2 | | | 25 | | | 26,063 |
| | | | | | | | | |
|
|
| | | | | | | | | | | 810,875 |
| | | | | | | | | |
|
|
Pipelines & Other — 2.0% | | | |
AmeriGas Partners LP, |
Sr. Notes | | | | | | | | |
| 7.125% | | 05/20/16 | | B1 | | | 50 | | | 50,000 |
El Paso Corp., |
Sr. Notes | | | |
| 7.00% | | 05/15/11 | | B2 | | | 465 | | | 482,437 |
| 7.80% | | 08/01/31 | | Caa1 | | | 100 | | | 109,250 |
El Paso Production Holding Co., |
Gtd. Notes | | | | | | | | |
| 7.75% | | 06/01/13 | | B1 | | | 150 | | | 156,938 |
Ferrellgas Partners LP/Ferrellgas Partners Finance, |
Sr. Notes | | | | | | | | |
| 8.75% | | 06/15/12 | | B2 | | | 200 | | | 205,000 |
Inergy LP Inergy Finance Corp., |
Sr. Notes | | | | | | | | |
| 6.875% | | 12/15/14 | | B1 | | | 50 | | | 49,125 |
Pacific Energy Partners LP, |
Sr. Notes | | | | | | | | |
| 7.125% | | 06/15/14 | | Baa3 | | | 25 | | | 25,655 |
Pemex Project Funding Master Trust, |
Gtd. Notes | | | | | | | | |
| 8.625% | | 02/01/22 | | Baa1 | | | 250 | | | 309,000 |
Targa Resources, Inc., |
Gtd. Notes, 144A | | | | | | | | |
| 8.50% | | 11/01/13 | | B3 | | | 125 | | | 125,938 |
Tennessee Gas Pipeline Co., |
Debs. | | | | | | | | |
| 7.00% | | 10/15/28 | | Ba1 | | | 50 | | | 52,794 |
| 7.625% | | 04/01/37 | | Ba1 | | | 145 | | | 162,986 |
Sr. Notes | | | | | | | | |
| 7.00% | | 03/15/27 | | Ba1 | | | 90 | | | 94,852 |
Transocean, Inc., |
Notes | | | | | | | | |
| 5.566% | | 09/05/08 | | Baa1 | | | 200 | | | 200,121 |
Williams Cos., Inc., |
Notes | | | |
| 6.375% | | 10/01/10 | | Ba2 | | | 350 | | | 352,187 |
| 7.125% | | 09/01/11 | | Ba2 | | | 225 | | | 234,000 |
| 7.875% | | 09/01/21 | | Ba2 | | | 40 | | | 42,900 |
Sr. Notes | | | |
| 7.625% | | 07/15/19 | | Ba2 | | | 25 | | | 26,750 |
Sr. Unsec’d. Notes | | | |
| 8.125% | | 03/15/12 | | Ba2 | | | 65 | | | 70,363 |
Williams Partners LP, |
Bonds | | | | | | | | |
| 7.25% | | 02/01/17 | | Ba3 | | | 100 | | | 102,000 |
| | | | | | | | | |
|
|
| | | | | | | | | | | 2,852,296 |
| | | | | | | | | |
|
|
Real Estate Investment Trusts — 0.1% | | | |
Nationwide Health Properties, |
Notes | | | | | | | | |
| 6.50% | | 07/15/11 | | Baa3 | | | 100 | | | 102,172 |
| | | | | | | | | |
|
|
| | | | | | | | | | |
Interest
Rate
| | Maturity
Date
| | Moody’s
Ratings
(Unaudited)
| | Principal
Amount
(000)#
| | Value
(Note 2)
|
| CORPORATE BONDS (Continued) | | | |
Retail — 0.3% | | | |
GSC Holdings Corp., |
Gtd. Notes | | | | | | | | |
| 9.247% | | 10/01/11 | | B1 | | $ | 25 | | $ | 25,938 |
Service Corp. International, |
Sr. Notes | | | |
| 7.00% | | 06/15/17 | | B1 | | | 125 | | | 126,562 |
| 7.375% | | 10/01/14 | | B1 | | | 25 | | | 26,125 |
Sr. Unsec’d. Notes | | | |
| 6.50% | | 03/15/08 | | Baa1 | | | 200 | | | 201,000 |
| | | | | | | | | |
|
|
| | | | | | | | | | | 379,625 |
| | | | | | | | | |
|
|
Retailers — 0.3% | | | |
Couche-Tard Finance Corp., |
Sr. Sub. Notes | | | | | | | | |
| 7.50% | | 12/15/13 | | Ba2 | | | 25 | | | 25,563 |
GSC Holdings Corp., |
Gtd. Notes | | | | | | | | |
| 8.00% | | 10/01/12 | | B1 | | | 75 | | | 78,375 |
Jean Coutu Group, Inc., |
Sr. Notes (Canada) | | | | | | | | |
| 7.625% | | 08/01/12 | | B3 | | | 25 | | | 26,312 |
Neiman Marcus Group, Inc., |
Gtd. Notes | | | |
| 9.00% | | 10/15/15 | | B2 | | | 85 | | | 92,756 |
| 10.375% | | 10/15/15 | | B3 | | | 20 | | | 22,250 |
Pantry, Inc., (The),
Sr. Sub. Notes | | | |
| 7.75% | | 02/15/14 | | B3 | | | 55 | | | 55,344 |
Rite Aid Corp.,
Sec’d. Notes | | | |
| 8.125% | | 05/01/10 | | B2 | | | 100 | | | 102,125 |
Steinway Musical Instruments,
Sr. Notes, 144A | | | |
| 7.00% | | 03/01/14 | | B1 | | | 40 | | | 39,100 |
Stripes Acquisition LLC,
Sr. Notes, 144A | | | |
| 10.625% | | 12/15/13 | | B2 | | | 36 | | | 39,060 |
| | | | | | | | | |
|
|
| | | | | | | | | | | 480,885 |
| | | | | | | | | |
|
|
Retailers – Food & Drug | | | |
Jean Coutu Group, Inc.,
Sr. Sub. Notes (Canada) | | | |
| 8.50% | | 08/01/14 | | Caa2 | | | 25 | | | 25,156 |
| | | | | | | | | |
|
|
Technology — 1.1% | | | |
Amkor Technology, Inc.,
Sr. Notes | | | |
| 7.125% | | 03/15/11 | | Caa1 | | | 25 | | | 23,313 |
Avago Technologies Financial, (Singapore) | | | |
Sr. Notes, 144A | | | |
| 10.125% | | 12/01/13 | | B3 | | | 85 | | | 90,737 |
Sr. Sub. Notes, 144A | | | |
| 11.875% | | 12/01/15 | | Caa2 | | | 30 | | | 32,850 |
Flextronics International Ltd., (Singapore) | | | |
Sr. Sub. Notes | | | |
| 6.25% | | 11/15/14 | | Ba2 | | | 50 | | | 48,250 |
| 6.50% | | 05/15/13 | | Ba2 | | | 50 | | | 49,375 |
SEE NOTES TO FINANCIAL STATEMENTS.
B12
| | | | |
| | | DIVERSIFIED CONSERVATIVE GROWTH PORTFOLIO (Continued) | | |
SCHEDULE OF INVESTMENTS | December 31, 2006 |
| | | | | | | | | | |
Interest
Rate
| | Maturity
Date
| | Moody’s
Ratings
(Unaudited)
| | Principal
Amount
(000)#
| | Value
(Note 2)
|
| CORPORATE BONDS (Continued) | | | |
Technology (cont’d.) | | | |
Freescale Semiconductor, Inc., | | | |
Sr. Notes | | | |
| 8.875% | | 12/15/14 | | B1 | | $ | 75 | | $ | 74,719 |
| 9.125% | | 12/15/14 | | B1 | | | 200 | | | 198,750 |
Sr. Sub. Notes | | | |
| 10.125% | | 12/15/16 | | B2 | | | 150 | | | 150,187 |
Iron Mountain, Inc., | | | |
Gtd. Notes | | | | | | | | |
| 8.625% | | 04/01/13 | | B3 | | | 95 | | | 98,087 |
Nortel Networks Corp., | | | |
Gtd. Notes (Canada) | | | | | | |
| 4.25% | | 09/01/08 | | B3 | | | 25 | | | 24,188 |
Nortel Networks Ltd., | | | |
Gtd. Notes (Canada) | | | | | | |
| 10.125% | | 07/15/13 | | B3 | | | 25 | | | 27,000 |
NXP BV, | | | |
| 7.875% | | 10/15/14 | | B2 | | | 200 | | | 206,750 |
| 9.50% | | 10/15/15 | | B2 | | | 100 | | | 102,500 |
Sensata Technologies BV, |
Sr. Notes, 144A (Netherlands) | | | | | | |
| 8.00% | | 05/01/14 | | Caa1 | | | 75 | | | 72,000 |
Serena Software, Inc., | | | |
Gtd. Notes | | | | | | | | |
| 10.375% | | 03/15/16 | | Caa1 | | | 95 | | | 100,819 |
Spansion LLC, | | | |
Sr. Notes, 144A | | | | | | | | |
| 11.25% | | 01/15/16 | | Caa1 | | | 100 | | | 105,000 |
Sungard Data Systems, Inc., | | | |
Gtd. Notes | | | | | | | | |
| 10.25% | | 08/15/15 | | Caa1 | | | 60 | | | 64,050 |
Unisys Corp., | | | |
Sr. Notes | | | | | | | | |
| 8.00% | | 10/15/12 | | B2 | | | 20 | | | 19,775 |
Xerox Corp., | | | |
Sr. Unsec’d. Notes | | | | | | | | |
| 6.40% | | 03/15/16 | | Baa3 | | | 50 | | | 51,062 |
| | | | | | | | | |
|
|
| | | | | | | | | | | 1,539,412 |
| | | | | | | | | |
|
|
Telecommunications — 1.8% | | | |
BellSouth Corp., | | | |
Sr. Unsec’d. Notes | | | | | | | | |
| 5.58% | | 08/15/08 | | A2 | | | 200 | | | 200,116 |
Centennial Communications Corp., | | | |
Sr. Notes | | | |
| 8.125% | | 02/01/14 | | B2 | | | 25 | | | 25,656 |
| 10.00% | | 01/01/13 | | Caa1 | | | 25 | | | 26,594 |
Cincinnati Bell, Inc., | | | |
Sr. Sub. Notes | | | | | | | | |
| 8.375% | | 01/15/14 | | B2 | | | 50 | | | 51,375 |
Citizens Communications Co., | | | |
Notes | | | |
| 9.25% | | 05/15/11 | | B2 | | | 75 | | | 82,969 |
Sr. Notes | | | |
| 6.25% | | 01/15/13 | | B2 | | | 40 | | | 39,250 |
| 9.00% | | 08/15/31 | | B2 | | | 15 | | | 16,275 |
| | | | | | | | | | |
Interest
Rate
| | Maturity
Date
| | Moody’s
Ratings
(Unaudited)
| | Principal
Amount
(000)#
| | Value
(Note 2)
|
| CORPORATE BONDS (Continued) | | | |
Telecommunications (cont’d.) | | | |
Cricket Communications, Inc., | | | |
Sr. Notes | | | | | | | | |
| 9.375% | | 11/01/14 | | Caa2 | | $ | 50 | | $ | 52,750 |
Dobson Cellular Systems, Inc., | | | |
Sec’d. Notes | | | | | | | | |
| 8.375% | | 11/01/11 | | Ba3 | | | 50 | | | 52,687 |
Dobson Communications Corp., | | | |
Sr. Notes | | | | | | | | |
| 9.624% | | 10/15/12 | | Caa2 | | | 10 | | | 10,200 |
Hawaiian Telcom Communications, Inc., | | | |
Gtd. Notes | | | |
| 9.75% | | 05/01/13 | | B3 | | | 25 | | | 25,063 |
| 12.50% | | 05/01/15 | | B3 | | | 50 | | | 52,375 |
Level 3 Communications, Inc., | | | |
Sr. Notes | | | | | | | | |
| 11.50% | | 03/01/10 | | CCC(d) | | | 25 | | | 26,500 |
Level 3 Financing, Inc., | | | |
Gtd. Notes | | | |
| 12.25% | | 03/15/13 | | B2 | | | 175 | | | 198,187 |
Sr. Notes | | | |
| 9.25% | | 11/01/14 | | B2 | | | 25 | | | 25,500 |
MetroPCS Wireless, Inc., | | | |
Sr. Notes | | | | | | | | |
| 9.25% | | 11/01/14 | | Caa2 | | | 50 | | | 52,250 |
Nordic Telephone Co. Holdings,
Sr. Notes (Denmark) | | | |
| 8.875% | | 05/01/16 | | B2 | | | 90 | | | 96,300 |
Qwest Communications International, Inc., | | | |
Gtd. Notes, 144A | | | | | | | | |
| 7.50% | | 02/15/14 | | Ba3 | | | 50 | | | 51,500 |
Debs. | | | | | | | | |
| 6.875% | | 09/15/33 | | Ba1 | | | 100 | | | 95,500 |
| 7.50% | | 06/15/23 | | Ba1 | | | 100 | | | 100,750 |
Notes | | | | | | | | |
| 8.875% | | 03/15/12 | | Ba1 | | | 25 | | | 27,844 |
Sr. Notes | | | | | | | | |
| 7.50% | | 10/01/14 | | Ba1 | | | 50 | | | 53,000 |
| 7.625% | | 06/15/15 | | Ba1 | | | 575 | | | 615,250 |
| 7.875% | | 09/01/11 | | Ba1 | | | 175 | | | 186,375 |
Rogers Wireless, Inc., | | | |
Sec’d. Notes (Canada) | | | | | | |
| 9.625% | | 05/01/11 | | Ba2 | | | 95 | | | 107,825 |
Rural Cellular Corp., | | | |
Sr. Notes | | | | | | | | |
| 9.875% | | 02/01/10 | | Ba3 | | | 45 | | | 47,869 |
Time Warner Telecom Holdings, Inc., | | | |
Gtd. Notes | | | | | | | | |
| 9.25% | | 02/15/14 | | B3 | | | 25 | | | 26,719 |
UbiquiTele Operating Co., | | | |
Gtd. Notes | | | | | | | | |
| 9.875% | | 03/01/11 | | BBB+(d) | | | 75 | | | 81,000 |
Windstream Corp., | | | |
Sr. Notes, 144A | | | | | | | | |
| 8.625% | | 08/01/16 | | Ba3 | | | 100 | | | 109,500 |
| | | | | | | | | |
|
|
| | | | | | | | | | | 2,537,179 |
| | | | | | | | | |
|
|
SEE NOTES TO FINANCIAL STATEMENTS.
B13
| | | | |
| | | DIVERSIFIED CONSERVATIVE GROWTH PORTFOLIO (Continued) | | |
SCHEDULE OF INVESTMENTS | December 31, 2006 |
| | | | | | | | | | |
Interest
Rate
| | Maturity
Date
| | Moody’s
Ratings
(Unaudited)
| | Principal
Amount
(000)#
| | Value
(Note 2)
|
| CORPORATE BONDS (Continued) | | | |
Tobacco — 0.1% | | | |
Reynolds American, Inc., | | | |
Gtd. Notes | | | |
| 6.50% | | 07/15/10 | | BB(d) | | $ | 25 | | $ | 25,359 |
| 7.625% | | 06/01/16 | | Ba3 | | | 55 | | | 58,274 |
| | | | | | | | | |
|
|
| | | | | | | | | | | 83,633 |
| | | | | | | | | |
|
|
TOTAL CORPORATE BONDS
(cost $31,825,837) | | | 32,771,633 |
| | | | | | | | | |
|
|
| U.S. GOVERNMENT MORTGAGE BACKED OBLIGATIONS — 22.5% |
Federal Home Loan Mortgage Corp. | | | |
| 5.80% | | 11/15/30 | | | | | 14 | | | 13,798 |
Federal National Mortgage Assoc. | | | |
| 4.00% | | 08/01/18-06/01/20 | | | | | 5,928 | | | 5,590,063 |
| 4.50% | | 11/01/21-09/01/35 | | | | | 5,347 | | | 5,039,513 |
| 4.945% | | 02/01/36 | | | | | 417 | | | 416,258 |
| 5.00% | | 01/01/19-02/01/36 | | | | | 2,117 | | | 2,047,191 |
| 5.50% | | 02/01/35-06/01/36 | | | | | 5,496 | | | 5,430,927 |
| 5.56% | | 05/01/36 | | | | | 199 | | | 200,624 |
| 6.00% | | 11/01/32-01/01/37 | | | | | 6,975 | | | 7,020,872 |
| 6.284% | | 08/01/29 | | | | | 35 | | | 35,534 |
| 6.50% | | 06/01/18-10/01/32 | | | | | 350 | | | 359,738 |
| 6.50% | | TBA | | | | | 4,000 | | | 4,075,000 |
| 6.875% | | 08/01/09 | | | | | 926 | | | 950,855 |
Government National Mortgage Assoc. | | | |
| 5.125% | | 10/20/27-11/20/29 | | | | | 66 | | | 67,064 |
| 5.375% | | 04/20/27 | | | | | 86 | | | 86,479 |
| 5.75% | | 08/20/24 | | | | | 8 | | | 7,749 |
| 8.00% | | 08/20/31 | | | | | 5 | | | 5,110 |
| 8.50% | | 04/20/26-04/20/31 | | | | | 36 | | | 38,611 |
| | | | | | | | | |
|
|
TOTAL U.S. GOVERNMENT MORTGAGE BACKED OBLIGATIONS
(cost $31,559,180) | | | 31,385,386 |
| | | | | | | | | |
|
|
| U.S. TREASURY OBLIGATIONS — 17.7% | | | |
United States Inflation Index Bonds | | | |
| 0.875% | | 04/15/10 | | | | | 1,700 | | | 1,716,697 |
| 2.375% | | 04/15/11 | | | | | 200 | | | 202,518 |
| 3.375% | | 01/15/07 | | | | | 2,700 | | | 3,432,917 |
United States Treasury Bonds | | | |
| 3.125% | | 01/31/07 | | | | | 100 | | | 99,855 |
| 3.375% | | 02/15/08 | | | | | 200 | | | 196,508 |
| 4.00% | | 04/15/10 | | | | | 100 | | | 97,852 |
| 7.875% | | 02/15/21 | | | | | 1,000 | | | 1,302,266 |
United States Treasury Notes | | | |
| 3.25% | | 01/15/09 | | | | | 200 | | | 194,062 |
| 3.50% | | 02/15/10 | | | | | 900 | | | 868,359 |
| 3.625% | | 01/15/10 | | | | | 200 | | | 193,828 |
| 3.75% | | 03/31/07 | | | | | 700 | | | 697,703 |
| 3.875% | | 09/15/10 | | | | | 300 | | | 291,621 |
| 4.25% | | 10/15/10-11/15/14 | | | | | 2,200 | | | 2,160,187 |
| 4.375% | | 11/15/08 | | | | | 200 | | | 198,391 |
| 4.50% | | 11/15/10-11/15/15 | | | | | 1,300 | | | 1,288,274 |
| 4.625% | | 11/15/16 | | | | | 1,000 | | | 993,438 |
| 4.75% | | 03/31/11 | | | | | 2,600 | | | 2,604,368 |
| 4.875% | | 04/30/11-07/31/11 | | | | | 6,600 | | | 6,646,186 |
| | | | | | | | | | |
Interest
Rate
| | Maturity
Date
| | Moody’s
Ratings
(Unaudited)
| | Principal
Amount
(000)#
| | Value
(Note 2)
|
| U.S. TREASURY OBLIGATIONS (Continued) |
| 5.125% | | 06/30/11 | | | | $ | 600 | | $ | 610,125 |
| 5.375% | | 02/15/31 | | | | | 900 | | | 964,055 |
| | | | | | | | | |
|
|
TOTAL U.S. TREASURY OBLIGATIONS
(cost $24,883,849) | | | 24,759,210 |
| | | | | | | | | |
|
|
| U.S. GOVERNMENT AGENCY OBLIGATIONS — 0.2% | | | |
Small Business Administration Participation Certificates, |
Series 2000-20A, Class 1 | | | |
| 7.59% | | 01/01/20 | | | | | 175 | | | 185,002 |
Series 2000-P10A, Class 1 | | | |
| 8.017% | | 02/10/10 | | | | | 91 | | | 96,102 |
| | | | | | | | | |
|
|
TOTAL U.S. GOVERNMENT AGENCY OBLIGATIONS
(cost $265,764) | | | 281,104 |
| | | | | | | | | |
|
|
| COLLATERALIZED MORTGAGE OBLIGATIONS — 4.0% |
Bear Stearns Adjustable Rate Mortgage Trust,
Series 2005-4, Class 23A2(c) | | | |
| 5.392% | | 05/25/35 | | Aaa | | | 184 | | | 183,247 |
Countrywide Alternative Loan Trust,
Series 2005-24, Class 2M(c) | | | |
| 5.50% | | 01/25/46 | | Aaa | | | 200 | | | 200,345 |
FHLMC Structured Pass Through Securities, Series T-61, Class 1A1(c) | | | |
| 6.064% | | 07/25/44 | | Aaa | | | 801 | | | 804,384 |
Freddie Mac,
Series 2888, Class ZG | | | |
| 4.50% | | 11/15/19 | | Aaa | | | 110 | | | 98,312 |
Series 3010, Class WB | | | |
| 4.50% | | 07/15/20 | | Aaa | | | 1,000 | | | 930,242 |
Government National Mortgage Assoc., Series 2000-15, Class Z | | | |
| 7.50% | | 02/20/30 | | Aaa | | | 290 | | | 301,076 |
Greenpoint Mortgage Funding Trust, Series 2006-AR6, Class A1A(c) | | | |
| 5.43% | | 10/25/46 | | Aaa | | | 199 | | | 198,732 |
Impac Secured Assets CMN Owner Trust, Series 2006-4, Class A2A | | | |
| 5.40% | | 09/25/36 | | Aaa | | | 195 | | | 195,684 |
Merrill Lynch Floating Trust,
Series 2006-1, Class A1(c) | | | |
| 5.42% | | 06/15/22 | | Aaa | | | 182 | | | 181,677 |
Structured Asset Mortgage Investments, Inc.,
Series 2005-AR8, Class A1(c) | | | |
| 5.60% | | 05/25/35 | | Aaa | | | 527 | | | 528,480 |
Thornburg Mortgage Securities Trust,
Series 2006-2, Class A1C(c) | | | |
| 5.47% | | 04/25/36 | | Aaa | | | 200 | | | 199,502 |
Washington Mutual, Inc.,(c) | | | |
Series 2002-AR17, Class 1A | | | |
| 5.958% | | 11/25/42 | | Aaa | | | 175 | | | 175,573 |
Series 2003-R1, Class A1 | | | |
| 5.59% | | 12/25/27 | | Aaa | | | 733 | | | 732,762 |
Series 2005-AR13, Class A1A1 | | | |
| 5.61% | | 10/25/45 | | Aaa | | | 192 | | | 192,417 |
SEE NOTES TO FINANCIAL STATEMENTS.
B14
| | | | |
| | | DIVERSIFIED CONSERVATIVE GROWTH PORTFOLIO (Continued) | | |
SCHEDULE OF INVESTMENTS | December 31, 2006 |
| | | | | | | | | | |
Interest
Rate
| | Maturity
Date
| | Moody’s
Ratings
(Unaudited)
| | Principal
Amount
(000)#
| | Value
(Note 2)
|
COLLATERALIZED MORTGAGE OBLIGATIONS
(Continued) |
Series 2005-AR6, Class 2AB1 | | | |
| 5.51% | | 04/25/45 | | Aaa | | $ | 232 | | $ | 232,436 |
Series 2006-AR17, Class 2A | | | |
| 5.882% | | 12/25/46 | | Aaa | | | 199 | | | 200,165 |
Series 2006-AR17, Class1A1A | | | |
| 5.56% | | 12/25/46 | | Aaa | | | 193 | | | 193,523 |
| | | | | | | | | |
|
|
TOTAL COLLATERALIZED MORTGAGE OBLIGATIONS
(cost $5,464,403) | | | 5,548,557 |
| | | | | | | | | |
|
|
| FOREIGN GOVERNMENT BONDS — 1.9% |
Development Bank of Japan (Japan) |
| 1.75% | | 06/21/10 | | Aaa | | | 10,000 | | | 86,148 |
Mexican Government International Bond (Mexico) |
| 8.125% | | 12/30/19 | | Baa1 | | | 170 | | | 206,550 |
Republic of Panama (Panama) |
| 9.625% | | 02/08/11 | | Ba1 | | | 150 | | | 171,000 |
Russian Government International Bond (Russia) |
| 5.00% | | 03/31/30 | | Baa2 | | | 50 | | | 56,445 |
United Kingdom Gilt (United Kingdom) |
| 4.25% | | 03/07/11 | | Aaa | | | 300 | | | 569,780 |
United Kingdom Treasury Stock (United Kingdom) |
| 5.00% | | 03/07/12-09/07/14 | | Aaa | | | GBP 800 | | | 1,580,228 |
| | | | | | | | | |
|
|
TOTAL FOREIGN GOVERNMENT BONDS (cost $2,578,132) | | | 2,670,151 |
| | | | | | | | | |
|
|
| ASSET-BACKED SECURITIES — 1.7% | | | |
Arkle Master Issuer PLC,
Series 2006-1A, Class 1A(c) |
| 5.33% | | 11/17/07 | | Aaa | | | 200 | | | 200,345 |
Asset Backed Securities Corp. Home Equity,
Series 2004-HE6, Class A1(c) |
| 5.625% | | 09/25/34 | | Aaa | | | 77 | | | 77,281 |
Bank One Issuance Trust,
Series 2004-A4, Class A4(c) |
| 5.39% | | 06/15/07 | | Aaa | | | 500 | | | 500,078 |
Ford Credit Auto Owner Trust,
Series 2006-A, Class A2B(c) |
| 5.36% | | 09/15/08 | | Aaa | | | 102 | | | 102,325 |
Honda Auto Receivables Owner Trust,
Series 2006-1, Class A2 |
| 5.10% | | 09/18/08 | | Aaa | | | 442 | | | 441,650 |
MBNA Master Credit Card Trust,
Series 2000-D, Class C |
| 8.40% | | 09/15/09 | | BBB(d) | | | 200 | | | 201,643 |
Nissan Auto Receivables Owner Trust,
Series 2006-B, Class A2 |
| 5.18% | | 08/15/08 | | Aaa | | | 500 | | | 499,737 |
WFS Financial Owner Trust,
Series 2005-1, Class A3 |
| 3.59% | | 10/19/09 | | Aaa | | | 346 | | | 342,805 |
| | | | | | | | | |
|
|
TOTAL ASSET-BACKED SECURITIES
(cost $2,367,619) | | | 2,365,864 |
| | | | | | | | | |
|
|
| | | | | | | | | | |
Interest
Rate
| | Maturity
Date
| | Moody’s
Ratings
(Unaudited)
| | Principal
Amount
(000)#
| | Value
(Note 2)
|
| MUNICIPAL BONDS — 0.9% | | | |
Golden State Tobacco Securitization Corp.,
Series 2003-A-1 |
| 6.25% | | 06/01/33 | | Baa3 | | $ | 300 | | $ | 335,115 |
Massachusetts Water Resources Authority,
Series 1080,(h) |
| 5.00% | | 08/01/32 | | Aaa | | | 250 | | | 262,145 |
Tobacco Settlement Financing Corp., |
| 6.375% | | 06/01/32 | | Baa3 | | | 250 | | | 281,158 |
Tobacco Settlement Financing Corp.,
Series 2001, Class B |
| 5.875% | | 05/15/39 | | Baa3 | | | 290 | | | 310,729 |
| | | | | | | | | |
|
|
TOTAL MUNICIPAL BONDS
(cost $1,007,340) | | | 1,189,147 |
| | | | | | | | | |
|
|
TOTAL LONG-TERM INVESTMENTS
(cost $142,020,218) | | | 156,789,512 |
| | | | | | | | | |
|
|
| SHORT-TERM INVESTMENTS — 10.0% | | | |
| COMMERCIAL PAPER — 0.2% | | | |
Time Warner, Inc.(n) (cost $298,922) |
| 5.39% | | 01/25/07 | | A2 | | | 300 | | | 298,940 |
| | | | | | | | | |
|
|
| CERTIFICATES OF DEPOSIT — 0.2% | | | |
Skandinavia Enskilda Bank (cost $199,955) |
| 5.272% | | 10/03/07 | | | | | 200 | | | 199,955 |
| | | | | | | | | |
|
|
| U.S. TREASURY OBLIGATIONS — 0.1% | | | |
U.S. Treasury Bills |
| 4.805% | | 03/15/07(k)(n) | | | | | 145 | | | 143,617 |
| 4.803% | | 03/15/07(k)(n) | | | | | 50 | | | 49,523 |
| | | | | | | | | |
|
|
TOTAL U.S. TREASURY OBLIGATIONS (cost $193,094) | | | 193,140 |
| | | | | | | | | |
|
|
| | | | | | | Notional/
Contract
Amounts
(000)
| | |
| OUTSTANDING OPTIONS PURCHASED* — 0.1% |
Call Options — 0.1% |
Eurodollar Futures, expiring 09/14/2007, Strike Price $95.25 | | | 21,000 | | | 13,125 |
Eurodollar Futures, expiring 09/14/2007, Strike Price $95.00 | | | 34,000 | | | 31,875 |
Swap Option 3 Month LIBOR & Fixed, expiring 07/02/2007 @ 5.37% | | | 5,400 | | | 42,493 |
Swap Option 3 Month LIBOR & Fixed, expiring 07/02/2007 @ 4.90% | | | 4,400 | | | 13,141 |
Swap Option 3 Month LIBOR & Fixed, expiring 12/20/2007 @ 5.00% | | | 3,000 | | | 18,301 |
Swap Option 3 Month LIBOR & Fixed, expiring 06/15/2007 @ 5.00% | | GBP | 2,500 | | | 2,086 |
U.S. Treasury Note Futures, expiring 02/23/2007, Strike Price $114.00 | | | 12,900 | | | 2,016 |
| | | | | | | | | |
|
|
| | | | | | | | | | | 123,037 |
| | | | | | | | | |
|
|
SEE NOTES TO FINANCIAL STATEMENTS.
B15
| | | | |
| | | DIVERSIFIED CONSERVATIVE GROWTH PORTFOLIO (Continued) | | |
SCHEDULE OF INVESTMENTS | December 31, 2006 |
| | | | | | | | | | |
| | | | | | | Notional/Contract
Amounts
(000)
| | Value
(Note 2)
|
| OUTSTANDING OPTIONS PURCHASED* (Continued) |
Put Options | | | | | | |
5 year U.S. Treasury Note Futures, expiring 02/23/2007, Strike Price $102.00 | | $ | 5,700 | | $ | 891 |
| | | | | | | | | | | |
5 year U.S. Treasury Note Futures, expiring 02/23/2007, Strike Price $102.50 | | | 4,500 | | | 703 |
Eurodollar Futures, expiring 12/17/2007, Strike Price $91.25 | | | 30,000 | | | 187 |
Eurodollar Futures, expiring 09/17/2007, Strike Price $90.25 | | | 51,000 | | | 319 |
Eurodollar Futures, expiring 09/17/2007, Strike Price $90.50 | | | 106,000 | | | 662 |
Eurodollar Futures, expiring 12/17/2007, Strike Price $92.00 | | | 1,000 | | | 6 |
Eurodollar Futures, expiring 12/17/2007, Strike Price $91.50 | | | 5,000 | | | 31 |
Eurodollar Futures, expiring 12/17/2007, Strike Price $91.75 | | | 22,000 | | | 138 |
Fannie Mae, expiring 03/06/2007, Strike Price $95.12 | | | 2,000 | | | 120 |
| | | | | | | | | |
|
|
| | | | | | | | | | | 3,057 |
| | | | | | | | | |
|
|
TOTAL OUTSTANDING OPTIONS PURCHASED* (cost $116,379) | | | 126,094 |
| | | | | | | | | |
|
|
| | | | |
| | | | | | | Shares
| | |
AFFILIATED MONEY MARKET MUTUAL
FUND — 4.7% |
Dryden Core Investment Fund — Taxable Money Market Series(w)
(cost $6,520,740) | | | 6,520,740 | | | 6,520,740 |
| | | | | | | | | |
|
|
Interest
Rate
| | Maturity
Date
| |
| | Principal
Amount
(000)#
| | |
| FOREIGN TREASURY BILLS — 4.7% | | | |
Bundesschatzanweisungen (Germany) | | | |
| 2.25% | | 03/23/07 | | | | $ | 1,010,000 | | | 1,330,099 |
Dutch Treasury Certificate (Netherlands) | | | |
| Zero | | 02/28/07 | | | | | 3,150,000 | | | 4,135,729 |
French Treasury Note (France) | | | |
| 2.25% | | 03/12/07 | | | | | 860,000 | | | 1,132,207 |
| | | | | | | | | |
|
|
TOTAL FOREIGN TREASURY BILLS (cost $6,545,881) | | | 6,598,035 |
| | | | | | | | | |
|
|
| | | | | | | | | | | | |
| | | | | | | Principal
Amount
(000)#
| | | Value
(Note 2)
| |
TOTAL SHORT-TERM INVESTMENTS (cost $13,874,970) | | | $ | 13,936,904 | |
| | | | | | | | | | |
|
|
|
TOTAL INVESTMENTS, BEFORE OUTSTANDING OPTIONS WRITTEN AND SECURITIES SOLD SHORT — 122.2%
(cost $155,895,189) | | | | 170,726,416 | |
| | | | | | | | | | |
|
|
|
| INVESTMENTS SOLD SHORT — (9.4)% | |
Federal National Mortgage Assoc. | | | | | |
| 5.50% | | TBA | | | | $ | (5,350 | ) | | | (5,284,794 | ) |
Federal National Mortgage Assoc. | | | | | |
| 5.00% | | TBA | | | | | (3,000 | ) | | | (2,895,936 | ) |
U.S. Treasury Notes | | | | | | | | |
| 3.25% | | 01/15/09 | | | | | (200 | ) | | | (194,062 | ) |
U.S. Treasury Notes | | | | | | | | |
| 3.625% | | 05/15/13 | | | | | (1,100 | ) | | | (1,036,450 | ) |
U.S. Treasury Notes | | | | | | | | |
| 4.875% | | 07/31/11 | | | | | (3,700 | ) | | | (3,726,015 | ) |
| | | | | | | | | | |
|
|
|
TOTAL INVESTMENTS SOLD SHORT (proceeds $(13,211,224)) | | | | (13,137,257 | ) |
| | | | | | | | | | |
|
|
|
| | | | |
| | | | | | | Notional/Contract
Amounts (000)
| | | | |
| OUTSTANDING OPTIONS WRITTEN* — (0.1)% | |
Call Options — (0.1)% | | | | | | | | |
Swap Option 3 Month LIBOR & Fixed, expiring 12/20/2007 @ 5.15% | | | 1,300 | | | | (19,756 | ) |
Swap Option 3 Month LIBOR & Fixed, expiring 07/02/2007 @ 5.00% | | | 1,900 | | | | (15,453 | ) |
Swap Option 3 Month LIBOR & Fixed, expiring 06/15/2007 @ 4.85% | | | 700 | | | | (3,370 | ) |
Swap Option 3 Month LIBOR & Fixed, expiring 07/02/2007 @ 5.50% | | | 1,800 | | | | (48,071 | ) |
| | | | | | | | | | |
|
|
|
TOTAL OUTSTANDING OPTIONS WRITTEN* (premium received $66,952) | | | | (86,650 | ) |
| | | | | | | | | | |
|
|
|
TOTAL INVESTMENTS, NET OF OUTSTANDING OPTIONS WRITTEN AND SECURITIES SOLD SHORT — 112.7%
(cost $142,617,012) | | | | 157,502,509 | |
LIABILITIES IN EXCESS OF
OTHER ASSETS(x) — (12.7)% | | | | (17,722,693 | ) |
| | | | | | | | | | |
|
|
|
NET ASSETS — 100.0% | | | $ | 139,779,816 | |
| | | | | | | | | | |
|
|
|
SEE NOTES TO FINANCIAL STATEMENTS.
B16
| | | | |
| | | DIVERSIFIED CONSERVATIVE GROWTH PORTFOLIO (Continued) | | |
SCHEDULE OF INVESTMENTS | December 31, 2006 |
The following abbreviations are used in portfolio descriptions:
| | |
| 144A | | Security was purchased pursuant to Rule 144A under the securities Act of 1933 and may not be resold subject to that rule except to qualified institutional buyers. Unless otherwise noted 144A securities are deemed to be liquid. |
| ADR | | American Depositary Receipt |
| RDU | | Restricted Depository Unit |
| NR | | Not Rated by Moodys or Standard & Poor’s |
| TBA | | Securities Purchased on a Forward Commitment Basis |
| GBP | | British Pound |
| JPY | | Japanese Yen |
| * | Non-income producing security. |
| # | Principal amount is shown in U.S. dollars unless otherwise stated. |
| (c) | Indicates a variable rate security. |
| (d) | Standard & Poor’s rating. |
| (g) | Indicates a security that has been deemed illiquid. |
| (h) | Represents all or partial amount utilized in a Municipal Tender Option Bond transaction. The aggregate principal amount of the inverse floater and the floating rate note (included in liabilities) are $125,000 and $125,000, respectively. |
| (i) | Represents issuer in default on interest payments. Non-income producing security. |
| (n) | Rates shown are the effective yields at purchase date. |
| (v) | The rate shown reflects the coupon rate after the step date. |
| (w) | Prudential Investments LLC, the manager of the Portfolio, also serves as manager of the Dryden Core Investment Fund—Taxable Money Market Series. |
| (k) | Securities or a portion thereof with an aggregate market value of $188,184 have been segregated with the custodian to cover margin requirements for future contracts open at December 31, 2006. |
| | | | | | | | | | | | | | |
Number of
Contracts
| | Type
| | Expiration
Date
| | Value at
Trade Date
| | Value at
December 31, 2006
| | Unrealized
Appreciation
(Depreciation)
| |
| Long Positions: | | | | | | | | | | | | | | |
| 4 | | 90 Day Euro Dollar | | Jun 07 | | $ | 949,900 | | $ | 947,700 | | $ | (2,200 | ) |
| 121 | | 90 Day Euro Dollar | | Sep 07 | | | 28,724,463 | | | 28,711,788 | | | (12,675 | ) |
| 26 | | 90 Day Euro Dollar | | Dec 07 | | | 6,191,450 | | | 6,178,250 | | | (13,200 | ) |
| 7 | | 90 Day Euro Dollar | | Mar 08 | | | 1,666,688 | | | 1,664,425 | | | (2,263 | ) |
| 46 | | 90 Day Euro Dollar | | Jun 08 | | | 10,964,800 | | | 10,940,525 | | | (24,275 | ) |
| 15 | | 90 Day Euro EURIBOR | | Jun 07 | | | 4,758,086 | | | 4,749,439 | | | (8,647 | ) |
| 6 | | 90 Day Sterling | | Jun 07 | | | 1,391,073 | | | 1,387,720 | | | (3,353 | ) |
| 12 | | 90 Day Sterling | | Sep 07 | | | 2,782,658 | | | 2,775,732 | | | (6,926 | ) |
| 108 | | 5 Year U.S. Treasury Notes | | Mar 07 | | | 11,412,390 | | | 11,346,750 | | | (65,640 | ) |
| | | | | | | | | | | | |
|
|
|
| | | | | | | | | | | | | | (139,179 | ) |
| Short Positions: | | | | | | | | | | | | | | |
| 140 | | 10 Year U.S. Treasury Notes | | Mar 07 | | | 15,214,062 | | | 15,045,625 | | | 168,437 | |
| | | | | | | | | | | | |
|
|
|
| | | | | | | | | | | | | $ | 29,258 | |
| | | | | | | | | | | | |
|
|
|
| (x) | Liabilities in excess of other assets includes unrealized appreciation (depreciation) on forward foreign currency exchange contracts and swap contracts as follows: |
Forward foreign currency exchange contracts outstanding at December 31, 2006:
| | | | | | | | | | |
Sales Contract
| | Value at
Settlement Date
| | Current
Value
| | Unrealized
Appreciation
(Depreciation)
| |
EUR 77,000, expiring 01/23/07 | | $ | 102,031 | | $ | 101,775 | | $ | 256 | |
EUR 1,235,000, expiring 01/23/07 | | | 1,620,383 | | | 1,632,356 | | | (11,973 | ) |
EUR 3,130,000, expiring 01/23/07 | | | 4,131,131 | | | 4,137,065 | | | (5,934 | ) |
GBP 1,138,000, expiring 01/11/07 | | | 2,217,962 | | | 2,228,399 | | | (10,437 | ) |
| | | | | | | | |
|
|
|
| | | | | | | | | $ | (28,088 | ) |
| | | | | | | | |
|
|
|
SEE NOTES TO FINANCIAL STATEMENTS.
B17
| | | | |
| | | DIVERSIFIED CONSERVATIVE GROWTH PORTFOLIO (Continued) | | |
SCHEDULE OF INVESTMENTS | December 31, 2006 |
Interest rate swap agreements outstanding at December 31, 2006:
| | | | | | | | | | | | | |
Counter Party
| | Termination
Date
| | Notional
Amount
| | Fixed
Rate
| | Floating Rate
| | Unrealized
Appreciation
(Depreciation)
| |
Morgan Stanley & Co.(1) | | 06/20/37 | | $ | 1,600,000 | | 5.00% | | 3 Month LIBOR | | $ | (35,603 | ) |
Deutsche Bank(1) | | 06/20/37 | | | 1,700,000 | | 5.00% | | 3 Month LIBOR | | | (42,951 | ) |
UBS AG(1) | | 06/18/09 | | | 5,000,000 | | 5.00% | | 3 Month LIBOR | | | 12,767 | |
Barclays Capital PLC(2) | | 06/18/34 | | GBP | 300,000 | | 5.00% | | 6 Month LIBOR | | | (24,956 | ) |
Deutsche Bank(2) | | 12/15/35 | | | 400,000 | | 4.00% | | 6 Month LIBOR | | | (4,857 | ) |
UBS AG(1) | | 10/15/10 | | EUR | 100,000 | | 2.1455% | | FRC-Excluding Tobacco-Non-Revised Consumer Price Index | | | 2,454 | |
Deutsche Bank(1) | | 06/15/07 | | AUD | 900,000 | | 6.00% | | 6 Month Australian Bank Bill rate | | | (11,615 | ) |
Merrill Lynch & Co.(2) | | 06/20/07 | | JPY | 30,000,000 | | 2.00% | | 6 Month LIBOR | | | (1,157 | ) |
Barclays Capital PLC(2) | | 06/20/07 | | | 10,000,000 | | 2.00% | | 6 Month LIBOR | | | (660 | ) |
Citigroup(2) | | 06/20/17 | | $ | 400,000 | | 5.00% | | 3 Month LIBOR | | | 8,452 | |
UBS AG(1) | | 06/20/37 | | | 800,000 | | 5.00% | | 3 Month LIBOR | | | (18,481 | ) |
Barclays Capital(1) | | 09/15/10 | | GBP | 200,000 | | 5.00% | | 6 Month LIBOR | | | (5,585 | ) |
Barclays Capital(1) | | 06/15/09 | | | 500,000 | | 5.00% | | 6 Month LIBOR | | | (6,409 | ) |
| | | | | | | | | | | |
|
|
|
| | | | | | | | | | | | $ | (128,601 | ) |
| | | | | | | | | | | |
|
|
|
| (1) | Portfolio pays the floating rate and receives the fixed rate. |
| (2) | Portfolio pays the fixed rate and receives the floating rate. |
Credit default swap agreements outstanding at December 31, 2006:
| | | | | | | | | | | | | |
Counter Party
| | Termination
Date
| | Notional
Amount
| | Fixed
Rate
| | Underlying Bond
| | Unrealized
Appreciation
(Depreciation)
| |
Lehman Brothers(2) | | 03/20/08 | | | $300,000 | | 0.06% | | AIG Corp., 5.6%, due 10/18/16 | | $ | 131 | |
Morgan Stanley & Co.(1) | | 12/20/08 | | | 200,000 | | 0.26% | | Allstate Corp., 6.125%, due 02/15/12 | | | (788 | ) |
UBS AG(1) | | 12/20/08 | | | 200,000 | | 0.35% | | AutoZone, Inc., 5.875%, due 10/15/12 | | | (1,179 | ) |
Citigroup(1) | | 12/20/16 | | | 400,000 | | 0.17% | | Bank of America Corp., 5.62%, 10/14/16 | | | 146 | |
Barclays Bank PLC(1) | | 06/20/15 | | | 100,000 | | 0.15% | | CitiFinancial, 6.625%, due 06/01/15 | | | (1 | ) |
Barclays Bank PLC(1) | | 09/20/11 | | | 100,000 | | 0.58% | | DaimlerChrysler NA Holdings,
5.75%, due 09/08/11 | | | (431 | ) |
Barclays Bank PLC(1) | | 12/20/11 | | | 1,200,000 | | 0.75% | | Dow Jones CDX HVOL7 Index | | | (141 | ) |
Morgan Stanley & Co.(2) | | 12/20/15 | | | 300,000 | | 0.46% | | Dow Jones CDX IG5 Index | | | 225 | |
Morgan Stanley & Co.(1) | | 12/20/12 | | | 400,000 | | 0.14% | | Dow Jones CDX IG5 Index | | | (183 | ) |
Morgan Stanley & Co.(2) | | 12/20/15 | | | 700,000 | | 0.46% | | Dow Jones CDX IG5 Index | | | 459 | |
Morgan Stanley & Co.(1) | | 12/20/12 | | | 1,000,000 | | 0.14% | | Dow Jones CDX IG5 Index | | | (451 | ) |
Morgan Stanley & Co.(1) | | 12/20/16 | | | 1,000,000 | | 0.65% | | Dow Jones CDX IG7 Index | | | 883 | |
JPMorgan Chase Bank(1) | | 12/20/16 | | EUR | 200,000 | | 0.85% | | Dow Jones CDX iTraxx HiVol Series 6 Version 1 Index | | | 248 | |
Goldman Sachs(1) | | 12/20/16 | | | 400,000 | | 0.85% | | Dow Jones CDX iTraxx HiVol Series 6 Version 4 Index | | | 338 | |
Deutsche Bank(1) | | 12/20/16 | | | 400,000 | | 0.85% | | Dow Jones CDX iTraxx HiVol Series 6 Version 4 Index | | | 278 | |
Barclays Bank PLC(1) | | 12/20/16 | | | 600,000 | | 0.85% | | Dow Jones CDX iTraxx HiVol Series 6 Version 4 Index | | | 689 | |
Bank of America Securities LLC(1) | | 12/20/08 | | $ | 100,000 | | 0.13% | | E.I. DuPont, 6.875%, due 10/15/09 | | | (140 | ) |
Citigroup(1) | | 12/20/08 | | | 200,000 | | 0.28% | | Eaton Corp., 5.75%, due 07/15/12 | | | (860 | ) |
Barclays Bank PLC(1) | | 12/20/08 | | | 200,000 | | 0.16% | | Eli Lilly & Co., 6.00%, due 03/15/12 | | | (548 | ) |
Morgan Stanley & Co.(1) | | 12/20/08 | | | 100,000 | | 0.21% | | Emerson Electric Co., 4.625%, due 10/15/12 | | | (300 | ) |
Citigroup(1) | | 12/20/08 | | | 100,000 | | 0.29% | | FedEx Corp., 7.25%, due 02/15/11 | | | (427 | ) |
Lehman Brothers(2) | | 03/20/07 | | | 1,200,000 | | 0.55% | | GMAC LLC, 6.875%, due 08/28/12 | | | 1,441 | |
Lehman Brothers(1) | | 12/20/08 | | | 100,000 | | 0.97% | | Goodrich Corp., 7.625%, due 12/15/12 | | | (1,793 | ) |
Bear Stearns International Ltd.(1) | | 12/20/08 | | | 200,000 | | 0.32% | | Hewlett-Packard Co., 6.50% due 07/01/12 | | | (1,090 | ) |
SEE NOTES TO FINANCIAL STATEMENTS.
B18
| | | | |
| | | DIVERSIFIED CONSERVATIVE GROWTH PORTFOLIO (Continued) | | |
SCHEDULE OF INVESTMENTS | December 31, 2006 |
| | | | | | | | | | | | | |
Counter Party
| | Termination
Date
| | Notional
Amount
| | Fixed
Rate
| | Underlying Bond
| | Unrealized
Appreciation
(Depreciation)
| |
Lehman Brothers(1) | | 12/20/08 | | | $200,000 | | 0.12% | | Home Depot, Inc., 5.375%, due 04/01/06 | | $ | (172 | ) |
Merrill Lynch & Co.(1) | | 12/20/08 | | | 100,000 | | 0.32% | | Ingersoll-Rand Corp., 6.48%, due 06/01/25 | | | (169 | ) |
Barclays Bank PLC(1) | | 03/20/12 | | | 100,000 | | 0.17% | | Int’l Lease, 5.4%, due 02/15/12 | | | (122 | ) |
Barclays Bank PLC(1) | | 03/20/11 | | | 100,000 | | 0.37% | | iStar Financial, Inc., 5.8%, due 03/15/11 | | | (146 | ) |
Lehman Brothers(1) | | 12/20/08 | | | 200,000 | | 0.11% | | Johnson & Johnson, 3.80%, due 05/15/13 | | | (387 | ) |
Lehman Brothers(1) | | 12/20/08 | | | 100,000 | | 0.53% | | Lockheed Martin Corp.,
8.20%, due 12/01/09 | | | (973 | ) |
Lehman Brothers(1) | | 12/20/08 | | | 100,000 | | 0.30% | | Masco Corp., 5.875%, due 07/15/12 | | | (274 | ) |
Deutsche Bank(1) | | 09/20/11 | | | 100,000 | | 0.62% | | Nationwide Health, 6.5%, due 07/15/11 | | | (262 | ) |
Lehman Brothers(1) | | 12/20/08 | | | 100,000 | | 0.48% | | Northrop & Grumman Corp.,
7.125%, due 02/15/11 | | | (838 | ) |
Lehman Brothers(1) | | 06/20/09 | | | 400,000 | | 0.40% | | People’s Republic of China,
6.80%, due 05/23/11 | | | (3,189 | ) |
Lehman Brothers(1) | | 12/20/08 | | | 100,000 | | 0.35% | | RadioShack Corp., 7.375%, due 05/15/11 | | | 1,030 | |
Merrill Lynch International(2) | | 03/20/07 | | | 200,000 | | 0.61% | | Russian Federation, 5.00%, due 03/31/30 | | | 559 | |
Morgan Stanley & Co.(1) | | 09/20/13 | | | 100,000 | | 0.58% | | Sealed Air Corp., 5.625%, due 07/15/13 | | | (476 | ) |
Citigroup(1) | | 12/20/08 | | | 300,000 | | 0.14% | | Wal-Mart Stores, Inc., 6.875%, due 08/10/09 | | | (649 | ) |
Barclays Bank PLC(1) | | 12/20/08 | | | 100,000 | | 0.67% | | Walt Disney Co. (The),
6.375%, due 03/12/12 | | | (1,220 | ) |
Bear Stearns International Ltd.(1) | | 06/20/16 | | | 100,000 | | 0.63% | | Whirlpool Corp., 6.5%, due 06/15/16 | | | 918 | |
Lehman Brothers(1) | | 12/20/08 | | | 100,000 | | 0.29% | | Whirlpool Corp., 8.60%, due 05/01/10 | | | (252 | ) |
| | | | | | | | | | | |
|
|
|
| | | | | | | | | | | | $ | (10,116 | ) |
| | | | | | | | | | | |
|
|
|
| (1) | Portfolio pays the fixed rate and receives from the counterparty par in the event that the underlying bond defaults. |
| (2) | Portfolio pays the counterparty par in the event that the underlying bond defaults and receives the fixed rate. |
SEE NOTES TO FINANCIAL STATEMENTS.
B19
| | | | |
| | | DIVERSIFIED CONSERVATIVE GROWTH PORTFOLIO (Continued) | | |
SCHEDULE OF INVESTMENTS | December 31, 2006 |
The industry classification of long-term portfolio holdings, short-term investments and liabilities in excess of other assets shown as a percentage of net assets as of December 31, 2006 were as follows:
| | | |
Industry
| | | |
U.S. Government Mortgage Backed Obligations | | 22.5 | % |
U.S. Treasury Obligations | | 17.7 | |
Foreign Treasury Bills | | 4.7 | |
Affiliated Money Market Mutual Fund | | 4.7 | |
Collateralized Mortgage Obligations | | 4.0 | |
Oil, Gas & Consumable Fuels | | 2.7 | |
Insurance | | 2.7 | |
Capital Markets | | 2.4 | |
Media | | 2.3 | |
Diversified Financial Services | | 2.2 | |
Pipelines & Other | | 2.0 | |
Telecommunications | | 2.0 | |
Foreign Government Bonds | | 1.9 | |
Software | | 1.9 | |
Communication Equipment | | 1.9 | |
Pharmaceuticals | | 1.8 | |
Asset-Backed Securities | | 1.7 | |
Electric | | 1.7 | |
Healthcare Providers & Services | | 1.6 | |
Aerospace & Defense | | 1.5 | |
Gaming | | 1.5 | |
Media & Entertainment | | 1.3 | |
Healthcare Equipment & Supplies | | 1.3 | |
Automotive | | 1.3 | |
Capital Goods | | 1.3 | |
Chemicals | | 1.3 | |
Healthcare & Pharmaceuticals | | 1.2 | |
Technology | | 1.1 | |
Hotels, Restaurants & Leisure | | 1.1 | |
Financial Services | | 1.0 | |
Financial – Bank & Trust | | 1.0 | |
Textiles, Apparel & Luxury Goods | | 1.0 | |
Internet Software & Services | | 1.0 | |
Biotechnology | | 0.9 | |
Commercial Services & Supplies | | 0.9 | |
Municipal Bonds | | 0.9 | |
Industrial Conglomerates | | 0.8 | |
Metals | | 0.8 | |
Wireless Telecommunication Services | | 0.8 | |
Energy | | 0.8 | |
Computers & Peripherals | | 0.7 | |
Cable | | 0.7 | |
Food & Staples Retailing | | 0.6 | |
Paper | | 0.6 | |
Household Products | | 0.5 | |
Consumer Finance | | 0.5 | |
Food Products | | 0.5 | |
Packaging | | 0.5 | |
Semiconductors & Semiconductor Equipment | | 0.5 | |
Multi-Line Retail | | 0.5 | |
Automobile Manufacturers | | 0.5 | |
Diversified Consumer Services | | 0.5 | |
Food | | 0.5 | |
Energy Equipment & Services | | 0.5 | |
Beverages | | 0.5 | |
Tobacco | | 0.5 | |
Commercial Banks | | 0.4 | |
| | | |
Industry
| | | |
Real Estate Investment Trusts | | 0.3 | % |
Retailers | | 0.3 | |
Lodging | | 0.3 | |
Office Electronics | | 0.3 | |
Metals & Mining | | 0.3 | |
Independent Power Producers & Energy Traders | | 0.3 | |
Specialty Retail | | 0.3 | |
Retail | | 0.3 | |
Household Durables | | 0.3 | |
Computer Services & Software | | 0.2 | |
Consumers | | 0.2 | |
Building Products | | 0.2 | |
Multi-Utilities | | 0.2 | |
Electronic Equipment & Instruments | | 0.2 | |
Commercial Paper | | 0.2 | |
Building Materials & Construction | | 0.2 | |
Medical Supplies & Equipment | | 0.2 | |
U.S. Government Agency Obligations | | 0.2 | |
Banks | | 0.2 | |
IT Services | | 0.2 | |
Manufacturing | | 0.2 | |
Diversified Telecommunication Services | | 0.2 | |
Machinery | | 0.2 | |
Certificates of Deposit | | 0.2 | |
Electronics | | 0.1 | |
Internet & Catalog Retail | | 0.1 | |
Electric Utilities | | 0.1 | |
Aerospace | | 0.1 | |
Business Services | | 0.1 | |
Thrifts & Mortgage Finance | | 0.1 | |
Semiconductors | | 0.1 | |
Airlines | | 0.1 | |
Entertainment & Leisure | | 0.1 | |
Outstanding Options Purchased | | 0.1 | |
Office Equipment | | 0.1 | |
Building & Construction | | 0.1 | |
Energy – Other | | 0.1 | |
Diversified | | 0.1 | |
Utilities | | 0.1 | |
Railroads | | 0.1 | |
Building Materials | | 0.1 | |
Consumer Products & Services | | 0.1 | |
Automotive Parts | | 0.1 | |
Internet | | 0.1 | |
Clothing & Apparel | | 0.1 | |
Healthcare Services | | 0.1 | |
U.S. Treasury Obligations | | 0.1 | |
Call Options | | (0.1 | ) |
Investments Sold Short | | (9.4 | ) |
| | |
|
|
| | | 112.7 | |
Liabilities in excess of other assets | | (12.7 | ) |
| | |
|
|
| | | 100.0 | % |
| | |
|
|
SEE NOTES TO FINANCIAL STATEMENTS.
B20
| | | | |
| | | JENNISON 20/20 FOCUS PORTFOLIO | | |
SCHEDULE OF INVESTMENTS | December 31, 2006 |
| | | | | |
| LONG-TERM INVESTMENTS — 95.7% | | Value (Note 2)
|
| COMMON STOCKS — 95.7% | | Shares
| |
Aerospace & Defense — 2.9% | | | | | |
Honeywell International, Inc. | | 197,000 | | $ | 8,912,280 |
| | | | |
|
|
Beverages — 2.5% | | | | | |
PepsiCo, Inc. | | 124,200 | | | 7,768,710 |
| | | | |
|
|
Biotechnology — 4.5% | | | | | |
Genentech, Inc.(a) | | 79,600 | | | 6,457,948 |
Gilead Sciences, Inc.(a) | | 115,200 | | | 7,479,936 |
| | | | |
|
|
| | | | | | 13,937,884 |
| | | | |
|
|
Building Products — 2.4% | | | | | |
American Standard Companies, Inc. | | 160,200 | | | 7,345,170 |
| | | | |
|
|
Capital Markets — 6.7% | | | | | |
Bank of New York Co., Inc. (The) | | 232,900 | | | 9,169,273 |
Goldman Sachs Group, Inc. (The)(b) | | 35,300 | | | 7,037,055 |
Lazard Ltd. (Class A)(b) | | 100,800 | | | 4,771,872 |
| | | | |
|
|
| | | | | | 20,978,200 |
| | | | |
|
|
Chemicals — 2.8% | | | | | |
E.I. du Pont de Nemours & Co. | | 181,300 | | | 8,831,123 |
| | | | |
|
|
Commercial Services & Supplies — 2.4% | | | |
Waste Management, Inc. | | 205,800 | | | 7,567,266 |
| | | | |
|
|
Communications Equipment — 5.8% | | | | | |
Motorola, Inc. | | 367,500 | | | 7,555,800 |
QUALCOMM, Inc. | | 151,100 | | | 5,710,069 |
Research In Motion Ltd.(a) | | 38,600 | | | 4,932,308 |
| | | | |
|
|
| | | | | | 18,198,177 |
| | | | |
|
|
Computers & Peripherals — 4.3% | | | | | |
Apple Computer, Inc.(a)(b) | | 99,100 | | | 8,407,644 |
Hewlett-Packard Co. | | 120,600 | | | 4,967,514 |
| | | | |
|
|
| | | | | | 13,375,158 |
| | | | |
|
|
Diversified Consumer Services — 0.5% | | | | | |
Career Education Corp.(a) | | 63,500 | | | 1,573,530 |
| | | | |
|
|
Diversified Financial Services — 2.6% | | | | | |
NYSE Group, Inc.(a)(b) | | 82,400 | | | 8,009,280 |
| | | | |
|
|
Energy Equipment & Services — 2.7% | | | | | |
Baker Hughes, Inc. | | 114,500 | | | 8,548,570 |
| | | | |
|
|
Food & Staples Retailing — 4.8% | | | | | |
Kroger Co. (The)(b) | | 378,100 | | | 8,722,767 |
Wal-Mart Stores, Inc. | | 138,900 | | | 6,414,402 |
| | | | |
|
|
| | | | | | 15,137,169 |
| | | | |
|
|
Food Products — 5.8% | | | | | |
Cadbury Schweppes PLC, ADR (United Kingdom)(b) | | 200,200 | | | 8,594,586 |
ConAgra Foods, Inc. | | 345,400 | | | 9,325,800 |
| | | | |
|
|
| | | | | | 17,920,386 |
| | | | |
|
|
Independent Power Producers & Energy Traders — 2.8% |
NRG Energy, Inc.(a)(b) | | 153,400 | | | 8,591,934 |
| | | | |
|
|
Insurance — 5.5% | | | | | |
American International Group, Inc. | | 240,300 | | | 17,219,899 |
| | | | |
|
|
Internet Software & Services — 2.8% | | | | | |
Google, Inc. (Class A)(a) | | 19,000 | | | 8,749,120 |
| | | | |
|
|
| | | | | | |
COMMON STOCKS (Continued) | | Shares
| | Value (Note 2)
| |
Media — 2.6% | | | | | | |
Disney (Walt) Co. | | 234,100 | | $ | 8,022,607 | |
| | | | |
|
|
|
Multi-Utilities — 2.7% | | | | | | |
Sempra Energy | | 150,700 | | | 8,445,228 | |
| | | | |
|
|
|
Office Electronics — 2.5% | | | | | | |
Xerox Corp.(a) | | 453,000 | | | 7,678,350 | |
| | | | |
|
|
|
Oil, Gas & Consumable Fuels — 5.2% | | | | | | |
Hess Corp | | 171,100 | | | 8,481,427 | |
Suncor Energy, Inc.(b) | | 96,000 | | | 7,575,360 | |
| | | | |
|
|
|
| | | | | | 16,056,787 | |
| | | | |
|
|
|
Pharmaceuticals — 4.6% | | | | | | |
Novartis AG, ADR (Switzerland) | | 110,400 | | | 6,341,376 | |
Roche Holding AG, ADR (Switzerland)(b) | | 90,300 | | | 8,081,651 | |
| | | | |
|
|
|
| | | | | | 14,423,027 | |
| | | | |
|
|
|
Semiconductors & Semiconductor Equipment — 1.8% | |
Marvell Technology Group Ltd.(a) | | 290,200 | | | 5,568,938 | |
| | | | |
|
|
|
Software — 6.8% | | | | | | |
Adobe Systems, Inc.(a)(b) | | 197,700 | | | 8,129,424 | |
Electronic Arts, Inc.(a) | | 110,500 | | | 5,564,780 | |
Microsoft Corp. | | 251,100 | | | 7,497,846 | |
| | | | |
|
|
|
| | | | | | 21,192,050 | |
| | | | |
|
|
|
Specialty Retail — 2.1% | | | | | | |
Lowe’s Companies, Inc. | | 207,800 | | | 6,472,970 | |
| | | | |
|
|
|
Wireless Telecommunication Services — 5.6% | | | | |
Alltel Corp. | | 149,200 | | | 9,023,616 | |
Sprint Nextel Corp.(b) | | 441,700 | | | 8,343,713 | |
| | | | |
|
|
|
| | | | | | 17,367,329 | |
| | | | |
|
|
|
TOTAL LONG-TERM INVESTMENTS
(cost $253,924,505) | | | | | 297,891,142 | |
| | | | |
|
|
|
| SHORT-TERM INVESTMENTS — 24.8% | | | | |
Affiliated Money Market Mutual Fund | | | | | | |
Dryden Core Investment Fund — Taxable Money Market Series
(cost $77,379,540; includes $53,718,962 of cash collateral received for securities on loan) (Note 4)(c)(d) | | 77,379,540 | | | 77,379,540 | |
| | | | |
|
|
|
TOTAL INVESTMENTS — 120.5%
(cost $331,304,045) | | | 375,270,682 | |
LIABILITIES IN EXCESS OF
OTHER ASSETS — (20.5)% | | | (63,795,660 | ) |
| | | | |
|
|
|
NET ASSETS — 100.0% | | $ | 311,475,022 | |
| | | | |
|
|
|
The following abbreviation is used in the portfolio descriptions:
| | |
| ADR | | American Depositary Receipt |
| (a) | Non-income producing security. |
| (b) | All or a portion of security is on loan. The aggregate market value of such securities is $51,660,586; cash collateral of $53,718,962 (included in liabilities) was received with which the Portfolio purchased highly liquid short-term investments. |
SEE NOTES TO FINANCIAL STATEMENTS.
B21
| | | | |
| | | JENNISON 20/20 FOCUS PORTFOLIO (Continued) | | |
SCHEDULE OF INVESTMENTS | December 31, 2006 |
| (c) | Represents security, or a portion thereof, purchased with cash collateral received for securities on loan. |
| (d) | Prudential Investments LLC, the manager of the Portfolio, also serves as manager of the Dryden Core Investment Fund-Taxable Money Market Series. |
The industry classification of portfolio holdings and liabilities in excess of other assets shown as a percentage of net assets as of December 31, 2006 was as follow:
| | | |
Affiliated Money Market Mutual Fund (including 17.2% of collateral received for securities on loan) | | 24.8 | % |
Software | | 6.8 | |
Capital Markets | | 6.7 | |
Communications Equipment | | 5.8 | |
Food Products | | 5.8 | |
Wireless Telecommunication Services | | 5.6 | |
Insurance | | 5.5 | |
Oil, Gas & Consumable Fuels | | 5.2 | |
Food & Staples Retailing | | 4.8 | |
Pharmaceuticals | | 4.6 | |
Biotechnology | | 4.5 | |
Computers & Peripherals | | 4.3 | |
Aerospace & Defense | | 2.9 | |
Chemicals | | 2.8 | |
Independent Power Producers & Energy Traders | | 2.8 | |
Internet Software & Services | | 2.8 | |
Energy Equipment & Services | | 2.7 | |
Multi-Utilities | | 2.7 | |
Diversified Financial Services | | 2.6 | |
Media | | 2.6 | |
Beverages | | 2.5 | |
Office Electronics | | 2.5 | |
Building Products | | 2.4 | |
Commercial Services & Supplies | | 2.4 | |
Specialty Retail | | 2.1 | |
Semiconductors & Semiconductor Equipment | | 1.8 | |
Diversified Consumer Services | | 0.5 | |
| | |
|
|
| | | 120.5 | |
Liabilities in excess of other assets | | (20.5 | ) |
| | |
|
|
| | | 100.0 | % |
| | |
|
|
SEE NOTES TO FINANCIAL STATEMENTS.
B22
NOTES TO THE FINANCIAL STATEMENTS OF
THE PRUDENTIAL SERIES FUND
The Prudential Series Fund, Inc. (“Series Fund”), was a Maryland corporation, organized on November 15, 1982, and continues to be a diversified open-end management investment company registered under the Investment Company Act of 1940, as amended. On January 2, 2006, each Portfolio of the Fund changed its federal income tax status from a regulated investment company to a partnership. As a result of that conversion, the Series Fund was reorganized from a Maryland corporation to a Delaware statutory trust. Pursuant to this reorganization, the Fund has been renamed “The Prudential Series Fund.” The Series Fund is composed of thirty-two Portfolios (“Portfolio” or “Portfolios”), each with a separate series shares. The information presented in these financial statements pertains to two Portfolios: Diversified Conservative Growth Portfolio and Jennison 20/20 Focus Portfolio.
The Portfolios of the Series Fund have the following as investment objectives:
Diversified Conservative Growth Portfolio: Current income and a reasonable level of capital appreciation by investing primarily in a diversified portfolio of debt and equity securities.
Jennison 20/20 Focus Portfolio: Long-term growth of capital by investing primarily in up to 40 equity securities of U.S. companies that the Portfolio manager believes to have strong capital appreciation potential.
The ability of issuers of debt securities (other than those issued or guaranteed by the U.S. Government) held by the Portfolios to meet their obligations may be affected by the economic or political developments in a specific industry, region or country.
| Note 2: | | Accounting Policies |
The following is a summary of significant accounting policies followed by the Series Fund and the Portfolios in preparation of their financial statements.
Securities Valuation: Securities listed on a securities exchange are valued at the last sale price on such exchange on the day of valuation or, if there was no sale on such day, at the mean between the last reported bid and asked prices, or at the last bid price on such day in the absence of an asked price. Securities traded via NASDAQ are valued at the official closing price provided by NASDAQ. Securities that are actively traded in the over-the-counter market, including listed securities for which the primary market is believed by Prudential Investments LLC (“PI” or “Manager”) in consultation with the subadvisor, to be over-the-counter, are valued at market value using prices provided by an independent pricing agent or principal market maker. Options on securities and indices traded on an exchange are valued at the last sale price as of the close of trading on the applicable exchange or, if there was no sale, at the mean between the most recently quoted bid and asked prices on such exchange, or at the last bid price in the absence of an asked price. Futures contracts and options thereon traded on a commodities exchange or board of trade are valued at the last sale price at the close of trading on such exchange or board of trade or, if there was no sale on the applicable commodities exchange or board of trade on such day, at the mean between the most recently quoted bid and asked prices on such exchange or board of trade or at the last bid price in the absence of an asked price. Prices may be obtained from independent pricing services which use information provided by market makers or estimates of market values obtained from yield data relating to investments or securities with similar characteristics. Securities for which reliable market quotations are not readily available, or whose values have been affected by events occurring after the close of the security’s foreign market and before the Series Fund’s normal pricing time, are valued at fair value in accordance with Board of Trustees’ approved fair valuation procedures. When determining the fair valuation of securities some of the factors influencing the valuation include, the nature of any restrictions on disposition of the securities; assessment of the general liquidity of the securities; the issuer’s financial condition and the markets in which it does business; the cost of the investment; the size of the holding and the capitalization of the issuer; the prices of any recent transactions or bids/offers for such securities of any comparable securities; any available analyst media or other reports or information deemed reliable by the investment adviser regarding the issuer or the markets or industry in which it operates. Using fair value to price securities may result in a value that is different from a security’s most recent closing price and from the price used by other mutual funds to calculate their net asset values.
C1
Investments in mutual funds are valued at their net asset value as of the close of the New York Stock Exchange on the date of valuation.
Short-term securities that are held in the Portfolios which mature in more than 60 days are valued at current market quotations and those short-term securities which mature in 60 days or less are valued at amortized cost which approximates market value. The amortized cost method values a security at its cost at the time of purchase and there after assumes a constant amortization to maturity of any discount or premium.
Repurchase Agreements: In connection with transactions in repurchase agreements with United States financial institutions, it is the Series Fund’s policy that its custodian or designated subcustodians, as the case may be, under triparty repurchase agreements, take possession of the underlying collateral securities, the value of which exceeds the principal amount of the repurchase transaction, including accrued interest. To the extent that any repurchase transaction exceeds one business day, the value of the collateral is marked to market on a daily basis to ensure the adequacy of the collateral. If the seller defaults or the value of the collateral declines, or if bankruptcy proceedings are commenced with respect to the seller of the security, realization of the collateral by the Series Fund may by delayed or limited.
Foreign Currency Translation: The books and records of the Series Fund are maintained in U.S. dollars. Foreign currency amounts are translated into U.S. dollars on the following basis:
(i) market value of investment securities, other assets and liabilities – at the current daily rates of exchange.
(ii) purchases and sales of investment securities, income and expenses – at the rates of exchange prevailing on the respective dates of such transactions.
Although the net assets of the Series Fund are presented at the foreign exchange rates and market values at the close of the year, the Series Fund does not isolate that portion of the results of operations arising as a result of changes in the foreign exchange rates from the fluctuations arising from changes in the market prices of securities held at the end of the period. Similarly, the Series Fund does not isolate the effect of changes in foreign exchange rates from the fluctuations arising from changes in the market prices of portfolio securities sold during the period. Accordingly, these realized foreign currency gains (losses) are included in the reported net realized gains (losses) on investment transactions.
Net realized gains (losses) on foreign currency transactions represent net foreign exchange gains (losses) from the holding of foreign currencies, currency gains (losses) realized between the trade date and settlement date on securities transactions, and the difference between the amounts of dividends, interest and foreign withholding taxes recorded on the Series Fund’s books and the U.S. dollar equivalent amounts actually received or paid. Net unrealized currency gains (losses) from valuing foreign currency denominated assets and liabilities (other than investments) at period end exchange rates are reflected as a component of net unrealized appreciation (depreciation) on investments and foreign currencies.
Foreign security and currency transactions may involve certain considerations and risks not typically associated with those of domestic origin as a result of, among other factors, the possibility of political and economic instability or the level of governmental supervision and regulation of foreign securities markets.
Forward Currency Contracts: A forward currency contract is a commitment to purchase or sell a foreign currency at a future date at a negotiated forward rate. Certain Portfolios of the Series Fund may enter into forward currency contracts in order to hedge their exposure to changes in foreign currency exchange rates on their foreign portfolio holdings or on specific receivables and payables denominated in a foreign currency. The contracts are valued daily at current forward exchange rates and any unrealized gain (loss) is included in assets and liabilities on the financial statements. Gain (loss) is realized on the settlement date of the contract equal to the difference between the settlement value of the original and negotiated forward contracts. This gain (loss), if any, is included in net realized gain (loss) on foreign currency transactions. Risks may arise upon entering into these contracts from the potential inability of the counterparties to meet the terms of their contracts.
Floating Rate Notes Issued in Conjunction with Securities Held: The Portfolios invest in inverse floating rate securities (“inverse floaters”) that pay interest at a rate that varies inversely with short-term interest rates. Certain of these securities may be leveraged, whereby the interest rate varies inversely at a multiple of the change in short-term rates. As interest rates rise, inverse floaters produce less current income. The price of such securities is more volatile than comparable fixed rate securities.
C2
When the Portfolios enter into agreements to create inverse floaters and floater note securities (also known as Tender Option Bond Transactions), the Portfolios transfer a fixed rate bond to a broker for cash. At the same time the Portfolios buy (receive) a residual interest in the assets and cash flows of the trust (the “trust”) set up by the broker, often referred to as an inverse floating rate obligation (“inverse floaters”). Generally, the broker deposits a fixed rate bond (the “fixed rate bond”) into the trust with the same CUSIP number as the fixed rate bond sold (transferred) to the broker by the Portfolio. The trust also issues floating-rate notes (“floating rate notes”) which are sold to third-parties. The floating rate notes have interest rates that reset weekly. The inverse floater held by the Portfolio gives the Portfolio the right (1) to cause the holders of the floating rate notes to tender (redeem) their notes at par, and (2) to have the broker transfer the fixed-rate bond held by the trust to the Portfolio thereby collapsing the trust. In accordance with FAS Statement No. 140, the Portfolio’s account for the transaction described above as funded leverage by including the fixed rate bond in its Portfolio of Investments, and accounts for the floating rate notes as a liability under the caption “payable for floating rate notes issued” in the Portfolio’s “Statement of Assets and Liabilities”.
The Portfolio’s investment policies and restrictions permit investments in inverse floating rate securities. Inverse floaters held by the Portfolio are securities exempt from registration under Rules 144A of the Securities Act of 1933.
Short Sales: Certain portfolios of the Series Fund may sell a security it does not own in anticipation of a decline in the market value of that security (short sale). When a Portfolio makes a short sale, it must borrow the security sold short and deliver it to the broker-dealer through which it made the short sale as collateral for its obligation to deliver the security upon conclusion of the transaction. The Portfolio may have to pay a fee to borrow the particular security and may be obligated to remit any interest or dividends received on such borrowed securities. Dividends declared on short positions open on record date are recorded on the ex-date as an expense. A gain, limited to the price at which the Portfolio sold the security short, or a loss, unlimited in magnitude, will be recognized upon the termination of a short sale if the market price at termination is less than or greater than, respectively, the proceeds originally received. The Portfolio maintains a segregated account of securities or other liquid assets, the dollar value of which is at least equal to its obligation with respect to short sales.
Options: The Series Fund may either purchase or write options in order to hedge against adverse market movements or fluctuations in value caused by changes in prevailing interest rates or foreign currency exchange rates or currencies with respect to securities which the Series Fund currently owns or intends to purchase. The Series Fund’s principal reason for writing options is to realize, through receipt of premiums, a greater current return than would be realized on the underlying security alone. When the Series Fund purchases an option, it pays a premium and an amount equal to that premium is recorded as an asset. When the Series Fund writes an option, it receives a premium and an amount equal to that premium is recorded as a liability. The asset or liability is adjusted daily to reflect the current market value of the option. If an option expires unexercised, the Series Fund realizes a gain (loss) to the extent of the premium received or paid. If an option is exercised, the premium received or paid is recorded as an adjustment to the proceeds from the sale or the cost basis of the purchase in determining whether the Series Fund has realized a gain (loss). The difference between the premium and the amount received or paid on effecting a closing purchase or sale transaction is also treated as a realized gain (loss). Gains (losses) on purchased options are included in net realized gains (losses) on investment transactions. Gains (losses) on written options are presented separately as net realized gains (losses) on written option transactions.
The Series Fund, as writer of an option, may have no control over whether the contract may be exercised. As a result, the Series Fund bears the market risk of an unfavorable change in the price of the security underlying the written option. The Series Fund, as purchaser of an over-the-counter option, bears the risk of the potential inability of the counterparties to meet the terms of their contracts.
Financial Futures Contracts: A financial futures contract is an agreement to purchase (long) or sell (short) an agreed amount of securities at a set price for delivery on a future date. Upon entering into a financial futures contract, the Series Fund is required to pledge to the broker an amount of cash and/or other assets equal to a certain percentage of the contract amount. This amount is known as the “initial margin”. Subsequent payments, known as “variation margin”, are made or received by the Series Fund each day, depending on the daily fluctuations in the value of the underlying security. Such variation margin is recorded for financial statement purposes on a daily basis as unrealized gain (loss). When the contract expires or is closed, the gain (loss) is realized and is presented in the Statement of Operations as net realized gain (loss) on financial futures contracts.
C3
The Series Fund invests in financial futures contracts in order to hedge its existing portfolio securities, or securities the Series Fund intends to purchase, against fluctuations in value caused by changes in prevailing rates or market conditions. Under a variety of circumstances, the Series Fund may not achieve the anticipated benefits of the financial futures contracts and may realize a loss. The use of futures transactions involves the risk of imperfect correlation in movements in the price of futures contracts and the underlying hedged assets.
Swap Agreements: The Portfolios may enter into interest rate swap agreements, forward swap spread lock agreements, and credit default swap agreements. A swap agreement is an agreement to exchange the return generated by one instrument for the return generated by another instrument. Interest rate swap agreements involve the exchange by the Portfolio with another party of their respective commitments to pay or receive interest. Forward spread lock swap agreements involve commitments to pay or receive a settlement amount calculated as the difference between the swap spread and a fixed spread, multiplied by the notional amount times the duration of the swap. The swap spread is the difference between the benchmark swap rate (market rate) and the specific Treasury rate. In a credit default swap agreement, one party (the protection buyer) makes a stream of payments to another party (the protection seller) in exchange for the right to receive a specified payment in the event of a default by a third party, typically corporate issues or sovereign issues of an emerging country, on its obligation. The maximum amount of the payment may equal the notional, at par, of the underlying index or security as a result of a default (or “credit event”). In addition to bearing the risk that the credit event will occur, the Portfolios could be exposed to market risk due to unfavorable changes in interest rates or in the price of the underlying security or index, the possibility that the fund may be unable to close out its position at the same time or at the same price as if it had purchased comparable publicly traded securities, or that the counterparty may default on it’s obligation to perform. The swaps are valued daily at current market value and any change in value is included in net unrealized appreciation or depreciation on investments. Payments received or paid by the Portfolio are recorded as realized gains or losses. Risk of loss may exceed amounts recognized on the statements of assets and liabilities. Swap agreements outstanding at period end, if any, are listed on the Schedule of Investments.
Forward currency contracts, written options, short sales, swaps and financial futures contracts involve elements of both market and credit risk in excess of the amounts reflected on the Statement of Assets and Liabilities.
Securities Lending: The Series Fund may lend its portfolio securities to broker-dealers. The loans are secured by collateral at least equal at all times to the market value of the securities loaned. Loans are subject to termination at the option of the borrower or the Series Fund. Upon termination of the loan, the borrower will return to the lender securities identical to the loaned securities. Should the borrower of the securities fail financially, the Series has the right to repurchase the securities using the collateral in the open market. The Series Fund recognizes income, net of any rebate and securities lending agent fees, for lending its securities in the form of fees or interest on the investment of any cash received as collateral. The Series Fund also continues to receive interest and dividends or amounts equivalent thereto on the securities loaned and recognizes any unrealized gain or loss in the market price of the securities loaned that may occur during the term of the loan.
When-Issued/Delayed Delivery Securities: Securities purchased or sold on a when-issued or delayed delivery basis may be settled a month or more after trade date; interest income is not accrued until settlement date. At the time a Portfolio enters into such transactions, it instructs the custodian to segregate assets with a current value at least equal to the amount of its when-issued or delayed-delivery purchase commitments.
Securities Transactions and Net Investment Income: Securities transactions are recorded on the trade date. Realized gains (losses) on sales of securities are calculated on the identified cost basis. Dividend income is recorded on the ex-dividend date; interest income, which is comprised of four elements: stated coupon, original issue discount, market discount and market premium, is recorded on the accrual basis. Expenses are recorded on the accrual basis. The Series Fund’s expenses are allocated to the respective Portfolios on the basis of relative net assets except for Portfolio specific expenses which are attributable directly to a Portfolio or class level.
For Portfolios with multiple classes of shares, net investment income (loss) (other than administration and distribution fees, which are charged to the respective class) and unrealized and realized gains (losses) are allocated daily to each class of shares based upon the relative proportion of net assets of each class at the beginning of the day.
C4
Custody Fee Credits: The Series Fund has an arrangement with its custodian bank, whereby uninvested monies earn credits which reduce the fees charged by the custodian. Such custody fee credits are presented as a reduction of gross expenses in the accompanying Statements of Operations.
Taxes: For federal income tax purposes, each Portfolio in the Series Fund is treated as a separate taxpaying entity. The Portfolios are treated as partnerships for tax purposes. No provision has been made in the financial statements for U.S. federal, state, or local taxes, as any tax liability arising from operations of the Portfolios are the responsibility of their partners. The Portfolios are not subject to tax. Partners of each Portfolio are subject to taxes on their distributive share of partnership items.
Withholding taxes on foreign dividends, interest and capital gains have been provided for in accordance with the Trust’s understanding of the applicable country’s tax rules and regulations.
Dividends and Distributions: Dividends and distributions of each Portfolio are declared in cash and automatically reinvested in additional shares of the same Portfolio. The Portfolios will declare and distribute dividends from net investment income and distributions from net capital gains, if any, at least annually. Dividends and distributions are recorded on the ex-dividend date.
Dividends and capital gain distributions are determined in accordance with income tax regulations which may differ from generally accepted accounting principles.
Estimates: The preparation of financial statements requires management to make estimates and assumptions that affect the reported amounts and disclosures in the financial statements. Actual results could differ from these estimates.
The Series Fund has a management agreement with PI. Pursuant to this agreement PI has responsibility for all investment advisory services and supervises the subadvisers’ performance of such services. PI has entered into subadvisory agreements with Prudential Investment Management, Inc. (“PIM”), Jennison Associates LLC (“Jennison”), RS Investment Management, L.P. (“RS”), Pacific Investment Management Company LLC (“PIMCO”) and EARNEST Partners LLC (“EARNEST”) (collectively, the “Subadvisers”), under which each provides investment advisory services for certain Portfolios of the Series Fund. PI pays for the services of the Subadvisers, compensation of officers of the Series Fund, occupancy and certain clerical and administrative expenses of the Series Fund. The Series Fund bears all other costs and expenses.
The management fee paid to PI is computed daily and payable monthly, at the annual rates specified below, of the value of each of the Portfolio’s average daily net assets.
| | | | | | |
Portfolio
| | Management Fee
| | | Effective Management Fee
| |
Diversified Conservative Growth Portfolio | | 0.75 | % | | 0.75 | % |
Jennison 20/20 Focus Portfolio | | 0.75 | | | 0.75 | |
At December 31, 2006 the Subadvisers that provide investment advisory services to the Portfolios as follows. Where more than one Subadviser is listed, each Subadviser provides services to a segment of the Portfolio:
| | |
Portfolio
| | Subadviser(s)
|
Diversified Conservative Growth Portfolio | | EARNEST, RS, Jennison, PIMCO, PIM |
Jennison 20/20 Focus Portfolio | | Jennison |
The Series Fund has a distribution agreement with Prudential Investment Management Services LLC (“PIMS”) which acts as the distributor of the Class I and Class II shares of the Series Fund. The Series Fund compensates PIMS for distributing and servicing the Series Fund’s Class II shares pursuant to a plan of distribution (the “Class II Plan”), regardless of expenses actually incurred by PIMS. The distribution fees are accrued daily and payable monthly. No distribution or service fees are paid to PIMS as distributor of the Class I shares of the Series Fund. Pursuant to the Class II Plan, the Class II shares of each Portfolio compensate PIMS for distribution-related activities at an annual rate of 0.25% of the average daily net assets of the Class II shares.
The Series Fund has an administration agreement with PI which acts as the administrator of the Class II shares of the Series Fund. The administration fee paid to PI is accrued daily and payable monthly, at the annual rate of 0.15% of the average daily net assets of the Class II shares.
C5
PIMS, PI, PIM and Jennison are indirect, wholly-owned subsidiaries of Prudential Financial, Inc. (“Prudential”).
| Note 4: | | Other Transactions with Affiliates |
Prudential Mutual Fund Services LLC (“PMFS”), an affiliate of PI and an indirect, wholly-owned subsidiary of Prudential, serves as the Series Fund’s transfer agent. Transfer agent’s fees and expenses in the Statements of Operations include certain out-of-pocket expenses paid to non-affiliates, where applicable.
For the year ended December 31, 2006, Prudential Equity Group, LLC, an indirect wholly-owned subsidiary of Prudential earned brokerage commissions from transactions executed on behalf of the Series Fund Portfolios as follows:
| | | |
Portfolio
| | Prudential
Equity Group
|
Diversified Conservative Growth Portfolio | | $ | 575 |
Jennison 20/20 Focus Portfolio | | | 2,205 |
PIM is the Series Fund’s security lending agent. For the year ended December 31, 2006, PIM was compensated $58,031 for these services for the Jennison 20/20 Focus Portfolio.
Certain Portfolios invest in the Taxable Money Market Series of Dryden Core Investment Fund (“Core Fund”), pursuant to an exemptive order received from the Securities and Exchange Commission. The Core Fund is a money market mutual fund registered under the Investment Company Act of 1940, as amended, and managed by PI.
| Note 5: | | Portfolio Securities |
The aggregate cost of purchases and the proceeds from the sales of securities (excluding government securities and short-term issues) for the year ended December 31, 2006 were as follows:
Cost of Purchases:
| | | |
Portfolio
| | |
Diversified Conservative Growth Portfolio | | $ | 127,244,384 |
Jennison 20/20 Focus Portfolio | | | 334,494,427 |
Proceeds from Sales:
| | | |
Portfolio
| | |
Diversified Conservative Growth Portfolio | | $ | 73,519,874 |
Jennison 20/20 Focus Portfolio | | | 311,863,482 |
The Diversified Conservative Growth Portfolio’s written options activity for the year ended December 31, 2006 was as follows:
| | | | | | | |
| | | Diversified Conservative Growth
| |
| | | Number of
Contracts/
Swap Notional
Amount
| | | Premium
| |
Balance at beginning of period | | 7,100,074 | | | $ | 67,913 | |
Written options | | 6,600,000 | | | | 71,017 | |
Expired options | | (74 | ) | | | (11,410 | ) |
Expired swap options | | (5,800,000 | ) | | | (44,973 | ) |
Closed options | | (2,200,000 | ) | | | (15,595 | ) |
| | |
|
| |
|
|
|
Balance at end of period | | 5,700,000 | | | $ | 66,952 | |
| | |
|
| |
|
|
|
As of January 2, 2006 all Portfolios are treated as partnerships for tax purposes. The character of the cash distributions paid by the partnership are generally classified as return of capital non taxable distributions. Later in 2007 each partner will receive information regarding their distributive allocable share of the partnerships’s income, gains, losses and deductions.
C6
Prior to January 2, 2006 each Portfolio qualified as a regulated investment company under the Internal Revenue Code and distributed all of its taxable income, including any net realized gains on investments, to shareholders. Accordingly, no provision for federal income or excise tax has been made.
Income and capital gains of the Portfolios were determined in accordance with both tax regulations and accounting principles generally accepted in the United States of America. Prior to being structured as Partnerships for tax purposes such determinations may have resulted in temporary and permanent differences between tax basis earnings and earnings reported for financial statement purposes.
The tax character of distributions paid during the year ended December 31, 2005 were as follows:
| | | | | | | | | |
Portfolio
| | Ordinary
Income
| | Long-Term
Capital Gains
| | Total
Distributions
|
Diversified Conservative Growth Portfolio | | $ | 4,898,162 | | $ | — | | $ | 4,898,162 |
Jennison 20/20 Focus Portfolio | | | 177,361 | | | — | | | 177,361 |
With respect to the Portfolios, book cost of assets differs from tax cost of assets as a result of each Portfolio’s adoption of a mark to market method of accounting for tax purposes. Under this method, tax cost of assets will approximate its fair market value. See Note 10 below regarding “Change in Federal Income Tax Status and Related Reorganization”.
The Series Fund offers Class I and Class II shares. Neither Class I nor Class II shares of a Portfolio are subject to any sales charge or redemption charge and are sold at the net asset value of the Portfolio. Class I shares are sold only to certain separate accounts of Prudential to fund benefits under certain variable life insurance and variable annuity contracts (“contracts”). Class II shares are sold only to separate accounts of non-Prudential insurance companies as investment options under certain contracts. The separate accounts invest in shares of the Series Fund through subaccounts that correspond to the Portfolios. The separate accounts will redeem shares of the Series Fund to the extent necessary to provide benefits under the contracts or for such other purposes as may be consistent with the contracts. As of December 31, 2006, the Jennison 20/20 Focus Portfolio has Class II shares outstanding.
Transactions in shares of beneficial interest of the Jennison 20/20 Focus were as follows:
| | | | | | | |
| Jennison 20/20 Focus Portfolio: | | | | | | | |
Class I
| | Shares
| | | Amount
| |
Year ended December 31, 2006: | | | | | | | |
Series shares sold | | 598,054 | | | $ | 9,065,259 | |
Series shares issued in reinvestment of dividends and distributions | | 401,108 | | | | 5,908,325 | |
Series shares repurchased | | (773,182 | ) | | | (11,540,414 | ) |
| | |
|
| |
|
|
|
Net increase (decrease) in shares outstanding | | 225,980 | | | $ | 3,433,170 | |
| | |
|
| |
|
|
|
Year ended December 31, 2005: | | | | | | | |
Series shares sold | | 637,038 | | | $ | 8,523,762 | |
Series shares issued in reinvestment of dividends and distributions | | 14,562 | | | | 177,361 | |
Series shares repurchased | | (594,774 | ) | | | (7,742,410 | ) |
| | |
|
| |
|
|
|
Net increase (decrease) in shares outstanding | | 56,826 | | | $ | 958,713 | |
| | |
|
| |
|
|
|
| | |
Class II
| | | | | | |
Year ended December 31, 2006: | | | | | | | |
Series shares sold | | 4,940,311 | | | $ | 73,458,993 | |
Series shares issued in reinvestment of dividends and distributions | | 743,915 | | | | 10,853,728 | |
Series shares repurchased | | (2,612,426 | ) | | | (37,438,528 | ) |
| | |
|
| |
|
|
|
Net increase (decrease) in shares outstanding | | 3,071,800 | | | $ | 46,874,193 | |
| | |
|
| |
|
|
|
Year ended December 31, 2005: | | | | | | | |
Series shares sold | | 3,979,596 | | | $ | 51,409,858 | |
Series shares repurchased | | (1,493,869 | ) | | | (19,993,661 | ) |
| | |
|
| |
|
|
|
Net increase (decrease) in shares outstanding | | 2,485,727 | | | $ | 31,416,197 | |
| | |
|
| |
|
|
|
C7
The Series Fund (excluding the Money Market Portfolio), along with other affiliated registered investment companies (the “Funds”), is a party to a Syndicated Credit Agreement (“SCA”) with two banks. The SCA provides for a commitment of $500 million. Interest on any borrowings under the SCA is incurred at contracted market rates and a commitment fee for the unused amount is accrued daily and paid quarterly. Effective October 27, 2006, the Funds renewed the SCA with the banks. The commitment under the renewed SCA continues to be $500 million. The Series Fund pays a commitment fee of .07 of 1% of the unused portion of the renewed SCA. The expiration date of the renewed SCA will be October 26, 2007. For the period from October 29, 2005 through October 26, 2006, the Funds paid a commitment fee of .0725 of 1% of the unused portion of the agreement. The purpose of the SCA is to provide an alternative source of temporary funding for capital share redemptions.
The following Portfolios utilized the line of credit during the year ended December 31, 2006. The average balance is for the number of days the Portfolio had an outstanding balance.
| | | | | | | | |
Portfolio
| | Average Balance
Outstanding
| | Number of Days
Outstanding
| | Weighted Average
Interest Rate
| |
Diversified Conservative Growth Portfolio | | $ | 800,000 | | 4 | | 4.98 | % |
Jennison 20/20 Focus Portfolio | | | 5,240,000 | | 5 | | 5.46 | |
| Note 9: | | Ownership and Affiliates |
As of December 31, 2006, all of Class I shares of each Portfolio were owned of record by the Prudential Insurance Company of America (“PICA”) on behalf of the owners of the variable insurance products issued by PICA.
| Note 10: | | Change in Federal Income Tax Status and Related Reorganization |
On January 2, 2006, each Portfolio of the Series Fund was reorganized from a Maryland corporation to a Delaware statutory trust. Each Portfolio of the Series Fund changed its federal income tax status from a regulated investment company to a partnership as a result of that conversion. Pursuant to this reorganization, the Series Fund has been renamed “The Prudential Series Fund.” Subsequent to January 2, 2006, each Portfolio’s income, gains, losses and credits will be allocated directly to its partners and will retain the same character for federal income tax purposes. Furthermore, subsequent to January 2, 2006 each Portfolio will not be able to realize any future benefit from any unused capital loss carryforward and other losses (if any) deferred from each Portfolio.
The investment objectives, policies, restrictions, net asset values per share, service providers, fiscal years, and investment portfolios of the Portfolios have not changed. In addition, the Series Fund obtained opinions of counsel that the change in the tax status and the related reorganization had no adverse federal income tax consequences for the Portfolios or contract owners.
| Note 11: | | New Accounting Pronouncements |
On July 13, 2006, the Financial Accounting Standards Board (FASB) released FASB Interpretation No. 48 “Accounting for Uncertainty in Income Taxes” (FIN 48). FIN 48 provides guidance for how uncertain tax positions should be recognized, measured, presented and disclosed in the financial statements. FIN 48 requires the evaluation of tax positions taken or expected to be taken in the course of preparing the Portfolios’ tax returns to determine whether the tax positions are “more-likely-than-not” of being sustained by the applicable tax authority. The impact of the tax positions not deemed to meet the more-likely-than-not threshold would be recorded in the year in which they arise. On December 22, 2006 the Securities and Exchange Commission delayed the effective date until June 30, 2007. At this time, management is evaluating the implications of FIN 48 and its impact, if any, in the financial statements has not yet been determined.
On September 20, 2006, the FASB released Statement of Financial Accounting Standards No. 157 “Fair Value Measurements” (FAS 157). FAS 157 establishes an authoritative definition of fair value, sets out a framework for measuring fair value, and requires additional disclosures about fair-value measurements. The application of FAS 157 is required for fiscal years beginning after November 15, 2007 and interim periods within those fiscal years. At this time, management is evaluating the implications of FAS 157 and its impact, if any, in the financial statements has not yet been determined.
C8
Financial Highlights
| | | | | | | | | | | | | | | | | | | | |
| | | Diversified Conservative Growth Portfolio
| |
| | | Year Ended December 31,
| |
| | | 2006
| | | 2005
| | | 2004
| | | 2003
| | | 2002
| |
Per Share Operating Performance: | | | | | | | | | | | | | | | | | | | | |
Net Asset Value, beginning of year | | $ | 11.67 | | | $ | 11.28 | | | $ | 10.63 | | | $ | 9.17 | | | $ | 9.89 | |
| | |
|
|
| |
|
|
| |
|
|
| |
|
|
| |
|
|
|
Income (Loss) From Investment Operations: | | | | | | | | | | | | | | | | | | | | |
Net investment income | | | .39 | | | | .34 | | | | .26 | | | | .32 | | | | .38 | |
Net realized and unrealized gain (loss) on investments | | | .43 | | | | .39 | | | | .72 | | | | 1.58 | | | | (1.08 | ) |
| | |
|
|
| |
|
|
| |
|
|
| |
|
|
| |
|
|
|
Total from investment operations | | | .82 | | | | .73 | | | | .98 | | | | 1.90 | | | | (.70 | ) |
| | |
|
|
| |
|
|
| |
|
|
| |
|
|
| |
|
|
|
Less Dividends and Distributions: | | | | | | | | | | | | | | | | | | | | |
Dividends from net investment income | | | — | | | | (.34 | ) | | | (.33 | ) | | | (.44 | ) | | | (.02 | ) |
Distributions | | | (.43 | ) | | | — | | | | — | | | | — | | | | — | |
| | |
|
|
| |
|
|
| |
|
|
| |
|
|
| |
|
|
|
Total dividends and distributions | | | (.43 | ) | | | (.34 | ) | | | (.33 | ) | | | (.44 | ) | | | (.02 | ) |
| | |
|
|
| |
|
|
| |
|
|
| |
|
|
| |
|
|
|
Net Asset Value, end of year | | $ | 12.06 | | | $ | 11.67 | | | $ | 11.28 | | | $ | 10.63 | | | $ | 9.17 | |
| | |
|
|
| |
|
|
| |
|
|
| |
|
|
| |
|
|
|
Total Investment Return(a) | | | 6.92 | % | | | 7.04 | % | | | 9.56 | % | | | 21.57 | % | | | (7.10 | )% |
Ratios/Supplemental Data: | | | | | | | | | | | | | | | | | | | | |
Net assets, end of year (in millions) | | $ | 139.8 | | | $ | 151.4 | | | $ | 167.0 | | | $ | 169.6 | | | $ | 157.1 | |
Ratios to average net assets: | | | | | | | | | | | | | | | | | | | | |
Expenses | | | .99 | %(b) | | | .95 | % | | | .97 | % | | | .98 | % | | | .92 | % |
Net investment income | | | 3.03 | % | | | 2.75 | % | | | 2.29 | % | | | 2.93 | % | | | 3.63 | % |
Portfolio turnover rate | | | 286 | % | | | 304 | % | | | 186 | % | | | 224 | % | | | 271 | % |
| (a) | Total investment return is calculated assuming a purchase of shares on the first day and a sale on the last day of each year reported and includes reinvestment of dividends and distributions. Total return does not reflect expenses associated with the separate account such as administrative fees, account charges and surrender charges which, if reflected, would reduce the total returns for all periods shown. Performance figures may reflect voluntary fee waivers and/or expense reimbursements. In the absence of voluntary fee waivers and/or expense reimbursements, the total return would be lower. Past performance is no guarantee of future results. |
| (b) | The expense ratio reflects the interest and fee expense related to the liability for the floating rate notes issued in conjunction with the inverse floater securities. The total expense ratio excluding interest and fees expense is .98%. |
| | | | | | | | | | | | | | | | | | | | |
| | | Jennison 20/20 Focus Portfolio
| |
| | | Class I
| |
| | | Year Ended December 31,
| |
| | | 2006
| | | 2005
| | | 2004
| | | 2003
| | | 2002
| |
Per Share Operating Performance: | | | | | | | | | | | | | | | | | | | | |
Net Asset Value, beginning of year | | $ | 15.00 | | | $ | 12.37 | | | $ | 10.68 | | | $ | 8.28 | | | $ | 10.65 | |
| | |
|
|
| |
|
|
| |
|
|
| |
|
|
| |
|
|
|
Income (Loss) From Investment Operations: | | | | | | | | | | | | | | | | | | | | |
Net investment income | | | .08 | | | | .06 | | | | .04 | | | | .02 | | | | .02 | |
Net realized and unrealized gain (loss) on investments | | | 1.95 | | | | 2.60 | | | | 1.66 | | | | 2.40 | | | | (2.39 | ) |
| | |
|
|
| |
|
|
| |
|
|
| |
|
|
| |
|
|
|
Total from investment operations | | | 2.03 | | | | 2.66 | | | | 1.70 | | | | 2.42 | | | | (2.37 | ) |
| | |
|
|
| |
|
|
| |
|
|
| |
|
|
| |
|
|
|
Less Dividends and Distributions: | | | | | | | | | | | | | | | | | | | | |
Dividends from net investment income | | | — | | | | (.03 | ) | | | (.01 | ) | | | (.02 | ) | | | — | (a) |
Distributions | | | (1.02 | ) | | | — | | | | — | | | | — | | | | — | |
| | |
|
|
| |
|
|
| |
|
|
| |
|
|
| |
|
|
|
Total dividends and distributions | | | (1.02 | ) | | | (.03 | ) | | | (.01 | ) | | | (.02 | ) | | | — | |
| | |
|
|
| |
|
|
| |
|
|
| |
|
|
| |
|
|
|
Net Asset Value, end of year | | $ | 16.01 | | | $ | 15.00 | | | $ | 12.37 | | | $ | 10.68 | | | $ | 8.28 | |
| | |
|
|
| |
|
|
| |
|
|
| |
|
|
| |
|
|
|
Total Investment Return(b) | | | 14.13 | % | | | 21.59 | % | | | 15.94 | % | | | 29.30 | % | | | (22.24 | )% |
Ratios/Supplemental Data: | | | | | | | | | | | | | | | | | | | | |
Net assets, end of year (in millions) | | $ | 93.1 | | | $ | 83.8 | | | $ | 68.4 | | | $ | 64.6 | | | $ | 57.2 | |
Ratios to average net assets: | | | | | | | | | | | | | | | | | | | | |
Expenses | | | .82 | % | | | .87 | % | | | .88 | % | | | .95 | % | | | .97 | % |
Net investment income | | | .58 | % | | | .43 | % | | | .29 | % | | | .18 | % | | | .19 | % |
Portfolio turnover rate | | | 119 | % | | | 93 | % | | | 87 | % | | | 102 | % | | | 75 | % |
| (a) | Less than $.005 per share. |
| (b) | Total investment return is calculated assuming a purchase of shares on the first day and a sale on the last day of each year reported and includes reinvestment of dividends and distributions. Total return does not reflect expenses associated with the separate account such as administrative fees, account charges and surrender charges which, if reflected, would reduce the total returns for all periods shown. Performance figures may reflect voluntary fee waivers and/or expense reimbursements. In the absence of voluntary fee waivers and/or expense reimbursements, the total return would be lower. Past performance is no guarantee of future results. |
SEE NOTES TO FINANCIAL STATEMENTS.
D1
Financial Highlights
| | | | | | | | | | | | | | | | | | | | |
| | | Jennison 20/20 Focus Portfolio
| |
| | | Class II
| |
| | | Year Ended December 31,
| |
| | | 2006
| | | 2005
| | | 2004
| | | 2003
| | | 2002
| |
Per Share Operating Performance: | | | | | | | | | | | | | | | | | | | | |
Net Asset Value, beginning of year | | $ | 14.83 | | | $ | 12.23 | | | $ | 10.60 | | | $ | 8.23 | | | $ | 10.63 | |
| | |
|
|
| |
|
|
| |
|
|
| |
|
|
| |
|
|
|
Income (Loss) From Investment Operations: | | | | | | | | | | | | | | | | | | | | |
Net investment income | | | .03 | | | | .01 | | | | .01 | | | | — | (a) | | | — | (a) |
Net realized and unrealized gain (loss) on investments | | | 1.91 | | | | 2.59 | | | | 1.62 | | | | 2.37 | | | | (2.40 | ) |
| | |
|
|
| |
|
|
| |
|
|
| |
|
|
| |
|
|
|
Total from investment operations | | | 1.94 | | | | 2.60 | | | | 1.63 | | | | 2.37 | | | | (2.40 | ) |
| | |
|
|
| |
|
|
| |
|
|
| |
|
|
| |
|
|
|
Less Distributions: | | | | | | | | | | | | | | | | | | | | |
Distributions | | | (.96 | ) | | | — | | | | — | | | | — | | | | — | |
| | |
|
|
| |
|
|
| |
|
|
| |
|
|
| |
|
|
|
Net Asset Value, end of year | | $ | 15.81 | | | $ | 14.83 | | | $ | 12.23 | | | $ | 10.60 | | | $ | 8.23 | |
| | |
|
|
| |
|
|
| |
|
|
| |
|
|
| |
|
|
|
Total Investment Return(b): | | | 13.61 | % | | | 21.26 | % | | | 15.38 | % | | | 28.80 | % | | | (22.58 | )% |
Ratios/Supplemental Data: | | | | | | | | | | | | | | | | | | | | |
Net assets, end of year (in millions) | | $ | 218.4 | | | $ | 159.3 | | | $ | 101.0 | | | $ | 39.6 | | | $ | 7.5 | |
Ratios to average net assets: | | | | | | | | | | | | | | | | | | | | |
Expenses | | | 1.22 | % | | | 1.27 | % | | | 1.28 | % | | | 1.35 | % | | | 1.37 | % |
Net investment income (loss) | | | .19 | % | | | .03 | % | | | (.02 | )% | | | (.22 | )% | | | (.21 | )% |
Portfolio turnover rate | | | 119 | % | | | 93 | % | | | 87 | % | | | 102 | % | | | 75 | % |
| (a) | Less than $.005 per share. |
| (b) | Total investment return is calculated assuming a purchase of shares on the first day and a sale on the last day of each year reported and includes reinvestment of dividends and distributions. Total return does not reflect expenses associated with the separate account such as administrative fees, account charges and surrender charges which, if reflected, would reduce the total returns for all periods shown. Performance figures may reflect voluntary fee waivers and/or expense reimbursements. In the absence of voluntary fee waivers and/or expense reimbursements, the total return would be lower. Past performance is no guarantee of future results. |
SEE NOTES TO FINANCIAL STATEMENTS.
D2
REPORT OF INDEPENDENT REGISTERED PUBLIC ACCOUNTING FIRM
THE BOARD OF TRUSTEES AND SHAREHOLDERS OF THE PRUDENTIAL SERIES FUND:
We have audited the accompanying statements of assets and liabilities of The Prudential Series Fund (comprised of Diversified Conservative Growth Portfolio and Jennison 20/20 Focus Portfolio, hereafter referred to as the “Funds”), including the portfolios of investments, as of December 31, 2006, and the related statements of operations for the year then ended, the statements of changes in net assets for each of the years in the two-year period then ended, and the financial highlights for each of the years in the three-year period then ended. These financial statements and financial highlights are the responsibility of the Funds’ management. Our responsibility is to express an opinion on these financial statements and financial highlights based on our audits. The financial highlights for the years presented prior to the year ended December 31, 2004, were audited by another independent registered public accounting firm whose report dated February 13, 2004, expressed an unqualified opinion thereon.
We conducted our audits in accordance with the standards of the Public Company Accounting Oversight Board (United States). Those standards require that we plan and perform the audit to obtain reasonable assurance about whether the financial statements and financial highlights are free of material misstatement. An audit includes examining, on a test basis, evidence supporting the amounts and disclosures in the financial statements. Our procedures included confirmation of securities owned as of December 31, 2006, by correspondence with the custodian and brokers or by other appropriate auditing procedures where replies from brokers were not received. An audit also includes assessing the accounting principles used and significant estimates made by management, as well as evaluating the overall financial statement presentation. We believe that our audits provide a reasonable basis for our opinion.
In our opinion, the financial statements and financial highlights referred to above present fairly, in all material respects, the financial position of The Prudential Series Fund as of December 31, 2006, and the results of its operations for the year then ended, the changes in its net assets for each of the years in the two-year period then ended, and the financial highlights for each of the years in the three-year period then ended, in conformity with U.S. generally accepted accounting principles.

New York, New York
February 21, 2007
E1
MANAGEMENT OF THE FUND
(Unaudited)
Information pertaining to the Trustees of the Fund is set forth below. Trustees who are not deemed to be “interested persons” of the Fund as defined in the Investment Company Act are referred to as “Independent Trustees.” Trustees who are deemed to be “interested persons” of the Fund are referred to as “Interested Trustees.” “Fund Complex” consists of the Fund and any other investment companies managed by PI.
| | | | | | |
Name, Address**,
and Age | | Position with Fund*
Term of Office***
Length of Time Served | | Number of Portfolios
In Fund Complex
Overseen by Trustee | | Other Directorships
Held by the Trustee**** |
| | | |
| Saul K. Fenster, Ph.D. (73) | | Trustee, Since 1983 | | 77 | | Member (since 2006), Board of The Ridgefield Foundation and The Leir Foundation. |
|
| Principal Occupations During Past 5 Years – Currently President Emeritus of New Jersey Institute of Technology (since 2002); formerly President (1978-2002) of New Jersey Institute of Technology; Commissioner (1998-2002) of the Middle States Association Commission on Higher Education; Commissioner (1985-2002) of the New Jersey Commission on Science and Technology; formerly Director (1998-2005) of Society of Manufacturing Engineering Education Foundation; formerly Director of Prosperity New Jersey; formerly a director or trustee of Liberty Science Center, Research and Development Council of New Jersey, New Jersey State Chamber of Commerce, and National Action Council for Minorities in Engineering. |
| | | |
| Delayne Dedrick Gold (68) | | Trustee, Since 2001 | | 76 | | — |
|
| Principal Occupations During Past 5 Years – Marketing Consultant (1982-present); formerly Senior Vice President and Member of the Board of Directors, Prudential Bache Securities, Inc. |
| | | |
| W. Scott McDonald, Jr. (69) | | Vice Chairman and Trustee, Since 1983 | | 77 | | — |
|
| Principal Occupations During Past 5 Years – Formerly Management Consultant (1997-2004) and of Counsel (2004-2005) at Kaludis Consulting Group, Inc. (company serving higher education); Formerly principal (1995-1997), Scott McDonald & Associates; Chief Operating Officer (1991-1995), Fairleigh Dickinson University; Executive Vice President and Chief Operating Officer (1975-1991), Drew University; interim President (1988-1990), Drew University; formerly Director of School, College and University Underwriters Ltd. |
| | | |
| Thomas T. Mooney (65) | | Chairman and Trustee, Since 2001 | | 76 | | — |
|
| Principal Occupations During Past 5 Years – Chief Executive Officer, Excell Partners, Inc.; formerly President of the Greater Rochester Metro Chamber of Commerce, Rochester City Manager; formerly Deputy Monroe County Executive. |
| | | |
| Thomas M. O’Brien (56) | | Trustee, Since 2003 | | 76 | | Formerly Director (December 1996-May 2000) of North Fork Bancorporation, Inc.; Formerly Director (May 2000-April 2006) of Atlantic Bank of New York; Director (since November 2006) of State Bancorp, Inc. (NASDAQ: STBC) and State Bank of Long Island. |
|
| Principal Occupations During Past 5 Years – President and COO (since November 2006) of State Bancorp, Inc. and State Bank; Vice Chairman (January 1997-April 2000) of North Fork Bank; President and Chief Executive Officer (December 1984-December 1996) of North Side Savings Bank; formerly President and Chief Executive Officer (May 2000-June 2006) Atlantic Bank of New York. |
| | | |
| John A. Pileski (67) | | Trustee, Since 2003 | | 76 | | Director (since April 2001) of New York Community Bank. Director (since May 1980) of Surf Club of Quogue, Inc. |
|
| Principal Occupations During Past 5 Years – Retired since June 2000; Tax Partner (July 1974-June 2000) of KPMG, LLP. |
| | | |
| F. Don Schwartz (71) | | Trustee, Since 2003 | | 76 | | — |
|
| Principal Occupations During Past 5 Years – Management Consultant (since April 1985). |
F1
| | | | | | |
|
Interested Trustees
|
Name, Address**,
and Age | | Position with Fund*
Term of Office***
Length of Time Served | | Number of Portfolios
In Fund Complex
Overseen by Trustee | | Other Directorships
Held by the Trustee**** |
| | | |
| *David R. Odenath (49) | | President and Trustee Since 1999 | | 76 | | — |
|
| Principal Occupations During Past 5 Years – President of Prudential Annuities (since August 2002); Senior Vice President (since June 1999) of Prudential; Executive Vice President (since May 2003) of Prudential Investment Management Services LLC; President, Chief Executive Officer, Chief Operating Officer, Officer in Charge and Director (since June 2005) of American Skandia Investment Services, Inc; Formerly President, Chief Executive Officer, Chief Operating Officer and Officer-In-Charge (September 1999-February 2003) of Prudential Investments LLC. |
| | | |
| *Robert F. Gunia (60) | | Vice President and Trustee since 2001 | | 154 | | Vice President and Director (since May 1989) and Treasurer (since 1999) of The Asia Pacific Fund, Inc.; |
|
| Principal Occupations During Past 5 Years – Chief Administrative Officer (since September 1999) and Executive Vice President (since December 1996) of Prudential Investments LLC; President (since April 1999) of Prudential Investment Management Services LLC; Executive Vice President (since March 1999) and Treasurer (since May 2000) of Prudential Mutual Fund Services LLC; Chief Administrative Officer, Executive Vice President and Director (since May 2003) of American Skandia Investment Services, Inc. |
| | | | |
|
Officers
|
Name, Address**,
and Age | | Position with Fund*
Term of Office***
Length of Time Served | | Principal Occupations During Past 5 Years |
| | |
| Grace C. Torres (47) | | Treasurer and Principal Financial and Accounting Officer Since 1997 | | Assistant Treasurer (since March 1999) and Senior Vice President (since September 1999) of PI; Assistant Treasurer (since May 2003) and Vice President (since June 2005) of American Skandia Investment Services, Inc.; Senior Vice President and Assistant Treasurer (since May 2003) of American Skandia Advisory Services, Inc.; formerly Senior Vice President (May 2003-June 2005) of American Skandia Investment Services, Inc. |
| | |
| Kathryn L. Quirk (54) | | Chief Legal Officer Since 2005 | | Vice President and Corporate Counsel (since September 2004) of Prudential; Executive Vice President, Chief Legal Officer and Secretary (since July 2005) of Prudential Investments LLC and Prudential Mutual Fund Services LLC; formerly Managing Director, General Counsel, Chief Compliance Officer, Chief Risk Officer and Corporate Secretary (1997-2002) of Zurich Scudder Investments, Inc. |
| | |
| Deborah A. Docs (49) | | Secretary Since 2005 | | Vice President and Corporate Counsel (since January 2001) of Prudential; Vice President (since December 1996) and Assistant Secretary (since March 1999) of PI; formerly Vice President and Assistant Secretary (May 2003-June 2005) of American Skandia Investment Services, Inc. |
| | |
| Jonathan D. Shain (48) | | Assistant Secretary Since 2005 | | Vice President and Corporate Counsel (since August 1998) of Prudential Insurance; Vice President and Assistant Secretary (since May 2003) of American Skandia Investment Services, Inc. and American Skandia Fund Services, Inc.; formerly Attorney with Fleet Bank, N.A. (January 1997-July 1998). |
| | |
| Claudia DiGiacomo (32) | | Assistant Secretary Since 2005 | | Vice President and Corporate Counsel (since January 2005) of Prudential; Vice President and Assistant Secretary of PI (since December 2005); Associate at Sidley Austin Brown & Wood LLP (1999-2004). |
| | |
| John P. Schwartz (35) | | Assistant Secretary Since 2006 | | Vice President and Corporate Counsel (since April 2005) of Prudential; Vice President and Assistant Secretary of PI (since December 2005); Associate at Sidley Austin Brown & Wood LLP (1997-2005). |
| | |
| Lee D. Augsburger (47) | | Chief Compliance Officer Since 2004 | | Senior Vice President and Chief Compliance Officer (since April 2003) of PI; Vice President (since November 2000) and Chief Compliance Officer (since October 2000) of Prudential Investment Management, Inc.; Chief Compliance Officer and Senior Vice President (since May 2003) of American Skandia Investment Services, Inc. |
| | |
| Valerie M. Simpson (48) | | Deputy Chief Compliance Officer | | Vice President and Senior Compliance Officer (since March 2006) of PI; Vice President – Financial Reporting (since March 2006) for Prudential Life and Annuities Finance. |
F2
| | | | |
Name, Address**,
and Age | | Position with Fund*
Term of Office***
Length of Time Served | | Principal Occupations During Past 5 Years |
| | |
| M. Sadiq Peshimam (43) | | Assistant Treasurer Since 2006 | | Vice President (since 2005) and Director (2000-2005) within Prudential Mutual Fund Administration. |
| | |
| Jack Benintende (42) | | Assistant Treasurer Since 2006 | | Vice President (since June 2000) within Prudential Mutual Fund Administration; formerly Senior Manager within the investment management practice of PricewaterhouseCoopers LLP (May 1994-June 2000). |
| | |
| Alan Fu (50) | | Assistant Treasurer Since 2006 | | Vice President – Tax, The Prudential Insurance Company of America (1999-October 2003); Vice President and Corporate Counsel – Tax, Prudential Financial, Inc. (since October 2003). |
| | |
| Andrew French (44) | | Assistant Secretary Since 2006 | | Director and Corporate Counsel (since May 2006) of Prudential; formerly Senior Legal Analyst of Prudential Mutual Fund Law Department (1997-2006). |
| | |
| Noreen M. Fierro (42) | | Anti-Money Laundering Compliance Officer Since 2006 | | Vice President, Corporate Compliance Officer (since May 2006) of Prudential; formerly Corporate Vice President, Associate General Counsel (April 2002-May 2005) of UBS Financial Services, Inc., in their Money Laundering Prevention Group; Senior Manager (May 2005-May 2006) of Deloitte Financial Advisory Services, LLP, in their Forensic and Dispute Services, Anti-Money Laundering Group. |
* “Interested” Trustee, as defined in the Investment Company Act, by reason of employment with the Manager (as defined below), and/or the Distributor (as defined below).
** Unless otherwise noted, the address of the Trustees and Officers is c/o: Prudential Investments LLC, Gateway Center Three, 100 Mulberry Street, Newark, New Jersey 07102.
*** There is no set term of office for Trustees and Officers.
**** This column includes only directorships of companies required to register, or file reports with the SEC under the Securities Exchange Act of 1934 (i.e., “public companies”) or other investment companies registered under the Investment Company Act.
F3
This report contains financial information about certain investment choices that may be available on the variable life insurance and variable annuity contracts listed below. You may receive additional reports and should refer to your variable life insurance or variable annuity contract prospectus to determine which portfolios are available to you.
VARIABLE LIFE INSURANCE
VARIABLE ANNUITIES
| n | | Pruco Life’s Discovery Select® |
| n | | Pruco Life of New Jersey’s Discovery Select® |
| n | | Pruco Life’s Discovery Choice® |
| n | | Pruco Life of New Jersey’s Discovery Choice® |
Life insurance policies and annuity contracts contain exclusions, limitations, reductions of benefits and terms for keeping them in force.
Variable life insurance is offered through Pruco Securities LLC, member SIPC, 751 Broad Street, Newark, NJ 07102-3777. Variable annuities are distributed by Prudential Investment Management Services LLC (PIMS), member SIPC, Gateway Center Three, 14th Floor, Newark, NJ 07102-4077. Variable life insurance and variable annuities are issued by The Prudential Insurance Company of America, Pruco Life Insurance Company, or in New York, Pruco Life Insurance Company of New Jersey. All are Prudential Financial companies. Each is solely responsible for its own financial condition and contractual obligations. Contract guarantees are based on the claims-paying ability of the issuing company.
The 2006 Audited Financial Statements of Pruco Life Insurance Company, Pruco Life Insurance Company of New Jersey, and The Prudential Insurance Company of America will be available commencing on April 30, 2007. You may call (888) 778-2888 to obtain a free copy of the audited financial statements of the insurance company that issued your contract.
To reduce costs, we now generally send only a single copy of prospectuses and shareholder reports to each household (“householding”) in lieu of sending a copy to each Contract Owner who resides in the household. You should be aware that by calling (877) 778-5008, you can revoke or “opt out” of householding at any time.
Prudential Financial and the Rock logo are service marks of The Prudential Insurance Company of America, Newark, NJ, and its affiliates.
751 Broad Street
Newark NJ 07102-3777
Presorted
Standard
U.S. Postage
PAID
Prudential
IFS-A114743 PSF-AR-C Ed. 02/2007

Item 2 – Code of Ethics — See Exhibit (a)
As of the end of the period covered by this report, the registrant has adopted a code of ethics (the “Section 406 Standards for Investment Companies – Ethical Standards for Principal Executive and Financial Officers”) that applies to the registrant’s Principal Executive Officer and Principal Financial Officer; the registrant’s Principal Financial Officer also serves as the Principal Accounting Officer.
The registrant hereby undertakes to provide any person, without charge, upon request, a copy of the code of ethics. To request a copy of the code of ethics, contact the registrant 973-367-7521, and ask for a copy of the Section 406 Standards for Investment Companies - Ethical Standards for Principal Executive and Financial Officers.
Item 3 – Audit Committee Financial Expert –
The registrant’s Board has determined that Mr. John A. Pileski, member of the Board’s Audit Committee is an “audit committee financial expert,” and that he is “independent,” for purposes of this Item.
Item 4 – Principal Accountant Fees and Services –
(a) Audit Fees
For the fiscal years ended December 31, 2006 and December 31, 2005, KPMG LLP (“KPMG”), the Registrant’s principal
accountant, billed the Registrant $511,900 and $511,900, respectively, for professional services rendered for the audit of the
Registrant’s annual financial statements or services that are normally provided in connection with statutory and regulatory
filings.
(b) Audit-Related Fees
None.
(c) Tax Fees
None.
(d) All Other Fees
None.
(e) (1) Audit Committee Pre-Approval Policies and Procedures
THE PRUDENTIAL MUTUAL FUNDS
AUDIT COMMITTEE POLICY
on
Pre-Approval of Services Provided by the Independent Accountants
The Audit Committee of each Prudential Mutual Fund is charged with the responsibility to monitor the independence of the Fund’s independent accountants. As part of this responsibility, the Audit Committee must pre-approve any independent accounting firm’s engagement to render audit and/or permissible non-audit services, as required by law. In evaluating a proposed engagement of the independent accountants, the Audit Committee will assess the effect that the engagement might reasonably be expected to have on the accountant’s independence. The Committee’s evaluation will be based on:
| | • | | a review of the nature of the professional services expected to be provided, |
| | • | | a review of the safeguards put into place by the accounting firm to safeguard independence, and |
| | • | | periodic meetings with the accounting firm. |
Policy for Audit and Non-Audit Services Provided to the Funds
On an annual basis, the scope of audits for each Fund, audit fees and expenses, and audit-related and non-audit services (and fees proposed in respect thereof) proposed to be performed by the Fund’s independent accountants will be presented by the Treasurer and the independent accountants to the Audit Committee for review and, as appropriate, approval prior to the initiation of such services. Such presentation shall be accompanied by confirmation by both the Treasurer and the independent accountants that the proposed services will not adversely affect the independence of the independent accountants. Proposed services shall be described in sufficient detail to enable the Audit Committee to assess the appropriateness of such services and fees, and the compatibility of the provision of such services with the auditor’s independence. The Committee shall receive periodic reports on the progress of the audit and other services which are approved by the Committee or by the Committee Chair pursuant to authority delegated in this Policy.
The categories of services enumerated under “Audit Services”, “Audit-related Services”, and “Tax Services” are intended to provide guidance to the Treasurer and the independent accountants as to those categories of services which the Committee believes are generally consistent with the independence of the independent accountants and which the Committee (or the Committee Chair) would expect upon the presentation of specific proposals to pre-approve. The enumerated categories are not intended as an exclusive list of audit, audit-related or tax services, which the Committee (or the Committee Chair) would consider for pre-approval.
Audit Services
The following categories of audit services are considered to be consistent with the role of the Fund’s independent accountants:
| | Ø | | Annual Fund financial statement audits |
| | Ø | | Seed audits (related to new product filings, as required) |
| | Ø | | SEC and regulatory filings and consents |
Audit-related Services
The following categories of audit-related services are considered to be consistent with the role of the Fund’s independent accountants:
| | Ø | | Accounting consultations |
| | Ø | | Fund merger support services |
| | Ø | | Agreed Upon Procedure Reports |
| | Ø | | Other Internal Control Reports |
Individual audit-related services that fall within one of these categories and are not presented to the Audit Committee as part of the annual pre-approval process will be subject to pre-approval by the Committee Chair (or any other Committee member on whom this responsibility has been delegated) so long as the estimated fee for those services does not exceed $50,000.
Tax Services
The following categories of tax services are considered to be consistent with the role of the Fund’s independent accountants:
| | Ø | | Tax compliance services related to the filing or amendment of the following: |
| | • | | Federal, state and local income tax compliance; and, |
| | • | | Sales and use tax compliance |
| | Ø | | Timely RIC qualification reviews |
| | Ø | | Tax distribution analysis and planning |
| | Ø | | Tax authority examination services |
| | Ø | | Tax appeals support services |
| | Ø | | Accounting methods studies |
| | Ø | | Fund merger support services |
| | Ø | | Tax consulting services and related projects |
Individual tax services that fall within one of these categories and are not presented to the Audit Committee as part of the annual pre-approval process will be subject to pre-approval by the Committee Chair (or any other Committee member on whom this responsibility has been delegated) so long as the estimated fee for those services does not exceed $50,000.
Other Non-audit Services
Certain non-audit services that the independent accountants are legally permitted to render will be subject to pre-approval by the Committee or by one or more Committee members to whom the Committee has delegated this authority and who will report to the full Committee any pre-approval decisions made pursuant to this Policy. Non-audit services presented for pre-approval pursuant to this paragraph will be accompanied by a confirmation from both the Treasurer and the independent accountants that the proposed services will not adversely affect the independence of the independent accountants.
Proscribed Services
The Fund’s independent accountants will not render services in the following categories of non-audit services:
| | Ø | | Bookkeeping or other services related to the accounting records or financial statements of the Fund |
| | Ø | | Financial information systems design and implementation |
| | Ø | | Appraisal or valuation services, fairness opinions, or contribution-in-kind reports |
| | Ø | | Internal audit outsourcing services |
| | Ø | | Management functions or human resources |
| | Ø | | Broker or dealer, investment adviser, or investment banking services |
| | Ø | | Legal services and expert services unrelated to the audit |
| | Ø | | Any other service that the Public Company Accounting Oversight Board determines, by regulation, is impermissible. |
Pre-approval of Non-Audit Services Provided to Other Entities Within the Prudential Fund Complex
Certain non-audit services provided to Prudential Investments LLC or any of its affiliates that also provide ongoing services to the Prudential Mutual Funds will be subject to pre-approval by the Audit Committee. The only non-audit services provided to these entities that will require pre-approval are those related directly to the operations and financial reporting of the Funds. Individual projects that are not presented to the Audit Committee as part of the annual pre-approval process will be subject to pre-approval by the Committee Chair (or any other Committee member on whom this responsibility has been delegated) so long as the estimated fee for those services does not exceed $50,000. Services presented for pre-approval pursuant to this paragraph will be accompanied by a confirmation from both the Treasurer and the independent accountants that the proposed services will not adversely affect the independence of the independent accountants.
Although the Audit Committee will not pre-approve all services provided to Prudential Investments LLC and its affiliates, the Committee will receive an annual report from the Fund’s independent accounting firm showing the aggregate fees for all services provided to Prudential Investments and its affiliates.
(e) (2) Percentage of services referred to in 4(b)- (4)(d) that were approved by the audit committee –
Not applicable.
(f) Percentage of hours expended attributable to work performed by other than full time employees of principal accountant if greater than 50%.
Not applicable.
(g) Non-Audit Fees
Not applicable to Registrant for the fiscal years 2006 and 2005. The aggregate non-audit fees billed by KPMG for services rendered to the registrant’s investment adviser and any entity controlling, controlled by, or under common control with the investment adviser that provides ongoing services to the registrant for the fiscal years 2006 and 2005 was $317,300 and $51,000, respectively.
(h) Principal Accountant’s Independence
Not applicable as KPMG has not provided non-audit services to the registrant’s investment adviser and any entity controlling, controlled by, or under common control with the investment adviser that provides ongoing services to the registrant that were not pre-approved pursuant to Rule 2-01(c)(7)(ii) of Regulation S-X.
| Item 5 | – Audit Committee of Listed Registrants – Not applicable. |
| Item 6 | – Schedule of Investments – The schedule is included as part of the report to shareholders filed under Item 1 of this Form. |
| Item 7 | – Disclosure of Proxy Voting Policies and Procedures for Closed-End Management Investment Companies – Not applicable. |
| Item 8 | – Portfolio Managers of Closed-End Management Investment Companies – Not applicable. |
| Item 9 | – Purchases of Equity Securities by Closed-End Management Investment Company and Affiliated Purchasers – Not applicable. |
| Item 10 | – Submission of Matters to a Vote of Security Holders – Not applicable. |
| Item 11 | – Controls and Procedures |
| | (a) | It is the conclusion of the registrant’s principal executive officer and principal financial officer that the effectiveness of the registrant’s current disclosure controls and procedures (such disclosure controls and procedures having been evaluated within 90 days of the date of this filing) provide reasonable assurance that the information required to be disclosed by the registrant has been recorded, processed, summarized and reported within the time period specified in the Commission’s rules and forms and that the information required to be disclosed by the registrant has been accumulated and communicated to the registrant’s principal executive officer and principal financial officer in order to allow timely decisions regarding required disclosure. |
| | (b) | There has been no significant change in the registrant’s internal control over financial reporting that occurred during the registrant’s most recent fiscal quarter of the period covered by this report that has materially affected, or is likely to materially affect, the registrant’s internal control over financial reporting. |
Item 12 – Exhibits
(a) (1) Code of Ethics – Attached hereto as Exhibit EX-99.CODE-ETH
| | (2) | Certifications pursuant to Section 302 of the Sarbanes-Oxley Act – Attached hereto as Exhibit EX-99.CERT. |
| | (3) | Any written solicitation to purchase securities under Rule 23c-1. – Not applicable. |
| | (b) | Certifications pursuant to Section 906 of the Sarbanes-Oxley Act – Attached hereto as Exhibit EX-99.906CERT. |
SIGNATURES
Pursuant to the requirements of the Securities Exchange Act of 1934 and the Investment Company Act of 1940, the registrant has duly caused this report to be signed on its behalf by the undersigned, thereunto duly authorized.
(Registrant) The Prudential Series Fund
| | |
| By (Signature and Title)* | | /s/ Deborah A. Docs |
| | Deborah A. Docs |
| | Secretary |
Date February 22, 2007
Pursuant to the requirements of the Securities Exchange Act of 1934 and the Investment Company Act of 1940, this report has been signed below by the following persons on behalf of the registrant and in the capacities and on the dates indicated.
| | |
| By (Signature and Title)* | | /s/ David R. Odenath |
| | David R. Odenath |
| | President and Principal Executive Officer |
Date February 22, 2007
| | |
| By (Signature and Title)* | | /s/ Grace C. Torres |
| | Grace C. Torres |
| | Treasurer and Principal Financial Officer |
Date February 22, 2007
| * | Print the name and title of each signing officer under his or her signature. |