UNITED STATES
SECURITIES AND EXCHANGE COMMISSION
Washington, D.C. 20549
FORM N-CSR
CERTIFIED SHAREHOLDER REPORT OF REGISTERED
MANAGEMENT INVESTMENT COMPANIES
| | |
| Investment Company Act file number: | | 811-03623 |
Exact name of registrant as specified in charter: | | The Prudential Series Fund |
Address of principal executive offices: | | Gateway Center 3, |
| | 100 Mulberry Street, |
| | Newark, New Jersey 07102 |
Name and address of agent for service: | | Deborah A. Docs |
| | Gateway Center 3, |
| | 100 Mulberry Street, |
| | Newark, New Jersey 07102 |
Registrant’s telephone number, including area code: | | 973-367-7521 |
Date of fiscal year end: | | 12/31/2009 |
Date of reporting period: | | 12/31/2009 |
Item 1 – Reports to Stockholders –
| | |
| | |
| ANNUAL REPORT | | DECEMBER 31, 2009 |
The Prudential Series Fund
| n | | Conservative Balanced Portfolio |
| n | | Diversified Bond Portfolio |
| n | | Flexible Managed Portfolio |
| n | | Government Income Portfolio |
| n | | High Yield Bond Portfolio |
| n | | Natural Resources Portfolio |
| n | | Small Capitalization Stock Portfolio |

Please note that inside is a Prospectus Supplement dated January 14, 2010.
This document is separate from and not part of the annual report.

0172024-00001-00
This report is one of several that provide financial information about certain investment choices available on variable life insurance and variable annuity contracts. Based on the variable contract you own or the portfolios you invested in, you may receive additional reports that provide financial information on those investment choices. Please refer to your variable life insurance or variable annuity contract prospectus to determine which portfolios are available to you.
This report must be preceded or accompanied by the current prospectuses for the Prudential Series Fund portfolios and the applicable variable life or annuity contract. The prospectuses contain information on the investment objectives, risks, and charges and expenses of the portfolios and the contract and should be read carefully.
The contract’s prospectus contains hypothetical performance illustrations that show the effect of various assumptions regarding the cost of insurance protection. You may also obtain a personalized illustration of historical performance that reflects the cost of your contract’s insurance protection.
A description of the Fund’s proxy voting policies and procedures is available, without charge, upon request. Owners of variable annuity contracts should call 888-778-2888 and owners of variable life insurance contracts should call 800-778-2255 to obtain descriptions of the Fund’s proxy voting policies and procedures. The description is also available on the website of the Securities and Exchange Commission (the “Commission”) at www.sec.gov. Information regarding how the Fund voted proxies relating to portfolio securities during the most recent 12-month period ended June 30, is available on the website of the Commission at www.sec.gov and on the Fund’s website.
The Fund files with the Commission a complete listing of portfolio holdings as of its first and third quarter-end on Form N-Q. Form N-Q is available on the Commission’s website at www.sec.gov or by visiting the Commission’s Public Reference Room. For more information on the Commission’s Public Reference Room, please visit the Commission’s website or call 1-800-SEC-0330. Form N-Q is also available on the Fund’s website at www.prudential.com or by calling the telephone numbers referenced above.
The Fund’s Statement of Additional Information contains additional information about the Fund’s Trustees and is available without charge upon request by calling 888-778-2888.
This report may include financial information pertaining to certain portfolios that are not available through the variable life insurance policy or variable annuity contract that you have chosen. Please refer to your variable life insurance or variable annuity prospectus to determine which portfolios are available to you.
| | | | |
The Prudential Series Fund Table of Contents | | Annual Report | | December 31, 2009 |
| n | | LETTER TO CONTRACT OWNERS |
| n | | PRESENTATION OF PORTFOLIO HOLDINGS |
| n | | FEES AND EXPENSES TABLE |
| | A1 | Schedule of Investments and Financial Statements |
| | B1 | Notes to Financial Statements |
| | D1 | Report of Independent Registered Public Accounting Firm |
| | E1 | Information about Trustees and Officers |
This report may include financial information pertaining to certain portfolios that are not available through the variable life insurance policy or variable annuity contract that you have chosen. Please refer to your variable life insurance or variable annuity prospectus to determine which portfolios are available to you.
| | | | |
The Prudential Series Fund Letter to Contract Owners | | Annual Report | | December 31, 2009 |
Our primary focus at Prudential is to help investors achieve and maintain long-term financial success. Our Prudential Series Fund annual report outlines our efforts to reach this goal. We hope you find it informative and useful.
Prudential has been building on a heritage of success for more than 130 years, and the quality of our businesses and risk diversification has enabled us to manage effectively through volatile markets. We believe the array of our products provides a highly attractive value proposition to clients like you who are focused on financial security.
Your financial professional is your best resource to make the most informed investment decisions to help meet your needs. Together, you can build a diversified investment portfolio that aligns with your long-term financial goals. Diversification does not assure a profit or protect against loss in declining markets.
Thank you for selecting Prudential as one of your financial partners. We value your trust and appreciate the opportunity to help you achieve financial security.
Sincerely,

Stephen Pelletier
President,
The Prudential Series Fund January 29, 2010 |

PRESIDENT
STEPHEN PELLETIER
| | |
The Prudential Series Fund, Conservative Balanced Portfolio Subadvised by: Prudential Investment Management, Inc., Quantitative Management Associates LLC | | December 31, 2009 |
Investment Manager’s Report - As of December 31, 2009
Average Annual Total Return Percentages
| | | | | | | | | |
| | | 1-Year | | | 5-Year | | | 10-Year | |
Portfolio | | 20.01 | % | | 2.72 | % | | 2.68 | % |
Blended Index | | 15.72 | | | 2.77 | | | 2.63 | |
S&P 500 Index | | 26.47 | | | 0.42 | | | -0.95 | |
Past performance does not guarantee future returns. The investment return and principal value of an investment will fluctuate, so that an investor’s shares, when redeemed, may be worth more or less than their original cost. Current performance may be lower or higher than the past performance data quoted.
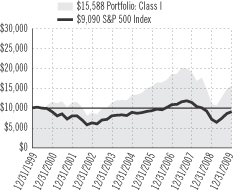
$10,000 INVESTED OVER 10 YEARS
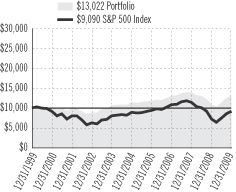
Portfolio inception: 5/13/1983. Portfolio performance is net of investment fees and fund expenses, but not product charges, which, if included, would significantly lower the performance quoted. Performance figures may reflect fee waivers and/or expense reimbursements. In the absence of such fee waivers and/or expense reimbursements, total returns would be lower.
For the year ended December 31, 2009, the Conservative Balanced Portfolio rose 20.01%.
Quantitative Management Associates, LLC runs the Portfolio whose objective is total return consistent with a conservatively managed diversified portfolio. The Portfolio is diversified across a combination of equity and equity-related securities, debt obligations, and money market instruments.
A scorching broad-based rally in global equity markets began in March 2009 and continued during the year as global economic conditions improved. Developed market equities outperformed the U.S. stock market partially due to a weakening greenback. In the United States, mid-cap stocks and the growth style of investing led gains. Emerging market stocks were the stars, returning nearly 79% overall in U.S. dollar terms as investors increasingly sought riskier assets in pursuit of higher returns.
In the fixed-income markets, yield-hungry investors favored riskier debt securities encouraged by improving global economic conditions and the low interest-rate environment, among other factors. This preference for riskier assets, supply pressures that emerged as a flood of U.S. Treasury securities were issued to fund the federal deficit and stimulus programs, and renewed inflation fears pressured the U.S. Treasury market, which ended the year in the red.
The Portfolio outperformed the blended index because it maintained a slightly larger exposure to equities than the guideline weight of 50%. The Portfolio also benefited from a fixed-income strategy that emphasized investment-grade corporate bonds, commercial mortgage-backed securities, emerging market bonds, and certain other types of debt securities that carry greater credit risk than ultra safe U.S. Treasuries, which are backed by the federal government. These riskier bond markets posted strong gains in 2009 that easily outperformed the Barclays Capital U.S. Aggregate Bond Index.
Prudential Investments LLC (PI), an indirect, wholly owned subsidiary of Prudential Financial, Inc., serves as the investment manager for the Fund.
Blended Index consists of S&P 500 Index (50%), Barclays Capital U.S. Aggregate Bond Index (40%), an unmanaged index comprised of more than 5,000 government and corporate bonds, and 3-Month T-Bill Index (10%), an unmanaged market value-weighted index of investment grade fixed rate public obligations of the U.S. Treasury with maturities of 3 months, excluding zero coupon strips. S&P 500 Index is an unmanaged, market value-weighted index of 500 stocks generally representative of the broad stock market. These returns do not include the effect of any investment management expenses. These returns would have been lower if they included the effect of these expenses. Investors cannot invest directly in a market index. For a complete list of holdings refer to the Schedule of Investments section of this report.
| | |
The Prudential Series Fund, Diversified Bond Portfolio Subadvised by: Prudential Investment Management, Inc. | | December 31, 2009 |
Investment Manager’s Report - As of December 31, 2009
Average Annual Total Return Percentages
| | | | | | | | | |
| | | 1-Year | | | 5-Year | | | 10-Year | |
Portfolio | | 20.51 | % | | 5.92 | % | | 6.64 | % |
Barclays Capital U.S. Aggregate Bond Index | | 5.93 | | | 4.97 | | | 6.33 | |
Past performance does not guarantee future returns. The investment return and principal value of an investment will fluctuate, so that an investor’s shares, when redeemed, may be worth more or less than their original cost. Current performance may be lower or higher than the past performance data quoted.
$10,000 INVESTED OVER 10 YEARS
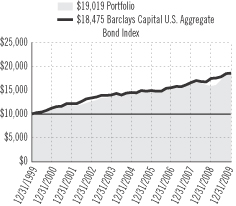
Portfolio inception: 5/13/1983. Portfolio performance is net of investment fees and fund expenses, but not product charges, which, if included, would significantly lower the performance quoted. Performance figures may reflect fee waivers and/or expense reimbursements. In the absence of such fee waivers and/or expense reimbursements, total returns would be lower.
For the year ended December 31, 2009, the Diversified Bond Portfolio rose 20.51%.
The U.S. government and the Federal Reserve took steps to steady the nation’s financial system and stimulate the economy. Both had been hurt by a protracted credit crisis. The financial system began to heal in 2009 and the economy began to tentatively emerge from the so-called “Great Recession,” even though job losses continued to climb. The favorable developments boosted investor confidence in bonds with greater credit risk than U.S. Treasury securities. Riskier bonds were also sought for their attractive yields in the low interest-rate environment. Most notably, prices soared on high yield corporate “junk” bonds, while the Treasury market ended 2009 in the red.
Prudential Fixed Income, which is part of Prudential Investment Management, Inc., runs the Portfolio, which outperformed the Barclays Capital U.S. Aggregate Bond Index (the Index) primarily because it had a larger exposure than the Index to investment-grade corporate bonds, commercial mortgage-backed securities, and asset-backed securities. Each of these markets beat the Index in 2009. In addition to support provided by generally improving economic conditions, corporate bonds gained as many firms strengthened their balance sheets. One initiative that aided the financial system was the Term Asset Backed Securities Loan Facility (TALF), which provides loans on favorable terms to investors who buy high-quality bonds backed by cash flows from credit cards, commercial mortgages, or certain other types of loans and leases. Sales of these bonds help keep credit flowing to businesses and consumers. TALF and a related initiative encouraged a rally in asset-backed securities, residential mortgage-backed securities not guaranteed by federal agencies, and commercial mortgage-backed securities.
The Portfolio had smaller exposures than the Index to Treasury securities, federal agency debt securities, and mortgage-backed securities guaranteed by Ginnie Mae, Fannie Mae, and Freddie Mac. This worked well because each of these markets trailed the Index in 2009. The Portfolio had a larger exposure than the Index to emerging market bonds, which also worked well as this market outperformed the Index.
The Portfolio benefited from its exposure to two riskier markets not included in the Index. It held high yield corporate bonds and leveraged bank loans, both of which beat the Index. Leveraged bank loans are generally considered a more conservative type of investment than high yield bonds because, in most cases, a bankrupt firm will pay off its leveraged loan before it pays off its high yield bonds.
Prudential Investments LLC (PI), an indirect, wholly owned subsidiary of Prudential Financial, Inc., serves as the investment manager for the Fund.
Barclays Capital U.S. Aggregate Bond Index is an unmanaged index comprised of more than 5,000 government and corporate bonds. These returns do not include the effect of any investment management expenses. These returns would have been lower if they included the effect of these expenses. Investors cannot invest directly in a market index. For a complete list of holdings refer to the Schedule of Investments section of this report.
| | |
The Prudential Series Fund, Equity Portfolio Subadvised by: Jennison Associates LLC | | December 31, 2009 |
Investment Manager’s Report - As of December 31, 2009
Average Annual Total Return Percentages
| | | | | | | | | |
| | | 1-Year | | | 5-Year | | | 10-Year | |
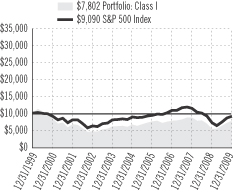
Portfolio: Class I | | 38.17 | % | | 3.23 | % | | 1.91 | % |
Portfolio: Class II | | 37.58 | | | 2.82 | | | 1.50 | |
Russell 1000® Index | | 28.43 | | | 0.79 | | | -0.49 | |
S&P 500 Index | | 26.47 | | | 0.42 | | | -0.95 | |
Past performance does not guarantee future returns. The investment return and principal value of an investment will fluctuate, so that an investor’s shares, when redeemed, may be worth more or less than their original cost. Current performance may be lower or higher than the past performance data quoted.
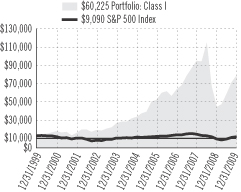
$10,000 INVESTED OVER 10 YEARS1
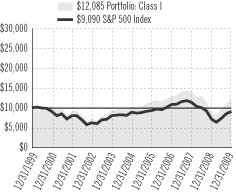
Portfolio (Class I) inception: 5/13/1983. Portfolio (Class II) inception: 5/4/1999. Portfolio performance is net of investment fees and fund expenses, but not product charges, which, if included, would significantly lower the performance quoted.
The Russell 1000® Index is a trademark/service mark of the Frank Russell Company. Russell® is a trademark of the Frank Russell Company. Performance figures may reflect fee waivers and/or expense reimbursements. In the absence of such fee waivers and/or expense reimbursements, total returns would be lower.
For the year ended December 31, 2009, the Equity Portfolio Class I shares rose 38.17%, while the Class II shares rose 37.58%, significantly outperforming the S&P 500 Index (the Index). The investment objective of this Portfolio is long-term growth of capital.
Every sector was a source of positive relative performance, and stock selection nearly across the board drove the Portfolio’s strong performance. The top 10 contributors came from seven different sectors.
Positions in information technology benefited absolute performance most. An overweight stance in the sector was the primary driver of outperformance. Energy positions also bolstered overall performance. Jennison remains bullish on the long-term supply/demand imbalances for oil and natural gas, and prefers exploration and production companies with organic production and reserve growth because they have the highest leverage to rising oil/gas prices. The investment team also seeks exploration and production companies with low per-barrel operating costs. The Portfolio substantially outperformed in financials and its underweight stance also added to performance relative to its benchmark, the S&P 500 Index.
Industrials was the one sector that detracted from absolute return. However, the Portfolio’s smaller exposure to the sector resulted in positive relative performance.
From the depths of their March lows, equity markets have posted impressive rebounds, with most indexes gaining 50% or more through year-end. Corporate profits, which have been much better than were thought possible at the beginning of 2009, largely due to workforce and inventory reductions, have provided much of the fuel for this recovery in equities. Favorable interest rate and liquidity conditions have been instrumental in spurring the rally, as well. With these tailwinds in place, there is reason to be optimistic that further gains lie ahead in 2010. Yet significant challenges remain, including high unemployment, still-weak housing markets, and probable increases in tax rates. Against this backdrop, Jennison remains cautiously optimistic.
Prudential Investments LLC (PI), an indirect, wholly owned subsidiary of Prudential Financial, Inc., serves as the investment manager for the Fund.
| 1 | The graph is based on the performance of Class I shares. Performance of Class II shares will be lower due to differences in the fee structure. Class II shares have associated 12b-1 and administrative fees at an annual rate of 0.25% and 0.15%, respectively, of the average daily net assets of the Class II shares. |
Russell 1000® Index is a market cap-weighted index that measures the performance of the 1,000 largest companies in the Russell 3000 Index, which represents approximately 92% of the total market. S&P 500 Index is an unmanaged, market value-weighted index of 500 stocks generally representative of the broad stock market. These returns do not include the effect of any investment management expenses. These returns would have been lower if they included the effect of these expenses. Investors cannot invest directly in a market index. For a complete list of holdings, refer to the Schedule of Investments section of this report.
| | |
The Prudential Series Fund, Flexible Managed Portfolio Subadvised by: Prudential Investment Management, Inc., Quantitative Management Associates, LLC | | December 31, 2009 |
Investment Manager’s Report - As of December 31, 2009
Average Annual Total Return Percentages
| | | | | | | | | |
| | | 1-Year | | | 5-Year | | | 10-Year | |
Portfolio | | 19.95 | % | | 2.30 | % | | 2.22 | % |
Blended Index | | 18.08 | | | 2.42 | | | 2.07 | |
S&P 500 Index | | 26.47 | | | 0.42 | | | -0.95 | |
Past performance does not guarantee future returns. The investment return and principal value of an investment will fluctuate, so that an investor’s shares, when redeemed, may be worth more or less than their original cost. Current performance may be lower or higher than the past performance data quoted.
$10,000 INVESTED OVER 10 YEARS
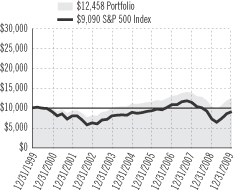
Portfolio inception: 5/13/1983. Portfolio performance is net of investment fees and fund expenses, but not product charges, which, if included, would significantly lower the performance quoted. Performance figures may reflect fee waivers and/or expense reimbursements. In the absence of such fee waivers and/or expense reimbursements, total returns would be lower.
For the year ended December 31, 2009, the Flexible Managed Portfolio rose 19.95%.
Quantitative Management Associates, LLC runs the Portfolio whose objective is total return consistent with an aggressively managed diversified portfolio. The Portfolio is diversified across a combination of equity and equity-related securities, debt obligations, and money market instruments.
A scorching broad-based rally in global equity markets began in March 2009 and continued during the year as global economic conditions improved. Developed market equities outperformed the U.S. stock market partially due to a weakening greenback. In the United States, mid-cap stocks and the growth style of investing led gains. Emerging market stocks were the stars, returning nearly 79% overall in U.S. dollar terms as investors increasingly sought riskier assets in pursuit of higher returns.
In the fixed-income markets, yield-hungry investors snapped up riskier debt securities encouraged by improving global economic conditions and the low interest-rate environment, among other factors. This preference for riskier assets, supply pressures that emerged as a flood of U.S. Treasuries were issued, and renewed inflation fears pressured the U.S. Treasury market, which ended the year in the red.
The Portfolio outperformed the blended index because it maintained a slightly larger exposure to equities than the guideline weight of 60%. The Portfolio also benefited from a fixed-income strategy that emphasized investment-grade corporate bonds, commercial mortgage-backed securities, emerging market bonds, and certain other types of debt securities that carry greater credit risk than ultra-safe U.S. Treasury securities, which are backed by the federal government. These riskier bond markets posted strong gains in 2009 that easily outperformed the Barclays Capital U.S. Aggregate Bond Index.
Prudential Investments LLC (PI), an indirect, wholly owned subsidiary of Prudential Financial, Inc., serves as the investment manager for the Fund.
Blended Index consists of S&P 500 Index (60%), Barclays Capital U.S. Aggregate Bond Index (35%), an unmanaged index comprised of more than 5,000 government and corporate bonds, and 3-Month T-Bill Index (5%), an unmanaged market value-weighted index of investment grade fixed rate public obligations of the U.S. Treasury with maturities of 3 months, excluding zero coupon strips. S&P 500 Index is an unmanaged, market value-weighted index of 500 stocks generally representative of the broad stock market. These returns do not include the effect of any investment management expenses. These returns would have been lower if they included the effect of these expenses. Investors cannot invest directly in a market index. For a complete list of holdings refer to the Schedule of Investments section of this report.
| | |
The Prudential Series Fund, Global Portfolio Subadvised by: LSV Asset Management, Marsico Capital Management, LLC, Quantitative Management Associates LLC, T. Rowe Price
Associates, Inc., William Blair & Company LLC | | December 31, 2009 |
Investment Manager’s Report - As of December 31, 2009
Average Annual Total Return Percentages
| | | | | | | | | |
| | | 1-Year | | | 5-Year | | | 10-Year | |
Portfolio | | 31.39 | % | | 2.85 | % | | -1.52 | % |
MSCI World Index (GD) | | 30.79 | | | 2.57 | | | 0.23 | |
Past performance does not guarantee future returns. The investment return and principal value of an investment will fluctuate, so that an investor’s shares, when redeemed, may be worth more or less than their original cost. Current performance may be lower or higher than the past performance data quoted.
$10,000 INVESTED OVER 10 YEARS
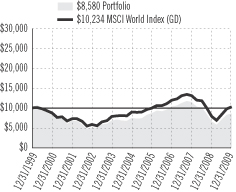
Portfolio inception: 9/19/1988. Portfolio performance is net of investment fees and fund expenses, but not product charges, which, if included, would significantly lower the performance quoted. Performance figures may reflect fee waivers and/or expense reimbursements. In the absence of such fee waivers and/or expense reimbursements, total returns would be lower.
For the year ended December 31, 2009, the Global Portfolio rose 31.39%.
The Portfolio is co-managed by four specialist firms: Marsico Capital Management (Marsico), T. Rowe Price Associates, Inc. (T. Rowe Price), William Blair & Company, LLC (William Blair), and LSV Asset Management (LSV). The Portfolio seeks growth of capital over the long term by investing in growth and value stocks of large companies in the United States and abroad.
A scorching broad-based rally in global equity markets began in March 2009 and continued during the year as global economic conditions improved. Developed market equities outperformed the U.S. stock market due partially to a weakening greenback. In the United States, mid-cap stocks and the growth style of investing led gains. Emerging market stocks were the stars, returning nearly 79% overall in U.S. dollar terms as investors increasingly sought riskier assets in pursuit of higher returns.
The Portfolio outperformed the MSCI World Index due to the strong relative performances of three of its portions versus their respective style-specific benchmark indexes. The U.S. large-cap value portion managed by T. Rowe Price outperformed its style-specific benchmark index driven by stock selection in the financials and industrials sectors. The T. Rowe Price portion also benefited from an overweight in the technology sector. An overweight in consumer discretionary and an underweight in utilities also aided relative results.
The LSV portion, which invests in international large-cap value stocks, outperformed its style-specific benchmark index largely because the attributes of its “deep value” investment style, including low price-to-earnings (P/E) and price-to-book (P/B) ratios and high dividend-yield stocks, were rewarded in 2009. The LSV portion also benefitted from strong stock selection in the industrials, consumer discretionary, and technology sectors.
The portion managed by William Blair, which invests in international mid- and large-cap growth stocks, outperformed its style-specific benchmark index largely due to country allocations. Exposure to emerging markets nations Brazil and South Africa boosted performance as they returned more than 100% and 50% respectively in U.S. dollar terms. An underweight in Japanese stocks also benefited performance as Japan was the worst performing developed market.
The Marsico portion, which invests in U.S. large-cap growth stocks, was the only one that underperformed its style-specific benchmark index. Most of its underperformance was driven by sector exposures, notably an overweight position in the financials sector, banks in particular, and an underweight to technology.
Prudential Investments LLC (PI), an indirect, wholly owned subsidiary of Prudential Financial, Inc., serves as the investment manager for the Fund.
MSCI World Index (GD) - The Morgan Stanley Capital International World Index is an unmanaged capitalization weighted index which includes the equity markets of Australia, Austria, Belgium, Canada, Denmark, Finland, France, Germany, Hong Kong, Ireland, Italy, Japan, Malaysia, Netherlands, New Zealand, Norway, Singapore, Spain, Sweden, Switzerland, United Kingdom and United States. The GD version does not reflect the impact of withholding taxes on reinvested dividends. These returns do not include the effect of any investment management expenses. These returns would have been lower if they included the effect of these expenses. Investors cannot invest directly in a market index. For a complete list of holdings, refer to the Schedule of Investments section of this report.
| | |
The Prudential Series Fund, Government Income Portfolio Subadvised by: Prudential Investment Management, Inc. | | December 31, 2009 |
Investment Manager’s Report - As of December 31, 2009
Average Annual Total Return Percentages
| | | | | | | | | |
| | | 1-Year | | | 5-Year | | | 10-Year | |
Portfolio | | 7.71 | % | | 4.78 | % | | 6.18 | % |
Barclays Capital Government Bond Index | | -2.20 | | | 4.87 | | | 6.17 | |
Past performance does not guarantee future returns. The investment return and principal value of an investment will fluctuate, so that an investor’s shares, when redeemed, may be worth more or less than their original cost. Current performance may be lower or higher than the past performance data quoted.
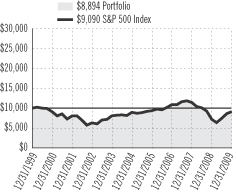
$10,000 INVESTED OVER 10 YEARS

Portfolio inception: 5/1/1989. Portfolio performance is net of investment fees and fund expenses, but not product charges, which, if included, would significantly lower the performance quoted. Performance figures may reflect fee waivers and/or expense reimbursements. In the absence of such fee waivers and/or expense reimbursements, total returns would be lower.
For the year ended December 31, 2009, the Government Income Portfolio rose 7.71%.
The U.S. government and the Federal Reserve took steps to steady the nation’s financial system and stimulate the economy. Both had been hurt by a protracted credit crisis. The financial system began to heal in 2009 and the economy began to tentatively emerge from the so-called “Great Recession,” even though job losses continued to climb. The favorable developments boosted investor confidence in bonds with greater credit risk than U.S. Treasury securities. Riskier bonds were also sought for their attractive yields in the low interest-rate environment. Therefore, prices climbed on debt securities such as corporate bonds, while the U.S. Treasury market ended 2009 in the red.
Prudential Fixed Income which is part of Prudential Investment Management, Inc., runs the Portfolio, which outperformed the Barclays Capital U.S. Government Bond Index (the Index) because it had exposure to commercial mortgage-backed securities as well as good security selection within that market, which easily outperformed the Index in 2009. Commercial mortgage-backed securities gained sharply after the Fed launched the Term Asset Backed Securities Loan Facility (TALF), which provides loans at favorable terms to investors who buy high-quality bonds backed by cash flows from pools of credit cards, auto loans, commercial mortgages, or certain other types of loans. Sales of these debt securities help keep credit flowing to businesses and consumers.
The Portfolio also benefited from taking advantage of pricing inefficiencies within in the U.S. Treasury market between STRIPS (Separate Trading of Registered Interest and Principal of Securities) and TIPS (Treasury Inflation Protected Securities) and between newly issued Treasury securities and those issued earlier with higher coupons.
Another positive was the Portfolio’s favorable security selection among residential mortgage-backed securities guaranteed by Ginnie Mae, Fannie Mae, and Freddie Mac. The Portfolio emphasized mortgage-backed securities with higher coupons that benefited from a decrease in the rate of expected prepayments on the securities and from a program in which the Fed purchased the securities to help support the housing market and mortgage industry. Additionally, the Portfolio held shares of the Dryden Core Investment Fund—Short Term Bond Series, which gained in value amid the environment that favored riskier assets.
On a negative note, the Portfolio’s strategies for managing its duration (sensitivity to changes in the level of interest rates) and its positioning on the yield curve subtracted slightly from its performance in 2009.
Prudential Investments LLC (PI), an indirect, wholly owned subsidiary of Prudential Financial, Inc., serves as the investment manager for the Fund.
Barclays Capital Government Bond Index is a weighted index comprised of securities issued or backed by the U.S. Government, its agencies and instrumentalities with a remaining maturity of one to thirty years. These returns do not include the effect of any investment management expenses. These returns would have been lower if they included the effect of these expenses. Investors cannot invest directly in a market index. For a complete list of holdings refer to the Schedule of Investments section of this report.
| | |
The Prudential Series Fund, High Yield Bond Portfolio Subadvised by: Prudential Investment Management, Inc. | | December 31, 2009 |
Investment Manager’s Report - As of December 31, 2009
Average Annual Total Return Percentages
| | | | | | | | | |
| | | 1-Year | | | 5-Year | | | 10-Year | |
Portfolio | | 47.16 | % | | 6.00 | % | | 5.56 | % |
Barclays Capital U.S. High Yield 2% Issuer Capped Index | | 58.76 | | | 6.49 | | | 6.87 | |
Barclays Capital U.S. High Yield 1% Issuer Capped Index | | 59.45 | | | 6.38 | | | 6.88 | |
Barclays Capital U.S. Corp. High Yield Bond Index | | 58.21 | | | 6.46 | | | 6.71 | |
Past performance does not guarantee future returns. The investment return and principal value of an investment will fluctuate, so that an investor’s shares, when redeemed, may be worth more or less than their original cost. Current performance may be lower or higher than the past performance data quoted.
$10,000 INVESTED OVER 10 YEARS
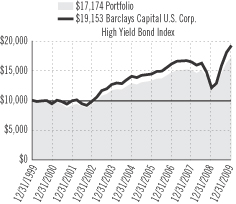
Portfolio inception: 2/23/1987. Portfolio performance is net of investment fees and fund expenses, but not product charges, which, if included, would significantly lower the performance quoted. Performance figures may reflect fee waivers and/or expense reimbursements. In the absence of such fee waivers and/or expense reimbursements, total returns would be lower.
For the year ended December 31, 2009, the High Yield Bond Portfolio rose 47.16%.
The U.S. government and the Federal Reserve took steps to steady the nation’s financial system and stimulate the economy. Both had been hurt by a protracted credit crisis. The financial system began to heal in 2009 and the economy began to tentatively emerge from the so-called “Great Recession,” even though job losses continued to climb. The favorable developments boosted investor confidence in bonds with greater credit risk than U.S. Treasury securities, which are backed by the federal government. Riskier bonds were also sought for their attractive yields in the low interest-rate environment. Most notably, prices soared on high yield corporate “junk” bonds, enabling the market for below investment-grade corporate bonds to post a record annual return in 2009 that outperformed other U.S. bond markets.
Within the high yield market, all ratings categories, sectors, and industries ended 2009 in positive territory. The lower rating categories, Caa and Ca-D, easily outperformed the higher rating categories, Ba and single-B. Some of the largest gains were posted by bonds of firms in cyclical industries that are more sensitive to the business cycle such as banking, retailers, automotive, and home construction. Some of the more modest gains were posted by bonds of firms in industries that tend to be less sensitive to the business cycle such as electric utilities and healthcare.
The Portfolio’s double-digit return reflected the bullish environment for investing in high yield bonds. However, it trailed the Barclays Capital U.S. High Yield 1% Issuer Capped Index (the Index) because Prudential Fixed Income which is part of Prudential Investment Management, Inc., maintained a generally cautious approach to sector allocation and security selection in the high yield market. Consequently, the Portfolio did not own certain types of lower-quality bonds that soared in value in 2009. For example, the Portfolio had a smaller exposure than the Index to the financial sector, which outperformed the Index in 2009. The Portfolio also had a larger exposure than the Index to defensive industries such as healthcare and electric utilities, which lagged the Index in 2009. As for security selection, holding bonds that performed particularly well in the paper sector helped the Portfolio’s performance versus the Index, but owning bank loans of a major utility holding company in Texas detracted from its relative performance.
Prudential Investments LLC (PI), an indirect, wholly owned subsidiary of Prudential Financial, Inc., serves as the investment manager for the Fund.
Barclays Capital U.S. High Yield 1% and 2% Issuer Capped Indexes cover the universe of U.S. dollar denominated, non-convertible, fixed-rate, non-investment-grade debt. Issuers are capped at 1% and 2% of the Index, respectively. Index holdings must have at least one year to final maturity, at least $150 million par amount outstanding, and be publicly issued with a rating of Ba1 or lower. Barclays Capital U.S. Corporate High Yield Bond Index is an unmanaged index of fixed-rate, non-investment-grade debt securities with at least one year remaining to maturity. It gives a broad look at how high yield (“junk”) bonds have performed. These returns do not include the effect of any investment management expenses. These returns would have been lower if they included the effect of these expenses. Investors cannot invest directly in a market index. For a complete list of holdings, refer to the Schedule of Investments section of this report.
| | |
The Prudential Series Fund, Jennison Portfolio Subadvised by: Jennison Associates LLC | | December 31, 2009 |
Investment Manager’s Report - As of December 31, 2009
Average Annual Total Return Percentages
| | | | | | | | | | | | |
| | | 1-Year | | | 5-Year | | | 10-Year | | | Since
Inception | |
Portfolio: Class I | | 43.03 | % | | 3.22 | % | | -2.45 | % | | N/A | |
Portfolio: Class II | | 42.58 | | | 2.80 | | | N/A | | | -3.42 | % |
Russell 1000® Growth Index | | 37.21 | | | 1.63 | | | -3.99 | | | -3.55 | |
S&P 500 Index | | 26.47 | | | 0.42 | | | -0.95 | | | -0.44 | |
Past performance does not guarantee future returns. The investment return and principal value of an investment will fluctuate, so that an investor’s shares, when redeemed, may be worth more or less than their original cost. Current performance may be lower or higher than the past performance data quoted.
$10,000 INVESTED OVER 10 YEARS1
Portfolio (Class I) inception: 4/25/1995. Portfolio (Class II) inception: 2/10/2000. Portfolio performance is net of investment fees and fund expenses, but not product charges, which, if included, would significantly lower the performance quoted. Unless noted otherwise, Index returns reflect performance beginning the closest month-end date to the Portfolio’s inception (Class II).
The Russell 1000® Growth Index is a trademark/service of the Frank Russell Company. Russell® is the Frank Russell Company. Performance figures may reflect fee waivers and/or expense reimbursements. In the absence of such fee waivers and/or expense reimbursements, total returns would be lower.
In the year ended December 31, 2009, the Jennison Portfolio Class I shares rose 43.03%, while the Class II shares rose 42.58%.
Information technology holdings contributed most to the Portfolio’s return, as both an overweighting relative to its benchmark, the Russell 1000® Growth Index (the Index), and strong stock selection were beneficial. Notable performers in the sector included a well-known computer innovator that is benefiting from its cutting-edge software for managing, editing, and sharing digital data, photos, music, and video. The company is also gaining access to significant incremental growth opportunities in the mobile phone market. Another key contributor advanced on its technological lead and dominant position in Internet search.
Stock selection was also strong in consumer discretionary, where an online retailer continues to be a prime beneficiary of the secular shift to e-commerce. Jennison believes this company’s highly targeted merchandising and ability to control pricing, fulfillment, and delivery times distinguish it from its e-commerce competitors. Jennison expects it to continue to gain market share in both overall retail and e-commerce.
In healthcare, an optical care leader benefited from takeover speculation and a leading pharmacy benefits manager gained on the industry’s positive fundamental outlook and the company’s diverse and differentiated product offering. In financials, a major financial services company, gained on strong capital markets activity, declining systemic risks, and an improving investment banking deal pipeline.
Key detractors from return included overweight positions relative to the Index in healthcare and energy, and stock selection in industrials, where a defense contractor fell on concerns that future defense spending might be affected by the tight federal budget. In the consumer staples sector, a major retailer was challenged by currency exchange issues, tough same-store sales results, and higher general and administrative expenses.
Prudential Investments LLC (PI), an indirect, wholly owned subsidiary of Prudential Financial, Inc., serves as the investment manager for the Fund.
| 1 | The graph is based on the performance of Class I shares. Performance of Class II shares will be lower due to differences in the fee structure. Class II shares have associated 12b-1 and administrative fees at an annual rate of 0.25% and 0.15%, respectively, of the average daily net assets of the Class II shares. |
Russell 1000 Growth Index is a market cap-weighted index that measures the performance of those Russell 1000 companies with higher price-to-book ratios and higher forecasted growth values. S&P 500 Index is an unmanaged, market value-weighted index of 500 stocks generally representative of the broad stock market. These returns do not include the effect of any investment management expenses. These returns would have been lower if they included the effect of these expenses. Investors cannot invest directly in a market index. For a complete list of holdings, refer to the Schedule of Investments section of this report.
| | |
The Prudential Series Fund, Money Market Portfolio Subadvised by: Prudential Investment Management, Inc. | | December 31, 2009 |
Investment Manager’s Report - As of December 31, 2009
Average Annual Total Return Percentages
| | | | | | | | | | | | |
| | | 7-Day*
Current
Net Yield | | | 1-Year | | | 5-Year | | | 10-Year | |
Portfolio | | 0.05 | % | | 0.40 | % | | 3.14 | % | | 2.92 | % |
Lipper (VIP) Money Market Funds Avg. | | N/A | | | 0.19 | | | 2.87 | | | 2.70 | |
Past performance does not guarantee future returns. The investment return and principal value of an investment will fluctuate, so that an investor’s shares, when redeemed, may be worth more or less than their original cost. Current performance may be lower or higher than the past performance data quoted.
7-DAY CURRENT NET YIELD*
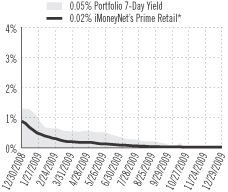
Portfolio inception: 5/13/1983. The yield quotation more closely reflects the current earnings of the Portfolio than the total return quotation. Portfolio performance is net of investment fees and fund expenses, but not product charges, which, if included, would significantly lower the performance quoted. Performance figures may reflect fee waivers and/or expense reimbursements. In the absence of such fee waivers and/or expense reimbursements, total returns would be lower.
For the year ended December 31, 2009, the Money Market Portfolio had a total return of 0.40%.
The U.S. government and the Federal Reserve took steps to steady the nation’s financial system and stimulate the economy. Both had been hurt by a protracted credit crisis. Improvement in the financial system began slowly, then accelerated as liquidity returned to the markets, boosting investor confidence. Meanwhile, key initiatives aimed at stimulating consumer spending aided the economic recovery.
Money market yields declined to historically low levels in 2009 as the Federal Open Market Committee kept its target for the overnight bank lending rate at a record low range of zero to 0.25%, and reiterated its desire for short-term rates to remain low for an extended period of time to boost economic growth. The decline in money market yields was further exacerbated by an enormous amount of cash that needed to be invested at a time when issuers were decreasing their reliance on short-term financing and, therefore, issuing fewer eligible money market securities.
The Portfolio outperformed the Lipper (VIP) Money Market Funds Average in 2009. On December 29, 2009, the Portfolio’s 7-day current net yield was 0.05%, down from 1.32% on December 30, 2008. This yield more closely reflects the current earnings of the Portfolio than does the total return.
Due to the uncertainty in the credit markets, the Portfolio continued to employ a conservative strategy. It invested primarily in money market securities of highly rated corporate issuers, highly rated banks, and government agencies. Additionally, the Portfolio also invested in overnight repurchase agreements, contracts in which a seller of securities agrees to buy them back the next day at a specified price. This prudent approach resulted in a high level of liquidity in the Portfolio and positioned the Portfolio’s weighted average maturity (WAM) shorter than that of the average comparable fund for much of the year. (WAM measures a fund’s sensitivity to changes in the level of interest rates. It considers the maturity and quantity of each security held in a portfolio.)
Prudential Investments LLC (PI), an indirect, wholly owned subsidiary of Prudential Financial, Inc., serves as the investment manager for the Fund.
| * | Source: iMoneyNet, Inc. based on 324 funds in the iMoneyNet Prime Retail universe. Weekly 7-day current net yields of the Money Market Portfolio and the iMoneyNet Prime Retail universe as of 12/29/2009. |
The Lipper Variable Insurance Products (VIP) Funds Averages are calculated by Lipper Analytical Services, Inc., and reflect the investment return of certain portfolios underlying variable life and annuity products. These returns are net of investment fees and fund expenses, but not product charges. These returns do not include the effect of any investment management expenses. These returns would have been lower if they included the effect of these expenses. Investors cannot invest directly in a market index or average. For a complete list of holdings refer to the Schedule of Investments section of this report.
| | |
The Prudential Series Fund, Natural Resources Portfolio Subadvised by: Jennison Associates LLC | | December 31, 2009 |
Investment Manager’s Report - As of December 31, 2009
Average Annual Total Return Percentages
| | | | | | | | | | | | |
| | | 1-Year | | | 5-Year | | | 10-Year | | | Since
Inception | |
Portfolio: Class I | | 77.10 | % | | 18.65 | % | | 19.67 | % | | N/A | |
Portfolio: Class II | | 76.41 | | | N/A | | | N/A | | | 18.76 | % |
Lipper (VIP) Natural Resources Funds Avg. | | 50.06 | | | 12.16 | | | 13.67 | | | 12.58 | |
Lipper (VUF) Natural Resources Funds Index | | 53.38 | | | 11.84 | | | N/A | | | 12.88 | |
S&P 500 Index | | 26.47 | | | 0.42 | | | -0.95 | | | 1.33 | |
Past performance does not guarantee future returns. The investment return and principal value of an investment will fluctuate, so that an investor’s shares, when redeemed, may be worth more or less than their original cost. Current performance may be lower or higher than the past performance data quoted.
$10,000 INVESTED OVER 10 YEARS1
Portfolio (Class I) inception: 5/1/1988. Portfolio (Class II) inception: 4/28/2005. Portfolio performance is net of investment fees and fund expenses, but not product charges, which, if included, would significantly lower the performance quoted. Unless noted otherwise, Index returns reflect performance beginning the closest month-end date to the Portfolio’s inception (Class II). Performance figures may reflect fee waivers and/or expense reimbursements. In the absence of such fee waivers and/or expense reimbursements, total returns would be lower.
For the year ended December 31, 2009, the Natural Resources Portfolio Class I shares rose 77.10%, while the Class II shares rose 76.41%. Jennison’s Natural Resources strategy seeks capital appreciation by investing in the stocks of companies that own, explore, mine, process, or otherwise develop natural resource commodities.
All industries that the Portfolio invested in achieved double-digit absolute returns for the year. Among the most meaningful contributors to performance were metals and mining, which advanced 90%, and energy equipment and services, which appreciated 83% during the year.
The top contributor to performance was a U.S.-based copper and gold producer. Shares rose as the company reported strong financial results that surpassed consensus expectations mostly on higher-than-expected volumes across all metals. Jennison believes a large, long-term supply deficit should boost prices for both of these commodities. Furthermore, Jennison has confidence in the company’s strong management team, which operated well during the commodities downturn by quickly reducing capital expenditures and production to strengthen its financial position while preserving its long-lived reserves and future growth options.
Another copper and gold producer, this one based in Canada, was among the key contributors to performance. The company operates properties in the Central African copper belt, including Zambia, the Democratic Republic of Congo (DRC) and Mauritania. The stock performed well following the completion of a convertible debt offering, which will allow the company to consider strategic merger and acquisition activity.
A Brazil-based early stage exploration and production company also contributed to performance. Jennison remains positive on the longer-term prospects for large-scale exploitation of Brazil’s offshore and believes share prices remain attractively valued despite recent appreciation.
Among the holdings that detracted from performance was an aluminum producer that declined sharply earlier in the year as rising aluminum inventories led to a significant price decline for the commodity. The company closed facilities and exercised strict production discipline. Share prices have begun to recover with an improving demand outlook for aluminum that is being driven by manufacturing growth in China.
An independent power producer also detracted from return. Weaker than previously issued 2010 guidance and the impending departure of the company’s CFO pressured shares. Jennison believes that the company is likely being conservative with its guidance and continues to hold the position, as it has the potential to be one of the best investments of the independent power producers.
Prudential Investments LLC (PI), an indirect, wholly owned subsidiary of Prudential Financial, Inc., serves as the investment manager for the Fund.
| 1 | The graph is based on the performance of Class I shares. Performance of Class II shares will be lower due to differences in the fee structure. Class II shares have associated 12b-1 and administrative fees at an annual rate of 0.25% and 0.15% respectively of the average daily net assets of the Class II shares. |
The Lipper Variable Insurance Products (VIP) Natural Resources Funds Averages are calculated by Lipper Analytical Services, Inc., and reflect the investment return of certain portfolios underlying variable life and annuity products. The Lipper Variable Underlying Funds (VUF) Natural Resources Funds Index consists of an equal dollar-weighted composite of the 10 largest funds in the Lipper VUF Natural Resources Fund classification. The index is rebalanced quarterly. Natural Resources Funds are deemed as funds that invest primarily in the equity securities of domestic and foreign companies engaged in natural resources. S&P 500 Index is an unmanaged, market value-weighted index of 500 stocks generally representative of the broad stock market. These returns are net of investment fees and fund expenses, but not product charges. Investors cannot invest directly in a market index or average. For a complete list of holdings, refer to the Schedule of Investments section of this report.
| | |
The Prudential Series Fund, Small Capitalization Stock Portfolio Subadvised by: Quantitative Management Associates LLC | | December 31, 2009 |
Investment Manager’s Report - As of December 31, 2009
Average Annual Total Return Percentages
| | | | | | | | | |
| | | 1-Year | | | 5-Year | | | 10-Year | |
Portfolio | | 25.18 | % | | 1.10 | % | | 6.09 | % |
S&P SmallCap 600 Index | | 25.57 | | | 1.36 | | | 6.35 | |
Past performance does not guarantee future returns. The investment return and principal value of an investment will fluctuate, so that an investor’s shares, when redeemed, may be worth more or less than their original cost. Current performance may be lower or higher than the past performance data quoted.
$10,000 INVESTED OVER 10 YEARS
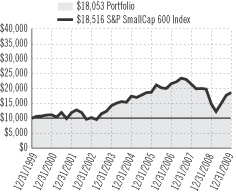
Portfolio inception: 4/25/1995. Portfolio performance is net of investment fees and fund expenses, but not product charges, which, if included, would significantly lower the performance quoted. Performance figures may reflect fee waivers and/or expense reimbursements. In the absence of such fee waivers and/or expense reimbursements, total returns would be lower.
For the year ended December 31, 2009, the Small Capitalization Stock Portfolio rose 25.18%.
Quantitative Management Associates, LLC runs the Portfolio, which is an index fund that uses quantitative techniques to replicate the holdings and weights of the S&P SmallCap 600 Index.
The Portfolio performed in line with the S&P SmallCap 600 Index, helped by income the Portfolio earned from lending its securities to others, favorable trading processes and results, and stabilizing interest rates.
The U.S. government and the Federal Reserve (the Fed) took steps to steady the nation’s financial system and stimulate the economy, both of which had been hurt by a protracted credit crisis. The financial system began to heal in 2009 and the economy began to tentatively emerge from the so-called “Great Recession,” even though job losses continued to climb. The favorable developments boosted investor confidence in stocks and a powerful rally in the U.S. stock market that began in March 2009 continued during the year.
Shares of small, risky value companies often are the first to outperform as an economic recovery begins. Initially, small-cap stocks outperformed large-cap stocks, while value stocks of all market capitalizations outperformed growth stocks. However, as U.S. debt and unemployment numbers grew, investors recognized that the economic recovery may be less robust than initially hoped. Consequently, larger, more established growth companies with the financial stamina to expand earnings and revenue during a prolonged economic malaise assumed leadership. For the year, mid-cap stocks outperformed both small- and large-cap stocks.
Within the S&P SmallCap 600 Index, seven out of 10 sectors scored double-digit gains for the year. The best performers were the energy and consumer discretionary sectors. The less economically sensitive utilities sector posted a single-digit gain for the year. The worst performers in 2009 were the financials sector, which posted a single-digit decline, and the telecommunications services sector, which posted a hefty double-digit decline. Large portions of the financial industry had nearly collapsed in 2008 and required extraordinary support by the federal government. Telecommunications were hamstrung by a combination of growing debt levels, due to expansion into the wireless arena from the fixed-line business, and falling revenues, due to declining consumer spending on telecommunications products, including cellular phones.
Prudential Investments LLC (PI), an indirect, wholly owned subsidiary of Prudential Financial, Inc., serves as the investment manager for the Fund.
S&P SmallCap 600 Index is an unmanaged index representing the aggregate market value of the common equity of 600 small-company stocks. These returns do not include the effect of any investment management expenses. These returns would have been lower if they included the effect of these expenses. Investors cannot invest directly in a market index. For a complete list of holdings refer to the Schedule of Investments section of this report.
| | |
The Prudential Series Fund, Stock Index Portfolio Subadvised by: Quantitative Management Associates LLC | | December 31, 2009 |
Investment Manager’s Report - As of December 31, 2009
Average Annual Total Return Percentages
| | | | | | | | | |
| | | 1-Year | | | 5-Year | | | 10-Year | |
Portfolio | | 26.07 | % | | 0.18 | % | | -1.16 | % |
S&P 500 Index | | 26.47 | | | 0.42 | | | -0.95 | |
Past performance does not guarantee future returns. The investment return and principal value of an investment will fluctuate, so that an investor’s shares, when redeemed, may be worth more or less than their original cost. Current performance may be lower or higher than the past performance data quoted.
$10,000 INVESTED OVER 10 YEARS
Portfolio inception: 10/19/1987. Portfolio performance is net of investment fees and fund expenses, but not product charges, which, if included, would significantly lower the performance quoted. Performance figures may reflect fee waivers and/or expense reimbursements. In the absence of such fee waivers and/or expense reimbursements, total returns would be lower.
For the year ended December 31, 2009, the Stock Index Portfolio rose 26.07%.
Quantitative Management Associates, LLC runs the Portfolio, which is an index fund that uses a quantitative approach to approximate the holdings and weights of the S&P 500 Index, except for shares of Prudential Financial, Inc. The Portfolio cannot hold these shares because of compliance restrictions.
The Portfolio performed in line with the S&P 500 Index in 2009. Income the Portfolio earned from lending its securities to others offset the negative impact from the restriction on holding shares of Prudential Financial.
The U.S. government and the Federal Reserve took steps to steady the nation’s financial system and stimulate the economy. Both had been hurt by a protracted credit crisis. The financial system began to heal in 2009 and the economy began to tentatively emerge from the so-called “Great Recession,” even though job losses continued to climb. The favorable developments helped boost investor confidence in stocks and a powerful rally in the U.S. stock market that began in March 2009 continued during the year.
All sectors of the S&P 500 Index benefited from the rally. The largest contributions came from more economically sensitive stocks, the cyclicals, including top contributors information technology, materials and consumer discretionary, which stand to benefit from a global economic rebound. Information technology benefited from strong balance sheets and the anticipation that companies would upgrade their technology in order to increase efficiencies. The materials sector was attractive for its exposure to companies tied to commodities. Consumer discretionary scored attractive returns based on stronger-than-anticipated consumer spending in light of tighter credit conditions and higher unemployment. The less economically sensitive utilities and telecommunications services sectors posted the worst, although still positive, returns of any sectors.
Prudential Investments LLC (PI), an indirect, wholly owned subsidiary of Prudential Financial, Inc., serves as the investment manager for the Fund.
S&P 500 Index is an unmanaged, market value-weighted index of 500 stocks generally representative of the broad stock market. These returns do not include the effect of any investment management expenses. These returns would have been lower if they included the effect of these expenses. Investors cannot invest directly in a market index. For a complete list of holdings refer to the Schedule of Investments section of this report.
| | |
The Prudential Series Fund, Value Portfolio Subadvised by: Jennison Associates LLC | | December 31, 2009 |
Investment Manager’s Report - As of December 31, 2009
Average Annual Total Return Percentages
| | | | | | | | | | | | |
| | | 1-Year | | | 5-Year | | | 10-Year | | | Since
Inception | |
Portfolio: Class I | | 41.93 | % | | 3.41 | % | | 4.52 | % | | N/A | |
Portfolio: Class II | | 41.39 | | | 3.00 | | | N/A | | | 2.83 | % |
Russell 1000® Value Index | | 19.69 | | | -0.25 | | | 2.47 | | | 2.20 | |
S&P 500 Index | | 26.47 | | | 0.42 | | | -0.95 | | | 0.59 | |
Past performance does not guarantee future returns. The investment return and principal value of an investment will fluctuate, so that an investor’s shares, when redeemed, may be worth more or less than their original cost. Current performance may be lower or higher than the past performance data quoted.
$10,000 INVESTED OVER 10 YEARS1
Portfolio (Class I) inception: 2/19/1988. Portfolio (Class II) inception: 5/14/2001. Portfolio performance is net of investment fees and fund expenses, but not product charges, which, if included, would significantly lower the performance quoted. Unless noted otherwise, Index returns reflect performance beginning the closest month-end date to the Portfolio’s inception (Class II). The Russell 1000® Value Index is a trademark/service mark of the Frank Russell Company. Russell® is a trademark of the Frank Russell Company. Performance figures may reflect fee waivers and/or expense reimbursements. In the absence of such fee waivers and/or expense reimbursements, total returns would be lower.
For the year ended December 31, 2009, the Value Portfolio Class I shares rose 41.93%, while the Class II shares rose 41.39%, significantly outperforming the Russell 1000® Value Index (the Index).
Stock selection nearly across the board drove the Portfolio’s strong returns.
Energy positions made the most meaningful positive impact on relative performance. Jennison remains bullish on the long-term supply/demand imbalances for oil and natural gas, and prefers exploration and production companies that are best positioned to benefit from rising oil/gas prices. The investment team also seeks exploration and production companies with low per-barrel operating costs.
The Portfolio’s overweight stance in information technology and stock selection in the financials, telecommunication services, healthcare, and consumer staples sectors also made a sizable contribution to relative performance.
The materials sector was the only sector that detracted from relative performance.
From the depths of their March lows, equity markets have posted impressive rebounds, with most indexes gaining 50% or more through year-end. Corporate profits, which have been much better than were thought possible at the beginning of 2009, largely due to workforce and inventory reductions, have provided much of the fuel for this recovery in equities. Favorable interest rate and liquidity conditions have been instrumental in spurring the rally, as well. Yet significant challenges remain, including high unemployment, still-weak housing markets, and probable increases in tax rates. Against this backdrop, Jennison remains cautiously optimistic.
Prudential Investments LLC (PI), an indirect, wholly owned subsidiary of Prudential Financial, Inc., serves as the investment manager for the Fund.
| 1 | The graph is based on the performance of Class I shares. Performance of Class II shares will be lower due to differences in the fee structure. Class II shares have associated 12b-1 and administrative fees at an annual rate of 0.25% and 0.15%, respectively, of the average daily net assets of the Class II shares. |
Russell 1000 Value Index is a market cap-weighted index that measures the performance of those Russell 1000 companies with lower price-to-book ratios and lower forecasted growth values. S&P 500 Index is an unmanaged, market value-weighted index of 500 stocks generally representative of the broad stock market. Investors cannot invest directly in a market index. For a complete list of holdings, refer to the Schedule of Investments section of this report.
| | |
The Prudential Series Fund Presentation of Portfolio Holdings — unaudited | | December 31, 2009 |
| | |
| Conservative Balanced |
| Five Largest Holdings (% of Net Assets) |
| Exxon Mobil Corp. | | 1.6% |
| Federal National Mortgage Association, 6.000%, TBA 30 YR | | 1.5% |
U.S. Treasury Notes,
2.625%, 12/31/14 | | 1.5% |
| Microsoft Corp. | | 1.2% |
| | | |
| Apple, Inc. | | 0.9% |
| | |
| Diversified Bond |
| Allocation (% of Net Assets) |
| Corporate Bonds | | 47.2% |
| Commercial Mortgage-Backed Securities | | 15.6% |
| U.S. Government Mortgage-Backed Securities | | 12.7% |
| Asset-Backed Securities | | 5.2% |
| Residential Mortgage-Backed Securities | | 3.7% |
| | |
| Equity |
| Five Largest Holdings (% of Net Assets) |
| Occidental Petroleum Corp. | | 2.9% |
| | | |
| Google, Inc. (Class A Stock) | | 2.9% |
| | | |
| Goldman Sachs Group, Inc. (The) | | 2.7% |
| Apple, Inc. | | 2.7% |
| | | |
| Amazon.com, Inc. | | 2.4% |
| | |
| Flexible Managed | | |
| Five Largest Holdings (% of Net Assets) |
| Exxon Mobil Corp. | | 2.1% |
| Apple, Inc. | | 1.4% |
| | | |
| Microsoft Corp. | | 1.3% |
| | | |
| Procter & Gamble Co. (The) | | 1.3% |
| | | |
| JPMorgan Chase & Co. | | 1.3% |
| | |
| Global |
| Top Five Countries (% of Net Assets) |
| United States | | 41.5% |
| United Kingdom | | 9.5% |
| | | |
| Japan | | 8.1% |
| | | |
| France | | 5.1% |
| | | |
| Switzerland | | 4.5% |
| | |
| Government Income |
| Allocation (% of Net Assets) |
| Mortgage-Backed Securities | | 42.5% |
| U.S. Treasury Securities | | 28.7% |
| U.S. Government Agency Obligations | | 8.8% |
| Commercial Mortgage-Backed Securities | | 8.5% |
| Collateralized Mortgage Obligations | | 3.7% |
| | |
| High Yield Bond |
| Allocation (% of Net Assets) |
| Corporate Bonds | | 89.2% |
| | | |
| Bank Loans | | 6.1% |
| Collateralized Mortgage Obligations | | 0.2% |
| Asset-Backed Securities | | 0.2% |
| Common Stocks | | 0.1% |
| | |
| Jennison |
| Five Largest Holdings (% of Net Assets) |
| Google, Inc. (Class A Stock) | | 4.9% |
| | | |
| Apple, Inc. | | 4.8% |
| | | |
| Amazon.com, Inc. | | 4.2% |
| Microsoft Corp. | | 4.1% |
| QUALCOMM, Inc. | | 3.5% |
| | |
| Natural Resources |
| Five Largest Holdings (% of Net Assets) |
| Southwestern Energy Co. | | 2.7% |
| Freeport-McMoRan Copper & Gold, Inc. | | 2.2% |
| | | |
| Occidental Petroleum Corp. | | 2.1% |
| Halliburton Co. | | 2.0% |
| Apache Corp. | | 1.8% |
| | |
| Small Capitalization Stock | | |
| Five Largest Holdings (% of Net Assets) |
| Mednax, Inc. | | 0.7% |
| Varian Semiconductor Equipment Associates, Inc. | | 0.7% |
| Skyworks Solutions, Inc. | | 0.6% |
| Gardener Denver, Inc. | | 0.6% |
| St Mary Land & Exploration Co. | | 0.5% |
| | |
| Stock Index | | |
| Five Largest Holdings (% of Net Assets) |
| Exxon Mobil Corp. | | 3.2% |
| | | |
| Microsoft Corp. | | 2.3% |
| Apple, Inc. | | 1.9% |
| Johnson & Johnson | | 1.8% |
| Procter & Gamble Co. (The) | | 1.8% |
| | |
| Value | | |
| Five Largest Holdings (% of Net Assets) |
| Symantec Corp. | | 3.0% |
| | | |
| CA, Inc. | | 3.0% |
| H&R Block, Inc. | | 2.5% |
| IAC/InterActiveCorp | | 2.4% |
| NII Holdings, Inc. | | 2.2% |
For a complete list of holdings, please refer to the Schedule of Investments section of this report. Holdings reflect only long-term investments. Holdings/Issues/Industries/Sectors are subject to change.
| | |
The Prudential Series Fund Fees and Expenses — unaudited | | December 31, 2009 |
As a contract owner investing in Portfolios of the Fund through a variable annuity or variable life contract, you incur ongoing costs, including management fees, and other Portfolio expenses. This example is intended to help you understand your ongoing costs (in dollars) of investing in the Fund and to compare these costs with the ongoing costs of investing in other investment options. This example does not reflect fees and charges under your variable annuity or variable life contract. If contract charges were included, the costs shown below would be higher. Please consult the prospectus for your contract for more information about contract fees and charges.
The example is based on an investment of $1,000 invested at the beginning of the period and held for the entire period July 1, 2009 through December 31, 2009.
Actual Expenses
The first line of the table below provides information about actual account values and actual expenses. You may use this information, together with the amount you invested, to estimate the Portfolio expenses that you paid over the period. Simply divide your account value by $1,000 (for example, an $8,600 account value divided by $1,000 = 8.6), then multiply the result by the number in the first line under the heading entitled “Expenses Paid During the Six-Month Period” to estimate the Portfolio expenses you paid on your account during this period. As noted above, the table does not reflect variable contract fees and charges.
Hypothetical Example for Comparison Purposes
The second line of the table below provides information about hypothetical account values and hypothetical expenses based on the Portfolio’s actual expense ratio and an assumed rate of return of 5% per year before expenses, which is not the Portfolio’s actual return. The hypothetical account values and expenses may not be used to estimate the actual ending account balance or expenses you paid for the period. You may use this information to compare the ongoing costs of investing in the Portfolio and other investment options. To do so, compare this 5% hypothetical example with the 5% hypothetical examples that appear in the shareholder reports of the other investment options.
Please note that the expenses shown in the table are meant to highlight your ongoing Portfolio costs only and do not reflect any contract fees and charges, such as sales charges (loads), insurance charges or administrative charges. Therefore the second line of the table is useful to compare ongoing investment option costs only, and will not help you determine the relative total costs of owning different contracts. In addition, if these contract fee and charges were included, your costs would have been higher.
| | | | | | | | | | | | | | |
| The Prudential Series Fund Portfolios | | Beginning
Account Value
July 1, 2009 | | Ending
Account Value
December 31, 2009 | | Annualized Expense
Ratio based on the
Six-Month period | | | Expenses Paid
During the
Six-Month period |
| Conservative Balanced (Class I) | | Actual | | $ | 1,000.00 | | $ | 1,150.80 | | 0.57 | % | | $ | 3.09 |
| | | Hypothetical | | $ | 1,000.00 | | $ | 1,022.33 | | 0.57 | % | | $ | 2.91 |
| Diversified Bond (Class I) | | Actual | | $ | 1,000.00 | | $ | 1,112.40 | | 0.42 | % | | $ | 2.24 |
| | | Hypothetical | | $ | 1,000.00 | | $ | 1,023.09 | | 0.42 | % | | $ | 2.14 |
| Equity (Class I) | | Actual | | $ | 1,000.00 | | $ | 1,241.00 | | 0.48 | % | | $ | 2.71 |
| | | Hypothetical | | $ | 1,000.00 | | $ | 1,022.79 | | 0.48 | % | | $ | 2.45 |
| Equity (Class II) | | Actual | | $ | 1,000.00 | | $ | 1,238.10 | | 0.88 | % | | $ | 4.96 |
| | | Hypothetical | | $ | 1,000.00 | | $ | 1,020.77 | | 0.88 | % | | $ | 4.48 |
| Flexible Managed (Class I) | | Actual | | $ | 1,000.00 | | $ | 1,161.90 | | 0.62 | % | | $ | 3.38 |
| | | Hypothetical | | $ | 1,000.00 | | $ | 1,022.08 | | 0.62 | % | | $ | 3.16 |
| Global (Class I) | | Actual | | $ | 1,000.00 | | $ | 1,222.90 | | 0.83 | % | | $ | 4.65 |
| | | Hypothetical | | $ | 1,000.00 | | $ | 1,021.02 | | 0.83 | % | | $ | 4.23 |
| Government Income (Class I) | | Actual | | $ | 1,000.00 | | $ | 1,046.90 | | 0.46 | % | | $ | 2.37 |
| | | Hypothetical | | $ | 1,000.00 | | $ | 1,022.89 | | 0.46 | % | | $ | 2.35 |
| High Yield Bond (Class I) | | Actual | | $ | 1,000.00 | | $ | 1,190.20 | | 0.58 | % | | $ | 3.20 |
| | | Hypothetical | | $ | 1,000.00 | | $ | 1,022.28 | | 0.58 | % | | $ | 2.96 |
| Jennison (Class I) | | Actual | | $ | 1,000.00 | | $ | 1,246.70 | | 0.63 | % | | $ | 3.57 |
| | | Hypothetical | | $ | 1,000.00 | | $ | 1,022.03 | | 0.63 | % | | $ | 3.21 |
| Jennison (Class II) | | Actual | | $ | 1,000.00 | | $ | 1,244.60 | | 1.03 | % | | $ | 5.83 |
| | | Hypothetical | | $ | 1,000.00 | | $ | 1,020.01 | | 1.03 | % | | $ | 5.24 |
| Money Market (Class I) | | Actual | | $ | 1,000.00 | | $ | 1,000.73 | | 0.36 | % | | $ | 1.82 |
| | | Hypothetical | | $ | 1,000.00 | | $ | 1,023.39 | | 0.36 | % | | $ | 1.84 |
| | |
The Prudential Series Fund Fees and Expenses — unaudited (continued) | | December 31, 2009 |
| | | | | | | | | | | | | | |
| The Prudential Series Fund Portfolios | | Beginning
Account Value
July 1, 2009 | | Ending
Account Value
December 31, 2009 | | Annualized Expense
Ratio based on the
Six-Month period | | | Expenses Paid
During the
Six-Month period |
| Natural Resources (Class I) | | Actual | | $ | 1,000.00 | | $ | 1,337.30 | | 0.53 | % | | $ | 3.12 |
| | | Hypothetical | | $ | 1,000.00 | | $ | 1,022.53 | | 0.53 | % | | $ | 2.70 |
| Natural Resources (Class II) | | Actual | | $ | 1,000.00 | | $ | 1,334.80 | | 0.93 | % | | $ | 5.47 |
| | | Hypothetical | | $ | 1,000.00 | | $ | 1,020.52 | | 0.93 | % | | $ | 4.74 |
| Small Capitalization Stock (Class I) | | Actual | | $ | 1,000.00 | | $ | 1,244.80 | | 0.47 | % | | $ | 2.66 |
| | Hypothetical | | $ | 1,000.00 | | $ | 1,022.84 | | 0.47 | % | | $ | 2.40 |
| Stock Index (Class I) | | Actual | | $ | 1,000.00 | | $ | 1,223.20 | | 0.36 | % | | $ | 2.02 |
| | | Hypothetical | | $ | 1,000.00 | | $ | 1,023.39 | | 0.36 | % | | $ | 1.84 |
| Value (Class I) | | Actual | | $ | 1,000.00 | | $ | 1,232.70 | | 0.42 | % | | $ | 2.36 |
| | | Hypothetical | | $ | 1,000.00 | | $ | 1,023.09 | | 0.42 | % | | $ | 2.14 |
| Value (Class II) | | Actual | | $ | 1,000.00 | | $ | 1,229.50 | | 0.82 | % | | $ | 4.61 |
| | | Hypothetical | | $ | 1,000.00 | | $ | 1,021.07 | | 0.82 | % | | $ | 4.18 |
Portfolio expenses (net of fee waivers or subsidies, if any) for each share class are equal to the annualized expense ratio for each share class (provided in the table), multiplied by the average account value over the period, multiplied by the 184 days in the six-month period ended December 31, 2009, and divided by the 365 days in the Portfolio’s fiscal year ended December 31, 2009 (to reflect the six-month period). Expenses presented in the table include the expenses of any underlying portfolios in which the Portfolio may invest.
| | | | | | |
| | | CONSERVATIVE BALANCED PORTFOLIO | | |
| |
| SCHEDULE OF INVESTMENTS | | December 31, 2009 |
| | | | | |
| LONG-TERM INVESTMENTS — 91.2% | | |
| COMMON STOCKS — 49.5% | | Shares
| | Value
(Note 2)
|
| | | | | | |
Aerospace & Defense — 1.4% | | | | | |
Boeing Co. (The) | | 77,000 | | $ | 4,168,010 |
General Dynamics Corp. | | 41,500 | | | 2,829,055 |
Goodrich Corp. | | 13,700 | | | 880,225 |
Honeywell International, Inc. | | 80,912 | | | 3,171,750 |
ITT Corp. | | 20,100 | | | 999,774 |
L-3 Communications Holdings, Inc. | | 11,900 | | | 1,034,705 |
Lockheed Martin Corp. | | 34,100 | | | 2,569,435 |
Northrop Grumman Corp. | | 33,662 | | | 1,880,023 |
Precision Castparts Corp. | | 13,900 | | | 1,533,865 |
Raytheon Co. | | 41,800 | | | 2,153,536 |
Rockwell Collins, Inc. | | 16,600 | | | 918,976 |
United Technologies Corp. | | 100,900 | | | 7,003,469 |
| | | | |
|
|
| | | | | | 29,142,823 |
| | | | |
|
|
Air Freight & Logistics — 0.5% | | | | | |
C.H. Robinson Worldwide, Inc. | | 18,800 | | | 1,104,124 |
Expeditors International of Washington, Inc. | | 22,700 | | | 788,371 |
FedEx Corp. | | 33,900 | | | 2,828,955 |
United Parcel Service, Inc. (Class B Stock) | | 107,000 | | | 6,138,590 |
| | | | |
|
|
| | | | | | 10,860,040 |
| | | | |
|
|
Airlines | | | | | |
Southwest Airlines Co. | | 79,300 | | | 906,399 |
| | | | |
|
|
Auto Components — 0.1% | | | | | |
Goodyear Tire & Rubber Co. (The)(a) | | 25,600 | | | 360,960 |
Johnson Controls, Inc. | | 70,600 | | | 1,923,144 |
| | | | |
|
|
| | | | | | 2,284,104 |
| | | | |
|
|
Automobiles — 0.2% | | | | | |
Ford Motor Co.(a)(b) | | 347,685 | | | 3,476,850 |
Harley-Davidson, Inc. | | 25,000 | | | 630,000 |
| | | | |
|
|
| | | | | | 4,106,850 |
| | | | |
|
|
Beverages — 1.3% | | | | | |
Brown-Forman Corp. (Class B Stock) | | 11,900 | | | 637,483 |
Coca-Cola Co. (The) | | 245,600 | | | 13,999,200 |
Coca-Cola Enterprises, Inc. | | 35,100 | | | 744,120 |
Constellation Brands, Inc. (Class A Stock)(a) | | 19,400 | | | 309,042 |
Dr Pepper Snapple Group, Inc. | | 27,800 | | | 786,740 |
Molson Coors Brewing Co. (Class B Stock) | | 17,100 | | | 772,236 |
Pepsi Bottling Group, Inc. | | 15,000 | | | 562,500 |
PepsiCo, Inc. | | 167,230 | | | 10,167,584 |
| | | | |
|
|
| | | | | | 27,978,905 |
| | | | |
|
|
Biotechnology — 0.8% | | | | | |
Amgen, Inc.(a) | | 108,920 | | | 6,161,604 |
Biogen Idec, Inc.(a)(b) | | 30,390 | | | 1,625,865 |
Celgene Corp.(a) | | 48,400 | | | 2,694,912 |
Cephalon, Inc.(a) | | 8,600 | | | 536,726 |
Genzyme Corp.(a) | | 26,400 | | | 1,293,864 |
Gilead Sciences, Inc.(a) | | 96,400 | | | 4,172,192 |
| | | | |
|
|
| | | | | | 16,485,163 |
| | | | |
|
|
Building Products | | | | | |
Masco Corp. | | 35,500 | | | 490,255 |
| | | | |
|
|
| | | | | |
COMMON STOCKS
(continued) | | Shares
| | Value
(Note 2)
|
| | | | | | |
Capital Markets — 1.4% | | | | | |
Ameriprise Financial, Inc. | | 28,720 | | $ | 1,114,911 |
Bank of New York Mellon Corp. (The) | | 130,058 | | | 3,637,722 |
Charles Schwab Corp. (The) | | 100,150 | | | 1,884,823 |
E*Trade Financial Corp.(a) | | 127,000 | | | 222,250 |
Federated Investors, Inc. (Class B Stock)(b) | | 10,800 | | | 297,000 |
Franklin Resources, Inc. | | 16,400 | | | 1,727,740 |
Goldman Sachs Group, Inc. (The) | | 55,700 | | | 9,404,388 |
Invesco Ltd. | | 48,300 | | | 1,134,567 |
Janus Capital Group, Inc.(b) | | 18,600 | | | 250,170 |
Legg Mason, Inc. | | 17,800 | | | 536,848 |
Morgan Stanley | | 146,980 | | | 4,350,608 |
Northern Trust Corp. | | 26,200 | | | 1,372,880 |
State Street Corp. | | 53,700 | | | 2,338,098 |
T. Rowe Price Group, Inc.(b) | | 27,800 | | | 1,480,350 |
| | | | |
|
|
| | | | | | 29,752,355 |
| | | | |
|
|
Chemicals — 1.0% | | | | | |
Air Products & Chemicals, Inc. | | 22,800 | | | 1,848,168 |
Airgas, Inc. | | 7,600 | | | 361,760 |
CF Industries Holdings, Inc. | | 5,700 | | | 517,446 |
Dow Chemical Co. (The) | | 121,731 | | | 3,363,428 |
E.I. du Pont de Nemours & Co. | | 95,320 | | | 3,209,424 |
Eastman Chemical Co. | | 7,800 | | | 469,872 |
Ecolab, Inc. | | 25,800 | | | 1,150,164 |
FMC Corp. | | 8,100 | | | 451,656 |
International Flavors & Fragrances, Inc. | | 9,600 | | | 394,944 |
Monsanto Co. | | 57,194 | | | 4,675,609 |
PPG Industries, Inc. | | 18,200 | | | 1,065,428 |
Praxair, Inc. | | 32,200 | | | 2,585,982 |
Sigma-Aldrich Corp. | | 12,200 | | | 616,466 |
| | | | |
|
|
| | | | | | 20,710,347 |
| | | | |
|
|
Commercial Banks — 1.4% | | | | | |
BB&T Corp.(b) | | 72,500 | | | 1,839,325 |
Comerica, Inc. | | 19,200 | | | 567,744 |
Fifth Third Bancorp | | 89,021 | | | 867,955 |
First Horizon National Corp.(a) | | 26,880 | | | 360,192 |
Huntington Bancshares, Inc. | | 77,936 | | | 284,466 |
KeyCorp | | 92,300 | | | 512,265 |
M&T Bank Corp.(b) | | 9,000 | | | 602,010 |
Marshall & Ilsley Corp. | | 48,500 | | | 264,325 |
PNC Financial Services Group, Inc. | | 50,033 | | | 2,641,242 |
Regions Financial Corp. | | 129,603 | | | 685,600 |
SunTrust Banks, Inc. | | 57,100 | | | 1,158,559 |
U.S. Bancorp | | 206,385 | | | 4,645,726 |
Wells Fargo & Co. | | 537,864 | | | 14,516,949 |
Zions Bancorporation(b) | | 13,550 | | | 173,847 |
| | | | |
|
|
| | | | | | 29,120,205 |
| | | | |
|
|
Commercial Services & Supplies — 0.3% | | | |
Avery Dennison Corp. | | 11,500 | | | 419,635 |
Cintas Corp. | | 14,600 | | | 380,330 |
Iron Mountain, Inc.(a)(b) | | 20,800 | | | 473,408 |
Matsuda Sangyo Co. Ltd. (Japan) | | 30 | | | 516 |
Pitney Bowes, Inc. | | 20,700 | | | 471,132 |
Republic Services, Inc. (Class A Stock) | | 35,065 | | | 992,690 |
SEE NOTES TO FINANCIAL STATEMENTS.
A1
| | | | | | |
| | | CONSERVATIVE BALANCED PORTFOLIO (continued) | | |
| |
| SCHEDULE OF INVESTMENTS | | December 31, 2009 |
| | | | | |
COMMON STOCKS
(continued) | | Shares
| | Value
(Note 2)
|
| | | | | | |
Commercial Services & Supplies (continued) | | | |
RR Donnelley & Sons Co. | | 21,400 | | $ | 476,578 |
Stericycle, Inc.(a)(b) | | 8,800 | | | 485,496 |
Waste Management, Inc.(b) | | 51,642 | | | 1,746,016 |
| | | | |
|
|
| | | | | | 5,445,801 |
| | | | |
|
|
Communications Equipment — 1.3% | | | |
Cisco Systems, Inc.(a) | | 617,600 | | | 14,785,344 |
Harris Corp. | | 14,200 | | | 675,210 |
JDS Uniphase Corp.(a) | | 21,475 | | | 177,169 |
Juniper Networks, Inc.(a)(b) | | 58,000 | | | 1,546,860 |
Motorola, Inc. | | 248,425 | | | 1,927,778 |
QUALCOMM, Inc. | | 175,600 | | | 8,123,256 |
Tellabs, Inc.(a) | | 45,800 | | | 260,144 |
| | | | |
|
|
| | | | | | 27,495,761 |
| | | | |
|
|
Computers & Peripherals — 3.0% | | | |
Apple, Inc.(a) | | 96,300 | | | 20,305,818 |
Dell, Inc.(a) | | 182,500 | | | 2,620,700 |
EMC Corp.(a) | | 218,950 | | | 3,825,057 |
Hewlett-Packard Co. | | 253,648 | | | 13,065,408 |
International Business Machines Corp. | | 140,700 | | | 18,417,630 |
Lexmark International, Inc. (Class A Stock)(a) | | 9,833 | | | 255,461 |
NetApp, Inc.(a) | | 35,700 | | | 1,227,723 |
QLogic Corp.(a)(b) | | 12,100 | | | 228,327 |
SanDisk Corp.(a)(b) | | 24,500 | | | 710,255 |
Sun Microsystems, Inc.(a) | | 79,275 | | | 742,807 |
Teradata Corp.(a) | | 19,300 | | | 606,599 |
Western Digital Corp.(a) | | 26,400 | | | 1,165,560 |
| | | | |
|
|
| | | | | | 63,171,345 |
| | | | |
|
|
Construction & Engineering — 0.1% | | | |
Fluor Corp. | | 19,100 | | | 860,264 |
Jacobs Engineering Group, Inc.(a)(b) | | 12,700 | | | 477,647 |
Quanta Services, Inc.(a) | | 20,100 | | | 418,884 |
| | | | |
|
|
| | | | | | 1,756,795 |
| | | | |
|
|
Construction Materials | | | | | |
Vulcan Materials Co. | | 13,400 | | | 705,778 |
| | | | |
|
|
Consumer Finance — 0.4% | | | | | |
American Express Co. | | 129,100 | | | 5,231,132 |
Capital One Financial Corp. | | 49,161 | | | 1,884,833 |
Discover Financial Services | | 60,540 | | | 890,543 |
SLM Corp.(a) | | 60,200 | | | 678,454 |
| | | | |
|
|
| | | | | | 8,684,962 |
| | | | |
|
|
Containers & Packaging — 0.1% | | | | | |
Ball Corp. | | 10,100 | | | 522,170 |
Bemis Co., Inc. | | 11,300 | | | 335,045 |
Owens-Illinois, Inc.(a) | | 17,500 | | | 575,225 |
Pactiv Corp.(a) | | 15,100 | | | 364,514 |
Sealed Air Corp. | | 17,100 | | | 373,806 |
| | | | |
|
|
| | | | | | 2,170,760 |
| | | | |
|
|
Distributors | | | | | |
Genuine Parts Co. | | 17,700 | | | 671,892 |
| | | | |
|
|
Diversified Consumer Services — 0.1% |
Apollo Group, Inc. (Class A Stock)(a)(b) | | 13,500 | | | 817,830 |
| | | | | |
COMMON STOCKS
(continued) | | Shares
| | Value
(Note 2)
|
| | | | | | |
Diversified Consumer Services (continued) |
DeVry, Inc. | | 6,300 | | $ | 357,399 |
H&R Block, Inc. | | 35,600 | | | 805,272 |
| | | | |
|
|
| | | | | | 1,980,501 |
| | | | |
|
|
Diversified Financial Services — 2.1% | | | | | |
Bank of America Corp. | | 1,061,121 | | | 15,980,482 |
Citigroup, Inc. | | 2,040,458 | | | 6,753,916 |
CME Group, Inc. (Class A Stock) | | 7,240 | | | 2,432,278 |
IntercontinentalExchange, Inc.(a)(b) | | 8,800 | | | 988,240 |
JPMorgan Chase & Co. | | 423,745 | | | 17,657,454 |
Leucadia National Corp.(a) | | 19,700 | | | 468,663 |
Moody’s Corp.(b) | | 23,600 | | | 632,480 |
Nasdaq OMX Group, Inc. (The)(a) | | 16,600 | | | 329,012 |
NYSE Euronext | | 30,500 | | | 771,650 |
| | | | |
|
|
| | | | | | 46,014,175 |
| | | | |
|
|
Diversified Telecommunication Services — 1.4% | | | |
AT&T, Inc. | | 632,368 | | | 17,725,275 |
CenturyTel, Inc.(b) | | 32,007 | | | 1,158,974 |
Frontier Communications Corp. | | 32,100 | | | 250,701 |
Qwest Communications International, Inc. | | 174,057 | | | 732,780 |
Verizon Communications, Inc. | | 305,476 | | | 10,120,420 |
Windstream Corp. | | 46,057 | | | 506,166 |
| | | | |
|
|
| | | | | | 30,494,316 |
| | | | |
|
|
Electric Utilities — 1.0% | | | | | |
Allegheny Energy, Inc. | | 16,800 | | | 394,464 |
American Electric Power Co., Inc. | | 51,860 | | | 1,804,209 |
Duke Energy Corp. | | 140,424 | | | 2,416,697 |
Edison International | | 36,400 | | | 1,265,992 |
Entergy Corp. | | 20,900 | | | 1,710,456 |
Exelon Corp. | | 70,574 | | | 3,448,951 |
FirstEnergy Corp. | | 32,601 | | | 1,514,317 |
FPL Group, Inc. | | 44,500 | | | 2,350,490 |
Northeast Utilities | | 18,200 | | | 469,378 |
Pepco Holdings, Inc. | | 23,800 | | | 401,030 |
Pinnacle West Capital Corp. | | 9,600 | | | 351,168 |
PPL Corp. | | 38,600 | | | 1,247,166 |
Progress Energy, Inc. | | 29,683 | | | 1,217,300 |
Southern Co. | | 84,500 | | | 2,815,540 |
| | | | |
|
|
| | | | | | 21,407,158 |
| | | | |
|
|
Electrical Equipment — 0.2% | | | | | |
Emerson Electric Co. | | 81,700 | | | 3,480,420 |
First Solar, Inc.(a)(b) | | 4,700 | | | 636,380 |
Rockwell Automation, Inc. | | 15,300 | | | 718,794 |
Roper Industries, Inc. | | 6,700 | | | 350,879 |
| | | | |
|
|
| | | | | | 5,186,473 |
| | | | |
|
|
Electronic Equipment & Instruments — 0.3% | | | |
Agilent Technologies, Inc.(a)(b) | | 35,614 | | | 1,106,527 |
Amphenol Corp. (Class A Stock) | | 18,700 | | | 863,566 |
Corning, Inc. | | 169,000 | | | 3,263,390 |
FLIR Systems, Inc.(a) | | 14,900 | | | 487,528 |
Jabil Circuit, Inc. | | 23,600 | | | 409,932 |
Molex, Inc. | | 15,000 | | | 323,250 |
| | | | |
|
|
| | | | | | 6,454,193 |
| | | | |
|
|
SEE NOTES TO FINANCIAL STATEMENTS.
A2
| | | | | | |
| | | CONSERVATIVE BALANCED PORTFOLIO (continued) | | |
| |
| SCHEDULE OF INVESTMENTS | | December 31, 2009 |
| | | | | |
COMMON STOCKS
(continued) | | Shares
| | Value
(Note 2)
|
| | | | | | |
Energy Equipment & Services — 0.9% | | | | | |
Baker Hughes, Inc.(b) | | 33,650 | | $ | 1,362,152 |
BJ Services Co. | | 28,600 | | | 531,960 |
Cameron International Corp.(a) | | 24,600 | | | 1,028,280 |
Diamond Offshore Drilling, Inc. | | 7,800 | | | 767,676 |
FMC Technologies, Inc.(a) | | 13,500 | | | 780,840 |
Halliburton Co. | | 95,200 | | | 2,864,568 |
Nabors Industries Ltd. (Bermuda)(a) | | 27,700 | | | 606,353 |
National Oilwell Varco, Inc. | | 45,500 | | | 2,006,095 |
Rowan Cos., Inc.(a) | | 13,200 | | | 298,848 |
Schlumberger Ltd. | | 128,300 | | | 8,351,047 |
Smith International, Inc. | | 23,600 | | | 641,212 |
| | | | |
|
|
| | | | | | 19,239,031 |
| | | | |
|
|
Food & Staples Retailing — 1.3% | | | | | |
Costco Wholesale Corp. | | 46,600 | | | 2,757,322 |
CVS Caremark Corp. | | 146,748 | | | 4,726,753 |
Kroger Co. (The) | | 65,746 | | | 1,349,766 |
Safeway, Inc. | | 45,400 | | | 966,566 |
SUPERVALU, Inc. | | 22,310 | | | 283,560 |
SYSCO Corp. | | 64,200 | | | 1,793,748 |
Walgreen Co. | | 105,500 | | | 3,873,960 |
Wal-Mart Stores, Inc. | | 229,700 | | | 12,277,465 |
Whole Foods Market, Inc.(a)(b) | | 16,200 | | | 444,690 |
| | | | |
|
|
| | | | | | 28,473,830 |
| | | | |
|
|
Food Products — 0.8% | | | | | |
Archer-Daniels-Midland Co. | | 69,426 | | | 2,173,728 |
Campbell Soup Co. | | 20,400 | | | 689,520 |
ConAgra Foods, Inc. | | 45,100 | | | 1,039,555 |
Dean Foods Co.(a)(b) | | 20,800 | | | 375,232 |
General Mills, Inc. | | 34,700 | | | 2,457,107 |
H.J. Heinz Co. | | 34,300 | | | 1,466,668 |
Hershey Co. (The)(b) | | 17,600 | | | 629,904 |
Hormel Foods Corp. | | 8,600 | | | 330,670 |
J.M. Smucker Co. (The) | | 12,500 | | | 771,875 |
Kellogg Co. | | 27,100 | | | 1,441,720 |
Kraft Foods, Inc. (Class A Stock) | | 156,353 | | | 4,249,675 |
McCormick & Co., Inc. | | 12,800 | | | 462,464 |
Sara Lee Corp. | | 75,800 | | | 923,244 |
Tyson Foods, Inc. (Class A Stock) | | 33,400 | | | 409,818 |
| | | | |
|
|
| | | | | | 17,421,180 |
| | | | |
|
|
Gas Utilities — 0.1% | | | | | |
EQT Corp. | | 13,700 | | | 601,704 |
Nicor, Inc. | | 4,700 | | | 197,870 |
Questar Corp. | | 16,800 | | | 698,376 |
| | | | |
|
|
| | | | | | 1,497,950 |
| | | | |
|
|
Healthcare Equipment & Supplies — 1.0% |
Baxter International, Inc. | | 64,000 | | | 3,755,520 |
Becton Dickinson And Co. | | 24,600 | | | 1,939,956 |
Boston Scientific Corp.(a) | | 160,467 | | | 1,444,203 |
C.R. Bard, Inc. | | 10,800 | | | 841,320 |
Carefusion Corp.(a) | | 19,475 | | | 487,070 |
DENTSPLY International, Inc. | | 16,200 | | | 569,754 |
Hospira, Inc.(a) | | 17,460 | | | 890,460 |
Intuitive Surgical, Inc.(a) | | 4,100 | | | 1,243,612 |
Medtronic, Inc. | | 117,600 | | | 5,172,048 |
St. Jude Medical, Inc.(a) | | 36,000 | | | 1,324,080 |
| | | | | |
COMMON STOCKS
(continued) | | Shares
| | Value
(Note 2)
|
| | | | | | |
Healthcare Equipment & Supplies (continued) |
Stryker Corp. | | 29,200 | | $ | 1,470,804 |
Varian Medical Systems, Inc.(a)(b) | | 13,100 | | | 613,735 |
Zimmer Holdings, Inc.(a) | | 23,000 | | | 1,359,530 |
| | | | |
|
|
| | | | | | 21,112,092 |
| | | | |
|
|
Healthcare Providers & Services — 1.1% |
Aetna, Inc. | | 45,400 | | | 1,439,180 |
AmerisourceBergen Corp. (Class A Stock) | | 33,700 | | | 878,559 |
Cardinal Health, Inc. | | 37,750 | | | 1,217,060 |
CIGNA Corp. | | 28,400 | | | 1,001,668 |
Coventry Health Care, Inc.(a) | | 17,050 | | | 414,145 |
DaVita, Inc.(a) | | 10,600 | | | 622,644 |
Express Scripts, Inc.(a) | | 28,900 | | | 2,498,405 |
Humana, Inc.(a) | | 16,700 | | | 732,963 |
Laboratory Corp. of America Holdings(a)(b) | | 11,400 | | | 853,176 |
McKesson Corp. | | 28,230 | | | 1,764,375 |
Medco Health Solutions, Inc.(a) | | 50,698 | | | 3,240,109 |
Patterson Cos., Inc.(a)(b) | | 9,000 | | | 251,820 |
Quest Diagnostics, Inc. | | 17,300 | | | 1,044,574 |
Tenet Healthcare Corp.(a) | | 44,600 | | | 240,394 |
UnitedHealth Group, Inc. | | 123,700 | | | 3,770,376 |
WellPoint, Inc.(a) | | 51,500 | | | 3,001,935 |
| | | | |
|
|
| | | | | | 22,971,383 |
| | | | |
|
|
Healthcare Technology | | | | | |
IMS Health, Inc. | | 21,800 | | | 459,108 |
| | | | |
|
|
Hotels, Restaurants & Leisure — 0.7% | | | | | |
Carnival Corp.(a) | | 46,300 | | | 1,467,247 |
Darden Restaurants, Inc. | | 13,950 | | | 489,227 |
International Game Technology | | 28,200 | | | 529,314 |
Marriott International, Inc. (Class A Stock) | | 25,228 | | | 687,463 |
McDonald’s Corp. | | 116,000 | | | 7,243,040 |
Starbucks Corp.(a)(b) | | 79,300 | | | 1,828,658 |
Starwood Hotels & Resorts Worldwide, Inc.(b) | | 18,200 | | | 665,574 |
Wyndham Worldwide Corp. | | 21,520 | | | 434,058 |
Wynn Resorts Ltd. | | 6,700 | | | 390,141 |
Yum! Brands, Inc. | | 50,200 | | | 1,755,494 |
| | | | |
|
|
| | | | | | 15,490,216 |
| | | | |
|
|
Household Durables — 0.2% | | | | | |
Black & Decker Corp. | | 6,900 | | | 447,327 |
D.R. Horton, Inc. | | 31,100 | | | 338,057 |
Fortune Brands, Inc. | | 16,600 | | | 717,120 |
Harman International Industries, Inc. | | 6,400 | | | 225,792 |
Leggett & Platt, Inc. | | 18,400 | | | 375,360 |
Lennar Corp. (Class A Stock) | | 17,200 | | | 219,644 |
Newell Rubbermaid, Inc. | | 32,914 | | | 494,039 |
Pulte Homes, Inc.(b) | | 35,522 | | | 355,220 |
Whirlpool Corp.(b) | | 7,926 | | | 639,311 |
| | | | |
|
|
| | | | | | 3,811,870 |
| | | | |
|
|
Household Products — 1.3% | | | | | |
Clorox Co.(b) | | 15,200 | | | 927,200 |
Colgate-Palmolive Co. | | 53,000 | | | 4,353,950 |
Kimberly-Clark Corp. | | 43,500 | | | 2,771,385 |
SEE NOTES TO FINANCIAL STATEMENTS.
A3
| | | | | | |
| | | CONSERVATIVE BALANCED PORTFOLIO (continued) | | |
| |
| SCHEDULE OF INVESTMENTS | | December 31, 2009 |
| | | | | |
COMMON STOCKS
(continued) | | Shares
| | Value
(Note 2)
|
| | | | | | |
Household Products (continued) | | | | | |
Procter & Gamble Co. (The) | | 312,225 | | $ | 18,930,202 |
| | | | |
|
|
| | | | | | 26,982,737 |
| | | | |
|
|
Independent Power Producers & Energy Traders — 0.1% |
AES Corp. (The)(a) | | 74,500 | | | 991,595 |
Constellation Energy Group, Inc. | | 21,200 | | | 745,604 |
| | | | |
|
|
| | | | | | 1,737,199 |
| | | | |
|
|
Industrial Conglomerates — 1.1% | | | | | |
3M Co. | | 75,600 | | | 6,249,852 |
General Electric Co. | | 1,131,000 | | | 17,112,030 |
Textron, Inc. | | 26,300 | | | 494,703 |
| | | | |
|
|
| | | | | | 23,856,585 |
| | | | |
|
|
Insurance — 1.1% | | | | | |
Aflac, Inc. | | 50,800 | | | 2,349,500 |
Allstate Corp. (The) | | 58,300 | | | 1,751,332 |
American International Group, Inc.(a)(b) | | 15,339 | | | 459,863 |
AON Corp. | | 30,100 | | | 1,154,034 |
Assurant, Inc. | | 15,600 | | | 459,888 |
Chubb Corp. | | 38,300 | | | 1,883,594 |
Cincinnati Financial Corp. | | 19,737 | | | 517,899 |
Genworth Financial, Inc. (Class A Stock)(a) | | 51,200 | | | 581,120 |
Hartford Financial Services Group, Inc. | | 41,000 | | | 953,660 |
Lincoln National Corp. | | 32,018 | | | 796,608 |
Loews Corp. | | 39,275 | | | 1,427,646 |
Marsh & McLennan Cos., Inc. | | 56,800 | | | 1,254,144 |
MetLife, Inc. | | 89,000 | | | 3,146,150 |
Principal Financial Group, Inc. | | 35,800 | | | 860,632 |
Progressive Corp. (The)(a) | | 74,100 | | | 1,333,059 |
Torchmark Corp. | | 10,000 | | | 439,500 |
Travelers Cos., Inc. (The) | | 61,135 | | | 3,048,191 |
Unum Group | | 39,010 | | | 761,475 |
XL Capital Ltd. (Class A Stock) | | 42,200 | | | 773,526 |
| | | | |
|
|
| | | | | | 23,951,821 |
| | | | |
|
|
Internet & Catalog Retail — 0.3% | | | | | |
Amazon.com, Inc.(a) | | 35,600 | | | 4,788,912 |
Expedia, Inc.(a) | | 23,300 | | | 599,043 |
priceline.com, Inc.(a) | | 4,200 | | | 917,700 |
| | | | |
|
|
| | | | | | 6,305,655 |
| | | | |
|
|
Internet Software & Services — 1.0% | | | | | |
Akamai Technologies, Inc.(a)(b) | | 18,300 | | | 463,539 |
eBay, Inc.(a) | | 119,300 | | | 2,808,322 |
Google, Inc. (Class A Stock)(a) | | 25,750 | | | 15,964,485 |
Verisign, Inc.(a)(b) | | 19,800 | | | 479,952 |
Yahoo!, Inc.(a) | | 128,000 | | | 2,147,840 |
| | | | |
|
|
| | | | | | 21,864,138 |
| | | | |
|
|
IT Services — 0.8% | | | | | |
Affiliated Computer Services, Inc. (Class A Stock)(a) | | 9,800 | | | 584,962 |
Automatic Data Processing, Inc. | | 53,400 | | | 2,286,588 |
Cognizant Technology Solutions Corp. (Class A Stock)(a) | | 30,200 | | | 1,368,060 |
Computer Sciences Corp.(a) | | 16,400 | | | 943,492 |
| | | | | |
COMMON STOCKS
(continued) | | Shares
| | Value
(Note 2)
|
| | | | | | |
IT Services (continued) | | | | | |
Fidelity National Information Services, Inc. | | 34,000 | | $ | 796,960 |
Fiserv, Inc.(a) | | 17,000 | | | 824,160 |
Mastercard, Inc. (Class A Stock) | | 10,100 | | | 2,585,398 |
Paychex, Inc. | | 33,100 | | | 1,014,184 |
SAIC, Inc.(a) | | 22,700 | | | 429,938 |
Total System Services, Inc. | | 19,096 | | | 329,788 |
Visa, Inc. (Class A Stock) | | 46,600 | | | 4,075,636 |
Western Union Co. (The) | | 76,010 | | | 1,432,788 |
| | | | |
|
|
| | | | | | 16,671,954 |
| | | | |
|
|
Leisure Equipment & Products — 0.1% | | | | | |
Eastman Kodak Co.(a)(b) | | 20,000 | | | 84,400 |
Hasbro, Inc. | | 12,200 | | | 391,132 |
Mattel, Inc. | | 38,251 | | | 764,255 |
| | | | |
|
|
| | | | | | 1,239,787 |
| | | | |
|
|
Life Sciences Tools & Services — 0.2% | | | | | |
Life Technologies Corp.(a)(b) | | 18,201 | | | 950,638 |
Millipore Corp.(a) | | 6,100 | | | 441,335 |
PerkinElmer, Inc. | | 12,600 | | | 259,434 |
Thermo Fisher Scientific, Inc.(a) | | 45,900 | | | 2,188,971 |
Waters Corp.(a)(b) | | 11,100 | | | 687,756 |
| | | | |
|
|
| | | | | | 4,528,134 |
| | | | |
|
|
Machinery — 0.8% | | | | | |
Caterpillar, Inc.(b) | | 65,900 | | | 3,755,641 |
Cummins, Inc. | | 22,400 | | | 1,027,264 |
Danaher Corp. | | 27,700 | | | 2,083,040 |
Deere & Co. | | 45,300 | | | 2,450,277 |
Dover Corp. | | 19,800 | | | 823,878 |
Eaton Corp. | | 18,400 | | | 1,170,608 |
Flowserve Corp. | | 6,500 | | | 614,445 |
Illinois Tool Works, Inc. | | 40,600 | | | 1,948,394 |
PACCAR, Inc. | | 36,943 | | | 1,339,923 |
Pall Corp. | | 12,000 | | | 434,400 |
Parker Hannifin Corp. | | 17,265 | | | 930,238 |
Snap-On, Inc. | | 7,000 | | | 295,820 |
Stanley Works (The)(b) | | 8,100 | | | 417,231 |
| | | | |
|
|
| | | | | | 17,291,159 |
| | | | |
|
|
Media — 1.4% | | | | | |
CBS Corp. (Class B Stock) | | 73,734 | | | 1,035,963 |
Comcast Corp. (Class A Stock) | | 308,690 | | | 5,204,513 |
DIRECTV (Class A Stock)(a) | | 98,300 | | | 3,278,305 |
Gannett Co., Inc. | | 22,500 | | | 334,125 |
Interpublic Group of Cos., Inc.(a) | | 49,500 | | | 365,310 |
McGraw-Hill Cos., Inc. (The) | | 34,600 | | | 1,159,446 |
Meredith Corp. | | 4,000 | | | 123,400 |
New York Times Co. (The) (Class A Stock)(a) | | 10,000 | | | 123,600 |
News Corp. (Class A Stock)(b) | | 241,100 | | | 3,300,659 |
Omnicom Group, Inc. | | 32,200 | | | 1,260,630 |
Scripps Networks Interactive, Inc. (Class A Stock) | | 9,600 | | | 398,400 |
Time Warner Cable, Inc. | | 37,314 | | | 1,544,427 |
Time Warner, Inc. | | 126,766 | | | 3,693,961 |
Viacom, Inc. (Class B Stock)(a) | | 65,934 | | | 1,960,218 |
Walt Disney Co. (The) | | 198,400 | | | 6,398,400 |
SEE NOTES TO FINANCIAL STATEMENTS.
A4
| | | | | | |
| | | CONSERVATIVE BALANCED PORTFOLIO (continued) | | |
| |
| SCHEDULE OF INVESTMENTS | | December 31, 2009 |
| | | | | |
COMMON STOCKS
(continued) | | Shares
| | Value
(Note 2)
|
| | | | | | |
Media (continued) | | | | | |
Washington Post Co. (The)
(Class B Stock) | | 600 | | $ | 263,760 |
| | | | |
|
|
| | | | | | 30,445,117 |
| | | | |
|
|
Metals & Mining — 0.5% |
AK Steel Holding Corp. | | 11,900 | | | 254,065 |
Alcoa, Inc. | | 102,240 | | | 1,648,109 |
Allegheny Technologies, Inc. | | 10,200 | | | 456,654 |
Cliffs Natural Resources, Inc. | | 10,000 | | | 460,900 |
Freeport-McMoRan Copper & Gold, Inc.(a) | | 44,794 | | | 3,596,510 |
Newmont Mining Corp. | | 52,800 | | | 2,497,968 |
Nucor Corp. | | 34,000 | | | 1,586,100 |
Titanium Metals Corp.(a) | | 4,000 | | | 50,080 |
United States Steel Corp. | | 15,600 | | | 859,872 |
| | | | |
|
|
| | | | | | 11,410,258 |
| | | | |
|
|
Multiline Retail — 0.4% |
Big Lots, Inc.(a)(b) | | 9,200 | | | 266,616 |
Family Dollar Stores, Inc. | | 14,300 | | | 397,969 |
J.C. Penney Co., Inc. | | 23,800 | | | 633,318 |
Kohl’s Corp.(a) | | 31,900 | | | 1,720,367 |
Macy’s, Inc. | | 44,874 | | | 752,088 |
Nordstrom, Inc.(b) | | 15,800 | | | 593,764 |
Sears Holdings Corp.(a)(b) | | 5,042 | | | 420,755 |
Target Corp. | | 80,000 | | | 3,869,600 |
| | | | |
|
|
| | | | | | 8,654,477 |
| | | | |
|
|
Multi-Utilities — 0.7% |
Ameren Corp. | | 24,500 | | | 684,775 |
CenterPoint Energy, Inc. | | 41,800 | | | 606,518 |
CMS Energy Corp.(b) | | 28,800 | | | 451,008 |
Consolidated Edison, Inc. | | 29,100 | | | 1,322,013 |
Dominion Resources, Inc. | | 62,932 | | | 2,449,313 |
DTE Energy Co. | | 16,600 | | | 723,594 |
Integrys Energy Group, Inc. | | 8,120 | | | 340,959 |
NiSource, Inc. | | 28,000 | | | 430,640 |
PG&E Corp. | | 38,600 | | | 1,723,490 |
Public Service Enterprise Group, Inc. | | 53,400 | | | 1,775,550 |
SCANA Corp. | | 11,300 | | | 425,784 |
Sempra Energy | | 25,619 | | | 1,434,152 |
TECO Energy, Inc. | | 20,500 | | | 332,510 |
Wisconsin Energy Corp. | | 12,300 | | | 612,909 |
Xcel Energy, Inc. | | 49,310 | | | 1,046,358 |
| | | | |
|
|
| | | | | | 14,359,573 |
| | | | |
|
|
Office Electronics |
Xerox Corp. | | 97,300 | | | 823,158 |
| | | | |
|
|
Oil, Gas & Consumable Fuels — 4.8% |
Anadarko Petroleum Corp. | | 52,654 | | | 3,286,663 |
Apache Corp. | | 36,014 | | | 3,715,564 |
Cabot Oil & Gas Corp. | | 11,500 | | | 501,285 |
Chesapeake Energy Corp. | | 68,300 | | | 1,767,604 |
Chevron Corp. | | 214,922 | | | 16,546,845 |
ConocoPhillips | | 159,177 | | | 8,129,169 |
Consol Energy, Inc. | | 18,600 | | | 926,280 |
Denbury Resources, Inc.(a)(b) | | 25,500 | | | 377,400 |
Devon Energy Corp. | | 48,300 | | | 3,550,050 |
El Paso Corp. | | 75,136 | | | 738,587 |
| | | | | |
COMMON STOCKS
(continued) | | Shares
| | Value
(Note 2)
|
| | | | | | |
Oil, Gas & Consumable Fuels (continued) |
EOG Resources, Inc. | | 27,200 | | $ | 2,646,560 |
Exxon Mobil Corp. | | 506,940 | | | 34,568,238 |
Hess Corp. | | 30,900 | | | 1,869,450 |
Marathon Oil Corp. | | 76,982 | | | 2,403,378 |
Massey Energy Co. | | 8,800 | | | 369,688 |
Murphy Oil Corp. | | 19,900 | | | 1,078,580 |
Noble Energy, Inc. | | 18,600 | | | 1,324,692 |
Occidental Petroleum Corp. | | 86,200 | | | 7,012,370 |
Peabody Energy Corp. | | 27,900 | | | 1,261,359 |
Pioneer Natural Resources Co. | | 11,000 | | | 529,870 |
Range Resources Corp. | | 16,900 | | | 842,465 |
Southwestern Energy Co.(a) | | 37,000 | | | 1,783,400 |
Spectra Energy Corp. | | 70,962 | | | 1,455,431 |
Sunoco, Inc. | | 10,300 | | | 268,830 |
Tesoro Corp.(b) | | 15,000 | | | 203,250 |
Valero Energy Corp. | | 61,400 | | | 1,028,450 |
Williams Cos., Inc. (The) | | 63,600 | | | 1,340,688 |
XTO Energy, Inc. | | 62,241 | | | 2,896,074 |
| | | | |
|
|
| | | | | | 102,422,220 |
| | | | |
|
|
Paper & Forest Products — 0.1% |
International Paper Co. | | 46,973 | | | 1,257,937 |
MeadWestvaco Corp. | | 16,514 | | | 472,796 |
Weyerhaeuser Co. | | 23,000 | | | 992,220 |
| | | | |
|
|
| | | | | | 2,722,953 |
| | | | |
|
|
Personal Products — 0.1% |
Avon Products, Inc. | | 45,700 | | | 1,439,550 |
Estee Lauder Cos., Inc. (The) (Class A Stock) | | 12,500 | | | 604,500 |
Mead Johnson Nutrition Co. (Class A Stock) | | 17,867 | | | 780,788 |
| | | | |
|
|
| | | | | | 2,824,838 |
| | | | |
|
|
Pharmaceuticals — 3.2% |
Abbott Laboratories | | 166,100 | | | 8,967,739 |
Allergan, Inc. | | 33,500 | | | 2,110,835 |
Bristol-Myers Squibb Co.(b) | | 186,270 | | | 4,703,317 |
Eli Lilly & Co. | | 107,100 | | | 3,824,541 |
Forest Laboratories, Inc.(a) | | 31,100 | | | 998,621 |
Johnson & Johnson | | 295,348 | | | 19,023,365 |
King Pharmaceuticals, Inc.(a) | | 23,866 | | | 292,836 |
Merck & Co., Inc. | | 327,333 | | | 11,960,748 |
Mylan, Inc.(a)(b) | | 30,900 | | | 569,487 |
Pfizer, Inc. | | 864,670 | | | 15,728,347 |
Watson Pharmaceuticals, Inc.(a)(b) | | 12,400 | | | 491,164 |
| | | | |
|
|
| | | | | | 68,671,000 |
| | | | |
|
|
Professional Services — 0.1% |
Dun & Bradstreet Corp. | | 5,800 | | | 489,346 |
Equifax, Inc. | | 12,700 | | | 392,303 |
Monster Worldwide, Inc.(a) | | 16,200 | | | 281,880 |
Robert Half International, Inc.(b) | | 15,700 | | | 419,661 |
| | | | |
|
|
| | | | | | 1,583,190 |
| | | | |
|
|
Real Estate Investment Trusts — 0.6% |
Apartment Investment & Management Co. (Class A Stock) | | 15,633 | | | 248,877 |
AvalonBay Communities, Inc.(b) | | 9,675 | | | 794,414 |
Boston Properties, Inc. | | 15,100 | | | 1,012,757 |
SEE NOTES TO FINANCIAL STATEMENTS.
A5
| | | | | | |
| | | CONSERVATIVE BALANCED PORTFOLIO (continued) | | |
| |
| SCHEDULE OF INVESTMENTS | | December 31, 2009 |
| | | | | |
COMMON STOCKS
(continued) | | Shares
| | Value
(Note 2)
|
| | | | | | |
Real Estate Investment Trusts (continued) |
Equity Residential(b) | | 31,000 | | $ | 1,047,180 |
HCP, Inc. | | 31,500 | | | 962,010 |
Health Care REIT, Inc. | | 13,300 | | | 589,456 |
Host Hotels & Resorts, Inc.(b) | | 66,782 | | | 779,346 |
Kimco Realty Corp.(b) | | 39,000 | | | 527,670 |
Plum Creek Timber Co., Inc.(b) | | 19,400 | | | 732,544 |
ProLogis(b) | | 48,600 | | | 665,334 |
Public Storage | | 14,400 | | | 1,172,880 |
Simon Property Group, Inc.(b) | | 30,643 | | | 2,445,311 |
Ventas, Inc. | | 17,200 | | | 752,328 |
Vornado Realty Trust(b) | | 18,025 | | | 1,260,669 |
| | | | |
|
|
| | | | | | 12,990,776 |
| | | | |
|
|
Real Estate Management & Development |
CB Richard Ellis Group, Inc. (Class A Stock)(a)(b) | | 28,100 | | | 381,317 |
| | | | |
|
|
Road & Rail — 0.5% |
Burlington Northern Santa Fe Corp. | | 28,200 | | | 2,781,084 |
CSX Corp. | | 42,600 | | | 2,065,674 |
Norfolk Southern Corp. | | 38,500 | | | 2,018,170 |
Ryder System, Inc. | | 4,900 | | | 201,733 |
Union Pacific Corp. | | 53,200 | | | 3,399,480 |
| | | | |
|
|
| | | | | | 10,466,141 |
| | | | |
|
|
Semiconductors & Semiconductor Equipment — 1.3% |
Advanced Micro Devices, Inc.(a) | | 68,800 | | | 665,984 |
Altera Corp.(b) | | 30,800 | | | 697,004 |
Analog Devices, Inc. | | 29,700 | | | 937,926 |
Applied Materials, Inc. | | 145,000 | | | 2,021,300 |
Broadcom Corp. (Class A Stock)(a) | | 46,450 | | | 1,460,853 |
Intel Corp. | | 596,100 | | | 12,160,440 |
KLA-Tencor Corp. | | 19,100 | | | 690,656 |
Linear Technology Corp. | | 23,300 | | | 711,582 |
LSI Corp.(a) | | 72,800 | | | 437,528 |
MEMC Electronic Materials, Inc.(a)(b) | | 25,400 | | | 345,948 |
Microchip Technology, Inc. | | 19,700 | | | 572,482 |
Micron Technology, Inc.(a)(b) | | 89,600 | | | 946,176 |
National Semiconductor Corp. | | 21,700 | | | 333,312 |
Novellus Systems, Inc.(a) | | 10,400 | | | 242,736 |
NVIDIA Corp.(a)(b) | | 58,450 | | | 1,091,846 |
Teradyne, Inc.(a)(b) | | 23,500 | | | 252,155 |
Texas Instruments, Inc. | | 138,000 | | | 3,596,280 |
Xilinx, Inc.(b) | | 27,900 | | | 699,174 |
| | | | |
|
|
| | | | | | 27,863,382 |
| | | | |
|
|
Software — 2.2% |
Adobe Systems, Inc.(a) | | 56,300 | | | 2,070,714 |
Autodesk, Inc.(a)(b) | | 23,700 | | | 602,217 |
BMC Software, Inc.(a) | | 19,900 | | | 797,990 |
CA, Inc. | | 43,364 | | | 973,956 |
Citrix Systems, Inc.(a)(b) | | 20,500 | | | 853,005 |
Compuware Corp.(a) | | 21,200 | | | 153,276 |
Electronic Arts, Inc.(a)(b) | | 33,000 | | | 585,750 |
Intuit, Inc.(a) | | 35,500 | | | 1,090,205 |
McAfee, Inc.(a)(b) | | 16,400 | | | 665,348 |
Microsoft Corp. | | 825,300 | | | 25,163,397 |
Novell, Inc.(a) | | 35,200 | | | 146,080 |
Oracle Corp. | | 417,300 | | | 10,240,542 |
Red Hat, Inc.(a) | | 18,800 | | | 580,920 |
| | | | | |
COMMON STOCKS
(continued) | | Shares
| | Value
(Note 2)
|
| | | | | | |
Software (continued) |
Salesforce.com, Inc.(a) | | 10,800 | | $ | 796,716 |
Symantec Corp.(a) | | 88,978 | | | 1,591,816 |
| | | | |
|
|
| | | | | | 46,311,932 |
| | | | |
|
|
Specialty Retail — 1.0% |
Abercrombie & Fitch Co. (Class A Stock) | | 8,700 | | | 303,195 |
AutoNation, Inc.(a)(b) | | 11,474 | | | 219,727 |
AutoZone, Inc.(a)(b) | | 3,300 | | | 521,631 |
Bed Bath & Beyond, Inc.(a)(b) | | 28,800 | | | 1,112,544 |
Best Buy Co., Inc. | | 35,925 | | | 1,417,600 |
GameStop Corp. (Class A Stock)(a)(b) | | 19,400 | | | 425,636 |
Gap, Inc. (The) | | 53,800 | | | 1,127,110 |
Home Depot, Inc. (The) | | 180,650 | | | 5,226,205 |
Limited Brands, Inc. | | 31,106 | | | 598,479 |
Lowe’s Cos., Inc. | | 157,400 | | | 3,681,586 |
Office Depot, Inc.(a) | | 27,800 | | | 179,310 |
O’Reilly Automotive, Inc.(a) | | 11,200 | | | 426,944 |
RadioShack Corp. | | 11,900 | | | 232,050 |
Ross Stores, Inc. | | 8,300 | | | 354,493 |
Sherwin-Williams Co. (The)(b) | | 10,300 | | | 634,995 |
Staples, Inc. | | 77,849 | | | 1,914,307 |
Tiffany & Co. | | 14,400 | | | 619,200 |
TJX Cos., Inc. | | 45,000 | | | 1,644,750 |
| | | | |
|
|
| | | | | | 20,639,762 |
| | | | |
|
|
Textiles, Apparel & Luxury Goods — 0.2% |
Coach, Inc. | | 35,500 | | | 1,296,815 |
NIKE, Inc. (Class B Stock) | | 41,700 | | | 2,755,119 |
Polo Ralph Lauren Corp. (Class A Stock) | | 6,500 | | | 526,370 |
VF Corp. | | 9,200 | | | 673,808 |
| | | | |
|
|
| | | | | | 5,252,112 |
| | | | |
|
|
Thrifts & Mortgage Finance — 0.1% |
Hudson City Bancorp, Inc.(b) | | 58,500 | | | 803,205 |
People’s United Financial, Inc. | | 42,300 | | | 706,410 |
| | | | |
|
|
| | | | | | 1,509,615 |
| | | | |
|
|
Tobacco — 0.8% |
Altria Group, Inc. | | 219,500 | | | 4,308,785 |
Lorillard, Inc. | | 17,047 | | | 1,367,681 |
Philip Morris International, Inc. | | 205,300 | | | 9,893,407 |
Reynolds American, Inc. | | 17,800 | | | 942,866 |
| | | | |
|
|
| | | | | | 16,512,739 |
| | | | |
|
|
Trading Companies & Distributors — 0.1% | | | |
Fastenal Co.(b) | | 14,700 | | | 612,108 |
W.W. Grainger, Inc. | | 6,900 | | | 668,127 |
| | | | |
|
|
| | | | | | 1,280,235 |
| | | | |
|
|
Wireless Telecommunication Services — 0.1% |
American Tower Corp. (Class A Stock)(a) | | 43,100 | | | 1,862,351 |
MetroPCS Communications, Inc.(a) | | 26,000 | | | 198,380 |
Sprint Nextel Corp.(a) | | 312,277 | | | 1,142,934 |
| | | | |
|
|
| | | | | | 3,203,665 |
| | | | |
|
|
TOTAL COMMON STOCKS
(cost $824,429,851) | | | 1,058,711,645 |
| | | | |
|
|
SEE NOTES TO FINANCIAL STATEMENTS.
A6
| | | | | | |
| | | CONSERVATIVE BALANCED PORTFOLIO (continued) | | |
| |
| SCHEDULE OF INVESTMENTS | | December 31, 2009 |
| | | | | | | | | | | | |
| ASSET-BACKED SECURITIES — 0.7% | | Moody’s
Rating
(Unaudited)†
| | Interest
Rate
| | Maturity
Date
| | Principal
Amount
(000)
| | Value
(Note 2)
|
| | | | | | | | | | | | | |
ARES CLO Funds (Cayman Islands), Ser. 2003-7AW, Class A1A, 144A(d) | | A2 | | 0.625% | | 05/08/15 | | $ | 2,460 | | $ | 2,318,943 |
Ballyrock CDO Ltd. (Cayman Islands), Ser. 2003-2A, Class A, 144A(d) | | Aa2 | | 0.799% | | 11/20/15 | | | 2,771 | | | 2,577,114 |
Bank of America Credit Card Trust, Ser. 2006-C5, Class C5(d) | | Baa1 | | 0.633% | | 01/15/16 | | | 4,159 | | | 3,584,655 |
Chatham Light CLO Ltd. (Cayman Islands), Ser. 2005-2A, Class A1, 144A(d) | | Aa1 | | 0.531% | | 08/03/19 | | | 495 | | | 450,560 |
Citibank Credit Card Issuance Trust, Ser. 2006-C1, Class C1(d) | | Baa2 | | 0.633% | | 02/20/15 | | | 1,500 | | | 1,371,253 |
Granite Ventures Ltd. (Cayman Islands), Ser. 2005-2A, Class A1, 144A(d) | | Aaa | | 0.544% | | 12/15/17 | | | 3,200 | | | 2,992,000 |
Mountain Capital CLO Ltd. (Cayman Islands), Ser. 2004-3A, Class A1LA, 144A(d) | | Aaa | | 0.688% | | 02/15/16 | | | 2,336 | | | 2,219,029 |
SVO VOI Mortgage Corp., Ser. 2005-AA, Class A, 144A | | Aaa | | 5.250% | | 02/20/21 | | | 477 | | | 440,041 |
| | | | | | | | | | | |
|
|
TOTAL ASSET-BACKED SECURITIES
(cost $16,652,160) | | | 15,953,595 |
| | | | | | | | | | | |
|
|
| BANK LOANS — 0.7% | | | | | | | | | | | | |
Automotive | | | | | | | | | | | | |
Oshkosh Truck Corp.(d)(e) | | B2 | | 6.269% | | 12/06/13 | | | 211 | | | 210,446 |
| | | | | | | | | | | |
|
|
Cable | | | | | | | | | | | | |
Insight Midwest Holding LLC(d)(e) | | B1 | | 1.790% | | 10/06/13 | | | 1,005 | | | 943,627 |
| | | | | | | | | | | |
|
|
Consumer | | | | | | | | | | | | |
Pilot Travel Centers LLC(d)(e) | | Ba2 | | TBA | | 12/31/15 | | | 300 | | | 301,197 |
| | | | | | | | | | | |
|
|
Electric — 0.1% | | | | | | | | | | | | |
NRG Energy(d)(e) | | Baa3 | | 0.151% | | 02/01/13 | | | 177 | | | 168,299 |
NRG Energy(d)(e) | | Baa3 | | 1.996% | | 02/01/13 | | | 301 | | | 285,544 |
Texas Competitive Electric Holdings Co. LLC(d)(e) | | B1 | | 3.735% | | 10/10/14 | | | 978 | | | 794,219 |
| | | | | | | | | | | |
|
|
| | | | | | | | | | | | | 1,248,062 |
| | | | | | | | | | | |
|
|
Healthcare & Pharmaceutical — 0.3% | | | | | | | | | | | | |
DaVita, Inc.(d)(e) | | Ba1 | | 1.748% | | 10/05/12 | | | 1,200 | | | 1,161,667 |
HCA, Inc.(d)(e) | | Ba3 | | 2.501% | | 11/18/13 | | | 1,481 | | | 1,412,592 |
Health Management Associates, Inc. Term B(d)(e) | | B1 | | 2.001% | | 02/28/14 | | | 1,104 | | | 1,026,794 |
Warner Chilcott Corp.(d)(e) | | B1 | | 5.500% | | 10/30/14 | | | 979 | | | 979,572 |
Warner Chilcott Corp.(d)(e) | | B1 | | 5.750% | | 04/30/15 | | | 1,077 | | | 1,077,530 |
Warner Chilcott Corp.(d)(e) | | B1 | | 5.750% | | 04/30/15 | | | 489 | | | 489,786 |
| | | | | | | | | | | |
|
|
| | | | | | | | | | | | | 6,147,941 |
| | | | | | | | | | | |
|
|
Media & Entertainment — 0.1% | | | | | | | | | | | | |
Discovery Communications, Inc.(d)(e) | | Baa3 | | 5.250% | | 05/14/14 | | | 953 | | | 960,541 |
| | | | | | | | | | | |
|
|
Paper | | | | | | | | | | | | |
Domtar, Inc.(d)(e) | | Baa3 | | 1.608% | | 03/05/14 | | | 523 | | | 507,854 |
| | | | | | | | | | | |
|
|
Pipelines & Other | | | | | | | | | | | | |
Enterprise GP Holdings LP(d)(e) | | Ba2 | | 2.514% | | 11/08/14 | | | 980 | | | 934,675 |
| | | | | | | | | | | |
|
|
Technology — 0.2% | | | | | | | | | | | | |
Fidelity National Information Services, Inc.(d)(e) | | Ba1 | | 4.481% | | 01/18/12 | | | 119 | | | 118,711 |
First Data Corp.(d)(e) | | B1 | | 2.983% | | 09/24/14 | | | 1,075 | | | 952,492 |
First Data Corp.(d)(e) | | B1 | | 2.999% | | 09/24/14 | | | 1,466 | | | 1,296,715 |
Flextronics International Ltd. (Singapore)(d)(e) | | Ba1 | | 2.514% | | 10/01/14 | | | 759 | | | 701,727 |
Flextronics International Ltd. (Singapore)(d)(e) | | Ba1 | | 2.534% | | 10/01/14 | | | 218 | | | 201,646 |
Sensata Technologies (Netherlands)(d)(e) | | B2 | | 2.031% | | 04/27/13 | | | 335 | | | 297,216 |
| | | | | | | | | | | |
|
|
| | | | | | | | | | | | | 3,568,507 |
| | | | | | | | | | | |
|
|
TOTAL BANK LOANS
(cost $15,512,638) | | | 14,822,850 |
| | | | | | | | | | | |
|
|
| COLLATERALIZED MORTGAGE OBLIGATIONS — 0.5% | | | | | | | | | | | | |
Banc of America Alternative Loan Trust, Ser. 2005-12, Class 3CB1 | | B3 | | 6.000% | | 01/25/36 | | | 3,139 | | | 2,382,756 |
Banc of America Mortgage Securities, Inc., Ser. 2005-A, Class 2A1(d) | | Ba1 | | 4.439% | | 02/25/35 | | | 848 | | | 651,136 |
SEE NOTES TO FINANCIAL STATEMENTS.
A7
| | | | | | |
| | | CONSERVATIVE BALANCED PORTFOLIO (continued) | | |
| |
| SCHEDULE OF INVESTMENTS | | December 31, 2009 |
| | | | | | | | | | | | |
COLLATERALIZED MORTGAGE OBLIGATIONS
(continued) | | Moody’s
Rating
(Unaudited)†
| | Interest
Rate
| | Maturity
Date
| | Principal
Amount
(000)
| | Value
(Note 2)
|
| | | | | | | | | | | | | |
Banc of America Mortgage Securities, Inc., Ser. 2005-B, Class 2A1(d) | | Ba2 | | 4.375% | | 03/25/35 | | $ | 834 | | $ | 660,569 |
Chase Mortgage Finance Corp., Ser. 2007-A1, Class 1A5(d) | | Ba2 | | 3.899% | | 02/25/37 | | | 2,347 | | | 2,168,044 |
Countrywide Alternative Loan Trust, Ser. 2004-18CB, Class 3A1 | | A1 | | 5.250% | | 09/25/19 | | | 1,289 | | | 1,247,205 |
JPMorgan Mortgage Trust, Ser. 2007-A1, Class 4A1(d) | | B1 | | 4.067% | | 07/25/35 | | | 1,483 | | | 1,333,000 |
Master Alternative Loans Trust, Ser. 2004-4, Class 4A1 | | Aaa | | 5.000% | | 04/25/19 | | | 351 | | | 331,413 |
Structured Adjustable Rate Mortgage Loan Trust, Ser. 2004-1, Class 4A3(d) | | A1 | | 3.586% | | 02/25/34 | | | 822 | | | 680,196 |
Washington Mutual Alternative Mortgage Pass-Thru Certificates, Ser. 2005-1, Class 3A | | AAA(f) | | 5.000% | | 03/25/20 | | | 841 | | | 644,645 |
| | | | | | | | | | | |
|
|
TOTAL COLLATERALIZED MORTGAGE OBLIGATIONS
(cost $11,907,535) | | | 10,098,964 |
| | | | | | | | | | | |
|
|
| COMMERCIAL MORTGAGE-BACKED SECURITIES — 4.8% | | | | | | |
Banc of America Commercial Mortgage, Inc., Ser. 2004-2, Class A4 | | Aaa | | 4.153% | | 11/10/38 | | | 3,680 | | | 3,666,890 |
Banc of America Commercial Mortgage, Inc., Ser. 2005-1, Class ASB(d) | | AAA(f) | | 4.965% | | 11/10/42 | | | 834 | | | 856,127 |
Banc of America Commercial Mortgage, Inc., Ser. 2006-4, Class A3A | | Aaa | | 5.600% | | 07/10/46 | | | 2,000 | | | 2,031,327 |
Banc of America Commercial Mortgage, Inc., Ser. 2007-3, Class A2(d) | | Aaa | | 5.658% | | 06/10/49 | | | 5,730 | | | 5,829,967 |
Bear Stearns Commercial Mortgage Securities, Ser. 2005-T18, Class AAB(d) | | Aaa | | 4.823% | | 02/13/42 | | | 2,250 | | | 2,271,335 |
Bear Stearns Commercial Mortgage Securities, Ser. 2005-T20, Class AAB(d) | | Aaa | | 5.133% | | 10/12/42 | | | 3,000 | | | 3,076,364 |
Bear Stearns Commercial Mortgage Securities, Ser. 2006-PW11, Class A4(d) | | AAA(f) | | 5.456% | | 03/11/39 | | | 1,200 | | | 1,172,916 |
Commercial Mortgage Acceptance Corp., Ser. 1998-C2, Class F, 144A(d) | | A-(f) | | 5.440% | | 09/15/30 | | | 890 | | | 847,827 |
Commercial Mortgage Loan Trust, Ser. 2008-LS1, Class A2(d) | | Aaa | | 6.019% | | 12/10/49 | | | 2,100 | | | 2,154,120 |
Commercial Mortgage Pass-Thru Certificates, Ser. 2006-C7, Class A4(d) | | AAA(f) | | 5.768% | | 06/10/46 | | | 4,000 | | | 3,922,356 |
Commercial Mortgage Pass-Thru Certificate, Ser. 2004-LB2A, Class X2, I/O, 144A(d) | | AAA(f) | | 0.862% | | 03/10/39 | | | 10,893 | | | 97,658 |
Commercial Mortgage Pass-Thru Certificate, Ser. 2006-C8, Class A2B | | Aaa | | 5.248% | | 12/10/46 | | | 3,740 | | | 3,755,383 |
Credit Suisse Mortgage Capital Certificates, Ser. 2006-C1, Class A4(d) | | AAA(f) | | 5.548% | | 02/15/39 | | | 4,330 | | | 4,265,238 |
CS First Boston Mortgage Securities Corp., Ser. 2004-C4, Class A4 | | Aaa | | 4.283% | | 10/15/39 | | | 1,500 | | | 1,501,399 |
CS First Boston Mortgage Securities Corp., Ser. 2005-C5, Class A4(d) | | AAA(f) | | 5.100% | | 08/15/38 | | | 3,000 | | | 2,890,196 |
CW Capital Cobalt Ltd., Ser. 2007-C3, Class A3(d) | | AAA(f) | | 5.820% | | 05/15/46 | | | 2,100 | | | 2,033,124 |
DLJ Commercial Mortgage Corp., Ser. 2000-CF1, Class A1B | | AAA(f) | | 7.620% | | 06/10/33 | | | 674 | | | 675,487 |
GE Commercial Mortgage Corp., Ser. 2004-C2, Class X2, I/O, 144A(d) | | Aaa | | 0.598% | | 03/10/40 | | | 20,836 | | | 148,871 |
GMAC Commercial Mortgage Securities, Inc., Ser. 2005-C1, Class A5 | | AAA(f) | | 4.697% | | 05/10/43 | | | 2,610 | | | 2,546,133 |
Greenwich Capital Commercial Funding Corp., Ser. 2005-GG5, Class A5(d) | | Aaa | | 5.224% | | 04/10/37 | | | 1,400 | | | 1,326,094 |
Greenwich Capital Commercial Funding Corp., Ser. 2007-GG9, Class A2 | | Aaa | | 5.381% | | 03/10/39 | | | 4,000 | | | 4,052,193 |
JPMorgan Chase Commercial Mortgage Securities Corp., Ser. 2005-LDP1, Class ASB(d) | | Aaa | | 4.853% | | 03/15/46 | | | 3,571 | | | 3,628,680 |
JPMorgan Chase Commercial Mortgage Securities Corp.,
Ser. 2005-LDP2, Class ASB | | Aaa | | 4.659% | | 07/15/42 | | | 6,380 | | | 6,446,264 |
JPMorgan Chase Commercial Mortgage Securities Corp.,
Ser. 2005-LDP5, Class A4(d) | | Aaa | | 5.179% | | 12/15/44 | | | 3,630 | | | 3,593,597 |
JPMorgan Chase Commercial Mortgage Securities Corp.,
Ser. 2006-CB16, Class ASB | | Aaa | | 5.523% | | 05/12/45 | | | 2,000 | | | 1,979,266 |
JPMorgan Chase Commercial Mortgage Securities Corp.,
Ser. 2006-LDP6, Class A4(d) | | Aaa | | 5.475% | | 04/15/43 | | | 2,436 | | | 2,343,960 |
SEE NOTES TO FINANCIAL STATEMENTS.
A8
| | | | | | |
| | | CONSERVATIVE BALANCED PORTFOLIO (continued) | | |
| |
| SCHEDULE OF INVESTMENTS | | December 31, 2009 |
| | | | | | | | | | | | |
COMMERCIAL MORTGAGE-BACKED SECURITIES
(continued) | | Moody’s
Rating
(Unaudited)†
| | Interest
Rate
| | Maturity
Date
| | Principal
Amount
(000)
| | Value
(Note 2)
|
| | | | | | | | | | | | | |
JPMorgan Chase Commercial Mortgage Securities Corp.,
Ser. 2006-LDP6, Class X2, I/O(d) | | Aaa | | 0.066% | | 04/15/43 | | $ | 131,659 | | $ | 388,025 |
JPMorgan Chase Commercial Mortgage Securities Corp.,
Ser. 2007-LD11, Class A2(d) | | Aaa | | 5.803% | | 06/15/49 | | | 2,000 | | | 2,053,856 |
LB-UBS Commercial Mortgage Trust, Ser. 2004-C6, Class A5(d) | | AAA(f) | | 4.826% | | 08/15/29 | | | 5,000 | | | 4,771,222 |
LB-UBS Commercial Mortgage Trust, Ser. 2005-C3, Class A5 | | Aaa | | 4.739% | | 07/15/30 | | | 695 | | | 672,340 |
LB-UBS Commercial Mortgage Trust, Ser. 2006-C6, Class AAB | | Aaa | | 5.341% | | 09/15/39 | | | 4,280 | | | 4,219,426 |
Merrill Lynch Mortgage Trust, Ser. 2004-KEY2, Class A3 | | Aaa | | 4.615% | | 08/12/39 | | | 1,900 | | | 1,867,012 |
Merrill Lynch Mortgage Trust, Ser. 2006-C1, Class A4(d) | | AAA(f) | | 5.656% | | 05/12/39 | | | 3,400 | | | 3,322,772 |
Merrill Lynch/Countrywide Commercial Mortgage Trust, Ser. 2006-2, Class A4(d) | | Aaa | | 5.909% | | 06/12/46 | | | 2,210 | | | 2,169,588 |
Merrill Lynch/Countrywide Commercial Mortgage Trust, Ser. 2007-5, Class A3 | | Aaa | | 5.364% | | 08/12/48 | | | 440 | | | 405,514 |
Morgan Stanley Capital I, Ser. 2006-IQ11, Class A4(d) | | AAA(f) | | 5.770% | | 10/15/42 | | | 2,600 | | | 2,572,110 |
Morgan Stanley Capital I, Ser. 2007-HQ11, Class AAB | | Aaa | | 5.444% | | 02/12/44 | | | 4,400 | | | 4,249,671 |
Morgan Stanley Capital I, Ser. 2007-T27, Class AAB(d) | | AAA(f) | | 5.650% | | 06/11/42 | | | 1,040 | | | 1,037,485 |
Wachovia Bank Commercial Mortgage Trust, Ser. 2006-C25, Class A3(d) | | Aaa | | 5.705% | | 05/15/43 | | | 2,000 | | | 2,012,176 |
Wachovia Bank Commercial Mortgage Trust, Ser. 2006-C25, Class A4(d) | | Aaa | | 5.740% | | 05/15/43 | | | 5,188 | | | 5,111,173 |
| | | | | | | | | | | |
|
|
TOTAL COMMERCIAL MORTGAGE-BACKED SECURITIES
(cost $98,363,723) | | | 101,965,142 |
| | | | | | | | | | | |
|
|
| CORPORATE BONDS — 13.5% | | | | | | | | | | | | |
Aerospace & Defense — 0.2% | | | | | | | | | | | | |
BAE Systems Holdings, Inc., Gtd. Notes, 144A | | Baa2 | | 4.750% | | 08/15/10 | | | 2,000 | | | 2,030,348 |
BAE Systems Holdings, Inc., Gtd. Notes, 144A | | Baa2 | | 6.375% | | 06/01/19 | | | 600 | | | 645,401 |
Boeing Capital Corp., Sr. Unsec’d. Notes | | A2 | | 6.100% | | 03/01/11 | | | 975 | | | 1,030,604 |
Goodrich Corp., Sr. Unsec’d. Notes | | Baa2 | | 6.800% | | 07/01/36 | | | 711 | | | 762,265 |
| | | | | | | | | | | |
|
|
| | | | | | | | | | | | | 4,468,618 |
| | | | | | | | | | | |
|
|
Airlines — 0.2% | | | | | | | | | | | | |
American Airlines Pass-Through Trust 2001-01, Pass-Thru Certs., Ser. 01-1 | | B2 | | 6.817% | | 05/23/11 | | | 2,420 | | | 2,323,200 |
Continental Airlines, Inc., Pass-Thru Certs., Ser. 981A | | Baa2 | | 6.648% | | 09/15/17 | | | 245 | | | 236,752 |
Continental Airlines, Inc., Pass-Thru Certs., Ser. 01A1(e) | | Baa2 | | 6.703% | | 06/15/21 | | | 142 | | | 131,982 |
Continental Airlines, Inc., Pass-Thru Certs., Ser. A(b) | | Baa2 | | 7.250% | | 11/10/19 | | | 725 | | | 737,687 |
Delta Air Lines, Inc., Pass-thru Certs., Ser. 071A | | Baa1 | | 6.821% | | 08/10/22 | | | 438 | | | 417,981 |
Southwest Airlines Co., Sr. Unsec’d. Notes | | Baa3 | | 6.500% | | 03/01/12 | | | 965 | | | 1,026,828 |
| | | | | | | | | | | |
|
|
| | | | | | | | | | | | | 4,874,430 |
| | | | | | | | | | | |
|
|
Automotive | | | | | | | | | | | | |
Harley-Davidson Funding Corp., Gtd. Notes, 144A, MTN | | Baa1 | | 5.750% | | 12/15/14 | | | 495 | | | 502,558 |
Johnson Controls, Inc., Sr. Unsec’d. Notes | | Baa2 | | 5.500% | | 01/15/16 | | | 235 | | | 239,012 |
| | | | | | | | | | | |
|
|
| | | | | | | | | | | | | 741,570 |
| | | | | | | | | | | |
|
|
Banking — 2.7% | | | | | | | | | | | | |
American Express Co., Sr. Unsec’d. Notes | | A3 | | 8.125% | | 05/20/19 | | | 4,015 | | | 4,758,020 |
Banco Bradesco SA (Cayman Islands), Sub. Notes | | A2 | | 8.750% | | 10/24/13 | | | 1,690 | | | 1,977,300 |
Bank of America Corp., Jr. Sub. Notes(d) | | Ba3 | | 8.000% | | 12/29/49 | | | 2,100 | | | 2,021,754 |
Bank of America Corp., Sr. Unsec’d. Notes | | A2 | | 7.625% | | 06/01/19 | | | 1,400 | | | 1,619,586 |
Bank of America NA, Sub. Notes | | A1 | | 5.300% | | 03/15/17 | | | 850 | | | 833,076 |
Bank of America NA, Sub. Notes | | A1 | | 6.000% | | 10/15/36 | | | 1,300 | | | 1,256,222 |
Bank One Corp., Sub. Notes | | A1 | | 7.875% | | 08/01/10 | | | 2,500 | | | 2,606,475 |
Bear Stearns Cos., Inc. (The), Sr. Unsec’d. Notes | | Aa3 | | 5.300% | | 10/30/15 | | | 550 | | | 581,712 |
Bear Stearns Cos., Inc. (The), Sr. Unsec’d. Notes | | Aa3 | | 6.400% | | 10/02/17 | | | 270 | | | 294,322 |
Bear Stearns Cos., Inc. (The), Sr. Unsec’d. Notes | | Aa3 | | 7.250% | | 02/01/18 | | | 1,135 | | | 1,302,813 |
Capital One Bank Corp., Sub. Notes | | A3 | | 6.500% | | 06/13/13 | | | 10 | | | 10,750 |
Capital One Capital V, Gtd. Notes | | Baa2 | | 10.250% | | 08/15/39 | | | 555 | | | 645,188 |
Capital One Capital VI, Gtd. Notes | | Baa2 | | 8.875% | | 05/15/40 | | | 1,130 | | | 1,203,450 |
SEE NOTES TO FINANCIAL STATEMENTS.
A9
| | | | | | |
| | | CONSERVATIVE BALANCED PORTFOLIO (continued) | | |
| |
| SCHEDULE OF INVESTMENTS | | December 31, 2009 |
| | | | | | | | | | | | |
CORPORATE BONDS
(continued) | | Moody’s
Rating
(Unaudited)†
| | Interest
Rate
| | Maturity
Date
| | Principal
Amount
(000)
| | Value
(Note 2)
|
| | | | | | | | | | | | | |
Banking (continued) | | | | | | | | | | | | |
Capital One Financial Corp., Sr. Unsec’d. Notes, MTN | | Baa1 | | 5.700% | | 09/15/11 | | $ | 570 | | $ | 598,711 |
Citigroup, Inc., Sub. Notes | | Baa1 | | 5.625% | | 08/27/12 | | | 1,900 | | | 1,954,281 |
Citigroup, Inc., Sub. Notes | | Baa1 | | 6.125% | | 08/25/36 | | | 725 | | | 621,756 |
Citigroup, Inc., Sr. Unsec’d. Notes | | A3 | | 6.875% | | 03/05/38 | | | 790 | | | 788,434 |
Citigroup, Inc., Sr. Unsec’d. Notes(b) | | A3 | | 8.125% | | 07/15/39 | | | 415 | | | 468,389 |
Citigroup, Inc., Unsec’d. Notes | | A3 | | 8.500% | | 05/22/19 | | | 600 | | | 692,852 |
Countrywide Financial Corp., Gtd. Notes, MTN | | A2 | | 5.800% | | 06/07/12 | | | 1,160 | | | 1,231,353 |
DEPFA ACS Bank (Ireland), Covered Notes, 144A | | Aa2 | | 5.125% | | 03/16/37 | | | 1,325 | | | 973,849 |
Discover Bank/Greenwood DE, Sub. Notes | | Ba1 | | 8.700% | | 11/18/19 | | | 900 | | | 964,219 |
Goldman Sachs Group, Inc. (The), Sr. Unsec’d. Notes | | A1 | | 5.450% | | 11/01/12 | | | 580 | | | 623,604 |
Goldman Sachs Group, Inc. (The), Sub. Notes | | A2 | | 5.625% | | 01/15/17 | | | 765 | | | 781,340 |
Goldman Sachs Group, Inc. (The), Sub. Notes | | A2 | | 6.450% | | 05/01/36 | | | 1,770 | | | 1,743,356 |
Goldman Sachs Group, Inc. (The), Sub. Notes | | A2 | | 6.750% | | 10/01/37 | | | 113 | | | 116,151 |
Goldman Sachs Group, Inc. (The), Sr. Unsec’d. Notes(b) | | A1 | | 7.500% | | 02/15/19 | | | 2,400 | | | 2,797,927 |
ICICI Bank Ltd. (India), Bonds, 144A(d) | | Baa2 | | 0.824% | | 01/12/10 | | | 1,880 | | | 1,876,302 |
ICICI Bank Ltd. (Singapore), Notes, 144A | | Baa2 | | 5.750% | | 11/16/10 | | | 1,670 | | | 1,705,280 |
JPMorgan Chase & Co., Jr. Sub. Notes, Ser. 1(d) | | Baa1 | | 7.900% | | 04/29/49 | | | 2,000 | | | 2,062,920 |
JPMorgan Chase & Co., Sr. Unsec’d. Notes | | Aa3 | | 4.600% | | 01/17/11 | | | 175 | | | 181,052 |
JPMorgan Chase Capital XXVI(Capital Security, fixed to floating preferred) | | A2 | | 8.000% | | 05/15/48 | | | 28 | | | 752,080 |
JPMorgan Chase Capital XXVII, Gtd. Notes, Ser. AA(b) | | A2 | | 7.000% | | 11/01/39 | | | 1,500 | | | 1,512,770 |
Merrill Lynch & Co., Inc., Sr. Unsec’d. Notes, Ser. C, MTN | | A2 | | 4.250% | | 02/08/10 | | | 1,470 | | | 1,475,085 |
Merrill Lynch & Co., Inc., Sr. Unsec’d. Notes | | A2 | | 4.790% | | 08/04/10 | | | 375 | | | 382,750 |
Merrill Lynch & Co., Inc., Sr. Unsec’d. Notes, Ser. C, MTN | | A2 | | 5.000% | | 01/15/15 | | | 190 | | | 193,235 |
Merrill Lynch & Co., Inc., Sr. Unsec’d. Notes, MTN | | A2 | | 5.770% | | 07/25/11 | | | 355 | | | 375,284 |
Merrill Lynch & Co., Inc., Notes, MTN | | A2 | | 6.875% | | 04/25/18 | | | 1,230 | | | 1,325,249 |
Morgan Stanley, Sr. Unsec’d. Notes | | A2 | | 5.300% | | 03/01/13 | | | 30 | | | 31,620 |
Morgan Stanley, Sr. Unsec’d. Notes, Ser. E | | A2 | | 5.450% | | 01/09/17 | | | 2,530 | | | 2,557,111 |
Morgan Stanley, Sr. Unsec’d. Notes, MTN | | A2 | | 5.625% | | 09/23/19 | | | 2,110 | | | 2,125,424 |
Morgan Stanley, Sr. Unsec’d. Notes, MTN | | A2 | | 5.950% | | 12/28/17 | | | 600 | | | 618,864 |
MUFG Capital Finance Corp. Ltd. (Cayman Islands), Gtd. Notes.(d) | | A2 | | 6.346% | | 07/25/49 | | | 800 | | | 728,117 |
PNC Funding Corp., Gtd. Notes.(b) | | A3 | | 6.700% | | 06/10/19 | | | 885 | | | 990,294 |
Royal Bank of Scotland Group PLC (United Kingdom), Sr. Unsec’d. Notes, MTN | | A1 | | 6.400% | | 10/21/19 | | | 1,775 | | | 1,769,302 |
Santander Central Hispano Issuances Ltd. (Cayman Islands), Gtd. Notes. | | Aa3 | | 7.625% | | 09/14/10 | | | 805 | | | 843,848 |
USB Capital XIII Trust, Gtd. Notes | | A2 | | 6.625% | | 12/15/39 | | | 755 | | | 767,337 |
Wells Fargo Bank NA, Sub. Notes | | Aa3 | | 6.450% | | 02/01/11 | | | 90 | | | 95,044 |
Wells Fargo Capital XIII, Gtd. Notes, Ser. G, MTN(d) | | Ba1 | | 7.700% | | 12/29/49 | | | 1,000 | | | 970,000 |
| | | | | | | | | | | |
|
|
| | | | | | | | | | | | | 56,805,858 |
| | | | | | | | | | | |
|
|
Brokerage | | | | | | | | | | | | |
Lehman Brothers Holdings, Inc., Sr. Unsec’d. Notes, MTN(h) | | NR | | 5.250% | | 02/06/12 | | | 1,850 | | | 360,750 |
Lehman Brothers Holdings, Inc., Sr. Unsec’d. Notes, MTN(h) | | NR | | 6.875% | | 05/02/18 | | | 700 | | | 145,250 |
| | | | | | | | | | | |
|
|
| | | | | | | | | | | | | 506,000 |
| | | | | | | | | | | |
|
|
Building Materials & Construction — 0.1% | | | | | | | | | | | | |
Hanson Ltd. (United Kingdom), Gtd. Notes(b) | | B1 | | 7.875% | | 09/27/10 | | | 1,270 | | | 1,316,012 |
Lafarge SA (France), Sr. Unsec’d. Notes | | Baa3 | | 6.150% | | 07/15/11 | | | 1,100 | | | 1,146,291 |
| | | | | | | | | | | |
|
|
| | | | | | | | | | | | | 2,462,303 |
| | | | | | | | | | | |
|
|
Cable — 0.5% | | | | | | | | | | | | |
Comcast Cable Communications Holdings, Inc., Gtd. Notes | | Baa1 | | 9.455% | | 11/15/22 | | | 115 | | | 147,907 |
Comcast Cable Holdings LLC, Sr. Unsec’d. Notes | | Baa1 | | 9.875% | | 06/15/22 | | | 1,440 | | | 1,754,313 |
Comcast Corp., Gtd. Notes | | Baa1 | | 6.400% | | 05/15/38 | | | 310 | | | 318,998 |
Comcast Corp., Gtd. Notes | | Baa1 | | 6.950% | | 08/15/37 | | | 290 | | | 316,069 |
COX Communications, Inc., Sr. Unsec’d. Notes | | Baa3 | | 6.750% | | 03/15/11 | | | 1,195 | | | 1,256,475 |
DIRECTV Holdings LLC / DIRECTV Financing Co., Inc., Gtd. Notes, 144A | | Ba2 | | 4.750% | | 10/01/14 | | | 1,940 | | | 1,977,512 |
SEE NOTES TO FINANCIAL STATEMENTS.
A10
| | | | | | |
| | | CONSERVATIVE BALANCED PORTFOLIO (continued) | | |
| |
| SCHEDULE OF INVESTMENTS | | December 31, 2009 |
| | | | | | | | | | | | |
CORPORATE BONDS
(continued) | | Moody’s
Rating
(Unaudited)†
| | Interest
Rate
| | Maturity
Date
| | Principal
Amount
(000)
| | Value
(Note 2)
|
| | | | | | | | | | | | | |
Cable (continued) | | | | | | | | | | | | |
DISH DBS Corp., Gtd. Notes | | Ba3 | | 6.375% | | 10/01/11 | | $ | 1,000 | | $ | 1,032,500 |
Time Warner Cable, Inc., Gtd. Notes | | Baa2 | | 5.400% | | 07/02/12 | | | 2,410 | | | 2,574,914 |
Time Warner Cable, Inc., Gtd. Notes(b) | | Baa2 | | 6.750% | | 06/15/39 | | | 1,340 | | | 1,403,389 |
| | | | | | | | | | | |
|
|
| | | | | | | | | | | | | 10,782,077 |
| | | | | | | | | | | |
|
|
Capital Goods — 0.2% | | | | | | | | | | | | |
Erac USA Finance Co., Gtd. Notes, 144A
(original cost $459,646; purchased 10/10/07)(e)(i) | | Baa2 | | 5.800% | | 10/15/12 | | | 460 | | | 482,332 |
Erac USA Finance Co., Gtd. Notes, 144A
(original cost $1,195,904; purchased 10/10/07)(e)(i) | | Baa2 | | 6.375% | | 10/15/17 | | | 1,198 | | | 1,210,060 |
Erac USA Finance Co., Gtd. Notes, 144A
(original cost $386,623; purchased 10/10/07)(e)(i) | | Baa2 | | 7.000% | | 10/15/37 | | | 390 | | | 381,735 |
FedEx Corp., Gtd. Notes | | Baa2 | | 7.250% | | 02/15/11 | | | 480 | | | 508,389 |
General Electric Co., Sr. Unsec’d. Notes | | Aa2 | | 5.250% | | 12/06/17 | | | 320 | | | 326,997 |
Trane US, Inc., Gtd. Notes(b) | | BBB+(f) | | 7.625% | | 02/15/10 | | | 1,000 | | | 1,006,004 |
United Technologies Corp., Sr. Unsec’d. Notes | | A2 | | 5.375% | | 12/15/17 | | | 515 | | | 548,809 |
| | | | | | | | | | | |
|
|
| | | | | | | | | | | | | 4,464,326 |
| | | | | | | | | | | |
|
|
Chemicals — 0.3% | | | | | | | | | | | | |
Dow Chemical Co. (The), Sr. Unsec’d. Notes | | Baa3 | | 6.125% | | 02/01/11 | | | 690 | | | 719,303 |
Dow Chemical Co. (The), Sr. Unsec’d. Notes | | Baa3 | | 7.600% | | 05/15/14 | | | 1,600 | | | 1,820,627 |
Dow Chemical Co. (The), Sr. Unsec’d. Notes | | Baa3 | | 8.550% | | 05/15/19 | | | 1,000 | | | 1,193,145 |
Dow Chemical Co. (The), Sr. Unsec’d. Notes | | Baa3 | | 9.400% | | 05/15/39 | | | 40 | | | 52,886 |
ICI Wilmington, Inc., Gtd. Notes | | Baa1 | | 5.625% | | 12/01/13 | | | 780 | | | 814,118 |
PPG Industries, Inc., Sr. Unsec’d. Notes | | Baa1 | | 5.750% | | 03/15/13 | | | 1,500 | | | 1,601,533 |
Union Carbide Corp., Sr. Unsec’d. Notes | | Ba2 | | 7.500% | | 06/01/25 | | | 500 | | | 459,719 |
| | | | | | | | | | | |
|
|
| | | | | | | | | | | | | 6,661,331 |
| | | | | | | | | | | |
|
|
Consumer — 0.3% | | | | | | | | | | | | |
Avon Products, Inc., Sr. Unsec’d. Notes | | A2 | | 5.750% | | 03/01/18 | | | 1,400 | | | 1,502,431 |
Fortune Brands, Inc., Sr. Unsec’d. Notes(b) | | Baa3 | | 6.375% | | 06/15/14 | | | 2,190 | | | 2,345,391 |
Newell Rubbermaid, Inc., Sr. Unsec’d. Notes | | Baa3 | | 6.250% | | 04/15/18 | | | 1,600 | | | 1,580,965 |
Whirlpool Corp., Sr. Unsec’d. Notes | | Baa3 | | 6.125% | | 06/15/11 | | | 1,045 | | | 1,086,092 |
| | | | | | | | | | | |
|
|
| | | | | | | | | | | | | 6,514,879 |
| | | | | | | | | | | |
|
|
Electric — 1.2% | | | | | | | | | | | | |
Appalachian Power Co., Sr. Unsec’d. Notes, Ser. J | | Baa2 | | 4.400% | | 06/01/10 | | | 790 | | | 798,840 |
Arizona Public Service Co., Sr. Unsec’d. Notes | | Baa2 | | 6.250% | | 08/01/16 | | | 170 | | | 179,731 |
Arizona Public Service Co., Sr. Unsec’d. Notes | | Baa2 | | 6.375% | | 10/15/11 | | | 1,250 | | | 1,338,110 |
Baltimore Gas & Electric Co., Sr. Unsec’d. Notes | | Baa2 | | 6.350% | | 10/01/36 | | | 530 | | | 544,395 |
Carolina Power & Light Co., First Mtge. Bonds | | A1 | | 5.250% | | 12/15/15 | | | 660 | | | 721,722 |
CenterPoint Energy Houston Electric LLC, Genl. Ref. Mtge., Ser. J2 | | Baa1 | | 5.700% | | 03/15/13 | | | 1,070 | | | 1,137,349 |
CenterPoint Energy Houston Electric LLC, Genl. Ref. Mtge., Ser. K2 | | Baa1 | | 6.950% | | 03/15/33 | | | 300 | | | 331,749 |
Consolidated Edison Co. of NY, Inc., Sr. Unsec’d. Notes, Ser. 05-C | | A3 | | 5.375% | | 12/15/15 | | | 820 | | | 886,148 |
Consolidated Edison Co. of NY, Inc., Sr. Unsec’d. Notes, Ser. 08-B(b) | | A3 | | 6.750% | | 04/01/38 | | | 130 | | | 148,211 |
Consumers Energy Co., First Mtge. Bonds, Ser. D | | A3 | | 5.375% | | 04/15/13 | | | 435 | | | 467,075 |
Duke Energy Carolinas LLC, First Mtge. Bonds | | A1 | | 6.050% | | 04/15/38 | | | 530 | | | 564,305 |
Duke Energy Carolinas LLC, Sr. Unsec’d. Notes | | A3 | | 6.100% | | 06/01/37 | | | 920 | | | 965,270 |
E.ON International Finance BV (Netherlands), Gtd. Notes, 144A | | A2 | | 6.650% | | 04/30/38 | | | 930 | | | 1,057,495 |
El Paso Electric Co., Sr. Unsec’d. Notes | | Baa2 | | 6.000% | | 05/15/35 | | | 845 | | | 759,902 |
Empresa Nacional de Electricidad S.A. (Chile), Unsub. Notes | | Baa3 | | 8.625% | | 08/01/15 | | | 1,160 | | | 1,374,969 |
ENEL Finance International SA (Luxembourg), Gtd. Notes, 144A | | A2 | | 6.000% | | 10/07/39 | | | 1,260 | | | 1,266,669 |
Energy East Corp., Sr. Unsec’d. Notes | | A3 | | 6.750% | | 09/15/33 | | | 140 | | | 146,075 |
Exelon Corp., Sr. Unsec’d. Notes | | Baa1 | | 4.900% | | 06/15/15 | | | 195 | | | 201,162 |
Exelon Generation Co. LLC, Sr. Unsec’d. Notes | | A3 | | 6.250% | | 10/01/39 | | | 1,375 | | | 1,400,893 |
FirstEnergy Solutions Corp., Gtd. Notes | | Baa2 | | 6.050% | | 08/15/21 | | | 620 | | | 625,460 |
Florida Power & Light Co., First Mtge. Bonds | | Aa2 | | 5.950% | | 10/01/33 | | | 380 | | | 397,770 |
Georgia Power Co., Sr. Unsec’d. Notes, Ser. B | | A2 | | 5.700% | | 06/01/17 | | | 470 | | | 509,987 |
Indiana Michigan Power Co., Sr. Unsec’d. Notes, Ser. INDF | | Baa2 | | 5.050% | | 11/15/14 | | | 575 | | | 596,427 |
SEE NOTES TO FINANCIAL STATEMENTS.
A11
| | | | | | |
| | | CONSERVATIVE BALANCED PORTFOLIO (continued) | | |
| |
| SCHEDULE OF INVESTMENTS | | December 31, 2009 |
| | | | | | | | | | | | |
CORPORATE BONDS
(continued) | | Moody’s
Rating
(Unaudited)†
| | Interest
Rate
| | Maturity
Date
| | Principal
Amount
(000)
| | Value
(Note 2)
|
| | | | | | | | | | | | | |
Electric (continued) | | | | | | | | | | | | |
Korea Hydro & Nuclear Power Co. Ltd. (South Korea), Sr. Unsec’d. Notes, 144A(b) | | A2 | | 6.250% | | 06/17/14 | | $ | 1,555 | | $ | 1,696,674 |
Midamerican Energy Holdings Co., Sr. Unsec’d. Notes | | Baa1 | | 5.750% | | 04/01/18 | | | 210 | | | 221,334 |
Midamerican Energy Holdings Co., Sr. Unsec’d. Notes | | Baa1 | | 5.950% | | 05/15/37 | | | 325 | | | 325,364 |
Nevada Power Co., Genl. Ref. Mtge., Ser. O | | Baa3 | | 6.500% | | 05/15/18 | | | 1,210 | | | 1,294,871 |
Niagara Mohawk Power Corp., Sr. Unsec’d. Notes, 144A | | A3 | | 4.881% | | 08/15/19 | | | 545 | | | 540,358 |
NiSource Finance Corp., Gtd. Notes | | Baa3 | | 5.450% | | 09/15/20 | | | 500 | | | 484,850 |
NSTAR | | A2 | | 4.500% | | 11/15/19 | | | 605 | | | 591,634 |
Oncor Electric Delivery Co. LLC, Sr. Sec’d. Notes | | Baa1 | | 6.375% | | 01/15/15 | | | 465 | | | 507,240 |
Oncor Electric Delivery Co. LLC, Sr. Sec’d. Notes | | Baa1 | | 7.000% | | 09/01/22 | | | 545 | | | 605,958 |
Pacific Gas & Electric Co., Sr. Unsec’d. Notes | | A3 | | 6.050% | | 03/01/34 | | | 1,610 | | | 1,680,895 |
Public Service Co. of New Mexico, Sr. Unsec’d. Notes | | Baa3 | | 7.950% | | 05/15/18 | | | 135 | | | 141,318 |
Public Service Electric & Gas Co., Sec’d. Notes, MTN | | A2 | | 5.800% | | 05/01/37 | | | 515 | | | 529,936 |
Southern California Edison Co., Ser. 04-F | | A1 | | 4.650% | | 04/01/15 | | | 610 | | | 644,973 |
Xcel Energy, Inc., Sr. Unsec’d. Notes | | Baa1 | | 5.613% | | 04/01/17 | | | 263 | | | 271,168 |
Xcel Energy, Inc., Sr. Unsec’d. Notes | | Baa1 | | 6.500% | | 07/01/36 | | | 445 | | | 468,777 |
| | | | | | | | | | | |
|
|
| | | | | | | | | | | | | 26,425,064 |
| | | | | | | | | | | |
|
|
Energy – Integrated — 0.2% | | | | | | | | | | | | |
Cenovus Energy, Inc. (Canada), Sr. Notes, 144A | | Baa2 | | 6.750% | | 11/15/39 | | | 975 | | | 1,062,803 |
Hess Corp., Sr. Unsec’d. Notes | | Baa2 | | 6.000% | | 01/15/40 | | | 390 | | | 386,196 |
Husky Energy, Inc. (Canada), Sr. Unsec’d. Notes | | Baa2 | | 7.250% | | 12/15/19 | | | 300 | | | 346,680 |
TNK-BP Finance SA (Luxembourg), Gtd. Notes, 144A | | Baa2 | | 7.500% | | 07/18/16 | | | 1,365 | | | 1,399,125 |
| | | | | | | | | | | |
|
|
| | | | | | | | | | | | | 3,194,804 |
| | | | | | | | | | | |
|
|
Energy – Other — 0.3% | | | | | | | | | | | | |
Devon Financing Corp. ULC (Canada), Gtd. Notes | | Baa1 | | 7.875% | | 09/30/31 | | | 280 | | | 350,815 |
Dolphin Energy Ltd. (United Arab Emirates), Sr. Sec’d. Notes, 144A | | Aa3 | | 5.888% | | 06/15/19 | | | 843 | | | 851,915 |
Halliburton Co., Sr. Unsec’d. Notes | | A2 | | 5.500% | | 10/15/10 | | | 200 | | | 208,137 |
Nexen, Inc. (Canada), Sr. Unsec’d. Notes | | Baa3 | | 6.400% | | 05/15/37 | | | 195 | | | 196,466 |
Pioneer Natural Resources Co., Sr. Unsec’d. Notes | | Ba1 | | 6.875% | | 05/01/18 | | | 1,450 | | | 1,434,659 |
Questar Market Resources, Inc., Sr. Unsec’d. Notes(b) | | Baa3 | | 6.800% | | 03/01/20 | | | 735 | | | 766,094 |
Valero Energy Corp., Gtd. Notes | | Baa2 | | 6.625% | | 06/15/37 | | | 250 | | | 234,583 |
Weatherford International Ltd. (Bermuda), Gtd. Notes | | Baa1 | | 6.500% | | 08/01/36 | | | 25 | | | 23,876 |
Woodside Finance Ltd. (Australia), Gtd. Notes, 144A | | Baa1 | | 5.000% | | 11/15/13 | | | 1,660 | | | 1,698,271 |
XTO Energy, Inc., Sr. Unsec’d. Notes | | Baa2 | | 6.250% | | 08/01/17 | | | 565 | | | 639,770 |
| | | | | | | | | | | |
|
|
| | | | | | | | | | | | | 6,404,586 |
| | | | | | | | | | | |
|
|
Foods — 0.7% | | | | | | | | | | | | |
Anheuser-Busch InBev Worldwide, Inc., Gtd. Notes, 144A | | Baa2 | | 5.375% | | 01/15/20 | | | 1,100 | | | 1,122,285 |
Anheuser-Busch InBev Worldwide, Inc., Gtd. Notes, 144A | | Baa2 | | 6.875% | | 11/15/19 | | | 1,100 | | | 1,228,022 |
Anheuser-Busch InBev Worldwide, Inc., Gtd. Notes, 144A | | Baa2 | | 8.000% | | 11/15/39 | | | 1,160 | | | 1,444,103 |
Anheuser-Busch InBev Worldwide, Inc., Gtd. Notes, 144A | | Baa2 | | 8.200% | | 01/15/39 | | | 230 | | | 290,835 |
Bunge Ltd. Finance Corp., Gtd. Notes(b) | | Baa2 | | 5.350% | | 04/15/14 | | | 1,000 | | | 1,022,270 |
Bunge Ltd. Finance Corp., Gtd. Notes | | Baa2 | | 8.500% | | 06/15/19 | | | 860 | | | 980,320 |
Cargill, Inc., Sr. Unsec’d. Notes, 144A
(original cost $646,913; purchased 11/19/07)(e)(i) | | A2 | | 6.000% | | 11/27/17 | | | 650 | | | 692,792 |
ConAgra Foods, Inc., Sr. Unsec’d. Notes | | Baa2 | | 7.875% | | 09/15/10 | | | 62 | | | 64,904 |
Delhaize America, Inc., Gtd. Notes | | Baa3 | | 9.000% | | 04/15/31 | | | 660 | | | 844,999 |
Delhaize Group (Belgium), Gtd. Notes | | Baa3 | | 6.500% | | 06/15/17 | | | 460 | | | 499,575 |
General Mills, Inc., Sr. Unsec’d. Notes | | Baa1 | | 6.000% | | 02/15/12 | | | 975 | | | 1,052,684 |
H.J. Heinz Finance Co., Gtd. Notes, 144A | | Baa2 | | 7.125% | | 08/01/39 | | | 405 | | | 457,868 |
Kroger Co. (The), Gtd. Notes | | Baa2 | | 6.750% | | 04/15/12 | | | 215 | | | 234,824 |
Kroger Co. (The), Gtd. Notes | | Baa2 | | 6.800% | | 04/01/11 | | | 575 | | | 610,586 |
McDonald’s Corp., Sr. Unsec’d. Notes, MTN | | A3 | | 6.300% | | 03/01/38 | | | 1,140 | | | 1,257,485 |
Ralcorp Holdings, Inc., Sr. Notes, 144A | | Baa3 | | 6.625% | | 08/15/39 | | | 800 | | | 780,194 |
Tyson Foods, Inc., Gtd. Notes | | Ba3 | | 7.850% | | 04/01/16 | | | 785 | | | 804,625 |
Yum! Brands, Inc., Sr. Unsec’d. Notes | | Baa3 | | 8.875% | | 04/15/11 | | | 235 | | | 254,287 |
| | | | | | | | | | | |
|
|
| | | | | | | | | | | | | 13,642,658 |
| | | | | | | | | | | |
|
|
SEE NOTES TO FINANCIAL STATEMENTS.
A12
| | | | | | |
| | | CONSERVATIVE BALANCED PORTFOLIO (continued) | | |
| |
| SCHEDULE OF INVESTMENTS | | December 31, 2009 |
| | | | | | | | | | | | |
CORPORATE BONDS
(continued) | | Moody’s
Rating
(Unaudited)†
| | Interest
Rate
| | Maturity
Date
| | Principal
Amount
(000)
| | Value
(Note 2)
|
| | | | | | | | | | | | | |
Healthcare & Pharmaceutical — 0.7% | | | | | | | | | | | | |
Abbott Laboratories, Sr. Unsec’d. Notes | �� | A1 | | 5.875% | | 05/15/16 | | $ | 1,100 | | $ | 1,213,288 |
AmerisourceBergen Corp., Gtd. Notes | | Baa3 | | 5.625% | | 09/15/12 | | | 915 | | | 974,249 |
AstraZeneca PLC (United Kingdom), Sr. Unsec’d. Notes | | A1 | | 6.450% | | 09/15/37 | | | 480 | | | 540,621 |
Boston Scientific Corp., Sr. Unsec’d. Notes | | Ba1 | | 4.500% | | 01/15/15 | | | 885 | | | 886,806 |
Boston Scientific Corp., Sr. Unsec’d. Notes | | Ba1 | | 6.000% | | 01/15/20 | | | 570 | | | 582,413 |
CareFusion Corp., Sr. Unsec’d. Notes, 144A | | Baa3 | | 6.375% | | 08/01/19 | | | 320 | | | 342,567 |
Genentech, Inc., Sr. Unsec’d. Notes | | AA-(f) | | 4.750% | | 07/15/15 | | | 270 | | | 288,974 |
GlaxoSmithKline Capital, Inc., Gtd. Notes | | A1 | | 6.375% | | 05/15/38 | | | 840 | | | 930,616 |
HCA, Inc., Sec’d. Notes | | B2 | | 9.250% | | 11/15/16 | | | 1,925 | | | 2,066,969 |
Laboratory Corp. of America Holdings, Sr. Unsec’d. Notes | | Baa3 | | 5.625% | | 12/15/15 | | | 560 | | | 585,503 |
Merck & Co., Inc., Gtd. Notes | | Aa3 | | 6.000% | | 09/15/17 | | | 842 | | | 935,247 |
Merck & Co., Inc., Gtd. Notes | | Aa3 | | 6.550% | | 09/15/37 | | | 330 | | | 374,783 |
Merck & Co., Inc., Sr. Unsec’d. Notes | | Aa3 | | 5.750% | | 11/15/36 | | | 280 | | | 286,957 |
Merck & Co., Inc., Sr. Unsec’d. Notes | | Aa3 | | 5.950% | | 12/01/28 | | | 205 | | | 216,034 |
Watson Pharmaceuticals, Inc., Sr. Unsec’d. Notes | | Ba1 | | 6.125% | | 08/15/19 | | | 440 | | | 453,989 |
Wyeth, Gtd. Notes | | A1 | | 5.500% | | 03/15/13 | | | 1,165 | | | 1,266,690 |
Wyeth, Gtd. Notes | | A1 | | 5.950% | | 04/01/37 | | | 1,645 | | | 1,715,370 |
Wyeth, Gtd. Notes | | A1 | | 6.450% | | 02/01/24 | | | 60 | | | 66,842 |
| | | | | | | | | | | |
|
|
| | | | | | | | | | | | | 13,727,918 |
| | | | | | | | | | | |
|
|
Healthcare Insurance — 0.3% | | | | | | | | | | | | |
Aetna, Inc., Sr. Unsec’d. Notes | | A3 | | 5.750% | | 06/15/11 | | | 430 | | | 450,944 |
Aetna, Inc., Sr. Unsec’d. Notes | | A3 | | 6.625% | | 06/15/36 | | | 480 | | | 492,191 |
CIGNA Corp., Sr. Unsec’d. Notes | | Baa2 | | 6.150% | | 11/15/36 | | | 640 | | | 571,727 |
Coventry Health Care, Inc., Sr. Unsec’d. Notes | | Ba1 | | 6.125% | | 01/15/15 | | | 1,200 | | | 1,146,252 |
UnitedHealth Group, Inc., Sr. Unsec’d. Notes | | Baa1 | | 5.250% | | 03/15/11 | | | 1,470 | | | 1,523,226 |
UnitedHealth Group, Inc., Sr. Unsec’d. Notes | | Baa1 | | 6.000% | | 06/15/17 | | | 115 | | | 120,355 |
UnitedHealth Group, Inc., Sr. Unsec’d. Notes | | Baa1 | | 6.500% | | 06/15/37 | | | 400 | | | 394,439 |
UnitedHealth Group, Inc., Sr. Unsec’d. Notes | | Baa1 | | 6.625% | | 11/15/37 | | | 410 | | | 410,734 |
WellPoint, Inc., Sr. Unsec’d. Notes(b) | | Baa1 | | 5.000% | | 12/15/14 | | | 1,085 | | | 1,128,746 |
WellPoint, Inc., Sr. Unsec’d. Notes | | Baa1 | | 5.250% | | 01/15/16 | | | 335 | | | 338,156 |
| | | | | | | | | | | |
|
|
| | | | | | | | | | | | | 6,576,770 |
| | | | | | | | | | | |
|
|
Insurance — 0.5% | | | | | | | | | | | | |
American International Group, Inc., Sr. Unsec’d. Notes | | A3 | | 4.250% | | 05/15/13 | | | 655 | | | 605,028 |
AXA SA (France), Sub. Notes | | A3 | | 8.600% | | 12/15/30 | | | 230 | | | 267,274 |
Berkshire Hathaway Finance Corp., Gtd. Notes | | Aa2 | | 4.750% | | 05/15/12 | | | 425 | | | 453,078 |
Liberty Mutual Group, Inc., Bonds, 144A | | Baa2 | | 7.000% | | 03/15/34 | | | 910 | | | 779,726 |
Lincoln National Corp., Sr. Unsec’d. Notes | | Baa2 | | 6.300% | | 10/09/37 | | | 476 | | | 435,926 |
Lincoln National Corp., Sr. Unsec’d. Notes | | Baa2 | | 8.750% | | 07/01/19 | | | 505 | | | 577,015 |
Marsh & McLennan Cos., Inc., Sr. Unsec’d. Notes | | Baa2 | | 5.150% | | 09/15/10 | | | 335 | | | 343,427 |
MetLife, Inc., Sr. Unsec’d. Notes | | A3 | | 5.700% | | 06/15/35 | | | 1,185 | | | 1,170,281 |
MetLife, Inc., Sr. Unsec’d. Notes | | A3 | | 6.125% | | 12/01/11 | | | 435 | | | 467,637 |
MetLife, Inc., Sr. Unsec’d. Notes | | A3 | | 6.375% | | 06/15/34 | | | 85 | | | 90,834 |
MetLife, Inc., Sr. Unsec’d. Notes | | A3 | | 6.750% | | 06/01/16 | | | 270 | | | 302,357 |
New York Life Insurance Co., Sub. Notes, 144A | | Aa2 | | 6.750% | | 11/15/39 | | | 650 | | | 664,736 |
Pacific Life Insurance Co., Sub. Notes, 144A
(original cost $869,582; purchased 06/16/09)(i) | | A3 | | 9.250% | | 06/15/39 | | | 870 | | | 1,004,620 |
Teachers Insurance & Annuity Association of America, Notes, 144A | | Aa2 | | 6.850% | | 12/16/39 | | | 1,430 | | | 1,478,246 |
Travelers Cos., Inc. (The), Sr. Unsec’d. Notes | | A2 | | 6.750% | | 06/20/36 | | | 740 | | | 816,821 |
W.R. Berkley Corp., Sr. Unsec’d. Notes | | Baa2 | | 5.600% | | 05/15/15 | | | 705 | | | 697,311 |
W.R. Berkley Corp., Sr. Unsec’d. Notes | | Baa2 | | 6.150% | | 08/15/19 | | | 575 | | | 545,791 |
XL Capital Ltd. (Cayman Islands), Sr. Unsec’d. Notes | | Baa2 | | 5.250% | | 09/15/14 | | | 110 | | | 107,725 |
| | | | | | | | | | | |
|
|
| | | | | | | | | | | | | 10,807,833 |
| | | | | | | | | | | |
|
|
Lodging — 0.2% | | | | | | | | | | | | |
Starwood Hotels & Resorts Worldwide, Inc., Sr. Unsec’d. Notes(b) | | Ba1 | | 6.250% | | 02/15/13 | | | 1,585 | | | 1,634,531 |
Starwood Hotels & Resorts Worldwide, Inc., Sr. Unsec’d. Notes(b) | | Ba1 | | 6.750% | | 05/15/18 | | | 2,700 | | | 2,706,750 |
| | | | | | | | | | | |
|
|
| | | | | | | | | | | | | 4,341,281 |
| | | | | | | | | | | |
|
|
SEE NOTES TO FINANCIAL STATEMENTS.
A13
| | | | | | |
| | | CONSERVATIVE BALANCED PORTFOLIO (continued) | | |
| |
| SCHEDULE OF INVESTMENTS | | December 31, 2009 |
| | | | | | | | | | | | |
CORPORATE BONDS
(continued) | | Moody’s
Rating
(Unaudited)†
| | Interest
Rate
| | Maturity
Date
| | Principal
Amount
(000)
| | Value
(Note 2)
|
| | | | | | | | | | | | | |
Media & Entertainment — 0.4% | | | | | | | | | | | | |
Gannett Co., Inc., Sr. Unsec’d. Notes | | Ba2 | | 6.375% | | 04/01/12 | | $ | 2,500 | | $ | 2,500,000 |
News America, Inc., Gtd. Notes | | Baa1 | | 7.625% | | 11/30/28 | | | 1,265 | | | 1,351,983 |
News America, Inc., Gtd. Notes, 144A(b) | | Baa1 | | 6.900% | | 08/15/39 | | | 325 | | | 354,534 |
Time Warner, Inc., Gtd. Notes | | Baa2 | | 6.750% | | 04/15/11 | | | 725 | | | 768,138 |
Time Warner, Inc., Gtd. Notes | | Baa2 | | 7.250% | | 10/15/17 | | | 745 | | | 834,342 |
Time Warner, Inc., Sr. Unsec’d. Notes | | Baa2 | | 9.150% | | 02/01/23 | | | 625 | | | 754,271 |
Viacom, Inc., Sr. Unsec’d. Notes(b) | | Baa2 | | 6.750% | | 10/05/37 | | | 420 | | | 433,304 |
Viacom, Inc., Sr. Unsec’d. Notes | | Baa2 | | 6.875% | | 04/30/36 | | | 620 | | | 670,410 |
| | | | | | | | | | | |
|
|
| | | | | | | | | | | | | 7,666,982 |
| | | | | | | | | | | |
|
|
Metals — 0.3% | | | | | | | | | | | | |
ArcelorMittal USA Partnership (Canada), Gtd. Notes | | Baa3 | | 9.750% | | 04/01/14 | | | 1,720 | | | 1,806,000 |
Newmont Mining Corp., Gtd. Notes | | Baa2 | | 6.250% | | 10/01/39 | | | 865 | | | 866,034 |
Rio Tinto Alcan, Inc. (Canada), Sr. Unsec’d. Notes | | BBB+(f) | | 4.500% | | 05/15/13 | | | 255 | | | 261,840 |
Rio Tinto Alcan, Inc. (Canada), Sr. Unsec’d. Notes | | BBB+(f) | | 5.000% | | 06/01/15 | | | 755 | | | 775,124 |
Rio Tinto Finance USA Ltd. (Australia), Gtd. Notes | | Baa1 | | 5.875% | | 07/15/13 | | | 500 | | | 539,518 |
Southern Copper Corp., Sr. Unsec’d. Notes | | Baa3 | | 7.500% | | 07/27/35 | | | 120 | | | 118,901 |
United States Steel Corp., Sr. Unsec’d. Notes | | Ba3 | | 5.650% | | 06/01/13 | | | 2,540 | | | 2,527,320 |
| | | | | | | | | | | |
|
|
| | | | | | | | | | | | | 6,894,737 |
| | | | | | | | | | | |
|
|
Non Captive Finance — 0.5% | | | | | | | | | | | | |
General Electric Capital Corp., Sr. Unsec’d. Notes, MTN(c). | | Aa2 | | 5.550% | | 05/04/20 | | | 1,555 | | | 1,541,216 |
General Electric Capital Corp., Sr. Unsec’d. Notes, MTN | | Aa2 | | 5.875% | | 01/14/38 | | | 970 | | | 898,107 |
General Electric Capital Corp., Sr. Unsec’d. Notes, Ser. G, MTN(c) | | Aa2 | | 6.000% | | 08/07/19 | | | 3,010 | | | 3,124,443 |
HSBC Finance Corp., Sr. Unsec’d. Notes | | A3 | | 5.700% | | 06/01/11 | | | 585 | | | 611,158 |
International Lease Finance Corp., Sr. Unsec’d. Notes | | B1 | | 6.375% | | 03/25/13 | | | 1,750 | | | 1,438,815 |
SLM Corp., Sr. Unsec’d. Notes, MTN | | Ba1 | | 8.450% | | 06/15/18 | | | 2,825 | | | 2,787,577 |
| | | | | | | | | | | |
|
|
| | | | | | | | | | | | | 10,401,316 |
| | | | | | | | | | | |
|
|
Packaging | | | | | | | | | | | | |
Sealed Air Corp., Sr. Unsec’d. Notes, 144A | | Baa3 | | 6.875% | | 07/15/33 | | | 450 | | | 423,363 |
| | | | | | | | | | | |
|
|
Paper — 0.1% | | | | | | | | | | | | |
International Paper Co., Sr. Unsec’d. Notes | | Baa3 | | 7.300% | | 11/15/39 | | | 1,080 | | | 1,145,730 |
International Paper Co., Sr. Unsec’d. Notes | | Baa3 | | 7.500% | | 08/15/21 | | | 460 | | | 515,417 |
| | | | | | | | | | | |
|
|
| | | | | | | | | | | | | 1,661,147 |
| | | | | | | | | | | |
|
|
Pipelines & Other — 0.3% | | | | | | | | | | | | |
DCP Midstream LLC, Sr. Unsec’d. Notes | | Baa2 | | 7.875% | | 08/16/10 | | | 1,830 | | | 1,902,512 |
Kinder Morgan Energy Partners LP, Sr. Unsec’d. Notes(b) | | Baa2 | | 6.500% | | 09/01/39 | | | 650 | | | 655,077 |
ONEOK Partners LP, Gtd. Notes | | Baa2 | | 6.650% | | 10/01/36 | | | 405 | | | 413,069 |
Sempra Energy, Sr. Unsec’d. Notes | | Baa1 | | 6.000% | | 02/01/13 | | | 80 | | | 85,307 |
Spectra Energy Capital LLC, Gtd. Notes | | Baa2 | | 6.200% | | 04/15/18 | | | 3,310 | | | 3,515,266 |
Spectra Energy Capital LLC, Sr. Unsec’d. Notes | | Baa2 | | 6.250% | | 02/15/13 | | | 205 | | | 220,418 |
| | | | | | | | | | | |
|
|
| | | | | | | | | | | | | 6,791,649 |
| | | | | | | | | | | |
|
|
Railroads — 0.1% | | | | | | | | | | | | |
Burlington Northern Santa Fe Corp., Sr. Unsec’d. Notes | | Baa1 | | 6.700% | | 08/01/28 | | | 735 | | | 787,815 |
CSX Corp., Sr. Unsec’d. Notes(b) | | Baa3 | | 6.150% | | 05/01/37 | | | 690 | | | 699,094 |
Norfolk Southern Corp., Sr. Unsec’d. Notes | | Baa1 | | 5.590% | | 05/17/25 | | | 630 | | | 612,441 |
Norfolk Southern Corp., Sr. Unsec’d. Notes | | Baa1 | | 7.800% | | 05/15/27 | | | 24 | | | 28,850 |
Union Pacific Corp., Sr. Unsec’d. Notes | | Baa2 | | 6.650% | | 01/15/11 | | | 760 | | | 801,627 |
| | | | | | | | | | | |
|
|
| | | | | | | | | | | | | 2,929,827 |
| | | | | | | | | | | |
|
|
Real Estate Investment Trusts — 0.3% | | | | | | | | | | | | |
Brandywine Operating Partnership LP, Gtd. Notes | | Baa3 | | 5.750% | | 04/01/12 | | | 391 | | | 398,545 |
Mack-Cali Realty LP, Sr. Unsec’d. Notes | | Baa2 | | 7.750% | | 08/15/19 | | | 685 | | | 708,807 |
Post Apartment Homes LP, Sr. Unsec’d. Notes | | Baa3 | | 5.450% | | 06/01/12 | | | 545 | | | 540,774 |
Post Apartment Homes LP, Sr. Unsec’d. Notes | | Baa3 | | 6.300% | | 06/01/13 | | | 650 | | | 646,260 |
Simon Property Group LP, Sr. Unsec’d. Notes | | A3 | | 5.750% | | 05/01/12 | | | 1,625 | | | 1,707,056 |
Simon Property Group LP, Sr. Unsec’d. Notes | | A3 | | 6.125% | | 05/30/18 | | | 2,700 | | | 2,743,168 |
| | | | | | | | | | | |
|
|
| | | | | | | | | | | | | 6,744,610 |
| | | | | | | | | | | |
|
|
SEE NOTES TO FINANCIAL STATEMENTS.
A14
| | | | | | |
| | | CONSERVATIVE BALANCED PORTFOLIO (continued) | | |
| |
| SCHEDULE OF INVESTMENTS | | December 31, 2009 |
| | | | | | | | | | | | |
CORPORATE BONDS
(continued) | | Moody’s
Rating
(Unaudited)†
| | Interest
Rate
| | Maturity
Date
| | Principal
Amount
(000)
| | Value
(Note 2)
|
| | | | | | | | | | | | | |
Retailers — 0.8% | | | | | | | | | | | | |
CVS Caremark Corp., Sr. Unsec’d. Notes | | Baa2 | | 5.750% | | 08/15/11 | | $ | 1,240 | | $ | 1,320,445 |
CVS Caremark Corp., Sr. Unsec’d. Notes | | Baa2 | | 5.750% | | 06/01/17 | | | 1,580 | | | 1,667,554 |
CVS Caremark Corp., Sr. Unsec’d. Notes | | Baa2 | | 6.125% | | 09/15/39 | | | 725 | | | 718,547 |
GameStop Corp./GameStop, Inc., Gtd. Notes | | Ba1 | | 8.000% | | 10/01/12 | | | 980 | | | 1,015,525 |
Home Depot, Inc. (The) Sr. Unsec’d. Notes | | Baa1 | | 5.875% | | 12/16/36 | | | 315 | | | 304,056 |
Kohl’s Corp., Sr. Unsec’d. Notes | | Baa1 | | 6.875% | | 12/15/37 | | | 1,000 | | | 1,134,152 |
Lowe’s Cos., Inc., Sr. Unsec’d. Notes | | A1 | | 6.500% | | 03/15/29 | | | 345 | | | 379,391 |
Macy’s Retail Holdings, Inc., Gtd. Notes | | Ba2 | | 5.350% | | 03/15/12 | | | 330 | | | 337,013 |
Macy’s Retail Holdings, Inc., Gtd. Notes | | Ba2 | | 5.875% | | 01/15/13 | | | 2,000 | | | 2,055,000 |
Nordstrom, Inc., Sr. Unsec’d. Notes(b) | | Baa2 | | 6.250% | | 01/15/18 | | | 4,500 | | | 4,871,115 |
Target Corp., Sr. Unsec’d. Notes | | A2 | | 7.000% | | 01/15/38 | | | 1,655 | | | 1,930,968 |
Wal-Mart Stores, Inc., Sr. Unsec’d. Notes | | Aa2 | | 5.250% | | 09/01/35 | | | 235 | | | 231,080 |
| | | | | | | | | | | |
|
|
| | | | | | | | | | | | | 15,964,846 |
| | | | | | | | | | | |
|
|
Technology — 0.5% | | | | | | | | | | | | |
Cisco Systems, Inc., Sr. Unsec’d. Notes | | A1 | | 4.450% | | 01/15/20 | | | 1,665 | | | 1,633,338 |
Computer Sciences Corp., Sr. Unsec’d. Notes, Ser. WI | | Baa1 | | 6.500% | | 03/15/18 | | | 1,700 | | | 1,855,207 |
Electronic Data Systems Corp., Sr. Unsec’d. Notes | | A2 | | 7.450% | | 10/15/29 | | | 120 | | | 141,996 |
Fiserv, Inc., Gtd. Notes | | Baa2 | | 6.125% | | 11/20/12 | | | 960 | | | 1,045,316 |
Intuit, Inc., Sr. Unsec’d. Notes | | Baa2 | | 5.400% | | 03/15/12 | | | 575 | | | 610,882 |
Motorola, Inc., Sr. Unsec’d. Notes | | Baa3 | | 8.000% | | 11/01/11 | | | 48 | | | 51,335 |
Oracle Corp., Sr. Unsec’d. Notes(b) | | A2 | | 6.125% | | 07/08/39 | | | 1,085 | | | 1,139,288 |
Seagate Technology HDD Holdings (Cayman Islands), Gtd. Notes | | Ba3 | | 6.375% | | 10/01/11 | | | 985 | | | 1,002,238 |
Xerox Corp., Sr. Unsec’d. Notes(b) | | Baa2 | | 4.250% | | 02/15/15 | | | 2,650 | | | 2,631,527 |
| | | | | | | | | | | |
|
|
| | | | | | | | | | | | | 10,111,127 |
| | | | | | | | | | | |
|
|
Telecommunications — 1.3% | | | | | | | | | | | | |
America Movil SAB de CV (Mexico), Gtd. Notes(b) | | A3 | | 6.375% | | 03/01/35 | | | 630 | | | 650,341 |
AT&T Corp., Gtd. Notes | | A2 | | 8.000% | | 11/15/31 | | | 505 | | | 616,362 |
AT&T, Inc., Sr. Unsec’d. Notes | | A2 | | 5.300% | | 11/15/10 | | | 1,180 | | | 1,226,661 |
Cellco Partnership/Verizon Wireless Capital LLC, Sr. Unsec’d. Notes | | A2 | | 8.500% | | 11/15/18 | | | 2,400 | | | 2,976,917 |
Deutsche Telekom International Finance BV (Netherlands), Gtd. Notes | | Baa1 | | 8.750% | | 06/15/30 | | | 345 | | | 443,708 |
Embarq Corp., Sr. Unsec’d. Notes
(original cost $349,979; purchased date 05/12/06)(e)(i) | | Baa3 | | 7.082% | | 06/01/16 | | | 350 | | | 386,602 |
Embarq Corp., Sr. Unsec’d. Notes
(original cost $1,667,844; purchased date 05/12/06-04/01/07)(e)(i) | | Baa3 | | 7.995% | | 06/01/36 | | | 1,645 | | | 1,769,523 |
France Telecom SA (France), Sr. Unsec’d. Notes | | A3 | | 8.500% | | 03/01/31 | | | 360 | | | 479,093 |
Koninklijke (Royal) KPN NV (Netherlands), Sr. Unsec’d. Notes | | Baa2 | | 8.000% | | 10/01/10 | | | 645 | | | 677,250 |
New Cingular Wireless Services, Inc., Gtd. Notes | | A2 | | 8.125% | | 05/01/12 | | | 800 | | | 903,946 |
New Cingular Wireless Services, Inc., Sr. Unsec’d. Notes | | A2 | | 8.750% | | 03/01/31 | | | 1,235 | | | 1,596,002 |
PCCW HKT Capital Ltd. (U.S. Virgin Islands), Gtd. Notes, 144A | | Baa2 | | 8.000% | | 11/15/11 | | | 2,275 | | | 2,452,222 |
Qwest Capital Funding, Inc., Gtd. Notes | | B1 | | 7.250% | | 02/15/11 | | | 720 | | | 730,800 |
Qwest Corp., Sr. Unsec’d. Notes | | Ba1 | | 8.875% | | 03/15/12 | | | 2,000 | | | 2,150,000 |
Telecom Italia Capital SA (Luxembourg), Gtd. Notes | | Baa2 | | 5.250% | | 11/15/13 | | | 170 | | | 178,804 |
Telecom Italia Capital SA (Luxembourg), Gtd. Notes | | Baa2 | | 7.175% | | 06/18/19 | | | 3,405 | | | 3,796,109 |
Telefonica Emisiones SAU (Spain), Gtd. Notes | | Baa1 | | 5.877% | | 07/15/19 | | | 640 | | | 685,971 |
Telefonica Emisiones SAU (Spain), Gtd. Notes | | Baa1 | | 7.045% | | 06/20/36 | | | 210 | | | 239,799 |
Telefonos de Mexico SAB de CV (Mexico), Sr. Unsec’d. Notes, 144A(b) | | A3 | | 5.500% | | 11/15/19 | | | 255 | | | 248,309 |
TELUS Corp. (Canada), Sr. Unsec’d. Notes | | Baa1 | | 8.000% | | 06/01/11 | | | 1,041 | | | 1,126,990 |
US Cellular Corp., Sr. Unsec’d. Notes | | Baa2 | | 6.700% | | 12/15/33 | | | 255 | | | 250,779 |
Verizon Communications, Inc., Sr. Unsec’d. Notes | | A3 | | 6.100% | | 04/15/18 | | | 3,500 | | | 3,804,181 |
Verizon Communications, Inc., Sr. Unsec’d. Notes | | A3 | | 6.400% | | 02/15/38 | | | 105 | | | 109,768 |
Vodafone Group PLC (United Kingdom), Sr. Unsec’d. Notes | | Baa1 | | 7.750% | | 02/15/10 | | | 950 | | | 957,581 |
| | | | | | | | | | | |
|
|
| | | | | | �� | | | | | | | 28,457,718 |
| | | | | | | | | | | |
|
|
SEE NOTES TO FINANCIAL STATEMENTS.
A15
| | | | | | |
| | | CONSERVATIVE BALANCED PORTFOLIO (continued) | | |
| |
| SCHEDULE OF INVESTMENTS | | December 31, 2009 |
| | | | | | | | | | | | |
CORPORATE BONDS
(continued) | | Moody’s
Rating
(Unaudited)†
| | Interest
Rate
| | Maturity
Date
| | Principal
Amount
(000)
| | Value
(Note 2)
|
| | | | | | | | | | | | | |
Tobacco — 0.3% | | | | | | | | | | | | |
Altria Group, Inc., Gtd. Notes | | Baa1 | | 9.250% | | 08/06/19 | | $ | 1,995 | | $ | 2,431,163 |
Altria Group, Inc., Gtd. Notes(b) | | Baa1 | | 9.700% | | 11/10/18 | | | 900 | | | 1,112,550 |
Altria Group, Inc., Gtd. Notes | | Baa1 | | 9.950% | | 11/10/38 | | | 130 | | | 169,456 |
Altria Group, Inc., Gtd. Notes | | Baa1 | | 10.200% | | 02/06/39 | | | 850 | | | 1,133,932 |
Lorillard Tobacco Co., Sr. Unsec’d. Notes(b) | | Baa2 | | 8.125% | | 06/23/19 | | | 670 | | | 736,589 |
Philip Morris International, Inc., Sr. Unsec’d. Notes | | A2 | | 4.875% | | 05/16/13 | | | 830 | | | 876,195 |
Reynolds American, Inc., Gtd. Notes | | Baa3 | | 7.250% | | 06/15/37 | | | 285 | | | 287,017 |
| | | | | | | | | | | |
|
|
| | | | | | | | | | | | | 6,746,902 |
| | | | | | | | | | | |
|
|
TOTAL CORPORATE BONDS
(cost $279,108,374) | | | 288,196,530 |
| | | | | | | | | | | |
|
|
| FOREIGN AGENCIES — 0.4% | | | | | | | | | | | | |
Commonwealth Bank of Australia (Australia), 144A | | Aaa | | 2.700% | | 11/25/14 | | | 7,220 | | | 7,076,040 |
Pemex Project Funding Master Trust, Gtd. Notes | | Baa1 | | 8.625% | | 12/01/23 | | | 350 | | | 422,625 |
RSHB Capital SA For OJSC Russian Agricultural Bank (Luxembourg), Sr. Sec’d. Notes, 144A | | Baa1 | | 6.299% | | 05/15/17 | | | 2,100 | | | 2,114,700 |
| | | | | | | | | | | |
|
|
TOTAL FOREIGN AGENCIES
(cost $9,724,479) | | | 9,613,365 |
| | | | | | | | | | | |
|
|
| FOREIGN LOCAL GOVERNMENT | | | | | | | | | | | | |
Qatar Government International Bond (Qatar), 144A
(cost $728,430)(b) | | Aa2 | | 6.400% | | 01/20/40 | | | 730 | | | 733,650 |
| | | | | | | | | | | |
|
|
| MORTGAGE-BACKED SECURITIES — 13.7% | | | | | | | | | | | | |
Federal Home Loan Mortgage Corp. | | | | 4.500% | | 02/01/19-07/01/20 | | | 5,097 | | | 5,293,808 |
Federal Home Loan Mortgage Corp. | | | | 4.500% | | TBA 15 YR | | | 1,400 | | | 1,438,500 |
Federal Home Loan Mortgage Corp. | | | | 4.500% | | TBA 30 YR | | | 2,000 | | | 1,995,000 |
Federal Home Loan Mortgage Corp. | | | | 5.000% | | 07/01/18-05/01/34 | | | 9,584 | | | 10,016,475 |
Federal Home Loan Mortgage Corp. | | | | 5.000% | | TBA 30 YR | | | 8,000 | | | 8,202,496 |
Federal Home Loan Mortgage Corp.(d) | | | | 5.214% | | 12/01/35 | | | 2,570 | | | 2,703,669 |
Federal Home Loan Mortgage Corp. | | | | 5.500% | | 12/01/33-05/01/38 | | | 10,718 | | | 11,267,331 |
Federal Home Loan Mortgage Corp.(d) | | | | 5.548% | | 06/01/36 | | | 1,980 | | | 2,086,992 |
Federal Home Loan Mortgage Corp. | | | | 6.000% | | 03/01/32-12/01/33 | | | 2,266 | | | 2,436,973 |
Federal Home Loan Mortgage Corp. | | | | 6.500% | | 12/01/14-09/01/16 | | | 257 | | | 276,185 |
Federal Home Loan Mortgage Corp. | | | | 7.000% | | 05/01/31-09/01/33 | | | 3,987 | | | 4,390,792 |
Federal Home Loan Mortgage Corp. | | | | 5.500% | | TBA 30 YR | | | 13,500 | | | 14,141,250 |
Federal National Mortgage Association(d) | | | | 3.233% | | 07/01/33 | | | 903 | | | 930,416 |
Federal National Mortgage Association | | | | 4.000% | | 06/01/19 | | | 1,828 | | | 1,868,235 |
Federal National Mortgage Association | | | | 4.000% | | TBA 15 YR | | | 7,000 | | | 7,016,408 |
Federal National Mortgage Association | | | | 4.500% | | 11/01/18-01/01/35 | | | 11,780 | | | 12,073,425 |
Federal National Mortgage Association | | | | 4.500% | | TBA 30 YR | | | 16,000 | | | 15,970,000 |
Federal National Mortgage Association | | | | 5.000% | | 10/01/18-05/01/36 | | | 14,879 | | | 15,363,504 |
Federal National Mortgage Association | | | | 5.000% | | TBA 30 YR | | | 9,500 | | | 9,747,893 |
Federal National Mortgage Association | | | | 5.500% | | 03/01/16-01/01/38 | | | 46,713 | | | 49,118,521 |
Federal National Mortgage Association | | | | 5.500% | | TBA 15 YR | | | 3,000 | | | 3,172,500 |
Federal National Mortgage Association | | | | 5.500% | | TBA 30 YR | | | 10,750 | | | 11,252,229 |
Federal National Mortgage Association(d) | | | | 5.904% | | 07/01/37 | | | 3,972 | | | 4,223,324 |
Federal National Mortgage Association(d) | | | | 5.921% | | 06/01/37 | | | 4,162 | | | 4,425,781 |
Federal National Mortgage Association | | | | 6.000% | | 04/01/13-06/01/38 | | | 25,917 | | | 27,643,791 |
Federal National Mortgage Association | | | | 6.000% | | TBA 30 YR | | | 30,500 | | | 32,301,391 |
Federal National Mortgage Association | | | | 6.500% | | 07/01/17-01/01/37 | | | 9,377 | | | 10,090,440 |
Federal National Mortgage Association | | | | 7.000% | | 08/01/11-07/01/32 | | | 767 | | | 851,320 |
Federal National Mortgage Association | | | | 7.500% | | 05/01/12-05/01/32 | | | 423 | | | 463,783 |
Government National Mortgage Association | | | | 4.500% | | TBA 30 YR | | | 6,000 | | | 6,052,697 |
Government National Mortgage Association | | | | 5.500% | | 08/15/33-04/15/36 | | | 7,882 | | | 8,306,009 |
Government National Mortgage Association | | | | 6.000% | | 11/15/23-07/15/34 | | | 2,540 | | | 2,705,582 |
Government National Mortgage Association | | | | 6.500% | | 10/15/23-09/15/36 | | | 4,922 | | | 5,279,363 |
SEE NOTES TO FINANCIAL STATEMENTS.
A16
| | | | | | |
| | | CONSERVATIVE BALANCED PORTFOLIO (continued) | | |
| |
| SCHEDULE OF INVESTMENTS | | December 31, 2009 |
| | | | | | | | | | | | |
MORTGAGE-BACKED SECURITIES
(continued) | | Moody’s
Rating
(Unaudited)†
| | Interest
Rate
| | Maturity
Date
| | Principal
Amount
(000)
| | Value
(Note 2)
|
| | | | | | | | | | | | | |
Government National Mortgage Association | | | | 7.000% | | 09/15/31 | | $ | 110 | | $ | 122,463 |
Government National Mortgage Association | | | | 8.000% | | 01/15/24-
04/15/25 | | | 79 | | | 90,427 |
| | | | | | | | | | | |
|
|
TOTAL MORTGAGE-BACKED SECURITIES
(cost $285,605,910) | | | 293,318,973 |
| | | | | | | | | | | |
|
|
| MUNICIPAL BONDS — 0.2% | | | | | | | | | | | | |
Bay Area Toll Authority | | Aa3 | | 6.263% | | 04/01/49 | | | 1,305 | | | 1,251,508 |
New Jersey State Turnpike Authority, BABs | | A3 | | 7.414% | | 01/01/40 | | | 395 | | | 445,244 |
New York City Transitional Finance Authority | | Aa2 | | 5.767% | | 08/01/36 | | | 1,100 | | | 1,066,087 |
State of California | | Baa1 | | 7.300% | | 10/01/39 | | | 1,250 | | | 1,181,350 |
State of California, BABs(b) | | Baa1 | | 7.550% | | 04/01/39 | | | 245 | | | 240,708 |
State of Washington | | Aa1 | | 5.481% | | 08/01/39 | | | 345 | | | 333,760 |
| | | | | | | | | | | |
|
|
TOTAL MUNICIPAL BONDS
(cost $4,653,616) | | | 4,518,657 |
| | | | | | | | | | | |
|
|
| RESIDENTIAL MORTGAGE-BACKED SECURITIES — 0.5% | | | | | | | | |
CDC Mortgage Capital Trust, Ser. 2002-HE3, Class M1(d) | | Baa2 | | 1.881% | | 03/25/33 | | | 690 | | | 440,466 |
CDC Mortgage Capital Trust, Ser. 2003-HE1, Class M2(d) | | Baa2 | | 3.156% | | 08/25/33 | | | 53 | | | 19,415 |
Centex Home Equity, Ser. 2005-A, Class M2(d) | | Aa3 | | 0.731% | | 01/25/35 | | | 2,250 | | | 1,687,112 |
Credit-Based Asset Servicing And Securitization LLC, Ser. 2005-CB6, Class A3 | | A3 | | 5.120% | | 07/25/35 | | | 667 | | | 557,365 |
Equity One ABS, Inc., Ser. 2004-3, Class M1 | | Aa2 | | 5.700% | | 07/25/34 | | | 1,028 | | | 782,090 |
First Franklin Mortgage Loan Trust, Ser. 2005-FFH1, Class M2(d) | | Ba3 | | 0.751% | | 06/25/36 | | | 1,800 | | | 195,370 |
HFC Home Equity Loan Trust, Ser. 2005-2, Class M2(d) | | Aa1 | | 0.723% | | 01/20/35 | | | 523 | | | 431,430 |
Long Beach Mortgage Loan Trust, Ser. 2004-2, Class M1(d) | | Aa2 | | 0.761% | | 06/25/34 | | | 1,250 | | | 864,264 |
Morgan Stanley ABS Capital I, Ser. 2004-NC1, Class M1(d) | | Aa2 | | 0.931% | | 12/25/33 | | | 1,468 | | | 1,082,074 |
Morgan Stanley Dean Witter Capital I, Ser. 2002-HE1, Class M1(d) | | B3 | | 1.131% | | 07/25/32 | | | 1,156 | | | 772,714 |
Morgan Stanley Dean Witter Capital I, Ser. 2002-NC4, Class M1(d) | | A2 | | 1.506% | | 09/25/32 | | | 1,156 | | | 824,596 |
Saxon Asset Securities Trust, Ser. 2005-2, Class M2(d) | | A2 | | 0.671% | | 10/25/35 | | | 1,480 | | | 427,849 |
Securitized Asset Backed Receivables LLC, Ser. 2004-OP1, Class M1(d) | | Aa2 | | 0.996% | | 02/25/34 | | | 1,660 | | | 1,247,911 |
Securitized Asset Backed Receivables LLC, Ser. 2006-FR3, Class A3(d) | | Caa1 | | 0.481% | | 05/25/36 | | | 1,400 | | | 463,740 |
| | | | | | | | | | | |
|
|
TOTAL RESIDENTIAL MORTGAGE-BACKED SECURITIES
(cost $15,737,981) | | | 9,796,396 |
| | | | | | | | | | | |
|
|
| U.S. GOVERNMENT AGENCY OBLIGATIONS — 1.0% | | | | | | | | | | | | |
Western Corporate Federal Credit Union, Gtd. Notes. | | | | 1.750% | | 11/02/12 | | | 4,550 | | | 4,529,570 |
Federal Farm Credit Bank(b) | | | | 4.875% | | 01/17/17 | | | 845 | | | 899,186 |
Federal Home Loan Banks | | | | 5.000% | | 11/17/17 | | | 420 | | | 454,322 |
Federal Home Loan Banks | | | | 5.625% | | 06/11/21 | | | 2,320 | | | 2,525,499 |
Federal Home Loan Mortgage Corp.(b) | | | | 3.750% | | 03/27/19 | | | 3,040 | | | 2,980,480 |
Federal National Mortgage Association(b) | | | | 2.625% | | 11/20/14 | | | 2,620 | | | 2,599,684 |
Federal National Mortgage Association | | | | 5.000% | | 02/13/17 | | | 1,955 | | | 2,122,147 |
Federal National Mortgage Association(b) | | | | 6.625% | | 11/15/30 | | | 2,010 | | | 2,415,634 |
Resolution Funding Corp. Interest Strip(j) | | | | 4.980% | | 04/15/18 | | | 2,645 | | | 1,864,569 |
Tennessee Valley Authority | | | | 4.500% | | 04/01/18 | | | 1,390 | | | 1,414,532 |
Tennessee Valley Authority | | | | 5.880% | | 04/01/36 | | | 85 | | | 90,792 |
Tennessee Valley Authority, Ser. E | | | | 6.250% | | 12/15/17 | | | 360 | | | 410,616 |
| | | | | | | | | | | |
|
|
TOTAL U.S. GOVERNMENT AGENCY OBLIGATIONS
(cost $22,486,354) | | | 22,307,031 |
| | | | | | | | | | | |
|
|
| U.S. TREASURY SECURITIES — 5.7% | | | | | | | | | | | | |
U.S. Treasury Bonds(b) | | | | 4.500% | | 08/15/39 | | | 2,595 | | | 2,536,208 |
U.S. Treasury Bonds | | | | 4.500% | | 02/15/36 | | | 3,070 | | | 3,023,950 |
U.S. Treasury Bonds | | | | 6.250% | | 08/15/23 | | | 6,140 | | | 7,333,463 |
U.S. Treasury Inflation Index | | | | 1.625% | | 01/15/15 | | | 13,857 | | | 14,411,307 |
SEE NOTES TO FINANCIAL STATEMENTS.
A17
| | | | | | |
| | | CONSERVATIVE BALANCED PORTFOLIO (continued) | | |
| |
| SCHEDULE OF INVESTMENTS | | December 31, 2009 |
| | | | | | | | | | | | | |
U.S. TREASURY SECURITIES
(continued) | | | | Interest
Rate
| | Maturity
Date
| | Principal
Amount
(000)
| | Value
(Note 2)
| |
| | | | | | | | | | | | | | |
U.S. Treasury Inflation Index | | | | 3.500% | | 01/15/11 | | $ | 3,832 | | $ | 3,974,485 | |
U.S. Treasury Notes(b) | | | | 0.750% | | 11/30/11 | | | 2,500 | | | 2,483,693 | |
U.S. Treasury Notes(b) | | | | 2.125% | | 11/30/14 | | | 16,875 | | | 16,475,569 | |
U.S. Treasury Notes | | | | 2.625% | | 12/31/14 | | | 31,530 | | | 31,438,878 | |
U.S. Treasury Notes(b) | | | | 3.375% | | 11/15/19 | | | 1,645 | | | 1,582,293 | |
U.S. Treasury Strips Coupon(m) | | | | 4.830% | | 11/15/24 | | | 14,565 | | | 7,108,419 | |
U.S. Treasury Strips Coupon(m) | | | | 4.840% | | 05/15/24 | | | 3,985 | | | 2,004,403 | |
U.S. Treasury Strips Coupon(m) | | | | 4.860% | | 08/15/24 | | | 12,545 | | | 6,218,105 | |
U.S. Treasury Strips Coupon(m) | | | | 5.270% | | 05/15/20 | | | 9,010 | | | 5,794,763 | |
U.S. Treasury Strips Coupon(m) | | | | 7.450% | | 05/15/26 | | | 5,000 | | | 2,234,300 | |
U.S. Treasury Strips Principal(b)(m) | | | | 4.750% | | 08/15/23 | | | 6,000 | | | 3,186,918 | |
U.S. Treasury Strips Principal(b)(m) | | | | 4.800% | | 11/15/24 | | | 5,000 | | | 2,468,395 | |
U.S. Treasury Strips Principal(m) | | | | 6.260% | | 02/15/23 | | | 16,780 | | | 9,151,443 | |
| | | | | | | | | | | |
|
|
|
TOTAL U.S. TREASURY SECURITIES
(cost $122,702,297) | | | 121,426,592 | |
| | | | | | | | | | | |
|
|
|
TOTAL LONG-TERM INVESTMENTS
(cost $1,707,613,348) | | | 1,951,463,390 | |
| | | | | | | | | | | |
|
|
|
| SHORT-TERM INVESTMENTS — 19.5% | | | | | | | | | | | | | |
U.S. TREASURY SECURITIES — 0.4% | | | | | | | | | | | | | |
U.S. Treasury Bill(g) | | | | 0.040% | | 03/18/10 | | | 3,000 | | | 2,999,697 | |
U.S. Treasury Bill(g) | | | | 0.157% | | 06/17/10 | | | 4,700 | | | 4,695,996 | |
| | | | | | | | | | | |
|
|
|
TOTAL U.S. TREASURY SECURITIES
(cost $7,696,367) | | | 7,695,693 | |
| | | | | | | | | | | |
|
|
|
| | | | | | | | | Shares
| | | |
AFFILIATED MUTUAL FUNDS — 19.1% | | | | | | | | | | | | | |
Dryden Core Investment Fund — Short-Term Bond Series (Note 4)(k) | | | 15,417,258 | | | 131,971,730 | |
Dryden Core Investment Fund — Taxable Money Market Series
(includes $122,857,073 of cash collateral received for securities on loan)(Note 4)(k)(l) | | | 277,211,474 | | | 277,211,474 | |
| | | | | | | | | | | |
|
|
|
TOTAL AFFILIATED MUTUAL FUNDS
(cost $427,520,895) | | | 409,183,204 | |
| | | | | | | | | | | |
|
|
|
TOTAL SHORT-TERM INVESTMENTS
(cost $435,217,262) | | | 416,878,897 | |
| | | | | | | | | | | |
|
|
|
TOTAL INVESTMENTS(n) — 110.7%
(cost $2,142,830,610) | | | 2,368,342,287 | |
LIABILITIES IN EXCESS OF OTHER ASSETS(o) — (10.7)% | | | (229,610,222 | ) |
| | | | | | | | | | | |
|
|
|
NET ASSETS — 100.0% | | $ | 2,138,732,065 | |
| | | | | | | | | | | |
|
|
|
The following abbreviations are used in portfolio descriptions:
| | |
| 144A | | Security was purchased pursuant to Rule 144A under the Securities Act of 1933 and may not be resold subject to that rule except to qualified institutional buyers. Unless otherwise noted, 144A securities are deemed to be liquid. |
| BABs | | Build America Bonds |
| I/O | | Interest Only |
| MTN | | Medium Term Note |
| NR | | Not Rated by Moody’s or Standard & Poor’s |
| TBA | | To Be Announced |
| ULC | | Unlimited Liability Corporation |
| † | The ratings reflected are as of December 31, 2009. Ratings of certain bonds may have changed subsequent to that date. |
| (a) | Non-income producing security. |
| (b) | All or a portion of security is on loan. The aggregate market value of such securities is $118,672,517; cash collateral of $122,857,073 (included in liabilities) was received with which the Portfolio purchased highly liquid short-term investments. |
| (c) | Security segregated as collateral for futures contracts. |
| (d) | Indicates a variable rate security. The maturity date presented for these instruments is the latter of the next date on which the security can be redeemed at par or the next date on which the rate of interest is adjusted. The interest rate shown reflects the rate in effect at December 31, 2009. |
SEE NOTES TO FINANCIAL STATEMENTS.
A18
| | | | | | |
| | | CONSERVATIVE BALANCED PORTFOLIO (continued) | | |
| |
| SCHEDULE OF INVESTMENTS | | December 31, 2009 |
| (e) | Indicates a security that has been deemed illiquid. |
| (f) | Standard & Poor’s Rating |
| (g) | Rate quoted represents yield-to-maturity as of purchase date. |
| (h) | Represents issuer in default on interest payments and/or principal repayment; non-income producing security. |
| (i) | Indicates a restricted security; the aggregate original cost of such securities is $5,576,491. The aggregate value of $5,927,664 is approximately 0.3% of net assets. |
| (j) | Represents zero coupon bond. Rate shown reflects the effective yield at December 31, 2009. |
| (k) | Prudential Investments LLC, the manager of the Portfolio, also serves as manager of the Dryden Core Investment Fund—Taxable Money Market Series and the Dryden Core Investment Fund—Short-Term Bond Series. |
| (l) | Represents security, or a portion thereof, purchased with cash collateral received for securities on loan. |
| (m) | Rate shown reflects the effective yield at December 31, 2009. |
| (n) | As of December 31, 2009, 2 securities representing $2,219,545 and 0.1% of the net assets were fair valued in accordance with the policies adopted by the Board of Trustees. |
| (o) | Liabilities in excess of other assets include net unrealized appreciation (depreciation) on financial futures contracts, interest rate and credit default swap agreements as follows: |
Open futures contracts outstanding at December 31, 2009:
| | | | | | | | | | | | | | |
Number of
Contracts
| | Type
| | Expiration
Date
| | Value at
Trade Date
| | Value at
December 31, 2009
| | Unrealized
Appreciation/
(Depreciation)
| |
| Long Positions: | | | | | | | | | | | | | | |
| 419 | | U.S. Treasury 2 Yr. Notes | | Mar. 2010 | | $ | 91,079,553 | | $ | 90,615,297 | | $ | (464,256 | ) |
| 796 | | U.S. Treasury 5 Yr. Notes | | Mar. 2010 | | | 92,172,583 | | | 91,048,719 | | | (1,123,864 | ) |
| 246 | | S&P 500 Index | | Mar. 2010 | | | 67,377,913 | | | 68,308,050 | | | 930,137 | |
| | | | | | | | | | | | |
|
|
|
| | | | | | | | | | | | | | (657,983 | ) |
| | | | | | | | | | | | |
|
|
|
| Short Positions: | | | | | | | | | | | | | | |
| 67 | | U.S. Treasury 10 Yr. Notes | | Mar. 2010 | | | 8,026,839 | | | 7,735,359 | | | 291,480 | |
| 309 | | U.S. Long Bond | | Mar. 2010 | | | 37,163,452 | | | 35,650,875 | | | 1,512,577 | |
| | | | | | | | | | | | |
|
|
|
| | | | | | | | | | | | | | 1,804,057 | |
| | | | | | | | | | | | |
|
|
|
| | | | | | | | | | | | | $ | 1,146,074 | |
| | | | | | | | | | | | |
|
|
|
Interest rate swap agreements outstanding at December 31, 2009:
| | | | | | | | | | | | | | | | | | | | |
Counterparty
| | Termination
Date
| | Notional
Amount
(000)#
| | Fixed
Rate
| | Floating Rate
| | Fair
Value
| | | Upfront
Premiums
Paid/
(Received)
| | Unrealized
Appreciation/
(Depreciation)
| |
Deutsche Bank AG(a) | | 05/31/2014 | | $ | 11,895 | | 2.355% | | 3 month LIBOR | | $ | (253,855 | ) | | $ | — | | $ | (253,855 | ) |
Morgan Stanley Capital Services, Inc.(b) | | 02/15/2036 | | | 2,985 | | 4.128% | | 3 month LIBOR | | | 167,792 | | | | — | | | 167,792 | |
| | | | | | | | | | | |
|
|
| |
|
| |
|
|
|
| | | | | | | | | | | | $ | (86,063 | ) | | $ | — | | $ | (86,063 | ) |
| | | | | | | | | | | |
|
|
| |
|
| |
|
|
|
| (a) | Portfolio pays the floating rate and receives the fixed rate. |
| (b) | Portfolio pays the fixed rate and receives the floating rate. |
| # | Notional amount is shown in U.S. dollars unless otherwise stated. |
Credit default swap agreements outstanding at December 31, 2009:
| | | | | | | | | | | | | | | | | | | | |
Counterparty
| | Termination
Date
| | Notional
Amount
(000)#(4)
| | Fixed
Rate
| | Reference Entity/Obligation
| | Fair
Value
| | | Upfront
Premiums
Paid/
(Received)
| | Unrealized
Appreciation/
(Depreciation)
| |
Credit Default Swaps on Corporate Issues—Buy Protection(1): | | | | | | | | |
Barclays Bank PLC | | 09/20/2012 | | $ | 2,800 | | 0.595% | | Fortune Brands, Inc.,
5.375%, 01/15/16 | | $ | 12,830 | | | $ | — | | $ | 12,830 | |
Barclays Bank PLC | | 03/20/2018 | | | 1,700 | | 1.220% | | Computer Sciences Corp.,
5.000%, 02/15/13 | | | (75,690 | ) | | | — | | | (75,690 | ) |
Citibank NA | | 09/20/2012 | | | 3,200 | | 0.320% | | Altria Group, Inc.,
7.000%, 11/04/13 | | | 35,999 | | | | — | | | 35,999 | |
Credit Suisse International | | 06/20/2018 | | | 3,500 | | 0.970% | | Verizon Communications, Inc., 4.900%, 09/15/15 | | | (33,357 | ) | | | — | | | (33,357 | ) |
SEE NOTES TO FINANCIAL STATEMENTS.
A19
| | | | | | |
| | | CONSERVATIVE BALANCED PORTFOLIO (continued) | | |
| |
| SCHEDULE OF INVESTMENTS | | December 31, 2009 |
| | | | | | | | | | | | | | | | | | | | | |
Counterparty
| | Termination
Date
| | Notional
Amount
(000)#(4)
| | Fixed
Rate
| | Reference Entity/Obligation
| | Fair
Value
| | | Upfront
Premiums
Paid/
(Received)
| | | Unrealized
Appreciation/
(Depreciation)
| |
Credit Default Swaps on Corporate Issues—Buy Protection(1) (continued): | | | | | |
Deutsche Bank AG | | 09/20/2011 | | $ | 1,000 | | 1.000% | | Dish DBS Corp.,
6.625%, 10/01/14 | | $ | (404 | ) | | $ | 13,678 | | | $ | (14,082 | ) |
Deutsche Bank AG | | 03/20/2012 | | | 2,000 | | 5.000% | | Gannett Co., Inc.,
6.375%, 04/01/12 | | | (128,921 | ) | | | (48,739 | ) | | | (80,182 | ) |
Deutsche Bank AG | | 12/20/2012 | | | 2,000 | | 1.000% | | Macys Retail Holdings, Inc.,
8.000%, 07/15/12 | | | 22,348 | | | | 74,480 | | | | (52,132 | ) |
Deutsche Bank AG | | 06/20/2013 | | | 1,750 | | 2.000% | | International Lease Finance Corp.,
4.150%, 01/20/15 | | | 320,259 | | | | — | | | | 320,259 | |
Deutsche Bank AG | | 06/20/2013 | | | 2,000 | | 1.000% | | United States Steel Corp.,
6.650%, 06/01/37 | | | 86,634 | | | | 113,706 | | | | (27,072 | ) |
Deutsche Bank AG | | 03/20/2014 | | | 1,585 | | 7.050% | | Starwood Hotels & Resorts Worldwide, Inc.,
7.875%, 05/01/12 | | | (360,821 | ) | | | — | | | | (360,821 | ) |
Deutsche Bank AG | | 03/20/2018 | | | 4,500 | | 0.990% | | Nordstrom, Inc.,
6.950%, 03/15/28 | | | 29,111 | | | | — | | | | 29,111 | |
Deutsche Bank AG | | 06/20/2018 | | | 2,800 | | 1.150% | | Spectra Energy Capital LLC,
6.250%, 02/15/13 | | | (74,782 | ) | | | — | | | | (74,782 | ) |
JPMorgan Chase Bank | | 06/20/2014 | | | 1,110 | | 0.650% | | Bunge Ltd. Finance Corp.,
5.350%, 04/15/14 | | | 24,937 | | | | — | | | | 24,937 | |
Merrill Lynch Capital Services, Inc. | | 09/20/2016 | | | 785 | | 1.730% | | Tyson Foods, Inc.,
7.850%, 04/01/16 | | | 33,442 | | | | — | | | | 33,442 | |
Merrill Lynch Capital Services, Inc. | | 06/20/2018 | | | 1,800 | | 3.050% | | SLM Corp.,
5.125%, 08/27/12 | | | 210,897 | | | | — | | | | 210,897 | |
Merrill Lynch Capital Services, Inc. | | 06/20/2018 | | | 2,700 | | 1.450% | | Starwood Hotels & Resorts Worldwide, Inc.,
6.750, 05/15/18 | | | 69,820 | | | | — | | | | 69,820 | |
Morgan Stanley Capital Services, Inc. | | 03/20/2012 | | | 500 | | 5.000% | | Gannett Co., Inc.,
6.375%, 04/01/12 | | | (32,230 | ) | | | (17,617 | ) | | | (14,613 | ) |
Morgan Stanley Capital Services, Inc. | | 03/20/2018 | | | 1,400 | | 0.700% | | Avon Products, Inc.,
6.500%, 03/01/19 | | | (28,252 | ) | | | — | | | | (28,252 | ) |
Morgan Stanley Capital Services, Inc. | | 06/20/2018 | | | 1,600 | | 1.000% | | Newell Rubbermaid, Inc.,
0.000%, 07/15/28 | | | 43,146 | | | | — | | | | 43,146 | |
Morgan Stanley Capital Services, Inc. | | 06/20/2018 | | | 2,700 | | 0.970% | | Simon Property Group LP,
5.250%, 12/01/16 | | | 101,340 | | | | — | | | | 101,340 | |
| | | | | | | | | | | |
|
|
| |
|
|
| |
|
|
|
| | | | | | | | | | | | $ | 256,306 | | | $ | 135,508 | | | $ | 120,798 | |
| | | | | | | | | | | |
|
|
| |
|
|
| |
|
|
|
| | | | | | | |
Counterparty
| | Termination
Date
| | Notional
Amount
(000)#(4)
| | Fixed
Rate
| | Reference Entity/Obligation
| | Fair
Value
| | | Upfront
Premiums
Paid/
(Received)
| | | Unrealized
Appreciation/
(Depreciation)
| |
Credit Default Swaps on Asset-Backed Issues—Buy Protection(1): | | | | | |
Merrill Lynch Capital Services, Inc. | | 03/25/2036 | | $ | 842 | | 3.720% | | AmeriQuest Mortgage Securities, Inc., 2.731%, 03/25/36 | | $ | 814,732 | | | $ | — | | | $ | 814,732 | |
| | | | | | | | | | | |
|
|
| |
|
|
| |
|
|
|
| | | | | | | |
Counterparty
| | Termination
Date
| | Notional
Amount
(000)#(4)
| | Fixed
Rate
| | Reference Entity/Obligation
| | Fair
Value(3)
| | | Upfront
Premiums
Paid/
(Received)
| | | Unrealized
Appreciation/
(Depreciation)
| |
Credit Default Swaps on Asset-Backed Issues—Sell Protection(2): | | | | | | | | | |
Merrill Lynch Capital Services, Inc. | | 03/25/2036 | | $ | 842 | | 9.000% | | AmeriQuest Mortgage Securities, Inc., 2.731%, 03/25/36 | | $ | (790,816 | ) | | $ | — | | | $ | (790,816 | ) |
| | | | | | | | | | | |
|
|
| |
|
|
| |
|
|
|
The Portfolio entered into credit default swaps as the protection seller on asset-backed issues to take an active short position with respect to the likelihood of a particular issuer’s default.
| (1) | If the Portfolio is a buyer of protection, it pays the fixed rate. When a credit event occurs, as defined under the terms of that particular swap agreement, the Portfolio will either (i) receive from the seller of protection an amount equal to the notional amount of the swap and make delivery |
SEE NOTES TO FINANCIAL STATEMENTS.
A20
| | | | | | |
| | | CONSERVATIVE BALANCED PORTFOLIO (continued) | | |
| |
| SCHEDULE OF INVESTMENTS | | December 31, 2009 |
| | of the referenced obligation or underlying securities comprising the referenced index or (ii) receive a net settlement amount in the form of cash or securities equal to the notional amount of the swap less the recovery value of the referenced obligation or underlying securities comprising the referenced index. |
| (2) | If the Portfolio is a seller of protection, it receives the fixed rate. When a credit event occurs, as defined under the terms of that particular swap agreement, the Portfolio will either (i) pay to the buyer of protection an amount equal to the notional amount of the swap and take delivery of the referenced obligation or underlying securities comprising the referenced index or (ii) pay a net settlement amount in the form of cash or securities equal to the notional amount of the swap less the recovery value of the referenced obligation or underlying securities comprising the referenced index. |
| (3) | The fair value of credit default swap agreements on asset-backed securities serve as an indicator of the current status of the payment/performance risk and represent the likelihood of an expected liability (or profit) for the credit derivative should the notional amount of the swap agreement be closed/sold as of the reporting date. Increasing fair value in absolute terms, represents a deterioration of the referenced entity’s credit soundness and a greater likelihood of risk of default or other credit event occuring as defined under the terms of the agreement. |
| (4) | Notional amount represents the maximum potential amount the Portfolio could be required to pay as a seller of credit protection or receive as a buyer of credit protection if a credit event occurs as defined under the terms of that particular swap agreement. |
| # | Notional amount is shown in U.S. dollars unless otherwise stated. |
Various inputs are used in determining the value of the Portfolio’s investments. These inputs are summarized in the three broad levels listed below.
Level 1—quoted prices in active markets for identical securities
Level 2—other significant observable inputs (including quoted prices for similar securities, interest rates, prepayment speeds, credit risk, etc.)
Level 3—significant unobservable inputs (including the Portfolio’s own assumptions in determining the fair value of investments)
The following is a summary of the inputs used as of December 31, 2009 in valuing the Portfolio’s assets carried at fair value:
| | | | | | | | | |
| | | Level 1
| | Level 2
| | Level 3
|
Investments in Securities | | | | | | | | | |
Asset-Backed Securities | | $ | — | | $ | 13,734,566 | | $ | 2,219,029 |
Bank Loans | | | — | | | 14,822,850 | | | — |
Collateralized Mortgage Obligations | | | — | | | 10,098,964 | | | — |
Commercial Mortgage-Backed Securities | | | — | | | 101,965,142 | | | — |
Corporate Bonds | | | — | | | 288,196,530 | | | — |
Common Stocks | | | 1,058,711,129 | | | 516 | | | — |
Foreign Agencies | | | — | | | 9,613,365 | | | — |
Foreign Local Government | | | — | | | 733,650 | | | — |
Mortgage-Backed Securities | | | — | | | 293,318,973 | | | — |
Municipal Bonds | | | — | | | 4,518,657 | | | — |
Residential Mortgage-Backed Securities | | | — | | | 9,796,396 | | | — |
U.S. Government Agency Obligations | | | — | | | 22,307,031 | | | — |
U.S. Treasury Securities | | | — | | | 129,122,285 | | | — |
Affiliated Mutual Funds | | | 409,183,204 | | | — | | | — |
| | |
|
| |
|
| |
|
|
| | | | 1,467,894,333 | | | 898,228,925 | | | 2,219,029 |
Other Financial Instruments* | | | 1,146,074 | | | 34,735 | | | 23,916 |
| | |
|
| |
|
| |
|
|
Total | | $ | 1,469,040,407 | | $ | 898,263,660 | | $ | 2,242,945 |
| | |
|
| |
|
| |
|
|
The following is a reconciliation of assets in which significant unobservable inputs (Level 3) were used in determining fair value:
| | | | | | | | |
| | | Asset-Backed
Security
| | | Other Financial
Instruments*
| |
Balance as of 12/31/08 | | $ | — | | | $ | 1,511,232 | |
Realized gain (loss) | | | — | | | | — | ** |
Change in unrealized appreciation (depreciation) | | | (933 | ) | | | (1,487,316 | ) |
Earned accretion/amortization | | | 933 | | | | — | |
Net purchases (sales) | | | 2,219,029 | | | | — | |
Transfers in and/or out of Level 3 | | | — | | | | — | |
| | |
|
|
| |
|
|
|
Balance as of 12/31/09 | | $ | 2,219,029 | | | $ | 23,916 | |
| | |
|
|
| |
|
|
|
| * | Other financial instruments are derivative instruments not reflected in the Schedule of Investments, such as futures, forwards and swap contracts, which are valued at the unrealized appreciation/depreciation on the instrument. |
| ** | The realized gain earned during the period for other financial instruments was $1,580,515. |
SEE NOTES TO FINANCIAL STATEMENTS.
A21
| | | | | | |
| | | CONSERVATIVE BALANCED PORTFOLIO (continued) | | |
| |
| SCHEDULE OF INVESTMENTS | | December 31, 2009 |
The industry classification of portfolio holdings and liabilities in excess of other assets shown as a percentage of net assets as of December 31, 2009 was as follows:
| | | |
Affiliated Mutual Fund (including 5.7% of collateral received for securities on loan) | | 19.1 | % |
Mortgage-Backed Securities | | 13.7 | |
U.S. Treasury Securities | | 6.1 | |
Commercial Mortgage-Backed Securities | | 4.8 | |
Oil, Gas & Consumable Fuels | | 4.8 | |
Pharmaceuticals | | 3.2 | |
Computers & Peripherals | | 3.0 | |
Banking | | 2.7 | |
Software | | 2.2 | |
Diversified Financial Services | | 2.1 | |
Aerospace & Defense | | 1.6 | |
Insurance | | 1.6 | |
Capital Markets | | 1.4 | |
Commercial Banks | | 1.4 | |
Diversified Telecommunication Services | | 1.4 | |
Media | | 1.4 | |
Beverages | | 1.3 | |
Chemicals | | 1.3 | |
Communications Equipment | | 1.3 | |
Electric | | 1.3 | |
Food & Staples Retailing | | 1.3 | |
Household Products | | 1.3 | |
Semiconductors & Semiconductor Equipment | | 1.3 | |
Telecommunications | | 1.3 | |
Healthcare Providers & Services | | 1.1 | |
Industrial Conglomerates | | 1.1 | |
Tobacco | | 1.1 | |
Electric Utilities | | 1.0 | |
Healthcare & Pharmaceutical | | 1.0 | |
Healthcare Equipment & Supplies | | 1.0 | |
Internet Software & Services | | 1.0 | |
Specialty Retail | | 1.0 | |
U.S. Government Agency Obligations | | 1.0 | |
Energy Equipment & Services | | 0.9 | |
Real Estate Investment Trusts | | 0.9 | |
Biotechnology | | 0.8 | |
Food Products | | 0.8 | |
IT Services | | 0.8 | |
Machinery | | 0.8 | |
Retailers | | 0.8 | |
Asset-Backed Securities | | 0.7 | |
Foods | | 0.7 | |
Hotels, Restaurants & Leisure | | 0.7 | |
Multi-Utilities | | 0.7 | |
Technology | | 0.7 | |
| | | |
Air Freight & Logistics | | 0.5 | % |
Cable | | 0.5 | |
Collateralized Mortgage Obligations | | 0.5 | |
Media & Entertainment | | 0.5 | |
Metals & Mining | | 0.5 | |
Non Captive Finance | | 0.5 | |
Residential Mortgage-Backed Securities | | 0.5 | |
Road & Rail | | 0.5 | |
Consumer Finance | | 0.4 | |
Foreign Agencies | | 0.4 | |
Multiline Retail | | 0.4 | |
Commercial Services & Supplies | | 0.3 | |
Consumer | | 0.3 | |
Electronic Equipment & Instruments | | 0.3 | |
Energy – Other | | 0.3 | |
Healthcare Insurance | | 0.3 | |
Internet & Catalog Retail | | 0.3 | |
Metals | | 0.3 | |
Pipelines & Other | | 0.3 | |
Airlines | | 0.2 | |
Automobiles | | 0.2 | |
Capital Goods | | 0.2 | |
Electrical Equipment | | 0.2 | |
Energy – Integrated | | 0.2 | |
Household Durables | | 0.2 | |
Life Sciences Tools & Services | | 0.2 | |
Lodging | | 0.2 | |
Municipal Bonds | | 0.2 | |
Textiles, Apparel & Luxury Goods | | 0.2 | |
Auto Components | | 0.1 | |
Building Materials & Construction | | 0.1 | |
Construction & Engineering | | 0.1 | |
Containers & Packaging | | 0.1 | |
Diversified Consumer Services | | 0.1 | |
Gas Utilities | | 0.1 | |
Independent Power Producers & Energy Traders | | 0.1 | |
Leisure Equipment & Products | | 0.1 | |
Paper | | 0.1 | |
Paper & Forest Products | | 0.1 | |
Personal Products | | 0.1 | |
Professional Services | | 0.1 | |
Railroads | | 0.1 | |
Thrifts & Mortgage Finance | | 0.1 | |
Trading Companies & Distributors | | 0.1 | |
Wireless Telecommunication Services | | 0.1 | |
| | |
|
|
| | | 110.7 | |
Liabilities in excess of other assets | | (10.7 | ) |
| | |
|
|
| | | 100.0 | % |
| | |
|
|
SEE NOTES TO FINANCIAL STATEMENTS.
A22
| | | | | | |
| | | CONSERVATIVE BALANCED PORTFOLIO (continued) | | |
| |
| SCHEDULE OF INVESTMENTS | | December 31, 2009 |
The Portfolio invested in derivative instruments during the reporting period. The primary types of risk associated with these derivative instruments are commodity risk, credit risk, equity risk, foreign exchange risk and interest rate risk. The effect of such derivative instruments on the Portfolio’s financial position and financial performance as reflected in the Statement of Assets and Liabilities and Statement of Operations is presented in the summary below.
Fair values of derivative Instruments as of December 31, 2009 as presented in the Statement of Assets and Liabilities:
| | | | | | | | | | | | |
Derivatives not designated as
hedging instruments, carried at
fair value
| | Asset Derivatives
| | | Liability Derivatives
| |
| | Balance Sheet Location
| | Fair
Value
| | | Balance Sheet Location
| | Fair
Value
| |
Credit contracts | | Premium paid for swaps agreements | | $ | 201,864 | | | Premium received for swaps agreements | | $ | 66,356 | |
Credit contracts | | Unrealized appreciation on swaps | | | 1,696,513 | | | Unrealized depreciation on swaps | | | 1,551,799 | |
Equity contracts | | Due to broker—variation margin | | | 930,137 | * | | — | | | — | |
Interest rate contracts | | Due to broker—variation margin | | | 1,804,057 | * | | Due to broker—variation margin | | | 1,588,120 | * |
Interest rate contracts | | Unrealized appreciation on swaps | | | 167,792 | | | Unrealized depreciation on swaps | | | 253,855 | |
| | | | |
|
|
| | | |
|
|
|
Total | | | | $ | 4,800,363 | | | | | $ | 3,460,130 | |
| | | | |
|
|
| | | |
|
|
|
| * | Includes cumulative appreciation/depreciation on futures contracts as reported in Schedule of Investments. Only unsettled variation margin receivable (payable) is reported within the Statement of Assets and Liabilities. |
The effects of derivative instruments on the Statement of Operations for the year ended December 31, 2009 are as follows:
| | | | | | | | | | | | | | | | |
Amount of Realized Gain or (Loss) on Derivatives Recognized in Income
|
Derivatives not designated as hedging
instruments, carried at fair value
| | Futures
| | Swaps
| | Purchased
Options
| | | Written
Options
| | Total
|
Credit contracts | | $ | — | | $ | 916,506 | | $ | — | | | $ | — | | $ | 916,506 |
Equity contracts | | | 16,217,169 | | | — | | | — | | | | — | | | 16,217,169 |
Interest rate contracts | | | 5,098,976 | | | 192,226 | | | (113,446 | ) | | | 39,538 | | | 5,217,294 |
| | |
|
| |
|
| |
|
|
| |
|
| |
|
|
Total | | $ | 21,316,145 | | $ | 1,108,732 | | $ | (113,446 | ) | | $ | 39,538 | | $ | 22,350,969 |
| | |
|
| |
|
| |
|
|
| |
|
| |
|
|
| | | | | | | | | | | | |
Change in Unrealized Appreciation or (Depreciation) on Derivatives Recognized in Income
| |
Derivatives not designated as hedging
instruments, carried at fair value
| | Futures
| | | Swaps
| | | Total
| |
Credit contracts | | $ | — | | | $ | (5,614,260 | ) | | $ | (5,614,260 | ) |
Equity contracts | | | 619,788 | | | | — | | | | 619,788 | |
Interest rate contracts | | | (2,547,298 | ) | | | 20,922 | | | | (2,526,376 | ) |
| | |
|
|
| |
|
|
| |
|
|
|
Total | | $ | (1,927,510 | ) | | $ | (5,593,338 | ) | | $ | (7,520,848 | ) |
| | |
|
|
| |
|
|
| |
|
|
|
For the year ended December 31, 2009, the Portfolio’s average volume of derivative activities is as follows:
| | | | | | |
Purchased Options
(Cost)
| | Written Options
(Premium Received)
| | Futures
Long Position
(Value at Trade Date)
| | Futures
Short Position
(Value at Trade Date)
|
$7,100 | | $2,899 | | $193,146,186 | | $14,597,723 |
| | | | |
Interest Rate Swaps
(Notional Amount in USD (000))
| | Credit Default
Swaps as Buyer
(Notional Amount in USD (000))
| | Credit Default
Swaps as Writer
(Notional Amount in USD (000))
|
$11,697 | | $38,723 | | $968 |
SEE NOTES TO FINANCIAL STATEMENTS.
A23
| | | | | | |
| | | CONSERVATIVE BALANCED PORTFOLIO (continued) | | |
STATEMENT OF ASSETS AND LIABILITIES December 31, 2009
| | | |
| ASSETS | | | |
Investments, at value including securities on loan of $118,672,517: | | | |
Unaffiliated investments (cost $1,715,309,715) | | $ | 1,959,159,083 |
Affiliated investments (cost $427,520,895) | | | 409,183,204 |
Foreign currency, at value (cost $9,325) | | | 9,323 |
Receivable for investments sold | | | 53,436,700 |
Dividends and interest receivable | | | 7,981,069 |
Unrealized appreciation on swaps | | | 1,864,305 |
Foreign tax reclaim receivable | | | 318,199 |
Premium paid for swaps agreements | | | 201,864 |
Receivable for Series shares sold | | | 34,088 |
Prepaid expenses | | | 22,474 |
| | |
|
|
Total Assets | | | 2,432,210,309 |
| | |
|
|
| LIABILITIES | | | |
Payable for investments purchased | | | 139,648,338 |
Collateral for securities on loan | | | 122,857,073 |
Payable to custodian | | | 26,943,962 |
Unrealized depreciation on swaps | | | 1,805,654 |
Management fee payable | | | 1,000,526 |
Due to broker-variation margin | | | 769,898 |
Accrued expenses and other liabilities | | | 268,240 |
Payable for Series shares repurchased | | | 117,602 |
Premium received for swaps agreements | | | 66,356 |
Affiliated transfer agent fee payable | | | 595 |
| | |
|
|
Total Liabilities | | | 293,478,244 |
| | |
|
|
| NET ASSETS | | $ | 2,138,732,065 |
| | |
|
|
Net assets were comprised of: | | | |
Paid-in capital | | $ | 2,004,241,267 |
Retained earnings | | | 134,490,798 |
| | |
|
|
Net assets, December 31, 2009 | | $ | 2,138,732,065 |
| | |
|
|
Net asset value and redemption price per share, $2,138,732,065 / 145,958,929 outstanding shares of beneficial interest | | $ | 14.65 |
| | |
|
|
STATEMENT OF OPERATIONS
Year Ended December 31, 2009
| | | | |
| INVESTMENT INCOME | | | | |
Interest | | $ | 37,092,927 | |
Unaffiliated dividend income (net of foreign withholding taxes of $124) | | | 22,885,291 | |
Affiliated dividend income | | | 3,023,297 | |
Affiliated income from securities loaned, net | | | 1,252,718 | |
| | |
|
|
|
| | | | 64,254,233 | |
| | |
|
|
|
| EXPENSES | | | | |
Management fee | | | 10,805,389 | |
Shareholders’ reports | | | 280,000 | |
Custodian’s fees and expenses | | | 267,000 | |
Audit fee | | | 41,000 | |
Insurance expenses | | | 41,000 | |
Trustees’ fees | | | 36,000 | |
Commitment fee on syndicated credit agreement | | | 15,000 | |
Legal fees and expenses | | | 15,000 | |
Transfer agent’s fee and expenses (including affiliated expense of $3,600) (Note 4) | | | 10,000 | |
Miscellaneous | | | 20,859 | |
| | |
|
|
|
Total expenses | | | 11,531,248 | |
| | |
|
|
|
| NET INVESTMENT INCOME | | | 52,722,985 | |
| | |
|
|
|
| NET REALIZED AND UNREALIZED GAIN (LOSS) ON INVESTMENTS, SWAPS AND FOREIGN CURRENCIES | | | | |
Net realized gain (loss) on: | | | | |
Investment transactions (including affiliated: $(2,250,188)) | | | (63,813,497 | ) |
Futures transactions | | | 21,316,145 | |
Swap agreement transactions | | | 1,108,732 | |
Foreign currency transactions | | | 1,626 | |
Written options transactions | | | 39,538 | |
| | |
|
|
|
| | | | (41,347,456 | ) |
| | |
|
|
|
Net change in unrealized appreciation (depreciation) on: | | | | |
Investments (including affiliated: $19,799,375) | | | 360,490,601 | |
Futures | | | (1,927,510 | ) |
Swaps | | | (5,593,338 | ) |
Foreign currencies | | | 8,220 | |
| | |
|
|
|
| | | | 352,977,973 | |
| | |
|
|
|
| NET GAIN ON INVESTMENTS, SWAPS AND FOREIGN CURRENCIES | | | 311,630,517 | |
| | |
|
|
|
| NET INCREASE IN NET ASSETS RESULTING FROM OPERATIONS | | $ | 364,353,502 | |
| | |
|
|
|
STATEMENT OF CHANGES IN NET ASSETS
| | | | | | | | |
| | | Year Ended December 31,
| |
| | | 2009
| | | 2008
| |
| INCREASE (DECREASE) IN NET ASSETS | | | | | | | | |
| OPERATIONS: | | | | | | | | |
Net investment income | | $ | 52,722,985 | | | $ | 74,151,854 | |
Net realized loss on investments, swaps and foreign currencies | | | (41,347,456 | ) | | | (65,065,328 | ) |
Net change in unrealized appreciation (depreciation) on investments, swaps and foreign currencies | | | 352,977,973 | | | | (563,716,770 | ) |
| | |
|
|
| |
|
|
|
NET INCREASE (DECREASE) IN NET ASSETS RESULTING FROM OPERATIONS | | | 364,353,502 | | | | (554,630,244 | ) |
| | |
|
|
| |
|
|
|
| DISTRIBUTIONS | | | (74,120,351 | ) | | | (81,811,715 | ) |
| | |
|
|
| |
|
|
|
| SERIES SHARE TRANSACTIONS: | | | | | | | | |
Series shares sold [1,049,111 and 1,194,754 shares, respectively] | | | 13,537,729 | | | | 16,824,187 | |
Series shares issued in reinvestment of dividends and distributions [5,781,619 and 5,295,257 shares, respectively] | | | 74,120,351 | | | | 81,811,715 | |
Series shares repurchased [15,167,586 and 15,304,061 shares, respectively] | | | (196,684,797 | ) | | | (226,520,392 | ) |
| | |
|
|
| |
|
|
|
NET DECREASE IN NET ASSETS RESULTING FROM SERIES SHARE TRANSACTIONS | | | (109,026,717 | ) | | | (127,884,490 | ) |
| | |
|
|
| |
|
|
|
| TOTAL INCREASE (DECREASE) IN NET ASSETS | | | 181,206,434 | | | | (764,326,449 | ) |
| NET ASSETS: | | | | | | | | |
Beginning of year | | | 1,957,525,631 | | | | 2,721,852,080 | |
| | |
|
|
| |
|
|
|
End of year | | $ | 2,138,732,065 | | | $ | 1,957,525,631 | |
| | |
|
|
| |
|
|
|
SEE NOTES TO FINANCIAL STATEMENTS.
A24
| | | | | | |
| | | DIVERSIFIED BOND PORTFOLIO | | |
| |
| SCHEDULE OF INVESTMENTS | | December 31, 2009 |
| | | | | | | | | | | | |
LONG-TERM INVESTMENTS — 91.7%
ASSET-BACKED SECURITIES — 5.2% | |
Moody’s
Rating
(Unaudited)†
| | Interest
Rate
| | Maturity
Date
| | Principal
Amount
(000)#
| | Value
(Note 2)
|
| | | | | | | | | | | | | |
Alfa Diversified Payment Rights Finance Co. (Russia), Ser. 1A, Class A, 144A(a) | | Ba1 | | 1.854% | | 03/15/11 | | $ | 954 | | $ | 858,375 |
Ballyrock Cdo Ltd. (Cayman Islands), Ser. 2003-2A, Class A, 144A(a) | | Aa2 | | 0.799% | | 11/20/15 | | | 5,542 | | | 5,154,228 |
Bank of America Credit Card Trust
Ser. 2006-C5, Class C5(a) | | Baa1 | | 0.633% | | 01/15/16 | | | 5,750 | | | 4,955,943 |
Ser. 2007-A3, Class A3(a) | | Aaa | | 0.253% | | 11/15/16 | | | 1,000 | | | 954,474 |
Bank One Issuance Trust
Ser. 2004-A3, Class A3(a) | | Aaa | | 0.403% | | 02/15/17 | | | 5,100 | | | 4,976,066 |
Ser. 2004-C2, Class C2(a) | | Baa2 | | 1.033% | | 02/15/17 | | | 2,100 | | | 1,946,647 |
Chase Issuance Trust, Ser. 2008-A13, Class A13(a) | | Aaa | | 1.754% | | 09/15/15 | | | 1,000 | | | 1,029,390 |
Chatham Light CLO Ltd. (Cayman Islands), Ser. 2005-2A, Class A1, 144A(a) | | Aa1 | | 0.531% | | 08/03/19 | | | 4,951 | | | 4,505,602 |
Citibank Credit Card Issuance Trust
Ser. 2003-C4, Class C4 | | Baa2 | | 5.000% | | 06/10/15 | | | 6,500 | | | 6,387,152 |
Ser. 2005-C3, Class C3(a) | | Baa2 | | 0.643% | | 07/15/14 | | | 3,780 | | | 3,523,873 |
Ser. 2006-A7, Class A7(a) | | Aaa | | 0.314% | | 12/15/18 | | | 6,000 | | | 5,651,543 |
Ser. 2006-C1, Class C1(a) | | Baa2 | | 0.633% | | 02/20/15 | | | 2,200 | | | 2,011,170 |
Ford Credit Auto Owner Trust, Ser. 2006-B, Class C | | Aaa | | 5.680% | | 06/15/12 | | | 2,100 | | | 2,192,933 |
Granite Ventures Ltd. (Cayman Islands), Ser. 2005-2A, Class A1, 144A(a) | | Aaa | | 0.544% | | 12/15/17 | | | 4,200 | | | 3,927,000 |
Katonah Ltd., Ser. 2005-7A, Class A2, 144A(a) | | A2 | | 0.533% | | 11/15/17 | | | 3,385 | | | 3,088,410 |
MBNA Credit Card Master Note Trust
Ser. 2002-C3, Class C3(a) | | Baa1 | | 1.583% | | 10/15/14 | | | 1,900 | | | 1,782,933 |
Ser. 2004-C2, Class C2(a) | | Baa1 | | 1.133% | | 11/15/16 | | | 1,500 | | | 1,274,295 |
Ser. 2005-A10, Class A10(a) | | Aaa | | 0.293% | | 11/15/15 | | | 2,400 | | | 2,322,634 |
Ser. 2005-A2, Class A2(a) | | Aaa | | 0.313% | | 10/15/14 | | | 2,100 | | | 2,057,307 |
Ser. 2006-A2, Class A2(a) | | Aaa | | 0.293% | | 06/15/15 | | | 1,000 | | | 972,096 |
Ser. 2006-A5, Class A5(a) | | Aaa | | 0.293% | | 10/15/15 | | | 1,250 | | | 1,210,882 |
Ser. 2006-C1, Class C1(a) | | Baa1 | | 0.653% | | 07/15/15 | | | 5,000 | | | 4,446,850 |
Mountain Capital CLO Ltd. (Cayman Islands), Ser. 2004-3A,
Class A1LA, 144A(a) | | Aaa | | 0.688% | | 02/15/16 | | | 3,550 | | | 3,372,924 |
Railcar Leasing LLC, Ser. 1997-1, Class A2, 144A | | Aa2 | | 7.125% | | 01/15/13 | | | 2,332 | | | 2,410,407 |
| | | | | | | | | | | |
|
|
TOTAL ASSET-BACKED SECURITIES
(cost $66,290,504) | | | 71,013,134 |
| | | | | | | | | | | |
|
|
| BANK LOANS — 2.8% | | | | | | | | | | | | |
Automotive — 0.1% | | | | | | | | | | | | |
Oshkosh Truck Corp.(a)(b) | | B2 | | 6.269% | | 12/06/13 | | | 1,144 | | | 1,141,009 |
| | | | | | | | | | | |
|
|
Cable — 0.3% | | | | | | | | | | | | |
Discovery Communications, Inc.(a)(b) | | Baa3 | | 5.250% | | 05/14/14 | | | 1,302 | | | 1,312,740 |
Insight Midwest Holding LLC(a)(b) | | B1 | | 1.790% | | 10/06/13 | | | 2,653 | | | 2,490,126 |
| | | | | | | | | | | |
|
|
| | | | | | | | | | | | | 3,802,866 |
| | | | | | | | | | | |
|
|
Capital Goods — 0.1% | | | | | | | | | | | | |
Capital Safety Group Ltd.(a)(b) | | B2 | | 2.723% | | 07/20/15 | | | 409 | | | 339,676 |
Capital Safety Group Ltd.(a)(b) | | B2 | | 2.981% | | 07/20/16 | | | 1,091 | | | 905,324 |
| | | | | | | | | | | |
|
|
| | | | | | | | | | | | | 1,245,000 |
| | | | | | | | | | | |
|
|
Consumer — 0.1% | | | | | | | | | | | | |
Huish Detergents, Inc.(a)(b) | | Ba2 | | 2.010% | | 04/26/14 | | | 206 | | | 192,471 |
Pilot Travel Centers LLC(b) | | Ba2 | | TBA | | 12/31/15 | | | 1,125 | | | 1,129,489 |
| | | | | | | | | | | |
|
|
| | | | | | | | | | | | | 1,321,960 |
| | | | | | | | | | | |
|
|
Electric — 0.3% | | | | | | | | | | | | |
NRG Energy, Inc.(a)(b) | | Baa3 | | 0.151% | | 02/01/13 | | | 1,171 | | | 1,112,508 |
NRG Energy, Inc.(a)(b) | | Baa3 | | 1.996% | | 02/01/13 | | | 1,991 | | | 1,891,124 |
Texas Competitive Electric Holdings Co. LLC(a)(b) | | B1 | | 3.735% | | 10/10/14 | | | 1,955 | | | 1,588,438 |
| | | | | | | | | | | |
|
|
| | | | | | | | | | | | | 4,592,070 |
| | | | | | | | | | | |
|
|
Gaming — 0.1% | | | | | | | | | | | | |
MotorCity Casino Hotel(b) | | B3 | | 8.500% | | 07/13/12 | | | 1,641 | | | 1,595,558 |
| | | | | | | | | | | |
|
|
SEE NOTES TO FINANCIAL STATEMENTS.
A25
| | | | | | |
| | | DIVERSIFIED BOND PORTFOLIO (continued) | | |
| |
| SCHEDULE OF INVESTMENTS | | December 31, 2009 |
| | | | | | | | | | | | |
BANK LOANS
(continued) | |
Moody’s
Rating
(Unaudited)†
| | Interest
Rate
| | Maturity
Date
| | Principal
Amount
(000)#
| | Value
(Note 2)
|
| | | | | | | | | | | | | |
Healthcare & Pharmaceutical — 1.3% | | | | | | | | | | | | |
HCA, Inc.(a)(b) | | Ba3 | | 2.501% | | 11/18/13 | | $ | 1,851 | | $ | 1,765,740 |
Health Management Associates Term B(a)(b) | | B1 | | 2.001% | | 02/28/14 | | | 1,880 | | | 1,748,650 |
Inverness Medical Innovations(a)(b) | | Ba2 | | 3.131% | | 06/26/14 | | | 2,925 | | | 2,756,812 |
PTS Acquisitions Corp.(a)(b) | | Ba3 | | 2.481% | | 04/10/14 | | | 3,803 | | | 3,220,242 |
Royalty Pharma Finance Trust(b) | | Baa3 | | 7.750% | | 05/15/15 | | | 4,000 | | | 3,720,000 |
Warner Chilcott Corp.(a)(b) | | B1 | | 5.500% | | 10/30/14 | | | 1,544 | | | 1,545,689 |
Warner Chilcott Corp.(a)(b) | | B1 | | 5.750% | | 04/30/15 | | | 1,699 | | | 1,700,257 |
Warner Chilcott Corp.(a)(b) | | B1 | | 5.750% | | 04/30/15 | | | 772 | | | 772,844 |
| | | | | | | | | | | |
|
|
| | | | | | | | | | | | | 17,230,234 |
| | | | | | | | | | | |
|
|
Paper | | | | | | | | | | | | |
Domtar, Inc.(a)(b) | | Baa3 | | 1.608% | | 03/05/14 | | | 840 | | | 816,375 |
| | | | | | | | | | | |
|
|
Pipelines & Other — 0.1% | | | | | | | | | | | | |
Enterprise GP Holdings LP(a)(b) | | Ba2 | | 2.514% | | 11/08/14 | | | 1,504 | | | 1,434,726 |
| | | | | | | | | | | |
|
|
Technology — 0.4% | | | | | | | | | | | | |
Fidelity National Information Services, Inc.(b) | | Ba1 | | 4.481% | | 01/18/12 | | | 298 | | | 296,779 |
First Data Corp.(a)(b) | | B1 | | 2.983% | | 09/24/14 | | | 1,026 | | | 909,197 |
First Data Corp.(a)(b) | | B1 | | 2.999% | | 09/24/14 | | | 1,955 | | | 1,728,953 |
Flextronics International Ltd. (Singapore)(a)(b) | | Ba1 | | 2.514% | | 10/01/14 | | | 2,278 | | | 2,105,182 |
Flextronics International Ltd. (Singapore)(a)(b) | | Ba1 | | 2.534% | | 10/01/14 | | | 655 | | | 604,938 |
| | | | | | | | | | | |
|
|
| | | | | | | | | | | | | 5,645,049 |
| | | | | | | | | | | |
|
|
TOTAL BANK LOANS
(cost $41,352,990) | | | 38,824,847 |
| | | | | | | | | | | |
|
|
| COLLATERALIZED MORTGAGE OBLIGATIONS — 0.4% | | | | | | | | | | | | |
Countrywide Alternative Loan Trust, Ser. 2004-18CB, Class 3A1 | | A1 | | 5.250% | | 09/25/19 | | | 1,594 | | | 1,542,596 |
Master Alternative Loans Trust, Ser. 2004-4, Class 4A1 | | Aaa | | 5.000% | | 04/25/19 | | | 351 | | | 331,412 |
Structured Adjustable Rate Mortgage Loan Trust, Ser. 2004-1, Class 4A3(a) | | A1 | | 3.586% | | 02/25/34 | | | 2,302 | | | 1,904,549 |
Washington Mutual Alternative Mortgage Pass-Through Certificates, Ser. 2005-1, Class 3A | | AAA(c) | | 5.000% | | 03/25/20 | | | 1,291 | | | 988,944 |
| | | | | | | | | | | |
|
|
TOTAL COLLATERALIZED MORTGAGE OBLIGATIONS
(cost $5,593,458) | | | 4,767,501 |
| | | | | | | | | | | |
|
|
| COMMERCIAL MORTGAGE-BACKED SECURITIES — 15.6% | | | | | | | | | | | | |
Banc of America Commercial Mortgage, Inc.
Ser. 2005-1, Class ASB(a) | | AAA(c) | | 4.965% | | 11/10/42 | | | 4,512 | | | 4,630,871 |
Ser. 2007-1, Class A2 | | Aaa | | 5.381% | | 01/15/49 | | | 5,000 | | | 5,093,416 |
Ser. 2007-4, Class A3(a) | | AAA(c) | | 5.811% | | 02/10/51 | | | 6,460 | | | 6,338,273 |
Ser. 2007-5, Class A3 | | AAA(c) | | 5.620% | | 02/10/51 | | | 2,445 | | | 2,372,995 |
Bear Stearns Commercial Mortgage Securities
Ser. 2005-T18, Class AAB(a) | | Aaa | | 4.823% | | 02/13/42 | | | 2,475 | | | 2,498,469 |
Ser. 2005-T20, Class AAB(a) | | Aaa | | 5.134% | | 10/12/42 | | | 3,400 | | | 3,486,546 |
Ser. 2006-PW11, Class A4(a) | | AAA(c) | | 5.456% | | 03/11/39 | | | 2,000 | | | 1,954,859 |
Ser. 2006-PW13, Class A3 | | AAA(c) | | 5.518% | | 09/11/41 | | | 4,024 | | | 4,015,491 |
Citigroup Commercial Mortgage Trust
Ser. 2006-C5, Class A2 | | Aaa | | 5.378% | | 10/15/49 | | | 7,000 | | | 7,112,874 |
Ser. 2008-C7, Class A2A | | Aaa | | 6.034% | | 12/10/49 | | | 3,620 | | | 3,769,770 |
Citigroup/Deutsche Bank Commercial Mortgage Trust, Ser. 2006-CD2, Class AAB(a) | | Aaa | | 5.393% | | 01/15/46 | | | 3,000 | | | 3,035,411 |
Commercial Mortgage Loan Trust, Ser. 2008-LS1, Class A2(a) | | Aaa | | 6.019% | | 12/10/49 | | | 3,000 | | | 3,077,314 |
Commercial Mortgage Loan Trust, Pass-Through Certificates, Ser. 2006-C7,
Class A3(a) | | AAA(c) | | 5.706% | | 06/10/46 | | | 1,598 | | | 1,605,750 |
Credit Suisse First Boston Mortgage Securities Corp., Ser. 2001-CP4, Class B | | AAA(c) | | 6.330% | | 12/15/35 | | | 1,400 | | | 1,432,952 |
Credit Suisse Mortgage Capital Certificates
Ser. 2006-C1, Class A4(a) | | AAA(c) | | 5.548% | | 02/15/39 | | | 4,400 | | | 4,334,191 |
Ser. 2006-C4, Class A2 | | Aaa | | 5.361% | | 09/15/39 | | | 460 | | | 466,342 |
SEE NOTES TO FINANCIAL STATEMENTS.
A26
| | | | | | |
| | | DIVERSIFIED BOND PORTFOLIO (continued) | | |
| |
| SCHEDULE OF INVESTMENTS | | December 31, 2009 |
| | | | | | | | | | | | |
COMMERCIAL MORTGAGE-BACKED SECURITIES
(continued) | | Moody’s
Rating
(Unaudited)†
| | Interest
Rate
| | Maturity
Date
| | Principal
Amount
(000)#
| | Value
(Note 2)
|
| | | | | | | | | | | | | |
Ser. 2006-C5, Class A2 | | Aaa | | 5.246% | | 12/15/39 | | $ | 3,810 | | $ | 3,877,044 |
Ser. 2007-C1, Class A2 | | Aaa | | 5.268% | | 02/15/40 | | | 7,430 | | | 7,473,817 |
CS First Boston Mortgage Securities Corp.
Ser. 2005-C3, Class A3 | | Aaa | | 4.645% | | 07/15/37 | | | 3,950 | | | 3,965,086 |
Ser. 2005-C5, Class A4(a) | | AAA(c) | | 5.100% | | 08/15/38 | | | 2,400 | | | 2,312,157 |
GE Capital Commercial Mortgage Corp., Ser. 2006-C1, Class A4(a) | | AAA(c) | | 5.336% | | 03/10/44 | | | 4,300 | | | 4,101,564 |
Greenwich Capital Commercial Funding Corp.
Ser. 2005-GG5, Class A5(a) | | Aaa | | 5.224% | | 04/10/37 | | | 4,900 | | | 4,641,329 |
Ser. 2007-GG9, Class A2 | | Aaa | | 5.381% | | 03/10/39 | | | 6,010 | | | 6,088,420 |
GS Mortgage Securities Corp. II, Ser. 2007-GG10, Class A2(a) | | Aaa | | 5.778% | | 08/10/45 | | | 6,920 | | | 7,087,677 |
JPMorgan Chase Commercial Mortgage Securities Corp.
Ser. 2005-LDP2, Class ASB | | Aaa | | 4.659% | | 07/15/42 | | | 9,300 | | | 9,396,592 |
Ser. 2006-CB14, Class A4(a) | | Aaa | | 5.481% | | 12/12/44 | | | 5,000 | | | 4,816,066 |
Ser. 2006-LDP6, Class A4(a) | | Aaa | | 5.475% | | 04/15/43 | | | 900 | | | 865,995 |
Ser. 2006-LDP7, Class A2(a) | | Aaa | | 5.861% | | 04/15/45 | | | 4,500 | | | 4,612,079 |
Ser. 2006-LDP9, Class A2 | | Aaa | | 5.134% | | 05/15/47 | | | 2,435 | | | 2,328,443 |
Ser. 2007-CB19, Class A2(a) | | Aaa | | 5.746% | | 02/12/49 | | | 656 | | | 673,152 |
Ser. 2007-LD11, Class A2(a) | | Aaa | | 5.803% | | 06/15/49 | | | 4,190 | | | 4,302,828 |
Ser. 2007-LDPX, Class A2 | | Aaa | | 5.434% | | 01/15/49 | | | 4,285 | | | 4,003,031 |
LB-UBS Commercial Mortgage Trust
Ser. 2004-C8, Class A6(a) | | Aaa | | 4.799% | | 12/15/29 | | | 4,200 | | | 3,882,842 |
Ser. 2006-C6, Class AAB | | Aaa | | 5.341% | | 09/15/39 | | | 7,126 | | | 7,025,147 |
Ser. 2007-C1, Class A2 | | AAA(c) | | 5.318% | | 02/15/40 | | | 6,000 | | | 6,109,477 |
Merrill Lynch Mortgage Trust
Ser. 2005-CIP1, Class A4(a) | | Aaa | | 5.047% | | 07/12/38 | | | 3,100 | | | 3,012,781 |
Ser. 2006-C1, Class A4(a) | | AAA(c) | | 5.656% | | 05/12/39 | | | 7,920 | | | 7,740,105 |
Merrill Lynch/Countrywide Commercial Mortgage Trust
Ser. 2006-2, Class A4(a) | | Aaa | | 5.909% | | 06/12/46 | | | 2,625 | | | 2,576,999 |
Ser. 2006-3, Class ASB(a) | | Aaa | | 5.382% | | 07/12/46 | | | 2,095 | | | 2,065,439 |
Ser. 2007-7, Class A2(a) | | Aaa | | 5.693% | | 06/12/50 | | | 347 | | | 355,508 |
Ser. 2007-8, Class A2(a) | | AAA(c) | | 5.920% | | 08/12/49 | | | 4,400 | | | 4,310,061 |
Ser. 2007-9, Class A2 | | AAA(c) | | 5.590% | | 09/12/49 | | | 5,415 | | | 5,472,896 |
Morgan Stanley Capital Group, Inc.
Ser. 2006-IQ12, Class AAB | | AAA(c) | | 5.325% | | 12/15/43 | | | 1,400 | | | 1,395,121 |
Ser. 2006-T23, Class A3(a) | | AAA(c) | | 5.807% | | 08/12/41 | | | 1,318 | | | 1,335,215 |
Ser. 2006-T23, Class A4(a) | | AAA(c) | | 5.810% | | 08/12/41 | | | 6,100 | | | 6,146,798 |
Morgan Stanley Capital I, Ser. 2006-IQ12, Class ANM | | AAA(c) | | 5.310% | | 12/15/43 | | | 5,500 | | | 5,575,506 |
Wachovia Bank Commercial Mortgage Trust
Ser. 2003-C9, Class A3 | | AAA(c) | | 4.608% | | 12/15/35 | | | 3,991 | | | 4,076,101 |
Ser. 2005-C18, Class APB | | Aaa | | 4.807% | | 04/15/42 | | | 1,500 | | | 1,513,945 |
Ser. 2005-C22, Class A3(a) | | Aaa | | 5.285% | | 12/15/44 | | | 2,800 | | | 2,812,914 |
Ser. 2006-C24, Class A3(a) | | Aaa | | 5.558% | | 03/15/45 | | | 2,050 | | | 2,003,723 |
Ser. 2006-C25, Class A4(a) | | Aaa | | 5.740% | | 05/15/43 | | | 6,000 | | | 5,911,719 |
Ser. 2006-C27, Class A2 | | Aaa | | 5.624% | | 07/15/45 | | | 5,000 | | | 5,118,811 |
Ser. 2007-C33, Class A2(a) | | Aaa | | 5.857% | | 02/15/51 | | | 5,000 | | | 5,117,400 |
Ser. 2007-C34, Class A2 | | Aaa | | 5.569% | | 05/15/46 | | | 3,600 | | | 3,668,610 |
| | | | | | | | | | | |
|
|
TOTAL COMMERCIAL MORTGAGE-BACKED SECURITIES
(cost $191,573,107) | | | 212,997,922 |
| | | | | | | | | | | |
|
|
| CORPORATE BONDS — 47.2% | | | | | | | | | | | | |
Aerospace & Defense — 0.1% | | | | | | | | | | | | |
BAE Systems Holdings, Inc., Gtd. Notes, 144A | | Baa2 | | 6.375% | | 06/01/19 | | | 1,350 | | | 1,452,153 |
| | | | | | | | | | | |
|
|
Airlines — 1.2% | | | | | | | | | | | | |
American Airlines Pass-Through Trust 2001-01, Pass-thru Certs., Ser. 01-1(d) | | B2 | | 6.817% | | 05/23/11 | | | 2,750 | | | 2,640,000 |
Continental Airlines, Inc., Pass-thru Certs.
Ser. 2000-1, Class A-1(b) | | Baa2 | | 7.487% | | 10/02/10 | | | 7,954 | | | 7,914,230 |
Ser. 2000-1, Class A-1(b) | | Baa2 | | 6.703% | | 06/15/21 | | | 3 | | | 2,490 |
SEE NOTES TO FINANCIAL STATEMENTS.
A27
| | | | | | |
| | | DIVERSIFIED BOND PORTFOLIO (continued) | | |
| |
| SCHEDULE OF INVESTMENTS | | December 31, 2009 |
| | | | | | | | | | | | |
CORPORATE BONDS
(continued) | | Moody’s
Rating
(Unaudited)†
| | Interest
Rate
| | Maturity
Date
| | Principal
Amount
(000)#
| | Value
(Note 2)
|
| | | | | | | | | | | | | |
Airlines (continued) | | | | | | | | | | | | |
Ser. 2001-1, Class A-1 | | Ba1 | | 7.373% | | 12/15/15 | | $ | 1,022 | | $ | 904,634 |
Ser. A(d) | | Baa1 | | 5.983% | | 04/19/22 | | | 1,850 | | | 1,785,250 |
Delta Air Lines, Inc., Pass-thru Certs., Ser. 071A | | Baa1 | | 6.821% | | 08/10/22 | | | 1,624 | | | 1,550,708 |
United Airlines, Inc., Pass-thru Certs., Ser. 2007-1, Class A(d) | | Ba1 | | 6.636% | | 07/02/22 | | | 1,183 | | | 1,005,827 |
| | | | | | | | | | | |
|
|
| | | | | | | | | | | | | 15,803,139 |
| | | | | | | | | | | |
|
|
Automotive — 0.5% | | | | | | | | | | | | |
Ford Motor Credit Co. LLC, Sr. Unsec’d. Notes | | B3 | | 7.875% | | 06/15/10 | | | 5,615 | | | 5,699,826 |
Harley-Davidson Funding Corp., Gtd. Notes, 144A, MTN | | Baa1 | | 5.750% | | 12/15/14 | | | 660 | | | 670,077 |
| | �� | | | | | | | | | |
|
|
| | | | | | | | | | | | | 6,369,903 |
| | | | | | | | | | | |
|
|
Banking — 6.5% | | | | | | | | | | | | |
Alfa MTN Markets Ltd. for ABH Financial Ltd. (Cyprus), Notes, 144A, MTN | | Ba1 | | 8.200% | | 06/25/12 | | | 1,500 | | | 1,500,000 |
American Express Co., Sr. Unsec’d. Notes | | A3 | | 8.125% | | 05/20/19 | | | 2,785 | | | 3,300,395 |
Bank of America, Sub. Notes | | A1 | | 5.300% | | 03/15/17 | | | 790 | | | 774,271 |
Bank of America Corp., Jr. Sub. Notes(a) | | Ba3 | | 8.000% | | 12/29/49 | | | 3,500 | | | 3,369,590 |
Bank of America Corp., Sr. Unsec’d. Notes | | A2 | | 6.000% | | 09/01/17 | | | 1,495 | | | 1,551,696 |
Barclays Bank PLC (United Kingdom), Sr. Unsec’d. Notes(d) | | Aa3 | | 6.750% | | 05/22/19 | | | 1,600 | | | 1,784,691 |
Bear Stearns Cos., Inc. (The), Sr. Unsec’d. Notes | | Aa3 | | 7.250% | | 02/01/18 | | | 1,575 | | | 1,807,868 |
Capital One Financial Corp., Sub. Notes | | Baa2 | | 6.150% | | 09/01/16 | | | 700 | | | 703,161 |
Chuo Mitsui Trust & Banking Co. Ltd. (Japan), Jr. Sub. Notes, 144A(a) | | A2 | | 5.506% | | 12/29/49 | | | 3,050 | | | 2,799,653 |
Citigroup, Inc., Sr. Unsec’d. Notes | | A3 | | 6.125% | | 11/21/17 | | | 2,050 | | | 2,066,349 |
Citigroup, Inc., Sr. Unsec’d. Notes(d) | | A3 | | 8.125% | | 07/15/39 | | | 4,120 | | | 4,650,026 |
Citigroup, Inc. | | A3 | | 8.500% | | 05/22/19 | | | 1,375 | | | 1,587,785 |
Countrywide Financial Corp., Gtd. Notes, MTN | | A2 | | 5.800% | | 06/07/12 | | | 3,670 | | | 3,895,745 |
Depfa ACS Bank (Ireland), Covered Notes, 144A | | Aa2 | | 5.125% | | 03/16/37 | | | 3,065 | | | 2,252,714 |
Goldman Sachs Group, Inc. (The), Sr. Unsec’d. Notes | | A1 | | 5.950% | | 01/18/18 | | | 1,550 | | | 1,636,758 |
Goldman Sachs Group, Inc. (The), Sr. Unsec’d. Notes(d) | | A1 | | 6.150% | | 04/01/18 | | | 1,900 | | | 2,033,948 |
Goldman Sachs Group, Inc. (The), Sr. Unsec’d. Notes | | A1 | | 6.250% | | 09/01/17 | | | 3,195 | | | 3,426,363 |
Goldman Sachs Group, Inc. (The), Sub. Notes | | A2 | | 6.750% | | 10/01/37 | | | 440 | | | 452,270 |
HSBC Holdings PLC (United Kingdom), Sub. Notes | | A1 | | 6.500% | | 05/02/36 | | | 995 | | | 1,043,580 |
HSBC Holdings PLC (United Kingdom), Sub. Notes | | A1 | | 6.500% | | 09/15/37 | | | 2,255 | | | 2,356,006 |
HSBC Holdings PLC (United Kingdom), Sub. Notes | | A1 | | 6.800% | | 06/01/38 | | | 2,035 | | | 2,208,526 |
HSBK Europe BV (Netherlands), Gtd. Notes., 144A | | Ba2 | | 7.250% | | 05/03/17 | | | 2,230 | | | 2,029,300 |
ICICI Bank Ltd. (India), Jr. Sub. Notes, 144A(a) | | Ba1 | | 7.250% | | 08/29/49 | | | 2,380 | | | 1,995,861 |
ICICI Bank Ltd. (Singapore), Notes, 144A | | Baa2 | | 5.750% | | 11/16/10 | | | 2,500 | | | 2,552,815 |
JPMorgan Chase & Co., Jr. Sub. Notes, Ser. 1(a) | | Baa1 | | 7.900% | | 04/29/49 | | | 2,180 | | | 2,248,583 |
JPMorgan Chase & Co., Sr. Unsec’d. Notes(e) | | Aa3 | | 6.300% | | 04/23/19 | | | 3,250 | | | 3,575,250 |
KBC Bank Funding Trust III, Gtd. Notes, 144A(a) | | Caa1 | | 4.331% | | 11/29/49 | | | 5,000 | | | 3,350,000 |
Krung Thai Bank PCL (Thailand), Sub. Notes(a) | | Baa3 | | 7.378% | | 10/29/49 | | | 1,590 | | | 1,393,357 |
Merrill Lynch & Co., Inc., Notes, MTN | | A2 | | 6.875% | | 04/25/18 | | | 2,860 | | | 3,081,472 |
Merrill Lynch & Co., Inc., Sr. Unsec’d. Notes | | A2 | | 6.050% | | 08/15/12 | | | 1,500 | | | 1,606,848 |
Merrill Lynch & Co., Inc., Sub. Notes | | A3 | | 6.110% | | 01/29/37 | | | 1,785 | | | 1,645,631 |
Morgan Stanley, Sr. Unsec’d. Notes, Ser. E | | A2 | | 5.450% | | 01/09/17 | | | 4,035 | | | 4,078,239 |
Morgan Stanley, Sr. Unsec’d. Notes, MTN | | A2 | | 5.625% | | 09/23/19 | | | 2,635 | | | 2,654,262 |
Royal Bank of Scotland Group PLC (United Kingdom), Sr. Unsec’d. Notes, MTN | | A1 | | 6.400% | | 10/21/19 | | | 1,525 | | | 1,520,105 |
Sumitomo Mitsui Banking Corp. (Japan), Sub. Notes, 144A(a) | | Aa3 | | 5.625% | | 07/29/49 | | | 6,380 | | | 6,081,831 |
USB Capital Xiii Trust, Gtd. Notes | | A2 | | 6.625% | | 12/15/39 | | | 1,975 | | | 2,007,272 |
Wachovia Bank NA, Sub. Notes(d) | | Aa3 | | 6.600% | | 01/15/38 | | | 1,300 | | | 1,372,123 |
Woori Bank (South Korea), Notes, 144A(d) | | A2 | | 7.000% | | 02/02/15 | | | 1,965 | | | 2,153,508 |
| | | | | | | | | | | |
|
|
| | | | | | | | | | | | | 88,547,852 |
| | | | | | | | | | | |
|
|
Brokerage — 0.1% | | | | | | | | | | | | |
Blackstone Holdings Finance Co. LLC, Gtd. Notes, 144A | | A(c) | | 6.625% | | 08/15/19 | | | 1,360 | | | 1,331,127 |
Lehman Brothers Holdings, Inc., Sr. Unsec’d. Notes, MTN(f) | | NR | | 6.875% | | 05/02/18 | | | 2,740 | | | 568,550 |
| | | | | | | | | | | |
|
|
| | | | | | | | | | | | | 1,899,677 |
| | | | | | | | | | | |
|
|
SEE NOTES TO FINANCIAL STATEMENTS.
A28
| | | | | | |
| | | DIVERSIFIED BOND PORTFOLIO (continued) | | |
| |
| SCHEDULE OF INVESTMENTS | | December 31, 2009 |
| | | | | | | | | | | | |
CORPORATE BONDS
(continued) | | Moody’s
Rating
(Unaudited)†
| | Interest
Rate
| | Maturity
Date
| | Principal
Amount
(000)#
| | Value
(Note 2)
|
| | | | | | | | | | | | | |
Building Materials & Construction — 1.1% | | | | | | | | | | | | |
Centex Corp., Sr. Unsec’d. Notes | | B1 | | 5.700% | | 05/15/14 | | $ | 2,500 | | $ | 2,550,000 |
Interline Brands, Inc., Gtd. Notes | | B3 | | 8.125% | | 06/15/14 | | | 1,685 | | | 1,693,425 |
KB Home, Gtd. Notes | | B1 | | 6.375% | | 08/15/11 | | | 447 | | | 447,000 |
Lennar Corp., Gtd. Notes, Ser. B | | B3 | | 5.950% | | 10/17/11 | | | 3,060 | | | 3,082,950 |
Masco Corp., Sr. Unsec’d. Notes | | Ba2 | | 7.125% | | 08/15/13 | | | 2,600 | | | 2,706,262 |
Toll Brothers Finance Corp., Gtd. Notes | | Ba1 | | 5.150% | | 05/15/15 | | | 4,695 | | | 4,492,448 |
| | | | | | | | | | | |
|
|
| | | | | | | | | | | | | 14,972,085 |
| | | | | | | | | | | |
|
|
Cable — 1.5% | | | | | | | | | | | | |
Comcast Cable Communications Holdings, Inc., Gtd. Notes | | Baa1 | | 9.455% | | 11/15/22 | | | 1,065 | | | 1,369,744 |
British Sky Broadcasting Group PLC (United Kingdom), Gtd. Notes, 144A | | Baa1 | | 6.100% | | 02/15/18 | | | 210 | | | 222,461 |
Cablevision Systems Corp., Sr. Notes, 144A | | B1 | | 8.625% | | 09/15/17 | | | 3,175 | | | 3,305,969 |
COX Communications, Inc., Sr. Unsec’d. Notes, 144A
(original cost $1,892,647; purchased date 02/12/09)(g) | | Baa3 | | 8.375% | | 03/01/39 | | | 1,900 | | | 2,365,840 |
DIRECTV Holdings LLC / DIRECTV Financing Co., Inc., Gtd. Notes, 144A | | Ba2 | | 4.750% | | 10/01/14 | | | 3,100 | | | 3,159,942 |
TCI Communications, Inc., Sr. Unsec’d. Notes | | Baa1 | | 7.875% | | 02/15/26 | | | 750 | | | 840,707 |
Time Warner Cable, Inc., Gtd. Notes | | Baa2 | | 5.850% | | 05/01/17 | | | 1,420 | | | 1,491,957 |
Time Warner Cable, Inc., Gtd. Notes | | Baa2 | | 6.750% | | 07/01/18 | | | 5,520 | | | 6,064,068 |
Time Warner Cable, Inc., Gtd. Notes | | Baa2 | | 8.250% | | 02/14/14 | | | 1,115 | | | 1,303,151 |
| | | | | | | | | | | |
|
|
| | | | | | | | | | | | | 20,123,839 |
| | | | | | | | | | | |
|
|
Capital Goods — 1.7% | | | | | | | | | | | | |
Ashtead Holdings PLC (United Kingdom), Sec’d. Notes, 144A(d) | | B2 | | 8.625% | | 08/01/15 | | | 1,300 | | | 1,306,500 |
Hutchison Whampoa International 09/16 Ltd. (Cayman Islands), Gtd. Notes, 144A(d) | | A3 | | 4.625% | | 09/11/15 | | | 4,960 | | | 5,004,590 |
Noble Group Ltd. (Bermuda), Sr. Unsec’d. Notes, 144A | | Baa3 | | 6.750% | | 01/29/20 | | | 2,860 | | | 2,935,075 |
Rockwell Automation, Inc., Sr. Unsec’d. Notes | | A3 | | 5.200% | | 01/15/98 | | | 6,500 | | | 4,874,200 |
Textron, Inc., Sr. Unsec’d. Notes | | Baa3 | | 7.250% | | 10/01/19 | | | 2,350 | | | 2,432,415 |
Trane U.S., Inc., Gtd. Notes | | BBB+(c) | | 7.625% | | 02/15/10 | | | 3,800 | | | 3,822,813 |
Waste Management, Inc., Sr. Unsec’d. Notes | | Baa3 | | 7.650% | | 03/15/11 | | | 2,100 | | | 2,224,977 |
| | | | | | | | | | | |
|
|
| | | | | | | | | | | | | 22,600,570 |
| | | | | | | | | | | |
|
|
Chemicals — 0.9% | | | | | | | | | | | | |
Dow Chemical Co. (The), Sr. Unsec’d. Notes | | Baa3 | | 5.900% | | 02/15/15 | | | 750 | | | 805,932 |
Dow Chemical Co. (The), Sr. Unsec’d. Notes | | Baa3 | | 7.600% | | 05/15/14 | | | 2,050 | | | 2,332,679 |
Dow Chemical Co. (The), Sr. Unsec’d. Notes | | Baa3 | | 8.550% | | 05/15/19 | | | 2,450 | | | 2,923,205 |
Dow Chemical Co. (The), Sr. Unsec’d. Notes | | Baa3 | | 9.400% | | 05/15/39 | | | 1,450 | | | 1,917,119 |
Nova Chemicals Corp. (Canada), Sr. Unsec’d. Notes | | B1 | | 6.500% | | 01/15/12 | | | 1,440 | | | 1,447,200 |
Union Carbide Chemical & Plastics Co., Gtd. Notes | | Ba2 | | 7.875% | | 04/01/23 | | | 3,058 | | | 2,730,922 |
| | | | | | | | | | | |
|
|
| | | | | | | | | | | | | 12,157,057 |
| | | | | | | | | | | |
|
|
Consumer — 0.3% | | | | | | | | | | | | |
Realogy Corp., Gtd. Notes, PIK | | Ca | | 11.000% | | 04/15/14 | | | 2,374 | | | 1,958,232 |
Visant Holding Corp., Sr. Notes | | B3 | | 8.750% | | 12/01/13 | | | 2,445 | | | 2,512,237 |
| | | | | | | | | | | |
|
|
| | | | | | | | | | | | | 4,470,469 |
| | | | | | | | | | | |
|
|
Electric — 4.1% | | | | | | | | | | | | |
AES Corp. (The), Sr. Sec’d. Notes, 144A | | Ba3 | | 8.750% | | 05/15/13 | | | 5,007 | | | 5,132,175 |
CenterPoint Energy Houston Electric LLC, Genl. Ref. Mtge., Ser. J2 | | Baa1 | | 5.700% | | 03/15/13 | | | 2,950 | | | 3,135,682 |
Consumers Energy Co., First Mtge. Bonds, Ser. D | | A3 | | 5.375% | | 04/15/13 | | | 1,000 | | | 1,073,736 |
Duke Energy Corp., Sr. Unsec’d. Notes | | Baa2 | | 6.300% | | 02/01/14 | | | 3,400 | | | 3,738,705 |
EDP Finance BV (Netherlands), Sr. Unsec’d. Notes, 144A | | A3 | | 6.000% | | 02/02/18 | | | 600 | | | 640,945 |
El Paso Electric Co., Sr. Unsec’d. Notes | | Baa2 | | 6.000% | | 05/15/35 | | | 2,325 | | | 2,090,854 |
Empresa Nacional de Electricidad SA (Chile), Unsub. Notes(d) | | Baa3 | | 8.350% | | 08/01/13 | | | 625 | | | 723,517 |
ENEL Finance International SA (Luxembourg), Gtd. Notes, 144A | | A2 | | 6.000% | | 10/07/39 | | | 3,200 | | | 3,216,938 |
Energy East Corp., Sr. Unsec’d. Notes | | A3 | | 6.750% | | 06/15/12 | | | 750 | | | 819,709 |
Energy East Corp., Sr. Unsec’d. Notes | | A3 | | 6.750% | | 09/15/33 | | | 1,150 | | | 1,199,902 |
Enersis SA (Chile), Sr. Unsec’d. Notes | | Baa3 | | 7.375% | | 01/15/14 | | | 3,700 | | | 4,124,593 |
SEE NOTES TO FINANCIAL STATEMENTS.
A29
| | | | | | |
| | | DIVERSIFIED BOND PORTFOLIO (continued) | | |
| |
| SCHEDULE OF INVESTMENTS | | December 31, 2009 |
| | | | | | | | | | | | |
CORPORATE BONDS
(continued) | | Moody’s
Rating
(Unaudited)†
| | Interest
Rate
| | Maturity
Date
| | Principal
Amount
(000)#
| | Value
(Note 2)
|
| | | | | | | | | | | | | |
Electric (continued) | | | | | | | | | | | | |
Exelon Corp., Sr. Unsec’d. Notes | | Baa1 | | 4.900% | | 06/15/15 | | $ | 500 | | $ | 515,800 |
Exelon Generation Co. LLC, Sr. Unsec’d. Notes | | A3 | | 6.200% | | 10/01/17 | | | 1,930 | | | 2,068,844 |
Exelon Generation Co. LLC, Sr. Unsec’d. Notes | | A3 | | 6.250% | | 10/01/39 | | | 1,900 | | | 1,935,779 |
FirstEnergy Solutions Corp., Gtd. Notes | | Baa2 | | 6.050% | | 08/15/21 | | | 1,750 | | | 1,765,411 |
Korea Hydro & Nuclear Power Co. Ltd. (South Korea), Sr. Unsec’d. Notes, 144A(d) | | A2 | | 6.250% | | 06/17/14 | | | 5,295 | | | 5,777,422 |
Mirant Americas Generation LLC, Sr. Unsec’d. Notes | | B3 | | 8.300% | | 05/01/11 | | | 2,655 | | | 2,721,375 |
Mirant MID Atlantic Pass-Through Trust A, Pass-thru Certs., Ser. A | | Ba1 | | 8.625% | | 06/30/12 | | | 2,770 | | | 2,828,380 |
NiSource Finance Corp., Gtd. Notes | | Baa3 | | 5.450% | | 09/15/20 | | | 1,345 | | | 1,304,248 |
North American Energy Alliance LLC / North American Energy Alliance Finance Corp., Sr. Sec’d. Notes, 144A (original cost $1,563,824; purchased date 09/22/09)(g) | | Ba3 | | 10.875% | | 06/01/16 | | | 1,600 | | | 1,700,000 |
Oncor Electric Delivery Co. LLC, First Mtge. Bonds | | Baa1 | | 6.800% | | 09/01/18 | | | 1,460 | | | 1,621,737 |
Orion Power Holdings, Inc., Sr. Unsec’d. Notes | | Ba3 | | 12.000% | | 05/01/10 | | | 3,535 | | | 3,623,375 |
Transalta Corp. (Canada), Sr. Unsec’d. Notes(d) | | Baa2 | | 6.650% | | 05/15/18 | | | 1,953 | | | 2,036,210 |
Xcel Energy, Inc., Sr. Unsec’d. Notes | | Baa1 | | 5.613% | | 04/01/17 | | | 1,947 | | | 2,007,470 |
| | | | | | | | | | | |
|
|
| | | | | | | | | | | | | 55,802,807 |
| | | | | | | | | | | |
|
|
Energy - Integrated — 0.5% | | | | | | | | | | | | |
Cenovus Energy, Inc. (Canada), Sr. Notes, 144A(d) | | Baa2 | | 6.750% | | 11/15/39 | | | 3,325 | | | 3,624,430 |
Hess Corp., Sr. Unsec’d. Notes | | Baa2 | | 6.000% | | 01/15/40 | | | 615 | | | 609,002 |
Hess Corp., Sr. Unsec’d. Notes(d) | | Baa2 | | 8.125% | | 02/15/19 | | | 500 | | | 602,978 |
Western Oil Sand, Inc. (Canada), Gtd. Notes | | Baa1 | | 8.375% | | 05/01/12 | | | 1,900 | | | 2,126,767 |
| | | | | | | | | | | |
|
|
| | | | | | | | | | | | | 6,963,177 |
| | | | | | | | | | | |
|
|
Energy - Other — 1.1% | | | | | | | | | | | | |
Dolphin Energy Ltd. (Uae), Sr. Sec’d. Notes, 144A | | Aa3 | | 5.888% | | 06/15/19 | | | 3,846 | | | 3,884,612 |
GS Caltex Corp. (South Korea), Sr. Unsec’d. Notes, 144A | | Baa2 | | 7.750% | | 07/25/11 | | | 3,000 | | | 3,186,432 |
Halliburton Co., Sr. Unsec’d. Notes | | A2 | | 7.450% | | 09/15/39 | | | 1,500 | | | 1,855,882 |
Pioneer Natural Resources Co., Sr. Unsec’d. Notes | | Ba1 | | 6.875% | | 05/01/18 | | | 1,750 | | | 1,731,485 |
XTO Energy, Inc., Sr. Unsec’d. Notes | | Baa2 | | 6.250% | | 04/15/13 | | | 4,107 | | | 4,523,302 |
| | | | | | | | | | | |
|
|
| | | | | | | | | | | | | 15,181,713 |
| | | | | | | | | | | |
|
|
Foods — 1.7% | | | | | | | | | | | | |
Anheuser-Busch InBev Worldwide, Inc., Gtd. Notes, 144A | | Baa2 | | 4.125% | | 01/15/15 | | | 2,975 | | | 3,020,669 |
Anheuser-Busch InBev Worldwide, Inc., Gtd. Notes, 144A | | Baa2 | | 6.875% | | 11/15/19 | | | 2,200 | | | 2,456,045 |
Anheuser-Busch InBev Worldwide, Inc., Gtd. Notes, 144A | | Baa2 | | 7.750% | | 01/15/19 | | | 1,640 | | | 1,920,104 |
Constellation Brands, Inc., Gtd. Notes, Ser. B(d) | | B2 | | 8.125% | | 01/15/12 | | | 2,678 | | | 2,688,043 |
Kraft Foods, Inc., Sr. Unsec’d. Notes | | Baa2 | | 6.125% | | 02/01/18 | | | 2,770 | | | 2,912,771 |
Mead Johnson Nutrition Co., Gtd. Notes, 144A | | Baa1 | | 3.500% | | 11/01/14 | | | 1,285 | | | 1,270,355 |
Ralcorp Holdings, Inc., Sr. Notes, 144A | | Baa3 | | 6.625% | | 08/15/39 | | | 2,825 | | | 2,755,062 |
Stater Brothers Holdings, Gtd. Notes | | B2 | | 8.125% | | 06/15/12 | | | 1,250 | | | 1,262,500 |
Tyson Foods, Inc., Gtd. Notes | | Ba3 | | 7.850% | | 04/01/16 | | | 1,000 | | | 1,025,000 |
Tyson Foods, Inc., Sr. Unsec’d. Notes | | B2 | | 8.250% | | 10/01/11 | | | 2,050 | | | 2,193,500 |
Yum! Brands, Inc., Sr. Unsec’d. Notes | | Baa3 | | 8.875% | | 04/15/11 | | | 1,705 | | | 1,844,934 |
| | | | | | | | | | | |
|
|
| | | | | | | | | | | | | 23,348,983 |
| | | | | | | | | | | |
|
|
Gaming — 0.3% | | | | | | | | | | | | |
MGM Mirage, Sr. Sec’d. Notes, 144A | | B1 | | 10.375% | | 05/15/14 | | | 1,115 | | | 1,209,775 |
MGM Mirage, Sr. Sec’d. Notes, 144A | | B1 | | 11.125% | | 11/15/17 | | | 1,115 | | | 1,234,863 |
Peninsula Gaming LLC, Sr. Sec’d. Notes, 144A | | Ba2 | | 8.375% | | 08/15/15 | | | 945 | | | 942,637 |
Peninsula Gaming LLC, Sr. Unsec’d. Notes, 144A | | B3 | | 10.750% | | 08/15/17 | | | 945 | | | 949,725 |
| | | | | | | | | | | |
|
|
| | | | | | | | | | | | | 4,337,000 |
| | | | | | | | | | | |
|
|
Healthcare & Pharmaceutical — 1.3% | | | | | | | | | | | | |
Apria Healthcare Group, Inc., Sr. Sec’d. Notes, 144A | | B1 | | 12.375% | | 11/01/14 | | | 1,650 | | | 1,815,000 |
Carefusion Corp., Sr. Unsec’d. Notes, 144A | | Baa3 | | 6.375% | | 08/01/19 | | | 1,525 | | | 1,632,545 |
Express Scripts, Inc., Gtd. Notes | | Baa3 | | 6.250% | | 06/15/14 | | | 3,450 | | | 3,764,398 |
HCA, Inc., Sr. Unsec’d. Notes, MTN | | Caa1 | | 8.700% | | 02/10/10 | | | 1,700 | | | 1,703,683 |
Hospira, Inc., Sr. Unsec’d. Notes | | Baa3 | | 5.550% | | 03/30/12 | | | 2,500 | | | 2,664,665 |
SEE NOTES TO FINANCIAL STATEMENTS.
A30
| | | | | | |
| | | DIVERSIFIED BOND PORTFOLIO (continued) | | |
| |
| SCHEDULE OF INVESTMENTS | | December 31, 2009 |
| | | | | | | | | | | | |
CORPORATE BONDS
(continued) | |
Moody’s
Rating
(Unaudited)†
| | Interest
Rate
| | Maturity
Date
| | Principal
Amount
(000)#
| | Value
(Note 2)
|
| | | | | | | | | | | | | |
Healthcare & Pharmaceutical (continued) | | | | | | | | | | | | |
McKesson Corp., Sr. Unsec’d. Notes | | Baa3 | | 6.500% | | 02/15/14 | | $ | 2,800 | | $ | 3,097,259 |
Senior Housing Properties Trust, Sr. Unsec’d. Notes | | Ba1 | | 8.625% | | 01/15/12 | | | 2,500 | | | 2,587,500 |
| | | | | | | | | | | |
|
|
| | | | | | | | | | | | | 17,265,050 |
| | | | | | | | | | | |
|
|
Healthcare Insurance — 1.0% | | | | | | | | | | | | |
Aetna, Inc., Sr. Unsec’d. Notes | | A3 | | 6.750% | | 12/15/37 | | | 1,900 | | | 1,981,185 |
Cigna Corp., Sr. Unsec’d. Notes | | Baa2 | | 5.375% | | 03/15/17 | | | 2,125 | | | 2,045,281 |
Coventry Health Care, Inc., Sr. Unsec’d. Notes | | Ba1 | | 6.125% | | 01/15/15 | | | 4,025 | | | 3,844,720 |
UnitedHealth Group, Inc., Sr. Unsec’d. Notes | | Baa1 | | 6.000% | | 06/15/17 | | | 2,610 | | | 2,731,540 |
UnitedHealth Group, Inc., Sr. Unsec’d. Notes | | Baa1 | | 6.500% | | 06/15/37 | | | 760 | | | 749,434 |
UnitedHealth Group, Inc., Sr. Unsec’d. Notes | | Baa1 | | 6.625% | | 11/15/37 | | | 195 | | | 195,349 |
UnitedHealth Group, Inc., Sr. Unsec’d. Notes | | Baa1 | | 6.875% | | 02/15/38 | | | 2,000 | | | 2,067,102 |
| | | | | | | | | | | |
|
|
| | | | | | | | | | | | | 13,614,611 |
| | | | | | | | | | | |
|
|
Insurance — 2.0% | | | | | | | | | | | | |
Allied World Assurance Co. Holdings Ltd. (Bermuda), Sr. Unsec’d. Notes | | Baa1 | | 7.500% | | 08/01/16 | | | 2,475 | | | 2,642,911 |
American International Group, Inc., Sr. Unsec’d. Notes | | A3 | | 4.250% | | 05/15/13 | | | 1,820 | | | 1,681,147 |
American International Group, Inc., Sr. Unsec’d. Notes | | A3 | | 5.050% | | 10/01/15 | | | 315 | | | 262,790 |
American International Group, Inc., Sr. Unsec’d. Notes, MTN | | A3 | | 5.850% | | 01/16/18 | | | 3,700 | | | 3,035,957 |
Axis Capital Holdings Ltd. (Bermuda), Sr. Unsec’d. Notes | | Baa1 | | 5.750% | | 12/01/14 | | | 3,350 | | | 3,372,077 |
Lincoln National Corp., Sr. Unsec’d. Notes | | Baa2 | | 8.750% | | 07/01/19 | | | 1,265 | | | 1,445,394 |
Massachusetts Mutual Life Insurance Co., Sub. Notes, 144A | | A1 | | 8.875% | | 06/01/39 | | | 1,200 | | | 1,471,739 |
MetLife, Inc., Sr. Unsec’d. Notes(d) | | A3 | | 7.717% | | 02/15/19 | | | 2,000 | | | 2,350,270 |
Teachers Insurance & Annuity Association of America, Notes, 144A | | Aa2 | | 6.850% | | 12/16/39 | | | 2,310 | | | 2,387,935 |
XL Capital Finance Europe PLC (United Kingdom), Gtd. Notes | | Baa2 | | 6.500% | | 01/15/12 | | | 6,820 | | | 7,057,704 |
XL Capital Ltd. (Cayman Islands), Jr. Sub. Notes, Ser. E(a) | | Ba1 | | 6.500% | | 12/31/49 | | | 1,880 | | | 1,419,400 |
XL Capital Ltd. (Cayman Islands), Sr. Unsec’d. Notes | | Baa2 | | 5.250% | | 09/15/14 | | | 140 | | | 137,105 |
| | | | | | | | | | | |
|
|
| | | | | | | | | | | | | 27,264,429 |
| | | | | | | | | | | |
|
|
Lodging — 0.5% | | | | | | | | | | | | |
Felcor Lodging LP, Sr. Sec’d. Notes, 144A(d) | | B2 | | 10.000% | | 10/01/14 | | | 2,350 | | | 2,370,563 |
Starwood Hotels & Resorts Worldwide, Inc., Gtd. Notes | | Ba1 | | 7.875% | | 05/01/12 | | | 3,060 | | | 3,300,975 |
Starwood Hotels & Resorts Worldwide, Inc., Sr. Unsec’d. Notes(d) | | Ba1 | | 6.250% | | 02/15/13 | | | 980 | | | 1,010,625 |
| | | | | | | | | | | |
|
|
| | | | | | | | | | | | | 6,682,163 |
| | | | | | | | | | | |
|
|
Media & Entertainment — 2.6% | | | | | | | | | | | | |
CBS Corp., Gtd. Notes(d) | | Baa3 | | 8.200% | | 05/15/14 | | | 4,800 | | | 5,456,726 |
Gannett Co., Inc., Sr. Unsec’d. Notes(d) | | Ba2 | | 5.750% | | 06/01/11 | | | 2,240 | | | 2,245,600 |
Gannett Co., Inc., Sr. Unsec’d. Notes | | Ba2 | | 6.375% | | 04/01/12 | | | 1,100 | | | 1,100,000 |
Historic TW, Inc., Gtd. Notes | | Baa2 | | 6.625% | | 05/15/29 | | | 225 | | | 234,608 |
News America, Inc., Gtd. Notes, 144A(d) | | Baa1 | | 6.900% | | 08/15/39 | | | 600 | | | 654,524 |
News America, Inc., Gtd. Notes | | Baa1 | | 7.625% | | 11/30/28 | | | 1,415 | | | 1,512,297 |
RR Donnelley & Sons Co., Sr. Unsec’d. Notes | | Baa3 | | 4.950% | | 04/01/14 | | | 7,000 | | | 7,002,121 |
RR Donnelley & Sons Co., Sr. Unsec’d. Notes | | Baa3 | | 8.600% | | 08/15/16 | | | 4,750 | | | 5,170,893 |
Time Warner Cos., Inc., Gtd. Notes | | Baa2 | | 6.950% | | 01/15/28 | | | 2,153 | | | 2,316,746 |
Time Warner Cos., Inc., Gtd. Notes | | Baa2 | | 7.250% | | 10/15/17 | | | 1,440 | | | 1,612,688 |
Viacom, Inc., Sr. Unsec’d. Notes | | Baa2 | | 4.250% | | 09/15/15 | | | 2,795 | | | 2,816,938 |
Viacom, Inc., Sr. Unsec’d. Notes | | Baa2 | | 4.375% | | 09/15/14 | | | 860 | | | 886,884 |
Viacom, Inc., Sr. Unsec’d. Notes(d) | | Baa2 | | 6.750% | | 10/05/37 | | | 1,240 | | | 1,279,278 |
Viacom, Inc., Sr. Unsec’d. Notes | | Baa2 | | 6.875% | | 04/30/36 | | | 580 | | | 627,158 |
Vivendi SA (France), Sr. Unsec’d. Notes, 144A | | Baa2 | | 5.750% | | 04/04/13 | | | 2,000 | | | 2,102,694 |
| | | | | | | | | | | |
|
|
| | | | | | | | | | | | | 35,019,155 |
| | | | | | | | | | | |
|
|
Metals — 2.0% | | | | | | | | | | | | |
AK Steel Corp., Gtd. Notes(d) | | Ba3 | | 7.750% | | 06/15/12 | | | 4,195 | | | 4,236,950 |
Arcelormittal (Luxembourg), Sr. Unsec’d. Notes(d) | | Baa3 | | 6.125% | | 06/01/18 | | | 1,550 | | | 1,599,346 |
Freeport-McMoRan Copper & Gold, Inc., Sr. Unsec’d. Notes | | Ba2 | | 8.375% | | 04/01/17 | | | 2,095 | | | 2,294,025 |
Newmont Mining Corp., Gtd. Notes | | Baa2 | | 6.250% | | 10/01/39 | | | 2,025 | | | 2,027,420 |
Rio Tinto Finance USA Ltd. (Australia), Gtd. Notes(d) | | Baa1 | | 9.000% | | 05/01/19 | | | 5,785 | | | 7,321,427 |
Teck Resources Ltd. (Canada), Sr. Sec’d. Notes | | Ba2 | | 10.250% | | 05/15/16 | | | 500 | | | 582,500 |
SEE NOTES TO FINANCIAL STATEMENTS.
A31
| | | | | | |
| | | DIVERSIFIED BOND PORTFOLIO (continued) | | |
| |
| SCHEDULE OF INVESTMENTS | | December 31, 2009 |
| | | | | | | | | | | | |
CORPORATE BONDS
(continued) | | Moody’s
Rating
(Unaudited)†
| | Interest
Rate
| | Maturity
Date
| | Principal
Amount
(000)#
| | Value
(Note 2)
|
| | | | | | | | | | | | | |
Metals (continued) | | | | | | | | | | | | |
Teck Resources Ltd. (Canada), Sr. Sec’d. Notes | | Ba2 | | 10.750% | | 05/15/19 | | $ | 1,800 | | $ | 2,151,000 |
United States Steel Corp., Sr. Unsec’d. Notes(d) | | Ba3 | | 7.000% | | 02/01/18 | | | 2,000 | | | 1,958,988 |
Vale Overseas Ltd. (Cayman Islands), Gtd. Notes | | Baa2 | | 6.875% | | 11/21/36 | | | 815 | | | 814,316 |
Vale Overseas Ltd. (Cayman Islands), Gtd. Notes | | Baa2 | | 6.875% | | 11/10/39 | | | 1,275 | | | 1,283,573 |
Xstrata Finance Canada Ltd. (Canada), Gtd. Notes, 144A | | Baa2 | | 5.500% | | 11/16/11 | | | 3,430 | | | 3,600,059 |
| | | | | | | | | | | |
|
|
| | | | | | | | | | | | | 27,869,604 |
| | | | | | | | | | | |
|
|
Non-Captive Finance — 2.6% | | | | | | | | | | | | |
Block Financial LLC, Gtd. Notes | | Baa1 | | 7.875% | | 01/15/13 | | | 5,700 | | | 6,350,005 |
Bosphorus Financial Services Ltd. (Cayman Islands), Sr. Sec’d. Notes, MTN(a)(b) | | A3 | | 2.073% | | 02/15/12 | | | 1,252 | | | 1,194,366 |
GATX Corp., Sr. Unsec’d. Notes | | Baa1 | | 4.750% | | 10/01/12 | | | 1,500 | | | 1,531,707 |
General Electric Capital Australia Funding Pty Ltd. (Australia), Gtd. Notes, MTN | | Aa2 | | 6.000% | | 04/15/15 | | | AUD 4,440 | | | 3,689,394 |
General Electric Capital Corp., Sr. Unsec’d. Notes, MTN | | Aa2 | | 5.875% | | 01/14/38 | | | 1,675 | | | 1,550,854 |
General Electric Capital Corp., Sr. Unsec’d. Notes, Ser. G, MTN(e)(h) | | Aa2 | | 6.000% | | 08/07/19 | | | 7,275 | | | 7,551,603 |
Nelnet, Inc., Jr. Sub. Notes(a) | | Ba2 | | 7.400% | | 09/29/36 | | | 6,500 | | | 4,734,022 |
Preferred Term Securities X (Cayman Islands), Sr. Sec’d. Notes, 144A(a)(b) | | A2 | | 1.003% | | 07/03/33 | | | 3,102 | | | 1,504,523 |
SLM Corp., Sr. Unsec’d. Notes, MTN | | Ba1 | | 5.050% | | 11/14/14 | | | 4,150 | | | 3,743,213 |
SLM Corp., Sr. Unsec’d. Notes, MTN | | Ba1 | | 8.450% | | 06/15/18 | | | 3,200 | | | 3,157,609 |
| | | | | | | | | | | |
|
|
| | | | | | | | | | | | | 35,007,296 |
| | | | | | | | | | | |
|
|
Packaging — 1.0% | | | | | | | | | | | | |
Ball Corp., Gtd. Notes(d) | | Ba1 | | 7.125% | | 09/01/16 | | | 1,320 | | | 1,353,000 |
Greif, Inc., Sr. Unsec’d. Notes | | Ba2 | | 7.750% | | 08/01/19 | | | 3,505 | | | 3,575,100 |
Reynolds Group Issuer, Inc. , Sr. Sec’d. Notes, 144A | | B1 | | 7.750% | | 10/15/16 | | | 1,600 | | | 1,636,000 |
Sealed Air Corp., Sr. Unsec’d. Notes, 144A(d) | | Baa3 | | 5.625% | | 07/15/13 | | | 6,600 | | | 6,978,589 |
| | | | | | | | | | | |
|
|
| | | | | | | | | | | | | 13,542,689 |
| | | | | | | | | | | |
|
|
Paper — 1.3% | | | | | | | | | | | | |
Cascades, Inc. (Canada), Sr. Notes, 144A | | Ba3 | | 7.750% | | 12/15/17 | | | 2,150 | | | 2,171,500 |
Georgia-Pacific LLC, Sr. Unsec’d. Notes(d) | | B2 | | 8.125% | | 05/15/11 | | | 3,965 | | | 4,163,250 |
Graphic Packaging International, Inc., Gtd. Notes | | B3 | | 9.500% | | 06/15/17 | | | 1,750 | | | 1,855,000 |
International Paper Co., Sr. Unsec’d. Notes | | Baa3 | | 7.300% | | 11/15/39 | | | 1,000 | | | 1,060,861 |
International Paper Co., Sr. Unsec’d. Notes | | Baa3 | | 7.500% | | 08/15/21 | | | 1,650 | | | 1,848,777 |
MeadWestvaco Corp., Sr. Unsec’d. Notes | | Ba1 | | 7.375% | | 09/01/19 | | | 4,400 | | | 4,833,383 |
Rock-Tenn Co., Sr. Sec’d. Notes | | Ba2 | | 8.200% | | 08/15/11 | | | 2,000 | | | 2,122,500 |
| | | | | | | | | | | |
|
|
| | | | | | | | | | | | | 18,055,271 |
| | | | | | | | | | | |
|
|
Pipelines & Other — 0.6% | | | | | | | | | | | | |
Kinder Morgan Energy Partners LP, Sr. Unsec’d. Notes(d) | | Baa2 | | 6.500% | | 09/01/39 | | | 1,545 | | | 1,557,068 |
Kinder Morgan Energy Partners LP, Sr. Unsec’d. Notes | | Baa2 | | 7.300% | | 08/15/33 | | | 1,550 | | | 1,690,542 |
Sempra Energy, Sr. Unsec’d. Notes(d) | | Baa1 | | 6.500% | | 06/01/16 | | | 2,275 | | | 2,467,258 |
Sonat, Inc., Sr. Unsec’d. Notes | | Ba3 | | 7.625% | | 07/15/11 | | | 2,240 | | | 2,308,770 |
| | | | | | | | | | | |
|
|
| | | | | | | | | | | | | 8,023,638 |
| | | | | | | | | | | |
|
|
Railroads — 0.1% | | | | | | | | | | | | |
Union Pacific Corp., Sr. Unsec’d. Notes(d) | | Baa2 | | 5.750% | | 11/15/17 | | | 1,450 | | | 1,529,889 |
| | | | | | | | | | | |
|
|
Real Estate Investment Trusts — 1.4% | | | | | | | | | | | | |
Country Garden Holdings Co. (Cayman Islands), Sr. Notes, 144A | | Ba3 | | 11.750% | | 09/10/14 | | | 1,220 | | | 1,220,000 |
Hospitality Properties Trust, Sr. Unsec’d. Notes | | Baa2 | | 7.875% | | 08/15/14 | | | 2,900 | | | 2,993,867 |
Post Apartment Homes LP, Sr. Unsec’d. Notes | | Baa3 | | 5.450% | | 06/01/12 | | | 2,300 | | | 2,282,166 |
ProLogis, Sr. Unsec’d. Notes | | Baa2 | | 7.375% | | 10/30/19 | | | 1,650 | | | 1,627,568 |
Realty Income Corp., Sr. Unsec’d. Notes(d) | | Baa1 | | 6.750% | | 08/15/19 | | | 1,545 | | | 1,512,887 |
Simon Property Group LP, Sr. Unsec’d. Notes | | A3 | | 5.300% | | 05/30/13 | | | 3,400 | | | 3,508,137 |
Simon Property Group LP, Sr. Unsec’d. Notes | | A3 | | 10.350% | | 04/01/19 | | | 1,685 | | | 2,116,473 |
WEA Finance LLC , Gtd. Notes, 144A | | A2 | | 5.750% | | 09/02/15 | | | 4,000 | | | 4,217,760 |
| | | | | | | | | | | |
|
|
| | | | | | | | | | | | | 19,478,858 |
| | | | | | | | | | | |
|
|
SEE NOTES TO FINANCIAL STATEMENTS.
A32
| | | | | | |
| | | DIVERSIFIED BOND PORTFOLIO (continued) | | |
| |
| SCHEDULE OF INVESTMENTS | | December 31, 2009 |
| | | | | | | | | | | |
CORPORATE BONDS
(continued) | |
Moody’s
Rating
(Unaudited)†
| | Interest
Rate
| | Maturity
Date
| | Principal
Amount
(000)#
| | Value
(Note 2)
|
| | | | | | | | | | | | |
Retailers — 1.4% | | | | | | | | | | | |
CVS Caremark Corp., Sr. Unsec’d. Notes | | Baa2 | | 6.125% | | 09/15/39 | | AUD 3,350 | | $ | 3,320,182 |
GameStop Corp., Gtd. Notes | | Ba1 | | 8.000% | | 10/01/12 | | $ 3,325 | | | 3,445,531 |
Macy’s Retail Holdings, Inc., Gtd. Notes | | Ba2 | | 5.350% | | 03/15/12 | | 1,800 | | | 1,838,250 |
Macy’s Retail Holdings, Inc., Gtd. Notes | | Ba2 | | 5.875% | | 01/15/13 | | 7,800 | | | 8,014,500 |
Target Corp., Sr. Unsec’d. Notes | | A2 | | 6.500% | | 10/15/37 | | 800 | | | 877,228 |
Target Corp., Sr. Unsec’d. Notes | | A2 | | 7.000% | | 01/15/38 | | 1,870 | | | 2,181,819 |
| | | | | | | | | | |
|
|
| | | | | | | | | | | | 19,677,510 |
| | | | | | | | | | |
|
|
Structured Notes — 1.3% | | | | | | | | | | | |
Dow Jones CDX North America High Yield, Pass-thru Certs., 144A
Ser. 5-T3 | | Caa3 | | 8.250% | | 12/29/10 | | 7,488 | | | 7,834,398 |
Ser. 6-T1 | | Caa3 | | 8.625% | | 06/29/11 | | 8,570 | | | 9,426,450 |
| | | | | | | | | | |
|
|
| | | | | | | | | | | | 17,260,848 |
| | | | | | | | | | |
|
|
Technology — 2.6% | | | | | | | | | | | |
Advanced Micro Devices, Inc., Sr. Unsec’d. Notes, 144A(d) | | B2 | | 8.125% | | 12/15/17 | | 1,530 | | | 1,524,263 |
Affiliated Computer Services, Inc., Sr. Unsec’d. Notes | | Ba2 | | 4.700% | | 06/01/10 | | 5,785 | | | 5,835,619 |
Amphenol Corp., Sr. Unsec’d. Notes | | Baa3 | | 4.750% | | 11/15/14 | | 2,475 | | | 2,475,869 |
Arrow Electronics, Inc., Sr. Unsec’d. Notes | | Baa3 | | 6.000% | | 04/01/20 | | 3,400 | | | 3,363,834 |
Cisco Systems, Inc., Sr. Unsec’d. Notes | | A1 | | 4.450% | | 01/15/20 | | 4,650 | | | 4,561,576 |
FISERV, Inc., Gtd. Notes | | Baa2 | | 6.125% | | 11/20/12 | | 1,600 | | | 1,742,194 |
Motorola, Inc., Sr. Unsec’d. Notes | | Baa3 | | 8.000% | | 11/01/11 | | 121 | | | 129,408 |
Oracle Corp., Sr. Unsec’d. Notes(d) | | A2 | | 6.125% | | 07/08/39 | | 1,100 | | | 1,155,038 |
Seagate Technology HDD Holdings (Cayman Islands), Gtd. Notes | | Ba3 | | 6.375% | | 10/01/11 | | 2,115 | | | 2,152,012 |
Sensata Technologies BV (Netherlands), Gtd. Notes | | Caa2 | | 8.000% | | 05/01/14 | | 4,370 | | | 4,282,600 |
Stats ChipPAC Ltd. (Singapore), Gtd. Notes | | Ba1 | | 6.750% | | 11/15/11 | | 2,500 | | | 2,515,625 |
SunGard Data Systems, Inc., Gtd. Notes(d) | | Caa1 | | 10.250% | | 08/15/15 | | 2,610 | | | 2,779,650 |
Xerox Corp., Sr. Unsec’d. Notes | | Baa2 | | 4.250% | | 02/15/15 | | 2,000 | | | 1,986,058 |
Xerox Corp., Sr. Unsec’d. Notes | | Baa2 | | 5.500% | | 05/15/12 | | 870 | | | 919,433 |
| | | | | | | | | | |
|
|
| | | | | | | | | | | | 35,423,179 |
| | | | | | | | | | |
|
|
Telecommunications — 3.2% | | | | | | | | | | | |
AT&T Corp., Gtd. Notes | | A2 | | 8.000% | | 11/15/31 | | 3,915 | | | 4,778,328 |
British Telecommunications PLC (United Kingdom), Sr. Unsec’d. Notes | | Baa2 | | 9.625% | | 12/15/30 | | 328 | | | 417,943 |
CC Holdings GS V LLC, Sr. Sec’d. Notes, 144A | | Baa3 | | 7.750% | | 05/01/17 | | 3,000 | | | 3,195,000 |
Cellco Partnership/Verizon Wireless Capital LLC, Sr. Unsec’d. Notes | | A2 | | 8.500% | | 11/15/18 | | 2,960 | | | 3,671,531 |
CenturyTel, Inc., Sr. Unsec’d. Notes, Ser. P(d) | | Baa3 | | 7.600% | | 09/15/39 | | 1,250 | | | 1,281,046 |
Embarq Corp., Sr. Unsec’d. Notes (original cost $8,523,664; purchased date 05/12/06-01/12/09)(b)(g) | | Baa3 | | 7.082% | | 06/01/16 | | 9,000 | | | 9,941,202 |
Qwest Capital Funding, Inc., Gtd. Notes | | B1 | | 7.250% | | 02/15/11 | | 1,925 | | | 1,953,875 |
Qwest Corp., Sr. Unsec’d. Notes | | Ba1 | | 8.375% | | 05/01/16 | | 1,100 | | | 1,179,750 |
Qwest Corp., Sr. Unsec’d. Notes | | Ba1 | | 8.875% | | 03/15/12 | | 3,300 | | | 3,547,500 |
Sprint Capital Corp., Gtd. Notes(d) | | Ba3 | | 7.625% | | 01/30/11 | | 5,235 | | | 5,359,331 |
Telecom Italia Capital SA (Luxembourg), Gtd. Notes | | Baa2 | | 4.875% | | 10/01/10 | | 3,400 | | | 3,479,890 |
Telefonica Emisiones Sau (Spain), Gtd. Notes | | Baa1 | | 7.045% | | 06/20/36 | | 5 | | | 5,709 |
Verizon Communications, Inc., Sr. Unsec’d. Notes | | A3 | | 6.350% | | 04/01/19 | | 900 | | | 992,907 |
Windstream Corp., Gtd. Notes, 144A | | Ba3 | | 7.875% | | 11/01/17 | | 3,750 | | | 3,703,125 |
| | | | | | | | | | |
|
|
| | | | | | | | | | | | 43,507,137 |
| | | | | | | | | | |
|
|
Tobacco — 0.7% | | | | | | | | | | | |
Altria Group, Inc., Gtd. Notes(e) | | Baa1 | | 9.950% | | 11/10/38 | | 6,005 | | | 7,827,578 |
Lorillard Tobacco Co., Sr. Unsec’d. Notes(d) | | Baa2 | | 8.125% | | 06/23/19 | | 2,075 | | | 2,281,226 |
| | | | | | | | | | |
|
|
| | | | | | | | | | | | 10,108,804 |
| | | | | | | | | | |
|
|
TOTAL CORPORATE BONDS
(cost $622,143,084) | | | 643,360,555 |
| | | | | | | | | | |
|
|
| FOREIGN AGENCIES — 1.7% | | | | | | | | | | | |
DP World Ltd. (United Arab Emirates), Sr. Unsec’d. Notes, MTN, Reg.- S. | | Ba1 | | 6.850% | | 07/02/37 | | 4,470 | | | 3,352,500 |
SEE NOTES TO FINANCIAL STATEMENTS.
A33
| | | | | | |
| | | DIVERSIFIED BOND PORTFOLIO (continued) | | |
| |
| SCHEDULE OF INVESTMENTS | | December 31, 2009 |
| | | | | | | | | | | | |
FOREIGN AGENCIES
(continued) | | Moody’s
Rating
(Unaudited)†
| | Interest
Rate
| | Maturity
Date
| | Principal
Amount
(000)#
| | Value
(Note 2)
|
| | | | | | | | | | | | | |
DP World Ltd. (United Arab Emirates), Sr. Unsec’d. Notes, 144A | | Ba1 | | 6.850% | | 07/02/37 | | $ | 190 | | $ | 146,152 |
Export-Import Bank of Korea (South Korea) | | A2 | | 5.875% | | 01/14/15 | | | 2,230 | | | 2,393,040 |
Export-Import Bank of Korea (South Korea) | | A2 | | 8.125% | | 01/21/14 | | | 820 | | | 951,928 |
GAZ Capital SA (Luxembourg), Sr. Unsec’d. Notes, 144A | | Baa1 | | 6.510% | | 03/07/22 | | | 4,740 | | | 4,348,950 |
GAZ Capital SA (Luxembourg), Sr. Unsec’d. Notes, 144A | | Baa1 | | 8.125% | | 07/31/14 | | | 2,810 | | | 2,978,600 |
GAZ Capital SA (Luxembourg), Sr. Unsec’d. Notes, Reg. - S. | | Baa1 | | 9.250% | | 04/23/19 | | | 2,055 | | | 2,291,325 |
GAZ Capital SA For Gazprom (Luxembourg), Sr. Unsec’d. Notes, Reg. - S. | | Baa1 | | 8.125% | | 07/31/14 | | | 600 | | | 640,500 |
Gazprom International SA (Luxembourg), Gtd. Notes, 144A | | BBB+(c) | | 7.201% | | 02/01/20 | | | 1,671 | | | 1,702,697 |
Korea Expressway Corp. (South Korea), 144A | | A2 | | 4.500% | | 03/23/15 | | | 2,825 | | | 2,878,336 |
National Power Corp. (Philippines), Gtd. Notes., 144A(a) | | BB-(c) | | 4.517% | | 08/23/11 | | | 1,530 | | | 1,591,200 |
| | | | | | | | | | | |
|
|
TOTAL FOREIGN AGENCIES
(cost $21,684,839) | | | 23,275,228 |
| | | | | | | | | | | |
|
|
| MUNICIPAL BONDS — 0.7% | | | | | | | | | | | | |
New Jersey State Turnpike Authority, Build America Bonds | | A3 | | 7.414% | | 01/01/40 | | | 2,050 | | | 2,310,760 |
State of California, Buid America Bonds | | Baa1 | | 7.300% | | 10/01/39 | | | 3,500 | | | 3,307,780 |
State of California, Build America Bonds(d) | | Baa1 | | 7.550% | | 04/01/39 | | | 2,205 | | | 2,166,368 |
University of California Rev., Build America Bonds | | Aa1 | | 5.770% | | 05/15/43 | | | 1,400 | | | 1,367,492 |
| | | | | | | | | | | |
|
|
TOTAL MUNICIPAL BONDS
(cost $9,020,462) | | | 9,152,400 |
| | | | | | | | | | | |
|
|
| RESIDENTIAL MORTGAGE-BACKED SECURITIES — 3.7% | | | | | | | | | | |
ACE Securities Corp., Ser. 2004-FM1, Class M1(a) | | Aa2 | | 1.131% | | 09/25/33 | | | 2,267 | | | 1,777,488 |
Ameriquest Mortgage Securities, Inc.
Ser. 2001-2, Class M3(a) | | Baa2 | | 3.156% | | 10/25/31 | | | 702 | | | 399,457 |
Ser. 2003-AR3, Class M6(a)(b) | | Ba3 | | 5.380% | | 10/25/33 | | | 1,600 | | | 205,536 |
Ser. 2004-R8, Class M1(a) | | Aa1 | | 0.871% | | 09/25/34 | | | 950 | | | 697,341 |
Amortizing Residential Collateral Trust, Ser. 2002-BC7, Class M2(a) | | CC(c) | | 1.581% | | 10/25/32 | | | 134 | | | 10,211 |
Argent Securities, Inc., Ser. 2003-W2, Class M4(a) | | Baa1 | | 5.169% | | 09/25/33 | | | 2,400 | | | 1,157,494 |
Asset Backed Funding Certificates, Ser. 2004-OPT1, Class M1(a) | | Aa2 | | 1.281% | | 08/25/33 | | | 2,592 | | | 1,895,056 |
Asset Backed Securities Corp. Home Equity, Ser. 2003-HE3, Class M1(a) | | Aa3 | | 1.478% | | 06/15/33 | | | 1,994 | | | 1,497,424 |
CDC Mortgage Capital Trust, Ser. 2002-HE3, Class M2(a) | | Ca | | 3.606% | | 03/25/33 | | | 348 | | | 23,714 |
Centex Home Equity, Ser. 2004-B, Class AF6 | | Aaa | | 4.186% | | 03/25/34 | | | 1,300 | | | 1,150,044 |
Citigroup Mortgage Loan Trust, Inc., Ser. 2004-RES1, Class M3(a) | | A3 | | 1.311% | | 11/25/34 | | | 239 | | | 106,018 |
Countrywide Asset-Backed Certificates, Ser. 2004-12, Class MV3(a) | | Aa3 | | 0.891% | | 03/25/35 | | | 2,670 | | | 1,679,610 |
CS First Boston Mortgage Securities Corp., Ser. 2002-HE4, Class M2(a) | | B2 | | 2.481% | | 08/25/32 | | | 159 | | | 28,423 |
Equity One ABS, Inc., Ser. 2004-3, Class M1 | | Aa2 | | 5.700% | | 07/25/34 | | | 1,300 | | | 989,391 |
FBR Securitization Trust, Ser. 2005-2, Class M1(a) | | A1 | | 0.711% | | 09/25/35 | | | 3,600 | | | 2,469,547 |
First Franklin Mortgage Loan Asset Backed Certificates, Ser. 2005-FF6, Class M2(a) | | A1 | | 0.671% | | 05/25/36 | | | 2,575 | | | 855,882 |
Fremont Home Loan Trust, Ser. 2003-B, Class M1(a) | | Aa3 | | 1.281% | | 12/25/33 | | | 382 | | | 283,038 |
GSAMP Trust, Ser. 2004-FM1, Class M1(a) | | Aaa | | 1.206% | | 11/25/33 | | | 4,075 | | | 3,341,532 |
HFC Home Equity Loan Asset Backed Certificates
Ser. 2004-1, Class A(a) | | Aaa | | 0.583% | | 09/20/33 | | | 2,114 | | | 1,884,176 |
Ser. 2004-1, Class M(a) | | Aa2 | | 0.753% | | 09/20/33 | | | 1,916 | | | 1,637,328 |
Ser. 2006-1, Class M1(a) | | Aa1 | | 0.513% | | 01/20/36 | | | 1,227 | | | 1,054,245 |
Ser. 2006-2, Class A1(a) | | Aaa | | 0.383% | | 03/20/36 | | | 340 | | | 299,019 |
Ser. 2006-2, Class A2(a) | | Aaa | | 0.413% | | 03/20/36 | | | 413 | | | 363,705 |
IXIS Real Estate Capital Trust, Ser. 2006-HE1, Class A4(a) | | Caa2 | | 0.531% | | 03/25/36 | | | 3,200 | | | 1,066,212 |
Long Beach Mortgage Loan Trust, Ser. 2004-1, Class M1(a) | | Aa1 | | 0.731% | | 02/25/34 | | | 4,250 | | | 2,999,566 |
Merrill Lynch Mortgage Investors, Inc., Ser. 2004-OPT1, Class A1A(a) | | AAA(c) | | 0.491% | | 06/25/35 | | | 3,249 | | | 2,538,626 |
Morgan Stanley ABS Capital I
Ser. 2002-NC6, Class M2(a) | | B3 | | 3.381% | | 11/25/32 | | | 174 | | | 36,801 |
Ser. 2003-HE1, Class M1(a) | | Aa2 | | 1.431% | | 05/25/33 | | | 2,141 | | | 1,639,566 |
Ser. 2004-NC1, Class M1(a) | | Aa2 | | 0.931% | | 12/25/33 | | | 1,193 | | | 879,185 |
Ser. 2004-OP1, Class M1(a) | | Aa1 | | 0.811% | | 11/25/34 | | | 3,688 | | | 2,817,759 |
SEE NOTES TO FINANCIAL STATEMENTS.
A34
| | | | | | |
| | | DIVERSIFIED BOND PORTFOLIO (continued) | | |
| |
| SCHEDULE OF INVESTMENTS | | December 31, 2009 |
| | | | | | | | | | | | |
RESIDENTIAL MORTGAGE-BACKED SECURITIES
(continued) | | Moody’s
Rating
(Unaudited)†
| | Interest
Rate
| | Maturity
Date
| | Principal
Amount
(000)#
| | Value
(Note 2)
|
| | | | | | | | | | | | | |
Ser. 2004-WMC1, Class M1(a) | | Aa1 | | 1.161% | | 06/25/34 | | $ | 3,176 | | $ | 2,251,742 |
Ser. 2004-WMC2, Class M1(a) | | Aa1 | | 1.146% | | 07/25/34 | | | 3,299 | | | 2,504,376 |
New Century Home Equity Loan Trust
Ser. 2003-4, Class M1(a) | | Aa2 | | 1.356% | | 10/25/33 | | | 5,016 | | | 3,716,162 |
Ser. 2004-4, Class M1(a) | | Aa1 | | 0.741% | | 02/25/35 | | | 3,524 | | | 3,103,478 |
Residential Asset Mortgage Products, Inc., Ser. 2004-RS12, Class MII2(a)(b) | | Aa3 | | 1.031% | | 12/25/34 | | | 1,546 | | | 1,411,189 |
Residential Asset Securities Corp., Ser. 2004-KS1, Class AI5 | | Aaa | | 5.221% | | 02/25/34 | | | 1,000 | | | 753,782 |
Saxon Asset Securities Trust, Ser. 2002-3, Class M1(a) | | Aaa | | 1.356% | | 12/25/32 | | | 849 | | | 680,655 |
Securitized Asset Backed Receivables LLC Trust, Ser. 2006-FR1, Class M1(a) | | Caa1 | | 0.631% | | 11/25/35 | | | 2,000 | | | 111,957 |
Structured Asset Securities Corp., Ser. 2002-HF2, Class M3(a)(b) | | CC(c) | | 3.231% | | 07/25/32 | | | 1,345 | | | 658,838 |
| | | | | | | | | | | |
|
|
TOTAL RESIDENTIAL MORTGAGE-BACKED SECURITIES
(cost $62,613,783) | | | 50,975,573 |
| | | | | | | | | | | |
|
|
| SOVEREIGNS — 1.1% | | | | | | | | | | | | |
Government of Hungary (Hungary), Ser. 15/A | | Baa1 | | 8.000% | | 02/12/15 | | | HUF 693,400 | | | 3,720,364 |
Government of Jamaica (Jamaica) | | Caa1 | | 11.000% | | 07/27/12 | | | EUR 620 | | | 799,920 |
Peru Government International Bond (Cayman Islands), Sr. Sec’d. Notes, 144A(i) | | Ba1 | | 6.350% | | 05/31/18 | | | 1,647 | | | 1,257,692 |
Poland Government International Bond (Poland) | | A2 | | 6.375% | | 07/15/19 | | | 1,550 | | | 1,685,909 |
Qatar Government International Bond (Qatar), 144A(d) | | Aa2 | | 6.400% | | 01/20/40 | | | 2,445 | | | 2,457,225 |
Republic of Poland (Poland), Ser. 1015 | | A2 | | 6.250% | | 10/24/15 | | | PLN 9,910 | | | 3,506,060 |
South Africa Government International Bond (South Africa) | | A3 | | 7.375% | | 04/25/12 | | | 600 | | | 658,500 |
Ukraine Government International Bond (Ukraine) | | B2 | | 6.385% | | 06/26/12 | | | 1,340 | | | 1,139,000 |
| | | | | | | | | | | |
|
|
TOTAL SOVEREIGNS
(cost $15,455,016) | | | 15,224,670 |
| | | | | | | | | | | |
|
|
| U.S. GOVERNMENT AGENCY OBLIGATION — 0.1% | | | | | | | | | | |
Federal National Mortgage Association (cost $1,332,952)(d) | | 2.625% | | 11/20/14 | | | 1,340 | | | 1,329,610 |
| | | | | | | | | | | |
|
|
| U.S. GOVERNMENT MORTGAGE-BACKED SECURITIES — 12.7% | | | | | | | | |
Federal Home Loan Mortgage Corporation | | | | 4.500% | | 02/01/19 | | | 1,287 | | | 1,340,508 |
Federal Home Loan Mortgage Corporation | | | | 5.000% | | 07/01/19-12/01/19 | | | 3,001 | | | 3,162,119 |
Federal Home Loan Mortgage Corporation | | | | 5.500% | | 10/01/33-06/01/34 | | | 4,008 | | | 4,255,662 |
Federal Home Loan Mortgage Corporation | | | | 5.500% | | TBA 30 YR | | | 23,000 | | | 24,092,500 |
Federal Home Loan Mortgage Corporation | | | | 6.000% | | 11/01/33-06/01/34 | | | 4,548 | | | 4,857,367 |
Federal Home Loan Mortgage Corporation | | | | 6.500% | | 07/01/32-09/01/32 | | | 2,140 | | | 2,311,162 |
Federal Home Loan Mortgage Corporation | | | | 7.000% | | 10/01/32-11/01/33 | | | 3,850 | | | 4,238,653 |
Federal National Mortgage Association | | | | 4.000% | | 05/01/19 | | | 960 | | | 980,658 |
Federal National Mortgage Association | | | | 4.500% | | 06/01/18-02/01/35 | | | 10,417 | | | 10,841,873 |
Federal National Mortgage Association | | | | 5.000% | | 01/01/19-01/01/20 | | | 5,759 | | | 6,064,903 |
Federal National Mortgage Association(a) | | | | 5.198% | | 10/01/37 | | | 8,332 | | | 8,742,220 |
Federal National Mortgage Association | | | | 5.500% | | 12/01/16-09/01/34 | | | 18,004 | | | 19,012,184 |
Federal National Mortgage Association | | | | 6.000% | | 09/01/17-03/01/38 | | | 16,532 | | | 17,674,615 |
Federal National Mortgage Association | | | | 6.000% | | TBA 30 YR | | | 25,500 | | | 27,006,081 |
Federal National Mortgage Association | | | | 6.500% | | 12/01/14-10/01/37 | | | 17,231 | | | 18,521,831 |
Federal National Mortgage Association | | | | 7.000% | | 05/01/32-06/01/32 | | | 415 | | | 458,304 |
Government National Mortgage Association | | | | 5.500% | | 01/15/33-01/15/36 | | | 7,461 | | | 7,869,918 |
Government National Mortgage Association | | | | 6.000% | | 12/15/32-11/15/34 | | | 6,304 | | | 6,722,953 |
Government National Mortgage Association | | | | 6.500% | | 09/15/32-11/15/33 | | | 4,050 | | | 4,351,102 |
Government National Mortgage Association | | | | 7.500% | | 10/15/25-02/15/26 | | | 140 | | | 157,180 |
| | | | | | | | | | | |
|
|
TOTAL U.S. GOVERNMENT MORTGAGE-BACKED SECURITIES
(cost $167,680,884) | | | 172,661,793 |
| | | | | | | | | | | |
|
|
SEE NOTES TO FINANCIAL STATEMENTS.
A35
| | | | | | |
| | | DIVERSIFIED BOND PORTFOLIO (continued) | | |
| |
| SCHEDULE OF INVESTMENTS | | December 31, 2009 |
| | | | | | | | | | | | | |
| U.S. GOVERNMENT TREASURY SECURITIES — 0.5% | | | | Interest
Rate
| | Maturity
Date
| | Principal
Amount
(000)#
| | Value
(Note 2)
| |
| | | | | | | | | | | | | | |
U.S. Treasury Notes(d) | | 0.750% | | 11/30/11 | | $ | 3,000 | | $ | 2,980,431 | |
U.S. Treasury Notes(d) | | 3.375% | | 11/15/19 | | | 2,860 | | | 2,750,977 | |
U.S. Treasury Strips Coupon(i) | | 4.860% | | 08/15/24 | | | 1,000 | | | 495,664 | |
| | | | | | | | | | | |
|
|
|
TOTAL U.S. GOVERNMENT TREASURY SECURITIES
(cost $6,356,338) | | | 6,227,072 | |
| | | | | | | | | | | |
|
|
|
TOTAL LONG-TERM INVESTMENTS
(cost $1,211,097,417) | | | 1,249,810,305 | |
| | | | | | | | | | | |
|
|
|
| | | | | |
| | | | | | | | | Shares
| | | |
| SHORT-TERM INVESTMENTS — 16.2% | | | | | | | | | | | | | |
| AFFILIATED MUTUAL FUNDS | | | | | | | | | | | | | |
Dryden Core Investment Fund — Short-Term Bond Series(j)
(cost $164,700,915) | | | 16,649,555 | | | 142,520,193 | |
Dryden Core Investment Fund — Taxable Money Market Series(j)(k)
(cost $78,783,202; includes $67,999,531 of cash collateral received for securities on loan) | | | 78,783,202 | | | 78,783,202 | |
| | | | | | | | | | | |
|
|
|
TOTAL SHORT-TERM INVESTMENTS
(cost $243,484,117) | | | 221,303,395 | |
| | | | | | | | | | | |
|
|
|
TOTAL INVESTMENTS (l) — 107.9%
(cost $1,454,581,534) | | | 1,471,113,700 | |
LIABILITIES IN EXCESS OF OTHER ASSETS(m) (7.9)% | | | (107,644,681 | ) |
| | | | | | | | | | | |
|
|
|
NET ASSETS — 100.0% | | $ | 1,363,469,019 | |
| | | | | | | | | | | |
|
|
|
The following abbreviations are used in portfolio descriptions:
| | |
| 144A | | Security was purchased pursuant to Rule 144A under the Securities Act of 1933 and may not be resold subject to that rule except to qualified institutional buyers. Unless otherwise noted, 144A securities are deemed to be liquid. |
| AUD | | Australian Dollar |
| CAD | | Canadian Dollar |
| EUR | | Euro |
| GBP | | British Pound |
| HUF | | Hungarian Forint |
| MTN | | Medium Term Note |
| NR | | Not Rated by Moody’s or Standard & Poor’s |
| NOK | | Norwegian Krone |
| NZD | | New Zealand Dollar |
| PIK | | Payment in Kind |
| PLN | | Polish Zloty |
| SEK | | Swedish Krona |
| TBA | | To Be Announced |
| † | The ratings reflected are as of December 31, 2009. Ratings of certain bonds may have changed subsequent to that date. |
| # | Principal amount shown in U.S. dollars unless otherwise stated. |
| (a) | Indicates a variable rate security. The maturity date presented for these instruments is the latter of the next date on which the security can be redeemed at par or the next date on which the rate of interest is adjusted. The interest rate shown reflects the rate in effect at December 31, 2009. |
| (b) | Indicates a security that has been deemed illiquid. |
| (c) | Standard & Poor’s Rating |
| (d) | All or a portion of security is on loan. The aggregate market value of such securities is $66,383,884; cash collateral of $67,999,531 (included in liabilities) was received with which the Portfolio purchased highly liquid short-term investments. |
| (e) | Security segregated as collateral for swap contracts. |
| (f) | Represents issuer in default on interest payments and/or principal repayment; non-income producing security. |
| (g) | Indicates a restricted security; the aggregate original cost of such securities is $11,980,135. The aggregate value of $14,007,042 is approximately 1.0% of net assets. |
| (h) | Security segregated as collateral for futures contracts. |
SEE NOTES TO FINANCIAL STATEMENTS.
A36
| | | | | | |
| | | DIVERSIFIED BOND PORTFOLIO (continued) | | |
| |
| SCHEDULE OF INVESTMENTS | | December 31, 2009 |
| (i) | Represents zero coupon bond. Rate shown reflects the effective yield at December 31, 2009. |
| (j) | Prudential Investments LLC, the manager of the Fund, also serves as manager of the Dryden Core Investment Fund—Taxable Money Market Series and the Dryden Core Investment Fund—Short-Term Bond Series. |
| (k) | Represents security, or a portion thereof, purchased with cash collateral received for securities on loan. |
| (l) | As of December 31, 2009, 1 security representing $3,372,924 and 0.2% of the net assets was fair valued in accordance with the policies adopted by the Board of Trustees. |
| (m) | Liabilities in excess of other assets include net unrealized appreciation (depreciation) on futures contracts, forward foreign currency exchange contracts, interest rate and credit default swap agreements as follows: |
Open futures contracts outstanding at December 31, 2009:
| | | | | | | | | | | | | | |
Number of
Contracts
| | Type
| | Expiration
Date
| | Value at
Trade Date
| | Value at
December 31, 2009
| | Unrealized
Appreciation/
(Depreciation)
| |
| Long Positions: | | | | | | | | | | | | | | |
| 11 | | Euro 10 Yrs. Bonds | | Mar. 2010 | | $ | 1,941,065 | | $ | 1,911,048 | | $ | (30,017 | ) |
| 235 | | U.S. Treasury 10 Yrs. Notes | | Mar. 2010 | | | 27,209,692 | | | 27,131,484 | | | (78,208 | ) |
| 340 | | U.S. Treasury 2 Yrs. Notes | | Mar. 2010 | | | 73,777,543 | | | 73,530,313 | | | (247,230 | ) |
| 425 | | U.S. Treasury 5 Yrs. Notes | | Mar. 2010 | | | 48,643,413 | | | 48,612,695 | | | (30,718 | ) |
| 507 | | U.S. Long Bonds | | Mar. 2010 | | | 59,445,617 | | | 58,495,125 | | | (950,492 | ) |
| | | | | | | | | | | | |
|
|
|
| | | | | | | | | | | | | | (1,336,665 | ) |
| | | | | | | | | | | | |
|
|
|
| Short Position: | | | | | | | | | | | | | | |
| 20 | | Australian 10 Yrs. Bonds | | Mar. 2010 | | | 1,855,897 | | | 1,828,925 | | | 26,972 | |
| | | | | | | | | | | | |
|
|
|
| | | | | | | | | | | | | $ | (1,309,693 | ) |
| | | | | | | | | | | | |
|
|
|
Forward foreign currency exchange contracts outstanding at December 31, 2009:
| | | | | | | | | | | | | | |
Foreign Currency Contract
| | Counterparty
| | Notional
Amount (000)
| | Payable at
Settlement Date
| | Value at
December 31, 2009
| | Unrealized
Appreciation/
(Depreciation)
| |
Purchased: | | | | | | | | | | | | | | |
Australian Dollar
expiring 01/20/10 | | JPMorgan Chase & Co. | | AUD 759 | | $ | 680,900 | | $ | 681,027 | | $ | 127 | |
British Pound
expiring 01/22/10 | | Citibank N.A. | | GBP 841 | | | 1,363,700 | | | 1,357,669 | | | (6,031 | ) |
Canadian Dollar
expiring 01/19/10 | | Morgan Stanley | | CAD 2,785 | | | 2,623,615 | | | 2,662,905 | | | 39,290 | |
Euro expiring 01/22/10 | | Citibank N.A. | | EUR 119 | | | 170,383 | | | 170,146 | | | (237 | ) |
Hungarian Forint
expiring 01/21/10 | | JPMorgan Chase & Co. | | HUF 129,681 | | | 680,900 | | | 687,718 | | | 6,818 | |
Hungarian Forint
expiring 01/21/10 | | Citibank N.A. | | HUF 257,125 | | | 1,363,700 | | | 1,363,570 | | | (130 | ) |
New Zealand Dollar
expiring 01/21/10 | | Deutsche Bank Securities Corp. | | NZD 1,666 | | | 1,198,424 | | | 1,207,874 | | | 9,450 | |
New Zealand Dollar
expiring 01/21/10 | | JPMorgan Chase & Co. | | NZD 1,326 | | | 953,300 | | | 961,132 | | | 7,832 | |
New Zealand Dollar
expiring 01/21/10 | | JPMorgan Chase & Co. | | NZD 1,879 | | | 1,363,700 | | | 1,362,259 | | | (1,441 | ) |
Norwegian Krone
expiring 01/21/10 | | Morgan Stanley | | NOK 18,708 | | | 3,170,775 | | | 3,228,149 | | | 57,374 | |
Swedish Krona
expiring 01/21/10 | | Morgan Stanley | | SEK 13,844 | | | 1,893,905 | | | 1,935,232 | | | 41,327 | |
Swedish Krona
expiring 01/21/10 | | Citibank N.A. | | SEK 4,876 | | | 680,900 | | | 681,629 | | | 729 | |
Swedish Krona
expiring 01/21/10 | | Citibank N.A. | | SEK 9,716 | | | 1,363,700 | | | 1,358,116 | | | (5,584 | ) |
| | | | | | |
|
| |
|
| |
|
|
|
| | | | | | | $ | 17,507,902 | | $ | 17,657,426 | | | 149,524 | |
| | | | | | |
|
| |
|
| |
|
|
|
SEE NOTES TO FINANCIAL STATEMENTS.
A37
| | | | | | |
| | | DIVERSIFIED BOND PORTFOLIO (continued) | | |
| |
| SCHEDULE OF INVESTMENTS | | December 31, 2009 |
| | | | | | | | | | | | | | |
Foreign Currency Contract
| | Counterparty
| | Notional
Amount (000)
| | Payable at
Settlement Date
| | Value at
December 31, 2009
| | Unrealized
Appreciation/
(Depreciation)
| |
Sold: | | | | | | | | | | | | | | |
Australian Dollar
expiring 01/20/10 | | JPMorgan Chase & Co. | | AUD 1,556 | | $ | 1,395,378 | | $ | 1,394,706 | | $ | 672 | |
Australian Dollar
expiring 01/20/10 | | JPMorgan Chase & Co. | | AUD 1,289 | | | 1,156,900 | | | 1,155,856 | | | 1,044 | |
Australian Dollar
expiring 01/20/10 | | Citibank N.A. | | AUD 1,288 | | | 1,137,100 | | | 1,154,288 | | | (17,188 | ) |
British Pound
expiring 01/22/10 | | Citibank N.A. | | GBP 2 | | | 3,088 | | | 3,096 | | | (8 | ) |
Hungarian Forint
expiring 01/21/10 | | Citibank N.A. | | HUF 212,185 | | | 1,088,800 | | | 1,125,247 | | | (36,447 | ) |
Hungarian Forint
expiring 01/21/10 | | Citibank N.A. | | HUF 549,626 | | | 2,819,752 | | | 2,914,741 | | | (94,989 | ) |
New Zealand Dollar
expiring 01/21/10 | | UBS Securities LLC | | NZD 1,958 | | | 1,365,800 | | | 1,419,260 | | | (53,460 | ) |
Norwegian Krone
expiring 01/21/10 | | JPMorgan Chase & Co. | | NOK 9,607 | | | 1,634,700 | | | 1,657,736 | | | (23,036 | ) |
Swedish Krona
expiring 01/21/10 | | JPMorgan Chase & Co. | | SEK 13,712 | | | 1,905,500 | | | 1,916,761 | | | (11,261 | ) |
Polish Zloty
expiring 01/21/10 | | Citibank N.A. | | PLN 4,170 | | | 1,417,249 | | | 1,454,304 | | | (37,055 | ) |
| | | | | | |
|
| |
|
| |
|
|
|
| | | | | | | $ | 13,924,267 | | $ | 14,195,995 | | | (271,728 | ) |
| | | | | | |
|
| |
|
| |
|
|
|
| | | | | | | | | | | | | $ | (122,204 | ) |
| | | | | | | | | | | | |
|
|
|
Interest rate swap agreements outstanding at December 31, 2009:
| | | | | | | | | | | | | | | | | | | | |
Counterparty
| | Termination
Date
| | Notional
Amount
(000)#
| | Fixed
Rate
| | Floating
Rate
| | Fair
Value
| | | Upfront
Premiums
Paid/
(Received)
| | Unrealized
Depreciation
| |
Deutsche Bank, AG(a) | | 5/31/2014 | | $ | 33,230 | | 2.355% | | 3 month LIBOR | | $ | (709,172 | ) | | $ | — | | $ | (709,172 | ) |
| | | | | | | | | | | |
|
|
| |
|
| |
|
|
|
| (a) | Portfolio pays the floating rate and receives the fixed rate. |
| # | Notional amount is shown in U.S. dollars unless otherwise stated. |
Credit default swap agreements outstanding as of December 31, 2009:
| | | | | | | | | | | | | | | | | | | | | |
Counterparty
| | Termination
Date
| | Notional
Amount
(000)#(3)
| | Fixed
Rate
| | Reference Entity/Obligation
| | Fair
Value
| | | Upfront
Premiums
Paid/
(Received)
| | | Unrealized
Appreciation/
(Depreciation)
| |
Credit default swaps on Corporate Issues—Buy Protections(1): | | | | | |
Barclays Bank PLC | | 6/20/2011 | | $ | 2,240 | | 5.000% | | Gannett Co., Inc.
6.375%, due 04/01/2012 | | $ | (111,953 | ) | | $ | (51,117 | ) | | $ | (60,836 | ) |
Citibank, N.A. | | 3/20/2012 | | | 6,900 | | 5.000% | | XL Capital Ltd.
5.250%, due 09/15/2014 | | | (656,264 | ) | | | (310,054 | ) | | | (346,210 | ) |
Citibank, N.A. | | 6/20/2014 | | | 5,000 | | 0.700% | | United Parcel Service, Inc.
8.375%, due 04/1/2030 | | | (84,951 | ) | | | — | | | | (84,951 | ) |
Citibank, N.A. | | 6/20/2014 | | | 4,800 | | 1.000% | | CBS Corp.
4.625%, due 05/15/2018 | | | 4,038 | | | | 337,097 | | | | (333,059 | ) |
Credit Suisse International | | 12/20/2012 | | | 1,500 | | 1.000% | | Gatx Corp.
5.500%, due 2/15/2012 | | | (13,068 | ) | | | 14,931 | | | | (27,999 | ) |
Credit Suisse International | | 6/20/2014 | | | 2,500 | | 1.000% | | Centex Corp.
5.250%, due 06/15/2015 | | | (11,196 | ) | | | (15,568 | ) | | | 4,372 | |
Credit Suisse International | | 3/20/2015 | | | 4,695 | | 1.000% | | Toll Brothers Financial Corp.
5.150%, due 05/15/2015 | | | 97,460 | | | | 38,252 | | | | 59,208 | |
Deutsche Bank, AG | | 3/20/2012 | | | 1,100 | | 5.000% | | Gannett Co., Inc.
6.375%, due 04/01/2012 | | | (70,906 | ) | | | (26,806 | ) | | | (44,100 | ) |
Deutsche Bank, AG | | 6/20/2012 | | | 3,060 | | 5.000% | | Starwood Hotels & Resorts Holdings, Inc. 7.875%, due 05/01/2012 | | | (308,811 | ) | | | (80,523 | ) | | | (228,288 | ) |
Deutsche Bank, AG | | 12/20/2012 | | | 4,400 | | 1.000% | | Block Financial LLC
5.125%, due 10/30/2014 | | | (79,315 | ) | | | (50,272 | ) | | | (29,043 | ) |
SEE NOTES TO FINANCIAL STATEMENTS.
A38
| | | | | | |
| | | DIVERSIFIED BOND PORTFOLIO (continued) | | |
| |
| SCHEDULE OF INVESTMENTS | | December 31, 2009 |
| | | | | | | | | | | | | | | | | | | | | |
Counterparty
| | Termination
Date
| | Notional
Amount
(000)#(3)
| | Fixed
Rate
| | Reference Entity/Obligation
| | Fair
Value
| | | Upfront
Premiums
Paid/
(Received)
| | | Unrealized
Appreciation/
(Depreciation)
| |
Deutsche Bank, AG | | 12/20/2012 | | $ | 7,800 | | 1.000% | | Macy’s Retail Holdings, Inc.
8.000%, due 07/15/2012 | | $ | 87,158 | | | $ | 293,476 | | | $ | (206,318 | ) |
Deutsche Bank, AG | | 6/20/2013 | | | 6,600 | | 1.000% | | Sealed Air Corp.
5.625%, due 07/15/2013 | | | (60,653 | ) | | | 97,851 | | | | (158,504 | ) |
Deutsche Bank, AG | | 9/20/2013 | | | 2,600 | | 1.000% | | Masco Corp.
6.125%, due 10/03/2016 | | | 60,759 | | | | 91,457 | | | | (30,698 | ) |
Deutsche Bank, AG | | 3/20/2014 | | | 980 | | 7.050% | | Starwood Hotels & Resorts Holdings, Inc.
7.875%, due 05/01/2012 | | | (223,095 | ) | | | — | | | | (223,095 | ) |
Deutsche Bank, AG | | 6/20/2014 | | | 7,000 | | 1.000% | | R.R. Donnelley & Sons Co.
4.950%, due 04/01/2014 | | | 123,313 | | | | 504,077 | | | | (380,764 | ) |
Deutsche Bank, AG | | 3/20/2018 | | | 3,700 | | 3.700% | | American International Group, Inc. 6.250%, due 05/01/2036 | | | 425,861 | | | | — | | | | 425,861 | |
Goldman Sachs International, Inc. | | 12/20/2011 | | | 3,060 | | 1.000% | | Lennar Corp.
6.500%, due 04/15/2016 | | | 74,717 | | | | 110,642 | | | | (35,925 | ) |
Goldman Sachs International, Inc. | | 3/20/2014 | | | 3,400 | | 6.600% | | Simon Propery Group L.P.
5.250%, due 12/01/2016 | | | (733,686 | ) | | | — | | | | (733,686 | ) |
Goldman Sachs International, Inc. | | 3/20/2014 | | | 3,400 | | 0.700% | | Duke Energy Corp.
5.650%, due 06/15/2013 | | | (48,971 | ) | | | — | | | | (48,971 | ) |
JPMorgan Chase Bank | | 6/20/2014 | | | 4,150 | | 5.000% | | SLM Corp.
5.125%, due 08/27/2012 | | | 2,467 | | | | 723,700 | | | | (721,233 | ) |
JPMorgan Chase Bank | | 6/20/2016 | | | 3,400 | | 1.500% | | Embarq Holdings Co. LLC
7.082%, due 06/01/2016 | | | (150,541 | ) | | | — | | | | (150,541 | ) |
JPMorgan Chase Bank | | 9/20/2016 | | | 4,750 | | 1.000% | | R.R. Donnelley & Sons Co.
4.950%, due 04/01/2014 | | | 212,873 | | | | 567,562 | | | | (354,689 | ) |
JPMorgan Chase Bank | | 9/20/2019 | | | 4,400 | | 1.000% | | MeadWestvaco Corp.
7.950%, due 02/15/2031 | | | 137,144 | | | | 84,164 | | | | 52,980 | |
Merrill Lynch Capital Services, Inc. | | 9/20/2016 | | | 1,000 | | 1.730% | | Tyson Foods, Inc.
7.850%, due 04/01/2016 | | | 42,602 | | | | — | | | | 42,602 | |
Morgan Stanley Capital Services, Inc. | | 6/20/2013 | | | 3,700 | | 1.650% | | Itraxx Euro zero,
due 06/20/2013 | | | (174,401 | ) | | | (117,396 | ) | | | (57,005 | ) |
Morgan Stanley Capital Services, Inc. | | 12/20/2019 | | | 3,400 | | 1.000% | | Arrow Electronics, Inc.
6.875%, due 06/01/2018 | | | 47,483 | | | | (27,003 | ) | | | 74,486 | |
| | | | | | | | | | | |
|
|
| |
|
|
| |
|
|
|
| | | | | | | | | | | | $ | (1,411,936 | ) | | $ | 2,184,470 | | | $ | (3,596,406 | ) |
| | | | | | | | | | | |
|
|
| |
|
|
| |
|
|
|
| | | | | | | | | | | | | | | | | | |
Counterparty
| | Termination
Date
| | Notional
Amount
(000)#(3)
| | Fixed
Rate
| | Reference Entity/Obligation
| | Fair
Value
| | Upfront
Premiums
Paid/
(Received)
| | Unrealized
Appreciation
|
Credit default swaps on Asset-Backed Issues—Buy Protections(1): | | | |
Merrill Lynch Capital Services, Inc. | | 3/25/2036 | | $ | 842 | | 3.720% | | AmeriQuest Mortgage Securities, Inc. Ser. 2006-R1, Class M9,
2.731%, due 03/25/2036 | | $ | 814,732 | | $ | — | | $ | 814,732 |
| | | | | | | | | | | |
|
| |
|
| |
|
|
| | | | | | | | | | | | | | | | | | | | | |
Counterparty
| | Termination
Date
| | Implied
Credit Spread at
December 31, 2009(4)
| | Notional
Amount
(000)#(3)
| | Fixed Rate
| | Reference Entity/Obligation
| | Fair
Value
| | Upfront
Premiums
Paid/
(Received)
| | | Unrealized
Appreciation
|
Credit default swaps on Corporate Issues—Sell Protections(2): | | | | |
Deutsche Bank, AG | | 3/20/2010 | | 0.275% | | $ | 2,500 | | 5.000% | | Arcelor Mittal Co.
6.125%, due 06/01/2018 | | $ | 30,059 | | $ | (115,762 | ) | | $ | 145,821 |
| | | | | | | | | | | | | |
|
| |
|
|
| |
|
|
| | | | | | | | | | | | | | | | | | | | |
Counterparty
| | Termination
Date
| | Notional
Amount
(000)#(3)
| | Fixed
Rate
| | Reference Entity/Obligation
| | Fair
Value(5)
| | | Upfront
Premiums
Paid/
(Received)
| | Unrealized
Depreciation
| |
Credit default swaps on Asset-Backed Issues—Sell Protections(2): | | | | |
Merrill Lynch Capital Services, Inc. | | 3/25/2036 | | $ | 842 | | 9.000% | | AmeriQuest Mortgage Securities, Inc. Ser. 2006-R1, Class M9,
2.731%, due 03/25/2036 | | $ | (790,816 | ) | | $ | — | | $ | (790,816 | ) |
| | | | | | | | | | | |
|
|
| |
|
| |
|
|
|
SEE NOTES TO FINANCIAL STATEMENTS.
A39
| | | | | | |
| | | DIVERSIFIED BOND PORTFOLIO (continued) | | |
| |
| SCHEDULE OF INVESTMENTS | | December 31, 2009 |
The Portfolio entered into credit default swaps as the protection seller on corporate issues and asset-backed issues to take an active short position with respect to the likelihood of a particular issuer’s default.
| (1) | If the Portfolio is a buyer of protection, it pays the fixed rate. When a credit event occurs, as defined under the terms of that particular swap agreement, the Portfolio will either (i) receive from the seller of protection an amount up to the notional amount of the swap and make delivery of the referenced obligation or underlying securities comprising the referenced index or (ii) receive a net settlement amount in the form of cash or securities up to the notional amount of the swap less the recovery value of the referenced obligation or underlying securities comprising the referenced index. |
| (2) | If the Portfolio is a seller of protection, it receives the fixed rate. When a credit event occurs, as defined under the terms of that particular swap agreement, the Portfolio will either (i) pay to the buyer of protection an amount equal to the notional amount of the swap and take delivery of the referenced obligation or underlying securities comprising the referenced index or (ii) pay a net settlement amount in the form of cash or securities equal to the notional amount of the swap less the recovery value of the referenced obligation or underlying securities comprising the referenced index. |
| (3) | Notional amount represents the maximum potential amount the Portfolio could be required to pay as a seller of credit protection or receive as a buyer of credit protection if a credit event occurs as defined under the terms of that particular swap agreement. |
| (4) | Implied credit spreads, represented in absolute terms, utilized in determining the market value of credit default swap agreements on corporate issues or sovereign issues of an emerging country as of the reporting date serve as an indicator of the current status of the payment/performance risk and represent the likelihood of risk of default for the credit derivative. The implied credit spread of a particular referenced entity reflects the cost of buying/selling protection and may include up-front payments required to be made to enter into the agreement. Wider credit spreads represent a deterioration of the referenced entity’s credit soundness and a greater likelihood of risk of default or other credit event occurring as defined under the terms of the agreement. |
| (5) | The fair value of credit default swap agreements on asset-backed securities serve as an indicator of the current status of the payment/performance risk and represents the likelihood of an expected liability (or profit) for the credit derivative should the notional amount of the swap agreement be closed/sold as of the reporting date. Increasing fair value in absolute terms, represents a deterioration of the referenced entity’s credit soundness and a greater likelihood of risk of default or other credit event occuring as defined under the terms of the agreement. |
| # | Notional amount is shown in U.S. dollars unless otherwise stated. |
Various inputs are used in determining the value of the Portfolio’s investments. These inputs are summarized in the three broad levels listed below.
Level 1—quoted prices in active markets for identical securities
Level 2—other significant observable inputs (including quoted prices for similar securities, interest rates, prepayment speeds, credit risk, etc.)
Level 3—significant unobservable inputs (including the Portfolio’s own assumptions in determining the fair value of investments)
The following is a summary of the inputs used as of December 31, 2009 in valuing the Portfolio’s assets carried at fair value:
| | | | | | | | | | | |
| | | Level 1
| | | Level 2
| | | Level 3
|
Investments in Securities | | | | | | | | | | | |
Asset-Backed Securities | | $ | — | | | $ | 67,640,210 | | | $ | 3,372,924 |
Bank Loans | | | — | | | | 38,824,847 | | | | — |
Collateralized Mortgage Obligations | | | — | | | | 4,767,501 | | | | — |
Commercial Mortgage-Backed Securities | | | — | | | | 212,997,922 | | | | — |
Corporate Bonds | | | — | | | | 643,360,555 | | | | — |
Foreign Agencies | | | — | | | | 23,275,228 | | | | — |
Municipal Bonds | | | — | | | | 9,152,400 | | | | — |
Residential Mortgage-Backed Securities | | | — | | | | 50,975,573 | | | | — |
Sovereigns | | | — | | | | 15,224,670 | | | | — |
U.S. Government Agency Obligation | | | — | | | | 1,329,610 | | | | — |
U.S. Government Mortgage-Backed Securities | | | — | | | | 172,661,793 | | | | — |
U.S. Government Treasury Securities | | | — | | | | 6,227,072 | | | | — |
Affiliated Mutual Funds | | | 221,303,395 | | | | — | | | | — |
| | |
|
|
| |
|
|
| |
|
|
| | | | 221,303,395 | | | | 1,246,437,381 | | | | 3,372,924 |
Other Financial Instruments* | | | (1,309,693 | ) | | | (4,281,961 | ) | | | 23,916 |
| | |
|
|
| |
|
|
| |
|
|
Total | | $ | 219,993,702 | | | $ | 1,242,155,420 | | | $ | 3,396,840 |
| | |
|
|
| |
|
|
| |
|
|
SEE NOTES TO FINANCIAL STATEMENTS.
A40
| | | | | | |
| | | DIVERSIFIED BOND PORTFOLIO (continued) | | |
| |
| SCHEDULE OF INVESTMENTS | | December 31, 2009 |
The following is a reconciliation of assets in which significant unobservable inputs (Level 3) were used in determining fair value:
| | | | | | | | | | | | |
| | | Corporate
Bonds
| | | Asset-Backed
Securities
| | | Other Financial
Instruments*
| |
Balance as of 12/31/08 | | $ | 2,023,560 | | | $ | — | | | $ | 2,641,021 | |
Realized gain (loss) | | | (1,642,574 | ) | | | — | | | | — | ** |
Change in unrealized appreciation (depreciation) | | | 578,234 | | | | (1,418 | ) | | | (2,617,105 | ) |
Earned amortization/accretion | | | — | | | | 1,418 | | | | — | |
Net purchases (sales) | | | (959,220 | ) | | | 3,372,924 | | | | — | |
Transfers in and/or out of Level 3 | | | — | | | | — | | | | — | |
| | |
|
|
| |
|
|
| |
|
|
|
Balance as of 12/31/09 | | $ | — | | | $ | 3,372,924 | | | $ | 23,916 | |
| | |
|
|
| |
|
|
| |
|
|
|
| * | Other financial instruments are derivative instruments not reflected in the Schedule of Investments, such as futures, forwards and swap contracts, which are valued at the unrealized appreciation/depreciation on the instrument. |
| ** | The realized gain earned during the period for other financial instruments was $2,612,480. |
The industry classification of portfolio holdings and liabilities in excess of other assets shown as a percentage of net assets as of December 31, 2009 was as follows:
| | | |
Affiliated Mutual Funds (including 5.0% of collateral received for securities on loan) | | 16.2 | % |
Commercial Mortgage-Backed Securities | | 15.6 | |
U.S. Government Mortgage-Backed Securities | | 12.7 | |
Banking | | 6.5 | |
Asset-Backed Securities | | 5.2 | |
Electric | | 4.4 | |
Residential Mortgage-Backed Securities | | 3.7 | |
Telecommunications | | 3.2 | |
Technology | | 3.0 | |
Healthcare & Pharmaceutical | | 2.6 | |
Media & Entertainment | | 2.6 | |
Non-Captive Finance | | 2.6 | |
Insurance | | 2.0 | |
Metals | | 2.0 | |
Capital Goods | | 1.8 | |
Cable | | 1.8 | |
Foods | | 1.7 | |
Foreign Agencies | | 1.7 | |
Real Estate Investment Trusts | | 1.4 | |
Retailers | | 1.4 | |
Paper | | 1.3 | |
Structured Notes | | 1.3 | |
Airlines | | 1.2 | |
Energy – Other | | 1.1 | |
Sovereigns | | 1.1 | |
Building Materials & Construction | | 1.1 | |
Healthcare Insurance | | 1.0 | |
Packaging | | 1.0 | |
Chemicals | | 0.9 | |
Municipal Bonds | | 0.7 | |
Pipelines & Other | | 0.7 | |
Tobacco | | 0.7 | |
Automotive | | 0.6 | |
Energy – Integrated | | 0.5 | |
Lodging | | 0.5 | |
U.S. Government Treasury Securities | | 0.5 | |
Collateralized Mortgage Obligations | | 0.4 | |
Consumer | | 0.4 | |
Gaming | | 0.4 | |
Aerospace & Defense | | 0.1 | |
Brokerage | | 0.1 | |
Railroads | | 0.1 | |
U.S. Government Agency Obligation | | 0.1 | |
| | |
|
|
| | | 107.9 | |
Liabilities in excess of other assets | | (7.9 | ) |
| | |
|
|
| | | 100.0 | % |
| | |
|
|
SEE NOTES TO FINANCIAL STATEMENTS.
A41
| | | | | | |
| | | DIVERSIFIED BOND PORTFOLIO (continued) | | |
| |
| SCHEDULE OF INVESTMENTS | | December 31, 2009 |
The Portfolio invested in derivative instruments during the reporting period. The primary types of risk associated with these derivative instruments are commodity risk, credit risk, equity risk, foreign exchange risk and interest rate risk. The effect of such derivative instruments on the Portfolio’s financial position and financial performance as reflected in the Statement of Assets and Liabilities and Statement of Operations is presented in the summary below.
Fair values of derivative Instruments as of December 31, 2009 as presented in the Statement of Assets and Liabilities:
| | | | | | | | | | | | |
Derivatives not designated as
hedging instruments, carried at
fair value
| | Asset Derivatives
| | | Liability Derivatives
| |
| | Balance Sheet Location
| | Fair
Value
| | | Balance Sheet Location
| | Fair
Value
| |
Credit contracts | | Premium paid for swaps agreements | | $ | 2,863,209 | | | Premium received for swaps agreements | | $ | 794,501 | |
Credit contracts | | Unrealized appreciation on swaps | | | 1,620,062 | | | Unrealized depreciation on swaps | | | 5,046,731 | |
Foreign exchange contracts | | Unrealized appreciation on forward
foreign currency exchange contracts | | | 164,663 | | | Unrealized depreciation on forward
foreign currency exchange contracts | | | 286,867 | |
Interest rate contracts | | Due to broker—variation margin | | | 26,972 | * | | Due to broker—variation margin | | | 1,336,665 | * |
Interest rate contracts | | — | | | — | | | Unrealized depreciation on swaps | | | 709,172 | |
| | | | |
|
|
| | | |
|
|
|
Total | | | | $ | 4,674,906 | | | | | $ | 8,173,936 | |
| | | | |
|
|
| | | |
|
|
|
| * | Includes cumulative appreciation/depreciation on futures contracts as reported in Schedule of Investments. Only unsettled variation margin receivable (payable) is reported within the Statement of Assets and Liabilities. |
The effects of derivative instruments on the Statement of Operations for the year ended December 31, 2009 are as follows:
| | | | | | | | | | | | | | | | | | | | | | | |
Amount of Realized Gain or (Loss) on Derivatives Recognized in Income
| |
Derivatives not designated as hedging
instruments, carried at fair value
| | Futures
| | Forward
Contracts
| | | Swaps
| | | Purchased
Options
| | | Written
Options
| | | Total
| |
Credit contracts | | $ | — | | $ | — | | | $ | 644,799 | | | $ | — | | | $ | — | | | $ | 644,799 | |
Foreign exchange contracts | | | — | | | (452,416 | ) | | | — | | | | — | | | | — | | | | (452,416 | ) |
Interest rate contracts | | | 5,789,315 | | | — | | | | 1,809,990 | | | | (187,350 | ) | | | 79,190 | | | | 7,491,145 | |
| | |
|
| |
|
|
| |
|
|
| |
|
|
| |
|
|
| |
|
|
|
Total | | $ | 5,789,315 | | $ | (452,416 | ) | | $ | 2,454,789 | | | $ | (187,350 | ) | | $ | 79,190 | | | $ | 7,683,528 | |
| | |
|
| |
|
|
| |
|
|
| |
|
|
| |
|
|
| |
|
|
|
|
Change in Unrealized Appreciation or (Depreciation) on Derivatives Recognized in Income
| |
Derivatives not designated as hedging
instruments, carried at fair value
| | | | | | | Futures
| | | Forward
Contracts
| | | Swaps
| | | Total
| |
Credit contracts | | | $ | — | | | $ | — | | | $ | (4,777,247 | ) | | $ | (4,777,247 | ) |
Foreign exchange contracts | | | | — | | | | (293,111 | ) | | | — | | | | (293,111 | ) |
Interest rate contracts | | | | (7,834,730 | ) | | | — | | | | (449,477 | ) | | | (8,284,207 | ) |
| | | | | | | | | |
|
|
| |
|
|
| |
|
|
| |
|
|
|
Total | | | $ | (7,834,730 | ) | | $ | (293,111 | ) | | $ | (5,226,724 | ) | | $ | (13,354,565 | ) |
| | | | | | | | | |
|
|
| |
|
|
| |
|
|
| |
|
|
|
For the year ended December 31, 2009, the Portfolio’s average volume of derivative activities is as follows:
| | | | | | | | | | | | | | |
Purchased Options
(Cost)
| | Written Options
(Premium Received)
| | Futures
Long Position
(Value at Trade Date)
| | Futures
Short Position
(Value at Trade Date)
| | Forward Currency
Contracts—Purchased
(Value at Settlement
Date Payable)
| | Forward Currency
Contracts—Sold
(Value at Settlement
Date Receivable)
|
| $9,203 | | $3,757 | | $ | 161,547,212 | | $ | 28,971,015 | | $ | 8,255,159 | | $ | 11,426,539 |
| | | | | |
Interest Rate Swaps
(Notional Amount in USD (000))
| | Credit Default
Swaps as Buyer
(Notional Amount in USD (000))
| | Credit Default
Swaps as Writer
(Notional Amount in USD (000))
|
| $52,763 | | $54,719 | | $ | 7,724 |
SEE NOTES TO FINANCIAL STATEMENTS.
A42
| | | | | | |
| | | DIVERSIFIED BOND PORTFOLIO (continued) | | |
STATEMENT OF ASSETS AND LIABILITIES
December 31, 2009
| | | |
| ASSETS | | | |
Investments, at value including securities on loan of $66,383,884: | | | |
Unaffiliated investments (cost $1,211,097,417) | | $ | 1,249,810,305 |
Affiliated investments (cost $243,484,117) | | | 221,303,395 |
Cash | | | 1,301,596 |
Receivable for investments sold | | | 23,624,548 |
Dividends and interest receivable | | | 13,658,667 |
Premium paid for swaps agreements | | | 2,863,209 |
Unrealized appreciation on swaps | | | 1,620,062 |
Unrealized appreciation on forward foreign currency exchange contracts | | | 164,663 |
Receivable for Series shares sold | | | 40,810 |
Prepaid expenses | | | 13,633 |
| | |
|
|
Total Assets | | | 1,514,400,888 |
| | |
|
|
| LIABILITIES | | | |
Payable for investments purchased | | | 74,976,408 |
Collateral for securities on loan | | | 67,999,531 |
Unrealized depreciation on swaps | | | 5,755,903 |
Premium received for swaps agreements | | | 794,501 |
Management fee payable | | | 462,592 |
Due to broker—variation margin | | | 407,874 |
Unrealized depreciation on forward foreign currency exchange contracts | | | 286,867 |
Accrued expenses and other liabilities | | | 132,384 |
Payable for Series shares repurchased | | | 108,981 |
Deferred trustees’ fees | | | 6,233 |
Affiliated transfer agent fee payable | | | 595 |
| | |
|
|
Total Liabilities | | | 150,931,869 |
| | |
|
|
| NET ASSETS | | $ | 1,363,469,019 |
| | |
|
|
Net assets were comprised of: | | | |
Paid-in capital | | $ | 1,329,937,441 |
Retained earnings | | | 33,531,578 |
| | |
|
|
Net assets, December 31, 2009 | | $ | 1,363,469,019 |
| | |
|
|
Net asset value and redemption price per share, $1,363,469,019 / 122,149,049 outstanding shares of beneficial interest | | $ | 11.16 |
| | |
|
|
STATEMENT OF OPERATIONS
Year Ended December 31, 2009
| | | | |
| INVESTMENT INCOME | | | | |
Interest | | $ | 60,004,476 | |
Affiliated dividend income | | | 2,659,194 | |
Affiliated income from securities loaned, net | | | 197,592 | |
| | |
|
|
|
| | | | 62,861,262 | |
| | |
|
|
|
| EXPENSES | | | | |
Management fee | | | 4,808,368 | |
Custodian’s fees and expenses | | | 190,000 | |
Shareholders’ reports | | | 120,000 | |
Audit fee | | | 33,000 | |
Trustees’ fees | | | 22,000 | |
Insurance expenses | | | 21,000 | |
Commitment fee on syndicated credit agreement | | | 10,000 | |
Legal fees and expenses | | | 10,000 | |
Transfer agent’s fee and expenses (including affiliated expense of $3,600) (Note 4) | | | 10,000 | |
Loan interest expense (Note 8) | | | 21 | |
Miscellaneous | | | 11,811 | |
| | |
|
|
|
Total expenses | | | 5,236,200 | |
| | |
|
|
|
| NET INVESTMENT INCOME | | | 57,625,062 | |
| | |
|
|
|
| NET REALIZED AND UNREALIZED GAIN (LOSS) ON INVESTMENTS, SWAPS AND FOREIGN CURRENCIES | | | | |
Net realized gain (loss) on: | | | | |
Investment transactions (including affiliated: $(72,467)) | | | 9,716,123 | |
Futures transactions | | | 5,789,315 | |
Swap agreement transactions | | | 2,454,789 | |
Foreign currency transactions | | | 270,625 | |
Written options transactions | | | 79,190 | |
| | |
|
|
|
| | | | 18,310,042 | |
| | |
|
|
|
Net change in unrealized appreciation (depreciation) on: | | | | |
Investments (including affiliated: $20,049,476) | | | 161,506,328 | |
Futures | | | (7,834,730 | ) |
Swaps | | | (5,226,724 | ) |
Foreign currencies | | | (265,100 | ) |
| | |
|
|
|
| | | | 148,179,774 | |
| | |
|
|
|
| NET GAIN ON INVESTMENTS, SWAPS AND FOREIGN CURRENCIES | | | 166,489,816 | |
| | |
|
|
|
| NET INCREASE IN NET ASSETS RESULTING FROM OPERATIONS | | $ | 224,114,878 | |
| | |
|
|
|
STATEMENT OF CHANGES IN NET ASSETS
| | | | | | | | |
| | | Year Ended December 31,
| |
| | | 2009
| | | 2008
| |
INCREASE (DECREASE) IN NET ASSETS
OPERATIONS: | | | | | | | | |
Net investment income | | $ | 57,625,062 | | | $ | 60,447,814 | |
Net realized gain on investments, swaps and foreign currencies | | | 18,310,042 | | | | 20,953,008 | |
Net change in unrealized appreciation (depreciation) on investments, swaps and foreign currencies | | | 148,179,774 | | | | (123,991,687 | ) |
| | |
|
|
| |
|
|
|
NET INCREASE (DECREASE) IN NET ASSETS RESULTING FROM OPERATIONS | | | 224,114,878 | | | | (42,590,865 | ) |
| | |
|
|
| |
|
|
|
| DISTRIBUTIONS | | | (77,854,926 | ) | | | (72,614,494 | ) |
| | |
|
|
| |
|
|
|
| SERIES SHARE TRANSACTIONS: | | | | | | | | |
Series shares sold [10,352,324 and 9,801,318 shares, respectively] | | | 113,677,834 | | | | 102,899,591 | |
Series shares issued in reinvestment of dividends and distributions [7,526,024 and 7,018,378 shares, respectively] | | | 77,854,926 | | | | 72,614,494 | |
Series shares repurchased [10,529,843 and 13,831,055 shares, respectively] | | | (109,159,405 | ) | | | (143,763,704 | ) |
| | |
|
|
| |
|
|
|
NET INCREASE IN NET ASSETS RESULTING FROM SERIES SHARE TRANSACTIONS | | | 82,373,355 | | | | 31,750,381 | |
| | |
|
|
| |
|
|
|
| TOTAL INCREASE (DECREASE) IN NET ASSETS | | | 228,633,307 | | | | (83,454,978 | ) |
| NET ASSETS: | | | | | | | | |
Beginning of year | | | 1,134,835,712 | | | | 1,218,290,690 | |
| | |
|
|
| |
|
|
|
End of year | | $ | 1,363,469,019 | | | $ | 1,134,835,712 | |
| | |
|
|
| |
|
|
|
SEE NOTES TO FINANCIAL STATEMENTS.
A43
| | | | | | |
| | | EQUITY PORTFOLIO | | |
| |
| SCHEDULE OF INVESTMENTS | | December 31, 2009 |
| | | | | |
| LONG-TERM INVESTMENTS — 98.2% |
| COMMON STOCKS — 97.5% | | Shares
| | Value
(Note 2)
|
| | | | | | |
Aerospace & Defense — 1.1% | | | |
Precision Castparts Corp. | | 192,000 | | $ | 21,187,200 |
United Technologies Corp. | | 191,800 | | | 13,312,838 |
| | | | |
|
|
| | | | | | 34,500,038 |
| | | | |
|
|
Auto Components — 0.9% | | | |
Goodyear Tire & Rubber Co. (The)* | | 1,936,800 | | | 27,308,880 |
| | | | |
|
|
Beverages — 0.7% | | | |
PepsiCo, Inc. | | 378,358 | | | 23,004,166 |
| | | | |
|
|
Biotechnology — 2.1% | | | |
Celgene Corp.* | | 545,320 | | | 30,363,418 |
Gilead Sciences, Inc.* | | 842,400 | | | 36,459,072 |
| | | | |
|
|
| | | | | | 66,822,490 |
| | | | |
|
|
Capital Markets — 5.9% | | | |
Bank of New York Mellon Corp. (The) | | 814,878 | | | 22,792,138 |
Charles Schwab Corp. (The) | | 1,506,530 | | | 28,352,894 |
Goldman Sachs Group, Inc. (The) | | 516,231 | | | 87,160,442 |
Morgan Stanley | | 1,056,700 | | | 31,278,320 |
TD Ameritrade Holding Corp.*(a) | | 1,000,100 | | | 19,381,938 |
| | | | |
|
|
| | | | | | 188,965,732 |
| | | | |
|
|
Chemicals — 1.0% | | | |
Dow Chemical Co. (The) | | 1,123,600 | | | 31,045,068 |
| | | | |
|
|
Commercial Banks — 0.6% | | | |
KeyCorp | | 3,305,300 | | | 18,344,415 |
| | | | |
|
|
Commercial Services & Supplies — 1.2% | | | |
Waste Management, Inc. | | 1,131,800 | | | 38,266,158 |
| | | | |
|
|
Communications Equipment — 3.5% | | | |
Cisco Systems, Inc.* | | 1,572,569 | | | 37,647,302 |
Juniper Networks, Inc.*(a) | | 481,400 | | | 12,838,938 |
QUALCOMM, Inc. | | 1,331,170 | | | 61,579,924 |
| | | | |
|
|
| | | | | | 112,066,164 |
| | | | |
|
|
Computers & Peripherals — 5.6% | | | |
Apple, Inc.* | | 412,466 | | | 86,972,581 |
Hewlett-Packard Co. | | 1,047,760 | | | 53,970,117 |
NetApp, Inc.*(a) | | 1,116,600 | | | 38,399,874 |
| | | | |
|
|
| | | | | | 179,342,572 |
| | | | |
|
|
Consumer Finance — 1.1% | | | |
SLM Corp.* | | 3,138,700 | | | 35,373,149 |
| | | | |
|
|
Diversified Consumer Services — 2.4% | | | |
Career Education Corp.*(a) | | 1,301,400 | | | 30,335,634 |
H&R Block, Inc. | | 1,981,200 | | | 44,814,744 |
| | | | |
|
|
| | | | | | 75,150,378 |
| | | | |
|
|
Diversified Financial Services — 1.3% | | | |
Bank of America Corp. | | 1,604,400 | | | 24,162,264 |
JPMorgan Chase & Co. | | 450,900 | | | 18,789,003 |
| | | | |
|
|
| | | | | | 42,951,267 |
| | | | |
|
|
Electronic Components — 0.6% | | | |
Flextronics International Ltd. (Singapore)* | | 2,521,342 | | | 18,431,010 |
| | | | |
|
|
| | | | | |
COMMON STOCKS
(continued) | | Shares
| | Value
(Note 2)
|
| | | | | | |
Energy Equipment & Services — 2.3% | | | |
National Oilwell Varco, Inc. | | 584,090 | | $ | 25,752,528 |
Schlumberger Ltd. (Netherlands) | | 749,400 | | | 48,778,446 |
| | | | |
|
|
| | | | | | 74,530,974 |
| | | | |
|
|
Food & Staples Retailing — 2.6% | | | |
Costco Wholesale Corp. | | 486,200 | | | 28,768,454 |
CVS Caremark Corp. | | 774,900 | | | 24,959,529 |
Kroger Co. (The) | | 1,420,500 | | | 29,162,865 |
| | | | |
|
|
| | | | | | 82,890,848 |
| | | | |
|
|
Food Products — 4.0% | | | |
Bunge Ltd. (Bermuda)(a) | | 493,500 | | | 31,500,105 |
ConAgra Foods, Inc. | | 1,409,500 | | | 32,488,975 |
Tyson Foods, Inc. (Class A Stock) | | 2,664,600 | | | 32,694,642 |
Unilever PLC (United Kingdom) | | 928,700 | | | 29,769,757 |
| | | | |
|
|
| | | | | | 126,453,479 |
| | | | |
|
|
Healthcare Equipment & Supplies — 2.9% | | | |
Alcon, Inc. (Switzerland)(a) | | 357,000 | | | 58,672,950 |
Baxter International, Inc. | | 572,300 | | | 33,582,564 |
| | | | |
|
|
| | | | | | 92,255,514 |
| | | | |
|
|
Healthcare Providers & Services — 5.1% | | | |
Aetna, Inc. | | 707,800 | | | 22,437,260 |
Express Scripts, Inc.* | | 66,700 | | | 5,766,215 |
Medco Health Solutions, Inc.* | | 904,300 | | | 57,793,813 |
Omnicare, Inc. | | 1,590,900 | | | 38,467,962 |
WellPoint, Inc.* | | 663,300 | | | 38,663,757 |
| | | | |
|
|
| | | | | | 163,129,007 |
| | | | |
|
|
Hotels, Restaurants & Leisure — 0.6% | | | |
Yum! Brands, Inc. | | 550,600 | | | 19,254,482 |
| | | | |
|
|
Household Products — 0.7% | | | |
Colgate-Palmolive Co. | | 290,800 | | | 23,889,220 |
| | | | |
|
|
Independent Power Producers & Energy Traders — 0.9% |
NRG Energy, Inc.*(a) | | 1,248,800 | | | 29,484,168 |
| | | | |
|
|
Insurance — 0.7% | | | |
Travelers Cos., Inc. (The) | | 464,400 | | | 23,154,984 |
| | | | |
|
|
Internet & Catalog Retail — 2.4% | | | |
Amazon.com, Inc.* | | 575,500 | | | 77,416,260 |
| | | | |
|
|
Internet Software & Services — 4.8% | | | |
Baidu, Inc., ADR (Cayman Islands)*(a) | | 54,732 | | | 22,507,440 |
Google, Inc. (Class A Stock)* | | 149,900 | | | 92,935,002 |
IAC/InterActiveCorp*(a) | | 1,824,050 | | | 37,356,544 |
| | | | |
|
|
| | | | | | 152,798,986 |
| | | | |
|
|
IT Services — 3.2% | | | |
MasterCard, Inc. (Class A Stock)(a) | | 177,100 | | | 45,334,058 |
Visa, Inc. (Class A Stock)(a) | | 637,230 | | | 55,732,136 |
| | | | |
|
|
| | | | | | 101,066,194 |
| | | | |
|
|
Media — 3.4% | | | | | |
Comcast Corp. (Class A Stock) | | 2,299,820 | | | 38,774,965 |
Liberty Global, Inc.
(Class C Stock)*(a) | | 1,386,250 | | | 30,289,563 |
Walt Disney Co. (The) | | 1,244,180 | | | 40,124,805 |
| | | | |
|
|
| | | | | | 109,189,333 |
| | | | |
|
|
SEE NOTES TO FINANCIAL STATEMENTS.
A44
| | | | | | |
| | | EQUITY PORTFOLIO (continued) | | |
| |
| SCHEDULE OF INVESTMENTS | | December 31, 2009 |
| | | | | |
COMMON STOCKS
(continued) | | Shares
| | Value
(Note 2)
|
| | | | | | |
Metals & Mining — 2.1% | | | | | |
Freeport-McMoRan Copper & Gold, Inc.* | | 420,360 | | $ | 33,750,705 |
Kinross Gold Corp. (Canada)(a) | | 1,846,600 | | | 33,977,440 |
| | | | |
|
|
| | | | | | 67,728,145 |
| | | | |
|
|
Multi-Line Retail — 0.9% | | | | | |
Kohl’s Corp.* | | 513,700 | | | 27,703,841 |
| | | | |
|
|
Multi-Utilities — 1.1% | | | | | |
Sempra Energy | | 629,986 | | | 35,266,616 |
| | | | |
|
|
Oil, Gas & Consumable Fuels — 11.7% | | | | | |
Apache Corp. | | 467,100 | | | 48,190,707 |
Canadian Natural Resources Ltd. (Canada) | | 469,500 | | | 33,780,525 |
EOG Resources, Inc. | | 342,900 | | | 33,364,170 |
Hess Corp. | | 166,600 | | | 10,079,300 |
Noble Energy, Inc. | | 307,100 | | | 21,871,662 |
Occidental Petroleum Corp. | | 1,146,900 | | | 93,300,315 |
Petroleo Brasileiro SA, ADR (Brazil) | | 964,000 | | | 45,963,520 |
Suncor Energy, Inc. (XNYS) (Canada) | | 157,500 | | | 5,561,325 |
Suncor Energy, Inc. (XTSE) (Canada) | | 922,547 | | | 32,823,038 |
Williams Cos., Inc. (The) | | 1,607,100 | | | 33,877,668 |
XTO Energy, Inc. | | 341,478 | | | 15,888,971 |
| | | | |
|
|
| | | | | | 374,701,201 |
| | | | |
|
|
Pharmaceuticals — 5.2% | | | | | |
Abbott Laboratories | | 460,305 | | | 24,851,867 |
Novartis AG, ADR (Switzerland)(a) | | 546,400 | | | 29,740,552 |
Pfizer, Inc. | | 1,304,400 | | | 23,727,036 |
Sanofi-Aventis SA, ADR (France)(a) | | 828,400 | | | 32,531,268 |
Shire PLC, ADR (United Kingdom)(a) | | 335,500 | | | 19,693,850 |
Teva Pharmaceutical Industries Ltd., ADR (Israel) | | 611,700 | | | 34,365,306 |
| | | | |
|
|
| | | | | | 164,909,879 |
| | | | |
|
|
Road & Rail — 1.9% | | | | | |
Union Pacific Corp. | | 933,900 | | | 59,676,210 |
| | | | |
|
|
Semiconductors & Semiconductor Equipment — 2.4% |
Advanced Micro Devices, Inc.*(a) | | 5,177,400 | | | 50,117,232 |
Intel Corp. | | 1,346,900 | | | 27,476,760 |
| | | | |
|
|
| | | | | | 77,593,992 |
| | | | |
|
|
Software — 7.6% | | | | | |
Adobe Systems, Inc.* | | 1,359,400 | | | 49,998,732 |
CA, Inc. | | 2,123,100 | | | 47,684,826 |
Microsoft Corp. | | 2,275,600 | | | 69,383,044 |
Symantec Corp.* | | 2,860,400 | | | 51,172,556 |
VMware, Inc. (Class A Stock)*(a) | | 611,700 | | | 25,923,846 |
| | | | |
|
|
| | | | | | 244,163,004 |
| | | | |
|
|
Textiles, Apparel & Luxury Goods — 1.9% | | | |
Coach, Inc. | | 699,100 | | | 25,538,123 |
NIKE, Inc. (Class B Stock)(a) | | 533,030 | | | 35,217,292 |
| | | | |
|
|
| | | | | | 60,755,415 |
| | | | |
|
|
| | | | | | |
COMMON STOCKS
(continued) | | Shares
| | Value
(Note 2)
| |
| | | | | | | |
Wireless Telecommunication Services — 1.1% | | | | |
NII Holdings, Inc.* | | 1,045,985 | | $ | 35,124,176 | |
| | | | |
|
|
|
TOTAL COMMON STOCKS
(cost $2,367,080,432) | | | 3,114,707,415 | |
| | | | |
|
|
|
| PREFERRED STOCK — 0.7% | | | | | | |
Diversified Financial Services | | | | | | |
Bank of America Corp. Common Equivalent Securities, 10.00%, CVT (cost $22,599,752) | | 1,502,000 | | | 22,409,840 | |
| | | | |
|
|
|
TOTAL LONG-TERM INVESTMENTS
(cost $2,389,680,184) | | | 3,137,117,255 | |
| | | | |
|
|
|
| SHORT-TERM INVESTMENT — 10.4% | | | | |
AFFILIATED MONEY MARKET MUTUAL FUND | | | | |
Dryden Core Investment Fund — Taxable Money Market Series (cost $332,803,820; includes $256,064,708 of cash collateral for securities on loan)(b)(w) (Note 4) | | 332,803,820 | | | 332,803,820 | |
| | | | |
|
|
|
TOTAL INVESTMENTS(o) — 108.6%
(cost $2,722,484,004) | | | 3,469,921,075 | |
LIABILITIES IN EXCESS OF
OTHER ASSETS — (8.6)% | | | (274,381,071 | ) |
| | | | |
|
|
|
NET ASSETS — 100.0% | | $ | 3,195,540,004 | |
| | | | |
|
|
|
The following abbreviations are used in Portfolio descriptions:
| | |
| ADR | | American Depositary Receipt |
| CVT | | Convertible Security |
| XNYS | | New York Stock Exchange |
| XTSE | | Toronto Stock Exchange |
| * | Non-income producing security. |
| (a) | All or a portion of security is on loan. The aggregate market value of such securities is $248,151,005; cash collateral of $256,064,708 (included with liabilities) was received with which the Portfolio purchased highly liquid short-term investments. |
| (b) | Represents security, or a portion thereof, purchased with cash collateral received for securities on loan. |
| (o) | As of December 31, 2009, one security representing $29,769,757 and 0.9% of net assets was fair valued in accordance with the policies adopted by the Board of Trustees. |
| (w) | Prudential Investments LLC, the manager of the Portfolio, also serves as manager of the Dryden Core Investment Fund-Taxable Money Market Series. |
SEE NOTES TO FINANCIAL STATEMENTS.
A45
| | | | | | |
| | | EQUITY PORTFOLIO (continued) | | |
| |
| SCHEDULE OF INVESTMENTS | | December 31, 2009 |
Various inputs are used in determining the value of the Portfolio’s investments. These inputs are summarized in the three broad levels listed below.
Level 1—quoted prices in active markets for identical securities
Level 2—other significant observable inputs (including quoted prices for similar securities, interest rates, prepayment speeds, credit risk, etc.)
Level 3—significant unobservable inputs (including the Portfolio’s own assumptions in determining the fair value of investments)
The following is a summary of the inputs used as of December 31, 2009 in valuing the Portfolio’s assets carried at fair value:
| | | | | | | | | |
Investments in Securities
| | Level 1
| | Level 2
| | Level 3
|
Common Stocks | | $ | 3,084,937,658 | | $ | 29,769,757 | | $ | — |
Preferred Stock | | | 22,409,840 | | | — | | | — |
Affiliated Money Market Mutual Fund | | | 332,803,820 | | | — | | | — |
| | |
|
| |
|
| |
|
|
| | | | 3,440,151,318 | | | 29,769,757 | | | — |
Other Financial Instruments* | | | — | | | — | | | — |
| | |
|
| |
|
| |
|
|
Total | | $ | 3,440,151,318 | | $ | 29,769,757 | | $ | — |
| | |
|
| |
|
| |
|
|
| * | Other financial instruments are derivative instruments not reflected in the Schedule of Investments, such as futures, forwards and swap contracts, which are valued at the unrealized appreciation/depreciation on the instrument. |
As of December 31, 2009 and 2008, the Portfolio did not use any significant unobservable inputs (Level 3) in determining the value of investments.
The industry classification of investments and liabilities in excess of other assets shown as a percentage of net assets as of December 31, 2009 were as follows:
| | | |
Oil, Gas & Consumable Fuels | | 11.7 | % |
Affiliated Money Market Mutual Fund (8.0% represents investments purchased with collateral from securities on loan) | | 10.4 | |
Software | | 7.6 | |
Capital Markets | | 5.9 | |
Computers & Peripherals | | 5.6 | |
Pharmaceuticals | | 5.2 | |
Healthcare Providers & Services | | 5.1 | |
Internet Software & Services | | 4.8 | |
Food Products | | 4.0 | |
Communications Equipment | | 3.5 | |
Media | | 3.4 | |
IT Services | | 3.2 | |
Healthcare Equipment & Supplies | | 2.9 | |
Food & Staples Retailing | | 2.6 | |
Semiconductors & Semiconductor Equipment | | 2.4 | |
Internet & Catalog Retail | | 2.4 | |
Diversified Consumer Services | | 2.4 | |
Energy Equipment & Services | | 2.3 | |
Metals & Mining | | 2.1 | |
Biotechnology | | 2.1 | |
Diversified Financial Services | | 2.0 | |
Textiles, Apparel & Luxury Goods | | 1.9 | |
Road & Rail | | 1.9 | |
Commercial Services & Supplies | | 1.2 | |
Consumer Finance | | 1.1 | |
Multi-Utilities | | 1.1 | |
Wireless Telecommunication Services | | 1.1 | |
Aerospace & Defense | | 1.1 | |
Chemicals | | 1.0 | |
Independent Power Producers & Energy Traders | | 0.9 | |
| | | |
Multi-Line Retail | | 0.9 | % |
Auto Components | | 0.9 | |
Household Products | | 0.7 | |
Insurance | | 0.7 | |
Beverages | | 0.7 | |
Hotels, Restaurants & Leisure | | 0.6 | |
Electronic Components | | 0.6 | |
Commercial Banks | | 0.6 | |
| | |
|
|
| | | 108.6 | |
Liabilities in excess of other assets | | (8.6 | ) |
| | |
|
|
| | | 100.0 | % |
| | |
|
|
SEE NOTES TO FINANCIAL STATEMENTS.
A46
| | | | | | |
| | | EQUITY PORTFOLIO (continued) | | |
STATEMENT OF ASSETS AND LIABILITIES December 31, 2009
| | | | |
| ASSETS | | | | |
Investments at value, including securities on loan of $248,151,005: | | | | |
Unaffiliated investments (cost $2,389,680,184) | | $ | 3,137,117,255 | |
Affiliated investments (cost $332,803,820) | | | 332,803,820 | |
Cash | | | 5,231,674 | |
Receivable for investments sold | | | 39,648,244 | |
Dividends receivable | | | 3,072,746 | |
Receivable for Series shares sold | | | 24,929 | |
Prepaid expenses | | | 26,956 | |
| | |
|
|
|
Total Assets | | | 3,517,925,624 | |
| | |
|
|
|
| LIABILITIES | | | | |
Collateral for securities on loan | | | 256,064,708 | |
Payable for investments purchased | | | 64,415,500 | |
Management fee payable | | | 1,209,469 | |
Payable for Series shares repurchased | | | 367,292 | |
Accrued expenses and other liabilities | | | 313,161 | |
Payable to custodian | | | 13,177 | |
Deferred trustees’ fees | | | 1,577 | |
Affiliated transfer agent fees payable | | | 595 | |
Distribution fee payable | | | 88 | |
Administration fee payable | | | 53 | |
| | |
|
|
|
Total Liabilities | | | 322,385,620 | |
| | |
|
|
|
| NET ASSETS | | $ | 3,195,540,004 | |
| | |
|
|
|
Net assets were comprised of: | | | | |
Paid-in capital | | $ | 3,238,063,916 | |
Retained earnings | | | (42,523,912 | ) |
| | |
|
|
|
Net assets, December 31, 2009 | | $ | 3,195,540,004 | |
| | |
|
|
|
| Class I: | | | | |
Net asset value and redemption price per share, $3,195,121,901 / 143,295,948 outstanding shares of beneficial interest | | $ | 22.30 | |
| | |
|
|
|
| Class II: | | | | |
Net asset value and redemption price per share, $418,103 / 18,616 outstanding shares of beneficial interest | | $ | 22.46 | |
| | |
|
|
|
STATEMENT OF OPERATIONS
Year Ended December 31, 2009
| | | | |
| INVESTMENT INCOME | | | | |
Unaffiliated dividend income (net of $958,775 foreign withholding tax) | | $ | 35,882,300 | |
Affiliated income from securities lending, net | | | 1,212,345 | |
Affiliated dividend income | | | 398,941 | |
| | |
|
|
|
| | | | 37,493,586 | |
| | |
|
|
|
| EXPENSES | | | | |
Management fee | | | 12,194,789 | |
Distribution fee—Class II | | | 891 | |
Administration fee—Class II | | | 535 | |
Custodian’s fees and expenses | | | 397,000 | |
Shareholders’ reports | | | 310,000 | |
Insurance expenses | | | 55,000 | |
Trustees’ fees | | | 43,000 | |
Commitment fee on syndicated credit agreement | | | 22,000 | |
Audit fee | | | 20,000 | |
Legal fees and expenses | | | 19,000 | |
Transfer agent’s fees and expenses (including affiliated expense of $3,600) (Note 4) | | | 10,000 | |
Miscellaneous | | | 18,793 | |
| | |
|
|
|
Total expenses | | | 13,091,008 | |
| | |
|
|
|
| NET INVESTMENT INCOME | | | 24,402,578 | |
| | |
|
|
|
| NET REALIZED AND UNREALIZED GAIN (LOSS) ON INVESTMENTS AND FOREIGN CURRENCIES | | | | |
Net realized loss on: | | | | |
Investment transactions | | | (316,965,250 | ) |
Foreign currency transactions | | | (169,716 | ) |
| | |
|
|
|
| | | | (317,134,966 | ) |
| | |
|
|
|
Net change in unrealized appreciation (depreciation) on: | | | | |
Investments | | | 1,193,076,920 | |
Foreign currencies | | | (9,550 | ) |
| | |
|
|
|
| | | | 1,193,067,370 | |
| | |
|
|
|
| NET GAIN ON INVESTMENTS AND FOREIGN CURRENCIES | | | 875,932,404 | |
| | |
|
|
|
| NET INCREASE IN NET ASSETS RESULTING FROM OPERATIONS | | $ | 900,334,982 | |
| | |
|
|
|
STATEMENT OF CHANGES IN NET ASSETS
| | | | | | | | |
| | | Year Ended December 31,
| |
| | | 2009
| | | 2008
| |
| INCREASE (DECREASE) IN NET ASSETS | | | | | | | | |
| OPERATIONS: | | | | | | | | |
Net investment income | | $ | 24,402,578 | | | $ | 43,413,611 | |
Net realized loss on investment and foreign currency transactions | | | (317,134,966 | ) | | | (413,360,852 | ) |
Net change in unrealized appreciation (depreciation) on investments and foreign currencies | | | 1,193,067,370 | | | | (1,236,215,453 | ) |
| | |
|
|
| |
|
|
|
NET INCREASE (DECREASE) IN NET ASSETS RESULTING FROM OPERATIONS | | | 900,334,982 | | | | (1,606,162,694 | ) |
| | |
|
|
| |
|
|
|
| DISTRIBUTIONS | | | | | | | | |
Class I | | | (43,394,722 | ) | | | (436,963,357 | ) |
Class II | | | (3,037 | ) | | | (63,526 | ) |
| | |
|
|
| |
|
|
|
TOTAL DISTRIBUTIONS | | | (43,397,759 | ) | | | (437,026,883 | ) |
| | |
|
|
| |
|
|
|
| SERIES SHARE TRANSACTIONS (NOTE 7): | | | | | | | | |
Series shares sold | | | 26,713,318 | | | | 31,235,697 | |
Series shares issued in reinvestment of distributions | | | 43,397,759 | | | | 437,026,883 | |
Series shares repurchased | | | (252,864,006 | ) | | | (328,918,685 | ) |
| | |
|
|
| |
|
|
|
INCREASE (DECREASE) IN NET ASSETS RESULTING FROM SERIES SHARE TRANSACTIONS | | | (182,752,929 | ) | | | 139,343,895 | |
| | |
|
|
| |
|
|
|
| TOTAL INCREASE (DECREASE) IN NET ASSETS | | | 674,184,294 | | | | (1,903,845,682 | ) |
| NET ASSETS: | | | | | | | | |
Beginning of year | | | 2,521,355,710 | | | | 4,425,201,392 | |
| | |
|
|
| |
|
|
|
End of year | | $ | 3,195,540,004 | | | $ | 2,521,355,710 | |
| | |
|
|
| |
|
|
|
SEE NOTES TO FINANCIAL STATEMENTS.
A47
| | | | | | |
| | | FLEXIBLE MANAGED PORTFOLIO | | |
| |
| SCHEDULE OF INVESTMENTS | | December 31, 2009 |
| | | | | |
| LONG-TERM INVESTMENTS — 93.6% |
| COMMON STOCKS — 62.3% | | Shares
| | Value
(Note 2)
|
| | | | | | |
Aerospace & Defense — 2.2% | | | | | |
Alliant Techsystems, Inc.(a)(b) | | 53,700 | | $ | 4,740,099 |
Dyncorp International, Inc. (Class A Stock)(b) | | 11,900 | | | 170,765 |
General Dynamics Corp. | | 210,300 | | | 14,336,151 |
ITT Corp. | | 32,800 | | | 1,631,472 |
L-3 Communications Holdings, Inc. | | 67,600 | | | 5,877,820 |
Lockheed Martin Corp. | | 37,600 | | | 2,833,160 |
Northrop Grumman Corp. | | 235,400 | | | 13,147,090 |
Raytheon Co. | | 267,600 | | | 13,786,752 |
United Technologies Corp. | | 94,800 | | | 6,580,068 |
| | | | |
|
|
| | | | | | 63,103,377 |
| | | | |
|
|
Air Freight & Logistics — 1.0% | | | | | |
C.H. Robinson Worldwide, Inc. | | 126,600 | | | 7,435,218 |
FedEx Corp. | | 108,500 | | | 9,054,325 |
United Parcel Service, Inc. (Class B Stock) | | 240,900 | | | 13,820,433 |
| | | | |
|
|
| | | | | | 30,309,976 |
| | | | |
|
|
Airlines | | | | | |
Alaska Air Group, Inc.(b) | | 32,200 | | | 1,112,832 |
| | | | |
|
|
Auto Components — 0.3% | | | | | |
Cooper Tire & Rubber Co. | | 40,100 | | | 804,005 |
Johnson Controls, Inc. | | 89,300 | | | 2,432,532 |
TRW Automotive Holdings Corp.(a)(b) | | 197,300 | | | 4,711,524 |
| | | | |
|
|
| | | | | | 7,948,061 |
| | | | |
|
|
Automobiles — 0.5% | | | | | |
Ford Motor Co.(a)(b) | | 1,377,100 | | | 13,771,000 |
Thor Industries, Inc. | | 14,700 | | | 461,580 |
| | | | |
|
|
| | | | | | 14,232,580 |
| | | | |
|
|
Beverages — 1.5% | | | | | |
Coca-Cola Co. (The)(a) | | 275,100 | | | 15,680,700 |
Coca-Cola Enterprises, Inc. | | 261,500 | | | 5,543,800 |
Dr. Pepper Snapple Group, Inc. | | 113,700 | | | 3,217,710 |
Molson Coors Brewing Co. (Class B Stock) | | 24,900 | | | 1,124,484 |
PepsiCo, Inc. | | 304,920 | | | 18,539,136 |
| | | | |
|
|
| | | | | | 44,105,830 |
| | | | |
|
|
Biotechnology — 0.7% | | | | | |
Amgen, Inc.(b) | | 253,008 | | | 14,312,663 |
Biogen Idec, Inc.(a)(b) | | 95,200 | | | 5,093,200 |
Gilead Sciences, Inc.(b) | | 35,600 | | | 1,540,768 |
| | | | |
|
|
| | | | | | 20,946,631 |
| | | | |
|
|
Building Products — 0.1% | | | | | |
Owens Corning(b) | | 57,100 | | | 1,464,044 |
| | | | |
|
|
Capital Markets — 1.7% | | | | | |
Ameriprise Financial, Inc. | | 45,400 | | | 1,762,428 |
Bank of New York Mellon Corp. (The) | | 109,700 | | | 3,068,309 |
Franklin Resources, Inc. | | 17,700 | | | 1,864,695 |
Goldman Sachs Group, Inc. (The) | | 142,300 | | | 24,025,932 |
Invesco Ltd. | | 58,900 | | | 1,383,561 |
Morgan Stanley | | 261,890 | | | 7,751,944 |
State Street Corp. | | 95,300 | | | 4,149,362 |
T. Rowe Price Group, Inc.(a) | | 94,100 | | | 5,010,825 |
| | | | |
|
|
| | | | | | 49,017,056 |
| | | | |
|
|
| | | | | |
COMMON STOCKS
(continued) | | Shares
| | Value
(Note 2)
|
| | | | | | |
Chemicals — 0.8% | | | | | |
Air Products & Chemicals, Inc. | | 39,500 | | $ | 3,201,870 |
E.I. du Pont de Nemours & Co. | | 158,600 | | | 5,340,062 |
Ecolab, Inc. | | 129,500 | | | 5,773,110 |
Koppers Holdings, Inc. | | 18,600 | | | 566,184 |
Lubrizol Corp. | | 32,200 | | | 2,348,990 |
Nalco Holding Co. | | 21,000 | | | 535,710 |
NewMarket Corp. | | 26,100 | | | 2,995,497 |
Praxair, Inc. | | 29,100 | | | 2,337,021 |
Scotts Miracle-Gro Co. (The) (Class A Stock) | | 17,500 | | | 687,925 |
| | | | |
|
|
| | | | | | 23,786,369 |
| | | | |
|
|
Commercial Banks — 1.3% | | | | | |
Community Bank System, Inc. | | 43,400 | | | 838,054 |
FNB Corp. | | 30,000 | | | 203,700 |
Fulton Financial Corp. | | 86,200 | | | 751,664 |
Huntington Bancshares, Inc. | | 910,000 | | | 3,321,500 |
International Bancshares Corp.(a) | | 20,100 | | | 380,493 |
KeyCorp | | 141,200 | | | 783,660 |
Regions Financial Corp. | | 1,067,600 | | | 5,647,604 |
Susquehanna Bancshares, Inc.(a) | | 176,000 | | | 1,036,640 |
U.S. Bancorp | | 145,332 | | | 3,271,423 |
Webster Financial Corp. | | 28,200 | | | 334,734 |
Wells Fargo & Co. | | 757,612 | | | 20,447,948 |
| | | | |
|
|
| | | | | | 37,017,420 |
| | | | |
|
|
Commercial Services & Supplies — 0.2% | | | |
Avery Dennison Corp. | | 100,200 | | | 3,656,298 |
RR Donnelley & Sons Co. | | 78,300 | | | 1,743,741 |
Waste Management, Inc.(a) | | 42,800 | | | 1,447,068 |
| | | | |
|
|
| | | | | | 6,847,107 |
| | | | |
|
|
Communications Equipment — 1.2% | | | | | |
Arris Group, Inc.(b) | | 37,100 | | | 424,053 |
Cisco Systems, Inc.(b) | | 1,176,700 | | | 28,170,198 |
Harris Corp. | | 14,600 | | | 694,230 |
JDS Uniphase Corp.(b) | | 34,400 | | | 283,800 |
Juniper Networks, Inc.(a)(b) | | 56,000 | | | 1,493,520 |
QUALCOMM, Inc. | | 93,500 | | | 4,325,310 |
| | | | |
|
|
| | | | | | 35,391,111 |
| | | | |
|
|
Computers & Peripherals — 4.2% | | | | | |
Apple, Inc.(b) | | 197,400 | | | 41,623,764 |
Dell, Inc.(b) | | 259,300 | | | 3,723,548 |
EMC Corp.(b) | | 405,900 | | | 7,091,073 |
Hewlett-Packard Co. | | 443,465 | | | 22,842,882 |
International Business Machines Corp. | | 234,600 | | | 30,709,140 |
Novatel Wireless, Inc.(a)(b) | | 12,100 | | | 96,437 |
Seagate Technology(a) | | 273,300 | | | 4,971,327 |
Teradata Corp.(b) | | 21,600 | | | 678,888 |
Western Digital Corp.(b) | | 210,100 | | | 9,275,915 |
| | | | |
|
|
| | | | | | 121,012,974 |
| | | | |
|
|
Consumer Finance — 0.9% | | | | | |
American Express Co. | | 319,400 | | | 12,942,088 |
Capital One Financial Corp.(a) | | 296,100 | | | 11,352,474 |
First Cash Financial Services, Inc.(a)(b) | | 16,700 | | | 370,573 |
| | | | |
|
|
| | | | | | 24,665,135 |
| | | | |
|
|
SEE NOTES TO FINANCIAL STATEMENTS.
A48
| | | | | | |
| | | FLEXIBLE MANAGED PORTFOLIO (continued) | | |
| |
| SCHEDULE OF INVESTMENTS | | December 31, 2009 |
| | | | | |
COMMON STOCKS
(continued) | | Shares
| | Value
(Note 2)
|
| | | | | | |
Containers & Packaging — 0.3% | | | | | |
Owens-Illinois, Inc.(b) | | 96,200 | | $ | 3,162,094 |
Pactiv Corp.(b) | | 214,500 | | | 5,178,030 |
Rock-Tenn Co. (Class A Stock) | | 6,200 | | | 312,542 |
| | | | |
|
|
| | | | | | 8,652,666 |
| | | | |
|
|
Distributors | | | | | |
Genuine Parts Co. | | 10,900 | | | 413,764 |
| | | | |
|
|
Diversified Consumer Services — 0.1% | | | | | |
DeVry, Inc. | | 23,900 | | | 1,355,847 |
Regis Corp. | | 23,500 | | | 365,895 |
Strayer Education, Inc. | | 2,000 | | | 424,980 |
| | | | |
|
|
| | | | | | 2,146,722 |
| | | | |
|
|
Diversified Financial Services — 3.1% | | | | | |
Bank of America Corp. | | 2,418,182 | | | 36,417,821 |
Citigroup, Inc. | | 3,776,900 | | | 12,501,539 |
CME Group, Inc. | | 6,400 | | | 2,150,080 |
JPMorgan Chase & Co. | | 909,694 | | | 37,906,949 |
NASDAQ OMX Group, Inc. (The)(b) | | 40,700 | | | 806,674 |
NYSE Euronext | | 26,600 | | | 672,980 |
| | | | |
|
|
| | | | | | 90,456,043 |
| | | | |
|
|
Diversified Telecommunication Services — 2.2% | | | |
AT&T, Inc. | | 1,239,647 | | | 34,747,305 |
CenturyTel, Inc.(a) | | 66,800 | | | 2,418,828 |
Verizon Communications, Inc. | | 838,288 | | | 27,772,482 |
| | | | |
|
|
| | | | | | 64,938,615 |
| | | | |
|
|
Electrical Equipment — 0.1% | | | | | |
A.O. Smith Corp. | | 9,700 | | | 420,883 |
Emerson Electric Co. | | 74,500 | | | 3,173,700 |
| | | | |
|
|
| | | | | | 3,594,583 |
| | | | |
|
|
Electrical Utilities — 0.8% | | | | | |
Allegheny Energy, Inc. | | 98,800 | | | 2,319,824 |
American Electric Power Co., Inc. | | 82,300 | | | 2,863,217 |
DPL, Inc. | | 34,300 | | | 946,680 |
Edison International | | 144,300 | | | 5,018,754 |
Exelon Corp. | | 17,600 | | | 860,112 |
FPL Group, Inc. | | 220,400 | | | 11,641,528 |
NV Energy, Inc. | | 32,200 | | | 398,636 |
| | | | |
|
|
| | | | | | 24,048,751 |
| | | | |
|
|
Electronic Equipment & Instruments — 0.5% | | | |
Corning, Inc. | | 473,500 | | | 9,143,285 |
Jabil Circuit, Inc. | | 296,200 | | | 5,144,994 |
Tech Data Corp.(b) | | 15,800 | | | 737,228 |
| | | | |
|
|
| | | | | | 15,025,507 |
| | | | |
|
|
Energy Equipment & Services — 0.7% | | | | | |
Cal Dive International, Inc.(b) | | 197,900 | | | 1,496,124 |
CARBO Ceramics, Inc.(a) | | 3,300 | | | 224,961 |
Dresser-Rand Group, Inc.(b) | | 62,300 | | | 1,969,303 |
FMC Technologies, Inc.(b) | | 98,800 | | | 5,714,592 |
Helix Energy Solutions Group, Inc.(b) | | 75,800 | | | 890,650 |
Schlumberger Ltd. | | 146,100 | | | 9,509,649 |
| | | | |
|
|
| | | | | | 19,805,279 |
| | | | |
|
|
| | | | | |
COMMON STOCKS
(continued) | | Shares
| | Value
(Note 2)
|
| | | | | | |
Food & Staples Retailing — 1.2% | | | | | |
Costco Wholesale Corp. | | 88,700 | | $ | 5,248,379 |
SUPERVALU, Inc. | | 76,800 | | | 976,128 |
Wal-Mart Stores, Inc. | | 493,400 | | | 26,372,230 |
Whole Foods Market, Inc.(a)(b) | | 102,200 | | | 2,805,390 |
| | | | |
|
|
| | | | | | 35,402,127 |
| | | | |
|
|
Food Products — 1.1% | | | | | |
Archer-Daniels-Midland Co. | | 256,000 | | | 8,015,360 |
Chiquita Brands International, Inc.(a)(b) | | 43,300 | | | 781,132 |
Dean Foods Co.(a)(b) | | 107,400 | | | 1,937,496 |
General Mills, Inc. | | 8,300 | | | 587,723 |
Kellogg Co. | | 83,300 | | | 4,431,560 |
Kraft Foods, Inc. (Class A Stock) | | 425,300 | | | 11,559,654 |
Lancaster Colony Corp. | | 13,800 | | | 685,860 |
Sanderson Farms, Inc. | | 54,400 | | | 2,293,504 |
Tyson Foods, Inc. (Class A Stock) | | 190,700 | | | 2,339,889 |
| | | | |
|
|
| | | | | | 32,632,178 |
| | | | |
|
|
Gas Utilities — 0.1% | | | | | |
AGL Resources, Inc. | | 10,000 | | | 364,700 |
UGI Corp. | | 53,700 | | | 1,299,003 |
| | | | |
|
|
| | | | | | 1,663,703 |
| | | | |
|
|
Healthcare Equipment & Supplies — 1.5% | | | |
American Medical Systems Holdings, Inc.(a)(b) | | 109,200 | | | 2,106,468 |
Baxter International, Inc. | | 123,700 | | | 7,258,716 |
Carefusion Corp.(b) | | 206,800 | | | 5,172,068 |
Hospira, Inc.(b) | | 74,700 | | | 3,809,700 |
Intuitive Surgical, Inc.(a)(b) | | 36,800 | | | 11,162,176 |
Medtronic, Inc. | | 321,900 | | | 14,157,162 |
Meridian Bioscience, Inc. | | 24,000 | | | 517,200 |
Quidel Corp.(b) | | 54,100 | | | 745,498 |
Sirona Dental Systems, Inc.(b) | | 9,000 | | | 285,660 |
| | | | |
|
|
| | | | | | 45,214,648 |
| | | | |
|
|
Healthcare Providers & Services — 1.2% | | | | | |
Laboratory Corp. of America Holdings(a)(b) | | 33,500 | | | 2,507,140 |
Medco Health Solutions, Inc.(b) | | 83,000 | | | 5,304,530 |
Quest Diagnostics, Inc. | | 140,500 | | | 8,483,390 |
UnitedHealth Group, Inc. | | 67,900 | | | 2,069,592 |
WellPoint, Inc.(b) | | 260,700 | | | 15,196,203 |
| | | | |
|
|
| | | | | | 33,560,855 |
| | | | |
|
|
Hotels, Restaurants & Leisure — 0.5% | | | | | |
McDonald’s Corp. | | 132,100 | | | 8,248,324 |
Texas Roadhouse, Inc. (Class A Stock)(a)(b) | | 48,900 | | | 549,147 |
Yum! Brands, Inc. | | 201,300 | | | 7,039,461 |
| | | | |
|
|
| | | | | | 15,836,932 |
| | | | |
|
|
Household Durables — 0.4% | | | | | |
American Greetings Corp. (Class A Stock) | | 25,200 | | | 549,108 |
Leggett & Platt, Inc. | | 251,500 | | | 5,130,600 |
Newell Rubbermaid, Inc. | | 182,400 | | | 2,737,824 |
Tempur-Pedic International, Inc.(b) | | 79,100 | | | 1,869,133 |
SEE NOTES TO FINANCIAL STATEMENTS.
A49
| | | | | | |
| | | FLEXIBLE MANAGED PORTFOLIO (continued) | | |
| |
| SCHEDULE OF INVESTMENTS | | December 31, 2009 |
| | | | | |
COMMON STOCKS
(continued) | | Shares
| | Value
(Note 2)
|
| | | | | | |
Household Durables (continued) | | | | | |
Tupperware Brands Corp. | | 9,900 | | $ | 461,043 |
Whirlpool Corp. | | 26,200 | | | 2,113,292 |
| | | | |
|
|
| | | | | | 12,861,000 |
| | | | |
|
|
Household Products — 1.8% | | | | | |
Clorox Co.(a) | | 40,000 | | | 2,440,000 |
Colgate-Palmolive Co. | | 58,600 | | | 4,813,990 |
Kimberly-Clark Corp. | | 118,100 | | | 7,524,151 |
Procter & Gamble Co. (The) | | 635,005 | | | 38,500,353 |
| | | | |
|
|
| | | | | | 53,278,494 |
| | | | |
|
|
Independent Power Producers & Energy Traders — 0.3% |
AES Corp. (The)(b) | | 9,500 | | | 126,445 |
Constellation Energy Group, Inc. | | 234,300 | | | 8,240,331 |
Mirant Corp.(b) | | 98,700 | | | 1,507,149 |
| | | | |
|
|
| | | | | | 9,873,925 |
| | | | |
|
|
Industrial Conglomerates — 1.4% | | | | | |
3M Co. | | 218,700 | | | 18,079,929 |
General Electric Co. | | 1,398,300 | | | 21,156,279 |
McDermott International, Inc. (Panama)(b) | | 24,300 | | | 583,443 |
| | | | |
|
|
| | | | | | 39,819,651 |
| | | | |
|
|
Insurance — 1.0% | | | | | |
Aflac, Inc., | | 99,500 | | | 4,601,875 |
Allied World Assurance Co. Holdings, Ltd. (Bermuda) | | 39,500 | | | 1,819,765 |
Argo Group International Holdings Ltd. (Bermuda)(b) | | 15,200 | | | 442,928 |
Axis Capital Holdings Ltd. | | 14,600 | | | 414,786 |
Chubb Corp. (The) | | 74,500 | | | 3,663,910 |
Endurance Specialty Holdings Ltd. (Bermuda) | | 95,100 | | | 3,540,573 |
Lincoln National Corp. | | 92,300 | | | 2,296,424 |
MetLife, Inc. | | 154,200 | | | 5,450,970 |
PartnerRe Ltd. (Bermuda) | | 18,800 | | | 1,403,608 |
Travelers Cos., Inc. (The) | | 70,800 | | | 3,530,088 |
Unum Group | | 167,300 | | | 3,265,696 |
| | | | |
|
|
| | | | | | 30,430,623 |
| | | | |
|
|
Internet & Catalog Retail | | | | | |
PetMed Express, Inc.(a) | | 45,800 | | | 807,454 |
| | | | |
|
|
Internet Software & Services — 1.1% | | | | | |
DealerTrack Holdings, Inc.(a)(b) | | 10,200 | | | 191,658 |
EarthLink, Inc. | | 42,900 | | | 356,499 |
Google, Inc. (Class A Stock)(b) | | 46,100 | | | 28,581,078 |
IAC/InterActiveCorp(b) | | 88,100 | | | 1,804,288 |
j2 Global Communications, Inc.(b) | | 16,000 | | | 325,600 |
| | | | |
|
|
| | | | | | 31,259,123 |
| | | | |
|
|
IT Services — 1.2% | | | | | |
Convergys Corp.(b) | | 37,800 | | | 406,350 |
DST Systems, Inc.(b) | | 14,800 | | | 644,540 |
Fidelity National Information Services, Inc. | | 113,500 | | | 2,660,440 |
Fiserv, Inc.(b) | | 16,600 | | | 804,768 |
Mastercard, Inc. (Class A Stock)(a) | | 20,200 | | | 5,170,796 |
Visa, Inc. (Class A Stock) | | 156,800 | | | 13,713,728 |
Western Union Co. (The) | | 532,100 | | | 10,030,085 |
| | | | |
|
|
| | | | | | 33,430,707 |
| | | | |
|
|
| | | | | |
COMMON STOCKS
(continued) | | Shares
| | Value
(Note 2)
|
| | | | | | |
Leisure Equipment & Products — 0.1% | | | | | |
Hasbro, Inc. | | 49,700 | | $ | 1,593,382 |
Smith & Wesson Holding Corp.(a)(b) | | 132,700 | | | 542,743 |
| | | | |
|
|
| | | | | | 2,136,125 |
| | | | |
|
|
Life Sciences Tools & Services — 0.7% | | | | | |
Bruker Corp.(b) | | 37,900 | | | 457,074 |
Mettler-Toledo International, Inc.(b) | | 20,300 | | | 2,131,297 |
Millipore Corp.(b) | | 59,000 | | | 4,268,650 |
Thermo Fisher Scientific, Inc.(b) | | 248,900 | | | 11,870,041 |
Waters Corp.(a)(b) | | 23,400 | | | 1,449,864 |
| | | | |
|
|
| | | | | | 20,176,926 |
| | | | |
|
|
Machinery — 0.7% | | | | | |
Dover Corp. | | 80,200 | | | 3,337,122 |
Flowserve Corp. | | 30,600 | | | 2,892,618 |
Illinois Tool Works, Inc. | | 134,000 | | | 6,430,660 |
Joy Global, Inc. | | 46,400 | | | 2,393,776 |
Oshkosh Corp. | | 98,700 | | | 3,654,861 |
Toro Co. | | 17,700 | | | 740,037 |
| | | | |
|
|
| | | | | | 19,449,074 |
| | | | |
|
|
Media — 1.6% | | | | | |
Comcast Corp. (Class A Stock) | | 1,100,973 | | | 18,562,405 |
Gannett Co., Inc. | | 471,700 | | | 7,004,745 |
Scholastic Corp. | | 7,800 | | | 232,674 |
Time Warner Cable, Inc. | | 20,000 | | | 827,800 |
Time Warner, Inc. | | 198,366 | | | 5,780,385 |
Viacom, Inc. (Class B Stock)(b) | | 320,500 | | | 9,528,465 |
Walt Disney Co. (The) | | 162,800 | | | 5,250,300 |
| | | | |
|
|
| | | | | | 47,186,774 |
| | | | |
|
|
Metals & Mining — 0.9% | | | | | |
Freeport-McMoRan Copper & Gold, Inc.(b) | | 203,900 | | | 16,371,131 |
Nucor Corp. | | 98,400 | | | 4,590,360 |
Southern Copper Corp.(a) | | 163,200 | | | 5,370,912 |
Walter Energy, Inc. | | 4,600 | | | 346,426 |
| | | | |
|
|
| | | | | | 26,678,829 |
| | | | |
|
|
Multiline Retail — 0.8% | | | | | |
99 Cents Only Stores(b) | | 34,400 | | | 449,608 |
Dollar Tree, Inc.(b) | | 25,800 | | | 1,246,140 |
Family Dollar Stores, Inc. | | 179,000 | | | 4,981,570 |
Target Corp. | | 342,100 | | | 16,547,377 |
| | | | |
|
|
| | | | | | 23,224,695 |
| | | | |
|
|
Multi-Utilities — 0.6% | | | | | |
Dominion Resources, Inc. | | 117,700 | | | 4,580,884 |
Public Service Enterprise Group, Inc. | | 214,100 | | | 7,118,825 |
Sempra Energy | | 92,900 | | | 5,200,542 |
TECO Energy, Inc. | | 27,300 | | | 442,806 |
Xcel Energy, Inc. | | 49,000 | | | 1,039,780 |
| | | | |
|
|
| | | | | | 18,382,837 |
| | | | |
|
|
Office Electronics — 0.1% | | | | | |
Xerox Corp. | | 313,600 | | | 2,653,056 |
| | | | |
|
|
Oil, Gas & Consumable Fuels — 6.1% | | | | | |
Anadarko Petroleum Corp. | | 92,900 | | | 5,798,818 |
Apache Corp. | | 22,300 | | | 2,300,691 |
SEE NOTES TO FINANCIAL STATEMENTS.
A50
| | | | | | |
| | | FLEXIBLE MANAGED PORTFOLIO (continued) | | |
| |
| SCHEDULE OF INVESTMENTS | | December 31, 2009 |
| | | | | |
COMMON STOCKS
(continued) | | Shares
| | Value
(Note 2)
|
| | | | | | |
Oil, Gas & Consumable Fuels (continued) | | | |
Chesapeake Energy Corp. | | 193,700 | | $ | 5,012,956 |
Chevron Corp. | | 484,056 | | | 37,267,472 |
ConocoPhillips | | 405,434 | | | 20,705,514 |
Devon Energy Corp. | | 120,100 | | | 8,827,350 |
El Paso Corp. | | 159,900 | | | 1,571,817 |
Exxon Mobil Corp. | | 880,416 | | | 60,035,567 |
Hess Corp. | | 9,000 | | | 544,500 |
Marathon Oil Corp. | | 313,500 | | | 9,787,470 |
Murphy Oil Corp. | | 111,600 | | | 6,048,720 |
Occidental Petroleum Corp. | | 124,500 | | | 10,128,075 |
Spectra Energy Corp. | | 339,700 | | | 6,967,247 |
Stone Energy Corp.(a)(b) | | 10,200 | | | 184,110 |
Western Refining, Inc.(a)(b) | | 83,800 | | | 394,698 |
World Fuel Services Corp. | | 12,700 | | | 340,233 |
| | | | |
|
|
| | | | | | 175,915,238 |
| | | | |
|
|
Personal Products | | | | | |
Avon Products, Inc. | | 32,900 | | | 1,036,350 |
| | | | |
|
|
Pharmaceuticals — 4.2% | | | | | |
Abbott Laboratories | | 178,500 | | | 9,637,215 |
Allergan, Inc. | | 160,500 | | | 10,113,105 |
Bristol-Myers Squibb Co.(a) | | 696,100 | | | 17,576,525 |
Eli Lilly & Co. | | 249,700 | | | 8,916,787 |
ENDO Pharmaceuticals Holdings, Inc.(b) | | 17,200 | | | 352,772 |
Johnson & Johnson | | 526,998 | | | 33,943,941 |
Merck & Co., Inc. | | 332,400 | | | 12,145,896 |
Par Pharmaceutical Cos., Inc.(b) | | 34,800 | | | 941,688 |
Perrigo Co. | | 7,800 | | | 310,752 |
Pfizer, Inc. | | 1,326,797 | | | 24,134,438 |
Valeant Pharmaceuticals International(a)(b) | | 102,700 | | | 3,264,833 |
| | | | |
|
|
| | | | | | 121,337,952 |
| | | | |
|
|
Professional Services — 0.3% | | | | | |
Equifax, Inc. | | 175,800 | | | 5,430,462 |
Robert Half International, Inc.(a) | | 29,600 | | | 791,208 |
Watson Wyatt Worldwide, Inc. (Class A Stock) | | 30,900 | | | 1,468,368 |
| | | | |
|
|
| | | | | | 7,690,038 |
| | | | |
|
|
Real Estate Investment Trusts — 0.5% | | | | | |
Annaly Capital Management, Inc. | | 437,800 | | | 7,595,830 |
Anworth Mortgage Asset Corp. | | 86,500 | | | 605,500 |
Brandywine Realty Trust(a) | | 50,100 | | | 571,140 |
CBL & Associates Properties, Inc. | | 101,700 | | | 983,439 |
Chimera Investment Corp. | | 546,900 | | | 2,121,972 |
MFA Financial, Inc. | | 552,900 | | | 4,063,815 |
| | | | |
|
|
| | | | | | 15,941,696 |
| | | | |
|
|
Road & Rail — 0.3% | | | | | |
Avis Budget Group, Inc.(b) | | 163,300 | | | 2,142,496 |
CSX Corp. | | 35,300 | | | 1,711,697 |
Dollar Thrifty Automotive Group, Inc.(b) | | 50,700 | | | 1,298,427 |
Ryder System, Inc. | | 79,100 | | | 3,256,547 |
Werner Enterprises, Inc. | | 11,500 | | | 227,585 |
| | | | |
|
|
| | | | | | 8,636,752 |
| | | | |
|
|
| | | | | |
COMMON STOCKS
(continued) | | Shares
| | Value
(Note 2)
|
| | | | | | |
Semiconductors & Semiconductor Equipment — 2.1% |
Broadcom Corp. (Class A Stock)(a)(b) | | 164,600 | | $ | 5,176,670 |
Intel Corp. | | 1,484,000 | | | 30,273,600 |
LSI Corp.(b) | | 203,800 | | | 1,224,838 |
Marvell Technology Group Ltd.(b) | | 49,600 | | | 1,029,200 |
Micron Technology, Inc.(b) | | 356,100 | | | 3,760,416 |
National Semiconductor Corp. | | 103,900 | | | 1,595,904 |
PMC — Sierra, Inc.(b) | | 71,200 | | | 616,592 |
Semtech Corp.(b) | | 32,600 | | | 554,526 |
Texas Instruments, Inc. | | 619,000 | | | 16,131,140 |
Zoran Corp.(b) | | 21,300 | | | 235,365 |
| | | | |
|
|
| | | | | | 60,598,251 |
| | | | |
|
|
Software — 2.6% | | | | | |
Adobe Systems, Inc.(b) | | 161,700 | | | 5,947,326 |
BMC Software, Inc.(b) | | 68,300 | | | 2,738,830 |
CA, Inc. | | 34,900 | | | 783,854 |
Intuit, Inc.(b) | | 96,700 | | | 2,969,657 |
McAfee, Inc.(a)(b) | | 132,000 | | | 5,355,240 |
Microsoft Corp. | | 1,264,400 | | | 38,551,556 |
Novell, Inc.(b) | | 93,100 | | | 386,365 |
Oracle Corp. | | 302,900 | | | 7,433,166 |
Pegasystems, Inc. | | 20,000 | | | 680,000 |
Symantec Corp.(b) | | 517,700 | | | 9,261,653 |
| | | | |
|
|
| | | | | | 74,107,647 |
| | | | |
|
|
Specialty Retail — 1.5% | | | | | |
AutoNation, Inc.(a)(b) | | 17,600 | | | 337,040 |
Best Buy Co., Inc. | | 255,000 | | | 10,062,300 |
Chico’s FAS, Inc.(b) | | 465,400 | | | 6,538,870 |
Gap, Inc. (The) | | 208,200 | | | 4,361,790 |
Home Depot, Inc. (The) | | 118,250 | | | 3,420,972 |
Rent-A-Center, Inc. (Class A Stock)(b) | | 10,000 | | | 177,200 |
Ross Stores, Inc. | | 194,200 | | | 8,294,282 |
Sally Beauty Holdings, Inc.(a)(b) | | 85,600 | | | 654,840 |
Sonic Automotive, Inc. (Class A Stock)(b) | | 113,600 | | | 1,180,304 |
TJX Cos., Inc. | | 227,500 | | | 8,315,125 |
| | | | |
|
|
| | | | | | 43,342,723 |
| | | | |
|
|
Textiles, Apparel & Luxury Goods — 0.6% | | | |
Carter’s, Inc.(b) | | 30,900 | | | 811,125 |
Coach, Inc. | | 360,700 | | | 13,176,371 |
Jones Apparel Group, Inc. | | 85,400 | | | 1,371,524 |
Phillips-Van Heusen Corp. | | 27,600 | | | 1,122,768 |
| | | | |
|
|
| | | | | | 16,481,788 |
| | | | |
|
|
Tobacco — 1.1% | | | | | |
Altria Group, Inc. | | 504,700 | | | 9,907,261 |
Lorillard, Inc. | | 6,800 | | | 545,564 |
Philip Morris International, Inc. (Switzerland) | | 284,400 | | | 13,705,236 |
Reynolds American, Inc. | | 142,600 | | | 7,553,522 |
| | | | |
|
|
| | | | | | 31,711,583 |
| | | | |
|
|
Trading Companies & Distributors — 0.2% | | | |
W.W. Grainger, Inc.(a) | | 70,000 | | | 6,778,100 |
| | | | |
|
|
Wireless Telecommunication Services — 0.1% | | | |
Sprint Nextel Corp.(b) | | 482,800 | | | 1,767,048 |
| | | | |
|
|
TOTAL COMMON STOCKS
(cost $1,512,480,744) | | | 1,811,347,335 |
| | | | |
|
|
SEE NOTES TO FINANCIAL STATEMENTS.
A51
| | | | | | |
| | | FLEXIBLE MANAGED PORTFOLIO (continued) | | |
| |
| SCHEDULE OF INVESTMENTS | | December 31, 2009 |
| | | | | | | | | | | | |
| ASSET-BACKED SECURITIES — 0.5% | | Moody’s
Rating
(Unaudited)†
| | Interest
Rate
| | Maturity
Date
| | Principal
Amount
(000)#
| | Value
(Note 2)
|
| | | | | | | | | | | | | |
ARES CLO Funds (Cayman Islands), Ser. 2003-7AW,
Class A1A, 144A(c) | | A2 | | 0.625% | | 05/08/15 | | $ | 2,498 | | $ | 2,354,674 |
Ballyrock CDO Ltd. (Cayman Islands), Ser. 2003-2A, Class A, 144A(c) | | Aa2 | | 0.799% | | 11/20/15 | | | 2,771 | | | 2,577,114 |
Bank of America Credit Card Trust, Ser. 2006-C5, Class C5(c) | | Baa1 | | 0.633% | | 01/15/16 | | | 3,209 | | | 2,765,847 |
Chatham Light CLO Ltd. (Cayman Islands), Ser. 2005-2A,
Class A1, 144A(c) | | Aa1 | | 0.531% | | 08/03/19 | | | 495 | | | 450,560 |
Citibank Credit Card Issuance Trust, Ser. 2006-C1, Class C1(c) | | Baa2 | | 0.633% | | 02/20/15 | | | 1,350 | | | 1,234,127 |
Granite Ventures Ltd. (Cayman Islands), Ser. 2005-2A, Class A1, 144A(c) | | Aaa | | 0.544% | | 12/15/17 | | | 3,200 | | | 2,992,000 |
Mountain Capital CLO Ltd. (Cayman Islands), Ser. 2004-3A,
Class A1LA, 144A(c) | | Aaa | | 0.688% | | 02/15/16 | | | 2,336 | | | 2,219,029 |
SVO VOI Mortgage Corp., Ser. 2005-AA, Class A, 144A | | Aaa | | 5.250% | | 02/20/21 | | | 382 | | | 352,033 |
| | | | | | | | | | | |
|
|
TOTAL ASSET-BACKED SECURITIES
(cost $15,492,437) | | | 14,945,384 |
| | | | | | | | | | | |
|
|
| BANK LOANS — 0.5% | | | | | | | | | | | | |
Automotive | | | | | | | | | | | | |
Oshkosh Truck Corp.(c)(d) | | B2 | | 6.269% | | 12/06/13 | | | 211 | | | 210,446 |
| | | | | | | | | | | |
|
|
Cable | | | | | | | | | | | | |
Insight Midwest Holdings LLC(c)(d) | | B1 | | 1.790% | | 10/06/13 | | | 1,005 | | | 943,627 |
| | | | | | | | | | | |
|
|
Consumer | | | | | | | | | | | | |
Pilot Travel Centers LLC(c)(d) | | Ba2 | | TBA | | 12/31/15 | | | 300 | | | 301,197 |
| | | | | | | | | | | |
|
|
Electric — 0.1% | | | | | | | | | | | | |
NRG Energy, Inc.(c)(d) | | Baa3 | | 0.151% | | 02/01/13 | | | 177 | | | 168,299 |
NRG Energy, Inc.(c)(d) | | Baa3 | | 1.996% | | 02/01/13 | | | 301 | | | 285,544 |
Texas Competitive Electric Holdings Co. LLC(c)(d) | | B1 | | 3.735% | | 10/10/14 | | | 978 | | | 794,219 |
| | | | | | | | | | | |
|
|
| | | | | | | | | | | | | 1,248,062 |
| | | | | | | | | | | |
|
|
Healthcare & Pharmaceutical — 0.2% | | | | | | | | | | | | |
DaVita, Inc.(c)(d) | | Ba1 | | 1.748% | | 10/05/12 | | | 1,200 | | | 1,161,667 |
HCA, Inc.(c)(d) | | Ba3 | | 2.501% | | 11/18/13 | | | 1,481 | | | 1,412,592 |
Health Management Association(c)(d) | | B1 | | 2.001% | | 02/28/14 | | | 1,104 | | | 1,026,794 |
Warner Chilcott Corp.(c)(d) | | B1 | | 5.500% | | 10/30/14 | | | 979 | | | 979,572 |
Warner Chilcott Corp.(c)(d) | | B1 | | 5.750% | | 04/30/15 | | | 1,077 | | | 1,077,530 |
Warner Chilcott Corp.(c)(d) | | B1 | | 5.750% | | 04/30/15 | | | 489 | | | 489,786 |
| | | | | | | | | | | |
|
|
| | | | | | | | | | | | | 6,147,941 |
| | | | | | | | | | | |
|
|
Media & Entertainment — 0.1% | | | | | | | | | | | | |
Discovery Communications, Inc.(c)(d) | | Baa3 | | 5.250% | | 05/14/14 | | | 1,056 | | | 1,064,600 |
| | | | | | | | | | | |
|
|
Paper | | | | | | | | | | | | |
Domtar Corp.(c)(d) | | Baa3 | | 1.608% | | 03/05/14 | | | 523 | | | 507,854 |
| | | | | | | | | | | |
|
|
Pipelines & Other | | | | | | | | | | | | |
Enterprise GP Holdings LP(c)(d) | | Ba2 | | 2.514% | | 11/08/14 | | | 980 | | | 934,675 |
| | | | | | | | | | | |
|
|
Technology — 0.1% | | | | | | | | | | | | |
Fidelity National Information Services, Inc.(c)(d) | | Ba1 | | 4.481% | | 01/18/12 | | | 119 | | | 118,712 |
First Data Corp.(c)(d) | | B1 | | 2.983% | | 09/24/14 | | | 1,173 | | | 1,039,082 |
First Data Corp.(c)(d) | | B1 | | 2.999% | | 09/24/14 | | | 1,466 | | | 1,296,715 |
Flextronics International Ltd. (Singapore)(c)(d) | | Ba1 | | 2.514% | | 10/01/14 | | | 987 | | | 912,245 |
Flextronics International Ltd. (Singapore)(c)(d) | | Ba1 | | 2.534% | | 10/01/14 | | | 284 | | | 262,139 |
Sensata Technologies (Netherlands)(c)(d) | | B2 | | 2.031% | | 04/27/13 | | | 335 | | | 297,216 |
| | | | | | | | | | | |
|
|
| | | | | | | | | | | | | 3,926,109 |
| | | | | | | | | | | |
|
|
TOTAL BANK LOANS
(cost $16,000,310) | | | 15,284,511 |
| | | | | | | | | | | |
|
|
| COLLATERALIZED MORTGAGE OBLIGATIONS — 0.4% | | | | | | | | | | | | |
Banc of America Alternative Loan Trust, Ser. 2005-12, Class 3CB1 | | B3 | | 6.000% | | 01/25/36 | | | 3,767 | | | 2,859,307 |
Banc of America Mortgage Securities, Inc., Ser. 2005-A, Class 2A1(c) | | Ba1 | | 4.439% | | 02/25/35 | | | 928 | | | 711,909 |
SEE NOTES TO FINANCIAL STATEMENTS.
A52
| | | | | | |
| | | FLEXIBLE MANAGED PORTFOLIO (continued) | | |
| |
| SCHEDULE OF INVESTMENTS | | December 31, 2009 |
| | | | | | | | | | | | |
COLLATERALIZED MORTGAGE OBLIGATIONS
(continued) | | Moody’s
Rating
(Unaudited)†
| | Interest
Rate
| | Maturity
Date
| | Principal
Amount
(000)#
| | Value
(Note 2)
|
| | | | | | | | | | | | | |
Banc of America Mortgage Securities, Inc., Ser. 2005-B, Class 2A1(c) | | Ba2 | | 4.375% | | 03/25/35 | | $ | 689 | | $ | 546,071 |
Chase Mortgage Finance Corp., Ser. 2007-A1, Class 1A5(c) | | Ba2 | | 3.899% | | 02/25/37 | | | 2,431 | | | 2,245,474 |
Countrywide Alternative Loan Trust, Ser. 2004-18CB, Class 3A1 | | A1 | | 5.250% | | 09/25/19 | | | 1,018 | | | 984,636 |
JPMorgan Mortgage Trust, Ser. 2007-A1, Class 4A1(c) | | B1 | | 4.067% | | 07/25/35 | | | 1,601 | | | 1,438,720 |
Master Alternative Loans Trust, Ser. 2004-4, Class 4A1 | | Aaa | | 5.000% | | 04/25/19 | | | 351 | | | 331,412 |
Structured Adjustable Rate Mortgage Loan Trust, Ser. 2004-1, Class 4A3(c) | | A1 | | 3.586% | | 02/25/34 | | | 658 | | | 544,157 |
Washington Mutual Alternative Mortgage Pass-Through Certificates, Ser. 2005-1, Class 3A | | AAA(e) | | 5.000% | | 03/25/20 | | | 430 | | | 329,648 |
| | | | | | | | | | | |
|
|
TOTAL COLLATERALIZED MORTGAGE OBLIGATIONS
(cost $11,505,565) | | | 9,991,334 |
| | | | | | | | | | | |
|
|
| COMMERCIAL MORTGAGE-BACKED SECURITIES — 3.8% | | | | | | | | | | |
Banc of America Commercial Mortgage, Inc., Ser. 2004-2, Class A4 | | Aaa | | 4.153% | | 11/10/38 | | | 2,800 | | | 2,790,025 |
Banc of America Commercial Mortgage, Inc., Ser. 2005-1, Class ASB(c) | | AAA(e) | | 4.965% | | 11/10/42 | | | 683 | | | 700,468 |
Banc of America Commercial Mortgage, Inc., Ser. 2006-4, Class A3A | | Aaa | | 5.600% | | 07/10/46 | | | 3,700 | | | 3,757,954 |
Banc of America Commercial Mortgage, Inc., Ser. 2007-3, Class A2(c) | | Aaa | | 5.658% | | 06/10/49 | | | 5,900 | | | 6,002,933 |
Banc of America Commercial Mortgage, Inc., Ser. 2007-5, Class A3 | | AAA(e) | | 5.620% | | 02/10/51 | | | 1,920 | | | 1,863,457 |
Bear Stearns Commercial Mortgage Securities, Ser. 2005-T18,
Class AAB(c) | | Aaa | | 4.823% | | 02/13/42 | | | 1,775 | | | 1,791,832 |
Bear Stearns Commercial Mortgage Securities, Ser. 2005-T20,
Class AAB(c) | | Aaa | | 5.134% | | 10/12/42 | | | 2,400 | | | 2,461,091 |
Commercial Mortgage Acceptance Corp., Ser. 1998-C2, Class F, 144A(c) | | A-(e) | | 5.440% | | 09/15/30 | | | 890 | | | 847,827 |
Commercial Mortgage Loan Trust, Ser. 2008-LS1, Class A2(c) | | Aaa | | 6.019% | | 12/10/49 | | | 2,200 | | | 2,256,697 |
Commercial Mortgage Pass-Through Certificates, Ser. 2004-LB2A,
Class X2, I/O, 144A(c) | | AAA(e) | | 0.862% | | 03/10/39 | | | 8,370 | | | 75,040 |
Commercial Mortgage Pass-Through Certificates, Ser. 2006-C8,
Class A2B | | Aaa | | 5.248% | | 12/10/46 | | | 1,000 | | | 1,004,113 |
Commercial Mortgage Pass-Thru Certificates, Ser. 2006-C7, Class A4(c) | | AAA(e) | �� | 5.768% | | 06/10/46 | | | 1,500 | | | 1,470,883 |
CS First Boston Mortgage Securities Corp., Ser. 2004-C3, Class A4 | | Aaa | | 4.835% | | 07/15/36 | | | 880 | | | 881,729 |
CS First Boston Mortgage Securities Corp., Ser. 2004-C4, Class A4 | | Aaa | | 4.283% | | 10/15/39 | | | 1,400 | | | 1,401,306 |
CS First Boston Mortgage Securities Corp., Ser. 2005-C5, Class A4(c) | | AAA(e) | | 5.100% | | 08/15/38 | | | 6,800 | | | 6,551,110 |
CS Mortgage Capital Certificate Corp., Ser. 2006-C1, Class A4(c) | | AAA(e) | | 5.548% | | 02/15/39 | | | 2,700 | | | 2,659,617 |
CW Capital Cobalt Ltd., Ser. 2007-C2, Class A2 | | Aaa | | 5.334% | | 04/15/47 | | | 750 | | | 754,020 |
CW Capital Cobalt Ltd., Ser. 2007-C3, Class A3(c) | | AAA(e) | | 5.820% | | 05/15/46 | | | 2,200 | | | 2,129,939 |
DLJ Commercial Mortgage Corp., Ser. 2000-CF1, Class A1B | | AAA(e) | | 7.620% | | 06/10/33 | | | 571 | | | 572,053 |
GE Capital Commercial Mortgage Corp., Ser. 2004-C2, Class X2, I/O, 144A(c) | | Aaa | | 0.597% | | 03/10/40 | | | 16,209 | | | 115,815 |
GMAC Commercial Mortgage Securities, Inc., Ser. 2005-C1, Class A5 | | AAA(e) | | 4.697% | | 05/10/43 | | | 2,720 | | | 2,653,441 |
Greenwich Capital Commercial Funding Corp., Ser. 2005-GG5, Class A5(c) | | Aaa | | 5.224% | | 04/10/37 | | | 8,050 | | | 7,625,041 |
Greenwich Capital Commercial Funding Corp., Ser. 2007-GG9, Class A2 | | Aaa | | 5.381% | | 03/10/39 | | | 4,000 | | | 4,052,193 |
GS Mortgage Securities Corp. II, Ser. 2006-GG6, Class AAB(c) | | AAA(e) | | 5.587% | | 04/10/38 | | | 6,650 | | | 6,613,854 |
JPMorgan Chase Commercial Mortgage Securities Corp.,
Ser. 2005-LDP1, Class ASB(c) | | Aaa | | 4.853% | | 03/15/46 | | | 3,749 | | | 3,810,114 |
JPMorgan Chase Commercial Mortgage Securities Corp.,
Ser. 2005-LDP2, Class ASB | | Aaa | | 4.659% | | 07/15/42 | | | 6,350 | | | 6,415,952 |
JPMorgan Chase Commercial Mortgage Securities Corp.,
Ser. 2006-CB16, Class ASB | | Aaa | | 5.523% | | 05/12/45 | | | 3,900 | | | 3,859,570 |
JPMorgan Chase Commercial Mortgage Securities Corp.,
Ser. 2006-LDP6, Class X2, I/O(c) | | Aaa | | 0.066% | | 04/15/43 | | | 119,690 | | | 352,750 |
SEE NOTES TO FINANCIAL STATEMENTS.
A53
| | | | | | |
| | | FLEXIBLE MANAGED PORTFOLIO (continued) | | |
| |
| SCHEDULE OF INVESTMENTS | | December 31, 2009 |
| | | | | | | | | | | | |
COMMERCIAL MORTGAGE-BACKED SECURITIES
(continued) | | Moody’s
Rating
(Unaudited)†
| | Interest
Rate
| | Maturity
Date
| | Principal
Amount
(000)#
| | Value
(Note 2)
|
| | | | | | | | | | | | | |
JPMorgan Chase Commercial Mortgage Securities Corp.,
Ser. 2006-LDP7, Class A3A(c) | | Aaa | | 5.875% | | 04/15/45 | | $ | 563 | | $ | 561,446 |
JPMorgan Chase Commercial Mortgage Securities Corp.,
Ser. 2007-LD12, Class A2 | | Aaa | | 5.827% | | 02/15/51 | | | 2,050 | | | 2,101,978 |
LB-UBS Commercial Mortgage Trust, Ser. 2004-C6, Class A5(c) | | AAA(e) | | 4.826% | | 08/15/29 | | | 3,910 | | | 3,731,096 |
LB-UBS Commercial Mortgage Trust, Ser. 2006-C6, Class AAB | | Aaa | | 5.341% | | 09/15/39 | | | 3,580 | | | 3,529,333 |
Merrill Lynch Mortgage Trust, Ser. 2004-KEY2, Class A3 | | Aaa | | 4.615% | | 08/12/39 | | | 2,000 | | | 1,965,275 |
Merrill Lynch Mortgage Trust, Ser. 2008-C1, Class A2 | | Aaa | | 5.425% | | 02/12/51 | | | 150 | | | 149,783 |
Merrill Lynch/Countrywide Commercial Mortgage Trust, Ser. 2006-2, Class A4(c) | | Aaa | | 5.909% | | 06/12/46 | | | 1,795 | | | 1,762,177 |
Morgan Stanley Capital I, Ser. 2006-IQ11, Class A4(c) | | AAA(e) | | 5.770% | | 10/15/42 | | | 2,600 | | | 2,572,110 |
Morgan Stanley Capital I, Ser. 2007-HQ11, Class AAB | | Aaa | | 5.444% | | 02/12/44 | | | 4,600 | | | 4,442,838 |
Morgan Stanley Capital I, Ser. 2007-T27, Class AAB(c) | | AAA(e) | | 5.650% | | 06/11/42 | | | 1,105 | | | 1,102,328 |
Wachovia Bank Commercial Mortgage Trust, Ser. 2006-C23, Class A4(c) | | Aaa | | 5.418% | | 01/15/45 | | | 2,500 | | | 2,394,716 |
Wachovia Bank Commercial Mortgage Trust, Ser. 2006-C25, Class A3(c) | | Aaa | | 5.705% | | 05/15/43 | | | 5,000 | | | 5,030,440 |
Wachovia Bank Commercial Mortgage Trust, Ser. 2006-C25, Class A4(c) | | Aaa | | 5.740% | | 05/15/43 | | | 1,000 | | | 985,286 |
Wachovia Bank Commercial Mortgage Trust, Ser. 2006-C27, Class A2 | | Aaa | | 5.624% | | 07/15/45 | | | 3,000 | | | 3,071,287 |
| | | | | | | | | | | |
|
|
TOTAL COMMERCIAL MORTGAGE-BACKED SECURITIES
(cost $105,476,171) | | | 108,870,917 |
| | | | | | | | | | | |
|
|
| CORPORATE BONDS — 9.6% | | | | | | | | | | | | |
Aerospace & Defense — 0.2% | | | | | | | | | | | | |
BAE Systems Holdings, Inc., Gtd. Notes, 144A | | Baa2 | | 4.750% | | 08/15/10 | | | 2,150 | | | 2,182,624 |
BAE Systems Holdings, Inc., Gtd. Notes, 144A | | Baa2 | | 6.375% | | 06/01/19 | | | 725 | | | 779,860 |
Boeing Capital Corp., Sr. Unsec’d. Notes | | A2 | | 6.100% | | 03/01/11 | | | 925 | | | 977,753 |
Goodrich Corp., Sr. Unsec’d. Notes | | Baa2 | | 6.800% | | 07/01/36 | | | 743 | | | 796,572 |
| | | | | | | | | | | |
|
|
| | | | | | | | | | | | | 4,736,809 |
| | | | | | | | | | | |
|
|
Airlines — 0.2% | | | | | | | | | | | | |
American Airlines, Inc., Pass-thru Certs., Ser. 01-1 | | B2 | | 6.817% | | 05/23/11 | | | 2,520 | | | 2,419,200 |
Continental Airlines, Inc., Pass-thru Certs., Ser. 981A | | Baa2 | | 6.648% | | 09/15/17 | | | 269 | | | 259,421 |
Continental Airlines, Inc., Pass-thru Certs., Ser. A(a) | | Baa2 | | 7.250% | | 11/10/19 | | | 790 | | | 803,825 |
Delta Air Lines, Inc., Pass-thru Certs., Ser. 071A(a) | | Baa1 | | 6.821% | | 08/10/22 | | | 455 | | | 434,700 |
Southwest Airlines Co., Sr. Unsec’d. Notes | | Baa3 | | 6.500% | | 03/01/12 | | | 1,005 | | | 1,069,390 |
| | | | | | | | | | | |
|
|
| | | | | | | | | | | | | 4,986,536 |
| | | | | | | | | | | |
|
|
Automotive | | | | | | | | | | | | |
Harley-Davidson Funding Corp., Gtd. Notes, 144A, MTN | | Baa1 | | 5.750% | | 12/15/14 | | | 500 | | | 507,634 |
Johnson Controls, Inc., Sr. Unsec’d. Notes | | Baa2 | | 5.500% | | 01/15/16 | | | 245 | | | 249,183 |
| | | | | | | | | | | |
|
|
| | | | | | | | | | | | | 756,817 |
| | | | | | | | | | | |
|
|
Banking — 1.9% | | | | | | | | | | | | |
American Express Co., Sr. Unsec’d. Notes | | A3 | | 8.125% | | 05/20/19 | | | 1,925 | | | 2,281,242 |
Banco Bradesco SA (Cayman Islands), Sub. Notes | | A2 | | 8.750% | | 10/24/13 | | | 1,760 | | | 2,059,200 |
Bank of America Corp., Sub. Notes | | A3 | | 5.750% | | 08/15/16 | | | 1,775 | | | 1,786,582 |
Bank of America Corp., Jr. Sub. Notes(c) | | Ba3 | | 8.000% | | 12/29/49 | | | 2,200 | | | 2,118,028 |
Bank of America NA, Sub. Notes | | A1 | | 5.300% | | 03/15/17 | | | 930 | | | 911,484 |
Bank of America NA, Sub. Notes | | A1 | | 6.000% | | 10/15/36 | | | 410 | | | 396,193 |
Bank One Corp., Sub. Notes | | A1 | | 7.875% | | 08/01/10 | | | 2,250 | | | 2,345,828 |
Bear Stearns Cos. LLC (The), Sr. Unsec’d. Notes | | Aa3 | | 5.300% | | 10/30/15 | | | 515 | | | 544,694 |
Bear Stearns Cos. LLC (The), Sr. Unsec’d. Notes | | Aa3 | | 6.400% | | 10/02/17 | | | 330 | | | 359,727 |
Bear Stearns Cos. LLC (The), Sr. Unsec’d. Notes | | Aa3 | | 7.250% | | 02/01/18 | | | 1,175 | | | 1,348,727 |
Capital One Bank USA NA., Sub. Notes | | A3 | | 6.500% | | 06/13/13 | | | 20 | | | 21,501 |
Capital One Capital V, Gtd. Notes | | Baa2 | | 10.250% | | 08/15/39 | | | 620 | | | 720,750 |
Capital One Capital VI, Gtd. Notes | | Baa2 | | 8.875% | | 05/15/40 | | | 1,080 | | | 1,150,200 |
SEE NOTES TO FINANCIAL STATEMENTS.
A54
| | | | | | |
| | | FLEXIBLE MANAGED PORTFOLIO (continued) | | |
| |
| SCHEDULE OF INVESTMENTS | | December 31, 2009 |
| | | | | | | | | | | | |
CORPORATE BONDS
(continued) | | Moody’s
Rating
(Unaudited)†
| | Interest
Rate
| | Maturity
Date
| | Principal
Amount
(000)#
| | Value
(Note 2)
|
| | | | | | | | | | | | | |
Banking (continued) | | | | | | | | | | | | |
Capital One Financial Corp., Sr. Unsec’d. Notes, MTN | | Baa1 | | 5.700% | | 09/15/11 | | $ | 600 | | $ | 630,223 |
Citigroup, Inc., Sub. Notes | | Baa1 | | 5.000% | | 09/15/14 | | | 454 | | | 437,667 |
Citigroup, Inc., Sub. Notes | | Baa1 | | 5.625% | | 08/27/12 | | | 2,800 | | | 2,879,993 |
Citigroup, Inc., Sub. Notes | | Baa1 | | 6.125% | | 08/25/36 | | | 570 | | | 488,829 |
Citigroup, Inc., Sr. Unsec’d. Notes | | A3 | | 6.875% | | 03/05/38 | | | 520 | | | 518,969 |
Citigroup, Inc., Sr. Unsec’d. Notes(a) | | A3 | | 8.125% | | 07/15/39 | | | 430 | | | 485,318 |
Citigroup, Inc., Unsec’d. Notes | | A3 | | 8.500% | | 05/22/19 | | | 975 | | | 1,125,884 |
Countrywide Financial Corp., Gtd. Notes, MTN | | A2 | | 5.800% | | 06/07/12 | | | 1,190 | | | 1,263,198 |
DEPFA ACS Bank (Ireland), Covered Notes, 144A | | Aa2 | | 5.125% | | 03/16/37 | | | 1,380 | | | 1,014,272 |
Discover Bank, Sub. Notes | | Ba1 | | 8.700% | | 11/18/19 | | | 900 | | | 964,219 |
Goldman Sachs Group, Inc. (The), Sr. Unsec’d. Notes | | A1 | | 5.450% | | 11/01/12 | | | 600 | | | 645,107 |
Goldman Sachs Group, Inc. (The), Sub. Notes | | A2 | | 5.625% | | 01/15/17 | | | 1,190 | | | 1,215,418 |
Goldman Sachs Group, Inc. (The), Sub. Notes | | A2 | | 6.450% | | 05/01/36 | | | 1,615 | | | 1,590,689 |
Goldman Sachs Group, Inc. (The), Sub. Notes | | A2 | | 6.750% | | 10/01/37 | | | 104 | | | 106,900 |
Goldman Sachs Group, Inc. (The), Sr. Unsec’d. Notes(a) | | A1 | | 7.500% | | 02/15/19 | | | 1,500 | | | 1,748,705 |
ICICI Bank Ltd. (India), Bonds, 144A(c) | | Baa2 | | 0.824% | | 01/12/10 | | | 2,385 | | | 2,380,308 |
ICICI Bank, Ltd. (Singapore), Notes, 144A | | Baa2 | | 5.750% | | 11/16/10 | | | 1,410 | | | 1,439,788 |
JPMorgan Chase & Co., Jr. Sub. Notes, Ser. 1(c) | | Baa1 | | 7.900% | | 04/29/49 | | | 2,000 | | | 2,062,920 |
JPMorgan Chase Capital XXVI (Capital Security, fixed to floating preferred)(c) | | A2 | | 8.000% | | 05/15/48 | | | 28 | | | 752,080 |
JPMorgan Chase Capital XXVII, Gtd. Notes, Ser. AA | | A2 | | 7.000% | | 11/01/39 | | | 1,500 | | | 1,512,770 |
Merrill Lynch & Co., Inc., Sr. Unsec’d. Notes, Ser. C, MTN | | A2 | | 4.250% | | 02/08/10 | | | 1,170 | | | 1,174,048 |
Merrill Lynch & Co., Inc., Sr. Unsec’d. Notes | | A2 | | 4.790% | | 08/04/10 | | | 295 | | | 301,096 |
Merrill Lynch & Co., Inc., Sr. Unsec’d. Notes, Ser. C, MTN | | A2 | | 5.000% | | 01/15/15 | | | 615 | | | 625,472 |
Merrill Lynch & Co., Inc., Sr. Unsec’d. Notes, MTN | | A2 | | 5.770% | | 07/25/11 | | | 520 | | | 549,712 |
Merrill Lynch & Co., Inc., Sr. Unsec’d. Notes | | A2 | | 6.400% | | 08/28/17 | | | 35 | | | 36,833 |
Merrill Lynch & Co., Inc., Notes, MTN | | A2 | | 6.875% | | 04/25/18 | | | 980 | | | 1,055,889 |
Morgan Stanley, Sr. Unsec’d. Notes | | A2 | | 5.300% | | 03/01/13 | | | 265 | | | 279,309 |
Morgan Stanley, Sr. Unsec’d. Notes, Ser. E | | A2 | | 5.450% | | 01/09/17 | | | 2,345 | | | 2,370,129 |
Morgan Stanley, Sr. Unsec’d. Notes, MTN | | A2 | | 5.625% | | 09/23/19 | | | 1,415 | | | 1,425,344 |
Morgan Stanley, Sr. Unsec’d. Notes, MTN | | A2 | | 5.950% | | 12/28/17 | | | 620 | | | 639,493 |
MUFG Capital Finance 1 Ltd. (Cayman Islands), Gtd. Notes.(c) | | A2 | | 6.346% | | 07/25/49 | | | 800 | | | 728,117 |
PNC Funding Corp., Gtd. Notes.(a) | | A3 | | 6.700% | | 06/10/19 | | | 1,000 | | | 1,118,976 |
Royal Bank of Scotland Group PLC (United Kingdom), Sr. Unsec’d. Notes, MTN | | A1 | | 6.400% | | 10/21/19 | | | 1,775 | | | 1,769,302 |
Santander Central Hispano Issuances Ltd. (Cayman Islands), Gtd. Notes. | | Aa3 | | 7.625% | | 09/14/10 | | | 695 | | | 728,539 |
USB Capital XIII Trust, Gtd. Notes | | A2 | | 6.625% | | 12/15/39 | | | 775 | | | 787,664 |
Wachovia Bank NA, Sub. Notes(a) | | Aa3 | | 7.800% | | 08/18/10 | | | 2,100 | | | 2,191,291 |
Wells Fargo Bank NA, Sub. Notes, Ser. AI | | Aa3 | | 4.750% | | 02/09/15 | | | 585 | | | 596,520 |
Wells Fargo Bank NA, Sub. Notes | | Aa3 | | 6.450% | | 02/01/11 | | | 65 | | | 68,643 |
Wells Fargo Capital XIII, Gtd. Notes, Ser. G, MTN(c) | | Ba1 | | 7.700% | | 12/29/49 | | | 1,000 | | | 970,000 |
| | | | | | | | | | | |
|
|
| | | | | | | | | | | | | 56,723,790 |
| | | | | | | | | | | |
|
|
Brokerage | | | | | | | | | | | | |
Lehman Brothers Holdings, Inc., Sr. Unsec’d. Notes, MTN(f) | | NR | | 5.250% | | 02/06/12 | | | 1,715 | | | 334,425 |
Lehman Brothers Holdings, Inc., Sr. Unsec’d. Notes, MTN(f) | | NR | | 6.875% | | 05/02/18 | | | 700 | | | 145,250 |
| | | | | | | | | | | |
|
|
| | | | | | | | | | | | | 479,675 |
| | | | | | | | | | | |
|
|
Building Materials & Construction — 0.1% | | | | | | | | | | | | |
Hanson Ltd. (United Kingdom), Gtd. Notes | | B1 | | 7.875% | | 09/27/10 | | | 1,000 | | | 1,036,230 |
Lafarge SA (France), Sr. Unsec’d. Notes | | Baa3 | | 6.150% | | 07/15/11 | | | 910 | | | 948,296 |
| | | | | | | | | | | |
|
|
| | | | | | | | | | | | | 1,984,526 |
| | | | | | | | | | | |
|
|
Cable — 0.4% | | | | | | | | | | | | |
Comcast Cable Communications Holdings, Inc., Gtd. Notes | | Baa1 | | 9.455% | | 11/15/22 | | | 255 | | | 327,967 |
Comcast Corp., Gtd. Notes | | Baa1 | | 6.400% | | 05/15/38 | | | 570 | | | 586,546 |
Comcast Corp., Gtd. Notes | | Baa1 | | 6.450% | | 03/15/37 | | | 155 | | | 159,816 |
SEE NOTES TO FINANCIAL STATEMENTS.
A55
| | | | | | |
| | | FLEXIBLE MANAGED PORTFOLIO (continued) | | |
| |
| SCHEDULE OF INVESTMENTS | | December 31, 2009 |
| | | | | | | | | | | | | |
CORPORATE BONDS
(continued) | | Moody’s
Rating
(Unaudited)†
| | | Interest
Rate
| | Maturity
Date
| | Principal
Amount
(000)#
| | Value
(Note 2)
|
| | | | | | | | | | | | | | |
Cable (continued) | | | | | | | | | | | | | |
Comcast Corp., Gtd. Notes | | Baa1 | | | 6.500% | | 11/15/35 | | $ | 450 | | $ | 466,587 |
Comcast Corp., Gtd. Notes | | Baa1 | | | 6.950% | | 08/15/37 | | | 605 | | | 659,385 |
Cox Communications, Inc., Sr. Unsec’d. Notes | | Baa3 | | | 6.750% | | 03/15/11 | | | 950 | | | 998,872 |
DIRECTV Holdings LLC / DIRECTV Financing Co., Inc., Gtd. Notes, 144A | | Ba2 | | | 4.750% | | 10/01/14 | | | 1,940 | | | 1,977,512 |
DISH DBS Corp., Gtd. Notes | | Ba3 | | | 6.375% | | 10/01/11 | | | 1,000 | | | 1,032,500 |
Time Warner Cable, Inc., Gtd. Notes | | Baa2 | | | 5.400% | | 07/02/12 | | | 2,510 | | | 2,681,757 |
Time Warner Cable, Inc., Gtd. Notes(a) | | Baa2 | | | 6.750% | | 06/15/39 | | | 1,575 | | | 1,649,505 |
| | | | | | | | | | | | |
|
|
| | | | | | | | | | | | | | 10,540,447 |
| | | | | | | | | | | | |
|
|
Capital Goods — 0.1% | | | | | | | | | | | | | |
ERAC USA Finance Co., Gtd. Notes, 144A (original cost $459,646; purchased 10/10/07)(d)(g) | | Baa2 | | | 5.800% | | 10/15/12 | | | 460 | | | 482,332 |
ERAC USA Finance Co., Gtd. Notes, 144A (original cost $1,299,722; purchased 10/10/07)(d)(g) | | Baa2 | | | 6.375% | | 10/15/17 | | | 1,302 | | | 1,315,107 |
ERAC USA Finance Co., Gtd. Notes, 144A (original cost $376,709; purchased 10/10/07)(d)(g) | | Baa2 | | | 7.000% | | 10/15/37 | | | 380 | | | 371,947 |
FedEx Corp., Gtd. Notes | | Baa2 | | | 7.250% | | 02/15/11 | | | 400 | | | 423,657 |
General Electric Co., Sr. Unsec’d. Notes | | Aa2 | | | 5.250% | | 12/06/17 | | | 200 | | | 204,373 |
Trane US, Inc., Gtd. Notes(a) | | BBB+ | (e) | | 7.625% | | 02/15/10 | | | 770 | | | 774,623 |
| | | | | | | | | | | | |
|
|
| | | | | | | | | | | | | | 3,572,039 |
| | | | | | | | | | | | |
|
|
Chemicals — 0.2% | | | | | | | | | | | | | |
Dow Chemical Co. (The), Sr. Unsec’d. Notes | | Baa3 | | | 6.125% | | 02/01/11 | | | 685 | | | 714,091 |
Dow Chemical Co. (The), Sr. Unsec’d. Notes | | Baa3 | | | 7.600% | | 05/15/14 | | | 1,800 | | | 2,048,206 |
Dow Chemical Co. (The), Sr. Unsec’d. Notes | | Baa3 | | | 9.400% | | 05/15/39 | | | 500 | | | 661,075 |
ICI Wilmington, Inc., Gtd. Notes | | Baa1 | | | 5.625% | | 12/01/13 | | | 720 | | | 751,494 |
PPG Industries, Inc., Sr. Unsec’d. Notes | | Baa1 | | | 5.750% | | 03/15/13 | | | 1,500 | | | 1,601,533 |
Union Carbide Corp., Sr. Unsec’d. Notes | | Ba2 | | | 7.500% | | 06/01/25 | | | 460 | | | 422,941 |
| | | | | | | | | | | | |
|
|
| | | | | | | | | | | | | | 6,199,340 |
| | | | | | | | | | | | |
|
|
Consumer — 0.2% | | | | | | | | | | | | | |
Avon Products, Inc., Sr. Unsec’d. Notes | | A2 | | | 5.750% | | 03/01/18 | | | 1,500 | | | 1,609,747 |
Fortune Brands, Inc., Sr. Unsec’d. Notes(a) | | Baa3 | | | 6.375% | | 06/15/14 | | | 2,250 | | | 2,409,649 |
Newell Rubbermaid, Inc., Sr. Unsec’d. Notes | | Baa3 | | | 6.250% | | 04/15/18 | | | 1,700 | | | 1,679,775 |
Whirlpool Corp., Sr. Unsec’d. Notes | | Baa3 | | | 6.125% | | 06/15/11 | | | 965 | | | 1,002,946 |
| | | | | | | | | | | | |
|
|
| | | | | | | | | | | | | | 6,702,117 |
| | | | | | | | | | | | |
|
|
Electric — 0.9% | | | | | | | | | | | | | |
Appalachian Power Co., Sr. Unsec’d. Notes, Ser. J | | Baa2 | | | 4.400% | | 06/01/10 | | | 620 | | | 626,938 |
Arizona Public Service Co., Sr. Unsec’d. Notes | | Baa2 | | | 6.250% | | 08/01/16 | | | 175 | | | 185,018 |
Arizona Public Service Co., Sr. Unsec’d. Notes | | Baa2 | | | 6.375% | | 10/15/11 | | | 1,305 | | | 1,396,987 |
Baltimore Gas & Electric Co., Sr. Unsec’d. Notes | | Baa2 | | | 6.350% | | 10/01/36 | | | 550 | | | 564,938 |
Carolina Power & Light Co., First Mtge. Bonds | | A1 | | | 5.250% | | 12/15/15 | | | 525 | | | 574,097 |
CenterPoint Energy Houston Electric LLC, Genl. Ref. Mtge., Ser. J2 | | Baa1 | | | 5.700% | | 03/15/13 | | | 740 | | | 786,578 |
CenterPoint Energy Houston Electric LLC, Genl. Ref. Mtge., Ser. K2 | | Baa1 | | | 6.950% | | 03/15/33 | | | 590 | | | 652,440 |
Consolidated Edison Co. of New York, Inc., Sr. Unsec’d. Notes,
Ser. 05-C | | A3 | | | 5.375% | | 12/15/15 | | | 730 | | | 788,888 |
Consolidated Edison Co. of New York, Inc., Sr. Unsec’d. Notes,
Ser. 08-B(a) | | A3 | | | 6.750% | | 04/01/38 | | | 200 | | | 228,017 |
Consumers Energy Co., First Mtge. Bonds, Ser. D | | A3 | | | 5.375% | | 04/15/13 | | | 325 | | | 348,964 |
Duke Energy Carolinas LLC, First Mtge. Bonds | | A1 | | | 6.050% | | 04/15/38 | | | 550 | | | 585,600 |
Duke Energy Carolinas LLC, Sr. Unsec’d. Notes | | A3 | | | 6.100% | | 06/01/37 | | | 960 | | | 1,007,239 |
E.ON International Finance BV (Netherlands), Gtd. Notes, 144A | | A2 | | | 6.650% | | 04/30/38 | | | 890 | | | 1,012,011 |
El Paso Electric Co., Sr. Unsec’d. Notes | | Baa2 | | | 6.000% | | 05/15/35 | | | 670 | | | 602,526 |
Empresa Nacional de Electricidad S.A. (Chile), Unsub. Notes | | Baa3 | | | 8.625% | | 08/01/15 | | | 1,295 | | | 1,534,987 |
ENEL Finance International SA (Luxembourg), Gtd. Notes, 144A(a) | | A2 | | | 6.000% | | 10/07/39 | | | 1,280 | | | 1,286,775 |
Energy East Corp., Sr. Unsec’d. Notes | | A3 | | | 6.750% | | 09/15/33 | | | 145 | | | 151,292 |
Exelon Corp., Sr. Unsec’d. Notes | | Baa1 | | | 4.900% | | 06/15/15 | | | 155 | | | 159,898 |
SEE NOTES TO FINANCIAL STATEMENTS.
A56
| | | | | | |
| | | FLEXIBLE MANAGED PORTFOLIO (continued) | | |
| |
| SCHEDULE OF INVESTMENTS | | December 31, 2009 |
| | | | | | | | | | | | |
CORPORATE BONDS
(continued) | | Moody’s
Rating
(Unaudited)†
| | Interest
Rate
| | Maturity
Date
| | Principal
Amount
(000)#
| | Value
(Note 2)
|
| | | | | | | | | | | | | |
Electric (continued) | | | | | | | | | | | | |
Exelon Generation Co. LLC, Sr. Unsec’d. Notes | | A3 | | 6.250% | | 10/01/39 | | $ | 1,425 | | $ | 1,451,834 |
FirstEnergy Solutions Corp., Gtd. Notes | | Baa2 | | 6.050% | | 08/15/21 | | | 695 | | | 701,120 |
Florida Power & Light Co., First Mtge. Bonds | | Aa2 | | 5.950% | | 10/01/33 | | | 295 | | | 308,795 |
Georgia Power Co., Sr. Unsec’d. Notes, Ser. B | | A2 | | 5.700% | | 06/01/17 | | | 495 | | | 537,114 |
Indiana Michigan Power Co., Sr. Unsec’d. Notes, Ser. INDF | | Baa2 | | 5.050% | | 11/15/14 | | | 460 | | | 477,141 |
Korea Hydro & Nuclear Power Co. Ltd. (South Korea), Sr. Unsec’d. Notes, 144A(a) | | A2 | | 6.250% | | 06/17/14 | | | 1,770 | | | 1,931,263 |
Midamerican Energy Holdings Co., Sr. Unsec’d. Notes | | Baa1 | | 5.750% | | 04/01/18 | | | 205 | | | 216,064 |
Midamerican Energy Holdings Co., Sr. Unsec’d. Notes | | Baa1 | | 5.950% | | 05/15/37 | | | 300 | | | 300,336 |
National Rural Utilities Cooperative Finance Corp., Sr. Unsec’d. Notes,
Ser. C, MTN | | A2 | | 7.250% | | 03/01/12 | | | 90 | | | 98,931 |
Nevada Power Co., Genl. Ref. Mtge., Ser. O | | Baa3 | | 6.500% | | 05/15/18 | | | 1,260 | | | 1,348,378 |
Niagara Mohawk Power Corp., Sr. Unsec’d. Notes, 144A | | A3 | | 4.881% | | 08/15/19 | | | 610 | | | 604,805 |
NiSource Finance Corp., Gtd. Notes | | Baa3 | | 5.250% | | 09/15/17 | | | 245 | | | 240,976 |
NiSource Finance Corp., Gtd. Notes | | Baa3 | | 5.450% | | 09/15/20 | | | 350 | | | 339,395 |
NSTAR | | A2 | | 4.500% | | 11/15/19 | | | 615 | | | 601,413 |
Oncor Electric Delivery Co. LLC, Sr. Sec’d. Notes | | Baa1 | | 6.375% | | 01/15/15 | | | 345 | | | 376,339 |
Oncor Electric Delivery Co. LLC, Sr. Sec’d. Notes | | Baa1 | | 7.000% | | 09/01/22 | | | 475 | | | 528,128 |
Pacific Gas & Electric Co., Sr. Unsec’d. Notes | | A3 | | 6.050% | | 03/01/34 | | | 1,550 | | | 1,618,253 |
Public Service Co. of New Mexico, Sr. Unsec’d. Notes | | Baa3 | | 7.950% | | 05/15/18 | | | 140 | | | 146,552 |
Public Service Electric & Gas Co., Sec’d. Notes, MTN | | A2 | | 5.800% | | 05/01/37 | | | 535 | | | 550,516 |
Southern California Edison Co., Ser. 04-F | | A1 | | 4.650% | | 04/01/15 | | | 470 | | | 496,946 |
Xcel Energy, Inc., Sr. Unsec’d. Notes | | Baa1 | | 5.613% | | 04/01/17 | | | 199 | | | 205,181 |
Xcel Energy, Inc., Sr. Unsec’d. Notes | | Baa1 | | 6.500% | | 07/01/36 | | | 445 | | | 468,777 |
| | | | | | | | | | | |
|
|
| | | | | | | | | | | | | 26,041,450 |
| | | | | | | | | | | |
|
|
Energy – Integrated — 0.1% | | | | | | | | | | | | |
Cenovus Energy, Inc. (Canada), Sr. Notes, 144A | | Baa2 | | 6.750% | | 11/15/39 | | | 975 | | | 1,062,802 |
Hess Corp., Sr. Unsec’d. Notes | | Baa2 | | 6.000% | | 01/15/40 | | | 400 | | | 396,099 |
Marathon Oil Canada Corp. (Canada), Gtd. Notes | | Baa1 | | 8.375% | | 05/01/12 | | | 360 | | | 402,966 |
Husky Energy, Inc. (Canada), Sr. Unsec’d. Notes | | Baa2 | | 7.250% | | 12/15/19 | | | 325 | | | 375,570 |
TNK-BP Finance SA (Luxembourg), Gtd. Notes, 144A | | Baa2 | | 7.500% | | 07/18/16 | | | 1,425 | | | 1,460,625 |
| | | | | | | | | | | |
|
|
| | | | | | | | | | | | | 3,698,062 |
| | | | | | | | | | | |
|
|
Energy – Other — 0.2% | | | | | | | | | | | | |
Devon Financing Corp. ULC (Canada), Gtd. Notes | | Baa1 | | 7.875% | | 09/30/31 | | | 225 | | | 281,905 |
Dolphin Energy Ltd. (United Arab Emirates), Sr. Sec’d. Notes, 144A | | Aa3 | | 5.888% | | 06/15/19 | | | 936 | | | 944,906 |
Halliburton Co., Sr. Unsec’d. Notes | | A2 | | 5.500% | | 10/15/10 | | | 150 | | | 156,103 |
Nexen, Inc. (Canada), Sr. Unsec’d. Notes | | Baa3 | | 6.400% | | 05/15/37 | | | 200 | | | 201,503 |
Pioneer Natural Resources Co., Sr. Unsec’d. Notes | | Ba1 | | 6.875% | | 05/01/18 | | | 1,500 | | | 1,484,130 |
Questar Market Resources, Inc., Sr. Unsec’d. Notes(a) | | Baa3 | | 6.800% | | 03/01/20 | | | 745 | | | 776,517 |
Valero Energy Corp., Gtd. Notes | | Baa2 | | 6.625% | | 06/15/37 | | | 255 | | | 239,275 |
Woodside Finance Ltd. (Australia), Gtd. Notes, 144A | | Baa1 | | 5.000% | | 11/15/13 | | | 1,315 | | | 1,345,317 |
XTO Energy, Inc., Sr. Unsec’d. Notes | | Baa2 | | 6.250% | | 08/01/17 | | | 585 | | | 662,417 |
| | | | | | | | | | | |
|
|
| | | | | | | | | | | | | 6,092,073 |
| | | | | | | | | | | |
|
|
Foods — 0.4% | | | | | | | | | | | | |
Anheuser-Busch InBev Worldwide, Inc., Gtd. Notes, 144A | | Baa2 | | 5.375% | | 01/15/20 | | | 1,800 | | | 1,836,466 |
Anheuser-Busch InBev Worldwide, Inc., Gtd. Notes, 144A | | Baa2 | | 8.000% | | 11/15/39 | | | 1,285 | | | 1,599,717 |
Anheuser-Busch InBev Worldwide, Inc., Gtd. Notes, 144A | | Baa2 | | 8.200% | | 01/15/39 | | | 250 | | | 316,125 |
Bunge Ltd. Finance Corp., Gtd. Notes(a) | | Baa2 | | 5.350% | | 04/15/14 | | | 1,040 | | | 1,063,161 |
Bunge Ltd. Finance Corp., Gtd. Notes | | Baa2 | | 8.500% | | 06/15/19 | | | 985 | | | 1,122,809 |
Cargill, Inc., Sr. Unsec’d. Notes, 144A (original cost $666,818; purchased 11/19/07)(d)(g) | | A2 | | 6.000% | | 11/27/17 | | | 670 | | | 714,108 |
ConAgra Foods, Inc., Sr. Unsec’d. Notes | | Baa2 | | 7.875% | | 09/15/10 | | | 46 | | | 48,154 |
Delhaize America, Inc., Gtd. Notes | | Baa3 | | 9.000% | | 04/15/31 | | | 752 | | | 962,787 |
Delhaize Group SA (Belgium), Gtd. Notes | | Baa3 | | 6.500% | | 06/15/17 | | | 480 | | | 521,295 |
General Mills, Inc., Sr. Unsec’d. Notes | | Baa1 | | 6.000% | | 02/15/12 | | | 1,050 | | | 1,133,660 |
SEE NOTES TO FINANCIAL STATEMENTS.
A57
| | | | | | |
| | | FLEXIBLE MANAGED PORTFOLIO (continued) | | |
| |
| SCHEDULE OF INVESTMENTS | | December 31, 2009 |
| | | | | | | | | | | | |
CORPORATE BONDS
(continued) | | Moody’s
Rating
(Unaudited)†
| | Interest
Rate
| | Maturity
Date
| | Principal
Amount
(000)#
| | Value
(Note 2)
|
| | | | | | | | | | | | | |
Foods (continued) | | | | | | | | | | | | |
H.J. Heinz Finance Co., Gtd. Notes, 144A | | Baa2 | | 7.125% | | 08/01/39 | | $ | 450 | | $ | 508,742 |
Kroger Co. (The), Gtd. Notes | | Baa2 | | 6.750% | | 04/15/12 | | | 45 | | | 49,149 |
Kroger Co. (The), Gtd. Notes | | Baa2 | | 6.800% | | 04/01/11 | | | 670 | | | 711,466 |
McDonald’s Corp., Sr. Unsec’d. Notes, MTN | | A3 | | 6.300% | | 03/01/38 | | | 685 | | | 755,594 |
Ralcorp Holdings, Inc., Sr. Notes, 144A | | Baa3 | | 6.625% | | 08/15/39 | | | 875 | | | 853,338 |
Tyson Foods, Inc., Gtd. Notes | | Ba3 | | 7.850% | | 04/01/16 | | | 735 | | | 753,375 |
Yum! Brands, Inc., Sr. Unsec’d. Notes | | Baa3 | | 8.875% | | 04/15/11 | | | 180 | | | 194,773 |
| | | | | | | | | | | |
|
|
| | | | | | | | | | | | | 13,144,719 |
| | | | | | | | | | | |
|
|
Healthcare & Pharmaceutical — 0.5% | | | | | | | | | | | | |
Abbott Laboratories, Sr. Unsec’d. Notes | | A1 | | 5.875% | | 05/15/16 | | | 1,145 | | | 1,262,922 |
AmerisourceBergen Corp., Gtd. Notes | | Baa3 | | 5.625% | | 09/15/12 | | | 915 | | | 974,249 |
Boston Scientific Corp., Sr. Unsec’d. Notes | | Ba1 | | 4.500% | | 01/15/15 | | | 910 | | | 911,857 |
Boston Scientific Corp., Sr. Unsec’d. Notes | | Ba1 | | 6.000% | | 01/15/20 | | | 565 | | | 577,304 |
Carefusion Corp., Sr. Unsec’d. Notes, 144A | | Baa3 | | 6.375% | | 08/01/19 | | | 355 | | | 380,035 |
Genentech, Inc., Sr. Unsec’d. Notes | | AA-(e) | | 4.750% | | 07/15/15 | | | 280 | | | 299,676 |
GlaxoSmithKline Capital, Inc., Gtd. Notes | | A1 | | 6.375% | | 05/15/38 | | | 870 | | | 963,852 |
HCA, Inc., Sec’d. Notes | | B2 | | 9.250% | | 11/15/16 | | | 1,925 | | | 2,066,969 |
Laboratory Corp. of America Holdings, Sr. Unsec’d. Notes | | Baa3 | | 5.625% | | 12/15/15 | | | 580 | | | 606,414 |
Merck & Co., Inc., Sr. Unsec’d. Notes | | Aa3 | | 5.750% | | 11/15/36 | | | 110 | | | 112,733 |
Merck & Co., Inc., Sr. Unsec’d. Notes | | Aa3 | | 5.850% | | 06/30/39 | | | 265 | | | 278,879 |
Merck & Co., Inc., Sr. Unsec’d. Notes | | Aa3 | | 5.950% | | 12/01/28 | | | 165 | | | 173,881 |
Schering-Plough Corp., Gtd. Notes(a) | | Aa3 | | 6.000% | | 09/15/17 | | | 884 | | | 981,899 |
Schering-Plough Corp., Gtd. Notes | | Aa3 | | 6.550% | | 09/15/37 | | | 340 | | | 386,140 |
Watson Pharmaceuticals, Inc., Sr. Unsec’d. Notes | | Ba1 | | 6.125% | | 08/15/19 | | | 445 | | | 459,148 |
Wyeth, Gtd. Notes | | A1 | | 5.500% | | 03/15/13 | | | 1,210 | | | 1,315,619 |
Wyeth, Gtd. Notes | | A1 | | 5.950% | | 04/01/37 | | | 1,715 | | | 1,788,364 |
Wyeth, Gtd. Notes | | A1 | | 6.450% | | 02/01/24 | | | 60 | | | 66,843 |
| | | | | | | | | | | |
|
|
| | | | | | | | | | | | | 13,606,784 |
| | | | | | | | | | | |
|
|
Healthcare Insurance — 0.2% | | | | | | | | | | | | |
Aetna, Inc., Sr. Unsec’d. Notes | | A3 | | 5.750% | | 06/15/11 | | | 390 | | | 408,995 |
Aetna, Inc., Sr. Unsec’d. Notes | | A3 | | 6.625% | | 06/15/36 | | | 515 | | | 528,080 |
Cigna Corp., Sr. Unsec’d. Notes | | Baa2 | | 6.150% | | 11/15/36 | | | 670 | | | 598,527 |
Coventry Health Care, Inc., Sr. Unsec’d. Notes | | Ba1 | | 6.125% | | 01/15/15 | | | 1,290 | | | 1,232,221 |
UnitedHealth Group, Inc., Sr. Unsec’d. Notes | | Baa1 | | 5.250% | | 03/15/11 | | | 1,350 | | | 1,398,881 |
UnitedHealth Group, Inc., Sr. Unsec’d. Notes | | Baa1 | | 6.000% | | 06/15/17 | | | 195 | | | 204,081 |
UnitedHealth Group, Inc., Sr. Unsec’d. Notes | | Baa1 | | 6.500% | | 06/15/37 | | | 420 | | | 414,161 |
UnitedHealth Group, Inc., Sr. Unsec’d. Notes | | Baa1 | | 6.625% | | 11/15/37 | | | 420 | | | 420,751 |
WellPoint, Inc., Sr. Unsec’d. Notes(a) | | Baa1 | | 5.000% | | 12/15/14 | | | 860 | | | 894,674 |
| | | | | | | | | | | |
|
|
| | | | | | | | | | | | | 6,100,371 |
| | | | | | | | | | | |
|
|
Insurance — 0.4% | | | | | | | | | | | | |
American International Group, Inc., Sr. Unsec’d. Notes | | A3 | | 4.250% | | 05/15/13 | | | 580 | | | 535,750 |
AXA SA (France), Sub. Notes | | A3 | | 8.600% | | 12/15/30 | | | 155 | | | 180,119 |
Berkshire Hathaway Finance Corp., Gtd. Notes | | Aa2 | | 4.750% | | 05/15/12 | | | 440 | | | 469,069 |
Liberty Mutual Group, Inc., Bonds, 144A | | Baa2 | | 7.000% | | 03/15/34 | | | 850 | | | 728,316 |
Lincoln National Corp., Sr. Unsec’d. Notes | | Baa2 | | 6.300% | | 10/09/37 | | | 492 | | | 450,579 |
Lincoln National Corp., Sr. Unsec’d. Notes | | Baa2 | | 8.750% | | 07/01/19 | | | 605 | | | 691,276 |
Marsh & McLennan Cos., Inc., Sr. Unsec’d. Notes | | Baa2 | | 5.150% | | 09/15/10 | | | 265 | | | 271,666 |
MetLife, Inc., Sr. Unsec’d. Notes | | A3 | | 5.700% | | 06/15/35 | | | 1,020 | | | 1,007,331 |
MetLife, Inc., Sr. Unsec’d. Notes | | A3 | | 6.125% | | 12/01/11 | | | 335 | | | 360,134 |
MetLife, Inc., Sr. Unsec’d. Notes | | A3 | | 6.375% | | 06/15/34 | | | 400 | | | 427,454 |
MetLife, Inc., Sr. Unsec’d. Notes | | A3 | | 6.750% | | 06/01/16 | | | 430 | | | 481,532 |
New York Life Insurance Co., Sub. Notes, 144A | | Aa2 | | 6.750% | | 11/15/39 | | | 660 | | | 674,962 |
Pacific Life Insurance Co., Sub. Notes, 144A (original cost $994,522; purchased 6/16/09)(g) | | A3 | | 9.250% | | 06/15/39 | | | 995 | | | 1,148,962 |
Teachers Insurance & Annuity Association of America, Notes, 144A | | Aa2 | | 6.850% | | 12/16/39 | | | 1,450 | | | 1,498,920 |
SEE NOTES TO FINANCIAL STATEMENTS.
A58
| | | | | | |
| | | FLEXIBLE MANAGED PORTFOLIO (continued) | | |
| |
| SCHEDULE OF INVESTMENTS | | December 31, 2009 |
| | | | | | | | | | | | |
CORPORATE BONDS
(continued) | | Moody’s
Rating
(Unaudited)†
| | Interest
Rate
| | Maturity
Date
| | Principal
Amount
(000)#
| | Value
(Note 2)
|
| | | | | | | | | | | | | |
Insurance (continued) | | | | | | | | | | | | |
Travelers Cos., Inc. (The), Sr. Unsec’d. Notes | | A2 | | 6.750% | | 06/20/36 | | $ | 685 | | $ | 756,111 |
W.R. Berkley Corp., Sr. Unsec’d. Notes | | Baa2 | | 5.600% | | 05/15/15 | | | 555 | | | 548,947 |
W.R. Berkley Corp., Sr. Unsec’d. Notes | | Baa2 | | 6.150% | | 08/15/19 | | | 460 | | | 436,633 |
XL Capital Ltd. (Cayman Islands), Sr. Unsec’d. Notes | | Baa2 | | 5.250% | | 09/15/14 | | | 85 | | | 83,242 |
| | | | | | | | | | | |
|
|
| | | | | | | | | | | | | 10,751,003 |
| | | | | | | | | | | |
|
|
Lodging — 0.2% | | | | | | | | | | | | |
Starwood Hotels & Resorts Worldwide, Inc., Sr. Unsec’d. Notes | | Ba1 | | 6.250% | | 02/15/13 | | | 1,645 | | | 1,696,406 |
Starwood Hotels & Resorts Worldwide, Inc., Sr. Unsec’d. Notes(a) | | Ba1 | | 6.750% | | 05/15/18 | | | 2,800 | | | 2,807,000 |
| | | | | | | | | | | |
|
|
| | | | | | | | | | | | | 4,503,406 |
| | | | | | | | | | | |
|
|
Media & Entertainment — 0.2% | | | | | | | | | | | | |
Gannett Co., Inc., Sr. Unsec’d. Notes | | Ba2 | | 6.375% | | 04/01/12 | | | 2,500 | | | 2,500,000 |
Historic TW, Inc., Sr. Unsec’d. Notes | | Baa2 | | 9.150% | | 02/01/23 | | | 505 | | | 609,451 |
News America, Inc., Gtd. Notes, 144A(a) | | Baa1 | | 6.900% | | 08/15/39 | | | 800 | | | 872,699 |
Time Warner, Inc., Gtd. Notes | | Baa2 | | 6.750% | | 04/15/11 | | | 640 | | | 678,081 |
Time Warner Cos., Inc., Gtd. Notes | | Baa2 | | 7.250% | | 10/15/17 | | | 790 | | | 884,738 |
Viacom, Inc., Sr. Unsec’d. Notes(a) | | Baa2 | | 6.750% | | 10/05/37 | | | 430 | | | 443,621 |
Viacom, Inc., Sr. Unsec’d. Notes | | Baa2 | | 6.875% | | 04/30/36 | | | 625 | | | 675,816 |
| | | | | | | | | | | |
|
|
| | | | | | | | | | | | | 6,664,406 |
| | | | | | | | | | | |
|
|
Metals — 0.2% | | | | | | | | | | | | |
Alcan, Inc. (Canada), Sr. Unsec’d. Notes | | BBB+(e) | | 4.500% | | 05/15/13 | | | 115 | | | 118,084 |
Alcan, Inc. (Canada), Sr. Unsec’d. Notes | | BBB+(e) | | 5.000% | | 06/01/15 | | | 600 | | | 615,993 |
Ispat Inland ULC (Canada), Gtd. Notes | | Baa3 | | 9.750% | | 04/01/14 | | | 1,745 | | | 1,832,250 |
Newmont Mining Corp., Gtd. Notes | | Baa2 | | 6.250% | | 10/01/39 | | | 880 | | | 881,052 |
Rio Tinto Finance USA Ltd. (Australia), Gtd. Notes | | Baa1 | | 5.875% | | 07/15/13 | | | 1,000 | | | 1,079,037 |
Southern Copper Corp., Sr. Unsec’d. Notes | | Baa3 | | 7.500% | | 07/27/35 | | | 125 | | | 123,855 |
United States Steel Corp., Sr. Unsec’d. Notes | | Ba3 | | 5.650% | | 06/01/13 | | | 2,580 | | | 2,567,121 |
| | | | | | | | | | | |
|
|
| | | | | | | | | | | | | 7,217,392 |
| | | | | | | | | | | |
|
|
Non-Captive Finance — 0.4% | | | | | | | | | | | | |
General Electric Capital Corp., Notes, MTN(a) | | Aa2 | | 3.500% | | 08/13/12 | | | 1,990 | | | 2,031,062 |
General Electric Capital Corp., Sr. Unsec’d. Notes, MTN | | Aa2 | | 5.550% | | 05/04/20 | | | 985 | | | 976,269 |
General Electric Capital Corp., Sr. Unsec’d. Notes, MTN | | Aa2 | | 5.875% | | 01/14/38 | | | 1,060 | | | 981,436 |
General Electric Capital Corp., Sr. Unsec’d. Notes, Ser. A, MTN | | Aa2 | | 6.125% | | 02/22/11 | | | 950 | | | 1,003,863 |
General Electric Capital Corp., Sr. Unsec’d. Notes, Ser. G, MTN | | Aa2 | | 6.000% | | 08/07/19 | | | 920 | | | 954,979 |
HSBC Finance Corp., Sr. Unsec’d. Notes | | A3 | | 5.700% | | 06/01/11 | | | 440 | | | 459,674 |
International Lease Finance Corp., Sr. Unsec’d. Notes | | B1 | | 6.375% | | 03/25/13 | | | 1,850 | | | 1,521,033 |
SLM Corp., Sr. Unsec’d. Notes, MTN | | Ba1 | | 8.450% | | 06/15/18 | | | 2,870 | | | 2,831,981 |
| | | | | | | | | | | |
|
|
| | | | | | | | | | | | | 10,760,297 |
| | | | | | | | | | | |
|
|
Packaging | | | | | | | | | | | | |
Sealed Air Corp., Sr. Unsec’d. Notes, 144A | | Baa3 | | 6.875% | | 07/15/33 | | | 515 | | | 484,516 |
| | | | | | | | | | | |
|
|
Paper — 0.1% | | | | | | | | | | | | |
International Paper Co., Sr. Unsec’d. Notes | | Baa3 | | 7.300% | | 11/15/39 | | | 1,080 | | | 1,145,730 |
International Paper Co., Sr. Unsec’d. Notes | | Baa3 | | 7.500% | | 08/15/21 | | | 510 | | | 571,440 |
| | | | | | | | | | | |
|
|
| | | | | | | | | | | | | 1,717,170 |
| | | | | | | | | | | |
|
|
Pipelines & Other — 0.2% | | | | | | | | | | | | |
DCP Midstream LLC, Sr. Unsec’d. Notes | | Baa2 | | 7.875% | | 08/16/10 | | | 1,760 | | | 1,829,738 |
Kinder Morgan Energy Partners LP, Sr. Unsec’d. Notes(a) | | Baa2 | | 6.500% | | 09/01/39 | | | 675 | | | 680,272 |
Oneok Partners LP, Gtd. Notes | | Baa2 | | 6.650% | | 10/01/36 | | | 420 | | | 428,368 |
Sempra Energy, Sr. Unsec’d. Notes | | Baa1 | | 6.000% | | 02/01/13 | | | 90 | | | 95,970 |
Spectra Energy Capital LLC, Gtd. Notes | | Baa2 | | 6.200% | | 04/15/18 | | | 3,190 | | | 3,387,825 |
Spectra Energy Capital LLC, Sr. Unsec’d. Notes | | Baa2 | | 6.250% | | 02/15/13 | | | 235 | | | 252,675 |
| | | | | | | | | | | |
|
|
| | | | | | | | | | | | | 6,674,848 |
| | | | | | | | | | | |
|
|
SEE NOTES TO FINANCIAL STATEMENTS.
A59
| | | | | | |
| | | FLEXIBLE MANAGED PORTFOLIO (continued) | | |
| |
| SCHEDULE OF INVESTMENTS | | December 31, 2009 |
| | | | | | | | | | | | |
CORPORATE BONDS
(continued) | | Moody’s
Rating
(Unaudited)†
| | Interest
Rate
| | Maturity
Date
| | Principal
Amount
(000)#
| | Value
(Note 2)
|
| | | | | | | | | | | | | |
Railroads — 0.1% | | | | | | | | | | | | |
Burlington Northern Santa Fe Corp., Sr. Unsec’d. Notes | | Baa1 | | 6.700% | | 08/01/28 | | $ | 670 | | $ | 718,144 |
CSX Corp., Sr. Unsec’d. Notes(a) | | Baa3 | | 6.150% | | 05/01/37 | | | 715 | | | 724,423 |
Norfolk Southern Corp., Sr. Unsec’d. Notes | | Baa1 | | 5.590% | | 05/17/25 | | | 525 | | | 510,367 |
Norfolk Southern Corp., Sr. Unsec’d. Notes | | Baa1 | | 7.800% | | 05/15/27 | | | 18 | | | 21,638 |
Union Pacific Corp., Sr. Unsec’d. Notes | | Baa2 | | 6.650% | | 01/15/11 | | | 750 | | | 791,080 |
| | | | | | | | | | | |
|
|
| | | | | | | | | | | | | 2,765,652 |
| | | | | | | | | | | |
|
|
Real Estate Investment Trusts — 0.2% | | | | | | | | | | | | |
Brandywine Operating Partnership LP, Gtd. Notes | | Baa3 | | 5.750% | | 04/01/12 | | | 361 | | | 367,966 |
Mack-Cali Realty LP, Sr. Unsec’d. Notes | | Baa2 | | 7.750% | | 08/15/19 | | | 765 | | | 791,588 |
Post Apartment Homes LP, Sr. Unsec’d. Notes | | Baa3 | | 5.450% | | 06/01/12 | | | 435 | | | 431,627 |
Post Apartment Homes LP, Sr. Unsec’d. Notes | | Baa3 | | 6.300% | | 06/01/13 | | | 660 | | | 656,202 |
Simon Property Group LP, Sr. Unsec’d. Notes | | A3 | | 5.750% | | 05/01/12 | | | 1,500 | | | 1,575,744 |
Simon Property Group LP, Sr. Unsec’d. Notes | | A3 | | 6.125% | | 05/30/18 | | | 2,800 | | | 2,844,766 |
| | | | | | | | | | | |
|
|
| | | | | | | | | | | | | 6,667,893 |
| | | | | | | | | | | |
|
|
Retailers — 0.6% | | | | | | | | | | | | |
CVS Caremark Corp., Sr. Unsec’d. Notes | | Baa2 | | 5.750% | | 08/15/11 | | | 1,000 | | | 1,064,875 |
CVS Caremark Corp., Sr. Unsec’d. Notes | | Baa2 | | 5.750% | | 06/01/17 | | | 1,640 | | | 1,730,879 |
CVS Caremark Corp., Sr. Unsec’d. Notes | | Baa2 | | 6.125% | | 09/15/39 | | | 750 | | | 743,324 |
Gamestop Corp. / Gamestop, Inc., Gtd. Notes | | Ba1 | | 8.000% | | 10/01/12 | | | 1,115 | | | 1,155,419 |
Home Depot, Inc. (The), Sr. Unsec’d. Notes | | Baa1 | | 5.875% | | 12/16/36 | | | 325 | | | 313,709 |
Kohl’s Corp., Sr. Unsec’d. Notes | | Baa1 | | 6.875% | | 12/15/37 | | | 1,015 | | | 1,151,164 |
Lowe’s Cos., Inc., Sr. Unsec’d. Notes | | A1 | | 6.500% | | 03/15/29 | | | 385 | | | 423,379 |
Macy’s Retail Holdings, Inc., Gtd. Notes | | Ba2 | | 5.350% | | 03/15/12 | | | 390 | | | 398,287 |
Macy’s Retail Holdings, Inc., Gtd. Notes | | Ba2 | | 5.875% | | 01/15/13 | | | 2,000 | | | 2,055,000 |
Nordstrom, Inc., Sr. Unsec’d. Notes(a) | | Baa2 | | 6.250% | | 01/15/18 | | | 4,500 | | | 4,871,115 |
Target Corp., Sr. Unsec’d. Notes | | A2 | | 7.000% | | 01/15/38 | | | 1,835 | | | 2,140,983 |
Wal-Mart Stores, Inc., Sr. Unsec’d. Notes | | Aa2 | | 5.250% | | 09/01/35 | | | 245 | | | 240,913 |
Wal-Mart Stores, Inc., Sr. Unsec’d. Notes | | Aa2 | | 6.200% | | 04/15/38 | | | 500 | | | 551,397 |
| | | | | | | | | | | |
|
|
| | | | | | | | | | | | | 16,840,444 |
| | | | | | | | | | | |
|
|
Technology — 0.4% | | | | | | | | | | | | |
Cisco Systems, Inc., Sr. Unsec’d. Notes | | A1 | | 4.450% | | 01/15/20 | | | 1,690 | | | 1,657,863 |
Computer Sciences Corp., Sr. Unsec’d. Notes, Ser. WI | | Baa1 | | 6.500% | | 03/15/18 | | | 1,800 | | | 1,964,336 |
Electronic Data Systems LLC., Sr. Unsec’d. Notes | | A2 | | 7.450% | | 10/15/29 | | | 120 | | | 141,996 |
Fiserv, Inc., Gtd. Notes | | Baa2 | | 6.125% | | 11/20/12 | | | 1,000 | | | 1,088,871 |
Intuit, Inc., Sr. Unsec’d. Notes | | Baa2 | | 5.400% | | 03/15/12 | | | 600 | | | 637,442 |
Motorola, Inc., Sr. Unsec’d. Notes | | Baa3 | | 8.000% | | 11/01/11 | | | 49 | | | 52,405 |
Oracle Corp., Sr. Unsec’d. Notes | | A2 | | 6.125% | | 07/08/39 | | | 1,215 | | | 1,275,793 |
Seagate Technology HDD Holdings (Cayman Islands), Gtd. Notes | | Ba3 | | 6.375% | | 10/01/11 | | | 1,000 | | | 1,017,500 |
Xerox Corp., Sr. Unsec’d. Notes(a) | | Baa2 | | 4.250% | | 02/15/15 | | | 2,720 | | | 2,701,039 |
| | | | | | | | | | | |
|
|
| | | | | | | | | | | | | 10,537,245 |
| | | | | | | | | | | |
|
|
Telecommunications — 0.8% | | | | | | | | | | | | |
America Movil SAB de CV (Mexico), Gtd. Notes(a) | | A3 | | 6.375% | | 03/01/35 | | | 580 | | | 598,726 |
AT&T Corp., Gtd. Notes | | A2 | | 8.000% | | 11/15/31 | | | 260 | | | 317,335 |
AT&T, Inc., Sr. Unsec’d. Notes | | A2 | | 5.300% | | 11/15/10 | | | 1,260 | | | 1,309,824 |
AT&T Mobility LLC, Sr. Unsec’d. Notes | | A2 | | 7.125% | | 12/15/31 | | | 505 | | | 564,429 |
Deutsche Telekom International Finance BV (Netherlands), Gtd. Notes | | Baa1 | | 8.750% | | 06/15/30 | | | 295 | | | 379,402 |
Embarq Corp., Sr. Unsec’d. Notes (original cost $349,979; purchased 05/12/06)(d)(g) | | Baa3 | | 7.082% | | 06/01/16 | | | 350 | | | 386,602 |
Embarq Corp., Sr. Unsec’d. Notes (original cost $1,626,279; purchased 05/12/06-04/10/07)(d)(g) | | Baa3 | | 7.995% | | 06/01/36 | | | 1,600 | | | 1,721,117 |
France Telecom SA (France), Sr. Unsec’d. Notes | | A3 | | 8.500% | | 03/01/31 | | | 375 | | | 499,055 |
Koninklijke KPN NV (Netherlands), Sr. Unsec’d. Notes | | Baa2 | | 8.000% | | 10/01/10 | | | 530 | | | 556,500 |
New Cingular Wireless Services, Inc., Gtd. Notes | | A2 | | 8.125% | | 05/01/12 | | | 640 | | | 723,157 |
New Cingular Wireless Services, Inc., Sr. Unsec’d. Notes | | A2 | | 8.750% | | 03/01/31 | | | 1,339 | | | 1,730,402 |
SEE NOTES TO FINANCIAL STATEMENTS.
A60
| | | | | | |
| | | FLEXIBLE MANAGED PORTFOLIO (continued) | | |
| |
| SCHEDULE OF INVESTMENTS | | December 31, 2009 |
| | | | | | | | | | | | |
CORPORATE BONDS
(continued) | | Moody’s
Rating
(Unaudited)†
| | Interest
Rate
| | Maturity
Date
| | Principal
Amount
(000)#
| | Value
(Note 2)
|
| | | | | | | | | | | | | |
Telecommunications (continued) | | | | | | | | | | | | |
PCCW-HKT Capital Ltd. (Virgin Islands (US)), Gtd. Notes, 144A | | Baa2 | | 8.000% | | 11/15/11 | | $ | 2,370 | | $ | 2,554,623 |
Qwest Capital Funding, Inc., Gtd. Notes | | B1 | | 7.250% | | 02/15/11 | | | 700 | | | 710,500 |
Qwest Corp., Sr. Unsec’d. Notes | | Ba1 | | 8.875% | | 03/15/12 | | | 2,000 | | | 2,150,000 |
Telecom Italia Capital SA (Luxembourg), Gtd. Notes | | Baa2 | | 5.250% | | 11/15/13 | | | 320 | | | 336,573 |
Telecom Italia Capital SA (Luxembourg), Gtd. Notes | | Baa2 | | 7.175% | | 06/18/19 | | | 2,095 | | | 2,335,638 |
Telefonica Emisiones SAU (Spain), Gtd. Notes | | Baa1 | | 5.877% | | 07/15/19 | | | 780 | | | 836,027 |
Telefonica Emisiones SAU (Spain), Gtd. Notes | | Baa1 | | 7.045% | | 06/20/36 | | | 210 | | | 239,799 |
Telefonos de Mexico SAB de CV (Mexico), Sr. Unsec’d. Notes, 144A(a) | | A3 | | 5.500% | | 11/15/19 | | | 255 | | | 248,309 |
TELUS Corp. (Canada), Sr. Unsec’d. Notes | | Baa1 | | 8.000% | | 06/01/11 | | | 899 | | | 973,260 |
United States Cellular Corp., Sr. Unsec’d. Notes | | Baa2 | | 6.700% | | 12/15/33 | | | 275 | | | 270,449 |
Verizon Communications, Inc., Sr. Unsec’d. Notes | | A3 | | 6.100% | | 04/15/18 | | | 3,400 | | | 3,695,491 |
Vodafone Group PLC (United Kingdom), Sr. Unsec’d. Notes | | Baa1 | | 7.750% | | 02/15/10 | | | 800 | | | 806,384 |
| | | | | | | | | | | |
|
|
| | | | | | | | | | | | | 23,943,602 |
| | | | | | | | | | | |
|
|
Tobacco — 0.2% | | | | | | | | | | | | |
Altria Group, Inc., Gtd. Notes | | Baa1 | | 9.250% | | 08/06/19 | | | 215 | | | 262,005 |
Altria Group, Inc., Gtd. Notes(a) | | Baa1 | | 9.700% | | 11/10/18 | | | 985 | | | 1,217,625 |
Altria Group, Inc., Gtd. Notes | | Baa1 | | 9.950% | | 11/10/38 | | | 140 | | | 182,491 |
Altria Group, Inc., Gtd. Notes | | Baa1 | | 10.200% | | 02/06/39 | | | 790 | | | 1,053,890 |
Lorillard Tobacco Co., Sr. Unsec’d. Notes(a) | | Baa2 | | 8.125% | | 06/23/19 | | | 765 | | | 841,030 |
Philip Morris International, Inc., Sr. Unsec’d. Notes | | A2 | | 4.875% | | 05/16/13 | | | 860 | | | 907,864 |
Reynolds American, Inc., Gtd. Notes | | Baa3 | | 7.250% | | 06/15/37 | | | 320 | | | 322,265 |
| | | | | | | | | | | |
|
|
| | | | | | | | | | | | | 4,787,170 |
| | | | | | | | | | | |
|
|
TOTAL CORPORATE BONDS
(cost $270,471,604) | | | 279,680,599 |
| | | | | | | | | | | |
|
|
| MORTGAGE-BACKED SECURITIES — 10.6% | | | | | | | | | | |
Federal Home Loan Mortgage Corporation | | | | 4.500% | | 02/01/19-07/01/20 | | | 4,342 | | | 4,508,231 |
Federal Home Loan Mortgage Corporation | | | | 5.000% | | 07/01/18-05/01/34 | | | 7,762 | | | 8,110,347 |
Federal Home Loan Mortgage Corporation | | | | 5.000% | | TBA 30 YR | | | 5,000 | | | 5,126,560 |
Federal Home Loan Mortgage Corporation(c) | | | | 5.214% | | 12/01/35 | | | 2,387 | | | 2,511,410 |
Federal Home Loan Mortgage Corporation | | | | 5.500% | | 12/01/33-05/01/38 | | | 10,490 | | | 11,024,532 |
Federal Home Loan Mortgage Corporation | | | | 5.500% | | TBA 30 YR | | | 18,000 | | | 18,855,000 |
Federal Home Loan Mortgage Corporation(c) | | | | 5.548% | | 06/01/36 | | | 2,970 | | | 3,130,489 |
Federal Home Loan Mortgage Corporation | | | | 6.000% | | 03/01/32-12/01/33 | | | 2,266 | | | 2,436,973 |
Federal Home Loan Mortgage Corporation | | | | 6.500% | | 12/01/14 | | | 194 | | | 208,892 |
Federal Home Loan Mortgage Corporation | | | | 7.000% | | 01/01/31-11/01/33 | | | 2,850 | | | 3,138,417 |
Federal National Mortgage Association(c) | | | | 3.233% | | 07/01/33 | | | 740 | | | 762,375 |
Federal National Mortgage Association | | | | 4.000% | | 06/01/19 | | | 1,371 | | | 1,401,176 |
Federal National Mortgage Association | | | | 4.000% | | TBA 15 YR | | | 6,000 | | | 6,014,064 |
Federal National Mortgage Association | | | | 4.500% | | 11/01/18-01/01/35 | | | 10,774 | | | 11,062,329 |
Federal National Mortgage Association | | | | 4.500% | | TBA 30 YR | | | 10,000 | | | 9,981,250 |
Federal National Mortgage Association | | | | 5.000% | | 10/01/18-05/01/36 | | | 29,419 | | | 30,315,867 |
Federal National Mortgage Association | | | | 5.000% | | TBA 30 YR | | | 2,000 | | | 2,052,188 |
Federal National Mortgage Association | | | | 5.500% | | 03/01/16-06/01/38 | | | 46,704 | | | 49,100,986 |
Federal National Mortgage Association | | | | 5.500% | | TBA 15 YR | | | 6,000 | | | 6,345,000 |
Federal National Mortgage Association | | | | 5.500% | | TBA 30 YR | | | 25,250 | | | 26,429,655 |
Federal National Mortgage Association(c) | | | | 5.921% | | 06/01/37 | | | 7,740 | | | 8,230,697 |
Federal National Mortgage Association | | | | 6.000% | | 04/01/13-08/01/38 | | | 25,264 | | | 26,923,258 |
Federal National Mortgage Association | | | | 6.000% | | TBA 30 YR | | | 30,500 | | | 32,301,391 |
Federal National Mortgage Association | | | | 6.500% | | 07/01/17-09/01/37 | | | 10,131 | | | 10,891,434 |
Federal National Mortgage Association | | | | 7.000% | | 08/01/11-07/01/32 | | | 714 | | | 793,668 |
Federal National Mortgage Association | | | | 7.500% | | 06/01/12-05/01/32 | | | 315 | | | 344,769 |
Government National Mortgage Association | | | | 4.500% | | TBA 30 YR | | | 8,000 | | | 8,070,284 |
SEE NOTES TO FINANCIAL STATEMENTS.
A61
| | | | | | |
| | | FLEXIBLE MANAGED PORTFOLIO (continued) | | |
| |
| SCHEDULE OF INVESTMENTS | | December 31, 2009 |
| | | | | | | | | | | | |
MORTGAGE-BACKED SECURITIES
(continued) | | Moody’s
Rating
(Unaudited)†
| | Interest
Rate
| | Maturity
Date
| | Principal
Amount
(000)#
| | Value
(Note 2)
|
| | | | | | | | | | | | | |
Government National Mortgage Association | | | | 5.500% | | 11/15/32-02/15/36 | | $ | 9,603 | | $ | 10,123,962 |
Government National Mortgage Association | | | | 6.000% | | 02/15/33-10/15/34 | | | 3,885 | | | 4,138,827 |
Government National Mortgage Association | | | | 6.500% | | 10/15/23-07/15/35 | | | 4,231 | | | 4,540,112 |
Government National Mortgage Association | | | | 8.000% | | 01/15/24-04/15/25 | | | 98 | | | 112,188 |
| | | | | | | | | | | |
|
|
TOTAL MORTGAGE-BACKED SECURITIES
(cost $301,109,630) | | | 308,986,331 |
| | | | | | | | | | | |
|
|
| MUNICIPAL BONDS — 0.2% | | | | | | | | | | | | |
Bay Area Toll Authority, BABs | | Aa3 | | 6.263% | | 04/01/49 | | | 1,325 | | | 1,270,689 |
New Jersey State Turnpike Authority, BABs | | A3 | | 7.414% | | 01/01/40 | | | 450 | | | 507,240 |
New York City Transitional Finance Authority, BABs | | Aa2 | | 5.767% | | 08/01/36 | | | 1,130 | | | 1,095,162 |
State of California, BABs | | Baa1 | | 7.300% | | 10/01/39 | | | 1,270 | | | 1,200,252 |
State of California, BABs(a) | | Baa1 | | 7.550% | | 04/01/39 | | | 245 | | | 240,707 |
State of Washington, BABs | | Aa1 | | 5.481% | | 08/01/39 | | | 355 | | | 343,434 |
| | | | | | | | | | | |
|
|
TOTAL MUNICIPAL BONDS
(cost $4,788,780) | | | 4,657,484 |
| | | | | | | | | | | |
|
|
| NON-CORPORATE FOREIGN AGENCIES — 0.3% | | | | | | | | | | | | |
Commonwealth Bank of Australia (Australia), 144A | | Aaa | | 2.700% | | 11/25/14 | | | 7,435 | | | 7,286,754 |
Pemex Project Funding Master Trust, Gtd. Notes | | Baa1 | | 8.625% | | 12/01/23 | | | 350 | | | 422,625 |
RSHB Capital SA For OJSC Russian Agricultural Bank (Luxembourg), Sr. Sec’d. Notes, 144A | | Baa1 | | 6.299% | | 05/15/17 | | | 2,190 | | | 2,205,330 |
| | | | | | | | | | | |
|
|
TOTAL NON-CORPORATE FOREIGN AGENCIES
(cost $10,029,329) | | | 9,914,709 |
| | | | | | | | | | | |
|
|
| NON-CORPORATE SOVEREIGN | | | | | | | | | | | | |
Qatar Government International Bond (Qatar), 144A (cost $738,409)(a) | | Aa2 | | 6.400% | | 01/20/40 | | | 740 | | | 743,700 |
| | | | | | | | | | | |
|
|
| RESIDENTIAL MORTGAGE-BACKED SECURITIES —0.3% | | | | | | | | |
Amortizing Residential Collateral Trust, Ser. 2002-BC7, Class M2(c) | | CC(e) | | 1.581% | | 10/25/32 | | | 107 | | | 8,139 |
CDC Mortgage Capital Trust, Ser. 2002-HE3, Class M1(c) | | Baa2 | | 1.881% | | 03/25/33 | | | 547 | | | 349,620 |
Centex Home Equity, Ser. 2005-A, Class M2(c) | | Aa3 | | 0.731% | | 01/25/35 | | | 1,790 | | | 1,342,191 |
Credit-Based Asset Servicing And Securitization LLC, Ser. 2005-CB6, Class A3 | | A3 | | 5.120% | | 07/25/35 | | | 536 | | | 448,455 |
Equity One ABS, Inc., Ser. 2004-3, Class M1 | | Aa2 | | 5.700% | | 07/25/34 | | | 793 | | | 603,058 |
First Franklin Mortgage Loan Trust, Ser. 2005-FFH1, Class M2(c) | | Ba3 | | 0.751% | | 06/25/36 | | | 1,450 | | | 157,382 |
HFC Home Equity Loan, Ser. 2005-2, Class M2(c) | | Aa1 | | 0.723% | | 01/20/35 | | | 422 | | | 348,462 |
Long Beach Mortgage Loan Trust, Ser. 2004-2, Class M1(c) | | Aa2 | | 0.761% | | 06/25/34 | | | 1,250 | | | 864,264 |
Morgan Stanley ABS Capital I, Ser. 2004-NC1, Class M1(c) | | Aa2 | | 0.931% | | 12/25/33 | | | 1,193 | | | 879,185 |
Morgan Stanley Dean Witter Capital I, Ser. 2002-HE1, Class M1(c) | | B3 | | 1.131% | | 07/25/32 | | | 1,065 | | | 711,711 |
Morgan Stanley Dean Witter Capital I, Ser. 2002-NC4, Class M1(c) | | A2 | | 1.506% | | 09/25/32 | | | 881 | | | 628,263 |
Morgan Stanley Dean Witter Capital I, Ser. 2002-NC2, Class M2, 144A(c) | | NR | | 2.556% | | 04/25/32 | | | 351 | | | 104,888 |
Saxon Asset Securities Trust, Ser. 2005-2, Class M2(c) | | A2 | | 0.671% | | 10/25/35 | | | 1,170 | | | 338,232 |
Securitized Asset Backed Receivables LLC Trust, Ser. 2004-OP1, Class M1(c) | | Aa2 | | 0.996% | | 02/25/34 | | | 1,325 | | | 995,484 |
Securitized Asset Backed Receivables LLC Trust, Ser. 2006-FR3, Class A3(c) | | Caa1 | | 0.481% | | 05/25/36 | | | 1,100 | | | 364,367 |
| | | | | | | | | | | |
|
|
TOTAL RESIDENTIAL MORTGAGE-BACKED SECURITIES
(cost $13,221,757) | | | 8,143,701 |
| | | | | | | | | | | |
|
|
SEE NOTES TO FINANCIAL STATEMENTS.
A62
| | | | | | |
| | | FLEXIBLE MANAGED PORTFOLIO (continued) | | |
| |
| SCHEDULE OF INVESTMENTS | | December 31, 2009 |
| | | | | | | | | | | | | |
| U.S. GOVERNMENT AGENCY OBLIGATIONS — 0.8% | | | | Interest
Rate
| | Maturity
Date
| | Principal
Amount
(000)#
| | Value
(Note 2)
| |
| | | | | | | | | | | | | | |
Western Corporate Federal Credit Union, US Gov’t. Gtd. Notes | | | | 1.750% | | 11/02/12 | | $ | 2,610 | | $ | 2,598,281 | |
Federal Farm Credit Bank(a) | | | | 4.875% | | 01/17/17 | | | 855 | | | 909,828 | |
Federal Home Loan Bank | | | | 5.000% | | 11/17/17 | | | 635 | | | 686,892 | |
Federal Home Loan Bank | | | | 5.625% | | 06/11/21 | | | 2,390 | | | 2,601,699 | |
Federal Home Loan Mortgage Corporation(a) | | | | 3.750% | | 03/27/19 | | | 4,835 | | | 4,740,335 | |
Federal National Mortgage Association | | | | 0.875% | | 01/12/12 | | | 115 | | | 114,114 | |
Federal National Mortgage Association(a) | | | | 2.625% | | 11/20/14 | | | 2,640 | | | 2,619,529 | |
Federal National Mortgage Association | | | | 5.000% | | 02/13/17 | | | 3,070 | | | 3,332,476 | |
Federal National Mortgage Association(a) | | | | 6.625% | | 11/15/30 | | | 2,245 | | | 2,698,059 | |
Resolution Funding Corp. Interest Strip(h) | | | | 4.980% | | 04/15/18 | | | 2,615 | | | 1,843,421 | |
Tennessee Valley Authority | | | | 4.500% | | 04/01/18 | | | 1,445 | | | 1,470,503 | |
Tennessee Valley Authority, Ser. E | | | | 6.250% | | 12/15/17 | | | 560 | | | 638,735 | |
| | | | | | | | | | | |
|
|
|
TOTAL U.S. GOVERNMENT AGENCY OBLIGATIONS
(cost $24,465,153) | | | 24,253,872 | |
| | | | | | | | | | | |
|
|
|
| U.S. GOVERNMENT TREASURY OBLIGATIONS — 4.3% | | | | | | | | | | | | | |
U.S. Treasury Bonds | | | | 4.500% | | 02/15/36 | | | 3,150 | | | 3,102,750 | |
U.S. Treasury Bonds(a) | | | | 4.500% | | 08/15/39 | | | 2,470 | | | 2,414,040 | |
U.S. Treasury Bonds | | | | 6.250% | | 08/15/23 | | | 10,495 | | | 12,534,966 | |
U.S. Treasury Bonds | | | | 7.125% | | 02/15/23 | | | 8,200 | | | 10,516,500 | |
U.S. Treasury Bonds(i) | | | | 8.875% | | 08/15/17 | | | 5,505 | | | 7,504,003 | |
U.S. Treasury Inflation Index Notes | | | | 1.625% | | 01/15/15 | | | 19,087 | | | 19,850,869 | |
U.S. Treasury Inflation Index Notes | | | | 3.500% | | 01/15/11 | | | 5,279 | | | 5,475,385 | |
U.S. Treasury Notes(a) | | | | 0.750% | | 11/30/11 | | | 3,155 | | | 3,134,420 | |
U.S. Treasury Notes(a) | | | | 2.125% | | 11/30/14 | | | 3,835 | | | 3,744,225 | |
U.S. Treasury Notes | | | | 2.625% | | 12/31/14 | | | 10,560 | | | 10,529,482 | |
U.S. Treasury Notes(a) | | | | 3.375% | | 11/15/19 | | | 9,110 | | | 8,762,727 | |
U.S. Treasury Strips Coupon(n) | | | | 3.980% | | 11/15/18 | | | 1,230 | | | 864,437 | |
U.S. Treasury Strips Coupon(n) | | | | 4.830% | | 11/15/24 | | | 10,880 | | | 5,309,962 | |
U.S. Treasury Strips Coupon(n) | | | | 4.840% | | 05/15/24 | | | 4,045 | | | 2,034,582 | |
U.S. Treasury Strips Coupon(n) | | | | 4.860% | | 08/15/24 | | | 6,980 | | | 3,459,735 | |
U.S. Treasury Strips Coupon(n) | | | | 5.270% | | 05/15/20 | | | 4,565 | | | 2,935,971 | |
U.S. Treasury Strips Coupon(n) | | | | 7.140% | | 05/15/25 | | | 9,500 | | | 4,493,500 | |
U.S. Treasury Strips Coupon(n) | | | | 7.450% | | 05/15/26 | | | 5,000 | | | 2,234,300 | |
U.S. Treasury Strips Principal(a)(h) | | | | 4.070% | | 02/15/19 | | | 4,295 | | | 2,984,110 | |
U.S. Treasury Strips Principal(a)(h) | | | | 4.800% | | 11/15/24 | | | 13,500 | | | 6,664,666 | |
U.S. Treasury Strips Principal(h) | | | | 6.260% | | 02/15/23 | | | 10,900 | | | 5,944,620 | |
| | | | | | | | | | | |
|
|
|
TOTAL U.S. GOVERNMENT TREASURY OBLIGATIONS
(cost $124,995,757) | | | 124,495,250 | |
| | | | | | | | | | | |
|
|
|
TOTAL LONG-TERM INVESTMENTS
(cost $2,410,775,646) | | | 2,721,315,127 | |
| | | | | | | | | | | |
|
|
|
| SHORT-TERM INVESTMENTS — 15.6% | | | | | | | | | | | | | |
U.S. GOVERNMENT TREASURY OBLIGATION — 0.2% | | | | | | | | | | | | | |
U.S. Treasury Bill (cost $4,396,836)(j) | | | | 0.157% | | 06/17/10 | | | 4,400 | | | 4,396,251 | |
| | | | | | | | | | | |
|
|
|
| | | | | |
| | | | | | | | | Shares
| | | |
AFFILIATED MUTUAL FUNDS — 15.4% | | | | | | | | | | | | | |
Dryden Core Investment Fund — Short-Term Bond Series
(cost $167,366,748) (Note 4)(k) | | | 16,901,556 | | | 144,677,318 | |
Dryden Core Investment Fund — Taxable Money Market Series
(cost $302,386,487; includes $156,084,644 of cash collateral received for securities on loan) (Note 4)(k)(l) | | | 302,386,487 | | | 302,386,487 | |
| | | | | | | | | | | |
|
|
|
TOTAL AFFILIATED MUTUAL FUNDS
(cost $469,753,234) | | | 447,063,805 | |
| | | | | | | | | | | |
|
|
|
TOTAL SHORT-TERM INVESTMENTS
(cost $474,150,070) | | | 451,460,056 | |
| | | | | | | | | | | |
|
|
|
TOTAL INVESTMENTS(m) — 109.2%
(cost $2,884,925,716) | | | 3,172,775,183 | |
LIABILITIES IN EXCESS OF OTHER ASSETS(o) — (9.2)% | | | (266,782,405 | ) |
| | | | | | | | | | | |
|
|
|
NET ASSETS — 100.0% | | $ | 2,905,992,778 | |
| | | | | | | | | | | |
|
|
|
SEE NOTES TO FINANCIAL STATEMENTS.
A63
| | | | | | |
| | | FLEXIBLE MANAGED PORTFOLIO (continued) | | |
| |
| SCHEDULE OF INVESTMENTS | | December 31, 2009 |
The following abbreviations are used in portfolio descriptions:
| | |
| 144A | | Security was purchased pursuant to Rule 144A under the Securities Act of 1933 and may not be resold subject to that rule except to qualified institutional buyers. Unless otherwise noted, 144A securities are deemed to be liquid. |
| BABs | | Build America Bonds |
| CDO | | Collateralized Debt Obligation |
| I/O | | Interest Only |
| MTN | | Medium Term Note |
| NR | | Not Rated by Moody’s or Standard & Poor’s |
| TBA | | To Be Announced |
| ULC | | Unlimited Liability Corporation |
| # | Principal amount shown in U.S. dollars unless otherwise stated. |
| † | The rating reflected is as of December 31, 2009. Ratings of certain bonds may have changed subsequent to that date. |
| (a) | All or a portion of security is on loan. The aggregate market value of such securities is $149,443,792; cash collateral of $156,084,644 (included in liabilities) was received with which the Portfolio purchased highly liquid short-term investments. |
| (b) | Non-income producing security. |
| (c) | Indicates a variable rate security. The maturity date presented for these instruments is the latter of the next date on which the security can be redeemed at par or the next date on which the rate of interest is adjusted. The interest rate shown reflects the rate in effect at December 31, 2009. |
| (d) | Indicates a security that has been deemed illiquid. |
| (e) | Standard & Poor’s Rating. |
| (f) | Represents issuer in default on interest payments and/or principal repayment; non-income producing security. |
| (g) | Indicates a restricted security; the aggregate original cost of such securities is $5,773,675. The aggregate value of $6,140,175 is approximately 0.2% of net assets. |
| (h) | Represents zero-coupon bond. Rate shown reflects the effective yield at December 31, 2009. |
| (i) | Security segregated as collateral for futures contracts. |
| (j) | Rate quoted represents yield-to-maturity as of purchase date. |
| (k) | Prudential Investments LLC, the manager of the Portfolio, also serves as manager of the Dryden Core Investment Fund—Taxable Money Market Series and the Dryden Core Investment Fund—Short-Term Bond Series. |
| (l) | Represents security, or a portion thereof, purchased with cash collateral received for securities on loan. |
| (m) | As of December 31, 2009, one security representing $2,219,029 and 0.08% of net assets was fair valued in accordance with the policies adopted by the Board of Trustees. |
| (n) | Rate shown reflects the effective yield at December 31, 2009. |
| (o) | Liabilities in excess of other assets includes net unrealized appreciation (depreciation) on futures contracts, interest rate and credit default swap agreements as follows: |
Open futures contracts outstanding at December 31, 2009:
| | | | | | | | | | | | | | |
Number of
Contracts
| | Type
| | Expiration
Date
| | Value at
Trade Date
| | Value at
December 31, 2009
| | Unrealized
Appreciation
(Depreciation)
| |
| Long Positions: | | | | | | | | | | | | | | |
| 123 | | U.S. Treasury 10 Yr. Notes | | Mar. 2010 | | $ | 14,262,634 | | $ | 14,200,735 | | $ | (61,899 | ) |
| 365 | | U.S. Treasury 2 Yr. Notes | | Mar. 2010 | | | 79,336,237 | | | 78,936,953 | | | (399,284 | ) |
| 805 | | U.S. Treasury 5 Yr. Notes | | Mar. 2010 | | | 93,365,192 | | | 92,078,164 | | | (1,287,028 | ) |
| 175 | | S&P 500 Index | | Mar. 2010 | | | 47,801,762 | | | 48,593,125 | | | 791,363 | |
| | | | | | | | | | | | |
|
|
|
| | | | | | | | | | | | | $ | (956,848 | ) |
| | | | | | | | | | | | |
|
|
|
| Short Position: | | | | | | | | | | | | | | |
| 378 | | U.S. Long Bond | | Mar. 2010 | | | 45,507,295 | | | 43,611,750 | | | 1,895,545 | |
| | | | | | | | | | | | |
|
|
|
| | | | | | | | | | | | | $ | 938,697 | |
| | | | | | | | | | | | |
|
|
|
SEE NOTES TO FINANCIAL STATEMENTS.
A64
| | | | | | |
| | | FLEXIBLE MANAGED PORTFOLIO (continued) | | |
| |
| SCHEDULE OF INVESTMENTS | | December 31, 2009 |
Interest rate swap agreements outstanding at December 31, 2009:
| | | | | | | | | | | | | | | | | | | | |
Counterparty
| | Termination
Date
| | Notional
Amount
(000)#
| | Fixed
Rate
| | Floating Rate
| | Fair
Value
| | | Upfront
Premiums
Paid/(Received)
| | Unrealized
Appreciation/
(Depreciation)
| |
Deutsche Bank AG(b) | | 5/31/2014 | | $ | 12,200 | | 2.355% | | 3 Month LIBOR | | $ | (260,364 | ) | | $ | — | | $ | (260,364 | ) |
Morgan Stanley Capital Services, Inc.(a) | | 2/15/2036 | | | 3,060 | | 4.128% | | 3 Month LIBOR | | | 172,008 | | | | — | | | 172,008 | |
| | | | | | | | | | | |
|
|
| |
|
| |
|
|
|
| | | | | | | | | | | | $ | (88,356 | ) | | $ | — | | $ | (88,356 | ) |
| | | | | | | | | | | |
|
|
| |
|
| |
|
|
|
| (a) | Portfolio pays the fixed rate and receives the floating rate. |
| (b) | Portfolio pays the floating rate and receives the fixed rate. |
| # | Notional amount is shown in U.S. dollars unless otherwise stated. |
Credit default swap agreements outstanding at December 31, 2009:
| | | | | | | | | | | | | | | | | | | | | |
Counterparty
| | Termination
Date
| | Notional
Amount
(000)#(4)
| | Fixed
Rate
| | Reference Entity/Obligation
| | Fair
Value
| | | Upfront
Premiums
Paid/
(Received)
| | | Unrealized
Appreciation/
(Depreciation)
| |
Credit Default Swaps on Corporate Issues—Buy protection(1) | | | | | | | | | | | | |
Barclays Bank PLC | | 9/20/2012 | | $ | 2,900 | | 0.595% | | Fortune Brands, Inc.,
5.375%, 01/15/16 | | $ | 13,288 | | | $ | — | | | $ | 13,288 | |
Barclays Bank PLC | | 3/20/2018 | | | 1,800 | | 1.220% | | Computer Sciences Corp.,
5.000%, 02/15/13 | | | (80,143 | ) | | | — | | | | (80,143 | ) |
Citibank NA | | 9/20/2012 | | | 3,200 | | 0.320% | | Altria Group, Inc.,
7.000%, 11/04/13 | | | 35,999 | | | | — | | | | 35,999 | |
Credit Suisse International | | 6/20/2018 | | | 3,400 | | 0.970% | | Verizon Communications, Inc.,
4.900%, 09/15/15 | | | (32,404 | ) | | | — | | | | (32,404 | ) |
Deutsche Bank AG | | 9/20/2011 | | | 1,000 | | 1.000% | | Dish DBS Corp.,
6.625%, 10/01/14 | | | (405 | ) | | | 11,828 | | | | (12,233 | ) |
Deutsche Bank AG | | 3/20/2012 | | | 2,000 | | 5.000% | | Gannett Co., Inc.,
6.375%, 4/01/12 | | | (128,921 | ) | | | (68,315 | ) | | | (60,606 | ) |
Deutsche Bank AG | | 12/20/2012 | | | 2,000 | | 1.000% | | Macy’s Retail Holdings, Inc.,
8.000%, 7/15/12 | | | 22,348 | | | | 70,988 | | | | (48,640 | ) |
Deutsche Bank AG | | 6/20/2013 | | | 1,850 | | 2.000% | | International Lease Finance Corp., 4.150%, 01/20/15 | | | 338,559 | | | | — | | | | 338,559 | |
Deutsche Bank AG | | 6/20/2013 | | | 2,000 | | 1.000% | | US Steel Corp.,
6.650%, 6/01/37 | | | 86,635 | | | | 109,913 | | | | (23,278 | ) |
Deutsche Bank AG | | 3/20/2014 | | | 1,645 | | 7.050% | | Starwood Hotels & Resorts Worldwide,
7.875%, 05/01/12 | | | (374,480 | ) | | | — | | | | (374,480 | ) |
Deutsche Bank AG | | 3/20/2018 | | | 4,500 | | 0.990% | | Nordstrom, Inc.,
6.950%, 03/15/28 | | | 29,111 | | | | — | | | | 29,111 | |
Deutsche Bank AG | | 6/20/2018 | | | 2,200 | | 1.150% | | Spectra Energy Capital LLC,
6.250%, 02/15/13 | | | (58,757 | ) | | | — | | | | (58,757 | ) |
JPMorgan Chase Bank | | 6/20/2014 | | | 1,150 | | 0.650% | | Bunge Ltd. Finance Corp.,
5.350%, 04/15/14 | | | 25,835 | | | | — | | | | 25,835 | |
Merrill Lynch Capital Services, Inc. | | 9/20/2016 | | | 735 | | 1.730% | | Tyson Foods, Inc.,
7.850%, 04/01/16 | | | 31,312 | | | | — | | | | 31,312 | |
Merrill Lynch Capital Services, Inc. | | 6/20/2018 | | | 1,800 | | 3.050% | | SLM Corp.,
5.125%, 08/27/12 | | | 210,897 | | | | — | | | | 210,897 | |
Merrill Lynch Capital Services, Inc. | | 6/20/2018 | | | 500 | | 1.130% | | Spectra Energy Capital LLC,
6.250%, 02/15/13 | | | (12,623 | ) | | | — | | | | (12,623 | ) |
Merrill Lynch Capital Services, Inc. | | 6/20/2018 | | | 2,800 | | 1.450% | | Starwood Hotels & Resorts Worldwide, Inc.,
6.750%, 05/15/18 | | | 72,406 | | | | — | | | | 72,406 | |
Morgan Stanley Capital Services, Inc. | | 3/20/2012 | | | 500 | | 5.000% | | Gannett Co., Inc.,
6.375%, 04/01/12 | | | (32,230 | ) | | | (17,617 | ) | | | (14,613 | ) |
Morgan Stanley Capital Services, Inc. | | 3/20/2018 | | | 1,500 | | 0.700% | | Avon Products, Inc.,
6.500%, 03/01/19 | | | (30,270 | ) | | | — | | | | (30,270 | ) |
SEE NOTES TO FINANCIAL STATEMENTS.
A65
| | | | | | |
| | | FLEXIBLE MANAGED PORTFOLIO (continued) | | |
| |
| SCHEDULE OF INVESTMENTS | | December 31, 2009 |
Credit default swap agreements outstanding at December 31, 2009 (continued):
| | | | | | | | | | | | | | | | | | |
Counterparty
| | Termination
Date
| | Notional
Amount
(000)#(4)
| | Fixed
Rate
| | Reference Entity/Obligation
| | Fair
Value
| | Upfront
Premiums
Paid/
(Received)
| | Unrealized
Appreciation/
(Depreciation)
|
Credit Default Swaps on Corporate Issues—Buy protection(1) (continued) | | | | | | | | | |
Morgan Stanley Capital Services, Inc. | | 6/20/2018 | | $ | 1,700 | | 1.000% | | Newell Rubbermaid, Inc.,
0.000%, 07/15/28 | | $ | 45,843 | | $ | — | | $ | 45,843 |
Morgan Stanley Capital Services, Inc. | | 6/20/2018 | | | 2,800 | | 0.970% | | Simon Property Group L.P.,
5.250%, 12/01/16 | | | 105,094 | | | — | | | 105,094 |
| | | | | | | | | | | |
|
| |
|
| |
|
|
| | | | | | | | | | | | $ | 267,094 | | $ | 106,797 | | $ | 160,297 |
| | | | | | | | | | | |
|
| |
|
| |
|
|
| | | | | | | | | | | | | | | | | | |
Counterparty
| | Termination
Date
| | Notional
Amount
(000)#(4)
| | Fixed
Rate
| | Reference Entity/Obligation
| | Fair
Value
| | Upfront
Premiums
Paid/
(Received)
| | Unrealized
Appreciation
|
Credit Default Swaps on Asset-Backed Issues—Buy protection(1) | | | | | | | | | |
Merrill Lynch Capital Services, Inc. | | 3/25/2036 | | $ | 842 | | 3.720% | | Ameriquest Mortgage Securities, Inc., Ser. 2006-R1, Class M9,
2.731%, 03/25/36 | | $ | 814,732 | | $ | — | | $ | 814,732 |
| | | | | | | | | | | |
|
| |
|
| |
|
|
| | | | | | | | | | | | | | | | | | | | |
Counterparty
| | Termination
Date
| | Notional
Amount
(000)#(4)
| | Fixed
Rate
| | Reference Entity/Obligation
| | Fair
Value(3)
| | | Upfront
Premiums
Paid/
(Received)
| | Unrealized
Depreciation
| |
Credit Default Swaps on Asset-Backed Issues—Sell protection(2) | | | | | | | | | | | |
Merrill Lynch Capital Services, Inc. | | 3/25/2036 | | $ | 842 | | 9.000% | | Ameriquest Mortgage Securities, Inc., Ser. 2006-R1, Class M9,
2.731%, 03/25/36 | | $ | (790,816 | ) | | $ | — | | $ | (790,816 | ) |
| | | | | | | | | | | |
|
|
| |
|
| |
|
|
|
The Portfolio entered into credit default swaps as the protection seller on asset-backed issues to take an active short position with respect to the likelihood of a particular issuer’s default.
| (1) | If the Portfolio is a buyer of protection, it pays the fixed rate. When a credit event occurs, as defined under the terms of that particular swap agreement, the Portfolio will either (i) receive from the seller of protection an amount equal to the notional amount of the swap and make delivery of the referenced obligation or underlying securities comprising the referenced index or (ii) receive a net settlement amount in the form of cash or securities equal to the notional amount of the swap less the recovery value of the referenced obligation or underlying securities comprising the referenced index. |
| (2) | If the Portfolio is a seller of protection, it receives the fixed rate. When a credit event occurs, as defined under the terms of that particular swap agreement, the Portfolio will either (i) pay to the buyer of protection an amount equal to the notional amount of the swap and take delivery of the referenced obligation or underlying securities comprising the referenced index or (ii) pay a net settlement amount in the form of cash or securities equal to the notional amount of the swap less the recovery value of the referenced obligation or underlying securities comprising the referenced index. |
| (3) | The fair value of credit default swap agreements on asset-backed securities serve as an indicator of the current status of the payment/performance risk and represent the likelihood of an expected liability (or profit) for the credit derivative should the notional amount of the swap agreement be closed/sold as of the reporting date. |
| (4) | Notional amount represents the maximum potential amount the Portfolio could be required to pay as a seller of credit protection or receive as a buyer of credit protection if a credit event occurs as defined under the terms of that particular swap agreement. |
| # | Notional amount is shown in U.S. dollars unless otherwise stated. |
Various inputs are used in determining the value of the Portfolio’s investments. These inputs are summarized in the three broad levels listed below.
Level 1—quoted prices in active markets for identical securities
Level 2—other significant observable inputs (including quoted prices for similar securities, interest rates, prepayment speeds, credit risk, etc.)
Level 3—significant unobservable inputs (including the Portfolio’s own assumptions in determining the fair value of investments)
SEE NOTES TO FINANCIAL STATEMENTS.
A66
| | | | | | |
| | | FLEXIBLE MANAGED PORTFOLIO (continued) | | |
| |
| SCHEDULE OF INVESTMENTS | | December 31, 2009 |
The following is a summary of the inputs used as of December 31, 2009 in valuing the Portfolio’s assets carried at fair value:
| | | | | | | | | |
| | | Level 1
| | Level 2
| | Level 3
|
Investments in Securities | | | | | | | | | |
Asset-Backed Securities | | $ | — | | $ | 12,726,355 | | $ | 2,219,029 |
Bank Loans | | | — | | | 15,284,511 | | | — |
Collateralized Mortgage Obligations | | | — | | | 9,991,334 | | | — |
Commercial Mortgage-Backed Securities | | | — | | | 108,870,917 | | | — |
Corporate Bonds | | | — | | | 279,680,599 | | | — |
Common Stocks | | | 1,811,347,335 | | | — | | | — |
Mortgage-Backed Securities | | | — | | | 308,986,331 | | | — |
Municipal Bonds | | | — | | | 4,657,484 | | | — |
Non-Corporate Foreign Agencies | | | — | | | 9,914,709 | | | — |
Non-Corporate Sovereign | | | — | | | 743,700 | | | — |
Residential Mortgage-Backed Securities | | | — | | | 8,143,701 | | | — |
U.S. Government Agency Obligations | | | — | | | 24,253,872 | | | — |
U.S. Government Treasury Obligations | | | — | | | 128,891,501 | | | — |
Affiliated Mutual Funds | | | 447,063,805 | | | — | | | — |
| | |
|
| |
|
| |
|
|
| | | | 2,258,411,140 | | | 912,145,014 | | | 2,219,029 |
Other Financial Instruments* | | | 938,697 | | | 71,941 | | | 23,916 |
| | |
|
| |
|
| |
|
|
Total | | $ | 2,259,349,837 | | $ | 912,216,955 | | $ | 2,242,945 |
| | |
|
| |
|
| |
|
|
The following is a reconciliation of assets in which significant unobservable inputs (Level 3) were used in determining fair value:
| | | | | | | | |
| | | Asset-Backed
Securities
| | | Other Financial
Instruments*
| |
Balance as of 12/31/08 | | $ | — | | | $ | 1,511,232 | |
Realized gain (loss) | | | — | | | | — | ** |
Change in unrealized appreciation (depreciation) | | | (933 | ) | | | (1,487,316 | ) |
Earned accretion/amortization | | | 933 | | | | — | |
Net purchases (sales) | | | 2,219,029 | | | | — | |
Transfers in and/or out of Level 3 | | | — | | | | — | |
| | |
|
|
| |
|
|
|
Balance as of 12/31/09 | | $ | 2,219,029 | | | $ | 23,916 | |
| | |
|
|
| |
|
|
|
| * | Other financial instruments are derivative instruments not reflected in the Schedule of Investments, such as futures, forwards and swap contracts, which are valued at the unrealized appreciation/depreciation on the instrument. |
| ** | The realized gain earned during the period for other financial instruments was $1,580,082. |
SEE NOTES TO FINANCIAL STATEMENTS.
A67
| | | | | | |
| | | FLEXIBLE MANAGED PORTFOLIO (continued) | | |
| |
| SCHEDULE OF INVESTMENTS | | December 31, 2009 |
The industry classification of portfolio holdings and liabilities in excess of other assets shown as a percentage of net assets as of December 31, 2009 was as follows:
| | | |
Affiliated Mutual Funds (including 5.4% of collateral received for securities on loan) | | 15.4 | % |
Mortgage-Backed Securities | | 10.6 | |
Oil, Gas & Consumable Fuels | | 6.1 | |
U.S. Government Treasury Obligations | | 4.5 | |
Computers & Peripherals | | 4.2 | |
Pharmaceuticals | | 4.2 | |
Commercial Mortgage-Backed Securities | | 3.8 | |
Diversified Financial Services | | 3.1 | |
Software | | 2.6 | |
Aerospace & Defense | | 2.4 | |
Diversified Telecommunication Services | | 2.2 | |
Semiconductors & Semiconductor Equipment | | 2.1 | |
Banking | | 1.9 | |
Household Products | | 1.8 | |
Capital Markets | | 1.7 | |
Media | | 1.6 | |
Beverages | | 1.5 | |
Healthcare Equipment & Supplies | | 1.5 | |
Specialty Retail | | 1.5 | |
Industrial Conglomerates | | 1.4 | |
Insurance | | 1.4 | |
Commercial Banks | | 1.3 | |
Tobacco | | 1.3 | |
Communications Equipment | | 1.2 | |
Food & Staples Retailing | | 1.2 | |
Healthcare Providers & Services | | 1.2 | |
IT Services | | 1.2 | |
Food Products | | 1.1 | |
Internet Software & Services | | 1.1 | |
Air Freight & Logistics | | 1.0 | |
Chemicals | | 1.0 | |
Electric | | 1.0 | |
Consumer Finance | | 0.9 | |
Metals & Mining | | 0.9 | |
Electrical Utilities | | 0.8 | |
Multiline Retail | | 0.8 | |
Telecommunications | | 0.8 | |
U.S. Government Agency Obligations | | 0.8 | |
Biotechnology | | 0.7 | |
Energy Equipment & Services | | 0.7 | |
Healthcare & Pharmaceutical | | 0.7 | |
Life Sciences Tools & Services | | 0.7 | |
Machinery | | 0.7 | |
Real Estate Investment Trusts | | 0.7 | |
| | | |
Multi-Utilities | | 0.6 | % |
Retailers | | 0.6 | |
Textiles, Apparel & Luxury Goods | | 0.6 | |
Asset-Backed Securities | | 0.5 | |
Automobiles | | 0.5 | |
Electronic Equipment & Instruments | | 0.5 | |
Hotels, Restaurants & Leisure | | 0.5 | |
Technology | | 0.5 | |
Cable | | 0.4 | |
Collateralized Mortgage Obligations | | 0.4 | |
Foods | | 0.4 | |
Household Durables | | 0.4 | |
Non-Captive Finance | | 0.4 | |
Auto Components | | 0.3 | |
Containers & Packaging | | 0.3 | |
Independent Power Producers & Energy Traders | | 0.3 | |
Media & Entertainment | | 0.3 | |
Non-Corporate Foreign Agencies | | 0.3 | |
Professional Services | | 0.3 | |
Residential Mortgage-Backed Securities | | 0.3 | |
Road & Rail | | 0.3 | |
Airlines | | 0.2 | |
Commercial Services & Supplies | | 0.2 | |
Consumer | | 0.2 | |
Energy – Other | | 0.2 | |
Healthcare Insurance | | 0.2 | |
Lodging | | 0.2 | |
Metals | | 0.2 | |
Municipal Bonds | | 0.2 | |
Pipelines & Other | | 0.2 | |
Trading Companies & Distributors | | 0.2 | |
Building Materials & Construction | | 0.1 | |
Building Products | | 0.1 | |
Capital Goods | | 0.1 | |
Diversified Consumer Services | | 0.1 | |
Electrical Equipment | | 0.1 | |
Energy – Integrated | | 0.1 | |
Gas Utilities | | 0.1 | |
Leisure Equipment & Products | | 0.1 | |
Office Electronics | | 0.1 | |
Paper | | 0.1 | |
Railroads | | 0.1 | |
Wireless Telecommunication Services | | 0.1 | |
| | |
|
|
| | | 109.2 | |
Liabilities in excess of other assets | | (9.2 | ) |
| | |
|
|
| | | 100.0 | % |
| | |
|
|
SEE NOTES TO FINANCIAL STATEMENTS.
A68
| | | | | | |
| | | FLEXIBLE MANAGED PORTFOLIO (continued) | | |
| |
| SCHEDULE OF INVESTMENTS | | December 31, 2009 |
The Portfolio invested in derivative instruments during the reporting period. The primary types of risk associated with these derivative instruments are commodity risk, credit risk, equity risk, foreign exchange risk and interest rate risk. The effect of such derivative instruments on the Portfolio’s financial position and financial performance as reflected in the Statement of Assets and Liabilities and Statement of Operations is presented in the summary below.
Fair values of derivative Instruments as of December 31, 2009 as presented in the Statement of Assets and Liabilities:
| | | | | | | | | | | | |
Derivatives not designated as
hedging instruments, carried at
fair value
| | Asset Derivatives
| | | Liability Derivatives
| |
| | Balance Sheet Location
| | Fair
Value
| | | Balance Sheet Location
| | Fair
Value
| |
Credit contracts | | Premium paid for swap agreements | | $ | 192,729 | | | Premium received for swap agreements | | $ | 85,932 | |
Credit contracts | | Unrealized appreciation on swaps | | | 1,723,076 | | | Unrealized depreciation on swaps | | | 1,538,863 | |
Equity contracts | | Due to broker—variation margin | | | 791,363 | * | | — | | | — | |
Interest rate contracts | | Due to broker—variation margin | | | 1,895,545 | * | | Due to broker—variation margin | | | 1,748,211 | * |
Interest rate contracts | | Unrealized appreciation on swaps | | | 172,008 | | | Unrealized depreciation on swaps | | | 260,364 | |
| | | | |
|
|
| | | |
|
|
|
Total | | | | $ | 4,774,721 | | | | | $ | 3,633,370 | |
| | | | |
|
|
| | | |
|
|
|
| * | Includes cumulative appreciation/depreciation on futures contracts as reported in Schedule of Investments. Only unsettled variation margin receivable (payable) is reported within the Statement of Assets and Liabilities. |
The effects of derivative instruments on the Statement of Operations for the year ended December 31, 2009 are as follows:
| | | | | | | | | | | | | | | |
| Amount of Realized Gain or (Loss) on Derivatives Recognized in Income |
Derivatives not designated as hedging
instruments, carried at fair value
| | Futures
| | Swaps
| | Purchased
Options
| | | Written
Options
| | Total
|
Credit contracts | | $ | — | | $ 882,749 | | $ | — | | | $ | — | | $ | 882,749 |
Equity contracts | | | 9,211,850 | | — | | | — | | | | — | | | 9,211,850 |
Interest rate contracts | | | 4,606,026 | | 270,773 | | | (119,911 | ) | | | 43,436 | | | 4,800,324 |
| | |
|
| |
| |
|
|
| |
|
| |
|
|
Total | | $ | 13,817,876 | | $1,153,522 | | $ | (119,911 | ) | | $ | 43,436 | | $ | 14,894,923 |
| | |
|
| |
| |
|
|
| |
|
| |
|
|
| | | | | | | | | | | | |
|
| Change in Unrealized Appreciation or (Depreciation) on Derivatives Recognized in Income | |
Derivatives not designated as hedging
instruments, carried at fair value
| | Futures
| | | Swaps
| | | Total
| |
Credit contracts | | $ | — | | | $ | (5,660,170 | ) | | $ | (5,660,170 | ) |
Equity contracts | | | 708,263 | | | | — | | | | 708,263 | |
Interest rate contracts | | | (2,524,923 | ) | | | 27,961 | | | | (2,496,962 | ) |
| | |
|
|
| |
|
|
| |
|
|
|
Total | | $ | (1,816,660 | ) | | $ | (5,632,209 | ) | | $ | (7,448,869 | ) |
| | |
|
|
| |
|
|
| |
|
|
|
For the year ended December 31, 2009, the Portfolio’s average volume of derivative activities is as follows:
| | | | | | |
Purchased Options
(Cost)
| | Written Options
(Premium Received)
| | Futures
Long Position
(Value at Trade Date)
| | Futures
Short Position
(Value at Trade Date)
|
$7,889 | | $3,221 | | $165,681,351 | | $10,767,010 |
| | | | |
Interest Rate Swaps
(Notional Amount in USD (000))
| | Credit Default
Swaps as Buyer
(Notional Amount in USD (000))
| | Credit Default
Swaps as Writer
(Notional Amount in USD (000))
|
$12,686 | | $39,281 | | $968 |
SEE NOTES TO FINANCIAL STATEMENTS.
A69
| | | | | | |
| | | FLEXIBLE MANAGED PORTFOLIO (continued) | | |
STATEMENT OF ASSETS AND LIABILITIES
December 31, 2009
| | | | |
| ASSETS | | | | |
Investments, at value including securities on loan of $149,443,792: | | | | |
Unaffiliated investments (cost $2,415,172,482) | | $ | 2,725,711,378 | |
Affiliated investments (cost $469,753,234) | | | 447,063,805 | |
Receivable for investments sold | | | 110,554,208 | |
Dividends and interest receivable | | | 10,181,644 | |
Unrealized appreciation on swaps | | | 1,895,084 | |
Foreign tax reclaim receivable | | | 512,246 | |
Premium paid for swap agreements | | | 192,729 | |
Receivable for Series shares sold | | | 1,735 | |
Prepaid expenses | | | 36,816 | |
| | |
|
|
|
Total Assets | | | 3,296,149,645 | |
| | |
|
|
|
| LIABILITIES | | | | |
Payable for investments purchased | | | 224,009,915 | |
Collateral for securities on loan | | | 156,084,644 | |
Payable to custodian | | | 5,636,062 | |
Unrealized depreciation on swaps | | | 1,799,227 | |
Management fee payable | | | 1,478,287 | |
Due to broker-variation margin | | | 594,568 | |
Accrued expenses and other liabilities | | | 265,490 | |
Payable for Series shares repurchased | | | 202,147 | |
Premium received for swap agreements | | | 85,932 | |
Affiliated transfer agent fee payable | | | 595 | |
| | |
|
|
|
Total Liabilities | | | 390,156,867 | |
| | |
|
|
|
| NET ASSETS | | $ | 2,905,992,778 | |
| | |
|
|
|
Net assets were comprised of: | | | | |
Paid-in capital | | $ | 3,135,070,544 | |
Retained earnings | | | (229,077,766 | ) |
| | |
|
|
|
Net assets, December 31, 2009 | | $ | 2,905,992,778 | |
| | |
|
|
|
Net asset value and redemption price per share, $2,905,992,778 / 203,489,907 outstanding shares of beneficial interest | | $ | 14.28 | |
| | |
|
|
|
STATEMENT OF OPERATIONS
Year Ended December 31, 2009
| | | | |
| INVESTMENT INCOME | | | | |
Unaffiliated dividend income (net of foreign withholding taxes of $253) | | $ | 39,107,636 | |
Unaffiliated interest | | | 38,949,481 | |
Affiliated dividend income | | | 3,332,189 | |
Affiliated income from securities loaned, net | | | 936,691 | |
| | |
|
|
|
| | | | 82,325,997 | |
| | |
|
|
|
| EXPENSES | | | | |
Management fee | | | 15,765,657 | |
Shareholders’ reports | | | 295,000 | |
Custodian’s fees and expenses | | | 280,000 | |
Insurance expenses | | | 49,000 | |
Trustees’ fees | | | 43,000 | |
Audit fee | | | 41,000 | |
Commitment fee on syndicated credit agreement | | | 22,000 | |
Legal fees and expenses | | | 18,000 | |
Transfer agent’s fee and expenses (including affiliated expense of $3,600) (Note 4) | | | 10,000 | |
Miscellaneous | | | 23,669 | |
| | |
|
|
|
Total expenses | | | 16,547,326 | |
| | |
|
|
|
| NET INVESTMENT INCOME | | | 65,778,671 | |
| | |
|
|
|
| NET REALIZED AND UNREALIZED GAIN (LOSS) ON INVESTMENTS, SWAPS AND FOREIGN CURRENCIES | | | | |
Net realized gain (loss) on: | | | | |
Investment transactions (including affiliated: $(1,632,891)) | | | (222,070,573 | ) |
Futures transactions | | | 13,817,876 | |
Swap agreement transactions | | | 1,153,522 | |
Foreign currency transactions | | | 1,607 | |
Written options transactions | | | 43,436 | |
| | |
|
|
|
| | | | (207,054,132 | ) |
| | |
|
|
|
Net change in unrealized appreciation (depreciation) on: | | | | |
Investments (including affiliated: $21,958,534) | | | 636,736,075 | |
Futures | | | (1,816,660 | ) |
Swaps | | | (5,632,209 | ) |
Foreign currencies | | | 13,970 | |
| | |
|
|
|
| | | | 629,301,176 | |
| | |
|
|
|
| NET GAIN ON INVESTMENTS, SWAPS AND FOREIGN CURRENCIES | | | 422,247,044 | |
| | |
|
|
|
| NET INCREASE IN NET ASSETS RESULTING FROM OPERATIONS | | $ | 488,025,715 | |
| | |
|
|
|
STATEMENT OF CHANGES IN NET ASSETS
| | | | | | | | |
| | | Year Ended December 31,
| |
| | | 2009
| | | 2008
| |
| INCREASE (DECREASE) IN NET ASSETS | | | | | | | | |
| OPERATIONS: | | | | | | | | |
Net investment income | | $ | 65,778,671 | | | $ | 91,569,165 | |
Net realized loss on investments, swaps and foreign currencies | | | (207,054,132 | ) | | | (353,630,781 | ) |
Net change in unrealized appreciation (depreciation) on investments, swaps and foreign currencies | | | 629,301,176 | | | | (627,558,587 | ) |
| | |
|
|
| |
|
|
|
NET INCREASE (DECREASE) IN NET ASSETS RESULTING FROM OPERATIONS | | | 488,025,715 | | | | (889,620,203 | ) |
| | |
|
|
| |
|
|
|
| DISTRIBUTIONS | | | (91,535,531 | ) | | | (353,573,797 | ) |
| | |
|
|
| |
|
|
|
| SERIES SHARE TRANSACTIONS: | | | | | | | | |
Series shares sold [1,203,125 and 1,347,523 shares, respectively] | | | 15,189,643 | | | | 19,045,784 | |
Series shares issued in reinvestment of dividends and distributions [7,405,787 and 22,635,967 shares, respectively] | | | 91,535,531 | | | | 353,573,797 | |
Series shares repurchased [17,489,813 and 14,641,462 shares, respectively] | | | (218,829,963 | ) | | | (224,142,062 | ) |
| | |
|
|
| |
|
|
|
NET INCREASE (DECREASE) IN NET ASSETS RESULTING FROM SERIES SHARE TRANSACTIONS | | | (112,104,789 | ) | | | 148,477,519 | |
| | |
|
|
| |
|
|
|
| TOTAL INCREASE (DECREASE) IN NET ASSETS | | | 284,385,395 | | | | (1,094,716,481 | ) |
| NET ASSETS: | | | | | | | | |
Beginning of year | | | 2,621,607,383 | | | | 3,716,323,864 | |
| | |
|
|
| |
|
|
|
End of year | | $ | 2,905,992,778 | | | $ | 2,621,607,383 | |
| | |
|
|
| |
|
|
|
SEE NOTES TO FINANCIAL STATEMENTS.
A70
| | | | | | |
| | | GLOBAL PORTFOLIO | | |
| |
| SCHEDULE OF INVESTMENTS | | December 31, 2009 |
| | | | | |
| LONG-TERM INVESTMENTS — 96.6% |
| COMMON STOCKS — 96.5% | | Shares
| | Value
(Note 2)
|
| | | | | | |
Australia — 2.9% | | | |
Amcor Ltd. | | 182,500 | | $ | 1,016,039 |
AWB Ltd.(a) | | 543,000 | | | 547,789 |
BHP Billiton Ltd., ADR(b) | | 22,684 | | | 1,737,141 |
BHP Billiton PLC, ADR | | 59,100 | | | 3,773,535 |
BlueScope Steel Ltd. | | 218,400 | | | 601,772 |
Challenger Financial Services Group, Ltd. | | 343,900 | | | 1,294,419 |
Downer EDI Ltd. | | 215,400 | | | 1,793,865 |
Goodman Fielder Ltd. | | 443,900 | | | 646,407 |
Macquarie Group Ltd. | | 21,200 | | | 908,338 |
Metcash Ltd. | | 216,600 | | | 868,512 |
Pacific Brands Ltd.(a) | | 460,600 | | | 464,618 |
Qantas Airways Ltd.(a) | | 308,500 | | | 823,107 |
TABCORP Holdings Ltd. | | 119,400 | | | 740,797 |
Woolworths Ltd. | | 52,868 | | | 1,325,970 |
WorleyParsons Ltd. | | 53,665 | | | 1,393,439 |
| | | | |
|
|
| | | | | | 17,935,748 |
| | | | |
|
|
Austria — 0.1% | | | |
Voestalpine AG | | 9,500 | | | 347,068 |
| | | | |
|
|
Belgium — 1.0% | | | |
AGFA-Gevaert NV(a) | | 62,200 | | | 400,949 |
Anheuser-Busch InBev NV | | 80,028 | | | 4,142,818 |
Delhaize Group SA | | 18,500 | | | 1,415,236 |
| | | | |
|
|
| | | | | | 5,959,003 |
| | | | |
|
|
Brazil — 2.1% | | | |
BM&F Bovespa SA | | 276,812 | | | 1,947,701 |
Itau Unibanco Holding SA, ADR(a) | | 119,800 | | | 2,736,232 |
Petroleo Brasileiro SA | | 98,036 | | | 2,066,020 |
Petroleo Brasileiro SA, ADR | | 108,798 | | | 5,187,489 |
Weg SA | | 117,200 | | | 1,238,645 |
| | | | |
|
|
| | | | | | 13,176,087 |
| | | | |
|
|
Canada — 1.9% | | | |
Brookfield Asset Management, Inc. (Class A Stock) | | 74,206 | | | 1,645,889 |
Canadian National Railway Co. | | 49,574 | | | 2,694,843 |
Goldcorp, Inc. | | 46,087 | | | 1,813,063 |
Potash Corp. of Saskatchewan, Inc. | | 16,880 | | | 1,831,480 |
Research In Motion Ltd.(a) | | 16,862 | | | 1,138,860 |
Royal Bank of Canada | | 30,230 | | | 1,630,226 |
Tim Hortons, Inc. | | 31,032 | | | 953,347 |
| | | | |
|
|
| | | | | | 11,707,708 |
| | | | |
|
|
China — 2.0% | | | |
Baidu, Inc., ADR(a) | | 9,599 | | | 3,947,397 |
China Life Insurance Co. Ltd. (Class H Stock) | | 407,000 | | | 1,991,563 |
China Overseas Land & Investment Ltd. | | 754,000 | | | 1,579,846 |
China Railway Construction Corp. Ltd. (Class H Stock) | | 1,081,500 | | | 1,378,105 |
CNOOC Ltd. | | 1,170,000 | | | 1,822,792 |
Li Ning Co. Ltd. | | 442,000 | | | 1,675,982 |
| | | | |
|
|
| | | | | | 12,395,685 |
| | | | |
|
|
| | | | | |
COMMON STOCKS
(continued) | | Shares
| | Value
(Note 2)
|
| | | | | | |
Denmark — 0.7% | | | |
Danisco A/S | | 14,500 | | $ | 967,431 |
Danske Bank A/S(a) | | 23,900 | | | 536,541 |
H Lundbeck A/S | | 49,400 | | | 892,519 |
Novo Nordisk A/S (Class B Stock) | | 33,566 | | | 2,142,911 |
| | | | |
|
|
| | | | | | 4,539,402 |
| | | | |
|
|
Finland — 0.5% | | | |
Nokia Oyj | | 83,800 | | | 1,083,532 |
Rautaruukki Oyj | | 22,300 | | | 515,833 |
Tieto Oyj | | 56,200 | | | 1,167,707 |
| | | | |
|
|
| | | | | | 2,767,072 |
| | | | |
|
|
France — 5.1% | | | |
Alstom SA | | 34,180 | | | 2,390,405 |
AXA SA | | 107,610 | | | 2,526,571 |
BNP Paribas | | 19,800 | | | 1,570,496 |
Casino Guichard Perrachon SA | | 14,200 | | | 1,265,150 |
Credit Agricole SA | | 29,400 | | | 515,965 |
France Telecom SA | | 42,900 | | | 1,071,996 |
Iliad SA | | 14,445 | | | 1,726,234 |
Lagardere SCA | | 14,000 | | | 566,798 |
Rallye SA | | 13,400 | | | 468,098 |
Safran SA | | 72,500 | | | 1,416,598 |
Sanofi-Aventis SA | | 43,600 | | | 3,428,824 |
Schneider Electric SA | | 19,669 | | | 2,286,965 |
SCOR SE | | 28,000 | | | 703,417 |
Thales SA | | 22,500 | | | 1,156,393 |
Total SA | | 27,900 | | | 1,792,014 |
Total SA, ADR(a) | | 68,700 | | | 4,399,548 |
Vinci SA | | 39,660 | | | 2,231,709 |
Vivendi SA | | 65,800 | | | 1,952,924 |
| | | | |
|
|
| | | | | | 31,470,105 |
| | | | |
|
|
Germany — 3.5% | | | |
Aurubis AG | | 10,300 | | | 441,075 |
BASF SE | | 32,400 | | | 2,018,176 |
Deutsche Bank AG | | 11,600 | | | 822,891 |
Deutsche Lufthansa AG | | 51,700 | | | 874,106 |
E.ON AG | | 110,270 | | | 4,609,475 |
Hannover Rueckversicherung AG(a) | | 11,800 | | | 553,322 |
MAN SE | | 22,984 | | | 1,781,084 |
MTU Aero Engines Holding AG | | 28,100 | | | 1,522,921 |
Muenchener Rueckversicherungs AG | | 12,000 | | | 1,872,555 |
Rheinmetall AG | | 11,800 | | | 744,144 |
RWE AG | | 9,300 | | | 906,079 |
SAP AG | | 47,182 | | | 2,254,765 |
Suedzucker AG | | 21,000 | | | 437,846 |
Thomas Cook Group PLC | | 164,000 | | | 605,845 |
ThyssenKrupp AG | | 45,900 | | | 1,737,248 |
Vossloh AG | | 4,300 | | | 427,493 |
| | | | |
|
|
| | | | | | 21,609,025 |
| | | | |
|
|
Greece | | | |
Alpha Bank A.E.(a) | | 13,000 | | | 151,700 |
| | | | |
|
|
Hong Kong — 1.0% | | | |
Chaoda Modern Agriculture Holdings Ltd. | | 966,070 | | | 1,028,374 |
Li & Fung Ltd. | | 432,000 | | | 1,786,077 |
Noble Group Ltd. | | 1,586,000 | | | 3,637,890 |
| | | | |
|
|
| | | | | | 6,452,341 |
| | | | |
|
|
SEE NOTES TO FINANCIAL STATEMENTS.
A71
| | | | | | |
| | | GLOBAL PORTFOLIO (continued) | | |
| |
| SCHEDULE OF INVESTMENTS | | December 31, 2009 |
| | | | | |
COMMON STOCKS
(continued) | | Shares
| | Value
(Note 2)
|
| | | | | | |
India — 1.0% | | | |
HDFC Bank, Ltd., ADR(b) | | 7,809 | | $ | 1,015,795 |
Infosys Technologies Ltd., ADR | | 43,025 | | | 2,377,992 |
Vedanta Resources PLC | | 60,069 | | | 2,512,433 |
| | | | |
|
|
| | | | | | 5,906,220 |
| | | | |
|
|
Indonesia — 0.2% | | | |
Bank Rakyat Indonesia | | 1,825,000 | | | 1,466,813 |
| | | | |
|
|
Ireland — 0.8% | | | |
Allied Irish Banks PLC(a) | | 42,100 | | | 72,030 |
Bank of Ireland (Governor & Co.)(a) | | 83,300 | | | 157,650 |
CRH PLC(a) | | 82,774 | | | 2,250,575 |
Irish Life & Permanent PLC(a) | | 51,300 | | | 225,878 |
Ryanair Holdings PLC, ADR(a) | | 73,855 | | | 1,980,791 |
| | | | |
|
|
| | | | | | 4,686,924 |
| | | | |
|
|
Israel — 0.6% | | | |
Teva Pharmaceutical Industries Ltd., ADR(a) | | 66,065 | | | 3,711,532 |
| | | | |
|
|
Italy — 1.4% | | | |
Banco Popolare SC(a) | | 38,200 | | | 286,163 |
Ciments Francais SA | | 5,200 | | | 550,929 |
Enel SpA | | 184,700 | | | 1,069,299 |
ENI SpA | | 89,300 | | | 2,274,094 |
Finmeccanica SpA | | 20,900 | | | 334,627 |
Fondiaria-Sai SpA | | 19,900 | | | 316,358 |
Saipem SpA | | 80,132 | | | 2,765,388 |
Telecom Italia SpA | | 796,300 | | | 1,242,184 |
| | | | |
|
|
| | | | | | 8,839,042 |
| | | | |
|
|
Japan — 8.3% | | | | | |
Aeon Credit Service Co. Ltd. | | 16,100 | | | 155,430 |
Alpine Electronics, Inc.(a) | | 41,600 | | | 441,189 |
Aoyama Trading Co. Ltd. | | 52,100 | | | 665,023 |
Astellas Pharma, Inc. | | 41,200 | | | 1,537,125 |
Canon, Inc. | | 58,100 | | | 2,471,485 |
Circle K Sunkus Co. Ltd. | | 46,900 | | | 578,546 |
COMSYS Holdings Corp. | | 72,800 | | | 765,831 |
Daikin Industries Ltd. | | 41,400 | | | 1,635,185 |
Fast Retailing Co. Ltd. | | 7,200 | | | 1,353,164 |
Fukuoka Financial Group, Inc. | | 158,000 | | | 550,630 |
Hitachi Capital Corp. | | 49,400 | | | 600,621 |
Honda Motor Co. Ltd. | | 79,400 | | | 2,693,938 |
Hoya Corp. | | 64,100 | | | 1,710,350 |
Itochu Techno-Solutions Corp. | | 26,200 | | | 703,561 |
Jupiter Telecommunications Co. Ltd. | | 1,674 | | | 1,656,465 |
KDDI Corp. | | 200 | | | 1,059,343 |
Keihin Corp. | | 78,900 | | | 1,179,469 |
Keyence Corp. | | 10,400 | | | 2,158,454 |
Konami Corp. | | 10,300 | | | 183,900 |
Kurabo Industries Ltd. | | 173,100 | | | 263,779 |
Kurita Water Industries Ltd. | | 69,400 | | | 2,180,377 |
Kyoei Steel Ltd. | | 42,800 | | | 788,790 |
Kyowa Exeo Corp. | | 56,000 | | | 476,489 |
Marubeni Corp. | | 271,000 | | | 1,496,998 |
Mitsubishi Corp. | | 135,400 | | | 3,372,623 |
Mitsui & Co. Ltd. | | 66,000 | | | 936,284 |
Mizuho Financial Group, Inc. | | 198,100 | | | 356,244 |
Nifco, Inc. | | 31,000 | | | 619,261 |
| | | | | |
COMMON STOCKS
(continued) | | Shares
| | Value
(Note 2)
|
| | | | | | |
Japan (continued) | | | | | |
Nippon Electric Glass Co., Ltd. | | 107,000 | | $ | 1,472,735 |
Nippon Express Co. Ltd. | | 160,000 | | | 660,761 |
Nippon Light Metal Co. Ltd.(a) | | 195,000 | | | 168,094 |
Nippon Oil Corp. | | 240,600 | | | 1,115,448 |
Nippon Shokubai Co. Ltd. | | 161,000 | | | 1,384,011 |
Nippon Telegraph & Telephone Corp. | | 37,000 | | | 1,461,614 |
Nissan Motor Co. Ltd.(a) | | 53,400 | | | 469,275 |
NTT DoCoMo, Inc. | | 1,100 | | | 1,535,037 |
Ricoh Co. Ltd. | | 52,000 | | | 745,096 |
Sankyu, Inc. | | 210,000 | | | 1,080,201 |
Sanwa Holdings Corp. | | 281,000 | | | 720,042 |
Seiko Epson Corp., | | 17,100 | | | 276,343 |
Seino Holdings Corp. | | 65,000 | | | 412,586 |
Shimachu Co. Ltd. | | 30,700 | | | 605,048 |
Sumitomo Corp. | | 115,400 | | | 1,175,089 |
Sumitomo Mitsui Financial Group, Inc. | | 59,300 | | | 1,701,636 |
Sumitomo Trust & Banking Co. Ltd. (The) | | 67,000 | | | 328,972 |
Takeda Pharmaceutical Co. Ltd. | | 39,900 | | | 1,643,930 |
Terumo Corp. | | 27,500 | | | 1,657,422 |
Yokohama Rubber Co. Ltd. (The) | | 59,600 | | | 263,481 |
| | | | |
|
|
| | | | | | 51,467,375 |
| | | | |
|
|
Liechtenstein | | | | | |
Verwaltungs- und Privat-Bank AG | | 2,578 | | | 253,289 |
| | | | |
|
|
Mexico — 0.1% | | | | | |
Wal-Mart de Mexico SAB de CV, Ser. V | | 90,700 | | | 404,205 |
| | | | |
|
|
Netherlands — 2.5% | | | | | |
Aegon NV(a) | | 56,800 | | | 363,724 |
ASM Pacific Technology Ltd. | | 85,900 | | | 812,155 |
Brit Insurance Holdings NV | | 227,200 | | | 717,535 |
CSM | | 32,790 | | | 861,283 |
European Aeronautic Defence and Space Co. NV | | 41,900 | | | 842,237 |
ING Groep NV(a) | | 62,700 | | | 603,825 |
Koninklijke DSM NV | | 31,100 | | | 1,528,050 |
Nutreco Holding NV | | 9,400 | | | 528,376 |
OCE NV(a) | | 53,300 | | | 653,473 |
QIAGEN NV(a) | | 76,936 | | | 1,731,528 |
Royal Dutch Shell PLC, ADR(b) | | 35,150 | | | 2,112,866 |
Royal Dutch Shell PLC (Class B Stock) | | 162,200 | | | 4,723,777 |
| | | | |
|
|
| | | | | | 15,478,829 |
| | | | |
|
|
New Zealand — 0.1% | | | | | |
Air New Zealand Ltd. | | 737,900 | | | 647,599 |
Fisher & Paykel Appliances Holdings Ltd. | | 85,100 | | | 35,706 |
| | | | |
|
|
| | | | | | 683,305 |
| | | | |
|
|
Norway — 0.4% | | | | | |
DnB NOR ASA(a) | | 67,200 | | | 725,473 |
Norsk Hydro ASA(a) | | 54,500 | | | 457,823 |
Statoil ASA | | 45,100 | | | 1,124,777 |
| | | | |
|
|
| | | | | | 2,308,073 |
| | | | |
|
|
Portugal — 0.2% | | | | | |
Banco Espirito Santo SA | | 43,600 | | | 283,966 |
Portugal Telecom SGPS SA | | 89,600 | | | 1,093,306 |
| | | | |
|
|
| | | | | | 1,377,272 |
| | | | |
|
|
SEE NOTES TO FINANCIAL STATEMENTS.
A72
| | | | | | |
| | | GLOBAL PORTFOLIO (continued) | | |
| |
| SCHEDULE OF INVESTMENTS | | December 31, 2009 |
| | | | | |
COMMON STOCKS
(continued) | | Shares
| | Value
(Note 2)
|
| | | | | | |
Singapore — 0.7% | | | | | |
CapitaLand Ltd. | | 666,000 | | $ | 1,975,730 |
MobileOne Ltd. | | 390,330 | | | 524,738 |
Singapore Airlines Ltd.(a) | | 72,000 | | | 762,550 |
Wilmar International Ltd. | | 183,000 | | | 832,103 |
| | | | |
|
|
| | | | | | 4,095,121 |
| | | | |
|
|
South Africa — 0.4% | | | | | |
Naspers Ltd. (Class N Stock) | | 60,800 | | | 2,460,586 |
| | | | |
|
|
Spain — 2.8% | | | | | |
Banco Bilbao Vizcaya Argentaria SA | | 114,000 | | | 2,077,651 |
Banco Espanol de Credito SA | | 71,978 | | | 881,738 |
Banco Santander SA | | 371,208 | | | 6,134,083 |
Inditex SA | | 40,797 | | | 2,547,872 |
Repsol YPF SA | | 66,100 | | | 1,773,765 |
Telefonica SA | | 144,788 | | | 4,052,474 |
| | | | |
|
|
| | | | | | 17,467,583 |
| | | | |
|
|
Sweden — 0.3% | | | | | |
Svenska Handelsbanken AB (Class A Stock) | | 73,200 | | | 2,085,454 |
| | | | |
|
|
Switzerland — 4.5% | | | | | |
ABB Ltd.(a) | | 102,769 | | | 1,980,290 |
Actelion Ltd.(a) | | 28,971 | | | 1,547,353 |
Baloise-Holding AG | | 14,600 | | | 1,212,199 |
Clariant AG(a) | | 103,700 | | | 1,226,264 |
Credit Suisse Group AG | | 86,887 | | | 4,304,501 |
Georg Fischer AG(a) | | 2,000 | | | 499,077 |
Julius Baer Group Ltd. | | 25,075 | | | 881,849 |
Nestle SA | | 45,532 | | | 2,209,833 |
Novartis AG | | 36,200 | | | 1,976,855 |
Philip Morris International, Inc. | | 22,500 | | | 1,084,275 |
Rieter Holding AG(a) | | 2,200 | | | 496,916 |
Roche Holding AG | | 16,639 | | | 2,845,483 |
Sonova Holding AG | | 7,442 | | | 901,599 |
Swiss Reinsurance Co. Ltd. | | 18,700 | | | 895,817 |
Swisscom AG | | 6,200 | | | 2,367,858 |
Zurich Financial Services AG | | 17,068 | | | 3,731,470 |
| | | | |
|
|
| | | | | | 28,161,639 |
| | | | |
|
|
Taiwan — 0.5% | | | | | |
MediaTek, Inc. | | 95,190 | | | 1,653,884 |
Taiwan Semiconductor Manufacturing Co. Ltd. | | 769,294 | | | 1,550,493 |
| | | | |
|
|
| | | | | | 3,204,377 |
| | | | |
|
|
Turkey — 0.2% | | | | | |
Turkiye Garanti Bankasi AS | | 341,048 | | | 1,452,833 |
| | | | |
|
|
United Kingdom — 9.5% | | | | | |
AMEC PLC | | 93,814 | | | 1,195,234 |
Amlin PLC | | 139,217 | | | 803,852 |
AstraZeneca PLC | | 71,500 | | | 3,360,296 |
Autonomy Corp. PLC(a) | | 88,272 | | | 2,143,630 |
Aviva PLC | | 118,200 | | | 751,886 |
Barclays PLC | | 753,129 | | | 3,318,626 |
Beazley PLC | | 360,794 | | | 580,742 |
BG Group PLC | | 178,982 | | | 3,231,744 |
BP PLC | | 472,900 | | | 4,566,397 |
British Sky Broadcasting Group PLC | | 317,999 | | | 2,872,420 |
| | | | | |
COMMON STOCKS
(continued) | | Shares
| | Value
(Note 2)
|
| | | | | | |
United Kingdom (continued) | | | | | |
BT Group PLC | | 602,100 | | $ | 1,311,269 |
Cairn Energy PLC(a) | | 257,990 | | | 1,381,093 |
Capita Group PLC (The) | | 124,631 | | | 1,506,973 |
Centrica PLC | | 88,100 | | | 399,052 |
Davis Service Group PLC | | 24,300 | | | 155,882 |
Drax Group PLC | | 94,500 | | | 630,015 |
DS Smith PLC | | 230,900 | | | 472,265 |
Experian PLC | | 130,380 | | | 1,287,853 |
GlaxoSmithKline PLC | | 118,600 | | | 2,515,014 |
HSBC Holdings PLC | | 142,465 | | | 1,620,531 |
HSBC Holdings PLC, ADR | | 52,000 | | | 2,968,680 |
IMI PLC | | 145,600 | | | 1,214,492 |
Legal & General Group PLC | | 624,000 | | | 802,758 |
Lloyds Banking Group PLC(a) | | 381,679 | | | 307,090 |
Marston’s PLC | | 339,130 | | | 480,020 |
Meggitt PLC | | 216,200 | | | 905,082 |
Northern Foods PLC | | 211,500 | | | 226,859 |
Old Mutual PLC(a) | | 527,200 | | | 923,229 |
Petrofac Ltd. | | 84,242 | | | 1,410,203 |
Reckitt Benckiser Group PLC | | 55,975 | | | 3,029,927 |
Rolls-Royce Group PLC(a) | | 332,964 | | | 2,592,927 |
Rolls-Royce Group PLC (Class C Stock)(a) | | 19,241,880 | | | 31,079 |
Rotork PLC | | 43,573 | | | 832,595 |
Royal Bank of Scotland Group PLC(a) | | 263,527 | | | 122,332 |
RSA Insurance Group PLC | | 300,200 | | | 583,222 |
Spectris PLC | | 98,200 | | | 1,168,025 |
Standard Chartered PLC | | 70,424 | | | 1,777,914 |
Tate & Lyle PLC | | 127,900 | | | 889,597 |
Tomkins PLC | | 201,400 | | | 625,855 |
Tullow Oil PLC | | 92,806 | | | 1,947,106 |
Vodafone Group PLC | | 751,500 | | | 1,740,254 |
| | | | |
|
|
| | | | | | 58,684,020 |
| | | | |
|
|
United States — 41.2% | | | | | |
3M Co. | | 30,050 | | | 2,484,234 |
Abbott Laboratories | | 92,880 | | | 5,014,591 |
Adobe Systems, Inc.(a) | | 47,969 | | | 1,764,300 |
Alcoa, Inc. | | 45,800 | | | 738,296 |
Altria Group, Inc. | | 48,100 | | | 944,203 |
Amazon.com, Inc.(a) | | 24,679 | | | 3,319,819 |
American Express Co. | | 123,225 | | | 4,993,077 |
American Tower Corp. (Class A Stock)(a) | | 59,275 | | | 2,561,273 |
Ameriprise Financial, Inc. | | 52,800 | | | 2,049,696 |
Amgen, Inc.(a) | | 25,750 | | | 1,456,677 |
Analog Devices, Inc., | | 41,500 | | | 1,310,570 |
Apple, Inc.(a)(b) | | 33,504 | | | 7,064,653 |
AT&T, Inc. | | 143,900 | | | 4,033,517 |
Avon Products, Inc. | | 23,900 | | | 752,850 |
Baker Hughes, Inc.(b) | | 55,450 | | | 2,244,616 |
Bank of America Corp. | | 304,400 | | | 4,584,264 |
Bank of New York Mellon Corp. (The) | | 29,800 | | | 833,506 |
Cablevision Systems Corp. (Class A Stock) | | 95,300 | | | 2,460,646 |
CenterPoint Energy, Inc. | | 35,400 | | | 513,654 |
Chevron Corp. | | 58,150 | | | 4,476,969 |
SEE NOTES TO FINANCIAL STATEMENTS.
A73
| | | | | | |
| | | GLOBAL PORTFOLIO (continued) | | |
| |
| SCHEDULE OF INVESTMENTS | | December 31, 2009 |
| | | | | |
COMMON STOCKS
(continued) | | Shares
| | Value
(Note 2)
|
| | | | | | |
United States (continued) | | | | | |
Citigroup, Inc. | | 172,200 | | $ | 569,982 |
Coca-Cola Co. (The)(b) | | 12,850 | | | 732,450 |
Covidien PLC | | 49,500 | | | 2,370,555 |
Dell, Inc.(a) | | 125,600 | | | 1,803,616 |
DIRECTV (Class A Stock)(a) | | 36,374 | | | 1,213,073 |
Dow Chemical Co. (The) | | 193,073 | | | 5,334,607 |
E.I. du Pont de Nemours & Co., | | 47,200 | | | 1,589,224 |
Eli Lilly & Co. | | 10,600 | | | 378,526 |
Entergy Corp. | | 26,950 | | | 2,205,588 |
EOG Resources, Inc., | | 28,079 | | | 2,732,087 |
Exxon Mobil Corp. | | 61,800 | | | 4,214,142 |
Fifth Third Bancorp | | 93,900 | | | 915,525 |
Fortune Brands, Inc. | | 42,350 | | | 1,829,520 |
General Dynamics Corp., | | 79,103 | | | 5,392,452 |
General Electric Co. | | 192,200 | | | 2,907,986 |
Gilead Sciences, Inc.(a) | | 67,568 | | | 2,924,343 |
Goldman Sachs Group, Inc. (The) | | 35,559 | | | 6,003,781 |
Google, Inc. (Class A Stock)(a) | | 12,466 | | | 7,728,671 |
H&R Block, Inc. | | 62,200 | | | 1,406,964 |
Home Depot, Inc. | | 123,800 | | | 3,581,534 |
Honeywell International, Inc. | | 31,900 | | | 1,250,480 |
Illinois Tool Works, Inc. | | 52,650 | | | 2,526,674 |
International Business Machines Corp. | | 57,718 | | | 7,555,286 |
International Paper Co. | | 85,300 | | | 2,284,334 |
Johnson & Johnson | | 97,263 | | | 6,264,710 |
JPMorgan Chase & Co. | | 218,723 | | | 9,114,187 |
KeyCorp, | | 189,600 | | | 1,052,280 |
Kraft Foods, Inc. (Class A Stock) | | 31,500 | | | 856,170 |
Liberty Media Corp. — Starz, Ser. Z(a) | | 15,750 | | | 726,863 |
Lockheed Martin Corp. | | 11,100 | | | 836,385 |
Marsh & McLennan Cos., Inc. | | 99,400 | | | 2,194,752 |
Mastercard, Inc. (Class A Stock) | | 16,353 | | | 4,186,041 |
McDonald’s Corp. | | 93,280 | | | 5,824,403 |
Merck & Co., Inc. | | 206,017 | | | 7,527,861 |
Microsoft Corp. | | 148,200 | | | 4,518,618 |
Morgan Stanley | | 39,100 | | | 1,157,360 |
Murphy Oil Corp. | | 40,750 | | | 2,208,650 |
National Oilwell Varco, Inc.(a) | | 38,010 | | | 1,675,861 |
Newell Rubbermaid, Inc. | | 87,100 | | | 1,307,371 |
NiSource, Inc., | | 64,600 | | | 993,548 |
Nordstrom, Inc.,(b) | | 27,195 | | | 1,021,988 |
Norfolk Southern Corp. | | 33,515 | | | 1,756,856 |
NRG Energy, Inc.(a) | | 30,300 | | | 715,383 |
Pfizer, Inc. | | 153,300 | | | 2,788,527 |
Pinnacle West Capital Corp. | | 25,000 | | | 914,500 |
PPG Industries, Inc. | | 38,166 | | | 2,234,238 |
Praxair, Inc. | | 56,606 | | | 4,546,028 |
priceline.com, Inc.(a) | | 5,011 | | | 1,094,904 |
Procter & Gamble Co. (The) | | 27,150 | | | 1,646,104 |
QUALCOMM, Inc. | | 98,758 | | | 4,568,545 |
Qwest Communications International, Inc. | | 133,800 | | | 563,298 |
Raytheon Co. | | 34,050 | | | 1,754,256 |
Schlumberger Ltd. | | 12,300 | | | 800,607 |
SLM Corp.(a) | | 102,000 | | | 1,149,540 |
Southwest Airlines Co. | | 273,800 | | | 3,129,534 |
| | | | | | |
COMMON STOCKS
(continued) | | Shares
| | Value
(Note 2)
| |
| | | | | | | |
United States (continued) | | | | | | |
Spectra Energy Corp. | | 101,400 | | $ | 2,079,714 | |
Sprint Nextel Corp.,(a) | | 340,900 | | | 1,247,694 | |
St Joe Co. (The)(a)(b) | | 48,500 | | | 1,401,165 | |
State Street Corp. | | 43,400 | | | 1,889,636 | |
Sunoco, Inc. | | 26,600 | | | 694,260 | |
Time Warner Cable, Inc. | | 36,800 | | | 1,523,152 | |
Time Warner, Inc. | | 89,700 | | | 2,613,858 | |
Transocean Ltd.(a) | | 68,376 | | | 5,661,533 | |
Tyco Electronics Ltd. | | 76,600 | | | 1,880,530 | |
Tyco International Ltd. | | 48,200 | | | 1,719,776 | |
U.S. Bancorp | | 179,359 | | | 4,037,371 | |
Union Pacific Corp. | | 116,691 | | | 7,456,555 | |
Verizon Communications, Inc. | | 27,100 | | | 897,823 | |
Visa, Inc. (Class A Stock)(b) | | 47,922 | | | 4,191,258 | |
Wal-Mart Stores, Inc. | | 39,350 | | | 2,103,257 | |
Waste Management, Inc.(b) | | 39,300 | | | 1,328,733 | |
Wells Fargo & Co. | | 189,948 | | | 5,126,697 | |
Western Union Co. (The) | | 89,700 | | | 1,690,845 | |
Weyerhaeuser Co. | | 55,150 | | | 2,379,171 | |
Wynn Resorts Ltd.(a) | | 30,288 | | | 1,763,670 | |
Yahoo!, Inc.(a) | | 85,202 | | | 1,429,689 | |
| | | | |
|
|
|
| | | | | | 255,298,566 | |
| | | | |
|
|
|
TOTAL COMMON STOCKS
(cost $542,348,854) | | | 598,004,002 | |
| | | | |
|
|
|
| PREFERRED STOCKS — 0.1% | | | | | | |
United States | | | | | | |
Bank of America Corp | | 8,300 | | | 123,836 | |
Wells Fargo & Co. | | 23,175 | | | 595,598 | |
| | | | |
|
|
|
TOTAL PREFERRED STOCKS
(cost $569,801) | | | 719,434 | |
| | | | |
|
|
|
TOTAL LONG-TERM INVESTMENTS
(cost $542,918,655) | | | 598,723,436 | |
| | | | |
|
|
|
| SHORT-TERM INVESTMENT — 6.3% | |
Affiliated Money Market Mutual Fund | | | | |
Dryden Core Investment Fund — Taxable Money Market Series
(cost $38,613,062; includes $23,197,723 of cash collateral
received for securities on
loan) (Note 4)(c)(d) | | 38,613,062 | | | 38,613,062 | |
| | | | |
|
|
|
TOTAL INVESTMENTS(e) — 102.9%
(cost $581,531,717) | | | 637,336,498 | |
LIABILITIES IN EXCESS OF
OTHER ASSETS — (2.9)% | | | (17,805,028 | ) |
| | | | |
|
|
|
NET ASSETS — 100.0% | | $ | 619,531,470 | |
| | | | |
|
|
|
The following abbreviation is used in portfolio descriptions:
| | |
| ADR | | American Depositary Receipt |
SEE NOTES TO FINANCIAL STATEMENTS.
A74
| | | | | | |
| | | GLOBAL PORTFOLIO (continued) | | |
| |
| SCHEDULE OF INVESTMENTS | | December 31, 2009 |
| (a) | Non-income producing security. |
| (b) | All or a portion of security is on loan. The aggregate market value of such securities is $22,543,645; cash collateral of $23,197,723 (included in liabilities) was received with which the Portfolio purchased highly liquid short-term investments. |
| (c) | Represents security, or a portion thereof, purchased with cash collateral received for securities on loan. |
| (d) | Prudential Investments LLC, the manager of the Portfolio, also serves as manager of the Dryden Core Investment Fund-Taxable Money Market Series. |
| (e) | As of December 31, 2009, 215 securities representing $287,394,956 and 46.4% of the net assets were fair valued in accordance with the policies adopted by the Board of Trustees. |
Various inputs are used in determining the value of the Portfolio’s investments. These inputs are summarized in the three broad levels listed below.
Level 1—quoted prices in active markets for identical securities
Level 2—other significant observable inputs (including quoted prices for similar securities, interest rates, prepayment speeds, credit risk, etc.)
Level 3—significant unobservable inputs (including the Portfolio’s own assumptions in determining the fair value of investments)
The following is a summary of the inputs used as of December 31, 2009 in valuing the Portfolio’s assets carried at fair value:
| | | | | | | | | |
Investments in Securities
| | Level 1
| | Level 2
| | Level 3
|
Common Stocks | | | | | | | | | |
Australia | | $ | 5,510,676 | | $ | 12,425,072 | | $ | — |
Austria | | | — | | | 347,068 | | | — |
Belgium | | | — | | | 5,959,003 | | | — |
Brazil | | | 13,176,087 | | | — | | | — |
Canada | | | 11,707,708 | | | — | | | — |
China | | | 3,947,397 | | | 8,448,288 | | | — |
Denmark | | | — | | | 4,539,402 | | | — |
Finland | | | — | | | 2,767,072 | | | — |
France | | | 4,399,548 | | | 27,070,557 | | | — |
Germany | | | — | | | 21,609,025 | | | — |
Greece | | | — | | | 151,700 | | | — |
Hong Kong | | | — | | | 6,452,341 | | | — |
India | | | 3,393,787 | | | 2,512,433 | | | — |
Indonesia | | | — | | | 1,466,813 | | | — |
Ireland | | | 1,980,791 | | | 2,706,133 | | | — |
Israel | | | 3,711,532 | | | — | | | — |
Italy | | | — | | | 8,839,042 | | | — |
Japan | | | — | | | 51,467,375 | | | — |
Liechtenstein | | | — | | | 253,289 | | | — |
Mexico | | | 404,205 | | | — | | | — |
Netherlands | | | 2,112,866 | | | 13,365,963 | | | — |
New Zealand | | | — | | | 683,305 | | | — |
Norway | | | — | | | 2,308,073 | | | — |
Portugal | | | — | | | 1,377,272 | | | — |
Singapore | | | — | | | 4,095,121 | | | — |
South Africa | | | — | | | 2,460,586 | | | — |
Spain | | | — | | | 17,467,583 | | | — |
Sweden | | | — | | | 2,085,454 | | | — |
Switzerland | | | 1,966,124 | | | 26,195,515 | | | — |
Taiwan | | | — | | | 3,204,377 | | | — |
Turkey | | | — | | | 1,452,833 | | | — |
United Kingdom | | | 2,968,680 | | | 55,715,340 | | | — |
United States | | | 255,298,566 | | | — | | | — |
Preferred Stock | | | | | | | | | |
United States | | | 719,434 | | | — | | | — |
Affiliated Money Market Mutual Fund | | | 38,613,062 | | | — | | | — |
| | |
|
| |
|
| |
|
|
| | | | 349,910,463 | | | 287,426,035 | | | — |
Other Financial Instruments* | | | — | | | — | | | — |
| | |
|
| |
|
| |
|
|
Total | | $ | 349,910,463 | | $ | 287,426,035 | | $ | — |
| | |
|
| |
|
| |
|
|
| * | Other financial instruments are derivative instruments not reflected in the Schedule of Investments, such as futures, forwards and swap contracts, which are valued at the unrealized appreciation/depreciation on the instrument. |
SEE NOTES TO FINANCIAL STATEMENTS.
A75
| | | | | | |
| | | GLOBAL PORTFOLIO (continued) | | |
| |
| SCHEDULE OF INVESTMENTS | | December 31, 2009 |
The following is a reconciliation of assets in which significant unobservable inputs (Level 3) were used in determining fair value:
| | | | | | | | |
| | | Common Stock
| | | Preferred Stock
| |
Balance as of 12/31/08 | | $ | 102,852 | | | $ | 295,558 | |
Realized gain (loss) | | | — | | | | — | |
Change in unrealized appreciation (depreciation) | | | — | | | | — | |
Net purchases (sales) | | | — | | | | — | |
Transfers in and/or out of Level 3 | | | (102,852 | ) | | | (295,558 | ) |
| | |
|
|
| |
|
|
|
Balance as of 12/31/09 | | $ | — | | | $ | — | |
| | |
|
|
| |
|
|
|
The industry classification of portfolio holdings and liabilities in excess of other assets shown as a percentage of net assets as of December 31, 2009 was as follows:
| | | |
Oil, Gas & Consumable Fuels | | 9.0 | % |
Commercial Banks | | 7.7 | |
Pharmaceuticals | | 7.4 | |
Affiliated Money Market Mutual Fund (including 3.7% of collateral received for securities on loan) | | 6.2 | |
Chemicals | | 3.6 | |
Insurance | | 3.5 | |
Diversified Telecommunication | | 3.2 | |
Capital Markets | | 3.1 | |
Diversified Financial Services | | 3.1 | |
Aerospace & Defense | | 2.9 | |
Media | | 2.9 | |
Energy Equipment & Services | | 2.8 | |
Computers & Peripherals | | 2.7 | |
IT Services | | 2.3 | |
Road & Rail | | 2.3 | |
Metals & Mining | | 2.2 | |
Internet Software & Services | | 2.1 | |
Food Products | | 1.7 | |
Hotels, Restaurants & Leisure | | 1.7 | |
Software | | 1.7 | |
Trading Companies & Distributors | | 1.7 | |
Machinery | | 1.6 | |
Electronic Equipment & Instruments | | 1.5 | |
Electric Utilities | | 1.4 | |
Industrial Conglomerates | | 1.4 | |
Wireless Telecommunication Services | | 1.4 | |
Airlines | | 1.3 | |
Food & Staples Retailing | | 1.3 | |
Specialty Retail | | 1.3 | |
Communications Equipment | | 1.1 | |
Consumer Finance | | 1.1 | |
| | | |
Electrical Equipment | | 1.1 | % |
Real Estate Management & Development | | 1.1 | |
Biotechnology | | 1.0 | |
Semiconductors & Semiconductor Equipment | | 0.9 | |
Beverages | | 0.8 | |
Construction & Engineering | | 0.8 | |
Healthcare Equipment & Supplies | | 0.8 | |
Household Products | | 0.8 | |
Commercial Services & Supplies | | 0.7 | |
Internet & Catalog Retail | | 0.7 | |
Paper & Forest Products | | 0.7 | |
Household Durables | | 0.6 | |
Office Electronics | | 0.6 | |
Automobiles | | 0.5 | |
Building Products | | 0.5 | |
Multi-Utilities | | 0.5 | |
Construction Materials | | 0.4 | |
Distributors | | 0.4 | |
Auto Components | | 0.3 | |
Gold | | 0.3 | |
Life Sciences Tools & Services | | 0.3 | |
Textiles, Apparel & Luxury Goods | | 0.3 | |
Tobacco | | 0.3 | |
Containers & Packaging | | 0.2 | |
Diversified Consumer Services | | 0.2 | |
Independent Power Producers & Energy Traders | | 0.2 | |
Multiline Retail | | 0.2 | |
Professional Services | | 0.2 | |
Healthcare Technology | | 0.1 | |
Personal Products | | 0.1 | |
| | |
|
|
| | | 102.8 | |
Liabilities in excess of other assets | | (2.8 | ) |
| | |
|
|
| | | 100.0 | % |
| | |
|
|
SEE NOTES TO FINANCIAL STATEMENTS.
A76
| | | | | | |
| | | GLOBAL PORTFOLIO (continued) | | |
| |
| SCHEDULE OF INVESTMENTS | | December 31, 2009 |
The Portfolio invested in various derivative instruments during the reporting period. The primary types of risk associated with derivative instruments are commodity risk, credit risk, equity risk, foreign exchange risk and interest rate risk. The effect of such derivative instruments on the Portfolio’s financial position and financial performance as reflected in the Statement of Assets and Liabilities and Statement of Operations is presented in the summary below.
The Portfolio did not hold any derivative instruments as of December 31, 2009, accordingly no derivative positions were presented in the Statement of Assets and Liabilities.
The effects of derivative instruments on the Statement of Operations for the year ended December 31, 2009 are as follows:
| | | | | | | | | | | | | | | | | |
| Amount of Realized Gain or (Loss) on Derivatives Recognized in Income | |
Derivatives not designated as hedging
instruments, carried at fair value
| | Warrant
| | Rights
| | | Forward
Contracts
| | Futures
| | Total
| |
Foreign exchange contracts | | $ | — | | $ | — | | | $ | 139,834 | | $ | — | | $ | 139,834 | |
Equity contracts | | | 14,588 | | | (1,962,957 | ) | | | — | | | 65,736 | | | (1,882,633 | ) |
| | |
|
| |
|
|
| |
|
| |
|
| |
|
|
|
Total | | $ | 14,588 | | $ | (1,962,957 | ) | | $ | 139,834 | | $ | 65,736 | | $ | (1,742,799 | ) |
| | |
|
| |
|
|
| |
|
| |
|
| |
|
|
|
| | | |
Change in Unrealized Appreciation or (Depreciation) on Derivatives Recognized in Income
|
Derivatives not designated as hedging
instruments, carried at fair value
| | Forward
Contracts
|
Foreign exchange contracts | | $ | 31,520 |
For the year ended December 31, 2009, the Portfolio’s average value at settlement date payable for forward foreign currency exchange purchase contracts was $2,313,902 and the average value at settlement date receivable for forward foreign currency exchange sale contracts was $2,310,645.
SEE NOTES TO FINANCIAL STATEMENTS.
A77
| | | | | | |
| | | GLOBAL PORTFOLIO (continued) | | |
STATEMENT OF ASSETS AND LIABILITIES
December 31, 2009
| | | | |
| ASSETS | | | | |
Investments, at value including securities on loan of $22,543,645: | | | | |
Unaffiliated investments (cost $542,918,655) | | $ | 598,723,436 | |
Affiliated investments (cost $38,613,062) | | | 38,613,062 | |
Foreign currency, at value (cost $5,010,415) | | | 4,937,937 | |
Cash | | | 7,020 | |
Receivable for investments sold | | | 1,550,569 | |
Foreign tax reclaim receivable | | | 1,153,373 | |
Dividends and interest receivable | | | 545,529 | |
Prepaid expenses | | | 6,078 | |
Receivable for Series shares sold | | | 29 | |
| | |
|
|
|
Total Assets | | | 645,537,033 | |
| | |
|
|
|
| LIABILITIES | | | | |
Collateral for securities on loan | | | 23,197,723 | |
Payable for investments purchased | | | 2,041,960 | |
Management fee payable | | | 393,904 | |
Payable for Series shares repurchased | | | 200,300 | |
Accrued expenses and other liabilities | | | 171,081 | |
Affiliated transfer agent fee payable | | | 595 | |
| | |
|
|
|
Total Liabilities | | | 26,005,563 | |
| | |
|
|
|
| NET ASSETS | | $ | 619,531,470 | |
| | |
|
|
|
Net assets were comprised of: | | | | |
Paid-in capital | | $ | 723,324,781 | |
Retained earnings | | | (103,793,311 | ) |
| | |
|
|
|
Net assets, December 31, 2009 | | $ | 619,531,470 | |
| | |
|
|
|
Net asset value and redemption price per share, $619,531,470 / 37,149,452 outstanding shares of beneficial interest | | $ | 16.68 | |
| | |
|
|
|
STATEMENT OF OPERATIONS
Year Ended December 31, 2009
| | | | |
| INVESTMENT INCOME | | | | |
Unaffiliated dividend income (net of foreign withholding taxes of $724,051) | | $ | 13,689,206 | |
Affiliated income from securities loaned, net | | | 227,558 | |
Affiliated dividend income | | | 88,164 | |
Interest | | | 5,442 | |
| | |
|
|
|
| | | | 14,010,370 | |
| | |
|
|
|
| EXPENSES | | | | |
Management fee | | | 4,006,515 | |
Custodian’s fees and expenses | | | 238,000 | |
Shareholders’ reports | | | 152,000 | |
Audit fee | | | 36,000 | |
Trustees’ fees | | | 15,000 | |
Insurance expenses | | | 13,000 | |
Transfer agent’s fee and expenses (including affiliated expense of $3,600) (Note 4) | | | 10,000 | |
Legal fees and expenses | | | 9,000 | |
Commitment fee on syndicated credit agreement | | | 2,000 | |
Miscellaneous | | | 47,866 | |
| | |
|
|
|
Total expenses | | | 4,529,381 | |
| | |
|
|
|
| NET INVESTMENT INCOME | | | 9,480,989 | |
| | |
|
|
|
| NET REALIZED AND UNREALIZED GAIN (LOSS) ON INVESTMENTS AND FOREIGN CURRENCIES | | | | |
Net realized gain (loss) on: | | | | |
Investment transactions | | | (62,900,316 | ) |
Futures transactions | | | 65,736 | |
Foreign currency transactions | | | (1,578,682 | ) |
| | |
|
|
|
| | | | (64,413,262 | ) |
| | |
|
|
|
Net change in unrealized appreciation (depreciation) on: | | | | |
Investments | | | 204,101,309 | |
Foreign currencies | | | 27,225 | |
| | |
|
|
|
| | | | 204,128,534 | |
| | |
|
|
|
| NET GAIN ON INVESTMENTS AND FOREIGN CURRENCIES | | | 139,715,272 | |
| | |
|
|
|
| NET INCREASE IN NET ASSETS RESULTING FROM OPERATIONS | | $ | 149,196,261 | |
| | |
|
|
|
STATEMENT OF CHANGES IN NET ASSETS
| | | | | | | | |
| | | Year Ended December 31,
| |
| | | 2009
| | | 2008
| |
| INCREASE (DECREASE) IN NET ASSETS | | | | | | | | |
| OPERATIONS: | | | | | | | | |
Net investment income | | $ | 9,480,989 | | | $ | 15,477,187 | |
Net realized loss on investments and foreign currencies | | | (64,413,262 | ) | | | (101,996,224 | ) |
Net change in unrealized appreciation (depreciation) on investments and foreign currencies | | | 204,128,534 | | | | (316,326,272 | ) |
| | |
|
|
| |
|
|
|
NET INCREASE (DECREASE) IN NET ASSETS RESULTING FROM OPERATIONS | | | 149,196,261 | | | | (402,845,309 | ) |
| | |
|
|
| |
|
|
|
| DISTRIBUTIONS | | | (15,473,292 | ) | | | (61,349,073 | ) |
| | |
|
|
| |
|
|
|
| SERIES SHARE TRANSACTIONS: | | | | | | | | |
Series shares sold [944,130 and 1,400,663 shares, respectively] | | | 13,276,492 | | | | 27,172,912 | |
Series shares issued in reinvestment of dividends and distributions [1,100,519 and 2,931,155 shares, respectively] | | | 15,473,292 | | | | 61,349,073 | |
Series shares repurchased [4,117,959 and 5,123,305 shares, respectively] | | | (55,673,306 | ) | | | (96,604,973 | ) |
| | |
|
|
| |
|
|
|
NET DECREASE IN NET ASSETS RESULTING FROM SERIES SHARE TRANSACTIONS | | | (26,923,522 | ) | | | (8,082,988 | ) |
| | |
|
|
| |
|
|
|
| TOTAL INCREASE (DECREASE) IN NET ASSETS | | | 106,799,447 | | | | (472,277,370 | ) |
| NET ASSETS: | | | | | | | | |
Beginning of year | | | 512,732,023 | | | | 985,009,393 | |
| | |
|
|
| |
|
|
|
End of year | | $ | 619,531,470 | | | $ | 512,732,023 | |
| | |
|
|
| |
|
|
|
SEE NOTES TO FINANCIAL STATEMENTS.
A78
| | | | | | |
| | | GOVERNMENT INCOME PORTFOLIO | | |
| |
| SCHEDULE OF INVESTMENTS | | December 31, 2009 |
| | | | | | | | | | | | |
| LONG-TERM INVESTMENTS — 94.8% | | | | Interest
Rate
| | Maturity
Date
| | Principal
Amount
(000)#
| | Value
(Note 2)
|
| | | | | | | | | | | | | |
Asset-Backed Securities — 2.1% | | | | | | | | | | | | |
Citibank Credit Card Issuance Trust, | | | | | | | | | | | | |
Ser. 2007-A8, Class A8 | | | | 5.650% | | 09/20/19 | | $ | 1,500 | | $ | 1,624,771 |
Small Business Administration Participation Certificates, | | | | | | | | | | | | |
Ser. 1996-20J, Class 1 | | | | 7.200% | | 10/01/16 | | | 1,895 | | | 2,053,713 |
Ser. 1997-20A, Class 1 | | | | 7.150% | | 01/01/17 | | | 1,512 | | | 1,649,675 |
Ser. 1997-20G, Class 1 | | | | 6.850% | | 07/01/17 | | | 677 | | | 721,576 |
Ser. 1998-20I, Class 1 | | | | 6.000% | | 09/01/18 | | | 1,529 | | | 1,639,058 |
| | | | | | | | | | | |
|
|
| | | | | | | | | | | | | 7,688,793 |
| | | | | | | | | | | |
|
|
Collateralized Mortgage Obligations — 3.7% | | | | | | | | | | | | |
Federal Home Loan Mortgage Corp., | | | | | | | | | | | | |
Ser. 2002-2496, Class PM | | | | 5.500% | | 09/15/17 | | | 2,775 | | | 2,938,133 |
Ser. 2002-2501, Class MC | | | | 5.500% | | 09/15/17 | | | 1,076 | | | 1,144,635 |
Ser. 2002-2513, Class HC | | | | 5.000% | | 10/15/17 | | | 2,339 | | | 2,476,624 |
Ser. 2002-2518, Class PV | | | | 5.500% | | 06/15/19 | | | 1,920 | | | 2,028,261 |
Federal National Mortgage Association, | | | | | | | | | | | | |
Ser. 2002-18, Class PC | | | | 5.500% | | 04/25/17 | | | 3,487 | | | 3,673,382 |
Ser. 2002-57, Class ND | | | | 5.500% | | 09/25/17 | | | 1,178 | | | 1,251,461 |
Merrill Lynch Mortgage Investors, Inc., | | | | | | | | | | | | |
Ser. 2003-E, Class A1(a) | | | | 0.541% | | 10/25/28 | | | 112 | | | 96,085 |
Structured Adjustable Rate Mortgage Loan Trust, | | | | | | | | | | | | |
Ser. 2004-1, Class 4A3(a) | | | | 3.586% | | 02/25/34 | | | 378 | | | 312,890 |
| | | | | | | | | | | |
|
|
| | | | | | | | | | | | | 13,921,471 |
| | | | | | | | | | | |
|
|
Commercial Mortgage-Backed Securities — 8.5% | | | | | | | | | | | | |
Bear Stearns Commercial Mortgage Securities, Inc., | | | | | | | | | | | | |
Ser. 2004-T16, Class A5 | | | | 4.600% | | 02/13/46 | | | 4,200 | | | 4,096,276 |
Ser. 2006-PW11, Class A4(a) | | | | 5.456% | | 03/11/39 | | | 860 | | | 840,589 |
Ser. 2006-T22, Class A4(a) | | | | 5.463% | | 04/12/38 | | | 2,825 | | | 2,844,214 |
Commercial Mortgage Loan Trust, | | | | | | | | | | | | |
Ser. 2008-LS1, Class A2(a) | | | | 6.019% | | 12/10/49 | | | 1,230 | | | 1,261,699 |
CW Capital Cobalt Ltd., | | | | | | | | | | | | |
Ser. 2007-C3, Class A3(a) | | | | 5.820% | | 05/15/46 | | | 1,300 | | | 1,258,600 |
Greenwich Capital Commercial Funding Corp., | | | | | | | | | | | | |
Ser. 2007-GG9, Class A2 | | | | 5.381% | | 03/10/39 | | | 2,415 | | | 2,446,512 |
Merrill Lynch Mortgage Trust, | | | | | | | | | | | | |
Ser. 2006-C1, Class ASB(a) | | | | 5.656% | | 05/12/39 | | | 1,500 | | | 1,504,155 |
Merrill Lynch/Countrywide Commercial Mortgage Trust, | | | | | | | | | | | | |
Ser. 2007-9, Class A2 | | | | 5.590% | | 09/12/49 | | | 3,000 | | | 3,032,075 |
Morgan Stanley Capital I, | | | | | | | | | | | | |
Ser. 2005-IQ9, Class AAB | | | | 4.510% | | 07/15/56 | | | 2,500 | | | 2,523,433 |
Ser. 2005-T19, Class AAB | | | | 4.852% | | 06/12/47 | | | 1,375 | | | 1,393,552 |
Ser. 2006-IQ11, Class A4(a) | | | | 5.770% | | 10/15/42 | | | 2,800 | | | 2,769,964 |
Wachovia Bank Commercial Mortgage Trust, | | | | | | | | | | | | |
Ser. 2006-C25, Class A4(a) | | | | 5.740% | | 05/15/43 | | | 2,000 | | | 1,970,573 |
Ser. 2006-C27, Class A2 | | | | 5.624% | | 07/15/45 | | | 3,000 | | | 3,071,287 |
Ser. 2007-C33, Class A3(a) | | | | 5.902% | | 02/15/51 | | | 3,000 | | | 2,950,483 |
| | | | | | | | | | | |
|
|
| | | | | | | | | | | | | 31,963,412 |
| | | | | | | | | | | |
|
|
Corporate Bond — 0.3% | | | | | | | | | | | | |
DEPFA ACS Bank (Ireland), Covered Notes, 144A | | | | 5.125% | | 03/16/37 | | | 1,520 | | | 1,117,170 |
| | | | | | | | | | | |
|
|
Mortgage-Backed Securities — 42.5% | | | | | | | | | | | | |
Federal Home Loan Mortgage Corp.(a) | | | | 2.761% | | 05/01/34 | | | 1,046 | | | 1,072,362 |
Federal Home Loan Mortgage Corp.(h) | | | | 4.500% | | TBA 15 Year | | | 3,500 | | | 3,596,250 |
Federal Home Loan Mortgage Corp. | | | | 5.000% | | 06/01/33-05/01/34 | | | 7,725 | | | 7,949,480 |
Federal Home Loan Mortgage Corp.(h) | | | | 5.000% | | TBA 30 Year | | | 9,500 | | | 9,740,464 |
Federal Home Loan Mortgage Corp. | | | | 5.500% | | 05/01/37-05/01/38 | | | 3,816 | | | 4,002,669 |
Federal Home Loan Mortgage Corp.(h) | | | | 5.500% | | TBA 30 Year | | | 9,000 | | | 9,427,500 |
SEE NOTES TO FINANCIAL STATEMENTS.
A79
| | | | | | |
| | | GOVERNMENT INCOME PORTFOLIO (continued) | | |
| |
| SCHEDULE OF INVESTMENTS | | December 31, 2009 |
| | | | | | | | | | | | |
| | | | | Interest
Rate
| | Maturity
Date
| | Principal
Amount
(000)#
| | Value
(Note 2)
|
| | | | | | | | | | | | | |
Mortgage-Backed Securities (continued) | | | | | | | | | | |
Federal Home Loan Mortgage Corp. | | | | 6.000% | | 09/01/34 | | $ | 498 | | $ | 531,593 |
Federal Home Loan Mortgage Corp. | | | | 6.500% | | 01/01/11-09/01/32 | | | 355 | | | 379,153 |
Federal Home Loan Mortgage Corp. | | | | 7.000% | | 08/01/11-10/01/32 | | | 142 | | | 151,763 |
Federal National Mortgage Association(a) | | | | 2.602% | | 07/01/33 | | | 2,920 | | | 3,000,816 |
Federal National Mortgage Association(a) | | | | 2.764% | | 06/01/34 | | | 907 | | | 929,779 |
Federal National Mortgage Association(a) | | | | 3.673% | | 04/01/34 | | | 842 | | | 871,392 |
Federal National Mortgage Association(a) | | | | 3.680% | | 04/01/34 | | | 384 | | | 397,096 |
Federal National Mortgage Association(h) | | | | 4.000% | | TBA 15 Year | | | 500 | | | 501,172 |
Federal National Mortgage Association(h) | | | | 4.000% | | TBA 30 Year | | | 2,000 | | | 1,930,624 |
Federal National Mortgage Association(a) | | | | 4.029% | | 08/01/33 | | | 1,868 | | | 1,900,612 |
Federal National Mortgage Association(h) | | | | 4.500% | | TBA 30 Year | | | 2,000 | | | 1,996,250 |
Federal National Mortgage Association | | | | 5.000% | | 07/01/18-05/01/36 | | | 12,554 | | | 13,055,092 |
Federal National Mortgage Association(h) | | | | 5.000% | | TBA 30 Year | | | 13,000 | | | 13,339,222 |
Federal National Mortgage Association | | | | 5.500% | | 01/01/17-05/01/37 | | | 29,053 | | | 30,536,409 |
Federal National Mortgage Association(h) | | | | 5.500% | | TBA 15 Year | | | 4,500 | | | 4,758,750 |
Federal National Mortgage Association | | | | 6.000% | | 11/01/14-05/01/38 | | | 11,234 | | | 11,951,070 |
Federal National Mortgage Association(h) | | | | 6.000% | | TBA 30 Year | | | 14,000 | | | 14,826,868 |
Federal National Mortgage Association | | | | 6.260% | | 03/01/11 | | | 1,108 | | | 1,149,048 |
Federal National Mortgage Association | | | | 6.500% | | 01/01/15-10/01/37 | | | 5,177 | | | 5,576,501 |
Federal National Mortgage Association | | | | 7.000% | | 02/01/12-01/01/36 | | | 1,073 | | | 1,180,286 |
Federal National Mortgage Association | | | | 7.500% | | 05/01/10-10/01/12 | | | 50 | | | 52,910 |
Federal National Mortgage Association | | | | 8.000% | | 03/01/22-02/01/26 | | | 31 | | | 35,234 |
Federal National Mortgage Association | | | | 9.000% | | 02/01/25-04/01/25 | | | 165 | | | 191,019 |
Government National Mortgage Association(h) | | | | 4.500% | | TBA 30 Year | | | 3,500 | | | 3,496,727 |
Government National Mortgage Association | | | | 5.000% | | 07/15/33-04/15/34 | | | 3,082 | | | 3,193,397 |
Government National Mortgage Association | | | | 5.500% | | 03/15/34-03/15/36 | | | 2,729 | | | 2,875,030 |
Government National Mortgage Association(h) | | | | 6.000% | | TBA 30 Year | | | 2,000 | | | 2,113,124 |
Government National Mortgage Association | | | | 6.500% | | 07/15/32-08/15/32 | | | 616 | | | 663,642 |
Government National Mortgage Association | | | | 7.000% | | 03/15/23-08/15/28 | | | 1,394 | | | 1,545,736 |
Government National Mortgage Association | | | | 7.500% | | 12/15/25-02/15/26 | | | 267 | | | 300,467 |
Government National Mortgage Association | | | | 8.500% | | 09/15/24-04/15/25 | | | 285 | | | 328,699 |
| | | | | | | | | | | |
|
|
| | | | | | | | | | | | | 159,548,206 |
| | | | | | | | | | | |
|
|
Municipal Bond — 0.2% | | | | | | | | | | | | |
State of Utah, Build America Bonds, Ser. D | | | | 4.554% | | 07/01/24 | | | 630 | | | 616,581 |
| | | | | | | | | | | |
|
|
U.S. Government Agency Obligations — 8.8% | | | | | | | | | | | | |
Federal Farm Credit Bank(c) | | | | 4.875% | | 01/17/17 | | | 980 | | | 1,042,843 |
Federal Home Loan Banks(b) | | | | 5.000% | | 11/17/17 | | | 1,285 | | | 1,390,009 |
Federal Home Loan Banks | | | | 5.625% | | 06/11/21 | | | 2,015 | | | 2,193,483 |
Federal Home Loan Mortgage Corp.(c) | | | | 3.750% | | 03/27/19 | | | 1,950 | | | 1,911,821 |
Federal National Mortgage Association(c) | | | | 2.625% | | 11/20/14 | | | 3,005 | | | 2,981,699 |
Federal National Mortgage Association(c) | | | | 5.000% | | 05/11/17 | | | 4,370 | | | 4,746,698 |
Federal National Mortgage Association(c) | | | | 6.625% | | 11/15/30 | | | 1,230 | | | 1,478,224 |
Financing Corp. FICO, | | | | | | | | | | | | |
Ser. 1P(d) | | | | 4.570% | | 05/11/18 | | | 4,000 | | | 2,753,748 |
Ser. 2P(d) | | | | 5.190% | | 11/30/17 | | | 2,940 | | | 2,075,081 |
Ser. 3P(d) | | | | 5.190% | | 11/30/17 | | | 3,640 | | | 2,569,149 |
Tennessee Valley Authority | | | | 4.500% | | 04/01/18 | | | 805 | | | 819,207 |
Tennessee Valley Authority | | | | 5.250% | | 09/15/39 | | | 870 | | | 862,044 |
Tennessee Valley Authority | | | | 5.500% | | 06/15/38 | | | 465 | | | 472,314 |
GMAC, Inc., FDIC Gtd. Notes | | | | 1.750% | | 10/30/12 | | | 4,415 | | | 4,386,258 |
Western Corporate Federal Credit Union, Gtd. Notes. | | | | 1.750% | | 11/02/12 | | | 3,405 | | | 3,389,712 |
| | | | | | | | | | | |
|
|
| | | | | | | | | | | | | 33,072,290 |
| | | | | | | | | | | |
|
|
U.S. Treasury Securities — 28.7% | | | | | | | | | | | | |
U.S. Treasury Bonds | | | | 3.500% | | 02/15/39 | | | 690 | | | 565,153 |
U.S. Treasury Bonds(c) | | | | 4.375% | | 11/15/39 | | | 4,545 | | | 4,350,419 |
U.S. Treasury Bonds | | | | 4.500% | | 02/15/36 | | | 2,510 | | | 2,472,350 |
U.S. Treasury Bonds(c) | | | | 4.500% | | 08/15/39 | | | 11,015 | | | 10,765,444 |
SEE NOTES TO FINANCIAL STATEMENTS.
A80
| | | | | | |
| | | GOVERNMENT INCOME PORTFOLIO (continued) | | |
| |
| SCHEDULE OF INVESTMENTS | | December 31, 2009 |
| | | | | | | | | | | | | |
| | | | | Interest
Rate
| | Maturity
Date
| | Principal
Amount
(000)#
| | Value
(Note 2)
| |
| | | | | | | | | | | | | | |
U.S. Treasury Securities (continued) | | | | | | | | | | | |
U.S. Treasury Bonds | | | | 6.250% | | 08/15/23 | | $ | 9,555 | | $ | 11,412,253 | |
U.S. Treasury Bonds | | | | 6.875% | | 08/15/25 | | | 15,000 | | | 19,038,285 | |
U.S. Treasury Bonds | | | | 7.125% | | 02/15/23 | | | 630 | | | 807,975 | |
U.S. Treasury Bonds | | | | 8.875% | | 08/15/17 | | | 9,900 | | | 13,494,938 | |
U.S. Treasury Notes | | | | 2.375% | | 08/31/14 | | | 40,560 | | | 40,262,127 | |
U.S. Treasury Strips Coupon(g) | | | | 4.830% | | 11/15/24 | | | 890 | | | 434,363 | |
U.S. Treasury Strips Coupon(g) | | | | 4.860% | | 08/15/24 | | | 1,095 | | | 542,752 | |
U.S. Treasury Strips Coupon(g) | | | | 5.270% | | 05/15/20 | | | 1,055 | | | 678,521 | |
U.S. Treasury Strips Principal(g) | | | | 6.260% | | 02/15/23 | | | 5,540 | | | 3,021,394 | |
| | | | | | | | | | | |
|
|
|
| | | | | | | | | | | | | 107,845,974 | |
| | | | | | | | | | | |
|
|
|
TOTAL LONG-TERM INVESTMENTS
(cost $349,490,039) | | | 355,773,897 | |
| | | | | | | | | | | |
|
|
|
| | | | | |
| | | | | | | | | Shares
| | | |
| SHORT-TERM INVESTMENTS — 26.4% | | | | | | | | | | | | | |
AFFILIATED MUTUAL FUNDS | | | | | | | | | | | | | |
Dryden Core Investment Fund — Short-Term Bond Series (Note 4)(e)
(cost $52,856,631) | | | 5,353,208 | | | 45,823,462 | |
Dryden Core Investment Fund — Taxable Money Market Series
(cost $53,269,210; includes $15,593,648 of cash collateral received for securities on loan)(Note 4)(e)(f) | | | 53,269,210 | | | 53,269,210 | |
| | | | | | | | | | | |
|
|
|
TOTAL AFFILIATED MUTUAL FUNDS
(cost $106,125,841) | | | 99,092,672 | |
| | | | | | | | | | | |
|
|
|
TOTAL INVESTMENTS, BEFORE SECURITY SOLD SHORT —121.2%
(cost $455,615,880) | | | 454,866,569 | |
| | | | | | | | | | | |
|
|
|
| | | | | |
| | | | | | | | | Principal
Amount
(000)#
| | | |
| SECURITY SOLD SHORT — (1.7)% | | | | | | | | | | | | | |
Mortgage-Backed Security | | | | | | | | | | | |
Federal National Mortgage Association
(proceeds $6,332,852) | | | | 5.500% | | TBA 30 Year | | $ | 6,000 | | | (6,280,314 | ) |
| | | | | | | | | | | |
|
|
|
TOTAL INVESTMENTS, NET OF SECURITY SOLD SHORT — 119.5%
(cost $449,283,028) | | | 448,586,255 | |
LIABILITIES IN EXCESS OF OTHER ASSETS(i) — (19.5)% | | | (73,195,863 | ) |
| | | | | | | | | | | |
|
|
|
NET ASSETS — 100.0% | | $ | 375,390,392 | |
| | | | | | | | | | | |
|
|
|
The following abbreviations are used in portfolio descriptions:
| | |
| 144A | | Security was purchased pursuant to Rule 144A under the Securities Act of 1933 and may not be resold subject to that rule except to qualified institutional buyers. Unless otherwise noted, 144A securities are deemed to be liquid. |
| FDIC | | Federal Deposit Insurance Corporation |
| FICO | | Financing Corporation |
| TBA | | To Be Announced |
| # | Principal amount shown in U.S. dollars unless otherwise stated. |
| (a) | Indicates a variable rate security. The maturity date presented for these instruments is the later of the next date on which the security can be redeemed at par or the next date on which the rate of interest is adjusted. The interest rate shown reflects the rate in effect at December 31, 2009. |
| (b) | Security segregated as collateral for futures contracts. |
| (c) | All or a portion of security is on loan. The aggregate market value of such securities is $15,162,729; cash collateral of $15,593,648 (included in liabilities) was received with which the Portfolio purchased highly liquid short-term investments. |
| (d) | Represents zero coupon bond. Rate shown reflects the effective yield at December 31, 2009. |
| (e) | Prudential Investments LLC, the manager of the Portfolio, also serves as manager of the Dryden Core Investment Fund—Taxable Money Market Series and the Dryden Core Investment Fund—Short-Term Bond Series. |
SEE NOTES TO FINANCIAL STATEMENTS.
A81
| | | | | | |
| | | GOVERNMENT INCOME PORTFOLIO (continued) | | |
| |
| SCHEDULE OF INVESTMENTS | | December 31, 2009 |
| (f) | Represents security, or a portion thereof, purchased with cash collateral received for securities on loan. |
| (g) | Rate shown reflects the effective yield at December 31, 2009. |
| (h) | All or partial principal amount totaling $57,500,000 represents to-be-announced (“TBA”) securities acquired under mortgage dollar roll agreement. |
| (i) | Liabilities in excess of other assets include net unrealized appreciation (depreciation) on financial futures contracts and interest rate swap agreements as follows: |
Open futures contracts outstanding at December 31, 2009:
| | | | | | | | | | | | | | |
Number of
Contracts
| | Type
| | Expiration
Date
| | Value at
Trade Date
| | Value at
December 31, 2009
| | Unrealized
Appreciation
(Depreciation)
| |
| Long Positions: | | | | | | | | | | | | | | |
| 96 | | U.S. Treasury 10 Yr. Notes | | Mar. 2010 | | $ | 11,076,868 | | $ | 11,083,500 | | $ | 6,632 | |
| 232 | | U.S. Treasury 2 Yr. Notes | | Mar. 2010 | | | 50,442,160 | | | 50,173,625 | | | (268,535 | ) |
| 17 | | U.S. Treasury 5 Yr. Notes | | Mar. 2010 | | | 1,948,115 | | | 1,944,508 | | | (3,607 | ) |
| | | | | | | | | | | | |
|
|
|
| | | | | | | | | | | | | | (265,510 | ) |
| | | | | | | | | | | | |
|
|
|
| Short Position: | | | | | | | | | | | | | | |
| 334 | | U.S. Long Bond | | Mar. 2010 | | | 39,305,840 | | | 38,535,250 | | | 770,590 | |
| | | | | | | | | | | | |
|
|
|
| | | | | | | | | | | | | $ | 505,080 | |
| | | | | | | | | | | | |
|
|
|
Interest rate swap agreements outstanding at December 31, 2009:
| | | | | | | | | | | | | | | | | | | | |
Counterparty
| | Termination
Date
| | Notional
Amount
(000)
| | Fixed
Rate
| | Floating Rate
| | Fair
value
| | | Upfront
Premium
Paid/
(Receivable)
| | Unrealized
Appreciation/
(Depreciation)
| |
Deutsche Bank AG(a) | | 5/31/2014 | | $ | 4,660 | | 2.355% | | 3 month LIBOR | | $ | (99,451 | ) | | $ | — | | $ | (99,451 | ) |
Morgan Stanley Capital Services(b) | | 2/15/2036 | | | 2,445 | | 4.128% | | 3 month LIBOR | | | 137,438 | | | | — | | | 137,438 | |
| | | | | | | | | | | |
|
|
| |
|
| |
|
|
|
| | | | | | | | | | | | $ | 37,987 | | | $ | — | | $ | 37,987 | |
| | | | | | | | | | | |
|
|
| |
|
| |
|
|
|
LIBOR—London Interbank Offered Rate
| (a) | Portfolio pays the floating rate and receives the fixed rate. |
| (b) | Portfolio pays the fixed rate and receives the floating rate. |
Various inputs are used in determining the value of the Portfolio’s investments. These inputs are summarized in the three broad levels listed below.
Level 1—quoted prices in active markets for identical securities
Level 2—other significant observable inputs (including quoted prices for similar securities, interest rates, prepayment speeds, credit risk, etc.)
Level 3—significant unobservable inputs (including the Portfolio’s own assumptions in determining the fair value of investments)
The following is a summary of the inputs used as of December 31, 2009 in valuing the Portfolio’s assets carried at fair value:
| | | | | | | | | | |
Investments in Securities
| | Level 1
| | Level 2
| | | Level 3
|
Asset-Backed Securities | | $ | — | | $ | 7,688,793 | | | $ | — |
Collateralized Mortgage Obligations | | | — | | | 13,921,471 | | | | — |
Commercial Mortgage-Backed Securities | | | — | | | 31,963,412 | | | | — |
Corporate Bond | | | — | | | 1,117,170 | | | | — |
Mortgage-Backed Securities | | | — | | | 159,548,206 | | | | — |
Municipal Bond | | | — | | | 616,581 | | | | — |
U.S. Government Agency Obligations | | | — | | | 33,072,290 | | | | — |
U.S. Treasury Securities | | | — | | | 107,845,974 | | | | — |
Affiliated Mutual Funds | | | 99,092,672 | | | — | | | | — |
Security Sold Short | | | — | | | (6,280,314 | ) | | | — |
| | |
|
| |
|
|
| |
|
|
| | | | 99,092,672 | | | 349,493,583 | | | | — |
Other Financial Instruments* | | | 505,080 | | | 37,987 | | | | — |
| | |
|
| |
|
|
| |
|
|
Total | | $ | 99,597,752 | | $ | 349,531,570 | | | $ | — |
| | |
|
| |
|
|
| |
|
|
| * | Other financial instruments are derivative instruments not reflected in the Schedule of Investments, such as futures, forwards and swap contracts, which are valued at the unrealized appreciation/depreciation on the instrument. |
As of December 31, 2009 and 2008, the Portfolio did not use any significant unobservable inputs (Level 3) in determining the value of investments.
SEE NOTES TO FINANCIAL STATEMENTS.
A82
| | | | | | |
| | | GOVERNMENT INCOME PORTFOLIO (continued) | | |
| |
| SCHEDULE OF INVESTMENTS | | December 31, 2009 |
The industry classification of portfolio holdings and liabilities in excess of other assets shown as a percentage of net assets as of December 31, 2009 was as follows:
| | | |
Mortgage-Backed Securities | | 42.5 | % |
U.S. Treasury Securities | | 28.7 | |
Affiliated Mutual Funds (including 4.2% of collateral received for securities on loan) | | 26.4 | |
U.S. Government Agency Obligations | | 8.8 | |
Commercial Mortgage-Backed Securities | | 8.5 | |
Collateralized Mortgage Obligations | | 3.7 | |
Asset-Backed Securities | | 2.1 | |
Corporate Bond | | 0.3 | |
Municipal Bond | | 0.2 | |
| | |
|
|
| | | 121.2 | |
Security Sold Short | | (1.7 | ) |
Liabilities in excess of other assets | | (19.5 | ) |
| | |
|
|
| | | 100.0 | % |
| | |
|
|
The Portfolio invested in derivative instruments during the reporting period. The primary types of risk associated with these derivative instruments are commodity risk, credit risk, equity risk, foreign exchange risk and interest rate risk. The effect of such derivative instruments on the Portfolio’s financial position and financial performance as reflected in the Statement of Assets and Liabilities and Statement of Operations is presented in the summary below.
Fair values of derivative Instruments as of December 31, 2009 as presented in the Statement of Assets and Liabilities:
| | | | | | | | | | | | |
Derivatives not designated as
hedging instruments, carried at
fair value
| | Asset Derivatives
| | | Liability Derivatives
| |
| | Balance Sheet Location
| | Fair
Value
| | | Balance Sheet Location
| | Fair
Value
| |
Interest rate contracts | | Due from broker—variation margin | | $ | 777,222 | * | | Due from broker—variation margin | | $ | 272,142 | * |
Interest rate contracts | | Unrealized appreciation on swaps | | | 137,438 | | | Unrealized depreciation on swaps | | | 99,451 | |
| | | | |
|
|
| | | |
|
|
|
Total | | | | $ | 914,660 | | | | | $ | 371,593 | |
| | | | |
|
|
| | | |
|
|
|
| * | Includes cumulative appreciation/depreciation on futures contracts as reported in Schedule of Investments. Only unsettled variation margin receivable (payable) is reported within the Statement of Assets and Liabilities. |
The effects of derivative instruments on the Statement of Operations for the year ended December 31, 2009 are as follows:
| | | | | | | | | | | | | | | | | | | | | |
| Amount of Realized Gain or (Loss) on Derivatives Recognized in Income | |
Derivatives not designated as hedging
instruments, carried at fair value
| | Futures
| | Forward
Contracts
| | | Swaps
| | Purchased
Options
| | | Written
Options
| | Total
| |
Foreign exchange contracts | | $ | — | | $ | (90,336 | ) | | $ | — | | $ | (49,981 | ) | | $ | — | | $ | (140,317 | ) |
Interest rate contracts | | | 3,982,348 | | | — | | | | 287,251 | | | (66,398 | ) | | | 12,250 | | | 4,215,451 | |
| | |
|
| |
|
|
| |
|
| |
|
|
| |
|
| |
|
|
|
Total | | $ | 3,982,348 | | $ | (90,336 | ) | | $ | 287,251 | | $ | (116,379 | ) | | $ | 12,250 | | $ | 4,075,134 | |
| | |
|
| |
|
|
| |
|
| |
|
|
| |
|
| |
|
|
|
|
| Change in Unrealized Appreciation or (Depreciation) on Derivatives Recognized in Income | |
Derivatives not designated as hedging
instruments, carried at fair value
| | | | | | | Futures
| | Forward
Contracts
| | | Swaps
| | Total
| |
Foreign exchange contracts | | | $ | — | | $ | 88,182 | | | $ | — | | $ | — | |
Interest rate contracts | | | | 290,928 | | | — | | | | 246,857 | | | 625,967 | |
| | | |
|
| |
|
|
| |
|
| |
|
|
|
Total | | | $ | 290,928 | | $ | 88,182 | | | $ | 246,857 | | $ | 625,967 | |
| | | |
|
| |
|
|
| |
|
| |
|
|
|
For the year ended December 31, 2009, the Portfolio’s average volume of derivative activities is as follows:
| | | | | | | | | | | | | | | | | | |
Purchased Options
(Cost)
| | Written Options
(Premium
Received)
| | Futures
Long Position
(Value at
Trade Date)
| | Futures
Short Position
(Value at
Trade Date)
| | Forward Currency
Contracts—Purchased
(Value at Settlement
Date Payable)
| | Forward Currency
Contracts—Sold
(Value at Settlement
Date Receivable)
| | Interest Rate Swaps
(Notional Amount in
USD (000))
|
| $12,889 | | $ | 1,181 | | $ | 40,653,521 | | $ | 26,139,070 | | $ | 66,132 | | $ | 20,299 | | $ | 25,467 |
| |
|
| |
|
| |
|
| |
|
| |
|
| |
|
|
SEE NOTES TO FINANCIAL STATEMENTS.
A83
| | | | | | |
| | | GOVERNMENT INCOME PORTFOLIO (continued) | | |
STATEMENT OF ASSETS AND LIABILITIES
December 31, 2009
| | | |
| ASSETS | | | |
Investments, at value including securities on loan of $15,162,729: | | | |
Unaffiliated investments (cost $349,490,039) | | $ | 355,773,897 |
Affiliated investments (cost $106,125,841) | | | 99,092,672 |
Cash | | | 24,343 |
Receivable for investments sold | | | 41,909,015 |
Dividends and interest receivable | | | 2,649,138 |
Unrealized appreciation on swaps | | | 137,438 |
Due from broker—variation margin | | | 126,924 |
Receivable for Series shares sold | | | 83,315 |
Prepaid expenses | | | 4,292 |
| | |
|
|
Total Assets | | | 499,801,034 |
| | |
|
|
| LIABILITIES | | | |
Payable for investments purchased | | | 102,146,806 |
Collateral for securities on loan | | | 15,593,648 |
Securities sold short, at value (proceeds received $6,332,852) | | | 6,280,314 |
Management fee payable | | | 128,816 |
Unrealized depreciation on swaps | | | 99,451 |
Accrued expenses and other liabilities | | | 94,726 |
Payable for Series shares repurchased | | | 65,312 |
Deferred trustees’ fees | | | 974 |
Affiliated transfer agent fee payable | | | 595 |
| | |
|
|
Total Liabilities | | | 124,410,642 |
| | |
|
|
| NET ASSETS | | $ | 375,390,392 |
| | |
|
|
Net assets were comprised of: | | | |
Paid-in capital | | $ | 365,116,986 |
Retained earnings | | | 10,273,406 |
| | |
|
|
Net assets, December 31, 2009 | | $ | 375,390,392 |
| | |
|
|
Net asset value and redemption price per share, $375,390,392 / 31,642,071 outstanding shares of beneficial interest | | $ | 11.86 |
| | |
|
|
STATEMENT OF OPERATIONS
Year Ended December 31, 2009
| | | | |
| INVESTMENT INCOME | | | | |
Interest | | $ | 12,196,732 | |
Affiliated dividend income | | | 1,067,749 | |
Affiliated income from securities loaned, net | | | 118,955 | |
| | |
|
|
|
| | | | 13,383,436 | |
| | |
|
|
|
| EXPENSES | | | | |
Management fee | | | 1,493,853 | |
Shareholders’ reports | | | 115,000 | |
Custodian’s fees and expenses | | | 76,000 | |
Audit fee | | | 28,000 | |
Trustees’ fees | | | 12,000 | |
Transfer agent’s fee and expenses (including affiliated expense of $3,600) (Note 4) | | | 10,000 | |
Interest expense (Note 8) | | | 7,925 | |
Insurance expenses | | | 6,000 | |
Legal fees and expenses | | | 6,000 | |
Commitment fee on syndicated credit agreement | | | 4,000 | |
Miscellaneous | | | 7,628 | |
| | |
|
|
|
Total expenses | | | 1,766,406 | |
| | |
|
|
|
| NET INVESTMENT INCOME | | | 11,617,030 | |
| | |
|
|
|
| NET REALIZED AND UNREALIZED GAIN (LOSS) ON INVESTMENTS, SWAPS AND FOREIGN CURRENCIES | | | | |
Net realized gain (loss) on: | | | | |
Investment transactions (including affiliated: $(23,213)) | | | 5,653,782 | |
Short sale transactions | | | (55,859 | ) |
Futures transactions | | | 3,982,348 | |
Swap agreement transactions | | | 287,251 | |
Foreign currency transactions | | | (90,591 | ) |
Written options transactions | | | 12,250 | |
| | |
|
|
|
| | | | 9,789,181 | |
| | |
|
|
|
Net change in unrealized appreciation (depreciation) on: | | | | |
Investments (including affiliated: $6,446,272) | | | 5,582,273 | |
Securities sold short | | | 52,538 | |
Futures | | | 290,928 | |
Swaps | | | 246,857 | |
Foreign currencies | | | 88,182 | |
| | |
|
|
|
| | | | 6,260,778 | |
| | |
|
|
|
| NET GAIN ON INVESTMENTS, SWAPS AND FOREIGN CURRENCIES | | | 16,049,959 | |
| | |
|
|
|
| NET INCREASE IN NET ASSETS RESULTING FROM OPERATIONS | | $ | 27,666,989 | |
| | |
|
|
|
STATEMENT OF CHANGES IN NET ASSETS
| | | | | | | | |
| | | Year Ended December 31,
| |
| | | 2009
| | | 2008
| |
| INCREASE (DECREASE) IN NET ASSETS | | | | | | | | |
| OPERATIONS: | | | | | | | | |
Net investment income | | $ | 11,617,030 | | | $ | 13,906,867 | |
Net realized gain on investments, swaps and foreign currencies | | | 9,789,181 | | | | 8,180,834 | |
Net change in unrealized appreciation (depreciation) on investments, swaps and foreign currencies | | | 6,260,778 | | | | (7,237,091 | ) |
| | |
|
|
| |
|
|
|
NET INCREASE IN NET ASSETS RESULTING FROM OPERATIONS | | | 27,666,989 | | | | 14,850,610 | |
| | |
|
|
| |
|
|
|
| DISTRIBUTIONS | | | (12,874,743 | ) | | | (14,159,429 | ) |
| | |
|
|
| |
|
|
|
| SERIES SHARE TRANSACTIONS: | | | | | | | | |
Series shares sold [1,335,219 and 3,779,508 shares, respectively] | | | 15,539,947 | | | | 43,082,961 | |
Series shares issued in reinvestment of dividends and distributions [1,112,755 and 1,259,137 shares, respectively] | | | 12,874,743 | | | | 14,159,429 | |
Series shares repurchased [3,294,616 and 2,453,088 shares, respectively] | | | (38,329,997 | ) | | | (27,727,532 | ) |
| | |
|
|
| |
|
|
|
NET INCREASE (DECREASE) IN NET ASSETS RESULTING FROM SERIES SHARE TRANSACTIONS | | | (9,915,307 | ) | | | 29,514,858 | |
| | |
|
|
| |
|
|
|
| TOTAL INCREASE IN NET ASSETS | | | 4,876,939 | | | | 30,206,039 | |
| NET ASSETS: | | | | | | | | |
Beginning of year | | | 370,513,453 | | | | 340,307,414 | |
| | |
|
|
| |
|
|
|
End of year | | $ | 375,390,392 | | | $ | 370,513,453 | |
| | |
|
|
| |
|
|
|
SEE NOTES TO FINANCIAL STATEMENTS.
A84
| | | | | | |
| | | HIGH YIELD BOND PORTFOLIO | | |
| |
| SCHEDULE OF INVESTMENTS | | December 31, 2009 |
| | | | | | | | | | | | |
LONG-TERM INVESTMENTS — 95.9% ASSET-BACKED SECURITIES — 0.2% | | Moody’s
Rating
(Unaudited)†
| | Interest
Rate
| | Maturity
Date
| | Principal
Amount
(000)
| | Value
(Note 2)
|
| | | | | | | | | | | | | |
Golden Knight CDO Ltd./Golden Knight CDO Corp., Ser. 2007-2A, Class B, 144A(a) | | Baa2 | | 0.674% | | 04/15/19 | | $ | 4,000 | | $ | 3,040,000 |
Primus CLO Ltd., Ser. 2007-2A, Class A, 144A(a) | | A1 | | 0.517% | | 07/15/21 | | | 487 | | | 396,789 |
| | | | | | | | | | | |
|
|
TOTAL ASSET-BACKED SECURITIES
(cost $1,311,069) | | | 3,436,789 |
| | | | | | | | | | | |
|
|
| BANK LOANS — 6.1% | | | | | | | | | | | | |
Automotive — 1.0% | | | | | | | | | | | | |
Ford Motor Co.(a)(b) | | Ba3 | | 3.287% | | 12/15/13 | | | 20,698 | | | 19,093,735 |
| | | | | | | | | | | |
|
|
Cable — 0.5% | | | | | | | | | | | | |
Charter Communications Operating LLC, Term B, Refi.(a)(b) | | Ba2 | | 2.260% | | 03/06/14 | | | 8,330 | | | 7,798,962 |
CSC Holdings, Term A1(a)(b) | | Baa3 | | 1.258% | | 02/24/12 | | | 2,650 | | | 2,570,296 |
| | | | | | | | | | | |
|
|
| | | | | | | | | | | | | 10,369,258 |
| | | | | | | | | | | |
|
|
Capital Goods — 0.1% | | | | | | | | | | | | |
Capital Safety Group Ltd.(a)(b) | | B2 | | 2.723% | | 07/20/15 | | | 176 | | | 146,178 |
Capital Safety Group Ltd.(a)(b) | | B2 | | 2.981% | | 07/20/16 | | | 924 | | | 766,822 |
| | | | | | | | | | | |
|
|
| | | | | | | | | | | | | 913,000 |
| | | | | | | | | | | |
|
|
Chemicals — 0.1% | | | | | | | | | | | | |
Sabic Innovative Plastic Holdings(a)(b) | | Ba2 | | 2.731% | | 08/29/14 | | | 2,212 | | | 2,112,086 |
| | | | | | | | | | | |
|
|
Consumer — 0.5% | | | | | | | | | | | | |
Realogy Corp.(a)(b) | | Caa1 | | 3.000% | | 10/10/13 | | | 842 | | | 746,580 |
Realogy Corp.(a)(b) | | Caa1 | | 3.287% | | 10/10/13 | | | 3,127 | | | 2,773,014 |
Realogy Corp.(a)(b) | | Caa3 | | 13.500% | | 10/15/17 | | | 3,000 | | | 3,170,001 |
Realogy Corp.(a)(b) | | Caa3 | | 13.500% | | 10/15/17 | | | 2,700 | | | 2,853,001 |
| | | | | | | | | | | |
|
|
| | | | | | | | | | | | | 9,542,596 |
| | | | | | | | | | | |
|
|
Electric — 1.7% | | | | | | | | | | | | |
Calpine Corp. (b) | | B2 | | 3.135% | | 03/29/14 | | | 3,769 | | | 3,559,509 |
Texas Competitive Electric Holdings Co. LLC(a)(b) | | B1 | | 3.735% | | 10/10/14 | | | 8,977 | | | 7,182,000 |
Texas Competitive Electric Holdings Co. LLC(a)(b) | | B1 | | 3.735% | | 10/10/14 | | | 27,324 | | | 22,009,587 |
| | | | | | | | | | | |
|
|
| | | | | | | | | | | | | 32,751,096 |
| | | | | | | | | | | |
|
|
Foods — 0.1% | | | | | | | | | | | | |
OSI Restaurant Partners, Inc.(a)(b) | | B3 | | 2.379% | | 06/14/13 | | | 265 | | | 215,129 |
OSI Restaurant Partners, Inc.(a)(b) | | B3 | | 2.668% | | 06/14/14 | | | 1,712 | | | 1,389,462 |
| | | | | | | | | | | |
|
|
| | | | | | | | | | | | | 1,604,591 |
| | | | | | | | | | | |
|
|
Gaming — 0.3% | | | | | | | | | | | | |
Harrah’s Operating Co., Inc.(a)(b) | | Caa1 | | 3.282% | | 01/28/15 | | | 2,748 | | | 2,211,805 |
Motorcity Casino(a)(b) | | B3 | | 8.500% | | 07/13/12 | | | 3,434 | | | 3,339,303 |
| | | | | | | | | | | |
|
|
| | | | | | | | | | | | | 5,551,108 |
| | | | | | | | | | | |
|
|
Healthcare & Pharmaceutical — 1.0% | | | | | | | | | | | | |
Concentra, Inc.(a)(b) | | B2 | | 5.760% | | 06/25/15 | | | 2,113 | | | 1,732,990 |
Royalty Pharma Finance Trust(b) | | Baa3 | | 7.750% | | 05/15/15 | | | 15,481 | | | 14,397,509 |
Skilled Healthcare, Inc.(a)(b) | | B1 | | 2.251% | | 06/15/12 | | | 3,918 | | | 3,653,266 |
| | | | | | | | | | | |
|
|
| | | | | | | | | | | | | 19,783,765 |
| | | | | | | | | | | |
|
|
Retailers — 0.1% | | | | | | | | | | | | |
Rite Aid Corp.(b) | | B3 | | 9.500% | | 06/10/15 | | | 2,000 | | | 2,066,876 |
| | | | | | | | | | | |
|
|
Technology — 0.6% | | | | | | | | | | | | |
First Data Corp.(a)(b) | | B1 | | 2.983% | | 09/24/14 | | | 2,400 | | | 2,126,196 |
First Data Corp.(a)(b) | | B1 | | 2.999% | | 09/24/14 | | | 6,457 | | | 5,735,271 |
First Data Corp.(a)(b) | | B1 | | 2.999% | | 09/24/14 | | | 4,888 | | | 4,322,383 |
| | | | | | | | | | | |
|
|
| | | | | | | | | | | | | 12,183,850 |
| | | | | | | | | | | |
|
|
Telecommunications — 0.1% | | | | | | | | | | | | |
Level 3 Communications, Inc.(a)(b) | | B1 | | 11.660% | | 03/13/14 | | | 1,500 | | | 1,593,750 |
| | | | | | | | | | | |
|
|
TOTAL BANK LOANS
(cost $109,512,781) | | | 117,565,711 |
| | | | | | | | | | | |
|
|
SEE NOTES TO FINANCIAL STATEMENTS.
A85
| | | | | | |
| | | HIGH YIELD BOND PORTFOLIO (continued) | | |
| |
| SCHEDULE OF INVESTMENTS | | December 31, 2009 |
| | | | | | | | | | | | |
COLLATERALIZED MORTGAGE OBLIGATIONS — 0.2% | | Moody’s
Rating
(Unaudited)†
| | Interest
Rate
| | Maturity
Date
| | Principal
Amount
(000)
| | Value
(Note 2)
|
| | | | | | | | | | | | | |
Adjustable Rate Mortgage Trust, Ser. 2005-7, Class 1A1(a) | | B2 | | 3.733% | | 10/25/35 | | $ | 171 | | $ | 87,028 |
American Home Mortgage Assets, Ser. 2006-1, Class 2A1(a) | | Ba2 | | 0.421% | | 05/25/46 | | | 51 | | | 26,351 |
American Home Mortgage Assets, Ser. 2006-4, Class 1A12(a) | | Caa3 | | 0.441% | | 10/25/46 | | | 69 | | | 34,937 |
American Home Mortgage Assets, Ser. 2006-5, Class A1(a) | | Caa1 | | 1.464% | | 11/25/46 | | | 526 | | | 246,553 |
American Home Mortgage Assets, Ser. 2007-3, Class 22A1 | | Ca | | 6.250% | | 06/25/37 | | | 239 | | | 136,999 |
American Home Mortgage Investment Trust, Ser. 2005-2, Class 4A1(a) | | A1 | | 5.660% | | 09/25/45 | | | 43 | | | 33,894 |
Banc of America Alternative Loan Trust, Ser. 2005-4, Class CB6(a) | | Baa3 | | 0.631% | | 05/25/35 | | | 102 | | | 71,751 |
Banc of America Funding Corp., Ser. 2006-B, Class 2A1(a) | | B3 | | 5.520% | | 03/20/36 | | | 273 | | | 186,351 |
Bear Stearns Adjustable Rate Mortgage Trust, Ser. 2005-10, Class A2(a) | | BBB+(c) | | 4.462% | | 10/25/35 | | | 500 | | | 423,387 |
Bear Stearns Adjustable Rate Mortgage Trust, Ser. 2007-3, Class 1A1(a) | | CCC(c) | | 5.436% | | 05/25/47 | | | 78 | | | 55,145 |
Citigroup Mortgage Loan Trust, Inc., Ser. 2007-10, Class 22AA(a) | | AAA(c) | | 5.978% | | 09/25/37 | | | 160 | | | 112,356 |
Countrywide Alternative Loan Trust, Ser. 2006-OA11, Class A1B(a) | | Caa2 | | 0.421% | | 09/25/46 | | | 80 | | | 38,274 |
Countrywide Alternative Loan Trust, Ser. 2006-OA17, Class 1A1A(a) | | Caa1 | | 0.428% | | 12/20/46 | | | 145 | | | 70,723 |
Countrywide Alternative Loan Trust, Ser. 2006-OA1, Class 2A1(a) | | B3 | | 0.443% | | 03/20/46 | | | 53 | | | 26,142 |
Countrywide Alternative Loan Trust, Ser. 2006-OA9, Class 2A1A(a) | | Caa3 | | 0.443% | | 07/20/46 | | | 65 | | | 28,050 |
Countrywide Alternative Loan Trust, Ser. 2005-59, Class 1A1(a) | | Caa1 | | 0.563% | | 11/20/35 | | | 50 | | | 26,432 |
Countrywide Alternative Loan Trust, Ser. 2005-62, Class 2A1(a) | | B3 | | 1.544% | | 12/25/35 | | | 151 | | | 80,838 |
Countrywide Alternative Loan Trust, Ser. 2005-43, Class 4A3(a) | | CCC(c) | | 5.636% | | 10/25/35 | | | 55 | | | 23,487 |
Countrywide Alternative Loan Trust, Ser. 2006-HY13, Class 4A1(a) | | CCC(c) | | 5.882% | | 02/25/37 | | | 71 | | | 48,508 |
Countrywide Home Loan Mortgage Pass-Through Trust, Ser. 2005-2, Class 2A1(a) | | A1 | | 0.551% | | 03/25/35 | | | 169 | | | 102,788 |
Downey Savings & Loan Association Mortgage Loan Trust, Ser. 2005-AR1, Class 2A1A(a) | | Aa2 | | 0.483% | | 03/19/45 | | | 21 | | | 11,792 |
First Horizon Alternative Mortgage Securities, Ser. 2006-FA2, Class 1A5 | | Caa1 | | 6.000% | | 05/25/36 | | | 159 | | | 116,633 |
Harborview Mortgage Loan Trust, Ser. 2006-5, Class 2A1A(a) | | Caa1 | | 0.413% | | 07/19/46 | | | 66 | | | 31,742 |
Harborview Mortgage Loan Trust, Ser. 2006-1, Class 2A1A(a) | | B3 | | 0.473% | | 03/19/36 | | | 518 | | | 280,298 |
Harborview Mortgage Loan Trust, Ser. 2006-7, Class 2A1B(a) | | Ca | | 0.483% | | 09/19/46 | | | 554 | | | 123,571 |
IndyMac Index Mortgage Loan Trust, Ser. 2006-AR12, Class A1(a) | | B3 | | 0.421% | | 09/25/46 | | | 58 | | | 28,633 |
IndyMac Index Mortgage Loan Trust, Ser. 2005-AR13, Class 4A1(a) | | B3 | | 5.146% | | 08/25/35 | | | 123 | | | 82,859 |
IndyMac Index Mortgage Loan Trust, Ser. 2005-AR15, Class A1(a) | | B2 | | 5.263% | | 09/25/35 | | | 114 | | | 83,952 |
JPMorgan Mortgage Trust, Ser. 2007-S3, Class 1A97 | | CCC(c) | | 6.000% | | 08/25/37 | | | 160 | | | 119,476 |
JPMorgan Mortgage Trust, Ser. 2007-S3, Class 1A96 | | CCC(c) | | 6.000% | | 08/25/37 | | | 80 | | | 66,118 |
Master Adjustable Rate Mortgages Trust, Ser. 2006-OA1, Class 1A1(a) | | Ba1 | | 0.441% | | 04/25/46 | | | 40 | | | 18,270 |
Residential Accredit Loans, Inc., Ser. 2006-QO10, Class A1(a) | | Caa1 | | 0.391% | | 01/25/37 | | | 751 | | | 389,579 |
Residential Accredit Loans, Inc., Ser. 2007-QS4, Class 2A1(a) | | Caa3 | | 0.561% | | 03/25/37 | | | 276 | | | 105,985 |
Residential Accredit Loans, Inc., Ser. 2006-QA2, Class 3A1(a) | | Caa3 | | 5.500% | | 02/25/36 | | | 389 | | | 251,210 |
Residential Asset Securitization Trust, Ser. 2007-A5, Class 2A3 | | Caa2 | | 6.000% | | 05/25/37 | | | 133 | | | 98,616 |
Structured Asset Mortgage Investments, Inc., Ser. 2006-AR6, Class 2A1(a) | | B3 | | 0.421% | | 07/25/46 | | | 72 | | | 34,636 |
SunTrust Alternative Loan Trust, Ser. 2006-1F, Class 3A(a) | | Ca | | 0.581% | | 04/25/36 | | | 218 | | | 68,270 |
Thornburg Mortgage Securities Trust, Ser. 2006-5, Class A1(a) | | A3 | | 0.351% | | 10/25/46 | | | 107 | | | 104,789 |
WAMU Mortgage Pass-Through Certificates, Ser. 2007-OA3, Class 2A1A(a) | | B3 | | 1.304% | | 04/25/47 | | | 72 | | | 39,397 |
WAMU Mortgage Pass-Through Certificates, Ser. 2007-OA1, Class A1A(a) | | Caa1 | | 1.332% | | 02/25/47 | | | 68 | | | 36,876 |
WAMU Mortgage Pass-Through Certificates, Ser. 2007-OA2, Class 1A(a) | | B3 | | 1.332% | | 03/25/47 | | | 72 | | | 39,200 |
WAMU Mortgage Pass-Through Certificates, Ser. 2007-HY1, Class 4A1(a) | | CCC(c) | | 5.387% | | 02/25/37 | | | 74 | | | 52,421 |
WAMU Mortgage Pass-Through Certificates, Ser. 2007-HY2, Class 1A1(a) | | CCC(c) | | 5.565% | | 12/25/36 | | | 75 | | | 50,038 |
WAMU Mortgage Pass-Through Certificates, Ser. 2007-HY1, Class 1A1(a) | | CCC(c) | | 5.673% | | 02/25/37 | | | 70 | | | 44,278 |
SEE NOTES TO FINANCIAL STATEMENTS.
A86
| | | | | | |
| | | HIGH YIELD BOND PORTFOLIO (continued) | | |
| |
| SCHEDULE OF INVESTMENTS | | December 31, 2009 |
| | | | | | | | | | | | |
COLLATERALIZED MORTGAGE OBLIGATIONS
(continued) | | Moody’s
Rating
(Unaudited)†
| | Interest
Rate
| | Maturity
Date
| | Principal
Amount
(000)
| | Value
(Note 2)
|
| | | | | | | | | | | | | |
WAMU Mortgage Pass-Through Certificates, Ser. 2006-AR12, Class 2A3(a) | | CCC(c) | | 5.721% | | 10/25/36 | | $ | 262 | | $ | 198,320 |
WAMU Mortgage Pass-Through Certificates, Ser. 2007-HY1, Class 2A3(a) | | CCC(c) | | 5.834% | | 02/25/37 | | | 69 | | | 47,273 |
| | | | | | | | | | | |
|
|
TOTAL COLLATERALIZED MORTGAGE OBLIGATIONS
(cost $4,492,066) | | | 4,384,226 |
| | | | | | | | | | | |
|
|
| CORPORATE BONDS — 89.2% | | | | | | | | | | | | |
Aerospace & Defense — 1.3% | | | | | | | | | | | | |
BE Aerospace, Inc., Sr. Unsec’d. Notes | | Ba3 | | 8.500% | | 07/01/18 | | | 2,900 | | | 3,074,000 |
Esterline Technologies Corp., Gtd. Notes(d) | | Ba2 | | 6.625% | | 03/01/17 | | | 750 | | | 731,250 |
Esterline Technologies Corp., Gtd. Notes | | B1 | | 7.750% | | 06/15/13 | | | 4,500 | | | 4,595,625 |
L-3 Communications Corp., Gtd. Notes | | Ba2 | | 6.125% | | 01/15/14 | | | 1,180 | | | 1,187,375 |
Moog, Inc., Sr. Sub. Notes | | Ba3 | | 6.250% | | 01/15/15 | | | 2,500 | | | 2,365,625 |
Moog, Inc., Sr. Sub. Notes | | Ba3 | | 7.250% | | 06/15/18 | | | 3,650 | | | 3,526,813 |
TransDigm, Inc., Gtd. Notes, 144A | | B3 | | 7.750% | | 07/15/14 | | | 4,200 | | | 4,263,000 |
TransDigm, Inc., Gtd. Notes(d) | | B3 | | 7.750% | | 07/15/14 | | | 4,350 | | | 4,404,375 |
| | | | | | | | | | | |
|
|
| | | | | | | | | | | | | 24,148,063 |
| | | | | | | | | | | |
|
|
Airlines — 0.2% | | | | | | | | | | | | |
AMR Corp., Sr. Unsec’d. Notes, Ser. B, MTN | | CCC+(c) | | 10.400% | | 03/10/11 | | | 1,000 | | | 892,500 |
AMR Corp., Sr. Unsec’d. Notes, Ser. B, MTN | | CCC+(c) | | 10.400% | | 03/15/11 | | | 1,000 | | | 892,500 |
AMR Corp., Sr. Unsec’d. Notes, Ser. B, MTN | | NR | | 10.550% | | 03/12/21 | | | 1,425 | | | 865,688 |
Continental Airlines, Inc., Pass-thru Certs., Ser. 981B, Class B(b) | | Ba2 | | 6.748% | | 03/15/17 | | | 714 | | | 635,599 |
Continental Airlines, Inc., Pass-thru Certs., Ser. 992B, Class B | | Ba2 | | 7.566% | | 03/15/20 | | | 316 | | | 287,245 |
Continental Airlines, Inc., Pass-thru Certs., Ser. 962A | | Baa2 | | 7.750% | | 07/02/14 | | | 827 | | | 794,106 |
| | | | | | | | | | | |
|
|
| | | | | | | | | | | | | 4,367,638 |
| | | | | | | | | | | |
|
|
Automotive — 3.1% | | | | | | | | | | | | |
American Axle & Manufacturing, Inc., Gtd. Notes | | Caa3 | | 7.875% | | 03/01/17 | | | 5,175 | | | 4,372,875 |
Ford Motor Co., Sr. Unsec’d. Notes | | Caa1 | | 7.450% | | 07/16/31 | | | 3,250 | | | 2,872,188 |
Ford Motor Credit Co., Sr. Unsec’d. Notes | | B3 | | 7.250% | | 10/25/11 | | | 6,080 | | | 6,140,143 |
Ford Motor Credit Co., Sr. Unsec’d. Notes | | B3 | | 9.875% | | 08/10/11 | | | 2,250 | | | 2,355,800 |
Ford Motor Credit Co. LLC, Sr. Unsec’d. Notes | | B3 | | 5.700% | | 01/15/10 | | | 130 | | | 130,045 |
Ford Motor Credit Co. LLC, Sr. Unsec’d. Notes | | B3 | | 7.500% | | 08/01/12 | | | 12,900 | | | 13,009,108 |
Ford Motor Credit Co. LLC, Sr. Unsec’d. Notes | | B3 | | 7.800% | | 06/01/12 | | | 2,540 | | | 2,567,313 |
Ford Motor Credit Co. LLC, Sr. Unsec’d. Notes | | B3 | | 8.000% | | 12/15/16 | | | 1,300 | | | 1,301,728 |
Goodyear Tire & Rubber Co. (The), Sr. Unsec’d. Notes | | B1 | | 10.500% | | 05/15/16 | | | 2,400 | | | 2,652,000 |
Navistar International Corp., Gtd. Notes | | B1 | | 8.250% | | 11/01/21 | | | 8,025 | | | 8,225,625 |
TRW Automotive, Inc., Gtd. Notes, 144A(d) | | Caa1 | | 7.250% | | 03/15/17 | | | 13,575 | | | 13,167,750 |
TRW Automotive, Inc., Sr. Notes, 144A | | Caa1 | | 8.875% | | 12/01/17 | | | 3,350 | | | 3,484,000 |
Visteon Corp., Sr. Unsec’d. Notes (original cost $2,208,719; purchased 10/25/04-02/16/07)(b)(e)(h) | | NR | | 7.000% | | 03/10/14 | | | 2,595 | | | 681,187 |
| | | | | | | | | | | |
|
|
| | | | | | | | | | | | | 60,959,762 |
| | | | | | | | | | | |
|
|
Banking — 0.8% | | | | | | | | | | | | |
BAC Capital Trust VI, Gtd. Notes. | | Baa3 | | 5.625% | | 03/08/35 | | | 1,400 | | | 1,120,626 |
Bank of America Corp., Jr. Sub. Notes(a) | | Ba3 | | 8.125% | | 12/29/49 | | | 1,750 | | | 1,684,795 |
BankAmerica Capital II, Gtd. Notes., Ser. 2 | | Baa3 | | 8.000% | | 12/15/26 | | | 1,000 | | | 980,000 |
HBOS PLC (United Kingdom), Sub. Notes, 144A | | Ba1 | | 6.750% | | 05/21/18 | | | 400 | | | 371,162 |
HSBK Europe BV (Netherlands), Gtd. Notes., 144A | | Ba2 | | 7.250% | | 05/03/17 | | | 3,500 | | | 3,185,000 |
MBNA Capital A, Gtd. Notes., Ser. A | | Baa3 | | 8.278% | | 12/01/26 | | | 2,750 | | | 2,653,750 |
Regions Financial Corp., Sub. Notes | | Ba1 | | 7.375% | | 12/10/37 | | | 250 | | | 204,640 |
Wind Acquisition Holdings Finance SpA (Italy), Sr. Notes, 144A(d) | | B3 | | 12.250% | | 07/15/17 | | | 5,225 | | | 5,146,625 |
| | | | | | | | | | | |
|
|
| | | | | | | | | | | | | 15,346,598 |
| | | | | | | | | | | |
|
|
Building Materials & Construction — 1.6% | | | | | | | | | | | | |
D.R. Horton, Inc., Gtd. Notes | | Ba3 | | 5.625% | | 09/15/14 | | | 619 | | | 598,882 |
D.R. Horton, Inc., Gtd. Notes | | Ba3 | | 6.500% | | 04/15/16 | | | 900 | | | 877,500 |
Goodman Global Group, Inc., Sr. Disc. Notes, 144A(f) | | B3 | | 11.760% | | 12/15/14 | | | 2,980 | | | 1,691,150 |
SEE NOTES TO FINANCIAL STATEMENTS.
A87
| | | | | | |
| | | HIGH YIELD BOND PORTFOLIO (continued) | | |
| |
| SCHEDULE OF INVESTMENTS | | December 31, 2009 |
| | | | | | | | | | | | | |
CORPORATE BONDS
(continued) | | Moody’s
Rating
(Unaudited)†
| | Interest
Rate
| | Maturity
Date
| | Principal
Amount
(000)
| | | Value
(Note 2)
|
| | | | | | | | | | | | | | |
Building Materials & Construction (continued) | | | | | | | | | | | | | |
Headwaters, Inc., Sr. Sec’d. Notes, 144A(d) | | B2 | | 11.375% | | 11/01/14 | | $ | 525 | | | $ | 547,313 |
Interline Brands, Inc., Gtd. Notes | | B3 | | 8.125% | | 06/15/14 | | | 4,865 | | | | 4,889,325 |
K Hovnanian Enterprises, Inc., Sr. Sec’d. Notes, 144A | | B1 | | 10.625% | | 10/15/16 | | | 2,125 | | | | 2,220,625 |
KB Home, Gtd. Notes | | B1 | | 6.375% | | 08/15/11 | | | 2,635 | | | | 2,635,000 |
Lennar Corp., Gtd. Notes, Ser. B | | B3 | | 5.950% | | 10/17/11 | | | 5,750 | | | | 5,793,125 |
Owens Corning, Gtd. Notes | | Ba1 | | 6.500% | | 12/01/16 | | | 2,975 | | | | 3,046,617 |
Standard Pacific Corp., Gtd. Notes | | Caa1 | | 7.000% | | 08/15/15 | | | 750 | | | | 652,500 |
Standard Pacific Escrow LLC, Sr. Sec’d. Notes, 144A | | Caa1 | | 10.750% | | 09/15/16 | | | 7,225 | | | | 7,369,500 |
| | | | | | | | | | | | |
|
|
| | | | | | | | | | | | | | 30,321,537 |
| | | | | | | | | | | | |
|
|
Cable — 4.2% | | | | | | | | | | | | | |
Cablevision Systems Corp., Sr. Notes, 144A | | B1 | | 8.625% | | 09/15/17 | | | 6,075 | | | | 6,325,594 |
CCH II LLC / CCH II Capital Corp., Sr. Notes | | B(c) | | 13.500% | | 11/30/16 | | | 2,650 | | | | 3,120,735 |
Cequel Communications Holdings I LLC And Cequel Capital Corp., Sr. Unsec’d. Notes, 144A(d) | | B3 | | 8.625% | | 11/15/17 | | | 6,000 | | | | 6,060,000 |
Comcast Cable Communications Holdings, Inc., Gtd. Notes | | Baa1 | | 8.375% | | 03/15/13 | | | 100 | (g) | | | 115 |
CSC Holdings, Inc., Sr. Unsec’d. Notes, Ser. B | | Ba3 | | 7.625% | | 04/01/11 | | | 3,875 | | | | 4,000,938 |
CSC Holdings, Inc., Sr. Unsec’d. Notes(d) | | Ba3 | | 7.625% | | 07/15/18 | | | 1,850 | | | | 1,905,500 |
CSC Holdings, Inc., Sr. Unsec’d. Notes(d) | | Ba3 | | 7.875% | | 02/15/18 | | | 1,300 | | | | 1,345,500 |
CSC Holdings, Inc., Sr. Unsec’d. Notes, 144A(d) | | Ba3 | | 8.500% | | 06/15/15 | | | 3,075 | | | | 3,274,875 |
CSC Holdings, Inc., Sr. Unsec’d. Notes, 144A | | Ba3 | | 8.625% | | 02/15/19 | | | 305 | | | | 328,256 |
DirectTV Holdings LLC/DirectTV Financing Co., Gtd. Notes | | Ba2 | | 7.625% | | 05/15/16 | | | 2,600 | | | | 2,840,500 |
Dish DBS Corp., Gtd. Notes | | Ba3 | | 6.375% | | 10/01/11 | | | 850 | | | | 877,625 |
Dish DBS Corp., Gtd. Notes | | Ba3 | | 7.125% | | 02/01/16 | | | 3,140 | | | | 3,206,725 |
Dish DBS Corp., Gtd. Notes | | Ba3 | | 7.750% | | 05/31/15 | | | 500 | | | | 523,750 |
Dish DBS Corp., Gtd. Notes | | Ba3 | | 7.875% | | 09/01/19 | | | 925 | | | | 970,094 |
Dish DBS Corp., Gtd. Notes, 144A | | BB-(c) | | 7.875% | | 09/01/19 | | | 1,500 | | | | 1,573,125 |
Mediacom Broadband LLC/Mediacom Broadband Corp., Sr. Unsec’d. Notes | | B3 | | 8.500% | | 10/15/15 | | | 1,975 | | | | 1,994,750 |
Mediacom LLC/Mediacom Capital Corp., Sr. Notes, 144A | | B3 | | 9.125% | | 08/15/19 | | | 2,100 | | | | 2,142,000 |
UPC Holding BV (Netherlands), Sr. Sec’d. Notes, 144A | | B2 | | 9.875% | | 04/15/18 | | | 10,100 | | | | 10,655,500 |
UPC Germany GMBH (Germany), Sr. Sec’d. Notes, 144A | | B1 | | 8.125% | | 12/01/17 | | | 2,100 | | | | 2,123,625 |
Videotron Ltee (Canada), Gtd. Notes | | Ba2 | | 6.375% | | 12/15/15 | | | 3,450 | | | | 3,372,375 |
Videotron Ltee (Canada), Gtd. Notes | | Ba2 | | 6.875% | | 01/15/14 | | | 5,820 | | | | 5,849,100 |
Videotron Ltee (Canada), Gtd. Notes, 144A | | Ba2 | | 9.125% | | 04/15/18 | | | 2,550 | | | | 2,805,000 |
Videotron Ltee (Canada), Gtd. Notes | | Ba2 | | 9.125% | | 04/15/18 | | | 500 | | | | 550,000 |
Virgin Media Finance PLC (United Kingdom), Gtd. Notes(d) | | B2 | | 8.375% | | 10/15/19 | | | 3,000 | | | | 3,086,250 |
Virgin Media Finance PLC (United Kingdom), Gtd. Notes(d) | | B2 | | 9.125% | | 08/15/16 | | | 2,075 | | | | 2,186,531 |
Virgin Media Finance PLC (United Kingdom), Gtd. Notes, Ser. 1(d) | | B2 | | 9.500% | | 08/15/16 | | | 9,700 | | | | 10,415,375 |
| | | | | | | | | | | | |
|
|
| | | | | | | | | | | | | | 81,533,838 |
| | | | | | | | | | | | |
|
|
Capital Goods — 7.7% | | | | | | | | | | | | | |
Actuant Corp., Gtd. Notes | | Ba2 | | 6.875% | | 06/15/17 | | | 4,845 | | | | 4,608,806 |
ALH Finance LLC/ ALH Finance Corp., Gtd. Notes(d) | | Caa1 | | 8.500% | | 01/15/13 | | | 10,350 | | | | 10,350,000 |
Aquilex Holdings LLC/Aquilex Finance Corp., Sr. Notes, 144A | | B3 | | 11.125% | | 12/15/16 | | | 3,300 | | | | 3,291,750 |
Ashtead Capital, Inc., Sec’d. Notes, 144A | | B2 | | 9.000% | | 08/15/16 | | | 9,840 | | | | 9,852,300 |
Ashtead Holdings PLC (United Kingdom), Sec’d. Notes, 144A(d) | | B2 | | 8.625% | | 08/01/15 | | | 5,325 | | | | 5,351,625 |
Blount, Inc., Gtd. Notes | | B2 | | 8.875% | | 08/01/12 | | | 9,790 | | | | 9,973,562 |
Brunswick Corp., Sr. Sec’d. Notes, 144A | | Ba3 | | 11.250% | | 11/01/16 | | | 2,200 | | | | 2,475,000 |
Citic Resources Finance 2007 Ltd., Gtd. Notes, 144A | | Ba3 | | 6.750% | | 05/15/14 | | | 25 | | | | 24,375 |
Columbus McKinnon Corp., Gtd. Notes | | B1 | | 8.875% | | 11/01/13 | | | 7,300 | | | | 7,455,125 |
Hertz Corp., Gtd. Notes | | B2 | | 8.875% | | 01/01/14 | | | 12,057 | | | | 12,328,283 |
Johnsondiversey Holdings, Inc., Sr. Notes, 144A | | Caa1 | | 10.500% | | 05/15/20 | | | 6,900 | | | | 6,934,500 |
Johnsondiversey, Inc., Sr. Unsec’d. Notes, 144A | | B3 | | 8.250% | | 11/15/19 | | | 4,100 | | | | 4,151,250 |
RBS Global, Inc. / Rexnord LLC, Gtd. Notes(d) | | Caa3 | | 11.750% | | 08/01/16 | | | 1,100 | | | | 1,089,000 |
RBS Global, Inc. and Rexnord Corp., Gtd. Notes | | Caa2 | | 9.500% | | 08/01/14 | | | 8,780 | | | | 8,801,950 |
RSC Equipment Rental, Inc., Gtd. Notes(d) | | Caa2 | | 9.500% | | 12/01/14 | | | 12,320 | | | | 12,335,400 |
RSC Equipment Rental, Inc., Sr. Sec’d. Notes, 144A | | B1 | | 10.000% | | 07/15/17 | | | 3,050 | | | | 3,316,875 |
SEE NOTES TO FINANCIAL STATEMENTS.
A88
| | | | | | |
| | | HIGH YIELD BOND PORTFOLIO (continued) | | |
| |
| SCHEDULE OF INVESTMENTS | | December 31, 2009 |
| | | | | | | | | | | | |
CORPORATE BONDS
(continued) | | Moody’s
Rating
(Unaudited)†
| | Interest
Rate
| | Maturity
Date
| | Principal
Amount
(000)
| | Value
(Note 2)
|
| | | | | | | | | | | | | |
Capital Goods (continued) | | | | | | | | | | | | |
RSC Equipment Rental, Inc./Rsc Holdings III LLC, Sr. Notes, 144A(d) | | Caa2 | | 10.250% | | 11/15/19 | | $ | 3,675 | | $ | 3,688,781 |
SPX Corp., Sr. Unsec’d. Notes | | Ba2 | | 7.625% | | 12/15/14 | | | 9,530 | | | 9,815,900 |
Stena AB (Sweden), Sr. Unsec’d. Notes | | Ba2 | | 7.000% | | 12/01/16 | | | 250 | | | 220,625 |
Stena AB (Sweden), Sr. Unsec’d. Notes | | Ba2 | | 7.500% | | 11/01/13 | | | 8,836 | | | 8,504,650 |
Terex Corp., Gtd. Notes(d) | | Ba3 | | 7.375% | | 01/15/14 | | | 4,790 | | | 4,843,888 |
Terex Corp., Sr. Sub. Notes(d) | | Caa1 | | 8.000% | | 11/15/17 | | | 10,025 | | | 9,649,063 |
Trimas Corp., Sr. Sec’d. Notes, 144A | | Caa1 | | 9.750% | | 12/15/17 | | | 2,625 | | | 2,575,781 |
United Rentals North America, Inc., Gtd. Notes | | B3 | | 6.500% | | 02/15/12 | | | 980 | | | 977,550 |
United Rentals North America, Inc., Gtd. Notes | | B3 | | 10.875% | | 06/15/16 | | | 6,400 | | | 6,960,000 |
| | | | | | | | | | | |
|
|
| | | | | | | | | | | | | 149,576,039 |
| | | | | | | | | | | |
|
|
Chemicals — 1.4% | | | | | | | | | | | | |
Invista, Sr. Unsec’d. Notes, 144A (original cost $8,589,250; purchased 07/09/09-08/13/09)(b)(h) | | Ba3 | | 9.250% | | 05/01/12 | | | 8,800 | | | 8,932,000 |
Koppers, Inc., Gtd. Notes, 144A | | B1 | | 7.875% | | 12/01/19 | | | 4,075 | | | 4,115,750 |
Momentive Performance Materials, Inc., Gtd. Notes(d) | | Caa2 | | 9.750% | | 12/01/14 | | | 4,580 | | | 4,408,250 |
Nova Chemicals Corp. (Canada), Sr. Unsec’d. Notes, 144A | | B1 | | 8.375% | | 11/01/16 | | | 8,975 | | | 9,109,625 |
| | | | | | | | | | | |
|
|
| | | | | | | | | | | | | 26,565,625 |
| | | | | | | | | | | |
|
|
Consumer — 2.8% | | | | | | | | | | | | |
Geo Group, Inc. (The), Gtd. Notes, 144A(d) | | B1 | | 7.750% | | 10/15/17 | | | 3,300 | | | 3,378,375 |
Mac-Gray Corp., Gtd. Notes | | B3 | | 7.625% | | 08/15/15 | | | 4,775 | | | 4,637,719 |
Mobile Mini, Inc., Gtd. Notes | | B2 | | 6.875% | | 05/01/15 | | | 3,732 | | | 3,526,740 |
Realogy Corp., Gtd. Notes | | Ca | | 10.500% | | 04/15/14 | | | 20,660 | | | 17,870,900 |
Realogy Corp., Gtd. Notes, PIK | | Ca | | 11.000% | | 04/15/14 | | | 6,521 | | | 5,379,639 |
Realogy Corp., Gtd. Notes | | Ca | | 12.375% | | 04/15/15 | | | 4,500 | | | 3,498,750 |
Revlon Consumer Products Corp., Gtd. Notes, 144A | | B3 | | 9.750% | | 11/15/15 | | | 2,000 | | | 2,065,000 |
Service Corp. International, Sr. Unsec’d. Notes | | B1 | | 6.750% | | 04/01/16 | | | 2,725 | | | 2,636,438 |
Service Corp. International, Sr. Unsec’d. Notes | | B1 | | 7.000% | | 06/15/17 | | | 3,448 | | | 3,344,560 |
Service Corp. International, Sr. Unsec’d. Notes | | B1 | | 7.875% | | 02/01/13 | | | 2,650 | | | 2,583,750 |
Stewart Enterprises, Inc., Gtd. Notes | | Ba3 | | 6.250% | | 02/15/13 | | | 5,350 | | | 5,209,562 |
| | | | | | | | | | | |
|
|
| | | | | | | | | | | | | 54,131,433 |
| | | | | | | | | | | |
|
|
Electric — 5.3% | | | | | | | | | | | | |
AES Corp., Sr. Sec’d. Notes, 144A | | Ba3 | | 8.750% | | 05/15/13 | | | 1,592 | | | 1,631,800 |
AES Corp., Sr. Unsec’d. Notes(d) | | B1 | | 7.750% | | 03/01/14 | | | 4,335 | | | 4,400,025 |
AES Corp., Sr. Unsec’d. Notes | | B1 | | 7.750% | | 10/15/15 | | | 3,365 | | | 3,415,475 |
AES Corp., Sr. Unsec’d. Notes | | B1 | | 8.000% | | 06/01/20 | | | 700 | | | 712,250 |
AES Corp., Sr. Unsec’d. Notes | | B1 | | 8.000% | | 10/15/17 | | | 3,375 | | | 3,463,594 |
AES Eastern Energy LP, Pass-thru Certs., Ser. 99-A | | Ba1 | | 9.000% | | 01/02/17 | | | 5,815 | | | 5,836,499 |
AES Eastern Energy LP, Pass-thru Certs., Ser. 99-B | | Ba1 | | 9.670% | | 01/02/29 | | | 2,000 | | | 2,105,000 |
AES Red Oak LLC, Sr. Sec’d. Notes, Ser. A (original cost $1,736,622; purchased 03/03/09)(b)(h) | | B1 | | 8.540% | | 11/30/19 | | | 1,766 | | | 1,761,210 |
CMS Energy Corp., Sr. Unsec’d. Notes | | Ba1 | | 6.550% | | 07/17/17 | | | 3,350 | | | 3,308,326 |
Dynegy Roseton/Danskammer, Pass-thru Certs., Ser. A | | B2 | | 7.270% | | 11/08/10 | | | 371 | | | 371,216 |
Dynegy Roseton/Danskammer, Pass-thru Certs., Ser. B | | B2 | | 7.670% | | 11/08/16 | | | 9,568 | | | 9,233,120 |
Energy Future Holdings Corp., Sr. Sec’d. Notes | | Caa3 | | 9.750% | | 10/15/19 | | | 486 | | | 484,564 |
Energy Future Intermediate Holding Co. LLC, Sr. Sec’d. Notes | | B+(c) | | 9.750% | | 10/15/19 | | | 594 | | | 592,245 |
Homer City Funding LLC, Sr. Sec’d. Notes | | Ba2 | | 8.734% | | 10/01/26 | | | 1,431 | | | 1,381,205 |
Midwest Generation LLC, Pass-thru Certs., Ser. B | | Ba1 | | 8.560% | | 01/02/16 | | | 2,943 | | | 2,972,098 |
Mirant Americas Generation LLC, Sr. Unsec’d. Notes | | B3 | | 8.300% | | 05/01/11 | | | 7,975 | | | 8,174,375 |
Mirant Americas Generation LLC, Sr. Unsec’d. Notes | | B3 | | 8.500% | | 10/01/21 | | | 600 | | | 570,000 |
Mirant Corp., Sr. Notes, 144A(b) | | NR | | 7.400% | | 07/15/49 | | | 1,825 | | | 1,825 |
Mirant Mid Atlantic LLC, Pass-thru Certs., Ser. A | | Ba1 | | 8.625% | | 06/30/12 | | | 173 | | | 176,774 |
Mirant Mid Atlantic LLC, Pass-thru Certs., Ser. B | | Ba1 | | 9.125% | | 06/30/17 | | | 3,824 | | | 4,015,312 |
Mirant North America LLC, Gtd. Notes | | B1 | | 7.375% | | 12/31/13 | | | 5,050 | | | 4,993,187 |
Nevada Power Co., Genl. Ref. Mtge., Ser. A | | Baa3 | | 8.250% | | 06/01/11 | | | 1,675 | | | 1,810,598 |
SEE NOTES TO FINANCIAL STATEMENTS.
A89
| | | | | | |
| | | HIGH YIELD BOND PORTFOLIO (continued) | | |
| |
| SCHEDULE OF INVESTMENTS | | December 31, 2009 |
| | | | | | | | | | | | |
CORPORATE BONDS
(continued) | | Moody’s
Rating
(Unaudited)†
| | Interest
Rate
| | Maturity
Date
| | Principal
Amount
(000)
| | Value
(Note 2)
|
| | | | | | | | | | | | | |
Electric (continued) | | | | | | | | | | | | |
North American Energy Alliance LLC / North American Energy Alliance Finance Corp., Sr. Sec’d. Notes, 144A(original cost $4,447,124; purchased 09/22/09)(h) | | Ba3 | | 10.875% | | 06/01/16 | | $ | 4,550 | | $ | 4,834,375 |
NRG Energy, Inc., Gtd. Notes | | B1 | | 7.250% | | 02/01/14 | | | 6,610 | | | 6,692,625 |
NRG Energy, Inc., Gtd. Notes | | B1 | | 7.375% | | 02/01/16 | | | 8,945 | | | 8,956,181 |
NRG Energy, Inc., Gtd. Notes | | B1 | | 7.375% | | 01/15/17 | | | 1,700 | | | 1,704,250 |
NSG Holdings LLC / NSG Holdings, Inc., Sr. Sec’d. Notes, 144A | | Ba2 | | 7.750% | | 12/15/25 | | | 800 | | | 716,000 |
Orion Power Holdings, Inc., Sr. Unsec’d. Notes | | Ba3 | | 12.000% | | 05/01/10 | | | 7,751 | | | 7,944,775 |
Reliant Energy Mid-Atlantic Power Holdings LLC, Pass-thru Certs., Ser. B(b) | | Ba1 | | 9.237% | | 07/02/17 | | | 2,326 | | | 2,430,280 |
Sithe/Independence Funding Corp., Sr. Sec’d. Notes, Ser. A(b) | | Ba2 | | 9.000% | | 12/30/13 | | | 6,119 | | | 6,284,365 |
Texas Competitive Electric Holdings Co. LLC, Gtd. Notes, PIK(d) | | Caa2 | | 10.500% | | 11/01/16 | | | 2,780 | | | 1,960,073 |
| | | | | | | | | | | |
|
|
| | | | | | | | | | | | | 102,933,622 |
| | | | | | | | | | | |
|
|
Energy – Other — 5.6% | | | | | | | | | | | | |
Cie Generale de Geophysique-Veritas (France), Gtd. Notes | | Ba3 | | 7.750% | | 05/15/17 | | | 2,150 | | | 2,133,875 |
Cie Generale de Geophysique-Veritas (France), Gtd. Notes, 144A | | Ba3 | | 9.500% | | 05/15/16 | | | 4,825 | | | 5,162,750 |
Compagnie Generale De Geophysique Veritas (France), Gtd. Notes | | Ba3 | | 7.500% | | 05/15/15 | | | 1,830 | | | 1,816,275 |
Denbury Resources, Inc., Gtd. Notes | | B1 | | 9.750% | | 03/01/16 | | | 4,050 | | | 4,323,375 |
McMoRan Exploration Co., Gtd. Notes | | Caa1 | | 11.875% | | 11/15/14 | | | 2,400 | | | 2,460,000 |
Newfield Exploration Co., Sr. Sub. Notes | | Ba3 | | 6.625% | | 04/15/16 | | | 2,425 | | | 2,431,062 |
Newfield Exploration Co., Sr. Sub. Notes | | Ba3 | | 7.125% | | 05/15/18 | | | 2,200 | | | 2,222,000 |
OPTI Canada, Inc. (Canada), Sr. Sec’d. Notes | | Caa3 | | 7.875% | | 12/15/14 | | | 17,400 | | | 14,268,000 |
OPTI Canada, Inc. (Canada), Sr. Sec’d. Notes | | Caa3 | | 8.250% | | 12/15/14 | | | 4,055 | | | 3,340,306 |
Parker Drilling Co., Gtd. Notes | | B2 | | 9.625% | | 10/01/13 | | | 2,195 | | | 2,255,362 |
PetroHawk Energy Corp., Gtd. Notes(d) | | B3 | | 7.875% | | 06/01/15 | | | 6,125 | | | 6,186,250 |
PetroHawk Energy Corp., Gtd. Notes | | B3 | | 9.125% | | 07/15/13 | | | 3,650 | | | 3,814,250 |
Petroplus Finance Ltd. (Bermuda), Sec’d. Notes, 144A | | B1 | | 7.000% | | 05/01/17 | | | 4,225 | | | 3,802,500 |
Petroplus Finance Ltd. (Bermuda), Sr. Sec’d. Notes, 144A(d) | | B1 | | 6.750% | | 05/01/14 | | | 12,150 | | | 11,421,000 |
Pioneer Natural Resources Co., Gtd. Notes | | Ba1 | | 5.875% | | 07/15/16 | | | 1,950 | | | 1,866,729 |
Pioneer Natural Resources Co., Sr. Unsec’d. Notes | | Ba1 | | 6.650% | | 03/15/17 | | | 9,965 | | | 9,828,151 |
Pioneer Natural Resources Co., Sr. Unsec’d. Notes | | Ba1 | | 6.875% | | 05/01/18 | | | 3,040 | | | 3,007,837 |
Pioneer Natural Resources Co., Sr. Unsec’d. Notes | | Ba1 | | 7.500% | | 01/15/20 | | | 5,000 | | | 5,002,270 |
Plains Exploration & Production Co., Gtd. Notes | | B1 | | 7.625% | | 06/01/18 | | | 1,500 | | | 1,533,750 |
Plains Exploration & Production Co., Gtd. Notes(d) | | B1 | | 7.750% | | 06/15/15 | | | 2,145 | | | 2,182,538 |
Plains Exploration & Production Co., Gtd. Notes(d) | | B1 | | 10.000% | | 03/01/16 | | | 1,800 | | | 1,971,000 |
Range Resources Corp., Gtd. Notes | | Ba3 | | 7.500% | | 05/15/16 | | | 4,100 | | | 4,212,750 |
SandRidge Energy, Inc., Gtd. Notes, 144A(d) | | B3 | | 8.000% | | 06/01/18 | | | 7,850 | | | 7,712,625 |
SandRidge Energy, Inc., Gtd. Notes, 144A(d) | | B3 | | 8.750% | | 01/15/20 | | | 4,775 | | | 4,775,000 |
| | | | | | | | | | | |
|
|
| | | | | | | | | | | | | 107,729,655 |
| | | | | | | | | | | |
|
|
Foods — 2.6% | | | | | | | | | | | | |
Aramark Corp., Gtd. Notes(d) | | B3 | | 8.500% | | 02/01/15 | | | 4,065 | | | 4,186,950 |
Carrols Corp., Gtd. Notes | | B3 | | 9.000% | | 01/15/13 | | | 500 | | | 507,500 |
Del Monte Corp., Sr. Sub. Notes, 144A | | B1 | | 7.500% | | 10/15/19 | | | 4,850 | | | 4,995,500 |
Ingles Markets, Inc., Sr. Unsec’d. Notes(d) | | B1 | | 8.875% | | 05/15/17 | | | 7,600 | | | 7,904,000 |
Landry’s Restaurants, Inc., Sr. Sec’d. Notes, 144A(d) | | B3 | | 11.625% | | 12/01/15 | | | 6,660 | | | 7,059,600 |
National Beef Packing Co. LLC/NB Finance Corp., Sr. Unsec’d. Notes | | Caa1 | | 10.500% | | 08/01/11 | | | 264 | | | 264,660 |
New Albertson’s, Inc., Sr. Unsec’d. Notes | | Ba3 | | 7.500% | | 02/15/11 | | | 850 | | | 869,125 |
New Albertson’s, Inc., Sr. Unsec’d. Notes | | Ba3 | | 8.350% | | 05/01/10 | | | 1,975 | | | 2,024,375 |
Smithfield Foods, Inc., Sr. Sec’d. Notes, 144A | | Ba3 | | 10.000% | | 07/15/14 | | | 3,290 | | | 3,569,650 |
Stater Brothers Holdings, Gtd. Notes | | B2 | | 7.750% | | 04/15/15 | | | 500 | | | 507,500 |
Stater Brothers Holdings, Gtd. Notes | | B2 | | 8.125% | | 06/15/12 | | | 900 | | | 909,000 |
Supervalu, Inc., Sr. Unsec’d. Notes(d) | | Ba3 | | 7.500% | | 05/15/12 | | | 400 | | | 412,000 |
Supervalu, Inc., Sr. Unsec’d. Notes | | Ba3 | | 7.500% | | 11/15/14 | | | 200 | | | 202,500 |
Supervalu, Inc., Sr. Unsec’d. Notes(d) | | Ba3 | | 8.000% | | 05/01/16 | | | 8,550 | | | 8,678,250 |
Tyson Foods, Inc., Gtd. Notes | | Ba3 | | 7.850% | | 04/01/16 | | | 4,150 | | | 4,253,750 |
Tyson Foods, Inc., Sr. Unsec’d. Notes | | Ba3 | | 10.500% | | 03/01/14 | | | 3,650 | | | 4,170,125 |
| | | | | | | | | | | |
|
|
| | | | | | | | | | | | | 50,514,485 |
| | | | | | | | | | | |
|
|
SEE NOTES TO FINANCIAL STATEMENTS.
A90
| | | | | | |
| | | HIGH YIELD BOND PORTFOLIO (continued) | | |
| |
| SCHEDULE OF INVESTMENTS | | December 31, 2009 |
| | | | | | | | | | | | |
CORPORATE BONDS
(continued) | | Moody’s
Rating
(Unaudited)†
| | Interest
Rate
| | Maturity
Date
| | Principal
Amount
(000)
| | Value
(Note 2)
|
| | | | | | | | | | | | | |
Gaming — 4.6% | | | | | | | | | | | | |
Ameristar Casinos, Inc., Sr. Unsec’d. Notes, 144A | | B2 | | 9.250% | | 06/01/14 | | $ | 700 | | $ | 726,250 |
CCM Merger, Inc., Notes, 144A (original cost $17,403,875; purchased 07/14/05-11/20/09)(d)(h) | | Caa3 | | 8.000% | | 08/01/13 | | | 19,020 | | | 15,429,975 |
Downstream Development Authority of The Quapaw Tribe of Oklahoma, Sr. Sec’d. Notes, 144A(original cost $1,413,750; purchased 09/27/07(b)(h) | | Caa1 | | 12.000% | | 10/15/15 | | | 1,450 | | | 1,194,438 |
Harrah’s Operating Co., Inc., Sr. Sec’d. Notes, 144A | | CCC-(c) | | 10.000% | | 12/15/18 | | | 17,979 | | | 14,428,148 |
Harrah’s Operating Co., Inc., Sr. Sec’d. Notes, 144A | | CCC-(c) | | 10.000% | | 12/15/18 | | | 4,813 | | | 3,862,433 |
Isle of Capri Casinos, Inc., Gtd. Notes(d) | | Caa1 | | 7.000% | | 03/01/14 | | | 2,132 | | | 1,897,480 |
Mandalay Resort Group, Gtd. Notes | | Ca | | 9.375% | | 02/15/10 | | | 581 | | | 582,095 |
MGM Mirage, Gtd. Notes(d) | | Caa2 | | 6.625% | | 07/15/15 | | | 2,900 | | | 2,254,750 |
MGM Mirage, Gtd. Notes(d) | | Caa2 | | 6.875% | | 04/01/16 | | | 2,000 | | | 1,525,000 |
MGM Mirage, Gtd. Notes(d) | | Caa2 | | 7.500% | | 06/01/16 | | | 2,635 | | | 2,055,300 |
MGM Mirage, Gtd. Notes(d) | | Caa2 | | 8.500% | | 09/15/10 | | | 3,400 | | | 3,383,000 |
MGM Mirage, Sr. Sec’d. Notes, 144A | | B1 | | 10.375% | | 05/15/14 | | | 1,915 | | | 2,077,775 |
MGM Mirage, Sr. Sec’d. Notes, 144A | | B1 | | 11.125% | | 11/15/17 | | | 2,745 | | | 3,040,087 |
MGM Mirage, Sr. Sec’d. Notes | | B1 | | 13.000% | | 11/15/13 | | | 9,785 | | | 11,228,287 |
Mohegan Tribal Gaming Authority, Sr. Sub. Notes | | Caa2 | | 8.000% | | 04/01/12 | | | 745 | | | 634,181 |
Peninsula Gaming LLC, Sr. Sec’d. Notes, 144A | | Ba2 | | 8.375% | | 08/15/15 | | | 2,250 | | | 2,244,375 |
Peninsula Gaming LLC, Sr. Unsec’d. Notes, 144A | | B3 | | 10.750% | | 08/15/17 | | | 7,725 | | | 7,763,625 |
Penn National Gaming, Inc., Sr. Sub. Notes, 144A(d) | | B1 | | 8.750% | | 08/15/19 | | | 3,100 | | | 3,169,750 |
Pinnacle Entertainment, Inc., Sr. Notes, 144A | | B2 | | 8.625% | | 08/01/17 | | | 2,050 | | | 2,091,000 |
Pokagon Gaming Authority, Sr. Notes, 144A(original cost $1,656,000; purchased 11/13/08)(b)(h) | | B2 | | 10.375% | | 06/15/14 | | | 1,800 | | | 1,872,000 |
Scientific Games International, Inc., Sr. Sub. Notes, 144A | | NR | | 9.250% | | 06/15/19 | | | 1,925 | | | 2,021,250 |
Seneca Gaming Corp., Sr. Unsec’d. Notes, Ser. B | | Ba2 | | 7.250% | | 05/01/12 | | | 5,125 | | | 4,996,875 |
Station Casinos, Inc., Sr. Sub. Notes(e) | | D(c) | | 6.500% | | 02/01/14 | | | 3,650 | | | 18,250 |
Station Casinos, Inc., Sr. Sub. Notes(e) | | D(c) | | 6.625% | | 03/15/18 | | | 2,200 | | | 11,000 |
Station Casinos, Inc., Sr. Unsec’d. Notes(e) | | D(c) | | 6.000% | | 04/01/12 | | | 2,251 | | | 340,517 |
Yonkers Racing Corp., Sr. Sec’d. Notes, 144A(original cost $529,168; purchased 07/13/09)(b)(h) | | B1 | | 11.375% | | 07/15/16 | | | 545 | | | 572,250 |
| | | | | | | | | | | |
|
|
| | | | | | | | | | | | | 89,420,091 |
| | | | | | | | | | | |
|
|
Healthcare & Pharmaceutical — 12.3% | | | | | | | | | | | | |
Accellent, Inc., Gtd. Notes | | Caa2 | | 10.500% | | 12/01/13 | | | 23,483 | | | 22,602,388 |
Alliance Healthcare Services, Inc., Sr. Notes, 144A | | B3 | | 8.000% | | 12/01/16 | | | 7,600 | | | 7,410,000 |
Apria Healthcare Group, Inc., Sr. Sec’d. Notes, 144A(d) | | Ba2 | | 11.250% | | 11/01/14 | | | 13,335 | | | 14,635,163 |
Apria Healthcare Group, Inc., Sr. Sec’d. Notes, 144A | | B1 | | 12.375% | | 11/01/14 | | | 7,700 | | | 8,470,000 |
Biomet, Inc., Gtd. Notes | | B3 | | 10.000% | | 10/15/17 | | | 3,225 | | | 3,503,156 |
Biomet, Inc., Gtd. Notes, PIK | | B3 | | 10.375% | | 10/15/17 | | | 9,675 | | | 10,497,375 |
Biomet, Inc., Gtd. Notes(d) | | Caa1 | | 11.625% | | 10/15/17 | | | 15,460 | | | 17,083,300 |
Bio-Rad Laboratories, Inc., Sr. Sub. Notes, 144A | | Ba3 | | 8.000% | | 09/15/16 | | | 900 | | | 949,500 |
Columbia/HCA Healthcare Corp., Sr. Unsec’d. Notes | | Caa1 | | 7.500% | | 12/15/23 | | | 600 | | | 548,246 |
Columbia/HCA Healthcare Corp., Sr. Unsec’d. Notes, MTN | | Caa1 | | 8.700% | | 02/10/10 | | | 3,145 | | | 3,151,813 |
Columbia/HCA Healthcare Corp., Sr. Unsec’d. Notes, MTN | | Caa1 | | 9.000% | | 12/15/14 | | | 4,365 | | | 4,357,204 |
Community Health Systems, Inc., Gtd. Notes(d) | | B3 | | 8.875% | | 07/15/15 | | | 7,895 | | | 8,171,325 |
FMC Finance III SA (Luxembourg), Gtd. Notes | | Ba2 | | 6.875% | | 07/15/17 | | | 1,500 | | | 1,488,750 |
HCA, Inc., Sec’d. Notes | | B2 | | 9.250% | | 11/15/16 | | | 6,470 | | | 6,947,162 |
HCA, Inc., Sr. Sec’d. Notes, 144A(d) | | Ba3 | | 7.875% | | 02/15/20 | | | 800 | | | 833,000 |
HCA, Inc., Sr. Sec’d. Notes, PIK | | B2 | | 9.625% | | 11/15/16 | | | 12,100 | | | 13,098,250 |
HCA, Inc., Sr. Unsec’d. Notes | | Caa1 | | 5.750% | | 03/15/14 | | | 3,660 | | | 3,440,400 |
HCA, Inc., Sr. Unsec’d. Notes | | Caa1 | | 6.250% | | 02/15/13 | | | 2,500 | | | 2,431,250 |
HCA, Inc., Sr. Unsec’d. Notes | | Caa1 | | 8.750% | | 09/01/10 | | | 3,208 | | | 3,284,190 |
Omega Healthcare Investors, Inc., Gtd. Notes(d) | | Ba3 | | 7.000% | | 01/15/16 | | | 7,955 | | | 7,835,675 |
Omega Healthcare Investors, Inc., Gtd. Notes | | Ba3 | | 7.000% | | 04/01/14 | | | 4,475 | | | 4,430,250 |
Psychiatric Solutions, Inc., Gtd. Notes, Ser. 1(d) | | B3 | | 7.750% | | 07/15/15 | | | 6,175 | | | 5,974,313 |
Psychiatric Solutions, Inc., Sr. Sub. Notes, 144A | | B3 | | 7.750% | | 07/15/15 | | | 2,325 | | | 2,191,312 |
Res-Care, Inc., Gtd. Notes | | B1 | | 7.750% | | 10/15/13 | | | 10,050 | | | 9,999,750 |
SEE NOTES TO FINANCIAL STATEMENTS.
A91
| | | | | | |
| | | HIGH YIELD BOND PORTFOLIO (continued) | | |
| |
| SCHEDULE OF INVESTMENTS | | December 31, 2009 |
| | | | | | | | | | | | |
CORPORATE BONDS
(continued) | | Moody’s
Rating
(Unaudited)†
| | Interest
Rate
| | Maturity
Date
| | Principal
Amount
(000)
| | Value
(Note 2)
|
| | | | | | | | | | | | | |
Healthcare & Pharmaceutical (continued) | | | | | | | | | | | | |
Select Medical Corp., Gtd. Notes | | B3 | | 7.625% | | 02/01/15 | | $ | 11,445 | | $ | 11,101,650 |
Senior Housing Properties Trust, Sr. Unsec’d. Notes | | Ba1 | | 7.875% | | 04/15/15 | | | 3,125 | | | 3,070,313 |
Senior Housing Properties Trust, Sr. Unsec’d. Notes | | Ba1 | | 8.625% | | 01/15/12 | | | 13,191 | | | 13,652,685 |
Skilled Healthcare Group, Inc., Gtd. Notes | | Caa1 | | 11.000% | | 01/15/14 | | | 9,394 | | | 9,934,155 |
Sun Healthcare Group, Inc., Gtd. Notes(d) | | B3 | | 9.125% | | 04/15/15 | | | 13,350 | | | 13,717,125 |
Surgical Care Affiliates, Inc., Sr. Sub. Notes, 144A(original cost $6,468,500; purchased 06/21/07-06/29/09)(b)(h) | | Caa1 | | 10.000% | | 07/15/17 | | | 7,750 | | | 7,130,000 |
Vanguard Health Holding Co. II LLC, Gtd. Notes | | Caa1 | | 9.000% | | 10/01/14 | | | 2,025 | | | 2,098,406 |
Ventas Realty LP/Ventas Capital Corp., Gtd. Notes | | Ba1 | | 6.750% | | 04/01/17 | | | 825 | | | 798,187 |
Ventas Realty LP/Ventas Capital Corp., Gtd. Notes | | Ba1 | | 7.125% | | 06/01/15 | | | 245 | | | 245,000 |
Viant Holdings, Inc., Gtd. Notes, 144A (original cost $10,848,144; purchased 07/30/07-12/17/08)(h) | | Caa1 | | 10.125% | | 07/15/17 | | | 13,732 | | | 13,663,340 |
| | | | | | | | | | | |
|
|
| | | | | | | | | | | | | 238,744,633 |
| | | | | | | | | | | |
|
|
Healthcare Insurance — 0.3% | | | | | | | | | | | | |
Coventry Health Care, Inc., Sr. Unsec’d. Notes | | Ba1 | | 5.950% | | 03/15/17 | | | 5,950 | | | 5,395,323 |
Coventry Health Care, Inc., Sr. Unsec’d. Notes | | Ba1 | | 6.125% | | 01/15/15 | | | 305 | | | 291,339 |
| | | | | | | | | | | |
|
|
| | | | | | | | | | | | | 5,686,662 |
| | | | | | | | | | | |
|
|
Life Insurance — 0.9% | | | | | | | | | | | | |
American International Group, Inc., Sr. Unsec’d. Notes | | A3 | | 5.050% | | 10/01/15 | | | 13,150 | | | 10,970,453 |
American International Group, Inc., Sr. Unsec’d. Notes, MTN | | A3 | | 5.600% | | 10/18/16 | | | 8,675 | | | 7,178,875 |
| | | | | | | | | | | |
|
|
| | | | | | | | | | | | | 18,149,328 |
| | | | | | | | | | | |
|
|
Lodging — 1.0% | | | | | | | | | | | | |
Felcor Lodging LP, Sr. Sec’d. Notes, 144A | | B2 | | 10.000% | | 10/01/14 | | | 5,700 | | | 5,749,875 |
Host Hotels & Resorts LP, Gtd. Notes, Ser. O | | Ba1 | | 6.375% | | 03/15/15 | | | 2,035 | | | 1,994,300 |
Host Hotels & Resorts LP, Gtd. Notes | | BB+(c) | | 6.875% | | 11/01/14 | | | 1,090 | | | 1,096,812 |
Host Hotels & Resorts LP, Gtd. Notes, Ser. M | | Ba1 | | 7.000% | | 08/15/12 | | | 330 | | | 335,363 |
Host Hotels & Resorts LP, Gtd. Notes | | Ba1 | | 7.125% | | 11/01/13 | | | 1,215 | | | 1,234,744 |
NCL Corp. Ltd. (Bermuda), First Mtge. Bonds, 144A | | B3 | | 11.750% | | 11/15/16 | | | 4,200 | | | 4,147,500 |
Royal Caribbean Cruises Ltd. (Liberia), Sr. Unsec’d. Notes(d) | | Ba3 | | 11.875% | | 07/15/15 | | | 1,350 | | | 1,560,937 |
Starwood Hotels & Resorts Worldwide, Inc., Gtd. Notes | | Ba1 | | 7.875% | | 05/01/12 | | | 25 | | | 26,969 |
Starwood Hotels & Resorts Worldwide, Inc., Sr. Unsec’d. Notes | | Ba1 | | 7.875% | | 10/15/14 | | | 3,775 | | | 4,034,531 |
| | | | | | | | | | | |
|
|
| | | | | | | | | | | | | 20,181,031 |
| | | | | | | | | | | |
|
|
Media & Entertainment — 3.8% | | | | | | | | | | | | |
AMC Entertainment, Inc., Gtd. Notes(d) | | Caa1 | | 8.000% | | 03/01/14 | | | 675 | | | 644,625 |
AMC Entertainment, Inc., Gtd. Notes(d) | | Caa1 | | 11.000% | | 02/01/16 | | | 2,465 | | | 2,575,925 |
Clear Channel Communications, Inc., Gtd. Notes | | Ca | | 10.750% | | 08/01/16 | | | 6,400 | | | 5,024,000 |
Clear Channel Communications, Inc., Sr. Unsec’d. Notes(d) | | Ca | | 5.500% | | 09/15/14 | | | 5,235 | | | 3,428,925 |
Clear Channel Communications, Inc., Sr. Unsec’d. Notes(d) | | Ca | | 5.750% | | 01/15/13 | | | 4,725 | | | 3,744,563 |
Clear Channel Communications, Inc., Sr. Unsec’d. Notes(d) | | Ca | | 6.250% | | 03/15/11 | | | 6,000 | | | 5,617,500 |
Clear Channel Communications, Inc., Sr. Unsec’d. Notes | | Ca | | 6.875% | | 06/15/18 | | | 625 | | | 339,062 |
CMP Susquehanna Corp., Gtd. Notes | | Ca | | 9.875% | | 05/15/14 | | | 2,550 | | | 51,000 |
Dex Media West LLC/ Dex Media West Finance Co., Sr. Sub. Notes, Ser. B(e) | | D(c) | | 9.875% | | 08/15/13 | | | 10,903 | | | 3,434,445 |
Dex Media, Inc., Sr. Unsec’d. Notes(e) | | D(c) | | 8.000% | | 11/15/13 | | | 2,825 | | | 713,312 |
Intelsat Jackson Holdings Ltd. (Bahamas), Gtd. Notes, 144A | | B3 | | 8.500% | | 11/01/19 | | | 6,125 | | | 6,308,750 |
Intelsat Ltd. (Bermuda), Sr. Unsec’d. Notes(d) | | Caa3 | | 7.625% | | 04/15/12 | | | 1,000 | | | 990,000 |
Intelsat Subsidiary Holding Co. Ltd. (Bermuda), Gtd. Notes(d) | | B3 | | 8.875% | | 01/15/15 | | | 4,125 | | | 4,269,375 |
LIN Television Corp., Gtd. Notes(d) | | B3 | | 6.500% | | 05/15/13 | | | 1,895 | | | 1,828,675 |
Medianews Group, Inc., Sr. Sub. Notes(e) | | NR | | 6.375% | | 04/01/14 | | | 625 | | | 63 |
Medianews Group, Inc., Sr. Sub. Notes(e) | | NR | | 6.875% | | 10/01/13 | | | 1,375 | | | 137 |
Morris Publishing Group LLC, Gtd. Notes(e) | | NR | | 7.000% | | 08/01/13 | | | 1,050 | | | 307,125 |
Quebecor Media, Inc. (Canada), Sr. Unsec’d. Notes | | B2 | | 7.750% | | 03/15/16 | | | 1,550 | | | 1,546,125 |
Quebecor Media, Inc. (Canada), Sr. Unsec’d. Notes | | B2 | | 7.750% | | 03/15/16 | | | 2,555 | | | 2,548,613 |
R.H. Donnelley Corp., Sr. Disc. Notes, Ser. A-1(e) | | D(c) | | 6.875% | | 01/15/13 | | | 1,300 | | | 121,875 |
R.H. Donnelley Corp., Sr. Disc. Notes, Ser. A-2(e) | | D(c) | | 6.875% | | 01/15/13 | | | 7,700 | | | 721,875 |
SEE NOTES TO FINANCIAL STATEMENTS.
A92
| | | | | | |
| | | HIGH YIELD BOND PORTFOLIO (continued) | | |
| |
| SCHEDULE OF INVESTMENTS | | December 31, 2009 |
| | | | | | | | | | | | |
CORPORATE BONDS
(continued) | | Moody’s
Rating
(Unaudited)†
| | Interest
Rate
| | Maturity
Date
| | Principal
Amount
(000)
| | Value
(Note 2)
|
| | | | | | | | | | | | | |
Media & Entertainment (continued) | | | | | | | | | | | | |
R.H. Donnelley Corp., Sr. Unsec’d. Notes, Ser. A-4(e) | | D(c) | | 8.875% | | 10/15/17 | | $ | 2,000 | | $ | 187,500 |
Rainbow National Services LLC, Gtd. Notes, 144A | | Ba3 | | 8.750% | | 09/01/12 | | | 825 | | | 840,469 |
Rainbow National Services LLC, Gtd. Notes, 144A | | B1 | | 10.375% | | 09/01/14 | | | 205 | | | 216,275 |
Salem Communications Corp., Sr. Sec’d. Notes, 144A | | B2 | | 9.625% | | 12/15/16 | | | 4,000 | | | 4,190,000 |
Sinclair Television Group, Inc., Sr. Sec’d. Notes, 144A(d) | | B2 | | 9.250% | | 11/01/17 | | | 5,200 | | | 5,408,000 |
Universal City Development Partners Ltd., Sr. Notes, 144A(original cost $1,779,750; purchased 10/28/09)(h) | | B3 | | 8.875% | | 11/15/15 | | | 1,800 | | | 1,761,750 |
Universal City Development Partners Ltd., Sr. Sub. Notes, 144A (original cost $1,136,154; purchased 10/27/09)(h) | | B3 | | 10.875% | | 11/15/16 | | | 1,150 | | | 1,152,875 |
Univision Communications, Inc., Gtd. Notes, PIK, 144A(d) | | Caa2 | | 9.750% | | 03/15/15 | | | 10,456 | | | 9,161,708 |
WMG Acquisition Corp., Sr. Sec’d. Notes, 144A | | Ba2 | | 9.500% | | 06/15/16 | | | 6,775 | | | 7,257,719 |
| | | | | | | | | | | |
|
|
| | | | | | | | | | | | | 74,392,266 |
| | | | | | | | | | | |
|
|
Metals — 4.3% | | | | | | | | | | | | |
AK Steel Corp., Gtd. Notes | | Ba3 | | 7.750% | | 06/15/12 | | | 6,800 | | | 6,868,000 |
Aleris International, Inc., Gtd. Notes, PIK(e) | | D(c) | | 9.000% | | 12/15/14 | | | 2,200 | | | 11,484 |
ArcelorMittal USA Partnership (Canada), Gtd. Notes | | Baa3 | | 9.750% | | 04/01/14 | | | 14,959 | | | 15,706,950 |
Arch Coal, Inc., Gtd. Notes, 144A | | B1 | | 8.750% | | 08/01/16 | | | 2,625 | | | 2,775,938 |
Century Aluminum Co., Sr. Sec’d. Notes | | B(c) | | 8.000% | | 05/15/14 | | | 12,183 | | | 11,878,054 |
FMG Resources August 2006 Pty Ltd. (Australia), Sr. Sec’d. Notes, 144A | | B2 | | 10.000% | | 09/01/13 | | | 6,550 | | | 6,812,000 |
FMG Resources August 2006 Pty Ltd. (Australia), Sr. Sec’d. Notes, 144A | | B2 | | 10.625% | | 09/01/16 | | | 1,775 | | | 1,963,594 |
Foundation PA Coal Co. LLC, Gtd. Notes | | Ba3 | | 7.250% | | 08/01/14 | | | 1,850 | | | 1,873,125 |
Freeport-McMoRan Copper & Gold, Inc., Sr. Unsec’d. Notes | | Ba2 | | 8.375% | | 04/01/17 | | | 1,945 | | | 2,129,775 |
Metals USA, Inc., Sr. Sec’d. Notes | | Caa1 | | 11.125% | | 12/01/15 | | | 3,920 | | | 3,964,100 |
Ryerson, Inc., Sr. Sec’d. Notes | | Caa1 | | 12.000% | | 11/01/15 | | | 4,195 | | | 4,383,775 |
Teck Resources Ltd. (Canada), Sr. Sec’d. Notes(d) | | Ba2 | | 9.750% | | 05/15/14 | | | 12,050 | | | 13,902,687 |
Teck Resources Ltd. (Canada), Sr. Sec’d. Notes | | Ba2 | | 10.250% | | 05/15/16 | | | 4,125 | | | 4,805,625 |
Teck Resources Ltd. (Canada), Sr. Sec’d. Notes(d) | | Ba2 | | 10.750% | | 05/15/19 | | | 4,500 | | | 5,377,500 |
United States Steel Corp., Sr. Unsec’d. Notes | | Ba3 | | 7.000% | | 02/01/18 | | | 800 | | | 783,595 |
| | | | | | | | | | | |
|
|
| | | | | | | | | | | | | 83,236,202 |
| | | | | | | | | | | |
|
|
Non-Captive Finance — 1.6% | | | | | | | | | | | | |
CIT Group, Inc., Sr. Sec’d. Notes | | NR | | 7.000% | | 05/01/14 | | | 731 | | | 679,282 |
CIT Group, Inc., Sr. Sec’d. Notes | | NR | | 7.000% | | 05/01/17 | | | 1,707 | | | 1,480,465 |
CIT Group, Inc., Sr. Sec’d. Notes | | NR | | 7.000% | | 05/01/13 | | | 488 | | | 454,682 |
CIT Group, Inc., Sr. Sec’d. Notes | | NR | | 7.000% | | 05/01/15 | | | 731 | | | 654,598 |
CIT Group, Inc., Sr. Sec’d. Notes, Ser. . | | NR | | 7.000% | | 05/01/16 | | | 10,519 | | | 9,256,711 |
GMAC, Inc., Gtd. Notes, 144A(d) | | Ca | | 6.625% | | 05/15/12 | | | 4,625 | | | 4,532,500 |
GMAC, Inc., Gtd. Notes, 144A | | Ca | | 6.750% | | 12/01/14 | | | 4,825 | | | 4,583,750 |
GMAC, Inc., Gtd. Notes, 144A(d) | | Ca | | 6.875% | | 08/28/12 | | | 4,925 | | | 4,826,500 |
GMAC, Inc., Gtd. Notes, 144A(d) | | Ca | | 6.875% | | 09/15/11 | | | 4,200 | | | 4,137,000 |
HSBC Finance Capital Trust IX, Gtd. Notes(a) | | Baa1 | | 5.911% | | 11/30/35 | | | 100 | | | 82,000 |
Jet Equipment Trust, Ser. 94-A, 144A(b) | | NR | | 10.000% | | 06/15/12 | | | 121 | | | 66,759 |
Jet Equipment Trust, Sr. Unsec’d. Notes, Ser. 95-B, 144A(e) | | NR | | 7.630% | | 08/15/12 | | | 11 | | | 6,011 |
| | | | | | | | | | | |
|
|
| | | | | | | | | | | | | 30,760,258 |
| | | | | | | | | | | |
|
|
Packaging — 2.5% | | | | | | | | | | | | |
Berry Plastics Holding Corp., Sec’d. Notes(a) | | Caa1 | | 4.129% | | 09/15/14 | | | 2,025 | | | 1,620,000 |
Berry Plastics Holding Corp., Sec’d. Notes(d) | | Caa1 | | 8.875% | | 09/15/14 | | | 6,750 | | | 6,564,375 |
BWAY Corp., Gtd. Notes, 144A | | B3 | | 10.000% | | 04/15/14 | | | 3,725 | | | 3,939,188 |
Crown Americas LLC/Crown Americas Capital Corp., Gtd. Notes | | B1 | | 7.625% | | 11/15/13 | | | 1,676 | | | 1,730,470 |
Exopack Holding Corp., Gtd. Notes | | B3 | | 11.250% | | 02/01/14 | | | 9,015 | | | 9,161,494 |
Graham Packaging Co. LP/GPC Capital Corp. I, Sr. Notes, 144A | | Caa1 | | 8.250% | | 01/01/17 | | | 3,550 | | | 3,505,625 |
Graham Packaging Co. LP/GPC Capital Corp. I, Inc., Gtd. Notes(d) | | Caa1 | | 9.875% | | 10/15/14 | | | 3,150 | | | 3,213,000 |
Greif, Inc., Sr. Unsec’d. Notes | | Ba2 | | 6.750% | | 02/01/17 | | | 4,140 | | | 4,057,200 |
Owens Brockway Glass Container, Inc., Gtd. Notes | | Ba3 | | 8.250% | | 05/15/13 | | | 3,825 | | | 3,930,187 |
SEE NOTES TO FINANCIAL STATEMENTS.
A93
| | | | | | |
| | | HIGH YIELD BOND PORTFOLIO (continued) | | |
| |
| SCHEDULE OF INVESTMENTS | | December 31, 2009 |
| | | | | | | | | | | | |
CORPORATE BONDS
(continued) | | Moody’s
Rating
(Unaudited)†
| | Interest
Rate
| | Maturity
Date
| | Principal
Amount
(000)
| | Value
(Note 2)
|
| | | | | | | | | | | | | |
Packaging (continued) | | | | | | | | | | | | |
Plastipak Holdings, Inc., Sr. Notes, 144A(original cost $1,993,875; purchased 07/23/09)(b)(d)(h) | | B3 | | 10.625% | | 08/15/19 | | $ | 2,040 | | $ | 2,249,100 |
Reynolds Group Issuer, Inc./Reynolds Group Issuer LLC/Reynolds Group Issuer Lu, Sr. Sec’d. Notes, 144A(d) | | B1 | | 7.750% | | 10/15/16 | | | 6,000 | | | 6,135,000 |
Silgan Holdings, Inc., Sr. Sub. Notes | | B1 | | 6.750% | | 11/15/13 | | | 3,118 | | | 3,149,180 |
| | | | | | | | | | | |
|
|
| | | | | | | | | | | | | 49,254,819 |
| | | | | | | | | | | |
|
|
Paper — 2.8% | | | | | | | | | | | | |
Cascades, Inc. (Canada), Gtd. Notes, 144A(d) | | Ba3 | | 7.875% | | 01/15/20 | | | 2,625 | | | 2,664,375 |
Cascades, Inc. (Canada), Sr. Notes, 144A | | Ba3 | | 7.750% | | 12/15/17 | | | 5,250 | | | 5,302,500 |
Cellu Tissue Holdings, Inc., Sr. Sec’d. Notes | | B2 | | 11.500% | | 06/01/14 | | | 6,290 | | | 6,981,900 |
Domtar Corp., Gtd. Notes | | Ba3 | | 5.375% | | 12/01/13 | | | 600 | | | 579,000 |
Domtar Corp., Gtd. Notes, Ser. GLOB | | Ba3 | | 7.125% | | 08/15/15 | | | 1,300 | | | 1,306,500 |
Domtar Corp., Gtd. Notes | | Ba3 | | 7.875% | | 10/15/11 | | | 442 | | | 461,890 |
Domtar Corp., Sr. Unsec’d. Notes(d) | | Ba3 | | 10.750% | | 06/01/17 | | | 3,425 | | | 4,024,375 |
Georgia-Pacific LLC, Gtd. Notes, 144A (original cost $335,986; purchased 03/12/08)(h) | | Ba3 | | 7.000% | | 01/15/15 | | | 350 | | | 354,375 |
Georgia-Pacific LLC., Gtd. Notes, 144A (original cost $5,283,656; purchased 12/31/06-07/18/08)(h) | | Ba3 | | 7.125% | | 01/15/17 | | | 5,401 | | | 5,468,513 |
Georgia-Pacific LLC, Gtd. Notes, 144A (original cost $5,001,090; purchased 04/20/09)(h) | | Ba3 | | 8.250% | | 05/01/16 | | | 5,200 | | | 5,512,000 |
Georgia-Pacific LLC, Sr. Unsec’d. Notes | | B2 | | 8.125% | | 05/15/11 | | | 200 | | | 210,000 |
Graphic Packaging International, Inc., Gtd. Notes | | B3 | | 9.500% | | 06/15/17 | | | 2,525 | | | 2,676,500 |
Jefferson Smurfit Corp., Sr. Unsec’d. Notes(d)(e) | | D(c) | | 8.250% | | 10/01/12 | | | 3,270 | | | 2,877,600 |
NewPage Corp., Sec’d. Notes | | Caa2 | | 10.000% | | 05/01/12 | | | 9,600 | | | 6,864,000 |
NewPage Corp., Sr. Sec’d. Notes, 144A | | B2 | | 11.375% | | 12/31/14 | | | 3,425 | | | 3,459,250 |
Rock-Tenn Co., Gtd. Notes | | Ba2 | | 9.250% | | 03/15/16 | | | 845 | | | 917,881 |
Smurfit-Stone Container Enterprises, Inc., Sr. Unsec’d. Notes(d)(e) | | D(c) | | 8.375% | | 07/01/12 | | | 3,800 | | | 3,363,000 |
Verso Paper Holdings LLC, Gtd. Notes, Ser. B | | Caa1 | | 11.375% | | 08/01/16 | | | 1,050 | | | 845,250 |
| | | | | | | | | | | |
|
|
| | | | | | | | | | | | | 53,868,909 |
| | | | | | | | | | | |
|
|
Pipelines & Other — 1.7% | | | | | | | | | | | | |
AmeriGas Partners LP/ AmeriGas Eagle Finance Corp., Sr. Unsec’d. Notes | | Ba3 | | 7.125% | | 05/20/16 | | | 2,225 | | | 2,225,000 |
MarkWest Energy Partners LP / MarkWest Energy Finance Corp., Gtd. Notes, Ser. B | | B2 | | 8.750% | | 04/15/18 | | | 2,000 | | | 2,060,000 |
Sonat, Inc., Sr. Unsec’d. Notes | | Ba3 | | 7.625% | | 07/15/11 | | | 2,490 | | | 2,566,445 |
Targa Resources Partners LP, Gtd. Notes | | B2 | | 8.250% | | 07/01/16 | | | 3,725 | | | 3,692,406 |
Targa Resources Partners LP, Gtd. Notes, 144A | | B2 | | 11.250% | | 07/15/17 | | | 4,475 | | | 4,928,094 |
Targa Resources, Inc., Gtd. Notes | | B3 | | 8.500% | | 11/01/13 | | | 10,275 | | | 10,686,000 |
Williams Partners LP/Williams Partners Finance Corp., Sr. Unsec’d. Notes | | Ba2 | | 7.250% | | 02/01/17 | | | 3,000 | | | 3,030,576 |
Williams Partners LP/Williams Partners Finance Corp., Sr. Unsec’d. Notes | | Ba2 | | 7.500% | | 06/15/11 | | | 3,725 | | | 3,808,753 |
| | | | | | | | | | | |
|
|
| | | | | | | | | | | | | 32,997,274 |
| | | | | | | | | | | |
|
|
Retailers — 2.4% | | | | | | | | | | | | |
Macy’s Retail Holding, Inc., Gtd. Notes | | Ba2 | | 5.900% | | 12/01/16 | | | 500 | | | 487,500 |
Neiman Marcus Group, Inc. (The), Gtd. Notes, PIK(d) | | Caa2 | | 9.000% | | 10/15/15 | | | 6,766 | | | 6,613,477 |
Neiman Marcus Group, Inc. (The), Gtd. Notes(d) | | Caa3 | | 10.375% | | 10/15/15 | | | 3,395 | | | 3,327,100 |
Pantry, Inc., Gtd. Notes | | Caa1 | | 7.750% | | 02/15/14 | | | 5,175 | | | 4,968,000 |
Rite Aid Corp., Gtd. Notes(d) | | Caa3 | | 9.500% | | 06/15/17 | | | 5,800 | | | 5,046,000 |
Rite Aid Corp., Sr. Sec’d. Notes(d) | | Caa2 | | 7.500% | | 03/01/17 | | | 7,265 | | | 6,829,100 |
Rite Aid Corp., Sr. Sec’d. Notes(d) | | Caa2 | | 10.375% | | 07/15/16 | | | 6,860 | | | 7,271,600 |
Susser Holdings LLC, Gtd. Notes | | B3 | | 10.625% | | 12/15/13 | | | 7,180 | | | 7,485,150 |
Toys “R” US Property Co. LLC, Sr. Sec’d. Notes, 144A(d) | | Ba2 | | 8.500% | | 12/01/17 | | | 3,450 | | | 3,510,375 |
| | | | | | | | | | | |
|
|
| | | | | | | | | | | | | 45,538,302 |
| | | | | | | | | | | |
|
|
SEE NOTES TO FINANCIAL STATEMENTS.
A94
| | | | | | |
| | | HIGH YIELD BOND PORTFOLIO (continued) | | |
| |
| SCHEDULE OF INVESTMENTS | | December 31, 2009 |
| | | | | | | | | | | | |
CORPORATE BONDS
(continued) | | Moody’s
Rating
(Unaudited)†
| | Interest
Rate
| | Maturity
Date
| | Principal
Amount
(000)
| | Value
(Note 2)
|
| | | | | | | | | | | | | |
Technology — 9.4% | | | | | | | | | | | | |
Advanced Micro Devices, Inc., Sr. Unsec’d. Notes, 144A(d) | | B2 | | 8.125% | | 12/15/17 | | $ | 9,675 | | $ | 9,638,719 |
Anixter International Inc., Gtd. Notes | | Ba2 | | 10.000% | | 03/15/14 | | | 7,650 | | | 8,453,250 |
Avago Technologies Finance Pte/ Avago Technologies US/Avago Technologies Wireless (Singapore), Gtd. Notes | | Ba3 | | 11.875% | | 12/01/15 | | | 4,200 | | | 4,625,250 |
Avaya, Inc., Sr. Notes, 144A (original cost $10,961,250; purchased 07/14/05-11/20/09)(b)(d)(h) | | Caa2 | | 9.750% | | 11/01/15 | | | 13,425 | | | 13,022,250 |
DuPont Fabros Technology LP, Gtd. Notes, 144A | | Ba2 | | 8.500% | | 12/15/17 | | | 4,825 | | | 4,903,406 |
First Data Corp., Gtd. Notes(d) | | Caa1 | | 9.875% | | 09/24/15 | | | 7,345 | | | 6,849,213 |
Freescale Semiconductor, Inc., Gtd. Notes, PIK(d) | | Caa2 | | 9.125% | | 12/15/14 | | | 1,929 | | | 1,704,512 |
GXS Worldwide, Inc., Sr. Sec’d. Notes, 144A | | B2 | | 9.750% | | 06/15/15 | | | 5,425 | | | 5,330,062 |
Lender Processing Services, Inc., Gtd. Notes | | Ba2 | | 8.125% | | 07/01/16 | | | 8,961 | | | 9,532,264 |
Nortel Networks Ltd. (Canada), Gtd. Notes(d)(e) | | NR | | 10.125% | | 07/15/13 | | | 3,050 | | | 2,180,750 |
NXP BV/NXP Funding LLC (Netherlands), Sr. Sec’d. Notes, Ser. ExCH(d) | | C | | 7.875% | | 10/15/14 | | | 20,150 | | | 18,286,125 |
Seagate Technology HDD Holdings (Cayman Islands), Gtd. Notes | | Ba3 | | 6.375% | | 10/01/11 | | | 10,500 | | | 10,683,750 |
Seagate Technology International (Cayman Islands), Sec’d. Notes, 144A | | Ba1 | | 10.000% | | 05/01/14 | | | 5,650 | | | 6,243,250 |
Sensata Technologies BV (Netherlands), Gtd. Notes | | Caa2 | | 8.000% | | 05/01/14 | | | 24,356 | | | 23,868,880 |
Serena Software, Inc., Gtd. Notes | | Caa1 | | 10.375% | | 03/15/16 | | | 4,840 | | | 4,652,450 |
STATS ChipPAC Ltd. (Singapore), Gtd. Notes | | Ba1 | | 6.750% | | 11/15/11 | | | 6,360 | | | 6,399,750 |
Sungard Data Systems, Inc., Gtd. Notes | | Caa1 | | 9.125% | | 08/15/13 | | | 2,080 | | | 2,132,000 |
Sungard Data Systems, Inc., Gtd. Notes(d) | | Caa1 | | 10.250% | | 08/15/15 | | | 13,050 | | | 13,898,250 |
Sungard Data Systems, Inc., Gtd. Notes(d) | | Caa1 | | 10.625% | | 05/15/15 | | | 14,925 | | | 16,436,156 |
Terremark Worldwide, Inc., Sr. Sec’d. Notes, 144A | | B2 | | 12.000% | | 06/15/17 | | | 2,525 | | | 2,790,125 |
Unisys Corp., Sr. Sec’d. Notes, 144A | | Ba3 | | 12.750% | | 10/15/14 | | | 5,050 | | | 5,832,750 |
Unisys Corp., Sr. Sec’d. Notes, 144A(d) | | Ba3 | | 14.250% | | 09/15/15 | | | 4,500 | | | 5,242,500 |
| | | | | | | | | | | |
|
|
| | | | | | | | | | | | | 182,705,662 |
| | | | | | | | | | | |
|
|
Telecommunications — 5.0% | | | | | | | | | | | | |
CC Holdings GS V LLC/Crown Castle GS III Corp., Sr. Sec’d. Notes, 144A | | Baa3 | | 7.750% | | 05/01/17 | | | 4,025 | | | 4,286,625 |
Clearwire Communications LLC/Clearwire Finance, Inc., Sr. Sec’d. Notes, 144A(d) | | Caa1 | | 12.000% | | 12/01/15 | | | 17,655 | | | 17,919,825 |
Clearwire Communications LLC/Clearwire Finance, Inc., Sr. Sec’d. Notes, 144A | | Caa1 | | 12.000% | | 12/01/15 | | | 2,000 | | | 2,030,000 |
Fairpoint Communications, Inc., Sr. Unsec’d. Notes, Ser. 1(e) | | NR | | 13.125% | | 04/01/18 | | | 9,138 | | | 959,485 |
Frontier Communications Corp., Sr. Unsec’d. Notes(d) | | Ba2 | | 8.250% | | 05/01/14 | | | 1,400 | | | 1,459,500 |
Hawaiian Telcom Communications, Inc., Gtd. Notes, Ser. B(b)(e) | | NR | | 8.765% | | 05/01/13 | | | 4,550 | | | 79,625 |
Hawaiian Telcom Communications, Inc., Gtd. Notes, Ser. B(b)(e) | | NR | | 12.500% | | 05/01/15 | | | 1,950 | | | 195 |
Level 3 Financing, Inc., Gtd. Notes(d) | | Caa1 | | 8.750% | | 02/15/17 | | | 1,825 | | | 1,665,313 |
Level 3 Financing, Inc., Gtd. Notes(d) | | Caa1 | | 12.250% | | 03/15/13 | | | 10,750 | | | 11,395,000 |
Nextel Communications, Inc., Gtd. Notes, Ser. E | | Ba2 | | 6.875% | | 10/31/13 | | | 1,250 | | | 1,212,500 |
Northwestern Bell Telephone, Sr. Unsec’d. Notes | | Ba1 | | 7.750% | | 05/01/30 | | | 750 | | | 641,250 |
Qwest Capital Funding, Inc., Gtd. Notes | | B1 | | 7.250% | | 02/15/11 | | | 500 | | | 507,500 |
Qwest Capital Funding, Inc., Gtd. Notes | | B1 | | 7.900% | | 08/15/10 | | | 275 | | | 280,500 |
Qwest Communications International, Inc., Gtd. Notes | | Ba3 | | 7.250% | | 02/15/11 | | | 50 | | | 50,250 |
Qwest Corp., Sr. Unsec’d. Notes | | Ba1 | | 7.500% | | 10/01/14 | | | 2,525 | | | 2,622,844 |
Qwest Corp., Sr. Unsec’d. Notes | | Ba1 | | 7.625% | | 06/15/15 | | | 5,115 | | | 5,294,025 |
Qwest Corp., Sr. Unsec’d. Notes | | Ba1 | | 7.875% | | 09/01/11 | | | 25 | | | 26,188 |
Qwest Corp., Sr. Unsec’d. Notes | | Ba1 | | 8.375% | | 05/01/16 | | | 2,525 | | | 2,708,062 |
Qwest Corp., Sr. Unsec’d. Notes | | Ba1 | | 8.875% | | 03/15/12 | | | 750 | | | 806,250 |
SBA Telecommunications, Inc., Gtd. Notes, 144A | | Ba2 | | 8.000% | | 08/15/16 | | | 1,335 | | | 1,395,075 |
SBA Telecommunications, Inc., Gtd. Notes, 144A(d) | | Ba2 | | 8.250% | | 08/15/19 | | | 1,335 | | | 1,415,100 |
Sprint Capital Corp., Gtd. Notes | | Ba3 | | 6.875% | | 11/15/28 | | | 1,500 | | | 1,246,875 |
Sprint Capital Corp., Gtd. Notes | | Ba3 | | 6.900% | | 05/01/19 | | | 1,575 | | | 1,449,000 |
Sprint Capital Corp., Gtd. Notes(d) | | Ba3 | | 7.625% | | 01/30/11 | | | 6,450 | | | 6,603,187 |
Sprint Capital Corp., Gtd. Notes | | Ba3 | | 8.375% | | 03/15/12 | | | 2,400 | | | 2,484,000 |
Sprint Nextel Corp., Sr. Unsec’d. Notes(a)(d) | | Ba3 | | 0.651% | | 06/28/10 | | | 2,250 | | | 2,214,499 |
SEE NOTES TO FINANCIAL STATEMENTS.
A95
| | | | | | |
| | | HIGH YIELD BOND PORTFOLIO (continued) | | |
| |
| SCHEDULE OF INVESTMENTS | | December 31, 2009 |
| | | | | | | | | | | | |
CORPORATE BONDS
(continued) | | Moody’s
Rating
(Unaudited)†
| | Interest
Rate
| | Maturity
Date
| | Principal
Amount
(000)
| | Value
(Note 2)
|
| | | | | | | | | | | | | |
Telecommunications (continued) | | | | | | | | | | | | |
Sprint Nextel Corp., Sr. Unsec’d. Notes | | Ba3 | | 6.000% | | 12/01/16 | | $ | 2,970 | | $ | 2,710,125 |
Sprint Nextel Corp., Sr. Unsec’d. Notes(d) | | Ba3 | | 8.375% | | 08/15/17 | | | 1,800 | | | 1,836,000 |
Time Warner Telecom Holdings, Inc., Gtd. Notes | | B2 | | 9.250% | | 02/15/14 | | | 3,975 | | | 4,099,219 |
Wind Acquisition Finance SA (Luxembourg), Gtd. Notes, 144A | | B2 | | 11.750% | | 07/15/17 | | | 6,300 | | | 6,882,750 |
Windstream Corp., Gtd. Notes, 144A | | Ba3 | | 7.875% | | 11/01/17 | | | 1,770 | | | 1,747,875 |
Windstream Corp., Gtd. Notes | | Ba3 | | 8.125% | | 08/01/13 | | | 2,650 | | | 2,749,375 |
Windstream Corp., Gtd. Notes | | Ba3 | �� | 8.625% | | 08/01/16 | | | 5,220 | | | 5,311,350 |
| | | | | | | | | | | |
|
|
| | | | | | | | | | | | | 96,089,367 |
| | | | | | | | | | | |
|
|
TOTAL CORPORATE BONDS
(cost $1,644,154,236) | | | 1,729,153,099 |
| | | | | | | | | | | |
|
|
| MUNICIPAL BOND — 0.1% | | | | | | | | | | | | |
Oakland Calif. Uni. Sch. Dist. Alameda Cnty., BABs
(cost $1,100,000) | | Baa1 | | 9.500% | | 08/01/34 | | | 1,100 | | | 1,124,057 |
| | | | | | | | | | | |
|
|
| RESIDENTIAL MORTGAGE-BACKED SECURITIES | | | | | | | | | | | | |
Argent Securities, Inc., Ser. 2003-W8, Class M1(a) | | Aa2 | | 1.281% | | 12/25/33 | | | 171 | | | 129,597 |
Credit-Based Asset Servicing And Securitization LLC, Ser. 2007-CB1, Class AF2 | | Caa3 | | 5.721% | | 01/25/37 | | | 600 | | | 270,017 |
Morgan Stanley ABS Capital I, Ser. 2007-HE6, Class A2(a) | | B3 | | 0.371% | | 05/25/37 | | | 100 | | | 39,593 |
Morgan Stanley Mortgage Loan Trust, Ser. 2006-12XS, Class A6A | | B3 | | 5.726% | | 10/25/36 | | | 493 | | | 266,649 |
Structured Asset Securities Corp., Ser. 2005-9XS, Class 2A1(a) | | Baa1 | | 0.531% | | 06/25/35 | | | 544 | | | 216,169 |
| | | | | | | | | | | |
|
|
TOTAL RESIDENTIAL MORTGAGE-BACKED SECURITIES
(cost $1,149,549) | | | 922,025 |
| | | | | | | | | | | |
|
|
| | | | | |
| | | | | | | | | Shares
| | |
| COMMON STOCKS — 0.1% | | | | | | | | | | | | |
Cable | | | | | | | | | | | | |
Adelphia Recovery Trust(b)(i) | | | 500,000 | | | 500 |
| | | | | | | | | | | |
|
|
Consumer | | | | | | | | | | | | |
ICON Fitness Corp.(i) | | | 18,093 | | | 181 |
| | | | | | | | | | | |
|
|
Electric | | | | | | | | | | | | |
Mirant Corp.(i) | | | 2,240 | | | 34,205 |
| | | | | | | | | | | |
|
|
Media & Entertainment | | | | | | | | | | | | |
Virgin Media, Inc. | | | 8,521 | | | 143,408 |
| | | | | | | | | | | |
|
|
Non-Captive Finance | | | | | | | | | | | | |
CIT Group, Inc.(i) | | | 16,991 | | | 469,122 |
| | | | | | | | | | | |
|
|
Pipelines & Other | | | | | | | | | | | | |
SemGroup Corp. (Class A Stock)(i) | | | 3,493 | | | 89,945 |
| | | | | | | | | | | |
|
|
Technology — 0.1% | | | | | | | | | | | | |
Xerox Corp. | | | 137,561 | | | 1,163,766 |
| | | | | | | | | | | |
|
|
Telecommunications | | | | | | | | | | | | |
Netia SA (Poland)(i) | | | 238,168 | | | 406,249 |
| | | | | | | | | | | |
|
|
TOTAL COMMON STOCKS
(cost $3,792,184) | | | 2,307,376 |
| | | | | | | | | | | |
|
|
| PREFERRED STOCKS | | | | | | | | | | | | |
Building Materials & Construction | | | | | | | | | | | | |
New Millenium Homes LLC(original cost $0; purchased 07/28/05)(b)(h)(i) | | | 3,000 | | | 708,000 |
| | | | | | | | | | | |
|
|
Cable | | | | | | | | | | | | |
Adelphia Communications Corp., PIK, 13.00%(b)(i) | | | 5,000 | | | 5 |
PTV, Inc., Ser. A, 10.00%(i) | | | 13 | | | 1 |
| | | | | | | | | | | |
|
|
| | | | | | | | | | | | | 6 |
| | | | | | | | | | | |
|
|
TOTAL PREFERRED STOCKS
(cost $4,765) | | | 708,006 |
| | | | | | | | | | | |
|
|
SEE NOTES TO FINANCIAL STATEMENTS.
A96
| | | | | | |
| | | HIGH YIELD BOND PORTFOLIO (continued) | | |
| |
| SCHEDULE OF INVESTMENTS | | December 31, 2009 |
| | | | | | | | | | | | | |
| WARRANTS(b)(i) | | | | | | Expiration
Date
| | Units
| | Value
(Note 2)
| |
Media & Entertainment | | | | | | | | | | | | | |
Sirius XM Radio, Inc., 144A | | 3/15/10 | | | 5,005 | | $ | 5 | |
| | | | | | | | | | | |
|
|
|
Pipelines & Other | | | | | | | | | | | | | |
SemGroup Corp. | | 1/1/20 | | | 3,676 | | | 16,542 | |
| | | | | | | | | | | |
|
|
|
Technology | | | | | | | | | | | | | |
Viasystems Group, Inc. | | 1/31/10 | | | 45,109 | | | 4 | |
| | | | | | | | | | | |
|
|
|
Telecommunications | | | | | | | | | | | | | |
GT Group Telecommunications, Inc. (Canada), 144A | | 2/1/10 | | | 3,050 | | | 3 | |
| | | | | | | | | | | |
|
|
|
TOTAL WARRANTS
(cost $1,246,361) | | | 16,554 | |
| | | | | | | | | | | |
|
|
|
TOTAL LONG-TERM INVESTMENTS
(cost $1,766,763,011) | | | 1,859,617,843 | |
| | | | | | | | | | | |
|
|
|
| | | | | |
| | | | |
Interest
Rate
| | Maturity
Date
| | Principal
Amount
(000)
| | | |
| SHORT-TERM INVESTMENTS — 15.2% | | | | | | | | | | | | | |
U.S. GOVERNMENT TREASURY SECURITY | | | | | | | | | | | | | |
United States Treasury Bill(j) (cost $385,811) | | 0.198% | | 04/01/10 | | $ | 386 | | | 385,944 | |
| | | | | | | | | | | |
|
|
|
| | | | | |
| | | | | | | | | Shares
| | | |
AFFILIATED MUTUAL FUNDS — 15.2% | | | | | | | | | | | | | |
Dryden Core Investment Fund — Short-Term Bond Series(Note 4)(k) | | | 500,314 | | | 4,282,690 | |
Dryden Core Investment Fund — Taxable Money Market Series
(cost $289,540,190; includes $256,445,495 of cash collateral received for securities on loan)(Note 4)(k)(l) | | | 289,540,190 | | | 289,540,190 | |
| | | | | | | | | | | |
|
|
|
TOTAL AFFILIATED MUTUAL FUNDS
(cost $294,303,189) | | | 293,822,880 | |
| | | | | | | | | | | |
|
|
|
TOTAL SHORT-TERM INVESTMENTS
(cost $294,689,000) | | | 294,208,824 | |
| | | | | | | | | | | |
|
|
|
TOTAL INVESTMENTS(m) — 111.1%
(cost $2,061,452,011) | | | 2,153,826,667 | |
LIABILITIES IN EXCESS OF OTHER ASSETS(n) — (11.1)% | | | (215,534,630 | ) |
| | | | | | | | | | | |
|
|
|
NET ASSETS — 100.0% | | $ | 1,938,292,037 | |
| | | | | | | | | | | |
|
|
|
The following abbreviations are used in portfolio descriptions:
| | |
| 144A | | Security was purchased pursuant to Rule 144A under the Securities Act of 1933 and may not be resold subject to that rule except to qualified institutional buyers. Unless otherwise noted, 144A securities are deemed to be liquid. |
| BABs | | Build America Bonds |
| CDO | | Collateralized Debt Obligation |
| MTN | | Medium Term Note |
| NR | | Not Rated by Moody’s or Standard & Poor’s |
| PIK | | Payment in Kind |
| † | The ratings reflected are as of December 31, 2009. Ratings of certain bonds may have changed subsequent to that date. |
| (a) | Indicates a variable rate security. The maturity date presented for these instruments is the latter of the next date on which the security can be redeemed at par or the next date on which the rate of interest is adjusted. The interest rate shown reflects the rate in effect at December 31, 2009. |
| (b) | Indicates a security that has been deemed illiquid. |
| (c) | Standard & Poor’s Rating |
| (d) | All or a portion of security is on loan. The aggregate market value of such securities is $250,638,350; cash collateral of $256,445,495 (included in liabilities) was received with which the Portfolio purchased highly liquid short-term investments. |
| (e) | Represents issuer in default on interest payments and/or principal repayment; non-income producing security. |
| (f) | Represents zero coupon bond. Rate shown reflects the effective yield at December 31, 2009. |
SEE NOTES TO FINANCIAL STATEMENTS.
A97
| | | | | | |
| | | HIGH YIELD BOND PORTFOLIO (continued) | | |
| |
| SCHEDULE OF INVESTMENTS | | December 31, 2009 |
| (g) | Amount is actual; not rounded to thousands. |
| (h) | Indicates a restricted security; the aggregate original cost of such securities is $81,792,913. The aggregate value of $86,299,638 is approximately 4.5% of net assets. |
| (i) | Non-income producing security. |
| (j) | Rate quoted represents yield-to-maturity as of purchase date. |
| (k) | Prudential Investments LLC, the manager of the Portfolio, also serves as manager of the Dryden Core Investment Fund—Taxable Money Market Series and the Dryden Core Investment Fund—Short-Term Bond Series. |
| (l) | Represents security, or a portion thereof, purchased with cash collateral received for securities on loan. |
| (m) | As of December 31, 2009, eleven securities representing $1,620,040 and 0.1% of net assets were fair valued in accordance with the policies adopted by the Board of Trustees. |
| (n) | Liabilities in excess of other assets includes net unrealized appreciation (depreciation) on credit default swap agreements as follows: |
Credit default swap agreements outstanding at December 31, 2009:
| | | | | | | | | | | | | | | | | | | | | |
Counterparty
| | Termination
Date
| | Notional
Amount
(000)(4)
| | Fixed
Rate
| | Reference Entity/Obligation
| | Fair
Value
| | | Upfront
Premiums
Paid/
(Received)
| | | Unrealized
Depreciation
| |
Buy Protection(1): | | | | | | | | | | | | | | | | | | | | | |
Goldman Sachs International | | 12/20/2011 | | $ | 5,750 | | 1.000% | | Lennar Corp.,
6.500%, 4/15/16 | | $ | 140,399 | | | $ | 207,906 | | | $ | (67,507 | ) |
JPMorgan Chase Bank | | 6/20/2013 | | | 5,000 | | 6.650% | | Tenet Healthcare Corp.,
7.375%, 2/01/13 | | | (469,286 | ) | | | — | | | | (469,286 | ) |
JPMorgan Chase Bank | | 12/20/2013 | | | 4,000 | | 3.900% | | JC Penney Co., Inc.,
6.375%, 10/15/36 | | | (413,454 | ) | | | 1,525 | | | | (414,979 | ) |
Goldman Sachs International | | 6/20/2019 | | | 2,500 | | 5.000% | | Sprint Nextel Corp.,
6.000%, 12/01/16 | | | (148,073 | ) | | | (12,784 | ) | | | (135,289 | ) |
Barclays Bank PLC | | 6/20/2019 | | | 2,500 | | 5.000% | | Sprint Nextel Corp.,
6.000%, 12/01/16 | | | (148,073 | ) | | | (35,302 | ) | | | (112,771 | ) |
| | | | | | | | | | | |
|
|
| |
|
|
| |
|
|
|
| | | | | | | | | | | | $ | (1,038,487 | ) | | $ | 161,345 | | | $ | (1,199,832 | ) |
| | | | | | | | | | | |
|
|
| |
|
|
| |
|
|
|
| | | | | | | | | | | | | | | | | | | | | | | |
Counterparty
| | Termination
Date
| | Implied
Credit Spread at
December 31, 2009(3)
| | Notional
Amount
(000)(4)
| | Fixed
Rate
| | Reference
Entity/Obligation
| | Fair Value
| | | Upfront
Premiums
Paid/
(Received)
| | | Unrealized
Appreciation/
(Depreciation)
| |
Credit default swaps on corporate issues—Sell Protection(2) | | | | | | | | | | | | | | |
Barclays Bank PLC | | 3/20/2010 | | 0.972% | | $ | 5,000 | | 5.000% | | HCA, Inc.,
6.375%, 1/15/15 | | $ | 52,424 | | | $ | (85,305 | ) | | $ | 137,729 | |
JPMorgan Chase Bank | | 3/20/2010 | | 0.690% | | | 8,000 | | 5.000% | | General Electric
Capital Corp.,
5.625%, 9/15/17 | | | 88,853 | | | | (604,108 | ) | | | 692,961 | |
Deutsche Bank AG | | 12/20/2014 | | 6.681% | | | 9,000 | | 5.000% | | Ford Motor Co.,
6.500%, 8/1/18 | | | (593,499 | ) | | | (1,175,000 | ) | | | 581,501 | |
Goldman Sachs International | | 3/20/2016 | | 4.999% | | | 3,150 | | 4.100% | | NRG Energy, Inc.,
7.250%, 2/01/14 | | | (129,989 | ) | | | — | | | | (129,989 | ) |
| | | | | | | | | | | | | |
|
|
| |
|
|
| |
|
|
|
| | | | | | | | | | | | | | $ | (582,211 | ) | | $ | (1,864,413 | ) | | $ | 1,282,202 | |
| | | | | | | | | | | | | |
|
|
| |
|
|
| |
|
|
|
The Portfolio entered into credit default swaps as the protection seller on corporate issues to take an active short position with respect to the likelihood of a particular issuer’s default.
| (1) | If the Portfolio is a buyer of protection, it pays the fixed rate. When a credit event occurs, as defined under the terms of that particular swap agreement, the Portfolio will either (i) receive from the seller of protection an amount equal to the notional amount of the swap and make delivery of the referenced obligation or underlying securities comprising the referenced index or (ii) receive a net settlement amount in the form of cash or securities equal to the notional amount of the swap less the recovery value of the referenced obligation or underlying securities comprising the referenced index. |
| (2) | If the Portfolio is a seller of protection, it receives the fixed rate. When a credit event occurs, as defined under the terms of that particular swap agreement, the Portfolio will either (i) pay to the buyer of protection an amount equal to the notional amount of the swap and take delivery of the referenced obligation or underlying securities comprising the referenced index or (ii) pay a net settlement amount in the form of cash or securities equal to the notional amount of the swap less the recovery value of the referenced obligation or underlying securities comprising the referenced index. |
SEE NOTES TO FINANCIAL STATEMENTS.
A98
| | | | | | |
| | | HIGH YIELD BOND PORTFOLIO (continued) | | |
| |
| SCHEDULE OF INVESTMENTS | | December 31, 2009 |
| (3) | Implied credit spreads, represented in absolute terms, utilized in determining the market value of credit default swap agreements on corporate issues or sovereign issues of an emerging country as of the reporting date serve as an indicator of the current status of the payment/performance risk and represent the likelihood of risk of default for the credit derivative. The implied credit spread of a particular referenced entity reflects the cost of buying/selling protection and may include up-front payments required to be made to enter into the agreement. Wider credit spreads represent a deterioration of the referenced entity’s credit soundness and a greater likelihood of risk of default or other credit event occurring as defined under the terms of the agreement. |
| (4) | Notional amount represents the maximum potential amount the Portfolio could be required to pay as a seller of credit protection or receive as a buyer or credit protection if a credit event occurs as defined under the terms of that particular swap agreement. |
Various inputs are used in determining the value of the Portfolio’s investments. These inputs are summarized in the three broad levels listed below.
Level 1—quoted prices in active markets for identical securities
Level 2—other significant observable inputs (including quoted prices for similar securities, interest rates, prepayment speeds, credit risk, etc.)
Level 3—significant unobservable inputs (including the Portfolio’s own assumptions in determining the fair value of investments)
The following is a summary of the inputs used as of December 31, 2009 in valuing the Portfolio’s assets carried at fair value:
| | | | | | | | | |
| | | Level 1
| | Level 2
| | Level 3
|
Investments in Securities | | | | | | | | | |
Asset-Backed Securities | | $ | — | | $ | 3,040,000 | | $ | 396,789 |
Bank Loans | | | — | | | 117,565,711 | | | — |
Collateralized Mortgage Obligations | | | — | | | 4,384,226 | | | — |
Corporate Bonds | | | — | | | 1,729,151,274 | | | 1,825 |
Municipal Bond | | | — | | | 1,124,057 | | | — |
Residential Mortgage-Backed Securities | | | — | | | 922,025 | | | — |
Common Stocks | | | 1,810,501 | | | 406,249 | | | 90,626 |
Preferred Stocks | | | 1 | | | — | | | 708,005 |
Warrants | | | 8 | | | — | | | 16,546 |
U.S. Government Treasury Security | | | — | | | 385,944 | | | — |
Affiliated Mutual Funds | | | 293,822,880 | | | — | | | — |
| | |
|
| |
|
| |
|
|
| | | | 295,633,390 | | | 1,856,979,486 | | | 1,213,791 |
Other Financial Instruments* | | | — | | | 82,370 | | | — |
| | |
|
| |
|
| |
|
|
Total | | $ | 295,633,390 | | $ | 1,857,061,856 | | $ | 1,213,791 |
| | |
|
| |
|
| |
|
|
The following is a reconciliation of assets in which significant unobservable inputs (Level 3) were used in determining fair value:
| | | | | | | | | | | | | | | | | | | |
| | | Corporate
Bonds
| | | Common
Stocks
| | | Preferred
Stocks
| | Warrants
| | | Asset-Backed
Securities
| |
Balance as of 12/31/08 | | $ | 165,500 | | | $ | 500 | | | $ | 471,005 | | $ | 5,607 | | | $ | — | |
Realized gain (loss) | | | (54,952 | ) | | | — | | | | — | | | (3,173,766 | ) | | | — | |
Earned amortization/accretion | | | (196,024 | ) | | | — | | | | — | | | — | | | | 970 | |
Change in unrealized appreciation (depreciation) | | | 503,248 | | | | (1,043,706 | ) | | | 237,000 | | | 2,978,171 | | | | (4,623 | ) |
Purchases (Sales) | | | (415,947 | ) | | | 1,133,832 | | | | — | | | 206,534 | | | | 400,442 | |
Transfers in and/or out of Level 3 | | | — | | | | — | | | | — | | | — | | | | — | |
| | |
|
|
| |
|
|
| |
|
| |
|
|
| |
|
|
|
Balance as of 12/31/09 | | $ | 1,825 | | | $ | 90,626 | | | $ | 708,005 | | $ | 16,546 | | | $ | 396,789 | |
| | |
|
|
| |
|
|
| |
|
| |
|
|
| |
|
|
|
| * | Other financial instruments are derivative instruments not reflected in the Schedule of Investments, such as futures, forwards and swap contracts, which are valued at the unrealized appreciation/depreciation on the instrument. |
SEE NOTES TO FINANCIAL STATEMENTS.
A99
| | | | | | |
| | | HIGH YIELD BOND PORTFOLIO (continued) | | |
| |
| SCHEDULE OF INVESTMENTS | | December 31, 2009 |
The industry classification of portfolio holdings and liabilities in excess of other assets shown as a percentage of net assets as of December 31, 2009 were as follows:
| | | |
Affiliated Mutual Funds (including 13.2% of collateral received for securities on loan) | | 15.2 | % |
Healthcare & Pharmaceutical | | 13.3 | |
Technology | | 10.1 | |
Capital Goods | | 7.8 | |
Electric | | 7.0 | |
Energy – Other | | 5.6 | |
Telecommunications | | 5.1 | |
Gaming | | 4.9 | |
Cable | | 4.7 | |
Metals | | 4.3 | |
Automotive | | 4.1 | |
Media & Entertainment | | 3.8 | |
Consumer | | 3.3 | |
Paper | | 2.8 | |
Foods | | 2.7 | |
Packaging | | 2.5 | |
Retailers | | 2.5 | |
Pipelines & Other | | 1.7 | |
Building Materials & Construction | | 1.6 | |
Non-Captive Finance | | 1.6 | |
Chemicals | | 1.5 | |
Aerospace & Defense | | 1.3 | |
Lodging | | 1.0 | |
Insurance | | 0.9 | |
Banking | | 0.8 | |
Healthcare Insurance | | 0.3 | |
Airlines | | 0.2 | |
Asset-Backed Securities | | 0.2 | |
Collateralized Mortgage Obligations | | 0.2 | |
Municipal Bond | | 0.1 | |
| | |
|
|
| | | 111.1 | |
Liabilities in excess of other assets | | (11.1 | ) |
| | |
|
|
| | | 100.0 | % |
| | |
|
|
The Portfolio invested in derivative instruments during the reporting period. The primary types of risk associated with derivative instruments are commodity risk, credit risk, equity risk, foreign exchange risk and interest rate risk. The effect of such derivative instruments on the Portfolio’s financial position and financial performance as reflected in the Statement of Assets and Liabilities and Statement of Operations is presented in the summary below.
Fair values of derivative instruments as of December 31, 2009 as presented in the Statement of Assets and Liabilities:
| | | | | | | | | | |
Derivatives not designated as
hedging instruments, carried at
fair value
| | Asset Derivatives
| | Liability Derivatives
|
| | Balance Sheet Location
| | Fair
Value
| | Balance Sheet Location
| | Fair
Value
|
Credit contracts | | Unrealized appreciation on swaps | | $ | 1,412,191 | | Unrealized depreciation on swaps | | $ | 1,329,821 |
Credit contracts | | Premium paid for swap agreements | | | 209,431 | | Premium received for swap agreements | | | 1,912,499 |
Equity contracts | | Unaffiliated investments | | | 16,554 | | — | | | — |
| | | | |
|
| | | |
|
|
Total | | | | $ | 1,638,176 | | | | $ | 3,242,320 |
| | | | |
|
| | | |
|
|
SEE NOTES TO FINANCIAL STATEMENTS.
A100
| | | | | | |
| | | HIGH YIELD BOND PORTFOLIO (continued) | | |
| |
| SCHEDULE OF INVESTMENTS | | December 31, 2009 |
The effects of derivative instruments on the Statement of Operations for the year ended December 31, 2009 are as follows:
| | | | | | | | | | | | |
Amount of Realized Gain or (Loss) on Derivatives Recognized in Income
| |
Derivatives not designated as hedging
instruments, carried at fair value
| | Swaps
| | | Warrants
| | | Total
| |
Credit contracts | | $ | (8,165,513 | ) | | $ | — | | | $ | (8,165,513 | ) |
Equity contracts | | | — | | | | (3,173,766 | ) | | | (3,173,766 | ) |
| | |
|
|
| |
|
|
| |
|
|
|
Total | | $ | (8,165,513 | ) | | $ | (3,173,766 | ) | | $ | (11,339,279 | ) |
| | |
|
|
| |
|
|
| |
|
|
|
|
Change in Unrealized Appreciation or (Depreciation) on Derivatives Recognized in Income
| |
Derivatives not designated as hedging
instruments, carried at fair value
| | Swaps
| | | Warrants
| | | Total
| |
Credit contracts | | $ | 3,446,866 | | | $ | — | | | $ | 3,446,866 | |
Equity contracts | | | — | | | | 2,978,171 | | | | 2,978,171 | |
| | |
|
|
| |
|
|
| |
|
|
|
Total | | $ | 3,446,866 | | | $ | 2,978,171 | | | $ | 6,425,037 | |
| | |
|
|
| |
|
|
| |
|
|
|
For the year ended December 31, 2009, the Portfolio’s average volume of derivative activities is as follows:
| | |
Credit Default
Swaps as Buyer
(Notional Amount in USD (000))
| | Credit Default
Swaps as Writer
(Notional Amount in USD (000))
|
$ 31,400 | | $24,153 |
SEE NOTES TO FINANCIAL STATEMENTS.
A101
| | | | | | |
| | | HIGH YIELD BOND PORTFOLIO (continued) | | |
STATEMENT OF ASSETS AND LIABILITIES
December 31, 2009
| | | | |
| ASSETS | | | | |
Investments, at value including securities on loan of $250,638,350: | | | | |
Unaffiliated investments (cost $1,767,148,822) | | $ | 1,860,003,787 | |
Affiliated investments (cost $294,303,189) | | | 293,822,880 | |
Cash | | | 3,093,631 | |
Dividends and interest receivable | | | 36,720,790 | |
Receivable for investments sold | | | 23,554,085 | |
Unrealized appreciation on swaps | | | 1,412,191 | |
Premium paid for swap agreements | | | 209,431 | |
Receivable for Series shares sold | | | 73,553 | |
Prepaid expenses | | | 19,407 | |
| | |
|
|
|
Total Assets | | | 2,218,909,755 | |
| | |
|
|
|
| LIABILITIES | | | | |
Collateral for securities on loan | | | 256,445,495 | |
Payable for investments purchased | | | 19,610,525 | |
Premium received for swap agreements | | | 1,912,499 | |
Unrealized depreciation on swaps | | | 1,329,821 | |
Management fee payable | | | 893,438 | |
Payable for Series shares repurchased | | | 278,311 | |
Accrued expenses and other liabilities | | | 141,048 | |
Deferred trustees’ fees | | | 5,688 | |
Affiliated transfer agent fee payable | | | 893 | |
| | |
|
|
|
Total Liabilities | | | 280,617,718 | |
| | |
|
|
|
| NET ASSETS | | $ | 1,938,292,037 | |
| | |
|
|
|
Net assets were comprised of: | | | | |
Paid-in capital | | $ | 2,293,186,092 | |
Retained earnings | | | (354,894,055 | ) |
| | |
|
|
|
Net assets, December 31, 2009 | | $ | 1,938,292,037 | |
| | |
|
|
|
Net asset value and redemption price per share, $1,938,292,037 / 400,909,217 outstanding shares of beneficial interest | | $ | 4.83 | |
| | |
|
|
|
STATEMENT OF OPERATIONS
Year Ended December 31, 2009
| | | | |
| INVESTMENT INCOME | | | | |
Unaffiliated interest | | $ | 157,457,579 | |
Affiliated income from securities loaned, net | | | 561,411 | |
Affiliated dividend income | | | 525,270 | |
Unaffiliated dividend income | | | 24,770 | |
| | |
|
|
|
| | | | 158,569,030 | |
| | |
|
|
|
| EXPENSES | | | | |
Management fee | | | 8,444,280 | |
Custodian’s fees and expenses | | | 204,000 | |
Shareholders’ reports | | | 136,000 | |
Insurance expenses | | | 29,000 | |
Audit fee | | | 23,000 | |
Trustees’ fees | | | 23,000 | |
Commitment fee on syndicated credit agreement | | | 14,000 | |
Legal fees and expenses | | | 11,000 | |
Transfer agent’s fee and expenses (including affiliated expense of $3,600) (Note 4) | | | 10,000 | |
Miscellaneous | | | 9,438 | |
| | |
|
|
|
Total expenses | | | 8,903,718 | |
| | |
|
|
|
| NET INVESTMENT INCOME | | | 149,665,312 | |
| | |
|
|
|
NET REALIZED AND UNREALIZED GAIN (LOSS) ON
INVESTMENTS, SWAPS AND FOREIGN CURRENCIES | |
Net realized loss on: | | | | |
Investment transactions (including affiliated: $(3,760,047)) | | | (91,683,416 | ) |
Swap agreement transactions | | | (8,165,513 | ) |
Foreign currency transactions | | | (107,308 | ) |
| | |
|
|
|
| | | | (99,956,237 | ) |
| | |
|
|
|
Net change in unrealized appreciation (depreciation) on: | | | | |
Investments (including affiliated: $5,282,209) | | | 531,616,520 | |
Swaps | | | 3,446,866 | |
Foreign currencies | | | 250,359 | |
| | |
|
|
|
| | | | 535,313,745 | |
| | |
|
|
|
| NET GAIN ON INVESTMENTS, SWAPS AND FOREIGN CURRENCIES | | | 435,357,508 | |
| | |
|
|
|
| NET INCREASE IN NET ASSETS RESULTING FROM OPERATIONS | | $ | 585,022,820 | |
| | |
|
|
|
STATEMENT OF CHANGES IN NET ASSETS
| | | | | | | | |
| | | Year Ended December 31,
| |
| | | 2009
| | | 2008
| |
| INCREASE (DECREASE) IN NET ASSETS | | | | | | | | |
| OPERATIONS: | | | | | | | | |
Net investment income | | $ | 149,665,312 | | | $ | 134,587,203 | |
Net realized loss on investment, swap and foreign currency transactions | | | (99,956,237 | ) | | | (105,734,132 | ) |
Net change in unrealized appreciation (depreciation) on investments, swaps and foreign currencies | | | 535,313,745 | | | | (389,181,610 | ) |
| | |
|
|
| |
|
|
|
NET INCREASE (DECREASE) IN NET ASSETS RESULTING FROM OPERATIONS | | | 585,022,820 | | | | (360,328,539 | ) |
| | |
|
|
| |
|
|
|
| DISTRIBUTIONS | | | (146,754,201 | ) | | | (133,562,726 | ) |
| | |
|
|
| |
|
|
|
| SERIES SHARE TRANSACTIONS: | | | | | | | | |
Series shares sold [4,625,109 and 1,247,295 shares, respectively] | | | 19,572,637 | | | | 5,374,155 | |
Series shares issued in reinvestment of dividends and distributions [34,474,693 and 30,575,224 shares, respectively] | | | 146,754,201 | | | | 133,562,726 | |
Net asset value of shares issued in merger [33,152,623 and 0 shares, respectively] (Note 10) | | | 157,806,487 | | | | — | |
Series shares repurchased [14,949,827 and 17,244,757 shares, respectively] | | | (63,973,510 | ) | | | (79,147,876 | ) |
| | |
|
|
| |
|
|
|
NET INCREASE IN NET ASSETS RESULTING FROM SERIES SHARE TRANSACTIONS | | | 260,159,815 | | | | 59,789,005 | |
| | |
|
|
| |
|
|
|
| TOTAL INCREASE (DECREASE) IN NET ASSETS | | | 698,428,434 | | | | (434,102,260 | ) |
| NET ASSETS: | | | | | | | | |
Beginning of year | | | 1,239,863,603 | | | | 1,673,965,863 | |
| | |
|
|
| |
|
|
|
End of year | | $ | 1,938,292,037 | | | $ | 1,239,863,603 | |
| | |
|
|
| |
|
|
|
SEE NOTES TO FINANCIAL STATEMENTS.
A102
| | | | | | |
| | | JENNISON PORTFOLIO | | |
| |
| SCHEDULE OF INVESTMENTS | | December 31, 2009 |
| | | | | |
| LONG-TERM INVESTMENTS — 99.1% |
| COMMON STOCKS — 98.1% | | Shares
| | Value
(Note 2)
|
| | | | | | |
Aerospace & Defense — 2.0% | | | | | |
Precision Castparts Corp. | | 124,280 | | $ | 13,714,298 |
United Technologies Corp. | | 186,889 | | | 12,971,965 |
| | | | |
|
|
| | | | | | 26,686,263 |
| | | | |
|
|
Auto Components — 0.6% | | | | | |
Johnson Controls, Inc. | | 320,300 | | | 8,724,972 |
| | | | |
|
|
Beverages — 1.1% | | | | | |
PepsiCo, Inc. | | 238,400 | | | 14,494,720 |
| | | | |
|
|
Biotechnology — 4.4% | | | | | |
Celgene Corp.(a) | | 369,500 | | | 20,573,760 |
Gilead Sciences, Inc.(a) | | 647,900 | | | 28,041,112 |
Vertex Pharmaceuticals, Inc.(a)(b) | | 215,400 | | | 9,229,890 |
| | | | |
|
|
| | | | | | 57,844,762 |
| | | | |
|
|
Capital Markets — 4.2% | | | | | |
Charles Schwab Corp. (The) | | 1,080,400 | | | 20,333,128 |
Goldman Sachs Group, Inc. (The) | | 196,900 | | | 33,244,596 |
Morgan Stanley | | 68,200 | | | 2,018,720 |
| | | | |
|
|
| | | | | | 55,596,444 |
| | | | |
|
|
Chemicals — 1.2% | | | | | |
Monsanto Co. | | 55,300 | | | 4,520,775 |
Praxair, Inc. | | 138,600 | | | 11,130,966 |
| | | | |
|
|
| | | | | | 15,651,741 |
| | | | |
|
|
Communications Equipment — 6.4% | | | | | |
Cisco Systems, Inc.(a) | | 1,165,900 | | | 27,911,646 |
Juniper Networks, Inc.(a)(b) | | 378,500 | | | 10,094,595 |
QUALCOMM, Inc. | | 994,100 | | | 45,987,066 |
| | | | |
|
|
| | | | | | 83,993,307 |
| | | | |
|
|
Computers & Peripherals — 9.5% | | | | | |
Apple, Inc.(a) | | 297,937 | | | 62,822,996 |
Hewlett-Packard Co. | | 711,900 | | | 36,669,969 |
NetApp, Inc.(a) | | 738,300 | | | 25,390,137 |
| | | | |
|
|
| | | | | | 124,883,102 |
| | | | |
|
|
Diversified Financial Services — 1.0% | | | | | |
JPMorgan Chase & Co. | | 308,400 | | | 12,851,028 |
| | | | |
|
|
Electronic Equipment & Instruments — 0.8% | | | |
Agilent Technologies, Inc.(a)(b) | | 350,910 | | | 10,902,774 |
| | | | |
|
|
Energy Equipment & Services — 1.9% | | | |
Schlumberger Ltd. | | 379,700 | | | 24,714,673 |
| | | | |
|
|
Food & Staples Retailing — 1.4% | | | |
Costco Wholesale Corp. | | 319,000 | | | 18,875,230 |
| | | | |
|
|
Food Products — 1.6% | | | |
Unilever PLC (United Kingdom) | | 666,500 | | | 21,364,857 |
| | | | |
|
|
Healthcare Equipment & Supplies — 4.3% | | | |
Alcon, Inc. | | 196,800 | | | 32,344,080 |
Baxter International, Inc. | | 413,200 | | | 24,246,576 |
| | | | |
|
|
| | | | | | 56,590,656 |
| | | | |
|
|
Healthcare Providers & Services — 3.3% | | | |
Express Scripts, Inc.(a) | | 77,500 | | | 6,699,875 |
Medco Health Solutions, Inc.(a) | | 568,700 | | | 36,345,617 |
| | | | |
|
|
| | | | | | 43,045,492 |
| | | | |
|
|
| | | | | |
COMMON STOCKS
(continued) | | Shares
| | Value
(Note 2)
|
| | | | | | |
Hotels Restaurants & Leisure — 1.5% | | | |
Marriott International, Inc. (Class A Stock)(b) | | 503,196 | | $ | 13,712,091 |
Starbucks Corp.(a)(b) | | 288,500 | | | 6,652,810 |
| | | | |
|
|
| | | | | | 20,364,901 |
| | | | |
|
|
Household Products — 1.3% | | | |
Colgate-Palmolive Co. | | 214,900 | | | 17,654,035 |
| | | | |
|
|
Internet & Catalog Retail — 4.2% | | | |
Amazon.com, Inc.(a) | | 413,600 | | | 55,637,472 |
| | | | |
|
|
Internet Software & Services — 6.7% | | | |
Baidu, Inc. (China), ADR(a) | | 29,764 | | | 12,239,850 |
Google, Inc. (Class A Stock)(a) | | 105,042 | | | 65,123,939 |
Tencent Holdings Ltd. (China) | | 495,800 | | | 10,723,023 |
| | | | |
|
|
| | | | | | 88,086,812 |
| | | | |
|
|
IT Services — 5.7% | | | |
Mastercard, Inc. (Class A Stock)(b) | | 146,700 | | | 37,552,266 |
Visa, Inc. (Class A Stock)(b) | | 427,000 | | | 37,345,420 |
| | | | |
|
|
| | | | | | 74,897,686 |
| | | | |
|
|
Life Sciences Tools & Services — 0.5% | | | |
Illumina, Inc.(a)(b) | | 212,200 | | | 6,503,930 |
| | | | |
|
|
Machinery — 0.5% | | | |
Cummins, Inc. | | 139,010 | | | 6,374,998 |
| | | | |
|
|
Media — 2.2% | | | |
Walt Disney Co. (The) | | 895,200 | | | 28,870,200 |
| | | | |
|
|
Multiline Retail — 2.5% | | | |
Kohl’s Corp.(a)(b) | | 312,600 | | | 16,858,518 |
Target Corp. | | 338,600 | | | 16,378,082 |
| | | | |
|
|
| | | | | | 33,236,600 |
| | | | |
|
|
Oil, Gas & Consumable Fuels — 4.7% | | | |
Apache Corp. | | 85,800 | | | 8,851,986 |
Occidental Petroleum Corp. | | 313,200 | | | 25,478,820 |
Petroleo Brasileiro SA (Brazil), ADR | | 314,100 | | | 14,976,288 |
Southwestern Energy Co.(a) | | 275,500 | | | 13,279,100 |
| | | | |
|
|
| | | | | | 62,586,194 |
| | | | |
|
|
Pharmaceuticals — 7.8% | | | |
Abbott Laboratories | | 302,800 | | | 16,348,172 |
Mylan, Inc.(a)(b) | | 554,600 | | | 10,221,278 |
Novartis AG (Switzerland), ADR | | 227,500 | | | 12,382,825 |
Pfizer, Inc. | | 705,500 | | | 12,833,045 |
Roche Holding AG (Switzerland), ADR | | 306,700 | | | 12,942,740 |
Shire PLC (Ireland), ADR(b) | | 240,570 | | | 14,121,459 |
Teva Pharmaceutical Industries Ltd. (Israel), ADR | | 434,300 | | | 24,398,974 |
| | | | |
|
|
| | | | | | 103,248,493 |
| | | | |
|
|
Road & Rail — 0.9% | | | |
Union Pacific Corp. | | 183,100 | | | 11,700,090 |
| | | | |
|
|
Semiconductor Equipment — 4.1% | | | |
Advanced Micro Devices, Inc.(a)(b) | | 1,292,000 | | | 12,506,560 |
Analog Devices, Inc., | | 474,900 | | | 14,997,342 |
Cree, Inc.(a)(b) | | 151,200 | | | 8,523,144 |
Intel Corp. | | 876,300 | | | 17,876,520 |
| | | | |
|
|
| | | | | | 53,903,566 |
| | | | |
|
|
SEE NOTES TO FINANCIAL STATEMENTS.
A103
| | | | | | |
| | | JENNISON PORTFOLIO (continued) | | |
| |
| SCHEDULE OF INVESTMENTS | | December 31, 2009 |
| | | | | | |
COMMON STOCKS
(continued) | | Shares
| | Value
(Note 2)
| |
| | | | | | | |
Software — 8.2% | | | | |
Adobe Systems, Inc.(a) | | 889,100 | | $ | 32,701,098 | |
Microsoft Corp. | | 1,754,300 | | | 53,488,607 | |
Salesforce.com, Inc.(a)(b) | | 227,340 | | | 16,770,872 | |
VMware, Inc. (Class A Stock)(a) | | 110,700 | | | 4,691,466 | |
| | | | |
|
|
|
| | | | | | 107,652,043 | |
| | | | |
|
|
|
Specialty Retail — 1.2% | | | | |
Staples, Inc. | | 266,000 | | | 6,540,940 | |
Tiffany & Co. | | 216,413 | | | 9,305,759 | |
| | | | |
|
|
|
| | | | | | 15,846,699 | |
| | | | |
|
|
|
Textiles, Apparel & Luxury Goods — 2.4% | | | | |
Coach, Inc. | | 208,180 | | | 7,604,815 | |
NIKE, Inc. (Class B Stock)(b) | | 363,980 | | | 24,048,159 | |
| | | | |
|
|
|
| | | | | | 31,652,974 | |
| | | | |
|
|
|
TOTAL COMMON STOCKS
(cost $890,226,407) | | | 1,294,436,714 | |
| | | | |
|
|
|
| PREFERRED STOCK — 1.0% | | | | |
Diversified Financial Services | | | | | | |
Bank of America Corp.(a)
(cost $13,168,652) | | 857,100 | | | 12,787,932 | |
| | | | |
|
|
|
TOTAL LONG-TERM INVESTMENTS
(cost $903,395,059) | | | 1,307,224,646 | |
| | | | |
|
|
|
| SHORT-TERM INVESTMENT — 13.0% | |
Affiliated Money Market Mutual Fund | | | | |
Dryden Core Investment Fund — Taxable Money Market Series (cost $171,487,172; includes $159,672,410 of cash collateral received for securities on loan)(Note 4)(c)(d) | | 171,487,172 | | | 171,487,172 | |
| | | | |
|
|
|
TOTAL INVESTMENTS (e) — 112.1%
(cost $1,074,882,231) | | | 1,478,711,818 | |
LIABILITIES IN EXCESS OF
OTHER ASSETS — (12.1)% | | | (159,738,409 | ) |
| | | | |
|
|
|
NET ASSETS — 100.0% | | $ | 1,318,973,409 | |
| | | | |
|
|
|
The following abbreviation is used in portfolio descriptions:
| | |
| ADR | | American Depositary Receipt |
| (a) | Non-income producing security. |
| (b) | All or a portion of security is on loan. The aggregate market value of such securities is $154,627,023; cash collateral of $159,672,410 (included in liabilities) was received with which the Portfolio purchased highly liquid short-term investments. |
| (c) | Represents security, or a portion thereof, purchased with cash collateral received for securities on loan. |
| (d) | Prudential Investments LLC, the manager of the Portfolio, also serves as manager of the Dryden Core Investment Fund-Taxable Money Market Series. |
| (e) | As of December 31, 2009, 2 securities representing $32,087,880 and 2.4% of the net assets were fair valued in accordance with the policies adopted by the Board of Trustees. |
Various inputs are used in determining the value of the Portfolio’s investments. These inputs are summarized in the three broad levels listed below.
Level 1—quoted prices in active markets for identical securities
Level 2—other significant observable inputs (including quoted prices for similar securities, interest rates, prepayment speeds, credit risk, etc.)
Level 3—significant unobservable inputs (including the Portfolio’s own assumptions in determining the fair value of investments)
The following is a summary of the inputs used as of December 31, 2009 in valuing the Portfolio’s assets carried at fair value:
| | | | | | | | | |
| | | Level 1
| | Level 2
| | Level 3
|
Investments in Securities | | | | | | | | | |
Common Stocks | | $ | 1,262,348,834 | | $ | 32,087,880 | | $ | — |
Preferred Stock | | | 12,787,932 | | | — | | | — |
Affiliated Money Market Mutual Fund | | | 171,487,172 | | | — | | | — |
| | |
|
| |
|
| |
|
|
| | | | 1,446,623,938 | | | 32,087,880 | | | — |
Other Financial Instruments* | | | — | | | — | | | — |
| | |
|
| |
|
| |
|
|
Total | | $ | 1,446,623,938 | | $ | 32,087,880 | | $ | — |
| | |
|
| |
|
| |
|
|
| * | Other financial instruments are derivative instruments not reflected in the Schedule of Investments, such as futures, forwards and swap contracts, which are valued at the unrealized appreciation/depreciation on the instrument. |
As of December 31, 2008 and December 31, 2009, the Portfolio did not use any significant unobservable inputs (Level 3) in determining the value of investments.
SEE NOTES TO FINANCIAL STATEMENTS.
A104
| | | | | | |
| | | JENNISON PORTFOLIO (continued) | | |
| |
| SCHEDULE OF INVESTMENTS | | December 31, 2009 |
The industry classification of portfolio holdings and liabilities in excess of other assets shown as a percentage of net assets as of December 31, 2009 was as follows:
| | | |
Affiliated Money Market Mutual Fund (including 12.1% of collateral received for securities on loan) | | 13.0 | % |
Computers & Peripherals | | 9.5 | |
Software | | 8.2 | |
Pharmaceuticals | | 7.8 | |
Internet Software & Services | | 6.7 | |
Communications Equipment | | 6.4 | |
IT Services | | 5.7 | |
Oil, Gas & Consumable Fuels | | 4.7 | |
Biotechnology | | 4.4 | |
Healthcare Equipment & Supplies | | 4.3 | |
Capital Markets | | 4.2 | |
Internet & Catalog Retail | | 4.2 | |
Semiconductor Equipment | | 4.1 | |
Healthcare Providers & Services | | 3.3 | |
Multiline Retail | | 2.5 | |
Textiles, Apparel & Luxury Goods | | 2.4 | |
Media | | 2.2 | |
Aerospace & Defense | | 2.0 | |
Diversified Financial Services | | 2.0 | |
Energy Equipment & Services | | 1.9 | |
Food Products | | 1.6 | |
Hotels Restaurants & Leisure | | 1.5 | |
Food & Staples Retailing | | 1.4 | |
Household Products | | 1.3 | |
Chemicals | | 1.2 | |
Specialty Retail | | 1.2 | |
Beverages | | 1.1 | |
Road & Rail | | 0.9 | |
Electronic Equipment & Instruments | | 0.8 | |
Auto Components | | 0.6 | |
Life Sciences Tools & Services | | 0.5 | |
Machinery | | 0.5 | |
| | |
|
|
| | | 112.1 | |
Liabilities in excess of other assets | | (12.1 | ) |
| | |
|
|
| | | 100.0 | % |
| | |
|
|
SEE NOTES TO FINANCIAL STATEMENTS.
A105
| | | | | | |
| | | JENNISON PORTFOLIO (continued) | | |
STATEMENT OF ASSETS AND LIABILITIES
December 31, 2009
| | | | |
| ASSETS | | | | |
Investments, at value including securities on loan of $154,627,023: | | | | |
Unaffiliated investments (cost $903,395,059) | | $ | 1,307,224,646 | |
Affiliated investments (cost $171,487,172) | | | 171,487,172 | |
Dividends and interest receivable | | | 1,314,785 | |
Receivable for investments sold | | | 1,097,162 | |
Foreign tax reclaim receivable | | | 406,742 | |
Receivable for Series shares sold | | | 189,650 | |
Prepaid expenses | | | 14,703 | |
| | |
|
|
|
Total Assets | | | 1,481,734,860 | |
| | |
|
|
|
| LIABILITIES | | | | |
Collateral for securities on loan | | | 159,672,410 | |
Payable for investments purchased | | | 1,844,042 | |
Management fee payable | | | 665,444 | |
Payable for Series shares repurchased | | | 367,917 | |
Accrued expenses and other liabilities | | | 175,626 | |
Payable to custodian | | | 28,750 | |
Distribution fee payable | | | 4,167 | |
Administration fee payable | | | 2,500 | |
Affiliated transfer agent fee payable | | | 595 | |
| | |
|
|
|
Total Liabilities | | | 162,761,451 | |
| | |
|
|
|
| NET ASSETS | | $ | 1,318,973,409 | |
| | |
|
|
|
Net assets were comprised of: | | | | |
Paid-in capital | | $ | 1,830,717,015 | |
Retained earnings | | | (511,743,606 | ) |
| | |
|
|
|
Net assets, December 31, 2009 | | $ | 1,318,973,409 | |
| | |
|
|
|
| Class I: | | | | |
Net asset value and redemption price per share, $1,298,738,937/62,215,969 outstanding shares of beneficial interest | | $ | 20.87 | |
| | |
|
|
|
| Class II: | | | | |
Net asset value and redemption price per share, $20,234,472/984,465 outstanding shares of beneficial interest | | $ | 20.55 | |
| | |
|
|
|
STATEMENT OF OPERATIONS
Year Ended December 31, 2009
| | | | |
| INVESTMENT INCOME | | | | |
Unaffiliated dividend income (net of foreign withholding taxes of $407,117) | | $ | 12,972,330 | |
Affiliated income from securities loaned, net | | | 513,433 | |
Affiliated dividend income | | | 76,591 | |
| | |
|
|
|
| | | | 13,562,354 | |
| | |
|
|
|
EXPENSES | | | | |
Management fee | | | 7,543,247 | |
Distribution fee—Class II | | | 38,270 | |
Administration fee—Class II | | | 22,962 | |
Shareholders’ reports | | | 175,000 | |
Custodian’s fees and expenses | | | 160,000 | |
Insurance expenses | | | 30,000 | |
Audit fee | | | 26,000 | |
Trustees’ fees | | | 26,000 | |
Commitment fee on syndicated credit agreement | | | 12,000 | |
Legal fees and expenses | | | 10,000 | |
Transfer agent’s fee and expenses (including affiliated expense of $3,600) (Note 4) | | | 10,000 | |
Loan interest expense (Note 8) | | | 214 | |
Miscellaneous | | | 21,392 | |
| | |
|
|
|
Total expenses | | | 8,075,085 | |
| | |
|
|
|
| NET INVESTMENT INCOME | | | 5,487,269 | |
| | |
|
|
|
| NET REALIZED AND UNREALIZED GAIN (LOSS) ON INVESTMENTS AND FOREIGN CURRENCIES | | | | |
Net realized gain (loss) on: | | | | |
Investment transactions | | | 80,175,176 | |
Foreign currency transactions | | | (179,518 | ) |
| | |
|
|
|
| | | | 79,995,658 | |
| | |
|
|
|
Net change in unrealized appreciation (depreciation) on: | | | | |
Investments | | | 373,410,077 | |
Foreign currencies | | | 1,842 | |
| | |
|
|
|
| | | | 373,411,919 | |
| | |
|
|
|
| NET GAIN ON INVESTMENTS AND FOREIGN CURRENCIES | | | 453,407,577 | |
| | |
|
|
|
| NET INCREASE IN NET ASSETS RESULTING FROM OPERATIONS | | $ | 458,894,846 | |
| | |
|
|
|
STATEMENT OF CHANGES IN NET ASSETS
| | | | | | | | |
| | | Year Ended December 31,
| |
| | | 2009
| | | 2008
| |
| INCREASE (DECREASE) IN NET ASSETS | | | | | | | | |
| OPERATIONS: | | | | | | | | |
Net investment income | | $ | 5,487,269 | | | $ | 8,629,931 | |
Net realized gain (loss) on investments and foreign currencies | | | 79,995,658 | | | | (196,857,449 | ) |
Net change in unrealized appreciation (depreciation) on investments and foreign currencies | | | 373,411,919 | | | | (549,977,705 | ) |
| | |
|
|
| |
|
|
|
NET INCREASE (DECREASE) IN NET ASSETS RESULTING FROM OPERATIONS | | | 458,894,846 | | | | (738,205,223 | ) |
| | |
|
|
| |
|
|
|
| DISTRIBUTIONS: | | | | | | | | |
Class I | | | (8,584,877 | ) | | | (8,646,693 | ) |
Class II | | | (43,518 | ) | | | (11,569 | ) |
| | |
|
|
| |
|
|
|
TOTAL DISTRIBUTIONS | | | (8,628,395 | ) | | | (8,658,262 | ) |
| | |
|
|
| |
|
|
|
| SERIES SHARE TRANSACTIONS (Note 7): | | | | | | | | |
Series shares sold | | | 59,834,121 | | | | 60,259,927 | |
Series shares issued in reinvestment of dividends and distributions | | | 8,628,395 | | | | 8,658,027 | |
Series shares repurchased | | | (359,926,940 | ) | | | (284,240,992 | ) |
| | |
|
|
| |
|
|
|
NET DECREASE IN NET ASSETS RESULTING FROM SERIES SHARE TRANSACTIONS | | | (291,464,424 | ) | | | (215,323,038 | ) |
| | |
|
|
| |
|
|
|
| TOTAL INCREASE (DECREASE) IN NET ASSETS | | | 158,802,027 | | | | (962,186,523 | ) |
| NET ASSETS: | | | | | | | | |
Beginning of year | | | 1,160,171,382 | | | | 2,122,357,905 | |
| | |
|
|
| |
|
|
|
End of year | | $ | 1,318,973,409 | | | $ | 1,160,171,382 | |
| | |
|
|
| |
|
|
|
SEE NOTES TO FINANCIAL STATEMENTS.
A106
| | | | | | |
| | | MONEY MARKET PORTFOLIO | | |
| |
| SCHEDULE OF INVESTMENTS | | December 31, 2009 |
| | | | | | | | | | | | |
| | |
| | Interest
Rate
| | Maturity
Date
| | Principal
Amount
(000)
| | Value
(Note 2)
|
| | | | | | | | | | | | | |
Certficates of Deposit — 30.1% | | | | | | | | | | | | |
Banco Bilbao Vizcaya Argentaria SA | | | | 0.255% | | 04/12/10 | | $ | 4,500 | | $ | 4,499,684 |
Bank of America NA | | | | 0.350% | | 01/28/10 | | | 30,000 | | | 30,000,000 |
Bank of America NA | | | | 0.220% | | 02/16/10 | | | 20,000 | | | 20,000,000 |
Bank of Nova Scotia Houston | | | | 0.210% | | 01/14/10 | | | 35,000 | | | 35,000,000 |
Bank of Tokyo Mitsubishi UFJ Ltd. | | | | 0.250% | | 01/29/10 | | | 55,000 | | | 55,000,000 |
BNP Paribas | | | | 0.240% | | 01/15/10 | | | 55,000 | | | 55,000,000 |
BNP Paribas SA NY | | | | 0.290% | | 03/08/10 | | | 816 | | | 815,985 |
Chase Bank USA NA | | | | 0.190% | | 02/10/10 | | | 25,000 | | | 25,000,000 |
Rabobank NA | | | | 0.310% | | 03/03/10 | | | 510 | | | 510,008 |
Rabobank NA | | | | 0.240% | | 03/16/10 | | | 588 | | | 587,928 |
Rabobank NA | | | | 0.340% | | 03/17/10 | | | 408 | | | 408,034 |
Royal Bank of Scotland PLC(c). | | | | 0.833% | | 01/19/10 | | | 10,000 | | | 10,000,000 |
State Street Bank & Trust Co. | | | | 0.210% | | 01/19/10 | | | 23,000 | | | 23,000,000 |
Sumitomo Mitsui Banking Corp./New York | | | | 0.260% | | 02/01/10 | | | 57,000 | | | 57,000,000 |
UBS AG | | | | 0.660% | | 01/29/10 | | | 50,000 | | | 50,000,000 |
Unicredit SPA | | | | 0.220% | | 01/27/10 | | | 1,176 | | | 1,175,932 |
| | | | | | | | | | | |
|
|
| | | | | | | | | | | | | 367,997,571 |
| | | | | | | | | | | |
|
|
Commercial Paper — 48.9% | | | | | | | | | | | | |
Banco Bilbao Vizcaya Argentaria SA, 144A(a) | | | | 0.250% | | 02/12/10 | | | 8,717 | | | 8,714,457 |
Banco Bilbao Vizcaya Argentaria SA, 144A(a) | | | | 0.300% | | 06/08/10 | | | 9,500 | | | 9,487,492 |
BlackRock, Inc., 144A(a) | | | | 0.200% | | 01/29/10 | | | 14,000 | | | 13,997,822 |
BPCE SA, 144A(a) | | | | 0.270% | | 02/16/10 | | | 61,000 | | | 60,978,955 |
CBA (Delaware) Finance(a) | | | | 0.220% | | 01/06/10 | | | 29,000 | | | 28,999,114 |
DNP Norbank ASA, 144A(a) | | | | 0.300% | | 01/25/10 | | | 1,000 | | | 999,800 |
DNP Norbank ASA, 144A(a) | | | | 0.230% | | 01/29/10 | | | 13,276 | | | 13,273,625 |
E.ON AG, 144A(a) | | | | 0.250% | | 01/12/10 | | | 12,000 | | | 11,999,083 |
GDF Suez, 144A(a) | | | | 0.190% | | 01/13/10 | | | 5,000 | | | 4,999,683 |
HSBC USA, Inc.(a) | | | | 0.225% | | 01/04/10 | | | 31,949 | | | 31,948,401 |
HSBC USA, Inc.(a) | | | | 0.220% | | 01/11/10 | | | 21,227 | | | 21,225,703 |
New York Life Capital Corp., 144A(a) | | | | 0.160% | | 01/15/10 | | | 19,000 | | | 18,998,818 |
Nordea North America(a) | | | | 0.190% | | 02/24/10 | | | 20,000 | | | 19,994,300 |
Old Line Funding LLC, 144A(a) | | | | 0.160% | | 01/15/10 | | | 8,000 | | | 7,999,502 |
Old Line Funding LLC, 144A(a) | | | | 0.180% | | 02/16/10 | | | 5,000 | | | 4,998,850 |
Prudential PLC, 144A(a) | | | | 0.230% | | 01/20/10 | | | 14,000 | | | 13,998,301 |
Royal Bank of Scotland PLC(a) | | | | 0.430% | | 02/05/10 | | | 50,000 | | | 49,979,097 |
Societe Generale North America, Inc.(a) | | | | 0.210% | | 01/19/10 | | | 25,000 | | | 24,997,375 |
Societe Generale North America, Inc.(a) | | | | 0.240% | | 02/05/10 | | | 21,832 | | | 21,826,906 |
Societe Generale North America, Inc.(a) | | | | 0.250% | | 04/01/10 | | | 10,000 | | | 9,993,750 |
State Street Corp.(a) | | | | 0.210% | | 03/01/10 | | | 30,000 | | | 29,989,675 |
Straight-A Funding LLC, 144A(a) | | | | 0.210% | | 01/20/10 | | | 4,000 | | | 3,999,557 |
Straight-A Funding LLC, 144A(a) | | | | 0.200% | | 02/01/10 | | | 13,000 | | | 12,997,761 |
Straight-A Funding LLC, 144A(a) | | | | 0.200% | | 02/08/10 | | | 15,000 | | | 14,996,833 |
Straight-A Funding LLC, 144A(a) | | | | 0.170% | | 02/16/10 | | | 29,000 | | | 28,993,701 |
Swedbank AB, 144A(a) | | | | 0.890% | | 02/10/10 | | | 38,000 | | | 37,962,422 |
Swedbank AB, 144A(a) | | | | 0.850% | | 02/11/10 | | | 12,000 | | | 11,988,383 |
Swedbank AB, 144A(a) | | | | 0.820% | | 02/17/10 | | | 10,000 | | | 9,989,294 |
Total Capital Canada Ltd., 144A(a) | | | | 0.200% | | 01/14/10 | | | 11,000 | | | 10,999,206 |
Total Capital Canada Ltd., 144A(a) | | | | 0.200% | | 01/15/10 | | | 23,000 | | | 22,998,211 |
Toyota Motor Credit Corp.(a) | | | | 0.170% | | 01/13/10 | | | 20,555 | | | 20,553,835 |
Unicredit Delaware, Inc., 144A(a) | | | | 0.320% | | 01/14/10 | | | 8,000 | | | 7,999,076 |
Unicredit Delaware, Inc., 144A(a) | | | | 0.330% | | 01/19/10 | | | 6,000 | | | 5,999,010 |
| | | | | | | | | | | |
|
|
| | | | | | | | | | | | | 598,877,998 |
| | | | | | | | | | | |
|
|
Other Corporate Obligations — 11.9% | | | | | | | | | | | | |
Bank of America NA, FDIC Gtd. Notes(c) | | | | 0.331% | | 01/29/10 | | | 30,000 | | | 30,000,000 |
Barclays Bank PLC NY(c) | | | | 0.482% | | 03/17/10 | | | 41,000 | | | 41,000,000 |
SEE NOTES TO FINANCIAL STATEMENTS.
A107
| | | | | | |
| | | MONEY MARKET PORTFOLIO (continued) | | |
| |
| SCHEDULE OF INVESTMENTS | | December 31, 2009 |
| | | | | | | | | | | | | |
| | |
| | Interest
Rate
| | Maturity
Date
| | Principal
Amount
(000)
| | Value
(Note 2)
| |
| | | | | | | | | | | | | | |
Other Corporate Obligations (continued) | | | | | | | | | | | | | |
Citigroup Funding, Inc., FDIC Gtd. Notes, M.T.N.(c) | | | | 0.381% | | 01/29/10 | | $ | 25,000 | | $ | 25,000,000 | |
Goldman Sachs Group, Inc., M.T.N.(b) | | | | 0.400% | | 02/03/10 | | | 50,000 | | | 50,000,000 | |
| | | | | | | | | | | |
|
|
|
| | | | | | | | | | | | | 146,000,000 | |
| | | | | | | | | | | |
|
|
|
U.S. Government Agencies — 7.4% | | | | | | | | | | | | | |
Federal Home Loan Mortgage Corp.(c) | | | | 0.242% | | 02/24/10 | | | 60,000 | | | 59,992,402 | |
Federal National Mortgage Association(c) | | | | 0.228% | | 02/05/10 | | | 30,000 | | | 29,993,840 | |
| | | | | | | | | | | |
|
|
|
| | | | | | | | | | | | | 89,986,242 | |
| | | | | | | | | | | |
|
|
|
U.S. Treasury Security — 1.7% | | | | | | | | | | | | | |
U.S. Treasury Bill(a) | | | | 0.430% | | 12/16/10 | | | 21,143 | | | 21,054,863 | |
| | | | | | | | | | | |
|
|
|
TOTAL INVESTMENTS — 100.0%
(amortized cost $1,223,916,674) | | | 1,223,916,674 | |
LIABILITIES IN EXCESS OF OTHER ASSETS | | | (539,368 | ) |
| | | | | | | | | | | |
|
|
|
NET ASSETS — 100.0% | | $ | 1,223,377,306 | |
| | | | | | | | | | | |
|
|
|
The following abbreviations are used in portfolio descriptions:
| | |
| 144A | | Security was purchased pursuant to Rule 144A under the Securities Act of 1933 and may not be resold subject to that rule except to qualified institutional buyers. Unless otherwise noted, 144A securities are deemed to be liquid. |
| FDIC | | Federal Deposit Insurance Corporation |
| M.T.N. | | Medium Term Note |
| (a) | Rate quoted represents yield-to-maturity as of purchase date. |
| (b) | Indicates a security that has been deemed illiquid. |
| (c) | Indicates a variable rate security. The maturity date presented for these instruments is the later of the next date on which the security can be redeemed at par or the next date on which the rate of interest is adjusted. The interest rate shown reflects the rate in effect at December 31, 2009. |
Various inputs are used in determining the value of the Portfolio’s investments. These inputs are summarized in the three broad levels listed below.
Level 1—quoted prices in active markets for identical securities
Level 2—other significant observable inputs (including quoted prices for similar securities, interest rates, prepayment speeds, credit risk, etc.)
Level 3—significant unobservable inputs (including the Portfolio’s own assumptions in determining the fair value of investments)
The following is a summary of the inputs used as of December 31, 2009 in valuing the Portfolio’s assets carried at fair value:
| | | | | | | | | |
| | | Level 1
| | Level 2
| | Level 3
|
Investments in Securities | | | | | | |
Certificates of Deposit | | $ | — | | $ | 367,997,571 | | $ | — |
Commerical Paper | | | — | | | 598,877,998 | | | — |
Other Corporate Obligations | | | — | | | 146,000,000 | | | — |
U.S. Government Agencies | | | — | | | 89,986,242 | | | — |
U.S. Treasury Security | | | — | | | 21,054,863 | | | — |
| | |
|
| |
|
| |
|
|
| | | | — | | | 1,223,916,674 | | | — |
Other Financial Instruments* | | | — | | | — | | | — |
| | |
|
| |
|
| |
|
|
Total | | $ | — | | $ | 1,223,916,674 | | $ | — |
| | |
|
| |
|
| |
|
|
| * | Other financial instruments are derivative instruments not reflected in the Schedule of Investments, such as futures, forwards and swap contracts, which are valued at the unrealized appreciation/depreciation on the instrument. |
As of December 31, 2009 and 2008, the Portfolio did not use any significant unobservable inputs (Level 3) in determining the value of investments.
SEE NOTES TO FINANCIAL STATEMENTS.
A108
| | | | | | |
| | | MONEY MARKET PORTFOLIO (continued) | | |
| |
| SCHEDULE OF INVESTMENTS | | December 31, 2009 |
The industry classification of portfolio holdings and liabilities in excess of other assets shown as a percentage of net assets as of December 31, 2009 was as follows:
| | | |
Commercial Paper | | 48.9 | % |
Certificates of Deposit | | 30.1 | |
Other Corporate Obligations | | 11.9 | |
U.S. Government Agencies | | 7.4 | |
U.S. Treasury Security | | 1.7 | |
| | |
|
|
| | | 100.0 | % |
| | |
|
|
SEE NOTES TO FINANCIAL STATEMENTS.
A109
| | | | | | |
| | | MONEY MARKET PORTFOLIO (continued) | | |
STATEMENT OF ASSETS AND LIABILITIES
December 31, 2009
| | | |
| ASSETS | | | |
Investments, at value (amortized cost of $1,223,916,674) | | $ | 1,223,916,674 |
Cash | | | 13,447 |
Interest receivable | | | 371,732 |
Receivable for Series shares sold | | | 52,806 |
Prepaid expenses | | | 15,653 |
| | |
|
|
Total Assets | | | 1,224,370,312 |
| | |
|
|
| LIABILITIES | | | |
Payable for Series shares repurchased | | | 594,237 |
Management fee payable | | | 255,862 |
Accrued expenses and other liabilities | | | 142,312 |
Affiliated transfer agent fee payable | | | 595 |
| | |
|
|
Total Liabilities | | | 993,006 |
| | |
|
|
| NET ASSETS | | $ | 1,223,377,306 |
| | |
|
|
Net assets were comprised of: | | | |
Paid-in capital | | $ | 1,223,377,306 |
| | |
|
|
Net assets, December 31, 2009 | | $ | 1,223,377,306 |
| | |
|
|
Net asset value and redemption price per share, $1,223,377,306 / 122,337,727 outstanding shares of beneficial interest | | $ | 10.00 |
| | |
|
|
STATEMENT OF OPERATIONS
Year Ended December 31, 2009
| | | | |
| INVESTMENT INCOME | | | | |
Interest | | $ | 10,939,034 | |
| | |
|
|
|
| EXPENSES | | | | |
Management fee | | | 5,467,308 | |
Custodian’s fees and expenses | | | 150,000 | |
Shareholders’ reports | | | 141,000 | |
Trustees’ fees | | | 29,000 | |
Insurance expenses | | | 24,000 | |
Audit fee | | | 16,000 | |
Legal fees and expenses | | | 14,000 | |
Transfer agent’s fee and expenses (including affiliated expense of $3,600) (Note 4) | | | 9,000 | |
Miscellaneous | | | 13,099 | |
| | |
|
|
|
Total expenses | | | 5,863,407 | |
Less: Management fee waiver (Note 3) | | | (476,147 | ) |
| | |
|
|
|
Net expenses | | | 5,387,260 | |
| | |
|
|
|
| NET INVESTMENT INCOME | | | 5,551,774 | |
| | |
|
|
|
| NET REALIZED GAIN ON INVESTMENT TRANSACTIONS | | | 87,871 | |
| | |
|
|
|
| NET INCREASE IN NET ASSETS RESULTING FROM OPERATIONS | | $ | 5,639,645 | |
| | |
|
|
|
STATEMENT OF CHANGES IN NET ASSETS
| | | | | | | | |
| | | Year Ended December 31,
| |
| | | 2009
| | | 2008
| |
| INCREASE (DECREASE) IN NET ASSETS | | | | | | | | |
| OPERATIONS: | | | | | | | | |
Net investment income | | $ | 5,551,774 | | | $ | 35,884,366 | |
Net realized gain on investments transactions | | | 87,871 | | | | 74,311 | |
| | |
|
|
| |
|
|
|
NET INCREASE IN NET ASSETS RESULTING FROM OPERATIONS | | | 5,639,645 | | | | 35,958,677 | |
| | |
|
|
| |
|
|
|
| DISTRIBUTIONS | | | (5,639,645 | ) | | | (35,958,677 | ) |
| | |
|
|
| |
|
|
|
| SERIES SHARE TRANSACTIONS: | | | | | | | | |
Series shares sold [28,709,615 and 41,282,769 shares, respectively] | | | 287,096,151 | | | | 412,827,618 | |
Series shares issued in reinvestment of dividends and distributions [563,962 and 3,595,860 shares, respectively] | | | 5,639,645 | | | | 35,958,677 | |
Series shares repurchased [55,911,624 and 24,895,819 shares, respectively] | | | (559,116,243 | ) | | | (248,958,192 | ) |
| | |
|
|
| |
|
|
|
NET INCREASE (DECREASE) IN NET ASSETS RESULTING FROM SERIES SHARE TRANSACTIONS | | | (266,380,447 | ) | | | 199,828,103 | |
| | |
|
|
| |
|
|
|
| TOTAL INCREASE (DECREASE) IN NET ASSETS | | | (266,380,447 | ) | | | 199,828,103 | |
| NET ASSETS: | | | | | | | | |
Beginning of year | | | 1,489,757,753 | | | | 1,289,929,650 | |
| | |
|
|
| |
|
|
|
End of year | | $ | 1,223,377,306 | | | $ | 1,489,757,753 | |
| | |
|
|
| |
|
|
|
SEE NOTES TO FINANCIAL STATEMENTS.
A110
| | | | | | |
| | | NATURAL RESOURCES PORTFOLIO | | |
| |
| SCHEDULE OF INVESTMENTS | | December 31, 2009 |
| | | | | |
| LONG-TERM INVESTMENTS — 97.7% |
| COMMON STOCKS — 97.7% | | Shares
| | Value
(Note 2)
|
| | | | | | |
Chemicals — 0.5% | | | | | |
Potash Corp. of Saskatchewan, Inc. | | 60,100 | | $ | 6,520,850 |
| | | | |
|
|
Electrical Equipment — 0.5% | | | | | |
Yingli Green Energy Holding Co. Ltd., (China), ADR(a)(b) | | 347,100 | | | 5,487,651 |
| | | | |
|
|
Energy Equipment & Services — 15.3% | | | |
Cameron International Corp.(b) | | 457,500 | | | 19,123,500 |
Dresser-Rand Group, Inc.(b) | | 264,700 | | | 8,367,167 |
DRIL-QUIP, Inc.(a)(b) | | 375,600 | | | 21,213,888 |
FMC Technologies, Inc.(b) | | 199,600 | | | 11,544,864 |
Halliburton Co. | | 778,000 | | | 23,410,020 |
Helmerich & Payne, Inc. | | 231,900 | | | 9,248,172 |
Integra Group Holdings, GDR(b) | | 1,236,950 | | | 3,710,850 |
National-Oilwell Varco, Inc. | | 389,500 | | | 17,173,055 |
Noble Corp. | | 416,400 | | | 16,947,480 |
Schlumberger Ltd. | | 235,300 | | | 15,315,677 |
Superior Energy Services, Inc.(a)(b) | | 371,900 | | | 9,033,451 |
Tenaris SA (Luxembourg), ADR(a) | | 302,000 | | | 12,880,300 |
Weatherford International Ltd.(b) | | 665,500 | | | 11,919,105 |
| | | | |
|
|
| | | | | | 179,887,529 |
| | | | |
|
|
Food Products — 1.1% | | | | | |
Agrenco Ltd. (Brazil), 144A(b) | | 1,166,700 | | | 1,909,877 |
Cosan Ltd. (Class A Stock)(b) | | 1,216,000 | | | 10,579,200 |
| | | | |
|
|
| | | | | | 12,489,077 |
| | | | |
|
|
Gas Utilities — 1.0% | | | | | |
EQT Corp., | | 281,600 | | | 12,367,872 |
| | | | |
|
|
Independent Power Producers & Energy Traders — 0.6% |
NRG Energy, Inc.(b) | | 320,000 | | | 7,555,200 |
| | | | |
|
|
Metals & Mining — 33.2% | | | | | |
African Rainbow Minerals Ltd. (South Africa) | | 502,250 | | | 11,770,846 |
Agnico-Eagle Mines Ltd. | | 176,200 | | | 9,514,800 |
Alcoa, Inc. | | 362,800 | | | 5,848,336 |
AXMIN, Inc. (Canada)(b) | | 4,139,800 | | | 336,456 |
BHP Billiton Ltd. (Australia), ADR(a) | | 182,600 | | | 13,983,508 |
Century Aluminum Co.(b) | | 535,800 | | | 8,674,602 |
Cia de Minas Buenaventura SA (Peru), ADR | | 572,100 | | | 19,148,187 |
Cliffs Natural Resources, Inc. | | 352,800 | | | 16,260,552 |
Eldorado Gold Corp. (Canada)(b) | | 1,400,000 | | | 19,972,271 |
European Goldfields Ltd. (Canada)(b) | | 1,402,700 | | | 8,154,531 |
First Quantum Minerals Ltd. (Canada) | | 216,900 | | | 16,645,211 |
First Uranium Corp. (South Africa), 144A(b) | | 400,000 | | | 879,667 |
First Uranium Corp. (South Africa)(b) | | 368,400 | | | 810,174 |
FNX Mining Co., Inc. (Canada), 144A(b) | | 56,300 | | | 622,296 |
FNX Mining Co., Inc. (Canada)(b) | | 331,000 | | | 3,658,613 |
Freeport-McMoRan Copper & Gold, Inc.(b) | | 323,519 | | | 25,975,340 |
Fronteer Development Group, Inc.(b) | | 700,800 | | | 2,754,144 |
Gabriel Resources Ltd. (Canada)(b) | | 1,691,900 | | | 7,069,468 |
Gold Reserve, Inc.(b) | | 124,300 | | | 136,678 |
| | | | | |
COMMON STOCKS
(continued) | | Shares
| | Value
(Note 2)
|
| | | | | | |
Metals & Mining (continued) | | | | | |
Gold Reserve, Inc.(b) | | 561,900 | | $ | 612,471 |
Goldcorp, Inc. | | 377,477 | | | 14,849,945 |
Hecla Mining Co.(a)(b) | | 1,388,500 | | | 8,580,930 |
Highland Gold Mining Ltd. (United Kingdom)(b) | | 408,300 | | | 594,131 |
Impala Platinum Holdings Ltd. (South Africa), ADR | | 450,100 | | | 12,287,730 |
Kinross Gold Corp. | | 791,000 | | | 14,554,400 |
Lihir Gold Ltd. (Papua New Guinea), ADR | | 421,200 | | | 12,294,828 |
MMX Mineracao e Metalicos SA (Brazil)(b) | | 779,000 | | | 5,525,933 |
Nevsun Resources Ltd. (Canada)(b) | | 1,643,700 | | | 3,976,250 |
Newcrest Mining Ltd. (Australia) | | 474,478 | | | 15,028,933 |
Newmont Mining Corp. | | 293,900 | | | 13,904,409 |
Northern Dynasty Minerals Ltd.(b) | | 820,300 | | | 6,783,881 |
Pan American Silver Corp.(b) | | 386,800 | | | 9,209,708 |
Pan American Silver Corp. (Canada)(b) | | 120,258 | | | 2,881,547 |
Platmin Ltd. (South Africa), 144A(b)(c) | | 276,900 | | | 349,484 |
Randgold Resources Ltd. (Jersey Islands), ADR(a) | | 165,200 | | | 13,070,624 |
Rio Tinto PLC (United Kingdom), ADR | | 56,000 | | | 12,061,840 |
Seabridge Gold, Inc.(a)(b) | | 204,900 | | | 4,972,923 |
SEMAFO, Inc. (Canada), 144A(b)(c) | | 2,385,200 | | | 10,103,204 |
Silver Wheaton Corp.(b) | | 672,300 | | | 10,097,946 |
Southern Copper Corp.(a) | | 202,800 | | | 6,674,148 |
Sterlite Industries India Ltd. (India), ADR(a) | | 919,700 | | | 16,756,934 |
Vale SA (Brazil), ADR(a) | | 645,700 | | | 18,744,671 |
Western Areas NL (Australia)(b) | | 590,900 | | | 2,641,122 |
| | | | |
|
|
| | | | | | 388,773,672 |
| | | | |
|
|
Oil, Gas & Consumable Fuels — 44.6% | | | |
Advantage Oil & Gas Ltd. (Canada) | | 407,900 | | | 2,691,122 |
Advantage Oil & Gas Ltd. (Canada) | | 145,300 | | | 958,617 |
Alpha Natural Resources, Inc.(a)(b) | | 279,600 | | | 12,129,048 |
Anadarko Petroleum Corp., | | 241,900 | | | 15,099,398 |
Apache Corp. | | 206,800 | | | 21,335,556 |
Atlas Energy, Inc. | | 298,100 | | | 8,993,677 |
BG Group PLC (United Kingdom) | | 1,057,500 | | | 19,094,484 |
BPI Energy Holdings, Inc.(b) | | 2,800,000 | | | 30,800 |
Cabot Oil & Gas Corp. | | 429,800 | | | 18,734,982 |
Cairn Energy PLC (United Kingdom)(b) | | 3,069,000 | | | 16,429,223 |
Cameco Corp. (Canada) | | 425,200 | | | 13,794,556 |
Canadian Natural Resources Ltd. | | 189,700 | | | 13,648,915 |
Cobalt International Energy, Inc.(b) | | 508,200 | | | 7,033,488 |
Concho Resources, Inc.(b) | | 410,200 | | | 18,417,980 |
EOG Resources, Inc., | | 167,900 | | | 16,336,670 |
Forest Oil Corp.(a)(b) | | 60,200 | | | 1,339,450 |
Hess Corp. | | 122,500 | | | 7,411,250 |
Linc Energy Ltd. (Australia), 144A(b)(c) | | 2,820,000 | | | 4,015,587 |
Newfield Exploration Co.,(b) | | 300,600 | | | 14,497,938 |
Noble Energy, Inc. | | 223,200 | | | 15,896,304 |
SEE NOTES TO FINANCIAL STATEMENTS.
A111
| | | | | | |
| | | NATURAL RESOURCES PORTFOLIO (continued) | | |
| |
| SCHEDULE OF INVESTMENTS | | December 31, 2009 |
| | | | | |
COMMON STOCKS
(continued) | | Shares
| | Value
(Note 2)
|
| | | | | | |
Oil, Gas & Consumable Fuels (continued) | | | |
Occidental Petroleum Corp. | | 309,200 | | $ | 25,153,420 |
OGX Petroleo e Gas Participacoes SA (Brazil) | | 2,021,300 | | | 19,853,090 |
Oil Search Ltd. (Papua New Guinea) | | 1,737,314 | | | 9,525,269 |
OPTI Canada, Inc. (Canada)(b) | | 564,348 | | | 1,095,402 |
Pacific Rubiales Energy Corp. (Canada)(b) | | 1,377,400 | | | 20,347,880 |
Petrohawk Energy Corp.(b) | | 553,700 | | | 13,283,263 |
Petroleo Brasileiro SA (Brazil), ADR | | 426,600 | | | 20,340,288 |
Range Resources Corp. | | 315,450 | | | 15,725,182 |
Reliance Industries Ltd. (India), GDR, 144A | | 260,000 | | | 12,090,000 |
SandRidge Energy, Inc.(a)(b) | | 746,100 | | | 7,035,723 |
Sasol Ltd. (South Africa), ADR(a) | | 407,000 | | | 16,255,580 |
Southwestern Energy Co.(b) | | 654,600 | | | 31,551,720 |
Suncor Energy, Inc. | | 298,700 | | | 10,547,097 |
Sunoco, Inc. | | 339,600 | | | 8,863,560 |
Talisman Energy, Inc. | | 999,400 | | | 18,628,816 |
Trident Resources Corp. (Canada), Private Placement (original cost $4,402,178; purchased 12/04/03)(b)(c)(d)(e) | | 412,657 | | | — |
Ultra Petroleum Corp.(b) | | 350,100 | | | 17,455,986 |
UTS Energy Corp. (Canada)(b) | | 899,600 | | | 1,961,168 |
Whiting Petroleum Corp.(b) | | 147,500 | | | 10,538,875 |
Woodside Petroleum Ltd. (Australia) | | 392,569 | | | 16,555,434 |
XTO Energy, Inc. | | 251,025 | | | 11,680,193 |
Zodiac Exploration Corp. (Canada), Private Placement (original cost $3,757,486; purchased 8/08/08)(b)(c)(d) | | 8,000,000 | | | 6,058,238 |
| | | | |
|
|
| | | | | | 522,435,229 |
| | | | |
|
|
Transportation Infrastructure — 0.9% | | | |
LLX Logistica SA (Brazil)(b) | | 1,801,962 | | | 10,464,007 |
| | | | |
|
|
TOTAL COMMON STOCKS
(cost $792,811,787) | | | 1,145,981,087 |
| | | | |
|
|
| | |
| | | Principal
Amount
(000)#
| | |
| CORPORATE BOND | | | | | |
Oil, Gas & Consumable Fuels | | | | | |
Trident Resources Corp. (Canada), Private Placement, due 8/12/12
(cost $16,937,913; purchased 8/20/07-8/31/09)(b)(c)(d)(e) | | CAD 18,026 | | | — |
| | | | |
|
|
| | |
| | | Units
| | |
| WARRANTS(b) | | | | | |
Metals & Mining | | | | | |
Crystallex International Corp. Warrant (Canada), Private Placement, expiring 8/11/09 (original cost $0; purchased 2/08/08)(c)(d) | | 221,350 | | | — |
| | | | |
|
|
| | | | | | |
WARRANTS(b)
(continued) | | Units
| | Value
(Note 2)
| |
| | | | | | | |
Oil, Gas & Consumable Fuels | | | | |
Trident Resources Corp. (Canada), Private Placement, expiring 1/1/15 (original cost $0; purchased 8/20/07)(c)(d)(e) | | 1,455,868 | | $ | — | |
Zodiac Exploration Corp. (Canada), Private Placement, expiring 2/10/12 (original cost $0; purchased 8/08/08)(c)(d) | | 8,000,000 | | | — | (f) |
| | | | |
|
|
|
| | | | | | — | |
| | | | |
|
|
|
TOTAL WARRANTS
(cost $0) | | | — | |
| | | | |
|
|
|
TOTAL LONG-TERM INVESTMENTS
(cost $809,749,700) | | | 1,145,981,087 | |
| | | | |
|
|
|
| | |
| | | Shares
| | | |
| SHORT-TERM INVESTMENT — 11.0% | |
Affiliated Money Market Mutual Fund | | | | |
Dryden Core Investment Fund — Taxable Money Market Series (cost $128,426,521; includes $101,825,271 of cash collateral received for securities on loan)(Note 4)(g)(h) | | 128,426,521 | | | 128,426,521 | |
| | | | |
|
|
|
TOTAL INVESTMENTS (i) — 108.7%
(cost $938,176,221) | | | 1,274,407,608 | |
| | | | |
|
|
|
LIABILITIES IN EXCESS OF
OTHER ASSETS — (8.7)% | | | (102,267,738 | ) |
| | | | |
|
|
|
NET ASSETS — 100.0% | | $ | 1,172,139,870 | |
| | | | |
|
|
|
The following abbreviations are used in portfolio descriptions:
| | |
| 144A | | Security was purchased pursuant to Rule 144A under the Securities Act of 1933 and may not be resold subject to that rule except to qualified institutional buyers. Unless otherwise noted, 144A securities are deemed to be liquid. |
| ADR | | American Depositary Receipt |
| CAD | | Canadian Dollar |
| GDR | | Global Depositary Receipt |
| # | Principal amount shown in U.S. dollars unless otherwise stated. |
| (a) | All or a portion of security is on loan. The aggregate market value of such securities is $98,567,498; cash collateral of $101,825,271 (included in liabilities) was received with which the Portfolio purchased highly liquid short-term investments. |
| (b) | Non-income producing security. |
| (c) | Indicates illiquid securities . |
| (d) | Indicates a security restricted to resale; The aggregate cost of such securities is $25,097,577. The aggregate value of $6,058,238 is approximately 0.5% of net assets. |
| (e) | The issuer has filed for bankruptcy, and has defaulted in the payment of interest on the debt instrument. The security has been fair valued at zero. |
| (g) | Represents security, or a portion thereof, purchased with cash collateral received for securities on loan. |
SEE NOTES TO FINANCIAL STATEMENTS.
A112
| | | | | | |
| | | NATURAL RESOURCES PORTFOLIO (continued) | | |
| |
| SCHEDULE OF INVESTMENTS | | December 31, 2009 |
| (h) | Prudential Investments LLC, the manager of the Portfolio, also serves as manager of the Dryden Core Investment Fund-Taxable Money Market Series. |
| (i) | As of December 31, 2009, 15 securities representing $101,713,266 and 8.7% of the net assets were fair valued in accordance with the policies adopted by the Board of Trustees. |
Various inputs are used in determining the value of the Portfolio’s investments. These inputs are summarized in the three broad levels listed below.
Level 1—quoted prices in active markets for identical securities
Level 2—other significant observable inputs (including quoted prices for similar securities, interest rates, prepayment speeds, credit risk, etc.)
Level 3—significant unobservable inputs (including the Portfolio’s own assumptions in determining the fair value of investments)
The following is a summary of the inputs used as of December 31, 2009 in valuing the Portfolio’s assets carried at fair value:
| | | | | | | | | | |
| | | Level 1
| | Level 2
| | Level 3
| |
Investments in Securities | | | | | | | | | | |
Common Stocks | | $ | 1,044,267,821 | | $ | 95,655,028 | | $ | 6,058,238 | |
Corporate Bond | | | — | | | — | | | — | |
Warrants | | | — | | | — | | | — | (a) |
Affiliated Money Market Mutual Fund | | | 128,426,521 | | | — | | | — | |
| | |
|
| |
|
| |
|
|
|
| | | | 1,172,694,342 | | | 95,655,028 | | | 6,058,238 | |
Other Financial Instruments* | | | — | | | — | | | — | |
| | |
|
| |
|
| |
|
|
|
Total | | $ | 1,172,694,342 | | $ | 95,655,028 | | $ | 6,058,238 | |
| | |
|
| |
|
| |
|
|
|
| * | Other financial instruments are derivative instruments not reflected in the Schedule of Investments, such as futures, forwards and swap contracts, which are valued at the unrealized appreciation/depreciation on the instrument. |
The following is a reconciliation of assets in which significant unobservable inputs (Level 3) were used in determining fair value:
| | | | | | | | | | | |
| | | Common
Stocks
| | Corporate
Bond
| | | Warrants
| |
Balance as of 12/31/08 | | $ | 4,865,491 | | $ | 4,671,234 | | | $ | 119 | |
Realized gain (loss) | | | — | | | — | | | | — | |
Change in unrealized appreciation (depreciation) | | | 1,192,747 | | | (5,371,532 | ) | | | (119 | ) |
Earned amortization/accretion | | | — | | | 13,722 | | | | — | |
Net purchases (sales) | | | — | | | 686,576 | | | | — | |
Transfers in and/or out of Level 3 | | | — | | | — | | | | — | |
| | |
|
| |
|
|
| |
|
|
|
Balance as of 12/31/09 | | $ | 6,058,238 | | $ | — | | | $ | — | (a) |
| | |
|
| |
|
|
| |
|
|
|
The industry classification of portfolio holdings and liabilities in excess of other assets shown as a percentage of net assets as of December 31, 2009 was as follows:
| | | |
Oil, Gas & Consumable Fuels | | 44.6 | % |
Metals & Mining | | 33.2 | |
Energy Equipment & Services | | 15.3 | |
Affiliated Money Market Mutual Fund (including 8.7% of collateral received for securities on loan) | | 11.0 | |
Food Products | | 1.1 | |
Gas Utilities | | 1.0 | |
Transportation Infrastructure | | 0.9 | |
Independent Power Producers & Energy Traders | | 0.6 | |
Chemicals | | 0.5 | |
Electrical Equipment | | 0.5 | |
| | |
|
|
| | | 108.7 | |
Liabilities in excess of other assets | | (8.7 | ) |
| | |
|
|
| | | 100.0 | % |
| | |
|
|
SEE NOTES TO FINANCIAL STATEMENTS.
A113
| | | | | | |
| | | NATURAL RESOURCES PORTFOLIO (continued) | | |
| |
| SCHEDULE OF INVESTMENTS | | December 31, 2009 |
The Portfolio invested in derivative instruments during the reporting period. The primary types of risk associated with derivative instruments are commodity risk, credit risk, equity risk, foreign exchange risk and interest rate risk. The effect of such derivative instruments on the Portfolio’s financial position and financial performance as reflected in the Statement of Assets and Liabilities and Statement of Operations is presented in the summary below.
Fair values of derivative Instruments as of December 31, 2009 as presented in the Statement of Assets and Liabilities:
| | | | | | | | | | | |
Derivatives not designated as
hedging instruments, carried at
fair value
| | Asset Derivatives
| | | Liability Derivatives
|
| | Balance Sheet Location
| | Fair
Value
| | | Balance Sheet Location
| | Fair
Value
|
Equity contracts | | Unaffiliated investments | | $ | — | * | | — | | $ | — |
| | | | |
|
|
| | | |
|
|
The effects of derivative instruments on the Statement of Operations for the year ended December 31, 2009 are as follows:
For the year ended December 31, 2009, the Portfolio did not have any realized gain or (loss) on derivatives recognized in income.
| | | | |
Change in Unrealized Appreciation or (Depreciation) on Derivatives Recognized in Income
| |
Derivatives not designated as hedging
instruments, carried at fair value
| | Warrants
| |
Equity contracts | | $ | (119 | ) |
| | |
|
|
|
SEE NOTES TO FINANCIAL STATEMENTS.
A114
| | | | | | |
| | | NATURAL RESOURCES PORTFOLIO (continued) | | |
STATEMENT OF ASSETS AND LIABILITIES
December 31, 2009
| | | |
| ASSETS | | | |
Investments, at value, including securities on loan of $98,567,498: | | | |
Unaffiliated investments (cost $809,749,700) | | $ | 1,145,981,087 |
Affiliated investments (cost $128,426,521) | | | 128,426,521 |
Cash | | | 112,000 |
Receivable for investments sold | | | 7,497,275 |
Dividends and interest receivable | | | 443,812 |
Foreign tax reclaim receivable | | | 70,516 |
Receivable for Series shares sold | | | 34,557 |
Prepaid expenses | | | 10,753 |
| | |
|
|
Total Assets | | | 1,282,576,521 |
| | |
|
|
| LIABILITIES | | | |
Collateral for securities on loan | | | 101,825,271 |
Payable for investments purchased | | | 7,476,451 |
Management fee payable | | | 439,712 |
Accrued expenses and other liabilities | | | 362,479 |
Payable for Series shares repurchased | | | 285,375 |
Distribution fee payable | | | 19,161 |
Payable to custodian | | | 16,111 |
Administration fee payable | | | 11,496 |
Affiliated transfer agent fee payable | | | 595 |
| | |
|
|
Total Liabilities | | | 110,436,651 |
| | |
|
|
| NET ASSETS | | $ | 1,172,139,870 |
| | |
|
|
Net assets were comprised of: | | | |
Paid-in capital | | $ | 920,408,938 |
Retained earnings | | | 251,730,932 |
| | |
|
|
Net assets, December 31, 2009 | | $ | 1,172,139,870 |
| | |
|
|
| Class I: | | | |
Net asset value and redemption price per share, $1,079,560,810 / 29,060,859 outstanding shares of beneficial interest | | $ | 37.15 |
| | |
|
|
| Class II: | | | |
Net asset value and redemption price per share, $92,579,060 / 2,510,505 outstanding shares of beneficial interest | | $ | 36.88 |
| | |
|
|
STATEMENT OF OPERATIONS
Year Ended December 31, 2009
| | | | |
| INVESTMENT INCOME | | | | |
Unaffiliated dividend income (net of foreign withholding taxes of $110,891) | | $ | 8,406,237 | |
Affiliated income from securities loaned, net | | | 688,293 | |
Interest | | | 686,300 | |
Affiliated dividend income | | | 41,755 | |
| | |
|
|
|
| | | | 9,822,585 | |
| | |
|
|
|
| EXPENSES | | | | |
Management fee | | | 4,251,565 | |
Distribution fee—Class II | | | 162,712 | |
Administration fee—Class II | | | 97,629 | |
Shareholders’ reports | | | 358,000 | |
Custodian’s fees and expenses | | | 245,000 | |
Transfer agent’s fee and expenses (including affiliated expense of $3,600) (Note 4) | | | 60,000 | |
Insurance expenses | | | 30,000 | |
Trustees’ fees | | | 18,000 | |
Audit fee | | | 17,000 | |
Legal fees and expenses | | | 16,000 | |
Commitment fee on syndicated credit agreement | | | 8,000 | |
Loan interest expense (Note 8) | | | 4,458 | |
Miscellaneous | | | 14,739 | |
| | |
|
|
|
Total expenses | | | 5,283,103 | |
| | |
|
|
|
| NET INVESTMENT INCOME | | | 4,539,482 | |
| | |
|
|
|
| NET REALIZED AND UNREALIZED GAIN (LOSS) ON INVESTMENTS AND FOREIGN CURRENCIES | | | | |
Net realized gain (loss) on: | | | | |
Investment transactions | | | (66,424,054 | ) |
Foreign currency transactions | | | (286,297 | ) |
| | |
|
|
|
| | | | (66,710,351 | ) |
| | |
|
|
|
Net change in unrealized appreciation (depreciation) on: | | | | |
Investments | | | 594,997,750 | |
Foreign currencies | | | 556 | |
| | |
|
|
|
| | | | 594,998,306 | |
| | |
|
|
|
| NET GAIN ON INVESTMENTS AND FOREIGN CURRENCIES | | | 528,287,955 | |
| | |
|
|
|
| NET INCREASE IN NET ASSETS RESULTING FROM OPERATIONS | | $ | 532,827,437 | |
| | |
|
|
|
STATEMENT OF CHANGES IN NET ASSETS
| | | | | | | | |
| | | Year Ended December 31,
| |
| | | 2009
| | | 2008
| |
| INCREASE (DECREASE) IN NET ASSETS | | | | | | | | |
| OPERATIONS: | | | | | | | | |
Net investment income | | $ | 4,539,482 | | | $ | 6,543,833 | |
Net realized gain (loss) on investments and foreign currency transactions | | | (66,710,351 | ) | | | 112,828,745 | |
Net change in unrealized appreciation (depreciation) on investments and foreign currencies | | | 594,998,306 | | | | (971,071,300 | ) |
| | |
|
|
| |
|
|
|
NET INCREASE (DECREASE) IN NET ASSETS RESULTING FROM OPERATIONS | | | 532,827,437 | | | | (851,698,722 | ) |
| | |
|
|
| |
|
|
|
| DISTRIBUTIONS: | | | | | | | | |
Class I | | | (111,232,160 | ) | | | (195,367,433 | ) |
Class II | | | (8,100,142 | ) | | | (8,068,760 | ) |
| | |
|
|
| |
|
|
|
TOTAL DISTRIBUTIONS | | | (119,332,302 | ) | | | (203,436,193 | ) |
| | |
|
|
| |
|
|
|
| SERIES SHARE TRANSACTIONS (Note 7): | | | | | | | | |
Series shares sold | | | 70,044,110 | | | | 121,940,234 | |
Series shares issued in reinvestment of dividends and distributions | | | 119,332,302 | | | | 203,436,193 | |
Series shares repurchased | | | (150,451,214 | ) | | | (268,319,139 | ) |
| | |
|
|
| |
|
|
|
NET INCREASE IN NET ASSETS RESULTING FROM SERIES SHARE TRANSACTIONS | | | 38,925,198 | | | | 57,057,288 | |
| | |
|
|
| |
|
|
|
| TOTAL INCREASE (DECREASE) IN NET ASSETS | | | 452,420,333 | | | | (998,077,627 | ) |
| NET ASSETS: | | | | | | | | |
Beginning of year | | | 719,719,537 | | | | 1,717,797,164 | |
| | |
|
|
| |
|
|
|
End of year | | $ | 1,172,139,870 | | | $ | 719,719,537 | |
| | |
|
|
| |
|
|
|
SEE NOTES TO FINANCIAL STATEMENTS.
A115
| | | | | | |
| | | SMALL CAPITALIZATION STOCK PORTFOLIO | | |
| |
| SCHEDULE OF INVESTMENTS | | December 31, 2009 |
| | | | | |
| LONG-TERM INVESTMENTS — 99.9% | | |
| COMMON STOCKS | | Shares
| | Value
(Note 2)
|
| | | | | | |
Aerospace & Defense — 2.8% | | | | | |
AAR Corp.(a)(b) | | 47,639 | | $ | 1,094,744 |
Aerovironment, Inc.(a)(b) | | 18,200 | | | 529,256 |
American Science & Engineering, Inc. | | 10,875 | | | 824,760 |
Applied Signal Technology, Inc. | | 16,072 | | | 310,029 |
Ceradyne, Inc.(b) | | 31,440 | | | 603,963 |
Cubic Corp. | | 18,997 | | | 708,588 |
Curtiss-Wright Corp. | | 55,851 | | | 1,749,253 |
Esterline Technologies Corp.(b) | | 36,374 | | | 1,482,968 |
GenCorp, Inc.(b) | | 62,195 | | | 435,365 |
Moog, Inc. (Class A Stock)(b) | | 55,471 | | | 1,621,417 |
Orbital Sciences Corp.(b) | | 69,470 | | | 1,060,112 |
Stanley, Inc.(b) | | 19,680 | | | 539,429 |
Teledyne Technologies, Inc.(b) | | 44,049 | | | 1,689,720 |
Triumph Group, Inc. | | 20,424 | | | 985,458 |
| | | | |
|
|
| | | | | | 13,635,062 |
| | | | |
|
|
Air Freight & Logistics — 0.4% | | | | | |
Forward Air Corp. | | 35,472 | | | 888,574 |
HUB Group, Inc. (Class A Stock)(a)(b) | | 46,330 | | | 1,243,034 |
| | | | |
|
|
| | | | | | 2,131,608 |
| | | | |
|
|
Airlines — 0.4% | | | | | |
Allegiant Travel Co.(b) | | 18,600 | | | 877,362 |
SkyWest, Inc. | | 67,965 | | | 1,149,968 |
| | | | |
|
|
| | | | | | 2,027,330 |
| | | | |
|
|
Auto Components — 0.3% | | | | | |
Drew Industries, Inc.(b) | | 23,012 | | | 475,198 |
Spartan Motors, Inc. | | 40,216 | | | 226,416 |
Standard Motor Products, Inc.(b) | | 22,334 | | | 190,286 |
Superior Industries International, Inc. | | 28,318 | | | 433,265 |
| | | | |
|
|
| | | | | | 1,325,165 |
| | | | |
|
|
Automobiles — 0.1% | | | | | |
Winnebago Industries(a)(b) | | 35,535 | | | 433,527 |
| | | | |
|
|
Beverages — 0.1% | | | | | |
Boston Beer Co., Inc.
(Class A Stock)(b) | | 12,450 | | | 580,170 |
| | | | |
|
|
Biotechnology — 1.1% | | | | | |
ArQule, Inc.(b) | | 34,416 | | | 126,995 |
Cubist Pharmaceuticals, Inc.(a)(b) | | 70,838 | | | 1,343,797 |
Emergent Biosolutions, Inc.(b) | | 20,300 | | | 275,877 |
Martek Biosciences Corp.(a)(b) | | 40,624 | | | 769,418 |
Regeneron Pharmaceuticals, Inc.(b) | | 77,771 | | | 1,880,503 |
Savient Pharmaceuticals, Inc.(a)(b) | | 81,429 | | | 1,108,249 |
| | | | |
|
|
| | | | | | 5,504,839 |
| | | | |
|
|
Building Products — 1.0% | | | | | |
AAON, Inc. | | 15,400 | | | 300,146 |
Apogee Enterprises, Inc.(a) | | 34,152 | | | 478,128 |
Gibraltar Industries, Inc.(b) | | 36,809 | | | 579,005 |
Griffon Corp.(b) | | 53,902 | | | 658,682 |
NCI Building Systems, Inc.(a)(b) | | 110,264 | | | 199,578 |
Quanex Building Products Corp. | | 45,999 | | | 780,603 |
Simpson Manufacturing Co., Inc. | | 47,031 | | | 1,264,664 |
Universal Forest Products, Inc. | | 23,711 | | | 872,802 |
| | | | |
|
|
| | | | | | 5,133,608 |
| | | | |
|
|
| | | | | |
COMMON STOCKS
(continued) | | Shares
| | Value
(Note 2)
|
| | | | | | |
Capital Markets — 1.6% | | | | | |
Greenhill & Co., Inc.(a) | | 25,098 | | $ | 2,013,863 |
Investment Technology Group, Inc.(b) | | 53,480 | | | 1,053,556 |
LaBranche & Co., Inc.(b) | | 64,637 | | | 183,569 |
optionsXpress Holdings, Inc. | | 52,219 | | | 806,784 |
Piper Jaffray Cos.(b) | | 19,549 | | | 989,375 |
Stifel Financial Corp.(a)(b) | | 37,145 | | | 2,200,470 |
SWS Group, Inc. | | 34,271 | | | 414,679 |
TradeStation Group, Inc.(b) | | 40,419 | | | 318,906 |
| | | | |
|
|
| | | | | | 7,981,202 |
| | | | |
|
|
Chemicals — 2.0% | | | | | |
A. Schulman, Inc. | | 31,897 | | | 643,681 |
American Vanguard Corp. | | 25,211 | | | 209,251 |
Arch Chemicals, Inc. | | 30,603 | | | 945,021 |
Balchem Corp. | | 22,816 | | | 764,564 |
Calgon Carbon Corp.(a)(b) | | 68,428 | | | 951,149 |
HB Fuller Co. | | 59,499 | | | 1,353,602 |
NewMarket Corp. | | 14,345 | | | 1,646,376 |
OM Group, Inc.(b) | | 37,357 | | | 1,172,636 |
Penford Corp. | | 13,816 | | | 120,061 |
PolyOne Corp.(b) | | 113,119 | | | 844,999 |
Quaker Chemical Corp. | | 13,504 | | | 278,723 |
Stepan Co. | | 9,406 | | | 609,603 |
Zep, Inc. | | 26,408 | | | 457,387 |
| | | | |
|
|
| | | | | | 9,997,053 |
| | | | |
|
|
Commercial Banks — 6.0% | | | | | |
Bank of The Ozarks, Inc. | | 15,932 | | | 466,330 |
Boston Private Financial Holdings, Inc. | | 79,318 | | | 457,665 |
City Holding Co. | | 19,500 | | | 630,435 |
Columbia Banking System, Inc. | | 34,378 | | | 556,236 |
Community Bank System, Inc. | | 40,054 | | | 773,443 |
East West Bancorp, Inc.(a) | | 112,166 | | | 1,772,223 |
First Bancorp (Puerto Rico) | | 92,774 | | | 213,380 |
First Commonwealth Financial Corp. | | 92,531 | | | 430,269 |
First Financial Bancorp | | 54,096 | | | 787,638 |
First Financial Bankshares, Inc. | | 25,504 | | | 1,383,082 |
First Midwest Bancorp, Inc. | | 66,967 | | | 729,271 |
Glacier Bancorp, Inc. | | 75,293 | | | 1,033,020 |
Hancock Holding Co. | | 34,752 | | | 1,521,790 |
Hanmi Financial Corp.(b) | | 62,616 | | | 75,139 |
Home Bancshares, Inc. | | 23,882 | | | 574,840 |
Independent Bank Corp./Rockland MA | | 25,555 | | | 533,844 |
Nara Bancorp, Inc.(b) | | 39,610 | | | 449,177 |
National Penn Bancshares, Inc. | | 153,756 | | | 890,247 |
NBT Bancorp, Inc. | | 42,033 | | | 856,212 |
Old National Bancorp | | 106,601 | | | 1,325,050 |
Pinnacle Financial Partners, Inc.(a)(b) | | 40,223 | | | 571,971 |
PrivateBancorp, Inc.(a) | | 71,570 | | | 641,983 |
Prosperity Bancshares, Inc. | | 56,763 | | | 2,297,199 |
S&T Bancorp, Inc.(a) | | 29,490 | | | 501,625 |
Signature Bank(a)(b) | | 49,702 | | | 1,585,494 |
Simmons First National Corp. (Class A Stock) | | 18,397 | | | 511,436 |
South Financial Group, Inc. (The)(a) | | 263,483 | | | 169,867 |
Sterling Bancorp | | 22,056 | | | 157,480 |
Sterling Bancshares, Inc. | | 99,954 | | | 512,764 |
Susquehanna Bancshares, Inc.(a) | | 105,594 | | | 621,949 |
SEE NOTES TO FINANCIAL STATEMENTS.
A116
| | | | | | |
| | | SMALL CAPITALIZATION STOCK PORTFOLIO (continued) | | |
| |
| SCHEDULE OF INVESTMENTS | | December 31, 2009 |
| | | | | |
COMMON STOCKS
(continued) | | Shares
| | Value
(Note 2)
|
| | | | | | |
Commercial Banks (continued) | | | | | |
Tompkins Financial Corp. | | 8,632 | | $ | 349,596 |
UMB Financial Corp. | | 36,599 | | | 1,440,171 |
Umpqua Holdings Corp. | | 106,101 | | | 1,422,814 |
United Bankshares, Inc.(a) | | 46,773 | | | 934,057 |
United Community Banks, Inc.(b) | | 101,036 | | | 342,512 |
Whitney Holding Corp.(a) | | 117,938 | | | 1,074,415 |
Wilshire Bancorp, Inc. | | 23,683 | | | 193,964 |
Wintrust Financial Corp.(a) | | 29,555 | | | 909,998 |
| | | | |
|
|
| | | | | | 29,698,586 |
| | | | |
|
|
Commercial Services & Supplies — 2.5% | | | | | |
ABM Industries, Inc. | | 56,728 | | | 1,172,000 |
ATC Technology Corp.(b) | | 24,424 | | | 582,512 |
Bowne & Co., Inc. | | 48,961 | | | 327,060 |
Consolidated Graphics, Inc.(b) | | 13,671 | | | 478,758 |
G&K Services, Inc. (Class A Stock) | | 22,800 | | | 572,964 |
Geo Group, Inc. (The)(b) | | 62,875 | | | 1,375,705 |
Healthcare Services Group, Inc. | | 53,172 | | | 1,141,071 |
Interface, Inc. (Class A Stock) | | 68,810 | | | 571,811 |
Mobile Mini, Inc.(a)(b) | | 43,439 | | | 612,056 |
Standard Register Co. (The) | | 15,467 | | | 78,882 |
Sykes Enterprises, Inc.(b) | | 43,038 | | | 1,096,178 |
Tetra Tech, Inc.(b) | | 74,940 | | | 2,036,120 |
United Stationers, Inc.(b) | | 29,251 | | | 1,662,919 |
Viad Corp. | | 25,097 | | | 517,751 |
| | | | |
|
|
| | | | | | 12,225,787 |
| | | | |
|
|
Communications Equipment — 2.1% | | | | | |
Arris Group, Inc.(b) | | 153,306 | | | 1,752,288 |
Bel Fuse, Inc. (Class B Stock) | | 14,187 | | | 304,879 |
Black Box Corp. | | 21,521 | | | 609,905 |
Blue Coat Systems, Inc.(a)(b) | | 49,695 | | | 1,418,295 |
Comtech Telecommunications Corp.(a)(b) | | 34,589 | | | 1,212,344 |
Digi International, Inc.(b) | | 30,133 | | | 274,813 |
EMS Technologies, Inc.(b) | | 18,586 | | | 269,497 |
Harmonic, Inc.(b) | | 117,552 | | | 744,104 |
NETGEAR, Inc.(b) | | 42,374 | | | 919,092 |
Network Equipment Technologies, Inc.(b) | | 36,362 | | | 147,266 |
PC-Tel, Inc.(b) | | 22,794 | | | 134,941 |
Symmetricom, Inc.(b) | | 53,457 | | | 277,976 |
Tekelec(a)(b) | | 82,325 | | | 1,257,926 |
Tollgrade Communications, Inc.(b) | | 15,437 | | | 94,320 |
ViaSat, Inc.(a)(b) | | 34,351 | | | 1,091,675 |
| | | | |
|
|
| | | | | | 10,509,321 |
| | | | |
|
|
Computers & Peripherals — 1.0% | | | | | |
Adaptec, Inc.(b) | | 147,290 | | | 493,421 |
Avid Technology, Inc.(b) | | 34,838 | | | 444,533 |
Compellent Technologies, Inc.(b) | | 27,800 | | | 630,504 |
Hutchinson Technology, Inc.(b) | | 28,545 | | | 292,872 |
Intermec, Inc.(b) | | 60,858 | | | 782,634 |
Intevac, Inc.(b) | | 26,980 | | | 309,461 |
Novatel Wireless, Inc.(a)(b) | | 37,736 | | | 300,756 |
Stratasys, Inc.(a)(b) | | 24,722 | | | 427,196 |
Synaptics, Inc.(a)(b) | | 41,648 | | | 1,276,511 |
| | | | |
|
|
| | | | | | 4,957,888 |
| | | | |
|
|
| | | | | |
COMMON STOCKS
(continued) | | Shares
| | Value
(Note 2)
|
| | | | | | |
Construction & Engineering — 0.9% | | | | | |
Comfort Systems USA, Inc. | | 46,718 | | $ | 576,500 |
Dycom Industries, Inc.(b) | | 47,700 | | | 383,031 |
EMCOR Group, Inc.(b) | | 80,641 | | | 2,169,243 |
Insituform Technologies, Inc. (Class A Stock)(b) | | 47,578 | | | 1,080,972 |
| | | | |
|
|
| | | | | | 4,209,746 |
| | | | |
|
|
Construction Materials — 0.6% | | | | | |
Eagle Materials, Inc. | | 53,610 | | | 1,396,541 |
Headwaters, Inc.(b) | | 73,668 | | | 480,315 |
Texas Industries, Inc.(a) | | 33,968 | | | 1,188,540 |
| | | | |
|
|
| | | | | | 3,065,396 |
| | | | |
|
|
Consumer Finance — 0.8% | | | | | |
Cash America International, Inc. | | 35,885 | | | 1,254,539 |
Ezcorp, Inc. (Class A Stock)(b) | | 59,500 | | | 1,023,995 |
First Cash Financial Services(a)(b) | | 32,488 | | | 720,909 |
Rewards Network, Inc. | | 10,665 | | | 134,806 |
World Acceptance Corp.(a)(b) | | 19,866 | | | 711,799 |
| | | | |
|
|
| | | | | | 3,846,048 |
| | | | |
|
|
Containers & Packaging — 0.5% | | | | | |
Myers Industries, Inc. | | 34,427 | | | 313,286 |
Rock-Tenn Co. (Class A Stock) | | 47,410 | | | 2,389,938 |
| | | | |
|
|
| | | | | | 2,703,224 |
| | | | |
|
|
Distributors | | | | | |
Audiovox Corp.(b) | | 22,649 | | | 160,581 |
| | | | |
|
|
Diversified Consumer Services — 1.1% | | | | | |
American Public Education, Inc.(b) | | 22,272 | | | 765,266 |
Capella Education Co.(a)(b) | | 17,818 | | | 1,341,696 |
Coinstar, Inc.(a)(b) | | 38,018 | | | 1,056,140 |
Hillenbrand, Inc. | | 75,704 | | | 1,426,263 |
Pre-Paid Legal Services, Inc.(a)(b) | | 8,980 | | | 368,898 |
Universal Technical Institute, Inc.(b) | | 24,765 | | | 500,253 |
| | | | |
|
|
| | | | | | 5,458,516 |
| | | | |
|
|
Diversified Financial Services — 0.4% | | | | | |
Financial Federal Corp. | | 31,971 | | | 879,202 |
Portfolio Recovery Associates, Inc.(a)(b) | | 18,970 | | | 851,374 |
| | | | |
|
|
| | | | | | 1,730,576 |
| | | | |
|
|
Diversified Telecommunication Services — 0.5% |
Cbeyond, Inc.(a)(b) | | 31,492 | | | 495,999 |
General Communication, Inc. (Class A Stock)(b) | | 54,521 | | | 347,844 |
Iowa Telecommunications Services, Inc. | | 40,086 | | | 671,841 |
Neutral Tandem, Inc.(a)(b) | | 41,082 | | | 934,616 |
| | | | |
|
|
| | | | | | 2,450,300 |
| | | | |
|
|
Electric Utilities — 1.0% | | | | | |
ALLETE, Inc. | | 36,258 | | | 1,184,911 |
Central Vermont Public Service Corp. | | 14,286 | | | 297,149 |
El Paso Electric Co.(b) | | 54,107 | | | 1,097,290 |
UIL Holdings Corp. | | 36,642 | | | 1,028,907 |
Unisource Energy Corp. | | 43,767 | | | 1,408,860 |
| | | | |
|
|
| | | | | | 5,017,117 |
| | | | |
|
|
SEE NOTES TO FINANCIAL STATEMENTS.
A117
| | | | | | |
| | | SMALL CAPITALIZATION STOCK PORTFOLIO (continued) | | |
| |
| SCHEDULE OF INVESTMENTS | | December 31, 2009 |
| | | | | |
COMMON STOCKS
(continued) | | Shares
| | Value
(Note 2)
|
| | | | | | |
Electrical Equipment — 2.0% | | | | | |
A.O. Smith Corp. | | 27,883 | | $ | 1,209,843 |
Acuity Brands, Inc.(a) | | 53,016 | | | 1,889,490 |
AZZ, Inc.(b) | | 15,092 | | | 493,508 |
Baldor Electric Co. | | 51,299 | | | 1,440,989 |
Belden, Inc. | | 57,123 | | | 1,252,136 |
Brady Corp. (Class A Stock) | | 64,095 | | | 1,923,491 |
Encore Wire Corp. | | 23,100 | | | 486,717 |
II-VI, Inc.(b) | | 30,364 | | | 965,575 |
Magnetek, Inc.(b) | | 37,868 | | | 58,317 |
Vicor Corp.(b) | | 23,915 | | | 222,410 |
| | | | |
|
|
| | | | | | 9,942,476 |
| | | | |
|
|
Electronic Equipment & Instruments — 3.4% | | | |
Agilysys, Inc. | | 24,459 | | | 222,577 |
Anixter International, Inc.(a)(b) | | 35,335 | | | 1,664,279 |
Benchmark Electronics, Inc.(b) | | 78,728 | | | 1,488,746 |
Brightpoint, Inc.(b) | | 81,066 | | | 595,835 |
Checkpoint Systems, Inc.(a)(b) | | 47,650 | | | 726,662 |
Cognex Corp. | | 48,502 | | | 859,455 |
CTS Corp. | | 41,438 | | | 398,634 |
Daktronics, Inc.(a) | | 42,075 | | | 387,511 |
DTS, Inc.(a)(b) | | 21,432 | | | 733,189 |
Electro Scientific Industries, Inc.(b) | | 33,507 | | | 362,546 |
FARO Technologies, Inc.(b) | | 19,718 | | | 422,754 |
Gerber Scientific, Inc.(b) | | 30,780 | | | 155,439 |
Insight Enterprises, Inc.(b) | | 56,078 | | | 640,411 |
Keithley Instruments, Inc. | | 16,491 | | | 76,683 |
Littelfuse, Inc.(b) | | 26,650 | | | 856,798 |
LoJack Corp.(b) | | 22,160 | | | 89,526 |
Mercury Computer Systems, Inc.(b) | | 28,751 | | | 316,549 |
Methode Electronics, Inc. | | 45,899 | | | 398,403 |
MTS Systems Corp. | | 20,351 | | | 584,888 |
Newport Corp.(b) | | 44,323 | | | 407,328 |
Park Electrochemical Corp. | | 25,160 | | | 695,422 |
Plexus Corp.(b) | | 48,388 | | | 1,379,058 |
RadiSys Corp.(b) | | 29,059 | | | 277,513 |
Rogers Corp.(b) | | 19,258 | | | 583,710 |
Scansource, Inc.(b) | | 32,474 | | | 867,056 |
SYNNEX Corp.(b) | | 25,271 | | | 774,809 |
Technitrol, Inc. | | 50,289 | | | 220,266 |
TTM Technologies, Inc.(b) | | 52,732 | | | 608,000 |
| | | | |
|
|
| | | | | | 16,794,047 |
| | | | |
|
|
Energy Equipment & Services — 3.2% | | | | | |
Basic Energy Services, Inc.(b) | | 27,563 | | | 245,311 |
Bristow Group, Inc.(b) | | 43,917 | | | 1,688,609 |
CARBO Ceramics, Inc.(a) | | 23,455 | | | 1,598,927 |
Dril-Quip, Inc.(b) | | 36,713 | | | 2,073,550 |
Gulf Island Fabrication, Inc. | | 17,436 | | | 366,679 |
Hornbeck Offshore Services, Inc.(b) | | 28,115 | | | 654,517 |
ION Geophysical Corp.(b) | | 144,895 | | | 857,778 |
Lufkin Industries, Inc. | | 18,198 | | | 1,332,094 |
Matrix Service Co.(b) | | 32,007 | | | 340,875 |
Oil States International, Inc.(b) | | 60,878 | | | 2,391,897 |
Pioneer Drilling Co.(b) | | 66,155 | | | 522,625 |
SEACOR Holdings, Inc.(a)(b) | | 24,838 | | | 1,893,897 |
Seahawk Drilling, Inc.(b) | | 14,200 | | | 320,068 |
| | | | | |
COMMON STOCKS
(continued) | | Shares
| | Value
(Note 2)
|
| | | | | | |
Energy Equipment & Services (continued) | | | | | |
Superior Well Services, Inc.(b) | | 22,458 | | $ | 320,251 |
Tetra Technologies, Inc.(b) | | 92,238 | | | 1,021,997 |
| | | | |
|
|
| | | | | | 15,629,075 |
| | | | |
|
|
Food & Staples Retailing — 1.1% | | | | | |
Andersons, Inc. (The) | | 22,346 | | | 576,974 |
Casey’s General Stores, Inc. | | 62,332 | | | 1,989,637 |
Great Atlantic & Pacific Tea Co.(a)(b) | | 35,547 | | | 419,099 |
Nash Finch Co. | | 15,753 | | | 584,279 |
Spartan Stores, Inc. | | 27,406 | | | 391,632 |
United Natural Foods, Inc.(a)(b) | | 52,854 | | | 1,413,316 |
| | | | |
|
|
| | | | | | 5,374,937 |
| | | | |
|
|
Food Products — 1.5% | | | | | |
Calavo Growers, Inc.(a) | | 14,300 | | | 243,100 |
Cal-Maine Foods, Inc.(a) | | 15,416 | | | 525,377 |
Darling International, Inc.(b) | | 100,592 | | | 842,961 |
Diamond Foods, Inc. | | 20,389 | | | 724,625 |
Hain Celestial Group, Inc. (The)(b) | | 49,803 | | | 847,149 |
J&J Snack Foods Corp. | | 17,346 | | | 693,146 |
Lance, Inc. | | 39,271 | | | 1,032,827 |
Sanderson Farms, Inc. | | 21,359 | | | 900,496 |
TreeHouse Foods, Inc.(b) | | 39,103 | | | 1,519,543 |
| | | | |
|
|
| | | | | | 7,329,224 |
| | | | |
|
|
Gas Utilities — 2.0% | | | | | |
Laclede Group, Inc. (The) | | 27,118 | | | 915,775 |
New Jersey Resources Corp. | | 50,932 | | | 1,904,857 |
Northwest Natural Gas Co. | | 32,441 | | | 1,461,143 |
Piedmont Natural Gas Co., Inc. | | 89,472 | | | 2,393,376 |
South Jersey Industries, Inc. | | 36,457 | | | 1,391,928 |
Southwest Gas Corp. | | 55,050 | | | 1,570,576 |
| | | | |
|
|
| | | | | | 9,637,655 |
| | | | |
|
|
Healthcare Equipment & Supplies — 4.1% | | | | | |
Abaxis, Inc.(b) | | 26,951 | | | 688,598 |
Align Technology, Inc.(a)(b) | | 81,784 | | | 1,457,391 |
American Medical Systems Holdings, Inc.(a)(b) | | 91,064 | | | 1,756,625 |
Analogic Corp. | | 15,748 | | | 606,456 |
Cantel Medical Corp.(b) | | 15,700 | | | 316,826 |
CONMED Corp.(b) | | 35,610 | | | 811,908 |
Cooper Cos., Inc. (The)(a) | | 55,336 | | | 2,109,408 |
CryoLife, Inc.(b) | | 34,750 | | | 223,095 |
Cyberonics, Inc.(a)(b) | | 29,237 | | | 597,604 |
Greatbatch, Inc.(b) | | 28,392 | | | 545,978 |
Haemonetics Corp.(b) | | 31,357 | | | 1,729,339 |
ICU Medical, Inc.(b) | | 15,620 | | | 569,193 |
Integra Lifesciences Holdings Corp.(a)(b) | | 25,121 | | | 923,950 |
Invacare Corp. | | 39,516 | | | 985,529 |
Kensey Nash Corp.(b) | | 13,580 | | | 346,290 |
Meridian Bioscience, Inc. | | 49,620 | | | 1,069,311 |
Merit Medical Systems, Inc.(b) | | 34,331 | | | 662,245 |
Natus Medical, Inc.(b) | | 34,661 | | | 512,636 |
Neogen Corp.(b) | | 27,193 | | | 642,027 |
Osteotech, Inc.(b) | | 22,022 | | | 70,470 |
Palomar Medical Technologies, Inc.(b) | | 22,015 | | | 221,911 |
SurModics, Inc.(a)(b) | | 21,329 | | | 483,315 |
SEE NOTES TO FINANCIAL STATEMENTS.
A118
| | | | | | |
| | | SMALL CAPITALIZATION STOCK PORTFOLIO (continued) | | |
| |
| SCHEDULE OF INVESTMENTS | | December 31, 2009 |
| | | | | |
COMMON STOCKS
(continued) | | Shares
| | Value
(Note 2)
|
| | | | | | |
Healthcare Equipment & Supplies (continued) | | | |
Symmetry Medical, Inc.(b) | | 43,749 | | $ | 352,617 |
Theragenics Corp.(b) | | 40,912 | | | 54,822 |
West Pharmaceutical Services, Inc.(a) | | 40,375 | | | 1,582,700 |
Zoll Medical Corp.(b) | | 25,816 | | | 689,804 |
| | | | |
|
|
| | | | | | 20,010,048 |
| | | | |
|
|
Healthcare Providers & Services — 6.0% | | | | | |
Air Methods Corp.(b) | | 13,313 | | | 447,583 |
Almost Family, Inc.(b) | | 9,965 | | | 393,916 |
Amedisys, Inc.(a)(b) | | 34,228 | | | 1,662,112 |
AMERIGROUP Corp.(b) | | 62,554 | | | 1,686,456 |
AMN Healthcare Services, Inc.(b) | | 39,873 | | | 361,249 |
AmSurg Corp.(b) | | 37,525 | | | 826,301 |
Bio-Reference Labs, Inc.(a)(b) | | 14,605 | | | 572,370 |
Catalyst Health Solutions, Inc.(b) | | 47,046 | | | 1,715,768 |
Centene Corp.(b) | | 52,611 | | | 1,113,775 |
Chemed Corp. | | 27,667 | | | 1,327,186 |
Corvel Corp.(b) | | 8,866 | | | 297,366 |
Cross Country Healthcare, Inc.(b) | | 37,668 | | | 373,290 |
Genoptix, Inc.(b) | | 20,968 | | | 744,993 |
Gentiva Health Services, Inc.(a)(b) | | 35,814 | | | 967,336 |
Hanger Orthopedic Group, Inc.(b) | | 38,723 | | | 535,539 |
Healthspring, Inc.(b) | | 59,883 | | | 1,054,540 |
Healthways, Inc.(b) | | 41,334 | | | 758,066 |
HMS Holdings Corp.(b) | | 31,451 | | | 1,531,349 |
nventive Health, Inc.(b) | | 41,064 | | | 664,005 |
IPC The Hospitalist Co., Inc.(b) | | 16,640 | | | 553,280 |
Landauer, Inc. | | 11,500 | | | 706,100 |
LCA-Vision, Inc.(b) | | 22,769 | | | 116,577 |
LHC Group, Inc.(b) | | 18,526 | | | 622,659 |
Magellan Health Services, Inc.(b) | | 42,984 | | | 1,750,738 |
Medcath Corp.(b) | | 21,555 | | | 170,500 |
Mednax, Inc.(b) | | 56,986 | | | 3,425,428 |
Molina Healthcare, Inc.(a)(b) | | 16,220 | | | 370,951 |
MWI Veterinary Supply, Inc.(b) | | 14,963 | | | 564,105 |
Odyssey HealthCare, Inc.(a)(b) | | 40,462 | | | 630,398 |
PharMerica Corp.(b) | | 37,446 | | | 594,642 |
PSS World Medical, Inc.(a)(b) | | 72,960 | | | 1,646,707 |
RehabCare Group, Inc.(b) | | 30,158 | | | 917,708 |
Res-Care, Inc.(b) | | 31,290 | | | 350,448 |
| | | | |
|
|
| | | | | | 29,453,441 |
| | | | |
|
|
Healthcare Technology — 0.9% | | | | | |
Computer Programs & Systems, Inc. | | 11,945 | | | 550,067 |
Eclipsys Corp.(b) | | 69,632 | | | 1,289,585 |
Omnicell, Inc.(b) | | 38,952 | | | 455,349 |
Phase Forward, Inc.(b) | | 52,891 | | | 811,877 |
Quality Systems, Inc.(a) | | 23,193 | | | 1,456,288 |
| | | | |
|
|
| | | | | | 4,563,166 |
| | | | |
|
|
Hotels, Restaurants & Leisure — 2.9% | | | | | |
BJ’s Restaurants, Inc.(a)(b) | | 25,900 | | | 487,438 |
Buffalo Wild Wings, Inc.(a)(b) | | 22,106 | | | 890,209 |
California Pizza Kitchen, Inc.(b) | | 29,578 | | | 397,824 |
CEC Entertainment, Inc.(a)(b) | | 27,856 | | | 889,164 |
CKE Restaurants, Inc. | | 67,422 | | | 570,390 |
Cracker Barrel Old Country Store, Inc. | | 28,001 | | | 1,063,758 |
DineEquity, Inc.(b) | | 18,538 | | | 450,288 |
| | | | | |
COMMON STOCKS
(continued) | | Shares
| | Value
(Note 2)
|
| | | | | | |
Hotels, Restaurants & Leisure (continued) | | | | | |
Interval Leisure Group, Inc.(b) | | 48,323 | | $ | 602,588 |
Jack In The Box, Inc.(a)(b) | | 70,087 | | | 1,378,611 |
Landry’s Restaurants, Inc.(a)(b) | | 9,829 | | | 209,259 |
Marcus Corp. | | 25,506 | | | 326,987 |
Monarch Casino & Resort, Inc.(b) | | 13,739 | | | 111,286 |
Multimedia Games, Inc.(b) | | 33,284 | | | 200,037 |
O’Charleys, Inc.(b) | | 22,855 | | | 149,700 |
Papa John’s International, Inc.(b) | | 26,898 | | | 628,337 |
Peet’s Coffee & Tea, Inc.(b) | | 15,919 | | | 530,580 |
PF Chang’s China Bistro, Inc.(a)(b) | | 28,304 | | | 1,073,005 |
Pinnacle Entertainment, Inc.(b) | | 73,445 | | | 659,536 |
Red Robin Gourmet Burgers, Inc.(a)(b) | | 18,988 | | | 339,885 |
Ruby Tuesday, Inc.(b) | | 78,803 | | | 567,382 |
Ruth’s Hospitality Group, Inc.(b) | | 24,480 | | | 51,163 |
Shuffle Master, Inc.(b) | | 65,533 | | | 539,992 |
Sonic Corp.(b) | | 74,643 | | | 751,655 |
Steak N Shake Co. (The)(b) | | 1,496 | | | 484,884 |
Texas Roadhouse, Inc.(a)(b) | | 62,726 | | | 704,413 |
| | | | |
|
|
| | | | | | 14,058,371 |
| | | | |
|
|
Household Durables — 1.0% | | | | | |
Blyth, Inc. | | 7,300 | | | 246,156 |
Ethan Allen Interiors, Inc. | | 31,748 | | | 426,058 |
Helen of Troy Ltd.(b) | | 36,851 | | | 901,376 |
Kid Brands, Inc.(b) | | 20,677 | | | 90,565 |
La-Z-Boy, Inc.(b) | | 63,032 | | | 600,695 |
M/I Homes, Inc.(b) | | 22,610 | | | 234,918 |
Meritage Homes Corp.(b) | | 38,854 | | | 751,048 |
National Presto Industries, Inc. | | 5,935 | | | 648,280 |
Skyline Corp. | | 8,296 | | | 152,646 |
Standard Pacific Corp.(b) | | 119,009 | | | 445,094 |
Universal Electronics, Inc.(b) | | 16,770 | | | 389,399 |
| | | | |
|
|
| | | | | | 4,886,235 |
| | | | |
|
|
Household Products — 0.3% | | | | | |
Central Garden and Pet Co. (Class A Stock)(b) | | 83,142 | | | 826,432 |
WD-40 Co. | | 20,231 | | | 654,675 |
| | | | |
|
|
| | | | | | 1,481,107 |
| | | | |
|
|
Industrial Conglomerates — 0.1% | | | | | |
Standex International Corp. | | 15,203 | | | 305,429 |
Tredegar Corp. | | 26,493 | | | 419,119 |
| | | | |
|
|
| | | | | | 724,548 |
| | | | |
|
|
Insurance — 2.8% | | | | | |
American Physicians Capital, Inc. | | 10,870 | | | 329,578 |
AMERISAFE, Inc.(b) | | 23,075 | | | 414,658 |
Delphi Financial Group, Inc. | | 57,991 | | | 1,297,259 |
eHealth, Inc.(b) | | 28,515 | | | 468,501 |
Employers Holdings, Inc. | | 53,831 | | | 825,768 |
Infinity Property & Casualty Corp. | | 16,641 | | | 676,290 |
National Financial Partners Corp.(b) | | 50,536 | | | 408,836 |
Navigators Group, Inc.(b) | | 16,474 | | | 776,090 |
Presidential Life Corp. | | 25,283 | | | 231,339 |
ProAssurance Corp.(b) | | 39,719 | | | 2,133,308 |
RLI Corp. | | 21,738 | | | 1,157,549 |
Safety Insurance Group, Inc. | | 18,412 | | | 667,067 |
SEE NOTES TO FINANCIAL STATEMENTS.
A119
| | | | | | |
| | | SMALL CAPITALIZATION STOCK PORTFOLIO (continued) | | |
| |
| SCHEDULE OF INVESTMENTS | | December 31, 2009 |
| | | | | |
COMMON STOCKS
(continued) | | Shares
| | Value
(Note 2)
|
| | | | | | |
Insurance (continued) | | | | | |
Selective Insurance Group | | 64,940 | | $ | 1,068,263 |
Stewart Information Services Corp. | | 22,227 | | | 250,721 |
Tower Group, Inc. | | 54,934 | | | 1,286,005 |
United Fire & Casualty Co. | | 27,314 | | | 497,934 |
Zenith National Insurance Corp. | | 45,732 | | | 1,360,984 |
| | | | |
|
|
| | | | | | 13,850,150 |
| | | | |
|
|
Internet & Catalog Retail — 0.9% | | | | | |
Blue Nile, Inc.(a)(b) | | 17,801 | | | 1,127,337 |
HSN, Inc.(b) | | 48,347 | | | 976,126 |
NutriSystem, Inc.(a) | | 37,888 | | | 1,180,969 |
PetMed Express, Inc.(a) | | 27,895 | | | 491,789 |
Stamps.com, Inc.(b) | | 14,199 | | | 127,791 |
Ticketmaster Entertainment, Inc.(b) | | 46,327 | | | 566,116 |
| | | | |
|
|
| | | | | | 4,470,128 |
| | | | |
|
|
Internet Software & Services — 0.9% | | | |
comScore, Inc.(b) | | 29,616 | | | 519,761 |
DealerTrack Holdings, Inc.(a)(b) | | 49,438 | | | 928,940 |
Infospace, Inc.(b) | | 43,272 | | | 370,841 |
j2 Global Communications, Inc.(b) | | 55,248 | | | 1,124,297 |
Knot, Inc. (The)(b) | | 36,697 | | | 369,539 |
Perficient, Inc.(b) | | 37,474 | | | 315,906 |
United Online, Inc. | | 103,403 | | | 743,467 |
| | | | |
|
|
| | | | | | 4,372,751 |
| | | | |
|
|
IT Services — 1.9% | | | | | |
CACI International, Inc. (Class A Stock)(a)(b) | | 36,823 | | | 1,798,804 |
Ciber, Inc.(b) | | 85,015 | | | 293,302 |
CSG Systems International, Inc.(b) | | 42,961 | | | 820,125 |
Cybersource Corp.(a)(b) | | 85,590 | | | 1,721,215 |
Forrester Research, Inc.(b) | | 18,182 | | | 471,823 |
Heartland Payment Systems, Inc. | | 45,831 | | | 601,761 |
Integral Systems, Inc.(b) | | 21,129 | | | 182,977 |
MAXIMUS, Inc. | | 21,587 | | | 1,079,350 |
StarTek, Inc.(b) | | 14,514 | | | 108,565 |
TeleTech Holdings, Inc.(b) | | 39,601 | | | 793,208 |
Wright Express Corp.(b) | | 46,691 | | | 1,487,575 |
| | | | |
|
|
| | | | | | 9,358,705 |
| | | | |
|
|
Leisure Equipment & Products — 1.2% | | | | | |
Arctic Cat, Inc.(b) | | 14,872 | | | 136,228 |
Brunswick Corp. | | 107,976 | | | 1,372,375 |
Callaway Golf Co. | | 78,800 | | | 594,152 |
Jakks Pacific, Inc.(b) | | 34,097 | | | 413,256 |
Nautilus, Inc.(b) | | 25,162 | | | 51,079 |
Polaris Industries, Inc.(a) | | 39,977 | | | 1,744,196 |
Pool Corp.(a) | | 59,918 | | | 1,143,235 |
RC2 Corp.(b) | | 26,167 | | | 385,963 |
Sturm Ruger & Co., Inc.(a) | | 23,254 | | | 225,564 |
| | |
|
|
| | | | | | 6,066,048 |
| | | | |
|
|
Life Sciences Tools & Services — 0.8% | | | | | |
Cambrex Corp.(b) | | 35,811 | | | 199,825 |
Dionex Corp.(b) | | 21,714 | | | 1,604,013 |
Enzo Biochem, Inc.(b) | | 40,871 | | | 219,886 |
eResearchTechnology, Inc.(b) | | 51,562 | | | 309,888 |
| | | | | |
COMMON STOCKS
(continued) | | Shares
| | Value
(Note 2)
|
| | | | | | |
Life Sciences Tools & Services (continued) | | | |
Kendle International, Inc.(b) | | 18,132 | | $ | 331,997 |
Parexel International Corp.(b) | | 71,115 | | | 1,002,722 |
| | | | |
|
|
| | | | | | 3,668,331 |
| | | | |
|
|
Machinery — 4.2% | | | | | |
Actuant Corp. (Class A Stock) | | 82,985 | | | 1,537,712 |
Albany International Corp. | | 33,531 | | | 753,106 |
Astec Industries, Inc.(a)(b) | | 24,236 | | | 652,918 |
Badger Meter, Inc. | | 18,332 | | | 729,980 |
Barnes Group, Inc. | | 52,817 | | | 892,607 |
Briggs & Stratton Corp. | | 61,124 | | | 1,143,630 |
Cascade Corp. | | 11,211 | | | 308,190 |
CIRCOR International, Inc. | | 20,807 | | | 523,920 |
CLARCOR, Inc. | | 61,547 | | | 1,996,585 |
EnPro Industries, Inc.(b) | | 24,417 | | | 644,853 |
ESCO Technologies, Inc. | | 32,403 | | | 1,161,648 |
Gardner Denver, Inc. | | 63,714 | | | 2,711,031 |
John Bean Technologies Corp. | | 33,742 | | | 573,952 |
Kaydon Corp. | | 40,695 | | | 1,455,253 |
Lindsay Corp. | | 15,192 | | | 605,401 |
Lydall, Inc.(b) | | 20,523 | | | 106,925 |
Mueller Industries, Inc. | | 46,011 | | | 1,142,913 |
Robbins & Myers, Inc. | | 40,184 | | | 945,128 |
Toro Co. | | 41,930 | | | 1,753,093 |
Watts Water Technologies, Inc. (Class A Stock) | | 35,944 | | | 1,111,389 |
| | | | |
|
|
| | | | | | 20,750,234 |
| | | | |
|
|
Media — 0.4% | | | | | |
Arbitron, Inc. | | 32,481 | | | 760,705 |
E.W. Scripps Co. (Class A Stock)(b) | | 35,350 | | | 246,036 |
Live Nation, Inc.(b) | | 102,328 | | | 870,811 |
| | | | |
|
|
| | | | | | 1,877,552 |
| | | | |
|
|
Metals & Mining — 0.8% | | | | | |
A.M. Castle & Co. | | 20,422 | | | 279,577 |
Amcol International Corp. | | 30,437 | | | 865,020 |
Brush Engineered Materials, Inc.(b) | | 24,699 | | | 457,919 |
Century Aluminum Co.(b) | | 70,145 | | | 1,135,648 |
Olympic Steel, Inc. | | 11,045 | | | 359,846 |
RTI International Metals, Inc.(b) | | 36,701 | | | 923,764 |
| | | | |
|
|
| | | | | | 4,021,774 |
| | | | |
|
|
Multiline Retail — 0.1% | | | | | |
Fred’s, Inc. (Class A Stock) | | 48,918 | | | 498,963 |
Tuesday Morning Corp.(b) | | 38,205 | | | 98,569 |
| | | | |
|
|
| | | | | | 597,532 |
| | | | |
|
|
Multi-Utilities — 0.5% | | | | | |
Avista Corp. | | 67,012 | | | 1,446,789 |
CH Energy Group, Inc. | | 19,334 | | | 822,082 |
| | | | |
|
|
| | | | | | 2,268,871 |
| | | | |
|
|
Oil, Gas & Consumable Fuels — 2.0% | | | | | |
Holly Corp. | | 50,450 | | | 1,293,033 |
Penn Virginia Corp. | | 55,536 | | | 1,182,361 |
Petroleum Development Corp.(b) | | 23,493 | | | 427,808 |
Petroquest Energy, Inc.(a)(b) | | 64,352 | | | 394,478 |
St. Mary Land & Exploration Co. | | 76,492 | | | 2,619,086 |
Stone Energy Corp.(a)(b) | | 51,281 | | | 925,622 |
SEE NOTES TO FINANCIAL STATEMENTS.
A120
| | | | | | |
| | | SMALL CAPITALIZATION STOCK PORTFOLIO (continued) | | |
| |
| SCHEDULE OF INVESTMENTS | | December 31, 2009 |
| | | | | |
COMMON STOCKS
(continued) | | Shares
| | Value
(Note 2)
|
| | | | | | |
Oil, Gas & Consumable Fuels (continued) | | | | | |
Swift Energy Co.(b) | | 45,764 | | $ | 1,096,505 |
World Fuel Services Corp. | | 72,735 | | | 1,948,571 |
| | | | |
|
|
| | | | | | 9,887,464 |
| | | | |
|
|
Paper & Forest Products — 0.9% | | | | | |
Buckeye Technologies, Inc.(b) | | 47,310 | | | 461,746 |
Clearwater Paper Corp.(b) | | 13,906 | | | 764,413 |
Deltic Timber Corp. | | 13,106 | | | 605,235 |
Neenah Paper, Inc. | | 17,909 | | | 249,831 |
Schweitzer-Mauduit International, Inc. | | 21,690 | | | 1,525,891 |
Wausau Paper Corp. | | 59,819 | | | 693,900 |
| | | | |
|
|
| | | | | | 4,301,016 |
| | | | |
|
|
Personal Products — 0.5% | | | | | |
Chattem, Inc.(b) | | 23,287 | | | 2,172,677 |
Mannatech, Inc. | | 19,068 | | | 59,492 |
| | | | |
|
|
| | | | | | 2,232,169 |
| | | | |
|
|
Pharmaceuticals — 0.7% | | | | | |
Par Pharmaceutical Cos., Inc.(b) | | 42,592 | | | 1,152,540 |
Salix Pharmaceuticals Ltd.(b) | | 67,926 | | | 1,725,320 |
ViroPharma, Inc.(a)(b) | | 94,653 | | | 794,139 |
| | | | |
|
|
| | | | | | 3,671,999 |
| | | | |
|
|
Professional Services — 0.9% | | | | | |
Administaff, Inc. | | 27,305 | | | 644,125 |
CDI Corp. | | 15,511 | | | 200,867 |
Exponent, Inc.(b) | | 16,813 | | | 468,074 |
Heidrick & Struggles International, Inc. | | 20,853 | | | 651,448 |
Kelly Services, Inc. (Class A Stock)(b) | | 32,400 | | | 386,532 |
On Assignment, Inc.(b) | | 44,104 | | | 315,343 |
School Specialty, Inc.(b) | | 19,635 | | | 459,263 |
Spherion Corp.(b) | | 62,195 | | | 349,536 |
TrueBlue, Inc.(b) | | 53,575 | | | 793,446 |
Volt Information Sciences, Inc.(b) | | 14,698 | | | 146,980 |
| | | | |
|
|
| | | | | | 4,415,614 |
| | | | |
|
|
Real Estate Investment Trusts — 6.4% | | | | | |
Acadia Realty Trust(a) | | 48,625 | | | 820,304 |
BioMed Realty Trust, Inc.(a) | | 120,127 | | | 1,895,604 |
Cedar Shopping Centers, Inc. | | 55,275 | | | 375,870 |
Colonial Properties Trust(a) | | 81,099 | | | 951,291 |
Diamondrock Hospitality Co. | | 144,584 | | | 1,224,627 |
EastGroup Properties, Inc. | | 32,026 | | | 1,225,955 |
Entertainment Properties Trust | | 51,463 | | | 1,815,100 |
Extra Space Storage, Inc. | | 105,694 | | | 1,220,766 |
Franklin Street Properties Corp. | | 82,814 | | | 1,209,913 |
Healthcare Realty Trust, Inc.(a) | | 72,652 | | | 1,559,112 |
Home Properties, Inc.(a) | | 41,070 | | | 1,959,450 |
Inland Real Estate Corp. | | 86,701 | | | 706,613 |
Kilroy Realty Corp.(a) | | 52,792 | | | 1,619,131 |
Kite Realty Group Trust | | 77,027 | | | 313,500 |
LaSalle Hotel Properties | | 77,697 | | | 1,649,507 |
Lexington Realty Trust(a) | | 125,106 | | | 760,644 |
LTC Properties, Inc. | | 28,359 | | | 758,603 |
Medical Properties Trust, Inc.(a) | | 98,043 | | | 980,430 |
Mid-America Apartment Communities, Inc.(a) | | 35,300 | | | 1,704,284 |
National Retail Properties, Inc.(a) | | 100,829 | | | 2,139,591 |
| | | | | |
COMMON STOCKS
(continued) | | Shares
| | Value
(Note 2)
|
| | | | | | |
Real Estate Investment Trusts (continued) | | | | | |
Parkway Properties, Inc. | | 26,464 | | $ | 550,980 |
Pennsylvania Real Estate Investment Trust(a) | | 48,482 | | | 410,158 |
Post Properties, Inc.(a) | | 59,217 | | | 1,160,653 |
PS Business Parks, Inc. | | 22,135 | | | 1,107,857 |
Sovran Self Storage, Inc. | | 33,637 | | | 1,201,850 |
Tanger Factory Outlet Centers | | 49,261 | | | 1,920,686 |
Urstadt Biddle Properties, Inc. (Class A Stock) | | 26,140 | | | 399,158 |
| | | | |
|
|
| | | | | | 31,641,637 |
| | | | |
|
|
Real Estate Management & Development — 0.2% | | | |
Forestar Group, Inc.(a)(b) | | 43,892 | | | 964,746 |
| | | | |
|
|
Road & Rail — 0.9% | | | | | |
Arkansas Best Corp. | | 30,943 | | | 910,652 |
Heartland Express, Inc. | | 64,356 | | | 982,716 |
Knight Transportation, Inc.(a) | | 71,309 | | | 1,375,551 |
Old Dominion Freight Line, Inc.(b) | | 34,246 | | | 1,051,352 |
| | | | |
|
|
| | | | | | 4,320,271 |
| | | | |
|
|
Semiconductors & Semiconductor Equipment — 5.3% |
Actel Corp.(b) | | 31,956 | | | 379,637 |
Advanced Energy Industries, Inc.(b) | | 40,564 | | | 611,705 |
ATMI, Inc.(b) | | 38,346 | | | 714,002 |
Brooks Automation, Inc.(b) | | 78,702 | | | 675,263 |
Cabot Microelectronics Corp.(b) | | 28,717 | | | 946,512 |
Cohu, Inc. | | 28,622 | | | 399,277 |
Cymer, Inc.(a)(b) | | 35,316 | | | 1,355,428 |
Cypress Semiconductor Corp.(a)(b) | | 190,428 | | | 2,010,920 |
Diodes, Inc.(a)(b) | | 42,720 | | | 873,624 |
DSP Group, Inc.(b) | | 27,991 | | | 157,589 |
Exar Corp.(b) | | 53,326 | | | 379,148 |
FEI Co.(a)(b) | | 46,075 | | | 1,076,312 |
Hittite Microwave Corp.(b) | | 26,228 | | | 1,068,791 |
Kopin Corp.(b) | | 81,023 | | | 338,676 |
Kulicke & Soffa Industries, Inc.(b) | | 84,721 | | | 456,646 |
Micrel, Inc. | | 52,589 | | | 431,230 |
Microsemi Corp.(b) | | 100,148 | | | 1,777,627 |
MKS Instruments, Inc.(b) | | 60,529 | | | 1,053,810 |
Pericom Semiconductor Corp.(b) | | 31,188 | | | 359,598 |
Rudolph Technologies, Inc.(b) | | 37,815 | | | 254,117 |
Sigma Designs, Inc.(a)(b) | | 32,700 | | | 349,890 |
Skyworks Solutions, Inc.(a)(b) | | 213,337 | | | 3,027,252 |
Standard Microsystems Corp.(b) | | 27,190 | | | 565,008 |
Supertex, Inc.(b) | | 15,777 | | | 470,155 |
TriQuint Semiconductor, Inc.(b) | | 186,109 | | | 1,116,654 |
Ultratech, Inc.(b) | | 28,900 | | | 429,454 |
Varian Semiconductor Equipment Associates, Inc.(b) | | 90,016 | | | 3,229,774 |
Veeco Instruments, Inc.(a)(b) | | 47,190 | | | 1,559,158 |
| | | | |
|
|
| | | | | | 26,067,257 |
| | | | |
|
|
Software — 3.1% | | | | | |
Blackbaud, Inc. | | 54,041 | | | 1,276,989 |
CommVault Systems, Inc.(b) | | 51,508 | | | 1,220,225 |
Concur Technologies, Inc.(a)(b) | | 52,189 | | | 2,231,080 |
Ebix, Inc.(a)(b) | | 12,318 | | | 601,488 |
Epicor Software Corp.(b) | | 56,296 | | | 428,975 |
SEE NOTES TO FINANCIAL STATEMENTS.
A121
| | | | | | |
| | | SMALL CAPITALIZATION STOCK PORTFOLIO (continued) | | |
| |
| SCHEDULE OF INVESTMENTS | | December 31, 2009 |
| | | | | |
COMMON STOCKS
(continued) | | Shares
| | Value
(Note 2)
|
| | | | | | |
Software (continued) | | | | | |
EPIQ Systems, Inc.(b) | | 39,767 | | $ | 556,340 |
JDA Software Group, Inc.(b) | | 37,135 | | | 945,828 |
Manhattan Associates, Inc.(b) | | 27,517 | | | 661,233 |
Netscout Systems, Inc.(b) | | 41,704 | | | 610,547 |
Phoenix Technologies Ltd.(b) | | 42,792 | | | 117,678 |
Progress Software Corp.(b) | | 49,140 | | | 1,435,379 |
Radiant Systems, Inc.(b) | | 33,612 | | | 349,565 |
Smith Micro Software, Inc.(b) | | 36,251 | | | 331,334 |
Sonic Solutions, Inc.(a)(b) | | 36,378 | | | 430,352 |
Take-Two Interactive Software, Inc.(a)(b) | | 99,281 | | | 997,774 |
Taleo Corp. (Class A Stock)(a)(b) | | 46,903 | | | 1,103,159 |
THQ, Inc.(b) | | 82,580 | | | 416,203 |
Tyler Technologies, Inc.(a)(b) | | 33,825 | | | 673,456 |
Websense, Inc.(b) | | 53,454 | | | 933,307 |
| | | | |
|
|
| | | | | | 15,320,912 |
| | | | |
|
|
Specialty Retail — 4.7% | | | | | |
Big 5 Sporting Goods Corp. | | 26,364 | | | 452,934 |
Brown Shoe Co., Inc. | | 52,342 | | | 516,616 |
Buckle, Inc. (The)(a) | | 31,118 | | | 911,135 |
Cabela’s, Inc.(a)(b) | | 49,319 | | | 703,289 |
Cato Corp. (The) (Class A Stock) | | 36,161 | | | 725,390 |
Childrens Place Retail Stores, Inc. (The)(a)(b) | | 33,515 | | | 1,106,330 |
Christopher & Banks Corp. | | 44,024 | | | 335,463 |
Dress Barn, Inc.(a)(b) | | 66,655 | | | 1,539,730 |
Finish Line, Inc. (The) (Class A Stock) | | 68,923 | | | 864,984 |
Genesco, Inc.(b) | | 27,755 | | | 762,152 |
Group 1 Automotive, Inc.(a)(b) | | 29,593 | | | 838,962 |
Gymboree Corp.(a)(b) | | 36,556 | | | 1,589,820 |
Haverty Furniture Cos., Inc. | | 22,865 | | | 313,936 |
Hibbett Sports, Inc.(a)(b) | | 35,013 | | | 769,936 |
Hot Topic, Inc.(b) | | 54,156 | | | 344,432 |
Jo-Ann Stores, Inc.(b) | | 32,769 | | | 1,187,549 |
Jos. A. Bank Clothiers, Inc.(a)(b) | | 22,354 | | | 943,115 |
Lithia Motors, Inc. (Class A Stock)(b) | | 25,880 | | | 212,734 |
Lumber Liquidators, Inc.(a)(b) | | 19,000 | | | 509,200 |
MarineMax, Inc.(b) | | 25,942 | | | 238,407 |
Men’s Wearhouse, Inc. (The) | | 63,839 | | | 1,344,449 |
Midas, Inc.(b) | | 17,422 | | | 147,216 |
Monro Muffler Brake, Inc. | | 24,112 | | | 806,305 |
OfficeMax, Inc.(b) | | 93,248 | | | 1,183,317 |
Pep Boys-Manny Moe & Jack | | 56,926 | | | 481,594 |
Sonic Automotive, Inc. (Class A Stock)(b) | | 48,416 | | | 503,042 |
Stage Stores, Inc. | | 46,558 | | | 575,457 |
Stein Mart, Inc.(b) | | 31,947 | | | 340,555 |
Tractor Supply Co.(a)(b) | | 44,225 | | | 2,342,156 |
Zale Corp.(a)(b) | | 28,989 | | | 78,850 |
Zumiez, Inc.(a)(b) | | 25,499 | | | 324,347 |
| | | | |
|
|
| | | | | | 22,993,402 |
| | | | |
|
|
Textiles, Apparel & Luxury Goods — 2.5% | | | |
Carter’s, Inc.(b) | | 69,488 | | | 1,824,060 |
CROCS, Inc.(b) | | 104,731 | | | 602,203 |
Deckers Outdoor Corp.(a)(b) | | 15,754 | | | 1,602,497 |
Iconix Brand Group, Inc.(a)(b) | | 87,312 | | | 1,104,497 |
| | | | | | |
COMMON STOCKS
(continued) | | Shares
| | Value
(Note 2)
|
| | | | | | | |
Textiles, Apparel & Luxury Goods (continued) | | | |
K-Swiss, Inc. (Class A Stock)(b) | | | 33,015 | | $ | 328,169 |
Liz Claiborne, Inc.(a)(b) | | | 116,158 | | | 653,970 |
Maidenform Brands, Inc.(b) | | | 23,755 | | | 396,471 |
Movado Group, Inc. | | | 21,835 | | | 212,236 |
Oxford Industries, Inc. | | | 16,962 | | | 350,774 |
Perry Ellis International, Inc.(b) | | | 12,411 | | | 186,910 |
Quiksilver, Inc.(b) | | | 157,282 | | | 317,710 |
Skechers U.S.A., Inc. (Class A Stock)(b) | | | 40,911 | | | 1,203,192 |
True Religion Apparel, Inc.(a)(b) | | | 31,004 | | | 573,264 |
Unifirst Corp. | | | 17,555 | | | 844,571 |
Volcom, Inc.(a)(b) | | | 20,265 | | | 339,236 |
Wolverine World Wide, Inc. | | | 60,619 | | | 1,650,049 |
| | | | | |
|
|
| | | | | | | 12,189,809 |
| | | | | |
|
|
Thrifts & Mortgage Finance — 0.4% | | | | | | |
Bank Mutual Corp. | | | 56,774 | | | 392,876 |
Brookline Bancorp, Inc. | | | 72,188 | | | 715,383 |
Dime Community Bancshares | | | 31,111 | | | 364,621 |
Trustco Bank Corp. NY(a) | | | 93,680 | | | 590,184 |
| | | | | |
|
|
| | | | | | | 2,063,064 |
| | | | | |
|
|
Tobacco — 0.1% | | | | | | |
Alliance One International, Inc.(a)(b) | | | 108,925 | | | 531,554 |
| | | | | |
|
|
Trading Companies & Distributors — 0.8% | | | |
Applied Industrial Technologies, Inc. | | | 45,593 | | | 1,006,237 |
Kaman Corp. | | | 31,543 | | | 728,328 |
Lawson Products, Inc. | | | 4,838 | | | 85,391 |
Watsco, Inc. | | | 39,230 | | | 1,921,485 |
| | | | | |
|
|
| | | | | | | 3,741,441 |
| | | | | |
|
|
Water Utilities — 0.2% | | | | | | |
American States Water Co. | | | 22,691 | | | 803,488 |
| | | | | |
|
|
Wireless Telecommunication Services — 0.1% | | | |
USA Mobility, Inc. | | | 27,612 | | | 304,008 |
| | | | | |
|
|
TOTAL LONG-TERM INVESTMENTS
(cost $471,725,547) | | | 491,418,907 |
| | | | | |
|
|
| SHORT-TERM INVESTMENTS — 21.6% |
| | | Principal
Amount
(000)
| | |
U.S Government Obligation | | | | | | |
U.S. Treasury Bill,
0.041%, 03/18/10(e)(f)
(cost $199,983) | | $ | 200 | | | 199,980 |
| | | | | |
|
|
SEE NOTES TO FINANCIAL STATEMENTS.
A122
| | | | | | |
| | | SMALL CAPITALIZATION STOCK PORTFOLIO (continued) | | |
| |
| SCHEDULE OF INVESTMENTS | | December 31, 2009 |
| | | | | | |
| | |
SHORT-TERM INVESTMENTS
(continued) | | Shares
| | Value
(Note 2)
| |
| | | | | | | |
Affiliated Money Market Mutual Fund — 21.5% | | | | |
Dryden Core Investment Fund — Taxable Money Market Series (cost $105,938,891; includes $105,538,590 of cash collateral received for securities on loan)(c)(d) | | 105,938,891 | | $ | 105,938,891 | |
| | | | |
|
|
|
TOTAL SHORT-TERM INVESTMENTS
(cost $106,138,874) | | | 106,138,871 | |
| | | | |
|
|
|
TOTAL INVESTMENTS — 121.4%
(cost $577,864,421) | | | 597,557,778 | |
LIABILITIES IN EXCESS OF
OTHER ASSETS(g) — (21.4)% | | | (105,390,262 | ) |
| | | | |
|
|
|
NET ASSETS — 100.0% | | $ | 492,167,516 | |
| | | | |
|
|
|
| (a) | All or a portion of security is on loan. The aggregate market value of such securities is $101,244,032; cash collateral of $105,538,590 (included in liabilities) was received with which the Portfolio purchased highly liquid short-term investments. |
| (b) | Non-income producing security. |
| (c) | Represents security, or a portion thereof, purchased with cash collateral received for securities on loan. |
| (d) | Prudential Investments LLC, the manager of the Portfolio, also serves as manager of the Dryden Core Investment Fund-Taxable Money Market Series. |
| (e) | Security segregated as collateral for futures contracts. |
| (f) | Rate quoted represents yield-to-maturity as of purchase date. |
| (g) | Liabilities in excess of other assets include net unrealized appreciation on financial futures contracts as follows: |
Open futures contracts outstanding at December 31, 2009:
| | | | | | | | | | | | | |
Number of
Contracts
| | Type
| | Expiration
Date
| | Value at
Trade Date
| | Value at
December 31, 2009
| | Unrealized
Appreciation
|
| Long Position: | | | | | | | | | | | | | |
| 16 | | Russell 2000 | | Mar. 2010 | | $ | 951,164 | | $ | 998,240 | | $ | 47,076 |
| | | | | | | | | | | | |
|
|
Various inputs are used in determining the value of the Portfolio’s investments. These inputs are summarized in the three broad levels listed below.
Level 1—quoted prices in active markets for identical securities
Level 2—other significant observable inputs (including quoted prices for similar securities, interest rates, prepayment speeds, credit risk, etc.)
Level 3—significant unobservable inputs (including the Portfolio’s own assumptions in determining the fair value of investments)
The following is a summary of the inputs used as of December 31, 2009 in valuing the Portfolio’s assets carried at fair value:
| | | | | | | | | |
| | | Level 1
| | Level 2
| | Level 3
|
Investments in Securities
| | | | | | | | | |
Common Stocks | | $ | 491,418,907 | | $ | — | | $ | — |
U.S. Government Obligation | | | — | | | 199,980 | | | — |
Affiliated Money Market Mutual Fund | | | 105,938,891 | | | — | | | — |
| | |
|
| |
|
| |
|
|
| | | | 597,357,798 | | | 199,980 | | | — |
Other Financial Instruments* | | | 47,076 | | | | | | |
| | |
|
| |
|
| |
|
|
Total | | $ | 597,404,874 | | $ | 199,980 | | $ | — |
| | |
|
| |
|
| |
|
|
| * | Other financial instruments are derivative instruments not reflected in the Schedule of Investments, such as futures, forwards and swap contracts, which are valued at the unrealized appreciation/depreciation on the instrument. |
As of December 31, 2008 and December 31, 2009, the Portfolio did not use any significant unobservable inputs (Level 3) in determining the value of investments.
SEE NOTES TO FINANCIAL STATEMENTS.
A123
| | | | | | |
| | | SMALL CAPITALIZATION STOCK PORTFOLIO (continued) | | |
| |
| SCHEDULE OF INVESTMENTS | | December 31, 2009 |
The industry classification of portfolio holdings and liabilities in excess of other assets shown as a percentage of net assets as of December 31, 2009 was as follows:
| | | |
Affiliated Money Market Mutual Fund (including 21.4% of collateral received for securities on loan) | | 21.5 | % |
Real Estate Investment Trusts | | 6.4 | |
Commercial Banks | | 6.0 | |
Healthcare Providers & Services | | 6.0 | |
Semiconductors & Semiconductor Equipment | | 5.3 | |
Specialty Retail | | 4.7 | |
Machinery | | 4.2 | |
Healthcare Equipment & Supplies | | 4.1 | |
Electronic Equipment & Instruments | | 3.4 | |
Energy Equipment & Services | | 3.2 | |
Software | | 3.1 | |
Hotels, Restaurants & Leisure | | 2.9 | |
Aerospace & Defense | | 2.8 | |
Insurance | | 2.8 | |
Commercial Services & Supplies | | 2.5 | |
Textiles, Apparel & Luxury Goods | | 2.5 | |
Communications Equipment | | 2.1 | |
Chemicals | | 2.0 | |
Electrical Equipment | | 2.0 | |
Gas Utilities | | 2.0 | |
Oil, Gas & Consumable Fuels | | 2.0 | |
IT Services | | 1.9 | |
Capital Markets | | 1.6 | |
Food Products | | 1.5 | |
Leisure Equipment & Products | | 1.2 | |
Biotechnology | | 1.1 | |
Diversified Consumer Services | | 1.1 | |
Food & Staples Retailing | | 1.1 | |
Building Products | | 1.0 | |
Computers & Peripherals | | 1.0 | |
Electric Utilities | | 1.0 | |
Household Durables | | 1.0 | |
| | | |
Construction & Engineering | | 0.9 | % |
Healthcare Technology | | 0.9 | |
Internet & Catalog Retail | | 0.9 | |
Internet Software & Services | | 0.9 | |
Paper & Forest Products | | 0.9 | |
Professional Services | | 0.9 | |
Road & Rail | | 0.9 | |
Consumer Finance | | 0.8 | |
Life Sciences Tools & Services | | 0.8 | |
Metals & Mining | | 0.8 | |
Trading Companies & Distributors | | 0.8 | |
Pharmaceuticals | | 0.7 | |
Construction Materials | | 0.6 | |
Containers & Packaging | | 0.5 | |
Diversified Telecommunication Services | | 0.5 | |
Multi-Utilities | | 0.5 | |
Personal Products | | 0.5 | |
Air Freight & Logistics | | 0.4 | |
Airlines | | 0.4 | |
Diversified Financial Services | | 0.4 | |
Media | | 0.4 | |
Thrifts & Mortgage Finance | | 0.4 | |
Auto Components | | 0.3 | |
Household Products | | 0.3 | |
Real Estate Management & Development | | 0.2 | |
Water Utilities | | 0.2 | |
Automobiles | | 0.1 | |
Beverages | | 0.1 | |
Industrial Conglomerates | | 0.1 | |
Multiline Retail | | 0.1 | |
Tobacco | | 0.1 | |
Wireless Telecommunication Services | | 0.1 | |
| | |
|
|
| | | 121.4 | |
Liabilities in excess of other assets | | (21.4 | ) |
| | |
|
|
| | | 100.0 | % |
| | |
|
|
The Portfolio invested in derivative instruments during the reporting period. The primary types of risk associated with derivative instruments are commodity risk, credit risk, equity risk, foreign exchange risk and interest rate risk. The effect of such derivative instruments on the Portfolio’s financial position and financial performance as reflected in the Statement of Assets and Liabilities and Statement of Operations is presented in the summary below.
Fair values of derivative instruments as of December 31, 2009 as presented in the Statement of Assets and Liabilities:
| | | | | | | | | | | |
Derivatives not designated as
hedging instruments, carried at
fair value
| | Asset Derivatives
| | | Liability Derivatives
|
| | Balance Sheet Location
| | Fair
Value
| | | Balance Sheet Location
| | Fair
Value
|
Equity contracts | | Due to broker—variation margin | | $ | 47,076 | * | | — | | $ | — |
| * | Includes cumulative appreciation/depreciation on futures contracts as reported in Schedule of Investments. Only unsettled variation margin receivable (payable) is reported within the Statement of Assets and Liabilities. |
SEE NOTES TO FINANCIAL STATEMENTS.
A124
| | | | | | |
| | | SMALL CAPITALIZATION STOCK PORTFOLIO (continued) | | |
| |
| SCHEDULE OF INVESTMENTS | | December 31, 2009 |
The effects of derivative instruments on the Statement of Operations for the year ended December 31, 2009 are as follows:
| | | | |
Amount of Realized Gain or (Loss) on Derivatives Recognized in Income
| |
Derivatives not designated as hedging
instruments, carried at fair value
| | Futures
| |
Equity contracts | | $ | 1,409,652 | |
| | |
|
|
|
|
Change in Unrealized Appreciation or (Depreciation) on Derivatives Recognized in Income
| |
Derivatives not designated as hedging
instruments, carried at fair value
| | Futures
| |
Equity contracts | | $ | (108,287 | ) |
| | |
|
|
|
For the year ended December 31, 2009, the average value at trade date for futures long position was $2,807,791.
SEE NOTES TO FINANCIAL STATEMENTS.
A125
| | | | | | |
| | | SMALL CAPITALIZATION STOCK PORTFOLIO (continued) | | |
STATEMENT OF ASSETS AND LIABILITIES
December 31, 2009
| | | |
| ASSETS | | | |
Investments, at value including securities on loan of $101,244,032: | | | |
Unaffiliated investments (cost $471,925,530) | | $ | 491,618,887 |
Affiliated investments (cost $105,938,891) | | | 105,938,891 |
Cash | | | 5,680 |
Dividends and interest receivable | | | 545,492 |
Prepaid expenses | | | 4,796 |
Receivable for Series shares sold | | | 672 |
| | |
|
|
Total Assets | | | 598,114,418 |
| | |
|
|
| LIABILITIES | | | |
Collateral for securities on loan | | | 105,538,590 |
Management fee payable | | | 163,146 |
Payable for Series shares repurchased | | | 120,616 |
Accrued expenses and other liabilities | | | 112,367 |
Due to broker—variation margin | | | 11,588 |
Affiliated transfer agent fee payable | | | 595 |
| | |
|
|
Total Liabilities | | | 105,946,902 |
| | |
|
|
| NET ASSETS | | $ | 492,167,516 |
| | |
|
|
Net assets were comprised of: | | | |
Paid-in capital | | $ | 491,891,741 |
Retained earnings | | | 275,775 |
| | |
|
|
Net assets, December 31, 2009 | | $ | 492,167,516 |
| | |
|
|
Net asset value and redemption price per share, $492,167,516 / 35,582,178 outstanding shares of beneficial interest | | $ | 13.83 |
| | |
|
|
STATEMENT OF OPERATIONS
Year Ended December 31, 2009
| | | | |
| INVESTMENT INCOME | | | | |
Unaffiliated dividend income (net of foreign withholding taxes of $1,354) | | $ | 5,531,456 | |
Affiliated income from securities loaned, net | | | 848,935 | |
Affiliated dividend income | | | 11,149 | |
Interest | | | 588 | |
| | |
|
|
|
| | | | 6,392,128 | |
| | |
|
|
|
| EXPENSES | | | | |
Management fee | | | 1,686,507 | |
Custodian’s fees and expenses | | | 150,000 | |
Shareholders’ reports | | | 113,000 | |
Audit fee | | | 17,000 | |
Trustees’ fees | | | 14,000 | |
Insurance expenses | | | 10,000 | |
Transfer agent’s fee and expenses (including affiliated expense of $3,600) (Note 4) | | | 10,000 | |
Legal fees and expenses | | | 8,000 | |
Commitment fee on syndicated credit agreement | | | 4,000 | |
Loan interest expense (Note 8) | | | 892 | |
Miscellaneous | | | 47,234 | |
| | |
|
|
|
Total expenses | | | 2,060,633 | |
| | |
|
|
|
| NET INVESTMENT INCOME | | | 4,331,495 | |
| | |
|
|
|
| NET REALIZED AND UNREALIZED GAIN (LOSS) ON INVESTMENTS | | | | |
Net realized gain (loss) on: | | | | |
Investment transactions | | | (16,598,507 | ) |
Futures transactions | | | 1,409,652 | |
| | |
|
|
|
| | | | (15,188,855 | ) |
| | |
|
|
|
Net change in unrealized appreciation (depreciation) on: | | | | |
Investments | | | 110,291,856 | |
Futures | | | (108,287 | ) |
| | |
|
|
|
| | | | 110,183,569 | |
| | |
|
|
|
| NET GAIN ON INVESTMENTS | | | 94,994,714 | |
| | |
|
|
|
| NET INCREASE IN NET ASSETS RESULTING FROM OPERATIONS | | $ | 99,326,209 | |
| | |
|
|
|
STATEMENT OF CHANGES IN NET ASSETS
| | | | | | | | |
| | | Year Ended December 31,
| |
| | | 2009
| | | 2008
| |
INCREASE (DECREASE) IN NET ASSETS
OPERATIONS: | | | | | | | | |
Net investment income | | $ | 4,331,495 | | | $ | 7,786,485 | |
Net realized gain (loss) on investments | | | (15,188,855 | ) | | | 42,259,695 | |
Net change in unrealized appreciation (depreciation) on investments | | | 110,183,569 | | | | (254,521,426 | ) |
| | |
|
|
| |
|
|
|
NET INCREASE (DECREASE) IN NET ASSETS RESULTING FROM OPERATIONS | | | 99,326,209 | | | | (204,475,246 | ) |
| | |
|
|
| |
|
|
|
| DISTRIBUTIONS | | | (50,038,749 | ) | | | (96,751,216 | ) |
| | |
|
|
| |
|
|
|
| SERIES SHARE TRANSACTIONS: | | | | | | | | |
Series shares sold [777,306 and 776,306 shares, respectively] | | | 9,044,644 | | | | 13,229,598 | |
Series shares issued in reinvestment of dividends and distributions [4,374,017 and 5,411,142 shares, respectively] | | | 50,038,749 | | | | 96,751,216 | |
Series shares repurchased [4,126,316 and 4,453,912 shares, respectively] | | | (48,713,794 | ) | | | (75,813,375 | ) |
| | |
|
|
| |
|
|
|
NET INCREASE IN NET ASSETS RESULTING FROM SERIES SHARE TRANSACTIONS | | | 10,369,599 | | | | 34,167,439 | |
| | |
|
|
| |
|
|
|
| TOTAL INCREASE (DECREASE) IN NET ASSETS | | | 59,657,059 | | | | (267,059,023 | ) |
| NET ASSETS: | | | | | | | | |
Beginning of year | | | 432,510,457 | | | | 699,569,480 | |
| | |
|
|
| |
|
|
|
End of year | | $ | 492,167,516 | | | $ | 432,510,457 | |
| | |
|
|
| |
|
|
|
SEE NOTES TO FINANCIAL STATEMENTS.
A126
| | | | | | |
| | | STOCK INDEX PORTFOLIO | | |
| |
| SCHEDULE OF INVESTMENTS | | December 31, 2009 |
| | | | | |
| LONG-TERM INVESTMENTS — 98.5% |
| COMMON STOCKS — 98.5% | | Shares
| | Value
(Note 2)
|
| | | | | | |
Aerospace & Defense — 2.7% | | | | | |
Boeing Co. (The) | | 148,836 | | $ | 8,056,493 |
General Dynamics Corp. | | 82,800 | | | 5,644,476 |
Goodrich Corp. | | 22,900 | | | 1,471,325 |
Honeywell International, Inc. | | 156,650 | | | 6,140,680 |
ITT Corp. | | 37,600 | | | 1,870,224 |
L-3 Communications Holdings, Inc. | | 24,600 | | | 2,138,970 |
Lockheed Martin Corp. | | 68,598 | | | 5,168,859 |
Northrop Grumman Corp. | | 70,826 | | | 3,955,632 |
Precision Castparts Corp. | | 28,000 | | | 3,089,800 |
Raytheon Co. | | 85,718 | | | 4,416,191 |
Rockwell Collins, Inc. | | 30,600 | | | 1,694,016 |
United Technologies Corp. | | 196,100 | | | 13,611,301 |
| | | | |
|
|
| | | | | | 57,257,967 |
| | | | |
|
|
Air Freight & Logistics — 1.0% | | | | | |
C.H. Robinson Worldwide, Inc. | | 38,200 | | | 2,243,486 |
Expeditors International of Washington, Inc. | | 41,600 | | | 1,444,768 |
FedEx Corp. | | 64,740 | | | 5,402,553 |
United Parcel Service, Inc. (Class B Stock) | | 209,400 | | | 12,013,278 |
| | | | |
|
|
| | | | | | 21,104,085 |
| | | | |
|
|
Airlines — 0.1% | | | | | |
Southwest Airlines Co. | | 164,137 | | | 1,876,086 |
| | | | |
|
|
Auto Components — 0.2% | | | | | |
Goodyear Tire & Rubber Co. (The)(a) | | 49,600 | | | 699,360 |
Johnson Controls, Inc. | | 141,300 | | | 3,849,012 |
| | | | |
|
|
| | | | | | 4,548,372 |
| | | | |
|
|
Automobiles — 0.4% | | | | | |
Ford Motor Co.(a)(b) | | 670,659 | | | 6,706,590 |
Harley-Davidson, Inc. | | 48,300 | | | 1,217,160 |
| | | | |
|
|
| | | | | | 7,923,750 |
| | | | |
|
|
Beverages — 2.6% | | | | | |
Brown-Forman Corp. (Class B Stock) | | 20,500 | | | 1,098,185 |
Coca-Cola Co. (The)(b) | | 482,400 | | | 27,496,800 |
Coca-Cola Enterprises, Inc. | | 69,000 | | | 1,462,800 |
Constellation Brands, Inc. (Class A Stock)(a) | | 43,200 | | | 688,176 |
Dr. Pepper Snapple Group, Inc. | | 50,600 | | | 1,431,980 |
Molson Coors Brewing Co. (Class B Stock) | | 31,100 | | | 1,404,476 |
Pepsi Bottling Group, Inc. | | 28,600 | | | 1,072,500 |
PepsiCo, Inc. | | 323,640 | | | 19,677,312 |
| | | | |
|
|
| | | | | | 54,332,229 |
| | | | |
|
|
Biotechnology — 1.5% | | | | | |
Amgen, Inc.(a) | | 211,364 | | | 11,956,861 |
Biogen Idec, Inc.(a)(b) | | 61,225 | | | 3,275,538 |
Celgene Corp.(a) | | 92,900 | | | 5,172,672 |
Cephalon, Inc.(a) | | 15,400 | | | 961,114 |
Genzyme Corp.(a) | | 51,900 | | | 2,543,619 |
Gilead Sciences, Inc.(a) | | 189,600 | | | 8,205,888 |
| | | | |
|
|
| | | | | | 32,115,692 |
| | | | |
|
|
Building Products — 0.1% | | | | | |
Masco Corp. | | 81,300 | | | 1,122,753 |
| | | | |
|
|
| | | | | |
COMMON STOCKS
(continued) | | Shares
| | Value
(Note 2)
|
| | | | | | |
Capital Markets — 2.8% | | | | | |
Ameriprise Financial, Inc. | | 51,600 | | $ | 2,003,112 |
Bank of New York Mellon Corp. (The) | | 254,989 | | | 7,132,042 |
Charles Schwab Corp. (The) | | 196,600 | | | 3,700,012 |
E*Trade Financial Corp.(a)(b) | | 252,400 | | | 441,700 |
Federated Investors, Inc. (Class B Stock)(b) | | 22,600 | | | 621,500 |
Franklin Resources, Inc. | | 33,100 | | | 3,487,085 |
Goldman Sachs Group, Inc. (The) | | 108,500 | | | 18,319,140 |
Invesco Ltd. | | 91,400 | | | 2,146,986 |
Janus Capital Group, Inc.(b) | | 39,000 | | | 524,550 |
Legg Mason, Inc. | | 32,600 | | | 983,216 |
Morgan Stanley | | 288,110 | | | 8,528,056 |
Northern Trust Corp. | | 51,000 | | | 2,672,400 |
State Street Corp. | | 104,900 | | | 4,567,346 |
T. Rowe Price Group, Inc.(b) | | 57,000 | | | 3,035,250 |
| | | | |
|
|
| | | | | | 58,162,395 |
| | | | |
|
|
Chemicals — 1.9% | | | | | |
Air Products & Chemicals, Inc. | | 44,700 | | | 3,623,382 |
Airgas, Inc. | | 14,400 | | | 685,440 |
CF Industries Holdings, Inc., | | 10,000 | | | 907,800 |
Dow Chemical Co. (The) | | 232,061 | | | 6,411,845 |
E.I. du Pont de Nemours & Co. | | 184,391 | | | 6,208,445 |
Eastman Chemical Co. | | 15,800 | | | 951,792 |
Ecolab, Inc. | | 50,000 | | | 2,229,000 |
FMC Corp. | | 15,300 | | | 853,128 |
International Flavors & Fragrances, Inc. | | 16,100 | | | 662,354 |
Monsanto Co. | | 111,596 | | | 9,122,973 |
PPG Industries, Inc. | | 35,800 | | | 2,095,732 |
Praxair, Inc. | | 64,300 | | | 5,163,933 |
Sigma-Aldrich Corp. | | 25,700 | | | 1,298,621 |
| | | | |
|
|
| | | | | | 40,214,445 |
| | | | |
|
|
Commercial Banks — 2.7% | | | | | |
BB&T Corp.(b) | | 142,200 | | | 3,607,614 |
Comerica, Inc. | | 36,450 | | | 1,077,827 |
Fifth Third Bancorp | | 163,649 | | | 1,595,578 |
First Horizon National Corp.(a) | | 49,979 | | | 669,721 |
Huntington Bancshares, Inc. | | 130,775 | | | 477,329 |
KeyCorp | | 174,700 | | | 969,585 |
M&T Bank Corp.(b) | | 16,300 | | | 1,090,307 |
Marshall & Ilsley Corp. | | 105,998 | | | 577,689 |
PNC Financial Services Group, Inc. | | 98,993 | | | 5,225,840 |
Regions Financial Corp. | | 252,212 | | | 1,334,202 |
SunTrust Banks, Inc. | | 103,000 | | | 2,089,870 |
U.S. Bancorp | | 407,481 | | | 9,172,397 |
Wells Fargo & Co. | | 1,058,686 | | | 28,573,935 |
Zions Bancorporation(b) | | 30,300 | | | 388,749 |
| | | | |
|
|
| | | | | | 56,850,643 |
| | | | |
|
|
Commercial Services & Supplies — 0.5% | | | |
Avery Dennison Corp. | | 25,400 | | | 926,846 |
Cintas Corp. | | 26,500 | | | 690,325 |
Iron Mountain, Inc.(a) | | 39,200 | | | 892,192 |
Pitney Bowes, Inc. | | 43,500 | | | 990,060 |
Republic Services, Inc. | | 65,410 | | | 1,851,757 |
SEE NOTES TO FINANCIAL STATEMENTS.
A127
| | | | | | |
| | | STOCK INDEX PORTFOLIO (continued) | | |
| |
| SCHEDULE OF INVESTMENTS | | December 31, 2009 |
| | | | | |
COMMON STOCKS
(continued) | | Shares
| | Value
(Note 2)
|
| | | | | | |
Commercial Services & Supplies (continued) | | | |
RR Donnelley & Sons Co. | | 46,600 | | $ | 1,037,782 |
Stericycle, Inc.(a)(b) | | 19,300 | | | 1,064,781 |
Waste Management, Inc.(b) | | 103,530 | | | 3,500,349 |
| | | | |
|
|
| | | | | | 10,954,092 |
| | | | |
|
|
Communications Equipment — 2.6% | | | | | |
Cisco Systems, Inc.(a) | | 1,207,500 | | | 28,907,550 |
Harris Corp. | | 28,200 | | | 1,340,910 |
JDS Uniphase Corp.(a) | | 45,587 | | | 376,093 |
Juniper Networks, Inc.(a)(b) | | 111,200 | | | 2,965,704 |
Motorola, Inc.(a) | | 487,795 | | | 3,785,289 |
QUALCOMM, Inc. | | 342,800 | | | 15,857,928 |
Tellabs, Inc.(a) | | 88,000 | | | 499,840 |
| | | | |
|
|
| | | | | | 53,733,314 |
| | | | |
|
|
Computers & Peripherals — 5.9% | | | | | |
Apple, Inc.(a)(b) | | 188,700 | | | 39,789,282 |
Dell, Inc.(a) | | 365,900 | | | 5,254,324 |
EMC Corp.(a)(b) | | 434,874 | | | 7,597,249 |
Hewlett-Packard Co. | | 496,316 | | | 25,565,237 |
International Business Machines Corp. | | 274,600 | | | 35,945,140 |
Lexmark International, Inc., (Class A Stock)(a) | | 15,514 | | | 403,054 |
NetApp, Inc.(a) | | 72,000 | | | 2,476,080 |
QLogic Corp.(a)(b) | | 27,700 | | | 522,699 |
SanDisk Corp.(a)(b) | | 47,900 | | | 1,388,621 |
Sun Microsystems, Inc.(a) | | 155,950 | | | 1,461,251 |
Teradata Corp.(a) | | 38,200 | | | 1,200,626 |
Western Digital Corp.(a) | | 45,900 | | | 2,026,485 |
| | | | |
|
|
| | | | | | 123,630,048 |
| | | | |
|
|
Construction & Engineering — 0.2% | | | |
Fluor Corp. | | 38,000 | | | 1,711,520 |
Jacobs Engineering Group, Inc.(a)(b) | | 25,700 | | | 966,577 |
Quanta Services, Inc.(a) | | 38,000 | | | 791,920 |
| | | | |
|
|
| | | | | | 3,470,017 |
| | | | |
|
|
Construction Materials — 0.1% | | | |
Vulcan Materials Co. | | 23,700 | | | 1,248,279 |
| | | | |
|
|
Consumer Finance — 0.8% | | | |
American Express Co. | | 252,100 | | | 10,215,092 |
Capital One Financial Corp. | | 96,169 | | | 3,687,119 |
Discover Financial Services | | 120,505 | | | 1,772,629 |
SLM Corp.(a) | | 99,000 | | | 1,115,730 |
| | | | |
|
|
| | | | | | 16,790,570 |
| | | | |
|
|
Containers & Packaging — 0.2% | | | |
Ball Corp. | | 20,400 | | | 1,054,680 |
Bemis Co., Inc. | | 21,300 | | | 631,545 |
Owens-Illinois, Inc.(a) | | 37,100 | | | 1,219,477 |
Pactiv Corp.(a) | | 29,300 | | | 707,302 |
Sealed Air Corp. | | 33,020 | | | 721,817 |
| | | | |
|
|
| | | | | | 4,334,821 |
| | | | |
|
|
Distributors — 0.1% | | | |
Genuine Parts Co. | | 33,025 | | | 1,253,629 |
| | | | |
|
|
| | | | | |
COMMON STOCKS
(continued) | | Shares
| | Value
(Note 2)
|
| | | | | | |
Diversified Consumer Services — 0.2% | | | |
Apollo Group, Inc. (Class A Stock)(a)(b) | | 26,900 | | $ | 1,629,602 |
DeVry, Inc. | | 13,700 | | | 777,201 |
H&R Block, Inc. | | 71,000 | | | 1,606,020 |
| | | | |
|
|
| | | | | | 4,012,823 |
| | | | |
|
|
Diversified Financial Services — 4.3% | | | |
Bank of America Corp.(b) | | 2,076,232 | | | 31,268,054 |
Citigroup, Inc. | | 4,020,676 | | | 13,308,438 |
CME Group, Inc. | | 14,070 | | | 4,726,816 |
IntercontinentalExchange, Inc.(a)(b) | | 16,000 | | | 1,796,800 |
JPMorgan Chase & Co. | | 827,545 | | | 34,483,800 |
Leucadia National Corp.(a) | | 38,900 | | | 925,431 |
Moody’s Corp.(b) | | 42,120 | | | 1,128,816 |
Nasdaq OMX Group, Inc. (The)(a) | | 25,700 | | | 509,374 |
NYSE Euronext | | 56,700 | | | 1,434,510 |
| | | | |
|
|
| | | | | | 89,582,039 |
| | | | |
|
|
Diversified Telecommunication Services — 2.9% | | | |
AT&T, Inc. | | 1,237,811 | | | 34,695,842 |
CenturyTel, Inc.(b) | | 63,130 | | | 2,285,937 |
Frontier Communications Corp. | | 77,200 | | | 602,932 |
Qwest Communications International, Inc. | | 322,047 | | | 1,355,818 |
Verizon Communications, Inc. | | 600,838 | | | 19,905,763 |
Windstream Corp. | | 90,665 | | | 996,409 |
| | | | |
|
|
| | | | | | 59,842,701 |
| | | | |
|
|
Electric Utilities — 2.0% | | | |
Allegheny Energy, Inc. | | 32,600 | | | 765,448 |
American Electric Power Co., Inc. | | 98,140 | | | 3,414,291 |
Duke Energy Corp. | | 272,082 | | | 4,682,531 |
Edison International | | 68,100 | | | 2,368,518 |
Entergy Corp. | | 38,800 | | | 3,175,392 |
Exelon Corp. | | 135,950 | | | 6,643,877 |
FirstEnergy Corp. | | 61,336 | | | 2,849,057 |
FPL Group, Inc. | | 86,300 | | | 4,558,366 |
Northeast Utilities | | 31,100 | | | 802,069 |
Pepco Holdings, Inc. | | 47,400 | | | 798,690 |
Pinnacle West Capital Corp. | | 20,900 | | | 764,522 |
PPL Corp. | | 78,500 | | | 2,536,335 |
Progress Energy, Inc. | | 58,414 | | | 2,395,558 |
Southern Co. | | 164,100 | | | 5,467,812 |
| | | | |
|
|
| | | | | | 41,222,466 |
| | | | |
|
|
Electrical Equipment — 0.5% | | | |
Emerson Electric Co. | | 159,600 | | | 6,798,960 |
First Solar, Inc.(a)(b) | | 8,500 | | | 1,150,900 |
Rockwell Automation, Inc. | | 30,300 | | | 1,423,494 |
Roper Industries, Inc. | | 14,900 | | | 780,313 |
| | | | |
|
|
| | | | | | 10,153,667 |
| | | | |
|
|
Electronic Equipment & Instruments — 0.6% | | | |
Agilent Technologies, Inc.(a)(b) | | 71,582 | | | 2,224,053 |
Amphenol Corp. (Class A Stock) | | 33,100 | | | 1,528,558 |
Corning, Inc. | | 326,500 | | | 6,304,715 |
FLIR Systems, Inc.(a) | | 30,700 | | | 1,004,504 |
Jabil Circuit, Inc. | | 44,000 | | | 764,280 |
Molex, Inc. | | 26,600 | | | 573,230 |
| | | | |
|
|
| | | | | | 12,399,340 |
| | | | |
|
|
SEE NOTES TO FINANCIAL STATEMENTS.
A128
| | | | | | |
| | | STOCK INDEX PORTFOLIO (continued) | | |
| |
| SCHEDULE OF INVESTMENTS | | December 31, 2009 |
| | | | | |
COMMON STOCKS
(continued) | | Shares
| | Value
(Note 2)
|
| | | | | | |
Energy Equipment & Services — 1.8% | | | |
Baker Hughes, Inc.(b) | | 61,130 | | $ | 2,474,542 |
BJ Services Co. | | 54,300 | | | 1,009,980 |
Cameron International Corp.(a) | | 48,100 | | | 2,010,580 |
Diamond Offshore Drilling, Inc. | | 13,600 | | | 1,338,512 |
FMC Technologies, Inc.(a) | | 24,500 | | | 1,417,080 |
Halliburton Co. | | 183,000 | | | 5,506,470 |
Nabors Industries Ltd. (Bermuda)(a) | | 60,800 | | | 1,330,912 |
National Oilwell Varco, Inc. | | 88,200 | | | 3,888,738 |
Rowan Cos., Inc.(a) | | 24,100 | | | 545,624 |
Schlumberger Ltd. | | 250,600 | | | 16,311,554 |
Smith International, Inc. | | 44,200 | | | 1,200,914 |
| | | | |
|
|
| | | | | | 37,034,906 |
| | | | |
|
|
Food & Staples Retailing — 2.6% | | | |
Costco Wholesale Corp. | | 88,232 | | | 5,220,687 |
CVS Caremark Corp. | | 289,238 | | | 9,316,356 |
Kroger Co. (The) | | 138,700 | | | 2,847,511 |
Safeway, Inc. | | 88,100 | | | 1,875,649 |
SUPERVALU, Inc. | | 47,508 | | | 603,827 |
Sysco Corp. | | 123,700 | | | 3,456,178 |
Walgreen Co. | | 206,400 | | | 7,579,008 |
Wal-Mart Stores, Inc. | | 441,500 | | | 23,598,175 |
Whole Foods Market, Inc.(a)(b) | | 28,300 | | | 776,835 |
| | | | |
|
|
| | | | | | 55,274,226 |
| | | | |
|
|
Food Products — 1.6% | | | |
Archer-Daniels-Midland Co. | | 135,238 | | | 4,234,302 |
Campbell Soup Co. | | 39,300 | | | 1,328,340 |
ConAgra Foods, Inc. | | 94,500 | | | 2,178,225 |
Dean Foods Co.(a)(b) | | 38,800 | | | 699,952 |
General Mills, Inc. | | 69,000 | | | 4,885,890 |
H.J. Heinz Co. | | 65,950 | | | 2,820,022 |
Hershey Co. (The)(b) | | 35,800 | | | 1,281,282 |
Hormel Foods Corp. | | 15,500 | | | 595,975 |
J.M. Smucker Co. (The) | | 25,700 | | | 1,586,975 |
Kellogg Co. | | 54,200 | | | 2,883,440 |
Kraft Foods, Inc. (Class A Stock) | | 308,311 | | | 8,379,893 |
McCormick & Co., Inc. | | 27,600 | | | 997,188 |
Sara Lee Corp. | | 151,100 | | | 1,840,398 |
Tyson Foods, Inc. (Class A Stock) | | 66,600 | | | 817,182 |
| | | | |
|
|
| | | | | | 34,529,064 |
| | | | |
|
|
Gas Utilities — 0.1% | | | |
EQT Corp. | | 25,100 | | | 1,102,392 |
Nicor, Inc. | | 10,200 | | | 429,420 |
Questar Corp. | | 33,200 | | | 1,380,124 |
| | | | |
|
|
| | | | | | 2,911,936 |
| | | | |
|
|
Healthcare Equipment & Supplies — 2.0% | | | |
Baxter International, Inc. | | 126,400 | | | 7,417,152 |
Becton, Dickinson & Co. | | 49,400 | | | 3,895,684 |
Boston Scientific Corp.(a) | | 313,199 | | | 2,818,791 |
C.R. Bard, Inc. | | 21,000 | | | 1,635,900 |
CareFusion Corp.(a) | | 36,237 | | | 906,287 |
DENTSPLY International, Inc. | | 31,700 | | | 1,114,889 |
Hospira, Inc.(a) | | 35,420 | | | 1,806,420 |
Intuitive Surgical, Inc.(a) | | 8,100 | | | 2,456,892 |
Medtronic, Inc. | | 231,900 | | | 10,198,962 |
St. Jude Medical, Inc.(a) | | 68,800 | | | 2,530,464 |
| | | | | |
COMMON STOCKS
(continued) | | Shares
| | Value
(Note 2)
|
| | | | | | |
Healthcare Equipment & Supplies (continued) | | | |
Stryker Corp. | | 59,500 | | $ | 2,997,015 |
Varian Medical Systems, Inc.(a)(b) | | 23,300 | | | 1,091,605 |
Zimmer Holdings, Inc.(a) | | 43,986 | | | 2,600,013 |
| | | | |
|
|
| | | | | | 41,470,074 |
| | | | |
|
|
Healthcare Providers & Services — 2.1% | | | |
Aetna, Inc. | | 91,748 | | | 2,908,412 |
AmerisourceBergen Corp. | | 61,300 | | | 1,598,091 |
Cardinal Health, Inc. | | 72,475 | | | 2,336,594 |
CIGNA Corp. | | 59,200 | | | 2,087,984 |
Coventry Health Care, Inc.(a) | | 32,750 | | | 795,497 |
DaVita, Inc.(a) | | 22,100 | | | 1,298,154 |
Express Scripts, Inc.(a) | | 55,800 | | | 4,823,910 |
Humana, Inc.(a) | | 36,100 | | | 1,584,429 |
Laboratory Corp. of America Holdings(a)(b) | | 22,300 | | | 1,668,932 |
McKesson Corp. | | 55,707 | | | 3,481,687 |
Medco Health Solutions, Inc.(a) | | 98,992 | | | 6,326,579 |
Patterson Cos., Inc.(a)(b) | | 17,100 | | | 478,458 |
Quest Diagnostics, Inc. | | 34,800 | | | 2,101,224 |
Tenet Healthcare Corp.(a) | | 90,000 | | | 485,100 |
UnitedHealth Group, Inc. | | 238,000 | | | 7,254,240 |
WellPoint, Inc.(a) | | 100,400 | | | 5,852,316 |
| | | | |
|
|
| | | | | | 45,081,607 |
| | | | |
|
|
Healthcare Technology | | | |
IMS Health, Inc. | | 36,820 | | | 775,429 |
| | | | |
|
|
Hotels, Restaurants & Leisure — 1.4% | | | |
Carnival Corp.(a) | | 89,100 | | | 2,823,579 |
Darden Restaurants, Inc.(b) | | 30,850 | | | 1,081,909 |
International Game Technology | | 56,700 | | | 1,064,259 |
Marriott International, Inc. (Class A Stock)(b) | | 48,703 | | | 1,327,157 |
McDonald’s Corp. | | 222,900 | | | 13,917,876 |
Starbucks Corp.(a)(b) | | 151,100 | | | 3,484,366 |
Starwood Hotels & Resorts Worldwide, Inc.(b) | | 36,000 | | | 1,316,520 |
Wyndham Worldwide Corp. | | 41,363 | | | 834,292 |
Wynn Resorts Ltd. | | 12,000 | | | 698,760 |
Yum! Brands, Inc. | | 99,300 | | | 3,472,521 |
| | | | |
|
|
| | | | | | 30,021,239 |
| | | | |
|
|
Household Durables — 0.3% | | | |
Black & Decker Corp. (The) | | 11,400 | | | 739,062 |
D.R. Horton, Inc. | | 55,200 | | | 600,024 |
Fortune Brands, Inc. | | 31,900 | | | 1,378,080 |
Harman International Industries, Inc. | | 14,100 | | | 497,448 |
Leggett & Platt, Inc. | | 36,800 | | | 750,720 |
Lennar Corp. (Class A Stock) | | 25,500 | | | 325,635 |
Newell Rubbermaid, Inc. | | 64,649 | | | 970,381 |
Pulte Homes, Inc.(a)(b) | | 53,485 | | | 534,850 |
Whirlpool Corp.(b) | | 14,607 | | | 1,178,201 |
| | | | |
|
|
| | | | | | 6,974,401 |
| | | | |
|
|
Household Products — 2.5% | | | |
Clorox Co.(b) | | 28,700 | | | 1,750,700 |
Colgate-Palmolive Co. | | 104,500 | | | 8,584,675 |
Kimberly-Clark Corp. | | 87,988 | | | 5,605,716 |
Procter & Gamble Co. (The) | | 610,981 | | | 37,043,778 |
| | | | |
|
|
| | | | | | 52,984,869 |
| | | | |
|
|
SEE NOTES TO FINANCIAL STATEMENTS.
A129
| | | | | | |
| | | STOCK INDEX PORTFOLIO (continued) | | |
| |
| SCHEDULE OF INVESTMENTS | | December 31, 2009 |
| | | | | |
COMMON STOCKS
(continued) | | Shares
| | Value
(Note 2)
|
| | | | | | |
Independent Power Producers & Energy Traders — 0.2% |
AES Corp. (The)(a) | | 145,300 | | $ | 1,933,943 |
Constellation Energy Group, Inc. | | 43,950 | | | 1,545,722 |
| | | | |
|
|
| | | | | | 3,479,665 |
| | | | |
|
|
Industrial Conglomerates — 2.2% | | | |
3M Co. | | 147,600 | | | 12,202,092 |
General Electric Co. | | 2,214,000 | | | 33,497,820 |
Textron, Inc. | | 48,400 | | | 910,404 |
| | | | |
|
|
| | | | | | 46,610,316 |
| | | | |
|
|
Insurance — 2.2% | | | |
Aflac, Inc. | | 101,900 | | | 4,712,875 |
Allstate Corp. (The) | | 118,388 | | | 3,556,376 |
American International Group, Inc.(a)(b) | | 25,229 | | | 756,365 |
Aon Corp. | | 57,125 | | | 2,190,173 |
Assurant, Inc. | | 24,500 | | | 722,260 |
Chubb Corp. (The), | | 75,000 | | | 3,688,500 |
Cincinnati Financial Corp. | | 39,028 | | | 1,024,095 |
Genworth Financial, Inc. (Class A Stock)(a) | | 105,200 | | | 1,194,020 |
Hartford Financial Services Group, Inc. | | 79,000 | | | 1,837,540 |
Lincoln National Corp. | | 62,963 | | | 1,566,519 |
Loews Corp. | | 73,226 | | | 2,661,765 |
Marsh & McLennan Cos., Inc. | | 114,700 | | | 2,532,576 |
MetLife, Inc. | | 175,000 | | | 6,186,250 |
Principal Financial Group, Inc. | | 65,500 | | | 1,574,620 |
Progressive Corp. (The)(a) | | 134,000 | | | 2,410,660 |
Torchmark Corp. | | 21,300 | | | 936,135 |
Travelers Cos., Inc. (The) | | 119,498 | | | 5,958,170 |
Unum Group | | 75,756 | | | 1,478,757 |
XL Capital Ltd. (Class A Stock) | | 74,300 | | | 1,361,919 |
| | | | |
|
|
| | | | | | 46,349,575 |
| | | | |
|
|
Internet & Catalog Retail — 0.6% | | | |
Amazon.com, Inc.(a) | | 69,300 | | | 9,322,236 |
Expedia, Inc.(a)(b) | | 44,900 | | | 1,154,379 |
priceline.com, Inc.(a) | | 8,700 | | | 1,900,950 |
| | | | |
|
|
| | | | | | 12,377,565 |
| | | | |
|
|
Internet Software & Services — 2.0% | | | |
Akamai Technologies, Inc.(a)(b) | | 36,100 | | | 914,413 |
eBay, Inc.(a) | | 229,900 | | | 5,411,846 |
Google, Inc. (Class A Stock)(a) | | 50,600 | | | 31,370,988 |
VeriSign, Inc.(a)(b) | | 41,300 | | | 1,001,112 |
Yahoo!, Inc.(a) | | 248,200 | | | 4,164,796 |
| | | | |
|
|
| | | | | | 42,863,155 |
| | | | |
|
|
IT Services — 1.6% | | | |
Affiliated Computer Services, Inc. (Class A Stock)(a) | | 19,700 | | | 1,175,893 |
Automatic Data Processing, Inc. | | 106,000 | | | 4,538,920 |
Cognizant Technology Solutions Corp. (Class A Stock)(a) | | 58,400 | | | 2,645,520 |
Computer Sciences Corp.(a) | | 31,900 | | | 1,835,207 |
Fidelity National Information Services, Inc. | | 63,600 | | | 1,490,784 |
Fiserv, Inc.(a) | | 33,000 | | | 1,599,840 |
| | | | | |
COMMON STOCKS
(continued) | | Shares
| | Value
(Note 2)
|
| | | | | | |
IT Services (continued) | | | |
Mastercard, Inc. (Class A Stock)(b) | | 20,200 | | $ | 5,170,796 |
Paychex, Inc. | | 63,250 | | | 1,937,980 |
SAIC, Inc.(a) | | 50,600 | | | 958,364 |
Total System Services, Inc. | | 41,593 | | | 718,311 |
Visa, Inc. (Class A Stock) | | 92,000 | | | 8,046,320 |
Western Union Co. (The) | | 153,704 | | | 2,897,321 |
| | | | |
|
|
| | | | | | 33,015,256 |
| | | | |
|
|
Leisure Equipment & Products — 0.1% | | | |
Eastman Kodak Co.(a)(b) | | 30,000 | | | 126,600 |
Hasbro, Inc. | | 27,150 | | | 870,429 |
Mattel, Inc. | | 73,281 | | | 1,464,154 |
| | | | |
|
|
| | | | | | 2,461,183 |
| | | | |
|
|
Life Sciences Tools & Services — 0.4% | | | |
Life Technologies Corp.(a)(b) | | 37,430 | | | 1,954,969 |
Millipore Corp.(a) | | 12,500 | | | 904,375 |
PerkinElmer, Inc. | | 27,200 | | | 560,048 |
Thermo Fisher Scientific, Inc.(a) | | 89,100 | | | 4,249,179 |
Waters Corp.(a)(b) | | 20,000 | | | 1,239,200 |
| | | | |
|
|
| | | | | | 8,907,771 |
| | | | |
|
|
Machinery — 1.6% | | | |
Caterpillar, Inc.(b) | | 128,600 | | | 7,328,914 |
Cummins, Inc. | | 40,600 | | | 1,861,916 |
Danaher Corp. | | 55,500 | | | 4,173,600 |
Deere & Co. | | 85,800 | | | 4,640,922 |
Dover Corp. | | 39,400 | | | 1,639,434 |
Eaton Corp. | | 34,500 | | | 2,194,890 |
Flowserve Corp. | | 12,000 | | | 1,134,360 |
Illinois Tool Works, Inc. | | 82,400 | | | 3,954,376 |
PACCAR, Inc. | | 73,328 | | | 2,659,607 |
Pall Corp. | | 26,200 | | | 948,440 |
Parker Hannifin Corp. | | 31,487 | | | 1,696,519 |
Snap-On, Inc. | | 12,700 | | | 536,702 |
Stanley Works (The)(b) | | 17,500 | | | 901,425 |
| | | | |
|
|
| | | | | | 33,671,105 |
| | | | |
|
|
Media — 2.8% | | | |
CBS Corp. (Class B Stock) | | 146,668 | | | 2,060,685 |
Comcast Corp. (Class A Stock) | | 600,846 | | | 10,130,264 |
DIRECTV (Class A Stock)(a) | | 192,700 | | | 6,426,545 |
Gannett Co., Inc. | | 56,300 | | | 836,055 |
Interpublic Group of Cos., Inc.(a) | | 90,900 | | | 670,842 |
McGraw-Hill Cos., Inc. (The) | | 67,800 | | | 2,271,978 |
Meredith Corp. | | 7,200 | | | 222,120 |
New York Times Co. (The) (Class A Stock)(a) | | 13,200 | | | 163,152 |
News Corp. (Class A Stock)(b) | | 465,800 | | | 6,376,802 |
Omnicom Group, Inc. | | 67,200 | | | 2,630,880 |
Scripps Networks Interactive, Inc. (Class A Stock) | | 20,300 | | | 842,450 |
Time Warner Cable, Inc. | | 75,826 | | | 3,138,438 |
Time Warner, Inc. | | 245,840 | | | 7,163,778 |
Viacom, Inc. (Class B Stock)(a) | | 128,568 | | | 3,822,327 |
Walt Disney Co. (The) | | 383,701 | | | 12,374,357 |
Washington Post Co. (The) (Class B Stock) | | 1,200 | | | 527,520 |
| | | | |
|
|
| | | | | | 59,658,193 |
| | | | |
|
|
SEE NOTES TO FINANCIAL STATEMENTS.
A130
| | | | | | |
| | | STOCK INDEX PORTFOLIO (continued) | | |
| |
| SCHEDULE OF INVESTMENTS | | December 31, 2009 |
| | | | | |
COMMON STOCKS
(continued) | | Shares
| | Value
(Note 2)
|
| | | | | | |
Metals & Mining — 1.1% | | | |
AK Steel Holding Corp. | | 23,900 | | $ | 510,265 |
Alcoa, Inc. | | 204,576 | | | 3,297,765 |
Allegheny Technologies, Inc. | | 18,440 | | | 825,559 |
Cliffs Natural Resources, Inc. | | 22,200 | | | 1,023,198 |
Freeport-McMoRan Copper & Gold, Inc.(a) | | 88,806 | | | 7,130,233 |
Newmont Mining Corp. | | 102,003 | | | 4,825,762 |
Nucor Corp. | | 65,000 | | | 3,032,250 |
Titanium Metals Corp.(a) | | 6,000 | | | 75,120 |
United States Steel Corp.(b) | | 27,340 | | | 1,506,981 |
| | | | |
|
|
| | | | | | 22,227,133 |
| | | | |
|
|
Multiline Retail — 0.8% | | | |
Big Lots, Inc.(a)(b) | | 16,900 | | | 489,762 |
Family Dollar Stores, Inc. | | 27,100 | | | 754,193 |
J.C. Penney Co., Inc. | | 48,900 | | | 1,301,229 |
Kohl’s Corp.(a) | | 64,900 | | | 3,500,057 |
Macy’s, Inc. | | 91,720 | | | 1,537,227 |
Nordstrom Inc.(b) | | 35,700 | | | 1,341,606 |
Sears Holdings Corp.(a)(b) | | 8,312 | | | 693,637 |
Target Corp. | | 162,568 | | | 7,863,414 |
| | | | |
|
|
| | | | | | 17,481,125 |
| | | | |
|
|
Multi-Utilities — 1.4% | | | |
Ameren Corp. | | 48,500 | | | 1,355,575 |
CenterPoint Energy, Inc. | | 79,010 | | | 1,146,435 |
CMS Energy Corp.(b) | | 48,100 | | | 753,246 |
Consolidated Edison, Inc.(b) | | 59,600 | | | 2,707,628 |
Dominion Resources, Inc. | | 126,084 | | | 4,907,189 |
DTE Energy Co. | | 35,600 | | | 1,551,804 |
Integrys Energy Group, Inc. | | 17,750 | | | 745,323 |
NiSource, Inc. | | 57,000 | | | 876,660 |
PG&E Corp. | | 78,800 | | | 3,518,420 |
Public Service Enterprise Group, Inc. | | 110,600 | | | 3,677,450 |
SCANA Corp. | | 22,200 | | | 836,496 |
Sempra Energy | | 52,554 | | | 2,941,973 |
TECO Energy, Inc. | | 48,200 | | | 781,804 |
Wisconsin Energy Corp. | | 22,600 | | | 1,126,158 |
Xcel Energy, Inc. | | 96,695 | | | 2,051,868 |
| | | | |
|
|
| | | | | | 28,978,029 |
| | | | |
|
|
Office Electronics — 0.1% | | | |
Xerox Corp. | | 191,692 | | | 1,621,714 |
| | | | |
|
|
Oil, Gas & Consumable Fuels — 9.5% | | | |
Anadarko Petroleum Corp. | | 102,726 | | | 6,412,157 |
Apache Corp. | | 70,750 | | | 7,299,278 |
Cabot Oil & Gas Corp. | | 19,000 | | | 828,210 |
Chesapeake Energy Corp. | | 134,000 | | | 3,467,920 |
Chevron Corp. | | 421,392 | | | 32,442,970 |
ConocoPhillips | | 311,679 | | | 15,917,447 |
Consol Energy, Inc. | | 37,300 | | | 1,857,540 |
Denbury Resources, Inc.(a)(b) | | 43,900 | | | 649,720 |
Devon Energy Corp. | | 94,000 | | | 6,909,000 |
El Paso Corp. | | 150,911 | | | 1,483,455 |
EOG Resources, Inc. | | 51,900 | | | 5,049,870 |
Exxon Mobil Corp. | | 989,370 | | | 67,465,140 |
Hess Corp. | | 62,000 | | | 3,751,000 |
Marathon Oil Corp. | | 150,494 | | | 4,698,423 |
| | | | | |
COMMON STOCKS
(continued) | | Shares
| | Value
(Note 2)
|
| | | | | | |
Oil, Gas & Consumable Fuels (continued) | | | |
Massey Energy Co. | | 17,500 | | $ | 735,175 |
Murphy Oil Corp. | | 40,600 | | | 2,200,520 |
Noble Energy, Inc. | | 35,900 | | | 2,556,798 |
Occidental Petroleum Corp. | | 168,100 | | | 13,674,935 |
Peabody Energy Corp. | | 56,400 | | | 2,549,844 |
Pioneer Natural Resources Co. | | 21,600 | | | 1,040,472 |
Range Resources Corp. | | 32,200 | | | 1,605,170 |
Southwestern Energy Co.(a) | | 72,500 | | | 3,494,500 |
Spectra Energy Corp. | | 137,542 | | | 2,820,986 |
Sunoco, Inc. | | 27,000 | | | 704,700 |
Tesoro Corp.(b) | | 31,500 | | | 426,825 |
Valero Energy Corp. | | 112,600 | | | 1,886,050 |
Williams Cos., Inc. (The) | | 124,400 | | | 2,622,352 |
XTO Energy, Inc. | | 121,800 | | | 5,667,354 |
| | | | |
|
|
| | | | | | 200,217,811 |
| | | | |
|
|
Paper & Forest Products — 0.3% | | | |
International Paper Co. | | 87,867 | | | 2,353,078 |
MeadWestvaco Corp. | | 38,689 | | | 1,107,666 |
Weyerhaeuser Co. | | 45,400 | | | 1,958,556 |
| | | | |
|
|
| | | | | | 5,419,300 |
| | | | |
|
|
Personal Products — 0.3% | | | |
Avon Products, Inc. | | 91,000 | | | 2,866,500 |
Estee Lauder Cos., Inc. (The) (Class A Stock) | | 22,900 | | | 1,107,444 |
Mead Johnson Nutrition Co., Inc. (Class A Stock) | | 34,493 | | | 1,507,344 |
| | | | |
|
|
| | | | | | 5,481,288 |
| | | | |
|
|
Pharmaceuticals — 6.4% | | | |
Abbott Laboratories | | 320,100 | | | 17,282,199 |
Allergan, Inc. | | 64,900 | | | 4,089,349 |
Bristol-Myers Squibb Co.(b) | | 366,540 | | | 9,255,135 |
Eli Lilly & Co. | | 213,300 | | | 7,616,943 |
Forest Laboratories, Inc.(a) | | 64,300 | | | 2,064,673 |
Johnson & Johnson | | 578,171 | | | 37,239,994 |
King Pharmaceuticals, Inc. (a) | | 45,233 | | | 555,009 |
Merck & Co., Inc. | | 636,104 | | | 23,243,234 |
Mylan, Inc.(a)(b) | | 59,200 | | | 1,091,056 |
Pfizer, Inc. | | 1,685,273 | | | 30,655,116 |
Watson Pharmaceuticals, Inc.(a)(b) | | 20,400 | | | 808,044 |
| | | | |
|
|
| | | | | | 133,900,752 |
| | | | |
|
|
Professional Services — 0.1% | | | |
Dun & Bradstreet Corp. | | 11,300 | | | 953,381 |
Equifax, Inc. | | 29,100 | | | 898,899 |
Monster Worldwide, Inc.(a)(b) | | 25,200 | | | 438,480 |
Robert Half International, Inc.(b) | | 32,500 | | | 868,725 |
| | | | |
|
|
| | | | | | 3,159,485 |
| | | | |
|
|
Real Estate Investment Trusts — 1.2% | | | |
Apartment Investment & Management Co., REIT (Class A Stock)(b) | | 34,974 | | | 556,786 |
AvalonBay Communities, Inc.(b) | | 16,918 | | | 1,389,137 |
Boston Properties, Inc. | | 28,100 | | | 1,884,667 |
Equity Residential(b) | | 57,500 | | | 1,942,350 |
HCP, Inc. | | 57,600 | | | 1,759,104 |
Health Care REIT, Inc.(b) | | 22,900 | | | 1,014,928 |
SEE NOTES TO FINANCIAL STATEMENTS.
A131
| | | | | | |
| | | STOCK INDEX PORTFOLIO (continued) | | |
| |
| SCHEDULE OF INVESTMENTS | | December 31, 2009 |
| | | | | |
COMMON STOCKS
(continued) | | Shares
| | Value
(Note 2)
|
| | | | | | |
Real Estate Investment Trusts (continued) | | | |
Host Hotels & Resorts, Inc.(a)(b) | | 131,726 | | $ | 1,537,242 |
Kimco Realty Corp.(b) | | 76,400 | | | 1,033,692 |
Plum Creek Timber Co., Inc.(b) | | 35,000 | | | 1,321,600 |
ProLogis(b) | | 91,500 | | | 1,252,635 |
Public Storage | | 27,600 | | | 2,248,020 |
Simon Property Group, Inc.(b) | | 59,001 | | | 4,708,280 |
Ventas, Inc. | | 32,600 | | | 1,425,924 |
Vornado Realty Trust(b) | | 33,557 | | | 2,346,977 |
| | | | |
|
|
| | | | | | 24,421,342 |
| | | | |
|
|
Real Estate Management & Development | | | |
CB Richard Ellis Group, Inc. (Class A Stock)(a)(b) | | 51,100 | | | 693,427 |
| | | | |
|
|
Road & Rail — 1.0% | | | |
Burlington Northern Santa Fe Corp. | | 54,626 | | | 5,387,216 |
CSX Corp. | | 82,424 | | | 3,996,740 |
Norfolk Southern Corp. | | 76,300 | | | 3,999,646 |
Ryder System, Inc. | | 12,800 | | | 526,976 |
Union Pacific Corp. | | 104,800 | | | 6,696,720 |
| | | | |
|
|
| | | | | | 20,607,298 |
| | | | |
|
|
Semiconductors & Semiconductor Equipment — 2.6% |
Advanced Micro Devices, Inc.(a) | | 115,600 | | | 1,119,008 |
Altera Corp.(b) | | 62,500 | | | 1,414,375 |
Analog Devices, Inc. | | 61,900 | | | 1,954,802 |
Applied Materials, Inc. | | 270,100 | | | 3,765,194 |
Broadcom Corp. (Class A Stock)(a)(b) | | 92,450 | | | 2,907,552 |
Intel Corp. | | 1,160,600 | | | 23,676,240 |
KLA-Tencor Corp. | | 32,000 | | | 1,157,120 |
Linear Technology Corp. | | 48,700 | | | 1,487,298 |
LSI Corp.(a) | | 141,700 | | | 851,617 |
MEMC Electronic Materials, Inc.(a)(b) | | 39,700 | | | 540,714 |
Microchip Technology, Inc. | | 38,900 | | | 1,130,434 |
Micron Technology, Inc.(a)(b) | | 167,700 | | | 1,770,912 |
National Semiconductor Corp. | | 40,500 | | | 622,080 |
Novellus Systems, Inc.(a)(b) | | 22,400 | | | 522,816 |
NVIDIA Corp.(a)(b) | | 116,650 | | | 2,179,022 |
Teradyne, Inc.(a)(b) | | 31,800 | | | 341,214 |
Texas Instruments, Inc. | | 270,200 | | | 7,041,412 |
Xilinx, Inc.(b) | | 54,900 | | | 1,375,794 |
| | | | |
|
|
| | | | | | 53,857,604 |
| | | | |
|
|
Software — 4.3% | | | |
Adobe Systems, Inc.(a) | | 108,200 | | | 3,979,596 |
Autodesk, Inc.(a)(b) | | 48,200 | | | 1,224,762 |
BMC Software, Inc.(a) | | 40,100 | | | 1,608,010 |
CA, Inc. | | 85,873 | | | 1,928,707 |
Citrix Systems, Inc.(a) | | 37,300 | | | 1,552,053 |
Compuware Corp.(a) | | 57,500 | | | 415,725 |
Electronic Arts, Inc.(a)(b) | | 58,700 | | | 1,041,925 |
Intuit, Inc.(a) | | 66,900 | | | 2,054,499 |
McAfee, Inc.(a) | | 34,200 | | | 1,387,494 |
Microsoft Corp. | | 1,612,000 | | | 49,149,880 |
Novell, Inc.(a) | | 73,100 | | | 303,365 |
Oracle Corp. | | 809,620 | | | 19,868,075 |
Red Hat, Inc.(a) | | 36,400 | | | 1,124,760 |
| | | | | |
COMMON STOCKS
(continued) | | Shares
| | Value
(Note 2)
|
| | | | | | |
Software (continued) | | | |
Salesforce.com, Inc.(a) | | 21,000 | | $ | 1,549,170 |
Symantec Corp.(a)(b) | | 178,311 | | | 3,189,984 |
| | | | |
|
|
| | | | | | 90,378,005 |
| | | | |
|
|
Specialty Retail — 1.9% | | | |
Abercrombie & Fitch Co. (Class A Stock) | | 15,500 | | | 540,175 |
AutoNation, Inc.(a)(b) | | 20,489 | | | 392,364 |
AutoZone, Inc.(a) | | 6,800 | | | 1,074,876 |
Bed Bath & Beyond, Inc.(a)(b) | | 52,900 | | | 2,043,527 |
Best Buy Co., Inc. | | 72,225 | | | 2,849,998 |
GameStop Corp. (Class A Stock)(a)(b) | | 33,800 | | | 741,572 |
Gap, Inc. (The), | | 101,187 | | | 2,119,868 |
Home Depot, Inc. | | 353,519 | | | 10,227,305 |
Limited Brands, Inc. | | 59,796 | | | 1,150,475 |
Lowe’s Cos., Inc. | | 301,400 | | | 7,049,746 |
Office Depot, Inc.(a) | | 44,900 | | | 289,605 |
O’Reilly Automotive, Inc.(a) | | 25,400 | | | 968,248 |
RadioShack Corp. | | 26,560 | | | 517,920 |
Ross Stores, Inc. | | 26,000 | | | 1,110,460 |
Sherwin-Williams Co. (The)(b) | | 18,400 | | | 1,134,360 |
Staples, Inc. | | 151,400 | | | 3,722,926 |
Tiffany & Co. | | 25,800 | | | 1,109,400 |
TJX Cos., Inc. | | 89,800 | | | 3,282,190 |
| | | | |
|
|
| | | | | | 40,325,015 |
| | | | |
|
|
Textiles, Apparel & Luxury Goods — 0.5% | | | |
Coach, Inc. | | 72,100 | | | 2,633,813 |
NIKE, Inc. (Class B Stock) | | 78,900 | | | 5,212,923 |
Polo Ralph Lauren Corp. (Class A Stock) | | 10,500 | | | 850,290 |
V.F. Corp. | | 19,336 | | | 1,416,169 |
| | | | |
|
|
| | | | | | 10,113,195 |
| | | | |
|
|
Thrifts & Mortgage Finance — 0.1% | | | |
Hudson City Bancorp, Inc.(b) | | 113,600 | | | 1,559,728 |
People’s United Financial, Inc. | | 71,900 | | | 1,200,730 |
| | | | |
|
|
| | | | | | 2,760,458 |
| | | | |
|
|
Tobacco — 1.5% | | | |
Altria Group, Inc. | | 424,900 | | | 8,340,787 |
Lorillard, Inc. | | 32,431 | | | 2,601,939 |
Philip Morris International, Inc. (Switzerland) | | 402,600 | | | 19,401,294 |
Reynolds American, Inc. | | 38,100 | | | 2,018,157 |
| | | | |
|
|
| | | | | | 32,362,177 |
| | | | |
|
|
Trading Companies & Distributors — 0.1% | | | |
Fastenal Co.(b) | | 24,200 | | | 1,007,688 |
W.W. Grainger, Inc.(b) | | 12,400 | | | 1,200,692 |
| | | | |
|
|
| | | | | | 2,208,380 |
| | | | |
|
|
Wireless Telecommunication Services — 0.3% | | | |
American Tower Corp. (Class A Stock)(a) | | 79,500 | | | 3,435,195 |
MetroPCS Communications, Inc.(a) | | 39,500 | | | 301,385 |
Sprint Nextel Corp.(a) | | 610,722 | | | 2,235,243 |
| | | | |
|
|
| | | | | | 5,971,823 |
| | | | |
|
|
TOTAL LONG-TERM INVESTMENTS
(cost $1,341,165,006) | | | 2,066,773,119 |
| | | | |
|
|
SEE NOTES TO FINANCIAL STATEMENTS.
A132
| | | | | | |
| | | STOCK INDEX PORTFOLIO (continued) | | |
| |
| SCHEDULE OF INVESTMENTS | | December 31, 2009 |
| | | | | |
SHORT-TERM
INVESTMENTS — 8.7% | | Shares
| | Value
(Note 2)
|
| | | | | | |
Affiliated Money Market Mutual Fund — 8.5% | | | |
Dryden Core Investment Fund — Taxable Money Market Series
(cost $177,953,852; includes $155,266,293 of cash collateral received for securities on loan) (Note 4)(c)(d) | | 177,953,832 | | $ | 177,953,832 |
| | | | |
|
|
| | | | | | | |
| | | Principal
Amount
(000)
| | Value
(Note 2)
| |
| | | | | | | | |
U.S. Government Obligation — 0.2% | | | | |
U.S. Treasury Bill,
0.04%, 03/18/2010
(cost $4,699,603) | | $ | 4,700 | | $ | 4,699,525 | |
| | | | | |
|
|
|
TOTAL SHORT-TERM INVESTMENTS
(cost $182,653,435) | | | 182,653,357 | |
| | | | | |
|
|
|
TOTAL INVESTMENTS — 107.2%
(cost $1,523,818,441) | | | 2,249,426,476 | |
LIABILITIES IN EXCESS OF
OTHER ASSETS(e) — (7.2)% | | | (151,367,182 | ) |
| | | | | |
|
|
|
NET ASSETS — 100.0% | | $ | 2,098,059,294 | |
| | | | | |
|
|
|
The following abbreviations are used in portfolio descriptions:
| (a) | Non-income producing security. |
| (b) | All or a portion of security is on loan. The aggregate market value of such securities is $149,549,726; cash collateral of $155,266,293 (included in liabilities) was received with which the Portfolio purchased highly liquid short-term investments. |
| (c) | Represents security, or a portion thereof, purchased with cash collateral received for securities on loan. |
| (d) | Prudential Investments LLC, the manager of the Portfolio, also serves as manager of the Dryden Core Investment Fund-Taxable Money Market Series. |
| (e) | Liabilities in excess of other assets include net unrealized appreciation (depreciation) on financial futures contracts as follows: |
Open futures contracts outstanding at December 31, 2009:
| | | | | | | | | | | | | |
Number of
Contracts
| | Type
| | Expiration
Date
| | Value at
Trade Date
| | Value at
December 31, 2009
| | Unrealized
Appreciation
|
| Long Position: | | | | | | | | | | | | | |
| 109 | | S&P 500 Index | | Mar. 2010 | | $ | 30,086,386 | | $ | 30,266,575 | | $ | 180,189 |
| | | | | | | | | | | | |
|
|
Various inputs are used in determining the value of the Portfolio’s investments. These inputs are summarized in the three broad levels listed below.
Level 1—quoted prices in active markets for identical securities
Level 2—other significant observable inputs (including quoted prices for similar securities, interest rates, prepayment speeds, credit risk, etc.)
Level 3—significant unobservable inputs (including the Portfolio’s own assumptions in determining the fair value of investments)
The following is a summary of the inputs used as of December 31, 2009 in valuing the Portfolio’s assets carried at fair value:
| | | | | | | | | |
| | | Level 1
| | Level 2
| | Level 3
|
Investments in Securities | | | | | | |
Common Stocks | | $ | 2,066,773,119 | | $ | — | | $ | — |
U.S. Government Obligations | | | — | | | 4,699,525 | | | — |
Affiliated Money Market Mutual Fund | | | 177,953,832 | | | — | | | — |
| | |
|
| |
|
| |
|
|
| | | | 2,244,726,951 | | | 4,699,525 | | | — |
Other Financial Instruments* | | | 180,189 | | | — | | | — |
| | |
|
| |
|
| |
|
|
Total | | $ | 2,244,907,140 | | $ | 4,699,525 | | $ | — |
| | |
|
| |
|
| |
|
|
| * | Other financial instruments are derivative instruments not reflected in the Schedule of Investments, such as futures, forwards and swap contracts, which are valued at the unrealized appreciation/depreciation on the instrument. |
As of December 31, 2009 and 2008, the Portfolio did not use any significant unobservable inputs (Level 3) in determining the value of investments.
SEE NOTES TO FINANCIAL STATEMENTS.
A133
| | | | | | |
| | | STOCK INDEX PORTFOLIO (continued) | | |
| |
| SCHEDULE OF INVESTMENTS | | December 31, 2009 |
The industry classification of portfolio holdings and liabilities in excess of other assets shown as a percentage of net assets as of December 31, 2009 was as follows:
| | | |
Oil, Gas & Consumable Fuels | | 9.5 | % |
Affiliated Money Market Mutual Fund (including 7.4% of collateral received for securities on loan) | | 8.5 | |
Pharmaceuticals | | 6.4 | |
Computers & Peripherals | | 5.9 | |
Diversified Financial Services | | 4.3 | |
Software | | 4.3 | |
Diversified Telecommunication Services | | 2.9 | |
Capital Markets | | 2.8 | |
Media | | 2.8 | |
Aerospace & Defense | | 2.7 | |
Commercial Banks | | 2.7 | |
Beverages | | 2.6 | |
Communications Equipment | | 2.6 | |
Food & Staples Retailing | | 2.6 | |
Semiconductors & Semiconductor Equipment | | 2.6 | |
Household Products | | 2.5 | |
Industrial Conglomerates | | 2.2 | |
Insurance | | 2.2 | |
Healthcare Providers & Services | | 2.1 | |
Electric Utilities | | 2.0 | |
Healthcare Equipment & Supplies | | 2.0 | |
Internet Software & Services | | 2.0 | |
Chemicals | | 1.9 | |
Specialty Retail | | 1.9 | |
Energy Equipment & Services | | 1.8 | |
Food Products | | 1.6 | |
IT Services | | 1.6 | |
Machinery | | 1.6 | |
Biotechnology | | 1.5 | |
Tobacco | | 1.5 | |
Hotels, Restaurants & Leisure | | 1.4 | |
Multi-Utilities | | 1.4 | |
| | | |
Real Estate Investment Trusts | | 1.2 | % |
Metals & Mining | | 1.1 | |
Air Freight & Logistics | | 1.0 | |
Road & Rail | | 1.0 | |
Consumer Finance | | 0.8 | |
Multiline Retail | | 0.8 | |
Electronic Equipment & Instruments | | 0.6 | |
Internet & Catalog Retail | | 0.6 | |
Commercial Services & Supplies | | 0.5 | |
Electrical Equipment | | 0.5 | |
Textiles, Apparel & Luxury Goods | | 0.5 | |
Automobiles | | 0.4 | |
Life Sciences Tools & Services | | 0.4 | |
Household Durables | | 0.3 | |
Paper & Forest Products | | 0.3 | |
Personal Products | | 0.3 | |
Wireless Telecommunication Services | | 0.3 | |
Auto Components | | 0.2 | |
Construction & Engineering | | 0.2 | |
Containers & Packaging | | 0.2 | |
Diversified Consumer Services | | 0.2 | |
Independent Power Producers & Energy Traders | | 0.2 | |
U.S. Government Obligation | | 0.2 | |
Airlines | | 0.1 | |
Building Products | | 0.1 | |
Construction Materials | | 0.1 | |
Distributors | | 0.1 | |
Gas Utilities | | 0.1 | |
Leisure Equipment & Products | | 0.1 | |
Office Electronics | | 0.1 | |
Professional Services | | 0.1 | |
Thrifts & Mortgage Finance | | 0.1 | |
Trading Companies & Distributors | | 0.1 | |
| | |
|
|
| | | 107.2 | |
Liabilities in excess of other assets | | (7.2 | ) |
| | |
|
|
| | | 100.0 | % |
| | |
|
|
The Portfolio invested in derivative instruments during the reporting period. The primary types of risk associated with derivative instruments are commodity risk, credit risk, equity risk, foreign exchange risk and interest rate risk. The effect of such derivative instruments on the Portfolio’s financial position and financial performance as reflected in the Statement of Assets and Liabilities and Statement of Operations is presented in the summary below.
Fair values of derivative instruments as of December 31, 2009 as presented in the Statement of Assets and Liabilities:
| | | | | | | | | | | |
Derivatives not designated as
hedging instruments, carried at
fair value
| | Asset Derivatives
| | | Liability Derivatives
|
| | Balance Sheet Location
| | Fair
Value
| | | Balance Sheet Location
| | Fair
Value
|
Equity contracts | | Due to broker—variation margin | | $ | 180,189 | * | | — | | $ | — |
| | | | |
|
|
| | | |
|
|
| * | Includes cumulative appreciation/depreciation on futures contracts as reported in the Schedule of Investments. Only unsettled variation margin receivable (payable) is reported within the Statement of Assets and Liabilities. |
SEE NOTES TO FINANCIAL STATEMENTS.
A134
| | | | | | |
| | | STOCK INDEX PORTFOLIO (continued) | | |
| |
| SCHEDULE OF INVESTMENTS | | December 31, 2009 |
The effects of derivative instruments on the Statement of Operations for the year ended December 31, 2009 are as follows:
| | | |
Amount of Realized Gain or (Loss) on Derivatives Recognized in Income
|
Derivatives not designated as hedging
instruments, carried at fair value
| | Futures
|
Equity contracts | | $ | 10,307,032 |
| | |
|
|
| | | | |
Change in Unrealized Appreciation or (Depreciation) on Derivatives Recognized in Income
| |
Derivatives not designated as hedging
instruments, carried at fair value
| | Futures
| |
Equity contracts | | $ | (379,818 | ) |
| | |
|
|
|
For the year ended December 31, 2009, the average value at trade date for futures long position was $36,988,610.
SEE NOTES TO FINANCIAL STATEMENTS.
A135
| | | | | | |
| | | STOCK INDEX PORTFOLIO (continued) | | |
STATEMENT OF ASSETS AND LIABILITIES
December 31, 2009
| | | |
| ASSETS | | | |
Investments, at value including securities on loan of $149,549,726: | | | |
Unaffiliated investments (cost $1,345,864,609) | | $ | 2,071,472,644 |
Affiliated investments (cost $177,953,832) | | | 177,953,832 |
Cash | | | 49,130 |
Receivable for investments sold | | | 6,314,127 |
Dividends and interest receivable | | | 2,854,527 |
Receivable for Series shares sold | | | 78,019 |
Prepaid expenses | | | 20,750 |
| | |
|
|
Total Assets | | | 2,258,743,029 |
| | |
|
|
| LIABILITIES | | | |
Collateral for securities on loan | | | 155,266,293 |
Payable for investments purchased | | | 4,066,123 |
Management fee payable | | | 622,119 |
Due to broker-variation margin | | | 310,650 |
Payable for Series shares repurchased | | | 277,366 |
Accrued expenses and other liabilities | | | 140,589 |
Affiliated transfer agent fee payable | | | 595 |
| | |
|
|
Total Liabilities | | | 160,683,735 |
| | |
|
|
| NET ASSETS | | $ | 2,098,059,294 |
| | |
|
|
Net assets were comprised of: | | | |
Paid-in capital | | $ | 1,435,013,755 |
Retained earnings | | | 663,045,539 |
| | |
|
|
Net assets, December 31, 2009 | | $ | 2,098,059,294 |
| | |
|
|
Net asset value and redemption price per share, $2,098,059,294 / 75,231,986 outstanding shares of beneficial interest | | $ | 27.89 |
| | |
|
|
STATEMENT OF OPERATIONS
Year Ended December 31, 2009
| | | | |
| INVESTMENT INCOME | | | | |
Unaffiliated dividend income | | $ | 42,565,351 | |
Affiliated income from securities loaned, net | | | 1,769,831 | |
Affiliated dividend income | | | 174,319 | |
Interest | | | 4,546 | |
| | |
|
|
|
| | | | 44,514,047 | |
| | |
|
|
|
| EXPENSES | | | | |
Management fee | | | 6,408,612 | |
Custodian’s fees and expenses | | | 163,000 | |
Shareholders’ reports | | | 50,000 | |
Insurance expenses | | | 43,000 | |
Trustees’ fees | | | 33,000 | |
Audit fee | | | 17,000 | |
Legal fees and expenses | | | 15,000 | |
Commitment fee on syndicated credit agreement | | | 12,000 | |
Transfer agent’s fee and expenses (including affiliated expense of $3,600) (Note 4) | | | 10,000 | |
Miscellaneous | | | 15,956 | |
| | |
|
|
|
Total expenses | | | 6,767,568 | |
| | |
|
|
|
| NET INVESTMENT INCOME | | | 37,746,479 | |
| | |
|
|
|
| NET REALIZED AND UNREALIZED GAIN (LOSS) ON INVESTMENTS | | | | |
Net realized gain (loss) on: | | | | |
Investment transactions | | | (22,151,368 | ) |
Futures transactions | | | 10,307,032 | |
| | |
|
|
|
| | | | (11,844,336 | ) |
| | |
|
|
|
Net change in unrealized appreciation (depreciation) on: | | | | |
Investments | | | 414,349,079 | |
Futures | | | (379,818 | ) |
| | |
|
|
|
| | | | 413,969,261 | |
| | |
|
|
|
| NET GAIN ON INVESTMENTS | | | 402,124,925 | |
| | |
|
|
|
| NET INCREASE IN NET ASSETS RESULTING FROM OPERATIONS | | $ | 439,871,404 | |
| | |
|
|
|
STATEMENT OF CHANGES IN NET ASSETS
| | | | | | | | |
| | | Year Ended December 31,
| |
| | | 2009
| | | 2008
| |
INCREASE (DECREASE) IN NET ASSETS
OPERATIONS: | | | | | | | | |
Net investment income | | $ | 37,746,479 | | | $ | 51,604,331 | |
Net realized loss on investments | | | (11,844,336 | ) | | | (28,775,151 | ) |
Net change in unrealized appreciation (depreciation) on investments | | | 413,969,261 | | | | (1,123,541,103 | ) |
| | |
|
|
| |
|
|
|
NET INCREASE (DECREASE) IN NET ASSETS RESULTING FROM OPERATIONS | | | 439,871,404 | | | | (1,100,711,923 | ) |
| | |
|
|
| |
|
|
|
| DISTRIBUTIONS | | | (51,594,261 | ) | | | (56,959,943 | ) |
| | |
|
|
| |
|
|
|
| SERIES SHARE TRANSACTIONS: | | | | | | | | |
Series shares sold [2,119,324 and 2,142,562 shares, respectively] | | | 48,926,542 | | | | 63,864,986 | |
Series shares issued in reinvestment of dividends and distributions [2,201,121 and 1,689,203 shares, respectively] | | | 51,594,261 | | | | 56,959,943 | |
Series shares repurchased [8,851,247 and 8,835,363 shares, respectively] | | | (206,536,067 | ) | | | (269,751,865 | ) |
| | |
|
|
| |
|
|
|
NET DECREASE IN NET ASSETS RESULTING FROM SERIES SHARE TRANSACTIONS | | | (106,015,264 | ) | | | (148,926,936 | ) |
| | |
|
|
| |
|
|
|
| TOTAL INCREASE (DECREASE) IN NET ASSETS | | | 282,261,879 | | | | (1,306,598,802 | ) |
| NET ASSETS: | | | | | | | | |
Beginning of year | | | 1,815,797,415 | | | | 3,122,396,217 | |
| | |
|
|
| |
|
|
|
End of year | | $ | 2,098,059,294 | | | $ | 1,815,797,415 | |
| | |
|
|
| |
|
|
|
SEE NOTES TO FINANCIAL STATEMENTS.
A136
| | | | | | |
| | | VALUE PORTFOLIO | | |
| |
| SCHEDULE OF INVESTMENTS | | December 31, 2009 |
| | | | | |
| LONG-TERM INVESTMENTS — 96.4% |
| COMMON STOCKS — 93.4% | | Shares
| | Value
(Note 2)
|
| | | | | | |
Aerospace & Defense — 1.5% | | | | | |
Precision Castparts Corp. | | 114,900 | | $ | 12,679,215 |
United Technologies Corp. | | 78,700 | | | 5,462,567 |
| | | | |
|
|
| | | | | | 18,141,782 |
| | | | |
|
|
Auto Components — 2.5% | | | | | |
Goodyear Tire & Rubber Co. (The)(a) | | 1,218,500 | | | 17,180,850 |
Johnson Controls, Inc. | | 160,500 | | | 4,372,020 |
Lear Corp.(a)(b) | | 120,800 | | | 8,170,912 |
| | | | |
|
|
| | | | | | 29,723,782 |
| | | | |
|
|
Biotechnology — 0.9% | | | | | |
Amgen, Inc.(a) | | 190,200 | | | 10,759,614 |
| | | | |
|
|
Capital Markets — 5.6% | | | | | |
Bank of New York Mellon Corp. (The) | | 477,895 | | | 13,366,723 |
Goldman Sachs Group, Inc. (The) | | 134,000 | | | 22,624,560 |
Morgan Stanley | | 556,400 | | | 16,469,440 |
TD Ameritrade Holding Corp.(a)(b) | | 693,400 | | | 13,438,092 |
| | | | |
|
|
| | | | | | 65,898,815 |
| | | | |
|
|
Chemicals — 1.4% | | | | | |
Dow Chemical Co. (The) | | 616,900 | | | 17,044,947 |
| | | | |
|
|
Commercial Banks — 0.7% | | | | | |
KeyCorp | | 1,589,600 | | | 8,822,280 |
| | | | |
|
|
Commercial Services & Supplies — 1.9% | | | |
Waste Management, Inc.(b) | | 667,000 | | | 22,551,270 |
| | | | |
|
|
Computers & Peripherals — 0.7% | | | | | |
Dell, Inc.(a) | | 542,800 | | | 7,794,608 |
| | | | |
|
|
Consumer Finance — 1.6% | | | | | |
SLM Corp.(a) | | 1,721,500 | | | 19,401,305 |
| | | | |
|
|
Diversified Consumer Services — 3.3% | | | | | |
Career Education Corp.(a)(b) | | 416,200 | | | 9,701,622 |
H&R Block, Inc. | | 1,318,000 | | | 29,813,160 |
| | | | |
|
|
| | | | | | 39,514,782 |
| | | | |
|
|
Diversified Financial Services — 0.8% | | | | | |
JPMorgan Chase & Co. | | 226,900 | | | 9,454,923 |
| | | | |
|
|
Electric Utilities — 1.1% | | | | | |
Entergy Corp. | | 163,700 | | | 13,397,208 |
| | | | |
|
|
Electronic Equipment & Instruments — 1.2% | | | |
Flextronics International Ltd.(a) | | 1,864,200 | | | 13,627,302 |
| | | | |
|
|
Food & Staples Retailing — 4.5% | | | | | |
CVS Caremark Corp. | | 433,400 | | | 13,959,814 |
Kroger Co. (The) | | 1,066,900 | | | 21,903,457 |
Wal-Mart Stores, Inc. | | 330,300 | | | 17,654,535 |
| | | | |
|
|
| | | | | | 53,517,806 |
| | | | |
|
|
Food Products — 4.6% | | | | | |
Bunge Ltd.(b) | | 209,500 | | | 13,372,385 |
ConAgra Foods, Inc. | | 1,074,700 | | | 24,771,835 |
Tyson Foods, Inc. (Class A Stock) | | 1,327,000 | | | 16,282,290 |
| | | | |
|
|
| | | | | | 54,426,510 |
| | | | |
|
|
Healthcare Equipment & Supplies — 0.1% | | | |
Baxter International, Inc. | | 24,500 | | | 1,437,660 |
| | | | |
|
|
| | | | | |
| COMMON STOCKS |
| (continued) | | Shares
| | Value
(Note 2)
|
| | | | | | |
Healthcare Providers & Services — 4.9% | | | |
Aetna, Inc. | | 243,900 | | $ | 7,731,630 |
Omnicare, Inc., | | 983,400 | | | 23,778,612 |
UnitedHealth Group, Inc., | | 239,900 | | | 7,312,152 |
WellPoint, Inc.(a) | | 338,400 | | | 19,725,336 |
| | | | |
|
|
| | | | | | 58,547,730 |
| | | | |
|
|
Hotels Restaurants & Leisure — 1.0% | | | | | |
Yum! Brands, Inc., | | 331,700 | | | 11,599,549 |
| | | | |
|
|
Household Products — 0.8% | | | | | |
Kimberly-Clark Corp. | | 147,582 | | | 9,402,449 |
| | | | |
|
|
Independent Power Producers & Energy Traders — 1.5% |
NRG Energy, Inc.(a) | | 745,700 | | | 17,605,977 |
| | | | |
|
|
Insurance — 4.2% | | | | | |
Arch Capital Group, Ltd.(a) | | 183,700 | | | 13,143,735 |
Axis Capital Holdings Ltd. | | 520,600 | | | 14,790,246 |
Berkshire Hathaway, Inc. (Class B Stock)(a)(b) | | 3,064 | | | 10,068,304 |
Travelers Cos., Inc. (The) | | 244,900 | | | 12,210,714 |
| | | | |
|
|
| | | | | | 50,212,999 |
| | | | |
|
|
Internet & Catalog Retail — 1.3% | | | | | |
Ticketmaster Entertainment, Inc.(a) | | 1,249,240 | | | 15,265,713 |
| | | | |
|
|
Internet Software & Services — 2.4% | | | | | |
IAC/InterActiveCorp(a)(b) | | 1,390,700 | | | 28,481,536 |
| | | | |
|
|
Media — 5.4% | | | | | |
Comcast Corp. (Class A Stock) | | 1,236,901 | | | 20,854,151 |
Liberty Global, Inc., Ser. C(a)(b) | | 1,158,035 | | | 25,303,065 |
Time Warner Cable, Inc.(b) | | 416,900 | | | 17,255,491 |
| | | | |
|
|
| | | | | | 63,412,707 |
| | | | |
|
|
Multi-Utilities — 2.1% | | | | | |
Sempra Energy | | 453,400 | | | 25,381,332 |
| | | | |
|
|
Office Electronics — 0.7% | | | | | |
Xerox Corp. | | 936,500 | | | 7,922,790 |
| | | | |
|
|
Oil, Gas & Consumable Fuels — 16.3% | | | |
Anadarko Petroleum Corp. | | 270,705 | | | 16,897,406 |
Apache Corp. | | 242,500 | | | 25,018,725 |
Canadian Natural Resources Ltd.(b) | | 250,600 | | | 18,030,670 |
EOG Resources, Inc. | | 203,100 | | | 19,761,630 |
Hess Corp. | | 123,800 | | | 7,489,900 |
Noble Energy, Inc. | | 187,200 | | | 13,332,384 |
Occidental Petroleum Corp. | | 292,200 | | | 23,770,470 |
Petroleo Brasileiro SA (Brazil), ADR | | 429,500 | | | 20,478,560 |
Suncor Energy, Inc.(b) | | 355,200 | | | 12,542,112 |
Trident Resources Corp. (Canada), Private Placement (original cost $16,980,633; purchased 3/11/05-1/05/06)(a)(c)(d)(e) | | 404,537 | | | — |
Williams Cos., Inc. (The) | | 1,116,000 | | | 23,525,280 |
XTO Energy, Inc. | | 253,800 | | | 11,809,314 |
| | | | |
|
|
| | | | | | 192,656,451 |
| | | | |
|
|
Pharmaceuticals — 5.2% | | | | | |
Mylan, Inc.(a)(b) | | 867,900 | | | 15,995,397 |
Novartis AG (Switzerland), ADR | | 305,200 | | | 16,612,036 |
SEE NOTES TO FINANCIAL STATEMENTS.
A137
| | | | | | |
| | | VALUE PORTFOLIO (continued) | | |
| |
| SCHEDULE OF INVESTMENTS | | December 31, 2009 |
| | | | | |
| COMMON STOCKS |
| (continued) | | Shares
| | Value
(Note 2)
|
| | | | | | |
Pharmaceuticals (continued) | | | | | |
Pfizer, Inc. | | 622,313 | | $ | 11,319,874 |
Sanofi-Aventis SA (France), ADR | | 440,500 | | | 17,298,435 |
| | | | |
|
|
| | | | | | 61,225,742 |
| | | | |
|
|
Road & Rail — 1.5% | | | | | |
Union Pacific Corp. | | 281,700 | | | 18,000,630 |
| | | | |
|
|
Semiconductors & Semiconductor Equipment — 1.8% |
Advanced Micro Devices, Inc.(a) | | 2,226,400 | | | 21,551,552 |
| | | | |
|
|
Software — 8.0% | | | | | |
CA, Inc. | | 1,572,700 | | | 35,322,842 |
Microsoft Corp. | | 359,200 | | | 10,952,008 |
Nuance Communications, Inc.(a)(b) | | 765,500 | | | 11,895,870 |
Symantec Corp.(a)(b) | | 2,018,500 | | | 36,110,965 |
| | | | |
|
|
| | | | | | 94,281,685 |
| | | | |
|
|
Thrifts & Mortgage Finance — 0.7% | | | | | |
People’s United Financial, Inc. | | 506,360 | | | 8,456,212 |
| | | | |
|
|
Wireless Telecommunication Services — 3.2% |
MetroPCS Communications, Inc.(a)(b) | | 1,561,300 | | | 11,912,719 |
NII Holdings, Inc.(a) | | 769,597 | | | 25,843,067 |
| | | | |
|
|
| | | | | | 37,755,786 |
| | | | |
|
|
TOTAL COMMON STOCKS
(cost $963,218,155) | | | 1,107,275,434 |
| | | | |
|
|
| CORPORATE BOND | | | | | |
| | | Principal
Amount
(000)#
| | |
Oil, Gas & Consumable Fuels | | | | | |
Trident Resources Corp. (Canada), Private Placement, 0.000%, due 8/12/12 (original cost $12,142,429; purchased 8/20/07-8/31/09)(a)(c)(d)(e) | | CAD 12,925 | | | — |
| | | | |
|
|
| CONVERTIBLE PREFERRED STOCKS — 3.0% |
| | | Shares
| | |
Consumer Finance — 0.5% | | | | | |
SLM Corp.(a) | | 9,540 | | | 5,778,855 |
| | | | |
|
|
Diversified Financial Services — 1.4% |
Bank of America Corp. | | 1,098,300 | | | 16,386,636 |
| | | | |
|
|
Pharmaceuticals — 1.1% | | | | | |
Mylan, Inc.(a) | | 11,040 | | | 12,633,734 |
| | | | |
|
|
TOTAL CONVERTIBLE PREFERRED STOCKS (cost $27,567,852) | | | 34,799,225 |
| | | | |
|
|
| WARRANT | | | | | |
| | | Units
| | |
Oil, Gas & Consumable Fuels | | | | | |
Trident Resources Corp. (Canada), Private Placement, expiring 1/1/15 (original cost $0; purchased 8/20/07)(a)(c)(d)(e) | | 1,043,852 | | | — |
| | | | |
|
|
TOTAL LONG-TERM INVESTMENTS
(cost $1,002,928,436) | | | 1,142,074,659 |
| | | | |
|
|
| | | | | | |
| SHORT-TERM INVESTMENT — 11.4% | | | | |
| | | Shares
| | Value
(Note 2)
| |
| | | | | | | |
Affiliated Money Market Mutual Fund | | | | |
Dryden Core Investment Fund — Taxable Money Market Series (cost $135,344,807; includes $105,824,048 of cash collateral received for securities on loan)(f)(g) | | 135,344,807 | | $ | 135,344,807 | |
| | | | |
|
|
|
TOTAL INVESTMENTS (h) — 107.8%
(cost $1,138,273,243) | | | 1,277,419,466 | |
LIABILITIES IN EXCESS OF
OTHER ASSETS — (7.8)% | | | (92,021,576 | ) |
| | | | |
|
|
|
NET ASSETS — 100.0% | | $ | 1,185,397,890 | |
| | | | |
|
|
|
The following abbreviations are used in portfolio descriptions:
| | |
| ADR | | American Depositary Receipt |
| CAD | | Canadian Dollar |
| # | Principal amount shown in U.S. dollars unless otherwise stated. |
| (a) | Non-income producing security. |
| (b) | All or a portion of security is on loan. The aggregate market value of such securities is $102,150,981; cash collateral of $105,824,048 (included in liabilities) was received with which the Portfolio purchased highly liquid short-term investments. |
| (c) | Indicates a security that has been deemed illiquid. |
| (d) | Indicates a restricted security; the aggregate original cost of such securities is $29,123,062. The aggregate value of $0 is 0.0% of net assets. |
| (e) | The issuer has filed for bankruptcy, and has defaulted in the payment of interest on the debt instrument. The security has been fair valued at zero. |
| (f) | Represents security, or a portion thereof, purchased with cash collateral received for securities on loan. |
| (g) | Prudential Investments LLC, the manager of the Portfolio, also serves as manager of the Dryden Core Investment Fund-Taxable Money Market Series. |
| (h) | As of December 31, 2009, 3 securities representing $0 and 0.0% of the net assets were fair valued in accordance with the policies adopted by the Board of Trustees. |
SEE NOTES TO FINANCIAL STATEMENTS.
A138
| | | | | | |
| | | VALUE PORTFOLIO (continued) | | |
| |
| SCHEDULE OF INVESTMENTS | | December 31, 2009 |
Various inputs are used in determining the value of the Portfolio’s investments. These inputs are summarized in the three broad levels listed below.
Level 1—quoted prices in active markets for identical securities
Level 2—other significant observable inputs (including quoted prices for similar securities, interest rates, prepayment speeds, credit risk, etc.)
Level 3—significant unobservable inputs (including the Portfolio’s own assumptions in determining the fair value of investments)
The following is a summary of the inputs used as of December 31, 2009 in valuing the Portfolio’s assets carried at fair value:
| | | | | | | | | | |
| | | Level 1
| | Level 2
| | Level 3
| |
Investments in Securities | | | | | | | | | | |
Common Stocks | | $ | 1,107,275,434 | | $ | — | | $ | — | ** |
Corporate Bond | | | — | | | — | | | — | ** |
Convertible Preferred Stocks | | | 34,799,225 | | | — | | | — | |
Warrant | | | — | | | — | | | — | ** |
Affiliated Money Market Mutual Fund | | | 135,344,807 | | | — | | | — | |
| | |
|
| |
|
| |
|
|
|
| | | | 1,277,419,466 | | | — | | | — | |
Other Financial Instruments* | | | — | | | — | | | — | |
| | |
|
| |
|
| |
|
|
|
Total | | $ | 1,277,419,466 | | $ | — | | $ | — | |
| | |
|
| |
|
| |
|
|
|
| * | Other financial instruments are derivative instruments not reflected in the Schedule of Investments, such as futures, forwards and swap contracts, which are valued at the unrealized appreciation/depreciation on the instrument. |
The following is a reconciliation of assets in which significant unobservable inputs (Level 3) were used in determining fair value:
| | | | | | | | | | | | |
| | | Common Stock
| | | Corporate Bond
| | | Warrant
| |
Balance as of 12/31/08 | | $ | 1,720,388 | | | $ | 3,349,256 | | | $ | 85 | |
Realized gain (loss) | | | — | | | | — | | | | — | |
Change in unrealized appreciation (depreciation) | | | (1,720,388 | ) | | | (3,851,367 | ) | | | (85 | ) |
Earned amortization/accretion | | | — | | | | 9,838 | | | | — | |
Net purchases (sales) | | | — | | | | 492,273 | | | | — | |
Transfers in and/or out of Level 3 | | | — | | | | — | | | | — | |
| | |
|
|
| |
|
|
| |
|
|
|
Balance as of 12/31/09 | | $ | — | ** | | $ | — | ** | | $ | — | ** |
| | |
|
|
| |
|
|
| |
|
|
|
SEE NOTES TO FINANCIAL STATEMENTS.
A139
| | | | | | |
| | | VALUE PORTFOLIO (continued) | | |
| |
| SCHEDULE OF INVESTMENTS | | December 31, 2009 |
The industry classification of portfolio holdings and liabilities in excess of other assets shown as a percentage of net assets as of December 31, 2009 was as follows:
| | | |
Oil, Gas & Consumable Fuels | | 16.3 | % |
Affiliated Money Market Mutual Fund (including 8.9% of collateral received for securities on loan) | | 11.4 | |
Software | | 8.0 | |
Pharmaceuticals | | 6.3 | |
Capital Markets | | 5.6 | |
Media | | 5.4 | |
Healthcare Providers & Services | | 4.9 | |
Food Products | | 4.6 | |
Food & Staples Retailing | | 4.5 | |
Insurance | | 4.2 | |
Diversified Consumer Services | | 3.3 | |
Wireless Telecommunication Services | | 3.2 | |
Auto Components | | 2.5 | |
Internet Software & Services | | 2.4 | |
Diversified Financial Services | | 2.2 | |
Consumer Finance | | 2.1 | |
Multi-Utilities | | 2.1 | |
Commercial Services & Supplies | | 1.9 | |
Semiconductors & Semiconductor Equipment | | 1.8 | |
Aerospace & Defense | | 1.5 | |
Independent Power Producers & Energy Traders | | 1.5 | |
Road & Rail | | 1.5 | |
Chemicals | | 1.4 | |
Internet & Catalog Retail | | 1.3 | |
Electronic Equipment & Instruments | | 1.2 | |
Electric Utilities | | 1.1 | |
Hotels Restaurants & Leisure | | 1.0 | |
Biotechnology | | 0.9 | |
Household Products | | 0.8 | |
Commercial Banks | | 0.7 | |
Computers & Peripherals | | 0.7 | |
Office Electronics | | 0.7 | |
Thrifts & Mortgage Finance | | 0.7 | |
Healthcare Equipment & Supplies | | 0.1 | |
| | |
|
|
| | | 107.8 | |
Liabilities in excess of other assets | | (7.8 | ) |
| | |
|
|
| | | 100.0 | % |
| | |
|
|
The Portfolio invested in derivative instruments during the reporting period. The primary types of risk associated with derivative instruments are commodity risk, credit risk, equity risk, foreign exchange risk and interest rate risk. The effect of such derivative instruments on the Portfolio’s financial position and financial performance as reflected in the Statement of Assets and Liabilities and Statement of Operations is presented in the summary below.
Fair values of derivative instruments as of December 31, 2009 as presented in the Statement of Assets and Liabilities:
| | | | | | | | | | | |
Derivatives not designated as
hedging instruments, carried at
fair value
| | Asset Derivatives
| | | Liability Derivatives
|
| | Balance Sheet Location
| | Fair
Value
| | | Balance Sheet Location
| | Fair
Value
|
Equity contracts | | Unaffiliated investments | | $ | — | * | | — | | $ | — |
| | | | |
|
|
| | | |
|
|
For the year ended December 31, 2009, the Portfolio did not have any realized gain or (loss) on derivatives recognized in income.
| | | | |
Change in Unrealized Appreciation or (Depreciation) on Derivatives Recognized in Income
| |
Derivatives not designated as hedging
instruments, carried at fair value
| | Warrant
| |
Equity contracts | | $ | (85 | ) |
| | |
|
|
|
SEE NOTES TO FINANCIAL STATEMENTS.
A140
| | | | | | |
| | | VALUE PORTFOLIO (continued) | | |
STATEMENT OF ASSETS AND LIABILITIES
December 31, 2009
| | | | |
| ASSETS | | | | |
Investments, at value including securities on loan of $102,150,981: | | | | |
Unaffiliated investments (cost $1,002,928,436) | | $ | 1,142,074,659 | |
Affiliated investments (cost $135,344,807) | | | 135,344,807 | |
Cash | | | 32,677 | |
Receivable for investments sold | | | 20,236,536 | |
Dividends and interest receivable | | | 1,354,005 | |
Foreign tax reclaim receivable | | | 261,649 | |
Receivable for Series shares sold | | | 54,464 | |
Prepaid expenses | | | 11,715 | |
| | |
|
|
|
Total Assets | | | 1,299,370,512 | |
| | |
|
|
|
| LIABILITIES | | | | |
Collateral for securities on loan | | | 105,824,048 | |
Payable for investments purchased | | | 7,555,697 | |
Management fee payable | | | 398,582 | |
Accrued expenses and other liabilities | | | 135,453 | |
Payable for Series shares repurchased | | | 57,066 | |
Distribution fee payable | | | 738 | |
Affiliated transfer agent fee payable | | | 595 | |
Administration fee payable | | | 443 | |
| | |
|
|
|
Total Liabilities | | | 113,972,622 | |
| | |
|
|
|
| NET ASSETS | | $ | 1,185,397,890 | |
| | |
|
|
|
Net assets were comprised of: | | | | |
Paid-in capital | | $ | 1,399,960,416 | |
Retained earnings | | | (214,562,526 | ) |
| | |
|
|
|
Net assets, December 31, 2009 | | $ | 1,185,397,890 | |
| | |
|
|
|
| Class I: | | | | |
Net asset value and redemption price per share, $1,181,659,893 / 78,268,587 outstanding shares of beneficial interest | | $ | 15.10 | |
| | |
|
|
|
| Class II: | | | | |
Net asset value and redemption price per share, $3,737,997 / 246,574 outstanding shares of
beneficial interest | | $ | 15.16 | |
| | |
|
|
|
STATEMENT OF OPERATIONS
Year Ended December 31, 2009
| | | | |
| INVESTMENT INCOME | | | | |
Unaffiliated dividend income (net of foreign withholding taxes of $26,337) | | $ | 14,257,752 | |
Interest | | | 1,183,725 | |
Affiliated income from securities loaned, net | | | 487,724 | |
Affiliated dividend income | | | 151,863 | |
| | |
|
|
|
| | | | 16,081,064 | |
| | |
|
|
|
| EXPENSES | | | | |
Management fee | | | 4,073,608 | |
Distribution fee—Class II | | | 5,688 | |
Administration fee—Class II | | | 3,413 | |
Shareholders’ reports | | | 140,000 | |
Custodian’s fees and expenses | | | 82,000 | |
Insurance expenses | | | 25,000 | |
Trustees’ fees | | | 20,000 | |
Audit fee | | | 17,000 | |
Legal fees and expenses | | | 15,000 | |
Commitment fee on syndicated credit agreement | | | 10,000 | |
Transfer agent’s fee and expenses (including affiliated expense of $3,600) (Note 4) | | | 10,000 | |
Loan interest expense (Note 8) | | | 25 | |
Miscellaneous | | | 13,308 | |
| | |
|
|
|
Total expenses | | | 4,415,042 | |
| | |
|
|
|
| NET INVESTMENT INCOME | | | 11,666,022 | |
| | |
|
|
|
| NET REALIZED AND UNREALIZED GAIN (LOSS) ON INVESTMENTS AND FOREIGN CURRENCIES | | | | |
Net realized gain (loss) on: | | | | |
Investment transactions | | | (132,511,710 | ) |
Foreign currency transactions | | | 2,788 | |
| | |
|
|
|
| | | | (132,508,922 | ) |
| | |
|
|
|
Net change in unrealized appreciation (depreciation) on: | | | | |
Investments | | | 482,224,778 | |
Foreign currencies | | | 310 | |
| | |
|
|
|
| | | | 482,225,088 | |
| | |
|
|
|
| NET GAIN ON INVESTMENTS AND FOREIGN CURRENCIES | | | 349,716,166 | |
| | |
|
|
|
| NET INCREASE IN NET ASSETS RESULTING FROM OPERATIONS | | $ | 361,382,188 | |
| | |
|
|
|
STATEMENT OF CHANGES IN NET ASSETS
| | | | | | | | |
| | | Year Ended December 31,
| |
| | | 2009
| | | 2008
| |
INCREASE (DECREASE) IN NET ASSETS
OPERATIONS: | | | | | | | | |
Net investment income | | $ | 11,666,022 | | | $ | 20,982,229 | |
Net realized loss on investments and foreign currencies | | | (132,508,922 | ) | | | (205,421,734 | ) |
Net change in unrealized appreciation (depreciation) on investments and foreign currencies | | | 482,225,088 | | | | (533,239,630 | ) |
| | |
|
|
| |
|
|
|
NET INCREASE (DECREASE) IN NET ASSETS RESULTING FROM OPERATIONS | | | 361,382,188 | | | | (717,679,135 | ) |
| | |
|
|
| |
|
|
|
| DISTRIBUTIONS: | | | | | | | | |
Class I | | | (20,940,047 | ) | | | (331,218,021 | ) |
Class II | | | (34,913 | ) | | | (495,826 | ) |
| | |
|
|
| |
|
|
|
| TOTAL DISTRIBUTIONS | | | (20,974,960 | ) | | | (331,713,847 | ) |
| | |
|
|
| |
|
|
|
| SERIES SHARE TRANSACTIONS (Note 7): | | | | | | | | |
Series shares sold | | | 11,756,400 | | | | 17,037,608 | |
Series shares issued in reinvestment of dividends and distributions | | | 20,974,960 | | | | 331,713,847 | |
Series shares repurchased | | | (122,511,338 | ) | | | (192,551,116 | ) |
| | |
|
|
| |
|
|
|
NET INCREASE (DECREASE) IN NET ASSETS RESULTING FROM SERIES SHARE TRANSACTIONS | | | (89,779,978 | ) | | | 156,200,339 | |
| | |
|
|
| |
|
|
|
| TOTAL INCREASE (DECREASE) IN NET ASSETS | | | 250,627,250 | | | | (893,192,643 | ) |
| NET ASSETS: | | | | | | | | |
Beginning of year | | | 934,770,640 | | | | 1,827,963,283 | |
| | |
|
|
| |
|
|
|
End of year | | $ | 1,185,397,890 | | | $ | 934,770,640 | |
| | |
|
|
| |
|
|
|
SEE NOTES TO FINANCIAL STATEMENTS.
A141
NOTES TO THE FINANCIAL STATEMENTS OF THE PRUDENTIAL SERIES FUND
The Prudential Series Fund (“Series Fund”), organized as a Delaware statutory trust, is a diversified open-end management investment company registered under the Investment Company Act of 1940, as amended. On January 2, 2006, each Portfolio of the Series Fund changed its federal income tax status from a regulated investment company to a partnership. As a result of that conversion, the Series Fund was reorganized from a Maryland corporation to a Delaware statutory trust. Pursuant to this reorganization, the Series Fund has been renamed “The Prudential Series Fund.” The Series Fund is composed of twenty-two Portfolios (“Portfolio” or “Portfolios”), each with separate series shares. The information presented in these financial statements pertains to thirteen Portfolios which are listed below along with each Portfolio’s investment objective.
Conservative Balanced Portfolio: Total investment return consistent with a conservatively managed diversified portfolio by investing in a mix of equity-related securities, debt obligations and money market instruments.
Diversified Bond Portfolio: High level of income over a longer term while providing reasonable safety of capital by investing in intermediate and long-term debt obligations that are rated investment grade and high quality money market instruments. The types of debt obligations in which the Portfolio can invest include U.S. government securities, mortgage-related securities and corporate bonds.
Equity Portfolio: Capital appreciation by investing primarily in stocks of major, established corporations as well as small companies.
Flexible Managed Portfolio: High total return consistent with an aggressively managed diversified portfolio by investing in a mix of equity and equity-related securities, debt obligations and money market instruments.
Global Portfolio: Long-term growth of capital by investing primarily in equity and equity-related securities of foreign and U.S. companies.
Government Income Portfolio: High level of income over the long-term consistent with the preservation of capital by investing primarily in intermediate and long-term U.S. government securities, including U.S. treasuries, government agency and mortgage-related securities.
High Yield Bond Portfolio: High total return by investing primarily in medium to lower rated debt securities.
Jennison Portfolio: Long-term growth of capital by investing primarily in equity securities of established companies that the Portfolio manager believes offer above-average growth prospects.
Money Market Portfolio: Maximum current income consistent with the stability of capital and maintenance of liquidity by investing in high quality short-term money market securities issued by the U.S. government and its agencies, as well as commercial paper, asset backed securities, certificates of deposit and other obligations issued by banks, corporations and other companies, that generally mature in 13 months or less.
Natural Resources Portfolio: Long-term growth of capital by investing primarily in stocks of companies that operate within, or do business with, the natural resources sector of the economy.
Small Capitalization Stock Portfolio: Long-term growth of capital that corresponds to the price and yield performance of the Standard & Poor’s Small Capitalization Stock Index (the “S&P 600 SmallCap Index”) by investing primarily in stocks of the S&P 600 SmallCap Index.
Stock Index Portfolio: Investment results that generally correspond to the price and yield performance of the S&P 500 Index by investing primarily in stocks in the S&P 500 Index.
Value Portfolio: Capital appreciation by investing in equity and equity-related securities that are considered to be undervalued.
The ability of issuers of debt securities (other than those issued or guaranteed by the U.S. Government) held by the Portfolios to meet their obligations may be affected by the economic or political developments in a specific industry, region or country.
B1
Foreign security and currency transactions may involve certain considerations and risks not typically associated with those of domestic origin as a result of, among other factors, the possibility of political and economic instability or the level of governmental supervision and regulation of foreign securities markets.
| Note 2: | | Accounting Policies |
The following is a summary of significant accounting policies followed by the Series Fund and the Portfolios in preparation of their financial statements.
Securities Valuation: Securities listed on a securities exchange are valued at the last sale price on such exchange on the day of valuation or, if there was no sale on such day, at the mean between the last reported bid and asked prices, or at the last bid price on such day in the absence of an asked price. Securities traded via NASDAQ are valued at the NASDAQ official closing price (“NOCP”) on the day of valuation, or if there was no NOCP, at the last sale price. Securities that are actively traded in the over-the-counter market, including listed securities for which the primary market is believed by Prudential Investments LLC (“PI” or “Manager”) in consultation with the subadvisors, to be over-the-counter, are valued at market value using prices provided by an independent pricing agent or principal market maker. Options on securities and indices traded on an exchange are valued at the last sale price as of the close of trading on the applicable exchange or, if there was no sale, at the mean between the most recently quoted bid and asked prices on such exchange, or at the last bid price in the absence of an asked price. Futures contracts and options thereon traded on a commodities exchange or board of trade are valued at the last sale price at the close of trading on such exchange or board of trade or, if there was no sale on the applicable commodities exchange or board of trade on such day, at the mean between the most recently quoted bid and asked prices on such exchange or board of trade or at the last bid price in the absence of an asked price. Prices may be obtained from independent pricing services which use information provided by market makers or estimates of market values obtained from yield data relating to investments or securities with similar characteristics. Securities for which reliable market quotations are not readily available, or whose values have been affected by events occurring after the close of the security’s foreign market and before the Series Fund’s normal pricing time, are valued at fair value in accordance with Board of Trustees approved fair valuation procedures. When determining the fair value of securities, some of the factors influencing the valuation include, the nature of any restrictions on disposition of the securities; assessment of the general liquidity of the securities; the issuer’s financial condition and the markets in which it does business; the cost of the investment; the size of the holding and the capitalization of the issuer; the prices of any recent transactions or bids/offers for such securities or any comparable securities; any available analyst media or other reports or information deemed reliable by the investment advisor regarding the issuer or the markets or industry in which it operates. Using fair value to price securities may result in a value that is different from a security’s most recent closing price and from the price used by other mutual funds to calculate their net asset values.
Investments in mutual funds are valued at their net asset value as of the close of the New York Stock Exchange on the date of valuation.
The Money Market Portfolio values all of its securities of sufficient credit quality at amortized cost, which approximates fair value. Short-term debt securities that are held in the other Portfolios which mature in more than 60 days are valued at fair value and those short-term debt securities of sufficient credit quality which mature in 60 days or less are valued at amortized cost which approximates fair value. The amortized cost method involves valuing a security at its cost at the time of purchase and thereafter assumes a constant amortization to maturity of any discount or premium.
Each Portfolio may hold up to 15% of its net assets (the Money Market Portfolio may hold up to 10% of its net assets) in illiquid securities, including those which are restricted as to disposition under securities law (“restricted securities”). Restricted securities, including private placements, are valued pursuant to the valuation procedures noted above.
Repurchase Agreements: In connection with transactions in repurchase agreements with United States financial institutions, it is the Series Fund’s policy that its custodian or designated subcustodians, as the case may be, under triparty repurchase agreements, take possession of the underlying collateral securities, the value of which exceeds the principal amount of the repurchase transaction, including accrued interest. To the extent that any repurchase transaction exceeds one business day, the value of the collateral is marked to market on a daily basis to ensure the adequacy of the collateral. If the seller defaults and the value of the
B2
collateral declines, or if bankruptcy proceedings are commenced with respect to the seller of the security, realization of the collateral by the Series Fund may by delayed or limited.
Foreign Currency Translation: The books and records of the Series Fund are maintained in U.S. dollars. Foreign currency amounts are translated into U.S. dollars on the following basis:
(i) market value of investment securities, other assets and liabilities at the current daily rates of exchange.
(ii) purchases and sales of investment securities, income and expenses at the rates of exchange prevailing on the respective dates of such transactions.
Although the net assets of the Series Fund are presented at the foreign exchange rates and market values at the close of the period, the Series Fund does not isolate that portion of the results of operations arising as a result of changes in the foreign exchange rates from the fluctuations arising from changes in the market prices of securities held at the end of the period. Similarly, the Series Fund does not isolate the effect of changes in foreign exchange rates from the fluctuations arising from changes in the market prices of portfolio securities sold during the period. Accordingly, these realized foreign currency gains (losses) are included in the reported net realized gains (losses) on investment transactions.
Net realized gains (losses) on foreign currency transactions represent net foreign exchange gains (losses) from the holding of foreign currencies, currency gains (losses) realized between the trade date and settlement date on securities transactions, and the difference between the amounts of dividends, interest and foreign withholding taxes recorded on the Series Fund’s books and the U.S. dollar equivalent amounts actually received or paid. Net unrealized currency gains (losses) from valuing foreign currency denominated assets and liabilities (other than investments) at period end exchange rates are reflected as a component of net unrealized appreciation (depreciation) on investments and foreign currencies.
Forward Currency Contracts: A forward currency contract is a commitment to purchase or sell a foreign currency at a future date at a negotiated forward rate between two parties. Certain Portfolios of the Series Fund entered into forward currency contracts in order to hedge their exposure to changes in foreign currency exchange rates on their foreign portfolio holdings or specific receivables and payables denominated in a foreign currency and to gain exposure to certain currencies. The contracts are valued daily at current exchange rates and any unrealized gain or loss is included in net unrealized appreciation or depreciation on foreign currencies. Gain or loss is realized on the settlement date of the contract equal to the difference between the settlement value of the original and renegotiated forward contracts. This gain or loss, if any, is included in net realized gain (loss) on foreign currency transactions. Risks may arise upon entering into these contracts from the potential inability of the counterparties to meet the terms of their contracts. Forward currency contracts involve risks from currency exchange rate and credit risk in excess of the amounts reflected on the Statement of Assets and Liabilities. The Portfolio’s maximum risk of loss from counterparty credit risk is the net value of the cash flows to be received from the counterparty at the end of the contract’s life. This risk may be mitigated by having a master netting arrangement between the Portfolio and the counterparty which may permit the Portfolio to offset amounts payable by the Portfolio to the same counterparty against amounts to be received; and by the receipt of collateral from the counterparty by the Portfolio to cover the Portfolio’s exposure to the counterparty. However, there is no assurance that such mitigating factors are easily enforceable.
Short Sales: Certain Portfolios of the Series Fund may sell a security it does not own in anticipation of a decline in the market value of that security (short sale). When a Portfolio makes a short sale, it must borrow the security sold short and deliver it to the broker-dealer through which it made the short sale as collateral for its obligation to deliver the security upon conclusion of the transaction. The Portfolio may have to pay a fee to borrow the particular security and may be obligated to remit any interest or dividends received on such borrowed securities. Dividends declared on short positions open are recorded on the ex-date and interest payable is accrued daily on fixed income securities sold short, both of which are recorded as an expense. A gain, limited to the price at which the Portfolio sold the security short, or a loss, unlimited in magnitude, will be recognized upon the termination of a short sale if the market price at termination is less than or greater than, respectively, the proceeds originally received.
Loan Participations: The High Yield Bond and Money Market Portfolios may invest in loan participations. When the Portfolio purchases a loan participation, the Portfolio typically enters into a contractual relationship with the lender or third party selling such participations (“Selling Participant”), but not the borrower. As a result, the Portfolio assumes the credit risk of the borrower and any other persons interpositioned between the
B3
Portfolio and the borrower. The Portfolio may not directly benefit from the collateral supporting the senior loan in which it has purchased the loan participation.
Financial Futures Contracts: A financial futures contract is an agreement to purchase (long) or sell (short) an agreed amount of securities at a set price for delivery on a future date. Upon entering into a financial futures contract, the Portfolio is required to pledge to the broker an amount of cash and/or other assets equal to a certain percentage of the contract amount. This amount is known as the “initial margin.” Subsequent payments, known as “variation margin,” are made or received by the Portfolio each day, depending on the daily fluctuations in the value of the underlying security. Such variation margin is recorded for financial statement purposes on a daily basis as unrealized gain (loss). When the contract expires or is closed, the gain (loss) is realized and is presented in the Statement of Operations as net realized gain (loss) on financial futures contracts.
Certain Portfolios of the Series Fund entered into financial futures contracts in order to hedge their existing portfolio securities, or securities the Portfolio intends to purchase, against fluctuations in value caused by changes in prevailing interest rates and to manage yield curve duration. Certain Portfolios entered into equity index futures contracts to gain market exposure. The Portfolio may not achieve the anticipated benefits of the financial futures contracts and may realize a loss. The use of futures transactions involves the risk of imperfect correlation in movements in the price of futures contracts, interest rates and the underlying hedged assets. Financial futures contracts involve elements of risk in excess of the amounts reflected on the Statement of Assets and Liabilities.
Options: Certain Portfolios of the Series Fund purchased or wrote options in order to hedge against adverse market movements or fluctuations in value caused by changes in prevailing interest rates and foreign currency exchange rates, with respect to securities which the Portfolio currently owns or intends to purchase. Certain Portfolios also used purchased options to gain exposure to certain securities and foreign currencies. The Portfolios’ principal reason for writing options is to realize, through receipt of premiums, a greater current return than would be realized on the underlying security alone. When the Portfolio purchases an option, it pays a premium and an amount equal to that premium is recorded as an asset. When the Portfolio writes an option, it receives a premium and an amount equal to that premium is recorded as a liability. The asset or liability is adjusted daily to reflect the current market value of the option. If an option expires unexercised, the Portfolio realizes a gain or loss to the extent of the premium received or paid. If an option is exercised, the premium received or paid is recorded as an adjustment to the proceeds from the sale or the cost of the purchase in determining whether the Portfolio has realized a gain or loss. The difference between the premium and the amount received or paid on at a closing purchase or sale transaction is also treated as a realized gain or loss. Gain or loss on purchased options is included in net realized gain or loss on investment transactions. Gain or loss on written options is presented separately as net realized gain or loss on options written. The Portfolio, as writer of an option, may have no control over whether the underlying securities may be sold (called) or purchased (put). As a result, the Portfolio bears the market risk of an unfavorable change in the price of the security underlying the written option. The Portfolio, as purchaser of an over-the-counter option, bears the risk of the potential inability of the counterparties to meet the terms of their contracts.
With exchange-traded futures and options contracts, there is minimal counterparty credit risk to the Portfolio since the exchanges’ clearinghouse acts as counterparty to all exchange traded futures and options, and guarantees the futures and options contracts against default.
Swap Agreements: Certain Portfolios of the Series Fund may enter into credit default, interest rate, total return and other forms of swap agreements. A swap agreement is an agreement to exchange the return generated by one instrument for the return generated by another instrument. The swap agreements are valued daily at current market value and any change in value is included in the net unrealized appreciation or depreciation on investments. Payments received or paid by the Portfolio are recorded as realized gains or losses upon termination or maturity of the swap. Risk of loss may exceed amounts recognized on the Statements of Assets and Liabilities. Swap agreements outstanding at period end, if any, are listed on the Schedule of Investments.
Interest Rate Swaps: Interest rate swaps represent agreements between counterparties to exchange cash flows based on the difference between two interest rates, applied to a notional principal amount for a specified period. The Portfolio is subject to interest rate risk exposure in the normal course of pursuing its investment objectives. Certain Portfolios used interest rate swaps to generate steady cash flow by receiving a stream of fixed rate payments and to increase exposure to prevailing market rates by receiving floating rate payments.
B4
The Portfolio’s maximum risk of loss from counterparty credit risk is the discounted net value of the cash flows to be received from the counterparty over the contract’s remaining life. This risk may be mitigated by having a master netting arrangement between the Portfolio and the counterparty which may permit the Portfolio to offset amounts payable by the Portfolio to the same counterparty against amounts to be received; and by the receipt of collateral from the counterparty by the Portfolio to cover the Portfolio’s exposure to the counterparty. However, there is no assurance that such mitigating factors are easily enforceable.
Credit Default Swaps: Credit default swaps involve one party (the protection buyer) making a stream of payments to another party (the protection seller) in exchange for the right to receive a specified payment in the event of a default or as a result of a default (“credit event”) for the referenced party, typically corporate issues or sovereign issues of an emerging country, on its obligation; or in the event of a write-down, principal shortfall, interest shortfall or default of all or part of the referenced entities comprising a credit index.
The Portfolio is subject to credit risk in the normal course of pursuing its investment objectives. Certain Portfolios purchased credit default swaps to provide a measure of protection against defaults of the issuers. Certain Portfolios in the Series Fund used credit default swaps on credit indices to hedge a portfolio of credit default swaps or bonds, which is less expensive than it would be to buy many credit default swaps to achieve a similar effect. Certain Portfolios took an active short position with respect to the likelihood of particular issuer’s default by selling credit default swaps. The Portfolios’ maximum risk of loss from counterparty credit risk for purchased credit default swaps is the notional value of a credit default swap agreement. A master netting arrangement between the Portfolio and the counterparty that permits the Portfolio to offset amounts payable by the Portfolio to the same counterparty against amounts to be received; and by the receipt of collateral from the counterparty by the Portfolio to cover the Portfolio’s exposure to the counterparty. However, there is no assurance that such mitigating factors are easily enforceable.
As a seller of protection on credit default swap agreements, a Portfolio will generally receive from the buyer of protection an agreed upon payment throughout the term of the swap provided that there is no credit event. As the seller, a Portfolio would effectively increase investment risk to its portfolio because, in addition to its total net assets, a Portfolio may be subject to investment exposure on the notional amount of the swap.
The maximum amount of the payment that a Portfolio as a seller of protection could be required to make under a credit default swap agreement would be equal the notional amount of the underlying security or index contract as a result of a credit event. These potential amounts will be partially offset by any recovery values of the respective referenced obligations, or net amounts received from the settlement of buy protection credit default swap agreements entered into by the Portfolio for the same referenced entity or index. As a buyer of protection, the Portfolio generally receives an amount up to the notional value of the swap if a credit event occurs.
Implied credit spreads, represented in absolute terms, utilized in determining the market value of credit default swap agreements on corporate issues or sovereign issues of an emerging country as of period end are disclosed in the footnotes to the Schedules of Investments and serve as an indicator of the current status of the payment/performance risk and represent the likelihood or risk of default for the credit derivative. The implied credit spread of a particular referenced entity reflects the cost of buying/selling protection and may include upfront payments required to enter into the agreement. For credit default swap agreements on asset- backed securities and credit indices, the quoted market prices and resulting values serve as the indicator of the current status of the payment and/or performance risk. Wider credit spreads and increasing market value in absolute terms, when compared to the notional amount of the swap, represent a deterioration of the referenced entity’s credit soundness and a greater likelihood or risk of default or other credit event occurring as defined under the terms of the agreement.
In addition to each instrument’s primary underlying risk exposure (e.g. interest rate, credit, equity or foreign exchange, etc.), swap agreements involve, to varying degrees, elements of credit, market and documentation risk. Such risks involve the possibility that there will be no liquid market for these agreements, that the counterparty to the agreement may default on its obligation to perform or disagree as to the meaning of the contractual terms in the agreement, and that there will be unfavorable changes in net interest rates. In connection with these agreements, securities in the portfolio may be identified as collateral or received as collateral from the counterparty in accordance with the terms of the respective swap agreements to provide or receive assets of value and serve as recourse in the event of default or bankruptcy/insolvency of either party. Such over-the-counter derivative agreements include conditions which when materialized, give the counterparty the right to cause an early termination of the transactions under those agreements. Any election by the counterparty for early termination of the contract(s) may impact the amounts reported on financial statements.
B5
As of December 31, 2009, none of the Portfolios have met conditions under such agreements, which give the counterparty the right to call for an early termination.
Forward currency contracts, written options, short sales, swaps and financial futures contracts involve elements of both market and credit risk in excess of the amounts reflected on the Statement of Assets and Liabilities.
Warrants and Rights: Certain Portfolios of the Series Fund hold warrants and rights acquired either through a direct purchase, included as part of a private placement, or pursuant to corporate actions. Warrants and rights entitle the holder to buy a proportionate amount of common stock at a specific price and time through the expiration dates. Such warrants and rights are held as long positions by the Portfolio until exercised, sold or expired. Warrants and rights are valued at fair value in accordance with the Board of Trustees’ approved fair valuation procedures.
Securities Lending: Each Portfolio of the Series Fund may lend its portfolio securities to broker-dealers. The loans are secured by collateral at least equal at all times to the market value of the securities loaned. Loans are subject to termination at the option of the borrower or the Portfolio. Upon termination of the loan, the borrower will return to the Portfolio securities identical to the loaned securities. Should the borrower of the securities fail financially, the Portfolio has the right to repurchase the securities using the collateral in the open market. The Portfolio recognizes income, net of any rebate and securities lending agent fees, for lending its securities in the form of fees or interest on the investment of any cash received as collateral. The Portfolio also continues to receive interest and dividends or amounts equivalent thereto on the securities loaned and recognizes any unrealized gain or loss in the market price of the securities loaned that may occur during the term of the loan.
Dollar Rolls: Certain Portfolios of the Series Fund enter into mortgage dollar rolls in which the Portfolio sells mortgage securities for delivery in the current month, realizing a gain (loss), and simultaneously contracts to repurchase somewhat similar (same type, coupon and maturity) securities on a specified future date. During the roll period, the Portfolio forgoes principal and interest paid on the securities. The Portfolio is compensated by the interest earned on the cash proceeds of the initial sale and by the lower repurchase price at the future date. The difference between the sales proceeds and the lower repurchase price is recorded as a realized gain. The Portfolio maintains a segregated account, the dollar value of which is at least equal to its obligations, with respect to dollar rolls.
When-Issued/Delayed Delivery Securities: Securities purchased or sold on a when-issued or delayed delivery basis may be settled a month or more after trade date; interest income is not accrued until settlement date. At the time a Portfolio enters into such transactions, it instructs the custodian to segregate assets with a current value at least equal to the amount of its when-issued or delayed-delivery purchase commitments.
Securities Transactions and Net Investment Income: Securities transactions are recorded on the trade date. Realized gains (losses) on sales of securities are calculated on the identified cost basis. Dividend income is recorded on the ex-dividend date; interest income, which is comprised of four elements: stated coupon, original issue discount, market discount and market premium, is recorded on the accrual basis. Expenses are recorded on the accrual basis. The Series Fund’s expenses are allocated to the respective Portfolios on the basis of relative net assets except for Portfolio specific expenses which are attributable directly to a Portfolio or class level.
For Portfolios with multiple classes of shares, net investment income (loss) (other than administration and distribution fees, which are charged to the respective class) and unrealized and realized gains (losses) are allocated daily to each class of shares based upon the relative proportion of net assets of each class at the beginning of the day.
Taxes: For federal income tax purposes, each Portfolio in the Series Fund is treated as a separate taxpaying entity. The Portfolios are treated as partnerships for tax purposes. No provision has been made in the financial statements for U.S. federal, state, or local taxes, as any tax liability arising from operations of the Portfolios is the responsibility of their partners. The Portfolios are not generally subject to entity-level taxation. Partners of each Portfolio are subject to taxes on their distributive share of partnership items.
Withholding taxes on foreign dividends, interest and capital gains have been provided for in accordance with the Series Fund’s understanding of the applicable country’s tax rules and regulations.
B6
Distributions: Distributions from each Portfolio are made in cash and automatically reinvested in additional shares of the same Portfolio. The Money Market Portfolio declares and reinvests distributions daily. The Diversified Bond, Government Income and High Yield Bond Portfolios make distributions, if any, quarterly. All other Portfolios’ distributions are generally made on an annual basis. Distributions are recorded on the ex-date.
Estimates: The preparation of financial statements requires management to make estimates and assumptions that affect the reported amounts and disclosures in the financial statements. Actual results could differ from these estimates.
The Series Fund has a management agreement with PI. Pursuant to this agreement PI has responsibility for all investment advisory services and supervises the subadvisors performance of such services. PI has entered into subadvisory agreements with Prudential Investment Management, Inc. (“PIM”), Jennison Associates LLC (“Jennison”), LSV Asset Management (“LSV”), Marsico Capital Management, LLC (“Marsico”), Quantitative Management Associates LLC (“QMA”), T. Rowe Price Associates, Inc. (“T. Rowe”) and William Blair & Company, L.L.C. (“William Blair”) (collectively, the “Subadvisors”), under which each provides investment advisory services for certain Portfolios of the Series Fund. PI pays for the services of the Subadvisors, compensation of officers of the Series Fund, occupancy and certain clerical and administrative expenses of the Series Fund. The Portfolios bear all other costs and expenses.
The management fee paid to PI is computed daily and payable monthly, at the annual rates specified below, of the value of each of the Portfolio’s average daily net assets.
| | | | | |
Portfolio
| | Management Fee
| | Effective
Management Fee
| |
Conservative Balanced Portfolio | | 0.55% | | 0.55 | % |
Diversified Bond Portfolio | | 0.40 | | 0.40 | |
Equity Portfolio | | 0.45 | | 0.45 | |
Flexible Managed Portfolio | | 0.60 | | 0.60 | |
Global Portfolio | | 0.75 | | 0.75 | |
Government Income Portfolio | | 0.40 | | 0.40 | |
High Yield Bond Portfolio | | 0.55 | | 0.55 | |
Jennison Portfolio | | 0.60 | | 0.60 | |
Money Market Portfolio | | 0.40 | | 0.37 | † |
Natural Resources Portfolio | | 0.45 | | 0.45 | |
Small Capitalization Stock Portfolio | | 0.40 | | 0.40 | |
Stock Index Portfolio | | 0.35% up to $4 billion | | | |
| | | 0.30% over $4 billion | | 0.35 | |
Value Portfolio | | 0.40 | | 0.40 | |
At December 31, 2009, the Subadvisors that provide investment advisory services to the Portfolios are as follows.
Where more than one Subadvisor is listed, each Subadvisor provides services to a segment of the Portfolio:
| | |
Portfolio
| | Subadvisor(s)
|
Conservative Balanced Portfolio | | PIM, QMA |
Diversified Bond Portfolio | | PIM |
Equity Portfolio | | Jennison |
Flexible Managed Portfolio | | PIM, QMA |
Global Portfolio | | LSV, Marsico, QMA, T. Rowe & William Blair |
Government Income Portfolio | | PIM |
High Yield Bond Portfolio | | PIM |
Jennison Portfolio | | Jennison |
Money Market Portfolio | | PIM |
Natural Resources Portfolio | | Jennison |
Small Capitalization Stock Portfolio | | QMA |
Stock Index Portfolio | | QMA |
Value Portfolio | | Jennison |
B7
The Series Fund has a distribution agreement with Prudential Investment Management Services LLC (“PIMS”), which acts as the distributor of the Class I and Class II shares of the Series Fund. The Series Fund compensates PIMS for distributing and servicing the Series Fund’s Class II shares pursuant to a plan of distribution (the “Class II Plan”), regardless of expenses actually incurred by PIMS. The distribution fees are accrued daily and payable monthly. No distribution or service fees are paid to PIMS as distributor of the Class I shares of the Series Fund. Pursuant to the Class II Plan, the Class II shares of each Portfolio compensate PIMS for distribution-related activities at an annual rate of 0.25% of the average daily net assets of the Class II shares.
The Series Fund has an administration agreement with PI, which acts as the administrator of the Class II shares of the Series Fund. The administration fee paid to PI is accrued daily and payable monthly, at the annual rate of 0.15% of the average daily net assets of the Class II shares.
PI has voluntarily agreed to reimburse each of the following Portfolios the portion of the management fee for that Portfolio equal to the amount that the aggregate annual ordinary operating expenses (excluding interest, taxes, and brokerage commissions) exceed the percentage stated below.
| | | | | |
Portfolio
| | Class I
Expense Limit
| | | Class II
Expense Limit
|
Government Income Portfolio | | 0.75 | *% | | N/A |
Stock Index Portfolio | | 0.75 | ** | | N/A |
| | * Effective | July 1, 2009, the expense limitation has been removed. |
| | ** Effective | July 1, 2009, the expense limitation has been renewed. |
| | N/A—Not | applicable—There are no Class II shares outstanding for this Portfolio. |
† PI has voluntarily agreed to limit the management fees of the Money Market Portfolio such that the 1-day yield (excluding capital gain or loss) does not fall below 0.50%. Effective March 16, 2009, May 6, 2009 and September 25, 2009, that threshold was reduced to 0.25%, 0.10% and 0.05%, respectively. The waiver/reimbursement is voluntary and may be modified or terminated by PI at any time without notice. During the year ended December 31, 2009, PI has reimbursed the Money Market Portfolio as a result of this voluntary agreement in the amount of $476,147 or 0.03% of the Money Market Portfolio average daily net assets.
PIMS, PI, PIM, QMA and Jennison are indirect, wholly-owned subsidiaries of Prudential Financial, Inc. (“Prudential”).
| Note 4: | | Other Transactions with Affiliates |
Prudential Mutual Fund Services LLC (“PMFS”), an affiliate of PI and an indirect, wholly-owned subsidiary of Prudential, serves as the Series Fund’s transfer agent. Transfer agent’s fees and expenses in the Statement of Operations include certain out-of-pocket expenses paid to non-affiliates, where applicable. PIM also serves as the Series Fund’s security lending agent. For the year ended December 31, 2009, PIM was compensated as follows for these services by the Series Fund Portfolios:
| | | |
Portfolio
| | PIM
|
Conservative Balanced Portfolio | | $ | 517,880 |
Diversified Bond Portfolio | | | 81,331 |
Equity Portfolio | | | 498,901 |
Flexible Managed Portfolio | | | 389,114 |
Global Portfolio | | | 95,348 |
Government Income Portfolio | | | 49,525 |
High Yield Bond Portfolio | | | 227,618 |
Jennison Portfolio | | | 210,485 |
Natural Resources Portfolio | | | 280,304 |
Small Capitalization Stock Portfolio | | | 344,378 |
Stock Index Portfolio | | | 730,418 |
Value Portfolio | | | 205,171 |
B8
For the year ended December 31, 2009, Wells Fargo Advisors, LLC (“Wells Fargo”), an affiliate of PI, earned brokerage commissions from transactions executed on behalf of the Series Fund Portfolios as follows:
| | | |
Portfolio
| | Wells Fargo
|
Equity Portfolio | | $ | 25,193 |
Natural Resources Portfolio | | | 5,898 |
Value Portfolio | | | 16,432 |
Certain Portfolios invest in the Short-Term Bond Series, pursuant to an exemptive order received from the Securities and Exchange Commission and in the Taxable Money Market Series, each a portfolio of the Dryden Core Investment Fund registered under the Investment Company Act of 1940, as amended, and managed by PI.
| Note 5: | | Portfolio Securities |
The aggregate cost of purchases and the proceeds from the sales of securities (excluding government securities and short-term issues) for the year ended December 31, 2009 were as follows:
| | | | | | |
Portfolio
| | Cost of Purchases
| | Proceeds from Sales
|
Conservative Balanced Portfolio | | $ | 3,472,864,979 | | $ | 3,622,098,710 |
Diversified Bond Portfolio | | | 3,416,474,438 | | | 3,397,509,296 |
Equity Portfolio | | | 2,585,967,605 | | | 2,784,347,808 |
Flexible Managed Portfolio | | | 5,094,802,384 | | | 5,231,291,236 |
Global Portfolio | | | 255,890,614 | | | 296,331,457 |
Government Income Portfolio | | | 2,562,157,425 | | | 2,619,410,508 |
High Yield Bond Portfolio | | | 1,438,109,309 | | | 1,222,819,497 |
Jennison Portfolio | | | 944,671,828 | | | 1,241,454,790 |
Natural Resources Portfolio | | | 250,186,134 | | | 349,640,155 |
Small Capitalization Stock Portfolio | | | 60,604,018 | | | 91,647,648 |
Stock Index Portfolio | | | 86,802,275 | | | 185,978,605 |
Value Portfolio | | | 500,118,833 | | | 599,194,542 |
The Conservative Balanced, Diversified Bond, Flexible Managed and Government Income Portfolios’ written options activity for the year ended December 31, 2009 were as follows:
| | | | | | | |
| Conservative Balanced Portfolio | | | | | | | |
| | | Contracts
| | | Premiums
| |
Balance as of December 31, 2008 | | — | | | $ | — | |
Options written | | 134 | | | | 94,675 | |
Options terminated in closing purchase transactions | | (134 | ) | | | (94,675 | ) |
Options expired | | — | | | | — | |
| | |
|
| |
|
|
|
Balance as of December 31, 2009 | | — | | | $ | — | |
| | |
|
| |
|
|
|
| | |
| Diversified Bond Portfolio | | | | | | | |
| | | Contracts
| | | Premiums
| |
Balance as of December 31, 2008 | | — | | | $ | — | |
Options written | | 243 | | | | 209,267 | |
Options terminated in closing purchase transactions | | (243 | ) | | | (209,267 | ) |
Options expired | | — | | | | — | |
| | |
|
| |
|
|
|
Balance as of December 31, 2009 | | — | | | $ | — | |
| | |
|
| |
|
|
|
| | |
| Flexible Managed Portfolio | | | | | | | |
| | | Contracts
| | | Premiums
| |
Balance as of December 31, 2008 | | — | | | $ | — | |
Options written | | 149 | | | | 105,195 | |
Options terminated in closing purchase transactions | | (149 | ) | | | (105,195 | ) |
Options expired | | — | | | | — | |
| | |
|
| |
|
|
|
Balance as of December 31, 2009 | | — | | | $ | — | |
| | |
|
| |
|
|
|
B9
| | | | | | | |
| Government Income Portfolio | | | | | | | |
| | | Contracts/
Notional
Amount
| | | Premiums
| |
Balance as of December 31, 2008 | | — | | | $ | — | |
Options written | | 17,400,080 | | | | 791,853 | |
Options terminated in closing purchase transactions | | (17,400,080 | ) | | | (791,853 | ) |
Options expired | | — | | | | — | |
| | |
|
| |
|
|
|
Balance as of December 31, 2009 | | — | | | $ | — | |
| | |
|
| |
|
|
|
After January 2, 2006, all Portfolios are treated as partnerships for tax purposes. The character of the cash distributions made by the partnerships is generally classified as return of capital nontaxable distributions. After each fiscal year each partner will receive information regarding their distributive allocable share of the partnership’s income, gains, losses and deductions.
Prior to January 2, 2006, each Portfolio, which was incorporated as of that date, qualified as a regulated investment company under the Internal Revenue Code and distributed all of its taxable income, including any net realized gains on investments, to shareholders.
With respect to the Portfolios, book cost of assets differs from tax cost of assets as a result of each Portfolio’s adoption of a mark to market method of accounting for tax purposes. Under this method, tax cost of assets will approximate its fair market value.
Management has analyzed the Portfolios’ tax positions taken on federal income tax returns for all open tax years and has concluded that as of December 31, 2009, no provision for income tax would be required in the Portfolios’ financial statements. The Portfolios’ federal and state income tax returns for tax years for which the applicable statutes of limitations have not expired are subject to examination by the Internal Revenue Service and state departments of revenue.
The Series Fund offers Class I and Class II shares. Neither Class I nor Class II shares of a Portfolio are subject to any sales charge or redemption charge and are sold at the net asset value of the Portfolio. Class I shares are sold only to certain separate accounts of Prudential to fund benefits under certain variable life insurance and variable annuity contracts (“contracts”). Class II shares are sold only to separate accounts of non-Prudential insurance companies as investment options under certain contracts. The separate accounts invest in shares of the Series Fund through subaccounts that correspond to the Portfolios. The separate accounts will redeem shares of the Series Fund to the extent necessary to provide benefits under the contracts or for such other purposes as may be consistent with the contracts. As of December 31, 2009, the Equity, Jennison, Natural Resources and Value Portfolios have Class II shares outstanding.
Transactions in shares of beneficial interest of the Equity, Jennison, Natural Resources and Value Portfolios were as follows:
| | | | | | | |
| Equity Portfolio: | | | | | | | |
Class I
| | Shares
| | | Amount
| |
Year ended December 31, 2009: | | | | | | | |
Series shares sold | | 1,441,609 | | | $ | 26,628,310 | |
Series shares issued in reinvestment of distributions | | 2,358,409 | | | | 43,394,722 | |
Series shares repurchased | | (14,177,442 | ) | | | (252,716,612 | ) |
| | |
|
| |
|
|
|
Net increase (decrease) in shares outstanding | | (10,377,424 | ) | | $ | (182,693,580 | ) |
| | |
|
| |
|
|
|
Year ended December 31, 2008: | | | | | | | |
Series shares sold | | 1,436,949 | | | $ | 31,146,917 | |
Series shares issued in reinvestment of distributions | | 17,082,227 | | | | 436,963,357 | |
Series shares repurchased | | (13,934,724 | ) | | | (328,218,745 | ) |
| | |
|
| |
|
|
|
Net increase (decrease) in shares outstanding | | 4,584,452 | | | $ | 139,891,529 | |
| | |
|
| |
|
|
|
B10
| | | | | | | |
Class II
| | Shares
| | | Amount
| |
Year ended December 31, 2009: | | | | | | | |
Series shares sold | | 4,210 | | | $ | 85,008 | |
Series shares issued in reinvestment of distributions | | 164 | | | | 3,037 | |
Series shares repurchased | | (8,224 | ) | | | (147,394 | ) |
| | |
|
| |
|
|
|
Net increase (decrease) in shares outstanding | | (3,850 | ) | | $ | (59,349 | ) |
| | |
|
| |
|
|
|
Year ended December 31, 2008: | | | | | | | |
Series shares sold | | 3,868 | | | $ | 88,780 | |
Series shares issued in reinvestment of distributions | | 2,468 | | | | 63,526 | |
Series shares repurchased | | (26,501 | ) | | | (699,940 | ) |
| | |
|
| |
|
|
|
Net increase (decrease) in shares outstanding | | (20,165 | ) | | $ | (547,634 | ) |
| | |
|
| |
|
|
|
| | |
| Jennison Portfolio: | | | | | | | |
Class I
| | Shares
| | | Amount
| |
Year ended December 31, 2009: | | | | | | | |
Series shares sold | | 3,308,645 | | | $ | 53,907,199 | |
Series shares issued in reinvestment of distributions | | 502,627 | | | | 8,584,877 | |
Series shares repurchased | | (19,767,153 | ) | | | (356,448,606 | ) |
| | |
|
| |
|
|
|
Net increase (decrease) in shares outstanding | | (15,955,881 | ) | | $ | (293,956,530 | ) |
| | |
|
| |
|
|
|
Year ended December 31, 2008: | | | | | | | |
Series shares sold | | 3,086,340 | | | $ | 57,779,660 | |
Series shares issued in reinvestment of distributions | | 390,007 | | | | 8,646,458 | |
Series shares repurchased | | (14,586,269 | ) | | | (279,799,118 | ) |
| | |
|
| |
|
|
|
Net increase (decrease) in shares outstanding | | (11,109,922 | ) | | $ | (213,373,000 | ) |
| | |
|
| |
|
|
|
| | |
Class II
| | | | | | |
Year ended December 31, 2009: | | | | | | | |
Series shares sold | | 348,998 | | | $ | 5,926,922 | |
Series shares issued in reinvestment of distributions | | 2,583 | | | | 43,518 | |
Series shares repurchased | | (209,990 | ) | | | (3,478,334 | ) |
| | |
|
| |
|
|
|
Net increase (decrease) in shares outstanding | | 141,591 | | | $ | 2,492,106 | |
| | |
|
| |
|
|
|
Year ended December 31, 2008: | | | | | | | |
Series shares sold | | 130,219 | | | | 2,480,267 | |
Series shares issued in reinvestment of distributions | | 528 | | | | 11,569 | |
Series shares repurchased | | (233,004 | ) | | | (4,441,874 | ) |
| | |
|
| |
|
|
|
Net increase (decrease) in shares outstanding | | (102,257 | ) | | $ | (1,950,038 | ) |
| | |
|
| |
|
|
|
| | |
| Natural Resources Portfolio: | | | | | | | |
Class I
| | Shares
| | | Amount
| |
Year ended December 31, 2009: | | | | | | | |
Series shares sold | | 1,178,414 | | | $ | 30,529,932 | |
Series shares issued in reinvestment of distributions | | 3,577,747 | | | | 111,232,160 | |
Series shares repurchased | | (4,281,505 | ) | | | (126,417,832 | ) |
| | |
|
| |
|
|
|
Net increase (decrease) in shares outstanding | | 474,656 | | | $ | 15,344,260 | |
| | |
|
| |
|
|
|
Year ended December 31, 2008: | | | | | | | |
Series shares sold | | 1,084,549 | | | $ | 57,023,489 | |
Series shares issued in reinvestment of distributions | | 3,318,624 | | | | 195,367,433 | |
Series shares repurchased | | (5,486,770 | ) | | | (239,959,723 | ) |
| | |
|
| |
|
|
|
Net increase (decrease) in shares outstanding | | (1,083,597 | ) | | $ | 12,431,199 | |
| | |
|
| |
|
|
|
B11
| | | | | | | |
Class II
| | Shares
| | | Amount
| |
Year ended December 31, 2009: | | | | | | | |
Series shares sold | | 1,274,171 | | | $ | 39,514,178 | |
Series shares issued in reinvestment of distributions | | 261,886 | | | | 8,100,142 | |
Series shares repurchased | | (820,865 | ) | | | (24,033,382 | ) |
| | |
|
| |
|
|
|
Net increase (decrease) in shares outstanding | | 715,192 | | | $ | 23,580,938 | |
| | |
|
| |
|
|
|
Year ended December 31, 2008: | | | | | | | |
Series shares sold | | 1,405,872 | | | $ | 64,916,745 | |
Series shares issued in reinvestment of distributions | | 137,692 | | | | 8,068,760 | |
Series shares repurchased | | (605,217 | ) | | | (28,359,416 | ) |
| | |
|
| |
|
|
|
Net increase (decrease) in shares outstanding | | 938,347 | | | $ | 44,626,089 | |
| | |
|
| |
|
|
|
| | |
| Value Portfolio: | | | | | | | |
Class I
| | Shares
| | | Amount
| |
Year ended December 31, 2009: | | | | | | | |
Series shares sold | | 832,942 | | | $ | 10,204,405 | |
Series shares issued in reinvestment of distributions | | 1,669,860 | | | | 20,940,047 | |
Series shares repurchased | | (10,122,888 | ) | | | (122,171,348 | ) |
| | |
|
| |
|
|
|
Net increase (decrease) in shares outstanding | | (7,620,086 | ) | | $ | (91,026,896 | ) |
| | |
|
| |
|
|
|
Year ended December 31, 2008: | | | | | | | |
Series shares sold | | 1,009,709 | | | $ | 16,588,714 | |
Series shares issued in reinvestment of distributions | | 17,981,434 | | | | 331,218,021 | |
Series shares repurchased | | (10,948,900 | ) | | | (192,163,813 | ) |
| | |
|
| |
|
|
|
Net increase (decrease) in shares outstanding | | 8,042,243 | | | $ | 155,642,922 | |
| | |
|
| |
|
|
|
| | |
Class II
| | | | | | |
Year ended December 31, 2009: | | | | | | | |
Series shares sold | | 114,420 | | | $ | 1,551,995 | |
Series shares issued in reinvestment of distributions | | 2,764 | | | | 34,913 | |
Series shares repurchased | | (27,091 | ) | | | (339,990 | ) |
| | |
|
| |
|
|
|
Net increase (decrease) in shares outstanding | | 90,093 | | | $ | 1,246,918 | |
| | |
|
| |
|
|
|
Year ended December 31, 2008: | | | | | | | |
Series shares sold | | 36,019 | | | $ | 448,894 | |
Series shares issued in reinvestment of distributions | | 26,744 | | | | 495,826 | |
Series shares repurchased | | (22,264 | ) | | | (387,303 | ) |
| | |
|
| |
|
|
|
Net increase (decrease) in shares outstanding | | 40,499 | | | $ | 557,417 | |
| | |
|
| |
|
|
|
| Note 8: | | Borrowings and Overdrafts |
The Portfolios (excluding the Money Market Portfolio), along with other affiliated registered investment companies (the “Funds”), are a party to a Syndicated Credit Agreement (“SCA”) with two banks. The SCA provides for a commitment of $500 million. Interest on any borrowings under the SCA is incurred at contracted market rates and a commitment fee for the unused amount is accrued daily and paid quarterly. Effective October 22, 2009, the Funds renewed the SCA with the banks. The commitment under the renewed SCA continues to be $500 million. The Funds pay a commitment fee of .15 of 1% of the unused portion of the renewed SCA. For the period from October 24, 2008 through October 21, 2009, the Portfolios paid a commitment fee of .13 of 1% of the unused portion of the agreement. The expiration date of the renewed SCA will be October 20, 2010. The purpose of the SCA is to provide an alternative source of temporary funding for capital share redemptions.
B12
The following Portfolios utilized the line of credit during the year ended December 31, 2009. The average balance outstanding is for the number of days the Portfolio had utilized the credit facility.
| | | | | | | | | | | |
Portfolio
| | Approximate
Average
Balance
Outstanding
| | Number of
Days
Outstanding
| | Weighted
Average
Interest
Rates
| | | Amount
Outstanding at
December 31,
2009
|
Diversified Bond Portfolio | | $ | 648,000 | | 1 | | 1.19 | % | | $ | — |
Jennison Portfolio | | | 637,111 | | 9 | | 1.24 | | | | — |
Natural Resources Portfolio | | | 2,683,913 | | 46 | | 1.30 | | | | — |
Small Capitalization Stock Portfolio | | | 492,980 | | 51 | | 1.25 | | | | — |
Value Portfolio | | | 645,000 | | 1 | | 1.39 | | | | — |
The average balance and weighted average interest rate on temporary overdrawn balances during the year ended December 31, 2009 were as follows:
| | | | | | |
Portfolio
| | Approximate
Average
Balance
Outstanding
| | Weighted
Average
Interest
Rates
| |
Government Income Portfolio . . . | | $ | 3,964,644 | | 2.25 | % |
| Note 9: | | Ownership and Affiliates |
As of December 31, 2009, all of Class I shares of each Portfolio were owned of record by the Prudential Insurance Company of America (“PICA”) on behalf of the owners of the variable insurance products issued by PICA.
On March 4, 2009, The Board of Trustees of the Fund approved an Agreement and Plan of Reorganization (the “Plan”) which provided for the transfer of all the assets of the following portfolio for shares of the acquiring portfolio and the assumption of the liabilities of the portfolio. Shareholders approved the Plan at a meeting on October 29, 2009 and the reorganization took place on November 13, 2009.
The purpose of the transaction was to combine two Portfolios with the same Investment Manager and with substantially similar investment objectives, policies and restrictions. The Acquiring Portfolio had a lower contractual investment management fee and annualized operating expense ratio as well as stronger historical investment performance.
The acquisition was accomplished by a tax-free exchange of the following shares on November 13, 2009:
| | | | | | | | | |
Merged Portfolio
| | Shares
| | Acquiring Portfolio
| | Shares
| | Value
|
SP PIMCO High Yield Portfolio | | 18,076,344 | | High Yield Bond Portfolio | | 33,152,623 | | $ | 157,806,487 |
For financial reporting purposes, assets received and shares issued by High Yield Bond Portfolio were recorded at fair value; however, the cost basis of the investments received from SP PIMCO High Yield Portfolio was carried forward to reflect the tax-free status of the acquisition.
The net assets and net unrealized depreciation immediately before the acquisition were as follows:
| | | | | | | | | | | | |
Merged Portfolio
| | Net Assets
| | Unrealized
Depreciation
| | | Acquiring Portfolio
| | Net Assets
|
SP PIMCO High Yield Portfolio | | $ | 157,806,487 | | $ | (678,204 | ) | | High Yield Bond Portfolio | | $ | 1,723,184,886 |
Assuming the acquisition had been completed on January 1, 2009, High Yield Bond Portfolio’s results of operations for the year ended December 31, 2009 were as follows:
| | | | |
Net investment income | | $ | 160,453,467 | (a) |
Net realized and unrealized gain on investments | | | 472,349,166 | (b) |
| | |
|
|
|
| | | $ | 632,802,633 | |
| | |
|
|
|
| | (a) | $149,665,312, as reported in the Statement of Operations, plus $10,726,063 Net Investment Income from SP PIMCO High Yield Portfolio pre-merger, plus $62,092 of pro-forma eliminated expenses. |
| | (b) | $435,357,508, as reported in the Statement of Operations, plus $36,991,658 Net Realized and Unrealized Gain on Investments from SP PIMCO High Yield Portfolio pre-merger. |
B13
Because both High Yield Bond Portfolio and SP PIMCO High Yield Portfolio sold and redeemed shares throughout the period, it is not practicable to provide pro-forma information on a per-share basis.
Because the combined investment portfolios have been managed as a single integrated portfolio since the acquisition was completed, it is also not practicable to separate the amounts of revenue and earnings of SP PIMCO High Yield Portfolio that have been included in High Yield Bond Portfolio’s Statement of Operations since November 13, 2009.
| Note 11: | | New Accounting Pronouncement |
In January 2010, the Financial Accounting Standards Board (“FASB”) issued Accounting Standards Update (“ASU”) No. 2010-06 “Improving Disclosures about Fair Value Measurements”. ASU 2010-06 will require reporting entities to make new disclosures about amounts and reasons for significant transfers in and out of Level 1 and Level 2 fair value measurements and input and valuation techniques used to measure fair value for both recurring and nonrecurring fair value measurements that fall in either Level 2 or Level 3, and information on purchases, sales, issuances, and settlements in the roll forward of activity in Level 3 fair value measurements. The new and revised disclosures are effective for interim and annual reporting periods beginning after December 15, 2009 except for the disclosures about purchases, sales, issuances, and settlements in the roll forward of activity in Level 3 fair value measurements, which are effective for interim and annual reporting periods beginning after December 15, 2010. At this time, management is evaluating the implications of ASU No. 2010-06 and its impact on the financial statements has not been determined.
| Note 12: | | Subsequent Events |
Management has evaluated the impact of all subsequent events on the Portfolios through February 16, 2010, the date the financial statements were issued, and has determined that the following subsequent events require recognition or disclosure in the financial statements:
Based on the approval of the Board of Trustees on December 7, 2009, the following portfolios will be merged during April or May of 2010.
| | |
Merging Portfolios
of The Prudential Series Fund
| | Acquiring Portfolios
of The Prudential Series Fund
|
SP Davis Value Portfolio | | Value Portfolio |
SP Strategic Partners Focused Growth Portfolio | | Jennison Portfolio |
The mergers are subject to the approval of shareholders.
B14
Financial Highlights
| | | | | | | | | | | | | | | | | | | | |
| | | Conservative Balanced Portfolio
| |
| | | Year Ended December 31,
| |
| | | 2009
| | | 2008
| | | 2007(a)
| | | 2006
| | | 2005
| |
Per Share Operating Performance: | | | | | | | | | | | | | | | | | | | | |
Net Asset Value, beginning of year | | $ | 12.69 | | | $ | 16.69 | | | $ | 16.21 | | | $ | 15.09 | | | $ | 15.10 | |
| | |
|
|
| |
|
|
| |
|
|
| |
|
|
| |
|
|
|
Income (Loss) From Investment Operations: | | | | | | | | | | | | | | | | | | | | |
Net investment income | | | 0.39 | | | | 0.50 | | | | 0.50 | | | | 0.48 | | | | 0.38 | |
Net realized and unrealized gain (loss) on investments | | | 2.08 | | | | (3.98 | ) | | | 0.49 | | | | 1.06 | | | | 0.11 | |
| | |
|
|
| |
|
|
| |
|
|
| |
|
|
| |
|
|
|
Total from investment operations | | | 2.47 | | | | (3.48 | ) | | | 0.99 | | | | 1.54 | | | | 0.49 | |
| | |
|
|
| |
|
|
| |
|
|
| |
|
|
| |
|
|
|
Less Dividends and Distributions: | | | | | | | | | | | | | | | | | | | | |
Dividends from net investment income | | | — | | | | — | | | | — | | | | — | | | | (0.35 | ) |
Distributions from net realized gains | | | — | | | | — | | | | — | | | | — | | | | (0.15 | ) |
Distributions | | | (0.51 | ) | | | (0.52 | ) | | | (0.51 | ) | | | (0.42 | ) | | | — | |
| | |
|
|
| |
|
|
| |
|
|
| |
|
|
| |
|
|
|
Total dividends and distributions | | | (0.51 | ) | | | (0.52 | ) | | | (0.51 | ) | | | (0.42 | ) | | | (0.50 | ) |
| | |
|
|
| |
|
|
| |
|
|
| |
|
|
| |
|
|
|
Net Asset Value, end of year | | $ | 14.65 | | | $ | 12.69 | | | $ | 16.69 | | | $ | 16.21 | | | $ | 15.09 | |
| | |
|
|
| |
|
|
| |
|
|
| |
|
|
| |
|
|
|
Total Return(b): | | | 20.01 | % | | | (21.41 | )% | | | 6.12 | % | | | 10.44 | % | | | 3.43 | % |
Ratios/Supplemental Data: | | | | | | | | | | | | | | | | | | | | |
Net assets, end of year (in millions) | | $ | 2,138.7 | | | $ | 1,957.5 | | | $ | 2,721.9 | | | $ | 2,770.6 | | | $ | 2,749.8 | |
Ratios to average net assets(c): | | | | | | | | | | | | | | | | | | | | |
Expenses | | | 0.59 | % | | | 0.59 | % | | | 0.59 | % | | | 0.57 | % | | | 0.58 | % |
Net investment income | | | 2.68 | % | | | 3.12 | % | | | 2.95 | % | | | 2.97 | % | | | 2.45 | % |
Portfolio turnover rate | | | 250 | % | | | 336 | % | | | 178 | % | | | 114 | % | | | 110 | % |
| (a) | Calculated based upon average shares outstanding during the year. |
| (b) | Total return is calculated assuming a purchase of a share on the first day and a sale on the last day of each year reported and includes reinvestment of dividends and distributions and does not reflect the effect of insurance contract charges. Total return does not reflect expenses associated with the separate account such as administrative fees, account charges and surrender charges which, if reflected, would reduce the total returns for all years shown. Performance figures may reflect voluntary fee waivers and/or expense reimbursements. In the absence of voluntary fee waivers and/or expense reimbursements, the total return would be lower. Past performance is no guarantee of future results. Total returns may reflect adjustments to conform to generally accepted accounting principles. |
| (c) | Does not include expenses of the underlying portfolios in which the Portfolio invests. |
| | | | | | | | | | | | | | | | | | | | |
| | | Diversified Bond Portfolio
| |
| | | Year Ended December 31,
| |
| | | 2009
| | | 2008
| | | 2007
| | | 2006
| | | 2005
| |
Per Share Operating Performance: | | | | | | | | | | | | | | | | | | | | |
Net Asset Value, beginning of year | | $ | 9.89 | | | $ | 10.90 | | | $ | 10.85 | | | $ | 10.96 | | | $ | 11.28 | |
| | |
|
|
| |
|
|
| |
|
|
| |
|
|
| |
|
|
|
Income (Loss) From Investment Operations: | | | | | | | | | | | | | | | | | | | | |
Net investment income | | | 0.50 | | | | 0.54 | | | | 0.58 | | | | 0.57 | | | | 0.55 | |
Net realized and unrealized gain (loss) on investments | | | 1.46 | | | | (0.90 | ) | | | 0.02 | | | | (0.05 | ) | | | (0.20 | ) |
| | |
|
|
| |
|
|
| |
|
|
| |
|
|
| |
|
|
|
Total from investment operations | | | 1.96 | | | | (0.36 | ) | | | 0.60 | | | | 0.52 | | | | 0.35 | |
| | |
|
|
| |
|
|
| |
|
|
| |
|
|
| |
|
|
|
Less Dividends and Distributions: | | | | | | | | | | | | | | | | | | | | |
Dividends from net investment income | | | — | | | | — | | | | — | | | | — | | | | (0.59 | ) |
Distributions from net realized gains | | | — | | | | — | | | | — | | | | — | | | | (0.08 | ) |
Distributions | | | (0.69 | ) | | | (0.65 | ) | | | (0.55 | ) | | | (0.63 | ) | | | — | |
| | |
|
|
| |
|
|
| |
|
|
| |
|
|
| |
|
|
|
Total dividends and distributions | | | (0.69 | ) | | | (0.65 | ) | | | (0.55 | ) | | | (0.63 | ) | | | (0.67 | ) |
| | |
|
|
| |
|
|
| |
|
|
| |
|
|
| |
|
|
|
Net Asset Value, end of year | | $ | 11.16 | | | $ | 9.89 | | | $ | 10.90 | | | $ | 10.85 | | | $ | 10.96 | |
| | |
|
|
| |
|
|
| |
|
|
| |
|
|
| |
|
|
|
Total Return(a): | | | 20.51 | % | | | (3.46 | )% | | | 5.71 | % | | | 4.98 | % | | | 3.28 | % |
Ratios/Supplemental Data: | | | | | | | | | | | | | | | | | | | | |
Net assets, end of year (in millions) | | $ | 1,363.5 | | | $ | 1,134.8 | | | $ | 1,218.3 | | | $ | 1,150.4 | | | $ | 1,230.6 | |
Ratios to average net assets(b): | | | | | | | | | | | | | | | | | | | | |
Expenses | | | 0.44 | % | | | 0.44 | % | | | 0.44 | % | | | 0.45 | % | | | 0.45 | % |
Net investment income | | | 4.79 | % | | | 5.07 | % | | | 5.39 | % | | | 5.18 | % | | | 4.81 | % |
Portfolio turnover rate | | | 401 | % | | | 723 | % | | | 476 | % | | | 393 | % | | | 278 | % |
| (a) | Total return is calculated assuming a purchase of a share on the first day and a sale on the last day of each year reported and includes reinvestment of dividends and distributions and does not reflect the effect of insurance contract charges. Total return does not reflect expenses associated with the separate account such as administrative fees, account charges and surrender charges which, if reflected, would reduce the total returns for all years shown. Performance figures may reflect voluntary fee waivers and/or expense reimbursements. In the absence of voluntary fee waivers and/or expense reimbursements, the total return would be lower. Past performance is no guarantee of future results. Total returns may reflect adjustments to conform to generally accepted accounting principles. |
| (b) | Does not include expenses of the underlying portfolios in which the Portfolio invests. |
SEE NOTES TO FINANCIAL STATEMENTS.
C1
Financial Highlights
| | | | | | | | | | | | | | | | | | | | |
| | | Equity Portfolio
| |
| | | Class I
| |
| | | Year Ended December 31,
| |
| | | 2009
| | | 2008(c)
| | | 2007
| | | 2006
| | | 2005
| |
Per Share Operating Performance: | | | | | | | | | | | | | | | | | | | | |
Net Asset Value, beginning of year | | $ | 16.40 | | | $ | 29.67 | | | $ | 27.45 | | | $ | 24.64 | | | $ | 22.31 | |
| | |
|
|
| |
|
|
| |
|
|
| |
|
|
| |
|
|
|
Income (Loss) From Investment Operations: | | | | | | | | | | | | | | | | | | | | |
Net investment income | | | .16 | | | | .29 | | | | .35 | | | | .30 | | | | .24 | |
Net realized and unrealized gain (loss) on investments | | | 6.04 | | | | (10.52 | ) | | | 2.21 | | | | 2.80 | | | | 2.32 | |
| | |
|
|
| |
|
|
| |
|
|
| |
|
|
| |
|
|
|
Total from investment operations | | | 6.20 | | | | (10.23 | ) | | | 2.56 | | | | 3.10 | | | | 2.56 | |
| | |
|
|
| |
|
|
| |
|
|
| |
|
|
| |
|
|
|
Less Dividends and Distributions: | | | | | | | | | | | | | | | | | | | | |
Dividends from net investment income | | | — | | | | — | | | | — | | | | — | | | | (.23 | ) |
Distributions | | | (.30 | ) | | | (3.04 | ) | | | (.34 | ) | | | (.29 | ) | | | — | |
| | |
|
|
| |
|
|
| |
|
|
| |
|
|
| |
|
|
|
Total dividends and distributions | | | (.30 | ) | | | (3.04 | ) | | | (.34 | ) | | | (.29 | ) | | | (.23 | ) |
| | |
|
|
| |
|
|
| |
|
|
| |
|
|
| |
|
|
|
Net Asset Value, end of year | | $ | 22.30 | | | $ | 16.40 | | | $ | 29.67 | | | $ | 27.45 | | | $ | 24.64 | |
| | |
|
|
| |
|
|
| |
|
|
| |
|
|
| |
|
|
|
Total Return(a) | | | 38.17 | % | | | (38.16 | )% | | | 9.32 | % | | | 12.57 | % | | | 11.47 | % |
Ratios/Supplemental Data: | | | | | | | | | | | | | | | | | | | | |
Net assets, end of year (in millions) | | $ | 3,195.1 | | | $ | 2,521.0 | | | $ | 4,423.9 | | | $ | 4,402.7 | | | $ | 4,283.9 | |
Ratios to average net assets(b): | | | | | | | | | | | | | | | | | | | | |
Expenses | | | .48 | % | | | .48 | % | | | .47 | % | | | .47 | % | | | .47 | % |
Net investment income | | | .90 | % | | | 1.21 | % | | | 1.16 | % | | | 1.10 | % | | | 1.01 | % |
Portfolio turnover rate | | | 98 | % | | | 67 | % | | | 57 | % | | | 60 | % | | | 77 | % |
| |
| | | Equity Portfolio
| |
| | | Class II
| |
| | | Year Ended December 31,
| |
| | | 2009
| | | 2008(c)
| | | 2007
| | | 2006
| | | 2005
| |
Per Share Operating Performance: | | | | | | | | | | | | | | | | | | | | |
Net Asset Value, beginning of year | | $ | 16.47 | | | $ | 29.81 | | | $ | 27.52 | | | $ | 24.69 | | | $ | 22.34 | |
| | |
|
|
| |
|
|
| |
|
|
| |
|
|
| |
|
|
|
Income (Loss) From Investment Operations: | | | | | | | | | | | | | | | | | | | | |
Net investment income | | | .09 | | | | .19 | | | | .28 | | | | .19 | | | | .12 | |
Net realized and unrealized gain (loss) on investments | | | 6.07 | | | | (10.61 | ) | | | 2.20 | | | | 2.80 | | | | 2.35 | |
| | �� |
|
|
| |
|
|
| |
|
|
| |
|
|
| |
|
|
|
Total from investment operations | | | 6.16 | | | | (10.42 | ) | | | 2.48 | | | | 2.99 | | | | 2.47 | |
| | |
|
|
| |
|
|
| |
|
|
| |
|
|
| |
|
|
|
Less Dividends and Distributions: | | | | | | | | | | | | | | | | | | | | |
Dividends from net investment income | | | — | | | | — | | | | — | | | | — | | | | (.12 | ) |
Distributions | | | (.17 | ) | | | (2.92 | ) | | | (.19 | ) | | | (.16 | ) | | | — | |
| | |
|
|
| |
|
|
| |
|
|
| |
|
|
| |
|
|
|
Total dividends and distributions | | | (.17 | ) | | | (2.92 | ) | | | (.19 | ) | | | (.16 | ) | | | (.12 | ) |
| | |
|
|
| |
|
|
| |
|
|
| |
|
|
| |
|
|
|
Net Asset Value, end of year | | $ | 22.46 | | | $ | 16.47 | | | $ | 29.81 | | | $ | 27.52 | | | $ | 24.69 | |
| | |
|
|
| |
|
|
| |
|
|
| |
|
|
| |
|
|
|
Total Return(a) | | | 37.58 | % | | | (38.47 | )% | | | 8.91 | % | | | 12.13 | % | | | 11.04 | % |
Ratios/Supplemental Data: | | | | | | | | | | | | | | | | | | | | |
Net assets, end of year (in millions) | | $ | 0.4 | | | $ | 0.4 | | | $ | 1.3 | | | $ | 1.9 | | | $ | 2.1 | |
Ratios to average net assets(b): | | | | | | | | | | | | | | | | | | | | |
Expenses | | | .88 | % | | | .88 | % | | | .87 | % | | | .87 | % | | | .87 | % |
Net investment income | | | .52 | % | | | .78 | % | | | .74 | % | | | .71 | % | | | .64 | % |
Portfolio turnover rate | | | 98 | % | | | 67 | % | | | 57 | % | | | 60 | % | | | 77 | % |
| (a) | Total return is calculated assuming a purchase of a share on the first day and a sale on the last day of each year reported and includes reinvestment of dividends and distributions and does not reflect the effect of insurance contract charges. Total return does not reflect expenses associated with the separate account such as administrative fees, account charges and surrender charges which, if reflected, would reduce the total returns for all years shown. Performance figures may reflect voluntary fee waivers and/or expense reimbursements. In the absence of voluntary fee waivers and/or expense reimbursements, the total return would be lower. Past performance is no guarantee of future results. Total returns may reflect adjustments to conform to generally accepted accounting principles. |
| (b) | Does not include expenses of the underlying portfolio in which the Portfolio invests. |
| (c) | Calculation based on average shares outstanding during the year. |
SEE NOTES TO FINANCIAL STATEMENTS.
C2
Financial Highlights
| | | | | | | | | | | | | | | | | | | | |
| | | Flexible Managed Portfolio
| |
| | | Year Ended December 31,
| |
| | | 2009
| | | 2008
| | | 2007
| | | 2006
| | | 2005(a)
| |
Per Share Operating Performance: | | | | | | | | | | | | | | | | | | | | |
Net Asset Value, beginning of year | | $ | 12.34 | | | $ | 18.30 | | | $ | 18.36 | | | $ | 16.92 | | | $ | 16.58 | |
| | |
|
|
| |
|
|
| |
|
|
| |
|
|
| |
|
|
|
Income (Loss) From Investment Operations: | | | | | | | | | | | | | | | | | | | | |
Net investment income | | | 0.34 | | | | 0.45 | | | | 0.50 | | | | 0.44 | | | | 0.32 | |
Net realized and unrealized gain (loss) on investments | | | 2.05 | | | | (4.62 | ) | | | 0.65 | | | | 1.59 | | | | 0.34 | |
| | |
|
|
| |
|
|
| |
|
|
| |
|
|
| |
|
|
|
Total from investment operations | | | 2.39 | | | | (4.17 | ) | | | 1.15 | | | | 2.03 | | | | 0.66 | |
| | |
|
|
| |
|
|
| |
|
|
| |
|
|
| |
|
|
|
Less Dividends and Distributions: | | | | | | | | | | | | | | | | | | | | |
Dividends from net investment income | | | — | | | | — | | | | — | | | | — | | | | (0.32 | ) |
Distributions | | | (0.45 | ) | | | (1.79 | ) | | | (1.21 | ) | | | (0.59 | ) | | | — | |
| | |
|
|
| |
|
|
| |
|
|
| |
|
|
| |
|
|
|
Total dividends and distributions | | | (0.45 | ) | | | (1.79 | ) | | | (1.21 | ) | | | (0.59 | ) | | | (0.32 | ) |
| | |
|
|
| |
|
|
| |
|
|
| |
|
|
| |
|
|
|
Net Asset Value, end of year | | $ | 14.28 | | | $ | 12.34 | | | $ | 18.30 | | | $ | 18.36 | | | $ | 16.92 | |
| | |
|
|
| |
|
|
| |
|
|
| |
|
|
| |
|
|
|
Total Return(b): | | | 19.95 | % | | | (24.82 | )% | | | 6.30 | % | | | 12.17 | % | | | 4.16 | % |
Ratios/Supplemental Data: | | | | | | | | | | | | | | | | | | | | |
Net assets, end of year (in millions) | | $ | 2,906.0 | | | $ | 2,621.6 | | | $ | 3,716.3 | | | $ | 3,723.6 | | | $ | 3,543.9 | |
Ratios to average net assets(c): | | | | | | | | | | | | | | | | | | | | |
Expenses | | | 0.63 | % | | | 0.64 | % | | | 0.63 | % | | | 0.62 | % | | | 0.63 | % |
Net investment income | | | 2.50 | % | | | 2.85 | % | | | 2.53 | % | | | 2.48 | % | | | 1.95 | % |
Portfolio turnover rate | | | 248 | % | | | 321 | % | | | 212 | % | | | 153 | % | | | 126 | % |
| (a) | Calculated based upon average shares outstanding during the year. |
| (b) | Total return is calculated assuming a purchase of a share on the first day and a sale on the last day of each year reported and includes reinvestment of dividends and distributions and does not reflect the effect of insurance contract charges. Total return does not reflect expenses associated with the separate account such as administrative fees, account charges and surrender charges which, if reflected, would reduce the total returns for all years shown. Performance figures may reflect voluntary fee waivers and/or expense reimbursements. In the absence of voluntary fee waivers and/or expense reimbursements, the total return would be lower. Past performance is no guarantee of future results. Total returns may reflect adjustments to conform to generally accepted accounting principles. |
| (c) | Does not include expenses of the underlying portfolios in which the Portfolio invests. |
| | | | | | | | | | | | | | | | | | | | |
| | | Global Portfolio
| |
| | | Year Ended December 31,
| |
| | | 2009
| | | 2008
| | | 2007
| | | 2006
| | | 2005
| |
Per Share Operating Performance: | | | | | | | | | | | | | | | | | | | | |
Net Asset Value, beginning of year | | $ | 13.07 | | | $ | 24.62 | | | $ | 22.53 | | | $ | 18.96 | | | $ | 16.43 | |
| | |
|
|
| |
|
|
| |
|
|
| |
|
|
| |
|
|
|
Income (Loss) From Investment Operations: | | | | | | | | | | | | | | | | | | | | |
Net investment income | | | 0.28 | | | | 0.40 | | | | 0.36 | | | | 0.26 | | | | 0.13 | |
Net realized and unrealized gain (loss) on investments | | | 3.75 | | | | (10.38 | ) | | | 2.00 | | | | 3.44 | | | | 2.50 | |
| | |
|
|
| |
|
|
| |
|
|
| |
|
|
| |
|
|
|
Total from investment operations | | | 4.03 | | | | (9.98 | ) | | | 2.36 | | | | 3.70 | | | | 2.63 | |
| | |
|
|
| |
|
|
| |
|
|
| |
|
|
| |
|
|
|
Less Dividends and Distributions: | | | | | | | | | | | | | | | | | | | | |
Dividends from net investment income | | | — | | | | — | | | | — | | | | — | | | | (0.10 | ) |
Distributions | | | (0.42 | ) | | | (1.57 | ) | | | (0.27 | ) | | | (0.13 | ) | | | — | |
| | |
|
|
| |
|
|
| |
|
|
| |
|
|
| |
|
|
|
Total dividends and distributions | | | (0.42 | ) | | | (1.57 | ) | | | (0.27 | ) | | | (0.13 | ) | | | (0.10 | ) |
| | |
|
|
| |
|
|
| |
|
|
| |
|
|
| |
|
|
|
Net Asset Value, end of year | | $ | 16.68 | | | $ | 13.07 | | | $ | 24.62 | | | $ | 22.53 | | | $ | 18.96 | |
| | |
|
|
| |
|
|
| |
|
|
| |
|
|
| |
|
|
|
Total Return(a): | | | 31.39 | % | | | (42.92 | )% | | | 10.48 | % | | | 19.65 | % | | | 16.06 | % |
Ratios/Supplemental Data: | | | | | | | | | | | | | | | | | | | | |
Net assets, end of year (in millions) | | $ | 619.5 | | | $ | 512.7 | | | $ | 985.0 | | | $ | 932.9 | | | $ | 814.1 | |
Ratios to average net assets(b): | | | | | | | | | | | | | | | | | | | | |
Expenses | | | 0.85 | % | | | 0.84 | % | | | 0.81 | % | | | 0.84 | % | | | 0.82 | % |
Net investment income | | | 1.77 | % | | | 2.01 | % | | | 1.43 | % | | | 1.24 | % | | | 0.77 | % |
Portfolio turnover rate | | | 50 | % | | | 65 | % | | | 48 | % | | | 50 | % | | | 155 | % |
| (a) | Total return is calculated assuming a purchase of a share on the first day and a sale on the last day of each year reported and includes reinvestment of dividends and distributions and does not reflect the effect of insurance contract charges. Total return does not reflect expenses associated with the separate account such as administrative fees, account charges and surrender charges which, if reflected, would reduce the total returns for all years shown. Performance figures may reflect voluntary fee waivers and/or expense reimbursements. In the absence of voluntary fee waivers and/or expense reimbursements, the total return would be lower. Past performance is no guarantee of future results. Total returns may reflect adjustments to conform to generally accepted accounting principles. |
| (b) | Does not include expenses of the underlying portfolios in which the Portfolio invests. |
SEE NOTES TO FINANCIAL STATEMENTS.
C3
Financial Highlights
| | | | | | | | | | | | | | | | | | | | |
| | | Government Income Portfolio
| |
| | | Year Ended December 31,
| |
| | | 2009
| | | 2008
| | | 2007
| | | 2006
| | | 2005
| |
Per Share Operating Performance: | | | | | | | | | | | | | | | | | | | | |
Net Asset Value, beginning of year | | $ | 11.40 | | | $ | 11.38 | | | $ | 11.26 | | | $ | 11.40 | | | $ | 11.65 | |
| | |
|
|
| |
|
|
| |
|
|
| |
|
|
| |
|
|
|
Income (Loss) From Investment Operations: | | | | | | | | | | | | | | | | | | | | |
Net investment income | | | 0.37 | | | | 0.45 | | | | 0.53 | | | | 0.54 | | | | 0.49 | |
Net realized and unrealized gain (loss) on investments | | | 0.49 | | | | 0.03 | | | | 0.10 | | | | (0.13 | ) | | | (0.20 | ) |
| | |
|
|
| |
|
|
| |
|
|
| |
|
|
| |
|
|
|
Total from investment operations | | | 0.86 | | | | 0.48 | | | | 0.63 | | | | 0.41 | | | | 0.29 | |
| | |
|
|
| |
|
|
| |
|
|
| |
|
|
| |
|
|
|
Less Dividends and Distributions: | | | | | | | | | | | | | | | | | | | | |
Dividends from net investment income | | | — | | | | — | | | | — | | | | — | | | | (0.54 | ) |
Distributions | | | (0.40 | ) | | | (0.46 | ) | | | (0.51 | ) | | | (0.55 | ) | | | — | |
| | |
|
|
| |
|
|
| |
|
|
| |
|
|
| |
|
|
|
Total dividends and distributions | | | (0.40 | ) | | | (0.46 | ) | | | (0.51 | ) | | | (0.55 | ) | | | (0.54 | ) |
| | |
|
|
| |
|
|
| |
|
|
| |
|
|
| |
|
|
|
Net Asset Value, end of year | | $ | 11.86 | | | $ | 11.40 | | | $ | 11.38 | | | $ | 11.26 | | | $ | 11.40 | |
| | |
|
|
| |
|
|
| |
|
|
| |
|
|
| |
|
|
|
Total Return(a): | | | 7.71 | % | | | 4.30 | % | | | 5.70 | % | | | 3.74 | % | | | 2.51 | % |
Ratios/Supplemental Data: | | | | | | | | | | | | | | | | | | | | |
Net assets, end of year (in millions) | | $ | 375.4 | | | $ | 370.5 | | | $ | 340.3 | | | $ | 354.3 | | | $ | 378.2 | |
Ratios to average net assets(b): | | | | | | | | | | | | | | | | | | | | |
Expenses | | | 0.47 | % | | | 0.52 | %(c) | | | 0.52 | % | | | 0.50 | % | | | 0.47 | % |
Net investment income | | | 3.11 | % | | | 3.98 | %(c) | | | 4.62 | % | | | 4.75 | % | | | 4.16 | % |
Portfolio turnover rate | | | 1179 | % | | | 2707 | % | | | 2377 | % | | | 734 | % | | | 507 | % |
| (a) | Total return is calculated assuming a purchase of a share on the first day and a sale on the last day of each year reported and includes reinvestment of dividends and distributions and does not reflect the effect of insurance contract charges. Total return does not reflect expenses associated with the separate account such as administrative fees, account charges and surrender charges which, if reflected, would reduce the total returns for all years shown. Performance figures may reflect voluntary fee waivers and/or expense reimbursements. In the absence of voluntary fee waivers and/or expense reimbursements, the total return would be lower. Past performance is no guarantee of future results. Total returns may reflect adjustments to conform to generally accepted accounting principles. |
| (b) | Does not include expenses of the underlying portfolios in which the Portfolio invests. |
| (c) | Includes interest expense of 0.03%. |
| | | | | | | | | | | | | | | | | | | | |
| | | High Yield Bond Portfolio
| |
| | | Year Ended December 31,
| |
| | | 2009
| | | 2008
| | | 2007
| | | 2006
| | | 2005
| |
Per Share Operating Performance: | | | | | | | | | | | | | | | | | | | | |
Net Asset Value, beginning of year | | $ | 3.61 | | | $ | 5.09 | | | $ | 5.33 | | | $ | 5.23 | | | $ | 5.42 | |
| | |
|
|
| |
|
|
| |
|
|
| |
|
|
| |
|
|
|
Income (Loss) From Investment Operations: | | | | | | | | | | | | | | | | | | | | |
Net investment income | | | 0.41 | | | | 0.41 | | | | 0.40 | | | | 0.39 | | | | 0.38 | |
Net realized and unrealized gain (loss) on investments | | | 1.22 | | | | (1.48 | ) | | | (0.26 | ) | | | 0.13 | | | | (0.20 | ) |
| | |
|
|
| |
|
|
| |
|
|
| |
|
|
| |
|
|
|
Total from investment operations | | | 1.63 | | | | (1.07 | ) | | | 0.14 | | | | 0.52 | | | | 0.18 | |
| | |
|
|
| |
|
|
| |
|
|
| |
|
|
| |
|
|
|
Less Dividends and Distributions: | | | | | | | | | | | | | | | | | | | | |
Dividends from net investment income | | | — | | | | — | | | | — | | | | — | | | | (0.37 | ) |
Distributions | | | (0.41 | ) | | | (0.41 | ) | | | (0.38 | ) | | | (0.42 | ) | | | — | |
| | |
|
|
| |
|
|
| |
|
|
| |
|
|
| |
|
|
|
Total dividends and distributions | | | (0.41 | ) | | | (0.41 | ) | | | (0.38 | ) | | | (0.42 | ) | | | (0.37 | ) |
| | |
|
|
| |
|
|
| |
|
|
| |
|
|
| |
|
|
|
Net Asset Value, end of year | | $ | 4.83 | | | $ | 3.61 | | | $ | 5.09 | | | $ | 5.33 | | | $ | 5.23 | |
| | |
|
|
| |
|
|
| |
|
|
| |
|
|
| |
|
|
|
Total Return(a): | | | 47.16 | % | | | (22.28 | )% | | | 2.62 | % | | | 10.25 | % | | | 3.41 | % |
Ratios/Supplemental Data: | | | | | | | | | | | | | | | | | | | | |
Net assets, end of year (in millions) | | $ | 1,938.3 | | | $ | 1,239.9 | | | $ | 1,674.0 | | | $ | 1,721.1 | | | $ | 1,635.7 | |
Ratios to average net assets(b): | | | | | | | | | | | | | | | | | | | | |
Expenses | | | 0.58 | % | | | 0.58 | % | | | 0.58 | % | | | 0.58 | % | | | 0.58 | % |
Net investment income | | | 9.75 | % | | | 8.78 | % | | | 7.49 | % | | | 7.39 | % | | | 7.14 | % |
Portfolio turnover rate | | | 84 | % | | | 61 | % | | | 58 | % | | | 49 | % | | | 56 | % |
| (a) | Total return is calculated assuming a purchase of a share on the first day and a sale on the last day of each year reported and includes reinvestment of dividends and distributions and does not reflect the effect of insurance contract charges. Total return does not reflect expenses associated with the separate account such as administrative fees, account charges and surrender charges which, if reflected, would reduce the total returns for all years shown. Performance figures may reflect voluntary fee waivers and/or expense reimbursements. In the absence of voluntary fee waivers and/or expense reimbursements, the total return would be lower. Past performance is no guarantee of future results. Total returns may reflect adjustments to conform to generally accepted accounting principles. |
| (b) | Does not include expenses of the underlying portfolios in which the Portfolio invests. |
SEE NOTES TO FINANCIAL STATEMENTS.
C4
Financial Highlights
| | | | | | | | | | | | | | | | | | | | |
| | | Jennison Portfolio
| |
| | | Class I
| |
| | | Year Ended December 31,
| |
| | | 2009(a)
| | | 2008(a)
| | | 2007
| | | 2006(a)
| | | 2005(a)
| |
Per Share Operating Performance: | | | | | | | | | | | | | | | | | | | | |
Net Asset Value, beginning of year | | $ | 14.69 | | | $ | 23.53 | | | $ | 21.07 | | | $ | 20.76 | | | $ | 18.14 | |
| | |
|
|
| |
|
|
| |
|
|
| |
|
|
| |
|
|
|
Income (Loss) From Investment Operations: | | | | | | | | | | | | | | | | | | | | |
Net investment income | | | 0.08 | | | | 0.10 | | | | 0.10 | | | | 0.06 | | | | 0.02 | |
Net realized and unrealized gain (loss) on investments | | | 6.22 | | | | (8.84 | ) | | | 2.43 | | | | 0.31 | | | | 2.62 | |
| | |
|
|
| |
|
|
| |
|
|
| |
|
|
| |
|
|
|
Total from investment operations | | | 6.30 | | | | (8.74 | ) | | | 2.53 | | | | 0.37 | | | | 2.64 | |
| | |
|
|
| |
|
|
| |
|
|
| |
|
|
| |
|
|
|
Less Dividends and Distributions: | | | | | | | | | | | | | | | | | | | | |
Dividends from net investment income | | | — | | | | — | | | | — | | | | — | | | | (0.02 | ) |
Distributions | | | (0.12 | ) | | | (0.10 | ) | | | (0.07 | ) | | | (0.06 | ) | | | — | |
| | |
|
|
| |
|
|
| |
|
|
| |
|
|
| |
|
|
|
Total dividends and distributions | | | (0.12 | ) | | | (0.10 | ) | | | (0.07 | ) | | | (0.06 | ) | | | (0.02 | ) |
| | |
|
|
| |
|
|
| |
|
|
| |
|
|
| |
|
|
|
Net Asset Value, end of year | | $ | 20.87 | | | $ | 14.69 | | | $ | 23.53 | | | $ | 21.07 | | | $ | 20.76 | |
| | |
|
|
| |
|
|
| |
|
|
| |
|
|
| |
|
|
|
Total Return(b): | | | 43.03 | % | | | (37.28 | )% | | | 12.00 | % | | | 1.79 | % | | | 14.55 | % |
Ratios/Supplemental Data: | | | | | | | | | | | | | | | | | | | | |
Net assets, end of year (in millions) | | $ | 1,298.7 | | | $ | 1,148.0 | | | $ | 2,100.5 | | | $ | 2,077.3 | | | $ | 2,297.0 | |
Ratios to average net assets(c): | | | | | | | | | | | | | | | | | | | | |
Expenses | | | 0.64 | % | | | 0.63 | % | | | 0.62 | % | | | 0.63 | % | | | 0.63 | % |
Net investment income | | | 0.44 | % | | | 0.52 | % | | | 0.42 | % | | | 0.29 | % | | | 0.10 | % |
Portfolio turnover rate | | | 76 | % | | | 74 | % | | | 69 | % | | | 67 | % | | | 57 | % |
| | | | | | | | | | | | | | | | | | | | |
| | | Jennison Portfolio
| |
| | | Class II
| |
| | | Year Ended December 31,
| |
| | | 2009(a)
| | | 2008(a)
| | | 2007
| | | 2006(a)
| | | 2005(a)
| |
Per Share Operating Performance: | | | | | | | | | | | | | | | | | | | | |
Net Asset Value, beginning of year | | $ | 14.46 | | | $ | 23.17 | | | $ | 20.77 | | | $ | 20.49 | | | $ | 17.97 | |
| | |
|
|
| |
|
|
| |
|
|
| |
|
|
| |
|
|
|
Income (Loss) From Investment Operations: | | | | | | | | | | | | | | | | | | | | |
Net investment income (loss) | | | 0.01 | | | | 0.02 | | | | — | (d) | | | (0.02 | ) | | | (0.05 | ) |
Net realized and unrealized gain (loss) on investments | | | 6.13 | | | | (8.72 | ) | | | 2.40 | | | | 0.30 | | | | 2.57 | |
| | |
|
|
| |
|
|
| |
|
|
| |
|
|
| |
|
|
|
Total from investment operations | | | 6.14 | | | | (8.70 | ) | | | 2.40 | | | | 0.28 | | | | 2.52 | |
| | |
|
|
| |
|
|
| |
|
|
| |
|
|
| |
|
|
|
Less Distributions: | | | | | | | | | | | | | | | | | | | | |
Distributions | | | (0.05 | ) | | | (0.01 | ) | | | — | | | | — | | | | — | |
| | |
|
|
| |
|
|
| |
|
|
| |
|
|
| |
|
|
|
Net Asset Value, end of year | | $ | 20.55 | | | $ | 14.46 | | | $ | 23.17 | | | $ | 20.77 | | | $ | 20.49 | |
| | |
|
|
| |
|
|
| |
|
|
| |
|
|
| |
|
|
|
Total Return(b): | | | 42.52 | % | | | (37.55 | )% | | | 11.56 | % | | | 1.37 | % | | | 14.02 | % |
Ratios/Supplemental Data: | | | | | | | | | | | | | | | | | | | | |
Net assets, end of year (in millions) | | $ | 20.2 | | | $ | 12.2 | | | $ | 21.9 | | | $ | 19.6 | | | $ | 18.2 | |
Ratios to average net assets(c): | | | | | | | | | | | | | | | | | | | | |
Expenses | | | 1.04 | % | | | 1.03 | % | | | 1.02 | % | | | 1.03 | % | | | 1.03 | % |
Net investment income (loss) | | | 0.03 | % | | | 0.12 | % | | | 0.02 | % | | | (0.12 | )% | | | (0.27 | )% |
Portfolio turnover rate | | | 76 | % | | | 74 | % | | | 69 | % | | | 67 | % | | | 57 | % |
| (a) | Calculated based upon average shares outstanding during the year. |
| (b) | Total return is calculated assuming a purchase of a share on the first day and a sale on the last day of each year reported and includes reinvestment of dividends and distributions and does not reflect the effect of insurance contract charges. Total return does not reflect expenses associated with the separate account such as administrative fees, account charges and surrender charges which, if reflected, would reduce the total returns for all years shown. Performance figures may reflect voluntary fee waivers and/or expense reimbursements. In the absence of voluntary fee waivers and/or expense reimbursements, the total return would be lower. Past performance is no guarantee of future results. Total returns may reflect adjustments to conform to generally accepted accounting principles. |
| (c) | Does not include expenses of the underlying portfolios in which the Portfolio invests. |
| (d) | Amount is less than $0.005 per share. |
SEE NOTES TO FINANCIAL STATEMENTS.
C5
Financial Highlights
| | | | | | | | | | | | | | | | | | | | |
| | | Money Market Portfolio
| |
| | | Year Ended December 31,
| |
| | | 2009
| | | 2008
| | | 2007
| | | 2006
| | | 2005
| |
Per Share Operating Performance: | | | | | | | | | | | | | | | | | | | | |
Net Asset Value, beginning of year | | $ | 10.00 | | | $ | 10.00 | | | $ | 10.00 | | | $ | 10.00 | | | $ | 10.00 | |
| | |
|
|
| |
|
|
| |
|
|
| |
|
|
| |
|
|
|
Income From Investment Operations: | | | | | | | | | | | | | | | | | | | | |
Net investment income and realized gains | | | 0.04 | | | | 0.26 | | | | 0.49 | | | | 0.46 | | | | 0.28 | |
Dividends and distributions | | | — | | | | — | | | | — | | | | — | | | | (0.28 | ) |
Distributions | | | (0.04 | ) | | | (0.26 | ) | | | (0.49 | ) | | | (0.46 | ) | | | — | |
| | |
|
|
| |
|
|
| |
|
|
| |
|
|
| |
|
|
|
Net Asset Value, end of year | | $ | 10.00 | | | $ | 10.00 | | | $ | 10.00 | | | $ | 10.00 | | | $ | 10.00 | |
| | |
|
|
| |
|
|
| |
|
|
| |
|
|
| |
|
|
|
Total Return(a): | | | 0.40 | % | | | 2.65 | % | | | 5.06 | % | | | 4.74 | % | | | 2.85 | % |
Ratios/Supplemental Data: | | | | | | | | | | | | | | | | | | | | |
Net assets, end of year (in millions) | | $ | 1,223.4 | | | $ | 1,489.8 | | | $ | 1,289.9 | | | $ | 1,060.5 | | | $ | 851.9 | |
Ratios to average net assets: | | | | | | | | | | | | | | | | | | | | |
Expenses | | | 0.39 | %(b) | | | 0.43 | % | | | 0.43 | % | | | 0.43 | % | | | 0.45 | % |
Net investment income | | | 0.41 | %(b) | | | 2.59 | % | | | 4.94 | % | | | 4.68 | % | | | 2.86 | % |
| (a) | Total return is calculated assuming a purchase of a share on the first day and a sale on the last day of each year reported and includes reinvestment of dividends and distributions and does not reflect the effect of insurance contract charges. Total return does not reflect expenses associated with the separate account such as administrative fees, account charges and surrender charges which, if reflected, would reduce the total returns for all years shown. Performance figures may reflect voluntary fee waivers and/or expense reimbursements. In the absence of voluntary fee waivers and/or expense reimbursements, the total return would be lower. Past performance is no guarantee of future results. Total returns may reflect adjustments to conform to generally accepted accounting principles. |
| (b) | Net of management fee waiver (Note 3). If the investment manager had not waived expenses, the expense ratio and the net investment income ratio would have been .43% and .37%, respectively for the year ended December 31, 2009. |
SEE NOTES TO FINANCIAL STATEMENTS.
C6
Financial Highlights
| | | | | | | | | | | | | | | | | | | | |
| | | Natural Resources Portfolio
| |
| | | Class I
| |
| | | Year Ended December 31,
| |
| | | 2009(a)
| | | 2008(a)
| | | 2007(a)
| | | 2006(a)
| | | 2005
| |
Per Share Operating Performance: | | | | | | | | | | | | | | | | | | | | |
Net Asset Value, beginning of year | | $ | 23.70 | | | $ | 56.28 | | | $ | 45.67 | | | $ | 45.46 | | | $ | 31.88 | |
| | |
|
|
| |
|
|
| |
|
|
| |
|
|
| |
|
|
|
Income (Loss) From Investment Operations: | | | | | | | | | | | | | | | | | | | | |
Net investment income | | | 0.15 | | | | 0.22 | | | | 0.43 | | | | 0.35 | | | | 0.33 | |
Net realized and unrealized gain (loss) on investments | | | 17.34 | | | | (25.97 | ) | | | 21.09 | | | | 8.65 | | | | 16.27 | |
| | |
|
|
| |
|
|
| |
|
|
| |
|
|
| |
|
|
|
Total from investment operations | | | 17.49 | | | | (25.75 | ) | | | 21.52 | | | | 9.00 | | | | 16.60 | |
| | |
|
|
| |
|
|
| |
|
|
| |
|
|
| |
|
|
|
Less Dividends and Distributions: | | | | | | | | | | | | | | | | | | | | |
Distributions from net realized gains | | | — | | | | — | | | | — | | | | — | | | | (3.02 | ) |
Distributions | | | (4.04 | ) | | | (6.83 | ) | | | (10.91 | ) | | | (8.79 | ) | | | — | |
| | |
|
|
| |
|
|
| |
|
|
| |
|
|
| |
|
|
|
Total dividends and distributions | | | (4.04 | ) | | | (6.83 | ) | | | (10.91 | ) | | | (8.79 | ) | | | (3.02 | ) |
| | |
|
|
| |
|
|
| |
|
|
| |
|
|
| |
|
|
|
Net Asset Value, end of year | | $ | 37.15 | | | $ | 23.70 | | | $ | 56.28 | | | $ | 45.67 | | | $ | 45.46 | |
| | |
|
|
| |
|
|
| |
|
|
| |
|
|
| |
|
|
|
Total Return(b): | | | 77.10 | % | | | (53.00 | )% | | | 48.30 | % | | | 22.20 | % | | | 55.91 | % |
Ratios/Supplemental Data: | | | | | | | | | | | | | | | | | | | | |
Net assets, end of year (in millions) | | $ | 1,079.6 | | | $ | 677.4 | | | $ | 1,669.9 | | | $ | 1,193.0 | | | $ | 1,016.3 | |
Ratios to average net assets(c): | | | | | | | | | | | | | | | | | | | | |
Expenses | | | 0.53 | % | | | 0.50 | % | | | 0.48 | % | | | 0.49 | % | | | 0.49 | % |
Net investment income | | | 0.51 | % | | | 0.47 | % | | | 0.80 | % | | | 0.78 | % | | | 0.66 | % |
Portfolio turnover rate | | | 27 | % | | | 40 | % | | | 39 | % | | | 58 | % | | | 59 | % |
| | | | | | | | | | | | | | | | | | | | |
| | | Natural Resources Portfolio
| |
| | | Class II
| |
| | | Year Ended December 31,
| | | April 28, 2005(d)
through
December 31, 2005
| |
| | | 2009(a)
| | | 2008(a)
| | | 2007(a)
| | | 2006(a)
| | |
Per Share Operating Performance: | | | | | | | | | | | | | | | | | | | | |
Net Asset Value, beginning of period | | $ | 23.54 | | | $ | 55.92 | | | $ | 45.55 | | | $ | 45.32 | | | $ | 30.10 | |
| | |
|
|
| |
|
|
| |
|
|
| |
|
|
| |
|
|
|
Income (Loss) From Investment Operations: | | | | | | | | | | | | | | | | | | | | |
Net investment income | | | 0.03 | | | | 0.05 | | | | 0.28 | | | | 0.18 | | | | 0.05 | |
Net realized and unrealized gain (loss) on investments | | | 17.21 | | | | (25.86 | ) | | | 20.92 | | | | 8.64 | | | | 15.17 | |
| | |
|
|
| |
|
|
| |
|
|
| |
|
|
| |
|
|
|
Total from investment operations | | | 17.24 | | | | (25.81 | ) | | | 21.20 | | | | 8.82 | | | | 15.22 | |
| | |
|
|
| |
|
|
| |
|
|
| |
|
|
| |
|
|
|
Less Distributions: | | | | | | | | | | | | | | | | | | | | |
Distributions | | | (3.90 | ) | | | (6.57 | ) | | | (10.83 | ) | | | (8.59 | ) | | | — | |
| | |
|
|
| |
|
|
| |
|
|
| |
|
|
| |
|
|
|
Net Asset Value, end of period | | $ | 36.88 | | | $ | 23.54 | | | $ | 55.92 | | | $ | 45.55 | | | $ | 45.32 | |
| | |
|
|
| |
|
|
| |
|
|
| |
|
|
| |
|
|
|
Total Return(b): | | | 76.41 | % | | | (53.19 | )% | | | 47.70 | % | | | 21.72 | % | | | 50.56 | %(e) |
Ratios/Supplemental Data: | | | | | | | | | | | | | | | | | | | | |
Net assets, end of period (in millions) | | $ | 92.6 | | | $ | 42.3 | | | $ | 47.9 | | | $ | 16.9 | | | $ | 5.1 | |
Ratios to average net assets(c): | | | | | | | | | | | | | | | | | | | | |
Expenses | | | 0.93 | % | | | 0.90 | % | | | 0.88 | % | | | 0.89 | % | | | 0.89 | %(f) |
Net investment income | | | 0.10 | % | | | 0.12 | % | | | 0.51 | % | | | 0.40 | % | | | 0.33 | %(f) |
Portfolio turnover rate | | | 27 | % | | | 40 | % | | | 39 | % | | | 58 | % | | | 59 | %(e) |
| (a) | Calculated based upon average shares outstanding during the year. |
| (b) | Total return is calculated assuming a purchase of a share on the first day and a sale on the last day of each period reported and includes reinvestment of dividends and distributions and does not reflect the effect of insurance contract charges. Total return does not reflect expenses associated with the separate account such as administrative fees, account charges and surrender charges which, if reflected, would reduce the total returns for all periods shown. Performance figures may reflect fee waivers and/or expense reimbursements. In the absence of fee waivers and/or expense reimbursements, the total return would be lower. Past performance is no guarantee of future results. Total returns may reflect adjustments to conform to generally accepted accounting principles. Total returns for periods less than one full year are not annualized. |
| (c) | Does not include expenses of the underlying portfolios in which the Portfolio invests. |
| (d) | Commencement of offering of Class II shares. |
SEE NOTES TO FINANCIAL STATEMENTS.
C7
Financial Highlights
| | | | | | | | | | | | | | | | | | | | |
| | | Small Capitalization Stock Portfolio
| |
| | | Year Ended December 31,
| |
| | | 2009
| | | 2008
| | | 2007
| | | 2006
| | | 2005
| |
Per Share Operating Performance: | | | | | | | | | | | | | | | | | | | | |
Net Asset Value, beginning of year | | $ | 12.52 | | | $ | 21.31 | | | $ | 23.29 | | | $ | 21.38 | | | $ | 21.33 | |
| | |
|
|
| |
|
|
| |
|
|
| |
|
|
| |
|
|
|
Income (Loss) From Investment Operations: | | | | | | | | | | | | | | | | | | | | |
Net investment income | | | 0.14 | | | | 0.24 | | | | 0.21 | | | | 0.14 | | | | 0.13 | |
Net realized and unrealized gain (loss) on investments | | | 2.70 | | | | (5.92 | ) | | | (0.36 | ) | | | 2.95 | | | | 1.30 | |
| | |
|
|
| |
|
|
| |
|
|
| |
|
|
| |
|
|
|
Total from investment operations | | | 2.84 | | | | (5.68 | ) | | | (0.15 | ) | | | 3.09 | | | | 1.43 | |
| | |
|
|
| |
|
|
| |
|
|
| |
|
|
| |
|
|
|
Less Dividends and Distributions: | | | | | | | | | | | | | | | | | | | | |
Dividends from net investment income | | | — | | | | — | | | | — | | | | — | | | | (0.13 | ) |
Distributions from net realized gains | | | — | | | | — | | | | — | | | | — | | | | (1.25 | ) |
Distributions | | | (1.53 | ) | | | (3.11 | ) | | | (1.83 | ) | | | (1.18 | ) | | | — | |
| | |
|
|
| |
|
|
| |
|
|
| |
|
|
| |
|
|
|
Total dividends and distributions | | | (1.53 | ) | | | (3.11 | ) | | | (1.83 | ) | | | (1.18 | ) | | | (1.38 | ) |
| | |
|
|
| |
|
|
| |
|
|
| |
|
|
| |
|
|
|
Net Asset Value, end of year | | $ | 13.83 | | | $ | 12.52 | | | $ | 21.31 | | | $ | 23.29 | | | $ | 21.38 | |
| | |
|
|
| |
|
|
| |
|
|
| |
|
|
| |
|
|
|
Total Return(a): | | | 25.18 | % | | | (31.04 | )% | | | (0.53 | )% | | | 14.67 | % | | | 7.26 | % |
Ratios/Supplemental Data: | | | | | | | | | | | | | | | | | | | | |
Net assets, end of year (in millions) | | $ | 492.2 | | | $ | 432.5 | | | $ | 699.6 | | | $ | 777.1 | | | $ | 738.3 | |
Ratios to average net assets(b): | | | | | | | | | | | | | | | | | | | | |
Expenses | | | 0.49 | % | | | 0.47 | % | | | 0.46 | % | | | 0.45 | % | | | 0.46 | % |
Net investment income | | | 1.03 | % | | | 1.33 | % | | | 0.86 | % | | | 0.59 | % | | | 0.62 | % |
Portfolio turnover rate | | | 14 | % | | | 25 | % | | | 16 | % | | | 12 | % | | | 16 | % |
| (a) | Total return is calculated assuming a purchase of a share on the first day and a sale on the last day of each year reported and includes reinvestment of dividends and distributions and does not reflect the effect of insurance contract charges. Total return does not reflect expenses associated with the separate account such as administrative fees, account charges and surrender charges which, if reflected, would reduce the total returns for all years shown. Performance figures may reflect voluntary fee waivers and/or expense reimbursements. In the absence of voluntary fee waivers and/or expense reimbursements, the total return would be lower. Past performance is no guarantee of future results. Total returns may reflect adjustments to conform to generally accepted accounting principles. |
| (b) | Does not include expenses of the underlying portfolios in which the Portfolio invests. |
| | | | | | | | | | | | | | | | | | | | |
| | | Stock Index Portfolio
| |
| | | Year Ended December 31,
| |
| | | 2009
| | | 2008
| | | 2007
| | | 2006
| | | 2005
| |
Per Share Operating Performance: | | | | | | | | | | | | | | | | | | | | |
Net Asset Value, beginning of year | | $ | 22.76 | | | $ | 36.84 | | | $ | 35.64 | | | $ | 31.41 | | | $ | 31.29 | |
| | |
|
|
| |
|
|
| |
|
|
| |
|
|
| |
|
|
|
Income (Loss) From Investment Operations: | | | | | | | | | | | | | | | | | | | | |
Net investment income | | | 0.49 | | | | 0.64 | | | | 0.68 | | | | 0.56 | | | | 0.48 | |
Net realized and unrealized gain (loss) on investments | | | 5.32 | | | | (14.02 | ) | | | 1.14 | | | | 4.31 | | | | 0.88 | |
| | |
|
|
| |
|
|
| |
|
|
| |
|
|
| |
|
|
|
Total from investment operations | | | 5.81 | | | | (13.38 | ) | | | 1.82 | | | | 4.87 | | | | 1.36 | |
| | |
|
|
| |
|
|
| |
|
|
| |
|
|
| |
|
|
|
Less Dividends and Distributions: | | | | | | | | | | | | | | | | | | | | |
Dividends from net investment income | | | — | | | | — | | | | — | | | | — | | | | (0.47 | ) |
Distributions from net realized gains | | | — | | | | — | | | | — | | | | — | | | | (0.77 | ) |
Distributions | | | (0.68 | ) | | | (0.70 | ) | | | (0.62 | ) | | | (0.64 | ) | | | — | |
| | |
|
|
| |
|
|
| |
|
|
| |
|
|
| |
|
|
|
Total dividends and distributions | | | (0.68 | ) | | | (0.70 | ) | | | (0.62 | ) | | | (0.64 | ) | | | (1.24 | ) |
| | |
|
|
| |
|
|
| |
|
|
| |
|
|
| |
|
|
|
Net Asset Value, end of year | | $ | 27.89 | | | $ | 22.76 | | | $ | 36.84 | | | $ | 35.64 | | | $ | 31.41 | |
| | |
|
|
| |
|
|
| |
|
|
| |
|
|
| |
|
|
|
Total Return(a): | | | 26.07 | % | | | (36.94 | )% | | | 5.10 | % | | | 15.54 | % | | | 4.54 | % |
Ratios/Supplemental Data: | | | | | | | | | | | | | | | | | | | | |
Net assets, end of year (in millions) | | $ | 2,098.1 | | | $ | 1,815.8 | | | $ | 3,122.4 | | | $ | 3,306.4 | | | $ | 3,212.7 | |
Ratios to average net assets(b): | | | | | | | | | | | | | | | | | | | | |
Expenses | | | 0.37 | % | | | 0.37 | % | | | 0.37 | % | | | 0.37 | % | | | 0.38 | % |
Net investment income | | | 2.06 | % | | | 2.04 | % | | | 1.73 | % | | | 1.61 | % | | | 1.52 | % |
Portfolio turnover rate | | | 5 | % | | | 4 | % | | | 3 | % | | | 3 | % | | | 7 | % |
| (a) | Total return is calculated assuming a purchase of a share on the first day and a sale on the last day of each year reported and includes reinvestment of dividends and distributions and does not reflect the effect of insurance contract charges. Total return does not reflect expenses associated with the separate account such as administrative fees, account charges and surrender charges which, if reflected, would reduce the total returns for all years shown. Performance figures may reflect voluntary fee waivers and/or expense reimbursements. In the absence of voluntary fee waivers and/or expense reimbursements, the total return would be lower. Past performance is no guarantee of future results. Total returns may reflect adjustments to conform to generally accepted accounting principles. |
| (b) | Does not include expenses of the underlying portfolios in which the Portfolio invests. |
SEE NOTES TO FINANCIAL STATEMENTS.
C8
Financial Highlights
| | | | | | | | | | | | | | | | | | | | |
| | | Value Portfolio
| |
| | | Class I
| |
| | | Year Ended December 31,
| |
| | | 2009
| | | 2008
| | | 2007
| | | 2006
| | | 2005
| |
Per Share Operating Performance: | | | | | | | | | | | | | | | | | | | | |
Net Asset Value, beginning of year | | $ | 10.86 | | | $ | 23.44 | | | $ | 26.21 | | | $ | 22.95 | | | $ | 19.93 | |
| | |
|
|
| |
|
|
| |
|
|
| |
|
|
| |
|
|
|
Income (Loss) From Investment Operations: | | | | | | | | | | | | | | | | | | | | |
Net investment income | | | 0.14 | | | | 0.30 | | | | 0.39 | | | | 0.36 | | | | 0.29 | |
Net realized and unrealized gain (loss) on investments | | | 4.36 | | | | (8.36 | ) | | | 0.42 | | | | 4.11 | | | | 3.03 | |
| | |
|
|
| |
|
|
| |
|
|
| |
|
|
| |
|
|
|
Total from investment operations | | | 4.50 | | | | (8.06 | ) | | | 0.81 | | | | 4.47 | | | | 3.32 | |
| | |
|
|
| |
|
|
| |
|
|
| |
|
|
| |
|
|
|
Less Dividends and Distributions: | | | | | | | | | | | | | | | | | | | | |
Dividends from net investment income | | | — | | | | — | | | | — | | | | — | | | | (0.30 | ) |
Distributions | | | (0.26 | ) | | | (4.52 | ) | | | (3.58 | ) | | | (1.21 | ) | | | — | |
| | |
|
|
| |
|
|
| |
|
|
| |
|
|
| |
|
|
|
Total dividends and distributions | | | (0.26 | ) | | | (4.52 | ) | | | (3.58 | ) | | | (1.21 | ) | | | (0.30 | ) |
| | |
|
|
| |
|
|
| |
|
|
| |
|
|
| |
|
|
|
Net Asset Value, end of year | | $ | 15.10 | | | $ | 10.86 | | | $ | 23.44 | | | $ | 26.21 | | | $ | 22.95 | |
| | |
|
|
| |
|
|
| |
|
|
| |
|
|
| |
|
|
|
Total Return(a): | | | 41.93 | % | | | (42.29 | )% | | | 3.19 | % | | | 19.94 | % | | | 16.66 | % |
Ratios/Supplemental Data: | | | | | | | | | | | | | | | | | | | | |
Net assets, end of year (in millions) | | $ | 1,181.7 | | | $ | 933.1 | | | $ | 1,824.9 | | | $ | 1,975.7 | | | $ | 1,750.1 | |
Ratios to average net assets(b): | | | | | | | | | | | | | | | | | | | | |
Expenses | | | 0.43 | % | | | 0.43 | % | | | 0.43 | % | | | 0.43 | % | | | 0.43 | % |
Net investment income | | | 1.15 | % | | | 1.46 | % | | | 1.35 | % | | | 1.45 | % | | | 1.35 | % |
Portfolio turnover rate | | | 51 | % | | | 71 | % | | | 52 | % | | | 49 | % | | | 56 | % |
| | | | | | | | | | | | | | | | | | | | |
| | | Value Portfolio
| |
| | | Class II
| |
| | | Year Ended December 31,
| |
| | | 2009
| | | 2008
| | | 2007
| | | 2006
| | | 2005
| |
Per Share Operating Performance: | | | | | | | | | | | | | | | | | | | | |
Net Asset Value, beginning of year | | $ | 10.91 | | | $ | 23.51 | | | $ | 26.26 | | | $ | 22.98 | | | $ | 19.94 | |
| | |
|
|
| |
|
|
| |
|
|
| |
|
|
| |
|
|
|
Income (Loss) From Investment Operations: | | | | | | | | | | | | | | | | | | | | |
Net investment income | | | 0.13 | | | | 0.21 | | | | 0.29 | | | | 0.27 | | | | 0.21 | |
Net realized and unrealized gain (loss) on investments | | | 4.33 | | | | (8.38 | ) | | | 0.42 | | | | 4.11 | | | | 3.01 | |
| | |
|
|
| |
|
|
| |
|
|
| |
|
|
| |
|
|
|
Total from investment operations | | | 4.46 | | | | (8.17 | ) | | | 0.71 | | | | 4.38 | | | | 3.22 | |
| | |
|
|
| |
|
|
| |
|
|
| |
|
|
| |
|
|
|
Less Dividends and Distributions: | | | | | | | | | | | | | | | | | | | | |
Dividends from net investment income | | | — | | | | — | | | | — | | | | — | | | | (0.18 | ) |
Distributions | | | (0.21 | ) | | | (4.43 | ) | | | (3.46 | ) | | | (1.10 | ) | | | — | |
| | |
|
|
| |
|
|
| |
|
|
| |
|
|
| |
|
|
|
Total dividends and distributions | | | (0.21 | ) | | | (4.43 | ) | | | (3.46 | ) | | | (1.10 | ) | | | (0.18 | ) |
| | |
|
|
| |
|
|
| |
|
|
| |
|
|
| |
|
|
|
Net Asset Value, end of year | | $ | 15.16 | | | $ | 10.91 | | | $ | 23.51 | | | $ | 26.26 | | | $ | 22.98 | |
| | |
|
|
| |
|
|
| |
|
|
| |
|
|
| |
|
|
|
Total Return(a): | | | 41.26 | % | | | (42.56 | )% | | | 2.82 | % | | | 19.43 | % | | | 16.21 | % |
Ratios/Supplemental Data: | | | | | | | | | | | | | | | | | | | | |
Net assets, end of year (in millions) | | $ | 3.7 | | | $ | 1.7 | | | $ | 2.7 | | | $ | 3.2 | | | $ | 3.1 | |
Ratios to average net assets(b): | | | | | | | | | | | | | | | | | | | | |
Expenses | | | 0.83 | % | | | 0.83 | % | | | 0.83 | % | | | 0.83 | % | | | 0.83 | % |
Net investment income | | | 0.74 | % | | | 1.08 | % | | | 0.96 | % | | | 1.04 | % | | | 0.95 | % |
Portfolio turnover rate | | | 51 | % | | | 71 | % | | | 52 | % | | | 49 | % | | | 56 | % |
| (a) | Total return is calculated assuming a purchase of a share on the first day and a sale on the last day of each year reported and includes reinvestment of dividends and distributions and does not reflect the effect of insurance contract charges. Total return does not reflect expenses associated with the separate account such as administrative fees, account charges and surrender charges which, if reflected, would reduce the total returns for all years shown. Performance figures may reflect voluntary fee waivers and/or expense reimbursements. In the absence of voluntary fee waivers and/or expense reimbursements, the total return would be lower. Past performance is no guarantee of future results. Total returns may reflect adjustments to conform to generally accepted accounting principles. |
| (b) | Does not include expenses of the underlying portfolios in which the Portfolio invests. |
SEE NOTES TO FINANCIAL STATEMENTS.
C9
REPORT OF INDEPENDENT REGISTERED PUBLIC ACCOUNTING FIRM
THE BOARD OF TRUSTEES AND SHAREHOLDERS
THE PRUDENTIAL SERIES FUND:
We have audited the accompanying statements of assets and liabilities of The Prudential Series Fund (comprised of Conservative Balanced Portfolio, Diversified Bond Portfolio, Equity Portfolio, Flexible Managed Portfolio, Global Portfolio, Government Income Portfolio, High Yield Bond Portfolio, Jennison Portfolio, Money Market Portfolio, Natural Resources Portfolio, Small Capitalization Stock Portfolio, Stock Index Portfolio and Value Portfolio), hereafter referred to as the “Funds”, including the portfolios of investments, as of December 31, 2009, and the related statements of operations for the year then ended, the statements of changes in net assets for each of the years in the two-year period then ended and the financial highlights for each of the years in the five-year period then ended. These financial statements and financial highlights are the responsibility of the Funds’ management. Our responsibility is to express an opinion on these financial statements and financial highlights based on our audits.
We conducted our audits in accordance with the standards of the Public Company Accounting Oversight Board (United States). Those standards require that we plan and perform the audit to obtain reasonable assurance about whether the financial statements and financial highlights are free of material misstatement. An audit includes examining, on a test basis, evidence supporting the amounts and disclosures in the financial statements. Our procedures included confirmation of securities owned as of December 31, 2009, by correspondence with the custodian, transfer agent and brokers or by other appropriate auditing procedures where replies from brokers were not received. An audit also includes assessing the accounting principles used and significant estimates made by management, as well as evaluating the overall financial statement presentation. We believe that our audits provide a reasonable basis for our opinion.
In our opinion, the financial statements and financial highlights referred to above present fairly, in all material respects, the financial position of the Funds as of December 31, 2009, and the results of their operations, the changes in their net assets and the financial highlights for the periods described in the first paragraph above, in conformity with U.S. generally accepted accounting principles.
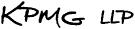
New York, New York
February 16, 2010
D1
INFORMATION ABOUT TRUSTEES AND OFFICERS (Unaudited)
Information about the Trustees and the Officers of the Fund is set forth below. Trustees who are not deemed to be “interested persons” of the Fund, as defined in the 1940 Act, are referred to as “Independent Trustees.” Trustees who are deemed to be “interested persons” of the Fund are referred to as “Interested Trustees.” The Trustees are responsible for the overall supervision of the operations of the Fund and perform the various duties imposed on the directors of investment companies by the 1940 Act.
| | | | |
Independent Trustees (1) | | | | |
Name, Address, Age No. of Portfolios Overseen | | Principal Occupation(s) During Past Five Years | | Other Directorships Held |
Saul K. Fenster, Ph.D. (76) No. of Portfolios Overseen: 83 | | Currently President Emeritus of New Jersey Institute of Technology (since 2002); formerly President (1978-2002) of New Jersey Institute of Technology; Commissioner (1998-2002) of the Middle States Association Commission on Higher Education; Commissioner (1985-2002) of the New Jersey Commission on Science and Technology; formerly Director (1998-2005) of Society of Manufacturing Engineering Education Foundation; formerly Director of Prosperity New Jersey; formerly a director or trustee of Liberty Science Center, Research and Development Council of New Jersey, New Jersey State Chamber of Commerce, and National Action Council for Minorities in Engineering. | | Member (since 2006), Board of The Ridgefield Foundation and The Leir Foundation. |
| | | |
Delayne Dedrick Gold (71) No. of Portfolios Overseen: 83 | | Marketing Consultant (1982-present); formerly Senior Vice President and Member of the Board of Directors, Prudential Bache Securities, Inc. | | None |
| | | |
W. Scott McDonald, Jr. (72) No. of Portfolios Overseen: 83 | | Formerly Management Consultant (1997-2004) and of Counsel (2004-2005) at Kaludis Consulting Group, Inc. (company serving higher education); Formerly principal (1995-1997), Scott McDonald Associates; Chief Operating Officer (1991-1995), Fairleigh Dickinson University; Executive Vice President and Chief Operating Officer (1975-1991), Drew University; interim President (1988-1990), Drew University; formerly Director of School, College and University Underwriters Ltd. | | None |
| | | |
Thomas T. Mooney (68) No. of Portfolios Overseen: 83 | | Formerly Chief Executive Officer, Excell Partners, Inc.; formerly President of the Greater Rochester Metro Chamber of Commerce, Rochester City Manager; formerly Deputy Monroe County Executive. | | None |
| | | |
Thomas M. O’Brien (59) No. of Portfolios Overseen: 83 | | President and COO (since November 2006) and CEO (since April 2007) of State Bancorp, Inc. and State Bank; Vice Chairman (January 1997-April 2000) of North Fork Bank; President and Chief Executive Officer (December 1984-December 1996) of North Side Savings Bank; formerly President and Chief Executive Officer (May 2000-June 2006) Atlantic Bank of New York. | | Formerly Director (December 1996-May 2000) of North Fork Bancorporation, Inc.; Formerly Director (May 2000-April 2006) of Atlantic Bank of New York; Director (since November 2006) of State Bancorp, Inc. (NASDAQ: STBC) and State Bank of Long Island. |
| | | |
F. Don Schwartz (74) No. of Portfolios Overseen: 83 | | Management Consultant (since April 1985). | | None |
| | | | |
Interested Trustee (1) | | | | |
Robert F. Gunia (63) No. of Portfolios Overseen: 83 | | Independent Consultant; formerly Chief Administrative Officer (September 1999-September 2009) and Executive Vice President (December 1996-September 2009) of Prudential Investments LLC; Executive Vice President (March 1999-September 2009) and Treasurer (May 2000-September 2009) of Prudential Mutual Fund Services LLC; President (April 1999-December 2008) and Executive Vice President and Chief Operating Officer (December 2008- December 2009) of Prudential Investment Management Services LLC; Chief Administrative Officer, Executive Vice President and Director (May 2003-September 2009) of AST Investment Services, Inc. | | Director (since May 1989) of The Asia Pacific Fund, Inc. |
| 1 | The year that each Trustee joined the Fund’s Board is as follows: Saul K. Fenster, 1983; Delayne Dedrick Gold, 2001; Robert F. Gunia, 2001; W. Scott McDonald, Jr., 1983; Thomas T. Mooney, 2001; Thomas M. O’Brien, 2003; F. Don Schwartz, 2003. |
E1
| | |
Fund Officers 1 | | |
Name, Address and Age Position with the Fund | | Principal Occupation(s) During the Past Five Years |
Steve Pelletier (56) President and Principal Executive Officer | | President of Prudential Annuities (since September 2008); Chairman and CEO, International Investments, Prudential Financial (since January 1998). |
| | |
Timothy S. Cronin (44) Vice President | | Chief Investment Officer and Strategist of Prudential Annuities (since January 2004); Director of Investment & Research Strategy (since February 1998); President of AST Investment Services, Inc. (since June 2005). |
| | |
Kathryn L. Quirk (57) Chief Legal Officer | | Vice President and Corporate Counsel (since September 2004) of Prudential; Executive Vice President, Chief Legal Officer and Secretary (since July 2005) of Prudential Investments LLC (PI) and Prudential Mutual Fund Services LLC (PMFS); Vice President and Corporate Counsel (since June 2005) and Secretary (since February 2006) of AST Investment Services, Inc.; formerly Senior Vice President and Assistant Secretary (November 2004-August 2005) of PI; formerly Assistant Secretary (June 2005-February 2006) of AST Investment Services, Inc.; formerly Managing Director, General Counsel, Chief Compliance Officer, Chief Risk Officer and Corporate Secretary (1997-2002) of Zurich Scudder Investments, Inc. |
| | |
Deborah A. Docs (52) Secretary | | Vice President and Corporate Counsel (since January 2001) of Prudential; Vice President (since December 1996) and Assistant Secretary (since March 1999) of PI; formerly Vice President and Assistant Secretary (May 2003-June 2005) of AST Investment Services, Inc. |
| | |
Jonathan D. Shain (51) Assistant Secretary | | Vice President and Corporate Counsel (since August 1998) of Prudential; Vice President and Assistant Secretary (since May 2001) of PI; Vice President and Assistant Secretary (since February 2001) of PMFS; formerly Vice President and Assistant Secretary (May 2003-June 2005) of AST Investment Services, Inc. |
| | |
Claudia DiGiacomo (35) Assistant Secretary | | Vice President and Corporate Counsel (since January 2005) of Prudential; Vice President and Assistant Secretary of PI (since December 2005); Associate at Sidley Austin Brown & Wood LLP (1999-2004). |
| | |
John P. Schwartz (38) Assistant Secretary | | Vice President and Corporate Counsel (since April 2005) of Prudential; Vice President and Assistant Secretary of PI (since December 2005); Associate at Sidley Austin Brown & Wood LLP (1997-2005). |
| | |
Andrew R. French (47) Assistant Secretary | | Director and Corporate Counsel (since May 2006) of Prudential; Vice President and Assistant Secretary (since January 2007) of PI; Vice President and Assistant Secretary (since January 2007) of PMFS; formerly Senior Legal Analyst of Prudential Mutual Fund Law Department (1997-2006). |
| | |
Timothy J. Knierim (51) Chief Compliance Officer | | Chief Compliance Officer of Prudential Investment Management, Inc.(PIM) (since July 2007); formerly Chief Risk Officer of PIM and PI (2002-2007) and formerly Chief Ethics Officer of PIM and PI (2006-2007). |
| | |
Valerie M. Simpson (51) Deputy Chief Compliance Officer | | Chief Compliance Officer (since April 2007) of PI and AST Investment Services, Inc.; formerly Vice President-Financial Reporting (June 1999-March 2006) for Prudential Life and Annuities Finance. |
| | |
Theresa C. Thompson (47) Deputy Chief Compliance Officer | | Vice President, Compliance, PI (since April 2004); and Director, Compliance, PI (2001 - 2004). |
| | |
Noreen M. Fierro (45) Anti-Money Laundering Compliance Officer | | Vice President, Corporate Compliance (since May 2006) of Prudential; formerly Corporate Vice President, Associate General Counsel (April 2002-May 2005) of UBS Financial Services, Inc., in their Money Laundering Prevention Group; Senior Manager (May 2005-May 2006) of Deloitte Financial Advisory Services, LLP, in their Forensic and Dispute Services, Anti-Money Laundering Group. |
| | |
Grace C. Torres (50) Treasurer and Principal Financial and Accounting Officer | | Assistant Treasurer (since March 1999) and Senior Vice President (since September 1999) of PI; Assistant Treasurer (since May 2003) and Vice President (since June 2005) of AST Investment Services, Inc.; Senior Vice President and Assistant Treasurer (since May 2003) of Prudential Annuities Advisory Services, Inc.; formerly Senior Vice President (May 2003-June 2005) of AST Investment Services, Inc. |
| | |
M. Sadiq Peshimam (46) Assistant Treasurer | | Vice President (since 2005) of Prudential Investments LLC. |
| | |
Peter Parrella (51) Assistant Treasurer | | Vice President (since 2007) and Director (2004-2007) within Prudential Mutual Fund Administration; formerly Tax Manager at SSB Citi Fund Management LLC (1997-2004). |
| | |
Alan Fu (52) Assistant Treasurer | | Vice President and Corporate Counsel - Tax, Prudential Financial, Inc. (since October 2003). |
| 1 | The year in which each individual became an Officer of the Fund is as follows: Stephen Pelletier, 2008; Timothy S. Cronin, 2009; Kathryn L. Quirk, 2005; Deborah A. Docs, 2005; Jonathan D. Shain, 2005; Claudia DiGiacomo, 2005; John P. Schwartz, 2006; Andrew R. French, 2006; Timothy J. Knierim, 2007; Valerie M. Simpson, 2007; Theresa C. Thompson, 2008; Noreen M. Fierro, 2006; Grace C. Torres, 1997; Peter Parrella, 2007; M. Sadiq Peshimam, 2006; Alan Fu, 2006. |
Explanatory Notes to Tables:
Trustees are deemed to be “Interested”, as defined in the 1940 Act, by reason of their affiliation with Prudential Investments LLC and/or an affiliate of Prudential Investments LLC. Robert F. Gunia will be considered an Interested Trustee for at least two years after his retirement from employment by the Manager and its affiliates (which was on or about October 21, 2009). He will also be an Interested Trustee as long as he holds a beneficial interest in securities issued by the Manager or its affiliates.
Unless otherwise noted, the address of all Trustees and Officers is c/o Prudential Investments LLC, Gateway Center Three, 100 Mulberry Street, Newark, New Jersey 07102.
There is no set term of office for Trustees or Officers. The Independent Trustees have adopted a retirement policy, which calls for the retirement of Trustees on December 31 of the year in which they reach the age of 75.
“Other Directorships Held” includes only directorships of companies required to register or file reports with the SEC under the Securities Exchange Act of 1934 (that is, “public companies”) or other investment companies registered under the 1940 Act.
“No. of Portfolios Overseen” includes all investment companies managed by Prudential Investments LLC. The investment companies for which PI serves as manager include the Prudential Investments Funds, The Prudential Variable Contract Accounts, The Target Portfolio Trust, The Prudential Series Fund, Advanced Series Trust and Prudential’s Gibraltar Fund, Inc.
E2
Annuities are issued by Pruco Life Insurance Company, or in New York, Pruco Life Insurance Company of New Jersey, both located at 213 Washington Street, Newark, NJ 07102-2992, and Prudential Annuities Life Assurance Corporation, located at One Corporate Drive, Shelton, CT, 06484. Variable annuities are distributed by Prudential Annuities Distributors, Inc., also located in Shelton, CT. Prudential Annuities is a business unit of Prudential Financial.
Variable life insurance is issued by The Prudential Insurance Company of America, 751 Broad Street, Newark, NJ 07102-3777, Pruco Life Insurance Company, or in New York, Pruco Life Insurance Company of New Jersey, both located at 213 Washington Street, Newark, NJ 07102-2992. Pruco Life Insurance Company is not licensed to do business in New York. Variable life insurance is offered through Pruco Securities LLC, 751 Broad Street, Newark, NJ 07102-3777.
All are Prudential Financial companies and each is solely responsible for its financial condition and contractual obligations.
Life insurance and annuity contracts contain exclusions, limitations, reductions of benefits and terms for keeping them in force. Your licensed financial professional can provide you with costs and complete details. Contract guarantees are based on the claims-paying ability of the issuing company.
The Prudential Insurance Company of America
751 Broad Street
Newark, NJ 07102-3777
PRST STD
POSTAGES &
FEES PAID VON
HOFFMANN
CORPORATION
The 2009 Audited Financial Statements of Pruco Life Insurance Company, Pruco Life Insurance Company of New Jersey, and The Prudential Insurance Company of America are available. You may call 888-778-2888 to obtain a free copy of the audited financial statements of the insurance company that issued your contract.
To reduce costs, we now generally send only a single copy of prospectuses and shareholder reports to each household (“householding”) in lieu of sending a copy to each Contract Owner who resides in the household. You should be aware that by calling 877-778-5008, you can revoke or “opt out” of householding at any time.
Pru, Prudential, Prudential Financial, Rock Solid, “The Rock,” the Rock Logo and the Rock Prudential Logo are registered service marks of The Prudential Insurance Company of America, Newark, NJ, and its affiliates.
0172024-00001-00 PSF-AR-A

| | |
| | |
| ANNUAL REPORT | | DECEMBER 31, 2009 |
The Prudential Series Fund
| n | | SP Davis Value Portfolio |
| n | | SP Growth Asset Allocation Portfolio |
| n | | SP International Growth Portfolio |
| n | | SP International Value Portfolio |
| n | | SP Mid Cap Growth Portfolio |
| n | | SP Prudential U.S. Emerging Growth Portfolio |
| n | | SP Small Cap Value Portfolio |
| n | | SP Strategic Partners Focused Growth Portfolio |

Please note that inside is a Prospectus Supplement dated January 14, 2010.
This document is separate from and not part of the annual report.

0172280-00001-00
This report is one of several that provide financial information about certain investment choices available on variable life insurance and variable annuity contracts. Based on the variable contract you own or the portfolios you invested in, you may receive additional reports that provide financial information on those investment choices. Please refer to your variable life insurance or variable annuity contract prospectus to determine which portfolios are available to you.
This report must be preceded or accompanied by the current prospectuses for the Prudential Series Fund portfolios and the applicable variable life or annuity contract. The prospectuses contain information on the investment objectives, risks, and charges and expenses of the portfolios and the contract and should be read carefully.
The contract’s prospectus contains hypothetical performance illustrations that show the effect of various assumptions regarding the cost of insurance protection. You may also obtain a personalized illustration of historical performance that reflects the cost of your contract’s insurance protection.
A description of the Fund’s proxy voting policies and procedures is available, without charge, upon request. Owners of variable annuity contracts should call 888-778-2888 and owners of variable life insurance contracts should call 800-778-2255 to obtain descriptions of the Fund’s proxy voting policies and procedures. The description is also available on the website of the Securities and Exchange Commission (the “Commission”) at www.sec.gov. Information regarding how the Fund voted proxies relating to portfolio securities during the most recent 12-month period ended December 31 is available on the website of the Commission at www.sec.gov and on the Fund’s website.
The Fund files with the Commission a complete listing of portfolio holdings as of its first and third quarter-ends on Form N-Q. Form N-Q is available on the Commission’s website at www.sec.gov or by visiting the Commission’s Public Reference Room. For more information on the Commission’s Public Reference Room, please visit the Commission’s website or call 800-SEC-0330. Form N-Q is also available on the Fund’s website at www.prudential.com or by calling the telephone numbers referenced above.
The Fund’s Statement of Additional Information contains additional information about the Fund’s Trustees and is available without charge upon request by calling 888-778-2888.
This report may include financial information pertaining to certain portfolios that are not available through the variable life insurance policy or variable annuity contract that you have chosen. Please refer to your variable life insurance or variable annuity prospectus to determine which portfolios are available to you.
| | | | |
The Prudential Series Fund Table of Contents | | Annual Report | | December 31, 2009 |
| n | | LETTER TO CONTRACT OWNERS |
| n | | PRESENTATION OF PORTFOLIO HOLDINGS |
| n | | FEES AND EXPENSES TABLE |
| | A1 | Schedule of Investments and Financial Statements |
| | B1 | Notes to Financial Statements |
| | D1 | Report of Independent Registered Public Accounting Firm |
| | E1 | Information about Trustees and Officers |
This report may include financial information pertaining to certain portfolios that are not available through the variable life insurance policy or variable annuity contract that you have chosen. Please refer to your variable life insurance or variable annuity prospectus to determine which portfolios are available to you.
| | | | |
The Prudential Series Fund Letter to Contract Owners | | Annual Report | | December 31, 2009 |
Our primary focus at Prudential is to help investors achieve and maintain long-term financial success. Our Prudential Series Fund annual report outlines our efforts to reach this goal. We hope you find it informative and useful.
Prudential has been building on a heritage of success for more than 130 years, and the quality of our businesses and risk diversification has enabled us to manage effectively through volatile markets. We believe the array of our products provides a highly attractive value proposition to clients like you who are focused on financial security.
Your financial professional is your best resource to make the most informed investment decisions to help meet your needs. Together, you can build a diversified investment portfolio that aligns with your long-term financial goals. Diversification does not assure a profit or protect against loss in declining markets.
Thank you for selecting Prudential as one of your financial partners. We value your trust and appreciate the opportunity to help you achieve financial security.
Sincerely,
Stephen Pelletier
President,
The Prudential Series Fund January 29, 2010 |
PRESIDENT
STEPHEN PELLETIER
| | |
The Prudential Series Fund, SP Davis Value Portfolio Subadvised by: Davis Advisors | | December 31, 2009 |
Investment Manager’s Report - As of December 31, 2009
Average Annual Total Return Percentages
| | | | | | | | | |
| | | 1-Year | | | 5-Year | | | Since
Inception | |
Portfolio | | 31.26 | % | | 0.78 | % | | 1.62 | % |
Russell 1000 ® Value Index | | 19.69 | | | -0.25 | | | 2.32 | |
S&P 500 Index | | 26.47 | | | 0.42 | | | -0.88 | |
Past performance does not guarantee future returns. The investment return and principal value of an investment will fluctuate, so that an investor’s shares, when redeemed, may be worth more or less than their original cost. Current performance may be lower or higher than the past performance data quoted.
$10,000 INVESTED SINCE INCEPTION

Portfolio inception: 9/22/2000. Portfolio performance is net of investment fees and fund expenses, but not product charges, which, if included, would significantly lower the performance quoted. Unless noted otherwise, Index returns reflect performance beginning the closest month-end date to the Portfolio’s inception. The Russell 1000® Index is a trademark/service mark of the Frank Russell Company. Russell® is a trademark of the Frank Russell Company. Performance figures may reflect fee waivers and/or expense reimbursements. In the absence of such fee waivers and/or expense reimbursements, total returns would be lower.
For the year ended December 31, 2009, the SP Davis Value Portfolio rose 31.26%. The Portfolio is managed by Davis Advisors to seek growth of capital. It invests primarily in stocks of companies within the capitalization range (a measure of company size) of the Russell 1000® Value Index (the Index).
Although the markets ended 2009 decidedly higher, dramatic weakness continuing from 2008 colored the early part of the year. Markets rallied from March through year-end. Growth stocks significantly outperformed value stocks during the period, as often happens when the market changes direction. The Index returned 19.69%, led by its materials, information technology, and consumer discretionary sectors. Telecommunication services and energy had the weakest performance, although their returns were still positive.
The Portfolio’s financial companies were the strongest contributors to its return and they outperformed the corresponding sector in the Index. Moreover, the Portfolio had a higher average weighting in this sector than the Index. A payments and travel company and an investment manager were among the top contributors to the Portfolio’s performance. A Japanese insurance company and two large U.S. banks were among the largest detractors and the Portfolio sold these three positions. The second largest sector contributor to the Portfolio’s return was its energy holdings, which was also the same for the Index. Stock selection in this sector was the primary reason it outperformed the Index. Several oil and natural gas firms were among the leading contributors to the Portfolio’s performance, but one large oil firm was the largest detractor.
The Portfolio also benefited from having more than twice the representation in the information technology sector than the Index. They included major internet, software, and semiconductor chip companies, but also a large electronics conglomerate that was among the most significant detractors. The latter was sold. Although the Portfolio’s materials companies added to its return, they trailed the materials sector of the Index. The Portfolio also benefited from holding a significant representation of foreign companies, which, on average, outperformed domestic holdings.
Prudential Investments LLC (PI), an indirect, wholly owned subsidiary of Prudential Financial, Inc., serves as the investment manager for the Fund.
Russell 1000 Value Index is a market cap-weighted index that measures the performance of those Russell 1000 companies with lower price-to-book ratios and lower forecasted growth values. S&P 500 Index is an unmanaged, market value-weighted index of 500 stocks generally representative of the broad stock market. These returns do not include the effect of any investment management expenses. These returns would have been lower if they included the effect of these expenses. Investors cannot invest directly in a market index. For a complete list of holdings, refer to the Schedule of Investments section of this report.
| | |
The Prudential Series Fund, SP Growth Asset Allocation Portfolio Subadvised by: Quantitative Management Associates LLC | | December 31, 2009 |
Investment Manager’s Report - As of December 31, 2009
Average Annual Total Return Percentages
| | | | | | | | | |
| | | 1-Year | | | 5-Year | | | Since
Inception | |
Portfolio | | 26.22 | % | | 1.59 | % | | 0.96 | % |
Blended Index | | 24.64 | | | 2.39 | | | 1.71 | |
S&P 500 Index | | 26.47 | | | 0.42 | | | -0.88 | |
Past performance does not guarantee future returns. The investment return and principal value of an investment will fluctuate, so that an investor’s shares, when redeemed, may be worth more or less than their original cost. Current performance may be lower or higher than the past performance data quoted.
$10,000 INVESTED SINCE INCEPTION
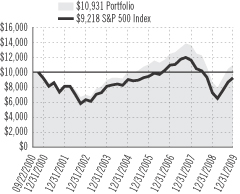
Portfolio inception: 9/22/2000. Portfolio performance is net of investment fees and fund expenses, but not product charges, which, if included, would significantly lower the performance quoted. Unless noted otherwise, Index returns reflect performance beginning the closest month-end date to the Portfolio’s inception. Performance figures may reflect fee waivers and/or expense reimbursements. In the absence of such fee waivers and/or expense reimbursements, total returns would be lower.
For the year ended December 31, 2009, the SP Growth Asset Allocation Portfolio rose 26.22%.
The Portfolio, which is run by Quantitative Management Associates and Prudential Investments, LLC, is a “fund of funds,” which means it invests in shares of other mutual funds. The Portfolio seeks to obtain the highest potential total return consistent with a level of risk appropriate for its growth objective.
A scorching broad-based rally in global equity markets began in March 2009 and continued during the year as global economic conditions improved. Developed market equities outperformed the U.S. stock market due partially to a weakening greenback. In the United States, mid-cap stocks and the growth style of investing led gains. Emerging market stocks were the stars, returning nearly 79% overall in U.S. dollar terms as investors increasingly sought riskier assets in pursuit of higher returns.
Improving economic conditions in the United States and a search for attractive yields, among other factors, helped fuel a rally in high yield corporate bonds (commonly called “junk” bonds because they are rated below investment grade) and certain other U.S. fixed income markets that carry greater credit risk than the super-safe U.S. Treasury market, which ended 2009 in the red. Meanwhile, commodity prices mostly gained during 2009 on hopes for a global economic recovery and renewed inflation fears.
The Portfolio outperformed its blended index primarily because the mutual funds that it invested in outperformed their respective indexes. The largest positive contribution was made by the Prudential Series Fund SP PIMCO Total Return Portfolio. The other mutual funds that made positive contributions were the Prudential Series Fund Jennison Growth Portfolio, the Prudential Series Fund SP International Growth Portfolio, Prudential Series Fund SP Small Cap Value, and the Advanced Series Trust Western Asset Core Plus Bond Portfolio.
On the other hand, allocation to different classes of assets had little impact on the Portfolio’s performance versus its blended index. The Portfolio had a slightly smaller exposure than the blended index to equities in April and May, which detracted from its performance versus the blended index. The Portfolio held high yield corporate bonds, natural resources stocks, and global real estate investment trusts (REITs), which had a positive impact on its performance.
Prudential Investments LLC (PI), an indirect, wholly owned subsidiary of Prudential Financial, Inc., serves as the investment manager for the Fund.
Blended Index consists of Russell 3000 Index (64%), a market cap-weighted index that measures the performance of the 1,000 largest companies in the Russell 3000 Index, which represents approximately 92% of the total market, Barclays Capital U.S. Aggregate Bond Index (20%), an unmanaged index comprised of more than 5,000 government and corporate bonds, and MSCI EAFE (Morgan Stanley Capital International Europe, Australasia, Far East) Index (GD) (16%), an unmanaged, capitalization-weighted index generally accepted as a benchmark for major overseas markets. The GD version does not reflect the impact of withholding taxes on reinvested dividends. S&P 500 Index is an unmanaged, market value-weighted index of 500 stocks generally representative of the broad stock market. These returns do not include the effect of any investment management expenses. These returns would have been lower if they included the effect of these expenses. Investors cannot invest directly in a market index. For a complete list of holdings, refer to the Schedule of Investments section of this report.
| | |
The Prudential Series Fund, SP International Growth Portfolio Subadvised by: Marsico Capital Management, LLC, William Blair & Company LLC | | December 31, 2009 |
Investment Manager’s Report - As of December 31, 2009
Average Annual Total Return Percentages
| | | | | | | | | |
| | | 1-Year | | | 5-Year | | | Since
Inception | |
Portfolio: Class I | | 37.15 | % | | 2.80 | % | | -2.49 | % |
Portfolio: Class II | | 36.44 | | | 2.33 | | | -2.69 | |
MSCI EAFE® Index (GD) | | 32.46 | | | 4.02 | | | 3.08 | |
Past performance does not guarantee future returns. The investment return and principal value of an investment will fluctuate, so that an investor’s shares, when redeemed, may be worth more or less than their original cost. Current performance may be lower or higher than the past performance data quoted.
$10,000 INVESTED SINCE INCEPTION1
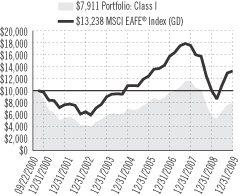
Portfolio (Class I) inception: 9/22/2000. Portfolio (Class II) inception: 10/4/2000. Portfolio performance is net of investment fees and fund expenses, but not product charges, which, if included, would significantly lower the performance quoted. Unless noted otherwise, Index returns reflect performance beginning the closest month-end date to the Portfolio’s inception (Class I). Performance figures may reflect fee waivers and/or expense reimbursements. In the absence of such fee waivers and/or expense reimbursements, total returns would be lower.
For the year ended December 31, 2009, the SP International Growth Portfolio rose 37.15%, while the Class II shares rose 36.44%. The Portfolio is managed by William Blair & Company LLC and Marsico Capital Management LLC. William Blair seeks to identify companies with earnings growth potential that may not be recognized by the market at large, whereas Marsico combines macro-economic analysis with stock selection. It may take into consideration factors such as interest rates, inflation, demographics, the regulatory environment, and the global competitive landscape. William Blair managed approximately two thirds of the Portfolio’s assets for the year.
Although international markets overall had a very strong year, the first few months of the year were characterized by heightened market volatility and large downward market movements. As investors realized that the financial system was stabilizing, volatility steadily decreased and markets rebounded. The MSCI EAFE Index (the Index) returned 32.46%, led by the Pacific region excluding Japan. In a reversal from the risk aversion characterizing late 2008, investors started buying more volatile stocks in the rally that began early in March 2009, apparently believing that the economic recovery was underway. Both managers routinely invest in stocks with higher projected earnings growth and share-price volatility, which enhanced their returns during the rally.
The energy and information technology holdings of both managers advanced significantly, recovering some of the prior year’s losses. The Portfolio also benefited from its country allocations, specifically an underweight in Japan compared with the Index and allocations to emerging markets countries, such as Brazil and India that are not in the Index. For years, both managers have underweighted Japan as opportunities there with above-average growth have been difficult to find. This helped in 2009, as the Japanese market again substantially trailed global returns.
On the negative side, stocks exhibiting price momentum underperformed because of the major turn in the market in March. Consequently, William Blair’s overexposure to price momentum detracted from performance. Also, an underweight to financials hurt, as many financial firms’ stock prices recovered during 2009. An average 5% cash position detracted from returns in a rising market environment.
Prudential Investments LLC (PI), an indirect, wholly owned subsidiary of Prudential Financial, Inc., serves as the investment manager for the Fund.
| 1 | The graph is based on the performance of Class I shares. Performance of Class II shares will be lower due to differences in the fee structure. Class II shares have associated 12b-1 and administrative fees at an annual rate of 0.25% and 0.15% respectively of the average daily net assets of the Class II shares. |
MSCI EAFE (Morgan Stanley Capital International Europe, Australasia, Far East) Index (GD) is an unmanaged, capitalization-weighted index generally accepted as a benchmark for major overseas markets. The GD version does not reflect the impact of withholding taxes on reinvested dividends. These returns do not include the effect of any investment management expenses. These returns would have been lower if they included the effect of these expenses. Investors cannot invest directly in a market index. For a complete list of holdings, refer to the Schedule of Investments section of this report.
| | |
The Prudential Series Fund, SP International Value Portfolio Subadvised by: LSV Asset Management, Thornburg Investment Management Inc. | | December 31, 2009 |
Investment Manager’s Report - As of December 31, 2009
Average Annual Total Return Percentages
| | | | | | | | | |
| | | 1-Year | | | 5-Year | | | Since
Inception | |
Portfolio | | 32.35 | % | | 5.13 | % | | 1.60 | % |
MSCI EAFE® Index (GD) | | 32.46 | | | 4.02 | | | 3.08 | |
Past performance does not guarantee future returns. The investment return and principal value of an investment will fluctuate, so that an investor’s shares, when redeemed, may be worth more or less than their original cost. Current performance may be lower or higher than the past performance data quoted.
$10,000 INVESTED SINCE INCEPTION
Portfolio inception: 9/22/2000. Portfolio performance is net of investment fees and fund expenses, but not product charges, which, if included, would significantly lower the performance quoted. Unless noted otherwise, Index returns reflect performance beginning the closest month-end date to the Portfolio’s inception. Performance figures may reflect fee waivers and/or expense reimbursements. In the absence of such fee waivers and/or expense reimbursements, total returns would be lower.
For the year ended December 31, 2009, the SP International Value Portfolio returned 32.35%. The Portfolio is managed by LSV Asset Management and Thornburg Investment Management. LSV uses proprietary quantitative investment models, whereas Thornburg invests opportunistically using traditional fundamental securities analysis. The overall objective is long-term capital appreciation. In January 2009, Thornburg managed slightly less than two thirds of the assets, but late in the period the balance was shifted to favor LSV slightly.
International markets overall had a very strong year, with the MSCI EAFE Index (the Index) returning 32.46%, led by the Pacific region, excluding Japan. However, the first few months of the year were characterized by heightened market volatility and large downward market movements. As investors realized that the financial system was stabilizing, volatility steadily decreased and markets rebounded.
In this environment, Thornburg’s more focused strategy performed well early in the period, while LSV assumed leadership after the March 9 lows. Active managers generally found it difficult to outperform the Index as broad macroeconomic factors tended to overwhelm company-specific fundamentals. However, the stock selection of both LSV and Thornburg added value. LSV had more impact as its deep value focus (greater deviations from the market average in valuation) rebounded significantly. Both managers selected well across both countries and sectors, but the Portfolio performed particularly well in France, Japan, and the United Kingdom and in the industrials, health care, financials and consumer discretionary sectors. Country allocations, including some countries not included in the Index (China), contributed positively to relative returns. An underweight in Japan also helped as the large Japanese market substantially trailed the rest of the world. Since LSV does not deviate significantly from the Index in country exposure or invest in emerging markets, almost all of the impact from country allocation came from Thornburg.
Sector allocations detracted marginally from relative performance, largely due to Thornburg’s overweights in the telecommunications and healthcare sectors and its underweight in materials. These were somewhat mitigated by a timely underweight in utilities, one of the worst-performing sectors in the Index.
Prudential Investments LLC (PI), an indirect, wholly owned subsidiary of Prudential Financial, Inc., serves as the investment manager for the Fund.
MSCI EAFE (Morgan Stanley Capital International Europe, Australasia, Far East) Index (GD) is an unmanaged, capitalization-weighted index generally accepted as a benchmark for major overseas markets. The GD version does not reflect the impact of withholding taxes on reinvested dividends. These returns do not include the effect of any investment management expenses. These returns would have been lower if they included the effect of these expenses. Investors cannot invest directly in a market index. For a complete list of holdings, refer to the Schedule of Investments section of this report.
| | |
The Prudential Series Fund, SP Mid Cap Growth Portfolio Subadvised by: Neuberger Berman Management, Inc. | | December 31, 2009 |
Investment Manager’s Report - As of December 31, 2009
Average Annual Total Return Percentages
| | | | | | | | | |
| | | 1-Year | | | 5-Year | | | Since
Inception | |
Portfolio | | 31.49 | % | | -1.96 | % | | -4.87 | % |
Russell Midcap® Growth Index | | 46.29 | | | 2.40 | | | -2.05 | |
Russell Midcap® Index | | 40.48 | | | 2.43 | | | 4.08 | |
Past performance does not guarantee future returns. The investment return and principal value of an investment will fluctuate, so that an investor’s shares, when redeemed, may be worth more or less than their original cost. Current performance may be lower or higher than the past performance data quoted.
$10,000 INVESTED SINCE INCEPTION
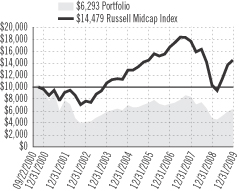
Portfolio inception: 9/22/2000. Portfolio performance is net of investment fees and fund expenses, but not product charges, which, if included, would significantly lower the performance quoted. Unless noted otherwise, Index returns reflect performance beginning the closest month-end date to the Portfolio’s inception. The Russell Midcap® and Midcap® Growth Indexes are trademarks/service marks of the Frank Russell Company. Russell® is a trademark of the Frank Russell Company. Performance figures may reflect fee waivers and/or expense reimbursements. In the absence of such fee waivers and/or expense reimbursements, total returns would be lower.
For the year ended December 31, 2009, the SP Mid-Cap Growth Portfolio rose 31.49%. It is managed by Neuberger Berman to seek capital growth. Normally, at least 80% of its assets are invested in companies with market capitalization (a measure of company size) within the range of the Russell Midcap® Growth Index (the Index).
Although the Index was up 46.29% by the end of 2009, the year contained two very different periods—first was dramatic weakness carrying over from 2008, then a rally from March through year-end. Mid-cap stocks led and growth stocks outperformed value. Information technology and energy were the best performing Index sectors, while utilities and telecommunications were the weakest.
Generally, the rally was led by lower quality stocks, including those of the smallest companies, firms with low return on equity, those having low stock prices, and companies with no earnings. Low quality stocks tend to lead early in a recovery. The Portfolio typically does not have exposure in this area because of Neuberger Berman’s stock selection process and belief that such stocks cannot outperform over longer periods of time. Given the market environment, stock selection was weak across much of the portfolio.
The Portfolio underperformed the Index in the healthcare and information technology sectors. Healthcare was affected by the uncertainty surrounding healthcare reform and by weak earnings. The Portfolio’s medical supplies and services companies underperformed on concerns about lower hospital spending, and it sold a joint replacement design and manufacturer. Medical diagnostic holdings also were weak and missed earnings estimates.
The Portfolio’s information technology holdings, primarily software and services companies, didn’t keep pace with more volatile industries during the rally. Nonetheless, a position in a lower-cost business products and services provider was among the Portfolio’s strongest performers. Several of the high quality holdings in the industrials sector exceeded earnings expectations, but did not keep up because of the market preference for more volatile stocks. A similar story of stocks underperforming despite exceeding earnings expectations could be told about the Portfolio’s secondary education holdings that were in the consumer discretionary sector. However, retailing benefitted Portfolio performance, with a department store among the top performers. Telecommunications holdings, particularly transmission tower companies, added to performance relative to the Index, as did the absence of any utilities.
Prudential Investments LLC (PI), an indirect, wholly owned subsidiary of Prudential Financial, Inc., serves as the investment manager for the Fund.
Russell Midcap Growth Index is a market cap-weighted index that measures the performance of those Russell Midcap companies with higher price-to-book ratios and higher forecasted growth values. Russell Midcap Index is a market cap-weighted index that measures the performance of the 800 smallest companies in the Russell 1000 Index, which represents approximately 25% of the total market. These returns do not include the effect of any investment management expenses. These returns would have been lower if they included the effect of these expenses. Investors cannot invest directly in a market index. For a complete list of holdings, refer to the Schedule of Investments section of this report.
| | |
*The Prudential Series Fund, SP Prudential U.S. Emerging Growth Portfolio Subadvised by: Jennison Associates LLC | | December 31, 2009 |
Investment Manager’s Report - As of December 31, 2009
Average Annual Total Return Percentages
| | | | | | | | | |
| | | 1-Year | | | 5-Year | | | Since
Inception | |
Portfolio: Class I | | 41.89 | % | | 6.41 | % | | 1.06 | % |
Portfolio: Class II | | 41.14 | | | 6.06 | | | 4.16 | |
Russell Midcap® Growth Index | | 46.29 | | | 2.40 | | | -2.05 | |
S&P Midcap 400 Index | | 37.38 | | | 3.27 | | | 4.60 | |
Past performance does not guarantee future returns. The investment return and principal value of an investment will fluctuate, so that an investor’s shares, when redeemed, may be worth more or less than their original cost. Current performance may be lower or higher than the past performance data quoted.
$10,000 INVESTED SINCE INCEPTION1
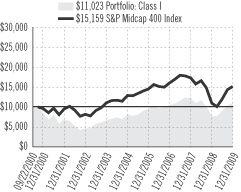
Portfolio (Class I) inception: 9/22/2000. Portfolio (Class II) inception: 7/9/2001. Portfolio performance is net of investment fees and fund expenses, but not product charges, which, if included, would significantly lower the performance quoted. Unless noted otherwise, Index returns reflect performance beginning the closest month-end date to the Portfolio’s inception (Class I). The Russell Midcap® Growth Index is a trademark/service mark of the Frank Russell Company. Russell® is a trademark of the Frank Russell Company. Performance figures may reflect fee waivers and/or expense reimbursements. In the absence of such fee waivers and/or expense reimbursements, total returns would be lower.
For the year ended December 31, 2009, the SP Prudential U.S. Emerging Growth Portfolio rose 41.89%, while the Class II shares rose 41.14%. The Portfolio is subadvised by Jennison Associates LLC for long-term capital appreciation.
Weak stock selection in the financials and industrials sectors detracted the most from relative return. Jennison was rewarded for strong stock selection in the telecom services sector.
One of the primary contributors to performance was a wireless communication tower operator. Expected demand growth in 2010, driven by 3G and 4G network development activity among the key wireless service providers, caused the company’s stock price to appreciate. In Jennison’s opinion, the wireless tower industry continues to represent a strong business model with both solid growth and defensive characteristics.
A Latin American wireless telecom service provider was also among the key contributors to performance. Shares appreciated significantly during the second half of the year, as the company recovered from concerns about the impact of foreign currency exchange rates and consistently delivered solid quarterly financial results despite continued pressures from the economy. In Jennison’s opinion, the company should continue to grow at a faster rate than other wireless companies despite increasing competition from other carriers offering similar service.
An energy exploration and production company also made a significant positive contribution to return. Shares benefited from strong financial results, stemming from lower costs and higher volumes, and a consequent increase in production guidance for 2010. In Jennison’s opinion, this is a high quality energy company with meaningful opportunities to continue to increase production at lower costs.
The primary individual detractor from performance in 2009 was a construction and engineering services provider. Project delays and a decrease in the company’s backlog of business caused management to reduce its earnings guidance for 2009. Jennison became concerned about the impact these delays could have on free cash flow generation and decided to exit this position in March. A property and casualty insurance company also detracted from return. While Jennison likes the company’s business model, the Portfolio sold shares in April due to liquidity concerns resulting from losses in the company’s investment portfolios and decided to revisit this investment at a later date. Another holding that hurt performance provides weight management products and services. In Jennison’s opinion, the company offers a best-in-class weight loss solution; however, Jennison exited this position in February due to the program’s weak attendance and difficulty attracting new members.
Prudential Investments LLC (PI), an indirect, wholly owned subsidiary of Prudential Financial, Inc., serves as the investment manager for the Fund.
| 1 | The graph is based on the performance of Class I shares. Performance of Class II shares will be lower due to differences in the fee structure. Class II shares have associated 12b-1 and administrative fees at an annual rate of 0.25% and 0.15% respectively of the average daily net assets of the Class II shares. |
Russell Midcap Growth Index is a market cap-weighted index that measures the performance of those Russell Midcap companies with higher price-to-book ratios and higher forecasted growth values. S&P Midcap 400 Index is a widely accepted, unmanaged total return index of 400 domestic stocks measuring the performance of the midsize company segment of the U.S. stock market. These returns do not include the effect of any investment management expenses. These returns would have been lower if they included the effect of these expenses. Investors cannot invest directly in a market index. For a complete list of holdings, refer to the Schedule of Investments section of this report.
| | |
The Prudential Series Fund, SP Small Cap Value Portfolio Subadvised by: ClearBridge Advisors, LLC, Goldman Sachs Asset Management L.P. | | December 31, 2009 |
Investment Manager’s Report - As of December 31, 2009
Average Annual Total Return Percentages
| | | | | | | | | |
| | | 1-Year | | | 5-Year | | | Since
Inception | |
Portfolio | | 30.80 | % | | 0.99 | % | | 5.60 | % |
Russell 2000® Value Index | | 20.58 | | | -0.01 | | | 7.48 | |
Russell 2500™ Index | | 34.39 | | | 1.58 | | | 4.42 | |
Past performance does not guarantee future returns. The investment return and principal value of an investment will fluctuate, so that an investor’s shares, when redeemed, may be worth more or less than their original cost. Current performance may be lower or higher than the past performance data quoted.
$10,000 INVESTED SINCE INCEPTION
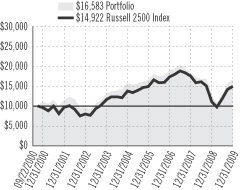
Portfolio inception: 9/22/2000. Portfolio performance is net of investment fees and fund expenses, but not product charges, which, if included, would significantly lower the performance quoted. Unless noted otherwise, Index returns reflect performance beginning the closest month-end date to the Portfolio’s inception. The Russell 2000® Value and Russell 2500TM Index are trademark/service marks of the Frank Russell Company. Russell® is a trademark of the Frank Russell Company. Performance figures may reflect fee waivers and/or expense reimbursements. In the absence of such fee waivers and/or expense reimbursements, total returns would be lower.
For the year ended December 31, 2009, the SP Small Cap Value Portfolio rose 30.80%. The Portfolio is managed by ClearBridge Advisors, LLC, and Goldman Sachs Asset Management L.P. for long-term growth of capital. The Portfolio invests in the stocks of companies within the market capitalization range (a measure of company size) of the Russell 2000® Value Index (the Index). Goldman focuses on quality, purchasing well-positioned businesses at attractive valuations. ClearBridge follows a relative value approach, looking for stocks selling at lower valuations than those of comparable firms.
Although the markets ended 2009 decidedly higher, dramatic weakness continuing from 2008 colored the early part of the year. Then, markets rallied from March through year-end. Growth stocks significantly outperformed value stocks during the period, as often happens when the market changes direction. The Index returned 20.58% for the year.
The Portfolio’s substantial margin of return over the Index was primarily due to specific stocks, rather than sector or risk-factor preferences. Holdings in oil services, airlines, information services, and equity REITs, as well as the avoidance of benchmark assets in cyclical industries, all helped the Portfolio outperform the Index. Relative performance was constrained, however, by holdings in the industrial parts, computer software, and computer hardware industries.
Although overall sector weightings did not have a meaningful impact on performance, the Portfolio’s underexposure to the financial sector and overexposure to the technology sector added value, while overexposures to the industrials and energy sectors detracted. The Portfolio was less sensitive to price fluctuations in the broad market than the Index, which weighed down relative performance during the broad market rally. Although style factors did not have a significant overall impact on the Portfolio’s overall performance during the year, a slight overexposure to stocks showing recent price strength (momentum) was a drag on results, while overexposures to securities exhibiting higher growth characteristics and those with a higher level of trading volume augmented results.
Prudential Investments LLC (PI), an indirect, wholly owned subsidiary of Prudential Financial, Inc., serves as the investment manager for the Fund.
Russell 2000 Value Index is an unmanaged index that measures the performance of those Russell 2000 companies with lower price-to-book ratios and lower forecasted growth values. Russell 2500 Index is a market cap-weighted index that measures the performance of the 2,500 smallest companies in the Russell 3000 Index, which represents approximately 17% of the total market capitalization of the Russell 3000 Index. These returns do not include the effect of any investment management expenses. These returns would have been lower if they included the effect of these expenses. Investors cannot invest directly in a market index. For a complete list of holdings, refer to the Schedule of Investments section of this report.
| | |
The Prudential Series Fund, SP Strategic Partners Focused Growth Portfolio Subadvised by: AllianceBernstein LP, Jennison Associates LLC | | December 31, 2009 |
Investment Manager’s Report - As of December 31, 2009
Average Annual Total Return Percentages
| | | | | | | | | |
| | | 1-Year | | | 5-Year | | | Since
Inception | |
Portfolio: Class I | | 44.14 | % | | 3.19 | % | | -2.12 | % |
Portfolio: Class II | | 43.38 | | | 2.80 | | | -0.76 | |
Russell 1000® Growth Index | | 37.21 | | | 1.63 | | | -4.16 | |
S&P 500 Index | | 26.47 | | | 0.42 | | | -0.88 | |
Past performance does not guarantee future returns. The investment return and principal value of an investment will fluctuate, so that an investor’s shares, when redeemed, may be worth more or less than their original cost. Current performance may be lower or higher than the past performance data quoted.
$10,000 INVESTED SINCE INCEPTION1
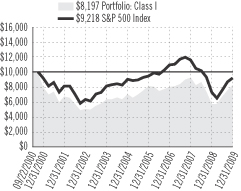
Portfolio (Class I) inception: 9/22/2000. Portfolio (Class II) inception: 1/12/2001. Portfolio performance is net of investment fees and fund expenses, but not product charges, which, if included, would significantly lower the performance quoted. Unless noted otherwise, Index returns reflect performance beginning the closest month-end date to the Portfolio’s inception (Class I). The Russell 1000® Growth Index is a trademark/service mark of the Frank Russell Company. Russell® is a trademark of the Frank Russell Company. Performance figures may reflect fee waivers and/or expense reimbursements. In the absence of such fee waivers and/or expense reimbursements, total returns would be lower.
For the year ended December 31, 2009, the SP Strategic Partners Focused Growth Portfolio’s Class I shares rose 44.14% and the Class II shares rose 43.38%.
The Portfolio, which seeks long-term growth of capital, is managed by Jennison Associates, LLC (Jennison) and Alliance Bernstein, L.P. (Alliance Bernstein), two asset managers with solid track records in the growth style of investing. The Portfolio is non-diversified, which means it can invest a relatively high percentage of its assets in a small number of companies located primarily in the United States. Jennison and Alliance Bernstein each select appropriately 20 to 30 securities for the Portfolio.
The U.S. government and the Federal Reserve took steps to steady the nation’s financial system and stimulate the economy. Both had been hurt by a protracted credit crisis. The financial system began to heal in 2009 and the economy began to tentatively emerge from the so-called “Great Recession,” even though job losses continued to climb. The favorable developments helped boost investor confidence in stocks, and a powerful rally in the U.S. stock market that began in March 2009 continued during the year. All 10 sectors of the Russell 1000 Growth Index (the Index) scored double-digit gains. The largest were from the information technology, materials, and consumer discretionary sectors, while the smallest were from the less economically sensitive utilities and consumer staples sectors.
The Portfolio beat the Index largely due to favorable stock selection, particularly in the information technology and healthcare sectors, but certain holdings in the industrials sector were a drag on its relative performance.
The Portfolio’s sector allocation strategy hurt its performance versus the Index. Compared to the Index, it had smaller exposures to the consumer cyclical and non-cyclical sectors and a larger exposure to the energy sector, all of which subtracted from its relative performance. But it benefited from an overweight exposure to information technology and underweight positions in the transportation and industrial sectors.
Many of the Portfolio’s risk exposures worked well, such as its overweight position in stocks that were heavily traded during 2009. Yet these gains were offset because it had larger exposures than the Index to firms exhibiting recent price strength and firms with bigger market capitalizations. That said, sizeable exposure to companies exhibiting solid earnings growth potential provided a tailwind to the Portfolio’s performance in 2009.
Prudential Investments LLC (PI), an indirect, wholly owned subsidiary of Prudential Financial, Inc., serves as the investment manager for the Fund.
| 1 | The graph is based on the performance of Class I shares. Performance of Class II shares will be lower due to differences in the fee structure. Class II shares have associated 12b-1 and administrative fees at an annual rate of 0.25% and 0.15% respectively of the average daily net assets of the Class II shares. |
Russell 1000 Growth Index is a market cap-weighted index that measures the performance of those Russell 1000 companies with higher price-to-book ratios and higher forecasted growth values. S&P 500 Index is an unmanaged, market value-weighted index of 500 stocks generally representative of the broad stock market. These returns do not include the effect of any investment management expenses. These returns would have been lower if they included the effect of these expenses. Investors cannot invest directly in a market index. For a complete list of holdings, refer to the Schedule of Investments section of this report.
| | |
Prudential Series Fund Presentation of Portfolio Holdings — unaudited | | December 31, 2009 |
| | |
| SP Davis Value |
| Five Largest Holdings (% of Net Assets) |
Occidental Petroleum Corp. | | 4.6% |
Berkshire Hathaway, Inc.
(Class A Stock) | | 4.3% |
Costco Wholesale Corp. | | 4.3% |
American Express Co. | | 4.0% |
Wells Fargo & Co. | | 3.8% |
| | |
| SP Growth Asset Allocation |
| Five Largest Holdings (% of Net Assets) |
Advanced Series Trust—Large-Cap Value Portfolio | | 27.9% |
PSF-Jennison Portfolio (Class I) | | 15.9% |
| Advanced Series Trust—Marsico Capital Growth Portfolio | | 15.7% |
Advanced Series Trust—AST PIMCO
Total Return Bond Portfolio | | 13.7% |
| PSF-SP International Growth Portfolio (Class I) | | 7.7% |
| | |
| SP International Growth |
| Five Largest Holdings (% of Net Assets) |
| Anheuser-Busch InBev NV (Belgium) | | 2.6% |
Telefonica SA (Spain) | | 2.4% |
| Credit Suisse Group AG (Switzerland) | | 2.4% |
| Teva Pharmaceutical Industries Ltd., ADR (Israel) | | 1.9% |
| Novo Nordisk A/S (Class B Stock) (Denmark) | | 1.6% |
| | |
| SP International Value |
| Five Largest Holdings (% of Net Assets) |
| BP PLC (United Kingdom) | | 1.7% |
Novartis AG (Switzerland) | | 1.7% |
| BNP Paribas (France) | | 1.5% |
| Royal Dutch Shell PLC (Class B Stock) (Netherlands) | | 1.5% |
| Teva Pharmaceutical Industries Ltd., ADR (Israel) | | 1.3% |
| | |
| SP Mid Cap Growth |
| Five Largest Holdings (% of Net Assets) |
| Urban Outfitters, Inc. | | 2.2% |
| SBA Communications Corp. (Class A Stock) | | 2.1% |
| Concho Resources, Inc. | | 1.9% |
Stericycle, Inc. | | 1.8% |
WMS Industries, Inc. | | 1.7% |
| | |
| SP Prudential U.S. Emerging Growth |
| Five Largest Holdings (% of Net Assets) |
| NII Holdings, Inc. | | 3.5% |
Annaly Capital Management, Inc. | | 3.2% |
| Southwestern Energy Co. | | 2.7% |
Crown Castle International Corp. | | 2.5% |
| American Tower Corp. (Class A Stock) | | 2.3% |
| | |
| SP Small Cap Value |
| Five Largest Holdings (% of Net Assets) |
| iShares Russell 2000 Value Index Fund | | 1.4% |
| Signature Bank | | 1.2% |
| Meadowbrook Insurance Group, Inc. | | 1.1% |
| Kaiser Aluminum Corp. | | 0.9% |
| El Paso Electric Co. | | 0.9% |
| | |
| SP Strategic Partners Focused Growth |
| Five Largest Holdings (% of Net Assets) |
Apple, Inc. | | 7.1% |
| Google, Inc. (Class A Stock) | | 6.7% |
Hewlett-Packard Co. | | 5.0% |
| QUALCOMM, Inc. | | 4.9% |
| Schlumberger Ltd. (Netherlands) | | 4.8% |
For a complete list of holdings, please refer to the Schedule of Investments section of this report. Holdings reflect only long-term investments. Holdings/Issues/Sectors are subject to change.
| | |
The Prudential Series Fund Fees and Expenses — unaudited | | December 31, 2009 |
As a contract owner investing in Portfolios of the Fund through a variable annuity or variable life contract, you incur ongoing costs, including management fees, and other Portfolio expenses. This example is intended to help you understand your ongoing costs (in dollars) of investing in the Fund and to compare these costs with the ongoing costs of investing in other investment options. This example does not reflect fees and charges under your variable annuity or variable life contract. If contract charges were included, the costs shown below would be higher. Please consult the prospectus for your contract for more information about contract fees and charges.
The example is based on an investment of $1,000 invested at the beginning of the period and held for the entire period July 1, 2009 through December 31, 2009.
Actual Expenses
The first line of the table below provides information about actual account values and actual expenses. You may use this information, together with the amount you invested, to estimate the Portfolio expenses that you paid over the period. Simply divide your account value by $1,000 (for example, an $8,600 account value divided by $1,000 = 8.6), then multiply the result by the number in the first line under the heading entitled “Expenses Paid During the Six-Month Period” to estimate the Portfolio expenses you paid on your account during this period. As noted above, the table does not reflect variable contract fees and charges.
Hypothetical Example for Comparison Purposes
The second line of the table below provides information about hypothetical account values and hypothetical expenses based on the Portfolio’s actual expense ratio and an assumed rate of return of 5% per year before expenses, which is not the Portfolio’s actual return. The hypothetical account values and expenses may not be used to estimate the actual ending account balance or expenses you paid for the period. You may use this information to compare the ongoing costs of investing in the Portfolio and other investment options. To do so, compare this 5% hypothetical example with the 5% hypothetical examples that appear in the shareholder reports of the other investment options.
Please note that the expenses shown in the table are meant to highlight your ongoing Portfolio costs only and do not reflect any contract fees and charges, such as sales charges (loads), insurance charges or administrative charges. Therefore the second line of the table is useful to compare ongoing investment option costs only, and will not help you determine the relative total costs of owning different contracts. In addition, if these contract fee and charges were included, your costs would have been higher.
| | | | | | | | | | | | | | |
| The Prudential Series Fund Portfolios | | Beginning
Account Value
July 1, 2009 | | Ending
Account Value
December 31, 2009 | | Annualized Expense
Ratio Based on the
Six-Month Period | | | Expenses Paid
During the
Six-Month Period |
| SP Davis Value (Class I) | | Actual | | $ | 1,000.00 | | $ | 1,241.80 | | 0.84 | % | | $ | 4.75 |
| | Hypothetical | | $ | 1,000.00 | | $ | 1,020.97 | | 0.84 | % | | $ | 4.28 |
| SP Growth Asset Allocation (Class I) | | Actual | | $ | 1,000.00 | | $ | 1,196.70 | | 1.02 | % | | $ | 5.65 |
| | Hypothetical | | $ | 1,000.00 | | $ | 1,020.06 | | 1.02 | % | | $ | 5.19 |
| SP International Growth (Class I) | | Actual | | $ | 1,000.00 | | $ | 1,212.00 | | 0.96 | % | | $ | 5.35 |
| | Hypothetical | | $ | 1,000.00 | | $ | 1,020.37 | | 0.96 | % | | $ | 4.89 |
| SP International Growth (Class II) | | Actual | | $ | 1,000.00 | | $ | 1,207.40 | | 1.36 | % | | $ | 7.57 |
| | Hypothetical | | $ | 1,000.00 | | $ | 1,018.35 | | 1.36 | % | | $ | 6.92 |
| SP International Value (Class I) | | Actual | | $ | 1,000.00 | | $ | 1,202.70 | | 1.01 | % | | $ | 5.61 |
| | Hypothetical | | $ | 1,000.00 | | $ | 1,020.11 | | 1.01 | % | | $ | 5.14 |
| SP Mid Cap Growth (Class I) | | Actual | | $ | 1,000.00 | | $ | 1,225.50 | | 0.98 | % | | $ | 5.50 |
| | Hypothetical | | $ | 1,000.00 | | $ | 1,020.27 | | 0.98 | % | | $ | 4.99 |
| SP Prudential U.S. Emerging Growth (Class I) | | Actual | | $ | 1,000.00 | | $ | 1,240.40 | | 0.70 | % | | $ | 3.95 |
| | Hypothetical | | $ | 1,000.00 | | $ | 1,021.68 | | 0.70 | % | | $ | 3.57 |
| SP Prudential U.S. Emerging Growth (Class II) | | Actual | | $ | 1,000.00 | | $ | 1,237.60 | | 1.10 | % | | $ | 6.20 |
| | Hypothetical | | $ | 1,000.00 | | $ | 1,019.66 | | 1.10 | % | | $ | 5.60 |
| SP Small Cap Value (Class I) | | Actual | | $ | 1,000.00 | | $ | 1,288.20 | | 0.98 | % | | $ | 5.65 |
| | Hypothetical | | $ | 1,000.00 | | $ | 1,020.27 | | 0.98 | % | | $ | 4.99 |
| SP Strategic Partners Focused Growth (Class I) | | Actual | | $ | 1,000.00 | | $ | 1,226.00 | | 1.23 | % | | $ | 6.90 |
| | Hypothetical | | $ | 1,000.00 | | $ | 1,019.00 | | 1.23 | % | | $ | 6.26 |
| SP Strategic Partners Focused Growth (Class II) | | Actual | | $ | 1,000.00 | | $ | 1,224.10 | | 1.63 | % | | $ | 9.14 |
| | Hypothetical | | $ | 1,000.00 | | $ | 1,016.99 | | 1.63 | % | | $ | 8.29 |
Portfolio expenses (net of fee waivers or subsidies, if any) for each share class are equal to the annualized expense ratio for each share class (provided in the table), multiplied by the average account value over the period, multiplied by the 184 days in the six-month period ended December 31, 2009, and divided by the 365 days in the Portfolio’s fiscal year ended December 31, 2009 (to reflect the six-month period). Expenses presented in the table include the expenses of any underlying portfolios in which the Portfolio may invest.
| | | | | | |
| | | SP DAVIS VALUE PORTFOLIO | | |
| |
| SCHEDULE OF INVESTMENTS | | December 31, 2009 |
| | | | | |
| LONG-TERM INVESTMENTS — 97.4% |
| COMMON STOCKS — 96.6% | | Shares
| | Value
(Note 2)
|
| | | | | | |
Automobile Manufacturers — 0.8% | | | | | |
CarMax, Inc.*(a) | | 63,200 | | $ | 1,532,600 |
| | | | |
|
|
Banks — 1.4% | | | | | |
Julius Baer Group Ltd. (Switzerland) | | 77,400 | | | 2,722,038 |
| | | | |
|
|
Beverages — 3.0% | | | | | |
Coca-Cola Co. (The) | | 19,000 | | | 1,083,000 |
Diageo PLC, ADR (United Kingdom)(a) | | 36,300 | | | 2,519,583 |
Heineken Holding NV (Netherlands) | | 54,306 | | | 2,271,245 |
| | | | |
|
|
| | | | | | 5,873,828 |
| | | | |
|
|
Broadcasting — 0.4% | | | | | |
Grupo Televisa SA, ADR (Mexico) | | 42,500 | | | 882,300 |
| | | | |
|
|
Business Services — 1.5% | | | | | |
Iron Mountain, Inc.*(a) | | 127,500 | | | 2,901,900 |
| | | | |
|
|
Chemicals — 0.7% | | | | | |
Monsanto Co. | | 11,500 | | | 940,125 |
Potash Corp. of Saskatchewan, Inc. (Canada)(a) | | 4,385 | | | 475,773 |
| | | | |
|
|
| | | | | | 1,415,898 |
| | | | |
|
|
Commercial Banks — 2.0% | | | | | |
Bank of New York Mellon Corp. (The) | | 144,000 | | | 4,027,680 |
| | | | |
|
|
Computers — 1.5% | | | | | |
Hewlett-Packard Co. | | 58,400 | | | 3,008,184 |
| | | | |
|
|
Containers & Packaging — 2.0% | | | | | |
Sealed Air Corp. | | 177,810 | | | 3,886,927 |
| | | | |
|
|
Cosmetics & Toiletries — 0.1% | | | | | |
Natura Cosmeticos SA (Brazil) | | 12,200 | | | 254,441 |
| | | | |
|
|
Diversified Financial Services — 1.0% | | | | | |
GAM Holding Ltd. (Switzerland) | | 77,400 | | | 937,242 |
Goldman Sachs Group, Inc. (The) | | 6,620 | | | 1,117,721 |
| | | | |
|
|
| | | | | | 2,054,963 |
| | | | |
|
|
Diversified Manufacturing Operations — 0.8% | | | |
Tyco International Ltd. (Switzerland) | | 42,428 | | | 1,513,831 |
| | | | |
|
|
Diversified Metals — 0.9% | | | | | |
BHP Billiton PLC (United Kingdom) | | 30,300 | | | 965,962 |
Rio Tinto PLC (United Kingdom) | | 16,470 | | | 889,325 |
| | | | |
|
|
| | | | | | 1,855,287 |
| | | | |
|
|
Electric — 0.2% | | | | | |
AES Corp. (The)* | | 28,100 | | | 374,011 |
| | | | |
|
|
Electrical Equipment — 0.4% | | | | | |
ABB Ltd., ADR (Switzerland)* | | 42,850 | | | 818,435 |
| | | | |
|
|
Electronic Equipment & Instruments — 1.2% | | | |
Agilent Technologies, Inc.*(a) | | 76,640 | | | 2,381,205 |
| | | | |
|
|
Entertainment & Leisure — 1.0% | | | | | |
Harley-Davidson, Inc. | | 81,800 | | | 2,061,360 |
| | | | |
|
|
Environmental Control — 1.0% | | | | | |
Sino-Forest Corp. (Canada)* | | 101,520 | | | 1,881,205 |
Sino-Forest Corp., 144A (Canada)* | | 3,400 | | | 63,003 |
| | | | |
|
|
| | | | | | 1,944,208 |
| | | | |
|
|
Financial Services — 10.2% | | | | | |
American Express Co. | | 193,960 | | | 7,859,259 |
Ameriprise Financial, Inc. | | 39,560 | | | 1,535,719 |
H&R Block, Inc. | | 51,300 | | | 1,160,406 |
| | | | | |
COMMON STOCKS
(continued) | | Shares
| | Value
(Note 2)
|
| | | | | | |
Financial Services (continued) | | | | | |
Moody’s Corp.(a) | | 50,900 | | $ | 1,364,120 |
Visa, Inc. (Class A Stock)(a) | | 6,590 | | | 576,361 |
Wells Fargo & Co. | | 280,330 | | | 7,566,107 |
| | | | |
|
|
| | | | | | 20,061,972 |
| | | | |
|
|
Food — 0.2% | | | | | |
Hershey Co. (The) | | 11,960 | | | 428,048 |
| | | | |
|
|
Healthcare Providers & Services — 1.9% | | | | | |
Cardinal Health, Inc. | | 38,300 | | | 1,234,792 |
Express Scripts, Inc.* | | 28,000 | | | 2,420,600 |
UnitedHealth Group, Inc. | | 5,500 | | | 167,640 |
| | | | |
|
|
| | | | | | 3,823,032 |
| | | | |
|
|
Healthcare Services — 0.4% | | | | | |
Laboratory Corp. of America Holdings*(a) | | 10,400 | | | 778,336 |
| | | | |
|
|
Household Durables — 0.2% | | | | | |
Garmin Ltd. (Cayman Islands) | | 200 | | | 6,140 |
Hunter Douglas NV (Netherlands) | | 8,453 | | | 413,238 |
| | | | |
|
|
| | | | | | 419,378 |
| | | | |
|
|
Household Products — 1.4% | | | | | |
Procter & Gamble Co. (The) | | 45,030 | | | 2,730,169 |
| | | | |
|
|
Insurance — 11.1% | | | | | |
Berkshire Hathaway, Inc. (Class A Stock)* | | 86 | | | 8,531,200 |
Fairfax Financial Holdings Ltd. (Canada)(a) | | 1,960 | | | 764,322 |
Hartford Financial Services Group, Inc. (The) | | 36,434 | | | 847,455 |
Loews Corp. | | 139,600 | | | 5,074,460 |
Markel Corp.*(a) | | 534 | | | 181,560 |
Principal Financial Group, Inc. | | 15,200 | | | 365,408 |
Progressive Corp. (The)*(a) | | 235,300 | | | 4,233,047 |
Transatlantic Holdings, Inc. | | 37,375 | | | 1,947,611 |
| | | | |
|
|
| | | | | | 21,945,063 |
| | | | |
|
|
Internet & Catalog Retail — 0.2% | | | | | |
Liberty Media Holding Corp. — Interactive (Class A Stock)* | | 38,925 | | | 421,947 |
| | | | |
|
|
Internet Services — 1.7% | | | | | |
Google, Inc. (Class A Stock)* | | 5,380 | | | 3,335,492 |
| | | | |
|
|
Internet Software & Services — 0.5% | | | | | |
Amazon.com, Inc.* | | 6,590 | | | 886,487 |
| | | | |
|
|
Investment Firms — 2.5% | | | | | |
JPMorgan Chase & Co. | | 116,416 | | | 4,851,055 |
| | | | |
|
|
Machinery — 0.2% | | | | | |
PACCAR, Inc. | | 12,620 | | | 457,727 |
| | | | |
|
|
Materials — 1.0% | | | | | |
Martin Marietta Materials, Inc.(a) | | 21,100 | | | 1,886,551 |
| | | | |
|
|
Media — 3.4% | | | | | |
Comcast Corp. (Special Class A Stock) | | 75,070 | | | 1,201,871 |
DIRECTV (Class A Stock)* | | 31,105 | | | 1,037,352 |
Liberty Media Corp. — Starz (Class A Stock)* | | 3,110 | | | 143,526 |
SEE NOTES TO FINANCIAL STATEMENTS.
A1
| | | | | | |
| | | SP DAVIS VALUE PORTFOLIO (continued) | | |
| |
| SCHEDULE OF INVESTMENTS | | December 31, 2009 |
| | | | | |
COMMON STOCKS
(continued) | | Shares
| | Value
(Note 2)
|
| | | | | | |
Media (continued) | | | | | |
News Corp. (Class A Stock) | | 198,500 | | $ | 2,717,465 |
Walt Disney Co. (The) | | 52,300 | | | 1,686,675 |
| | | | |
|
|
| | | | | | 6,786,889 |
| | | | |
|
|
Medical Supplies & Equipment — 1.2% | | | | | |
Becton, Dickinson and Co. | | 23,000 | | | 1,813,780 |
CareFusion Corp.* | | 19,100 | | | 477,691 |
| | | | |
|
|
| | | | | | 2,291,471 |
| | | | |
|
|
Metals & Mining — 1.1% | | | | | |
China Coal Energy Co. (Class H Stock) (Hong Kong) | | 1,140,700 | | | 2,069,884 |
| | | | |
|
|
Mining — 0.6% | | | | | |
Vulcan Materials Co.(a) | | 21,100 | | | 1,111,337 |
| | | | |
|
|
Oil, Gas & Consumable Fuels — 15.3% | | | | | |
Canadian Natural Resources Ltd. (Canada) | | 60,600 | | | 4,360,170 |
ConocoPhillips | | 13,568 | | | 692,918 |
Devon Energy Corp. | | 86,340 | | | 6,345,990 |
EOG Resources, Inc. | | 71,296 | | | 6,937,101 |
Occidental Petroleum Corp. | | 110,500 | | | 8,989,175 |
OGX Petroleo e Gas Participacoes SA (Brazil) | | 110,000 | | | 1,080,414 |
Transocean Ltd. (Switzerland)* | | 19,708 | | | 1,631,822 |
| | | | |
|
|
| | | | | | 30,037,590 |
| | | | |
|
|
Pharmaceuticals — 5.8% | | | | | |
Johnson & Johnson | | 64,400 | | | 4,148,004 |
Mead Johnson Nutrition Co. (Class A Stock) | | 14,700 | | | 642,390 |
Merck & Co., Inc. | | 131,895 | | | 4,819,443 |
Pfizer, Inc. | | 95,800 | | | 1,742,602 |
| | | | |
|
|
| | | | | | 11,352,439 |
| | | | |
|
|
Real Estate Operation & Development — 1.1% | | | |
Brookfield Asset Management, Inc. (Class A Stock) (Canada) | | 41,500 | | | 920,470 |
Hang Lung Group Ltd. (Hong Kong) | | 240,000 | | | 1,186,925 |
| | | | |
|
|
| | | | | | 2,107,395 |
| | | | |
|
|
Retail & Merchandising — 7.9% | | | | | |
Bed Bath & Beyond, Inc.*(a) | | 62,500 | | | 2,414,375 |
Costco Wholesale Corp. | | 143,020 | | | 8,462,493 |
CVS Caremark Corp. | | 147,310 | | | 4,744,855 |
| | | | |
|
|
| | | | | | 15,621,723 |
| | | | |
|
|
Semiconductors & Semiconductor Equipment — 1.5% |
Texas Instruments, Inc. | | 114,500 | | | 2,983,870 |
| | | | |
|
|
Software — 3.7% | | | | | |
Activision Blizzard, Inc.* | | 78,300 | | | 869,913 |
Dun & Bradstreet Corp. (The) | | 28,600 | | | 2,412,982 |
Microsoft Corp. | | 128,380 | | | 3,914,306 |
| | | | |
|
|
| | | | | | 7,197,201 |
| | | | |
|
|
Tobacco — 0.9% | | | | | |
Philip Morris International, Inc. | | 35,765 | | | 1,723,515 |
| | | | |
|
|
Transportation — 2.7% | | | | | |
China Merchants Holdings International Co. Ltd. (Hong Kong) | | 623,661 | | | 2,011,892 |
| | | | | |
COMMON STOCKS
(continued) | | Shares
| | Value
(Note 2)
|
| | | | | | |
Transportation (continued) | | | | | |
China Shipping Development Co. Ltd. (Class H Stock) (Hong Kong) | | 426,000 | | $ | 633,558 |
COSCO Pacific Ltd. (Bermuda) | | 414,255 | | | 525,728 |
Kuehne & Nagel International AG (Switzerland) | | 11,445 | | | 1,112,788 |
LLX Logistica SA (Brazil)* | | 24,800 | | | 144,014 |
United Parcel Service, Inc. (Class B Stock) | | 16,800 | | | 963,816 |
| | | | |
|
|
| | | | | | 5,391,796 |
| | | | |
|
|
TOTAL COMMON STOCKS
(cost $140,689,156) | | | 190,209,463 |
| | | | |
|
|
| | | | | | | | | | |
| | | | |
Interest
Rate
| | Maturity
Date
| | Moody’s
Rating†
(Unaudited)
| | Principal
Amount
(000)#
| | |
| | | | | | | | | | | |
| CORPORATE BOND — 0.6% | | |
Entertainment & Leisure | | | | | | |
Harley-Davidson, Inc.,
Sr. Unsec’d. Notes
(cost $1,000,000)(g) | | | | | | |
15.00% | | 02/01/14 | | BBB(d) | | $ | 1,000 | | | 1,224,015 |
| | | | | | | | | |
|
|
| CONVERTIBLE BOND — 0.2% | | |
Environmental Control | | | | | | |
Sino-Forest Corp. (Canada) (cost $357,000)(g) | | | | | | |
5.00% | | 08/01/13 | | Ba2 | | | 357 | | | 421,706 |
| | | | | | | | | |
|
|
TOTAL LONG-TERM INVESTMENTS
(cost $142,046,156) | | | 191,855,184 |
| | | | | | | | | |
|
|
| | | | | | | Shares
| | |
| | | | | | | | | | | |
| SHORT-TERM INVESTMENT — 12.1% |
AFFILIATED MONEY MARKET MUTUAL FUND |
Dryden Core Investment Fund — Taxable Money Market Series (cost $23,781,395; includes $18,598,475 of cash collateral for securities on loan)(b)(w)(Note 4) | | | 23,781,395 | | | 23,781,395 |
| | | | | | | | | |
|
|
TOTAL INVESTMENTS(o) — 109.5%
(cost $165,827,551) | | | 215,636,579 |
LIABILITIES IN EXCESS OF OTHER ASSETS — (9.5)% | | | (18,751,263) |
| | | | | | | | | |
|
|
NET ASSETS — 100.0% | | $ | 196,885,316 |
| | | | | | | | | |
|
|
The following abbreviations are used in the Portfolio descriptions:
| | |
| 144A | | Security was purchased pursuant to Rule 144A under the Securities Act of 1933 and may not be resold subject to that rule except to qualified institutional buyers. Unless otherwise noted, 144A securities are deemed to be liquid. |
| ADR | | American Depositary Receipt |
| # | Principal amount is shown in U.S. dollars unless otherwise stated. |
SEE NOTES TO FINANCIAL STATEMENTS.
A2
| | | | | | |
| | | SP DAVIS VALUE PORTFOLIO (continued) | | |
| |
| SCHEDULE OF INVESTMENTS | | December 31, 2009 |
| † | The rating reflected is as of December 31, 2009. Rating of certain bonds may have changed subsequent to that date. |
| * | Non-income producing security. |
| (a) | All or a portion of security is on loan. The aggregate market value of such securities is $17,987,157; cash collateral of $18,598,475 (included with liabilities) was received with which the Portfolio purchased highly liquid short-term investments. |
| (b) | Represents security, or a portion thereof, purchased with cash collateral received for securities on loan. |
| (d) | Standard & Poor’s rating. |
| (g) | Indicates a security that has been deemed illiquid. |
| (o) | As of December 31, 2009, 11 securities representing $13,017,787 and 6.6% of net assets were fair valued in accordance with the policies adopted by the Board of Trustees. |
| (w) | Prudential Investments LLC, the manager of the Portfolio, also serves as manager of the Dryden Core Investment Fund—Taxable Money Market Series. |
Various inputs are used in determining the value of the Portfolio’s investments. These inputs are summarized in the three broad levels listed below.
Level 1—quoted prices in active markets for identical securities
Level 2—other significant observable inputs (including quoted prices for similar securities, interest rates, prepayment speeds, credit risk, etc.)
Level 3—significant unobservable inputs (including the Portfolio’s own assumptions in determining the fair value of investments)
The following is a summary of the inputs used as of December 31, 2009 in valuing the Portfolio’s assets carried at fair value:
| | | | | | | | | |
Investments in Securities
| | Level 1
| | Level 2
| | Level 3
|
Common Stocks | | $ | 177,191,676 | | $ | 13,017,787 | | $ | — |
Corporate Bond | | | — | | | 1,224,015 | | | — |
Convertible Bond | | | — | | | 421,706 | | | — |
Affiliated Money Market Mutual Fund | | | 23,781,395 | | | — | | | — |
| | |
|
| |
|
| |
|
|
| | | | 200,973,071 | | | 14,663,508 | | | — |
Other Financial Instruments* | | | — | | | — | | | — |
| | |
|
| |
|
| |
|
|
Total | | $ | 200,973,071 | | $ | 14,663,508 | | $ | — |
| | |
|
| |
|
| |
|
|
| * | Other financial instruments are derivative instruments not reflected in the Schedule of Investments, such as futures, forwards and swap contracts, which are valued at the unrealized appreciation/depreciation on the instrument. |
As of December 31, 2009 and 2008, the Portfolio did not use any significant unobservable inputs (Level 3) in determining the value of investments.
The industry classification of investments and liabilities in excess of other assets shown as a percentage of net assets as of December 31, 2009 were as follows:
| | | |
Oil, Gas & Consumable Fuels | | 15.3 | % |
Affiliated Money Market Mutual Fund (9.4% represents investments purchased with collateral from securities on loan) | | 12.1 | |
Insurance | | 11.1 | |
Financial Services | | 10.2 | |
Retail & Merchandising | | 7.9 | |
Pharmaceuticals | | 5.8 | |
Software | | 3.7 | |
Media | | 3.4 | |
Beverages | | 3.0 | |
Transportation | | 2.7 | |
Investment Firms | | 2.5 | |
Commercial Banks | | 2.0 | |
Containers & Packaging | | 2.0 | |
Healthcare Providers & Services | | 1.9 | |
Internet Services | | 1.7 | |
Entertainment & Leisure | | 1.6 | |
Computers | | 1.5 | |
Semiconductors & Semiconductor Equipment | | 1.5 | |
Business Services | | 1.5 | |
Household Products | | 1.4 | |
Banks | | 1.4 | |
Electronic Equipment & Instruments | | 1.2 | |
Medical Supplies & Equipment | | 1.2 | |
Environmental Control | | 1.2 | |
Real Estate Operation & Development | | 1.1 | |
Metals & Mining | | 1.1 | |
Diversified Financial Services | | 1.0 | |
Materials | | 1.0 | |
Diversified Metals | | 0.9 | |
Tobacco | | 0.9 | |
Automobile Manufacturers | | 0.8 | |
Diversified Manufacturing Operations | | 0.8 | |
Chemicals | | 0.7 | |
Mining | | 0.6 | |
Internet Software & Services | | 0.5 | |
Broadcasting | | 0.4 | |
Electrical Equipment | | 0.4 | |
Healthcare Services | | 0.4 | |
Machinery | | 0.2 | |
Foods | | 0.2 | |
Internet & Catalog Retail | | 0.2 | |
Household Durables | | 0.2 | |
Electric | | 0.2 | |
Cosmetics & Toiletries | | 0.1 | |
| | |
|
|
| | | 109.5 | |
Liabilities in excess of other assets | | (9.5 | ) |
| | |
|
|
| | | 100.0 | % |
| | |
|
|
SEE NOTES TO FINANCIAL STATEMENTS.
A3
| | | | | | |
| | | SP DAVIS VALUE PORTFOLIO (continued) | | |
STATEMENT OF ASSETS AND LIABILITIES
December 31, 2009
| | | |
| ASSETS | | | |
Investments at value, including securities on loan of $17,987,157: | | | |
Unaffiliated investments (cost $142,046,156) | | $ | 191,855,184 |
Affiliated investments (cost $23,781,395) | | | 23,781,395 |
Foreign currency, at value (cost $32) | | | 32 |
Dividends and interest receivable | | | 183,196 |
Receivable for investments sold | | | 108,522 |
Tax reclaim receivable | | | 36,571 |
Prepaid expenses | | | 1,700 |
Receivable for Series shares sold | | | 470 |
| | |
|
|
Total Assets | | | 215,967,070 |
| | |
|
|
| LIABILITIES | | | |
Collateral for securities on loan | | | 18,598,475 |
Payable for investments purchased | | | 193,412 |
Management fee payable | | | 124,065 |
Payable for Series shares repurchased | | | 89,555 |
Accrued expenses and other liabilities | | | 49,983 |
Payable to custodian | | | 23,668 |
Deferred trustees’ fees | | | 2,001 |
Affiliated transfer agent fees payable | | | 595 |
| | |
|
|
Total Liabilities | | | 19,081,754 |
| | |
|
|
| NET ASSETS | | $ | 196,885,316 |
| | |
|
|
Net assets were comprised of: | | | |
Paid-in capital | | $ | 171,560,067 |
Retained earnings | | | 25,325,249 |
| | |
|
|
Net assets, December 31, 2009 | | $ | 196,885,316 |
| | |
|
|
Net asset value and redemption price per share, $196,885,316 / 22,676,046 outstanding shares of beneficial interest | | $ | 8.68 |
| | |
|
|
STATEMENT OF OPERATIONS
Year Ended December 31, 2009
| | | | |
| INVESTMENT INCOME | | | | |
Unaffiliated dividend income (net of $31,556 foreign withholding tax) | | $ | 2,732,494 | |
Interest income | | | 153,546 | |
Affiliated income from securities lending, net | | | 93,663 | |
Affiliated dividend income | | | 48,267 | |
| | |
|
|
|
| | | | 3,027,970 | |
| | |
|
|
|
| EXPENSES | | | | |
Management fee | | | 1,282,791 | |
Custodian’s fees and expenses | | | 70,000 | |
Shareholders’ reports | | | 37,000 | |
Audit fee | | | 20,000 | |
Trustees’ fees | | | 10,000 | |
Transfer agent’s fees and expenses (including affiliated expense of $3,600) (Note 4) | | | 10,000 | |
Legal fees and expenses | | | 5,000 | |
Insurance expenses | | | 4,000 | |
Commitment fee on syndicated credit agreement | | | 2,000 | |
Miscellaneous | | | 10,827 | |
| | |
|
|
|
Total expenses | | | 1,451,618 | |
| | |
|
|
|
| NET INVESTMENT INCOME | | | 1,576,352 | |
| | |
|
|
|
| NET REALIZED AND UNREALIZED GAIN (LOSS) ON INVESTMENTS AND FOREIGN CURRENCIES | | | | |
Net realized loss on: | | | | |
Investment transactions | | | (21,638,066 | ) |
Foreign currency transactions | | | (14,128 | ) |
| | |
|
|
|
| | | | (21,652,194 | ) |
| | |
|
|
|
Net change in unrealized appreciation (depreciation) on: | | | | |
Investments | | | 68,365,542 | |
Foreign currencies | | | 1,280 | |
| | |
|
|
|
| | | | 68,366,822 | |
| | |
|
|
|
| NET GAIN ON INVESTMENTS AND FOREIGN CURRENCIES | | | 46,714,628 | |
| | |
|
|
|
| NET INCREASE IN NET ASSETS RESULTING FROM OPERATIONS | | $ | 48,290,980 | |
| | |
|
|
|
STATEMENT OF CHANGES IN NET ASSETS:
| | | | | | | | |
| | | Year Ended December 31,
| |
| | | 2009
| | | 2008
| |
| INCREASE (DECREASE) IN NET ASSETS | | | | | | | | |
| OPERATIONS: | | | | | | | | |
Net investment income | | $ | 1,576,352 | | | $ | 2,765,033 | |
Net realized loss on investment and foreign currency transactions | | | (21,652,194 | ) | | | (4,190,693 | ) |
Net change in unrealized appreciation (depreciation) on investments and foreign currencies | | | 68,366,822 | | | | (113,459,269 | ) |
| | |
|
|
| |
|
|
|
NET INCREASE (DECREASE) IN NET ASSETS RESULTING FROM OPERATIONS | | | 48,290,980 | | | | (114,884,929 | ) |
| | |
|
|
| |
|
|
|
| DISTRIBUTIONS | | | (2,763,578 | ) | | | (18,966,489 | ) |
| | |
|
|
| |
|
|
|
| SERIES SHARE TRANSACTIONS: | | | | | | | | |
Series shares sold [877,931 and 892,207 shares, respectively] | | | 6,153,372 | | | | 8,010,655 | |
Series shares issued in reinvestment of distributions [384,364 and 1,787,605 shares, respectively] | | | 2,763,578 | | | | 18,966,489 | |
Series shares repurchased [3,185,155 and 3,833,951 shares, respectively] | | | (22,870,308 | ) | | | (36,829,057 | ) |
| | |
|
|
| |
|
|
|
DECREASE IN NET ASSETS RESULTING FROM SERIES SHARE TRANSACTIONS | | | (13,953,358 | ) | | | (9,851,913 | ) |
| | |
|
|
| |
|
|
|
| TOTAL INCREASE (DECREASE) IN NET ASSETS | | | 31,574,044 | | | | (143,703,331 | ) |
| NET ASSETS: | | | | | | | | |
Beginning of year | | | 165,311,272 | | | | 309,014,603 | |
| | |
|
|
| |
|
|
|
End of year | | $ | 196,885,316 | | | $ | 165,311,272 | |
| | |
|
|
| |
|
|
|
SEE NOTES TO FINANCIAL STATEMENTS.
A4
| | | | | | |
| | | SP GROWTH ASSET ALLOCATION PORTFOLIO | | |
| |
| SCHEDULE OF INVESTMENTS | | December 31, 2009 |
| | | | | | |
| | | | |
LONG-TERM
INVESTMENTS — 99.6% | | Shares
| | Value
(Note 2)
| |
AFFILIATED MUTUAL FUNDS | | | | | | |
Advanced Series Trust — | | | | | | |
AST Global Real Estate Portfolio | | 1,103,481 | | $ | 7,602,981 | |
AST Large-Cap Value Portfolio | | 18,583,673 | | | 221,145,705 | |
AST Marsico Capital Growth Portfolio | | 7,649,755 | | | 124,461,509 | |
AST PIMCO Total Return Bond Portfolio | | 9,280,796 | | | 108,585,318 | |
AST Small-Cap Growth Portfolio | | 1,427,641 | | | 21,400,344 | |
AST Western Asset Core Plus Bond Portfolio | | 2,709,396 | | | 27,039,775 | |
The Prudential Series Fund — | | | | | | |
High Yield Bond Portfolio | | 552,806 | | | 2,672,652 | |
Jennison Portfolio (Class I) | | 6,038,446 | | | 126,022,371 | |
Money Market Portfolio | | 6,451 | | | 64,510 | |
Natural Resources Portfolio (Class I) | | 196,568 | | | 7,302,512 | |
SP International Growth Portfolio (Class I) | | 13,202,854 | | | 61,129,215 | |
SP International Value Portfolio | | 9,507,995 | | | 60,375,765 | |
SP Small Cap Value Portfolio | | 2,208,979 | | | 21,625,900 | |
| | | | |
|
|
|
TOTAL LONG-TERM INVESTMENTS
(cost $809,749,104) | | | 789,428,557 | |
| | | | |
|
|
|
| SHORT-TERM INVESTMENT — 0.4% | | | | |
Affiliated Money Market Mutual Fund | | | | |
Dryden Core Investment Fund —
Taxable Money Market Series (cost $3,558,105) (Note 4) | | 3,558,105 | | | 3,558,105 | |
| | | | |
|
|
|
TOTAL INVESTMENTS — 100.0%
(cost $813,307,209)(a) | | | 792,986,662 | |
LIABILITIES IN EXCESS OF
OTHER ASSETS | | | (187,213 | ) |
| | | | |
|
|
|
NET ASSETS — 100.0% | | $ | 792,799,449 | |
| | | | |
|
|
|
| (a) | Prudential Investments LLC, the manager of the Portfolio, also serves as manager/co-manager of the underlying portfolios in which the Portfolio invests. |
Various inputs are used in determining the value of the Portfolio’s investments. These inputs are summarized in the three broad levels listed below.
Level 1—quoted prices in active markets for identical securities
Level 2—other significant observable inputs (including quoted prices for similar securities, interest rates, prepayment speeds, credit risk, etc.)
Level 3—significant unobservable inputs (including the Portfolio’s own assumptions in determining the fair value of investments)
The following is a summary of the inputs used as of December 31, 2009 in valuing the Portfolio’s assets carried at fair value:
| | | | | | | | | |
| | | Level 1
| | Level 2
| | Level 3
|
Investments in Securities | | | | | | | | | |
Affiliated Mutual Funds | | $ | 789,428,557 | | $ | — | | $ | — |
Affiliated Money Market Mutual Fund | | | 3,558,105 | | | — | | | — |
| | |
|
| |
|
| |
|
|
| | | | 792,986,662 | | | — | | | — |
Other Financial Instruments* | | | — | | | — | | | — |
| | |
|
| |
|
| |
|
|
Total | | $ | 792,986,662 | | $ | — | | $ | — |
| | |
|
| |
|
| |
|
|
| * | Other financial instruments are derivative instruments not reflected in the Schedule of Investments, such as futures, forwards and swap contracts, which are valued at the unrealized appreciation/depreciation on the instrument. |
As of December 31, 2009 and 2008, the Portfolio did not use any significant unobservable inputs (Level 3) in determining the value of investments.
The investment allocation of portfolio holdings and liabilities in excess of other assets shown as a percentage of net assets as of December 31, 2009 were as follows:
| | | |
Investment Type
| | | |
Large/Mid-Cap Growth | | 31.6 | % |
Large/Mid-Cap Value | | 27.9 | |
Core Bonds | | 17.1 | |
International Growth | | 7.7 | |
International Value | | 7.6 | |
Small-Cap Growth | | 2.7 | |
Small-Cap Value | | 2.7 | |
Sector | | 1.9 | |
High Yield | | 0.4 | |
Money Market | | — | (b) |
| | |
|
|
| | | 99.6 | |
Short-Term Investment | | 0.4 | |
| | |
|
|
| | | 100.0 | % |
| | |
|
|
SEE NOTES TO FINANCIAL STATEMENTS.
A5
| | | | | | |
| | | SP GROWTH ASSET ALLOCATION PORTFOLIO (continued) | | |
STATEMENT OF ASSETS AND LIABILITIES
December 31, 2009
| | | | |
| ASSETS | | | | |
Affiliated investments, at value
(cost $813,307,209) | | $ | 792,986,662 | |
Cash | | | 7,360 | |
Receivable for Series shares sold | | | 17,807 | |
Prepaid expenses | | | 8,057 | |
Dividends receivable | | | 193 | |
| | |
|
|
|
Total Assets | | | 793,020,079 | |
| | |
|
|
|
| LIABILITIES | | | | |
Payable for Series shares repurchased | | | 142,701 | |
Accrued expenses and other liabilities | | | 43,011 | |
Management fee payable | | | 33,563 | |
Deferred trustees’ fees | | | 760 | |
Affiliated transfer agent fee payable | | | 595 | |
| | |
|
|
|
Total Liabilities | | | 220,630 | |
| | |
|
|
|
| NET ASSETS | | $ | 792,799,449 | |
| | |
|
|
|
Net assets were comprised of: | | | | |
Paid-in capital | | $ | 872,887,234 | |
Retained earnings | | | (80,087,785 | ) |
| | |
|
|
|
Net assets, December 31, 2009 | | $ | 792,799,449 | |
| | |
|
|
|
Net asset value and redemption price per share, $792,799,449 / 98,741,281 outstanding shares of beneficial interest | | $ | 8.03 | |
| | |
|
|
|
STATEMENT OF OPERATIONS
Year Ended December 31, 2009
| | | | |
| INVESTMENT INCOME | | | | |
Affiliated dividend income | | $ | 15,728,535 | |
| | |
|
|
|
| EXPENSES | | | | |
Management fee | | | 353,640 | |
Custodian’s fees and expenses | | | 57,000 | |
Shareholders’ reports | | | 42,000 | |
Audit fee | | | 17,000 | |
Insurance expenses | | | 17,000 | |
Transfer agent’s fee and expenses (including affiliated expense of $3,600) (Note 4) | | | 10,000 | |
Commitment fee on syndicated credit agreement | | | 8,000 | |
Trustees’ fees | | | 7,000 | |
Legal fees and expenses | | | 5,000 | |
Loan interest expense (Note 8) | | | 4 | |
Miscellaneous | | | 8,591 | |
| | |
|
|
|
Total expenses | | | 525,235 | |
| | |
|
|
|
| NET INVESTMENT INCOME | | | 15,203,300 | |
| | |
|
|
|
| NET REALIZED AND UNREALIZED GAIN (LOSS) ON AFFILIATED INVESTMENTS | | | | |
Net realized loss on investment transactions | | | (77,659,954 | ) |
Net capital gain distributions received | | | 4,004,298 | |
| | |
|
|
|
| | | | (73,655,656 | ) |
| | |
|
|
|
Net change in unrealized appreciation (depreciation) on investments | | | 226,168,654 | |
| | |
|
|
|
| NET GAIN ON INVESTMENTS | | | 152,512,998 | |
| | |
|
|
|
| NET INCREASE IN NET ASSETS RESULTING FROM OPERATIONS | | $ | 167,716,298 | |
| | |
|
|
|
STATEMENT OF CHANGES IN NET ASSETS
| | | | | | | | |
| | | Year Ended December 31,
| |
| | | 2009
| | | 2008
| |
| INCREASE (DECREASE) IN NET ASSETS | | | | | | | | |
| OPERATIONS: | | | | | | | | |
Net investment income | | $ | 15,203,300 | | | $ | 15,546,603 | |
Net realized gain (loss) on investment transactions | | | (73,655,656 | ) | | | 10,167,335 | |
Net change in unrealized appreciation (depreciation) on investments | | | 226,168,654 | | | | (450,725,970 | ) |
| | |
|
|
| |
|
|
|
NET INCREASE (DECREASE) IN NET ASSETS RESULTING FROM OPERATIONS | | | 167,716,298 | | | | (425,012,032 | ) |
| | |
|
|
| |
|
|
|
| DISTRIBUTIONS | | | (25,712,126 | ) | | | (116,144,619 | ) |
| | |
|
|
| |
|
|
|
| SERIES SHARE TRANSACTIONS: | | | | | | | | |
Series shares sold [3,177,301 and 3,093,662 shares, respectively] | | | 21,824,902 | | | | 27,735,159 | |
Series shares issued in reinvestment of distributions [3,748,123 and 11,998,411 shares, respectively] | | | 25,712,126 | | | | 116,144,619 | |
Series shares repurchased [13,490,422 and 17,822,457 shares, respectively] | | | (91,581,608 | ) | | | (160,542,195 | ) |
| | |
|
|
| |
|
|
|
NET DECREASE IN NET ASSETS RESULTING FROM SERIES SHARE TRANSACTIONS | | | (44,044,580 | ) | | | (16,662,417 | ) |
| | |
|
|
| |
|
|
|
| TOTAL INCREASE (DECREASE) IN NET ASSETS | | | 97,959,592 | | | | (557,819,068 | ) |
| NET ASSETS: | | | | | | | | |
Beginning of year | | | 694,839,857 | | | | 1,252,658,925 | |
| | |
|
|
| |
|
|
|
End of year | | $ | 792,799,449 | | | $ | 694,839,857 | |
| | |
|
|
| |
|
|
|
SEE NOTES TO FINANCIAL STATEMENTS.
A6
| | | | | | |
| | | SP INTERNATIONAL GROWTH PORTFOLIO | | |
| |
| SCHEDULE OF INVESTMENTS | | December 31, 2009 |
| | | | | |
| LONG-TERM INVESTMENTS — 97.1% | | |
| COMMON STOCKS — 97.1% | | Shares
| | Value
(Note 2)
|
| | | | | | |
Australia — 2.4% | | | | | |
BHP Billiton Ltd., ADR(a) | | 15,864 | | $ | 1,214,865 |
CSL Ltd. | | 32,508 | | | 945,313 |
Woolworths Ltd. | | 36,974 | | | 927,336 |
WorleyParsons Ltd. | | 38,798 | | | 1,007,411 |
| | | | |
|
|
| | | | | | 4,094,925 |
| | | | |
|
|
Belgium — 2.6% | | | | | |
Anheuser-Busch InBev NV | | 88,579 | | | 4,585,479 |
| | | | |
|
|
Brazil — 5.9% | | | | | |
BM&F BOVESPA SA | | 193,626 | | | 1,362,389 |
Cyrela Brazil Realty SA | | 62,600 | | | 880,930 |
Gafisa SA | | 54,400 | | | 882,399 |
Itau Unibanco Holding SA, ADR | | 27,024 | | | 617,228 |
JBS SA | | 65,400 | | | 350,102 |
OGX Petroleo e Gas Participacoes SA | | 110,000 | | | 1,080,413 |
PDG Realty SA Empreendimentos e Participacoes | | 57,500 | | | 573,018 |
Petroleo Brasileiro SA (PRFC Shares) | | 68,542 | | | 1,444,461 |
Petroleo Brasileiro SA, ADR | | 28,623 | | | 1,364,745 |
Vale SA, ADR(a) | | 30,000 | | | 870,900 |
Weg SA | | 82,400 | | | 870,856 |
| | | | |
|
|
| | | | | | 10,297,441 |
| | | | |
|
|
Canada — 4.3% | | | | | |
Brookfield Asset Management, Inc. (Class A Stock) | | 51,897 | | | 1,151,076 |
Canadian National Railway Co. | | 39,933 | | | 2,170,758 |
Goldcorp, Inc.(a) | | 31,995 | | | 1,258,683 |
Research In Motion Ltd.* | | 16,486 | | | 1,113,464 |
Royal Bank of Canada | | 21,012 | | | 1,133,123 |
Tim Hortons, Inc. | | 22,648 | | | 695,779 |
| | | | |
|
|
| | | | | | 7,522,883 |
| | | | |
|
|
Cayman Islands — 0.3% | | | | | |
Baidu, Inc., ADR*(a) | | 1,350 | | | 555,160 |
Chaoda Modern Agriculture Holdings Ltd. | | 12,000 | | | 12,774 |
| | | | |
|
|
| | | | | | 567,934 |
| | | | |
|
|
China — 2.1% | | | | | |
China Life Insurance Co. Ltd. (Class H Stock) | | 285,000 | | | 1,394,583 |
China Railway Construction Corp. (Class H Stock) | | 756,500 | | | 963,973 |
Ctrip.com International Ltd., ADR*(a) | | 7,700 | | | 553,322 |
Longtop Financial Technologies Ltd., ADR*(a) | | 10,790 | | | 399,446 |
Tencent Holdings Ltd. | | 17,700 | | | 382,810 |
| | | | |
|
|
| | | | | | 3,694,134 |
| | | | |
|
|
Denmark — 2.2% | | | | | |
Novo Nordisk A/S (Class B Stock) | | 42,860 | | | 2,736,256 |
Novozymes A/S (Class B Stock) | | 3,100 | | | 322,517 |
Vestas Wind Systems A/S* | | 12,767 | | | 777,290 |
| | | | |
|
|
| | | | | | 3,836,063 |
| | | | |
|
|
| | | | | |
COMMON STOCKS
(continued) | | Shares
| | Value
(Note 2)
|
| | | | | | |
France — 6.0% | | | | | |
Accor SA | | 6,161 | | $ | 337,143 |
Alstom SA | | 38,505 | | | 2,692,878 |
AXA SA | | 45,587 | | | 1,070,336 |
BNP Paribas | | 7,071 | | | 560,857 |
Iliad SA | | 10,103 | | | 1,207,348 |
Publicis Groupe SA | | 6,933 | | | 281,896 |
Schneider Electric SA | | 23,305 | | | 2,709,732 |
Vinci SA | | 27,737 | | | 1,560,790 |
| | | | |
|
|
| | | | | | 10,420,980 |
| | | | |
|
|
Germany — 6.2% | | | | | |
BASF SE | | 32,741 | | | 2,026,361 |
Daimler AG | | 41,482 | | | 2,209,481 |
E.ON AG | | 27,185 | | | 1,141,064 |
Infineon Technologies AG* | | 175,604 | | | 976,951 |
MAN SE | | 16,060 | | | 1,246,129 |
Metro AG | | 14,260 | | | 870,897 |
SAP AG | | 32,998 | | | 1,573,117 |
ThyssenKrupp AG | | 17,143 | | | 644,444 |
| | | | |
|
|
| | | | | | 10,688,444 |
| | | | |
|
|
Hong Kong — 4.5% | | | | | |
ASM Pacific Technology Ltd. | | 60,500 | | | 572,007 |
Cheung Kong Holdings Ltd. | | 93,000 | | | 1,195,067 |
China Overseas Land & Investment Ltd. | | 528,000 | | | 1,106,311 |
China Resources Enterprise | | 84,000 | | | 305,162 |
CNOOC Ltd. | | 1,192,800 | | | 1,858,313 |
Esprit Holdings Ltd. | | 1,864 | | | 12,367 |
Hang Lung Properties Ltd. | | 73,000 | | | 286,186 |
Li & Fung Ltd. | | 302,000 | | | 1,248,600 |
Li Ning Co. Ltd. | | 320,500 | | | 1,215,277 |
| | | | |
|
|
| | | | | | 7,799,290 |
| | | | |
|
|
India — 2.6% | | | | | |
HDFC Bank Ltd., ADR(a) | | 5,684 | | | 739,375 |
ICICI Bank Ltd., ADR(a) | | 31,266 | | | 1,179,041 |
Infosys Technologies Ltd., ADR | | 29,763 | | | 1,645,001 |
Reliance Industries Ltd., GDR, 144A* | | 19,250 | | | 902,249 |
| | | | |
|
|
| | | | | | 4,465,666 |
| | | | |
|
|
Indonesia — 0.6% | | | | | |
Bank Rakyat Indonesia | | 1,280,500 | | | 1,029,181 |
| | | | |
|
|
Ireland — 2.6% | | | | | |
Covidien PLC | | 12,800 | | | 612,992 |
CRH PLC | | 57,744 | | | 1,570,024 |
Experian PLC | | 94,629 | | | 934,716 |
Ryanair Holdings PLC, ADR* | | 51,272 | | | 1,375,115 |
| | | | |
|
|
| | | | | | 4,492,847 |
| | | | |
|
|
Israel — 1.9% | | | | | |
Teva Pharmaceutical Industries Ltd., ADR | | 59,441 | | | 3,339,395 |
| | | | |
|
|
Italy — 1.6% | | | | | |
Fiat SpA* | | 61,688 | | | 902,739 |
Saipem SpA | | 56,042 | | | 1,934,032 |
| | | | |
|
|
| | | | | | 2,836,771 |
| | | | |
|
|
SEE NOTES TO FINANCIAL STATEMENTS.
A7
| | | | | | |
| | | SP INTERNATIONAL GROWTH PORTFOLIO (continued) | | |
| |
| SCHEDULE OF INVESTMENTS | | December 31, 2009 |
| | | | | |
COMMON STOCKS
(continued) | | Shares
| | Value
(Note 2)
|
| | | | | | |
Japan — 11.2% | | | | | |
Canon, Inc. | | 40,300 | | $ | 1,714,300 |
Daikin Industries Ltd. | | 43,300 | | | 1,710,230 |
Daiwa Securities Group, Inc. | | 115,000 | | | 578,754 |
FamilyMart Co. Ltd. | | 18,300 | | | 540,245 |
Fast Retailing Co. Ltd. | | 5,100 | | | 958,491 |
Honda Motor Co. Ltd. | | 60,400 | | | 2,049,293 |
Hoya Corp. | | 44,500 | | | 1,187,372 |
Jupiter Telecommunications Co. Ltd. | | 1,171 | | | 1,158,734 |
Keyence Corp. | | 7,300 | | | 1,515,069 |
Kurita Water Industries Ltd. | | 48,500 | | | 1,523,751 |
Marubeni Corp. | | 231,000 | | | 1,276,039 |
Mitsubishi Corp. | | 70,700 | | | 1,761,037 |
Mizuho Financial Group, Inc. | | 346,500 | | | 623,112 |
Nintendo Co. Ltd. | | 1,400 | | | 334,372 |
Nippon Electric Glass Co. Ltd. | | 74,000 | | | 1,018,527 |
Sumco Corp. | | 16,600 | | | 293,329 |
Terumo Corp. | | 19,100 | | | 1,151,155 |
| | | | |
|
|
| | | | | | 19,393,810 |
| | | | |
|
|
Mexico — 0.7% | | | | | |
Cemex SAB de CV, ADR* | | 76,425 | | | 903,344 |
Wal-Mart de Mexico SAB de CV (Class V Stock) | | 67,200 | | | 299,477 |
| | | | |
|
|
| | | | | | 1,202,821 |
| | | | |
|
|
Netherlands — 1.6% | | | | | |
Akzo Nobel NV | | 13,534 | | | 897,505 |
ASML Holding NV | | 21,118 | | | 721,006 |
Qiagen NV* | | 53,807 | | | 1,211,760 |
| | | | |
|
|
| | | | | | 2,830,271 |
| | | | |
|
|
Singapore — 2.7% | | | | | |
CapitaLand Ltd. | | 860,500 | | | 2,552,726 |
Noble Group Ltd. | | 637,000 | | | 1,461,120 |
Wilmar International Ltd. | | 133,000 | | | 604,752 |
| | | | |
|
|
| | | | | | 4,618,598 |
| | | | |
|
|
South Africa — 1.0% | | | | | |
Naspers Ltd. (Class N Stock) | | 42,500 | | | 1,719,982 |
| | | | |
|
|
South Korea — 1.1% | | | | | |
Hyundai Motor Co.* | | 18,636 | | | 1,929,043 |
| | | | |
|
|
Spain — 5.0% | | | | | |
Banco Bilbao Vizcaya Argentaria SA | | 31,774 | | | 579,081 |
Banco Santander SA | | 98,337 | | | 1,624,985 |
Industria de Diseno Textil SA | | 37,494 | | | 2,341,592 |
Telefonica SA | | 149,403 | | | 4,181,643 |
| | | | |
|
|
| | | | | | 8,727,301 |
| | | | |
|
|
Switzerland — 9.2% | | | | | |
ABB Ltd.* | | 105,580 | | | 2,034,456 |
Actelion Ltd.* | | 25,045 | | | 1,337,664 |
Credit Suisse Group AG | | 83,121 | | | 4,117,928 |
Julius Baer Group Ltd. | | 31,001 | | | 1,090,257 |
Lonza Group AG | | 9,775 | | | 688,737 |
Nestle SA | | 21,693 | | | 1,052,840 |
Novartis AG | | 26,873 | | | 1,467,514 |
Roche Holding AG | | 10,114 | | | 1,729,624 |
| | | | | |
COMMON STOCKS
(continued) | | Shares
| | Value
(Note 2)
|
| | | | | | |
Switzerland (continued) | | | | | |
Sonova Holding AG | | 5,608 | | $ | 679,410 |
Syngenta AG | | 2,104 | | | 594,186 |
Zurich Financial Services AG | | 5,304 | | | 1,159,580 |
| | | | |
|
|
| | | | | | 15,952,196 |
| | | | |
|
|
Taiwan — 1.9% | | | | | |
Hon Hai Precision Industry Co. Ltd. | | 202,362 | | | 946,377 |
MediaTek, Inc. | | 71,218 | | | 1,237,381 |
Taiwan Semiconductor Manufacturing Co. Ltd. | | 537,824 | | | 1,083,971 |
| | | | |
|
|
| | | | | | 3,267,729 |
| | | | |
|
|
Turkey — 0.6% | | | | | |
Turkiye Garanti Bankasi A/S | | 238,518 | | | 1,011,896 |
| | | | |
|
|
United Kingdom — 15.3% | | | | | |
AMEC PLC | | 65,828 | | | 838,679 |
Amlin PLC | | 100,828 | | | 582,190 |
Autonomy Corp. PLC* | | 87,008 | | | 2,112,934 |
Barclays PLC | | 294,035 | | | 1,295,651 |
BG Group PLC | | 125,175 | | | 2,260,191 |
British Sky Broadcasting Group PLC | | 222,399 | | | 2,008,885 |
Cairn Energy PLC* | | 176,270 | | | 943,623 |
Capita Group PLC (The) | | 87,163 | | | 1,053,930 |
Compass Group PLC | | 77,519 | | | 554,764 |
HSBC Holdings PLC (XHKG) | | 98,336 | | | 1,118,566 |
HSBC Holdings PLC (XLON) | | 179,346 | | | 2,046,037 |
Petrofac Ltd. | | 58,916 | | | 986,248 |
Reckitt Benckiser Group PLC | | 50,385 | | | 2,727,340 |
Rolls-Royce Group PLC* | | 232,865 | | | 1,813,415 |
Rolls-Royce Group PLC
(Class C Stock)* | | 22,107,000 | | | 35,707 |
Rotork PLC | | 31,604 | | | 603,891 |
Standard Chartered PLC | | 72,010 | | | 1,817,954 |
Tesco PLC | | 82,677 | | | 570,370 |
Tullow Oil PLC | | 64,906 | | | 1,361,753 |
Vedanta Resources PLC | | 42,011 | | | 1,757,143 |
| | | | |
|
|
| | | | | | 26,489,271 |
| | | | |
|
|
United States — 1.0% | | | | | |
Transocean Ltd.* | | 21,641 | | | 1,791,875 |
| | | | |
|
|
TOTAL COMMON STOCKS
(cost $127,264,730) | | | 168,606,226 |
| | | | |
|
|
| RIGHTS* | | Units
| | | |
Brazil | | | | | |
JBS SA, expiring 01/29/10 (cost $0) | | 94 | | | — |
| | | | |
|
|
TOTAL LONG-TERM INVESTMENTS
(cost $127,264,730) | | | 168,606,226 |
| | | | |
|
|
SEE NOTES TO FINANCIAL STATEMENTS.
A8
| | | | | | |
| | | SP INTERNATIONAL GROWTH PORTFOLIO (continued) | | |
| |
| SCHEDULE OF INVESTMENTS | | December 31, 2009 |
| | | | | | |
SHORT-TERM
INVESTMENT — 5.9% | | Shares
| | Value
(Note 2)
| |
| | | | | | | |
AFFILIATED MONEY MARKET MUTUAL FUND | | | | |
Dryden Core Investment Fund — Taxable Money Market Series (cost $10,299,741; includes $4,965,587 of cash collateral for securities on loan)(b)(w)(Note 4) | | 10,299,741 | | $ | 10,299,741 | |
| | | | |
|
|
|
TOTAL INVESTMENTS(o) — 103.0%
(cost $137,564,471) | | | 178,905,967 | |
LIABILITIES IN EXCESS OF OTHER ASSETS — (3.0)% | | | (5,244,067 | ) |
| | | | |
|
|
|
NET ASSETS — 100.0% | | $ | 173,661,900 | |
| | | | |
|
|
|
The following abbreviations are used in portfolio descriptions:
| | |
| 144A | | Security was purchased pursuant to Rule 144A under the Securities Act of 1933 and may not be resold subject to that rule except to qualified institutional buyers. Unless otherwise noted, 144A securities are deemed to be liquid. |
| ADR | | American Depositary Receipt |
| GDR | | Global Depositary Receipt |
| PRFC | | Preference Shares |
| REIT | | Real Estate Investment Trust |
| XHKG | | Hong Kong Stock Exchange |
| XLON | | London Stock Exchange |
| * | Non-income producing security. |
| (a) | All or a portion of security is on loan. The aggregate market value of such securities is $4,846,077; cash collateral of $4,965,587 (included with liabilities) was received with which the Portfolio purchased highly liquid short-term investments. |
| (b) | Represents security, or a portion thereof, purchased with cash collateral received for securities on loan. |
| (o) | As of December 31, 2009, 103 securities representing $134,149,281 and 77.2% of net assets were fair valued in accordance with the policies adopted by the Board of Trustees. |
| (w) | Prudential Investments LLC, the manager of the Portfolio, also serves as manager of the Dryden Core Investment Fund-Taxable Money Market Series. |
Various inputs are used in determining the value of the Portfolio’s investments. These inputs are summarized in the three broad levels listed below.
Level 1—quoted prices in active markets for identical securities
Level 2—other significant observable inputs (including quoted prices for similar securities, interest rates, prepayment speeds, credit risk, etc.)
Level 3—significant unobservable inputs (including the Portfolio’s own assumptions in determining the fair value of investments)
The following is a summary of the inputs used as of December 31, 2009 in valuing the Portfolio’s assets carried at fair value:
| | | | | | | | | | |
| Investments in Securities | | Level 1
| | Level 2
| | Level 3
| |
Common Stocks: | | | | | | | | | | |
Australia | | $ | 1,214,865 | | $ | 2,880,060 | | $ | — | |
Belgium | | | — | | | 4,585,479 | | | — | |
Brazil | | | 10,297,441 | | | — | | | — | |
Canada | | | 7,522,883 | | | — | | | — | |
Cayman Islands | | | 555,160 | | | 12,774 | | | — | |
China | | | 952,768 | | | 2,741,366 | | | — | |
Denmark | | | — | | | 3,836,063 | | | — | |
France | | | — | | | 10,420,980 | | | — | |
Germany | | | — | | | 10,688,444 | | | — | |
Hong Kong | | | — | | | 7,799,290 | | | — | |
India | | | 4,465,666 | | | — | | | — | |
Indonesia | | | — | | | 1,029,181 | | | — | |
Ireland | | | 1,988,107 | | | 2,504,740 | | | — | |
Israel | | | 3,339,395 | | | — | | | — | |
Italy | | | — | | | 2,836,771 | | | — | |
Japan | | | — | | | 19,393,810 | | | — | |
Mexico | | | 1,202,821 | | | — | | | — | |
Netherlands | | | — | | | 2,830,271 | | | — | |
Singapore | | | — | | | 4,618,598 | | | — | |
South Africa | | | — | | | 1,719,982 | | | — | |
South Korea | | | — | | | 1,929,043 | | | — | |
Spain | | | — | | | 8,727,301 | | | — | |
Switzerland | | | 1,090,257 | | | 14,861,939 | | | — | |
Taiwan | | | — | | | 3,267,729 | | | — | |
Turkey | | | — | | | 1,011,896 | | | — | |
United Kingdom | | | — | | | 26,489,271 | | | — | |
United States | | | 1,791,875 | | | — | | | — | |
Rights | | | — | | | — | | | — | ** |
Affiliated Money Market Mutual Fund | | | 10,299,741 | | | — | | | — | |
| | |
|
| |
|
| |
|
|
|
| | | | 44,720,979 | | | 134,184,988 | | | — | |
Other Financial Instruments* | | | — | | | — | | | — | |
| | |
|
| |
|
| |
|
|
|
Total | | $ | 44,720,979 | | $ | 134,184,988 | | $ | — | |
| | |
|
| |
|
| |
|
|
|
| * | Other financial instruments are derivative instruments not reflected in the Schedule of Investments, such as futures, forwards and swap contracts, which are valued at the unrealized appreciation/depreciation on the instrument. |
The following is a reconciliation of assets in which significant unobservable inputs (Level 3) were used in determining fair value:
| | | | |
| | | Common
Stocks
| |
Balance as of 12/31/08 | | $ | 761,640 | |
Realized gain (loss) | | | — | |
Change in unrealized appreciation (depreciation) | | | — | |
Net purchases (sales) | | | — | |
Transfers in and/or out of Level 3 | | | (761,640 | ) |
| | |
|
|
|
Balance as of 12/31/09 | | $ | — | |
| | |
|
|
|
| ** | As of December 31, 2009, the Portfolio had one Level 3 security with a fair value of $0. |
SEE NOTES TO FINANCIAL STATEMENTS.
A9
| | | | | | |
| | | SP INTERNATIONAL GROWTH PORTFOLIO (continued) | | |
| |
| SCHEDULE OF INVESTMENTS | | December 31, 2009 |
The industry classification of investments and liabilities in excess of other assets shown as a percentage of net assets as of December 31, 2009 were as follows:
| | | |
Oil, Gas & Consumable Fuels | | 9.8 | % |
Financial Services | | 9.7 | |
Pharmaceuticals | | 6.8 | |
Affiliated Money Market Mutual Fund (2.9% represents investments purchased with collateral from securities on loan) | | 5.9 | |
Computers | | 5.2 | |
Real Estate Operation & Development | | 4.5 | |
Automobile Manufacturers | | 4.1 | |
Electronic Components | | 3.6 | |
Construction | | 3.6 | |
Banks | | 3.0 | |
Machinery | | 2.7 | |
Beverages | | 2.6 | |
Foods | | 2.4 | |
Chemicals | | 2.4 | |
Insurance | | 2.4 | |
Telecommunications | | 2.4 | |
Metals & Mining | | 2.2 | |
Commercial Banks | | 2.2 | |
Consumer Products & Services | | 2.2 | |
Building Materials | | 1.9 | |
Semiconductors | | 1.7 | |
Media | | 1.7 | |
Retail & Merchandising | | 1.6 | |
Transportation | | 1.2 | |
Broadcasting | | 1.2 | |
Healthcare Products | | 1.1 | |
Aerospace & Defense | | 1.0 | |
Office Equipment | | 1.0 | |
Industrial Machinery | | 0.9 | |
Holding Companies—Diversified | | 0.8 | |
Airlines | | 0.8 | |
Biotechnology | | 0.8 | |
Conglomerates | | 0.7 | |
Distribution/Wholesale | | 0.7 | |
Specialty Retail | | 0.7 | |
Apparel | | 0.7 | |
Mineral Resources | | 0.7 | |
Electronics | | 0.7 | |
Utilities | | 0.6 | |
Commercial Services | | 0.6 | |
Clothing & Apparel | | 0.5 | |
Oil & Gas | | 0.5 | |
Internet Software & Services | | 0.5 | |
Medical Products | | 0.4 | |
Steel Producers/Products | | 0.4 | |
Agriculture | | 0.4 | |
Instruments—Controls | | 0.4 | |
Business Services | | 0.3 | |
Hotels, Restaurants & Leisure | | 0.2 | |
Entertainment & Leisure | | 0.2 | |
Diversified Operations | | 0.2 | |
Advertising | | 0.2 | |
| | |
|
|
| | | 103.0 | |
Liabilities in excess of other assets | | (3.0 | ) |
| | |
|
|
| | | 100.0 | % |
| | |
|
|
SEE NOTES TO FINANCIAL STATEMENTS.
A10
| | | | | | |
| | | SP INTERNATIONAL GROWTH PORTFOLIO (continued) | | |
| |
| SCHEDULE OF INVESTMENTS | | December 31, 2009 |
The Portfolio invested in various derivative instruments during the reporting period. The primary types of risk associated with derivative instruments are commodity risk, credit risk, equity risk, foreign exchange risk and interest rate risk.
The effect of such derivative instruments on the Portfolio’s financial position and financial performance as reflected in the Statement of Assets and Liabilities and Statement of Operations is presented in the summary below.
Fair values of derivative instruments as of December 31, 2009 as presented in the Statement of Assets and Liabilities:
| | | | | | | | | | | |
Derivatives not designated as hedging
instruments, carried at fair value
| | Asset Derivatives
| | | Liability Derivatives
|
| | Balance Sheet Location
| | Fair Value
| | | Balance Sheet Location
| | Fair Value
|
Equity contracts | | Unaffiliated investments | | $ | — | * | | — | | $ | — |
| * | Includes one security with a fair value of $0. |
The effects of derivative instruments on the Statement of Operations for the year ended December 31, 2009 are as follows:
| | | | | | |
Amount of Realized Gain or (Loss) on Derivatives Recognized in Income
|
Derivatives not accounted for as hedging
instruments, carried at fair value
| | Rights
| | Forward
Currency
Contracts
|
Foreign exchange contracts | | $ | — | | $ | 3,814 |
Equity contracts | | | 85,218 | | | — |
| | |
|
| |
|
|
Total | | $ | 85,218 | | $ | 3,814 |
| | |
|
| |
|
|
| | | | | | |
Change in Unrealized Appreciation or (Depreciation) on Derivatives Recognized in Income
|
Derivatives not accounted for as hedging
instruments, carried at fair value
| | Rights
| | Forward
Currency
Contracts
|
Foreign exchange contracts | | $ | — | | $ | 37,327 |
Equity contracts | | | — | | | — |
| | |
|
| |
|
|
Total | | | — | | $ | 37,327 |
| | |
|
| |
|
|
For the year ended December 31, 2009, the Portfolio’s average value at settlement date payable for forward foreign currency exchange purchase contracts was $2,304,979 and the average value at settlement date receivable for forward foreign currency exchange sale contracts was $2,300,931.
SEE NOTES TO FINANCIAL STATEMENTS.
A11
| | | | | | |
| | | SP INTERNATIONAL GROWTH PORTFOLIO (continued) | | |
STATEMENT OF ASSETS AND LIABILITIES
December 31, 2009
| | | | |
| ASSETS | | | | |
Investments at value, including securities on loan of $4,846,077: | | | | |
Unaffiliated investments (cost $127,264,730) | | $ | 168,606,226 | |
Affiliated investments (cost $10,299,741) | | | 10,299,741 | |
Foreign currency, at value (cost $821,889) | | | 831,656 | |
Tax reclaim receivable | | | 1,073,002 | |
Receivable for investments sold | | | 209,754 | |
Dividends receivable | | | 105,644 | |
Prepaid expenses | | | 4,782 | |
Receivable for Series shares sold | | | 172 | |
| | |
|
|
|
Total Assets | | | 181,130,977 | |
| | |
|
|
|
| LIABILITIES | | | | |
Collateral for securities on loan | | | 4,965,587 | |
Payable for investments purchased | | | 1,996,286 | |
Payable for Series shares repurchased | | | 158,658 | |
Management fee payable | | | 124,421 | |
Accrued expenses and other liabilities | | | 110,637 | |
Payable to custodian | | | 109,192 | |
Distribution fee payable | | | 2,313 | |
Administration fee payable | | | 1,388 | |
Affiliated transfer agent fees payable | | | 595 | |
| | |
|
|
|
Total Liabilities | | | 7,469,077 | |
| | |
|
|
|
| NET ASSETS | | $ | 173,661,900 | |
| | |
|
|
|
Net assets were comprised of: | | | | |
Paid-in capital | | $ | 229,879,471 | |
Retained earnings | | | (56,217,571 | ) |
| | |
|
|
|
Net assets, December 31, 2009 | | $ | 173,661,900 | |
| | |
|
|
|
| Class I: | | | | |
Net asset value and redemption price per share, $162,517,012 / 35,136,004 outstanding shares of beneficial interest | | $ | 4.63 | |
| | |
|
|
|
| Class II: | | | | |
Net asset value and redemption price per share, $11,144,888 / 2,454,410 outstanding shares of beneficial interest | | $ | 4.54 | |
| | |
|
|
|
STATEMENT OF OPERATIONS
Year Ended December 31, 2009
| | | | |
| INVESTMENT INCOME | | | | |
Unaffiliated dividend income (net of $457,773 foreign withholding tax) | | $ | 4,624,392 | |
Affiliated dividend income | | | 51,499 | |
Affiliated income from securities lending, net | | | 33,862 | |
| | |
|
|
|
| | | | 4,709,753 | |
| | |
|
|
|
| EXPENSES | | | | |
Management fee | | | 1,844,308 | |
Distribution fee—Class II | | | 24,590 | |
Administration fee—Class II | | | 14,754 | |
Custodian’s fees and expenses | | | 176,000 | |
Shareholders’ reports | | | 46,000 | |
Audit fee | | | 31,000 | |
Trustees’ fees | | | 10,000 | |
Transfer agent’s fees and expenses (including affiliated expense of $3,600) (Note 4) | | | 10,000 | |
Legal fees and expenses | | | 6,000 | |
Insurance expenses | | | 5,000 | |
Commitment fee on syndicated credit agreement | | | 4,000 | |
Loan interest expense (Note 8) | | | 959 | |
Miscellaneous | | | 24,603 | |
| | |
|
|
|
Total expenses | | | 2,197,214 | |
| | |
|
|
|
| NET INVESTMENT INCOME | | | 2,512,539 | |
| | |
|
|
|
| NET REALIZED AND UNREALIZED GAIN (LOSS) ON INVESTMENTS AND FOREIGN CURRENCIES | | | | |
Net realized loss on: | | | | |
Investment transactions | | | (17,202,910 | ) |
Foreign currency transactions | | | (893,648 | ) |
| | |
|
|
|
| | | | (18,096,558 | ) |
| | |
|
|
|
Net change in unrealized appreciation (depreciation) on: | | | | |
Investments | | | 86,134,131 | |
Foreign currencies | | | 184,558 | |
| | |
|
|
|
| | | | 86,318,689 | |
| | |
|
|
|
| NET GAIN ON INVESTMENTS AND FOREIGN CURRENCIES | | | 68,222,131 | |
| | |
|
|
|
| NET INCREASE IN NET ASSETS RESULTING FROM OPERATIONS | | $ | 70,734,670 | |
| | |
|
|
|
STATEMENT OF CHANGES IN NET ASSETS
| | | | | | | | |
| | | Year Ended December 31,
| |
| | | 2009
| | | 2008
| |
| INCREASE (DECREASE) IN NET ASSETS | | | | | | | | |
| OPERATIONS: | | | | | | | | |
Net investment income | | $ | 2,512,539 | | | $ | 4,894,643 | |
Net realized loss on investment and foreign currency transactions | | | (18,096,558 | ) | | | (74,000,995 | ) |
Net change in unrealized appreciation (depreciation) on investments and foreign currencies | | | 86,318,689 | | | | (161,195,020 | ) |
| | |
|
|
| |
|
|
|
NET INCREASE (DECREASE) IN NET ASSETS RESULTING FROM OPERATIONS | | | 70,734,670 | | | | (230,301,372 | ) |
| | |
|
|
| |
|
|
|
| DISTRIBUTIONS | | | | | | | | |
Class I | | | (4,665,219 | ) | | | (70,133,161 | ) |
Class II | | | (129,607 | ) | | | (5,535,160 | ) |
| | |
|
|
| |
|
|
|
TOTAL DISTRIBUTIONS | | | (4,794,826 | ) | | | (75,668,321 | ) |
| | |
|
|
| |
|
|
|
| SERIES SHARE TRANSACTIONS (NOTE 7): | | | | | | | | |
Series shares sold | | | 27,320,659 | | | | 53,349,858 | |
Series shares issued in reinvestment of distributions | | | 4,794,826 | | | | 75,668,321 | |
Series shares repurchased | | | (141,293,319 | ) | | | (137,692,011 | ) |
| | |
|
|
| |
|
|
|
INCREASE (DECREASE) IN NET ASSETS RESULTING FROM SERIES SHARE TRANSACTIONS | | | (109,177,834 | ) | | | (8,673,832 | ) |
| | |
|
|
| |
|
|
|
| TOTAL INCREASE (DECREASE) IN NET ASSETS | | | (43,237,990 | ) | | | (314,643,525 | ) |
| NET ASSETS: | | | | | | | | |
Beginning of year | | | 216,899,890 | | | | 531,543,415 | |
| | |
|
|
| |
|
|
|
End of year | | $ | 173,661,900 | | | $ | 216,899,890 | |
| | |
|
|
| |
|
|
|
SEE NOTES TO FINANCIAL STATEMENTS.
A12
| | | | | | |
| | | SP INTERNATIONAL VALUE PORTFOLIO | | |
| |
| SCHEDULE OF INVESTMENTS | | December 31, 2009 |
| | | | | |
| LONG-TERM INVESTMENTS — 98.6% |
| COMMON STOCKS — 98.6% | | Shares
| | Value
(Note 2)
|
| | | | | | |
Australia — 4.3% | | | | | |
AWB Ltd.* | | 328,700 | | $ | 331,599 |
BHP Billiton Ltd. | | 51,542 | | | 1,972,338 |
Challenger Financial Services Group Ltd. | | 190,900 | | | 718,536 |
Downer EDI Ltd. | | 109,200 | | | 909,425 |
Emeco Holdings Ltd. | | 611,315 | | | 432,582 |
Goodman Fielder Ltd. | | 339,700 | | | 494,671 |
Macquarie Group Ltd. | | 13,200 | | | 565,569 |
Metcash Ltd. | | 131,700 | | | 528,084 |
Onesteel Ltd. | | 214,500 | | | 644,267 |
Pacific Brands Ltd.* | | 502,100 | | | 506,481 |
Tabcorp Holdings Ltd. | | 142,800 | | | 885,978 |
Telstra Corp. Ltd. | | 236,900 | | | 728,318 |
| | | | |
|
|
| | | | | | 8,717,848 |
| | | | |
|
|
Austria — 0.2% | | | | | |
Voestalpine AG | | 12,200 | | | 445,709 |
| | | | |
|
|
Belgium — 1.1% | | | | | |
AGFA-Gevaert NV* | | 84,400 | | | 544,053 |
Delhaize Group SA | | 13,100 | | | 1,002,140 |
Dexia NV/SA* | | 24,800 | | | 156,110 |
Solvay SA | | 5,100 | | | 549,246 |
| | | | |
|
|
| | | | | | 2,251,549 |
| | | | |
|
|
Brazil — 2.2% | | | | | |
BM&F BOVESPA SA | | 155,650 | | | 1,095,182 |
Embraer-Empresa Brasileira de Aeronautica SA, ADR | | 30,840 | | | 681,873 |
Natura Cosmeticos SA | | 53,800 | | | 1,122,044 |
Petroleo Brasileiro SA, ADR | | 32,390 | | | 1,544,355 |
| | | | |
|
|
| | | | | | 4,443,454 |
| | | | |
|
|
Canada — 2.8% | | | | | |
Canadian National Railway Co. | | 32,760 | | | 1,796,107 |
Canadian Natural Resources Ltd. | | 21,689 | | | 1,576,100 |
Potash Corp. of Saskatchewan, Inc. | | 11,360 | | | 1,232,560 |
Rogers Communications, Inc. (Class B Stock) | | 37,740 | | | 1,179,634 |
| | | | |
|
|
| | | | | | 5,784,401 |
| | | | |
|
|
Cayman Islands — 0.4% | | | | | |
Baidu, Inc., ADR* | | 1,880 | | | 773,112 |
| | | | |
|
|
China — 2.6% | | | | | |
China Merchants Bank Co. Ltd. (Class H Stock) | | 687,326 | | | 1,788,354 |
Industrial & Commercial Bank of China Ltd. (Class H Stock) | | 2,929,520 | | | 2,412,646 |
Sinopharm Group Co. (Class H Stock)* | | 293,200 | | | 1,041,822 |
| | | | |
|
|
| | | | | | 5,242,822 |
| | | | |
|
|
Denmark — 2.1% | | | | | |
Danske Bank A/S* | | 13,800 | | | 309,802 |
H. Lundbeck A/S | | 25,300 | | | 457,100 |
Novo Nordisk A/S (Class B Stock) | | 31,070 | | | 1,983,562 |
Vestas Wind Systems A/S* | | 23,564 | | | 1,434,642 |
| | | | |
|
|
| | | | | | 4,185,106 |
| | | | |
|
|
| | | | | |
COMMON STOCKS
(continued) | | Shares
| | Value
(Note 2)
|
| | | | | | |
Finland — 0.7% | | | | | |
Nokia Oyj | | 49,100 | | $ | 634,862 |
Rautaruukki Oyj | | 10,900 | | | 252,133 |
Tieto Oyj | | 21,500 | | | 446,721 |
| | | | |
|
|
| | | | | | 1,333,716 |
| | | | |
|
|
France — 10.6% | | | | | |
Air Liquide SA | | 13,298 | | | 1,581,501 |
AXA SA | | 99,990 | | | 2,347,662 |
BNP Paribas | | 38,870 | | | 3,083,089 |
Cap Gemini SA | | 9,500 | | | 433,391 |
Casino Guichard Perrachon SA | | 6,400 | | | 570,208 |
Ciments Francais SA | | 4,200 | | | 444,981 |
Credit Agricole SA | | 33,400 | | | 586,165 |
France Telecom SA | | 20,300 | | | 507,261 |
Lafarge SA | | 19,499 | | | 1,605,822 |
Lagardere SCA | | 12,800 | | | 518,215 |
LVMH Moet Hennessy Louis Vuitton SA | | 20,155 | | | 2,259,933 |
Rallye SA | | 12,800 | | | 447,139 |
Safran SA | | 59,300 | | | 1,158,679 |
Sanofi-Aventis SA | | 28,100 | | | 2,209,862 |
SCOR SE | | 19,100 | | | 479,831 |
SEB SA | | 7,200 | | | 408,445 |
Societe Generale | | 6,000 | | | 416,879 |
Thales SA | | 9,300 | | | 477,976 |
Total SA | | 10,200 | | | 655,145 |
Vivendi | | 46,900 | | | 1,391,978 |
| | | | |
|
|
| | | | | | 21,584,162 |
| | | | |
|
|
Germany — 8.1% | | | | | |
Allianz SE | | 8,000 | | | 991,679 |
BASF SE | | 12,500 | | | 773,633 |
Deutsche Bank AG | | 37,030 | | | 2,618,390 |
Deutsche Lufthansa AG | | 25,300 | | | 427,208 |
E.ON AG | | 60,573 | | | 2,542,493 |
Fresenius Medical Care AG & Co. KGaA | | 27,930 | | | 1,481,601 |
Hannover Rueckversicherung AG* | | 9,300 | | | 434,499 |
MTU Aero Engines Holding AG | | 9,700 | | | 527,918 |
Muenchener Rueckversicherungs-Gesellschaft AG | | 5,500 | | | 856,678 |
Rheinmetall AG | | 14,800 | | | 939,634 |
RWE AG | | 9,900 | | | 960,718 |
SAP AG | | 43,792 | | | 2,087,700 |
Suedzucker AG | | 21,700 | | | 452,130 |
ThyssenKrupp AG | | 13,800 | | | 518,773 |
Tognum AG | | 28,600 | | | 473,435 |
Vossloh AG | | 3,200 | | | 317,952 |
| | | | |
|
|
| | | | | | 16,404,441 |
| | | | |
|
|
Greece — 0.8% | | | | | |
National Bank of Greece SA* | | 62,580 | | | 1,607,796 |
| | | | |
|
|
Guernsey — 0.5% | | | | | |
Amdocs Ltd.* | | 36,160 | | | 1,031,645 |
| | | | |
|
|
Hong Kong — 3.0% | | | | | |
Chaoda Modern Agriculture Holdings Ltd. | | 567,462 | | | 604,059 |
CNOOC Ltd. | | 1,174,195 | | | 1,829,328 |
SEE NOTES TO FINANCIAL STATEMENTS.
A13
| | | | | | |
| | | SP INTERNATIONAL VALUE PORTFOLIO (continued) | | |
| |
| SCHEDULE OF INVESTMENTS | | December 31, 2009 |
| | | | | |
COMMON STOCKS
(continued) | | Shares
| | Value
(Note 2)
|
| | | | | | |
Hong Kong (continued) | | | | | |
First Pacific Co. | | 986,400 | | $ | 599,507 |
Hong Kong Exchanges and Clearing Ltd. | | 109,077 | | | 1,940,741 |
Kingboard Chemical Holdings Ltd. | | 120,000 | | | 472,788 |
Noble Group Ltd. | | 282,000 | | | 646,838 |
Solomon Systech International Ltd. | | 525,000 | | | 53,430 |
| | | | |
|
|
| | | | | | 6,146,691 |
| | | | |
|
|
Ireland — 0.6% | | | | | |
Covidien PLC | | 21,550 | | | 1,032,030 |
Irish Life & Permanent PLC* | | 45,500 | | | 213,709 |
| | | | |
|
|
| | | | | | 1,245,739 |
| | | | |
|
|
Israel — 1.3% | | | | | |
Teva Pharmaceutical Industries Ltd., ADR | | 48,009 | | | 2,697,146 |
| | | | |
|
|
Italy — 2.3% | | | | | |
Banco Popolare Scarl* | | 23,700 | | | 177,541 |
Enel SpA | | 177,100 | | | 1,025,300 |
ENI SpA | | 31,400 | | | 799,625 |
Finmeccanica SpA | | 48,400 | | | 774,926 |
Fondiaria-SAI SpA | | 17,000 | | | 270,255 |
Intesa Sanpaolo SpA* | | 253,882 | | | 1,142,474 |
Telecom Italia SpA | | 314,100 | | | 489,979 |
| | | | |
|
|
| | | | | | 4,680,100 |
| | | | |
|
|
Japan — 16.0% | | | | | |
Aoyama Trading Co. Ltd. | | 30,100 | | | 384,207 |
Astellas Pharma, Inc. | | 31,200 | | | 1,164,036 |
Circle K Sunkus Co. Ltd. | | 31,000 | | | 382,408 |
Comsys Holdings Corp. | | 50,500 | | | 531,243 |
Cosmo Oil Co. Ltd. | | 239,000 | | | 502,193 |
Fanuc Ltd. | | 14,412 | | | 1,343,227 |
Fukuoka Financial Group, Inc. | | 180,000 | | | 627,300 |
Fuyo General Lease Co. Ltd. | | 8,400 | | | 177,759 |
Hitachi Capital Corp. | | 31,300 | | | 380,555 |
Itochu Techno-Solutions Corp. | | 17,400 | | | 467,251 |
Kddi Corp. | | 150 | | | 794,507 |
Keihin Corp. | | 39,600 | | | 591,977 |
Keiyo Bank Ltd. (The) | | 121,000 | | | 538,328 |
Komatsu Ltd. | | 115,713 | | | 2,422,356 |
Konami Corp. | | 30,000 | | | 535,632 |
Kurabo Industries Ltd. | | 108,000 | | | 164,576 |
Kyoei Steel Ltd. | | 14,600 | | | 269,073 |
Kyorin Co. Ltd. | | 25,000 | | | 366,266 |
Kyowa Exeo Corp. | | 44,700 | | | 380,341 |
Marubeni Corp. | | 234,300 | | | 1,294,268 |
Miraca Holdings, Inc. | | 15,200 | | | 418,321 |
Mitsubishi Corp. | | 19,500 | | | 485,717 |
Mitsubishi Tanabe Pharma Corp. | | 41,000 | | | 511,592 |
Mitsubishi UFJ Financial Group, Inc. | | 316,390 | | | 1,558,469 |
Mitsui & Co. Ltd. | | 39,200 | | | 556,096 |
Mizuho Financial Group, Inc. | | 199,200 | | | 358,222 |
Namco Bandai Holdings Inc | | 56,700 | | | 541,655 |
Nichirei Corp. | | 134,000 | | | 465,206 |
Nifco, Inc. | | 23,000 | | | 459,452 |
Nintendo Co. Ltd. | | 2,410 | | | 575,597 |
Nippon Light Metal Co. Ltd.* | | 112,000 | | | 96,546 |
| | | | | |
COMMON STOCKS
(continued) | | Shares
| | Value
(Note 2)
|
| | | | | | |
Japan (continued) | | | | | |
Nippon Oil Corp. | | 111,000 | | $ | 514,608 |
Nippon Shokubai Co. Ltd. | | 61,000 | | | 524,377 |
Nippon Telegraph & Telephone Corp. | | 12,600 | | | 497,739 |
Nissan Shatai Co. Ltd. | | 56,000 | | | 500,412 |
NTT DoCoMo, Inc. | | 400 | | | 558,195 |
Onward Holdings Co. Ltd. | | 63,000 | | | 389,792 |
Ricoh Co. Ltd. | | 34,000 | | | 487,178 |
Sankyo Co. Ltd. | | 10,300 | | | 515,755 |
Sankyu, Inc. | | 110,000 | | | 565,819 |
Sanwa Holdings Corp. | | 136,000 | | | 348,490 |
Seino Holding Co. Ltd. | | 60,000 | | | 380,849 |
Shimachu Co. Ltd. | | 22,500 | | | 443,439 |
Shizuoka Gas Co. Ltd. | | 77,000 | | | 495,124 |
Sumitomo Corp. | | 53,900 | | | 548,850 |
Sumitomo Mitsui Financial Group, Inc. | | 30,100 | | | 863,731 |
Sumitomo Trust & Banking Co. Ltd. (The) | | 43,000 | | | 211,132 |
Takeda Pharmaceutical Co. Ltd. | | 30,500 | | | 1,256,639 |
Takefuji Corp. | | 62,000 | | | 260,218 |
Tokyo Steel Manufacturing Co. Ltd. | | 26,200 | | | 294,951 |
Toppan Forms Co. Ltd. | | 50,100 | | | 522,481 |
Toyota Motor Corp. | | 51,100 | | | 2,154,425 |
Tsuruha Holdings, Inc. | | 13,300 | | | 475,668 |
Yokohama Rubber Co. Ltd. (The) | | 82,700 | | | 365,602 |
| | | | |
|
|
| | | | | | 32,519,850 |
| | | | |
|
|
Liechtenstein — 0.1% | | | | | |
Verwaltungs-und Privat-Bank AG | | 2,900 | | | 284,925 |
| | | | |
|
|
Mexico — 1.5% | | | | | |
America Movil SAB de CV (Class L Stock), ADR | | 29,393 | | | 1,380,883 |
Wal-Mart de Mexico SAB de CV (Class V Stock) | | 378,430 | | | 1,686,475 |
| | | | |
|
|
| | | | | | 3,067,358 |
| | | | |
|
|
Netherlands — 3.8% | | | | | |
CSM NV | | 19,501 | | | 512,225 |
ING Groep NV, ADR* | | 126,600 | | | 1,219,206 |
Koninklijke (Royal) Philips Electronics NV | | 19,900 | | | 588,230 |
Koninklijke DSM NV | | 11,200 | | | 550,294 |
Nutreco Holding NV | | 7,000 | | | 393,472 |
Royal Dutch Shell PLC (Class B Stock) | | 105,500 | | | 3,072,494 |
Schlumberger Ltd. | | 21,250 | | | 1,383,163 |
| | | | |
|
|
| | | | | | 7,719,084 |
| | | | |
|
|
New Zealand — 0.2% | | | | | |
Air New Zealand Ltd. | | 580,000 | | | 509,022 |
| | | | |
|
|
Norway — 0.5% | | | | | |
DnB NOR ASA* | | 44,800 | | | 483,648 |
Statoil ASA | | 21,037 | | | 524,655 |
| | | | |
|
|
| | | | | | 1,008,303 |
| | | | |
|
|
Portugal — 0.3% | | | | | |
Portugal Telecom SGPS SA | | 43,200 | | | 527,130 |
| | | | |
|
|
SEE NOTES TO FINANCIAL STATEMENTS.
A14
| | | | | | |
| | | SP INTERNATIONAL VALUE PORTFOLIO (continued) | | |
| |
| SCHEDULE OF INVESTMENTS | | December 31, 2009 |
| | | | | |
COMMON STOCKS
(continued) | | Shares
| | Value
(Note 2)
|
| | | | | | |
Singapore — 0.9% | | | | | |
MobileOne Ltd. | | 293,000 | | $ | 393,893 |
Oversea-Chinese Banking Corp. Ltd. | | 144,000 | | | 927,237 |
Venture Corp. Ltd. | | 92,000 | | | 577,143 |
| | | | |
|
|
| | | | | | 1,898,273 |
| | | | |
|
|
South Korea — 0.5% | | | | | |
Hyundai Motor Co.* | | 10,261 | | | 1,062,133 |
| | | | |
|
|
Spain — 3.8% | | | | | |
Banco Bilbao Vizcaya Argentaria SA | | 69,800 | | | 1,272,106 |
Banco Espanol de Credito SA | | 39,000 | | | 477,754 |
Banco Santander SA | | 154,600 | | | 2,554,711 |
Repsol YPF SA | | 38,000 | | | 1,019,714 |
Telefonica SA | | 85,110 | | | 2,382,145 |
| | | | |
|
|
| | | | | | 7,706,430 |
| | | | |
|
|
Sweden — 1.5% | | | | | |
Boliden AB | | 64,600 | | | 827,801 |
Hennes & Mauritz AB (Class B Stock) | | 31,437 | | | 1,742,765 |
Svenska Cellulosa AB SCA (Class B Stock) | | 37,200 | | | 495,977 |
| | | | |
|
|
| | | | | | 3,066,543 |
| | | | |
|
|
Switzerland — 6.9% | | | | | |
Baloise Holding AG | | 8,500 | | | 705,733 |
Clariant AG* | | 61,900 | | | 731,975 |
Credit Suisse Group AG | | 8,200 | | | 406,239 |
Georg Fischer AG* | | 1,400 | | | 349,354 |
Julius Baer Group Ltd. | | 20,932 | | | 736,146 |
Logitech International SA* | | 45,570 | | | 790,405 |
Nestle SA | | 44,700 | | | 2,169,453 |
Novartis AG | | 62,352 | | | 3,404,996 |
Roche Holding AG | | 8,565 | | | 1,464,725 |
Swiss Reinsurance Co. Ltd. | | 17,800 | | | 852,703 |
Swisscom AG | | 3,200 | | | 1,222,120 |
Zurich Financial Services AG | | 5,500 | | | 1,202,430 |
| | | | |
|
|
| | | | | | 14,036,279 |
| | | | |
|
|
Taiwan — 0.3% | | | | | |
Taiwan Semiconductor Manufacturing Co. Ltd., ADR | | 45,524 | | | 520,794 |
| | | | |
|
|
Turkey — 0.5% | | | | | |
Turkcell Iletisim Hizmet A/S | | 147,490 | | | 1,041,810 |
| | | | |
|
|
United Kingdom — 17.5% | | | | | |
ARM Holdings PLC | | 296,500 | | | 846,637 |
AstraZeneca PLC | | 33,300 | | | 1,565,005 |
Aviva PLC | | 72,600 | | | 461,818 |
Barclays PLC | | 125,400 | | | 552,569 |
Beazley PLC | | 207,230 | | | 333,562 |
BP PLC | | 353,135 | | | 3,409,928 |
Brit Insurance Holdings NV | | 129,500 | | | 408,982 |
British American Tobacco PLC | | 59,012 | | | 1,915,723 |
British Sky Broadcasting Group PLC | | 152,745 | | | 1,379,714 |
BT Group PLC | | 150,000 | | | 326,674 |
Cairn Energy PLC* | | 91,800 | | | 491,431 |
Carnival PLC* | | 49,113 | | | 1,673,188 |
Centrica PLC | | 109,200 | | | 494,626 |
Dairy Crest Group PLC | | 40,400 | | | 235,561 |
Davis Service Group PLC | | 74,900 | | | 480,475 |
| | | | | |
COMMON STOCKS
(continued) | | Shares
| | Value
(Note 2)
|
| | | | | | |
United Kingdom (continued) | | | | | |
Drax Group PLC | | 66,400 | | $ | 442,677 |
DS Smith PLC | | 260,700 | | | 533,216 |
GlaxoSmithKline PLC | | 88,700 | | | 1,880,959 |
Home Retail Group PLC | | 149,600 | | | 678,505 |
IMI PLC | | 68,400 | | | 570,544 |
Kingfisher PLC | | 394,130 | | | 1,450,872 |
Legal & General Group PLC | | 394,400 | | | 507,384 |
Lloyds Banking Group PLC* | | 309,285 | | | 248,844 |
Marston’s PLC | | 104,410 | | | 147,787 |
Meggitt PLC | | 122,700 | | | 513,661 |
Northern Foods PLC | | 162,900 | | | 174,730 |
Old Mutual PLC* | | 678,700 | | | 1,188,535 |
Pearson PLC | | 72,851 | | | 1,044,534 |
Reckitt Benckiser Group PLC | | 37,286 | | | 2,018,291 |
RSA Insurance Group PLC | | 195,300 | | | 379,424 |
SABMiller PLC | | 50,040 | | | 1,470,877 |
Smith & Nephew PLC | | 86,450 | | | 889,257 |
Spectris PLC | | 45,900 | | | 545,951 |
Standard Chartered PLC | | 72,997 | | | 1,842,871 |
Tate & Lyle PLC | | 67,800 | | | 471,577 |
Tesco PLC | | 205,627 | | | 1,418,574 |
Thomas Cook Group PLC | | 150,100 | | | 554,495 |
TT Electronics PLC* | | 127,500 | | | 150,138 |
Tullett Prebon PLC | | 119,900 | | | 536,817 |
Vodafone Group PLC | | 549,400 | | | 1,272,250 |
| | | | |
|
|
| | | | | | 35,508,663 |
| | | | |
|
|
United States — 0.7% | | | | | |
Southern Copper Corp. | | 26,350 | | | 867,178 |
Synthes, Inc. | | 3,668 | | | 479,753 |
| | | | |
|
|
| | | | | | 1,346,931 |
| | | | |
|
|
TOTAL COMMON STOCKS
(cost $186,984,726) | | | | | 200,398,965 |
| | | | |
|
|
| | |
| | | Units
| | |
| RIGHTS* | | | | | |
Belgium | | | | | |
Fortis, expiring 03/09/14 (cost $0) | | 22,900 | | | — |
| | | | |
|
|
TOTAL LONG-TERM INVESTMENTS
(cost $186,984,726) | | | 200,398,965 |
| | | | |
|
|
| | |
| | | Shares
| | |
| SHORT-TERM INVESTMENT — 0.4% | | | |
AFFILIATED MONEY MARKET MUTUAL FUND | | | |
Dryden Core Investment Fund — Taxable Money Market Series (cost $889,444)(w)(Note 4) | | 889,444 | | | 889,444 |
| | | | |
|
|
TOTAL INVESTMENTS(o) — 99.0%
(cost $187,874,170) | | $ | 201,288,409 |
OTHER ASSETS IN EXCESS OF LIABILITIES(x) — 1.0% | | | 1,974,262 |
| | | | |
|
|
NET ASSETS — 100.0% | | $ | 203,262,671 |
| | | | |
|
|
SEE NOTES TO FINANCIAL STATEMENTS.
A15
| | | | | | |
| | | SP INTERNATIONAL VALUE PORTFOLIO (continued) | | |
| |
| SCHEDULE OF INVESTMENTS | | December 31, 2009 |
The following abbreviations are used in the Portfolio descriptions:
| | |
| ADR | | American Depositary Receipt |
| AUD | | Australian Dollar |
| BRL | | Brazilian Real |
| HKD | | Hong Kong Dollar |
| MXN | | Mexican Peso |
| * | Non-income producing security. |
| (o) | As of December 31, 2009, 207 securities representing $176,540,963 and 86.9% of net assets were fair valued in accordance with the policies adopted by the Board of Trustees. |
| (w) | Prudential Investments LLC, the manager of the Portfolio, also serves as manager of the Dryden Core Investment Fund-Taxable Money Market Series. |
| (x) | Other assets in excess of liabilities includes net unrealized appreciation (depreciation) on forward foreign currency exchange contracts as follows: |
Forward foreign currency exchange contracts outstanding at December 31, 2009:
| | | | | | | | | | | | | | | |
Purchase Contracts
| | Counterparty
| | Notional
Amount (000)
| | Value at
Settlement Date
Payable
| | Current
Value
| | Unrealized
Appreciation
| |
Australian Dollar, | | | | | | | | | | | | | | | |
Expiring 01/04/10 | | UBS Securities LLC | | AUD | 53 | | $ | 47,294 | | $ | 47,367 | | $ | 73 | |
Brazilian Real, | | | | | | | | | | | | | | | |
Expiring 01/22/10 | | State Street Bank | | BRL | 1,335 | | | 759,170 | | | 763,057 | | | 3,887 | |
Expiring 01/22/10 | | State Street Bank | | BRL | 1,072 | | | 611,761 | | | 612,446 | | | 685 | |
Expiring 01/22/10 | | State Street Bank | | BRL | 375 | | | 214,286 | | | 214,342 | | | 56 | |
Hong Kong Dollar, | | | | | | | | | | | | | | | |
Expiring 01/04/10 | | UBS Securities LLC | | HKD | 531 | | | 68,429 | | | 68,434 | | | 5 | |
| | | | | | | |
|
| |
|
| |
|
|
|
| | | | | | | | $ | 1,700,940 | | $ | 1,705,646 | | $ | 4,706 | |
| | | | | | | |
|
| |
|
| |
|
|
|
| | | | | |
Sale Contracts
| | Counterparty
| | Notional
Amount (000)
| | Value at
Settlement Date
Receivable
| | Current
Value
| | Unrealized
Appreciation
(Depreciation)
| |
Brazilian Real, | | | | | | | | | | | | | | | |
Expiring 01/22/10 | | State Street Bank | | BRL | 6,395 | | $ | 3,588,041 | | $ | 3,654,955 | | $ | (66,914 | ) |
Mexican Peso, | | | | | | | | | | | | | | | |
Expiring 05/28/10 | | State Street Bank | | MXN | 36,880 | | | 2,799,879 | | | 2,768,370 | | | 31,509 | |
| | | | | | | |
|
| |
|
| |
|
|
|
| | | | | | | | $ | 6,387,920 | | $ | 6,423,325 | | $ | (35,405 | ) |
| | | | | | | |
|
| |
|
| |
|
|
|
Various inputs are used in determining the value of the Portfolio’s investments. These inputs are summarized in the three broad levels listed below.
Level 1—quoted prices in active markets for identical securities
Level 2—other significant observable inputs (including quoted prices for similar securities, interest rates, prepayment speeds, credit risk, etc.)
Level 3—significant unobservable inputs (including the Portfolio’s own assumptions in determining the fair value of investments)
The following is a summary of the inputs used as of December 31, 2009 in valuing the Portfolio’s assets carried at fair value:
| | | | | | | | | |
Investments in Securities
| | Level 1
| | Level 2
| | Level 3
|
Common Stocks: | | | | | | | | | |
Australia | | $ | — | | $ | 8,717,848 | | $ | — |
Austria | | | — | | | 445,709 | | | — |
Belgium | | | — | | | 2,251,549 | | | — |
Brazil | | | 4,443,454 | | | — | | | — |
Canada | | | 5,784,401 | | | — | | | — |
Cayman Islands | | | 773,112 | | | — | | | — |
China | | | 1,041,822 | | | 4,201,000 | | | — |
Denmark | | | — | | | 4,185,106 | | | — |
Finland | | | — | | | 1,333,716 | | | — |
France | | | — | | | 21,584,162 | | | — |
Germany | | | — | | | 16,404,441 | | | — |
Greece | | | — | | | 1,607,796 | | | — |
Guernsey | | | 1,031,645 | | | — | | | — |
Hong Kong | | | — | | | 6,146,691 | | | — |
Ireland | | | 1,032,030 | | | 213,709 | | | — |
SEE NOTES TO FINANCIAL STATEMENTS.
A16
| | | | | | |
| | | SP INTERNATIONAL VALUE PORTFOLIO (continued) | | |
| |
| SCHEDULE OF INVESTMENTS | | December 31, 2009 |
| | | | | | | | | | | |
Investments in Securities (continued)
| | Level 1
| | Level 2
| | | Level 3
| |
Israel | | $ | 2,697,146 | | $ | — | | | $ | — | |
Italy | | | — | | | 4,680,100 | | | | — | |
Japan | | | — | | | 32,519,850 | | | | — | |
Liechtenstein | | | — | | | 284,925 | | | | — | |
Mexico | | | 3,067,358 | | | — | | | | — | |
Netherlands | | | 1,383,163 | | | 6,335,921 | | | | — | |
New Zealand | | | — | | | 509,022 | | | | — | |
Norway | | | — | | | 1,008,303 | | | | — | |
Portugal | | | — | | | 527,130 | | | | — | |
Singapore | | | — | | | 1,898,273 | | | | — | |
South Korea | | | — | | | 1,062,133 | | | | — | |
Spain | | | — | | | 7,706,430 | | | | — | |
Sweden | | | — | | | 3,066,543 | | | | — | |
Switzerland | | | 736,146 | | | 13,300,133 | | | | — | |
Taiwan | | | 520,794 | | | — | | | | — | |
Turkey | | | — | | | 1,041,810 | | | | — | |
United Kingdom | | | — | | | 35,508,663 | | | | — | |
United States | | | 1,346,931 | | | — | | | | — | |
Rights | | | — | | | — | | | | — | ** |
Affiliated Money Market Mutual Fund | | | 889,444 | | | — | | | | — | |
| | |
|
| |
|
|
| |
|
|
|
| | | | 24,747,446 | | | 176,540,963 | | | | — | |
Other Financial Instuments* | | | — | | | (30,699 | ) | | | — | |
| | |
|
| |
|
|
| |
|
|
|
Total | | $ | 24,747,446 | | $ | 176,510,264 | | | $ | — | |
| | |
|
| |
|
|
| |
|
|
|
| * | Other financial instruments are derivative instruments not reflected in the Schedule of Investments, such as futures, forwards and swap contracts, which are valued at the unrealized appreciation/depreciation on the instrument. |
The following is a reconciliation of assets in which significant unobservable inputs (Level 3) were used in determining fair value:
| | | | |
| | | Common Stocks
| |
Balance as of 12/31/08 | | $ | 1,985,689 | |
Realized gain (loss) | | | — | |
Change in unrealized appreciation (depreciation) | | | — | |
Net purchases (sales) | | | — | |
Transfers in and/or out of Level 3 | | | (1,985,689 | ) |
| | |
|
|
|
Balance as of 12/31/09 | | $ | — | ** |
| | |
|
|
|
| ** | As of December 31, 2009, the Portfolio had one Level 3 security with a fair value of $0. |
SEE NOTES TO FINANCIAL STATEMENTS.
A17
| | | | | | |
| | | SP INTERNATIONAL VALUE PORTFOLIO (continued) | | |
| |
| SCHEDULE OF INVESTMENTS | | December 31, 2009 |
The industry classification of investments and other assets in excess of liabilities shown as a percentage of net assets as of December 31, 2009 were as follows:
| | | |
Banks | | 12.3 | % |
Insurance | | 5.6 | |
Oil & Gas | | 5.1 | |
Pharmaceuticals | | 4.8 | |
Pharmaceuticals & Biotechnology | | 4.7 | |
Telecommunications | | 3.9 | |
Diversified Financials | | 3.8 | |
Materials | | 3.6 | |
Energy | | 3.3 | |
Telecommunication Services | | 3.0 | |
Capital Goods | | 2.9 | |
Food, Beverage, & Tobacco | | 2.7 | |
Foods | | 2.5 | |
Healthcare Equipment & Services | | 2.4 | |
Electric | | 2.2 | |
Software/Services | | 2.2 | |
Media | | 2.2 | |
Chemicals | | 1.8 | |
Aerospace/Defense | | 1.8 | |
Automobiles & Components | | 1.6 | |
Retailing | | 1.6 | |
Household & Personal Products | | 1.6 | |
Food & Drug Retailing | | 1.5 | |
Diversified Financial Services | | 1.5 | |
Distribution/Wholesale | | 1.4 | |
Transportation | | 1.4 | |
Retail | | 1.3 | |
Iron / Steel | | 1.2 | |
Electronics | | 1.2 | |
Consumer Durables & Apparel | | 1.1 | |
| | | |
Engineering/Construction | | 0.9 | % |
Auto Parts & Equipment | | 0.9 | |
Holding Companies — Diversified | | 0.8 | |
Hotels, Restaurants & Leisure | | 0.8 | |
Commercial Services | | 0.7 | |
Machinery & Equipment | | 0.7 | |
Entertainment | | 0.7 | |
Semiconductors & Semiconductor Equipment | | 0.7 | |
Computers | | 0.6 | |
Miscellaneous Manufacturing | | 0.5 | |
Agriculture | | 0.5 | |
Gas | | 0.4 | |
Airlines | | 0.4 | |
Mining | | 0.4 | |
Affiliated Money Market Mutual Fund | | 0.4 | |
Building Materials | | 0.4 | |
Technology Hardware & Equipment | | 0.4 | |
Leisure Time | | 0.3 | |
Toys | | 0.3 | |
Software | | 0.3 | |
Forest & Paper Products | | 0.3 | |
Household Products / Wares | | 0.2 | |
Automobile Manufacturers | | 0.2 | |
Paper & Forest Products | | 0.2 | |
Office Equipment | | 0.2 | |
Home Furnishings | | 0.2 | |
Apparel | | 0.2 | |
Textiles | | 0.1 | |
Beverages | | 0.1 | |
| | |
|
|
| | | 99.0 | |
Other assets in excess of liabilities | | 1.0 | |
| | |
|
|
| | | 100.0 | % |
| | |
|
|
The Portfolio invested in various derivative instruments during the reporting period. The primary types of risk associated with derivative instruments are commodity risk, credit risk, equity risk, foreign exchange risk and interest rate risk. The effect of such derivative instruments on the Portfolio’s financial position and financial performance as reflected in the Statement of Assets and Liabilities and Statement of Operations is presented in the summary below.
Fair values of derivative instruments as of December 31, 2009 as presented in the Statement of Assets and Liabilities:
| | | | | | | | | | | |
Derivatives not accounted for
as hedging instruments, carried
at fair value
| | Asset Derivatives
| | | Liability Derivatives
|
| | Balance Sheet Location
| | Fair
Value
| | | Balance Sheet Location
| | Fair
Value
|
Equity contracts | | Unaffiliated investments | | $ | — | * | | — | | $ | — |
Foreign exchange contracts | | Unrealized appreciation on foreign currency forward contracts | | | 36,215 | | | Unrealized depreciation on foreign currency forward contracts | | | 66,914 |
| | | | |
|
|
| | | |
|
|
| | | | | $ | 36,215 | | | | | $ | 66,914 |
| | | | |
|
|
| | | |
|
|
| * | Includes one security with a fair value of $0. |
The effects of derivative instruments on the Statement of Operations for the year ended December 31, 2009 are as follows:
| | | | | | | | | | | | | | | |
Amount of Realized Gain or (Loss) on Derivatives Recognized in Income
| |
Derivatives not accounted for as hedging
instruments, carried at fair value
| | Rights
| | | Warrants
| | Forward
Currency
Contracts
| | | Total
| |
Foreign exchange contracts | | $ | — | | | $ | — | | $ | (849,670 | ) | | $ | (849,670 | ) |
Equity contracts | | | (910,213 | ) | | | 4,461 | | | — | | | | (905,752 | ) |
| | |
|
|
| |
|
| |
|
|
| |
|
|
|
Total | | $ | (910,213 | ) | | $ | 4,461 | | $ | (849,670 | ) | | $ | (1,755,422 | ) |
| | |
|
|
| |
|
| |
|
|
| |
|
|
|
SEE NOTES TO FINANCIAL STATEMENTS.
A18
| | | | | | |
| | | SP INTERNATIONAL VALUE PORTFOLIO (continued) | | |
| |
| SCHEDULE OF INVESTMENTS | | December 31, 2009 |
| | | | | | | | | |
Change in Unrealized Appreciation or (Depreciation) on Derivatives Recognized in Income
|
Derivatives not accounted for as hedging
instruments, carried at fair value
| | Rights
| | Forward
Currency
Contracts
| | Total
|
Foreign exchange contracts | | $ | — | | $ | 133,274 | | $ | 133,274 |
Equity contracts | | | — | | | — | | | — |
| | |
|
| |
|
| |
|
|
Total | | $ | — | | $ | 133,274 | | $ | 133,274 |
| | |
|
| |
|
| |
|
|
For the year ended December 31, 2009, the Portfolio’s average value at settlement date payable for forward foreign currency exchange purchase contracts was $3,704,207 and the average value at settlement date receivable for forward foreign currency exchange sale contracts was $10,551,247.
SEE NOTES TO FINANCIAL STATEMENTS.
A19
| | | | | | |
| | | SP INTERNATIONAL VALUE PORTFOLIO (continued) | | |
STATEMENT OF ASSETS AND LIABILITIES
December 31, 2009
| | | | |
ASSETS | | | | |
Investments at value: | | | | |
Unaffiliated investments (cost $186,984,726) | | $ | 200,398,965 | |
Affiliated investments (cost $889,444) | | | 889,444 | |
Foreign currency, at value (cost $486,394) | | | 478,022 | |
Cash | | | 30,513 | |
Tax reclaim receivable | | | 1,424,697 | |
Receivable for investments sold | | | 305,691 | |
Dividends and interest receivable | | | 148,169 | |
Unrealized appreciation on foreign currency forward contracts | | | 36,215 | |
Prepaid expenses | | | 4,153 | |
Receivable for Series shares sold | | | 1,873 | |
| | |
|
|
|
Total Assets | | | 203,717,742 | |
| | |
|
|
|
LIABILITIES | | | | |
Management fee payable | | | 154,089 | |
Accrued expenses and other liabilities | | | 152,103 | |
Payable for investments purchased | | | 79,721 | |
Unrealized depreciation on foreign currency forward contracts | | | 66,914 | |
Payable for Series shares repurchased | | | 1,649 | |
Affiliated transfer agent fees payable | | | 595 | |
| | |
|
|
|
Total Liabilities | | | 455,071 | |
| | |
|
|
|
| NET ASSETS | | $ | 203,262,671 | |
| | |
|
|
|
Net assets were comprised of: | | | | |
Paid-in capital | | $ | 238,471,494 | |
Retained earnings | | | (35,208,823 | ) |
| | |
|
|
|
Net assets, December 31, 2009 | | $ | 203,262,671 | |
| | |
|
|
|
Net asset value and redemption price per share, $203,262,671 / 32,018,299 outstanding shares of beneficial interest | | $ | 6.35 | |
| | |
|
|
|
STATEMENT OF OPERATIONS
Year Ended December 31, 2009
| | | | |
| INVESTMENT INCOME | | | | |
Unaffiliated dividend income (net of $713,381 foreign withholding tax) | | $ | 6,873,119 | |
Affiliated dividend income | | | 51,291 | |
Interest income | | | 165 | |
| | |
|
|
|
| | | | 6,924,575 | |
| | |
|
|
|
| EXPENSES | | | | |
Management fee | | | 2,188,487 | |
Custodian’s fees and expenses | | | 192,000 | |
Shareholders’ reports | | | 25,000 | |
Audit fee | | | 23,000 | |
Trustees’ fees | | | 10,000 | |
Transfer agent’s fees and expenses (including affiliated expense of $3,600) (Note 4) | | | 10,000 | |
Legal fees and expenses | | | 5,000 | |
Insurance expenses | | | 5,000 | |
Loan interest expense (Note 8) | | | 5,577 | |
Commitment fee on syndicated credit agreement | | | 3,000 | |
Miscellaneous | | | 27,308 | |
| | |
|
|
|
Total expenses | | | 2,494,372 | |
| | |
|
|
|
| NET INVESTMENT INCOME | | | 4,430,203 | |
| | |
|
|
|
| NET REALIZED AND UNREALIZED GAIN (LOSS) ON INVESTMENTS AND FOREIGN CURRENCIES | | | | |
Net realized loss on: | | | | |
Investment transactions | | | (34,658,359 | ) |
Foreign currency transactions | | | (952,732 | ) |
| | |
|
|
|
| | | | (35,611,091 | ) |
| | |
|
|
|
Net change in unrealized appreciation (depreciation) on: | | | | |
Investments | | | 104,071,846 | |
Foreign currencies | | | 114,622 | |
| | |
|
|
|
| | | | 104,186,468 | |
| | |
|
|
|
| NET GAIN ON INVESTMENTS AND FOREIGN CURRENCIES | | | 68,575,377 | |
| | |
|
|
|
| NET INCREASE IN NET ASSETS RESULTING FROM OPERATIONS | | $ | 73,005,580 | |
| | |
|
|
|
STATEMENT OF CHANGES IN NET ASSETS
| | | | | | | | |
| | | Year Ended December 31,
| |
| | | 2009
| | | 2008
| |
| INCREASE (DECREASE) IN NET ASSETS | | | | | | | | |
| OPERATIONS: | | | | | | | | |
Net investment income | | $ | 4,430,203 | | | $ | 7,948,362 | |
Net realized loss on investment and foreign currency transactions | | | (35,611,091 | ) | | | (17,134,095 | ) |
Net change in unrealized appreciation (depreciation) on investments and foreign currencies | | | 104,186,468 | | | | (178,187,733 | ) |
| | |
|
|
| |
|
|
|
NET INCREASE (DECREASE) IN NET ASSETS RESULTING FROM OPERATIONS | | | 73,005,580 | | | | (187,373,466 | ) |
| | |
|
|
| |
|
|
|
| DISTRIBUTIONS | | | (7,801,297 | ) | | | (63,282,147 | ) |
| | |
|
|
| |
|
|
|
| SERIES SHARE TRANSACTIONS: | | | | | | | | |
Series shares sold [5,386,533 and 5,480,269 shares, respectively] | | | 27,653,179 | | | | 30,802,427 | |
Series shares issued in reinvestment of distributions [1,434,062 and 8,000,271, respectively] | | | 7,801,297 | | | | 63,282,147 | |
Series shares repurchased [23,029,776 and 11,702,481 shares, respectively] | | | (135,909,297 | ) | | | (98,546,520 | ) |
| | |
|
|
| |
|
|
|
DECREASE IN NET ASSETS RESULTING FROM SERIES SHARE TRANSACTIONS | | | (100,454,821 | ) | | | (4,461,946 | ) |
| | |
|
|
| |
|
|
|
| TOTAL DECREASE IN NET ASSETS | | | (35,250,538 | ) | | | (255,117,559 | ) |
| NET ASSETS: | | | | | | | | |
Beginning of year | | | 238,513,209 | | | | 493,630,768 | |
| | |
|
|
| |
|
|
|
End of year | | $ | 203,262,671 | | | $ | 238,513,209 | |
| | |
|
|
| |
|
|
|
SEE NOTES TO FINANCIAL STATEMENTS.
A20
| | | | | | |
| | | SP MID CAP GROWTH PORTFOLIO | | |
| |
| SCHEDULE OF INVESTMENTS | | December 31, 2009 |
| | | | | |
| LONG-TERM INVESTMENTS — 98.8% | | |
| COMMON STOCKS | | Shares
| | Value
(Note 2)
|
| | | | | | |
Aerospace — 0.8% | | | | | |
Rockwell Collins, Inc.(a) | | 11,500 | | $ | 636,640 |
| | | | |
|
|
Air Freight & Logistics — 1.2% | | | | | |
C.H. Robinson Worldwide, Inc. | | 17,100 | | | 1,004,283 |
| | | | |
|
|
Apparel — 0.2% | | | | | |
Polo Ralph Lauren Corp. | | 2,500 | | | 202,450 |
| | | | |
|
|
Automobile Manufacturers — 0.6% | | | | | |
CarMax, Inc.*(a) | | 20,000 | | | 485,000 |
| | | | |
|
|
Biotechnology — 2.7% | | | | | |
Alexion Pharmaceuticals, Inc.* | | 17,000 | | | 829,940 |
Human Genome Sciences, Inc.*(a) | | 20,000 | | | 612,000 |
Talecris Biotherapeutics Holdings Corp.* | | 35,000 | | | 779,450 |
| | | | |
|
|
| | | | | | 2,221,390 |
| | | | |
|
|
Cable — 0.5% | | | | | |
Scripps Networks Interactive, Inc.
(Class A Stock) | | 10,000 | | | 415,000 |
| | | | |
|
|
Chemicals — 3.0% | | | | | |
Airgas, Inc. | | 28,500 | | | 1,356,600 |
Ecolab, Inc. | | 25,000 | | | 1,114,500 |
| | | | |
|
|
| | | | | | 2,471,100 |
| | | | |
|
|
Clothing & Apparel — 0.6% | | | | | |
Coach, Inc.(a) | | 13,000 | | | 474,890 |
| | | | |
|
|
Commercial Services — 1.7% | | | | | |
Alliance Data Systems Corp.*(a) | | 7,500 | | | 484,425 |
Verisk Analytics, Inc. (Class A Stock)* | | 30,000 | | | 908,400 |
| | | | |
|
|
| | | | | | 1,392,825 |
| | | | |
|
|
Commercial Services & Supplies — 1.4% | | | | | |
HMS Holdings Corp.* | | 15,000 | | | 730,350 |
Nalco Holding Co. | | 16,500 | | | 420,915 |
| | | | |
|
|
| | | | | | 1,151,265 |
| | | | |
|
|
Computer Hardware — 1.9% | | | | | |
Cognizant Technology Solutions Corp. (Class A Stock)* | | 20,000 | | | 906,000 |
Western Digital Corp.* | | 15,000 | | | 662,250 |
| | | | |
|
|
| | | | | | 1,568,250 |
| | | | |
|
|
Computer Services & Software — 4.7% | | | | | |
Allscripts-Misys Healthcare Solutions,
Inc.*(a) | | 30,000 | | | 606,900 |
Avago Technologies Ltd. (Singapore)*(a) | | 30,000 | | | 548,700 |
IHS, Inc. (Class A Stock)*(a) | | 20,400 | | | 1,118,124 |
MICROS Systems, Inc.*(a) | | 13,000 | | | 403,390 |
salesforce.com, Inc.* | | 6,000 | | | 442,620 |
Sybase, Inc.*(a) | | 16,500 | | | 716,100 |
| | | | |
|
|
| | | | | | 3,835,834 |
| | | | |
|
|
Computers & Peripherals — 0.8% | | | | | |
NetApp, Inc.* | | 20,000 | | | 687,800 |
| | | | |
|
|
Consumer Products & Services — 1.5% | | | | | |
Avon Products, Inc. | | 14,000 | | | 441,000 |
Church & Dwight Co., Inc. | | 13,000 | | | 785,850 |
| | | | |
|
|
| | | | | | 1,226,850 |
| | | | |
|
|
Distribution/Wholesale — 2.2% | | | | | |
Fastenal Co.(a) | | 24,000 | | | 999,360 |
W.W. Grainger, Inc. | | 8,500 | | | 823,055 |
| | | | |
|
|
| | | | | | 1,822,415 |
| | | | |
|
|
| | | | | |
COMMON STOCKS
(continued) | | Shares
| | Value
(Note 2)
|
| | | | | | |
Diversified Financial Services — 2.6% | | | | | |
Artio Global Investors, Inc.* | | 13,500 | | $ | 344,115 |
IntercontinentalExchange, Inc.*(a) | | 8,000 | | | 898,400 |
Invesco Ltd. (Bermuda) | | 37,500 | | | 880,875 |
| | | | |
|
|
| | | | | | 2,123,390 |
| | | | |
|
|
Diversified Machinery — 0.8% | | | | | |
Flowserve Corp. | | 6,500 | | | 614,445 |
| | | | |
|
|
Education — 2.3% | | | | | |
DeVry, Inc. | | 15,500 | | | 879,315 |
Strayer Education, Inc.(a) | | 4,800 | | | 1,019,952 |
| | | | |
|
|
| | | | | | 1,899,267 |
| | | | |
|
|
Electrical Equipment — 0.9% | | | | | |
Roper Industries, Inc.(a) | | 13,500 | | | 706,995 |
| | | | |
|
|
Electronic Components — 4.5% | | | | | |
AMETEK, Inc.(a) | | 26,500 | | | 1,013,360 |
Amphenol Corp. (Class A Stock) | | 18,000 | | | 831,240 |
Dolby Laboratories, Inc.
(Class A Stock)*(a) | | 22,000 | | | 1,050,060 |
Trimble Navigation Ltd.*(a) | | 30,000 | | | 756,000 |
| | | | |
|
|
| | | | | | 3,650,660 |
| | | | |
|
|
Electronics — 0.9% | | | | | |
National Instruments Corp. | | 25,000 | | | 736,250 |
| | | | |
|
|
Entertainment & Leisure — 4.1% | | | | | |
Bally Technologies, Inc.* | | 9,250 | | | 381,933 |
DreamWorks Animation SKG, Inc.
(Class A Stock)* | | 15,000 | | | 599,250 |
Penn National Gaming, Inc.* | | 34,500 | | | 937,710 |
WMS Industries, Inc.*(a) | | 35,000 | | | 1,400,000 |
| | | | |
|
|
| | | | | | 3,318,893 |
| | | | |
|
|
Environmental Control — 1.8% | | | | | |
Stericycle, Inc.*(a) | | 26,000 | | | 1,434,420 |
| | | | |
|
|
Financial Services — 2.1% | | | | | |
Affiliated Managers Group, Inc.*(a) | | 11,500 | | | 774,525 |
MSCI, Inc. (Class A Stock)* | | 30,000 | | | 954,000 |
| | | | |
|
|
| | | | | | 1,728,525 |
| | | | |
|
|
Food — 0.6% | | | | | |
J.M. Smucker Co. (The) | | 7,500 | | | 463,125 |
| | | | |
|
|
Healthcare Products — 3.4% | | | | | |
Edwards Lifesciences Corp.* | | 8,500 | | | 738,225 |
Intuitive Surgical, Inc.*(a) | | 1,500 | | | 454,980 |
Masimo Corp.*(a) | | 10,500 | | | 319,410 |
ResMed, Inc.*(a) | | 8,500 | | | 444,295 |
Sirona Dental System, Inc.* | | 13,000 | | | 412,620 |
Volcano Corp.* | | 22,500 | | | 391,050 |
| | | | |
|
|
| | | | | | 2,760,580 |
| | | | |
|
|
Home Entertainment Software — 0.9% | | | | | |
Activision Blizzard, Inc.* | | 66,500 | | | 738,815 |
| | | | |
|
|
Internet — 0.5% | | | | | |
GSI Commerce, Inc.* | | 15,000 | | | 380,850 |
| | | | |
|
|
Internet Services — 2.2% | | | | | |
Equinix, Inc.*(a) | | 10,000 | | | 1,061,500 |
priceline.com, Inc.* | | 3,500 | | | 764,750 |
| | | | |
|
|
| | | | | | 1,826,250 |
| | | | |
|
|
SEE NOTES TO FINANCIAL STATEMENTS.
A21
| | | | | | |
| | | SP MID CAP GROWTH PORTFOLIO (continued) | | |
| |
| SCHEDULE OF INVESTMENTS | | December 31, 2009 |
| | | | | |
COMMON STOCKS
(continued) | | Shares
| | Value
(Note 2)
|
| | | | | | |
Manufacturing — 1.2% | | | | | |
Danaher Corp. | | 13,000 | | $ | 977,600 |
| | | | |
|
|
Media — 0.9% | | | | | |
Cablevision Systems Corp.
(Class A Stock) | | 15,000 | | | 387,300 |
Discovery Communications, Inc.
(Class A Stock)*(a) | | 12,500 | | | 383,375 |
| | | | |
|
|
| | | | | | 770,675 |
| | | | |
|
|
Medical Products — 0.4% | | | | | |
Dendreon Corp.* | | 11,500 | | | 302,220 |
| | | | |
|
|
Medical Supplies & Equipment — 1.2% | | | | | |
NuVasive, Inc.*(a) | | 18,000 | | | 575,640 |
PSS World Medical, Inc.*(a) | | 17,000 | | | 383,690 |
| | | | |
|
|
| | | | | | 959,330 |
| | | | |
|
|
Metals & Mining — 2.6% | | | | | |
Alpha Natural Resources, Inc.*(a) | | 7,500 | | | 325,350 |
Cliffs Natural Resources, Inc.(a) | | 13,500 | | | 622,215 |
Precision Castparts Corp. | | 10,500 | | | 1,158,675 |
| | | | |
|
|
| | | | | | 2,106,240 |
| | | | |
|
|
Oil & Gas Services — 2.6% | | | | | |
CARBO Ceramics, Inc.(a) | | 18,000 | | | 1,227,060 |
Core Laboratories NV (Netherlands)(a) | | 7,550 | | | 891,806 |
| | | | |
|
|
| | | | | | 2,118,866 |
| | | | |
|
|
Oil, Gas & Consumable Fuels — 5.9% | | | | | |
Cabot Oil & Gas Corp. | | 12,500 | | | 544,875 |
Concho Resources, Inc.*(a) | | 35,000 | | | 1,571,500 |
Oceaneering International, Inc.* | | 8,000 | | | 468,160 |
Range Resources Corp. | | 21,500 | | | 1,071,775 |
Southwestern Energy Co.* | | 23,500 | | | 1,132,700 |
| | | | |
|
|
| | | | | | 4,789,010 |
| | | | |
|
|
Pharmaceuticals — 4.9% | | | | | |
BioMarin Pharmaceutical, Inc.* | | 15,000 | | | 282,150 |
Express Scripts, Inc.* | | 16,000 | | | 1,383,200 |
Mead Johnson Nutrition Co.
(Class A Stock) | | 21,500 | | | 939,550 |
Mylan, Inc.* | | 35,000 | | | 645,050 |
Vertex Pharmaceuticals, Inc.*(a) | | 16,500 | | | 707,025 |
| | | | |
|
|
| | | | | | 3,956,975 |
| | | | |
|
|
Printing & Publishing — 1.7% | | | | | |
VistaPrint NV (Netherlands)*(a) | | 24,500 | | | 1,388,170 |
| | | | |
|
|
Retail & Merchandising — 6.7% | | | | | |
Bed Bath & Beyond, Inc.*(a) | | 23,500 | | | 907,805 |
Dollar Tree, Inc.* | | 16,000 | | | 772,800 |
J. Crew Group, Inc.*(a) | | 16,000 | | | 715,840 |
Nordstrom, Inc.(a) | | 24,000 | | | 901,920 |
Ross Stores, Inc. | | 28,000 | | | 1,195,880 |
Tiffany & Co. | | 6,500 | | | 279,500 |
TJX Cos., Inc. | | 19,500 | | | 712,725 |
| | | | |
|
|
| | | | | | 5,486,470 |
| | | | |
|
|
Semiconductors — 5.6% | | | | | |
Analog Devices, Inc. | | 25,000 | | | 789,500 |
Marvell Technology Group Ltd. (Bermuda)* | | 44,000 | | | 913,000 |
Microchip Technology, Inc.(a) | | 36,000 | | | 1,046,160 |
| | | | | | |
COMMON STOCKS
(continued) | | Shares
| | Value
(Note 2)
| |
| | | | | | | |
Semiconductors (continued) | | | | | | |
Novellus Systems, Inc.* | | 18,500 | | $ | 431,790 | |
Rovi Corp.*(a) | | 22,500 | | | 717,075 | |
Varian Semiconductor Equipment Associates, Inc.*(a) | | 18,000 | | | 645,840 | |
| | | | |
|
|
|
| | | | | | 4,543,365 | |
| | | | |
|
|
|
Semiconductors & Semiconductor Equipment — 1.2% | |
Silicon Laboratories, Inc.* | | 20,000 | | | 966,800 | |
| | | | |
|
|
|
Software — 3.2% | | | | | | |
ANSYS, Inc.*(a) | | 26,000 | | | 1,129,960 | |
Citrix Systems, Inc.*(a) | | 10,500 | | | 436,905 | |
McAfee, Inc.* | | 10,000 | | | 405,700 | |
MedAssets, Inc.*(a) | | 20,000 | | | 424,200 | |
Solera Holdings, Inc.(a) | | 6,000 | | | 216,060 | |
| | | | |
|
|
|
| | | | | | 2,612,825 | |
| | | | |
|
|
|
Specialty Retail — 2.8% | | | | | | |
Urban Outfitters, Inc.* | | 50,000 | | | 1,749,500 | |
Williams-Sonoma, Inc.(a) | | 24,500 | | | 509,110 | |
| | | | |
|
|
|
| | | | | | 2,258,610 | |
| | | | |
|
|
|
Telecommunications — 5.5% | | | | | | |
American Tower Corp.
(Class A Stock)* | | 22,000 | | | 950,620 | |
Crown Castle International Corp.*(a) | | 11,500 | | | 448,960 | |
Juniper Networks, Inc.* | | 31,500 | | | 840,105 | |
NII Holdings, Inc.* | | 16,000 | | | 537,280 | |
SBA Communications Corp.
(Class A Stock)*(a) | | 50,000 | | | 1,708,000 | |
| | | | |
|
|
|
| | | | | | 4,484,965 | |
| | | | |
|
|
|
Transportation — 1.0% | | | | | | |
J.B. Hunt Transport Services, Inc. | | 26,000 | | | 839,020 | |
| | | | |
|
|
|
TOTAL LONG-TERM INVESTMENTS
(cost $67,503,006) | | | 80,539,598 | |
| | | | |
|
|
|
| SHORT-TERM INVESTMENT — 38.4% | | | | |
AFFILIATED MONEY MARKET MUTUAL FUND | | | | |
Dryden Core Investment Fund —
Taxable Money Market Series (cost $31,269,732; includes $30,175,990 of cash collateral for securities on loan)(b)(w)(Note 4) | | 31,269,732 | | | 31,269,732 | |
| | | | |
|
|
|
TOTAL INVESTMENTS — 137.2%
(cost $98,772,738) | | | | | 111,809,330 | |
LIABILITIES IN EXCESS OF OTHER ASSETS — (37.2)% | | | | | (30,310,688 | ) |
| | | | |
|
|
|
NET ASSETS — 100.0% | | | | $ | 81,498,642 | |
| | | | |
|
|
|
| * | Non-income producing security. |
| (a) | All or a portion of security is on loan. The aggregate market value of such securities is $29,195,297; cash collateral of $30,175,990 (included with liabilities) was received with which the Portfolio purchased highly liquid short-term investments. |
| (b) | Represents security, or a portion thereof, purchased with cash collateral received for securities on loan. |
| (w) | Prudential Investments LLC, the manager of the Portfolio, also serves as manager of the Dryden Core Investment Fund-Taxable Money Market Series. |
SEE NOTES TO FINANCIAL STATEMENTS.
A22
| | | | | | |
| | | SP MID CAP GROWTH PORTFOLIO (continued) | | |
| |
| SCHEDULE OF INVESTMENTS | | December 31, 2009 |
Various inputs are used in determining the value of the Portfolio’s investments. These inputs are summarized in the three broad levels listed below.
Level 1—quoted prices in active markets for identical securities
Level 2—other significant observable inputs (including quoted prices for similar securities, interest rates, prepayment speeds, credit risk, etc.)
Level 3—significant unobservable inputs (including the Portfolio’s own assumptions in determining the fair value of investments)
The following is a summary of the inputs used as of December 31, 2009 in valuing the Portfolio’s assets carried at fair value:
| | | | | | | | | |
| | | Level 1
| | Level 2
| | Level 3
|
Investments in Securities | | | | | | | | | |
Common Stocks | | $ | 80,539,598 | | $ | — | | $ | — |
Affiliated Money Market
Mutual Fund | | | 31,269,732 | | | — | | | — |
| | |
|
| |
|
| |
|
|
| | | | 111,809,330 | | | — | | | — |
Other Financial Instruments* | | | — | | | — | | | — |
| | |
|
| |
|
| |
|
|
Total | | $ | 111,809,330 | | $ | — | | $ | — |
| | |
|
| |
|
| |
|
|
| * | Other financial instruments are derivative instruments not reflected in the Schedule of Investments, such as futures, forwards and swap contracts, which are valued at the unrealized appreciation/depreciation on the instrument. |
As of December 31, 2009 and 2008, the Portfolio did not use any significant unobservable inputs (Level 3) in determining the value of investments.
The industry classification of investments and liabilities in excess of other assets shown as a percentage of net assets as of December 31, 2009 were as follows:
| | | |
Affiliated Money Market Mutual Fund (37.0% represents investments purchased with collateral from securities on loan) | | 38.4 | % |
Retail & Merchandising | | 6.7 | |
Oil, Gas & Consumable Fuels | | 5.9 | |
Semiconductors | | 5.6 | |
Telecommunications | | 5.5 | |
Pharmaceuticals | | 4.9 | |
| | | |
Computer Services & Software | | 4.7 | % |
Electronic Components | | 4.5 | |
Entertainment & Leisure | | 4.1 | |
Healthcare Products | | 3.4 | |
Software | | 3.2 | |
Chemicals | | 3.0 | |
Specialty Retail | | 2.8 | |
Biotechnology | | 2.7 | |
Diversified Financial Services | | 2.6 | |
Oil & Gas Services | | 2.6 | |
Metals & Mining | | 2.6 | |
Education | | 2.3 | |
Internet Services | | 2.2 | |
Distribution/Wholesale | | 2.2 | |
Financial Services | | 2.1 | |
Computer Hardware | | 1.9 | |
Environmental Control | | 1.8 | |
Commercial Services | | 1.7 | |
Printing & Publishing | | 1.7 | |
Consumer Products & Services | | 1.5 | |
Commercial Services & Supplies | | 1.4 | |
Air Freight & Logistics | | 1.2 | |
Manufacturing | | 1.2 | |
Semiconductors & Semiconductor Equipment | | 1.2 | |
Medical Supplies & Equipment | | 1.2 | |
Transportation | | 1.0 | |
Media | | 0.9 | |
Home Entertainment Software | | 0.9 | |
Electronics | | 0.9 | |
Electrical Equipment | | 0.9 | |
Computers & Peripherals | | 0.8 | |
Aerospace | | 0.8 | |
Diversified Machinery | | 0.8 | |
Automobile Manufacturers | | 0.6 | |
Clothing & Apparel | | 0.6 | |
Foods | | 0.6 | |
Cable | | 0.5 | |
Internet | | 0.5 | |
Medical Products | | 0.4 | |
Apparel | | 0.2 | |
| | |
|
|
| | | 137.2 | |
Liabilities in excess of other assets | | (37.2 | ) |
| | |
|
|
| | | 100.0 | % |
| | |
|
|
SEE NOTES TO FINANCIAL STATEMENTS.
A23
| | | | | | |
| | | SP MID CAP GROWTH PORTFOLIO (continued) | | |
STATEMENT OF ASSETS AND LIABILITIES
December 31, 2009
| | | | |
| ASSETS | | | | |
Investments at value, including securities on loan of $29,195,297: | | | | |
Unaffiliated investments (cost $67,503,006) | | $ | 80,539,598 | |
Affiliated investments (cost $31,269,732) | | | 31,269,732 | |
Cash | | | 8,866 | |
Dividends receivable | | | 31,187 | |
Prepaid expenses | | | 1,547 | |
Receivable for Series shares sold | | | 1,544 | |
| | |
|
|
|
Total Assets | | | 111,852,474 | |
| | |
|
|
|
| LIABILITIES | | | | |
Collateral for securities on loan | | | 30,175,990 | |
Payable for Series shares repurchased | | | 77,937 | |
Management fee payable | | | 54,639 | |
Accrued expenses and other liabilities | | | 41,500 | |
Deferred trustees’ fees | | | 3,171 | |
Affiliated transfer agent fees payable | | | 595 | |
| | |
|
|
|
Total Liabilities | | | 30,353,832 | |
| | |
|
|
|
| NET ASSETS | | $ | 81,498,642 | |
| | |
|
|
|
Net assets were comprised of: | | | | |
Paid-in capital | | $ | 106,426,267 | |
Retained earnings | | | (24,927,625 | ) |
| | |
|
|
|
Net assets, December 31, 2009 | | $ | 81,498,642 | |
| | |
|
|
|
Net asset value and redemption price per share, $81,498,642 / 18,078,369 outstanding shares of beneficial interest | | $ | 4.51 | |
| | |
|
|
|
STATEMENT OF OPERATIONS
Year Ended December 31, 2009
| | | | |
| INVESTMENT INCOME | | | | |
Unaffiliated dividend income (net of $1,452 foreign withholding tax) | | $ | 411,957 | |
Affiliated income from securities lending, net | | | 104,020 | |
Affiliated dividend income | | | 8,267 | |
| | |
|
|
|
| | | | 524,244 | |
| | |
|
|
|
| EXPENSES | | | | |
Management fee | | | 565,826 | |
Custodian’s fees and expenses | | | 51,000 | |
Shareholders’ reports | | | 19,000 | |
Audit fee | | | 17,000 | |
Trustees’ fees | | | 10,000 | |
Transfer agent’s fees and expenses (including affiliated expense of $3,600) (Note 4) | | | 10,000 | |
Legal fees and expenses | | | 5,000 | |
Insurance expenses | | | 2,000 | |
Commitment fee on syndicated credit agreement | | | 2,000 | |
Loan interest expense (Note 8) | | | 163 | |
Miscellaneous | | | 5,837 | |
| | |
|
|
|
Total expenses | | | 687,826 | |
| | |
|
|
|
| NET INVESTMENT LOSS | | | (163,582 | ) |
| | |
|
|
|
| NET REALIZED AND UNREALIZED GAIN (LOSS) ON INVESTMENTS | | | | |
Net realized loss on investment transactions | | | (13,046,351 | ) |
Net change in unrealized appreciation on investments | | | 33,022,606 | |
| | |
|
|
|
| NET GAIN ON INVESTMENTS | | | 19,976,255 | |
| | |
|
|
|
| NET INCREASE IN NET ASSETS RESULTING FROM OPERATIONS | | $ | 19,812,673 | |
| | |
|
|
|
STATEMENT OF CHANGES IN NET ASSETS
| | | | | | | | |
| | | Year Ended December 31,
| |
| | | 2009
| | | 2008
| |
| INCREASE (DECREASE) IN NET ASSETS | | | | | | | | |
| OPERATIONS: | | | | | | | | |
Net investment loss | | $ | (163,582 | ) | | $ | (239,527 | ) |
Net realized loss on investment transactions | | | (13,046,351 | ) | | | (24,414,486 | ) |
Net change in unrealized appreciation (depreciation) on investments | | | 33,022,606 | | | | (28,331,776 | ) |
| | |
|
|
| |
|
|
|
NET INCREASE (DECREASE) IN NET ASSETS RESULTING FROM OPERATIONS | | | 19,812,673 | | | | (52,985,789 | ) |
| | |
|
|
| |
|
|
|
| DISTRIBUTIONS | | | — | | | | (24,381,654 | ) |
| | |
|
|
| |
|
|
|
| SERIES SHARE TRANSACTIONS: | | | | | | | | |
Series shares sold [1,147,208 and 1,083,638 shares, respectively] | | | 4,214,406 | | | | 5,887,530 | |
Series shares issued in reinvestment of distributions [0 and 4,377,317, respectively] | | | — | | | | 24,381,654 | |
Series shares repurchased [2,738,439 and 3,700,399 shares, respectively] | | | (10,046,592 | ) | | | (20,213,722 | ) |
| | |
|
|
| |
|
|
|
NET INCREASE (DECREASE) IN NET ASSETS RESULTING FROM SERIES SHARE TRANSACTIONS | | | (5,832,186 | ) | | | 10,055,462 | |
| | |
|
|
| |
|
|
|
| TOTAL INCREASE (DECREASE) IN NET ASSETS | | | 13,980,487 | | | | (67,311,981 | ) |
| NET ASSETS: | | | | | | | | |
Beginning of year | | | 67,518,155 | | | | 134,830,136 | |
| | |
|
|
| |
|
|
|
End of year | | $ | 81,498,642 | | | $ | 67,518,155 | |
| | |
|
|
| |
|
|
|
SEE NOTES TO FINANCIAL STATEMENTS.
A24
| | | | | | |
| | | SP PRUDENTIAL U.S. EMERGING GROWTH PORTFOLIO | | |
| |
| SCHEDULE OF INVESTMENTS | | December 31, 2009 |
| | | | | |
| LONG-TERM INVESTMENTS — 98.0% |
| COMMON STOCKS | | Shares
| | Value
(Note 2)
|
| | | | | | |
Aerospace & Defense — 1.6% |
ITT Corp., | | 45,800 | | $ | 2,278,092 |
| | | | |
|
|
Air Freight & Logistics — 1.0% |
C.H. Robinson Worldwide, Inc. | | 12,100 | | | 710,633 |
Expeditors International of Washington, Inc. | | 21,300 | | | 739,749 |
| | | | |
|
|
| | | | | | 1,450,382 |
| | | | |
|
|
Biotechnology — 0.9% |
Vertex Pharmaceuticals, Inc.(a)(b) | | 29,600 | | | 1,268,360 |
| | | | |
|
|
Capital Markets — 2.8% |
Eaton Vance Corp. | | 77,300 | | | 2,350,693 |
TD Ameritrade Holding Corp.(b) | | 82,200 | | | 1,593,036 |
| | | | |
|
|
| | | | | | 3,943,729 |
| | | | |
|
|
Chemicals — 2.2% |
Ecolab, Inc. | | 54,600 | | | 2,434,068 |
FMC Corp. | | 12,800 | | | 713,728 |
| | | | |
|
|
| | | | | | 3,147,796 |
| | | | |
|
|
Commercial Services & Supplies — 1.7% |
Copart, Inc.(b) | | 11,700 | | | 428,571 |
Iron Mountain, Inc.(a)(b) | | 86,000 | | | 1,957,360 |
| | | | |
|
|
| | | | | | 2,385,931 |
| | | | |
|
|
Communications Equipment — 0.8% |
Juniper Networks, Inc.(b) | | 43,100 | | | 1,149,477 |
| | | | |
|
|
Computers & Peripherals — 1.9% |
NetApp, Inc.,(b) | | 76,898 | | | 2,644,522 |
| | | | |
|
|
Diversified Consumer Services — 1.3% |
Apollo Group, Inc. (Class A Stock)(b) | | 30,600 | | | 1,853,748 |
| | | | |
|
|
Electrical Equipment — 2.7% |
AMETEK, Inc. | | 51,600 | | | 1,973,184 |
Roper Industries, Inc., | | 35,200 | | | 1,843,424 |
| | | | |
|
|
| | | | | | 3,816,608 |
| | | | |
|
|
Electronic Equipment & Instruments — 2.7% |
Amphenol Corp. (Class A Stock) | | 37,900 | | | 1,750,222 |
Anixter International, Inc.(a)(b) | | 44,700 | | | 2,105,370 |
| | | | |
|
|
| | | | | | 3,855,592 |
| | | | |
|
|
Energy Equipment & Services — 2.1% |
Cameron International Corp.(b) | | 52,700 | | | 2,202,860 |
FMC Technologies, Inc.(b) | | 13,300 | | | 769,272 |
| | | | |
|
|
| | | | | | 2,972,132 |
| | | | |
|
|
Food Products — 3.2% |
Bunge Ltd. | | 17,800 | | | 1,136,174 |
ConAgra Foods, Inc. | | 74,100 | | | 1,708,005 |
Ralcorp Holdings, Inc.(b) | | 29,800 | | | 1,779,358 |
| | | | |
|
|
| | | | | | 4,623,537 |
| | | | |
|
|
Healthcare Equipment & Supplies — 3.2% |
Beckman Coulter, Inc. | | 32,600 | | | 2,133,344 |
C.R. Bard, Inc. | | 31,000 | | | 2,414,900 |
| | | | |
|
|
| | | | | | 4,548,244 |
| | | | |
|
|
Healthcare Providers & Services — 8.9% |
Community Health Systems, Inc.(a)(b) | | 40,400 | | | 1,438,240 |
DaVita, Inc.(b) | | 47,600 | | | 2,796,024 |
Express Scripts, Inc.(b) | | 27,300 | | | 2,360,085 |
| | | | | |
COMMON STOCKS
(continued) | | Shares
| | Value
(Note 2)
|
| | | | | | |
Healthcare Providers & Services (continued) |
Henry Schein, Inc.(a)(b) | | 26,600 | | $ | 1,399,160 |
Laboratory Corp. of America Holdings(a)(b) | | 15,300 | | | 1,145,052 |
Patterson Cos., Inc.(a)(b) | | 42,500 | | | 1,189,150 |
Quest Diagnostics, Inc. | | 38,400 | | | 2,318,592 |
| | | | |
|
|
| | | | | | 12,646,303 |
| | | | |
|
|
Hotels Restaurants & Leisure — 4.0% |
Darden Restaurants, Inc. | | 43,900 | | | 1,539,573 |
Tim Hortons, Inc. | | 63,600 | | | 1,940,436 |
Yum! Brands, Inc. | | 62,700 | | | 2,192,619 |
| | | | |
|
|
| | | | | | 5,672,628 |
| | | | |
|
|
Household Products — 1.7% |
Church & Dwight Co., Inc. | | 39,800 | | | 2,405,910 |
| | | | |
|
|
Insurance — 0.9% |
W.R. Berkley Corp. | | 53,800 | | | 1,325,632 |
| | | | |
|
|
Internet Software & Services — 3.2% |
Akamai Technologies, Inc.(a)(b) | | 63,000 | | | 1,595,790 |
VeriSign, Inc.(a)(b) | | 123,800 | | | 3,000,912 |
| | | | |
|
|
| | | | | | 4,596,702 |
| | | | |
|
|
IT Services — 3.3% |
Alliance Data Systems Corp.(a)(b) | | 23,800 | | | 1,537,242 |
Amdocs Ltd.(b) | | 65,400 | | | 1,865,862 |
Cognizant Technology Solutions Corp. (Class A Stock)(b) | | 28,600 | | | 1,295,580 |
| | | | |
|
|
| | | | | | 4,698,684 |
| | | | |
|
|
Life Sciences Tools & Services — 2.0% |
Thermo Fisher Scientific, Inc.(b) | | 60,700 | | | 2,894,783 |
| | | | |
|
|
Machinery — 2.4% |
Danaher Corp. | | 26,300 | | | 1,977,760 |
IDEX Corp. | | 47,830 | | | 1,489,904 |
| | | | |
|
|
| | | | | | 3,467,664 |
| | | | |
|
|
Media — 1.0% |
Regal Entertainment Group (Class A Stock) | | 99,400 | | | 1,435,336 |
| | | | |
|
|
Metals & Mining — 1.9% |
Cliffs Natural Resources, Inc. | | 26,000 | | | 1,198,340 |
Goldcorp, Inc. (Canada) | | 40,000 | | | 1,573,600 |
| | | | |
|
|
| | | | | | 2,771,940 |
| | | | |
|
|
Multiline Retail — 1.0% |
Dollar Tree, Inc.(b) | | 29,600 | | | 1,429,680 |
| | | | |
|
|
Oil, Gas & Consumable Fuels — 5.6% |
Alpha Natural Resources, Inc.(b) | | 23,900 | | | 1,036,782 |
Newfield Exploration Co.(b) | | 25,800 | | | 1,244,334 |
Range Resources Corp. | | 21,400 | | | 1,066,790 |
Southwestern Energy Co.(b) | | 80,600 | | | 3,884,920 |
Ultra Petroleum Corp.(b) | | 13,900 | | | 693,054 |
| | | | |
|
|
| | | | | | 7,925,880 |
| | | | |
|
|
Personal Products — 1.4% |
Avon Products, Inc. | | 62,900 | | | 1,981,350 |
| | | | |
|
|
Pharmaceuticals — 1.0% |
Mylan, Inc.(a)(b) | | 79,500 | | | 1,465,185 |
| | | | |
|
|
SEE NOTES TO FINANCIAL STATEMENTS.
A25
| | | | | | |
| | | SP PRUDENTIAL U.S. EMERGING GROWTH PORTFOLIO (continued) | | |
| |
| SCHEDULE OF INVESTMENTS | | December 31, 2009 |
| | | | | |
COMMON STOCKS
(continued) | | Shares
| | Value
(Note 2)
|
| | | | | | |
Professional Services — 1.8% |
FTI Consulting, Inc.(a)(b) | | 19,600 | | $ | 924,336 |
Robert Half International, Inc.(a) | | 63,700 | | | 1,702,701 |
| | | | |
|
|
| | | | | | 2,627,037 |
| | | | |
|
|
Real Estate Investment Trusts — 3.2% |
Annaly Capital Management, Inc. | | 262,500 | | | 4,554,375 |
| | | | |
|
|
Semiconductors & Semiconductor Equipment — 5.2% |
Altera Corp.(a) | | 46,500 | | | 1,052,295 |
Broadcom Corp. (Class A Stock)(a)(b) | | 67,750 | | | 2,130,738 |
Marvell Technology Group Ltd.(b) | | 64,800 | | | 1,344,600 |
Maxim Integrated Products, Inc. | | 75,800 | | | 1,538,740 |
Xilinx, Inc. | | 52,100 | | | 1,305,626 |
| | | | |
|
|
| | | | | | 7,371,999 |
| | | | |
|
|
Software — 5.9% |
Adobe Systems, Inc.(b) | | 26,800 | | | 985,704 |
Check Point Software Technologies,(a)(b) | | 84,600 | | | 2,866,248 |
McAfee, Inc.(b) | | 26,100 | | | 1,058,877 |
Nuance Communications, Inc.(a)(b) | | 79,300 | | | 1,232,322 |
Sybase, Inc.(a)(b) | | 36,700 | | | 1,592,780 |
Symantec Corp.(b) | | 37,600 | | | 672,664 |
| | | | |
|
|
| | | | | | 8,408,595 |
| | | | |
|
|
Specialty Retail — 6.1% |
Bed Bath & Beyond, Inc.(b) | | 37,100 | | | 1,433,173 |
GameStop Corp. (Class A Stock)(a)(b) | | 70,300 | | | 1,542,382 |
Guess?, Inc. | | 36,800 | | | 1,556,640 |
Ross Stores, Inc. | | 34,100 | | | 1,456,411 |
TJX Cos., Inc. | | 58,500 | | | 2,138,175 |
Urban Outfitters, Inc.(b) | | 15,300 | | | 535,347 |
| | | | |
|
|
| | | | | | 8,662,128 |
| | | | |
|
|
Textiles, Apparel & Luxury Goods — 1.1% |
Phillips-Van Heusen Corp. | | 38,800 | | | 1,578,384 |
| | | | |
|
|
Wireless Telecommunication Services — 8.3% |
American Tower Corp. (Class A Stock)(b) | | 76,700 | | | 3,314,207 |
Crown Castle International Corp.(a)(b) | | 91,800 | | | 3,583,872 |
NII Holdings, Inc.(b) | | 149,300 | | | 5,013,494 |
| | | | |
|
|
| | | | | | 11,911,573 |
| | | | |
|
|
TOTAL LONG-TERM INVESTMENTS
(cost $110,161,770) | | | 139,769,918 |
| | | | |
|
|
| | | | | | |
| SHORT-TERM INVESTMENT — 19.9% | |
| | | Shares
| | Value
(Note 2)
| |
| | | | | | | |
Affiliated Money Market Mutual Fund | |
Dryden Core Investment Fund — Taxable Money Market Series (cost $28,451,303; includes $24,152,135 of cash collateral received for securities on loan)(Note 4)(c)(d) | | 28,451,303 | | $ | 28,451,303 | |
| | | | |
|
|
|
TOTAL INVESTMENTS — 117.9%
(cost $138,613,073) | | | 168,221,221 | |
LIABILITIES IN EXCESS OF
OTHER ASSETS — (17.9)% | | | (25,591,586 | ) |
| | | | |
|
|
|
NET ASSETS — 100.0% | | $ | 142,629,635 | |
| | | | |
|
|
|
| (a) | All or a portion of security is on loan. The aggregate market value of such securities is $23,236,592; cash collateral of $24,152,135 (included in liabilities) was received with which the Portfolio purchased highly liquid short-term investments. |
| (b) | Non-income producing security. |
| (c) | Represents security, or a portion thereof, purchased with cash collateral received for securities on loan. |
| (d) | Prudential Investments LLC, the manager of the Portfolio, also serves as manager of the Dryden Core Investment Fund-Taxable Money Market Series. |
Various inputs are used in determining the value of the Portfolio’s investments. These inputs are summarized in the three broad levels listed below.
Level 1—quoted prices in active markets for identical securities
Level 2—other significant observable inputs (including quoted prices for similar securities, interest rates, prepayment speeds, credit risk, etc.)
Level 3—significant unobservable inputs (including the Portfolio’s own assumptions in determining the fair value of investments)
The following is a summary of the inputs used as of December 31, 2009 in valuing the Portfolio’s assets carried at fair value:
| | | | | | | | | |
| | | Level 1
| | Level 2
| | Level 3
|
Investments in Securities | | | | | | | | | |
Common Stocks | | $ | 139,769,918 | | $ | — | | $ | — |
Affiliated Money Market
Mutual Fund | | | 28,451,303 | | | — | | | — |
| | |
|
| |
|
| |
|
|
| | | | 168,221,221 | | | — | | | — |
Other Financial Instruments* | | | — | | | — | | | — |
| | |
|
| |
|
| |
|
|
Total | | $ | 168,221,221 | | $ | — | | $ | — |
| | |
|
| |
|
| |
|
|
| * | Other financial instruments are derivative instruments not reflected in the Schedule of Investments, such as futures, forwards and swap contracts, which are valued at the unrealized appreciation/depreciation on the instrument. |
As of December 31, 2009 and 2008, the Portfolio did not use any significant unobservable inputs (Level 3) in determining the value of investments.
SEE NOTES TO FINANCIAL STATEMENTS.
A26
| | | | | | |
| | | SP PRUDENTIAL U.S. EMERGING GROWTH PORTFOLIO (continued) | | |
| |
| SCHEDULE OF INVESTMENTS | | December 31, 2009 |
The industry classification of portfolio holdings and liabilities in excess of other assets shown as a percentage of net assets as of December 31, 2009 were as follows:
| | | |
Affiliated Money Market Mutual Fund (including 16.9% of collateral received for securities on loan) | | 19.9 | % |
Healthcare Providers & Services | | 8.9 | |
Wireless Telecommunication Services | | 8.3 | |
Specialty Retail | | 6.1 | |
Software | | 5.9 | |
Oil, Gas & Consumable Fuels | | 5.6 | |
Semiconductors & Semiconductor Equipment | | 5.2 | |
Hotels Restaurants & Leisure | | 4.0 | |
IT Services | | 3.3 | |
Food Products | | 3.2 | |
Healthcare Equipment & Supplies | | 3.2 | |
Internet Software & Services | | 3.2 | |
Real Estate Investment Trusts (REITs) | | 3.2 | |
Capital Markets | | 2.8 | |
Electrical Equipment | | 2.7 | |
Electronic Equipment & Instruments | | 2.7 | |
Machinery | | 2.4 | |
Chemicals | | 2.2 | |
Energy Equipment & Services | | 2.1 | |
Life Sciences Tools & Services | | 2.0 | |
Computers & Peripherals | | 1.9 | |
Metals & Mining | | 1.9 | |
Professional Services | | 1.8 | |
Commercial Services & Supplies | | 1.7 | |
Household Products | | 1.7 | |
Aerospace & Defense | | 1.6 | |
Personal Products | | 1.4 | |
Diversified Consumer Services | | 1.3 | |
Textiles, Apparel & Luxury Goods | | 1.1 | |
Air Freight & Logistics | | 1.0 | |
Media | | 1.0 | |
Multiline Retail | | 1.0 | |
Pharmaceuticals | | 1.0 | |
Biotechnology | | 0.9 | |
Insurance | | 0.9 | |
Communications Equipment | | 0.8 | |
| | |
|
|
| | | 117.9 | |
Liabilities in excess of other assets | | (17.9 | ) |
| | |
|
|
| | | 100.0 | % |
| | |
|
|
SEE NOTES TO FINANCIAL STATEMENTS.
A27
| | | | | | |
| | | SP PRUDENTIAL U.S. EMERGING GROWTH PORTFOLIO (continued) | | |
STATEMENT OF ASSETS AND LIABILITIES
December 31, 2009
| | | |
| ASSETS | | | |
Investments, at value including securities on loan of $23,236,592: | | | |
Unaffiliated investments (cost $110,161,770) | | $ | 139,769,918 |
Affiliated investments (cost $28,451,303) | | | 28,451,303 |
Cash | | | 5,384 |
Receivable for investments sold | | | 253,131 |
Dividends and interest receivable | | | 228,023 |
Prepaid expenses | | | 1,380 |
Receivable for Series shares sold | | | 970 |
| | |
|
|
Total Assets | | | 168,710,109 |
| | |
|
|
| LIABILITIES | | | |
Collateral for securities on loan | | | 24,152,135 |
Payable for investments purchased | | | 1,727,287 |
Management fee payable | | | 71,983 |
Accrued expenses and other liabilities | | | 67,041 |
Payable for Series shares repurchased | | | 59,665 |
Deferred trustees’ fees | | | 1,672 |
Affiliated transfer agent fee payable | | | 595 |
Distribution fee payable | | | 60 |
Administration fee payable | | | 36 |
| | |
|
|
Total Liabilities | | | 26,080,474 |
| | |
|
|
| NET ASSETS | | $ | 142,629,635 |
| | |
|
|
Net assets were comprised of: | | | |
Paid-in capital | | $ | 132,736,119 |
Retained earnings | | | 9,893,516 |
| | |
|
|
Net assets, December 31, 2009 | | $ | 142,629,635 |
| | |
|
|
| Class I: | | | |
Net asset value and redemption price per share, $142,345,182 / 22,061,864 outstanding shares of beneficial interest | | $ | 6.45 |
| | |
|
|
| Class II: | | | |
Net asset value and redemption price per share, $284,453 / 45,513 outstanding shares of beneficial interest | | $ | 6.25 |
| | |
|
|
STATEMENT OF OPERATIONS
Year Ended December 31, 2009
| | | | |
| INVESTMENT INCOME | | | | |
Unaffiliated dividend income (net of foreign withholding taxes of $2,052) | | $ | 1,547,662 | |
Affiliated income from securities loaned, net | | | 119,111 | |
Affiliated dividend income | | | 11,764 | |
| | |
|
|
|
| | | | 1,678,537 | |
| | |
|
|
|
| EXPENSES | | | | |
Management fee | | | 735,587 | |
Distribution fee—Class II | | | 607 | |
Administration fee—Class II | | | 364 | |
Custodian’s fees and expenses | | | 46,000 | |
Shareholders’ reports | | | 37,000 | |
Audit fee | | | 17,000 | |
Transfer agent’s fee and expenses (including affiliated expense of $3,600) (Note 4) | | | 10,000 | |
Trustees’ fees | | | 9,000 | |
Legal fees and expenses | | | 5,000 | |
Insurance expenses | | | 3,000 | |
Commitment fee on syndicated credit agreement | | | 2,000 | |
Loan interest expense (Note 8) | | | 18 | |
Miscellaneous | | | 9,647 | |
| | |
|
|
|
Total expenses | | | 875,223 | |
| | |
|
|
|
| NET INVESTMENT INCOME | | | 803,314 | |
| | |
|
|
|
| NET REALIZED AND UNREALIZED GAIN (LOSS) ON INVESTMENTS: | | | | |
Net realized loss on investment transactions | | | (14,201,132 | ) |
Net change in unrealized appreciation (depreciation) on investments | | | 56,597,184 | |
| | |
|
|
|
| NET GAIN ON INVESTMENTS | | | 42,396,052 | |
| | |
|
|
|
| NET INCREASE IN NET ASSETS RESULTING FROM OPERATIONS | | $ | 43,199,366 | |
| | |
|
|
|
STATEMENT OF CHANGES IN NET ASSETS
| | | | | | | | |
| | | Year Ended December 31,
| |
| | | 2009
| | | 2008
| |
| INCREASE (DECREASE) IN NET ASSETS | | | | | | | | |
| OPERATIONS: | | | | | | | | |
Net investment income | | $ | 803,314 | | | $ | 904,839 | |
Net realized loss on investments | | | (14,201,132 | ) | | | (5,949,806 | ) |
Net change in unrealized appreciation (depreciation) on investments | | | 56,597,184 | | | | (63,167,616 | ) |
| | |
|
|
| |
|
|
|
NET INCREASE (DECREASE) IN NET ASSETS RESULTING FROM OPERATIONS | | | 43,199,366 | | | | (68,212,583 | ) |
| | |
|
|
| |
|
|
|
| DISTRIBUTIONS: | | | | | | | | |
Class I | | | (903,679 | ) | | | (28,074,791 | ) |
Class II | | | (638 | ) | | | (52,710 | ) |
| | |
|
|
| |
|
|
|
TOTAL DISTRIBUTIONS | | | (904,317 | ) | | | (28,127,501 | ) |
| | |
|
|
| |
|
|
|
| CAPITAL STOCK TRANSACTIONS (Note 7): | | | | | | | | |
Series shares sold | | | 5,689,964 | | | | 6,076,143 | |
Series shares issued in reinvestment of distributions | | | 904,317 | | | | 28,127,501 | |
Series shares repurchased | | | (18,713,861 | ) | | | (31,617,051 | ) |
| | |
|
|
| |
|
|
|
NET INCREASE (DECREASE) IN NET ASSETS RESULTING FROM SERIES SHARE TRANSACTIONS | | | (12,119,580 | ) | | | 2,586,593 | |
| | |
|
|
| |
|
|
|
| TOTAL INCREASE (DECREASE) IN NET ASSETS | | | 30,175,469 | | | | (93,753,491 | ) |
| NET ASSETS: | | | | | | | | |
Beginning of year | | | 112,454,166 | | | | 206,207,657 | |
| | |
|
|
| |
|
|
|
End of year | | $ | 142,629,635 | | | $ | 112,454,166 | |
| | |
|
|
| |
|
|
|
SEE NOTES TO FINANCIAL STATEMENTS.
A28
| | | | | | |
| | | SP SMALL CAP VALUE PORTFOLIO | | |
| |
| SCHEDULE OF INVESTMENTS | | December 31, 2009 |
| | | | | |
| LONG-TERM INVESTMENTS — 98.2% |
| COMMON STOCKS | | Shares
| | Value
(Note 2)
|
| | | | | | |
Aerospace & Defense — 0.8% | | | | | |
AAR Corp.*(a) | | 34,121 | | $ | 784,101 |
Spirit Aerosystems Holdings, Inc. (Class A Stock)* | | 21,220 | | | 421,429 |
TransDigm Group, Inc. | | 8,429 | | | 400,293 |
| | | | |
|
|
| | | | | | 1,605,823 |
| | | | |
|
|
Airlines — 0.8% | | | | | |
AirTran Holdings, Inc.*(a) | | 243,820 | | | 1,272,741 |
JetBlue Airways Corp.*(a) | | 60,172 | | | 327,937 |
| | | | |
|
|
| | | | | | 1,600,678 |
| | | | |
|
|
Auto Components — 1.6% | | | | | |
Cooper Tire & Rubber Co. | | 83,850 | | | 1,681,193 |
Superior Industries International, Inc. | | 33,230 | | | 508,419 |
TRW Automotive Holdings Corp.* | | 22,680 | | | 541,598 |
WABCO Holdings, Inc. | | 23,400 | | | 603,486 |
| | | | |
|
|
| | | | | | 3,334,696 |
| | | | |
|
|
Automotive Parts — 0.3% | | | | | |
Asbury Automotive Group, Inc.* | | 22,949 | | | 264,602 |
Tenneco, Inc.* | | 18,920 | | | 335,452 |
| | | | |
|
|
| | | | | | 600,054 |
| | | | |
|
|
Banks — 1.5% | | | | | |
Bridge Capital Holdings*(a) | | 8,878 | | | 62,146 |
Dime Community Bancshares | | 16,435 | | | 192,618 |
East West Bancorp, Inc. | | 34,833 | | | 550,361 |
Hancock Holding Co. | | 20,329 | | | 890,207 |
Lakeland Financial Corp. | | 11,040 | | | 190,440 |
Pinnacle Financial Partners, Inc.*(a) | | 29,071 | | | 413,390 |
Sierra Bancorp | | 6,901 | | | 52,655 |
Trico Bancshares | | 16,130 | | | 268,565 |
UMB Financial Corp. | | 14,047 | | | 552,749 |
| | | | |
|
|
| | | | | | 3,173,131 |
| | | | |
|
|
Building Materials — 0.8% | | | | | |
Comfort Systems USA, Inc. | | 90,161 | | | 1,112,587 |
Universal Forest Products, Inc. | | 15,174 | | | 558,555 |
| | | | |
|
|
| | | | | | 1,671,142 |
| | | | |
|
|
Building Products — 0.8% | | | | | |
Gibraltar Industries, Inc.* | | 76,950 | | | 1,210,423 |
Simpson Manufacturing Co., Inc. | | 16,950 | | | 455,786 |
| | | | |
|
|
| | | | | | 1,666,209 |
| | | | |
|
|
Business Services — 0.2% | | | | | |
Resources Connection, Inc.* | | 15,987 | | | 339,244 |
| | | | |
|
|
Capital Markets — 2.4% | | | | | |
Affiliated Managers Group, Inc.*(a) | | 14,110 | | | 950,308 |
Artio Global Investors, Inc.* | | 23,260 | | | 592,897 |
Cohen & Steers, Inc.(a) | | 23,270 | | | 531,487 |
Duff & Phelps Corp. (Class A Stock) | | 36,870 | | | 673,246 |
FBR Capital Markets Corp.* | | 78,400 | | | 484,512 |
HFF, Inc. (Class A Stock)* | | 112,270 | | | 701,688 |
Raymond James Financial, Inc. | | 31,450 | | | 747,567 |
Thomas Weisel Partners Group, Inc.* | | 96,460 | | | 364,619 |
| | | | |
|
|
| | | | | | 5,046,324 |
| | | | |
|
|
Chemicals — 2.7% | | | | | |
Ferro Corp. | | 114,290 | | | 941,750 |
| | | | | |
COMMON STOCKS
(continued) | | Shares
| | Value
(Note 2)
|
| | | | | | |
Chemicals (continued) | | | | | |
Fuller (H.B.) Co. | | 44,480 | | $ | 1,011,920 |
KMG Chemicals, Inc. | | 6,090 | | | 91,045 |
Koppers Holdings, Inc. | | 13,640 | | | 415,202 |
Minerals Technologies, Inc. | | 19,283 | | | 1,050,345 |
PolyOne Corp.* | | 154,533 | | | 1,154,362 |
Rockwood Holdings, Inc.* | | 8,590 | | | 202,380 |
Solutia, Inc.* | | 61,710 | | | 783,717 |
| | | | |
|
|
| | | | | | 5,650,721 |
| | | | |
|
|
Clothing & Apparel — 0.6% | | | | | |
G-III Apparel Group Ltd.* | | 14,310 | | | 310,098 |
Gymboree Corp.*(a) | | 19,185 | | | 834,355 |
| | | | |
|
|
| | | | | | 1,144,453 |
| | | | |
|
|
Commercial Banks — 6.0% | | | | | |
Bancorp, Inc. (The)* | | 187,390 | | | 1,285,495 |
City National Corp.(a) | | 9,940 | | | 453,264 |
CoBiz Financial, Inc. | | 33,703 | | | 160,089 |
Cullen/Frost Bankers, Inc. | | 16,690 | | | 834,500 |
First Security Group, Inc. | | 168,904 | | | 401,992 |
FNB Corp. | | 50,286 | | | 341,442 |
Heritage Financial Corp. | | 10,820 | | | 149,100 |
IBERIABANK Corp. | | 31,414 | | | 1,690,387 |
KeyCorp | | 132,520 | | | 735,486 |
Signature Bank*(a) | | 79,678 | | | 2,541,728 |
Simmons First National Corp. (Class A Stock) | | 7,930 | | | 220,454 |
SVB Financial Group* | | 19,370 | | | 807,535 |
Tompkins Financial Corp. | | 8,340 | | | 337,770 |
Umpqua Holdings Corp. | | 70,760 | | | 948,892 |
Wintrust Financial Corp.(a) | | 48,380 | | | 1,489,620 |
| | | | |
|
|
| | | | | | 12,397,754 |
| | | | |
|
|
Commercial Services — 0.3% | | | | | |
Monro Muffler Brake, Inc. | | 12,469 | | | 416,964 |
On Assignment, Inc.* | | 37,375 | | | 267,231 |
| | | | |
|
|
| | | | | | 684,195 |
| | | | |
|
|
Commercial Services & Supplies — 0.6% | | | | | |
School Specialty, Inc.* | | 15,461 | | | 361,633 |
Team, Inc.* | | 2,890 | | | 54,361 |
United Stationers, Inc.* | | 15,690 | | | 891,976 |
| | | | |
|
|
| | | | | | 1,307,970 |
| | | | |
|
|
Communication Equipment — 1.3% | | | | | |
Bel Fuse, Inc. (Class B Stock) | | 11,940 | | | 256,591 |
Black Box Corp. | | 18,220 | | | 516,355 |
Digi International, Inc.* | | 50,520 | | | 460,742 |
Plantronics, Inc. | | 60,360 | | | 1,568,153 |
| | | | |
|
|
| | | | | | 2,801,841 |
| | | | |
|
|
Computer Hardware — 0.7% | | | | | |
Electronics for Imaging, Inc.* | | 71,720 | | | 933,077 |
MTS Systems Corp. | | 17,318 | | | 497,720 |
| | | | |
|
|
| | | | | | 1,430,797 |
| | | | |
|
|
Computer Services & Software — 1.3% | | | | | |
Avid Technology, Inc.*(a) | | 56,092 | | | 715,734 |
JDA Software Group, Inc.*(a) | | 33,961 | | | 864,987 |
Monotype Imaging Holdings, Inc.* | | 29,113 | | | 262,890 |
SEE NOTES TO FINANCIAL STATEMENTS.
A29
| | | | | | |
| | | SP SMALL CAP VALUE PORTFOLIO (continued) | | |
| |
| SCHEDULE OF INVESTMENTS | | December 31, 2009 |
| | | | | |
COMMON STOCKS
(continued) | | Shares
| | Value
(Note 2)
|
| | | | | | |
Computer Services & Software (continued) |
Parametric Technology Corp.* | | 56,793 | | $ | 927,998 |
| | | | |
|
|
| | | | | | 2,771,609 |
| | | | |
|
|
Computers & Peripherals — 0.2% | | | | | |
Rimage Corp.* | | 18,700 | | | 324,258 |
| | | | |
|
|
Construction — 0.5% | | | | | |
Meritage Homes Corp.* | | 22,200 | | | 429,126 |
Ryland Group, Inc. | | 25,854 | | | 509,324 |
| | | | |
|
|
| | | | | | 938,450 |
| | | | |
|
|
Construction & Engineering — 1.0% | | | | | |
EMCOR Group, Inc.* | | 32,650 | | | 878,285 |
Granite Construction, Inc. | | 6,440 | | | 216,770 |
Michael Baker Corp.* | | 4,090 | | | 169,326 |
Tutor Perini Corp.*(a) | | 44,930 | | | 812,335 |
| | | | |
|
|
| | | | | | 2,076,716 |
| | | | |
|
|
Consumer Finance — 0.2% | | | | | |
First Cash Financial Services, Inc.* | | 15,063 | | | 334,248 |
| | | | |
|
|
Consumer Products & Services — 0.3% | | | | | |
Central Garden & Pet Co.* | | 33,840 | | | 362,088 |
Elizabeth Arden, Inc.* | | 24,523 | | | 354,112 |
| | | | |
|
|
| | | | | | 716,200 |
| | | | |
|
|
Containers & Packaging — 0.3% | | | | | |
AptarGroup, Inc.(a) | | 14,800 | | | 528,952 |
| | | | |
|
|
Distribution/Wholesale — 0.6% | | | | | |
Watsco, Inc. | | 21,341 | | | 1,045,282 |
WESCO International, Inc.*(a) | | 8,970 | | | 242,280 |
| | | | |
|
|
| | | | | | 1,287,562 |
| | | | |
|
|
Diversified Consumer Services — 0.6% | | | | | |
Sotheby’s(a) | | 13,980 | | | 314,270 |
Steiner Leisure Ltd. (Bahamas)* | | 25,910 | | | 1,030,182 |
| | | | |
|
|
| | | | | | 1,344,452 |
| | | | |
|
|
Diversified Financial Services — 1.4% | | | | | |
Boston Private Financial Holdings, Inc. | | 49,740 | | | 287,000 |
E*Trade Financial Corp.*(a) | | 288,160 | | | 504,280 |
Financial Federal Corp. | | 47,885 | | | 1,316,837 |
KBW, Inc.*(a) | | 14,177 | | | 387,883 |
MF Global Ltd. (Bermuda)(a) | | 53,500 | | | 371,825 |
| | | | |
|
|
| | | | | | 2,867,825 |
| | | | |
|
|
Diversified Machinery — 0.2% | | | | | |
Intermec, Inc.* | | 34,699 | | | 446,229 |
| | | | |
|
|
Electric Utilities — 0.9% | | | | | |
Great Plains Energy, Inc. | | 9,870 | | | 191,379 |
MYR Group, Inc.* | | 14,990 | | | 271,019 |
NorthWestern Corp. | | 7,690 | | | 200,094 |
NV Energy, Inc. | | 67,640 | | | 837,383 |
Portland General Electric Co. | | 16,750 | | | 341,868 |
| | | | |
|
|
| | | | | | 1,841,743 |
| | | | |
|
|
Electrical Equipment — 1.3% | | | | | |
EnerSys* | | 20,460 | | | 447,460 |
GrafTech International Ltd.* | | 29,320 | | | 455,926 |
Regal-Beloit Corp. | | 36,290 | | | 1,884,903 |
| | | | |
|
|
| | | | | | 2,788,289 |
| | | | |
|
|
| | | | | |
COMMON STOCKS
(continued) | | Shares
| | Value
(Note 2)
|
| | | | | | |
Electronic Components | | | | | |
Empire District Electric Co. (The) | | 5,161 | | $ | 96,666 |
| | | | |
|
|
Electronic Components & Equipment — 0.3% |
Gentex Corp. | | 18,060 | | | 322,371 |
Watts Water Technologies, Inc. (Class A Stock) | | 13,050 | | | 403,506 |
| | | | |
|
|
| | | | | | 725,877 |
| | | | |
|
|
Electronic Equipment & Instruments — 0.2% |
Littelfuse, Inc.* | | 12,630 | | | 406,054 |
| | | | |
|
|
Energy Equipment & Services — 3.1% | | | | | |
Atlas Energy, Inc. | | 54,290 | | | 1,637,929 |
Dril-Quip, Inc.*(a) | | 14,954 | | | 844,602 |
Gulf Island Fabrication, Inc. | | 29,490 | | | 620,175 |
Hornbeck Offshore Services, Inc.* | | 28,140 | | | 655,099 |
ION Geophysical Corp.* | | 73,350 | | | 434,232 |
Key Energy Services, Inc.* | | 45,100 | | | 396,429 |
Matrix Service Co.* | | 52,330 | | | 557,314 |
National Oilwell Varco, Inc. | | 11,220 | | | 494,690 |
Superior Well Services, Inc.*(a) | | 15,310 | | | 218,321 |
T-3 Energy Services, Inc.* | | 24,740 | | | 630,870 |
| | | | |
|
|
| | | | | | 6,489,661 |
| | | | |
|
|
Entertainment & Leisure — 0.3% | | | | | |
Gaylord Entertainment Co.*(a) | | 27,350 | | | 540,162 |
| | | | |
|
|
Environmental Services — 0.4% | | | | | |
Waste Connections, Inc.* | | 23,656 | | | 788,691 |
| | | | |
|
|
Exchange Traded Funds — 1.9% | | | | | |
iShares Nasdaq Biotechnology Index Fund*(a) | | 13,060 | | | 1,069,222 |
iShares Russell 2000 Value Index Fund(a) | | 50,694 | | | 2,942,280 |
| | | | |
|
|
| | | | | | 4,011,502 |
| | | | |
|
|
Financial — Bank & Trust — 3.1% | | | | | |
Bank of the Ozarks, Inc. | | 24,944 | | | 730,111 |
Capital City Bank Group, Inc.(a) | | 8,600 | | | 119,024 |
First Financial Bankshares, Inc.(a) | | 19,212 | | | 1,041,867 |
FirstMerit Corp. | | 27,896 | | | 561,825 |
Glacier Bancorp, Inc. | | 63,109 | | | 865,856 |
NewAlliance Bancshares, Inc.(a) | | 36,708 | | | 440,863 |
Northwest Bancshares, Inc.(a) | | 14,620 | | | 165,498 |
PacWest Bancorp(a) | | 8,339 | | | 168,031 |
Prosperity Bancshares, Inc. | | 24,618 | | | 996,290 |
Retail Opportunity Investments Corp.* | | 39,620 | | | 400,558 |
S.Y. Bancorp, Inc. | | 3,326 | | | 71,010 |
SCBT Financial Corp. | | 15,879 | | | 439,690 |
Seacoast Banking Corp. of Florida | | 36,731 | | | 59,872 |
Southcoast Financial Corp.* | | 13,375 | | | 43,201 |
Summit State Bank | | 8,712 | | | 45,738 |
Texas Capital Bancshares, Inc.* | | 12,192 | | | 170,200 |
United Community Banks, Inc.* | | 17,048 | | | 57,793 |
WSFS Financial Corp. | | 4,989 | | | 127,868 |
| | | | |
|
|
| | | | | | 6,505,295 |
| | | | |
|
|
Financial — Brokerage | | | | | |
Teton Advisors, Inc. (Class B Stock)* | | 489 | | | — |
| | | | |
|
|
SEE NOTES TO FINANCIAL STATEMENTS.
A30
| | | | | | |
| | | SP SMALL CAP VALUE PORTFOLIO (continued) | | |
| |
| SCHEDULE OF INVESTMENTS | | December 31, 2009 |
| | | | | |
COMMON STOCKS
(continued) | | Shares
| | Value
(Note 2)
|
| | | | | | |
Financial Services — 2.1% | | | | | |
Apollo Investment Corp. | | 51,542 | | $ | 491,195 |
Ares Capital Corp. | | 38,967 | | | 485,139 |
Berkshire Hills Bancorp, Inc. | | 7,071 | | | 146,228 |
BGC Partners, Inc. (Class A Stock) | | 30,606 | | | 141,400 |
Brookline Bancorp, Inc. | | 44,930 | | | 445,256 |
Cypress Sharpridge Investments, Inc.(a) | | 45,097 | | | 609,261 |
Home BancShares, Inc. | | 15,057 | | | 362,422 |
Knight Capital Group, Inc. (Class A Stock)*(a) | | 32,832 | | | 505,613 |
MB Financial, Inc. | | 14,610 | | | 288,109 |
PennantPark Investment Corp. | | 36,537 | | | 325,910 |
RSC Holdings, Inc.* | | 77,183 | | | 543,369 |
| | | | |
|
|
| | | | | | 4,343,902 |
| | | | |
|
|
Food & Staples Retailing — 0.3% | | | | | |
Weis Markets, Inc. | | 15,370 | | | 558,853 |
| | | | |
|
|
Food Products — 0.3% | | | | | |
Sensient Technologies Corp. | | 11,395 | | | 299,688 |
Smithfield Foods, Inc.*(a) | | 23,900 | | | 363,041 |
| | | | |
|
|
| | | | | | 662,729 |
| | | | |
|
|
Foods — 1.4% | | | | | |
American Italian Pasta Co. (Class A Stock)* | | 12,330 | | | 428,961 |
Casey’s General Stores, Inc. | | 38,095 | | | 1,215,992 |
Hain Celestial Group, Inc. (The)* | | 22,480 | | | 382,385 |
Lance, Inc. | | 12,701 | | | 334,036 |
TreeHouse Foods, Inc.* | | 14,770 | | | 573,962 |
| | | | |
|
|
| | | | | | 2,935,336 |
| | | | |
|
|
Gas Utilities — 0.5% | | | | | |
New Jersey Resources Corp. | | 10,910 | | | 408,034 |
Northwest Natural Gas Co. | | 13,330 | | | 600,383 |
| | | | |
|
|
| | | | | | 1,008,417 |
| | | | |
|
|
Healthcare Equipment & Supplies — 0.3% | | | | | |
National Dentex Corp.* | | 52,990 | | | 535,199 |
| | | | |
|
|
Healthcare Products — 0.5% | | | | | |
American Medical Systems Holdings, Inc.*(a) | | 41,952 | | | 809,254 |
Kinetic Concepts, Inc.*(a) | | 6,757 | | | 254,401 |
| | | | |
|
|
| | | | | | 1,063,655 |
| | | | |
|
|
Healthcare Providers & Services — 2.1% | | | | | |
Cross Country Healthcare, Inc.* | | 58,450 | | | 579,240 |
LifePoint Hospitals, Inc.*(a) | | 35,730 | | | 1,161,582 |
Lincare Holdings, Inc.*(a) | | 25,742 | | | 955,543 |
RehabCare Group, Inc.* | | 54,680 | | | 1,663,912 |
| | | | |
|
|
| | | | | | 4,360,277 |
| | | | |
|
|
Healthcare Services — 1.1% | | | | | |
Amedisys, Inc.*(a) | | 27,581 | | | 1,339,333 |
Hill-Rom Holdings, Inc. | | 14,886 | | | 357,115 |
Psychiatric Solutions, Inc.* | | 26,210 | | | 554,080 |
| | | | |
|
|
| | | | | | 2,250,528 |
| | | | |
|
|
Healthcare Technology — 0.1% | | | | | |
MedQuist, Inc. | | 17,500 | | | 117,075 |
| | | | |
|
|
| | | | | |
COMMON STOCKS
(continued) | | Shares
| | Value
(Note 2)
|
| | | | | | |
Hotels, Restaurants & Leisure — 0.5% | | | | | |
Ameristar Casinos, Inc. | | 27,480 | | $ | 418,520 |
Brinker International, Inc. | | 13,140 | | | 196,049 |
CKE Restaurants, Inc. | | 49,100 | | | 415,386 |
Morgans Hotel Group Co.* | | 18,810 | | | 85,209 |
| | | | |
|
|
| | | | | | 1,115,164 |
| | | | |
|
|
Household Products — 0.3% | | | | | |
Central Garden & Pet Co. (Class A Stock)* | | 70,490 | | | 700,671 |
| | | | |
|
|
Insurance — 5.7% | | | | | |
Allied World Assurance Co. Holdings Ltd. (Bermuda) | | 31,020 | | | 1,429,091 |
Ambac Financial Group, Inc.*(a) | | 60,415 | | | 50,144 |
American Equity Investment Life Holding Co. | | 124,486 | | | 926,176 |
Arch Capital Group Ltd. (Bermuda)* | | 10,500 | | | 751,275 |
Aspen Insurance Holdings Ltd. (Bermuda) | | 18,954 | | | 482,379 |
Assured Guaranty Ltd. (Bermuda) | | 11,918 | | | 259,336 |
CNA Surety Corp.* | | 48,752 | | | 725,917 |
Donegal Group, Inc. | | 16,623 | | | 258,321 |
EMC Insurance Group, Inc. | | 22,660 | | | 487,417 |
Max Capital Group Ltd. (Bermuda) | | 42,643 | | | 950,939 |
Meadowbrook Insurance Group, Inc. | | 302,907 | | | 2,241,512 |
MGIC Investment Corp.*(a) | | 33,340 | | | 192,705 |
PMI Group, Inc. (The)* | | 19,880 | | | 50,098 |
ProAssurance Corp.* | | 18,925 | | | 1,016,462 |
RLI Corp. | | 12,468 | | | 663,921 |
Tower Group, Inc. | | 31,851 | | | 745,632 |
Zenith National Insurance Corp. | | 23,180 | | | 689,837 |
| | | | |
|
|
| | | | | | 11,921,162 |
| | | | |
|
|
Internet & Catalog Retail — 0.3% | | | | | |
HSN, Inc.* | | 26,310 | | | 531,199 |
| | | | |
|
|
Iron / Steel — 0.4% | | | | | |
Olympic Steel, Inc. | | 24,477 | | | 797,461 |
| | | | |
|
|
Leisure Equipment & Products — 0.8% | | | | | |
Callaway Golf Co.(a) | | 167,595 | | | 1,263,666 |
Pool Corp.(a) | | 22,481 | | | 428,938 |
| | | | |
|
|
| | | | | | 1,692,604 |
| | | | |
|
|
Life Science Tools & Services — 0.1% | | | | | |
Enzo Biochem, Inc.* | | 36,080 | | | 194,110 |
| | | | |
|
|
Machinery — 4.3% | | | | | |
AGCO Corp.* | | 28,500 | | | 921,690 |
Albany International Corp. (Class A Stock) | | 43,480 | | | 976,561 |
Altra Holdings, Inc.* | | 116,280 | | | 1,436,058 |
IDEX Corp. | | 14,340 | | | 446,691 |
Kaydon Corp. | | 22,210 | | | 794,230 |
Mueller Water Products, Inc. (Class A Stock) | | 253,420 | | | 1,317,784 |
RBC Bearings, Inc.*(a) | | 48,760 | | | 1,186,331 |
Snap-on, Inc. | | 19,610 | | | 828,718 |
Wabtec Corp. | | 24,320 | | | 993,229 |
| | | | |
|
|
| | | | | | 8,901,292 |
| | | | |
|
|
SEE NOTES TO FINANCIAL STATEMENTS.
A31
| | | | | | |
| | | SP SMALL CAP VALUE PORTFOLIO (continued) | | |
| |
| SCHEDULE OF INVESTMENTS | | December 31, 2009 |
| | | | | |
COMMON STOCKS
(continued) | | Shares
| | Value
(Note 2)
|
| | | | | | |
Machinery & Equipment — 1.8% | | | | | |
Actuant Corp. (Class A Stock) | | 62,408 | | $ | 1,156,420 |
Applied Industrial Technologies, Inc. | | 44,942 | | | 991,870 |
Franklin Electric Co., Inc. | | 9,035 | | | 262,738 |
Graco, Inc. | | 20,070 | | | 573,400 |
Robbins & Myers, Inc. | | 15,670 | | | 368,558 |
Tennant Co. | | 18,224 | | | 477,287 |
| | | | |
|
|
| | | | | | 3,830,273 |
| | | | |
|
|
Marine — 0.4% | | | | | |
Kirby Corp.*(a) | | 25,950 | | | 903,838 |
| | | | |
|
|
Medical Supplies & Equipment — 0.4% | | | | | |
Cardiac Science Corp.* | | 88,386 | | | 197,101 |
Symmetry Medical, Inc.* | | 72,016 | | | 580,449 |
| | | | |
|
|
| | | | | | 777,550 |
| | | | |
|
|
Metals & Mining — 3.2% | | | | | |
Carpenter Technology Corp. | | 15,920 | | | 429,044 |
Cliffs Natural Resources, Inc. | | 6,230 | | | 287,141 |
Commercial Metals Co. | | 56,563 | | | 885,211 |
Haynes International, Inc. | | 35,286 | | | 1,163,379 |
Horsehead Holding Corp.* | | 37,610 | | | 479,527 |
Kaiser Aluminum Corp. | | 46,734 | | | 1,945,069 |
Mueller Industries, Inc. | | 50,865 | | | 1,263,487 |
Schnitzer Steel Industries, Inc. (Class A Stock) | | 4,490 | | | 214,173 |
| | | | |
|
|
| | | | | | 6,667,031 |
| | | | |
|
|
Multi-Utilities — 0.1% | | | | | |
CMS Energy Corp.(a) | | 16,250 | | | 254,475 |
| | | | |
|
|
Oil, Gas & Consumable Fuels — 3.5% | | | | | |
Bill Barrett Corp.* | | 30,660 | | | 953,833 |
Brigham Exploration Co.* | | 51,216 | | | 693,977 |
Carrizo Oil & Gas, Inc.*(a) | | 17,750 | | | 470,197 |
Denbury Resources, Inc.*(a) | | 32,000 | | | 473,600 |
Golar LNG Ltd. (Bermuda)* | | 9,630 | | | 123,457 |
Laclede Group, Inc. (The) | | 4,650 | | | 157,030 |
Oil States International, Inc.*(a) | | 9,989 | | | 392,468 |
Petroquest Energy, Inc.*(a) | | 38,920 | | | 238,580 |
Resolute Energy Corp.* | | 69,170 | | | 796,838 |
Rex Energy Corp.* | | 85,871 | | | 1,030,452 |
Rosetta Resources, Inc.* | | 28,940 | | | 576,774 |
South Jersey Industries, Inc. | | 1,790 | | | 68,342 |
Southwest Gas Corp. | | 27,310 | | | 779,154 |
St. Mary Land & Exploration Co. | | 14,190 | | | 485,866 |
| | | | |
|
|
| | | | | | 7,240,568 |
| | | | |
|
|
Paper & Forest Products — 0.2% | | | | | |
Louisiana-Pacific Corp.*(a) | | 49,220 | | | 343,556 |
| | | | |
|
|
Professional Services — 0.9% | | | | | |
CDI Corp. | | 480 | | | 6,216 |
COMSYS IT Partners, Inc.* | | 35,290 | | | 313,728 |
Korn/Ferry International*(a) | | 14,360 | | | 236,940 |
TrueBlue, Inc.* | | 52,230 | | | 773,526 |
Watson Wyatt Worldwide, Inc. (Class A Stock)* | | 11,720 | | | 556,935 |
| | | | |
|
|
| | | | | | 1,887,345 |
| | | | |
|
|
| | | | | |
COMMON STOCKS
(continued) | | Shares
| | Value
(Note 2)
|
| | | | | | |
Real Estate Investment Trusts — 7.2% | | | | | |
Acadia Realty Trust | | 38,692 | | $ | 652,734 |
American Campus Communities, Inc. | | 55,911 | | | 1,571,099 |
BioMed Realty Trust, Inc.(a) | | 113,555 | | | 1,791,898 |
Cogdell Spencer, Inc. | | 55,010 | | | 311,357 |
Corporate Office Properties Trust | | 5,250 | | | 192,307 |
Cousins Properties, Inc. | | 35,129 | | | 268,034 |
Digital Realty Trust, Inc.(a) | | 16,972 | | | 853,352 |
EastGroup Properties, Inc. | | 5,220 | | | 199,822 |
Entertainment Properties Trust(a) | | 32,829 | | | 1,157,879 |
Hatteras Financial Corp. | | 10,470 | | | 292,741 |
LaSalle Hotel Properties(a) | | 64,010 | | | 1,358,932 |
MFA Financial, Inc. | | 118,370 | | | 870,019 |
Mid-America Apartment Communities, Inc. | | 16,810 | | | 811,587 |
National Retail Properties, Inc.(a) | | 56,898 | | | 1,207,376 |
Omega Healthcare Investors, Inc.(a) | | 55,773 | | | 1,084,785 |
Parkway Properties, Inc. | | 56,228 | | | 1,170,667 |
Pebblebrook Hotel Trust* | | 29,760 | | | 655,018 |
Saul Centers, Inc. | | 5,400 | | | 176,904 |
Senior Housing Properties Trust(a) | | 10,060 | | | 220,012 |
Washington Real Estate Investment Trust | | 6,830 | | | 188,166 |
| | | | |
|
|
| | | | | | 15,034,689 |
| | | | |
|
|
Real Estate Management & Development — 1.1% | | | |
CB Richard Ellis Group, Inc.
(Class A Stock)*(a) | | 46,420 | | | 629,919 |
Jones Lang LaSalle, Inc. | | 27,630 | | | 1,668,852 |
| | | | |
|
|
| | | | | | 2,298,771 |
| | | | |
|
|
Restaurants — 0.6% | | | | | |
California Pizza Kitchen, Inc.* | | 73,084 | | | 982,980 |
CEC Entertainment, Inc.*(a) | | 10,519 | | | 335,766 |
| | | | |
|
|
| | | | | | 1,318,746 |
| | | | |
|
|
Retail & Merchandising — 1.6% | | | | | |
Aaron’s, Inc.(a) | | 23,826 | | | 660,695 |
Big Lots, Inc.* | | 13,435 | | | 389,346 |
Finish Line, Inc. (The) (Class A Stock) | | 51,958 | | | 652,073 |
Hibbett Sports, Inc.*(a) | | 20,690 | | | 454,973 |
Jo-Ann Stores, Inc.* | | 28,750 | | | 1,041,900 |
Pantry, Inc. (The)* | | 15,480 | | | 210,373 |
| | | | |
|
|
| | | | | | 3,409,360 |
| | | | |
|
|
Road & Rail — 1.1% | | | | | |
Genesee & Wyoming, Inc. (Class A Stock)* | | 29,370 | | | 958,637 |
J.B. Hunt Transport Services, Inc. | | 22,020 | | | 710,585 |
Landstar System, Inc. | | 13,580 | | | 526,497 |
| | | | |
|
|
| | | | | | 2,195,719 |
| | | | |
|
|
Semiconductors & Semiconductor Equipment — 4.8% |
ATMI, Inc.*(a) | | 18,217 | | | 339,201 |
Emulex Corp.* | | 51,348 | | | 559,693 |
Entegris, Inc.* | | 252,110 | | | 1,331,141 |
Exar Corp.* | | 116,313 | | | 826,985 |
Fairchild Semiconductor International,
Inc.* | | 160,817 | | | 1,606,562 |
Micrel, Inc. | | 50,980 | | | 418,036 |
SEE NOTES TO FINANCIAL STATEMENTS.
A32
| | | | | | |
| | | SP SMALL CAP VALUE PORTFOLIO (continued) | | |
| |
| SCHEDULE OF INVESTMENTS | | December 31, 2009 |
| | | | | |
COMMON STOCKS
(continued) | | Shares
| | Value
(Note 2)
|
| | | | | | |
Semiconductors & Semiconductor Equipment (continued) |
MKS Instruments, Inc.* | | 31,989 | | $ | 556,929 |
Omnivision Technologies, Inc.* | | 36,440 | | | 529,473 |
ON Semiconductor Corp.* | | 115,890 | | | 1,020,991 |
Semtech Corp.* | | 36,446 | | | 619,946 |
Varian Semiconductor Equipment Associates, Inc.*(a) | | 29,590 | | | 1,061,689 |
Verigy Ltd. (Singapore)* | | 94,620 | | | 1,217,759 |
| | | | |
|
|
| | | | | | 10,088,405 |
| | | | |
|
|
Software — 1.9% | | | | | |
Citrix Systems, Inc.*(a) | | 33,900 | | | 1,410,579 |
EPIQ Systems, Inc.*(a) | | 24,680 | | | 345,273 |
Lawson Software, Inc.* | | 212,310 | | | 1,411,862 |
McAfee, Inc.* | | 18,560 | | | 752,979 |
| | | | |
|
|
| | | | | | 3,920,693 |
| | | | |
|
|
Specialty Retail — 2.0% | | | | | |
AnnTaylor Stores Corp.* | | 26,100 | | | 356,004 |
Cato Corp. (The) (Class A Stock) | | 55,590 | | | 1,115,135 |
Children’s Place Retail Stores, Inc. (The)*(a) | | 31,353 | | | 1,034,963 |
Jos. A. Bank Clothiers, Inc.*(a) | | 11,750 | | | 495,732 |
MarineMax, Inc.* | | 63,830 | | | 586,598 |
Williams-Sonoma, Inc. | | 22,950 | | | 476,901 |
| | | | |
|
|
| | | | | | 4,065,333 |
| | | | |
|
|
Telecommunications — 1.5% | | | | | |
ADC Telecommunications, Inc.* | | 60,722 | | | 377,084 |
Anixter International, Inc.* | | 21,600 | | | 1,017,360 |
Knology, Inc.* | | 40,632 | | | 444,920 |
Polycom, Inc.*(a) | | 25,789 | | | 643,951 |
Premiere Global Services, Inc.* | | 78,460 | | | 647,295 |
| | | | |
|
|
| | | | | | 3,130,610 |
| | | | |
|
|
Textiles — 0.3% | | | | | |
G & K Services, Inc. (Class A Stock) | | 23,622 | | | 593,621 |
| | | | |
|
|
Textiles, Apparel & Luxury Goods — 1.6% |
Fossil, Inc.* | | 37,218 | | | 1,249,036 |
Hanesbrands, Inc.* | | 48,410 | | | 1,167,165 |
Timberland Co. (Class A Stock)*(a) | | 54,680 | | | 980,413 |
| | | | |
|
|
| | | | | | 3,396,614 |
| | | | |
|
|
Thrifts & Mortgage Finance — 0.3% |
First Financial Holdings, Inc. | | 15,750 | | | 204,592 |
Westfield Financial, Inc. | | 47,080 | | | 388,410 |
| | | | |
|
|
| | | | | | 593,002 |
| | | | |
|
|
Trading Companies & Distributors — 0.4% | | | |
Beacon Roofing Supply, Inc.* | | 29,046 | | | 464,736 |
Rush Enterprises, Inc. (Class A Stock)* | | 34,250 | | | 407,232 |
| | | | |
|
|
| | | | | | 871,968 |
| | | | |
|
|
Transportation — 0.5% | | | | | |
Aegean Marine Petroleum Network, Inc. (Marshall Island) | | 34,066 | | | 936,134 |
| | | | |
|
|
Utilities — 2.2% | | | | | |
CH Energy Group, Inc. | | 1,460 | | | 62,079 |
Cleco Corp. | | 37,204 | | | 1,016,784 |
El Paso Electric Co.* | | 94,498 | | | 1,916,420 |
MGE Energy, Inc. | | 13,168 | | | 470,624 |
| | | | | | |
COMMON STOCKS
(continued) | | Shares
| | Value
(Note 2)
| |
| | | | | | | |
Utilities (continued) | | | | | | |
UniSource Energy Corp. | | 10,230 | | $ | 329,304 | |
Westar Energy, Inc. | | 33,662 | | | 731,139 | |
| | | | |
|
|
|
| | | | | | 4,526,350 | |
| | | | |
|
|
|
TOTAL LONG-TERM INVESTMENTS
(cost $182,497,351) | | | 204,259,758 | |
| | | | |
|
|
|
| SHORT-TERM INVESTMENT — 20.4% | |
AFFILIATED MONEY MARKET MUTUAL FUND | |
Dryden Core Investment Fund —
Taxable Money Market Series (cost $42,474,932; includes $38,830,952 of cash collateral for securities on loan)(b)(w)(Note 4) | | 42,474,932 | | | 42,474,932 | |
| | | | |
|
|
|
TOTAL INVESTMENTS(o) — 118.6%
(cost $224,972,283) | | | | | 246,734,690 | |
LIABILITIES IN EXCESS OF OTHER ASSETS — (18.6)% | | | | | (38,709,290 | ) |
| | | | |
|
|
|
NET ASSETS — 100.0% | | | | $ | 208,025,400 | |
| | | | |
|
|
|
| * | Non-income producing security. |
| (a) | All or a portion of security is on loan. The aggregate market value of such securities is $37,201,303; cash collateral of $38,830,952 (included with liabilities) was received with which the Portfolio purchased highly liquid short-term investments. |
| (b) | Represents security, or a portion thereof, purchased with cash collateral received for securities on loan. |
| (o) | As of December 31, 2009, one security representing $0 and 0% of net assets was fair valued in accordance with the policies adopted by the Board of Trustees. |
| (w) | Prudential Investments LLC, the manager of the Portfolio, also serves as manager of the Dryden Core Investment Fund-Taxable Money Market Series. |
Various inputs are used in determining the value of the Portfolio’s investments. These inputs are summarized in the three broad levels listed below.
Level 1—quoted prices in active markets for identical securities
Level 2—other significant observable inputs (including quoted prices for similar securities, interest rates, prepayment speeds, credit risk, etc.)
Level 3—significant unobservable inputs (including the Portfolio’s own assumptions in determining the fair value of investments)
The following is a summary of the inputs used as of December 31, 2009 in valuing the Portfolio’s assets carried at fair value:
| | | | | | | | | |
| | | Level 1
| | Level 2
| | Level 3
|
Investments in Securities | | | | | | | | | |
Common Stocks | | $ | 204,259,758 | | $ | — | | $ | — |
Affiliated Money Market Mutual Fund | | | 42,474,932 | | | — | | | — |
| | |
|
| |
|
| |
|
|
| | | | 246,734,690 | | | — | | | — |
Other Financial Instuments* | | | — | | | — | | | — |
| | |
|
| |
|
| |
|
|
Total | | $ | 246,734,690 | | $ | — | | $ | — |
| | |
|
| |
|
| |
|
|
| * | Other financial instruments are derivative instruments not reflected in the Schedule of Investments, such as futures, forwards and swap contracts, which are valued at the unrealized appreciation/depreciation on the instrument. |
SEE NOTES TO FINANCIAL STATEMENTS.
A33
| | | | | | |
| | | SP SMALL CAP VALUE PORTFOLIO (continued) | | |
| |
| SCHEDULE OF INVESTMENTS | | December 31, 2009 |
As of December 31, 2008, the Portfolio did not use any significant unobservable inputs (Level 3) in determining the value of investments. As of December 31, 2009, the Portfolio had one Level 3 security with a fair value of $0.
The industry classification of investments and liabilities in excess of other assets shown as a percentage of net assets as of December 31, 2009 were as follows:
| | | |
Affiliated Money Market Mutual Fund (18.7% represents investments purchased with collateral from securities on loan) | | 20.4 | % |
Real Estate Investment Trusts | | 7.2 | |
Commercial Banks | | 6.0 | |
Insurance | | 5.7 | |
Semiconductors & Semiconductor Equipment | | 4.8 | |
Machinery | | 4.3 | |
Oil, Gas & Consumable Fuels | | 3.5 | |
Metals & Mining | | 3.2 | |
Financial—Bank & Trust | | 3.1 | |
Energy Equipment & Services | | 3.1 | |
Chemicals | | 2.7 | |
Capital Markets | | 2.4 | |
Utilities | | 2.2 | |
Healthcare Providers & Services | | 2.1 | |
Financial Services | | 2.1 | |
Specialty Retail | | 2.0 | |
Exchange Traded Funds | | 1.9 | |
Software | | 1.9 | |
Machinery & Equipment | | 1.8 | |
Retail & Merchandising | | 1.6 | |
Textiles, Apparel & Luxury Goods | | 1.6 | |
Auto Components | | 1.6 | |
Banks | | 1.5 | |
Telecommunications | | 1.5 | |
Foods | | 1.4 | |
Diversified Financial Services | | 1.4 | |
Communication Equipment | | 1.3 | |
Electrical Equipment | | 1.3 | |
Computer Services & Software | | 1.3 | |
Real Estate Management & Development | | 1.1 | |
Healthcare Services | | 1.1 | |
Road & Rail | | 1.1 | |
Construction & Engineering | | 1.0 | |
Professional Services | | 0.9 | |
Electric Utilities | | 0.9 | |
Leisure Equipment & Products | | 0.8 | |
| | | |
Building Materials | | 0.8 | % |
Building Products | | 0.8 | |
Aerospace & Defense | | 0.8 | |
Airlines | | 0.8 | |
Computer Hardware | | 0.7 | |
Diversified Consumer Services | | 0.6 | |
Restaurants | | 0.6 | |
Commercial Services & Supplies | | 0.6 | |
Distribution/Wholesale | | 0.6 | |
Clothing & Apparel | | 0.6 | |
Hotels, Restaurants & Leisure | | 0.5 | |
Healthcare Products | | 0.5 | |
Gas Utilities | | 0.5 | |
Construction | | 0.5 | |
Transportation | | 0.5 | |
Marine | | 0.4 | |
Trading Companies & Distributors | | 0.4 | |
Iron/Steel | | 0.4 | |
Environmental Services | | 0.4 | |
Medical Supplies & Equipment | | 0.4 | |
Electronic Components & Equipment | | 0.3 | |
Consumer Products & Services | | 0.3 | |
Household Products | | 0.3 | |
Commercial Services | | 0.3 | |
Food Products | | 0.3 | |
Automotive Parts | | 0.3 | |
Textiles | | 0.3 | |
Thrifts & Mortgage Finance | | 0.3 | |
Food & Staples Retailing | | 0.3 | |
Entertainment & Leisure | | 0.3 | |
Healthcare Equipment & Supplies | | 0.3 | |
Internet & Catalog Retail | | 0.3 | |
Containers & Packaging | | 0.3 | |
Diversified Machinery | | 0.2 | |
Electronic Equipment & Instruments | | 0.2 | |
Paper & Forest Products | | 0.2 | |
Business Services | | 0.2 | |
Consumer Finance | | 0.2 | |
Computers & Peripherals | | 0.2 | |
Multi-Utilities | | 0.1 | |
Life Science Tools & Services | | 0.1 | |
Healthcare Technology | | 0.1 | |
| | |
|
|
| | | 118.6 | |
Liabilities in excess of other assets | | (18.6 | ) |
| | |
|
|
| | | 100.0 | % |
| | |
|
|
SEE NOTES TO FINANCIAL STATEMENTS.
A34
| | | | | | |
| | | SP SMALL CAP VALUE PORTFOLIO (continued) | | |
STATEMENT OF ASSETS AND LIABILITIES
December 31, 2009
| | | | |
ASSETS | | | | |
Investments at value, including securities on loan of $37,201,303: | | | | |
Unaffiliated investments (cost $182,497,351) | | $ | 204,259,758 | |
Affiliated investments (cost $42,474,932) | | | 42,474,932 | |
Receivable for investments sold | | | 1,108,425 | |
Dividends receivable | | | 280,367 | |
Prepaid expenses | | | 4,473 | |
Receivable for Series shares sold | | | 430 | |
| | |
|
|
|
Total Assets | | | 248,128,385 | |
| | |
|
|
|
LIABILITIES | | | | |
Collateral for securities on loan | | | 38,830,952 | |
Payable for investments purchased | | | 869,087 | |
Management fee payable | | | 155,835 | |
Accrued expenses and other liabilities | | | 93,579 | |
Payable to custodian | | | 88,970 | |
Payable for Series shares repurchased | | | 62,218 | |
Deferred trustees’ fees | | | 1,749 | |
Affiliated transfer agent fees payable | | | 595 | |
| | |
|
|
|
Total Liabilities | | | 40,102,985 | |
| | |
|
|
|
NET ASSETS | | $ | 208,025,400 | |
| | |
|
|
|
Net assets were comprised of: | | | | |
Paid-in capital | | $ | 241,254,185 | |
Retained earnings | | | (33,228,785 | ) |
| | |
|
|
|
Net assets, December 31, 2009 | | $ | 208,025,400 | |
| | |
|
|
|
Net asset value and redemption price per share, $208,025,400 / 21,245,444 outstanding shares of beneficial interest | | $ | 9.79 | |
| | |
|
|
|
STATEMENT OF OPERATIONS
Year Ended December 31, 2009
| | | | |
INVESTMENT INCOME | | | | |
Unaffiliated dividend income (net of $1,367 foreign withholding tax) | | $ | 3,129,216 | |
Affiliated income from securities lending, net | | | 192,971 | |
Affiliated dividend income | | | 19,563 | |
| | |
|
|
|
| | | | 3,341,750 | |
| | |
|
|
|
EXPENSES | | | | |
Management fee | | | 1,775,887 | |
Custodian’s fees and expenses | | | 100,000 | |
Shareholders’ reports | | | 35,000 | |
Audit fee | | | 20,000 | |
Trustees’ fees | | | 11,000 | |
Transfer agent’s fees and expenses (including affiliated expense of $3,600) (Note 4) | | | 10,000 | |
Legal fees and expenses | | | 5,000 | |
Insurance expenses | | | 4,000 | |
Commitment fee on syndicated credit agreement | | | 3,000 | |
Loan interest expense (Note 8) | | | 16 | |
Miscellaneous | | | 4,652 | |
| | |
|
|
|
Total expenses | | | 1,968,555 | |
| | |
|
|
|
NET INVESTMENT INCOME | | | 1,373,195 | |
| | |
|
|
|
NET REALIZED AND UNREALIZED GAIN (LOSS) ON INVESTMENTS | | | | |
Net realized loss on investment transactions | | | (33,228,182 | ) |
Net change in unrealized appreciation on investments | | | 85,129,259 | |
| | |
|
|
|
NET GAIN ON INVESTMENTS | | | 51,901,077 | |
| | |
|
|
|
NET INCREASE IN NET ASSETS RESULTING FROM OPERATIONS | | $ | 53,274,272 | |
| | |
|
|
|
STATEMENT OF CHANGES IN NET ASSETS
| | | | | | | | |
| | | Year Ended December 31,
| |
| | | 2009
| | | 2008
| |
INCREASE (DECREASE) IN NET ASSETS | | | | | | | | |
OPERATIONS: | | | | | | | | |
Net investment income | | $ | 1,373,195 | | | $ | 3,030,798 | |
Net realized loss on investment transactions | | | (33,228,182 | ) | | | (22,100,237 | ) |
Net change in unrealized appreciation (depreciation) on investments | | | 85,129,259 | | | | (63,567,798 | ) |
| | |
|
|
| |
|
|
|
NET INCREASE (DECREASE) IN NET ASSETS RESULTING FROM OPERATIONS | | | 53,274,272 | | | | (82,637,237 | ) |
| | |
|
|
| |
|
|
|
DISTRIBUTIONS | | | (3,031,501 | ) | | | (30,200,109 | ) |
| | |
|
|
| |
|
|
|
SERIES SHARE TRANSACTIONS: | | | | | | | | |
Series shares sold [1,174,838 and 4,858,589 shares, respectively] | | | 9,089,265 | | | | 41,844,195 | |
Series shares issued in reinvestment of distributions [384,221 and 2,801,494 shares, respectively] | | | 3,031,501 | | | | 30,200,109 | |
Series shares repurchased [6,912,276 and 6,373,598 shares, respectively] | | | (56,495,635 | ) | | | (66,485,501 | ) |
| | |
|
|
| |
|
|
|
INCREASE (DECREASE) IN NET ASSETS RESULTING FROM SERIES SHARE TRANSACTIONS | | | (44,374,869 | ) | | | 5,558,803 | |
| | |
|
|
| |
|
|
|
TOTAL INCREASE (DECREASE) IN NET ASSETS | | | 5,867,902 | | | | (107,278,543 | ) |
NET ASSETS: | | | | | | | | |
Beginning of year | | | 202,157,498 | | | | 309,436,041 | |
| | |
|
|
| |
|
|
|
End of year | | $ | 208,025,400 | | | $ | 202,157,498 | |
| | |
|
|
| |
|
|
|
SEE NOTES TO FINANCIAL STATEMENTS.
A35
| | | | | | |
| | | SP STRATEGIC PARTNERS FOCUSED GROWTH PORTFOLIO | | |
| |
| SCHEDULE OF INVESTMENTS | | December 31, 2009 |
| | | | | |
| LONG-TERM INVESTMENTS — 99.3% |
| COMMON STOCKS | | Shares
| | Value
(Note 2)
|
| | | | | | |
Beverages — 1.5% | | | | | |
Anheuser-Busch InBev NV, ADR (Belgium)* | | 6,600 | | $ | 343,398 |
PepsiCo, Inc. | | 5,315 | | | 323,152 |
| | | | |
|
|
| | | | | | 666,550 |
| | | | |
|
|
Biotechnology — 4.4% | | | | | |
Celgene Corp.* | | 23,925 | | | 1,332,144 |
Gilead Sciences, Inc.* | | 13,375 | | | 578,870 |
| | | | |
|
|
| | | | | | 1,911,014 |
| | | | |
|
|
Capital Markets — 6.3% | | | | | |
Blackstone Group LP (The) | | 28,148 | | | 369,302 |
Franklin Resources, Inc. | | 4,000 | | | 421,400 |
Goldman Sachs Group, Inc. (The) | | 11,800 | | | 1,992,312 |
| | | | |
|
|
| | | | | | 2,783,014 |
| | | | |
|
|
Communication Equipment — 6.2% | | | | | |
Cisco Systems, Inc.* | | 24,650 | | | 590,121 |
QUALCOMM, Inc. | | 46,450 | | | 2,148,777 |
| | | | |
|
|
| | | | | | 2,738,898 |
| | | | |
|
|
Computers & Peripherals — 15.5% | | | | | |
Apple, Inc.* | | 14,787 | | | 3,117,987 |
Hewlett-Packard Co. | | 42,625 | | | 2,195,614 |
NetApp, Inc.* | | 42,800 | | | 1,471,892 |
| | | | |
|
|
| | | | | | 6,785,493 |
| | | | |
|
|
Diversified Financial Services — 3.0% | | | | | |
Bank of America Corp. | | 32,800 | | | 493,968 |
JPMorgan Chase & Co. | | 19,800 | | | 825,066 |
| | | | |
|
|
| | | | | | 1,319,034 |
| | | | |
|
|
Electrical Equipment — 0.4% | | | | | |
Vestas Wind Systems A/S (Denmark)* | | 8,400 | | | 170,520 |
| | | | |
|
|
Energy Equipment & Services — 4.8% | | | | | |
Schlumberger Ltd. (Netherlands) | | 32,700 | | | 2,128,443 |
| | | | |
|
|
Food & Staples Retailing — 1.2% | | | | | |
Costco Wholesale Corp. | | 8,650 | | | 511,820 |
| | | | |
|
|
Food Products — 2.2% | | | | | |
Unilever PLC, ADR (United Kingdom) | | 30,000 | | | 957,000 |
| | | | |
|
|
Healthcare Equipment & Supplies — 4.7% | | | | | |
Alcon, Inc. (Switzerland) | | 12,600 | | | 2,070,810 |
| | | | |
|
|
Healthcare Providers & Services — 3.9% | | | | | |
Medco Health Solutions, Inc.* | | 26,755 | | | 1,709,912 |
| | | | |
|
|
Internet & Catalog Retail — 3.9% | | | | | |
Amazon.com, Inc.* | | 12,700 | | | 1,708,404 |
| | | | |
|
|
Internet Software & Services — 10.0% | | | | | |
Baidu, Inc., ADR (Cayman Islands)* | | 3,504 | | | 1,440,950 |
Google, Inc. (Class A Stock)* | | 4,740 | | | 2,938,705 |
| | | | |
|
|
| | | | | | 4,379,655 |
| | | | |
|
|
IT Services — 6.1% | | | | | |
MasterCard, Inc. (Class A Stock) | | 5,300 | | | 1,356,694 |
Visa, Inc. (Class A Stock) | | 15,200 | | | 1,329,392 |
| | | | |
|
|
| | | | | | 2,686,086 |
| | | | |
|
|
| | | | | |
COMMON STOCKS
(continued) | | Shares
| | Value
(Note 2)
|
| | | | | | |
Machinery — 2.8% | | | | | |
Danaher Corp. | | 7,390 | | $ | 555,728 |
Illinois Tool Works, Inc. | | 13,900 | | | 667,061 |
| | | | |
|
|
| | | | | | 1,222,789 |
| | | | |
|
|
Media — 0.6% | | | | | |
Comcast Corp. (Class A Stock) | | 14,800 | | | 249,528 |
| | | | |
|
|
Metals & Mining — 1.2% | | | | | |
ArcelorMittal (Luxembourg) | | 11,300 | | | 516,975 |
| | | | |
|
|
Multi-Line Retail — 1.6% | | | | | |
Kohl’s Corp.* | | 7,900 | | | 426,047 |
Target Corp. | | 6,000 | | | 290,220 |
| | | | |
|
|
| | | | | | 716,267 |
| | | | |
|
|
Oil, Gas and Consumable Fuels — 4.8% | | | | | |
EOG Resources, Inc. | | 3,200 | | | 311,360 |
Occidental Petroleum Corp. | | 21,900 | | | 1,781,565 |
| | | | |
|
|
| | | | | | 2,092,925 |
| | | | |
|
|
Pharmaceuticals — 5.9% | | | | | |
Novartis AG, ADR (Switzerland) | | 24,700 | | | 1,344,421 |
Teva Pharmaceutical Industries Ltd., ADR (Israel) | | 22,395 | | | 1,258,151 |
| | | | |
|
|
| | | | | | 2,602,572 |
| | | | |
|
|
Road & Rail — 2.4% | | | | | |
Union Pacific Corp. | | 16,600 | | | 1,060,740 |
| | | | |
|
|
Semiconductor & Semi-Conductor Instruments — 2.4% |
Intel Corp. | | 35,740 | | | 729,096 |
KLA-Tencor Corp. | | 9,300 | | | 336,288 |
| | | | |
|
|
| | | | | | 1,065,384 |
| | | | |
|
|
Software — 3.5% | | | | | |
Adobe Systems, Inc.* | | 41,800 | | | 1,537,404 |
| | | | |
|
|
TOTAL LONG-TERM INVESTMENTS
(cost $32,363,203) | | | 43,591,237 |
| | | | |
|
|
| SHORT-TERM INVESTMENT — 0.7% | | | |
AFFILIATED MONEY MARKET MUTUAL FUND | | | |
Dryden Core Investment Fund — Taxable Money Market Series(w)(Note 4) (cost $320,316) | | 320,316 | | | 320,316 |
| | | | |
|
|
TOTAL INVESTMENTS — 100.0%
(cost $32,683,519) | | | 43,911,553 |
OTHER ASSETS IN EXCESS OF LIABILITIES | | | 2,807 |
| | | | |
|
|
NET ASSETS — 100.0% | | $ | 43,914,360 |
| | | | |
|
|
The following abbreviation is used in the Portfolio descriptions:
| | |
| ADR | | American Depositary Receipt |
| * | | Non-income producing security. |
| (w) | | Prudential Investments LLC, the manager of the Portfolio, also serves as manager of the Dryden Core Investment Fund-Taxable Money Market Series. |
SEE NOTES TO FINANCIAL STATEMENTS.
A36
| | | | | | |
| | | SP STRATEGIC PARTNERS FOCUSED GROWTH PORTFOLIO (continued) | | |
| |
| SCHEDULE OF INVESTMENTS | | December 31, 2009 |
Various inputs are used in determining the value of the Portfolio’s investments. These inputs are summarized in the three broad levels listed below.
Level 1—quoted prices in active markets for identical securities
Level 2—other significant observable inputs (including quoted prices for similar securities, interest rates, prepayment speeds, credit risk, etc.)
Level 3—significant unobservable inputs (including the Portfolio’s own assumptions in determining the fair value of investments)
The following is a summary of the inputs used as of December 31, 2009 in valuing the Portfolio’s assets carried at fair value:
| | | | | | | | | |
Investments in Securities
| | Level 1
| | Level 2
| | Level 3
|
Common Stocks | | $ | 43,591,237 | | $ | — | | $ | — |
Affiliated Money Market Mutual Fund | | | 320,316 | | | — | | | — |
| | |
|
| |
|
| |
|
|
| | | | 43,911,553 | | | — | | | — |
Other Financial Instuments* | | | — | | | — | | | — |
| | |
|
| |
|
| |
|
|
Total | | $ | 43,911,553 | | $ | — | | $ | — |
| | |
|
| |
|
| |
|
|
| * | Other financial instruments are derivative instruments not reflected in the Schedule of Investments, such as futures, forwards and swap contracts, which are valued at the unrealized appreciation/depreciation on the instrument. |
As of December 31, 2009 and 2008, the Portfolio did not use any significant unobservable inputs (Level 3) in determining the value of investments.
The industry classification of investments and other assets in excess of liabilities shown as a percentage of net assets as of December 31, 2009 were as follows:
| | | |
Computers & Peripherals | | 15.5 | % |
Internet Software & Services | | 10.0 | |
Capital Markets | | 6.3 | |
Communication Equipment | | 6.2 | |
IT Services | | 6.1 | |
Pharmaceuticals | | 5.9 | |
Energy Equipment & Services | | 4.8 | |
Oil, Gas and Consumable Fuels | | 4.8 | |
Healthcare Equipment & Supplies | | 4.7 | |
Biotechnology | | 4.4 | |
Healthcare Providers & Services | | 3.9 | |
Internet & Catalog Retail | | 3.9 | |
Software | | 3.5 | |
Diversified Financial Services | | 3.0 | |
Machinery | | 2.8 | |
Semiconductor & Semi-Conductor Instruments | | 2.4 | |
Road & Rail | | 2.4 | |
Food Products | | 2.2 | |
Multi-Line Retail | | 1.6 | |
Beverages | | 1.5 | |
Metals & Mining | | 1.2 | |
Food & Staples Retailing | | 1.2 | |
Affiliated Money Market Mutual Fund | | 0.7 | |
Media | | 0.6 | |
Electrical Equipment | | 0.4 | |
| | |
|
|
| | | 100.0 | |
Other assets in excess of liabilities | | — | * |
| | |
|
|
| | | 100.0 | % |
| | |
|
|
SEE NOTES TO FINANCIAL STATEMENTS.
A37
| | | | | | |
| | | SP STRATEGIC PARTNERS FOCUSED GROWTH PORTFOLIO (continued) | | |
STATEMENT OF ASSETS AND LIABILITIES
December 31, 2009
| | | |
ASSETS | | | |
Investments at value: | | | |
Unaffiliated investments (cost $32,363,203) | | $ | 43,591,237 |
Affiliated investments (cost $320,316) | | | 320,316 |
Cash | | | 56,106 |
Dividends receivable | | | 40,314 |
Prepaid expenses | | | 790 |
Receivable for Series shares sold | | | 336 |
| | |
|
|
Total Assets | | | 44,009,099 |
| | |
|
|
LIABILITIES | | | |
Accrued expenses and other liabilities | | | 44,394 |
Management fee payable | | | 33,264 |
Payable for Series shares repurchased | | | 10,282 |
Distribution fee payable | | | 2,880 |
Administration fee payable | | | 1,729 |
Deferred trustees’ fees | | | 1,595 |
Affiliated transfer agent fees payable | | | 595 |
| | |
|
|
Total Liabilities | | | 94,739 |
| | |
|
|
NET ASSETS | | $ | 43,914,360 |
| | |
|
|
Net assets were comprised of: | | | |
Paid-in capital | | $ | 40,809,136 |
Retained earnings | | | 3,105,224 |
| | |
|
|
Net assets, December 31, 2009 | | $ | 43,914,360 |
| | |
|
|
Class I: | | | |
Net asset value and redemption price per share, $30,226,788 / 4,389,006 outstanding shares of beneficial interest | | $ | 6.89 |
| | |
|
|
Class II: | | | |
Net asset value and redemption price per share, $13,687,572 / 2,071,685 outstanding shares of beneficial interest | | $ | 6.61 |
| | |
|
|
STATEMENT OF OPERATIONS
Year Ended December 31, 2009
| | | | |
INVESTMENT INCOME | | | | |
Unaffiliated dividend income (net of $13,941 foreign withholding tax) | | $ | 408,141 | |
Affiliated dividend income | | | 4,347 | |
| | |
|
|
|
| | | | 412,488 | |
| | |
|
|
|
EXPENSES | | | | |
Management fee | | | 337,096 | |
Distribution fee—Class II | | | 29,923 | |
Administration fee—Class II | | | 17,954 | |
Custodian’s fees and expenses | | | 58,000 | |
Shareholders’ reports | | | 42,000 | |
Audit fee | | | 20,000 | |
Transfer agent’s fees and expenses (including affiliated expense of $3,600) (Note 4) | | | 9,000 | |
Trustees’ fees | | | 8,000 | |
Legal fees and expenses | | | 6,000 | |
Insurance expenses | | | 1,000 | |
Commitment fee on syndicated credit agreement | | | 1,000 | |
Loan interest expense (Note 8) | | | 39 | |
Miscellaneous | | | 5,660 | |
| | |
|
|
|
Total expenses | | | 535,672 | |
| | |
|
|
|
NET INVESTMENT LOSS | | | (123,184 | ) |
| | |
|
|
|
NET REALIZED AND UNREALIZED GAIN (LOSS) ON INVESTMENTS | | | | |
Net realized loss on investment transactions | | | (253,712 | ) |
Net change in unrealized appreciation (depreciation) on investments | | | 14,192,418 | |
| | |
|
|
|
NET GAIN ON INVESTMENTS | | | 13,938,706 | |
| | |
|
|
|
NET INCREASE IN NET ASSETS RESULTING FROM OPERATIONS | | $ | 13,815,522 | |
| | |
|
|
|
STATEMENT OF CHANGES IN NET ASSETS
| | | | | | | | |
| | | Year Ended December 31,
| |
| | | 2009
| | | 2008
| |
INCREASE (DECREASE) IN NET ASSETS OPERATIONS: | | | | | | | | |
Net investment loss | | $ | (123,184 | ) | | $ | (230,608 | ) |
Net realized loss on investment transactions | | | (253,712 | ) | | | (5,291,643 | ) |
Net change in unrealized appreciation (depreciation) on investments | | | 14,192,418 | | | | (17,178,750 | ) |
| | |
|
|
| |
|
|
|
NET INCREASE (DECREASE) IN NET ASSETS RESULTING FROM OPERATIONS | | | 13,815,522 | | | | (22,701,001 | ) |
| | |
|
|
| |
|
|
|
DISTRIBUTIONS: | | | | | | | | |
Class I | | | — | | | | (2,371,440 | ) |
Class II | | | — | | | | (1,588,341 | ) |
| | |
|
|
| |
|
|
|
TOTAL DISTRIBUTIONS | | | — | | | | (3,959,781 | ) |
| | |
|
|
| |
|
|
|
SERIES SHARE TRANSACTIONS (NOTE 7): | | | | | | | | |
Series shares sold | | | 6,332,838 | | | | 6,604,302 | |
Series shares issued in reinvestment of distributions | | | — | | | | 3,959,781 | |
Series shares repurchased | | | (8,292,419 | ) | | | (17,551,936 | ) |
| | |
|
|
| |
|
|
|
DECREASE IN NET ASSETS RESULTING FROM SERIES SHARE TRANSACTIONS | | | (1,959,581 | ) | | | (6,987,853 | ) |
| | |
|
|
| |
|
|
|
TOTAL INCREASE (DECREASE) IN NET ASSETS | | | 11,855,941 | | | | (33,648,635 | ) |
NET ASSETS: | | | | | | | | |
Beginning of year | | | 32,058,419 | | | | 65,707,054 | |
| | |
|
|
| |
|
|
|
End of year | | $ | 43,914,360 | | | $ | 32,058,419 | |
| | |
|
|
| |
|
|
|
SEE NOTES TO FINANCIAL STATEMENTS.
A38
NOTES TO THE FINANCIAL STATEMENTS OF
THE PRUDENTIAL SERIES FUND
The Prudential Series Fund (“Series Fund”), organized as a Delaware statutory trust, is a diversified open-end management investment company registered under the Investment Company Act of 1940, as amended. On January 2, 2006, each Portfolio of the Series Fund changed its federal income tax status from a regulated investment company to a partnership. As a result of that conversion, the Series Fund was reorganized from a Maryland corporation to a Delaware statutory trust. Pursuant to this reorganization, the Series Fund has been renamed “The Prudential Series Fund.” The Series Fund is composed of twenty-two Portfolios (“Portfolio” or “Portfolios”), each with separate series shares. The information presented in these financial statements pertains to eight Portfolios which are listed below along with each Portfolio’s investment objective.
SP Davis Value Portfolio: Capital growth through investments primarily in common stock of U.S. companies with market capitalization of at least $5 billion.
SP Growth Asset Allocation Portfolio: Provide long-term growth of capital with consideration also given to current income by investing in large-cap equity portfolios, fixed income portfolios, international equity portfolios and small/mid-cap equity portfolios. The Portfolio will achieve this by investing in certain other Series Fund Portfolios and Advanced Series Trust Portfolios.
SP International Growth Portfolio: Long-term growth of capital by investing primarily in equity-related securities of foreign issuers.
SP International Value Portfolio: Long-term capital appreciation by investing primarily in the stocks and other equity securities of companies in developed countries outside the United States.
SP Mid Cap Growth Portfolio: Long-term growth of capital by investing primarily in common stocks and related securities, such as preferred stocks, convertible securities and depository receipts for those securities.
SP Prudential U.S. Emerging Growth Portfolio: Long-term capital appreciation by investing primarily in equity securities of small and medium-sized U.S. companies that the Portfolio manager believes have the potential for above-average growth.
SP Small Cap Value Portfolio: Long-term growth of capital by investing primarily in common stocks of companies with small to medium market capitalization.
SP Strategic Partners Focused Growth Portfolio: Long-term capital growth by investing primarily in equity-related securities of U.S. companies that the Portfolio manager believes to have strong capital appreciation potential.
The ability of issuers of debt securities (other than those issued or guaranteed by the U.S. Government) held by the Portfolios to meet their obligations may be affected by the economic or political developments in a specific industry, region or country.
Foreign security and currency transactions may involve certain considerations and risks not typically associated with those of domestic origin as a result of, among other factors, the possibility of political and economic instability or the level of governmental supervision and regulation of foreign securities markets.
| Note 2: | | Accounting Policies |
The following is a summary of significant accounting policies followed by the Series Fund and the Portfolios in preparation of their financial statements.
Securities Valuation: Securities listed on a securities exchange are valued at the last sale price on such exchange on the day of valuation or, if there was no sale on such day, at the mean between the last reported bid and asked prices, or at the last bid price on such day in the absence of an asked price. Securities traded via NASDAQ are valued at the official closing price provided by NASDAQ. Securities that are actively traded in the over-the-counter market, including listed securities for which the primary market is believed by Prudential Investments LLC (“PI” or “Manager”) in consultation with the subadviser, to be over-the-counter, are valued at market value using prices provided by an independent pricing agent or principal market maker. Options on
B1
securities and indices traded on an exchange are valued at the last sale price as of the close of trading on the applicable exchange or, if there was no sale, at the mean between the most recently quoted bid and asked prices on such exchange or at the last bid price in absence of an asked price. Futures contracts and options thereon traded on a commodities exchange or board of trade are valued at the last sale price at the close of trading on such exchange or board of trade or, if there was no sale on the applicable commodities exchange or board of trade on such day, at the mean between the most recently quoted bid and asked prices on such exchange or board of trade or at the last bid price in the absence of an asked price. Prices may be obtained from independent pricing services which use information provided by market makers or estimates of market values obtained from yield data relating to investments or securities with similar characteristics. Securities for which reliable market quotations are not readily available, or whose values have been affected by events occurring after the close of the security’s foreign market and before the Series Fund’s normal pricing time, are valued at fair value in accordance with Board of Trustees’ approved fair valuation procedures. When determining the fair valuation of securities, some of the factors influencing the valuation include, the nature of any restrictions on disposition of the securities; assessment of the general liquidity of the securities; the issuer’s financial condition and the markets in which it does business; the cost of the investment; the size of the holding and the capitalization of the issuer; the prices of any recent transactions or bids/offers for such securities or any comparable securities; any available analyst media or other reports or information deemed reliable by the investment adviser regarding the issuer or the markets or industry in which it operates. Using fair value to price securities may result in a value that is different from a security’s most recent closing price and from the price used by other mutual funds to calculate their net asset values.
Investments in mutual funds are valued at their net asset value as of the close of the New York Stock Exchange on the date of valuation.
Short-term debt securities of sufficient credit quality that are held in the Portfolios which mature in more than 60 days are valued at fair value and those short-term debt securities of sufficient credit quality which mature in 60 days or less are valued at amortized cost which approximates fair value. The amortized cost method values a security at its cost at the time of purchase and thereafter assumes a constant amortization to maturity of any discount or premium.
Each Portfolio may hold up to 15% of their net assets in illiquid securities, including those which are restricted as to disposition under securities law (“restricted securities”). Restricted securities, including private placements, are valued pursuant to the valuation procedures noted above.
Repurchase Agreements: In connection with transactions in repurchase agreements with United States financial institutions, it is the Series Fund’s policy that its custodian or designated subcustodians, as the case may be, under triparty repurchase agreements, take possession of the underlying collateral securities, the value of which exceeds the principal amount of the repurchase transaction, including accrued interest. To the extent that any repurchase transaction exceeds one business day, the value of the collateral is marked to market on a daily basis to ensure the adequacy of the collateral. If the seller defaults or the value of the collateral declines, or if bankruptcy proceedings are commenced with respect to the seller of the security, realization of the collateral by the Series Fund may by delayed or limited.
Foreign Currency Translation: The books and records of the Series Fund are maintained in U.S. dollars. Foreign currency amounts are translated into U.S. dollars on the following basis:
(i) market value of investment securities, other assets and liabilities—at the current daily rates of exchange.
(ii) purchases and sales of investment securities, income and expenses—at the rates of exchange prevailing on the respective dates of such transactions.
Although the net assets of the Series Fund are presented at the foreign exchange rates and market values at the close of the period, the Series Fund does not isolate that portion of the results of operations arising as a result of changes in the foreign exchange rates from the fluctuations arising from changes in the market prices of securities held at the end of the year. Similarly, the Series Fund does not isolate the effect of changes in foreign exchange rates from the fluctuations arising from changes in the market prices of portfolio securities sold during the period. Accordingly, these realized foreign currency gains (losses) are included in the reported net realized gains (losses) on investment transactions.
Net realized gains (losses) on foreign currency transactions represent net foreign exchange gains (losses) from the holding of foreign currencies, currency gains (losses) realized between the trade date and settlement
B2
date on securities transactions, and the difference between the amounts of dividends, interest and foreign withholding taxes recorded on the Series Fund’s books and the U.S. dollar equivalent amounts actually received or paid. Net unrealized currency gains (losses) from valuing foreign currency denominated assets and liabilities (other than investments) at period end exchange rates are reflected as a component of net unrealized appreciation (depreciation) on investments and foreign currencies.
Forward Currency Contracts: A forward currency contract is a commitment to purchase or sell a foreign currency at a future date at a negotiated forward rate between two parties. Certain Portfolios of the Series Fund entered into forward currency contracts in order to hedge their exposure to changes in foreign currency exchange rates on their foreign portfolio holdings or specific receivables and payables denominated in a foreign currency and to gain exposure to certain currencies. The contracts are valued daily at current forward exchange rates and any unrealized gain or loss is included in net unrealized appreciation or depreciation on foreign currencies. Gain or loss is realized on the settlement date of the contract equal to the difference between the settlement value of the original and renegotiated forward contracts. This gain or loss, if any, is included in net realized gain (loss) on foreign currency transactions. Risks may arise upon entering into these contracts from the potential inability of the counterparties to meet the terms of their contracts. Forward currency contracts involve risks from currency exchange rate and credit risk in excess of the amounts reflected on the Statement of Assets and Liabilities. The Portfolio’s maximum risk of loss from counterparty credit risk is the net value of the cash flows to be received from the counterparty at the end of the contract’s life. A master netting arrangement between the Portfolio and the counterparty permits the Portfolio to offset amounts payable by the Portfolio to the same counterparty against amounts to be received; and by the receipt of collateral from the counterparty by the Portfolio to cover the Portfolio’s exposure to the counterparty. However, there is no assurance that such mitigating factors are easily enforceable.
Warrants and Rights: Certain Portfolios of the Series Fund hold warrants and rights acquired either through a direct purchase, included as part of a private placement, or pursuant to corporate actions. Warrants and rights entitle the holder to buy a proportionate amount of common stock at a specific price and time through the expiration dates. Such warrants and rights are held as long positions by the Portfolio until exercised, sold or expired. Warrants and rights are valued at fair value in accordance with the Board of Trustees’ approved fair valuation procedures.
Securities Lending: Each Portfolio of the Series Fund may lend its portfolio securities to broker-dealers. The loans are secured by collateral at least equal at all times to the market value of the securities loaned. Loans are subject to termination at the option of the borrower or Portfolio. Upon termination of the loan, the borrower will return to the Portfolio securities identical to the loaned securities. Should the borrower of the securities fail financially, the Portfolio has the right to repurchase the securities using the collateral in the open market. The Portfolio recognizes income, net of any rebate and securities lending agent fees, for lending its securities in the form of fees or interest on the investment of any cash received as collateral. The Portfolio also continues to receive interest and dividends or amounts equivalent thereto on the securities loaned and recognizes any unrealized gain or loss in the market price of the securities loaned that may occur during the term of the loan.
Securities Transactions and Net Investment Income: Securities transactions are recorded on the trade date. Realized gains (losses) on sales of securities are calculated on the identified cost basis. Dividend income is recorded on the ex-dividend date; interest income, which is comprised of four elements: stated coupon, original issue discount, market discount and market premium, is recorded on the accrual basis. Expenses are recorded on the accrual basis. The Series Fund’s expenses are allocated to the respective Portfolios on the basis of relative net assets except for Portfolio specific expenses which are attributable directly to a Portfolio or class level.
For Portfolios with multiple classes of shares, net investment income (loss) (other than administration and distribution fees, which are charged to the respective class) and unrealized and realized gains (losses) are allocated daily to each class of shares based upon the relative proportion of net assets of each class at the beginning of the day.
Custody Fee Credits: The Series Fund has an arrangement with its custodian bank, whereby uninvested monies earn credits which reduce the fees charged by the custodian. Such custody fee credits are presented as a reduction of gross expenses in the accompanying Statements of Operations.
B3
Taxes: For federal income tax purposes, each Portfolio in the Series Fund is treated as a separate taxpaying entity. The Portfolios are treated as partnerships for tax purposes. No provision has been made in the financial statements for U.S. Federal, state, or local taxes, as any tax liability arising from operations of the Portfolio is the responsibility of their partners. The Portfolios are not subject to entity-level taxation. Partners of each Portfolio are subject to taxes on their distributive share of partnership items.
Withholding taxes on foreign dividends, interest and capital gains have been provided for in accordance with the Series Fund’s understanding of the applicable country’s tax rules and regulations.
Distributions: Distributions from each Portfolio are made in cash and automatically reinvested in additional shares of the same Portfolio. The Portfolios’ distributions are generally made on an annual basis. Distributions are recorded on the ex-date.
Estimates: The preparation of financial statements requires management to make estimates and assumptions that affect the reported amounts and disclosures in the financial statements. Actual results could differ from these estimates.
The Series Fund has a management agreement with PI. Pursuant to this agreement PI has responsibility for all investment advisory services and supervises the subadvisers’ performance of such services. PI has entered into subadvisory agreements with Jennison Associates LLC (“Jennison”), AllianceBernstein LP (“AllianceBernstein”), Davis Selected Advisers, LP (“Davis”), Goldman Sachs Asset Management, L.P. (“GSAM”), LSV Asset Management (“LSV”), Marsico Capital Management, LLC (“Marsico”), Neuberger Berman Management, Inc. (“Neuberger Berman”), Quantitative Management Associates LLC (“QMA”), William Blair & Company LLC (“William Blair”), Thornburg Investment Management, Inc. (“Thornburg”), and ClearBridge Advisors LLC (“ClearBridge”) (collectively, the “Subadvisers”), under which each provides investment advisory services for certain Portfolios of the Series Fund. PI pays for the services of the Subadvisers, compensation of officers of the Series Fund, occupancy and certain clerical and administrative expenses of the Series Fund. The Portfolios bear all other costs and expenses.
The management fee paid to PI is computed daily and payable monthly, at the annual rates specified below, of the value of each of the Portfolio’s average daily net assets.
| | | | | | |
Portfolio
| | Management Fee
| | | Effective
Management Fee
| |
SP Davis Value Portfolio | | 0.75 | % | | 0.75 | % |
SP Growth Asset Allocation Portfolio | | 0.05 | | | 0.05 | |
SP International Growth Portfolio | | 0.85 | | | 0.85 | |
SP International Value Portfolio | | 0.90 | | | 0.90 | |
SP Mid Cap Growth Portfolio | | 0.80 | | | 0.80 | |
SP Prudential U.S. Emerging Growth Portfolio | | 0.60 | | | 0.60 | |
SP Small Cap Value Portfolio | | 0.90 | | | 0.90 | |
SP Strategic Partners Focused Growth Portfolio | | 0.90 | | | 0.90 | |
At December 31, 2009 the Subadvisers that provide investment advisory services to the Portfolio are as follows. Where more than one Subadviser is listed, each Subadviser provides services to a segment of the Portfolio:
| | |
Portfolio
| | Subadviser(s)
|
SP Davis Value Portfolio | | Davis |
SP Growth Asset Allocation Portfolio | | QMA |
SP International Growth Portfolio | | William Blair, Marsico |
SP International Value Portfolio | | LSV, Thornburg |
SP Mid Cap Growth Portfolio | | Neuberger Berman |
SP Prudential U.S. Emerging Growth Portfolio | | Jennison |
SP Small Cap Value Portfolio | | GSAM, ClearBridge |
SP Strategic Partners Focused Growth Portfolio | | AllianceBernstein, Jennison |
B4
The Series Fund has a distribution agreement with Prudential Investment Management Services LLC (“PIMS”) which acts as the distributor of the Class I and Class II shares of the Series Fund. The Series Fund compensates PIMS for distributing and servicing the Series Fund’s Class II shares pursuant to a plan of distribution (the “Class II Plan”), regardless of expenses actually incurred by PIMS. The distribution fees are accrued daily and payable monthly. No distribution or service fees are paid to PIMS as distributor of the Class I shares of the Series Fund. Pursuant to the Class II Plan, the Class II shares of each Portfolio compensate PIMS for distribution-related activities at an annual rate of 0.25% of the average daily net assets of the Class II shares.
The Series Fund has an administration agreement with PI which acts as the administrator of the Class II shares of the Series Fund. The administration fee paid to PI is accrued daily and payable monthly, at the annual rate of 0.15% of the average daily net assets of the Class II shares.
PIMS, PI, QMA and Jennison are indirect, wholly-owned subsidiaries of Prudential Financial, Inc. (“Prudential”).
| Note 4: | | Other Transactions with Affiliates |
Prudential Mutual Fund Services LLC (“PMFS”), an affiliate of PI and an indirect, wholly-owned subsidiary of Prudential, serves as the Series Fund’s transfer agent. Transfer agent fees and expenses in the Statements of Operations include certain out-of-pocket expenses paid to non-affiliates, where applicable.
Prudential Investment Management, Inc. (“PIM”), an indirect, wholly-owned subsidiary of Prudential, is the Series Fund’s security lending agent. For the year ended December 31, 2009, PIM was compensated as follows for these services by the Series Funds:
| | | |
| | | PIM
|
SP Davis Value Portfolio | | $ | 39,118 |
SP International Growth Portfolio | | | 13,978 |
SP Mid Cap Growth Portfolio | | | 42,078 |
SP Prudential U.S. Emerging Growth Portfolio | | | 49,077 |
SP Small Cap Value Portfolio | | | 80,154 |
Certain Portfolios invest in the Taxable Money Market Series (the “Series”), a portfolio of Dryden Core Investment. The Series is a money market fund registered under the Investment Company Act of 1940, as amended, and managed by PI.
| Note 5: | | Portfolio Securities |
The aggregate cost of purchases and the proceeds from the sales of securities (excluding government securities and short-term issues) for the year ended December 31, 2009 were as follows:
| | | | | | |
Portfolio
| | Cost of
Purchases
| | Proceeds
from Sales
|
SP Davis Value Portfolio | | $ | 21,553,953 | | $ | 33,182,568 |
SP Growth Asset Allocation Portfolio | | | 158,024,788 | | | 208,976,000 |
SP International Growth Portfolio | | | 183,135,491 | | | 290,545,733 |
SP International Value Portfolio | | | 155,951,034 | | | 241,140,075 |
SP Mid Cap Growth Portfolio | | | 47,819,952 | | | 53,617,535 |
SP Prudential U.S. Emerging Growth Portfolio | | | 60,108,039 | | | 73,284,442 |
SP Small Cap Value Portfolio | | | 100,602,396 | | | 145,367,243 |
SP Strategic Partners Focused Growth Portfolio | | | 44,658,979 | | | 45,982,603 |
After January 2, 2006, all Portfolios are treated as partnerships for tax purposes. The character of the cash distributions paid by the partnerships is generally classified as return of capital nontaxable distributions. After each fiscal year each partner will receive information regarding their distributive allocable share of the partnership’s income, gains, losses and deductions.
B5
Prior to January 2, 2006, was incorporated as of that date, qualified as a regulated investment company under the Internal Revenue Code and distributed all of its taxable income, including any net realized gains on investments, to shareholders.
With respect to the Portfolios, book cost of assets differs from tax cost of assets as a result of each Portfolio’s adoption of a mark to market method of accounting for tax purposes. Under this method, tax cost of assets will approximate its fair market value.
Management has analyzed the Portfolios’ tax positions taken on federal income tax returns for all open tax years and has concluded that as of December 31, 2009, no provision for income tax would be required in the Portfolio’s financial statements. The Portfolios’ federal and state income tax returns for tax years for which the applicable statues of limitations have not expired are subject to examination by the Internal Revenue Service and state departments of revenue.
The Series Fund offers Class I and Class II shares. Neither Class I nor Class II shares of a Portfolio are subject to any sales charge or redemption charge and are sold at the net asset value of the Portfolio. Class I shares are sold only to certain separate accounts of Prudential to fund benefits under certain variable life insurance and variable annuity contracts (“contracts”). Class II shares are sold only to separate accounts of non-Prudential insurance companies as investment options under certain contracts. The separate accounts invest in shares of the Series Fund through subaccounts that correspond to the Portfolio. The separate accounts will redeem shares of the Series Fund to the extent necessary to provide benefits under the contracts or for such other purposes as may be consistent with the contracts. As of December 31, 2009, the SP Prudential U.S. Emerging Growth, SP Strategic Partners Focused Growth and SP International Growth Portfolios have Class II shares outstanding.
Transactions in shares of beneficial interest of the SP International Growth, SP Prudential U.S. Emerging Growth and SP Strategic Partners Focused Growth Portfolios were as follows:
| | | | | | | |
| | |
| SP International Growth Portfolio: | | | | | | | |
| | |
Class I
| | Shares
| | | Amount
| |
Year ended December 31, 2009: | | | | | | | |
Series shares sold | | 7,117,878 | | | $ | 26,400,946 | |
Series shares issued in reinvestment of distributions | | 1,184,066 | | | | 4,665,219 | |
Series shares repurchased | | (33,262,684 | ) | | | (138,967,214 | ) |
| | |
|
| |
|
|
|
Net increase (decrease) in shares outstanding | | (24,960,740 | ) | | $ | (107,901,049 | ) |
| | |
|
| |
|
|
|
Year ended December 31, 2008: | | | | | | | |
Series shares sold | | 7,707,426 | | | $ | 42,123,871 | |
Series shares issued in reinvestment of distributions | | 11,132,248 | | | | 70,133,161 | |
Series shares repurchased | | (17,448,954 | ) | | | (118,140,650 | ) |
| | |
|
| |
|
|
|
Net increase (decrease) in shares outstanding | | 1,390,720 | | | $ | (5,883,618 | ) |
| | |
|
| |
|
|
|
| | |
Class II
| | | | | | |
Year ended December 31, 2009: | | | | | | | |
Series shares sold | | 236,769 | | | $ | 919,713 | |
Series shares issued in reinvestment of distributions | | 33,404 | | | | 129,607 | |
Series shares repurchased | | (607,512 | ) | | | (2,326,105 | ) |
| | |
|
| |
|
|
|
Net increase (decrease) in shares outstanding | | (337,339 | ) | | $ | (1,276,785 | ) |
| | |
|
| |
|
|
|
Year ended December 31, 2008: | | | | | | | |
Series shares sold | | 1,647,667 | | | $ | 11,225,987 | |
Series shares issued in reinvestment of distributions | | 897,109 | | | | 5,535,160 | |
Series shares repurchased | | (3,525,674 | ) | | | (19,551,361 | ) |
| | |
|
| |
|
|
|
Net increase (decrease) in shares outstanding | | (980,898 | ) | | $ | (2,790,214 | ) |
| | |
|
| |
|
|
|
B6
| | | | | | | |
| SP Prudential U.S. Emerging Growth Portfolio | | | | | | | |
Class I
| | Shares
| | | Amount
| |
Year ended December 31, 2009: | | | | | | | |
Series shares sold | | 1,056,236 | | | $ | 5,684,842 | |
Series shares issued in reinvestment of distributions | | 170,506 | | | | 903,679 | |
Series shares repurchased | | (3,659,643 | ) | | | (18,695,363 | ) |
| | |
|
| |
|
|
|
Net increase (decrease) in shares outstanding | | (2,432,901 | ) | | $ | (12,106,842 | ) |
| | |
|
| |
|
|
|
Year ended December 31, 2008: | | | | | | | |
Series shares sold | | 951,155 | | | $ | 6,074,026 | |
Series shares issued in reinvestment of distributions | | 3,888,475 | | | | 28,074,791 | |
Series shares repurchased | | (4,826,937 | ) | | | (31,576,609 | ) |
| | |
|
| |
|
|
|
Net increase (decrease) in shares outstanding | | 12,693 | | | $ | 2,572,208 | |
| | |
|
| |
|
|
|
| | |
Class II
| | | | | | |
Year ended December 31, 2009: | | | | | | | |
Series shares sold | | 943 | | | $ | 5,122 | |
Series shares issued in reinvestment of distributions | | 124 | | | | 638 | |
Series shares repurchased | | (3,558 | ) | | | (18,498 | ) |
| | |
|
| |
|
|
|
Net increase (decrease) in shares outstanding | | (2,491 | ) | | $ | (12,738 | ) |
| | |
|
| |
|
|
|
Year ended December 31, 2008: | | | | | | | |
Series shares sold | | 516 | | | $ | 2,117 | |
Series shares issued in reinvestment of distributions | | 7,530 | | | | 52,710 | |
Series shares repurchased | | (6,498 | ) | | | (40,442 | ) |
| | |
|
| |
|
|
|
Net increase (decrease) in shares outstanding | | 1,548 | | | $ | 14,385 | |
| | |
|
| |
|
|
|
| | |
| SP Strategic Partners Focused Growth Portfolio: | | | | | | | |
Class I
| | Shares
| | | Amount
| |
Year ended December 31, 2009: | | | | | | | |
Series shares sold | | 662,089 | | | $ | 3,652,339 | |
Series shares issued in reinvestment of distributions | | — | | | | — | |
Series shares repurchased | | (793,843 | ) | | | (4,461,067 | ) |
| | |
|
| |
|
|
|
Net increase (decrease) in shares outstanding | | (131,754 | ) | | $ | (808,728 | ) |
| | |
|
| |
|
|
|
Year ended December 31, 2008: | | | | | | | |
Series shares sold | | 421,146 | | | $ | 2,929,158 | |
Series shares issued in reinvestment of distributions | | 314,098 | | | | 2,371,440 | |
Series shares repurchased | | (847,025 | ) | | | (5,562,995 | ) |
| | |
|
| |
|
|
|
Net increase (decrease) in shares outstanding | | (111,781 | ) | | $ | (262,397 | ) |
| | |
|
| |
|
|
|
| | |
Class II
| | | | | | |
Year ended December 31, 2009: | | | | | | | |
Series shares sold | | 514,867 | | | $ | 2,680,499 | |
Series shares issued in reinvestment of distributions | | — | | | | — | |
Series shares repurchased | | (710,090 | ) | | | (3,831,352 | ) |
| | |
|
| |
|
|
|
Net increase (decrease) in shares outstanding | | (195,223 | ) | | $ | (1,150,853 | ) |
| | |
|
| |
|
|
|
Year ended December 31, 2008: | | | | | | | |
Series shares sold | | 517,775 | | | $ | 3,675,144 | |
Series shares issued in reinvestment of distributions | | 217,879 | | | | 1,588,341 | |
Series shares repurchased | | (1,859,584 | ) | | | (11,988,941 | ) |
| | |
|
| |
|
|
|
Net increase (decrease) in shares outstanding | | (1,123,930 | ) | | $ | (6,725,456 | ) |
| | |
|
| |
|
|
|
B7
The Portfolios, along with other affiliated registered investment companies (the “Funds”), are a party to a Syndicated Credit Agreement (“SCA”) with two banks. The SCA provides for a commitment of $500 million. Interest on any borrowings under the SCA is incurred at market rates and a commitment fee for the unused amount is accrued daily and paid quarterly. Effective October 22, 2009, the Funds renewed the SCA with the banks. The commitment under the renewed SCA continues to be $500 million. The Funds pay a commitment fee of .15 of 1% of the unused portion of the renewed SCA. For the period October 24, 2008 through October 21, 2009, the Funds paid a commitment fee of .13 of 1% of the unused portion of the agreement. The expiration date of the renewed SCA will be October 20, 2010. The purpose of the SCA is to provide an alternative source of temporary funding for capital share redemptions.
The following Portfolios utilized the line of credit during the year ended December 31, 2009. The average balance is for the number of days the Portfolios had utilized the credit facility.
| | | | | | | | | | | |
Portfolio
| | Approximate
Average
Balance
Outstanding
| | Number of
Days
Outstanding
| | Weighted
Average
Interest
Rate
| | | Outstanding
Borrowings at
December 31,
2009
|
SP International Growth Portfolio | | $ | 1,827,881 | | 16 | | 1.180 | % | | $ | — |
SP International Value Portfolio | | | 2,628,743 | | 60 | | 1.273 | % | | | — |
SP Mid Cap Growth Portfolio | | | 187,285 | | 27 | | 1.160 | % | | | — |
SP Small Cap Value Portfolio | | | 163,000 | | 3 | | 1.190 | % | | | — |
SP Strategic Partners Focused Growth Portfolio | | | 251,600 | | 5 | | 1.120 | % | | | — |
| Note 9: | | Ownership and Affiliates |
As of December 31, 2009, all of Class I shares of each Portfolio were owned of record by The Prudential Insurance Company of America (“PICA”) on behalf of the owners of the variable insurance products issued by PICA.
| Note 10: | | New Accounting Pronouncement |
In January 2010, the Financial Accounting Standards Board (“FASB”) issued Accounting Standards Update (“ASU”) No. 2010-06 “Improving Disclosures about Fair Value Measurements”. ASU 2010-06 will require reporting entities to make new disclosures about amounts and reasons for significant transfers in and out of Level 1 and Level 2 fair value measurements and input and valuation techniques used to measure fair value for both recurring and nonrecurring fair value measurements that fall in either Level 2 or Level 3, and information on purchases, sales, issuances, and settlements in the roll forward of activity in Level 3 fair value measurements. The new and revised disclosures are effective for interim and annual reporting periods beginning after December 15, 2009 except for the disclosures about purchases, sales, issuances, and settlements in the roll forward of activity in Level 3 fair value measurements, which are effective for interim and annual reporting periods beginning after December 15, 2010. At this time, management is evaluating the implications of ASU No. 2010-06 and its impact on the financial statements has not been determined.
B8
| Note 11: | | Subsequent Events |
Management has evaluated the impact of all subsequent events on the Portfolios through February 17, 2010, the date the financial statements were issued, and has determined that the following subsequent events require recognition or disclosure in the financial statements:
Based on the approval of the Board of Trustees on December 7, 2009, the following portfolios will be merged during April or May of 2010.
| | |
Merging Portfolios
of The Prudential Series Fund
| | Acquiring Portfolios
of The Prudential Series Fund
|
SP Mid Cap Growth Portfolio | | SP Prudential U.S. Emerging
Growth Portfolio |
| |
SP Davis Value Portfolio | | Value Portfolio |
| |
SP Strategic Partners Focused Growth Portfolio | | Jennison Portfolio |
The mergers are subject to the approval of shareholders.
B9
Financial Highlights
| | | | | | | | | | | | | | | | | | | | |
| | | SP Davis Value Portfolio
| |
| | | Year Ended December 31,
| |
| | | 2009
| | | 2008
| | | 2007
| | | 2006
| | | 2005
| |
Per Share Operating Performance: | | | | | | | | | | | | | | | | | | | | |
Net Asset Value, beginning of year | | $ | 6.72 | | | $ | 12.00 | | | $ | 11.99 | | | $ | 10.68 | | | $ | 10.98 | |
| | |
|
|
| |
|
|
| |
|
|
| |
|
|
| |
|
|
|
Income (Loss) From Investment Operations: | | | | | | | | | | | | | | | | | | | | |
Net investment income | | | .07 | | | | .12 | | | | .15 | | | | .09 | | | | .09 | |
Net realized and unrealized gain (loss) on investments | | | 2.01 | | | | (4.62 | ) | | | .39 | | | | 1.49 | | | | .82 | |
| | |
|
|
| |
|
|
| |
|
|
| |
|
|
| |
|
|
|
Total from investment operations | | | 2.08 | | | | (4.50 | ) | | | .54 | | | | 1.58 | | | | .91 | |
| | |
|
|
| |
|
|
| |
|
|
| |
|
|
| |
|
|
|
Less Dividends and Distributions: | | | | | | | | | | | | | | | | | | | | |
Dividends from net investment income | | | — | | | | — | | | | — | | | | — | | | | (.10 | ) |
Distributions from net realized gains | | | — | | | | — | | | | — | | | | — | | | | (1.11 | ) |
Distributions | | | (.12 | ) | | | (.78 | ) | | | (.53 | ) | | | (.27 | ) | | | — | |
| | |
|
|
| |
|
|
| |
|
|
| |
|
|
| |
|
|
|
Total dividends and distributions | | | (.12 | ) | | | (.78 | ) | | | (.53 | ) | | | (.27 | ) | | | (1.21 | ) |
| | |
|
|
| |
|
|
| |
|
|
| |
|
|
| |
|
|
|
Net Asset Value, end of year | | $ | 8.68 | | | $ | 6.72 | | | $ | 12.00 | | | $ | 11.99 | | | $ | 10.68 | |
| | |
|
|
| |
|
|
| |
|
|
| |
|
|
| |
|
|
|
Total Return(a) | | | 31.26 | % | | | (39.88 | )% | | | 4.58 | % | | | 15.02 | % | | | 9.52 | % |
Ratios/Supplemental Data: | | | | | | | | | | | | | | | | | | | | |
Net assets, end of year (in millions) | | $ | 196.9 | | | $ | 165.3 | | | $ | 309.0 | | | $ | 328.0 | | | $ | 311.7 | |
Ratios to average net assets(b): | | | | | | | | | | | | | | | | | | | | |
Expenses | | | .85 | % | | | .82 | % | | | .80 | % | | | .81 | % | | | .82 | % |
Net investment income | | | .92 | % | | | 1.13 | % | | | 1.11 | % | | | .81 | % | | | .87 | % |
Portfolio turnover rate | | | 13 | % | | | 19 | % | | | 9 | % | | | 14 | % | | | 14 | % |
| (a) | Total return is calculated assuming a purchase of a share on the first day and a sale on the last day of each year reported and includes reinvestment of dividends and distributions and does not reflect the effect of insurance contract charges. Total return does not reflect expenses associated with the separate account such as administrative fees, account charges and surrender charges which, if reflected, would reduce the total returns for all years shown. Performance figures may reflect voluntary fee waivers and/or expense reimbursements. In the absence of voluntary fee waivers and/or expense reimbursements, the total return would be lower. Past performance is no guarantee of future results. Total returns may reflect adjustments to conform to generally accepted accounting principles. |
| (b) | Does not include expenses of the underlying portfolio in which the Portfolio invests. |
| | | | | | | | | | | | | | | | | | | | |
| | | SP Growth Asset Allocation Portfolio
| |
| | | Year Ended December 31,
| |
| | | 2009
| | | 2008
| | | 2007
| | | 2006
| | | 2005
| |
Per Share Operating Performance: | | | | | | | | | | | | | | | | | | | | |
Net Asset Value, beginning of year | | $ | 6.60 | | | $ | 11.59 | | | $ | 11.17 | | | $ | 10.23 | | | $ | 9.80 | |
| | |
|
|
| |
|
|
| |
|
|
| |
|
|
| |
|
|
|
Income (Loss) From Investment Operations: | | | | | | | | | | | | | | | | | | | | |
Net investment income | | | .16 | | | | .16 | | | | .18 | | | | .16 | | | | .19 | |
Net realized and unrealized gain (loss) on investments | | | 1.53 | | | | (4.01 | ) | | | .85 | | | | 1.13 | | | | .66 | |
| | |
|
|
| |
|
|
| |
|
|
| |
|
|
| |
|
|
|
Total from investment operations | | | 1.69 | | | | (3.85 | ) | | | 1.03 | | | | 1.29 | | | | .85 | |
| | |
|
|
| |
|
|
| |
|
|
| |
|
|
| |
|
|
|
Less Dividends and Distributions: | | | | | | | | | | | | | | | | | | | | |
Dividends from net investment income | | | — | | | | — | | | | — | | | | — | | | | (.06 | ) |
Distributions from net realized gains | | | — | | | | — | | | | — | | | | — | | | | (.36 | ) |
Distributions | | | (.26 | ) | | | (1.14 | ) | | | (.61 | ) | | | (.35 | ) | | | — | |
| | |
|
|
| |
|
|
| |
|
|
| |
|
|
| |
|
|
|
Total dividends and distributions | | | (.26 | ) | | | (1.14 | ) | | | (.61 | ) | | | (.35 | ) | | | (.42 | ) |
| | |
|
|
| |
|
|
| |
|
|
| |
|
|
| |
|
|
|
Net Asset Value, end of year | | $ | 8.03 | | | $ | 6.60 | | | $ | 11.59 | | | $ | 11.17 | | | $ | 10.23 | |
| | |
|
|
| |
|
|
| |
|
|
| |
|
|
| |
|
|
|
Total Return(a) | | | 26.22 | % | | | (36.36 | )% | | | 9.23 | % | | | 12.88 | % | | | 9.24 | % |
Ratios/Supplemental Data: | | | | | | | | | | | | | | | | | | | | |
Net assets, end of year (in millions) | | $ | 792.8 | | | $ | 694.8 | | | $ | 1,252.7 | | | $ | 1,283.9 | | | $ | 1,212.0 | |
Ratios to average net assets(b): | | | | | | | | | | | | | | | | | | | | |
Expenses | | | .07 | % | | | .07 | % | | | .06 | % | | | .05 | % | | | .05 | % |
Net investment income | | | 2.15 | % | | | 1.57 | % | | | 1.32 | % | | | 1.50 | % | | | 2.65 | % |
Portfolio turnover rate | | | 22 | % | | | 29 | % | | | 21 | % | | | 25 | % | | | 18 | % |
| (a) | Total return is calculated assuming a purchase of a share on the first day and a sale on the last day of each year reported and includes reinvestment of dividends and distributions and does not reflect the effect of insurance contract charges. Total return does not reflect expenses associated with the separate account such as administrative fees, account charges and surrender charges which, if reflected, would reduce the total returns for all years shown. Performance figures may reflect fee waivers and/or expense reimbursements. In the absence of fee waivers and/or expense reimbursements, the total return would be lower. Past performance is no guarantee of future results. Total returns may reflect adjustments to conform to generally accepted accounting principles. |
| (b) | Does not include expenses of the underlying portfolios in which the Portfolio invests. |
SEE NOTES TO FINANCIAL STATEMENTS.
C1
Financial Highlights
| | | | | | | | | | | | | | | | | | | | |
| | | SP International Growth Portfolio
| |
| | | Class I
| |
| | | Year Ended December 31,
| |
| | | 2009(c)
| | | 2008
| | | 2007(c)
| | | 2006
| | | 2005
| |
Per Share Operating Performance: | | | | | | | | | | | | | | | | | | | | |
Net Asset Value, beginning of year | | $ | 3.45 | | | $ | 8.52 | | | $ | 8.30 | | | $ | 7.55 | | | $ | 6.85 | |
| | |
|
|
| |
|
|
| |
|
|
| |
|
|
| |
|
|
|
Income (Loss) From Investment Operations: | | | | | | | | | | | | | | | | | | | | |
Net investment income | | | .05 | | | | .10 | | | | .10 | | | | .05 | | | | .04 | |
Net realized and unrealized gain (loss) on investments | | | 1.22 | | | | (3.74 | ) | | | 1.50 | | | | 1.45 | | | | 1.01 | |
| | |
|
|
| |
|
|
| |
|
|
| |
|
|
| |
|
|
|
Total from investment operations | | | 1.27 | | | | (3.64 | ) | | | 1.60 | | | | 1.50 | | | | 1.05 | |
| | |
|
|
| |
|
|
| |
|
|
| |
|
|
| |
|
|
|
Less Dividends and Distributions: | | | | | | | | | | | | | | | | | | | | |
Dividends from net investment income | | | — | | | | — | | | | — | | | | — | | | | (.04 | ) |
Distributions from net realized gains | | | — | | | | — | | | | — | | | | — | | | | (.31 | ) |
Distributions | | | (.09 | ) | | | (1.43 | ) | | | (1.38 | ) | | | (.75 | ) | | | — | |
| | |
|
|
| |
|
|
| |
|
|
| |
|
|
| |
|
|
|
Total dividends and distributions | | | (.09 | ) | | | (1.43 | ) | | | (1.38 | ) | | | (.75 | ) | | | (.35 | ) |
| | |
|
|
| |
|
|
| |
|
|
| |
|
|
| |
|
|
|
Net Asset Value, end of year | | $ | 4.63 | | | $ | 3.45 | | | $ | 8.52 | | | $ | 8.30 | | | $ | 7.55 | |
| | |
|
|
| |
|
|
| |
|
|
| |
|
|
| |
|
|
|
Total Return(a) | | | 37.15 | % | | | (50.30 | )% | | | 19.55 | % | | | 21.05 | % | | | 16.39 | % |
Ratios/Supplemental Data: | | | | | | | | | | | | | | | | | | | | |
Net assets, end of year (in millions) | | $ | 162.5 | | | $ | 207.5 | | | $ | 500.0 | | | $ | 456.0 | | | $ | 453.6 | |
Ratios to average net assets(b): | | | | | | | | | | | | | | | | | | | | |
Expenses | | | .99 | % | | | .99 | % | | | .94 | % | | | .97 | % | | | .98 | % |
Net investment income | | | 1.18 | % | | | 1.36 | % | | | 1.14 | % | | | .69 | % | | | .64 | % |
Portfolio turnover rate | | | 89 | % | | | 101 | % | | | 81 | % | | | 111 | % | | | 99 | % |
| | | | | | | | | | | | | | | | | | | | |
| | | SP International Growth Portfolio
| |
| | | Class II
| |
| | | Year Ended December 31,
| |
| | | 2009(c)
| | | 2008
| | | 2007(c)
| | | 2006
| | | 2005
| |
Per Share Operating Performance: | | | | | | | | | | | | | | | | | | | | |
Net Asset Value, beginning of year | | $ | 3.37 | | | $ | 8.36 | | | $ | 8.17 | | | $ | 7.45 | | | $ | 6.77 | |
| | |
|
|
| |
|
|
| |
|
|
| |
|
|
| |
|
|
|
Income (Loss) From Investment Operations: | | | | | | | | | | | | | | | | | | | | |
Net investment income | | | .03 | | | | .07 | | | | .07 | | | | .02 | | | | .03 | |
Net realized and unrealized gain (loss) on investments | | | 1.19 | | | | (3.65 | ) | | | 1.47 | | | | 1.42 | | | | .98 | |
| | |
|
|
| |
|
|
| |
|
|
| |
|
|
| |
|
|
|
Total from investment operations | | | 1.22 | | | | (3.58 | ) | | | 1.54 | | | | 1.44 | | | | 1.01 | |
| | |
|
|
| |
|
|
| |
|
|
| |
|
|
| |
|
|
|
Less Dividends and Distributions: | | | | | | | | | | | | | | | | | | | | |
Dividends from net investment income | | | — | | | | — | | | | — | | | | — | | | | (.02 | ) |
Distributions from net realized gains | | | — | | | | — | | | | — | | | | — | | | | (.31 | ) |
Distributions | | | (.05 | ) | | | (1.41 | ) | | | (1.35 | ) | | | (.72 | ) | | | — | |
| | |
|
|
| |
|
|
| |
|
|
| |
|
|
| |
|
|
|
Total dividends and distributions | | | (.05 | ) | | | (1.41 | ) | | | (1.35 | ) | | | (.72 | ) | | | (.33 | ) |
| | |
|
|
| |
|
|
| |
|
|
| |
|
|
| |
|
|
|
Net Asset Value, end of year | | $ | 4.54 | | | $ | 3.37 | | | $ | 8.36 | | | $ | 8.17 | | | $ | 7.45 | |
| | |
|
|
| |
|
|
| |
|
|
| |
|
|
| |
|
|
|
Total Return(a) | | | 36.44 | % | | | (50.49 | )% | | | 19.12 | % | | | 20.42 | % | | | 15.79 | % |
Ratios/Supplemental Data: | | | | | | | | | | | | | | | | | | | | |
Net assets, end of year (in millions) | | $ | 11.1 | | | $ | 9.4 | | | $ | 31.5 | | | $ | 23.8 | | | $ | 23.1 | |
Ratios to average net assets(b): | | | | | | | | | | | | | | | | | | | | |
Expenses | | | 1.39 | % | | | 1.39 | % | | | 1.34 | % | | | 1.37 | % | | | 1.38 | % |
Net investment income | | | .70 | % | | | 1.10 | % | | | .70 | % | | | .28 | % | | | .56 | % |
Portfolio turnover rate | | | 89 | % | | | 101 | % | | | 81 | % | | | 111 | % | | | 99 | % |
| (a) | Total return is calculated assuming a purchase of a share on the first day and a sale on the last day of each year reported and includes reinvestment of dividends and distributions and does not reflect the effect of insurance contract charges. Total return does not reflect expenses associated with the separate account such as administrative fees, account charges and surrender charges which, if reflected, would reduce the total returns for all years shown. Performance figures may reflect voluntary fee waivers and/or expense reimbursements. In the absence of voluntary fee waivers and/or expense reimbursements, the total return would be lower. Past performance is no guarantee of future results. Total returns may reflect adjustments to conform to generally accepted accounting principles. |
| (b) | Does not include expenses of the underlying portfolio in which the Portfolio invests. |
| (c) | Calculation based on average shares outstanding during the year. |
SEE NOTES TO FINANCIAL STATEMENTS.
C2
Financial Highlights
| | | | | | | | | | | | | | | | | | | | |
| | | SP International Value Portfolio
| |
| | | Year Ended December 31,
| |
| | | 2009
| | | 2008(c)
| | | 2007
| | | 2006
| | | 2005(c)
| |
Per Share Operating Performance: | | | | | | | | | | | | | | | | | | | | |
Net Asset Value, beginning of year | | $ | 4.95 | | | $ | 10.63 | | | $ | 11.40 | | | $ | 9.08 | | | $ | 8.84 | |
| | |
|
|
| |
|
|
| |
|
|
| |
|
|
| |
|
|
|
Income (Loss) From Investment Operations: | | | | | | | | | | | | | | | | | | | | |
Net investment income | | | .14 | | | | .18 | | | | .24 | | | | .24 | | | | .17 | |
Net realized and unrealized gain (loss) on investments | | | 1.43 | | | | (4.27 | ) | | | 1.79 | | | | 2.35 | | | | .94 | |
| | |
|
|
| |
|
|
| |
|
|
| |
|
|
| |
|
|
|
Total from investment operations | | | 1.57 | | | | (4.09 | ) | | | 2.03 | | | | 2.59 | | | | 1.11 | |
| | |
|
|
| |
|
|
| |
|
|
| |
|
|
| |
|
|
|
Less Dividends and Distributions: | | | | | | | | | | | | | | | | | | | | |
Dividends from net investment income | | | — | | | | — | | | | — | | | | — | | | | (.04 | ) |
Distributions from net realized gains | | | — | | | | — | | | | — | | | | — | | | | (.83 | ) |
Distributions | | | (.17 | ) | | | (1.59 | ) | | | (2.80 | ) | | | (.27 | ) | | | — | |
| | |
|
|
| |
|
|
| |
|
|
| |
|
|
| |
|
|
|
Total dividends and distributions | | | (.17 | ) | | | (1.59 | ) | | | (2.80 | ) | | | (.27 | ) | | | (.87 | ) |
| | |
|
|
| |
|
|
| |
|
|
| |
|
|
| |
|
|
|
Net Asset Value, end of year | | $ | 6.35 | | | $ | 4.95 | | | $ | 10.63 | | | $ | 11.40 | | | $ | 9.08 | |
| | |
|
|
| |
|
|
| |
|
|
| |
|
|
| |
|
|
|
Total Return(a) | | | 32.35 | % | | | (44.06 | )% | | | 18.08 | % | | | 29.09 | % | | | 13.77 | % |
Ratios/Supplemental Data: | | | | | | | | | | | | | | | | | | | | |
Net assets, end of year (in millions) | | $ | 203.3 | | | $ | 238.5 | | | $ | 493.6 | | | $ | 487.4 | | | $ | 389.3 | |
Ratios to average net assets(b): | | | | | | | | | | | | | | | | | | | | |
Expenses | | | 1.03 | % | | | 1.02 | % | | | .99 | % | | | .99 | % | | | 1.06 | % |
Net investment income | | | 1.82 | % | | | 2.32 | % | | | 1.80 | % | | | 2.28 | % | | | 2.08 | % |
Portfolio turnover rate | | | 67 | % | | | 34 | % | | | 46 | % | | | 113 | % | | | 18 | % |
| (a) | Total return is calculated assuming a purchase of a share on the first day and a sale on the last day of each year reported and includes reinvestment of dividends and distributions and does not reflect the effect of insurance contract charges. Total return does not reflect expenses associated with the separate account such as administrative fees, account charges and surrender charges which, if reflected, would reduce the total returns for all years shown. Performance figures may reflect voluntary fee waivers and/or expense reimbursements. In the absence of voluntary fee waivers and/or expense reimbursements, the total return would be lower. Past performance is no guarantee of future results. Total returns may reflect adjustments to conform to generally accepted accounting principles. |
| (b) | Does not include expenses of the underlying portfolio in which the Portfolio invests. |
| (c) | Calculated based upon average shares outstanding during the year. |
| | | | | | | | | | | | | | | | | | | | |
| | | SP Mid Cap Growth Portfolio
| |
| | | Year Ended December 31,
| |
| | | 2009
| | | 2008
| | | 2007
| | | 2006
| | | 2005
| |
Per Share Operating Performance: | | | | | | | | | | | | | | | | | | | | |
Net Asset Value, beginning of year | | $ | 3.43 | | | $ | 7.53 | | | $ | 7.07 | | | $ | 7.21 | | | $ | 6.85 | |
| | |
|
|
| |
|
|
| |
|
|
| |
|
|
| |
|
|
|
Income (Loss) From Investment Operations: | | | | | | | | | | | | | | | | | | | | |
Net investment income (loss) | | | (.01 | ) | | | (.01 | ) | | | (.02 | ) | | | .02 | | | | (.03 | ) |
Net realized and unrealized gain (loss) on investments | | | 1.09 | | | | (2.64 | ) | | | 1.16 | | | | (.16 | ) | | | .39 | |
| | |
|
|
| |
|
|
| |
|
|
| |
|
|
| |
|
|
|
Total from investment operations | | | 1.08 | | | | (2.65 | ) | | | 1.14 | | | | (.14 | ) | | | .36 | |
| | |
|
|
| |
|
|
| |
|
|
| |
|
|
| |
|
|
|
Less Distributions: | | | | | | | | | | | | | | | | | | | | |
Distributions | | | — | | | | (1.45 | ) | | | (.68 | ) | | | — | | | | — | |
| | |
|
|
| |
|
|
| |
|
|
| |
|
|
| |
|
|
|
Net Asset Value, end of year | | $ | 4.51 | | | $ | 3.43 | | | $ | 7.53 | | | $ | 7.07 | | | $ | 7.21 | |
| | |
|
|
| |
|
|
| |
|
|
| |
|
|
| |
|
|
|
Total Return(a) | | | 31.49 | % | | | (42.56 | )% | | | 16.21 | % | | | (1.94 | )% | | | 5.26 | % |
Ratios/Supplemental Data: | | | | | | | | | | | | | | | | | | | | |
Net assets, end of year (in millions) | | $ | 81.5 | | | $ | 67.5 | | | $ | 134.8 | | | $ | 133.1 | | | $ | 152.9 | |
Ratios to average net assets(b): | | | | | | | | | | | | | | | | | | | | |
Expenses | | | .97 | % | | | .89 | % | | | .87 | % | | | .91 | % | | | 1.00 | %(c) |
Net investment income (loss) | | | (.23 | )% | | | (.23 | )% | | | (.30 | )% | | | .20 | % | | | (.56 | )%(c) |
Portfolio turnover rate | | | 69 | % | | | 66 | % | | | 156 | % | | | 107 | % | | | 94 | % |
| (a) | Total return is calculated assuming a purchase of a share on the first day and a sale on the last day of each year reported and includes reinvestment of dividends and distributions and does not reflect the effect of insurance contract charges. Total return does not reflect expenses associated with the separate account such as administrative fees, account charges and surrender charges which, if reflected, would reduce the total returns for all years shown. Performance figures may reflect voluntary fee waivers and/or expense reimbursements. In the absence of voluntary fee waivers and/or expense reimbursements, the total return would be lower. Past performance is no guarantee of future results. Total returns may reflect adjustments to conform to generally accepted accounting principles. |
| (b) | Does not include expenses of the underlying portfolio in which the Portfolio invests. |
| (c) | Net of expense reimbursement. If the investment advisor had not reimbursed expenses, the annual expense and net investment loss ratios would have been 1.02% and (.58)%, respectively, for the year ended December 31, 2005. |
SEE NOTES TO FINANCIAL STATEMENTS.
C3
Financial Highlights
| | | | | | | | | | | | | | | | | | | | |
| | | SP Prudential U.S. Emerging Growth Portfolio
| |
| | | Class I
| |
| | | Year Ended December 31,
| |
| | | 2009
| | | 2008
| | | 2007
| | | 2006
| | | 2005
| |
Per Share Operating Performance: | | | | | | | | | | | | | | | | | | | | |
Net Asset Value, beginning of year | | $ | 4.58 | | | $ | 8.41 | | | $ | 7.99 | | | $ | 7.87 | | | $ | 8.07 | |
| | |
|
|
| |
|
|
| |
|
|
| |
|
|
| |
|
|
|
Income (Loss) From Investment Operations: | | | | | | | | | | | | | | | | | | | | |
Net investment income (loss) | | | .04 | | | | .04 | | | | .02 | | | | .03 | | | | (.02 | ) |
Net realized and unrealized gain (loss) on investments | | | 1.87 | | | | (2.64 | ) | | | 1.31 | | | | .71 | | | | 1.16 | |
| | |
|
|
| |
|
|
| |
|
|
| |
|
|
| |
|
|
|
Total from investment operations | | | 1.91 | | | | (2.60 | ) | | | 1.33 | | | | .74 | | | | 1.14 | |
| | |
|
|
| |
|
|
| |
|
|
| |
|
|
| |
|
|
|
Less Dividends and Distributions: | | | | | | | | | | | | | | | | | | | | |
Dividends from net investment income | | | — | | | | — | | | | — | | | | — | | | | — | (c) |
Distributions from net realized gains | | | — | | | | — | | | | — | | | | — | | | | (1.34 | ) |
Distributions | | | (.04 | ) | | | (1.23 | ) | | | (.91 | ) | | | (.62 | ) | | | — | |
| | |
|
|
| |
|
|
| |
|
|
| |
|
|
| |
|
|
|
Total dividends and distributions | | | (.04 | ) | | | (1.23 | ) | | | (.91 | ) | | | (.62 | ) | | | (1.34 | ) |
| | |
|
|
| |
|
|
| |
|
|
| |
|
|
| |
|
|
|
Net Asset Value, end of year | | $ | 6.45 | | | $ | 4.58 | | | $ | 8.41 | | | $ | 7.99 | | | $ | 7.87 | |
| | |
|
|
| |
|
|
| |
|
|
| |
|
|
| |
|
|
|
Total Return(a) | | | 41.89 | % | | | (36.23 | )% | | | 16.82 | % | | | 9.59 | % | | | 17.77 | % |
Ratios/Supplemental Data: | | | | | | | | | | | | | | | | | | | | |
Net assets, end of year (in millions) | | $ | 142.3 | | | $ | 112.3 | | | $ | 205.8 | | | $ | 202.6 | | | $ | 194.8 | |
Ratios to average net assets(b): | | | | | | | | | | | | | | | | | | | | |
Expenses | | | .71 | % | | | .68 | % | | | .65 | % | | | .67 | % | | | .80 | % |
Net investment income (loss) | | | .66 | % | | | .55 | % | | | .24 | % | | | .32 | % | | | (.28 | )% |
Portfolio turnover rate | | | 50 | % | | | 59 | % | | | 54 | % | | | 70 | % | | | 142 | % |
| | | | | | | | | | | | | | | | | | | | |
| | | SP Prudential U.S. Emerging Growth Portfolio
| |
| | | Class II
| |
| | | December 31,
| |
| | | 2009
| | | 2008
| | | 2007
| | | 2006
| | | 2005
| |
Per Share Operating Performance: | | | | | | | | | | | | | | | | | | | | |
Net Asset Value, beginning of year | | $ | 4.44 | | | $ | 8.17 | | | $ | 7.79 | | | $ | 7.72 | | | $ | 7.96 | |
| | |
|
|
| |
|
|
| |
|
|
| |
|
|
| |
|
|
|
Income (Loss) From Investment Operations: | | | | | | | | | | | | | | | | | | | | |
Net investment income (loss) | | | .01 | | | | .01 | | | | (.01 | ) | | | (.01 | ) | | | (.05 | ) |
Net realized and unrealized gain (loss) on investments | | | 1.81 | | | | (2.53 | ) | | | 1.27 | | | | .70 | | | | 1.15 | |
| | |
|
|
| |
|
|
| |
|
|
| |
|
|
| |
|
|
|
Total from investment operations | | | 1.82 | | | | (2.52 | ) | | | 1.26 | | | | .69 | | | | 1.10 | |
| | |
|
|
| |
|
|
| |
|
|
| |
|
|
| |
|
|
|
Less Dividends and Distributions: | | | | | | | | | | | | | | | | | | | | |
Distributions from net realized gains | | | — | | | | — | | | | — | | | | — | | | | (1.34 | ) |
Distributions | | | (.01 | ) | | | (1.21 | ) | | | (.88 | ) | | | (.62 | ) | | | — | |
| | |
|
|
| |
|
|
| |
|
|
| |
|
|
| |
|
|
|
Total dividends and distributions | | | (.01 | ) | | | (1.21 | ) | | | (.88 | ) | | | (.62 | ) | | | (1.34 | ) |
| | |
|
|
| |
|
|
| |
|
|
| |
|
|
| |
|
|
|
Net Asset Value, end of year | | $ | 6.25 | | | $ | 4.44 | | | $ | 8.17 | | | $ | 7.79 | | | $ | 7.72 | |
| | |
|
|
| |
|
|
| |
|
|
| |
|
|
| |
|
|
|
Total Return(a): | | | 41.14 | % | | | (36.24 | )% | | | 16.34 | % | | | 9.10 | % | | | 17.47 | % |
Ratios/Supplemental Data: | | | | | | | | | | | | | | | | | | | | |
Net assets, end of year (in millions) | | $ | 0.3 | | | $ | 0.2 | | | $ | 0.4 | | | $ | 0.3 | | | $ | 0.3 | |
Ratios to average net assets(b): | | | | | | | | | | | | | | | | | | | | |
Expenses | | | 1.11 | % | | | 1.08 | % | | | 1.05 | % | | | 1.07 | % | | | 1.20 | % |
Net investment income (loss) | | | .25 | % | | | .15 | % | | | (.16 | )% | | | (.04 | )% | | | (.70 | )% |
Portfolio turnover rate | | | 50 | % | | | 59 | % | | | 54 | % | | | 70 | % | | | 142 | % |
| (a) | Total return is calculated assuming a purchase of a share on the first day and a sale on the last day of each year reported and includes reinvestment of dividends and distributions and does not reflect the effect of insurance contract charges. Total return does not reflect expenses associated with the separate account such as administrative fees, account charges and surrender charges which, if reflected, would reduce the total returns for all years shown. Performance figures may reflect fee waivers and/or expense reimbursements. In the absence of fee waivers and/or expense reimbursements, the total return would be lower. Past performance is no guarantee of future results. Total returns may reflect adjustments to conform to generally accepted accounting principles. |
| (b) | Does not include expenses of the underlying portfolio in which the Portfolio invests. |
| (c) | Less than $0.005 per share. |
SEE NOTES TO FINANCIAL STATEMENTS.
C4
Financial Highlights
| | | | | | | | | | | | | | | | | | | | |
| | | SP Small Cap Value Portfolio
| |
| | | Year Ended December 31,
| |
| | | 2009
| | | 2008
| | | 2007
| | | 2006
| | | 2005
| |
Per Share Operating Performance: | | | | | | | | | | | | | | | | | | | | |
Net Asset Value, beginning of year | | $ | 7.60 | | | $ | 12.22 | | | $ | 13.68 | | | $ | 14.27 | | | $ | 15.51 | |
| | |
|
|
| |
|
|
| |
|
|
| |
|
|
| |
|
|
|
Income (Loss) From Investment Operations: | | | | | | | | | | | | | | | | | | | | |
Net investment income | | | .07 | | | | .12 | | | | .13 | | | | .10 | | | | .07 | |
Net realized and unrealized gain (loss) on investments | | | 2.24 | | | | (3.47 | ) | | | (.64 | ) | | | 1.78 | | | | .52 | |
| | |
|
|
| |
|
|
| |
|
|
| |
|
|
| |
|
|
|
Total from investment operations | | | 2.31 | | | | (3.35 | ) | | | (.51 | ) | | | 1.88 | | | | .59 | |
| | |
|
|
| |
|
|
| |
|
|
| |
|
|
| |
|
|
|
Less Dividends and Distributions: | | | | | | | | | | | | | | | | | | | | |
Dividends from net investment income | | | — | | | | — | | | | — | | | | — | | | | (.08 | ) |
Distributions from net realized gains | | | — | | | | — | | | | — | | | | — | | | | (1.75 | ) |
Distributions | | | (.12 | ) | | | (1.27 | ) | | | (.95 | ) | | | (2.47 | ) | | | — | |
| | |
|
|
| |
|
|
| |
|
|
| |
|
|
| |
|
|
|
Total dividends and distributions | | | (.12 | ) | | | (1.27 | ) | | | (.95 | ) | | | (2.47 | ) | | | (1.83 | ) |
| | |
|
|
| |
|
|
| |
|
|
| |
|
|
| |
|
|
|
Net Asset Value, end of year | | $ | 9.79 | | | $ | 7.60 | | | $ | 12.22 | | | $ | 13.68 | | | $ | 14.27 | |
| | |
|
|
| |
|
|
| |
|
|
| |
|
|
| |
|
|
|
Total Return(a) | | | 30.80 | % | | | (30.50 | )% | | | (3.63 | )% | | | 14.60 | % | | | 4.61 | % |
Ratios/Supplemental Data: | | | | | | | | | | | | | | | | | | | | |
Net assets, end of year (in millions) | | $ | 208.0 | | | $ | 202.2 | | | $ | 309.4 | | | $ | 369.0 | | | $ | 350.7 | |
Ratios to average net assets(b): | | | | | | | | | | | | | | | | | | | | |
Expenses | | | 1.00 | % | | | .98 | % | | | .96 | % | | | .96 | % | | | .97 | % |
Net investment income | | | .70 | % | | | 1.17 | % | | | .81 | % | | | .71 | % | | | .49 | % |
Portfolio turnover rate | | | 52 | % | | | 56 | % | | | 45 | % | | | 55 | % | | | 119 | % |
| (a) | Total return is calculated assuming a purchase of a share on the first day and a sale on the last day of each year reported and includes reinvestment of dividends and distributions. Total return does not reflect expenses associated with the separate account such as administrative fees, account charges and surrender charges which, if reflected, would reduce the total returns for all periods shown. Performance figures may reflect voluntary fee waivers and/or expense reimbursements. In the absence of voluntary fee waivers and/or expense reimbursements, the total return would be lower. Past performance is no guarantee of future results. Total returns may reflect adjustments to conform to generally accepted accounting principles. |
| (b) | Does not include expenses of the underlying portfolio in which the Portfolio invests. |
SEE NOTES TO FINANCIAL STATEMENTS.
C5
Financial Highlights
| | | | | | | | | | | | | | | | | | | | |
| | | SP Strategic Partners Focused Growth Portfolio
| |
| | | Class I
| |
| | | Year Ended December 31,
| |
| | | 2009(e)
| | | 2008(e)
| | | 2007
| | | 2006
| | | 2005
| |
Per Share Operating Performance: | | | | | | | | | | | | | | | | | | | | |
Net Asset Value, beginning of year | | $ | 4.78 | | | $ | 8.30 | | | $ | 7.49 | | | $ | 8.07 | | | $ | 7.00 | |
| | |
|
|
| |
|
|
| |
|
|
| |
|
|
| |
|
|
|
Income (Loss) From Investment Operations: | | | | | | | | | | | | | | | | | | | | |
Net investment loss | | | (.01 | ) | | | (.02 | ) | | | (.04 | ) | | | (.04 | ) | | | (.03 | ) |
Net realized and unrealized gain (loss) on investments | | | 2.12 | | | | (2.98 | ) | | | 1.18 | | | | (.02 | ) | | | 1.10 | |
| | |
|
|
| |
|
|
| |
|
|
| |
|
|
| |
|
|
|
Total from investment operations | | | 2.11 | | | | (3.00 | ) | | | 1.14 | | | | (.06 | ) | | | 1.07 | |
| | |
|
|
| |
|
|
| |
|
|
| |
|
|
| |
|
|
|
Less Distributions: | | | | | | | | | | | | | | | | | | | | |
Distributions | | | — | | | | (.52 | ) | | | (.33 | ) | | | (.52 | ) | | | — | |
| | |
|
|
| |
|
|
| |
|
|
| |
|
|
| |
|
|
|
Net Asset Value, end of year | | $ | 6.89 | | | $ | 4.78 | | | $ | 8.30 | | | $ | 7.49 | | | $ | 8.07 | |
| | |
|
|
| |
|
|
| |
|
|
| |
|
|
| |
|
|
|
Total Return(a) | | | 44.14 | % | | | (38.42 | )% | | | 15.24 | % | | | (.66 | )% | | | 15.29 | % |
Ratios/Supplemental Data: | | | | | | | | | | | | | | | | | | | | |
Net assets, end of year (in millions) | | $ | 30.2 | | | $ | 21.6 | | | $ | 38.4 | | | $ | 38.7 | | | $ | 38.3 | |
Ratios to average net assets(b): | | | | | | | | | | | | | | | | | | | | |
Expenses | | | 1.30 | % | | | 1.23 | % | | | 1.15 | % | | | 1.15 | % | | | 1.07 | %(c) |
Net investment loss | | | (.20 | )% | | | (.30 | )% | | | (.43 | )% | | | (.47 | )% | | | (.44 | )%(c) |
Portfolio turnover rate | | | 113 | % | | | 62 | % | | | 120 | % | | | 142 | % | | | 110 | % |
| | | | | | | | | | | | | | | | | | | | |
| | | SP Strategic Partners Focused Growth Portfolio
| |
| | | Class II
| |
| | | Year Ended December 31,
| |
| | | 2009(e)
| | | 2008(e)
| | | 2007
| | | 2006
| | | 2005
| |
Per Share Operating Performance: | | | | | | | | | | | | | | | | | | | | |
Net Asset Value, beginning of year | | $ | 4.61 | | | $ | 8.04 | | | $ | 7.30 | | | $ | 7.91 | | | $ | 6.88 | |
| | |
|
|
| |
|
|
| |
|
|
| |
|
|
| |
|
|
|
Income (Loss) From Investment Operations: | | | | | | | | | | | | | | | | | | | | |
Net investment loss | | | (.03 | ) | | | (.05 | ) | | | (.10 | ) | | | (.08 | ) | | | (.06 | ) |
Net realized and unrealized gain (loss) on investments | | | 2.03 | | | | (2.86 | ) | | | 1.17 | | | | (.01 | ) | | | 1.09 | |
| | |
|
|
| |
|
|
| |
|
|
| |
|
|
| |
|
|
|
Total from investment operations | | | 2.00 | | | | (2.91 | ) | | | 1.07 | | | | (.09 | ) | | | 1.03 | |
| | |
|
|
| |
|
|
| |
|
|
| |
|
|
| |
|
|
|
Less Distributions: | | | | | | | | | | | | | | | | | | | | |
Distributions | | | — | | | | (.52 | ) | | | (.33 | ) | | | (.52 | ) | | | — | |
| | |
|
|
| |
|
|
| |
|
|
| |
|
|
| |
|
|
|
Net Asset Value, end of year | | $ | 6.61 | | | $ | 4.61 | | | $ | 8.04 | | | $ | 7.30 | | | $ | 7.91 | |
| | |
|
|
| |
|
|
| |
|
|
| |
|
|
| |
|
|
|
Total Return(a) | | | 43.38 | % | | | (38.54 | )% | | | 14.68 | % | | | (1.07 | )% | | | 14.97 | % |
Ratios/Supplemental Data: | | | | | | | | | | | | | | | | | | | | |
Net assets, end of year (in millions) | | $ | 13.7 | | | $ | 10.4 | | | $ | 27.3 | | | $ | 31.3 | | | $ | 42.8 | |
Ratios to average net assets(b): | | | | | | | | | | | | | | | | | | | | |
Expenses | | | 1.70 | % | | | 1.63 | % | | | 1.55 | % | | | 1.55 | % | | | 1.47 | %(d) |
Net investment loss | | | (.60 | )% | | | (.70 | )% | | | (.83 | )% | | | (.88 | )% | | | (.84 | )%(d) |
Portfolio turnover rate | | | 113 | % | | | 62 | % | | | 120 | % | | | 142 | % | | | 110 | % |
| (a) | Total return is calculated assuming a purchase of a share on the first day and a sale on the last day of each year reported and includes reinvestment of dividends and distributions and does not reflect the effect of insurance contract charges. Total return does not reflect expenses associated with the separate account such as administrative fees, account charges and surrender charges which, if reflected, would reduce the total returns for all years shown. Performance figures may reflect voluntary fee waivers and/or expense reimbursements. In the absence of voluntary fee waivers and/or expense reimbursements, the total return would be lower. Past performance is no guarantee of future results. Total returns may reflect adjustments to conform to generally accepted accounting principles. |
| (b) | Does not include expenses of the underlying portfolio in which the Portfolio invests. |
| (c) | Net of expense reimbursement. If the investment advisor had not reimbursed expenses, the annual expense and net investment loss ratios would have been 1.14% and (.51)%, respectively, for the year ended December 31, 2005. |
| (d) | Net of expense reimbursement. If the investment advisor had not reimbursed expenses, the annual expense and net investment loss ratios would have been 1.54% and (.91)%, respectively, for the year ended December 31, 2005. |
| (e) | Calculated based on average shares outstanding during the year. |
SEE NOTES TO FINANCIAL STATEMENTS.
C6
REPORT OF INDEPENDENT REGISTERED PUBLIC ACCOUNTING FIRM
THE BOARD OF TRUSTEES AND SHAREHOLDERS
THE PRUDENTIAL SERIES FUND:
We have audited the accompanying statements of assets and liabilities of The Prudential Series Fund (comprised of SP Davis Value Portfolio, SP Growth Asset Allocation Portfolio, SP International Growth Portfolio, SP International Value Portfolio, SP Mid-Cap Growth Portfolio, SP Prudential U.S. Emerging Growth Portfolio, SP Small Cap Value Portfolio and SP Strategic Partners Focused Growth Portfolio), hereafter referred to as the “Funds”, including the portfolios of investments, as of December 31, 2009, and the related statements of operations for the year then ended, the statements of changes in net assets for each of the years in the two-year period then ended and the financial highlights for each of the years in the five-year period then ended. These financial statements and financial highlights are the responsibility of the Funds’ management. Our responsibility is to express an opinion on these financial statements and financial highlights based on our audits.
We conducted our audits in accordance with the standards of the Public Company Accounting Oversight Board (United States). Those standards require that we plan and perform the audit to obtain reasonable assurance about whether the financial statements and financial highlights are free of material misstatement. An audit includes examining, on a test basis, evidence supporting the amounts and disclosures in the financial statements. Our procedures included confirmation of securities owned as of December 31, 2009, by correspondence with the custodian, transfer agent and brokers or by other appropriate auditing procedures where replies from brokers were not received. An audit also includes assessing the accounting principles used and significant estimates made by management, as well as evaluating the overall financial statement presentation. We believe that our audits provide a reasonable basis for our opinion.
In our opinion, the financial statements and financial highlights referred to above present fairly, in all material respects, the financial position of the Funds as of December 31, 2009, and the results of their operations, the changes in their net assets and the financial highlights for the periods described in the first paragraph above, in conformity with U.S. generally accepted accounting principles.

New York, New York
February 17, 2010
D1
INFORMATION ABOUT TRUSTEES AND OFFICERS (Unaudited)
Information about the Trustees and the Officers of the Fund is set forth below. Trustees who are not deemed to be “interested persons” of the Fund, as defined in the 1940 Act, are referred to as “Independent Trustees.” Trustees who are deemed to be “interested persons” of the Fund are referred to as “Interested Trustees.” The Trustees are responsible for the overall supervision of the operations of the Fund and perform the various duties imposed on the directors of investment companies by the 1940 Act.
| | | | |
Independent Trustees (1) | | | | |
Name, Address, Age No. of Portfolios Overseen | | Principal Occupation(s) During Past Five Years | | Other Directorships Held |
Saul K. Fenster, Ph.D. (76) No. of Portfolios Overseen: 83 | | Currently President Emeritus of New Jersey Institute of Technology (since 2002); formerly President (1978-2002) of New Jersey Institute of Technology; Commissioner (1998-2002) of the Middle States Association Commission on Higher Education; Commissioner (1985-2002) of the New Jersey Commission on Science and Technology; formerly Director (1998-2005) of Society of Manufacturing Engineering Education Foundation; formerly Director of Prosperity New Jersey; formerly a director or trustee of Liberty Science Center, Research and Development Council of New Jersey, New Jersey State Chamber of Commerce, and National Action Council for Minorities in Engineering. | | Member (since 2006), Board of The Ridgefield Foundation and The Leir Foundation. |
| | | |
Delayne Dedrick Gold (71) No. of Portfolios Overseen: 83 | | Marketing Consultant (1982-present); formerly Senior Vice President and Member of the Board of Directors, Prudential Bache Securities, Inc. | | None |
| | | |
W. Scott McDonald, Jr. (72) No. of Portfolios Overseen: 83 | | Formerly Management Consultant (1997-2004) and of Counsel (2004-2005) at Kaludis Consulting Group, Inc. (company serving higher education); Formerly principal (1995-1997), Scott McDonald Associates; Chief Operating Officer (1991-1995), Fairleigh Dickinson University; Executive Vice President and Chief Operating Officer (1975-1991), Drew University; interim President (1988-1990), Drew University; formerly Director of School, College and University Underwriters Ltd. | | None |
| | | |
Thomas T. Mooney (68) No. of Portfolios Overseen: 83 | | Formerly Chief Executive Officer, Excell Partners, Inc.; formerly President of the Greater Rochester Metro Chamber of Commerce, Rochester City Manager; formerly Deputy Monroe County Executive. | | None |
| | | |
Thomas M. O’Brien (59) No. of Portfolios Overseen: 83 | | President and COO (since November 2006) and CEO (since April 2007) of State Bancorp, Inc. and State Bank; Vice Chairman (January 1997-April 2000) of North Fork Bank; President and Chief Executive Officer (December 1984-December 1996) of North Side Savings Bank; formerly President and Chief Executive Officer (May 2000-June 2006) Atlantic Bank of New York. | | Formerly Director (December 1996-May 2000) of North Fork Bancorporation, Inc.; Formerly Director (May 2000-April 2006) of Atlantic Bank of New York; Director (since November 2006) of State Bancorp, Inc. (NASDAQ: STBC) and State Bank of Long Island. |
| | | |
F. Don Schwartz (74) No. of Portfolios Overseen: 83 | | Management Consultant (since April 1985). | | None |
| | | | |
Interested Trustee (1) | | | | |
Robert F. Gunia (63) No. of Portfolios Overseen: 83 | | Independent Consultant; formerly Chief Administrative Officer (September 1999-September 2009) and Executive Vice President (December 1996-September 2009) of Prudential Investments LLC; Executive Vice President (March 1999-September 2009) and Treasurer (May 2000-September 2009) of Prudential Mutual Fund Services LLC; President (April 1999-December 2008) and Executive Vice President and Chief Operating Officer (December 2008- December 2009) of Prudential Investment Management Services LLC; Chief Administrative Officer, Executive Vice President and Director (May 2003-September 2009) of AST Investment Services, Inc. | | Director (since May 1989) of The Asia Pacific Fund, Inc. |
| 1 | The year that each Trustee joined the Fund’s Board is as follows: Saul K. Fenster, 1983; Delayne Dedrick Gold, 2001; Robert F. Gunia, 2001; W. Scott McDonald, Jr., 1983; Thomas T. Mooney, 2001; Thomas M. O’Brien, 2003; F. Don Schwartz, 2003. |
E1
| | |
Fund Officers 1 | | |
Name, Address and Age Position with the Fund | | Principal Occupation(s) During the Past Five Years |
Steve Pelletier (56) President and Principal Executive Officer | | President of Prudential Annuities (since September 2008); Chairman and CEO, International Investments, Prudential Financial (since January 1998). |
| | |
Timothy S. Cronin (44) Vice President | | Chief Investment Officer and Strategist of Prudential Annuities (since January 2004); Director of Investment & Research Strategy (since February 1998); President of AST Investment Services, Inc. (since June 2005). |
| | |
Kathryn L. Quirk (57) Chief Legal Officer | | Vice President and Corporate Counsel (since September 2004) of Prudential; Executive Vice President, Chief Legal Officer and Secretary (since July 2005) of Prudential Investments LLC (PI) and Prudential Mutual Fund Services LLC (PMFS); Vice President and Corporate Counsel (since June 2005) and Secretary (since February 2006) of AST Investment Services, Inc.; formerly Senior Vice President and Assistant Secretary (November 2004-August 2005) of PI; formerly Assistant Secretary (June 2005-February 2006) of AST Investment Services, Inc.; formerly Managing Director, General Counsel, Chief Compliance Officer, Chief Risk Officer and Corporate Secretary (1997-2002) of Zurich Scudder Investments, Inc. |
| | |
Deborah A. Docs (52) Secretary | | Vice President and Corporate Counsel (since January 2001) of Prudential; Vice President (since December 1996) and Assistant Secretary (since March 1999) of PI; formerly Vice President and Assistant Secretary (May 2003-June 2005) of AST Investment Services, Inc. |
| | |
Jonathan D. Shain (51) Assistant Secretary | | Vice President and Corporate Counsel (since August 1998) of Prudential; Vice President and Assistant Secretary (since May 2001) of PI; Vice President and Assistant Secretary (since February 2001) of PMFS; formerly Vice President and Assistant Secretary (May 2003-June 2005) of AST Investment Services, Inc. |
| | |
Claudia DiGiacomo (35) Assistant Secretary | | Vice President and Corporate Counsel (since January 2005) of Prudential; Vice President and Assistant Secretary of PI (since December 2005); Associate at Sidley Austin Brown & Wood LLP (1999-2004). |
| | |
John P. Schwartz (38) Assistant Secretary | | Vice President and Corporate Counsel (since April 2005) of Prudential; Vice President and Assistant Secretary of PI (since December 2005); Associate at Sidley Austin Brown & Wood LLP (1997-2005). |
| | |
Andrew R. French (47) Assistant Secretary | | Director and Corporate Counsel (since May 2006) of Prudential; Vice President and Assistant Secretary (since January 2007) of PI; Vice President and Assistant Secretary (since January 2007) of PMFS; formerly Senior Legal Analyst of Prudential Mutual Fund Law Department (1997-2006). |
| | |
Timothy J. Knierim (51) Chief Compliance Officer | | Chief Compliance Officer of Prudential Investment Management, Inc.(PIM) (since July 2007); formerly Chief Risk Officer of PIM and PI (2002-2007) and formerly Chief Ethics Officer of PIM and PI (2006-2007). |
| | |
Valerie M. Simpson (51) Deputy Chief Compliance Officer | | Chief Compliance Officer (since April 2007) of PI and AST Investment Services, Inc.; formerly Vice President-Financial Reporting (June 1999-March 2006) for Prudential Life and Annuities Finance. |
| | |
Theresa C. Thompson (47) Deputy Chief Compliance Officer | | Vice President, Compliance, PI (since April 2004); and Director, Compliance, PI (2001 - 2004). |
| | |
Noreen M. Fierro (45) Anti-Money Laundering Compliance Officer | | Vice President, Corporate Compliance (since May 2006) of Prudential; formerly Corporate Vice President, Associate General Counsel (April 2002-May 2005) of UBS Financial Services, Inc., in their Money Laundering Prevention Group; Senior Manager (May 2005-May 2006) of Deloitte Financial Advisory Services, LLP, in their Forensic and Dispute Services, Anti-Money Laundering Group. |
| | |
Grace C. Torres (50) Treasurer and Principal Financial and Accounting Officer | | Assistant Treasurer (since March 1999) and Senior Vice President (since September 1999) of PI; Assistant Treasurer (since May 2003) and Vice President (since June 2005) of AST Investment Services, Inc.; Senior Vice President and Assistant Treasurer (since May 2003) of Prudential Annuities Advisory Services, Inc.; formerly Senior Vice President (May 2003-June 2005) of AST Investment Services, Inc. |
| | |
M. Sadiq Peshimam (46) Assistant Treasurer | | Vice President (since 2005) of Prudential Investments LLC. |
| | |
Peter Parrella (51) Assistant Treasurer | | Vice President (since 2007) and Director (2004-2007) within Prudential Mutual Fund Administration; formerly Tax Manager at SSB Citi Fund Management LLC (1997-2004). |
| | |
Alan Fu (52) Assistant Treasurer | | Vice President and Corporate Counsel - Tax, Prudential Financial, Inc. (since October 2003). |
| 1 | The year in which each individual became an Officer of the Fund is as follows: Stephen Pelletier, 2008; Timothy S. Cronin, 2009; Kathryn L. Quirk, 2005; Deborah A. Docs, 2005; Jonathan D. Shain, 2005; Claudia DiGiacomo, 2005; John P. Schwartz, 2006; Andrew R. French, 2006; Timothy J. Knierim, 2007; Valerie M. Simpson, 2007; Theresa C. Thompson, 2008; Noreen M. Fierro, 2006; Grace C. Torres, 1997; Peter Parrella, 2007; M. Sadiq Peshimam, 2006; Alan Fu, 2006. |
Explanatory Notes to Tables:
Trustees are deemed to be “Interested”, as defined in the 1940 Act, by reason of their affiliation with Prudential Investments LLC and/or an affiliate of Prudential Investments LLC. Robert F. Gunia will be considered an Interested Trustee for at least two years after his retirement from employment by the Manager and its affiliates (which was on or about October 21, 2009). He will also be an Interested Trustee as long as he holds a beneficial interest in securities issued by the Manager or its affiliates.
Unless otherwise noted, the address of all Trustees and Officers is c/o Prudential Investments LLC, Gateway Center Three, 100 Mulberry Street, Newark, New Jersey 07102.
There is no set term of office for Trustees or Officers. The Independent Trustees have adopted a retirement policy, which calls for the retirement of Trustees on December 31 of the year in which they reach the age of 75.
“Other Directorships Held” includes only directorships of companies required to register or file reports with the SEC under the Securities Exchange Act of 1934 (that is, “public companies”) or other investment companies registered under the 1940 Act.
“No. of Portfolios Overseen” includes all investment companies managed by Prudential Investments LLC. The investment companies for which PI serves as manager include the Prudential Investments Funds, The Prudential Variable Contract Accounts, The Target Portfolio Trust, The Prudential Series Fund, Advanced Series Trust and Prudential’s Gibraltar Fund, Inc.
E2
Annuities are issued by Pruco Life Insurance Company, or in New York, Pruco Life Insurance Company of New Jersey, both located at 213 Washington Street, Newark, NJ 07102-2992, and Prudential Annuities Life Assurance Corporation, located at One Corporate Drive, Shelton, CT, 06484. Variable annuities are distributed by Prudential Annuities Distributors, Inc., also located in Shelton, CT. Prudential Annuities is a business unit of Prudential Financial.
Variable life insurance is issued by The Prudential Insurance Company of America, 751 Broad Street, Newark, NJ 07102-3777, Pruco Life Insurance Company, or in New York, Pruco Life Insurance Company of New Jersey, both located at 213 Washington Street, Newark, NJ 07102-2992. Pruco Life Insurance Company is not licensed to do business in New York. Variable life insurance is offered through Pruco Securities LLC, 751 Broad Street, Newark, NJ 07102-3777.
All are Prudential Financial companies and each is solely responsible for its financial condition and contractual obligations.
Life insurance and annuity contracts contain exclusions, limitations, reductions of benefits and terms for keeping them in force. Your licensed financial professional can provide you with costs and complete details. Contract guarantees are based on the claims-paying ability of the issuing company.
The Prudential Insurance Company of America
751 Broad Street
Newark, NJ 07102-3777
PRST STD POSTAGES & FEES PAID VON HOFFMANN CORPORATION
The 2009 Audited Financial Statements of Pruco Life Insurance Company, Pruco Life Insurance Company of New Jersey, and The Prudential Insurance Company of America are available. You may call 888-778-2888 to obtain a free copy of the audited financial statements of the insurance company that issued your contract.
To reduce costs, we now generally send only a single copy of prospectuses and shareholder reports to each household (“householding”) in lieu of sending a copy to each Contract Owner who resides in the household. You should be aware that by calling 877-778-5008, you can revoke or “opt out” of householding at any time.
Pru, Prudential, Prudential Financial, Rock Solid, “The Rock,” the Rock Logo and the Rock Prudential Logo are registered service marks of The Prudential Insurance Company of America, Newark, NJ, and its affiliates.
0172280-00001-00 PSF-AR-B

| | |
| | |
| ANNUAL REPORT | | DECEMBER 31, 2009 |
The Prudential Series Fund
| n | | Jennison 20/20 Focus Portfolio |


0172223-00001-00
This report is only authorized for distribution when preceded or accompanied by a current prospectus. Investors should carefully consider the contract and the underlying portfolios’ investment objectives, risks, and charges and expenses before investing. The contract prospectus and the underlying portfolio prospectuses contain information on the investment objectives, risks, and charges and expenses, as well as other important information. Read them carefully before investing or sending money.
A description of the Fund’s proxy voting policies and procedures is available, without charge, upon request. Owners of variable annuity contracts should call 888-778-2888 and owners of variable life insurance contracts should call 800-778-2255 to obtain descriptions of the Fund’s proxy voting policies and procedures. The description is also available on the website of the Securities and Exchange Commission (the “Commission”) at www.sec.gov. Information regarding how the Fund voted proxies relating to portfolio securities during the most recent 12-month period ended June 30 is available on the website of the Commission at www.sec.gov and on the Fund’s website.
The Fund files with the Commission a complete listing of portfolio holdings as of its first and third quarter-end on Form N-Q. Form N-Q is available on the Commission’s website at www.sec.gov or by visiting the Commission’s Public Reference Room. For more information on the Commission’s Public Reference Room, please visit the Commission’s website or call 1-800-SEC-0330. Form N-Q is also available on the Fund’s website at www.prudential.com or by calling the telephone numbers referenced above.
Life insurance policies and annuity contracts contain exclusions, limitations, reductions of benefits, and terms for keeping them in force. Your licensed financial professional can provide you with costs and complete details. Contract guarantees are based on the claims-paying ability of the issuing company.
Annuities are issued by Pruco Life Insurance Company, or in New York, Pruco Life Insurance Company of New Jersey, both located at 213 Washington Street, Newark, NJ 07102-2992, and Prudential Annuities Life Assurance Corporation, located at One Corporate Drive, Shelton, CT, 06484. Variable annuities are distributed by Prudential Annuities Distributors, Inc., also located in Shelton, CT. Prudential Annuities is a business unit of Prudential Financial.
Variable life insurance is issued by The Prudential Insurance Company of America, 751 Broad Street, Newark, NJ 07102- 3777, Pruco Life Insurance Company, or in New York, Pruco Life Insurance Company of New Jersey, both located at 213 Washington Street, Newark, NJ 07102-2992. Pruco Life Insurance Company is not licensed to do business in New York. Variable life insurance is offered through Pruco Securities LLC, 751 Broad Street, Newark, NJ 07102-3777.
All are Prudential Financial companies and each is solely responsible for its financial condition and contractual obligations.
Pru, Prudential, Prudential Financial, Rock Solid, “The Rock,” the Rock Logo and the Rock Prudential Logo are registered service marks of The Prudential Insurance Company of America, Newark, NJ, and its affiliates.
The Prudential Series Fund Class II Portfolios are available through life insurance contracts issued by various insurance companies other than The Prudential Insurance Company of America and its affiliates and distributed by Prudential Annuities Distributors, Inc., member SIPC, a Prudential Financial Company. Each company is solely responsible for its own financial condition and contractual obligations.
The Fund’s Statement of Additional Information contains additional information about the Fund’s Trustees and is available without charge upon request by calling 800-778-2255.
| | | | |
The Prudential Series Fund Table of Contents | | Annual Report | | December 31, 2009 |
| n | | LETTER TO CONTRACT OWNERS |
| n | | PRESENTATION OF PORTFOLIO HOLDINGS |
| n | | FEES AND EXPENSES TABLE |
| | A1 | Schedule of Investments and Financial Statements |
| | B1 | Notes to Financial Statements |
| | D1 | Report of Independent Registered Public Accounting Firm |
| | E1 | Information About Trustees and Officers |
| | | | |
The Prudential Series Fund Letter to Contract Owners | | Annual Report | | December 31, 2009 |
Our primary focus at Prudential is to help investors achieve and maintain long-term financial success. Our Prudential Series Fund annual report outlines our efforts to reach this goal. We hope you find it informative and useful.
Prudential has been building on a heritage of success for more than 130 years, and the quality of our businesses and risk diversification has enabled us to manage effectively through volatile markets. We believe the array of our products provides a highly attractive value proposition to clients like you who are focused on financial security.
Your financial professional is your best resource to make the most informed investment decisions to help meet your needs. Together, you can build a diversified investment portfolio that aligns with your long-term financial goals. Diversification does not assure a profit or protect against loss in declining markets.
Thank you for selecting Prudential as one of your financial partners. We value your trust and appreciate the opportunity to help you achieve financial security.
Sincerely,
Stephen Pelletier
President,
The Prudential Series Fund January 29, 2010 |
PRESIDENT
STEPHEN PELLETIER
| | |
The Prudential Series Fund, Jennison 20/20 Focus Portfolio Subadvised by: Jennison Associates LLC | | December 31, 2009 |
Investment Manager’s Report - As of December 31, 2009
Average Annual Total Return Percentages
| | | | | | | | | | | |
| | | 1-Year | | | 5-Year | | | 10-Year | | | Since
Inception |
Portfolio: Class I | | 57.83 | % | | 8.07 | % | | 4.87 | % | | N/A |
Portfolio: Class II | | 57.40 | | | 7.67 | | | N/A | | | 4.99 |
Russell 1000® Index | | 28.43 | | | 0.79 | | | -0.49 | | | 0.56 |
S&P 500 Index | | 26.47 | | | 0.42 | | | -0.95 | | | 0.08 |
Past performance does not guarantee future returns. The investment return and principal value of an investment will fluctuate, so that an investor’s shares, when redeemed, may be worth more or less than their original cost. Current performance may be lower or higher than the past performance data quoted.
$10,000 INVESTED OVER 10 YEARS

Portfolio Class I inception: 5/3/1999. Portfolio Class II inception: 2/15/2000. Portfolio performance is net of investment fees and fund expenses, but not product charges, which, if included, would significantly lower the performance quoted. Unless noted otherwise, Index returns reflect performance beginning the closest month-end date to the Portfolio’s inception (Class I). The Russell 1000® Index is a trademark/service mark of the Frank Russell Company. Russell® is a trademark of the Frank Russell Company. Performance figures may reflect fee waivers and/or expense reimbursements. In the absence of such fee waivers and/or expense reimbursements, total returns would be lower.
For the year ended December 31, 2009, the Jennison 20/20 Focus Portfolio rose 57.83%, while the Class II shares rose 57.40%, substantially outperforming the S&P 500 (the Index). The Portfolio is composed of two concentrated portfolios; one invests in growth stocks and the other invests in value stocks. Growth investors look for companies that have the potential to continue to generate above-average gains in earnings. Value investors look for undervalued firms that have the potential to rise to their true value over time.
Every sector added to results and was a source of positive performance relative to the Index. Stock selection nearly across the board drove the Portfolio’s outperformance. Positions in information technology benefited the Portfolio’s absolute performance most. Stock selection and an overweight stance in the sector resulted in positive relative performance. Positions in energy and materials further bolstered overall performance. The Portfolio also outperformed in healthcare, consumer discretionary, financials, telecommunication services, consumer staples and utilities. An underweight stance in financials also benefited relative return.
Industrials was the one sector that underperformed the Index. However, the Portfolio’s lower exposure to the sector resulted in positive relative performance.
From the depths of their March lows, equity markets have posted impressive rebounds, with most indexes gaining 50% or more through year-end. Corporate profits, which have been much better than were thought possible at the beginning of 2009, largely due to workforce and inventory reductions, have provided much of the fuel for this recovery in equities. Favorable interest rate and liquidity conditions have been instrumental in spurring the rally, as well. Yet significant challenges remain, including high unemployment, still-weak housing markets, and probable increases in tax rates. Against this backdrop, Jennison remains cautiously optimistic.
Prudential Investments LLC (PI), an indirect, wholly owned subsidiary of Prudential Financial, Inc., serves as the investment manager for the Fund.
| 1 | The graph is based on the performance of Class I shares. Performance of Class II shares will be lower due to differences in the fee structure. Class II shares have associated 12b-1 and administrative fees at an annual rate of 0.25% and 0.15%, respectively, of the average daily net assets of the Class II shares. |
Russell 1000® Index is a market cap-weighted index that measures the performance of the 1,000 largest companies in the Russell 3000 Index, which represents approximately 92% of the total market. S&P 500 Index is an unmanaged, market value-weighted index of 500 stocks generally representative of the broad stock market. These returns do not include the effect of any investment management expenses. These returns would have been lower if they included the effect of these expenses. Investors cannot invest directly in a market index. For a complete list of holdings, refer to the Schedule of Investments section of this report.
| | |
The Prudential Series Fund Presentation of Portfolio Holdings — unaudited | | December 31, 2009 |
| | |
| Jennison 20/20 Focus | | |
| Five Largest Holdings (% of Net Assets) |
| Apple, Inc. | | 3.4% |
| Google, Inc. (Class A Stock) | | 3.2% |
| H&R Block, Inc. | | 3.0% |
| Amazon.com, Inc. | | 3.0% |
| WellPoint, Inc. | | 2.9% |
For a complete list of holdings, please refer to the Schedule of Investments section of this report. Holdings reflect only long-term investments. Holdings/Issues/Sectors/Industries are subject to change.
| | |
The Prudential Series Fund Fees and Expenses — unaudited | | December 31, 2009 |
As a contract owner investing in Portfolios of the Fund through a variable annuity or variable life contract, you incur ongoing costs, including management fees, and other Portfolio expenses. This example is intended to help you understand your ongoing costs (in dollars) of investing in the Fund and to compare these costs with the ongoing costs of investing in other investment options. This example does not reflect fees and charges under your variable annuity or variable life contract. If contract charges were included, the costs shown below would be higher. Please consult the prospectus for your contract for more information about contract fees and charges.
The example is based on an investment of $1,000 invested at the beginning of the period and held for the entire period July 1, 2009 through December 31, 2009.
Actual Expenses
The first line of the table below provides information about actual account values and actual expenses. You may use this information, together with the amount you invested, to estimate the Portfolio expenses that you paid over the period. Simply divide your account value by $1,000 (for example, an $8,600 account value divided by $1,000 = 8.6), then multiply the result by the number in the first line under the heading entitled “Expenses Paid During the Six-Month Period” to estimate the Portfolio expenses you paid on your account during this period. As noted above, the table does not reflect variable contract fees and charges.
Hypothetical Example for Comparison Purposes
The second line of the table below provides information about hypothetical account values and hypothetical expenses based on the Portfolio’s actual expense ratio and an assumed rate of return of 5% per year before expenses, which is not the Portfolio’s actual return. The hypothetical account values and expenses may not be used to estimate the actual ending account balance or expenses you paid for the period. You may use this information to compare the ongoing costs of investing in the Portfolio and other investment options. To do so, compare this 5% hypothetical example with the 5% hypothetical examples that appear in the shareholder reports of the other investment options.
Please note that the expenses shown in the table are meant to highlight your ongoing Portfolio costs only and do not reflect any contract fees and charges, such as sales charges (loads), insurance charges or administrative charges. Therefore the second line of the table is useful to compare ongoing investment option costs only, and will not help you determine the relative total costs of owning different contracts. In addition, if these contract fee and charges were included, your costs would have been higher.
| | | | | | | | | | | | | | |
| The Prudential Series Fund Portfolios | | Beginning Account Value
July 1, 2009 | | Ending Account Value
December 31, 2009 | | Annualized Expense Ratio based on the
Six-Month period | | | Expenses Paid
During the
Six-Month period* |
| Jennison 20/20 Focus (Class I) | | Actual | | $ | 1,000.00 | | $ | 1,293.30 | | 0.79 | % | | $ | 4.57 |
| | | Hypothetical | | $ | 1,000.00 | | $ | 1,021.22 | | 0.79 | % | | $ | 4.02 |
| Jennison 20/20 Focus (Class II) | | Actual | | $ | 1,000.00 | | $ | 1,290.50 | | 1.19 | % | | $ | 6.87 |
| | | Hypothetical | | $ | 1,000.00 | | $ | 1,019.21 | | 1.19 | % | | $ | 6.06 |
* Portfolio expenses (net of fee waivers or subsidies, if any) for each share class are equal to the annualized expense ratio for each share class (provided in the table), multiplied by the average account value over the period, multiplied by the 184 days in the six-month period ended December 31, 2009, and divided by the 365 days in the Portfolio’s fiscal year ended December 31, 2009 (to reflect the six-month period). Expenses presented in the table include the expenses of any underlying portfolios in which the Portfolio may invest.
| | | | | | |
| | | JENNISON 20/20 FOCUS PORTFOLIO | | |
| |
| SCHEDULE OF INVESTMENTS | | December 31, 2009 |
| | | | | |
| LONG-TERM INVESTMENTS — 99.8% |
| COMMON STOCKS | | Shares
| | Value
(Note 2)
|
| | | | | | |
Biotechnology — 1.6% | | | | | |
Celgene Corp.(a) | | 104,600 | | $ | 5,824,128 |
| | | | |
|
|
Capital Markets — 2.1% | | | | | |
Goldman Sachs Group, Inc. (The) | | 45,000 | | | 7,597,800 |
| | | | |
|
|
Chemicals — 2.3% | | | | | |
Dow Chemical Co. (The) | | 297,500 | | | 8,219,925 |
| | | | |
|
|
Commercial Services & Supplies — 2.7% | | | | | |
Waste Management, Inc.(b) | | 278,500 | | | 9,416,085 |
| | | | |
|
|
Communications Equipment — 2.4% | | | | | |
QUALCOMM, Inc. | | 185,700 | | | 8,590,482 |
| | | | |
|
|
Computers & Peripherals — 8.4% | | | | | |
Apple, Inc.(a)(b) | | 57,810 | | | 12,189,817 |
Hewlett-Packard Co. | | 162,000 | | | 8,344,620 |
NetApp, Inc.(a) | | 268,400 | | | 9,230,276 |
| | | | |
|
|
| | | | | | 29,764,713 |
| | | | |
|
|
Consumer Finance — 2.7% | | | | | |
SLM Corp.(a) | | 838,600 | | | 9,451,022 |
| | | | |
|
|
Diversified Consumer Services — 5.2% | | | | | |
Career Education Corp.(a)(b) | | 333,800 | | | 7,780,878 |
H&R Block, Inc. | | 475,900 | | | 10,764,858 |
| | | | |
|
|
| | | | | | 18,545,736 |
| | | | |
|
|
Energy Equipment & Services — 2.5% | | | | | |
Schlumberger Ltd. | | 134,000 | | | 8,722,060 |
| | | | |
|
|
Food & Staples Retailing — 2.3% | | | | | |
Kroger Co. (The) | | 396,000 | | | 8,129,880 |
| | | | |
|
|
Food Products — 3.9% | | | | | |
ConAgra Foods, Inc. | | 338,500 | | | 7,802,425 |
Unilever PLC (United Kingdom), ADR(b) | | 188,500 | | | 6,013,150 |
| | | | |
|
|
| | | | | | 13,815,575 |
| | | | |
|
|
Healthcare Equipment & Supplies — 2.1% | | | | | |
Alcon, Inc. | | 46,400 | | | 7,625,840 |
| | | | |
|
|
Healthcare Providers & Services — 5.6% | | | | | |
Medco Health Solutions, Inc.(a) | | 150,700 | | | 9,631,237 |
WellPoint, Inc.(a) | | 175,900 | | | 10,253,211 |
| | | | |
|
|
| | | | | | 19,884,448 |
| | | | |
|
|
Internet & Catalog Retail — 3.0% | | | | | |
Amazon.com, Inc.(a) | | 79,000 | | | 10,627,080 |
| | | | |
|
|
Internet Software & Services — 7.4% | | | | | |
Baidu, Inc. (China), ADR(a) | | 20,885 | | | 8,588,538 |
Google, Inc. (Class A Stock)(a)(b) | | 18,200 | | | 11,283,636 |
IAC/InterActiveCorp(a)(b) | | 306,500 | | | 6,277,120 |
| | | | |
|
|
| | | | | | 26,149,294 |
| | | | |
|
|
IT Services — 4.7% | | | | | |
Mastercard, Inc. (Class A Stock) | | 33,000 | | | 8,447,340 |
Visa, Inc. (Class A Stock)(b) | | 95,200 | | | 8,326,192 |
| | | | |
|
|
| | | | | | 16,773,532 |
| | | | |
|
|
Metals & Mining — 4.7% | | | | | |
Century Aluminum Co.(a)(b) | | 542,600 | | | 8,784,694 |
Freeport-McMoRan Copper & Gold, Inc.(a) | | 96,700 | | | 7,764,043 |
| | | | |
|
|
| | | | | | 16,548,737 |
| | | | |
|
|
| | | | | | |
COMMON STOCKS (continued) | | Shares
| | Value
(Note 2)
| |
| | | | | | | |
Multi-Utilities — 2.6% | | | | | | |
Sempra Energy | | 166,000 | | $ | 9,292,680 | |
| | | | |
|
|
|
Oil, Gas & Consumable Fuels — 12.9% | | | | | | |
Anadarko Petroleum Corp. | | 152,300 | | | 9,506,566 | |
Canadian Natural Resources Ltd. | | 125,000 | | | 8,993,750 | |
Occidental Petroleum Corp. | | 84,500 | | | 6,874,075 | |
Petroleo Brasileiro SA (Brazil), ADR | | 192,800 | | | 9,192,704 | |
Southwestern Energy Co.(a) | | 191,200 | | | 9,215,840 | |
Williams Cos., Inc. (The) | | 105,200 | | | 2,217,616 | |
| | | | |
|
|
|
| | | | | | 46,000,551 | |
| | | | |
|
|
|
Pharmaceuticals — 6.5% | | | | | | |
Novartis AG (Switzerland), ADR | | 153,900 | | | 8,376,777 | |
Sanofi-Aventis SA (France), ADR | | 237,200 | | | 9,314,844 | |
Teva Pharmaceutical Industries Ltd. (Israel), ADR | | 94,400 | | | 5,303,392 | |
| | | | |
|
|
|
| | | | | | 22,995,013 | |
| | | | |
|
|
|
Road & Rail — 1.9% | | | | | | |
Union Pacific Corp. | | 104,100 | | | 6,651,990 | |
| | | | |
|
|
|
Semiconductors & Semiconductor Equipment — 2.2% | |
Advanced Micro Devices, Inc.(a) | | 813,900 | | | 7,878,552 | |
| | | | |
|
|
|
Software — 7.9% | | | | | | |
Adobe Systems, Inc.(a) | | 261,000 | | | 9,599,580 | |
CA, Inc. | | 406,300 | | | 9,125,498 | |
Symantec Corp.(a) | | 532,200 | | | 9,521,058 | |
| | | | |
|
|
|
| | | | | | 28,246,136 | |
| | | | |
|
|
|
Wireless Telecommunication Services — 2.2% | | | | |
NII Holdings, Inc.(a) | | 236,100 | | | 7,928,238 | |
| | | | |
|
|
|
TOTAL LONG-TERM INVESTMENTS
(cost $257,857,141) | | | 354,679,497 | |
| | | | |
|
|
|
| SHORT-TERM INVESTMENT — 19.9% | |
AFFILIATED MONEY MARKET MUTUAL FUND | | | | | | |
Dryden Core Investment Fund — Taxable Money Market Series (cost $70,740,114; includes $60,267,391 of cash collateral received for securities on loan) (Note 4)(c)(d) | | 70,740,114 | | | 70,740,114 | |
| | | | |
|
|
|
TOTAL INVESTMENTS — 119.7%
(cost $328,597,255) | | | 425,419,611 | |
LIABILITIES IN EXCESS OF
OTHER ASSETS — (19.7)% | | | (70,043,293 | ) |
| | | | |
|
|
|
NET ASSETS — 100.0% | | $ | 355,376,318 | |
| | | | |
|
|
|
The following abbreviation is used in portfolio descriptions:
| | |
| ADR | | American Depositary Receipt |
| (a) | Non-income producing security. |
| (b) | All or a portion of security is on loan. The aggregate market value of such securities is $58,379,378; cash collateral of $60,267,391 (included in liabilities) was received with which the Portfolio purchased highly liquid short-term investments. |
| (c) | Represents security, or a portion thereof, purchased with cash collateral received for securities on loan. |
SEE NOTES TO FINANCIAL STATEMENTS.
A1
| | | | | | |
| | | JENNISON 20/20 FOCUS PORTFOLIO (continued) | | |
| |
| SCHEDULE OF INVESTMENTS | | December 31, 2009 |
| (d) | Prudential Investments LLC, the manager of the Portfolio, also serves as manager of the Dryden Core Investment Fund-Taxable Money Market Series. |
Various inputs are used in determining the value of the Portfolio’s investments. These inputs are summarized in the three broad levels listed below.
Level 1—quoted prices in active markets for identical securities
Level 2—other significant observable inputs (including quoted prices for similar securities, interest rates, prepayment speeds, credit risk, etc.)
Level 3—significant unobservable inputs (including the Portfolio’s own assumptions in determining the fair value of investments)
The following is a summary of the inputs used as of December 31, 2009 in valuing the Portfolio’s assets carried at fair value:
| | | | | | | | | |
| | | Level 1
| | Level 2
| | Level 3
|
Investments in Securities | | | | | | | | | |
Common Stocks | | $ | 354,679,497 | | $ | — | | $ | — |
Affiliated Money Market Mutual Fund | | | 70,740,114 | | | — | | | — |
| | |
|
| |
|
| |
|
|
| | | | 425,419,611 | | | — | | | — |
Other Financial Instruments* | | | — | | | — | | | — |
| | |
|
| |
|
| |
|
|
Total | | $ | 425,419,611 | | $ | — | | $ | — |
| | |
|
| |
|
| |
|
|
| * | Other financial instruments are derivative instruments not reflected in the Schedule of Investments, such as futures, forwards and swap contracts, which are valued at the unrealized appreciation/depreciation on the instrument. |
As of December 31, 2009 and 2008, the Portfolio did not use any significant unobservable inputs (Level 3) in determining the value of investments.
The industry classification of portfolio holdings and liabilities in excess of other assets shown as a percentage of net assets as of December 31, 2009 was as follows:
| | | |
Affiliated Money Market Mutual Fund (including 17.0% of collateral received for securities on loan) | | 19.9 | % |
Oil, Gas & Consumable Fuels | | 12.9 | |
Computers & Peripherals | | 8.4 | |
Software | | 7.9 | |
Internet Software & Services | | 7.4 | |
Pharmaceuticals | | 6.5 | |
Healthcare Providers & Services | | 5.6 | |
Diversified Consumer Services | | 5.2 | |
IT Services | | 4.7 | |
Metals & Mining | | 4.7 | |
Food Products | | 3.9 | |
Internet & Catalog Retail | | 3.0 | |
Commercial Services & Supplies | | 2.7 | |
Consumer Finance | | 2.7 | |
Multi-Utilities | | 2.6 | |
Energy Equipment & Services | | 2.5 | |
Communications Equipment | | 2.4 | |
Chemicals | | 2.3 | |
Food & Staples Retailing | | 2.3 | |
Semiconductors & Semiconductor Equipment | | 2.2 | |
Wireless Telecommunication Services | | 2.2 | |
Capital Markets | | 2.1 | |
Healthcare Equipment & Supplies | | 2.1 | |
Road & Rail | | 1.9 | |
Biotechnology | | 1.6 | |
| | |
|
|
| | | 119.7 | |
Liabilities in excess of other assets | | (19.7 | ) |
| | |
|
|
| | | 100.0 | % |
| | |
|
|
SEE NOTES TO FINANCIAL STATEMENTS.
A2
| | | | | | |
| | | JENNISON 20/20 FOCUS PORTFOLIO (continued) | | |
STATEMENT OF ASSETS AND LIABILITIES
December 31, 2009
| | | |
| ASSETS | | | |
Investments, at value including securities on loan of $58,379,378: | | | |
Unaffiliated investments (cost $257,857,141) | | $ | 354,679,497 |
Affiliated investments (cost $70,740,114) | | | 70,740,114 |
Cash | | | 275,015 |
Receivable for investments sold | | | 6,315,516 |
Receivable for Series shares sold | | | 405,501 |
Dividends and interest receivable | | | 387,103 |
Foreign tax reclaim receivable | | | 34,481 |
Prepaid expenses | | | 3,316 |
| | |
|
|
Total Assets | | | 432,840,543 |
| | |
|
|
| LIABILITIES | | | |
Collateral for securities on loan | | | 60,267,391 |
Payable for investments purchased | | | 8,517,073 |
Payable for Series shares repurchased | | | 8,301,945 |
Management fee payable | | | 225,173 |
Distribution fee payable | | | 60,353 |
Accrued expenses and other liabilities | | | 55,483 |
Administration fee payable | | | 36,212 |
Affiliated transfer agent fee payable | | | 595 |
| | |
|
|
Total Liabilities | | | 77,464,225 |
| | |
|
|
| NET ASSETS | | $ | 355,376,318 |
| | |
|
|
Net assets were comprised of: | | | |
Paid-in capital | | $ | 326,219,037 |
Retained earnings | | | 29,157,281 |
| | |
|
|
Net assets, December 31, 2009 | | $ | 355,376,318 |
| | |
|
|
| Class I: | | | |
Net asset value and redemption price per share, $70,523,057 / 4,891,717 outstanding shares of beneficial interest | | $ | 14.42 |
| | |
|
|
| Class II: | | | |
Net asset value and redemption price per share, $284,853,261 / 19,982,860 outstanding shares of beneficial interest | | $ | 14.25 |
| | |
|
|
STATEMENT OF OPERATIONS
Year Ended December 31, 2009
| | | | |
| INVESTMENT INCOME | | | | |
Unaffiliated dividend income (net of foreign withholding taxes of $54,478) | | $ | 2,767,121 | |
Affiliated income from securities loaned, net | | | 116,256 | |
Affiliated dividend income | | | 62,817 | |
| | |
|
|
|
| | | | 2,946,194 | |
| | |
|
|
|
| EXPENSES | | | | |
Management fee | | | 2,042,759 | |
Distribution fee—Class II | | | 540,756 | |
Administration fee—Class II | | | 324,405 | |
Shareholders’ reports | | | 56,000 | |
Custodian’s fees and expenses | | | 44,000 | |
Audit fee | | | 17,000 | |
Trustees’ fees | | | 11,000 | |
Transfer agent’s fee and expenses (including affiliated expense of $3,600) (Note 4) | | | 10,000 | |
Insurance expenses | | | 7,000 | |
Legal fees and expenses | | | 6,000 | |
Commitment fee on syndicated credit agreement | | | 3,000 | |
Miscellaneous | | | 9,457 | |
| | |
|
|
|
Total expenses | | | 3,071,377 | |
| | |
|
|
|
| NET INVESTMENT LOSS | | | (125,183 | ) |
| | |
|
|
|
| NET REALIZED AND UNREALIZED GAIN (LOSS) ON INVESTMENTS | | | | |
Net realized loss on: | | | | |
Investment transactions | | | (719,514 | ) |
Foreign currency transactions | | | (126,713 | ) |
| | |
|
|
|
| | | | (846,227 | ) |
| | |
|
|
|
Net change in unrealized appreciation (depreciation) on: | | | | |
Investments | | | 128,233,365 | |
Foreign currencies | | | 87 | |
| | |
|
|
|
| | | | 128,233,452 | |
| | |
|
|
|
| NET GAIN ON INVESTMENTS | | | 127,387,225 | |
| | |
|
|
|
| NET INCREASE IN NET ASSETS RESULTING FROM OPERATIONS | | $ | 127,262,042 | |
| | |
|
|
|
STATEMENT OF CHANGES IN NET ASSETS
| | | | | | | | |
| | | Year Ended December 31,
| |
| | | 2009
| | | 2008
| |
| INCREASE (DECREASE) IN NET ASSETS | | | | | | | | |
| OPERATIONS: | | | | | | | | |
Net investment income (loss) | | $ | (125,183 | ) | | $ | 278,888 | |
Net realized loss on investment and foreign currency transactions | | | (846,227 | ) | | | (66,694,837 | ) |
Net change in unrealized appreciation (depreciation) on investments and foreign currencies | | | 128,233,452 | | | | (83,136,386 | ) |
| | |
|
|
| |
|
|
|
NET INCREASE (DECREASE) IN NET ASSETS RESULTING FROM OPERATIONS | | | 127,262,042 | | | | (149,552,335 | ) |
| | |
|
|
| |
|
|
|
| DISTRIBUTIONS: | | | | | | | | |
Class I | | | (271,462 | ) | | | (4,686,743 | ) |
Class II | | | (8,120 | ) | | | (18,572,262 | ) |
| | |
|
|
| |
|
|
|
TOTAL DISTRIBUTIONS | | | (279,582 | ) | | | (23,259,005 | ) |
| | |
|
|
| |
|
|
|
| SERIES SHARE TRANSACTIONS (Note 7): | | | | | | | | |
Series shares sold | | | 136,748,176 | | | | 160,071,162 | |
Series shares issued in reinvestment of distributions | | | 279,582 | | | | 23,259,005 | |
Series shares repurchased | | | (111,650,583 | ) | | | (187,443,418 | ) |
| | |
|
|
| |
|
|
|
NET INCREASE (DECREASE) IN NET ASSETS RESULTING FROM SERIES SHARE TRANSACTIONS | | | 25,377,175 | | | | (4,113,251 | ) |
| | |
|
|
| |
|
|
|
| TOTAL INCREASE (DECREASE) IN NET ASSETS | | | 152,359,635 | | | | (176,924,591 | ) |
| NET ASSETS: | | | | | | | | |
Beginning of year | | | 203,016,683 | | | | 379,941,274 | |
| | |
|
|
| |
|
|
|
End of year | | $ | 355,376,318 | | | $ | 203,016,683 | |
| | |
|
|
| |
|
|
|
SEE NOTES TO FINANCIAL STATEMENTS.
A3
NOTES TO THE FINANCIAL STATEMENTS OF
THE PRUDENTIAL SERIES FUND
The Prudential Series Fund (“Series Fund”), organized as a Delaware statutory trust, is a diversified open-end management investment company registered under the Investment Company Act of 1940, as amended. On January 2, 2006, each Portfolio of the Series Fund changed its federal income tax status from a regulated investment company to a partnership. As a result of that conversion, the Series Fund was reorganized from a Maryland corporation to a Delaware statutory trust. Pursuant to this reorganization, the Series Fund has been renamed “The Prudential Series Fund.” The Series Fund is composed of twenty-two Portfolios (“Portfolio” or “Portfolios”), each with separate series shares. The information presented in these financial statements pertains to Jennison 20/20 Focus Portfolio.
The Portfolio has the following as investment objectives:
Long-term growth of capital by investing primarily in approximately 40 equity securities of U.S. companies that the Portfolio manager believes to have strong capital appreciation potential.
The ability of issuers of debt securities (other than those issued or guaranteed by the U.S. Government) held by the Portfolio to meet their obligations may be affected by the economic or political developments in a specific industry, region or country.
Foreign security and currency transactions may involve certain considerations and risks not typically associated with those of domestic origin as a result of, among other factors, the possibility of political and economic instability or the level of governmental supervision and regulation of foreign securities markets.
| Note 2: | | Accounting Policies |
The following is a summary of significant accounting policies followed by the Series Fund and the Portfolio in preparation of its financial statements.
Securities Valuation: Securities listed on a securities exchange are valued at the last sale price on such exchange on the day of valuation or, if there was no sale on such day, at the mean between the last reported bid and asked prices, or at the last bid price on such day in the absence of an asked price. Securities traded via NASDAQ are valued at the NASDAQ official closing price (“NOCP”) on the day of valuation, or if there was no NOCP, at the last sale price. Securities that are actively traded in the over-the-counter market, including listed securities for which the primary market is believed by Prudential Investments LLC (“PI” or “Manager”) in consultation with the subadviser, to be over-the-counter, are valued at market value using prices provided by an independent pricing agent or principal market maker. Options on securities and indices traded on an exchange are valued at the last sale price as of the close of trading on the applicable exchange or, if there was no sale, at the mean between the most recently quoted bid and asked prices on such exchange, or at the last bid price in the absence of an asked price. Futures contracts and options thereon traded on a commodities exchange or board of trade are valued at the last sale price at the close of trading on such exchange or board of trade or, if there was no sale on the applicable commodities exchange or board of trade on such day, at the mean between the most recently quoted bid and asked prices on such exchange or board of trade or at the last bid price in the absence of an asked price. Prices may be obtained from independent pricing services which use information provided by market makers or estimates of market values obtained from yield data relating to investments or securities with similar characteristics. Securities for which reliable market quotations are not readily available, or whose values have been affected by events occurring after the close of the security’s foreign market and before the Series Fund’s normal pricing time, are valued at fair value in accordance with Board of Trustees approved fair valuation procedures. When determining the fair valuation of securities, some of the factors influencing the valuation include, the nature of any restrictions on disposition of the securities; assessment of the general liquidity of the securities; the issuer’s financial condition and the markets in which it does business; the cost of the investment; the size of the holding and the capitalization of the issuer; the prices of any recent transactions or bids/offers for such securities of any comparable securities; any available analyst media or other reports or information deemed reliable by the investment adviser regarding the issuer or the markets or industry in which it operates. Using fair value to price securities may result in a value that is different from a security’s most recent closing price and from the price used by other mutual funds to calculate their net asset values.
B1
Investments in mutual funds are valued at their net asset value as of the close of the New York Stock Exchange on the date of valuation.
Short-term debt securities of sufficient credit quality that are held in the Portfolio which mature in more than 60 days are valued at fair value and those short-term debt securities of sufficient credit quality which mature in 60 days or less are valued at amortized cost which approximates fair value. The amortized cost method values a security at its cost at the time of purchase and thereafter assumes a constant amortization to maturity of any discount or premium.
Foreign Currency Translation: The books and records of the Series Fund are maintained in U.S. dollars. Foreign currency amounts are translated into U.S. dollars on the following basis:
(i) market value of investment securities, other assets and liabilities—at the current daily rates of exchange.
(ii) purchases and sales of investment securities, income and expenses—at the rates of exchange prevailing on the respective dates of such transactions.
Although the net assets of the Series Fund are presented at the foreign exchange rates and market values at the close of the year, the Series Fund does not isolate that portion of the results of operations arising as a result of changes in the foreign exchange rates from the fluctuations arising from changes in the market prices of securities held at the end of the period. Similarly, the Series Fund does not isolate the effect of changes in foreign exchange rates from the fluctuations arising from changes in the market prices of portfolio securities sold during the period. Accordingly, these realized foreign currency gains (losses) are included in the reported net realized gains (losses) on investment transactions.
Net realized gains (losses) on foreign currency transactions represent net foreign exchange gains (losses) from the holding of foreign currencies, currency gains (losses) realized between the trade date and settlement date on securities transactions, and the difference between the amounts of dividends, interest and foreign withholding taxes recorded on the Series Fund’s books and the U.S. dollar equivalent amounts actually received or paid. Net unrealized currency gains (losses) from valuing foreign currency denominated assets and liabilities (other than investments) at period end exchange rates are reflected as a component of net unrealized appreciation (depreciation) on investments and foreign currencies.
Securities Lending: The Portfolio may lend its portfolio securities to broker-dealers. The loans are secured by collateral at least equal at all times to the market value of the securities loaned. Loans are subject to termination at the option of the borrower or the Portfolio. Upon termination of the loan, the borrower will return to the Portfolio securities identical to the loaned securities. Should the borrower of the securities fail financially, the Portfolio has the right to repurchase the securities using the collateral in the open market. The Portfolio recognizes income, net of any rebate and securities lending agent fees, for lending its securities in the form of fees or interest on the investment of any cash received as collateral. The Portfolio also continues to receive interest and dividends or amounts equivalent thereto on the securities loaned and recognizes any unrealized gain or loss in the market price of the securities loaned that may occur during the term of the loan.
Securities Transactions and Net Investment Income: Securities transactions are recorded on the trade date. Realized gains (losses) on sales of securities are calculated on the identified cost basis. Dividend income is recorded on the ex-dividend date; interest income, which is comprised of four elements: stated coupon, original issue discount, market discount and market premium, is recorded on the accrual basis. Expenses are recorded on the accrual basis. The Series Fund’s expenses are allocated to the respective Portfolios on the basis of relative net assets except for Portfolio specific expenses which are attributable directly to a Portfolio or class level.
For Portfolios with multiple classes of shares, net investment income (loss) (other than administration and distribution fees, which are charged to the respective class) and unrealized and realized gains (losses) are allocated daily to each class of shares based upon the relative proportion of net assets of each class at the beginning of the day.
B2
Taxes: For federal income tax purposes, each Portfolio in the Series Fund is treated as a separate taxpaying entity. The Portfolios are treated as partnerships for tax purposes. No provision has been made in the financial statements for U.S. Federal, state, or local taxes, as any tax liability arising from operations of the Portfolios is the responsibility of their partners. The Portfolios are not generally subject to entity-level taxation. Partners of each Portfolio are subject to taxes on their distributive share of partnership items.
Withholding taxes on foreign dividends, interest and capital gains have been provided for in accordance with the Series Fund’s understanding of the applicable country’s tax rules and regulations.
Distributions: Distributions from each Portfolio are made in cash and automatically reinvested in additional shares of the same Portfolio. The Jennison 20/20 Focus Portfolio makes distributions, if any, at least annually. Distributions are recorded on the ex-date.
Estimates: The preparation of financial statements requires management to make estimates and assumptions that affect the reported amounts and disclosures in the financial statements. Actual results could differ from these estimates.
The Series Fund has a management agreement with PI. Pursuant to this agreement PI has responsibility for all investment advisory services and supervises the subadviser’s performance of such services. PI has entered into a subadvisory agreement with Jennison Associates LLC (“Jennison”) (the “Subadviser”), under which Jennison provides investment advisory services for the Portfolio. PI pays for the services of the Subadviser, compensation of officers of the Series Fund, occupancy and certain clerical and administrative expenses of the Series Fund. The Portfolio bears all other costs and expenses.
The management fee paid to PI is computed daily and payable monthly at an annual rate of .75 of 1% of the Portfolio’s average daily net assets.
The Series Fund has a distribution agreement with Prudential Investment Management Services LLC (“PIMS”), which acts as the distributor of the Class I and Class II shares of the Series Fund. The Series Fund compensates PIMS for distributing and servicing the Series Fund’s Class II shares pursuant to a plan of distribution (the “Class II Plan”), regardless of expenses actually incurred by PIMS. The distribution fees are accrued daily and payable monthly. No distribution or service fees are paid to PIMS as distributor of the Class I shares of the Series Fund. Pursuant to the Class II Plan, the Class II shares of each Portfolio compensate PIMS for distribution-related activities at an annual rate of 0.25% of the average daily net assets of the Class II shares.
The Series Fund has an administration agreement with PI, which acts as the administrator of the Class II shares of the Series Fund. The administration fee paid to PI is accrued daily and payable monthly, at the annual rate of 0.15% of the average daily net assets of the Class II shares.
PIMS, PI and Jennison are indirect, wholly-owned subsidiaries of Prudential Financial, Inc. (“Prudential”).
The Portfolio, along with other affiliated registered investment companies (the “Funds”), is a party to a Syndicated Credit Agreement (“SCA”) with two banks. The SCA provides for a commitment of $500 million.
Interest on any borrowings under the SCA is incurred at contracted market rates and a commitment fee for the unused amount is accrued daily and paid quarterly. Effective October 22, 2009, the Funds renewed the SCA with the banks. The commitment under the renewed SCA continues to be $500 million. The Funds pay a commitment fee of .15 of 1% of the unused portion of the renewed SCA. For the period October 24, 2008 through October 21, 2009, the Funds paid a commitment fee of .13 of 1% of the unused portion of the agreement. The expiration date of the renewed SCA will be October 20, 2010. The purpose of the SCA is to provide an alternative source of temporary funding for capital share redemptions. The Portfolio did not utilize the line of credit during the year ended December 31, 2009.
B3
| Note 4: | | Other Transactions with Affiliates |
Prudential Mutual Fund Services LLC (“PMFS”), an affiliate of PI and an indirect, wholly-owned subsidiary of Prudential, serves as the Series Fund’s transfer agent. Transfer agent fees and expenses in the Statement of Operations include certain out-of-pocket expenses paid to non-affiliates, where applicable.
For the year ended December 31, 2009, Wells Fargo Advisors, LLC, an affiliate of PI, earned approximately $5,199 in brokerage commissions from transactions executed on behalf of the Portfolio.
Prudential Investment Management, Inc. (“PIM”) an indirect, wholly-owned subsidiary of Prudential, serves as the Series Fund’s security lending agent. For the year ended December 31, 2009, PIM was compensated $47,545 for these services for the Jennison 20/20 Focus Portfolio.
The Portfolio invests in the Taxable Money Market Series (the “Series”), a portfolio of Dryden Core Investment Fund. The Series is a money market mutual fund registered under the Investment Company Act of 1940, as amended, and managed by PI.
| Note 5: | | Portfolio Securities |
The aggregate cost of purchases and the proceeds from the sales of securities (excluding government securities and short-term issues) for the year ended December 31, 2009 were $316,679,174 and $277,601,253, respectively.
After January 2, 2006, all Portfolios are treated as partnerships for tax purposes. The character of the cash distributions made by the partnerships is generally classified as return of capital nontaxable distributions. After each fiscal year each partner will receive information regarding their distributive allocable share of the partnership’s income, gains, losses and deductions.
Prior to January 2, 2006, each Portfolio, which was incorporated as of that date, qualified as a regulated investment company under the Internal Revenue Code and distributed all of its taxable income, including any net realized gains on investments, to shareholders.
With respect to the Portfolios, book cost of assets differs from tax cost of assets as a result of each Portfolio’s adoption of a mark to market method of accounting for tax purposes. Under this method, tax cost of assets will approximate its fair market value.
Management has analyzed the Portfolios’ tax positions taken on federal income tax returns for all open tax years and has concluded that as of December 31, 2009, no provision for income tax would be required in the Portfolios’ financial statements. The Portfolios’ federal and state income tax returns for tax years for which the applicable statutes of limitations have not expired are subject to examination by the Internal Revenue Service and state departments of revenue.
The Series Fund offers Class I and Class II shares. Neither Class I nor Class II shares of a Portfolio are subject to any sales charge or redemption charge and are sold at the net asset value of the Portfolio. Class I shares are sold only to certain separate accounts of Prudential to fund benefits under certain variable life insurance and variable annuity contracts (“contracts”). Class II shares are sold only to separate accounts of non-Prudential insurance companies as investment options under certain contracts. The separate accounts invest in shares of the Series Fund through subaccounts that correspond to the Portfolios. The separate accounts will redeem shares of the Series Fund to the extent necessary to provide benefits under the contracts or for such other purposes as may be consistent with the contracts.
B4
Transactions in shares of beneficial interest of the Jennison 20/20 Focus were as follows:
| | | | | | | |
Class I
| | Shares
| | | Amount
| |
Year ended December 31, 2009: | | | | | | | |
Series shares sold | | 487,920 | | | $ | 5,417,265 | |
Series shares issued in reinvestment of distributions | | 23,834 | | | | 271,462 | |
Series shares repurchased | | (708,606 | ) | | | (7,635,195 | ) |
| | |
|
| |
|
|
|
Net increase (decrease) in shares outstanding | | (196,852 | ) | | $ | (1,946,468 | ) |
| | |
|
| |
|
|
|
Year ended December 31, 2008: | | | | | | | |
Series shares sold | | 449,176 | | | $ | 6,090,576 | |
Series shares issued in reinvestment of distributions | | 301,592 | | | | 4,686,743 | |
Series shares repurchased | | (1,079,530 | ) | | | (14,157,181 | ) |
| | |
|
| |
|
|
|
Net increase (decrease) in shares outstanding | | (328,762 | ) | | $ | (3,379,862 | ) |
| | |
|
| |
|
|
|
| | |
Class II
| | | | | | |
Year ended December 31, 2009: | | | | | | | |
Series shares sold | | 11,910,373 | | | $ | 131,330,911 | |
Series shares issued in reinvestment of distributions | | 720 | | | | 8,120 | |
Series shares repurchased | | (9,174,043 | ) | | | (104,015,388 | ) |
| | |
|
| |
|
|
|
Net increase (decrease) in shares outstanding | | 2,737,050 | | | $ | 27,323,643 | |
| | |
|
| |
|
|
|
Year ended December 31, 2008: | | | | | | | |
Series shares sold | | 11,620,427 | | | $ | 153,980,586 | |
Series shares issued in reinvestment of distributions | | 1,208,345 | | | | 18,572,262 | |
Series shares repurchased | | (14,165,938 | ) | | | (173,286,237 | ) |
| | |
|
| |
|
|
|
Net increase (decrease) in shares outstanding | | (1,337,166 | ) | | $ | (733,389 | ) |
| | |
|
| |
|
|
|
| Note 8: | | Ownership and Affiliates |
As of December 31, 2009, all of Class I shares of the Portfolio were owned of record by the Prudential Insurance Company of America (“PICA”) on behalf of the owners of the variable insurance products issued by PICA.
| Note 9: | | New Accounting Pronouncement |
In January 2010, the Financial Accounting Standards Board (“FASB”) issued Accounting Standards Update (“ASU”) No. 2010-06 “Improving Disclosures about Fair Value Measurements”. ASU 2010-06 will require reporting entities to make new disclosures about amounts and reasons for significant transfers in and out of Level 1 and Level 2 fair value measurements and input and valuation techniques used to measure fair value for both recurring and nonrecurring fair value measurements that fall in either Level 2 or Level 3, and information on purchases, sales, issuances, and settlements in the roll forward of activity in Level 3 fair value measurements. The new and revised disclosures are effective for interim and annual reporting periods beginning after December 15, 2009 except for the disclosures about purchases, sales, issuances, and settlements in the roll forward of activity in Level 3 fair value measurements, which are effective for interim and annual reporting periods beginning after December 15, 2010. At this time, management is evaluating the implications of ASU No. 2010-06 and its impact on the financial statements has not been determined.
| Note 10: | | Subsequent Events |
Management has evaluated the impact of all subsequent events on the Portfolio through February 18, 2010, the date the financial statements were issued, and has determined that there were no subsequent events requiring recognition or disclosure in the financial statements.
B5
Financial Highlights
| | | | | | | | | | | | | | | | | | | | |
| | | Jennison 20/20 Focus Portfolio
| |
| | | Class I
| |
| | | Year Ended December 31,
| |
| | | 2009
| | | 2008
| | | 2007(c)
| | | 2006
| | | 2005
| |
Per Share Operating Performance: | | | | | | | | | | | | | | | | | | | | |
Net Asset Value, beginning of year | | $ | 9.18 | | | $ | 15.99 | | | $ | 16.01 | | | $ | 15.00 | | | $ | 12.37 | |
| | |
|
|
| |
|
|
| |
|
|
| |
|
|
| |
|
|
|
Income (Loss) From Investment Operations: | | | | | | | | | | | | | | | | | | | | |
Net investment income | | | .03 | | | | .06 | | | | .07 | | | | .08 | | | | .06 | |
Net realized and unrealized gain (loss) on investments | | | 5.26 | | | | (5.94 | ) | | | 1.63 | | | | 1.95 | | | | 2.60 | |
| | |
|
|
| |
|
|
| |
|
|
| |
|
|
| |
|
|
|
Total from investment operations | | | 5.29 | | | | (5.88 | ) | | | 1.70 | | | | 2.03 | | | | 2.66 | |
| | |
|
|
| |
|
|
| |
|
|
| |
|
|
| |
|
|
|
Less Dividends and Distributions: | | | | | | | | | | | | | | | | | | | | |
Dividends from net investment income | | | — | | | | — | | | | — | | | | — | | | | (.03 | ) |
Distributions | | | (.05 | ) | | | (.93 | ) | | | (1.72 | ) | | | (1.02 | ) | | | — | |
| | |
|
|
| |
|
|
| |
|
|
| |
|
|
| |
|
|
|
Total dividends and distributions | | | (.05 | ) | | | (.93 | ) | | | (1.72 | ) | | | (1.02 | ) | | | (.03 | ) |
| | |
|
|
| |
|
|
| |
|
|
| |
|
|
| |
|
|
|
Net Asset Value, end of year | | $ | 14.42 | | | $ | 9.18 | | | $ | 15.99 | | | $ | 16.01 | | | $ | 15.00 | |
| | |
|
|
| |
|
|
| |
|
|
| |
|
|
| |
|
|
|
Total Return(a) | | | 57.83 | % | | | (39.15 | )% | | | 10.59 | % | | | 14.13 | % | | | 21.59 | % |
Ratios/Supplemental Data: | | | | | | | | | | | | | | | | | | | | |
Net assets, end of year (in millions) | | $ | 70.5 | | | $ | 46.7 | | | $ | 86.6 | | | $ | 93.1 | | | $ | 83.8 | |
Ratios to average net assets(b): | | | | | | | | | | | | | | | | | | | | |
Expenses | | | .81 | % | | | .82 | % | | | .82 | % | | | .82 | % | | | .87 | % |
Net investment income | | | .27 | % | | | .41 | % | | | .41 | % | | | .58 | % | | | .43 | % |
Portfolio turnover rate | | | 106 | % | | | 125 | % | | | 115 | % | | | 119 | % | | | 93 | % |
| | | | | | | | | | | | | | | | | | | | |
| | | Jennison 20/20 Focus Portfolio
| |
| | | Class II
| |
| | | Year Ended December 31,
| |
| | | 2009
| | | 2008
| | | 2007(c)
| | | 2006
| | | 2005
| |
Per Share Operating Performance: | | | | | | | | | | | | | | | | | | | | |
Net Asset Value, beginning of year | | $ | 9.06 | | | $ | 15.78 | | | $ | 15.81 | | | $ | 14.83 | | | $ | 12.23 | |
| | |
|
|
| |
|
|
| |
|
|
| |
|
|
| |
|
|
|
Income (Loss) From Investment Operations: | | | | | | | | | | | | | | | | | | | | |
Net investment income (loss) | | | (.01 | ) | | | — | (d) | | | — | (d) | | | .03 | | | | .01 | |
Net realized and unrealized gain (loss) on investments | | | 5.20 | | | | (5.87 | ) | | | 1.60 | | | | 1.91 | | | | 2.59 | |
| | |
|
|
| |
|
|
| |
|
|
| |
|
|
| |
|
|
|
Total from investment operations | | | 5.19 | | | | (5.87 | ) | | | 1.60 | | | | 1.94 | | | | 2.60 | |
| | |
|
|
| |
|
|
| |
|
|
| |
|
|
| |
|
|
|
Less Distributions: | | | | | | | | | | | | | | | | | | | | |
Distributions | | | — | (d) | | | (.85 | ) | | | (1.63 | ) | | | (.96 | ) | | | — | |
| | |
|
|
| |
|
|
| |
|
|
| |
|
|
| |
|
|
|
Net Asset Value, end of year | | $ | 14.25 | | | $ | 9.06 | | | $ | 15.78 | | | $ | 15.81 | | | $ | 14.83 | |
| | |
|
|
| |
|
|
| |
|
|
| |
|
|
| |
|
|
|
Total Return(a) | | | 57.29 | % | | | (39.40 | )% | | | 10.12 | % | | | 13.61 | % | | | 21.26 | % |
Ratios/Supplemental Data: | | | | | | | | | | | | | | | | | | | | |
Net assets, end of year (in millions) | | $ | 284.9 | | | $ | 156.3 | | | $ | 293.3 | | | $ | 218.4 | | | $ | 159.3 | |
Ratios to average net assets(b): | | | | | | | | | | | | | | | | | | | | |
Expenses | | | 1.21 | % | | | 1.22 | % | | | 1.22 | % | | | 1.22 | % | | | 1.27 | % |
Net investment income (loss) | | | (.13 | )% | | | — | %(e) | | | — | %(e) | | | .19 | % | | | .03 | % |
Portfolio turnover rate | | | 106 | % | | | 125 | % | | | 115 | % | | | 119 | % | | | 93 | % |
| (a) | Total return is calculated assuming a purchase of a share on the first day and a sale on the last day of each year reported and includes reinvestment of dividends and distributions and does not reflect the effect of insurance contract charges. Total return does not reflect expenses associated with the separate account such as administrative fees, account charges and surrender charges which, if reflected, would reduce the total returns for all years shown. Performance figures may reflect voluntary fee waivers and/or expense reimbursements. In the absence of voluntary fee waivers and/or expense reimbursements, the total return would be lower. Past performance is no guarantee of future results. Total returns may reflect adjustments to conform to generally accepted accounting principles. |
| (b) | Does not include expenses of the underlying portfolios in which the Portfolio invests. |
| (c) | Calculated based upon average shares outstanding. |
| (d) | Less than $.005 per share. |
SEE NOTES TO FINANCIAL STATEMENTS.
C1
REPORT OF INDEPENDENT REGISTERED PUBLIC ACCOUNTING FIRM
THE BOARD OF TRUSTEES AND SHAREHOLDERS
THE PRUDENTIAL SERIES FUND — JENNISON 20/20 FOCUS PORTFOLIO:
We have audited the accompanying statement of assets and liabilities of The Prudential Series Fund — Jennison 20/20 Focus Portfolio (hereafter referred to as the “Fund”), including the portfolio of investments, as of December 31, 2009, and the related statement of operations for the year then ended, the statement of changes in net assets for each of the years in the two-year period then ended and the financial highlights for each of the years in the five-year period then ended. These financial statements and financial highlights are the responsibility of the Fund’s management. Our responsibility is to express an opinion on these financial statements and financial highlights based on our audits.
We conducted our audits in accordance with the standards of the Public Company Accounting Oversight Board (United States). Those standards require that we plan and perform the audit to obtain reasonable assurance about whether the financial statements and financial highlights are free of material misstatement. An audit includes examining, on a test basis, evidence supporting the amounts and disclosures in the financial statements. Our procedures included confirmation of securities owned as of December 31, 2009, by correspondence with the custodian, transfer agent and brokers or by other appropriate auditing procedures where replies from brokers were not received. An audit also includes assessing the accounting principles used and significant estimates made by management, as well as evaluating the overall financial statement presentation. We believe that our audits provide a reasonable basis for our opinion.
In our opinion, the financial statements and financial highlights referred to above present fairly, in all material respects, the financial position of the Fund as of December 31, 2009, and the results of their operations, the changes in their net assets and the financial highlights for the periods described in the first paragraph above, in conformity with U.S. generally accepted accounting principles.

New York, New York
February 18, 2010
D1
INFORMATION ABOUT TRUSTEES AND OFFICERS (Unaudited)
Information about the Trustees and the Officers of the Fund is set forth below. Trustees who are not deemed to be “interested persons” of the Fund, as defined in the 1940 Act, are referred to as “Independent Trustees.” Trustees who are deemed to be “interested persons” of the Fund are referred to as “Interested Trustees.” The Trustees are responsible for the overall supervision of the operations of the Fund and perform the various duties imposed on the directors of investment companies by the 1940 Act.
| | | | |
Independent Trustees (1) | | | | |
Name, Address, Age No. of Portfolios Overseen | | Principal Occupation(s) During Past Five Years | | Other Directorships Held |
Saul K. Fenster, Ph.D. (76) No. of Portfolios Overseen: 83 | | Currently President Emeritus of New Jersey Institute of Technology (since 2002); formerly President (1978-2002) of New Jersey Institute of Technology; Commissioner (1998-2002) of the Middle States Association Commission on Higher Education; Commissioner (1985-2002) of the New Jersey Commission on Science and Technology; formerly Director (1998-2005) of Society of Manufacturing Engineering Education Foundation; formerly Director of Prosperity New Jersey; formerly a director or trustee of Liberty Science Center, Research and Development Council of New Jersey, New Jersey State Chamber of Commerce, and National Action Council for Minorities in Engineering. | | Member (since 2006), Board of The Ridgefield Foundation and The Leir Foundation. |
| | | |
Delayne Dedrick Gold (71) No. of Portfolios Overseen: 83 | | Marketing Consultant (1982-present); formerly Senior Vice President and Member of the Board of Directors, Prudential Bache Securities, Inc. | | None |
| | | |
W. Scott McDonald, Jr. (72) No. of Portfolios Overseen: 83 | | Formerly Management Consultant (1997-2004) and of Counsel (2004-2005) at Kaludis Consulting Group, Inc. (company serving higher education); Formerly principal (1995-1997), Scott McDonald Associates; Chief Operating Officer (1991-1995), Fairleigh Dickinson University; Executive Vice President and Chief Operating Officer (1975-1991), Drew University; interim President (1988-1990), Drew University; formerly Director of School, College and University Underwriters Ltd. | | None |
| | | |
Thomas T. Mooney (68) No. of Portfolios Overseen: 83 | | Formerly Chief Executive Officer, Excell Partners, Inc.; formerly President of the Greater Rochester Metro Chamber of Commerce, Rochester City Manager; formerly Deputy Monroe County Executive. | | None |
| | | |
Thomas M. O’Brien (59) No. of Portfolios Overseen: 83 | | President and COO (since November 2006) and CEO (since April 2007) of State Bancorp, Inc. and State Bank; Vice Chairman (January 1997-April 2000) of North Fork Bank; President and Chief Executive Officer (December 1984-December 1996) of North Side Savings Bank; formerly President and Chief Executive Officer (May 2000-June 2006) Atlantic Bank of New York. | | Formerly Director (December 1996-May 2000) of North Fork Bancorporation, Inc.; Formerly Director (May 2000-April 2006) of Atlantic Bank of New York; Director (since November 2006) of State Bancorp, Inc. (NASDAQ: STBC) and State Bank of Long Island. |
| | | |
F. Don Schwartz (74) No. of Portfolios Overseen: 83 | | Management Consultant (since April 1985). | | None |
| | | | |
Interested Trustee (1) | | | | |
Robert F. Gunia (63) No. of Portfolios Overseen: 83 | | Independent Consultant; formerly Chief Administrative Officer (September 1999-September 2009) and Executive Vice President (December 1996-September 2009) of Prudential Investments LLC; Executive Vice President (March 1999-September 2009) and Treasurer (May 2000-September 2009) of Prudential Mutual Fund Services LLC; President (April 1999-December 2008) and Executive Vice President and Chief Operating Officer (December 2008- December 2009) of Prudential Investment Management Services LLC; Chief Administrative Officer, Executive Vice President and Director (May 2003-September 2009) of AST Investment Services, Inc. | | Director (since May 1989) of The Asia Pacific Fund, Inc. |
| 1 | The year that each Trustee joined the Fund’s Board is as follows: Saul K. Fenster, 1983; Delayne Dedrick Gold, 2001; Robert F. Gunia, 2001; W. Scott McDonald, Jr., 1983; Thomas T. Mooney, 2001; Thomas M. O’Brien, 2003; F. Don Schwartz, 2003. |
E1
| | |
Fund Officers 1 | | |
Name, Address and Age Position with the Fund | | Principal Occupation(s) During the Past Five Years |
Steve Pelletier (56) President and Principal Executive Officer | | President of Prudential Annuities (since September 2008); Chairman and CEO, International Investments, Prudential Financial (since January 1998). |
| | |
Timothy S. Cronin (44) Vice President | | Chief Investment Officer and Strategist of Prudential Annuities (since January 2004); Director of Investment & Research Strategy (since February 1998); President of AST Investment Services, Inc. (since June 2005). |
| | |
Kathryn L. Quirk (57) Chief Legal Officer | | Vice President and Corporate Counsel (since September 2004) of Prudential; Executive Vice President, Chief Legal Officer and Secretary (since July 2005) of Prudential Investments LLC (PI) and Prudential Mutual Fund Services LLC (PMFS); Vice President and Corporate Counsel (since June 2005) and Secretary (since February 2006) of AST Investment Services, Inc.; formerly Senior Vice President and Assistant Secretary (November 2004-August 2005) of PI; formerly Assistant Secretary (June 2005-February 2006) of AST Investment Services, Inc.; formerly Managing Director, General Counsel, Chief Compliance Officer, Chief Risk Officer and Corporate Secretary (1997-2002) of Zurich Scudder Investments, Inc. |
| | |
Deborah A. Docs (52) Secretary | | Vice President and Corporate Counsel (since January 2001) of Prudential; Vice President (since December 1996) and Assistant Secretary (since March 1999) of PI; formerly Vice President and Assistant Secretary (May 2003-June 2005) of AST Investment Services, Inc. |
| | |
Jonathan D. Shain (51) Assistant Secretary | | Vice President and Corporate Counsel (since August 1998) of Prudential; Vice President and Assistant Secretary (since May 2001) of PI; Vice President and Assistant Secretary (since February 2001) of PMFS; formerly Vice President and Assistant Secretary (May 2003-June 2005) of AST Investment Services, Inc. |
| | |
Claudia DiGiacomo (35) Assistant Secretary | | Vice President and Corporate Counsel (since January 2005) of Prudential; Vice President and Assistant Secretary of PI (since December 2005); Associate at Sidley Austin Brown & Wood LLP (1999-2004). |
| | |
John P. Schwartz (38) Assistant Secretary | | Vice President and Corporate Counsel (since April 2005) of Prudential; Vice President and Assistant Secretary of PI (since December 2005); Associate at Sidley Austin Brown & Wood LLP (1997-2005). |
| | |
Andrew R. French (47) Assistant Secretary | | Director and Corporate Counsel (since May 2006) of Prudential; Vice President and Assistant Secretary (since January 2007) of PI; Vice President and Assistant Secretary (since January 2007) of PMFS; formerly Senior Legal Analyst of Prudential Mutual Fund Law Department (1997-2006). |
| | |
Timothy J. Knierim (51) Chief Compliance Officer | | Chief Compliance Officer of Prudential Investment Management, Inc.(PIM) (since July 2007); formerly Chief Risk Officer of PIM and PI (2002-2007) and formerly Chief Ethics Officer of PIM and PI (2006-2007). |
| | |
Valerie M. Simpson (51) Deputy Chief Compliance Officer | | Chief Compliance Officer (since April 2007) of PI and AST Investment Services, Inc.; formerly Vice President-Financial Reporting (June 1999-March 2006) for Prudential Life and Annuities Finance. |
| | |
Theresa C. Thompson (47) Deputy Chief Compliance Officer | | Vice President, Compliance, PI (since April 2004); and Director, Compliance, PI (2001 - 2004). |
| | |
Noreen M. Fierro (45) Anti-Money Laundering Compliance Officer | | Vice President, Corporate Compliance (since May 2006) of Prudential; formerly Corporate Vice President, Associate General Counsel (April 2002-May 2005) of UBS Financial Services, Inc., in their Money Laundering Prevention Group; Senior Manager (May 2005-May 2006) of Deloitte Financial Advisory Services, LLP, in their Forensic and Dispute Services, Anti-Money Laundering Group. |
| | |
Grace C. Torres (50) Treasurer and Principal Financial and Accounting Officer | | Assistant Treasurer (since March 1999) and Senior Vice President (since September 1999) of PI; Assistant Treasurer (since May 2003) and Vice President (since June 2005) of AST Investment Services, Inc.; Senior Vice President and Assistant Treasurer (since May 2003) of Prudential Annuities Advisory Services, Inc.; formerly Senior Vice President (May 2003-June 2005) of AST Investment Services, Inc. |
| | |
M. Sadiq Peshimam (46) Assistant Treasurer | | Vice President (since 2005) of Prudential Investments LLC. |
| | |
Peter Parrella (51) Assistant Treasurer | | Vice President (since 2007) and Director (2004-2007) within Prudential Mutual Fund Administration; formerly Tax Manager at SSB Citi Fund Management LLC (1997-2004). |
| | |
Alan Fu (52) Assistant Treasurer | | Vice President and Corporate Counsel - Tax, Prudential Financial, Inc. (since October 2003). |
| 1 | The year in which each individual became an Officer of the Fund is as follows: Stephen Pelletier, 2008; Timothy S. Cronin, 2009; Kathryn L. Quirk, 2005; Deborah A. Docs, 2005; Jonathan D. Shain, 2005; Claudia DiGiacomo, 2005; John P. Schwartz, 2006; Andrew R. French, 2006; Timothy J. Knierim, 2007; Valerie M. Simpson, 2007; Theresa C. Thompson, 2008; Noreen M. Fierro, 2006; Grace C. Torres, 1997; Peter Parrella, 2007; M. Sadiq Peshimam, 2006; Alan Fu, 2006. |
Explanatory Notes to Tables:
Trustees are deemed to be “Interested”, as defined in the 1940 Act, by reason of their affiliation with Prudential Investments LLC and/or an affiliate of Prudential Investments LLC. Robert F. Gunia will be considered an Interested Trustee for at least two years after his retirement from employment by the Manager and its affiliates (which was on or about October 21, 2009). He will also be an Interested Trustee as long as he holds a beneficial interest in securities issued by the Manager or its affiliates.
Unless otherwise noted, the address of all Trustees and Officers is c/o Prudential Investments LLC, Gateway Center Three, 100 Mulberry Street, Newark, New Jersey 07102.
There is no set term of office for Trustees or Officers. The Independent Trustees have adopted a retirement policy, which calls for the retirement of Trustees on December 31 of the year in which they reach the age of 75.
“Other Directorships Held” includes only directorships of companies required to register or file reports with the SEC under the Securities Exchange Act of 1934 (that is, “public companies”) or other investment companies registered under the 1940 Act.
“No. of Portfolios Overseen” includes all investment companies managed by Prudential Investments LLC. The investment companies for which PI serves as manager include the Prudential Investments Funds, The Prudential Variable Contract Accounts, The Target Portfolio Trust, The Prudential Series Fund, Advanced Series Trust and Prudential’s Gibraltar Fund, Inc.
E2
The 2009 Audited Financial Statements of Pruco Life Insurance Company, Pruco Life Insurance Company of New Jersey, and The Prudential Insurance Company of America are available. You may call 888-778-2888 to obtain a free copy of the audited financial statements of the insurance company that issued your contract.
To reduce costs, we now generally send only a single copy of prospectuses and shareholder reports to each household (“householding”) in lieu of sending a copy to each Contract Owner who resides in the household. You should be aware that by calling 877-778-5008, you can revoke or “opt out” of householding at any time.
Pru, Prudential, Prudential Financial, Rock Solid, “The Rock,” the Rock Logo and the Rock Prudential Logo are registered service marks of The Prudential Insurance Company of America, Newark, NJ, and its affiliates.
The Prudential Insurance Company of America
751 Broad Street
Newark, NJ 07102-3777
Presorted
Standard
U.S. Postage
PAID
Prudential
0172223-00001-00 PSF-AR J2020F

Item 2 – Code of Ethics – See Exhibit (a)
As of the end of the period covered by this report, the registrant has adopted a code of ethics (the “Section 406 Standards for Investment Companies – Ethical Standards for Principal Executive and Financial Officers”) that applies to the registrant’s Principal Executive Officer and Principal Financial Officer; the registrant’s Principal Financial Officer also serves as the Principal Accounting Officer.
The registrant hereby undertakes to provide any person, without charge, upon request, a copy of the code of ethics. To request a copy of the code of ethics, contact the registrant 973-367-7521, and ask for a copy of the Section 406 Standards for Investment Companies – Ethical Standards for Principal Executive and Financial Officers.
Item 3 – Audit Committee Financial Expert –
The registrant’s Board has determined that Mr. Thomas M. O’Brien, member of the Board’s Audit Committee is an “audit committee financial expert,” and that he is “independent,” for purposes of this Item.
Item 4 – Principal Accountant Fees and Services –
(a) Audit Fees
For the fiscal years ended December 31, 2009 and December 31, 2008, KPMG LLP (“KPMG”), the Registrant’s principal accountant, billed the Registrant $525,681 and $688,081, respectively, for professional services rendered for the audit of the Registrant’s annual financial statements or services that are normally provided in connection with statutory and regulatory filings.
(b) Audit-Related Fees
During the fiscal year ended December 31, 2009, KPMG, the Registrant’s principal accountant, billed the Registrant $41,103 for professional services rendered in connection with agreed upon procedures performed related to a custody conversion. Not applicable for the fiscal year ended December 31, 2008.
(c) Tax Fees
During the fiscal year ended December 31, 2009, KPMG, the Registrant’s principal accountant, billed the Registrant $45,500 for professional tax consulting services rendered on behalf of certain portfolios of the Registrant. Not applicable for the fiscal year ended December 31, 2008.
(d) All Other Fees
None.
(e) (1) Audit Committee Pre-Approval Policies and Procedures
THE PRUDENTIAL MUTUAL FUNDS
AUDIT COMMITTEE POLICY
on
Pre-Approval of Services Provided by the Independent Accountants
The Audit Committee of each Prudential Mutual Fund is charged with the responsibility to monitor the independence of the Fund’s independent accountants. As part of this responsibility, the Audit Committee must pre-approve any independent accounting firm’s engagement to render audit and/or permissible non-audit services, as required by law. In evaluating a proposed engagement of the independent accountants, the Audit Committee will assess the effect that the engagement might reasonably be expected to have on the accountant’s independence. The Committee’s evaluation will be based on:
| | • | | a review of the nature of the professional services expected to be provided, |
| | • | | a review of the safeguards put into place by the accounting firm to safeguard independence, and |
| | • | | periodic meetings with the accounting firm. |
Policy for Audit and Non-Audit Services Provided to the Funds
On an annual basis, the scope of audits for each Fund, audit fees and expenses, and audit-related and non-audit services (and fees proposed in respect thereof) proposed to be performed by the Fund’s independent accountants will be presented by the Treasurer and the independent accountants to the Audit Committee for review and, as appropriate, approval prior to the initiation of such services. Such presentation shall be accompanied by confirmation by both the Treasurer and the independent accountants that the proposed services will not adversely affect the independence of the independent accountants. Proposed services shall be described in sufficient detail to enable the Audit Committee to assess the appropriateness of such services and fees, and the compatibility of the provision of such services with the auditor’s independence. The Committee shall receive periodic reports on the progress of the audit and other services which are approved by the Committee or by the Committee Chair pursuant to authority delegated in this Policy.
The categories of services enumerated under “Audit Services”, “Audit-related Services”, and “Tax Services” are intended to provide guidance to the Treasurer and the independent accountants as to those categories of services which the Committee believes are generally consistent with the independence of the independent accountants and which the Committee (or the Committee Chair) would expect upon the presentation of specific proposals to pre-approve. The enumerated categories are not intended as an exclusive list of audit, audit-related or tax services, which the Committee (or the Committee Chair) would consider for pre-approval.
Audit Services
The following categories of audit services are considered to be consistent with the role of the Fund’s independent accountants:
| | • | | Annual Fund financial statement audits |
| | • | | Seed audits (related to new product filings, as required) |
| | • | | SEC and regulatory filings and consents |
Audit-related Services
The following categories of audit-related services are considered to be consistent with the role of the Fund’s independent accountants:
| | • | | Accounting consultations |
| | • | | Fund merger support services |
| | • | | Agreed Upon Procedure Reports |
| | • | | Other Internal Control Reports |
Individual audit-related services that fall within one of these categories and are not presented to the Audit Committee as part of the annual pre-approval process will be subject to pre-approval by the Committee Chair (or any other Committee member on whom this responsibility has been delegated) so long as the estimated fee for those services does not exceed $50,000.
Tax Services
The following categories of tax services are considered to be consistent with the role of the Fund’s independent accountants:
| | • | | Tax compliance services related to the filing or amendment of the following: |
| | • | | Federal, state and local income tax compliance; and, |
| | • | | Sales and use tax compliance |
| | • | | Timely RIC qualification reviews |
| | • | | Tax distribution analysis and planning |
| | • | | Tax authority examination services |
| | • | | Tax appeals support services |
| | • | | Accounting methods studies |
| | • | | Fund merger support services |
| | • | | Tax consulting services and related projects |
Individual tax services that fall within one of these categories and are not presented to the Audit Committee as part of the annual pre-approval process will be subject to pre-approval by the Committee Chair (or any other Committee member on whom this responsibility has been delegated) so long as the estimated fee for those services does not exceed $50,000.
Other Non-audit Services
Certain non-audit services that the independent accountants are legally permitted to render will be subject to pre-approval by the Committee or by one or more Committee members to whom the Committee has delegated this authority and who will report to the full Committee any pre-approval decisions made pursuant to this Policy. Non-audit services presented for pre-approval pursuant to this paragraph will be accompanied by a confirmation from both the Treasurer and the independent accountants that the proposed services will not adversely affect the independence of the independent accountants.
Proscribed Services
The Fund’s independent accountants will not render services in the following categories of non-audit services:
| | • | | Bookkeeping or other services related to the accounting records or financial statements of the Fund |
| | • | | Financial information systems design and implementation |
| | • | | Appraisal or valuation services, fairness opinions, or contribution-in-kind reports |
| | • | | Internal audit outsourcing services |
| | • | | Management functions or human resources |
| | • | | Broker or dealer, investment adviser, or investment banking services |
| | • | | Legal services and expert services unrelated to the audit |
| | • | | Any other service that the Public Company Accounting Oversight Board determines, by regulation, is impermissible. |
Pre-approval of Non-Audit Services Provided to Other Entities Within the Prudential Fund Complex
Certain non-audit services provided to Prudential Investments LLC or any of its affiliates that also provide ongoing services to the Prudential Mutual Funds will be subject to pre-approval by the Audit Committee. The only non-audit services provided to these entities that will require pre-approval are those related directly to the operations and financial reporting of the Funds. Individual projects that are not presented to the Audit Committee as part of the annual pre-approval process will be subject to pre-approval by the Committee Chair (or any other Committee member on whom this responsibility has been delegated) so long as the estimated fee for those services does not exceed $50,000. Services presented for pre-approval pursuant to this paragraph will be accompanied by a confirmation from both the Treasurer and the independent accountants that the proposed services will not adversely affect the independence of the independent accountants.
Although the Audit Committee will not pre-approve all services provided to Prudential Investments LLC and its affiliates, the Committee will receive an annual report from the Fund’s independent accounting firm showing the aggregate fees for all services provided to Prudential Investments and its affiliates.
(e) (2) Percentage of services referred to in 4(b) – 4(d) that were approved by the audit committee –
One hundred percent of the services described in Item 4(b) and 4(c) was approved by the audit committee.
(f) Percentage of hours expended attributable to work performed by other than full time employees of principal accountant if greater than 50%.
The percentage of hours expended on the principal accountant’s engagement to audit the registrant’s financial statements for the most recent fiscal year that were attributed to work performed by persons other than the principal accountant’s full-time, permanent employees was 0%.
(g) Non-Audit Fees
Not applicable to Registrant for the fiscal years 2009 and 2008. The aggregate non-audit fees billed by KPMG for services rendered to the registrant’s investment adviser and any entity controlling, controlled by, or under common control with the investment adviser that provides ongoing services to the registrant for the fiscal years 2009 and 2008 was $0 and $0, respectively.
(h) Principal Accountant’s Independence
Not applicable as KPMG has not provided non-audit services to the registrant’s investment adviser and any entity controlling, controlled by, or under common control with the investment adviser that provides ongoing services to the registrant that were not pre-approved pursuant to Rule 2-01(c)(7)(ii) of Regulation S-X.
Item 5 – Audit Committee of Listed Registrants – Not applicable.
Item 6 – Schedule of Investments – The schedule is included as part of the report to shareholders filed under Item 1 of this Form.
Item 7 – Disclosure of Proxy Voting Policies and Procedures for Closed-End Management Investment Companies – Not applicable.
Item 8 – Portfolio Managers of Closed-End Management Investment Companies – Not applicable.
Item 9 – Purchases of Equity Securities by Closed-End Management Investment Company and Affiliated Purchasers – Not applicable.
Item 10 – Submission of Matters to a Vote of Security Holders – Not applicable.
Item 11 – Controls and Procedures
| | (a) | It is the conclusion of the registrant’s principal executive officer and principal financial officer that the effectiveness of the registrant’s current disclosure controls and procedures (such disclosure controls and procedures having been evaluated within 90 days of the date of this filing) provide reasonable assurance that the information required to be disclosed by the registrant has been recorded, processed, summarized and reported within the time period specified in the Commission’s rules and forms and that the information required to be disclosed by the registrant has been accumulated and communicated to the registrant’s principal executive officer and principal financial officer in order to allow timely decisions regarding required disclosure. |
| | (b) | There has been no significant change in the registrant’s internal control over financial reporting that occurred during the registrant’s most recent fiscal quarter of the period covered by this report that has materially affected, or is likely to materially affect, the registrant’s internal control over financial reporting. |
Item 12 – Exhibits
| | (a) | (1) Code of Ethics – Attached hereto as Exhibit EX-99.CODE-ETH |
(2) Certifications pursuant to Section 302 of the Sarbanes-Oxley Act – Attached hereto as Exhibit EX-99.CERT.
(3) Any written solicitation to purchase securities under Rule 23c-1. – Not applicable.
| | (b) | Certifications pursuant to Section 906 of the Sarbanes-Oxley Act – Attached hereto as Exhibit EX-99.906CERT. |
SIGNATURES
Pursuant to the requirements of the Securities Exchange Act of 1934 and the Investment Company Act of 1940, the registrant has duly caused this report to be signed on its behalf by the undersigned, thereunto duly authorized.
(Registrant) The Prudential Series Fund
| | | | |
| By (Signature and Title)* | | /s/ DEBORAH A. DOCS | | |
| | Deborah A. Docs | | |
| | Secretary | | |
Date February 16, 2010
Pursuant to the requirements of the Securities Exchange Act of 1934 and the Investment Company Act of 1940, this report has been signed below by the following persons on behalf of the registrant and in the capacities and on the dates indicated.
| | | | |
| By (Signature and Title)* | | /s/ STEPHEN PELLETIER | | |
| | Stephen Pelletier | | |
| | President and Principal Executive Officer | | |
Date February 16, 2010
| | | | |
| By (Signature and Title)* | | /s/ GRACE C. TORRES | | |
| | Grace C. Torres | | |
| | Treasurer and Principal Financial Officer | | |
Date February 16, 2010
| * | Print the name and title of each signing officer under his or her signature. |