UNITED STATES
SECURITIES AND EXCHANGE COMMISSION
Washington, D.C. 20549
FORM N-CSR
CERTIFIED SHAREHOLDER REPORT OF REGISTERED MANAGEMENT
INVESTMENT COMPANIES
| | |
Investment Company Act file number: | | 811-03623 |
The Prudential Series Fund
|
| Exact name of registrant as specified in charter: |
|
Gateway Center 3, 100 Mulberry Street, Newark, New Jersey 07102 |
| Address of principal executive offices: |
Deborah A. Docs
Gateway Center 3,
100 Mulberry Street,
Newark, New Jersey 07102
|
| Name and address of agent for service: |
Registrant’s telephone number, including area code: 973-367-7521
Date of fiscal year end: 12/31/2008
Date of reporting period: 12/31/2008
Item 1 – Reports to Stockholders
| | |
| | |
| ANNUAL REPORT | | December 31, 2008 |
The Prudential Series Fund
| n | | Conservative Balanced Portfolio |
| n | | Diversified Bond Portfolio |
| n | | Flexible Managed Portfolio |
| n | | Government Income Portfolio |
| n | | High Yield Bond Portfolio |
| n | | Natural Resources Portfolio |
| n | | Small Capitalization Stock Portfolio |

Please note that inside is a Prospectus Supplement dated January 21, 2009. This document is separate from and not part of the annual report.

IFS-A114446
This report is one of several that provide financial information about certain investment choices available on variable life insurance and variable annuity contracts. Based on the variable contract you own or the portfolios you invested in, you may receive additional reports that provide financial information on those investment choices. Please refer to your variable life insurance or variable annuity contract prospectus to determine which portfolios are available to you.
This report must be preceded or accompanied by the current prospectuses for the Prudential Series Fund portfolios and the applicable variable life or annuity contract. The prospectuses contain information on the investment objectives, risks, and charges and expenses of the portfolios and the contract and should be read carefully.
The contract’s prospectus contains hypothetical performance illustrations that show the effect of various assumptions regarding the cost of insurance protection. You may also obtain a personalized illustration of historical performance that reflects the cost of your contract’s insurance protection.
A description of the Fund’s proxy voting policies and procedures is available, without charge, upon request. Owners of variable annuity contracts should call 888-778-2888 and owners of variable life insurance contracts should call 800-778-2255 to obtain descriptions of the Fund’s proxy voting policies and procedures. The description is also available on the website of the Securities and Exchange Commission (the “Commission”) at www.sec.gov. Information regarding how the Fund voted proxies relating to portfolio securities during the most recent 12-month period ended June 30, is available on the website of the Commission at www.sec.gov and on the Fund’s website.
The Fund files with the Commission a complete listing of portfolio holdings as of its first and third quarter-end on Form N-Q. Form N-Q is available on the Commission’s website at www.sec.gov or by visiting the Commission’s Public Reference Room. For more information on the Commission’s Public Reference Room, please visit the Commission’s website or call 1-800-SEC-0330. Form N-Q is also available on the Fund’s website at www.prudential.com or by calling the telephone numbers referenced above.
The Fund’s Statement of Additional Information contains additional information about the Fund’s Trustees and is available without charge upon request by calling 888-778-2888.
This report may include financial information pertaining to certain portfolios that are not available through the variable life insurance policy or variable annuity contract that you have chosen. Please refer to your variable life insurance or variable annuity prospectus to determine which portfolios are available to you.
| | | | |
The Prudential Series Fund Letter to Contract Owners | | Annual Report | | December 31, 2008 |
Our objective at Prudential is very simple — we strive to help our clients achieve and maintain financial success. Our Prudential Series Fund annual report details this commitment to you as we focus on ways to help you with your financial security. We hope you find it both informative and useful.
While 2008 presented unprecedented challenges to investors, it also proved that Prudential’s strategies around growing and protecting our clients’ wealth have never been more important.
Your financial professional is the best resource to help you understand how market changes affect your investments. Together, you can develop a diversified mix of investments that works best for you and review it periodically to ensure your financial objectives remain on target.
Thank you for selecting Prudential as one of your financial partners. We value your trust and appreciate the opportunity to help you reach your financial goals.
Sincerely,

Steve Pelletier
President,
The Prudential Series Fund | January 30, 2009 |

PRESIDENT
STEVE PELLETIER
| | |
The Prudential Series Fund, Conservative Balanced Portfolio Subadvised by: Prudential Investment Management, Inc., Quantitative Management Associates LLC | | December 31, 2008 |
Investment Manager’s Report - As of December 31, 2008
Average Annual Total Return Percentages
| | | | | | | | | |
| | | 1-Year | | | 5-Year | | | 10-Year | |
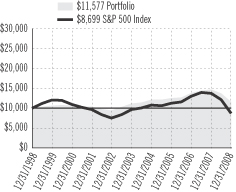
Portfolio | | -21.41 | % | | 0.58 | % | | 1.47 | % |
S&P 500 Index | | -36.99 | | | -2.19 | | | -1.38 | |
Blended Index | | -18.23 | | | 1.24 | | | 2.15 | |
Past performance does not guarantee future returns. The investment return and principal value of an investment will fluctuate, so that an investor’s shares, when redeemed, may be worth more or less than their original cost. Current performance may be lower or higher than the past performance data quoted.
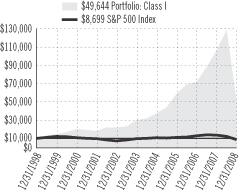
$10,000 INVESTED OVER 10 YEARS
Portfolio inception: 5/13/1983. Portfolio performance is net of investment fees and fund expenses, but not product charges, which, if included, would significantly lower the performance quoted. Performance figures may reflect fee waivers and/or expense reimbursements. In the absence of such fee waivers and/or expense reimbursements, total returns would be lower.
For the year ended December 31, 2008, the Conservative Balanced Portfolio underperformed the blended index (the Index).
Both fixed income and equity were slightly overweight for much of the year. However, in the risk-averse investment environment, the ultra-safe U.S. Treasury securities market outperformed all other U.S. fixed income markets. An underweight position in U.S. Treasury securities and overweight positions in credit-sensitive sectors, such as investment grade corporate bonds, primarily drove the Portfolio’s underperformance.
The equity portion of the Portfolio closely matched its benchmark for the year. Early in 2008 an overweight in equities (versus the guideline weight of 50%) slightly detracted from performance relative to the Index. Equities declined in all sectors and styles for the year. By the end of the third quarter, equities had fallen to very near their guideline level.
The Portfolio held overweight positions in fixed income for most of 2008. Some of the Portfolio’s cash holdings were used to fund the fixed income component, which did not reward relative performance during the year. The Portfolio’s guideline weight for cash is 10%, but it varied between 1% and 3% in 2008.
Prudential Investments LLC (PI), an indirect, wholly owned subsidiary of Prudential Financial, Inc., serves as the investment manager for the Fund.
S&P 500 Index is an unmanaged, market value-weighted index of 500 stocks generally representative of the broad stock market. Blended Index consists of S&P 500 Index (50%), Barclays Capital Aggregate Bond Index (40%), an unmanaged index comprised of more than 5,000 government and corporate bonds, and 3-Month T-Bill Index (10%), an unmanaged market value-weighted index of investment grade fixed rate public obligations of the U.S. Treasury with maturities of 3 months, excluding zero coupon strips. These returns do not include the effect of any investment management expenses. These returns would have been lower if they included the effect of these expenses. Investors cannot invest directly in a market index. For a complete list of holdings refer to the Schedule of Investments section of this report.
| | |
The Prudential Series Fund, Diversified Bond Portfolio Subadvised by: Prudential Investment Management, Inc. | | December 31, 2008 |
Investment Manager’s Report - As of December 31, 2008
Average Annual Total Return Percentages
| | | | | | | | | |
| | | 1-Year | | | 5-Year | | | 10-Year | |
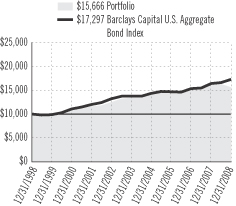
Portfolio | | -3.46 | % | | 3.16 | % | | 4.59 | % |
Barclays Capital U.S. Aggregate Bond Index | | 5.24 | | | 4.65 | | | 5.63 | |
Past performance does not guarantee future returns. The investment return and principal value of an investment will fluctuate, so that an investor’s shares, when redeemed, may be worth more or less than their original cost. Current performance may be lower or higher than the past performance data quoted.
$10,000 INVESTED OVER 10 YEARS
Portfolio inception: 5/13/1983. Portfolio performance is net of investment fees and fund expenses, but not product charges, which, if included, would significantly lower the performance quoted. Performance figures may reflect fee waivers and/or expense reimbursements. In the absence of such fee waivers and/or expense reimbursements, total returns would be lower.
For the year ended December 31, 2008, the Diversified Bond Portfolio posted a decline that underperformed its benchmark index, which posted a gain.
A burst housing bubble in the United States led to a collapse in the subprime mortgage market that escalated into a full-scale credit crisis in which financial institutions continued to take massive write-downs and losses in 2008. The U.S. economy, mired in one of its worst recessions since the Great Depression, shed some 2.5 million jobs in 2008. The Federal Reserve (the Fed) tried to boost growth by cutting its target for the overnight bank lending rate from 4.25% in January to a range of zero to 0.25% in December. The Fed and the U.S. Department of the Treasury employed unconventional measures to encourage commercial banks and finance firms to lend, yet it remained difficult for businesses and individuals to borrow money.
Preservation of capital became a top priority of investors who fled to super-safe U.S. Treasury securities, enabling that market to post a gain for 2008 that led other U.S. bond markets. A key reason the Portfolio trailed its benchmark index was its investment in the Dryden Core Investment Fund—Short Term Bond Series, which declined in value due to exposure to securities backed by subprime home equity loans. Another negative for the Portfolio was its exposures to high yield corporate (“junk”) bonds and bank loans, both of which ended 2008 in the red as these riskier assets fell out of favor. (Neither is in the benchmark index, which is made up of investment-grade debt securities.) Among investment-grade bond markets, the Portfolio had larger exposures than its benchmark index to commercial mortgage-backed securities and asset-backed securities, particularly those backed by home equity loans. This strategy did not work well as both posted declines for 2008. Another strategy that did not work well was security selection within the high-grade corporate bond market. The Portfolio emphasized lower investment-grade bonds, which underperformed higher quality bonds.
Meanwhile, the Portfolio benefited from other strategies such as its approach to managing duration, which measures a fund’s sensitivity to changes in interest rates. A long duration increases responsiveness to changes in rates, while a short duration lessens responsiveness. The Portfolio’s duration in the Treasury market was slightly longer than that of its benchmark index in November and December. During this time, the Fed cut rates and announced it was considering purchasing longer-term Treasurys, which might help reduce long-term rates. Yields on Treasurys declined in anticipation, pushing their prices higher, as bond prices move inversely to yields. Having a slightly longer duration helped the Portfolio derive greater benefit from the Treasury market rally.
Prudential Investments LLC (PI), an indirect, wholly owned subsidiary of Prudential Financial, Inc., serves as the investment manager for the Fund.
Barclays Capital U.S. Aggregate Bond Index is an unmanaged index comprised of more than 5,000 government and corporate bonds. These returns do not include the effect of any investment management expenses. These returns would have been lower if they included the effect of these expenses. Investors cannot invest directly in a market index. For a complete list of holdings refer to the Schedule of Investments section of this report.
| | |
The Prudential Series Fund, Equity Portfolio Subadvised by: ClearBridge Advisors, LLC, Jennison Associates LLC | | December 31, 2008 |
Investment Manager’s Report - As of December 31, 2008
Average Annual Total Return Percentages
| | | | | | | | | | | | |
| | | 1-Year | | | 5-Year | | | 10-Year | | | Since
Inception | |
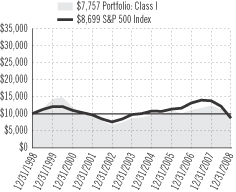
Portfolio: Class I | | -38.16 | % | | -1.39 | % | | -0.16 | % | | N/A | |
Portfolio: Class II | | -38.41 | | | -1.77 | | | N/A | | | -1.81 | % |
S&P 500 Index | | -36.99 | | | -2.19 | | | -1.38 | | | -2.31 | |
Russell 1000® Index | | -37.60 | | | -2.04 | | | -1.09 | | | -1.96 | |
Past performance does not guarantee future returns. The investment return and principal value of an investment will fluctuate, so that an investor’s shares, when redeemed, may be worth more or less than their original cost. Current performance may be lower or higher than the past performance data quoted.
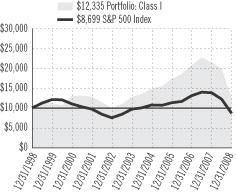
$10,000 INVESTED OVER 10 YEARS1
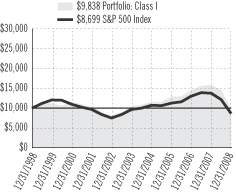
Portfolio (Class I) inception: 5/13/1983. Portfolio (Class II) inception: 5/4/1999. Portfolio performance is net of investment fees and fund expenses, but not product charges, which, if included, would significantly lower the performance quoted. Unless noted otherwise, Index returns reflect performance beginning the closest month-end date to the Portfolio’s inception (Class II).
The Russell 1000® Index is a trademark/service mark of the Frank Russell Company. Russell® is a trademark of the Frank Russell Company. Performance figures may reflect fee waivers and/or expense reimbursements. In the absence of such fee waivers and/or expense reimbursements, total returns would be lower.
For the year ended December 31, 2008, the Equity Portfolio slightly underperformed its benchmark index, the Russell 1000® Index.
The Portfolio is co-managed by Jennison Associates and ClearBridge Advisors. Style and risk factors contributed to the Portfolio’s underperformance during 2008. An overexposure to factors such as earnings variation, a multiple that measures a company’s historical earnings variability and cash flow fluctuations, hurt performance.
The Portfolio’s exposure to leveraged stocks (companies with a higher debt-to-capital ratio) detracted from performance. In addition, an underexposure to earnings yield, or stocks with low price-to-earnings ratios (P/E), further hindered performance.
Stock selection in the banking industry helped relative performance, as did some stocks in the healthcare and technology sectors. Both subadvisers contributed positively in terms of stock selection.
Overall, sector selection had negligible effects on performance during 2008.
Prudential Investments LLC (PI), an indirect, wholly owned subsidiary of Prudential Financial, Inc., serves as the investment manager for the Fund.
| 1 | The graph is based on the performance of Class I shares. Performance of Class II shares will be lower due to differences in the fee structure. Class II shares have associated 12b-1 and administrative fees at an annual rate of 0.25% and 0.15%, respectively, of the average daily net assets of the Class II shares. |
S&P 500 Index is an unmanaged, market value-weighted index of 500 stocks generally representative of the broad stock market. Russell 1000® Index is a market cap-weighted index that measures the performance of the 1,000 largest companies in the Russell 3000 Index, which represents approximately 92% of the total market. These returns do not include the effect of any investment management expenses. These returns would have been lower if they included the effect of these expenses. Investors cannot invest directly in a market index. For a complete list of holdings, refer to the Schedule of Investments section of this report.
| | |
The Prudential Series Fund, Flexible Managed Portfolio Subadvised by: Prudential Investment Management, Inc., Quantitative Management Associates, LLC | | December 31, 2008 |
Investment Manager’s Report - As of December 31, 2008
Average Annual Total Return Percentages
| | | | | | | | | |
| | | 1-Year | | | 5-Year | | | 10-Year | |
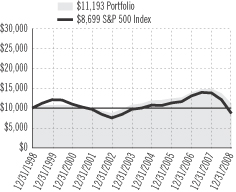
Portfolio | | -24.82 | % | | 0.68 | % | | 1.13 | % |
S&P 500 Index | | -36.99 | | | -2.19 | | | -1.38 | |
Blended Index | | -22.20 | | | 0.63 | | | 1.56 | |
Past performance does not guarantee future returns. The investment return and principal value of an investment will fluctuate, so that an investor’s shares, when redeemed, may be worth more or less than their original cost. Current performance may be lower or higher than the past performance data quoted.
$10,000 INVESTED OVER 10 YEARS
Portfolio inception: 5/13/1983. Portfolio performance is net of investment fees and fund expenses, but not product charges, which, if included, would significantly lower the performance quoted. Performance figures may reflect fee waivers and/or expense reimbursements. In the absence of such fee waivers and/or expense reimbursements, total returns would be lower.
For the year ended December 31, 2008, the Flexible Managed Portfolio underperformed the blended index.
The fixed income portion of the Portfolio primarily drove the Portfolio’s overall subpar performance. Underweight holdings in U.S. Treasury securities, which outperformed bonds (as measured by Barclays Capital Aggregate Index), hindered the Portfolio’s performance.
The Portfolio had an overweight position in equities (versus the guideline weight of 60%), which slightly hurt performance relative to the Index. The subadvisers began 2008 with an overweight position in equities. However, by the end of the third quarter, equities had fallen to very near their guideline level.
The fixed income portion of the Portfolio hovered quite close to its guideline weight through most of the year (the cash portion of the Portfolio varied between nearly 0.0% and 4.0%). Asset class weights represented only a minor factor in determining relative performance.
Prudential Investments LLC (PI), an indirect, wholly owned subsidiary of Prudential Financial, Inc., serves as the investment manager for the Fund.
S&P 500 Index is an unmanaged, market value-weighted index of 500 stocks generally representative of the broad stock market. Blended Index consists of S&P 500 Index (60%), Barclays Capital Aggregate Bond Index (35%), an unmanaged index comprised of more than 5,000 government and corporate bonds, and 3-Month T-Bill Index (5%), an unmanaged market value-weighted index of investment grade fixed rate public obligations of the U.S. Treasury with maturities of 3 months, excluding zero coupon strips. These returns do not include the effect of any investment management expenses. These returns would have been lower if they included the effect of these expenses. Investors cannot invest directly in a market index. For a complete list of holdings refer to the Schedule of Investments section of this report.
| | |
The Prudential Series Fund, Global Portfolio Subadvised by: LSV Asset Management, Marsico Capital Management, LLC, Quantitative Management Associates LLC, T. Rowe Price
Associates, Inc., William Blair & Company LLC | | December 31, 2008 |
Investment Manager’s Report - As of December 31, 2008
Average Annual Total Return Percentages
| | | | | | | | | |
| | | 1-Year | | | 5-Year | | | 10-Year | |
Portfolio | | -42.92 | % | | -0.82 | % | | -0.32 | % |
MSCI World Index (GD) | | -40.33 | | | 0.00 | | | -0.19 | |
Past performance does not guarantee future returns. The investment return and principal value of an investment will fluctuate, so that an investor’s shares, when redeemed, may be worth more or less than their original cost. Current performance may be lower or higher than the past performance data quoted.
$10,000 INVESTED OVER 10 YEARS

Portfolio inception: 9/19/1988. Portfolio performance is net of investment fees and fund expenses, but not product charges, which, if included, would significantly lower the performance quoted. Performance figures may reflect fee waivers and/or expense reimbursements. In the absence of such fee waivers and/or expense reimbursements, total returns would be lower.
For the year ended December 31, 2008, the Global Portfolio underperformed its benchmark, the MSCI World Index (GD) (the Index).
This multi-managed portfolio seeks to outperform the Index. The Portfolio is co-managed by four specialist subadvisers: Marsico Capital Management manages large-cap domestic growth stocks; T. Rowe Price manages large-cap domestic value stocks; William Blair & Company manages international growth stocks; and LSV Asset Management manages international value stocks. William Blair has the flexibility to invest in emerging markets stocks, which are not part of the benchmark. Usually, this portfolio maintains a modest exposure to the sector, which may detract from performance during periods characterized by a “flight to quality” when investors move money out of equities and into other investments such as government securities and money market funds.
During 2008, stock selection primarily drove the Portfolio’s underperformance during the period. In the U.S., the Portfolio was underweight compared with the Index in some of the top-performing companies in the energy sector. Stock selection in the utilities and consumer staples sectors, particularly by growth-oriented managers Marsico Capital Management, LLC and William Blair & Company LLC, detracted from results. From a country standpoint, exposure to emerging markets, specifically China, Brazil, and Russia detracted, as did underweight positions in Japan and the United States. An overweight position in Switzerland and an underweight position in Australia also helped performance. All of these countries experienced significant declines in the Index at the end of the reporting period.
Sector exposures detracted from results relative to the Index. For the year, all sectors in the Index posted declines. Underweight positions in defensive sectors (companies that tend to remain more stable throughout the business cycle), including healthcare, consumer staples, and utilities, negatively affected performance. Conversely, an underweight to financial services, which declined the most in the Index, was rewarded.
The fairly modest cash allocation held in the Portfolio for transactional purposes had a positive impact on performance due to the sharp sell-off in equity markets.
Prudential Investments LLC (PI), an indirect, wholly owned subsidiary of Prudential Financial, Inc., serves as the investment manager for the Fund.
MSCI World Index (GD) - The Morgan Stanley Capital International World Index is an unmanaged capitalization weighted index which includes the equity markets of Australia, Austria, Belgium, Canada, Denmark, Finland, France, Germany, Hong Kong, Ireland, Italy, Japan, Malaysia, Netherlands, New Zealand, Norway, Singapore, Spain, Sweden, Switzerland, United Kingdom and United States. The GD version does not reflect the impact of withholding taxes on reinvested dividends. These returns do not include the effect of any investment management expenses. These returns would have been lower if they included the effect of these expenses. Investors cannot invest directly in a market index. For a complete list of holdings, refer to the Schedule of Investments section of this report.
| | |
The Prudential Series Fund, Government Income Portfolio Subadvised by: Prudential Investment Management, Inc. | | December 31, 2008 |
Investment Manager’s Report - As of December 31, 2008
Average Annual Total Return Percentages
| | | | | | | | | |
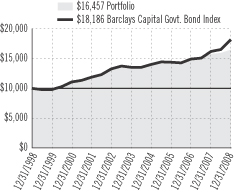
| | | 1-Year | | | 5-Year | | | 10-Year | |
Portfolio | | 4.30 | % | | 3.87 | % | | 5.11 | % |
Barclays Capital Government Bond Index | | 12.39 | | | 6.06 | | | 6.16 | |
Past performance does not guarantee future returns. The investment return and principal value of an investment will fluctuate, so that an investor’s shares, when redeemed, may be worth more or less than their original cost. Current performance may be lower or higher than the past performance data quoted.
$10,000 INVESTED OVER 10 YEARS
Portfolio inception: 5/1/1989. Portfolio performance is net of investment fees and fund expenses, but not product charges, which, if included, would significantly lower the performance quoted. Performance figures may reflect fee waivers and/or expense reimbursements. In the absence of such fee waivers and/or expense reimbursements, total returns would be lower.
For the year ended December 31, 2008, the Government Income Portfolio posted a positive total return that was below its benchmark index.
A burst housing bubble in the United States led to a collapse in the subprime mortgage market that escalated into a credit crisis in which financial institutions around the world continued to take massive write-downs and losses during 2008. The U.S. economy, mired in one of its worst recessions since the Great Depression, shed some 2.5 million jobs in 2008. The Federal Reserve (the Fed) tried to boost growth by cutting its target for the overnight bank lending rate from 4.25% in January to a range of zero to 0.25% in December. The Fed and the U.S. Department of the Treasury employed unconventional measures to encourage commercial banks and finance firms to lend, yet it remained difficult for businesses and individuals to borrow money.
Preservation of capital became a top priority for investors who fled to super-safe U.S. Treasury securities, enabling that market to post a double-digit gain in 2008 that outperformed other U.S. bond markets. The Portfolio invested in a diverse group of debt securities that included Treasurys, federal agency securities, mortgage-backed securities, commercial mortgage-backed securities and, to a lesser extent, corporate bonds and asset-backed securities. The latter are backed by pools of consumer loans such as credit cards and home equity loans that are packaged into securities and sold to investors. A key reason the Portfolio trailed its benchmark index was its investment in the Dryden Core Investment Fund—Short Term Bond Series, which declined in value because it held securities backed by subprime home equity loans. The Portfolio also had a larger exposure than its benchmark index to mortgage-backed securities. This hurt its relative performance as that market underperformed the Treasury market. Poor security selection within the mortgage-backed market also detracted from the Portfolio’s performance versus its benchmark index.
On a positive note, favorable security selection within the commercial mortgage-backed market aided the Portfolio’s performance versus its benchmark index. The Portfolio also benefited from its strategy for managing duration, which measures a fund’s sensitivity to changes in interest rates. A long duration increases responsiveness to changes in rates, while a short duration lessens responsiveness. The Portfolio’s duration in the U.S. Treasury market was slightly longer than that of its benchmark index in November and December. During this time, the Fed cut rates and announced it was considering purchasing longer-term Treasurys, which might reduce long-term rates. In anticipation, yields on Treasurys declined, pushing their prices higher, as bond prices move inversely to yields. Having a slightly longer duration helped the Portfolio derive greater benefit from the Treasury market rally.
Prudential Investments LLC (PI), an indirect, wholly owned subsidiary of Prudential Financial, Inc., serves as the investment manager for the Fund.
Barclays Capital Government Bond Index is a weighted index comprised of securities issued or backed by the U.S. Government, its agencies and instrumentalities with a remaining maturity of one to thirty years. These returns do not include the effect of any investment management expenses. These returns would have been lower if they included the effect of these expenses. Investors cannot invest directly in a market index. For a complete list of holdings refer to the Schedule of Investments section of this report.
| | |
The Prudential Series Fund, High Yield Bond Portfolio Subadvised by: Prudential Investment Management, Inc. | | December 31, 2008 |
Investment Manager’s Report - As of December 31, 2008
Average Annual Total Return Percentages
| | | | | | | | | |
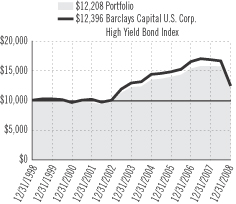
| | | 1-Year | | | 5-Year | | | 10-Year | |
Portfolio | | -22.28 | % | | 0.06 | % | | 2.02 | % |
Barclays Capital U.S. Corp. High Yield Bond Index | | -26.16 | | | -0.80 | | | 2.17 | |
Barclays Capital U.S. High Yield 2% Issuer Capped Index | | -25.88 | | | -0.84 | | | 2.28 | |
Barclays Capital U.S. High Yield 1% Issuer Capped Index | | -26.57 | | | -1.04 | | | 2.25 | |
Past performance does not guarantee future returns. The investment return and principal value of an investment will fluctuate, so that an investor’s shares, when redeemed, may be worth more or less than their original cost. Current performance may be lower or higher than the past performance data quoted.
$10,000 INVESTED OVER 10 YEARS
Portfolio inception: 2/23/1987. Portfolio performance is net of investment fees and fund expenses, but not product charges, which, if included, would significantly lower the performance quoted. Performance figures may reflect fee waivers and/or expense reimbursements. In the absence of such fee waivers and/or expense reimbursements, total returns would be lower.
For the year ended December 31, 2008, the High Yield Bond Portfolio declined less than its benchmark indexes.
A burst housing bubble in the United States led to a collapse in the subprime mortgage market that escalated into a credit crisis in which financial institutions around the world continued to take massive write-downs and losses during 2008. The U.S. economy, mired in one of its worst recessions since the Great Depression, shed some 2.5 million jobs in 2008. The Federal Reserve (the Fed) tried to boost growth by cutting its target for the overnight bank lending rate from 4.25% in January to a range of zero to 0.25% in December. The Fed and the U.S. Department of the Treasury employed unconventional measures to encourage commercial banks and finance firms to lend, yet it remained difficult for businesses and individuals to borrow money.
High yield corporate bonds, which are rated below investment grade, are commonly called “junk” bonds. The worsening credit crisis led investors to avoid risky classes of assets such as high yield bonds. There was concern that an increasing number of companies will be unable to make interest and principal payments on their bonds amid the weak economic conditions. Consequently, the high yield market posted a large decline for the year, even though high yield bond prices generally gained in December after the Fed cut rates and stated its intention to use all available tools to lift the U.S. economy out of recession.
The Portfolio declined less than its benchmark index because its allocation to industries within the high yield market generally worked well and because of its favorable security selection within industries such as technology, chemicals, and capital goods. For example, the Portfolio had a larger exposure than its benchmark index to healthcare, an industry that posted one of the smallest annual declines in the high yield market. The Portfolio’s relative performance also benefited because it had smaller exposures than the benchmark index to the media & entertainment and auto industries. The former was negatively affected by declining advertising sales and a widespread shift to Internet-based media options. The latter was hurt by steep declines in auto sales and the high costs of auto companies such as their retirement healthcare plans.
That said, bonds of an auto financing firm soared in value because the company was granted bank holding status that enabled it to qualify for assistance from the federal government. Having a smaller exposure to these bonds than its benchmark index was one of the largest detractors from the Portfolio’s relative performance.
Prudential Investments LLC (PI), an indirect, wholly owned subsidiary of Prudential Financial, Inc., serves as the investment manager for the Fund.
Barclays Capital U.S. Corporate High Yield Index is an unmanaged index of fixed-rate, non-investment-grade debt securities with at least one year remaining to maturity. It gives a broad look at how high yield (“junk”) bonds have performed. Barclays Capital U.S. Corporate High Yield 1% and 2% Issuer Capped Indexes cover the universe of U.S. dollar denominated, non-convertible, fixed-rate, non-investment-grade debt. Issuers are capped at 1% and 2% of the Index, respectively. Index holdings must have at least one year to final maturity, at least $150 million par amount outstanding, and be publicly issued with a rating of Ba1 or lower. These returns do not include the effect of any investment management expenses. These returns would have been lower if they included the effect of these expenses. Investors cannot invest directly in a market index. For a complete list of holdings, refer to the Schedule of Investments section of this report.
| | |
The Prudential Series Fund, Jennison Portfolio Subadvised by: Jennison Associates LLC | | December 31, 2008 |
Investment Manager’s Report - As of December 31, 2008
Average Annual Total Return Percentages
| | | | | | | | | | | | |
| | | 1-Year | | | 5-Year | | | 10-Year | | | Since
Inception | |
Portfolio: Class I | | -37.28 | % | | -2.13 | % | | -2.51 | % | | N/A | |
Portfolio: Class II | | -37.55 | | | -2.54 | | | N/A | | | -7.56 | % |
S&P 500 Index | | -36.99 | | | -2.19 | | | -1.38 | | | -3.08 | |
Russell 1000® Growth Index | | -38.44 | | | -3.42 | | | -4.27 | | | -7.29 | |
Past performance does not guarantee future returns. The investment return and principal value of an investment will fluctuate, so that an investor’s shares, when redeemed, may be worth more or less than their original cost. Current performance may be lower or higher than the past performance data quoted.
$10,000 INVESTED OVER 10 YEARS1
Portfolio (Class I) inception: 4/25/1995. Portfolio (Class II) inception: 2/10/2000. Portfolio performance is net of investment fees and fund expenses, but not product charges, which, if included, would significantly lower the performance quoted. Unless noted otherwise, Index returns reflect performance beginning the closest month-end date to the Portfolio’s inception (Class II).
The Russell 1000® Growth Index is a trademark/service of the Frank Russell Company. Russell® is the Frank Russell Company. Performance figures may reflect fee waivers and/or expense reimbursements. In the absence of such fee waivers and/or expense reimbursements, total returns would be lower.
For the year ended December 31, 2008, the Jennison Portfolio outperformed its benchmark index, the Russell 1000® Growth Index.
The greatest contributor to relative performance was stock selection in the healthcare sector. One example was a manufacturer of drugs for HIV treatments. The solid results seemed to reinforce the idea held by many investors that the company will likely benefit in a jittery market. It also received an additional boost when analysts upgraded the stock and increased their earnings per share and revenue projections for the company. On a negative note, stock selection within the technology sector hindered performance. For example, a major producer of graphic design software fell on concerns that the deteriorating macroeconomic environment would likely lead to further cuts in corporate discretionary spending on technology, hurting the company despite its operating efficiency and strong expense control.
A conservative risk posture mitigated negative returns. More recently, the subadviser has been finding opportunities in more conservative stocks, as defined by their beta factors. (Beta measures a stock’s volatility to the degree in which its price fluctuates in relation to the overall market.) In 2008, a year that saw large negative returns across the board, lower beta stocks generally declined less than more aggressive stocks. Consequently, the manager’s overexposure to more conservative stocks benefited the Portfolio.
Sector allocations contributed to positive relative performance. Overweight positions in the healthcare and technology sectors contributed positively to relative performance for the year; however, an underweight in consumer services pared gains made through sector positioning. Sector allocations are a residual of the manager’s bottom-up stock selection.
Risk factors detracted from performance. Returns for the year were hurt by the Portfolio’s overexposure to momentum stocks (stocks in companies experiencing recent price strength). Additionally, an overweight position in larger capitalization stocks (compared to the benchmark) detracted from results. On the positive side, the manager’s underexposure to leveraged stocks (stocks in companies with above-market debt-to-asset ratios) helped performance.
Prudential Investments LLC (PI), an indirect, wholly owned subsidiary of Prudential Financial, Inc., serves as the investment manager for the Fund.
| 1 | The graph is based on the performance of Class I shares. Performance of Class II shares will be lower due to differences in the fee structure. Class II shares have associated 12b-1 and administrative fees at an annual rate of 0.25% and 0.15%, respectively, of the average daily net assets of the Class II shares. |
S&P 500 Index is an unmanaged, market value-weighted index of 500 stocks generally representative of the broad stock market. Russell 1000 Growth Index is a market cap-weighted index that measures the performance of those Russell 1000 companies with higher price-to-book ratios and higher forecasted growth values. These returns do not include the effect of any investment management expenses. These returns would have been lower if they included the effect of these expenses. Investors cannot invest directly in a market index. For a complete list of holdings, refer to the Schedule of Investments section of this report.
| | |
The Prudential Series Fund, Money Market Portfolio Subadvised by: Prudential Investment Management, Inc. | | December 31, 2008 |
Investment Manager’s Report - As of December 31, 2008
Average Annual Total Return Percentages
| | | | | | | | | | | | |
| | | 7-Day*
Current
Net Yield | | | 1-Year | | | 5-Year | | | 10-Year | |
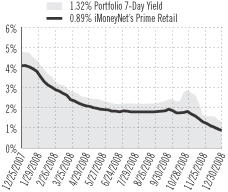
Portfolio | | 1.32 | % | | 2.65 | % | | 3.27 | % | | 3.38 | % |
Lipper (VIP) Money Market Funds Avg. | | N/A | | | 2.23 | | | 3.00 | | | 3.15 | |
Past performance does not guarantee future returns. The investment return and principal value of an investment will fluctuate, so that an investor’s shares, when redeemed, may be worth more or less than their original cost. Current performance may be lower or higher than the past performance data quoted.
7-DAY CURRENT NET YIELD*
Portfolio inception: 5/13/1983. The yield quotation more closely reflects the current earnings of the Portfolio than the total return quotation. Portfolio performance is net of investment fees and fund expenses, but not product charges, which, if included, would significantly lower the performance quoted. Performance figures may reflect fee waivers and/or expense reimbursements. In the absence of such fee waivers and/or expense reimbursements, total returns would be lower.
For the year ended December 31, 2008, the Money Market Portfolio had a total return of 2.65%, which was above the average of its peer group, the Lipper (VIP) Money Market Funds Average. On December 30, 2008, the Portfolio’s 7-day current net yield was 1.32%, down from 4.81% on December 25, 2007. The yield more closely reflects the current earnings of the Portfolio than the total return.
The year was marked by severe stress in financial systems around the world, increasing aversion to risky investments, and sharply declining interest rates in the United States. A bursting housing bubble in the United States led to the collapse of the subprime mortgage market. The resulting large write-downs and losses escalated into a full-scale credit crisis that affected commercial banks and other financial institutions. The magnitude of the financial crisis required aggressive and inventive measures by the Federal Reserve (Fed) and the U.S. Department of the Treasury to ease stress in the credit markets. The Fed also tried to stimulate growth in the economy by cutting its target for the overnight bank lending rate from 4.25% in January to a range of zero to 0.25% in December.
Due to the uncertainty in the credit markets, the Portfolio employed a conservative strategy in which it invested primarily in money market securities of highly rated corporate issuers, highly rated banks, and government agencies. Additionally, the Portfolio also invested in overnight repurchase agreements, contracts in which a seller of securities agrees to buy them back the next day at a specified price. This prudent approach resulted in a high level of liquidity in the Portfolio and positioned the Portfolio’s weighted average maturity (WAM) shorter than that of the average comparable fund for much of the year. (WAM measures a fund’s sensitivity to changes in the level of interest rates. It considers the maturity and quantity of each security held in a portfolio.)
Prudential Investments LLC (PI), an indirect, wholly owned subsidiary of Prudential Financial, Inc., serves as the investment manager for the Fund.
| * | Source: iMoneyNet, Inc. based on 335 funds in the iMoneyNet Prime Retail universe. Weekly 7-day current net yields of the Money Market Portfolio and the iMoneyNet Prime Retail universe as of 12/30/2008. |
The Lipper Variable Insurance Products (VIP) Funds Averages are calculated by Lipper Analytical Services, Inc., and reflect the investment return of certain portfolios underlying variable life and annuity products. These returns are net of investment fees and fund expenses, but not product charges. These returns do not include the effect of any investment management expenses. These returns would have been lower if they included the effect of these expenses. Investors cannot invest directly in a market index or average. For a complete list of holdings refer to the Schedule of Investments section of this report.
| | |
The Prudential Series Fund, Natural Resources Portfolio Subadvised by: Jennison Associates LLC | | December 31, 2008 |
Investment Manager’s Report - As of December 31, 2008
Average Annual Total Return Percentages
| | | | | | | | | | | | |
| | | 1-Year | | | 5-Year | | | 10-Year | | | Since
Inception | |
Portfolio: Class I | | -53.00 | % | | 10.70 | % | | 17.38 | % | | N/A | |
Portfolio: Class II | | -53.19 | | | N/A | | | N/A | | | 6.65 | % |
S&P 500 Index | | -36.99 | | | -2.19 | | | -1.38 | | | -4.61 | |
Lipper (VIP) Natural Resources Funds Avg. | | -47.18 | | | 7.04 | | | 11.57 | | | 4.05 | |
Lipper (VUF) Natural Resources Funds Index | | -50.13 | | | 6.07 | | | N/A | | | 3.83 | |
Past performance does not guarantee future returns. The investment return and principal value of an investment will fluctuate, so that an investor’s shares, when redeemed, may be worth more or less than their original cost. Current performance may be lower or higher than the past performance data quoted.
$10,000 INVESTED OVER 10 YEARS1
Portfolio (Class I) inception: 5/1/1988. Portfolio (Class II) inception: 4/28/2005. Portfolio performance is net of investment fees and fund expenses, but not product charges, which, if included, would significantly lower the performance quoted. Unless noted otherwise, Index returns reflect performance beginning the closest month-end date to the Portfolio’s inception (Class II). Performance figures may reflect fee waivers and/or expense reimbursements. In the absence of such fee waivers and/or expense reimbursements, total returns would be lower.
For the year ended December 31, 2008, the Natural Resources Portfolio underperformed its benchmark, the Lipper (VUF) Natural Resources Funds Index.
The metals and mining subsector drove performance during the year while stock selection of oil and gas exploration and production companies was weak. The most significant contributors to performance were gold mining companies. Oil and gas refiners were among the most significant detractors from performance as record-high commodity prices earlier in the year led to lower margins. Energy service holdings also underperformed as the impact of the global economic slowdown on oil and gas exploration and production led many of these holdings to report weaker-than-expected financial results.
Copper underperformed given the pronounced decline in the commodities market and subsequent fall in metal prices due to fears of a global recession. The Portfolio continued to emphasize fiscally-conservative exploration and production companies that are growing production and reserves by successfully exploiting unconventional sources of oil or gas and as such, offering more leverage to historically high oil and/or natural gas prices.
Prudential Investments LLC (PI), an indirect, wholly owned subsidiary of Prudential Financial, Inc., serves as the investment manager for the Fund.
| 1 | The graph is based on the performance of Class I shares. Performance of Class II shares will be lower due to differences in the fee structure. Class II shares have associated 12b-1 and administrative fees at an annual rate of 0.25% and 0.15% respectively of the average daily net assets of the Class II shares. |
S&P 500 Index is an unmanaged, market value-weighted index of 500 stocks generally representative of the broad stock market. The Lipper Variable Insurance Products (VIP) Funds Averages are calculated by Lipper Analytical Services, Inc., and reflect the investment return of certain portfolios underlying variable life and annuity products. The Lipper Variable Underlying Funds (VUF) Natural Resources Funds Index consists of an equal dollar-weighted composite of the 10 largest funds in the Lipper VUF Natural Resources Fund classification. The index is rebalanced quarterly. Natural Resources Funds are deemed as funds that invest primarily in the equity securities of domestic and foreign companies engaged in natural resources. These returns are net of investment fees and fund expenses, but not product charges. Investors cannot invest directly in a market index or average. For a complete list of holdings, refer to the Schedule of Investments section of this report.
| | |
The Prudential Series Fund, Small Capitalization Stock Portfolio Subadvised by: Quantitative Management Associates LLC | | December 31, 2008 |
Investment Manager’s Report - As of December 31, 2008
Average Annual Total Return Percentages
| | | | | | | | | |
| | | 1-Year | | | 5-Year | | | 10-Year | |
Portfolio | | -31.04 | % | | 0.59 | % | | 4.98 | % |
S&P SmallCap 600 Index | | -31.07 | | | 0.88 | | | 5.18 | |
Past performance does not guarantee future returns. The investment return and principal value of an investment will fluctuate, so that an investor’s shares, when redeemed, may be worth more or less than their original cost. Current performance may be lower or higher than the past performance data quoted.
$10,000 INVESTED OVER 10 YEARS
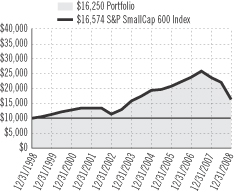
Portfolio inception: 4/25/1995. Portfolio performance is net of investment fees and fund expenses, but not product charges, which, if included, would significantly lower the performance quoted. Performance figures may reflect fee waivers and/or expense reimbursements. In the absence of such fee waivers and/or expense reimbursements, total returns would be lower.
For the year ended December 31, 2008, the Small Capitalization Stock Portfolio performed in line with its benchmark, the S&P SmallCap 600 Index (the Index).
Quantitative Management Associates LLC (QMA) subadvises the Portfolio. Its investment strategy entails replication of the holdings and weights of the Index, which holds small-cap stocks. The managers accomplish this performance by using quantitative techniques. The Portfolio is somewhat different from the typical index fund because the managers have the flexibility to build positions slowly when the composition of the Index changes.
The Portfolio met its goal of replicating the returns of the Index. The Index experienced a large decline, which was in line with the performance of small cap stocks in general. Indeed, 2008 was a year of historically poor returns for nearly every category of investable assets. Events related to the credit crisis and the economy pressured all equity sectors and indexes downward. There were no substantial differences in positions, weights, or performance between the Portfolio and the Index.
Prudential Investments LLC (PI), an indirect, wholly owned subsidiary of Prudential Financial, Inc., serves as the investment manager for the Fund.
S&P SmallCap 600 Index is an unmanaged index representing the aggregate market value of the common equity of 600 small-company stocks. These returns do not include the effect of any investment management expenses. These returns would have been lower if they included the effect of these expenses. Investors cannot invest directly in a market index. For a complete list of holdings refer to the Schedule of Investments section of this report.
| | |
The Prudential Series Fund, Stock Index Portfolio Subadvised by: Quantitative Management Associates LLC | | December 31, 2008 |
Investment Manager’s Report - As of December 31, 2008
Average Annual Total Return Percentages
| | | | | | | | | |
| | | 1-Year | | | 5-Year | | | 10-Year | |
Portfolio | | -36.94 | % | | -2.43 | % | | -1.61 | % |
S&P 500 Index | | -36.99 | | | -2.19 | | | -1.38 | |
Past performance does not guarantee future returns. The investment return and principal value of an investment will fluctuate, so that an investor’s shares, when redeemed, may be worth more or less than their original cost. Current performance may be lower or higher than the past performance data quoted.
$10,000 INVESTED OVER 10 YEARS
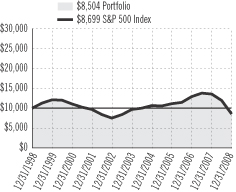
Portfolio inception: 10/19/1987. Portfolio performance is net of investment fees and fund expenses, but not product charges, which, if included, would significantly lower the performance quoted. Performance figures may reflect fee waivers and/or expense reimbursements. In the absence of such fee waivers and/or expense reimbursements, total returns would be lower.
For the year ended December 31, 2008, the Stock Index Portfolio performed in line with the S&P 500 Index, its benchmark index (the Index).
The Portfolio is subadvised by Quantitative Management Associates LLC (QMA). This is an index portfolio based on the S&P 500. The managers approximate the holdings and weights of the Index using a purely quantitative approach. For compliance purposes, the Portfolio cannot hold Prudential stock, which will result in a slight difference in weights.
The large decline of the Portfolio was in line with the performance of U.S. equities in general. Indeed, 2008 was a year of historically poor returns for nearly every category of investable assets. The managers matched the performance of the Index, thus meeting their goal of reproducing its performance. There were no substantial differences in positions, weights, or performance between the Portfolio and the Index.
All sectors in the Index were down significantly for the year. The distressed financial sector, reeling from the credit crisis, was the worst performing sector during the year. Materials and energy stocks posted significant declines as global construction demand collapsed, especially in China. Global demand for energy resources deteriorated, and the price of crude oil plunged from its record high in July to a low of under $40 late in the year, pushing the energy sector down.
Industrials, stalled by the credit crisis and global slowdown, declined. Demand for computers and software slumped as information technology fell. Weak consumer spending drove the consumer discretionary sector deep into negative territory. The smallest declines were in two sectors of defensive stocks (companies that tend to remain more stable throughout the business cycle): healthcare and consumer staples. Telecommunications and utilities also fell sharply.
Prudential Investments LLC (PI), an indirect, wholly owned subsidiary of Prudential Financial, Inc., serves as the investment manager for the Fund.
S&P 500 Index is an unmanaged, market value-weighted index of 500 stocks generally representative of the broad stock market. These returns do not include the effect of any investment management expenses. These returns would have been lower if they included the effect of these expenses. Investors cannot invest directly in a market index. For a complete list of holdings refer to the Schedule of Investments section of this report.
| | |
The Prudential Series Fund, Value Portfolio Subadvised by: Jennison Associates LLC | | December 31, 2008 |
Investment Manager’s Report - As of December 31, 2008
Average Annual Total Return Percentages
| | | | | | | | | | | | |
| | | 1-Year | | | 5-Year | | | 10-Year | | | Since
Inception | |
Portfolio: Class I | | -42.29 | % | | -0.63 | % | | 2.12 | % | | N/A | |
Portfolio: Class II | | -42.56 | | | -1.03 | | | N/A | | | -1.37 | % |
S&P 500 Index | | -36.99 | | | -2.19 | | | -1.38 | | | -2.36 | |
Russell 1000® Value Index | | -36.85 | | | -0.79 | | | 1.36 | | | 0.12 | |
Past performance does not guarantee future returns. The investment return and principal value of an investment will fluctuate, so that an investor’s shares, when redeemed, may be worth more or less than their original cost. Current performance may be lower or higher than the past performance data quoted.
$10,000 INVESTED OVER 10 YEARS1
Portfolio (Class I) inception: 2/19/1988. Portfolio (Class II) inception: 5/14/2001. Portfolio performance is net of investment fees and fund expenses, but not product charges, which, if included, would significantly lower the performance quoted. Unless noted otherwise, Index returns reflect performance beginning the closest month-end date to the Portfolio’s inception (Class II). The Russell 1000® Value Index is a trademark/service mark of the Frank Russell Company. Russell® is a trademark of the Frank Russell Company. Performance figures may reflect fee waivers and/or expense reimbursements. In the absence of such fee waivers and/or expense reimbursements, total returns would be lower.
For the year ended December 31, 2008, the Value Portfolio underperformed its benchmark index (the Index, the Russell 1000® Value Index).
Energy holdings were the primary cause of underperformance relative to the Index. Telecommunications, due to a couple individual stock disappointments, was also a meaningful source of relative loss. Although the Portfolio trailed the Index in financials, a persistent underweight in the sector benefited relative return and greatly mitigated the performance lag. The consumer discretionary sector detracted from relative performance; however, individual holdings had mixed results.
An aggressive risk posture hurt performance. In 2008, a year that saw large negative returns across the board, stocks with higher beta factors generally declined more than less aggressive stocks. (Beta measures a stock’s volatility to the degree in which its price fluctuates in relation to the overall market). Consequently, the subadviser’s higher beta positioning detracted from returns.
Overall, risk factors also hurt relative performance. The subadviser’s overexposure to leveraged stocks (stocks in companies with above-market debt-to-asset ratios) and high earnings variability (earnings variation, which measures the volatility in a company’s earnings and cash flow) detracted from returns.
On the positive side, security selection was strong in healthcare. One of the largest single contributors was a healthcare company that dispenses drugs to nursing homes and other long-term care facilities. The Portfolio also outperformed the Index in consumer staples, industrials, and information technology. A smaller exposure to materials added to relative performance.
Prudential Investments LLC (PI), an indirect, wholly owned subsidiary of Prudential Financial, Inc., serves as the investment manager for the Fund.
| 1 | The graph is based on the performance of Class I shares. Performance of Class II shares will be lower due to differences in the fee structure. Class II shares have associated 12b-1 and administrative fees at an annual rate of 0.25% and 0.15%, respectively, of the average daily net assets of the Class II shares. |
S&P 500 Index is an unmanaged, market value-weighted index of 500 stocks generally representative of the broad stock market. Russell 1000 Value Index is a market cap-weighted index that measures the performance of those Russell 1000 companies with lower price-to-book ratios and lower forecasted growth values. Investors cannot invest directly in a market index. For a complete list of holdings, refer to the Schedule of Investments section of this report.
| | |
The Prudential Series Fund Presentation of Portfolio Holdings — unaudited | | December 31, 2008 |
| | |
| Conservative Balanced |
| Five Largest Holdings (% of Net Assets) |
Federal National Mortgage
Association, 5.00%, TBA 30 YR | | 2.6% |
Exxon Mobil Corp. | | 2.4% |
Federal National Mortgage
Association, 6.00%, TBA 30 YR | | 2.3% |
Federal Home Loan Mortgage
Corp., 5.50%, TBA 30 YR | | 1.9% |
Procter & Gamble Co. | | 1.1% |
| | |
| Diversified Bond |
| Allocation (% of Net Assets) |
U.S. Government Mortgage-
Backed Securities | | 45.8% |
Corporate Bonds | | 30.9% |
| Commercial Mortgage-Backed Securities | | 7.8% |
U.S. Government Treasury
Securities | | 4.9% |
Bank Loans | | 3.4% |
| | |
| Equity |
| Five Largest Holdings (% of Net Assets) |
Wal-Mart Stores, Inc. | | 2.7% |
QUALCOMM, Inc. | | 2.5% |
Cisco Systems, Inc. | | 2.0% |
Gilead Sciences, Inc. | | 2.0% |
PepsiCo, Inc. | | 2.0% |
| | |
| Flexible Managed | | |
| Five Largest Holdings (% of Net Assets) |
Exxon Mobil Corp. | | 2.5% |
Federal National Mortgage
Assn., 5.00%, TBA 30 YR | | 1.9% |
Federal Home Loam Mortgage
Corp., 5.50%, TBA 30 YR | | 1.7% |
Federal National Mortgage
Assn., 6.00%, 1/01/35 | | 1.6% |
Microsoft Corp. | | 1.4% |
| | |
| Global |
| Top Five Countries (% of Net Assets) |
United States | | 47.9% |
United Kingdom | | 9.7% |
Japan | | 8.1% |
Switzerland | | 5.6% |
France | | 4.8% |
| | |
| Government Income |
| Allocation (% of Net Assets) |
Mortgage Backed Securities | | 48.8% |
U.S. Government Agency
Obligations | | 14.8% |
U.S. Government Treasury
Securities | | 14.3% |
Commercial Mortgage Backed
Securities | | 6.2% |
| Collateralized Mortgage Obligations | | 6.0% |
| | | |
| High Yield Bond | |
| Allocation (% of Net Assets) | |
Corporate Bonds | | 89.6% | |
Common Stock | | 0.1% | |
Preferred Stock | | 0.0% | * |
Warrants | | 0.0% | * |
| * Less than 0.05% | | | |
| | |
| Jennison |
| Five Largest Holdings (% of Net Assets) |
Gilead Sciences, Inc. | | 6.7% |
Google, Inc. (Class A Stock) | | 4.5% |
Genentech, Inc. | | 4.3% |
Wal-Mart Stores, Inc. | | 3.8% |
QUALCOMM, Inc. | | 3.8% |
| | |
| Natural Resources |
| Five Largest Holdings (% of Net Assets) |
Southwestern Energy Co. | | 3.1% |
Kinross Gold Corp. | | 2.8% |
Occidental Petroleum Corp. | | 2.5% |
Devon Energy Corp. | | 2.2% |
Eldorado Gold Corp. | | 2.2% |
| | |
| Small Capitalization Stock | | |
| Five Largest Holdings (% of Net Assets) |
Piedmont Natural Gas Co., Inc. | | 0.7% |
Itron, Inc. | | 0.7% |
Atmos Energy Corp. | | 0.7% |
Senior Housing Properties Trust | | 0.6% |
Watson Wyatt Worldwide, Inc. (Class A Stock) | | 0.6% |
| | |
| Stock Index | | |
| Five Largest Holdings (% of Net Assets) |
Exxon Mobil Corp | | 5.1% |
Procter & Gamble Co | | 2.3% |
General Electric Co. | | 2.1% |
AT&T, Inc. | | 2.1% |
Johnson & Johnson | | 2.1% |
| | |
| Value | | |
| Five Largest Holdings (% of Net Assets) |
Symantec Corp. | | 3.1% |
Comcast Corp. (Class A Stock) | | 3.1% |
CA, Inc. | | 3.1% |
IAC/InterActiveCorp. | | 2.9% |
H&R Block, Inc. | | 2.8% |
For a complete list of holdings, please refer to the Schedule of Investments section of this report. Holdings reflect only long-term investments. Holdings/Issues/Industries/Sectors are subject to change.
| | |
The Prudential Series Fund Fees and Expenses — unaudited | | December 31, 2008 |
As a contract owner investing in Portfolios of the Fund through a variable annuity or variable life contract, you incur ongoing costs, including management fees, and other Portfolio expenses. This example is intended to help you understand your ongoing costs (in dollars) of investing in the Fund and to compare these costs with the ongoing costs of investing in other investment options. This example does not reflect fees and charges under your variable annuity or variable life contract. If contract charges were included, the costs shown below would be higher. Please consult the prospectus for your contract for more information about contract fees and charges.
The example is based on an investment of $1,000 invested at the beginning of the period and held for the entire period July 1, 2008 through December 31, 2008.
Actual Expenses
The first line of the table below provides information about actual account values and actual expenses. You may use this information, together with the amount you invested, to estimate the Portfolio expenses that you paid over the period. Simply divide your account value by $1,000 (for example, an $8,600 account value divided by $1,000 = 8.6), then multiply the result by the number in the first line under the heading entitled “Expenses Paid During the Six-Month Period” to estimate the Portfolio expenses you paid on your account during this period. As noted above, the table does not reflect variable contract fees and charges.
Hypothetical Example for Comparison Purposes
The second line of the table below provides information about hypothetical account values and hypothetical expenses based on the Portfolio’s actual expense ratio and an assumed rate of return of 5% per year before expenses, which is not the Portfolio’s actual return. The hypothetical account values and expenses may not be used to estimate the actual ending account balance or expenses you paid for the period. You may use this information to compare the ongoing costs of investing in the Portfolio and other investment options. To do so, compare this 5% hypothetical example with the 5% hypothetical examples that appear in the shareholder reports of the other investment options.
Please note that the expenses shown in the table are meant to highlight your ongoing Portfolio costs only and do not reflect any contract fees and charges, such as sales charges (loads), insurance charges or administrative charges. Therefore the second line of the table is useful to compare ongoing investment option costs only, and will not help you determine the relative total costs of owning different contracts. In addition, if these contract fee and charges were included, your costs would have been higher.
| | | | | | | | | | | | | | |
| The Prudential Series Fund Portfolios | | Beginning
Account Value
July 1, 2008 | | Ending
Account Value
December 31, 2008 | | Annualized Expense
Ratio based on the
Six-Month period | | | Expenses Paid
During the
Six-Month period |
| Conservative Balanced (Class I) | | Actual | | $ | 1,000.00 | | $ | 842.10 | | 0.60 | % | | $ | 2.78 |
| | | Hypothetical | | $ | 1,000.00 | | $ | 1,022.17 | | 0.60 | % | | $ | 3.05 |
| Diversified Bond (Class I) | | Actual | | $ | 1,000.00 | | $ | 961.20 | | 0.45 | % | | $ | 2.22 |
| | | Hypothetical | | $ | 1,000.00 | | $ | 1,022.87 | | 0.45 | % | | $ | 2.29 |
| Equity (Class I) | | Actual | | $ | 1,000.00 | | $ | 673.00 | | 0.49 | % | | $ | 2.06 |
| | | Hypothetical | | $ | 1,000.00 | | $ | 1,022.67 | | 0.49 | % | | $ | 2.49 |
| Equity (Class II) | | Actual | | $ | 1,000.00 | | $ | 671.70 | | 0.89 | % | | $ | 3.74 |
| | | Hypothetical | | $ | 1,000.00 | | $ | 1,020.66 | | 0.89 | % | | $ | 4.52 |
| Flexible Managed (Class I) | | Actual | | $ | 1,000.00 | | $ | 814.50 | | 0.64 | % | | $ | 2.92 |
| | | Hypothetical | | $ | 1,000.00 | | $ | 1,021.92 | | 0.64 | % | | $ | 3.25 |
| Global (Class I) | | Actual | | $ | 1,000.00 | | $ | 648.30 | | 0.87 | % | | $ | 3.60 |
| | | Hypothetical | | $ | 1,000.00 | | $ | 1,020.76 | | 0.87 | % | | $ | 4.42 |
| Government Income (Class I) | | Actual | | $ | 1,000.00 | | $ | 1,033.50 | | 0.50 | % | | $ | 2.56 |
| | | Hypothetical | | $ | 1,000.00 | | $ | 1,022.62 | | 0.50 | % | | $ | 2.54 |
| High Yield Bond (Class I) | | Actual | | $ | 1,000.00 | | $ | 780.80 | | 0.58 | % | | $ | 2.60 |
| | | Hypothetical | | $ | 1,000.00 | | $ | 1,022.22 | | 0.58 | % | | $ | 2.95 |
| Jennison (Class I) | | Actual | | $ | 1,000.00 | | $ | 689.70 | | 0.63 | % | | $ | 2.68 |
| | | Hypothetical | | $ | 1,000.00 | | $ | 1,021.97 | | 0.63 | % | | $ | 3.20 |
| Jennison (Class II) | | Actual | | $ | 1,000.00 | | $ | 688.20 | | 1.03 | % | | $ | 4.37 |
| | | Hypothetical | | $ | 1,000.00 | | $ | 1,019.96 | | 1.03 | % | | $ | 5.23 |
| Money Market (Class I) | | Actual | | $ | 1,000.00 | | $ | 1,011.00 | | 0.43 | % | | $ | 2.17 |
| | | Hypothetical | | $ | 1,000.00 | | $ | 1,022.97 | | 0.43 | % | | $ | 2.19 |
| | |
The Prudential Series Fund Fees and Expenses — unaudited (continued) | | December 31, 2008 |
| | | | | | | | | | | | | | |
| The Prudential Series Fund Portfolios | | Beginning
Account Value
July 1, 2008 | | Ending
Account Value
December 31, 2008 | | Annualized Expense
Ratio based on the
Six-Month period | | | Expenses Paid
During the
Six-Month period |
| Natural Resources (Class I) | | Actual | | $ | 1,000.00 | | $ | 389.30 | | 0.53 | % | | $ | 1.85 |
| | | Hypothetical | | $ | 1,000.00 | | $ | 1,022.47 | | 0.53 | % | | $ | 2.69 |
| Natural Resources (Class II) | | Actual | | $ | 1,000.00 | | $ | 388.60 | | 0.93 | % | | $ | 3.25 |
| | | Hypothetical | | $ | 1,000.00 | | $ | 1,020.46 | | 0.93 | % | | $ | 4.72 |
| Small Capitalization Stock (Class I) | | Actual | | $ | 1,000.00 | | $ | 742.10 | | 0.47 | % | | $ | 2.06 |
| | Hypothetical | | $ | 1,000.00 | | $ | 1,022.77 | | 0.47 | % | | $ | 2.39 |
| Stock Index (Class I) | | Actual | | $ | 1,000.00 | | $ | 716.40 | | 0.37 | % | | $ | 1.60 |
| | | Hypothetical | | $ | 1,000.00 | | $ | 1,023.28 | | 0.37 | % | | $ | 1.88 |
| Value (Class I) | | Actual | | $ | 1,000.00 | | $ | 623.10 | | 0.43 | % | | $ | 1.75 |
| | | Hypothetical | | $ | 1,000.00 | | $ | 1,022.97 | | 0.43 | % | | $ | 2.19 |
| Value (Class II) | | Actual | | $ | 1,000.00 | | $ | 621.40 | | 0.83 | % | | $ | 3.38 |
| | | Hypothetical | | $ | 1,000.00 | | $ | 1,020.96 | | 0.83 | % | | $ | 4.22 |
*Portfolio expenses (net of fee waivers or subsidies, if any) for each share class are equal to the annualized expense ratio for each share class (provided in the table), multiplied by the average account value over the period, multiplied by the 184 days in the six-month period ended December 31, 2008, and divided by the 366 days in the Portfolio's fiscal year ended December 31, 2008 (to reflect the six-month period). Expenses presented in the table include the expenses of any underlying portfolios in which the Portfolio may invest.
| | | | | | |
| | | CONSERVATIVE BALANCED PORTFOLIO | | |
| |
| SCHEDULE OF INVESTMENTS | | December 31, 2008 |
| | | | | |
| LONG-TERM INVESTMENTS — 91.8% | | |
| COMMON STOCKS — 45.7% | | Shares
| | Value
(Note 2)
|
Aerospace & Defense — 1.3% | | | | | |
Boeing Co. | | 84,200 | | $ | 3,592,814 |
General Dynamics Corp. | | 45,200 | | | 2,603,068 |
Goodrich Corp. | | 15,600 | | | 577,512 |
Honeywell International, Inc. | | 84,712 | | | 2,781,095 |
L-3 Communications Holdings, Inc. | | 13,500 | | | 996,030 |
Lockheed Martin Corp. | | 37,900 | | | 3,186,632 |
Northrop Grumman Corp. | | 39,462 | | | 1,777,368 |
Precision Castparts Corp. | | 15,500 | | | 921,940 |
Raytheon Co. | | 48,500 | | | 2,475,440 |
Rockwell Collins, Inc. | | 17,300 | | | 676,257 |
United Technologies Corp. | | 109,700 | | | 5,879,920 |
| | | | |
|
|
| | | | | | 25,468,076 |
| | | | |
|
|
Air Freight & Logistics — 0.5% | | | | | |
C.H. Robinson Worldwide, Inc. | | 19,300 | | | 1,062,079 |
Expeditors International Washington, Inc.(b) | | 24,400 | | | 811,788 |
FedEx Corp. | | 35,400 | | | 2,270,910 |
United Parcel Service, Inc. (Class B Stock) | | 112,700 | | | 6,216,532 |
| | | | |
|
|
| | | | | | 10,361,309 |
| | | | |
|
|
Airlines | | | | | |
Southwest Airlines Co. | | 83,500 | | | 719,770 |
| | | | |
|
|
Auto Components — 0.1% | | | | | |
Goodyear Tire & Rubber Co. (The)(a) | | 23,400 | | | 139,698 |
Johnson Controls, Inc. | | 70,300 | | | 1,276,648 |
| | | | |
|
|
| | | | | | 1,416,346 |
| | | | |
|
|
Automobiles — 0.1% | | | | | |
Ford Motor Co.(a)(b) | | 257,185 | | | 588,954 |
General Motors Corp.(b) | | 73,491 | | | 235,171 |
Harley-Davidson, Inc.(b) | | 26,000 | | | 441,220 |
| | | | |
|
|
| | | | | | 1,265,345 |
| | | | |
|
|
Beverages — 1.2% | | | | | |
Brown-Forman Corp. (Class B Stock) | | 11,000 | | | 566,390 |
Coca-Cola Co. (The) | | 226,100 | | | 10,235,547 |
Coca-Cola Enterprises, Inc. | | 40,200 | | | 483,606 |
Constellation Brands, Inc.(a) | | 22,000 | | | 346,940 |
Dr Pepper Snapple Group, Inc.(a) | | 28,900 | | | 469,625 |
Molson Coors Brewing Co. (Class B Stock) | | 17,100 | | | 836,532 |
Pepsi Bottling Group, Inc. | | 17,700 | | | 398,427 |
PepsiCo, Inc. | | 178,030 | | | 9,750,703 |
| | | | |
|
|
| | | | | | 23,087,770 |
| | | | |
|
|
Biotechnology — 1.0% | | | | | |
Amgen, Inc.(a)(b) | | 120,360 | | | 6,950,790 |
Biogen Idec, Inc.(a) | | 32,990 | | | 1,571,314 |
Celgene Corp.(a) | | 51,700 | | | 2,857,976 |
Cephalon, Inc.(a)(b) | | 7,700 | | | 593,208 |
Genzyme Corp.(a) | | 30,600 | | | 2,030,922 |
Gilead Sciences, Inc.(a) | | 104,600 | | | 5,349,244 |
| | | | |
|
|
| | | | | | 19,353,454 |
| | | | |
|
|
Building Products | | | | | |
Masco Corp. | | 43,100 | | | 479,703 |
| | | | |
|
|
| | | | | |
| COMMON STOCKS | | |
| (continued) | | Shares
| | Value
(Note 2)
|
Capital Markets — 1.1% | | | | | |
American Capital Ltd.(b) | | 45,100 | | $ | 146,124 |
Ameriprise Financial, Inc. | | 27,820 | | | 649,875 |
Bank of New York Mellon Corp. (The) | | 130,358 | | | 3,693,042 |
Charles Schwab Corp. (The) | | 106,150 | | | 1,716,446 |
E*Trade Financial Corp.(a)(b) | | 104,600 | | | 120,290 |
Federated Investors, Inc. (Class B Stock) | | 9,000 | | | 152,640 |
Franklin Resources, Inc. | | 17,300 | | | 1,103,394 |
Goldman Sachs Group, Inc. (The) | | 50,400 | | | 4,253,256 |
Invesco Ltd. (Bermuda) | | 43,200 | | | 623,808 |
Janus Capital Group, Inc. | | 18,600 | | | 149,358 |
Legg Mason, Inc. | | 17,800 | | | 389,998 |
Merrill Lynch & Co., Inc. | | 182,600 | | | 2,125,464 |
Morgan Stanley | | 126,180 | | | 2,023,927 |
Northern Trust Corp. | | 24,500 | | | 1,277,430 |
State Street Corp. | | 49,100 | | | 1,931,103 |
T. Rowe Price Group, Inc.(b) | | 29,700 | | | 1,052,568 |
| | | | |
|
|
| | | | | | 21,408,723 |
| | | | |
|
|
Chemicals — 0.8% | | | | | |
Air Products and Chemicals, Inc. | | 23,900 | | | 1,201,453 |
CF Industries Holding, Inc. | | 7,300 | | | 358,868 |
Dow Chemical Co. (The) | | 105,231 | | | 1,587,936 |
E. I. Du Pont de Nemours & Co. | | 102,620 | | | 2,596,286 |
Eastman Chemical Co. | | 8,000 | | | 253,680 |
Ecolab, Inc. | | 20,000 | | | 703,000 |
International Flavors & Fragrances, Inc. | | 8,300 | | | 246,676 |
Monsanto Co. | | 59,594 | | | 4,192,437 |
PPG Industries, Inc. | | 18,700 | | | 793,441 |
Praxair, Inc. | | 35,800 | | | 2,125,088 |
Rohm & Haas Co. | | 12,811 | | | 791,592 |
Sigma-Aldrich Corp.(b) | | 14,400 | | | 608,256 |
| | | | |
|
|
| | | | | | 15,458,713 |
| | | | |
|
|
Commercial Banks — 1.4% | | | | | |
BB&T Corp.(b) | | 62,500 | | | 1,716,250 |
Comerica, Inc. | | 19,200 | | | 381,120 |
Fifth Third Bancorp | | 68,321 | | | 564,331 |
First Horizon National Corp.(b) | | 21,198 | | | 224,063 |
Huntington Bancshares, Inc. | | 59,936 | | | 459,110 |
KeyCorp.(b) | | 59,400 | | | 506,088 |
M&T Bank Corp.(b) | | 8,100 | | | 465,021 |
Marshall & Ilsley Corp.(b) | | 29,200 | | | 398,288 |
National City Corp. | | 238,100 | | | 430,961 |
PNC Financial Services Group, Inc. | | 39,400 | | | 1,930,600 |
Regions Financial Corp. | | 81,203 | | | 646,376 |
SunTrust Banks, Inc. | | 40,200 | | | 1,187,508 |
U.S. Bancorp | | 203,185 | | | 5,081,657 |
Wachovia Corp. | | 181,640 | | | 1,006,286 |
Wells Fargo & Co. | | 431,900 | | | 12,732,411 |
Zions Bancorporation(b) | | 13,550 | | | 332,111 |
| | | | |
|
|
| | | | | | 28,062,181 |
| | | | |
|
|
Commercial Services & Supplies — 0.2% | | | | | |
Avery Dennison Corp. | | 12,100 | | | 396,033 |
Cintas Corp. | | 15,000 | | | 348,450 |
Matsuda Sangyo Co. Ltd. (Japan) | | 30 | | | 298 |
Pitney Bowes, Inc. | | 23,600 | | | 601,328 |
SEE NOTES TO FINANCIAL STATEMENTS.
A1
| | | | | | |
| | | CONSERVATIVE BALANCED PORTFOLIO (continued) | | |
| |
| SCHEDULE OF INVESTMENTS | | December 31, 2008 |
| | | | | |
| COMMON STOCKS | | |
| (continued) | | Shares
| | Value
(Note 2)
|
Commercial Services & Supplies (continued) | | | |
Republic Services, Inc. | | 36,465 | | $ | 903,967 |
RR Donnelley & Sons Co. | | 22,900 | | | 310,982 |
Stericycle, Inc.(a) | | 9,400 | | | 489,552 |
Waste Management, Inc. | | 55,742 | | | 1,847,290 |
| | | | |
|
|
| | | | | | 4,897,900 |
| | | | |
|
|
Communications Equipment — 1.1% | | | | | |
Ciena Corp.(a) | | 10,142 | | | 67,951 |
Cisco Systems, Inc.(a) | | 668,900 | | | 10,903,070 |
Corning, Inc. | | 179,500 | | | 1,710,635 |
Harris Corp. | | 15,300 | | | 582,165 |
JDS Uniphase Corp.(a) | | 21,475 | | | 78,384 |
Juniper Networks, Inc.(a)(b) | | 60,800 | | | 1,064,608 |
Motorola, Inc. | | 248,725 | | | 1,101,852 |
QUALCOMM, Inc. | | 183,800 | | | 6,585,554 |
Tellabs, Inc.(a) | | 45,800 | | | 188,696 |
| | | | |
|
|
| | | | | | 22,282,915 |
| | | | |
|
|
Computers & Peripherals — 1.9% | | | | | |
Apple, Inc.(a) | | 99,000 | | | 8,449,650 |
Dell, Inc.(a) | | 197,400 | | | 2,021,376 |
EMC Corp.(a) | | 235,550 | | | 2,466,209 |
Hewlett-Packard Co. | | 278,548 | | | 10,108,507 |
International Business Machines Corp. | | 154,100 | | | 12,969,055 |
Lexmark International, Inc. (Class A Stock)(a)(b) | | 9,833 | | | 264,508 |
NetApp, Inc.(a) | | 38,800 | | | 542,036 |
QLogic Corp.(a)(b) | | 19,600 | | | 263,424 |
SanDisk Corp.(a) | | 31,800 | | | 305,280 |
Sun Microsystems, Inc.(a) | | 81,575 | | | 311,617 |
Teradata Corp.(a) | | 23,500 | | | 348,505 |
| | | | |
|
|
| | | | | | 38,050,167 |
| | | | |
|
|
Construction & Engineering — 0.1% | | | | | |
Fluor Corp. | | 21,400 | | | 960,218 |
Jacobs Engineering Group, Inc.(a) | | 13,400 | | | 644,540 |
| | | | |
|
|
| | | | | | 1,604,758 |
| | | | |
|
|
Construction Materials | | | | | |
Vulcan Materials Co.(b) | | 12,300 | | | 855,834 |
| | | | |
|
|
Consumer Finance — 0.2% | | | | | |
American Express Co. | | 131,900 | | | 2,446,745 |
Capital One Financial Corp. | | 45,161 | | | 1,440,184 |
Discover Financial Services | | 57,540 | | | 548,356 |
SLM Corp.(a)(b) | | 54,200 | | | 482,380 |
| | | | |
|
|
| | | | | | 4,917,665 |
| | | | |
|
|
Containers & Packaging — 0.1% | | | | | |
Ball Corp. | | 12,100 | | | 503,239 |
Bemis Co., Inc. | | 11,300 | | | 267,584 |
Pactiv Corp.(a) | | 15,100 | | | 375,688 |
Sealed Air Corp. | | 21,800 | | | 325,692 |
| | | | |
|
|
| | | | | | 1,472,203 |
| | | | |
|
|
Distributors | | | | | |
Genuine Parts Co. | | 17,900 | | | 677,694 |
| | | | |
|
|
Diversified Consumer Services — 0.1% | | | | | |
Apollo Group, Inc. (Class A Stock)(a)(b) | | 12,300 | | | 942,426 |
H&R Block, Inc. | | 37,300 | | | 847,456 |
| | | | |
|
|
| | | | | | 1,789,882 |
| | | | |
|
|
| | | | | |
| COMMON STOCKS | | |
| (continued) | | Shares
| | Value
(Note 2)
|
Diversified Financial Services — 1.5% | | | | | |
Bank of America Corp. | | 570,477 | | $ | 8,032,316 |
CIT Group, Inc.(b) | | 30,800 | | | 139,832 |
Citigroup, Inc. | | 619,358 | | | 4,155,892 |
CME Group, Inc. | | 7,640 | | | 1,589,960 |
IntercontinentalExchange, Inc.(a) | | 8,800 | | | 725,472 |
JPMorgan Chase & Co. | | 425,345 | | | 13,411,129 |
Leucadia National Corp.(b) | | 20,700 | | | 409,860 |
Moody’s Corp.(b) | | 21,100 | | | 423,899 |
Nasdaq OMX Group, Inc. (The)(a) | | 12,000 | | | 296,520 |
NYSE Euronext | | 31,100 | | | 851,518 |
| | | | |
|
|
| | | | | | 30,036,398 |
| | | | |
|
|
Diversified Telecommunication Services — 1.7% | | | |
AT&T, Inc. | | 672,068 | | | 19,153,939 |
CenturyTel, Inc. | | 14,200 | | | 388,086 |
Embarq Corp. | | 16,943 | | | 609,270 |
Frontier Communications Corp. | | 39,500 | | | 345,230 |
Qwest Communications International, Inc.(b) | | 163,057 | | | 593,527 |
Verizon Communications Group, Inc. | | 323,976 | | | 10,982,787 |
Windstream Corp. | | 51,857 | | | 477,084 |
| | | | |
|
|
| | | | | | 32,549,923 |
| | | | |
|
|
Electric Utilities — 1.1% | | | | | |
Allegheny Energy, Inc. | | 18,800 | | | 636,568 |
American Electric Power Co., Inc. | | 45,760 | | | 1,522,893 |
Duke Energy Corp. | | 143,824 | | | 2,158,798 |
Edison International | | 37,600 | | | 1,207,712 |
Entergy Corp. | | 21,800 | | | 1,812,234 |
Exelon Corp. | | 74,774 | | | 4,158,181 |
FirstEnergy Corp. | | 34,701 | | | 1,685,775 |
FPL Group, Inc. | | 46,500 | | | 2,340,345 |
Pepco Holdings, Inc. | | 27,700 | | | 491,952 |
Pinnacle West Capital Corp. | | 11,700 | | | 375,921 |
PPL Corp. | | 42,600 | | | 1,307,394 |
Progress Energy, Inc. | | 29,483 | | | 1,174,898 |
Southern Co. (The) | | 85,600 | | | 3,167,200 |
| | | | |
|
|
| | | | | | 22,039,871 |
| | | | |
|
|
Electrical Equipment — 0.2% | | | | | |
Cooper Industries Ltd. (Class A Stock)(Bermuda) | | 20,400 | | | 596,292 |
Emerson Electric Co. | | 88,300 | | | 3,232,663 |
Rockwell Automation, Inc. | | 16,200 | | | 522,288 |
| | | | |
|
|
| | | | | | 4,351,243 |
| | | | |
|
|
Electronic Equipment & Instruments — 0.1% | | | |
Agilent Technologies, Inc.(a) | | 40,714 | | | 636,360 |
Amphenol Corp., (Class A Stock) | | 15,200 | | | 364,496 |
Jabil Circuit, Inc. | | 23,600 | | | 159,300 |
Molex, Inc. | | 15,000 | | | 217,350 |
Tyco Electronics Ltd. (Bermuda) | | 56,515 | | | 916,108 |
| | | | |
|
|
| | | | | | 2,293,614 |
| | | | |
|
|
Energy Equipment & Services — 0.7% | | | | | |
B.J. Services Co. | | 31,900 | | | 372,273 |
Baker Hughes, Inc. | | 36,950 | | | 1,184,987 |
Cameron International Corp.(a)(b) | | 24,800 | | | 508,400 |
ENSCO International, Inc. | | 16,800 | | | 476,952 |
SEE NOTES TO FINANCIAL STATEMENTS.
A2
| | | | | | |
| | | CONSERVATIVE BALANCED PORTFOLIO (continued) | | |
| |
| SCHEDULE OF INVESTMENTS | | December 31, 2008 |
| | | | | |
| COMMON STOCKS | | |
| (continued) | | Shares
| | Value
(Note 2)
|
Energy Equipment & Services (continued) | | | | | |
Halliburton Co. | | 99,700 | | $ | 1,812,546 |
Nabors Industries Ltd. (Bermuda)(a) | | 31,900 | | | 381,843 |
National Oilwell Varco, Inc.(a) | | 44,400 | | | 1,085,136 |
Noble Corp. (Cayman Islands) | | 30,600 | | | 675,954 |
Rowan Cos., Inc. | | 13,200 | | | 209,880 |
Schlumberger Ltd. | | 136,400 | | | 5,773,812 |
Smith International, Inc. | | 21,200 | | | 485,268 |
Weatherford International Ltd. (Bermuda)(a) | | 70,100 | | | 758,482 |
| | | | |
|
|
| | | | | | 13,725,533 |
| | | | |
|
|
Food & Staples Retailing — 1.5% | | | | | |
Costco Wholesale Corp. | | 49,500 | | | 2,598,750 |
CVS Caremark Corp. | | 163,248 | | | 4,691,748 |
Kroger Co. (The) | | 74,446 | | | 1,966,119 |
Safeway, Inc. | | 49,500 | | | 1,176,615 |
SUPERVALU, Inc. | | 24,110 | | | 352,006 |
SYSCO Corp. | | 68,500 | | | 1,571,390 |
Walgreen Co.(b) | | 109,600 | | | 2,703,832 |
Wal-Mart Stores, Inc. | | 254,200 | | | 14,250,451 |
Whole Foods Market, Inc.(b) | | 14,100 | | | 133,104 |
| | | | |
|
|
| | | | | | 29,444,015 |
| | | | |
|
|
Food Products — 0.8% | | | | | |
Archer-Daniels-Midland Co. | | 73,326 | | | 2,113,989 |
Campbell Soup Co.(b) | | 23,500 | | | 705,235 |
ConAgra Foods, Inc. | | 55,000 | | | 907,500 |
Dean Foods Co.(a)(b) | | 17,300 | | | 310,881 |
General Mills, Inc. | | 38,200 | | | 2,320,650 |
H.J. Heinz Co. | | 37,200 | | | 1,398,720 |
Hershey Co. (The) | | 18,500 | | | 642,690 |
J.M. Smucker Co. (The) | | 13,300 | | | 576,688 |
Kellogg Co. | | 29,900 | | | 1,311,115 |
Kraft Foods, Inc. | | 172,653 | | | 4,635,733 |
McCormick & Co., Inc. | | 14,400 | | | 458,784 |
Sara Lee Corp. | | 79,200 | | | 775,368 |
Tyson Foods, Inc. (Class A Stock) | | 38,000 | | | 332,880 |
| | | | |
|
|
| | | | | | 16,490,233 |
| | | | |
|
|
Gas Utilities — 0.1% | | | | | |
Equitable Resources, Inc.(b) | | 10,900 | | | 365,695 |
Nicor, Inc. | | 4,600 | | | 159,804 |
Questar Corp.(b) | | 19,700 | | | 643,993 |
| | | | |
|
|
| | | | | | 1,169,492 |
| | | | |
|
|
Healthcare Equipment & Supplies — 1.0% | | | | | |
Baxter International, Inc. | | 71,400 | | | 3,826,326 |
Becton Dickinson & Co. | | 28,600 | | | 1,955,954 |
Boston Scientific Corp.(a) | | 171,767 | | | 1,329,477 |
C.R. Bard, Inc. | | 13,000 | | | 1,095,380 |
Covidien Ltd. (Bermuda) | | 57,115 | | | 2,069,848 |
Densply International, Inc. | | 16,900 | | | 477,256 |
Hospira, Inc.(a) | | 18,360 | | | 492,415 |
Intuitive Surgical, Inc.(a)(b) | | 4,400 | | | 558,756 |
Medtronic, Inc. | | 128,300 | | | 4,031,185 |
St. Jude Medical, Inc.(a) | | 38,900 | | | 1,282,144 |
Stryker Corp. | | 28,100 | | | 1,122,595 |
Varian Medical Systems, Inc.(a)(b) | | 14,200 | | | 497,568 |
Zimmer Holdings, Inc.(a) | | 25,600 | | | 1,034,752 |
| | | | |
|
|
| | | | | | 19,773,656 |
| | | | |
|
|
| | | | | |
| COMMON STOCKS | | |
| (continued) | | Shares
| | Value
(Note 2)
|
Healthcare Providers & Services — 1.0% | | | | | |
Aetna, Inc. | | 53,600 | | $ | 1,527,600 |
AmerisourceBergen Corp. | | 19,300 | | | 688,238 |
Cardinal Health, Inc. | | 42,050 | | | 1,449,464 |
Cigna Corp. | | 37,400 | | | 630,190 |
Coventry Health Care, Inc.(a) | | 19,150 | | | 284,952 |
DaVita, Inc.(a) | | 11,900 | | | 589,883 |
Express Scripts, Inc.(a)(b) | | 28,100 | | | 1,544,938 |
Humana, Inc.(a)(b) | | 22,900 | | | 853,712 |
Laboratory Corp. of America Holdings(a)(b) | | 11,200 | | | 721,392 |
McKesson Corp. | | 31,430 | | | 1,217,284 |
Medco Health Solutions, Inc.(a) | | 57,498 | | | 2,409,741 |
Patterson Cos., Inc.(a) | | 11,400 | | | 213,750 |
Quest Diagnostics, Inc. | | 17,100 | | | 887,661 |
Tenet Healthcare Corp.(a) | | 44,600 | | | 51,290 |
UnitedHealth Group, Inc. | | 138,500 | | | 3,684,100 |
WellPoint, Inc.(a) | | 58,200 | | | 2,451,966 |
| | | | |
|
|
| | | | | | 19,206,161 |
| | | | |
|
|
Healthcare Technology | | | | | |
IMS Health, Inc. | | 22,200 | | | 336,552 |
| | | | |
|
|
Hotels, Restaurants & Leisure — 0.7% | | | | | |
Carnival Corp. | | 51,500 | | | 1,252,480 |
Darden Restaurants, Inc. | | 16,950 | | | 477,651 |
International Game Technology | | 35,200 | | | 418,528 |
Marriott International, Inc. (Class A Stock) | | 33,600 | | | 653,520 |
McDonald’s Corp. | | 127,900 | | | 7,954,101 |
Starbucks Corp.(a) | | 80,200 | | | 758,692 |
Starwood Hotels & Resorts Worldwide, Inc. | | 19,500 | | | 349,050 |
Wyndham Worldwide Corp. | | 16,420 | | | 107,551 |
Wynn Resorts Ltd.(a)(b) | | 6,200 | | | 262,012 |
Yum! Brands, Inc. | | 53,300 | | | 1,678,950 |
| | | | |
|
|
| | | | | | 13,912,535 |
| | | | |
|
|
Household Durables — 0.2% | | | | | |
Black & Decker Corp. (The)(b) | | 6,900 | | | 288,489 |
Centex Corp. | | 11,900 | | | 126,616 |
D.R. Horton, Inc. | | 31,100 | | | 219,877 |
Fortune Brands, Inc. | | 17,000 | | | 701,760 |
Harman International Industries, Inc.(b) | | 6,400 | | | 107,072 |
KB Home(b) | | 8,200 | | | 111,684 |
Leggett & Platt, Inc. | | 17,600 | | | 267,344 |
Lennar Corp. (Class A Stock)(b) | | 13,300 | | | 115,311 |
Newell Rubbermaid, Inc. | | 32,914 | | | 321,899 |
Pulte Homes, Inc. | | 20,800 | | | 227,344 |
Snap-On, Inc. | | 7,000 | | | 275,660 |
Stanley Works (The) | | 10,500 | | | 358,050 |
Whirlpool Corp.(b) | | 9,626 | | | 398,035 |
| | | | |
|
|
| | | | | | 3,519,141 |
| | | | |
|
|
Household Products — 1.5% | | | | | |
Clorox Co. | | 15,400 | | | 855,624 |
Colgate-Palmolive Co. | | 57,500 | | | 3,941,050 |
Kimberly-Clark Corp. | | 47,100 | | | 2,484,054 |
Procter & Gamble Co. | | 342,925 | | | 21,199,624 |
| | | | |
|
|
| | | | | | 28,480,352 |
| | | | |
|
|
SEE NOTES TO FINANCIAL STATEMENTS.
A3
| | | | | | |
| | | CONSERVATIVE BALANCED PORTFOLIO (continued) | | |
| |
| SCHEDULE OF INVESTMENTS | | December 31, 2008 |
| | | | | |
| COMMON STOCKS | | |
| (continued) | | Shares
| | Value
(Note 2)
|
Independent Power Producers & Energy Traders — 0.1% |
AES Corp. (The)(a)(b) | | 75,300 | | $ | 620,472 |
Constellation Energy Group, Inc. | | 17,000 | | | 426,530 |
Dynegy, Inc. (Class A Stock)(a) | | 48,400 | | | 96,800 |
| | | | |
|
|
| | | | | | 1,143,802 |
| | | | |
|
|
Industrial Conglomerates — 1.3% | | | | | |
3M Co. | | 79,500 | | | 4,574,430 |
General Electric Co. | | 1,187,800 | | | 19,242,360 |
Textron, Inc. | | 28,300 | | | 392,521 |
Tyco International Ltd. (Bermuda) | | 56,415 | | | 1,218,564 |
| | | | |
|
|
| | | | | | 25,427,875 |
| | | | |
|
|
Insurance — 1.2% | | | | | |
Aflac, Inc.(b) | | 54,200 | | | 2,484,528 |
Allstate Corp. (The) | | 61,600 | | | 2,018,016 |
American International Group, Inc.(b) | | 295,788 | | | 464,387 |
AON Corp. | | 30,700 | | | 1,402,376 |
Assurant, Inc. | | 17,400 | | | 522,000 |
Chubb Corp. | | 41,000 | | | 2,091,000 |
Cincinnati Financial Corp. | | 17,837 | | | 518,522 |
Genworth Financial, Inc. | | 62,800 | | | 177,724 |
Hartford Financial Services Group, Inc. | | 36,800 | | | 604,256 |
Lincoln National Corp. | | 28,118 | | | 529,743 |
Loews Corp. | | 39,775 | | | 1,123,644 |
Marsh & McLennan Cos., Inc. | | 57,000 | | | 1,383,390 |
MBIA, Inc.(b) | | 29,800 | | | 121,286 |
MetLife, Inc. | | 90,700 | | | 3,161,802 |
Principal Financial Group, Inc. | | 27,400 | | | 618,418 |
Progressive Corp. (The) | | 75,600 | | | 1,119,636 |
Torchmark Corp. | | 10,000 | | | 447,000 |
Travelers Cos., Inc. (The) | | 67,235 | | | 3,039,022 |
Unum Group | | 40,010 | | | 744,186 |
XL Capital Ltd. (Class A Stock) (Bermuda) | | 31,000 | | | 114,700 |
| | | | |
|
|
| | | | | | 22,685,636 |
| | | | |
|
|
Internet & Catalog Retail — 0.1% | | | | | |
Amazon.com, Inc.(a) | | 35,300 | | | 1,810,184 |
Expedia, Inc.(a) | | 23,300 | | | 191,992 |
| | | | |
|
|
| | | | | | 2,002,176 |
| | | | |
|
|
Internet Software & Services — 0.6% | | | | | |
Akamai Technologies, Inc.(a) | | 19,200 | | | 289,728 |
eBay, Inc.(a) | | 124,300 | | | 1,735,228 |
Google, Inc. (Class A Stock)(a) | | 27,150 | | | 8,352,698 |
Verisign, Inc.(a) | | 21,600 | | | 412,128 |
Yahoo!, Inc.(a) | | 150,600 | | | 1,837,320 |
| | | | |
|
|
| | | | | | 12,627,102 |
| | | | |
|
|
IT Services — 0.4% | | | | | |
Affiliated Computer Services, Inc. (Class A Stock)(a) | | 10,400 | | | 477,880 |
Automatic Data Processing, Inc. | | 57,900 | | | 2,277,786 |
Cognizant Technology Solutions Corp. (Class A Stock)(a) | | 32,500 | | | 586,950 |
Computer Sciences Corp.(a) | | 17,200 | | | 604,408 |
Convergys Corp.(a) | | 17,800 | | | 114,098 |
Fidelity National Information Services, Inc. | | 21,600 | | | 351,432 |
| | | | | |
| COMMON STOCKS | | |
| (continued) | | Shares
| | Value
(Note 2)
|
IT Services (continued) | | | | | |
Fiserv, Inc.(a) | | 18,200 | | $ | 661,934 |
Mastercard, Inc. (Class A Stock) | | 8,200 | | | 1,172,026 |
Paychex, Inc. | | 38,700 | | | 1,017,036 |
Total System Services, Inc. | | 25,796 | | | 361,144 |
Western Union Co. | | 81,210 | | | 1,164,551 |
| | | | |
|
|
| | | | | | 8,789,245 |
| | | | |
|
|
Leisure Equipment & Products — 0.1% | | | | | |
Eastman Kodak Co.(b) | | 28,100 | | | 184,898 |
Hasbro, Inc. | | 15,800 | | | 460,886 |
Mattel, Inc. | | 41,051 | | | 656,816 |
| | | | |
|
|
| | | | | | 1,302,600 |
| | | | |
|
|
Life Sciences Tools & Services — 0.2% | | | | | |
Life Technologies Corp.(a) | | 19,601 | | | 456,899 |
Millipore Corp.(a) | | 5,700 | | | 293,664 |
PerkinElmer, Inc. | | 12,800 | | | 178,048 |
Thermo Fisher Scientific, Inc.(a) | | 47,700 | | | 1,625,139 |
Waters Corp.(a) | | 11,300 | | | 414,145 |
| | | | |
|
|
| | | | | | 2,967,895 |
| | | | |
|
|
Machinery — 0.8% | | | | | |
Caterpillar, Inc.(b) | | 67,200 | | | 3,001,824 |
Cummins, Inc. | | 23,200 | | | 620,136 |
Danaher Corp. | | 29,000 | | | 1,641,690 |
Deere & Co. | | 48,600 | | | 1,862,352 |
Dover Corp. | | 21,400 | | | 704,488 |
Eaton Corp. | | 20,200 | | | 1,004,142 |
Flowserve Corp. | | 7,700 | | | 396,550 |
Illinois Tool Works, Inc. | | 45,500 | | | 1,594,775 |
Ingersoll-Rand Co. Ltd. (Class A Stock) (Bermuda) | | 34,455 | | | 597,794 |
ITT Corp. | | 20,700 | | | 951,993 |
Manitowoc Co., Inc. (The) | | 14,600 | | | 126,436 |
PACCAR, Inc.(b) | | 40,343 | | | 1,153,810 |
Pall Corp. | | 15,300 | | | 434,979 |
Parker Hannifin Corp. | | 19,065 | | | 811,025 |
| | | | |
|
|
| | | | | | 14,901,994 |
| | | | |
|
|
Media — 1.2% | | | | | |
CBS Corp. (Class B Stock) | | 83,534 | | | 684,143 |
Comcast Corp. (Class A Stock) | | 331,890 | | | 5,602,304 |
DIRECTV Group, Inc. (The)(a)(b) | | 64,500 | | | 1,477,695 |
Gannett Co., Inc.(b) | | 30,700 | | | 245,600 |
Interpublic Group of Cos., Inc.(a)(b) | | 67,400 | | | 266,904 |
McGraw-Hill Cos., Inc. (The) | | 38,100 | | | 883,539 |
Meredith Corp.(b) | | 4,000 | | | 68,480 |
New York Times Co. (The) (Class A Stock)(b) | | 15,700 | | | 115,081 |
News Corp. (Class A Stock) | | 261,100 | | | 2,373,399 |
Omnicom Group, Inc. | | 36,300 | | | 977,196 |
Scripps Networks Interactive, Inc. (Class A Stock) | | 12,900 | | | 283,800 |
Time Warner, Inc. | | 400,500 | | | 4,029,030 |
Viacom, Inc. (Class B Stock)(a) | | 70,634 | | | 1,346,284 |
Walt Disney Co. (The) | | 213,400 | | | 4,842,046 |
Washington Post Co. (The) (Class B Stock) | | 800 | | | 312,200 |
| | | | |
|
|
| | | | | | 23,507,701 |
| | | | |
|
|
SEE NOTES TO FINANCIAL STATEMENTS.
A4
| | | | | | |
| | | CONSERVATIVE BALANCED PORTFOLIO (continued) | | |
| |
| SCHEDULE OF INVESTMENTS | | December 31, 2008 |
| | | | | |
| COMMON STOCKS | | |
| (continued) | | Shares
| | Value
(Note 2)
|
Metals & Mining — 0.4% | | | | | |
AK Steel Holding Corp. | | 11,400 | | $ | 106,248 |
Alcoa, Inc.(b) | | 93,040 | | | 1,047,630 |
Allegheny Technologies, Inc. | | 13,600 | | | 347,208 |
Freeport-McMoRan Copper & Gold, Inc. | | 42,394 | | | 1,036,109 |
Newmont Mining Corp. | | 51,900 | | | 2,112,331 |
Nucor Corp. | | 36,000 | | | 1,663,200 |
Titanium Metals Corp.(b) | | 8,600 | | | 75,766 |
United States Steel Corp.(b) | | 13,400 | | | 498,480 |
| | | | |
|
|
| | | | | | 6,886,972 |
| | | | |
|
|
Multiline Retail — 0.3% | | | | | |
Big Lots, Inc.(a) | | 9,200 | | | 133,308 |
Family Dollar Stores, Inc. | | 15,900 | | | 414,513 |
J.C. Penney Co., Inc. | | 25,300 | | | 498,410 |
Kohl’s Corp.(a) | | 34,600 | | | 1,252,520 |
Macy’s, Inc.(b) | | 47,874 | | | 495,496 |
Nordstrom, Inc.(b) | | 20,000 | | | 266,200 |
Sears Holding Corp.(a)(b) | | 6,042 | | | 234,853 |
Target Corp.(b) | | 85,800 | | | 2,962,673 |
| | | | |
|
|
| | | | | | 6,257,973 |
| | | | |
|
|
Multi-Utilities — 0.7% | | | | | |
Ameren Corp. | | 23,900 | | | 794,914 |
CenterPoint Energy, Inc. | | 38,200 | | | 482,084 |
CMS Energy Corp.(b) | | 28,800 | | | 291,168 |
Consolidated Edison, Inc. | | 32,600 | | | 1,269,118 |
Dominion Resources, Inc. | | 65,932 | | | 2,363,002 |
DTE Energy Co. | | 18,600 | | | 663,462 |
Integrys Energy Group, Inc. | | 8,820 | | | 379,084 |
NiSource, Inc. | | 36,800 | | | 403,696 |
PG&E Corp. | | 40,800 | | | 1,579,368 |
Public Service Enterprise Group, Inc. | | 57,800 | | | 1,686,026 |
Sempra Energy | | 27,419 | | | 1,168,872 |
TECO Energy, Inc. | | 27,900 | | | 344,565 |
Wisconsin Energy Corp. | | 13,000 | | | 545,740 |
Xcel Energy, Inc. | | 49,410 | | | 916,556 |
| | | | |
|
|
| | | | | | 12,887,655 |
| | | | |
|
|
Office Electronics | | | | | |
Xerox Corp. | | 99,200 | | | 790,624 |
| | | | |
|
|
Oil, Gas & Consumable Fuels — 5.3% | | | | | |
Anadarko Petroleum Corp. | | 53,254 | | | 2,052,942 |
Apache Corp. | | 38,014 | | | 2,833,183 |
Cabot Oil & Gas Corp. | | 11,800 | | | 306,800 |
Chesapeake Energy Corp. | | 58,500 | | | 945,945 |
Chevron Corp. | | 229,322 | | | 16,962,948 |
ConocoPhillips | | 172,877 | | | 8,955,029 |
CONSOL Energy, Inc. | | 20,800 | | | 594,464 |
Devon Energy Corp. | | 50,300 | | | 3,305,213 |
El Paso Corp. | | 79,436 | | | 621,984 |
EOG Resources, Inc. | | 28,300 | | | 1,884,214 |
Exxon Mobil Corp. | | 579,940 | | | 46,296,609 |
Hess Corp. | | 32,200 | | | 1,727,208 |
Marathon Oil Corp. | | 80,282 | | | 2,196,516 |
Massey Energy Corp. | | 8,800 | | | 121,352 |
Murphy Oil Corp. | | 21,100 | | | 935,785 |
Noble Energy, Inc. | | 19,500 | | | 959,790 |
Occidental Petroleum Corp. | | 90,900 | | | 5,453,091 |
| | | | | | |
| COMMON STOCKS | | | |
| (continued) | | Shares
| | | Value
(Note 2)
|
Oil, Gas & Consumable Fuels (continued) | | | | | | |
Peabody Energy Corp. | | 30,400 | | | $ | 691,600 |
Pioneer Natural Resources Co. | | 12,300 | | | | 199,014 |
Range Resources Corp. | | 17,200 | | | | 591,508 |
Southwestern Energy Co.(a) | | 39,000 | | | | 1,129,830 |
Spectra Energy Corp. | | 69,962 | | | | 1,101,202 |
Sunoco, Inc.(b) | | 14,500 | | | | 630,170 |
Tesoro Corp. | | 20,600 | | | | 271,302 |
Valero Energy Corp. | | 59,500 | | | | 1,287,580 |
Williams Cos., Inc. | | 69,500 | | | | 1,006,360 |
XTO Energy, Inc. | | 62,441 | | | | 2,202,294 |
| | | | | |
|
|
| | | | | | | 105,263,933 |
| | | | | |
|
|
Paper & Forest Products — 0.1% | | | | | | |
International Paper Co. | | 48,373 | | | | 570,801 |
MeadWestvaco Corp. | | 20,514 | | | | 229,552 |
Weyerhaeuser Co. | | 24,100 | | | | 737,701 |
| | | | | |
|
|
| | | | | | | 1,538,054 |
| | | | | |
|
|
Personal Products — 0.1% | | | | | | |
Avon Products, Inc. | | 47,600 | | | | 1,143,828 |
Estee Lauder Cos., Inc. (The) (Class A Stock)(b) | | 13,100 | | | | 405,576 |
| | | | | |
|
|
| | | | | | | 1,549,404 |
| | | | | |
|
|
Pharmaceuticals — 3.6% | | | | | | |
Abbott Laboratories | | 176,900 | | | | 9,441,153 |
Allergan, Inc. | | 35,000 | | | | 1,411,200 |
Bristol-Myers Squibb Co. | | 225,200 | | | | 5,235,900 |
Eli Lilly & Co. | | 113,800 | | | | 4,582,726 |
Forest Laboratories, Inc.(a) | | 34,100 | | | | 868,527 |
Johnson & Johnson | | 316,648 | | | | 18,945,050 |
King Pharmaceuticals, Inc.(a) | | 33,366 | | | | 354,347 |
Merck & Co., Inc. | | 243,700 | | | | 7,408,480 |
Mylan, Inc.(a)(b) | | 33,000 | | | | 326,370 |
Pfizer, Inc.(b) | | 768,945 | | | | 13,618,016 |
Schering-Plough Corp. | | 184,900 | | | | 3,148,847 |
Teva Pharmaceutical Industries Ltd. (ADR)(Israel) | | — | (m) | | | 12 |
Watson Pharmaceuticals, Inc.(a)(b) | | 12,200 | | | | 324,154 |
Wyeth | | 151,700 | | | | 5,690,267 |
| | | | | |
|
|
| | | | | | | 71,355,049 |
| | | | | |
|
|
Professional Services — 0.1% | | | | | | |
Dun & Bradstreet Corp. (The) | | 5,800 | | | | 447,760 |
Equifax, Inc. | | 13,700 | | | | 363,324 |
Monster Worldwide, Inc.(a)(b) | | 13,100 | | | | 158,379 |
Robert Half International, Inc. | | 20,000 | | | | 416,400 |
| | | | | |
|
|
| | | | | | | 1,385,863 |
| | | | | |
|
|
Real Estate Investment Trusts — 0.4% | | | | |
Apartment Investment & Management Co. (Class A Stock) | | 13,611 | | | | 157,207 |
AvalonBay Communities, Inc. | | 8,700 | | | | 527,046 |
Boston Properties, Inc.(b) | | 13,200 | | | | 726,000 |
Developers Diversified Realty Corp.(b) | | 14,200 | | | | 69,296 |
Equity Residential | | 29,600 | | | | 882,672 |
HCP, Inc.(b) | | 29,300 | | | | 813,661 |
Host Hotels & Resorts, Inc.(b) | | 63,700 | | | | 482,209 |
Kimco Realty Corp.(b) | | 25,200 | | | | 460,656 |
SEE NOTES TO FINANCIAL STATEMENTS.
A5
| | | | | | |
| | | CONSERVATIVE BALANCED PORTFOLIO (continued) | | |
| |
| SCHEDULE OF INVESTMENTS | | December 31, 2008 |
| | | | | |
| COMMON STOCKS | | |
| (continued) | | Shares
| | Value
(Note 2)
|
Real Estate Investment Trusts (continued) | | | |
Plum Creek Timber Co., Inc.(b) | | 19,100 | | $ | 663,534 |
ProLogis(b) | | 26,700 | | | 370,863 |
Public Storage | | 14,200 | | | 1,128,900 |
Simon Property Group, Inc. | | 25,600 | | | 1,360,128 |
Vornado Realty Trust | | 15,100 | | | 911,285 |
| | | | |
|
|
| | | | | | 8,553,457 |
| | | | |
|
|
Real Estate Management & Development | | | | | |
CB Richard Ellis Group, Inc.(Class A
Stock)(a) | | 21,600 | | | 93,312 |
| | | | |
|
|
Road & Rail — 0.5% | | | | | |
Burlington Northern Santa Fe Corp. | | 32,100 | | | 2,430,291 |
CSX Corp. | | 42,100 | | | 1,366,987 |
Norfolk Southern Corp. | | 42,700 | | | 2,009,035 |
Ryder System, Inc. | | 6,900 | | | 267,582 |
Union Pacific Corp.(b) | | 57,900 | | | 2,767,620 |
| | | | |
|
|
| | | | | | 8,841,515 |
| | | | |
|
|
Semiconductors & Semiconductor Equipment — 1.0% |
Advanced Micro Devices, Inc.(a)(b) | | 59,000 | | | 127,440 |
Altera Corp.(b) | | 33,500 | | | 559,785 |
Analog Devices, Inc. | | 33,000 | | | 627,660 |
Applied Materials, Inc. | | 148,600 | | | 1,505,318 |
Broadcom Corp. (Class A Stock)(a) | | 51,150 | | | 868,016 |
Intel Corp.(b) | | 639,500 | | | 9,375,069 |
KLA-Tencor Corp. | | 19,700 | | | 429,263 |
Linear Technology Corp.(b) | | 24,500 | | | 541,940 |
LSI Corp.(a) | | 72,800 | | | 239,512 |
MEMC Electronic Materials, Inc.(a) | | 29,400 | | | 419,832 |
Microchip Technology, Inc. | | 19,800 | | | 386,694 |
Micron Technology, Inc.(a)(b) | | 104,000 | | | 274,560 |
National Semiconductor Corp. | | 25,900 | | | 260,813 |
Novellus Systems, Inc.(a) | | 10,400 | | | 128,336 |
NVIDIA Corp.(a) | | 63,350 | | | 511,235 |
Teradyne, Inc.(a) | | 23,500 | | | 99,170 |
Texas Instruments, Inc. | | 149,100 | | | 2,314,032 |
Xilinx, Inc. | | 31,400 | | | 559,548 |
| | | | |
|
|
| | | | | | 19,228,223 |
| | | | |
|
|
Software — 1.7% | | | | | |
Adobe Systems, Inc.(a) | | 60,300 | | | 1,283,787 |
Autodesk, Inc.(a) | | 25,600 | | | 503,040 |
BMC Software, Inc.(a) | | 21,300 | | | 573,183 |
CA, Inc. | | 43,264 | | | 801,682 |
Citrix Systems, Inc.(a) | | 20,700 | | | 487,899 |
Compuware Corp.(a) | | 31,800 | | | 214,650 |
Electronic Arts, Inc.(a) | | 32,800 | | | 526,112 |
Intuit, Inc.(a)(b) | | 38,800 | | | 923,052 |
McAfee, Inc.(a) | | 13,800 | | | 477,066 |
Microsoft Corp. | | 883,000 | | | 17,165,519 |
Novell, Inc.(a) | | 34,200 | | | 133,038 |
Oracle Corp.(a) | | 434,800 | | | 7,709,004 |
Salesforce.com, Inc.(a)(b) | | 8,700 | | | 278,487 |
Symantec Corp.(a) | | 95,478 | | | 1,290,863 |
| | | | |
|
|
| | | | | | 32,367,382 |
| | | | |
|
|
Specialty Retail — 0.8% | | | | | |
Abercrombie & Fitch Co.(b) | | 8,700 | | | 200,709 |
AutoNation, Inc.(a)(b) | | 16,974 | | | 167,703 |
| | | | | | |
| COMMON STOCKS | | | |
| (continued) | | Shares
| | Value
(Note 2)
| |
Specialty Retail (continued) | | | | | | |
AutoZone, Inc.(a) | | 4,400 | | $ | 613,668 | |
Bed Bath & Beyond, Inc.(a)(b) | | 29,600 | | | 752,432 | |
Best Buy Co., Inc. | | 38,425 | | | 1,080,127 | |
GameStop Corp. (Class A Stock)(a)(b) | | 19,400 | | | 420,204 | |
Gap, Inc. (The) | | 53,400 | | | 715,026 | |
Home Depot, Inc. | | 193,150 | | | 4,446,313 | |
Lowe’s Cos., Inc. | | 163,700 | | | 3,522,824 | |
Limited Brands, Inc. | | 31,106 | | | 312,304 | |
Office Depot, Inc.(a)(b) | | 27,800 | | | 82,844 | |
RadioShack Corp. | | 18,700 | | | 223,278 | |
Sherwin-Williams Co. (The)(b) | | 11,200 | | | 669,200 | |
Staples, Inc.(b) | | 73,849 | | | 1,323,374 | |
Tiffany & Co. | | 13,200 | | | 311,916 | |
TJX Cos., Inc. (The)(b) | | 46,900 | | | 964,733 | |
| | | | |
|
|
|
| | | | | | 15,806,655 | |
| | | | |
|
|
|
Textiles, Apparel & Luxury Goods — 0.2% | | | | | | |
Coach, Inc.(a) | | 38,400 | | | 797,568 | |
Jones Apparel Group, Inc. | | 12,600 | | | 73,836 | |
NIKE, Inc. (Class B Stock)(b) | | 42,100 | | | 2,147,100 | |
Polo Ralph Lauren Corp. | | 6,500 | | | 295,165 | |
VF Corp. | | 9,600 | | | 525,792 | |
| | | | |
|
|
|
| | | | | | 3,839,461 | |
| | | | |
|
|
|
Thrifts & Mortgage Finance — 0.1% | | | | | | |
Hudson City Bancorp, Inc. | | 57,500 | | | 917,700 | |
People’s United Financial, Inc. | | 39,500 | | | 704,285 | |
Sovereign Bancorp, Inc. | | 82,655 | | | 246,312 | |
| | | | |
|
|
|
| | | | | | 1,868,297 | |
| | | | |
|
|
|
Tobacco — 0.9% | | | | | | |
Altria Group, Inc. | | 234,300 | | | 3,528,558 | |
Lorillard, Inc. | | 20,947 | | | 1,180,363 | |
Philip Morris International, Inc. | | 232,800 | | | 10,129,128 | |
Reynolds American, Inc. | | 19,300 | | | 777,983 | |
UST, Inc. | | 16,800 | | | 1,165,584 | |
| | | | |
|
|
|
| | | | | | 16,781,616 | |
| | | | |
|
|
|
Trading Companies & Distributors — 0.1% | | | | | | |
Fastenal Co.(b) | | 14,700 | | | 512,295 | |
W.W. Grainger, Inc. | | 8,100 | | | 638,604 | |
| | | | |
|
|
|
| | | | | | 1,150,899 | |
| | | | |
|
|
|
Wireless Telecommunication Services — 0.1% | | | | |
American Tower Corp. (Class A Stock)(a) | | 44,800 | | | 1,313,536 | |
Sprint Nextel Corp.(b) | | 324,677 | | | 594,159 | |
| | | | |
|
|
|
| | | | | | 1,907,695 | |
| | | | |
|
|
|
TOTAL COMMON STOCKS
(cost $943,231,701) | | | 894,669,192 | |
| | | | |
|
|
|
| PREFERRED STOCK | | | | | | |
Banking | | | | | | |
JPMorgan Chase Capital XXVI
(cost $700,000) | | 28,000 | | | 685,720 | |
| | | | |
|
|
|
| | |
| | | Units
| | | |
| RIGHTS | | | | | | |
Diversified Financial Services | | | | |
Fortis (Belgium)(a)
(cost $0) | | 5,951 | | | — | (n) |
| | | | |
|
|
|
SEE NOTES TO FINANCIAL STATEMENTS.
A6
| | | | | | |
| | | CONSERVATIVE BALANCED PORTFOLIO (continued) | | |
| |
| SCHEDULE OF INVESTMENTS | | December 31, 2008 |
| | | | | | | | | | | | |
| LONG-TERM BONDS — 46.1% | | Moody’s
Rating*
(Unaudited)
| | Interest
Rate
| | Maturity
Date
| | Principal
Amount
(000)
| | Value
(Note 2)
|
| | | | | | | | | | | | | |
Aerospace & Defense — 0.2% | | | | | | | | | | | | |
BAE Systems Holding, Inc., Gtd. Notes, 144A | | Baa2 | | 4.75% | | 08/15/10 | | $ | 2,000 | | $ | 1,988,232 |
Boeing Capital Corp., Sr. Unsec’d. Notes | | A2 | | 6.10% | | 03/01/11 | | | 975 | | | 987,223 |
Goodrich Corp., Sr. Unsec’d. Notes | | Baa2 | | 6.80% | | 07/01/36 | | | 811 | | | 865,868 |
Raytheon Co., Sr. Unsec’d. Notes | | Baa1 | | 5.50% | | 11/15/12 | | | 625 | | | 631,793 |
| | | | | | | | | | | |
|
|
| | | | | | | | | | | | | 4,473,116 |
| | | | | | | | | | | |
|
|
Airlines — 0.2% | | | | | | | | | | | | |
American Airlines, Inc., Pass-thru Certs., Ser. 01-1 | | B1 | | 6.817% | | 05/23/11 | | | 2,420 | | | 1,548,800 |
Continental Airlines, Inc., Pass-thru Certs. | | Baa2 | | 6.648% | | 09/15/17 | | | 266 | | | 194,431 |
Continental Airlines, Inc., Pass-thru Certs.(j) | | Baa2 | | 6.703% | | 06/15/21 | | | 155 | | | 116,402 |
Delta Air Lines, Inc., Pass-thru Certs. | | Baa1 | | 6.821% | | 08/10/22 | | | 467 | | | 296,842 |
Southwest Airlines Co., Sr. Unsec’d. Notes | | Baa1 | | 6.50% | | 03/01/12 | | | 965 | | | 903,232 |
| | | | | | | | | | | |
|
|
| | | | | | | | | | | | | 3,059,707 |
| | | | | | | | | | | |
|
|
Asset-Backed Securities — 0.9% | | | | | | | | | | | | |
American Express Credit Account Master Trust I, Series 2004-4,
Class C, 144A(g) | | Baa1 | | 1.665% | | 03/15/12 | | | 1,510 | | | 1,274,922 |
American Express Credit Account Master Trust I, Series 2004-C,
Class C, 144A(g) | | Baa1 | | 1.695% | | 02/15/12 | | | 78 | | | 67,163 |
Amortizing Residential Collateral Trust, Series 2002-BC9, Class M1(g) | | A1 | | 2.121% | | 12/25/32 | | | 2,359 | | | 1,270,488 |
Bank of America Credit Card Trust, Series 2006-C5, Class C5(g) | | Baa2 | | 1.595% | | 01/15/16 | | | 4,159 | | | 1,493,977 |
CDC Mortgage Capital Trust, Series 2002-HE3, Class M1(g) | | Baa2 | | 2.121% | | 03/25/33 | | | 808 | | | 482,938 |
CDC Mortgage Capital Trust, Series 2003-HE1, Class M2(g) | | Baa2 | | 3.396% | | 08/25/33 | | | 67 | | | 34,777 |
Centex Home Equity, Series 2005-A, Class M2(g) | | Aa2 | | 0.971% | | 01/25/35 | | | 2,250 | | | 1,471,265 |
Citibank Credit Card Issuance Trust, Series 2006-C1, Class C1(g) | | Baa2 | | 0.908% | | 02/20/15 | | | 1,500 | | | 693,941 |
Credit-Based Asset Servicing and Securitization LLC, Series 2005-CB6,
Class A3 | | Aaa | | 5.12% | | 07/25/35 | | | 1,074 | | | 993,612 |
Equity One ABS, Inc., Series 2004-3, Class M1 | | Aa2 | | 5.70% | | 07/25/34 | | | 1,660 | | | 1,166,153 |
First Franklin Mortgage Loan Trust, Series 2005-FFH1, Class M2(g) | | A2 | | 0.991% | | 06/25/36 | | | 1,800 | | | 782,088 |
HFC Home Equity Loan Trust, Series 2005-2, Class M2(g) | | Aa1 | | 1.00% | | 01/20/35 | | | 558 | | | 357,888 |
MBNA Master Credit Card Trust, Series 1999-J, Class A | | Aaa | | 7.00% | | 02/15/12 | | | 2,370 | | | 2,377,312 |
Morgan Stanley ABS Capital I, Series 2004-NC3, Class M2(g) | | A2 | | 2.121% | | 03/25/34 | | | 643 | | | 448,971 |
Morgan Stanley Dean Witter Capital I, Series 2002-HE1, Class M1(g) | | Aa2 | | 1.371% | | 07/25/32 | | | 1,443 | | | 797,060 |
Morgan Stanley Dean Witter Capital I, Series 2002-NC4, Class M1(g) | | Aaa | | 1.746% | | 09/25/32 | | | 1,324 | | | 786,476 |
Saxon Asset Securities Trust, Series 2005-2, Class M2(g) | | Aa2 | | 0.911% | | 10/25/35 | | | 1,480 | | | 659,698 |
Securitized Asset Backed Receivables LLC, Series 2004-OP1, Class M1(g) | | Aa2 | | 0.981% | | 02/25/34 | | | 1,660 | | | 974,304 |
Securitized Asset Backed Receivables LLC, Series 2006-FR3, Class A3(g) | | B2 | | 0.721% | | 05/25/36 | | | 1,400 | | | 491,251 |
SVO VOI Mortgage Corp., Series 2005-AA, Class A, 144A | | Aaa | | 5.25% | | 02/20/21 | | | 627 | | | 524,053 |
| | | | | | | | | | | |
|
|
| | | | | | | | | | | | | 17,148,337 |
| | | | | | | | | | | |
|
|
Automotive — 0.1% | | | | | | | | | | | | |
Johnson Controls, Inc., Sr. Unsec’d. Notes | | A3 | | 5.50% | | 01/15/16 | | | 235 | | | 182,110 |
Oshkosh Truck Corp., Bank Loan(j) | | Ba3 | | 3.425% | | 12/06/13 | | | 1,761 | | | 1,019,780 |
| | | | | | | | | | | |
|
|
| | | | | | | | | | | | | 1,201,890 |
| | | | | | | | | | | |
|
|
Banking — 1.4% | | | | | | | | | | | | |
Banco Bradesco (Cayman Islands), Sr. Sub Notes | | A2 | | 8.75% | | 10/24/13 | | | 1,690 | | | 1,859,000 |
Bank of America Corp., Jr. Sub. Notes(g) | | A2 | | 8.00% | | 12/29/49 | | | 2,100 | | | 1,510,505 |
Bank of America NA, Sub. Notes | | Aa2 | | 5.30% | | 03/15/17 | | | 850 | | | 807,097 |
Bank of America NA, Sub. Notes | | Aa2 | | 6.00% | | 10/15/36 | | | 1,300 | | | 1,380,317 |
Bank One Corp., Sub. Notes | | Aa3 | | 7.875% | | 08/01/10 | | | 2,500 | | | 2,620,375 |
Bear Stearns Cos., Inc. (The), Sr. Unsec’d. Notes | | Aa2 | | 5.30% | | 10/30/15 | | | 550 | | | 529,154 |
Bear Stearns Cos., Inc. (The), Sr. Unsec’d. Notes | | Aa2 | | 6.40% | | 10/02/17 | | | 270 | | | 280,578 |
Bear Stearns Cos., Inc. (The), Sr. Unsec’d. Notes | | Aa2 | | 7.25% | | 02/01/18 | | | 1,135 | | | 1,243,797 |
Citigroup, Inc., Jr. Sub. Notes(b)(g) | | Baa2 | | 8.40% | | 04/29/49 | | | 2,000 | | | 1,320,580 |
Citigroup, Inc., Sr. Unsec’d. Notes(b) | | A2 | | 6.875% | | 03/05/38 | | | 790 | | | 898,931 |
Citigroup, Inc., Sub. Notes | | A3 | | 5.625% | | 08/27/12 | | | 1,900 | | | 1,781,111 |
Citigroup, Inc., Sub. Notes | | A3 | | 6.125% | | 08/25/36 | | | 725 | | | 649,451 |
DEPFA ACS Bank (Ireland), 144A | | Aa1 | | 5.125% | | 03/16/37 | | | 1,325 | | | 959,463 |
SEE NOTES TO FINANCIAL STATEMENTS.
A7
| | | | | | |
| | | CONSERVATIVE BALANCED PORTFOLIO (continued) | | |
| |
| SCHEDULE OF INVESTMENTS | | December 31, 2008 |
| | | | | | | | | | | | |
LONG-TERM BONDS
(continued) | | Moody’s
Rating*
(Unaudited)
| | Interest
Rate
| | Maturity
Date
| | Principal
Amount
(000)
| | Value
(Note 2)
|
| | | | | | | | | | | | | |
Banking (continued) | | | | | | | | | | | | |
Goldman Sachs Group, Inc. (The), Sr. Unsec’d. Notes | | A1 | | 5.45% | | 11/01/12 | | $ | 580 | | $ | 553,267 |
Goldman Sachs Group, Inc. (The), Sub. Notes | | A2 | | 5.625% | | 01/15/17 | | | 765 | | | 657,194 |
Goldman Sachs Group, Inc. (The), Sub. Notes | | A2 | | 6.45% | | 05/01/36 | | | 1,770 | | | 1,374,587 |
Goldman Sachs Group, Inc. (The), Sub. Notes | | A2 | | 6.75% | | 10/01/37 | | | 113 | | | 91,741 |
HSBC Bank USA, Sr. Unsec’d. Notes | | Aa2 | | 3.875% | | 09/15/09 | | | 250 | | | 249,577 |
ICICI Bank Ltd. (India), 144A(g) | | Baa2 | | 5.29% | | 01/12/10 | | | 1,880 | | | 1,555,700 |
ICICI Bank Ltd. (Singapore), 144A | | Baa2 | | 5.75% | | 11/16/10 | | | 1,670 | | | 1,418,949 |
JPMorgan Chase & Co., Jr. Sub. Notes(g) | | A1 | | 7.90% | | 04/29/49 | | | 2,000 | | | 1,663,660 |
JPMorgan Chase & Co., Sr. Unsec’d. Notes | | Aa2 | | 4.60% | | 01/17/11 | | | 175 | | | 171,905 |
JPMorgan Chase & Co., Sub. Notes | | Aa3 | | 6.50% | | 01/15/09 | | | 1,100 | | | 1,099,780 |
MUFG Capital Finance Group Ltd. (Cayman Islands) | | A2 | | 6.346% | | 07/25/49 | | | 800 | | | 557,378 |
Santander Central Hispano Issuances Ltd. (Cayman Islands), Bank Gtd. Notes | | Aa2 | | 7.625% | | 09/14/10 | | | 805 | | | 786,271 |
Wells Fargo Bank, Sub. Notes | | Aa2 | | 6.45% | | 02/01/11 | | | 90 | | | 93,289 |
Wells Fargo Capital XIII, Bank Gtd. Notes, M.T.N.(g) | | A1 | | 7.70% | | 12/29/49 | | | 1,000 | | | 825,311 |
| | | | | | | | | | | |
|
|
| | | | | | | | | | | | | 26,938,968 |
| | | | | | | | | | | |
|
|
Brokerage — 0.3% | | | | | | | | | | | | |
Lehman Brothers Holdings, Inc., Jr. Sub. Notes(l) | | NR | | 6.50% | | 07/19/17 | | | 514 | | | 51 |
Lehman Brothers Holdings, Inc., Sr. Unsec’d. Notes, M.T.N.(l) | | NR | | 5.25% | | 02/06/12 | | | 1,850 | | | 175,750 |
Lehman Brothers Holdings, Inc., Sr. Unsec’d. Notes, M.T.N.(l) | | NR | | 6.875% | | 05/02/18 | | | 700 | | | 66,500 |
Merrill Lynch & Co., Inc., Notes, M.T.N.(b) | | A2 | | 6.875% | | 04/25/18 | | | 1,230 | | | 1,286,612 |
Merrill Lynch & Co., Inc., Sr. Unsec’d. Notes | | A2 | | 4.79% | | 08/04/10 | | | 375 | | | 364,587 |
Merrill Lynch & Co., Inc., Sr. Unsec’d. Notes, M.T.N.(b) | | A2 | | 4.25% | | 02/08/10 | | | 1,470 | | | 1,436,840 |
Merrill Lynch & Co., Inc., Sr. Unsec’d. Notes, M.T.N. | | A2 | | 5.00% | | 01/15/15 | | | 190 | | | 183,262 |
Merrill Lynch & Co., Inc., Sr. Unsec’d. Notes, M.T.N. | | A2 | | 5.77% | | 07/25/11 | | | 355 | | | 350,785 |
Morgan Stanley Group, Inc., Sr. Unsec’d. Notes, M.T.N. | | A2 | | 5.25% | | 11/02/12 | | | 30 | | | 27,284 |
Morgan Stanley Group, Inc., Sr. Unsec’d. Notes, M.T.N. | | A2 | | 5.45% | | 01/09/17 | | | 670 | | | 552,269 |
Morgan Stanley Group, Inc., Sr. Unsec’d. Notes, M.T.N.(b) | | A2 | | 5.75% | | 10/18/16 | | | 1,860 | | | 1,562,907 |
Morgan Stanley Group, Inc., Sr. Unsec’d. Notes, M.T.N. | | A2 | | 5.95% | | 12/28/17 | | | 600 | | | 497,989 |
| | | | | | | | | | | |
|
|
| | | | | | | | | | | | | 6,504,836 |
| | | | | | | | | | | |
|
|
Building Materials & Construction — 0.1% | | | | | | | | | | | | |
American Standard, Inc., Gtd. Notes(b) | | Baa3 | | 7.625% | | 02/15/10 | | | 1,000 | | | 999,991 |
Hanson PLC (United Kingdom), Gtd. Notes | | Ba3 | | 7.875% | | 09/27/10 | | | 1,270 | | | 512,905 |
Lafarge SA (France), Sr. Unsec’d. Notes | | Baa2 | | 6.15% | | 07/15/11 | | | 1,100 | | | 957,749 |
| | | | | | | | | | | |
|
|
| | | | | | | | | | | | | 2,470,645 |
| | | | | | | | | | | |
|
|
Cable — 0.4% | | | | | | | | | | | | |
AT&T Broadband, Gtd. Notes | | Baa2 | | 9.455% | | 11/15/22 | | | 115 | | | 128,841 |
Cox Communications, Inc., Sr. Unsec’d. Notes | | Baa3 | | 6.75% | | 03/15/11 | | | 1,195 | | | 1,163,233 |
Cox Communications, Inc., Sr. Unsec’d. Notes | | Baa3 | | 7.875% | | 08/15/09 | | | 1,160 | | | 1,140,267 |
Insight Midwest Holdings LLC, Bank Loan(j) | | B1 | | 3.66% | | 10/06/13 | | | 1,216 | | | 978,545 |
Tele-Communications, Inc., Gtd. Notes | | Baa2 | | 9.875% | | 06/15/22 | | | 1,440 | | | 1,710,054 |
Time Warner Cable, Inc., Gtd. Notes(b) | | Baa2 | | 5.40% | | 07/02/12 | | | 2,410 | | | 2,250,331 |
| | | | | | | | | | | |
|
|
| | | | | | | | | | | | | 7,371,271 |
| | | | | | | | | | | |
|
|
Capital Goods — 0.3% | | | | | | | | | | | | |
Caterpillar Financial Service Corp., Sr. Unsec’d. Notes, M.T.N. | | A2 | | 5.50% | | 03/15/16 | | | 780 | | | 742,240 |
Caterpillar, Inc., Sr. Unsec’d. Notes | | A2 | | 7.25% | | 09/15/09 | | | 1,000 | | | 1,018,197 |
Erac USA Finance Co., Gtd. Notes, 144A | | Baa2 | | 5.80% | | 10/15/12 | | | 460 | | | 384,803 |
Erac USA Finance Co., Gtd. Notes, 144A | | Baa2 | | 6.375% | | 10/15/17 | | | 1,198 | | | 831,426 |
Erac USA Finance Co., Gtd. Notes, 144A | | Baa2 | | 7.00% | | 10/15/37 | | | 390 | | | 214,803 |
FedEx Corp., Gtd. Notes | | Baa2 | | 7.25% | | 02/15/11 | | | 480 | | | 487,622 |
General Electric Co., Sr. Unsec’d. Notes | | Aaa | | 5.25% | | 12/06/17 | | | 320 | | | 319,023 |
Sensata Technologies, Bank Loan(j) | | B1 | | 5.258% | | 04/27/13 | | | 1,379 | | | 689,394 |
United Technologies Corp., Sr. Unsec’d. Notes(e) | | A2 | | 6.35% | | 03/01/11 | | | 810 | | | 856,452 |
United Technologies Corp., Sr. Unsec’d. Notes(c)(e) | | A2 | | 8.875% | | 11/15/19 | | | 375 | | | 496,799 |
| | | | | | | | | | | |
|
|
| | | | | | | | | | | | | 6,040,759 |
| | | | | | | | | | | |
|
|
SEE NOTES TO FINANCIAL STATEMENTS.
A8
| | | | | | |
| | | CONSERVATIVE BALANCED PORTFOLIO (continued) | | |
| |
| SCHEDULE OF INVESTMENTS | | December 31, 2008 |
| | | | | | | | | | | | |
LONG-TERM BONDS
(continued) | | Moody’s
Rating*
(Unaudited)
| | Interest
Rate
| | Maturity
Date
| | Principal
Amount
(000)
| | Value
(Note 2)
|
| | | | | | | | | | | | | |
Chemicals — 0.4% | | | | | | | | | | | | |
Dow Chemical Co., Sr. Unsec’d. Notes | | Baa1 | | 5.97% | | 01/15/09 | | $ | 430 | | $ | 430,011 |
Dow Chemical Co., Sr. Unsec’d. Notes | | Baa1 | | 6.125% | | 02/01/11 | | | 690 | | | 690,936 |
Huntsman LLC, Sec’d. Notes | | Ba1 | | 11.625% | | 10/15/10 | | | 2,000 | | | 1,750,000 |
ICI Wilmington, Inc., Gtd. Notes | | A3 | | 5.625% | | 12/01/13 | | | 780 | | | 751,996 |
Lubrizol Corp., Gtd. Notes | | Baa2 | | 4.625% | | 10/01/09 | | | 1,090 | | | 1,070,641 |
PPG Industries, Inc., Sr. Unsec’d. Notes | | A3 | | 5.75% | | 03/15/13 | | | 3,500 | | | 3,461,275 |
Union Carbide Corp., Sr. Unsec’d. Notes | | Ba2 | | 7.50% | | 06/01/25 | | | 500 | | | 411,214 |
| | | | | | | | | | | |
|
|
| | | | | | | | | | | | | 8,566,073 |
| | | | | | | | | | | |
|
|
Collateralized Mortgage Obligations — 0.6% | | | | | | | | | | | | |
Bank of America Alternative Loan Trust, Series 2005-12, Class 3CB1 | | Aaa | | 6.00% | | 01/25/36 | | | 3,495 | | | 2,723,607 |
Bank of America Mortgage Securities, Inc., Series 2005-A, Class 2A1(g) | | Aaa | | 4.443% | | 02/25/35 | | | 1,087 | | | 721,510 |
Bank of America Mortgage Securities, Inc., Series 2005-B, Class 2A1(g) | | Aaa | | 4.386% | | 03/25/35 | | | 1,077 | | | 658,303 |
Chase Mortgage Finance Corp., Series 2007-A1, Class 1A5(g) | | Aaa | | 4.884% | | 02/25/37 | | | 2,853 | | | 2,178,208 |
Countrywide Alternative Loan Trust, Pass-Thru Certificates, Series 2004-18CB, Class 3A1 | | Aaa | | 5.25% | | 09/25/19 | | | 1,566 | | | 1,427,916 |
JPMorgan Chase Commerical Mortgage Securities Corp., Series 2007-A1, Class 4A1(g) | | Aaa | | 4.066% | | 07/25/35 | | | 2,240 | | | 1,629,100 |
Master Alternative Loans Trust, Pass-Thru Certificates, Series 2004-4, Class 4A1 | | Aaa | | 5.00% | | 04/25/19 | | | 428 | | | 396,293 |
Structured Adjustable Rate Mortgage Loan, Series 2004-1, Class 4A3(g) | | Aaa | | 5.365% | | 02/25/34 | | | 969 | | | 601,941 |
Washington Mutual Alternative Loan Trust, Mortgage Pass-Thru Certificates, Series 2005-1, Class 3A | | AAA(d) | | 5.00% | | 03/25/20 | | | 947 | | | 759,611 |
| | | | | | | | | | | |
|
|
| | | | | | | | | | | | | 11,096,489 |
| | | | | | | | | | | |
|
|
Commercial Mortgage Backed Securities — 4.5% | | | | | | | | | | | | |
Bank of America Commercial Mortgage, Inc., Series 2003-2, Class A3(g) | | AAA(d) | | 4.873% | | 03/11/41 | | | 3,350 | | | 3,063,279 |
Bank of America Commercial Mortgage, Inc., Series 2004-2, Class A4 | | Aaa | | 4.153% | | 11/10/38 | | | 3,680 | | | 3,377,779 |
Bank of America Commercial Mortgage, Inc., Series 2005-1, Class ASB(g) | | AAA(d) | | 4.967% | | 11/10/42 | | | 975 | | | 827,490 |
Banc of America Commercial Mortgage, Inc., Series 2006-4, Class A3A | | Aaa | | 5.60% | | 07/10/46 | | | 2,000 | | | 1,423,153 |
Banc of America Commercial Mortgage, Inc., Series 2007-3, Class A2(g) | | Aaa | | 5.658% | | 06/10/49 | | | 5,730 | | | 4,524,822 |
Bear Stearns Commercial Mortgage Securities, Series 2005-T18, Class AAB(g) | | Aaa | | 4.823% | | 02/13/42 | | | 2,250 | | | 1,783,301 |
Bear Stearns Commercial Mortgage Securities, Series 2005-T20, Class AAB(g) | | Aaa | | 5.135% | | 10/12/42 | | | 3,000 | | | 2,457,740 |
Commercial Mortgage Acceptance Corp., Series 1998-C2, Class F, 144A(g) | | A-(d) | | 5.44% | | 09/15/30 | | | 890 | | | 790,206 |
Commercial Mortgage Load Trust, Series 2008-LS1, Class A2(g) | | Aaa | | 6.020% | | 12/10/49 | | | 2,100 | | | 1,658,043 |
Commercial Mortgage Pass-Thru Certificate, Series 2004-LB2A, Class X2, I/O, 144A(g) | | AAA(d) | | 0.85% | | 03/10/39 | | | 11,829 | | | 175,963 |
Credit Suisse First Boston Mortgage Securities Corp., Series 2004-C4, Class A4 | | Aaa | | 4.283% | | 10/15/39 | | | 1,500 | | | 1,367,289 |
Credit Suisse First Boston Mortgage Securities Corp., Series 2005-C5,
Class A4(g) | | AAA(d) | | 5.10% | | 08/15/38 | | | 3,000 | | | 2,454,909 |
Credit Suisse Mortgage Capital Certificates, Series 2006-C1, Class A4(g) | | AAA(d) | | 5.552% | | 02/15/39 | | | 4,330 | | | 3,515,706 |
CW Capital Cobalt Ltd., Series 2007-C3, Class A3(g) | | AAA(d) | | 5.82% | | 05/15/46 | | | 2,100 | | | 1,376,376 |
DLJ Commercial Mortgage Corp., Series 2000-CF1, Class A1B | | AAA(d) | | 7.62% | | 06/10/33 | | | 3,056 | | | 3,058,297 |
GE Commercial Mortgage Corp., Series 2004-C2, Class X2, I/O, 144A(g) | | Aaa | | 0.53% | | 03/10/40 | | | 22,735 | | | 250,676 |
GMAC Commercial Mortgage Securities, Inc., Ser. 2005-C1, Class A5 | | AAA(d) | | 4.697% | | 05/10/43 | | | 2,610 | | | 2,115,880 |
Greenwich Capital Commercial Funding Corp., Series 2005-GG5, Class A5(g) | | Aaa | | 5.224% | | 04/10/37 | | | 3,600 | | | 2,958,491 |
JPMorgan Chase Commercial Mortgage Securities Corp., Series 2000-C10, Class A2(g) | | Aaa | | 7.371% | | 08/15/32 | | | 5,832 | | | 5,818,766 |
JPMorgan Chase Commercial Mortgage Securities Corp., Series 2005-LDP1, Class ASB(g) | | Aaa | | 4.853% | | 03/15/46 | | | 4,000 | | | 3,359,583 |
JPMorgan Chase Commerical Mortgage Securities Corp., Series 2005-LDP2, Class ASB | | Aaa | | 4.659% | | 07/15/42 | | | 6,380 | | | 5,195,662 |
SEE NOTES TO FINANCIAL STATEMENTS.
A9
| | | | | | |
| | | CONSERVATIVE BALANCED PORTFOLIO (continued) | | |
| |
| SCHEDULE OF INVESTMENTS | | December 31, 2008 |
| | | | | | | | | | | | |
LONG-TERM BONDS
(continued) | | Moody’s
Rating*
(Unaudited)
| | Interest
Rate
| | Maturity
Date
| | Principal
Amount
(000)
| | Value
(Note 2)
|
| | | | | | | | | | | | | |
Commercial Mortgage Backed Securities (continued) | | | | | | | | | | | | |
JPMorgan Chase Commercial Mortgage Securities Corp., Series 2005-LDP5, Class A4(g) | | Aaa | | 5.179% | | 12/15/44 | | $ | 3,630 | | $ | 2,909,190 |
JPMorgan Chase Commercial Mortgage Securities Corp., Series 2006-CB16, Class ASB | | Aaa | | 5.523% | | 05/12/45 | | | 2,000 | | | 1,523,830 |
JPMorgan Chase Commercial Mortgage Securities Corp., Series 2006-LDP6, Class X2 I/O(g) | | Aaa | | 0.07% | | 04/15/43 | | | 143,712 | | | 468,945 |
Keycorp., Series 2000-C1, Class A2(g) | | Aaa | | 7.727% | | 05/17/32 | | | 9,668 | | | 9,668,159 |
LB-UBS Commercial Mortgage Trust, Series 2003-C8, Class A3 | | Aaa | | 4.83% | | 11/15/27 | | | 2,720 | | | 2,513,318 |
LB-UBS Commercial Mortgage Trust, Series 2004-C6, Class A5(g) | | AAA(d) | | 4.826% | | 08/15/29 | | | 5,000 | | | 4,456,330 |
LB-UBS Commercial Mortgage Trust, Series 2005-C3, Class A5 | | Aaa | | 4.739% | | 07/15/30 | | | 695 | | | 561,686 |
LB-UBS Commercial Mortgage Trust, Series 2006-C6, Class AAB | | Aaa | | 5.341% | | 09/15/39 | | | 4,280 | | | 3,216,352 |
Merrill Lynch Mortgage Trust, Series 2004-Key 2, Class A3 | | Aaa | | 4.615% | | 08/12/39 | | | 1,900 | | | 1,693,519 |
Merrill Lynch/Countrywide Commercial Mortgage Trust, Series 2006-2, Class A4(g) | | Aaa | | 5.909% | | 06/12/46 | | | 2,210 | | | 1,770,685 |
Morgan Stanley Capital I, Series 2006-IQ11, Class A4(g) | | AAA(d) | | 5.772% | | 10/15/42 | | | 2,600 | | | 2,134,096 |
Morgan Stanley Capital I, Series 2007-HQ11, Class AAB | | Aaa | | 5.444% | | 02/12/44 | | | 4,400 | | | 3,148,583 |
Morgan Stanley Capital I, Series 2007-T27, Class AAB(g) | | AAA(d) | | 5.65% | | 06/11/42 | | | 1,040 | | | 777,902 |
Wachovia Bank Commercial Mortgage Trust, Series 2002-C2, Class A4 | | Aaa | | 4.98% | | 11/15/34 | | | 1,700 | | | 1,508,101 |
| | | | | | | | | | | |
|
|
| | | | | | | | | | | | | 87,904,107 |
| | | | | | | | | | | |
|
|
Consumer — 0.2% | | | | | | | | | | | | |
Avon Products, Inc., Sr. Unsec’d. Notes | | A2 | | 5.75% | | 03/01/18 | | | 1,400 | | | 1,317,242 |
Newell Rubbermaid, Inc., Sr. Unsec’d. Notes | | Baa2 | | 6.25% | | 04/15/18 | | | 1,600 | | | 1,287,037 |
Whirlpool Corp., Sr. Unsec’d. Notes | | Baa2 | | 6.125% | | 06/15/11 | | | 1,045 | | | 930,542 |
| | | | | | | | | | | |
|
|
| | | | | | | | | | | | | 3,534,821 |
| | | | | | | | | | | |
|
|
Electric — 1.3% | | | | | | | | | | | | |
Appalachian Power Co., Sr. Unsec’d. Notes | | Baa2 | | 4.40% | | 06/01/10 | | | 790 | | | 773,050 |
Arizona Public Service Co., Sr. Unsec’d. Notes | | Baa2 | | 6.25% | | 08/01/16 | | | 170 | | | 136,692 |
Arizona Public Service Co., Sr. Unsec’d. Notes | | Baa2 | | 6.375% | | 10/15/11 | | | 1,250 | | | 1,176,654 |
Baltimore Gas & Electric Co., Sr. Unsec’d. Notes | | Baa2 | | 6.35% | | 10/01/36 | | | 530 | | | 436,180 |
Carolina Power & Light Co., First Mtge. Bonds | | A2 | | 5.25% | | 12/15/15 | | | 660 | | | 669,555 |
CenterPoint Energy Houston Electric LLC, Mtge. Bonds | | Baa2 | | 5.70% | | 03/15/13 | | | 1,070 | | | 1,018,343 |
CenterPoint Energy Houston Electric LLC, Mtge. Bonds | | Baa2 | | 6.95% | | 03/15/33 | | | 300 | | | 275,829 |
Consolidated Edison, Inc., Sr. Unsec’d. Notes | | A1 | | 5.375% | | 12/15/15 | | | 820 | | | 804,864 |
Consolidated Edison, Inc., Sr. Unsec’d. Notes | | A1 | | 6.75% | | 04/01/38 | | | 130 | | | 138,901 |
Consumers Energy Co., First Mtge. Bonds, Series D | | Baa1 | | 5.375% | | 04/15/13 | | | 435 | | | 428,095 |
Dominion Resources, Inc., Sr. Unsec’d. Notes | | Baa2 | | 5.125% | | 12/15/09 | | | 1,255 | | | 1,252,238 |
Duke Energy Carolinas LLC, First Mtge. Bond | | A2 | | 6.05% | | 04/15/38 | | | 530 | | | 581,415 |
Duke Energy Carolinas LLC, Sr. Unsec’d. Notes | | A3 | | 6.10% | | 06/01/37 | | | 920 | | | 966,474 |
E.ON International Finance BV, Gtd. Notes, 144A | | A2 | | 6.65% | | 04/30/38 | | | 930 | | | 863,824 |
El Paso Electric Co., Sr. Unsec’d. Notes | | Baa2 | | 6.00% | | 05/15/35 | | | 845 | | | 579,220 |
Empresa Nacional de Electricidad S.A. (Chile), Unsec’d. Notes | | Baa3 | | 8.50% | | 04/01/09 | | | 1,350 | | | 1,372,777 |
Empresa Nacional de Electricidad S.A. (Chile), Unsub. Notes | | Baa3 | | 8.625% | | 08/01/15 | | | 1,160 | | | 1,254,846 |
Energy East Corp., Sr. Unsec’d. Notes | | Baa2 | | 6.75% | | 09/15/33 | | | 140 | | | 112,583 |
Exelon Corp., Sr. Unsec’d. Notes | | Baa1 | | 4.90% | | 06/15/15 | | | 195 | | | 159,867 |
Florida Power & Light Co., First Mtge. Bond | | Aa3 | | 5.95% | | 10/01/33 | | | 380 | | | 420,112 |
Georgia Power Co., Sr. Unsec’d. Notes, Series B | | A2 | | 5.70% | | 06/01/17 | | | 470 | | | 469,970 |
Indiana Michigan Power Co., Sr. Unsec’d. Notes | | Baa2 | | 5.05% | | 11/15/14 | | | 575 | | | 517,971 |
MidAmerican Energy Holdings Co., Sr. Unsec’d. Notes | | Baa1 | | 5.75% | | 04/01/18 | | | 210 | | | 204,845 |
MidAmerican Energy Holdings Co., Sr. Unsec’d. Notes | | Baa1 | | 5.95% | | 05/15/37 | | | 325 | | | 294,695 |
Nevada Power Co., Mtge. Bond | | Baa3 | | 6.50% | | 05/15/18 | | | 1,210 | | | 1,164,823 |
NiSource Finance Corp., Gtd. Notes | | Baa3 | | 5.45% | | 09/15/20 | | | 500 | | | 267,796 |
NRG Energy, Bank Loan(j) | | Ba1 | | 1.359% | | 02/01/13 | | | 439 | | | 379,414 |
NRG Energy, Bank Loan(j) | | Ba1 | | 2.675% | | 02/01/13 | | | 891 | | | 769,995 |
NSTAR Electric Co., Sr. Unsec’d. Notes | | A1 | | 4.875% | | 04/15/14 | | | 730 | | | 730,788 |
Oncor Electric Delivery Co., Sr. Sec’d. Notes | | Baa3 | | 6.375% | | 01/15/15 | | | 465 | | | 445,407 |
Oncor Electric Delivery Co., Sr. Sec’d. Notes | | Baa3 | | 7.00% | | 09/01/22 | | | 545 | | | 509,252 |
SEE NOTES TO FINANCIAL STATEMENTS.
A10
| | | | | | |
| | | CONSERVATIVE BALANCED PORTFOLIO (continued) | | |
| |
| SCHEDULE OF INVESTMENTS | | December 31, 2008 |
| | | | | | | | | | | | |
LONG-TERM BONDS
(continued) | | Moody’s
Rating*
(Unaudited)
| | Interest
Rate
| | Maturity
Date
| | Principal
Amount
(000)
| | Value
(Note 2)
|
| | | | | | | | | | | | | |
Electric (continued) | | | | | | | | | | | | |
Pacific Gas & Electric Co., Sr. Unsec’d. Notes | | A3 | | 6.05% | | 03/01/34 | | $ | 1,610 | | $ | 1,709,915 |
PPL Electric Utilities Corp., Sr. Sec’d. Notes | | A3 | | 6.25% | | 08/15/09 | | | 1,900 | | | 1,910,943 |
Public Service Co. of New Mexico, Sr. Unsec’d. Notes | | Baa3 | | 7.95% | | 05/15/18 | | | 135 | | | 109,857 |
Public Service Electric & Gas Co., Sec’d. Notes, M.T.N. | | A3 | | 5.80% | | 05/01/37 | | | 515 | | | 481,965 |
Southern California Edison Co., First Mtge. Bond | | A2 | | 4.65% | | 04/01/15 | | | 610 | | | 608,327 |
Texas Competitive Electric Holdings Co. LLC, Bank Loan(j) | | Ba3 | | 5.582% | | 10/10/14 | | | 988 | | | 682,609 |
Xcel Energy, Inc., Sr. Unsec’d. Notes | | Baa1 | | 5.613% | | 04/01/17 | | | 263 | | | 232,879 |
Xcel Energy, Inc., Sr. Unsec’d. Notes | | Baa1 | | 6.50% | | 07/01/36 | | | 445 | | | 408,564 |
| | | | | | | | | | | |
|
|
| | | | | | | | | | | | | 25,321,534 |
| | | | | | | | | | | |
|
|
Energy — Integrated 0.1% | | | | | | | | | | | | |
Phillips Petroleum Co., Sr. Unsec’d. Notes | | A1 | | 8.75% | | 05/25/10 | | | 1,900 | | | 2,002,475 |
TNK-BP Finance SA (Luxembourg), Gtd. Notes, 144A | | Baa2 | | 7.50% | | 07/18/16 | | | 1,365 | | | 709,800 |
| | | | | | | | | | | |
|
|
| | | | | | | | | | | | | 2,712,275 |
| | | | | | | | | | | |
|
|
Energy — Other 0.3% | | | | | | | | | | | | |
Devon Energy Corp., Gtd. Notes | | Baa1 | | 7.875% | | 09/30/31 | | | 280 | | | 308,309 |
Halliburton Co., Sr. Unsec’d. Notes | | A2 | | 5.50% | | 10/15/10 | | | 200 | | | 204,276 |
Nexen, Inc. (Canada), Sr. Unsec’d. Notes | | Baa2 | | 6.40% | | 05/15/37 | | | 195 | | | 152,584 |
Pioneer Natural Resources Co., Sr. Unsec’d. Notes | | Ba1 | | 6.875% | | 05/01/18 | | | 1,450 | | | 1,014,133 |
Valero Energy Corp., Sr. Unsec’d. Notes | | Baa2 | | 6.625% | | 06/15/37 | | | 250 | | | 183,876 |
Weatherford International, Inc. (Bermuda), Gtd. Notes | | Baa1 | | 6.50% | | 08/01/36 | | | 25 | | | 18,767 |
Weatherford International, Inc., Gtd. Notes | | Baa1 | | 6.35% | | 06/15/17 | | | 895 | | | 763,825 |
Woodside Finance Ltd. (Australia), Gtd. Notes, 144A | | Baa1 | | 5.00% | | 11/15/13 | | | 1,660 | | | 1,661,268 |
XTO Energy, Inc., Sr. Unsec’d. Notes | | Baa2 | | 6.25% | | 08/01/17 | | | 565 | | | 542,557 |
| | | | | | | | | | | |
|
|
| | | | | | | | | | | | | 4,849,595 |
| | | | | | | | | | | |
|
|
Foods — 0.6% | | | | | | | | | | | | |
Aramark Corp. Bank Loan(j) | | Ba3 | | 3.334% | | 01/26/14 | | | 1,658 | | | 1,359,741 |
Aramark Corp. Bank Loan(j) | | Ba3 | | 5.787% | | 01/26/14 | | | 105 | | | 86,384 |
Bunge Ltd. Finance Corp., Gtd. Notes | | Baa2 | | 5.35% | | 04/15/14 | | | 1,000 | | | 717,415 |
Cargill, Inc., Sr. Unsec’d. Notes, 144A | | A2 | | 6.00% | | 11/27/17 | | | 650 | | | 582,819 |
ConAgra Foods, Inc., Sr. Unsec’d. Notes | | Baa2 | | 7.875% | | 09/15/10 | | | 585 | | | 605,327 |
Delhaize Group (Belgium), Sr. Unsec’d. Notes(b) | | Baa3 | | 6.50% | | 06/15/17 | | | 460 | | | 417,677 |
Dr Pepper Snapple Group, Inc., Gtd. Notes, 144A | | Baa3 | | 6.82% | | 05/01/18 | | | 530 | | | 522,767 |
General Mills, Inc., Sr. Unsec’d. Notes | | Baa1 | | 6.00% | | 02/15/12 | | | 975 | | | 1,011,434 |
Kellogg Co., Sr. Unsec’d. Notes | | A3 | | 6.60% | | 04/01/11 | | | 1,285 | | | 1,344,880 |
Kroger Co. (The), Gtd. Notes | | Baa2 | | 6.75% | | 04/15/12 | | | 215 | | | 217,012 |
Kroger Co. (The), Gtd. Notes | | Baa2 | | 6.80% | | 04/01/11 | | | 575 | | | 593,693 |
McDonald’s Corp., Sr. Unsec’d. Notes, M.T.N. | | A3 | | 6.30% | | 03/01/38 | | | 1,140 | | | 1,257,426 |
Tricon Global Restaurants, Inc., Sr. Unsec’d. Notes | | Baa3 | | 8.875% | | 04/15/11 | | | 235 | | | 238,029 |
Tyson Foods, Inc., Gtd. Notes | | Ba3 | | 7.85% | | 04/01/16 | | | 785 | | | 580,900 |
Whitman Corp., Sr. Unsec’d. Notes | | Baa1 | | 6.375% | | 05/01/09 | | | 1,645 | | | 1,652,826 |
| | | | | | | | | | | |
|
|
| | | | | | | | | | | | | 11,188,330 |
| | | | | | | | | | | |
|
|
Foreign Government Bonds — 0.2% | | | | | | | | | | | | |
DP World Ltd., Bonds, 144A | | A1 | | 6.85% | | 07/02/37 | | | 1,610 | | | 829,259 |
Macquarie Bank Ltd., Gov’t. Liquid Gtd. Notes,144A | | Aaa | | 4.10% | | 12/17/13 | | | 1,495 | | | 1,543,528 |
Pemex Project Funding Master Trust, Gtd. Notes | | Baa1 | | 8.625% | | 12/01/23 | | | 350 | | | 343,420 |
RSHB Capital SA for OJSC Russian Agricultural Bank (Luxembourg), Sr. Sec’d. Notes, 144A | | A3 | | 6.299% | | 05/15/17 | | | 2,100 | | | 1,197,000 |
| | | | | | | | | | | |
|
|
| | | | | | | | | | | | | 3,913,207 |
| | | | | | | | | | | |
|
|
Gaming | | | | | | | | | | | | |
Harrah’s Operating Co., Inc., Gtd. Notes | | Caa3 | | 5.50% | | 07/01/10 | | | 970 | | | 615,950 |
| | | | | | | | | | | |
|
|
Healthcare & Pharmaceutical — 0.9% | | | | | | | | | | | | |
Abbott Laboratories, Sr. Unsec’d. Notes | | A1 | | 5.875% | | 05/15/16 | | | 1,100 | | | 1,191,374 |
AmerisourceBergen Corp., Gtd. Notes | | Baa3 | | 5.625% | | 09/15/12 | | | 915 | | | 856,725 |
SEE NOTES TO FINANCIAL STATEMENTS.
A11
| | | | | | |
| | | CONSERVATIVE BALANCED PORTFOLIO (continued) | | |
| |
| SCHEDULE OF INVESTMENTS | | December 31, 2008 |
| | | | | | | | | | | | |
LONG-TERM BONDS
(continued) | | Moody’s
Rating*
(Unaudited)
| | Interest
Rate
| | Maturity
Date
| | Principal
Amount
(000)
| | Value
(Note 2)
|
| | | | | | | | | | | | | |
Healthcare & Pharmaceutical (continued) | | | | | | | | | | | | |
AstraZeneca PLC (United Kingdom), Sr. Unsec’d. Notes | | A1 | | 6.45% | | 09/15/37 | | $ | 480 | | $ | 545,606 |
Community Health Systems, Bank Loan(j) | | Ba3 | | 3.404% | | 07/25/14 | | | 81 | | | 62,955 |
Community Health Systems, Bank Loan(j) | | Ba3 | | 4.445% | | 07/25/14 | | | 1,588 | | | 1,230,959 |
Covidien International Finance SA (Luxembourg), Gtd. Notes | | Baa1 | | 6.00% | | 10/15/17 | | | 1,100 | | | 1,085,157 |
DaVita, Inc., Bank Loan(j) | | Ba1 | | 3.295% | | 10/05/12 | | | 1,200 | | | 1,043,143 |
Genentech, Inc., Sr. Unsec’d. Notes | | A1 | | 4.75% | | 07/15/15 | | | 270 | | | 271,637 |
GlaxoSmithKline Capital, Inc., Gtd. Notes(c) | | A1 | | 5.65% | | 05/15/18 | | | 780 | | | 819,256 |
GlaxoSmithKline Capital, Inc., Gtd. Notes | | A1 | | 6.375% | | 05/15/38 | | | 840 | | | 949,061 |
HCA, Inc., Bank Loan(j) | | Ba3 | | 3.709% | | 11/18/13 | | | 1,960 | | | 1,532,475 |
HCA, Inc., Sr. Sec’d. Notes | | B2 | | 9.25% | | 11/15/16 | | | 1,925 | | | 1,766,188 |
Health Management Associates, Inc. Term B, Bank Loan(j) | | B1 | | 3.209% | | 02/28/14 | | | 1,135 | | | 694,061 |
Laboratory Corp. of America Holdings, Sr. Unsec’d. Notes | | Baa3 | | 5.625% | | 12/15/15 | | | 560 | | | 471,311 |
Merck & Co., Inc., Sr. Unsec’d. Notes | | Aa3 | | 5.75% | | 11/15/36 | | | 65 | | | 68,447 |
Merck & Co., Inc., Sr. Unsec’d. Notes | | Aa3 | | 5.95% | | 12/01/28 | | | 205 | | | 218,331 |
Schering-Plough Corp., Sr. Unsec’d. Notes | | Baa1 | | 5.55% | | 12/01/13 | | | 695 | | | 700,082 |
Schering-Plough Corp., Sr. Unsec’d. Notes | | Baa1 | | 6.00% | | 09/15/17 | | | 842 | | | 833,503 |
Schering Plough Corp., Sr. Unsec’d. Notes | | Baa1 | | 6.55% | | 09/15/37 | | | 330 | | | 332,651 |
Teva Pharmaceutical Finance LLC (Israel), Gtd. Notes | | Baa2 | | 6.15% | | 02/01/36 | | | 115 | | | 113,694 |
Wyeth, Sr. Unsec’d. Notes | | A3 | | 5.50% | | 03/15/13 | | | 1,165 | | | 1,186,690 |
Wyeth, Sr. Unsec’d. Notes | | A3 | | 5.95% | | 04/01/37 | | | 1,645 | | | 1,826,421 |
Wyeth, Sr. Unsec’d. Notes | | A3 | | 6.45% | | 02/01/24 | | | 60 | | | 67,663 |
| | | | | | | | | | | |
|
|
| | | | | | | | | | | | | 17,867,390 |
| | | | | | | | | | | |
|
|
Healthcare Insurance — 0.3% | | | | | | | | | | | | |
Aetna, Inc., Sr. Unsec’d. Notes | | A3 | | 5.75% | | 06/15/11 | | | 430 | | | 420,033 |
Aetna, Inc., Sr. Unsec’d. Notes | | A3 | | 6.625% | | 06/15/36 | | | 480 | | | 399,566 |
Cigna Corp., Sr. Unsec’d. Notes | | Baa2 | | 6.15% | | 11/15/36 | | | 640 | | | 486,977 |
Coventry Health Care, Inc., Sr. Unsec’d. Notes | | Ba1 | | 6.125% | | 01/15/15 | | | 2,200 | | | 1,307,097 |
UnitedHealth Group, Inc., Sr. Unsec’d. Notes | | Baa1 | | 5.25% | | 03/15/11 | | | 1,470 | | | 1,382,188 |
UnitedHealth Group, Inc., Sr. Unsec’d. Notes | | Baa1 | | 6.00% | | 06/15/17 | | | 115 | | | 103,549 |
UnitedHealth Group, Inc., Sr. Unsec’d. Notes | | Baa1 | | 6.50% | | 06/15/37 | | | 400 | | | 335,741 |
UnitedHealth Group, Inc., Sr. Unsec’d. Notes | | Baa1 | | 6.625% | | 11/15/37 | | | 410 | | | 345,605 |
UnitedHealth Group, Inc., Sr. Unsec’d. Notes | | Baa1 | | 6.875% | | 02/15/38 | | | 430 | | | 376,512 |
WellPoint, Inc., Sr. Unsec’d. Notes | | Baa1 | | 5.00% | | 12/15/14 | | | 1,085 | | | 942,446 |
WellPoint, Inc., Sr. Unsec’d. Notes | | Baa1 | | 5.25% | | 01/15/16 | | | 335 | | | 296,561 |
| | | | | | | | | | | |
|
|
| | | | | | | | | | | | | 6,396,275 |
| | | | | | | | | | | |
|
|
Insurance — 0.4% | | | | | | | | | | | | |
American International Group, Inc., Jr. Sub. Debs., 144A(g) | | Baa1 | | 8.175% | | 05/15/58 | | | 860 | | | 334,562 |
American International Group, Inc., Jr. Sub. Notes | | Baa1 | | 6.25% | | 03/15/37 | | | 260 | | | 97,181 |
American International Group, Inc., Sr. Unsec’d. Notes | | A3 | | 4.25% | | 05/15/13 | | | 1,355 | | | 998,616 |
American International Group, Inc., Sr. Unsec’d. Notes | | A3 | | 5.05% | | 10/01/15 | | | 125 | | | 83,821 |
American International Group, Inc., Sr. Unsec’d. Notes, M.T.N. | | A3 | | 5.85% | | 01/16/18 | | | 1,620 | | | 1,085,861 |
AXA SA (France), Sub. Notes | | A3 | | 8.60% | | 12/15/30 | | | 230 | | | 150,599 |
Berkshire Hathaway, Inc., Gtd. Notes | | Aaa | | 4.75% | | 05/15/12 | | | 425 | | | 436,274 |
Liberty Mutual Group, Bonds, 144A | | Baa2 | | 7.00% | | 03/15/34 | | | 910 | | | 540,188 |
Lincoln National Corp., Sr. Unsec’d. Notes | | A3 | | 6.30% | | 10/09/37 | | | 476 | | | 289,108 |
Marsh & McLennan Cos., Inc., Sr. Unsec’d. Notes | | Baa2 | | 5.15% | | 09/15/10 | | | 335 | | | 326,098 |
MetLife, Inc., Sr. Unsec’d. Notes | | A2 | | 5.70% | | 06/15/35 | | | 1,185 | | | 964,975 |
MetLife, Inc., Sr. Unsec’d. Notes | | A2 | | 6.125% | | 12/01/11 | | | 435 | | | 429,060 |
MetLife, Inc., Sr. Unsec’d. Notes | | A2 | | 6.375% | | 06/15/34 | | | 85 | | | 70,364 |
Travelers Cos., Inc. (The), Sr. Unsec’d. Notes | | A2 | | 6.75% | | 06/20/36 | | | 740 | | | 770,377 |
W.R. Berkley Corp., Sr. Unsub. Notes | | Baa2 | | 5.60% | | 05/15/15 | | | 705 | | | 590,687 |
W.R. Berkley Corp., Sr. Unsub. Notes | | Baa2 | | 6.15% | | 08/15/19 | | | 575 | | | 521,729 |
XL Capital Ltd. (Cayman Islands), Sr. Unsec’d. Notes | | Baa2 | | 5.25% | | 09/15/14 | | | 110 | | | 61,088 |
| | | | | | | | | | | |
|
|
| | | | | | | | | | | | | 7,750,588 |
| | | | | | | | | | | |
|
|
SEE NOTES TO FINANCIAL STATEMENTS.
A12
| | | | | | |
| | | CONSERVATIVE BALANCED PORTFOLIO (continued) | | |
| |
| SCHEDULE OF INVESTMENTS | | December 31, 2008 |
| | | | | | | | | | | | |
LONG-TERM BONDS
(continued) | | Moody’s
Rating*
(Unaudited)
| | Interest
Rate
| | Maturity
Date
| | Principal
Amount
(000)
| | Value
(Note 2)
|
| | | | | | | | | | | | | |
Lodging — 0.1% | | | | | | | | | | | | |
Starwood Hotels & Resorts Worldwide, Inc., Sr. Unsec’d. Notes | | Baa3 | | 6.25% | | 02/15/13 | | $ | 1,585 | | $ | 1,093,650 |
Starwood Hotels & Resorts Worldwide, Inc., Sr. Unsec’d. Notes | | Baa3 | | 6.75% | | 05/15/18 | | | 2,700 | | | 1,485,000 |
| | | | | | | | | | | |
|
|
| | | | | | | | | | | | | 2,578,650 |
| | | | | | | | | | | |
|
|
Media & Entertainment — 0.2% | | | | | | | | | | | | |
Idearc, Inc., Bank Loan(j) | | B2 | | 1.97% | | 11/17/13 | | | 1,000 | | | 325,000 |
Idearc, Inc., Bank Loan(j) | | B2 | | 3.575% | | 11/17/14 | | | 473 | | | 144,126 |
News America Holdings, Inc., Gtd. Notes | | Baa1 | | 7.625% | | 11/30/28 | | | 1,265 | | | 1,268,818 |
Time Warner, Inc., Gtd. Notes | | Baa2 | | 6.75% | | 04/15/11 | | | 725 | | | 707,871 |
Time Warner, Inc., Gtd. Notes | | Baa2 | | 7.25% | | 10/15/17 | | | 745 | | | 683,772 |
Time Warner, Inc., Sr. Unsec’d. Notes | | Baa2 | | 9.15% | | 02/01/23 | | | 625 | | | 666,564 |
Viacom, Inc., Sr. Unsec’d. Notes | | Baa3 | | 6.75% | | 10/05/37 | | | 290 | | | 223,527 |
Viacom, Inc., Sr. Unsec’d. Notes | | Baa3 | | 6.875% | | 04/30/36 | | | 580 | | | 458,361 |
| | | | | | | | | | | |
|
|
| | | | | | | | | | | | | 4,478,039 |
| | | | | | | | | | | |
|
|
Metals — 0.1% | | | | | | | | | | | | |
Alcan, Inc. (Canada), Sr. Unsec’d. Notes | | BBB(d) | | 4.50% | | 05/15/13 | | | 255 | | | 186,934 |
Alcan, Inc. (Canada), Sr. Unsec’d. Notes | | BBB(d) | | 5.00% | | 06/01/15 | | | 755 | | | 559,055 |
Alcoa, Inc., Sr. Unsec’d. Notes | | Baa1 | | 5.90% | | 02/01/27 | | | 70 | | | 46,045 |
Rio Tinto Finance USA Ltd., Gtd. Notes | | Baa1 | | 5.875% | | 07/15/13 | | | 500 | | | 398,257 |
Southern Copper Corp., Sr. Unsec’d. Notes | | Baa2 | | 7.50% | | 07/27/35 | | | 120 | | | 89,784 |
United States Steel Corp., Sub. Notes | | Baa3 | | 5.65% | | 06/01/13 | | | 540 | | | 403,899 |
| | | | | | | | | | | |
|
|
| | | | | | | | | | | | | 1,683,974 |
| | | | | | | | | | | |
|
|
Mortgage Backed Securities — 19.4% | | | | | | | | | | | | |
Federal Home Loan Mortgage Corp. | | | | 4.50% | | 02/01/19-07/01/20 | | | 6,429 | | | 6,598,175 |
Federal Home Loan Mortgage Corp. | | | | 5.00% | | 07/01/18-05/01/34 | | | 11,658 | | | 11,998,276 |
Federal Home Loan Mortgage Corp. | | | | 5.00% | | TBA 30 YR | | | 2,500 | | | 2,554,688 |
Federal Home Loan Mortgage Corp.(g) | | | | 5.222% | | 12/01/35 | | | 3,099 | | | 3,147,534 |
Federal Home Loan Mortgage Corp.(g) | | | | 5.525% | | 06/01/36 | | | 2,926 | | | 2,979,118 |
Federal Home Loan Mortgage Corp. | | | | 5.50% | | 12/01/33-05/01/38 | | | 13,732 | | | 14,081,375 |
Federal Home Loan Mortgage Corp. | | | | 5.50% | | TBA 30 YR | | | 36,500 | | | 37,355,487 |
Federal Home Loan Mortgage Corp. | | | | 6.00% | | 03/01/32-12/01/33 | | | 3,020 | | | 3,128,362 |
Federal Home Loan Mortgage Corp. | | | | 6.50% | | 12/01/14-09/01/16 | | | 387 | | | 402,009 |
Federal Home Loan Mortgage Corp. | | | | 7.00% | | 05/01/31-09/01/33 | | | 4,722 | | | 4,962,526 |
Federal National Mortgage Association | | | | 4.00% | | 06/01/19 | | | 2,274 | | | 2,311,760 |
Federal National Mortgage Association(g) | | | | 4.142% | | 07/01/33 | | | 1,004 | | | 1,010,185 |
Federal National Mortgage Association | | | | 4.50% | | 11/01/18-01/01/35 | | | 14,811 | | | 15,165,378 |
Federal National Mortgage Association | | | | 5.00% | | 10/01/18-05/01/38 | | | 17,914 | | | 18,343,841 |
Federal National Mortgage Association | | | | 5.00% | | TBA 30 YR | | | 50,000 | | | 51,046,899 |
Federal National Mortgage Association | | | | 5.50% | | 03/01/16-01/01/38 | | | 55,472 | | | 57,004,060 |
Federal National Mortgage Association | | | | 5.50% | | TBA 15 YR | | | 2,000 | | | 2,059,376 |
Federal National Mortgage Association | | | | 5.50% | | TBA 30 YR | | | 14,250 | | | 14,606,250 |
Federal National Mortgage Association(g) | | | | 5.894% | | 06/01/37 | | | 5,974 | | | 6,146,895 |
Federal National Mortgage Association(g) | | | | 5.95% | | 07/01/37 | | | 4,829 | | | 4,966,699 |
Federal National Mortgage Association | | | | 6.00% | | 04/01/13-08/01/38 | | | 29,891 | | | 30,876,338 |
Federal National Mortgage Association | | | | 6.00% | | TBA 30 YR | | | 44,500 | | | 45,807,188 |
Federal National Mortgage Association | | | | 6.50% | | 07/01/17-01/01/37 | | | 10,792 | | | 11,233,993 |
Federal National Mortgage Association | | | | 7.00% | | 08/01/11-07/01/32 | | | 981 | | | 1,035,945 |
Federal National Mortgage Association | | | | 7.50% | | 05/01/12-05/01/32 | | | 759 | | | 798,167 |
Government National Mortgage Association | | | | 5.50% | | 08/15/33-04/15/36 | | | 9,849 | | | 10,173,378 |
Government National Mortgage Association | | | | 6.00% | | 11/15/23-03/15/37 | | | 5,392 | | | 5,573,216 |
Government National Mortgage Association | | | | 6.00% | | TBA 30 YR | | | 7,000 | | | 7,220,934 |
Government National Mortgage Association | | | | 6.50% | | 10/15/23-09/15/36 | | | 5,940 | | | 6,224,617 |
Government National Mortgage Association | | | | 7.00% | | 09/15/31 | | | 146 | | | 154,640 |
Government National Mortgage Association | | | | 8.00% | | 01/15/24-04/15/25 | | | 146 | | | 155,049 |
| | | | | | | | | | | |
|
|
| | | | | | | | | | | | | 379,122,358 |
| | | | | | | | | | | |
|
|
SEE NOTES TO FINANCIAL STATEMENTS.
A13
| | | | | | |
| | | CONSERVATIVE BALANCED PORTFOLIO (continued) | | |
| |
| SCHEDULE OF INVESTMENTS | | December 31, 2008 |
| | | | | | | | | | | | |
LONG-TERM BONDS
(continued) | | Moody’s
Rating*
(Unaudited)
| | Interest
Rate
| | Maturity
Date
| | Principal
Amount
(000)
| | Value
(Note 2)
|
| | | | | | | | | | | | | |
Non Captive Finance — 0.6% | | | | | | | | | | | | |
Capital One Bank, Sr. Sub. Notes | | A3 | | 6.50% | | 06/13/13 | | $ | 10 | | $ | 8,911 |
Capital One Financial Corp., Sr. Unsec’d. Notes, M.T.N. | | A3 | | 5.70% | | 09/15/11 | | | 570 | | | 531,528 |
CIT Group, Inc., Sr. Unsec’d. Notes | | Baa1 | | 4.25% | | 02/01/10 | | | 195 | | | 178,771 |
Countrywide Financial Corp., Gtd. Notes, M.T.N. | | Aa2 | | 5.80% | | 06/07/12 | | | 1,160 | | | 1,130,597 |
General Electric Capital Corp., Sr. Unsec’d. Notes, M.T.N.(c) | | Aaa | | 5.55% | | 05/04/20 | | | 1,875 | | | 1,792,742 |
General Electric Capital Corp., Sr. Unsec’d. Notes, M.T.N.(b) | | Aaa | | 5.875% | | 01/14/38 | | | 970 | | | 949,494 |
Household Finance Corp., Sr. Unsec’d. Notes | | Aa3 | | 4.75% | | 05/15/09 | | | 370 | | | 369,862 |
HSBC Finance Corp., Sr. Unsec’d. Notes | | Aa3 | | 5.70% | | 06/01/11 | | | 585 | | | 570,484 |
International Lease Finance Corp., Sr. Unsec’d. Notes | | Baa1 | | 3.50% | | 04/01/09 | | | 750 | | | 712,130 |
International Lease Finance Corp., Sr. Unsec’d. Notes(b) | | Baa1 | | 6.375% | | 03/25/13 | | | 1,750 | | | 1,188,768 |
SLM Corp., Sr. Unsec’d. Notes, M.T.N. | | Baa2 | | 8.45% | | 06/15/18 | | | 4,725 | | | 3,735,685 |
| | | | | | | | | | | |
|
|
| | | | | | | | | | | | | 11,168,972 |
| | | | | | | | | | | |
|
|
Paper — 0.1% | | | | | | | | | | | | |
Domtar Corp., Bank Loan(j) | | Baa3 | | 3.251% | | 03/05/14 | | | 952 | | | 636,508 |
Plum Creek Timberlands LP, Gtd. Notes | | Baa3 | | 5.875% | | 11/15/15 | | | 515 | | | 420,631 |
| | | | | | | | | | | |
|
|
| | | | | | | | | | | | | 1,057,139 |
| | | | | | | | | | | |
|
|
Pipelines & Other — 0.5% | | | | | | | | | | | | |
Atmos Energy Corp., Sr. Unsec’d. Notes | | Baa3 | | 4.00% | | 10/15/09 | | | 1,815 | | | 1,777,584 |
Duke Energy Field Services Corp., Sr. Unsec’d. Notes | | Baa2 | | 7.875% | | 08/16/10 | | | 1,830 | | | 1,799,104 |
Enterprise GP Holdings LP, Bank Loan(j) | | Ba2 | | 5.357% | | 11/08/14 | | | 1,000 | | | 810,000 |
Enterprise Products Operating LP, Gtd. Notes | | Baa3 | | 4.625% | | 10/15/09 | | | 710 | | | 687,664 |
Enterprise Products Operating LP, Gtd. Notes | | Baa3 | | 6.875% | | 03/01/33 | | | 140 | | | 107,318 |
ONEOK Partners LP, Gtd. Notes | | Baa2 | | 6.65% | | 10/01/36 | | | 405 | | | 313,804 |
Sempra Energy, Sr. Unsec’d. Notes | | Baa1 | | 6.00% | | 02/01/13 | | | 80 | | | 76,804 |
Spectra Energy Capital LLC, Gtd. Notes | | Baa1 | | 6.20% | | 04/15/18 | | | 3,310 | | | 2,872,253 |
Spectra Energy Capital LLC, Sr. Unsec’d. Notes | | Baa1 | | 6.25% | | 02/15/13 | | | 205 | | | 195,056 |
TransCanada Pipelines Ltd., Sr. Unsec’d. Notes | | A3 | | 7.25% | | 08/15/38 | | | 420 | | | 418,077 |
| | | | | | | | | | | |
|
|
| | | | | | | | | | | | | 9,057,664 |
| | | | | | | | | | | |
|
|
Railroads — 0.2% | | | | | | | | | | | | |
Burlington Northern Santa Fe Corp., Sr. Unsec’d. Notes | | Baa1 | | 6.70% | | 08/01/28 | | | 735 | | | 719,294 |
CSX Corp. , Sr. Unsec’d. Notes | | Baa3 | | 6.15% | | 05/01/37 | | | 690 | | | 552,146 |
Norfolk Southern Corp., Sr. Unsec’d. Notes | | Baa1 | | 5.59% | | 05/17/25 | | | 630 | | | 564,673 |
Norfolk Southern Corp., Sr. Unsec’d. Notes | | Baa1 | | 7.80% | | 05/15/27 | | | 24 | | | 26,173 |
Union Pacific Corp., Sr. Unsec’d. Notes | | Baa2 | | 3.625% | | 06/01/10 | | | 1,395 | | | 1,382,826 |
Union Pacific Corp., Sr. Unsec’d. Notes | | Baa2 | | 6.65% | | 01/15/11 | | | 760 | | | 757,348 |
| | | | | | | | | | | |
|
|
| | | | | | | | | | | | | 4,002,460 |
| | | | | | | | | | | |
|
|
Real Estate Investments Trusts — 0.3% | | | | | | | | | | | | |
Brandywine Operating Partnership LP, Gtd. Notes | | Baa3 | | 5.75% | | 04/01/12 | | | 1,405 | | | 1,053,369 |
Mack-Cali Realty Corp., Sr. Unsec’d. Notes | | Baa2 | | 7.25% | | 03/15/09 | | | 1,595 | | | 1,575,799 |
Post Apartment Homes LP, Sr. Unsec’d. Notes | | Baa3 | | 5.45% | | 06/01/12 | | | 545 | | | 444,091 |
Post Apartment Homes LP, Sr. Unsec’d. Notes | | Baa3 | | 6.30% | | 06/01/13 | | | 650 | | | 523,482 |
Simon Property Group LP, Sr. Unsec’d. Notes | | A3 | | 5.75% | | 05/01/12 | | | 1,625 | | | 1,299,010 |
Simon Property Group LP, Sr. Unsec’d. Notes | | A3 | | 6.125% | | 05/30/18 | | | 2,700 | | | 1,824,396 |
| | | | | | | | | | | |
|
|
| | | | | | | | | | | | | 6,720,147 |
| | | | | | | | | | | |
|
|
Retailers — 0.4% | | | | | | | | | | | | |
CVS Caremark Corp., Sr. Unsec’d. Notes | | Baa2 | | 5.75% | | 08/15/11 | | | 1,240 | | | 1,244,288 |
CVS Caremark Corp., Sr. Unsec’d. Notes | | Baa2 | | 5.75% | | 06/01/17 | | | 1,580 | | | 1,487,521 |
Federated Retail Holdings, Inc., Gtd. Notes | | Baa3 | | 5.35% | | 03/15/12 | | | 815 | | | 605,360 |
Federated Retail Holdings, Inc., Gtd. Notes | | Baa3 | | 5.90% | | 12/01/16 | | | 100 | | | 60,711 |
Home Depot, Inc., Sr. Unsec’d. Notes | | Baa1 | | 5.875% | | 12/16/36 | | | 315 | | | 246,992 |
May Department Stores Co., Gtd. Notes | | Baa3 | | 6.65% | | 07/15/24 | | | 60 | | | 32,934 |
Nordstrom, Inc., Sr. Unsec’d. Notes | | Baa1 | | 6.25% | | 01/15/18 | | | 4,500 | | | 3,160,732 |
Target Corp., Sr. Unsec’d. Notes | | A2 | | 7.00% | | 01/15/38 | | | 1,475 | | | 1,367,023 |
Wal-Mart Stores, Inc., Sr. Unsec’d. Notes | | Aa2 | | 5.25% | | 09/01/35 | | | 235 | | | 233,981 |
| | | | | | | | | | | |
|
|
| | | | | | | | | | | | | 8,439,542 |
| | | | | | | | | | | |
|
|
SEE NOTES TO FINANCIAL STATEMENTS.
A14
| | | | | | |
| | | CONSERVATIVE BALANCED PORTFOLIO (continued) | | |
| |
| SCHEDULE OF INVESTMENTS | | December 31, 2008 |
| | | | | | | | | | | | |
LONG-TERM BONDS
(continued) | | Moody’s
Rating*
(Unaudited)
| | Interest
Rate
| | Maturity
Date
| | Principal
Amount
(000)
| | Value
(Note 2)
|
| | | | | | | | | | | | | |
Structured Notes — 0.1% | | | | | | | | | | | | |
CDX North America High Yield, Sec’d. Notes, Series 10-T, 144A | | B3 | | 8.875% | | 06/29/13 | | $ | 2,200 | | $ | 1,980,000 |
| | | | | | | | | | | |
|
|
Technology — 0.5% | | | | | | | | | | | | |
Computer Sciences Corp., Sr. Unsec’d. Notes, 144A | | Baa1 | | 6.50% | | 03/15/18 | | | 1,700 | | | 1,464,423 |
Dell, Inc., Sr. Unsec’d. Notes | | A2 | | 4.70% | | 04/15/13 | | | 1,565 | | | 1,472,279 |
Electronic Data Systems Corp., Sr. Unsec’d. Notes | | A2 | | 7.45% | | 10/15/29 | | | 120 | | | 129,998 |
First Data Corp., Bank Loan(j) | | Ba3 | | 3.211% | | 09/24/14 | | | 1,086 | | | 694,812 |
First Data Corp., Bank Loan(j) | | Ba3 | | 3.211% | | 09/24/14 | | | 1,481 | | | 947,471 |
Fiserv, Inc., Gtd. Notes | | Baa2 | | 6.125% | | 11/20/12 | | | 960 | | | 901,954 |
Flextronics International Ltd. (Singapore), Bank Loan(j) | | Ba1 | | 6.155% | | 10/01/14 | | | 767 | | | 480,701 |
Flextronics International Ltd. (Singapore), Bank Loan(j) | | Ba1 | | 7.069% | | 10/01/14 | | | 220 | | | 138,133 |
Intuit, Inc., Sr. Unsec’d. Notes | | Baa2 | | 5.40% | | 03/15/12 | | | 575 | | | 522,549 |
Jabil Circuit, Inc., Sr. Unsec’d. Notes | | Ba1 | | 5.875% | | 07/15/10 | | | 1,800 | | | 1,646,999 |
Metavante Corp., Bank Loan(j) | | Ba2 | | 4.942% | | 11/01/14 | | | 993 | | | 734,450 |
Motorola, Inc., Sr. Unsec’d. Notes | | Baa2 | | 8.00% | | 11/01/11 | | | 48 | | | 40,055 |
Oracle Corp., Sr. Unsec’d. Notes | | A2 | | 6.50% | | 04/15/38 | | | 620 | | | 682,595 |
| | | | | | | | | | | |
|
|
| | | | | | | | | | | | | 9,856,419 |
| | | | | | | | | | | |
|
|
Telecommunications — 1.4% | | | | | | | | | | | | |
America Movil SA de CV (Mexico), Gtd. Notes | | A3 | | 6.375% | | 03/01/35 | | | 630 | | | 534,247 |
AT&T Corp., Gtd. Notes(c) | | A2 | | 8.00% | | 11/15/31 | | | 1,400 | | | 1,758,589 |
AT&T Wireless Services, Inc., Sr. Unsec’d. Notes | | A2 | | 8.125% | | 05/01/12 | | | 800 | | | 857,895 |
AT&T Wireless Services, Inc., Sr. Unsec’d. Notes | | A2 | | 8.75% | | 03/01/31 | | | 1,235 | | | 1,543,856 |
BellSouth Corp., Sr. Unsec’d. Notes | | A2 | | 4.20% | | 09/15/09 | | | 1,365 | | | 1,370,355 |
British Telecommunications PLC (United Kingdom), Sr. Unsec’d. Notes | | Baa1 | | 9.125% | | 12/15/30 | | | 1,415 | | | 1,504,063 |
Cingular Wireless LLC, Sr. Unsec’d. Notes | | A2 | | 7.125% | | 12/15/31 | | | 535 | | | 562,264 |
Deutsche Telekom International Finance BV (Netherlands), Gtd. Notes | | Baa1 | | 8.75% | | 06/15/30 | | | 345 | | | 425,434 |
Embarq Corp., Sr. Unsec’d. Notes | | Baa3 | | 7.082% | | 06/01/16 | | | 350 | | | 269,500 |
Embarq Corp., Sr. Unsec’d. Notes | | Baa3 | | 7.995% | | 06/01/36 | | | 1,645 | | | 1,110,375 |
France Telecom SA (France), Sr. Unsec’d. Notes | | A3 | | 8.50% | | 03/01/31 | | | 360 | | | 451,977 |
PCCW HKT Capital Ltd., Gtd. Notes, 144A | | Baa2 | | 8.00% | | 11/15/11 | | | 2,275 | | | 2,222,584 |
Qwest Capital Funding, Inc., Gtd. Notes | | B1 | | 7.00% | | 08/03/09 | | | 2,000 | | | 1,960,000 |
Qwest Capital Funding, Inc., Sr. Unsec’d. Notes | | Ba1 | | 8.875% | | 03/15/12 | | | 2,000 | | | 1,850,000 |
Rogers Communications, Inc. , Gtd. Notes | | Baa3 | | 6.80% | | 08/15/18 | | | 1,120 | | | 1,131,683 |
Royal KPN NV (Netherlands), Sr. Unsec’d. Notes | | Baa2 | | 8.00% | | 10/01/10 | | | 645 | | | 650,936 |
SBC Communications, Inc., Sr. Unsec’d. Notes | | A2 | | 4.125% | | 09/15/09 | | | 1,335 | | | 1,340,470 |
SBC Communications, Inc., Sr. Unsec’d. Notes | | A2 | | 5.30% | | 11/15/10 | | | 1,180 | | | 1,199,443 |
Telecom Italia Capital SA, Gtd. Notes | | Baa2 | | 6.999% | | 06/04/18 | | | 1,000 | | | 811,250 |
Telecom Italia Finance (Luxembourg), Gtd. Notes | | Baa2 | | 5.25% | | 11/15/13 | | | 170 | | | 129,625 |
Telefonica Emisiones SAU (Spain), Gtd. Notes | | Baa1 | | 7.045% | | 06/20/36 | | | 210 | | | 229,222 |
TELUS Corp. (Cananda), Sr. Unsec’d. Notes | | Baa1 | | 8.00% | | 06/01/11 | | | 1,500 | | | 1,491,882 |
US Cellular Corp., Sr. Unsec’d. Notes | | Baa2 | | 6.70% | | 12/15/33 | | | 255 | | | 183,778 |
Verizon Communications, Inc., Sr. Unsec’d. Notes(b) | | A3 | | 6.10% | | 04/15/18 | | | 3,500 | | | 3,487,368 |
Verizon Communications, Inc., Sr. Unsec’d. Notes | | A3 | | 6.25% | | 04/01/37 | | | 105 | | | 108,728 |
Vodafone Group PLC (United Kingdom), Sr. Unsec’d. Notes | | Baa1 | | 7.75% | | 02/15/10 | | | 950 | | | 970,914 |
| | | | | | | | | | | |
|
|
| | | | | | | | | | | | | 28,156,438 |
| | | | | | | | | | | |
|
|
Tobacco — 0.2% | | | | | | | | | | | | |
Altria Group, Inc., Gtd. Notes | | Baa1 | | 9.70% | | 11/10/18 | | | 1,315 | | | 1,421,292 |
Philip Morris International, Inc., Sr. Unsec’d. Notes | | A2 | | 4.875% | | 05/16/13 | | | 830 | | | 832,375 |
Reynolds American, Inc., Sr. Sec’d. Notes | | Baa3 | | 6.75% | | 06/15/17 | | | 910 | | | 722,345 |
Reynolds American, Inc., Sr. Sec’d. Notes | | Baa3 | | 7.25% | | 06/15/37 | | | 345 | | | 232,312 |
| | | | | | | | | | | |
|
|
| | | | | | | | | | | | | 3,208,324 |
| | | | | | | | | | | |
|
|
U.S. Government Agency Obligations — 2.9% | | | | | | | | | | | | |
Federal Farm Credit Bank | | | | 3.875% | | 10/07/13 | | | 2,480 | | | 2,635,878 |
Federal Farm Credit Bank | | | | 4.75% | | 05/07/10 | | | 280 | | | 294,637 |
Federal Farm Credit Bank | | | | 4.875% | | 01/17/17 | | | 845 | | | 952,274 |
Federal Home Loan Bank | | | | 4.75% | | 04/24/09 | | | 3,655 | | | 3,705,406 |
SEE NOTES TO FINANCIAL STATEMENTS.
A15
| | | | | | |
| | | CONSERVATIVE BALANCED PORTFOLIO (continued) | | |
| |
| SCHEDULE OF INVESTMENTS | | December 31, 2008 |
| | | | | | | | | | |
LONG-TERM BONDS
(continued) | | Interest
Rate
| | Maturity
Date
| | Principal
Amount
(000)
| | Value
(Note 2)
|
| | | | | | | | | | | |
U.S. Government Agency Obligations (continued) | | | | | | | | | | |
Federal Home Loan Bank | | 5.00% | | 11/17/17 | | $ | 800 | | $ | 917,199 |
Federal Home Loan Bank | | 5.625% | | 06/11/21 | | | 2,320 | | | 2,673,232 |
Federal Home Loan Bank | | 5.75% | | 05/15/12 | | | 6,915 | | | 7,754,115 |
Federal Home Loan Mortgage Corp. | | 4.125% | | 09/27/13 | | | 2,325 | | | 2,505,250 |
Federal Home Loan Mortgage Corp.(b) | | 4.875% | | 06/13/18 | | | 1,015 | | | 1,166,529 |
Federal Home Loan Mortgage Corp. | | 5.25% | | 07/18/11-04/18/16 | | | 5,610 | | | 6,257,858 |
Federal National Mortgage Association | | 2.875% | | 12/11/13 | | | 8,175 | | | 8,373,432 |
Federal National Mortgage Association | | 3.625% | | 08/15/11 | | | 8,125 | | | 8,611,662 |
Federal National Mortgage Association | | 4.875% | | 05/18/12 | | | 500 | | | 544,485 |
Federal National Mortgage Association | | 6.125% | | 03/15/12 | | | 1,220 | | | 1,385,638 |
General Electric Capital Corp., FDIC Gtd. Notes. | | 3.00% | | 12/09/11 | | | 7,690 | | | 7,950,307 |
Tennessee Valley Authority, Notes | | 4.50% | | 04/01/18 | | | 1,390 | | | 1,533,447 |
Tennessee Valley Authority, Series B | | 5.88% | | 04/01/36 | | | 85 | | | 109,446 |
| | | | | | | | | |
|
|
| | | | | | | | | | | 57,370,795 |
| | | | | | | | | |
|
|
U.S. Treasury Securities — 5.4% | | | | | | | | | | |
United States Treasury Bonds(b) | | 4.375% | | 02/15/38 | | | 1,005 | | | 1,346,072 |
United States Treasury Bonds | | 4.50% | | 05/15/38 | | | 1,990 | | | 2,716,040 |
United States Treasury Bonds | | 6.00% | | 02/15/26 | | | 370 | | | 516,381 |
United States Treasury Bonds | | 6.125% | | 08/15/29 | | | 315 | | | 462,361 |
United States Treasury Bonds(b) | | 6.25% | | 08/15/23 | | | 10,640 | | | 14,511,961 |
United States Treasury Bonds(b) | | 7.50% | | 11/15/16 | | | 3,110 | | | 4,246,120 |
United States Treasury Bonds | | 7.875% | | 02/15/21 | | | 1,900 | | | 2,823,875 |
United States Treasury Bonds(c) | | 8.125% | | 05/15/21-08/15/21 | | | 2,395 | | | 3,634,765 |
United States Treasury Bonds(b) | | 8.875% | | 08/15/17 | | | 3,350 | | | 4,987,051 |
United States Treasury Inflation Index | | 0.63% | | 04/15/13 | | | 430 | | | 411,586 |
United States Treasury Inflation Index | | 0.88% | | 04/15/10 | | | 1,475 | | | 1,386,463 |
United States Treasury Inflation Index | | 1.375% | | 07/15/18 | | | 1,678 | | | 1,569,119 |
United States Treasury Inflation Index | | 1.625% | | 01/15/15-01/15/18 | | | 1,835 | | | 1,715,745 |
United States Treasury Inflation Index | | 1.75% | | 01/15/28 | | | 626 | | | 578,035 |
United States Treasury Inflation Index(b) | | 1.875% | | 07/15/13-07/15/15 | | | 4,282 | | | 4,034,291 |
United States Treasury Inflation Index(b) | | 2.00% | | 04/15/12-01/15/26 | | | 11,151 | | | 10,584,098 |
United States Treasury Inflation Index | | 2.375% | | 04/15/11-01/15/27 | | | 3,504 | | | 3,460,683 |
United States Treasury Inflation Index | | 2.50% | | 07/15/16 | | | 858 | | | 851,428 |
United States Treasury Inflation Index | | 2.625% | | 07/15/17 | | | 674 | | | 690,916 |
United States Treasury Inflation Index | | 3.00% | | 07/15/12 | | | 1,379 | | | 1,352,003 |
United States Treasury Inflation Index | | 3.375% | | 01/15/12-04/15/32 | | | 604 | | | 655,550 |
United States Treasury Inflation Index | | 3.50% | | 01/15/11 | | | 492 | | | 482,576 |
United States Treasury Inflation Index | | 3.625% | | 04/15/28 | | | 830 | | | 989,356 |
United States Treasury Inflation Index | | 3.875% | | 04/15/29 | | | 922 | | | 1,139,345 |
United States Treasury Inflation Index | | 4.25% | | 01/15/10 | | | 522 | | | 512,176 |
United States Treasury Notes | | 1.50% | | 12/31/13 | | | 11,100 | | | 11,074,847 |
United States Treasury Notes | | 3.75% | | 11/15/18 | | | 509 | | | 575,637 |
United States Treasury Notes | | 4.00% | | 09/30/09 | | | 405 | | | 415,916 |
United States Treasury Strips(b)(f) | | 3.01% | | 02/15/19 | | | 2,345 | | | 1,737,019 |
United States Treasury Strips(f) | | 3.13% | | 08/15/19 | | | 1,630 | | | 1,175,031 |
United States Treasury Strips(b)(f) | | 3.81% | | 02/15/20 | | | 10,100 | | | 7,062,051 |
United States Treasury Strips(b)(f) | | 3.94% | | 05/15/20 | | | 17,395 | | | 11,961,881 |
United States Treasury Strips(f) | | 4.18% | | 02/15/23 | | | 1,495 | | | 935,148 |
United States Treasury Strips(b)(f) | | 4.21% | | 11/15/21 | | | 4,775 | | | 3,095,809 |
United States Treasury Strips(f) | | 4.25% | | 08/15/29 | | | 4,455 | | | 2,358,000 |
| | | | | | | | | |
|
|
| | | | | | | | | | | 106,049,335 |
| | | | | | | | | |
|
|
TOTAL LONG-TERM BONDS
(cost $950,120,223) | | | 901,856,419 |
| | | | | | | | | |
|
|
TOTAL LONG-TERM INVESTMENTS
(cost $1,894,051,924) | | | 1,797,211,331 |
| | | | | | | | | |
|
|
SEE NOTES TO FINANCIAL STATEMENTS.
A16
| | | | | | |
| | | CONSERVATIVE BALANCED PORTFOLIO (continued) | | |
| |
| SCHEDULE OF INVESTMENTS | | December 31, 2008 |
| | | | | | | | | | | |
| SHORT-TERM INVESTMENTS — 23.0% | | Interest
Rate
| | Maturity
Date
| | Principal
Amount
(000)
| | Value
(Note 2)
| |
U.S. Treasury Security — 0.5% | | | | | | | | | | | |
United States Treasury Bill(k)
(cost $9,045,953) | | 0.10% | | 06/11/09 | | $ | 9,050 | | $ | 9,044,688 | |
| | | | | | | | | |
|
|
|
| | | | |
| | | | | | | Shares
| | | |
Affiliated Mutual Funds — 22.5% | | | | | | | | | | | |
Dryden Core Investment Fund — Short-Term Bond Series (Note 4)(i) | | | 14,895,019 | | | 109,627,339 | |
Dryden Core Investment Fund — Taxable Money Market Series
(includes $143,440,658 of cash collateral received for securities on loan) (Note 4)(h)(i) | | | 331,002,077 | | | 331,002,077 | |
| | | | | | | | | |
|
|
|
TOTAL AFFILIATED MUTUAL FUNDS
(cost $478,766,482) | | | 440,629,416 | |
| | | | | | | | | |
|
|
|
TOTAL SHORT-TERM INVESTMENTS
(cost $487,812,435) | | | 449,674,104 | |
| | | | | | | | | |
|
|
|
TOTAL INVESTMENTS(o) — 114.8%
(cost $2,381,864,359) | | | 2,246,885,435 | |
LIABILITIES IN EXCESS OF OTHER ASSETS(p) — (14.8)% | | | (289,359,804 | ) |
| | | | | | | | | |
|
|
|
NET ASSETS — 100.0% | | $ | 1,957,525,631 | |
| | | | | | | | | |
|
|
|
The following abbreviations are used in portfolio descriptions:
| | |
| 144A | | Security was purchased pursuant to Rule 144A under the Securities Act of 1933 and may not be resold subject to that rule except to qualified institutional buyers. Unless otherwise noted, 144A securities are deemed to be liquid. |
| I/O | | Interest Only |
| M.T.N. | | Medium Term Note |
| NR | | Not Rated by Moody’s or Standard & Poor |
| TBA | | To Be Announced |
| * | The ratings reflected are as of December 31, 2008. Ratings of certain bonds may have changed subsequent to that date. |
| (a) | Non-income producing security. |
| (b) | All or portion of security is on loan. The aggregate market value of such securities is $138,390,357; cash collateral of $143,440,658 (included in liabilities) was received with which the Portfolio purchased highly liquid short-term investments. |
| (c) | Security segregated as collateral for futures contracts. |
| (d) | Standard & Poor’s rating. |
| (e) | Increase/decrease in rate variable upon increase/decrease in Moody’s or Standard & Poor’s rating. |
| (f) | Represents zero coupon bond. Rate shown reflects the effective yield at reporting date. |
| (g) | Indicates a variable rate security. The maturity date presented for these instruments is the latter of the next date on which the security can be redeemed at par or the next date on which the rate of interest is adjusted. The interest rate shown reflects the rate in effect at December 31, 2008. |
| (h) | Represents security, or a portion thereof, purchased with cash collateral for securities on loan. |
| (i) | Prudential Investments LLC, the manager of the Portfolio, also serves as manager of the Dryden Core Investment Fund-Taxable Money Market Series and Dryden Core Investment Fund—Short-Term Bond Series. |
| (j) | Indicates a security that has been deemed illiquid. |
| (k) | Rate quoted represents yield-to-maturity as of purchase date. |
| (l) | Represents issuer in default on interest payments and/or principal repayment; non income producing security. |
| (o) | As of December 31, 2008, 2 securities representing $298 and 0.0% of net assets were fair valued in accordance with the policies adopted by the Board of Trustees. |
SEE NOTES TO FINANCIAL STATEMENTS.
A17
| | | | | | |
| | | CONSERVATIVE BALANCED PORTFOLIO (continued) | | |
| |
| SCHEDULE OF INVESTMENTS | | December 31, 2008 |
| (p) | Liabilities in excess of other assets include unrealized appreciation (depreciation) on financial futures, credit default swaps and interest rate swaps as follows: |
Open futures contracts outstanding at December 31, 2008:
| | | | | | | | | | | | | |
Number of
Contracts
| | Type
| | Expiration
Date
| | Value at
Trade Date
| | Value at
December 31, 2008
| | Unrealized
Appreciation
|
| Long Positions: | | | | | | | | | | | | | |
| 344 | | S&P 500 Index | | Mar. 2009 | | $ | 77,098,250 | | $ | 77,408,600 | | $ | 310,350 |
| 45 | | U.S. Treasury 2 Yr. Notes | | Mar. 2009 | | | 9,754,958 | | | 9,812,813 | | | 57,855 |
| 447 | | U.S. Treasury 5 Yr. Notes | | Mar. 2009 | | | 52,174,324 | | | 53,217,445 | | | 1,043,121 |
| 126 | | U.S. Treasury 10 Yr. Notes | | Mar. 2009 | | | 14,834,137 | | | 15,844,500 | | | 1,010,363 |
| 87 | | U.S. Treasury 30 Yr. Bond | | Mar. 2009 | | | 11,358,183 | | | 12,010,078 | | | 651,895 |
| | | | | | | | | | | | |
|
|
| | | | | | | | | | | | | $ | 3,073,584 |
| | | | | | | | | | | | |
|
|
Credit default swap agreements outstanding at December 31, 2008:
| | | | | | | | | | | | | |
Counterparty
| | Termination
Date
| | Notional
Amount
(000)#(4)
| | Fixed
Rate
| | Reference Entity/Obligation
| | Unrealized
Appreciation/
(Depreciation)
| |
Buy Protection(1): | | | | | | |
Citibank NA | | 09/20/2012 | | $ | 3,200 | | 0.32% | | Altria Group, Inc.,
7.00%, 11/04/13 | | $ | 114,248 | |
Barclays Bank PLC | | 09/20/2012 | | | 2,800 | | 0.595% | | Fortune Brands, Inc.,
5.375%, 01/15/16 | | | 129,315 | |
Deutsche Bank AG | | 06/20/2013 | | | 1,750 | | 2.00% | | International Lease Finance Corp.,
4.15%, 01/15/10 | | | 343,295 | |
JPMorgan Chase Bank | | 06/20/2014 | | | 1,110 | | 0.65% | | Bunge Ltd. Finance Corp.,
5.35%, 04/15/14 | | | 248,050 | |
Merrill Lynch Capital Services | | 09/20/2016 | | | 785 | | 1.73% | | Tyson Foods, Inc.,
6.6%, 04/01/16 | | | 113,682 | |
Morgan Stanley Capital Services, Inc. | | 03/20/2018 | | | 1,400 | | 0.70% | | Avon Products, Inc.,
7.15%, 11/15/09 | | | 30,340 | |
Barclays Bank PLC | | 03/20/2018 | | | 1,700 | | 1.22% | | Computer Sciences Corp.,
5.0%, 02/15/13 | | | (22,171 | ) |
Morgan Stanley Capital Services, Inc. | | 06/20/2018 | | | 1,600 | | 1.00% | | Newell Rubbermaid, Inc.,
6.35%, 07/15/28 | | | 101,088 | |
Citibank NA | | 03/25/2035 | | | 523 | | 3.00% | | Centex Home Equity,
6.215%, 03/25/35 | | | 250,826 | |
Citibank NA | | 01/25/2035 | | | 506 | | 3.00% | | Morgan Stanley ABS Capital I,
6.765%, 01/25/35 | | | 316,016 | |
Barclays Bank PLC | | 09/25/2035 | | | 1,000 | | 3.35% | | Accredited Mortgage Loan Trust,
7.02%, 09/25/35 | | | 935,634 | |
Merrill Lynch Capital Services, Inc. | | 03/25/2036 | | | 1,000 | | 3.72% | | AmeriQuest Mortgage Securities Inc.,
7.82%, 3/25/36 | | | 959,705 | |
Merrill Lynch Capital Services, Inc. | | 06/20/2018 | | | 1,800 | | 3.05% | | SLM Corp.
5.125%, 8/27/12 | | | 333,711 | |
Goldman Sachs International | | 09/20/2013 | | | 1,200 | | 1.02% | | Anheuser-Busch Cos., Inc.
5.525%, 10/1/10 | | | 53,475 | |
Deutsche Bank AG | | 03/20/2018 | | | 4,500 | | 0.99% | | Nordstrom, Inc.
6.95%, 3/15/26 | | | 995,637 | |
Morgan Stanley Capital Services, Inc. | | 06/20/2018 | | | 2,700 | | 0.97% | | Simon Property Group LP
5.25%, 12/1/18 | | | 807,789 | |
Merrill Lynch Capital Services, Inc. | | 06/20/2018 | | | 2,700 | | 1.45% | | Starwood Hotels & Resorts Worldwide, Inc.
6.75%, 5/15/18 | | | 714,680 | |
Credit Suisse International | | 06/20/2018 | | | 3,500 | | 0.97% | | Verizon Communications, Inc.
4.90%, 9/15/15 | | | 120,215 | |
Deutsche Bank AG | | 06/20/2018 | | | 2,800 | | 1.15% | | Spectra Energy Capital LLC
6.25%, 2/15/13 | | | 164,388 | |
| | | | | | | | | | | |
|
|
|
| | | | | | | | | | | | $ | 6,709,923 | |
| | | | | | | | | | | |
|
|
|
SEE NOTES TO FINANCIAL STATEMENTS.
A18
| | | | | | |
| | | CONSERVATIVE BALANCED PORTFOLIO (continued) | | |
| |
| SCHEDULE OF INVESTMENTS | | December 31, 2008 |
Credit default swap agreements outstanding at December 31, 2008 (continued):
| | | | | | | | | | | | | | | | | | |
Counterparty
| | Termination
Date
| | Notional
Amount
(000)#(4)
| | Fixed
Rate
| | Reference Entity/Obligation
| | Fair
Value(3)
| | Upfront
Premiums
Paid/
(Received)
| | Unrealized
Appreciation/
(Depreciation)
| |
Credit Default Swaps on Asset-Backed Issues-Sell Protection(2): | |
Merrill Lynch Capital Services, Inc. | | 03/25/2036 | | $ | 1,000 | | 9.00% | | AmeriQuest Mortgage Securities, Inc.,
7.82%, 03/25/36 | | $(950,949) | | $ | — | | $ | (950,949 | ) |
| | | | | | | | | | | | | | | | |
|
|
|
| | | | | | | | | | | | | | | | | $ | 5,758,974 | |
| | | | | | | | | | | | | | | | |
|
|
|
The Portfolio entered into credit default swaps as the protection seller on asset-backed issues to take an active short position with respect to the likelihood of a particular issuer’s default.
| (1) | If the Portfolio is a buyer of protection, it pays the fixed rate. When a credit event occurs, as defined under the terms of that particular swap agreement, the Portfolio will either (i) receive from the seller of protection an amount equal to the notional amount of the swap and take delivery of the referenced obligation or underlying securities comprising the referenced index or (ii) receive a net settlement amount in the form of cash or securities equal to the notional amount of the swap less the recovery value of the referenced obligation or underlying securities comprising the referenced index. |
| (2) | If the Portfolio is a seller of protection, it receives the fixed rate. When a credit event occurs, as defined under the terms of that particular swap agreement, the Portfolio will either (i) pay to the buyer of protection an amount equal to the notional amount of the swap and take delivery of the referenced obligation or underlying securities comprising the referenced index or (ii) pay a net settlement amount in the form of cash or securities equal to the notional amount of the swap less the recovery value of the referenced obligation or underlying securities comprising the referenced index. |
| (3) | The fair value of credit default swap agreements on asset-backed securities serve as an indicator of the current status of the payment/performance risk and represent the likelihood of an expected liability (or profit) for the credit derivative should the notional amount of the swap agreement be closed/sold as of the reporting date. |
| (4) | Notional amount represents the maximum potential amount the Portfolio could be required to pay as a seller of credit protection or receive as a buyer of credit protection if a credit event occurs as defined under the terms of that particular swap agreement. |
| # | Notional amount is shown in U.S. dollars unless otherwise stated. |
Interest rate swap agreements outstanding at December 31, 2008:
| | | | | | | | | | | | | |
Counterparty
| | Termination
Date
| | Notional
Amount
(000)#
| | Fixed
Rate
| | Floating Rate
| | Unrealized
Appreciation/
(Depreciation)
| |
Deutsche Bank AG(a) | | 8/15/2015 | | $ | 1,235 | | 3.712% | | 3 month LIBOR | | $ | (103,475 | ) |
Merrill Lynch Capital Services, Inc.(a) | | 5/15/2016 | | | 2,465 | | 4.397% | | 3 month LIBOR | | | (331,387 | ) |
Deutsche Bank AG(a) | | 5/15/2016 | | | 445 | | 4.490% | | 3 month LIBOR | | | (62,639 | ) |
Merrill Lynch Capital Services, Inc.(b) | | 10/10/2013 | | | 2,465 | | 3.784% | | 3 month LIBOR | | | 179,554 | |
Citibank, NA(b) | | 10/20/2013 | | | 2,465 | | 4.059% | | 3 month LIBOR | | | 210,962 | |
| | | | | | | | | | | |
|
|
|
| | | | | | | | | | | | $ | (106,985 | ) |
| | | | | | | | | | | |
|
|
|
| (a) | Portfolio pays the fixed rate and receives the floating rate. |
| (b) | Portfolio pays the floating rate and receives the fixed rate. |
Various inputs are used in determining the value of the Portfolio’s investments. These inputs are summarized in the three broad levels listed below.
Level 1—quoted prices in active markets for identical securities
Level 2—other significant observable inputs (including quoted prices for similar securities, interest rates, prepayment speeds, credit risk, etc.)
Level 3—significant unobservable inputs (including the Portfolio’s own assumptions in determining the fair value of investments)
The following is a summary of the inputs used as of December 31, 2008 in valuing the Portfolio’s assets carried at fair value:
| | | | | | |
Valuation inputs
| | Investments
in Securities
| | Other Financial
Instruments*
|
Level 1—Quoted Prices | | $ | 1,335,984,030 | | $ | 3,073,584 |
Level 2—Other Significant Observable Inputs | | | 910,901,405 | | | 4,140,757 |
Level 3—Significant Unobservable Inputs | | | — | | | 1,511,232 |
| | |
|
| |
|
|
Total | | $ | 2,246,885,435 | | $ | 8,725,573 |
| | |
|
| |
|
|
| * | Other financial instruments are derivative instruments not reflected in the Schedule of Investments, such as futures, forwards and swap contracts, which are valued at the unrealized appreciation/depreciation on the instrument. |
SEE NOTES TO FINANCIAL STATEMENTS.
A19
| | | | | | |
| | | CONSERVATIVE BALANCED PORTFOLIO (continued) | | |
| |
| SCHEDULE OF INVESTMENTS | | December 31, 2008 |
The following is a reconciliation of assets in which significant unobservable inputs (Level 3) were used in determining fair value:
| | | | | | | |
| | | Investments
in Securities
| | Other Financial
Instruments
| |
Balance as of 12/31/07 | | $ | — | | $ | 1,609,091 | |
Realized gain (loss) | | | — | | | * | |
Change in unrealized appreciation (depreciation) | | | — | | | (74,090 | ) |
Net purchases (sales) | | | — | | | — | |
Transfers in and/or out of Level 3 | | | — | | | (23,769 | ) |
| | |
|
| |
|
|
|
Balance as of 12/31/08 | | $ | — | | $ | 1,511,232 | |
| | |
|
| |
|
|
|
| * | The realized gain earned during the period for other financial instruments was $1,437,589. |
The industry classification of portfolio holdings and liabilities in excess of other assets shown as a percentage of net assets as of December 31, 2008 were as follows:
| | | |
Affiliated Mutual Funds (including 7.3% of collateral received for securities on loan) | | 22.5 | % |
Mortgage Backed Securities | | 19.4 | |
U.S. Treasury Securities | | 5.9 | |
Oil, Gas & Consumable Fuels | | 5.3 | |
Commercial Mortgage Backed Securities | | 4.5 | |
Pharmaceuticals | | 3.6 | |
U.S. Government Agency Obligations | | 2.9 | |
Computers & Peripherals | | 1.9 | |
Diversified Telecommunication Services | | 1.7 | |
Software | | 1.7 | |
Insurance | | 1.6 | |
Aerospace & Defense | | 1.5 | |
Diversified Financial Services | | 1.5 | |
Food & Staples Retailing | | 1.5 | |
Household Products | | 1.5 | |
Banking | | 1.4 | |
Commercial Banks | | 1.4 | |
Telecommunications | | 1.4 | |
Electric | | 1.3 | |
Industrial Conglomerates | | 1.3 | |
Beverages | | 1.2 | |
Chemicals | | 1.2 | |
Media | | 1.2 | |
Capital Markets | | 1.1 | |
Communications Equipment | | 1.1 | |
Electric Utilities | | 1.1 | |
Tobacco | | 1.1 | |
Biotechnology | | 1.0 | |
Healthcare Equipment & Supplies | | 1.0 | |
Healthcare Providers & Services | | 1.0 | |
Semiconductors & Semiconductor Equipment | | 1.0 | |
Asset Backed Securities | | 0.9 | |
Healthcare & Pharmaceutical | | 0.9 | |
Food Products | | 0.8 | |
Machinery | | 0.8 | |
Specialty Retail | | 0.8 | |
Energy Equipment & Services | | 0.7 | |
Hotels, Restaurants & Leisure | | 0.7 | |
Multi-Utilities | | 0.7 | |
Real Estate Investment Trust | | 0.7 | |
Collateralized Mortgage Obligations | | 0.6 | |
Foods | | 0.6 | |
Internet Software & Services | | 0.6 | |
Non Captive Finance | | 0.6 | |
Air Freight & Logistics | | 0.5 | |
Pipelines & Other | | 0.5 | |
Road & Rail | | 0.5 | |
| | | |
Technology | | 0.5 | % |
Cable | | 0.4 | |
IT Services | | 0.4 | |
Metals & Mining | | 0.4 | |
Retailers | | 0.4 | |
Brokerage | | 0.3 | |
Capital Goods | | 0.3 | |
Healthcare Insurance | | 0.3 | |
Multiline Retail | | 0.3 | |
Energy – Other | | 0.3 | |
Commercial Services & Supplies | | 0.2 | |
Consumer Finance | | 0.2 | |
Airlines | | 0.2 | |
Consumer | | 0.2 | |
Electrical Equipment | | 0.2 | |
Foreign Government Bonds | | 0.2 | |
Household Durables | | 0.2 | |
Life Sciences Tools & Services | | 0.2 | |
Media & Entertainment | | 0.2 | |
Railroads | | 0.2 | |
Textiles, Apparel & Luxury Goods | | 0.2 | |
Auto Components | | 0.1 | |
Automobiles | | 0.1 | |
Automotive | | 0.1 | |
Building Materials & Construction | | 0.1 | |
Construction & Engineering | | 0.1 | |
Containers & Packaging | | 0.1 | |
Diversified Consumer Services | | 0.1 | |
Electronic Equipment & Instruments | | 0.1 | |
Energy – Integrated | | 0.1 | |
Gas Utilities | | 0.1 | |
Independent Power Producers & Energy Traders | | 0.1 | |
Internet & Catalog Retail | | 0.1 | |
Leisure Equipment & Products | | 0.1 | |
Lodging | | 0.1 | |
Metals | | 0.1 | |
Paper | | 0.1 | |
Paper & Forest Products | | 0.1 | |
Personal Products | | 0.1 | |
Professional Services | | 0.1 | |
Structured Notes | | 0.1 | |
Thrifts & Mortgage Finance | | 0.1 | |
Trading Companies & Distributors | | 0.1 | |
Wireless Telecommunication Services | | 0.1 | |
| | |
|
|
| | | 114.8 | |
Liabilities in excess of other assets | | (14.8 | ) |
| | |
|
|
| | | 100.0 | % |
| | |
|
|
SEE NOTES TO FINANCIAL STATEMENTS.
A20
| | | | | | |
| | | CONSERVATIVE BALANCED PORTFOLIO (continued) | | |
STATEMENT OF ASSETS AND LIABILITIES
December 31, 2008
| | | | |
| ASSETS | | | | |
Investments, at value including securities on loan of $138,390,357: | | | | |
Unaffiliated investments (cost $1,903,097,877) | | $ | 1,806,256,019 | |
Affiliated investments (cost $478,766,482) | | | 440,629,416 | |
Foreign currency, at value (cost $61,269) | | | 62,568 | |
Receivable for investments sold | | | 35,171,192 | |
Dividends and interest receivable | | | 9,472,789 | |
Unrealized appreciation on swaps | | | 7,122,610 | |
Due from broker—variation margin | | | 361,641 | |
Foreign tax reclaim receivable | | | 322,148 | |
Premium for swaps purchased | | | 308,734 | |
Prepaid expenses | | | 30,023 | |
Receivable for Series shares sold | | | 7,663 | |
| | |
|
|
|
Total Assets | | | 2,299,744,803 | |
| | |
|
|
|
| LIABILITIES | | | | |
Payable for investments purchased | | | 186,224,372 | |
Collateral for securities on loan | | | 143,440,658 | |
Payable to custodian | | | 9,237,323 | |
Unrealized depreciation on swaps | | | 1,470,621 | |
Management fee payable | | | 898,815 | |
Payable for Series shares repurchased | | | 638,831 | |
Accrued expenses and other liabilities | | | 307,850 | |
Affiliated transfer agent fee payable | | | 702 | |
| | |
|
|
|
Total Liabilities | | | 342,219,172 | |
| | |
|
|
|
| NET ASSETS | | $ | 1,957,525,631 | |
| | |
|
|
|
Net assets were comprised of: | | | | |
Paid-in capital | | $ | 2,113,267,984 | |
Retained earnings | | | (155,742,353 | ) |
| | |
|
|
|
Net assets, December 31, 2008 | | $ | 1,957,525,631 | |
| | |
|
|
|
Net asset value and redemption price per share, $1,957,525,631 / 154,295,785 outstanding shares of beneficial interest | | $ | 12.69 | |
| | |
|
|
|
STATEMENT OF OPERATIONS
Year Ended December 31, 2008
| | | | |
| INVESTMENT INCOME | | | | |
Interest | | $ | 44,422,711 | |
Unaffiliated dividend income (net of foreign withholding taxes of $333,574) | | | 28,834,754 | |
Affiliated dividend income | | | 13,212,691 | |
Affiliated income from securities loaned, net | | | 1,778,072 | |
| | |
|
|
|
| | | | 88,248,228 | |
| | |
|
|
|
| EXPENSES | | | | |
Management fee | | | 13,051,807 | |
Custodian’s fees and expenses | | | 474,000 | |
Shareholders’ reports | | | 349,000 | |
Trustees’ fees | | | 40,000 | |
Interest expense (Note 8) | | | 38,023 | |
Audit fee | | | 36,000 | |
Insurance expenses | | | 30,000 | |
Legal fees and expenses | | | 17,000 | |
Commitment fee on syndicated credit agreement | | | 13,000 | |
Transfer agent’s fee and expenses (including affiliated expense of $4,000) (Note 4) | | | 4,000 | |
Miscellaneous | | | 43,544 | |
| | |
|
|
|
Total expenses | | | 14,096,374 | |
| | |
|
|
|
| NET INVESTMENT INCOME | | | 74,151,854 | |
| | |
|
|
|
| NET REALIZED AND UNREALIZED GAIN (LOSS) ON INVESTMENTS, SWAPS AND FOREIGN CURRENCIES | | | | |
Net realized gain (loss) on: | | | | |
Investment transactions (including affiliated: $(2,193,469)) | | | (37,651,704 | ) |
Short sale transactions | | | (233,023 | ) |
Futures transactions | | | (29,870,404 | ) |
Swap agreement transactions | | | 2,841,502 | |
Foreign currency transactions | | | (151,699 | ) |
| | |
|
|
|
| | | | (65,065,328 | ) |
| | |
|
|
|
Net change in unrealized appreciation (depreciation) on: | | | | |
Investments (including affiliated: $(29,774,501)) | | | (570,712,515 | ) |
Futures | | | 3,643,456 | |
Swaps | | | 3,356,506 | |
Foreign currencies | | | (4,217 | ) |
| | |
|
|
|
| | | | (563,716,770 | ) |
| | |
|
|
|
| NET LOSS ON INVESTMENTS, SWAPS AND FOREIGN CURRENCIES | | | (628,782,098 | ) |
| | |
|
|
|
| NET DECREASE IN NET ASSETS RESULTING FROM OPERATIONS | | $ | (554,630,244 | ) |
| | |
|
|
|
STATEMENT OF CHANGES IN NET ASSETS
| | | | | | | | |
| | | Year Ended December 31,
| |
| | | 2008
| | | 2007
| |
| INCREASE (DECREASE) IN NET ASSETS | | | | | | | | |
| OPERATIONS: | | | | | | | | |
Net investment income | | $ | 74,151,854 | | | $ | 81,811,715 | |
Net realized gain (loss) on investment, swap agreement and foreign currency transactions | | | (65,065,328 | ) | | | 91,118,299 | |
Net change in unrealized appreciation (depreciation) on investments, swaps and foreign currencies | | | (563,716,770 | ) | | | (8,785,193 | ) |
| | |
|
|
| |
|
|
|
NET INCREASE (DECREASE) IN NET ASSETS RESULTING FROM OPERATIONS | | | (554,630,244 | ) | | | 164,144,821 | |
| | |
|
|
| |
|
|
|
| DISTRIBUTIONS | | | (81,811,715 | ) | | | (80,805,076 | ) |
| | |
|
|
| |
|
|
|
| SERIES SHARE TRANSACTIONS: | | | | | | | | |
Series shares sold [1,194,754 and 894,544 shares, respectively] | | | 16,824,187 | | | | 14,946,386 | |
Series shares issued in reinvestment of distributions [5,295,257 and 4,870,710 shares, respectively] | | | 81,811,715 | | | | 80,805,076 | |
Series shares repurchased [15,304,061 and 13,534,553 shares, respectively] | | | (226,520,392 | ) | | | (227,819,116 | ) |
| | |
|
|
| |
|
|
|
NET DECREASE IN NET ASSETS RESULTING FROM SERIES SHARE TRANSACTIONS | | | (127,884,490 | ) | | | (132,067,654 | ) |
| | |
|
|
| |
|
|
|
| TOTAL DECREASE IN NET ASSETS | | | (764,326,449 | ) | | | (48,727,909 | ) |
| NET ASSETS: | | | | | | | | |
Beginning of year | | | 2,721,852,080 | | | | 2,770,579,989 | |
| | |
|
|
| |
|
|
|
End of year | | $ | 1,957,525,631 | | | $ | 2,721,852,080 | |
| | |
|
|
| |
|
|
|
SEE NOTES TO FINANCIAL STATEMENTS.
A21
| | | | | | |
| | | DIVERSIFIED BOND PORTFOLIO | | |
| |
| SCHEDULE OF INVESTMENTS | | December 31, 2008 |
| | | | | | | | | | | | |
LONG-TERM INVESTMENTS — 98.7%
LONG-TERM BONDS — 95.3% | | Moody’s
Rating†
(Unaudited)
| | Interest
Rate
| | Maturity
Date
| | Principal
Amount
(000)#
| | Value
(Note 2)
|
| | | | | | | | | | | | | |
Airlines — 1.1% | | | | | | | | | | | | |
American Airlines, Inc., Pass-Thru Certificates, Series 2001-1 | | B1 | | 6.817% | | 05/23/11 | | $ | 2,750 | | $ | 1,760,000 |
Continental Airlines, Inc., Pass-Thru Certificates, Series 2000-1, Class A-1 | | Ba1 | | 7.373% | | 12/15/15 | | | 1,067 | | | 618,920 |
Continental Airlines, Inc., Pass-Thru Certificates, Series 2000-1, Class A-1(h) | | Baa2 | | 6.703% | | 06/15/21 | | | 3 | | | 2,196 |
Continental Airlines, Inc., Pass-Thru Certificates, Series 2000-1, Class A-1(h) | | Baa2 | | 7.487% | | 10/02/10 | | | 7,954 | | | 7,158,600 |
Continental Airlines, Inc., Pass-Thru Certificates, Series A(a) | | Baa1 | | 5.983% | | 04/19/22 | | | 1,850 | | | 1,239,500 |
Delta Air Lines, Inc., Pass-Thru Certificates | | Baa1 | | 6.821% | | 08/10/22 | | | 1,734 | | | 1,101,284 |
United Airlines, Inc., Pass-Thru Certificates, Series 2007-1, Class A | | Ba1 | | 6.636% | | 07/02/22 | | | 1,237 | | | 729,769 |
| | | | | | | | | | | |
|
|
| | | | | | | | | | | | | 12,610,269 |
| | | | | | | | | | | |
|
|
Asset-Backed Securities — 2.5% | | | | | | | | | | | | |
American Express Credit Account Master Trust, Series 2004-C,
Class C, 144A(f) | | Baa1 | | 1.695% | | 02/15/12 | | | 98 | | | 84,820 |
AmeriQuest Mortgage Securities, Inc., Series 2001-2, Class M3(f) | | Baa2 | | 3.396% | | 10/25/31 | | | 725 | | | 479,388 |
AmeriQuest Mortgage Securities, Inc., Series 2003-AR3, Class M6(f)(h) | | Baa3 | | 6.5005% | | 10/25/33 | | | 1,600 | | | 235,202 |
Amortizing Residential Collateral Trust, Series 2002-BC7, Class M2(f) | | CCC(e) | | 1.821% | | 10/25/32 | | | 134 | | | 13,216 |
Argent Securities, Inc. Series 2003-W2, Class M4(f) | | Baa1 | | 6.776% | | 09/25/33 | | | 2,400 | | | 2,077,368 |
Asset Backed Funding Certificates, Series 2004-OPT1, Class M1(f) | | Aa2 | | 1.171% | | 08/25/33 | | | 2,592 | | | 1,269,628 |
Asset Backed Securities Corp. Home Equity, Series 2003-HE3, Class M1(f) | | Aa1 | | 2.44% | | 06/15/33 | | | 2,346 | | | 1,388,552 |
Bank of America Credit Card Trust, Series 2006-C5, Class C5(f) | | Baa2 | | 1.595% | | 01/15/16 | | | 5,750 | | | 2,065,487 |
CDC Mortgage Capital Trust, Series 2002-HE3, Class M2(f) | | Ba3 | | 3.846% | | 03/25/33 | | | 355 | | | 23,596 |
Citibank Credit Card Issuance Trust, Series 2003-C4, Class C-4 | | Baa2 | | 5.00% | | 06/10/15 | | | 6,500 | | | 3,505,096 |
Citigroup Mortgage Loan Trust, Inc., Series 2004-RES1, Class M3(f) | | Aa3 | | 1.551% | | 11/25/34 | | | 890 | | | 756,946 |
Countrywide Asset-Backed Certificates, Series 2004-12, Class MV3(f) | | Aa3 | | 1.131% | | 03/25/35 | | | 2,670 | | | 1,207,382 |
CS First Boston Mortgage Securities Corp., Series 2002-HE4, Class M2(f) | | Baa3 | | 2.7213% | | 08/25/32 | | | 174 | | | 22,042 |
Equity One ABS, Inc., Series 2004-3, Class M1 | | Aa2 | | 5.70% | | 07/25/34 | | | 2,100 | | | 1,475,254 |
FBR Securitization Trust, Series 2005-2, Class M1(f) | | Aa1 | | .95% | | 09/25/35 | | | 3,600 | | | 2,509,670 |
First Franklin Mortgage Loan Asset-Backed Certificates, Series 2005-FF6, Class M2(f) | | Aa2 | | .91% | | 05/25/36 | | | 2,575 | | | 1,314,411 |
Ford Credit Auto Owner Trust, Series 2006-B, Class C | | Baa1 | | 5.68% | | 06/15/12 | | | 2,100 | | | 1,590,689 |
Fremont Home Loan Trust, Series 2003-B, Class M1 | | Aa1 | | 1.521% | | 12/25/33 | | | 435 | | | 210,751 |
HFC Household Home Equity Loan Trust Asset-Backed Certificates, Series 2006-2, Class A1(f) | | Aaa | | .66% | | 03/20/36 | | | 400 | | | 280,908 |
IXIS Real Estate Capital Trust, Series 2006-HE1, Class A4(f) | | Baa3 | | .77% | | 03/25/36 | | | 3,200 | | | 1,806,359 |
Morgan Stanley ABS Capital I, Series 2002-NC6, Class M2(f) | | Ba2 | | 3.621% | | 11/25/32 | | | 174 | | | 29,487 |
Morgan Stanley ABS Capital I, Series 2003-HE1, Class M1(f) | | Aa2 | | 1.671% | | 05/25/33 | | | 2,187 | | | 1,249,322 |
New Century Home Equity Loan Trust, Series 2004-4, Class M1(f) | | Aa1 | | .98% | | 02/25/35 | | | 3,680 | | | 1,441,626 |
Residential Asset Mortgage Products, Inc., Series 2004-RS12, Class MII2(f)(h) | | Aa3 | | 1.271% | | 12/25/34 | | | 2,100 | | | 1,672,135 |
Residential Asset Securities Corp., Series 2004-KS1, Class AI5 | | Aaa | | 5.221% | | 02/25/34 | | | 1,000 | | | 526,575 |
Saxon Asset Securities Trust, Series 2002-3, Class M1(f) | | Aaa | | 1.596% | | 12/25/32 | | | 1,155 | | | 797,375 |
Securitized Asset Backed Receivables LLC Trust, Series 2006-FR1,
Class M1(f) | | Baa2 | | .87% | | 11/25/35 | | | 2,000 | | | 235,252 |
Structured Asset Securities Corp., Series 2002-HF2, Class M3(f)(h) | | B(e) | | 3.471% | | 07/25/32 | | | 1,345 | | | 579,462 |
| | | | | | | | | | | |
|
|
| | | | | | | | | | | | | 28,847,999 |
| | | | | | | | | | | |
|
|
Banking — 3.2% | | | | | | | | | | | | |
Alfa MTN Markets Ltd. for ABH Financial Ltd. (Cypress), 144A | | Ba1 | | 8.20% | | 06/25/12 | | | 1,500 | | | 870,000 |
Banc of America Corp., Notes | | A1 | | 8.00% | | 12/29/49 | | | 3,500 | | | 2,517,508 |
Bank of America Corp., Sr. Unsec’d. Notes | | Aa2 | | 5.65% | | 05/01/18 | | | 1,420 | | | 1,428,426 |
Bank of America Corp., Sub. Notes | | Aa2 | | 5.30% | | 03/15/17 | | | 790 | | | 750,126 |
Bear Stearns Cos., Inc. (The), Sr. Unsec’d. Notes | | Aa2 | | 7.25% | | 02/01/18 | | | 1,575 | | | 1,725,973 |
Chuo Mitsui Trust & Banking Co. Ltd., Jr. Sub. Notes (Japan), 144A(f) | | A2 | | 5.506% | | 12/29/49 | | | 3,050 | | | 2,098,812 |
Citigroup, Inc., Jr. Sub. Notes(a)(f) | | Baa2 | | 8.40% | | 04/29/49 | | | 5,150 | | | 3,400,494 |
SEE NOTES TO FINANCIAL STATEMENTS.
A22
| | | | | | |
| | | DIVERSIFIED BOND PORTFOLIO (continued) | | |
| |
| SCHEDULE OF INVESTMENTS | | December 31, 2008 |
| | | | | | | | | | | | |
LONG-TERM BONDS
(continued) | | Moody’s
Rating†
(Unaudited)
| | Interest
Rate
| | Maturity
Date
| | Principal
Amount
(000)#
| | Value
(Note 2)
|
| | | | | | | | | | | | | |
Banking (continued) | | | | | | | | | | | | |
Credit Suisse, Sub. Notes (Switzerland) | | Aa2 | | 6.00% | | 02/15/18 | | $ | 610 | | $ | 560,178 |
Depfa ACS Bank (Ireland), 144A | | Aa1 | | 5.125% | | 03/16/37 | | | 3,065 | | | 2,219,437 |
HSBC Holdings PLC, Sub. Notes (United Kingdom) | | Aa3 | | 6.50% | | 09/15/37 | | | 2,255 | | | 2,290,144 |
HSBC Holdings PLC, Sub. Notes (United Kingdom), | | Aa3 | | 6.80% | | 06/01/38 | | | 1,970 | | | 2,081,778 |
HSBK Europe BV, Gtd. Notes (Netherlands), 144A | | Baa3 | | 7.25% | | 05/03/17 | | | 2,230 | | | 1,204,200 |
ICICI Bank Ltd., Jr. Sub. Notes (India), 144A(a)(f) | | Baa2 | | 7.25% | | 12/31/49 | | | 2,380 | | | 1,144,656 |
ICICI Bank Ltd., Notes (Singapore), 144A | | Baa2 | | 5.75% | | 11/16/10 | | | 2,500 | | | 2,124,175 |
JPMorgan Chase & Co., Jr. Sub. Notes(f) | | A1 | | 7.90% | | 04/29/49 | | | 2,180 | | | 1,813,389 |
KBC Bank Funding Trust III, Gtd. Notes 144A(f) | | A1 | | 9.86% | | 11/29/49 | | | 5,000 | | | 2,289,255 |
Krung Thai Bank PCL, Sub. Notes (Thailand)(f) | | Baa3 | | 7.378% | | 10/29/49 | | | 1,590 | | | 738,965 |
Northern Rock PLC, Sub. Notes (United Kingdom), 144A(f) | | B3 | | 6.594% | | 06/29/49 | | | 920 | | | 349,600 |
Resona Bank Ltd., Notes, 144A(f) | | A2 | | 5.85% | | 09/29/49 | | | 2,900 | | | 1,643,943 |
Sumitomo Mitsui Banking Corp., Sub. Notes (Japan), 144A(f) | | Aa3 | | 5.625% | | 07/29/49 | | | 6,380 | | | 4,724,850 |
| | | | | | | | | | | |
|
|
| | | | | | | | | | | | | 35,975,909 |
| | | | | | | | | | | |
|
|
Brokerage — 1.0% | | | | | | | | | | | | |
Goldman Sachs Group, Inc., Sr. Unsec’d Notes | | A1 | | 6.15% | | 04/01/18 | | | 3,105 | | | 2,983,784 |
Goldman Sachs Group, Inc., Sub. Notes | | A2 | | 6.75% | | 10/01/37 | | | 440 | | | 357,222 |
Lehman Brothers Holdings, Inc., Jr. Sub. Notes(i) | | NR | | 6.50% | | 07/19/17 | | | 1,210 | | | 121 |
Lehman Brothers Holdings, Inc., Sr. Unsec’d. Notes, MTN(i) | | NR | | 6.875% | | 05/02/18 | | | 2,740 | | | 260,300 |
Merrill Lynch & Co., Inc., Notes, MTN(a) | | Aa3 | | 6.875% | | 04/25/18 | | | 2,860 | | | 2,991,634 |
Merrill Lynch & Co., Inc., Sr. Unsec’d. Notes, MTN | | Aa3 | | 6.05% | | 08/15/12 | | | 1,500 | | | 1,479,869 |
Merrill Lynch & Co., Inc., Sub. Notes | | A3 | | 6.11% | | 01/29/37 | | | 275 | | | 247,204 |
Morgan Stanley, Sr. Unsec’d. Notes, MTN | | A2 | | 5.45% | | 01/09/17 | | | 4,035 | | | 3,325,978 |
| | | | | | | | | | | |
|
|
| | | | | | | | | | | | | 11,646,112 |
| | | | | | | | | | | |
|
|
Building Materials & Construction — 0.3% | | | | | | | | | | | | |
American Standard, Inc., Gtd. Notes(a) | | Baa3 | | 7.625% | | 02/15/10 | | | 3,800 | | | 3,799,966 |
| | | | | | | | | | | |
|
|
Cable — 0.3% | | | | | | | | | | | | |
AT&T Broadband, Gtd. Notes | | Baa2 | | 9.455% | | 11/15/22 | | | 1,065 | | | 1,193,181 |
TCI Communications, Inc., Gtd. Notes | | Baa2 | | 7.875% | | 02/15/26 | | | 750 | | | 778,238 |
Time Warner Cable ,Inc., Gtd. Notes(a) | | Baa2 | | 8.25% | | 02/14/14 | | | 1,100 | | | 1,115,913 |
| | | | | | | | | | | |
|
|
| | | | | | | | | | | | | 3,087,332 |
| | | | | | | | | | | |
|
|
Capital Goods — 0.7% | | | | | | | | | | | | |
Rockwell International Co., Sr. Unsec’d Notes | | A2 | | 5.20% | | 01/15/98 | | | 6,500 | | | 5,851,722 |
Waste Management, Inc., Sr. Unsec’d Notes | | Baa3 | | 7.65% | | 03/15/11 | | | 2,100 | | | 2,095,901 |
| | | | | | | | | | | |
|
|
| | | | | | | | | | | | | 7,947,623 |
| | | | | | | | | | | |
|
|
Chemicals — 1.1% | | | | | | | | | | | | |
Huntsman International LLC, Sec’d. Notes | | Ba1 | | 11.625% | | 10/15/10 | | | 2,100 | | | 1,837,500 |
Lubrizol Corp., Gtd. Notes | | Baa2 | | 4.625% | | 10/01/09 | | | 5,600 | | | 5,500,539 |
Potash Corp. of Saskatchewan, Sr. Unsec’d. Notes (Canada) | | Baa1 | | 5.875% | | 12/01/36 | | | 3,180 | | | 2,800,874 |
Union Carbide Chemical & Plastics Co., Gtd Notes | | Ba2 | | 7.875% | | 04/01/23 | | | 3,058 | | | 2,734,861 |
| | | | | | | | | | | |
|
|
| | | | | | | | | | | | | 12,873,774 |
| | | | | | | | | | | |
|
|
Collateralized Mortgage Obligations — 0.5% | | | | | | | | | | | | |
Countrywide Alternative Loan Trust, Series 2004-18CB, Class 3A1 | | Aaa | | 5.25% | | 09/25/19 | | | 1,937 | | | 1,766,106 |
Master Alternative Loan Trust, Series 2004-4, Class 4A1 | | Aaa | | 5.00% | | 04/25/19 | | | 428 | | | 396,292 |
Structured Adjustable Rate Mortgage Loan Trust, Series 2004-1, Class 4A3(f) | | Aaa | | 5.3648% | | 02/25/34 | | | 2,714 | | | 1,685,437 |
Washington Mutual Mortgage Pass-Through Certificates, Series 2005-1,
Class 3A | | AAA(e) | | 5.00% | | 03/25/20 | | | 1,453 | | | 1,165,312 |
| | | | | | | | | | | |
|
|
| | | | | | | | | | | | | 5,013,147 |
| | | | | | | | | | | |
|
|
Commercial Mortgage-Backed Securities — 7.8% | | | | | | | | | | | | |
Banc of America Commercial Mortgage, Inc., Series 2005-1, Class ASB(f) | | AAA(e) | | 4.9667% | | 11/10/42 | | | 5,275 | | | 4,475,969 |
Banc of America Commercial Mortgage, Inc., Series 2007-4, Class A3(f) | | AAA(e) | | 5.8117% | | 02/10/51 | | | 3,805 | | | 2,487,671 |
SEE NOTES TO FINANCIAL STATEMENTS.
A23
| | | | | | |
| | | DIVERSIFIED BOND PORTFOLIO (continued) | | |
| |
| SCHEDULE OF INVESTMENTS | | December 31, 2008 |
| | | | | | | | | | | | |
LONG-TERM BONDS
(continued) | | Moody’s
Rating†
(Unaudited)
| | Interest
Rate
| | Maturity
Date
| | Principal
Amount
(000)#
| | Value
(Note 2)
|
| | | | | | | | | | | | | |
Commercial Mortgage-Backed Securities (continued) | | | | | | | | | | | | |
Bear Stearns Commercial Mortgage Securities, Inc., Series 2005-T18, Class AAB(f) | | Aaa | | 4.823% | | 02/13/42 | | $ | 2,475 | | $ | 1,961,631 |
Bear Stearns Commercial Mortgage Securities, Inc., Series 2005-T20, Class AAB(f) | | Aaa | | 5.135% | | 10/12/42 | | | 3,400 | | | 2,785,439 |
Citigroup Commercial Mortgage Trust, Series 2008-C7, Class A2A | | Aaa | | 6.034% | | 12/10/49 | | | 3,620 | | | 3,216,457 |
Commercial Mortgage Load Trust, Series 2008-LS1, Class A2(f) | | Aaa | | 6.0197% | | 12/10/49 | | | 3,000 | | | 2,368,632 |
CS First Boston Mortgage Securities Corp., Ser. 2005-C5, Class A4(f) | | AAA(e) | | 5.10% | | 08/15/38 | | | 2,400 | | | 1,963,927 |
GMAC Commercial Mortgage Securities, Inc., Series 2002-C3, Class A2 | | Aaa | | 4.93% | | 07/10/39 | | | 8,500 | | | 7,681,435 |
Greenwich Capital Commercial Funding Corp., Series 2003-C1, Class A4 | | Aaa | | 4.111% | | 07/05/35 | | | 12,700 | | | 11,034,164 |
Greenwich Capital Commercial Funding Corp., Series 2005-GG5, Class A5(f) | | Aaa | | 5.224% | | 04/10/37 | | | 2,400 | | | 1,972,327 |
Greenwich Capital Commercial Funding Corp., Series 2007-GG9, Class A2 | | Aaa | | 5.381% | | 03/10/39 | | | 3,610 | | | 2,845,615 |
JP Morgan Chase Commercial Mortgage Securities Corp., Series 2003-ML1A, Class A2 | | Aaa | | 4.767% | | 03/12/39 | | | 4,969 | | | 4,389,857 |
JP Morgan Chase Commerical Mortgage Securities Corp., Series 2005-LDP2, Class ASB | | Aaa | | 4.659% | | 07/15/42 | | | 9,300 | | | 7,573,614 |
JP Morgan Chase Commerical Mortgage Securities Corp., Series 2007-LDPX, Class A2 | | Aaa | | 5.434% | | 01/15/49 | | | 1,520 | | | 949,623 |
LB-UBS Commercial Mortgage Trust, Series 2003-C8, Class A3 | | Aaa | | 4.83% | | 11/15/27 | | | 3,375 | | | 3,118,547 |
LB-UBS Commercial Mortgage Trust, Series 2004-C8, Class A6(f) | | Aaa | | 4.799% | | 12/15/29 | | | 4,200 | | | 3,473,526 |
LB-UBS Commerical Mortgage Trust, Series 2006-C6, Class AAB | | Aaa | | 5.341% | | 09/15/39 | | | 7,126 | | | 5,355,076 |
Merrill Lynch/Countrywide Commercial Mortgage Trust, Series 2006-2, Class A4(f) | | Aaa | | 5.909% | | 06/12/46 | | | 2,325 | | | 1,862,825 |
Merrill Lynch/Countrywide Commercial Mortgage Trust, Series 2007-9, Class A2 | | AAA(e) | | 5.59% | | 09/12/49 | | | 2,400 | | | 1,841,797 |
PNC Mortgage Acceptance Corp., Series 2001-C1, Class A1 | | Aaa | | 5.91% | | 03/12/34 | | | 774 | | | 767,585 |
Wachovia Bank Commercial Mortgage Trust, Series 2002-C2, Class A4 | | Aaa | | 4.98% | | 11/15/34 | | | 2,500 | | | 2,217,796 |
Wachovia Bank Commercial Mortgage Trust, Series 2003-C3, Class A2 | | AAA(e) | | 4.867% | | 02/15/35 | | | 7,330 | | | 6,525,716 |
Wachovia Bank Commercial Mortgage Trust, Series 2003-C9, Class A3 | | AAA(e) | | 4.608% | | 12/15/35 | | | 4,401 | | | 4,091,838 |
Wachovia Bank Commercial Mortgage Trust, Series 2005-C18, Class APB | | Aaa | | 4.807% | | 04/15/42 | | | 1,500 | | | 1,218,032 |
Wachovia Bank Commercial Mortgage Trust, Series 2007-C34, Class A2 | | Aaa | | 5.569% | | 05/15/46 | | | 3,600 | | | 2,767,539 |
| | | | | | | | | | | |
|
|
| | | | | | | | | | | | | 88,946,638 |
| | | | | | | | | | | |
|
|
Consumer | | | | | | | | | | | | |
Realogy Corp., Gtd. Notes, PIK | | Ca | | 11.00% | | 04/15/14 | | | 2,118 | | | 243,513 |
| | | | | | | | | | | |
|
|
Electric — 2.1% | | | | | | | | | | | | |
CenterPoint Energy Houston Electric LLC, Series J2 | | Baa2 | | 5.70% | | 03/15/13 | | | 2,950 | | | 2,807,580 |
Consumers Energy Co., Series D | | Baa1 | | 5.375% | | 04/15/13 | | | 1,000 | | | 984,127 |
EDP Finance BV (Netherlands), 144A | | A2 | | 6.00% | | 02/02/18 | | | 600 | | | 498,088 |
El Paso Electric Co., Sr. Unsec’d Notes | | Baa2 | | 6.00% | | 05/15/35 | | | 2,325 | | | 1,593,713 |
Empresa Nacional de Electricidad SA, Unsub. Notes (Chile) | | Baa3 | | 8.35% | | 08/01/13 | | | 625 | | | 660,029 |
Energy East Corp., Sr. Unsec’d. Notes | | Baa2 | | 6.75% | | 09/15/33 | | | 1,150 | | | 924,792 |
Energy East Corp., Sr. Unsub. Notes | | Baa2 | | 6.75% | | 06/15/12 | | | 750 | | | 751,616 |
Enersis SA, Sr. Unsec’d. Notes (Chile) | | Baa3 | | 7.375% | | 01/15/14 | | | 3,700 | | | 3,853,332 |
Exelon Corp., Sr. Unsec’d. Notes | | Baa1 | | 4.90% | | 06/15/15 | | | 500 | | | 409,915 |
Exelon Generation Co. LLC, Sr. Unsec’d. Notes | | A3 | | 6.20% | | 10/01/17 | | | 1,930 | | | 1,659,823 |
Korea East-West Power Co. Ltd., Sr. Unsub. Notes (South Korea), 144A | | A1 | | 4.875% | | 04/21/11 | | | 1,700 | | | 1,624,064 |
NiSource Finance Corp., Gtd. Notes | | Baa3 | | 5.45% | | 09/15/20 | | | 1,345 | | | 720,370 |
Northern States Power Co., Series B | | A2 | | 8.00% | | 08/28/12 | | | 2,800 | | | 2,952,849 |
Orion Power Holdings, Inc., Sr. Unsec’d Notes | | Ba3 | | 12.00% | | 05/01/10 | | | 1,920 | | | 1,920,000 |
Sierra Pacific Power Co., Series P | | Baa3 | | 6.75% | | 07/01/37 | | | 125 | | | 111,538 |
Southern California Edison Co., Sr. Unsec’d. Notes | | A3 | | 7.625% | | 01/15/10 | | | 1,100 | | | 1,125,563 |
Xcel Energy, Inc., Sr. Unsec’d. Notes | | Baa1 | | 5.613% | | 04/01/17 | | | 1,947 | | | 1,724,010 |
| | | | | | | | | | | |
|
|
| | | | | | | | | | | | | 24,321,409 |
| | | | | | | | | | | |
|
|
SEE NOTES TO FINANCIAL STATEMENTS.
A24
| | | | | | |
| | | DIVERSIFIED BOND PORTFOLIO (continued) | | |
| |
| SCHEDULE OF INVESTMENTS | | December 31, 2008 |
| | | | | | | | | | | | |
LONG-TERM BONDS
(continued) | | Moody’s
Rating†
(Unaudited)
| | Interest
Rate
| | Maturity
Date
| | Principal
Amount
(000)#
| | Value
(Note 2)
|
| | | | | | | | | | | | | |
Emerging Markets — 0.1% | | | | | | | | | | | | |
Alfa Diversified Payment Rights Finance Co., Series 1A, Class A, 144A(f) | | Ba1 | | 3.596% | | 03/15/11 | | $ | 1,717 | | $ | 1,115,888 |
| | | | | | | | | | | |
|
|
Energy – Integrated — 0.1% | | | | | | | | | | | | |
Shell International Finance BV, Gtd. Notes (Netherlands) | | Aa1 | | 6.375% | | 12/15/38 | | | 1,400 | | | 1,574,985 |
| | | | | | | | | | | |
|
|
Energy – Other — 1.0% | | | | | | | | | | | | |
EnCana Corp., Sr. Unsec’d. Notes (Canada) | | Baa2 | | 5.90% | | 12/01/17 | | | 2,500 | | | 2,085,763 |
GS Caltex Corp., Sr. Unsec’d. Notes (South Korea), 144A | | Baa1 | | 7.75% | | 07/25/11 | | | 3,250 | | | 3,000,253 |
Newfield Exploration Co., Sr. Sub. Notes | | Ba3 | | 6.625% | | 04/15/16 | | | 320 | | | 254,400 |
Nexen, Inc., Sr. Unsec’d. Notes (Canada) | | Baa2 | | 6.40% | | 05/15/37 | | | 1,890 | | | 1,478,891 |
Pioneer Natural Resources Co., Sr. Unsec’d. Notes | | Ba1 | | 6.875% | | 05/01/18 | | | 1,750 | | | 1,223,954 |
Transocean, Inc., Sr. Unsec’d. Notes (Cayman Islands) | | Baa2 | | 6.80% | | 03/15/38 | | | 1,200 | | | 1,070,336 |
Western Oil Sand, Inc., Sr. Sec’d. Notes (Canada) | | Baa1 | | 8.375% | | 05/01/12 | | | 1,900 | | | 1,813,820 |
| | | | | | | | | | | |
|
|
| | | | | | | | | | | | | 10,927,417 |
| | | | | | | | | | | |
|
|
Foods — 1.0% | | | | | | | | | | | | |
General Mills, Inc., Sr. Unsec’d. Notes | | Baa1 | | 5.20% | | 03/17/15 | | | 1,880 | | | 1,837,542 |
Kraft Foods, Inc., Sr. Unsec’d. Notes | | Baa2 | | 5.625% | | 11/01/11 | | | 860 | | | 878,737 |
Kraft Foods, Inc., Sr. Unsec’d. Notes | | Baa2 | | 6.125% | | 02/01/18 | | | 2,770 | | | 2,714,314 |
PepsiCo, Inc., Sr. Unsec’d. Notes | | Aa2 | | 7.90% | | 11/01/18 | | | 1,100 | | | 1,348,212 |
Tyson Foods, Inc., Gtd. Notes | | Ba3 | | 7.85% | | 04/01/16 | | | 1,000 | | | 740,000 |
Tyson Foods, Inc., Sr. Unsec’d. Notes | | B2 | | 8.25% | | 10/01/11 | | | 2,050 | | | 1,824,500 |
Yum! Brands, Inc., Sr. Unsec’d. Notes | | Baa3 | | 8.875% | | 04/15/11 | | | 1,705 | | | 1,726,974 |
| | | | | | | | | | | |
|
|
| | | | | | | | | | | | | 11,070,279 |
| | | | | | | | | | | |
|
|
Foreign Government Bonds — 0.3% | | | | | | | | | | | | |
Pemex Project Funding Master Trust, Gtd. Notes, 144A(f) | | Baa1 | | 6.5525% | | 10/15/09 | | | 3,190 | | | 3,126,200 |
| | | | | | | | | | | |
|
|
Gaming — 0.2% | | | | | | | | | | | | |
Harrah’s Operating Co., Inc., Gtd. Notes | | Caa3 | | 5.625% | | 06/01/15 | | | 665 | | | 113,050 |
Harrah’s Operating Co., Inc., Gtd. Notes, 144A | | NR | | 10.00% | | 12/15/18 | | | 134 | | | 48,910 |
MGM Mirage, Inc., Gtd. Notes | | Ba3 | | 6.875% | | 04/01/16 | | | 3,000 | | | 1,897,500 |
| | | | | | | | | | | |
|
|
| | | | | | | | | | | | | 2,059,460 |
| | | | | | | | | | | |
|
|
Health Care & Pharmaceutical — 1.4% | | | | | | | | | | | | |
Alliance Imaging, Inc., Sr. Sub. Notes | | B3 | | 7.25% | | 12/15/12 | | | 1,500 | | | 1,275,000 |
AmerisourceBergen Corp., Gtd. Notes | | Baa3 | | 5.875% | | 09/15/15 | | | 2,325 | | | 2,032,013 |
Cardinal Health, Inc., Sr. Unsec’d. Notes | | Baa2 | | 5.80% | | 10/15/16 | | | 265 | | | 239,740 |
GlaxoSmithKline Capital, Inc., Gtd. Notes(d) | | A1 | | 5.65% | | 05/15/18 | | | 4,000 | | | 4,201,311 |
HCA, Inc., Sr. Unsec’d. Notes, MTN | | Caa1 | | 8.70% | | 02/10/10 | | | 1,700 | | | 1,620,381 |
Hospira, Inc., Sr. Unsec’d. Notes | | Baa3 | | 5.55% | | 03/30/12 | | | 2,500 | | | 2,368,670 |
Schering-Plough Corp., Sr. Unsec’d. Notes | | Baa1 | | 5.55% | | 12/01/13 | | | 2,735 | | | 2,754,998 |
Wyeth, Sr. Unsec’d. Notes | | A3 | | 5.50% | | 02/15/16 | | | 1,630 | | | 1,659,803 |
| | | | | | | | | | | |
|
|
| | | | | | | | | | | | | 16,151,916 |
| | | | | | | | | | | |
|
|
Health Care Insurance — 0.8% | | | | | | | | | | | | |
Aetna, Inc., Sr. Unsec’d. Notes | | A3 | | 6.75% | | 12/15/37 | | | 1,900 | | | 1,600,592 |
Cigna Corp., Sr. Unsec’d. Notes | | Baa2 | | 5.375% | | 03/15/17 | | | 2,125 | | | 1,786,022 |
Coventry Health Care, Inc., Sr. Unsec’d. Notes | | Ba1 | | 6.125% | | 01/15/15 | | | 4,025 | | | 2,391,394 |
Health Net, Inc., Sr. Unsec’d. Notes(a) | | Ba3 | | 6.375% | | 06/01/17 | | | 1,315 | | | 526,000 |
UnitedHealth Group, Inc., Sr. Unsec’d. Notes | | Baa1 | | 6.00% | | 06/15/17 | | | 2,610 | | | 2,350,109 |
UnitedHealth Group, Inc., Sr. Unsec’d. Notes | | Baa1 | | 6.50% | | 06/15/37 | | | 760 | | | 637,908 |
UnitedHealth Group, Inc., Sr. Unsec’d. Notes | | Baa1 | | 6.875% | | 02/15/38 | | | 180 | | | 157,610 |
| | | | | | | | | | | |
|
|
| | | | | | | | | | | | | 9,449,635 |
| | | | | | | | | | | |
|
|
Insurance — 1.1% | | | | | | | | | | | | |
Ace INA Holdings, Inc., Gtd. Notes | | A3 | | 5.70% | | 02/15/17 | | | 1,135 | | | 1,017,691 |
Allied World Insurance Holdings Ltd., Sr. Unsec’d. Notes (Bermuda) | | Baa1 | | 7.50% | | 08/01/16 | | | 1,700 | | | 1,198,475 |
American International Group, Inc., Jr. Sub. Notes, 144A(f) | | Baa1 | | 8.175% | | 05/15/58 | | | 2,600 | | | 1,011,465 |
American International Group, Inc., Sr. Unsec’d. Notes | | A3 | | 4.25% | | 05/15/13 | | | 1,820 | | | 1,341,316 |
American International Group, Inc., Sr. Unsec’d. Notes | | A3 | | 5.05% | | 10/01/15 | | | 315 | | | 211,230 |
SEE NOTES TO FINANCIAL STATEMENTS.
A25
| | | | | | |
| | | DIVERSIFIED BOND PORTFOLIO (continued) | | |
| |
| SCHEDULE OF INVESTMENTS | | December 31, 2008 |
| | | | | | | | | | | | |
LONG-TERM BONDS
(continued) | | Moody’s
Rating†
(Unaudited)
| | Interest
Rate
| | Maturity
Date
| | Principal
Amount
(000)#
| | Value
(Note 2)
|
| | | | | | | | | | | | | |
Insurance (continued) | | | | | | | | | | | | |
Axis Capital Holdings Ltd., Sr. Unsec’d. Notes (Bermuda) | | Baa1 | | 5.75% | | 12/01/14 | | $ | 3,350 | | $ | 2,212,688 |
Chubb Corp., Sr. Notes | | A2 | | 5.75% | | 05/15/18 | | | 2,950 | | | 2,832,493 |
Travelers Cos, Inc., Sr. Unsec’d. Notes, MTN | | A2 | | 6.25% | | 06/15/37 | | | 1,890 | | | 1,817,180 |
XL Capital Ltd., Jr. Sub. Notes, Class E (Cayman Islands)(f) | | Ba1 | | 6.50% | | 12/31/49 | | | 1,880 | | | 432,400 |
XL Capital Ltd., Sr. Unsec’d. Notes, Class A (Cayman Islands) | | Baa2 | | 5.25% | | 09/15/14 | | | 140 | | | 77,748 |
| | | | | | | | | | | |
|
|
| | | | | | | | | | | | | 12,152,686 |
| | | | | | | | | | | |
|
|
Lodging — 0.3% | | | | | | | | | | | | |
Felcore Lodging LP, Sr. Sec’d. Notes(f) | | Ba3 | | 4.442% | | 12/01/11 | | | 1,800 | | | 1,116,000 |
Royal Caribbean Cruises Ltd., Sr. Unsec’d. Notes (Liberia), Sr. Notes | | Ba1 | | 8.00% | | 05/15/10 | | | 1,730 | | | 1,479,150 |
Starwood Hotels & Resorts Worldwide, Inc., Sr. Unsec’d. Notes | | Baa3 | | 6.25% | | 02/15/13 | | | 980 | | | 676,200 |
| | | | | | | | | | | |
|
|
| | | | | | | | | | | | | 3,271,350 |
| | | | | | | | | | | |
|
|
Media & Entertainment — 0.6% | | | | | | | | | | | | |
British Sky Broadcasting Group PLC (United Kingdom), 144A | | Baa2 | | 6.10% | | 02/15/18 | | | 210 | | | 172,431 |
Dex Media West LLC, Sr. Sub. Notes, Series B | | B2 | | 9.875% | | 08/15/13 | | | 950 | | | 225,625 |
News America, Inc., Gtd. Notes | | Baa1 | | 7.625% | | 11/30/28 | | | 1,415 | | | 1,419,270 |
Time Warner, Inc., Gtd. Notes, | | Baa2 | | 7.25% | | 10/15/17 | | | 1,440 | | | 1,321,654 |
Viacom, Inc., Sr. Unsec’d. Notes | | Baa3 | | 6.875% | | 04/30/36 | | | 740 | | | 584,805 |
Viacom, Inc., Sr. Unsec’d. Notes | | Baa3 | | 6.75% | | 10/05/37 | | | 1,075 | | | 828,593 |
Vivendi, Notes (France), 144A | | Baa2 | | 5.75% | | 04/04/13 | | | 2,000 | | | 1,755,476 |
| | | | | | | | | | | |
|
|
| | | | | | | | | | | | | 6,307,854 |
| | | | | | | | | | | |
|
|
Metals — 0.5% | | | | | | | | | | | | |
Freeport-McMoRan Copper & Gold, Inc., Sr. Unsec’d. Notes | | Ba2 | | 8.375% | | 04/01/17 | | | 2,095 | | | 1,717,900 |
United States Steel Corp., Sr. Unsec’d. Notes | | Baa3 | | 7.00% | | 02/01/18 | | | 2,000 | | | 1,363,080 |
Xstrata Finance Canada Ltd., Gtd. Notes (Canada), 144A | | Baa2 | | 5.50% | | 11/16/11 | | | 3,430 | | | 2,680,041 |
| | | | | | | | | | | |
|
|
| | | | | | | | | | | | | 5,761,021 |
| | | | | | | | | | | |
|
|
Non-Captive Finance — 1.7% | | | | | | | | | | | | |
Bosphorus Financial Services Ltd., Sr. Sec’d. Notes (Cayman
Islands), 144A(f)(h) | | Baa2 | | 3.949% | | 02/15/12 | | | 1,808 | | | 1,538,268 |
Capital One Financial Corp., Sub. Notes | | Baa1 | | 6.15% | | 09/01/16 | | | 700 | | | 492,588 |
CITGroup, Inc., Sub. Notes, 144A | | Baa2 | | 12.00% | | 12/18/18 | | | 2,628 | | | 2,023,560 |
CitiGroup, Inc., Sr. Unsec’d. Notes | | Baa1 | | 5.65% | | 02/13/17 | | | 1,708 | | | 1,187,660 |
Countrywide Financial Corp., Gtd. Notes, MTN | | Aa2 | | 5.80% | | 06/07/12 | | | 3,670 | | | 3,576,976 |
General Electric Capital Australia Funding Pty Ltd., Gtd. Notes (Australia), MTN | | Aaa | | 6.00% | | 04/15/15 | | | AUD 4,440 | | | 2,447,184 |
Nelnet, Inc., Sub. Notes(f) | | Ba2 | | 7.40% | | 09/29/36 | | | 6,500 | | | 1,948,986 |
Preferred Term Securities X, Sr. Notes, Class A-1 (Cayman
Islands), 144A(f) | | Aa1 | | 4.196% | | 07/03/33 | | | 3,280 | | | 1,485,554 |
SLM Corp., Sr. Unsec’d. Notes, MTN | | Baa2 | | 8.45% | | 06/15/18 | | | 6,170 | | | 4,878,131 |
| | | | | | | | | | | |
|
|
| | | | | | | | | | | | | 19,578,907 |
| | | | | | | | | | | |
|
|
Non-Corporate Foreign Agency — 1.4% | | | | | | | | | | | | |
Credit Suisse First Boston International for CJSC, Sec’d. Notes (The) (United Kingdom) | | Ba3 | | 6.80% | | 10/04/12 | | | 1,400 | | | 560,000 |
Dresdner Kleinwort Wasserstein for CJSC, Sec’d. Notes (The) (Germany) | | Ba3 | | 7.75% | | 09/23/09 | | | 1,400 | | | 980,000 |
Gazprom International SA, Gtd. Notes (Luxembourg), 144A | | BBB+(e) | | 7.201% | | 02/01/20 | | | 1,932 | | | 1,410,374 |
Gazprom OAO (Russia) | | A3 | | 10.50% | | 10/21/09 | | | 1,685 | | | 1,693,617 |
Macquarie Group Ltd. Gov’t. Liquid Gtd. Notes (Australia), 144A | | Aaa | | 4.10% | | 12/17/13 | | | 1,955 | | | 2,018,459 |
National Power Corp., Gov’t. Gtd. Notes (Philippines), 144A(f) | | BB-(e) | | 6.403% | | 08/23/11 | | | 1,530 | | | 1,422,900 |
Petronas Capital, Ltd., Gtd. Notes (Malaysia), 144A | | A1 | | 7.00% | | 05/22/12 | | | 7,300 | | | 7,737,125 |
| | | | | | | | | | | |
|
|
| | | | | | | | | | | | | 15,822,475 |
| | | | | | | | | | | |
|
|
Non-Corporate Sovereign — 2.3% | | | | | | | | | | | | |
Federal Republic of Brazil (Brazil) | | Ba1 | | 12.50% | | 01/05/16 | | | BRL 250 | | | 112,564 |
Federal Republic of Brazil, Unsec’d. Notes (Brazil) | | Ba1 | | 9.25% | | 10/22/10 | | | 5,325 | | | 5,836,201 |
Government of Hungary, Bonds (Hungary) | | A3 | | 8.00% | | 02/12/15 | | | HUF 693,400 | | | 3,479,052 |
SEE NOTES TO FINANCIAL STATEMENTS.
A26
| | | | | | |
| | | DIVERSIFIED BOND PORTFOLIO (continued) | | |
| |
| SCHEDULE OF INVESTMENTS | | December 31, 2008 |
| | | | | | | | | | | | |
LONG-TERM BONDS
(continued) | | Moody’s
Rating†
(Unaudited)
| | Interest
Rate
| | Maturity
Date
| | Principal
Amount
(000)#
| | Value
(Note 2)
|
| | | | | | | | | | | | | |
Non-Corporate Sovereign (continued) | | | | | | | | | | | | |
Government of Jamaica, Sr. Unsec’d. Notes (Jamaica) | | B1 | | 11.00% | | 07/27/12 | | | EUR 995 | | $ | 1,137,597 |
Japan Government CPI Linked Bonds, Series 16 (Japan) | | Aa3 | | 1.40% | | 06/10/18 | | | JPY 248,148 | | | 2,389,502 |
Peru Government International Bond, Sr. Sec’d. (Peru), 144A(g) | | Ba1 | | 6.857% | | 05/31/18 | | $ | 1,779 | | | 942,993 |
Republic of Panama, Unsub. Notes (Panama) | | Ba1 | | 9.375% | | 07/23/12 | | | 1,295 | | | 1,405,075 |
Republic of Poland, Bonds (Poland) | | A2 | | 6.25% | | 10/24/15 | | | PLN 9,910 | | | 3,486,745 |
Republic of Uruguay, Unsub. Notes (Uruguay) | | B1 | | 7.25% | | 02/15/11 | | | 660 | | | 666,600 |
Russian Government International Bond, Unsub. Notes (Russia), 144A(a) | | Baa1 | | 8.25% | | 03/31/10 | | | 1,730 | | | 1,790,748 |
United Mexican States, Sr. Unsec’d. Notes (Mexico) | | Baa1 | | 7.50% | | 01/14/12 | | | 4,250 | | | 4,568,750 |
| | | | | | | | | | | |
|
|
| | | | | | | | | | | | | 25,815,827 |
| | | | | | | | | | | |
|
|
Paper — 0.5% | | | | | | | | | | | | |
Graphic Packaging International, Inc., Gtd. Notes | | B3 | | 8.50% | | 08/15/11 | | | 2,970 | | | 2,479,950 |
International Paper Co., Sr. Unsec’d. Notes | | Baa3 | | 4.00% | | 04/01/10 | | | 2,815 | | | 2,708,897 |
Norampac, Inc., Gtd. Notes (Canada) | | Ba3 | | 6.75% | | 06/01/13 | | | 1,400 | | | 630,000 |
| | | | | | | | | | | |
|
|
| | | | | | | | | | | | | 5,818,847 |
| | | | | | | | | | | |
|
|
Pipelines & Other — 0.8% | | | | | | | | | | | | |
Atmos Energy Corp., Sr. Unsec’d. Notes | | Baa3 | | 4.00% | | 10/15/09 | | | 5,300 | | | 5,190,741 |
Energy Transfer Partners LP, Sr. Unsec’d. Notes | | Baa3 | | 7.50% | | 07/01/38 | | | 1,945 | | | 1,518,668 |
Transcanada Pipelines Ltd., Sr. Unsec’d. Notes (Cananda) | | A3 | | 7.25% | | 08/15/38 | | | 2,200 | | | 2,189,928 |
| | | | | | | | | | | |
|
|
| | | | | | | | | | | | | 8,899,337 |
| | | | | | | | | | | |
|
|
Railroads — 0.2% | | | | | | | | | | | | |
CSX Corp., Sr. Unsec’d. Notes | | Baa3 | | 5.75% | | 03/15/13 | | | 2,600 | | | 2,443,015 |
| | | | | | | | | | | |
|
|
Real Estate Investments Trusts — 0.4% | | | | | | | | | | | | |
Equity One, Inc., Gtd. Notes | | Baa3 | | 3.875% | | 04/15/09 | | | 1,450 | | | 1,414,202 |
Post Apartment Homes LP, Sr. Unsec’d. Notes | | Baa3 | | 5.45% | | 06/01/12 | | | 2,300 | | | 1,874,144 |
Realty Income Corp., Sr. Unsec’d. Notes | | Baa1 | | 6.75% | | 08/15/19 | | | 1,545 | | | 894,115 |
| | | | | | | | | | | |
|
|
| | | | | | | | | | | | | 4,182,461 |
| | | | | | | | | | | |
|
|
Retailers — 0.6% | | | | | | | | | | | | |
CVS/Caremark Corp., Sr. Unsec’d. Notes | | Baa2 | | 6.25% | | 06/01/27 | | | 3,020 | | | 2,808,002 |
Neiman-Marcus Group, Inc., Gtd. Notes, PIK | | B3 | | 9.00% | | 10/15/15 | | | 1,250 | | | 550,000 |
Target Corp., Sr. Unsec’d. Notes | | A2 | | 6.50% | | 10/15/37 | | | 800 | | | 686,937 |
Target Corp., Sr. Unsec’d. Notes | | A2 | | 7.00% | | 01/15/38 | | | 1,870 | | | 1,733,107 |
Wal-Mart Stores, Inc., Sr. Unsec’d. Notes | | Aa2 | | 6.50% | | 08/15/37 | | | 545 | | | 647,086 |
Wal-Mart Stores, Inc., Sr. Unsec’d. Notes(d) | | Aa2 | | 6.20% | | 04/15/38 | | | 200 | | | 228,891 |
| | | | | | | | | | | |
|
|
| | | | | | | | | | | | | 6,654,023 |
| | | | | | | | | | | |
|
|
Structured Notes — 1.6% | | | | | | | | | | | | |
Dow Jones CDX High Yield, 144A | | Caa2 | | 8.25% | | 12/29/10 | | | 8,298 | | | 8,349,475 |
Dow Jones CDX High Yield, 144A(a) | | B3 | | 8.625% | | 06/29/11 | | | 9,555 | | | 9,494,784 |
| | | | | | | | | | | |
|
|
| | | | | | | | | | | | | 17,844,259 |
| | | | | | | | | | | |
|
|
Technology — 1.0% | | | | | | | | | | | | |
Affiliated Computer Services, Inc., Sr. Unsec’d. Notes | | Ba2 | | 4.70% | | 06/01/10 | | | 3,000 | | | 2,790,000 |
Dell, Inc., Sr. Unsec’d Notes | | A2 | | 4.70% | | 04/15/13 | | | 1,800 | | | 1,693,357 |
Fiserv, Inc., Gtd. Notes | | Baa2 | | 6.125% | | 11/20/12 | | | 1,600 | | | 1,503,256 |
International Business Machines Corp., Sr. Unsec’d. Notes | | A1 | | 8.00% | | 10/15/38 | | | 640 | | | 851,995 |
Jabil Circuit, Inc., Sr. Unsec’d. Notes | | Ba1 | | 5.875% | | 07/15/10 | | | 2,000 | | | 1,830,000 |
Motorola, Inc., Sr. Unsec’d. Notes | | Baa2 | | 8.00% | | 11/01/11 | | | 121 | | | 100,971 |
Oracle Corp., Sr. Unsec’d. Notes | | A2 | | 5.75% | | 04/15/18 | | | 1,265 | | | 1,323,150 |
SunGard Data Systems, Inc., Gtd. Notes | | B3 | | 3.75% | | 01/15/09 | | | 720 | | | 716,016 |
Xerox Corp., Sr. Unsec’d. Notes | | Baa2 | | 5.50% | | 05/15/12 | | | 870 | | | 729,104 |
| | | | | | | | | | | |
|
|
| | | | | | | | | | | | | 11,537,849 |
| | | | | | | | | | | |
|
|
Telecommunications — 2.4% | | | | | | | | | | | | |
AT&T Corp., Gtd. Notes | | A2 | | 8.00% | | 11/15/31 | | | 2,475 | | | 3,108,934 |
Embarq Corp., Sr. Unsec’d. Notes | | Baa3 | | 7.082% | | 06/01/16 | | | 5,600 | | | 4,311,999 |
New Cingular Wireless Services, Inc., Sr. Unsec’d. Notes | | A2 | | 8.125% | | 05/01/12 | | | 1,810 | | | 1,940,988 |
SEE NOTES TO FINANCIAL STATEMENTS.
A27
| | | | | | |
| | | DIVERSIFIED BOND PORTFOLIO (continued) | | |
| |
| SCHEDULE OF INVESTMENTS | | December 31, 2008 |
| | | | | | | | | | | | |
LONG-TERM BONDS
(continued) | | Moody’s
Rating†
(Unaudited)
| | Interest
Rate
| | Maturity
Date
| | Principal
Amount
(000)#
| | Value
(Note 2)
|
| | | | | | | | | | | | | |
Telecommunications (continued) | | | | | | | | | | | | |
New Cingular Wireless Services, Inc., Sr. Unsec’d. Notes | | A2 | | 8.75% | | 03/01/31 | | $ | 2,375 | | $ | 2,968,954 |
Qwest Corp. | | Ba1 | | 8.875% | | 03/15/12 | | | 3,300 | | | 3,052,500 |
Rogers Communications, Inc. (Canada) | | Baa3 | | 6.80% | | 08/15/18 | | | 2,600 | | | 2,627,121 |
Telecom Italia Capital (Luxembourg) | | Baa2 | | 4.875% | | 10/01/10 | | | 3,400 | | | 3,077,000 |
Telefonica Emisiones SAU (Spain) | | Baa1 | | 7.045% | | 06/20/36 | | | 5 | | | 5,458 |
Verizon Communications, Inc., Sr. Unsec’d. Notes | | A3 | | 5.25% | | 04/15/13 | | | 2,420 | | | 2,429,257 |
Verizon Wireless, Sr. Unsec’d. Notes, 144A | | A2 | | 7.375% | | 11/15/13 | | | 3,500 | | | 3,692,780 |
| | | | | | | | | | | |
|
|
| | | | | | | | | | | | | 27,214,991 |
| | | | | | | | | | | |
|
|
Tobacco — 1.1% | | | | | | | | | | | | |
Altria Group, Inc., Gtd. Notes | | Baa1 | | 9.95% | | 11/10/38 | | | 4,100 | | | 4,464,125 |
Altria Group, Inc., Gtd. Notes | | Baa1 | | 9.70% | | 11/10/18 | | | 500 | | | 540,415 |
Philip Morris International, Inc., Sr. Unsec’d. Notes | | A2 | | 5.65% | | 05/16/18 | | | 3,000 | | | 2,973,999 |
Reynolds American, Inc., Sr. Sec’d. Notes | | Baa3 | | 6.50% | | 07/15/10 | | | 4,000 | | | 3,974,640 |
| | | | | | | | | | | |
|
|
| | | | | | | | | | | | | 11,953,179 |
| | | | | | | | | | | |
|
|
U.S. Government Agency Obligations — 2.6% | | | | | | | | | | | | |
Federal Farm Credit Bank | | Aaa | | 4.875% | | 01/17/17 | | | 580 | | | 653,632 |
Federal Home Loan Bank | | Aaa | | 5.125% | | 10/19/16 | | | 120 | | | 137,265 |
Federal Home Loan Mortgage Corp. | | Aaa | | 4.125% | | 09/27/13 | | | 17,455 | | | 18,808,233 |
Federal National Mortgage Association | | Aaa | | 2.875% | | 12/11/13 | | | 9,750 | | | 9,986,662 |
Federal National Mortgage Association | | Aaa | | 5.625% | | 07/15/37 | | | 165 | | | 212,879 |
| | | | | | | | | | | |
|
|
| | | | | | | | | | | | | 29,798,671 |
| | | | | | | | | | | |
|
|
U.S. Government Mortgage-Backed Securities — 45.8% | | | | | | | | | | | | |
Federal Home Loan Mortgage Corp. | | Aaa | | 4.50% | | 02/01/19-07/01/19 | | | 12,891 | | | 13,235,245 |
Federal Home Loan Mortgage Corp. | | Aaa | | 5.00% | | 07/01/19-05/01/34 | | | 6,552 | | | 6,739,157 |
Federal Home Loan Mortgage Corp. | | Aaa | | 5.00% | | TBA 30 YR | | | 9,500 | | | 9,707,813 |
Federal Home Loan Mortgage Corp. | | Aaa | | 5.50% | | 10/01/33-05/01/37 | | | 15,535 | | | 15,939,987 |
Federal Home Loan Mortgage Corp. | | Aaa | | 5.50% | | TBA 30 YR | | | 29,500 | | | 30,191,421 |
Federal Home Loan Mortgage Corp. | | Aaa | | 6.00% | | 11/01/33-04/01/34 | | | 5,562 | | | 5,744,662 |
Federal Home Loan Mortgage Corp. | | Aaa | | 6.50% | | 07/01/32 | | | 2,566 | | | 2,677,179 |
Federal Home Loan Mortgage Corp. | | Aaa | | 7.00% | | 10/01/32-11/01/33 | | | 4,763 | | | 5,005,918 |
Federal National Mortgage Association | | Aaa | | 4.00% | | 05/01/19-06/01/19 | | | 6,245 | | | 6,347,310 |
Federal National Mortgage Association | | Aaa | | 4.50% | | 06/01/18-02/01/35 | | | 18,985 | | | 19,448,115 |
Federal National Mortgage Association | | Aaa | | 5.00% | | 01/01/19-05/01/38 | | | 21,408 | | | 21,951,877 |
Federal National Mortgage Association | | Aaa | | 5.00% | | TBA 30 YR | | | 71,500 | | | 72,997,066 |
Federal National Mortgage Association | | Aaa | | 5.195% | | 10/01/37 | | | 9,719 | | | 9,807,908 |
Federal National Mortgage Association | | Aaa | | 5.307% | | 01/01/36 | | | 2,864 | | | 2,915,030 |
Federal National Mortgage Association | | Aaa | | 5.50% | | 12/01/16-02/01/38 | | | 109,137 | | | 112,088,919 |
Federal National Mortgage Association | | Aaa | | 5.50% | | TBA 30 YR | | | 2,250 | | | 2,306,250 |
Federal National Mortgage Association | | Aaa | | 5.894% | | 06/01/37 | | | 3,414 | | | 3,512,512 |
Federal National Mortgage Association | | Aaa | | 6.00% | | 09/01/17-06/01/38 | | | 28,628 | | | 29,572,465 |
Federal National Mortgage Association | | Aaa | | 6.00% | | TBA 30 YR | | | 80,500 | | | 82,864,687 |
Federal National Mortgage Association | | Aaa | | 6.036% | | 09/01/37 | | | 9,098 | | | 9,351,248 |
Federal National Mortgage Association | | Aaa | | 6.50% | | 11/01/09-10/01/37 | | | 20,667 | | | 21,514,978 |
Federal National Mortgage Association | | Aaa | | 7.00% | | 05/01/32 | | | 428 | | | 452,912 |
Government National Mortgage Association | | Aaa | | 5.50% | | 01/15/33-01/15/35 | | | 8,919 | | | 9,216,391 |
Government National Mortgage Association | | Aaa | | 5.50% | | TBA 30 YR | | | 5,600 | | | 5,748,781 |
Government National Mortgage Association | | Aaa | | 6.00% | | 12/15/32-11/15/34 | | | 8,197 | | | 8,472,433 |
Government National Mortgage Association | | Aaa | | 6.00% | | TBA 30 YR | | | 7,000 | | | 7,220,934 |
Government National Mortgage Association | | Aaa | | 6.50% | | 09/15/32-11/15/33 | | | 4,578 | | | 4,799,550 |
Government National Mortgage Association | | Aaa | | 7.50% | | 10/15/25-02/15/26 | | | 157 | | | 166,196 |
| | | | | | | | | | | |
|
|
| | | | | | | | | | | | | 519,996,944 |
| | | | | | | | | | | |
|
|
U.S. Government Treasury Securities — 4.9% | | | | | | | | | | | | |
U.S. Treasury Bonds(a) | | Aaa | | 4.375% | | 02/15/38 | | | 330 | | | 441,994 |
U.S. Treasury Bonds(j) | | Aaa | | 4.50% | | 05/15/38 | | | 5,420 | | | 7,397,454 |
U.S. Treasury Inflation Indexed Bonds(a) | | Aaa | | 1.875% | | 07/15/13 | | | 6,287 | | | 5,919,212 |
SEE NOTES TO FINANCIAL STATEMENTS.
A28
| | | | | | |
| | | DIVERSIFIED BOND PORTFOLIO (continued) | | |
| |
| SCHEDULE OF INVESTMENTS | | December 31, 2008 |
| | | | | | | | | | | | |
LONG-TERM BONDS
(continued) | | Moody’s
Rating†
(Unaudited)
| | Interest
Rate
| | Maturity
Date
| | Principal
Amount
(000)#
| | Value
(Note 2)
|
| | | | | | | | | | | | | |
U.S. Government Treasury Securities (continued) | | | | | | | | | | | | |
U.S. Treasury Inflation Indexed Bonds(a)(j) | | Aaa | | 2.00% | | 01/15/14 | | $ | 12,065 | | $ | 11,431,416 |
U.S. Treasury Inflation Indexed Bonds | | Aaa | | 1.375% | | 07/15/18 | | | 8,590 | | | 8,033,513 |
U.S. Treasury Notes | | Aaa | | 1.50% | | 12/31/13 | | | 11,485 | | | 11,458,974 |
U.S. Treasury Strips(a)(g) | | Aaa | | 4.21% | | 11/15/21 | | | 8,545 | | | 5,540,040 |
U.S. Treasury Strips(g) | | Aaa | | 4.25% | | 08/15/29 | | | 10,165 | | | 5,380,263 |
| | | | | | | | | | | |
|
|
| | | | | | | | | | | | | 55,602,866 |
| | | | | | | | | | | |
|
|
TOTAL LONG-TERM BONDS
(cost $1,168,010,451) | | | 1,081,446,033 |
| | | | | | | | | | | |
|
|
| BANK LOANS — 3.4% | | | | | | | | | | |
Automotive — 0.1% | | | | | | | | | | | | |
Oshkosh Truck Corp.(h) | | Ba3 | | 3.4248% | | 12/06/13 | | | 1,414 | | | 818,855 |
| | | | | | | | | | | |
|
|
Cable — 0.2% | | | | | | | | | | | | |
Insight Midwest Holding LLC(h) | | B1 | | 3.66% | | 10/06/13 | | | 3,208 | | | 2,582,273 |
| | | | | | | | | | | |
|
|
Capital Goods — 0.1% | | | | | | | | | | | | |
Capital Safety Group Ltd.(h) | | B2 | | 2.711% | | 07/20/15 | | | 409 | | | 315,121 |
Capital Safety Group Ltd.(h) | | B2 | | 3.211% | | 07/20/16 | | | 1,091 | | | 839,879 |
| | | | | | | | | | | |
|
|
| | | | | | | | | | | | | 1,155,000 |
| | | | | | | | | | | |
|
|
Consumer — 0.2% | | | | | | | | | | | | |
Huish Detergents, Inc.(h) | | Ba3 | | 2.48% | | 04/26/14 | | | 2,955 | | | 2,078,349 |
| | | | | | | | | | | |
|
|
Electric — 0.5% | | | | | | | | | | | | |
NRG Energy, Inc.(h) | | Ba1 | | 1.3588% | | 02/01/13 | | | 1,171 | | | 1,011,770 |
NRG Energy, Inc.(h) | | Ba1 | | 2.675% | | 02/01/13 | | | 2,377 | | | 2,053,319 |
Reliant Energy, Inc.(h) | | Ba3 | | 1.88% | | 06/30/14 | | | 2,500 | | | 1,790,000 |
Texas Competitive Electric Holdings Co. LLC(h) | | Ba3 | | 5.582% | | 10/10/14 | | | 1,975 | | | 1,365,219 |
| | | | | | | | | | | |
|
|
| | | | | | | | | | | | | 6,220,308 |
| | | | | | | | | | | |
|
|
Foods — 0.1% | | | | | | | | | | | | |
Supervalu, Inc.(h) | | Ba3 | | 2.3138% | | 06/02/11 | | | 2,077 | | | 1,692,692 |
| | | | | | | | | | | |
|
|
Gaming — 0.1% | | | | | | | | | | | | |
Las Vegas Sands LLC Term B(h) | | B2 | | 2.22% | | 05/23/14 | | | 2,167 | | | 972,742 |
Las Vegas Sands LLC Term DD(h) | | B2 | | 2.22% | | 05/23/14 | | | 547 | | | 245,655 |
| | | | | | | | | | | |
|
|
| | | | | | | | | | | | | 1,218,397 |
| | | | | | | | | | | |
|
|
Health Care & Pharmaceutical — 1.2% | | | | | | | | | | | | |
Community Health Systems, Inc.(h) | | Ba3 | | 3.4038% | | 07/25/14 | | | 135 | | | 104,326 |
Community Health Systems, Inc.(h) | | Ba3 | | 4.445% | | 07/25/14 | | | 2,631 | | | 2,039,874 |
HCA, Inc.(h) | | Ba3 | | 3.7088% | | 11/18/13 | | | 2,450 | | | 1,915,594 |
Health Management Associates Term B(h) | | B1 | | 3.2088% | | 02/28/14 | | | 1,933 | | | 1,181,999 |
Inverness Medical Innovations(h) | | B1 | | 3.723% | | 06/26/14 | | | 2,955 | | | 1,942,913 |
PTS Acquisition Corp.(h) | | Ba3 | | 3.7088% | | 04/10/14 | | | 3,842 | | | 2,285,692 |
Royalty Pharma Finance Trust(h) | | Baa3 | | 6.5688% | | 05/15/15 | | | 4,000 | | | 3,513,331 |
| | | | | | | | | | | |
|
|
| | | | | | | | | | | | | 12,983,729 |
| | | | | | | | | | | |
|
|
Media & Entertainment — 0.1% | | | | | | | | | | | | |
Idearc, Inc.(h) | | B2 | | 1.97% | | 11/17/13 | | | 1,000 | | | 325,000 |
Idearc, Inc.(h) | | B2 | | 3.5745% | | 11/17/14 | | | 1,715 | | | 523,075 |
| | | | | | | | | | | |
|
|
| | | | | | | | | | | | | 848,075 |
| | | | | | | | | | | |
|
|
Paper — 0.1% | | | | | | | | | | | | |
Domtar, Inc.(h) | | Baa3 | | 3.251% | | 03/05/14 | | | 1,530 | | | 1,023,188 |
| | | | | | | | | | | |
|
|
Pipelines & Other — 0.1% | | | | | | | | | | | | |
Enterprise GP Holdings LP(h) | | Ba2 | | 5.3568% | | 11/08/14 | | | 1,520 | | | 1,230,917 |
| | | | | | | | | | | |
|
|
Technology — 0.5% | | | | | | | | | | | | |
First Data Corp.(h) | | Ba3 | | 3.211% | | 09/24/14-09/24/14 | | | 3,012 | | | 1,926,525 |
Flextronics International Ltd. Term A (Singapore)(h) | | Ba1 | | 6.155% | | 10/01/14 | | | 2,301 | | | 1,442,103 |
SEE NOTES TO FINANCIAL STATEMENTS.
A29
| | | | | | |
| | | DIVERSIFIED BOND PORTFOLIO (continued) | | |
| |
| SCHEDULE OF INVESTMENTS | | December 31, 2008 |
| | | | | | | | | | | | | |
BANK LOANS
(continued) | | Moody’s
Rating†
(Unaudited)
| | Interest
Rate
| | Maturity
Date
| | Principal
Amount
(000)#
| | Value
(Note 2)
| |
Technology (continued) | | | | | | | | | | | | | |
Flextronics International Ltd. Term A-1-A (Singapore)(h) | | Ba1 | | 7.0688% | | 10/01/14 | | $ | 661 | | $ | 414,398 | |
Metavante Corp.(h) | | Ba2 | | 4.942% | | 11/01/14 | | | 2,481 | | | 1,836,125 | |
| | | | | | | | | | | |
|
|
|
| | | | | | | | | | | | | 5,619,151 | |
| | | | | | | | | | | |
|
|
|
Telecommunications — 0.1% | | | | | | | | | | | | | |
Alltel Communications, Inc.(h) | | Ba3 | | 3.9388% | | 05/15/15 | | | 1,580 | | | 1,550,375 | |
| | | | | | | | | | | |
|
|
|
TOTAL BANK LOANS
(cost $55,200,855) | | | 39,021,310 | |
| | | | | | | | | | | |
|
|
|
TOTAL LONG-TERM INVESTMENTS
(cost $1,223,211,306) | | | 1,120,467,342 | |
| | | | | | | | | | | |
|
|
|
| | | | | |
| | | | | | | | | Shares
| | | |
| SHORT-TERM INVESTMENTS — 22.9% | | | | | | | | | | | | | |
AFFILIATED MUTUAL FUNDS | | | | | | | | | | | |
Dryden Core Investment Fund — Short-Term Bond Series
(cost $164,222,330) (Note 4)(c) | | | 16,575,018 | | | 121,992,132 | |
Dryden Core Investment Fund — Taxable Money Market Fund Series
(cost $137,331,502; includes $44,158,988 of cash collateral received for securities on loan) (Note 4)(b)(c) | | | 137,331,502 | | | 137,331,502 | |
| | | | | | | | | | | |
|
|
|
TOTAL AFFILIATED MUTUAL FUNDS
(cost $301,553,832) | | | 259,323,634 | |
| | | | | | | | | | | |
|
|
|
TOTAL INVESTMENTS(k) — 121.6%
(cost $1,524,765,138) | | | 1,379,790,976 | |
LIABILITIES IN EXCESS OF OTHER ASSETS(l) — (21.6)% | | | (244,955,264 | ) |
| | | | | | | | | | | |
|
|
|
NET ASSETS — 100.0% | | $ | 1,134,835,712 | |
| | | | | | | | | | | |
|
|
|
The following abbreviations are used in portfolio descriptions:
| | |
| 144A | | Security was purchased pursuant to Rule 144A under the Securities Act of 1933 and may not be resold subject to that rule except to qualified institutional buyers. Unless otherwise noted, 144A securities are deemed to be liquid. |
| MTN | | Medium Term Note |
| NR | | Not Rated by Moody’s or Standard & Poor’s |
| PIK | | Payment-in-kind |
| TBA | | To Be Announced |
| AUD | | Australian Dollar |
| BRL | | Brazilian Real |
| EUR | | Euro |
| HUF | | Hungarian Forint |
| JPY | | Japanese Yen |
| MXN | | Mexican Peso |
| PLN | | Polish Zloty |
| # | Principal amount shown in U.S. dollars unless otherwise stated. |
| † | The rating reflected is as of December 31, 2008. Rating of certain bonds may have changed subsequent to that date. |
| (a) | All or portion of security is on loan. The aggregate market value of such securities is $42,538,539; cash collateral of $44,158,988 (included in liabilities) was received with which the Portfolio purchased highly liquid short-term investments. |
| (b) | Represents security, or a portion thereof, purchased with cash collateral received for securities on loan. |
| (c) | Prudential Investments LLC, the manager of the Portfolio, also serves as manager of the Dryden Core Investment Fund—Taxable Money Market Series and the Dryden Core Investment Fund—Short-Term Bond Series. |
| (d) | Security segregated as collateral for futures contracts. |
| (e) | Standard & Poor’s rating. |
| (f) | Indicates a variable rate security. The maturity date presented for these instruments is the latter of the next date on which the security can be redeemed at par or the next date on which the rate of interest is adjusted. The interest rate shown reflects the rate in effect at December 31, 2008. |
| (g) | Represents a zero coupon bond. Rate shown reflects the effective yield at reporting date. |
SEE NOTES TO FINANCIAL STATEMENTS.
A30
| | | | | | |
| | | DIVERSIFIED BOND PORTFOLIO (continued) | | |
| |
| SCHEDULE OF INVESTMENTS | | December 31, 2008 |
| (h) | Indicates a security that has been deemed illiquid. |
| (i) | Represents issuer in default of interest payments; non-income producing security. |
| (j) | Security segregated as collateral for swap contracts. |
| (k) | As of December 31, 2008, 1 security representing $2,023,560 and 0.18% of net assets was fair valued in accordance with the policies adopted by the Board of Trustees. |
| (l) | Liabilities in excess of other assets include net unrealized appreciation (depreciation) on futures contracts, forward foreign currency exchange contracts, interest rate and credit default swap agreements as follows: |
Open futures contracts outstanding at December 31, 2008:
| | | | | | | | | | | | | | |
Number of
Contracts
| | Type
| | Expiration
Date
| | Value at
Trade Date
| | Value at
December 31, 2008
| | Unrealized
Appreciation/
(Depreciation)
| |
| Long Positions: | | | | | | | | | | | | | | |
| 661 | | 10 Yr. U.S. Treasury Notes | | Mar. 2009 | | $ | 78,061,253 | | $ | 83,120,750 | | $ | 5,059,497 | |
| 11 | | 10 Yr. Euro Bonds | | Mar. 2009 | | | 1,897,774 | | | 1,908,869 | | | 11,095 | |
| 8 | | 2 Yr. Euro British Pound | | Mar. 2009 | | | 1,335,397 | | | 1,420,154 | | | 84,757 | |
| 272 | | 5 Yr. U.S. Treasury Notes | | Mar. 2009 | | | 32,327,939 | | | 32,382,875 | | | 54,936 | |
| 167 | | 30 Yr. U.S. Treasury Bonds | | Mar. 2009 | | | 21,219,857 | | | 23,053,828 | | | 1,833,971 | |
| | | | | | | | | | | | |
|
|
|
| | | | | | | | | | | | | | 7,044,256 | |
| | | | | | | | | | | | |
|
|
|
| Short Positions: | | | | | | | | | | | | | | |
| 20 | | Australian 10 Yr. Bonds | | Mar. 2009 | | | 1,334,313 | | | 1,338,692 | | | (4,379 | ) |
| 251 | | 2 Yr.U.S. Treasury Notes | | Mar. 2009 | | | 54,218,848 | | | 54,733,688 | | | (514,840 | ) |
| | | | | | | | | | | | |
|
|
|
| | | | | | | | | | | | | | (519,219 | ) |
| | | | | | | | | | | | |
|
|
|
| | | | | | | | | | | | | $ | 6,525,037 | |
| | | | | | | | | | | | |
|
|
|
Forward foreign currency exchange contracts outstanding at December 31, 2008:
| | | | | | | | | | | | |
Foreign Currency Contract
| | Notional
Amount (000)
| | Value at
Settlement Date
| | Value at
December 31, 2008
| | Unrealized
Appreciation/
(Depreciation)
| |
Purchased: | | | | | | | | | | | | |
Euro, Expiring 01/23/09 | | EUR 908 | | $ | 1,262,630 | | $ | 1,261,119 | | $ | (1,511 | ) |
Mexican Nuevo Peso, Expiring 01/20/09 | | MXN 71,035 | | | 5,306,098 | | | 5,092,266 | | | (213,832 | ) |
Polish Zloty, Expiring 01/22/09 | | PLN 1,936 | | | 681,400 | | | 651,332 | | | (30,068 | ) |
| | | | |
|
| |
|
| |
|
|
|
| | | | | | 7,250,128 | | | 7,004,717 | | | (245,411 | ) |
| | | | |
|
| |
|
| |
|
|
|
Sold: | | | | | | | | | | | | |
Australian Dollar, Expiring 01/21/09 | | AUD 1,981 | | | 1,374,992 | | | 1,377,740 | | | (2,748 | ) |
Hungarian Forint, Expiring 01/22/09 | | HUF 636,108 | | | 3,395,113 | | | 3,313,654 | | | 81,459 | |
Japanese Yen, Expiring 01/23/09 | | JPY 219,267 | | | 2,449,757 | | | 2,420,000 | | | 29,757 | |
Mexican Nuevo Peso, Expiring 01/20/09 | | MXN 71,035 | | | 5,287,339 | | | 5,092,265 | | | 195,074 | |
Polish Zloty, Expiring 01/22/09 | | PLN 10,371 | | | 3,602,679 | | | 3,489,903 | | | 112,776 | |
| | | | |
|
| |
|
| |
|
|
|
| | | | | | 16,109,880 | | | 15,693,562 | | | 416,318 | |
| | | | |
|
| |
|
| |
|
|
|
| | | | | | | | | | | $ | 170,907 | |
| | | | | | | | | | |
|
|
|
Interest rate swap agreements outstanding at December 31, 2008:
| | | | | | | | | | | | | |
Counterparty
| | Termination
Date
| | Notional
Amount
(000)#
| | Fixed
Rate
| | Floating Rate
| | Unrealized
Appreciation/
(Depreciation)
| |
Deutsche Bank AG(b) | | 8/15/2015 | | $ | 2,990 | | 3.71% | | 3 month LIBOR | | $ | (250,518 | ) |
Deutsche Bank AG(b) | | 5/15/2016 | | | 1,080 | | 4.49% | | 3 month LIBOR | | | (152,023 | ) |
Citibank, N.A.(a) | | 10/20/2013 | | | 5,955 | | 4.06% | | 3 month LIBOR | | | 509,646 | |
Merrill Lynch Capital Services, Inc.(a) | | 10/10/2013 | | | 5,955 | | 3.78% | | 3 month LIBOR | | | 433,770 | |
Merrill Lynch Capital Services, Inc.(b) | | 5/15/2016 | | | 5,955 | | 4.40% | | 3 month LIBOR | | | (800,570 | ) |
| | | | | | | | | | | |
|
|
|
| | | | | | | | | | | | $ | (259,695 | ) |
| | | | | | | | | | | |
|
|
|
| (a) | Portfolio pays the floating rate and receives the fixed rate. |
| (b) | Portfolio pays the fixed rate and receives the floating rate. |
SEE NOTES TO FINANCIAL STATEMENTS.
A31
| | | | | | |
| | | DIVERSIFIED BOND PORTFOLIO (continued) | | |
| |
| SCHEDULE OF INVESTMENTS | | December 31, 2008 |
Credit default swap agreements outstanding as of December 31, 2008:
| | | | | | | | | | | | |
Counterparty
| | Termination
Date
| | Notional
Amount
(000)#(3)
| | Fixed
Rate
| | Reference Entity/Obligation
| | Unrealized
Appreciation
|
Buy protection(1): | | | |
Morgan Stanley Capital Services, Inc. | | 9/20/2012 | | $ | 5,600 | | 1.70% | | CIT Group, Inc.
7.75%, due 04/02/12 | | $ | 951,740 |
Morgan Stanley Capital Services, Inc. | | 6/20/2013 | | | 3,700 | | 1.65% | | Itraxx Euro zero,
due 06/20/13 | | | 164,252 |
Merrill Lynch Capital Services, Inc. | | 9/20/2016 | | | 1,000 | | 1.73% | | Tyson Foods, Inc.
6.6%, due 04/01/16 | | | 144,818 |
Barclays Bank PLC | | 9/25/2035 | | | 1,000 | | 3.35% | | Accredited Mortgage Loan Trust,
Ser. 2005-3, Class M9
7.02%, 09/25/35 | | | 935,634 |
Citibank, N.A. | | 1/25/2035 | | | 512 | | 3.00% | | Morgan Stanley ABS Capital 1,
Ser. 2005-HE2, Class B2,
6.165%, 01/25/35 | | | 281,374 |
Citibank, N.A. | | 1/25/2035 | | | 506 | | 3.00% | | Morgan Stanley ABS Capital 1,
Ser. 2005-HE2, Class B3,
6.765%, 01/25/35 | | | 316,016 |
Citibank, N.A. | | 3/25/2035 | | | 523 | | 3.00% | | Centex Home Equity,
Ser. 2005-B, Class B,
6.215%, 03/25/35 | | | 250,826 |
Merrill Lynch Capital Services, Inc. | | 3/25/2036 | | | 1,000 | | 3.72% | | AmeriQuest Mortgage Securities, Inc.
Ser. 2006-R1, Class M9,
7.82%, 03/25/36 | | | 959,705 |
Morgan Stanley Capital Services, Inc. | | 5/25/2036 | | | 1,000 | | 3.23% | | Countrywide Asset-Backed Certificates,
Ser. 2005-16, Class MV8,
7.57%, 05/25/36 | | | 991,770 |
| | | | | | | | | | | |
|
|
| | | | | | | | | | | | $ | 4,996,135 |
| | | | | | | | | | | |
|
|
| | | | | | | | | | | | | | | | | | | | | | | |
Counterparty
| | Termination
Date
| | Implied Credit
Spread at
December 31,
2008(4)
| | Notional
Amount
(000)#(3)
| | Fixed
Rate
| | Reference Entity/
Obligation
| | Fair
Value
| | | Upfront
Premiums
Paid/
(Received)
| | | Unrealized
Depreciation
| |
Credit Default Swaps on Corporate Issues-Sell Protection(2): | | | | | | | | | | | | |
Morgan Stanley Capital Services, Inc. | | 6/20/2009 | | 1.50% | | $ | 1,334 | | 0.82% | | Tyco International Group SA, 6.00%, due 11/15/13 | | $ | (3,887 | ) | | $ | 3,798 | | | $ | (7,685 | ) |
Morgan Stanley Capital Services, Inc. | | 6/20/2009 | | 1.50% | | | 1,333 | | 0.82% | | Covidien Ltd.,
6.00%, due 10/15/17 | | | (3,886 | ) | | | 3,798 | | | | (7,684 | ) |
Morgan Stanley Capital Services, Inc. | | 6/20/2009 | | 1.50% | | | 1,333 | | 0.82% | | Tyco Electronics Ltd.,
6.00%, due 10/01/12 | | | (3,888 | ) | | | 3,799 | | | | (7,687 | ) |
Morgan Stanley Capital Services, Inc. | | 6/20/2009 | | 12.76% | | | 3,000 | | 1.90% | | Texas Competitive Electric Holdings Co., LLC
6.21287%, due 10/10/14 | | | (143,356 | ) | | | — | | | | (143,356 | ) |
JPMorgan Chanse Bank | | 6/20/2009 | | 31.40% | | | 1,750 | | 5.00% | | Harrah’s Operating Co., Inc.
5.625%, due 06/01/15 | | | (198,358 | ) | | | (44,199 | ) | | | (154,159 | ) |
Barclays Bank PLC | | 6/20/2013 | | 87.70% | | | 1,930 | | 5.00% | | Station Casinos, Inc.,
6.00%, 04/01/12 | | | (1,508,484 | ) | | | (300,231 | ) | | | (1,208,253 | ) |
Morgan Stanley Capital Services, Inc. | | 12/20/2014 | | 18.70% | | | 2,500 | | 1.17% | | Nextel Communications, Inc.,
7.375%, due 8/1/15 | | | (1,165,784 | ) | | | — | | | | (1,165,784 | ) |
| | | | | | | | | |
| |
| |
|
|
| |
|
|
| |
|
|
|
| | | | | | | | | | | | | | $ | (3,027,643 | ) | | $ | (333,035 | ) | | $ | (2,694,608 | ) |
| | | | | | | | | |
| |
| |
|
|
| |
|
|
| |
|
|
|
SEE NOTES TO FINANCIAL STATEMENTS.
A32
| | | | | | |
| | | DIVERSIFIED BOND PORTFOLIO (continued) | | |
| |
| SCHEDULE OF INVESTMENTS | | December 31, 2008 |
| | | | | | | | | | | | | | | | | | | |
Counterparty
| | Termination
Date
| | Notional
Amount
(000)#(3)
| | Fixed
Rate
| | Reference Entity/
Obligation
| | Fair
Value(5)
| | | Upfront
Premiums
Paid/
(Received)
| | Unrealized
Depreciation
| |
Credit Default Swaps on Asset-Backed Issues-Sell Protection(2): | | | | | | | | |
Merrill Lynch Capital Services, Inc. | | 3/25/2036 | | 1,000 | | 9.00% | | AmeriQuest Mortgage Securities, Inc.
Ser. 2006-R1, Class M9, 7.82%, 03/25/36 | | $ | (950,949 | ) | | $ | — | | $ | (950,949 | ) |
| | | | | | |
| |
| |
|
|
| |
|
| |
|
|
|
| | | | | | | | | | | $ | (950,949 | ) | | $ | — | | $ | (950,949 | ) |
| | | | | | |
| |
| |
|
|
| |
|
| |
|
|
|
The Portfolio entered into credit default swaps as the protection seller on corporate issues and asset-backed issues to take an active short position with respect to the likelihood of a particular issuer’s default.
| (1) | If the Portfolio is a buyer of protection, it pays the fixed rate. When a credit event occurs, as defined under the terms of that particular swap agreement, the Portfolio will either (i) receive from the seller of protection an amount equal to the notional amount of the swap and take delivery of the referenced obligation or underlying securities comprising the referenced index or (ii) receive a net settlement amount in the form of cash or securities equal to the notional amount of the swap less the recovery value of the referenced obligation or underlying securities comprising the referenced index. |
| (2) | If the Portfolio is a seller of protection, it receives the fixed rate. When a credit event occurs, as defined under the terms of that particular swap agreement, the Portfolio will either (i) pay to the buyer of protection an amount equal to the notional amount of the swap and take delivery of the referenced obligation or underlying securities comprising the referenced index or (ii) pay a net settlement amount in the form of cash or securities equal to the notional amount of the swap less the recovery value of the referenced obligation or underlying securities comprising the referenced index. |
| (3) | Notional amount represents the maximum potential amount the Portfolio could be required to pay as a seller of credit protection or receive as a buyer of credit protection if a credit event occurs as defined under the terms of that particular swap agreement. |
| (4) | Implied credit spreads, represented in absolute terms, utilized in determining the market value of credit default swap agreements on corporate issues or sovereign issues of an emerging country as of the reporting date serve as an indicator of the current status of the payment/ performance risk and represent the likelihood of risk of default for the credit derivative. The implied credit spread of a particular referenced entity reflects the cost of buying/selling protection and may include up-front payments required to be made to enter into the agreement. Wider credit spreads represent a deterioration of the referenced entity’s credit soundness and a greater likelihood of risk of default or other credit event occurring as defined under the terms of the agreement. |
| (5) | The fair value of credit default swap agreements on asset-backed securities serve as an indicator of the current status of the payment/performance risk and represent the likelihood of an expected liability (or profit) for the credit derivative should the notional amount of the swap agreement be closed/sold as of the reporting date. |
| # | Notional amount is shown in U.S. dollars unless otherwise stated. |
Various inputs are used in determining the value of the Portfolio’s investments. These inputs are summarized in the three broad levels listed below.
Level 1—quoted prices in active markets for identical securities
Level 2—other significant observable inputs (including quoted prices for similar securities, interest rates, prepayment speeds, credit risk, etc.)
Level 3—significant unobservable inputs (including the Portfolio’s own assumptions in determining the fair value of investments)
The following is a summary of the inputs used as of December 31, 2008 in valuing the Portfolio’s assets carried at fair value:
| | | | | | | |
Valuation inputs
| | Investments
in Securities
| | Other Financial
Instruments*
| |
Level 1—Quoted Prices | | $ | 259,323,634 | | $ | 6,525,037 | |
Level 2—Other Significant Observable Inputs | | | 1,118,443,782 | | | (1,379,231 | ) |
Level 3—Significant Unobservable Inputs | | | 2,023,560 | | | 2,641,021 | |
| | |
|
| |
|
|
|
Total | | $ | 1,379,790,976 | | $ | 7,786,827 | |
| | |
|
| |
|
|
|
| * | Other financial instruments are derivative instruments not reflected in the Schedule of Investments, such as futures, forwards and swap contracts, which are valued at the unrealized appreciation/depreciation on the instrument. |
SEE NOTES TO FINANCIAL STATEMENTS.
A33
| | | | | | |
| | | DIVERSIFIED BOND PORTFOLIO (continued) | | |
| |
| SCHEDULE OF INVESTMENTS | | December 31, 2008 |
The following is a reconciliation of assets in which significant unobservable inputs (Level 3) were used in determining fair value:
| | | | | | | | |
| | | Investments
in Securities
| | | Other Financial
Instruments
| |
Balance as of 12/31/07 | | $ | — | | | $ | 2,173,171 | |
Realized gain (loss) | | | — | | | | * | |
Change in unrealized appreciation (depreciation) | | | (578,234 | ) | | | 986,780 | |
Net purchases (sales) | | | 2,601,794 | | | | — | |
Transfers in and/or out of Level 3 | | | — | | | | (518,930 | ) |
| | |
|
|
| |
|
|
|
Balance as of 12/31/08 | | $ | 2,023,560 | | | $ | 2,641,021 | |
| | |
|
|
| |
|
|
|
| * | The realized loss incurred during the period for other financial instruments was $494,272. |
The industry classification of portfolio holdings and liabilities in excess of other assets shown as a percentage of net assets as of December 31, 2008 was as follows:
| | | |
U.S. Government Mortgage-Backed Securities | | 45.8 | % |
Affiliated Money Market Mutual Funds (including 3.9% of collateral received for securities on loan) | | 22.9 | |
Commercial Mortgage-Backed Securities | | 7.8 | |
U.S. Government Treasury Securities | | 4.9 | |
Banking | | 3.2 | |
Electric | | 2.6 | |
U.S. Government Agency Obligations | | 2.6 | |
Health Care & Pharmaceutical | | 2.6 | |
Asset-Backed Securities | | 2.5 | |
Telecommunications | | 2.5 | |
Non-Corporate Sovereign | | 2.3 | |
Non-Captive Finance | | 1.7 | |
Structured Notes | | 1.6 | |
Technology | | 1.5 | |
Non-Corporate Foreign Agency | | 1.4 | |
Airlines | | 1.1 | |
Chemicals | | 1.1 | |
Foods | | 1.1 | |
Insurance | | 1.1 | |
Tobacco | | 1.1 | |
Brokerage | | 1.0 | |
Energy – Other | | 1.0 | |
Pipelines & Other | | 0.9 | |
Capital Goods | | 0.8 | |
Health Care Insurance | | 0.8 | |
Media & Entertainment | | 0.7 | |
Paper | | 0.6 | |
Retailers | | 0.6 | |
Cable | | 0.5 | |
Collateralized Mortgage Obligations | | 0.5 | |
Metals | | 0.5 | |
Real Estate Investment Trusts | | 0.4 | |
Gaming | | 0.3 | |
Building Materials & Construction | | 0.3 | |
Foreign Government Bonds | | 0.3 | |
Lodging | | 0.3 | |
Consumer | | 0.2 | |
Railroads | | 0.2 | |
Automotive | | 0.1 | |
Emerging Markets | | 0.1 | |
Enery – Integrated | | 0.1 | |
| | |
|
|
| | | 121.6 | |
Liabilities in excess of other assets | | (21.6 | ) |
| | |
|
|
| | | 100.0 | % |
| | |
|
|
SEE NOTES TO FINANCIAL STATEMENTS.
A34
| | | | | | |
| | | DIVERSIFIED BOND PORTFOLIO (continued) | | |
STATEMENT OF ASSETS AND LIABILITIES
December 31, 2008
| | | | |
| ASSETS | | | | |
Investments, at value including securities on loan of $42,538,539: | | | | |
Unaffiliated investments (cost $1,223,211,306) | | $ | 1,120,467,342 | |
Affiliated investments (cost $301,553,832) | | | 259,323,634 | |
Foreign currency, at value (cost $309) | | | 309 | |
Receivable for investments sold | | | 53,992,213 | |
Interest receivable | | | 9,629,246 | |
Unrealized appreciation on swaps | | | 5,939,551 | |
Premium for swaps purchased | | | 448,162 | |
Unrealized appreciation on forward foreign currency exchange contracts | | | 419,066 | |
Receivable for Series shares sold | | | 16,109 | |
Prepaid expenses | | | 14,562 | |
| | |
|
|
|
Total Assets | | | 1,450,250,194 | |
| | |
|
|
|
| LIABILITIES | | | | |
Payable for investments purchased | | | 256,536,806 | |
Collateral for securities on loan | | | 44,158,988 | |
Payable to custodian | | | 6,606,289 | |
Unrealized depreciation on swaps | | | 4,848,668 | |
Due to broker-variation margin | | | 1,740,484 | |
Premium for swaps written | | | 480,772 | |
Management fee payable | | | 381,914 | |
Unrealized depreciation on forward foreign currency exchange contracts | | | 248,159 | |
Payable for Series shares repurchased | | | 223,751 | |
Accrued expenses and other liabilities | | | 181,079 | |
Deferred trustees’ fees | | | 6,785 | |
Affiliated transfer agent fee payable | | | 787 | |
| | |
|
|
|
Total Liabilities | | | 315,414,482 | |
| | |
|
|
|
| NET ASSETS | | $ | 1,134,835,712 | |
| | |
|
|
|
Net assets were comprised of: | | | | |
Paid-in capital | | $ | 1,247,564,086 | |
Retained earnings | | | (112,728,374 | ) |
| | |
|
|
|
Net assets, December 31, 2008 | | $ | 1,134,835,712 | |
| | |
|
|
|
Net asset value and redemption price per share, $1,134,835,712 / 114,800,544 outstanding shares of beneficial interest | | $ | 9.89 | |
| | |
|
|
|
STATEMENT OF OPERATIONS
Year Ended December 31, 2008
| | | | |
| INVESTMENT INCOME | | | | |
Interest | | $ | 56,912,144 | |
Affiliated dividend income | | | 8,289,602 | |
Affiliated income from securities loaned, net | | | 524,003 | |
| | |
|
|
|
| | | | 65,725,749 | |
| | |
|
|
|
| EXPENSES | | | | |
Management fee | | | 4,766,674 | |
Custodian’s fees and expenses | | | 309,000 | |
Shareholders’ reports | | | 73,000 | |
Audit fee | | | 33,000 | |
Interest expense (Note 8) | | | 31,313 | |
Trustees’ fees | | | 23,000 | |
Insurance expenses | | | 12,000 | |
Legal fees and expenses | | | 9,000 | |
Commitment fee on syndicated credit agreement | | | 6,000 | |
Transfer agent’s fee and expenses (including affiliated expense of $4,000) (Note 4) | | | 4,000 | |
Miscellaneous | | | 10,948 | |
| | |
|
|
|
Total expenses | | | 5,277,935 | |
| | |
|
|
|
| NET INVESTMENT INCOME | | | 60,447,814 | |
| | |
|
|
|
| NET REALIZED AND UNREALIZED GAIN (LOSS) ON INVESTMENTS, SWAPS AND FOREIGN CURRENCIES | | | | |
Net realized gain on: | | | | |
Investment transactions | | | 2,354,434 | |
Short sale transactions | | | 94,551 | |
Futures transactions | | | 11,455,174 | |
Swap transactions | | | 5,656,697 | |
Foreign currency transactions | | | 1,392,152 | |
| | |
|
|
|
| | | | 20,953,008 | |
| | |
|
|
|
Net change in unrealized appreciation (depreciation) on: | | | | |
Investments (including affiliated: $(33,944,971)) | | | (125,445,660 | ) |
Securities sold short | | | 41,247 | |
Futures | | | 5,767,689 | |
Swaps | | | (3,439,766 | ) |
Foreign currencies | | | (915,197 | ) |
| | |
|
|
|
| | | | (123,991,687 | ) |
| | |
|
|
|
| NET LOSS ON INVESTMENTS, SWAPS AND FOREIGN CURRENCIES | | | (103,038,679 | ) |
| | |
|
|
|
| NET DECREASE IN NET ASSETS RESULTING FROM OPERATIONS | | $ | (42,590,865 | ) |
| | |
|
|
|
STATEMENT OF CHANGES IN NET ASSETS
| | | | | | | | |
| | | Year Ended December 31,
| |
| | | 2008
| | | 2007
| |
| INCREASE (DECREASE) IN NET ASSETS | | | | | | | | |
| OPERATIONS: | | | | | | | | |
Net investment income | | $ | 60,447,814 | | | $ | 63,095,081 | |
Net realized gain on investment, swap and foreign currency transactions | | | 20,953,008 | | | | 22,075,622 | |
Net change in unrealized appreciation (depreciation) on investments, swaps and foreign currencies | | | (123,991,687 | ) | | | (19,462,861 | ) |
| | |
|
|
| |
|
|
|
NET INCREASE (DECREASE) IN NET ASSETS RESULTING FROM OPERATIONS | | | (42,590,865 | ) | | | 65,707,842 | |
| | |
|
|
| |
|
|
|
| DISTRIBUTIONS | | | (72,614,494 | ) | | | (59,479,872 | ) |
| | |
|
|
| |
|
|
|
| SERIES SHARE TRANSACTIONS: | | | | | | | | |
Series shares sold [9,801,318 and 12,326,563 shares, respectively] | | | 102,899,591 | | | | 133,636,466 | |
Series shares issued in reinvestment of distributions [7,018,378 and 5,514,681 shares, respectively] | | | 72,614,494 | | | | 59,479,872 | |
Series shares repurchased [13,831,055 and 12,074,002 shares, respectively] | | | (143,763,704 | ) | | | (131,418,698 | ) |
| | |
|
|
| |
|
|
|
NET INCREASE IN NET ASSETS RESULTING FROM SERIES SHARE TRANSACTIONS | | | 31,750,381 | | | | 61,697,640 | |
| | |
|
|
| |
|
|
|
| TOTAL INCREASE (DECREASE) IN NET ASSETS | | | (83,454,978 | ) | | | 67,925,610 | |
| NET ASSETS: | | | | | | | | |
Beginning of year | | | 1,218,290,690 | | | | 1,150,365,080 | |
| | |
|
|
| |
|
|
|
End of year | | $ | 1,134,835,712 | | | $ | 1,218,290,690 | |
| | |
|
|
| |
|
|
|
SEE NOTES TO FINANCIAL STATEMENTS.
A35
| | | | | | |
| | | EQUITY PORTFOLIO | | |
| |
| SCHEDULE OF INVESTMENTS | | December 31, 2008 |
| | | | | |
| LONG-TERM INVESTMENTS — 97.8% |
| COMMON STOCKS | | Shares
| | Value
(Note 2)
|
| | | | | | |
Aerospace & Defense — 1.4% | | | |
Lockheed Martin Corp. | | 152,006 | | $ | 12,780,665 |
Orbital Sciences Corp.*(a) | | 1,203,380 | | | 23,502,011 |
| | | | |
|
|
| | | | | | 36,282,676 |
| | | | |
|
|
Air Freight & Logistics — 0.6% | | | |
Expeditors International of Washington, Inc.(a) | | 435,800 | | | 14,499,066 |
| | | | |
|
|
Auto Components — 0.2% | | | |
Goodyear Tire & Rubber Co. (The)*(a) | | 660,500 | | | 3,943,185 |
| | | | |
|
|
Beverages — 2.0% | | | |
PepsiCo, Inc. | | 920,828 | | | 50,433,750 |
| | | | |
|
|
Biotechnology — 5.6% | | | |
BioMarin Pharmaceutical, Inc.*(a) | | 254,300 | | | 4,526,540 |
Celgene Corp.* | | 372,500 | | | 20,591,800 |
Genentech, Inc.* | | 414,300 | | | 34,349,613 |
Genzyme Corp.*(a) | | 471,550 | | | 31,296,773 |
Gilead Sciences, Inc.*(a) | | 996,500 | | | 50,961,010 |
| | | | |
|
|
| | | | | | 141,725,736 |
| | | | |
|
|
Building Materials — 0.9% | | | |
Masco Corp. | | 2,019,632 | | | 22,478,504 |
| | | | |
|
|
Capital Markets — 2.6% | | | |
Bank of New York Mellon Corp. (The) | | 452,078 | | | 12,807,370 |
Goldman Sachs Group, Inc. (The)(a) | | 247,731 | | | 20,906,019 |
Morgan Stanley(a) | | 604,900 | | | 9,702,596 |
Schwab, (Charles) Corp. (The) | | 1,398,150 | | | 22,608,085 |
| | | | |
|
|
| | | | | | 66,024,070 |
| | | | |
|
|
Chemicals — 1.1% | | | |
Air Products & Chemicals, Inc. | | 890 | | | 44,740 |
Monsanto Co. | | 409,990 | | | 28,842,797 |
| | | | |
|
|
| | | | | | 28,887,537 |
| | | | |
|
|
Commercial Banks — 1.4% | | | |
Wells Fargo & Co.(a) | | 1,193,724 | | | 35,190,984 |
| | | | |
|
|
Commercial Services — 0.4% | | | |
Moody’s Corp.(a) | | 445,460 | | | 8,949,291 |
| | | | |
|
|
Commercial Services & Supplies — 1.1% | | | |
McKesson Corp. | | 279,070 | | | 10,808,381 |
Waste Management, Inc. | | 515,600 | | | 17,086,984 |
| | | | |
|
|
| | | | | | 27,895,365 |
| | | | |
|
|
Communication Equipment — 5.9% | | | |
Cisco Systems, Inc.* | | 3,140,649 | | | 51,192,579 |
Corning, Inc. | | 1,805,915 | | | 17,210,370 |
QUALCOMM, Inc.(a) | | 1,767,300 | | | 63,322,359 |
Research In Motion Ltd. (Canada)*(a) | | 409,600 | | | 16,621,568 |
| | | | |
|
|
| | | | | | 148,346,876 |
| | | | |
|
|
Computers & Peripherals — 3.2% | | | |
Apple, Inc.*(a) | | 390,006 | | | 33,287,012 |
Hewlett-Packard Co. | | 1,274,760 | | | 46,261,041 |
| | | | |
|
|
| | | | | | 79,548,053 |
| | | | |
|
|
| | | | | |
COMMON STOCKS
(continued) | | Shares
| | Value
(Note 2)
|
| | | | | | |
Construction — 2.2% | | | |
Centex Corp.(a) | | 1,148,640 | | $ | 12,221,529 |
Toll Brothers, Inc.*(a) | | 2,033,760 | | | 43,583,477 |
| | | | |
|
|
| | | | | | 55,805,006 |
| | | | |
|
|
Consumer Finance — 1.0% | | | |
American Express Co.(a) | | 634,888 | | | 11,777,172 |
SLM Corp.*(a) | | 1,575,400 | | | 14,021,060 |
| | | | |
|
|
| | | | | | 25,798,232 |
| | | | |
|
|
Diversified Consumer Services — 1.4% | | | |
Career Education Corp.*(a) | | 797,600 | | | 14,308,944 |
H&R Block, Inc. | | 878,100 | | | 19,950,432 |
| | | | |
|
|
| | | | | | 34,259,376 |
| | | | |
|
|
Diversified Financial Services — 1.4% | | | |
JPMorgan Chase & Co. | | 1,160,202 | | | 36,581,169 |
| | | | |
|
|
Diversified Telecommunication Services — 0.7% | | | |
Verizon Communications, Inc. | | 532,210 | | | 18,041,919 |
| | | | |
|
|
Electric Utilities — 1.1% | | | |
Dominion Resources, Inc. | | 239,080 | | | 8,568,627 |
Exelon Corp. | | 363,830 | | | 20,232,587 |
| | | | |
|
|
| | | | | | 28,801,214 |
| | | | |
|
|
Electronic Components — 1.0% | | | |
Dolby Laboratories, Inc. (Class A Stock)*(a) | | 762,398 | | | 24,976,158 |
| | | | |
|
|
Energy – Alternate Sources — 0.5% | | | |
First Solar, Inc.*(a) | | 85,710 | | | 11,824,552 |
| | | | |
|
|
Energy Equipment & Services — 3.3% | | | |
Diamond Offshore Drilling, Inc.(a) | | 336,460 | | | 19,830,952 |
Halliburton Co. | | 1,477,980 | | | 26,869,677 |
National Oilwell Varco, Inc.* | | 881,920 | | | 21,554,125 |
Schlumberger Ltd. (Netherlands)(a) | | 326,900 | | | 13,837,677 |
| | | | |
|
|
| | | | | | 82,092,431 |
| | | | |
|
|
Financial – Bank & Trust — 0.7% | | | |
Hudson City Bancorp, Inc.(a) | | 564,650 | | | 9,011,814 |
State Street Corp. | | 226,830 | | | 8,921,224 |
| | | | |
|
|
| | | | | | 17,933,038 |
| | | | |
|
|
Food & Staples Retailing — 4.6% | | | |
Costco Wholesale Corp.(a) | | 257,500 | | | 13,518,750 |
CVS/Caremark Corp. | | 651,700 | | | 18,729,858 |
Kroger Co. (The) | | 614,800 | | | 16,236,868 |
Wal-Mart Stores, Inc.(a) | | 1,215,862 | | | 68,161,224 |
| | | | |
|
|
| | | | | | 116,646,700 |
| | | | |
|
|
Food Products — 3.9% | | | |
Cadbury PLC (United Kingdom) | | 398,000 | | | 3,464,825 |
Cadbury PLC, ADR (United Kingdom)(a) | | 546,564 | | | 19,495,938 |
ConAgra Foods, Inc. | | 1,040,600 | | | 17,169,900 |
Kellogg Co.(a) | | 521,405 | | | 22,863,609 |
McCormick & Co., Inc. | | 565,143 | | | 18,005,456 |
Tyson Foods, Inc. (Class A Stock) | | 1,869,900 | | | 16,380,324 |
| | | | |
|
|
| | | | | | 97,380,052 |
| | | | |
|
|
SEE NOTES TO FINANCIAL STATEMENTS.
A36
| | | | | | |
| | | EQUITY PORTFOLIO (continued) | | |
| |
| SCHEDULE OF INVESTMENTS | | December 31, 2008 |
| | | | | |
COMMON STOCKS
(continued) | | Shares
| | Value
(Note 2)
|
| | | | | | |
Healthcare Equipment & Supplies — 2.3% | | | |
Alcon, Inc. (Switzerland)(a) | | 235,700 | | $ | 21,022,083 |
Baxter International, Inc. | | 538,100 | | | 28,836,779 |
Medtronic, Inc. | | 301,646 | | | 9,477,717 |
| | | | |
|
|
| | | | | | 59,336,579 |
| | | | |
|
|
Healthcare Providers & Services — 2.4% | | | |
Aetna, Inc. | | 595,400 | | | 16,968,900 |
Medco Health Solutions, Inc.* | | 560,400 | | | 23,486,364 |
Omnicare, Inc.(a) | | 471,700 | | | 13,094,392 |
UnitedHealth Group, Inc. | | 244,200 | | | 6,495,720 |
| | | | |
|
|
| | | | | | 60,045,376 |
| | | | |
|
|
Hotels, Restaurants & Leisure — 0.6% | | | |
McDonald’s Corp. | | 235,455 | | | 14,642,946 |
| | | | |
|
|
Household Products — 2.5% | | | |
Colgate-Palmolive Co.(a) | | 309,700 | | | 21,226,838 |
Kimberly-Clark Corp. | | 203,500 | | | 10,732,590 |
Procter & Gamble Co. | | 489,148 | | | 30,239,129 |
| | | | |
|
|
| | | | | | 62,198,557 |
| | | | |
|
|
Independent Power Producers & Energy Traders — 0.9% |
NRG Energy, Inc.* | | 954,900 | | | 22,277,817 |
| | | | |
|
|
Industrial Conglomerates — 1.7% | | | |
Eaton Corp. | | 201,400 | | | 10,011,594 |
General Electric Co. | | 2,020,603 | | | 32,733,769 |
| | | | |
|
|
| | | | | | 42,745,363 |
| | | | |
|
|
Insurance — 3.7% | | | |
Aflac, Inc.(a) | | 334,030 | | | 15,311,935 |
Allstate Corp. (The) | | 255,700 | | | 8,376,732 |
Berkshire Hathaway, Inc. (Class A Stock)* | | 204 | | | 19,706,400 |
Berkshire Hathaway, Inc. (Class B Stock)*(a) | | 3,005 | | | 9,658,070 |
Loews Corp. | | 505,100 | | | 14,269,075 |
Progressive Corp. (The)(a) | | 1,320,420 | | | 19,555,420 |
XL Capital Ltd. (Class A Stock) (Cayman Islands) | | 1,649,300 | | | 6,102,410 |
| | | | |
|
|
| | | | | | 92,980,042 |
| | | | |
|
|
Internet & Catalog Retail — 0.8% | | | |
Amazon.com, Inc.*(a) | | 363,400 | | | 18,635,152 |
HSN, Inc.* | | 152,860 | | | 1,111,292 |
| | | | |
|
|
| | | | | | 19,746,444 |
| | | | |
|
|
Internet Software & Services — 2.1% | | | |
Google, Inc. (Class A Stock)* | | 109,100 | | | 33,564,615 |
IAC/InterActiveCorp*(a) | | 1,171,050 | | | 18,420,617 |
| | | | |
|
|
| | | | | | 51,985,232 |
| | | | |
|
|
IT Services — 1.4% | | | |
Infosys Technologies Ltd., ADR (India)(a) | | 310,600 | | | 7,631,442 |
Visa, Inc. (Class A Stock) | | 538,400 | | | 28,239,080 |
| | | | |
|
|
| | | | | | 35,870,522 |
| | | | |
|
|
Life Science Tools & Services — 0.7% | | | |
Thermo Fisher Scientific, Inc.*(a) | | 512,300 | | | 17,454,061 |
| | | | |
|
|
| | | | | |
COMMON STOCKS
(continued) | | Shares
| | Value
(Note 2)
|
| | | | | | |
Media — 3.1% | | | |
Comcast Corp. (Class A Stock) | | 1,056,490 | | $ | 17,833,551 |
Liberty Global, Inc. (Class C Stock)* | | 860,350 | | | 13,060,113 |
News Corp. (Class B Stock)(a) | | 2,025,768 | | | 19,406,857 |
Sirius XM Radio, Inc.*(a) | | 20,187,800 | | | 2,422,536 |
Walt Disney Co. (The) | | 1,076,830 | | | 24,433,273 |
| | | | |
|
|
| | | | | | 77,156,330 |
| | | | |
|
|
Metals & Mining — 1.3% | | | |
Freeport-McMoRan Copper & Gold, Inc.(a) | | 571,900 | | | 13,977,236 |
Kinross Gold Corp. (Canada)(a) | | 1,019,200 | | | 18,773,664 |
| | | | |
|
|
| | | | | | 32,750,900 |
| | | | |
|
|
Multi-Line Retail — 1.7% | | | |
Lowe’s Cos., Inc.(a) | | 516,950 | | | 11,124,764 |
Staples, Inc.(a) | | 1,837,393 | | | 32,926,083 |
| | | | |
|
|
| | | | | | 44,050,847 |
| | | | |
|
|
Multi-Utilities — 1.3% | | | |
Sempra Energy | | 797,626 | | | 34,002,796 |
| | | | |
|
|
Oil, Gas & Consumable Fuels — 9.2% | | | |
Apache Corp. | | 121,400 | | | 9,047,942 |
ConocoPhillips | | 294,526 | | | 15,256,447 |
EOG Resources, Inc.(a) | | 190,400 | | | 12,676,832 |
Exxon Mobil Corp. | | 411,898 | | | 32,881,817 |
Hess Corp.(a) | | 125,700 | | | 6,742,548 |
Newfield Exploration Co.*(a) | | 778,450 | | | 15,374,387 |
Occidental Petroleum Corp. | | 606,900 | | | 36,407,931 |
Petroleo Brasileiro SA, ADR (Brazil) | | 554,600 | | | 13,582,154 |
Suncor Energy, Inc. (Canada) | | 582,939 | | | 11,200,740 |
Total SA, ADR (France)(a) | | 628,466 | | | 34,754,170 |
Williams Cos., Inc. | | 968,900 | | | 14,029,672 |
XTO Energy, Inc. | | 826,200 | | | 29,140,074 |
| | | | |
|
|
| | | | | | 231,094,714 |
| | | | |
|
|
Pharmaceuticals — 6.9% | | | |
Abbott Laboratories | | 920,765 | | | 49,141,228 |
Novartis AG, ADR (Switzerland)(a) | | 635,100 | | | 31,602,576 |
Schering-Plough Corp.(a) | | 2,819,460 | | | 48,015,404 |
Shire PLC, ADR (United Kingdom) | | 110,200 | | | 4,934,756 |
Teva Pharmaceutical Industries Ltd., ADR (Israel)(a) | | 508,800 | | | 21,659,616 |
Wyeth | | 486,600 | | | 18,252,366 |
| | | | |
|
|
| | | | | | 173,605,946 |
| | | | |
|
|
Semiconductors & Semiconductor Equipment — 0.9% |
ASML Holding NV (Netherlands)(a) | | 1,211,308 | | | 21,888,336 |
Spansion, Inc. (Class A Stock)*(a) | | 2,861,500 | | | 541,682 |
| | | | |
|
|
| | | | | | 22,430,018 |
| | | | |
|
|
Software — 3.2% | | | | | |
Adobe Systems, Inc.* | | 546,600 | | | 11,637,114 |
CA, Inc.(a) | | 1,000,900 | | | 18,546,677 |
Microsoft Corp.(a) | | 1,203,124 | | | 23,388,731 |
SEE NOTES TO FINANCIAL STATEMENTS.
A37
| | | | | | |
| | | EQUITY PORTFOLIO (continued) | | |
| |
| SCHEDULE OF INVESTMENTS | | December 31, 2008 |
| | | | | | |
COMMON STOCKS
(continued) | | Shares
| | Value
(Note 2)
| |
| | | | | | | |
Software (continued) | | | | | | |
Oracle Corp.* | | 405,300 | | $ | 7,185,969 | |
Symantec Corp.*(a) | | 1,553,900 | | | 21,008,728 | |
| | | | |
|
|
|
| | | | | | 81,767,219 | |
| | | | |
|
|
|
Textiles, Apparel & Luxury Goods — 0.5% | | | | |
NIKE, Inc. (Class B Stock) | | 246,800 | | | 12,586,800 | |
| | | | |
|
|
|
Tobacco — 1.0% | | | | | | |
Philip Morris International, Inc. | | 597,560 | | | 25,999,836 | |
| | | | |
|
|
|
Transportation — 0.5% | | | | | | |
Norfolk Southern Corp. | | 288,040 | | | 13,552,282 | |
| | | | |
|
|
|
Wireless Telecommunication Services — 0.9% | | | | |
American Tower Corp. (Class A Stock)* | | 94,780 | | | 2,778,949 | |
NII Holdings, Inc.*(a) | | 815,500 | | | 14,825,790 | |
Sprint Nextel Corp.*(a) | | 2,622,836 | | | 4,799,790 | |
| | | | |
|
|
|
| | | | | | 22,404,529 | |
| | | | |
|
|
|
TOTAL LONG-TERM INVESTMENTS
(cost $2,910,669,945) | | | 2,465,030,096 | |
| | | | |
|
|
|
| SHORT-TERM INVESTMENT — 25.7% | |
Affiliated Money Market Mutual Fund | |
Dryden Core Investment Fund —Taxable Money Market Series
(cost $648,452,738; includes $596,704,279 of cash collateral
for securities on
loan)(b)(w)(Note 4) | | 648,452,738 | | | 648,452,738 | |
| | | | |
|
|
|
TOTAL INVESTMENTS — 123.5%
(cost $3,559,122,683) | | | 3,113,482,834 | |
LIABILITIES IN EXCESS OF
OTHER ASSETS — (23.5)% | | | (592,127,124 | ) |
| | | | |
|
|
|
NET ASSETS — 100.0% | | $ | 2,521,355,710 | |
| | | | |
|
|
|
The following abbreviation is used in portfolio descriptions:
| | |
| ADR | | American Depositary Receipt |
| * | Non-income producing security. |
| (a) | All or a portion of security is on loan. The aggregate market value of such securities is $565,214,365; cash collateral of $596,704,279 (included with liabilities) was received with which the Portfolio purchased highly liquid short-term investments. |
| (b) | Represents security, or a portion thereof, purchased with cash collateral received for securities on loan. |
| (w) | Prudential Investments LLC, the manager of the Portfolio also serves as manager of the Dryden Core Investment Fund-Taxable Money Market Series. |
Various inputs are used in determining the value of the Portfolio's investments. These inputs are summarized in the three broad levels listed below.
Level 1—quoted prices in active markets for identical securities
Level 2—other significant observable inputs (including quoted prices for similar securities, interest rates, prepayment speeds, credit risk, etc.)
Level 3—significant unobservable inputs (including the Portfolio's own assumptions in determining the fair value of investments)
The following is a summary of the inputs used as of December 31, 2008 in valuing the Portfolio's assets carried at fair value:
| | | | | |
Valuation inputs
| | Investments
in Securities
| | Other Financial
Instruments*
|
Level 1—Quoted Prices | | $ | 3,113,482,834 | | — |
Level 2—Other Significant Observable Inputs | | | — | | — |
Level 3—Significant Unobservable Inputs | | | — | | — |
| | |
|
| |
|
Total | | $ | 3,113,482,834 | | — |
| | |
|
| |
|
| * | Other financial instruments are derivative instruments not reflected in the Schedule of Investments, such as futures, forwards and swap contracts, which are valued at the unrealized appreciation/depreciation on the instrument. |
The following is a reconciliation of assets in which significant unobservable inputs (Level 3) were used in determining fair value:
| | | | |
| | | Investments in
Securities
| |
Balance as of 12/31/07 | | $ | 23,529,912 | |
Realized gain (loss) | | | (28,385,420 | ) |
Change in unrealized appreciation (depreciation) | | | 8,236,728 | |
Net purchases (sales) | | | (3,381,220 | ) |
Transfers in and/or out of Level 3 | | | — | |
| | |
|
|
|
Balance as of 12/31/08 | | $ | — | |
| | |
|
|
|
SEE NOTES TO FINANCIAL STATEMENTS.
A38
| | | | | | |
| | | EQUITY PORTFOLIO (continued) | | |
The industry classification of investments and liabilities in excess of other assets shown as a percentage of net assets as of December 31, 2008 were as follows:
| | | |
Affiliated Money Market Mutual Fund (23.7% represents investments purchased with collateral from securities on loan) | | 25.7 | % |
Oil, Gas & Consumable Fuels | | 9.2 | |
Pharmaceuticals | | 6.9 | |
Communication Equipment | | 5.9 | |
Biotechnology | | 5.6 | |
Food & Staples Retailing | | 4.6 | |
Food Products | | 3.9 | |
Insurance | | 3.7 | |
Energy Equipment & Services | | 3.3 | |
Software | | 3.2 | |
Computers & Peripherals | | 3.2 | |
Media | | 3.1 | |
Capital Markets | | 2.6 | |
Household Products | | 2.5 | |
Healthcare Providers & Services | | 2.4 | |
Healthcare Equipment & Supplies | | 2.3 | |
Construction | | 2.2 | |
Internet Software & Services | | 2.1 | |
Beverages | | 2.0 | |
Multi-line Retail | | 1.7 | |
Industrial Conglomerates | | 1.7 | |
Diversified Financial Services | | 1.4 | |
Aerospace & Defense | | 1.4 | |
IT Services | | 1.4 | |
Commercial Banks | | 1.4 | |
Diversified Consumer Services | | 1.4 | |
Multi-Utilities | | 1.3 | |
Metals & Mining | | 1.3 | |
Chemicals | | 1.1 | |
Electric Utilities | | 1.1 | |
Commercial Services & Supplies | | 1.1 | |
Tobacco | | 1.0 | |
Consumer Finance | | 1.0 | |
Electronic Components | | 1.0 | |
Building Materials | | 0.9 | |
Semiconductors & Semiconductor Equipment | | 0.9 | |
Wireless Telecommunication Services | | 0.9 | |
Independent Power Producers & Energy Traders | | 0.9 | |
Internet & Catalog Retail | | 0.8 | |
Diversified Telecommunication Services | | 0.7 | |
Financial – Bank & Trust | | 0.7 | |
Life Science Tools & Services | | 0.7 | |
Hotels, Restaurants & Leisure | | 0.6 | |
Air Freight & Logistics | | 0.6 | |
Transportation | | 0.5 | |
Textiles, Apparel & Luxury Goods | | 0.5 | |
Energy – Alternate Sources | | 0.5 | |
Commercial Services | | 0.4 | |
Auto Components | | 0.2 | |
| | |
|
|
| | | 123.5 | |
Liabilities in excess of other assets | | (23.5 | ) |
| | |
|
|
| | | 100.0 | % |
| | |
|
|
SEE NOTES TO FINANCIAL STATEMENTS.
A39
| | | | | | |
| | | EQUITY PORTFOLIO (continued) | | |
STATEMENT OF ASSETS AND LIABILITIES
December 31, 2008
| | | | |
| ASSETS | | | | |
Investments at value, including securities on loan of $565,214,365: | | | | |
Unaffiliated investments (cost $2,910,669,945) | | $ | 2,465,030,096 | |
Affiliated investments (cost $648,452,738) | | | 648,452,738 | |
Receivable for investments sold | | | 6,852,551 | |
Dividends and interest receivable | | | 4,552,066 | |
Receivable for Series shares sold | | | 26,136 | |
Prepaid expenses | | | 35,852 | |
| | |
|
|
|
Total Assets | | | 3,124,949,439 | |
| | |
|
|
|
| LIABILITIES | | | | |
Collateral for securities on loan | | | 596,704,279 | |
Payable for investments purchased | | | 2,691,535 | |
Payable to custodian | | | 1,670,136 | |
Payable for Series shares repurchased | | | 1,240,172 | |
Management fee payable | | | 932,920 | |
Accrued expenses and other liabilities | | | 351,859 | |
Deferred trustees’ fees | | | 1,770 | |
Affiliated transfer agent fees payable | | | 933 | |
Distribution fee payable | | | 78 | |
Administration fee payable | | | 47 | |
| | |
|
|
|
Total Liabilities | | | 603,593,729 | |
| | |
|
|
|
| NET ASSETS | | $ | 2,521,355,710 | |
| | |
|
|
|
Net assets were comprised of: | | | | |
Paid-in capital | | $ | 3,420,816,845 | |
Retained earnings | | | (899,461,135 | ) |
| | |
|
|
|
Net assets, December 31, 2008 | | $ | 2,521,355,710 | |
| | |
|
|
|
| Class I: | | | | |
Net asset value and redemption price per share, $2,520,985,725 / 153,673,372 outstanding shares of beneficial interest | | $ | 16.40 | |
| | |
|
|
|
| Class II: | | | | |
Net asset value and redemption price per share, $369,985 / 22,466 outstanding shares of beneficial interest | | $ | 16.47 | |
| | |
|
|
|
STATEMENT OF OPERATIONS
Year Ended December 31, 2008
| | | | |
| INVESTMENT INCOME | | | | |
Unaffiliated dividend income (net of $897,280 foreign withholding tax) | | $ | 55,161,588 | |
Affiliated income from securities lending, net | | | 3,427,623 | |
Affiliated dividend income | | | 2,139,421 | |
| | |
|
|
|
| | | | 60,728,632 | |
| | |
|
|
|
| EXPENSES | | | | |
Management fee | | | 16,189,920 | |
Distribution fee—Class II | | | 1,612 | |
Administration fee—Class II | | | 967 | |
Custodian’s fees and expenses | | | 577,000 | |
Shareholders’ reports | | | 356,000 | |
Insurance expenses | | | 62,000 | |
Trustees’ fees | | | 59,000 | |
Legal fees and expenses | | | 20,000 | |
Audit fee | | | 19,000 | |
Commitment fee on syndicated credit agreement | | | 18,000 | |
Transfer agent’s fees and expenses (including affiliated expense of $5,000) (Note 4) | | | 5,000 | |
Miscellaneous | | | 6,522 | |
| | |
|
|
|
Total expenses | | | 17,315,021 | |
| | |
|
|
|
| NET INVESTMENT INCOME | | | 43,413,611 | |
| | |
|
|
|
| NET REALIZED AND UNREALIZED GAIN (LOSS) ON INVESTMENTS AND FOREIGN CURRENCIES | | | | |
Net realized loss on: | | | | |
Investment transactions | | | (413,215,126 | ) |
Foreign currency transactions | | | (145,726 | ) |
| | |
|
|
|
| | | | (413,360,852 | ) |
| | |
|
|
|
Net change in unrealized appreciation (depreciation) on: | | | | |
Investments | | | (1,236,224,567 | ) |
Foreign currencies | | | 9,114 | |
| | |
|
|
|
| | | | (1,236,215,453 | ) |
| | |
|
|
|
| NET LOSS ON INVESTMENTS AND FOREIGN CURRENCIES | | | (1,649,576,305 | ) |
| | |
|
|
|
| NET DECREASE IN NET ASSETS RESULTING FROM OPERATIONS | | $ | (1,606,162,694 | ) |
| | |
|
|
|
STATEMENT OF CHANGES IN NET ASSETS
| | | | | | | | |
| | | Year Ended December 31,
| |
| | | 2008
| | | 2007
| |
| INCREASE (DECREASE) IN NET ASSETS | | | | | | | | |
| OPERATIONS: | | | | | | | | |
Net investment income | | $ | 43,413,611 | | | $ | 51,836,584 | |
Net realized gain (loss) on investment and foreign currency transactions | | | (413,360,852 | ) | | | 385,190,299 | |
Net change in unrealized appreciation (depreciation) on investments and foreign currencies | | | (1,236,215,453 | ) | | | (37,720,589 | ) |
| | |
|
|
| |
|
|
|
NET INCREASE (DECREASE) IN NET ASSETS RESULTING FROM OPERATIONS | | | (1,606,162,694 | ) | | | 399,306,294 | |
| | |
|
|
| |
|
|
|
| DISTRIBUTIONS | | | | | | | | |
Class I | | | (436,963,357 | ) | | | (49,976,890 | ) |
Class II | | | (63,526 | ) | | | (9,549 | ) |
| | |
|
|
| |
|
|
|
| TOTAL DISTRIBUTIONS | | | (437,026,883 | ) | | | (49,986,439 | ) |
| | |
|
|
| |
|
|
|
| SERIES SHARE TRANSACTIONS (NOTE 7): | | | | | | | | |
Series shares sold | | | 31,235,697 | | | | 29,826,206 | |
Series shares issued in reinvestment of distributions | | | 437,026,883 | | | | 49,986,439 | |
Series shares repurchased | | | (328,918,685 | ) | | | (408,578,092 | ) |
| | |
|
|
| |
|
|
|
INCREASE (DECREASE) IN NET ASSETS RESULTING FROM SERIES SHARE TRANSACTIONS | | | 139,343,895 | | | | (328,765,447 | ) |
| | |
|
|
| |
|
|
|
| TOTAL INCREASE (DECREASE) IN NET ASSETS | | | (1,903,845,682 | ) | | | 20,554,408 | |
| NET ASSETS: | | | | | | | | |
Beginning of year | | | 4,425,201,392 | | | | 4,404,646,984 | |
| | |
|
|
| |
|
|
|
End of year | | $ | 2,521,355,710 | | | $ | 4,425,201,392 | |
| | |
|
|
| |
|
|
|
SEE NOTES TO FINANCIAL STATEMENTS.
A40
| | | | | | |
| | | FLEXIBLE MANAGED PORTFOLIO | | |
| |
| SCHEDULE OF INVESTMENTS | | December 31, 2008 |
| | | | | |
| LONG-TERM INVESTMENTS — 93.7% |
| COMMON STOCKS — 56.7% | | Shares
| | Value
(Note 2)
|
| | | | | | |
Aerospace & Defense — 2.0% |
Boeing Co. (The) | | 176,000 | | $ | 7,509,920 |
General Dynamics Corp. | | 206,000 | | | 11,863,540 |
Honeywell International, Inc. | | 17,300 | | | 567,959 |
Lockheed Martin Corp. | | 58,400 | | | 4,910,272 |
Northrop Grumman Corp. | | 236,700 | | | 10,660,968 |
Raytheon Co. | | 214,800 | | | 10,963,392 |
United Technologies Corp. | | 129,500 | | | 6,941,200 |
| | | | |
|
|
| | | | | | 53,417,251 |
| | | | |
|
|
Air Freight & Logistics — 0.2% |
FedEx Corp. | | 21,700 | | | 1,392,055 |
Pacer International, Inc. | | 105,800 | | | 1,103,494 |
United Parcel Service, Inc. (Class B Stock) | | 70,200 | | | 3,872,232 |
| | | | |
|
|
| | | | | | 6,367,781 |
| | | | |
|
|
Airlines — 0.1% |
Allegiant Travel Co.(a) | | 18,700 | | | 908,259 |
Continental Airlines, Inc. (Class B Stock)(a)(b) | | 148,800 | | | 2,687,328 |
| | | | |
|
|
| | | | | | 3,595,587 |
| | | | |
|
|
Auto Components — 0.3% |
Fuel Systems Solutions, Inc.(a)(b) | | 95,800 | | | 3,138,408 |
Johnson Controls, Inc. | | 199,300 | | | 3,619,288 |
| | | | |
|
|
| | | | | | 6,757,696 |
| | | | |
|
|
Beverages — 1.3% |
Coca-Cola Co. (The)(b) | | 383,400 | | | 17,356,518 |
Coca-Cola Enterprises, Inc. | | 162,600 | | | 1,956,078 |
Constellation Brands, Inc. (Class A Stock)(a) | | 67,500 | | | 1,064,475 |
Dr. Pepper Snapple Group, Inc.(a) | | 31,000 | | | 503,750 |
Pepsi Bottling Group, Inc. | | 64,200 | | | 1,445,142 |
PepsiAmericas, Inc. | | 16,900 | | | 344,084 |
PepsiCo, Inc. | | 225,920 | | | 12,373,638 |
| | | | |
|
|
| | | | | | 35,043,685 |
| | | | |
|
|
Biotechnology — 1.0% |
Amgen, Inc.(a)(b) | | 325,408 | | | 18,792,312 |
Biogen Idec, Inc.(a) | | 129,800 | | | 6,182,374 |
Cubist Pharmaceuticals, Inc.(a)(b) | | 15,500 | | | 374,480 |
| | | | |
|
|
| | | | | | 25,349,166 |
| | | | |
|
|
Building Products |
NCI Buildings Systems, Inc.(a)(b) | | 27,300 | | | 444,990 |
| | | | |
|
|
Capital Markets — 1.2% |
Ameriprise Financial, Inc. | | 121,200 | | | 2,831,232 |
Bank of New York Mellon Corp. (The) | | 152,100 | | | 4,308,993 |
Charles Schwab Corp. (The) | | 121,000 | | | 1,956,570 |
Goldman Sachs Group, Inc. (The) | | 114,600 | | | 9,671,094 |
Morgan Stanley(b) | | 612,990 | | | 9,832,360 |
State Street Corp. | | 104,700 | | | 4,117,851 |
| | | | |
|
|
| | | | | | 32,718,100 |
| | | | |
|
|
Chemicals — 0.6% |
Air Products and Chemicals, Inc. | | 61,900 | | | 3,111,713 |
Ashland, Inc. | | 203,000 | | | 2,133,530 |
Dow Chemical Co. (The) | | 432,200 | | | 6,521,898 |
Eastman Chemical Co. | | 15,200 | | | 481,992 |
| | | | | |
COMMON STOCKS
(continued) | | Shares
| | Value
(Note 2)
|
| | | | | | |
Chemicals (continued) |
Mosaic Co. (The) | | 75,100 | | $ | 2,598,460 |
Nalco Holdings Co. | | 94,100 | | | 1,085,914 |
Rockwood Holdings, Inc.(a) | | 29,700 | | | 320,760 |
Solutia, Inc.(a) | | 24,500 | | | 110,250 |
Terra Industries, Inc. | | 36,900 | | | 615,123 |
| | | | |
|
|
| | | | | | 16,979,640 |
| | | | |
|
|
Commercial Banks — 1.6% |
Bank of Hawaii Corp. | | 6,900 | | | 311,673 |
First Midwest Bancorp, Inc. | | 26,800 | | | 535,196 |
Huntington Bancshares, Inc.(b) | | 315,600 | | | 2,417,496 |
Oriental Financial Group, Inc. (Puerto Rico) | | 18,100 | | | 109,505 |
PNC Financial Services Corp.(b) | | 156,300 | | | 7,658,700 |
Regions Financial Corp. | | 137,300 | | | 1,092,908 |
SunTrust Banks, Inc. | | 70,000 | | | 2,067,800 |
Susquehanna Bancshares, Inc. | | 33,900 | | | 539,349 |
U.S. Bancorp | | 400,932 | | | 10,027,309 |
Wachovia Corp. | | 119,600 | | | 662,584 |
Webster Financial Corp. | | 53,600 | | | 738,608 |
Wells Fargo & Co.(b) | | 565,900 | | | 16,682,732 |
| | | | |
|
|
| | | | | | 42,843,860 |
| | | | |
|
|
Commercial Services & Supplies |
Deluxe Corp. | | 51,000 | | | 762,960 |
| | | | |
|
|
Communications Equipment — 1.5% |
Cisco Systems, Inc.(a) | | 1,249,300 | | | 20,363,590 |
Corning, Inc. | | 977,700 | | | 9,317,481 |
F5 Networks, Inc.(a)(b) | | 164,100 | | | 3,751,326 |
Harris Corp. | | 24,100 | | | 917,005 |
InterDigital, Inc.(a)(b) | | 23,800 | | | 654,500 |
QUALCOMM, Inc. | | 90,800 | | | 3,253,364 |
| | | | |
|
|
| | | | | | 38,257,266 |
| | | | |
|
|
Computers & Peripherals — 2.8% |
Apple, Inc.(a) | | 84,300 | | | 7,195,005 |
Dell, Inc.(a) | | 982,300 | | | 10,058,752 |
Hewlett-Packard Co. | | 679,065 | | | 24,643,269 |
International Business Machines Corp. | | 314,400 | | | 26,459,904 |
Lexmark International, Inc. (Class A Stock)(a) | | 23,600 | | | 634,840 |
NCR Corp.(a) | | 20,700 | | | 292,698 |
QLogic Corp.(a)(b) | | 75,800 | | | 1,018,752 |
Synaptics, Inc.(a) | | 93,500 | | | 1,548,360 |
Western Digital Corp.(a) | | 163,200 | | | 1,868,640 |
| | | | |
|
|
| | | | | | 73,720,220 |
| | | | |
|
|
Construction & Engineering — 0.3% |
Fluor Corp. | | 91,300 | | | 4,096,631 |
Jacobs Engineering Group, Inc.(a) | | 58,900 | | | 2,833,090 |
| | | | |
|
|
| | | | | | 6,929,721 |
| | | | |
|
|
Construction Materials |
Headwaters, Inc.(a)(b) | | 82,900 | | | 559,575 |
| | | | |
|
|
Consumer Finance — 0.1% |
American Express Co. | | 100,700 | | | 1,867,985 |
Capital One Financial Corp.(b) | | 23,200 | | | 739,848 |
| | | | |
|
|
| | | | | | 2,607,833 |
| | | | |
|
|
SEE NOTES TO FINANCIAL STATEMENTS.
A41
| | | | | | |
| | | FLEXIBLE MANAGED PORTFOLIO (continued) | | |
| |
| SCHEDULE OF INVESTMENTS | | December 31, 2008 |
| | | | | |
COMMON STOCKS
(continued) | | Shares
| | Value
(Note 2)
|
| | | | | | |
Diversified Consumer Services — 0.3% |
Apollo Group, Inc. (Class A Stock)(a) | | 51,200 | | $ | 3,922,944 |
H&R Block, Inc. | | 62,900 | | | 1,429,088 |
ITT Educational Services, Inc.(a)(b) | | 18,300 | | | 1,738,134 |
Jackson Hewitt Tax Service, Inc. | | 20,300 | | | 318,507 |
Regis Corp. | | 18,900 | | | 274,617 |
Weight Watchers International, Inc. | | 12,400 | | | 364,808 |
| | | | |
|
|
| | | | | | 8,048,098 |
| | | | |
|
|
Diversified Financial Services — 2.0% |
Bank of America Corp.(b) | | 1,470,482 | | | 20,704,386 |
CIT Group, Inc.(b) | | 138,900 | | | 630,606 |
Citigroup, Inc. | | 1,833,762 | | | 12,304,543 |
Interactive Brokers Group, Inc. (Class A Stock)(a)(b) | | 30,400 | | | 543,856 |
JPMorgan Chase & Co. | | 590,194 | | | 18,608,817 |
| | | | |
|
|
| | | | | | 52,792,208 |
| | | | |
|
|
Diversified Telecommunication Services — 2.3% |
AT&T, Inc. | | 1,139,147 | | | 32,465,690 |
CenturyTel, Inc. | | 94,000 | | | 2,569,020 |
Embarq Corp. | | 26,900 | | | 967,324 |
Frontier Communications Corp. | | 64,500 | | | 563,730 |
Verizon Communications, Inc. | | 479,388 | | | 16,251,253 |
Windstream Corp. | | 732,000 | | | 6,734,400 |
| | | | |
|
|
| | | | | | 59,551,417 |
| | | | |
|
|
Electrical Equipment — 0.6% |
Acuity Brands, Inc. | | 69,400 | | | 2,422,754 |
Emerson Electric Co. | | 338,100 | | | 12,377,841 |
Energy Conversion Devices, Inc.(a)(b) | | 27,300 | | | 688,233 |
Polypore International, Inc.(a) | | 42,000 | | | 317,520 |
| | | | |
|
|
| | | | | | 15,806,348 |
| | | | |
|
|
Electrical Utilities — 1.7% |
American Electric Power Co., Inc. | | 311,100 | | | 10,353,408 |
DPL, Inc. | | 23,200 | | | 529,888 |
Duke Energy Corp. | | 62,000 | | | 930,620 |
Edison International | | 295,800 | | | 9,501,096 |
Entergy Corp. | | 61,400 | | | 5,104,182 |
Exelon Corp. | | 123,700 | | | 6,878,957 |
FirstEnergy Corp. | | 125,900 | | | 6,116,222 |
Pepco Holdings, Inc. | | 111,200 | | | 1,974,912 |
PPL Corp. | | 135,400 | | | 4,155,426 |
| | | | |
|
|
| | | | | | 45,544,711 |
| | | | |
|
|
Electronic Equipment & Instruments — 0.1% |
Daktronics, Inc.(b) | | 32,000 | | | 299,520 |
Tyco Electronics Ltd. (Bermuda) | | 199,600 | | | 3,235,516 |
| | | | |
|
|
| | | | | | 3,535,036 |
| | | | |
|
|
Energy Equipment & Services — 1.0% |
Complete Production Services, Inc.(a) | | 112,100 | | | 913,615 |
ENSCO International, Inc. | | 156,200 | | | 4,434,518 |
Halliburton Co. | | 239,800 | | | 4,359,564 |
Noble Corp. | | 220,300 | | | 4,866,427 |
Schlumberger Ltd. (Netherlands) | | 239,800 | | | 10,150,734 |
Superior Energy Services, Inc.(a) | | 45,200 | | | 720,036 |
Willbros Group, Inc. (Panama)(a)(b) | | 38,900 | | | 329,483 |
| | | | |
|
|
| | | | | | 25,774,377 |
| | | | |
|
|
| | | | | |
COMMON STOCKS
(continued) | | Shares
| | Value
(Note 2)
|
| | | | | | |
Food & Staples Retailing — 1.8% |
Costco Wholesale Corp. | | 18,100 | | $ | 950,250 |
CVS Caremark Corp. | | 21,700 | | | 623,658 |
Kroger Co. (The) | | 350,900 | | | 9,267,269 |
Safeway, Inc. | | 386,100 | | | 9,177,597 |
SUPERVALU, Inc. | | 145,300 | | | 2,121,380 |
Sysco Corp. | | 174,600 | | | 4,005,324 |
Wal-Mart Stores, Inc. | | 355,300 | | | 19,918,118 |
| | | | |
|
|
| | | | | | 46,063,596 |
| | | | |
|
|
Food Products — 1.4% |
Archer-Daniels-Midland Co.(b) | | 325,600 | | | 9,387,048 |
Bunge Ltd. | | 48,100 | | | 2,490,137 |
ConAgra Foods, Inc. | | 407,300 | | | 6,720,450 |
General Mills, Inc. | | 134,600 | | | 8,176,950 |
Kellogg Co. | | 54,500 | | | 2,389,825 |
Kraft Foods, Inc. (Class A Stock) | | 253,700 | | | 6,811,845 |
| | | | |
|
|
| | | | | | 35,976,255 |
| | | | |
|
|
Gas Utilities — 0.1% |
ONEOK, Inc. | | 79,000 | | | 2,300,480 |
| | | | |
|
|
Healthcare Equipment & Supplies — 1.5% |
American Medical Systems Holdings, Inc.(a) | | 84,100 | | | 756,059 |
Becton, Dickinson & Co. | | 155,900 | | | 10,662,001 |
Boston Scientific Corp.(a) | | 790,300 | | | 6,116,922 |
Covidien Ltd. (Bermuda) | | 203,900 | | | 7,389,336 |
Haemonetics Corp.(a) | | 3,900 | | | 220,350 |
Invacare Corp. | | 12,500 | | | 194,000 |
Medtronic, Inc. | | 442,300 | | | 13,897,066 |
Varian Medical Systems, Inc.(a)(b) | | 24,300 | | | 851,472 |
| | | | |
|
|
| | | | | | 40,087,206 |
| | | | |
|
|
Healthcare Providers & Services — 1.3% |
Coventry Health Care, Inc.(a) | | 198,200 | | | 2,949,216 |
Express Scripts, Inc.(a) | | 214,000 | | | 11,765,720 |
Humana, Inc.(a)(b) | | 259,100 | | | 9,659,248 |
McKesson Corp. | | 5,100 | | | 197,523 |
UnitedHealth Group, Inc. | | 106,400 | | | 2,830,240 |
WellPoint, Inc.(a)(b) | | 133,600 | | | 5,628,568 |
| | | | |
|
|
| | | | | | 33,030,515 |
| | | | |
|
|
Hotels, Restaurants & Leisure — 0.8% | | | | | |
Carnival Corp. | | 204,600 | | | 4,975,872 |
Domino’s Pizza, Inc.(a) | | 13,400 | | | 63,114 |
International Speedway Corp.
(Class A Stock) | | 14,200 | | | 407,966 |
McDonald’s Corp. | | 111,300 | | | 6,921,747 |
Royal Caribbean Cruises Ltd. | | 336,500 | | | 4,626,875 |
WMS Industries, Inc.(a) | | 27,800 | | | 747,820 |
Wyndham Worldwide Corp. | | 75,400 | | | 493,870 |
Yum! Brands, Inc. | | 132,600 | | | 4,176,900 |
| | | | |
|
|
| | | | | | 22,414,164 |
| | | | |
|
|
Household Durables — 0.4% | | | | | |
Harman International Industries, Inc.(b) | | 115,800 | | | 1,937,334 |
Jarden Corp.(a)(b) | | 192,800 | | | 2,217,200 |
Leggett & Platt, Inc. | | 344,200 | | | 5,228,398 |
| | | | |
|
|
| | | | | | 9,382,932 |
| | | | |
|
|
SEE NOTES TO FINANCIAL STATEMENTS.
A42
| | | | | | |
| | | FLEXIBLE MANAGED PORTFOLIO (continued) | | |
| |
| SCHEDULE OF INVESTMENTS | | December 31, 2008 |
| | | | | |
COMMON STOCKS
(continued) | | Shares
| | Value
(Note 2)
|
| | | | | | |
Household Products — 2.2% | | | | | |
Colgate-Palmolive Co. | | 193,300 | | $ | 13,248,782 |
Kimberly-Clark Corp. | | 197,900 | | | 10,437,246 |
Procter & Gamble Co. | | 557,005 | | | 34,434,049 |
| | | | |
|
|
| | | | | | 58,120,077 |
| | | | |
|
|
Independent Power Producers & Energy Traders — 0.2% |
AES Corp. (The)(a)(b) | | 551,900 | | | 4,547,656 |
| | | | |
|
|
Industrial Conglomerates — 1.4% | | | | | |
3M Co. | | 71,500 | | | 4,114,110 |
General Electric Co. | | 1,496,200 | | | 24,238,440 |
Tyco International Ltd. (Bermuda) | | 354,700 | | | 7,661,520 |
| | | | |
|
|
| | | | | | 36,014,070 |
| | | | |
|
|
Insurance — 1.8% | | | | | |
Aflac, Inc.(b) | | 240,100 | | | 11,006,184 |
Allstate Corp. (The) | | 306,900 | | | 10,054,044 |
American Financial Group, Inc. | | 118,500 | | | 2,711,280 |
Assurant, Inc.(b) | | 171,200 | | | 5,136,000 |
Chubb Corp. (The) | | 13,500 | | | 688,500 |
CNA Financial Corp. | | 20,600 | | | 338,664 |
Delphi Financial Group, Inc.
(Class A Stock) | | 22,100 | | | 407,524 |
Loews Corp. | | 126,900 | | | 3,584,925 |
MBIA, Inc.(b) | | 451,900 | | | 1,839,233 |
MetLife, Inc. | | 67,200 | | | 2,342,592 |
Platinum Underwriters Holdings Ltd. (Bermuda) | | 83,000 | | | 2,994,640 |
Travelers Cos, Inc. (The) | | 94,900 | | | 4,289,480 |
XL Capital Ltd. (Class A Stock) | | 143,800 | | | 532,060 |
| | | | |
|
|
| | | | | | 45,925,126 |
| | | | |
|
|
Internet & Catalog Retail — 0.1% | | | | | |
Expedia, Inc.(a) | | 285,000 | | | 2,348,400 |
PetMed Express, Inc.(a) | | 32,400 | | | 571,212 |
| | | | |
|
|
| | | | | | 2,919,612 |
| | | | |
|
|
Internet Software & Services — 0.9% |
EarthLink, Inc.(a)(b) | | 377,800 | | | 2,553,928 |
eBay, Inc.(a) | | 593,900 | | | 8,290,844 |
Google, Inc. (Class A Stock)(a) | | 40,400 | | | 12,429,060 |
| | | | |
|
|
| | | | | | 23,273,832 |
| | | | |
|
|
IT Services — 0.3% |
Accenture Ltd. (Class A Stock) (Bermuda) | | 132,100 | | | 4,331,559 |
Automatic Data Processing, Inc. | | 85,000 | | | 3,343,900 |
Convergys Corp.(a) | | 151,200 | | | 969,192 |
| | | | |
|
|
| | | | | | 8,644,651 |
| | | | |
|
|
Leisure Equipment & Products |
Jakks Pacific, Inc.(a) | | 15,000 | | | 309,450 |
| | | | |
|
|
Life Sciences, Tools & Services |
Life Technologies Corp.(a) | | 52,536 | | | 1,224,614 |
| | | | |
|
|
Machinery — 0.5% |
AGCO Corp.(a) | | 59,800 | | | 1,410,682 |
Bucyrus International, Inc. | | 125,300 | | | 2,320,556 |
Crane Co. | | 14,200 | | | 244,808 |
Cummins, Inc. | | 57,000 | | | 1,523,610 |
Deere & Co. | | 109,700 | | | 4,203,704 |
Flowserve Corp. | | 44,500 | | | 2,291,750 |
| | | | | |
COMMON STOCKS
(continued) | | Shares
| | Value
(Note 2)
|
| | | | | | |
Machinery (continued) |
Illinois Tool Works, Inc. | | 9,800 | | $ | 343,490 |
Titan International, Inc. | | 63,700 | | | 525,525 |
| | | | |
|
|
| | | | | | 12,864,125 |
| | | | |
|
|
Media — 1.3% |
CBS Corp. (Class B Stock) | | 362,019 | | | 2,964,936 |
Comcast Corp. (Class A Stock) | | 40,673 | | | 686,560 |
DIRECTV Group, Inc.(a)(b) | | 362,700 | | | 8,309,457 |
DISH Network Corp. (Class A Stock)(a) | | 180,300 | | | 1,999,527 |
Gannett Co., Inc.(b) | | 689,800 | | | 5,518,400 |
Liberty Media Corp. (Class A Stock)(a) | | 161,300 | | | 2,819,524 |
Meredith Corp.(b) | | 43,400 | | | 743,008 |
Time Warner, Inc. | | 409,800 | | | 4,122,588 |
Walt Disney Co. (The) | | 272,500 | | | 6,183,025 |
| | | | |
|
|
| | | | | | 33,347,025 |
| | | | |
|
|
Metals & Mining — 0.7% |
AK Steel Holding Corp. | | 512,000 | | | 4,771,840 |
Century Aluminum Co.(a) | | 203,000 | | | 2,030,000 |
Cliffs Natural Resources, Inc.(b) | | 23,100 | | | 591,591 |
Newmont Mining Corp. | | 154,800 | | | 6,300,360 |
Reliance Steel & Aluminum Co. | | 13,700 | | | 273,178 |
United States Steel Corp.(b) | | 126,200 | | | 4,694,640 |
| | | | |
|
|
| | | | | | 18,661,609 |
| | | | |
|
|
Multiline Retail — 0.1% |
Big Lots, Inc.(a)(b) | | 103,100 | | | 1,493,919 |
| | | | |
|
|
Multi-Utilities — 0.8% |
Centerpoint Energy, Inc. | | 153,800 | | | 1,940,956 |
CMS Energy Corp.(b) | | 188,300 | | | 1,903,713 |
Dominion Resources, Inc. | | 30,500 | | | 1,093,120 |
NiSource, Inc. | | 147,900 | | | 1,622,463 |
Public Service Enterprise Group, Inc. | | 337,400 | | | 9,841,958 |
Sempra Energy | | 79,500 | | | 3,389,085 |
| | | | |
|
|
| | | | | | 19,791,295 |
| | | | |
|
|
Office Electronics — 0.2% |
Xerox Corp. | | 630,100 | | | 5,021,897 |
| | | | |
|
|
Oil, Gas & Consumable Fuels — 6.3% |
Apache Corp. | | 36,700 | | | 2,735,251 |
Chevron Corp. | | 348,256 | | | 25,760,496 |
ConocoPhillips (Class B Stock) | | 399,634 | | | 20,701,041 |
CONSOL Energy, Inc. | | 35,900 | | | 1,026,022 |
Devon Energy Corp. | | 57,700 | | | 3,791,467 |
Encore Acquisition Co.(a) | | 7,000 | | | 178,640 |
EOG Resources, Inc. | | 7,900 | | | 525,982 |
Exxon Mobil Corp. | | 837,416 | | | 66,850,920 |
Forest Oil Corp.(a) | | 105,900 | | | 1,746,291 |
Foundation Coal Holdings, Inc. | | 42,100 | | | 590,242 |
Marathon Oil Corp. | | 249,400 | | | 6,823,584 |
Mariner Energy, Inc.(a) | | 64,100 | | | 653,820 |
McMoRan Exploration Co.(a) | | 144,500 | | | 1,416,100 |
Murphy Oil Corp. | | 120,200 | | | 5,330,870 |
Newfield Exploration Co.(a) | | 45,900 | | | 906,525 |
Occidental Petroleum Corp. | | 34,000 | | | 2,039,660 |
Overseas Shipholding Group, Inc. | | 15,300 | | | 644,283 |
SEE NOTES TO FINANCIAL STATEMENTS.
A43
| | | | | | |
| | | FLEXIBLE MANAGED PORTFOLIO (continued) | | |
| |
| SCHEDULE OF INVESTMENTS | | December 31, 2008 |
| | | | | |
COMMON STOCKS
(continued) | | Shares
| | Value
(Note 2)
|
| | | | | | |
Oil, Gas & Consumable Fuels (continued) |
Peabody Energy Corp. | | 344,100 | | $ | 7,828,275 |
Southwestern Energy Co.(a) | | 248,600 | | | 7,201,942 |
Tesoro Petroleum Corporation | | 84,300 | | | 1,110,231 |
Valero Energy Corp. | | 272,300 | | | 5,892,572 |
Western Refining, Inc.(b) | | 106,100 | | | 823,336 |
| | | | |
|
|
| | | | | | 164,577,550 |
| | | | |
|
|
Paper & Forest Products |
MeadWestvaco Corp. | | 37,200 | | | 416,268 |
| | | | |
|
|
Pharmaceuticals — 5.0% |
Abbott Laboratories | | 273,600 | | | 14,602,032 |
Allergan, Inc. | | 72,200 | | | 2,911,104 |
Bristol-Myers Squibb Co. | | 435,200 | | | 10,118,400 |
Eli Lilly & Co. | | 395,400 | | | 15,922,758 |
Forest Laboratories, Inc.(a) | | 179,600 | | | 4,574,412 |
Johnson & Johnson | | 408,498 | | | 24,440,435 |
Medicines Co. (The)(a)(b) | | 56,600 | | | 833,718 |
Merck & Co., Inc. | | 632,300 | | | 19,221,920 |
Pfizer, Inc.(b) | | 1,556,165 | | | 27,559,682 |
Warner Chilcott Ltd. (Class A Stock) (Bermuda)(a) | | 42,800 | | | 620,600 |
Wyeth | | 263,400 | | | 9,880,134 |
| | | | |
|
|
| | | | | | 130,685,195 |
| | | | |
|
|
Real Estate Investment Trusts — 0.3% |
Brandywine Realty Trust | | 278,400 | | | 2,146,464 |
CBL & Associates Properties, Inc.(b) | | 203,900 | | | 1,325,350 |
Colonial Properties Trust | | 87,300 | | | 727,209 |
First Industrial Realty Trust, Inc. | | 58,200 | | | 439,410 |
Host Hotels & Resorts, Inc. | | 248,500 | | | 1,881,145 |
Pennsylvania Real Estate Investment Trust(b) | | 105,800 | | | 788,210 |
Sunstone Hotel Investors, Inc. | | 152,200 | | | 942,118 |
| | | | |
|
|
| | | | | | 8,249,906 |
| | | | |
|
|
Real Estate Management & Development |
CB Richard Ellis Group, Inc. (Class A Stock)(a) | | 165,600 | | | 715,392 |
| | | | |
|
|
Road & Rail — 0.9% |
Burlington Northern Santa Fe Corp.(b) | | 79,800 | | | 6,041,658 |
Norfolk Southern Corp.(b) | | 226,000 | | | 10,633,300 |
Ryder System, Inc. | | 69,100 | | | 2,679,698 |
Union Pacific Corp.(b) | | 105,500 | | | 5,042,900 |
| | | | |
|
|
| | | | | | 24,397,556 |
| | | | |
|
|
Semiconductors & Semiconductor Equipment — 0.9% |
Analog Devices, Inc. | | 37,900 | | | 720,858 |
Broadcom Corp. (Class A Stock)(a) | | 73,600 | | | 1,248,992 |
Integrated Device Technology, Inc.(a) | | 35,000 | | | 196,350 |
Intel Corp.(b) | | 1,192,500 | | | 17,482,050 |
Silicon Laboratories, Inc.(a)(b) | | 90,800 | | | 2,250,024 |
Texas Instruments, Inc. | | 25,900 | | | 401,968 |
Volterra Semiconductor Corp.(a)(b) | | 48,500 | | | 346,775 |
| | | | |
|
|
| | | | | | 22,647,017 |
| | | | |
|
|
| | | | | |
COMMON STOCKS
(continued) | | Shares
| | Value
(Note 2)
|
| | | | | | |
Software — 2.2% |
Adobe Systems, Inc.(a) | | 208,700 | | $ | 4,443,223 |
Factset Research Systems, Inc.(b) | | 43,300 | | | 1,915,592 |
Microsoft Corp. | | 1,858,200 | | | 36,123,408 |
Oracle Corp.(a) | | 233,300 | | | 4,136,409 |
Quest Software, Inc.(a) | | 42,000 | | | 528,780 |
Symantec Corp.(a)(b) | | 719,300 | | | 9,724,936 |
| | | | |
|
|
| | | | | | 56,872,348 |
| | | | |
|
|
Specialty Retail — 0.6% |
Aeropostale, Inc.(a) | | 18,900 | | | 304,290 |
Gap, Inc. (The) | | 241,500 | | | 3,233,685 |
Gymboree Corp.(a)(b) | | 52,000 | | | 1,356,680 |
Home Depot, Inc. | | 286,950 | | | 6,605,589 |
Ltd. Brands, Inc. | | 111,300 | | | 1,117,452 |
Rent-A-Center, Inc.(a) | | 82,600 | | | 1,457,890 |
TJX Cos., Inc.(b) | | 75,600 | | | 1,555,092 |
Tractor Supply Co.(a) | | 35,400 | | | 1,279,356 |
| | | | |
|
|
| | | | | | 16,910,034 |
| | | | |
|
|
Textiles, Apparel & Luxury Goods — 0.5% |
Coach, Inc.(a) | | 455,600 | | | 9,462,812 |
Jones Apparel Group, Inc. | | 262,700 | | | 1,539,422 |
Polo Ralph Lauren Corp. | | 47,100 | | | 2,138,811 |
| | | | |
|
|
| | | | | | 13,141,045 |
| | | | |
|
|
Tobacco — 1.1% |
Altria Group, Inc. | | 706,100 | | | 10,633,866 |
Philip Morris International, Inc. | | 251,200 | | | 10,929,712 |
Reynolds American, Inc. | | 148,500 | | | 5,986,035 |
| | | | |
|
|
| | | | | | 27,549,613 |
| | | | |
|
|
Trading Companies & Distributors — 0.1% |
WESCO International, Inc.(a) | | 100,800 | | | 1,938,384 |
| | | | |
|
|
TOTAL COMMON STOCKS
(cost $1,745,160,944) | | | | | 1,486,921,940 |
| | | | |
|
|
| PREFERRED STOCK |
Banking |
JPMorgan Chase Capital XXVI
(cost $700,000) | | 28,000 | | | 685,720 |
| | | | |
|
|
| | |
| | | Units
| | |
| RIGHTS |
Diversified Financial Services |
Fortis
(cost $0) | | 8,208 | | | — |
| | | | |
|
|
SEE NOTES TO FINANCIAL STATEMENTS.
A44
| | | | | | |
| | | FLEXIBLE MANAGED PORTFOLIO (continued) | | |
| |
| SCHEDULE OF INVESTMENTS | | December 31, 2008 |
| | | | | | | | | | | | |
| LONG-TERM BONDS — 36.4% | | Moody’s
Rating*
(Unaudited)
| | Interest
Rate
| | Maturity
Date
| | Principal
Amount
(000)
| | Value
(Note 2)
|
| | | | | | | | | | | | | |
| | | | | | | | | | | | | |
Aerospace/Defense — 0.2% | | | | | | | | | | |
BAE Systems Holdings, Inc., Gtd. Notes, 144A | | Baa2 | | 4.75% | | 08/15/10 | | $ | 2,150 | | $ | 2,137,350 |
Boeing Capital Corp., Sr. Unsec. Notes | | A2 | | 6.10% | | 03/01/11 | | | 925 | | | 936,596 |
Goodrich Corp., Sr. Unsec. Notes | | Baa2 | | 6.80% | | 07/01/36 | | | 848 | | | 905,371 |
Raytheon Co., Sr. Unsec. Notes | | Baa1 | | 5.50% | | 11/15/12 | | | 595 | | | 601,467 |
| | | | | | | | | | | |
|
|
| | | | | | | | | | | | | 4,580,784 |
| | | | | | | | | | | |
|
|
Airlines — 0.1% | | | | | | | | | | | | |
American Airlines, Inc., Pass-thru Certs., Ser. 01-1 | | B1 | | 6.817% | | 05/23/11 | | | 2,520 | | | 1,612,800 |
Continental Airlines, Inc., Pass-thru Certs., Ser. 981A | | Baa2 | | 6.648% | | 09/15/17 | | | 292 | | | 213,047 |
Delta Air Lines, Inc., Pass-thru Certs., Ser. 071A | | Baa1 | | 6.821% | | 08/10/22 | | | 486 | | | 308,716 |
Southwest Airlines Co., Sr. Unsec. Notes | | Baa1 | | 6.50% | | 03/01/12 | | | 1,005 | | | 940,672 |
| | | | | | | | | | | |
|
|
| | | | | | | | | | | | | 3,075,235 |
| | | | | | | | | | | |
|
|
Asset Backed Securities — 0.5% | | | | | | | | | | | | |
American Express Credit Account Master Trust, Ser. 2004-4, Class C, 144A(g) | | Baa1 | | 1.665% | | 03/15/12 | | | 1,170 | | | 987,854 |
American Express Credit Account Master Trust, Ser. 2004-C, Class C, 144A(g) | | Baa1 | | 1.695% | | 02/15/12 | | | 60 | | | 51,584 |
Amortizing Residential Collateral Trust, Ser. 2002-BC7 M2(g) | | CCC(f) | | 1.8213% | | 10/25/32 | | | 107 | | | 10,534 |
Amortizing Residential Collateral Trust, Ser. 2002-BC9 M1(g) | | A1 | | 2.1212% | | 12/25/32 | | | 2,212 | | | 1,191,083 |
Bank of America Credit Card Trust, Ser. 2006-C5, Class C5(g) | | Baa2 | | 1.595% | | 01/15/16 | | | 3,209 | | | 1,152,721 |
CDC Mortgage Capital Trust, Ser. 2002-HE3, Class M1(g) | | Baa2 | | 2.1212% | | 03/25/33 | | | 642 | | | 383,332 |
Centex Home Equity, Ser. 2005-A, Class M2(g) | | Aa2 | | 0.971% | | 01/25/35 | | | 1,790 | | | 1,170,473 |
Citibank Credit Card Insurance Trust, Ser. 2006-C1, Class C1(g) | | Baa2 | | 0.908% | | 02/20/15 | | | 1,350 | | | 624,547 |
Credit-Based Asset Servicing and Securitization LLC, Ser. 2005-CB6, Class A3 | | Aaa | | 5.12% | | 07/25/35 | | | 864 | | | 799,458 |
Equity One ABS, Inc., Ser. 2004-3, Class M1 | | Aa2 | | 5.70% | | 07/25/34 | | | 1,280 | | | 899,203 |
First Franklin Mortgage Loan Trust, Ser. 2005-FFH1, Class M2(g) | | A2 | | .991% | | 06/25/36 | | | 1,450 | | | 630,016 |
Household Home Equity Loan Trust, Ser. 2005-2, Class M2(g) | | Aa1 | | 0.998% | | 01/20/35 | | | 451 | | | 289,064 |
MBNA Master Credit Card Trust, Ser. 1999-J, Class A | | Aaa | | 7.00% | | 02/15/12 | | | 1,830 | | | 1,835,645 |
Morgan Stanley ABS Capital I, Ser. 2004-NC3, Class M2(g) | | A2 | | 2.1212% | | 03/25/34 | | | 522 | | | 364,165 |
Morgan Stanley Dean Witter Capital I, Ser. 2002-HE1, Class M1(g) | | Aa2 | | 1.3713% | | 07/25/32 | | | 1,329 | | | 734,134 |
Morgan Stanley Dean Witter Capital I, Ser. 2002-NC2, Class M2, 144A(g) | | B(f) | | 2.7962% | | 04/25/32 | | | 361 | | | 207,428 |
Morgan Stanley Dean Witter Capital I, Ser. 2002-NC4, Class M1(g) | | Aaa | | 1.7462% | | 09/25/32 | | | 1,009 | | | 599,220 |
Saxon Asset Securities Trust, Ser. 2005-2, Class M2(g) | | Aa2 | | 0.911% | | 10/25/35 | | | 1,170 | | | 521,518 |
Securitized Asset Backed Receivables LLC, Ser. 2004-OP1, Class M1(g) | | Aa2 | | 0.981% | | 02/25/34 | | | 1,325 | | | 777,223 |
Securitized Asset Backed Receivables LLC, Ser. 2006-FR3, Class A3(g) | | B2 | | 0.721% | | 05/25/36 | | | 1,100 | | | 385,983 |
SVO VOI Mortgage Corp., Ser. 2005-AA, Class A, 144A | | Aaa | | 5.25% | | 02/20/21 | | | 502 | | | 419,242 |
| | | | | | | | | | | |
|
|
| | | | | | | | | | | | | 14,034,427 |
| | | | | | | | | | | |
|
|
Automotive | | | | | | | | | | | | |
Johnson Controls, Inc., Sr. Unsec. Notes | | A3 | | 5.50% | | 01/15/16 | | | 245 | | | 189,860 |
| | | | | | | | | | | |
|
|
Banking — 1.4% | | | | | | | | | | | | |
Banco Bradesco (Cayman Islands), Sr. Sub. Notes | | A2 | | 8.75% | | 10/24/13 | | | 1,760 | | | 1,936,000 |
Bank of America Corp., Jr. Sub. Notes(g) | | A1 | | 8.00% | | 12/29/49 | | | 2,200 | | | 1,582,434 |
Bank of America Corp., Sub. Notes | | A1 | | 5.75% | | 08/15/16 | | | 1,775 | | | 1,658,947 |
Bank of America NA, Sub. Notes | | Aa1 | | 5.30% | | 03/15/17 | | | 930 | | | 883,059 |
Bank of America NA, Sub. Notes | | Aa1 | | 6.00% | | 10/15/36 | | | 410 | | | 435,331 |
Bank One Corp., Sub. Notes | | Aa3 | | 7.875% | | 08/01/10 | | | 2,250 | | | 2,358,337 |
Bear Stearns Co., Inc. (The), Sr. Unsec. Notes | | Aa2 | | 5.30% | | 10/30/15 | | | 515 | | | 495,481 |
Bear Stearns Co., Inc. (The), Sr. Unsec. Notes | | Aa2 | | 6.40% | | 10/02/17 | | | 330 | | | 342,929 |
Bear Stearns Co., Inc. (The), Sr. Unsec. Notes | | Aa2 | | 7.25% | | 02/01/18 | | | 1,175 | | | 1,287,631 |
Capital One Bank Corp., Sr. Sub. Notes | | A3 | | 6.50% | | 06/13/13 | | | 20 | | | 17,822 |
Capital One Financial Corp., Sr. Unsec. Notes, M.T.N. | | A3 | | 5.70% | | 09/15/11 | | | 600 | | | 559,504 |
SEE NOTES TO FINANCIAL STATEMENTS.
A45
| | | | | | |
| | | FLEXIBLE MANAGED PORTFOLIO (continued) | | |
| |
| SCHEDULE OF INVESTMENTS | | December 31, 2008 |
| | | | | | | | | | | | |
LONG-TERM BONDS
(continued) | | Moody’s
Rating*
(Unaudited)
| | Interest
Rate
| | Maturity
Date
| | Principal
Amount
(000)
| | Value
(Note 2)
|
| | | | | | | | | | | | | |
Banking (continued) | �� | | | | | | | | | | | |
Citigroup, Inc., Jr. Sub. Notes(b)(g) | | Baa2 | | 8.40% | | 04/29/49 | | $ | 1,900 | | $ | 1,254,551 |
Citigroup, Inc., Sr. Unsec. Notes(b) | | A2 | | 6.875% | | 03/05/38 | | | 520 | | | 591,701 |
Citigroup, Inc., Sub. Notes | | A3 | | 5.00% | | 09/15/14 | | | 454 | | | 399,330 |
Citigroup, Inc., Sub. Notes | | A3 | | 6.125% | | 08/25/36 | | | 570 | | | 510,603 |
Citigroup, Inc., Sub. Notes | | A3 | | 5.625% | | 08/27/12 | | | 2,800 | | | 2,624,795 |
Countrywide Financial Corp., Gtd. Notes, M.T.N. | | Aa2 | | 5.80% | | 06/07/12 | | | 1,190 | | | 1,159,837 |
DEPFA ACS Bank (Ireland), Covered Notes, 144A | | Aa1 | | 5.125% | | 03/16/37 | | | 1,380 | | | 999,290 |
First Union National Bank, Sub. Notes | | Aa3 | | 7.80% | | 08/18/10 | | | 2,100 | | | 2,084,266 |
Goldman Sachs Group, Inc. (The), Sr. Unsec. Notes | | A1 | | 5.45% | | 11/01/12 | | | 600 | | | 572,345 |
Goldman Sachs Group, Inc. (The), Sub. Notes | | A2 | | 5.625% | | 01/15/17 | | | 1,190 | | | 1,022,302 |
Goldman Sachs Group, Inc. (The), Sub. Notes | | A2 | | 6.45% | | 05/01/36 | | | 1,615 | | | 1,254,214 |
Goldman Sachs Group, Inc. (The), Sub. Notes | | A2 | | 6.75% | | 10/01/37 | | | 104 | | | 84,434 |
HSBC Bank USA, Sr. Unsec. Notes | | Aa2 | | 3.875% | | 09/15/09 | | | 250 | | | 249,577 |
ICICI Bank Ltd. (India), Notes, 144A(g) | | Baa2 | | 5.29% | | 01/12/10 | | | 2,385 | | | 1,973,588 |
ICICI Bank Ltd. (Singapore), Bonds, 144A | | Baa2 | | 5.75% | | 11/16/10 | | | 1,410 | | | 1,198,035 |
JPMorgan Chase & Co., Sub. Notes | | Aa3 | | 6.50% | | 01/15/09 | | | 1,100 | | | 1,099,780 |
JPMorgan Chase & Co., Jr. Sub. Notes(b)(g) | | A1 | | 7.90% | | 04/29/49 | | | 2,000 | | | 1,663,660 |
Morgan Stanley, Sr. Unsec. Notes | | A2 | | 5.30% | | 03/01/13 | | | 265 | | | 240,326 |
Morgan Stanley, Sr. Unsec. Notes | | A2 | | 5.45% | | 01/09/17 | | | 1,045 | | | 861,375 |
Morgan Stanley, Sr. Unsec. Notes, M.T.N.(b) | | A2 | | 5.75% | | 10/18/16 | | | 1,300 | | | 1,092,355 |
Morgan Stanley, Sr. Unsec. Notes, M.T.N. | | A2 | | 5.95% | | 12/28/17 | | | 620 | | | 514,588 |
MUFG Capital Finance 1 Ltd., (Cayman Islands), Gtd. Notes(g) | | A2 | | 6.346% | | 07/25/49 | | | 800 | | | 557,378 |
Santander Central Hispano Issuances (Cayman Islands), Bank Gtd. Notes | | Aa2 | | 7.625% | | 09/14/10 | | | 695 | | | 678,830 |
Wells Fargo Bank, Sub. Notes | | Aa1 | | 4.75% | | 02/09/15 | | | 585 | | | 592,131 |
Wells Fargo Bank, Sub. Notes | | Aa1 | | 6.45% | | 02/01/11 | | | 65 | | | 67,375 |
Wells Fargo Capital XIII, Bank Gtd. Notes, M.T.N.(g) | | Aa2 | | 7.70% | | 12/26/49 | | | 1,000 | | | 825,311 |
| | | | | | | | | | | |
|
|
| | | | | | | | | | | | | 35,729,452 |
| | | | | | | | | | | |
|
|
Brokerage — 0.2% | | | | | | | | | | | | |
Lehman Brothers Holdings, Inc., Sr. Unsec. Notes, M.T.N.(k) | | NR | | 6.875% | | 05/02/18 | | | 700 | | | 66,500 |
Lehman Brothers Holdings, Inc., Sr. Unsec. Notes, M.T.N.(k) | | NR | | 5.25% | | 02/06/12 | | | 1,715 | | | 162,925 |
Lehman Brothers Holdings, Inc., Sub. Notes(k) | | NR | | 6.50% | | 07/19/17 | | | 582 | | | 58 |
Merrill Lynch & Co., Inc., Notes, M.T.N.(b) | | A2 | | 6.875% | | 04/25/18 | | | 980 | | | 1,025,105 |
Merrill Lynch & Co., Inc., Sr. Unsec. Notes, M.T.N.(b) | | A2 | | 4.25% | | 02/08/10 | | | 1,170 | | | 1,143,608 |
Merrill Lynch & Co., Inc., Sr. Unsec. Notes | | A2 | | 4.79% | | 08/04/10 | | | 295 | | | 286,808 |
Merrill Lynch & Co., Inc., Sr. Unsec. Notes | | A2 | | 6.40% | | 08/28/17 | | | 35 | | | 35,065 |
Merrill Lynch & Co., Inc., Sr. Unsec. Notes, M.T.N. | | A2 | | 5.00% | | 01/15/15 | | | 615 | | | 593,189 |
Merrill Lynch & Co., Inc., Sr. Unsec. Notes, M.T.N | | A2 | | 5.77% | | 07/25/11 | | | 520 | | | 513,826 |
| | | | | | | | | | | |
|
|
| | | | | | | | | | | | | 3,827,084 |
| | | | | | | | | | | |
|
|
Building Materials & Construction | | | | | | | | | | | | |
Hanson PLC (United Kingdom), Gtd. Notes | | Ba3 | | 7.875% | | 09/27/10 | | | 1,000 | | | 403,862 |
Lafarge SA (France), Sr. Unsec. Notes | | Baa2 | | 6.15% | | 07/15/11 | | | 910 | | | 792,320 |
| | | | | | | | | | | |
|
|
| | | | | | | | | | | | | 1,196,182 |
| | | | | | | | | | | |
|
|
Cable — 0.2% | | | | | | | | | | | | |
AT&T Broadband LLC, Gtd. Notes | | Baa2 | | 9.455% | | 11/15/22 | | | 255 | | | 285,691 |
Comcast Corp., Gtd. Notes | | Baa2 | | 6.50% | | 11/15/35 | | | 450 | | | 447,858 |
Comcast Corp., Gtd. Notes | | Baa2 | | 6.95% | | 08/15/37 | | | 65 | | | 68,448 |
Comcast Corp., Gtd. Notes | | Baa2 | | 6.45% | | 03/15/37 | | | 155 | | | 154,243 |
Cox Communications, Inc., Sr. Unsec. Notes, Class A | | Baa3 | | 6.75% | | 03/15/11 | | | 950 | | | 924,746 |
Cox Communications, Inc., Sr. Unsec. Notes, Class A | | Baa3 | | 7.875% | | 08/15/09 | | | 1,275 | | | 1,253,311 |
Time Warner Cable, Inc., Gtd. Notes(b) | | Baa2 | | 5.40% | | 07/02/12 | | | 2,510 | | | 2,343,706 |
| | | | | | | | | | | |
|
|
| | | | | | | | | | | | | 5,478,003 |
| | | | | | | | | | | |
|
|
Capital Goods — 0.2% | | | | | | | | | | | | |
American Standard, Inc., Gtd. Notes(b) | | Baa3 | | 7.625% | | 02/15/10 | | | 770 | | | 769,993 |
Caterpillar Financial Services Corp., Sr. Unsec. Notes, M.T.N. | | A2 | | 5.50% | | 03/15/16 | | | 825 | | | 785,062 |
SEE NOTES TO FINANCIAL STATEMENTS.
A46
| | | | | | |
| | | FLEXIBLE MANAGED PORTFOLIO (continued) | | |
| |
| SCHEDULE OF INVESTMENTS | | December 31, 2008 |
| | | | | | | | | | | | |
LONG-TERM BONDS
(continued) | | Moody’s
Rating*
(Unaudited)
| | Interest
Rate
| | Maturity
Date
| | Principal
Amount
(000)
| | Value
(Note 2)
|
| | | | | | | | | | | | | |
Capital Goods (continued) | | | | | | | | | | | | |
Caterpillar, Inc., Sr. Unsec. Notes | | A2 | | 7.25% | | 09/15/09 | | $ | 700 | | $ | 712,737 |
Erac USA Finance Co., Gtd. Notes, 144A | | Baa2 | | 5.80% | | 10/15/12 | | | 460 | | | 384,803 |
Erac USA Finance Co., Gtd. Notes, 144A | | Baa2 | | 6.375% | | 10/15/17 | | | 1,302 | | | 903,604 |
Erac USA Finance Co., Gtd. Notes, 144A | | Baa2 | | 7.00% | | 10/15/37 | | | 380 | | | 209,295 |
FedEx Corp., Gtd. Notes | | Baa2 | | 7.25% | | 02/15/11 | | | 400 | | | 406,352 |
General Electric Co., Sr. Unsec. Notes | | Aaa | | 5.25% | | 12/06/17 | | | 200 | | | 199,389 |
United Technologies Corp., Sr. Unsec. Notes | | A2 | | 6.35% | | 03/01/11 | | | 825 | | | 872,312 |
| | | | | | | | | | | |
|
|
| | | | | | | | | | | | | 5,243,547 |
| | | | | | | | | | | |
|
|
Chemicals — 0.3% | | | | | | | | | | | | |
Dow Chemical Co. (The), Sr. Unsec. Notes | | Baa1 | | 5.97% | | 01/15/09 | | | 390 | | | 390,010 |
Dow Chemical Co. (The), Sr. Unsec. Notes | | Baa1 | | 6.125% | | 02/01/11 | | | 685 | | | 685,930 |
Huntsman LLC, Sec. Notes | | Ba1 | | 11.625% | | 10/15/10 | | | 2,000 | | | 1,749,999 |
ICI Wilmington, Inc., Gtd. Notes | | A3 | | 5.625% | | 12/01/13 | | | 720 | | | 694,150 |
Lubrizol Corp., Gtd. Notes | | Baa2 | | 4.625% | | 10/01/09 | | | 860 | | | 844,726 |
Monsanto Co., Sr. Unsec. Notes | | A2 | | 5.875% | | 04/15/38 | | | 605 | | | 648,841 |
PPG Industries, Inc., Sr. Unsec. Notes | | A3 | | 5.75% | | 03/15/13 | | | 3,500 | | | 3,461,275 |
Union Carbide Corp., Sr. Unsec. Notes | | Ba2 | | 7.50% | | 06/01/25 | | | 460 | | | 378,317 |
| | | | | | | | | | | |
|
|
| | | | | | | | | | | | | 8,853,248 |
| | | | | | | | | | | |
|
|
Collateralized Mortgage Obligations — 0.4% | | | | | | | | | | | | |
Banc of America Mortgage Securities, Inc., Ser. 2005-A, Class 2A1(g) | | Aaa | | 4.443% | | 02/25/35 | | | 1,189 | | | 788,851 |
Banc of America Mortgage Securities, Inc., Ser. 2005-B, Class 2A1(g) | | Aaa | | 4.386% | | 03/25/35 | | | 890 | | | 544,197 |
Bank of America Alternative Loan Trust, Ser. 2005-12, Class 3CB1 | | Aaa | | 6.00% | | 01/25/36 | | | 3,495 | | | 2,723,606 |
Chase Mortgage Finance Corp., Ser. 2007-A1 Class 1A5(g) | | Aaa | | 4.884% | | 02/25/37 | | | 2,968 | | | 2,265,336 |
Countrywide Alternative Loan Trust, Ser. 2004-18CB, Class 3A1 | | Aaa | | 5.25% | | 09/25/19 | | | 1,236 | | | 1,127,302 |
JPMorgan Mortgage Trust, Ser. 2007-A1, Class 4A1(g) | | Aaa | | 4.066% | | 07/25/35 | | | 2,317 | | | 1,685,276 |
Master Alternative Loan Trust, Ser. 2004-4, Class 4A1 | | Aaa | | 5.00% | | 04/25/19 | | | 428 | | | 396,292 |
Structured Adjustable Rate Mortgage Loan, Ser. 2004-1, Class 4A3(g) | | Aaa | | 5.365% | | 02/25/34 | | | 775 | | | 481,553 |
Washington Mutual Alternative Mortgage, Pass-Through Certificates, Ser. 2005-1, Class 3A | | AAA(f) | | 5.00% | | 03/25/20 | | | 484 | | | 388,438 |
| | | | | | | | | | | |
|
|
| | | | | | | | | | | | | 10,400,851 |
| | | | | | | | | | | |
|
|
Commercial Mortgage Backed Securities — 3.6% | | | | | | | | | | | | |
Banc of America Commercial Mortgage, Inc., Ser. 2003-2, Class A3(g) | | AAA(f) | | 4.873% | | 03/11/41 | | | 2,500 | | | 2,286,029 |
Banc of America Commercial Mortgage, Inc., Ser. 2004-2, Class A4 | | Aaa | | 4.153% | | 11/10/38 | | | 2,800 | | | 2,570,049 |
Banc of America Commercial Mortgage, Inc, Ser. 2005-1, Class ASB(g) | | AAA(f) | | 4.967% | | 11/10/42 | | | 798 | | | 677,037 |
Banc of America Commercial Mortgage, Inc., Ser. 2006-4, Class A3A | | Aaa | | 5.60% | | 07/10/46 | | | 3,700 | | | 2,632,833 |
Banc of America Commercial Mortgage, Inc., Ser. 2007-3, Class A2(g) | | Aaa | | 5.658% | | 06/10/49 | | | 5,900 | | | 4,659,066 |
Bear Stearns Commercial Mortgage Securities, Ser.2005-T18, Class AAB(g) | | Aaa | | 4.823% | | 02/13/42 | | | 1,775 | | | 1,406,826 |
Bear Stearns Commercial Mortgage Securities, Ser.2005-T20, Class AAB, I/O(g) | | Aaa | | 5.135% | | 10/12/42 | | | 2,400 | | | 1,966,192 |
Commercial Mortgage Load Trust, Ser. 2008-LS1, Class A2(g) | | Aaa | | 6.0197% | | 12/10/49 | | | 2,200 | | | 1,736,997 |
Commercial Mortgage Pass-Through Certificates, I/O, Ser. 2004-LB2A, Class X2, 144A(g) | | AAA(f) | | 0.852% | | 03/10/39 | | | 9,090 | | | 135,208 |
Commercial Mortgage Acceptance Corp., Ser. 1998-C2, Class F, 144A(g) | | A-(f) | | 5.44% | | 09/15/30 | | | 890 | | | 790,206 |
CS First Boston Mortgage Securities Corp., Ser. 2004-C3, Class A4 | | Aaa | | 4.835% | | 07/15/36 | | | 880 | | | 800,940 |
CS First Boston Mortgage Securities Corp., Ser. 2004-C4, Class A4 | | Aaa | | 4.283% | | 10/15/39 | | | 1,400 | | | 1,276,137 |
CS First Boston Mortgage Securities Corp., Ser. 2005-C5, Class A4(g) | | AAA(f) | | 5.10% | | 08/15/38 | | | 6,800 | | | 5,564,461 |
CS Mortgage Capital Certificate Corp., Ser. 2006-C1, Class A4(g) | | AAA(f) | | 5.552% | | 02/15/39 | | | 2,700 | | | 2,192,242 |
CW Capital Cobalt Ltd., Ser. 2007-C3, Class A3(g) | | AAA(f) | | 5.82% | | 05/15/46 | | | 2,200 | | | 1,441,918 |
DLJ Commercial Mortgage Corp., Ser. 2000-CF1, Class A1B | | AAA(f) | | 7.62% | | 06/10/33 | | | 2,588 | | | 2,589,995 |
General Electric Capital Commercial Mortgage Corp., I/O Ser. 2004-C2, Class X2, 144A(g) | | Aaa | | 0.532% | | 03/10/40 | | | 17,687 | | | 195,015 |
GMAC Commercial Mortgage Securities, Inc., Ser. 2005-C1, Class A5 | | AAA(f) | | 4.697% | | 05/10/43 | | | 2,720 | | | 2,205,055 |
SEE NOTES TO FINANCIAL STATEMENTS.
A47
| | | | | | |
| | | FLEXIBLE MANAGED PORTFOLIO (continued) | | |
| |
| SCHEDULE OF INVESTMENTS | | December 31, 2008 |
| | | | | | | | | | | | |
LONG-TERM BONDS
(continued) | | Moody’s
Rating*
(Unaudited)
| | Interest
Rate
| | Maturity
Date
| | Principal
Amount
(000)
| | Value
(Note 2)
|
| | | | | | | | | | | | | |
Commercial Mortgage Backed Securities (continued) | | | | | | | | | | | | |
Greenwich Capital Commercial Funding Corp., Inc., Ser. 2005-GG5, Class A5(g) | | Aaa | | 5.224% | | 04/10/37 | | $ | 9,550 | | $ | 7,848,220 |
GS Mortgage Securities Corp. II, Ser. 2006-GG6, Class AAB(g) | | AAA(f) | | 5.587% | | 04/10/38 | | | 6,650 | | | 5,157,541 |
JPMorgan Chase Commercial Mortgage Securities Corp., Ser. 2005-LDP1, Class ASB(g) | | Aaa | | 4.853% | | 03/15/46 | | | 4,200 | | | 3,527,562 |
JPMorgan Chase Commercial Mortgage Securities Corp., Ser. 2005-LDP2, Class ASB | | Aaa | | 4.659% | | 07/15/42 | | | 6,350 | | | 5,171,231 |
JPMorgan Chase Commercial Mortgage Securities Corp., Ser. 2006-CB16, Class ASB | | Aaa | | 5.523% | | 05/12/45 | | | 3,900 | | | 2,971,468 |
JPMorgan Chase Commercial Mortgage Securities Corp., Ser. 2006-LDP6, Class X2, I/O(g) | | Aaa | | 0.066% | | 04/15/43 | | | 130,647 | | | 426,314 |
JPMorgan Commercial Mortgage Finance Corp., Ser. 2000-C10, Class A2(g) | | Aaa | | 7.371% | | 08/15/32 | | | 7,402 | | | 7,385,356 |
JPMorgan Commercial Mortgage Finance Corp., Ser. 2003-CB6, Class A2(g) | | Aaa | | 5.255% | | 07/12/37 | | | 2,100 | | | 1,903,536 |
KeyCorp., Ser. 2000-C1, Class A2(g) | | Aaa | | 7.727% | | 05/17/32 | | | 7,783 | | | 7,782,954 |
LB-UBS Commercial Mortgage Trust, Ser. 2003-C8, Class A3 | | Aaa | | 4.83% | | 11/15/27 | | | 1,460 | | | 1,349,060 |
LB-UBS Commercial Mortgage Trust, Ser. 2004-C6, Class A5(g) | | AAA(f) | | 4.826% | | 08/15/29 | | | 3,910 | | | 3,484,850 |
LB-UBS Commercial Mortgage Trust, Ser. 2006-C6, Class AAB | | Aaa | | 5.341% | | 09/15/39 | | | 3,580 | | | 2,690,313 |
Merrill Lynch Mortgage Trust, Ser. 2004-KEY2, Class A3 | | Aaa | | 4.615% | | 08/12/39 | | | 2,000 | | | 1,782,652 |
Merrill Lynch/Countrywide Commercial Mortgage Trust, Ser. 2006-2, Class A4(g) | | Aaa | | 5.9093% | | 06/12/46 | | | 1,795 | | | 1,438,181 |
Morgan Stanley Capital I, Ser. 2006-IQ11, Class A4(g) | | AAA(f) | | 5.772% | | 10/15/42 | | | 2,600 | | | 2,134,096 |
Morgan Stanley Capital I, Ser. 2007-HQ11, Class AAB | | Aaa | | 5.444% | | 02/12/44 | | | 4,600 | | | 3,291,701 |
Morgan Stanley Capital I, Ser. 2007-T27, AAB(g) | | AAA(f) | | 5.65% | | 06/11/42 | | | 1,105 | | | 826,521 |
| | | | | | | | | | | |
|
|
| | | | | | | | | | | | | 94,297,762 |
| | | | | | | | | | | |
|
|
Consumer — 0.1% | | | | | | | | | | | | |
Avon Products, Inc., Sr. Unsec. Notes | | A2 | | 5.75% | | 03/01/18 | | | 1,500 | | | 1,411,330 |
Newell Rubbermaid, Inc., Sr. Unsec. Notes | | Baa2 | | 6.25% | | 04/15/18 | | | 1,700 | | | 1,367,477 |
Whirlpool Corp., Sr. Unsec. Notes | | Baa2 | | 6.125% | | 06/15/11 | | | 965 | | | 859,305 |
| | | | | | | | | | | |
|
|
| | | | | | | | | | | | | 3,638,112 |
| | | | | | | | | | | |
|
|
Electric — 0.8% | | | | | | | | | | | | |
Appalachian Power Co., Sr. Unsec. Notes, Ser. J | | Baa2 | | 4.40% | | 06/01/10 | | | 620 | | | 606,697 |
Arizona Public Service Co., Sr. Unsec. Notes | | Baa2 | | 6.25% | | 08/01/16 | | | 175 | | | 140,713 |
Arizona Public Service Co., Sr. Unsec. Notes | | Baa2 | | 6.375% | | 10/15/11 | | | 1,305 | | | 1,228,427 |
Baltimore Gas & Electric Co., Sr. Unsec. Notes | | Baa2 | | 6.35% | | 10/01/36 | | | 550 | | | 452,640 |
Carolina Power & Light Co., First Mtge. Bonds | | A2 | | 5.25% | | 12/15/15 | | | 525 | | | 532,601 |
CenterPoint Energy Houston Electric LLC, Mtge. Bonds, Ser. J2 | | Baa2 | | 5.70% | | 03/15/13 | | | 740 | | | 704,274 |
CenterPoint Energy Houston Electric LLC, Mtge. Bonds, Ser. K2 | | Baa2 | | 6.95% | | 03/15/33 | | | 590 | | | 542,463 |
Consolidated Edison Co. of New York, Sr. Unsec. Notes | | A1 | | 5.375% | | 12/15/15 | | | 730 | | | 716,526 |
Consolidated Edison Co. of New York, Inc., Sr. Unsec. Notes | | A1 | | 6.75% | | 04/01/38 | | | 200 | | | 213,693 |
Consumers Energy Co., First Mtge. Bonds, Ser. B | | Baa1 | | 5.375% | | 04/15/13 | | | 325 | | | 319,841 |
Dominion Resources, Inc., Sr. Unsec. Notes, Ser. D | | Baa2 | | 5.125% | | 12/15/09 | | | 970 | | | 967,865 |
Duke Energy Carolinas LLC, First Mtge. Bonds | | A2 | | 6.05% | | 04/15/38 | | | 550 | | | 603,356 |
Duke Energy Carolinas LLC, Sr. Unsec. Notes | | A3 | | 6.10% | | 06/01/37 | | | 960 | | | 1,008,494 |
E.ON International Finance BV (Netherlands), Gtd. Notes, 144A | | A2 | | 6.65% | | 04/30/38 | | | 890 | | | 826,670 |
El Paso Electric Co., Sr. Unsec. Notes | | Baa2 | | 6.00% | | 05/15/35 | | | 670 | | | 459,264 |
Empresa Nacional de Electricidad S.A. (Chile), Unsec. Notes, Ser. B | | Baa3 | | 8.50% | | 04/01/09 | | | 1,070 | | | 1,088,053 |
Empresa Nacional de Electricidad S.A. (Chile), Unsub. Notes | | Baa3 | | 8.625% | | 08/01/15 | | | 1,295 | | | 1,400,884 |
Energy East Corp., Sr. Unsec. Notes | | Baa2 | | 6.75% | | 09/15/33 | | | 145 | | | 116,604 |
Exelon Corp., Sr. Unsec. Notes | | Baa1 | | 4.90% | | 06/15/15 | | | 155 | | | 127,074 |
Florida Power & Light Co., First Mtge. Bonds | | Aa3 | | 5.95% | | 10/01/33 | | | 295 | | | 326,139 |
Georgia Power Co., Sr. Unsec. Notes | | A2 | | 5.70% | | 06/01/17 | | | 495 | | | 494,969 |
Indiana Michigan Power Co., Sr. Unsec. Notes | | Baa2 | | 5.05% | | 11/15/14 | | | 460 | | | 414,377 |
Midamerican Energy Holdings Co., Sr. Unsec. Notes | | Baa1 | | 5.75% | | 04/01/18 | | | 205 | | | 199,968 |
Midamerican Energy Holdings Co., Sr. Unsec. Notes | | Baa1 | | 5.95% | | 05/15/37 | | | 300 | | | 272,026 |
SEE NOTES TO FINANCIAL STATEMENTS.
A48
| | | | | | |
| | | FLEXIBLE MANAGED PORTFOLIO (continued) | | |
| |
| SCHEDULE OF INVESTMENTS | | December 31, 2008 |
| | | | | | | | | | | | |
LONG-TERM BONDS
(continued) | | Moody’s
Rating*
(Unaudited)
| | Interest
Rate
| | Maturity
Date
| | Principal
Amount
(000)
| | Value
(Note 2)
|
| | | | | | | | | | | | | |
Electric (continued) | | | | | | | | | | | | |
National Rural Utilities Cooperative Finance Corp., Sr. Unsec. Notes, Ser. C, M.T.N. | | A2 | | 7.25% | | 03/01/12 | | $ | 185 | | $ | 190,480 |
Nevada Power Co., Mtge. Bonds, Ser. O | | Baa3 | | 6.50% | | 05/15/18 | | | 1,260 | | | 1,212,957 |
NiSource Finance Corp., Gtd. Notes | | Baa3 | | 5.25% | | 09/15/17 | | | 245 | | | 148,513 |
NiSource Finance Corp., Gtd. Notes | | Baa3 | | 5.45% | | 09/15/20 | | | 350 | | | 187,457 |
NSTAR Electric Co., Sr. Unsec. Notes | | A1 | | 4.875% | | 04/15/14 | | | 565 | | | 565,610 |
Oncor Electric Delivery Co., Sr. Sec. Notes | | Baa3 | | 6.375% | | 01/15/15 | | | 345 | | | 330,463 |
Oncor Electric Delivery Co., Sr. Sec. Notes | | Baa3 | | 7.00% | | 09/01/22 | | | 475 | | | 443,844 |
Pacific Gas & Electric Co., Sr. Unsec. Notes | | A3 | | 6.05% | | 03/01/34 | | | 1,550 | | | 1,646,190 |
PPL Electric Utilities Corp., Sr. Sec. Notes | | A3 | | 6.25% | | 08/15/09 | | | 1,500 | | | 1,508,639 |
Public Service Co. of New Mexico, Sr. Unsec. Notes | | Baa3 | | 7.95% | | 05/15/18 | | | 140 | | | 113,926 |
Public Service Electric & Gas Co., Sec. Notes M.T.N. | | A3 | | 5.80% | | 05/01/37 | | | 535 | | | 500,682 |
Southern California Edison Co., First Mtge. Bonds | | A2 | | 4.65% | | 04/01/15 | | | 470 | | | 468,711 |
Xcel Energy, Inc., Sr. Unsec. Notes | | Baa1 | | 5.613% | | 04/01/17 | | | 199 | | | 176,209 |
Xcel Energy, Inc., Sr. Unsec. Notes | | Baa1 | | 6.50% | | 07/01/36 | | | 445 | | | 408,564 |
| | | | | | | | | | | |
|
|
| | | | | | | | | | | | | 21,665,863 |
| | | | | | | | | | | |
|
|
Energy - Integrated — 0.1% | | | | | | | | | | | | |
ConocoPhillips, Sr. Unsec. Notes | | A1 | | 8.75% | | 05/25/10 | | | 1,505 | | | 1,586,171 |
TNK-BP Finance SA (Luxembourg), Gtd. Notes, 144A | | Baa2 | | 7.50% | | 07/18/16 | | | 1,425 | | | 741,000 |
| | | | | | | | | | | |
|
|
| | | | | | | | | | | | | 2,327,171 |
| | | | | | | | | | | |
|
|
Energy - Other — 0.2% | | | | | | | | | | | | |
Devon Financing Corp. ULC (Canada), Gtd. Notes | | Baa1 | | 7.875% | | 09/30/31 | | | 225 | | | 247,748 |
Halliburton Co., Sr. Unsec. Notes | | A2 | | 5.50% | | 10/15/10 | | | 150 | | | 153,207 |
Nexen, Inc. (Canada), Sr. Unsec. Notes | | Baa2 | | 6.40% | | 05/15/37 | | | 200 | | | 156,496 |
Pioneer Natural Resources Co., Sr. Unsec. Notes | | Ba1 | | 6.875% | | 05/01/18 | | | 1,500 | | | 1,049,103 |
Valero Energy Corp., Sr. Unsec. Notes | | Baa2 | | 6.625% | | 06/15/37 | | | 255 | | | 187,553 |
Weatherford International, Inc., Gtd. Notes | | Baa1 | | 6.35% | | 06/15/17 | | | 970 | | | 827,833 |
Western Oil Sands, Inc. (Canada), Sr. Sec. Notes | | Baa1 | | 8.375% | | 05/01/12 | | | 360 | | | 343,671 |
Woodside Finance Ltd. (Australia), Gtd. Notes, 144A | | Baa1 | | 5.00% | | 11/15/13 | | | 1,315 | | | 1,316,006 |
XTO Energy, Inc., Sr. Unsec. Notes | | Baa2 | | 6.25% | | 08/01/17 | | | 585 | | | 561,762 |
| | | | | | | | | | | |
|
|
| | | | | | | | | | | | | 4,843,379 |
| | | | | | | | | | | |
|
|
Foods — 0.5% | | | | | | | | | | | | |
Bunge Ltd. Finance Corp., Gtd. Notes | | Baa2 | | 5.35% | | 04/15/14 | | | 1,040 | | | 746,112 |
Cargill, Inc., Sr. Unsec. Notes, 144A | | A2 | | 3.625% | | 03/04/09 | | | 1,875 | | | 1,872,746 |
Cargill, Inc., Sr. Unsec. Notes, 144A | | A2 | | 6.00% | | 11/27/17 | | | 670 | | | 600,752 |
ConAgra Foods, Inc., Sr. Unsec. Notes | | Baa2 | | 7.875% | | 09/15/10 | | | 430 | | | 444,941 |
Delhaize Group (Belgium), Sr. Unsec. Notes(b) | | Baa3 | | 6.50% | | 06/15/17 | | | 480 | | | 435,837 |
Diageo Capital PLC (United Kingdom), Gtd. Notes | | A3 | | 5.75% | | 10/23/17 | | | 1,005 | | | 972,439 |
Dr Pepper Snapple Group, Inc., Gtd. Notes, 144A | | Baa3 | | 6.82% | | 05/01/18 | | | 510 | | | 503,040 |
General Mills, Inc., Sr. Unsec. Notes | | Baa1 | | 6.00% | | 02/15/12 | | | 1,050 | | | 1,089,236 |
Kellogg Co., Sr. Unsec. Notes, Ser. B | | A3 | | 6.60% | | 04/01/11 | | | 1,875 | | | 1,962,373 |
Kroger Co. (The), Gtd. Notes | | Baa2 | | 6.75% | | 04/15/12 | | | 45 | | | 45,421 |
Kroger Co. (The), Gtd. Notes | | Baa2 | | 6.80% | | 04/01/11 | | | 670 | | | 691,782 |
McDonald’s Corp., Sr. Unsec. Notes, M.T.N. | | A3 | | 6.30% | | 03/01/38 | | | 1,185 | | | 1,307,061 |
Tricon Global Restaurants, Sr. Unsec. Notes. | | Baa3 | | 8.875% | | 04/15/11 | | | 180 | | | 182,320 |
Tyson Foods, Inc., Gtd. Notes | | Ba3 | | 7.85% | | 04/01/16 | | | 735 | | | 543,900 |
Whitman Corp., Sr. Unsec. Notes | | Baa1 | | 6.375% | | 05/01/09 | | | 1,530 | | | 1,537,280 |
| | | | | | | | | | | |
|
|
| | | | | | | | | | | | | 12,935,240 |
| | | | | | | | | | | |
|
|
Foreign Government Bonds — 0.2% | | | | | | | | | | | | |
DP World Ltd., Bonds, 144A | | A1 | | 6.85% | | 07/02/37 | | | 1,680 | | | 865,314 |
Macquarie Bank Ltd., Gov’t. Liquid Gtd. Notes, 144A | | Aaa | | 4.10% | | 12/17/13 | | | 2,345 | | | 2,421,119 |
Pemex Project Funding Master Trust (Mexico), Gtd. Notes | | Baa1 | | 8.625% | | 12/01/23 | | | 350 | | | 343,420 |
SEE NOTES TO FINANCIAL STATEMENTS.
A49
| | | | | | |
| | | FLEXIBLE MANAGED PORTFOLIO (continued) | | |
| |
| SCHEDULE OF INVESTMENTS | | December 31, 2008 |
| | | | | | | | | | | | |
LONG-TERM BONDS
(continued) | | Moody’s
Rating*
(Unaudited)
| | Interest
Rate
| | Maturity
Date
| | Principal
Amount
(000)
| | Value
(Note 2)
|
| | | | | | | | | | | | | |
Foreign Government Bonds (continued) | | | | | | | | | | | | |
Quebec Province (Canada), Sr. Unsec. Notes | | Aa2 | | 5.75% | | 02/15/09 | | $ | 500 | | $ | 501,123 |
RSHB Capital SA for OJSC Russian Agricultural Bank, (Russia) Sr. Sec. Notes, 144A | | A3 | | 6.299% | | 05/15/17 | | | 2,190 | | | 1,248,300 |
| | | | | | | | | | | |
|
|
| | | | | | | | | | | | | 5,379,276 |
| | | | | | | | | | | |
|
|
Gaming | | | | | | | | | | | | |
Harrah’s Operating Co., Inc., Gtd. Notes | | Caa3 | | 5.50% | | 07/01/10 | | | 625 | | | 396,875 |
| | | | | | | | | | | |
|
|
Healthcare & Pharmaceutical 0.5% | | | | | | | | | | | | |
Abbott Laboratories, Sr. Unsec. Notes(e) | | A1 | | 5.875% | | 05/15/16 | | | 1,145 | | | 1,240,112 |
AmerisourceBergen Corp., Gtd. Notes | | Baa3 | | 5.625% | | 09/15/12 | | | 915 | | | 856,725 |
AstraZeneca PLC (United Kingdom), Sr. Unsec. Notes | | A1 | | 6.45% | | 09/15/37 | | | 495 | | | 562,657 |
Covidien International Finance SA (Luxembourg), Gtd. Notes | | Baa1 | | 6.00% | | 10/15/17 | | | 1,150 | | | 1,134,482 |
Genentech, Inc., Sr. Unsec. Notes | | A1 | | 4.75% | | 07/15/15 | | | 280 | | | 281,698 |
GlaxoSmithKline Capital, Inc., Gtd. Notes(e) | | A1 | | 5.65% | | 05/15/18 | | | 810 | | | 850,766 |
GlaxoSmithKline Capital, Inc., Gtd. Notes | | A1 | | 6.375% | | 05/15/38 | | | 870 | | | 982,956 |
HCA, Inc., Sr. Sec. Notes | | B2 | | 9.25% | | 11/15/16 | | | 1,925 | | | 1,766,187 |
Laboratory Corp. of America Holdings, Sr. Unsec. Notes | | Baa3 | | 5.625% | | 12/15/15 | | | 580 | | | 488,143 |
Merck & Co., Inc., Sr. Unsec. Notes | | Aa3 | | 5.75% | | 11/15/36 | | | 110 | | | 115,833 |
Merck & Co., Inc., Sr. Unsec. Notes | | Aa3 | | 5.95% | | 12/01/28 | | | 165 | | | 175,730 |
Schering-Plough Corp., Sr. Unsec. Notes | | Baa1 | | 5.55% | | 12/01/13 | | | 720 | | | 725,265 |
Schering-Plough Corp., Sr. Unsec. Notes | | Baa1 | | 6.00% | | 09/15/17 | | | 884 | | | 875,080 |
Schering-Plough Corp., Sr. Unsec. Notes | | Baa1 | | 6.55% | | 09/15/37 | | | 340 | | | 342,731 |
Teva Pharmaceutical Finance LLC, Gtd. Notes | | Baa2 | | 6.15% | | 02/01/36 | | | 120 | | | 118,637 |
Wyeth, Sr. Unsec. Notes | | A3 | | 5.95% | | 04/01/37 | | | 1,715 | | | 1,904,141 |
Wyeth, Sr. Unsec. Notes | | A3 | | 5.50% | | 03/15/13 | | | 1,210 | | | 1,232,528 |
Wyeth, Sr. Unsec. Notes | | A3 | | 6.45% | | 02/01/24 | | | 60 | | | 67,663 |
| | | | | | | | | | | |
|
|
| | | | | | | | | | | | | 13,721,334 |
| | | | | | | | | | | |
|
|
Healthcare Insurance — 0.2% | | | | | | | | | | | | |
Aetna, Inc., Sr. Unsec. Notes | | A3 | | 5.75% | | 06/15/11 | | | 390 | | | 380,960 |
Aetna, Inc., Sr. Unsec. Notes | | A3 | | 6.625% | | 06/15/36 | | | 515 | | | 428,701 |
Cigna Corp., Sr. Unsec. Notes | | Baa2 | | 6.15% | | 11/15/36 | | | 670 | | | 509,804 |
Coventry Health Care, Inc., Sr. Unsec. Notes | | Ba1 | | 6.125% | | 01/15/15 | | | 2,290 | | | 1,360,570 |
UnitedHealth Group, Inc., Sr. Unsec. Notes | | Baa1 | | 5.25% | | 03/15/11 | | | 1,350 | | | 1,269,356 |
UnitedHealth Group, Inc., Sr. Unsec. Notes | | Baa1 | | 6.00% | | 06/15/17 | | | 195 | | | 175,583 |
UnitedHealth Group, Inc., Sr. Unsec. Notes | | Baa1 | | 6.50% | | 06/15/37 | | | 420 | | | 352,528 |
UnitedHealth Group, Inc., Sr. Unsec. Notes | | Baa1 | | 6.625% | | 11/15/37 | | | 420 | | | 354,034 |
UnitedHealth Group, Inc., Sr. Unsec. Notes | | Baa1 | | 6.875% | | 02/15/38 | | | 445 | | | 389,646 |
Wellpoint, Inc., Sr. Unsec. Notes | | Baa1 | | 5.00% | | 12/15/14 | | | 860 | | | 747,008 |
| | | | | | | | | | | |
|
|
| | | | | | | | | | | | | 5,968,190 |
| | | | | | | | | | | |
|
|
Insurance — 0.3% | | | | | | | | | | | | |
American International Group, Inc., Jr. Sub. Debs., 144A(b)(g) | | Baa1 | | 8.175% | | 05/15/58 | | | 890 | | | 346,232 |
American International Group, Inc., Jr. Sub. Notes | | Baa1 | | 6.25% | | 03/15/37 | | | 420 | | | 156,984 |
American International Group, Inc., Sr. Unsec. Notes | | A3 | | 4.25% | | 05/15/13 | | | 1,080 | | | 795,946 |
American International Group, Inc., Sr. Unsec. Notes | | A3 | | 5.05% | | 10/01/15 | | | 180 | | | 120,703 |
American International Group, Inc., Sr. Unsec. Notes, M.T.N. | | A3 | | 5.85% | | 01/16/18 | | | 1,660 | | | 1,112,672 |
AXA SA (France), Sub. Notes | | A3 | | 8.60% | | 12/15/30 | | | 155 | | | 101,491 |
Berkshire Hathaway Finance Corp., Gtd. Notes | | Aaa | | 4.75% | | 05/15/12 | | | 440 | | | 451,672 |
Liberty Mutual Group, Inc., Bonds, 144A | | Baa2 | | 7.00% | | 03/15/34 | | | 850 | | | 504,571 |
Lincoln National Corp., Sr. Unsec. Notes | | A3 | | 6.30% | | 10/09/37 | | | 492 | | | 298,826 |
Marsh & McLennan Cos., Inc., Sr. Unsec. Notes | | Baa2 | | 5.15% | | 09/15/10 | | | 265 | | | 257,958 |
MetLife, Inc., Sr. Unsec. Notes | | A2 | | 5.70% | | 06/15/35 | | | 1,020 | | | 830,612 |
MetLife, Inc., Sr. Unsec. Notes | | A2 | | 6.125% | | 12/01/11 | | | 335 | | | 330,425 |
MetLife, Inc., Sr. Unsec. Notes | | A2 | | 6.375% | | 06/15/34 | | | 400 | | | 331,124 |
St. Paul Travelers Cos., Inc. (The), Sr. Unsec. Notes | | A2 | | 6.75% | | 06/20/36 | | | 685 | | | 713,119 |
SEE NOTES TO FINANCIAL STATEMENTS.
A50
| | | | | | |
| | | FLEXIBLE MANAGED PORTFOLIO (continued) | | |
| |
| SCHEDULE OF INVESTMENTS | | December 31, 2008 |
| | | | | | | | | | | | |
LONG-TERM BONDS
(continued) | | Moody’s
Rating*
(Unaudited)
| | Interest
Rate
| | Maturity Date
| | Principal
Amount
(000)
| | Value
(Note 2)
|
| | | | | | | | | | | | | |
Insurance (continued) | | | | | | | | | | | | |
W.R. Berkley Corp., Sr. Unsec. Notes | | Baa2 | | 5.60% | | 05/15/15 | | $ | 555 | | $ | 465,009 |
W.R. Berkley Corp., Sr. Unsec. Notes | | Baa2 | | 6.15% | | 08/15/19 | | | 460 | | | 417,383 |
XL Capital Ltd. (Cayman Islands), Sr. Unsec. Notes | | Baa2 | | 5.25% | | 09/15/14 | | | 85 | | | 47,204 |
| | | | | | | | | | | |
|
|
| | | | | | | | | | | | | 7,281,931 |
| | | | | | | | | | | |
|
|
Lodging — 0.1% | | | | | | | | | | | | |
Starwood Hotels & Resorts Worldwide, Inc., Sr. Unsec. Notes | | Baa3 | | 6.25% | | 02/15/13 | | | 1,645 | | | 1,135,050 |
Starwood Hotels & Resorts Worldwide, Inc., Sr. Unsec. Notes | | Baa3 | | 6.75% | | 05/15/18 | | | 2,800 | | | 1,540,000 |
| | | | | | | | | | | |
|
|
| | | | | | | | | | | | | 2,675,050 |
| | | | | | | | | | | |
|
|
Media & Entertainment — 0.1% | | | | | | | | | | | | |
Time Warner, Inc., Gtd. Notes | | Baa2 | | 6.75% | | 04/15/11 | | | 640 | | | 624,879 |
Time Warner, Inc., Gtd. Notes | | Baa2 | | 7.25% | | 10/15/17 | | | 790 | | | 725,074 |
Time Warner, Inc., Sr. Unsec. Notes | | Baa2 | | 9.15% | | 02/01/23 | | | 505 | | | 538,584 |
Viacom, Inc., Sr. Unsec. Notes | | Baa3 | | 6.75% | | 10/05/37 | | | 295 | | | 227,381 |
Viacom, Inc., Sr. Unsec. Notes | | Baa3 | | 6.875% | | 04/30/36 | | | 605 | | | 478,118 |
| | | | | | | | | | | |
|
|
| | | | | | | | | | | | | 2,594,036 |
| | | | | | | | | | | |
|
|
Metals — 0.1% | | | | | | | | | | | | |
Alcan, Inc. (Canada), Sr. Unsec. Notes | | BBB(f) | | 4.50% | | 05/15/13 | | | 115 | | | 84,303 |
Alcan, Inc. (Canada), Sr. Unsec. Notes | | BBB(f) | | 5.00% | | 06/01/15 | | | 600 | | | 444,283 |
Alcoa, Inc., Sr. Unsec. Notes | | Baa1 | | 5.90% | | 02/01/27 | | | 70 | | | 46,045 |
Rio Tinto Finance USA Ltd. (Luxembourg), Gtd. Notes | | Baa1 | | 5.875% | | 07/15/13 | | | 1,000 | | | 796,514 |
Southern Copper Corp., Sr. Unsec. Notes | | Baa2 | | 7.50% | | 07/27/35 | | | 125 | | | 93,525 |
United States Steel Corp., Sr. Unsec. Notes | | Baa3 | | 5.65% | | 06/01/13 | | | 580 | | | 433,817 |
| | | | | | | | | | | |
|
|
| | | | | | | | | | | | | 1,898,487 |
| | | | | | | | | | | |
|
|
Mortgage Backed Securities — 15.5% | | | | | | | | | | | | |
Federal Home Loan Mortgage Corp. | | | | 4.50% | | 02/01/19-07/01/20 | | | 5,488 | | | 5,630,720 |
Federal Home Loan Mortgage Corp. | | | | 5.00% | | 07/01/18-05/01/34 | | | 9,396 | | | 9,670,393 |
Federal Home Loan Mortgage Corp. | | | | 5.00% | | TBA 30 YR | | | 3,500 | | | 3,576,563 |
Federal Home Loan Mortgage Corp.(g) | | | | 5.222% | | 12/01/35 | | | 2,878 | | | 2,923,711 |
Federal Home Loan Mortgage Corp. | | | | 5.50% | | 12/01/33-05/01/38 | | | 12,880 | | | 13,204,485 |
Federal Home Loan Mortgage Corp. | | | | 5.50% | | TBA 30 YR | | | 44,000 | | | 45,031,272 |
Federal Home Loan Mortgage Corp.(g) | | | | 5.525% | | 06/01/36 | | | 4,389 | | | 4,468,678 |
Federal Home Loan Mortgage Corp. | | | | 6.00% | | 03/01/32-12/01/33 | | | 3,020 | | | 3,128,361 |
Federal Home Loan Mortgage Corp. | | | | 6.50% | | 12/01/14 | | | 290 | | | 300,848 |
Federal Home Loan Mortgage Corp. | | | | 7.00% | | 02/01/31-11/01/33 | | | 3,495 | | | 3,672,601 |
Federal National Mortgage Assn. | | | | 4.00% | | 06/01/19 | | | 1,706 | | | 1,733,820 |
Federal National Mortgage Assn.(g) | | | | 4.142% | | 07/01/33 | | | 823 | | | 827,737 |
Federal National Mortgage Assn. | | | | 4.50% | | 11/01/18-01/01/35 | | | 11,916 | | | 12,196,999 |
Federal National Mortgage Assn. | | | | 4.50% | | TBA 15 YR | | | 3,500 | | | 3,576,563 |
Federal National Mortgage Assn. | | | | 5.00% | | 10/01/18-05/01/38 | | | 21,267 | | | 21,763,440 |
Federal National Mortgage Assn. | | | | 5.00% | | TBA 15 YR | | | 250 | | | 256,562 |
Federal National Mortgage Assn. | | | | 5.00% | | TBA 30 YR | | | 48,000 | |
| 49,005,024
|
Federal National Mortgage Assn. | | | | 5.50% | | 03/01/16-08/01/38 | | | 55,276 | | | 56,790,492 |
Federal National Mortgage Assn. | | | | 5.50% | | TBA 15 YR | | | 7,000 | | | 7,207,816 |
Federal National Mortgage Assn. | | | | 5.50% | | TBA 30 YR | | | 31,750 | | | 32,543,750 |
Federal National Mortgage Assn.(g) | | | | 5.894% | | 06/01/37 | | | 11,110 | | | 11,431,480 |
Federal National Mortgage Assn. | | | | 6.00% | | 04/01/13-01/01/38 | | | 26,508 | | | 27,380,241 |
Federal National Mortgage Assn. | | | | 6.00% | | TBA 30 YR | | | 40,200 | | | 41,380,874 |
Federal National Mortgage Assn. | | | | 6.50% | | 07/01/17-09/01/37 | | | 12,000 | | | 12,486,512 |
Federal National Mortgage Assn. | | | | 7.00% | | 08/01/11-06/01/32 | | | 904 | | | 954,980 |
Federal National Mortgage Assn. | | | | 7.50% | | 06/01/12-06/01/32 | | | 650 | | | 682,423 |
Government National Mortgage Assn. | | | | 5.50% | | 11/15/32-02/15/36 | | | 12,140 | | | 12,541,778 |
Government National Mortgage Assn. | | | | 6.00% | | 09/15/33-08/15/37 | | | 7,019 | | | 7,256,412 |
Government National Mortgage Assn. | | | | 6.00% | | TBA 30 YR | | | 8,000 | | | 8,252,496 |
SEE NOTES TO FINANCIAL STATEMENTS.
A51
| | | | | | |
| | | FLEXIBLE MANAGED PORTFOLIO (continued) | | |
| |
| SCHEDULE OF INVESTMENTS | | December 31, 2008 |
| | | | | | | | | | | | |
LONG-TERM BONDS
(continued) | | Moody’s
Rating*
(Unaudited)
| | Interest
Rate
| | Maturity Date
| | Principal
Amount
(000)
| | Value
(Note 2)
|
| | | | | | | | | | | | | |
Mortgage Backed Securities (continued) | | | | | | | | | | | | |
Government National Mortgage Assn. | | | | 6.50% | | 02/15/24-07/15/35 | | $ | 5,058 | | $ | 5,303,530 |
Government National Mortgage Assn. | | | | 8.00% | | 01/15/24-04/15/25 | | | 172 | | | 183,000 |
| | | | | | | | | | | |
|
|
| | | | | | | | | | | | | 405,363,561 |
| | | | | | | | | | | |
|
|
Non-Captive Finance — 0.5% | | | | | | | | | | | | |
CIT Group Funding Co. (Canada), Gtd. Notes | | Baa1 | | 5.20% | | 06/01/15 | | | 680 | | | 477,396 |
General Electric Capital Corp., Sr. Unsec. Notes(b) | | Aaa | | 5.625% | | 05/01/18 | | | 500 | | | 503,625 |
General Electric Capital Corp., Sr. Unsec. Notes, M.T.N.(b) | | Aaa | | 5.875% | | 01/14/38 | | | 720 | | | 704,779 |
General Electric Capital Corp., Sr. Unsec. Notes, M.T.N. | | Aaa | | 5.55% | | 05/04/20 | | | 1,190 | | | 1,137,794 |
General Electric Capital Corp., Sr. Unsec. Notes, M.T.N. | | Aaa | | 4.375% | | 11/21/11 | | | 2,525 | | | 2,466,271 |
General Electric Capital Corp., Sr. Unsec. Notes, Ser. A, M.T.N | | Aaa | | 6.125% | | 02/22/11 | | | 950 | | | 983,248 |
Household Finance Corp., Sr. Unsec. Notes | | Aa3 | | 4.75% | | 05/15/09 | | | 370 | | | 369,862 |
HSBC Finance Corp., Sr. Unsec. Notes | | Aa3 | | 5.70% | | 06/01/11 | | | 440 | | | 429,082 |
International Lease Finance Corp., Sr. Unsec. Notes | | Baa1 | | 3.50% | | 04/01/09 | | | 580 | | | 550,713 |
International Lease Finance Corp., Sr. Unsec. Notes(b) | | Baa1 | | 6.375% | | 03/25/13 | | | 1,850 | | | 1,256,698 |
SLM Corp., Sr. Unsec. Notes, M.T.N. | | Baa2 | | 8.45% | | 06/15/18 | | | 4,840 | | | 3,826,605 |
| | | | | | | | | | | |
|
|
| | | | | | | | | | | | | 12,706,073 |
| | | | | | | | | | | |
|
|
Non-Corporate | | | | | | | | | | | | |
Republic of Italy (Italy), Sr. Unsec. Notes, M.T.N. | | A+(f) | | 5.375% | | 06/15/33 | | | 800 | | | 898,384 |
| | | | | | | | | | | |
|
|
Paper | | | | | | | | | | | | |
Plum Creek Timberlands LP, Gtd. Notes | | Baa3 | | 5.875% | | 11/15/15 | | | 535 | | | 436,966 |
| | | | | | | | | | | |
|
|
Pipelines & Other — 0.3% | | | | | | | | | | | | |
Atmos Energy Corp., Sr. Unsec. Notes | | Baa3 | | 4.00% | | 10/15/09 | | | 1,680 | | | 1,645,367 |
Duke Energy Field Services LLC, Sr. Unsec. Notes | | Baa2 | | 7.875% | | 08/16/10 | | | 1,760 | | | 1,730,286 |
Enterprise Products Operating LP, Gtd. Notes | | Baa3 | | 4.625% | | 10/15/09 | | | 740 | | | 716,720 |
Enterprise Products Operating LP, Gtd. Notes, Ser. B | | Baa3 | | 6.875% | | 03/01/33 | | | 140 | | | 107,318 |
Oneok Partners LP, Gtd. Notes | | Baa2 | | 6.65% | | 10/01/36 | | | 420 | | | 325,427 |
Sempra Energy, Sr. Unsec. Notes | | Baa1 | | 6.00% | | 02/01/13 | | | 90 | | | 86,405 |
Spectra Energy Capital LLC, Gtd. Notes | | Baa1 | | 6.20% | | 04/15/18 | | | 3,190 | | | 2,768,122 |
Spectra Energy Capital LLC, Sr. Unsec. Notes | | Baa1 | | 6.25% | | 02/15/13 | | | 235 | | | 223,601 |
TransCanada Pipelines Ltd. (Canada), Sr. Unsec. Notes | | A3 | | 7.25% | | 08/15/38 | | | 450 | | | 447,940 |
| | | | | | | | | | | |
|
|
| | | | | | | | | | | | | 8,051,186 |
| | | | | | | | | | | |
|
|
Railroads — 0.2% | | | | | | | | | | | | |
Burlington Northern Santa Fe Corp., Sr. Unsec. Notes | | Baa1 | | 6.70% | | 08/01/28 | | | 670 | | | 655,683 |
CSX Corp., Sr. Unsec. Notes | | Baa3 | | 6.15% | | 05/01/37 | | | 715 | | | 572,151 |
Norfolk Southern Corp., Sr. Unsec. Notes | | Baa1 | | 5.59% | | 05/17/25 | | | 525 | | | 470,561 |
Norfolk Southern Corp., Sr. Unsec. Notes | | Baa1 | | 7.80% | | 05/15/27 | | | 18 | | | 19,630 |
Union Pacific Corp., Sr. Unsec. Notes | | Baa2 | | 3.625% | | 06/01/10 | | | 1,375 | | | 1,363,000 |
Union Pacific Corp., Sr. Unsec. Notes | | Baa2 | | 6.65% | | 01/15/11 | | | 750 | | | 747,383 |
| | | | | | | | | | | |
|
|
| | | | | | | | | | | | | 3,828,408 |
| | | | | | | | | | | |
|
|
Real Estate Investment Trusts — 0.2% | | | | | | | | | | | | |
Brandywine Operating Partners LP, Gtd. Notes | | Baa3 | | 5.75% | | 04/01/12 | | | 1,295 | | | 970,899 |
Mack-Cali Realty LP, Sr. Unsec. Notes | | Baa2 | | 7.25% | | 03/15/09 | | | 1,270 | | | 1,254,711 |
Post Apartment Homes LP, Sr. Unsec. Notes | | Baa3 | | 5.45% | | 06/01/12 | | | 435 | | | 354,458 |
Post Apartment Homes LP, Sr. Unsec. Notes | | Baa3 | | 6.30% | | 06/01/13 | | | 660 | | | 531,536 |
Simon Property Group LP, Sr. Unsec. Notes | | A3 | | 5.75% | | 05/01/12 | | | 1,500 | | | 1,199,087 |
Simon Property Group LP, Sr. Unsec. Notes(b) | | A3 | | 6.125% | | 05/30/18 | | | 2,800 | | | 1,891,965 |
| | | | | | | | | | | |
|
|
| | | | | | | | | | | | | 6,202,656 |
| | | | | | | | | | | |
|
|
Retailers — 0.4% | | | | | | | | | | | | |
CVS Caremark Corp., Sr. Unsec. Notes | | Baa2 | | 5.75% | | 06/01/17 | | | 1,640 | | | 1,544,009 |
CVS Caremark Corp., Sr. Unsec. Notes | | Baa2 | | 5.75% | | 08/15/11 | | | 1,000 | | | 1,003,458 |
Federated Retail Holdings, Inc., Gtd. Notes | | Baa3 | | 5.35% | | 03/15/12 | | | 850 | | | 631,357 |
Federated Retail Holdings, Inc., Gtd. Notes | | Baa3 | | 5.90% | | 12/01/16 | | | 5 | | | 3,036 |
SEE NOTES TO FINANCIAL STATEMENTS.
A52
| | | | | | |
| | | FLEXIBLE MANAGED PORTFOLIO (continued) | | |
| |
| SCHEDULE OF INVESTMENTS | | December 31, 2008 |
| | | | | | | | | | | | |
LONG-TERM BONDS
(continued) | | Moody’s
Rating*
(Unaudited)
| | Interest
Rate
| | Maturity
Date
| | Principal
Amount
(000)
| | Value
(Note 2)
|
| | | | | | | | | | | | | |
Retailers (continued) | | | | | | | | | | | | |
Home Depot, Inc., (The), Sr. Unsec. Notes | | Baa1 | | 5.875% | | 12/16/36 | | $ | 325 | | $ | 254,833 |
May Department Stores Co. (The), Notes | | Baa3 | | 6.65% | | 07/15/24 | | | 135 | | | 74,103 |
Nordstrom, Inc., Sr. Unsec. Notes(b) | | Baa1 | | 6.25% | | 01/15/18 | | | 4,500 | | | 3,160,733 |
Target Corp., Sr. Unsec. Notes | | A2 | | 7.00% | | 01/15/38 | | | 1,525 | | | 1,413,362 |
Wal-Mart Stores, Inc., (The) Sr. Unsec. Notes | | Aa2 | | 5.25% | | 09/01/35 | | | 245 | | | 243,937 |
Wal-Mart Stores, Inc., (The) Sr. Unsec. Notes | | Aa2 | | 6.20% | | 04/15/38 | | | 1,045 | | | 1,195,955 |
| | | | | | | | | | | |
|
|
| | | | | | | | | | | | | 9,524,783 |
| | | | | | | | | | | |
|
|
Structured Note — 0.1% | | | | | | | | | | | | |
CDX North America High Yield, Sec. Notes, Ser. 10-T, 144A | | B3 | | 8.875% | | 06/29/13 | | | 2,300 | | | 2,070,000 |
| | | | | | | | | | | |
|
|
Technology — 0.3% | | | | | | | | | | | | |
Computer Sciences Corp., Sr. Unsec. Notes, 144A | | Baa1 | | 6.50% | | 03/15/18 | | | 1,800 | | | 1,550,565 |
Dell, Inc., Sr. Unsec. Notes | | A2 | | 4.70% | | 04/15/13 | | | 1,625 | | | 1,528,725 |
Electronic Data Systems Corp., Sr. Unsec. Notes | | A2 | | 7.45% | | 10/15/29 | | | 120 | | | 129,998 |
Fiserv, Inc., Gtd. Notes | | Baa2 | | 6.125% | | 11/20/12 | | | 1,000 | | | 939,535 |
Intuit, Inc., Sr. Unsec. Notes. | | Baa2 | | 5.40% | | 03/15/12 | | | 600 | | | 545,268 |
Jabil Circuit, Inc., Sr. Unsec. Notes | | Ba1 | | 5.875% | | 07/15/10 | | | 1,875 | | | 1,715,626 |
Motorola, Inc., Sr. Unsec. Notes | | Baa2 | | 8.00% | | 11/01/11 | | | 49 | | | 40,889 |
Oracle Corp., Sr. Unsec. Notes | | A2 | | 6.50% | | 04/15/38 | | | 600 | | | 660,575 |
| | | | | | | | | | | |
|
|
| | | | | | | | | | | | | 7,111,181 |
| | | | | | | | | | | |
|
|
Telecommunications — 1.1% | | | | | | | | | | | | |
America Movil SAB de CV (Mexico), Gtd. Notes | | A3 | | 6.375% | | 03/01/35 | | | 580 | | | 491,846 |
AT&T Corp., Gtd. Notes(e) | | A2 | | 8.00% | | 11/15/31 | | | 1,530 | | | 1,921,887 |
AT&T, Inc., Sr. Unsec. Notes(b) | | A2 | | 4.125% | | 09/15/09 | | | 1,070 | | | 1,074,384 |
AT&T, Inc., Sr. Unsec. Notes | | A2 | | 5.30% | | 11/15/10 | | | 1,260 | | | 1,280,761 |
AT&T Wireless Services, Inc., Sr. Unsec. Notes | | A2 | | 8.125% | | 05/01/12 | | | 640 | | | 686,316 |
AT&T Wireless Services, Inc., Sr. Unsec. Notes | | A2 | | 8.75% | | 03/01/31 | | | 1,339 | | | 1,673,865 |
BellSouth Corp., Sr. Unsec. Notes | | A2 | | 4.20% | | 09/15/09 | | | 1,175 | | | 1,179,610 |
British Telecom PLC (United Kingdom), Sr. Unsec. Notes | | Baa1 | | 9.125% | | 12/15/30 | | | 1,475 | | | 1,567,839 |
Cingular Wireless LLC, Sr. Unsec. Notes | | A2 | | 7.125% | | 12/15/31 | | | 505 | | | 530,735 |
Deutsche Telekom International Finance BV (Netherlands), Gtd. Notes | | Baa1 | | 8.75% | | 06/15/30 | | | 295 | | | 363,777 |
Embarq Corp., Sr. Unsec. Notes | | Baa3 | | 7.082% | | 06/01/16 | | | 350 | | | 269,500 |
Embarq Corp., Sr. Unsec. Notes | | Baa3 | | 7.995% | | 06/01/36 | | | 1,600 | | | 1,080,000 |
France Telecom SA (France), Sr. Unsec. Notes | | A3 | | 8.50% | | 03/01/31 | | | 375 | | | 470,810 |
Koninklijke (Royal) KPN NV (Netherlands), Sr. Unsec. Notes | | Baa2 | | 8.00% | | 10/01/10 | | | 530 | | | 534,878 |
PCCW-HKT Capital Ltd., Gtd. Notes, 144A | | Baa2 | | 8.00% | | 11/15/11 | | | 2,370 | | | 2,315,395 |
Qwest Capital Funding, Inc., Gtd. Notes | | B1 | | 7.00% | | 08/03/09 | | | 2,000 | | | 1,960,000 |
Qwest Corp., Sr. Unsec. Notes | | Ba1 | | 8.875% | | 03/15/12 | | | 2,000 | | | 1,850,000 |
Rogers Communications, Inc. (Canada), Gtd. Notes | | Baa3 | | 6.80% | | 08/15/18 | | | 1,220 | | | 1,232,726 |
Telecom Italia Capital SA (Luxembourg), Gtd. Notes | | Baa2 | | 5.25% | | 11/15/13 | | | 320 | | | 244,000 |
Telecom Italia Capital SA (Luxembourg), Gtd. Notes | | Baa2 | | 6.999% | | 06/04/18 | | | 1,000 | | | 811,250 |
Telefonica Emisiones SAU (Spain), Gtd. Notes | | Baa1 | | 7.045% | | 06/20/36 | | | 210 | | | 229,222 |
TELUS Corp. (Canada), Sr. Unsec. Notes | | Baa1 | | 8.00% | | 06/01/11 | | | 1,255 | | | 1,248,208 |
U.S. Cellular Corp., Sr. Unsec. Notes | | Baa2 | | 6.70% | | 12/15/33 | | | 275 | | | 198,192 |
Verizon Communications, Inc., Sr. Unsec. Notes(b) | | A3 | | 6.10% | | 04/15/18 | | | 3,400 | | | 3,387,728 |
Vodafone Group PLC (United Kingdom), Sr. Unsec. Notes | | Baa1 | | 7.75% | | 02/15/10 | | | 800 | | | 817,612 |
| | | | | | | | | | | |
|
|
| | | | | | | | | | | | | 27,420,541 |
| | | | | | | | | | | |
|
|
Tobacco — 0.1% | | | | | | | | | | | | |
Altria Group, Inc., Gtd. Notes | | Baa1 | | 9.70% | | 11/10/18 | | | 1,440 | | | 1,556,395 |
Philip Morris International, Inc., Sr. Unsec. Notes | | A2 | | 4.875% | | 05/16/13 | | | 860 | | | 862,461 |
Reynolds American, Inc., Sr. Sec. Notes | | Baa3 | | 6.75% | | 06/15/17 | | | 950 | | | 754,097 |
Reynolds American, Inc., Sr. Sec. Notes | | Baa3 | | 7.25% | | 06/15/37 | | | 390 | | | 262,614 |
| | | | | | | | | | | |
|
|
| | | | | | | | | | | | | 3,435,567 |
| | | | | | | | | | | |
|
|
SEE NOTES TO FINANCIAL STATEMENTS.
A53
| | | | | | |
| | | FLEXIBLE MANAGED PORTFOLIO (continued) | | |
| |
| SCHEDULE OF INVESTMENTS | | December 31, 2008 |
| | | | | | | | | | | | |
LONG-TERM BONDS
(continued) | |
| | Interest
Rate
| | Maturity Date
| | Principal
Amount
(000)
| | Value
(Note 2)
|
| | | | | | | | | | | | | |
U.S. Government Agency Obligations — 2.6% | | | | | | | | | | | | |
Federal Farm Credit Bank | | | | 3.875% | | 10/07/13 | | $ | 3,070 | | $ | 3,262,962 |
Federal Farm Credit Bank | | | | 4.75% | | 05/07/10 | | | 415 | | | 436,695 |
Federal Farm Credit Bank | | | | 4.875% | | 01/17/17 | | | 855 | | | 963,543 |
Federal Home Loan Bank | | | | 4.50% | | 05/13/11 | | | 160 | | | 171,861 |
Federal Home Loan Bank | | | | 4.75% | | 04/24/09 | | | 4,470 | | | 4,531,646 |
Federal Home Loan Bank | | | | 5.00% | | 11/17/17 | | | 1,225 | | | 1,404,461 |
Federal Home Loan Bank | | | | 5.625% | | 06/11/21 | | | 2,390 | | | 2,753,889 |
Federal Home Loan Bank | | | | 5.75% | | 05/15/12 | | | 7,835 | | | 8,785,754 |
Federal Home Loan Mortgage Corp. | | | | 4.125% | | 09/27/13 | | | 3,635 | | | 3,916,811 |
Federal Home Loan Mortgage Corp.(b) | | | | 4.875% | | 06/13/18 | | | 1,420 | | | 1,631,992 |
Federal Home Loan Mortgage Corp. | | | | 5.25% | | 07/18/11 | | | 4,300 | | | 4,715,724 |
Federal Home Loan Mortgage Corp. | | | | 5.25% | | 04/18/16 | | | 3,935 | | | 4,480,804 |
Federal National Mortgage Assn. | | | | 2.875% | | 12/11/13 | | | 8,135 | | | 8,332,461 |
Federal National Mortgage Assn. | | | | 3.625% | | 08/15/11 | | | 9,240 | | | 9,793,448 |
Federal National Mortgage Assn. | | | | 4.875% | | 05/18/12 | | | 600 | | | 653,382 |
Federal National Mortgage Assn. | | | | 6.125% | | 03/15/12 | | | 1,275 | | | 1,448,105 |
General Electric Capital Corp., FDIC Gtd. Notes(b) | | | | 3.00% | | 12/09/11 | | | 7,785 | | | 8,048,522 |
Tennessee Valley Authority | | | | 4.50% | | 04/01/18 | | | 1,445 | | | 1,594,123 |
| | | | | | | | | | | |
|
|
| | | | | | | | | | | | | 66,926,183 |
| | | | | | | | | | | |
|
|
U.S. Government Treasury Obligations — 4.8% | | | | | | | | | | | | |
United States Treasury Bonds(b) | | | | 4.375% | | 02/15/38 | | | 3,405 | | | 4,560,572 |
United States Treasury Bonds | | | | 4.50% | | 05/15/38 | | | 1,825 | | | 2,490,840 |
United States Treasury Bonds | | | | 5.50% | | 08/15/28 | | | 540 | | | 729,844 |
United States Treasury Bonds | | | | 6.00% | | 02/15/26 | | | 385 | | | 537,316 |
United States Treasury Bonds | | | | 6.125% | | 08/15/29 | | | 325 | | | 477,039 |
United States Treasury Bonds(b) | | | | 6.25% | | 08/15/23 | | | 10,495 | | | 14,314,193 |
United States Treasury Bonds(b) | | | | 7.50% | | 11/15/16 | | | 4,395 | | | 6,000,546 |
United States Treasury Bonds | | | | 7.875% | | 02/15/21 | | | 2,290 | | | 3,403,513 |
United States Treasury Bonds | | | | 8.125% | | 08/15/21 | | | 3,665 | | | 5,574,238 |
United States Treasury Bonds | | | | 8.75% | | 08/15/20 | | | 2,830 | | | 4,417,896 |
United States Treasury Bonds(b) | | | | 8.875% | | 08/15/17 | | | 5,505 | | | 8,195,139 |
United States Treasury Inflation Index Bonds | | | | 2.375% | | 01/15/25 | | | 1,718 | | | 1,688,715 |
United States Treasury Inflation Index Bonds | | | | 3.625% | | 04/15/28 | | | 1,085 | | | 1,292,546 |
United States Treasury Inflation Index Bonds | | | | 3.375% | | 01/15/12-04/15/32 | | | 787 | | | 854,473 |
United States Treasury Inflation Index Note | | | | 0.625% | | 04/15/13 | | | 564 | | | 538,982 |
United States Treasury Inflation Index Note | | | | 0.875% | | 04/15/10 | | | 1,990 | | | 1,870,113 |
United States Treasury Inflation Index Note | | | | 1.375% | | 07/15/18 | | | 1,909 | | | 1,785,225 |
United States Treasury Inflation Index Note | | | | 1.625% | | 01/15/15-01/15/18 | | | 2,382 | | | 2,228,050 |
United States Treasury Inflation Index Note | | | | 1.75% | | 01/15/28 | | | 812 | | | 750,012 |
United States Treasury Inflation Index Note(b) | | | | 1.875% | | 07/15/13-07/15/15 | | | 4,474 | | | 4,215,304 |
United States Treasury Inflation Index Note(b) | | | | 2.00% | | 04/15/12-01/15/26 | | | 11,833 | | | 11,238,189 |
United States Treasury Inflation Index Note | | | | 2.375% | | 04/15/11-01/15/27 | | | 2,890 | | | 2,862,237 |
United States Treasury Inflation Index Note | | | | 2.50% | | 07/15/16 | | | 1,116 | | | 1,106,856 |
United States Treasury Inflation Index Note | | | | 2.625% | | 07/15/17 | | | 878 | | | 899,798 |
United States Treasury Inflation Index Note | | | | 3.00% | | 07/15/12 | | | 1,711 | | | 1,676,788 |
United States Treasury Inflation Index Note | | | | 3.50% | | 01/15/11 | | | 635 | | | 623,073 |
United States Treasury Inflation Index Note | | | | 3.875% | | 04/15/29 | | | 1,114 | | | 1,375,352 |
United States Treasury Inflation Index Note | | | | 4.25% | | 01/15/10 | | | 676 | | | 663,932 |
United States Treasury Notes | | | | 1.50% | | 12/31/13 | | | 17,085 | | | 17,046,284 |
United States Treasury Notes | | | | 3.75% | | 11/15/18 | | | 312 | | | 352,627 |
United States Treasury Strips(b)(i) | | | | 3.01% | | 02/15/19 | | | 11,340 | | | 8,399,912 |
United States Treasury Strips(b)(i) | | | | 4.21% | | 11/15/21 | | | 1,545 | | | 1,001,681 |
United States Treasury Strips(i) | | | | 4.25% | | 08/15/29 | | | 4,545 | | | 2,405,637 |
United States Treasury Strips, I/O(i) | | | | 2.99% | | 11/15/18 | | | 1,230 | | | 917,166 |
SEE NOTES TO FINANCIAL STATEMENTS.
A54
| | | | | | |
| | | FLEXIBLE MANAGED PORTFOLIO (continued) | | |
| |
| SCHEDULE OF INVESTMENTS | | December 31, 2008 |
| | | | | | | | | | | | |
LONG-TERM BONDS
(continued) | | Moody’s
Rating*
(Unaudited)
| | Interest
Rate
| | Maturity
Date
| | Principal
Amount
(000)
| | Value
(Note 2)
|
| | | | | | | | | | | | | |
U.S. Government Treasury Obligations (continued) | | | | | | | | | | | | |
United States Treasury Strips, I/O(b)(i) | | | | 3.81% | | 02/15/20 | | $ | 8,090 | | $ | 5,656,633 |
United States Treasury Strips, I/O(b)(i) | | | | 3.94% | | 05/15/20 | | | 5,865 | | | 4,033,138 |
| | | | | | | | | | | |
|
|
| | | | | | | | | | | | | 126,183,859 |
| | | | | | | | | | | |
|
|
TOTAL LONG-TERM BONDS
(cost $991,754,732) | | | 952,390,727 |
| | | | | | | | | | | |
|
|
| BANK LOANS — 0.6% | | | | | | | | | | | | |
Automotive | | | | | | | | | | | | |
Oshkosh Truck Corp., Bank Loan(h) | | Ba3 | | 3.4248% | | 12/06/13 | | | 1,761 | | | 1,019,779 |
| | | | | | | | | | | |
|
|
Cable | | | | | | | | | | | | |
Insight Midwest Holdings LLC, Bank Loan(h) | | B1 | | 3.66% | | 10/06/13 | | | 1,216 | | | 978,545 |
| | | | | | | | | | | |
|
|
Electric — 0.1% | | | | | | | | | | | | |
NRG Energy, Bank Loan(h) | | Ba1 | | 1.359% | | 02/01/13 | | | 439 | | | 379,414 |
NRG Energy, Bank Loan(h) | | Ba1 | | 2.675% | | 02/01/13 | | | 891 | | | 769,995 |
Texas Competitive Electric Holdings Co. LLC, Bank Loan(h) | | Ba3 | | 5.5822% | | 10/10/14 | | | 988 | | | 682,609 |
| | | | | | | | | | | |
|
|
| | | | | | | | | | | | | 1,832,018 |
| | | | | | | | | | | |
|
|
Foods — 0.1% | | | | | | | | | | | | |
Aramark Corp., Bank Loan(h) | | Ba3 | | 3.3338% | | 01/26/14 | | | 1,658 | | | 1,359,741 |
Aramark Corp., Bank Loan(h) | | Ba3 | | 5.787% | | 01/26/14 | | | 105 | | | 86,384 |
| | | | | | | | | | | |
|
|
| | | | | | | | | | | | | 1,446,125 |
| | | | | | | | | | | |
|
|
Healthcare & Pharmaceutical — 0.1% | | | | | | | | | | | | |
Community Health Systems, Bank Loan(h) | | Ba3 | | 3.4037% | | 07/25/14 | | | 81 | | | 62,955 |
Community Health Systems, Bank Loan(h) | | Ba3 | | 4.445% | | 07/25/14 | | | 1,588 | | | 1,230,959 |
DaVita, Inc., Bank Loan(h) | | Ba1 | | 3.295% | | 10/05/12 | | | 1,200 | | | 1,043,143 |
HCA, Inc. Bank Loan(h) | | Ba3 | | 3.7088% | | 11/17/13 | | | 1,960 | | | 1,532,476 |
Health Management Association, Bank Loan(h) | | B1 | | 3.209% | | 02/28/14 | | | 1,135 | | | 694,061 |
| | | | | | | | | | | |
|
|
| | | | | | | | | | | | | 4,563,594 |
| | | | | | | | | | | |
|
|
Media & Entertainment | | | | | | | | | | | | |
Idearc, Inc., Bank Loan(h) | | B2 | | 1.97% | | 11/17/13 | | | 516 | | | 167,814 |
Idearc, Inc., Bank Loan(h) | | B2 | | 3.5745% | | 11/17/14 | | | 955 | | | 291,264 |
| | | | | | | | | | | |
|
|
| | | | | | | | | | | | | 459,078 |
| | | | | | | | | | | |
|
|
Paper — 0.1% | | | | | | | | | | | | |
Domtar Corp., Bank Loan(h) | | Baa3 | | 3.2513% | | 03/05/14 | | | 952 | | | 636,509 |
Georgia Pacific, Bank Loan(h) | | Baa3 | | 4.1079% | | 12/20/12 | | | 886 | | | 719,186 |
| | | | | | | | | | | |
|
|
| | | | | | | | | | | | | 1,355,695 |
| | | | | | | | | | | |
|
|
Pipelines & Other | | | | | | | | | | | | |
Enterprise GP Holdings LP, Bank Loan(h) | | Ba2 | | 5.3568% | | 11/08/14 | | | 990 | | | 801,150 |
| | | | | | | | | | | |
|
|
Technology — 0.2% | | | | | | | | | | | | |
First Data Corp., Bank Loan(h) | | Ba3 | | 3.2113% | | 09/24/14 | | | 1,481 | | | 947,471 |
First Data Corp., Bank Loan(h) | | Ba3 | | 3.2113% | | 09/24/14 | | | 1,185 | | | 757,977 |
Flextronics International Ltd. (Singapore), Bank Loan(h) | | Ba1 | | 6.1554% | | 10/01/14 | | | 997 | | | 624,912 |
Flextronics International Ltd. (Singapore), Bank Loan(h) | | Ba1 | | 7.0688% | | 10/01/14 | | | 287 | | | 179,572 |
Metavante Corp., Bank Loan(h) | | Ba2 | | 4.9425% | | 11/01/14 | | | 993 | | | 734,450 |
Sensata Technologies, Bank Loan(h) | | B1 | | 5.2575% | | 04/27/13 | | | 1,379 | | | 689,394 |
| | | | | | | | | | | |
|
|
| | | | | | | | | | | | | 3,933,776 |
| | | | | | | | | | | |
|
|
TOTAL BANK LOANS
(cost $23,010,473) | | | 16,389,760 |
| | | | | | | | | | | |
|
|
TOTAL LONG-TERM INVESTMENTS
(cost $2,760,626,149) | | | 2,456,388,147 |
| | | | | | | | | | | |
|
|
SEE NOTES TO FINANCIAL STATEMENTS.
A55
| | | | | | |
| | | FLEXIBLE MANAGED PORTFOLIO (continued) | | |
| |
| SCHEDULE OF INVESTMENTS | | December 31, 2008 |
| | | | | | | | | | | | | |
| SHORT-TERM INVESTMENTS — 23.5% | | | | Interest
Rate
| | Maturity
Date
| | Shares
| | Value
(Note 2)
| |
| | | | | | | | | | | | | | |
AFFILIATED MUTUAL FUNDS — 23.3% | | | | | | | | | | | | | |
Dryden Core Investment Fund — Short-Term Bond Series (Note 4)(d) | | | 17,428,295 | | $ | 128,272,254 | |
Dryden Core Investment Fund — Taxable Money Market Series
(includes $279,029,312 of cash collateral for securities on loan) (Note 4)(c)(d) | | | 484,007,395 | | | 484,007,395 | |
| | | | | | | | | | | |
|
|
|
TOTAL AFFILIATED MUTUAL FUNDS
(cost $656,927,612) | | | 612,279,649 | |
| | | | | | | | | | | |
|
|
|
| | |
| | | Principal
Amount
(000)
| | | |
U.S. Government Treasury Obligation — 0.2% | | | | | | | | | | | | | |
United States Treasury Bill
(cost $4,597,943)(e)(j) | | 0.10% | | 06/11/09 | | $ | 4,600 | | | 4,597,300 | |
| | | | | | | | | | | |
|
|
|
TOTAL SHORT-TERM INVESTMENTS
(cost $661,525,555) | | | 616,876,949 | |
| | | | | | | | | | | |
|
|
|
TOTAL INVESTMENTS(l) — 117.2%
(cost $3,422,151,704) | | | 3,073,265,096 | |
LIABILITIES IN EXCESS OF OTHER ASSETS(m) — (17.2%) | | | (451,657,713 | ) |
| | | | | | | | | | | |
|
|
|
NET ASSETS — 100.0% | | $ | 2,621,607,383 | |
| | | | | | | | | | | |
|
|
|
The following abbreviations are used in portfolio descriptions:
| | |
| 144A | | Security was purchased pursuant to Rule 144A under the Securities Act of 1933 and may not be resold subject to that rule except to qualified institutional buyers. Unless otherwise noted, 144A securities are deemed to be liquid. |
| I/O | | Interest Only |
| M.T.N. | | Medium Term Note |
| NR | | Not Rated by Moody’s or Standard & Poor’s |
| TBA | | To Be Announced |
| * | The rating reflected is as of December 31, 2008. Ratings of certain bonds may have changed subsequent to that date. |
| (a) | Non income-producing security. |
| (b) | All or portion of security is on loan. The aggregate market value of such securities is $270,420,154; cash collateral of $279,029,312 (included in liabilities) was received with which the Portfolio purchased highly liquid short-term investments. |
| (c) | Represents security, or portion thereof, purchased with cash collateral received for securities on loan. |
| (d) | Prudential Investments LLC, the manager of the Portfolio, also serves as manager of the Dryden Core Investment Fund—Taxable Money Market Series and the Dryden Core Investment Fund—Short-Term Bond Series. |
| (e) | Security segregated as collateral for futures contracts. |
| (f) | Standard & Poor’s rating. |
| (g) | Indicates a variable rate security. The maturity date presented for these instruments is the latter of the next date on which the security can be redeemed at par or the next date on which the rate of interest is adjusted. The interest rate shown reflects the rate in effect at December 31, 2008. |
| (h) | Indicates a security that has been deemed illiquid. |
| (i) | Represents zero-coupon bond. Rate shown reflects effective yield at December 31, 2008. |
| (j) | Rate quoted represents yield-to-maturity as of purchase date. |
| (k) | Represents issuer in default on interest payments and/or principal repayment; non income producing security. |
| (l) | As of December 31, 2008, one security representing $0 and 0.0% of net assets was fair valued in accordance with the policies adopted by the Board of Trustees. |
| (m) | Liabilities in excess of other assets includes net unrealized appreciation (depreciation) on financial futures contracts, interest rate and credit default swap agreements as follows: |
SEE NOTES TO FINANCIAL STATEMENTS.
A56
| | | | | | |
| | | FLEXIBLE MANAGED PORTFOLIO (continued) | | |
| |
| SCHEDULE OF INVESTMENTS | | December 31, 2008 |
Open futures contracts outstanding at December 31, 2008:
| | | | | | | | | | | | | |
Number of
Contracts
| | Type
| | Expiration
Date
| | Value at
Trade Date
| | Value at
December 31, 2008
| | Unrealized
Appreciation
|
| Long Positions: | | | | | | | | | | | | | |
| 27 | | 2-Yr. U.S. T-Notes | | Mar. 2009 | | $ | 5,883,502 | | $ | 5,887,688 | | $ | 4,186 |
| 437 | | 5-Yr. U.S. T-Notes | | Mar. 2009 | | | 51,192,493 | | | 52,026,899 | | | 834,406 |
| 95 | | 10-Yr. U.S. T-Notes | | Mar. 2009 | | | 11,174,960 | | | 11,946,250 | | | 771,290 |
| 175 | | S&P 500 Index | | Mar. 2009 | | | 39,296,275 | | | 39,379,375 | | | 83,100 |
| 94 | | U.S. Long Bond | | Mar. 2009 | | | 11,914,031 | | | 12,976,406 | | | 1,062,375 |
| | | | | | | | | | | | |
|
|
| | | | | | | | | | | | | $ | 2,755,357 |
| | | | | | | | | | | | |
|
|
Interest rate swap agreements outstanding at December 31, 2008:
| | | | | | | | | | | | | |
Counterparty
| | Termination
Date
| | Notional
Amount
(000)#
| | Fixed
Rate
| | Floating Rate
| | Unrealized
Appreciation/
(Depreciation)
| |
Merrill Lynch Capital Services, Inc.(b) | | 10/10/2013 | | $ | 2,660 | | 3.784% | | 3 Month LIBOR | | $ | 193,758 | |
Citibank NA(b) | | 10/20/2013 | | | 2,660 | | 4.059% | | 3 Month LIBOR | | | 227,650 | |
Deutsche Bank AG(a) | | 8/15/2015 | | | 1,335 | | 3.712% | | 3 Month LIBOR | | | (111,853 | ) |
Merrill Lynch Capital Services, Inc.(a) | | 5/15/2016 | | | 2,660 | | 4.397% | | 3 Month LIBOR | | | (357,602 | ) |
Deutsche Bank AG(a) | | 5/15/2016 | | | 485 | | 4.490% | | 3 Month LIBOR | | | (68,270 | ) |
| | | | | | | | | | | |
|
|
|
| | | | | | | | | | | | $ | (116,317 | ) |
| | | | | | | | | | | |
|
|
|
| (a) | Portfolio pays the fixed rate and receives the floating rate. |
| (b) | Portfolio pays the floating rate and receives the fixed rate. |
Credit default swap agreements outstanding at December 31, 2008:
| | | | | | | | | | | | | |
Counterparty
| | Termination
Date
| | Notional
Amount
(000)#(3)
| | Fixed
Rate
| | Reference Entity/Obligation
| | Unrealized
Appreciation/
(Depreciation)
| |
Buy protection(1): | | | | | | |
Citibank NA | | 9/20/2012 | | $ | 3,200 | | 0.32% | | Altria Group, Inc.,
7.00%, 11/04/13 | | $ | 114,248 | |
Barclays Bank PLC | | 9/20/2012 | | | 2,900 | | 0.595% | | Fortune Brands, Inc.,
5.375%, 01/15/16 | | | 133,934 | |
Deutsche Bank AG | | 6/20/2013 | | | 1,850 | | 2.00% | | International Lease Finance Corp.,
4.15%, 01/20/15 | | | 362,912 | |
Goldman Sachs International | | 9/20/2013 | | | 1,300 | | 1.02% | | Anheuser Busch Cos., Inc.,
5.625%, 10/01/10 | | | 57,931 | |
JPMorgan Chase Bank | | 6/20/2014 | | | 1,150 | | 0.65% | | Bunge Ltd. Finance Corp.,
5.35%, 04/15/14 | | | 256,989 | |
Credit Suisse International | | 6/20/2018 | | | 3,400 | | 0.97% | | Verizon Communications, Inc.,
4.90%, 09/15/15 | | | 116,780 | |
Merrill Lynch Capital Services, Inc. | | 9/20/2016 | | | 735 | | 1.73% | | Tyson Foods, Inc.,
6.85%, 04/01/16 | | | 106,441 | |
Morgan Stanley Capital Services, Inc. | | 3/20/2018 | | | 1,500 | | 0.70% | | Avon Products, Inc.,
7.15%, 11/15/09 | | | 32,507 | |
Barclays Bank PLC | | 3/20/2018 | | | 1,800 | | 1.22% | | Computer Sciences Corp.,
5.00%, 02/15/13 | | | (23,475 | ) |
Deutsche Bank AG | | 3/20/2018 | | | 4,500 | | 0.99% | | Nordstrom, Inc.,
6.95%, 3/15/28 | | | 995,637 | |
Merrill Lynch Capital Services, Inc. | | 6/20/2018 | | | 500 | | 1.13% | | Spectra Energy Capital LLC,
6.25%, 02/15/13 | | | 30,111 | |
Morgan Stanley Capital Services, Inc. | | 6/20/2018 | | | 1,700 | | 1.00% | | Newell Rubbermaid, Inc.,
6.35%, 7/15/28 | | | 107,406 | |
Merrill Lynch Capital Services, Inc. | | 6/20/2018 | | | 1,800 | | 3.05% | | SLM Corp.,
5.125%, 06/27/12 | | | 333,711 | |
Deutsche Bank AG | | 6/20/2018 | | | 2,200 | | 1.15% | | Spectra Energy Capital LLC,
6.25%, 02/15/13 | | | 129,162 | |
Morgan Stanley Capital Services, Inc. | | 6/20/2018 | | | 2,800 | | 0.97% | | Simon Property Group L.P.,
5.25%, 12/01/16 | | | 837,707 | |
Merrill Lynch Capital Services, Inc. | | 6/20/2018 | | | 2,800 | | 1.45% | | Starwood Hotels & Resorts Worldwide, Inc.,
6.75%, 05/15/18 | | | 741,150 | |
Citibank NA | | 3/25/2035 | | | 523 | | 3.00% | | Centex Home Equity,
Ser. 2005-B, Class B,
6.215%, 03/25/35 | | | 250,826 | |
SEE NOTES TO FINANCIAL STATEMENTS.
A57
| | | | | | |
| | | FLEXIBLE MANAGED PORTFOLIO (continued) | | |
| |
| SCHEDULE OF INVESTMENTS | | December 31, 2008 |
Credit default swap agreements outstanding at December 31, 2008 (continued)
| | | | | | | | | | | |
Counterparty
| | Termination
Date
| | Notional
Amount
(000)#(3)
| | Fixed
Rate
| | Reference Entity/Obligation
| | Unrealized
Appreciation/
(Depreciation)
|
Buy protection(1): (continued) | | | | |
Citibank NA | | 1/25/2035 | | $ | 506 | | 3.00% | | Morgan Stanley ABS Capital I,
Ser. 2005-HE2, Class B3,
6.765%, 01/25/35 | | 316,016 |
Barclays Bank PLC | | 9/25/2035 | | | 1,000 | | 3.35% | | Accredited Mortgage Loan Trust,
Ser. 2005-3, Class M9,
7.02%, 09/25/35 | | 935,634 |
Merrill Lynch Capital Services, Inc. | | 3/25/2036 | | | 1,000 | | 3.72% | | Ameriquest Mortgage Securities, Inc.,
Ser. 2006-R1, Class M9,
7.82%, 03/25/36 | | 959,705 |
| | | | | | | | | | | |
|
| | | | | | | | | | | | 6,795,332 |
| | | | | | | | | | | |
|
| | | | | | | | | | | | | | | | | |
Counterparty
| | Termination
Date
| | Notional
Amount
(000)#(3)
| | Fixed
Rate
| | Reference Entity/Obligation
| | Fair
Value(4)
| | Upfront
Premiums
Paid/
(Received)
| | Unrealized
Appreciation/
(Depreciation)
| |
Credit Default Swaps on Asset-Backed Issues — Sell protection(2): | | | | | | | | | |
Merrill Lynch Capital Services, Inc. | | 3/25/2036 | | 1,000 | | 9.00% | | Ameriquest Mortgage Securities, Inc.,
Ser. 2006-R1, Class M9,
7.82%, 03/25/36 | | $(950,949) | | $ | — | | $ | (950,949 | ) |
| | | | | | | | | | | | | | | |
|
|
|
| | | | | | | | | | | | | | | | $ | 5,844,383 | |
| | | | | | | | | | | | | | | |
|
|
|
The Portfolio entered into credit default swaps as the protection seller on asset-backed issues to take an active short position with respect to the likelihood of a particular issuer’s default.
| (1) | If the Portfolio is a buyer of protection, it pays the fixed rate. When a credit event occurs, as defined under the terms of that particular swap agreement, the Portfolio will either (i) receive from the seller of protection an amount equal to the notional amount of the swap and take delivery of the referenced obligation or underlying securities comprising the referenced index or (ii) receive a net settlement amount in the form of cash or securities equal to the notional amount of the swap less the recovery value of the referenced obligation or underlying securities comprising the referenced index. |
| (2) | If the Portfolio is a seller of protection, it receives the fixed rate. When a credit event occurs, as defined under the terms of that particular swap agreement, the Portfolio will either (i) pay to the buyer of protection an amount equal to the notional amount of the swap and take delivery of the referenced obligation or underlying securities comprising the referenced index or (ii) pay a net settlement amount in the form of cash or securities equal to the notional amount of the swap less the recovery value of the referenced obligation or underlying securities comprising the referenced index. |
| (3) | Notional amount represents the maximum potential amount the Portfolio could be required to pay as a seller of credit protection or receive as a buyer of credit protection if a credit event occurs as defined under the terms of that particular swap agreement. |
| (4) | The fair value of credit default swap agreements on asset-backed securities serve as an indicator of the current status of the payment/performance risk and represent the likelihood of an expected liability (or profit) for the credit derivative should the notional amount of the swap agreement be closed/sold as of the reporting date. |
Various inputs are used in determining the value of the Portfolio’s investments. These inputs are summarized in the three broad levels listed below.
Level 1—quoted prices in active markets for identical securities
Level 2—other significant observable inputs (including quoted prices for similar securities, interest rates, prepayment speeds, credit risk, etc.)
Level 3—significant unobservable inputs (including the Portfolio’s own assumptions in determining the fair value of investments)
The following is a summary of the inputs used as of December 31, 2008 in valuing the Portfolio’s assets carried at fair value:
| | | | | | |
Valuation inputs
| | Investments
in Securities
| | Other Financial
Instruments*
|
Level 1—Quoted Prices | | $ | 2,099,887,309 | | $ | 2,755,357 |
Level 2—Other Significant Observable Inputs-Long | | | 973,377,787 | | | 4,216,834 |
Level 3—Significant Unobservable Inputs | | | — | | | 1,511,232 |
| | |
|
| |
|
|
Total | | $ | 3,073,265,096 | | $ | 8,483,423 |
| | |
|
| |
|
|
| * | Other financial instruments are derivative instruments not reflected in the Schedule of Investments, such as futures, forwards and swap contracts, which are valued at the unrealized appreciation/depreciation on the instrument. |
SEE NOTES TO FINANCIAL STATEMENTS.
A58
| | | | | | |
| | | FLEXIBLE MANAGED PORTFOLIO (continued) | | |
| |
| SCHEDULE OF INVESTMENTS | | December 31, 2008 |
The following is a reconciliation of assets in which significant unobservable inputs (Level 3) were used in determining fair value:
| | | | |
| | | Other Financial
Instruments
| |
Balance as of 12/31/07 | | $ | 1,651,223 | |
Realized gain (loss) | | | — | * |
Change in unrealized appreciation (depreciation) | | | (115,323 | ) |
Net purchases (sales) | | | — | |
Transfers in and/or out of Level 3 | | | (24,668 | ) |
| | |
|
|
|
Balance as of 12/31/08 | | $ | 1,511,232 | |
| | |
|
|
|
| * | The realized gain earned during the period for other financial instruments was $1,516,997. |
The industry classification of portfolio holdings and liabilities in excess of other assets shown as a percentage of net assets as of December 31, 2008 was as follows:
| | | |
Affiliated Mutual Funds (including 10.6% of collateral received for securities on loan | | 23.3 | % |
Mortgage Backed Securities | | 15.5 | |
Oil, Gas & Consumable Fuels | | 6.3 | |
Pharmaceuticals | | 5.0 | |
U.S. Government Treasury Obligations | | 5.0 | |
Commercial Mortgage Backed Securities | | 3.6 | |
Computers & Peripherals | | 2.8 | |
U.S. Government Agency Obligations | | 2.6 | |
Diversified Telecommunication Services | | 2.3 | |
Software | | 2.2 | |
Aerospace/Defense | | 2.2 | |
Household Products | | 2.2 | |
Insurance | | 2.1 | |
Diversified Financial Services | | 2.0 | |
Food & Staples Retailing | | 1.8 | |
Electrical Utilities | | 1.7 | |
Commercial Banks | | 1.6 | |
Communications Equipment | | 1.5 | |
Healthcare Equipment & Supplies | | 1.5 | |
Industrial Conglomerates | | 1.4 | |
Food Products | | 1.4 | |
Banking | | 1.4 | |
Media | | 1.3 | |
Beverages | | 1.3 | |
Healthcare Providers & Services | | 1.3 | |
Tobacco | | 1.2 | |
Capital Markets | | 1.2 | |
Energy Equipment & Services | | 1.0 | |
Telecommunications | | 1.0 | |
Biotechnology | | 1.0 | |
Semiconductors & Semiconductor Equipment | | 0.9 | |
Hotels, Restaurants & Leisure | | 0.9 | |
Internet Software & Services | | 0.9 | |
Road & Rail | | 0.9 | |
Electric | | 0.9 | |
Chemicals | | 0.9 | |
Multi-Utilities | | 0.8 | |
Metals & Mining | | 0.7 | |
Electrical Equipment | | 0.6 | |
Foods | | 0.6 | |
Specialty Retail | | 0.6 | |
Healthcare & Pharmaceutical | | 0.6 | |
| | | |
Machinery | | 0.5 | % |
Real Estate Investment Trusts | | 0.5 | |
Textiles, Apparel & Luxury Goods | | 0.5 | |
Asset Backed Securities | | 0.5 | |
Non-Captive Finance | | 0.5 | |
Technology | | 0.5 | |
Collateralized Mortgage Obligations | | 0.4 | |
Retailers | | 0.4 | |
Household Durables | | 0.4 | |
Diversified Consumer Services | | 0.3 | |
Construction & Engineering | | 0.3 | |
IT Services | | 0.3 | |
Auto Components | | 0.3 | |
Pipelines & Other | | 0.3 | |
Brokerage | | 0.2 | |
Foreign Government Bonds | | 0.2 | |
Office Electronics | | 0.2 | |
Air Freight & Logistics | | 0.2 | |
Cable | | 0.2 | |
Capital Goods | | 0.2 | |
Energy – Other | | 0.2 | |
Healthcare Insurance | | 0.2 | |
Independent Power Producers & Energy Traders | | 0.2 | |
Airlines | | 0.2 | |
Railroads | | 0.2 | |
Gas Utilities | | 0.1 | |
Paper | | 0.1 | |
Consumer | | 0.1 | |
Consumer Finance | | 0.1 | |
Electronic Equipment & Instruments | | 0.1 | |
Energy – Integrated | | 0.1 | |
Internet & Catalog Retail | | 0.1 | |
Lodging | | 0.1 | |
Media & Entertainment | | 0.1 | |
Metals | | 0.1 | |
Multiline Retail | | 0.1 | |
Structured Note | | 0.1 | |
Trading Companies & Distributors | | 0.1 | |
| | |
|
|
| | | 117.2 | |
Liabilities in excess of other assets | | (17.2 | ) |
| | |
|
|
| | | 100.0 | % |
| | |
|
|
SEE NOTES TO FINANCIAL STATEMENTS.
A59
| | | | | | |
| | | FLEXIBLE MANAGED PORTFOLIO (continued) | | |
STATEMENT OF ASSETS AND LIABILITIES
December 31, 2008
| | | | |
| ASSETS | | | | |
Investments, at value including securities on loan of $270,420,154: | | | | |
Unaffiliated investments (cost $2,765,224,092) | | $ | 2,460,985,447 | |
Affiliated investments (cost $656,927,612) | | | 612,279,649 | |
Cash | | | 162,655 | |
Foreign currency, at value (cost $86,310) | | | 88,192 | |
Receivable for investments sold | | | 33,161,731 | |
Dividends and interest receivable | | | 12,458,829 | |
Unrealized appreciation on swaps | | | 7,240,215 | |
Foreign tax reclaim receivable | | | 500,105 | |
Premium for swaps purchased | | | 308,734 | |
Receivable for Series shares sold | | | 1,191 | |
Prepaid expenses | | | 40,799 | |
| | |
|
|
|
Total Assets | | | 3,127,227,547 | |
| | |
|
|
|
| LIABILITIES | | | | |
Collateral for securities on loan | | | 279,029,312 | |
Payable for investments purchased | | | 222,062,318 | |
Unrealized depreciation on swaps | | | 1,512,149 | |
Management fee payable | | | 1,306,483 | |
Payable for Series shares repurchased | | | 1,252,375 | |
Accrued expenses and other liabilities | | | 336,399 | |
Due to broker—variation margin | | | 120,428 | |
Affiliated transfer agent fee payable | | | 700 | |
| | |
|
|
|
Total Liabilities | | | 505,620,164 | |
| | |
|
|
|
| NET ASSETS | | $ | 2,621,607,383 | |
| | |
|
|
|
Net assets were comprised of: | | | | |
Paid-in capital | | $ | 3,247,175,333 | |
Retained earnings | | | (625,567,950 | ) |
| | |
|
|
|
Net assets, December 31, 2008 | | $ | 2,621,607,383 | |
| | |
|
|
|
Net asset value and redemption price per share, $2,621,607,383 / 212,370,808 outstanding shares of beneficial interest | | $ | 12.34 | |
| | |
|
|
|
STATEMENT OF OPERATIONS
Year Ended December 31, 2008
| | | | |
| INVESTMENT INCOME | | | | |
Unaffiliated dividend income (net of foreign withholding taxes of $390,530) | | $ | 51,904,035 | |
Unaffiliated interest income | | | 45,297,744 | |
Affiliated dividend income | | | 12,527,169 | |
Affiliated income from securities loaned, net | | | 2,270,054 | |
| | |
|
|
|
| | | | 111,999,002 | |
| | |
|
|
|
| EXPENSES | | | | |
Management fee | | | 19,251,536 | |
Custodian’s fees and expenses | | | 574,000 | |
Shareholders’ reports | | | 350,000 | |
Trustees’ fees | | | 52,000 | |
Interest expense (Note 8) | | | 50,287 | |
Insurance expenses | | | 41,000 | |
Audit fee | | | 36,000 | |
Legal fees and expenses | | | 18,000 | |
Commitment fee on syndicated credit agreement | | | 15,000 | |
Transfer agent’s fee and expenses (including affiliated expense of $4,000) (Note 4) | | | 4,000 | |
Miscellaneous | | | 38,014 | |
| | |
|
|
|
Total expenses | | | 20,429,837 | |
| | |
|
|
|
| NET INVESTMENT INCOME | | | 91,569,165 | |
| | |
|
|
|
| NET REALIZED AND UNREALIZED GAIN (LOSS) ON INVESTMENTS, SWAPS AND FOREIGN CURRENCIES | | | | |
Net realized gain (loss) on: | | | | |
Investment transactions (including affiliated: ($2,578,600)) | | | (344,985,357 | ) |
Short sale transactions | | | 2,500 | |
Futures transactions | | | (11,451,281 | ) |
Swap agreement transactions | | | 3,029,766 | |
Foreign currency transactions | | | (226,409 | ) |
| | |
|
|
|
| | | | (353,630,781 | ) |
| | |
|
|
|
Net change in unrealized appreciation (depreciation) on: | | | | |
Investments (including affiliated: $(35,057,618)) | | | (634,400,415 | ) |
Futures | | | 3,493,420 | |
Swaps | | | 3,354,220 | |
Foreign currencies | | | (5,812 | ) |
| | |
|
|
|
| | | | (627,558,587 | ) |
| | |
|
|
|
| NET LOSS ON INVESTMENTS, SWAPS AND FOREIGN CURRENCIES | | | (981,189,368 | ) |
| | |
|
|
|
| NET DECREASE IN NET ASSETS RESULTING FROM OPERATIONS | | $ | (889,620,203 | ) |
| | |
|
|
|
STATEMENT OF CHANGES IN NET ASSETS
| | | | | | | | |
| | | Year Ended December 31,
| |
| | | 2008
| | | 2007
| |
| INCREASE (DECREASE) IN NET ASSETS | | | | | | | | |
| OPERATIONS: | | | | | | | | |
Net investment income | | $ | 91,569,165 | | | $ | 95,193,683 | |
Net realized gain (loss) on investment, swap and foreign currency transactions | | | (353,630,781 | ) | | | 258,380,114 | |
Net change in unrealized appreciation (depreciation) on investments, swaps and foreign currencies | | | (627,558,587 | ) | | | (122,643,174 | ) |
| | |
|
|
| |
|
|
|
NET INCREASE (DECREASE) IN NET ASSETS RESULTING FROM OPERATIONS | | | (889,620,203 | ) | | | 230,930,623 | |
| | |
|
|
| |
|
|
|
| DISTRIBUTIONS | | | (353,573,797 | ) | | | (231,155,961 | ) |
| | |
|
|
| |
|
|
|
| SERIES SHARE TRANSACTIONS: | | | | | | | | |
Series shares sold [1,347,523 and 986,911 shares, respectively] | | | 19,045,784 | | | | 18,632,642 | |
Series shares issued in reinvestment of distributions [22,635,967 and 12,679,976 shares, respectively] | | | 353,573,797 | | | | 231,155,961 | |
Series shares repurchased [14,641,462 and 13,414,705 shares, respectively] | | | (224,142,062 | ) | | | (256,790,391 | ) |
| | |
|
|
| |
|
|
|
NET INCREASE (DECREASE) IN NET ASSETS RESULTING FROM SERIES SHARE TRANSACTIONS | | | 148,477,519 | | | | (7,001,788 | ) |
| | |
|
|
| |
|
|
|
| TOTAL DECREASE IN NET ASSETS | | | (1,094,716,481 | ) | | | (7,227,126 | ) |
| NET ASSETS: | | | | | | | | |
Beginning of year | | | 3,716,323,864 | | | | 3,723,550,990 | |
| | |
|
|
| |
|
|
|
End of year | | $ | 2,621,607,383 | | | $ | 3,716,323,864 | |
| | |
|
|
| |
|
|
|
SEE NOTES TO FINANCIAL STATEMENTS.
A60
| | | | | | |
| | | GLOBAL PORTFOLIO | | |
| |
| SCHEDULE OF INVESTMENTS | | December 31, 2008 |
| | | | | |
| LONG-TERM INVESTMENTS — 97.2% | | |
| COMMON STOCKS — 97.0% | | Shares
| | Value
(Note 2)
|
| | | | | | |
Australia — 2.7% | | | | | |
Amcor Ltd. | | 114,000 | | $ | 463,274 |
AWB Ltd. | | 271,500 | | | 483,942 |
BHP Billiton Ltd.(b) | | 23,267 | | | 998,154 |
BlueScope Steel Ltd. | | 218,400 | | | 536,586 |
Centennial Coal Co., Ltd. | | 220,700 | | | 517,099 |
CSR Ltd. | | 173,200 | | | 214,229 |
Downer EDI Ltd. | | 215,400 | | | 577,991 |
Foster’s Brewing Group Ltd. | | 113,500 | | | 436,530 |
Goodman Fielder Ltd. | | 291,100 | | | 270,609 |
Macquarie Bank Ltd. | | 48,553 | | | 985,400 |
National Australian Bank Ltd. | | 86,200 | | | 1,267,283 |
OZ Minerals Ltd. | | 268,220 | | | 102,852 |
Pacific Brands Ltd. | | 460,600 | | | 138,876 |
Qantas Airways Ltd. | | 520,100 | | | 958,183 |
QBE Insurance Group Ltd. | | 129,292 | | | 2,336,735 |
TABCORP Holdings Ltd. | | 90,900 | | | 444,736 |
Woolworths Ltd. | | 139,587 | | | 2,602,767 |
WorleyParsons Ltd. | | 39,429 | | | 393,342 |
| | | | |
|
|
| | | | | | 13,728,588 |
| | | | |
|
|
Austria | | | | | |
Voestalpine AG | | 9,500 | | | 198,610 |
| | | | |
|
|
Belgium | | | | | |
AGFA-Gevaert NV | | 62,200 | | | 160,818 |
Fortis | | 36,400 | | | 47,005 |
| | | | |
|
|
| | | | | | 207,823 |
| | | | |
|
|
Bermuda — 1.2% | | | | | |
Covidien Ltd. | | 53,500 | | | 1,938,840 |
Credicorp Ltd. | | 14,696 | | | 734,212 |
Tyco Electronics Ltd. | | 100,800 | | | 1,633,968 |
Tyco International Ltd. | | 75,000 | | | 1,620,000 |
| | | | |
|
|
| | | | | | 5,927,020 |
| | | | |
|
|
Brazil — 0.6% | | | | | |
BM&F Bovespa SA | | 201,212 | | | 519,424 |
LLX Logistica SA(a) | | 42,300 | | | 27,390 |
MMX Mineracao e Metalicos SA(a) | | 53,900 | | | 64,024 |
Petroleo Brasileiro SA | | 97,721 | | | 957,095 |
Petroleo Brasileiro SA, ADR | | 51,834 | | | 1,269,414 |
Weg SA | | 70,500 | | | 377,895 |
| | | | |
|
|
| | | | | | 3,215,242 |
| | | | |
|
|
Canada — 1.2% | | | | | |
Canadian National Railway Co. | | 49,885 | | | 1,833,773 |
Rogers Communications, Inc.
(Class B Stock)(a) | | 64,100 | | | 1,899,894 |
Shoppers Drug Mart Corp. | | 62,800 | | | 2,444,341 |
| | | | |
|
|
| | | | | | 6,178,008 |
| | | | |
|
|
Chile | | | | | |
Centros Comerciales Sudamericanos SA 144A | | 1,294 | | | 27,566 |
| | | | |
|
|
China — 1.4% | | | | | |
China Life Insurance Co. | | 541,000 | | | 1,662,213 |
China Merchants Bank Co. Ltd. | | 555,500 | | | 1,039,381 |
China Oilfield Services Ltd. | | 942,000 | | | 769,073 |
Industrial & Commercial Bank of China (Class H Stock)(a) | | 6,441,000 | | | 3,419,635 |
| | | | |
|
|
| | | | | | 6,890,302 |
| | | | |
|
|
| | | | | |
COMMON STOCKS
(continued) | | Shares
| | Value
(Note 2)
|
| | | | | | |
Czech Republic — 0.2% | | | | | |
CEZ | | 26,363 | | $ | 1,071,324 |
| | | | |
|
|
Denmark — 1.1% | | | | | |
Danske Bank A/S | | 44,500 | | | 432,148 |
H Lundbeck A/S | | 72,700 | | | 1,493,468 |
Novo Nordisk SA | | 65,766 | | | 3,328,432 |
Vestas Wind Systems A/S | | 5,931 | | | 336,167 |
| | | | |
|
|
| | | | | | 5,590,215 |
| | | | |
|
|
Finland — 0.3% | | | | | |
Pohjola Bank PLC | | 30,700 | | | 416,076 |
Rautaruukki Oyj | | 22,300 | | | 376,936 |
Tietoenator Oyj | | 56,200 | | | 606,998 |
| | | | |
|
|
| | | | | | 1,400,010 |
| | | | |
|
|
France — 4.8% | | | | | |
Alstom SA | | 34,395 | | | 2,007,092 |
Arkema | | 530 | | | 9,025 |
AXA SA | | 86,528 | | | 1,905,805 |
BNP Paribas | | 19,800 | | | 832,569 |
Ciments Francais SA | | 5,200 | | | 436,008 |
Compagnie Generale des Etablissements Michelin (Class B Stock) | | 8,400 | | | 438,682 |
Credit Agricole SA | | 29,400 | | | 326,939 |
Eurazeo | | 14,235 | | | 663,865 |
France Telecom SA | | 48,300 | | | 1,340,100 |
Iliad SA | | 14,536 | | | 1,252,755 |
Lagardere SCA | | 14,000 | | | 564,359 |
Natixis | | 57,000 | | | 99,041 |
Peugeot SA | | 21,000 | | | 354,671 |
Rallye SA | | 13,400 | | | 299,889 |
Renault SA | | 9,500 | | | 244,961 |
Safran SA | | 54,600 | | | 731,188 |
Sanofi-Aventis SA | | 43,600 | | | 2,751,514 |
Societe Generale | | 5,300 | | | 265,221 |
Thales SA | | 13,700 | | | 568,072 |
Thomson | | 80,000 | | | 106,756 |
Total SA | | 27,900 | | | 1,509,020 |
Total SA, ADR | | 79,250 | | | 4,382,524 |
Valeo SA | | 17,600 | | | 259,694 |
Veolia Environnement | | 76,739 | | | 2,368,093 |
Vivendi | | 26,100 | | | 844,060 |
| | | | |
|
|
| | | | | | 24,561,903 |
| | | | |
|
|
Germany — 3.1% | | | | | |
BASF AG | | 51,800 | | | 1,983,003 |
Beiersdorf AG | | 32,528 | | | 1,904,927 |
Daimler AG | | 19,500 | | | 715,596 |
Deutsche Bank AG | | 11,600 | | | 452,455 |
Deutsche Lufthansa AG | | 51,700 | | | 813,876 |
E.ON AG | | 112,728 | | | 4,390,657 |
Hannover Rueckversicherung AG | | 16,300 | | | 518,183 |
Heidelberger Druckmaschinen AG | | 27,400 | | | 237,665 |
MTU Aero Engines Holding AG | | 28,100 | | | 748,005 |
Muenchener Rueckversicherungs-Gesellschaft AG | | 13,400 | | | 2,040,548 |
Norddeutsche Affinerie AG | | 10,300 | | | 404,612 |
Suedzucker AG | | 6,700 | | | 102,446 |
ThyssenKrupp AG | | 65,000 | | | 1,736,586 |
| | | | |
|
|
| | | | | | 16,048,559 |
| | | | |
|
|
SEE NOTES TO FINANCIAL STATEMENTS.
A61
| | | | | | |
| | | GLOBAL PORTFOLIO (continued) | | |
| |
| SCHEDULE OF INVESTMENTS | | December 31, 2008 |
| | | | | |
COMMON STOCKS
(continued) | | Shares
| | Value
(Note 2)
|
| | | | | | |
Greece | | | | | |
Alpha Bank A.E. | | 19,800 | | $ | 184,404 |
| | | | |
|
|
Hong Kong — 0.4% | | | | | |
Chaoda Modern Agriculture | | 825,470 | | | 530,455 |
Citic Pacific Ltd. | | 204,000 | | | 222,873 |
CNOOC Ltd. | | 1,166,000 | | | 1,109,071 |
| | | | |
|
|
| | | | | | 1,862,399 |
| | | | |
|
|
India — 0.3% | | | | | |
Infosys Technologies Ltd., ADR(b) | | 59,682 | | | 1,466,387 |
| | | | |
|
|
Indonesia — 0.2% | | | | | |
Bank Rakyat Indonesia | | 1,825,000 | | | 776,084 |
| | | | |
|
|
Ireland — 0.2% | | | | | |
Allied Irish Banks PLC | | 42,100 | | | 101,300 |
Bank of Ireland | | 83,300 | | | 96,570 |
Irish Life & Permanent PLC | | 51,300 | | | 112,312 |
Ryanair Holdings PLC, ADR(a)(b) | | 21,679 | | | 630,425 |
| | | | |
|
|
| | | | | | 940,607 |
| | | | |
|
|
Israel — 0.8% | | | | | |
Teva Pharmaceutical Industries Ltd., ADR(b) | | 96,901 | | | 4,125,076 |
| | | | |
|
|
Italy — 1.5% | | | | | |
Banco Popolare SC | | 38,200 | | | 262,844 |
ENI SpA | | 89,300 | | | 2,077,957 |
Finmeccanica SpA | | 20,900 | | | 316,376 |
Fondiaria-Sai SpA | | 19,900 | | | 354,073 |
Indesit Co. SpA | | 51,100 | | | 304,725 |
Intesa Sanpaolo SpA | | 166,300 | | | 586,581 |
Saipem SpA | | 137,141 | | | 2,253,275 |
Telecom Italia SpA | | 796,300 | | | 1,272,929 |
Unione di Banche Italiane SCPA | | 33,200 | | | 474,879 |
| | | | |
|
|
| | | | | | 7,903,639 |
| | | | |
|
|
Japan — 8.1% | | | | | |
Aeon Mall Co. Ltd. | | 52,300 | | | 1,011,045 |
Alpine Electronics, Inc. | | 41,600 | | | 333,935 |
Alps Electric Co. Ltd. | | 49,700 | | | 245,122 |
Asahi Glass Co. Ltd. | | 103,000 | | | 587,132 |
Asahi Kasei Corp. | | 226,100 | | | 998,018 |
Circle K Sunkus Co. Ltd. | | 65,000 | | | 1,175,970 |
Daiichi Sankyo Co. Ltd. | | 12,100 | | | 286,145 |
Denki Kagaku Kogyo K K | | 224,900 | | | 553,824 |
Fast Retailing Co. Ltd. | | 6,800 | | | 997,783 |
Fuji Heavy Industries Ltd. | | 129,000 | | | 354,508 |
Hitachi Information Systems Ltd. | | 28,300 | | | 584,766 |
Honda Motor Co. Ltd. | | 82,800 | | | 1,763,531 |
Jupiter Telecommunications Co. Ltd.(a) | | 2,805 | | | 2,919,559 |
Keihin Corp. | | 78,900 | | | 574,888 |
Kurabo Industries Ltd. | | 173,100 | | | 288,910 |
Kyoei Steel Ltd. | | 57,600 | | | 1,156,893 |
Kyowa Exeo Corp. | | 76,000 | | | 817,185 |
Marubeni Corp. | | 196,700 | | | 753,078 |
Matsushita Electric Industrial Co., Ltd. | | 74,000 | | | 909,625 |
Mitsubishi Corp. | | 34,400 | | | 487,244 |
Mitsui & Co. Ltd. | | 66,000 | | | 678,504 |
| | | | | |
COMMON STOCKS
(continued) | | Shares
| | Value
(Note 2)
|
| | | | | | |
Japan (continued) | | | | | |
Mitsui Chemicals, Inc. | | 148,000 | | $ | 549,978 |
Mizuho Financial Group, Inc. | | 119 | | | 343,315 |
Nifco, Inc. | | 33,400 | | | 338,710 |
Nintendo Co. Ltd. | | 10,300 | | | 3,936,163 |
Nippon Light Metal Co. Ltd. | | 457,000 | | | 464,136 |
Nippon Oil Corp. | | 185,600 | | | 941,060 |
Nippon Shokubai Co. Ltd. | | 161,000 | | | 1,240,668 |
Nippon Telegraph and Telephone Corp. | | 370 | | | 2,012,060 |
Nissan Motor Co. Ltd. | | 317,000 | | | 1,140,449 |
NTT DoCoMo, Inc. | | 1,052 | | | 2,070,669 |
Omron Corp. | | 47,900 | | | 643,578 |
Ricoh Co. Ltd. | | 95,600 | | | 1,225,279 |
Sanwa Holdings Corp. | | 281,000 | | | 1,080,795 |
Seiko Epson Corp. | | 3,600 | | | 57,283 |
Sumitomo Corp. | | 115,400 | | | 1,023,515 |
Sumitomo Electric Industries, Ltd. | | 72,300 | | | 559,689 |
Sumitomo Trust & Banking Co. Ltd. (The) | | 36,000 | | | 212,805 |
Suruga Bank Ltd. | | 69,000 | | | 685,488 |
Takeda Pharmaceutical Co. Ltd. | | 14,000 | | | 729,712 |
TDK Corp. | | 11,200 | | | 413,802 |
Terumo Corp. | | 32,700 | | | 1,531,846 |
Toyota Motor Corp. | | 29,500 | | | 975,221 |
Yamanouchi Pharmaceutical Co., Ltd. | | 31,000 | | | 1,268,901 |
Yokohama Rubber Co. Ltd. (The) | | 159,600 | | | 800,914 |
| | | | |
|
|
| | | | | | 41,723,701 |
| | | | |
|
|
Mexico — 0.3% | | | | | |
Wal-Mart de Mexico SAB de CV, Ser. V | | 620,400 | | | 1,657,566 |
| | | | |
|
|
Netherlands — 1.3% | | | | | |
Aegon NV | | 56,800 | | | 357,270 |
CSM | | 31,300 | | | 500,348 |
ING Groep NV | | 80,400 | | | 819,199 |
Koninklijke DSM NV | | 31,100 | | | 792,198 |
Koninklijke (Royal) Philips Electronics N.V. | | 38,900 | | | 747,827 |
OCE NV | | 53,300 | | | 232,641 |
Qiagen NV(a) | | 76,682 | | | 1,310,011 |
Royal Dutch Shell PLC, ADR | | 38,700 | | | 2,048,778 |
| | | | |
|
|
| | | | | | 6,808,272 |
| | | | |
|
|
New Zealand — 0.1% | | | | | |
Air New Zealand Ltd. | | 737,900 | | | 414,610 |
Fisher & Paykel Appliances Holdings Ltd. | | 319,700 | | | 252,913 |
| | | | |
|
|
| | | | | | 667,523 |
| | | | |
|
|
Norway — 0.3% | | | | | |
DnB NOR ASA | | 120,700 | | | 465,418 |
Norsk Hydro ASA | | 54,500 | | | 216,378 |
StatoiHydro ASA | | 45,100 | | | 733,621 |
| | | | |
|
|
| | | | | | 1,415,417 |
| | | | |
|
|
Portugal — 0.3% | | | | | |
Banco Espirito Santo SA | | 55,100 | | | 512,398 |
Portugal Telecom SGPS SA | | 109,400 | | | 923,072 |
| | | | |
|
|
| | | | | | 1,435,470 |
| | | | |
|
|
SEE NOTES TO FINANCIAL STATEMENTS.
A62
| | | | | | |
| | | GLOBAL PORTFOLIO (continued) | | |
| |
| SCHEDULE OF INVESTMENTS | | December 31, 2008 |
| | | | | |
COMMON STOCKS
(continued) | | Shares
| | Value
(Note 2)
|
| | | | | | |
Singapore — 0.5% | | | | | |
MobileOne Ltd. | | 390,330 | | $ | 402,998 |
Neptune Orient Lines Ltd. | | 313,800 | | | 246,598 |
Noble Group Ltd. | | 908,000 | | | 650,366 |
Singapore Airlines Ltd. | | 134,266 | | | 1,055,994 |
| | | | |
|
|
| | | | | | 2,355,956 |
| | | | |
|
|
South Africa — 0.6% | | | | | |
MTN Group Ltd. | | 149,680 | | | 1,756,656 |
Naspers Ltd. | | 60,600 | | | 1,089,751 |
| | | | |
|
|
| | | | | | 2,846,407 |
| | | | |
|
|
Spain — 2.1% | | | | | |
Banco Bilbao Vizcaya Argentaria SA | | 94,800 | | | 1,141,184 |
Banco Santander SA | | 465,425 | | | 4,355,127 |
Endesa SA | | 6,660 | | | 264,771 |
Iberdrola Renovables SA(a) | | 380,804 | | | 1,614,473 |
Inditex SA | | 36,907 | | | 1,607,307 |
Repsol YPF SA | | 55,000 | | | 1,154,434 |
Telefonica SA | | 34,700 | | | 764,519 |
| | | | |
|
|
| | | | | | 10,901,815 |
| | | | |
|
|
Sweden — 0.3% | | | | | |
Electrolux AB, Ser. B | | 83,600 | | | 705,658 |
Nordea Bank AB | | 45,600 | | | 315,419 |
Volvo AB (Class B Stock) | | 44,800 | | | 243,036 |
| | | | |
|
|
| | | | | | 1,264,113 |
| | | | |
|
|
Switzerland — 5.6% | | | | | |
ABB Ltd. ADR | | 191,909 | | | 2,809,172 |
Actelion Ltd.(a) | | 26,972 | | | 1,505,273 |
Adecco SA | | 13,100 | | | 440,380 |
Baloise Holding AG | | 12,100 | | | 892,423 |
Ciba Holding AG(a) | | 11,600 | | | 518,777 |
Clariant AG | | 103,700 | | | 694,678 |
Credit Suisse Group | | 72,305 | | | 1,936,104 |
Georg Fischer AG(a) | | 2,000 | | | 450,792 |
Nestle SA | | 102,159 | | | 3,992,872 |
Rieter Holding AG | | 2,200 | | | 353,455 |
Roche Holdings AG | | 23,799 | | | 3,633,520 |
SGS SA | | 1,476 | | | 1,525,438 |
Swiss Reinsurance | | 25,500 | | | 1,205,102 |
Swisscom AG | | 6,200 | | | 1,977,639 |
Synthes, Inc. | | 14,667 | | | 1,838,284 |
Verwalt & Privat-Bank AG | | 2,578 | | | 339,341 |
Zurich Financial Services AG | | 22,308 | | | 4,757,754 |
| | | | |
|
|
| | | | | | 28,871,004 |
| | | | |
|
|
United Arab Emirates — 0.1% | | | | | |
DP World Ltd. | | 1,342,669 | | | 523,641 |
| | | | |
|
|
United Kingdom — 9.7% | | | | | |
Amec PLC | | 93,814 | | | 664,628 |
Amlin PLC | | 62,563 | | | 321,572 |
AstraZeneca PLC | | 71,500 | | | 2,885,576 |
Autonomy Corp. PLC | | 86,630 | | | 1,184,494 |
Aviva PLC | | 118,200 | | | 662,775 |
BAE Systems PLC | | 562,905 | | | 3,049,106 |
Barclays PLC | | 158,700 | | | 350,015 |
Beazley Group PLC | | 289,000 | | | 563,017 |
BG Group PLC | | 220,972 | | | 3,040,418 |
| | | | | |
COMMON STOCKS
(continued) | | Shares
| | Value
(Note 2)
|
| | | | | | |
United Kingdom (continued) | | | | | |
BP PLC | | 472,900 | | $ | 3,576,343 |
Brit Insurance Holdings PLC | | 227,200 | | | 718,646 |
British Sky Broadcasting PLC | | 208,609 | | | 1,439,655 |
BT Group PLC | | 602,100 | | | 1,170,387 |
Capita Group PLC | | 222,151 | | | 2,357,158 |
Centrica PLC | | 88,100 | | | 336,932 |
Davis Service Group PLC | | 24,300 | | | 94,942 |
Drax Group PLC | | 52,400 | | | 422,647 |
DS Smith PLC | | 230,900 | | | 251,473 |
GKN PLC | | 302,000 | | | 421,175 |
GlaxoSmithKline PLC | | 55,000 | | | 1,015,736 |
HBOS PLC | | 178,142 | | | 176,726 |
IMI PLC | | 147,300 | | | 575,515 |
Legal & General Group PLC | | 624,000 | | | 689,017 |
Lloyds TSB Group PLC | | 121,900 | | | 220,830 |
Marston’s PLC | | 289,300 | | | 486,652 |
Northern Foods PLC | | 211,500 | | | 172,568 |
Old Mutual PLC | | 527,200 | | | 416,891 |
Petrofac Ltd. | | 87,510 | | | 435,329 |
Reckitt Benckiser Group PLC | | 86,922 | | | 3,221,786 |
Rolls Royce Group PLC
(Class C Stock)(a) | | 33,146,599 | | | 47,657 |
Rolls Royce Group PLC(a) | | 555,395 | | | 2,679,036 |
Rotork PLC | | 46,943 | | | 534,202 |
Royal & Sun Alliance Insurance Group PLC | | 300,200 | | | 596,058 |
Royal Bank of Scotland Group PLC (The) | | 263,527 | | | 187,170 |
Royal Dutch Shell PLC
(Class B Stock) | | 153,500 | | | 3,809,195 |
Spectris PLC | | 81,000 | | | 623,050 |
Standard Chartered PLC | | 154,007 | | | 1,937,460 |
Tate & Lyle PLC | | 113,000 | | | 651,083 |
Tomkins PLC | | 374,600 | | | 662,456 |
Tullow Oil PLC | | 198,415 | | | 1,881,367 |
Vedanta Resources PLC | | 115,387 | | | 1,014,466 |
Vodafone Group PLC | | 1,858,320 | | | 3,713,808 |
WPP PLC | | 100,200 | | | 579,853 |
| | | | |
|
|
| | | | | | 49,838,870 |
| | | | |
|
|
United States — 47.7% | | | | | |
3M Co. | | 29,500 | | | 1,697,430 |
ABB Ltd. | | 49,105 | | | 737,066 |
Air Products & Chemicals, Inc. | | 25,309 | | | 1,272,283 |
Alcoa, Inc.(b) | | 58,000 | | | 653,080 |
Altria Group, Inc. | | 46,800 | | | 704,808 |
Amazon.com, Inc.(a) | | 8,638 | | | 442,957 |
American Express Co. | | 42,600 | | | 790,230 |
Ameriprise Financial, Inc. | | 74,500 | | | 1,740,320 |
Amgen, Inc.(a)(b) | | 31,750 | | | 1,833,563 |
Apple, Inc.(a) | | 44,829 | | | 3,826,155 |
AT&T, Inc. | | 115,700 | | | 3,297,450 |
Avon Products, Inc. | | 44,000 | | | 1,057,320 |
Baker Hughes, Inc. | | 64,000 | | | 2,052,480 |
Bank of America Corp. | | 191,400 | | | 2,694,912 |
Bank of New York Mellon Corp. (The) | | 33,900 | | | 960,387 |
Boston Scientific Corp.(a) | | 80,600 | | | 623,844 |
SEE NOTES TO FINANCIAL STATEMENTS.
A63
| | | | | | |
| | | GLOBAL PORTFOLIO (continued) | | |
| |
| SCHEDULE OF INVESTMENTS | | December 31, 2008 |
| | | | | |
COMMON STOCKS
(continued) | | Shares
| | Value
(Note 2)
|
| | | | | | |
United States (continued) | | | | | |
Cablevision Systems Corp.
(Class A Stock)(a) | | 92,200 | | $ | 1,552,648 |
Cameron International Corp.(a)(b) | | 36,031 | | | 738,636 |
Chevron Corp. | | 66,400 | | | 4,911,608 |
Citigroup, Inc. | | 164,600 | | | 1,104,466 |
Coca-Cola Co. (The)(b) | | 34,400 | | | 1,557,288 |
Costco Wholesale Corp.(b) | | 59,306 | | | 3,113,565 |
CVS Caremark Corp. | | 153,147 | | | 4,401,445 |
Deere & Co. | | 13,455 | | | 515,596 |
Dell, Inc.(a) | | 150,300 | | | 1,539,072 |
Devon Energy Corp. | | 7,581 | | | 498,148 |
E.I. du Pont de Nemours & Co. | | 54,400 | | | 1,376,320 |
Entergy Corp. | | 27,800 | | | 2,311,014 |
Exxon Mobil Corp. | | 71,250 | | | 5,687,888 |
Fifth Third Bancorp | | 99,300 | | | 820,218 |
Fortune Brands, Inc. | | 41,900 | | | 1,729,632 |
Genentech, Inc.(a) | | 107,686 | | | 8,928,245 |
General Dynamics Corp. | | 85,774 | | | 4,939,725 |
General Electric Co. | | 221,700 | | | 3,591,540 |
General Motors Corp.(b) | | 41,700 | | | 133,440 |
Gilead Sciences, Inc.(a) | | 23,373 | | | 1,195,295 |
Goldman Sachs Group, Inc. (The) | | 47,326 | | | 3,993,841 |
Google, Inc. (Class A Stock)(a) | | 5,080 | | | 1,562,862 |
H&R Block, Inc. | | 101,200 | | | 2,299,264 |
Hartford Financial Services Group, Inc. | | 23,400 | | | 384,228 |
Hess Corp. | | 24,526 | | | 1,315,575 |
Home Depot, Inc. (The) | | 163,400 | | | 3,761,468 |
Honeywell International, Inc. | | 33,600 | | | 1,103,088 |
ICICI Bank Ltd.(b) | | 93,009 | | | 1,790,423 |
Illinois Tool Works, Inc. | | 66,700 | | | 2,337,835 |
Intel Corp.(b) | | 84,700 | | | 1,241,702 |
International Business Machines Corp. | | 24,800 | | | 2,087,168 |
International Paper Co. | | 98,400 | | | 1,161,120 |
Johnson & Johnson | | 73,935 | | | 4,423,531 |
JPMorgan Chase & Co. | | 176,973 | | | 5,579,959 |
Kraft Foods, Inc. (Class A Stock) | | 35,900 | | | 963,915 |
Las Vegas Sands Corp.(a) | | 330,476 | | | 1,959,723 |
Liberty Media Corp. — Entertainment, Ser. A(a) | | 51,800 | | | 905,464 |
Liberty Media Corp. — Interactive, Ser. A(a) | | 58,100 | | | 181,272 |
Lockheed Martin Corp. | | 80,170 | | | 6,740,694 |
Lowe’s Cos., Inc. | | 201,797 | | | 4,342,671 |
Marsh & McLennan Cos., Inc. | | 116,600 | | | 2,829,882 |
Mastercard, Inc. (Class A Stock) | | 28,650 | | | 4,094,945 |
McDonald’s Corp. | | 195,141 | | | 12,135,818 |
Merck & Co., Inc. | | 91,500 | | | 2,781,600 |
Merrill Lynch & Co., Inc. | | 52,200 | | | 607,608 |
Microsoft Corp. | | 168,100 | | | 3,267,864 |
Monsanto Co. | | 76,921 | | | 5,411,392 |
Morgan Stanley(b) | | 22,500 | | | 360,900 |
Murphy Oil Corp. | | 46,700 | | | 2,071,145 |
New York Times Co. (The)
(Class A Stock)(b) | | 55,400 | | | 406,082 |
Newell Rubbermaid, Inc. | | 126,700 | | | 1,239,126 |
| | | | | |
COMMON STOCKS
(continued) | | Shares
| | Value
(Note 2)
|
| | | | | | |
United States (continued) | | | | | |
Nike, Inc.(b) | | 58,392 | | $ | 2,977,992 |
NiSource, Inc. | | 66,900 | | | 733,893 |
Norfolk Southern Corp.(b) | | 64,458 | | | 3,032,749 |
Oracle Corp.(a) | | 30,494 | | | 540,659 |
Pfizer, Inc.(b) | | 131,200 | | | 2,323,552 |
Philip Morris International, Inc. | | 17,500 | | | 761,425 |
Pinnacle West Capital Corp. | | 44,300 | | | 1,423,359 |
Praxair, Inc. | | 91,780 | | | 5,448,061 |
QUALCOMM, Inc. | | 83,887 | | | 3,005,671 |
Qwest Communications International, Inc.(a)(b) | | 152,500 | | | 555,100 |
Raytheon Co. | | 28,750 | | | 1,467,400 |
Schering-Plough Corp. | | 148,006 | | | 2,520,542 |
Schlumberger Ltd. | | 43,034 | | | 1,821,629 |
Southwest Airlines Co. | | 212,500 | | | 1,831,750 |
Spectra Energy Corp. | | 73,400 | | | 1,155,316 |
Sprint Nextel Corp.(b) | | 342,300 | | | 626,409 |
St. Joe Co. (The) | | 44,600 | | | 1,084,672 |
State Street Corp. | | 45,700 | | | 1,797,381 |
Sunoco, Inc.(b) | | 32,250 | | | 1,401,585 |
Target Corp.(b) | | 51,232 | | | 1,769,041 |
Time Warner Cable, Inc.(a) | | 30,400 | | | 652,080 |
Time Warner, Inc.(b) | | 300,400 | | | 3,022,024 |
Transocean Ltd.(a) | | 62,621 | | | 2,958,842 |
U.S. Bancorp | | 207,300 | | | 5,184,573 |
Union Pacific Corp.(b) | | 144,278 | | | 6,896,487 |
Verizon Communications, Inc. | | 39,800 | | | 1,349,220 |
Viacom, Inc. (Class B Stock)(a) | | 23,300 | | | 444,098 |
Visa, Inc. (Class A Stock)(b) | | 82,201 | | | 4,311,443 |
Wal-Mart Stores, Inc. | | 87,162 | | | 4,886,302 |
Walt Disney Co. (The) | | 24,149 | | | 547,941 |
Waste Management, Inc. | | 53,800 | | | 1,782,932 |
Wells Fargo & Co. | | 226,617 | | | 6,680,669 |
Western Union Co. | | 80,000 | | | 1,147,200 |
Weyerhaeuser Co. | | 19,000 | | | 581,590 |
Wyeth | | 67,700 | | | 2,539,427 |
Wynn Resorts Ltd.(a)(b) | | 66,547 | | | 2,812,276 |
Yum! Brands, Inc.(b) | | 132,140 | | | 4,162,410 |
| | | | |
|
|
| | | | | | 244,609,939 |
| | | | |
|
|
TOTAL COMMON STOCKS
(cost $645,139,791) | | | 497,223,460 |
| | | | |
|
|
| PREFERRED STOCKS — 0.2% | | |
United States | | | | | |
Merrill Lynch Restricted Convertible (Private Placement)
(cost $739,980; purchased 7/29/08-10/31/08)(e) | | 26,728 | | | 295,558 |
Wachovia Corp. | | 23,475 | | | 515,511 |
| | | | |
|
|
TOTAL PREFERRED STOCKS
(cost $1,191,183) | | | 811,069 |
| | | | |
|
|
SEE NOTES TO FINANCIAL STATEMENTS.
A64
| | | | | | |
| | | GLOBAL PORTFOLIO (continued) | | |
| |
| SCHEDULE OF INVESTMENTS | | December 31, 2008 |
| | | | | | | |
| RIGHTS | |
| | | Units
| | Value
(Note 2)
| |
Belgium | | | | | | | |
Fortis (cost $0) | | | 37,600 | | $ | 0 | |
| | | | | |
|
|
|
TOTAL LONG-TERM INVESTMENTS
(cost $646,330,974) | | | 498,034,529 | |
| | | | | |
|
|
|
| | | Shares
| | | |
| SHORT-TERM INVESTMENTS — 10.6% | | | | |
Affiliated Money Market Mutual Fund — 10.5% | | | | |
Dryden Core Investment Fund — Taxable Money Market Series (cost $54,051,456; includes $41,794,833 of cash collateral received for securities
on loan) (Note 4)(c)(d) | | | 54,051,456 | | | 54,051,456 | |
| | | | | |
|
|
|
| | |
| | | Principal
Amount
(000)
| | | |
U.S. Government Obligation — 0.1% | | | | | | | |
US Treasury Bills,
0.02%, 4/16/2009(f)
(cost $499,972) | | $ | 500 | | | 499,889 | |
| | | | | |
|
|
|
TOTAL SHORT-TERM INVESTMENTS
(cost $54,551,428) | | | 54,551,345 | |
| | | | | |
|
|
|
TOTAL INVESTMENTS(g) 107.8%
(cost $700,882,402) | | | 552,585,874 | |
LIABILITIES IN EXCESS OF
OTHER ASSETS(h) (7.8)% | | | (39,853,851 | ) |
| | | | | |
|
|
|
NET ASSETS 100.0% | | $ | 512,732,023 | |
| | | | | |
|
|
|
The following abbreviations are used in portfolio descriptions:
| | |
| ADR | | American Depositary Receipt |
| 144A | | Security was purchased pursuant to rule 144A under the Securities Act of 1933 and may not be resold subject to that rule except to qualified institutional buyers. Unless otherwise noted, 144A securities are deemed to be liquid. |
| (a) | Non-income producing security. |
| (b) | All or a portion of security is on loan. The aggregate market value of such securities is $40,783,895; cash collateral of $41,794,833 (included in liabilities) was received with which the Portfolio purchased highly liquid short-term investments. |
| (c) | Represents security, or a portion thereof, purchased with cash collateral for securities on loan. |
| (d) | Prudential Investments LLC, the manager of the Portfolio, also serves as manager of the Dryden Core Investment Fund — Taxable Money Market Series. |
| (e) | Indicates a security that has been deemed illiquid. |
| (f) | Rate quoted represents yield-to-maturity at purchase date. |
| (g) | As of December 31, 2008, 78 securities valued at $64,946,582 and representing 12.7% of the net assets were fair valued in accordance with policies adopted by the Board of Trustees. |
| (h) | Liabilities in excess of other assets include net unrealized depreciation on forward foreign currency contracts as follows: |
Open forward foreign currency exchange contracts outstanding at December 31, 2008:
| | | | | | | | | | | | |
Purchase Contracts
| | Notional
Amount
| | Payable at
Settlement Date
| | Value at
December 31, 2008
| | Unrealized
Depreciation
| |
| Japanese Yen, Expiring 3/17/09 | | JPY 99,598,000 | | $ | 1,112,019 | | $ | 1,100,478 | | $ | (11,541 | ) |
| | | | | | | | | | |
|
|
|
| | | | |
Sales Contracts
| | Notional
Amount
| | Receivable at
Settlement Date
| | Value at
December 31, 2008
| | Unrealized
Depreciation
| |
| Japanese Yen, expiring 3/17/09 | | JPY 48,394,000 | | $ | 522,022 | | $ | 534,715 | | $ | (12,693 | ) |
| Japanese Yen, expiring 3/17/09 | | JPY 51,204,000 | | | 558,477 | | | 565,763 | | | (7,286 | ) |
| | | | | | | | | | |
|
|
|
| | | | | | | | | | | | (19,979 | ) |
| | | | | | | | | | |
|
|
|
| | | | | | | | | | | $ | (31,520 | ) |
| | | | | | | | | | |
|
|
|
Various inputs are used in determining the value of the Portfolio’s investments. These inputs are summarized in the three broad levels listed below.
Level 1—quoted prices in active markets for identical securities
Level 2—other significant observable inputs (including quoted prices for similar securities, interest rates, prepayment speeds, credit risk, etc.)
Level 3—significant unobservable inputs (including the Portfolio’s own assumptions in determining the fair value of investments)
The following is a summary of the inputs used as of December 31, 2008 in valuing the Portfolio’s assets carried at fair value:
| | | | | | | |
Valuation inputs
| | Investments
in Securities
| | Other Financial
Instruments*
| |
Level 1—Quoted Prices | | $ | 487,139,404 | | | — | |
Level 2—Other Significant Observable Inputs | | | 65,048,060 | | $ | (31,520 | ) |
Level 3—Significant Unobservable Inputs | | | 398,410 | | | — | |
| | |
|
| |
|
|
|
Total | | $ | 552,585,874 | | $ | (31,520 | ) |
| | |
|
| |
|
|
|
| * | Other financial instruments are derivative instruments not reflected in the Schedule of Investments, such as futures, forwards and swap contracts, which are valued at the unrealized appreciation/depreciation on the instrument. |
SEE NOTES TO FINANCIAL STATEMENTS.
A65
| | | | | | |
| | | GLOBAL PORTFOLIO (continued) | | |
| |
| SCHEDULE OF INVESTMENTS | | December 31, 2008 |
The following is a reconciliation of assets in which significant unobservable inputs (Level 3) were used in determining fair value:
| | | | |
| | | Investments
in Securities
| |
Balance as of 12/31/07 | | | — | |
Realized gain (loss) | | | — | |
Change in unrealized appreciation (depreciation) | | $ | (1,481,223 | ) |
Net purchases (sales) | | | 1,879,633 | |
Transfers in and/or out of Level 3 | | | — | |
| | |
|
|
|
Balance as of 12/31/08 | | $ | 398,410 | |
| | |
|
|
|
The industry classification of portfolio holdings and liabilities in excess of other assets shown as a percentage of net assets as of December 31, 2008 were as follows:
| | | |
Affiliated Money Market Mutual Fund (including 8.1% of collateral received for securities on loan) | | 10.5 | % |
Oil, Gas & Consumable Fuels | | 9.0 | |
Commercial Banks | | 7.2 | |
Pharmaceuticals | | 7.0 | |
Insurance | | 4.6 | |
Aerospace & Defense | | 4.4 | |
Hotels Restaurants & Leisure | | 4.2 | |
Chemicals | | 4.1 | |
Food & Staples Retailing | | 4.1 | |
Diversified Telecommunication | | 3.1 | |
Media | | 2.9 | |
Biotechnology | | 2.6 | |
Capital Markets | | 2.6 | |
Energy Equipment & Services | | 2.4 | |
IT Services | | 2.4 | |
Diversified Financial Services | | 2.3 | |
Road & Rail | | 2.3 | |
Specialty Retail | | 2.1 | |
Wireless Telecommunication Services | | 2.0 | |
Electric Utilities | | 1.9 | |
Household Durables | | 1.7 | |
Industrial Conglomerates | | 1.7 | |
Software | | 1.7 | |
Computers & Peripherals | | 1.5 | |
Metals & Mining | | 1.5 | |
Food Products | | 1.4 | |
Electrical Equipment | | 1.3 | |
Healthcare Equipment & Supplies | | 1.2 | |
Airlines | | 1.1 | |
Automobiles | | 1.1 | |
Machinery | | 0.9 | |
Electronic Equipment & Instruments | | 0.8 | |
Professional Services | | 0.8 | |
Multi-Utilities | | 0.7 | |
Trading Companies & Distributors | | 0.7 | |
Auto Components | | 0.6 | |
Communications Equipment | | 0.6 | |
Personal Products | | 0.6 | |
Textiles, Apparel & Luxury Goods | | 0.6 | |
Beverages | | 0.5 | |
Commercial Services & Supplies | | 0.5 | |
Diversified Consumer Services | | 0.5 | |
Independent Power Producers & Energy Traders | | 0.4 | |
Real Estate Management & Development | | 0.4 | |
Building Products | | 0.3 | |
Internet Software & Services | | 0.3 | |
| | | |
Life Sciences Tools & Services | | 0.3 | |
Multiline Retail | | 0.3 | |
Office Electronics | | 0.3 | |
Paper & Forest Products | | 0.3 | |
Tobacco | | 0.3 | |
Construction & Engineering | | 0.2 | |
Consumer Finance | | 0.2 | |
Semiconductors & Semiconductor Equipment | | 0.2 | |
Construction Materials | | 0.1 | |
Containers & Packaging | | 0.1 | |
Internet & Catalog Retail | | 0.1 | |
Marine | | 0.1 | |
Transportation Infrastructure | | 0.1 | |
U.S. Government Obligation | | 0.1 | |
| | |
|
|
| | | 107.8 | |
Liabilities in excess of other assets | | (7.8 | ) |
| | |
|
|
| | | 100.0 | % |
| | |
|
|
SEE NOTES TO FINANCIAL STATEMENTS.
A66
| | | | | | |
| | | GLOBAL PORTFOLIO (continued) | | |
STATEMENT OF ASSETS AND LIABILITIES
December 31, 2008
| | | | |
| ASSETS | | | | |
Investments, at value including securities on loan of $40,783,895: | | | | |
Unaffiliated investments (cost $646,830,946) | | $ | 498,534,418 | |
Affiliated investments (cost $54,051,456) | | | 54,051,456 | |
Foreign currency, at value (cost $1,093,416) | | | 1,071,199 | |
Receivable for investments sold | | | 2,767,830 | |
Dividends and interest receivable | | | 793,246 | |
Foreign tax reclaim receivable | | | 787,129 | |
Receivable for Series shares sold | | | 33,811 | |
Due from broker—variation margin | | | 15,792 | |
Prepaid expenses | | | 10,187 | |
| | |
|
|
|
Total Assets | | | 558,065,068 | |
| | |
|
|
|
| LIABILITIES | | | | |
Collateral for securities on loan | | | 41,794,833 | |
Payable for investments purchased | | | 2,155,535 | |
Payable to custodian | | | 493,894 | |
Payable for Series shares repurchased | | | 354,048 | |
Management fee payable | | | 315,587 | |
Accrued expenses and other liabilities | | | 186,839 | |
Unrealized depreciation on forward foreign currency exchange contracts | | | 31,520 | |
Affiliated transfer agent fee payable | | | 789 | |
| | |
|
|
|
Total Liabilities | | | 45,333,045 | |
| | |
|
|
|
| NET ASSETS | | $ | 512,732,023 | |
| | |
|
|
|
Net assets were comprised of: | | | | |
Paid-in capital | | $ | 750,248,303 | |
Retained earnings | | | (237,516,280 | ) |
| | |
|
|
|
Net assets, December 31, 2008 | | $ | 512,732,023 | |
| | |
|
|
|
Net asset value and redemption price per share, $512,732,023 / 39,222,762 outstanding shares of beneficial interest | | $ | 13.07 | |
| | |
|
|
|
STATEMENT OF OPERATIONS
Year Ended December 31, 2008
| | | | |
| INVESTMENT INCOME | | | | |
Unaffiliated dividend income (net of foreign withholding taxes of $929,030) | | $ | 20,232,460 | |
Affiliated dividend income | | | 1,053,583 | |
Affiliated income from securities loaned, net | | | 653,468 | |
Interest | | | 37,995 | |
| | |
|
|
|
| | | | 21,977,506 | |
| | |
|
|
|
| EXPENSES | | | | |
Management fee | | | 5,774,376 | |
Custodian’s fees and expenses | | | 318,000 | |
Shareholders’ reports | | | 286,000 | |
Audit fee | | | 25,000 | |
Trustees’ fees | | | 19,000 | |
Insurance expenses | | | 11,000 | |
Legal fees and expenses | | | 8,000 | |
Interest expense (Note 8) | | | 5,872 | |
Transfer agent’s fees and expenses (including affiliated expense of $4,000) (Note 4) | | | 4,000 | |
Commitment fee on syndicated credit agreement | | | 2,000 | |
Miscellaneous | | | 47,071 | |
| | |
|
|
|
Total expenses | | | 6,500,319 | |
| | |
|
|
|
| NET INVESTMENT INCOME | | | 15,477,187 | |
| | |
|
|
|
| NET REALIZED AND UNREALIZED LOSS ON INVESTMENTS AND FOREIGN CURRENCIES | | | | |
Net realized loss on: | | | | |
Investment transactions | | | (100,792,830 | ) |
Futures transactions | | | (221,846 | ) |
Foreign currency transactions | | | (981,548 | ) |
| | |
|
|
|
| | | | (101,996,224 | ) |
| | |
|
|
|
Net change in unrealized appreciation (depreciation) on: | | | | |
Investments | | | (316,117,734 | ) |
Foreign currencies | | | (208,538 | ) |
| | |
|
|
|
| | | | (316,326,272 | ) |
| | |
|
|
|
| NET LOSS ON INVESTMENTS AND FOREIGN CURRENCIES | | | (418,322,496 | ) |
| | |
|
|
|
| NET DECREASE IN NET ASSETS RESULTING FROM OPERATIONS | | $ | (402,845,309 | ) |
| | |
|
|
|
STATEMENT OF CHANGES IN NET ASSETS
| | | | | | | | |
| | | Year Ended December 31,
| |
| | | 2008
| | | 2007
| |
| INCREASE (DECREASE) IN NET ASSETS | | | | | | | | |
| OPERATIONS: | | | | | | | | |
Net investment income | | $ | 15,477,187 | | | $ | 14,020,422 | |
Net realized gain (loss) on investment, futures and foreign currency transactions | | | (101,996,224 | ) | | | 63,900,215 | |
Net change in unrealized appreciation (depreciation) on investments and foreign currencies | | | (316,326,272 | ) | | | 17,964,927 | |
| | |
|
|
| |
|
|
|
NET INCREASE (DECREASE) IN NET ASSETS RESULTING FROM OPERATIONS | | | (402,845,309 | ) | | | 95,885,564 | |
| | |
|
|
| |
|
|
|
| DISTRIBUTIONS | | | (61,349,073 | ) | | | (10,692,295 | ) |
| | |
|
|
| |
|
|
|
| SERIES SHARE TRANSACTIONS: | | | | | | | | |
Series shares sold [1,400,663 and 1,809,090 shares, respectively] | | | 27,172,912 | | | | 43,514,915 | |
Series shares issued in reinvestment of distributions [2,931,155 and 435,886 shares, respectively] | | | 61,349,073 | | | | 10,692,295 | |
Series shares repurchased [5,123,305 and 3,630,416 shares, respectively] | | | (96,604,973 | ) | | | (87,249,982 | ) |
| | |
|
|
| |
|
|
|
NET DECREASE IN NET ASSETS RESULTING FROM SERIES SHARE TRANSACTIONS | | | (8,082,988 | ) | | | (33,042,772 | ) |
| | |
|
|
| |
|
|
|
| TOTAL INCREASE (DECREASE) IN NET ASSETS | | | (472,277,370 | ) | | | 52,150,497 | |
| NET ASSETS: | | | | | | | | |
Beginning of year | | | 985,009,393 | | | | 932,858,896 | |
| | |
|
|
| |
|
|
|
End of year | | $ | 512,732,023 | | | $ | 985,009,393 | |
| | |
|
|
| |
|
|
|
SEE NOTES TO FINANCIAL STATEMENTS.
A67
| | | | | | |
| | | GOVERNMENT INCOME PORTFOLIO | | |
| |
| SCHEDULE OF INVESTMENTS | | December 31, 2008 |
| | | | | | | | | | |
| LONG-TERM INVESTMENTS — 93.3% | | Interest
Rate
| | Maturity
Date
| | Principal
Amount
(000)#
| | Value
(Note 2)
|
| | | | | | | | | | | |
Asset Backed Securities — 2.4% | | | | | | | | | | |
Citibank Credit Card Issuance Trust, | | | | | | | | | | |
Series 2007-A8, Class A8 | | 5.65% | | 09/20/19 | | $ | 1,500 | | $ | 1,224,738 |
Small Business Administration Participation Certificates, | | | | | | | | | | |
Series 1996-20J, Class 1 | | 7.20% | | 10/01/16 | | | 2,319 | | | 2,440,992 |
Series 1997-20A, Class 1 | | 7.15% | | 01/01/17 | | | 2,361 | | | 2,479,221 |
Series 1997-20G, Class 1 | | 6.85% | | 07/01/17 | | | 837 | | | 861,948 |
Series 1998-20I, Class 1 | | 6.00% | | 09/01/18 | | | 1,894 | | | 1,950,338 |
| | | | | | | | | |
|
|
| | | | | | | | | | | 8,957,237 |
| | | | | | | | | |
|
|
Collateralized Mortgage Obligations — 6.0% | | | | | | | | | | |
Federal Home Loan Mortgage Corp., | | | | | | | | | | |
Series 2496, Class PM | | 5.50% | | 09/15/17 | | | 2,819 | | | 2,903,795 |
Series 2501, Class MC | | 5.50% | | 09/15/17 | | | 1,457 | | | 1,507,798 |
Series 2513, Class HC | | 5.00% | | 10/15/17 | | | 2,339 | | | 2,365,728 |
Series 2518, Class PV | | 5.50% | | 06/15/19 | | | 1,920 | | | 1,982,436 |
Federal National Mortgage Association, | | | | | | | | | | |
Series 2002-18, Class PC | | 5.50% | | 04/25/17 | | | 5,000 | | | 5,135,163 |
Series 2002-57, Class ND | | 5.50% | | 09/25/17 | | | 1,648 | | | 1,702,746 |
Series 2002-94, Class HQ | | 4.50% | | 01/25/18 | | | 6,419 | | | 6,442,950 |
Merrill Lynch Mortgage Investors, Inc., | | | | | | | | | | |
Series 2003-E, Class A1(a) | | .781% | | 10/25/28 | | | 124 | | | 86,951 |
Structured Adjustable Rate Mortgage Loan, | | | | | | | | | | |
Series 2004-1, Class 4A-3(a) | | 5.365% | | 02/25/34 | | | 446 | | | 276,893 |
| | | | | | | | | |
|
|
| | | | | | | | | | | 22,404,460 |
| | | | | | | | | |
|
|
Commercial Mortgage Backed Securities — 6.2% | | | | | | | | | | |
Bear Stearns Commercial Mortgage Securities, Inc., | | | | | | | | | | |
Series 2004-T16, Class A5 | | 4.60% | | 02/13/46 | | | 4,200 | | | 3,362,143 |
Series 2006-PW11, Class A4(a) | | 5.456% | | 03/11/39 | | | 860 | | | 733,872 |
Series 2006-T22, Class A4(a) | | 5.464% | | 04/12/38 | | | 2,700 | | | 2,308,903 |
Commercial Mortgage Load Trust, | | | | | | | | | | |
Series 2008-LS1, Class A2(a) | | 6.020% | | 12/10/49 | | | 1,230 | | | 971,139 |
CW Capital Cobalt Ltd., | | | | | | | | | | |
Series 2007-C3, Class A3(a) | | 5.82% | | 05/15/46 | | | 1,300 | | | 852,042 |
GS Mortgage Securities Corp. II, | | | | | | | | | | |
Series 2003-C1, Class A3 | | 4.608% | | 01/10/40 | | | 6,800 | | | 5,991,103 |
Merrill Lynch Mortgage Trust, | | | | | | | | | | |
Series 2006-C1, Class ASB(a) | | 5.657% | | 05/12/39 | | | 1,500 | | | 1,172,269 |
Morgan Stanley Capital I, | | | | | | | | | | |
Series 2005-IQ9, Class AAB | | 4.51% | | 07/15/56 | | | 2,500 | | | 2,104,880 |
Series 2005-T19, Class AAB | | 4.852% | | 06/12/47 | | | 1,375 | | | 1,101,484 |
Series 2006-IQ11, Class A4(a) | | 5.772% | | 10/15/42 | | | 2,800 | | | 2,298,257 |
Wachovia Bank Commercial Mortgage Trust, | | | | | | | | | | |
Series 2007-C33, Class A3(a) | | 5.903% | | 02/15/51 | | | 3,000 | | | 1,947,987 |
| | | | | | | | | |
|
|
| | | | | | | | | | | 22,844,079 |
| | | | | | | | | |
|
|
Corporate Bonds — 0.3% | | | | | | | | | | |
DEPFA ACS Bank, 144A | | 5.125% | | 03/16/37 | | | 1,520 | | | 1,100,667 |
| | | | | | | | | |
|
|
Mortgage Backed Securities — 48.8% | | | | | | | | | | |
Federal Home Loan Mortgage Corp.(a) | | 3.537% | | 05/01/34 | | | 1,395 | | | 1,390,847 |
Federal Home Loan Mortgage Corp. | | 5.00% | | 06/01/33-05/01/34 | | | 9,041 | | | 9,257,175 |
Federal Home Loan Mortgage Corp. | | 5.50% | | 05/01/37-05/01/38 | | | 4,915 | | | 5,036,248 |
Federal Home Loan Mortgage Corp. | | 5.50% | | TBA 30 YR | | | 9,000 | | | 9,210,941 |
Federal Home Loan Mortgage Corp. | | 6.00% | | 09/01/34 | | | 577 | | | 596,102 |
Federal Home Loan Mortgage Corp. | | 6.50% | | 02/01/09-09/01/32 | | | 531 | | | 552,321 |
Federal Home Loan Mortgage Corp. | | 7.00% | | 08/01/11-10/01/32 | | | 253 | | | 261,258 |
Federal National Mortgage Association(a) | | 3.677% | | 07/01/33 | | | 3,693 | | | 3,519,435 |
Federal National Mortgage Association(a) | | 3.769% | | 04/01/34 | | | 526 | | | 526,935 |
Federal National Mortgage Association(a) | | 4.056% | | 08/01/33 | | | 2,488 | | | 2,472,778 |
SEE NOTES TO FINANCIAL STATEMENTS.
A68
| | | | | | |
| | | GOVERNMENT INCOME PORTFOLIO (continued) | | |
| |
| SCHEDULE OF INVESTMENTS | | December 31, 2008 |
| | | | | | | | | | | |
LONG-TERM INVESTMENTS
(continued) | | Interest
Rate
| | | Maturity
Date
| | Principal
Amount
(000)#
| | Value
(Note 2)
|
| | | | | | | | | | | | |
Mortgage Backed Securities (continued) | | | | | | | | | | | |
Federal National Mortgage Association | | 4.50% | | | TBA 15 YR | | $ | 7,000 | | $ | 7,153,124 |
Federal National Mortgage Association(a) | | 4.514% | | | 06/01/34 | | | 1,052 | | | 1,039,323 |
Federal National Mortgage Association(a) | | 4.735% | | | 04/01/34 | | | 1,177 | | | 1,183,353 |
Federal National Mortgage Association | | 5.00% | | | 07/01/18-05/01/36 | | | 11,278 | | | 11,598,396 |
Federal National Mortgage Association | | 5.00% | | | TBA 30 YR | | | 14,500 | | | 14,803,600 |
Federal National Mortgage Association | | 5.50% | | | 01/01/17-05/01/37 | | | 37,559 | | | 38,561,171 |
Federal National Mortgage Association | | 5.50% | | | TBA 15 YR | | | 4,500 | | | 4,633,596 |
Federal National Mortgage Association | | 5.50% | | | TBA 30 YR | | | 19,500 | | | 19,987,499 |
Federal National Mortgage Association | | 6.00% | | | 11/01/14-05/01/36 | | | 13,160 | | | 13,579,945 |
Federal National Mortgage Association | | 6.00% | | | TBA 30 YR | | | 5,000 | | | 5,146,875 |
Federal National Mortgage Association | | 6.26% | | | 03/01/11 | | | 1,128 | | | 1,175,081 |
Federal National Mortgage Association | | 6.50% | | | 11/01/09-10/01/37 | | | 6,184 | | | 6,441,847 |
Federal National Mortgage Association | | 7.00% | | | 02/01/12-01/01/36 | | | 1,341 | | | 1,410,057 |
Federal National Mortgage Association | | 7.50% | | | 11/01/09-10/01/12 | | | 96 | | | 100,181 |
Federal National Mortgage Association | | 8.00% | | | 03/01/22-02/01/26 | | | 33 | | | 35,069 |
Federal National Mortgage Association | | 9.00% | | | 02/01/25-04/01/25 | | | 190 | | | 207,933 |
Government National Mortgage Association | | 5.00% | | | 07/15/33-04/15/34 | | | 3,507 | | | 3,610,755 |
Government National Mortgage Association | | 5.50% | | | 03/15/34-03/15/36 | | | 3,562 | | | 3,678,409 |
Government National Mortgage Association | | 6.00% | | | TBA 30 YR | | | 10,000 | | | 10,315,619 |
Government National Mortgage Association | | 6.50% | | | 07/15/32-08/15/32 | | | 708 | | | 744,007 |
Government National Mortgage Association | | 7.00% | | | 03/15/23-08/15/28 | | | 1,616 | | | 1,712,894 |
Government National Mortgage Association | | 7.50% | | | 12/15/25-02/15/26 | | | 324 | | | 343,935 |
Government National Mortgage Association | | 8.50% | | | 09/15/24-04/15/25 | | | 457 | | | 489,247 |
| | | | | | | | | | |
|
|
| | | | | | | | | | | | 180,775,956 |
| | | | | | | | | | |
|
|
Municipal Bonds — 0.5% | | | | | | | | | | | |
Connecticut St. Hlth. & Ed. Facs. Auth. Rev., Yale Univ. | | 5.05% | | | 07/01/42 | | | 1,800 | | | 1,791,342 |
| | | | | | | | | | |
|
|
U.S. Government Agency Obligations — 14.8% | | | | | | | | | | | |
Federal Farm Credit Bank | | 3.875% | | | 10/07/13 | | | 3,855 | | | 4,097,302 |
Federal Farm Credit Bank | | 4.875% | | | 01/17/17 | | | 980 | | | 1,104,412 |
Federal Farm Credit Bank | | 5.125% | | | 08/25/16 | | | 2,060 | | | 2,357,242 |
Federal Home Loan Bank | | 5.00% | | | 11/17/17 | | | 1,285 | | | 1,473,251 |
Federal Home Loan Bank | | 5.625% | | | 06/11/21 | | | 2,015 | | | 2,321,794 |
Federal Home Loan Mortgage Corp. | | 4.875% | | | 11/15/13 | | | 12,460 | | | 13,902,045 |
Federal National Mortgage Association | | 4.875% | | | 05/18/12 | | | 6,805 | | | 7,410,441 |
Federal National Mortgage Association | | 5.00% | | | 05/11/17 | | | 4,370 | | | 4,982,757 |
FICO Strip Principal | | 3.23% | (d) | | 05/11/18 | | | 4,000 | | | 2,971,200 |
General Electric Cap Corp. | | 3.00% | | | 12/09/11 | | | 12,420 | | | 12,840,417 |
Tennessee Valley Authority | | 4.50% | | | 04/01/18 | | | 805 | | | 888,075 |
Tennessee Valley Authority | | 5.50% | | | 06/15/38 | | | 465 | | | 588,439 |
| | | | | | | | | | |
|
|
| | | | | | | | | | | | 54,937,375 |
| | | | | | | | | | |
|
|
U.S. Government Securities — 14.3% | | | | | | | | | | | |
United States Treasury Bonds(c) | | 4.375% | | | 02/15/38 | | | 40 | | | 53,575 |
United States Treasury Bonds | | 4.50% | | | 05/15/38 | | | 1,290 | | | 1,760,649 |
United States Treasury Bonds | | 4.75% | | | 02/15/37 | | | 280 | | | 390,163 |
United States Treasury Bonds | | 5.00% | | | 05/15/37 | | | 75 | | | 108,668 |
United States Treasury Bonds | | 6.00% | | | 02/15/26 | | | 245 | | | 341,928 |
United States Treasury Bonds | | 6.125% | | | 08/15/29 | | | 210 | | | 308,241 |
United States Treasury Bonds(c) | | 6.25% | | | 08/15/23 | | | 18,400 | | | 25,095,870 |
United States Treasury Bonds | | 7.875% | | | 02/15/21 | | | 585 | | | 869,456 |
United States Treasury Bonds(b) | | 8.75% | | | 08/15/20 | | | 505 | | | 788,352 |
United States Treasury Inflation Index | | 1.375% | | | 07/15/18 | | | 2,793 | | | 2,612,066 |
United States Treasury Inflation Index(c) | | 1.875% | | | 07/15/13 | | | 1,893 | | | 1,782,427 |
United States Treasury Inflation Index(c) | | 2.00% | | | 01/15/14 | | | 5,716 | | | 5,415,758 |
United States Treasury Notes | | .88% | | | 12/31/10 | | | 370 | | | 370,810 |
United States Treasury Notes | | 1.50% | | | 12/31/13 | | | 1,920 | | | 1,915,649 |
United States Treasury Strips(b) | | 3.36% | (d) | | 05/15/21 | | | 6,880 | | | 4,553,975 |
SEE NOTES TO FINANCIAL STATEMENTS.
A69
| | | | | | |
| | | GOVERNMENT INCOME PORTFOLIO (continued) | | |
| |
| SCHEDULE OF INVESTMENTS | | December 31, 2008 |
| | | | | | | | | | | | |
LONG-TERM INVESTMENTS
(continued) | | Interest
Rate
| | | Maturity
Date
| | Principal
Amount
(000)#
| | Value
(Note 2)
| |
| | | | | | | | | | | | | |
U.S. Government Securities (continued) | | | | | | | | | | | | |
United States Treasury Strips(c) | | 3.94% | (d) | | 05/15/20 | | $ | 3,220 | | $ | 2,214,272 | |
United States Treasury Strips(c) | | 4.21% | (d) | | 11/15/21 | | | 3,840 | | | 2,489,614 | |
United States Treasury Strips | | 4.25% | (d) | | 08/15/29 | | | 3,320 | | | 1,757,253 | |
| | | | | | | | | | |
|
|
|
| | | | | | | | | | | | 52,828,726 | |
| | | | | | | | | | |
|
|
|
TOTAL LONG-TERM INVESTMENTS
(cost $338,442,008) | | | 345,639,842 | |
| | | | | | | | | | |
|
|
|
| | |
| | | Shares
| | | |
| SHORT-TERM INVESTMENTS — 35.0% | | | | | | | |
AFFILIATED MUTUAL FUNDS — 35.0% | | | | | | | |
Dryden Core Investment Fund — Short-Term Bond Series (cost $52,702,668) (Note 4)(f) | | | 5,329,243 | | | 39,223,226 | |
Dryden Core Investment Fund — Taxable Money Market Series
(cost $90,360,512; includes $35,682,480 of cash collateral received for securities on loan) (Note 4)(e)(f) | | | 90,360,512 | | | 90,360,512 | |
| | | | | | | | | | |
|
|
|
TOTAL AFFILIATED MUTUAL FUNDS
(cost $143,063,180) | | | 129,583,738 | |
| | | | | | | | | | |
|
|
|
| | |
| | | Contracts
| | | |
OUTSTANDING OPTIONS PURCHASED | | | | | | | |
Put Options | | | | | | | |
Euro, expiring 03/17/09 @ $124.50 (cost $49,981) | | | 347,600 | | | 5 | |
| | | | | |
|
|
|
TOTAL SHORT-TERM INVESTMENTS
(cost $143,113,161) | | | 129,583,743 | |
| | | | | |
|
|
|
TOTAL INVESTMENTS — 128.3%
(cost $481,555,169) | | | 475,223,585 | |
LIABILITIES IN EXCESS OF OTHER ASSETS(g) — (28.3)% | | | (104,710,132 | ) |
| | | | | | | | | | |
|
|
|
NET ASSETS — 100.0% | | $ | 370,513,453 | |
| | |
|
|
|
The following abbreviations are used in portfolio descriptions:
| | |
| 144A | | Securities were purchased pursuant to Rule 144A under the Securities Act of 1933 and may not be resold subject to that rule except to qualified institutional buyers. Unless otherwise noted, 144A securities are deemed to be liquid. |
| FICO | | Financing Corporation |
| TBA | | To be announced |
| # | Principal amount shown in U.S. dollars unless otherwise stated. |
| (a) | Indicates a variable rate security. The maturity date presented for these instruments is the later of the next date on which the security can be redeemed at par or the next date on which the rate of interest is adjusted. The interest rate shown reflects the rate in effect at December 31, 2008. |
| (b) | Security segregated as collateral for futures contracts. |
| (c) | All or portion of security is on loan. The aggregate market value of such securities is $34,323,716; cash collateral of $35,682,480 (included in liabilities) was received with which the Portfolio purchased highly liquid short-term investments. |
| (d) | Represents zero coupon bond. Rate shown reflects the effective yield at reporting date. |
| (e) | Represents security, or a portion thereof, purchased with cash collateral received for securities on loan. |
| (f) | Prudential Investments LLC, the manager of the Portfolio, also serves as manager of the Dryden Core Investment Fund—Taxable Money Market Series and the Dryden Core Investment Fund — Short-Term Bond Series. |
SEE NOTES TO FINANCIAL STATEMENTS.
A70
| | | | | | |
| | | GOVERNMENT INCOME PORTFOLIO (continued) | | |
| |
| SCHEDULE OF INVESTMENTS | | December 31, 2008 |
| (g) | Liabilities in excess of other assets include net unrealized appreciation (depreciation) on financial future contracts, forward foreign currency contracts and interest rate swap agreements as follows: |
Open future contracts outstanding at December 31, 2008:
| | | | | | | | | | | | | | |
Number of
Contracts
| | Type
| | Expiration
Date
| | Value at
December 31, 2008
| | Value at
Trade Date
| | Unrealized
Appreciation
(Depreciation)
| |
| Long Positions: | | | | | | | | | | | | | | |
| 7 | | U.S. Treasury 5 Yr. Notes | | Mar. 09 | | $ | 833,383 | | $ | 835,087 | | $ | (1,704 | ) |
| 114 | | U.S. Treasury 10 Yr. Notes | | Mar. 09 | | | 14,335,500 | | | 13,418,293 | | | 917,207 | |
| | | | | | | | | | | | |
|
|
|
| | | | | | | | | | | | | | 915,503 | |
| | | | | | | | | | | | |
|
|
|
| Short Positions: | | | | | | | | | | | | | | |
| 6 | | U.S. Treasury 2 Yr. Notes | | Mar. 09 | | | 1,308,375 | | | 1,303,297 | | | (5,078 | ) |
| 105 | | U.S. Long Bond | | Mar. 09 | | | 14,494,922 | | | 13,798,649 | | | (696,273 | ) |
| | | | | | | | | | | | |
|
|
|
| | | | | | | | | | | | | | (701,351 | ) |
| | | | | | | | | | | | |
|
|
|
| | | | | | | | | | | | | $ | 214,152 | |
| | | | | | | | | | | | |
|
|
|
Open forward foreign currency exchange contracts outstanding at December 31, 2008:
| | | | | | | | | | | | |
Purchase Contracts:
| | Notional
Amount (000)
| | Payable at
Statement Date
| | Value at
December 31, 2008
| | Unrealized
Depreciation
| |
Pound Sterling expiring 1/23/09 | | GBP 38,370 | | $ | 57,458 | | $ | 55,129 | | $ | (2,329 | ) |
Iceland Krona expiring 5/29/09 | | ISK 5,513,175 | | | 68,700 | | | 44,058 | | | (24,642 | ) |
Iceland Krona expiring 5/29/09 | | ISK 5,803,413 | | | 67,900 | | | 46,377 | | | (21,523 | ) |
| | | | | | | | | | |
|
|
|
| | | | | | | | | | | $ | (48,494 | ) |
| | | | | | | | | | |
|
|
|
| | | | | | | | | | | | |
Sales Contracts:
| | Notional
Amount (000)
| | Receivable at
Statement Date
| | Value at
December 31, 2008
| | Unrealized
Depreciation
| |
Iceland Krona expiring 5/29/09 | | ISK 11,316,588 | | $ | 50,747 | | $ | 90,435 | | $ | (39,688 | ) |
| | | | | | | | | | |
|
|
|
| | | | | | | | | | | $ | (88,182 | ) |
| | | | | | | | | | |
|
|
|
Interest rate swap agreements outstanding at December 31, 2008:
| | | | | | | | | | | | | |
Counterparty
| | Termination
Date
| | Notional
Amount
(000)
| | Fixed
Rate
| | Floating Rate
| | Unrealized
Appreciation/
(Depreciation)
| |
Deutsche Bank AG(1) | | 8/15/15 | | $ | 2,255 | | 3.71198% | | 3 month LIBOR | | $ | (188,936 | ) |
Merrill Lynch Capital Services(1) | | 5/15/16 | | | 3,335 | | 4.39706% | | 3 month LIBOR | | | (448,346 | ) |
Deutsche Bank AG(1) | | 5/15/16 | | | 1,465 | | 4.49000% | | 3 month LIBOR | | | (206,217 | ) |
Royal Bank of Scotland(2) | | 10/21/13 | | | 7,000 | | 3.88272% | | 3 month LIBOR | | | 540,837 | |
Royal Bank of Scotland(1) | | 10/24/13 | | | 7,000 | | 3.52959% | | 3 month LIBOR | | | (435,885 | ) |
Royal Bank of Scotland(2) | | 10/31/13 | | | 7,000 | | 3.77203% | | 3 month LIBOR | | | 518,565 | |
Royal Bank of Scotland(1) | | 10/31/13 | | | 7,000 | | 3.76805% | | 3 month LIBOR | | | (517,233 | ) |
Merrill Lynch Capital Services(2) | | 10/10/13 | | | 3,335 | | 3.78448% | | 3 month LIBOR | | | 242,926 | |
Citigroup(2) | | 10/20/13 | | | 3,335 | | 4.05924% | | 3 month LIBOR | | | 285,419 | |
| | | | | | | | | | | |
|
|
|
| | | | | | | | | | | | $ | (208,870 | ) |
| | | | | | | | | | | |
|
|
|
| | | | | | |
| LIBOR | | London Interbank Offered Rate |
| (1) | Portfolio pays the fixed rate and receives the floating rate. |
| (2) | Portfolio pays the floating rate and receives the fixed rate. |
| | |
| GBP | | British Pound |
| ISK | | Iceland Krona |
SEE NOTES TO FINANCIAL STATEMENTS.
A71
| | | | | | |
| | | GOVERNMENT INCOME PORTFOLIO (continued) | | |
| |
| SCHEDULE OF INVESTMENTS | | December 31, 2008 |
Various inputs are used in determining the value of the Portfolio’s investments. These inputs are summarized in the three broad levels listed below.
Level 1—quoted prices in active markets for identical securities
Level 2—other significant observable inputs (including quoted prices for similar securities, interest rates, prepayment speeds, credit risk, etc.)
Level 3—significant unobservable inputs (including the Portfolio’s own assumptions in determining the fair value of investments)
The following is a summary of the inputs used as of December 31, 2008 in valuing the Portfolio’s assets carried at fair value:
| | | | | | | |
Valuation inputs
| | Investments
in Securities
| | Other Financial
Instruments*
| |
Level 1—Quoted Prices | | $ | 129,583,738 | | $ | 214,152 | |
Level 2—Other Significant Observable Inputs | | | 345,639,847 | | | (297,052 | ) |
Level 3—Significant Unobservable Inputs | | | — | | | — | |
| | |
|
| |
|
|
|
Total | | $ | 475,223,585 | | $ | (82,900 | ) |
| | |
|
| |
|
|
|
| * | Other financial instruments are derivative instruments not reflected in the Schedule of Investments, such as futures, forwards and swap contracts, which are valued at the unrealized appreciation/depreciation on the instrument. |
As of December 31, 2007 and December 31, 2008, the Portfolio did not use any significant unobservable input (Level 3) in determining the valuation of investments.
The industry classification of portfolio holdings and liabilities in excess of other assets shown as a percentage of net assets as of December 31, 2008 was as follows:
| | | |
Mortgage Backed Securities | | 48.8 | % |
Affiliated Money Market Mutual Funds (including 9.6% of collateral received for securities on loan) | | 35.0 | |
U.S. Government Agency Obligations | | 14.8 | |
U.S. Government Treasury Securities | | 14.3 | |
Commercial Mortgage Backed Securities | | 6.2 | |
Collateralized Mortgage Obligations | | 6.0 | |
Asset Backed Securities | | 2.4 | |
Municipal Bonds | | 0.5 | |
Corporate Bonds | | 0.3 | |
| | |
|
|
| | | 128.3 | |
Liabilities in excess of other assets | | (28.3 | ) |
| | |
|
|
| | | 100.0 | % |
| | |
|
|
SEE NOTES TO FINANCIAL STATEMENTS.
A72
| | | | | | |
| | | GOVERNMENT INCOME PORTFOLIO (continued) | | |
STATEMENT OF ASSETS AND LIABILITIES
December 31, 2008
| | | | |
| ASSETS | | | | |
Investments, at value including securities on loan of $34,323,716: | | | | |
Unaffiliated investments (cost $338,491,989) | | $ | 345,639,847 | |
Affiliated investments (cost $143,063,180) | | | 129,583,738 | |
Receivable for investments sold | | | 46,550,320 | |
Dividends and interest receivable | | | 2,095,820 | |
Unrealized appreciation on swaps | | | 1,587,747 | |
Due from broker—variation margin | | | 161,800 | |
Receivable for Series shares sold | | | 49,876 | |
Prepaid expenses | | | 4,198 | |
| | |
|
|
|
Total Assets | | | 525,673,346 | |
| | |
|
|
|
| LIABILITIES | | | | |
Payable for investments purchased | | | 117,272,372 | |
Collateral for securities on loan | | | 35,682,480 | |
Unrealized depreciation on swaps | | | 1,796,617 | |
Management fee payable | | | 124,762 | |
Accrued expenses and other liabilities | | | 118,102 | |
Unrealized depreciation on forward currency contracts | | | 88,182 | |
Payable for Series shares repurchased | | | 67,577 | |
Payable to custodian | | | 6,313 | |
Deferred trustees’ fees | | | 2,859 | |
Affiliated transfer agent fee payable | | | 629 | |
| | |
|
|
|
Total Liabilities | | | 155,159,893 | |
| | |
|
|
|
| NET ASSETS | | $ | 370,513,453 | |
| | |
|
|
|
Net assets were comprised of: | | | | |
Paid-in capital | | $ | 375,032,293 | |
Retained earnings | | | (4,518,840 | ) |
| | |
|
|
|
Net assets, December 31, 2008 | | $ | 370,513,453 | |
| | |
|
|
|
Net asset value and redemption price per share, $370,513,453 / 32,488,713 outstanding shares of beneficial interest | | $ | 11.40 | |
| | |
|
|
|
STATEMENT OF OPERATIONS
Year Ended December 31, 2008
| | | | |
| INVESTMENT INCOME | | | | |
Unaffiliated interest income | | $ | 12,343,455 | |
Affiliated dividend income | | | 3,076,191 | |
Affiliated income from securities loaned, net | | | 310,267 | |
| | |
|
|
|
| | | | 15,729,913 | |
| | |
|
|
|
| EXPENSES | | | | |
Management fee | | | 1,397,986 | |
Shareholders’ reports | | | 144,000 | |
Interest expense (Note 8) | | | 115,988 | |
Custodian’s fees and expenses | | | 102,000 | |
Audit fee | | | 28,000 | |
Trustees’ fees | | | 12,000 | |
Legal fees and expenses | | | 6,000 | |
Insurance expenses | | | 4,000 | |
Transfer agent’s fees and expenses (including affiliated expense of $3,600) (Note 4) | | | 4,000 | |
Miscellaneous | | | 9,072 | |
| | |
|
|
|
Total expenses | | | 1,823,046 | |
| | |
|
|
|
| NET INVESTMENT INCOME | | | 13,906,867 | |
| | |
|
|
|
| NET REALIZED AND UNREALIZED GAIN (LOSS) ON INVESTMENTS AND FOREIGN CURRENCIES | | | | |
Net realized gain (loss) on: | | | | |
Investment transactions | | | 5,203,908 | |
Foreign currency transactions | | | 27,197 | |
Futures transactions | | | 1,679,784 | |
Short sale transactions | | | (609,778 | ) |
Swap transactions | | | 1,879,723 | |
| | |
|
|
|
| | | | 8,180,834 | |
| | |
|
|
|
Net change in unrealized appreciation (depreciation) on: | | | | |
Investments (including affiliated: $(10,914,076)) | | | (6,622,115 | ) |
Foreign currencies | | | (95,038 | ) |
Futures | | | 328,929 | |
Swaps | | | (848,867 | ) |
| | |
|
|
|
| | | | (7,237,091 | ) |
| | |
|
|
|
| NET GAIN ON INVESTMENTS AND FOREIGN CURRENCIES | | | 943,743 | |
| | |
|
|
|
| NET INCREASE IN NET ASSETS RESULTING FROM OPERATIONS | | $ | 14,850,610 | |
| | |
|
|
|
STATEMENT OF CHANGES IN NET ASSETS
| | | | | | | | |
| | | Year Ended December 31,
| |
| | | 2008
| | | 2007
| |
| INCREASE (DECREASE) IN NET ASSETS | | | | | | | | |
| OPERATIONS: | | | | | | | | |
Net investment income | | $ | 13,906,867 | | | $ | 15,840,887 | |
Net realized gain (loss) on investments and foreign currency transactions | | | 8,180,834 | | | | (618,671 | ) |
Net change in unrealized appreciation (depreciation) on investments and foreign currencies | | | (7,237,091 | ) | | | 3,580,948 | |
| | |
|
|
| |
|
|
|
NET INCREASE IN NET ASSETS RESULTING FROM OPERATIONS | | | 14,850,610 | | | | 18,803,164 | |
| | |
|
|
| |
|
|
|
| DISTRIBUTIONS | | | (14,159,429 | ) | | | (15,181,670 | ) |
| | |
|
|
| |
|
|
|
| SERIES SHARE TRANSACTIONS: | | | | | | | | |
Series shares sold [3,779,508 and 722,847 shares, respectively] | | | 43,082,961 | | | | 8,166,048 | |
Series shares issued in reinvestment of distributions [1,259,137 and 1,353,614 shares, respectively] | | | 14,159,429 | | | | 15,181,670 | |
Series shares repurchased [2,453,088 and 3,624,503 shares, respectively] | | | (27,727,532 | ) | | | (40,920,583 | ) |
| | |
|
|
| |
|
|
|
NET INCREASE (DECREASE) IN NET ASSETS RESULTING FROM SERIES SHARE TRANSACTIONS | | | 29,514,858 | | | | (17,572,865 | ) |
| | |
|
|
| |
|
|
|
| TOTAL INCREASE (DECREASE) IN NET ASSETS | �� | | 30,206,039 | | | | (13,951,371 | ) |
| NET ASSETS: | | | | | | | | |
Beginning of year | | | 340,307,414 | | | | 354,258,785 | |
| | |
|
|
| |
|
|
|
End of year | | $ | 370,513,453 | | | $ | 340,307,414 | |
| | |
|
|
| |
|
|
|
SEE NOTES TO FINANCIAL STATEMENTS.
A73
| | | | | | |
| | | HIGH YIELD BOND PORTFOLIO | | |
| |
| SCHEDULE OF INVESTMENTS | | December 31, 2008 |
| | | | | | | | | | | | | |
LONG-TERM INVESTMENTS — 89.7%
CORPORATE BONDS — 89.6% | | Moody’s
Rating†
(Unaudited)
| | Interest
Rate
| | Maturity
Date
| | Principal
Amount
(000)
| | | Value
(Note 2)
|
| | | | | | | | | | | | | | |
Aerospace/Defense — 3.3% | | | | | | | | | | | | | |
BE Aerospace, Inc., Sr. Unsec’d. Notes | | Ba3 | | 8.50% | | 07/01/18 | | $ | 2,900 | | | $ | 2,610,000 |
DRS Technologies, Inc., Gtd. Notes | | A3 | | 6.625% | | 02/01/16 | | | 4,600 | | | | 4,600,000 |
DRS Technologies, Inc., Gtd. Notes | | Baa1 | | 6.875% | | 11/01/13 | | | 2,000 | | | | 1,990,000 |
DRS Technologies, Inc., Gtd. Notes | | Baa1 | | 7.625% | | 02/01/18 | | | 6,775 | | | | 6,775,000 |
Esterline Technologies Corp., Gtd. Notes | | Ba2 | | 6.625% | | 03/01/17 | | | 750 | | | | 637,500 |
Esterline Technologies Corp., Gtd. Notes | | B1 | | 7.75% | | 06/15/13 | | | 4,500 | | | | 3,915,000 |
L-3 Communications Corp., Gtd. Notes | | Ba3 | | 6.125% | | 01/15/14 | | | 1,180 | | | | 1,070,850 |
L-3 Communications Corp., Gtd. Notes | | Ba3 | | 7.625% | | 06/15/12 | | | 6,800 | | | | 6,647,000 |
L-3 Communications Corp., Gtd. Notes, Ser. B | | Ba3 | | 6.375% | | 10/15/15 | | | 4,875 | | | | 4,558,125 |
Moog, Inc., Sr. Sub. Notes | | Ba3 | | 6.25% | | 01/15/15 | | | 2,000 | | | | 1,600,000 |
Moog, Inc., Sr. Sub. Notes, 144A | | Ba3 | | 7.25% | | 06/15/18 | | | 3,500 | | | | 2,800,000 |
TransDigm, Inc., Gtd. Notes | | B3 | | 7.75% | | 07/15/14 | | | 4,350 | | | | 3,567,000 |
| | | | | | | | | | | | |
|
|
| | | | | | | | | | | | | | 40,770,475 |
| | | | | | | | | | | | |
|
|
Airlines — 0.2% | | | | | | | | | | | | | |
AMR Corp., Sr. Unsec’d. Notes, MTN | | CCC+(g) | | 10.40% | | 03/10/11 | | | 1,000 | | | | 481,250 |
AMR Corp., Sr. Unsec’d. Notes, MTN | | CCC+(g) | | 10.40% | | 03/15/11 | | | 1,000 | | | | 481,250 |
AMR Corp., Sr. Unsec’d. Notes, MTN | | NR | | 10.55% | | 03/12/21 | | | 1,425 | | | | 564,656 |
Continental Airlines, Inc., Pass-thru Certs.,
Ser. 98-1, Class B(b) | | Ba2 | | 6.748% | | 03/15/17 | | | 985 | | | | 689,169 |
Ser. 99-2, Class B | | Ba2 | | 7.566% | | 03/15/20 | | | 448 | | | | 291,393 |
| | | | | | | | | | | | |
|
|
| | | | | | | | | | | | | | 2,507,718 |
| | | | | | | | | | | | |
|
|
Automotive — 1.9% | | | | | | | | | | | | | |
Ford Motor Co., Bank Loan(f) | | B2 | | 5.00% | | 12/15/13 | | | 12,740 | | | | 5,111,925 |
Ford Motor Credit Co., Sr. Unsec’d. Notes(b) | | Caa1 | | 7.25% | | 10/25/11 | | | 8,780 | | | | 6,413,869 |
Ford Motor Credit Co., Sr. Unsec’d. Notes(b) | | Caa1 | | 7.875% | | 06/15/10 | | | 5,300 | | | | 4,240,954 |
Ford Motor Credit Co., Sr. Unsec’d. Notes(b) | | Caa1 | | 9.875% | | 08/10/11 | | | 2,250 | | | | 1,659,870 |
Lear Corp., Gtd. Notes, Ser. B | | B3 | | 8.75% | | 12/01/16 | | | 2,175 | | | | 630,750 |
TRW Automotive, Inc., Bank Loan(f) | | Ba1 | | 5.211% | | 02/09/14 | | | 2,187 | | | | 1,434,606 |
TRW Automotive, Inc., Gtd. Notes, 144A(b) | | B2 | | 7.25% | | 03/15/17 | | | 6,900 | | | | 3,519,000 |
Visteon Corp., Sr. Unsec’d. Notes | | Caa3 | | 7.00% | | 03/10/14 | | | 2,595 | | | | 389,250 |
| | | | | | | | | | | | |
|
|
| | | | | | | | | | | | | | 23,400,224 |
| | | | | | | | | | | | |
|
|
Banking — 0.4% | | | | | | | | | | | | | |
Halyk Savings Bank of Kazakhstan, Sr. Unsec’d. Notes
(Kazakhstan), 144A | | Baa3 | | 8.125% | | 10/07/09 | | | 1,305 | | | | 1,207,125 |
HSBK Europe BV, Gtd. Notes (Netherlands), 144A | | Baa3 | | 7.25% | | 05/03/17 | | | 3,500 | | | | 1,890,000 |
Kazkommerts International BV, Gtd. Notes (Netherlands), 144A | | Ba1 | | 7.00% | | 11/03/09 | | | 1,685 | | | | 1,449,100 |
| | | | | | | | | | | | |
|
|
| | | | | | | | | | | | | | 4,546,225 |
| | | | | | | | | | | | |
|
|
Building Materials & Construction — 0.6% | | | | | | | | | | | | | |
D.R. Horton, Inc., Gtd. Notes | | Ba3 | | 8.00% | | 02/01/09 | | | 6,350 | | | | 6,283,377 |
Nortek, Inc., Sr. Sub. Notes | | Caa1 | | 8.50% | | 09/01/14 | | | 3,445 | | | | 792,350 |
Toll Corp., Gtd. Notes | | Ba2 | | 8.25% | | 02/01/11 | | | 800 | | | | 736,000 |
| | | | | | | | | | | | |
|
|
| | | | | | | | | | | | | | 7,811,727 |
| | | | | | | | | | | | |
|
|
Cable — 4.3% | | | | | | | | | | | | | |
AT&T Broadband LLC, Gtd. Notes | | Baa2 | | 8.375% | | 03/15/13 | | | 100 | (i) | | | 103 |
CCH I LLC, Gtd. Notes | | Caa3 | | 11.125% | | 01/15/14 | | | 1,515 | | | | 77,644 |
CCH I LLC, Gtd. Notes | | Caa3 | | 13.50% | | 01/15/14 | | | 50 | | | | 2,562 |
CCH I LLC, Gtd. Notes(b) | | Caa3 | | 10.00% | | 05/15/14 | | | 2,517 | | | | 100,680 |
CCH I/CCH I CP, Sr. Sec’d. Notes | | NR | | 11.00% | | 10/01/15 | | | 3,265 | | | | 506,075 |
CCH I/CCH I CP, Sr. Sec’d. Notes | | Caa3 | | 11.00% | | 10/01/15 | | | 828 | | | | 144,900 |
CCH II LLC / CCH II Capital Corp., Gtd. Notes, 144A | | Caa2 | | 10.25% | | 10/01/13 | | | 2,100 | | | | 714,000 |
CCH II/ CCH II CP, Gtd. Notes(b) | | NR | | 10.25% | | 10/01/13 | | | 1,683 | | | | 605,880 |
Charter Communications Operating LLC, BK Ln B Refi., Bank Loan(f) | | B1 | | 5.064% | | 09/06/14 | | | 8,415 | | | | 6,142,950 |
CSC Holdings, BK Ln A1, Bank Loan(f) | | Ba1 | | 2.195% | | 02/24/12 | | | 3,669 | | | | 3,188,308 |
CSC Holdings, Inc., Sr. Unsec’d. Notes(b) | | B1 | | 7.625% | | 07/15/18 | | | 2,500 | | | | 1,950,000 |
SEE NOTES TO FINANCIAL STATEMENTS.
A74
| | | | | | |
| | | HIGH YIELD BOND PORTFOLIO (continued) | | |
| |
| SCHEDULE OF INVESTMENTS | | December 31, 2008 |
| | | | | | | | | | | | |
CORPORATE BONDS
(continued) | | Moody’s
Rating†
(Unaudited)
| | Interest
Rate
| | Maturity
Date
| | Principal
Amount
(000)
| | Value
(Note 2)
|
| | | | | | | | | | | | | |
Cable (continued) | | | | | | | | | | | | |
CSC Holdings, Inc., Sr. Unsec’d. Notes | | B1 | | 7.875% | | 02/15/18 | | $ | 800 | | $ | 628,000 |
CSC Holdings, Inc., Sr. Unsec’d. Notes, 144A | | B1 | | 8.50% | | 06/15/15 | | | 7,000 | | | 6,159,999 |
CSC Holdings, Inc., Sr. Unsec’d. Notes, Ser. B | | B1 | | 7.625% | | 04/01/11 | | | 4,600 | | | 4,335,500 |
CSC Holdings, Inc., Sr. Unsec’d. Notes, Ser. B(b) | | B1 | | 8.125% | | 07/15/09 | | | 2,410 | | | 2,397,950 |
CSC Holdings, Inc., Sr. Unsec’d. Notes, Ser. B | | B1 | | 8.125% | | 08/15/09 | | | 5,450 | | | 5,422,750 |
Mediacom Broadband LLC, Sr. Unsec’d. Notes | | B3 | | 8.50% | | 10/15/15 | | | 1,975 | | | 1,286,219 |
Mediacom LLC, Sr. Unsec’d. Notes(b) | | B3 | | 9.50% | | 01/15/13 | | | 1,925 | | | 1,453,375 |
Shaw Communications, Inc., Sr. Unsec’d. Notes (Canada) | | Ba1 | | 7.20% | | 12/15/11 | | | 3,300 | | | 3,118,500 |
UPC Broadband Holding BV, Bank Loan(f) | | Ba3 | | 3.181% | | 12/31/14 | | | 7,000 | | | 4,648,000 |
Videotron Ltee, Gtd. Notes (Canada) | | Ba2 | | 6.375% | | 12/15/15 | | | 3,450 | | | 2,708,250 |
Videotron Ltee, Gtd. Notes (Canada) | | Ba2 | | 6.875% | | 01/15/14 | | | 4,020 | | | 3,557,700 |
Videotron Ltee, Gtd. Notes (Canada), 144A(b) | | Ba2 | | 9.125% | | 04/15/18 | | | 3,850 | | | 3,580,500 |
Virgin Media Finance PLC, Gtd. Notes (United Kingdom)(b) | | B2 | | 9.125% | | 08/15/16 | | | 1,275 | | | 943,500 |
| | | | | | | | | | | |
|
|
| | | | | | | | | | | | | 53,673,345 |
| | | | | | | | | | | |
|
|
Capital Goods — 10.2% | | | | | | | | | | | | |
Actuant Corp., Gtd. Notes | | Ba2 | | 6.875% | | 06/15/17 | | | 3,375 | | | 2,539,688 |
ALH Finance LLC, Gtd. Notes(b) | | B3 | | 8.50% | | 01/15/13 | | | 6,900 | | | 5,313,000 |
Allied Waste North America, Inc., Sr. Sec’d. Notes | | BBB(g) | | 7.125% | | 05/15/16 | | | 550 | | | 500,500 |
Allied Waste North America, Inc., Sr. Sec’d. Notes | | BBB(g) | | 7.875% | | 04/15/13 | | | 675 | | | 641,250 |
Allied Waste North America, Inc., Sr. Sec’d. Notes(b) | | Baa3 | | 6.125% | | 02/15/14 | | | 1,000 | | | 905,000 |
Allied Waste North America, Inc., Sr. Sec’d. Notes(b) | | BBB(g) | | 7.25% | | 03/15/15 | | | 4,400 | | | 4,092,000 |
Allied Waste North America, Inc., Sr. Sec’d. Notes, Ser. B(b) | | BBB(g) | | 5.75% | | 02/15/11 | | | 5,320 | | | 4,987,500 |
Ashtead Capital, Inc., Sr. Sec’d. Notes, 144A | | B1 | | 9.00% | | 08/15/16 | | | 9,545 | | | 4,915,675 |
Ashtead Holdings PLC, Sr. Sec’d. Notes (United Kingdom), 144A | | B1 | | 8.625% | | 08/01/15 | | | 5,325 | | | 2,795,625 |
Baldor Electric Co., Gtd. Notes(b) | | B3 | | 8.625% | | 02/15/17 | | | 7,535 | | | 5,613,575 |
Blount, Inc., Gtd. Notes | | B2 | | 8.875% | | 08/01/12 | | | 9,790 | | | 9,055,750 |
Capital Safety Group Ltd., Bank Loan(f) | | B2 | | 2.711% | | 07/20/15 | | | 2,728 | | | 2,100,810 |
Capital Safety Group Ltd., Bank Loan(f) | | B2 | | 3.211% | | 07/20/16 | | | 7,272 | | | 5,599,190 |
Columbus Mckinnon Corp., Gtd. Notes | | B1 | | 8.875% | | 11/01/13 | | | 7,300 | | | 6,132,000 |
GrafTech Finance, Inc., Gtd. Notes | | Ba3 | | 10.25% | | 02/15/12 | | | 937 | | | 852,670 |
Hertz Corp., Gtd. Notes | | B1 | | 8.875% | | 01/01/14 | | | 17,736 | | | 10,907,639 |
Hertz Corp., Gtd. Notes(b) | | B2 | | 10.50% | | 01/01/16 | | | 950 | | | 433,438 |
Interline Brands, Inc., Gtd. Notes | | B3 | | 8.125% | | 06/15/14 | | | 3,315 | | | 2,618,850 |
Johnsondiversey Holdings, Inc., Disc. Notes | | Caa1 | | 10.67% | | 05/15/13 | | | 7,281 | | | 5,096,700 |
Johnsondiversey, Inc., Gtd. Notes, Ser. B(b) | | B2 | | 9.625% | | 05/15/12 | | | 3,710 | | | 3,042,200 |
Mobile Mini, Inc., Gtd. Notes | | B2 | | 6.875% | | 05/01/15 | | | 3,732 | | | 2,537,760 |
RBS Global, Inc. and Rexnord Corp., Gtd. Notes(b) | | B3 | | 9.50% | | 08/01/14 | | | 8,205 | | | 6,112,725 |
Rental Service Corp., Gtd. Notes(b) | | Caa1 | | 9.50% | | 12/01/14 | | | 10,095 | | | 5,552,250 |
SPX Corp., Sr. Unsec’d. Notes, 144A | | Ba2 | | 7.625% | | 12/15/14 | | | 9,130 | | | 7,943,100 |
Stena AB, Sr. Unsec’d. Notes (Sweden) | | Ba2 | | 7.00% | | 12/01/16 | | | 250 | | | 160,000 |
Stena AB, Sr. Unsec’d. Notes (Sweden) | | Ba2 | | 7.50% | | 11/01/13 | | | 7,175 | | | 4,744,469 |
Terex Corp., Gtd. Notes | | Ba1 | | 7.375% | | 01/15/14 | | | 4,790 | | | 4,167,300 |
Terex Corp., Sr. Sub. Notes(b) | | Ba3 | | 8.00% | | 11/15/17 | | | 6,000 | | | 5,100,000 |
United Rentals North America, Inc., Gtd. Notes | | B1 | | 6.50% | | 02/15/12 | | | 7,035 | | | 5,557,650 |
United Rentals North America, Inc., Gtd. Notes(b) | | B2 | | 7.75% | | 11/15/13 | | | 2,785 | | | 1,810,250 |
Valmont Industries, Inc., Gtd. Notes | | Ba2 | | 6.875% | | 05/01/14 | | | 4,920 | | | 4,182,000 |
| | | | | | | | | | | |
|
|
| | | | | | | | | | | | | 126,010,564 |
| | | | | | | | | | | |
|
|
Chemicals — 2.5% | | | | | | | | | | | | |
Huntsman International LLC, Sec’d. Notes | | Ba1 | | 11.625% | | 10/15/10 | | | 15,136 | | | 13,244,000 |
ISP Chemco, Inc., Bank Loan(f) | | Ba3 | | 3.327% | | 06/04/14 | | | 5,486 | | | 3,675,671 |
Koppers, Inc., Sr. Sec’d. Notes(b) | | Ba3 | | 9.875% | | 10/15/13 | | | 8,180 | | | 7,525,600 |
Momentive Performance Materials, Inc., Gtd. Notes(b) | | B3 | | 9.75% | | 12/01/14 | | | 4,910 | | | 2,086,750 |
Momentive Performance Materials, Inc., Gtd. Notes(b) | | Caa2 | | 11.50% | | 12/01/16 | | | 1,299 | | | 383,205 |
Mosaic Co., Sr. Unsec’d. Notes, 144A | | Baa3 | | 7.375% | | 12/01/14 | | | 2,375 | | | 1,947,500 |
SEE NOTES TO FINANCIAL STATEMENTS.
A75
| | | | | | |
| | | HIGH YIELD BOND PORTFOLIO (continued) | | |
| |
| SCHEDULE OF INVESTMENTS | | December 31, 2008 |
| | | | | | | | | | | | |
CORPORATE BONDS
(continued) | | Moody’s
Rating†
(Unaudited)
| | Interest
Rate
| | Maturity
Date
| | Principal
Amount
(000)
| | Value
(Note 2)
|
| | | | | | | | | | | | | |
Chemicals (continued) | | | | | | | | | | | | |
Mosaic Co., Sr. Unsec’d. Notes, 144A | | Baa3 | | 7.625% | | 12/01/16 | | $ | 825 | | $ | 660,000 |
Nalco Co., Gtd. Notes | | B3 | | 8.875% | | 11/15/13 | | | 1,720 | | | 1,453,400 |
| | | | | | | | | | | |
|
|
| | | | | | | | | | | | | 30,976,126 |
| | | | | | | | | | | |
|
|
Consumer — 2.1% | | | | | | | | | | | | |
Levi Strauss & Co., Sr. Unsec’d. Notes(b) | | B2 | | 9.75% | | 01/15/15 | | | 2,500 | | | 1,850,000 |
Mac-Gray Corp., Gtd. Notes | | B3 | | 7.625% | | 08/15/15 | | | 2,950 | | | 2,714,000 |
Realogy Corp., Gtd. Notes | | Ca | | 10.50% | | 04/15/14 | | | 15,375 | | | 2,652,188 |
Realogy Corp., Gtd. Notes, PIK | | Ca | | 11.00% | | 04/15/14 | | | 6,006 | | | 690,699 |
Service Corp. International, Sr. Unsec’d. Notes(b) | | B1 | | 6.75% | | 04/01/15 | | | 1,475 | | | 1,165,250 |
Service Corp. International, Sr. Unsec’d. Notes | | B1 | | 6.75% | | 04/01/16 | | | 5,725 | | | 4,351,000 |
Service Corp. International, Sr. Unsec’d. Notes | | B1 | | 7.00% | | 06/15/17 | | | 5,323 | | | 3,992,250 |
Service Corp. International, Sr. Unsec’d. Notes(b) | | B1 | | 7.375% | | 10/01/14 | | | 1,425 | | | 1,211,250 |
Service Corp. International, Sr. Unsec’d. Notes | | B1 | | 7.875% | | 02/01/13 | | | 2,000 | | | 1,782,500 |
Stewart Enterprises, Inc., Gtd. Notes | | Ba3 | | 6.25% | | 02/15/13 | | | 5,025 | | | 3,894,375 |
Ticketmaster, Gtd. Notes, 144A | | Ba3 | | 10.75% | | 08/01/16 | | | 3,775 | | | 2,038,500 |
| | | | | | | | | | | |
|
|
| | | | | | | | | | | | | 26,342,012 |
| | | | | | | | | | | |
|
|
Electric — 9.6% | | | | | | | | | | | | |
AES Corp., Sr. Sec’d. Notes, 144A | | Ba3 | | 8.75% | | 05/15/13 | | | 5,620 | | | 5,395,200 |
AES Corp., Sr. Unsec’d. Notes | | B1 | | 7.75% | | 03/01/14 | | | 3,650 | | | 3,212,000 |
AES Corp., Sr. Unsec’d. Notes | | B1 | | 7.75% | | 10/15/15 | | | 2,050 | | | 1,722,000 |
AES Corp., Sr. Unsec’d. Notes | | B1 | | 8.00% | | 10/15/17 | | | 2,725 | | | 2,234,500 |
AES Eastern Energy LP, Pass-thru-Certs.,
Ser. 99-A | | Ba1 | | 9.00% | | 01/02/17 | | | 5,657 | | | 5,028,952 |
Ser. 99-B(f) | | Ba1 | | 9.67% | | 01/02/29 | | | 2,000 | | | 1,620,000 |
CMS Energy Corp., Sr. Unsec’d. Notes | | Ba1 | | 6.55% | | 07/17/17 | | | 3,350 | | | 2,696,844 |
Dynegy Holdings, Inc., Sr. Unsec’d. Notes | | B2 | | 7.50% | | 06/01/15 | | | 1,900 | | | 1,330,000 |
Dynegy Roseton/Danskammer, Pass-thru Certs., Ser. B | | Ba3 | | 7.67% | | 11/08/16 | | | 10,335 | | | 7,344,258 |
Energy Future Holdings Corp., Gtd. Notes, 144A, PIK | | B3 | | 11.25% | | 11/01/17 | | | 7,175 | | | 3,479,875 |
Mirant Americas Generation LLC, Sr. Unsec’d. Notes | | B3 | | 8.30% | | 05/01/11 | | | 4,325 | | | 4,195,250 |
Mirant Americas Generation LLC, Sr. Unsec’d. Notes | | B3 | | 8.50% | | 10/01/21 | | | 850 | | | 646,000 |
Mirant Corp., Sr. Notes, 144A(c)(f) | | NR | | 7.40% | | 07/15/49 | | | 1,825 | | | 1,825 |
Mirant Mid Atlantic LLC, Pass-thru Certs., Ser. B | | Ba1 | | 9.125% | | 06/30/17 | | | 2,728 | | | 2,458,889 |
Mirant North America LLC, Gtd. Notes(b) | | B1 | | 7.375% | | 12/31/13 | | | 7,400 | | | 7,104,000 |
Nevada Power Co., Gen Ref. Mtge. Notes, Ser. A | | Baa3 | | 8.25% | | 06/01/11 | | | 1,675 | | | 1,709,523 |
NRG Energy, Inc., Gtd. Notes | | B1 | | 7.25% | | 02/01/14 | | | 6,550 | | | 6,124,250 |
NRG Energy, Inc., Gtd. Notes | | B1 | | 7.375% | | 02/01/16 | | | 845 | | | 785,850 |
Orion Power Holdings, Inc., Sr. Unsec’d. Notes | | Ba3 | | 12.00% | | 05/01/10 | | | 9,976 | | | 9,976,000 |
PSEG Energy Holdings LLC, Sr. Unsec’d. Notes | | Ba3 | | 8.50% | | 06/15/11 | | | 9,675 | | | 9,119,810 |
Reliant Energy Mid-Atlantic Power Holdings LLC, Pass-thru Certs., Ser. B(f) | | Ba1 | | 9.237% | | 07/02/17 | | | 4,231 | | | 3,849,963 |
Reliant Energy Mid-Atlantic Power Holdings LLC, Pass-thru Certs., Ser. C | | Ba1 | | 9.681% | | 07/02/26 | | | 250 | | | 200,000 |
Reliant Energy, Inc., Sr. Sec’d. Notes | | Ba3 | | 6.75% | | 12/15/14 | | | 1,300 | | | 1,170,000 |
Sithe/Independence Funding Corp., Sr. Sec’d. Notes | | Ba2 | | 9.00% | | 12/30/13 | | | 2,443 | | | 2,076,021 |
Tenaska Alabama Partners LP, Sr. Sec’d. Notes, 144A (original cost $2,944,975; purchased 5/2/08)(k) | | Ba2 | | 7.00% | | 06/30/21 | | | 3,108 | | | 2,437,839 |
Texas Competitive Electric Holdings Co. LLC, Bank Loan(f) | | Ba3 | | 5.36% | | 10/10/14 | | | 31,047 | | | 21,461,003 |
Texas Competitive Electric Holdings Co. LLC, Bank Loan(f) | | Ba3 | | 5.364% | | 10/10/14 | | | 1,991 | | | 1,376,243 |
Texas Competitive Electric Holdings Co. LLC, Bank Loan(f) | | Ba3 | | 5.582% | | 10/10/14 | | | 4,602 | | | 3,180,892 |
Texas Competitive Electric Holdings Co. LLC, Gtd. Notes, 144A(b) | | B3 | | 10.50% | | 11/01/15 | | | 5,500 | | | 3,905,000 |
Texas Competitive Electric Holdings Co. LLC, Gtd. Notes, 144A(b) | | B3 | | 10.50% | | 11/01/15 | | | 4,650 | | | 3,301,500 |
| | | | | | | | | | | |
|
|
| | | | | | | | | | | | | 119,143,487 |
| | | | | | | | | | | |
|
|
Energy - Integrated — 0.1% | | | | | | | | | | | | |
TNK-BP Finance SA, Gtd. Notes (Luxembourg), 144A | | Baa2 | | 7.50% | | 07/18/16 | | | 3,000 | | | 1,560,000 |
| | | | | | | | | | | |
|
|
SEE NOTES TO FINANCIAL STATEMENTS.
A76
| | | | | | |
| | | HIGH YIELD BOND PORTFOLIO (continued) | | |
| |
| SCHEDULE OF INVESTMENTS | | December 31, 2008 |
| | | | | | | | | | | | |
CORPORATE BONDS
(continued) | | Moody’s
Rating†
(Unaudited)
| | Interest
Rate
| | Maturity
Date
| | Principal
Amount
(000)
| | Value
(Note 2)
|
| | | | | | | | | | | | | |
Energy - Other — 5.4% | | | | | | | | | | | | |
Cie Generale Geophysique-Veritas, Gtd. Notes (France) | | Ba3 | | 7.75% | | 05/15/17 | | $ | 1,750 | | $ | 1,015,000 |
Compagnie Generale De Geophysique Veritas, Gtd. Notes (France) | | Ba3 | | 7.50% | | 05/15/15 | | | 780 | | | 483,600 |
McMoRan Exploration Co., Gtd. Notes | | Caa1 | | 11.875% | | 11/15/14 | | | 8,250 | | | 5,857,500 |
Newfield Exploration Co., Sr. Sub. Notes | | Ba3 | | 6.625% | | 04/15/16 | | | 8,050 | | | 6,399,750 |
Newfield Exploration Co., Sr. Sub. Notes | | Ba3 | | 7.125% | | 05/15/18 | | | 3,725 | | | 2,942,750 |
OPTI Canada, Inc., Sec’d. Notes (Canada) | | B2 | | 7.875% | | 12/15/14 | | | 8,525 | | | 4,347,750 |
OPTI Canada, Inc., Sec’d. Notes (Canada) | | B2 | | 8.25% | | 12/15/14 | | | 3,400 | | | 1,836,000 |
Parker Drilling Co., Gtd. Notes | | B2 | | 9.625% | | 10/01/13 | | | 1,365 | | | 1,057,875 |
PetroHawk Energy Corp., Gtd. Notes | | B3 | | 9.125% | | 07/15/13 | | | 5,100 | | | 4,131,000 |
PetroHawk Energy Corp., Gtd. Notes, 144A | | B3 | | 7.875% | | 06/01/15 | | | 5,625 | | | 4,162,500 |
Petroplus Finance Ltd., Gtd. Notes (Bermuda), 144A(b) | | B1 | | 6.75% | | 05/01/14 | | | 12,600 | | | 8,001,000 |
Petroplus Finance Ltd., Gtd. Notes (Bermuda), 144A(b) | | B1 | | 7.00% | | 05/01/17 | | | 4,225 | | | 2,577,250 |
Pioneer Natural Resources Co., Gtd. Notes | | Ba1 | | 5.875% | | 07/15/16 | | | 1,950 | | | 1,352,892 |
Pioneer Natural Resources Co., Sr. Unsec’d. Notes | | Ba1 | | 6.65% | | 03/15/17 | | | 7,730 | | | 5,516,136 |
Pioneer Natural Resources Co., Sr. Unsec’d. Notes | | Ba1 | | 6.875% | | 05/01/18 | | | 4,865 | | | 3,402,591 |
Plains Exploration & Production Co., Gtd. Notes | | B1 | | 7.625% | | 06/01/18 | | | 2,150 | | | 1,472,750 |
Plains Exploration & Production Co., Gtd. Notes | | B1 | | 7.75% | | 06/15/15 | | | 8,545 | | | 6,451,475 |
SandRidge Energy, Inc., Sr. Unsec’d. Notes, 144A | | B3 | | 8.00% | | 06/01/18 | | | 9,400 | | | 5,217,000 |
| | | | | | | | | | | |
|
|
| | | | | | | | | | | | | 66,224,819 |
| | | | | | | | | | | |
|
|
Foods — 1.9% | | | | | | | | | | | | |
Ahold Finance USA, Inc., Gtd. Notes | | Baa3 | | 8.25% | | 07/15/10 | | | 1,120 | | | 1,113,928 |
Albertson’s LLC, Sr. Unsec’d. Notes | | B1 | | 8.70% | | 05/01/30 | | | 1,235 | | | 796,575 |
Aramark Corp., Gtd. Notes(b) | | B3 | | 8.50% | | 02/01/15 | | | 4,650 | | | 4,208,250 |
Aramark Corp., Gtd. Notes(h) | | B3 | | 6.692% | | 02/01/15 | | | 2,600 | | | 1,963,000 |
Carrols Corp., Gtd. Notes | | B3 | | 9.00% | | 01/15/13 | | | 500 | | | 337,500 |
Del Monte Corp., Gtd. Notes | | B2 | | 8.625% | | 12/15/12 | | | 3,100 | | | 3,007,000 |
Dole Food Co., Inc., Gtd. Notes | | Caa2 | | 7.25% | | 06/15/10 | | | 3,700 | | | 2,580,750 |
National Beef Packing Co., LLC, Sr. Unsec’d. Notes | | Caa1 | | 10.50% | | 08/01/11 | | | 4,284 | | | 2,998,800 |
Smithfield Foods, Inc., Sr. Unsec’d. Notes | | B3 | | 7.00% | | 08/01/11 | | | 2,040 | | | 1,448,400 |
Smithfield Foods, Inc., Sr. Unsec’d. Notes, Ser. B | | B3 | | 7.75% | | 05/15/13 | | | 1,650 | | | 1,060,125 |
Stater Brothers Holdings, Gtd. Notes | | B2 | | 7.75% | | 04/15/15 | | | 3,150 | | | 2,646,000 |
Stater Brothers Holdings, Gtd. Notes | | B2 | | 8.125% | | 06/15/12 | | | 1,890 | | | 1,710,450 |
| | | | | | | | | | | |
|
|
| | | | | | | | | | | | | 23,870,778 |
| | | | | | | | | | | |
|
|
Gaming — 4.1% | | | | | | | | | | | | |
CCM Merger, Inc., Notes, 144A (original cost $14,420,250; purchased 7/14/05-8/21/08)(k) | | Caa2 | | 8.00% | | 08/01/13 | | | 15,340 | | | 7,900,100 |
Downstream Development Authority of the Quapaw Tribe of Oklahoma, Sr. Sec’d. Notes, 144A | | Caa1 | | 12.00% | | 10/15/15 | | | 2,800 | | | 1,540,000 |
Fontainebleau Las Vegas Holdings LLC, Mortgage Backed, 144A (original cost $7,797,031; purchased 5/24/07-07/02/07)(b)(f)(k) | | Caa3 | | 11.00% | | 06/15/15 | | | 7,750 | | | 755,625 |
Harrah’s Operating Co., Inc., Gtd. Notes | | Caa3 | | 5.50% | | 07/01/10 | | | 3,000 | | | 1,905,000 |
Harrah’s Operating Co., Inc., Gtd. Notes | | Caa3 | | 5.625% | | 06/01/15 | | | 2,637 | | | 448,290 |
Harrah’s Operating Co., Inc., Gtd. Notes | | Caa3 | | 6.50% | | 06/01/16 | | | 515 | | | 79,825 |
Harrah’s Operating Co., Inc., Gtd. Notes, 144A | | B(g) | | 10.00% | | 12/15/18 | | | 4,813 | | | 1,756,745 |
Harrah’s Operating Co., Inc., Gtd. Notes, 144A | | Caa2 | | 10.75% | | 02/01/16 | | | 18,198 | | | 5,186,430 |
Isle of Capri Casinos, Inc., Gtd. Notes | | Caa1 | | 7.00% | | 03/01/14 | | | 6,795 | | | 2,887,875 |
Mandalay Resort Group, Gtd. Notes | | B2 | | 9.375% | | 02/15/10 | | | 581 | | | 424,130 |
MGM Mirage, Inc., Gtd. Notes | | Ba3 | | 6.00% | | 10/01/09 | | | 2,740 | | | 2,616,700 |
MGM Mirage, Inc., Gtd. Notes | | Ba3 | | 6.875% | | 04/01/16 | | | 2,000 | | | 1,265,000 |
MGM Mirage, Inc., Gtd. Notes | | Ba3 | | 8.50% | | 09/15/10 | | | 700 | | | 588,000 |
MGM Mirage, Sr. Sec’d. Notes, 144A(b) | | Ba1 | | 13.00% | | 11/15/13 | | | 6,050 | | | 5,762,625 |
Mohegan Tribal Gaming Authority, Gtd. Notes | | Ba3 | | 6.125% | | 02/15/13 | | | 3,750 | | | 2,362,500 |
Mohegan Tribal Gaming Authority, Sr. Sub. Notes | | B3 | | 8.00% | | 04/01/12 | | | 4,345 | | | 2,650,450 |
Mohegan Tribal Gaming Authority, Sr. Sub. Notes | | B3 | | 8.375% | | 07/01/11 | | | 400 | | | 326,000 |
Park Place Entertainment Corp., Gtd. Notes | | Caa3 | | 8.125% | | 05/15/11 | | | 4,430 | | | 2,170,700 |
Pokagon Gaming Authority, Sr. Notes, 144A | | B2 | | 10.375% | | 06/15/14 | | | 1,800 | | | 1,548,000 |
SEE NOTES TO FINANCIAL STATEMENTS.
A77
| | | | | | |
| | | HIGH YIELD BOND PORTFOLIO (continued) | | |
| |
| SCHEDULE OF INVESTMENTS | | December 31, 2008 |
| | | | | | | | | | | | |
CORPORATE BONDS
(continued) | | Moody’s
Rating†
(Unaudited)
| | Interest
Rate
| | Maturity
Date
| | Principal
Amount
(000)
| | Value
(Note 2)
|
| | | | | | | | | | | | | |
Gaming (continued) | | | | | | | | | | | | |
River Rock Entertainment Authority (The), Sr. Sec’d. Notes | | B2 | | 9.75% | | 11/01/11 | | $ | 1,750 | | $ | 1,452,500 |
Seneca Gaming Corp., Sr. Unsec’d. Notes, Ser. B | | Ba2 | | 7.25% | | 05/01/12 | | | 5,125 | | | 4,125,625 |
Shingle Springs Tribal Gaming Authority, Sr. Notes, 144A(b) | | B3 | | 9.375% | | 06/15/15 | | | 5,523 | | | 2,761,500 |
Station Casinos, Inc., Sr. Sub. Notes | | Ca | | 6.50% | | 02/01/14 | | | 3,650 | | | 209,875 |
Station Casinos, Inc., Sr. Sub. Notes(b) | | Ca | | 6.625% | | 03/15/18 | | | 2,200 | | | 126,500 |
Station Casinos, Inc., Sr. Unsec’d. Notes(b) | | Caa3 | | 6.00% | | 04/01/12 | | | 2,251 | | | 450,270 |
| | | | | | | | | | | |
|
|
| | | | | | | | | | | | | 51,300,265 |
| | | | | | | | | | | |
|
|
Healthcare & Pharmaceutical — 13.8% | | | | | | | | | | | | |
Accellent, Inc., Gtd. Notes | | Caa3 | | 10.50% | | 12/01/13 | | | 16,858 | | | 11,547,730 |
Alliance Imaging, Inc., Sr. Sub. Notes, Ser. B | | B3 | | 7.25% | | 12/15/12 | | | 1,325 | | | 1,126,250 |
Biomet, Inc., Gtd. Notes(b) | | B3 | | 10.375% | | 10/15/17 | | | 7,275 | | | 5,747,250 |
Biomet, Inc., Gtd. Notes | | Caa1 | | 11.625% | | 10/15/17 | | | 15,815 | | | 13,521,825 |
Bio-Rad Laboratories, Inc., Sr. Sub. Notes | | Ba3 | | 7.50% | | 08/15/13 | | | 3,650 | | | 3,239,375 |
Boston Scientific Corp., Sr. Unsec’d. Notes | | Ba2 | | 6.25% | | 11/15/15 | | | 6,850 | | | 5,754,000 |
Catalent Pharma Solutions, Inc., Gtd. Notes, PIK(b) | | Caa1 | | 9.50% | | 04/15/15 | | | 7,325 | | | 2,783,500 |
Columbia/HCA Healthcare Corp. Sr. Unsec’d. Notes, MTN | | Caa1 | | 8.70% | | 02/10/10 | | | 1,800 | | | 1,715,697 |
Columbia/HCA Healthcare Corp., Debs. | | Caa1 | | 7.50% | | 12/15/23 | | | 600 | | | 281,791 |
Columbia/HCA Healthcare Corp., Notes, MTN | | Caa1 | | 9.00% | | 12/15/14 | | | 4,365 | | | 2,797,288 |
Community Health Systems, Inc., Bank Loan(f) | | Ba3 | | 3.404% | | 07/25/14 | | | 600 | | | 464,918 |
Community Health Systems, Inc., Bank Loan(f) | | Ba3 | | 4.445% | | 07/25/14 | | | 11,726 | | | 9,090,496 |
Community Health Systems, Inc., Gtd. Notes(b) | | B3 | | 8.875% | | 07/15/15 | | | 2,720 | | | 2,502,400 |
Concentra, Inc., Bank Loan(f) | | Caa1 | | 6.96% | | 06/25/15 | | | 2,000 | | | 400,000 |
Elan Finance PLC, Gtd. Notes (Ireland) | | B3 | | 7.75% | | 11/15/11 | | | 1,780 | | | 1,050,200 |
Elan Finance PLC, Gtd. Notes (Ireland) | | B3 | | 8.875% | | 12/01/13 | | | 850 | | | 442,000 |
FMC Finance III SA, Gtd. Notes (Luxembourg) | | Ba2 | | 6.875% | | 07/15/17 | | | 1,500 | | | 1,402,500 |
HCA, Inc., Bank Loan(f) | | Ba3 | | 2.959% | | 11/17/12 | | | 16,651 | | | 13,987,823 |
HCA, Inc., Bank Loan(f) | | Ba3 | | 3.709% | | 11/17/13 | | | 9,520 | | | 7,443,789 |
HCA, Inc., Sr. Sec’d. Notes | | B2 | | 9.125% | | 11/15/14 | | | 1,775 | | | 1,646,313 |
HCA, Inc., Sr. Sec’d. Notes, PIK(b) | | B2 | | 9.625% | | 11/15/16 | | | 10,310 | | | 8,041,800 |
HCA, Inc., Sr. Unsec’d. Notes | | Caa1 | | 6.25% | | 02/15/13 | | | 2,500 | | | 1,562,500 |
HCA, Inc., Sr. Unsec’d. Notes | | Caa1 | | 8.75% | | 09/01/10 | | | 708 | | | 679,680 |
Omega Healthcare Investors, Inc., Gtd. Notes | | Ba3 | | 7.00% | | 04/01/14 | | | 4,475 | | | 3,624,750 |
Omega Healthcare Investors, Inc., Gtd. Notes | | Ba3 | | 7.00% | | 01/15/16 | | | 7,955 | | | 5,966,250 |
PTS Acquisition Corp., Bank Loan(f) | | Ba3 | | 3.709% | | 04/10/14 | | | 6,895 | | | 4,102,525 |
Res-Care, Inc., Gtd. Notes | | B1 | | 7.75% | | 10/15/13 | | | 8,900 | | | 7,253,500 |
Royalty Pharma Finance Trust, Bank Loan(f) | | Baa3 | | 6.569% | | 05/15/15 | | | 11,250 | | | 9,881,246 |
Select Medical Corp., Gtd. Notes(b) | | B3 | | 7.625% | | 02/01/15 | | | 1,925 | | | 1,020,250 |
Senior Housing Properties Trust, Sr. Unsec’d. Notes | | Ba1 | | 7.875% | | 04/15/15 | | | 3,125 | | | 2,500,000 |
Senior Housing Properties Trust, Sr. Unsec’d. Notes | | Ba1 | | 8.625% | | 01/15/12 | | | 10,841 | | | 9,323,260 |
Skilled Healthcare Group, Inc., Gtd. Notes | | Caa1 | | 11.00% | | 01/15/14 | | | 9,819 | | | 9,229,860 |
Skilled Healthcare, Inc., Bank Loan(f) | | B1 | | 4.441% | | 06/15/12 | | | 3,969 | | | 3,115,784 |
Sun Healthcare Group, Inc., Gtd. Notes | | B3 | | 9.125% | | 04/15/15 | | | 7,500 | | | 6,562,500 |
Surgical Care Affiliates, Inc., Sr. Sub. Notes, 144A(f) | | Caa1 | | 10.00% | | 07/15/17 | | | 4,300 | | | 2,236,000 |
Ventas Realty LP, Gtd. Notes | | Ba1 | | 9.00% | | 05/01/12 | | | 2,887 | | | 2,569,430 |
Viant Holdings, Inc., Gtd Notes, 144A(f) | | Caa1 | | 10.125% | | 07/15/17 | | | 18,439 | | | 6,084,870 |
| | | | | | | | | | | |
|
|
| | | | | | | | | | | | | 170,699,350 |
| | | | | | | | | | | |
|
|
Healthcare Insurance | | | | | | | | | | | | |
Coventry Health Care, Inc., Sr. Unsec’d. Notes | | Ba1 | | 6.125% | | 01/15/15 | | | 1,000 | | | 594,135 |
| | | | | | | | | | | |
|
|
Lodging — 1.1% | | | | | | | | | | | | |
Felcor Lodging LP, Gtd. Notes(b) | | Ba3 | | 8.50% | | 06/01/11 | | | 5,170 | | | 3,825,800 |
Host Marriott LP, Sr. Sec’d. Notes | | Ba1 | | 6.75% | | 06/01/16 | | | 475 | | | 346,750 |
Host Marriott LP, Sr. Sec’d. Notes | | BBB-(g) | | 6.875% | | 11/01/14 | | | 925 | | | 712,250 |
Host Marriott LP, Sr. Sec’d. Notes | | Ba1 | | 7.125% | | 11/01/13 | | | 4,215 | | | 3,393,075 |
Host Marriott LP, Sr. Sec’d. Notes, Ser. M(b) | | Ba1 | | 7.00% | | 08/15/12 | | | 6,400 | | | 5,424,000 |
| | | | | | | | | | | |
|
|
| | | | | | | | | | | | | 13,701,875 |
| | | | | | | | | | | |
|
|
SEE NOTES TO FINANCIAL STATEMENTS.
A78
| | | | | | |
| | | HIGH YIELD BOND PORTFOLIO (continued) | | |
| |
| SCHEDULE OF INVESTMENTS | | December 31, 2008 |
| | | | | | | | | | | | |
CORPORATE BONDS
(continued) | | Moody’s
Rating†
(Unaudited)
| | Interest
Rate
| | Maturity
Date
| | Principal
Amount
(000)
| | Value
(Note 2)
|
| | | | | | | | | | | | | |
Media & Entertainment — 2.7% | | | | | | | | | | | | |
AMC Entertainment, Inc., Gtd. Notes(b) | | B2 | | 11.00% | | 02/01/16 | | $ | 2,465 | | $ | 1,722,419 |
AMC Entertainment, Inc., Gtd. Notes, Ser. B | | Ba3 | | 8.625% | | 08/15/12 | | | 2,125 | | | 1,700,000 |
AMC Entertainment, Inc., Sr. Sub. Notes(b) | | B2 | | 8.00% | | 03/01/14 | | | 675 | | | 415,125 |
Cinemark, Inc., Sr. Disc. Notes(j) | | B3 | | 4.12% | | 03/15/14 | | | 1,855 | | | 1,500,231 |
Clear Channel Communications, Inc., Sr. Unsec’d. Notes | | Caa1 | | 5.50% | | 09/15/14 | | | 1,735 | | | 208,200 |
Clear Channel Communications, Inc., Sr. Unsec’d. Notes | | Caa1 | | 5.75% | | 01/15/13 | | | 4,725 | | | 685,125 |
Clear Channel Communications, Inc., Sr. Unsec’d. Notes | | Caa1 | | 6.875% | | 06/15/18 | | | 625 | | | 75,000 |
CMP Susquehanna Corp., Gtd. Notes | | Ca | | 9.875% | | 05/15/14 | | | 2,550 | | | 102,000 |
Dex Media West LLC, Sr. Sub. Notes, Ser. B | | B2 | | 9.875% | | 08/15/13 | | | 10,578 | | | 2,512,275 |
Dex Media, Inc., Sr. Unsec’d. Notes(b) | | B3 | | 8.00% | | 11/15/13 | | | 2,825 | | | 522,625 |
DirecTV Holdings LLC, Gtd. Notes | | Ba3 | | 8.375% | | 03/15/13 | | | 1,125 | | | 1,119,375 |
DirecTV Holdings LLC/DirecTV Financing Co., Gtd. Notes | | Ba3 | | 7.625% | | 05/15/16 | | | 3,400 | | | 3,298,000 |
Echostar DBS Corp., Gtd. Notes | | Ba3 | | 7.125% | | 02/01/16 | | | 2,545 | | | 2,125,075 |
Echostar DBS Corp., Gtd. Notes | | Ba3 | | 7.75% | | 05/31/15 | | | 500 | | | 425,000 |
Echostar DBS Corp., Gtd. Notes(b) | | Ba3 | | 7.00% | | 10/01/13 | | | 1,075 | | | 932,563 |
Idearc, Inc., Bank Loan(f) | | B2 | | 1.97% | | 11/17/13 | | | 7,000 | | | 2,275,000 |
Idearc, Inc., Bank Loan(f) | | B2 | | 3.575% | | 11/17/14 | | | 1,214 | | | 370,274 |
Idearc, Inc., Gtd. Notes | | Caa2 | | 8.00% | | 11/15/16 | | | 5,115 | | | 383,625 |
LIN Television Corp., Gtd. Notes(b) | | B3 | | 6.50% | | 05/15/13 | | | 5,750 | | | 2,745,625 |
Medianews Group, Inc., Sr. Sub. Notes | | Ca | | 6.375% | | 04/01/14 | | | 625 | | | 39,844 |
Medianews Group, Inc., Sr. Sub. Notes | | Ca | | 6.875% | | 10/01/13 | | | 1,375 | | | 87,656 |
Morris Publishing Group LLC, Gtd. Notes | | Ca | | 7.00% | | 08/01/13 | | | 1,050 | | | 94,500 |
Quebecor Media, Inc., Sr. Unsec’d. Notes (Canada) | | B2 | | 7.75% | | 03/15/16 | | | 2,550 | | | 1,721,250 |
Quebecor Media, Inc., Sr. Unsec’d. Notes (Canada) | | B2 | | 7.75% | | 03/15/16 | | | 2,930 | | | 1,977,750 |
R.H. Donnelley Corp., Sr. Disc. Notes, Ser. A-1 | | Caa1 | | 6.875% | | 01/15/13 | | | 1,300 | | | 175,500 |
R.H. Donnelley Corp., Sr. Disc. Notes, Ser. A-2(b) | | Caa1 | | 6.875% | | 01/15/13 | | | 7,700 | | | 1,039,500 |
R.H. Donnelley Corp., Sr. Unsec’d. Notes | | Caa1 | | 8.875% | | 10/15/17 | | | 2,000 | | | 300,000 |
R.H. Donnelley Corp., Sr. Unsec’d. Notes, Ser. A-3 | | Caa1 | | 8.875% | | 01/15/16 | | | 1,310 | | | 196,500 |
Rainbow National Services LLC, Gtd. Notes, 144A | | B1 | | 8.75% | | 09/01/12 | | | 2,000 | | | 1,800,000 |
Rainbow National Services LLC, Gtd. Notes, 144A | | B2 | | 10.375% | | 09/01/14 | | | 205 | | | 182,450 |
Universal City Florida Holding Co. I/II, Sr. Notes(b) | | B3 | | 8.375% | | 05/01/10 | | | 3,625 | | | 1,649,375 |
Univision Communications, Inc., Gtd. Notes, PIK, 144A | | Caa2 | | 9.75% | | 03/15/15 | | | 7,535 | | | 941,875 |
| | | | | | | | | | | |
|
|
| | | | | | | | | | | | | 33,323,737 |
| | | | | | | | | | | |
|
|
Metals — 5.1% | | | | | | | | | | | | |
Aleris International, Inc., Gtd. Notes, PIK | | Caa2 | | 9.00% | | 12/15/14 | | | 2,200 | | | 132,000 |
Century Aluminum Co., Gtd. Notes | | B3 | | 7.50% | | 08/15/14 | | | 2,222 | | | 1,277,650 |
FMG Finance Pty Ltd., Sr. Sec’d. Notes (Australia), 144A | | B1 | | 10.00% | | 09/01/13 | | | 1,150 | | | 678,500 |
FMG Finance Pty Ltd., Sr. Sec’d. Notes (Australia), 144A | | B1 | | 10.625% | | 09/01/16 | | | 11,675 | | | 6,771,500 |
Freeport-McMoRan Copper & Gold, Inc., Sr. Unsec’d Notes(h) | | Ba2 | | 7.084% | | 04/01/15 | | | 4,500 | | | 2,970,000 |
Freeport-McMoRan Copper & Gold, Inc., Sr. Unsec’d. Notes | | Ba2 | | 8.375% | | 04/01/17 | | | 12,010 | | | 9,848,200 |
Gerdau AmeriSteel Corp., Gtd. Notes (Canada) | | Ba1 | | 10.375% | | 07/15/11 | | | 11,870 | | | 11,988,700 |
Ispat Inland ULC, Gtd. Notes (Canada) | | Baa2 | | 9.75% | | 04/01/14 | | | 17,308 | | | 14,814,297 |
Metals USA, Inc., Sr, Sec’d. Notes | | B3 | | 11.125% | | 12/01/15 | | | 9,975 | | | 5,885,250 |
Novelis, Inc., Gtd. Notes (Canada) | | B3 | | 7.25% | | 02/15/15 | | | 2,615 | | | 1,516,700 |
Ryerson, Inc., Sr. Sec’d. Notes, 144A (original cost $195,000;
purchased 10/3/07-10/26/07)(k) | | Caa1 | | 12.25% | | 11/01/15 | | | 195 | | | 120,413 |
Southern Copper Corp., Sr. Unsec’d. Notes | | Baa2 | | 7.50% | | 07/27/35 | | | 3,550 | | | 2,656,110 |
United States Steel Corp., Sr. Unsec’d. Notes | | Baa3 | | 7.00% | | 02/01/18 | | | 6,540 | | | 4,457,272 |
| | | | | | | | | | | |
|
|
| | | | | | | | | | | | | 63,116,592 |
| | | | | | | | | | | |
|
|
Non Captive Finance — 0.7% | | | | | | | | | | | | |
Lender Processing Services, Inc., Gtd. Notes | | Ba2 | | 8.125% | | 07/01/16 | | | 9,561 | | | 8,521,241 |
| | | | | | | | | | | |
|
|
Packaging — 3.0% | | | | | | | | | | |
Ball Corp., Gtd. Notes | | Ba1 | | 6.625% | | 03/15/18 | | | 5,205 | | | 4,658,475 |
Berry Plastics Holding Corp., Sec’d. Notes(h) | | Caa1 | | 5.871% | | 09/15/14 | | | 2,025 | | | 688,500 |
Berry Plastics Holding Corp., Sr. Sec’d. Notes(b) | | Caa1 | | 8.875% | | 09/15/14 | | | 7,550 | | | 3,284,250 |
Crown Americas LLC, Gtd. Notes(b) | | B1 | | 7.625% | | 11/15/13 | | | 8,375 | | | 8,291,250 |
SEE NOTES TO FINANCIAL STATEMENTS.
A79
| | | | | | |
| | | HIGH YIELD BOND PORTFOLIO (continued) | | |
| |
| SCHEDULE OF INVESTMENTS | | December 31, 2008 |
| | | | | | | | | | | | |
CORPORATE BONDS
(continued) | | Moody’s
Rating†
(Unaudited)
| | Interest
Rate
| | Maturity
Date
| | Principal
Amount
(000)
| | Value
(Note 2)
|
| | | | | | | | | | | | | |
Packaging (continued) | | | | | | | | | | | | |
Exopack Holding Corp., Gtd. Notes | | B3 | | 11.25% | | 02/01/14 | | $ | 6,565 | | $ | 3,840,525 |
Graham Packaging Co., Inc., Gtd. Notes | | Caa1 | | 8.50% | | 10/15/12 | | | 1,605 | | | 1,143,563 |
Graham Packaging Co., Inc., Gtd. Notes(b) | | Caa1 | | 9.875% | | 10/15/14 | | | 2,650 | | | 1,629,750 |
Greif Brothers Corp., Gtd. Notes | | Ba2 | | 6.75% | | 02/01/17 | | | 7,075 | | | 6,261,375 |
Owens Brockway Glass Container, Inc., Gtd. Notes | | Ba3 | | 8.25% | | 05/15/13 | | | 4,425 | | | 4,358,625 |
Silgan Holdings, Inc., Sr. Sub. Notes | | B1 | | 6.75% | | 11/15/13 | | | 3,250 | | | 2,795,000 |
| | | | | | | | | | | |
|
|
| | | | | | | | | | | | | 36,951,313 |
| | | | | | | | | | | |
|
|
Paper — 2.4% | | | | | | | | | | | | |
Cascades, Inc., Gtd. Notes (Canada) | | Ba3 | | 7.25% | | 02/15/13 | | | 5,025 | | | 2,562,750 |
Catalyst Paper Corp., Gtd. Notes, Ser. D (Canada) | | B2 | | 8.625% | | 06/15/11 | | | 417 | | | 183,480 |
Cellu Tissue Holdings, Inc., Sec’d. Notes(f) | | B2 | | 9.75% | | 03/15/10 | | | 2,500 | | | 2,000,000 |
Domtar Corp., Gtd. Notes (Canada) | | Ba3 | | 5.375% | | 12/01/13 | | | 1,200 | | | 744,000 |
Domtar Corp., Gtd. Notes (Canada) | | Ba3 | | 7.875% | | 10/15/11 | | | 6,125 | | | 5,206,250 |
Georgia Pacific, Bank Loan(f) | | Ba2 | | 3.903% | | 12/20/10 | | | 3,722 | | | 3,287,533 |
Georgia-Pacific, Corp., Gtd. Notes, 144A (original cost $5,475,180;
purchased 12/13/06-7/18/08)(k) | | Ba3 | | 7.125% | | 01/15/17 | | | 5,526 | | | 4,641,840 |
Glatfelter, Gtd. Notes | | Ba2 | | 7.125% | | 05/01/16 | | | 320 | | | 278,400 |
Graphic Packaging International Corp., Gtd. Notes(b) | | B3 | | 8.50% | | 08/15/11 | | | 7,188 | | | 6,001,980 |
Jefferson Smurfit Corp., Sr. Unsec’d. Notes | | Caa1 | | 8.25% | | 10/01/12 | | | 3,270 | | | 555,900 |
Millar Western Forest Products Ltd., Sr. Notes (Canada) | | B2 | | 7.75% | | 11/15/13 | | | 375 | | | 187,500 |
Norampac, Inc., Gtd. Notes (Canada) | | Ba3 | | 6.75% | | 06/01/13 | | | 1,130 | | | 508,500 |
Smurfit-Stone Container Enterprises, Inc., Sr. Unsec’d. Notes | | Caa1 | | 8.375% | | 07/01/12 | | | 3,800 | | | 627,000 |
Verso Paper Holdings LLC, Gtd. Notes, Ser. B(b) | | B3 | | 11.375% | | 08/01/16 | | | 7,475 | | | 2,242,500 |
| | | | | | | | | | | |
|
|
| | | | | | | | | | | | | 29,027,633 |
| | | | | | | | | | | |
|
|
Pipelines & Others — 1.9% | | | | | | | | | | | | |
AmeriGas Partners LP, Sr. Unsec’d. Notes | | Ba3 | | 7.125% | | 05/20/16 | | | 3,600 | | | 2,880,000 |
Inergy LP/Inergy Finance Corp., Gtd. Notes | | B1 | | 8.25% | | 03/01/16 | | | 1,125 | | | 877,500 |
MarkWest Energy Partners LP / MarkWest Energy Finance Corp., Gtd. Notes | | B2 | | 8.75% | | 04/15/18 | | | 3,850 | | | 2,387,000 |
Pacific Energy Partners LP, Gtd. Notes | | Baa3 | | 7.125% | | 06/15/14 | | | 1,475 | | | 1,288,318 |
Sonat, Inc., Sr. Unsec’d. Notes | | Ba3 | | 7.625% | | 07/15/11 | | | 1,840 | | | 1,677,598 |
Targa Resources, Inc., Gtd. Notes | | B3 | | 8.50% | | 11/01/13 | | | 6,175 | | | 3,334,500 |
Targa Resources Partners LP, Sr. Notes, 144A | | B2 | | 8.25% | | 07/01/16 | | | 3,400 | | | 2,108,000 |
Williams Cos., Inc., Sr. Unsec’d. Notes | | Baa3 | | 7.125% | | 09/01/11 | | | 1,175 | | | 1,081,000 |
Williams Cos., Inc., Sr. Unsec’d. Notes | | Baa3 | | 8.125% | | 03/15/12 | | | 7,916 | | | 7,292,615 |
Williams Partners LP/Williams Partners Finance Corp.,
Sr. Unsec’d. Notes | | Ba2 | | 7.50% | | 06/15/11 | | | 1,125 | | | 967,500 |
| | | | | | | | | | | |
|
|
| | | | | | | | | | | | | 23,894,031 |
| | | | | | | | | | | |
|
|
Railroads — 0.1% | | | | | | | | | | | | |
Kansas City Southern Railway, Gtd. Notes | | B2 | | 7.50% | | 06/15/09 | | | 1,540 | | | 1,543,850 |
| | | | | | | | | | | |
|
|
Retailers — 0.8% | | | | | | | | | | | | |
GSC Holdings Corp., Gtd. Notes | | Ba1 | | 8.00% | | 10/01/12 | | | 1,020 | | | 948,600 |
Neiman-Marcus Group, Inc., Gtd. Notes, PIK | | B3 | | 9.00% | | 10/15/15 | | | 5,500 | | | 2,420,000 |
Susser Holdings LLC, Gtd. Notes | | B3 | | 10.625% | | 12/15/13 | | | 7,730 | | | 6,763,750 |
| | | | | | | | | | | |
|
|
| | | | | | | | | | | | | 10,132,350 |
| | | | | | | | | | | |
|
|
Technology — 6.6% | | | | | | | | | | | | |
Affiliated Computer Services, Inc., Sr. Unsec’d. Notes | | Ba2 | | 4.70% | | 06/01/10 | | | 18,850 | | | 17,530,501 |
Ampex Corp. (original cost $772,815; purchased 10/8/08)(f)(k) | | NR | | 12.00% | | 09/30/09 | | | 416 | | | 163,675 |
Avago Technologies, Gtd. Notes (Singapore) | | B1 | | 10.125% | | 12/01/13 | | | 14,728 | | | 11,211,691 |
Avago Technologies, Gtd. Notes (Singapore) | | B3 | | 11.875% | | 12/01/15 | | | 3,000 | | | 2,085,000 |
First Data Corp., Bank Loan(f) | | Ba3 | | 3.211% | | 09/24/14 | | | 4,938 | | | 3,158,237 |
First Data Corp., Bank Loan(f) | | Ba3 | | 3.211% | | 09/24/14 | | | 4,938 | | | 3,158,237 |
First Data Corp., Gtd. Notes(b) | | B3 | | 9.875% | | 09/24/15 | | | 1,850 | | | 1,119,250 |
Flextronics International Ltd., Bank Loan (Singapore)(f) | | Ba1 | | 6.155% | | 10/01/14 | | | 4,602 | | | 2,884,207 |
Flextronics International Ltd., Bank Loan (Singapore)(f) | | Ba1 | | 7.069% | | 10/01/14 | | | 1,323 | | | 828,795 |
SEE NOTES TO FINANCIAL STATEMENTS.
A80
| | | | | | |
| | | HIGH YIELD BOND PORTFOLIO (continued) | | |
| |
| SCHEDULE OF INVESTMENTS | | December 31, 2008 |
| | | | | | | | | | | | |
CORPORATE BONDS
(continued) | | Moody’s
Rating†
(Unaudited)
| | Interest
Rate
| | Maturity
Date
| | Principal
Amount
(000)
| | Value
(Note 2)
|
| | | | | | | | | | | | | |
Technology (continued) | | | | | | | | | | | | |
Flextronics International Ltd., Sr. Sub. Notes (Singapore) | | Ba2 | | 6.25% | | 11/15/14 | | $ | 1,000 | | $ | 745,000 |
Freescale Semiconductor, Inc., Gtd. Notes, PIK | | B2 | | 9.125% | | 12/15/14 | | | 16,800 | | | 3,864,000 |
Iron Mountain, Inc., Gtd. Notes | | B2 | | 8.00% | | 06/15/20 | | | 3,950 | | | 3,169,875 |
Iron Mountain, Inc., Gtd. Notes | | B2 | | 8.625% | | 04/01/13 | | | 6,600 | | | 6,204,000 |
Nortel Networks Ltd., Gtd. Notes, (Canada) | | Caa2 | | 10.125% | | 07/15/13 | | | 3,050 | | | 808,250 |
Open Solutions, Inc., Gtd. Notes, 144A | | Caa2 | | 9.75% | | 02/01/15 | | | 1,700 | | | 255,000 |
Seagate Technology HDD Holdings, Gtd. Notes (Cayman Islands) | | Ba1 | | 6.375% | | 10/01/11 | | | 4,600 | | | 3,174,000 |
Sensata Technologies BV, Gtd. Notes (Netherlands) | | Caa1 | | 8.00% | | 05/01/14 | | | 8,523 | | | 3,835,350 |
Sensata Technologies, Bank Loan(f) | | B1 | | 5.258% | | 04/27/13 | | | 4,071 | | | 2,035,318 |
Serena Software, Inc., Gtd. Notes | | Caa1 | | 10.375% | | 03/15/16 | | | 8,840 | | | 4,486,300 |
STATS ChipPAC Ltd., Gtd. Notes (Singapore) | | Ba1 | | 6.75% | | 11/15/11 | | | 4,110 | | | 3,051,675 |
Sungard Data Systems, Inc., Sr. Unsec’d. Notes, 144A | | Caa1 | | 10.625% | | 05/15/15 | | | 8,050 | | | 6,882,750 |
Unisys Corp., Sr. Unsec’d. Notes | | B2 | | 8.00% | | 10/15/12 | | | 330 | | | 92,400 |
Xerox Corp., Gtd. Notes | | Baa2 | | 6.875% | | 08/15/11 | | | 1,350 | | | 1,166,949 |
| | | | | | | | | | | |
|
|
| | | | | | | | | | | | | 81,910,460 |
| | | | | | | | | | | |
|
|
Telecommunications — 4.8% | | | | | | | | | | | | |
Alltel Communications, Inc., Bank Loan(f) | | Ba3 | | 3.939% | | 05/15/15 | | | 4,987 | | | 4,882,285 |
American Tower Corp., Sr. Unsec’d. Notes | | Ba1 | | 7.125% | | 10/15/12 | | | 855 | | | 842,175 |
Centennial Cellular Operating Co., Gtd Notes | | B2 | | 10.125% | | 06/15/13 | | | 8,225 | | | 8,307,250 |
Citizens Communications Co., Sr. Unsec’d. Notes | | Ba2 | | 9.00% | | 08/15/31 | | | 3,135 | | | 1,975,050 |
Citizens Communications Co., Sr. Unsec’d. Notes | | Ba2 | | 9.25% | | 05/15/11 | | | 1,475 | | | 1,401,250 |
Citizens Communications Co., Sr. Unsec’d. Notes(b) | | Ba2 | | 6.25% | | 01/15/13 | | | 1,590 | | | 1,351,500 |
Fairpoint Communications, Inc., Sr. Unsec’d. Notes, 144A | | B3 | | 13.125% | | 04/01/18 | | | 7,000 | | | 3,360,000 |
Hawaiian Telcom Communications, Inc., Gtd. Notes, Ser. B(c)(f) | | Ca | | 8.765% | | 05/01/13 | | | 4,550 | | | 238,875 |
Hawaiian Telcom Communications, Inc., Gtd. Notes, Ser. B(c)(f) | | C | | 12.50% | | 05/01/15 | | | 1,950 | | | 9,750 |
Level 3 Financing, Inc., Gtd. Notes | | Caa1 | | 12.25% | | 03/15/13 | | | 8,950 | | | 5,414,750 |
Qwest Communications International, Inc., Gtd. Notes, Ser. B | | Ba3 | | 7.50% | | 02/15/14 | | | 3,150 | | | 2,252,250 |
Qwest Corp., Sr. Unsec’d. Notes | | Ba1 | | 7.625% | | 06/15/15 | | | 5,115 | | | 4,194,300 |
Qwest Corp., Sr. Unsec’d. Notes | | Ba1 | | 8.875% | | 03/15/12 | | | 650 | | | 601,250 |
Qwest Corp., Sr. Unsec’d. Notes(b) | | Ba1 | | 7.50% | | 10/01/14 | | | 6,325 | | | 5,249,750 |
Sprint Capital Corp., Gtd. Notes | | Ba2 | | 7.625% | | 01/30/11 | | | 2,500 | | | 2,087,500 |
Sprint Capital Corp., Gtd. Notes | | Ba2 | | 8.375% | | 03/15/12 | | | 2,000 | | | 1,600,000 |
Sprint Capital Corp., Gtd. Notes | | Ba2 | | 8.75% | | 03/15/32 | | | 2,750 | | | 1,856,250 |
Time Warner Telecom Holdings, Inc., Gtd. Notes | | B3 | | 9.25% | | 02/15/14 | | | 6,225 | | | 5,104,500 |
Windstream Corp., Gtd. Notes | | Ba3 | | 8.125% | | 08/01/13 | | | 3,500 | | | 3,220,000 |
Windstream Corp., Gtd. Notes | | Ba3 | | 8.625% | | 08/01/16 | | | 5,950 | | | 5,265,750 |
| | | | | | | | | | | |
|
|
| | | | | | | | | | | | | 59,214,435 |
| | | | | | | | | | | |
|
|
TOTAL CORPORATE BONDS
(cost $1,538,953,588) | | | 1,110,768,767 |
| | | | | | | | | | | |
|
|
| | | | | | | | | Shares
| | |
| COMMON STOCKS — 0.1% | | | | | | | | | | | | |
Cable | | | | | | | | | | | | |
Adelphia Recovery Trust(a)(f) | | | 500,000 | | | 500 |
| | | | | | | | | | | |
|
|
Electric | | | | | | | | | | | | |
Mirant Corp.(a) | | | 2,240 | | | 42,269 |
| | | | | | | | | | | |
|
|
Media | | | | | | | | | | | | |
Virgin Media, Inc. | | | 8,521 | | | 42,520 |
| | | | | | | | | | | |
|
|
Technology — 0.1% | | | | | | | | | | | | |
Xerox Corp. | | | 137,561 | | | 1,096,360 |
| | | | | | | | | | | |
|
|
Telecommunications | | | | | | | | | | | | |
Netia SA (Poland)(a) | | | 238,168 | | | 192,914 |
| | | | | | | | | | | |
|
|
TOTAL COMMON STOCKS
(cost $2,249,158) | | | 1,374,563 |
| | | | | | | | | | | |
|
|
SEE NOTES TO FINANCIAL STATEMENTS.
A81
| | | | | | |
| | | HIGH YIELD BOND PORTFOLIO (continued) | | |
| |
| SCHEDULE OF INVESTMENTS | | December 31, 2008 |
| | | | | | | | | | | | |
| PREFERRED STOCKS | |
| |
| | | | Shares
| | Value
(Note 2)
| |
| | | | | | | | | | | | | |
Building Materials & Construction | | | | | | | | | | | | |
New Millenium Homes LLC
(original cost $0; purchased 7/28/05)(a)(f)(k) | | 3,000 | | $ | 471,000 | |
| | | | | | | | | | |
|
|
|
Cable | | | | | | | | | | | | |
Adelphia Communications Corp., PIK, 13.00%(a)(f) | | 5,000 | | | 5 | |
PTV, Inc., Ser. A, 10.00% | | 13 | | | 12 | |
| | | | | | | | | | |
|
|
|
| | | | | | | | | | | | 17 | |
| | | | | | | | | | |
|
|
|
TOTAL PREFERRED STOCKS
(cost $4,765) | | | 471,017 | |
| | | | | | | | | | |
|
|
|
| | | | | |
| WARRANTS(a)(f) | | | | | | Expiration
Date
| | Units
| | | |
Cable | | | | | | | | | | | | |
TVN Entertainment (original cost $1,215,008; purchased 3/30/01-3/15/04)(k) | | 8/21/11 | | 9,347 | | | 5,421 | |
| | | | | | | | | | |
|
|
|
Consumer | | | | | | | | |
ICON Fitness Corp. | | 9/27/09 | | 18,093 | | | 181 | |
| | | | | | | | | | |
|
|
|
Media | | | | | | | | |
Sirius XM Radio, Inc., 144A | | 3/15/10 | | 5,005 | | | 5 | |
| | | | | | | | | | |
|
|
|
Technology | | | | | | | | |
Viasystems Group, Inc. | | 1/31/10 | | 45,109 | | | 5 | |
| | | | | | | | | | |
|
|
|
Telecommunications | | | | | | | | | | |
GT Group Telecommunications, Inc. (Canada), 144A | | 2/1/10 | | 3,050 | | | 3 | |
| | | | | | | | | | |
|
|
|
TOTAL WARRANTS
(cost $4,213,593) | | | 5,615 | |
| | | | | | | | | | |
|
|
|
| | | | | | | | | | | | | |
TOTAL LONG-TERM INVESTMENTS
(cost $1,545,421,104) | | | 1,112,619,962 | |
| | | | | | | | | | |
|
|
|
| | | | | | | | | | | | | |
| | | | | |
| | |
| |
| | | | Shares
| | | |
| SHORT-TERM INVESTMENTS — 18.0% | | | | | | | | | | | | |
AFFILIATED MUTUAL FUNDS | | | | | | | | | | | | |
Dryden Core Investment Fund — Short-Term Bond Series (Note 4)(e) | | 2,246,922 | | | 16,537,347 | |
Dryden Core Investment Fund — Taxable Money Market Series
(cost $205,669,464 includes $128,094,292 of cash collateral received for securities on loan) (Note 4)(d)(e) | | 205,669,464 | | | 205,669,464 | |
| | | | | | | | | | |
|
|
|
TOTAL SHORT-TERM INVESTMENTS
(cost $227,969,329) | | | 222,206,811 | |
| | | | | | | | | | |
|
|
|
TOTAL INVESTMENTS(l) — 107.7%
(cost $1,773,390,433) | | | 1,334,826,773 | |
LIABILITIES IN EXCESS OF OTHER ASSETS(m) — (7.7)% | | | (94,963,170 | ) |
| | | | | | | | | | |
|
|
|
NET ASSETS — 100.0% | | $ | 1,239,863,603 | |
| | | | | | | | | | |
|
|
|
The following abbreviations are used in portfolio descriptions:
| | |
| 144A | | Security was purchased pursuant to Rule 144A under the Securities Act of 1933 and may not be resold subject to that rule except to qualified institutional buyers. Unless otherwise noted, 144A securities are deemed to be liquid. |
| MTN | | Medium Term Note |
| NR | | Not Rated by Moody’s or Standard & Poor’s |
| PIK | | Payment-in-kind |
| † | The rating reflected is as of December 31, 2008. Rating of certain bonds may have changed subsequent to that date. |
| (a) | Non-income producing security. |
| (b) | All or portion of security is on loan. The aggregate market value of such securities is $125,217,703; cash collateral of $128,094,292 (included in liabilities) was received with which the portfolio purchased highly liquid short-term investments. |
| (c) | Represents issuer in default on interest payments and/or principal repayment; non-income producing security. |
| (d) | Represents security, or a portion thereof, purchased with cash collateral received for securities on loan. |
SEE NOTES TO FINANCIAL STATEMENTS.
A82
| | | | | | |
| | | HIGH YIELD BOND PORTFOLIO (continued) | | |
| |
| SCHEDULE OF INVESTMENTS | | December 31, 2008 |
| (e) | Prudential Investments LLC, the manager of the Portfolio, also serves as manager of the Dryden Core Investment Fund—Short-Term Bond Series and the Dryden Core Investment Fund—Taxable Money Market Series. |
| (f) | Indicates a security that has been deemed illiquid. |
| (g) | Standard & Poor’s rating. |
| (h) | Indicates a variable rate security. The maturity date presented for these instruments is the latter of the next date on which the security can be redeemed at par or the next date on which the rate of interest is adjusted. The interest rate shown reflects the rate in effect at December 31, 2008. |
| (i) | Amount is actual; not rounded to thousands. |
| (j) | Represents zero coupon or step bond. Rate shown reflects the effective yield at reporting date. |
| (k) | Indicates a restricted security; the aggregate cost of such securities is $32,820,259. The aggregate value of $16,495,913 is approximately 1.3% of net assets. |
| (l) | As of December 31, 2008, 8 securities representing $642,612 and 0.05% of the net assets were fair valued in accordance with the policies adopted by the Board of Trustees. |
| (m) | Liabilities in excess of other assets include net unrealized appreciation (depreciation) on credit default swap agreements as follows: |
Credit default swap agreements outstanding at December 31, 2008:
| | | | | | | | | | | | | |
Counterparty
| | Termination
Date
| | Notional
Amount
(000)#(4)
| | Fixed
Rate
| | Reference Entity/Obligation
| | Unrealized
Appreciation/
(Depreciation)
| |
Buy protection(1): | | | | |
JPMorgan Chase Bank | | 6/20/2013 | | $ | 5,000 | | 6.65% | | Tenet Healthcare Corp.,
7.375%, 2/01/13 | | $ | 750,009 | |
Deutsche Bank AG | | 12/20/2013 | | | 3,000 | | 2.00% | | Allied Waste North America, Inc.,
7.375%, 4/15/14 | | | (63,478 | ) |
Deutsche Bank AG | | 12/20/2013 | | | 5,000 | | 3.12% | | Alltel Corp.,
7.875%, 07/01/32 | | | (488,580 | ) |
JPMorgan Chase Bank | | 12/20/2013 | | | 4,000 | | 3.90% | | JC Penney Co., Inc.,
6.375%, 10/15/36 | | | 167,090 | |
Merrill Lynch Capital Services | | 12/20/2013 | | | 5,000 | | 2.50% | | Alltel Corp.,
7.875%, 7/01/32 | | | (342,290 | ) |
Merrill Lynch Capital Services | | 12/20/2013 | | | 5,000 | | 3.40% | | Windstream Corp.,
8.125%, 8/01/13 | | | (109,108 | ) |
Merrill Lynch Capital Services | | 12/20/2013 | | | 5,000 | | 4.35% | | Ryland Group, Inc.,
5.375%, 1/15/15 | | | 350,282 | |
Merrill Lynch Capital Services | | 12/20/2013 | | | 5,000 | | 4.60% | | KB Home,
6.25%, 6/15/15 | | | 381,385 | |
| | | | | | | | | | | |
|
|
|
| | | | | | | | | | | | $ | 645,310 | |
| | | | | | | | | | | |
|
|
|
| | | | | | | | | | | | | | | | | | | | | | | |
Counterparty
| | Termination
Date
| | Implied Credit
Spread at
December 31,
2008(3)
| | Notional
Amount
(000)#(4)
| | Fixed
Rate
| | Reference Entity/Obligation
| | Fair
Value
| | | Upfront
Premiums
Received
| | | Unrealized
Appreciation/
(Depreciation)
| |
Credit default swaps on corporate issues-Sell Protection(2): | | | | | | | | | | | | | | |
Barclays Bank PLC | | 3/20/2009 | | 16.949% | | $ | 5,000 | | 0.00% | | MGM Mirage, Inc.,
5.875%, 2/27/14 | | $ | (180,157 | ) | | $ | (166,608 | ) | | $ | (13,549 | ) |
Barclays Bank PLC | | 3/20/2009 | | 12.966% | | | 5,000 | | 0.00% | | Texas Competitive Electric Holdings Co.,
10.50%, 11/1/2015 | | | (138,832 | ) | | | (118,680 | ) | | | (20,152 | ) |
JPMorgan Chase Bank | | 6/20/2009 | | 31.384% | | | 3,250 | | 5.00% | | Harrah’s Operating Co., Inc.,
5.625%, 6/01/15 | | | (368,379 | ) | | | (82,084 | ) | | | (286,295 | ) |
Merrill Lynch Capital Services | | 9/20/2009 | | 180.386% | | | 2,000 | | 4.65% | | General Motors Corp.,
7.125%, 7/15/13 | | | (1,350,470 | ) | | | — | | | | (1,350,470 | ) |
Morgan Stanley Capital Services, Inc. | | 9/20/2010 | | 39.041% | | | 2,500 | | 4.20% | | Lear Corp.,
8.11%, 5/15/09 | | | (1,040,099 | ) | | | — | | | | (1,040,099 | ) |
Barclays Bank PLC | | 6/20/2013 | | 87.734% | | | 1,615 | | 5.00% | | Station Casino’s, Inc.,
6.00%, 4/01/12 | | | (1,262,280 | ) | | | (251,229 | ) | | | (1,011,051 | ) |
Goldman Sachs International | | 3/20/2016 | | 5.983% | | | 3,150 | | 4.10% | | NRG Energy, Inc.,
7.25%, 2/01/14 | | | (288,190 | ) | | | — | | | | (288,190 | ) |
| | | | | | | | | | | | | |
|
|
| |
|
|
| |
|
|
|
| | | | | | | | | | | | | | $ | (4,628,407 | ) | | $ | (618,601 | ) | | | (4,009,806 | ) |
| | | | | | | | | | | | | |
|
|
| |
|
|
| |
|
|
|
| | | | | | | | | | | | | | | | | | | | | | $ | (3,364,496 | ) |
| | | | | | | | | | | | | | | | | | | | | |
|
|
|
The Portfolio entered into credit default swaps as the protection seller on corporate issues to take an active short position with respect to the likelihood of a particular issuer’s default.
SEE NOTES TO FINANCIAL STATEMENTS.
A83
| | | | | | |
| | | HIGH YIELD BOND PORTFOLIO (continued) | | |
| |
| SCHEDULE OF INVESTMENTS | | December 31, 2008 |
| (1) | If the Portfolio is a buyer of protection, it pays the fixed rate. When a credit event occurs, as defined under the terms of that particular swap agreement, the Portfolio will either (i) receive from the seller of protection an amount equal to the notional amount of the swap and take delivery of the referenced obligation or underlying securities comprising the referenced index or (ii) receive a net settlement amount in the form of cash or securities equal to the notional amount of the swap less the recovery value of the referenced obligation or underlying securities comprising the referenced index. |
| (2) | If the Portfolio is a seller of protection, it receives the fixed rate. When a credit event occurs, as defined under the terms of that particular swap agreement, the Portfolio will either (i) pay to the buyer of protection an amount equal to the notional amount of the swap and take delivery of the referenced obligation or underlying securities comprising the referenced index or (ii) pay a net settlement amount in the form of cash or securities equal to the notional amount of the swap less the recovery value of the referenced obligation or underlying securities comprising the referenced index. |
| (3) | Implied credit spreads, represented in absolute terms, utilized in determining the market value of credit default swap agreements on corporate issues or sovereign issues of an emerging country as of the reporting date serve as an indicator of the current status of the payment/ performance risk and represent the likelihood of risk of default for the credit derivative. The implied credit spread of a particular referenced entity reflects the cost of buying/selling protection and may include up-front payments required to be made to enter into the agreement. Wider credit spreads represent a deterioration of the referenced entity’s credit soundness and a greater likelihood of risk of default or other credit event occurring as defined under the terms of the agreement. |
| (4) | Notional amount represents the maximum potential amount the Portfolio could be required to pay as a seller of credit protection or receive as a buyer of credit protection if a credit event occurs as defined under the terms of that particular swap agreement. |
Various inputs are used in determining the value of the Portfolio’s investments. These inputs are summarized in the three broad levels listed below.
Level 1—quoted prices in active markets for identical securities
Level 2—other significant observable inputs (including quoted prices for similar securities, interest rates, prepayment speeds, credit risk, etc.)
Level 3—significant unobservable inputs (including the Portfolio’s own assumptions in determining the fair value of investments)
The following is a summary of the inputs used as of December 31, 2008 in valuing the Portfolio’s assets carried at fair value:
| | | | | | | |
Valuation inputs
| | Investments
in Securities
| | Other
Financial
Instruments*
| |
Level 1—Quoted Prices | | $ | 223,580,895 | | $ | — | |
Level 2—Other Significant Observable Inputs | | | 1,110,603,266 | | | (3,364,496 | ) |
Level 3—Significant Unobservable Inputs | | | 642,612 | | | — | |
| | |
|
| |
|
|
|
Total | | $ | 1,334,826,773 | | $ | (3,364,496 | ) |
| | |
|
| |
|
|
|
| * | Other financial instruments are derivative instruments not reflected in the Schedule of Investments, such as futures, forwards and swap contracts, which are valued at the unrealized appreciation/depreciation on the instrument. |
The following is a reconciliation of assets in which significant unobservable inputs (Level 3) were used in determining fair value:
| | | | | | | | |
| | | Investments
in Securities
| | | Other Financial
Instruments
| |
Balance as of 12/31/07 | | $ | 1,109,740 | | | $ | 150,060 | |
Change in unrealized appreciation (depreciation) | | | (467,128 | ) | | | (158,637 | ) |
Transfers in and/or out of Level 3 | | | — | | | | 8,577 | |
| | |
|
|
| |
|
|
|
Balance as of 12/31/08 | | $ | 642,612 | | | | — | |
| | |
|
|
| |
|
|
|
The industry classification of portfolio holdings and liabilities in excess of other assets shown as a percentage of net assets as of December 31, 2008 was as follows:
| | | |
Affiliated Mutual Funds (including 10.3% of collateral received for securities on loan) | | 18.0 | % |
Healthcare & Pharmaceutical | | 13.8 | |
Capital Goods | | 10.2 | |
Electric | | 9.6 | |
Technology | | 6.7 | |
Energy – Other | | 5.4 | |
Metals | | 5.1 | |
Telecommunications | | 4.8 | |
Cable | | 4.3 | |
Gaming | | 4.1 | |
Aerospace/Defense | | 3.3 | |
Packaging | | 3.0 | |
Media & Entertainment | | 2.7 | |
Chemicals | | 2.5 | |
Paper | | 2.4 | |
| | | |
Consumer | | 2.1 | % |
Automotive | | 1.9 | |
Foods | | 1.9 | |
Pipelines & Other | | 1.9 | |
Lodging | | 1.1 | |
Retailers | | 0.8 | |
Non Captive Finance | | 0.7 | |
Building Materials & Construction | | 0.6 | |
Banking | | 0.4 | |
Airlines | | 0.2 | |
Energy – Integrated | | 0.1 | |
Railroads | | 0.1 | |
| | |
|
|
| | | 107.7 | |
Liabilities in excess of other assets | | (7.7 | ) |
| | |
|
|
| | | 100.0 | % |
| | |
|
|
SEE NOTES TO FINANCIAL STATEMENTS.
A84
| | | | | | |
| | | HIGH YIELD BOND PORTFOLIO (continued) | | |
STATEMENT OF ASSETS AND LIABILITIES
December 31, 2008
| | | | |
| ASSETS | | | | |
Investments, at value including securities on loan of $125,217,703: | | | | |
Unaffiliated investments (cost $1,545,421,104) | | $ | 1,112,619,962 | |
Affiliated investments (cost $227,969,329) | | | 222,206,811 | |
Cash | | | 5,172,519 | |
Foreign currency, at value (cost $1,364,268) | | | 1,113,909 | |
Dividends and interest receivable | | | 31,842,815 | |
Receivable for investments sold | | | 25,645,546 | |
Unrealized appreciation on swaps | | | 1,648,766 | |
Receivable for Series shares sold | | | 176,666 | |
Prepaid expenses | | | 20,018 | |
Premium for swaps purchased | | | 6,372 | |
| | |
|
|
|
Total Assets | | | 1,400,453,384 | |
| | |
|
|
|
| LIABILITIES | | | | |
Collateral for securities on loan | | | 128,094,292 | |
Payable for investments purchased | | | 25,999,141 | |
Unrealized depreciation on swaps | | | 5,013,262 | |
Premium for swaps written | | | 618,601 | |
Management fee payable | | | 552,942 | |
Payable for Series shares repurchased | | | 182,441 | |
Accrued expenses and other liabilities | | | 124,143 | |
Deferred trustees’ fees | | | 4,250 | |
Affiliated transfer agent fee payable | | | 709 | |
| | |
|
|
|
Total Liabilities | | | 160,589,781 | |
| | |
|
|
|
| NET ASSETS | | $ | 1,239,863,603 | |
| | |
|
|
|
Net assets were comprised of: | | | | |
Paid-in capital | | $ | 2,032,348,073 | |
Retained earnings | | | (792,484,470 | ) |
| | |
|
|
|
Net assets, December 31, 2008 | | $ | 1,239,863,603 | |
| | |
|
|
|
Net asset value and redemption price per share, $1,239,863,603/ 343,606,619 outstanding shares of beneficial interest | | $ | 3.61 | |
| | |
|
|
|
STATEMENT OF OPERATIONS
Year Ended December 31, 2008
| | | | |
| INVESTMENT INCOME | | | | |
Interest | | $ | 139,925,252 | |
Unaffiliated dividend income | | | 24,769 | |
Affiliated dividend income | | | 2,360,403 | |
Affiliated income from securities loaned, net | | | 1,222,904 | |
| | |
|
|
|
Total income | | | 143,533,328 | |
| | |
|
|
|
| EXPENSES | | | | |
Management fee | | | 8,430,421 | |
Custodian’s fees and expenses | | | 226,000 | |
Shareholders’ reports | | | 151,000 | |
Insurance expenses | | | 29,000 | |
Trustees’ fees | | | 28,000 | |
Audit fee | | | 23,000 | |
Interest expense (Note 8) | | | 14,904 | |
Legal fees and expenses | | | 13,000 | |
Commitment fee on syndicated credit agreement | | | 8,000 | |
Transfer agent’s fee and expenses (including affiliated expense of $4,000) (Note 4) | | | 4,000 | |
Miscellaneous | | | 18,800 | |
| | |
|
|
|
Total expenses | | | 8,946,125 | |
| | |
|
|
|
| NET INVESTMENT INCOME | | | 134,587,203 | |
| | |
|
|
|
| NET REALIZED AND UNREALIZED GAIN (LOSS) ON INVESTMENTS, SWAPS AND FOREIGN CURRENCIES | | | | |
Net realized gain (loss) on: | | | | |
Investment transactions (including affiliated: $(1,337,868)) | | | (109,180,129 | ) |
Swap transactions | | | 3,400,401 | |
Foreign currency transactions | | | 45,596 | |
| | |
|
|
|
| | | | (105,734,132 | ) |
| | |
|
|
|
Net change in unrealized appreciation (depreciation) on: | | | | |
Investments (including affiliated: $(3,962,807)) | | | (385,233,829 | ) |
Swaps | | | (3,514,556 | ) |
Foreign currencies | | | (433,225 | ) |
| | |
|
|
|
| | | | (389,181,610 | ) |
| | |
|
|
|
| NET LOSS ON INVESTMENTS, SWAPS AND FOREIGN CURRENCIES | | | (494,915,742 | ) |
| | |
|
|
|
| NET DECREASE IN NET ASSETS RESULTING FROM OPERATIONS | | $ | (360,328,539 | ) |
| | |
|
|
|
STATEMENT OF CHANGES IN NET ASSETS
| | | | | | | | |
| | | Year Ended December 31,
| |
| | | 2008
| | | 2007
| |
| INCREASE (DECREASE) IN NET ASSETS | | | | | | | | |
| OPERATIONS: | | | | | | | | |
Net investment income | | $ | 134,587,203 | | | $ | 128,014,209 | |
Net realized gain (loss) on investment, swap and foreign currency transactions | | | (105,734,132 | ) | | | 8,684,076 | |
Net change in unrealized appreciation (depreciation) on investments and foreign currencies | | | (389,181,610 | ) | | | (93,222,925 | ) |
| | |
|
|
| |
|
|
|
NET INCREASE (DECREASE) IN NET ASSETS RESULTING FROM OPERATIONS | | | (360,328,539 | ) | | | 43,475,360 | |
| | |
|
|
| |
|
|
|
| DISTRIBUTIONS: | | | (133,562,726 | ) | | | (121,240,261 | ) |
| | |
|
|
| |
|
|
|
| SERIES SHARES TRANSACTIONS: | | | | | | | | |
Series shares sold (1,247,295 and 8,066,804 shares, respectively) | | | 5,374,155 | | | | 42,674,086 | |
Series shares issued in reinvestment of dividends (30,575,224 and 23,224,719 shares, respectively) | | | 133,562,726 | | | | 121,240,261 | |
Series shares repurchased (17,244,757 and 25,105,500 shares, respectively) | | | (79,147,876 | ) | | | (133,249,807 | ) |
| | |
|
|
| |
|
|
|
NET INCREASE IN NET ASSETS RESULTING FROM SERIES SHARES TRANSACTIONS | | | 59,789,005 | | | | 30,664,540 | |
| | |
|
|
| |
|
|
|
| TOTAL DECREASE IN NET ASSETS | | | (434,102,260 | ) | | | (47,100,361 | ) |
| NET ASSETS: | | | | | | | | |
Beginning of year | | | 1,673,965,863 | | | | 1,721,066,224 | |
| | |
|
|
| |
|
|
|
End of year | | $ | 1,239,863,603 | | | $ | 1,673,965,863 | |
| | |
|
|
| |
|
|
|
SEE NOTES TO FINANCIAL STATEMENTS.
A85
| | | | | | |
| | | JENNISON PORTFOLIO | | |
| |
| SCHEDULE OF INVESTMENTS | | December 31, 2008 |
| | | | | |
| LONG-TERM INVESTMENTS — 99.2% |
| COMMON STOCKS | | Shares
| | Value
(Note 2)
|
| | | | | | |
Aerospace & Defense — 3.1% | | | | | |
Lockheed Martin Corp. | | 217,500 | | $ | 18,287,400 |
Raytheon Co. | | 352,900 | | | 18,012,016 |
| | | | |
|
|
| | | | | | 36,299,416 |
| | | | |
|
|
Beverages — 4.1% | | | | | |
Coca-Cola Co.(The)(b) | | 543,300 | | | 24,595,191 |
PepsiCo, Inc. | | 425,900 | | | 23,326,543 |
| | | | |
|
|
| | | | | | 47,921,734 |
| | | | |
|
|
Biotechnology — 14.0% | | | | | |
Celgene Corp.(a) | | 500,100 | | | 27,645,528 |
Genentech, Inc.(a) | | 595,800 | | | 49,397,778 |
Genzyme Corp.(a) | | 119,100 | | | 7,904,667 |
Gilead Sciences, Inc.(a) | | 1,516,200 | | | 77,538,467 |
| | | | |
|
|
| | | | | | 162,486,440 |
| | | | |
|
|
Capital Markets — 3.0% | | | | | |
Charles Schwab Corp.(The) | | 1,636,500 | | | 26,462,205 |
Goldman Sachs Group, Inc.(The) | | 83,100 | | | 7,012,809 |
Lazard Ltd. (Class A Stock) | | 52,100 | | | 1,549,454 |
| | | | |
|
|
| | | | | | 35,024,468 |
| | | | |
|
|
Chemicals — 2.4% | | | | | |
Monsanto Co. | | 401,400 | | | 28,238,490 |
| | | | |
|
|
Communications Equipment — 8.6% | | | |
Cisco Systems, Inc.(a) | | 1,710,600 | | | 27,882,780 |
QUALCOMM, Inc. | | 1,234,200 | | | 44,221,386 |
Research In Motion Ltd.(a)(b) | | 666,700 | | | 27,054,686 |
| | | | |
|
|
| | | | | | 99,158,852 |
| | | | |
|
|
Computers & Peripherals — 6.5% | | | |
Apple, Inc.(a) | | 304,137 | | | 25,958,093 |
Hewlett-Packard Co. | | 973,500 | | | 35,328,315 |
International Business Machines Corp. | | 164,000 | | | 13,802,240 |
| | | | |
|
|
| | | | | | 75,088,648 |
| | | | |
|
|
Energy Equipment & Services — 2.2% | | | |
Schlumberger Ltd. | | 596,700 | | | 25,258,311 |
| | | | |
|
|
Food & Staples Retailing — 7.9% | | | | | |
Costco Wholesale Corp.(b) | | 370,900 | | | 19,472,250 |
CVS/Caremark Corp. | | 981,900 | | | 28,219,806 |
Wal-Mart Stores, Inc. | | 790,000 | | | 44,287,400 |
| | | | |
|
|
| | | | | | 91,979,456 |
| | | | |
|
|
Food Products — 0.5% | | | | | |
Cadbury PLC (United Kingdom) | | 659,500 | | | 5,741,338 |
| | | | |
|
|
Health Care Equipment & Supplies — 6.0% | | | |
Alcon, Inc. | | 353,900 | | | 31,564,341 |
Baxter International, Inc. | | 716,300 | | | 38,386,517 |
| | | | |
|
|
| | | | | | 69,950,858 |
| | | | |
|
|
Health Care Providers & Services — 2.7% | | | |
Medco Health Solutions, Inc.(a) | | 588,400 | | | 24,659,844 |
UnitedHealth Group, Inc. | | 244,600 | | | 6,506,360 |
| | | | |
|
|
| | | | | | 31,166,204 |
| | | | |
|
|
| | | | | |
COMMON STOCKS
(continued) | | Shares
| | Value
(Note 2)
|
| | | | | | |
Household Products — 3.3% | | | | | |
Colgate-Palmolive Co. | | 556,800 | | $ | 38,163,072 |
| | | | |
|
|
Internet & Catalog Retail — 2.4% | | | | | |
Amazon.com, Inc.(a)(b) | | 538,100 | | | 27,593,768 |
| | | | |
|
|
Internet Software & Services — 4.5% | | | | | |
Google, Inc.(Class A Stock)(a) | | 169,100 | | | 52,023,615 |
| | | | |
|
|
IT Services — 4.3% | | | | | |
Infosys Technologies Ltd., ADR (India)(b) | | 513,600 | | | 12,619,152 |
Visa, Inc. (Class A Stock) | | 699,800 | | | 36,704,510 |
| | | | |
|
|
| | | | | | 49,323,662 |
| | | | |
|
|
Life Sciences, Tools & Services — 1.9% | | | |
Thermo Fisher Scientfic, Inc.(a) | | 663,700 | | | 22,612,259 |
| | | | |
|
|
Media — 1.6% | | | | | |
Walt Disney Co. (The) | | 828,900 | | | 18,807,741 |
| | | | |
|
|
Multiline Retail — 0.3% | | | | | |
Target Corp. | | 97,600 | | | 3,370,128 |
| | | | |
|
|
Oil, Gas & Consumable Fuels — 3.7% | | | | | |
Occidental Petroleum Corp. | | 323,100 | | | 19,382,769 |
Southwestern Energy Co.(a) | | 495,600 | | | 14,357,532 |
XTO Energy, Inc. | | 249,000 | | | 8,782,230 |
| | | | |
|
|
| | | | | | 42,522,531 |
| | | | |
|
|
Pharmaceuticals — 9.7% | | | | | |
Abbott Laboratories | | 654,200 | | | 34,914,654 |
Mylan, Inc.(a)(b) | | 706,500 | | | 6,987,285 |
Roche Holding Group, ADR (Switzerland)(b) | | 123,100 | | | 9,423,305 |
Shire PLC, ADR (United Kingdom) | | 273,470 | | | 12,245,987 |
Teva Pharmaceutical Industries Ltd., ADR (Israel)(b) | | 820,900 | | | 34,945,713 |
Wyeth | | 369,000 | | | 13,841,190 |
| | | | |
|
|
| | | | | | 112,358,134 |
| | | | |
|
|
Road & Rail — 0.3% | | | | | |
Union Pacific Corp.(b) | | 70,300 | | | 3,360,340 |
| | | | |
|
|
Semiconductors & Semiconductor Equipment — 0.4% |
NVIDIA Corp.(a) | | 547,600 | | | 4,419,132 |
| | | | |
|
|
Software — 4.1% | | | | | |
Adobe Systems, Inc.(a) | | 903,100 | | | 19,226,999 |
Microsoft Corp. | | 848,200 | | | 16,489,008 |
Oracle Corp.(a) | | 667,800 | | | 11,840,094 |
| | | | |
|
|
| | | | | | 47,556,101 |
| | | | |
|
|
Textiles, Apparel & Luxury Goods — 1.7% | | | |
NIKE, Inc.(Class B Stock)(b) | | 394,400 | | | 20,114,400 |
| | | | |
|
|
TOTAL LONG-TERM INVESTMENTS
(cost $1,120,119,588) | | | 1,150,539,098 |
| | | | |
|
|
SEE NOTES TO FINANCIAL STATEMENTS.
A86
| | | | | | |
| | | JENNISON PORTFOLIO (continued) | | |
| |
| SCHEDULE OF INVESTMENTS | | December 31, 2008 |
| | | | | | |
| SHORT-TERM INVESTMENT — 8.5% | |
| | | Shares
| | Value
(Note 2)
| |
Affiliated Money Market Mutual Fund | | | | |
Dryden Core Investment Fund — Taxable Money Market Series (cost $98,410,347; includes $84,689,288 of cash collateral received for securities on loan)(c)(d) | | 98,410,347 | | $ | 98,410,347 | |
| | | | |
|
|
|
TOTAL INVESTMENTS — 107.7%
(cost $1,218,529,935) | | | 1,248,949,445 | |
LIABILITIES IN EXCESS OF
OTHER ASSETS — (7.7)% | | | (88,778,063 | ) |
| | | | |
|
|
|
NET ASSETS 100.0% | | $ | 1,160,171,382 | |
| | | | |
|
|
|
The following abbreviation is used in portfolio descriptions:
| | |
| ADR | | American Depositary Receipt |
| (a) | Non-income producing security. |
| (b) | All or portion of security is on loan. The aggregate market value of such securities is $83,984,880; cash collateral of $84,689,288 (included in liabilities) was received with which the Portfolio purchased highly liquid short-term investments. |
| (c) | Represents security, or a portion thereof, purchased with cash collateral received for securities on loan. |
| (d) | Prudential Investments LLC, the manager of the Portfolio, also serves as manager of the Dryden Core Investment Fund-Taxable Money Market Series. |
Various inputs are used in determining the value of the Portfolio’s investments. These inputs are summarized in the three broad levels listed below.
Level 1—quoted prices in active markets for identical securities
Level 2—other significant observable inputs (including quoted prices for similar securities, interest rates, prepayment speeds, credit risk, etc.)
Level 3—significant unobservable inputs (including the Portfolio’s own assumptions in determining the fair value of investments)
The following is a summary of the inputs used as of December 31, 2008 in valuing the Portfolio’s assets carried at fair value:
| | | | | |
Valuation inputs
| | Investments
in Securities
| | Other Financial
Instruments*
|
Level 1—Quoted Prices | | $ | 1,248,949,445 | | — |
Level 2—Other Significant Observable Inputs | | | — | | — |
Level 3—Significant Unobservable Inputs | | | — | | — |
| | |
|
| |
|
Total | | $ | 1,248,949,445 | | — |
| | |
|
| |
|
| * | Other financial instruments are derivative instruments not reflected in the Schedule of Investments, such as futures, forwards and swap contracts, which are valued at the unrealized appreciation/depreciation on the instrument. |
As of December 31, 2007 and December 31, 2008, the Portfolio did not use any significant unobservable inputs (Level 3) in determining the valuation of investments.
The industry classification of portfolio holdings and liabilities in excess of other assets shown as a percentage of net assets as of December 31, 2008 were as follows:
| | | |
Biotechnology | | 14.0 | % |
Pharmaceuticals | | 9.7 | |
Communications Equipment | | 8.6 | |
Affiliated Money Market Mutual Fund (including 7.3% of collateral received for securities on loan) | | 8.5 | |
Food & Staples Retailing | | 7.9 | |
Computers & Peripherals | | 6.5 | |
Health Care Equipment & Supplies | | 6.0 | |
Internet Software & Services | | 4.5 | |
IT Services | | 4.3 | |
Beverages | | 4.1 | |
Software | | 4.1 | |
Oil, Gas & Consumable Fuels | | 3.7 | |
Household Products | | 3.3 | |
Aerospace & Defense | | 3.1 | |
Capital Markets | | 3.0 | |
Health Care Providers & Services | | 2.7 | |
Chemicals | | 2.4 | |
Internet & Catalog Retail | | 2.4 | |
Energy Equipment & Services | | 2.2 | |
Life Sciences, Tools & Services | | 1.9 | |
Textiles, Apparel & Luxury Goods | | 1.7 | |
Media | | 1.6 | |
Food Products | | 0.5 | |
Semiconductors & Semiconductor Equipment | | 0.4 | |
Multiline Retail | | 0.3 | |
Road & Rail | | 0.3 | |
| | |
|
|
| | | 107.7 | |
Liabilities in excess of other assets | | (7.7 | ) |
| | |
|
|
| | | 100.0 | % |
| | |
|
|
SEE NOTES TO FINANCIAL STATEMENTS.
A87
| | | | | | |
| | | JENNISON PORTFOLIO (continued) | | |
STATEMENT OF ASSETS AND LIABILITIES
December 31, 2008
| | | | |
| ASSETS | | | | |
Investments, at value including securities on loan of $83,984,880: | | | | |
Unaffiliated investments (cost $1,120,119,588) | | $ | 1,150,539,098 | |
Affiliated investments (cost $98,410,347) | | | 98,410,347 | |
Cash | | | 32,624 | |
Dividends receivable | | | 1,701,319 | |
Foreign tax reclaim receivable | | | 450,648 | |
Receivable for Series shares sold | | | 249,695 | |
Prepaid expenses | | | 22,226 | |
Receivable for investments sold | | | 3,000 | |
| | |
|
|
|
Total Assets | | | 1,251,408,957 | |
| | |
|
|
|
| LIABILITIES | | | | |
Collateral for securities on loan | | | 84,689,288 | |
Payable for investments purchased | | | 5,295,845 | |
Management fee payable | | | 574,457 | |
Payable for Series shares repurchased | | | 507,141 | |
Accrued expenses and other liabilities | | | 165,177 | |
Distribution fee payable | | | 2,522 | |
Affiliated transfer agent fee payable | | | 1,632 | |
Administration fee payable | | | 1,513 | |
| | |
|
|
|
Total Liabilities | | | 91,237,575 | |
| | |
|
|
|
| NET ASSETS | | $ | 1,160,171,382 | |
| | |
|
|
|
Net assets were comprised of: | | | | |
Paid-in capital | | | 2,122,181,439 | |
Retained earnings | | | (962,010,057 | ) |
| | |
|
|
|
Net assets, December 31, 2008 | | $ | 1,160,171,382 | |
| | |
|
|
|
| Class I: | | | | |
Net asset value and redemption price per share, $1,147,982,288 / 78,171,850 outstanding shares of beneficial interest | | $ | 14.69 | |
| | |
|
|
|
| Class II: | | | | |
Net asset value and redemption price per share, $12,189,094 / 842,874 outstanding shares of beneficial interest | | $ | 14.46 | |
| | |
|
|
|
STATEMENT OF OPERATIONS
Year Ended December 31, 2008
| | | | |
| INVESTMENT INCOME | | | | |
Unaffiliated dividend income (net of foreign withholding taxes of $413,184) | | $ | 17,033,551 | |
Affiliated income from securities loaned, net | | | 1,482,532 | |
Affiliated dividend income | | | 769,369 | |
| | |
|
|
|
| | | | 19,285,452 | |
| | |
|
|
|
| EXPENSES | | | | |
Management fee | | | 10,069,788 | |
Distribution fee—Class II | | | 42,903 | |
Administration fee—Class II | | | 25,742 | |
Shareholders’ reports | | | 215,000 | |
Custodian’s fees and expenses | | | 185,000 | |
Trustees’ fees | | | 30,000 | |
Audit fee | | | 17,000 | |
Insurance expenses | | | 17,000 | |
Legal fees and expenses | | | 15,000 | |
Transfer agent’s fees and expenses (including affiliated expense of $9,000) (Note 4) | | | 9,000 | |
Commitment fee on syndicated credit agreement | | | 7,000 | |
Interest expense (Note 8) | | | 5,108 | |
Miscellaneous | | | 16,980 | |
| | |
|
|
|
Total expenses | | | 10,655,521 | |
| | |
|
|
|
| NET INVESTMENT INCOME | | | 8,629,931 | |
| | |
|
|
|
| NET REALIZED AND UNREALIZED LOSS ON INVESTMENTS AND FOREIGN CURRENCIES | | | | |
Net realized loss on: | | | | |
Investment transactions | | | (196,810,023 | ) |
Foreign currency transactions | | | (47,426 | ) |
| | |
|
|
|
| | | | (196,857,449 | ) |
| | |
|
|
|
Net change in unrealized appreciation (depreciation) on: | | | | |
Investments | | | (549,975,863 | ) |
Foreign currencies | | | (1,842 | ) |
| | |
|
|
|
| | | | (549,977,705 | ) |
| | |
|
|
|
| NET LOSS ON INVESTMENTS AND FOREIGN CURRENCIES | | | (746,835,154 | ) |
| | |
|
|
|
| NET DECREASE IN NET ASSETS RESULTING FROM OPERATIONS | | $ | (738,205,223 | ) |
| | |
|
|
|
STATEMENT OF CHANGES IN NET ASSETS
| | | | | | | | |
| | | Year Ended December 31,
| |
| | | 2008
| | | 2007
| |
| INCREASE (DECREASE) IN NET ASSETS OPERATIONS: | | | | | | | | |
Net investment income | | $ | 8,629,931 | | | $ | 8,658,027 | |
Net realized gain (loss) on investment and foreign currency transactions | | | (196,857,449 | ) | | | 134,749,640 | |
Net change in unrealized appreciation (depreciation) on investments | | | (549,977,705 | ) | | | 94,375,405 | |
| | |
|
|
| |
|
|
|
NET INCREASE (DECREASE) IN NET ASSETS RESULTING FROM OPERATIONS | | | (738,205,223 | ) | | | 237,783,072 | |
| | |
|
|
| |
|
|
|
| DISTRIBUTIONS: | | | | | | | | |
Class I | | | (8,646,693 | ) | | | (6,070,485 | ) |
Class II | | | (11,569 | ) | | | — | |
| | |
|
|
| |
|
|
|
| TOTAL DISTRIBUTIONS | | | (8,658,262 | ) | | | (6,070,485 | ) |
| | |
|
|
| |
|
|
|
| SERIES SHARE TRANSACTIONS (Note 7): | | | | | | | | |
Series shares sold [3,216,559 and 4,033,362 shares, respectively] | | | 60,259,927 | | | | 91,274,690 | |
Series shares issued in reinvestment of distributions [390,535 and 259,312 shares, respectively] | | | 8,658,027 | | | | 6,070,485 | |
Series shares repurchased [14,819,273 and 13,603,127 shares, respectively] | | | (284,240,992 | ) | | | (303,588,872 | ) |
| | |
|
|
| |
|
|
|
NET DECREASE IN NET ASSETS RESULTING FROM SERIES SHARE TRANSACTIONS | | | (215,323,038 | ) | | | (206,243,697 | ) |
| | |
|
|
| |
|
|
|
| TOTAL INCREASE (DECREASE) IN NET ASSETS | | | (962,186,523 | ) | | | 25,468,890 | |
| NET ASSETS: | | | | | | | | |
Beginning of year | | | 2,122,357,905 | | | | 2,096,889,015 | |
| | |
|
|
| |
|
|
|
End of year | | $ | 1,160,171,382 | | | $ | 2,122,357,905 | |
| | |
|
|
| |
|
|
|
SEE NOTES TO FINANCIAL STATEMENTS.
A88
| | | | | | |
| | | MONEY MARKET PORTFOLIO | | |
| |
| SCHEDULE OF INVESTMENTS | | December 31, 2008 |
| | | | | | | | | | |
| | | Interest
Rate
| | Maturity
Date
| | Principal
Amount
(000)
| | Value
(Note 2)
|
| | | | | | | | | | | |
Certificates of Deposit — 21.9% | | | | | | | | | | |
Australia & New Zealand Banking | | 2.050% | | 02/19/09 | | $ | 15,000 | | $ | 14,999,986 |
BNP Paribas | | 2.070% | | 01/14/09 | | | 25,413 | | | 25,413,000 |
BNP Paribas | | 2.080% | | 01/26/09 | | | 44,009 | | | 44,009,000 |
Credit Suisse (NY Branch) | | 2.150% | | 01/21/09 | | | 39,310 | | | 39,310,000 |
Royal Bank of Scotland/New York | | 2.110% | | 02/02/09 | | | 50,000 | | | 50,000,000 |
Royal Bank of Scotland/New York | | 1.200% | | 02/17/09 | | | 20,000 | | | 20,000,000 |
Toronto Dominion Bank (The) | | 2.420% | | 06/15/09 | | | 17,692 | | | 17,692,801 |
Toronto Dominion Bank (The) | | 1.970% | | 09/24/09 | | | 50,000 | | | 50,000,000 |
US Bank NA | | 1.000% | | 03/30/09 | | | 65,000 | | | 65,000,000 |
| | | | | | | | | |
|
|
| | | | | | | | | | | 326,424,787 |
| | | | | | | | | |
|
|
Commercial Paper — 57.3% | | | | | | | | | | |
Australia & New Zealand Banking, 144A(a)(c) | | 2.601% | | 10/02/09 | | | 40,000 | | | 40,000,000 |
Bank of America Corp.(d) | | 2.000% | | 01/05/09 | | | 10,000 | | | 9,997,778 |
Bank of Ireland 144A(a)(c) | | 2.701% | | 09/04/09 | | | 41,000 | | | 41,000,000 |
BASF AG, 144A(c)(d) | | 1.860% | | 01/14/09 | | | 15,000 | | | 14,989,925 |
Calyon North America, Inc.(d) | | 0.490% | | 01/22/09 | | | 60,000 | | | 59,982,850 |
CBA (Delaware) Finance(d) | | 2.000% | | 03/03/09 | | | 10,000 | | | 9,966,111 |
Citigroup Funding, Inc.(d) | | 1.000% | | 02/10/09 | | | 29,161 | | | 29,128,599 |
Conocophillips CPP Fdg., 144A(c)(d) | | 1.250% | | 01/27/09 | | | 20,500 | | | 20,481,493 |
Credit Suisse (NY Branch)(d) | | 1.950% | | 01/16/09 | | | 10,000 | | | 9,991,875 |
E.ON AG, 144A(c)(d) | | 2.300% | | 01/09/09 | | | 22,000 | | | 21,988,756 |
GDF Suez, 144A(c)(d) | | 2.290% | | 01/28/09 | | | 18,000 | | | 17,969,085 |
HSBC USA, Inc.(d) | | 2.000% | | 02/05/09 | | | 60,000 | | | 59,883,333 |
Lloyds TSB Bank PLC(d) | | 1.080% | | 02/17/09 | | | 65,000 | | | 64,908,350 |
Long Lane Master Trust IV, 144A(c)(d) | | 0.050% | | 01/02/09 | | | 33,000 | | | 32,999,954 |
Merrill Lynch & Co., Inc.(d) | | 2.250% | | 01/15/09 | | | 70,000 | | | 69,938,749 |
National Australia Funding Delaware, 144A(c)(d) | | 1.900% | | 02/02/09 | | | 50,000 | | | 49,915,556 |
New York Life Capital Corp., 144A(c)(d) | | 1.650% | | 01/09/09 | | | 20,000 | | | 19,992,667 |
Nordea Bank AB(d) | | 2.000% | | 01/16/09 | | | 15,000 | | | 14,987,500 |
Old Line Funding LLC, 144A(c)(d) | | 1.400% | | 01/14/09 | | | 37,155 | | | 37,136,216 |
Old Line Funding LLC, 144A(c)(d) | | 0.500% | | 01/15/09 | | | 19,565 | | | 19,561,196 |
Reckitt Benckiser TSY, 144A(c)(d) | | 2.050% | | 01/27/09 | | | 10,000 | | | 9,985,194 |
San Paolo IMI US Financial Co.(d) | | 2.050% | | 02/02/09 | | | 27,000 | | | 26,950,800 |
San Paolo IMI US Financial Co.(d) | | 1.320% | | 03/02/09 | | | 12,000 | | | 11,973,600 |
Santander Central Hispano Finance(d) | | 2.000% | | 01/20/09 | | | 50,000 | | | 49,947,222 |
Societe Generale North America, Inc.(d) | | 0.680% | | 03/02/09 | | | 40,000 | | | 39,954,667 |
UBS Finance (Delaware) LLC(d) | | 0.300% | | 01/22/09 | | | 20,000 | | | 19,996,500 |
UBS Finance (Delaware) LLC(d) | | 1.170% | | 02/18/09 | | | 20,000 | | | 19,968,800 |
Westpac Securities NZ LT, 144A(a)(c) | | 3.069% | | 01/28/09 | | | 30,000 | | | 30,000,000 |
| | | | | | | | | |
|
|
| | | | | | | | | | | 853,596,776 |
| | | | | | | | | |
|
|
Other Corporate Obligations — 8.0% | | | | | | | | | | |
Bank of America Corp., Sr. Unsec’d. Notes(a) | | 2.906% | | 08/06/09 | | | 30,000 | | | 30,000,000 |
General Electric Capital Corp., Sr. Unsec’d. Notes, M.T.N.(a) | | 4.247% | | 01/05/09 | | | 10,000 | | | 10,001,923 |
MetLife Insurance Co. of Connecticut(a)(b)(e) (original cost $6,000,000; purchased 7/07/08) | | 4.739% | | 07/07/09 | | | 6,000 | | | 6,000,000 |
Metropolitan Life Insurance Co. (a)(b)(e) (original cost $8,000,000; purchased 2/01/08) | | 3.442% | | 02/02/09 | | | 8,000 | | | 8,000,000 |
Nordea Bank AB, M.T.N., 144A(a)(c) | | 3.891% | | 09/24/09 | | | 40,000 | | | 40,000,000 |
Wells Fargo & Co., Sr. Unsec’d. Notes, M.T.N.(a) | | 1.668% | | 09/23/09 | | | 25,000 | | | 25,011,414 |
| | | | | | | | | |
|
|
| | | | | | | | | | | 119,013,337 |
| | | | | | | | | |
|
|
Time Deposit — 0.5% | | | | | | | | | | |
Royal Bank of Canada | | 0.030% | | 01/02/09 | | | 7,670 | | | 7,670,000 |
| | | | | | | | | |
|
|
U.S. Government Agency — 12.3% | | | | | | | | | | |
Federal Home Loan Bank(a) | | 0.861% | | 02/17/09 | | | 10,000 | | | 10,000,000 |
Federal Home Loan Bank(a) | | 0.240% | | 02/19/09 | | | 25,000 | | | 25,000,000 |
Federal Home Loan Bank(a) | | 0.270% | | 02/23/09 | | | 25,000 | | | 25,000,000 |
Federal Home Loan Bank(a) | | 0.315% | | 02/27/09 | | | 33,000 | | | 33,000,000 |
SEE NOTES TO FINANCIAL STATEMENTS.
A89
| | | | | | |
| | | MONEY MARKET PORTFOLIO (continued) | | |
| |
| SCHEDULE OF INVESTMENTS | | December 31, 2008 |
| | | | | | | | | | |
| | | Interest
Rate
| | Maturity
Date
| | Principal
Amount
(000)
| | Value
(Note 2)
|
U.S. Government Agency (continued) | | | | | | | | | | |
Federal Home Loan Bank(a) | | 0.350% | | 03/27/09 | | $ | 25,000 | | $ | 25,000,000 |
Goldman Sachs Promissory Notes Gtd.(b)(f) | | 2.250% | | 03/09/09 | | | 65,000 | | | 65,000,000 |
| | | | | | | | | |
|
|
| | | | | | | | | | | 183,000,000 |
| | | | | | | | | |
|
|
TOTAL INVESTMENTS — 100.0%
(amortized cost $1,489,704,900)(g) | | | 1,489,704,900 |
OTHER ASSETS IN EXCESS OF LIABILITIES | | | 52,853 |
| | | | | | | | | |
|
|
NET ASSETS — 100.0% | | $ | 1,489,757,753 |
| | | | | | | | | |
|
|
The following abbreviation is used in portfolio descriptions:
| (a) | Indicates a variable rate security. The maturity date presented for these instruments is the later of the next date on which the security can be redeemed at par or the next date on which the rate of interest is adjusted. The interest rate shown reflects the rate in effect at December 31, 2008. |
| (b) | Indicates an illiquid security. |
| (c) | Securities were purchased pursuant to Rule 144A under the Securities Act of 1933 and may not be resold subject to that rule except to qualified institutional buyers. Unless otherwise noted, 144A securities are deemed to be liquid. |
| (d) | Rate quoted represents yield-to-maturity as of purchase date. |
| (e) | Indicates a restricted security; the aggregate original cost of such securities is $14,000,000. The aggregate value of $14,000,000 is approximately 0.9% of net assets. |
| (f) | FDIC—Guaranteed issued under temporary liquidity guarantee program. |
| (g) | The cost of securities for federal income tax purposes is substantially the same as for financial reporting purposes. |
Various inputs are used in determining the value of the Portfolio’s investments. These inputs are summarized in the three broad levels listed below.
Level 1—quoted prices in active markets for identical securities
Level 2—other significant observable inputs (including quoted prices for similar securities, interest rates, prepayment speeds, credit risk, etc.)
Level 3—significant unobservable inputs (including the Portfolio’s own assumptions in determining the fair value of investments)
The following is a summary of the inputs used as of December 31, 2008 in valuing the Portfolio’s assets carried at fair value:
| | | | | |
Valuation inputs
| | Investments
in Securities
| | Other Financial
Instruments*
|
Level 1—Quoted Prices | | $ | — | | — |
Level 2—Other Significant Observable Inputs | | | 1,489,704,900 | | — |
Level 3—Significant Unobservable Inputs | | | — | | — |
| | |
|
| |
|
Total | | $ | 1,489,704,900 | | — |
| | |
|
| |
|
| * | Other financial instruments are derivative instruments not reflected in the Schedule of Investments, such as futures, forwards and swap contracts, which are valued at the unrealized appreciation/depreciation on the instrument. |
As of December 31, 2007 and December 31, 2008, the Portfolio did not use any significant unobservable input (Level 3) in determining the valuation of investments.
The industry classification of portfolio holdings and other assets in excess of liabilities shown as a percentage of net assets as of December 31, 2008 was as follows:
| | | |
Foreign Banks | | 33.6 | % |
Commercial Banks | | 22.7 | |
Assets Backed Securities | | 15.9 | |
Security Broker & Dealers | | 9.1 | |
Finance Services | | 6.6 | |
Non Captive Finance | | 4.7 | |
Energy | | 4.1 | |
Insurance | | 2.3 | |
Chemicals | | 1.0 | |
| | |
|
|
| | | 100.0 | |
Other assets in excess of liabilities | | — | |
| | |
|
|
| | | 100.0 | % |
| | |
|
|
SEE NOTES TO FINANCIAL STATEMENTS.
A90
| | | | | | |
| | | MONEY MARKET PORTFOLIO (continued) | | |
STATEMENT OF ASSETS AND LIABILITIES
December 31, 2008
| | | |
| ASSETS | | | |
Investments, at value (amortized cost $1,489,704,900) | | $ | 1,489,704,900 |
Interest receivable | | | 1,586,810 |
Receivable for Series shares sold | | | 603,668 |
Prepaid expenses | | | 16,456 |
| | |
|
|
Total Assets | | | 1,491,911,834 |
| | |
|
|
| LIABILITIES | | | |
Payable for Series shares repurchased | | | 1,479,213 |
Management fee payable | | | 507,226 |
Accrued expenses and other liabilities | | | 145,817 |
Payable to custodian | | | 20,864 |
Affiliated transfer agent fee payable | | | 961 |
| | |
|
|
Total Liabilities | | | 2,154,081 |
| | |
|
|
| NET ASSETS | | $ | 1,489,757,753 |
| | |
|
|
Net assets were comprised of: | | | |
Paid-in capital | | $ | 1,489,757,753 |
| | |
|
|
Net assets, December 31, 2008 | | $ | 1,489,757,753 |
| | |
|
|
Net asset value and redemption price per share, $1,489,757,753 / 148,975,774 outstanding shares of beneficial interest | | $ | 10.00 |
| | |
|
|
STATEMENT OF OPERATIONS
Year Ended December 31, 2008
| | | |
| INVESTMENT INCOME | | | |
Interest | | $ | 41,813,349 |
| | |
|
|
| EXPENSES | | | |
Management fee | | | 5,547,767 |
Shareholders’ reports | | | 165,000 |
Custodian’s fees and expenses | | | 137,000 |
Trustees’ fees | | | 23,000 |
Audit fee | | | 16,000 |
Insurance expenses | | | 14,000 |
Legal fees and expenses | | | 11,000 |
Transfer agent’s fee and expenses (including affiliated expense of $4,700) (Note 4) | | | 6,000 |
Miscellaneous | | | 9,216 |
| | |
|
|
Total expenses | | | 5,928,983 |
| | |
|
|
| NET INVESTMENT INCOME | | | 35,884,366 |
| | |
|
|
| NET REALIZED GAIN ON INVESTMENT TRANSACTIONS | | | 74,311 |
| | |
|
|
| NET INCREASE IN NET ASSETS RESULTING FROM OPERATIONS | | $ | 35,958,677 |
| | |
|
|
STATEMENT OF CHANGES IN NET ASSETS
| | | | | | | | |
| | | Year Ended December 31,
| |
| | | 2008
| | | 2007
| |
| INCREASE (DECREASE) IN NET ASSETS | | | | | | | | |
| OPERATIONS: | | | | | | | | |
Net investment income | | $ | 35,884,366 | | | $ | 62,090,264 | |
Net realized gain on investment transactions | | | 74,311 | | | | 25,015 | |
| | |
|
|
| |
|
|
|
NET INCREASE IN NET ASSETS RESULTING FROM OPERATIONS | | | 35,958,677 | | | | 62,115,279 | |
| | |
|
|
| |
|
|
|
| DISTRIBUTIONS: | | | (35,958,677 | ) | | | (62,115,279 | ) |
| | |
|
|
| |
|
|
|
| SERIES SHARE TRANSACTIONS: | | | | | | | | |
Series shares sold [41,282,769 and 70,927,906 shares, respectively] | | | 412,827,618 | | | | 709,279,065 | |
Series shares issued in reinvestment of distributions [3,595,860 and 6,211,703 shares, respectively] | | | 35,958,677 | | | | 62,117,029 | |
Series shares repurchased [24,895,819 and 54,199,025 shares, respectively] | | | (248,958,192 | ) | | | (541,990,247 | ) |
| | |
|
|
| |
|
|
|
NET INCREASE IN NET ASSETS RESULTING FROM SERIES SHARE TRANSACTIONS | | | 199,828,103 | | | | 229,405,847 | |
| | |
|
|
| |
|
|
|
| TOTAL INCREASE IN NET ASSETS | | | 199,828,103 | | | | 229,405,847 | |
| NET ASSETS: | | | | | | | | |
Beginning of year | | | 1,289,929,650 | | | | 1,060,523,803 | |
| | |
|
|
| |
|
|
|
End of year | | $ | 1,489,757,753 | | | $ | 1,289,929,650 | |
| | |
|
|
| |
|
|
|
SEE NOTES TO FINANCIAL STATEMENTS.
A91
| | | | | | |
| | | NATURAL RESOURCES PORTFOLIO | | |
| |
| SCHEDULE OF INVESTMENTS | | December 31, 2008 |
| | | | | |
| LONG-TERM INVESTMENTS — 99.6% | | |
| COMMON STOCKS — 99.0% | | Shares
| | Value
(Note 2)
|
| | | | | | |
All Other Basic Metals — 1.1% | | | | | |
Cameco Corp. (Canada) | | 466,800 | | $ | 7,959,611 |
Platmin Ltd., 144A
(South Africa)(a)(f) | | 276,900 | | | 116,637 |
| | | | |
|
|
| | | | | | 8,076,248 |
| | | | |
|
|
Aluminum — 0.8% | | | | | |
Century Aluminum Co.(a)(b) | | 581,200 | | | 5,812,000 |
| | | | |
|
|
Coal — 0.5% | | | | | |
Patriot Coal Corp.(a)(b) | | 568,300 | | | 3,551,875 |
| | | | |
|
|
Copper — 2.5% | | | | | |
First Quantum Minerals Ltd. (Canada) | | 259,500 | | | 3,701,738 |
Freeport-McMoRan Copper & Gold, Inc.
(Class B)(b) | | 396,019 | | | 9,678,704 |
Southern Copper Corp.(b) | | 290,700 | | | 4,668,642 |
| | | | |
|
|
| | | | | | 18,049,084 |
| | | | |
|
|
Diversified Exploration & Production — 19.7% | | | |
Cabot Oil And Gas Corp. (Class A)(b) | | 361,700 | | | 9,404,200 |
Cairn Energy PLC
(United Kingdom)(a) | | 398,000 | | | 11,530,344 |
Concho Resources, Inc.(a) | | 474,700 | | | 10,832,654 |
Denbury Resources, Inc.(a) | | 884,900 | | | 9,663,108 |
Devon Energy Corp. | | 246,100 | | | 16,171,231 |
EOG Resources, Inc. | | 201,900 | | | 13,442,502 |
Newfield Exploration Co.(a) | | 337,600 | | | 6,667,600 |
OGX Petroleo e Gas Participacoes SA (Brazil)(a) | | 55,913 | | | 12,611,834 |
Noble Energy, Inc. | | 245,000 | | | 12,058,900 |
Oil Search Ltd. (Papua New Guinea) | | 1,882,841 | | | 6,165,386 |
Pacific Rubiales Energy Corp. (Canada)(a) | | 1,691,300 | | | 3,000,362 |
Pioneer Natural Resources Co.(b) | | 289,000 | | | 4,676,020 |
St. Mary Land & Exploration Co. | | 166,500 | | | 3,381,615 |
Talisman Energy, Inc. | | 1,143,900 | | | 11,427,561 |
Woodside Petroleum Ltd. (Australia) | | 420,462 | | | 10,880,423 |
| | | | |
|
|
| | | | | | 141,913,740 |
| | | | |
|
|
Diversified Metals & Mining — 3.0% | | | | | |
African Rainbow Minerals Ltd.
(South Africa) | | 545,850 | | | 6,553,742 |
First Uranium Corp. (South Africa)(a) | | 390,800 | | | 579,315 |
First Uranium Corp., 144A
(South Africa)(a)(f) | | 400,000 | | | 592,953 |
FNX Mining Co., Inc. (Canada)(a) | | 351,100 | | | 864,596 |
FNX Mining Co., Inc., 144A (Canada)(a) | | 56,300 | | | 138,641 |
Northern Dynasty Minerals Ltd.(a)(b) | | 859,700 | | | 3,163,696 |
Rio Tinto PLC ADR
(United Kingdom)(b) | | 43,400 | | | 3,858,694 |
Sterlite Industries India Ltd., ADR (India) | | 1,009,700 | | | 5,573,544 |
| | | | |
|
|
| | | | | | 21,325,181 |
| | | | |
|
|
Diversified Resources — 0.3% | | | | | |
Edp Renovaveis SA., 144A (Spain)(a) | | 285,700 | | | 1,986,874 |
| | | | |
|
|
| | | | | |
COMMON STOCKS
(continued) | | Shares
| | Value
(Note 2)
|
| | | | | | |
Drillers — 2.7% | | | | | |
Helmerich & Payne, Inc. | | 254,500 | | $ | 5,789,875 |
Noble Corp. | | 291,600 | | | 6,441,444 |
Transocean Inc.(a) | | 120,503 | | | 5,693,767 |
Vantage Drilling Co.(a) | | 1,457,800 | | | 1,603,580 |
| | | | |
|
|
| | | | | | 19,528,666 |
| | | | |
|
|
Energy Services — 11.1% | | | | | |
Cameron International Corp.(a)(b) | | 603,200 | | | 12,365,600 |
Complete Production Services, Inc.(a) | | 527,000 | | | 4,295,050 |
DRIL-QUIP, Inc.(a) | | 244,900 | | | 5,022,899 |
Exterran Holdings, Inc.(a)(b) | | 181,000 | | | 3,855,300 |
Halliburton Co. | | 568,100 | | | 10,328,058 |
Integra Group Holdings, GDR(a) | | 1,236,950 | | | 1,397,754 |
National-Oilwell Varco, Inc.(a) | | 475,700 | | | 11,626,108 |
Schlumberger Ltd. | | 317,100 | | | 13,422,843 |
Superior Energy Services, Inc.(a) | | 408,300 | | | 6,504,219 |
Tenaris SA, ADR (Luxembourg)(b) | | 525,800 | | | 11,031,284 |
| | | | |
|
|
| | | | | | 79,849,115 |
| | | | |
|
|
Food — 0.6% | | | | | |
Agrenco Ltd., 144A (Brazil)(a) | | 1,166,700 | | | 110,066 |
Cosan Ltd., (Class A)(a) | | 1,274,400 | | | 4,409,424 |
| | | | |
|
|
| | | | | | 4,519,490 |
| | | | |
|
|
Gold — 21.9% | | | | | |
AGNICO-EAGLE Mines Ltd.(b) | | 305,900 | | | 15,701,847 |
AXMIN, Inc. (Canada)(a) | | 4,338,700 | | | 263,590 |
Barrick Gold Corp.(b) | | 356,994 | | | 13,126,669 |
Centerra Gold, Inc. (Canada)(a) | | 597,600 | | | 2,149,327 |
Cia de Minas Buenaventura SA, ADR (Peru) | | 652,000 | | | 12,987,840 |
Eldorado Gold Corp. (Canada)(a) | | 2,048,000 | | | 16,009,073 |
European Goldfields Ltd. (Canada)(a) | | 2,382,600 | | | 6,253,239 |
Gabriel Resources Ltd. (Canada)(a) | | 1,758,800 | | | 2,165,554 |
Gold Reserve, Inc.(a) | | 596,000 | | | 560,240 |
Gold Reserve, Inc. (Canada)(a) | | 131,900 | | | 125,009 |
Goldcorp, Inc. | | 414,277 | | | 13,062,154 |
Highland Gold Mining Ltd.
(United Kingdom)(a) | | 427,900 | | | 221,477 |
Kinross Gold Corp.(b) | | 1,089,800 | | | 20,074,115 |
Lihir Gold Ltd., 144A
(Papua New Guinea)(a) | | 2,344,983 | | | 5,055,179 |
Lihir Gold Ltd., ADR
(Papua New Guinea)(a)(b) | | 462,300 | | | 10,138,239 |
Nevsun Resources Ltd. (Canada)(a) | | 1,782,900 | | | 1,372,017 |
Newcrest Mining Ltd. (Australia) | | 575,799 | | | 13,705,660 |
Newcrest Mining Ltd., 144A (Australia) | | 127,627 | | | 3,037,887 |
Newmont Mining Corp. | | 391,700 | | | 15,942,190 |
Seabridge Gold, Inc.(a)(b) | | 97,300 | | | 1,272,684 |
SEMAFO, Inc. (Canada)(a) | | 1,302,800 | | | 1,266,391 |
SEMAFO, Inc., 144A (Canada)(a)(f) | | 3,216,300 | | | 3,126,416 |
| | | | |
|
|
| | | | | | 157,616,797 |
| | | | |
|
|
SEE NOTES TO FINANCIAL STATEMENTS.
A92
| | | | | | |
| | | NATURAL RESOURCES PORTFOLIO (continued) | | |
| |
| SCHEDULE OF INVESTMENTS | | December 31, 2008 |
| | | | | |
COMMON STOCKS
(continued) | | Shares
| | Value
(Note 2)
|
| | | | | | |
Integrated Oil/Domestic — 4.1% | | | | | |
Hess Corp. | | 208,400 | | $ | 11,178,576 |
Occidental Petroleum Corp. | | 300,500 | | | 18,026,995 |
| | | | |
|
|
| | | | | | 29,205,571 |
| | | | |
|
|
Integrated Oil/International — 6.6% | | | | | |
BG Group PLC (United Kingdom) | | 1,060,900 | | | 14,597,232 |
Petroleo Brasileiro SA, ADR (Brazil) | | 428,200 | | | 10,486,618 |
Reliance Industries Ltd., GDR 144A (India) | | 141,400 | | | 7,155,618 |
Sasol Ltd., ADR (South Africa)(b) | | 493,200 | | | 14,958,756 |
| | | | |
|
|
| | | | | | 47,198,224 |
| | | | |
|
|
Iron & Steel — 1.3% | | | | | |
Cliffs Natural Resources, Inc. | | 314,700 | | | 8,059,467 |
MMX Mineracao e Metalicos SA (Brazil)(a) | | 1,384,000 | | | 1,643,945 |
| | | | |
|
|
| | | | | | 9,703,412 |
| | | | |
|
|
Mineral Sands — 2.2% | | | | | |
OPTI Canada, Inc. (Canada)(a) | | 1,416,448 | | | 2,065,295 |
Suncor Energy, Inc. | | 640,100 | | | 12,481,950 |
UTS Energy Corp. (Canada)(a) | | 2,296,900 | | | 1,488,473 |
| | | | |
|
|
| | | | | | 16,035,718 |
| | | | |
|
|
Natural Gas Production — 13.9% | | | | | |
Bill Barrett Corp.(a)(b) | | 288,300 | | | 6,091,779 |
BPI Energy Holdings, Inc.(a) | | 2,800,000 | | | 28,000 |
Equitable Resources, Inc. | | 275,100 | | | 9,229,605 |
Linc Energy Ltd., 144A (Australia)(a)(f) | | 2,820,000 | | | 3,965,919 |
Petrohawk Energy Corp.(a) | | 475,100 | | | 7,425,813 |
Range Resources Corp. | | 438,050 | | | 15,064,540 |
SandRidge Energy, Inc.(a) | | 733,400 | | | 4,510,410 |
Southwestern Energy Co.(a) | | 778,800 | | | 22,561,835 |
Trident Resources Corp.(Canada)(Private) (cost $4,402,178; purchased 12/4/03)(a)(f)(g) | | 412,657 | | | 1,754,920 |
Ultra Petroleum Corp.(a) | | 299,000 | | | 10,318,490 |
XTO Energy, Inc. | | 450,325 | | | 15,882,963 |
Zodiac Exploration Corp. (Canada)(Private) (cost $3,757,486; purchased 8/08/08)(a)(f)(g) | | 8,000,000 | | | 3,110,571 |
| | | | |
|
|
| | | | | | 99,944,845 |
| | | | |
|
|
Non-Natural Resources — 1.5% | | | | | |
NRG Energy, Inc.(a)(b) | | 451,600 | | | 10,535,828 |
| | | | |
|
|
Oil & Gas Storage & Transportation — 1.6% | | | |
LLX Logistica SA (Brazil)(a) | | 1,384,000 | | | 896,158 |
Williams Cos., Inc. | | 744,800 | | | 10,784,704 |
| | �� | | |
|
|
| | | | | | 11,680,862 |
| | | | |
|
|
Platinum — 1.0% | | | | | |
Impala Platinum Holdings Ltd., ADR (South Africa) | | 494,100 | | | 7,263,270 |
| | | | |
|
|
Silver — 2.6% | | | | | |
Hecla Mining Co.(a)(b) | | 1,506,100 | | | 4,217,080 |
Pan American Silver Corp. (Canada)(a) | | 130,458 | | | 2,220,269 |
| | | | | | | |
COMMON STOCKS
(continued) | | Shares
| | Value
(Note 2)
| |
Silver (continued) | | | | | | | |
Pan American Silver Corp.(a)(b) | | | 419,600 | | $ | 7,162,572 | |
Silver Wheaton Corp.(a)(b) | | | 738,000 | | | 4,789,620 | |
| | | | | |
|
|
|
| | | | | | | 18,389,541 | |
| | | | | |
|
|
|
TOTAL COMMON STOCKS
(cost $959,386,442) | | | 712,186,341 | |
| | | | | |
|
|
|
| | |
| | | Principal
Amount
(000)#
| | | |
| CORPORATE BOND — 0.6% | | | | |
Natural Gas Production — 0.6% | | | | | | | |
Trident Subordinated Unsecured Note, PIK, 7.9712%, due 8/12/12 (cost $16,237,615; purchased 8/20/07-12/29/08)
(Canada)(Private) (f)(g) | | CAD | 17,086 | | | 4,671,234 | |
| | | | | |
|
|
|
| | |
| | | Units
| | | |
| WARRANTS(a) | | | | | |
Gold | | | | | | | |
Crystallex International Corp. Warrant, expiring 8/11/09 (Canada)(Private) (cost $0; purchased 2/08/08)(f)(g) | | | 221,350 | | | 1 | |
| | | | | |
|
|
|
Natural Gas Production | | | | | | | |
Trident Warrant, expiring 1/01/15 (Canada)(Private) (cost $0; purchased 8/20/07)(f)(g) | | | 1,455,868 | | | 118 | |
Zodiac Exploration Corp. Warrant, expiring 2/10/12 (Canada)(Private) (cost $0; purchased 8/08/08)(f)(g) | | | 8,000,000 | | | — | (e) |
| | | | | |
|
|
|
| | | | | | | 118 | |
| | | | | |
|
|
|
TOTAL WARRANTS
(cost $0) | | | 119 | |
| | | | | |
|
|
|
TOTAL LONG TERM INVESTMENTS
(cost $975,624,057) | | | 716,857,694 | |
| | | | | |
|
|
|
| | |
| | | Shares
| | | |
| SHORT-TERM INVESTMENT — 10.7% | | | | |
Affiliated Money Market Mutual Fund | | | | |
Dryden Core Investment Fund — Taxable Money Market Series (cost $76,873,018; includes $76,873,017 of cash collateral received for securities on loan)(Note 4)(c)(d) | | | 76,873,018 | | | 76,873,018 | |
| | | | | |
|
|
|
TOTAL INVESTMENTS(h) — 110.3%
(cost $1,052,497,075) | | | 793,730,712 | |
LIABILITIES IN EXCESS OF
OTHER ASSETS — (10.3)% | | | (74,011,175 | ) |
| | | | | |
|
|
|
NET ASSETS — 100.0% | | $ | 719,719,537 | |
| | | | | |
|
|
|
SEE NOTES TO FINANCIAL STATEMENTS.
A93
| | | | | | |
| | | NATURAL RESOURCES PORTFOLIO (continued) | | |
| |
| SCHEDULE OF INVESTMENTS | | December 31, 2008 |
The following abbreviations are used in portfolio descriptions:
| | |
| 144A | | Security was purchased pursuant to Rule 144A under the Securities Act of 1933 and may not be resold subject to that rule except to qualified institutional buyers. Unless otherwise noted, 144A securities are deemed to be liquid. |
| ADR | | American Depositary Receipt |
| CAD | | Canadian Dollar |
| GDR | | Global Depositary Receipt |
| PIK | | Payment in Kind |
| # | Principal amount shown in U.S. Dollars unless otherwise stated. |
| (a) | Non-income producing security. |
| (b) | All or portion of security is on loan. The aggregate market value of such securities is $75,071,460; cash collateral of $76,873,017 (included in liabilities) was received with which the Portfolio purchased highly liquid short-term investments. |
| (c) | Represents security, or portion thereof, purchased with cash collateral for securities on loan. |
| (d) | Prudential Investments LLC, the manager of the Portfolio, also serves as manager of the Dryden Core Investment Fund-Taxable Money Market Series. |
| (f) | Indicates illiquid securities. |
| (g) | Indicates a security restricted to resale. The aggregate cost of such securities was $24,397,279. The aggregate value of $9,536,844 is approximately 1.3% of the net assets. |
| (h) | As of December 31, 2008, 11 securities representing $52,347,298 and 7.3% of the net assets were fair valued in accordance with the policies adopted by the Board of Trustees. |
Various inputs are used in determining the value of the Portfolio’s investments. These inputs are summarized in the three broad levels listed below.
Level 1—quoted prices in active markets for identical securities
Level 2—other significant observable inputs (including quoted prices for similar securities, interest rates, prepayment speeds, credit risk, etc.)
Level 3—significant unobservable inputs (including the Portfolio’s own assumptions in determining the fair value of investments)
The following is a summary of the inputs used as of December 31, 2008 in valuing the Portfolio’s assets carried at fair value:
| | | | | |
Valuation inputs
| | Investments
in Securities
| | Other
Financial
Instruments*
|
Level 1—Quoted Prices | | $ | 741,383,414 | | — |
Level 2—Other Significant
Observable Inputs | | | 42,810,454 | | — |
Level 3—Significant Unobservable Inputs | | | 9,536,844 | | — |
| | |
|
| |
|
Total | | $ | 793,730,712 | | — |
| | |
|
| |
|
| * | Other financial instruments are derivative instruments not reflected in the Schedule of Investments, such as futures, forwards and swap contracts, which are valued at the unrealized appreciation/depreciation on the instrument. |
The following is a reconciliation of assets in which significant unobservable inputs (Level 3) were used in determining fair value:
| | | | |
| | | Investments
in Securities
| |
Balance as of 12/31/07 | | $ | 33,530,418 | |
Realized gain (loss) | | | 7,953 | |
Change in unrealized appreciation (depreciation) | | | (15,601,253 | ) |
Net purchases (sales) | | | 5,201,731 | |
Transfers in and/or out of Level 3 | | | (13,602,005 | ) |
| | |
|
|
|
Balance as of 12/31/08 | | $ | 9,536,844 | |
| | |
|
|
|
The industry classification of portfolio holdings and liabilities in excess of other assets shown as a percentage of net assets as of December 31, 2008 was as follows:
| | | |
Gold | | 21.9 | % |
Diversified Exploration & Production | | 19.7 | |
Natural Gas Production | | 14.5 | |
Energy Services | | 11.1 | |
Affiliated Money Market Mutual Fund (including 10.7% of collateral received for securities on loan) | | 10.7 | |
Integrated Oil/International | | 6.6 | |
Integrated Oil/Domestic | | 4.1 | |
Diversified Metals & Mining | | 3.0 | |
Drillers | | 2.7 | |
Silver | | 2.6 | |
Copper | | 2.5 | |
Mineral Sands | | 2.2 | |
Oil & Gas Storage & Transportation | | 1.6 | |
Non-Natural Resources | | 1.5 | |
Iron & Steel | | 1.3 | |
All Other Basic Metals | | 1.1 | |
Platinum | | 1.0 | |
Aluminum | | 0.8 | |
Food | | 0.6 | |
Coal | | 0.5 | |
Diversified Resources | | 0.3 | |
| | |
|
|
| | | 110.3 | |
Liabilities in excess of other assets | | (10.3 | ) |
| | |
|
|
| | | 100.0 | % |
| | |
|
|
SEE NOTES TO FINANCIAL STATEMENTS.
A94
| | | | | | |
| | | NATURAL RESOURCES PORTFOLIO (continued) | | |
STATEMENT OF ASSETS AND LIABILITIES
December 31, 2008
| | | | |
| ASSETS | | | | |
Investments, at value, including securities on loan of $75,071,460: | | | | |
Unaffiliated investments (cost $975,624,057) | | $ | 716,857,694 | |
Affiliated investments (cost $76,873,018) | | | 76,873,018 | |
Cash | | | 248,784 | |
Foreign currency, at value (cost $60) | | | 61 | |
Receivable for investments sold | | | 3,207,132 | |
Dividends and interest receivable | | | 713,841 | |
Receivable for Series shares sold | | | 197,867 | |
Tax reclaims receivable | | | 70,516 | |
Prepaid expenses | | | 24,847 | |
| | |
|
|
|
Total Assets | | | 798,193,760 | |
| | |
|
|
|
| LIABILITIES | | | | |
Collateral for securities on loan | | | 76,873,017 | |
Loan payable | | | 583,000 | |
Payable for Series shares repurchased | | | 567,529 | |
Management fee payable | | | 252,741 | |
Accrued expenses and other liabilities | | | 183,758 | |
Distribution fee payable | | | 8,077 | |
Administration fee payable | | | 4,849 | |
Affiliated transfer agent fee payable | | | 1,252 | |
| | |
|
|
|
Total Liabilities | | | 78,474,223 | |
| | |
|
|
|
| NET ASSETS | | $ | 719,719,537 | |
| | |
|
|
|
Net assets were comprised of: | | | | |
Paid-in capital | | $ | 881,483,740 | |
Retained earnings | | | (161,764,203 | ) |
| | |
|
|
|
Net assets, December 31, 2008 | | $ | 719,719,537 | |
| | |
|
|
|
| Class I: | | | | |
Net asset value and redemption price per share, $677,458,263 / 28,586,203 outstanding shares of beneficial interest | | $ | 23.70 | |
| | |
|
|
|
| Class II: | | | | |
Net asset value and redemption price per share, $42,261,274 / 1,795,313 outstanding shares of beneficial interest | | $ | 23.54 | |
| | |
|
|
|
STATEMENT OF OPERATIONS
Year Ended December 31, 2008
| | | | |
| INVESTMENT INCOME | | | | |
Unaffiliated dividend income (net of foreign withholding taxes of $291,005) | | $ | 10,287,404 | |
Affiliated income from securities loaned, net | | | 1,801,625 | |
Interest | | | 1,564,234 | |
Affiliated dividend income | | | 386,765 | |
| | |
|
|
|
| | | | 14,040,028 | |
| | |
|
|
|
| EXPENSES | | | | |
Management fee | | | 6,505,593 | |
Distribution fee—Class II | | | 134,288 | |
Administration fee—Class II | | | 80,573 | |
Custodian’s fees and expenses | | | 350,000 | |
Shareholders’ reports | | | 196,000 | |
Transfer agent’s fee and expenses (including affiliated expense of $7,000) (Note 4) | | | 76,000 | |
Trustees’ fees | | | 29,000 | |
Loan interest expense (Note 8) | | | 20,833 | |
Audit fee | | | 17,000 | |
Insurance expenses | | | 15,000 | |
Legal fees and expenses | | | 15,000 | |
Interest expense | | | 14,964 | |
Commitment fee on syndicated credit agreement | | | 7,000 | |
Miscellaneous | | | 34,944 | |
| | |
|
|
|
Total expenses | | | 7,496,195 | |
| | |
|
|
|
| NET INVESTMENT INCOME | | | 6,543,833 | |
| | |
|
|
|
| NET REALIZED AND UNREALIZED GAIN (LOSS) ON INVESTMENTS AND FOREIGN CURRENCIES | | | | |
Net realized gain (loss) on: | | | | |
Investment transactions | | | 113,761,782 | |
Foreign currency transactions | | | (933,037 | ) |
| | |
|
|
|
| | | | 112,828,745 | |
| | |
|
|
|
Net change in unrealized appreciation (depreciation) on: | | | | |
Investments | | | (971,071,204 | ) |
Foreign currencies | | | (96 | ) |
| | |
|
|
|
| | | | (971,071,300 | ) |
| | |
|
|
|
| NET LOSS ON INVESTMENTS AND FOREIGN CURRENCIES | | | (858,242,555 | ) |
| | |
|
|
|
| NET DECREASE IN NET ASSETS RESULTING FROM OPERATIONS | | $ | (851,698,722 | ) |
| | |
|
|
|
STATEMENT OF CHANGES IN NET ASSETS
| | | | | | | | |
| | | Year Ended December 31,
| |
| | | 2008
| | | 2007
| |
| INCREASE (DECREASE) IN NET ASSETS | | | | | | | | |
| OPERATIONS: | | | | | | | | |
Net investment income | | $ | 6,543,833 | | | $ | 11,099,863 | |
Net realized gain on investments and foreign currency transactions | | | 112,828,745 | | | | 192,336,330 | |
Net change in unrealized appreciation (depreciation) on investments and foreign currencies | | | (971,071,300 | ) | | | 354,652,375 | |
| | |
|
|
| |
|
|
|
NET INCREASE (DECREASE) IN NET ASSETS RESULTING FROM OPERATIONS | | | (851,698,722 | ) | | | 558,088,568 | |
| | |
|
|
| |
|
|
|
| DISTRIBUTIONS: | | | | | | | | |
Class I | | | (195,367,433 | ) | | | (269,445,554 | ) |
Class II | | | (8,068,760 | ) | | | (7,597,067 | ) |
| | |
|
|
| |
|
|
|
| TOTAL DISTRIBUTIONS | | | (203,436,193 | ) | | | (277,042,621 | ) |
| | |
|
|
| |
|
|
|
| SERIES SHARE TRANSACTIONS (Note 7): | | | | | | | | |
Series shares sold [2,490,421 and 2,086,590 shares, respectively] | | | 121,940,234 | | | | 120,995,195 | |
Series shares issued in reinvestment of dividends and distributions [3,456,316 and 5,163,802 shares, respectively] | | | 203,436,193 | | | | 277,042,621 | |
Series shares repurchased [6,091,987 and 3,216,652 shares, respectively] | | | (268,319,139 | ) | | | (171,222,869 | ) |
| | |
|
|
| |
|
|
|
NET INCREASE IN NET ASSETS RESULTING FROM SERIES SHARE TRANSACTIONS | | | 57,057,288 | | | | 226,814,947 | |
| | |
|
|
| |
|
|
|
| TOTAL INCREASE (DECREASE) IN NET ASSETS | | | (998,077,627 | ) | | | 507,860,894 | |
| NET ASSETS: | | | | | | | | |
Beginning of year | | | 1,717,797,164 | | | | 1,209,936,270 | |
| | |
|
|
| |
|
|
|
End of year | | $ | 719,719,537 | | | $ | 1,717,797,164 | |
| | |
|
|
| |
|
|
|
SEE NOTES TO FINANCIAL STATEMENTS.
A95
| | | | | | |
| | | SMALL CAPITALIZATION STOCK PORTFOLIO | | |
| |
| SCHEDULE OF INVESTMENTS | | December 31, 2008 |
| | | | | |
| LONG-TERM INVESTMENTS — 99.3% | | |
| COMMON STOCKS | | Shares
| | Value
(Note 2)
|
| | | | | | |
Aerospace & Defense — 3.1% | | | | | |
AAR Corp.(a) | | 50,552 | | $ | 930,662 |
Applied Signal Technology, Inc. | | 16,696 | | | 299,526 |
Axsys Technologies, Inc.(a)(b) | | 12,000 | | | 658,320 |
Ceradyne, Inc.(a) | | 34,365 | | | 697,953 |
Cubic Corp. | | 20,209 | | | 549,685 |
Curtiss-Wright Corp. | | 58,766 | | | 1,962,197 |
Esterline Technologies Corp.(a)(b) | | 38,688 | | | 1,465,888 |
GenCorp, Inc.(a) | | 63,874 | | | 235,056 |
Moog, Inc. (Class A Stock)(a)(b) | | 55,845 | | | 2,042,252 |
Orbital Sciences Corp.(a) | | 76,759 | | | 1,499,103 |
Teledyne Technologies, Inc.(a)(b) | | 46,883 | | | 2,088,639 |
Triumph Group, Inc. | | 21,722 | | | 922,316 |
| | | | |
|
|
| | | | | | 13,351,597 |
| | | | |
|
|
Air Freight & Logistics — 0.5% | | | | | |
Forward Air Corp. | | 37,758 | | | 916,387 |
HUB Group, Inc. (Class A Stock)(a) | | 49,142 | | | 1,303,737 |
| | | | |
|
|
| | | | | | 2,220,124 |
| | | | |
|
|
Airlines — 0.3% | | | | | |
SkyWest, Inc. | | 74,497 | | | 1,385,644 |
| | | | |
|
|
Auto Components — 0.2% | | | | | |
Drew Industries, Inc.(a)(b) | | 25,237 | | | 302,844 |
Spartan Motors, Inc. | | 42,613 | | | 201,559 |
Standard Motor Products, Inc. | | 15,614 | | | 54,024 |
Superior Industries International, Inc. | | 30,283 | | | 318,578 |
| | | | |
|
|
| | | | | | 877,005 |
| | | | |
|
|
Automobiles — 0.1% | | | | | |
Winnebago Industries, Inc.(b) | | 37,959 | | | 228,893 |
| | | | |
|
|
Beverages — 0.1% | | | | | |
Boston Beer Co., Inc. (Class A Stock)(a) | | 13,165 | | | 373,886 |
| | | | |
|
|
Biotechnology — 1.2% | | | | | |
ArQule, Inc.(a) | | 36,859 | | | 155,545 |
Cubist Pharmaceuticals, Inc.(a)(b) | | 74,446 | | | 1,798,614 |
Martek Biosciences Corp. | | 43,276 | | | 1,311,696 |
Regeneron Pharmaceuticals, Inc.(a)(b) | | 82,138 | | | 1,508,054 |
Savient Pharmaceuticals, Inc.(a)(b) | | 61,715 | | | 357,330 |
| | | | |
|
|
| | | | | | 5,131,239 |
| | | | |
|
|
Building Products — 1.4% | | | | | |
Apogee Enterprises, Inc. | | 36,318 | | | 376,254 |
Gibraltar Industries, Inc.(b) | | 35,192 | | | 420,192 |
Griffon Corp.(a) | | 63,294 | | | 590,533 |
Lennox International, Inc. | | 61,415 | | | 1,983,091 |
NCI Building Systems, Inc.(a)(b) | | 25,736 | | | 419,497 |
Quanex Building Products Corp. | | 49,155 | | | 460,582 |
Simpson Manufacturing Co., Inc. | | 48,941 | | | 1,358,602 |
Universal Forest Products, Inc. | | 21,905 | | | 589,464 |
| | | | |
|
|
| | | | | | 6,198,215 |
| | | | |
|
|
Capital Markets — 1.7% | | | | | |
Greenhill & Co., Inc.(b) | | 23,765 | | | 1,658,084 |
Investment Technology Group, Inc.(a) | | 56,426 | | | 1,281,999 |
| | | | | |
COMMON STOCKS
(continued) | | Shares
| | Value
(Note 2)
|
| | | | | | |
Capital Markets (continued) | | | | | |
LaBranche & Co., Inc.(a) | | 68,514 | | $ | 328,182 |
OptionsXpress Holdings, Inc. | | 55,516 | | | 741,694 |
Piper Jaffray Cos., Inc.(a) | | 19,661 | | | 781,721 |
Stifel Financial Corp.(a)(b) | | 33,509 | | | 1,536,388 |
SWS Group, Inc. | | 35,874 | | | 679,812 |
TradeStation Group, Inc.(a) | | 41,672 | | | 268,784 |
| | | | |
|
|
| | | | | | 7,276,664 |
| | | | |
|
|
Chemicals — 1.7% | | | | | |
A. Schulman, Inc. | | 34,108 | | | 579,836 |
Arch Chemicals, Inc. | | 32,525 | | | 847,927 |
Balchem Corp. | | 23,726 | | | 591,015 |
Calgon Carbon Corp.(a) | | 70,528 | | | 1,083,310 |
Georgia Gulf Corp.(b) | | 39,107 | | | 41,844 |
H.B. Fuller Co.(b) | | 63,173 | | | 1,017,717 |
New Market Corp. | | 16,042 | | | 560,026 |
OM Group, Inc.(a) | | 39,770 | | | 839,545 |
Penford Corp. | | 14,667 | | | 148,430 |
PolyOne Corp.(a) | | 120,772 | | | 380,432 |
Quaker Chemical Corp. | | 14,127 | | | 232,389 |
Stepan Co. | | 9,400 | | | 441,706 |
Zep, Inc.(b) | | 28,265 | | | 545,797 |
| | | | |
|
|
| | | | | | 7,309,974 |
| | | | |
|
|
Commercial Banks — 8.2% | | | | | |
Boston Private Financial Holdings, Inc.(b) | | 83,166 | | | 568,855 |
Cascade Bancorp(b) | | 36,586 | | | 246,956 |
Central Pacific Financial Corp. | | 37,441 | | | 375,908 |
Columbia Banking Systems, Inc. | | 23,646 | | | 282,097 |
Community Bank System, Inc. | | 42,606 | | | 1,039,160 |
East West Bancorp, Inc.(b) | | 83,140 | | | 1,327,746 |
First BanCorp/Puerto Rico | | 98,997 | | | 1,102,827 |
First Commonwealth Financial Corp. | | 95,872 | | | 1,186,895 |
First Financial Bancorp. | | 41,583 | | | 515,213 |
First Financial Bankshares, Inc. | | 27,149 | | | 1,498,896 |
First Midwest Bancorp, Inc. | | 63,450 | | | 1,267,097 |
Frontier Financial Corp.(b) | | 61,318 | | | 267,346 |
Glacier Bancorp, Inc. | | 78,189 | | | 1,487,155 |
Hancock Holding Co. | | 31,085 | | | 1,413,124 |
Hanmi Financial Corp. | | 48,533 | | | 99,978 |
Home Bancshares, Inc./Conway AR | | 17,399 | | | 468,903 |
Independent Bank Corp./MI | | 24,842 | | | 53,659 |
Independent Bank Corp./Rockland MA | | 21,200 | | | 554,592 |
Irwin Financial Corp. | | 24,808 | | | 32,002 |
Nara Bancorp, Inc. | | 29,028 | | | 285,345 |
National Penn Bancshares, Inc.(b) | | 104,565 | | | 1,517,238 |
Old National Bancorp/IN(b) | | 86,568 | | | 1,572,075 |
PrivateBancorp, Inc.(b) | | 35,958 | | | 1,167,197 |
Prosperity Bancshares, Inc. | | 53,520 | | | 1,583,657 |
Provident Bankshares Corp.(b) | | 43,760 | | | 422,722 |
S&T Bancorp, Inc. | | 30,660 | | | 1,088,430 |
Signature Bank(a) | | 45,974 | | | 1,318,994 |
South Financial Group, Inc. (The)(b) | | 96,440 | | | 416,621 |
SEE NOTES TO FINANCIAL STATEMENTS.
A96
| | | | | | |
| | | SMALL CAPITALIZATION STOCK PORTFOLIO (continued) | | |
| |
| SCHEDULE OF INVESTMENTS | | December 31, 2008 |
| | | | | |
COMMON STOCKS
(continued) | | Shares
| | Value
(Note 2)
|
| | | | | | |
Commercial Banks (continued) | | | | | |
Sterling Bancorp. | | 23,539 | | $ | 330,252 |
Sterling Bancshares, Inc.(b) | | 95,596 | | | 581,224 |
Sterling Financial Corp.(b) | | 68,027 | | | 598,638 |
Susquehanna Bancshares, Inc. | | 112,448 | | | 1,789,048 |
Tompkins Financial Corp. | | 8,700 | | | 504,165 |
UCBH Holdings, Inc. | | 144,997 | | | 997,579 |
UMB Financial Corp. | | 38,493 | | | 1,891,545 |
Umpqua Holdings Corp. | | 78,531 | | | 1,136,344 |
United Bankshares, Inc.(b) | | 49,226 | | | 1,635,288 |
United Community Banks, Inc.(b) | | 53,252 | | | 723,162 |
Whitney Holding Corp. | | 83,582 | | | 1,336,476 |
Wilshire Bancorp, Inc. | | 25,277 | | | 229,515 |
Wintrust Financial Corp.(b) | | 31,001 | | | 637,691 |
| | | | |
|
|
| | | | | | 35,551,615 |
| | | | |
|
|
Commercial Services & Supplies — 2.4% |
ABM Industries, Inc. | | 57,740 | | | 1,099,947 |
ATC Technology Corp.(a) | | 26,451 | | | 386,978 |
Bowne & Co., Inc. | | 35,216 | | | 207,070 |
Consolidated Graphics, Inc.(a) | | 14,548 | | | 329,367 |
G&K Services, Inc. (Class A Stock) | | 24,725 | | | 499,940 |
Geo Group, Inc. (The)(a) | | 66,760 | | | 1,203,683 |
Healthcare Services Group, Inc. | | 56,141 | | | 894,326 |
Interface, Inc. (Class A Stock) | | 73,268 | | | 339,964 |
Mobile Mini, Inc.(a) | | 45,459 | | | 655,519 |
Standard Register Co. (The) | | 16,442 | | | 146,827 |
Sykes Enterprises, Inc.(a) | | 43,579 | | | 833,230 |
Tetra Tech, Inc.(a) | | 78,167 | | | 1,887,733 |
United Stationers, Inc.(a) | | 30,766 | | | 1,030,353 |
Viad Corp. | | 26,733 | | | 661,374 |
| | | | |
|
|
| | | | | | 10,176,311 |
| | | | |
|
|
Communications Equipment — 2.0% | | | | | |
Arris Group, Inc.(a) | | 160,324 | | | 1,274,577 |
Bel Fuse, Inc. (Class B Stock) | | 15,092 | | | 319,950 |
Black Box Corp. | | 22,904 | | | 598,252 |
Blue Coat Systems, Inc.(a) | | 50,922 | | | 427,745 |
Comtech Telecommunications Corp.(a) | | 32,370 | | | 1,483,194 |
Digi International, Inc.(a) | | 33,140 | | | 268,765 |
EMS Technologies, Inc.(a) | | 19,801 | | | 512,252 |
Harmonic, Inc.(a) | | 124,023 | | | 695,769 |
NETGEAR, Inc.(a) | | 46,057 | | | 525,510 |
Network Equipment Technologies, Inc.(a) | | 38,277 | | | 110,238 |
PC-Tel, Inc. | | 23,786 | | | 156,274 |
Symmetricom, Inc.(a) | | 58,053 | | | 229,309 |
Tekelec, Inc.(a) | | 86,273 | | | 1,150,882 |
Tollgrade Communications, Inc.(a) | | 17,191 | | | 82,173 |
ViaSat, Inc.(a) | | 35,476 | | | 854,262 |
| | | | |
|
|
| | | | | | 8,689,152 |
| | | | |
|
|
Computers & Peripherals — 0.8% | | | | | |
Adaptec, Inc.(a)(b) | | 159,093 | | | 525,007 |
Avid Technology, Inc.(a) | | 39,665 | | | 432,745 |
Hutchinson Technology, Inc.(a)(b) | | 29,913 | | | 104,097 |
Intermec, Inc.(a) | | 64,100 | | | 851,248 |
| | | | | |
COMMON STOCKS
(continued) | | Shares
| | Value
(Note 2)
|
| | | | | | |
Computers & Peripherals (continued) | | | | | |
Intevac, Inc.(a)(b) | | 28,380 | | $ | 143,887 |
Novatel Wireless, Inc.(a) | | 39,545 | | | 183,489 |
Stratasys, Inc.(a) | | 26,388 | | | 283,671 |
Synaptics, Inc.(a)(b) | | 44,140 | | | 730,958 |
| | | | |
|
|
| | | | | | 3,255,102 |
| | | | |
|
|
Construction & Engineering — 0.6% | | | | | |
EMCOR Group, Inc.(a) | | 85,517 | | | 1,918,147 |
Insituform Technologies, Inc.(a) | | 36,505 | | | 718,783 |
| | | | |
|
|
| | | | | | 2,636,930 |
| | | | |
|
|
Construction Materials — 0.6% | | | | | |
Eagle Materials, Inc. | | 56,817 | | | 1,046,001 |
Headwaters, Inc.(a)(b) | | 55,093 | | | 371,878 |
Texas Industries, Inc.(b) | | 36,010 | | | 1,242,345 |
| | | | |
|
|
| | | | | | 2,660,224 |
| | | | |
|
|
Consumer Finance — 0.5% | | | | | |
Cash America International, Inc. | | 37,921 | | | 1,037,139 |
First Cash Financial Services, Inc.(a) | | 33,593 | | | 640,283 |
Rewards Network, Inc.(a) | | 35,176 | | | 91,106 |
World Acceptance Corp.(a)(b) | | 21,108 | | | 417,094 |
| | | | |
|
|
| | | | | | 2,185,622 |
| | | | |
|
|
Containers & Packaging — 0.5% | | | | | |
Myers Industries, Inc. | | 36,773 | | | 294,184 |
Rock-Tenn Co. (Class A Stock)(b) | | 49,909 | | | 1,705,890 |
| | | | |
|
|
| | | | | | 2,000,074 |
| | | | |
|
|
Distributors | | | | | |
Audiovox Corp.(a) | | 24,177 | | | 121,127 |
| | | | |
|
|
Diversified Consumer Services — 0.9% | | | |
Capella Education Co.(a)(b) | | 18,500 | | | 1,087,060 |
Coinstar, Inc.(a) | | 36,909 | | | 720,095 |
Hillenbrand, Inc. | | 80,670 | | | 1,345,576 |
Pre-Paid Legal Services, Inc.(a)(b) | | 9,860 | | | 367,679 |
Universal Technical Institute, Inc.(a)(b) | | 28,138 | | | 483,129 |
| | | | |
|
|
| | | | | | 4,003,539 |
| | | | |
|
|
Diversified Financial Services — 0.3% | | | | | |
Financial Federal Corp. | | 33,565 | | | 781,057 |
Portfolio Recovery Associates, Inc.(a)(b) | | 20,015 | | | 677,308 |
| | | | |
|
|
| | | | | | 1,458,365 |
| | | | |
|
|
Diversified Telecommunication Services — 0.2% | | | |
Fairpoint Communications, Inc. | | 116,161 | | | 381,008 |
General Communication, Inc. (Class A Stock)(a) | | 57,672 | | | 466,567 |
| | | | |
|
|
| | | | | | 847,575 |
| | | | |
|
|
Electric Utilities — 1.5% | | | | | |
ALLETE, Inc. | | 34,696 | | | 1,119,640 |
Central Vermont Public Services Corp. | | 14,998 | | | 357,852 |
Cleco Corp.(b) | | 78,621 | | | 1,794,918 |
El Paso Electric Co.(a) | | 58,560 | | | 1,059,350 |
SEE NOTES TO FINANCIAL STATEMENTS.
A97
| | | | | | |
| | | SMALL CAPITALIZATION STOCK PORTFOLIO (continued) | | |
| |
| SCHEDULE OF INVESTMENTS | | December 31, 2008 |
| | | | | |
COMMON STOCKS
(continued) | | Shares
| | Value
(Note 2)
|
| | | | | | |
Electric Utilities (continued) | | | | | |
UIL Holdings Corp.(b) | | 32,957 | | $ | 989,699 |
Unisource Energy Corp. | | 46,391 | | | 1,362,040 |
| | | | |
|
|
| | | | | | 6,683,499 |
| | | | |
|
|
Electrical Equipment — 2.1% | | | | | |
A.O. Smith Corp. | | 29,490 | | | 870,545 |
Acuity Brands, Inc. | | 52,696 | | | 1,839,618 |
Baldor Electric Co.(b) | | 60,418 | | | 1,078,461 |
Belden, Inc. | | 60,730 | | | 1,268,042 |
Brady Corp. (Class A Stock) | | 68,318 | | | 1,636,216 |
C&D Technologies, Inc.(a)(b) | | 34,176 | | | 106,971 |
II-VI, Inc.(a) | | 31,655 | | | 604,294 |
Magnetek, Inc.(a) | | 39,979 | | | 95,950 |
Regal Beloit Corp. | | 42,175 | | | 1,602,228 |
Vicor Corp. | | 25,538 | | | 168,806 |
| | | | |
|
|
| | | | | | 9,271,131 |
| | | | |
|
|
Electronic Equipment & Instruments — 3.3% | | | |
Agilysys, Inc. | | 29,655 | | | 127,220 |
Anixter International, Inc.(a)(b) | | 39,181 | | | 1,180,132 |
Benchmark Electronics, Inc.(a)(b) | | 84,967 | | | 1,085,029 |
Brightpoint, Inc.(a) | | 67,154 | | | 292,120 |
Checkpoint Systems, Inc.(a)(b) | | 50,492 | | | 496,841 |
Cognex Corp. | | 51,617 | | | 763,932 |
CTS Corp. | | 43,938 | | | 242,098 |
Daktronics, Inc.(b) | | 44,568 | | | 417,156 |
Electro Scientific Industries, Inc.(a) | | 35,247 | | | 239,327 |
FARO Technologies, Inc.(a) | | 21,745 | | | 366,621 |
Gerber Scientific, Inc.(a) | | 31,454 | | | 160,730 |
Insight Enterprises, Inc.(a)(b) | | 59,428 | | | 410,053 |
Itron, Inc.(a)(b) | | 45,010 | | | 2,868,936 |
Keithley Instruments, Inc. | | 17,855 | | | 65,171 |
Littelfuse, Inc.(a) | | 28,329 | | | 470,261 |
LoJack Corp.(a) | | 22,631 | | | 93,240 |
Mercury Computer Systems, Inc.(a)(b) | | 29,577 | | | 186,631 |
Methode Electronics, Inc.
(Class A Stock)(b) | | 49,328 | | | 332,471 |
MTS Systems Corp. | | 22,161 | | | 590,369 |
Newport Corp.(a) | | 46,975 | | | 318,491 |
Park Electrochemical Corp. | | 26,724 | | | 506,687 |
Plexus Corp.(a)(b) | | 51,312 | | | 869,738 |
Radisys Corp.(a)(b) | | 29,781 | | | 164,689 |
Rogers Corp.(a)(b) | | 23,573 | | | 654,622 |
Scansource, Inc.(a)(b) | | 34,525 | | | 665,297 |
SYNNEX Corp.(a) | | 24,379 | | | 276,214 |
Technitrol, Inc. | | 53,518 | | | 186,243 |
TTM Technologies, Inc.(a) | | 55,851 | | | 290,984 |
| | | | |
|
|
| | | | | | 14,321,303 |
| | | | |
|
|
Energy Equipment & Services — 2.5% | | | | | |
Atwood Oceanics, Inc.(a)(b) | | 72,693 | | | 1,110,749 |
Basic Energy Services, Inc.(a) | | 30,275 | | | 394,786 |
Bristow Group, Inc.(a) | | 37,979 | | | 1,017,457 |
CARBO Ceramics, Inc. | | 26,556 | | | 943,535 |
Drill-Quip, Inc.(a)(b) | | 39,225 | | | 804,505 |
Gulf Island Fabrication, Inc.(b) | | 18,657 | | | 268,847 |
| | | | | |
COMMON STOCKS
(continued) | | Shares
| | Value
(Note 2)
|
| | | | | | |
Energy Equipment & Services (continued) |
Hornbeck Offshore Services, Inc.(a) | | 30,041 | | $ | 490,870 |
ION Geophysical Corp.(a) | | 116,747 | | | 400,442 |
Lufkin Industries, Inc. | | 19,414 | | | 669,783 |
Matrix Service Co.(a)(b) | | 34,042 | | | 261,102 |
NATCO Group, Inc.(a) | | 26,376 | | | 400,388 |
Oil States International, Inc.(a) | | 65,000 | | | 1,214,850 |
Pioneer Drilling Co.(a)(b) | | 65,198 | | | 363,153 |
SEACOR Holdings, Inc.(a)(b) | | 26,157 | | | 1,743,364 |
Superior Well Services, Inc.(a) | | 21,475 | | | 214,750 |
Tetra Technologies, Inc.(a) | | 97,955 | | | 476,061 |
| | | | |
|
|
| | | | | | 10,774,642 |
| | | | |
|
|
Exchange Traded Fund — 0.1% | | | | | |
iShares S&P SmallCap 600 Index | | 6,319 | | | 278,036 |
| | | | |
|
|
Food & Staples Retailing — 1.1% | | | | | |
Andersons, Inc. (The) | | 23,799 | | | 392,208 |
Casey’s General Stores, Inc. | | 66,395 | | | 1,511,814 |
Great Atlantic & Pacific Tea Co.(a) | | 39,363 | | | 246,806 |
Nash-Finch Co. | | 16,718 | | | 750,471 |
Spartan Stores, Inc. | | 28,836 | | | 670,437 |
United Natural Foods, Inc.(a)(b) | | 56,005 | | | 998,009 |
| | | | |
|
|
| | | | | | 4,569,745 |
| | | | |
|
|
Food Products — 1.6% | | | | | |
Cal-Maine Foods, Inc. | | 16,450 | | | 472,115 |
Darling International, Inc.(a) | | 106,823 | | | 586,458 |
Diamond Foods, Inc. | | 21,381 | | | 430,827 |
Green Mountain Coffee Roasters, Inc.(a)(b) | | 22,833 | | | 883,637 |
Hain Celestial Group, Inc.(a)(b) | | 52,766 | | | 1,007,303 |
J&J Snack Foods Corp. | | 18,227 | | | 653,985 |
Lance, Inc. | | 41,199 | | | 945,105 |
Sanderson Farms, Inc. | | 22,782 | | | 787,346 |
TreeHouse Foods, Inc.(a)(b) | | 41,219 | | | 1,122,806 |
| | | | |
|
|
| | | | | | 6,889,582 |
| | | | |
|
|
Gas Utilities — 3.2% | | | | | |
Atmos Energy Corp. | | 118,984 | | | 2,819,921 |
Laclede Group, Inc. (The) | | 28,949 | | | 1,355,971 |
New Jersey Resources Corp. | | 55,022 | | | 2,165,116 |
Northwest Natural Gas Co.(b) | | 34,608 | | | 1,530,712 |
Piedmont Natural Gas Co., Inc. | | 95,650 | | | 3,029,235 |
South Jersey Industries, Inc.(b) | | 38,824 | | | 1,547,136 |
Southwest Gas Corp. | | 57,300 | | | 1,445,106 |
| | | | |
|
|
| | | | | | 13,893,197 |
| | | | |
|
|
Healthcare Equipment & Supplies — 4.7% |
Abaxis, Inc.(a) | | 28,614 | | | 458,682 |
American Medical Systems Holdings, Inc.(a)(b) | | 95,681 | | | 860,172 |
Analogic Corp. | | 17,266 | | | 471,016 |
Arthrocare Corp.(a)(b) | | 34,746 | | | 165,738 |
CONMED Corp.(a) | | 37,923 | | | 907,877 |
Cooper Cos., Inc. (The) | | 58,751 | | | 963,516 |
CryoLife, Inc.(a)(b) | | 36,696 | | | 356,318 |
Cyberonics, Inc.(a)(b) | | 30,235 | | | 500,994 |
Datascope Corp. | | 17,458 | | | 912,006 |
SEE NOTES TO FINANCIAL STATEMENTS.
A98
| | | | | | |
| | | SMALL CAPITALIZATION STOCK PORTFOLIO (continued) | | |
| |
| SCHEDULE OF INVESTMENTS | | December 31, 2008 |
| | | | | |
COMMON STOCKS
(continued) | | Shares
| | Value
(Note 2)
|
| | | | | | |
Healthcare Equipment & Supplies (continued) |
Greatbatch, Inc.(a) | | 29,904 | | $ | 791,260 |
Haemonetics Corp.(a) | | 33,021 | | | 1,865,687 |
ICU Medical, Inc.(a) | | 16,484 | | | 546,280 |
Immucor, Inc.(a)(b) | | 92,057 | | | 2,446,876 |
Integra LifeSciences Holdings Corp.(a)(b) | | 25,623 | | | 911,410 |
Invacare Corp. | | 41,992 | | | 651,716 |
Kensey Nash Corp.(a) | | 15,120 | | | 293,479 |
Mentor Corp. | | 44,128 | | | 1,364,879 |
Meridian Bioscience, Inc.(b) | | 52,653 | | | 1,341,072 |
Merit Medical Systems, Inc.(a) | | 36,585 | | | 655,969 |
Natus Medical, Inc.(a)(b) | | 36,519 | | | 472,921 |
Osteotech, Inc.(a) | | 23,390 | | | 39,529 |
Palomar Medical Technologies, Inc.(a)(b) | | 23,625 | | | 272,396 |
SurModics, Inc.(a)(b) | | 19,794 | | | 500,194 |
Symmetry Medical, Inc.(a) | | 46,783 | | | 372,861 |
Theragenics Corp.(a) | | 43,335 | | | 50,702 |
West Pharmaceutical Services, Inc.(b) | | 42,757 | | | 1,614,932 |
Zoll Medical Corp.(a) | | 27,454 | | | 518,606 |
| | | | |
|
|
| | | | | | 20,307,088 |
| | | | |
|
|
Healthcare Providers & Services — 5.9% |
Air Methods Corp.(a) | | 13,917 | | | 222,533 |
Amedisys, Inc.(a) | | 35,240 | | | 1,456,822 |
AMERIGROUP Corp.(a) | | 69,170 | | | 2,041,898 |
AMN Healthcare Services, Inc.(a) | | 42,489 | | | 359,457 |
AmSurg Corp.(a) | | 41,061 | | | 958,364 |
Catalyst Health Solutions, Inc.(a)(b) | | 50,057 | | | 1,218,888 |
Centene Corp.(a)(b) | | 55,987 | | | 1,103,504 |
Chemed Corp. | | 29,248 | | | 1,163,193 |
Corvel Corp.(a) | | 10,313 | | | 226,680 |
Cross Country Healthcare, Inc.(a) | | 40,106 | | | 352,532 |
Gentiva Health Services, Inc.(a) | | 37,651 | | | 1,101,668 |
Healthspring, Inc.(a) | | 64,962 | | | 1,297,291 |
Healthways, Inc.(a) | | 43,882 | | | 503,765 |
HMS Holdings Corp.(a) | | 32,864 | | | 1,035,873 |
inVentiv Health, Inc.(a) | | 43,430 | | | 501,182 |
Landauer, Inc | | 12,213 | | | 895,213 |
LCA-Vision, Inc.(b) | | 24,140 | | | 99,215 |
LHC Group, Inc.(a) | | 19,323 | | | 695,628 |
Magellan Health Services, Inc.(a)(b) | | 52,832 | | | 2,068,900 |
Medcath Corp.(a) | | 25,552 | | | 266,763 |
Pediatrix Medical Group.(a) | | 59,608 | | | 1,889,574 |
Molina Healthcare, Inc.(a)(b) | | 18,291 | | | 322,105 |
MWI Veterinary Supply, Inc.(a)(b) | | 15,793 | | | 425,779 |
Odyssey Healthcare, Inc.(a) | | 42,800 | | | 395,900 |
Owens & Minor, Inc. | | 54,034 | | | 2,034,380 |
PharMerica Corp.(a) | | 39,745 | | | 622,804 |
PSS World Medical, Inc.(a)(b) | | 78,958 | | | 1,485,990 |
RehabCare Group, Inc.(a) | | 23,538 | | | 356,836 |
Res-Care, Inc.(a) | | 33,441 | | | 502,284 |
| | | | |
|
|
| | | | | | 25,605,021 |
| | | | |
|
|
| | | | | |
COMMON STOCKS
(continued) | | Shares
| | Value
(Note 2)
|
| | | | | | |
Healthcare Technology — 0.5% | | | | | |
Eclipsys Corp.(a)(b) | | 71,368 | | $ | 1,012,711 |
Omnicell, Inc.(a) | | 40,833 | | | 498,571 |
Phase Forward, Inc.(a) | | 55,930 | | | 700,244 |
| | | | |
|
|
| | | | | | 2,211,526 |
| | | | |
|
|
Hotels, Restaurants & Leisure — 3.4% | | | | | |
Buffalo Wild Wings, Inc.(a)(b) | | 23,247 | | | 596,286 |
California Pizza Kitchen, Inc.(a) | | 31,436 | | | 336,994 |
CEC Entertainment, Inc.(a)(b) | | 29,674 | | | 719,595 |
CKE Restaurants, Inc. | | 71,278 | | | 618,693 |
Cracker Barrel Old Country Store, Inc. | | 29,233 | | | 601,907 |
DineEquity, Inc.(b) | | 20,065 | | | 231,951 |
Interval Leisure Group, Inc.(a) | | 51,320 | | | 276,615 |
Jack in the Box, Inc.(a) | | 74,163 | | | 1,638,261 |
Landry’s Restaurants, Inc.(b) | | 16,146 | | | 187,294 |
Marcus Corp. | | 27,516 | | | 446,585 |
Monarch Casino & Resort, Inc.(a) | | 14,929 | | | 173,923 |
Multimedia Games, Inc.(a) | | 30,198 | | | 71,871 |
O’Charleys, Inc. | | 27,781 | | | 55,562 |
P.F. Chang’s China Bistro, Inc.(a)(b) | | 31,075 | | | 650,711 |
Panera Bread Co. (Class A Stock)(a)(b) | | 40,045 | | | 2,091,950 |
Papa John’s International, Inc.(a)(b) | | 28,054 | | | 517,035 |
Peet’s Coffee & Tea, Inc.(a) | | 15,615 | | | 363,049 |
Pinnacle Entertainment, Inc.(a) | | 78,262 | | | 601,052 |
Red Robin Gourmet Burgers, Inc.(a)(b) | | 20,230 | | | 340,471 |
Ruby Tuesday, Inc.(a)(b) | | 68,802 | | | 107,331 |
Ruth’s Hospitality Group, Inc.(a) | | 25,214 | | | 34,795 |
Shuffle Master, Inc.(a) | | 72,510 | | | 359,650 |
Sonic Corp.(a)(b) | | 78,885 | | | 960,030 |
Steak N Shake Co. (The)(a) | | 37,371 | | | 222,357 |
Texas Roadhouse, Inc. (Class A Stock)(a)(b) | | 66,740 | | | 517,235 |
WMS Industries, Inc.(a)(b) | | 65,329 | | | 1,757,350 |
| | | | |
|
|
| | | | | | 14,478,553 |
| | | | |
|
|
Household Durables — 0.6% | | | | | |
Bassett Furniture Industries, Inc. | | 14,957 | | | 50,106 |
Champion Enterprises, Inc.(a) | | 101,479 | | | 56,828 |
Ethan Allen Interiors, Inc. | | 37,465 | | | 538,373 |
La-Z-Boy, Inc.(b) | | 67,189 | | | 145,800 |
M/I Homes, Inc. | | 18,302 | | | 192,903 |
Meritage Home Corp.(a)(b) | | 40,016 | | | 486,995 |
National Presto Industries, Inc. | | 6,265 | | | 482,405 |
Russ Berrie & Co., Inc.(a) | | 21,886 | | | 65,001 |
Skyline Corp. | | 8,919 | | | 178,291 |
Standard Pacific Corp.(a) | | 120,462 | | | 214,422 |
Universal Electronics, Inc.(a) | | 18,206 | | | 295,301 |
| | | | |
|
|
| | | | | | 2,706,425 |
| | | | |
|
|
Household Products — 0.3% | | | | | |
Central Garden & Pet Co. (Class A Stock)(a) | | 92,887 | | | 548,033 |
WD-40 Co. | | 21,515 | | | 608,660 |
| | | | |
|
|
| | | | | | 1,156,693 |
| | | | |
|
|
SEE NOTES TO FINANCIAL STATEMENTS.
A99
| | | | | | |
| | | SMALL CAPITALIZATION STOCK PORTFOLIO (continued) | | |
| |
| SCHEDULE OF INVESTMENTS | | December 31, 2008 |
| | | | | |
COMMON STOCKS
(continued) | | Shares
| | Value
(Note 2)
|
| | | | | | |
Industrial Conglomerates — 0.2% | | | | | |
Standex International Corp. | | 16,365 | | $ | 324,682 |
Tredegar Corp. | | 25,248 | | | 459,008 |
| | | | |
|
|
| | | | | | 783,690 |
| | | | |
|
|
Insurance — 3.3% | | | | | |
American Physicians Capital, Inc. | | 10,500 | | | 505,050 |
Amerisafe, Inc.(a) | | 24,600 | | | 505,038 |
Delphi Financial Group, Inc. | | 53,845 | | | 992,902 |
Infinity Property & Casualty Corp. | | 18,770 | | | 877,122 |
National Financial Partners Corp.(b) | | 51,740 | | | 157,290 |
Navigators Group, Inc.(a) | | 17,303 | | | 950,108 |
Presidential Life Corp. | | 28,127 | | | 278,176 |
ProAssurance Corp.(a) | | 43,737 | | | 2,308,439 |
RLI Corp. | | 23,250 | | | 1,421,970 |
Safety Insurance Group, Inc. | | 21,318 | | | 811,363 |
Selective Insurance Group. | | 68,924 | | | 1,580,427 |
Stewart Information Services Corp.(b) | | 23,717 | | | 557,112 |
Tower Group, Inc. | | 26,477 | | | 746,916 |
United Fire & Casualty Co. | | 29,312 | | | 910,724 |
Zenith National Insurance Corp. | | 48,631 | | | 1,535,281 |
| | | | |
|
|
| | | | | | 14,137,918 |
| | | | |
|
|
Internet & Catalog Retail — 0.6% | | | | | |
Blue Nile, Inc.(a)(b) | | 18,960 | | | 464,330 |
HSN, Inc.(a) | | 51,371 | | | 373,467 |
NutriSystem, Inc.(b) | | 38,654 | | | 563,962 |
PetMed Express, Inc.(a)(b) | | 30,671 | | | 540,730 |
Stamps.com, Inc.(a)(b) | | 18,493 | | | 181,786 |
Ticketmaster Entertainment, Inc.(a) | | 52,233 | | | 335,336 |
| | | | |
|
|
| | | | | | 2,459,611 |
| | | | |
|
|
Internet Software & Services — 1.3% | | | | | |
Bankrate, Inc.(a)(b) | | 18,200 | | | 691,600 |
DealerTrack Holdings, Inc.(a) | | 51,985 | | | 618,102 |
Infospace, Inc. | | 45,114 | | | 340,611 |
Interwoven, Inc.(a) | | 60,180 | | | 758,268 |
j2 Global Communications, Inc.(a) | | 57,312 | | | 1,148,532 |
Knot, Inc. (The)(a)(b) | | 37,472 | | | 311,767 |
Perficient, Inc.(a) | | 42,263 | | | 202,017 |
United Online, Inc. | | 106,981 | | | 649,375 |
Websense, Inc.(a)(b) | | 58,787 | | | 880,041 |
| | | | |
|
|
| | | | | | 5,600,313 |
| | | | |
|
|
IT Services — 1.6% | | | | | |
CACI International, Inc.
(Class A Stock)(a)(b) | | 39,026 | | | 1,759,681 |
Ciber, Inc.(a) | | 69,777 | | | 335,627 |
CSG Systems International, Inc.(a) | | 45,689 | | | 798,187 |
Cybersource Corp.(a)(b) | | 90,774 | | | 1,088,380 |
Forrester Research, Inc.(a)(b) | | 20,000 | | | 564,200 |
Gevity HR, Inc. | | 32,172 | | | 48,580 |
Heartland Payment Systems, Inc.(b) | | 31,949 | | | 559,108 |
Integral Systems, Inc.(a) | | 22,323 | | | 268,992 |
MAXIMUS, Inc. | | 23,950 | | | 840,885 |
Startek, Inc.(a) | | 15,037 | | | 66,915 |
Wright Express Corp.(a)(b) | | 50,558 | | | 637,031 |
| | | | |
|
|
| | | | | | 6,967,586 |
| | | | |
|
|
| | | | | |
COMMON STOCKS
(continued) | | Shares
| | Value
(Note 2)
|
| | | | | | |
Leisure Equipment & Products — 0.9% |
Arctic Cat, Inc. | | 15,544 | | $ | 74,456 |
Brunswick Corp. | | 114,406 | | | 481,649 |
JAKKS Pacific, Inc.(a)(b) | | 35,911 | | | 740,844 |
Nautilus, Inc.(a) | | 29,098 | | | 64,307 |
Polaris Industries, Inc.(b) | | 42,313 | | | 1,212,266 |
Pool Corp.(b) | | 62,545 | | | 1,123,934 |
RC2 Corp.(a) | | 22,458 | | | 239,627 |
Sturm Ruger & Co., Inc.(a) | | 25,339 | | | 151,274 |
| | | | |
|
|
| | | | | | 4,088,357 |
| | | | |
|
|
Life Sciences Tools & Services — 0.6% |
Cambrex Corp.(a) | | 38,016 | | | 175,634 |
Dionex Corp.(a)(b) | | 23,537 | | | 1,055,634 |
Enzo Biochem, Inc.(a) | | 42,399 | | | 207,331 |
Kendle International, Inc.(a) | | 17,436 | | | 448,454 |
Parexel International Corp.(a) | | 72,145 | | | 700,528 |
| | | | |
|
|
| | | | | | 2,587,581 |
| | | | |
|
|
Machinery — 4.2% | | | | | |
Actuant Corp. (Class A Stock) | | 73,300 | | | 1,394,166 |
Albany International Corp. | | 34,656 | | | 444,983 |
Astec Industries, Inc. (Class A Stock)(a) | | 25,723 | | | 805,902 |
Barnes Group, Inc. | | 56,029 | | | 812,421 |
Briggs & Stratton Corp.(b) | | 65,012 | | | 1,143,561 |
Cascade Corp. | | 11,033 | | | 329,445 |
Circor International, Inc. | | 22,400 | | | 616,000 |
CLARCOR, Inc.(b) | | 66,276 | | | 2,199,038 |
EnPro Industries, Inc.(a) | | 26,520 | | | 571,241 |
Gardner Denver, Inc.(a) | | 67,591 | | | 1,577,574 |
John Bean Technologies Corp. | | 35,929 | | | 293,540 |
Kaydon Corp. | | 44,707 | | | 1,535,685 |
Lindsay Corp.(b) | | 15,994 | | | 508,449 |
Lydall, Inc.(a) | | 21,704 | | | 124,798 |
Mueller Industries, Inc. | | 48,550 | | | 1,217,634 |
Robbins & Myers, Inc. | | 45,337 | | | 733,099 |
Toro Co. | | 46,419 | | | 1,531,827 |
Valmont Industries, Inc. | | 22,929 | | | 1,406,923 |
Wabash National Corp.(b) | | 40,023 | | | 180,104 |
Watts Water Technologies, Inc.
(Class A Stock) | | 38,158 | | | 952,805 |
| | | | |
|
|
| | | | | | 18,379,195 |
| | | | |
|
|
Marine — 0.4% | | | | | |
Kirby Corp.(a) | | 69,779 | | | 1,909,153 |
| | | | |
|
|
Media — 0.3% | | | | | |
4Kids Entertainment, Inc.(a) | | 15,512 | | | 30,404 |
A.H. Belo Corp. (Class A Stock) | | 22,933 | | | 49,994 |
Arbitron, Inc. | | 34,379 | | | 456,553 |
E.W. Scripps Co. (Class A Stock) | | 37,945 | | | 83,858 |
Live Nation, Inc.(a)(b) | | 102,018 | | | 585,583 |
| | | | |
|
|
| | | | | | 1,206,392 |
| | | | |
|
|
Metals & Mining — 0.5% | | | | | |
A.M. Castle & Co. | | 21,512 | | | 232,975 |
AMCOL International Corp.(b) | | 29,383 | | | 615,574 |
Brush Engineered Materials, Inc.(a) | | 26,494 | | | 337,004 |
Century Aluminum Co.(a)(b) | | 47,959 | | | 479,590 |
SEE NOTES TO FINANCIAL STATEMENTS.
A100
| | | | | | |
| | | SMALL CAPITALIZATION STOCK PORTFOLIO (continued) | | |
| |
| SCHEDULE OF INVESTMENTS | | December 31, 2008 |
| | | | | |
COMMON STOCKS
(continued) | | Shares
| | Value
(Note 2)
|
| | | | | | |
Metals & Mining (continued) | | | | | |
Olympic Steel, Inc. | | 11,727 | | $ | 238,879 |
RTI International Metals, Inc.(a)(b) | | 30,036 | | | 429,815 |
| | | | |
|
|
| | | | | | 2,333,837 |
| | | | |
|
|
Multiline Retail — 0.1% | | | | | |
Fred’s, Inc. (Class A Stock) | | 52,137 | | | 560,994 |
Tuesday Morning Corp.(b) | | 40,002 | | | 65,203 |
| | | | |
|
|
| | | | | | 626,197 |
| | | | |
|
|
Multi-Utilities — 0.6% | | | | | |
Avista Corp.(b) | | 71,086 | | | 1,377,646 |
CH Energy Group, Inc. | | 20,604 | | | 1,058,840 |
| | | | |
|
|
| | | | | | 2,436,486 |
| | | | |
|
|
Oil, Gas & Consumable Fuels — 1.7% | | | | | |
Holly Corp. | | 53,180 | | | 969,471 |
Penn Virginia Corp.(b) | | 54,654 | | | 1,419,911 |
Petroleum Development Corp.(a) | | 19,362 | | | 466,043 |
Petroquest Energy, Inc.(a)(b) | | 56,600 | | | 382,616 |
St. Mary Land & Exploration Co. | | 81,176 | | | 1,648,685 |
Stone Energy Corp.(a) | | 45,262 | | | 498,787 |
Swift Energy Co.(a) | | 40,244 | | | 676,502 |
World Fuel Services Corp. | | 38,266 | | | 1,415,842 |
| | | | |
|
|
| | | | | | 7,477,857 |
| | | | |
|
|
Paper & Forest Products — 0.5% | | | | | |
Buckeye Technologies, Inc.(a)(b) | | 50,398 | | | 183,449 |
Clearwater Paper Corp.(a) | | 14,700 | | | 123,333 |
Deltic Timber Corp. | | 13,816 | | | 632,082 |
Neenah Paper, Inc. | | 18,959 | | | 167,598 |
Schweitzer-Mauduit International, Inc. | | 20,102 | | | 402,442 |
Wausau Paper Corp.(b) | | 63,666 | | | 728,338 |
| | | | |
|
|
| | | | | | 2,237,242 |
| | | | |
|
|
Personal Products — 0.4% | | | | | |
Chattem, Inc.(a) | | 24,747 | | | 1,770,153 |
Mannatech, Inc. | | 20,358 | | | 49,877 |
| | | | |
|
|
| | | | | | 1,820,030 |
| | | | |
|
|
Pharmaceuticals — 0.7% | | | | | |
Noven Pharmaceuticals, Inc.(a) | | 32,488 | | | 357,368 |
Par Pharmaceutical Cos., Inc.(a) | | 45,032 | | | 603,879 |
Salix Pharmaceuticals, Ltd.(a)(b) | | 62,671 | | | 553,385 |
ViroPharma, Inc.(a)(b) | | 102,671 | | | 1,336,776 |
| | | | |
|
|
| | | | | | 2,851,408 |
| | | | |
|
|
Professional Services — 1.3% | | | | | |
Administaff, Inc. | | 28,808 | | | 624,557 |
CDI Corp. | | 16,784 | | | 217,185 |
Heidrick & Struggles International, Inc.(b) | | 21,341 | | | 459,685 |
On Assignment, Inc.(a) | | 46,557 | | | 263,978 |
School Specialty, Inc.(a)(b) | | 20,805 | | | 397,792 |
Spherion Corp.(a) | | 67,179 | | | 148,466 |
TrueBlue, Inc.(a) | | 56,554 | | | 541,222 |
Volt Information Sciences, Inc.(a) | | 16,660 | | | 120,452 |
Watson Wyatt Worldwide, Inc. (Class A Stock) | | 55,616 | | | 2,659,557 |
| | | | |
|
|
| | | | | | 5,432,894 |
| | | | |
|
|
| | | | | |
COMMON STOCKS
(continued) | | Shares
| | Value
(Note 2)
|
| | | | | | |
Real Estate Investment Trusts (REITs) — 6.1% |
Acadia Realty Trust | | 42,210 | | $ | 602,337 |
Biomed Realty Trust, Inc. | | 104,824 | | | 1,228,537 |
Cedar Shopping Centers, Inc.(b) | | 58,081 | | | 411,213 |
Colonial Properties Trust | | 62,630 | | | 521,708 |
Diamondrock Hospitality Co.(b) | | 117,482 | | | 595,634 |
EastGroup Properties, Inc.(b) | | 32,758 | | | 1,165,530 |
Entertainment Properties Trust | | 42,956 | | | 1,280,089 |
Extra Space Storage, Inc. | | 111,612 | | | 1,151,836 |
Franklin Street Properties Corp. | | 76,900 | | | 1,134,275 |
Home Properties, Inc.(b) | | 42,182 | | | 1,712,589 |
Inland Real Estate Corp. | | 75,341 | | | 977,926 |
Kilroy Realty Corp.(b) | | 43,197 | | | 1,445,372 |
Kite Realty Group Trust(b) | | 44,384 | | | 246,775 |
LaSalle Hotel Properties(b) | | 53,510 | | | 591,286 |
Lexington Realty Trust(b) | | 95,641 | | | 478,205 |
LTC Properties, Inc.(b) | | 30,251 | | | 613,490 |
Medical Properties Trust, Inc. | | 86,582 | | | 546,332 |
Mid-America Apartment Communities, Inc. | | 36,873 | | | 1,370,201 |
National Retail Properties, Inc.(b) | | 102,359 | | | 1,759,551 |
Parkway Properties, Inc. | | 19,999 | | | 359,982 |
Pennsylvania Real Estate Invest Trust(b) | | 51,380 | | | 382,781 |
Post Properties, Inc.(b) | | 57,645 | | | 951,143 |
PS Business Parks, Inc. | | 19,562 | | | 873,639 |
Senior Housing Properties Trust(b) | | 149,491 | | | 2,678,878 |
Sovran Self Storage, Inc.(b) | | 28,707 | | | 1,033,452 |
Tanger Factory Outlet Centers(b) | | 41,373 | | | 1,556,452 |
Urstadt Biddle Properties, Inc. (Class A Stock) | | 27,855 | | | 443,730 |
| | | | |
|
|
| | | | | | 26,112,943 |
| | | | |
|
|
Real Estate Management & Development — 0.1% |
Forestar Real Estate Group, Inc.(a)(b) | | 46,605 | | | 443,680 |
| | | | |
|
|
Road & Rail — 1.6% | | | | | |
Arkansas Best Corp. | | 32,988 | | | 993,269 |
Heartland Express, Inc. | | 72,764 | | | 1,146,761 |
Knight Transportation, Inc.(b) | | 74,639 | | | 1,203,181 |
Landstar System, Inc.(b) | | 68,452 | | | 2,630,609 |
Old Dominion Freight Line, Inc.(a)(b) | | 35,993 | | | 1,024,361 |
| | | | |
|
|
| | | | | | 6,998,181 |
| | | | |
|
|
Semiconductors & Semiconductor Equipment — 3.7% |
Actel Corp.(a) | | 33,577 | | | 393,522 |
Advanced Energy Industries, Inc.(a) | | 42,530 | | | 423,174 |
ATMI, Inc.(a)(b) | | 41,964 | | | 647,505 |
Axcelis Technologies, Inc.(a) | | 134,464 | | | 68,577 |
Brooks Automation, Inc.(a)(b) | | 82,990 | | | 482,172 |
Cabot Microelectronics Corp.(a)(b) | | 30,336 | | | 790,860 |
Cohu, Inc. | | 30,383 | | | 369,153 |
Cymer, Inc.(a)(b) | | 38,667 | | | 847,194 |
Cypress Semiconductor Corp.(a) | | 189,060 | | | 845,098 |
Diodes, Inc.(a)(b) | | 42,318 | | | 256,447 |
DSP Group, Inc.(a) | | 34,976 | | | 280,508 |
SEE NOTES TO FINANCIAL STATEMENTS.
A101
| | | | | | |
| | | SMALL CAPITALIZATION STOCK PORTFOLIO (continued) | | |
| |
| SCHEDULE OF INVESTMENTS | | December 31, 2008 |
| | | | | |
COMMON STOCKS
(continued) | | Shares
| | Value
(Note 2)
|
| | | | | | |
Semiconductors & Semiconductor Equipment (continued) |
Exar Corp.(a) | | 55,920 | | $ | 372,986 |
FEI Co.(a) | | 48,434 | | | 913,465 |
Hittite Microwave Corp.(a) | | 25,100 | | | 739,446 |
Kopin Corp.(a) | | 88,473 | | | 180,485 |
Kulicke & Soffa Industries, Inc.(a) | | 69,977 | | | 118,961 |
Micrel, Inc. | | 62,713 | | | 458,432 |
Microsemi Corp.(a)(b) | | 105,798 | | | 1,337,286 |
MKS Instruments, Inc.(a) | | 64,139 | | | 948,616 |
Pericom Semiconductor Corp.(a)(b) | | 33,291 | | | 182,435 |
Rudolph Technologies, Inc.(a)(b) | | 39,973 | | | 141,105 |
Skyworks Solutions, Inc.(a) | | 216,356 | | | 1,198,611 |
Standard Microsystems Corp.(a)(b) | | 29,040 | | | 474,514 |
Supertex, Inc.(a)(b) | | 16,818 | | | 403,800 |
TriQuint Semiconductor, Inc.(a)(b) | | 190,339 | | | 654,766 |
Ultratech, Inc.(a) | | 30,635 | | | 366,395 |
Varian Semiconductor Equipment Associates, Inc.(a)(b) | | 94,780 | | | 1,717,413 |
Veeco Instruments, Inc.(a) | | 41,934 | | | 265,862 |
| | | | |
|
|
| | | | | | 15,878,788 |
| | | | |
|
|
Software — 3.0% | | | | | |
Blackbaud, Inc.(b) | | 56,497 | | | 762,710 |
Catapult Communications Corp.(a) | | 10,437 | | | 68,571 |
Concur Technologies, Inc.(a)(b) | | 55,435 | | | 1,819,377 |
Epicor Software Corp.(a) | | 78,196 | | | 375,341 |
EPIQ Systems, Inc.(a)(b) | | 46,449 | | | 776,163 |
Informatica Corp.(a)(b) | | 114,438 | | | 1,571,234 |
JDA Software Group, Inc.(a) | | 35,709 | | | 468,859 |
Manhattan Associates, Inc.(a)(b) | | 31,328 | | | 495,296 |
MICROS Systems, Inc.(a)(b) | | 104,967 | | | 1,713,061 |
Phoenix Technologies Ltd.(a) | | 37,546 | | | 131,411 |
Progress Software Corp.(a) | | 52,034 | | | 1,002,175 |
Quality Systems, Inc.(b) | | 23,694 | | | 1,033,532 |
Radiant Systems, Inc.(a) | | 35,992 | | | 121,293 |
Smith Micro Software, Inc.(a) | | 36,283 | | | 201,733 |
Sonic Solutions, Inc.(a)(b) | | 34,618 | | | 60,928 |
SPSS, Inc.(a)(b) | | 23,726 | | | 639,653 |
Take-Two Interactive Software, Inc. | | 101,241 | | | 765,382 |
Taleo Corp. (Class A Stock)(a) | | 39,894 | | | 312,370 |
THQ, Inc.(a)(b) | | 87,512 | | | 366,675 |
Tyler Technologies, Inc.(a)(b) | | 38,428 | | | 460,367 |
| | | | |
|
|
| | | | | | 13,146,131 |
| | | | |
|
|
Specialty Retail — 3.5% | | | | | |
Aaron Rents, Inc. | | 69,848 | | | 1,859,353 |
Big 5 Sporting Goods Corp. | | 28,089 | | | 146,344 |
Brown Shoe Co., Inc. | | 55,210 | | | 467,629 |
Buckle, Inc. (The) | | 30,713 | | | 670,158 |
Cabela’s, Inc.(a)(b) | | 51,363 | | | 299,446 |
Cato Corp. (The) (Class A Stock) | | 38,337 | | | 578,889 |
Charlotte Russe Holdings, Inc.(a) | | 27,310 | | | 177,242 |
Children’s Place Retail Stores, Inc. (The)(a)(b) | | 31,429 | | | 681,381 |
Christopher & Banks Corp. | | 46,329 | | | 259,442 |
Dress Barn, Inc.(a)(b) | | 58,725 | | | 630,707 |
Finish Line, Inc. (Class A Stock) | | 71,639 | | | 401,176 |
Genesco, Inc.(a) | | 25,095 | | | 424,607 |
| | | | | |
COMMON STOCKS
(continued) | | Shares
| | Value
(Note 2)
|
| | | | | | |
Specialty Retail (continued) | | | | | |
Group 1 Automotive, Inc.(b) | | 30,364 | | $ | 327,020 |
Gymboree Corp.(a)(b) | | 37,868 | | | 987,976 |
Haverty Furniture Cos., Inc.(b) | | 24,175 | | | 225,553 |
Hibbett Sports, Inc.(a) | | 37,202 | | | 584,443 |
Hot Topic, Inc.(a) | | 57,176 | | | 530,022 |
Jo-Ann Stores, Inc.(a) | | 33,072 | | | 512,285 |
Jos. A. Bank Clothiers, Inc.(a)(b) | | 23,811 | | | 622,658 |
Lithia Motors, Inc. (Class A Stock) | | 21,615 | | | 70,465 |
MarineMax, Inc.(a) | | 23,957 | | | 81,214 |
Men’s Wearhouse, Inc. | | 67,494 | | | 913,869 |
Midas, Inc.(a)(b) | | 18,291 | | | 191,873 |
OfficeMax, Inc. | | 99,110 | | | 757,200 |
Pep Boys-Manny, Moe & Jack | | 58,148 | | | 240,151 |
Sonic Automotive, Inc.
(Class A Stock) | | 36,573 | | | 145,561 |
Stage Stores, Inc. | | 49,535 | | | 408,664 |
Stein Mart, Inc. | | 33,102 | | | 37,405 |
Tractor Supply Co.(a)(b) | | 41,652 | | | 1,505,303 |
Tween Brands, Inc.(a)(b) | | 32,256 | | | 139,346 |
Zale Corp.(a)(b) | | 41,624 | | | 138,608 |
Zumiez, Inc.(a) | | 26,254 | | | 195,592 |
| | | | |
|
|
| | | | | | 15,211,582 |
| | | | |
|
|
Textiles, Apparel & Luxury Goods — 2.2% | | | |
Carter’s, Inc.(a)(b) | | 73,565 | | | 1,416,862 |
Crocs, Inc.(a)(b) | | 108,369 | | | 134,378 |
Deckers Outdoor Corp.(a) | | 17,101 | | | 1,365,857 |
Fossil, Inc.(a)(b) | | 58,250 | | | 972,775 |
Iconix Brand Group, Inc.(a)(b) | | 76,087 | | | 744,131 |
K-Swiss, Inc. (Class A Stock) | | 34,968 | | | 398,635 |
Liz Claiborne, Inc.(b) | | 123,560 | | | 321,256 |
Maidenform Brands, Inc.(a) | | 24,426 | | | 247,924 |
Movado Group, Inc. | | 23,539 | | | 221,031 |
Oxford Industries, Inc. | | 17,699 | | | 155,220 |
Perry Ellis International, Inc.(a)(b) | | 15,322 | | | 97,141 |
Quiksilver, Inc.(a)(b) | | 165,776 | | | 305,028 |
Skechers USA, Inc. (Class A Stock)(a) | | 43,367 | | | 555,965 |
True Religion Apparel, Inc.(a)(b) | | 23,955 | | | 298,000 |
Unifirst Corp. | | 18,647 | | | 553,629 |
Volcom, Inc.(a)(b) | | 20,675 | | | 225,358 |
Wolverine World Wide, Inc. | | 63,921 | | | 1,344,898 |
| | | | |
|
|
| | | | | | 9,358,088 |
| | | | |
|
|
Thrifts & Mortgage Finance — 0.8% | | | | | |
Anchor Bancorp Wisconsin, Inc. | | 23,548 | | | 64,992 |
Bank Mutual Corp. | | 63,017 | | | 727,216 |
BankAtlantic Bancorp, Inc.
(Class A Stock) | | 10,639 | | | 61,706 |
Brookline Bancorp, Inc. | | 76,166 | | | 811,168 |
Corus Bankshares, Inc.(b) | | 40,657 | | | 45,129 |
Dime Community Bancshares | | 34,297 | | | 456,150 |
Flagstar Bancorp, Inc. | | 76,383 | | | 54,232 |
Guaranty Financial Group, Inc.(a)(b) | | 142,180 | | | 371,090 |
TrustCo Bank Corp. | | 99,015 | | | 941,634 |
| | | | |
|
|
| | | | | | 3,533,317 |
| | | | |
|
|
SEE NOTES TO FINANCIAL STATEMENTS.
A102
| | | | | | |
| | | SMALL CAPITALIZATION STOCK PORTFOLIO (continued) | | |
| |
| SCHEDULE OF INVESTMENTS | | December 31, 2008 |
| | | | | |
COMMON STOCKS
(continued) | | Shares
| | Value
(Note 2)
|
| | | | | | |
Tobacco — 0.1% | | | | | |
Alliance One International, Inc.(a) | | 116,092 | | $ | 341,310 |
| | | | |
|
|
Trading Companies & Distributors — 0.7% | | | |
Applied Industrial Technologies, Inc. | | 47,535 | | | 899,362 |
Kaman Corp. (Class A Stock) | | 33,250 | | | 602,823 |
Lawson Products | | 5,428 | | | 124,030 |
Watsco, Inc.(b) | | 36,978 | | | 1,419,955 |
| | | | |
|
|
| | | | | | 3,046,170 |
| | | | |
|
|
Water Utilites — 0.2% | | | | | |
American States Water Co. | | 22,552 | | | 743,765 |
| | | | |
|
|
TOTAL LONG-TERM INVESTMENTS
(cost $519,833,326) | | | 429,235,020 |
| | | | |
|
|
| SHORT-TERM INVESTMENTS — 30.0% | | | |
Affiliated Money Market Mutual Fund — 29.8% | | | |
Dryden Core Investment Fund — Taxable Money Market Series (cost $128,952,727; includes $121,818,806 of cash collateral received for securities on loan)(c)(d) | | 128,952,727 | | | 128,952,727 |
| | | | |
|
|
| | | | | | | |
SHORT-TERM
INVESTMENTS (continued) | | Principal
Amount
000
| | Value
(Note 2)
| |
| | | | | | | | |
U.S. Government Obligation — 0.2% | | | | |
U.S. Treasury Bills, 0.10%, 6/11/2009(e)(f)
(cost $899,665) | | $ | 900 | | $ | 899,472 | |
| | | | | |
|
|
|
TOTAL SHORT-TERM INVESTMENTS
(cost $129,852,392) | | | 129,852,199 | |
| | | | | |
|
|
|
TOTAL INVESTMENTS — 129.3%
(cost $649,685,718) | | | 559,087,219 | |
LIABILITIES IN EXCESS OF
OTHER ASSETS(g) — (29.3)% | | | (126,576,762 | ) |
| | | | | |
|
|
|
NET ASSETS — 100.0% | | $ | 432,510,457 | |
| | | | | |
|
|
|
| (a) | Non-income producing security. |
| (b) | All or a portion of security is on loan. The aggregate market value of such securities is $118,910,338; cash collateral of $121,818,806 (included in liabilities) was received with which the Portfolio purchased highly liquid short-term investments. |
| (c) | Represents security, or a portion thereof, purchased with cash collateral received for securities on loan. |
| (d) | Prudential Investments LLC, the manager of the Portfolio, also serves as manager of the Dryden Core Investment Fund-Taxable Money Market Series. |
| (e) | Security segregated as collateral for futures contracts. |
| (f) | Rate quoted represents yield-to-maturity as of purchase date. |
| (g) | Liabilities in excess of other assets include net unrealized appreciation on financial futures as follows: |
Open future contracts outstanding at December 31, 2008:
| | | | | | | | | | | | | |
Number of
Contracts
| | Type
| | Expiration
Date
| | Value at
December 31, 2008
| | Value at
Trade Date
| | Unrealized
Appreciation
|
| Long Position: | | | | | | | | | | | | | |
| 68 | | Russell 2000 | | Mar. 09 | | $ | 3,385,720 | | $ | 3,230,357 | | $ | 155,363 |
Various inputs are used in determining the value of the Portfolio’s investments. These inputs are summarized in the three broad levels listed below.
Level 1—quoted prices in active markets for identical securities
Level 2—other significant observable inputs (including quoted prices for similar securities, interest rates, prepayment speeds, credit risk, etc.)
Level 3—significant unobservable inputs (including the Portfolio’s own assumptions in determining the fair value of investments)
The following is a summary of the inputs used as of December 31, 2008 in valuing the Portfolio’s assets carried at fair value:
| | | | | | |
Valuation inputs
| | Investments
in Securities
| | Other Financial
Instruments*
|
Level 1—Quoted Prices | | $ | 558,187,747 | | $ | 155,363 |
Level 2—Other Significant Observable Inputs | | | 899,472 | | | — |
Level 3—Significant Unobservable Inputs | | | — | | | — |
| | |
|
| |
|
|
Total | | $ | 559,087,219 | | $ | 155,363 |
| | |
|
| |
|
|
| * | Other financial instruments are derivative instruments not reflected in the Schedule of Investments, such as futures, forwards and swap contracts, which are valued at the unrealized appreciation/depreciation on the instrument. |
As of December 31, 2007 and December 31, 2008, the Portfolio did not use any Significant Unobservable Inputs (Level 3) in determining the valuation of investments.
SEE NOTES TO FINANCIAL STATEMENTS.
A103
| | | | | | |
| | | SMALL CAPITALIZATION STOCK��PORTFOLIO (continued) | | |
| |
| SCHEDULE OF INVESTMENTS | | December 31, 2008 |
The industry classification of portfolio holdings and liabilities in excess of other assets shown as a percentage of net assets as of December 31, 2008 were as follows:
| | | |
Affiliated Money Market Mutual Fund (including 28.2% of collateral received for securities on loan) | | 29.8 | % |
Commercial Banks | | 8.2 | |
Real Estate Investment Trusts (REITs) | | 6.1 | |
Healthcare Providers & Services | | 5.9 | |
Healthcare Equipment & Supplies | | 4.7 | |
Machinery | | 4.2 | |
Semiconductors & Semiconductor Equipment | | 3.7 | |
Specialty Retail | | 3.5 | |
Hotels, Restaurants & Leisure | | 3.4 | |
Electronic Equipment & Instruments | | 3.3 | |
Insurance | | 3.3 | |
Gas Utilities | | 3.2 | |
Aerospace & Defense | | 3.1 | |
Software | | 3.0 | |
Energy Equipment & Services | | 2.5 | |
Commercial Services & Supplies | | 2.4 | |
Textiles, Apparel & Luxury Goods | | 2.2 | |
Electrical Equipment | | 2.1 | |
Communications Equipment | | 2.0 | |
Capital Markets | | 1.7 | |
Chemicals | | 1.7 | |
Oil, Gas & Consumable Fuels | | 1.7 | |
Food Products | | 1.6 | |
IT Services | | 1.6 | |
Road & Rail | | 1.6 | |
Electric Utilities | | 1.5 | |
Building Products | | 1.4 | |
Internet Software & Services | | 1.3 | |
Professional Services | | 1.3 | |
Biotechnology | | 1.2 | |
Food & Staples Retailing | | 1.1 | |
Diversified Consumer Services | | 0.9 | |
Leisure Equipment & Products | | 0.9 | |
Computers & Peripherals | | 0.8 | |
| | | |
Thrifts & Mortgage Finance | | 0.8 | % |
Pharmaceuticals | | 0.7 | |
Trading Companies & Distributors | | 0.7 | |
Construction & Engineering | | 0.6 | |
Construction Materials | | 0.6 | |
Household Durables | | 0.6 | |
Internet & Catalog Retail | | 0.6 | |
Life Sciences Tools & Services | | 0.6 | |
Multi-Utilities | | 0.6 | |
Air Freight & Logistics | | 0.5 | |
Consumer Finance | | 0.5 | |
Containers & Packaging | | 0.5 | |
Healthcare Technology | | 0.5 | |
Metals & Mining | | 0.5 | |
Paper & Forest Products | | 0.5 | |
Marine | | 0.4 | |
Personal Products | | 0.4 | |
Airlines | | 0.3 | |
Diversified Financial Services | | 0.3 | |
Household Products | | 0.3 | |
Media | | 0.3 | |
Auto Components | | 0.2 | |
Diversified Telecommunication Services | | 0.2 | |
Industrial Conglomerates | | 0.2 | |
U.S. Government Obligation | | 0.2 | |
Water Utilities | | 0.2 | |
Automobiles | | 0.1 | |
Beverages | | 0.1 | |
Exchange Traded Fund | | 0.1 | |
Multiline Retail | | 0.1 | |
Real Estate Management & Development | | 0.1 | |
Tobacco | | 0.1 | |
| | |
|
|
| | | 129.3 | |
Liabilities in excess of other assets | | (29.3 | ) |
| | |
|
|
| | | 100.0 | % |
| | |
|
|
SEE NOTES TO FINANCIAL STATEMENTS.
A104
| | | | | | |
| | | SMALL CAPITALIZATION STOCK PORTFOLIO (continued) | | |
STATEMENT OF ASSETS AND LIABILITIES
December 31, 2008
| | | | |
| ASSETS | | | | |
Investments, at value including securities on loan of $118,910,338: | | | | |
Unaffiliated investments (cost $520,732,991) | | $ | 430,134,492 | |
Affiliated investments (cost $128,952,727) | | | 128,952,727 | |
Dividends and interest receivable | | | 806,605 | |
Due from broker—variation margin | | | 153,701 | |
Receivable for investments sold | | | 121,591 | |
Receivable for Series shares sold | | | 45,566 | |
Prepaid expenses | | | 7,556 | |
| | |
|
|
|
Total Assets | | | 560,222,238 | |
| | |
|
|
|
| LIABILITIES | | | | |
Collateral for securities on loan | | | 121,818,806 | |
Payable for investments purchased | | | 4,946,150 | |
Payable for Series shares repurchased | | | 429,961 | |
Payable to custodian | | | 258,103 | |
Management fee payable | | | 137,680 | |
Accrued expenses and other liabilities | | | 120,459 | |
Affiliated transfer agent fee payable | | | 622 | |
| | |
|
|
|
Total Liabilities | | | 127,711,781 | |
| | |
|
|
|
| NET ASSETS | | $ | 432,510,457 | |
| | |
|
|
|
Net assets were comprised of: | | | | |
Paid-in capital | | $ | 481,522,142 | |
Retained earnings | | | (49,011,685 | ) |
| | |
|
|
|
Net assets, December 31, 2008 | | $ | 432,510,457 | |
| | |
|
|
|
Net asset value and redemption price per share,
$432,510,457 / 34,557,171 outstanding shares of beneficial interest | | $ | 12.52 | |
| | |
|
|
|
STATEMENT OF OPERATIONS
Year Ended December 31, 2008
| | | | |
| INVESTMENT INCOME | | | | |
Unaffiliated dividend income (net of foreign withholding taxes of $2,772) | | $ | 7,377,862 | |
Affiliated income from securities loaned, net | | | 3,055,964 | |
Affiliated dividend income | | | 73,761 | |
Interest | | | 9,373 | |
| | |
|
|
|
| | | | 10,516,960 | |
| | |
|
|
|
| EXPENSES | | | | |
Management fee | | | 2,341,790 | |
Shareholders’ reports | | | 153,000 | |
Custodian’s fees and expenses | | | 98,000 | |
Audit fee | | | 17,000 | |
Trustees’ fees | | | 17,000 | |
Insurance expenses | | | 9,000 | |
Legal fees and expenses | | | 9,000 | |
Interest expense (Note 8) | | | 8,854 | |
Transfer agent’s fee and expenses (including affiliated expense of $3,600) (Note 4) | | | 4,000 | |
Commitment fee on syndicated credit agreement | | | 3,000 | |
Miscellaneous | | | 69,831 | |
| | |
|
|
|
Total expenses | | | 2,730,475 | |
| | |
|
|
|
| NET INVESTMENT INCOME | | | 7,786,485 | |
| | |
|
|
|
| NET REALIZED AND UNREALIZED GAIN (LOSS) ON INVESTMENTS | | | | |
Net realized gain (loss) on: | | | | |
Investment transactions | | | 46,344,588 | |
Futures transactions | | | (4,084,893 | ) |
| | |
|
|
|
| | | | 42,259,695 | |
| | |
|
|
|
Net change in unrealized appreciation (depreciation) on: | | | | |
Investments | | | (254,737,869 | ) |
Futures | | | 216,443 | |
| | |
|
|
|
| | | | (254,521,426 | ) |
| | |
|
|
|
| NET LOSS ON INVESTMENTS | | | (212,261,731 | ) |
| | |
|
|
|
| NET DECREASE IN NET ASSETS RESULTING FROM OPERATIONS | | $ | (204,475,246 | ) |
| | |
|
|
|
STATEMENT OF CHANGES IN NET ASSETS
| | | | | | | | |
| | | Year Ended December 31,
| |
| | | 2008
| | | 2007
| |
| DECREASE IN NET ASSETS OPERATIONS: | | | | | | | | |
Net investment income | | $ | 7,786,485 | | | $ | 6,742,973 | |
Net realized gain on investment transactions | | | 42,259,695 | | | | 90,008,243 | |
Net change in unrealized depreciation on investments | | | (254,521,426 | ) | | | (96,841,969 | ) |
| | |
|
|
| |
|
|
|
NET DECREASE IN NET ASSETS RESULTING FROM OPERATIONS | | | (204,475,246 | ) | | | (90,753 | ) |
| | |
|
|
| |
|
|
|
| DISTRIBUTIONS: | | | (96,751,216 | ) | | | (55,581,459 | ) |
| | |
|
|
| |
|
|
|
| SERIES SHARE TRANSACTIONS: | | | | | | | | |
Series shares sold [776,306 and 1,460,342 shares, respectively] | | | 13,229,598 | | | | 34,590,005 | |
Series shares issued in reinvestment of dividends and distributions [5,411,142 and 2,642,961 shares, respectively] | | | 96,751,216 | | | | 55,581,459 | |
Series shares repurchased [4,453,912 and 4,643,527 shares, respectively] | | | (75,813,375 | ) | | | (112,066,691 | ) |
| | |
|
|
| |
|
|
|
NET INCREASE (DECREASE) IN NET ASSETS RESULTING FROM SERIES SHARE TRANSACTIONS | | | 34,167,439 | | | | (21,895,227 | ) |
| | |
|
|
| |
|
|
|
| TOTAL DECREASE IN NET ASSETS | | | (267,059,023 | ) | | | (77,567,439 | ) |
| NET ASSETS: | | | | | | | | |
Beginning of year | | | 699,569,480 | | | | 777,136,919 | |
| | |
|
|
| |
|
|
|
End of year | | $ | 432,510,457 | | | $ | 699,569,480 | |
| | |
|
|
| |
|
|
|
SEE NOTES TO FINANCIAL STATEMENTS.
A105
| | | | | | |
| | | STOCK INDEX PORTFOLIO | | |
| |
| SCHEDULE OF INVESTMENTS | | December 31, 2008 |
| | | | | |
| LONG-TERM INVESTMENTS — 97.9% |
| COMMON STOCKS | | Shares
| | Value
(Note 2)
|
| | | | | | |
Aerospace/Defense — 2.8% | | | | | |
Boeing Co.(b) | | 167,036 | | $ | 7,127,426 |
General Dynamics Corp. | | 92,900 | | | 5,350,111 |
Goodrich Corp. | | 28,600 | | | 1,058,772 |
Honeywell International, Inc. | | 164,750 | | | 5,408,743 |
L-3 Communications Holdings, Inc. | | 27,400 | | | 2,021,572 |
Lockheed Martin Corp. | | 76,598 | | | 6,440,360 |
Northrop Grumman Corp. | | 79,426 | | | 3,577,347 |
Precision Castparts Corp. | | 30,800 | | | 1,831,984 |
Raytheon Co. | | 98,118 | | | 5,007,943 |
Rockwell Collins, Inc. | | 33,300 | | | 1,301,697 |
United Technologies Corp. | | 214,300 | | | 11,486,480 |
| | | | |
|
|
| | | | | | 50,612,435 |
| | | | |
|
|
Air Freight & Logistics — 1.2% | | | | | |
C.H. Robinson Worldwide, Inc. | | 38,200 | | | 2,102,146 |
Expeditors International Washington, Inc.(b) | | 48,200 | | | 1,603,614 |
FedEx Corp. | | 70,440 | | | 4,518,726 |
United Parcel Service, Inc.
(Class B Stock) | | 226,400 | | | 12,488,224 |
| | | | |
|
|
| | | | | | 20,712,710 |
| | | | |
|
|
Airlines — 0.1% | | | | | |
Southwest Airlines Co. | | 164,137 | | | 1,414,861 |
| | | | |
|
|
Auto Components — 0.2% | | | | | |
Goodyear Tire & Rubber Co. (The)(a) | | 37,200 | | | 222,084 |
Johnson Controls, Inc. | | 138,300 | | | 2,511,528 |
| | | | |
|
|
| | | | | | 2,733,612 |
| | | | |
|
|
Automobiles — 0.1% | | | | | |
Ford Motor Co.(a)(b) | | 480,959 | | | 1,101,396 |
General Motors Corp.(b) | | 110,100 | | | 352,320 |
Harley-Davidson, Inc.(b) | | 52,600 | | | 892,622 |
| | | | |
|
|
| | | | | | 2,346,338 |
| | | | |
|
|
Beverages — 2.5% | | | | | |
Brown-Forman Corp. (Class B) | | 21,500 | | | 1,107,035 |
Coca-Cola Co. (The)(b) | | 448,600 | | | 20,308,122 |
Coca-Cola Enterprises, Inc. | | 74,800 | | | 899,844 |
Constellation Brands, Inc.
(Class A Stock)(a) | | 38,200 | | | 602,414 |
DR Pepper Snapple Group Inc (a) | | 57,400 | | | 932,750 |
Molson Coors Brewing Co.
(Class B Stock) | | 34,100 | | | 1,668,172 |
Pepsi Bottling Group, Inc. | | 33,600 | | | 756,336 |
PepsiCo, Inc. | | 353,340 | | | 19,352,432 |
| | | | |
|
|
| | | | | | 45,627,105 |
| | | | |
|
|
Biotechnology — 2.1% | | | | | |
Amgen, Inc.(a) | | 242,164 | | | 13,984,971 |
Biogen Idec, Inc.(a) | | 68,925 | | | 3,282,898 |
Celgene Corp.(a)(b) | | 100,000 | | | 5,528,000 |
Cephalon, Inc.(a)(b) | | 14,400 | | | 1,109,376 |
Genzyme Corp.(a) | | 60,300 | | | 4,002,111 |
Gilead Sciences, Inc.(a)(b) | | 206,200 | | | 10,545,068 |
| | | | |
|
|
| | | | | | 38,452,424 |
| | | | |
|
|
| | | | | |
COMMON STOCKS
(continued) | | Shares
| | Value
(Note 2)
|
| | | | | | |
Building Products — 0.1% | | | | | |
Masco Corp. | | 81,300 | | $ | 904,869 |
| | | | |
|
|
Capital Markets — 2.4% | | | | | |
American Capital Strategies Ltd.(b) | | 46,900 | | | 151,956 |
Ameriprise Financial, Inc. | | 58,200 | | | 1,359,552 |
Bank of New York Mellon Corp.(The) | | 261,189 | | | 7,399,484 |
Charles Schwab Corp. | | 216,600 | | | 3,502,422 |
E*Trade Financial Corp.(a)(b) | | 72,800 | | | 83,720 |
Federated Investors, Inc.
(Class B Stock) | | 22,600 | | | 383,296 |
Franklin Resources, Inc. | | 36,800 | | | 2,347,104 |
Goldman Sachs Group, Inc. (The) | | 99,000 | | | 8,354,610 |
Invesco Limited | | 81,400 | | | 1,175,416 |
Janus Capital Group, Inc. | | 39,000 | | | 313,170 |
Legg Mason, Inc. | | 32,600 | | | 714,266 |
Merrill Lynch & Co., Inc. | | 344,500 | | | 4,009,980 |
Morgan Stanley (b) | | 257,810 | | | 4,135,272 |
Northern Trust Corp. | | 50,000 | | | 2,607,000 |
State Street Corp. | | 96,100 | | | 3,779,613 |
T. Rowe Price Group, Inc.(b) | | 60,600 | | | 2,147,664 |
| | | | |
|
|
| | | | | | 42,464,525 |
| | | | |
|
|
Chemicals — 1.7% | | | | | |
Air Products & Chemicals, Inc. | | 48,200 | | | 2,423,014 |
CF Industries Holding Inc | | 11,900 | | | 585,004 |
Dow Chemical Co. (The) | | 212,861 | | | 3,212,072 |
E.I. du Pont de Nemours & Co. | | 200,191 | | | 5,064,832 |
Eastman Chemical Co. | | 19,600 | | | 621,516 |
Ecolab, Inc. | | 36,300 | | | 1,275,945 |
International Flavors & Fragrances, Inc. | | 16,100 | | | 478,492 |
Monsanto Co. | | 122,296 | | | 8,603,524 |
PPG Industries, Inc. | | 35,800 | | | 1,518,994 |
Praxair, Inc. | | 71,300 | | | 4,232,368 |
Rohm & Haas Co. | | 25,600 | | | 1,581,824 |
Sigma-Aldrich Corp.(b) | | 27,600 | | | 1,165,824 |
| | | | |
|
|
| | | | | | 30,763,409 |
| | | | |
|
|
Commercial Banks — 3.1% | | | | | |
BB&T Corp.(b) | | 128,300 | | | 3,523,118 |
Comerica, Inc. | | 36,450 | | | 723,533 |
Fifth Third Bancorp | | 132,849 | | | 1,097,333 |
First Horizon National Corp.(b) | | 46,479 | | | 491,283 |
Huntington Bancshares, Inc.(b) | | 114,775 | | | 879,177 |
KeyCorp.(b) | | 109,000 | | | 928,680 |
M&T Bank Corp.(b) | | 17,600 | | | 1,010,416 |
Marshall & Ilsley Corp.(b) | | 58,698 | | | 800,641 |
National City Corp. | | 443,700 | | | 803,097 |
PNC Financial Services Group, Inc.(b) | | 80,000 | | | 3,920,000 |
Regions Financial Corp. | | 176,212 | | | 1,402,648 |
SunTrust Banks, Inc. | | 81,900 | | | 2,419,326 |
US Bancorp | | 399,481 | | | 9,991,020 |
Wachovia Corp. | | 471,455 | | | 2,611,861 |
Wells Fargo & Co.(b) | | 852,220 | | | 25,123,446 |
Zions Bancorporation(b) | | 30,300 | | | 742,653 |
| | | | |
|
|
| | | | | | 56,468,232 |
| | | | |
|
|
SEE NOTES TO FINANCIAL STATEMENTS.
A106
| | | | | | |
| | | STOCK INDEX PORTFOLIO (continued) | | |
| |
| SCHEDULE OF INVESTMENTS | | December 31, 2008 |
| | | | | |
COMMON STOCKS
(continued) | | Shares
| | Value
(Note 2)
|
| | | | | | |
Commercial Services & Supplies — 0.5% |
Avery Dennison Corp. | | 25,400 | | $ | 831,342 |
Cintas Corp. | | 28,500 | | | 662,055 |
Pitney Bowes, Inc. | | 47,900 | | | 1,220,492 |
Republic Services, Inc. | | 64,410 | | | 1,596,724 |
R.R. Donnelley & Sons Co. | | 54,200 | | | 736,036 |
Stericycle, Inc.(a) | | 19,300 | | | 1,005,144 |
Waste Management, Inc. | | 113,330 | | | 3,755,756 |
| | | | |
|
|
| | | | | | 9,807,549 |
| | | | |
|
|
Communications Equipment — 2.4% | | | | | |
Ciena Corp.(a) | | 10,657 | | | 71,402 |
Cisco Systems, Inc.(a) | | 1,334,400 | | | 21,750,720 |
Corning, Inc. | | 368,400 | | | 3,510,852 |
Harris Corp. | | 30,400 | | | 1,156,720 |
JDS Uniphase Corp.(a) | | 45,587 | | | 166,393 |
Juniper Networks, Inc.(a)(b) | | 120,900 | | | 2,116,959 |
Motorola, Inc. | | 480,595 | | | 2,129,036 |
QUALCOMM, Inc. | | 367,400 | | | 13,163,942 |
Tellabs, Inc.(a) | | 88,000 | | | 362,560 |
| | | | |
|
|
| | | | | | 44,428,584 |
| | | | |
|
|
Computers & Peripherals — 4.2% | | | | | |
Apple, Inc.(a) | | 198,600 | | | 16,950,510 |
Dell, Inc.(a) | | 410,200 | | | 4,200,448 |
EMC Corp.(a)(b) | | 475,074 | | | 4,974,025 |
Hewlett-Packard Co. | | 558,916 | | | 20,283,062 |
International Business Machines Corp.(b) | | 306,200 | | | 25,769,792 |
Lexmark International, Inc. (Class A Stock)(a)(b) | | 23,614 | | | 635,217 |
Netapp, Inc.(a)(b) | | 79,400 | | | 1,109,218 |
QLogic Corp.(a)(b) | | 36,100 | | | 485,184 |
SanDisk Corp.(a) | | 47,800 | | | 458,880 |
Sun Microsystems, Inc.(a) | | 178,950 | | | 683,589 |
Teradata Corp.(a) | | 46,300 | | | 686,629 |
| | | | |
|
|
| | | | | | 76,236,554 |
| | | | |
|
|
Construction & Engineering — 0.2% | | | | | |
Fluor Corp. | | 41,400 | | | 1,857,618 |
Jacobs Engineering Group, Inc.(a) | | 28,500 | | | 1,370,850 |
| | | | |
|
|
| | | | | | 3,228,468 |
| | | | |
|
|
Construction Materials — 0.1% | | | | | |
Vulcan Materials Co.(b) | | 21,900 | | | 1,523,802 |
| | | | |
|
|
Consumer Finance — 0.5% | | | | | |
American Express Co.(b) | | 268,200 | | | 4,975,110 |
Capital One Financial Corp.(b) | | 88,569 | | | 2,824,465 |
Discover Financial Services | | 120,505 | | | 1,148,413 |
SLM Corp.(a)(b) | | 99,000 | | | 881,100 |
| | | | |
|
|
| | | | | | 9,829,088 |
| | | | |
|
|
Containers & Packaging — 0.2% | | | | | |
Ball Corp. | | 23,400 | | | 973,206 |
Bemis Co., Inc. | | 21,300 | | | 504,384 |
Pactiv Corp.(a) | | 26,300 | | | 654,344 |
Sealed Air Corp. | | 39,820 | | | 594,911 |
| | | | |
|
|
| | | | | | 2,726,845 |
| | | | |
|
|
| | | | | |
COMMON STOCKS
(continued) | | Shares
| | Value
(Note 2)
|
| | | | | | |
Distributors — 0.1% | | | | | |
Genuine Parts Co. | | 37,325 | | $ | 1,413,125 |
| | | | |
|
|
Diversified Consumer Services — 0.2% |
Apollo Group, Inc. (Class A Stock)(a) | | 25,700 | | | 1,969,134 |
H&R Block, Inc. | | 79,500 | | | 1,806,240 |
| | | | |
|
|
| | | | | | 3,775,374 |
| | | | |
|
|
Diversified Financial Services — 3.3% |
Bank of America Corp.(b) | | 1,130,235 | | | 15,913,709 |
CIT Group, Inc.(b) | | 77,300 | | | 350,942 |
Citigroup, Inc. | | 1,237,476 | | | 8,303,464 |
CME Group, Inc. | | 14,670 | | | 3,052,974 |
IntercontinentalExchange, Inc.(a) | | 15,100 | | | 1,244,844 |
JPMorgan Chase & Co. | | 839,845 | | | 26,480,313 |
Leucadia National Corp.(b) | | 38,900 | | | 770,220 |
Moody’s Corp.(b) | | 46,620 | | | 936,596 |
Nasdaq Stock Market (The), Inc.(a) | | 25,700 | | | 635,047 |
NYSE Euronext | | 56,700 | | | 1,552,446 |
| | | | |
|
|
| | | | | | 59,240,555 |
| | | | |
|
|
Diversified Telecommunication Services — 3.6% | | | |
AT&T, Inc. | | 1,333,711 | | | 38,010,763 |
CenturyTel, Inc. | | 22,200 | | | 606,726 |
Embarq Corp. | | 35,176 | | | 1,264,929 |
Frontier Communications Corp. | | 84,200 | | | 735,908 |
Qwest Communications International, Inc.(b) | | 341,747 | | | 1,243,959 |
Verizon Communications, Inc. | | 641,638 | | | 21,751,528 |
Windstream Corp. | | 117,565 | | | 1,081,598 |
| | | | |
|
|
| | | | | | 64,695,411 |
| | | | |
|
|
Electric Utilities — 2.4% | | | | | |
Allegheny Energy, Inc. | | 36,000 | | | 1,218,960 |
American Electric Power Co., Inc. | | 94,140 | | | 3,132,979 |
Duke Energy Corp. | | 285,382 | | | 4,283,584 |
Edison International | | 78,300 | | | 2,514,996 |
Entergy Corp. | | 43,000 | | | 3,574,590 |
Exelon Corp. | | 148,050 | | | 8,233,061 |
FirstEnergy Corp. | | 70,336 | | | 3,416,923 |
FPL Group, Inc. | | 92,500 | | | 4,655,525 |
Pepco Holdings, Inc. | | 47,400 | | | 841,824 |
Pinnacle West Capital Corp. | | 24,200 | | | 777,546 |
PPL Corp. | | 84,800 | | | 2,602,512 |
Progress Energy, Inc. | | 58,414 | | | 2,327,798 |
Southern Co. | | 170,300 | | | 6,301,100 |
| | | | |
|
|
| | | | | | 43,881,398 |
| | | | |
|
|
Electrical Equipment — 0.5% | | | | | |
Cooper Industries, Ltd. (Class A Stock) | | 40,500 | | | 1,183,815 |
Emerson Electric Co. | | 175,600 | | | 6,428,716 |
Rockwell Automation, Inc. | | 32,500 | | | 1,047,800 |
| | | | |
|
|
| | | | | | 8,660,331 |
| | | | |
|
|
Electronic Equipment & Instruments — 0.3% | | | |
Agilent Technologies, Inc.(a) | | 85,582 | | | 1,337,647 |
Amphenol Corp., (Class A Stock) | | 33,000 | | | 791,340 |
Jabil Circuit, Inc. | | 44,000 | | | 297,000 |
SEE NOTES TO FINANCIAL STATEMENTS.
A107
| | | | | | |
| | | STOCK INDEX PORTFOLIO (continued) | | |
| |
| SCHEDULE OF INVESTMENTS | | December 31, 2008 |
| | | | | |
COMMON STOCKS
(continued) | | Shares
| | Value
(Note 2)
|
| | | | | | |
Electronic Equipment & Instruments (continued) | | | |
Molex, Inc. | | 26,600 | | $ | 385,434 |
Tyco Electronics Ltd. (Bermuda) | | 114,460 | | | 1,855,397 |
| | | | |
|
|
| | | | | | 4,666,818 |
| | | | |
|
|
Energy Equipment & Services — 1.5% | | | |
Baker Hughes, Inc. | | 68,530 | | | 2,197,757 |
BJ Services Co. | | 67,500 | | | 787,725 |
Cameron International Corp.(a) | | 49,500 | | | 1,014,750 |
ENSCO International, Inc. | | 32,200 | | | 914,158 |
Halliburton Co. | | 195,400 | | | 3,552,372 |
Nabors Industries Ltd.(a) | | 54,000 | | | 646,380 |
National-Oilwell Varco, Inc.(a) | | 89,200 | | | 2,180,048 |
Noble Corp. | | 60,600 | | | 1,338,654 |
Rowan Cos., Inc. | | 24,100 | | | 383,190 |
Schlumberger Ltd. | | 271,500 | | | 11,492,595 |
Smith International, Inc. | | 43,200 | | | 988,848 |
Weatherford International Ltd.(a) | | 152,000 | | | 1,644,640 |
| | | | |
|
|
| | | | | | 27,141,117 |
| | | | |
|
|
Food & Staples Retailing — 3.2% | | | | | |
Costco Wholesale Corp. | | 99,132 | | | 5,204,430 |
CVS Caremark Corp. | | 322,838 | | | 9,278,364 |
Kroger Co. (The) | | 145,900 | | | 3,853,219 |
Safeway, Inc. | | 103,900 | | | 2,469,703 |
SUPERVALU, Inc. | | 50,508 | | | 737,417 |
Sysco Corp. | | 137,200 | | | 3,147,368 |
Walgreen Co.(b) | | 217,300 | | | 5,360,791 |
Wal-Mart Stores, Inc. | | 506,700 | | | 28,405,601 |
Whole Foods Market, Inc.(b) | | 28,300 | | | 267,152 |
| | | | |
|
|
| | | | | | 58,724,045 |
| | | | |
|
|
Food Products — 1.8% | | | | | |
Archer-Daniels-Midland Co.(b) | | 148,338 | | | 4,276,585 |
Campbell Soup Co.(b) | | 48,800 | | | 1,464,488 |
ConAgra Food, Inc. | | 114,000 | | | 1,881,000 |
Dean Foods Co.(a) | | 31,800 | | | 571,446 |
General Mills, Inc. | | 76,900 | | | 4,671,675 |
H.J. Heinz Co. | | 71,150 | | | 2,675,240 |
Hershey Co. (The) | | 37,700 | | | 1,309,698 |
J.M. Smucker Co. (The) | | 25,700 | | | 1,114,352 |
Kellogg Co. | | 55,200 | | | 2,420,520 |
Kraft Foods, Inc. (Class A Stock) | | 339,811 | | | 9,123,925 |
McCormick & Co., Inc. | | 31,300 | | | 997,218 |
Sara Lee Corp. | | 168,000 | | | 1,644,720 |
Tyson Foods, Inc. (Class A Stock) | | 59,900 | | | 524,724 |
| | | | |
|
|
| | | | | | 32,675,591 |
| | | | |
|
|
Gas Utilities — 0.1% | | | | | |
Equitable Resources, Inc.(b) | | 21,600 | | | 724,680 |
Nicor, Inc. | | 10,200 | | | 354,348 |
Questar Corp.(b) | | 39,800 | | | 1,301,062 |
| | | | |
|
|
| | | | | | 2,380,090 |
| | | | |
|
|
Healthcare Equipment & Supplies — 2.2% | | | |
Baxter International, Inc. | | 142,600 | | | 7,641,934 |
Becton Dickinson & Co. | | 57,700 | | | 3,946,103 |
Boston Scientific Corp.(a) | | 339,999 | | | 2,631,592 |
C.R. Bard, Inc. | | 23,400 | | | 1,971,684 |
Covidien Ltd. (Bermuda) | | 113,960 | | | 4,129,910 |
| | | | | |
COMMON STOCKS
(continued) | | Shares
| | Value
(Note 2)
|
| | | | | | |
Healthcare Equipment & Supplies (continued) | | | |
Densply International, Inc. | | 33,600 | | $ | 948,864 |
Hospira, Inc.(a) | | 37,220 | | | 998,240 |
Intuitive Surgical, Inc.(a)(b) | | 8,800 | | | 1,117,512 |
Medtronic, Inc. | | 259,300 | | | 8,147,206 |
St. Jude Medical, Inc.(a) | | 79,300 | | | 2,613,728 |
Stryker Corp. | | 56,000 | | | 2,237,200 |
Varian Medical Systems, Inc.(a)(b) | | 28,100 | | | 984,624 |
Zimmer Holdings, Inc.(a) | | 53,886 | | | 2,178,072 |
| | | | |
|
|
| | | | | | 39,546,669 |
| | | | |
|
|
Healthcare Providers & Services — 2.1% | | | |
Aetna, Inc. | | 110,348 | | | 3,144,918 |
AmerisourceBergen Corp. | | 38,300 | | | 1,365,778 |
Cardinal Health, Inc. | | 80,175 | | | 2,763,632 |
CIGNA Corp. | | 69,600 | | | 1,172,760 |
Coventry Health Care, Inc.(a) | | 35,650 | | | 530,472 |
Davita Inc.(a) | | 23,600 | | | 1,169,852 |
Express Scripts, Inc.(a) | | 59,900 | | | 3,293,302 |
Humana, Inc.(a) | | 40,800 | | | 1,521,024 |
Laboratory Corp. of America Holdings(a)(b) | | 23,300 | | | 1,500,753 |
McKesson Corp. | | 64,107 | | | 2,482,864 |
Medco Health Solutions, Inc.(a) | | 113,092 | | | 4,739,686 |
Patterson Cos., Inc.(a) | | 19,100 | | | 358,125 |
Quest Diagnostics, Inc. | | 38,300 | | | 1,988,153 |
Tenet Healthcare Corp.(a) | | 90,000 | | | 103,500 |
UnitedHealth Group, Inc. | | 272,200 | | | 7,240,520 |
Wellpoint, Inc.(a)(b) | | 118,600 | | | 4,996,618 |
| | | | |
|
|
| | | | | | 38,371,957 |
| | | | |
|
|
Healthcare Technology | | | | | |
IMS Health, Inc. | | 47,420 | | | 718,887 |
| | | | |
|
|
Hotels, Restaurants & Leisure — 1.5% | | | |
Carnival Corp. | | 96,100 | | | 2,337,152 |
Darden Restaurants, Inc. | | 35,550 | | | 1,001,799 |
International Game Technology | | 59,000 | | | 701,510 |
Marriott International, Inc. (Class A Stock) | | 63,600 | | | 1,237,020 |
McDonald’s Corp. | | 253,500 | | | 15,765,165 |
Starbucks Corp.(a) | | 159,100 | | | 1,505,086 |
Starwood Hotels & Resorts Worldwide, Inc. | | 43,000 | | | 769,700 |
Wynn Resorts Ltd. (a) | | 9,900 | | | 418,374 |
Wyndham Worldwide Corp.(b) | | 44,763 | | | 293,198 |
Yum! Brands, Inc. | | 107,100 | | | 3,373,650 |
| | | | |
|
|
| | | | | | 27,402,654 |
| | | | |
|
|
Household Durables — 0.4% | | | | | |
Black & Decker Corp.(b) | | 11,400 | | | 476,634 |
Centex Corp. | | 24,600 | | | 261,744 |
D.R. Horton, Inc. | | 55,200 | | | 390,264 |
Fortune Brands, Inc. | | 33,800 | | | 1,395,264 |
Harman International Industries, Inc.(b) | | 14,100 | | | 235,893 |
KB Home.(b) | | 17,232 | | | 234,700 |
Leggett & Platt, Inc. | | 44,300 | | | 672,917 |
Lennar Corp. (Class A Stock)(b) | | 29,000 | | | 251,430 |
SEE NOTES TO FINANCIAL STATEMENTS.
A108
| | | | | | |
| | | STOCK INDEX PORTFOLIO (continued) | | |
| |
| SCHEDULE OF INVESTMENTS | | December 31, 2008 |
| | | | | |
COMMON STOCKS
(continued) | | Shares
| | Value
(Note 2)
|
| | | | | | |
Household Durables (continued) | | | | | |
Newell Rubbermaid, Inc. | | 64,649 | | $ | 632,267 |
Pulte Homes, Inc. | | 35,700 | | | 390,201 |
Snap-On, Inc. | | 12,300 | | | 484,374 |
Stanley Works (The) | | 19,100 | | | 651,310 |
Whirlpool Corp.(b) | | 17,507 | | | 723,914 |
| | | | |
|
|
| | | | | | 6,800,912 |
| | | | |
|
|
Household Products — 3.1% | | | | | |
Clorox Co. | | 31,300 | | | 1,739,028 |
Colgate-Palmolive Co. | | 117,400 | | | 8,046,596 |
Kimberly-Clark Corp. | | 95,788 | | | 5,051,859 |
Procter & Gamble Co. | | 677,981 | | | 41,912,784 |
| | | | |
|
|
| | | | | | 56,750,267 |
| | | | |
|
|
Independent Power Producers & Energy Traders — 0.1% |
AES Corp. (The)(a)(b) | | 159,700 | | | 1,315,928 |
Constellation Energy Group, Inc. | | 34,850 | | | 874,387 |
Dynegy, Inc. (Class A Stock)(a) | | 92,800 | | | 185,600 |
| | | | |
|
|
| | | | | | 2,375,915 |
| | | | |
|
|
Industrial Conglomerates — 2.8% | | | | | |
3M Co. | | 157,200 | | | 9,045,288 |
General Electric Co. | | 2,365,700 | | | 38,324,339 |
Textron, Inc. | | 57,800 | | | 801,686 |
Tyco International Ltd. (Bermuda) | | 115,160 | | | 2,487,456 |
| | | | |
|
|
| | | | | | 50,658,769 |
| | | | |
|
|
Insurance — 2.5% | | | | | |
AFLAC, Inc.(b) | | 108,700 | | | 4,982,808 |
Allstate Corp. (The) | | 123,488 | | | 4,045,467 |
American International Group, Inc.(b) | | 536,587 | | | 842,442 |
Aon Corp. | | 63,925 | | | 2,920,094 |
Assurant, Inc.(b) | | 24,500 | | | 735,000 |
Chubb Corp. | | 83,200 | | | 4,243,200 |
Cincinnati Financial Corp. | | 41,528 | | | 1,207,219 |
Genworth Financial, Inc. (Class A Stock) | | 112,300 | | | 317,809 |
Hartford Financial Services Group, Inc. | | 74,800 | | | 1,228,216 |
Lincoln National Corp. | | 62,963 | | | 1,186,223 |
Loews Corp. | | 79,426 | | | 2,243,785 |
Marsh & McLennan Co., Inc. | | 117,100 | | | 2,842,017 |
MBIA, Inc.(b) | | 36,550 | | | 148,759 |
MetLife, Inc. | | 176,700 | | | 6,159,762 |
Principal Financial Group, Inc.(b) | | 61,300 | | | 1,383,541 |
Progressive Corp. (The) | | 148,100 | | | 2,193,361 |
Torchmark Corp. | | 21,900 | | | 978,930 |
Travelers Cos., Inc. (The) | | 136,798 | | | 6,183,270 |
Unum Group | | 86,456 | | | 1,608,082 |
XL Capital Ltd. (Class A Stock) | | 74,300 | | | 274,910 |
| | | | |
|
|
| | | | | | 45,724,895 |
| | | | |
|
|
Internet & Catalog Retail — 0.2% | | | | | |
Amazon.Com, Inc.(a)(b) | | 68,700 | | | 3,522,936 |
Expedia, Inc.(a) | | 44,900 | | | 369,976 |
| | | | |
|
|
| | | | | | 3,892,912 |
| | | | |
|
|
Internet Software & Services — 1.4% | | | | | |
Akamai Technologies, Inc.(a) | | 36,100 | | | 544,749 |
eBay, Inc.(a) | | 254,600 | | | 3,554,216 |
| | | | | |
COMMON STOCKS
(continued) | | Shares
| | Value
(Note 2)
|
| | | | | | |
Internet Software & Services (continued) |
Google, Inc. (Class A Stock)(a) | | 54,050 | | $ | 16,628,483 |
VeriSign, Inc.(a) | | 44,500 | | | 849,060 |
Yahoo!, Inc.(a)(b) | | 302,600 | | | 3,691,720 |
| | | | |
|
|
| | | | | | 25,268,228 |
| | | | |
|
|
IT Services — 0.9% | | | | | |
Affiliated Computer Services, Inc.
(Class A Stock)(a) | | 22,500 | | | 1,033,875 |
Automatic Data Processing, Inc. | | 117,400 | | | 4,618,516 |
Cognizant Technology Solutions Corp. (Class A Stock)(a) | | 58,600 | | | 1,058,316 |
Computer Sciences Corp.(a) | | 36,700 | | | 1,289,638 |
Convergys Corp.(a) | | 32,200 | | | 206,402 |
Fidelity National Information Services, Inc. | | 37,900 | | | 616,633 |
Fiserv, Inc.(a) | | 34,700 | | | 1,262,039 |
Mastercard Inc (Class A Stock) | | 15,200 | | | 2,172,536 |
Paychex, Inc.(b) | | 71,250 | | | 1,872,450 |
Total System Services, Inc. | | 41,593 | | | 582,302 |
Western Union Co. (The) | | 166,704 | | | 2,390,535 |
| | | | |
|
|
| | | | | | 17,103,242 |
| | | | |
|
|
Leisure Equipment & Products — 0.1% |
Eastman Kodak Co.(b) | | 61,000 | | | 401,380 |
Hasbro, Inc. | | 31,550 | | | 920,314 |
Mattel, Inc. | | 78,181 | | | 1,250,896 |
| | | | |
|
|
| | | | | | 2,572,590 |
| | | | |
|
|
Life Sciences, Tools & Services — 0.3% |
Life Technologies Corp Com (a) | | 38,930 | | | 907,458 |
Millipore Corp.(a) | | 12,500 | | | 644,000 |
PerkinElmer, Inc. | | 18,000 | | | 250,380 |
Thermo Fisher Scientific, Inc.(a) | | 89,100 | | | 3,035,637 |
Waters Corp.(a) | | 23,000 | | | 842,950 |
| | | | |
|
|
| | | | | | 5,680,425 |
| | | | |
|
|
Machinery — 1.6% | | | | | |
Caterpillar, Inc.(b) | | 132,100 | | | 5,900,907 |
Cummins, Inc. | | 42,600 | | | 1,138,698 |
Danaher Corp. | | 55,200 | | | 3,124,872 |
Deere & Co. | | 97,300 | | | 3,728,536 |
Dover Corp. | | 43,500 | | | 1,432,020 |
Eaton Corp. | | 36,500 | | | 1,814,415 |
Flowserve Corp. | | 12,000 | | | 618,000 |
Illinois Tool Works, Inc. | | 90,500 | | | 3,172,025 |
Ingersoll-Rand Co. Ltd. (Class A Stock) | | 70,247 | | | 1,218,785 |
ITT Corp.(b) | | 41,500 | | | 1,908,585 |
Manitowoc Co., Inc.(The) | | 22,600 | | | 195,716 |
PACCAR, Inc.(b) | | 84,028 | | | 2,403,201 |
Pall Corp. | | 26,200 | | | 744,866 |
Parker Hannifin Corp. | | 39,687 | | | 1,688,285 |
| | | | |
|
|
| | | | | | 29,088,911 |
| | | | |
|
|
Media — 2.5% | | | | | |
CBS Corp. (Class B Stock)(b) | | 168,768 | | | 1,382,210 |
Comcast Corp. (Class A Stock) | | 650,446 | | | 10,979,528 |
DIRECTV Group, Inc. (The)(a)(b) | | 124,200 | | | 2,845,422 |
Gannett Co., Inc.(b) | | 56,300 | | | 450,400 |
SEE NOTES TO FINANCIAL STATEMENTS.
A109
| | | | | | |
| | | STOCK INDEX PORTFOLIO (continued) | | |
| |
| SCHEDULE OF INVESTMENTS | | December 31, 2008 |
| | | | | |
COMMON STOCKS
(continued) | | Shares
| | Value
(Note 2)
|
| | | | | | |
Media (continued) | | | | | |
Interpublic Group of Cos., Inc.(a)(b) | | 96,000 | | $ | 380,160 |
McGraw-Hill Cos., Inc. (The) | | 72,900 | | | 1,690,551 |
Meredith Corp.(b) | | 7,200 | | | 123,264 |
New York Times Co. (The)
(Class A Stock)(b) | | 23,500 | | | 172,255 |
News Corp. (Class A Stock) | | 515,000 | | | 4,681,350 |
Omnicom Group, Inc. | | 71,500 | | | 1,924,780 |
Scripps Networks Interactive, Inc.
(Class A Stock) | | 20,300 | | | 446,600 |
Time Warner, Inc.(b) | | 814,820 | | | 8,197,089 |
Viacom, Inc. (Class B Stock)(a) | | 137,168 | | | 2,614,422 |
Walt Disney Co. (The) | | 428,201 | | | 9,715,881 |
Washington Post Co. (The)
(Class B Stock) | | 1,200 | | | 468,300 |
| | | | |
|
|
| | | | | | 46,072,212 |
| | | | |
|
|
Metals & Mining — 0.8% | | | | | |
AK Steel Holding Corp | | 23,900 | | | 222,748 |
Alcoa, Inc.(b) | | 189,476 | | | 2,133,500 |
Allegheny Technologies, Inc. | | 23,240 | | | 593,317 |
Freeport-McMoRan Copper & Gold, Inc. | | 88,006 | | | 2,150,867 |
Newmont Mining Corp. | | 106,103 | | | 4,318,392 |
Nucor Corp. | | 72,800 | | | 3,363,360 |
Titanium Metals Corp.(b) | | 8,000 | | | 70,480 |
United States Steel Corp.(b) | | 27,740 | | | 1,031,928 |
| | | | |
|
|
| | | | | | 13,884,592 |
| | | | |
|
|
Multiline Retail — 0.7% | | | | | |
Big Lots, Inc.(a)(b) | | 16,900 | | | 244,881 |
Family Dollar Stores, Inc. | | 34,400 | | | 896,808 |
J.C. Penney Co., Inc. | | 48,000 | | | 945,600 |
Kohl’s Corp.(a) | | 63,200 | | | 2,287,840 |
Macy’s, Inc.(b) | | 91,720 | | | 949,302 |
Nordstrom, Inc.(b) | | 36,500 | | | 485,815 |
Sears Holdings Corp.(a)(b) | | 12,312 | | | 478,567 |
Target Corp.(b) | | 170,268 | | | 5,879,354 |
| | | | |
|
|
| | | | | | 12,168,167 |
| | | | |
|
|
Multi-Utilities — 1.4% | | | | | |
Ameren Corp. | | 48,500 | | | 1,613,110 |
CenterPoint Energy, Inc. | | 79,010 | | | 997,106 |
CMS Energy Corp.(b) | | 58,500 | | | 591,435 |
Consolidated Edison, Inc. | | 62,800 | | | 2,444,804 |
Dominion Resources, Inc. | | 132,584 | | | 4,751,811 |
DTE Energy Co. | | 36,900 | | | 1,316,223 |
Integrys Energy Group, Inc. | | 17,750 | | | 762,895 |
NiSource, Inc. | | 65,900 | | | 722,923 |
PG&E Corp. | | 79,600 | | | 3,081,316 |
Public Service Enterprise Group, Inc. | | 112,900 | | | 3,293,293 |
Sempra Energy | | 54,454 | | | 2,321,374 |
TECO Energy, Inc. | | 42,100 | | | 519,935 |
Wisconsin Energy Corp. | | 24,500 | | | 1,028,510 |
Xcel Energy, Inc. | | 101,295 | | | 1,879,022 |
| | | | |
|
|
| | | | | | 25,323,757 |
| | | | |
|
|
| | | | | |
COMMON STOCKS
(continued) | | Shares
| | Value
(Note 2)
|
| | | | | | |
Office Electronics — 0.1% | | | | | |
Xerox Corp. | | 220,692 | | $ | 1,758,915 |
| | | | |
|
|
Oil, Gas & Consumable Fuels — 11.5% |
Anadarko Petroleum Corp. | | 105,626 | | | 4,071,882 |
Apache Corp. | | 75,250 | | | 5,608,383 |
Cabot Oil & Gas Corporation | | 19,000 | | | 494,000 |
Chesapeake Energy Corp. | | 114,900 | | | 1,857,933 |
Chevron Corp. | | 459,692 | | | 34,003,416 |
ConocoPhillips | | 341,379 | | | 17,683,432 |
Consol Energy, Inc. | | 42,700 | | | 1,220,366 |
Devon Energy Corp. | | 100,200 | | | 6,584,142 |
El Paso Corp.(b) | | 158,811 | | | 1,243,490 |
EOG Resources, Inc. | | 56,900 | | | 3,788,402 |
Exxon Mobil Corp. | | 1,152,270 | | | 91,985,713 |
Hess Corp. | | 63,800 | | | 3,422,232 |
Marathon Oil Corp. | | 158,194 | | | 4,328,188 |
Massey Energy Co. | | 17,500 | | | 241,325 |
Murphy Oil Corp. | | 44,600 | | | 1,978,010 |
Noble Energy, Inc. | | 36,900 | | | 1,816,218 |
Occidental Petroleum Corp. | | 181,400 | | | 10,882,186 |
Peabody Energy Corp. | | 60,700 | | | 1,380,925 |
Pioneer Natural Resources Co. | | 27,100 | | | 438,478 |
Range Resources Corp. | | 32,200 | | | 1,107,358 |
Southwestern Energy Co.(a) | | 78,100 | | | 2,262,557 |
Spectra Energy Corp. | | 142,142 | | | 2,237,315 |
Sunoco, Inc.(b) | | 27,000 | | | 1,173,420 |
Tesoro Petroleum Corporation | | 29,500 | | | 388,515 |
Valero Energy Corp. | | 120,900 | | | 2,616,276 |
Williams Cos., Inc. | | 131,900 | | | 1,909,912 |
XTO Energy, Inc. | | 123,600 | | | 4,359,372 |
| | | | |
|
|
| | | | | | 209,083,446 |
| | | | |
|
|
Paper & Forest Products — 0.2% | | | | | |
International Paper Co. | | 96,267 | | | 1,135,951 |
MeadWestvaco Corp. | | 42,489 | | | 475,452 |
Weyerhaeuser Co. | | 45,400 | | | 1,389,694 |
| | | | |
|
|
| | | | | | 3,001,097 |
| | | | |
|
|
Personal Products — 0.2% | | | | | |
Avon Products, Inc. | | 95,900 | | | 2,304,477 |
Estee Lauder Cos., Inc. (The) (Class A Stock)(b) | | 21,000 | | | 650,160 |
| | | | |
|
|
| | | | | | 2,954,637 |
| | | | |
|
|
Pharmaceuticals — 7.8% | | | | | |
Abbott Laboratories | | 348,900 | | | 18,620,793 |
Allergan, Inc. | | 68,800 | | | 2,774,016 |
Bristol-Myers Squibb Co. | | 447,460 | | | 10,403,445 |
Eli Lilly & Co. | | 229,200 | | | 9,229,884 |
Forest Laboratories, Inc.(a) | | 71,400 | | | 1,818,558 |
Johnson & Johnson | | 630,171 | | | 37,703,130 |
King Pharmaceuticals, Inc.(a) | | 70,733 | | | 751,184 |
Merck & Co., Inc. | | 484,700 | | | 14,734,880 |
Mylan, Inc.(a)(b) | | 62,500 | | | 618,125 |
Pfizer, Inc.(b) | | 1,533,708 | | | 27,161,968 |
Schering-Plough Corp. | | 364,600 | | | 6,209,138 |
Teva Pharmaceutical Industries Ltd., ADR (Israel)(a) | | 1 | | | 39 |
SEE NOTES TO FINANCIAL STATEMENTS.
A110
| | | | | | |
| | | STOCK INDEX PORTFOLIO (continued) | | |
| |
| SCHEDULE OF INVESTMENTS | | December 31, 2008 |
| | | | | |
COMMON STOCKS
(continued) | | Shares
| | Value
(Note 2)
|
| | | | | | |
Pharmaceuticals (continued) | | | | | |
Watson Pharmaceuticals, Inc.(a)(b) | | 25,900 | | $ | 688,163 |
Wyeth | | 304,900 | | | 11,436,799 |
| | | | |
|
|
| | | | | | 142,150,122 |
| | | | |
|
|
Professional Services — 0.1% | | | | | |
Equifax, Inc. | | 31,100 | | | 824,772 |
Robert Half International, Inc.(b) | | 32,500 | | | 676,650 |
Monster Worldwide, Inc.(a)(b) | | 25,200 | | | 304,668 |
Dun & Bradstreet Corp | | 10,200 | | | 787,440 |
| | | | |
|
|
| | | | | | 2,593,530 |
| | | | |
|
|
Real Estate Investment Trusts — 0.9% | | | |
Apartment Investment & Management Co. (Class A Stock) | | 25,487 | | | 294,375 |
AvalonBay Communities, Inc. | | 16,400 | | | 993,512 |
Boston Properties, Inc.(b) | | 27,600 | | | 1,518,000 |
Developers Diversified Realty Corp.(b) | | 26,400 | | | 128,832 |
Equity Residential Properties Trust | | 57,500 | | | 1,714,650 |
HCP, Inc.(b) | | 57,000 | | | 1,582,890 |
Host Hotels & Resorts, Inc.(b) | | 129,000 | | | 976,530 |
Kimco Realty Corp.(b) | | 55,700 | | | 1,018,196 |
Plum Creek Timber Co., Inc.(b) | | 35,000 | | | 1,215,900 |
ProLogis(b) | | 63,000 | | | 875,070 |
Public Storage, Inc. | | 27,300 | | | 2,170,350 |
Simon Property Group, Inc.(b) | | 51,800 | | | 2,752,134 |
Vornado Realty Trust | | 31,000 | | | 1,870,850 |
| | | | |
|
|
| | | | | | 17,111,289 |
| | | | |
|
|
Real Estate Management & Development | | | |
CB Richard Ellis Group, Inc., (Class A Stock)(a) | | 51,100 | | | 220,752 |
| | | | |
|
|
Road & Rail — 1.0% | | | | | |
Burlington Northern Santa Fe Corp.(b) | | 63,026 | | | 4,771,698 |
CSX Corp. | | 85,024 | | | 2,760,729 |
Norfolk Southern Corp.(b) | | 87,100 | | | 4,098,055 |
Ryder System, Inc. | | 12,800 | | | 496,384 |
Union Pacific Corp.(b) | | 116,200 | | | 5,554,360 |
| | | | |
|
|
| | | | | | 17,681,226 |
| | | | |
|
|
Semiconductors & Semiconductor Equipment — 2.1% |
Advanced Micro Devices, Inc.(a)(b) | | 106,900 | | | 230,904 |
Altera Corp.(b) | | 68,300 | | | 1,141,293 |
Analog Devices, Inc. | | 66,900 | | | 1,272,438 |
Applied Materials, Inc. | | 291,500 | | | 2,952,895 |
Broadcom Corp., (Class A Stock)(a) | | 104,550 | | | 1,774,214 |
Intel Corp.(b) | | 1,269,400 | | | 18,609,404 |
KLA-Tencor Corp.(b) | | 33,400 | | | 727,786 |
Linear Technology Corp.(b) | | 48,700 | | | 1,077,244 |
LSI Corp.(a) | | 156,900 | | | 516,201 |
MEMC Electronic Materials, Inc.(a) | | 46,700 | | | 666,876 |
Microchip Technology, Inc.(b) | | 38,900 | | | 759,717 |
Micron Technology, Inc.(a)(b) | | 154,900 | | | 408,936 |
National Semiconductor Corp. | | 48,900 | | | 492,423 |
| | | | | |
COMMON STOCKS
(continued) | | Shares
| | Value
(Note 2)
|
| | | | | | |
Semiconductors & Semiconductor Equipment (continued) |
Novellus Systems, Inc.(a) | | 22,400 | | $ | 276,416 |
NVIDIA Corp.(a) | | 109,850 | | | 886,490 |
Teradyne, Inc.(a) | | 24,000 | | | 101,280 |
Texas Instruments, Inc. | | 303,000 | | | 4,702,560 |
Xilinx, Inc. | | 64,200 | | | 1,144,044 |
| | | | |
|
|
| | | | | | 37,741,121 |
| | | | |
|
|
Software — 3.6% | | | | | |
Adobe Systems, Inc.(a) | | 121,400 | | | 2,584,606 |
Autodesk, Inc.(a) | | 48,200 | | | 947,130 |
BMC Software, Inc.(a) | | 44,400 | | | 1,194,804 |
CA, Inc. | | 85,873 | | | 1,591,227 |
Citrix Systems, Inc.(a) | | 41,900 | | | 987,583 |
Compuware Corp.(a) | | 71,300 | | | 481,275 |
Electronic Arts, Inc.(a) | | 63,700 | | | 1,021,748 |
Intuit, Inc.(a)(b) | | 72,900 | | | 1,734,291 |
Mcafee INC.(a) | | 28,500 | | | 985,245 |
Microsoft Corp. | | 1,743,400 | | | 33,891,695 |
Novell, Inc.(a) | | 73,100 | | | 284,359 |
Oracle Corp.(a) | | 877,820 | | | 15,563,749 |
Salesforce.com Inc.(a)(b) | | 18,600 | | | 595,386 |
Symantec Corp.(a) | | 203,011 | | | 2,744,709 |
| | | | |
|
|
| | | | | | 64,607,807 |
| | | | |
|
|
Specialty Retail — 1.7% | | | | | |
Abercrombie & Fitch Co. (Class A Stock)(b) | | 15,500 | | | 357,585 |
AutoNation, Inc.(a)(b) | | 35,789 | | | 353,595 |
AutoZone, Inc.(a) | | 8,700 | | | 1,213,389 |
Bed Bath & Beyond, Inc.(a)(b) | | 55,900 | | | 1,420,978 |
Best Buy Co., Inc. | | 74,225 | | | 2,086,465 |
GameStop Corp. (Class A Stock)(a)(b) | | 37,000 | | | 801,420 |
Gap, Inc. (The) | | 110,587 | | | 1,480,760 |
Home Depot, Inc. | | 377,919 | | | 8,699,695 |
Limited Brands, Inc. | | 64,396 | | | 646,536 |
Lowe’s Cos., Inc. | | 326,300 | | | 7,021,976 |
Office Depot, Inc.(a) | | 30,000 | | | 89,400 |
RadioShack Corp. | | 31,760 | | | 379,214 |
Sherwin-Williams Co. (The)(b) | | 21,600 | | | 1,290,600 |
Staples, Inc.(b) | | 149,900 | | | 2,686,208 |
Tiffany & Co. | | 22,300 | | | 526,949 |
TJX Cos., Inc.(b) | | 95,500 | | | 1,964,435 |
| | | | |
|
|
| | | | | | 31,019,205 |
| | | | |
|
|
Textiles, Apparel & Luxury Goods — 0.4% |
Coach, Inc.(a) | | 84,200 | | | 1,748,834 |
Jones Apparel Group, Inc. | | 28,000 | | | 164,080 |
NIKE, Inc., (Class B Stock).(b) | | 85,800 | | | 4,375,800 |
Polo Ralph Lauren Corp. | | 13,200 | | | 599,412 |
V.F. Corp. | | 20,136 | | | 1,102,849 |
| | | | |
|
|
| | | | | | 7,990,975 |
| | | | |
|
|
Thrifts & Mortgage Finance — 0.2% | | | | | |
Hudson City Bancorp, Inc. | | 123,500 | | | 1,971,060 |
People’s United Financial Inc | | 74,300 | | | 1,324,769 |
Sovereign Bancorp, Inc. | | 113,405 | | | 337,947 |
| | | | |
|
|
| | | | | | 3,633,776 |
| | | | |
|
|
SEE NOTES TO FINANCIAL STATEMENTS.
A111
| | | | | | |
| | | STOCK INDEX PORTFOLIO (continued) | | |
| |
| SCHEDULE OF INVESTMENTS | | December 31, 2008 |
| | | | | |
COMMON STOCKS
(continued) | | Shares
| | Value
(Note 2)
|
| | | | | | |
Tobacco — 1.8% | | | | | |
Altria Group, Inc. | | 477,100 | | $ | 7,185,126 |
Lorillard Inc. | | 39,331 | | | 2,216,302 |
Philip Morris International, Inc. | | 457,800 | | | 19,918,878 |
Reynolds American, Inc. | | 43,400 | | | 1,749,454 |
UST, Inc.(b) | | 32,400 | | | 2,247,912 |
| | | | |
|
|
| | | | | | 33,317,672 |
| | | | |
|
|
Trading Companies & Distributors — 0.1% | | | |
Fastenal Co.(b) | | 29,200 | | | 1,017,620 |
W.W. Grainger, Inc. | | 14,800 | | | 1,166,832 |
| | | | |
|
|
| | | | | | 2,184,452 |
| | | | |
|
|
Wireless Telecommunication Services — 0.2% | | | |
American Tower Corp. (Class A Stock)(a) | | 84,200 | | | 2,468,744 |
Sprint Nextel Corp.(b) | | 667,322 | | | 1,221,199 |
| | | | |
|
|
| | | | | | 3,689,943 |
TOTAL LONG-TERM INVESTMENTS
(cost $1,466,421,113) | |
|
|
| | | 1,777,681,191 |
| | | | |
|
|
| |
| SHORT-TERM INVESTMENTS — 15.7% | | | |
Affiliated Money Market Mutual Fund — 15.5% | | | |
Dryden Core Investment Fund —Taxable Money Market Series (cost $280,621,328; includes $251,874,485 of cash
collateral received for securities
on loan) (Note 4)(c)(f)
(cost $280,621,328) | | 280,621,328 | | | 280,621,328 |
| | | | |
|
|
| | | | | | | |
SHORT-TERM
INVESTMENTS (continued) | | Principal
Amount
(000)
| | Value
(Note 2)
| |
| | | | | | | | |
U.S. Government Obligations(d)(e) — 0.2% | |
United States Treasury Bill 6/11/2009 | | $ | 4,300 | | $ | 4,297,476 | |
United States Treasury Bill 3/19/2009 | | | 250 | | | 249,975 | |
| | | | | |
|
|
|
TOTAL U.S. TREASURY OBLIGATIONS
(cost $4,548,573) | | | 4,547,451 | |
| | | | | |
|
|
|
TOTAL SHORT-TERM INVESTMENTS
(cost $285,169,901) | | | 285,168,779 | |
| | | | | |
|
|
|
TOTAL INVESTMENTS — 113.6%
(cost $1,751,591,014) | | | 2,062,849,970 | |
LIABILITIES IN EXCESS OF OTHER
ASSETS — (13.6)% | | | (247,052,555 | ) |
| | | | | |
|
|
|
NET ASSETS — 100.0% | | $ | 1,815,797,415 | |
| | | | | |
|
|
|
| (a) | Non income-producing security. |
| (b) | All or portion of security is on loan. The aggregate market value of such securities is $245,048,950 cash collateral of $ 251,874,485 (included in liabilities) was received with which the Portfolio purchased highly liquid short-term investments. |
| (c) | Represents security, or portion thereof, purchased with cash collateral received for securities on loan. |
| (d) | Security segregated as collateral for futures contracts. |
| (e) | Rate quoted represents yield-to-maturity at purchase date. |
| (f) | Prudential Investments LLC, the manager of the Portfolio, also serves as manager of the Dryden Core Investment Fund – Taxable Money Market Series. |
Open futures contract outstanding at December 31, 2008:
| | | | | | | | | | | | | |
Number of
Contracts
| | Type
| | Expiration
Date
| | Value at
December 31, 2008
| | Value at
Trade Date
| | Unrealized
Appreciation
|
| Long Position: | | | | | | | | | | | | | |
| 167 | | S&P 500 Index | | March 2009 | | $ | 37,579,176 | | $ | 37,019,169 | | $ | 560,007 |
Various inputs are used in determining the value of the Portfolio’s investments. These inputs are summarized in the three broad levels listed below.
Level 1—quoted prices in active markets for identical securities
Level 2—other significant observable inputs (including quoted prices for similar securities, interest rates, prepayment speeds, credit risk, etc.)
Level 3—significant unobservable inputs (including the Portfolio’s own assumptions in determining the fair value of investments)
The following is a summary of the inputs used as of December 31, 2008 in valuing the Portfolio’s assets carried at fair value:
| | | | | | |
Valuation inputs
| | Investments
in Securities
| | Other
Financial
Instruments*
|
Level 1—Quoted Prices | | $ | 2,058,302,519 | | $ | 560,007 |
Level 2—Other Significant Observable Inputs | | | 4,547,451 | | | — |
Level 3—Significant Unobservable Inputs | | | — | | | — |
| | |
|
| |
|
|
Total | | $ | 2,062,849,970 | | $ | 560,007 |
| | |
|
| |
|
|
| * | Other financial instruments are derivative instruments not reflected in the Schedule of Investments, such as futures, forwards and swap contracts, which are valued at the unrealized appreciation/depreciation on the instrument. |
As of December 31, 2007 and December 31, 2008, the Portfolio did not use any significant unobservable inputs (Level 3) in determining the valuation of investments.
SEE NOTES TO FINANCIAL STATEMENTS.
A112
| | | | | | |
| | | STOCK INDEX PORTFOLIO (continued) | | |
The industry classification of portfolio holdings and liabilities in excess of other assets shown as a percentage of net assets as of December 31, 2008 were as follows:
| | | |
Affiliated Money Market Mutual Fund (including 13.5% of collateral received for securities on loan) | | 15.5 | % |
Oil, Gas & Consumable Fuels | | 11.5 | |
Pharmaceuticals | | 7.8 | |
Computers & Peripherals | | 4.2 | |
Diversified Telecommunication Services | | 3.6 | |
Software | | 3.6 | |
Diversified Financial Services | | 3.3 | |
Food & Staples Retailing | | 3.2 | |
Commercial Banks | | 3.1 | |
Household Products | | 3.1 | |
Aerospace/Defense | | 2.8 | |
Industrial Conglomerates | | 2.8 | |
Beverages | | 2.5 | |
Insurance | | 2.5 | |
Media | | 2.5 | |
Capital Markets | | 2.4 | |
Communications Equipment | | 2.4 | |
Electric Utilities | | 2.4 | |
Healthcare Equipment & Supplies | | 2.2 | |
Biotechnology | | 2.1 | |
Healthcare Providers & Services | | 2.1 | |
Semiconductors & Semiconductor Equipment | | 2.1 | |
Food Products | | 1.8 | |
Tobacco | | 1.8 | |
Chemicals | | 1.7 | |
Specialty Retail | | 1.7 | |
Machinery | | 1.6 | |
Energy Equipment & Services | | 1.5 | |
Hotels, Restaurants & Leisure | | 1.5 | |
Internet Software & Services | | 1.4 | |
Multi-Utilities | | 1.4 | |
Air Freight & Logistics | | 1.2 | |
Road & Rail | | 1.0 | |
| | | |
IT Services | | 0.9 | % |
Real Estate Investment Trusts | | 0.9 | |
Metals & Mining | | 0.8 | |
Multiline Retail | | 0.7 | |
Commercial Services & Supplies | | 0.5 | |
Consumer Finance | | 0.5 | |
Electrical Equipment | | 0.5 | |
Household Durables | | 0.4 | |
Textiles, Apparel & Luxury Goods | | 0.4 | |
Electronic Equipment & Instruments | | 0.3 | |
Life Sciences, Tools & Services | | 0.3 | |
Auto Components | | 0.2 | |
Construction & Engineering | | 0.2 | |
Containers & Packaging | | 0.2 | |
Diversified Consumer Services | | 0.2 | |
Internet & Catalog Retail | | 0.2 | |
Paper & Forest Products | | 0.2 | |
Personal Products | | 0.2 | |
Thrifts & Mortgage Finance | | 0.2 | |
U.S. Government Obligations | | 0.2 | |
Wireless Telecommunication Services | | 0.2 | |
Airlines | | 0.1 | |
Automobiles | | 0.1 | |
Building Products | | 0.1 | |
Construction Materials | | 0.1 | |
Distributors | | 0.1 | |
Gas Utilities | | 0.1 | |
Independent Power Producers & Energy Traders | | 0.1 | |
Leisure Equipment & Products | | 0.1 | |
Office Electronics | | 0.1 | |
Professional Services | | 0.1 | |
Trading Companies & Distributors | | 0.1 | |
| | |
|
|
| | | 113.6 | |
Liabilities in excess of other assets | | (13.6 | ) |
| | |
|
|
| | | 100.0 | % |
| | |
|
|
SEE NOTES TO FINANCIAL STATEMENTS.
A113
| | | | | | |
| | | STOCK INDEX PORTFOLIO (continued) | | |
STATEMENT OF ASSETS AND LIABILITIES
December 31, 2008
| | | |
| ASSETS | | | |
Investments, at value including securities on loan of $245,048,950: | | | |
Unaffiliated investments (cost $1,470,969,686) | | $ | 1,782,228,642 |
Affiliated investments (cost $280,621,328) | | | 280,621,328 |
Dividends receivable | | | 4,322,800 |
Receivable for investments sold | | | 2,692,243 |
Due from broker-variation margin | | | 496,825 |
Prepaid expenses | | | 32,384 |
Receivable for Series shares sold | | | 24,968 |
| | |
|
|
Total Assets | | | 2,070,419,190 |
| | |
|
|
| LIABILITIES | | | |
Collateral for securities on loan | | | 251,874,485 |
Payable for Series shares repurchased | | | 919,436 |
Payable for investments purchased | | | 911,958 |
Management fee payable | | | 524,672 |
Accrued expenses | | | 273,025 |
Payable to custodian | | | 117,477 |
Affiliated transfer agent fee payable | | | 722 |
| | |
|
|
Total Liabilities | | | 254,621,775 |
| | |
|
|
| NET ASSETS | | $ | 1,815,797,415 |
| | |
|
|
Net assets were comprised of: | | | |
Paid-in capital | | $ | 1,541,029,019 |
Retained earnings | | | 274,768,396 |
| | |
|
|
Net assets, December 31, 2008 | | $ | 1,815,797,415 |
| | |
|
|
Net asset value and redemption price per share,
$1,815,797,415 / 79,762,788 outstanding shares of beneficial interest | | $ | 22.76 |
| | |
|
|
STATEMENT OF OPERATIONS
Year Ended December 31, 2008
| | | | |
| INVESTMENT INCOME | | | | |
Unaffiliated dividend income (net of foreign withholding taxes of $1,491) | | $ | 57,169,351 | |
Affiliated income from securities loaned, net | | | 2,547,481 | |
Affiliated dividend income | | | 1,151,120 | |
Interest | | | 41,086 | |
| | |
|
|
|
| | | | 60,909,038 | |
| | |
|
|
|
| EXPENSES | | | | |
Management fee | | | 8,836,203 | |
Custodian’s fees and expenses | | | 268,000 | |
Shareholders’ reports | | | 50,000 | |
Trustees’ fees | | | 45,000 | |
Insurance expenses | | | 36,000 | |
Legal fees and expenses | | | 18,000 | |
Audit fee | | | 17,000 | |
Commitment fee on syndicated credit agreement | | | 12,000 | |
Transfer agent’s fee and expenses (including affiliated expense of $3,400) (Note 4) | | | 4,000 | |
Miscellaneous | | | 18,504 | |
| | |
|
|
|
Total expenses | | | 9,304,707 | |
| | |
|
|
|
| NET INVESTMENT INCOME | | | 51,604,331 | |
| | |
|
|
|
| NET REALIZED AND UNREALIZED GAIN (LOSS) ON INVESTMENTS | | | | |
Net realized loss on: | | | | |
Investment transactions | | | (7,230,635 | ) |
Futures transactions | | | (21,544,516 | ) |
| | |
|
|
|
| | | | (28,775,151 | ) |
| | |
|
|
|
Net change in unrealized appreciation (depreciation) on: | | | | |
Investments | | | (1,123,576,060 | ) |
Futures | | | 34,957 | |
| | |
|
|
|
| | | | (1,123,541,103 | ) |
| | |
|
|
|
| NET LOSS ON INVESTMENTS | | | (1,152,316,254 | ) |
| | |
|
|
|
| NET DECREASE IN NET ASSETS RESULTING FROM OPERATIONS | | $ | (1,100,711,923 | ) |
| | |
|
|
|
STATEMENT OF CHANGES IN NET ASSETS
| | | | | | | | |
| | | Year Ended December 31,
| |
| | | 2008
| | | 2007
| |
| INCREASE (DECREASE) IN NET ASSETS | | | | | | | | |
| OPERATIONS: | | | | | | | | |
Net investment income | | $ | 51,604,331 | | | $ | 56,959,943 | |
Net realized gain (loss) on investment transactions | | | (28,775,151 | ) | | | 76,759,365 | |
Net change in unrealized appreciation (depreciation) on investments | | | (1,123,541,103 | ) | | | 34,602,331 | |
| | |
|
|
| |
|
|
|
NET INCREASE (DECREASE) IN NET ASSETS RESULTING FROM OPERATIONS | | | (1,100,711,923 | ) | | | 168,321,639 | |
| | |
|
|
| |
|
|
|
| DISTRIBUTIONS | | | (56,959,943 | ) | | | (51,529,141 | ) |
| | |
|
|
| |
|
|
|
| SERIES SHARE TRANSACTIONS: | | | | | | | | |
Series shares sold [2,142,562 and 1,884,280 shares, respectively] | | | 63,864,986 | | | | 70,200,353 | |
Series shares issued in reinvestment of distributions [1,689,203 and 1,400,248 shares, respectively] | | | 56,959,943 | | | | 51,529,141 | |
Series shares repurchased [8,835,363 and 11,303,103 shares, respectively] | | | (269,751,865 | ) | | | (422,534,751 | ) |
| | |
|
|
| |
|
|
|
NET DECREASE IN NET ASSETS RESULTING FROM SERIES SHARE TRANSACTIONS | | | (148,926,936 | ) | | | (300,805,257 | ) |
| | |
|
|
| |
|
|
|
| TOTAL DECREASE IN NET ASSETS | | | (1,306,598,802 | ) | | | (184,012,759 | ) |
| NET ASSETS: | | | | | | | | |
Beginning of year | | | 3,122,396,217 | | | | 3,306,408,976 | |
| | |
|
|
| |
|
|
|
End of year | | $ | 1,815,797,415 | | | $ | 3,122,396,217 | |
| | |
|
|
| |
|
|
|
SEE NOTES TO FINANCIAL STATEMENTS.
A114
| | | | | | |
| | | VALUE PORTFOLIO | | |
| |
| SCHEDULE OF INVESTMENTS | | December 31, 2008 |
| | | | | |
| LONG-TERM INVESTMENTS — 95.7% |
| COMMON STOCKS — 94.1% | | Shares
| | Value
(Note 2)
|
| | | | | | |
Auto Components — 0.6% | | | | | |
Goodyear Tire & Rubber Co. (The)(a)(b) | | 943,400 | | $ | 5,632,098 |
| | | | |
|
|
Capital Markets — 6.7% | | | | | |
Bank of New York Mellon Corp. (The) | | 640,895 | | | 18,156,555 |
Goldman Sachs Group, Inc. (The) | | 239,700 | | | 20,228,283 |
Morgan Stanley(b) | | 859,300 | | | 13,783,172 |
TD Ameritrade Holding Corp.(a) | | 711,100 | | | 10,133,175 |
| | | | |
|
|
| | | | | | 62,301,185 |
| | | | |
|
|
Commercial Banks — 0.4% | | | | | |
SunTrust Banks, Inc. | | 127,700 | | | 3,772,258 |
| | | | |
|
|
Commercial Services & Supplies — 2.4% | | | |
Waste Management, Inc. | | 687,600 | | | 22,787,064 |
| | | | |
|
|
Communications Equipment — 1.1% | | | | | |
QUALCOMM, Inc. | | 276,800 | | | 9,917,744 |
| | | | |
|
|
Consumer Finance — 1.5% | | | | | |
SLM Corp.(a)(b) | | 1,601,900 | | | 14,256,910 |
| | | | |
|
|
Diversified Consumer Services — 4.2% | | | |
Career Education Corp.(a)(b) | | 711,800 | | | 12,769,692 |
H&R Block, Inc. | | 1,153,700 | | | 26,212,064 |
| | | | |
|
|
| | | | | | 38,981,756 |
| | | | |
|
|
Diversified Financial Services — 0.8% | | | |
JPMorgan Chase & Co. | | 231,200 | | | 7,289,736 |
| | | | |
|
|
Electric Utilities — 1.6% | | | | | |
Entergy Corp. | | 177,400 | | | 14,747,262 |
| | | | |
|
|
Energy Equipment & Services — 1.1% | | | |
National Oilwell Varco, Inc.(a) | | 404,500 | | | 9,885,980 |
| | | | |
|
|
Food & Staples Retailing — 6.7% | | | | | |
CVS Caremark Corp. | | 800,900 | | | 23,017,866 |
Kroger Co. (The) | | 765,600 | | | 20,219,496 |
Wal-Mart Stores, Inc. | | 340,500 | | | 19,088,430 |
| | | | |
|
|
| | | | | | 62,325,792 |
| | | | |
|
|
Food Products — 6.3% | | | | | |
Cadbury PLC, ADR (United Kingdom) | | 557,272 | | | 19,877,892 |
ConAgra Foods, Inc. | | 1,158,800 | | | 19,120,200 |
Tyson Foods, Inc. (Class A Stock) | | 2,322,100 | | | 20,341,596 |
| | | | |
|
|
| | | | | | 59,339,688 |
| | | | |
|
|
Healthcare Providers & Services — 4.8% | | | |
Aetna, Inc. | | 571,300 | | | 16,282,050 |
Omnicare, Inc.(b) | | 692,000 | | | 19,209,920 |
UnitedHealth Group, Inc. | | 346,600 | | | 9,219,560 |
| | | | |
|
|
| | | | | | 44,711,530 |
| | | | |
|
|
Household Products — 1.9% | | | | | |
Kimberly-Clark Corp. | | 344,300 | | | 18,158,382 |
| | | | |
|
|
Independent Power Producers & Energy Traders — 2.4% |
NRG Energy, Inc.(a)(b) | | 982,900 | | | 22,931,057 |
| | | | |
|
|
Insurance — 5.7% | | | | | |
Allstate Corp. (The) | | 340,600 | | | 11,158,056 |
Axis Capital Holdings Ltd. | | 444,000 | | | 12,929,280 |
| | | | | |
COMMON STOCKS
(continued) | | Shares
| | Value
(Note 2)
|
| | | | | | |
Insurance (continued) | | | | | |
Berkshire Hathaway, Inc.
(Class B Stock)(a) | | 3,064 | | $ | 9,847,696 |
Loews Corp. | | 469,900 | | | 13,274,675 |
XL Capital Ltd.
(Class A Stock)(Bermuda) | | 1,767,773 | | | 6,540,760 |
| | | | |
|
|
| | | | | | 53,750,467 |
| | | | |
|
|
Internet & Catalog Retail — 1.4% | | | | | |
HSN, Inc.(a) | | 402,280 | | | 2,924,576 |
Ticketmaster Entertainment, Inc.(a) | | 1,524,640 | | | 9,788,188 |
| | | | |
|
|
| | | | | | 12,712,764 |
| | | | |
|
|
Internet Software & Services — 2.9% | | | | | |
IAC/InterActiveCorp.(a)(b) | | 1,709,200 | | | 26,885,716 |
| | | | |
|
|
Media — 6.3% | | | | | |
Comcast Corp. (Class A Stock) | | 1,707,200 | | | 28,817,536 |
Discovery Communications, Inc.
(Class A Stock)(a) | | 667,000 | | | 9,444,720 |
Liberty Global, Inc.
(Class C Stock)(a)(b) | | 1,193,735 | | | 18,120,897 |
Sirius XM Radio, Inc.(a)(b) | | 20,337,100 | | | 2,440,452 |
| | | | |
|
|
| | | | | | 58,823,605 |
| | | | |
|
|
Multi-Utilities — 2.2% | | | | | |
Sempra Energy | | 475,000 | | | 20,249,250 |
| | | | |
|
|
Office Electronics — 1.4% | | | | | |
Xerox Corp. | | 1,621,500 | | | 12,923,355 |
| | | | |
|
|
Oil, Gas & Consumable Fuels — 13.7% |
Apache Corp. | | 122,500 | | | 9,129,925 |
Devon Energy Corp. | | 243,000 | | | 15,967,530 |
EOG Resources, Inc. | | 217,500 | | | 14,481,150 |
Hess Corp. | | 171,600 | | | 9,204,624 |
Occidental Petroleum Corp. | | 314,800 | | | 18,884,852 |
Petroleo Brasileiro SA, ADR (Brazil) | | 392,700 | | | 9,617,223 |
Suncor Energy, Inc.(b) | | 445,600 | | | 8,689,200 |
Trident Resources Corp. (Canada), Private Placement(a)(f)(g)
(original cost $16,980,633; purchased 3/11/05-1/05/06) | | 404,537 | | | 1,720,388 |
Williams Cos., Inc. | | 1,209,500 | | | 17,513,560 |
XTO Energy, Inc. | | 649,500 | | | 22,907,865 |
| | | | |
|
|
| | | | | | 128,116,317 |
| | | | |
|
|
Paper & Forest Products — 0.6% | | | | | |
Domtar Corp.(a) | | 3,239,600 | | | 5,410,132 |
| | | | |
|
|
Pharmaceuticals — 5.3% | | | | | |
Mylan, Inc.(a)(b) | | 1,198,800 | | | 11,856,132 |
Schering-Plough Corp. | | 1,163,600 | | | 19,816,108 |
Wyeth | | 489,500 | | | 18,361,145 |
| | | | |
|
|
| | | | | | 50,033,385 |
| | | | |
|
|
Semiconductors & Semiconductor Equipment — 1.3% |
Marvell Technology Group Ltd.(a) | | 1,721,700 | | | 11,483,739 |
Spansion, Inc. (Class A Stock)(a) | | 3,307,200 | | | 626,053 |
| | | | |
|
|
| | | | | | 12,109,792 |
| | | | |
|
|
SEE NOTES TO FINANCIAL STATEMENTS.
A115
| | | | | | |
| | | VALUE PORTFOLIO (continued) | | |
| |
| SCHEDULE OF INVESTMENTS | | December 31, 2008 |
| | | | | |
COMMON STOCKS
(continued) | | Shares
| | Value
(Note 2)
|
| | | | | | |
Software — 7.3% | | | | | |
CA, Inc.(b) | | 1,555,000 | | $ | 28,814,150 |
Microsoft Corp. | | 566,500 | | | 11,012,760 |
Symantec Corp.(a) | | 2,140,700 | | | 28,942,264 |
| | | | |
|
|
| | | | | | 68,769,174 |
| | | | |
|
|
Thrifts & Mortgage Finance — 1.0% | | | | | |
People’s United Financial, Inc. | | 517,060 | | | 9,219,180 |
| | | | |
|
|
Wireless Telecommunication Services — 2.5% | | | |
NII Holdings, Inc.(a) | | 947,100 | | | 17,218,278 |
Sprint Nextel Corp. | | 2,403,236 | | | 4,397,922 |
Virgin Mobile USA, Inc. (Class A Stock)(a)(b) | | 2,181,000 | | | 1,832,040 |
| | | | |
|
|
| | | | | | 23,448,240 |
| | | | |
|
|
TOTAL COMMON STOCKS
(cost $1,215,162,296) | | | 879,489,819 |
| | | | |
|
|
| CONVERTIBLE PREFERRED STOCKS(a) — 1.2% |
Consumer Finance — 0.4% | | | | | |
SLM Corp. | | 9,540 | | | 4,391,978 |
| | | | |
|
|
Pharmaceuticals — 0.8% | | | | | |
Mylan, Inc. | | 11,040 | | | 7,275,691 |
| | | | |
|
|
TOTAL CONVERTIBLE PREFERRED STOCKS
(cost $10,782,770) | | | 11,667,669 |
| | | | |
|
|
| | |
| | | Principal
Amount
(000)
| | |
| CORPORATE BOND — 0.4% | | | | | |
Oil, Gas & Consumable Fuels | | | | | |
Trident Resources Corp. (Canada), Private Placement, PIK, 7.9712%, due 8/12/12(f)(g) (original cost $11,640,318; purchased 8/20/07-12/29/08) | | CAD 12,250 | | | 3,349,256 |
| | | | |
|
|
| | |
| | | Units
| | |
| WARRANT | | | | | |
Oil, Gas & Consumable Fuels | | | | | |
Trident Resources Corp. (Canada), Private Placement, expiring 1/01/15(a)(f)(g) (original cost $0; purchased 8/20/07) | | 1,043,852 | | | 85 |
| | | | |
|
|
TOTAL LONG -TERM INVESTMENTS
(cost $1,237,585,384) | | | 894,506,829 |
| | | | |
|
|
| | | | | | |
| |
| SHORT-TERM INVESTMENT — 17.2% | | | | |
| | | Shares
| | Value
(Note 2)
| |
| | | | | | | |
Affiliated Money Market Mutual Fund | | | | |
Dryden Core Investment Fund — Taxable Money Market Series (cost $160,600,574; includes $124,170,983 of cash collateral for securities on loan) (Note 4)(c)(d) | | 160,600,574 | | $ | 160,600,574 | |
| | | | |
|
|
|
TOTAL INVESTMENTS(e) — 112.9%
(cost $1,398,185,958) | | | 1,055,107,403 | |
LIABILITIES IN EXCESS OF
OTHER ASSETS — (12.9)% | | | (120,336,763 | ) |
| | | | |
|
|
|
NET ASSETS — 100.0% | | $ | 934,770,640 | |
| | | | |
|
|
|
The following abbreviations are used in portfolio descriptions:
| | |
| ADR | | American Depositary Receipt |
| CAD | | Canadian Dollar |
| PIK | | Payment in Kind |
| (a) | Non-income producing security. |
| (b) | All or a portion of security is on loan. The aggregate market value of such securities is $104,916,950; cash collateral of $124,170,983 (included in liabilities) was received with which the Portfolio purchased highly liquid short-term investments. |
| (c) | Represents security, or portion thereof, purchased with cash collateral received for securities on loan. |
| (d) | Prudential Investments LLC, the Manager of the Portfolio, also serves as Manager of the Dryden Core Investment Fund – Taxable Money Market Series. |
| (e) | As of December 31, 2008, three securities valued at $5,069,729 and representing 0.5% of net assets were fair valued in accordance with the policies adopted by the Board of Trustees. |
| (f) | Indicates an illiquid security. |
| (g) | Indicates a security restricted to resale. The aggregate cost of such securities was $28,620,951. The aggregate value of $5,069,729 is approximately 0.5% of net assets. |
Various inputs are used in determining the value of the Portfolio’s investments. These inputs are summarized in the three broad levels listed below.
Level 1—quoted prices in active markets for identical securities
Level 2—other significant observable inputs (including quoted prices for similar securities, interest rates, prepayment speeds, credit risk, etc.)
Level 3—significant unobservable inputs (including the Portfolio’s own assumptions in determining the fair value of investments)
SEE NOTES TO FINANCIAL STATEMENTS.
A116
| | | | | | |
| | | VALUE PORTFOLIO (continued) | | |
| |
| SCHEDULE OF INVESTMENTS | | December 31, 2008 |
The following is a summary of the inputs used as of December 31, 2008 in valuing the Portfolio’s assets carried at fair value:
| | | | | |
Valuation inputs
| | Investments
in Securities
| | Other Financial
Instruments*
|
Level 1—Quoted Prices | | $ | 1,050,037,674 | | — |
Level 2—Other Significant Observable Inputs | | | — | | — |
Level 3—Significant Unobservable Inputs | | | 5,069,729 | | — |
| | |
|
| |
|
Total | | $ | 1,055,107,403 | | — |
| | |
|
| |
|
| * | Other financial instruments are derivative instruments not reflected in the Schedule of Investments, such as futures, forwards and swap contracts, which are valued at the unrealized appreciation/depreciation on the instrument. |
The following is a reconciliation of assets in which significant unobservable inputs (Level 3) were used in determining fair value:
| | | | |
| | | Investments
in Securities
| |
Balance as of 12/31/07 | | $ | 31,877,059 | |
Realized gain (loss) | | | (18,065,534 | ) |
Change in unrealized appreciation (depreciation) | | | (5,206,967 | ) |
Net purchases (sales) | | | (3,534,829 | ) |
Transfers in and/or out of Level 3 | | | — | |
| | |
|
|
|
Balance as of 12/31/08 | | $ | 5,069,729 | |
| | |
|
|
|
The industry classification of portfolio holdings and liabilities in excess of other assets shown as a percentage of net assets as of December 31, 2008 was as follows:
| | | |
Affiliated Money Market Mutual Fund (including 13.3% of collateral received for securities on loan) | | 17.2 | % |
Oil, Gas & Consumable Fuels | | 14.1 | |
Software | | 7.3 | |
Capital Markets | | 6.7 | |
Food & Staples Retailing | | 6.7 | |
Food Products | | 6.3 | |
Media | | 6.3 | |
Pharmaceuticals | | 6.1 | |
Insurance | | 5.7 | |
Healthcare Providers & Services | | 4.8 | |
Diversified Consumer Services | | 4.2 | |
Internet Software & Services | | 2.9 | |
Wireless Telecommunication Services | | 2.5 | |
Commercial Services & Supplies | | 2.4 | |
Independent Power Producers & Energy Traders | | 2.4 | |
Multi-Utilities | | 2.2 | |
Consumer Finance | | 1.9 | |
Household Products | | 1.9 | |
Electric Utilities | | 1.6 | |
Internet & Catalog Retail | | 1.4 | |
Office Electronics | | 1.4 | |
Semiconductors & Semiconductor Equipment | | 1.3 | |
Communications Equipment | | 1.1 | |
Energy Equipment & Services | | 1.1 | |
Thrifts & Mortgage Finance | | 1.0 | |
Diversified Financial Services | | 0.8 | |
Auto Components | | 0.6 | |
Paper & Forest Products | | 0.6 | |
Commercial Banks | | 0.4 | |
| | |
|
|
| | | 112.9 | |
Liabilities in excess of other assets | | (12.9 | ) |
| | |
|
|
| | | 100.0 | % |
| | |
|
|
SEE NOTES TO FINANCIAL STATEMENTS.
A117
| | | | | | |
| | | VALUE PORTFOLIO (continued) | | |
STATEMENT OF ASSETS AND LIABILITIES
December 31, 2008
| | | | |
| ASSETS | | | | |
Investments, at value including securities on loan of $104,916,950: | | | | |
Unaffiliated investments (cost $1,237,585,384) | | $ | 894,506,829 | |
Affiliated investments (cost $160,600,574) | | | 160,600,574 | |
Cash | | | 518,463 | |
Foreign currency, at value (cost $8) | | | 8 | |
Receivable for investments sold | | | 2,423,907 | |
Dividends and interest receivable | | | 1,508,942 | |
Foreign tax reclaim receivable | | | 261,649 | |
Prepaid expenses | | | 19,496 | |
Receivable for Series shares sold | | | 4,795 | |
| | |
|
|
|
Total Assets | | | 1,059,844,663 | |
| | |
|
|
|
| LIABILITIES | | | | |
Collateral for securities on loan | | | 124,170,983 | |
Payable for Series shares repurchased | | | 420,276 | |
Management fee payable | | | 302,680 | |
Accrued expenses and other liabilities | | | 178,374 | |
Affiliated transfer agent fee payable | | | 1,166 | |
Distribution fee payable | | | 340 | |
Administration fee payable | | | 204 | |
| | |
|
|
|
Total Liabilities | | | 125,074,023 | |
| | |
|
|
|
| NET ASSETS | | $ | 934,770,640 | |
| | |
|
|
|
Net assets were comprised of: | | | | |
Paid-in capital | | $ | 1,489,740,394 | |
Retained earnings | | | (554,969,754 | ) |
| | |
|
|
|
Net assets, December 31, 2008 | | $ | 934,770,640 | |
| | |
|
|
|
| Class I: | | | | |
Net asset value and redemption price per share,
$933,063,706 / 85,888,673 outstanding shares of beneficial interest | | $ | 10.86 | |
| | |
|
|
|
| Class II: | | | | |
Net asset value and redemption price per share,
$1,706,934 / 156,481 outstanding shares of beneficial interest | | $ | 10.91 | |
| | |
|
|
|
STATEMENT OF OPERATIONS
Year Ended December 31, 2008
| | | | |
| INVESTMENT INCOME | | | | |
Unaffiliated dividend income (net of foreign withholding taxes of $178,187) | | $ | 23,477,278 | |
Affiliated income from securities loaned, net | | | 1,565,040 | |
Interest | | | 1,333,979 | |
Affiliated dividend income | | | 796,666 | |
| | |
|
|
|
| | | | 27,172,963 | |
| | |
|
|
|
| EXPENSES | | | | |
Management fee | | | 5,732,527 | |
Distribution fee—Class II | | | 5,523 | |
Administration fee—Class II | | | 3,314 | |
Shareholders’ reports | | | 165,000 | |
Custodian’s fees and expenses | | | 152,000 | |
Trustees’ fees | | | 29,000 | |
Insurance expenses | | | 22,000 | |
Audit fee | | | 17,000 | |
Legal fees and expenses | | | 12,000 | |
Interest expense (Note 8) | | | 11,019 | |
Transfer agent’s fee and expenses (including affiliated expense of $6,700) (Note 4) | | | 7,000 | |
Commitment fee on syndicated credit agreement | | | 4,000 | |
Miscellaneous | | | 30,351 | |
| | |
|
|
|
Total expenses | | | 6,190,734 | |
| | |
|
|
|
| NET INVESTMENT INCOME | | | 20,982,229 | |
| | |
|
|
|
| NET REALIZED AND UNREALIZED GAIN (LOSS) ON INVESTMENTS AND FOREIGN CURRENCIES | | | | |
Net realized loss on: | | | | |
Investment transactions | | | (205,279,699 | ) |
Foreign currency transactions | | | (142,035 | ) |
| | |
|
|
|
| | | | (205,421,734 | ) |
| | |
|
|
|
Net change in unrealized appreciation (depreciation) on: | | | | |
Investments | | | (533,239,551 | ) |
Foreign currencies | | | (79 | ) |
| | |
|
|
|
| | | | (533,239,630 | ) |
| | |
|
|
|
| NET LOSS ON INVESTMENTS AND FOREIGN CURRENCIES | | | (738,661,364 | ) |
| | |
|
|
|
| NET DECREASE IN NET ASSETS RESULTING FROM OPERATIONS | | $ | (717,679,135 | ) |
| | |
|
|
|
STATEMENT OF CHANGES IN NET ASSETS
| | | | | | | | |
| | | Year Ended December 31,
| |
| | | 2008
| | | 2007
| |
| INCREASE (DECREASE) IN NET ASSETS OPERATIONS: | | | | | | | | |
Net investment income | | $ | 20,982,229 | | | $ | 26,611,582 | |
Net realized gain (loss) on investment and foreign currency transactions | | | (205,421,734 | ) | | | 305,443,018 | |
Net change in unrealized appreciation (depreciation) on investments and foreign currencies | | | (533,239,630 | ) | | | (265,627,465 | ) |
| | |
|
|
| |
|
|
|
NET INCREASE (DECREASE) IN NET ASSETS RESULTING FROM OPERATIONS | | | (717,679,135 | ) | | | 66,427,135 | |
| | |
|
|
| |
|
|
|
| DISTRIBUTIONS: | | | | | | | | |
Class I | | | (331,218,021 | ) | | | (242,165,135 | ) |
Class II | | | (495,826 | ) | | | (373,906 | ) |
| | |
|
|
| |
|
|
|
| TOTAL DISTRIBUTIONS | | | (331,713,847 | ) | | | (242,539,041 | ) |
| | |
|
|
| |
|
|
|
| SERIES SHARE TRANSACTIONS (Note 7): | | | | | | | | |
Series shares sold [1,045,728 and 1,101,337 shares, respectively] | | | 17,037,608 | | | | 29,566,166 | |
Series shares issued in reinvestment of distributions [18,008,178 and 10,431,739 shares, respectively] | | | 331,713,847 | | | | 242,539,041 | |
Series shares repurchased [10,971,164 and 9,083,303 shares, respectively] | | | (192,551,116 | ) | | | (246,981,367 | ) |
| | |
|
|
| |
|
|
|
NET INCREASE IN NET ASSETS RESULTING FROM SERIES SHARE TRANSACTIONS | | | 156,200,339 | | | | 25,123,840 | |
| | |
|
|
| |
|
|
|
| TOTAL DECREASE IN NET ASSETS | | | (893,192,643 | ) | | | (150,988,066 | ) |
| NET ASSETS: | | | | | | | | |
Beginning of year | | | 1,827,963,283 | | | | 1,978,951,349 | |
| | |
|
|
| |
|
|
|
End of year | | $ | 934,770,640 | | | $ | 1,827,963,283 | |
| | |
|
|
| |
|
|
|
SEE NOTES TO FINANCIAL STATEMENTS.
A118
NOTES TO THE FINANCIAL STATEMENTS OF
THE PRUDENTIAL SERIES FUND
The Prudential Series Fund (“Series Fund”), organized as a Delaware statutory trust, is a diversified open-end management investment company registered under the Investment Company Act of 1940, as amended. On January 2, 2006, each Portfolio of the Series Fund changed its federal income tax status from a regulated investment company to a partnership. As a result of that conversion, the Series Fund was reorganized from a Maryland corporation to a Delaware statutory trust. Pursuant to this reorganization, the Series Fund has been renamed “The Prudential Series Fund.” The Series Fund is composed of twenty-eight Portfolios (“Portfolio” or “Portfolios”), each with separate series shares. The information presented in these financial statements pertains to thirteen Portfolios: Conservative Balanced Portfolio, Diversified Bond Portfolio, Equity Portfolio, Flexible Managed Portfolio, Global Portfolio, Government Income Portfolio, High Yield Bond Portfolio, Jennison Portfolio, Money Market Portfolio, Natural Resources Portfolio, Small Capitalization Stock Portfolio, Stock Index Portfolio and Value Portfolio.
The Portfolios of the Series Fund have the following as investment objectives:
Conservative Balanced Portfolio: Total investment return consistent with a conservatively managed diversified portfolio by investing in a mix of equity-related securities, debt obligations and money market instruments.
Diversified Bond Portfolio: High level of income over a longer term while providing reasonable safety of capital by investing in intermediate and long-term debt obligations that are rated investment grade and high quality money market instruments. The types of debt obligations in which the Portfolio can invest include U.S. government securities, mortgage-related securities and corporate bonds.
Equity Portfolio: Capital appreciation by investing primarily in stocks of major, established corporations as well as small companies.
Flexible Managed Portfolio: High total return consistent with an aggressively managed diversified portfolio by investing in a mix of equity and equity-related securities, debt obligations and money market instruments.
Global Portfolio: Long-term growth of capital by investing primarily in equity and equity-related securities of foreign and U.S. companies.
Government Income Portfolio: High level of income over the long-term consistent with the preservation of capital by investing primarily in intermediate and long-term U.S. government securities, including U.S. treasuries, government agency and mortgage-related securities.
High Yield Bond Portfolio: High total return by investing primarily in medium to lower rated debt securities.
Jennison Portfolio: Long-term growth of capital by investing primarily in equity securities of established companies that the Portfolio manager believes offer above-average growth prospects.
Money Market Portfolio: Maximum current income consistent with the stability of capital and maintenance of liquidity by investing in high quality short-term money market securities issued by the U.S. government and its agencies, as well as commercial paper, asset backed securities, certificates of deposit and other obligations issued by banks, corporations and other companies, that generally mature in 13 months or less.
Natural Resources Portfolio: Long-term growth of capital by investing primarily in stocks of companies that operate within, or do business with, the natural resources sector of the economy.
Small Capitalization Stock Portfolio: Long-term growth of capital that corresponds to the price and yield performance of the Standard & Poor’s Small Capitalization Stock Index (the “S&P 600 SmallCap Index”) by investing primarily in stocks of the S&P 600 SmallCap Index.
Stock Index Portfolio: Investment results that generally correspond to the price and yield performance of the S&P 500 Index by investing primarily in stocks in the S&P 500 Index.
Value Portfolio: Capital appreciation by investing in equity and equity-related securities that are considered to be undervalued.
B1
The ability of issuers of debt securities (other than those issued or guaranteed by the U.S. Government) held by the Portfolios to meet their obligations may be affected by the economic or political developments in a specific industry, region or country.
Foreign security and currency transactions may involve certain considerations and risks not typically associated with those of domestic origin as a result of, among other factors, the possibility of political and economic instability or the level of governmental supervision and regulation of foreign securities markets.
| Note 2: | | Accounting Policies |
The following is a summary of significant accounting policies followed by the Series Fund and the Portfolios in preparation of their financial statements.
Securities Valuation: Securities listed on a securities exchange are valued at the last sale price on such exchange on the day of valuation or, if there was no sale on such day, at the mean between the last reported bid and asked prices, or at the last bid price on such day in the absence of an asked price. Securities traded via NASDAQ are valued at the official closing price provided by NASDAQ. Securities that are actively traded in the over-the-counter market, including listed securities for which the primary market is believed by Prudential Investments LLC (“PI” or “Manager”) in consultation with the subadvisors, to be over-the-counter, are valued at market value using prices provided by an independent pricing agent or principal market maker. Options on securities and indices traded on an exchange are valued at the last sale price as of the close of trading on the applicable exchange or, if there was no sale, at the mean between the most recently quoted bid and asked prices on such exchange, or at the last bid price in the absence of an asked price. Futures contracts and options thereon traded on a commodities exchange or board of trade are valued at the last sale price at the close of trading on such exchange or board of trade or, if there was no sale on the applicable commodities exchange or board of trade on such day, at the mean between the most recently quoted bid and asked prices on such exchange or board of trade or at the last bid price in the absence of an asked price. Prices may be obtained from independent pricing services which use information provided by market makers or estimates of market values obtained from yield data relating to investments or securities with similar characteristics. Securities for which reliable market quotations are not readily available, or whose values have been affected by events occurring after the close of the security’s foreign market and before the Series Fund’s normal pricing time, are valued at fair value in accordance with Board of Trustees approved fair valuation procedures. When determining the fair value of securities, some of the factors influencing the valuation include, the nature of any restrictions on disposition of the securities; assessment of the general liquidity of the securities; the issuer’s financial condition and the markets in which it does business; the cost of the investment; the size of the holding and the capitalization of the issuer; the prices of any recent transactions or bids/offers for such securities or any comparable securities; any available analyst media or other reports or information deemed reliable by the investment advisor regarding the issuer or the markets or industry in which it operates. Using fair value to price securities may result in a value that is different from a security’s most recent closing price and from the price used by other mutual funds to calculate their net asset values.
Investments in mutual funds are valued at their net asset value as of the close of the New York Stock Exchange on the date of valuation.
The Money Market Portfolio values all of its securities at amortized cost. The Conservative Balanced and Flexible Managed Portfolios use amortized cost to value their short-term debt securities. Short-term debt securities that are held in the other Portfolios which mature in more than 60 days are valued at current market quotations and those short-term debt securities which mature in 60 days or less are valued at amortized cost which approximates market value. The amortized cost method involves valuing a security at its cost at the time of purchase and thereafter assumes a constant amortization to maturity of any discount or premium.
The Diversified Bond, High Yield Bond and Natural Resources Portfolios may hold up to 15% of their net assets in illiquid securities, including those which are restricted as to disposition under securities law (“restricted securities”). Restricted securities, including private placements, are valued pursuant to the valuation procedures noted above.
Repurchase Agreements: In connection with transactions in repurchase agreements with United States financial institutions, it is the Series Fund’s policy that its custodian or designated subcustodians, as the case
B2
may be, under triparty repurchase agreements, take possession of the underlying collateral securities, the value of which exceeds the principal amount of the repurchase transaction, including accrued interest. To the extent that any repurchase transaction exceeds one business day, the value of the collateral is marked to market on a daily basis to ensure the adequacy of the collateral. If the seller defaults and the value of the collateral declines, or if bankruptcy proceedings are commenced with respect to the seller of the security, realization of the collateral by the Series Fund may by delayed or limited.
Foreign Currency Translation: The books and records of the Series Fund are maintained in U.S. dollars. Foreign currency amounts are translated into U.S. dollars on the following basis:
(i) market value of investment securities, other assets and liabilities at the current daily rates of exchange.
(ii) purchases and sales of investment securities, income and expenses at the rates of exchange prevailing on the respective dates of such transactions.
Although the net assets of the Series Fund are presented at the foreign exchange rates and market values at the close of the period, the Series Fund does not isolate that portion of the results of operations arising as a result of changes in the foreign exchange rates from the fluctuations arising from changes in the market prices of securities held at the end of the period. Similarly, the Series Fund does not isolate the effect of changes in foreign exchange rates from the fluctuations arising from changes in the market prices of portfolio securities sold during the period. Accordingly, these realized foreign currency gains (losses) are included in the reported net realized gains (losses) on investment transactions.
Net realized gains (losses) on foreign currency transactions represent net foreign exchange gains (losses) from the holding of foreign currencies, currency gains (losses) realized between the trade date and settlement date on securities transactions, and the difference between the amounts of dividends, interest and foreign withholding taxes recorded on the Series Fund’s books and the U.S. dollar equivalent amounts actually received or paid. Net unrealized currency gains (losses) from valuing foreign currency denominated assets and liabilities (other than investments) at period end exchange rates are reflected as a component of net unrealized appreciation (depreciation) on investments and foreign currencies.
Forward Currency Contracts: A forward currency contract is a commitment to purchase or sell a foreign currency at a future date at a negotiated forward rate. Certain Portfolios of the Series Fund may enter into forward currency contracts in order to hedge their exposure to changes in foreign currency exchange rates on their foreign portfolio holdings or on specific receivables and payables denominated in a foreign currency. The contracts are valued daily at current forward exchange rates and any unrealized gain (loss) is included in the assets and liabilities in the financial statements. Gain (loss) is realized on the settlement date of the contract equal to the difference between the settlement value of the original and negotiated forward contracts. This gain (loss), if any, is included in net realized gain (loss) on foreign currency transactions. Risks may arise upon entering into these contracts from the potential inability of the counterparties to meet the terms of their contracts.
Short Sales: Certain Portfolios of the Series Fund may sell a security it does not own in anticipation of a decline in the market value of that security (short sale). When a Portfolio makes a short sale, it must borrow the security sold short and deliver it to the broker-dealer through which it made the short sale as collateral for its obligation to deliver the security upon conclusion of the transaction. The Portfolio may have to pay a fee to borrow the particular security and may be obligated to remit any interest or dividends received on such borrowed securities. Dividends declared on short positions open are recorded on the ex-date and interest payable is accrued daily on fixed income securities sold short, both of which are recorded as an expense. A gain, limited to the price at which the Portfolio sold the security short, or a loss, unlimited in magnitude, will be recognized upon the termination of a short sale if the market price at termination is less than or greater than, respectively, the proceeds originally received.
Loan Participations: The High Yield Bond and Money Market Portfolios may invest in loan participations. When the Portfolio purchases a loan participation, the Portfolio typically enters into a contractual relationship with the lender or third party selling such participations (“Selling Participant”), but not the borrower. As a result, the Portfolio assumes the credit risk of the borrower and any other persons interpositioned between the Portfolio and the borrower. The Portfolio may not directly benefit from the collateral supporting the senior loan in which it has purchased the loan participation.
B3
Options: Certain Portfolios of the Series Fund may either purchase or write options in order to hedge against adverse market movements or fluctuations in value caused by changes in prevailing interest rates or foreign currency exchange rates or currencies with respect to securities which the Portfolio currently owns or intends to purchase. The Portfolio’s principal reason for writing options is to realize, through receipt of premiums, a greater current return than would be realized on the underlying security alone. When the Portfolio purchases an option, it pays a premium and an amount equal to that premium is recorded as an asset. When the Portfolio writes an option, it receives a premium and an amount equal to that premium is recorded as a liability. The asset or liability is adjusted daily to reflect the current market value of the option. If an option expires unexercised, the Portfolio realizes a gain (loss) to the extent of the premium received or paid. If an option is exercised, the premium received or paid is recorded as an adjustment to the proceeds from the sale or the cost basis of the purchase, in determining whether the Portfolio has realized a gain (loss). The difference between the premium and the amount received or paid on effecting a closing purchase or sale transaction is also treated as a realized gain (loss). Gains (losses) on purchased options are included in net realized gains (losses) on investment transactions. Gains (losses) on written options are presented separately as net realized gains (losses) on written option transactions.
The Portfolio, as writer of an option, may have no control over whether the contract may be exercised. As a result, the Portfolio bears the market risk of an unfavorable change in the price of the security underlying the written option. The Portfolio, as purchaser of an over-the-counter option, bears the risk of the potential inability of the counterparties to meet the terms of their contracts.
Financial Futures Contracts: A financial futures contract is an agreement to purchase (long) or sell (short) an agreed amount of securities at a set price for delivery on a future date. Upon entering into a financial futures contract, the Portfolio is required to pledge to the broker an amount of cash and/or other assets equal to a certain percentage of the contract amount. This amount is known as the initial margin . Subsequent payments, known as variation margin, are made or received by the Portfolio each day, depending on the daily fluctuations in the value of the underlying security. Such variation margin is recorded for financial statement purposes on a daily basis as unrealized gain (loss). When the contract expires or is closed, the gain (loss) is realized and is presented in the Statement of Operations as net realized gain (loss) on financial futures transactions.
The Portfolio invests in financial futures contracts in order to hedge its existing portfolio securities, or securities the Portfolio intends to purchase, against fluctuations in value caused by changes in prevailing rates or market conditions. Under a variety of circumstances, the Portfolio may not achieve the anticipated benefits of the financial futures contracts and may realize a loss. The use of futures transactions involves the risk of imperfect correlation in movements in the price of futures contracts and the underlying hedged assets.
Swap Agreements: The Portfolios may enter into credit default, interest rate, total return and other forms of swap agreements. A swap agreement is an agreement to exchange the return generated by one instrument for the return generated by another instrument. In connection with these agreements, securities may be identified as collateral or received as collateral from the counterparty in accordance with the terms of the respective swap agreements to provide or receive assets of value and serve as a recourse in the event of default or bankruptcy/insolvency of either party.
Interest rate swaps represent an agreement between counterparties to exchange cash flows based on the difference between two interest rates, applied to a notional principal amount for a specified period.
Credit default swaps involve one party (the protection buyer) making a stream of payments to another party (the protection seller) in exchange for the right to receive a specified payment in the event of a default or as a result of a default (“credit event”) for the referenced party, typically corporate issues or sovereign issues of an emerging country, on its obligation; or in the event of a write-down, principal shortfall, interest shortfall or default of all or part of the referenced entities comprising a credit index.
A Portfolio may use credit default swaps to provide a measure of protection against defaults of the issuers or to take an active long or short position with respect to the likelihood of a particular issuer’s default. A Portfolio may use credit default swaps on credit indices to hedge a portfolio of credit default swaps or bonds, which is less expensive than it would be to buy many credit default swaps to achieve a similar effect.
As a seller of protection on credit default swap agreements, a Portfolio will generally receive from the buyer of protection an agreed upon payment throughout the term of the swap provided that there is no credit event. As the seller, a Portfolio would effectively increase investment risk to its portfolio because, in addition to its total net assets, a Portfolio may be subject to investment exposure on the notional amount of the swap.
B4
The maximum amount of the payments that a Portfolio as a seller of protection could be required to pay under a credit default swap agreement would be equal the notional amount of the underlying security or index contract as a result of a credit event. These potential amounts will be partially offset by any recovery values of the respective referenced obligations, or net amounts received from the settlement of buy protection credit default swap agreements entered into by the Portfolio for the same referenced entity or index. As a buyer of protection, the Portfolio generally receives an amount up to the notional value of the swap if a credit event occurs.
Implied credit spreads, represented in absolute terms, utilized in determining the market value of credit default swap agreements on corporate issues or sovereign issues of an emerging country as of period end are disclosed in the footnotes to the Schedules of Investments and serve as an indicator of the current status of the payment/performance risk and represent the likelihood of risk of default for the credit derivative. The implied credit spread of a particular referenced entity reflects the cost of buying /selling protection and may include upfront payments required to enter into the agreement. For credit default swap agreements on asset-backed securities and credit indices, the fair values serve as the indicator of the current status of the payment/performance risk. Wider credit spreads and increasing market value in absolute terms, when compared to the notional amount of the swap, represent a deterioration of the referenced entity’s credit soundness and a greater likelihood of risk of default or other credit event occurring as defined under the terms of the agreement.
Some Portfolios may enter into total return swaps to manage their exposure to a security, commodity or an index. In a total return swap, one party would receive payments based on the market value of the security or the commodity involved, or total return of a specific referenced asset, such as an equity, index or bond, and in return pay a fixed amount.
These swap agreements involve, to varying degrees, elements of credit risk, market risk and documentation risk. Such risks involve the possibility that there will be no liquid market for these agreements, that the counterparty to the agreement may default on its obligation to perform or disagree as to the meaning of the contractual terms in the agreement, and that there will be unfavorable changes in net interest rates. The swaps are valued daily at current market value and any change in value is included in the net unrealized appreciation or depreciation on investments. Payments received or paid by the Portfolio are recorded as realized gains or losses upon termination or maturity of the swap. Risk of loss may exceed amounts recognized on the Statement of Assets and Liabilities. Swap agreements outstanding at period end, if any, are listed in the footnotes to the Schedule of Investments.
Forward currency contracts, written options, short sales, swaps and financial futures contracts may involve elements of both market and credit risk in excess of the amounts reflected on the Statement of Assets and Liabilities.
Securities Lending: Each Portfolio of the Series Fund may lend its portfolio securities to broker-dealers. The loans are secured by collateral at least equal at all times to the market value of the securities loaned. Loans are subject to termination at the option of the borrower or the Portfolio. Upon termination of the loan, the borrower will return to the Portfolio securities identical to the loaned securities. Should the borrower of the securities fail financially, the Portfolio has the right to repurchase the securities using the collateral in the open market. The Portfolio recognizes income, net of any rebate and securities lending agent fees, for lending its securities in the form of fees or interest on the investment of any cash received as collateral. The Portfolio also continues to receive interest and dividends or amounts equivalent thereto on the securities loaned and recognizes any unrealized gain or loss in the market price of the securities loaned that may occur during the term of the loan.
As a result of the bankruptcy filing by Lehman Brothers Holdings Inc., which was the parent company to the Portfolios’ Securities Lending Counter Party, Lehman Brothers Inc. (Lehman), the Portfolios’ Securities Lending Agent utilized collateral held on behalf of the Portfolios for securities out on loan to compensate the Portfolios for the failure of Lehman to return the securities. Any excess collateral was returned to Lehman.
Dollar Rolls: Certain Portfolios of the Series Fund enter into mortgage dollar rolls in which the Portfolio sells mortgage securities for delivery in the current month, realizing a gain (loss), and simultaneously contracts to repurchase somewhat similar (same type, coupon and maturity) securities on a specified future date. During the roll period, the Portfolio forgoes principal and interest paid on the securities. The Portfolio is compensated by the interest earned on the cash proceeds of the initial sale and by the lower repurchase price at the future
B5
date. The difference between the sales proceeds and the lower repurchase price is recorded as a realized gain. The Portfolio maintains a segregated account, the dollar value of which is a least equal to its obligations, with respect to dollar rolls.
When-Issued/Delayed Delivery Securities: Securities purchased or sold on a when-issued or delayed-delivery basis may be settled a month or more after trade date; interest income is not accrued until settlement date. At the time a Portfolio enters into such transactions, it instructs the custodian to segregate assets with a current value at least equal to the amount of its when-issued or delayed-delivery purchase commitments.
Securities Transactions and Net Investment Income: Securities transactions are recorded on the trade date. Realized gains (losses) on sales of securities are calculated on the identified cost basis. Dividend income is recorded on the ex-dividend date; interest income, which is comprised of four elements: stated coupon, original issue discount, market discount and market premium, is recorded on the accrual basis. Expenses are recorded on the accrual basis. The Series Fund’s expenses are allocated to the respective Portfolios on the basis of relative net assets except for Portfolio specific expenses which are attributable directly to a Portfolio or class level.
For Portfolios with multiple classes of shares, net investment income (loss) (other than administration and distribution fees, which are charged to the respective class) and unrealized and realized gains (losses) are allocated daily to each class of shares based upon the relative proportion of net assets of each class at the beginning of the day.
Taxes: For federal income tax purposes, each Portfolio in the Series Fund is treated as a separate taxpaying entity. The Portfolios are treated as partnerships for tax purposes. No provision has been made in the financial statements for U.S. federal, state, or local taxes, as any tax liability arising from operations of the Portfolios is the responsibility of their partners. The Portfolios are not generally subject to entity-level taxation. Partners of each Portfolio are subject to taxes on their distributive share of partnership items.
Withholding taxes on foreign dividends, interest and capital gains have been provided for in accordance with the Series Fund’s understanding of the applicable country’s tax rules and regulations.
Distributions: Distributions from each Portfolio are made in cash and automatically reinvested in additional shares of the same Portfolio. The Money Market Portfolio declares and reinvests distributions daily. The Diversified Bond, Government Income and High Yield Bond Portfolios make distributions, if any, quarterly. All other Portfolios’ distributions are generally made on an annual basis. Distributions are recorded on the ex-date.
Estimates: The preparation of financial statements requires management to make estimates and assumptions that affect the reported amounts and disclosures in the financial statements. Actual results could differ from these estimates.
The Series Fund has a management agreement with PI. Pursuant to this agreement PI has responsibility for all investment advisory services and supervises the subadvisors performance of such services. PI has entered into subadvisory agreements with Prudential Investment Management, Inc. (“PIM”), Jennison Associates LLC (“Jennison”), LSV Asset Management (“LSV”), Marsico Capital Management, LLC (“Marsico”), Quantitative Management Associates LLC (“QMA”), ClearBridge Advisors LLC (“ClearBridge”), T. Rowe Price Associates, Inc. (“T. Rowe”) and William Blair & Company, L.L.C. (“William Blair”) (collectively, the “Subadvisors”), under which each provides investment advisory services for certain Portfolios of the Series Fund. PI pays for the services of the Subadvisors, compensation of officers of the Series Fund, occupancy and certain clerical and administrative expenses of the Series Fund. The Portfolios bear all other costs and expenses.
B6
The management fee paid to PI is computed daily and payable monthly, at the annual rates specified below, of the value of each of the Portfolio’s average daily net assets.
| | | | | |
Portfolio
| | Management Fee
| | Effective
Management Fee
| |
Conservative Balanced Portfolio | | 0.55% | | 0.55 | % |
Diversified Bond Portfolio | | 0.40 | | 0.40 | |
Equity Portfolio | | 0.45 | | 0.45 | |
Flexible Managed Portfolio | | 0.60 | | 0.60 | |
Global Portfolio | | 0.75 | | 0.75 | |
Government Income Portfolio | | 0.40 | | 0.40 | |
High Yield Bond Portfolio | | 0.55 | | 0.55 | |
Jennison Portfolio | | 0.60 | | 0.60 | |
Money Market Portfolio | | 0.40 | | 0.40 | |
Natural Resources Portfolio | | 0.45 | | 0.45 | |
Small Capitalization Stock Portfolio | | 0.40 | | 0.40 | |
Stock Index Portfolio | | 0.35% up to $4 billion
0.30% over $4 billion | | 0.35 | |
Value Portfolio | | 0.40 | | 0.40 | |
At December 31, 2008, the Subadvisors that provide investment advisory services to the Portfolios are as follows. Where more than one Subadvisor is listed, each Subadvisor provides services to a segment of the Portfolio:
| | |
Portfolio
| | Subadvisor(s)
|
Conservative Balanced Portfolio | | PIM, QMA |
Diversified Bond Portfolio | | PIM |
Equity Portfolio | | ClearBridge, Jennison |
Flexible Managed Portfolio | | PIM, QMA |
Global Portfolio | | LSV, Marsico, QMA,
T. Rowe & William Blair |
Government Income Portfolio | | PIM |
High Yield Bond Portfolio | | PIM |
Jennison Portfolio | | Jennison |
Money Market Portfolio | | PIM |
Natural Resources Portfolio | | Jennison |
Small Capitalization Stock Portfolio | | QMA |
Stock Index Portfolio | | QMA |
Value Portfolio | | Jennison |
The Series Fund has a distribution agreement with Prudential Investment Management Services LLC (“PIMS”), which acts as the distributor of the Class I and Class II shares of the Series Fund. The Series Fund compensates PIMS for distributing and servicing the Series Fund’s Class II shares pursuant to a plan of distribution (the “Class II Plan”), regardless of expenses actually incurred by PIMS. The distribution fees are accrued daily and payable monthly. No distribution or service fees are paid to PIMS as distributor of the Class I shares of the Series Fund. Pursuant to the Class II Plan, the Class II shares of each Portfolio compensate PIMS for distribution-related activities at an annual rate of 0.25% of the average daily net assets of the Class II shares.
The Series Fund has an administration agreement with PI, which acts as the administrator of the Class II shares of the Series Fund. The administration fee paid to PI is accrued daily and payable monthly, at the annual rate of 0.15% of the average daily net assets of the Class II shares.
PI has agreed to reimburse each of the following Portfolios the portion of the management fee for that Portfolio equal to the amount that the aggregate annual ordinary operating expenses (excluding interest, taxes, and brokerage commissions) exceed the percentage stated below.
| | | | | | |
Portfolio
| | Class I
Expense Limit
| | | Class II
Expense Limit
| |
Government Income Portfolio | | 0.75 | % | | N/A | |
Stock Index Portfolio | | 0.75 | | | N/A | |
Value Portfolio | | 0.75 | * | | 1.15 | %* |
B7
N/A—Not applicable—There are no Class II shares outstanding for this Portfolio.
* Effective July 1, 2008, the expense limitation was removed.
PIMS, PI, PIM, QMA and Jennison are indirect, wholly-owned subsidiaries of Prudential Financial, Inc. (“Prudential”).
| Note 4: | | Other Transactions with Affiliates |
Prudential Mutual Fund Services LLC (“PMFS”), an affiliate of PI and an indirect, wholly-owned subsidiary of Prudential, serves as the Series Fund’s transfer agent. Transfer agent’s fees and expenses in the Statement of Operations include certain out-of-pocket expenses paid to non-affiliates, where applicable.
PIM also serves as the Series Fund’s security lending agent. For the year ended December 31, 2008, PIM was compensated as follows for these services by the Series Fund Portfolios:
| | | |
Portfolio
| | PIM
|
Conservative Balanced Portfolio | | $ | 762,370 |
Diversified Bond Portfolio | | | 224,842 |
Equity Portfolio | | | 1,469,114 |
Flexible Managed Portfolio | | | 974,060 |
Global Portfolio | | | 280,180 |
Government Income Portfolio | | | 133,190 |
High Yield Bond Portfolio | | | 524,043 |
Jennison Portfolio | | | 635,667 |
Natural Resources Portfolio | | | 772,567 |
Small Capitalization Stock Portfolio | | | 1,307,997 |
Stock Index Portfolio | | | 1,092,434 |
Value Portfolio | | | 668,162 |
For the year ended December 31, 2008, Wachovia Securities, LLC (“Wachovia”), an affiliate of PI, earned brokerage commissions from transactions executed on behalf of the Series Fund Portfolios as follows:
| | | |
Portfolio
| | Wachovia
|
Value Portfolio | | $ | 28,680 |
Certain Portfolios invest in the Short-Term Bond Series, pursuant to an exemptive order received from the Securities and Exchange Commission and in the Taxable Money Market Series, each a portfolio of the Dryden Core Investment Fund registered under the Investment Company Act of 1940, as amended, and managed by PI.
| Note 5: | | Portfolio Securities |
The aggregate cost of purchases and the proceeds from the sales of securities (excluding government securities and short-term issues) for the year ended December 31, 2008 were as follows:
Cost of Purchases:
| | | |
Portfolio
| | |
Conservative Balanced Portfolio | | $ | 5,942,568,925 |
Diversified Bond Portfolio | | | 6,720,369,157 |
Equity Portfolio | | | 2,399,413,777 |
Flexible Managed Portfolio | | | 8,473,448,070 |
Global Portfolio | | | 477,906,846 |
Government Income Portfolio | | | 6,040,966,942 |
High Yield Bond Portfolio | | | 938,594,664 |
Jennison Portfolio | | | 1,240,532,846 |
Natural Resources Portfolio | | | 573,934,032 |
Small Capitalization Stock Portfolio | | | 146,225,578 |
Stock Index Portfolio | | | 99,418,753 |
Value Portfolio | | | 1,004,102,637 |
B8
Proceeds from Sales:
| | | |
Portfolio
| | |
Conservative Balanced Portfolio | | $ | 5,961,870,658 |
Diversified Bond Portfolio | | | 6,728,811,349 |
Equity Portfolio | | | 2,602,171,168 |
Flexible Managed Portfolio | | | 8,516,295,674 |
Global Portfolio | | | 511,509,388 |
Government Income Portfolio | | | 6,054,312,877 |
High Yield Bond Portfolio | | | 869,133,075 |
Jennison Portfolio | | | 1,459,621,224 |
Natural Resources Portfolio | | | 678,582,147 |
Small Capitalization Stock Portfolio | | | 198,919,719 |
Stock Index Portfolio | | | 257,258,949 |
Value Portfolio | | | 1,140,740,339 |
After January 2, 2006, all Portfolios are treated as partnerships for tax purposes. The character of the cash distributions made by the partnerships is generally classified as return of capital nontaxable distributions. After each fiscal year each partner will receive information regarding their distributive allocable share of the partnership’s income, gains, losses and deductions.
Prior to January 2, 2006, each Portfolio, which was incorporated as of that date, qualified as a regulated investment company under the Internal Revenue Code and distributed all of its taxable income, including any net realized gains on investments, to shareholders.
With respect to the Portfolios, book cost of assets differs from tax cost of assets as a result of each Portfolio’s adoption of a mark to market method of accounting for tax purposes. Under this method, tax cost of assets will approximate its fair market value.
Management has analyzed the Portfolios’ tax positions taken on federal income tax returns for all open tax years and has concluded that as of December 31, 2008, no provision for income tax would be required in the Portfolios’ financial statements. The Portfolios’ federal and state income tax returns for tax years for which the applicable statutes of limitations have not expired are subject to examination by the Internal Revenue Service and state departments of revenue.
The Series Fund offers Class I and Class II shares. Neither Class I nor Class II shares of a Portfolio are subject to any sales charge or redemption charge and are sold at the net asset value of the Portfolio. Class I shares are sold only to certain separate accounts of Prudential to fund benefits under certain variable life insurance and variable annuity contracts (“contracts”). Class II shares are sold only to separate accounts of non-Prudential insurance companies as investment options under certain contracts. The separate accounts invest in shares of the Series Fund through subaccounts that correspond to the Portfolios. The separate accounts will redeem shares of the Series Fund to the extent necessary to provide benefits under the contracts or for such other purposes as may be consistent with the contracts. As of December 31, 2008, the Equity, Jennison, Natural Resources and Value Portfolios have Class II shares outstanding.
B9
Transactions in shares of beneficial interest of the Equity, Jennison, Natural Resources and Value Portfolios were as follows:
| | | | | | | |
| Equity Portfolio: | | | | | | | |
Class I
| | Shares
| | | Amount
| |
Year ended December 31, 2008: | | | | | | | |
Series shares sold | | 1,436,949 | | | $ | 31,146,917 | |
Series shares issued in reinvestment of distributions | | 17,082,227 | | | | 436,963,357 | |
Series shares repurchased | | (13,934,724 | ) | | | (328,218,745 | ) |
| | |
|
| |
|
|
|
Net increase (decrease) in shares outstanding | | 4,584,452 | | | $ | 139,891,529 | |
| | |
|
| |
|
|
|
Year ended December 31, 2007: | | | | | | | |
Series shares sold | | 1,031,862 | | | $ | 29,740,507 | |
Series shares issued in reinvestment of distributions | | 1,691,265 | | | | 49,976,890 | |
Series shares repurchased | | (14,024,490 | ) | | | (407,692,362 | ) |
| | |
|
| |
|
|
|
Net increase (decrease) in shares outstanding | | (11,301,363 | ) | | $ | (327,974,965 | ) |
| | |
|
| |
|
|
|
| | |
Class II
| | | | | | |
Year ended December 31, 2008: | | | | | | | |
Series shares sold | | 3,868 | | | $ | 88,780 | |
Series shares issued in reinvestment of distributions | | 2,468 | | | | 63,526 | |
Series shares repurchased | | (26,501 | ) | | | (699,940 | ) |
| | |
|
| |
|
|
|
Net increase (decrease) in shares outstanding | | (20,165 | ) | | $ | (547,634 | ) |
| | |
|
| |
|
|
|
Year ended December 31, 2007: | | | | | | | |
Series shares sold | | 2,870 | | | $ | 85,699 | |
Series shares issued in reinvestment of distributions | | 322 | | | | 9,549 | |
Series shares repurchased | | (29,757 | ) | | | (885,730 | ) |
| | |
|
| |
|
|
|
Net increase (decrease) in shares outstanding | | (26,565 | ) | | $ | (790,482 | ) |
| | |
|
| |
|
|
|
| | |
| Jennison Portfolio: | | | | | | | |
Class I
| | | | | | |
Year ended December 31, 2008: | | | | | | | |
Series shares sold | | 3,086,340 | | | $ | 57,779,660 | |
Series shares issued in reinvestment of distributions | | 390,007 | | | | 8,646,458 | |
Series shares repurchased | | (14,586,269 | ) | | | (279,799,118 | ) |
| | |
|
| |
|
|
|
Net increase (decrease) in shares outstanding | | (11,109,922 | ) | | $ | (213,373,000 | ) |
| | |
|
| |
|
|
|
Year ended December 31, 2007: | | | | | | | |
Series shares sold | | 3,875,996 | | | $ | 87,806,461 | |
Series shares issued in reinvestment of distributions | | 259,312 | | | | 6,070,485 | |
Series shares repurchased | | (13,447,590 | ) | | | (300,176,044 | ) |
| | |
|
| |
|
|
|
Net increase (decrease) in shares outstanding | | (9,312,282 | ) | | $ | (206,299,098 | ) |
| | |
|
| |
|
|
|
| | |
Class II
| | | | | | |
Year ended December 31, 2008: | | | | | | | |
Series shares sold | | 130,219 | | | $ | 2,480,267 | |
Series shares issued in reinvestment of distributions | | 528 | | | | 11,569 | |
Series shares repurchased | | (233,004 | ) | | | (4,441,874 | ) |
| | |
|
| |
|
|
|
Net increase (decrease) in shares outstanding | | (102,257 | ) | | $ | (1,950,038 | ) |
| | |
|
| |
|
|
|
Year ended December 31, 2007: | | | | | | | |
Series shares sold | | 157,366 | | | $ | 3,468,229 | |
Series shares repurchased | | (155,537 | ) | | | (3,412,828 | ) |
| | |
|
| |
|
|
|
Net increase (decrease) in shares outstanding | | 1,829 | | | $ | 55,401 | |
| | |
|
| |
|
|
|
B10
| | | | | | | |
| | |
| Natural Resources Portfolio: | | | | | | | |
Class I
| | Shares
| | | Amount
| |
Year ended December 31, 2008: | | | | | | | |
Series shares sold | | 1,084,549 | | | $ | 57,023,489 | |
Series shares issued in reinvestment of distributions | | 3,318,624 | | | | 195,367,433 | |
Series shares repurchased | | (5,486,770 | ) | | | (239,959,723 | ) |
| | |
|
| |
|
|
|
Net increase (decrease) in shares outstanding | | (1,083,597 | ) | | $ | 12,431,199 | |
| | |
|
| |
|
|
|
Year ended December 31, 2007: | | | | | | | |
Series shares sold | | 1,540,804 | | | $ | 90,988,390 | |
Series shares issued in reinvestment of distributions | | 5,021,348 | | | | 269,445,554 | |
Series shares repurchased | | (3,014,255 | ) | | | (159,841,129 | ) |
| | |
|
| |
|
|
|
Net increase (decrease) in shares outstanding | | 3,547,897 | | | $ | 200,592,815 | |
| | |
|
| |
|
|
|
| | |
Class II
| | | | | | |
Year ended December 31, 2008: | | | | | | | |
Series shares sold | | 1,405,872 | | | $ | 64,916,745 | |
Series shares issued in reinvestment of distributions | | 137,692 | | | | 8,068,760 | |
Series shares repurchased | | (605,217 | ) | | | (28,359,416 | ) |
| | |
|
| |
|
|
|
Net increase (decrease) in shares outstanding | | 938,347 | | | $ | 44,626,089 | |
| | |
|
| |
|
|
|
Year ended December 31, 2007: | | | | | | | |
Series shares sold | | 545,786 | | | $ | 30,006,805 | |
Series shares issued in reinvestment of distributions | | 142,454 | | | | 7,597,067 | |
Series shares repurchased | | (202,397 | ) | | | (11,381,740 | ) |
| | |
|
| |
|
|
|
Net increase (decrease) in shares outstanding | | 485,843 | | | $ | 26,222,132 | |
| | |
|
| |
|
|
|
| | |
| Value Portfolio: | | | | | | | |
Class I
| | | | | | |
Year ended December 31, 2008: | | | | | | | |
Series shares sold | | 1,009,709 | | | $ | 16,588,714 | |
Series shares issued in reinvestment of distributions | | 17,981,434 | | | | 331,218,021 | |
Series shares repurchased | | (10,948,900 | ) | | | (192,163,813 | ) |
| | |
|
| |
|
|
|
Net increase (decrease) in shares outstanding | | 8,042,243 | | | $ | 155,642,922 | |
| | |
|
| |
|
|
|
Year ended December 31, 2007: | | | | | | | |
Series shares sold | | 1,095,975 | | | $ | 29,415,525 | |
Series shares issued in reinvestment of distributions | | 10,415,705 | | | | 242,165,135 | |
Series shares repurchased | | (9,054,986 | ) | | | (246,234,280 | ) |
| | |
|
| |
|
|
|
Net increase (decrease) in shares outstanding | | 2,456,694 | | | $ | 25,346,380 | |
| | |
|
| |
|
|
|
| | |
Class II
| | | | | | |
Year ended December 31, 2008: | | | | | | | |
Series shares sold | | 36,019 | | | $ | 448,894 | |
Series shares issued in reinvestment of distributions | | 26,744 | | | | 495,826 | |
Series shares repurchased | | (22,264 | ) | | | (387,303 | ) |
| | |
|
| |
|
|
|
Net increase (decrease) in shares outstanding | | 40,499 | | | $ | 557,417 | |
| | |
|
| |
|
|
|
Year ended December 31, 2007: | | | | | | | |
Series shares sold | | 5,362 | | | $ | 150,641 | |
Series shares issued in reinvestment of distributions | | 16,034 | | | | 373,906 | |
Series shares repurchased | | (28,317 | ) | | | (747,087 | ) |
| | |
|
| |
|
|
|
Net increase (decrease) in shares outstanding | | (6,921 | ) | | $ | (222,540 | ) |
| | |
|
| |
|
|
|
B11
| Note 8: | | Borrowings and Overdrafts |
The Portfolios (excluding the Money Market Portfolio), along with other affiliated registered investment companies (the “Funds”), are a party to a Syndicated Credit Agreement (“SCA”) with two banks. The SCA provides for a commitment of $500 million. Interest on any borrowings under the SCA is incurred at contracted market rates and a commitment fee for the unused amount is accrued daily and paid quarterly. Effective October 24, 2008, the Funds renewed the SCA with the banks. The commitment under the renewed SCA continues to be $500 million. The Funds pay a commitment fee of .13 of 1% of the unused portion of the renewed SCA. The expiration date of the renewed SCA will be October 23, 2009. For the period from October 26, 2007 through October 23, 2008, the Funds paid a commitment fee of .06 of 1% of the unused portion of the agreement. The purpose of the SCA is to provide an alternative source of temporary funding for capital share redemptions.
The following Portfolios utilized the line of credit during year ended December 31, 2008. The average balance outstanding is for the number of days the Portfolio had utilized the credit facility.
| | | | | | | | | | | |
Portfolio
| | Approximate
Average
Balance
Outstanding
| | Number of
Days
Outstanding
| | Weighted
Average
Interest
Rates
| | | Amount
Outstanding at
December 31,
2008
|
Global Portfolio | | $ | 3,257,000 | | 1 | | 2.36 | % | | | — |
Jennison Portfolio | | | 2,783,556 | | 9 | | 2.43 | | | | — |
Natural Resources Portfolio | | | 4,876,908 | | 66 | | 2.33 | | | $ | 583,000 |
Small Capitalization Stock Portfolio | | | 581,939 | | 33 | | 2.44 | | | | — |
Value Portfolio | | | 1,061,500 | | 6 | | 2.40 | | | | — |
The amount of interest on temporary overdrawn balances paid to the custodian during the year ended December 31, 2008 was as follows:
| | | | | | |
Portfolio
| | Approximate
Average
Balance
Outstanding
| | Weighted
Average
Interest
Rates
| |
Conservative Balanced Portfolio | | $ | 5,050,826 | | 1.89 | % |
Diversified Bond Portfolio | | | 3,299,536 | | 3.46 | |
Flexible Managed Portfolio | | | 4,579,319 | | 3.97 | |
Global Portfolio | | | 879,293 | | 4.28 | |
Government Income Portfolio | | | 6,651,253 | | 4.44 | |
High Yield Bond Portfolio | | | 1,087,857 | | 2.67 | |
Jennison Portfolio | | | 1,292,881 | | 1.33 | |
Money Market Portfolio | | | 327,557 | | 3.83 | |
Natural Resources Portfolio | | | 3,332,493 | | 3.82 | |
Small Capitalization Stock Portfolio | | | 2,880,260 | | 4.00 | |
Value Portfolio | | | 2,229,511 | | 3.77 | |
| Note 9: | | Ownership and Affiliates |
As of December 31, 2008, all of Class I shares of each Portfolio were owned of record by the Prudential Insurance Company of America (“PICA”) on behalf of the owners of the variable insurance products issued by PICA.
| Note 10: | | New Accounting Pronouncements |
In March 2008, the Financial Accounting Standards Board (“FASB”) released Statement of Financial Accounting Standards No. 161, Disclosures about Derivative Instruments and Hedging Activities (“FAS 161”). FAS 161 requires qualitative disclosures about objectives and strategies for using derivatives, quantitative disclosures about fair value amounts of and gains and losses on derivative instruments, and disclosures about credit-risk-related contingent features in derivative agreements. The application of FAS 161 is required for any reporting period beginning after November 15, 2008. At this time, management is evaluating the implications of FAS 161 and its impact on the financial statements has not yet been determined.
B12
Financial Highlights
| | | | | | | | | | | | | | | | | | | | |
| | | Conservative Balanced Portfolio
| |
| | | Year Ended December 31,
| |
| | | 2008
| | | 2007(c)
| | | 2006
| | | 2005
| | | 2004
| |
Per Share Operating Performance: | | | | | | | | | | | | | | | | | | | | |
Net Asset Value, beginning of year | | $ | 16.69 | | | $ | 16.21 | | | $ | 15.09 | | | $ | 15.10 | | | $ | 14.34 | |
| | |
|
|
| |
|
|
| |
|
|
| |
|
|
| |
|
|
|
Income (Loss) From Investment Operations: | | | | | | | | | | | | | | | | | | | | |
Net investment income | | | .50 | | | | .50 | | | | .48 | | | | .38 | | | | .34 | |
Net realized and unrealized gain (loss) on investments | | | (3.98 | ) | | | .49 | | | | 1.06 | | | | .11 | | | | .78 | |
| | |
|
|
| |
|
|
| |
|
|
| |
|
|
| |
|
|
|
Total from investment operations | | | (3.48 | ) | | | .99 | | | | 1.54 | | | | .49 | | | | 1.12 | |
| | |
|
|
| |
|
|
| |
|
|
| |
|
|
| |
|
|
|
Less Dividends and Distributions: | | | | | | | | | | | | | | | | | | | | |
Dividends from net investment income | | | — | | | | — | | | | — | | | | (.35 | ) | | | (.28 | ) |
Distributions from net realized gains | | | — | | | | — | | | | — | | | | (.15 | ) | | | (.08 | ) |
Distributions | | | (.52 | ) | | | (.51 | ) | | | (.42 | ) | | | — | | | | — | |
| | |
|
|
| |
|
|
| |
|
|
| |
|
|
| |
|
|
|
Total dividends and distributions | | | (.52 | ) | | | (.51 | ) | | | (.42 | ) | | | (.50 | ) | | | (.36 | ) |
| | |
|
|
| |
|
|
| |
|
|
| |
|
|
| |
|
|
|
Net Asset Value, end of year | | $ | 12.69 | | | $ | 16.69 | | | $ | 16.21 | | | $ | 15.09 | | | $ | 15.10 | |
| | |
|
|
| |
|
|
| |
|
|
| |
|
|
| |
|
|
|
Total Return(a) | | | (21.41 | )% | | | 6.12 | % | | | 10.44 | % | | | 3.43 | % | | | 8.04 | % |
Ratios/Supplemental Data: | | | | | | | | | | | | | | | | | | | | |
Net assets, end of year (in millions) | | $ | 1,957.5 | | | $ | 2,721.9 | | | $ | 2,770.6 | | | $ | 2,749.8 | | | $ | 2,893.6 | |
Ratios to average net assets(b): | | | | | | | | | | | | | | | | | | | | |
Expenses | | | .59 | % | | | .59 | % | | | .57 | % | | | .58 | % | | | .59 | % |
Net investment income | | | 3.12 | % | | | 2.95 | % | | | 2.97 | % | | | 2.45 | % | | | 2.27 | % |
Portfolio turnover rate | | | 336 | % | | | 178 | % | | | 114 | % | | | 110 | % | | | 153 | % |
| (a) | Total return is calculated assuming a purchase of a share on the first day and a sale on the last day of each year reported and includes reinvestment of dividends and distributions and does not reflect the effect of insurance contract charges. Total return does not reflect expenses associated with the separate account such as administrative fees, account charges and surrender charges which, if reflected, would reduce the total returns for all years shown. Performance figures may reflect fee waivers and/or expense reimbursements. In the absence of fee waivers and/or expense reimbursements, the total return would be lower. Past performance is no guarantee of future results. Total returns may reflect adjustments to conform to generally accepted accounting principles. |
| (b) | Does not include expenses of the underlying portfolios in which the Portfolio invests. |
| (c) | Calculated based upon average shares outstanding during the year. |
| | | | | | | | | | | | | | | | | | | | |
| | | Diversified Bond Portfolio
| |
| | | Year Ended December 31,
| |
| | | 2008
| | | 2007
| | | 2006
| | | 2005
| | | 2004
| |
Per Share Operating Performance: | | | | | | | | | | | | | | | | | | | | |
Net Asset Value, beginning of year | | $ | 10.90 | | | $ | 10.85 | | | $ | 10.96 | | | $ | 11.28 | | | $ | 11.17 | |
| | |
|
|
| |
|
|
| |
|
|
| |
|
|
| |
|
|
|
Income (Loss) From Investment Operations: | | | | | | | | | | | | | | | | | | | | |
Net investment income | | | .54 | | | | .58 | | | | .57 | | | | .55 | | | | .52 | |
Net realized and unrealized gain (loss) on investments | | | (.90 | ) | | | .02 | | | | (.05 | ) | | | (.20 | ) | | | .09 | |
| | |
|
|
| |
|
|
| |
|
|
| |
|
|
| |
|
|
|
Total from investment operations | | | (.36 | ) | | | .60 | | | | .52 | | | | .35 | | | | .61 | |
| | |
|
|
| |
|
|
| |
|
|
| |
|
|
| |
|
|
|
Less Dividends and Distributions: | | | | | | | | | | | | | | | | | | | | |
Dividends from net investment income | | | — | | | | — | | | | — | | | | (.59 | ) | | | (.50 | ) |
Distributions from net realized gains | | | — | | | | — | | | | — | | | | (.08 | ) | | | — | |
Distributions | | | (.65 | ) | | | (.55 | ) | | | (.63 | ) | | | — | | | | — | |
| | |
|
|
| |
|
|
| |
|
|
| |
|
|
| |
|
|
|
Total dividends and distributions | | | (.65 | ) | | | (.55 | ) | | | (.63 | ) | | | (.67 | ) | | | (.50 | ) |
| | |
|
|
| |
|
|
| |
|
|
| |
|
|
| |
|
|
|
Net Asset Value, end of year | | $ | 9.89 | | | $ | 10.90 | | | $ | 10.85 | | | $ | 10.96 | | | $ | 11.28 | |
| | |
|
|
| |
|
|
| |
|
|
| |
|
|
| |
|
|
|
Total Return(a) | | | (3.46 | )% | | | 5.71 | % | | | 4.98 | % | | | 3.28 | % | | | 5.59 | % |
Ratios/Supplemental Data: | | | | | | | | | | | | | | | | | | | | |
Net assets, end of year (in millions) | | $ | 1,134.8 | | | $ | 1,218.3 | | | $ | 1,150.4 | | | $ | 1,230.6 | | | $ | 1,283.7 | |
Ratios to average net assets(b): | | | | | | | | | | | | | | | | | | | | |
Expenses | | | .44 | % | | | .44 | % | | | .45 | % | | | .45 | % | | | .45 | % |
Net investment income | | | 5.07 | % | | | 5.39 | % | | | 5.18 | % | | | 4.81 | % | | | 4.57 | % |
Portfolio turnover rate | | | 723 | % | | | 476 | % | | | 393 | % | | | 278 | % | | | 382 | % |
| (a) | Total return is calculated assuming a purchase of a share on the first day and a sale on the last day of each year reported and includes reinvestment of dividends and distributions and does not reflect the effect of insurance contract charges. Total return does not reflect expenses associated with the separate account such as administrative fees, account charges and surrender charges which, if reflected, would reduce the total returns for all years shown. Performance figures may reflect fee waivers and/or expense reimbursements. In the absence of fee waivers and/or expense reimbursements, the total return would be lower. Past performance is no guarantee of future results. Total returns may reflect adjustments to conform to generally accepted accounting principles. |
| (b) | Does not include expenses of the underlying portfolios in which the Portfolio invests. |
SEE NOTES TO FINANCIAL STATEMENTS.
C1
Financial Highlights
| | | | | | | | | | | | | | | | | | | | |
| | | Equity Portfolio
| |
| | | Class I
| |
| | | Year Ended December 31,
| |
| | | 2008(c)
| | | 2007
| | | 2006
| | | 2005
| | | 2004
| |
Per Share Operating Performance: | | | | | | | | | | | | | | | | | | | | |
Net Asset Value, beginning of year | | $ | 29.67 | | | $ | 27.45 | | | $ | 24.64 | | | $ | 22.31 | | | $ | 20.55 | |
| | |
|
|
| |
|
|
| |
|
|
| |
|
|
| |
|
|
|
Income (Loss) From Investment Operations: | | | | | | | | | | | | | | | | | | | | |
Net investment income | | | .29 | | | | .35 | | | | .30 | | | | .24 | | | | .28 | |
Net realized and unrealized gain (loss) on investments | | | (10.52 | ) | | | 2.21 | | | | 2.80 | | | | 2.32 | | | | 1.75 | |
| | |
|
|
| |
|
|
| |
|
|
| |
|
|
| |
|
|
|
Total from investment operations | | | (10.23 | ) | | | 2.56 | | | | 3.10 | | | | 2.56 | | | | 2.03 | |
| | |
|
|
| |
|
|
| |
|
|
| |
|
|
| |
|
|
|
Less Dividends and Distributions: | | | | | | | | | | | | | | | | | | | | |
Dividends from net investment income | | | — | | | | — | | | | — | | | | (.23 | ) | | | (.27 | ) |
Distributions | | | (3.04 | ) | | | (.34 | ) | | | (.29 | ) | | | — | | | | — | |
| | |
|
|
| |
|
|
| |
|
|
| |
|
|
| |
|
|
|
Total dividends and distributions | | | (3.04 | ) | | | (.34 | ) | | | (.29 | ) | | | (.23 | ) | | | (.27 | ) |
| | |
|
|
| |
|
|
| |
|
|
| |
|
|
| |
|
|
|
Net Asset Value, end of year | | $ | 16.40 | | | $ | 29.67 | | | $ | 27.45 | | | $ | 24.64 | | | $ | 22.31 | |
| | |
|
|
| |
|
|
| |
|
|
| |
|
|
| |
|
|
|
Total Return(a) | | | (38.16 | )% | | | 9.32 | % | | | 12.57 | % | | | 11.47 | % | | | 9.93 | % |
Ratios/Supplemental Data: | | | | | | | | | | | | | | | | | | | | |
Net assets, end of year (in millions) | | $ | 2,521.0 | | | $ | 4,423.9 | | | $ | 4,402.7 | | | $ | 4,283.9 | | | $ | 4,135.7 | |
Ratios to average net assets(b): | | | | | | | | | | | | | | | | | | | | |
Expenses | | | .48 | % | | | .47 | % | | | .47 | % | | | .47 | % | | | .48 | % |
Net investment income | | | 1.21 | % | | | 1.16 | % | | | 1.10 | % | | | 1.01 | % | | | 1.29 | % |
Portfolio turnover rate | | | 67 | % | | | 57 | % | | | 60 | % | | | 77 | % | | | 50 | % |
| (a) | Total return is calculated assuming a purchase of a share on the first day and a sale on the last day of each year reported and includes reinvestment of dividends and distributions. Total return does not reflect expenses associated with the separate account such as administrative fees, account charges and surrender charges which, if reflected, would reduce the total returns for all periods shown. Performance figures may reflect fee waivers and/or expense reimbursements. In the absence of fee waivers and/or expense reimbursements, the total return would be lower. Past performance is no guarantee of future results. Total returns may reflect adjustments to conform to generally accepted accounting principles. |
| (b) | Does not include expenses of the underlying portfolio in which the Portfolio invests. |
| (c) | Calculation based on average shares outstanding during the year. |
| | | | | | | | | | | | | | | | | | | | |
| | | Equity Portfolio
| |
| | | Class II
| |
| | | Year Ended December 31,
| |
| | | 2008(c)
| | | 2007
| | | 2006
| | | 2005
| | | 2004
| |
Per Share Operating Performance: | | | | | | | | | | | | | | | | | | | | |
Net Asset Value, beginning of year | | $ | 29.81 | | | $ | 27.52 | | | $ | 24.69 | | | $ | 22.34 | | | $ | 20.58 | |
| | |
|
|
| |
|
|
| |
|
|
| |
|
|
| |
|
|
|
Income (Loss) From Investment Operations: | | | | | | | | | | | | | | | | | | | | |
Net investment income | | | .19 | | | | .28 | | | | .19 | | | | .12 | | | | .20 | |
Net realized and unrealized gain (loss) on investments | | | (10.61 | ) | | | 2.20 | | | | 2.80 | | | | 2.35 | | | | 1.74 | |
| | |
|
|
| |
|
|
| |
|
|
| |
|
|
| |
|
|
|
Total from investment operations | | | (10.42 | ) | | | 2.48 | | | | 2.99 | | | | 2.47 | | | | 1.94 | |
| | |
|
|
| |
|
|
| |
|
|
| |
|
|
| |
|
|
|
Less Dividends and Distributions: | | | | | | | | | | | | | | | | | | | | |
Dividends from net investment income | | | — | | | | — | | | | — | | | | (.12 | ) | | | (.18 | ) |
Distributions | | | (2.92 | ) | | | (.19 | ) | | | (.16 | ) | | | — | | | | — | |
| | |
|
|
| |
|
|
| |
|
|
| |
|
|
| |
|
|
|
Total dividends and distributions | | | (2.92 | ) | | | (.19 | ) | | | (.16 | ) | | | (.12 | ) | | | (.18 | ) |
| | |
|
|
| |
|
|
| |
|
|
| |
|
|
| |
|
|
|
Net Asset Value, end of year | | $ | 16.47 | | | $ | 29.81 | | | $ | 27.52 | | | $ | 24.69 | | | $ | 22.34 | |
| | |
|
|
| |
|
|
| |
|
|
| |
|
|
| |
|
|
|
Total Return(a) | | | (38.47 | )% | | | 8.91 | % | | | 12.13 | % | | | 11.04 | % | | | 9.51 | % |
Ratios/Supplemental Data: | | | | | | | | | | | | | | | | | | | | |
Net assets, end of year (in millions) | | $ | 0.4 | | | $ | 1.3 | | | $ | 1.9 | | | $ | 2.1 | | | $ | 1.1 | |
Ratios to average net assets(b): | | | | | | | | | | | | | | | | | | | | |
Expenses | | | .88 | % | | | .87 | % | | | .87 | % | | | .87 | % | | | .88 | % |
Net investment income | | | .78 | % | | | .74 | % | | | .71 | % | | | .64 | % | | | .91 | % |
Portfolio turnover rate | | | 67 | % | | | 57 | % | | | 60 | % | | | 77 | % | | | 50 | % |
| (a) | Total return is calculated assuming a purchase of a share on the first day and a sale on the last day of each year reported and includes reinvestment of dividends and distributions. Total return does not reflect expenses associated with the separate account such as administrative fees, account charges and surrender charges which, if reflected, would reduce the total returns for all periods shown. Performance figures may reflect fee waivers and/or expense reimbursements. In the absence of fee waivers and/or expense reimbursements, the total return would be lower. Past performance is no guarantee of future results. Total returns may reflect adjustments to conform to generally accepted accounting principles. |
| (b) | Does not include expenses of the underlying portfolio in which the Portfolio invests. |
| (c) | Calculation based on average shares outstanding during the year. |
SEE NOTES TO FINANCIAL STATEMENTS.
C2
Financial Highlights
| | | | | | | | | | | | | | | | | | | | |
| | | Flexible Managed Portfolio
| |
| | | Year Ended December 31,
| |
| | | 2008
| | | 2007
| | | 2006
| | | 2005(c)
| | | 2004
| |
Per Share Operating Performance: | | | | | | | | | | | | | | | | | | | | |
Net Asset Value, beginning of year | | $ | 18.30 | | | $ | 18.36 | | | $ | 16.92 | | | $ | 16.58 | | | $ | 15.19 | |
| | |
|
|
| |
|
|
| |
|
|
| |
|
|
| |
|
|
|
Income (Loss) From Investment Operations: | | | | | | | | | | | | | | | | | | | | |
Net investment income | | | .45 | | | | .50 | | | | .44 | | | | .32 | | | | .29 | |
Net realized and unrealized gain (loss) on investments | | | (4.62 | ) | | | .65 | | | | 1.59 | | | | .34 | | | | 1.32 | |
| | |
|
|
| |
|
|
| |
|
|
| |
|
|
| |
|
|
|
Total from investment operations | | | (4.17 | ) | | | 1.15 | | | | 2.03 | | | | .66 | | | | 1.61 | |
| | |
|
|
| |
|
|
| |
|
|
| |
|
|
| |
|
|
|
Less Dividends and Distributions: | | | | | | | | | | | | | | | | | | | | |
Dividends from net investment income | | | — | | | | — | | | | — | | | | (.32 | ) | | | (.22 | ) |
Distributions | | | (1.79 | ) | | | (1.21 | ) | | | (.59 | ) | | | — | | | | — | |
| | |
|
|
| |
|
|
| |
|
|
| |
|
|
| |
|
|
|
Total dividends and distributions | | | (1.79 | ) | | | (1.21 | ) | | | (.59 | ) | | | (.32 | ) | | | (.22 | ) |
| | |
|
|
| |
|
|
| |
|
|
| |
|
|
| |
|
|
|
Net Asset Value, end of year | | $ | 12.34 | | | $ | 18.30 | | | $ | 18.36 | | | $ | 16.92 | | | $ | 16.58 | |
| | |
|
|
| |
|
|
| |
|
|
| |
|
|
| |
|
|
|
Total Return(a) | | | (24.82 | )% | | | 6.30 | % | | | 12.17 | % | | | 4.16 | % | | | 10.74 | % |
Ratios/Supplemental Data: | | | | | | | | | | | | | | | | | | | | |
Net assets, end of year (in millions) | | $ | 2,621.6 | | | $ | 3,716.3 | | | $ | 3,723.6 | | | $ | 3,543.9 | | | $ | 3,883.5 | |
Ratios to average net assets(b): | | | | | | | | | | | | | | | | | | | | |
Expenses | | | .64 | % | | | .63 | % | | | .62 | % | | | .63 | % | | | .62 | % |
Net investment income | | | 2.85 | % | | | 2.53 | % | | | 2.48 | % | | | 1.95 | % | | | 1.83 | % |
Portfolio turnover rate | | | 321 | % | | | 212 | % | | | 153 | % | | | 126 | % | | | 150 | % |
| (a) | Total return is calculated assuming a purchase of a share on the first day and a sale on the last day of each year reported and includes reinvestment of dividends and distributions and does not reflect the effect of insurance contract charges. Total return does not reflect expenses associated with the separate account such as administrative fees, account charges and surrender charges which, if reflected, would reduce the total returns for all years shown. Performance figures may reflect fee waivers and/or expense reimbursements. In the absence of fee waivers and/or expense reimbursements, the total return would be lower. Past performance is no guarantee of future results. Total returns may reflect adjustments to conform to generally accepted accounting principles. |
| (b) | Does not include expenses of the underlying portfolios in which the Portfolio invests. |
| (c) | Calculated based upon average shares outstanding during the year. |
| | | | | | | | | | | | | | | | | | | | |
| | | Global Portfolio
| |
| | | Year Ended December 31,
| |
| | | 2008
| | | 2007
| | | 2006
| | | 2005
| | | 2004
| |
Per Share Operating Performance: | | | | | | | | | | | | | | | | | | | | |
Net Asset Value, beginning of year | | $ | 24.62 | | | $ | 22.53 | | | $ | 18.96 | | | $ | 16.43 | | | $ | 15.14 | |
| | |
|
|
| |
|
|
| |
|
|
| |
|
|
| |
|
|
|
Income (Loss) From Investment Operations: | | | | | | | | | | | | | | | | | | | | |
Net investment income | | | .40 | | | | .36 | | | | .26 | | | | .13 | | | | .11 | |
Net realized and unrealized gain (loss) on investments | | | (10.38 | ) | | | 2.00 | | | | 3.44 | | | | 2.50 | | | | 1.33 | |
| | |
|
|
| |
|
|
| |
|
|
| |
|
|
| |
|
|
|
Total from investment operations | | | (9.98 | ) | | | 2.36 | | | | 3.70 | | | | 2.63 | | | | 1.44 | |
| | |
|
|
| |
|
|
| |
|
|
| |
|
|
| |
|
|
|
Less Dividends and Distributions: | | | | | | | | | | | | | | | | | | | | |
Dividends from net investment income | | | — | | | | — | | | | — | | | | (.10 | ) | | | (.15 | ) |
Distributions | | | (1.57 | ) | | | (.27 | ) | | | (.13 | ) | | | — | | | | — | |
| | |
|
|
| |
|
|
| |
|
|
| |
|
|
| |
|
|
|
Total dividends and distributions | | | (1.57 | ) | | | (.27 | ) | | | (.13 | ) | | | (.10 | ) | | | (.15 | ) |
| | |
|
|
| |
|
|
| |
|
|
| |
|
|
| |
|
|
|
Net Asset Value, end of year | | $ | 13.07 | | | $ | 24.62 | | | $ | 22.53 | | | $ | 18.96 | | | $ | 16.43 | |
| | |
|
|
| |
|
|
| |
|
|
| |
|
|
| |
|
|
|
Total Return(a) | | | (42.92 | )% | | | 10.48 | % | | | 19.65 | % | | | 16.06 | % | | | 9.59 | % |
Ratios/Supplemental Data: | | | | | | | | | | | | | | | | | | | | |
Net assets, end of year (in millions) | | $ | 512.7 | | | $ | 985.0 | | | $ | 932.9 | | | $ | 814.1 | | | $ | 691.1 | |
Ratios to average net assets(b): | | | | | | | | | | | | | | | | | | | | |
Expenses | | | .84 | % | | | .81 | % | | | .84 | % | | | .82 | % | | | .84 | % |
Net investment income | | | 2.01 | % | | | 1.43 | % | | | 1.24 | % | | | .77 | % | | | .67 | % |
Portfolio turnover rate | | | 65 | % | | | 48 | % | | | 50 | % | | | 155 | % | | | 128 | % |
| (a) | Total return is calculated assuming a purchase of a share on the first day and a sale on the last day of each year reported and includes reinvestment of dividends and distributions and does not reflect the effect of insurance contract charges. Total return does not reflect expenses associated with the separate account such as administrative fees, account charges and surrender charges which, if reflected, would reduce the total returns for all years shown. Performance figures may reflect fee waivers and/or expense reimbursements. In the absence of fee waivers and/or expense reimbursements, the total return would be lower. Past performance is no guarantee of future results. Total returns may reflect adjustments to conform to generally accepted accounting principles. |
| (b) | Does not include expenses of the underlying portfolio in which the Portfolio invests. |
SEE NOTES TO FINANCIAL STATEMENTS.
C3
Financial Highlights
| | | | | | | | | | | | | | | | | | | | |
| | | Government Income Portfolio
| |
| | | Year Ended December 31,
| |
| | | 2008
| | | 2007
| | | 2006
| | | 2005
| | | 2004
| |
Per Share Operating Performance: | | | | | | | | | | | | | | | | | | | | |
Net Asset Value, beginning of year | | $ | 11.38 | | | $ | 11.26 | | | $ | 11.40 | | | $ | 11.65 | | | $ | 11.92 | |
| | |
|
|
| |
|
|
| |
|
|
| |
|
|
| |
|
|
|
Income From Investment Operations: | | | | | | | | | | | | | | | | | | | | |
Net investment income | | | .45 | | | | .53 | | | | .54 | | | | .49 | | | | .49 | |
Net realized and unrealized gain (loss) on investments | | | .03 | | | | .10 | | | | (.13 | ) | | | (.20 | ) | | | (.13 | ) |
| | |
|
|
| |
|
|
| |
|
|
| |
|
|
| |
|
|
|
Total from investment operations | | | .48 | | | | .63 | | | | .41 | | | | .29 | | | | .36 | |
| | |
|
|
| |
|
|
| |
|
|
| |
|
|
| |
|
|
|
Less Dividends and Distributions: | | | | | | | | | | | | | | | | | | | | |
Dividends from net investment income | | | — | | | | — | | | | — | | | | (.54 | ) | | | (.44 | ) |
Distributions from net realized gains | | | — | | | | — | | | | — | | | | — | | | | (.19 | ) |
Distributions | | | (.46 | ) | | | (.51 | ) | | | (.55 | ) | | | — | | | | — | |
| | |
|
|
| |
|
|
| |
|
|
| |
|
|
| |
|
|
|
Total dividends and distributions | | | (.46 | ) | | | (.51 | ) | | | (.55 | ) | | | (.54 | ) | | | (.63 | ) |
| | |
|
|
| |
|
|
| |
|
|
| |
|
|
| |
|
|
|
Net Asset Value, end of year | | $ | 11.40 | | | $ | 11.38 | | | $ | 11.26 | | | $ | 11.40 | | | $ | 11.65 | |
| | |
|
|
| |
|
|
| |
|
|
| |
|
|
| |
|
|
|
Total Return(a) | | | 4.30 | % | | | 5.70 | % | | | 3.74 | % | | | 2.51 | % | | | 3.12 | % |
Ratios/Supplemental Data: | | | | | | | | | | | | | | | | | | | | |
Net assets, end of year (in millions) | | $ | 370.5 | | | $ | 340.3 | | | $ | 354.3 | | | $ | 378.2 | | | $ | 420.2 | |
Ratios to average net assets(b): | | | | | | | | | | | | | | | | | | | | |
Expenses | | | .52 | %(c) | | | .52 | % | | | .50 | % | | | .47 | % | | | .47 | % |
Net investment income | | | 3.98 | %(c) | | | 4.62 | % | | | 4.75 | % | | | 4.16 | % | | | 4.07 | % |
Portfolio turnover rate | | | 2707 | % | | | 2377 | % | | | 734 | % | | | 507 | % | | | 617 | % |
| (a) | Total return is calculated assuming a purchase of a share on the first day and a sale on the last day of each year reported and includes reinvestment of dividends and distributions and does not reflect the effect of insurance contract charges. Total return does not reflect expenses associated with the separate account such as administrative fees, account charges and surrender charges which, if reflected, would reduce the total returns for all years shown. Performance figures may reflect fee waivers and/or expense reimbursements. In the absence of fee waivers and/or expense reimbursements, the total return would be lower. Past performance is no guarantee of future results. Total returns may reflect adjustments to conform to generally accepted accounting principles. |
| (b) | Does not include expenses of the underlying portfolios in which the Portfolio invests. |
| (c) | Includes interest expense of 0.03%. |
| | | | | | | | | | | | | | | | | | | | |
| | | High Yield Bond Portfolio
| |
| | | Year Ended December 31,
| |
| | | 2008
| | | 2007
| | | 2006
| | | 2005
| | | 2004
| |
Per Share Operating Performance: | | | | | | | | | | | | | | | | | | | | |
Net Asset Value, beginning of year | | $ | 5.09 | | | $ | 5.33 | | | $ | 5.23 | | | $ | 5.42 | | | $ | 5.29 | |
| | |
|
|
| |
|
|
| |
|
|
| |
|
|
| |
|
|
|
Income (Loss) From Investment Operations: | | | | | | | | | | | | | | | | | | | | |
Net investment income | | | .41 | | | | .40 | | | | .39 | | | | .38 | | | | .39 | |
Net realized and unrealized gain (loss) on investments | | | (1.48 | ) | | | (.26 | ) | | | .13 | | | | (.20 | ) | | | .13 | |
| | |
|
|
| |
|
|
| |
|
|
| |
|
|
| |
|
|
|
Total from investment operations | | | (1.07 | ) | | | .14 | | | | .52 | | | | .18 | | | | .52 | |
| | |
|
|
| |
|
|
| |
|
|
| |
|
|
| |
|
|
|
Less Dividends and Distributions: | | | | | | | | | | | | | | | | | | | | |
Dividends from net investment income | | | — | | | | — | | | | — | | | | (.37 | ) | | | (.39 | ) |
Distributions | | | (.41 | ) | | | (.38 | ) | | | (.42 | ) | | | — | | | | — | |
| | |
|
|
| |
|
|
| |
|
|
| |
|
|
| |
|
|
|
Total dividends and distributions | | | (.41 | ) | | | (.38 | ) | | | (.42 | ) | | | (.37 | ) | | | (.39 | ) |
| | |
|
|
| |
|
|
| |
|
|
| |
|
|
| |
|
|
|
Net Asset Value, end of year | | $ | 3.61 | | | $ | 5.09 | | | $ | 5.33 | | | $ | 5.23 | | | $ | 5.42 | |
| | |
|
|
| |
|
|
| |
|
|
| |
|
|
| |
|
|
|
Total Return(a): | | | (22.28 | )% | | | 2.62 | % | | | 10.25 | % | | | 3.41 | % | | | 10.30 | % |
Ratios/Supplemental Data: | | | | | | | | | | | | | | | | | | | | |
Net assets, end of year (in millions) | | $ | 1,239.9 | | | $ | 1,674.0 | | | $ | 1,721.1 | | | $ | 1,635.7 | | | $ | 1,595.7 | |
Ratios to average net assets(b): | | | | | | | | | | | | | | | | | | | | |
Expenses | | | .58 | % | | | .58 | % | | | .58 | % | | | .58 | % | | | .59 | % |
Net investment income | | | 8.78 | % | | | 7.49 | % | | | 7.39 | % | | | 7.14 | % | | | 7.42 | % |
Portfolio turnover rate | | | 61 | % | | | 58 | % | | | 49 | % | | | 56 | % | | | 65 | % |
| (a) | Total return is calculated assuming a purchase of a share on the first day and a sale on the last day of each year reported and includes reinvestment of dividends and distributions and does not reflect the effect of insurance contract charges. Total return does not reflect expenses associated with the separate account such as administrative fees, account charges and surrender charges which, if reflected, would reduce the total returns for all years shown. Performance figures may reflect fee waivers and/or expense reimbursements. In the absence of fee waivers and/or expense reimbursements, the total return would be lower. Past performance is no guarantee of future results. Total returns may reflect adjustments to conform to generally accepted accounting principles. |
| (b) | Does not include expenses of the underlying portfolios in which the Portfolio invests. |
SEE NOTES TO FINANCIAL STATEMENTS.
C4
Financial Highlights
| | | | | | | | | | | | | | | | | | | | |
| | | Jennison Portfolio
| |
| | | Class I
| |
| | | Year Ended December 31,
| |
| | | 2008(c)
| | | 2007
| | | 2006(c)
| | | 2005(c)
| | | 2004
| |
Per Share Operating Performance: | | | | | | | | | | | | | | | | | | | | |
Net Asset Value, beginning of year | | $ | 23.53 | | | $ | 21.07 | | | $ | 20.76 | | | $ | 18.14 | | | $ | 16.62 | |
| | |
|
|
| |
|
|
| |
|
|
| |
|
|
| |
|
|
|
Income (Loss) From Investment Operations: | | | | | | | | | | | | | | | | | | | | |
Net investment income | | | .10 | | | | .10 | | | | .06 | | | | .02 | | | | .08 | |
Net realized and unrealized gain (loss) on investments | | | (8.84 | ) | | | 2.43 | | | | .31 | | | | 2.62 | | | | 1.52 | |
| | |
|
|
| |
|
|
| |
|
|
| |
|
|
| |
|
|
|
Total from investment operations | | | (8.74 | ) | | | 2.53 | | | | .37 | | | | 2.64 | | | | 1.60 | |
| | |
|
|
| |
|
|
| |
|
|
| |
|
|
| |
|
|
|
Less Dividends and Distributions: | | | | | | | | | | | | | | | | | | | | |
Dividends from net investment income | | | — | | | | — | | | | — | | | | (.02 | ) | | | (.08 | ) |
Distributions | | | (.10 | ) | | | (.07 | ) | | | (.06 | ) | | | — | | | | — | |
| | |
|
|
| |
|
|
| |
|
|
| |
|
|
| |
|
|
|
Total dividends and distributions | | | (.10 | ) | | | (.07 | ) | | | (.06 | ) | | | (.02 | ) | | | (.08 | ) |
| | |
|
|
| |
|
|
| |
|
|
| |
|
|
| |
|
|
|
Net Asset Value, end of year | | $ | 14.69 | | | $ | 23.53 | | | $ | 21.07 | | | $ | 20.76 | | | $ | 18.14 | |
| | |
|
|
| |
|
|
| |
|
|
| |
|
|
| |
|
|
|
Total Return(a) | | | (37.28 | )% | | | 12.00 | % | | | 1.79 | % | | | 14.55 | % | | | 9.63 | % |
Ratios/Supplemental Data: | | | | | | | | | | | | | | | | | | | | |
Net assets, end of year (in millions) | | $ | 1,148.0 | | | $ | 2,100.5 | | | $ | 2,077.3 | | | $ | 2,297.0 | | | $ | 2,044.1 | |
Ratios to average net assets(b): | | | | | | | | | | | | | | | | | | | | |
Expenses | | | .63 | % | | | .62 | % | | | .63 | % | | | .63 | % | | | .64 | % |
Net investment income | | | .52 | % | | | .42 | % | | | .29 | % | | | .10 | % | | | .50 | % |
Portfolio turnover rate | | | 74 | % | | | 69 | % | | | 67 | % | | | 57 | % | | | 74 | % |
| (a) | Total return is calculated assuming a purchase of a share on the first day and a sale on the last day of each year reported and includes reinvestment of dividends and distributions and does not reflect the effect of insurance contract charges. Total return does not reflect expenses associated with the separate account such as administrative fees, account charges and surrender charges which, if reflected, would reduce the total returns for all years shown. Performance figures may reflect fee waivers and/or expense reimbursements. In the absence of fee waivers and/or expense reimbursements, the total return would be lower. Past performance is no guarantee of future results. Total returns may reflect adjustments to conform to generally accepted accounting principles. |
| (b) | Does not include expenses of the underlying portfolio in which the Portfolio invests. |
| (c) | Calculated based upon average shares outstanding during the year. |
| | | | | | | | | | | | | | | | | | | | |
| | | Jennison Portfolio
| |
| | | Class II
| |
| | | Year Ended December 31,
| |
| | | 2008(d)
| | | 2007
| | | 2006(d)
| | | 2005(d)
| | | 2004
| |
Per Share Operating Performance: | | | | | | | | | | | | | | | | | | | | |
Net Asset Value, beginning of year | | $ | 23.17 | | | $ | 20.77 | | | $ | 20.49 | | | $ | 17.97 | | | $ | 16.46 | |
| | |
|
|
| |
|
|
| |
|
|
| |
|
|
| |
|
|
|
Income (Loss) From Investment Operations: | | | | | | | | | | | | | | | | | | | | |
Net investment income (loss) | | | .02 | | | | — | (c) | | | (.02 | ) | | | (.05 | ) | | | .02 | |
Net realized and unrealized gain (loss) on investments | | | (8.72 | ) | | | 2.40 | | | | .30 | | | | 2.57 | | | | 1.50 | |
| | |
|
|
| |
|
|
| |
|
|
| |
|
|
| |
|
|
|
Total from investment operations | | | (8.70 | ) | | | 2.40 | | | | .28 | | | | 2.52 | | | | 1.52 | |
| | |
|
|
| |
|
|
| |
|
|
| |
|
|
| |
|
|
|
Less Dividends and Distributions: | | | | | | | | | | | | | | | | | | | | |
Dividends from net investment income | | | — | | | | — | | | | — | | | | — | | | | (.01 | ) |
Distributions | | | (.01 | ) | | | — | | | | — | | | | — | | | | — | |
| | |
|
|
| |
|
|
| |
|
|
| |
|
|
| |
|
|
|
Total dividends and distributions | | | (.01 | ) | | | — | | | | — | | | | — | | | | (.01 | ) |
| | |
|
|
| |
|
|
| |
|
|
| |
|
|
| |
|
|
|
Net Asset Value, end of year | | $ | 14.46 | | | $ | 23.17 | | | $ | 20.77 | | | $ | 20.49 | | | $ | 17.97 | |
| | |
|
|
| |
|
|
| |
|
|
| |
|
|
| |
|
|
|
Total Return(a) | | | (37.55 | )% | | | 11.56 | % | | | 1.37 | % | | | 14.02 | % | | | 9.22 | % |
Ratios/Supplemental Data: | | | | | | | | | | | | | | | | | | | | |
Net assets, end of year (in millions) | | $ | 12.2 | | | $ | 21.9 | | | $ | 19.6 | | | $ | 18.2 | | | $ | 84.9 | |
Ratios to average net assets(b): | | | | | | | | | | | | | | | | | | | | |
Expenses | | | 1.03 | % | | | 1.02 | % | | | 1.03 | % | | | 1.03 | % | | | 1.04 | % |
Net investment income (loss) | | | .12 | % | | | .02 | % | | | (.12 | )% | | | (.27 | )% | | | .11 | % |
Portfolio turnover rate | | | 74 | % | | | 69 | % | | | 67 | % | | | 57 | % | | | 74 | % |
| (a) | Total return is calculated assuming a purchase of a share on the first day and a sale on the last day of each year reported and includes reinvestment of dividends and distributions and does not reflect the effect of insurance contract charges. Total return does not reflect expenses associated with the separate account such as administrative fees, account charges and surrender charges which, if reflected, would reduce the total returns for all years shown. Performance figures may reflect fee waivers and/or expense reimbursements. In the absence of fee waivers and/or expense reimbursements, the total return would be lower. Past performance is no guarantee of future results. Total returns may reflect adjustments to conform to generally accepted accounting principles. |
| (b) | Does not include expenses of the underlying portfolio in which the Portfolio invests. |
| (c) | Less than $.005 per share. |
| (d) | Calculated based upon average shares outstanding during the year. |
SEE NOTES TO FINANCIAL STATEMENTS.
C5
Financial Highlights
| | | | | | | | | | | | | | | | | | | | |
| | | Money Market Portfolio
| |
| | | Year Ended December 31,
| |
| | | 2008
| | | 2007
| | | 2006
| | | 2005
| | | 2004
| |
Per Share Operating Performance: | | | | | | | | | | | | | | | | | | | | |
Net Asset Value, beginning of year | | $ | 10.00 | | | $ | 10.00 | | | $ | 10.00 | | | $ | 10.00 | | | $ | 10.00 | |
| | |
|
|
| |
|
|
| |
|
|
| |
|
|
| |
|
|
|
Income From Investment Operations: | | | | | | | | | | | | | | | | | | | | |
Net investment income and realized gains | | | .26 | | | | .49 | | | | .46 | | | | .28 | | | | .10 | |
Dividends and distributions | | | — | | | | — | | | | — | | | | (.28 | ) | | | (.10 | ) |
Distributions | | | (.26 | ) | | | (.49 | ) | | | (.46 | ) | | | — | | | | — | |
| | |
|
|
| |
|
|
| |
|
|
| |
|
|
| |
|
|
|
Net Asset Value, end of year | | $ | 10.00 | | | $ | 10.00 | | | $ | 10.00 | | | $ | 10.00 | | | $ | 10.00 | |
| | |
|
|
| |
|
|
| |
|
|
| |
|
|
| |
|
|
|
Total Return(a) | | | 2.65 | % | | | 5.06 | % | | | 4.74 | % | | | 2.85 | % | | | 1.01 | % |
Ratios/Supplemental Data: | | | | | | | | | | | | | | | | | | | | |
Net assets, end of year (in millions) | | $ | 1,489.8 | | | $ | 1,289.9 | | | $ | 1,060.5 | | | $ | 851.9 | | | $ | 885.4 | |
Ratios to average net assets: | | | | | | | | | | | | | | | | | | | | |
Expenses | | | .43 | % | | | .43 | % | | | .43 | % | | | .45 | % | | | .45 | % |
Net investment income | | | 2.59 | % | | | 4.94 | % | | | 4.68 | % | | | 2.86 | % | | | 1.01 | % |
| (a) | Total return is calculated assuming a purchase of a share on the first day and a sale on the last day of each year reported and includes reinvestment of dividends and distributions and does not reflect the effect of insurance contract charges. Total return does not reflect expenses associated with the separate account such as administrative fees, account charges and surrender charges which, if reflected, would reduce the total returns for all years shown. Performance figures may reflect fee waivers and/or expense reimbursements. In the absense of fee waivers and /or expense reimbursements, the total return would be lower. Past performance is no guarantee of future results. Total returns may reflect adjustments to conform to generally accepted accounting principles. |
SEE NOTES TO FINANCIAL STATEMENTS.
C6
Financial Highlights
| | | | | | | | | | | | | | | | | | | | |
| | | Natural Resources Portfolio
| |
| | | Class I
| |
| | | Year Ended December 31,
| |
| | | 2008(a)
| | | 2007(a)
| | | 2006(a)
| | | 2005
| | | 2004
| |
Per Share Operating Performance: | | | | | | | | | | | | | | | | | | | | |
Net Asset Value, beginning of year | | $ | 56.28 | | | $ | 45.67 | | | $ | 45.46 | | | $ | 31.88 | | | $ | 27.49 | |
| | |
|
|
| |
|
|
| |
|
|
| |
|
|
| |
|
|
|
Income (Loss) From Investment Operations: | | | | | | | | | | | | | | | | | | | | |
Net investment income | | | .22 | | | | .43 | | | | .35 | | | | .33 | | | | .19 | |
Net realized and unrealized gain (loss) on investments | | | (25.97 | ) | | | 21.09 | | | | 8.65 | | | | 16.27 | | | | 6.28 | |
| | |
|
|
| |
|
|
| |
|
|
| |
|
|
| |
|
|
|
Total from investment operations | | | (25.75 | ) | | | 21.52 | | | | 9.00 | | | | 16.60 | | | | 6.47 | |
| | |
|
|
| |
|
|
| |
|
|
| |
|
|
| |
|
|
|
Less Dividends and Distributions: | | | | | | | | | | | | | | | | | | | | |
Dividends from net investment income | | | — | | | | — | | | | — | | | | — | (c) | | | (1.00 | ) |
Distributions from net realized gains | | | — | | | | — | | | | — | | | | (3.02 | ) | | | (1.08 | ) |
Distributions | | | (6.83 | ) | | | (10.91 | ) | | | (8.79 | ) | | | — | | | | — | |
| | |
|
|
| |
|
|
| |
|
|
| |
|
|
| |
|
|
|
Total dividends and distributions | | | (6.83 | ) | | | (10.91 | ) | | | (8.79 | ) | | | (3.02 | ) | | | (2.08 | ) |
| | |
|
|
| |
|
|
| |
|
|
| |
|
|
| |
|
|
|
Net Asset Value, end of year | | $ | 23.70 | | | $ | 56.28 | | | $ | 45.67 | | | $ | 45.46 | | | $ | 31.88 | |
| | |
|
|
| |
|
|
| |
|
|
| |
|
|
| |
|
|
|
Total Return(d) | | | (53.00 | )% | | | 48.30 | % | | | 22.20 | % | | | 55.91 | % | | | 25.17 | % |
Ratios/Supplemental Data: | | | | | | | | | | | | | | | | | | | | |
Net assets, end of year (in millions) | | $ | 677.4 | | | $ | 1,669.9 | | | $ | 1,193.0 | | | $ | 1,016.3 | | | $ | 622.6 | |
Ratios to average net assets(b): | | | | | | | | | | | | | | | | | | | | |
Expenses | | | .50 | % | | | .48 | % | | | .49 | % | | | .49 | % | | | .51 | % |
Net investment income | | | .47 | % | | | .80 | % | | | .78 | % | | | .66 | % | | | .49 | % |
Portfolio turnover rate | | | 40 | % | | | 39 | % | | | 58 | % | | | 59 | % | | | 24 | % |
| (a) | Calculated based upon average shares outstanding during the year. |
| (b) | Does not include expenses of the underlying portfolio in which the Portfolio invests. |
| (c) | Amount is less than $0.005 per share. |
| (d) | Total return is calculated assuming a purchase of a share on the first day and a sale on the last day of each year reported and includes reinvestment of dividends and distributions and does not reflect the effect of insurance contract charges. Total return does not reflect expenses associated with the separate account such as administrative fees, account charges and surrender charges which, if reflected, would reduce the total returns for all periods shown. Performance figures may reflect fee waivers and/or expense reimbursements. In the absence of fee waivers and/or expense reimbursements, the total return would be lower. Past performance is no guarantee of future results. Total returns may reflect adjustments to conform to generally accepted accounting principles. |
| | | | | | | | | | | | | | | | |
| | | Natural Resources Portfolio
| |
| | | Class II
| |
| | | Year Ended
December 31,
| | | April 28, 2005(c)
through
December 31, 2005
| |
| | | 2008(a)
| | | 2007(a)
| | | 2006(a)
| | |
Per Share Operating Performance: | | | | | | | | | | | | | | | | |
Net Asset Value, beginning of period | | $ | 55.92 | | | $ | 45.55 | | | $ | 45.32 | | | $ | 30.10 | |
| | |
|
|
| |
|
|
| |
|
|
| |
|
|
|
Income (Loss) From Investment Operations: | | | | | | | | | | | | | | | | |
Net investment income | | | .05 | | | | .28 | | | | .18 | | | | .05 | |
Net realized and unrealized gain (loss) on investments | | | (25.86 | ) | | | 20.92 | | | | 8.64 | | | | 15.17 | |
| | |
|
|
| |
|
|
| |
|
|
| |
|
|
|
Total from investment operations | | | (25.81 | ) | | | 21.20 | | | | 8.82 | | | | 15.22 | |
| | |
|
|
| |
|
|
| |
|
|
| |
|
|
|
Less Distributions: | | | | | | | | | | | | | | | | |
Distributions | | | (6.57 | ) | | | (10.83 | ) | | | (8.59 | ) | | | — | |
| | |
|
|
| |
|
|
| |
|
|
| |
|
|
|
Net Asset Value, end of period | | $ | 23.54 | | | $ | 55.92 | | | $ | 45.55 | | | $ | 45.32 | |
| | |
|
|
| |
|
|
| |
|
|
| |
|
|
|
Total Return(d) | | | (53.19 | )% | | | 47.70 | % | | | 21.72 | % | | | 50.56 | %(f) |
Ratios/Supplemental Data: | | | | | | | | | | | | | | | | |
Net assets, end of period (in millions) | | $ | 42.3 | | | $ | 47.9 | | | $ | 16.9 | | | $ | 5.1 | |
Ratios to average net assets(b): | | | | | | | | | | | | | | | | |
Expenses | | | .90 | % | | | .88 | % | | | .89 | % | | | .89 | %(e) |
Net investment income | | | .12 | % | | | .51 | % | | | .40 | % | | | .33 | %(e) |
Portfolio turnover rate | | | 40 | % | | | 39 | % | | | 58 | % | | | 59 | %(f) |
| (a) | Calculated based upon average shares outstanding during the year. |
| (b) | Does not include expenses of the underlying portfolio in which the Portfolio invests. |
| (c) | Commencement of offering of Class II shares. |
| (d) | Total return is calculated assuming a purchase of a share on the first day and a sale on the last day of each period reported and includes reinvestment of dividends and distributions and does not reflect the effect of insurance contract charges. Total return does not reflect expenses associated with the separate account such as administrative fees, account charges and surrender charges which, if reflected, would reduce the total returns for all periods shown. Performance figures may reflect fee waivers and/or expense reimbursements. In the absence of fee waivers and/or expense reimbursements, the total return would be lower. Past performance is no guarantee of future results. Total returns may reflect adjustments to conform to generally accepted accounting principles. Total returns for periods less than one full year are not annualized. |
SEE NOTES TO FINANCIAL STATEMENTS.
C7
Financial Highlights
| | | | | | | | | | | | | | | | | | | | |
| | | Small Capitalization Stock Portfolio
| |
| | | Year Ended December 31,
| |
| | | 2008
| | | 2007
| | | 2006
| | | 2005
| | | 2004
| |
Per Share Operating Performance: | | | | | | | | | | | | | | | | | | | | |
Net Asset Value, beginning of year | | $ | 21.31 | | | $ | 23.29 | | | $ | 21.38 | | | $ | 21.33 | | | $ | 17.64 | |
| | |
|
|
| |
|
|
| |
|
|
| |
|
|
| |
|
|
|
Income (Loss) From Investment Operations: | | | | | | | | | | | | | | | | | | | | |
Net investment income | | | .24 | | | | .21 | | | | .14 | | | | .13 | | | | .12 | |
Net realized and unrealized gain (loss) on investments | | | (5.92 | ) | | | (.36 | ) | | | 2.95 | | | | 1.30 | | | | 3.75 | |
| | |
|
|
| |
|
|
| |
|
|
| |
|
|
| |
|
|
|
Total from investment operations | | | (5.68 | ) | | | (.15 | ) | | | 3.09 | | | | 1.43 | | | | 3.87 | |
| | |
|
|
| |
|
|
| |
|
|
| |
|
|
| |
|
|
|
Less Dividends and Distributions: | | | | | | | | | | | | | | | | | | | | |
Dividends from net investment income | | | — | | | | — | | | | — | | | | (.13 | ) | | | (.11 | ) |
Distributions from net realized gains | | | — | | | | — | | | | — | | | | (1.25 | ) | | | (.07 | ) |
Distributions | | | (3.11 | ) | | | (1.83 | ) | | | (1.18 | ) | | | — | | | | — | |
| | |
|
|
| |
|
|
| |
|
|
| |
|
|
| |
|
|
|
Total dividends and distributions | | | (3.11 | ) | | | (1.83 | ) | | | (1.18 | ) | | | (1.38 | ) | | | (.18 | ) |
| | |
|
|
| |
|
|
| |
|
|
| |
|
|
| |
|
|
|
Net Asset Value, end of year | | $ | 12.52 | | | $ | 21.31 | | | $ | 23.29 | | | $ | 21.38 | | | $ | 21.33 | |
| | |
|
|
| |
|
|
| |
|
|
| |
|
|
| |
|
|
|
Total Return(a) | | | (31.04 | )% | | | (.53 | )% | | | 14.67 | % | | | 7.26 | % | | | 22.04 | % |
Ratios/Supplemental Data: | | | | | | | | | | | | | | | | | | | | |
Net assets, end of year (in millions) | | $ | 432.5 | | | $ | 699.6 | | | $ | 777.1 | | | $ | 738.3 | | | $ | 743.2 | |
Ratios to average net assets(b): | | | | | | | | | | | | | | | | | | | | |
Expenses | | | .47 | % | | | .46 | % | | | .45 | % | | | .46 | % | | | .47 | % |
Net investment income | | | 1.33 | % | | | .86 | % | | | .59 | % | | | .62 | % | | | .62 | % |
Portfolio turnover rate | | | 25 | % | | | 16 | % | | | 12 | % | | | 16 | % | | | 18 | % |
| (a) | Total return is calculated assuming a purchase of a share on the first day and a sale on the last day of each year reported and includes reinvestment of dividends and distributions and does not reflect the effect of insurance contract charges. Total return does not reflect expenses associated with the separate account such as administrative fees, account charges and surrender charges which, if reflected, would reduce the total returns for all years shown. Performance figures may reflect fee waivers and/or expense reimbursements. In the absence of fee waivers and/or expense reimbursements, the total return would be lower. Past performance is no guarantee of future results. Total returns may reflect adjustments to conform to generally accepted accounting principles. |
| (b) | Does not include expenses of the underlying portfolio in which the Portfolio invests. |
| | | | | | | | | | | | | | | | | | | | |
| | | Stock Index Portfolio
| |
| | | Year Ended December 31,
| |
| | | 2008
| | | 2007
| | | 2006
| | | 2005
| | | 2004
| |
Per Share Operating Performance: | | | | | | | | | | | | | | | | | | | | |
Net Asset Value, beginning of year | | $ | 36.84 | | | $ | 35.64 | | | $ | 31.41 | | | $ | 31.29 | | | $ | 29.29 | |
| | |
|
|
| |
|
|
| |
|
|
| |
|
|
| |
|
|
|
Income (Loss) From Investment Operations: | | | | | | | | | | | | | | | | | | | | |
Net investment income | | | .64 | | | | .68 | | | | .56 | | | | .48 | | | | .50 | |
Net realized and unrealized gain (loss) on investments | | | (14.02 | ) | | | 1.14 | | | | 4.31 | | | | .88 | | | | 2.50 | |
| | |
|
|
| |
|
|
| |
|
|
| |
|
|
| |
|
|
|
Total from investment operations | | | (13.38 | ) | | | 1.82 | | | | 4.87 | | | | 1.36 | | | | 3.00 | |
| | |
|
|
| |
|
|
| |
|
|
| |
|
|
| |
|
|
|
Less Dividends and Distributions: | | | | | | | | | | | | | | | | | | | | |
Dividends from net investment income | | | — | | | | — | | | | — | | | | (.47 | ) | | | (.49 | ) |
Distributions from net realized gains | | | — | | | | — | | | | — | | | | (.77 | ) | | | (.51 | ) |
Distributions | | | (.70 | ) | | | (.62 | ) | | | (.64 | ) | | | — | | | | — | |
| | |
|
|
| |
|
|
| |
|
|
| |
|
|
| |
|
|
|
Total dividends and distributions | | | (.70 | ) | | | (.62 | ) | | | (.64 | ) | | | (1.24 | ) | | | (1.00 | ) |
| | |
|
|
| |
|
|
| |
|
|
| |
|
|
| |
|
|
|
Net Asset Value, end of year | | $ | 22.76 | | | $ | 36.84 | | | $ | 35.64 | | | $ | 31.41 | | | $ | 31.29 | |
| | |
|
|
| |
|
|
| |
|
|
| |
|
|
| |
|
|
|
Total Return(a) | | | (36.94 | )% | | | 5.10 | % | | | 15.54 | % | | | 4.54 | % | | | 10.45 | % |
Ratios/Supplemental Data: | | | | | | | | | | | | | | | | | | | | |
Net assets, end of year (in millions) | | $ | 1,815.8 | | | $ | 3,122.4 | | | $ | 3,306.4 | | | $ | 3,212.7 | | | $ | 3,094.7 | |
Ratios to average net assets(b): | | | | | | | | | | | | | | | | | | | | |
Expenses | | | .37 | % | | | .37 | % | | | .37 | % | | | .38 | % | | | .38 | % |
Net investment income | | | 2.04 | % | | | 1.73 | % | | | 1.61 | % | | | 1.52 | % | | | 1.64 | % |
Portfolio turnover rate | | | 4 | % | | | 3 | % | | | 3 | % | | | 7 | % | | | 3 | % |
| (a) | Total return is calculated assuming a purchase of a share on the first day and a sale on the last day of each year reported and includes reinvestment of dividends and distributions and does not reflect the effect of insurance contract charges. Total return does not reflect expenses associated with the separate account such as administrative fees, account charges and surrender charges which, if reflected, would reduce the total returns for all years shown. Performance figures may reflect fee waivers and/or expense reimbursements. In the absence of fee waivers and/or expense reimbursements, the total return would be lower. Past performance is no guarantee of future results. Total returns may reflect adjustments to conform to generally accepted accounting principles. |
| (b) | Does not include expenses of the underlying portfolio in which the Portfolio invests. |
SEE NOTES TO FINANCIAL STATEMENTS.
C8
Financial Highlights
| | | | | | | | | | | | | | | | | | | | |
| | | Value Portfolio
| |
| | | Class I
| |
| | | Year Ended December 31,
| |
| | | 2008
| | | 2007
| | | 2006
| | | 2005
| | | 2004
| |
Per Share Operating Performance: | | | | | | | | | | | | | | | | | | | | |
Net Asset Value, beginning of year | | $ | 23.44 | | | $ | 26.21 | | | $ | 22.95 | | | $ | 19.93 | | | $ | 17.36 | |
| | |
|
|
| |
|
|
| |
|
|
| |
|
|
| |
|
|
|
Income (Loss) From Investment Operations: | | | | | | | | | | | | | | | | | | | | |
Net investment income | | | .30 | | | | .39 | | | | .36 | | | | .29 | | | | .28 | |
Net realized and unrealized gain (loss) on investments | | | (8.36 | ) | | | .42 | | | | 4.11 | | | | 3.03 | | | | 2.55 | |
| | |
|
|
| |
|
|
| |
|
|
| |
|
|
| |
|
|
|
Total from investment operations | | | (8.06 | ) | | | .81 | | | | 4.47 | | | | 3.32 | | | | 2.83 | |
| | |
|
|
| |
|
|
| |
|
|
| |
|
|
| |
|
|
|
Less Dividends and Distributions: | | | | | | | | | | | | | | | | | | | | |
Dividends from net investment income | | | — | | | | — | | | | — | | | | (.30 | ) | | | (.26 | ) |
Distributions | | | (4.52 | ) | | | (3.58 | ) | | | (1.21 | ) | | | — | | | | — | |
| | |
|
|
| |
|
|
| |
|
|
| |
|
|
| |
|
|
|
Total dividends and distributions | | | (4.52 | ) | | | (3.58 | ) | | | (1.21 | ) | | | (.30 | ) | | | (.26 | ) |
| | |
|
|
| |
|
|
| |
|
|
| |
|
|
| |
|
|
|
Net Asset Value, end of year | | $ | 10.86 | | | $ | 23.44 | | | $ | 26.21 | | | $ | 22.95 | | | $ | 19.93 | |
| | |
|
|
| |
|
|
| |
|
|
| |
|
|
| |
|
|
|
Total Return(a) | | | (42.29 | )% | | | 3.19 | % | | | 19.94 | % | | | 16.66 | % | | | 16.31 | % |
Ratios/Supplemental Data: | | | | | | | | | | | | | | | | | | | | |
Net assets, end of year (in millions) | | $ | 933.1 | | | $ | 1,824.9 | | | $ | 1,975.7 | | | $ | 1,750.1 | | | $ | 1,595.6 | |
Ratios to average net assets(b): | | | | | | | | | | | | | | | | | | | | |
Expenses | | | .43 | % | | | .43 | % | | | .43 | % | | | .43 | % | | | .44 | % |
Net investment income | | | 1.46 | % | | | 1.35 | % | | | 1.45 | % | | | 1.35 | % | | | 1.48 | % |
Portfolio turnover rate | | | 71 | % | | | 52 | % | | | 49 | % | | | 56 | % | | | 52 | % |
| (a) | Total return is calculated assuming a purchase of a share on the first day and a sale on the last day of each year reported and includes reinvestment of dividends and distributions and does not reflect the effect of insurance contract charges. Total return does not reflect expenses associated with the separate account such as administrative fees, account charges and surrender charges which, if reflected, would reduce the total returns for all years shown. Performance figures may reflect fee waivers and/or expense reimbursements. In the absence of fee waivers and/or expense reimbursements, the total return would be lower. Past performance is no guarantee of future results. Total returns may reflect adjustments to conform to generally accepted accounting principles. |
| (b) | Does not include expenses of the underlying portfolio in which the Portfolio invests. |
| | | | | | | | | | | | | | | | | | | | |
| | | Value Portfolio
| |
| | | Class II
| |
| | | Year Ended December 31,
| |
| | | 2008
| | | 2007
| | | 2006
| | | 2005
| | | 2004
| |
Per Share Operating Performance: | | | | | | | | | | | | | | | | | | | | |
Net Asset Value, beginning of year | | $ | 23.51 | | | $ | 26.26 | | | $ | 22.98 | | | $ | 19.94 | | | $ | 17.37 | |
| | |
|
|
| |
|
|
| |
|
|
| |
|
|
| |
|
|
|
Income (Loss) From Investment Operations: | | | | | | | | | | | | | | | | | | | | |
Net investment income | | | .21 | | | | .29 | | | | .27 | | | | .21 | | | | .20 | |
Net realized and unrealized gain (loss) on investments | | | (8.38 | ) | | | .42 | | | | 4.11 | | | | 3.01 | | | | 2.55 | |
| | |
|
|
| |
|
|
| |
|
|
| |
|
|
| |
|
|
|
Total from investment operations | | | (8.17 | ) | | | .71 | | | | 4.38 | | | | 3.22 | | | | 2.75 | |
| | |
|
|
| |
|
|
| |
|
|
| |
|
|
| |
|
|
|
Less Dividends and Distributions: | | | | | | | | | | | | | | | | | | | | |
Dividends from net investment income | | | — | | | | — | | | | — | | | | (.18 | ) | | | (.18 | ) |
Distributions | | | (4.43 | ) | | | (3.46 | ) | | | (1.10 | ) | | | — | | | | — | |
| | |
|
|
| |
|
|
| |
|
|
| |
|
|
| |
|
|
|
Total dividends and distributions | | | (4.43 | ) | | | (3.46 | ) | | | (1.10 | ) | | | (.18 | ) | | | (.18 | ) |
| | |
|
|
| |
|
|
| |
|
|
| |
|
|
| |
|
|
|
Net Asset Value, end of year | | $ | 10.91 | | | $ | 23.51 | | | $ | 26.26 | | | $ | 22.98 | | | $ | 19.94 | |
| | |
|
|
| |
|
|
| |
|
|
| |
|
|
| |
|
|
|
Total Return(a) | | | (42.56 | )% | | | 2.82 | % | | | 19.43 | % | | | 16.21 | % | | | 15.83 | % |
Ratios/Supplemental Data: | | | | | | | | | | | | | | | | | | | | |
Net assets, end of year (in millions) | | $ | 1.7 | | | $ | 2.7 | | | $ | 3.2 | | | $ | 3.1 | | | $ | 3.0 | |
Ratios to average net assets(b): | | | | | | | | | | | | | | | | | | | | |
Expenses | | | .83 | % | | | .83 | % | | | .83 | % | | | .83 | % | | | .84 | % |
Net investment income | | | 1.08 | % | | | .96 | % | | | 1.04 | % | | | .95 | % | | | 1.08 | % |
Portfolio turnover rate | | | 71 | % | | | 52 | % | | | 49 | % | | | 56 | % | | | 52 | % |
| (a) | Total return is calculated assuming a purchase of a share on the first day and a sale on the last day of each year reported and includes reinvestment of dividends and distributions and does not reflect the effect of insurance contract charges. Total return does not reflect expenses associated with the separate account such as administrative fees, account charges and surrender charges which, if reflected, would reduce the total returns for all years shown. Performance figures may reflect fee waivers and/or expense reimbursements. In the absence of fee waivers and/or expense reimbursements, the total return would be lower. Past performance is no guarantee of future results. Total returns may reflect adjustments to conform to generally accepted accounting principles. |
| (b) | Does not include expenses of the underlying portfolio in which the Portfolio invests. |
SEE NOTES TO FINANCIAL STATEMENTS.
C9
REPORT OF INDEPENDENT REGISTERED PUBLIC ACCOUNTING FIRM
THE BOARD OF TRUSTEES AND SHAREHOLDERS THE PRUDENTIAL SERIES FUND:
We have audited the accompanying statements of assets and liabilities of The Prudential Series Fund (comprised of Conservative Balanced Portfolio, Diversified Bond Portfolio, Equity Portfolio, Flexible Managed Portfolio, Global Portfolio, Government Income Portfolio, High Yield Bond Portfolio, Jennison Portfolio, Money Market Portfolio, Natural Resources Portfolio, Small Capitalization Stock Portfolio, Stock Index Portfolio and Value Portfolio, hereafter referred to as the “Funds”), including the portfolios of investments, as of December 31, 2008, and the related statements of operations for the year then ended, the statements of changes in net assets for each of the years in the two-year period then ended and the financial highlights for each of the years in the five-year period then ended. These financial statements and financial highlights are the responsibility of the Funds’ management. Our responsibility is to express an opinion on these financial statements and financial highlights based on our audits.
We conducted our audits in accordance with the standards of the Public Company Accounting Oversight Board (United States). Those standards require that we plan and perform the audit to obtain reasonable assurance about whether the financial statements and financial highlights are free of material misstatement. An audit includes examining, on a test basis, evidence supporting the amounts and disclosures in the financial statements. Our procedures included confirmation of securities owned as of December 31, 2008, by correspondence with the custodian, transfer agent and brokers or by other appropriate auditing procedures where replies from brokers were not received. An audit also includes assessing the accounting principles used and significant estimates made by management, as well as evaluating the overall financial statement presentation. We believe that our audits provide a reasonable basis for our opinion.
In our opinion, the financial statements and financial highlights referred to above present fairly, in all material respects, the financial position of the Funds as of December 31, 2008, and the results of their operations for the year then ended, the changes in their net assets for each of the years in the two-year period then ended and the financial highlights for each of the years in the five-year period then ended, in conformity with U.S. generally accepted accounting principles.

New York, New York
February 18, 2009
D1
INFORMATION ABOUT TRUSTEES AND OFFICERS (Unaudited)
Information about the Trustees and the Officers of the Fund is set forth below. Trustees who are not deemed to be “interested persons” of the Fund, as defined in the 1940 Act, are referred to as “Independent Trustees.” Trustees who are deemed to be “interested persons” of the Fund are referred to as “Interested Trustees.” The Trustees are responsible for the overall supervision of the operations of the Fund and perform the various duties imposed on the directors of investment companies by the 1940 Act.
| | | | |
Independent Trustees (1) |
Name, Address, Age No. of Portfolios Overseen | | Principal Occupation(s) During Past Five Years | | Other Directorships Held |
Saul K. Fenster, Ph.D. (75) No. of Portfolios Overseen: 86 | | Currently President Emeritus of New Jersey Institute of Technology (since 2002); formerly President (1978-2002) of New Jersey Institute of Technology; Commissioner (1998-2002) of the Middle States Association Commission on Higher Education; Commissioner (1985-2002) of the New Jersey Commission on Science and Technology; formerly Director (1998-2005) of Society of Manufacturing Engineering Education Foundation; formerly Director of Prosperity New Jersey; formerly a director or trustee of Liberty Science Center, Research and Development Council of New Jersey, New Jersey State Chamber of Commerce, and National Action Council for Minorities in Engineering. | | Member (since 2006), Board of The Ridgefield Foundation and The Leir Foundation. |
Delayne Dedrick Gold (70) No. of Portfolios Overseen: 86 | | Marketing Consultant (1982-present); formerly Senior Vice President and Member of the Board of Directors, Prudential Bache Securities, Inc. | | |
W. Scott McDonald, Jr. (71) No. of Portfolios Overseen: 86 | | Formerly Management Consultant (1997-2004) and of Counsel (2004-2005) at Kaludis Consulting Group, Inc. (company serving higher education); Formerly principal (1995-1997), Scott McDonald Associates; Chief Operating Officer (1991-1995), Fairleigh Dickinson University; Executive Vice President and Chief Operating Officer (1975-1991), Drew University; interim President (1988-1990), Drew University; formerly Director of School, College and University Underwriters Ltd. | | |
Thomas T. Mooney (67) No. of Portfolios Overseen: 86 | | Formerly Chief Executive Officer, Excell Partners, Inc.; formerly President of the Greater Rochester Metro Chamber of Commerce, Rochester City Manager; formerly Deputy Monroe County Executive. | | |
Thomas M. O’Brien (58) No. of Portfolios Overseen: 86 | | President and COO (since November 2006) and CEO (since April 2007) of State Bancorp, Inc. and State Bank; Vice Chairman (January 1997-April 2000) of North Fork Bank; President and Chief Executive Officer (December 1984-December 1996) of North Side Savings Bank; formerly President and Chief Executive Officer (May 2000-June 2006) Atlantic Bank of New York. | | Formerly Director (December 1996-May 2000) of North Fork Bancorporation, Inc.; Formerly Director (May 2000-April 2006) of Atlantic Bank of New York; Director (since November 2006) of State Bancorp, Inc. (NASDAQ: STBC) and State Bank of Long Island. |
F. Don Schwartz (73) No. of Portfolios Overseen: 86 | | Management Consultant (since April 1985). | | |
| | | | |
Interested Trustee (1) |
Robert F. Gunia (62) No. of Portfolios Overseen: 148 | | Chief Administrative Officer (since September 1999) and Executive Vice President (since December 1996) of Prudential Investments LLC; President (April 1999-December 2008) and Executive Vice President and Chief Operating Officer (since December 2008) of Prudential Investment Management Services LLC; Executive Vice President (since March 1999) and Treasurer (since May 2000) of Prudential Mutual Fund Services LLC; Chief Administrative Officer, Executive Vice President and Director (since May 2003) of AST Investment Services, Inc. | | Director (since May 1989) of The Asia Pacific Fund, Inc. |
1 The year that each Trustee joined the Fund’s Board is as follows: Saul K. Fenster, 1983; Delayne Dedrick Gold, 2001; Robert F. Gunia, 2001; W. Scott McDonald, Jr., 1983; Thomas T. Mooney, 2001; Thomas M. O’Brien, 2003; F. Don Schwartz, 2003.
E1
| | |
Fund Officers (a)(1) |
| Name, Address and Age | | Principal Occupation(s) During the Past Five Years |
| Position with the Fund | | |
Steve Pelletier (55) President and Principal Executive Officer | | President of Prudential Annuities (since September 2008); Chairman and CEO, International Investments, Prudential Financial (since January 1998). |
Kathryn L. Quirk (56) Chief Legal Officer | | Vice President and Corporate Counsel (since September 2004) of Prudential; Executive Vice President, Chief Legal Officer and Secretary (since July 2005) of Prudential Investments LLC (PI) and Prudential Mutual Fund Services LLC (PMFS); Vice President and Corporate Counsel (since June 2005) and Secretary (since February 2006) of AST Investment Services, Inc.; formerly Senior Vice President and Assistant Secretary (November 2004-August 2005) of PI; formerly Assistant Secretary (June 2005-February 2006) of AST Investment Services, Inc.; formerly Managing Director, General Counsel, Chief Compliance Officer, Chief Risk Officer and Corporate Secretary (1997-2002) of Zurich Scudder Investments, Inc. |
Deborah A. Docs (51) Secretary | | Vice President and Corporate Counsel (since January 2001) of Prudential; Vice President (since December 1996) and Assistant Secretary (since March 1999) of PI; formerly Vice President and Assistant Secretary (May 2003-June 2005) of AST Investment Services, Inc. |
Jonathan D. Shain (50) Assistant Secretary | | Vice President and Corporate Counsel (since August 1998) of Prudential; Vice President and Assistant Secretary (since May 2001) of PI; Vice President and Assistant Secretary (since February 2001) of PMFS; formerly Vice President and Assistant Secretary (May 2003-June 2005) of AST Investment Services, Inc. |
Claudia DiGiacomo (34) Assistant Secretary | | Vice President and Corporate Counsel (since January 2005) of Prudential; Vice President and Assistant Secretary of PI (since December 2005); Associate at Sidley Austin Brown & Wood LLP (1999-2004). |
John P. Schwartz (37) Assistant Secretary | | Vice President and Corporate Counsel (since April 2005) of Prudential; Vice President and Assistant Secretary of PI (since December 2005); Associate at Sidley Austin Brown & Wood LLP (1997-2005). |
Andrew R. French (46) Assistant Secretary | | Director and Corporate Counsel (since May 2006) of Prudential; Vice President and Assistant Secretary (since January 2007) of PI; Vice President and Assistant Secretary (since January 2007) of PMFS; formerly Senior Legal Analyst of Prudential Mutual Fund Law Department (1997-2006). |
Timothy J. Knierim (49) Chief Compliance Officer | | Chief Compliance Officer of Prudential Investment Management, Inc.(PIM) (since July 2007); formerly Chief Risk Officer of PIM and PI (2002-2007) and formerly Chief Ethics Officer of PIM and PI (2006-2007). |
Valerie M. Simpson (50) Deputy Chief Compliance Officer | | Chief Compliance Officer (since April 2007) of PI and AST Investment Services, Inc.; formerly Vice President-Financial Reporting (June 1999-March 2006) for Prudential Life and Annuities Finance. |
Theresa C. Thompson (46) Deputy Chief Compliance Officer | | Vice President, Compliance, PI (since April 2004); and Director, Compliance, PI (2001 - 2004). |
Noreen M. Fierro (44) Anti-Money Laundering Compliance Officer | | Vice President, Corporate Compliance (since May 2006) of Prudential; formerly Corporate Vice President, Associate General Counsel (April 2002-May 2005) of UBS Financial Services, Inc., in their Money Laundering Prevention Group; Senior Manager (May 2005-May 2006) of Deloitte Financial Advisory Services, LLP, in their Forensic and Dispute Services, Anti-Money Laundering Group. |
Grace C. Torres (49) Treasurer and Principal Financial and Accounting Officer | | Assistant Treasurer (since March 1999) and Senior Vice President (since September 1999) of PI; Assistant Treasurer (since May 2003) and Vice President (since June 2005) of AST Investment Services, Inc.; Senior Vice President and Assistant Treasurer (since May 2003) of Prudential Annuities Advisory Services, Inc.; formerly Senior Vice President (May 2003-June 2005) of AST Investment Services, Inc. |
M. Sadiq Peshimam (45) Assistant Treasurer | | Vice President (since 2005) and Director (2000-2005) within Prudential Mutual Fund Administration. |
Peter Parrella (50) Assistant Treasurer | | Vice President (since 2007) and Director (2004-2007) within Prudential Mutual Fund Administration; formerly Tax Manager at SSB Citi Fund Management LLC (1997-2004). |
Alan Fu (51) Assistant Treasurer | | Vice President – Tax, The Prudential Insurance Company of America (1999 to October 2003); Vice President and Corporate Counsel – Tax, Prudential Financial, Inc. (since October 2003). |
(a) Excludes interested Board Members who also serve as President or Vice President.
1 The year in which each individual became an Officer of the Fund is as follows: Stephen Pelletier, 2008; Kathryn L. Quirk, 2005; Deborah A. Docs, 2005; Jonathan D. Shain, 2005; Claudia DiGiacomo, 2005; John P. Schwartz, 2006; Andrew R. French, 2006; Timothy J. Knierim, 2007; Valerie M. Simpson, 2007; Theresa C. Thompson, 2008; Noreen M. Fierro, 2006; Grace C. Torres, 1997; Peter Parrella, 2007; M. Sadiq Peshimam, 2006; Alan Fu, 2006.
Explanatory Notes to Tables:
Trustees are deemed to be “Interested”, as defined in the 1940 Act, by reason of their affiliation with Prudential Investments LLC and/or an affiliate of Prudential Investments LLC.
Unless otherwise noted, the address of all Trustees and Officers is c/o Prudential Investments LLC, Gateway Center Three, 100 Mulberry Street, Newark, New Jersey 07102.
There is no set term of office for Trustees or Officers. The Independent Trustees have adopted a retirement policy, which calls for the retirement of Trustees on December 31 of the year in which they reach the age of 75.
“Other Directorships Held” includes only directorships of companies required to register or file reports with the SEC under the Securities Exchange Act of 1934 (that is, “public companies”) or other investment companies registered under the 1940 Act.
“No. of Portfolios Overseen” includes all investment companies managed by Prudential Investments LLC. The investment companies for which PI serves as manager include the JennisonDryden Funds, Strategic Partners Funds, The Prudential Variable Contract Accounts, The Target Portfolio Trust, The Prudential Series Fund, Advanced Series Trust, The High Yield Income Fund, Inc., The High Yield Plus Fund, Inc., Nicholas-Applegate Fund, Inc. and Prudential’s Gibraltar Fund, Inc.
E2
Annuities are issued by Pruco Life Insurance Company, or in New York, Pruco Life Insurance Company of New Jersey, both located at 213 Washington Street, Newark, NJ 07102-2992, and Prudential Annuities Life Assurance Corporation, located at One Corporate Drive, Shelton, CT, 06484. Variable annuities are distributed by Prudential Annuities Distributors, Inc., also located in Shelton, CT. Prudential Annuities is a business unit of Prudential Financial.
Variable life insurance is issued by The Prudential Insurance Company of America, 751 Broad Street, Newark, NJ 07102-3777, Pruco Life Insurance Company, or in New York, Pruco Life Insurance Company of New Jersey, both located at 213 Washington Street, Newark, NJ 07102-2992. Pruco Life Insurance Company is not licensed to do business in New York. Variable life insurance is offered through Pruco Securities LLC, 751 Broad Street, Newark, NJ 07102-3777.
All are Prudential Financial companies and each is solely responsible for its financial condition and contractual obligations.
Life insurance and annuity contracts contain exclusions, limitations, reductions of benefits and terms for keeping them in force. Your licensed financial professional can provide you with costs and complete details. Contract guarantees are based on the claims-paying ability of the issuing company.
The 2008 Audited Financial Statements of Pruco Life Insurance Company, Pruco Life Insurance Company of New Jersey, and The Prudential Insurance Company of America are available. You may call 888-778-2888 to obtain a free copy of the audited financial statements of the insurance company that issued your contract.
To reduce costs, we now generally send only a single copy of prospectuses and shareholder reports to each household (“householding”) in lieu of sending a copy to each Contract Owner who resides in the household. You should be aware that by calling 877-778-5008, you can revoke or “opt out” of householding at any time.
Pru, Prudential, Prudential Financial, Rock Solid, “The Rock”, the Rock Logo and the Rock Prudential Logo are registered service marks of The Prudential Insurance Company of America, Newark, NJ, and its affiliates.
The Prudential Insurance Company of America
751 Broad Street
Newark, NJ 07102-3777
PRST STD POSTAGES & FEES PAID VON HOFFMANN CORPORATION
IFS-A114446 PSF-AR-A Ed.2/2009

| | |
| | |
| ANNUAL REPORT | | December 31, 2008 |
The Prudential Series Fund
| n | | SP Aggressive Growth Asset Allocation Portfolio |
| n | | SP Balanced Asset Allocation Portfolio |
| n | | SP Conservative Asset Allocation Portfolio |
| n | | SP Davis Value Portfolio |
| n | | SP Growth Asset Allocation Portfolio |
| n | | SP International Growth Portfolio |
| n | | SP International Value Portfolio |
| n | | SP Mid Cap Growth Portfolio |
| n | | SP PIMCO High Yield Portfolio |
| n | | SP PIMCO Total Return Portfolio |
| n | | SP Prudential U.S. Emerging Growth Portfolio |
| n | | SP Small Cap Value Portfolio |
| n | | SP Strategic Partners Focused Growth Portfolio |

Please note that inside is a Prospectus Supplement dated January 21, 2009.
This document is separate from and not part of the annual report.

IFS-A114669
This report is one of several that provide financial information about certain investment choices available on variable life insurance and variable annuity contracts. Based on the variable contract you own or the portfolios you invested in, you may receive additional reports that provide financial information on those investment choices. Please refer to your variable life insurance or variable annuity contract prospectus to determine which portfolios are available to you.
This report must be preceded or accompanied by the current prospectuses for the Prudential Series Fund portfolios and the applicable variable life or annuity contract. The prospectuses contain information on the investment objectives, risks, and charges and expenses of the portfolios and the contract and should be read carefully.
The contract’s prospectus contains hypothetical performance illustrations that show the effect of various assumptions regarding the cost of insurance protection. You may also obtain a personalized illustration of historical performance that reflects the cost of your contract’s insurance protection.
A description of the Fund’s proxy voting policies and procedures is available, without charge, upon request. Owners of variable annuity contracts should call 888-778-2888 and owners of variable life insurance contracts should call 800-778-2255 to obtain descriptions of the Fund’s proxy voting policies and procedures. The description is also available on the website of the Securities and Exchange Commission (the “Commission”) at www.sec.gov. Information regarding how the Fund voted proxies relating to portfolio securities during the most recent 12-month period ended June 30 is available on the website of the Commission at www.sec.gov and on the Fund’s website.
The Fund files with the Commission a complete listing of portfolio holdings as of its first and third quarter-ends on Form N-Q. Form N-Q is available on the Commission’s website at www.sec.gov or by visiting the Commission’s Public Reference Room. For more information on the Commission’s Public Reference Room, please visit the Commission’s website or call 800-SEC-0330. Form N-Q is also available on the Fund’s website at www.prudential.com or by calling the telephone numbers referenced above.
The Fund’s Statement of Additional Information contains additional information about the Fund’s Trustees and is available without charge upon request by calling 888-778-2888.
This report may include financial information pertaining to certain portfolios that are not available through the variable life insurance policy or variable annuity contract that you have chosen. Please refer to your variable life insurance or variable annuity prospectus to determine which portfolios are available to you.
| | | | |
| The Prudential Series Fund | | Annual Report | | December 31, 2008 |
Table of Contents
| n | | LETTER TO CONTRACT OWNERS |
| n | | FEES AND EXPENSES TABLE |
| | A1 | Schedule of Investments and Financial Statements |
| | B1 | Notes to Financial Statements |
| | D1 | Report of Independent Registered Public Accounting Firm |
| | E1 | Information About Trustees and Officers |
This report may include financial information pertaining to certain portfolios that are not available through the variable life insurance policy or variable annuity contract that you have chosen. Please refer to your variable life insurance or variable annuity prospectus to determine which portfolios are available to you.
| | | | |
The Prudential Series Fund Letter to Contract Owners | | Annual Report | | December 31, 2008 |
Our objective at Prudential is very simple — we strive to help our clients achieve and maintain financial success. Our Prudential Series Fund annual report details this commitment to you as we focus on ways to help you with your financial security. We hope you find it both informative and useful.
While 2008 presented unprecedented challenges to investors, it also proved that Prudential’s strategies around growing and protecting our clients’ wealth have never been more important.
Your financial professional is the best resource to help you understand how market changes affect your investments. Together, you can develop a diversified mix of investments that works best for you and review it periodically to ensure your financial objectives remain on target.
Thank you for selecting Prudential as one of your financial partners. We value your trust and appreciate the opportunity to help you reach your financial goals.
Sincerely,
Steve Pelletier
President,
The Prudential Series Fund | January 30, 2009 |
PRESIDENT
STEVE PELLETIER
| | |
The Prudential Series Fund, SP Aggressive Growth Asset Allocation Portfolio Subadvised by: Quantitative Management Associates LLC | | December 31, 2008 |
Investment Manager’s Report - As of December 31, 2008
Average Annual Total Return Percentages
| | | | | | | | | |
| | | 1-Year | | | 5-Year | | | Since
Inception | |
Portfolio | | -42.18 | % | | -1.77 | % | | -3.82 | % |
S&P 500 Index | | -36.99 | | | -2.19 | | | -3.76 | |
Blended Index | | -38.43 | | | -1.11 | | | -2.69 | |
Past performance does not guarantee future returns. The investment return and principal value of an investment will fluctuate, so that an investor’s shares, when redeemed, may be worth more or less than their original cost. Current performance may be lower or higher than the past performance data quoted.
$10,000 INVESTED SINCE INCEPTION
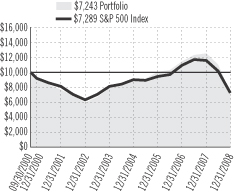
Portfolio inception: 9/22/2000. Portfolio performance is net of investment fees and fund expenses, but not product charges, which, if included, would significantly lower the performance quoted. Unless noted otherwise, Index returns reflect performance beginning the closest month-end date to the Portfolio’s inception. Performance figures may reflect fee waivers and/or expense reimbursements. In the absence of such fee waivers and/or expense reimbursements, total returns would be lower.
For the year ended December 31, 2008, the SP Aggressive Growth Asset Allocation Portfolio underperformed its custom blended index.
In equities, a modest investment in energy hurt relative performance, as the sector declined heavily during 2008. This negative return was further amplified by the Portfolio’s holdings of large-cap versus small-cap stocks, as small companies held up better than expected.
Only five out of the Portfolio’s eleven constituents matched or outperformed their respective style benchmarks in 2008. Asset class selection by managers detracted from performance during the period. Active managers, in general, had a difficult time outperforming benchmarks in 2008. Often managers perform well during periods of rising volatility, where uncertainty leads to greater variation in stock returns, providing opportunities for active management selection. The past year was different, however, because the systemic shocks from the financial crisis increased correlations (price movements) between stocks to all-time highs, reducing the opportunities in actively managed portfolios. During the year, broad economic factors and deleveraging (selling positions to reduce debt) drove market activity rather than more traditional factors such as valuation and company-specific fundamentals. It was a difficult environment for most investment strategies. At some point, we expect the historically high correlations between stocks to subside and valuation and fundamentals to drive performance, providing opportunities for skilled managers to outperform their benchmark indexes.
Against this backdrop, the largest detractors from relative return were the Advanced Series Trust (AST) Large Cap Value Portfolio, AST Marsico Capital Growth Portfolio, and the Prudential Series Fund (PSF) SP International Growth Portfolio. The largest contributor to relative return was the PSF Jennison Portfolio.
Prudential Investments LLC (PI), an indirect, wholly owned subsidiary of Prudential Financial, Inc., serves as the investment manager for the Fund.
S&P 500 Index is an unmanaged, market value-weighted index of 500 stocks generally representative of the broad stock market. Blended Index consists of Russell 3000 Index (80%), a market cap-weighted index that measures the performance of the 1,000 largest companies in the Russell 3000 Index, which represents approximately 92% of the total market, and MSCI EAFE (Morgan Stanley Capital International Europe, Australasia, Far East) Index (GD) (20%), an unmanaged, capitalization-weighted index generally accepted as a benchmark for major overseas markets. The GD version does not reflect the impact of withholding taxes on reinvested dividends. These returns do not include the effect of any investment management expenses. These returns would have been lower if they included the effect of these expenses. Investors cannot invest directly in a market index. For a complete list of holdings, refer to the Schedule of Investments section of this report.
| | |
The Prudential Series Fund, SP Balanced Asset Allocation Portfolio Subadvised by: Quantitative Management Associates LLC | | December 31, 2008 |
Investment Manager’s Report - As of December 31, 2008
Average Annual Total Return Percentages
| | | | | | | | | |
| | | 1-Year | | | 5-Year | | | Since
Inception | |
Portfolio | | -28.55 | % | | 0.67 | % | | 0.47 | % |
S&P 500 Index | | -36.99 | | | -2.19 | | | -3.76 | |
Blended Index | | -23.05 | | | 1.41 | | | 1.08 | |
Past performance does not guarantee future returns. The investment return and principal value of an investment will fluctuate, so that an investor’s shares, when redeemed, may be worth more or less than their original cost. Current performance may be lower or higher than the past performance data quoted.
$10,000 INVESTED SINCE INCEPTION
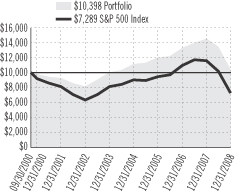
Portfolio inception: 9/22/2000. Portfolio performance is net of investment fees and fund expenses, but not product charges, which, if included, would significantly lower the performance quoted. Unless noted otherwise, Index returns reflect performance beginning the closest month-end date to the Portfolio’s inception. Performance figures may reflect fee waivers and/or expense reimbursements. In the absence of such fee waivers and/or expense reimbursements, total returns would be lower.
For the year ended December 31, 2008, the SP Balanced Asset Allocation Portfolio underperformed its custom blended benchmark index (the Index).
An underweight position in fixed income versus equity contributed negatively to relative return, since bonds, as measured by the Barclays Capital U.S. Aggregate Bond Index, significantly outperformed stocks and the Russell 3000® fell into negative territory for the year. Regarding equity performance, a modest position in the energy sector hurt performance.
In the Portfolio’s fixed income component, moderate cash holdings hampered relative performance, since U.S. Treasurys outperformed investment-grade bonds. In addition, a modest, non-benchmark investment in high yield bonds also contributed negatively to relative return. In the risk-averse environment during the year, high yield bonds underperformed investment-grade bonds by a wide margin.
Active managers, in general, had a difficult time outperforming benchmarks in 2008. Often managers perform well during periods of rising volatility, where uncertainty leads to greater variation in stock returns, providing opportunities for active stock selection. The past year was different, however, because the systemic shocks from the financial crisis increased correlations (price movements) between stocks to all-time highs, reducing opportunities in actively managed portfolios. During the year, broad economic factors and deleveraging (selling positions to reduce debt) drove market activity rather than more traditional factors such as valuation and company-specific fundamentals. It was a difficult environment for most investment strategies. At some point, we expect the historically high correlations between stocks to subside and valuation and fundamentals to drive performance, providing opportunities for skilled managers to outperform their benchmark indexes.
In the fixed income market, risk sectors underperformed significantly. Government bonds gained, as investors flocked to liquidity and safety. High quality mortgage-backed securities (MBS) posted gains for the reporting period, while investment-grade credit declined moderately. High yield bonds ended the year with double-digit declines.
Against this highly challenging investment backdrop, the largest detractors from the Portfolio’s relative return were the Prudential Series Fund (PSF) SP PIMCO Total Return Portfolio, Advanced Series Trust (AST) Large Cap Value Portfolio, AST Marsico Capital Growth Portfolio, and the PSF SP International Growth Portfolio. The largest positive contributor to relative performance was the PSF Jennison Portfolio.
Prudential Investments LLC (PI), an indirect, wholly owned subsidiary of Prudential Financial, Inc., serves as the investment manager for the Fund.
S&P 500 Index is an unmanaged, market value-weighted index of 500 stocks generally representative of the broad stock market. Blended Index consists of Russell 3000 Index (48%), a market cap-weighted index that measures the performance of the 1,000 largest companies in the Russell 3000 Index, which represents approximately 92% of the total market, Barclays Capital U.S. Aggregate Bond Index (40%), an unmanaged index comprised of more than 5,000 government and corporate bonds, and MSCI EAFE (Morgan Stanley Capital International Europe, Australasia, Far East) Index (GD) (12%), an unmanaged, capitalization-weighted index generally accepted as a benchmark for major overseas markets. The GD version does not reflect the impact of withholding taxes on reinvested dividends. These returns do not include the effect of any investment management expenses. These returns would have been lower if they included the effect of these expenses. Investors cannot invest directly in a market index. For a complete list of holdings, refer to the Schedule of Investments section of this report.
| | |
The Prudential Series Fund, SP Conservative Asset Allocation Portfolio Subadvised by: Quantitative Management Associates LLC | | December 31, 2008 |
Investment Manager’s Report - As of December 31, 2008
Average Annual Total Return Percentages
| | | | | | | | | |
| | | 1-Year | | | 5-Year | | | Since
Inception | |
Portfolio | | -20.21 | % | | 1.81 | % | | 2.29 | % |
S&P 500 Index | | -36.99 | | | -2.19 | | | -3.76 | |
Blended Index (GD) | | -14.35 | | | 2.56 | | | 2.84 | |
Past performance does not guarantee future returns. The investment return and principal value of an investment will fluctuate, so that an investor’s shares, when redeemed, may be worth more or less than their original cost. Current performance may be lower or higher than the past performance data quoted.
$10,000 INVESTED SINCE INCEPTION
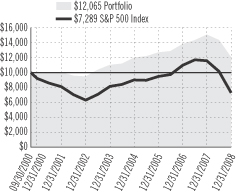
Portfolio inception: 9/22/2000. Portfolio performance is net of investment fees and fund expenses, but not product charges, which, if included, would significantly lower the performance quoted. Unless noted otherwise, Index returns reflect performance beginning the closest month-end date to the Portfolio’s inception. Performance figures may reflect fee waivers and/or expense reimbursements. In the absence of such fee waivers and/or expense reimbursements, total returns would be lower.
For the year ended December 31, 2008, the SP Conservative Asset Allocation Portfolio underperformed its custom blended index.
In equities, a modest investment in energy hurt relative performance, as the sector declined heavily during 2008. This negative return was further amplified by the Portfolio’s holdings of large-cap versus small-cap stocks, as small companies held up better than expected. An underweight position in fixed income versus equities contributed negatively to relative performance, since bonds, as measured by the Barclays Capital U.S. Aggregate Bond Index, significantly outperformed stocks in 2008.
In the Portfolio’s fixed income holdings, a moderate exposure to U.S. Treasury bills, which are very short term, gained less than the broader U.S. investment–grade bond market. A modest position in high yield corporate (“junk”) bonds, which are not in the benchmark, negatively affected returns. High yield bonds declined sharply for the year, as these below-investment-grade bonds fell out of favor in the risk-averse environment.
Only five out of the Portfolio’s 14 constituents matched or outperformed their respective style benchmarks in 2008. Asset class selection by managers detracted from performance during the period. Active managers, in general, had a difficult time outperforming benchmarks in 2008. Often managers perform well during periods of rising volatility, where uncertainty leads to greater variation in stock returns, providing opportunities for active management selection. The past year was different, however, because the systemic shocks from the financial crisis increased correlations (price movements) between stocks to all-time highs, reducing opportunities in actively managed portfolios. During the year, broad economic factors and deleveraging (selling positions to reduce debt) drove market activity rather than more traditional factors such as valuation and company-specific fundamentals. It was a difficult environment for most investment strategies. At some point, we expect the historically high correlations between stocks to subside and valuation and fundamentals to drive performance, providing opportunities for skilled managers to outperform their benchmark indexes.
Against this backdrop, the largest detractors from relative return were the Prudential Series Fund (PSF) SP PIMCO Total Return Portfolio, AST Large Cap Value Portfolio, AST Marsico Capital Growth Portfolio, and the PSF SP International Growth Portfolio. The largest contributor to relative performance was the PSF Jennison Portfolio.
Prudential Investments LLC (PI), an indirect, wholly owned subsidiary of Prudential Financial, Inc., serves as the investment manager for the Fund.
S&P 500 Index is an unmanaged, market value-weighted index of 500 stocks generally representative of the broad stock market. Blended Index consists of Russell 3000 Index (32%), a market cap-weighted index that measures the performance of the 1,000 largest companies in the Russell 3000 Index, which represents approximately 92% of the total market, Barclays Capital U.S. Aggregate Bond Index (60%), an unmanaged index comprised of more than 5,000 government and corporate bonds, and MSCI EAFE (Morgan Stanley Capital International Europe, Australasia, Far East) Index (GD) (8%), an unmanaged, capitalization-weighted index generally accepted as a benchmark for major overseas markets. The GD version does not reflect the impact of withholding taxes on reinvested dividends. These returns do not include the effect of any investment management expenses. These returns would have been lower if they included the effect of these expenses. Investors cannot invest directly in a market index. For a complete list of holdings, refer to the Schedule of Investments section of this report.
| | |
The Prudential Series Fund, SP Davis Value Portfolio Subadvised by: Davis Advisors | | December 31, 2008 |
Investment Manager’s Report - As of December 31, 2008
Average Annual Total Return Percentages
| | | | | | | | | |
| | | 1-Year | | | 5-Year | | | Since
Inception | |
Portfolio | | -39.88 | % | | -2.28 | % | | -1.46 | % |
S&P 500 Index | | -36.99 | | | -2.19 | | | -3.76 | |
Russell 1000® Value Index | | -36.85 | | | -0.79 | | | 0.39 | |
Past performance does not guarantee future returns. The investment return and principal value of an investment will fluctuate, so that an investor’s shares, when redeemed, may be worth more or less than their original cost. Current performance may be lower or higher than the past performance data quoted.
$10,000 INVESTED SINCE INCEPTION
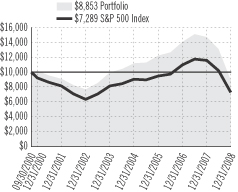
Portfolio inception: 9/22/2000. Portfolio performance is net of investment fees and fund expenses, but not product charges, which, if included, would significantly lower the performance quoted. Unless noted otherwise, Index returns reflect performance beginning the closest month-end date to the Portfolio’s inception. The Russell 1000® Index is a trademark/service mark of the Frank Russell Company. Russell® is a trademark of the Frank Russell Company. Performance figures may reflect fee waivers and/or expense reimbursements. In the absence of such fee waivers and/or expense reimbursements, total returns would be lower.
For the year ended December 31, 2008, the SP Davis Value Portfolio underperformed its benchmark, the Russell 1000® Value Index (the Index).
Davis follows a bottom-up/top-down investment approach that is solidly grounded in a value discipline. The top-down analysis consists of attempting to discover those industries/sectors that are likely to benefit from specific economic developments. The bottom-up components of the analysis involve identifying good quality but currently out-of-favor securities that are able to sustain growth over full market cycles. Security selection is driven by a combination of relative and intrinsic valuation of individual companies.
Virtually all sectors showed negative returns for the reporting period. The Portfolio’s holdings in specific sectors detracted from relative performance. Specifically, the Portfolio’s relative performance was hurt by an overweight in financials, energy, and consumer services sectors, in addition to underweight positions in the telecommunications and healthcare sectors. An overweight in the consumer cyclicals sector contributed positively to relative performance.
Overall, risk factors hampered the Portfolio’s relative performance for the year. The Portfolio’s overexposure to momentum stocks (stocks experiencing recent price strength) and its underweight holdings in dividend-paying stocks combined to weaken relative performance. Conversely, the Portfolio was underweight in value-oriented stocks in relation to the Index, which helped.
The subadviser’s stock selection in the financials, consumer services, and healthcare sectors contributed positively for the year. Conversely, assets held in the consumer staples and technology sectors were not rewarded.
Prudential Investments LLC (PI), an indirect, wholly owned subsidiary of Prudential Financial, Inc., serves as the investment manager for the Fund.
S&P 500 Index is an unmanaged, market value-weighted index of 500 stocks generally representative of the broad stock market. Russell 1000 Value Index is a market cap-weighted index that measures the performance of those Russell 1000 companies with lower price-to-book ratios and lower forecasted growth values. These returns do not include the effect of any investment management expenses. These returns would have been lower if they included the effect of these expenses. Investors cannot invest directly in a market index. For a complete list of holdings, refer to the Schedule of Investments section of this report.
| | |
The Prudential Series Fund, SP Growth Asset Allocation Portfolio Subadvised by: Quantitative Management Associates LLC | | December 31, 2008 |
Investment Manager’s Report - As of December 31, 2008
Average Annual Total Return Percentages
| | | | | | | | | |
| | | 1-Year | | | 5-Year | | | Since
Inception | |
Portfolio | | -36.36 | % | | -0.63 | % | | -1.72 | % |
S&P 500 Index | | -36.99 | | | -2.19 | | | -3.76 | |
Blended Index | | -31.06 | | | 0.19 | | | -0.77 | |
Past performance does not guarantee future returns. The investment return and principal value of an investment will fluctuate, so that an investor’s shares, when redeemed, may be worth more or less than their original cost. Current performance may be lower or higher than the past performance data quoted.
$10,000 INVESTED SINCE INCEPTION
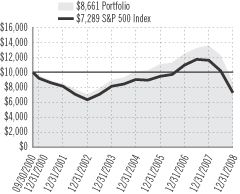
Portfolio inception: 9/22/2000. Portfolio performance is net of investment fees and fund expenses, but not product charges, which, if included, would significantly lower the performance quoted. Unless noted otherwise, Index returns reflect performance beginning the closest month-end date to the Portfolio’s inception. Performance figures may reflect fee waivers and/or expense reimbursements. In the absence of such fee waivers and/or expense reimbursements, total returns would be lower.
For the year ended December 31, 2008, the SP Growth Asset Allocation Portfolio underperformed its custom blended index (the Index).
In the Portfolio’s fixed income holdings, a moderate exposure to U.S. Treasury bills, which are very short term, gained less than the broader U.S. investment–grade bond market. A modest position in high yield corporate (“junk”) bonds, which are not in the Index, negatively affected returns. High yield bonds declined sharply for the year, as these below-investment-grade bonds fell out of favor in the risk-averse environment.
Active managers, in general, had a difficult time outperforming benchmarks in 2008. Often managers perform well during periods of rising volatility, where uncertainty leads to greater variation in stock returns, providing opportunities for active stock selection. The past year was different, however, because the systemic shocks from the financial crisis increased correlations (price movements) between stocks to all-time highs, reducing opportunities in actively managed portfolios. During the year, broad economic factors and deleveraging (selling positions to reduce debt) drove market activity rather than more traditional factors such as valuation and company-specific fundamentals. It was a difficult environment for most investment strategies. At some point, we expect the historically high correlations between stocks to subside and valuation and fundamentals to drive performance, providing opportunities for skilled managers to outperform their benchmark indexes.
Against this backdrop, the largest detractors from relative return were the Prudential Series Fund (PSF) SP PIMCO Total Return Portfolio, Advanced Series Trust (AST) Large Cap Value Portfolio, AST Marsico Capital Growth Portfolio, and the PSF SP International Growth Portfolio. The largest contributor to relative performance was the PSF Jennison Portfolio.
Prudential Investments LLC (PI), an indirect, wholly owned subsidiary of Prudential Financial, Inc., serves as the investment manager for the Fund.
S&P 500 Index is an unmanaged, market value-weighted index of 500 stocks generally representative of the broad stock market. Blended Index consists of Russell 3000 Index (64%), a market cap-weighted index that measures the performance of the 1,000 largest companies in the Russell 3000 Index, which represents approximately 92% of the total market, Barclays Capital U.S. Aggregate Bond Index (20%), an unmanaged index comprised of more than 5,000 government and corporate bonds, and MSCI EAFE (Morgan Stanley Capital International Europe, Australasia, Far East) Index (GD) (16%), an unmanaged, capitalization-weighted index generally accepted as a benchmark for major overseas markets. The GD version does not reflect the impact of withholding taxes on reinvested dividends. These returns do not include the effect of any investment management expenses. These returns would have been lower if they included the effect of these expenses. Investors cannot invest directly in a market index. For a complete list of holdings, refer to the Schedule of Investments section of this report.
| | |
The Prudential Series Fund, SP International Growth Portfolio Subadvised by: Marsico Capital Management, LLC, William Blair & Company LLC | | December 31, 2008 |
Investment Manager’s Report - As of December 31, 2008
Average Annual Total Return Percentages
| | | | | | | | | |
| | | 1-Year | | | 5-Year | | | Since
Inception | |
Portfolio: Class I | | -50.30 | % | | -0.49 | % | | -6.44 | % |
Portfolio: Class II | | -50.49 | | | -0.92 | | | -6.60 | |
MSCI EAFE® Index (GD) | | -43.06 | | | 2.10 | | | -0.01 | |
Past performance does not guarantee future returns. The investment return and principal value of an investment will fluctuate, so that an investor’s shares, when redeemed, may be worth more or less than their original cost. Current performance may be lower or higher than the past performance data quoted.
$10,000 INVESTED SINCE INCEPTION1
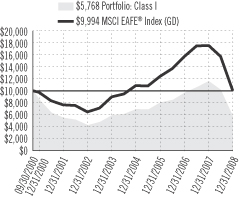
Portfolio (Class I) inception: 9/22/2000. Portfolio (Class II) inception: 10/4/2000. Portfolio performance is net of investment fees and fund expenses, but not product charges, which, if included, would significantly lower the performance quoted. Unless noted otherwise, Index returns reflect performance beginning the closest month-end date to the Portfolio’s inception (Class I). Performance figures may reflect fee waivers and/or expense reimbursements. In the absence of such fee waivers and/or expense reimbursements, total returns would be lower.
For the year ended December 31, 2008, the SP International Growth Portfolio underperformed the MSCI EAFE Index (GD) (the Index).
Stock selection detracted from overall returns for the year. Specifically, the industrial and energy holdings of both managers declined significantly, as many of the stocks that were linked to the emerging markets infrastructure expansion declined when global growth slowed more than originally expected.
Risk factors negatively affected performance. Historically, both subadvisers have been overweight in stocks with high volatility and earnings growth versus the Index. These positions detracted from performance. Given the climate of risk aversion, most investors favored more stable stocks with lower volatility. Furthermore, companies with higher earnings growth rates declined as investors started to doubt that these growth rates were sustainable, given the global economic slowdown.
Holdings in specific countries detracted from returns. An underweight in Japan and overweights to emerging market countries such as Brazil and China negatively affected performance. For years, both subadvisers have underweighted Japan, as higher growth opportunities have been difficult to find. This underweight particularly hurt relative performance, as the Japanese Yen advanced versus other world currencies during the flight to quality, in which investors sought safer securities such as U.S. Treasurys.
Sector-specific holdings mitigated negative performance. Specifically, an underweight in the financials sector and overweight positions in telecommunications and consumer staples helped performance. Since investments in sectors are byproducts of the subadvisers’ bottom up stock selection, not as much emphasis was placed on the returns resulting from them.
Prudential Investments LLC (PI), an indirect, wholly owned subsidiary of Prudential Financial, Inc., serves as the investment manager for the Fund.
| 1 | The graph is based on the performance of Class I shares. Performance of Class II shares will be lower due to differences in the fee structure. Class II shares have associated 12b-1 and administrative fees at an annual rate of 0.25% and 0.15% respectively of the average daily net assets of the Class II shares. |
MSCI EAFE (Morgan Stanley Capital International Europe, Australasia, Far East) Index (GD) is an unmanaged, capitalization-weighted index generally accepted as a benchmark for major overseas markets. The GD version does not reflect the impact of withholding taxes on reinvested dividends. These returns do not include the effect of any investment management expenses. These returns would have been lower if they included the effect of these expenses. Investors cannot invest directly in a market index. For a complete list of holdings, refer to the Schedule of Investments section of this report.
| | |
The Prudential Series Fund, SP International Value Portfolio Subadvised by: LSV Asset Management, Thornburg Investment Management Inc. | | December 31, 2008 |
Investment Manager’s Report - As of December 31, 2008
Average Annual Total Return Percentages
| | | | | | | | | |
| | | 1-Year | | | 5-Year | | | Since
Inception | |
Portfolio | | -44.06 | % | | 2.36 | % | | -1.59 | % |
MSCI EAFE® Index (GD) | | -43.06 | | | 2.10 | | | -0.01 | |
Past performance does not guarantee future returns. The investment return and principal value of an investment will fluctuate, so that an investor’s shares, when redeemed, may be worth more or less than their original cost. Current performance may be lower or higher than the past performance data quoted.
$10,000 INVESTED SINCE INCEPTION
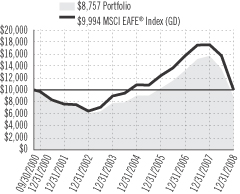
Portfolio inception: 9/22/2000. Portfolio performance is net of investment fees and fund expenses, but not product charges, which, if included, would significantly lower the performance quoted. Unless noted otherwise, Index returns reflect performance beginning the closest month-end date to the Portfolio’s inception. Performance figures may reflect fee waivers and/or expense reimbursements. In the absence of such fee waivers and/or expense reimbursements, total returns would be lower.
For the year ended December 31, 2008, the SP International Value Portfolio declined more than its benchmark, the MSCI EAFE Index (GD).
LSV Asset Management and Thornburg Investment Management subadvised the Portfolio. LSV is a deep value manager that employs an active quantitative investment strategy based on research into value investing and studies of investor behavior. Thornburg is a relative value manager that uses quantitative screening to initially identify attractively valued stocks. The most attractive stocks are then evaluated using fundamental research analysis.
The bursting of the credit and housing bubbles in 2008 depressed stock and bond prices. Risk-averse investors increasingly fled to U.S. Treasury bonds and the U.S. dollar, pushing up the prices of both. The dollar appreciated relative to other currencies, with the exception of the Japanese yen. The broad international stock market lagged the broad domestic stock market.
Both subadvisers underperformed the benchmark. The global credit crunch that began in August 2007 intensified in September 2008 following the failure of Lehman Brothers and the $85 billion Federal Reserve bailout of AIG. Financial turmoil spread to international markets. The period was characterized by heightened stock market volatility and greater correlation among stocks on a global basis. Active managers in the international arena found it difficult to outperform the MSCI EAFE Index because macro trends, not stock-specific fundamentals, drove returns.
Both LSV and Thornburg struggled from a stock selection standpoint, although LSV’s deep value focus was more out of favor than Thornburg’s relative value approach. Holdings in the financial, energy, and consumer discretionary sectors detracted the most, followed by positions in utilities and consumer staples.
Sector allocations contributed positively to performance. Allocations within Thornburg’s sleeve, specifically an underweight to the financial and an overweight to the telecommunications sectors, were a positive. Detracting from performance was LSV’s underweight in utilities that resulted when the subadviser’s quantitative models indicated a negative outlook for the sector.
Exposure to non-benchmark countries detracted from performance, with investments in the BRIC countries of China, Russia, and Brazil being the most detrimental. The allocation to emerging countries is attributable to the Thornburg sleeve as LSV does not take significant country bets or invest in emerging markets. An underweight to Japan also hurt performance as the Japanese market fell significantly less than the broad EAFE benchmark. Assets held in Japan, France, and the U.K. detracted but were partially offset by good stock selection in China.
Prudential Investments LLC (PI), an indirect, wholly owned subsidiary of Prudential Financial, Inc., serves as the investment manager for the Fund.
MSCI EAFE (Morgan Stanley Capital International Europe, Australasia, Far East) Index (GD) is an unmanaged, capitalization-weighted index generally accepted as a benchmark for major overseas markets. The GD version does not reflect the impact of withholding taxes on reinvested dividends. These returns do not include the effect of any investment management expenses. These returns would have been lower if they included the effect of these expenses. Investors cannot invest directly in a market index. For a complete list of holdings, refer to the Schedule of Investments section of this report.
| | |
The Prudential Series Fund, SP Mid Cap Growth Portfolio Subadvised by: Neuberger Berman Management, Inc. | | December 31, 2008 |
Investment Manager’s Report - As of December 31, 2008
Average Annual Total Return Percentages
| | | | | | | | | |
| | | 1-Year | | | 5-Year | | | Since
Inception | |
Portfolio | | -42.56 | % | | -3.81 | % | | -8.52 | % |
Russell Midcap® Index | | -41.46 | | | -0.71 | | | 0.37 | |
Russell Midcap® Growth Index | | -44.32 | | | -2.33 | | | -6.70 | |
Past performance does not guarantee future returns. The investment return and principal value of an investment will fluctuate, so that an investor’s shares, when redeemed, may be worth more or less than their original cost. Current performance may be lower or higher than the past performance data quoted.
$10,000 INVESTED SINCE INCEPTION
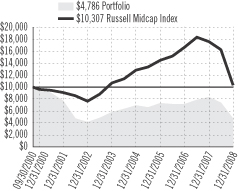
Portfolio inception: 9/22/2000. Portfolio performance is net of investment fees and fund expenses, but not product charges, which, if included, would significantly lower the performance quoted. Unless noted otherwise, Index returns reflect performance beginning the closest month-end date to the Portfolio’s inception. The Russell Midcap® and Midcap® Growth Indexes are trademarks/service marks of the Frank Russell Company. Russell® is a trademark of the Frank Russell Company. Performance figures may reflect fee waivers and/or expense reimbursements. In the absence of such fee waivers and/or expense reimbursements, total returns would be lower.
For the year ended December 31, 2008, the SP Mid Cap Growth Portfolio outperformed its style benchmark, the Russell Midcap® Growth Index.
The SP Mid Cap Growth Portfolio is subadvised by Neuberger Berman (“Neuberger”). Neuberger’s mid cap growth strategy utilizes a top-down/bottom-up investment process that seeks to outperform, on a risk-adjusted basis, the Russell Midcap® Growth Index (the Index) over a full market cycle (four to six years).
A more conservative risk posture proved to be the primary source of relative return in 2008. The Portfolio’s subdued sensitivity to market movements mitigated its negative absolute and relative return, particularly in September, October, and early November, when stocks abruptly declined in value.
Stock-specific factors hurt relative results. Assets held within the alcohol, medical products, semiconductor, and defense/aerospace industries detracted from relative performance. These weak returns were partially offset by strong stock picks in the energy reserves and industrial services industries.
Style factors detracted from relative performance. The Portfolio’s overexposure to stocks exhibiting momentum characteristics (i.e., recent price strength) and stocks with above-market asset and earnings growth rates hurt performance. Conversely, an underexposure to companies with leveraged balance sheets, high earnings variability, and above-index-average market capitalizations partially offset negative results.
Positions in specific sectors hurt results relative to the Index. The Portfolio’s underexposure to the consumer services and basic materials sectors proved detrimental, as these were two of the stronger performing sectors in the Index. Conversely, an overexposure to the commercial services sector was favorable for performance.
Prudential Investments LLC (PI), an indirect, wholly owned subsidiary of Prudential Financial, Inc., serves as the investment manager for the Fund.
Russell Midcap Growth Index is a market cap-weighted index that measures the performance of those Russell Midcap companies with higher price-to-book ratios and higher forecasted growth values. Russell Midcap Index is a market cap-weighted index that measures the performance of the 800 smallest companies in the Russell 1000 Index, which represents approximately 25% of the total market. These returns do not include the effect of any investment management expenses. These returns would have been lower if they included the effect of these expenses. Investors cannot invest directly in a market index. For a complete list of holdings, refer to the Schedule of Investments section of this report.
| | |
The Prudential Series Fund, SP PIMCO High Yield Portfolio Subadvised by: Pacific Investment Management Company LLC (PIMCO) | | December 31, 2008 |
Investment Manager’s Report - As of December 31, 2008
Average Annual Total Return Percentages
| | | | | | | | | |
| | | 1-Year | | | 5-Year | | | Since
Inception | |
Portfolio | | -25.50 | % | | -0.75 | % | | 2.75 | % |
Barclays Capital Intermediate BB Corp. Index | | -16.81 | | | 0.76 | | | 3.58 | |
Merrill Lynch U.S. High Yield Master II BB-B Rated Index | | -23.71 | | | -0.30 | | | 2.36 | |
Merrill Lynch U.S. High Yield Master II Constrained Index | | -26.11 | | | -0.89 | | | 2.78 | |
Past performance does not guarantee future returns. The investment return and principal value of an investment will fluctuate, so that an investor’s shares, when redeemed, may be worth more or less than their original cost. Current performance may be lower or higher than the past performance data quoted.
$10,000 INVESTED SINCE INCEPTION
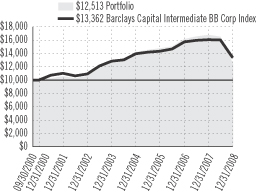
Portfolio inception: 9/22/2000. Portfolio performance is net of investment fees and fund expenses, but not product charges, which, if included, would significantly lower the performance quoted. Unless noted otherwise, Index returns reflect performance beginning the closest month-end date to the Portfolio’s inception. Performance figures may reflect fee waivers and/or expense reimbursements. In the absence of such fee waivers and/or expense reimbursements, total returns would be lower.
For the year ended December 31, 2008, the SP PIMCO High Yield Portfolio declined 25.50%.
A burst housing bubble in the United States had led to a collapse in the subprime mortgage market that escalated into a credit crisis in which financial institutions continued to take massive write-downs and losses in 2008. The U.S. economy, mired in one of its worst recessions since the Great Depression, shed some 2.5 million jobs in 2008. The Federal Reserve (the Fed) tried to boost growth by cutting its target for the overnight bank lending rate from 4.25% in January to a range of zero to 0.25% in December. The Fed and the U.S. Department of the Treasury employed unconventional measures to encourage commercial banks and finance firms to lend, yet it remained difficult for businesses and individuals to borrow money.
The worsening credit crisis led investors to avoid risky assets such as high yield bonds, which are called “junk” bonds because they are rated below investment grade. There was concern weak economic conditions will leave many firms unable to make interest and principal payments on their high yield bonds. The high yield market ended 2008 in the red, though the Fed rate cut in December and stated intention to use all available tools to lift the U.S. economy out of recession helped bond prices rally that month.
Some aspects of PIMCO’s sector allocation strategy caused the Portfolio to trail its benchmark index. The consumer non-cyclical sector outperformed the high yield market as demand for products such as food, beverages, and tobacco tends to remain solid during economic downturns. The Portfolio had a smaller exposure than its benchmark index to bonds of consumer non-cyclicals, which detracted from its relative performance. The financial institutions sector was really hard hit by the credit crisis, and the Portfolio’s emphasis on that sector hurt its performance. But the negative impact was lessened as financial bond prices gained in December on the Fed’s stated resolve to end the economic downturn. Poor security selection in the telecommunications sector in the first half of 2008 was another negative for the Portfolio, which favored bonds of integrated service and fixed-line providers that underperformed wireless telecom firms.
Some of PIMCO’s sector-allocation decisions worked well. Compared to its benchmark index, the Portfolio benefited from having a smaller exposure to the gaming sector, which was plagued by weak earnings, high levels of borrowed money, and declining consumer travel. The Portfolio’s relative performance also benefited from its larger exposure than its benchmark index to the healthcare sector, which outperformed the broader high yield market.
Prudential Investments LLC (PI), an indirect, wholly owned subsidiary of Prudential Financial, Inc., serves as the investment manager for the Fund.
Barclays Capital Intermediate BB Corporate Bond Index is an unmanaged index comprised of various fixed income securities rated BB. Merrill Lynch U.S. High Yield Master II BB-B Rated Index is a broad high yield index including high yield bonds across the maturity spectrum, within the BB-B rated credit quality spectrum, included in the below-investment-grade universe. Merrill Lynch U.S. High Yield Master II Constrained Index is a market value-weighted index of all domestic and yankee high-yield bonds, including deferred interest bonds and payment-in-kind bonds and securities. Issues included in the index have maturities of one year or more and have a credit rating lower than BBB/Baa3, but are not in default. The Merrill Lynch U.S. High Yield Master II Constrained Index limits any individual issuer to a maximum of 2% benchmark exposure. These returns do not include the effect of any investment management expenses. These returns would have been lower if they included the effect of these expenses. Investors cannot invest directly in a market index. For a complete list of holdings, refer to the Schedule of Investments section of this report.
| | |
The Prudential Series Fund, SP PIMCO Total Return Portfolio Subadvised by: Pacific Investment Management Company LLC (PIMCO) | | December 31, 2008 |
Investment Manager’s Report - As of December 31, 2008
Average Annual Total Return Percentages
| | | | | | | | | |
| | | 1-Year | | | 5-Year | | | Since
Inception | |
Portfolio | | -0.20 | % | | 4.07 | % | | 5.97 | % |
Barclays Capital U.S. Aggregate Bond Index | | 5.24 | | | 4.65 | | | 6.09 | |
Past performance does not guarantee future returns. The investment return and principal value of an investment will fluctuate, so that an investor’s shares, when redeemed, may be worth more or less than their original cost. Current performance may be lower or higher than the past performance data quoted.
$10,000 INVESTED SINCE INCEPTION
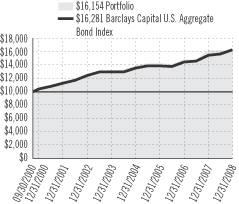
Portfolio inception: 9/22/2000. Portfolio performance is net of investment fees and fund expenses, but not product charges, which, if included, would significantly lower the performance quoted. Unless noted otherwise, Index returns reflect performance beginning the closest month-end date to the Portfolio’s inception. Performance figures may reflect fee waivers and/or expense reimbursements. In the absence of such fee waivers and/or expense reimbursements, total returns would be lower.
For the year ended December 31, 2008, the SP PIMCO Total Return Portfolio underperformed its benchmark index, the Barclays Capital U.S. Aggregate Bond Index (the Index), which posted a gain.
A burst housing bubble in the United States had led to a collapse in the subprime mortgage market that escalated into a full-scale credit crisis in which financial institutions continued to take massive write-downs and losses in 2008. The U.S. economy, mired in one of its worst recessions since the Great Depression, shed some 2.5 million jobs in 2008. The Federal Reserve (the Fed) tried to boost growth by cutting its target for the overnight bank lending rate from 4.25% in January to a range of zero to 0.25% in December. The Fed and the U.S. Department of the Treasury employed unconventional measures to encourage commercial banks and finance firms to lend, yet it remained difficult for businesses and individuals to borrow money.
Preservation of capital became a top priority of investors who fled to super safe U.S. Treasury securities, enabling that market to post a gain for 2008 that outperformed all other U.S. bond markets. Some aspects of PIMCO’s allocation strategy caused the Portfolio to underperform “the Index”. Most notably, the Portfolio had a larger exposure than “the Index” to mortgage-backed securities of federal agencies, one of the markets that underperformed the U.S. Treasury market. As the financial system deleveraged — sold positions to pay off debt — large financial institutions shed their most liquid assets to raise cash. In most cases, these assets were mortgage-backed securities of federal agencies.
The Portfolio benefited from having a smaller exposure than “the Index” to investment-grade corporate bonds, a market that dramatically underperformed the U.S. Treasury market in 2008. However, security selection among investment-grade corporate bonds did not work well because PIMCO emphasized bonds of financial companies. This was one of the worst performing areas of the investment-grade corporate bond market as many commercial banks, a major Wall Street firm, and some other financial institutions collapsed in 2008.
Finally, the Portfolio was positioned to benefit from an anticipated normalization in the market for interest rate swaps, agreements between two parties to exchange one stream of interest payments for another over a set period of time. But market conditions deteriorated in November, detracting from its performance.
Prudential Investments LLC (PI), an indirect, wholly owned subsidiary of Prudential Financial, Inc., serves as the investment manager for the Fund.
Barclays Capital U.S. Aggregate Bond Index is an unmanaged index comprised of more than 5,000 government and corporate bonds. These returns do not include the effect of any investment management expenses. These returns would have been lower if they included the effect of these expenses. Investors cannot invest directly in a market index. For a complete list of holdings, refer to the Schedule of Investments section of this report.
| | |
The Prudential Series Fund, SP Prudential U.S. Emerging Growth Portfolio Subadvised by: Jennison Associates LLC | | December 31, 2008 |
Investment Manager’s Report - As of December 31, 2008
Average Annual Total Return Percentages
| | | | | | | | | |
| | | 1-Year | | | 5-Year | | | Since
Inception | |
Portfolio: Class I | | -36.23 | % | | 3.14 | % | | -3.03 | % |
Portfolio: Class II | | -36.24 | | | 2.84 | | | 0.02 | |
S&P Midcap 400 Index | | -36.23 | | | -0.08 | | | 1.20 | |
Russell Midcap® Growth Index | | -44.32 | | | -2.33 | | | -6.70 | |
Past performance does not guarantee future returns. The investment return and principal value of an investment will fluctuate, so that an investor’s shares, when redeemed, may be worth more or less than their original cost. Current performance may be lower or higher than the past performance data quoted.
$10,000 INVESTED SINCE INCEPTION1
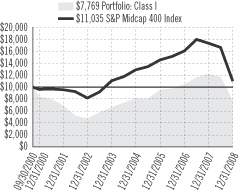
Portfolio (Class I) inception: 9/22/2000. Portfolio (Class II) inception: 7/9/2001. Portfolio performance is net of investment fees and fund expenses, but not product charges, which, if included, would significantly lower the performance quoted. Unless noted otherwise, Index returns reflect performance beginning the closest month-end date to the Portfolio’s inception (Class I). The Russell Midcap® Growth Index is a trademark/service mark of the Frank Russell Company. Russell® is a trademark of the Frank Russell Company. Performance figures may reflect fee waivers and/or expense reimbursements. In the absence of such fee waivers and/or expense reimbursements, total returns would be lower.
For the year ended December 31, 2008, the SP Prudential U.S. Emerging Growth Portfolio outperformed the Russell Midcap® Growth Index (the Index).
For the year, Jennison successfully avoided some of the worst performing technology companies in the Index, thus enhancing relative returns. In addition, individual holdings declined less than the Index. One of the top performers was a real estate investment trust (REIT), that owns, manages, and finances a portfolio of mortgage-backed securities (MBS) guaranteed by the Federal National Mortgage Association and the Federal Home Loan Mortgage Corporation. Its stock price increased significantly since the Portfolio initiated the position in August. Despite the volatile environment, the company announced solid financial results for the third quarter and kept its leverage low relative to historical levels. This company also benefited from widening spreads in the MBS market. The company avoids assuming credit risk by investing in government-insured mortgages and profits from an increase in the spread between long- and short-term rates.
The Portfolio’s conservative risk posture mitigated negative returns. More recently, the subadviser has been finding opportunities in more “conservative” stocks with lower beta factors. (Beta measures a stock’s volatility to the degree in which its price fluctuates in relation to the overall market). In 2008, a year that saw large negative returns across the board, lower beta stocks generally declined less than more aggressive stocks. Subsequently, an overexposure to more conservative stocks benefited the portfolio.
As the flight to quality intensified throughout the year, the subadviser’s overexposure to leverage (measures of a company’s debt to capital) detracted from returns. On the positive side, an underexposure to earnings variation (a measure of the volatility in a company’s earnings and cash flow) helped performance.
Certain sector weightings affected performance. An overweight in the healthcare sector, specifically the medical services industry, contributed negatively to performance for the year; however, an overweight in technology and an underweight in the consumer services sector helped pare losses. Within the technology sector, an overweight to the Internet industry contributed positively to relative performance.
Prudential Investments LLC (PI), an indirect, wholly owned subsidiary of Prudential Financial, Inc., serves as the investment manager for the Fund.
| 1 | The graph is based on the performance of Class I shares. Performance of Class II shares will be lower due to differences in the fee structure. Class II shares have associated 12b-1 and administrative fees at an annual rate of 0.25% and 0.15% respectively of the average daily net assets of the Class II shares. |
S&P Midcap 400 Index is a widely accepted, unmanaged total return index of 400 domestic stocks measuring the performance of the midsize company segment of the U.S. stock market. Russell Midcap Growth Index is a market cap-weighted index that measures the performance of those Russell Midcap companies with higher price-to-book ratios and higher forecasted growth values. These returns do not include the effect of any investment management expenses. These returns would have been lower if they included the effect of these expenses. Investors cannot invest directly in a market index. For a complete list of holdings, refer to the Schedule of Investments section of this report.
| | |
The Prudential Series Fund, SP Small Cap Value Portfolio Subadvised by: ClearBridge Advisors, LLC, Goldman Sachs Asset Management L.P. | | December 31, 2008 |
Investment Manager’s Report - As of December 31, 2008
Average Annual Total Return Percentages
| | | | | | | | | |
| | | 1-Year | | | 5-Year | | | Since
Inception | |
Portfolio | | -30.50 | % | | -0.63 | % | | 2.91 | % |
Russell 2500™ Index | | -36.79 | | | -0.98 | | | 1.28 | |
Russell 2000® Value Index | | -28.92 | | | 0.27 | | | 0.78 | |
Past performance does not guarantee future returns. The investment return and principal value of an investment will fluctuate, so that an investor’s shares, when redeemed, may be worth more or less than their original cost. Current performance may be lower or higher than the past performance data quoted.
$10,000 INVESTED SINCE INCEPTION
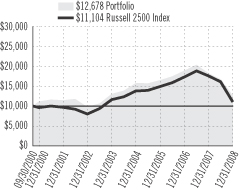
Portfolio inception: 9/22/2000. Portfolio performance is net of investment fees and fund expenses, but not product charges, which, if included, would significantly lower the performance quoted. Unless noted otherwise, Index returns reflect performance beginning the closest month-end date to the Portfolio’s inception. The Russell 2000® Value and Russell 2500TM Index are trademark/service marks of the Frank Russell Company. Russell® is a trademark of the Frank Russell Company. Performance figures may reflect fee waivers and/or expense reimbursements. In the absence of such fee waivers and/or expense reimbursements, total returns would be lower.
For the year ended December 31, 2008, the SP Small Cap Value Portfolio produced a total return that was slightly below its style benchmark, the Russell 2000® Value Index (the Index).
The Portfolio is subadvised by Goldman Sachs and ClearBridge Advisors. The Goldman portion follows a traditional small-cap value strategy with an emphasis on quality, purchasing well-positioned businesses at attractive valuations. ClearBridge follows a relative value approach that seeks “undiscovered” companies at lower valuations compared to peers.
Overall, the Portfolio’s performance lagged the Index due to stock- and sector-specific factors. The Portfolio was less sensitive to overall market movements, which mitigated its negative return, particularly in June, September, October, and early November, when stocks abruptly declined in value.
Stock-specific factors detracted from relative results. Holdings in the energy reserves, restaurants, and banks industries performed weakly and detracted from relative performance. However, asset selection in the oil services and financial services industries fared well.
Certain sector-specific positions also were not rewarded. The Portfolio’s underexposure to the financial sector and overexposure to the energy and technology sectors hurt performance relative to the Index. Conversely, an underexposure to consumer services augmented returns, which partially offset positions that underperformed.
The Portfolio’s relatively low beta means that it is less sensitive to price fluctuations in the broad market. (Beta measures a stock’s volatility to the degree in which its price fluctuates in relation to the overall market). In 2008, this more conservative risk posture served as a strong tailwind, propping up performance during the significant downturn in the broad market.
Prudential Investments LLC (PI), an indirect, wholly owned subsidiary of Prudential Financial, Inc., serves as the investment manager for the Fund.
Russell 2500 Index is a market cap-weighted index that measures the performance of the 2,500 smallest companies in the Russell 3000 Index, which represents approximately 17% of the total market capitalization of the Russell 3000 Index. Russell 2000 Value Index is an unmanaged index that measures the performance of those Russell 2000 companies with lower price-to-book ratios and lower forecasted growth values. These returns do not include the effect of any investment management expenses. These returns would have been lower if they included the effect of these expenses. Investors cannot invest directly in a market index. For a complete list of holdings, refer to the Schedule of Investments section of this report.
| | |
The Prudential Series Fund, SP Strategic Partners Focused Growth Portfolio Subadvised by: AllianceBernstein LP, Jennison Associates LLC | | December 31, 2008 |
Investment Manager’s Report - As of December 31, 2008
Average Annual Total Return Percentages
| | | | | | | | | |
| | | 1-Year | | | 5-Year | | | Since
Inception | |
Portfolio: Class I | | -38.42 | % | | -2.13 | % | | -6.59 | % |
Portfolio: Class II | | -38.54 | | | -2.53 | | | -5.24 | |
S&P 500 Index | | -36.99 | | | -2.19 | | | -3.76 | |
Russell 1000® Growth Index | | -38.44 | | | -3.42 | | | -8.24 | |
Past performance does not guarantee future returns. The investment return and principal value of an investment will fluctuate, so that an investor’s shares, when redeemed, may be worth more or less than their original cost. Current performance may be lower or higher than the past performance data quoted.
$10,000 INVESTED SINCE INCEPTION1
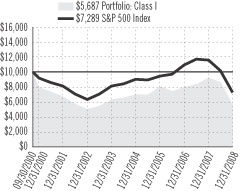
Portfolio (Class I) inception: 9/22/2000. Portfolio (Class II) inception: 1/12/2001. Portfolio performance is net of investment fees and fund expenses, but not product charges, which, if included, would significantly lower the performance quoted. Unless noted otherwise, Index returns reflect performance beginning the closest month-end date to the Portfolio’s inception (Class I). The Russell 1000® Growth Index is a trademark/service mark of the Frank Russell Company. Russell® is a trademark of the Frank Russell Company. Performance figures may reflect fee waivers and/or expense reimbursements. In the absence of such fee waivers and/or expense reimbursements, total returns would be lower.
For the year ended December 31, 2008, the SP Strategic Partners Focused Growth Portfolio performed in line with the style-appropriate Russell 1000® Growth Index (the Index).
The SP Strategic Partners Focused Growth Portfolio is subadvised by Jennison Associates and AllianceBernstein LP. Jennison Associates uses a bottom-up approach to identify attractive growth companies. AllianceBernstein LP is an “earnings driven” investor, focusing on the early recognition of change on the premise that value is created through the dynamics of changing company, industry, and economic fundamentals.
Generally, risk exposures posed the greatest challenge to the Portfolio’s relative performance. Active managers faced difficulty in outperforming benchmarks during the year. In 2008, markets were driven by broad economic factors and deleveraging (selling positions to reduce debt) rather than valuation and company fundamentals. The systemic shocks from the financial crisis increased correlations (price movements between stocks) to all-time highs. Often managers perform well in periods of rising volatility, in which uncertainty leads to greater variation in stock returns. At some point it is expected that the historical correlations between stocks will subside and valuation and fundamentals will drive performance, providing opportunities for skilled managers to outperform.
Specifically, risk factors that detracted included an overexposure to momentum stocks (companies experiencing recent price strength). Other exposures that hurt relative performance included a bias toward stocks with larger market capitalizations and lower earnings yield, in addition to companies that have a greater variability of earnings (earnings variation) than the Index.
For both subadvisers, stock selection in basic materials, industrials, healthcare, and financials helped drive performance.
Individual companies that helped performance were in biotechnology, chemicals, electronic equipment/telecommunications, and financial services. Positions detracting from relative results included a medical supplier, a pharmaceutical manufacturer, and a well-known Internet search engine.
Sector exposure in the Portfolio proved to be neutral. An underweight in energy hurt performance for the period, while an overweight in healthcare helped.
Prudential Investments LLC (PI), an indirect, wholly owned subsidiary of Prudential Financial, Inc., serves as the investment manager for the Fund.
| 1 | The graph is based on the performance of Class I shares. Performance of Class II shares will be lower due to differences in the fee structure. Class II shares have associated 12b-1 and administrative fees at an annual rate of 0.25% and 0.15% respectively of the average daily net assets of the Class II shares. |
S&P 500 Index is an unmanaged, market value-weighted index of 500 stocks generally representative of the broad stock market. Russell 1000 Growth Index is a market cap-weighted index that measures the performance of those Russell 1000 companies with higher price-to-book ratios and higher forecasted growth values. These returns do not include the effect of any investment management expenses. These returns would have been lower if they included the effect of these expenses. Investors cannot invest directly in a market index. For a complete list of holdings, refer to the Schedule of Investments section of this report.
| | |
Prudential Series Fund Presentation of Portfolio Holdings — unaudited | | December 31, 2008 |
| | |
| SP Aggressive Growth Asset Allocation |
| Five Largest Holdings (% of Net Assets) |
Advanced Series Trust-Large-
Cap Value Portfolio | | 36.4% |
PSF-Jennison Portfolio (Class I) | | 18.3% |
Advanced Series Trust-Marsico
Capital Growth Portfolio | | 18.3% |
PSF-SP International Growth
Portfolio (Class I) | | 8.5% |
PSF-SP International Value Portfolio | | 8.4% |
| | |
| SP Balanced Asset Allocation |
| Five Largest Holdings (% of Net Assets) |
PSF-SP PIMCO Total Return
Portfolio | | 30.4% |
Advanced Series Trust-AST
Large-Cap Value Portfolio | | 22.0% |
Advanced Series Trust-AST
Marsico Capital Growth Portfolio | | 11.1% |
PSF-Jennison Portfolio (Class I) | | 11.1% |
Advanced Series Trust-AST Western Asset Core Plus Bond Portfolio | | 7.5% |
| | |
| SP Conservative Asset Allocation |
| Five Largest Holdings (% of Net Assets) |
PSF-SP PIMCO Total Return
Portfolio | | 46.9% |
Advanced Series Trust-Large
Cap Value Portfolio | | 14.7% |
Advanced Series Trust-Western
Asset Core Plus Bond Portfolio | | 11.5% |
Advanced Series Trust-Marisco
Capital Growth Portfolio | | 7.5% |
PSF-Jennison Portfolio (Class I) | | 7.5% |
| | |
| SP Davis Value |
| Five Largest Holdings (% of Net Assets) |
Costco Wholesale Corp. | | 5.1% |
Berkshire Hathaway, Inc.
(Class A Stock) | | 5.0% |
Wells Fargo & Co. | | 4.4% |
| JPMorgan Chase & Co. | | 4.3% |
ConocoPhillips | | 4.3% |
| | |
| SP Growth Asset Allocation |
| Five Largest Holdings (% of Net Assets) |
Advanced Series Trust-Large
Cap Value Portfolio | | 29.3% |
Advanced Series Trust-Marisco
Capital Growth Portfolio | | 14.8% |
PSF-SP PIMCO Total Return
Portfolio | | 14.8% |
PSF-Jennison Portfolio (Class I) | | 14.8% |
PSF-SP International Growth
Portfolio (Class I) | | 7.6% |
| | |
| SP International Growth |
| Five Largest Holdings (% of Net Assets) |
| Teva Pharmaceutical Industries Ltd., ADR (Israel) | | 3.5% |
Nintendo Co. Ltd. (Japan) | | 3.4% |
Nestle SA (Switzerland) | | 3.2% |
| Roche Holding AG (Switzerland) | | 3.1% |
BG Group PLC (United Kingdom) | | 2.3% |
| | |
| SP International Value |
| Five Largest Holdings (% of Net Assets) |
| Teva Pharmaceutical Industries Ltd., ADR (Israel) | | 2.7% |
| Nestle SA (Switzerland) | | 2.6% |
Novo Nordisk A/S
(Class B Stock) (Denmark) | | 2.4% |
| Roche Holding AG (Switzerland) | | 2.3% |
| Rogers Communications, Inc. (Class B Stock) (Canada) | | 1.9% |
| | |
| SP Mid Cap Growth |
| Five Largest Holdings (% of Net Assets) |
DeVry, Inc. | | 2.3% |
| Strayer Education, Inc. | | 2.2% |
Stericycle, Inc. | | 2.0% |
| Myriad Genetics, Inc. | | 1.9% |
WMS Industries, Inc. | | 1.8% |
| | |
| SP PIMCO High Yield |
| Allocation (% of Net Assets) |
Corporate Bonds | | 80.0% |
Bank Notes | | 6.0% |
U.S. Government Mortgage-Backed Obligations | | 3.1% |
Municipal Bonds | | 2.5% |
| Collateralized Mortgage Obligations | | 1.4% |
| | |
| SP PIMCO Total Return |
| Allocation (% of Net Assets) |
| U.S. Government Mortgage-Backed Obligations | | 73.1% |
Corporate Bonds | | 41.6% |
| U.S Treasury Obligations | | 36.3% |
| Municipal Bonds | | 6.8% |
| Collateralized Mortgage Obligations | | 6.7% |
| | |
| SP Prudential U.S. Emerging Growth |
| Five Largest Holdings (% of Net Assets) |
Annaly Capital Management,
Inc. | | 4.0% |
Southwestern Energy Co. | | 3.4% |
NII Holdings, Inc. | | 3.0% |
DaVita, Inc. | | 3.0% |
Iron Mountain, Inc. | | 2.4% |
| | |
| SP Small Cap Value |
| Five Largest Holdings (% of Net Assets) |
| iShares Russell 2000 Value Index Fund | | 2.0% |
| Meadowbrook Insurance Group, Inc. | | 1.2% |
| Lawson Software, Inc. | | 1.1% |
| El Paso Electric Co. | | 1.1% |
| Allied World Assurance Holdings Ltd. (Bermuda) | | 1.0% |
| | |
| SP Strategic Partners Focused Growth |
| Five Largest Holdings (% of Net Assets) |
| Gilead Sciences, Inc. | | 7.1% |
| QUALCOMM, Inc. | | 6.3% |
| Google, Inc. (Class A Stock) | | 6.3% |
| Genentech, Inc. | | 5.3% |
| Cisco Systems, Inc. | | 4.7% |
For a complete list of holdings, please refer to the Schedule of Investments section of this report. Holdings reflect only long-term investments. Holdings/Issues/Sectors are subject to change.
| | |
The Prudential Series Fund Fees and Expenses — unaudited | | December 31, 2008 |
As a contract owner investing in Portfolios of the Fund through a variable annuity or variable life contract, you incur ongoing costs, including management fees, and other Portfolio expenses. This example is intended to help you understand your ongoing costs (in dollars) of investing in the Fund and to compare these costs with the ongoing costs of investing in other investment options. This example does not reflect fees and charges under your variable annuity or variable life contract. If contract charges were included, the costs shown below would be higher. Please consult the prospectus for your contract for more information about contract fees and charges.
The example is based on an investment of $1,000 invested at the beginning of the period and held for the entire period July 1, 2008 through December 31, 2008.
Actual Expenses
The first line of the table below provides information about actual account values and actual expenses. You may use this information, together with the amount you invested, to estimate the Portfolio expenses that you paid over the period. Simply divide your account value by $1,000 (for example, an $8,600 account value divided by $1,000 = 8.6), then multiply the result by the number in the first line under the heading entitled “Expenses Paid During the Six-Month Period” to estimate the Portfolio expenses you paid on your account during this period. As noted above, the table does not reflect variable contract fees and charges.
Hypothetical Example for Comparison Purposes
The second line of the table below provides information about hypothetical account values and hypothetical expenses based on the Portfolio’s actual expense ratio and an assumed rate of return of 5% per year before expenses, which is not the Portfolio’s actual return. The hypothetical account values and expenses may not be used to estimate the actual ending account balance or expenses you paid for the period. You may use this information to compare the ongoing costs of investing in the Portfolio and other investment options. To do so, compare this 5% hypothetical example with the 5% hypothetical examples that appear in the shareholder reports of the other investment options.
Please note that the expenses shown in the table are meant to highlight your ongoing Portfolio costs only and do not reflect any contract fees and charges, such as sales charges (loads), insurance charges or administrative charges. Therefore the second line of the table is useful to compare ongoing investment option costs only, and will not help you determine the relative total costs of owning different contracts. In addition, if these contract fee and charges were included, your costs would have been higher.
| | | | | | | | | | | | | | |
| The Prudential Series Fund Portfolios | | Beginning
Account Value
July 1, 2008 | | Ending
Account Value
December 31, 2008 | | Annualized Expense
Ratio Based on the
Six-Month period | | | Expenses Paid
During the
Six-Month Period |
| SP Aggressive Growth Asset Allocation (Class I) | | Actual | | $ | 1,000.00 | | $ | 657.60 | | 1.03 | % | | $ | 4.29 |
| | Hypothetical | | $ | 1,000.00 | | $ | 1,019.96 | | 1.03 | % | | $ | 5.23 |
| SP Balanced Asset Allocation (Class I) | | Actual | | $ | 1,000.00 | | $ | 772.70 | | 1.12 | % | | $ | 4.99 |
| | Hypothetical | | $ | 1,000.00 | | $ | 1,019.51 | | 1.12 | % | | $ | 5.69 |
| SP Conservative Asset Allocation (Class I) | | Actual | | $ | 1,000.00 | | $ | 839.50 | | 1.22 | % | | $ | 5.64 |
| | Hypothetical | | $ | 1,000.00 | | $ | 1,019.00 | | 1.22 | % | | $ | 6.19 |
| SP Davis Value (Class I) | | Actual | | $ | 1,000.00 | | $ | 676.70 | | 0.82 | % | | $ | 3.46 |
| | Hypothetical | | $ | 1,000.00 | | $ | 1,021.01 | | 0.82 | % | | $ | 4.17 |
| SP Growth Asset Allocation (Class I) | | Actual | | $ | 1,000.00 | | $ | 708.20 | | 1.02 | % | | $ | 4.38 |
| | Hypothetical | | $ | 1,000.00 | | $ | 1,020.01 | | 1.02 | % | | $ | 5.18 |
| SP International Growth (Class I) | | Actual | | $ | 1,000.00 | | $ | 563.70 | | 1.01 | % | | $ | 3.97 |
| | Hypothetical | | $ | 1,000.00 | | $ | 1,020.06 | | 1.01 | % | | $ | 5.13 |
| SP International Growth (Class II) | | Actual | | $ | 1,000.00 | | $ | 563.50 | | 1.41 | % | | $ | 5.54 |
| | Hypothetical | | $ | 1,000.00 | | $ | 1,018.05 | | 1.41 | % | | $ | 7.15 |
| SP International Value (Class I) | | Actual | | $ | 1,000.00 | | $ | 650.50 | | 1.04 | % | | $ | 4.31 |
| | Hypothetical | | $ | 1,000.00 | | $ | 1,019.91 | | 1.04 | % | | $ | 5.28 |
| SP Mid Cap Growth (Class I) | | Actual | | $ | 1,000.00 | | $ | 642.30 | | 0.90 | % | | $ | 3.72 |
| | Hypothetical | | $ | 1,000.00 | | $ | 1,020.61 | | 0.90 | % | | $ | 4.57 |
| SP PIMCO High Yield (Class I) | | Actual | | $ | 1,000.00 | | $ | 759.00 | | 0.77 | % | | $ | 3.40 |
| | Hypothetical | | $ | 1,000.00 | | $ | 1,021.27 | | 0.77 | % | | $ | 3.91 |
| SP PIMCO Total Return (Class I) | | Actual | | $ | 1,000.00 | | $ | 995.80 | | 2.47 | % | | $ | 12.39 |
| | Hypothetical | | $ | 1,000.00 | | $ | 1,012.72 | | 2.47 | % | | $ | 12.50 |
| SP Prudential U.S. Emerging Growth (Class I) | | Actual | | $ | 1,000.00 | | $ | 664.70 | | 0.69 | % | | $ | 2.89 |
| | Hypothetical | | $ | 1,000.00 | | $ | 1,021.67 | | 0.69 | % | | $ | 3.51 |
| | |
The Prudential Series Fund Fees and Expenses — unaudited (continued) | | December 31, 2008 |
| | | | | | | | | | | | | | |
| The Prudential Series Fund Portfolios | | Beginning
Account Value
July 1, 2008 | | Ending
Account Value
December 31, 2008 | | Annualized Expense
Ratio Based on the
Six-Month period | | | Expenses Paid
During the
Six-Month Period |
| SP Prudential U.S. Emerging Growth (Class II) | | Actual | | $ | 1,000.00 | | $ | 664.70 | | 1.09 | % | | $ | 4.56 |
| | Hypothetical | | $ | 1,000.00 | | $ | 1,019.66 | | 1.09 | % | | $ | 5.53 |
| SP Small Cap Value (Class I) | | Actual | | $ | 1,000.00 | | $ | 757.70 | | 0.99 | % | | $ | 4.37 |
| | Hypothetical | | $ | 1,000.00 | | $ | 1,020.16 | | 0.99 | % | | $ | 5.03 |
| SP Strategic Partners Focused Growth (Class I) | | Actual | | $ | 1,000.00 | | $ | 657.50 | | 1.30 | % | | $ | 5.42 |
| | Hypothetical | | $ | 1,000.00 | | $ | 1,018.60 | | 1.30 | % | | $ | 6.60 |
| SP Strategic Partners Focused Growth (Class II) | | Actual | | $ | 1,000.00 | | $ | 656.70 | | 1.70 | % | | $ | 7.08 |
| | Hypothetical | | $ | 1,000.00 | | $ | 1,016.59 | | 1.70 | % | | $ | 8.62 |
* Portfolio expenses (net of fee waivers or subsidies, if any) for each share class are equal to the annualized expense ratio for each share class (provided in the table), multiplied by the average account value over the period, multiplied by the 184 days in the six-month period ended December 31, 2008, and divided by the 366 days in the Portfolio’s fiscal year ended December 31, 2008 (to reflect the six-month period). Expenses presented in the table include the expenses of any underlying portfolios in which the Portfolio may invest.
| | | | | | |
| | | SP AGGRESSIVE GROWTH ASSET ALLOCATION PORTFOLIO | | |
| |
| SCHEDULE OF INVESTMENTS | | December 31, 2008 |
| | | | | | |
LONG-TERM
INVESTMENTS — 99.0% | | Shares
| | Value
(Note 2)
| |
Affiliated Mutual Funds | | | | |
Advanced Series Trust — | | | | | | |
Global Real Estate Portfolio(a) | | 220,612 | | $ | 1,153,801 | |
Large-Cap Value Portfolio | | 3,812,326 | | | 39,114,462 | |
Marsico Capital Growth Portfolio | | 1,559,885 | | | 19,732,540 | |
Small-Cap Growth Portfolio(a) | | 313,499 | | | 3,511,187 | |
The Prudential Series Fund — | | | | | | |
Jennison Portfolio (Class I) | | 1,343,294 | | | 19,732,990 | |
Money Market Portfolio | | 202 | | | 2,022 | |
Natural Resources Portfolio (Class I) | | 52,055 | | | 1,233,705 | |
SP International Growth Portfolio (Class I) | | 2,651,258 | | | 9,146,840 | |
SP International Value Portfolio | | 1,824,920 | | | 9,033,354 | |
SP Small Cap Value Portfolio | | 508,154 | | | 3,861,972 | |
| | | | |
|
|
|
TOTAL LONG-TERM INVESTMENTS
(cost $149,241,079) | | | 106,522,873 | |
| | | | |
|
|
|
| SHORT-TERM INVESTMENT — 1.1% | | | | |
Affiliated Money Market Mutual Fund | | | | |
Dryden Core Investment Fund — Taxable Money Market Series
(cost $1,140,231) (Note 4) | | 1,140,231 | | | 1,140,231 | |
| | | | |
|
|
|
TOTAL INVESTMENTS — 100.1%
(cost $150,381,310)(b) | | | 107,663,104 | |
LIABILITIES IN EXCESS OF OTHER
ASSETS — (0.1)% | | | (77,509 | ) |
| | | | |
|
|
|
NET ASSETS — 100.0% | | $ | 107,585,595 | |
| | | | |
|
|
|
| (a) | Non-income producing security. |
| (b) | Prudential Investments LLC, the manager of the Portfolio, also serves as manager of the underlying portfolios in which the Portfolio invests. |
Various inputs are used in determining the value of the Portfolio’s investments. These inputs are summarized in the three broad levels listed below.
Level 1—quoted prices in active markets for identical securities
Level 2—other significant observable inputs (including quoted prices for similar securities, interest rates, prepayment speeds, credit risk, etc.)
Level 3—significant unobservable inputs (including the Portfolio’s own assumptions in determining the fair value of investments)
The following is a summary of the inputs used as of December 31, 2008 in valuing the Portfolio’s assets carried at fair value:
| | | | | |
Valuation inputs
| | Investments
in Securities
| | Other Financial
Instruments*
|
Level 1—Quoted Prices | | $ | 107,663,104 | | — |
Level 2—Other Significant Observable Inputs | | | — | | — |
Level 3—Significant Unobservable Inputs | | | — | | — |
| | |
|
| |
|
Total | | $ | 107,663,104 | | — |
| | |
|
| |
|
| * | Other financial instruments are derivative instruments not reflected in the Schedule of Investments, such as futures, forwards and swap contracts, which are valued at the unrealized appreciation/depreciation on the instrument. |
As of December 31, 2007 and December 31, 2008, the Portfolio did not use any significant unobservable inputs (Level 3) in determining the value of investments.
The investment allocation of portfolio holdings and liabilities in excess of other assets shown as a percentage of net assets as of December 31, 2008 were as follows:
| | | |
Investment Type | | | |
Large/Mid-Cap Growth | | 36.6 | % |
Large/Mid-Cap Value | | 36.4 | |
International Growth | | 8.5 | |
International Value | | 8.4 | |
Small-Cap Value | | 3.6 | |
Small-Cap Growth | | 3.3 | |
Sector | | 2.2 | |
Money Market | | — | (c) |
| | |
|
|
| | | 99.0 | |
Short-Term Investment | | 1.1 | |
Liabilities in excess of other assets | | (0.1 | ) |
| | |
|
|
| | | 100.0 | % |
| | |
|
|
SEE NOTES TO FINANCIAL STATEMENTS.
A1
| | | | | | |
| | | SP AGGRESSIVE GROWTH ASSET ALLOCATION PORTFOLIO (continued) | | |
STATEMENT OF ASSETS AND LIABILITIES
December 31, 2008
| | | | |
| ASSETS | | | | |
Affiliated investments, at value (cost $150,381,310) | | $ | 107,663,104 | |
Cash | | | 6,809 | |
Receivable for Series shares sold | | | 51,105 | |
Prepaid expenses | | | 2,119 | |
Dividends receivable | | | 377 | |
| | |
|
|
|
Total Assets | | | 107,723,514 | |
| | |
|
|
|
| LIABILITIES | | | | |
Payable for investments purchased | | | 70,000 | |
Accrued expenses and other liabilities | | | 41,987 | |
Payable for Series shares repurchased | | | 20,361 | |
Management fee payable | | | 4,394 | |
Deferred trustees’ fees | | | 670 | |
Affiliated transfer agent fee payable | | | 507 | |
| | |
|
|
|
Total Liabilities | | | 137,919 | |
| | |
|
|
|
| NET ASSETS | | $ | 107,585,595 | |
| | |
|
|
|
Net assets were comprised of: | | | | |
Paid-in capital | | $ | 150,938,716 | |
Retained earnings | | | (43,353,121 | ) |
| | |
|
|
|
Net assets, December 31, 2008 | | $ | 107,585,595 | |
| | |
|
|
|
Net asset value and redemption price per share, $107,585,595 / 19,309,062 outstanding shares of beneficial interest | | $ | 5.57 | |
| | |
|
|
|
STATEMENT OF OPERATIONS
Year Ended December 31, 2008
| | | | |
| INVESTMENT INCOME | | | | |
Affiliated dividend income | | $ | 1,805,854 | |
| | |
|
|
|
| EXPENSES | | | | |
Management fee | | | 79,763 | |
Custodian’s fees and expenses | | | 60,000 | |
Shareholders’ reports | | | 49,000 | |
Audit fee | | | 17,000 | |
Trustees’ fees | | | 8,000 | |
Legal fees and expenses | | | 7,000 | |
Transfer agent’s fee and expenses (including affiliated expense of $3,000) (Note 4) | | | 3,000 | |
Insurance expenses | | | 2,000 | |
Miscellaneous | | | 10,596 | |
| | |
|
|
|
Total expenses | | | 236,359 | |
| | |
|
|
|
| NET INVESTMENT INCOME | | | 1,569,495 | |
| | |
|
|
|
| NET REALIZED AND UNREALIZED GAIN (LOSS) ON AFFILIATED INVESTMENTS | | | | |
Net realized loss on investment transactions | | | (12,562,397 | ) |
Net capital gain distributions received | | | 10,642,207 | |
| | |
|
|
|
| | | | (1,920,190 | ) |
| | |
|
|
|
Net change in unrealized appreciation (depreciation) on investments | | | (81,110,463 | ) |
| | |
|
|
|
| NET LOSS ON INVESTMENTS | | | (83,030,653 | ) |
| | |
|
|
|
| NET DECREASE IN NET ASSETS RESULTING FROM OPERATIONS | | $ | (81,461,158 | ) |
| | |
|
|
|
STATEMENT OF CHANGES IN NET ASSETS
| | | | | | | | |
| | | Year Ended December 31,
| |
| | | 2008
| | | 2007
| |
| INCREASE (DECREASE) IN NET ASSETS | | | | | | | | |
| OPERATIONS: | | | | | | | | |
Net investment income | | $ | 1,569,495 | | | $ | 1,717,713 | |
Net realized gain (loss) on investment transactions | | | (1,920,190 | ) | | | 17,039,733 | |
Net change in unrealized appreciation (depreciation) on investments | | | (81,110,463 | ) | | | (738,074 | ) |
| | |
|
|
| |
|
|
|
NET INCREASE (DECREASE) IN NET ASSETS RESULTING FROM OPERATIONS | | | (81,461,158 | ) | | | 18,019,372 | |
| | |
|
|
| |
|
|
|
| DISTRIBUTIONS: | | | (18,757,446 | ) | | | (11,080,580 | ) |
| | |
|
|
| |
|
|
|
| SERIES SHARE TRANSACTIONS: | | | | | | | | |
Series shares sold [1,381,549 and 1,251,048 shares, respectively] | | | 11,065,156 | | | | 13,719,809 | |
Series shares issued in reinvestment of distributions [2,114,706 and 1,036,537 shares, respectively] | | | 18,757,446 | | | | 11,080,580 | |
Series shares repurchased [3,291,598 and 2,543,081 shares, respectively] | | | (27,308,057 | ) | | | (28,055,738 | ) |
| | |
|
|
| |
|
|
|
NET INCREASE (DECREASE) IN NET ASSETS RESULTING FROM SERIES SHARE TRANSACTIONS | | | 2,514,545 | | | | (3,255,349 | ) |
| | |
|
|
| |
|
|
|
| TOTAL INCREASE (DECREASE) IN NET ASSETS | | | (97,704,059 | ) | | | 3,683,443 | |
| NET ASSETS: | | | | | | | | |
Beginning of year | | | 205,289,654 | | | | 201,606,211 | |
| | |
|
|
| |
|
|
|
End of year | | $ | 107,585,595 | | | $ | 205,289,654 | |
| | |
|
|
| |
|
|
|
SEE NOTES TO FINANCIAL STATEMENTS.
A2
| | | | | | |
| | | SP BALANCED ASSET ALLOCATION PORTFOLIO | | |
| |
| SCHEDULE OF INVESTMENTS | | December 31, 2008 |
| | | | | |
LONG-TERM
INVESTMENTS — 99.5% | | Shares
| | Value
(Note 2)
|
AFFILIATED MUTUAL FUNDS | | | |
Advanced Series Trust — | | | | | |
Global Real Estate Portfolio(a) | | 1,168,844 | | $ | 6,113,054 |
Large-Cap Value Portfolio | | 18,116,975 | | | 185,880,161 |
Marsico Capital Growth Portfolio | | 7,433,798 | | | 94,037,544 |
Small-Cap Growth Portfolio(a) | | 1,487,869 | | | 16,664,130 |
Western Asset Core Plus Bond Portfolio | | 6,688,692 | | | 63,275,031 |
The Prudential Series Fund — | | | | | |
Jennison Portfolio (Class I) | | 6,386,268 | | | 93,814,281 |
Money Market Portfolio | | 3,555 | | | 35,553 |
Natural Resources Portfolio (Class I) | | 262,458 | | | 6,220,258 |
SP International Growth Portfolio (Class I) | | 14,044,654 | | | 48,454,056 |
SP International Value Portfolio | | 9,490,607 | | | 46,978,503 |
SP PIMCO High Yield Portfolio | | 697,673 | | | 4,674,412 |
SP PIMCO Total Return Portfolio | | 23,244,337 | | | 257,082,365 |
SP Small Cap Value Portfolio | | 2,332,865 | | | 17,729,776 |
| | | | |
|
|
TOTAL LONG-TERM INVESTMENTS
(cost $1,054,248,010) | | | 840,959,124 |
| | | | |
|
|
| SHORT-TERM INVESTMENT — 0.5% | | | |
AFFILIATED MONEY MARKET MUTUAL FUND | | | |
Dryden Core Investment Fund — Taxable Money Market Series
(cost $3,895,359) (Note 4) | | 3,895,359 | | | 3,895,359 |
| | | | |
|
|
TOTAL INVESTMENTS — 100.0%
(cost $1,058,143,369)(b) | | | 844,854,483 |
OTHER ASSETS IN EXCESS OF LIABILITIES | | | 168,309 |
| | | | |
|
|
NET ASSETS — 100.0% | | $ | 845,022,792 |
| | | | |
|
|
| (a) | Non-income producing security. |
| (b) | Prudential Investments LLC, the manager of the Portfolio, also serves as manager/co-manager of the underlying portfolios in which the Portfolio invests. |
Various inputs are used in determining the value of the Portfolio’s investments. These inputs are summarized in the three broad levels listed below.
Level 1—quoted prices in active markets for identical securities
Level 2—other significant observable inputs (including quoted prices for similar securities, interest rates, prepayment speeds, credit risk, etc.)
Level 3—significant unobservable inputs (including the Portfolio’s own assumptions in determining the fair value of investments)
The following is a summary of the inputs used as of December 31, 2008 in valuing the Portfolio’s assets carried at fair value:
| | | | | |
Valuation inputs
| | Investments
in Securities
| | Other Financial
Instruments*
|
Level 1—Quoted Prices | | $ | 844,854,483 | | — |
Level 2—Other Significant Observable Inputs | | | — | | — |
Level 3—Significant Unobservable Inputs | | | — | | — |
| | |
|
| |
|
Total | | $ | 844,854,483 | | — |
| | |
|
| |
|
| * | Other financial instruments are derivative instruments not reflected in the Schedule of Investments, such as futures, forwards and swap contracts, which are valued at the unrealized appreciation/depreciation on the instrument. |
As of December 31, 2007 and December 31, 2008, the Portfolio did not use any significant unobservable inputs (Level 3) in determining the valuation of investments.
The investment allocation of portfolio holdings and other assets in excess of liabilities shown as a percentage of net assets as of December 31, 2008 were as follows:
| | | |
Investment Type | | | |
Core Bonds | | 37.9 | % |
Large/Mid-Cap Growth | | 22.2 | |
Large/Mid-Cap Value | | 22.0 | |
International Growth | | 5.7 | |
International Value | | 5.6 | |
Small-Cap Value | | 2.1 | |
Small-Cap Growth | | 2.0 | |
Sector | | 1.4 | |
High Yield | | 0.6 | |
Money Market | | — | (c) |
| | |
|
|
| | | 99.5 | |
Short-Term Investment | | 0.5 | |
Other assets in excess of liabilities | | — | (c) |
| | |
|
|
| | | 100.0 | % |
| | |
|
|
SEE NOTES TO FINANCIAL STATEMENTS.
A3
| | | | | | |
| | | SP BALANCED ASSET ALLOCATION PORTFOLIO (continued) | | |
STATEMENT OF ASSETS AND LIABILITIES
December 31, 2008
| | | | |
| ASSETS | | | | |
Affiliated investments, at value (cost $1,058,143,369) | | $ | 844,854,483 | |
Cash | | | 6,438 | |
Receivable for investments sold | | | 1,700,017 | |
Prepaid expenses | | | 14,866 | |
Dividends receivable | | | 1,461 | |
Receivable for Series shares sold | | | 1,180 | |
| | |
|
|
|
Total Assets | | | 846,578,445 | |
| | |
|
|
|
| LIABILITIES | | | | |
Payable for investments purchased | | | 1,300,001 | |
Payable for Series shares repurchased | | | 177,979 | |
Accrued expenses and other liabilities | | | 41,729 | |
Management fee payable | | | 34,651 | |
Deferred trustees’ fees | | | 825 | |
Transfer agent fee payable | | | 468 | |
| | |
|
|
|
Total Liabilities | | | 1,555,653 | |
| | |
|
|
|
| NET ASSETS | | $ | 845,022,792 | |
| | |
|
|
|
Net assets were comprised of: | | | | |
Paid-in capital | | $ | 1,028,087,844 | |
Retained earnings | | | (183,065,052 | ) |
| | |
|
|
|
Net assets, December 31, 2008 | | $ | 845,022,792 | |
| | |
|
|
|
Net asset value and redemption price per share, $845,022,792 / 108,103,476 outstanding shares of beneficial interest | | $ | 7.82 | |
| | |
|
|
|
STATEMENT OF OPERATIONS
Year Ended December 31, 2008
| | | | |
| INVESTMENT INCOME | | | | |
Affiliated dividend income | | $ | 25,762,393 | |
| | |
|
|
|
| EXPENSES | | | | |
Management fee | | | 571,785 | |
Shareholders’ reports | | | 68,000 | |
Custodian’s fees and expenses | | | 57,000 | |
Audit fee | | | 17,000 | |
Insurance expenses | | | 15,000 | |
Trustees’ fees | | | 8,000 | |
Legal fees and expenses | | | 7,000 | |
Commitment fee on syndicated credit agreement | | | 5,000 | |
Transfer agent’s fee and expenses (including affiliated expense of $2,700) (Note 4) | | | 3,000 | |
Miscellaneous | | | 7,367 | |
| | |
|
|
|
Total expenses | | | 759,152 | |
| | |
|
|
|
| NET INVESTMENT INCOME | | | 25,003,241 | |
| | |
|
|
|
| NET REALIZED AND UNREALIZED GAIN (LOSS) ON AFFILIATED INVESTMENTS | | | | |
Net realized loss on investment transactions | | | (40,204,556 | ) |
Net capital gain distributions received | | | 46,843,031 | |
| | |
|
|
|
| | | | 6,638,475 | |
| | |
|
|
|
Net change in unrealized appreciation (depreciation) on investments | | | (399,640,992 | ) |
| | |
|
|
|
| NET LOSS ON INVESTMENTS | | | (393,002,517 | ) |
| | |
|
|
|
| NET DECREASE IN NET ASSETS RESULTING FROM OPERATIONS | | $ | (367,999,276 | ) |
| | |
|
|
|
STATEMENT OF CHANGES IN NET ASSETS
| | | | | | | | |
| | | Year Ended December 31,
| |
| | | 2008
| | | 2007
| |
| INCREASE (DECREASE) IN NET ASSETS | | | | | | | | |
| OPERATIONS: | | | | | | | | |
Net investment income | | $ | 25,003,241 | | | $ | 28,163,670 | |
Net realized gain (loss) on investments | | | 6,638,475 | | | | 85,374,112 | |
Net change in unrealized appreciation (depreciation) on investments | | | (399,640,992 | ) | | | 12,573,441 | |
| | |
|
|
| |
|
|
|
NET INCREASE (DECREASE) IN NET ASSETS RESULTING FROM OPERATIONS | | | (367,999,276 | ) | | | 126,111,223 | |
| | |
|
|
| |
|
|
|
| DISTRIBUTIONS | | | (113,537,782 | ) | | | (69,161,551 | ) |
| | |
|
|
| |
|
|
|
| SERIES SHARE TRANSACTIONS: | | | | | | | | |
Series shares sold [1,614,224 and 2,822,407 shares, respectively] | | | 16,097,836 | | | | 33,772,326 | |
Series shares issued in reinvestment of distributions [10,927,602 and 5,792,424 shares, respectively] | | | 113,537,782 | | | | 69,161,551 | |
Series shares repurchased [19,930,907 and 14,463,180 shares, respectively] | | | (194,105,168 | ) | | | (175,165,503 | ) |
| | |
|
|
| |
|
|
|
NET DECREASE IN NET ASSETS RESULTING FROM SERIES SHARE TRANSACTIONS | | | (64,469,550 | ) | | | (72,231,626 | ) |
| | |
|
|
| |
|
|
|
| TOTAL DECREASE IN NET ASSETS | | | (546,006,608 | ) | | | (15,281,954 | ) |
| NET ASSETS: | | | | | | | | |
Beginning of year | | | 1,391,029,400 | | | | 1,406,311,354 | |
| | |
|
|
| |
|
|
|
End of year | | $ | 845,022,792 | | | $ | 1,391,029,400 | |
| | |
|
|
| |
|
|
|
SEE NOTES TO FINANCIAL STATEMENTS.
A4
| | | | | | |
| | | SP CONSERVATIVE ASSET ALLOCATION PORTFOLIO | | |
| |
| SCHEDULE OF INVESTMENTS | | December 31, 2008 |
| | | | | | |
LONG-TERM
INVESTMENTS — 99.6% | | Shares
| | Value
(Note 2)
| |
Affiliated Mutual Funds | | | | | | |
Advanced Series Trust — | | | | | | |
Global Real Estate Portfolio(a) | | 360,396 | | $ | 1,884,871 | |
Large Cap Value | | 6,048,930 | | | 62,062,022 | |
Marsico Capital Growth Portfolio | | 2,508,071 | | | 31,727,103 | |
Small Cap Growth Portfolio(a) | | 505,308 | | | 5,659,453 | |
Western Asset Core Plus Bond Portfolio | | 5,146,262 | | | 48,683,640 | |
The Prudential Series Fund — | | | | | | |
Jennison Portfolio (Class I) | | 2,146,612 | | | 31,533,731 | |
Money Market Portfolio | | 23,699 | | | 236,993 | |
Natural Resources Portfolio (Class I) | | 78,883 | | | 1,869,532 | |
SP International Growth Portfolio (Class I) | | 4,557,686 | | | 15,724,016 | |
SP International Value Portfolio | | 3,021,872 | | | 14,958,265 | |
SP PIMCO High Yield Portfolio | | 330,386 | | | 2,213,588 | |
SP PIMCO Total Return Portfolio | | 17,880,398 | | | 197,757,203 | |
SP Small Cap Value Portfolio | | 775,793 | | | 5,896,027 | |
| | | | |
|
|
|
TOTAL LONG-TERM INVESTMENTS
(cost $486,999,609) | | | 420,206,444 | |
| | | | |
|
|
|
| SHORT-TERM INVESTMENT — 0.4% | | | | |
Affiliated Money Market Mutual Fund | | | | | | |
Dryden Core Investment Fund — Taxable Money Market Series
(cost $1,687,981) (Note 4) | | 1,687,981 | | | 1,687,981 | |
| | | | |
|
|
|
TOTAL INVESTMENTS — 100.0%
(cost $488,687,590)(b) | | | 421,894,425 | |
LIABILITIES IN EXCESS OF OTHER ASSETS | | | (94,087 | ) |
| | | | |
|
|
|
NET ASSETS — 100.0% | | $ | 421,800,338 | |
| | | | |
|
|
|
| (a) | Non-income producing security. |
| (b) | Prudential Investments LLC, the manager of the Portfolio, also serves as manager/co-manager of the underlying portfolios in which the Portfolio invests. |
Various inputs are used in determining the value of the Portfolio’s investments. These inputs are summarized in the three broad levels listed below.
Level 1—quoted prices in active markets for identical securities
Level 2—other significant observable inputs (including quoted prices for similar securities, interest rates, prepayment speeds, credit risk, etc.)
Level 3—significant unobservable inputs (including the Portfolio’s own assumptions in determining the fair value of investments)
The following is a summary of the inputs used as of December 31, 2008 in valuing the Portfolio’s assets carried at fair value:
| | | | | |
Valuation inputs
| | Investments
in Securities
| | Other Financial
Instruments*
|
Level 1—Quoted Prices | | $ | 421,894,425 | | — |
Level 2—Other Significant Observable Inputs | | | — | | — |
Level 3—Significant Unobservable Inputs | | | — | | — |
| | |
|
| |
|
Total | | $ | 421,894,425 | | — |
| | |
|
| |
|
| * | Other financial instruments are derivative instruments not reflected in the Schedule of Investments, such as futures, forwards and swap contracts, which are valued at the unrealized appreciation/depreciation on the instrument. |
As of December 31, 2007 and December 31, 2008, the Portfolio did not use any significant unobservable inputs (Level 3) in determining the valuation of investments.
The investment allocation of portfolio holdings and liabilities in excess of other assets shown as a percentage of net assets as of December 31, 2008 were as follows:
| | | |
Investment Type | | | |
Core Bonds | | 58.4 | % |
Large/Mid-Cap Growth | | 15.0 | |
Large/Mid-Cap Value | | 14.7 | |
International Growth | | 3.7 | |
International Value | | 3.6 | |
Small-Cap Value | | 1.4 | |
Small-Cap Growth | | 1.3 | |
Sector | | 0.9 | |
High Yield | | 0.5 | |
Money Market | | 0.1 | |
| | |
|
|
| | | 99.6 | |
Short-Term Investment | | 0.4 | |
Liabilities in excess of other assets | | — | (c) |
| | |
|
|
| | | 100.0 | % |
| | |
|
|
SEE NOTES TO FINANCIAL STATEMENTS.
A5
| | | | | | |
| | | SP CONSERVATIVE ASSET ALLOCATION PORTFOLIO (continued) | | |
STATEMENT OF ASSETS AND LIABILITIES
December 31, 2008
| | | | |
| ASSETS | | | | |
Affiliated investments, at value (cost $488,687,590) | | $ | 421,894,425 | |
Cash | | | 6,465 | |
Receivable for investments sold | | | 800,086 | |
Prepaid expenses and other assets | | | 6,849 | |
Receivable for Series shares sold | | | 3,935 | |
Dividends receivable | | | 627 | |
| | |
|
|
|
Total Assets | | | 422,712,387 | |
| | |
|
|
|
| LIABILITIES | | | | |
Payable for Series shares repurchased | | | 454,210 | |
Payable for investments purchased | | | 400,008 | |
Accrued expenses and other liabilities | | | 39,195 | |
Management fee payable | | | 17,392 | |
Deferred trustees’ fees | | | 769 | |
Affiliated transfer agent fee payable | | | 475 | |
| | |
|
|
|
Total Liabilities | | | 912,049 | |
| | |
|
|
|
| NET ASSETS | | $ | 421,800,338 | |
| | |
|
|
|
Net assets were comprised of: | | | | |
Paid-in capital | | $ | 477,462,031 | |
Retained earnings | | | (55,661,693 | ) |
| | |
|
|
|
Net assets, December 31, 2008 | | $ | 421,800,338 | |
| | |
|
|
|
Net asset value and redemption price per share, $421,800,338 / 47,458,627 outstanding shares of beneficial interest | | $ | 8.89 | |
| | |
|
|
|
STATEMENT OF OPERATIONS
Year Ended December 31, 2008
| | | | |
| INVESTMENT INCOME | | | | |
Affiliated dividend income | | $ | 15,228,385 | |
| | |
|
|
|
| EXPENSES | | | | |
Management fee | | | 268,064 | |
Custodian’s fees and expenses | | | 56,000 | |
Shareholders’ reports | | | 48,000 | |
Audit fee | | | 17,000 | |
Legal fees and expenses | | | 8,000 | |
Trustees’ fees | | | 8,000 | |
Insurance expenses | | | 7,000 | |
Commitment fee on syndicated credit agreement | | | 3,000 | |
Transfer agent’s fees and expenses (including affiliated expense of $2,700) (Note 4) | | | 3,000 | |
Miscellaneous | | | 8,471 | |
| | |
|
|
|
Total expenses | | | 426,535 | |
| | |
|
|
|
| NET INVESTMENT INCOME | | | 14,801,850 | |
| | |
|
|
|
| NET REALIZED AND UNREALIZED GAIN (LOSS) ON AFFILIATED INVESTMENTS | | | | |
Net realized loss on investments | | | (17,419,708 | ) |
Net capital gain distributions received | | | 14,441,790 | |
| | |
|
|
|
| | | | (2,977,918 | ) |
| | |
|
|
|
Net change in unrealized appreciation (depreciation) on investments | | | (129,232,252 | ) |
| | |
|
|
|
| NET LOSS ON INVESTMENTS | | | (132,210,170 | ) |
| | |
|
|
|
| NET DECREASE IN NET ASSETS RESULTING FROM OPERATIONS | | $ | (117,408,320 | ) |
| | |
|
|
|
STATEMENT OF CHANGES IN NET ASSETS
| | | | | | | | |
| | | Year Ended December 31,
| |
| | | 2008
| | | 2007
| |
| INCREASE (DECREASE) IN NET ASSETS | | | | | | | | |
| OPERATIONS: | | | | | | | | |
Net investment income | | $ | 14,801,850 | | | $ | 16,780,695 | |
Net realized gain (loss) on investments | | | (2,977,918 | ) | | | 27,871,601 | |
Net change in unrealized appreciation (depreciation) on investments | | | (129,232,252 | ) | | | 11,875,158 | |
| | |
|
|
| |
|
|
|
NET INCREASE (DECREASE) IN NET ASSETS RESULTING FROM OPERATIONS | | | (117,408,320 | ) | | | 56,527,454 | |
| | |
|
|
| |
|
|
|
| DISTRIBUTIONS: | | | (44,652,296 | ) | | | (32,125,621 | ) |
| | |
|
|
| |
|
|
|
| SERIES SHARE TRANSACTIONS: | | | | | | | | |
Series shares sold [1,279,452 and 1,460,726 shares, respectively] | | | 14,143,074 | | | | 17,545,432 | |
Series shares issued in reinvestment of distributions [4,149,842 and 2,686,089 shares, respectively] | | | 44,652,296 | | | | 32,125,621 | |
Series shares repurchased [9,358,699 and 7,029,208 shares, respectively] | | | (96,271,253 | ) | | | (85,525,482 | ) |
| | |
|
|
| |
|
|
|
NET DECREASE IN NET ASSETS RESULTING FROM SERIES SHARE TRANSACTIONS | | | (37,475,883 | ) | | | (35,854,429 | ) |
| | |
|
|
| |
|
|
|
| TOTAL DECREASE IN NET ASSETS | | | (199,536,499 | ) | | | (11,452,596 | ) |
| NET ASSETS: | | | | | | | | |
Beginning of year | | | 621,336,837 | | | | 632,789,433 | |
| | |
|
|
| |
|
|
|
End of year | | $ | 421,800,338 | | | $ | 621,336,837 | |
| | |
|
|
| |
|
|
|
SEE NOTES TO FINANCIAL STATEMENTS.
A6
| | | | | | |
| | | SP DAVIS VALUE PORTFOLIO | | |
| |
| SCHEDULE OF INVESTMENTS | | December 31, 2008 |
| | | | | |
LONG-TERM INVESTMENTS — 95.9% |
| COMMON STOCKS — 95.8% | | Shares
| | Value
(Note 2)
|
| | | | | | |
Automobile Retailers — 0.4% | | | | | |
CarMax, Inc.*(a) | | 81,600 | | $ | 643,008 |
| | | | |
|
|
Beverages — 2.3% | | | | | |
Diageo PLC, ADR (United Kingdom) | | 42,800 | | | 2,428,472 |
Heineken Holding NV (Netherlands) | | 51,206 | | | 1,452,758 |
| | | | |
|
|
| | | | | | 3,881,230 |
| | | | |
|
|
Broadcasting — 1.1% | | | | | |
Grupo Televisa SA, ADR (Mexico) | | 117,000 | | | 1,747,980 |
| | | | |
|
|
Business Services — 1.8% | | | | | |
Iron Mountain, Inc.*(a) | | 120,300 | | | 2,975,019 |
| | | | |
|
|
Chemicals — 0.5% | | | | | |
Monsanto Co. | | 11,500 | | | 809,025 |
| | | | |
|
|
Commercial Banks — 1.9% | | | | | |
Bank of New York Mellon Corp. (The) | | 111,800 | | | 3,167,294 |
| | | | |
|
|
Computers — 1.4% | | | | | |
Dell, Inc.* | | 52,600 | | | 538,624 |
Hewlett-Packard Co. | | 51,200 | | | 1,858,048 |
| | | | |
|
|
| | | | | | 2,396,672 |
| | | | |
|
|
Containers & Packaging — 1.6% | | | | | |
Sealed Air Corp. | | 177,810 | | | 2,656,481 |
| | | | |
|
|
Cosmetics & Toiletries — 0.3% | | | | | |
Avon Products, Inc. | | 20,800 | | | 499,824 |
| | | | |
|
|
Diversified Financial Services — 0.8% | | | | | |
E*Trade Financial Corp.*(a) | | 16,200 | | | 18,630 |
Goldman Sachs Group, Inc. (The) | | 6,620 | | | 558,662 |
Merrill Lynch & Co., Inc. | | 61,462 | | | 715,417 |
| | | | |
|
|
| | | | | | 1,292,709 |
| | | | |
|
|
Diversified Metals — 0.5% | | | | | |
BHP Billiton PLC (United Kingdom) | | 30,300 | | | 563,717 |
Rio Tinto PLC (United Kingdom) | | 10,800 | | | 231,363 |
| | | | |
|
|
| | | | | | 795,080 |
| | | | |
|
|
Electric — 0.2% | | | | | |
AES Corp. (The)* | | 42,800 | | | 352,672 |
| | | | |
|
|
Electrical Equipment — 0.1% | | | | | |
ABB Ltd., ADR (Switzerland) | | 15,750 | | | 236,408 |
| | | | |
|
|
Electronic Equipment & Instruments — 1.2% |
Agilent Technologies, Inc.* | | 78,740 | | | 1,230,706 |
Tyco Electronics Ltd.(a) | | 46,378 | | | 751,788 |
| | | | |
|
|
| | | | | | 1,982,494 |
| | | | |
|
|
Entertainment & Leisure — 0.8% | | | | | |
Harley-Davidson, Inc.(a) | | 74,900 | | | 1,271,053 |
| | | | |
|
|
Environmental Control — 0.4% | | | | | |
Sino-Forest Corp. (Canada)*(g) | | 92,200 | | | 737,152 |
| | | | |
|
|
Financial – Bank & Trust — 0.2% | | | | | |
Wachovia Corp. | | 56,407 | | | 312,495 |
| | | | |
|
|
Financial Services — 10.0% | | | | | |
American Express Co.(a) | | 214,860 | | | 3,985,653 |
Ameriprise Financial, Inc. | | 38,160 | | | 891,418 |
Discover Financial Services | | 12,000 | | | 114,360 |
H&R Block, Inc. | | 116,800 | | | 2,653,696 |
Moody’s Corp.(a) | | 50,900 | | | 1,022,581 |
State Street Corp. | | 6,180 | | | 243,059 |
Visa, Inc. (Class A Stock) | | 6,590 | | | 345,646 |
Wells Fargo & Co.(a) | | 247,500 | | | 7,296,300 |
| | | | |
|
|
| | | | | | 16,552,713 |
| | | | |
|
|
| | | | | |
COMMON STOCKS
(continued) | | Shares
| | Value
(Note 2)
|
| | | | | | |
Food & Staples Retailing — 0.1% | | | | | |
Whole Foods Market, Inc.(a) | | 15,600 | | $ | 147,264 |
| | | | |
|
|
Foods — 0.3% | | | | | |
Hershey Co. (The) | | 11,960 | | | 415,490 |
| | | | |
|
|
Healthcare Providers & Services — 2.6% | | | |
Cardinal Health, Inc. | | 36,400 | | | 1,254,708 |
Express Scripts, Inc.* | | 28,000 | | | 1,539,440 |
UnitedHealth Group, Inc. | | 54,900 | | | 1,460,340 |
| | | | |
|
|
| | | | | | 4,254,488 |
| | | | |
|
|
Household Durables — 0.3% | | | | | |
Garmin Ltd. (Cayman Islands) | | 11,000 | | | 210,870 |
Hunter Douglas NV (Netherlands) | | 8,453 | | | 276,127 |
| | | | |
|
|
| | | | | | 486,997 |
| | | | |
|
|
Household Products — 1.7% | | | | | |
Procter & Gamble Co. | | 45,030 | | | 2,783,755 |
| | | | |
|
|
Industrial Conglomerates — 1.1% | | | | | |
Siemens AG (Germany) | | 10,200 | | | 746,922 |
Tyco International Ltd. (Bermuda) | | 46,228 | | | 998,525 |
| | | | |
|
|
| | | | | | 1,745,447 |
| | | | |
|
|
Insurance — 12.1% | | | | | |
American International Group, Inc.(a) | | 191,320 | | | 300,372 |
Berkshire Hathaway, Inc. (Class A Stock)* | | 86 | | | 8,307,600 |
Hartford Financial Service Group, Inc. (The)(a) | | 34,400 | | | 564,848 |
Loews Corp. | | 131,400 | | | 3,712,050 |
Markel Corp.*(a) | | 534 | | | 159,666 |
MBIA, Inc.*(a) | | 12,900 | | | 52,503 |
NIPPONKOA Insurance Co. Ltd. (Japan) | | 171,800 | | | 1,336,570 |
Principal Financial Group, Inc.(a) | | 15,200 | | | 343,064 |
Progressive Corp. (The)(a) | | 229,000 | | | 3,391,490 |
Sun Life Financial, Inc. (Canada) | | 9,100 | | | 210,574 |
Transatlantic Holdings, Inc. | | 39,075 | | | 1,565,345 |
| | | | |
|
|
| | | | | | 19,944,082 |
| | | | |
|
|
Internet & Catalog Retail — 0.1% | | | | | |
Liberty Media Holding Corp. — Interactive (Class A Stock)* | | 38,925 | | | 121,446 |
| | | | |
|
|
Internet Services — 0.9% | | | | | |
eBay, Inc.*(a) | | 23,400 | | | 326,664 |
Google, Inc. (Class A Stock)* | | 3,950 | | | 1,215,218 |
| | | | |
|
|
| | | | | | 1,541,882 |
| | | | |
|
|
Internet Software & Services — 0.5% | | | | | |
Amazon.com, Inc.*(a) | | 15,700 | | | 805,096 |
| | | | |
|
|
Investment Firms — 4.6% | | | | | |
Citigroup, Inc.(a) | | 53,270 | | | 357,442 |
JPMorgan Chase & Co. | | 224,516 | | | 7,078,989 |
Morgan Stanley(a) | | 8,000 | | | 128,320 |
| | | | |
|
|
| | | | | | 7,564,751 |
| | | | |
|
|
Machinery — 0.3% | | | | | |
PACCAR, Inc.(a) | | 18,820 | | | 538,252 |
| | | | |
|
|
Materials — 1.2% | | | | | |
Martin Marietta Materials, Inc.(a) | | 21,100 | | | 2,048,388 |
| | | | |
|
|
SEE NOTES TO FINANCIAL STATEMENTS.
A7
| | | | | | |
| | | SP DAVIS VALUE PORTFOLIO (continued) | | |
| |
| SCHEDULE OF INVESTMENTS | | December 31, 2008 |
| | | | | |
COMMON STOCKS
(continued) | | Shares
| | Value
(Note 2)
|
| | | | | | |
Media — 3.9% | | | | | |
Comcast Corp. (Special Class A Stock) | | 247,870 | | $ | 4,003,101 |
Liberty Media Corp. — Entertainment (Class A Stock)* | | 31,100 | | | 543,628 |
News Corp. (Class A Stock) | | 211,300 | | | 1,920,717 |
| | | | |
|
|
| | | | | | 6,467,446 |
| | | | |
|
|
Media & Entertainment | | | | | |
WPP PLC, ADR (United Kingdom) | | 1,300 | | | 38,467 |
| | | | |
|
|
Metals & Mining — 0.6% | | | | | |
China Coal Energy Co. (Class H Stock) (Hong Kong) | | 1,140,700 | | | 921,863 |
| | | | |
|
|
Mining — 0.9% | | | | | |
Vulcan Materials Co.(a) | | 21,100 | | | 1,468,138 |
| | | | |
|
|
Multi-Line Retail — 0.1% | | | | | |
Sears Holdings Corp.*(a) | | 2,550 | | | 99,119 |
| | | | |
|
|
Oil, Gas & Consumable Fuels — 16.7% | | | | | |
Canadian Natural Resources Ltd. (Canada)(a) | | 60,600 | | | 2,422,788 |
ConocoPhillips | | 136,468 | | | 7,069,043 |
Devon Energy Corp. | | 83,640 | | | 5,495,984 |
EOG Resources, Inc. | | 71,170 | | | 4,738,499 |
Occidental Petroleum Corp. | | 113,900 | | | 6,832,861 |
OGX Petroleo E Gas Participacoes SA (Brazil)* | | 800 | | | 180,449 |
Transocean Ltd.*(a) | | 18,808 | | | 888,678 |
| | | | |
|
|
| | | | | | 27,628,302 |
| | | | |
|
|
Pharmaceuticals — 1.8% | | | | | |
Johnson & Johnson | | 17,500 | | | 1,047,025 |
Schering-Plough Corp. | | 116,600 | | | 1,985,698 |
| | | | |
|
|
| | | | | | 3,032,723 |
| | | | |
|
|
Real Estate Investment Trust — 0.5% | | | | | |
Brookfield Asset Management, Inc. (Canada)(a) | | 54,400 | | | 830,688 |
| | | | |
|
|
Real Estate Operation & Development — 0.4% | | | |
Hang Lung Group Ltd. (Hong Kong) | | 240,000 | | | 733,163 |
| | | | |
|
|
| | | | | |
COMMON STOCKS
(continued) | | Shares
| | Value
(Note 2)
|
| | | | | | |
Retail & Merchandising — 8.1% | | | | | |
Bed Bath & Beyond, Inc.*(a) | | 59,000 | | $ | 1,499,780 |
Costco Wholesale Corp. | | 159,900 | | | 8,394,750 |
CVS Caremark Corp. | | 119,910 | | | 3,446,213 |
| | | | |
|
|
| | | | | | 13,340,743 |
| | | | |
|
|
Semiconductors & Semiconductor Equipment — 1.4% |
Texas Instruments, Inc. | | 146,400 | | | 2,272,128 |
| | | | |
|
|
Software — 3.3% | | | | | |
Dun & Bradstreet Corp. (The)(a) | | 28,600 | | | 2,207,920 |
Microsoft Corp. | | 168,280 | | | 3,271,363 |
| | | | |
|
|
| | | | | | 5,479,283 |
| | | | |
|
|
Specialty Retail — 0.6% | | | | | |
Lowe’s Cos., Inc. | | 42,800 | | | 921,056 |
| | | | |
|
|
Telecommunications — 0.7% | | | | | |
Cisco Systems, Inc.* | | 56,400 | | | 919,320 |
Sprint Nextel Corp.* | | 158,000 | | | 289,140 |
| | | | |
|
|
| | | | | | 1,208,460 |
| | | | |
|
|
Tobacco — 3.3% | | | | | |
Altria Group, Inc. | | 6,300 | | | 94,878 |
Philip Morris International, Inc. | | 123,665 | | | 5,380,664 |
| | | | |
|
|
| | | | | | 5,475,542 |
| | | | |
|
|
Transportation — 2.2% | | | | | |
China Merchants Holdings International Co. Ltd.
(Hong Kong) | | 606,359 | | | 1,184,178 |
China Shipping Development Co. Ltd. (Class H Stock) (Hong Kong) | | 426,000 | | | 429,286 |
COSCO Pacific Ltd. (Hong Kong) | | 409,200 | | | 420,725 |
Kuehne & Nagel International AG (Switzerland) | | 11,745 | | | 745,408 |
United Parcel Service, Inc. (Class B Stock) | | 16,800 | | | 926,688 |
| | | | |
|
|
| | | | | | 3,706,285 |
| | | | |
|
|
TOTAL COMMON STOCKS
(cost $176,783,037) | | | 158,330,053 |
| | | | |
|
|
| | | | | | | | | | | | | |
| | | Interest
Rate
| | Maturity
Date
| | Moody’s
Ratings†
(Unaudited)
| | Principal
Amount
(000)#
| | | |
| CONVERTIBLE BOND — 0.1% | | | | | | | | | | | | | |
Environmental Control | | | | | | | | | | | | | |
Sino-Forest Corp. (Canada)
(cost $357,000) | | 5.00% | | 08/01/13 | | Ba2 | | $ | 357 | | | 253,470 | |
| | | | | | | | | | | |
|
|
|
TOTAL LONG-TERM INVESTMENTS
(cost $177,140,037) | | | 158,583,523 | |
| | | | | | | | | | | |
|
|
|
| | |
| | | Shares
| | | |
| SHORT-TERM INVESTMENT — 20.4% | | | | | | | | | | | | | |
AFFILIATED MONEY MARKET MUTUAL FUND | | | | | | | | | | | | | |
Dryden Core Investment Fund — Taxable Money Market Series
(cost $33,614,237; includes $27,227,346 of cash collateral for securities on loan)(b)(w) (Note 4) | | | 33,614,237 | | | 33,614,237 | |
| | | | | | | | | | | |
|
|
|
TOTAL INVESTMENTS(o) — 116.3%
(cost $210,754,274) | | | 192,197,760 | |
LIABILITIES IN EXCESS OF OTHER ASSETS — (16.3)% | | | (26,886,488 | ) |
| | | | | | | | | | | |
|
|
|
NET ASSETS — 100.0% | | $ | 165,311,272 | |
| | | | | | | | | | | |
|
|
|
SEE NOTES TO FINANCIAL STATEMENTS.
A8
| | | | | | |
| | | SP DAVIS VALUE PORTFOLIO (continued) | | |
| |
| SCHEDULE OF INVESTMENTS | | December 31, 2008 |
The following abbreviation is used in the Portfolio descriptions:
| | |
| ADR | | American Depositary Receipt |
| † | The rating reflected is as of December 31, 2008. Rating of certain bonds may have changed subsequent to that date. |
| * | Non-income producing security. |
| # | Principal amount is shown in U.S. dollars unless otherwise stated. |
| (a) | All or a portion of security is on loan. The aggregate market value of such securities is $26,902,847; cash collateral of $27,227,346 (included with liabilities) was received with which the Portfolio purchased highly liquid short-term investments. Cash collateral is less than 102% of the market value of securities loaned due to significant market increases on December 31, 2008. Collateral was subsequently received on January 2, 2009 and the Portfolio remained in compliance. |
| (b) | Represents security, or a portion thereof, purchased with cash collateral received for securities on loan. |
| (g) | Indicates a security that has been deemed illiquid. |
| (o) | As of December 31, 2008, 6 securities representing $5,025,786 and 3.0% of net assets were fair valued in accordance with the policies adopted by the Board of Trustees. |
| (w) | Prudential Investments LLC, the manager of the Portfolio, also serves as manager of the Dryden Core Investment Fund—Taxable Money Market Series. |
Various inputs are used in determining the value of the Portfolio’s investments. These inputs are summarized in the three broad levels listed below.
Level 1—quoted prices in active markets for identical securities
Level 2—other significant observable inputs (including quoted prices for similar securities, interest rates, prepayment speeds, credit risk, etc.)
Level 3—significant unobservable inputs (including the Portfolio’s own assumptions in determining the fair value of investments)
The following is a summary of the inputs used as of December 31, 2008 in valuing the Portfolio’s assets carried at fair value:
| | | | |
Valuation inputs
| | Investments
in Securities
| | Other Financial
Instruments*
|
Level 1—Quoted Prices | | 186,918,504 | | — |
Level 2—Other Significant Observable Inputs | | 5,279,256 | | — |
Level 3—Significant Unobservable Inputs | | — | | — |
| | |
| |
|
Total | | 192,197,760 | | — |
| | |
| |
|
| * | Other financial instruments are derivative instruments not reflected in the Schedule of Investments, such as futures, forwards and swap contracts, which are valued at the unrealized appreciation/depreciation on the instrument. |
As of December 31, 2007 and December 31, 2008, the Portfolio did not use any significant unobservable inputs (Level 3) in determining the value of investments.
The industry classification of investments and liabilities in excess of other assets shown as a percentage of net assets as of December 31, 2008 were as follows:
| | | |
Affiliated Money Market Mutual Fund (16.5% represents investments purchased with collateral from securities on loan) | | 20.4 | % |
Oil, Gas & Consumable Fuels | | 16.7 | |
Insurance | | 12.1 | |
Financial Services | | 10.0 | |
Retail & Merchandising | | 8.1 | |
Investment Firms | | 4.6 | |
Media | | 3.9 | |
Software | | 3.3 | |
Tobacco | | 3.3 | |
Healthcare Providers & Services | | 2.6 | |
Beverages | | 2.3 | |
Transportation | | 2.2 | |
Commercial Banks | | 1.9 | |
Pharmaceuticals | | 1.8 | |
Business Services | | 1.8 | |
Household Products | | 1.7 | |
Containers & Packaging | | 1.6 | |
Computers | | 1.4 | |
Semiconductors & Semiconductor Equipment | | 1.4 | |
Materials | | 1.2 | |
Electronic Equipment & Instruments | | 1.2 | |
Broadcasting | | 1.1 | |
Industrial Conglomerates | | 1.1 | |
Internet Services | | 0.9 | |
Mining | | 0.9 | |
Diversified Financial Services | | 0.8 | |
Entertainment & Leisure | | 0.8 | |
Telecommunications | | 0.7 | |
Metals & Mining | | 0.6 | |
Specialty Retail | | 0.6 | |
Real Estate Investment Trusts | | 0.5 | |
Chemicals | | 0.5 | |
Internet Software & Services | | 0.5 | |
Diversified Metals | | 0.5 | |
Environmental Control | | 0.5 | |
Real Estate Operation & Development | | 0.4 | |
Automobile Retailers | | 0.4 | |
Machinery | | 0.3 | |
Cosmetics & Toiletries | | 0.3 | |
Household Durables | | 0.3 | |
Foods | | 0.3 | |
Electric | | 0.2 | |
Financial – Bank & Trust | | 0.2 | |
Electrical Equipment | | 0.1 | |
Food & Staples Retailing | | 0.1 | |
Internet & Catalog Retail | | 0.1 | |
Multi-Line Retail | | 0.1 | |
| | |
|
|
| | | 116.3 | |
Liabilities in excess of other assets | | (16.3 | ) |
| | |
|
|
| | | 100.0 | % |
| | |
|
|
SEE NOTES TO FINANCIAL STATEMENTS.
A9
| | | | | | |
| | | SP DAVIS VALUE PORTFOLIO (continued) | | |
STATEMENT OF ASSETS AND LIABILITIES
December 31, 2008
| | | | |
| ASSETS | | | | |
Investments at value, including securities on loan of $26,902,847: | | | | |
Unaffiliated investments (cost $177,140,037) | | $ | 158,583,523 | |
Affiliated investments (cost $33,614,237) | | | 33,614,237 | |
Cash | | | 114,724 | |
Receivable for investments sold | | | 203,826 | |
Dividends and interest receivable | | | 203,357 | |
Tax reclaim receivable | | | 34,199 | |
Prepaid expenses | | | 2,368 | |
Receivable for Series shares sold | | | 1,328 | |
| | |
|
|
|
Total Assets | | | 192,757,562 | |
| | |
|
|
|
| LIABILITIES | | | | |
Collateral for securities on loan | | | 27,227,346 | |
Management fee payable | | | 102,032 | |
Payable for Series shares repurchased | | | 67,008 | |
Accrued expenses and other liabilities | | | 46,838 | |
Deferred trustees’ fees | | | 2,250 | |
Transfer agent fees payable | | | 816 | |
| | |
|
|
|
Total Liabilities | | | 27,446,290 | |
| | |
|
|
|
| NET ASSETS | | $ | 165,311,272 | |
| | |
|
|
|
Net assets were comprised of: | | | | |
Paid-in capital | | $ | 185,513,425 | |
Retained earnings | | | (20,202,153 | ) |
| | |
|
|
|
Net assets, December 31, 2008 | | $ | 165,311,272 | |
| | |
|
|
|
Net asset value and redemption price per share, $165,311,272 / 24,598,906 outstanding shares of beneficial interest | | $ | 6.72 | |
| | |
|
|
|
STATEMENT OF OPERATIONS
Year Ended December 31, 2008
| | | | |
| INVESTMENT INCOME | | | | |
Unaffiliated dividend income (net of $43,669 foreign withholding tax) | | $ | 4,198,328 | |
Affiliated income from securities lending, net | | | 447,060 | |
Affiliated dividend income | | | 113,666 | |
Interest income | | | 7,486 | |
| | |
|
|
|
| | | | 4,766,540 | |
| | |
|
|
|
| EXPENSES | | | | |
Management fee | | | 1,833,940 | |
Custodian’s fees and expenses | | | 85,000 | |
Shareholders’ reports | | | 30,000 | |
Audit fee | | | 17,000 | |
Trustees’ fees | | | 12,000 | |
Legal fees and expenses | | | 7,000 | |
Insurance expenses | | | 5,000 | |
Transfer agent’s fees and expenses (including affiliated expense of $2,000) (Note 4) | | | 2,000 | |
Commitment fee on syndicated credit agreement | | | 1,000 | |
Miscellaneous | | | 8,567 | |
| | |
|
|
|
Total expenses | | | 2,001,507 | |
| | |
|
|
|
| NET INVESTMENT INCOME | | | 2,765,033 | |
| | |
|
|
|
| NET REALIZED AND UNREALIZED GAIN (LOSS) ON INVESTMENTS AND FOREIGN CURRENCIES | | | | |
Net realized loss on: | | | | |
Investment transactions | | | (4,163,184 | ) |
Foreign currency transactions | | | (27,509 | ) |
| | |
|
|
|
| | | | (4,190,693 | ) |
| | |
|
|
|
Net change in unrealized appreciation (depreciation) on: | | | | |
Investments | | | (113,461,211 | ) |
Foreign currencies | | | 1,942 | |
| | |
|
|
|
| | | | (113,459,269 | ) |
| | |
|
|
|
| NET LOSS ON INVESTMENTS AND FOREIGN CURRENCIES | | | (117,649,962 | ) |
| | |
|
|
|
| NET DECREASE IN NET ASSETS RESULTING FROM OPERATIONS | | $ | (114,884,929 | ) |
| | |
|
|
|
STATEMENT OF CHANGES IN NET ASSETS
| | | | | | | | |
| | | Year Ended December 31,
| |
| | | 2008
| | | 2007
| |
| INCREASE (DECREASE) IN NET ASSETS | | | | | | | | |
| OPERATIONS: | | | | | | | | |
Net investment income | | $ | 2,765,033 | | | $ | 3,606,228 | |
Net realized gain (loss) on investment and foreign currency transactions | | | (4,190,693 | ) | | | 15,360,261 | |
Net change in unrealized appreciation (depreciation) on investments and foreign currencies | | | (113,459,269 | ) | | | (4,117,172 | ) |
| | |
|
|
| |
|
|
|
NET INCREASE (DECREASE) IN NET ASSETS RESULTING FROM OPERATIONS | | | (114,884,929 | ) | | | 14,849,317 | |
| | |
|
|
| |
|
|
|
| DISTRIBUTIONS | | | (18,966,489 | ) | | | (13,230,456 | ) |
| | |
|
|
| |
|
|
|
| SERIES SHARE TRANSACTIONS: | | | | | | | | |
Series shares sold [892,207 and 1,130,984 shares, respectively] | | | 8,010,655 | | | | 13,913,747 | |
Series shares issued in reinvestment of distributions [1,787,605 and 1,113,675 shares, respectively] | | | 18,966,489 | | | | 13,230,457 | |
Series shares repurchased [3,833,951 and 3,844,986 shares, respectively] | | | (36,829,057 | ) | | | (47,719,907 | ) |
| | |
|
|
| |
|
|
|
DECREASE IN NET ASSETS RESULTING FROM SERIES SHARE TRANSACTIONS | | | (9,851,913 | ) | | | (20,575,703 | ) |
| | |
|
|
| |
|
|
|
| TOTAL DECREASE IN NET ASSETS | | | (143,703,331 | ) | | | (18,956,842 | ) |
| NET ASSETS: | | | | | | | | |
Beginning of year | | | 309,014,603 | | | | 327,971,445 | |
| | |
|
|
| |
|
|
|
End of year | | $ | 165,311,272 | | | $ | 309,014,603 | |
| | |
|
|
| |
|
|
|
SEE NOTES TO FINANCIAL STATEMENTS.
A10
| | | | | | |
| | | SP GROWTH ASSET ALLOCATION PORTFOLIO | | |
| |
| SCHEDULE OF INVESTMENTS | | December 31, 2008 |
| | | | | | |
| LONG-TERM INVESTMENTS — 99.6% | |
| | | Shares
| | Value
(Note 2)
| |
Affiliated Mutual Funds | | | | | | |
Advanced Series Trust | | | | | | |
Global Real Estate Portfolio(a) | | 1,203,008 | | $ | 6,291,734 | |
Large Cap Value Portfolio | | 19,824,506 | | | 203,399,430 | |
Marsico Capital Growth Portfolio | | 8,153,753 | | | 103,144,973 | |
Small Cap Growth Portfolio(a) | | 1,603,756 | | | 17,962,065 | |
Western Asset Core Plus Bond Portfolio | | 2,585,528 | | | 24,459,091 | |
The Prudential Series Fund | | | | |
Jennison Portfolio (Class I) | | 6,988,920 | | | 102,667,240 | |
Money Market Portfolio | | 6,423 | | | 64,228 | |
Natural Resources Portfolio (Class I) | | 290,144 | | | 6,876,413 | |
SP International Growth Portfolio (Class I) | | 15,288,545 | | | 52,745,480 | |
SP International Value Portfolio | | 10,427,601 | | | 51,616,627 | |
SP PIMCO High Yield Portfolio | | 275,898 | | | 1,848,517 | |
SP PIMCO Total Return Portfolio | | 9,286,852 | | | 102,712,579 | |
SP Small Cap Value Portfolio | | 2,379,302 | | | 18,082,692 | |
| | | | |
|
|
|
TOTAL LONG-TERM INVESTMENTS
(cost $938,360,270) | | | 691,871,069 | |
| | | | |
|
|
|
| SHORT-TERM INVESTMENT — 0.5% | | | | |
Affiliated Money Market Mutual Fund | | | | | | |
Dryden Core Investment Fund —Taxable Money Market Series
(cost $3,379,366) (Note 4) | | 3,379,366 | | | 3,379,366 | |
| | | | |
|
|
|
TOTAL INVESTMENTS — 100.1%
(cost $941,739,636)(b) | | | 695,250,435 | |
LIABILITIES IN EXCESS OF
OTHER ASSETS — (0.1)% | | | (410,578 | ) |
| | | | |
|
|
|
NET ASSETS — 100.0% | | $ | 694,839,857 | |
| | | | |
|
|
|
| (a) | Non-income producing security. |
| (b) | Prudential Investments LLC, the manager of the Portfolio, also serves as manager/co-manager of the underlying portfolios in which the Portfolio invests. |
Various inputs are used in determining the value of the Portfolio’s investments. These inputs are summarized in the three broad levels listed below.
Level 1—quoted prices in active markets for identical securities
Level 2—other significant observable inputs (including quoted prices for similar securities, interest rates, prepayment speeds, credit risk, etc.)
Level 3—significant unobservable inputs (including the Portfolio’s own assumptions in determining the fair value of investments)
The following is a summary of the inputs used as of December 31, 2008 in valuing the Portfolio’s assets carried at fair value:
| | | | | |
Valuation inputs
| | Investments
in Securities
| | Other Financial
Instruments*
|
Level 1—Quoted Prices | | $ | 695,250,435 | | — |
Level 2—Other Significant Observable Inputs | | | — | | — |
Level 3—Significant Unobservable Inputs | | | — | | — |
| | |
|
| |
|
Total | | $ | 695,250,435 | | — |
| | |
|
| |
|
| * | Other financial instruments are derivative instruments not reflected in the Schedule of Investments, such as futures, forwards and swap contracts, which are valued at the unrealized appreciation/depreciation on the instrument. |
As of December 31, 2007 and December 31, 2008, the Portfolio did not use any significant unobservable inputs (Level 3) in determining the valuation of investments.
The investment allocation of portfolio holdings and liabilities in excess of other assets shown as a percentage of net assets as of December 31, 2008 were as follows:
| | | |
Investment Type
| | | |
Large/Mid-Cap Growth | | 29.6 | % |
Large/Mid-Cap Value | | 29.3 | |
Core Bonds | | 18.3 | |
International Growth | | 7.6 | |
International Value | | 7.4 | |
Small-Cap Growth | | 2.6 | |
Small-Cap Value | | 2.6 | |
Sector | | 1.9 | |
High Yield | | 0.3 | |
| | |
|
|
| | | 99.6 | |
Short-Term Investment | | 0.5 | |
Liabilities in excess of other assets | | (0.1 | ) |
| | |
|
|
| | | 100.0 | % |
| | |
|
|
SEE NOTES TO FINANCIAL STATEMENTS.
A11
| | | | | | |
| | | SP GROWTH ASSET ALLOCATION PORTFOLIO (continued) | | |
STATEMENT OF ASSETS AND LIABILITIES
December 31, 2008
| | | | |
| ASSETS | | | | |
Affiliated investments, at value (cost $941,739,636) | | $ | 695,250,435 | |
Cash | | | 6,315 | |
Receivable for investments sold | | | 2,000,027 | |
Receivable for Series shares sold | | | 29,255 | |
Prepaid expenses | | | 13,018 | |
Dividends receivable | | | 1,426 | |
| | |
|
|
|
Total Assets | | | 697,300,476 | |
| | |
|
|
|
| LIABILITIES | | | | |
Payable for investments purchased | | | 2,000,002 | |
Payable for Series shares repurchased | | | 393,599 | |
Accrued expenses and other liabilities | | | 37,273 | |
Management fee payable | | | 28,465 | |
Deferred trustees’ fees | | | 804 | |
Affiliated transfer agent fee payable | | | 476 | |
| | |
|
|
|
Total Liabilities | | | 2,460,619 | |
| | |
|
|
|
| NET ASSETS | | $ | 694,839,857 | |
| | |
|
|
|
Net assets were comprised of: | | | | |
Paid-in capital | | $ | 916,931,814 | |
Retained earnings | | | (222,091,957 | ) |
| | |
|
|
|
Net assets, December 31, 2008 | | $ | 694,839,857 | |
| | |
|
|
|
Net asset value and redemption price per share, $694,839,857 / 105,306,279 outstanding shares of beneficial interest | | $ | 6.60 | |
| | |
|
|
|
STATEMENT OF OPERATIONS
Year Ended December 31, 2008
| | | | |
| INVESTMENT INCOME | | | | |
Affiliated dividend income | | $ | 16,220,538 | |
| | |
|
|
|
| EXPENSES | | | | |
Management fee | | | 496,428 | |
Shareholders’ reports | | | 64,000 | |
Custodian’s fees and expenses | | | 55,000 | |
Audit fee | | | 17,000 | |
Insurance expenses | | | 14,000 | |
Trustees’ fees | | | 8,000 | |
Legal fees and expenses | | | 6,000 | |
Commitment fee on syndicated credit agreement | | | 3,000 | |
Transfer agent’s fee and expenses (including affiliated expense of $2,000) (Note 4) | | | 2,000 | |
Miscellaneous | | | 8,507 | |
| | |
|
|
|
Total expenses | | | 673,935 | |
| | |
|
|
|
| NET INVESTMENT INCOME | | | 15,546,603 | |
| | |
|
|
|
| NET REALIZED AND UNREALIZED GAIN (LOSS) ON AFFILIATED INVESTMENTS | | | | |
Net realized loss on investment transactions | | | (44,164,900 | ) |
Net capital gain distributions received | | | 54,332,235 | |
| | |
|
|
|
| | | | 10,167,335 | |
| | |
|
|
|
Net change in unrealized appreciation (depreciation) on investments | | | (450,725,970 | ) |
| | |
|
|
|
| NET LOSS ON INVESTMENTS | | | (440,558,635 | ) |
| | |
|
|
|
| NET DECREASE IN NET ASSETS RESULTING FROM OPERATIONS | | $ | (425,012,032 | ) |
| | |
|
|
|
STATEMENT OF CHANGES IN NET ASSETS
| | | | | | | | |
| | | Year Ended December 31,
| |
| | | 2008
| | | 2007
| |
| INCREASE (DECREASE) IN NET ASSETS | | | | | | | | |
| OPERATIONS: | | | | | | | | |
Net investment income | | $ | 15,546,603 | | | $ | 16,936,925 | |
Net realized gain on investment transactions | | | 10,167,335 | | | | 99,207,694 | |
Net change in unrealized appreciation (depreciation) on investments | | | (450,725,970 | ) | | | (1,774,234 | ) |
| | |
|
|
| |
|
|
|
NET INCREASE (DECREASE) IN NET ASSETS RESULTING FROM OPERATIONS | | | (425,012,032 | ) | | | 114,370,385 | |
| | |
|
|
| |
|
|
|
| DISTRIBUTIONS | | | (116,144,619 | ) | | | (62,515,434 | ) |
| | |
|
|
| |
|
|
|
| SERIES SHARE TRANSACTIONS: | | | | | | | | |
Series shares sold [3,093,662 and 4,149,530 shares, respectively] | | | 27,735,159 | | | | 48,388,069 | |
Series shares issued in reinvestment of distributions [11,998,411 and 5,426,687 shares, respectively] | | | 116,144,619 | | | | 62,515,434 | |
Series shares repurchased [17,822,457 and 16,523,123 shares, respectively] | | | (160,542,195 | ) | | | (193,998,790 | ) |
| | |
|
|
| |
|
|
|
NET DECREASE IN NET ASSETS RESULTING FROM SERIES SHARE TRANSACTIONS | | | (16,662,417 | ) | | | (83,095,287 | ) |
| | |
|
|
| |
|
|
|
| TOTAL DECREASE IN NET ASSETS | | | (557,819,068 | ) | | | (31,240,336 | ) |
| NET ASSETS: | | | | | | | | |
Beginning of year | | | 1,252,658,925 | | | | 1,283,899,261 | |
| | |
|
|
| |
|
|
|
End of year | | $ | 694,839,857 | | | $ | 1,252,658,925 | |
| | |
|
|
| |
|
|
|
SEE NOTES TO FINANCIAL STATEMENTS.
A12
| | | | | | |
| | | SP INTERNATIONAL GROWTH PORTFOLIO | | |
| |
| SCHEDULE OF INVESTMENTS | | December 31, 2008 |
| | | | | |
| LONG-TERM INVESTMENTS — 95.4% |
| COMMON STOCKS | | Shares
| | Value
(Note 2)
|
| | | | | | |
Australia — 4.9% | | | | | |
BHP Billiton Ltd., ADR(a) | | 28,830 | | $ | 1,236,807 |
CSL Ltd. | | 87,397 | | | 2,060,982 |
Macquarie Group Ltd. | | 44,245 | | | 897,967 |
QBE Insurance Group Ltd. | | 157,434 | | | 2,845,354 |
Woolworths Ltd. | | 172,668 | | | 3,219,603 |
WorleyParsons Ltd. | | 47,711 | | | 475,963 |
| | | | |
|
|
| | | | | | 10,736,676 |
| | | | |
|
|
Bermuda — 0.4% | | | | | |
Credicorp Ltd. | | 18,700 | | | 934,252 |
| | | | |
|
|
Brazil — 3.0% | | | | | |
BM&FBOVESPA SA | | 243,526 | | | 628,656 |
Gafisa SA | | 101,400 | | | 456,126 |
LLX Logistica SA* | | 50,700 | | | 32,829 |
MMX Mineracao e Metalicos SA* | | 62,800 | | | 74,595 |
Petroleo Brasileiro SA (PRFC Shares) | | 121,100 | | | 1,186,074 |
Petroleo Brasileiro SA, ADR | | 85,438 | | | 2,092,377 |
Unibanco — Uniao de Bancos Brasileiros SA, GDR | | 24,862 | | | 1,606,582 |
Weg SA | | 90,900 | | | 487,243 |
| | | | |
|
|
| | | | | | 6,564,482 |
| | | | |
|
|
Canada — 4.4% | | | | | |
Canadian National Railway Co.(a) | | 61,319 | | | 2,254,086 |
Research In Motion Ltd.* | | 5,798 | | | 235,283 |
Rogers Communications, Inc.
(Class B Stock) | | 144,876 | | | 4,294,057 |
Shoppers Drug Mart Corp. | | 73,300 | | | 2,853,029 |
| | | | |
|
|
| | | | | | 9,636,455 |
| | | | |
|
|
Chile | | | | | |
Centros Comerciales Sudamericanos SA, ADR, 144A* | | 1,578 | | | 33,616 |
| | | | |
|
|
China — 2.3% | | | | | |
China Life Insurance Co. Ltd. (Class H Stock) | | 666,000 | | | 2,046,273 |
China Merchants Bank Co. Ltd.
(Class H Stock) | | 705,000 | | | 1,319,107 |
China Oilfield Services Ltd.
(Class H Stock) | | 1,214,000 | | | 991,141 |
Industrial & Commercial Bank of China Ltd. (Class H Stock) | | 1,148,000 | | | 609,492 |
| | | | |
|
|
| | | | | | 4,966,013 |
| | | | |
|
|
Czech Republic — 0.6% | | | | | |
CEZ A/S | | 32,746 | | | 1,330,713 |
| | | | |
|
|
Denmark — 3.3% | | | | | |
Novo Nordisk A/S (Class B Stock) | | 81,611 | | | 4,130,350 |
Vestas Wind Systems A/S* | | 54,508 | | | 3,089,498 |
| | | | |
|
|
| | | | | | 7,219,848 |
| | | | |
|
|
Finland — 0.5% | | | | | |
Nokia Oyj | | 63,977 | | | 987,135 |
| | | | |
|
|
France — 6.6% | | | | | |
Accor SA | | 27,305 | | | 1,332,608 |
Alstom SA | | 59,186 | | | 3,453,751 |
| | | | | |
COMMON STOCKS
(continued) | | Shares
| | Value
(Note 2)
|
| | | | | | |
France (continued) | | | | | |
AXA SA | | 104,852 | | $ | 2,309,397 |
BNP Paribas | | 21,745 | | | 914,354 |
Cie Generale de Geophysique-Veritas* | | 34,194 | | | 503,832 |
Eurazeo | | 17,690 | | | 824,992 |
Iliad SA | | 17,775 | | | 1,531,902 |
JC Decaux SA | | 29,652 | | | 506,771 |
Veolia Environnement | | 94,373 | | | 2,912,261 |
| | | | |
|
|
| | | | | | 14,289,868 |
| | | | |
|
|
Germany — 3.5% | | | | | |
Bayerische Motoren Werke AG | | 20,957 | | | 629,526 |
Beiersdorf AG | | 39,984 | | | 2,334,345 |
E.ON AG | | 72,436 | | | 2,863,608 |
Linde AG | | 20,050 | | | 1,668,046 |
| | | | |
|
|
| | | | | | 7,495,525 |
| | | | |
|
|
Hong Kong — 2.0% | | | | | |
Cheung Kong Holdings Ltd. | | 78,000 | | | 744,091 |
CNOOC Ltd. | | 2,141,800 | | | 2,037,227 |
Esprit Holdings Ltd. | | 152,000 | | | 866,158 |
Noble Group Ltd. | | 1,012,000 | | | 724,857 |
| | | | |
|
|
| | | | | | 4,372,333 |
| | | | |
|
|
India — 2.7% | | | | | |
ICICI Bank Ltd., ADR(a) | | 147,254 | | | 2,834,639 |
Infosys Technologies Ltd., ADR | | 72,746 | | | 1,787,369 |
Vedanta Resources PLC | | 141,654 | | | 1,245,402 |
| | | | |
|
|
| | | | | | 5,867,410 |
| | | | |
|
|
Indonesia — 0.4% | | | | | |
Bank Rakyat Indonesia | | 2,282,000 | | | 970,424 |
| | | | |
|
|
Ireland — 0.3% | | | | | |
Ryanair Holdings PLC, ADR*(a) | | 25,917 | | | 753,666 |
| | | | |
|
|
Israel — 3.5% | | | | | |
Teva Pharmaceutical Industries Ltd., ADR(a) | | 176,513 | | | 7,514,158 |
| | | | |
|
|
Italy — 1.3% | | | | | |
Saipem SpA | | 168,361 | | | 2,766,232 |
| | | | |
|
|
Japan — 9.5% | | | | | |
Aeon Mall Co. Ltd. | | 61,500 | | | 1,188,896 |
Daikin Industries Ltd. | | 28,200 | | | 741,618 |
Daiwa Securities Group, Inc. | | 140,000 | | | 840,465 |
Fast Retailing Co. Ltd. | | 8,300 | | | 1,217,883 |
Honda Motor Co. Ltd. | | 32,200 | | | 685,818 |
Jupiter Telecommunications Co. Ltd. | | 3,478 | | | 3,620,044 |
Marubeni Corp. | | 290,000 | | | 1,110,282 |
Mizuho Financial Group, Inc. | | 264 | | | 761,640 |
Nintendo Co. Ltd. | | 19,500 | | | 7,451,958 |
Panasonic Corp. | | 17,000 | | | 208,968 |
Sumitomo Realty & Development Co. Ltd. | | 10,000 | | | 150,321 |
Suruga Bank Ltd. | | 81,000 | | | 804,704 |
Terumo Corp. | | 40,200 | | | 1,883,187 |
| | | | |
|
|
| | | | | | 20,665,784 |
| | | | |
|
|
SEE NOTES TO FINANCIAL STATEMENTS.
A13
| | | | | | |
| | | SP INTERNATIONAL GROWTH PORTFOLIO (continued) | | |
| |
| SCHEDULE OF INVESTMENTS | | December 31, 2008 |
| | | | | |
COMMON STOCKS
(continued) | | Shares
| | Value
(Note 2)
|
| | | | | | |
Mexico — 1.6% | | | | | |
Cemex SAB de CV, ADR*(a) | | 147,575 | | $ | 1,348,836 |
Wal-Mart de Mexico SAB de CV (Class V Stock) | | 760,300 | | | 2,031,346 |
| | | | |
|
|
| | | | | | 3,380,182 |
| | | | |
|
|
Netherlands — 1.6% | | | | | |
Heineken NV | | 58,539 | | | 1,782,046 |
Qaigen NV* | | 94,777 | | | 1,629,680 |
| | | | |
|
|
| | | | | | 3,411,726 |
| | | | |
|
|
Singapore — 0.2% | | | | | |
CapitaLand Ltd. | | 76,000 | | | 165,827 |
Singapore Airlines Ltd. | | 41,000 | | | 322,462 |
| | | | |
|
|
| | | | | | 488,289 |
| | | | |
|
|
South Africa — 1.6% | | | | | |
MTN Group Ltd. | | 183,434 | | | 2,152,795 |
Naspers Ltd. (Class N Stock) | | 75,400 | | | 1,355,895 |
| | | | |
|
|
| | | | | | 3,508,690 |
| | | | |
|
|
Spain — 4.3% | | | | | |
Banco Santander SA | | 259,782 | | | 2,437,488 |
Gamesa Corp. Tecnologica SA | | 78,928 | | | 1,397,752 |
Iberdrola Renovables SA* | | 482,500 | | | 2,045,628 |
Industria de Diseno Textil SA | | 45,235 | | | 1,969,992 |
Telefonica SA | | 64,037 | | | 1,410,879 |
| | | | |
|
|
| | | | | | 9,261,739 |
| | | | |
|
|
Sweden — 0.2% | | | | | |
Hennes & Mauritz AB (Class B Stock) | | 8,664 | | | 334,708 |
| | | | |
|
|
Switzerland — 16.3% | | | | | |
ABB Ltd.* | | 280,942 | | | 4,112,441 |
Actelion Ltd.* | | 45,696 | | | 2,550,235 |
Compagnie Financiere Richemont SA (Class A stock) | | 17,358 | | | 330,737 |
Credit Suisse Group AG | | 133,020 | | | 3,561,864 |
Julius Baer Holding AG | | 27,054 | | | 1,016,225 |
Lonza Group AG | | 23,674 | | | 2,169,774 |
Nestle SA | | 176,926 | | | 6,915,133 |
Roche Holding AG | | 44,220 | | | 6,751,303 |
SGS SA | | 1,816 | | | 1,876,826 |
Synthes, Inc. | | 17,976 | | | 2,253,017 |
Zurich Financial Services AG | | 17,408 | | | 3,712,703 |
| | | | |
|
|
| | | | | | 35,250,258 |
| | | | |
|
|
Taiwan — 1.4% | | | | | |
Hon Hai Precision Industry Co. Ltd. | | 491,750 | | | 969,613 |
Taiwan Semiconductor Manufacturing Co. Ltd., ADR | | 257,950 | | | 2,037,805 |
| | | | |
|
|
| | | | | | 3,007,418 |
| | | | |
|
|
United Arab Emirates — 0.3% | | | | | |
DP World Ltd. | | 1,682,540 | | | 656,191 |
| | | | |
|
|
United Kingdom — 18.0% | | | | | |
AMEC PLC | | 120,040 | | | 850,427 |
Amlin PLC | | 74,836 | | | 384,654 |
Autonomy Corp. PLC* | | 107,510 | | | 1,469,987 |
BAE Systems PLC | | 698,868 | | | 3,785,581 |
| | | | | | |
COMMON STOCKS
(continued) | | Shares
| | Value
(Note 2)
| |
| | | | | | | |
United Kingdom (continued) | | | | | | |
BG Group PLC | | 361,895 | | $ | 4,979,419 | |
BP PLC | | 161,294 | | | 1,219,799 | |
British Sky Broadcasting Group PLC | | 256,854 | | | 1,772,604 | |
Capita Group PLC (The) | | 272,907 | | | 2,895,711 | |
HSBC Holdings PLC | | 68,439 | | | 651,397 | |
Petrofac Ltd. | | 104,948 | | | 522,077 | |
Reckitt Benckiser Group PLC | | 132,645 | | | 4,916,521 | |
Rolls-Royce Group PLC* | | 687,777 | | | 3,317,602 | |
Rolls-Royce Group PLC
(Class C Stock) | | 37,316,822 | | | 53,652 | |
Rotork PLC | | 56,400 | | | 641,821 | |
Standard Chartered PLC | | 187,885 | | | 2,363,656 | |
Tesco PLC | | 381,216 | | | 1,973,139 | |
Tullow Oil PLC | | 243,894 | | | 2,312,598 | |
Vodafone Group PLC | | 2,433,038 | | | 4,862,368 | |
| | | | |
|
|
|
| | | | | | 38,973,013 | |
| | | | |
|
|
|
United States — 0.7% | | | | | | |
Las Vegas Sands Corp.* | | 104,338 | | | 618,725 | |
Transocean Ltd.* | | 21,057 | | | 994,943 | |
| | | | |
|
|
|
| | | | | | 1,613,668 | |
| | | | |
|
|
|
TOTAL LONG-TERM INVESTMENTS (cost $251,783,107) | | | 206,990,472 | |
| | | | |
|
|
|
| SHORT-TERM INVESTMENT — 9.7% | |
AFFILIATED MONEY MARKET MUTUAL FUND | | | | |
Dryden Core Investment Fund —Taxable Money Market Series (cost $21,057,735; includes $10,455,867 of cash collateral for securities on loan)(b)(w)(Note 4) | | 21,057,735 | | | 21,057,735 | |
| | | | |
|
|
|
TOTAL INVESTMENTS(o) — 105.1%
(cost $272,840,842) | | | 228,048,207 | |
LIABILITIES IN EXCESS OF
OTHER ASSETS(x) — (5.1)% | | | (11,148,317 | ) |
| | | | |
|
|
|
NET ASSETS — 100.0% | | $ | 216,899,890 | |
| | | | |
|
|
|
The following abbreviations are used in Portfolio descriptions:
| | |
| 144A | | Security was purchased pursuant to Rule 144A under the Securities Act of 1933 and may not be resold subject to that rule except to qualified institutional buyers. Unless otherwise noted, 144A securities are deemed to be liquid. |
| ADR | | American Depositary Receipt |
| GDR | | Global Depositary Receipt |
| PRFC | | Preference Shares |
| * | Non-income producing security. |
SEE NOTES TO FINANCIAL STATEMENTS.
A14
| | | | | | |
| | | SP INTERNATIONAL GROWTH PORTFOLIO (continued) | | |
| |
| SCHEDULE OF INVESTMENTS | | December 31, 2008 |
| (a) | All or a portion of security is on loan. The aggregate market value of such securities is $10,185,581; cash collateral of $10,455,867 (included with liabilities) was received with which the Portfolio purchased highly liquid short-term investments. |
| (b) | Represents security, or a portion thereof, purchased with cash collateral received for securities on loan. |
| (o) | As of December 31, 2008, 30 securities representing $41,932,325 and 19.3% of net assets were fair valued in accordance with the policies adopted by the Board of Trustees. |
| (w) | Prudential Investments LLC, the manager of the Portfolio, also serves as manager of the underlying portfolios in which the Portfolio invests. |
| (x) | Liabilities in excess of other assets includes net unrealized depreciation on forward foreign currency exchange contracts as follows: |
Forward foreign currency exchange contracts outstanding at December 31, 2008:
| | | | | | | | | | | | |
Purchase Contracts
| | Notional
Amount (000)
| | Value at
Settlement
Date Payable
| | Current
Value
| | Unrealized
Depreciation
| |
| Japanese Yen, Expiring 03/17/09 | | JPY 117,955 | | $ | 1,316,977 | | $ | 1,303,308 | | $ | (13,669 | ) |
| | | | | | | | | | | | |
| | | | |
Sale Contracts
| | Notional
Amount (000)
| | Value at
Settlement
Date Receivable
| | Current
Value
| | Unrealized
Depreciation
| |
| Japanese Yen, Expiring 03/17/09 | | JPY 117,955 | | $ | 1,279,650 | | $ | 1,303,308 | | $ | (23,658 | ) |
Various inputs are used in determining the value of the Portfolio’s investments. These inputs are summarized in the three broad levels listed below.
Level 1—quoted prices in active markets for identical securities
Level 2—other significant observable inputs (including quoted prices for similar securities, interest rates, prepayment speeds, credit risk, etc.)
Level 3—significant unobservable inputs (including the Portfolio’s own assumptions in determining the fair value of investments)
The following is a summary of the inputs used as of December 31, 2008 in valuing the Portfolio’s assets carried at fair value:
| | | | | | | |
Valuation inputs
| | Investments
in Securities
| | Other Financial
Instruments*
| |
Level 1—Quoted Prices | | $ | 186,115,882 | | | — | |
Level 2—Other Significant Observable Inputs | | | 41,170,685 | | $ | (37,327 | ) |
Level 3—Significant Unobservable Inputs | | | 761,640 | | | — | |
| | |
|
| |
|
|
|
Total | | $ | 228,048,207 | | $ | (37,327 | ) |
| | |
|
| |
|
|
|
| * | Other financial instruments are derivative instruments not reflected in the Schedule of Investments, such as futures, forwards and swap contracts, which are valued at the unrealized appreciation/depreciation on the instrument. |
The following is a reconciliation of assets in which significant unobservable inputs (Level 3) were used in determining fair value:
| | | | |
| | | Investments
in Securities
| |
Balance as of 12/31/07 | | $ | — | |
Accrued discounts/premiums | | | — | |
Realized gain (loss) | | | (270,576 | ) |
Change in unrealized appreciation (depreciation) | | | (406,848 | ) |
Net purchases (sales) | | | 1,439,064 | |
Transfers in and/or out of Level 3 | | | — | |
| | |
|
|
|
Balance as of 12/31/08 | | $ | 761,640 | |
| | |
|
|
|
SEE NOTES TO FINANCIAL STATEMENTS.
A15
| | | | | | |
| | | SP INTERNATIONAL GROWTH PORTFOLIO (continued) | | |
| |
| SCHEDULE OF INVESTMENTS | | December 31, 2008 |
The industry classification of investments and liabilities in excess of other assets shown as a percentage of net assets as of December 31, 2008 were as follows:
| | | |
Pharmaceuticals | | 11.4 | % |
Oil, Gas & Consumable Fuels | | 11.0 | |
Affiliated Money Market Mutual Fund (4.8% represents investments purchased with collateral from securities on loan) | | 9.7 | |
Financial Services | | 8.5 | |
Foods | | 5.6 | |
Insurance | | 5.2 | |
Media | | 4.3 | |
Entertainment & Leisure | | 3.6 | |
Retail & Merchandising | | 3.4 | |
Commercial Banks | | 2.7 | |
Computers | | 2.3 | |
Consumer Products & Services | | 2.3 | |
Utilities | | 2.2 | |
Wireless Telecommunication Services | | 2.2 | |
Commercial Services | | 2.2 | |
Telecommunications | | 2.2 | |
Automobile Manufacturers | | 2.1 | |
Medical Supplies & Equipment | | 2.1 | |
Aerospace | | 1.8 | |
Diversified Machinery | | 1.6 | |
Real Estate Investment Trusts | | 1.5 | |
Electronic Components & Equipment | | 1.4 | |
Water | | 1.4 | |
Diversified Resources | | 1.0 | |
Construction | | 1.0 | |
Chemicals | | 1.0 | |
Engineering/Construction | | 1.0 | |
Semiconductors | | 0.9 | |
Hotels, Restaurants & Leisure | | 0.9 | |
Healthcare Products | | 0.9 | |
Beverages | | 0.8 | |
Broadcasting | | 0.8 | |
Equipment Services | | 0.7 | |
Metals & Mining | | 0.6 | |
Electric – Generation | | 0.6 | |
Mineral Resources | | 0.6 | |
Clothing & Apparel | | 0.6 | |
Conglomerates | | 0.5 | |
Computer Hardware | | 0.5 | |
Airlines | | 0.4 | |
Building Products | | 0.3 | |
Transportation | | 0.3 | |
Instruments – Controls | | 0.3 | |
Advertising | | 0.2 | |
Machinery | | 0.2 | |
Building & Construction | | 0.2 | |
Electronic Components | | 0.1 | |
| | |
|
|
| | | 105.1 | |
Liabilities in excess of other assets | | (5.1 | ) |
| | |
|
|
| | | 100.0 | % |
| | |
|
|
SEE NOTES TO FINANCIAL STATEMENTS.
A16
| | | | | | |
| | | SP INTERNATIONAL GROWTH PORTFOLIO (continued) | | |
STATEMENT OF ASSETS AND LIABILITIES
December 31, 2008
| | | | |
| ASSETS | | | | |
Investments at value, including securities on loan of $10,185,581: | | | | |
Unaffiliated investments (cost $251,783,107) | | $ | 206,990,472 | |
Affiliated investments (cost $21,057,735) | | | 21,057,735 | |
Foreign currency, at value (cost $1,467,321) | | | 1,402,412 | |
Tax reclaim receivable | | | 1,064,764 | |
Receivable for investments sold | | | 293,108 | |
Dividends and interest receivable | | | 271,305 | |
Receivable for Series shares sold | | | 172,119 | |
Prepaid expenses | | | 6,183 | |
| | |
|
|
|
Total Assets | | | 231,258,098 | |
| | |
|
|
|
| LIABILITIES | | | | |
Collateral for securities on loan | | | 10,455,867 | |
Payable to custodian | | | 2,790,105 | |
Payable for investments purchased | | | 745,031 | |
Accrued expenses and other liabilities | | | 149,673 | |
Management fee payable | | | 149,193 | |
Unrealized depreciation on foreign currency forward contracts | | | 37,327 | |
Payable for Series shares repurchased | | | 26,718 | |
Distribution fee payable | | | 1,844 | |
Affiliated transfer agent fees payable | | | 1,343 | |
Administration fee payable | | | 1,107 | |
| | |
|
|
|
Total Liabilities | | | 14,358,208 | |
| | |
|
|
|
| NET ASSETS | | $ | 216,899,890 | |
| | |
|
|
|
Net assets were comprised of: | | | | |
Paid-in capital | | $ | 339,057,305 | |
Retained earnings | | | (122,157,415 | ) |
| | |
|
|
|
Net assets, December 31, 2008 | | $ | 216,899,890 | |
| | |
|
|
|
| Class I: | | | | |
Net asset value and redemption price per share, $207,484,424 / 60,096,744 outstanding shares of beneficial interest | | $ | 3.45 | |
| | |
|
|
|
| Class II: | | | | |
Net asset value and redemption price per share, $9,415,466 / 2,791,749 outstanding shares of beneficial interest | | $ | 3.37 | |
| | |
|
|
|
STATEMENT OF OPERATIONS
Year Ended December 31, 2008
| | | | |
| INVESTMENT INCOME | | | | |
Unaffiliated dividend income (net of $626,489 foreign withholding tax) | | $ | 8,057,626 | |
Affiliated dividend income | | | 433,692 | |
Affiliated income from securities lending, net | | | 84,356 | |
| | |
|
|
|
| | | | 8,575,674 | |
| | |
|
|
|
| EXPENSES | | | | |
Management fee | | | 3,093,178 | |
Distribution fee—Class II | | | 57,681 | |
Administration fee—Class II | | | 34,608 | |
Custodian’s fees and expenses | | | 341,000 | |
Shareholders’ reports | | | 54,000 | |
Audit fee | | | 23,000 | |
Trustees’ fees | | | 15,000 | |
Loan interest expense (Note 8) | | | 12,390 | |
Transfer agent’s fees and expenses (including affiliated expense of $7,600) (Note 4) | | | 8,000 | |
Legal fees and expenses | | | 8,000 | |
Insurance expenses | | | 4,000 | |
Commitment fee on syndicated credit agreement | | | 1,000 | |
Miscellaneous | | | 29,174 | |
| | |
|
|
|
Total expenses | | | 3,681,031 | |
| | |
|
|
|
| NET INVESTMENT INCOME | | | 4,894,643 | |
| | |
|
|
|
| NET REALIZED AND UNREALIZED GAIN (LOSS) ON INVESTMENTS AND FOREIGN CURRENCIES | | | | |
Net realized loss on: | | | | |
Investment transactions | | | (73,182,868 | ) |
Foreign currency transactions | | | (818,127 | ) |
| | |
|
|
|
| | | | (74,000,995 | ) |
| | |
|
|
|
Net change in unrealized appreciation (depreciation) on: | | | | |
Investments | | | (161,029,792 | ) |
Foreign currencies | | | (165,228 | ) |
| | |
|
|
|
| | | | (161,195,020 | ) |
| | |
|
|
|
| NET LOSS ON INVESTMENTS AND FOREIGN CURRENCIES | | | (235,196,015 | ) |
| | |
|
|
|
| NET DECREASE IN NET ASSETS RESULTING FROM OPERATIONS | | $ | (230,301,372 | ) |
| | |
|
|
|
STATEMENT OF CHANGES IN NET ASSETS
| | | | | | | | |
| | | Year Ended December 31,
| |
| | | 2008
| | | 2007
| |
| INCREASE (DECREASE) IN NET ASSETS | | | | | | | | |
| OPERATIONS: | | | | | | | | |
Net investment income | | $ | 4,894,643 | | | $ | 5,658,929 | |
Net realized gain (loss) on investment and foreign currency transactions | | | (74,000,995 | ) | | | 70,009,392 | |
Net change in unrealized appreciation (depreciation) on investments and foreign currencies | | | (161,195,020 | ) | | | 14,904,679 | |
| | |
|
|
| |
|
|
|
NET INCREASE (DECREASE) IN NET ASSETS RESULTING FROM OPERATIONS | | | (230,301,372 | ) | | | 90,573,000 | |
| | |
|
|
| |
|
|
|
| DISTRIBUTIONS | | | | | | | | |
Class I | | | (70,133,161 | ) | | | (69,883,162 | ) |
Class II | | | (5,535,160 | ) | | | (4,307,436 | ) |
| | |
|
|
| |
|
|
|
| TOTAL DISTRIBUTIONS | | | (75,668,321 | ) | | | (74,190,598 | ) |
| | |
|
|
| |
|
|
|
| SERIES SHARE TRANSACTIONS (NOTE 7): | | | | | | | | |
Series shares sold | | | 53,349,858 | | | | 100,653,807 | |
Series shares issued in reinvestment of distributions | | | 75,668,321 | | | | 74,190,598 | |
Series shares repurchased | | | (137,692,011 | ) | | | (139,468,986 | ) |
| | |
|
|
| |
|
|
|
INCREASE (DECREASE) IN NET ASSETS RESULTING FROM SERIES SHARE TRANSACTIONS | | | (8,673,832 | ) | | | 35,375,419 | |
| | |
|
|
| |
|
|
|
| TOTAL INCREASE (DECREASE) IN NET ASSETS | | | (314,643,525 | ) | | | 51,757,821 | |
| NET ASSETS: | | | | | | | | |
Beginning of year | | | 531,543,415 | | | | 479,785,594 | |
| | |
|
|
| |
|
|
|
End of year | | $ | 216,899,890 | | | $ | 531,543,415 | |
| | |
|
|
| |
|
|
|
SEE NOTES TO FINANCIAL STATEMENTS.
A17
| | | | | | |
| | | SP INTERNATIONAL VALUE PORTFOLIO | | |
| |
| SCHEDULE OF INVESTMENTS | | December 31, 2008 |
| | | | | |
| LONG-TERM INVESTMENTS — 90.9% |
| COMMON STOCKS — 90.9% | | Shares
| | Value
(Note 2)
|
| | | | | | |
Australia — 1.4% | | | | | |
Amcor Ltd. | | 93,400 | | $ | 379,559 |
AWB Ltd. | | 227,800 | | | 406,048 |
BlueScope Steel Ltd. | | 104,200 | | | 256,009 |
Centennial Coal Co. Ltd. | | 149,800 | | | 350,981 |
Foster’s Group Ltd. | | 50,700 | | | 194,996 |
Gloucester Coal Ltd. | | 38,900 | | | 106,506 |
Goodman Fielder Ltd. | | 193,500 | | | 179,879 |
National Australia Bank Ltd. | | 20,000 | | | 294,033 |
OZ Minerals Ltd. | | 148,479 | | | 52,795 |
Pacific Brands Ltd. | | 231,100 | | | 69,679 |
Qantas Airways Ltd. | | 393,600 | | | 725,131 |
Tabcorp Holdings Ltd. | | 62,000 | | | 303,341 |
| | | | |
|
|
| | | | | | 3,318,957 |
| | | | |
|
|
Austria — 0.1% | | | | | |
Voestalpine AG | | 12,200 | | | 255,057 |
| | | | |
|
|
Belgium — 0.1% | | | | | |
AGFA-Gevaert NV* | | 39,400 | | | 101,868 |
Dexia NV/SA | | 24,800 | | | 110,314 |
Fortis | | 22,100 | | | 28,539 |
| | | | |
|
|
| | | | | | 240,721 |
| | | | |
|
|
Brazil — 1.1% | | | | | |
Empresa Brasileira de Aeronautica SA, ADR | | 78,300 | | | 1,269,243 |
Redecard SA | | 113,600 | | | 1,251,938 |
| | | | |
|
|
| | | | | | 2,521,181 |
| | | | |
|
|
Canada — 4.6% | | | | | |
Canadian National Railway Co. | | 71,000 | | | 2,575,439 |
Canadian Natural Resources Ltd. | | 52,200 | | | 2,061,361 |
Canadian Oil Sands Trust | | 29,200 | | | 499,085 |
Potash Corp. of Saskatchewan, Inc. | | 18,700 | | | 1,369,214 |
Rogers Communications, Inc. (Class B Stock) | | 152,100 | | | 4,508,172 |
| | | | |
|
|
| | | | | | 11,013,271 |
| | | | |
|
|
China — 2.7% | | | | | |
China Life Insurance Co. Ltd. (Class H Stock) | | 1,378,000 | | | 4,233,880 |
China Merchants Bank Co. Ltd. (Class H Stock) | | 1,177,553 | | | 2,203,288 |
| | | | |
|
|
| | | | | | 6,437,168 |
| | | | |
|
|
Denmark — 3.7% | | | | | |
Danske Bank A/S | | 28,900 | | | 280,653 |
H. Lundbeck A/S | | 36,900 | | | 758,033 |
Novo Nordisk A/S (Class B Stock) | | 110,300 | | | 5,582,307 |
Vestas Wind Systems A/S* | | 37,664 | | | 2,134,784 |
| | | | |
|
|
| | | | | | 8,755,777 |
| | | | |
|
|
Finland — 2.8% | | | | | |
Fortum Oyj | | 81,029 | | | 1,715,418 |
Nokia Oyj | | 275,500 | | | 4,250,834 |
Rautaruukki Oyj | | 17,900 | | | 302,563 |
TietoEnator Oyj | | 35,600 | | | 384,504 |
| | | | |
|
|
| | | | | | 6,653,319 |
| | | | |
|
|
| | | | | |
COMMON STOCKS
(continued) | | Shares
| | Value
(Note 2)
|
| | | | | | |
France — 10.7% | | | | | |
Air Liquide | | 16,744 | | $ | 1,523,345 |
Arkema | | 130 | | | 2,214 |
AXA SA | | 162,300 | | | 3,574,706 |
BNP Paribas | | 74,200 | | | 3,120,030 |
Ciments Francais SA | | 3,000 | | | 251,543 |
Compagnie Generale des Establissements Michelin (Class B Stock) | | 9,700 | | | 506,573 |
Credit Agricole SA | | 31,300 | | | 348,068 |
France Telecom SA | | 139,117 | | | 3,859,849 |
Groupe Danone | | 59,200 | | | 3,553,317 |
LVMH Moet Hennessy Louis Vuitton SA | | 50,535 | | | 3,355,653 |
Natixis SA | | 30,000 | | | 52,127 |
Peugeot SA | | 10,900 | | | 184,091 |
Rallye SA | | 7,300 | | | 163,372 |
Renault SA | | 6,600 | | | 170,183 |
Safran SA | | 26,600 | | | 356,220 |
Sanofi-Aventis SA | | 28,800 | | | 1,817,515 |
Societe Generale | | 3,300 | | | 165,138 |
Thales SA | | 8,600 | | | 356,600 |
THOMSON* | | 61,800 | | | 82,469 |
Total SA | | 17,200 | | | 930,292 |
Valeo SA | | 15,000 | | | 221,330 |
Vivendi | | 29,500 | | | 954,014 |
| | | | |
|
|
| | | | | | 25,548,649 |
| | | | |
|
|
Germany — 5.8% | | | | | |
BASF SE | | 37,800 | | | 1,457,039 |
Daimler AG | | 15,600 | | | 578,983 |
Deutsche Bank AG | | 20,200 | | | 781,437 |
Deutsche Lufthansa AG | | 35,500 | | | 552,189 |
E.ON AG | | 92,273 | | | 3,647,823 |
Hannover Rueckversicherung AG | | 9,300 | | | 290,867 |
Heidelberger Druckmaschinen AG | | 21,100 | | | 177,447 |
MTU Aero Engines Holding AG | | 19,800 | | | 538,899 |
Muenchener Rueckversicherungs AG | | 10,200 | | | 1,573,812 |
SAP AG | | 92,602 | | | 3,248,922 |
ThyssenKrupp AG* | | 42,100 | | | 1,109,558 |
| | | | |
|
|
| | | | | | 13,956,976 |
| | | | |
|
|
Greece — 1.1% | | | | | |
National Bank of Greece SA | | 89,960 | | | 1,650,642 |
OPAP SA | | 33,896 | | | 974,381 |
| | | | |
|
|
| | | | | | 2,625,023 |
| | | | |
|
|
Guernsey — 0.7% | | | | | |
Amdocs Ltd.* | | 94,700 | | | 1,732,063 |
| | | | |
|
|
Hong Kong — 2.6% | | | | | |
Chaoda Modern Agriculture Holdings Ltd. | | 567,462 | | | 364,657 |
China Mobile Ltd. | | 347,565 | | | 3,526,435 |
CITIC Pacific Ltd. | | 109,000 | | | 119,084 |
Hong Kong Exchanges and Clearing Ltd. | | 184,677 | | | 1,773,072 |
Noble Group Ltd. | | 60,000 | | | 42,976 |
SEE NOTES TO FINANCIAL STATEMENTS.
A18
| | | | | | |
| | | SP INTERNATIONAL VALUE PORTFOLIO (continued) | | |
| |
| SCHEDULE OF INVESTMENTS | | December 31, 2008 |
| | | | | |
COMMON STOCKS
(continued) | | Shares
| | Value
(Note 2)
|
| | | | | | |
Hong Kong (continued) | | | | | |
Orient Overseas International Ltd. | | 117,392 | | $ | 263,227 |
Solomon Systech International Ltd. | | 525,000 | | | 12,158 |
| | | | |
|
|
| | | | | | 6,101,609 |
| | | | |
|
|
Ireland — 0.1% | | | | | |
Allied Irish Banks PLC | | 51,100 | | | 122,955 |
Bank of Ireland | | 61,500 | | | 71,297 |
Irish Life & Permanent PLC | | 45,500 | | | 99,298 |
| | | | |
|
|
| | | | | | 293,550 |
| | | | |
|
|
Israel — 2.7% | | | | | |
Teva Pharmaceutical Industries Ltd., ADR | | 150,400 | | | 6,402,528 |
| | | | |
|
|
Italy — 1.6% | | | | | |
Banche Popolari Unite ScpA | | 26,200 | | | 374,754 |
Banco Popolare SC | | 23,700 | | | 163,073 |
ENI SpA | | 63,100 | | | 1,468,299 |
Finmeccanica SpA | | 14,200 | | | 214,954 |
Fondiaria-Sai SpA | | 17,000 | | | 302,474 |
Indesit Co. SpA | | 27,500 | | | 163,991 |
Intesa Sanpaolo SpA | | 81,700 | | | 288,176 |
Telecom Italia SpA | | 588,300 | | | 940,430 |
| | | | |
|
|
| | | | | | 3,916,151 |
| | | | |
|
|
Japan — 12.4% | | | | | |
Alpine Electronics, Inc. | | 45,300 | | | 363,636 |
Alps Electric Co. Ltd. | | 51,800 | | | 255,479 |
Asahi Glass Co. Ltd. | | 66,000 | | | 376,220 |
Asahi Kasei Corp. | | 161,000 | | | 710,663 |
Astellas Pharma, Inc. | | 14,700 | | | 601,705 |
Cosmo Oil Co. Ltd. | | 31,000 | | | 96,507 |
Daiichi Sankyo Co Ltd | | 8,700 | | | 205,741 |
Denki Kagaku Kogyo Kabushiki Kaisha | | 133,000 | | | 327,517 |
Fanuc Ltd. | | 43,800 | | | 3,139,225 |
Fuji Heavy Industries Ltd. | | 100 | | | 275 |
Hitachi Information Systems Ltd. | | 21,800 | | | 450,456 |
Honda Motor Co. Ltd. | | 61,400 | | | 1,307,740 |
Komatsu Ltd. | | 122,521 | | | 1,562,941 |
Kurabo Industries Ltd. | | 145,000 | | | 242,011 |
Kyoei Steel Ltd. | | 300 | | | 6,025 |
Kyowa Exeo Corp. | | 33,000 | | | 354,830 |
Marubeni Corp. | | 100,083 | | | 383,174 |
Matsushita Electric Industrial Co. Ltd. | | 45,000 | | | 553,150 |
Mitsui & Co. Ltd. | | 19,000 | | | 195,327 |
Mizuho Financial Group, Inc. | | 119 | | | 343,315 |
Nifco, Inc. | | 28,200 | | | 285,977 |
Nintendo Co. Ltd. | | 11,210 | | | 4,283,920 |
Nippon Light Metal Co. Ltd. | | 245,000 | | | 248,826 |
Nippon Oil Corp. | | 73,000 | | | 370,137 |
Nippon Shokubai Co. Ltd. | | 101,000 | | | 778,307 |
Nippon Telegraph & Telephone Corp. | | 240 | | | 1,306,079 |
Nissan Motor Co. Ltd. | | 230,200 | | | 828,175 |
Nissan Shatai Co. Ltd. | | 10,000 | | | 60,881 |
NTT DoCoMo, Inc. | | 716 | | | 1,409,314 |
Omron Corp. | | 38,500 | | | 517,280 |
Ricoh Co. Ltd. | | 69,000 | | | 884,354 |
Sanwa Holdings Corp. | | 136,000 | | | 523,089 |
| | | | | |
COMMON STOCKS
(continued) | | Shares
| | Value
(Note 2)
|
| | | | | | |
Japan (continued) | | | | | |
Seiko Epson Corp. | | 2,300 | | $ | 36,597 |
Sumitomo Corp. | | 75,000 | | | 665,196 |
Sumitomo Electric Industries Ltd. | | 34,800 | | | 269,394 |
Sumitomo Mitsui Financial Group, Inc. | | 70 | | | 283,500 |
Sumitomo Trust & Banking Co. Ltd. (The) | | 25,000 | | | 147,781 |
Suzuken Co. Ltd. | | 6,500 | | | 193,779 |
Takeda Pharmaceutical Co. Ltd. | | 8,100 | | | 422,191 |
Tokyo Steel Manufacturing Co. Ltd. | | 26,200 | | | 274,901 |
Toyota Motor Corp. | | 115,500 | | | 3,818,237 |
UNY Co. Ltd. | | 3,000 | | | 33,198 |
Yokogawa Electric Corp. | | 16,200 | | | 106,609 |
Yokohama Rubber Co. Ltd. (The) | | 78,700 | | | 394,937 |
| | | | |
|
|
| | | | | | 29,618,596 |
| | | | |
|
|
Liechtenstein — 0.2% | | | | | |
Verwaltungs und Privat Bank AG | | 2,900 | | | 381,726 |
| | | | |
|
|
Mexico — 1.9% | | | | | |
America Movil SAB de CV (Class L Stock), ADR | | 72,453 | | | 2,245,319 |
Wal-Mart de Mexico SAB de CV (Class V Stock) | | 824,200 | | | 2,202,072 |
| | | | |
|
|
| | | | | | 4,447,391 |
| | | | |
|
|
Netherlands — 1.6% | | | | | |
Aegon NV | | 48,400 | | | 304,434 |
CSM NV | | 11,500 | | | 183,834 |
ING Groep NV, ADR | | 64,800 | | | 660,250 |
Koninklijke DSM NV | | 23,600 | | | 601,154 |
Koninklijke Philips Electronics NV | | 17,600 | | | 338,349 |
OCE NV | | 58,900 | | | 257,084 |
Royal Dutch Shell PLC (Class A Stock) | | 1,300 | | | 33,882 |
Schlumberger Ltd. | | 34,470 | | | 1,459,115 |
| | | | |
|
|
| | | | | | 3,838,102 |
| | | | |
|
|
New Zealand — 0.1% | | | | | |
Air New Zealand Ltd. | | 580,000 | | | 325,889 |
| | | | |
|
|
Norway — 0.3% | | | | | |
DnB NOR ASA | | 63,900 | | | 246,398 |
Norsk Hydro ASA | | 24,400 | | | 96,874 |
StatoilHydro ASA | | 21,037 | | | 342,199 |
| | | | |
|
|
| | | | | | 685,471 |
| | | | |
|
|
Portugal — 0.3% | | | | | |
Banco Espirito Santo SA | | 32,000 | | | 297,581 |
Portugal Telecom SGPS SA | | 58,500 | | | 493,599 |
| | | | |
|
|
| | | | | | 791,180 |
| | | | |
|
|
Russia — 0.3% | | | | | |
Gazprom OAO, ADR | | 51,700 | | | 736,725 |
| | | | |
|
|
Singapore — 0.6% | | | | | |
MobileOne Ltd. | | 293,000 | | | 302,509 |
Neptune Orient Lines Ltd. | | 264,000 | | | 207,463 |
Singapore Airlines Ltd. | | 104,100 | | | 818,741 |
| | | | |
|
|
| | | | | | 1,328,713 |
| | | | |
|
|
SEE NOTES TO FINANCIAL STATEMENTS.
A19
| | | | | | |
| | | SP INTERNATIONAL VALUE PORTFOLIO (continued) | | |
| |
| SCHEDULE OF INVESTMENTS | | December 31, 2008 |
| | | | | |
COMMON STOCKS
(continued) | | Shares
| | Value
(Note 2)
|
| | | | | | |
Spain — 3.2% | | | | | |
Banco Bilbao Vizcaya Argentaria SA | | 60,500 | | $ | 728,288 |
Banco Santander SA | | 159,700 | | | 1,498,436 |
Endesa SA | | 3,200 | | | 127,217 |
Repsol YPF SA | | 42,100 | | | 883,667 |
Telefonica SA | | 200,100 | | | 4,408,653 |
| | | | |
|
|
| | | | | | 7,646,261 |
| | | | |
|
|
Sweden — 1.9% | | | | | |
Electrolux AB (Class B Stock) | | 59,500 | | | 502,232 |
Hennes & Mauritz AB (Class B Stock) | | 89,247 | | | 3,447,791 |
Nordea Bank AB | | 42,800 | | | 296,051 |
Volvo AB (Class B Stock) | | 34,600 | | | 187,702 |
| | | | |
|
|
| | | | | | 4,433,776 |
| | | | |
|
|
Switzerland — 11.7% | | | | | |
Baloise Holding AG | | 7,000 | | | 516,278 |
Clariant AG* | | 61,900 | | | 414,663 |
Credit Suisse Group AG | | 35,500 | | | 950,580 |
Georg Fischer AG* | | 1,400 | | | 315,554 |
Givaudan SA | | 2,492 | | | 1,944,479 |
Julius Baer Holding AG | | 23,735 | | | 891,554 |
Logitech International SA* | | 108,480 | | | 1,668,453 |
Nestle SA | | 160,100 | | | 6,257,490 |
Novartis AG | | 68,616 | | | 3,397,438 |
Rieter Holding AG | | 1,400 | | | 224,926 |
Roche Holding AG | | 35,185 | | | 5,371,882 |
Swiss Reinsurance | | 74,247 | | | 3,508,831 |
Swisscom AG | | 3,500 | | | 1,116,409 |
Zurich Financial Services AG | | 5,800 | | | 1,236,999 |
| | | | |
|
|
| | | | | | 27,815,536 |
| | | | |
|
|
Turkey — 0.8% | | | | | |
Turkcell Iletisim Hizmet A/S | | 358,100 | | | 2,030,045 |
| | | | |
|
|
United Kingdom — 13.8% | | | | | |
ARM Holdings PLC | | 887,500 | | | 1,103,745 |
AstraZeneca PLC | | 41,900 | | | 1,690,988 |
Aviva PLC | | 73,000 | | | 409,328 |
Banco Santander SA* | | 13,933 | | | 127,308 |
Barclays PLC | | 150,400 | | | 331,709 |
Beazley Group PLC | | 166,000 | | | 323,394 |
BP PLC | | 316,500 | | | 2,393,556 |
Brit Insurance Holdings PLC | | 129,500 | | | 409,616 |
BT Group PLC | | 482,800 | | | 938,487 |
Carnival PLC | | 148,546 | | | 3,222,807 |
Centrica PLC | | 109,200 | | | 417,627 |
Dairy Crest Group PLC | | 40,400 | | | 123,721 |
Drax Group PLC | | 46,611 | | | 375,955 |
DS Smith PLC | | 158,000 | | | 172,077 |
GKN PLC | | 203,300 | | | 283,526 |
GlaxoSmithKline PLC | | 47,500 | | | 877,227 |
HBOS PLC | | 147,459 | | | 146,287 |
IMI PLC | | 82,400 | | | 321,944 |
Legal & General Group PLC | | 430,100 | | | 474,914 |
Lloyds TSB Group PLC | | 96,900 | | | 175,541 |
Marston’s PLC | | 89,100 | | | 149,881 |
NEXT PLC | | 17,923 | | | 278,561 |
Northern Foods PLC | | 162,900 | | | 132,914 |
Old Mutual PLC | | 230,800 | | | 182,508 |
| | | | | |
COMMON STOCKS
(continued) | | Shares
| | Value
(Note 2)
|
| | | | | | |
United Kingdom (continued) | | | | | |
Reckitt Benckiser Group PLC | | 111,776 | | $ | 4,143,006 |
Royal & Sun Alliance Insurance Group PLC | | 195,300 | | | 387,775 |
Royal Bank of Scotland Group PLC | | 174,353 | | | 123,834 |
Royal Dutch Shell PLC (Class B Stock) | | 103,100 | | | 2,558,489 |
SABMiller PLC | | 108,900 | | | 1,820,924 |
Smith & Nephew PLC | | 329,600 | | | 2,077,978 |
Spectris PLC | | 4,700 | | | 36,152 |
Standard Chartered PLC | | 184,142 | | | 2,316,565 |
Tate & Lyle PLC | | 65,200 | | | 375,669 |
Tomkins PLC | | 125,800 | | | 222,469 |
TT Electronics PLC | | 127,500 | | | 64,160 |
Vodafone Group PLC | | 268,600 | | | 536,791 |
Vodafone Group PLC, ADR | | 159,000 | | | 3,249,960 |
| | | | |
|
|
| | | | | | 32,977,393 |
| | | | |
|
|
TOTAL COMMON STOCKS
(cost $307,486,411) | | | 216,828,804 |
| | | | |
|
|
| | | Units
| | |
| RIGHTS* | | | | | |
Belgium | | | | | |
Fortis, expiring 03/09/09 | | 22,900 | | | — |
| | | | |
|
|
United Kingdom | | | | | |
HBOS, expiring 01/09/09 | | 204,069 | | | — |
Lloyds TSB, expiring 01/09/09 | | 42,122 | | | — |
| | | | |
|
|
| | | | | | — |
| | | | |
|
|
TOTAL RIGHTS
(cost $0) | | | — |
| | | | |
|
|
TOTAL LONG-TERM INVESTMENTS
(cost $307,486,411) | | | 216,828,804 |
| | | | |
|
|
| | | Shares
| | |
| SHORT-TERM INVESTMENT — 6.1% | | | |
AFFILIATED MONEY MARKET MUTUAL FUND | | | |
Dryden Core Investment Fund —
Taxable Money Market Series
(cost $14,563,840)(w) (Note 4) | | 14,563,840 | | | 14,563,840 |
| | | | |
|
|
TOTAL INVESTMENTS(o) — 97.0%
(cost $322,050,251) | | | 231,392,644 |
OTHER ASSETS IN EXCESS OF
LIABILITIES(x) — 3.0% | | | 7,120,565 |
| | | | |
|
|
NET ASSETS — 100.0% | | $ | 238,513,209 |
| | | | |
|
|
The following abbreviation is used in the Portfolio descriptions:
| | |
| ADR | | American Depositary Receipt |
| EUR | | Euro |
| GBP | | British Pound |
| MXN | | Mexican Peso |
| * | Non-income producing security. |
| (o) | As of December 31, 2008, 69 securities representing $47,078,137 and 19.7% of net assets were fair valued in accordance with the policies adopted by the Board of Trustees. |
| (w) | Prudential Investments LLC, the manager of the Portfolio, also serves as manager of the Dryden Core Investment Fund-Taxable Money Market Series. |
SEE NOTES TO FINANCIAL STATEMENTS.
A20
| | | | | | |
| | | SP INTERNATIONAL VALUE PORTFOLIO (continued) | | |
| |
| SCHEDULE OF INVESTMENTS | | December 31, 2008 |
| (x) | Other assets in excess of liabilities includes net unrealized appreciation (depreciation) on forward foreign currency exchange contracts as follows: |
Forward foreign currency exchange contracts outstanding at December 31, 2008:
| | | | | | | | | | | |
Purchase Contracts
| | Notional
Amount (000)
| | Value at
Settlement
Date Payable
| | Current
Value
| | Unrealized
Appreciation
|
| Euro, Expiring 06/16/09 | | EUR 4,942 | | $ | 6,761,150 | | $ | 6,838,034 | | $ | 76,884 |
| | | | |
|
| |
|
| |
|
|
| | | | | | | | | | | | |
| | | | |
Sale Contracts
| | Notional
Amount (000)
| | Value at
Settlement
Date Receivable
| | Current
Value
| | Unrealized
Appreciation
(Depreciation)
| |
| British Pound, Expiring 06/16/09 | | GBP 1,771 | | $ | 2,714,147 | | $ | 2,541,436 | | $ | 172,711 | |
| Euro, Expiring 06/16/09 | | EUR 8,814 | | | 11,747,927 | | | 12,195,555 | | | (447,628 | ) |
| Mexican Pesos, Expiring 05/29/09 | | MXN 44,250 | | | 3,109,081 | | | 3,075,021 | | | 34,060 | |
| | | | |
|
| |
|
| |
|
|
|
| | | | | $ | 17,571,155 | | $ | 17,812,012 | | $ | (240,857 | ) |
| | | | |
|
| |
|
| |
|
|
|
Various inputs are used in determining the value of the Portfolio’s investments. These inputs are summarized in the three broad levels listed below.
Level 1—quoted prices in active markets for identical securities
Level 2—other significant observable inputs (including quoted prices for similar securities, interest rates, prepayment speeds, credit risk, etc.)
Level 3—significant unobservable inputs (including the Portfolio’s own assumptions in determining the fair value of investments)
The following is a summary of the inputs used as of December 31, 2008 in valuing the Portfolio’s assets carried at fair value:
| | | | | | | |
Valuation inputs
| | Investments
in Securities
| | Other Financial
Instruments*
| |
Level 1—Quoted Prices | | $ | 184,314,507 | | | — | |
Level 2—Other Significant Observable Inputs | | | 45,092,448 | | $ | (163,973 | ) |
Level 3—Significant Unobservable Inputs | | | 1,985,689 | | | — | |
| | |
|
| |
|
|
|
Total | | $ | 231,392,644 | | $ | (163,973 | ) |
| | |
|
| |
|
|
|
| * | Other financial instruments are derivative instruments not reflected in the Schedule of Investments, such as futures, forwards and swap contracts, which are valued at the unrealized appreciation/depreciation on the instrument. |
The following is a reconciliation of assets in which significant unobservable inputs (Level 3) were used in determining fair value:
| | | | |
| | | Investments
in Securities
| |
Balance as of 12/31/07 | | $ | — | |
Accrued discounts/premiums | | | — | |
Realized gain (loss) | | $ | 36,874 | |
Change in unrealized appreciation (depreciation) | | | (29,585,194 | ) |
Net purchases (sales) | | | 29,545,637 | |
Transfers in and/or out of Level 3 | | | 1,988,372 | |
| | |
|
|
|
Balance as of 12/31/08 | | $ | 1,985,689 | |
| | |
|
|
|
The industry classification of investments and other assets in excess of liabilities shown as a percentage of net assets as of December 31, 2008 were as follows:
| | | |
Telecommunications | | 15.3 | % |
Pharmaceuticals | | 11.6 | |
| | | |
Financial – Bank & Trust | | 8.1 | % |
Insurance | | 7.7 | |
Affiliated Money Market Mutual Fund | | 6.1 | |
Oil, Gas & Consumable Fuels | | 5.8 | |
Food | | 4.6 | |
Chemicals | | 3.8 | |
Entertainment & Leisure | | 3.6 | |
Automobile Manufacturers | | 2.9 | |
Retail | | 2.6 | |
Electric | | 2.3 | |
Machinery & Equipment | | 2.3 | |
Consumer Products & Services | | 1.7 | |
Diversified Operations | | 1.5 | |
Software | | 1.4 | |
Electronic Components | | 1.3 | |
Transportation | | 1.3 | |
Diversified Financial Services | | 1.2 | |
Aerospace/defense | | 1.2 | |
Computers | | 1.1 | |
Airlines | | 1.0 | |
Beverages | | 1.0 | |
Medical Supplies & Equipment | | 0.9 | |
Iron/Steel | | 0.7 | |
Automotive Parts | | 0.6 | |
Office Equipment | | 0.5 | |
Home Furnishings | | 0.5 | |
Building Materials | | 0.5 | |
Distribution/Wholesale | | 0.5 | |
Metals & Mining | | 0.4 | |
Semiconductors | | 0.4 | |
Media | | 0.4 | |
Auto Parts & Equipment | | 0.3 | |
Miscellaneous Manufacturing | | 0.2 | |
Furniture | | 0.2 | |
Environmental Services | | 0.2 | |
Gas Distribution | | 0.2 | |
Agriculture | | 0.2 | |
Containers & Packaging | | 0.2 | |
Farming & Agriculture | | 0.2 | |
Engineering/Construction | | 0.2 | |
Independent Power Producers & Energy Traders | | 0.1 | |
Textiles | | 0.1 | |
Paper & Forest Products | | 0.1 | |
| | |
|
|
| | | 97.0 | |
Other assets in excess of liabilities | | 3.0 | |
| | |
|
|
| | | 100.0 | % |
| | |
|
|
SEE NOTES TO FINANCIAL STATEMENTS.
A21
| | | | | | |
| | | SP INTERNATIONAL VALUE PORTFOLIO (continued) | | |
STATEMENT OF ASSETS AND LIABILITIES
December 31, 2008
| | | | |
| ASSETS | | | | |
Investments at value: | | | | |
Unaffiliated investments (cost $307,486,411) | | $ | 216,828,804 | |
Affiliated investments (cost $14,563,840) | | | 14,563,840 | |
Cash | | | 3,115,307 | |
Foreign currency, at value (cost $1,369,421) | | | 1,422,663 | |
Receivable for Series shares sold | | | 2,021,893 | |
Tax reclaim receivable | | | 1,414,661 | |
Unrealized appreciation on foreign currency forward contracts | | | 283,655 | |
Dividends and interest receivable | | | 224,552 | |
Receivable for investments sold | | | 72,768 | |
Prepaid expenses | | | 4,962 | |
| | |
|
|
|
Total Assets | | | 239,953,105 | |
| | |
|
|
|
| LIABILITIES | | | | |
Payable for investments purchased | | | 607,534 | |
Unrealized depreciation on foreign currency forward contracts | | | 447,628 | |
Accrued expenses and other liabilities | | | 182,455 | |
Management fee payable | | | 173,847 | |
Payable for Series shares repurchased | | | 27,722 | |
Transfer agent fees payable | | | 710 | |
| | |
|
|
|
Total Liabilities | | | 1,439,896 | |
| | |
|
|
|
| NET ASSETS | | $ | 238,513,209 | |
| | |
|
|
|
Net assets were comprised of: | | | | |
Paid-in capital | | $ | 338,926,315 | |
Retained earnings | | | (100,413,106 | ) |
| | |
|
|
|
Net assets, December 31, 2008 | | $ | 238,513,209 | |
| | |
|
|
|
Net asset value and redemption price per share, $238,513,209 / 48,227,480 outstanding shares of beneficial interest | | $ | 4.95 | |
| | |
|
|
|
STATEMENT OF OPERATIONS
Year Ended December 31, 2008
| | | | |
| INVESTMENT INCOME | | | | |
Unaffiliated dividend income (net of $1,192,938 foreign withholding tax) | | $ | 11,264,985 | |
Affiliated dividend income | | | 169,598 | |
Interest income | | | 2,328 | |
| | |
|
|
|
| | | | 11,436,911 | |
| | |
|
|
|
| EXPENSES | | | | |
Management fee | | | 3,086,690 | |
Custodian’s fees and expenses | | | 266,452 | |
Shareholders’ reports | | | 50,000 | |
Audit fee | | | 23,000 | |
Trustees’ fees | | | 14,000 | |
Loan interest expense (Note 8) | | | 9,642 | |
Legal fees and expenses | | | 8,000 | |
Transfer agent’s fees and expenses (including affiliated expense of $4,000) (Note 4) | | | 4,000 | |
Insurance expenses | | | 4,000 | |
Commitment fee on syndicated credit agreement | | | 1,000 | |
Miscellaneous | | | 21,765 | |
| | |
|
|
|
Total expenses | | | 3,488,549 | |
| | |
|
|
|
| NET INVESTMENT INCOME | | | 7,948,362 | |
| | |
|
|
|
| NET REALIZED AND UNREALIZED GAIN (LOSS) ON INVESTMENTS AND FOREIGN CURRENCIES | | | | |
Net realized gain (loss) on: | | | | |
Investment transactions | | | (18,763,216 | ) |
Foreign currency transactions | | | 1,629,121 | |
| | |
|
|
|
| | | | (17,134,095 | ) |
| | |
|
|
|
Net change in unrealized appreciation (depreciation) on: | | | | |
Investments | | | (178,523,176 | ) |
Foreign currencies | | | 335,443 | |
| | |
|
|
|
| | | | (178,187,733 | ) |
| | |
|
|
|
| NET LOSS ON INVESTMENTS AND FOREIGN CURRENCIES | | | (195,321,828 | ) |
| | |
|
|
|
| NET DECREASE IN NET ASSETS RESULTING FROM OPERATIONS | | $ | (187,373,466 | ) |
| | |
|
|
|
STATEMENT OF CHANGES IN NET ASSETS
| | | | | | | | |
| | | Year Ended December 31,
| |
| | | 2008
| | | 2007
| |
| INCREASE (DECREASE) IN NET ASSETS | | | | | | | | |
| OPERATIONS: | | | | | | | | |
Net investment income | | $ | 7,948,362 | | | $ | 9,309,748 | |
Net realized gain (loss) on investment and foreign currency transactions | | | (17,134,095 | ) | | | 53,972,399 | |
Net change in unrealized appreciation (depreciation) on investments and foreign currencies | | | (178,187,733 | ) | | | 24,169,653 | |
| | |
|
|
| |
|
|
|
NET INCREASE (DECREASE) IN NET ASSETS RESULTING FROM OPERATIONS | | | (187,373,466 | ) | | | 87,451,800 | |
| | |
|
|
| |
|
|
|
| DISTRIBUTIONS | | | (63,282,147 | ) | | | (103,097,386 | ) |
| | |
|
|
| |
|
|
|
| SERIES SHARE TRANSACTIONS (NOTE 7): | | | | | | | | |
Series shares sold [5,480,269 and 3,727,566 shares, respectively] | | | 30,802,427 | | | | 45,503,186 | |
Series shares issued in reinvestment of distributions [8,000,271 and 9,781,536, respectively] | | | 63,282,147 | | | | 103,097,386 | |
Series shares repurchased [11,702,481 and 9,807,700 shares, respectively] | | | (98,546,520 | ) | | | (126,710,224 | ) |
| | |
|
|
| |
|
|
|
INCREASE (DECREASE) IN NET ASSETS RESULTING FROM SERIES SHARE TRANSACTIONS | | | (4,461,946 | ) | | | 21,890,348 | |
| | |
|
|
| |
|
|
|
| TOTAL INCREASE (DECREASE) IN NET ASSETS | | | (255,117,559 | ) | | | 6,244,762 | |
| NET ASSETS: | | | | | | | | |
Beginning of year | | | 493,630,768 | | | | 487,386,006 | |
| | |
|
|
| |
|
|
|
End of year | | $ | 238,513,209 | | | $ | 493,630,768 | |
| | |
|
|
| |
|
|
|
SEE NOTES TO FINANCIAL STATEMENTS.
A22
| | | | | | |
| | | SP MID CAP GROWTH PORTFOLIO | | |
| |
| SCHEDULE OF INVESTMENTS | | December 31, 2008 |
| | | | | |
| LONG-TERM INVESTMENTS — 98.4% |
| COMMON STOCKS | | Shares
| | Value
(Note 2)
|
| | | | | | |
Air Freight & Logistics — 1.4% | | | | | |
C.H. Robinson Worldwide, Inc.(a) | | 17,100 | | $ | 941,013 |
| | | | |
|
|
Banks — 1.2% | | | | | |
Northern Trust Corp. | | 16,000 | | | 834,240 |
| | | | |
|
|
Beverages — 0.3% | | | | | |
Central European Distribution Corp.* | | 9,000 | | | 177,300 |
| | | | |
|
|
Biotechnology — 1.4% | | | | | |
Alexion Pharmaceuticals, Inc.* | | 12,000 | | | 434,280 |
Illumina, Inc.*(a) | | 20,500 | | | 534,025 |
| | | | |
|
|
| | | | | | 968,305 |
| | | | |
|
|
Building & Construction — 0.3% | | | | | |
Martin Marietta Materials, Inc.(a) | | 2,150 | | | 208,722 |
| | | | |
|
|
Business Services — 0.6% | | | | | |
MasterCard, Inc. (Class A Stock)(a) | | 3,000 | | | 428,790 |
| | | | |
|
|
Capital Markets — 1.6% | | | | | |
Lazard Ltd. (Class A Stock) (Bermuda) | | 36,000 | | | 1,070,640 |
| | | | |
|
|
Chemicals — 3.5% | | | | | |
Airgas, Inc. | | 28,500 | | | 1,111,215 |
Ecolab, Inc. | | 34,900 | | | 1,226,735 |
| | | | |
|
|
| | | | | | 2,337,950 |
| | | | |
|
|
Commercial Services — 5.6% | | | | | |
Alliance Data Systems Corp.* | | 20,750 | | | 965,498 |
CoStar Group, Inc.*(a) | | 16,500 | | | 543,510 |
FTI Consulting, Inc.* | | 14,000 | | | 625,520 |
Iron Mountain, Inc.* | | 47,000 | | | 1,162,310 |
VistaPrint Ltd. (Bermuda)* | | 24,500 | | | 455,945 |
| | | | |
|
|
| | | | | | 3,752,783 |
| | | | |
|
|
Commercial Services & Supplies — 2.3% |
Corrections Corp. of America* | | 40,000 | | | 654,400 |
HMS Holdings Corp.* | | 7,500 | | | 236,400 |
SAIC, Inc.* | | 32,500 | | | 633,100 |
| | | | |
|
|
| | | | | | 1,523,900 |
| | | | |
|
|
Computer Hardware — 1.1% | | | | | |
Cognizant Technology Solutions Corp. (Class A Stock)* | | 40,000 | | | 722,400 |
| | | | |
|
|
Computer Services & Software — 1.9% | | | | | |
IHS, Inc. (Class A Stock)* | | 20,400 | | | 763,368 |
salesforce.com*(a) | | 15,500 | | | 496,155 |
| | | | |
|
|
| | | | | | 1,259,523 |
| | | | |
|
|
Construction — 1.2% | | | | | |
Jacobs Engineering Group, Inc.* | | 17,000 | | | 817,700 |
| | | | |
|
|
Consumer Products & Services — 1.3% | | | | | |
Chattem, Inc.*(a) | | 5,000 | | | 357,650 |
Church & Dwight Co., Inc. | | 9,500 | | | 533,140 |
| | | | |
|
|
| | | | | | 890,790 |
| | | | |
|
|
Containers & Packaging — 0.6% | | | | | |
Pactiv Corp.* | | 17,000 | | | 422,960 |
| | | | |
|
|
Distribution/Wholesale — 1.2% | | | | | |
Fastenal Co.(a) | | 24,000 | | | 836,400 |
| | | | |
|
|
| | | | | |
COMMON STOCKS
(continued) | | Shares
| | Value
(Note 2)
|
| | | | | | |
Diversified Financial Services — 0.8% | | | | | |
IntercontinentalExchange, Inc.* | | 7,000 | | $ | 577,080 |
| | | | |
|
|
Education — 5.0% | | | | | |
American Public Education, Inc.* | | 9,000 | | | 334,710 |
DeVry, Inc. | | 27,000 | | | 1,550,070 |
Strayer Education, Inc. | | 7,000 | | | 1,500,870 |
| | | | |
|
|
| | | | | | 3,385,650 |
| | | | |
|
|
Electronic Components — 5.2% | | | | | |
Activision Blizzard, Inc.* | | 90,000 | | | 777,600 |
AMETEK, Inc. | | 27,500 | | | 830,775 |
Dolby Laboratories, Inc. (Class A Stock)*(a) | | 35,500 | | | 1,162,980 |
Trimble Navigation Ltd.* | | 36,000 | | | 777,960 |
| | | | |
|
|
| | | | | | 3,549,315 |
| | | | |
|
|
Electronic Equipment & Instruments — 0.4% |
Mettler-Toledo International, Inc.*(a) | | 4,000 | | | 269,600 |
| | | | |
|
|
Electronics — 1.8% | | | | | |
FLIR Systems, Inc.*(a) | | 28,000 | | | 859,040 |
National Instruments Corp. | | 14,500 | | | 353,220 |
| | | | |
|
|
| | | | | | 1,212,260 |
| | | | |
|
|
Energy – Alternate Sources — 1.1% | | | | | |
Covanta Holding Corp.* | | 33,500 | | | 735,660 |
| | | | |
|
|
Entertainment & Leisure — 2.6% | | | | | |
Penn National Gaming, Inc.* | | 24,500 | | | 523,810 |
WMS Industries, Inc.*(a) | | 46,000 | | | 1,237,400 |
| | | | |
|
|
| | | | | | 1,761,210 |
| | | | |
|
|
Environmental Control — 3.5% | | | | | |
Clean Harbors, Inc.* | | 8,000 | | | 507,520 |
Stericycle, Inc.* | | 26,000 | | | 1,354,080 |
Waste Connections, Inc.* | | 15,000 | | | 473,550 |
| | | | |
|
|
| | | | | | 2,335,150 |
| | | | |
|
|
Financial Services — 1.3% | | | | | |
BlackRock, Inc.(a) | | 4,500 | | | 603,675 |
NASDAQ OMX Group (The)* | | 12,500 | | | 308,875 |
| | | | |
|
|
| | | | | | 912,550 |
| | | | |
|
|
Food & Drug Retailers — 1.7% | | | | | |
Perrigo Co. | | 36,000 | | | 1,163,160 |
| | | | |
|
|
Food — 1.4% | | | | | |
Ralcorp Holdings, Inc.* | | 16,000 | | | 934,400 |
| | | | |
|
|
Healthcare Equipment & Supplies — 1.0% |
Intuitive Surgical, Inc.*(a) | | 5,500 | | | 698,445 |
| | | | |
|
|
Healthcare Products — 5.5% | | | | | |
C.R. Bard, Inc. | | 12,500 | | | 1,053,250 |
Gen-Probe, Inc.* | | 19,700 | | | 843,948 |
IDEXX Laboratories, Inc.*(a) | | 15,500 | | | 559,240 |
Myriad Genetics, Inc.*(a) | | 19,000 | | | 1,258,940 |
| | | | |
|
|
| | | | | | 3,715,378 |
| | | | |
|
|
Healthcare Services — 0.8% | | | | | |
Psychiatric Solutions, Inc.*(a) | | 18,500 | | | 515,225 |
| | | | |
|
|
Hotels & Motels — 0.6% | | | | | |
Wynn Resorts Ltd.*(a) | | 9,000 | | | 380,340 |
| | | | |
|
|
SEE NOTES TO FINANCIAL STATEMENTS.
A23
| | | | | | |
| | | SP MID CAP GROWTH PORTFOLIO (continued) | | |
| |
| SCHEDULE OF INVESTMENTS | | December 31, 2008 |
| | | | | |
COMMON STOCKS
(continued) | | Shares
| | Value
(Note 2)
|
| | | | | | |
Insurance — 1.6% | | | | | |
Aon Corp. | | 12,500 | | $ | 571,000 |
Everest Re Group Ltd. (Bermuda)(a) | | 2,000 | | | 152,280 |
Fidelity National Financial, Inc. (Class A Stock) | | 11,000 | | | 195,250 |
W.R. Berkley Corp. | | 6,000 | | | 186,000 |
| | | | |
|
|
| | | | | | 1,104,530 |
| | | | |
|
|
Internet — 0.8% | | | | | |
Equinix, Inc.*(a) | | 10,000 | | | 531,900 |
| | | | |
|
|
Manufacturing — 1.3% | | | | | |
Danaher Corp. | | 15,000 | | | 849,150 |
| | | | |
|
|
Medical Supplies & Equipment — 2.8% | | | | | |
Masimo Corp.*(a) | | 18,500 | | | 551,855 |
NuVasive, Inc.* | | 11,000 | | | 381,150 |
Wright Medical Group, Inc.* | | 45,500 | | | 929,565 |
| | | | |
|
|
| | | | | | 1,862,570 |
| | | | |
|
|
Metals & Mining — 1.5% | | | | | |
Agnico-Eagle Mines Ltd. (Canada) | | 6,000 | | | 307,980 |
Precision Castparts Corp. | | 11,500 | | | 684,020 |
| | | | |
|
|
| | | | | | 992,000 |
| | | | |
|
|
Oil & Gas — 0.4% | | | | | |
Continental Resources, Inc.*(a) | | 12,500 | | | 258,875 |
| | | | |
|
|
Oil & Gas Services — 1.5% | | | | | |
CARBO Ceramics, Inc. | | 18,000 | | | 639,540 |
Core Laboratories NV (Netherlands)(a) | | 6,750 | | | 404,055 |
| | | | |
|
|
| | | | | | 1,043,595 |
| | | | |
|
|
Oil, Gas & Consumable Fuels — 4.0% | | | | | |
Concho Resources, Inc.* | | 35,000 | | | 798,700 |
Range Resources Corp. | | 18,500 | | | 636,215 |
Southwestern Energy Co.*(a) | | 23,500 | | | 680,795 |
XTO Energy, Inc. | | 17,500 | | | 617,225 |
| | | | |
|
|
| | | | | | 2,732,935 |
| | | | |
|
|
Pharmaceuticals — 4.5% | | | | | |
Cephalon, Inc.*(a) | | 9,000 | | | 693,360 |
Express Scripts, Inc.* | | 19,000 | | | 1,044,620 |
United Therapeutics Corp.*(a) | | 5,500 | | | 344,025 |
VCA Antech, Inc.* | | 29,300 | | | 582,484 |
Vertex Pharmaceuticals, Inc.* | | 12,500 | | | 379,750 |
| | | | |
|
|
| | | | | | 3,044,239 |
| | | | |
|
|
Retail & Merchandising — 6.0% | | | | | |
BJ’s Wholesale Club, Inc.*(a) | | 15,000 | | | 513,900 |
GameStop Corp. (Class A Stock)*(a) | | 25,000 | | | 541,500 |
Kohl’s Corp.*(a) | | 10,500 | | | 380,100 |
Ross Stores, Inc. | | 31,000 | | | 921,630 |
Shoppers Drug Mart Corp. (Canada) | | 30,000 | | | 1,167,679 |
Staples, Inc. | | 13,500 | | | 241,920 |
TJX Co., Inc.(a) | | 13,000 | | | 267,410 |
| | | | |
|
|
| | | | | | 4,034,139 |
| | | | |
|
|
Retail – Auto Parts — 0.4% | | | | | |
Copart, Inc.* | | 10,000 | | | 271,900 |
| | | | |
|
|
Retail Apparel — 0.4% | | | | | |
Gap, Inc. (The) | | 19,000 | | | 254,410 |
| | | | |
|
|
| | | | | |
COMMON STOCKS
(continued) | | Shares
| | Value
(Note 2)
|
| | | | | | |
Semiconductors — 2.5% | | | | | |
Itron, Inc.*(a) | | 9,000 | | $ | 573,660 |
Lam Research Corp.*(a) | | 12,500 | | | 266,000 |
Microchip Technology, Inc.(a) | | 26,500 | | | 517,545 |
Microsemi Corp.*(a) | | 26,000 | | | 328,640 |
| | | | |
|
|
| | | | | | 1,685,845 |
| | | | |
|
|
Semiconductors & Semiconductor Equipment — 0.5% |
Silicon Laboratories, Inc.*(a) | | 14,500 | | | 359,310 |
| | | | |
|
|
Software — 2.0% | | | | | |
ANSYS, Inc.* | | 33,500 | | | 934,315 |
Blackboard, Inc.*(a) | | 15,000 | | | 393,450 |
| | | | |
|
|
| | | | | | 1,327,765 |
| | | | |
|
|
Specialty Retail — 1.0% | | | | | |
Urban Outfitters, Inc.*(a) | | 46,500 | | | 696,570 |
| | | | |
|
|
Telecommunications — 7.1% | | | | | |
American Tower Corp. (Class A Stock)* | | 37,100 | | | 1,087,772 |
Harris Corp. | | 27,500 | | | 1,046,375 |
Juniper Networks, Inc.*(a) | | 40,100 | | | 702,151 |
MetroPCS Communications, Inc.* | | 13,500 | | | 200,475 |
NII Holdings, Inc.* | | 42,500 | | | 772,650 |
SBA Communications Corp. (Class A Stock)* | | 60,500 | | | 987,360 |
| | | | |
|
|
| | | | | | 4,796,783 |
| | | | |
|
|
Transportation — 1.9% | | | | | |
Expeditors International of Washington, Inc. | | 20,500 | | | 682,035 |
J.B. Hunt Transport Services, Inc.(a) | | 22,500 | | | 591,075 |
| | | | |
|
|
| | | | | | 1,273,110 |
| | | | |
|
|
TOTAL LONG-TERM INVESTMENTS
(cost $86,444,479) | | | 66,458,465 |
| | | | |
|
|
| SHORT-TERM INVESTMENT — 29.6% |
AFFILIATED MONEY MARKET MUTUAL FUND | | | |
Dryden Core Investment Fund — Taxable Money Market Series (cost $19,948,665; includes $18,913,997 of cash collateral for securities on loan)(b)(w)(Note 4) | | 19,948,665 | | | 19,948,665 |
| | | | |
|
|
| | | | | | |
TOTAL SHORT-TERM INVESTMENTS
(cost $19,948,665) | | | 19,948,665 | |
| | | | |
|
|
|
TOTAL INVESTMENTS — 128.0%
(cost $106,393,144) | | | 86,407,130 | |
LIABILITIES IN EXCESS OF
OTHER ASSETS — (28.0)% | | | (18,888,975 | ) |
| | | | |
|
|
|
NET ASSETS — 100.0% | | $ | 67,518,155 | |
| | | | |
|
|
|
| * | Non-income producing security. |
| (a) | All or a portion of security is on loan. The aggregate market value of such securities is $18,520,098; cash collateral of $18,913,997 (included with liabilities) was received with which the Portfolio purchased highly liquid short-term investments. |
SEE NOTES TO FINANCIAL STATEMENTS.
A24
| | | | | | |
| | | SP MID CAP GROWTH PORTFOLIO (continued) | | |
| |
| SCHEDULE OF INVESTMENTS | | December 31, 2008 |
| (b) | Represents security, or a portion thereof, purchased with cash collateral received for securities on loan. |
| (w) | Prudential Investments LLC, the manager of the Portfolio, also serves as manager of the Dryden Core Investment Fund-Taxable Money Market Series. |
Various inputs are used in determining the value of the Portfolio’s investments. These inputs are summarized in the three broad levels listed below.
Level 1—quoted prices in active markets for identical securities
Level 2—other significant observable inputs (including quoted prices for similar securities, interest rates, prepayment speeds, credit risk, etc.)
Level 3—significant unobservable inputs (including the Portfolio’s own assumptions in determining the fair value of investments)
The following is a summary of the inputs used as of December 31, 2008 in valuing the Portfolio’s assets carried at fair value:
| | | | |
Valuation inputs
| | Investments
in Securities
| | Other Financial
Instruments*
|
Level 1—Quoted Prices | | 86,407,130 | | — |
Level 2—Other Significant Observable Inputs | | — | | — |
Level 3—Significant Unobservable Inputs | | — | | — |
| | |
| |
|
Total | | 86,407,130 | | — |
| | |
| |
|
| * | Other financial instruments are derivative instruments not reflected in the Schedule of Investments, such as futures, forwards and swap contracts, which are valued at the unrealized appreciation/depreciation on the instrument. |
As of December 31, 2007 and December 31, 2008, the Portfolio did not use any significant unobservable inputs (Level 3) in determining the value of investments.
The industry classification of investments and liabilities in excess of other assets shown as a percentage of net assets as of December 31, 2008 were as follows:
| | | |
Affiliated Money Market Mutual Fund (28.0% represents investments purchased with collateral from securities on loan) | | 29.6 | % |
Telecommunications | | 7.1 | |
Retail & Merchandising | | 6.0 | |
Commercial Services | | 5.6 | |
Healthcare Products | | 5.5 | |
Electronic Components | | 5.2 | |
Education | | 5.0 | |
Pharmaceuticals | | 4.5 | |
Oil, Gas & Consumable Fuels | | 4.0 | |
Chemicals | | 3.5 | |
Environmental Control | | 3.5 | |
Medical Supplies & Equipment | | 2.8 | |
Entertainment & Leisure | | 2.6 | |
Semiconductors | | 2.5 | |
Commercial Services & Supplies | | 2.3 | |
Software | | 2.0 | |
Transportation | | 1.9 | |
Computer Services & Software | | 1.9 | |
| | | |
Electronics | | 1.8 | % |
Food & Drug Retailers | | 1.7 | |
Insurance | | 1.6 | |
Capital Markets | | 1.6 | |
Oil & Gas Services | | 1.5 | |
Metals & Mining | | 1.5 | |
Biotechnology | | 1.4 | |
Air Freight & Logistics | | 1.4 | |
Foods | | 1.4 | |
Financial Services | | 1.3 | |
Consumer Products & Services | | 1.3 | |
Manufacturing | | 1.3 | |
Distribution/Wholesale | | 1.2 | |
Banks | | 1.2 | |
Construction | | 1.2 | |
Energy – Alternate Sources | | 1.1 | |
Computer Hardware | | 1.1 | |
Healthcare Equipment & Supplies | | 1.0 | |
Specialty Retail | | 1.0 | |
Diversified Financial Services | | 0.8 | |
Internet | | 0.8 | |
Healthcare Services | | 0.8 | |
Business Services | | 0.6 | |
Containers & Packaging | | 0.6 | |
Hotels & Motels | | 0.6 | |
Semiconductors & Semiconductor Equipment | | 0.5 | |
Retail – Auto Parts | | 0.4 | |
Electronic Equipment & Instruments | | 0.4 | |
Oil & Gas | | 0.4 | |
Retail Apparel | | 0.4 | |
Building & Construction | | 0.3 | |
Beverages | | 0.3 | |
| | |
|
|
| | | 128.0 | |
Liabilities in excess of other assets | | (28.0 | ) |
| | |
|
|
| | | 100.0 | % |
| | |
|
|
SEE NOTES TO FINANCIAL STATEMENTS.
A25
| | | | | | |
| | | SP MID CAP GROWTH PORTFOLIO (continued) | | |
STATEMENT OF ASSETS AND LIABILITIES
December 31, 2008
| | | | |
| ASSETS | | | | |
Investments at value, including securities on loan of $18,520,098: | | | | |
Unaffiliated investments (cost $86,444,479) | | $ | 66,458,465 | |
Affiliated investments (cost $19,948,665) | | | 19,948,665 | |
Cash | | | 18,606 | |
Receivable for investments sold | | | 305,568 | |
Dividends and interest receivable | | | 45,710 | |
Receivable for Series shares sold | | | 20,014 | |
Prepaid expenses | | | 1,875 | |
| | |
|
|
|
Total Assets | | | 86,798,903 | |
| | |
|
|
|
| LIABILITIES | | | | |
Collateral for securities on loan | | | 18,913,997 | |
Payable for investments purchased | | | 256,552 | |
Accrued expenses and other liabilities | | | 58,872 | |
Management fee payable | | | 44,085 | |
Deferred trustees’ fees | | | 3,561 | |
Payable for Series shares repurchased | | | 3,285 | |
Transfer agent fees payable | | | 396 | |
| | |
|
|
|
Total Liabilities | | | 19,280,748 | |
| | |
|
|
|
| NET ASSETS | | $ | 67,518,155 | |
| | |
|
|
|
Net assets were comprised of: | | | | |
Paid-in capital | | $ | 112,258,453 | |
Retained earnings | | | (44,740,298 | ) |
| | |
|
|
|
Net assets, December 31, 2008 | | $ | 67,518,155 | |
| | |
|
|
|
Net asset value and redemption price per share, $67,518,155 / 19,669,600 outstanding shares of beneficial interest | | $ | 3.43 | |
| | |
|
|
|
STATEMENT OF OPERATIONS
Year Ended December 31, 2008
| | | | |
| INVESTMENT INCOME | | | | |
Unaffiliated dividend income (net of $6,733 foreign withholding tax) | | $ | 324,911 | |
Affiliated income from securities lending, net | | | 213,926 | |
Affiliated dividend income | | | 127,901 | |
| | |
|
|
|
| | | | 666,738 | |
| | |
|
|
|
| EXPENSES | | | | |
Management fee | | | 815,525 | |
Custodian’s fees and expenses | | | 50,000 | |
Audit fee | | | 17,000 | |
Trustees’ fees | | | 10,000 | |
Legal fees and expenses | | | 5,000 | |
Transfer agent’s fees and expenses (including affiliated expense of $2,000) (Note 4) | | | 2,000 | |
Insurance expenses | | | 2,000 | |
Commitment fee on syndicated credit agreement | | | 1,000 | |
Miscellaneous | | | 3,740 | |
| | |
|
|
|
Total expenses | | | 906,265 | |
| | |
|
|
|
| NET INVESTMENT LOSS | | | (239,527 | ) |
| | |
|
|
|
| NET REALIZED AND UNREALIZED GAIN (LOSS) ON INVESTMENTS | | | | |
Net realized loss on investment transactions | | | (24,414,486 | ) |
Net change in unrealized appreciation (depreciation) on investments | | | (28,331,776 | ) |
| | |
|
|
|
| NET LOSS ON INVESTMENTS | | | (52,746,262 | ) |
| | |
|
|
|
| NET DECREASE IN NET ASSETS RESULTING FROM OPERATIONS | | $ | (52,985,789 | ) |
| | |
|
|
|
STATEMENT OF CHANGES IN NET ASSETS
| | | | | | | | |
| | | Year Ended December 31,
| |
| | | 2008
| | | 2007
| |
| INCREASE (DECREASE) IN NET ASSETS | | | | | | | | |
| OPERATIONS: | | | | | | | | |
Net investment loss | | $ | (239,527 | ) | | $ | (408,265 | ) |
Net realized gain (loss) on investment transactions | | | (24,414,486 | ) | | | 24,789,919 | |
Net change in unrealized appreciation (depreciation) on investments | | | (28,331,776 | ) | | | (4,065,241 | ) |
| | |
|
|
| |
|
|
|
NET INCREASE (DECREASE) IN NET ASSETS RESULTING FROM OPERATIONS | | | (52,985,789 | ) | | | 20,316,413 | |
| | |
|
|
| |
|
|
|
| DISTRIBUTIONS | | | (24,381,654 | ) | | | (11,224,860 | ) |
| | |
|
|
| |
|
|
|
| SERIES SHARE TRANSACTIONS: | | | | | | | | |
Series shares sold [1,083,638 and 1,258,734 shares, respectively] | | | 5,887,530 | | | | 9,512,072 | |
Series shares issued in reinvestment of distributions [4,377,317 and 1,502,659, respectively] | | | 24,381,654 | | | | 11,224,860 | |
Series shares repurchased [3,700,399 and 3,690,457 shares, respectively] | | | (20,213,722 | ) | | | (28,108,838 | ) |
| | |
|
|
| |
|
|
|
NET INCREASE (DECREASE) IN NET ASSETS RESULTING FROM SERIES SHARE TRANSACTIONS | | | 10,055,462 | | | | (7,371,906 | ) |
| | |
|
|
| |
|
|
|
| TOTAL INCREASE (DECREASE) IN NET ASSETS | | | (67,311,981 | ) | | | 1,719,647 | |
| NET ASSETS: | | | | | | | | |
Beginning of year | | | 134,830,136 | | | | 133,110,489 | |
| | |
|
|
| |
|
|
|
End of year | | $ | 67,518,155 | | | $ | 134,830,136 | |
| | |
|
|
| |
|
|
|
SEE NOTES TO FINANCIAL STATEMENTS.
A26
| | | | | | |
| | | SP PIMCO HIGH YIELD PORTFOLIO | | |
| |
| SCHEDULE OF INVESTMENTS | | December 31, 2008 |
| | | | | | | | | | | | |
LONG-TERM INVESTMENTS — 95.6%
BANK NOTES(c) — 6.0% | | Moody’s
Ratings†
(Unaudited)
| | Interest
Rate
| | Maturity
Date
| | Principal
Amount
(000)#
| | Value
(Note 2)
|
| | | | | | | | | | | | | |
Chrysler Financial, Term, 144A (original cost $1,876,250;
purchased 07/31/07, 11/28/07)(f)(g) | | Caa | | 6.00% | | 08/03/14 | | $ | 1,975 | | $ | 994,553 |
Community Health System, Term B (original cost $11,601;
purchased 12/29/08)(f)(g) | | Ba | | 3.40% | | 07/02/14 | | | 12 | | | 8,994 |
Community Health System, Term B (original cost $23,202;
purchased 06/28/07)(f)(g) | | Ba | | 4.00% | | 07/02/14 | | | 23 | | | 17,987 |
Community Health System, Term B (original cost $83,047;
purchased 06/03/08)(f)(g) | | Ba | | 4.44% | | 07/25/14 | | | 83 | | | 64,382 |
Community Health System, Term B (original cost $597,448;
purchased 06/28/07, 12/18/07)(f)(g) | | Ba | | 4.45% | | 07/02/14 | | | 597 | | | 463,171 |
Ford Motor Corp., (original cost $1,657,429; purchased
12/12/06-05/21/08)(f)(g) | | B(d) | | 5.00% | | 11/29/13 | | | 1,724 | | | 691,877 |
HCA, Inc., Term B (original cost $735,000; purchased 11/14/06)(f)(g) | | Ba- | | 3.71% | | 11/14/13 | | | 735 | | | 574,678 |
Idearc, Inc., Term B (original cost $55,928; purchased 03/27/08, 04/02/08)(f)(g) | | Ba | | 2.47% | | 11/17/14 | | | 64 | | | 19,458 |
Idearc, Inc., Term B (original cost $1,170,393; purchased 02/07/08)(f)(g) | | Ba | | 3.46% | | 11/17/14 | | | 1,421 | | | 433,421 |
Nordic Telephone (Denmark) (original cost $356,445;
purchased 04/19/06)(f)(g) | | Ba+ | | 5.45% | | 11/30/13 | | | EUR 354 | | | 427,204 |
Nordic Telephone (Denmark) (original cost $429,723;
purchased 04/19/06)(f)(g) | | Ba+ | | 5.70% | | 11/30/14 | | | EUR 427 | | | 496,041 |
Quicksilver (original cost $458,224; purchased 08/05/08)(f)(g) | | Ba- | | 7.75% | | 08/05/13 | | | 468 | | | 301,586 |
Roundy’s, Inc., Term B (original cost $390,510; purchased 11/04/08)(f)(g) | | Ba- | | 4.19% | | 10/27/11 | | | 391 | | | 268,476 |
Roundy’s, Inc., Term B (original cost $43,313; purchased 12/31/08)(f)(g) | | Ba- | | 4.19% | | 10/27/11 | | | 43 | | | 29,777 |
Roundy’s, Inc., Term B (original cost $443,958;
purchased 11/01/05-11/12/07)(f)(g) | | Ba- | | 4.63% | | 10/27/11 | | | 444 | | | 305,221 |
Thomson Learning, Term B (original cost $978,683;
purchased 06/27/07, 07/02/08)(f)(g) | | B+(d) | | 2.96% | | 06/27/14 | | | 988 | | | 638,035 |
Tribune Co., Term B (original cost $448,824; purchased 06/18/08)(f)(g) | | Ba | | 5.25% | | 06/04/14 | | | 593 | | | 107,639 |
Tribune Co., Term X (original cost $119,467; purchased 05/17/07)(f)(g)(i) | | D | | 7.08% | | 05/30/09 | | | 119 | | | 32,734 |
Univision Communications, Inc., Term B (original cost $939,597;
purchased 03/16/07)(f)(g) | | B(d) | | 2.71% | | 09/15/14 | | | 940 | | | 374,273 |
Univision Communications, Inc., Term DD (original cost $60,403;
purchased 10/12/07, 05/08/08)(f)(g) | | B+(d) | | 2.71% | | 09/15/14 | | | 60 | | | 24,060 |
VNU/Nielsen Finance LLC, Term B (original cost $502,303;
purchased 11/10/08)(f)(g) | | B+(d) | | 3.83% | | 08/08/13 | | | 502 | | | 338,113 |
VNU/Nielsen Finance LLC, Term B (original cost $1,446,561;
purchased 08/08/06,05/21/08)(f)(g) | | B+(d) | | 4.39% | | 08/08/13 | | | 1,453 | | | 977,858 |
Wind Acquisitions Finance SA, Term B (original cost $368,855;
purchased 12/07/06-09/02/08)(f)(g) | | B-(d) | | 11.75% | | 12/21/11 | | | 369 | | | 303,691 |
| | | | | | | | | | | |
|
|
TOTAL BANK NOTES
(cost $13,442,129) | | | 7,893,229 |
| | | | | | | | | | | |
|
|
| CONVERTIBLE BONDS — 1.1% | | | | | | | | | | | | |
Oil & Gas Exploration/Production — 0.3% | | | | | | | | | | | | |
Chesapeake Energy Corp., Gtd. Notes | | Ba3 | | 2.25% | | 12/15/38 | | | 725 | | | 325,344 |
Chesapeake Energy Corp., Gtd. Notes | | BB(d) | | 2.50% | | 05/15/37 | | | 150 | | | 87,562 |
| | | | | | | | | | | |
|
|
| | | | | | | | | | | | | 412,906 |
| | | | | | | | | | | |
|
|
Pharmaceuticals — 0.2% | | | | | | | | | | | | |
Mylan, Inc., Gtd. Notes | | B+(d) | | 1.25% | | 03/15/12 | | | 325 | | | 238,875 |
| | | | | | | | | | | |
|
|
Semiconductors — 0.1% | | | | | | | | | | | | |
Advanced Micro Devices, Inc., Sr. Unsec`d. Notes | | B(d) | | 6.00% | | 05/01/15 | | | 350 | | | 99,750 |
| | | | | | | | | | | |
|
|
Telecommunications — 0.3% | | | | | | | | | | | | |
Nortel Networks Corp., Gtd. Notes (Canada)(i) | | Caa2 | | 2.125% | | 04/15/14 | | | 400 | | | 56,000 |
Qwest Communications International, Inc., Sr. Unsec`d. Notes | | B1 | | 3.50% | | 11/15/25 | | | 400 | | | 336,500 |
| | | | | | | | | | | |
|
|
| | | | | | | | | | | | | 392,500 |
| | | | | | | | | | | |
|
|
SEE NOTES TO FINANCIAL STATEMENTS.
A27
| | | | | | |
| | | SP PIMCO HIGH YIELD PORTFOLIO (continued) | | |
| |
| SCHEDULE OF INVESTMENTS | | December 31, 2008 |
| | | | | | | | | | | | | |
CONVERTIBLE BONDS
(continued) | | Moody’s
Ratings†
(Unaudited)
| | Interest
Rate
| | | Maturity
Date
| | Principal
Amount
(000)#
| | Value
(Note 2)
|
| | | | | | | | | | | | | | |
Utilities — 0.2% | | | | | | | | | | | | | |
CMS Energy Corp., Sr. Unsec`d. Notes | | Ba1 | | 2.875% | | | 12/01/24 | | $ | 325 | | $ | 281,531 |
| | | | | | | | | | | | |
|
|
TOTAL CONVERTIBLE BONDS
(cost $2,628,527) | | | 1,425,562 |
| | | | | | | | | | | | |
|
|
| CORPORATE BONDS — 80.0% | | | | | | | | | | | | | |
Advertising — 0.4% | | | | | | | | | | | | | |
R.H. Donnelley Corp., Sr. Disc. Notes | | Caa1 | | 6.875% | | | 01/15/13 | | | 175 | | | 23,625 |
R.H. Donnelley Corp., Sr. Unsec`d. Notes | | Caa1 | | 8.875% | | | 01/15/16 | | | 1,925 | | | 288,750 |
R.H. Donnelley Corp., Sr. Unsec`d. Notes | | Caa1 | | 8.875% | | | 10/15/17 | | | 950 | | | 142,500 |
R.H. Donnelley, Inc., Gtd. Notes, 144A (original cost $37,500;
purchased 09/02/08)(f)(g) | | B1 | | 11.75% | | | 05/15/15 | | | 50 | | | 12,250 |
| | | | | | | | | | | | |
|
|
| | | | | | | | | | | | | | 467,125 |
| | | | | | | | | | | | |
|
|
Airlines — 0.1% | | | | | | | | | | | | | |
United AirLines, Inc., Series 01-1, Pass-Through Cerificates | | Ba2 | | 6.201% | | | 03/01/10 | | | 94 | | | 87,907 |
United AirLines, Inc., Series 01-1, Pass-Through Cerificates | | Ba2 | | 6.602% | | | 09/01/13 | | | 56 | | | 52,197 |
| | | | | | | | | | | | |
|
|
| | | | | | | | | | | | | | 140,104 |
| | | | | | | | | | | | |
|
|
Automotive — 2.7% | | | | | | | | | | | | | |
Allison Transmission, Inc., Gtd. Notes, 144A (original cost $814,281;
purchased 10/11/07-05/09/08)(f)(g) | | Caa1 | | 11.00% | | | 11/01/15 | | | 850 | | | 416,500 |
ArvinMeritor, Inc., Gtd. Notes | | B3 | | 8.125% | | | 09/15/15 | | | 655 | | | 294,750 |
ArvinMeritor, Inc., Gtd. Notes | | B3 | | 8.75% | | | 03/01/12 | | | 1,030 | | | 556,200 |
Cooper-Standard Automotive, Inc., Gtd. Notes | | Caa1 | | 7.00% | | | 12/15/12 | | | 570 | | | 171,000 |
Ford Motor Co., Sr. Unsec`d. Notes | | Ca | | 9.215% | | | 09/15/21 | | | 100 | | | 23,000 |
General Motors Corp., Sr. Unsec`d. Notes | | C | | 7.40% | | | 09/01/25 | | | 50 | | | 8,250 |
General Motors Corp., Sr. Unsec`d. Notes | | C | | 7.70% | | | 04/15/16 | | | 1,550 | | | 286,750 |
General Motors Corp., Sr. Unsec`d. Notes | | C | | 8.25% | | | 07/15/23 | | | 400 | | | 66,000 |
Goodyear Tire & Rubber Co. (The), Gtd. Notes | | B1 | | 6.318% | (c) | | 12/01/09 | | | 225 | | | 204,750 |
Goodyear Tire & Rubber Co. (The), Gtd. Notes | | B1 | | 9.00% | | | 07/01/15 | | | 450 | | | 362,250 |
Tenneco, Inc., Gtd. Notes | | B2 | | 8.125% | | | 11/15/15 | | | 615 | | | 282,900 |
Tenneco, Inc., Sr. Sec`d. Notes | | Ba3 | | 10.25% | | | 07/15/13 | | | 351 | | | 217,620 |
TRW Automotive, Inc., Gtd. Notes, 144A (original cost $245,938;
purchased 03/21/07)(f)(g) | | B2 | | 7.00% | | | 03/15/14 | | | 250 | | | 132,500 |
TRW Automotive, Inc., Gtd. Notes, 144A (original cost $1,081,300;
purchased 03/14/07-02/25/08)(f)(g) | | B2 | | 7.25% | | | 03/15/17 | | | 1,125 | | | 573,750 |
| | | | | | | | | | | | |
|
|
| | | | | | | | | | | | | | 3,596,220 |
| | | | | | | | | | | | |
|
|
Banks — 0.5% | | | | | | | | | | | | | |
ANZ National International Ltd., Bank Gtd. Notes, 144A (New Zealand) (original cost $699,342; purchased 07/09/08)(f)(g) | | Aa2 | | 6.20% | | | 07/19/13 | | | 700 | | | 677,292 |
| | | | | | | | | | | | |
|
|
Business Services — 0.8% | | | | | | | | | | | | | |
NSG Holdings LLC / NSG Holdings, Inc., Sr. Sec`d. Notes, 144A
(original cost $798,500; purchased 03/06/07-05/20/08)(f)(g) | | Ba2 | | 7.75% | | | 12/15/25 | | | 800 | | | 624,000 |
Petroplus Finance Ltd., Gtd. Notes, 144A (Bermuda) (original cost $175,000; purchased 04/25/07)(f)(g) | | B1 | | 6.75% | | | 05/01/14 | | | 175 | | | 111,125 |
Petroplus Finance Ltd., Gtd. Notes, 144A (Bermuda) (original cost $175,000; purchased 04/25/07)(f)(g) | | B1 | | 7.00% | | | 05/01/17 | | | 175 | | | 106,750 |
TransCapitalInvest Ltd., Sec`d. Notes (Ireland) | | A3 | | 6.103% | | | 06/27/12 | | | 325 | | | 248,284 |
| | | | | | | | | | | | |
|
|
| | | | | | | | | | | | | | 1,090,159 |
| | | | | | | | | | | | |
|
|
Cable — 0.4% | | | | | | | | | | | | | |
CCO Holdings LLC / CCO Holdings Capital Corp., Sr. Unsec`d. Notes | | Caa1 | | 8.75% | | | 11/15/13 | | | 895 | | | 563,850 |
| | | | | | | | | | | | |
|
|
Capital Goods — 0.6% | | | | | | | | | | | | | |
Allied Waste North America, Inc., Sr. Sec`d. Notes | | Baa3 | | 7.125% | | | 05/15/16 | | | 625 | | | 568,750 |
Allied Waste North America, Inc., Sr. Sec`d. Notes | | Baa3 | | 7.25% | | | 03/15/15 | | | 250 | | | 232,500 |
| | | | | | | | | | | | |
|
|
| | | | | | | | | | | | | | 801,250 |
| | | | | | | | | | | | |
|
|
SEE NOTES TO FINANCIAL STATEMENTS.
A28
| | | | | | |
| | | SP PIMCO HIGH YIELD PORTFOLIO (continued) | | |
| |
| SCHEDULE OF INVESTMENTS | | December 31, 2008 |
| | | | | | | | | | | | | |
CORPORATE BONDS
(continued) | | Moody’s
Ratings†
(Unaudited)
| | Interest
Rate
| | | Maturity
Date
| | Principal
Amount
(000)#
| | Value
(Note 2)
|
| | | | | | | | | | | | | | |
Chemicals — 1.1% | | | | | | | | | | | | | |
Ineos Group Holdings PLC, Sec`d. Notes, 144A (United Kingdom) (original cost $1,389,169; purchased 06/08/06-05/02/08)(f)(g) | | Caa2 | | 8.50% | | | 02/15/16 | | $ | 1,525 | | $ | 137,250 |
Nalco Co., Gtd. Notes | | B3 | | 8.875% | | | 11/15/13 | | | 560 | | | 473,200 |
Rockwood Specialties Group, Inc., Gtd. Notes | | B3 | | 7.50% | | | 11/15/14 | | | 1,025 | | | 789,250 |
| | | | | | | | | | | | |
|
|
| | | | | | | | | | | | | | 1,399,700 |
| | | | | | | | | | | | |
|
|
Commercial Services — 1.2% | | | | | | | | | | | | | |
ARAMARK Corp., Gtd. Notes | | B3 | | 8.50% | | | 02/01/15 | | | 605 | | | 547,525 |
United Rentals North America, Inc., Gtd. Notes | | B1 | | 6.50% | | | 02/15/12 | | | 1,255 | | | 991,450 |
| | | | | | | | | | | | |
|
|
| | | | | | | | | | | | | | 1,538,975 |
| | | | | | | | | | | | |
|
|
Computer Services & Software — 2.1% | | | | | | | | | | | | | |
First Data Corp., Gtd. Notes, 144A | | B3 | | 9.875% | | | 09/24/15 | | | 2,650 | | | 1,603,250 |
Seagate Technology HDD Holdings, Gtd. Notes (Cayman Islands) | | Ba1 | | 2.275% | (c) | | 10/01/09 | | | 825 | | | 754,875 |
Seagate Technology HDD Holdings, Gtd. Notes (Cayman Islands) | | Ba1 | | 6.375% | | | 10/01/11 | | | 600 | | | 414,000 |
| | | | | | | | | | | | |
|
|
| | | | | | | | | | | | | | 2,772,125 |
| | | | | | | | | | | | |
|
|
Containers & Packaging — 1.0% | | | | | | | | | | | | | |
Berry Plastics Holding Corp., Sr. Sec`d. Notes | | Caa1 | | 8.875% | | | 09/15/14 | | | 875 | | | 380,625 |
Crown Americas LLC / Crown Americas Capital Corp., Gtd. Notes | | B1 | | 7.625% | | | 11/15/13 | | | 200 | | | 198,000 |
Crown Americas LLC / Crown Americas Capital Corp., Gtd. Notes | | B1 | | 7.75% | | | 11/15/15 | | | 700 | | | 696,500 |
| | | | | | | | | | | | |
|
|
| | | | | | | | | | | | | | 1,275,125 |
| | | | | | | | | | | | |
|
|
Diversified Financial Services — 12.3% | | | | | | | | | | | | | |
AES Red Oak LLC, Sr. Sec`d. Notes | | B1 | | 8.54% | | | 11/30/19 | | | 656 | | | 577,443 |
American Express Co., Sr. Sec`d. Notes | | A2 | | 7.00% | | | 03/19/18 | | | 1,750 | | | 1,769,502 |
Bank of America Corp., Jr. Sub. Notes | | A2 | | 8.00% | (c) | | 12/29/49 | | | 2,425 | | | 1,744,273 |
Chukchansi Economic Development Authority, Sr. Unsec`d. Notes, 144A (original cost $350,000; purchased 10/31/05)(f)(g) | | B2 | | 8.00% | | | 11/15/13 | | | 350 | | | 161,875 |
CIT Group Funding Co. of Canada, Gtd. Notes (Canada) | | Baa1 | | 5.60% | | | 11/02/11 | | | 75 | | | 61,153 |
CIT Group, Inc., Sr. Unsec`d. Notes | | Baa1 | | 2.219% | (c) | | 03/12/10 | | | 125 | | | 115,916 |
CIT Group, Inc., Sr. Unsec`d. Notes | | Baa1 | | 5.20% | | | 11/03/10 | | | 475 | | | 411,636 |
CIT Group, Inc., Sr. Unsec`d. Notes | | Baa1 | | 5.60% | | | 04/27/11 | | | 130 | | | 109,758 |
CIT Group, Inc., Sr. Unsec`d. Notes | | Baa1 | | 5.80% | | | 07/28/11 | | | 100 | | | 83,796 |
CIT Group, Inc., Sr. Unsec`d. Notes, MTN | | Baa1 | | 4.75% | | | 12/15/10 | | | 550 | | | 484,146 |
Citigroup, Inc., Jr. Sub. Notes | | Baa2 | | 8.40% | (c) | | 04/29/49 | | | 2,900 | | | 1,914,841 |
Citigroup, Inc., Sr. Unsec`d. Notes | | A2 | | 5.50% | | | 04/11/13 | | | 5 | | | 4,868 |
El Paso Performance-Linked Trust, Sr. Unsec`d. Notes, 144A (original cost $2,139,438; purchased 04/08/08, 07/18/08)(f)(g) | | Ba3 | | 7.75% | | | 07/15/11 | | | 2,100 | | | 1,818,075 |
Ford Motor Credit Co. LLC, Sr. Unsec`d. Notes | | Caa1 | | 5.70% | | | 01/15/10 | | | 130 | | | 110,478 |
Ford Motor Credit Co. LLC, Sr. Unsec`d. Notes | | Caa1 | | 7.80% | | | 06/01/12 | | | 2,540 | | | 1,781,998 |
Ford Motor Credit Co. LLC, Sr. Unsec`d. Notes | | Caa1 | | 8.00% | | | 12/15/16 | | | 400 | | | 260,547 |
Goldman Sachs Group, Inc. (The), Sr. Unsec`d. Notes | | A1 | | 5.95% | | | 01/18/18 | | | 400 | | | 379,269 |
Goldman Sachs Group, Inc. (The), Sr. Unsec`d. Notes | | A1 | | 6.15% | | | 04/01/18 | | | 375 | | | 360,360 |
Goldman Sachs Group, Inc. (The), Sub. Notes | | A2 | | 6.75% | | | 10/01/37 | | | 1,200 | | | 974,242 |
JET Equipment Trust Equipment Trust, 144A (original cost $122,211; purchased 03/04/02)(f)(g)(i) | | NR | | 10.00% | | | 06/15/12 | | | 132 | | | 92,321 |
JET Equipment Trust Sr. Unsec`d. Notes, 144A (original cost $11,899; purchased 10/18/01)(f)(g) | | NR | | 7.63% | | | 08/15/12 | | | 11 | | | 41 |
KRATON Polymers LLC / KRATON Polymers Capital Corp., Gtd. Notes | | Caa1 | | 8.125% | | | 01/15/14 | | | 675 | | | 270,000 |
Lehman Brothers Holdings, Inc., Sr. Unsec`d. Notes(i) | | NR | | 6.625% | | | 01/18/12 | | | 50 | | | 4,750 |
Lehman Brothers Holdings, Inc., Sr. Unsec`d. Notes, MTN(i) | | NR | | 5.625% | | | 01/24/13 | | | 775 | | | 73,625 |
Lehman Brothers Holdings, Inc., Sub. Notes(i) | | NR | | 7.50% | | | 05/11/38 | | | 450 | | | 45 |
Lehman Brothers Holdings, Inc., Sub. Notes, MTN(i) | | NR | | 6.75% | | | 12/28/17 | | | 200 | | | 20 |
Merrill Lynch & Co., Inc., Sr. Unsec`d. Notes, MTN | | Aa3 | | 4.485% | (c) | | 05/12/10 | | | 400 | | | 385,420 |
SLM Corp., Sr. Unsec`d. Notes, MTN | | Baa2 | | 3.695% | (c) | | 07/26/10 | | | 150 | | | 128,022 |
SLM Corp., Sr. Unsec`d. Notes, MTN | | Baa2 | | 4.75% | | | 03/17/14 | | | 1,000 | | | 806,227 |
SLM Corp., Sr. Unsec`d. Notes, MTN | | Baa2 | | 5.00% | | | 10/01/13 | | | 475 | | | 339,872 |
SEE NOTES TO FINANCIAL STATEMENTS.
A29
| | | | | | |
| | | SP PIMCO HIGH YIELD PORTFOLIO (continued) | | |
| |
| SCHEDULE OF INVESTMENTS | | December 31, 2008 |
| | | | | | | | | | | | | |
CORPORATE BONDS
(continued) | | Moody’s
Ratings†
(Unaudited)
| | Interest
Rate
| | | Maturity
Date
| | Principal
Amount
(000)#
| | Value
(Note 2)
|
| | | | | | | | | | | | | | |
Diversified Financial Services (continued) | | | | | | | | | | | | | |
SMFG Preferred Capital USD 3 Ltd., Sr. Sub. Notes, 144A (Cayman Islands) (original cost $205,690; purchased 08/27/08)(f)(g) | | A2 | | 9.50% | (c) | | 07/25/49 | | $ | 200 | | $ | 183,246 |
Smurfit Kappa Funding PLC, Sr. Sub. Notes (Ireland) | | B2 | | 7.75% | | | 04/01/15 | | | 100 | | | 54,500 |
TNK-BP Finance SA, Gtd. Notes, 144A (Luxembourg) (original cost $297,603; purchased 03/13/07)(f)(g) | | Baa2 | | 6.625% | | | 03/20/17 | | | 300 | | | 144,000 |
TNK-BP Finance SA, Gtd. Notes, 144A (Luxembourg) (original cost $398,504; purchased 07/13/06)(f)(g) | | Baa2 | | 7.50% | | | 07/18/16 | | | 400 | | | 208,000 |
Universal City Florida Holding Co. I/II, Sr. Notes | | B3 | | 7.943% | (c) | | 05/01/10 | | | 50 | | | 21,500 |
Universal City Florida Holding Co. I/II, Sr. Notes | | B3 | | 8.375% | | | 05/01/10 | | | 950 | | | 432,250 |
| | | | | | | | | | | | |
|
|
| | | | | | | | | | | | | | 16,268,015 |
| | | | | | | | | | | | |
|
|
Diversified Manufacturing — 0.6% | | | | | | | | | | | | | |
Actuant Corp., Gtd. Notes | | Ba2 | | 6.875% | | | 06/15/17 | | | 345 | | | 259,613 |
Bombardier, Inc., Sr. Unsec`d. Notes, 144A (Canada) (original cost $1,221,645; purchased 11/10/06)(f)(g) | | Ba2 | | 7.25% | | | 11/15/16 | | | EUR 700 | | | 583,820 |
| | | | | | | | | | | | |
|
|
| | | | | | | | | | | | | | 843,433 |
| | | | | | | | | | | | |
|
|
Electric — 4.0% | | | | | | | | | | | | | |
AES Corp. (The), Sr. Unsec`d. Notes | | B1 | | 7.75% | | | 03/01/14 | | | 300 | | | 264,000 |
AES Corp. (The), Sr. Unsec`d. Notes | | B1 | | 8.00% | | | 10/15/17 | | | 625 | | | 512,500 |
AES Corp. (The), Sr. Unsec`d. Notes, 144A (original cost $100,000; purchased 05/14/08)(f)(g) | | B1 | | 8.00% | | | 06/01/20 | | | 100 | | | 77,500 |
Energy Future Holdings Corp., Gtd. Notes, 144A (original cost $3,168,588; purchased 11/07/07-05/13/08)(f)(g) | | B3 | | 10.875% | | | 11/01/17 | | | 3,150 | | | 2,236,500 |
Energy Future Holdings Corp., Gtd. Notes, PIK, 144A (original cost $130,813; purchased 04/23/08-04/29/08)(f)(g) | | B3 | | 11.25% | | | 11/01/17 | | | 125 | | | 60,625 |
Intergen NV, Sr. Sec`d. Notes, 144A (Netherlands) (original cost $844,625; purchased 04/14/08-06/06/08)(f)(g) | | Ba3 | | 9.00% | | | 06/30/17 | | | 800 | | | 656,000 |
Ipalco Enterprises, Inc., Sr. Sec`d. Notes, 144A (original cost $644,042; purchased 04/02/08-04/25/08)(f)(g) | | Ba1 | | 7.25% | | | 04/01/16 | | | 645 | | | 528,900 |
Texas Competitive Electric Holdings Co. LLC, Gtd. Notes, 144A (original cost $1,171,000; purchased 04/04/08, 07/09/08)(f)(g) | | B3 | | 10.25% | | | 11/01/15 | | | 1,150 | | | 816,500 |
Texas Competitive Electric Holdings Co. LLC, Gtd. Notes, PIK, 144A (original cost $177,188; purchased 04/16/08)(f)(g) | | B3 | | 10.50% | | | 11/01/16 | | | 175 | | | 87,500 |
| | | | | | | | | | | | |
|
|
| | | | | | | | | | | | | | 5,240,025 |
| | | | | | | | | | | | |
|
|
Electronic Components — 0.8% | | | | | | | | | | | | | |
Celestica, Inc., Sr. Sub. Notes (Canada) | | B3 | | 7.625% | | | 07/01/13 | | | 330 | | | 267,300 |
Celestica, Inc., Sr. Sub. Notes (Canada) | | B3 | | 7.875% | | | 07/01/11 | | | 400 | | | 364,000 |
Legrand France SA, Unsub. Notes (France) | | Baa3 | | 8.50% | | | 02/15/25 | | | 500 | | | 437,365 |
| | | | | | | | | | | | |
|
|
| | | | | | | | | | | | | | 1,068,665 |
| | | | | | | | | | | | |
|
|
Environmental Services — 0.2% | | | | | | | | | | | | | |
Cie Generale de Geophysique-Veritas, Gtd. Notes (France) | | Ba3 | | 7.75% | | | 05/15/17 | | | 550 | | | 319,000 |
| | | | | | | | | | | | |
|
|
Financial – Bank & Trust — 6.3% | | | | | | | | | | | | | |
American Express Bank FSB, Sr. Unsec`d. Notes | | A1 | | 5.50% | | | 04/16/13 | | | 900 | | | 852,516 |
Barclays Bank PLC, Jr. Sub. Notes, 144A (United Kingdom) (original cost $1,191,045; purchased 12/13/07, 12/19/07)(f)(g) | | Aa3 | | 7.434% | (c) | | 09/29/49 | | | 1,150 | | | 581,417 |
Barclays Bank PLC, Sr. Sub. Notes, 144A (United Kingdom) (original cost $496,635; purchased 12/07/07)(f)(g) | | Aa2 | | 6.05% | | | 12/04/17 | | | 500 | | | 441,097 |
Barclays Bank PLC, Sub. Notes, 144A (United Kingdom) (original cost $421,670; purchased 04/18/08, 06/25/08)(f)(g) | | Aa2 | | 7.70% | (c) | | 04/29/49 | | | 425 | | | 281,036 |
C8 Capital SPV Ltd., Notes, 144A (British Virgin Islands) (original cost $800,000; purchased 02/06/07)(f)(g) | | BB+(d) | | 6.64% | (c) | | 12/29/49 | | | 800 | | | 405,600 |
HBOS PLC, Sr. Sub. Notes, 144A (United Kingdom) (original cost $398,336; purchased 05/15/08)(f)(g) | | Aa3 | | 6.75% | | | 05/21/18 | | | 400 | | | 352,040 |
HSBC Holdings PLC, Sub. Notes (United Kingdom) | | Aa3 | | 6.50% | | | 09/15/37 | | | 1,100 | | | 1,117,143 |
Royal Bank of Scotland Group PLC, Jr. Sub. Notes, 144A (United Kingdom) (original cost $453,906; purchased 06/06/08-06/11/08)(f)(g) | | A1 | | 6.99% | (c) | | 10/29/49 | | | 500 | | | 233,768 |
SEE NOTES TO FINANCIAL STATEMENTS.
A30
| | | | | | |
| | | SP PIMCO HIGH YIELD PORTFOLIO (continued) | | |
| |
| SCHEDULE OF INVESTMENTS | | December 31, 2008 |
| | | | | | | | | | | | | |
CORPORATE BONDS
(continued) | | Moody’s
Ratings†
(Unaudited)
| | Interest
Rate
| | | Maturity
Date
| | Principal
Amount
(000)#
| | Value
(Note 2)
|
| | | | | | | | | | | | | | |
Financial – Bank & Trust (continued) | | | | | | | | | | | | | |
Royal Bank of Scotland Group PLC, Jr. Sub. Notes, MTN (United Kingdom) | | A1 | | 7.64% | (c) | | 03/31/49 | | $ | 1,300 | | $ | 517,769 |
Santander Perpetual SA Unipersonal, Bank Gtd. Notes, 144A (Spain) (original cost $496,712; purchased 10/18/07, 12/13/07)(f)(g) | | Aa2 | | 6.671% | (c) | | 10/29/49 | | | 500 | | | 318,020 |
UBS AG / Stamford Branch, Sr. Unsec`d. Notes, MTN (Switzerland) | | Aa2 | | 5.75% | | | 04/25/18 | | | 1,200 | | | 1,089,114 |
UBS Preferred Funding Trust V, Gtd. Notes | | A1 | | 6.243% | (c) | | 05/29/49 | | | 250 | | | 136,531 |
Wells Fargo Capital XIII, Gtd. Notes | | A1 | | 7.70% | (c) | | 12/29/49 | | | 300 | | | 247,593 |
Wells Fargo Capital XV, Jr. Sub. Notes | | Aa2 | | 9.75% | (c) | | 12/29/49 | | | 1,750 | | | 1,767,500 |
| | | | | | | | | | | | |
|
|
| | | | | | | | | | | | | | 8,341,144 |
| | | | | | | | | | | | |
|
|
Foods — 0.9% | | | | | | | | | | | | | |
American Stores Co., Sr. Unsec`d. Notes | | Ba3 | | 8.00% | | | 06/01/26 | | | 400 | | | 250,000 |
New Albertsons, Inc., Sr. Unsec`d. Notes | | Ba3 | | 7.45% | | | 08/01/29 | | | 610 | | | 359,900 |
New Albertsons, Inc., Sr. Unsec`d. Notes | | Ba3 | | 7.75% | | | 06/15/26 | | | 630 | | | 384,300 |
New Albertsons, Inc., Sr. Unsec`d. Notes, MTN | | Ba3 | | 6.57% | | | 02/23/28 | | | 300 | | | 141,000 |
| | | | | | | | | | | | |
|
|
| | | | | | | | | | | | | | 1,135,200 |
| | | | | | | | | | | | |
|
|
Forest & Paper Products — 3.1% | | | | | | | | | | | | | |
Cascades, Inc., Gtd. Notes (Canada) | | Ba3 | | 7.25% | | | 02/15/13 | | | 900 | | | 468,000 |
Georgia Pacific LLC, Gtd. Notes, 144A (original cost $674,125; purchased 12/28/07-03/12/08)(f)(g) | | Ba3 | | 7.00% | | | 01/15/15 | | | 700 | | | 595,000 |
Georgia Pacific LLC, Gtd. Notes, 144A (original cost $1,309,188; purchased 07/19/07-08/21/08)(f)(g) | | Ba3 | | 7.125% | | | 01/15/17 | | | 1,375 | | | 1,155,000 |
Georgia Pacific LLC, Sr. Unsec`d. Notes | | B2 | | 7.375% | | | 12/01/25 | | | 1,350 | | | 864,000 |
Georgia Pacific LLC, Sr. Unsec`d. Notes | | B2 | | 8.00% | | | 01/15/24 | | | 100 | | | 67,500 |
Georgia Pacific LLC, Sr. Unsec`d. Notes | | B2 | | 8.125% | | | 05/15/11 | | | 200 | | | 188,000 |
Smurfit Kappa Treasury Funding Ltd., Gtd. Notes (Ireland) | | Ba2 | | 7.50% | | | 11/20/25 | | | 700 | | | 413,000 |
Verso Paper Holdings LLC / Verson Paper, Inc., Sr. Sec`d. Notes | | B2 | | 9.125% | | | 08/01/14 | | | 825 | | | 325,875 |
| | | | | | | | | | | | |
|
|
| | | | | | | | | | | | | | 4,076,375 |
| | | | | | | | | | | | |
|
|
Gaming — 0.8% | | | | | | | | | | | | | |
Harrah’s Operating Co., Inc., Gtd. Notes, 144A (original cost $678,875; purchased 05/09/08)(f)(g) | | Caa2 | | 10.75% | | | 02/01/16 | | | 1,125 | | | 320,625 |
Mirage Resorts, Inc., Gtd. Notes | | Ba3 | | 7.25% | | | 08/01/17 | | | 500 | | | 302,500 |
Wynn Las Vegas Capital Corp., First Mortgage | | Ba2 | | 6.625% | | | 12/01/14 | | | 620 | | | 468,100 |
| | | | | | | | | | | | |
|
|
| | | | | | | | | | | | | | 1,091,225 |
| | | | | | | | | | | | |
|
|
Healthcare Products — 2.5% | | | | | | | | | | | | | |
Biomet, Inc., Gtd. Notes | | B3 | | 10.00% | | | 10/15/17 | | | 500 | | | 480,000 |
Biomet, Inc., Gtd. Notes | | Caa1 | | 11.625% | | | 10/15/17 | | | 3,245 | | | 2,774,475 |
Biomet, Inc., Gtd. Notes, PIK | | B3 | | 10.375% | | | 10/15/17 | | | 50 | | | 39,500 |
| | | | | | | | | | | | |
|
|
| | | | | | | | | | | | | | 3,293,975 |
| | | | | | | | | | | | |
|
|
Healthcare Services — 1.4% | | | | | | | | | | | | | |
CHS / Community Health Systems, Inc., Gtd. Notes | | B3 | | 8.875% | | | 07/15/15 | | | 1,465 | | | 1,347,800 |
Health Management Associates, Inc., Sr. Unsec`d. Notes | | BB-(d) | | 6.125% | | | 04/15/16 | | | 175 | | | 108,500 |
Service Corp. International, Sr. Unsec`d. Notes | | B1 | | 7.625% | | | 10/01/18 | | | 500 | | | 370,000 |
| | | | | | | | | | | | |
|
|
| | | | | | | | | | | | | | 1,826,300 |
| | | | | | | | | | | | |
|
|
Hospitals/Hospital Management — 3.9% | | | | | | | | | | | | | |
DaVita, Inc., Gtd. Notes | | B1 | | 6.625% | | | 03/15/13 | | | 150 | | | 142,500 |
DaVita, Inc., Gtd. Notes | | B2 | | 7.25% | | | 03/15/15 | | | 605 | | | 574,750 |
HCA, Inc., Sr. Sec`d. Notes | | B2 | | 9.25% | | | 11/15/16 | | | 4,870 | | | 4,468,225 |
| | | | | | | | | | | | |
|
|
| | | | | | | | | | | | | | 5,185,475 |
| | | | | | | | | | | | |
|
|
Insurance — 1.7% | | | | | | | | | | | | | |
American International Group, Inc., Jr. Sub. Debs, 144A (original cost $426,332; purchased 05/13/08, 05/14/08)(f)(g) | | Baa1 | | 8.175% | (c) | | 05/15/68 | | | 425 | | | 165,336 |
American International Group, Inc., Jr. Sub. Notes(g) | | Baa1 | | 8.625% | (c) | | 05/22/68 | | | 250 | | | 107,831 |
American International Group, Inc., Sr. Unsec`d. Notes | | A3 | | 1.193% | (c) | | 10/18/11 | | | 100 | | | 71,895 |
SEE NOTES TO FINANCIAL STATEMENTS.
A31
| | | | | | |
| | | SP PIMCO HIGH YIELD PORTFOLIO (continued) | | |
| |
| SCHEDULE OF INVESTMENTS | | December 31, 2008 |
| | | | | | | | | | | | | |
CORPORATE BONDS
(continued) | | Moody’s
Ratings†
(Unaudited)
| | Interest
Rate
| | | Maturity
Date
| | Principal
Amount
(000)#
| | Value
(Note 2)
|
| | | | | | | | | | | | | | |
Insurance (continued) | | | | | | | | | | | | | |
American International Group, Inc., Sr. Unsec`d. Notes, 144A (original cost $1,856,500; purchased 08/13/08, 11/25/08)(f)(g) | | A3 | | 8.25% | | | 08/15/18 | | $ | 2,025 | | $ | 1,482,136 |
American International Group, Inc., Sr. Unsec`d. Notes, MTN | | A3 | | 5.85% | | | 01/16/18 | | | 650 | | | 435,685 |
| | | | | | | | | | | | |
|
|
| | | | | | | | | | | | | | 2,262,883 |
| | | | | | | | | | | | |
|
|
Machinery & Equipment — 0.3% | | | | | | | | | | | | | |
Chart Industries, Inc., Sr. Sub. Notes | | B3 | | 9.125% | | | 10/15/15 | | | 500 | | | 375,000 |
| | | | | | | | | | | | |
|
|
Media — 5.9% | | | | | | | | | | | | | |
CSC Holdings, Inc., Sr. Unsec`d. Notes | | B1 | | 6.75% | | | 04/15/12 | | | 100 | | | 91,500 |
CSC Holdings, Inc., Sr. Unsec`d. Notes | | B1 | | 7.625% | | | 04/01/11 | | | 1,600 | | | 1,508,000 |
CSC Holdings, Inc., Sr. Unsec`d. Notes | | B1 | | 7.625% | | | 07/15/18 | | | 450 | | | 351,000 |
Dex Media West LLC / Dex Media Finance Co., Sr. Sub. Notes | | B2 | | 9.875% | | | 08/15/13 | | | 50 | | | 11,875 |
Dex Media West LLC / Dex Media Finance Co., Sr. Unsec`d. Notes | | B1 | | 8.50% | | | 08/15/10 | | | 830 | | | 502,150 |
Dex Media, Inc., Sr. Unsec`d. Notes | | B3 | | 8.00% | | | 11/15/13 | | | 225 | | | 41,625 |
Echostar DBS Corp., Gtd. Notes | | Ba3 | | 7.00% | | | 10/01/13 | | | 475 | | | 412,062 |
Echostar DBS Corp., Gtd. Notes | | Ba3 | | 7.125% | | | 02/01/16 | | | 2,020 | | | 1,686,700 |
Lighthouse International Co. SA, Sr. Sec`d. Notes, 144A (Luxembourg)
(original cost $550,750; purchased 04/08/04 - 07/06/08)(f)(g) | | B3 | | 8.00% | | | 04/30/14 | | | EUR 745 | | | 491,903 |
Quebecor Media, Inc., Sr. Unsec’d. Notes (Canada) | | B2 | | 7.75% | | | 03/15/16 | | | 1,225 | | | 826,875 |
Unity Media GmbH, Sr. Sec`d. Notes, 144A (Germany)
(original cost $450,000; purchased 07/11/05)(f)(g) | | Caa1 | | 10.375% | | | 02/15/15 | | | 450 | | | 349,875 |
UPC Holding BV, Sr. Sec`d. Notes (Netherlands) | | B3 | | 7.75% | | | 01/15/14 | | | EUR 675 | | | 717,786 |
UPC Holding BV, Sr. Sec`d. Notes (Netherlands) | | B3 | | 8.625% | | | 01/15/14 | | | EUR 300 | | | 325,271 |
Videotron Ltee, Gtd. Notes, 144A (Canada)
(original cost $536,250; purchased 04/28/08)(f)(g) | | Ba2 | | 9.125% | | | 04/15/18 | | | 500 | | | 465,000 |
| | | | | | | | | | | | |
|
|
| | | | | | | | | | | | | | 7,781,622 |
| | | | | | | | | | | | |
|
|
Metals & Mining — 0.7% | | | | | | | | | | | | | |
Freeport-McMoRan Copper & Gold, Inc., Sr. Unsec`d. Notes | | Ba2 | | 7.084% | (c) | | 04/01/15 | | | 460 | | | 303,600 |
Freeport-McMoRan Copper & Gold, Inc., Sr. Unsec`d. Notes | | Ba2 | | 8.375% | | | 04/01/17 | | | 800 | | | 656,000 |
| | | | | | | | | | | | |
|
|
| | | | | | | | | | | | | | 959,600 |
| | | | | | | | | | | | |
|
|
Oil & Gas Exploration/Production — 1.7% | | | | | | | | | | | | | |
Chesapeake Energy Corp., Gtd. Notes | | Ba3 | | 6.25% | | | 01/15/17 | | | 125 | | | 104,253 |
Chesapeake Energy Corp., Gtd. Notes | | Ba3 | | 6.875% | | | 01/15/16 | | | 125 | | | 100,000 |
Chesapeake Energy Corp., Gtd. Notes | | Ba3 | | 7.00% | | | 08/15/14 | | | 375 | | | 311,250 |
Chesapeake Energy Corp., Gtd. Notes | | Ba3 | | 7.50% | | | 06/15/14 | | | 425 | | | 359,125 |
Citic Resources Finance Ltd., Gtd. Notes, 144A (Bermuda)
(original cost $24,932; purchased 05/14/07)(f)(g) | | Ba2 | | 6.75% | | | 05/15/14 | | | 25 | | | 16,250 |
El Paso Corp., Sr. Unsec`d. Notes | | Ba3 | | 7.00% | | | 06/15/17 | | | 385 | | | 301,303 |
El Paso Corp., Sr. Unsec`d. Notes | | Ba3 | | 8.05% | | | 10/15/30 | | | 200 | | | 130,323 |
SemGroup LP, Sr. Notes, 144A
(original cost $1,338,192; purchased 11/04/05 - 05/21/08)(f)(g)(i) | | NR | | 8.75% | | | 11/15/15 | | | 1,350 | | | 47,250 |
Sonat, Inc., Sr. Unsec`d. Notes | | Ba3 | | 7.625% | | | 07/15/11 | | | 650 | | | 592,630 |
Williams Cos., Inc., Sr. Unsec`d. Notes | | Baa3 | | 7.875% | | | 09/01/21 | | | 300 | | | 229,500 |
| | | | | | | | | | | | |
|
|
| | | | | | | | | | | | | | 2,191,884 |
| | | | | | | | | | | | |
|
|
Oil, Gas & Consumable Fuels — 1.4% | | | | | | | | | | | | | |
Enterprise Products Operating LLC, Gtd. Notes | | Ba1 | | 7.034% | (c) | | 01/15/68 | | | 300 | | | 141,000 |
Enterprise Products Operating LLC, Gtd. Notes | | Ba1 | | 8.375% | (c) | | 08/01/66 | | | 510 | | | 280,500 |
Newfield Exploration Co., Sr. Sub. Notes | | Ba3 | | 7.125% | | | 05/15/18 | | | 100 | | | 79,000 |
OPTI Canada, Inc., Sec`d. Notes (Canada) | | B2 | | 8.25% | | | 12/15/14 | | | 480 | | | 259,200 |
Petrohawk Energy Corp., Gtd. Notes, 144A
(original cost $74,063; purchased 06/20/08)(f)(g) | | B3 | | 7.875% | | | 06/01/15 | | | 75 | | | 55,500 |
SandRidge Energy, Inc., Gtd. Notes, 144A | | B3 | | 8.625% | | | 04/01/15 | | | 2,000 | | | 1,050,000 |
| | | | | | | | | | | | |
|
|
| | | | | | | | | | | | | | 1,865,200 |
| | | | | | | | | | | | |
|
|
Paper & Forest Products — 0.3% | | | | | | | | | | | | | |
Berry Plastics Corp., Sr. Sec`d. Notes | | B1 | | 5.844% | (c) | | 02/15/15 | | | 525 | | | 362,250 |
| | | | | | | | | | | | |
|
|
SEE NOTES TO FINANCIAL STATEMENTS.
A32
| | | | | | |
| | | SP PIMCO HIGH YIELD PORTFOLIO (continued) | | |
| |
| SCHEDULE OF INVESTMENTS | | December 31, 2008 |
| | | | | | | | | | | | | |
CORPORATE BONDS
(continued) | | Moody’s
Ratings†
(Unaudited)
| | Interest
Rate
| | | Maturity
Date
| | Principal
Amount
(000)#
| | Value
(Note 2)
|
| | | | | | | | | | | | | | |
Pipelines & Other — 2.2% | | | | | | | | | | | | | |
Dynegy Roseton / Danskammer Pass-Through Trust,
Series A, Pass-Through Cerificates | | Ba3 | | 7.27% | | | 11/08/10 | | $ | 1,150 | | $ | 1,092,310 |
Dynegy Roseton / Danskammer Pass-Through Trust,
Series B, Pass-Through Cerificates | | Ba3 | | 7.67% | | | 11/08/16 | | | 375 | | | 266,485 |
Kinder Morgan Finance Co. ULC, Gtd. Notes (Canada) | | Ba1 | | 5.70% | | | 01/05/16 | | | 1,225 | | | 912,625 |
Knight, Inc., Sr. Unsec`d. Notes | | Ba1 | | 5.15% | | | 03/01/15 | | | 100 | | | 74,500 |
NGPL PipeCo. LLC, Sr. Unsec`d. Notes, 144A
(original cost $625,000; purchased 12/14/07)(f)(g) | | Baa3 | | 7.119% | | | 12/15/17 | | | 625 | | | 562,621 |
| | | | | | | | | | | | |
|
|
| | | | | | | | | | | | | | 2,908,541 |
| | | | | | | | | | | | |
|
|
Real Estate Investment Trusts — 0.6% | | | | | | | | | | | | | |
Ventas Realty LP / Ventas Capital Corp., Gtd. Notes | | Ba1 | | 6.75% | | | 04/01/17 | | | 825 | | | 627,000 |
Ventas Realty LP / Ventas Capital Corp., Gtd. Notes | | Ba1 | | 7.125% | | | 06/01/15 | | | 250 | | | 195,625 |
| | | | | | | | | | | | |
|
|
| | | | | | | | | | | | | | 822,625 |
| | | | | | | | | | | | |
|
|
Retail — 2.0% | | | | | | | | | | | | | |
AmeriGas Partners LP, Sr. Unsec`d. Notes | | Ba3 | | 7.25% | | | 05/20/15 | | | 1,500 | | | 1,222,500 |
Ferrellgas Escrow LLC / Ferrellgas Finance Escrow Corp., Sr. Unsec`d. Notes | | Ba3 | | 6.75% | | | 05/01/14 | | | 805 | | | 555,450 |
Ferrellgas Partners LP / Ferrellgas Partners Finance Corp., Sr. Unsec`d. Notes | | B2 | | 8.75% | | | 06/15/12 | | | 610 | | | 427,000 |
Suburban Propane Partners LP / Suburban Energy Finance Corp., Sr. Unsec`d. Notes | | B1 | | 6.875% | | | 12/15/13 | | | 495 | | | 405,900 |
| | | | | | | | | | | | |
|
|
| | | | | | | | | | | | | | 2,610,850 |
| | | | | | | | | | | | |
|
|
Semiconductors — 1.0% | | | | | | | | | | | | | |
Freescale Semiconductor, Inc., Gtd. Notes | | B2 | | 8.875% | | | 12/15/14 | | | 1,000 | | | 440,000 |
Freescale Semiconductor, Inc., Gtd. Notes, PIK | | B2 | | 9.125% | | | 12/15/14 | | | 425 | | | 97,750 |
Sensata Technologies BV, Gtd. Notes (Netherlands) | | Caa1 | | 8.00% | | | 05/01/14 | | | 1,650 | | | 742,500 |
| | | | | | | | | | | | |
|
|
| | | | | | | | | | | | | | 1,280,250 |
| | | | | | | | | | | | |
|
|
Services Cyclical – Rental Equipment — 0.5% | | | | | | | | | | | | | |
Hertz Corp. (The), Gtd. Notes | | B1 | | 8.875% | | | 01/01/14 | | | 1,095 | | | 673,425 |
| | | | | | | | | | | | |
|
|
Technology — 0.7% | | | | | | | | | | | | | |
Sanmina-SCI Corp., Gtd. Notes | | B3 | | 8.125% | | | 03/01/16 | | | 450 | | | 175,500 |
SunGard Data Systems, Inc., Gtd. Notes | | Caa1 | | 9.125% | | | 08/15/13 | | | 800 | | | 692,000 |
| | | | | | | | | | | | |
|
|
| | | | | | | | | | | | | | 867,500 |
| | | | | | | | | | | | |
|
|
Telecommunications — 7.3% | | | | | | | | | | | | | |
Cincinnati Bell, Inc., Gtd. Notes | | Ba3 | | 7.25% | | | 07/15/13 | | | 125 | | | 110,000 |
Frontier Communications Corp., Sr. Unsec`d. Notes | | Ba2 | | 6.625% | | | 03/15/15 | | | 200 | | | 146,000 |
Frontier Communications Corp., Sr. Unsec`d. Notes | | Ba2 | | 7.125% | | | 03/15/19 | | | 470 | | | 314,900 |
Frontier Communications Corp., Sr. Unsec`d. Notes | | Ba2 | | 7.875% | | | 01/15/27 | | | 725 | | | 420,500 |
Hawaiian Telecom Communications, Inc., Gtd. Notes(i) | | Ca | | 9.75% | | | 05/01/13 | | | 700 | | | 52,500 |
Nordic Telephone Co. Holdings ApS, Sr. Sec`d. Notes, 144A (Denmark) (original cost $250,000; purchased 04/26/06)(f)(g) | | B2 | | 8.875% | | | 05/01/16 | | | 250 | | | 175,000 |
Nortel Networks Ltd., Gtd. Notes (Canada)(i) | | Caa2 | | 10.125% | | | 07/15/13 | | | 2,030 | | | 537,950 |
Northwestern Bell Telephone, Sr. Unsec`d. Notes | | Ba1 | | 7.75% | | | 05/01/30 | | | 750 | | | 446,250 |
Qwest Capital Funding, Inc., Gtd. Notes | | B1 | | 7.25% | | | 02/15/11 | | | 500 | | | 420,000 |
Qwest Capital Funding, Inc., Gtd. Notes | | B1 | | 7.90% | | | 08/15/10 | | | 775 | | | 705,250 |
Qwest Communications International, Inc., Gtd. Notes | | Ba3 | | 7.50% | | | 02/15/14 | | | 1,730 | | | 1,236,950 |
Qwest Corp., Sr. Unsec`d. Notes | | Ba1 | | 5.246% | (c) | | 06/15/13 | | | 325 | | | 242,125 |
Sprint Capital Corp., Gtd. Notes | | Ba2 | | 6.375% | | | 05/01/09 | | | 250 | | | 248,437 |
Sprint Capital Corp., Gtd. Notes | | Ba2 | | 6.90% | | | 05/01/19 | | | 1,650 | | | 1,171,500 |
Sprint Capital Corp., Gtd. Notes | | Ba2 | | 8.75% | | | 03/15/32 | | | 200 | | | 135,000 |
Sprint Nextel Corp., Sr. Unsec`d. Notes | | Ba2 | | 6.00% | | | 12/01/16 | | | 820 | | | 578,100 |
Telesat Canada / Telesat LLC, Sr. Sub. Notes, 144A (original cost $199,000; purchased 06/27/08)(f)(g) | | Caa1 | | 12.50% | | | 11/01/17 | | | 200 | | | 120,000 |
SEE NOTES TO FINANCIAL STATEMENTS.
A33
| | | | | | |
| | | SP PIMCO HIGH YIELD PORTFOLIO (continued) | | |
| |
| SCHEDULE OF INVESTMENTS | | December 31, 2008 |
| | | | | | | | | | | | | |
CORPORATE BONDS
(continued) | | Moody’s
Ratings†
(Unaudited)
| | Interest
Rate
| | | Maturity
Date
| | Principal
Amount
(000)#
| | Value
(Note 2)
|
| | | | | | | | | | | | | | |
Telecommunications (continued) | | | | | | | | | | | | | |
Telesat Canada / Telesat LLC, Sr. Unsec`d. Notes, 144A (original cost $474,625; purchased 06/27/08, 07/09/08)(f)(g) | | Caa1 | | 11.00% | | | 11/01/15 | | $ | 520 | | $ | 371,800 |
Time Warner Telecom Holdings, Inc., Gtd. Notes | | B3 | | 9.25% | | | 02/15/14 | | | 400 | | | 328,000 |
West Corp., Gtd. Notes | | Caa1 | | 9.50% | | | 10/15/14 | | | 950 | | | 522,500 |
Wind Acquisition Finance SA, Sr. Sec`d. Notes, 144A (Luxembourg) (original cost $600,000; purchased 11/22/05)(f)(g) | | B2 | | 10.75% | | | 12/01/15 | | | 600 | | | 516,000 |
Windstream Corp., Gtd. Notes | | Ba3 | | 8.125% | | | 08/01/13 | | | 100 | | | 92,000 |
Windstream Corp., Gtd. Notes | | Ba3 | | 8.625% | | | 08/01/16 | | | 890 | | | 787,650 |
| | | | | | | | | | | | |
|
|
| | | | | | | | | | | | | | 9,678,412 |
| | | | | | | | | | | | |
|
|
Utilities — 6.0% | | | | | | | | | | | | | |
Edison Mission Energy, Sr. Unsec`d. Notes | | B1 | | 7.20% | | | 05/15/19 | | | 850 | | | 697,000 |
Homer City Funding LLC, Sr. Sec`d. Notes | | Ba2 | | 8.734% | | | 10/01/26 | | | 1,444 | | | 1,328,250 |
IPALCO Enterprises, Inc., Sr. Sec`d. Notes | | Ba1 | | 8.625% | | | 11/14/11 | | | 175 | | | 163,625 |
NRG Energy, Inc., Gtd. Notes | | B1 | | 7.25% | | | 02/01/14 | | | 210 | | | 196,350 |
NRG Energy, Inc., Gtd. Notes | | B1 | | 7.375% | | | 02/01/16 | | | 2,950 | | | 2,743,500 |
NRG Energy, Inc., Gtd. Notes | | B1 | | 7.375% | | | 01/15/17 | | | 100 | | | 92,000 |
PSE&G Energy Holdings LLC, Sr. Unsec`d. Notes | | Ba3 | | 8.50% | | | 06/15/11 | | | 1,000 | | | 942,616 |
Reliant Energy Mid-Atlantic Power Holdings LLC, Series B, Pass-Through Cerificates | | Ba1 | | 9.237% | | | 07/02/17 | | | 318 | | | 289,652 |
Reliant Energy, Inc., Sr. Sec`d. Notes | | Ba3 | | 6.75% | | | 12/15/14 | | | 1,000 | | | 900,000 |
Tenaska Alabama Partners LP, Sr. Sec`d. Notes, 144A (original cost $747,066; purchased 06/13/05, 08/01/05)(f)(g) | | Ba2 | | 7.00% | | | 06/30/21 | | | 733 | | | 574,633 |
| | | | | | | | | | | | |
|
|
| | | | | | | | | | | | | | 7,927,626 |
| | | | | | | | | | | | |
|
|
TOTAL CORPORATE BONDS
(cost $148,793,071) | | | 105,578,425 |
| | | | | | | | | | | | |
|
|
| MUNICIPAL BONDS — 2.5% | | | | | | | | | | | | | |
Texas — 2.5% | | | | | | | | | | | | | |
Comal Texas Independent School District, General Obligation Unlimited Bond | | Aaa | | 5.00% | | | 02/01/36 | | | 3,000 | | | 2,921,700 |
Transition Communication Mobility, State of Texas, General Obligation Unlimited Bond | | Aa1 | | 5.00% | | | 04/01/37 | | | 400 | | | 388,192 |
| | | | | | | | | | | | |
|
|
TOTAL MUNICIPAL BONDS
(cost $3,377,986) | | | 3,309,892 |
| | | | | | | | | | | | |
|
|
| U.S. GOVERNMENT MORTGAGE-BACKED OBLIGATION — 3.1% | | | | | | | | | | | |
Federal National Mortgage Assoc. (cost $4,071,875) | | | | 6.00% | | | TBA | | | 4,000 | | | 4,117,500 |
| | | | | | | | | | | | |
|
|
| COLLATERALIZED MORTGAGE OBLIGATIONS — 1.4% | | | | | | | | | | | |
American Home Mortgage Assets, Series 2006-1, Class 2A1 | | Aaa | | 0.661% | (c) | | 05/25/46 | | | 55 | | | 21,670 |
American Home Mortgage Assets, Series 2006-4, Class 1A12 | | Aaa | | 0.681% | (c) | | 10/25/46 | | | 77 | | | 26,828 |
American Home Mortgage Assets, Series 2006-5, Class A1 | | Aaa | | 3.176% | (c) | | 11/25/46 | | | 574 | | | 195,276 |
American Home Mortgage Assets, Series 2007-3, Class 22A1 | | Aaa | | 6.25% | | | 06/25/37 | | | 263 | | | 118,151 |
American Home Mortgage Investment Trust, Series 2005-2, Class 4A1 | | Aa1 | | 5.66% | (c) | | 09/25/45 | | | 49 | | | 23,319 |
Bear Stearns Adjustable Rate Mortgage Trust, Series 2007-3, Class 1A1 | | AAA(d) | | 5.472% | (c) | | 05/25/47 | | | 87 | | | 50,183 |
Citigroup Mortgage Loan Trust, Inc., Series 2007-10, Class 22AA | | AAA(d) | | 6.012% | (c) | | 09/25/37 | | | 179 | | | 94,910 |
Countrywide Alternative Loan Trust, Series 2005-59, Class 1A1 | | Aaa | | 0.838% | (c) | | 11/20/35 | | | 54 | | | 26,849 |
Countrywide Alternative Loan Trust, Series 2005-62, Class 2A1 | | Aaa | | 3.256% | (c) | | 12/25/35 | | | 42 | | | 20,807 |
Countrywide Alternative Loan Trust, Series 2006-HY13, Class 4A1 | | AAA(d) | | 5.894% | (c) | | 02/25/37 | | | 77 | | | 41,772 |
Countrywide Alternative Loan Trust, Series 2006-OA9, Class 2A1A | | Aaa | | 0.718% | (c) | | 07/20/46 | | | 69 | | | 28,049 |
Countrywide Alternative Loan Trust, Series 2006-OA11, Class A1B | | Aaa | | 0.661% | (c) | | 09/25/46 | | | 89 | | | 34,576 |
Countrywide Alternative Loan Trust, Series 2006-OA17, Class 1A1A | | Aaa | | 0.703% | (c) | | 12/20/46 | | | 152 | | | 65,976 |
Harborview Mortgage Loan Trust, Series 2006-5, Class 2A1A | | Aaa | | 0.761% | (c) | | 07/19/46 | | | 71 | | | 28,647 |
Harborview Mortgage Loan Trust, Series 2006-7, Class 2A1B | | Aaa | | 0.831% | (c) | | 09/19/46 | | | 623 | | | 142,664 |
Indymac Index Mortgage Loan Trust, Series 2006-AR12, Class A1 | | Aaa | | 0.661% | (c) | | 09/25/46 | | | 68 | | | 27,350 |
Mastr Adjustable Rate Mortgages Trust, Series 2006-OA1, Class 1A1 | | Aaa | | 0.681% | (c) | | 04/25/46 | | | 47 | | | 18,280 |
Residential Accredit Loans, Inc., Series 2007-QS4, Class 2A1 | | Aaa | | 0.801% | (c) | | 03/25/37 | | | 312 | | | 91,964 |
SEE NOTES TO FINANCIAL STATEMENTS.
A34
| | | | | | |
| | | SP PIMCO HIGH YIELD PORTFOLIO (continued) | | |
| |
| SCHEDULE OF INVESTMENTS | | December 31, 2008 |
| | | | | | | | | | | | | |
COLLATERALIZED MORTGAGE OBLIGATIONS
(continued) | | Moody’s
Ratings†
(Unaudited)
| | Interest
Rate
| | | Maturity
Date
| | Principal
Amount
(000)#
| | Value
(Note 2)
|
| | | | | | | | | | | | | | |
Structured Asset Mortgage Investments, Inc., Series 2006-AR6,
Class 2A1 | | Aaa | | 0.661% | (c) | | 07/25/46 | | $ | 79 | | $ | 34,409 |
Structured Asset Securities Corp., Series 2005-9XS, Class 2A1 | | Aaa | | 0.771% | (c) | | 06/25/35 | | | 643 | | | 355,594 |
Suntrust Alternative Loan Trust, Series 2006-1F, Class 3A | | B1 | | 0.821% | (c) | | 04/25/36 | | | 263 | | | 109,129 |
WaMu Mortgage Pass-Through Certificates, Series 2007-HY1, Class 1A1 | | AA(d) | | 5.706% | (c) | | 02/25/37 | | | 79 | | | 43,333 |
WaMu Mortgage Pass-Through Certificates, Series 2007-HY1, Class 2A3 | | BB(d) | | 5.863% | (c) | | 02/25/37 | | | 78 | | | 54,951 |
WaMu Mortgage Pass-Through Certificates, Series 2007-HY1, Class 4A1 | | AAA(d) | | 5.449% | (c) | | 02/25/37 | | | 83 | | | 49,375 |
WaMu Mortgage Pass-Through Certificates, Series 2007-HY2, Class 1A1 | | AAA(d) | | 5.606% | (c) | | 12/25/36 | | | 82 | | | 40,845 |
WaMu Mortgage Pass-Through Certificates, Series 2007-OA1, Class A1A | | Aaa | | 2.956% | (c) | | 02/25/47 | | | 74 | | | 27,444 |
WaMu Mortgage Pass-Through Certificates, Series 2007-OA2, Class 1A | | Aaa | | 2.956% | (c) | | 03/25/47 | | | 77 | | | 28,883 |
WaMu Mortgage Pass-Through Certificates, Series 2007-OA3, Class 2A1A | | Aaa | | 3.016% | (c) | | 04/25/47 | | | 79 | | | 34,915 |
| | | | | | | | | | | | |
|
|
TOTAL COLLATERALIZED MORTGAGE OBLIGATIONS
(cost $2,757,963) | | | 1,836,149 |
| | | | | | | | | | | | |
|
|
| ASSET-BACKED SECURITIES — 0.2% | | | | | | | | | | | | | |
Morgan Stanley Mortgage Loan Trust, Series 2006-12XS, Class A6A
(cost $396,740) | | Aaa | | 5.726% | (c) | | 10/25/36 | | | 500 | | | 330,998 |
| | | | | | | | | | | | |
|
|
| | | | | |
| | | | | | | | | | Shares
| | |
| PREFERRED STOCKS — 1.3% | | | | | | | | | | | | | |
Automotive — 0.1% | | | | | | | | | | | | | |
General Motors Corp., 5.25%, CVT | | | 22,000 | | | 75,680 |
| | | | | | | | | | | | |
|
|
Diversified Financial Services — 1.1% | | | | | | | | | | | | | |
Bank of America Corp., 7.25%, CVT | | | 2,200 | | | 1,430,000 |
Citigroup, Inc., 6.50%, CVT | | | 3,850 | | | 107,761 |
| | | | | | | | | | | | |
|
|
| | | | | | | | | | | | | | 1,537,761 |
| | | | | | | | | | | | |
|
|
Insurance | | | | | | | | | | | | | |
American International Group, Inc., 8.50%, CVT | | | 2,900 | | | 24,650 |
| | | | | | | | | | | | |
|
|
Metals & Mining — 0.1% | | | | | | | | | | | | | |
Freeport-McMoRan Copper & Gold, Inc., 6.75%, CVT | | | 1,900 | | | 90,155 |
| | | | | | | | | | | | |
|
|
TOTAL PREFERRED STOCKS
(cost $2,938,578) | | | 1,728,246 |
| | | | | | | | | | | | |
|
|
TOTAL LONG-TERM INVESTMENTS
(cost $178,406,869) | | | 126,220,001 |
| | | | | | | | | | | | |
|
|
| | | | |
| SHORT-TERM INVESTMENTS — 12.8% | | | | | | | Principal
Amount
(000)#
| | |
U.S. TREASURY OBLIGATIONS(n) — 3.4% | | | | | | | | | | | |
U.S. Cash Management Bill | | 0.22% | | | 04/29/09 | | $ | 1,600 | | | 1,599,646 |
U.S. Treasury Bill | | 0.025% | | | 04/09/09 | | | 280 | | | 279,917 |
U.S. Treasury Bill | | 0.10% | | | 02/26/09 | | | 800 | | | 799,971 |
U.S. Treasury Bill | | 0.23% | | | 01/29/09 | | | 730 | | | 729,979 |
U.S. Treasury Bill | | 0.27% | | | 01/02/09 | | | 550 | | | 550,000 |
U.S. Treasury Bill | | 1.10% | | | 01/29/09 | | | 550 | | | 550,000 |
| | | | | | | | | | |
|
|
TOTAL U.S. TREASURY OBLIGATIONS
(cost $4,508,663) | | | 4,509,513 |
| | | | | | | | | | |
|
|
| | | Shares
| | |
AFFILIATED MONEY MARKET MUTUAL FUND — 3.1% | | | | | | |
Dryden Core Investment Fund — Taxable Money Market Series
(cost $4,110,142) (Note 4)(w) | | | 4,110,142 | | | 4,110,142 |
| | | | | | | | | | | | |
|
|
SEE NOTES TO FINANCIAL STATEMENTS.
A35
| | | | | | |
| | | SP PIMCO HIGH YIELD PORTFOLIO (continued) | | |
| |
| SCHEDULE OF INVESTMENTS | | December 31, 2008 |
| | | | | | | | | | | | | |
| COMMERCIAL PAPER(n) — 0.6% | | Moody’s
Ratings†
(Unaudited)
| | Interest
Rate
| | Maturity
Date
| | Principal
Amount
(000)#
| | Value
(Note 2)
| |
| | | | | | | | | | | | | | |
Morgan Stanley
(cost $748,021) | | A1 | | 3.80% | | 01/26/09 | | $ | 750 | | $ | 747,198 | |
| | | | | | | | | | | |
|
|
|
| | |
| OPTIONS PURCHASED * — 5.7% | | Contracts/
Notional
Amounts
(000)#
| | | |
Call Options — 5.7% | | | | | | | |
Interest Rate Swap Options,
expiring 07/06/2009 @ 4.25% | | | 62,000 | | | 3,049,180 | |
expiring 07/06/2009 @ 4.25% | | | 23,000 | | | 1,136,066 | |
expiring 09/08/2009 @ 4.75% | | | 60,000 | | | 3,418,046 | |
| | | | | | | | | | | |
|
|
|
TOTAL OPTIONS PURCHASED
(cost $1,350,170) | | | 7,603,292 | |
| | | | | | | | | | | |
|
|
|
TOTAL SHORT-TERM INVESTMENTS
(cost $10,716,996) | | | 16,970,145 | |
| | | | | | | | | | | |
|
|
|
TOTAL INVESTMENTS, BEFORE OPTIONS WRITTEN(o) — 108.4%
(cost $189,123,865) | | | 143,190,146 | |
| | | | | | | | | | | |
|
|
|
| OPTIONS WRITTEN — (5.9)% | | | | | | | | | | | | | |
Call Options — (5.9)% | | | | | | | | | | | | | |
Interest Rate Swap Options,
expiring 07/06/2009 @ 4.90% | | | 7,700 | | | (1,198,190 | ) |
expiring 07/06/2009 @ 4.90% | | | 20,700 | | | (3,221,109 | ) |
expiring 09/08/2009 @ 5.15% | | | 20,000 | | | (3,364,539 | ) |
| | | | | | | | | | | |
|
|
|
TOTAL OPTIONS WRITTEN
(premium received $1,316,570) | | | (7,783,838 | ) |
| | | | | | | | | | | |
|
|
|
TOTAL INVESTMENTS, NET OF OPTIONS WRITTEN — 102.5% | | | | | | | | | | | | | |
(cost $187,807,295) | | | 135,406,308 | |
OTHER LIABILITIES IN EXCESS OF OTHER ASSETS(x) — (2.5)% | | | (3,366,672 | ) |
| | | | | | | | | | | |
|
|
|
NET ASSETS — 100.0% | | $ | 132,039,636 | |
| | | | | | | | | | | |
|
|
|
The following abbreviations are used in Portfolio descriptions:
| | |
| 144A | | Security was purchased pursuant to Rule 144A under the Securities Act of 1933 and may not be resold subject to that rule except to qualified institutional buyers. Unless otherwise noted, 144A securities are deemed to be liquid. |
| CVT | | Convertible Security |
| MTN | | Medium Term Note |
| NR | | Not Rated by Moody’s or Standard & Poor’s |
| PIK | | Payment-in-kind |
| TBA | | To Be Announced |
| BRL | | Brazilian Real |
| EUR | | Euro |
| GBP | | British Pound |
| MXN | | Mexican Peso |
| MYR | | Malaysian Ringgit |
| PHP | | Philippine Peso |
| RUB | | Russian Ruble |
| SGD | | Singapore Dollar |
| * | Non-income producing security. |
| † | The cost of securities for federal income tax purposes is substantially the same as for financial reporting purposes. |
| # | Principal amount is shown in U.S. dollars unless otherwise stated. |
| (c) | Indicates a variable rate security. |
| (d) | Standard & Poor’s rating. |
| (f) | Private Placement restricted as to resale and does not have a readily available market. The aggregate original cost of such securities is $44,669,642. The aggregate value of $28,416,456 is approximately 21.5% of net assets. |
SEE NOTES TO FINANCIAL STATEMENTS.
A36
| | | | | | |
| | | SP PIMCO HIGH YIELD PORTFOLIO (continued) | | |
| |
| SCHEDULE OF INVESTMENTS | | December 31, 2008 |
| (g) | Indicates a security that has been deemed illiquid. |
| (i) | Represents issuer in default on interest payments. Non-income producing security. |
| (n) | Rates shown are the effective yields at reporting date. |
| (o) | As of December 31, 2008, 2 securities representing $92,362 and 0.1% of net assets were fair valued in accordance with the policies adopted by the Board of Trustees. |
| (w) | Prudential Investments LLC, the manager of the Portfolio also serves as manager of the Dryden Core Investment Fund-Taxable Money Market Series. |
| (x) | Other liabilities in excess of other assets include unrealized appreciation (depreciation) on futures contracts, forward foreign currency exchange contracts, interest rate and credit default swap agreements as follows: |
Futures contracts open at December 31, 2008:
| | | | | | | | | | | | |
Number of
Contracts
| | Type
| | Expiration
Date
| | Value at
Trade Date
| | Value at
December 31, 2008
| | Unrealized
Appreciation
| |
| Long Position: | | | | | | | | | | | | |
| 1 | | 90 Day Euro Dollar | | Jun 09 | | 241,550 | | 247,175 | | $ | 5,625 | (1) |
| | | | | | | | | | |
|
|
|
(1) | Cash of $163,700 has been segregated with the broker to cover requirements for open futures contracts at December 31, 2008 |
Forward foreign currency exchange contracts outstanding at December 31, 2008:
| | | | | | | | | | | | |
Purchase Contracts
| | Notional
Amount (000)
| | Value at
Settlement Date
Payable
| | Current
Value
| | Unrealized
Appreciation
(Depreciation)
| |
Brazilian Real, Expiring 02/03/09 | | BRL 4,639 | | $ | 2,114,086 | | $ | 1,961,951 | | $ | (152,135 | ) |
British Pound, Expiring 01/13/09 | | GBP 98 | | | 150,758 | | | 140,846 | | | (9,912 | ) |
Mexican Pesos, Expiring 05/19/09 | | MXN 57 | | | 4,172 | | | 3,962 | | | (210 | ) |
Malaysian Ringgit,
Expiring 02/12/09 | | MYR 2,166 | | | 615,481 | | | 625,137 | | | 9,656 | |
Expiring 04/14/09 | | MYR 1,235 | | | 350,000 | | | 356,384 | | | 6,384 | |
Philippines Peso,
Expiring 02/06/09 | | PHP 19,811 | | | 430,932 | | | 414,816 | | | (16,116 | ) |
Expiring 05/06/09 | | PHP 9,682 | | | 200,000 | | | 201,439 | | | 1,439 | |
Expiring 12/23/10 | | PHP 500 | | | 11,171 | | | 9,681 | | | (1,490 | ) |
Russian Ruble, Expiring 05/06/09 | | RUB 59,763 | | | 2,452,933 | | | 1,733,101 | | | (719,832 | ) |
Singapore Dollar,
Expiring 04/14/09 | | SGD 1,276 | | | 870,000 | | | 884,627 | | | 14,627 | |
Expiring 07/30/09 | | SGD 217 | | | 150,000 | | | 150,301 | | | 301 | |
| | | | |
|
| |
|
| |
|
|
|
| | | | | $ | 7,349,533 | | $ | 6,482,245 | | $ | (867,288 | ) |
| | | | |
|
| |
|
| |
|
|
|
| | | | | | | | | | | | |
Sale Contracts
| | Notional
Amount (000)
| | Value at
Settlement Date
Receivable
| | Current
Value
| | Unrealized
Appreciation
(Depreciation)
| |
Brazilian Real, Expiring 02/03/09 | | BRL 4,639 | | $ | 1,923,857 | | $ | 1,961,951 | | $ | (38,094 | ) |
British Pound, Expiring 01/13/09 | | GBP 561 | | | 830,928 | | | 806,273 | | | 24,655 | |
Euro, Expiring 01/13/09 | | EUR 2,973 | | | 3,776,306 | | | 4,130,125 | | | (353,819 | ) |
Mexican Pesos, Expiring 05/19/09 | | MXN 57 | | | 4,181 | | | 3,962 | | | 219 | |
Malaysian Ringgit,
Expiring 02/12/09 | | MYR 2,166 | | | 602,000 | | | 625,137 | | | (23,137 | ) |
Expiring 04/14/09 | | MYR 1,235 | | | 353,546 | | | 356,384 | | | (2,838 | ) |
Philippines Peso,
Expiring 02/06/09 | | PHP 19,811 | | | 391,859 | | | 414,816 | | | (22,957 | ) |
Expiring 05/06/09 | | PHP 9,682 | | | 187,674 | | | 201,439 | | | (13,765 | ) |
Expiring 12/23/10 | | PHP 500 | | | 10,346 | | | 9,681 | | | 665 | |
Russian Ruble, Expiring 05/06/09 | | RUB 59,763 | | | 2,130,921 | | | 1,733,101 | | | 397,820 | |
Singapore Dollar,
Expiring 04/14/09 | | SGD 1,276 | | | 863,097 | | | 884,627 | | | (21,530 | ) |
Expiring 07/30/09 | | SGD 217 | | | 151,312 | | | 150,301 | | | 1,011 | |
| | | | |
|
| |
|
| |
|
|
|
| | | | | $ | 11,226,027 | | $ | 11,277,797 | | $ | (51,770 | ) |
| | | | |
|
| |
|
| |
|
|
|
SEE NOTES TO FINANCIAL STATEMENTS.
A37
| | | | | | |
| | | SP PIMCO HIGH YIELD PORTFOLIO (continued) | | |
| |
| SCHEDULE OF INVESTMENTS | | December 31, 2008 |
Interest rate swap agreements outstanding at December 31, 2008:
| | | | | | | | | | | | | |
Counterparty
| | Termination
Date
| | Notional
Amount#
(000)
| | Fixed
Rate
| | Floating Rate
| | Unrealized
Appreciation
(Depreciation)
| |
Barclays Bank PLC(1) | | 06/17/10 | | $ | 6,400 | | 4.00% | | 3 month LIBOR | | $ | 30,902 | |
Barclays Bank PLC(1) | | 06/17/16 | | | 120 | | 4.00% | | 3 month LIBOR | | | 2,184 | |
Barclays Bank PLC(2) | | 12/17/28 | | | 900 | | 5.00% | | 3 month LIBOR | | | (303,201 | ) |
Citigroup(2) | | 12/17/28 | | | 4,400 | | 5.00% | | 3 month LIBOR | | | (1,501,423 | ) |
Citigroup(2) | | 12/17/38 | | | 2,700 | | 5.00% | | 3 month LIBOR | | | (1,227,194 | ) |
Credit Suisse International, Ltd.(1) | | 06/17/14 | | | 4,200 | | 4.00% | | 3 month LIBOR | | | 160,472 | |
Credit Suisse International, Ltd.(2) | | 06/17/24 | | | 1,000 | | 4.00% | | 3 month LIBOR | | | (18,841 | ) |
Deutsche Bank(1) | | 09/17/11 | | | 22,200 | | 4.00% | | 3 month LIBOR | | | 342,922 | |
Merrill Lynch & Co.(2) | | 12/17/38 | | | 1,700 | | 5.00% | | 3 month LIBOR | | | (809,323 | ) |
Morgan Stanley Capital Services, Inc.(2) | | 12/17/38 | | | 2,400 | | 5.00% | | 3 month LIBOR | | | (1,105,745 | ) |
Barclays Bank PLC(1) | | 01/02/12 | | | BRL 11,800 | | 10.68% | | Brazilian interbank lending rate | | | (194,090 | ) |
Goldman Sachs(1) | | 01/02/12 | | | BRL 1,700 | | 10.15% | | Brazilian interbank lending rate | | | (37,778 | ) |
Merrill Lynch & Co.(1) | | 01/02/12 | | | BRL 1,000 | | 14.77% | | Brazilian interbank lending rate | | | 13,842 | |
Morgan Stanley Capital Services, Inc.(1) | | 01/02/12 | | | BRL 16,500 | | 10.12% | | Brazilian interbank lending rate | | | (426,899 | ) |
| | | | | | | | | | | |
|
|
|
| | | | | | | | | | | | $ | (5,074,172 | ) |
| | | | | | | | | | | |
|
|
|
| (1) | Portfolio pays the floating rate and receives the fixed rate. |
| (2) | Portfolio pays the fixed rate and receives the floating rate. |
| # | Notional Amount is shown in U.S. dollars unless otherwise stated. |
Credit default swap agreements outstanding at December 31, 2008:
| | | | | | | | | | | | | | | | | | | | |
Counterparty
| | Termination
Date
| | Notional
Amount#
(000)(2)
| | Fixed
Rate
| | Reference Entity/Obligation
| | Fair
Value(4)
| | | Upfront
Premiums
Paid
(Received)
| | Unrealized
(Depreciation)
| |
Credit default swaps on credit indices—Sell Protection(1) | |
Morgan Stanley Capital Services, Inc. | | 12/20/10 | | $ | 294 | | 1.55% | | Dow Jones CDX HY-9 Index | | $ | (3,655 | ) | | $ | — | | $ | (3,655 | ) |
| | | | | | | | | | | | | | | | | | |
|
|
|
| | | | | | | | | | | | | | | | | | | | | | | |
Counterparty
| | Termination
Date
| | Notional
Amount#
(000)(2)
| | Fixed
Rate
| | Reference Entity/Obligation
| | Implied
Credit
Spread at
December 31,
2008(3)
| | Fair
Value
| | | Upfront
Premiums
Paid
(Received)
| | | Unrealized
Appreciation
(Depreciation)
| |
Credit default swaps on Corporate and/or Sovereign Issues—Sell Protection(1) | |
Goldman Sachs | | 09/20/13 | | $ | 400 | | 4.50% | | Aramark Services, Inc.,
8.50%, due 02/01/15 | | 6.329% | | $ | (26,495 | ) | | $ | — | | | $ | (26,495 | ) |
Merrill Lynch & Co. | | 09/20/13 | | | 3,000 | | 5.00% | | GMAC LLC,
6.875%, due 08/28/12 | | 8.063% | | | (327,833 | ) | | | (710,024 | ) | | | 382,191 | |
Goldman Sachs | | 09/20/13 | | | 100 | | 4.20% | | NRG Energy, Inc.,
7.25%, due 02/01/14 | | 5.538% | | | (5,098 | ) | | | — | | | | (5,098 | ) |
Barclays Bank PLC | | 03/20/09 | | | 500 | | 0.74% | | OJSC Russian Agricultural Bank, 6.875%, due 11/29/10 | | 11.299% | | | (10,452 | ) | | | — | | | | (10,452 | ) |
Barclays Bank PLC | | 02/20/09 | | | 1,000 | | 0.76% | | OJSC Russian Agricultural Bank, 6.875%, due 11/29/10 | | 11.292% | | | (12,190 | ) | | | — | | | | (12,190 | ) |
Credit Suisse International, LTD. | | 09/20/12 | | | 150 | | 4.22% | | Sanmina-SCI Corp.,
8.125%, due 03/01/16 | | 16.332% | | | (42,461 | ) | | | — | | | | (42,461 | ) |
Barclays Bank PLC | | 06/20/09 | | | 500 | | 7.15% | | Sprint Nextel Corp.,
6.00%, due 12/01/16 | | 13.737% | | | (13,642 | ) | | | — | | | | (13,642 | ) |
Deutsche Bank | | 09/20/13 | | | 850 | | 4.50% | | Sungard Data Systems, Inc.,
9.125%, due 08/15/13 | | 8.418% | | | (110,143 | ) | | | — | | | | (110,143 | ) |
| | | | | | | | | | | | | |
|
|
| |
|
|
| |
|
|
|
| | | | | | | | | | | | | | $ | (548,314 | ) | | $ | (710,024 | ) | | $ | 161,710 | |
| | | | | | | | | | | | | |
|
|
| |
|
|
| |
|
|
|
The Portfolio entered into credit default swap agreements on corporate issues, sovereign issues and credit indices as the protection seller to provide a measure of protection against the current portfolio of investments’ exposure to market conditions, or to take an active position with respect to the likelihood of a particular issuer’s default or the referenced entity’s credit soundness.
SEE NOTES TO FINANCIAL STATEMENTS.
A38
| | | | | | |
| | | SP PIMCO HIGH YIELD PORTFOLIO (continued) | | |
| |
| SCHEDULE OF INVESTMENTS | | December 31, 2008 |
Credit default swap agreements outstanding at December 31, 2008 (continued):
| (1) | If the Portfolio is a seller of protection, it receives the fixed rate. When a credit event occurs, as defined under the terms of that particular swap agreement, the Portfolio will either (i) pay to the buyer of protection an amount equal to the notional amount of the swap and take delivery of the referenced obligation or underlying securities comprising the referenced index or (ii) pay a net settlement amount in the form of cash or securities equal to the notional amount of the swap less the recovery value of the referenced obligation or underlying securities comprising the referenced index. |
| (2) | Notional amount represents the maximum potential amount the Portfolio could be required to make as a seller of credit protection or receive as a buyer of credit protection if a credit event occurs as defined under the terms of that particular swap agreement. |
| (3) | Implied credit spreads, represented in absolute terms, utilized in determining the market value of credit default swap agreements on corporate issues or sovereign issues of an emerging country as of period end serve as an indicator of the current status of the payment/performance risk and represent the likelihood of risk of default for the credit derivative. The implied credit spread of a particular referenced entity reflects the cost of buying/selling protection and may include up-front payments required to be made to enter into the agreement. Wider credit spreads represent a deterioration of the referenced entity's credit soundness and a greater likelihood of risk of default or other credit event occurring as defined under the terms of the agreement. |
| (4) | The fair values for credit default swap agreements on asset-backed securities and credit indices serve as an indicator of the current status of the payment/performance risk and represent the likelihood of an expected liability (or profit) for the credit derivative should the notional amount of the swap agreement been closed/sold as of the reporting date. |
| # | Notional Amount is shown in U.S. dollars unless otherwise stated. |
Various inputs are used in determining the value of the Portfolio’s investments. These inputs are summarized in the three broad levels listed below.
Level 1—quoted prices in active markets for identical securities
Level 2—other significant observable inputs (including quoted prices for similar securities, interest rates, prepayment speeds, credit risk, etc.)
Level 3—significant unobservable inputs (including the Portfolio’s own assumptions in determining the fair value of investments)
The following is a summary of the inputs used as of December 31, 2008 in valuing the Portfolio’s assets carried at fair value:
| | | | | | | | |
Valuation inputs
| | Investments
in Securities
| | | Other Financial
Instruments*
| |
Level 1—Quoted Prices | | $ | 5,838,389 | | | $ | 5,625 | |
Level 2—Other Significant Observable Inputs-Long | | | 137,259,395 | | | | (5,835,175 | ) |
Level 2—Other Significant Observable Inputs-Short | | | (7,783,838 | ) | | | — | |
Level 3—Significant Unobservable Inputs | | | 92,362 | | | | — | |
| | |
|
|
| |
|
|
|
Total | | $ | 135,406,308 | | | $ | (5,829,550 | ) |
| | |
|
|
| |
|
|
|
| * | Other financial instruments are derivative instruments not reflected in the Schedule of Investments, such as futures, forwards and swap contracts, which are valued at the unrealized appreciation/depreciation on the instrument. |
The following is a reconciliation of assets in which significant unobservable inputs (Level 3) were used in determining fair value:
| | | | |
| | | Investments
in Securities
| |
Balance as of 12/31/07 | | $ | 6,339 | |
Accrued discounts/premiums | | | 679 | |
Realized gain (loss) | | | (1,081 | ) |
Change in unrealized appreciation (depreciation) | | | (27,062 | ) |
Net purchases (sales) | | | (27,951 | ) |
Transfers in and/or out of Level 3 | | | 141,438 | |
| | |
|
|
|
Balance as of 12/31/08 | | $ | 92,362 | |
| | |
|
|
|
SEE NOTES TO FINANCIAL STATEMENTS.
A39
| | | | | | |
| | | SP PIMCO HIGH YIELD PORTFOLIO (continued) | | |
| |
| SCHEDULE OF INVESTMENTS | | December 31, 2008 |
The industry classification of investments and other liabilities in excess of other assets shown as a percentage of net assets as December 31, 2008 were as follows:
| | | |
Industry
| | | |
Diversified Financial Services | | 13.4 | % |
Telecommunications | | 7.3 | |
Financial – Bank & Trust | | 6.3 | |
Utilities | | 6.0 | |
Bank Notes | | 6.0 | |
Media | | 5.9 | |
Options Purchased | | 5.7 | |
Electric | | 4.0 | |
Hospitals/Hospital Management | | 3.9 | |
U.S. Treasury Obligations | | 3.4 | |
U.S. Government Mortgage-Backed Obligations | | 3.1 | |
Affiliated Money Market Mutual Fund | | 3.1 | |
Forest & Paper Products | | 3.1 | |
Automotive | | 2.8 | |
Municipal Bonds | | 2.5 | |
Healthcare Products | | 2.5 | |
Pipelines & Other | | 2.2 | |
Computer Services & Software | | 2.1 | |
Retail | | 2.0 | |
Insurance | | 1.7 | |
Oil & Gas Exploration/Production | | 1.7 | |
Oil, Gas & Consumable Fuels | | 1.4 | |
Collateralized Mortgage Obligations | | 1.4 | |
Healthcare Services | | 1.4 | |
Commercial Services | | 1.2 | |
Convertible Bonds | | 1.1 | |
Chemicals | | 1.1 | |
Semiconductors | | 1.0 | |
Containers & Packaging | | 1.0 | |
Foods | | 0.9 | |
Gaming | | 0.8 | |
Business Services | | 0.8 | |
Electronic Components | | 0.8 | |
Metals & Mining | | 0.8 | |
Technology | | 0.7 | |
Real Estate Investment Trusts | | 0.6 | |
Capital Goods | | 0.6 | |
Commercial Paper | | 0.6 | |
Diversified Manufacturing | | 0.6 | |
Banks | | 0.5 | |
Services Cyclical – Rental Equipment | | 0.5 | |
Cable | | 0.4 | |
Advertising | | 0.4 | |
Machinery & Equipment | | 0.3 | |
Paper & Forest Products | | 0.3 | |
Asset-Backed Securities | | 0.2 | |
Environmental Services | | 0.2 | |
Airlines | | 0.1 | |
| | |
|
|
| | | 108.4 | |
Options Written | | (5.9 | ) |
Other liabilities in excess of other assets | | (2.5 | ) |
| | |
|
|
| | | 100.0 | % |
| | |
|
|
SEE NOTES TO FINANCIAL STATEMENTS.
A40
| | | | | | |
| | | SP PIMCO HIGH YIELD PORTFOLIO (continued) | | |
STATEMENT OF ASSETS AND LIABILITIES
December 31, 2008
| | | | |
| ASSETS | | | | |
Investments at value: | | | | |
Unaffiliated investments (cost $185,013,723) | | $ | 139,080,004 | |
Affiliated investments (cost $4,110,142) | | | 4,110,142 | |
Cash | | | 2,492,243 | |
Foreign currency, at value (cost $34,403) | | | 33,010 | |
Receivable for investments sold | | | 44,960,140 | |
Dividends and interest receivable | | | 3,338,528 | |
Unrealized appreciation on swap agreements | | | 932,513 | |
Unrealized appreciation on foreign currency forward contracts | | | 456,777 | |
Payments made for swap agreements | | | 164,204 | |
Receivable for Series shares sold | | | 54,997 | |
Prepaid expenses | | | 1,794 | |
| | |
|
|
|
Total Assets | | | 195,624,352 | |
| | |
|
|
|
| LIABILITIES | | | | |
Payable for investments purchased | | | 48,411,037 | |
Written options outstanding, at value (premium received $1,316,570) | | | 7,783,838 | |
Unrealized depreciation on swap agreements | | | 5,848,630 | |
Unrealized depreciation on foreign currency forward contracts | | | 1,375,835 | |
Accrued expenses and other liabilities | | | 98,516 | |
Management fee payable | | | 62,421 | |
Deferred trustees’ fees | | | 1,875 | |
Payments received for swap agreements | | | 1,073 | |
Transfer agent fees payable | | | 773 | |
Payable for Series shares repurchased | | | 630 | |
Due to broker-variation margin | | | 88 | |
| | |
|
|
|
Total Liabilities | | | 63,584,716 | |
| | |
|
|
|
| NET ASSETS | | $ | 132,039,636 | |
| | |
|
|
|
Net assets were comprised of: | | | | |
Paid-in capital | | $ | 197,755,636 | |
Retained earnings | | | (65,716,000 | ) |
| | |
|
|
|
Net assets, December 31, 2008 | | $ | 132,039,636 | |
| | |
|
|
|
Net asset value and redemption price per share, $132,039,636 / 19,720,185 outstanding shares of beneficial interest | | $ | 6.70 | |
| | |
|
|
|
STATEMENT OF OPERATIONS
Year Ended December 31, 2008
| | | | |
| INVESTMENT INCOME | | | | |
Interest income | | $ | 15,255,066 | |
Unaffiliated dividend income | | | 173,838 | |
Affiliated dividend income | | | 27,860 | |
| | |
|
|
|
| | | | 15,456,764 | |
| | |
|
|
|
| EXPENSES | | | | |
Management fee | | | 1,075,118 | |
Custodian’s fees and expenses | | | 126,500 | |
Audit fee | | | 44,000 | |
Shareholders’ reports | | | 30,500 | |
Trustees’ fees | | | 13,000 | |
Legal fees and expenses | | | 7,000 | |
Transfer agent’s fees and expenses (including affiliated expense of $4,000) (Note 4) | | | 4,000 | |
Insurance expenses | | | 3,000 | |
Commitment fee on syndicated credit agreement | | | 2,000 | |
Miscellaneous | | | 14,736 | |
| | |
|
|
|
Total expenses | | | 1,319,854 | |
| | |
|
|
|
| NET INVESTMENT INCOME | | | 14,136,910 | |
| | |
|
|
|
| NET REALIZED AND UNREALIZED GAIN (LOSS) ON INVESTMENTS AND FOREIGN CURRENCIES | | | | |
Net realized gain (loss) on: | | | | |
Investment transactions | | | (8,601,628 | ) |
Futures transactions | | | 415,723 | |
Options written transactions | | | 1,174,980 | |
Swap agreement transactions | | | (1,224,538 | ) |
Foreign currency transactions | | | 143,127 | |
| | |
|
|
|
| | | | (8,092,336 | ) |
| | |
|
|
|
Net change in unrealized appreciation (depreciation) on: | | | | |
Investments | | | (45,079,113 | ) |
Futures | | | (159,825 | ) |
Options written | | | (5,080,549 | ) |
Swap agreements | | | (3,668,779 | ) |
Foreign currencies | | | (1,062,084 | ) |
| | |
|
|
|
| | | | (55,050,350 | ) |
| | |
|
|
|
| NET LOSS ON INVESTMENTS AND FOREIGN CURRENCIES | | | (63,142,686 | ) |
| | |
|
|
|
| NET DECREASE IN NET ASSETS RESULTING FROM OPERATIONS | | $ | (49,005,776 | ) |
| | |
|
|
|
STATEMENT OF CHANGES IN NET ASSETS
| | | | | | | | |
| | | Year Ended December 31,
| |
| | | 2008
| | | 2007
| |
| INCREASE (DECREASE) IN NET ASSETS | | | | | | | | |
| OPERATIONS: | | | | | | | | |
Net investment income | | $ | 14,136,910 | | | $ | 16,906,097 | |
Net realized gain (loss) on investments and foreign currency transactions | | | (8,092,336 | ) | | | 193,278 | |
Net change in unrealized appreciation (depreciation) on investments and foreign currencies | | | (55,050,350 | ) | | | (8,467,395 | ) |
| | |
|
|
| |
|
|
|
NET INCREASE (DECREASE) IN NET ASSETS RESULTING FROM OPERATIONS | | | (49,005,776 | ) | | | 8,631,980 | |
| | |
|
|
| |
|
|
|
| DISTRIBUTIONS | | | (14,819,386 | ) | | | (19,316,825 | ) |
| | |
|
|
| |
|
|
|
| SERIES SHARE TRANSACTIONS: | | | | | | | | |
Series shares sold [1,389,047 and 974,027 shares, respectively] | | | 13,052,609 | | | | 10,047,357 | |
Series shares issued in reinvestment of distributions [1,796,984 and 1,921,263 shares, respectively] | | | 14,819,386 | | | | 19,316,825 | |
Series shares repurchased [4,415,455 and 8,500,462 shares, respectively] | | | (38,000,243 | ) | | | (87,117,703 | ) |
| | |
|
|
| |
|
|
|
DECREASE IN NET ASSETS RESULTING FROM SERIES SHARE TRANSACTIONS | | | (10,128,248 | ) | | | (57,753,521 | ) |
| | |
|
|
| |
|
|
|
| TOTAL DECREASE IN NET ASSETS | | | (73,953,410 | ) | | | (68,438,366 | ) |
| NET ASSETS: | | | | | | | | |
Beginning of year | | | 205,993,046 | | | | 274,431,412 | |
| | |
|
|
| |
|
|
|
End of year | | $ | 132,039,636 | | | $ | 205,993,046 | |
| | |
|
|
| |
|
|
|
SEE NOTES TO FINANCIAL STATEMENTS.
A41
| | | | | | |
| | | SP PIMCO TOTAL RETURN PORTFOLIO | | |
| |
| SCHEDULE OF INVESTMENTS | | December 31, 2008 |
| | | | | | | | | | | | | | |
LONG-TERM INVESTMENTS — 174.2%
ASSET-BACKED SECURITIES(c) — 1.0% | | Moody’s
Ratings†
(Unaudited)
| | Interest
Rate
| | | Maturity
Date
| | Principal
Amount
(000)#
| | | Value
(Note 2)
|
| | | | | | | | | | | | | | | |
Asset Backed Securities Corp. Home Equity, Series 2004-HE6, Class A1 | | Aaa | | 0.746% | | | 09/25/34 | | $ | 614 | | | $ | 480,651 |
Aurum CLO 2002-1 Ltd./Aurum CLO 2002-1 Corp., Series 2002-1A, Class A1, 144A (original cost $1,475,206; purchased 12/05/08)(g)(l) | | Aaa | | 5.183% | | | 04/15/14 | | | 1,731 | | | | 1,633,245 |
Countrywide Asset-Backed Certificates, Series 2006-SD1, Class A1, 144A (original cost $467,348; purchased 02/17/06)(g)(l) | | AAA(d) | | 0.631% | | | 02/25/36 | | | 467 | | | | 436,173 |
MBNA Credit Card Master Note Trust, Series 2004-A7, Class A7 | | Aaa | | 1.295% | | | 12/15/11 | | | 2,000 | | | | 1,942,909 |
Merrill Lynch Mortgage Investors, Inc., Series 2006-FF1, Class A2A | | Aaa | | 0.541% | | | 08/25/36 | | | 1,435 | | | | 1,351,696 |
Morgan Stanley IXIS Real Estate Capital Trust, Series 2006-2, Class A1 | | Aaa | | 0.521% | | | 11/25/36 | | | 491 | | | | 459,641 |
Soundview Home Equity Loan Trust, Series 2007-OPT5, Class 2A1 | | Aaa | | 1.271% | | | 10/25/37 | | | 1,348 | | | | 1,201,698 |
Structured Asset Securities Corp., Series 2006-BC3, Class A2 | | Aaa | | 0.521% | | | 10/25/36 | | | 3,337 | | | | 3,084,162 |
| | | | | | | | | | | | | |
|
|
TOTAL ASSET-BACKED SECURITIES
(cost $10,739,644) | | | | 10,590,175 |
| | | | | | | | | | | | | |
|
|
| BANK NOTES(c) — 2.7% | | | | | | | | | | | | | | |
Chrysler Financial, Term, 144A (original cost $27,956,125; purchased 07/31/07, 11/28/07)(g)(l) | | CAA(d) | | 6.00% | | | 08/03/14 | | | 29,427 | | | | 14,818,836 |
CSC Holdings, Inc., Term B (original cost $1,777,939; purchased 02/11/08, 02/12/08)(g)(l) | | BAA-(d) | | 2.95% | | | 02/24/13 | | | 1,980 | | | | 1,681,872 |
First Data Corp., Term B2 (original cost $53,087; purchased 02/13/08)(g)(l) | | BA-(d) | | 3.21% | | | 09/24/14 | | | 59 | | | | 37,771 |
First Data Corp., Term B2 (original cost $884,124; purchased 02/13/08)(g)(l) | | BA-(d) | | 3.21% | | | 09/24/14 | | | 931 | | | | 596,166 |
HCA, Inc., Term B (original cost $7,767,218; purchased 07/24/07, 02/12/08)(g)(l) | | BA-(d) | | 3.71% | | | 11/14/13 | | | 8,082 | | | | 6,319,388 |
Metro Goldwyn, Term B1 (original cost $3,930,000; purchased 03/14/07)(g)(l) | | BA-(d) | | 4.71% | | | 04/08/12 | | | 3,930 | | | | 1,611,300 |
NRG Energy, Inc., Term B (original cost $4; purchased 02/11/08, 02/12/08)(g)(l) | | BA+(d) | | 2.96% | | | 02/01/13 | | | — | (r) | | | 4 |
TXU Corp., Term B3 (original cost $20,551; purchased 08/28/08)(g)(l) | | BA-(d) | | 3.96% | | | 10/10/14 | | | 21 | | | | 14,206 |
TXU Corp., Term B3 (original cost $3,934,368; purchased
01/15/08-08/28/08)(g)(l) | | BA-(d) | | 5.37% | | | 10/10/14 | | | 4,038 | | | | 2,791,507 |
| | | | | | | | | | | | | |
|
|
TOTAL BANK NOTES
(cost $46,680,462) | | | | 27,871,050 |
| | | | | | | | | | | | | |
|
|
| COLLATERALIZED MORTGAGE OBLIGATIONS — 6.7% | | | | | | | | | | | | |
Asset Backed Funding Certificates, Series 2006-OPT3, Class A3A | | Aaa | | 0.531% | (c) | | 11/25/36 | | | 493 | | | | 468,436 |
Banc of America Mortgage Securities, Inc., Series 2004-2, Class 5A1 | | Aaa | | 6.50% | | | 10/25/31 | | | 127 | | | | 117,224 |
Bear Stearns Adjustable Rate Mortgage Trust, Series 2002-11, Class 1A1 | | Aaa | | 5.605% | (c) | | 02/25/33 | | | 361 | | | | 290,326 |
Bear Stearns Adjustable Rate Mortgage Trust, Series 2005-2, Class A2 | | Aaa | | 4.125% | (c) | | 03/25/35 | | | 4,125 | | | | 3,212,241 |
Bear Stearns Adjustable Rate Mortgage Trust, Series 2005-4, Class 23A2 | | Aaa | | 5.366% | (c) | | 05/25/35 | | | 2,634 | | | | 1,819,493 |
Bear Stearns Alt-A Trust, Series 2006-2, Class 23A1 | | Aaa | | 5.85% | (c) | | 03/25/36 | | | 766 | | | | 352,354 |
Brazos Student Finance Corp., Series 1998-A, Class A2 | | NR | | 2.70% | (c) | | 06/01/23 | | | 21 | | | | 20,251 |
Citigroup Mortgage Loan Trust, Inc., Series 2005-10, Class 1A2A | | Aaa | | 5.345% | (c) | | 12/25/35 | | | 653 | | | | 360,156 |
Countrywide Alternative Loan Trust, Series 2005-63, Class 3A1 | | Aaa | | 5.889% | | | 11/25/35 | | | 734 | | | | 351,104 |
Countrywide Alternative Loan Trust, Series 2007-OA7, Class A1A | | Aaa | | 0.651% | (c) | | 05/25/47 | | | 4,220 | | | | 1,732,302 |
Countrywide Alternative Loan Trust, Series 2006-OA16, Class A3 | | Aaa | | 0.721% | (c) | | 10/25/46 | | | 632 | | | | 131,867 |
Countrywide Alternative Loan Trust, Series 2006-OA19, Class A1 | | Aaa | | 0.688% | (c) | | 02/20/47 | | | 5,659 | | | | 2,321,241 |
Countrywide Alternative Loan Trust, Series 2006-OA3, Class 2A2 | | Baa1 | | 0.741% | (c) | | 05/25/36 | | | 618 | | | | 163,027 |
Countrywide Home Loan Mortgage Pass-Through Trust,
Series 2005-HYB6, Class 5A1 | | Aaa | | 5.367% | (c) | | 10/20/35 | | | 821 | | | | 424,591 |
Countrywide Home Loan Mortgage Pass-Through Trust, Series 2006-3, Class 2A2 | | Aaa | | 0.811% | (c) | | 03/25/36 | | | 1,009 | | | | 248,318 |
SEE NOTES TO FINANCIAL STATEMENTS.
A42
| | | | | | |
| | | SP PIMCO TOTAL RETURN PORTFOLIO (continued) | | |
| |
| SCHEDULE OF INVESTMENTS | | December 31, 2008 |
| | | | | | | | | | | | | |
COLLATERALIZED MORTGAGE OBLIGATIONS
(continued) | | Moody’s
Ratings†
(Unaudited)
| | Interest
Rate
| | | Maturity
Date
| | Principal
Amount
(000)#
| | Value
(Note 2)
|
| | | | | | | | | | | | | | |
Countrywide Home Loan Mortgage Pass-Through Trust, Series 2006-3, Class 3A2 | | Baa3 | | 0.821% | (c) | | 02/25/36 | | $ | 573 | | $ | 129,402 |
Countrywide Home Loan Mortgage Pass-Through Trust,
Series 2006-HYB3, Class 3A1B | | Aaa | | 5.764% | (c) | | 05/20/36 | | | 1,662 | | | 829,653 |
Deutsche Alt-A Securities, Inc. Alternate Loan Trust, Series 2006-AB3, Class A5B | | Aaa | | 6.30% | | | 07/25/36 | | | 900 | | | 496,164 |
Downey Savings & Loan Association Mortgage Loan Trust,
Series 2005-AR3, Class 2A2 | | A2 | | 0.901% | (c) | | 07/19/45 | | | 624 | | | 186,152 |
Fannie Mae, Series 2001-29, Class Z | | Aaa | | 6.50% | | | 07/25/31 | | | 216 | | | 223,724 |
FHLMC Structured Pass-Through Securities, Series T-61, Class 1A1 | | Aaa | | 3.655% | (c) | | 07/25/44 | | | 2,121 | | | 1,912,651 |
FHLMC Structured Pass-Through Securities, Series T-62, Class 1A1 | | Aaa | | 3.455% | (c) | | 10/25/44 | | | 1,394 | | | 1,335,695 |
Freddie Mac, Series 3346, Class FA | | Aaa | | 1.425% | (c) | | 02/15/19 | | | 8,826 | | | 8,478,000 |
Government Lease Trust, Series 1999-C1A, Class B2, 144A
(original cost $1,346,953; purchased 02/14/03)(g)(l) | | AAA(d) | | 4.00% | | | 05/18/11 | | | 1,500 | | | 1,463,164 |
Government National Mortgage Assoc., Series 2000-14, Class F | | Aaa | | 1.699% | (c) | | 02/16/30 | | | 16 | | | 15,673 |
Greenpoint Mortgage Funding Trust, Series 2006-AR3, Class 4A2 | | Aaa | | 0.741% | (c) | | 04/25/36 | | | 850 | | | 273,218 |
Greenpoint Mortgage Funding Trust, Series 2006-AR6, Class A1A | | Aaa | | 0.551% | (c) | | 10/25/46 | | | 2,546 | | | 2,043,900 |
GSR Mortgage Loan Trust, Series 2005-AR6, Class 2A1 | | AAA(d) | | 4.54% | (c) | | 09/25/35 | | | 5,020 | | | 3,700,637 |
Harborview Mortgage Loan Trust, Series 2006-7, Class 2A1B | | Aaa | | 0.831% | (c) | | 09/19/46 | | | 810 | | | 185,463 |
Harborview Mortgage Loan Trust, Series 2006-12, Class 2A11 | | Aaa | | 0.671% | (c) | | 01/19/38 | | | 891 | | | 797,460 |
Homebanc Mortgage Trust, Series 2006-2, Class A1 | | Aaa | | 0.651% | (c) | | 12/25/36 | | | 970 | | | 377,497 |
Impac Secured Assets CMN Owner Trust, Series 2006-4, Class A2A | | Aa2 | | 0.551% | (c) | | 01/25/37 | | | 161 | | | 150,026 |
Indymac Adjustable Rate Mortgage Trust, Series 2001-H2, Class A1 | | Aaa | | 4.446% | (c) | | 01/25/32 | | | 4 | | | 4,236 |
Indymac Index Mortgage Loan Trust, Series 2005-AR7, Class 4A1 | | Aaa | | 5.279% | (c) | | 06/25/35 | | | 691 | | | 394,384 |
Indymac Index Mortgage Loan Trust, Series 2005-AR15, Class A2 | | Aaa | | 5.099% | | | 09/25/35 | | | 696 | | | 334,057 |
Lehman XS Trust, Series 2006-14N, Class 1A2(i) | | Aaa | | 0.711% | (c) | | 09/25/46 | | | 938 | | | 206,208 |
Lehman XS Trust, Series 2006-16N, Class A4B(i) | | Aaa | | 0.711% | (c) | | 11/25/46 | | | 902 | | | 194,079 |
Lehman XS Trust, Series 2006-GP2, Class 3A2(i) | | Aaa | | 0.701% | (c) | | 06/25/46 | | | 828 | | | 200,595 |
Master Asset Securitization Trust, Series 2003-7, Class 1A2 | | AAA(d) | | 5.50% | | | 09/25/33 | | | 2,332 | | | 2,204,006 |
Mastr Reperforming Loan Trust, Series 2006-1, Class 1A4, 144A (original cost $1,285,444; purchased 12/05/08)(g)(l) | | Aaa | | 8.00% | | | 07/25/35 | | | 1,330 | | | 1,476,559 |
Merrill Lynch Alternative Note Asset, Series 2007-A2, Class A3C | | B3 | | 0.771% | (c) | | 03/25/37 | | | 1,000 | | | 275,179 |
Merrill Lynch Floating Trust, Series 2006-1, Class A1, 144A
(original cost $1,440,298; purchased 10/31/06)(g)(l) | | Aaa | | 1.265% | (c) | | 06/15/22 | | | 1,440 | | | 1,092,546 |
Merrill Lynch Mortgage Backed Securities Trust, Series 2007-1, Class 2A1 | | AA(d) | | 5.849% | (c) | | 04/25/37 | | | 1,783 | | | 1,273,534 |
Merrill Lynch Mortgage Investors, Inc., Series 2005-A10, Class A | | Aaa | | 0.681% | (c) | | 02/25/36 | | | 2,237 | | | 1,190,186 |
Morgan Stanley Mortgage Loan Trust, Series 2006-12XS, Class A6A | | Aaa | | 5.726% | | | 10/25/36 | | | 600 | | | 397,198 |
Morgan Stanley Mortgage Loan Trust, Series 2007-7AX, Class 2A3 | | Ba3 | | 0.831% | (c) | | 04/25/37 | | | 1,800 | | | 653,708 |
Nomura Asset Acceptance Corp., Series 2007-1, Class 1A4 | | Aa3 | | 6.138% | | | 03/25/47 | | | 700 | | | 331,781 |
Nomura Asset Acceptance Corp., Series 2007-1, Class 1A6 | | Aa3 | | 5.82% | | | 03/25/47 | | | 700 | | | 476,475 |
Opteum Mortgage Acceptance Corp., Series 2005-3, Class A1B | | Aaa | | 0.731% | (c) | | 07/25/35 | | | 782 | | | 646,369 |
Residential Accredit Loans, Inc., Series 2007-QH4, Class A2 | | Aaa | | 0.701% | (c) | | 05/25/37 | | | 1,225 | | | 263,061 |
Residential Funding Mortgage Securities I, Series 2003-S9, Class A1 | | Aaa | | 6.50% | | | 03/25/32 | | | 370 | | | 355,011 |
Structured Adjustable Rate Mortgage Loan Trust, Series 2006-1, Class 8A1 | | A(d) | | 5.95% | (c) | | 02/25/36 | | | 682 | | | 323,506 |
Structured Asset Mortgage Investments, Inc., Series 2006-AR5, Class 1A2 | | Aaa | | 0.731% | (c) | | 05/25/46 | | | 615 | | | 165,445 |
Structured Asset Mortgage Investments, Inc., Series 2006-AR5, Class 2A2 | | Aaa | | 0.731% | (c) | | 05/25/46 | | | 809 | | | 236,418 |
Structured Asset Mortgage Investments, Inc., Series 2006-AR7, Class A1BG | | Aaa | | 0.591% | (c) | | 08/25/36 | | | 4,976 | | | 1,990,147 |
Thornburg Mortgage Securities Trust, Series 2003-2, Class A1 | | Aaa | | 1.151% | (c) | | 04/25/43 | | | 336 | | | 292,478 |
WaMu Mortgage Pass-Through Certificates, Series 2002-AR17, Class 1A | | Aaa | | 3.456% | (c) | | 11/25/42 | | | 512 | | | 421,803 |
WaMu Mortgage Pass-Through Certificates, Series 2003-AR9, Class 2A | | Aaa | | 4.493% | (c) | | 09/25/33 | | | 536 | | | 461,319 |
SEE NOTES TO FINANCIAL STATEMENTS.
A43
| | | | | | |
| | | SP PIMCO TOTAL RETURN PORTFOLIO (continued) | | |
| |
| SCHEDULE OF INVESTMENTS | | December 31, 2008 |
| | | | | | | | | | | | | |
COLLATERALIZED MORTGAGE OBLIGATIONS
(continued) | | Moody’s
Ratings†
(Unaudited)
| | Interest
Rate
| | | Maturity
Date
| | Principal
Amount
(000)#
| | Value
(Note 2)
|
| | | | | | | | | | | | | | |
WaMu Mortgage Pass-Through Certificates, Series 2003-R1, Class A1 | | Aaa | | 1.011% | (c) | | 12/25/27 | | $ | 8,279 | | $ | 6,855,427 |
WaMu Mortgage Pass-Through Certificates, Series 2004-AR13, Class A1B2 | | Aaa | | 0.865% | (c) | | 11/25/34 | | | 1,559 | | | 521,472 |
WaMu Mortgage Pass-Through Certificates, Series 2005-AR13, Class A1A1 | | Aaa | | 0.761% | (c) | | 10/25/45 | | | 2,760 | | | 1,507,207 |
WaMu Mortgage Pass-Through Certificates, Series 2005-AR15, Class A1B2 | | Aaa | | 0.881% | (c) | | 11/25/45 | | | 700 | | | 160,690 |
WaMu Mortgage Pass-Through Certificates, Series 2005-AR17, Class A1B2 | | Aaa | | 0.881% | (c) | | 12/25/45 | | | 700 | | | 137,775 |
WaMu Mortgage Pass-Through Certificates, Series 2006-AR10, Class 1A1 | | AAA(d) | | 5.917% | (c) | | 09/25/36 | | | 1,033 | | | 597,469 |
WaMu Mortgage Pass-Through Certificates, Series 2006-AR16,
Class 1A1 | | AAA(d) | | 5.594% | (c) | | 12/25/36 | | | 293 | | | 169,222 |
WaMu Mortgage Pass-Through Certificates, Series 2006-AR17,
Class 1A | | Aaa | | 3.076% | (c) | | 12/25/46 | | | 1,683 | | | 632,348 |
WaMu Mortgage Pass-Through Certificates, Series 2006-AR17,
Class 1A1A | | Aaa | | 3.066% | (c) | | 12/25/46 | | | 2,049 | | | 874,416 |
WaMu Mortgage Pass-Through Certificates, Series 2006-AR17,
Class 2A | | Aaa | | 4.625% | (c) | | 12/25/46 | | | 563 | | | 259,014 |
WaMu Mortgage Pass-Through Certificates, Series 2006-AR18,
Class 1A1 | | A(d) | | 5.324% | (c) | | 01/25/37 | | | 1,271 | | | 715,773 |
WaMu Mortgage Pass-Through Certificates, Series 2007-HY4,
Class 1A1 | | BBB(d) | | 5.503% | (c) | | 04/25/37 | | | 3,914 | | | 2,062,734 |
Washington Mutual Alternative Mortgage Pass-Through Certificates, Series 2006-AR3, Class A1A | | Aaa | | 3.226% | (c) | | 05/25/46 | | | 3,909 | | | 1,671,931 |
Washington Mutual Mortgage Pass-Through Certificates,
Series 2003-AR1, Class 2A | | Aaa | | 5.813% | (c) | | 02/25/33 | | | 35 | | | 28,024 |
Washington Mutual MSC Mortgage Pass-Through Certifiecates,
Series 2004-RA4, Class 2A | | AAA | | 6.50% | | | 08/25/34 | | | 2,924 | | | 2,598,222 |
Washington Mutual, Inc., Series 2002-AR2, Class A | | Aaa | | 4.375% | (c) | | 02/27/34 | | | 892 | | | 722,797 |
| | | | | | | | | | | | |
|
|
TOTAL COLLATERALIZED MORTGAGE OBLIGATIONS
(cost $97,760,825) | | | 69,986,219 |
| | | | | | | | | | | | |
|
|
| CORPORATE BONDS — 41.6% | | | | | | | | | | | | | |
Aerospace — 0.2% | | | | | | | | | | | | | |
Goodrich Corp., Sr. Unsec’d. Notes(g) | | Baa2 | | 6.29% | | | 07/01/16 | | | 2,200 | | | 2,186,470 |
| | | | | | | | | | | | |
|
|
Airlines | | | | | | | | | | | | | |
United AirLines, Inc., Pass-Through Certificates(g)(i) | | NR | | 9.21% | | | 01/21/17 | | | 81 | | | 65 |
| | | | | | | | | | | | |
|
|
Automobile Manufacturers — 0.6% | | | | | | | | | | | | | |
DaimlerChrysler NA Holding Corp., Gtd. Notes | | A3 | | 2.426% | (c) | | 03/13/09 | | | 3,500 | | | 3,374,560 |
DaimlerChrysler NA Holding Corp., Gtd. Notes, MTN | | A3 | | 5.75% | | | 09/08/11 | | | 3,400 | | | 2,871,433 |
| | | | | | | | | | | | |
|
|
| | | | | | | | | | | | | | 6,245,993 |
| | | | | | | | | | | | |
|
|
Biotechnology — 0.1% | | | | | | | | | | | | | |
Amgen, Inc., Sr. Unsec’d. Notes | | A3 | | 5.85% | | | 06/01/17 | | | 1,100 | | | 1,136,017 |
| | | | | | | | | | | | |
|
|
Building Materials — 0.4% | | | | | | | | | | | | | |
Lennar Corp., Gtd. Notes | | Ba3 | | 5.95% | | | 10/17/11 | | | 5,000 | | | 3,825,000 |
| | | | | | | | | | | | |
|
|
Diversified — 1.9% | | | | | | | | | | | | | |
C10 Capital SPV Ltd., Debs., 144A (original cost $2,500,000;
purchased 12/11/06)(g)(l) | | BB+(d) | | 6.722% | (c) | | 12/31/49 | | | 2,500 | | | 1,189,575 |
General Electric Co., Sr. Unsec’d. Notes | | Aaa | | 5.25% | | | 12/06/17 | | | 3,800 | | | 3,788,399 |
iStar Financial, Inc., Sr. Unsec’d. Notes(g) | | Ba3 | | 5.80% | | | 03/15/11 | | | 1,000 | | | 350,000 |
Siemens Financieringsmaatschappij NV, Gtd. Notes, 144A (Netherlands) (original cost $14,700,000; purchased 08/09/06)(g)(l) | | A1 | | 2.183% | (c) | | 08/14/09 | | | 14,700 | | | 14,713,068 |
| | | | | | | | | | | | |
|
|
| | | | | | | | | | | | | | 20,041,042 |
| | | | | | | | | | | | |
|
|
SEE NOTES TO FINANCIAL STATEMENTS.
A44
| | | | | | |
| | | SP PIMCO TOTAL RETURN PORTFOLIO (continued) | | |
| |
| SCHEDULE OF INVESTMENTS | | December 31, 2008 |
| | | | | | | | | | | | | |
CORPORATE BONDS
(continued) | | Moody’s
Ratings†
(Unaudited)
| | Interest
Rate
| | | Maturity
Date
| | Principal
Amount
(000)#
| | Value
(Note 2)
|
| | | | | | | | | | | | | | |
Financial – Bank & Trust — 15.3% | | | | | | | | | | | | | |
American Express Bank FSB, Sr. Unsec’d. Notes | | A1 | | 5.50% | | | 04/16/13 | | $ | 6,000 | | $ | 5,683,440 |
ANZ National International Ltd., Bank Gtd. Notes, 144A (New Zealand) (original cost $12,987,780; purchased 07/09/08)(g)(l) | | Aa2 | | 6.20% | | | 07/19/13 | | | 13,000 | | | 12,578,280 |
Bank of America Corp., Jr. Sub. Notes | | A2 | | 8.125% | (c) | | 12/29/49 | | | 8,000 | | | 5,984,000 |
Bank of America Corp., Sr. Unsec’d. Notes | | A1 | | 5.65% | | | 05/01/18 | | | 1,500 | | | 1,508,901 |
Barclays Bank PLC, Sub. Notes, 144A (United Kingdom)
(original cost $13,900,000; purchased 04/18/08)(g)(l) | | Aa2 | | 7.70% | (c) | | 04/29/49 | | | 13,900 | | | 9,191,514 |
Citigroup, Inc., Jr. Sub. Notes | | Baa3 | | 8.40% | (c) | | 04/29/49 | | | 17,300 | | | 11,423,017 |
Credit Suisse / New York NY, Sr. Unsec’d. Notes, MTN (Switzerland) | | Aa1 | | 5.00% | | | 05/15/13 | | | 21,200 | | | 20,403,537 |
Deutsche Bank AG, Sr. Unsec’d. Notes (Germany) | | Aa1 | | 4.875% | | | 05/20/13 | | | 18,400 | | | 18,064,936 |
Deutsche Bank AG, Sr. Unsec’d. Notes (Germany) | | Aa1 | | 6.00% | | | 09/01/17 | | | 5,400 | | | 5,729,686 |
Goldman Sachs Group, Inc. (The), Sr. Unsec’d. Notes | | A1 | | 6.25% | | | 09/01/17 | | | 5,600 | | | 5,429,962 |
National Australia Bank Ltd., Bonds, 144A (Australia)
(original cost $7,600,000; purchased 02/01/08)(g)(l) | | Aa1 | | 2.838% | (c) | | 02/08/10 | | | 7,600 | | | 7,605,092 |
Norddeutsche Landesbank Girozentrale AG, Pfandriefe, MTN (Germany) | | Aaa | | 0.45% | | | 01/19/09 | | | JPY2,456,000 | | | 27,088,203 |
PNC Funding Corp., FDIC Gtd. | | Aaa | | 2.30% | | | 06/22/12 | | | 5,300 | | | 5,352,942 |
Rabobank Nederland, Sr. Notes, 144A (Netherlands)
(original cost $6,700,000; purchased 01/17/06)(g)(l) | | NR | | 4.773% | (c) | | 01/15/09 | | | 6,700 | | | 6,705,588 |
Santander US Debt SA Unipersonal, Bank Gtd. Notes, 144A (Spain) (original cost $15,495,645; purchased 01/13/06)(g)(l) | | Aa1 | | 2.766% | (c) | | 02/06/09 | | | 15,500 | | | 15,494,916 |
UBS AG, Sr. Unsec’d. Notes (Switzerland) | | Aa2 | | 5.875% | | | 12/20/17 | | | 200 | | | 183,729 |
Vornado Realty LP, Sr. Unsec’d. Notes | | Baa2 | | 5.60% | | | 02/15/11 | | | 1,000 | | | 903,806 |
| | | | | | | | | | | | |
|
|
| | | | | | | | | | | | | | 159,331,549 |
| | | | | | | | | | | | |
|
|
Financial Services — 15.7% | | | | | | | | | | | | | |
American Express Co., Sr. Unsec’d. Notes | | A2 | | 7.00% | | | 03/19/18 | | | 13,000 | | | 13,144,872 |
American Express Credit Corp., Sr. Unsec’d. Notes, MTN | | A1 | | 5.875% | | | 05/02/13 | | | 4,500 | | | 4,319,883 |
Bank of America Corp., Jr. Sub. Notes | | A2 | | 8.00% | (c) | | 12/29/49 | | | 40,600 | | | 29,203,093 |
CitiFinancial, Inc., Sr. Unsec’d. Notes(g) | | A2 | | 6.625% | | | 06/01/15 | | | 600 | | | 556,394 |
Citigroup Capital XXI, Gtd. Notes | | A3 | | 8.30% | (c) | | 12/21/57 | | | 11,000 | | | 8,483,607 |
Citigroup, Inc., Sr. Unsec’d. Notes | | A2 | | 3.505% | (c) | | 01/30/09 | | | 1,900 | | | 1,900,600 |
Citigroup, Inc., Sr. Unsec’d. Notes | | A2 | | 5.50% | | | 04/11/13 | | | 8,900 | | | 8,665,788 |
General Electric Capital Corp., Sr. Unsec’d. Notes, MTN | | Aaa | | 5.875% | | | 01/14/38 | | | 15,800 | | | 15,465,988 |
General Electric Capital Corp., Sub. Notes, 144A
(original cost $14,999,395; purchased 08/30/07)(g)(l) | | Aa1 | | 6.50% | (c) | | 09/15/67 | | | GBP 7,500 | | | 6,804,164 |
General Motors Acceptance Corp. LLC, Sr. Unsec’d. Notes | | C | | 6.75% | | | 12/01/14 | | | 10,500 | | | 7,178,283 |
General Motors Acceptance Corp. LLC, Sr. Unsec’d. Notes | | C | | 6.875% | | | 08/28/12 | | | 10,800 | | | 8,189,359 |
General Motors Acceptance Corp. LLC, Sr. Unsec’d. Notes | | C | | 8.00% | | | 11/01/31 | | | 600 | | | 351,059 |
Goldman Sachs Group, Inc. (The), Sr. Unsec’d. Notes | | A1 | | 5.35% | | | 01/15/16 | | | 1,300 | | | 1,187,195 |
Goldman Sachs Group, Inc. (The), Sr. Unsec’d. Notes | | A1 | | 5.75% | | | 10/01/16 | | | 6,000 | | | 5,622,372 |
Goldman Sachs Group, Inc. (The), Sub. Notes | | A2 | | 6.75% | | | 10/01/37 | | | 8,200 | | | 6,657,318 |
Lehman Brothers Holdings, Inc., Sr. Unsec’d. Notes, MTN(i) | | NR | | 5.625% | | | 01/24/13 | | | 16,800 | | | 1,596,000 |
Merrill Lynch & Co., Inc., Notes, MTN | | A1 | | 6.875% | | | 04/25/18 | | | 14,000 | | | 14,644,364 |
Morgan Stanley, Sr. Unsec’d. Notes | | A2 | | 6.75% | | | 04/15/11 | | | 2,000 | | | 1,967,852 |
Morgan Stanley, Sr. Unsec’d. Notes, MTN | | A2 | | 2.498% | (c) | | 02/09/09 | | | 15,400 | | | 15,323,277 |
Morgan Stanley, Sr. Unsec’d. Notes, MTN | | A2 | | 6.625% | | | 04/01/18 | | | 12,100 | | | 10,615,209 |
Pemex Project Funding Master Trust, Gtd. Notes | | Baa1 | | 9.125% | | | 10/13/10 | | | 430 | | | 452,575 |
Petroleum Export Ltd., Sr. Sec’d. Notes, 144A (Cayman Islands) (original cost $1,511,499; purchased 07/14/05)(g)(l) | | Baa1 | | 5.265% | | | 06/15/11 | | | 1,512 | | | 1,403,033 |
| | | | | | | | | | | | |
|
|
| | | | | | | | | | | | | | 163,732,285 |
| | | | | | | | | | | | |
|
|
Healthcare – Services — 0.1% | | | | | | | | | | | | | |
Cardinal Health, Inc., Sr. Unsec’d. Notes | | Baa2 | | 6.00% | | | 06/15/17 | | | 1,100 | | | 1,003,234 |
HCA, Inc., Sr. Sec’d. Notes | | B2 | | 9.25% | | | 11/15/16 | | | 200 | | | 183,500 |
| | | | | | | | | | | | |
|
|
| | | | | | | | | | | | | | 1,186,734 |
| | | | | | | | | | | | |
|
|
SEE NOTES TO FINANCIAL STATEMENTS.
A45
| | | | | | |
| | | SP PIMCO TOTAL RETURN PORTFOLIO (continued) | | |
| |
| SCHEDULE OF INVESTMENTS | | December 31, 2008 |
| | | | | | | | | | | | | |
CORPORATE BONDS
(continued) | | Moody’s
Ratings†
(Unaudited)
| | Interest
Rate
| | | Maturity
Date
| | Principal
Amount
(000)#
| | | Value
(Note 2)
|
| | | | | | | | | | | | | | |
Insurance — 2.4% | | | | | | | | | | | | | |
American International Group, Inc., Jr. Sub. Debs., 144A (original cost $14,000,000; purchased 05/13/08)(g)(l) | | Baa1 | | 8.175% | (c) | | 05/15/58 | | 14,000 | | | $ | 5,446,350 |
American International Group, Inc., Sr. Unsec’d. Notes, 144A (original cost $11,000,000; purchased 08/13/08)(g)(l) | | A3 | | 8.25% | | | 08/15/18 | | 11,000 | | | | 8,051,109 |
American International Group, Inc., Sr. Unsec’d. Notes, MTN | | A3 | | 2.628% | (c) | | 07/19/13 | | EUR 3,100 | | | | 2,388,913 |
ASIF III Jersey Ltd., Sr. Sec’d. Notes, MTN (Japan) | | Aa3 | | 0.95% | | | 07/15/09 | | JPY 875,000 | | | | 8,921,429 |
| | | | | | | | | | | | |
|
|
| | | | | | | | | | | | | | 24,807,801 |
| | | | | | | | | | | | |
|
|
Oil, Gas & Consumable Fuels — 0.1% | | | | | | | | | | | | | |
El Paso Corp., Sr. Unsec’d. Notes | | Ba3 | | 7.00% | | | 05/15/11 | | 200 | | | | 181,957 |
El Paso Corp., Sr. Unsec’d. Notes, MTN | | Ba3 | | 7.80% | | | 08/01/31 | | 850 | | | | 553,777 |
| | | | | | | | | | | | |
|
|
| | | | | | | | | | | | | | 735,734 |
| | | | | | | | | | | | |
|
|
Paper & Forest Products — 0.4% | | | | | | | | | | | | | |
Georgia-Pacific LLC, Gtd. Notes, 144A (original cost $900,000;
purchased 12/31/06)(g)(l) | | Ba3 | | 7.00% | | | 01/15/15 | | 900 | | | | 765,000 |
Georgia-Pacific LLC, Gtd. Notes, 144A (original cost $1,300,000;
purchased 12/13/06)(g)(l) | | Ba3 | | 7.125% | | | 01/15/17 | | 1,300 | | | | 1,092,000 |
Georgia-Pacific LLC, Sr. Unsec’d. Notes | | B2 | | 7.75% | | | 11/15/29 | | 3,000 | | | | 1,890,000 |
| | | | | | | | | | | | |
|
|
| | | | | | | | | | | | | | 3,747,000 |
| | | | | | | | | | | | |
|
|
Retail & Merchandising — 0.6% | | | | | | | | | | | | | |
CVS Caremark Corp., Sr. Unsec’d. Notes | | Baa2 | | 5.75% | | | 08/15/11 | | 3,700 | | | | 3,712,794 |
Wal-Mart Stores, Inc., Sr. Unsec’d. Notes | | Aa2 | | 5.80% | | | 02/15/18 | | 2,200 | | | | 2,434,410 |
Wal-Mart Stores, Inc., Sr. Unsec’d. Notes | | Aa2 | | 6.50% | | | 08/15/37 | | 400 | | | | 474,926 |
| | | | | | | | | | | | |
|
|
| | | | | | | | | | | | | | 6,622,130 |
| | | | | | | | | | | | |
|
|
Telecommunications — 1.4% | | | | | | | | | | | | | |
Embarq Corp., Sr. Unsec’d. Notes | | Baa3 | | 7.082% | | | 06/01/16 | | 6,000 | | | | 4,620,000 |
Qwest Corp., Sr. Unsec’d. Notes | | Ba1 | | 7.625% | | | 06/15/15 | | 7,000 | | | | 5,740,000 |
Qwest Corp., Sr. Unsec’d. Notes | | Ba1 | | 8.875% | | | 03/15/12 | | 1,650 | | | | 1,526,250 |
Verizon Communications, Inc., Sr. Unsec’d. Notes | | A3 | | 5.85% | | | 09/15/35 | | 2,500 | | | | 2,487,375 |
| | | | | | | | | | | | |
|
|
| | | | | | | | | | | | | | 14,373,625 |
| | | | | | | | | | | | |
|
|
Tobacco — 0.3% | | | | | | | | | | | | | |
Reynolds American, Inc., Sr. Sec’d. Notes | | Baa3 | | 7.625% | | | 06/01/16 | | 4,000 | | | | 3,331,252 |
| | | | | | | | | | | | |
|
|
Utilities — 2.1% | | | | | | | | | | | | | |
Edison Mission Energy, Sr. Unsec’d. Notes | | B1 | | 7.625% | | | 05/15/27 | | 4,700 | | | | 3,642,500 |
Illinois Power Co., Sr. Sec’d. Notes | | Baa3 | | 6.25% | | | 04/01/18 | | 14,300 | | | | 12,771,316 |
Virginia Electric and Power Co., Sr. Unsec’d. Notes | | Baa1 | | 8.875% | | | 11/15/38 | | 4,500 | | | | 5,695,033 |
| | | | | | | | | | | | |
|
|
| | | | | | | | | | | | | | 22,108,849 |
| | | | | | | | | | | | |
|
|
TOTAL CORPORATE BONDS
(cost $504,325,670) | | | | 433,411,546 |
| | | | | | | | | | | | |
|
|
| FOREIGN GOVERNMENT BONDS — 2.8% | | | | | | | | | | | | | |
Bundesrepublik Deutschland, Bonds (Germany) | | Aaa | | 4.25% | | | 07/04/39 | | EUR 10,000 | | | | 15,787,045 |
France Government, Bonds (France) | | Aaa | | 4.00% | | | 04/25/55 | | EUR 1,400 | | | | 2,096,896 |
Republic of Brazil, Sr. Unsec’d. Notes (Brazil) | | Ba1 | | 12.50% | | | 01/05/22 | | BRL 18,300 | | | | 8,121,998 |
United Kingdom Gilt, Bonds (United Kingdom) | | AAA(d) | | 4.50% | | | 12/07/42 | | GBP 2,200 | | | | 3,598,608 |
| | | | | | | | | | | | |
|
|
TOTAL FOREIGN GOVERNMENT BONDS
(cost $28,098,170) | | | | 29,604,547 |
| | | | | | | | | | | | |
|
|
| MUNICIPAL BONDS — 6.8% | | | | | | | | | | | | | |
Arizona — 0.1% | | | | | | | | | | | | | |
Salt River Project Agricultural Improvement & Power District,
Revenue Bonds | | Aa1 | | 4.75% | | | 01/01/32 | | 1,000 | (f) | | | 936,210 |
Salt River Project Agricultural Improvement & Power District,
Series B, Revenue Bonds (original cost $516,495;
purchased 04/29/05)(g)(l) | | AA(d) | | 7.72% | (c) | | 01/01/32 | | 500 | | | | 436,210 |
| | | | | | | | | | | | |
|
|
| | | | | | | | | | | | | | 1,372,420 |
| | | | | | | | | | | | |
|
|
SEE NOTES TO FINANCIAL STATEMENTS.
A46
| | | | | | |
| | | SP PIMCO TOTAL RETURN PORTFOLIO (continued) | | |
| |
| SCHEDULE OF INVESTMENTS | | December 31, 2008 |
| | | | | | | | | | | | | | |
MUNICIPAL BONDS
(continued) | | Moody’s
Ratings†
(Unaudited)
| | Interest
Rate
| | | Maturity
Date
| | Principal
Amount
(000)#
| | | Value
(Note 2)
|
| | | | | | | | | | | | | | | |
California — 0.1% | | | | | | | | | | | | | | |
State of California, General Obligation Bonds | | A1 | | 4.50% | | | 08/01/28 | | $ | 100 | | | $ | 80,967 |
University of California, Revenue Bonds | | Aa2 | | 5.00% | | | 05/15/37 | | | 500 | | | | 456,255 |
| | | | | | | | | | | | | |
|
|
| | | | | | | | | | | | | | | 537,222 |
| | | | | | | | | | | | | |
|
|
Georgia — 0.1% | | | | | | | | | | | | | | |
Georgia State Road & Tollway Authority, Revenue Bonds | | Aaa | | 5.00% | | | 03/01/21 | | | 700 | | | | 710,388 |
| | | | | | | | | | | | | |
|
|
Hawaii — 0.3% | | | | | | | | | | | | | | |
Honolulu Hawaii City & County, Series 1115, General Obligation Bonds | | Aa2 | | 5.00% | | | 07/01/23 | | | 3,075 | (f) | | | 3,100,738 |
| | | | | | | | | | | | | |
|
|
Illinois — 3.0% | | | | | | | | | | | | | | |
Chicago Illinois Transit Authority, Revenue Bonds | | Aa3 | | 6.899% | | | 12/01/40 | | | 16,600 | | | | 16,382,540 |
Illinois Finance Authority, Revenue Bonds | | Aa1 | | 5.75% | | | 07/01/33 | | | 4,900 | | | | 4,989,572 |
Illinois State, General Obligation Bond | | Aa3 | | 5.00% | | | 11/01/22 | | | 300 | | | | 302,106 |
Illinois State, General Obligation, Unlimited Notes | | MIG2 | | 4.50% | | | 06/24/09 | | | 8,500 | | | | 8,574,035 |
Regional Transportation Authority, Series A, Revenue Bonds | | Aa2 | | 5.00% | | | 07/01/25 | | | 1,600 | | | | 1,597,328 |
| | | | | | | | | | | | | |
|
|
| | | | | | | | | | | | | | | 31,845,581 |
| | | | | | | | | | | | | |
|
|
Massachusetts — 1.9% | | | | | | | | | | | | | | |
Massachusetts Health & Educational Facilities Authority, Revenue Bonds | | Aaa | | 5.50% | | | 07/01/36 | | | 5,100 | | | | 5,279,010 |
Massachusetts Health & Educational Facilities Authority, Revenue Bonds | | Aaa | | 6.00% | | | 07/01/36 | | | 5,100 | | | | 5,469,546 |
Massachusetts Health & Educational Facilities Authority,
Series A, Revenue Bonds | | Aaa | | 5.50% | | | 11/15/36 | | | 6,500 | | | | 6,734,715 |
Massachusetts Water Resources Authority, Series J, Revenue Bonds | | Aa2 | | 5.00% | | | 08/01/32 | | | 2,500 | (f) | | | 2,367,400 |
| | | | | | | | | | | | | |
|
|
| | | | | | | | | | | | | | | 19,850,671 |
| | | | | | | | | | | | | |
|
|
New York — 0.9% | | | | | | | | | | | | | | |
New York City Municipal Water Finance Authority, Revenue Bonds | | Aa3 | | 5.75% | | | 06/15/40 | | | 300 | | | | 302,160 |
Port Authority of New York & New Jersey, Revenue Bonds | | Aa3 | | 4.75% | | | 07/15/33 | | | 10,000 | | | | 8,934,500 |
| | | | | | | | | | | | | |
|
|
| | | | | | | | | | | | | | | 9,236,660 |
| | | | | | | | | | | | | |
|
|
Rhode Island — 0.1% | | | | | | | | | | | | | | |
Tobacco Settlement Financing Corp., Revenue Bonds | | Baa3 | | 6.125% | | | 06/01/32 | | | 1,205 | | | | 851,140 |
Tobacco Settlement Financing Corp., Revenue Bonds | | Baa3 | | 6.25% | | | 06/01/42 | | | 400 | | | | 250,132 |
| | | | | | | | | | | | | |
|
|
| | | | | | | | | | | | | | | 1,101,272 |
| | | | | | | | | | | | | |
|
|
Washington — 0.3% | | | | | | | | | | | | | | |
Pierce County School District No. 3, General Obligation
Bonds | | Aa1 | | 5.00% | | | 12/01/23 | | | 3,000 | (f) | | | 3,022,800 |
| | | | | | | | | | | | | |
|
|
TOTAL MUNICIPAL BONDS
(cost $70,484,893) | | | | 70,777,752 |
| | | | | | | | | | | | | |
|
|
| U.S. GOVERNMENT AGENCY OBLIGATIONS — 2.9% | | | | | | | | | | | | |
Federal Home Loan Mortgage Corp., Notes
(cost $28,255,032) | | Aaa | | 4.875% | | | 06/13/18 | | | 26,300 | | | | 30,226,327 |
| | | | | | | | | | | | | |
|
|
| U.S. GOVERNMENT MORTGAGE-BACKED OBLIGATIONS — 73.1% | | | | | | | | | | |
Federal Home Loan Mortgage Corp. | | | | 4.00% | | | 09/01/18 | | | 556 | | | | 570,577 |
Federal Home Loan Mortgage Corp. | | | | 5.00% | | | TBA | | | 47,100 | | | | 48,130,312 |
Federal Home Loan Mortgage Corp. | | | | 5.50% | | | 02/01/38 | | | 1,840 | | | | 1,885,465 |
Federal Home Loan Mortgage Corp. | | | | 5.50% | | | TBA | | | 34,000 | | | | 34,796,892 |
Federal National Mortgage Assoc. | | | | 4.00% | | | 07/01/18-03/01/20 | | | 53,733 | | | | 54,689,447 |
Federal National Mortgage Assoc. | | | | 4.00% | | | TBA | | | 25,000 | | | | 25,257,800 |
Federal National Mortgage Assoc. | | | | 4.42% | (c) | | 05/01/36 | | | 69 | | | | 68,675 |
Federal National Mortgage Assoc. | | | | 4.50% | | | 02/01/23-08/01/35 | | | 70,734 | | | | 72,168,017 |
SEE NOTES TO FINANCIAL STATEMENTS.
A47
| | | | | | |
| | | SP PIMCO TOTAL RETURN PORTFOLIO (continued) | | |
| |
| SCHEDULE OF INVESTMENTS | | December 31, 2008 |
| | | | | | | | | | | | | |
U.S. GOVERNMENT MORTGAGE-BACKED OBLIGATIONS
(continued) | |
| | Interest
Rate
| | | Maturity
Date
| | Principal
Amount
(000)#
| | Value
(Note 2)
|
| | | | | | | | | | | | | | |
Federal National Mortgage Assoc.(k) | | 4.50% | | | 08/01/35 | | $ | 2,437 | | $ | 2,473,298 |
Federal National Mortgage Assoc. | | 4.987% | (c) | | 06/01/35 | | | 1,157 | | | 1,169,544 |
Federal National Mortgage Assoc. | | 5.00% | | | 12/01/18-11/01/33 | | | 93,662 | | | 95,878,795 |
Federal National Mortgage Assoc. | | 5.00% | | | TBA | | | 97,100 | | | 99,133,080 |
Federal National Mortgage Assoc. | | 5.131% | (c) | | 12/01/36 | | | 1,589 | | | 1,588,483 |
Federal National Mortgage Assoc. | | 5.50% | | | 09/01/32-08/01/37 | | | 140,253 | | | 144,049,277 |
Federal National Mortgage Assoc.(k) | | 5.50% | | | 09/01/35 | | | 6,792 | | | 6,970,194 |
Federal National Mortgage Assoc. | | 5.50% | | | TBA | | | 43,500 | | | 44,587,500 |
Federal National Mortgage Assoc. | | 6.00% | | | 04/01/16-08/01/35 | | | 2,254 | | | 2,334,642 |
Government National Mortgage Assoc. | | 4.50% | | | 09/15/33 | | | 34 | | | 34,919 |
Government National Mortgage Assoc. | | 4.625% | (c) | | 08/20/24-08/20/27 | | | 134 | | | 132,735 |
Government National Mortgage Assoc. | | 5.00% | | | TBA | | | 6,000 | | | 6,150,000 |
Government National Mortgage Assoc. | | 5.00% | | | TBA | | | 37,000 | | | 37,751,544 |
Government National Mortgage Assoc. | | 5.375% | (c) | | 04/20/25-05/20/25 | | | 39 | | | 39,384 |
Government National Mortgage Assoc. | | 5.50% | | | TBA | | | 13,300 | | | 13,694,850 |
Government National Mortgage Assoc. | | 6.00% | | | 06/15/37-10/15/38 | | | 7,577 | | | 7,830,746 |
Government National Mortgage Assoc. | | 6.00% | | | TBA | | | 4,000 | | | 4,126,248 |
Government National Mortgage Assoc. | | 6.50% | | | 12/15/33-10/15/38 | | | 38,838 | | | 40,456,366 |
Government National Mortgage Assoc. | | 6.50% | | | TBA | | | 14,000 | | | 14,555,632 |
Government National Mortgage Assoc. | | 9.00% | | | 07/15/30-08/15/30 | | | 2 | | | 2,449 |
| | | | | | | | | | | | |
|
|
TOTAL U.S. GOVERNMENT MORTGAGE-BACKED OBLIGATIONS
(cost $738,661,155) | | | 760,526,871 |
| | | | | | | | | | | | |
|
|
| U.S. TREASURY OBLIGATIONS — 36.3% | | | | | | | | | | | | | |
U.S. Treasury Bonds | | 5.375% | | | 02/15/31 | | | 125,800 | | | 172,856,999 |
U.S. Treasury Bonds | | 6.75% | | | 08/15/26 | | | 17,900 | | | 26,998,230 |
U.S. Treasury Bonds | | 8.75% | | | 08/15/20 | | | 13,500 | | | 21,074,769 |
U.S. Treasury Inflationary Indexed Bonds, TIPS | | 1.75% | | | 01/15/28 | | | 1,100 | | | 1,050,627 |
U.S. Treasury Inflationary Indexed Bonds, TIPS | | 2.375% | | | 01/15/25 | | | 14,697 | | | 16,595,879 |
U.S. Treasury Inflationary Indexed Bonds, TIPS | | 3.625% | | | 04/15/28 | | | 4,800 | | | 7,657,018 |
U.S. Treasury Notes | | 3.125% | | | 04/30/13 | | | 28,400 | | | 30,740,785 |
U.S. Treasury Notes | | 4.00% | | | 08/15/18 | | | 4,500 | | | 5,196,447 |
U.S. Treasury Notes | | 4.75% | | | 05/15/14 | | | 400 | | | 470,719 |
U.S. Treasury Strips | | 7.25% | | | 02/15/22 | | | 23,000 | | | 14,800,155 |
U.S. Treasury Strips | | 7.875% | | | 02/15/21 | | | 17,100 | | | 11,389,045 |
U.S. Treasury Strips | | 8.00% | | | 11/15/21 | | | 6,700 | | | 4,335,624 |
U.S. Treasury Strips | | 8.125% | | | 05/15/21 | | | 21,700 | | | 14,339,099 |
U.S. Treasury Strips | | 8.125% | | | 08/15/21 | | | 18,900 | | | 12,328,035 |
U.S. Treasury Strips | | 6.00% | | | 02/15/26 | | | 13,700 | | | 8,104,057 |
U.S. Treasury Strips | | 6.75% | | | 08/15/26 | | | 10,900 | | | 6,362,886 |
U.S. Treasury Strips | | 7.25% | | | 08/15/22 | | | 37,500 | | | 23,868,975 |
| | | | | | | | | | | | |
|
|
TOTAL U.S. TREASURY OBLIGATIONS
(cost $333,290,454) | | | 378,169,349 |
| | | | | | | | | | | | |
|
|
| | | | | |
| | | | | | | | | | Shares
| | |
| PREFERRED STOCKS — 0.3% | | | | | | | | | | | | | |
Business Services | | | | | | | | | | | | | |
Bank of America Corp., 7.25%, CVT
(cost $4,200,000) | | | 4,200 | | | 2,730,000 |
| | | | | | | | | | | | |
|
|
TOTAL LONG-TERM INVESTMENTS
(cost $1,862,496,305) | | | 1,813,893,836 |
| | | | | | | | | | | | |
|
|
SHORT-TERM INVESTMENTS — 16.2%
REPURCHASE AGREEMENTS(m) — 12.8% | |
| | | | | | | Principal
Amount
(000)#
| | |
Goldman Sachs & Co. (The), 0.00%, dated 12/29/08, due 01/05/09 in the amount of $83,529,411
(cost $83,529,411; the value of collateral plus accrued interest was $83,803,125)(p) | | $ | 83,529 | | | 83,529,411 |
JPMorgan Chase Bank, 0.00%, dated 12/08/08, due 01/12/09 in the amount of $5,006,250 (cost $5,006,250; the value of collateral plus accrued interest was $5,274,141)(s) | | | 5,006 | | | 5,006,250 |
SEE NOTES TO FINANCIAL STATEMENTS.
A48
| | | | | | |
| | | SP PIMCO TOTAL RETURN PORTFOLIO (continued) | | |
| |
| SCHEDULE OF INVESTMENTS | | December 31, 2008 |
| | | | | | | | | | | | |
REPURCHASE AGREEMENTS(m)
(continued) | |
| | | | | | Principal
Amount
(000)#
| | Value
(Note 2)
|
| | | | | | | | | | | | | |
JPMorgan Chase Bank, 0.00%, dated 12/09/08, due 01/14/09 in the amount of $30,814,000 (cost $30,814,000; the value of collateral plus accrued interest was $30,879,239)(p) | | $ | 30,814 | | $ | 30,814,000 |
JPMorgan Chase Bank, 0.00%, dated 12/09/08, due 01/14/09 in the amount of $469,000 (cost $469,000; the value of collateral plus accrued interest was $473,164)(s) | | | 469 | | | 469,000 |
JPMorgan Chase Bank, 0.01%, dated 12/05/08, due 01/09/09 in the amount of $13,222,618 (cost $13,222,500; the value of collateral plus accrued interest was $13,490,095) | | | 13,223 | | | 13,222,500 |
| | | | | | | | | | | |
|
|
TOTAL REPURCHASE AGREEMENTS
(cost $133,041,161) | | | 133,041,161 |
| | | | | | | | | | | |
|
|
| | | | | |
| | | | | Interest
Rate
| | Maturity
Date
| | | | |
| U.S. TREASURY OBLIGATIONS(n) — 1.9% | | | | | | | | | | | | |
Cash Management Bill | | 0.98% | | 05/15/09 | | | 460 | | | 459,849 |
U.S. Treasury Bills | | 0.009% | | 03/19/09 | | | 440 | | | 439,956 |
U.S. Treasury Bills | | 0.052% | | 03/05/09 | | | 870 | | | 869,855 |
U.S. Treasury Bills | | 0.054% | | 03/05/09 | | | 400 | | | 399,933 |
U.S. Treasury Bills | | 0.059% | | 03/05/09 | | | 3,010 | | | 3,009,497 |
U.S. Treasury Bills | | 0.117% | | 01/22/09 | | | 2,210 | | | 2,209,961 |
U.S. Treasury Bills | | 0.149% | | 02/12/09 | | | 270 | | | 269,992 |
U.S. Treasury Bills | | 0.153% | | 02/19/09 | | | 1,020 | | | 1,019,987 |
U.S. Treasury Bills | | 0.156% | | 02/19/09 | | | 570 | | | 569,993 |
U.S. Treasury Bills | | 0.18% | | 02/12/09 | | | 490 | | | 489,986 |
U.S. Treasury Bills | | 0.745% | | 01/15/09 | | | 2,130 | | | 2,129,992 |
U.S. Treasury Bills | | 0.80% | | 03/05/09 | | | 3,330 | | | 3,329,444 |
U.S. Treasury Bills | | 0.80% | | 06/04/09 | | | 1,650 | | | 1,649,271 |
U.S. Treasury Bills | | 0.889% | | 01/15/09 | | | 660 | | | 659,995 |
U.S. Treasury Bills | | 1.743% | | 01/15/09 | | | 2,600 | | | 2,599,990 |
| | | | | | | | | | | |
|
|
TOTAL U.S. TREASURY OBLIGATIONS
(cost $20,107,861) | | | 20,107,701 |
| | | | | | | | | | | |
|
|
| | | | | |
| | | | | | | | | Shares
| | |
| AFFILIATED MONEY MARKET MUTUAL FUND — 1.3% | | | | | | | | | | | | |
Dryden Core Investment Fund — Taxable Money Market Series
(cost $13,192,057)(Note 4)(w) | | | 13,192,057 | | | 13,192,057 |
| | | | | | | | | | | |
|
|
| | | | | |
| | | | | | | | | Notional
Amount
(000)
| | |
| OPTIONS PURCHASED* — 0.2% | | | | | | | | | | | | |
Call Options — 0.1% | | | | | | | | | | | | |
2 Year Euro-Schatz Futures, expiring 01/23/2009, Strike Price $116.00 | | | EUR 65,100 | | | 4,525 |
2 Year U.S. Treasury Note Futures, expiring 01/23/2009, Strike Price $111.00 | | | 23,400 | | | 1,828 |
5 Year Euro-Bobl Futures, expiring 02/20/2009, Strike Price $135.00 | | | EUR 58,200 | | | 4,045 |
5 Year U.S. Treasury Note Futures, expiring 01/23/2009, Strike Price $126.00 | | | 314,400 | | | 24,563 |
10 Year Euro-Bund Futures, expiring 02/20/2009, Strike Price $145.00 | | | EUR 20,800 | | | 2,891 |
Currency Option, on EUR vs USD, expiring 05/19/2010 @ FX Rate 1.37 | | | EUR 8,400 | | | 1,123,596 |
GNMA, expiring 01/14/2009, Strike Price $111.00 | | | 40,700 | | | — |
U.S. Treasury Bond Futures,
expiring 01/23/2009, Strike Price $173.00 | | | 20,500 | | | 3,203 |
expiring 02/20/2009, Strike Price $173.00 | | | 52,500 | | | 8,203 |
U.S. Treasury Note Futures,
expiring 01/23/2009, Strike Price $142.00 | | | 30,500 | | | 4,766 |
expiring 03/13/2009, Strike Price $112.00 | | | 37,600 | | | 3,760 |
expiring 03/13/2009, Strike Price $113.00 | | | 39,400 | | | 8,668 |
expiring 04/17/2009, Strike Price $119.00 | | | 28,400 | | | 1,988 |
| | | | | | | | | | | |
|
|
| | | | | | | | | | | | | 1,192,036 |
| | | | | | | | | | | |
|
|
Put Options — 0.1% | | | | | | | | | | | | |
2 Year U.S. Treasury Note Futures, expiring 02/20/2009, Strike Price $84.00 | | | 22,000 | | | 1,719 |
5 Year U.S. Treasury Note Futures, expiring 02/20/2009, Strike Price $85.00 | | | 29,900 | | | 2,336 |
Currency Option, on EUR vs USD, expiring 05/19/2010 @ FX Rate 1.37 | | | 8,400 | | | 947,820 |
SEE NOTES TO FINANCIAL STATEMENTS.
A49
| | | | | | |
| | | SP PIMCO TOTAL RETURN PORTFOLIO (continued) | | |
| |
| SCHEDULE OF INVESTMENTS | | December 31, 2008 |
| | | | | | | | | | | | | |
OPTIONS PURCHASED*
(continued) | |
| | | | | | Notional
Amount
(000)
| | Value
(Note 2)
| |
| | | | | | | | | | | | | | |
Put Options (continued) | | | | | | | | | | | | | |
FNMA Gold,
expiring 01/06/2009, Strike Price $73.00 | | | EUR 8,000 | | $ | — | |
expiring 02/05/2009, Strike Price $45.00 | | | 20,000 | | | — | |
expiring 02/05/2009, Strike Price $50.00 | | | 15,000 | | | — | |
expiring 02/05/2009, Strike Price $71.25 | | | 12,000 | | | — | |
FNMA,
expiring 01/06/2009, Strike Price $43.00 | | | 129,000 | | | — | |
expiring 01/06/2009, Strike Price $56.25 | | | 20,000 | | | — | |
expiring 01/06/2009, Strike Price $58.00 | | | 32,000 | | | — | |
expiring 01/13/2009, Strike Price $50.00 | | | 15,000 | | | — | |
expiring 02/05/2009, Strike Price $47.00 | | | 23,000 | | | — | |
expiring 02/05/2009, Strike Price $52.00 | | | 5,800 | | | — | |
expiring 02/05/2009, Strike Price $55.00 | | | 7,500 | | | — | |
expiring 02/05/2009, Strike Price $75.50 | | | 27,000 | | | — | |
GNMA,
expiring 01/14/2009, Strike Price $45.00 | | | 37,000 | | | — | |
expiring 01/14/2009, Strike Price $55.00 | | | 85,000 | | | — | |
expiring 01/14/2009, Strike Price $55.00 | | | 148,000 | | | — | |
expiring 01/14/2009, Strike Price $60.00 | | | 39,000 | | | — | |
expiring 02/12/2009, Strike Price $50.00 | | | 7,000 | | | — | |
expiring 02/12/2009, Strike Price $74.25 | | | 17,000 | | | — | |
Interest Rate Swap Option, expiring 12/15/2009 @ 3.65% | | | 700 | | | 14,388 | |
U.S. Treasury Bond Futures,
expiring 02/20/2009, Strike Price $66.00 | | | 50,000 | | | 7,813 | |
expiring 02/20/2009, Strike Price $70.00 | | | 117,500 | | | 18,359 | |
U.S. Treasury Inflationary,
expiring 01/05/2009, Strike Price $65.00 | | | 4,800 | | | — | |
expiring 01/05/2009, Strike Price $65.00 | | | 15,900 | | | — | |
expiring 04/17/2009, Strike Price $80.00 | | | 6,500 | | | 130 | |
U.S. Treasury Note Futures, expiring 03/13/2009, Strike Price $90.00 | | | 7,000 | | | — | |
| | | | | | | | | | | |
|
|
|
| | | | | | | | | | | | | 992,565 | |
| | | | | | | | | | | |
|
|
|
TOTAL OPTIONS PURCHASED
(cost $1,359,726) | | | 2,184,601 | |
| | | | | | | | | | | |
|
|
|
TOTAL SHORT-TERM INVESTMENTS
(cost $167,700,805) | | | 168,525,520 | |
| | | | | | | | | | | |
|
|
|
TOTAL INVESTMENTS, BEFORE OPTIONS WRITTEN AND SECURITIES SOLD SHORT—190.4%
(cost $2,030,197,110) | | $ | 1,982,419,356 | |
| | | | | | | | | | | |
|
|
|
| OPTIONS WRITTEN* | | Contracts/
Notional
Amounts
(000)#
| | | |
Put Options | | | | | | | |
Interest Rate Swap Option,
expiring 12/15/2009 @ 2.95% | | | 2,800 | | | (7,911 | ) |
expiring 12/15/2009 @ 2.95% | | | 300 | | | (847 | ) |
| | | | | | | | | | | |
|
|
|
TOTAL OPTIONS WRITTEN
(premium received $19,400) | | | (8,758 | ) |
| | | | | | | | | | | |
|
|
|
| SECURITIES SOLD SHORT — (29.9)% | | | | Interest
Rate
| | Maturity
Date
| | Principal
Amount
(000)#
| | | |
Federal National Mortgage Association — (4.0)% | | | | | | | | | | | | | |
Federal National Mortgage Assoc. | | | | 4.50% | | TBA | | $ | 11,000 | | | (11,147,818 | ) |
Federal National Mortgage Assoc. | | | | 4.50% | | TBA | | | 15,000 | | | (15,135,930 | ) |
Federal National Mortgage Assoc. | | | | 5.50% | | TBA | | | 14,200 | | | (14,621,570 | ) |
Federal National Mortgage Assoc. | | | | 6.00% | | TBA | | | 900 | | | (926,437 | ) |
| | | | | | | | | | | |
|
|
|
| | | | | | | | | | | | | (41,831,755 | ) |
| | | | | | | | | | | |
|
|
|
SEE NOTES TO FINANCIAL STATEMENTS.
A50
| | | | | | |
| | | SP PIMCO TOTAL RETURN PORTFOLIO (continued) | | |
| |
| SCHEDULE OF INVESTMENTS | | December 31, 2008 |
| | | | | | | | | | | | | |
SECURITIES SOLD SHORT
(continued) | | | | Interest
Rate
| | Maturity
Date
| | Principal
Amount
(000)#
| | Value
(Note 2)
| |
| | | | | | | | | | | | | | |
U.S. Treasury Obligations — (25.9)% | | | | | | | | | | | | | |
U.S. Treasury Bonds | | 6.75% | | 08/15/26 | | $ | 17,900 | | $ | (26,998,230 | ) |
U.S. Treasury Bonds | | 8.75% | | 08/15/20 | | | 13,500 | | | (21,074,769 | ) |
U.S. Treasury Notes | | 3.125% | | 04/30/13 | | | 28,400 | | | (30,740,785 | ) |
U.S. Treasury Notes | | 4.00% | | 08/15/18 | | | 4,500 | | | (5,196,447 | ) |
U.S. Treasury Notes | | 4.75% | | 05/15/14 | | | 400 | | | (470,718 | ) |
U.S. Treasury Notes | | 4.875% | | 07/31/11 | | | 12,000 | | | (13,244,064 | ) |
U.S. Treasury Notes | | 5.375% | | 02/15/31 | | | 125,400 | | | (172,307,375 | ) |
| | | | | | | | | | | |
|
|
|
| | | | | | | | | | | | | (270,032,388 | ) |
| | | | | | | | | | | |
|
|
|
TOTAL SECURITIES SOLD SHORT
(proceeds received $313,159,343) | | | (311,864,143 | ) |
| | | | | | | | | | | |
|
|
|
TOTAL INVESTMENTS, NET OF OPTIONS WRITTEN AND SECURITIES SOLD SHORT — 160.5%
(cost $1,717,018,367) | | | 1,670,546,455 | |
OTHER LIABILITIES IN EXCESS OF OTHER ASSETS(x) — 60.5% | | | (629,465,337 | ) |
| | | | | | | | | | | |
|
|
|
NET ASSETS — 100.0% | | $ | 1,041,081,118 | |
| | | | | | | | | | | |
|
|
|
The following abbreviations are used in portfolio descriptions:
| | |
| 144A | | Security was purchased pursuant to Rule 144A under the Securities Act of 1933 and may not be resold subject to that rule except to qualified institutional buyers. Unless otherwise noted, 144A securities are deemed to be liquid. |
| CVT | | Convertible Security |
| FDIC | | Federal Deposit Insurance Corp. |
| FHLMC | | Federal Home Loan Mortgage Corp. |
| FNMA | | Federal National Mortgage Association |
| GNMA | | Government National Mortgage Assoc. |
| MTN | | Medium Term Note |
| NR | | Not Rated by Moody’s or Standard & Poor’s |
| TBA | | To Be Announced |
| TIPS | | Treasury Inflation Protected Securities |
| BRL | | Brazilian Real |
| CAD | | Canadian Dollar |
| CNY | | Chinese Yuan |
| EUR | | Euro |
| GBP | | British Pound |
| INR | | Indian Rupee |
| JPY | | Japanese Yen |
| MXN | | Mexican Peso |
| MYR | | Malaysian Ringgit |
| RUB | | Russian Ruble |
| USD | | United States Dollar |
| # | Principal amount is shown in U.S. dollars unless otherwise stated. |
| * | Non-income producing security. |
| † | The rating reflected is as of December 31, 2008. Rating of certain bonds may have changed subsequent to that date. |
| (c) | Indicates a variable rate security. |
| (d) | Standard & Poor’s rating. |
| (f) | Represents all or partial amount utilized in the Municipal Tender Option Bond transaction. The aggregated principal amount of the inverse floaters and the floating rate notes (included in liabilities) are $4,787,500 and $4,787,500, respectively. |
| (i) | Represents issuer in default on interest payments. Non-income producing security. |
| (g) | Indicates a security that has been deemed illiquid. |
| (k) | Securities segregated as collateral for futures contracts. |
| (l) | Private Placement restricted as to resale and does not have a readily available market. The aggregate original cost of such securities is $170,449,479. The aggregate value of $125,448,636 is approximately 12.0% of net assets. |
| (m) | Repurchase agreement is collateralized by United States Treasuries or federal agency obligations. |
| (n) | Rates shown are the effective yields at purchase date. |
SEE NOTES TO FINANCIAL STATEMENTS.
A51
| | | | | | |
| | | SP PIMCO TOTAL RETURN PORTFOLIO (continued) | | |
| |
| SCHEDULE OF INVESTMENTS | | December 31, 2008 |
| (p) | Security segregated as collateral to cover short contracts. |
| (s) | Security segregated as collateral to cover sell trades. |
| (w) | Prudential Investments LLC, the manager of the Portfolio, also serves as manager of the Dryden Core Investment Fund-Taxable Money Market Series. |
| (x) | Liabilities in excess of other assets includes net unrealized appreciation on futures contracts, forward foreign currency exchange contracts, interest rate and credit default swaps and reverse repurchase agreements as follows: |
Future contracts open at December 31, 2008.
| | | | | | | | | | | | | | |
Number of
Contracts
| | Type
| | Expiration
Date
| | Value at
Trade Date
| | Value at
December 31, 2008
| | Unrealized
Appreciation
(Depreciation)
| |
| Long Positions: | | | | | | | | | | | | | | |
| 327 | | 90 Day Euro Dollar | | Mar 09 | | $ | 80,159,963 | | $ | 80,883,450 | | $ | 723,487 | |
| 395 | | 90 Day Euro Dollar | | Jun 09 | | | 98,745,063 | | | 97,634,125 | | | (1,110,938 | ) |
| 104 | | 90 Day Euro Dollar | | Sep 09 | | | 25,145,900 | | | 25,673,700 | | | 527,800 | |
| 1,209 | | 90 Day Euro Dollar | | Mar 10 | | | 290,740,987 | | | 297,625,575 | | | 6,884,588 | |
| 292 | | 90 Day Euro EURIBOR | | Mar 09 | | | 96,516,787 | | | 99,210,592 | | | 2,693,805 | |
| 356 | | 90 Day Euro EURIBOR | | Jun 09 | | | 117,991,482 | | | 121,270,851 | | | 3,279,369 | |
| 116 | | 90 Day Euro EURIBOR | | Dec 09 | | | 38,473,172 | | | 39,406,380 | | | 933,208 | |
| 12 | | 90 Day Sterling | | Mar 09 | | | 2,098,672 | | | 2,118,564 | | | 19,892 | |
| 375 | | 90 Day Sterling | | Sep 09 | | | 63,746,461 | | | 66,218,612 | | | 2,472,151 | |
| 81 | | 90 Day Sterling | | Dec 09 | | | 13,790,077 | | | 14,249,358 | | | 459,281 | |
| 160 | | 90 Day Sterling | | Jun 10 | | | 27,248,303 | | | 27,962,848 | | | 714,545 | |
| 221 | | 5 Year U.S. Treasury Notes | | Mar 09 | | | 26,179,867 | | | 26,311,086 | | | 131,219 | |
| | | | | | | | | | | | |
|
|
|
| | | | | | | | | | | | | | 17,728,407 | |
| | | | | | | | | | | | |
|
|
|
| Short Position: | | | | | | | | | | | | | | |
| 559 | | 5 Year Euro-Bobl | | Mar 09 | | | 89,574,238 | | | 90,299,402 | | | (725,164 | ) |
| | | | | | | | | | | | |
|
|
|
| | | | | | | | | | | | | $ | 17,003,243 | (1) |
| | | | | | | | | | | | |
|
|
|
(1) | Cash of $4,316,900 and securities with a market value of $9,443,492 have been segregated with the broker to cover requirements for open futures contracts at December 31, 2008 |
Forward foreign currency exchange contracts outstanding at December 31, 2008:
| | | | | | | | | | | | |
Purchase Contracts
| | Notional
Amount (000)
| | Value at
Settlement
Date Payable
| | Current
Value
| | Unrealized
Appreciation
(Depreciation)
| |
British Pound Expiring 01/13/09 | | GBP 7,925 | | $ | 11,998,309 | | $ | 11,391,867 | | $ | (606,442 | ) |
Canadian Dollar Expiring 01/14/09 | | CAD 536 | | | 433,072 | | | 434,080 | | | 1,008 | |
Chinese Yuan, | | | | | | | | | | | | |
Expiring 05/06/09 | | CNY 90,741 | | | 13,109,098 | | | 13,096,994 | | | (12,104 | ) |
Expiring 07/15/09 | | CNY 110,290 | | | 16,187,056 | | | 15,877,036 | | | (310,020 | ) |
Expiring 09/08/09 | | CNY 44,263 | | | 6,420,000 | | | 6,362,139 | | | (57,861 | ) |
Euro, Expiring 01/13/098 | | EUR 7,854 | | | 11,269,588 | | | 10,910,866 | | | (358,722 | ) |
Indian Rupee, Expiring 04/09/09 | | INR 610,602 | | | 12,165,957 | | | 12,431,997 | | | 266,040 | |
Malaysian Ringgit, | | | | | | | | | | | | |
Expiring 02/12/09 | | MYR 8,012 | | | 2,267,457 | | | 2,312,178 | | | 44,721 | |
Expiring 04/14/09 | | MYR 6,351 | | | 1,800,000 | | | 1,832,397 | | | 32,397 | |
Russian Ruble, Expiring 05/06/09 | | RUB 335,129 | | | 12,397,725 | | | 9,718,562 | | | (2,679,163 | ) |
| | | | |
|
| |
|
| |
|
|
|
| | | | | $ | 88,048,262 | | $ | 84,368,116 | | $ | (3,680,146 | ) |
| | | | |
|
| |
|
| |
|
|
|
| | | | | | | | | | | | |
Sale Contracts
| | Notional
Amount (000)
| | Value at
Settlement
Date Receivable
| | Current
Value
| | Unrealized
Appreciation
(Depreciation)
| |
Brazilian Real, Expiring 02/03/09 | | BRL 3,880 | | $ | 1,762,711 | | $ | 1,640,708 | | $ | 122,003 | |
British Pound, Expiring 01/13/09 | | GBP 12,295 | | | 18,392,661 | | | 17,670,462 | | | 722,199 | |
Chinese Yuan, Expiring 07/15/09 | | CNY 204,746 | | | 29,417,000 | | | 29,474,665 | | | (57,665 | ) |
Euro Expiring 01/13/09 | | EUR 6,309 | | | 7,982,981 | | | 8,764,534 | | | (781,553 | ) |
Japanese Yen, Expiring 01/08/09 | | JPY 3,249,828 | | | 34,145,977 | | | 35,856,304 | | | (1,710,327 | ) |
SEE NOTES TO FINANCIAL STATEMENTS.
A52
| | | | | | |
| | | SP PIMCO TOTAL RETURN PORTFOLIO (continued) | | |
| |
| SCHEDULE OF INVESTMENTS | | December 31, 2008 |
Forward foreign currency exchange contracts outstanding at December 31, 2008 (continued):
| | | | | | | | | | | | |
Sale Contracts
| | Notional
Amount (000)
| | Value at
Settlement
Date Receivable
| | Current
Value
| | Unrealized
Appreciation
(Depreciation)
| |
Mexican Pesos Expiring 05/19/09 | | MXN 314 | | $ | 24,024 | | $ | 21,866 | | $ | 2,158 | |
Russian Ruble, Expiring 05/06/09 | | RUB 335,129 | | | 10,392,188 | | | 9,718,562 | | | 673,626 | |
| | | | |
|
| |
|
| |
|
|
|
| | | | | $ | 102,117,542 | | $ | 103,147,101 | | $ | (1,029,559 | ) |
| | | | |
|
| |
|
| |
|
|
|
Interest rate swap agreements outstanding at December 31, 2008:
| | | | | | | | | | | | | |
Counterparty
| | Termination
Date
| | Notional
Amount#
(000)
| | Fixed
Rate
| | Floating Rate
| | Unrealized
Appreciation
(Depreciation)
| |
Bank of America Securities LLC(2) | | 12/17/28 | | $ | 29,000 | | 5.00% | | 3 month LIBOR | | $ | (8,470,124 | ) |
Bank of America Securities LLC(2) | | 12/17/23 | | | 10,900 | | 5.00% | | 3 month LIBOR | | | (3,060,481 | ) |
Barclays Capital(1) | | 12/17/13 | | | 192,500 | | 4.00% | | 3 month LIBOR | | | 20,109,507 | |
Barclays Capital(1) | | 06/17/14 | | | 40,000 | | 4.00% | | 3 month LIBOR | | | 3,230,774 | |
Barclays Capital(2) | | 12/17/23 | | | 23,000 | | 5.00% | | 3 month LIBOR | | | (5,201,138 | ) |
Barclays Capital(2) | | 12/17/18 | | | 10,600 | | 5.00% | | 3 month LIBOR | | | (1,825,302 | ) |
Barclays Capital(2) | | 12/17/28 | | | 8,400 | | 5.00% | | 3 month LIBOR | | | (2,812,567 | ) |
Citigroup(2) | | 12/17/28 | | | 113,700 | | 5.00% | | 3 month LIBOR | | | (33,443,069 | ) |
Credit Suisse International, Ltd.(2) | | 06/17/24 | | | 10,400 | | 4.00% | | 3 month LIBOR | | | (184,235 | ) |
Credit Suisse International, Ltd.(1) | | 06/17/14 | | | 500,000 | | 3.00% | | 3 month LIBOR | | | 22,266,376 | |
Deutsche Bank(2) | | 12/17/28 | | | 7,600 | | 5.00% | | 3 month LIBOR | | | (2,649,512 | ) |
Goldman Sachs(2) | | 12/17/23 | | | 25,600 | | 5.00% | | 3 month LIBOR | | | (5,617,834 | ) |
Merrill Lynch & Co.(1) | | 06/17/14 | | | 5,900 | | 4.00% | | 3 month LIBOR | | | 468,772 | |
Merrill Lynch & Co.(2) | | 12/17/23 | | | 164,300 | | 5.00% | | 3 month LIBOR | | | (45,870,713 | ) |
Merrill Lynch & Co.(2) | | 12/17/28 | | | 13,700 | | 5.00% | | 3 month LIBOR | | | (4,385,622 | ) |
Morgan Stanley Capital Services, Inc.(1) | | 12/17/13 | | | 431,900 | | 4.00% | | 3 month LIBOR | | | 45,801,071 | |
Morgan Stanley Capital Services, Inc.(2) | | 06/17/19 | | | 11,900 | | 4.00% | | 3 month LIBOR | | | 84,596 | |
Royal Bank of Scotland PLC(2) | | 12/17/28 | | | 30,000 | | 5.00% | | 3 month LIBOR | | | (8,771,573 | ) |
Royal Bank of Scotland PLC(2) | | 12/17/23 | | | 9,600 | | 5.00% | | 3 month LIBOR | | | (2,773,242 | ) |
Royal Bank of Scotland PLC(2) | | 06/17/24 | | | 6,500 | | 4.00% | | 3 month LIBOR | | | (114,611 | ) |
Merrill Lynch & Co.(2) | | 01/23/09 | | | 2,300 | | 4.50% | | ICAP CMM FRA Fixing Rate | | | (135,159 | ) |
HSBC Bank USA, N.A.(1) | | 01/02/12 | | | BRL 2,200 | | 14.77% | | Brazilian interbank lending rate | | | 31,272 | |
Merrill Lynch & Co.(1) | | 01/02/12 | | | BRL 6,000 | | 14.77% | | Brazilian interbank lending rate | | | 95,363 | |
Morgan Stanley Capital Services, Inc.(1) | | 01/02/12 | | | BRL 29,700 | | 12.54% | | Brazilian interbank lending rate | | | 205,149 | |
Morgan Stanley Capital Services, Inc.(1) | | 01/02/12 | | | BRL 72,800 | | 10.12% | | Brazilian interbank lending rate | | | 1,582,764 | |
UBS AG(1) | | 01/02/12 | | | BRL 39,600 | | 10.58% | | Brazilian interbank lending rate | | | (593,367 | ) |
UBS AG(1) | | 01/02/12 | | | BRL 13,400 | | 12.54% | | Brazilian interbank lending rate | | | 88,319 | |
Barclays Capital(2) | | 03/18/39 | | | EUR 10,000 | | 5.00% | | 6 month EURIBOR | | | (2,872,632 | ) |
UBS AG(1) | | 10/15/10 | | | EUR 1,400 | | 2.15% | | FRC-Excluding Tobacco-Non-Revised Consumer Price Index | | | 74,265 | |
Barclays Capital(2) | | 12/07/42 | | | GBP 2,300 | | 4.34% | | 6 month LIBOR | | | (691,093 | ) |
Barclays Capital(2) | | 06/15/37 | | | GBP 2,500 | | 4.00% | | 6 month LIBOR | | | (268,125 | ) |
Deutsche Bank(2) | | 06/15/37 | | | GBP 9,500 | | 4.25% | | 6 month LIBOR | | | (1,066,776 | ) |
Goldman Sachs(2) | | 06/15/37 | | | GBP 2,800 | | 4.00% | | 6 month LIBOR | | | (295,213 | ) |
HSBC Bank USA, N.A.(2) | | 06/15/37 | | | GBP 10,000 | | 4.25% | | 6 month LIBOR | | | (1,170,822 | ) |
Morgan Stanley Capital Services, Inc.(2) | | 06/15/37 | | | GBP 2,500 | | 4.25% | | 6 month LIBOR | | | (277,277 | ) |
Royal Bank of Scotland PLC(2) | | 06/17/18 | | | JPY 350,000 | | 1.50% | | 6 month LIBOR | | | (29,483 | ) |
UBS AG(2) | | 06/17/18 | | | JPY 830,000 | | 1.50% | | 6 month LIBOR | | | (93,623 | ) |
Citigroup(1) | | 05/14/09 | | | MXN 525,000 | | 7.91% | | 28 day Mexican interbank rate | | | (38,802 | ) |
| | | | | | | | | | | |
|
|
|
| | | | | | | | | | | | $ | (38,674,167 | ) |
| | | | | | | | | | | |
|
|
|
| (1) | Portfolio pays the floating rate and receives the fixed rate. |
| (2) | Portfolio pays the fixed rate and receives the floating rate. |
| # | Notional Amount is shown in U.S. dollars unless otherwise stated. |
SEE NOTES TO FINANCIAL STATEMENTS.
A53
| | | | | | |
| | | SP PIMCO TOTAL RETURN PORTFOLIO (continued) | | |
| |
| SCHEDULE OF INVESTMENTS | | December 31, 2008 |
Credit default swap agreements outstanding at December 31, 2008:
| | | | | | | | | | | | | | | | | | | | | |
Counterparty
| | Termination
Date
| | Notional
Amount#
(000)(3)
| | Fixed
Rate
| | Reference Entity/Obligation
| | Fair
Value(5)
| | | Upfront
Premiums
Paid
(Received)
| | | Unrealized
Appreciation
(Depreciation)
| |
Credit default swaps on credit indices—Sell Protection(1) | | | | | | | | | | | | |
Credit Suisse International, LTD. | | 05/25/46 | | $ | 1,200 | | 0.11% | | ABX.HE.AAA.06-2 Index | | $ | (606,938 | ) | | $ | (253,795 | ) | | $ | (353,143 | ) |
Bear Stearns International Ltd. | | 05/25/46 | | | 13,200 | | 0.11% | | ABX.HE.AAA.06-2 Index | | | (6,676,278 | ) | | | (2,904,709 | ) | | | (3,771,569 | ) |
Credit Suisse International, LTD. | | 08/25/37 | | | 11,900 | | 0.09% | | ABX.HE.AAA.07-1 Index | | | (7,181,471 | ) | | | (4,751,011 | ) | | | (2,430,460 | ) |
Credit Suisse International, LTD. | | 08/25/37 | | | 19,900 | | 0.15% | | ABX.HE.AAA.07-1 Index | | | (18,805,002 | ) | | | (13,532,924 | ) | | | (5,272,078 | ) |
Citigroup | | 01/25/38 | | | 14,700 | | 0.76% | | ABX.HE.AAA.07-2 Index | | | (8,959,568 | ) | | | (4,837,004 | ) | | | (4,122,564 | ) |
Citigroup | | 06/20/12 | | | 2,700 | | 2.18% | | Dow Jones CDX HY-8 Index | | | (456,426 | ) | | | — | | | | (456,426 | ) |
Citigroup | | 06/20/12 | | | 10,700 | | 2.14% | | Dow Jones CDX HY-8 Index | | | (1,820,392 | ) | | | — | | | | (1,820,392 | ) |
Merrill Lynch & Co. | | 06/20/12 | | | 15,400 | | 2.08% | | Dow Jones CDX HY-8 Index | | | (2,648,604 | ) | | | — | | | | (2,648,604 | ) |
Citigroup | | 06/20/12 | | | 28,200 | | 2.11% | | Dow Jones CDX HY-8 Index | | | (4,831,712 | ) | | | — | | | | (4,831,712 | ) |
Citigroup | | 06/20/12 | | | 83,277 | | 0.47% | | Dow Jones CDX HY-8 Index | | | (5,204,127 | ) | | | — | | | | (5,204,127 | ) |
Deutsche Bank | | 12/20/13 | | | 5,700 | | 1.50% | | Dow Jones CDX IG11 5Y Index | | | (111,464 | ) | | | (34,113 | ) | | | (77,351 | ) |
Merrill Lynch & Co. | | 12/20/13 | | | 23,700 | | 1.50% | | Dow Jones CDX IG11 5Y Index | | | (463,454 | ) | | | (121,692 | ) | | | (341,762 | ) |
Morgan Stanley & Co. | | 12/20/15 | | | 8,140 | | 0.46% | | Dow Jones CDX IG5 Index | | | (2,194,870 | ) | | | — | | | | (2,194,870 | ) |
Morgan Stanley & Co. | | 12/20/15 | | | 19,000 | | 0.46% | | Dow Jones CDX IG5 Index | | | (5,117,952 | ) | | | — | | | | (5,117,952 | ) |
Barclays Bank PLC | | 06/20/17 | | | 17,958 | | 0.60% | | Dow Jones CDX IG8 Index | | | (1,187,335 | ) | | | (271,421 | ) | | | (915,914 | ) |
Deutsche Bank | | 12/20/12 | | | 13,029 | | 0.82% | | Dow Jones CDX IG9 5Y Index | | | 145,195 | | | | — | | | | 145,195 | |
Barclays Bank PLC | | 12/20/12 | | | 23,335 | | 0.82% | | Dow Jones CDX IG9 5Y Index | | | 215,935 | | | | — | | | | 215,935 | |
| | | | | | | | | | | |
|
|
| |
|
|
| |
|
|
|
| | | | | | | | | | | | $ | (65,904,463 | ) | | $ | (26,706,669 | ) | | $ | (39,197,794 | ) |
| | | | | | | | | | | |
|
|
| |
|
|
| |
|
|
|
| | | | | | | | | | | | | | | | | | | | | | |
Counterparty
| | Termination
Date
| | Notional
Amount#
(000)(3)
| | Fixed
Rate
| | Reference Entity/Obligation
| | Implied
Credit
Spread at
December 31,
2008(4)
| | Fair
Value
| | | Upfront
Premiums
Paid
(Received)
| | Unrealized
Appreciation
(Depreciation)
| |
Credit default swaps on Corporate and/or Sovereign Issues—Sell Protection(1) | | | | | | | | | | | | | |
Barclays Bank PLC | | 09/20/13 | | $ | 2,500 | | 1.75% | | John Deere Capital Corp.,
5.00%, due 02/15/09 | | 1.724% | | $ | 4,160 | | | $ | — | | $ | 4,160 | |
Merrill Lynch & Co. | | 02/25/34 | | | 1,028 | | 2.25% | | Long Beach Mortgage Loan Trust 2004-1, 6.71%, due 02/25/34(6) | | 60.700% | | | (738,756 | ) | | | — | | | (738,756 | ) |
| | | | | | | | | | | | | |
|
|
| |
|
| |
|
|
|
| | | | | | | | | | | | | | $ | (734,596 | ) | | $ | — | | $ | (734,596 | ) |
| | | | | | | | | | | | | |
|
|
| |
|
| |
|
|
|
The Portfolio entered into credit default swap agreements on corporate issues, sovereign issues and credit indices as the protection seller to provide a measure of protection against the current portfolio of investments’ exposure to market conditions, or to take an active position with respect to the likelihood of a particular issuer’s default or the referenced entity’s credit soundness.
| | | | | | | | | | | | |
Counterparty
| | Termination
Date
| | Notional
Amount#
(000)(3)
| | Fixed
Rate
| | Reference Entity/Obligation
| | Unrealized
Appreciation
(Depreciation)
|
Credit default swaps—Buy Protection(2) | | | | | | | | | | | | |
Goldman Sachs | | 03/20/12 | | $ | 2,300 | | 0.40% | | AutoZone, Inc.,
5.875%, due 10/15/12 | | $ | 76,382 |
Barclays Bank PLC | | 06/20/12 | | | 1,300 | | 0.15% | | Baker Hughes, Inc.,
6.00%, due 02/15/09 | | | 42,479 |
Barclays Bank PLC | | 09/20/13 | | | 4,700 | | 0.35% | | Baxter International, Inc.,
6.625%, due 02/15/28 | | | 29,648 |
UBS AG | | 09/20/13 | | | 1,800 | | 0.35% | | Campbell Soup Co.,
4.875%, due 10/01/13 | | | 7,068 |
Barclays Bank PLC | | 09/20/13 | | | 2,500 | | 0.35% | | Campbell Soup Co.,
4.875%, due 10/01/13 | | | 9,817 |
UBS AG | | 06/20/17 | | | 1,100 | | 0.56% | | Cardinal Health, Inc.,
6.00%, due 06/15/17 | | | 18,038 |
SEE NOTES TO FINANCIAL STATEMENTS.
A54
| | | | | | |
| | | SP PIMCO TOTAL RETURN PORTFOLIO (continued) | | |
| |
| SCHEDULE OF INVESTMENTS | | December 31, 2008 |
Credit default swap agreements outstanding at December 31, 2008 (continued):
| | | | | | | | | | | | | |
Counterparty
| | Termination
Date
| | Notional
Amount#
(000)(3)
| | Fixed
Rate
| | Reference Entity/Obligation
| | Unrealized
Appreciation
(Depreciation)
| |
Barclays Bank PLC | | 06/20/15 | | $ | 700 | | 0.15% | | CitiFinancial,
6.625%, due 06/01/15 | | $ | 66,833 | |
Morgan Stanley & Co. | | 09/20/11 | | | 3,800 | | 0.24% | | CVS Corp.,
5.75%, due 08/15/11 | | | 70,851 | |
Barclays Bank PLC | | 09/20/11 | | | 3,400 | | 0.58% | | DaimlerChrysler NA,
5.75%, due 09/08/11 | | | 381,375 | |
Royal Bank of Scotland PLC | | 12/20/13 | | | 8,200 | | 1.45% | | Deutsche Bank AG,
4.875%, due 05/20/13 | | | (59,098 | ) |
Barclays Bank PLC | | 06/20/13 | | | 6,500 | | 5.00% | | Dow Jones CDX HY-10 100 Index | | | 889,376 | |
UBS AG | | 06/20/13 | | | 6,500 | | 5.00% | | Dow Jones CDX HY-10 100 Index | | | 892,957 | |
Merrill Lynch & Co. | | 12/20/11 | | | 2,500 | | 0.00% | | Dow Jones CDX HY-7 Index | | | 964,841 | |
Bank of America Securities LLC | | 06/20/12 | | | 15,876 | | 2.75% | | Dow Jones CDX HY-8 Index | | | 2,131,905 | |
UBS AG | | 06/20/12 | | | 27,048 | | 2.75% | | Dow Jones CDX HY-8 Index | | | 3,664,650 | |
Merrill Lynch & Co. | | 06/20/12 | | | 27,636 | | 2.75% | | Dow Jones CDX HY-8 Index | | | 4,203,111 | |
Deutsche Bank | | 06/20/18 | | | 27,230 | | 1.50% | | Dow Jones CDX IG10 10Y Index | | | 450,603 | |
Goldman Sachs | | 06/20/18 | | | 43,139 | | 1.50% | | Dow Jones CDX IG10 10Y Index | | | 1,257,822 | |
Morgan Stanley & Co. | | 06/20/18 | | | 45,774 | | 1.50% | | Dow Jones CDX IG10 10Y Index | | | 1,176,727 | |
Goldman Sachs | | 06/20/13 | | | 4,685 | | 1.55% | | Dow Jones CDX IG10 5Y Index | | | 151,244 | |
Credit Suisse International, LTD. | | 06/20/13 | | | 13,078 | | 1.55% | | Dow Jones CDX IG10 5Y Index | | | 319,887 | |
Deutsche Bank | | 06/20/13 | | | 24,205 | | 1.55% | | Dow Jones CDX IG10 5Y Index | | | 645,265 | |
Morgan Stanley & Co. | | 12/20/12 | | | 11,400 | | 0.14% | | Dow Jones CDX IG5 Index | | | 2,151,265 | |
Morgan Stanley & Co. | | 12/20/12 | | | 26,700 | | 0.14% | | Dow Jones CDX IG5 Index | | | 5,038,490 | |
Barclays Bank PLC | | 12/20/11 | | | 1,000 | | 0.75% | | Dow Jones CDX IG7 Index | | | 114,667 | |
Bank of America Securities LLC | | 06/20/12 | | | 139,470 | | 0.35% | | Dow Jones CDX IG8 Index | | | 7,823,057 | |
Royal Bank of Scotland PLC | | 12/20/17 | | | 3,221 | | 0.80% | | Dow Jones CDX IG9 10Y Index | | | 119,802 | |
Barclays Bank PLC | | 12/20/17 | | | 8,686 | | 0.80% | | Dow Jones CDX IG9 10Y Index | | | 339,117 | |
Goldman Sachs | | 12/20/17 | | | 11,126 | | 0.80% | | Dow Jones CDX IG9 10Y Index | | | 390,985 | |
Morgan Stanley & Co. | | 12/20/17 | | | 33,086 | | 0.80% | | Dow Jones CDX IG9 10Y Index | | | 928,543 | |
Barclays Bank PLC | | 06/20/12 | | | 1,300 | | 0.09% | | Duke Energy,
7.375%, due 03/01/10 | | | 29,611 | |
Barclays Bank PLC | | 09/20/13 | | | 2,300 | | 0.50% | | General Mills, Inc.,
5.70%, due 02/15/17 | | | 28,869 | |
Deutsche Bank | | 09/20/16 | | | 2,400 | | 0.51% | | Goodrich Corp.,
6.29%, due 07/01/16 | | | 86,295 | |
Barclays Bank PLC | | 03/20/12 | | | 1,500 | | 0.17% | | International Lease Finance Corp.,
5.40%, due 02/15/12 | | | 341,243 | |
Barclays Bank PLC | | 03/20/11 | | | 1,000 | | 0.37% | | iStar Financial, Inc.,
5.80%, due 03/15/11 | | | 592,112 | |
UBS AG | | 09/20/13 | | | 2,500 | | 0.63% | | John Deere Capital Corp.,
6.00%, due 02/15/09 | | | 117,860 | |
Morgan Stanley & Co. | | 03/20/13 | | | 5,000 | | 0.56% | | Kroger Co.,
5.50%, due 02/01/13 | | | 78,971 | |
Bear Stearns International Ltd. | | 03/20/16 | | | 3,100 | | 0.28% | | Loews Corp.,
5.25%, due 03/15/16 | | | 118,414 | |
Barclays Bank PLC | | 06/20/12 | | | 1,300 | | 0.12% | | Loews Corp.,
8.875%, due 04/15/11 | | | 25,636 | |
Goldman Sachs | | 02/25/34 | | | 1,028 | | 2.00% | | Long Beach Mortgage Loan Trust 2004-1,
6.71%, due 02/25/34(6) | | | 741,904 | |
Bear Stearns International Ltd. | | 10/13/46 | | | 4,774 | | 1.40% | | Mercury CDO, Ltd.,
4.19%, due 07/27/48(6) | | | 4,673,092 | |
UBS AG | | 06/20/17 | | | 800 | | 0.48% | | Newell Rubbermaid, Inc.,
6.75%, due 03/15/12 | | | 71,923 | |
Goldman Sachs | | 03/20/12 | | | 2,300 | | 0.26% | | Newell Rubbermaid, Inc.,
6.75%, due 03/15/12 | | | 95,069 | |
Merrill Lynch & Co. | | 04/15/20 | | | 1,800 | | 1.95% | | Race Point CLO,
7.01%, due 04/15/20 | | | 1,197,342 | |
SEE NOTES TO FINANCIAL STATEMENTS.
A55
| | | | | | |
| | | SP PIMCO TOTAL RETURN PORTFOLIO (continued) | | |
| |
| SCHEDULE OF INVESTMENTS | | December 31, 2008 |
Credit default swap agreements outstanding at December 31, 2008 (continued):
| | | | | | | | | | | | |
Counterparty
| | Termination
Date
| | Notional
Amount#
(000)(3)
| | Fixed
Rate
| | Reference Entity/Obligation
| | Unrealized
Appreciation
(Depreciation)
|
Merrill Lynch & Co. | | 04/15/20 | | $ | 2,500 | | 4.03% | | Race Point CLO,
9.61%, due 04/15/20 | | $ | 2,067,005 |
Barclays Bank PLC | | 09/20/13 | | | 4,100 | | 0.48% | | Raytheon Co.,
7.20%, due 08/15/27 | | | 32,422 |
Citigroup | | 03/20/12 | | | 2,300 | | 0.34% | | Safeway, Inc.
5.80%, 08/15/12 | | | 35,651 |
Barclays Bank PLC | | 12/20/12 | | | 3,000 | | 0.35% | | Safeway, Inc.
5.80%, 08/15/12 | | | 62,635 |
Merrill Lynch & Co. | | 12/15/19 | | | 1,600 | | 1.88% | | Saratoga CLO, Ltd.,
6.84%, due 12/15/19 | | | 966,707 |
Merrill Lynch & Co. | | 12/15/19 | | | 2,500 | | 3.78% | | Saratoga CLO, Ltd.,
8.81%, due 12/15/19 | | | 1,636,819 |
Barclays Bank PLC | | 06/20/12 | | | 1,300 | | 0.12% | | Schlumberger Limited,
1.50%, due 06/01/23 | | | 97,660 |
Morgan Stanley & Co. | | 09/20/13 | | | 1,600 | | 0.58% | | Sealed Air Corp.,
5.625%, due 07/15/13 | | | 268,383 |
Citigroup | | 09/20/13 | | | 10,000 | | 0.67% | | Sempra Energy,
6.00%, due 02/01/13 | | | 208,443 |
Bank of America Securities LLC | | 12/20/12 | | | 2,200 | | 0.30% | | Sherwin-Williams,
7.375%, due 02/01/27 | | | 97,633 |
Barclays Bank PLC | | 12/20/12 | | | 3,000 | | 0.44% | | Sherwin-Williams,
7.375%, due 02/01/27 | | | 117,414 |
Morgan Stanley & Co. | | 06/20/12 | | | 5,000 | | 0.11% | | Target Corp.,
5.875%, 03/01/12 | | | 276,492 |
Morgan Stanley & Co. | | 12/20/12 | | | 2,100 | | 0.33% | | TJX Cos., Inc.,
7.45%, due 12/15/09 | | | 68,921 |
Bear Stearns International Ltd. | | 03/20/11 | | | 1,000 | | 0.33% | | Vornado Realty,
5.60%, due 02/15/11 | | | 137,594 |
Morgan Stanley & Co. | | 06/20/17 | | | 4,900 | | 0.15% | | Wal-Mart Stores, Inc.,
5.75%, due 12/19/30 | | | 319,015 |
Goldman Sachs | | 12/20/12 | | | 5,300 | | 0.24% | | Wal-Mart Stores, Inc.,
5.75%, due 12/19/30 | | | 159,715 |
Barclays Bank PLC | | 09/20/13 | | | 500 | | 0.39% | | Wyeth,
5.25%, due 03/15/13 | | | 6,499 |
Barclays Bank PLC | | 03/20/12 | | | 1,300 | | 0.21% | | XL Cap Europe PLC,
6.50%, due 01/15/12 | | | 306,542 |
| | | | | | | | | | | |
|
|
| | | | | | | | | | | | $ | 49,361,598 |
| | | | | | | | | | | |
|
|
| (1) | If the Portfolio is a seller of protection, it receives the fixed rate. When a credit event occurs, as defined under the terms of that particular swap agreement, the Portfolio will either (i) pay to the buyer of protection an amount equal to the notional amount of the swap and take delivery of the referenced obligation or underlying securities comprising the referenced index or (ii) pay a net settlement amount in the form of cash or securities equal to the notional amount of the swap less the recovery value of the referenced obligation or underlying securities comprising the referenced index. |
| (2) | If the Portfolio is a buyer of protection, it pays the fixed rate. When a credit event occurs, as defined under the terms of that particular swap agreement, the Portfolio will either (i) receive from the seller of protection an amount equal to the notional amount of the swap and take delivery of the referenced obligation or underlying securities comprising the referenced index or (ii) receive a net settlement amount in the form of cash or securities equal to the notional amount of the swap less the recovery value of the referenced obligation or underlying securities comprising the referenced index. |
| (3) | Notional amount represents the maximum potential amount the Portfolio could be required to make as a seller of credit protection or receive as a buyer of credit protection if a credit event occurs as defined under the terms of that particular swap agreement. |
| (4) | Implied credit spreads, represented in absolute terms, utilized in determining the market value of credit default swap agreements on corporate issues or sovereign issues of an emerging country as of period end serve as an indicator of the current status of the payment/performance risk and represent the likelihood of risk of default for the credit derivative. The implied credit spread of a particular referenced entity reflects the cost of buying/selling protection and may include up-front payments required to be made to enter into the agreement. Wider credit spreads represent a deterioration of the referenced entity’s credit soundness and a greater likelihood of risk of default or other credit event occurring as defined under the terms of the agreement. |
SEE NOTES TO FINANCIAL STATEMENTS.
A56
| | | | | | |
| | | SP PIMCO TOTAL RETURN PORTFOLIO (continued) | | |
| |
| SCHEDULE OF INVESTMENTS | | December 31, 2008 |
| (5) | The fair values for credit default swap agreements on asset-backed securities and credit indices serve as an indicator of the current status of the payment/performance risk and represent the likelihood of an expected liability (or profit) for the credit derivative should the notional amount of the swap agreement been closed/sold as of the reporting date. |
| (6) | Variable rate, displayed rate is as of 12/31/08. |
| # | Notional Amount is shown in U.S. dollars unless otherwise stated. |
Reverse repurchase agreements outstanding at December 31, 2008:
| | | | | | | | | | | | | |
Broker
| | Interest
Rate
| | | Trade
Date
| | Value at
December 31, 2008
| | Maturity
Date
| | Cost
|
Barclays Bank PLC | | 2.00 | % | | 12/15/08 | | $ | 21,000,000 | | 01/21/09 | | $ | 21,000,000 |
| | | | | | | |
|
| | | |
|
|
Various inputs are used in determining the value of the Portfolio’s investments. These inputs are summarized in the three broad levels listed below.
Level 1—quoted prices in active markets for identical securities
Level 2—other significant observable inputs (including quoted prices for similar securities, interest rates, prepayment speeds, credit risk, etc.)
Level 3—significant unobservable inputs (including the Portfolio’s own assumptions in determining the fair value of investments)
The following is a summary of the inputs used as of December 31, 2008 in valuing the Portfolio’s assets carried at fair value:
| | | | | | | | |
Valuation inputs
| | Investments
in Securities
| | | Other Financial
Instruments*
| |
Level 1—Quoted Prices | | $ | 15,922,057 | | | $ | 17,003,243 | |
Level 2—Other Significant Observable Inputs-Long | | | 1,964,864,053 | | | | (44,569,894 | ) |
Level 2—Other Significant Observable Inputs-Short | | | (332,872,901 | ) | | | — | |
Level 3—Significant Unobservable Inputs | | | 1,633,246 | | | | 10,615,230 | |
| | |
|
|
| |
|
|
|
Total | | $ | 1,649,546,455 | | | $ | (16,951,421 | ) |
| | |
|
|
| |
|
|
|
| * | Other financial instruments are derivative instruments not reflected in the Schedule of Investments, such as futures, forwards and swap contracts, which are valued at the unrealized appreciation/depreciation on the instrument. |
The following is a reconciliation of assets in which significant unobservable inputs (Level 3) were used in determining fair value:
| | | | | | | |
| | | Investments
in Securities
| | | Other Financial
Instruments
|
Balance as of 12/31/07 | | $ | 204 | | | | — |
Accrued discounts/premiums | | | — | | | | — |
Realized gain (loss) | | | 31 | | | | — |
Change in unrealized appreciation (depreciation) | | | 77,433 | | | $ | 6,042,750 |
Net purchases (sales) | | | 1,555,644 | | | | — |
Transfers in and/or out of Level 3 | | | (66 | ) | | | 4,572,480 |
| | |
|
|
| |
|
|
Balance as of 12/31/08 | | $ | 1,633,246 | | | $ | 10,615,230 |
| | |
|
|
| |
|
|
The industry classification of investments and other liabilities in excess of other assets shown as a percentage of net assets as December 31, 2008 were as follows:
| | | |
U.S. Government Mortgage-Backed Obligations | | 73.1 | % |
U.S. Treasury Obligations | | 38.2 | |
Financial Services | | 15.7 | |
Financial – Bank & Trust | | 15.3 | |
Repurchase Agreements | | 12.8 | |
Municipal Bonds | | 6.8 | |
Collateralized Mortgage Obligations | | 6.7 | |
U.S. Government Agency Obligations | | 2.9 | |
Foreign Government Bonds | | 2.8 | |
Bank Notes | | 2.7 | |
Insurance | | 2.4 | |
Utilities | | 2.1 | |
Diversified | | 1.9 | |
Telecommunications | | 1.4 | |
Affiliated Money Market Mutual Fund | | 1.3 | |
| | | |
Asset-Backed Securities | | 1.0 | % |
Retail & Merchandising | | 0.6 | |
Automobile Manufacturers | | 0.6 | |
Building Materials | | 0.4 | |
Paper & Forest Products | | 0.4 | |
Tobacco | | 0.3 | |
Business Services | | 0.3 | |
Aerospace | | 0.2 | |
Options Purchased | | 0.2 | |
Healthcare – Services | | 0.1 | |
Biotechnology | | 0.1 | |
Oil, Gas & Consumable Fuels | | 0.1 | |
| | |
|
|
| | | 190.4 | |
Options Written and Securities Sold Short | | (29.9 | ) |
Other liabilities in excess of other assets | | (60.5 | ) |
| | |
|
|
| | | 100.0 | % |
| | |
|
|
SEE NOTES TO FINANCIAL STATEMENTS.
A57
| | | | | | |
| | | SP PIMCO TOTAL RETURN PORTFOLIO (continued) | | |
STATEMENT OF ASSETS AND LIABILITIES
December 31, 2008
| | | | |
| ASSETS | | | | |
Investments at value: | | | | |
Unaffiliated investments (cost $2,017,005,053) | | $ | 1,969,227,299 | |
Affiliated investments (cost $13,192,057) | | | 13,192,057 | |
Foreign currency, at value (cost $7,014,457) | | | 6,851,440 | |
Deposit with broker | | | 4,316,900 | |
Receivable for investments sold | | | 1,879,901,468 | |
Unrealized appreciation on swap agreements | | | 143,824,214 | |
Dividends and interest receivable | | | 14,046,182 | |
Unrealized appreciation on foreign currency forward contracts | | | 1,864,152 | |
Due from broker | | | 99,007 | |
Receivable for Series shares sold | | | 63,297 | |
Prepaid expenses | | | 12,025 | |
| | |
|
|
|
Total Assets | | | 4,033,398,041 | |
| | |
|
|
|
| LIABILITIES | | | | |
Payable for investments purchased | | | 2,392,836,596 | |
Securities sold short, at value (proceeds received $313,159,343) | | | 311,864,143 | |
Payments received for swap agreements | | | 59,356,317 | |
Unrealized depreciation on swap agreements | | | 173,069,173 | |
Reverse repurchase agreement | | | 21,000,000 | |
Payable to custodian | | | 11,821,419 | |
Unrealized depreciation on foreign currency forward contracts | | | 6,573,857 | |
Payable for Series shares repurchased | | | 5,130,740 | |
Payable for floating rate issued | | | 4,787,500 | |
Interest payable on investments sold short | | | 4,092,468 | |
Due to broker | | | 1,030,000 | |
Management fee payable | | | 520,018 | |
Accrued expenses and other liabilities | | | 223,156 | |
Written options outstanding, at value (premium received $19,400) | | | 8,758 | |
Deferred trustees’ fees | | | 2,154 | |
Transfer agent fees payable | | | 624 | |
| | |
|
|
|
Total Liabilities | | | 2,992,316,923 | |
| | |
|
|
|
| NET ASSETS | | $ | 1,041,081,118 | |
| | |
|
|
|
Net assets were comprised of: | | | | |
Paid-in capital | | $ | 1,063,499,529 | |
Retained earnings | | | (22,418,411 | ) |
| | |
|
|
|
Net assets, December 31, 2008 | | $ | 1,041,081,118 | |
| | |
|
|
|
Net asset value and redemption price per share, $1,041,081,118 / 94,094,239 outstanding shares of beneficial interest | | $ | 11.06 | |
| | |
|
|
|
STATEMENT OF OPERATIONS
Year Ended December 31, 2008
| | | | |
| INVESTMENT INCOME | | | | |
Interest income | | $ | 84,832,857 | |
Unaffiliated dividend income (net of $354 foreign withholding tax) | | | 304,992 | |
Affiliated dividend income | | | 164,518 | |
| | |
|
|
|
| | | | 85,302,367 | |
| | |
|
|
|
| EXPENSES | | | | |
Interest expense (Note 2) | | | 10,461,970 | |
Management fee | | | 7,672,309 | |
Custodian’s fees and expenses | | | 603,000 | |
Audit fee | | | 60,000 | |
Shareholders’ reports | | | 39,000 | |
Trustees’ fees | | | 25,000 | |
Legal fees and expenses | | | 12,000 | |
Insurance expenses | | | 10,000 | |
Commitment fee on syndicated credit agreement | | | 6,000 | |
Transfer agent’s fees and expenses (including affiliated expense of $3,600) (Note 4) | | | 4,000 | |
Miscellaneous | | | 19,326 | |
| | |
|
|
|
Total expenses | | | 18,912,605 | |
| | |
|
|
|
| NET INVESTMENT INCOME | | | 66,389,762 | |
| | |
|
|
|
| NET REALIZED AND UNREALIZED GAIN (LOSS) ON INVESTMENTS AND FOREIGN CURRENCIES | | | | |
Net realized gain (loss) on: | | | | |
Investment transactions | | | 67,235,225 | |
Futures transactions | | | (45,143,808 | ) |
Options written transactions | | | 12,342,499 | |
Swap agreement transactions | | | 38,939,206 | |
Short sale transactions | | | (52,697,036 | ) |
Foreign currency transactions | | | 8,880,770 | |
| | |
|
|
|
| | | | 29,556,856 | |
| | |
|
|
|
Net change in unrealized appreciation (depreciation) on: | | | | |
Investments | | | (76,714,280 | ) |
Futures | | | 9,338,206 | |
Options written | | | 9,383,548 | |
Swap agreements | | | (36,242,687 | ) |
Short sales | | | 5,274,880 | |
Foreign currencies | | | (11,784,702 | ) |
| | |
|
|
|
| | | | (100,745,035 | ) |
| | |
|
|
|
| NET LOSS ON INVESTMENTS AND FOREIGN CURRENCIES | | | (71,188,179 | ) |
| | |
|
|
|
| NET DECREASE IN NET ASSETS RESULTING FROM OPERATIONS | | $ | (4,798,417 | ) |
| | |
|
|
|
STATEMENT OF CHANGES IN NET ASSETS
| | | | | | | | |
| | | Year Ended December 31,
| |
| | | 2008
| | | 2007
| |
INCREASE (DECREASE) IN NET ASSETS
OPERATIONS: | | | | | | | | |
Net investment income | | $ | 66,389,762 | | | $ | 68,649,473 | |
Net realized gain (loss) on investments and foreign currencies | | | 29,556,856 | | | | 22,421,387 | |
Net change in unrealized appreciation (depreciation) on investments and foreign currencies | | | (100,745,035 | ) | | | 42,033,956 | |
| | |
|
|
| |
|
|
|
NET INCREASE (DECREASE) IN NET ASSETS RESULTING FROM OPERATIONS | | | (4,798,417 | ) | | | 133,104,816 | |
| | |
|
|
| |
|
|
|
| DISTRIBUTIONS | | | (63,508,390 | ) | | | (62,651,148 | ) |
| | |
|
|
| |
|
|
|
| SERIES SHARE TRANSACTIONS (NOTE 7): | | | | | | | | |
Series shares sold [11,356,258 and 19,086,017 shares, respectively] | | | 129,682,479 | | | | 215,233,306 | |
Series shares issued in reinvestment of distributions [5,631,269 and 5,569,936 shares, respectively] | | | 63,508,390 | | | | 62,651,148 | |
Series shares repurchased [45,007,508 and 45,249,342 shares, respectively] | | | (508,584,957 | ) | | | (513,850,170 | ) |
| | |
|
|
| |
|
|
|
DECREASE IN NET ASSETS RESULTING FROM SERIES SHARE TRANSACTIONS | | | (315,394,088 | ) | | | (235,965,716 | ) |
| | |
|
|
| |
|
|
|
| TOTAL DECREASE IN NET ASSETS | | | (383,700,895 | ) | | | (165,512,048 | ) |
| NET ASSETS: | | | | | | | | |
Beginning of year | | | 1,424,782,013 | | | | 1,590,294,061 | |
| | |
|
|
| |
|
|
|
End of year | | $ | 1,041,081,118 | | | $ | 1,424,782,013 | |
| | |
|
|
| |
|
|
|
SEE NOTES TO FINANCIAL STATEMENTS.
A58
| | | | | | |
| | | SP PRUDENTIAL U.S. EMERGING GROWTH PORTFOLIO | | |
| |
| SCHEDULE OF INVESTMENTS | | December 31, 2008 |
| | | | | |
| LONG-TERM INVESTMENTS — 98.4% |
| COMMON STOCKS — 98.4% | | Shares
| | Value
(Note 2)
|
| | | | | | |
Air Freight & Logistics — 2.1% | | | | | |
C.H. Robinson Worldwide, Inc.(b) | | 14,800 | | $ | 814,444 |
Expeditors International of Washington, Inc.(b) | | 47,200 | | | 1,570,344 |
| | | | |
|
|
| | | | | | 2,384,788 |
| | | | |
|
|
Capital Markets — 2.9% | | | | | |
Eaton Vance Corp. | | 68,800 | | | 1,445,488 |
TD Ameritrade Holdings Corp.(a) | | 130,300 | | | 1,856,775 |
| | | | |
|
|
| | | | | | 3,302,263 |
| | | | |
|
|
Chemicals — 2.3% | | | | | |
Ecolab, Inc. | | 74,000 | | | 2,601,100 |
| | | | |
|
|
Commercial Services & Supplies — 3.2% | | | | | |
Iron Mountain, Inc.(a)(b) | | 109,000 | | | 2,695,570 |
Stericycle, Inc.(a) | | 17,400 | | | 906,192 |
| | | | |
|
|
| | | | | | 3,601,762 |
| | | | |
|
|
Communications Equipment — 0.6% | | | | | |
Juniper Networks, Inc.(a)(b) | | 37,400 | | | 654,874 |
| | | | |
|
|
Computers & Peripherals — 0.5% | | | | | |
NetApp, Inc.(a) | | 40,900 | | | 571,373 |
| | | | |
|
|
Construction & Engineering — 1.8% | | | | | |
Chicago Bridge & Iron Co., N.V. | | 99,000 | | | 994,950 |
Fluor Corp. | | 22,700 | | | 1,018,549 |
| | | | |
|
|
| | | | | | 2,013,499 |
| | | | |
|
|
Consumer Finance — 0.8% | | | | | |
Alliance Data Systems Corp.(a)(b) | | 18,500 | | | 860,805 |
| | | | |
|
|
Diversified Consumer Services — 0.7% | | | | | |
Weight Watchers International, Inc. | | 26,800 | | | 788,456 |
| | | | |
|
|
Electrical Equipment — 4.1% | | | | | |
Ametek, Inc. | | 75,400 | | | 2,277,834 |
Roper Industries, Inc. | | 54,600 | | | 2,370,186 |
| | | | |
|
|
| | | | | | 4,648,020 |
| | | | |
|
|
Electronic Equipment & Instruments — 2.7% |
Amphenol Corp. (Class A Stock) | | 42,100 | | | 1,009,558 |
Anixter International, Inc.(a)(b) | | 33,800 | | | 1,018,056 |
Avnet, Inc.(a) | | 57,600 | | | 1,048,896 |
| | | | |
|
|
| | | | | | 3,076,510 |
| | | | |
|
|
Energy Equipment & Services — 1.9% | | | | | |
Cameron International Corp.(a)(b) | | 65,400 | | | 1,340,700 |
Pride International, Inc.(a) | | 52,700 | | | 842,146 |
| | | | |
|
|
| | | | | | 2,182,846 |
| | | | |
|
|
Food & Staples Retailing — 0.5% | | | | | |
Whole Foods Market, Inc.(b) | | 58,200 | | | 549,408 |
| | | | |
|
|
Food Products — 3.8% | | | | | |
ConAgra Foods, Inc. | | 99,800 | | | 1,646,700 |
Dean Foods Co.(a) | | 145,200 | | | 2,609,244 |
| | | | |
|
|
| | | | | | 4,255,944 |
| | | | |
|
|
Healthcare Equipment & Supplies — 2.8% | | | | | |
Bard (C.R.), Inc.(b) | | 15,000 | | | 1,263,900 |
DENTSPLY International, Inc. | | 45,600 | | | 1,287,744 |
ResMed, Inc.(a) | | 15,100 | | | 565,948 |
| | | | |
|
|
| | | | | | 3,117,592 |
| | | | |
|
|
| | | | | |
COMMON STOCKS
(continued) | | Shares
| | Value
(Note 2)
|
| | | | | | |
Healthcare Providers & Services — 11.3% | | | | | |
Community Health Systems, Inc.(a)(b) | | 83,600 | | $ | 1,218,888 |
DaVita, Inc.(a)(b) | | 67,100 | | | 3,326,147 |
Express Scripts, Inc.(a)(b) | | 22,100 | | | 1,215,058 |
Henry Schein, Inc.(a)(b) | | 41,800 | | | 1,533,642 |
Laboratory Corp. of America Holdings(a)(b) | | 33,400 | | | 2,151,294 |
Patterson Cos., Inc.(a) | | 53,900 | | | 1,010,625 |
Quest Diagnostics, Inc. | | 44,600 | | | 2,315,186 |
| | | | |
|
|
| | | | | | 12,770,840 |
| | | | |
|
|
Hotels, Restaurants & Leisure — 2.6% | | | | | |
Tim Hortons, Inc.(b) | | 41,800 | | | 1,205,512 |
Yum! Brands, Inc.(b) | | 55,700 | | | 1,754,550 |
| | | | |
|
|
| | | | | | 2,960,062 |
| | | | |
|
|
Household Products — 1.0% | | | | | |
Church & Dwight Co., Inc. | | 19,900 | | | 1,116,788 |
| | | | |
|
|
Independent Power Producers & Energy Traders — 1.2% | | | | | |
AES Corp. (The)(a)(b) | | 158,700 | | | 1,307,688 |
| | | | |
|
|
Insurance — 3.1% | | | | | |
White Mountains Insurance Group, Ltd. | | 4,800 | | | 1,282,128 |
W.R. Berkley Corp. | | 71,000 | | | 2,201,000 |
| | | | |
|
|
| | | | | | 3,483,128 |
| | | | |
|
|
Internet Software & Services — 1.0% | | | | | |
VeriSign, Inc.(a) | | 59,900 | | | 1,142,892 |
| | | | |
|
|
IT Services — 1.2% | | | | | |
Paychex, Inc.(b) | | 50,600 | | | 1,329,768 |
| | | | |
|
|
Leisure Equipment & Products — 0.5% | | | | | |
Electronic Arts, Inc.(a) | | 33,800 | | | 542,152 |
| | | | |
|
|
Life Sciences, Tools & Services — 2.5% | | | | | |
Charles River Laboratories International, Inc.(a)(b) | | 52,500 | | | 1,375,500 |
Thermo Fisher Scientific, Inc.(a) | | 43,400 | | | 1,478,638 |
| | | | |
|
|
| | | | | | 2,854,138 |
| | | | |
|
|
Machinery — 6.0% | | | | | |
Danaher Corp. | | 35,600 | | | 2,015,316 |
IDEX Corp. | | 98,400 | | | 2,376,360 |
ITT Corp.(b) | | 50,700 | | | 2,331,693 |
| | | | |
|
|
| | | | | | 6,723,369 |
| | | | |
|
|
Media — 2.1% | | | | | |
Regal Entertainment Group
(Class A Stock) | | 231,000 | | | 2,358,510 |
| | | | |
|
|
Metals & Mining — 0.6% | | | | | |
Goldcorp, Inc.(b) | | 20,100 | | | 633,753 |
| | | | |
|
|
Oil, Gas & Consumable Fuels — 8.4% | | | | | |
Denbury Resources, Inc.(a) | | 76,100 | | | 831,012 |
Newfield Exploration Co.(a) | | 45,500 | | | 898,625 |
Range Resources Corp. | | 29,300 | | | 1,007,627 |
Southwestern Energy Co.(a) | | 133,800 | | | 3,876,186 |
Ultra Petroleum Corp.(a) | | 28,120 | | | 970,421 |
XTO Energy, Inc. | | 51,675 | | | 1,822,577 |
| | | | |
|
|
| | | | | | 9,406,448 |
| | | | |
|
|
SEE NOTES TO FINANCIAL STATEMENTS.
A59
| | | | | | |
| | | SP PRUDENTIAL U.S. EMERGING GROWTH PORTFOLIO (continued) | | |
| |
| SCHEDULE OF INVESTMENTS | | December 31, 2008 |
| | | | | | |
COMMON STOCKS
(continued) | | Shares
| | Value
(Note 2)
| |
| | | | | | | |
Personal Products — 1.1% | | | | | | |
Avon Products, Inc. | | 52,300 | | $ | 1,256,769 | |
| | | | |
|
|
|
Pharmaceuticals — 1.1% | | | | | | |
Mylan, Inc.(a)(b) | | 128,200 | | | 1,267,898 | |
| | | | |
|
|
|
Professional Services — 1.1% | | | | | | |
Corporate Executive Board Co. (The) | | 26,204 | | | 578,060 | |
Robert Half International, Inc.(b) | | 29,000 | | | 603,780 | |
| | | | |
|
|
|
| | | | | | 1,181,840 | |
| | | | |
|
|
|
Real Estate Investment Trusts — 4.0% | | | | | | |
Annaly Capital Management, Inc. | | 284,700 | | | 4,518,189 | |
| | | | |
|
|
|
Semiconductors & Semiconductor Equipment — 2.3% | |
Broadcom Corp. (Class A Stock)(a) | | 90,450 | | | 1,534,937 | |
Maxim Integrated Products, Inc.(b) | | 88,600 | | | 1,011,812 | |
| | | | |
|
|
|
| | | | | | 2,546,749 | |
| | | | |
|
|
|
Software — 4.7% | | | | | | |
Amdocs Ltd.(a) | | 86,000 | | | 1,572,940 | |
Check Point Software Technologies(a) | | 120,300 | | | 2,284,497 | |
Mcafee Inc.(a)(b) | | 39,700 | | | 1,372,429 | |
| | | | |
|
|
|
| | | | | | 5,229,866 | |
| | | | |
|
|
|
Specialty Retail — 2.4% | | | | | | |
Abercrombie & Fitch Co.
(Class “A” Stock)(b) | | 19,900 | | | 459,093 | |
GameStop Corp.(a)(b) | | 63,900 | | | 1,384,074 | |
Ross Stores, Inc.(b) | | 30,100 | | | 894,873 | |
| | | | |
|
|
|
| | | | | | 2,738,040 | |
| | | | |
|
|
|
Textiles, Apparel & Luxury Goods — 1.1% | | | | |
Phillips-Van Heusen Corp. | | 58,800 | | | 1,183,644 | |
| | | | |
|
|
|
Trading Companies & Distributors — 1.0% | | | | |
Fastenal Co.(b) | | 32,300 | | | 1,125,655 | |
| | | | |
|
|
|
Wireless Telecommunication Services — 7.4% | | | | |
American Tower Corp.
(Class A Stock)(a) | | 86,400 | | | 2,533,248 | |
Crown Castle International Corp.(a)(b) | | 133,700 | | | 2,350,446 | |
NII Holdings, Inc.(a)(b) | | 186,600 | | | 3,392,388 | |
| | | | |
|
|
|
| | | | | | 8,276,082 | |
| | | | |
|
|
|
TOTAL LONG-TERM INVESTMENTS
(cost $137,552,544) | | | 110,563,508 | |
| | | | |
|
|
|
| SHORT-TERM INVESTMENT — 32.1% | | | | |
Affiliated Money Market Mutual Fund — 32.1% | | | | |
Dryden Core Investment Fund —
Taxable Money Market Series
(cost $36,133,759 includes
$34,496,493 of cash collateral
received for securities on
loan)(c)(d)(Note 4) | | 36,133,759 | | | 36,133,759 | |
| | | | |
|
|
|
TOTAL INVESTMENTS — 130.5%
(cost $173,686,303) | | | 146,697,267 | |
LIABILITIES IN EXCESS OF
OTHER ASSETS — (30.5)% | | | (34,243,101 | ) |
| | | | |
|
|
|
NET ASSETS — 100.0% | | $ | 112,454,166 | |
| | | | |
|
|
|
| (a) | Non-income producing security. |
| (b) | All or a portion of security is on loan. The aggregate market value of such securities is $33,758,199; cash collateral of $34,496,493 (included in liabilities) was received with which the Portfolio purchased highly liquid short-term investments. |
| (c) | Represents security, or portion thereof, purchased with cash collateral received for securities on loan. |
| (d) | Prudential Investments LLC, the manager of the Portfolio, also serves as manager of the Dryden Core Investment Fund-Taxable Money Market Series. |
Various inputs are used in determining the value of the Portfolio’s investments. These inputs are summarized in the three broad levels listed below.
Level 1—quoted prices in active markets for identical securities
Level 2—other significant observable inputs (including quoted prices for similar securities, interest rates, prepayment speeds, credit risk, etc.)
Level 3—significant unobservable inputs (including the Portfolio’s own assumptions in determining the fair value of investments)
The following is a summary of the inputs used as of December 31, 2008 in valuing the Portfolio’s assets carried at fair value:
| | | | | |
Valuation inputs
| | Investments
in Securities
| | Other Financial
Instruments*
|
Level 1—Quoted Prices | | $ | 146,697,267 | | — |
Level 2—Other Significant Observable Inputs | | | — | | — |
Level 3—Significant Unobservable Inputs | | | — | | — |
| | |
|
| |
|
Total | | $ | 146,697,267 | | — |
| | |
|
| |
|
| * | Other financial instruments are derivative instruments not reflected in the Schedule of Investments, such as futures, forwards and swap contracts, which are valued at the unrealized appreciation/depreciation on the instrument. |
As of December 31, 2007 and December 31, 2008, the Portfolio did not use any Significant Unobservable Inputs (Level 3) in determining the valuation of investments.
SEE NOTES TO FINANCIAL STATEMENTS.
A60
| | | | | | |
| | | SP PRUDENTIAL U.S. EMERGING GROWTH PORTFOLIO (continued) | | |
| |
| SCHEDULE OF INVESTMENTS | | December 31, 2008 |
The industry classification of portfolio holdings and liabilities in excess of other assets shown as a percentage of net assets as of December 31, 2008 were as follows:
| | | |
Affiliated Money Market Mutual Fund ( including 30.7% of collateral received for securities on loan) | | 32.1 | % |
Healthcare Providers & Services | | 11.3 | |
Oil, Gas & Consumable Fuels | | 8.4 | |
Wireless Telecommunication Services | | 7.4 | |
Machinery | | 6.0 | |
Software | | 4.7 | |
Electrical Equipment | | 4.1 | |
Real Estate Investment Trusts (REITs) | | 4.0 | |
Food Products | | 3.8 | |
Commercial Services & Supplies | | 3.2 | |
Insurance | | 3.1 | |
Capital Markets | | 2.9 | |
Healthcare Equipment & Supplies | | 2.8 | |
Electronic Equipment & Instruments | | 2.7 | |
Hotels, Restaurants & Leisure | | 2.6 | |
Life Sciences, Tools & Services | | 2.5 | |
Specialty Retail | | 2.4 | |
Chemicals | | 2.3 | |
Semiconductors & Semiconductor Equipment | | 2.3 | |
Air Freight & Logistics | | 2.1 | |
Media | | 2.1 | |
Energy Equipment & Services | | 1.9 | |
Construction & Engineering | | 1.8 | |
Independent Power Producers & Energy Traders | | 1.2 | |
IT Services | | 1.2 | |
Personal Products | | 1.1 | |
Pharmaceuticals | | 1.1 | |
Professional Services | | 1.1 | |
Textiles, Apparel & Luxury Goods | | 1.1 | |
Household Products | | 1.0 | |
Internet Software & Services | | 1.0 | |
Trading Companies & Distributors | | 1.0 | |
Consumer Finance | | 0.8 | |
Diversified Consumer Services | | 0.7 | |
Communications Equipment | | 0.6 | |
Metals & Mining | | 0.6 | |
Computers & Peripherals | | 0.5 | |
Food & Staples Retailing | | 0.5 | |
Leisure Equipment & Products | | 0.5 | |
| | |
|
|
| | | 130.5 | |
Liabilities in excess of other assets | | (30.5 | ) |
| | |
|
|
| | | 100.0 | % |
| | |
|
|
SEE NOTES TO FINANCIAL STATEMENTS.
A61
| | | | | | |
| | | SP PRUDENTIAL U.S. EMERGING GROWTH PORTFOLIO (continued) | | |
STATEMENT OF ASSETS AND LIABILITIES
December 31, 2008
| | | | |
| ASSETS | | | | |
Investments, at value including securities on loan of $33,758,199: | | | | |
Unaffiliated investments (cost $137,552,544) | | $ | 110,563,508 | |
Affiliated investments (cost $36,133,759) | | | 36,133,759 | |
Cash | | | 1,375 | |
Receivable for investments sold | | | 261,465 | |
Dividends and interest receivable | | | 218,235 | |
Prepaid expenses | | | 2,251 | |
Receivable for Series shares sold | | | 348 | |
| | |
|
|
|
Total Assets | | | 147,180,941 | |
| | |
|
|
|
| LIABILITIES | | | | |
Collateral for securities on loan | | | 34,496,493 | |
Payable for Series shares repurchased | | | 97,128 | |
Accrued expenses and other liabilities | | | 77,749 | |
Management fee payable | | | 54,704 | |
Affiliated transfer agent fee payable | | | 632 | |
Distribution fee payable | | | 43 | |
Administration fee payable | | | 26 | |
| | |
|
|
|
Total Liabilities | | | 34,726,775 | |
| | |
|
|
|
| NET ASSETS | | $ | 112,454,166 | |
| | |
|
|
|
Net assets were comprised of: | | | | |
Paid-in capital | | $ | 144,855,699 | |
Retained earnings | | | (32,401,533 | ) |
| | |
|
|
|
Net assets, December 31, 2008 | | $ | 112,454,166 | |
| | |
|
|
|
| Class I: | | | | |
Net asset value and redemption price per share, $112,241,266 / 24,494,765 outstanding shares of beneficial interest | | $ | 4.58 | |
| | |
|
|
|
| Class II: | | | | |
Net asset value and redemption price per share, $212,900 / 48,004 outstanding shares of beneficial interest | | $ | 4.44 | |
| | |
|
|
|
STATEMENT OF OPERATIONS
Year Ended December 31, 2008
| | | | |
| INVESTMENT INCOME | | | | |
Unaffiliated dividend income (net of foreign withholding taxes of $2,035) | | $ | 1,578,804 | |
Affiliated income from securities loaned, net | | | 322,563 | |
Affiliated dividend income | | | 125,245 | |
| | |
|
|
|
| | | | 2,026,612 | |
| | |
|
|
|
| EXPENSES | | | | |
Management fee | | | 991,044 | |
Distribution fee—Class II | | | 781 | |
Administration fee—Class II | | | 468 | |
Custodian’s fees and expenses | | | 48,000 | |
Shareholders’ reports | | | 30,000 | |
Audit fee | | | 17,000 | |
Trustees’ fees | | | 11,000 | |
Legal fees and expenses | | | 6,000 | |
Transfer agent’s fee and expenses (including affiliated expense of $3,600) (Note 4) | | | 4,000 | |
Insurance expenses | | | 2,000 | |
Commitment fee on syndicated credit agreement | | | 1,000 | |
Miscellaneous | | | 10,480 | |
| | |
|
|
|
Total expenses | | | 1,121,773 | |
| | |
|
|
|
| NET INVESTMENT INCOME | | | 904,839 | |
| | |
|
|
|
| NET REALIZED AND UNREALIZED GAIN (LOSS) ON INVESTMENTS: | | | | |
Net realized loss on investment transactions | | | (5,949,806 | ) |
Net change in unrealized appreciation (depreciation) on investments | | | (63,167,616 | ) |
| | |
|
|
|
| NET LOSS ON INVESTMENTS | | | (69,117,422 | ) |
| | |
|
|
|
| NET DECREASE IN NET ASSETS RESULTING FROM OPERATIONS | | $ | (68,212,583 | ) |
| | |
|
|
|
STATEMENT OF CHANGES IN NET ASSETS
| | | | | | | | |
| | | Year Ended December 31,
| |
| | | 2008
| | | 2007
| |
| INCREASE (DECREASE) IN NET ASSETS | | | | | | | | |
| OPERATIONS: | | | | | | | | |
Net investment income | | $ | 904,839 | | | $ | 493,880 | |
Net realized gain (loss) on investments | | | (5,949,806 | ) | | | 27,633,621 | |
Net change in unrealized appreciation (depreciation) on investments | | | (63,167,616 | ) | | | 4,131,011 | |
| | |
|
|
| |
|
|
|
NET INCREASE (DECREASE) IN NET ASSETS RESULTING FROM OPERATIONS | | | (68,212,583 | ) | | | 32,258,512 | |
| | |
|
|
| |
|
|
|
| DISTRIBUTIONS: | | | | | | | | |
Class I | | | (28,074,791 | ) | | | (20,193,651 | ) |
Class II | | | (52,710 | ) | | | (36,860 | ) |
| | |
|
|
| |
|
|
|
TOTAL DISTRIBUTIONS | | | (28,127,501 | ) | | | (20,230,511 | ) |
| | |
|
|
| |
|
|
|
SERIES SHARE TRANSACTIONS (Note 7): | | | | | | | | |
Series shares sold | | | 6,076,143 | | | | 13,349,237 | |
Series shares issued in reinvestment of distributions | | | 28,127,501 | | | | 20,230,511 | |
Series shares repurchased | | | (31,617,051 | ) | | | (42,334,740 | ) |
| | |
|
|
| |
|
|
|
NET INCREASE (DECREASE) IN NET ASSETS RESULTING FROM SERIES SHARE TRANSACTIONS | | | 2,586,593 | | | | (8,754,992 | ) |
| | |
|
|
| |
|
|
|
| TOTAL INCREASE (DECREASE) IN NET ASSETS | | | (93,753,491 | ) | | | 3,273,009 | |
| NET ASSETS: | | | | | | | | |
Beginning of year | | | 206,207,657 | | | | 202,934,648 | |
| �� | |
|
|
| |
|
|
|
End of year | | $ | 112,454,166 | | | $ | 206,207,657 | |
| | |
|
|
| |
|
|
|
SEE NOTES TO FINANCIAL STATEMENTS.
A62
| | | | | | |
| | | SP SMALL CAP VALUE PORTFOLIO | | |
| |
| SCHEDULE OF INVESTMENTS | | December 31, 2008 |
| | | | | |
| LONG-TERM INVESTMENTS — 97.8% |
| COMMON STOCKS | | Shares
| | Value
(Note 2)
|
| | | | | | |
Aerospace & Defense — 1.7% | | | | | |
AAR Corp.*(a) | | 33,661 | | $ | 619,699 |
Heico Corp. (Class A Stock) | | 47,530 | | | 1,376,469 |
Limco-Piedmont, Inc.* | | 71,813 | | | 217,593 |
Orbital Sciences Corp.* | | 49,700 | | | 970,641 |
Spirit Aerosystems Holdings, Inc. (Class A Stock)* | | 29,120 | | | 296,151 |
| | | | |
|
|
| | | | | | 3,480,553 |
| | | | |
|
|
Air Freight & Logistics — 0.3% | | | | | |
Pacer International, Inc. | | 56,990 | | | 594,406 |
| | | | |
|
|
Airlines — 0.7% | | | | | |
AirTran Holdings, Inc.*(a) | | 332,250 | | | 1,475,190 |
| | | | |
|
|
Auto Components — 0.4% | | | | | |
Cooper Tire & Rubber Co. | | 87,480 | | | 538,877 |
WABCO Holdings, Inc. | | 16,460 | | | 259,903 |
| | | | |
|
|
| | | | | | 798,780 |
| | | | |
|
|
Automobile Manufacturers — 0.2% | | | | | |
Wabash National Corp.(a) | | 81,543 | | | 366,943 |
| | | | |
|
|
Automotive Parts — 0.5% | | | | | |
Advance Auto Parts, Inc. | | 11,700 | | | 393,705 |
Asbury Automotive Group, Inc. | | 84,902 | | | 388,002 |
Tenneco, Inc.* | | 62,147 | | | 183,334 |
| | | | |
|
|
| | | | | | 965,041 |
| | | | |
|
|
Banks — 2.0% | | | | | |
Bridge Capital Holdings*(a) | | 11,748 | | | 44,642 |
Dime Community Bancshares | | 15,328 | | | 203,863 |
East West Bancorp, Inc.(a) | | 44,201 | | | 705,890 |
Hancock Holding Co. | | 24,766 | | | 1,125,862 |
Pinnacle Financial Partners, Inc.*(a) | | 15,375 | | | 458,329 |
Sterling Bancshares, Inc. | | 25,177 | | | 153,076 |
Sterling Financial Corp. | | 22,500 | | | 198,000 |
Trico Bancshares | | 13,158 | | | 328,555 |
UMB Financial Corp. | | 14,898 | | | 732,088 |
| | | | |
|
|
| | | | | | 3,950,305 |
| | | | |
|
|
Building Materials — 0.8% | | | | | |
Comfort Systems USA, Inc. | | 96,391 | | | 1,021,744 |
Universal Forest Products, Inc. | | 23,993 | | | 645,652 |
| | | | |
|
|
| | | | | | 1,667,396 |
| | | | |
|
|
Building Products — 1.2% | | | | | |
Gibraltar Industries, Inc.(a) | | 103,830 | | | 1,239,730 |
Patrick Industries, Inc.* | | 90,900 | | | 55,267 |
Simpson Manufacturing Co., Inc. | | 40,950 | | | 1,136,772 |
| | | | |
|
|
| | | | | | 2,431,769 |
| | | | |
|
|
Business Services — 0.2% | | | | | |
Resources Connection, Inc.* | | 25,214 | �� | | 413,005 |
| | | | |
|
|
Capital Markets — 0.7% | | | | | |
GAMCO Investment, Inc.
(Class A Stock) | | 23,570 | | | 643,932 |
Raymond James Financial, Inc. | | 34,250 | | | 586,702 |
Thomas Weisel Partners Group, Inc.* | | 21,190 | | | 100,017 |
| | | | |
|
|
| | | | | | 1,330,651 |
| | | | |
|
|
| | | | | |
COMMON STOCKS
(continued) | | Shares
| | Value
(Note 2)
|
| | | | | | |
Chemicals — 1.6% | | | | | |
Ferro Corp. | | 26,740 | | $ | 188,517 |
Fuller (H.B.) Co.(a) | | 60,262 | | | 970,821 |
KMG Chemicals, Inc. | | 46,774 | | | 232,467 |
Koppers Holdings, Inc. | | 12,070 | | | 260,953 |
Minerals Technologies, Inc. | | 17,596 | | | 719,676 |
PolyOne Corp.*(a) | | 245,602 | | | 773,646 |
| | | | |
|
|
| | | | | | 3,146,080 |
| | | | |
|
|
Clothing & Apparel — 0.4% | | | | | |
Gymboree Corp.*(a) | | 17,012 | | | 443,843 |
K-Swiss, Inc. (Class A Stock) | | 27,391 | | | 312,257 |
| | | | |
|
|
| | | | | | 756,100 |
| | | | |
|
|
Commercial Banks — 7.7% | | | | | |
Bancorp, Inc. (The)* | | 6,441 | | | 24,154 |
Cascade Financial Corp. | | 129,495 | | | 701,863 |
Central Pacific Financial Corp. | | 61,480 | | | 617,259 |
City Bank/Lynnwood WA | | 44,330 | | | 230,516 |
City Holding Co.(a) | | 14,360 | | | 499,441 |
City National Corp. | | 14,380 | | | 700,306 |
CoBiz Financial, Inc.(a) | | 127,669 | | | 1,243,496 |
Cullen/Frost Bankers, Inc. | | 39,420 | | | 1,997,806 |
First Security Group, Inc. | | 202,160 | | | 933,979 |
FNB Corp. | | 61,178 | | | 807,550 |
IBERIABANK Corp. | | 33,126 | | | 1,590,048 |
PAB Bankshares, Inc. | | 18,470 | | | 81,268 |
South Financial Group, Inc. (The)(a) | | 36,200 | | | 156,384 |
SVB Financial Group*(a) | | 26,150 | | | 685,914 |
Synovus Financial Corp. | | 97,040 | | | 805,432 |
Tompkins Trustco, Inc. | | 11,590 | | | 671,640 |
UCBH Holdings, Inc. | | 135,780 | | | 934,166 |
Umpqua Holdings Corp. | | 98,470 | | | 1,424,861 |
Webster Financial Corp. | | 31,400 | | | 432,692 |
Wintrust Financial Corp.(a) | | 51,810 | | | 1,065,732 |
| | | | |
|
|
| | | | | | 15,604,507 |
| | | | |
|
|
Commercial Services — 0.1% | | | | | |
On Assignment, Inc.* | | 47,451 | | | 269,047 |
| | | | |
|
|
Commercial Services & Supplies — 0.6% | | | |
Hillenbrand, Inc. | | 22,870 | | | 381,472 |
Watson Wyatt Worldwide, Inc.
(Class A Stock) | | 16,300 | | | 779,466 |
| | | | |
|
|
| | | | | | 1,160,938 |
| | | | |
|
|
Communication Equipment — 1.8% | | | | | |
Bel Fuse, Inc. (Class B Stock) | | 16,360 | | | 346,832 |
Black Box Corp. | | 38,420 | | | 1,003,530 |
Digi International, Inc.* | | 70,300 | | | 570,133 |
Plantronics, Inc.(a) | | 129,985 | | | 1,715,802 |
| | | | |
|
|
| | | | | | 3,636,297 |
| | | | |
|
|
Computer Hardware — 0.7% | | | | | |
Electronics for Imaging, Inc.*(a) | | 88,238 | | | 843,555 |
MTS Systems Corp. | | 20,435 | | | 544,389 |
| | | | |
|
|
| | | | | | 1,387,944 |
| | | | |
|
|
Computer Services & Software — 1.6% | | | | | |
Avid Technology, Inc.* | | 54,104 | | | 590,275 |
Factset Research Systems, Inc.(a) | | 10,429 | | | 461,379 |
JDA Software Group, Inc.*(a) | | 36,464 | | | 478,772 |
SEE NOTES TO FINANCIAL STATEMENTS.
A63
| | | | | | |
| | | SP SMALL CAP VALUE PORTFOLIO (continued) | | |
| |
| SCHEDULE OF INVESTMENTS | | December 31, 2008 |
| | | | | |
COMMON STOCKS
(continued) | | Shares
| | Value
(Note 2)
|
| | | | | | |
Computer Services & Software (continued) |
Monotype Imaging Holdings, Inc.* | | 36,668 | | $ | 212,674 |
Parametric Technology Corp.* | | 66,168 | | | 837,025 |
Progress Software Corp.* | | 15,941 | | | 307,024 |
Solera Holdings, Inc.*(a) | | 14,190 | | | 341,979 |
| | | | |
|
|
| | | | | | 3,229,128 |
| | | | |
|
|
Computers & Peripherals — 0.2% | | | | | |
Rimage Corp.* | | 26,020 | | | 348,928 |
| | | | |
|
|
Construction — 0.7% | | | | | |
MDC Holdings, Inc.(a) | | 8,845 | | | 268,004 |
Ryland Group, Inc. | | 63,863 | | | 1,128,459 |
| | | | |
|
|
| | | | | | 1,396,463 |
| | | | |
|
|
Construction & Engineering — 1.0% | | | | | |
Dycom Industries, Inc.* | | 19,980 | | | 164,236 |
EMCOR Group, Inc.* | | 45,450 | | | 1,019,443 |
Perini Corp.*(a) | | 32,830 | | | 767,565 |
| | | | |
|
|
| | | | | | 1,951,244 |
| | | | |
|
|
Construction Materials — 0.1% | | | | | |
Vulcan Materials Co.(a) | | 1,919 | | | 133,524 |
| | | | |
|
|
Consumer Finance — 0.2% | | | | | |
First Cash Financial Services, Inc.* | | 21,794 | | | 415,394 |
| | | | |
|
|
Consumer Products & Services — 1.0% | | | | | |
Elizabeth Arden, Inc.*(a) | | 61,648 | | | 777,382 |
Fossil, Inc.* | | 43,016 | | | 718,367 |
Prestige Brands Holdings, Inc.* | | 57,251 | | | 603,998 |
| | | | |
|
|
| | | | | | 2,099,747 |
| | | | |
|
|
Containers & Packaging — 0.5% | | | | | |
AptarGroup, Inc. | | 30,850 | | | 1,087,154 |
| | | | |
|
|
Distribution/Wholesale — 0.6% | | | | | |
Watsco, Inc.(a) | | 32,946 | | | 1,265,126 |
| | | | |
|
|
Diversified Consumer Services — 0.5% | | | | | |
Steiner Leisure Ltd. (Bahamas)* | | 36,060 | | | 1,064,491 |
| | | | |
|
|
Diversified Financial Services — 1.4% | | | | | |
Boston Private Financial Holdings, Inc. | | 37,180 | | | 254,311 |
Financial Federal Corp. | | 86,422 | | | 2,011,040 |
KBW, Inc.*(a) | | 22,445 | | | 516,235 |
| | | | |
|
|
| | | | | | 2,781,586 |
| | | | |
|
|
Electric Utilities — 1.6% | | | | | |
MGE Energy, Inc. | | 21,927 | | | 723,591 |
NV Energy, Inc. | | 204,828 | | | 2,025,749 |
Portland General Electric Co. | | 24,250 | | | 472,147 |
| | | | |
|
|
| | | | | | 3,221,487 |
| | | | |
|
|
Electrical Equipment — 1.0% | | | | | |
Hubbell, Inc. (Class B Stock) | | 14,300 | | | 467,324 |
Regal-Beloit Corp. | | 43,800 | | | 1,663,962 |
| | | | |
|
|
| | | | | | 2,131,286 |
| | | | |
|
|
Electronic Components — 0.2% | | | | | |
Empire District Electric Co. (The) | | 26,321 | | | 463,250 |
| | | | |
|
|
| | | | | |
COMMON STOCKS
(continued) | | Shares
| | Value
(Note 2)
|
| | | | | | |
Energy Equipment & Services — 0.9% | | | | | |
Dril-Quip, Inc.* | | 34,210 | | $ | 701,647 |
ION Geophysical Corp.*(a) | | 102,080 | | | 350,135 |
National Oilwell Varco, Inc.* | | 18,880 | | | 461,427 |
Superior Well Services, Inc.* | | 21,290 | | | 212,900 |
| | | | |
|
|
| | | | | | 1,726,109 |
| | | | |
|
|
Environmental Services — 0.5% | | | | | |
Waste Connections, Inc.* | | 30,734 | | | 970,272 |
| | | | |
|
|
Exchange Traded Funds — 2.7% | | | | | |
iShares NASDAQ Biotechnology Index Fund(a) | | 18,400 | | | 1,307,320 |
iShares Russell 2000 Value Index Fund | | 83,781 | | | 4,119,512 |
| | | | |
|
|
| | | | | | 5,426,832 |
| | | | |
|
|
Financial – Bank & Trust — 4.9% | | | | | |
Bank of Hawaii Corp. | | 5,040 | | | 227,657 |
Bank of the Ozarks, Inc. | | 32,413 | | | 960,721 |
First Financial Bankshares, Inc.(a) | | 29,557 | | | 1,631,842 |
Glacier Bancorp, Inc. | | 69,549 | | | 1,322,822 |
NewAlliance Bancshares, Inc.(a) | | 47,981 | | | 631,910 |
PacWest Bancorp | | 17,457 | | | 469,593 |
Prosperity Bancshares, Inc. | | 42,738 | | | 1,264,617 |
Provident Financial Services, Inc. | | 17,680 | | | 270,504 |
SCBT Financial Corp. | | 10,598 | | | 365,631 |
Seacoast Banking Corp. of Florida(a) | | 27,718 | | | 182,939 |
Signature Bank / New York*(a) | | 51,272 | | | 1,470,994 |
Southcoast Financial Corp.* | | 14,765 | | | 61,718 |
Sterling Bancorp | | 16,462 | | | 230,962 |
Summit State Bank | | 10,981 | | | 50,513 |
Texas Capital Bancshares, Inc.*(a) | | 27,889 | | | 372,597 |
United Community Banks, Inc.(a) | | 9,918 | | | 134,688 |
WSFS Financial Corp.(a) | | 5,745 | | | 275,702 |
| | | | |
|
|
| | | | | | 9,925,410 |
| | | | |
|
|
Financial – Brokerage — 0.2% | | | | | |
Compass Diversified Holdings | | 39,819 | | | 447,964 |
| | | | |
|
|
Financial – Securities/Asset Management — 0.1% | | | |
Gladstone Capital Corp. | | 20,764 | | | 167,981 |
| | | | |
|
|
Financial Services — 2.1% | | | | | |
Ares Capital Corp. | | 29,696 | | | 187,976 |
Berkshire Hills Bancorp, Inc. | | 12,594 | | | 388,651 |
BGC Partners, Inc. (Class A Stock) | | 39,496 | | | 109,009 |
Brookline Bancorp, Inc.(a) | | 54,437 | | | 579,754 |
Highland Distressed Opportunities, Inc. | | 18,944 | | | 40,730 |
Home BancShares, Inc.(a) | | 8,548 | | | 230,369 |
Interactive Data Corp. | | 31,958 | | | 788,084 |
Knight Capital Group, Inc.
(Class A Stock)*(a) | | 40,673 | | | 656,869 |
PennantPark Investment Corp. | | 53,527 | | | 193,232 |
RSC Holdings, Inc.*(a) | | 123,436 | | | 1,051,675 |
| | | | |
|
|
| | | | | | 4,226,349 |
| | | | |
|
|
Food & Staples Retailing — 1.2% | | | | | |
Casey’s General Stores, Inc.(a) | | 78,855 | | | 1,795,528 |
Weis Markets, Inc. | | 21,370 | | | 718,673 |
| | | | |
|
|
| | | | | | 2,514,201 |
| | | | |
|
|
SEE NOTES TO FINANCIAL STATEMENTS.
A64
| | | | | | |
| | | SP SMALL CAP VALUE PORTFOLIO (continued) | | |
| |
| SCHEDULE OF INVESTMENTS | | December 31, 2008 |
| | | | | |
COMMON STOCKS
(continued) | | Shares
| | Value
(Note 2)
|
| | | | | | |
Food Products — 2.3% | | | | | |
Del Monte Foods Co. | | 241,500 | | $ | 1,724,310 |
Nash-Finch Co. | | 8,671 | | | 389,241 |
Ralcorp Holdings, Inc.* | | 15,390 | | | 898,776 |
Sensient Technologies Corp. | | 50,722 | | | 1,211,242 |
Smithfield Foods, Inc.*(a) | | 33,260 | | | 467,968 |
| | | | |
|
|
| | | | | | 4,691,537 |
| | | | |
|
|
Gas Utilities — 0.9% | | | | | |
New Jersey Resources Corp. | | 19,380 | | | 762,603 |
Northwest Natural Gas Co.(a) | | 24,840 | | | 1,098,673 |
| | | | |
|
|
| | | | | | 1,861,276 |
| | | | |
|
|
Healthcare – Services — 0.1% | | | | | |
Hill-Rom Holdings, Inc.(a) | | 17,472 | | | 287,589 |
| | | | |
|
|
Healthcare Equipment & Supplies — 0.2% |
National Dentex Corp.* | | 75,610 | | | 344,025 |
| | | | |
|
|
Healthcare Products — 0.4% | | | | | |
American Medical Systems Holdings, Inc.* | | 65,345 | | | 587,451 |
Kinetic Concepts, Inc.*(a) | | 8,470 | | | 162,455 |
| | | | |
|
|
| | | | | | 749,906 |
| | | | |
|
|
Healthcare Providers & Services — 1.9% | | | |
Cross Country Healthcare, Inc.* | | 81,340 | | | 714,979 |
Healthways, Inc.* | | 22,559 | | | 258,977 |
LifePoint Hospitals, Inc.*(a) | | 49,720 | | | 1,135,605 |
Lincare Holdings, Inc.*(a) | | 18,900 | | | 508,977 |
RehabCare Group, Inc.* | | 76,080 | | | 1,153,373 |
| | | | |
|
|
| | | | | | 3,771,911 |
| | | | |
|
|
Healthcare Technology | | | | | |
MedQuist, Inc. | | 23,170 | | | 47,499 |
| | | | |
|
|
Hotels, Restaurants & Leisure — 0.4% | | | | | |
Brinker International, Inc. | | 18,330 | | | 193,198 |
Cheesecake Factory, Inc. (The)* | | 27,339 | | | 276,124 |
Choice Hotels International, Inc. | | 10,972 | | | 329,818 |
| | | | |
|
|
| | | | | | 799,140 |
| | | | |
|
|
Household Durables — 1.1% | | | | | |
Ethan Allen Interiors, Inc.(a) | | 9,220 | | | 132,491 |
Snap-on, Inc. | | 27,550 | | | 1,084,919 |
Tupperware Brands Corp. | | 45,958 | | | 1,043,247 |
| | | | |
|
|
| | | | | | 2,260,657 |
| | | | |
|
|
Household Products — 0.5% | | | | | |
Central Garden & Pet Co.
(Class A Stock)*(a) | | 157,000 | | | 926,300 |
| | | | |
|
|
Information Technology Services — 0.7% | | | |
Perot Systems Corp.
(Class A Stock)*(a) | | 108,570 | | | 1,484,152 |
| | | | |
|
|
Insurance — 8.6% | | | | | |
Allied World Assurance Holdings Ltd. (Bermuda) | | 51,050 | | | 2,072,630 |
AMBAC Financial Group, Inc.(a) | | 79,110 | | | 102,843 |
American Equity Investment Life Holding Co. | | 140,507 | | | 983,549 |
Arch Capital Group Ltd. (Bermuda)* | | 10,270 | | | 719,927 |
| | | | | |
COMMON STOCKS
(continued) | | Shares
| | Value
(Note 2)
|
| | | | | | |
Insurance (continued) | | | | | |
Aspen Insurance Holdings Ltd. (Bermuda) | | 47,359 | | $ | 1,148,456 |
Assured Guaranty Ltd. (Bermuda)(a) | | 13,970 | | | 159,258 |
CNA Surety Corp.*(a) | | 67,842 | | | 1,302,566 |
Donegal Group, Inc. | | 23,142 | | | 388,091 |
EMC Insurance Group, Inc.(a) | | 31,540 | | | 809,001 |
Max Capital Group Ltd. (Bermuda) | | 86,512 | | | 1,531,262 |
Meadowbrook Insurance Group, Inc. | | 389,329 | | | 2,507,279 |
MGIC Investment Corp. | | 33,408 | | | 116,260 |
Navigators Group, Inc.* | | 8,057 | | | 442,410 |
ProAssurance Corp.* | | 31,165 | | | 1,644,889 |
RLI Corp. | | 14,996 | | | 917,155 |
Tower Group, Inc.(a) | | 27,800 | | | 784,238 |
Willis Group Holdings Ltd. (United Kingdom) | | 30,640 | | | 762,323 |
Zenith National Insurance Corp. | | 32,280 | | | 1,019,080 |
| | | | |
|
|
| | | | | | 17,411,217 |
| | | | |
|
|
Internet Services — 0.4% | | | | | |
Ariba, Inc.*(a) | | 59,889 | | | 431,800 |
F5 Networks, Inc.*(a) | | 16,640 | | | 380,390 |
| | | | |
|
|
| | | | | | 812,190 |
| | | | |
|
|
Iron/Steel — 0.2% | | | | | |
Olympic Steel, Inc. | | 16,000 | | | 325,920 |
| | | | |
|
|
Leisure Equipment & Products — 0.1% | | | | | |
Callaway Golf Co. | | 28,525 | | | 264,997 |
| | | | |
|
|
Life Science Tools & Services — 0.1% | | | | | |
Enzo Biochem, Inc.* | | 52,000 | | | 254,280 |
| | | | |
|
|
Machinery — 3.2% | | | | | |
Albany International Corp.
(Class A Stock) | | 55,000 | | | 704,000 |
IDEX Corp. | | 24,590 | | | 593,849 |
Kaydon Corp. | | 35,870 | | | 1,232,134 |
Kennametal, Inc. | | 52,490 | | | 1,164,753 |
RBC Bearings, Inc.*(a) | | 53,000 | | | 1,074,840 |
Sauer-Danfoss, Inc. | | 50,390 | | | 440,913 |
Wabtec Corp. | | 33,220 | | | 1,320,495 |
| | | | |
|
|
| | | | | | 6,530,984 |
| | | | |
|
|
Machinery & Equipment — 1.6% | | | | | |
Actuant Corp. (Class A Stock) | | 64,391 | | | 1,224,717 |
Applied Industrial Technologies, Inc. | | 57,686 | | | 1,091,419 |
Franklin Electric Co., Inc.(a) | | 11,313 | | | 318,009 |
Tennant Co. | | 38,256 | | | 589,142 |
| | | | |
|
|
| | | | | | 3,223,287 |
| | | | |
|
|
Marine — 0.5% | | | | | |
Kirby Corp.* | | 36,110 | | | 987,970 |
| | | | |
|
|
Medical Supplies & Equipment — 1.6% | | | | | |
Cardiac Science Corp.*(a) | | 103,462 | | | 775,965 |
Edwards Lifesciences Corp.*(a) | | 10,574 | | | 581,041 |
Orthofix International NV (Netherlands)*(a) | | 24,528 | | | 376,014 |
PSS World Medical, Inc.*(a) | | 37,312 | | | 702,212 |
Symmetry Medical, Inc.* | | 88,140 | | | 702,476 |
| | | | |
|
|
| | | | | | 3,137,708 |
| | | | |
|
|
SEE NOTES TO FINANCIAL STATEMENTS.
A65
| | | | | | |
| | | SP SMALL CAP VALUE PORTFOLIO (continued) | | |
| |
| SCHEDULE OF INVESTMENTS | | December 31, 2008 |
| | | | | |
COMMON STOCKS
(continued) | | Shares
| | Value
(Note 2)
|
| | | | | | |
Metals & Mining — 2.2% | | | | | |
Carpenter Technology Corp. | | 21,470 | | $ | 440,994 |
Cliffs Natural Resources, Inc.(a) | | 9,540 | | | 244,319 |
Commercial Metals Co. | | 31,780 | | | 377,229 |
Haynes International, Inc.* | | 25,170 | | | 619,685 |
Kaiser Aluminum Corp. | | 40,839 | | | 919,694 |
Mueller Industries, Inc. | | 66,415 | | | 1,665,688 |
Schnitzer Steel Industries, Inc.
(Class A Stock) | | 5,861 | | | 220,667 |
| | | | |
|
|
| | | | | | 4,488,276 |
| | | | |
|
|
Oil, Gas & Consumable Fuels — 2.3% | | | | | |
Cabot Oil & Gas Corp. | | 20,060 | | | 521,560 |
Core Laboratories NV (Netherlands)(a) | | 14,019 | | | 839,177 |
Denbury Resources, Inc.*(a) | | 44,200 | | | 482,664 |
Goodrich Petroleum Corp.* | | 10,080 | | | 301,896 |
Petroleum Development Corp.* | | 31,967 | | | 769,446 |
Southwest Gas Corp. | | 25,807 | | | 650,853 |
St. Mary Land & Exploration Co. | | 11,090 | | | 225,238 |
XTO Energy, Inc. | | 24,945 | | | 879,810 |
| | | | |
|
|
| | | | | | 4,670,644 |
| | | | |
|
|
Paper & Forest Products — 0.1% | | | | | |
Caraustar Industries, Inc.* | | 143,281 | | | 65,909 |
Louisiana-Pacific Corp. | | 68,500 | | | 106,860 |
| | | | |
|
|
| | | | | | 172,769 |
| | | | |
|
|
Pharmaceuticals — 0.4% | | | | | |
Charles River Laboratories International, Inc.* | | 12,500 | | | 327,500 |
Medarex, Inc.* | | 74,612 | | | 416,335 |
| | | | |
|
|
| | | | | | 743,835 |
| | | | |
|
|
Professional Services — 0.8% | | | |
Korn/Ferry International* | | 19,980 | | | 228,172 |
TrueBlue, Inc.* | | 72,670 | | | 695,452 |
United Stationers, Inc.*(a) | | 21,840 | | | 731,421 |
| | | | |
|
|
| | | | | | 1,655,045 |
| | | | |
|
|
Real Estate Investment Trusts — 6.9% | | | | | |
Acadia Realty Trust | | 44,841 | | | 639,881 |
American Campus Communities, Inc. | | 61,329 | | | 1,256,018 |
American Land Lease, Inc. | | 30,090 | | | 415,844 |
BioMed Realty Trust, Inc.(a) | | 135,389 | | | 1,586,759 |
Cogdell Spencer, Inc. | | 27,235 | | | 254,920 |
Corporate Office Properties Trust | | 7,480 | | | 229,636 |
Cousins Properties, Inc.(a) | | 48,410 | | | 670,478 |
Digital Realty Trust, Inc.(a) | | 38,723 | | | 1,272,050 |
iStar Financial, Inc. | | 40,990 | | | 91,408 |
LaSalle Hotel Properties(a) | | 42,700 | | | 471,835 |
MFA Mortgage Investments, Inc. | | 230,166 | | | 1,355,678 |
Mid-America Apartment Communities, Inc.(a) | | 37,490 | | | 1,393,128 |
National Retail Properties, Inc.(a) | | 79,161 | | | 1,360,778 |
Omega Healthcare Investors, Inc. | | 75,442 | | | 1,204,809 |
Parkway Properties, Inc. | | 52,267 | | | 940,806 |
Saul Centers, Inc. | | 7,360 | | | 290,720 |
U-Store-It Trust | | 56,713 | | | 252,373 |
| | | | | |
COMMON STOCKS
(continued) | | Shares
| | Value
(Note 2)
|
| | | | | | |
Real Estate Investment Trusts (continued) | | | |
Washington Real Estate Investment Trust | | 9,170 | | $ | 259,511 |
| | | | |
|
|
| | | | | | 13,946,632 |
| | | | |
|
|
Restaurants — 0.4% | | | | | |
California Pizza Kitchen, Inc.* | | 49,964 | | | 535,614 |
CEC Entertainment, Inc.* | | 14,831 | | | 359,652 |
| | �� | | |
|
|
| | | | | | 895,266 |
| | | | |
|
|
Retail & Merchandising — 1.3% | | | | | |
Aaron Rents, Inc. | | 63,309 | | | 1,685,285 |
Big Lots, Inc.*(a) | | 36,157 | | | 523,915 |
School Specialty, Inc.*(a) | | 18,065 | | | 345,403 |
| | | | |
|
|
| | | | | | 2,554,603 |
| | | | |
|
|
Road & Rail — 0.2% |
J.B. Hunt Transport Services, Inc.(a) | | 18,720 | | | 491,775 |
| | | | |
|
|
Semiconductors & Semiconductor Equipment — 3.8% |
Atmel Corp.* | | 137,556 | | | 430,550 |
ATMI, Inc.* | | 10,480 | | | 161,706 |
Emulex Corp.* | | 68,960 | | | 481,341 |
Entegris, Inc.* | | 248,770 | | | 544,806 |
Exar Corp.*(a) | | 218,480 | | | 1,457,262 |
Fairchild Semiconductor International, Inc.* | | 129,200 | | | 631,788 |
FormFactor, Inc.* | | 24,016 | | | 350,634 |
MKS Instruments, Inc.*(a) | | 28,540 | | | 422,107 |
Omnivision Technologies, Inc.* | | 89,720 | | | 471,030 |
ON Semiconductor Corp.*(a) | | 302,853 | | | 1,029,700 |
Semtech Corp.* | | 55,599 | | | 626,601 |
Verigy Ltd. (Singapore)* | | 114,600 | | | 1,102,452 |
| | | | |
|
|
| | | | | | 7,709,977 |
| | | | |
|
|
Software — 2.8% | | | | | |
Citrix Systems, Inc.* | | 49,140 | | | 1,158,230 |
EPIQ Systems, Inc.*(a) | | 55,148 | | | 921,523 |
Lawson Software, Inc.*(a) | | 481,713 | | | 2,283,320 |
McAfee, Inc.*(a) | | 39,620 | | | 1,369,663 |
| | | | |
|
|
| | | | | | 5,732,736 |
| | | | |
|
|
Specialty Retail — 1.2% | | | | | |
Aeropostale, Inc.* | | 26,807 | | | 431,593 |
Buckle, Inc. (The)(a) | | 11,175 | | | 243,838 |
Cato Corp. (The) (Class A Stock) | | 77,360 | | | 1,168,136 |
Penske Auto Group, Inc.(a) | | 31,060 | | | 238,541 |
Williams-Sonoma, Inc.(a) | | 30,850 | | | 242,481 |
| | | | |
|
|
| | | | | | 2,324,589 |
| | | | |
|
|
Telecommunications — 1.2% | | | | | |
ADC Telecommunications, Inc.*(a) | | 64,685 | | | 353,827 |
Alaska Communications Systems Group, Inc. | | 13,283 | | | 124,595 |
Anixter International, Inc.*(a) | | 17,299 | | | 521,046 |
Polycom, Inc.*(a) | | 19,201 | | | 259,406 |
Premiere Global Services, Inc.* | | 35,586 | | | 306,395 |
RCN Corp.* | | 9,468 | | | 55,861 |
Syniverse Holdings, Inc.*(a) | | 34,113 | | | 407,309 |
Tekelec*(a) | | 28,377 | | | 378,549 |
| | | | |
|
|
| | | | | | 2,406,988 |
| | | | |
|
|
SEE NOTES TO FINANCIAL STATEMENTS.
A66
| | | | | | |
| | | SP SMALL CAP VALUE PORTFOLIO (continued) | | |
| |
| SCHEDULE OF INVESTMENTS | | December 31, 2008 |
| | | | | | |
COMMON STOCKS
(continued) | | Shares
| | Value
(Note 2)
| |
| | | | | | | |
Textiles — 0.3% | | | | | | |
G & K Services, Inc. (Class A Stock) | | 33,171 | | $ | 670,718 | |
| | | | |
|
|
|
Textiles, Apparel & Luxury Goods — 0.5% | | | | |
Movado Group, Inc. | | 4,210 | | | 39,532 | |
Timberland Co. (Class A Stock)* | | 76,080 | | | 878,724 | |
| | | | |
|
|
|
| | | | | | 918,256 | |
| | | | |
|
|
|
Thrifts & Mortgage Finance — 0.3% | | | | | | |
Westfield Financial, Inc. | | 65,530 | | | 676,270 | |
| | | | |
|
|
|
Transportation — 0.8% | | | | | | |
Aegean Marine Petroleum Network, Inc. (Greece) | | 44,716 | | | 758,383 | |
Forward Air Corp.(a) | | 8,685 | | | 210,785 | |
Heartland Express, Inc. | | 37,811 | | | 595,901 | |
| | | | |
|
|
|
| | | | | | 1,565,069 | |
| | | | |
|
|
|
Utilities — 2.7% | | | | | | |
Cleco Corp.(a) | | 57,860 | | | 1,320,944 | |
CMS Energy Corp.(a) | | 72,840 | | | 735,684 | |
El Paso Electric Co.* | | 122,693 | | | 2,219,516 | |
Unisource Energy Corp. | | 7,378 | | | 216,618 | |
Westar Energy, Inc. | | 45,104 | | | 925,083 | |
| | | | |
|
|
|
| | | | | | 5,417,845 | |
| | | | |
|
|
|
TOTAL LONG-TERM INVESTMENTS
(cost $261,009,568) | | | 197,642,716 | |
| | | | |
|
|
|
| SHORT-TERM INVESTMENT — 22.9% | | | | |
AFFILIATED MONEY MARKET MUTUAL FUND | |
Dryden Core Investment Fund —
Taxable Money Market Series (cost $46,308,253; includes $41,797,395 of cash collateral for securities on loan)(Note 4)(b)(w) | | 46,308,253 | | | 46,308,253 | |
| | | | |
|
|
|
TOTAL INVESTMENTS — 120.7%
(cost $307,317,821) | | | 243,950,969 | |
LIABILITIES IN EXCESS OF
OTHER ASSETS — (20.7)% | | | (41,793,471 | ) |
| | | | |
|
|
|
NET ASSETS — 100.0% | | $ | 202,157,498 | |
| | | | |
|
|
|
| * | Non-income producing security. |
| (a) | All or a portion of security is on loan. The aggregate market value of such securities is $40,668,921; cash collateral of $41,797,395 (included with liabilities) was received with which the Portfolio purchased highly liquid short-term investments. |
| (b) | Represents security, or a portion thereof, purchased with cash collateral received for securities on loan. |
| (w) | Prudential Investments LLC, the manager of the Portfolio, also serves as manager of the Dryden Core Investment Fund-Taxable Money Market Series. |
Various inputs are used in determining the value of the Portfolio’s investments. These inputs are summarized in the three broad levels listed below.
Level 1—quoted prices in active markets for identical securities
Level 2—other significant observable inputs (including quoted prices for similar securities, interest rates, prepayment speeds, credit risk, etc.)
Level 3—significant unobservable inputs (including the Portfolio’s own assumptions in determining the fair value of investments)
The following is a summary of the inputs used as of December 31, 2008 in valuing the Portfolio’s assets carried at fair value:
| | | | | |
Valuation inputs
| | Investments
in Securities
| | Other Financial
Instruments*
|
Level 1—Quoted Prices | | $ | 243,950,969 | | — |
Level 2—Other Significant Observable Inputs | | | — | | — |
Level 3—Significant Unobservable Inputs | | | — | | — |
| | |
|
| |
|
Total | | $ | 243,950,969 | | — |
| | |
|
| |
|
| * | Other financial instruments are derivative instruments not reflected in the Schedule of Investments, such as futures, forwards and swap contracts, which are valued at the unrealized appreciation/depreciation on the instrument. |
As of December 31, 2007 and December 31, 2008, the Portfolio did not use any significant unobservable inputs (Level 3) in determining the value of investments.
SEE NOTES TO FINANCIAL STATEMENTS.
A67
| | | | | | |
| | | SP SMALL CAP VALUE PORTFOLIO (continued) | | |
| |
| SCHEDULE OF INVESTMENTS | | December 31, 2008 |
The industry classification of investments and liabilities in excess of other assets shown as a percentage of net assets as of December 31, 2008 were as follows:
| | | |
Affiliated Money Market Mutual Fund (20.7% represents investments purchased with collateral from securities on loan) | | 22.9 | % |
Insurance | | 8.6 | |
Commercial Banks | | 7.7 | |
Real Estate Investment Trusts | | 6.9 | |
Financial – Bank & Trust | | 4.9 | |
Semiconductors & Semiconductor Equipment | | 3.8 | |
Machinery | | 3.2 | |
Software | | 2.8 | |
Exchange Traded Funds | | 2.7 | |
Utilities | | 2.7 | |
Food Products | | 2.3 | |
Oil, Gas & Consumable Fuels | | 2.3 | |
Metals & Mining | | 2.2 | |
Financial Services | | 2.1 | |
Banks | | 2.0 | |
Healthcare Providers & Services | | 1.9 | |
Communication Equipment | | 1.8 | |
Aerospace & Defense | | 1.7 | |
Computer Services & Software | | 1.6 | |
Machinery & Equipment | | 1.6 | |
Chemicals | | 1.6 | |
Medical Supplies & Equipment | | 1.6 | |
Electric Utilities | | 1.6 | |
Diversified Financial Services | | 1.4 | |
Retail & Merchandising | | 1.3 | |
Food & Staples Retailing | | 1.2 | |
Building Products | | 1.2 | |
Telecommunications | | 1.2 | |
Specialty Retail | | 1.2 | |
Household Durables | | 1.1 | |
Electrical Equipment | | 1.0 | |
Consumer Products & Services | | 1.0 | |
Construction & Engineering | | 1.0 | |
Gas Utilities | | 0.9 | |
Energy Equipment & Services | | 0.9 | |
Professional Services | | 0.8 | |
Building Materials | | 0.8 | |
Transportation | | 0.8 | |
Information Technology Services | | 0.7 | |
| | | |
Airlines | | 0.7 | % |
Construction | | 0.7 | |
Computer Hardware | | 0.7 | |
Capital Markets | | 0.7 | |
Distribution/Wholesale | | 0.6 | |
Commercial Service & Supplies | | 0.6 | |
Containers & Packaging | | 0.5 | |
Diversified Consumer Services | | 0.5 | |
Marine | | 0.5 | |
Environmental Services | | 0.5 | |
Automotive Parts | | 0.5 | |
Household Products | | 0.5 | |
Textiles, Apparel & Luxury Goods | | 0.5 | |
Restaurants | | 0.4 | |
Internet Services | | 0.4 | |
Hotels, Restaurants & Leisure | | 0.4 | |
Auto Components | | 0.4 | |
Clothing & Apparel | | 0.4 | |
Healthcare Products | | 0.4 | |
Pharmaceuticals | | 0.4 | |
Thrifts & Mortgage Finance | | 0.3 | |
Textiles | | 0.3 | |
Air Freight & Logistics | | 0.3 | |
Road & Rail | | 0.2 | |
Electronic Components | | 0.2 | |
Financial – Brokerage | | 0.2 | |
Consumer Finance | | 0.2 | |
Business Services | | 0.2 | |
Automobile Manufacturers | | 0.2 | |
Computers & Peripherals | | 0.2 | |
Healthcare Equipment & Supplies | | 0.2 | |
Iron/Steel | | 0.2 | |
Healthcare – Services | | 0.1 | |
Commercial Services | | 0.1 | |
Leisure Equipment & Products | | 0.1 | |
Life Science Tools & Services | | 0.1 | |
Paper & Forest Products | | 0.1 | |
Financial – Securities/Asset Management | | 0.1 | |
Construction Materials | | 0.1 | |
| | |
|
|
| | | 120.7 | |
Liabilities in excess of other assets | | (20.7 | ) |
| | |
|
|
| | | 100.0 | % |
| | |
|
|
SEE NOTES TO FINANCIAL STATEMENTS.
A68
| | | | | | |
| | | SP SMALL CAP VALUE PORTFOLIO (continued) | | |
STATEMENT OF ASSETS AND LIABILITIES
December 31, 2008
| | | | |
| ASSETS | | | | |
Investments at value, including securities on loan of $40,668,921: | | | | |
Unaffiliated investments (cost $261,009,568) | | $ | 197,642,716 | |
Affiliated investments (cost $46,308,253) | | | 46,308,253 | |
Cash | | | 68,329 | |
Receivable for investments sold | | | 922,008 | |
Dividends and interest receivable | | | 404,111 | |
Prepaid expenses | | | 4,975 | |
Receivable for Series shares sold | | | 158 | |
| | |
|
|
|
Total Assets | | | 245,350,550 | |
| | |
|
|
|
| LIABILITIES | | | | |
Collateral for securities on loan | | | 41,797,395 | |
Payable for investments purchased | | | 1,077,864 | |
Management fee payable | | | 144,916 | |
Accrued expenses and other liabilities | | | 101,118 | |
Payable for Series shares repurchased | | | 69,083 | |
Deferred trustees’ fees | | | 1,966 | |
Transfer agent fees payable | | | 710 | |
| | |
|
|
|
Total Liabilities | | | 43,193,052 | |
| | |
|
|
|
| NET ASSETS | | $ | 202,157,498 | |
| | |
|
|
|
Net assets were comprised of: | | | | |
Paid-in capital | | $ | 285,629,054 | |
Retained earnings | | | (83,471,556 | ) |
| | |
|
|
|
Net assets, December 31, 2008 | | $ | 202,157,498 | |
| | |
|
|
|
Net asset value and redemption price per share, $202,157,498 / 26,598,661 outstanding shares of beneficial interest | | $ | 7.60 | |
| | |
|
|
|
STATEMENT OF OPERATIONS
Year Ended December 31, 2008
| | | | |
| INVESTMENT INCOME | | | | |
Unaffiliated dividend income (net of $162 foreign withholding tax) | | $ | 4,426,563 | |
Affiliated income from securities lending, net | | | 885,828 | |
Affiliated dividend income | | | 266,576 | |
| | |
|
|
|
| | | | 5,578,967 | |
| | |
|
|
|
| EXPENSES | | | | |
Management fee | | | 2,331,875 | |
Custodian’s fees and expenses | | | 123,000 | |
Shareholders’ reports | | | 35,000 | |
Audit fee | | | 20,000 | |
Trustees’ fees | | | 12,000 | |
Legal fees and expenses | | | 8,000 | |
Insurance expenses | | | 4,000 | |
Transfer agent’s fees and expenses (including affiliated expense of $4,000) (Note 4) | | | 4,000 | |
Commitment fee on syndicated credit agreement | | | 1,000 | |
Miscellaneous | | | 9,294 | |
| | |
|
|
|
Total expenses | | | 2,548,169 | |
| | |
|
|
|
| NET INVESTMENT INCOME | | | 3,030,798 | |
| | |
|
|
|
| NET REALIZED AND UNREALIZED GAIN (LOSS) ON INVESTMENTS | | | | |
Net realized loss on investment transactions | | | (22,100,237 | ) |
Net change in unrealized appreciation (depreciation) on investments | | | (63,567,798 | ) |
| | |
|
|
|
| NET LOSS ON INVESTMENTS | | | (85,668,035 | ) |
| | |
|
|
|
| NET DECREASE IN NET ASSETS RESULTING FROM OPERATIONS | | $ | (82,637,237 | ) |
| | |
|
|
|
STATEMENT OF CHANGES IN NET ASSETS
| | | | | | | | |
| | | Year Ended December 31,
| |
| | | 2008
| | | 2007
| |
| INCREASE (DECREASE) IN NET ASSETS | | | | | | | | |
| OPERATIONS: | | | | | | | | |
Net investment income | | $ | 3,030,798 | | | $ | 2,856,776 | |
Net realized gain (loss) on investment transactions | | | (22,100,237 | ) | | | 27,343,333 | |
Net change in unrealized appreciation (depreciation) on investments | | | (63,567,798 | ) | | | (38,692,595 | ) |
| | |
|
|
| |
|
|
|
NET DECREASE IN NET ASSETS RESULTING FROM OPERATIONS | | | (82,637,237 | ) | | | (8,492,486 | ) |
| | |
|
|
| |
|
|
|
| DISTRIBUTIONS | | | (30,200,109 | ) | | | (22,383,872 | ) |
| | |
|
|
| |
|
|
|
| SERIES SHARE TRANSACTIONS: | | | | | | | | |
Series shares sold [4,858,589 and 2,115,636 shares, respectively] | | | 41,844,195 | | | | 29,174,651 | |
Series shares issued in reinvestment of distributions [2,801,494 and 1,854,505 shares, respectively] | | | 30,200,109 | | | | 22,383,872 | |
Series shares repurchased [6,373,598 and 5,621,968 shares, respectively] | | | (66,485,501 | ) | | | (80,228,555 | ) |
| | |
|
|
| |
|
|
|
INCREASE (DECREASE) IN NET ASSETS RESULTING FROM SERIES SHARE TRANSACTIONS | | | 5,558,803 | | | | (28,670,032 | ) |
| | |
|
|
| |
|
|
|
| TOTAL DECREASE IN NET ASSETS | | | (107,278,543 | ) | | | (59,546,390 | ) |
| NET ASSETS: | | | | | | | | |
Beginning of year | | | 309,436,041 | | | | 368,982,431 | |
| | |
|
|
| |
|
|
|
End of year | | $ | 202,157,498 | | | $ | 309,436,041 | |
| | |
|
|
| |
|
|
|
SEE NOTES TO FINANCIAL STATEMENTS.
A69
| | | | | | |
| | | SP STRATEGIC PARTNERS FOCUSED GROWTH PORTFOLIO | | |
| |
| SCHEDULE OF INVESTMENTS | | December 31, 2008 |
| | | | | |
| LONG-TERM INVESTMENTS — 97.3% |
| COMMON STOCKS | | Shares
| | Value
(Note 2)
|
| | | | | | |
Aerospace & Defense — 0.5% | | | |
Lockheed Martin Corp. | | 2,000 | | $ | 168,160 |
| | | | |
|
|
Beverages — 2.5% | | | |
PepsiCo, Inc. | | 14,400 | | | 788,688 |
| | | | |
|
|
Biotechnology — 16.9% | | | |
Celgene Corp.* | | 25,625 | | | 1,416,550 |
Genentech, Inc.* | | 20,600 | | | 1,707,946 |
Gilead Sciences, Inc.* | | 44,675 | | | 2,284,679 |
| | | | |
|
|
| | | | | | 5,409,175 |
| | | | |
|
|
Capital Markets — 3.1% | | | |
Schwab, (Charles) Corp. (The) | | 61,300 | | | 991,221 |
| | | | |
|
|
Chemicals — 3.2% | | | |
Monsanto Co. | | 14,750 | | | 1,037,663 |
| | | | |
|
|
Commercial Services & Supplies — 0.3% | | | |
Apollo Group, Inc. (Class A Stock)* | | 1,300 | | | 99,606 |
| | | | |
|
|
Communication Equipment — 13.9% | | | |
Cisco Systems, Inc.* | | 93,350 | | | 1,521,605 |
QUALCOMM, Inc. | | 56,400 | | | 2,020,812 |
Research In Motion Ltd. (Canada)* | | 22,600 | | | 917,108 |
| | | | |
|
|
| | | | | | 4,459,525 |
| | | | |
|
|
Computers & Peripherals — 7.5% | | | |
Apple, Inc.* | | 16,937 | | | 1,445,573 |
Hewlett-Packard Co. | | 26,200 | | | 950,798 |
| | | | |
|
|
| | | | | | 2,396,371 |
| | | | |
|
|
Diversified Consumer Services — 3.7% | | | |
Visa, Inc. (Class A Stock) | | 22,900 | | | 1,201,105 |
| | | | |
|
|
Diversified Financial Services — 0.8% | | | |
JPMorgan Chase & Co. | | 8,500 | | | 268,005 |
| | | | |
|
|
Diversified Financials — 1.6% | | | |
CME Group, Inc. | | 2,505 | | | 521,316 |
| | | | |
|
|
Electronic Components & Equipment — 0.7% | | | |
Emerson Electric Co. | | 5,900 | | | 215,999 |
| | | | |
|
|
Energy Equipment & Services — 1.7% | | | |
Schlumberger Ltd. (Netherlands) | | 12,700 | | | 537,591 |
| | | | |
|
|
Financial – Bank & Trust — 0.5% | | | |
Blackstone Group LP (The) | | 24,048 | | | 157,033 |
| | | | |
|
|
Financials — 1.3% | | | |
Goldman Sachs Group, Inc. (The) | | 5,025 | | | 424,060 |
| | | | |
|
|
Food & Staples Retailing — 3.8% | | | |
Costco Wholesale Corp. | | 5,950 | | | 312,375 |
CVS/Caremark Corp. | | 31,400 | | | 902,436 |
| | | | |
|
|
| | | | | | 1,214,811 |
| | | | |
|
|
Healthcare Equipment & Supplies — 4.2% | | | |
Baxter International, Inc. | | 24,900 | | | 1,334,391 |
| | | | |
|
|
Healthcare Providers & Services — 0.8% | | | |
Medco Health Solutions, Inc.* | | 6,400 | | | 268,224 |
| | | | |
|
|
Household Products — 3.0% | | | |
Colgate-Palmolive Co. | | 13,800 | | | 945,852 |
| | | | |
|
|
Internet & Catalog Retail — 2.9% | | | |
Amazon.com, Inc.* | | 18,400 | | | 943,552 |
| | | | |
|
|
| | | | | | |
COMMON STOCKS
(continued) | | Shares
| | Value
(Note 2)
| |
| | | | | | | |
Internet Software & Services — 6.3% | | | | |
Google, Inc. (Class A Stock)* | | 6,545 | | $ | 2,013,569 | |
| | | | |
|
|
|
Media — 0.6% | | | | |
Walt Disney Co. (The) | | 8,650 | | | 196,269 | |
| | | | |
|
|
|
Multi-Line Retail — 1.0% | | | | |
Kohl’s Corp.* | | 8,700 | | | 314,940 | |
| | | | |
|
|
|
Oil, Gas and Consumable Fuels — 4.0% | | | | |
EOG Resources, Inc. | | 4,175 | | | 277,971 | |
Occidental Petroleum Corp. | | 8,400 | | | 503,916 | |
XTO Energy, Inc. | | 13,900 | | | 490,253 | |
| | | | |
|
|
|
| | | | | | 1,272,140 | |
| | | | |
|
|
|
Pharmaceuticals — 8.4% | | | | |
Abbott Laboratories | | 6,350 | | | 338,899 | |
Alcon, Inc. (Switzerland) | | 11,700 | | | 1,043,523 | |
Teva Pharmaceutical Industries Ltd., ADR (Israel) | | 31,000 | | | 1,319,670 | |
| | | | |
|
|
|
| | | | | | 2,702,092 | |
| | | | |
|
|
|
Restaurants — 1.2% | | | | |
McDonald’s Corp. | | 6,300 | | | 391,797 | |
| | | | |
|
|
|
Semiconductors & Semiconductor Equipment — 0.7% | |
Intel Corp. | | 14,600 | | | 214,036 | |
| | | | |
|
|
|
Software — 1.6% | | | | |
Adobe Systems, Inc.* | | 23,800 | | | 506,702 | |
| | | | |
|
|
|
Telecommunications | | | | |
Nortel Networks Corp. (Canada)* | | 25 | | | 7 | |
| | | | |
|
|
|
Tobacco — 0.6% | | | | |
Philip Morris International, Inc. | | 4,400 | | | 191,444 | |
| | | | |
|
|
|
TOTAL LONG-TERM INVESTMENTS
(cost $34,149,728) | | | 31,185,344 | |
| | | | |
|
|
|
| SHORT-TERM INVESTMENT — 2.9% | | | | |
AFFILIATED MONEY MARKET MUTUAL FUND | | | | |
Dryden Core Investment Fund —
Taxable Money Market Series
(cost $942,438)(w) (Note 4) | | 942,438 | | | 942,438 | |
| | | | |
|
|
|
TOTAL INVESTMENTS — 100.2%
(cost $35,092,166) | | | 32,127,782 | |
LIABILITIES IN EXCESS OF
OTHER ASSETS — (0.2)% | | | (69,363 | ) |
| | | | |
|
|
|
NET ASSETS — 100.0% | | $ | 32,058,419 | |
| | | | |
|
|
|
The following abbreviation is used in Portfolio descriptions:
| | |
| ADR | | American Depositary Receipt |
| * | Non-income producing security. |
| (w) | Prudential Investments LLC, the manager of the Portfolio, also serves as manager of the Dryden Core Investment Fund-Taxable Money Market Series. |
SEE NOTES TO FINANCIAL STATEMENTS.
A70
| | | | | | |
| | | SP STRATEGIC PARTNERS FOCUSED GROWTH PORTFOLIO (continued) | | |
| |
| SCHEDULE OF INVESTMENTS | | December 31, 2008 |
Various inputs are used in determining the value of the Portfolio’s investments. These inputs are summarized in the three broad levels listed below.
Level 1—quoted prices in active markets for identical securities
Level 2—other significant observable inputs (including quoted prices for similar securities, interest rates, prepayment speeds, credit risk, etc.)
Level 3—significant unobservable inputs (including the Portfolio’s own assumptions in determining the fair value of investments)
The following is a summary of the inputs used as of December 31, 2008 in valuing the Portfolio’s assets carried at fair value:
| | | | | |
Valuation inputs
| | Investments
in Securities
| | Other Financial
Instruments*
|
Level 1—Quoted Prices | | $ | 32,127,782 | | — |
Level 2—Other Significant Observable Inputs | | | — | | — |
Level 3—Significant Unobservable Inputs | | | — | | — |
| | |
|
| |
|
Total | | $ | 32,127,782 | | — |
| | |
|
| |
|
| * | Other financial instruments are derivative instruments not reflected in the Schedule of Investments, such as futures, forwards and swap contracts, which are valued at the unrealized appreciation/depreciation on the instrument. |
As of December 31, 2007 and December 31, 2008, the Portfolio did not use any significant unobservable inputs (Level 3) in determining the value of investments.
The industry classification of investments and liabilities in excess of other assets shown as a percentage of net assets as of December 31, 2008 were as follows:
| | | |
Biotechnology | | 16.9 | % |
Communication Equipment | | 13.9 | |
Pharmaceuticals | | 8.4 | |
Computers & Peripherals | | 7.5 | |
Internet Software & Services | | 6.3 | |
Healthcare Equipment & Supplies | | 4.2 | |
Oil, Gas and Consumable Fuels | | 4.0 | |
Food & Staples Retailing | | 3.8 | |
Diversified Consumer Services | | 3.7 | |
Chemicals | | 3.2 | |
Capital Markets | | 3.1 | |
Household Products | | 3.0 | |
Internet & Catalog Retail | | 2.9 | |
Affiliated Money Market Mutual Fund | | 2.9 | |
Beverages | | 2.5 | |
Energy Equipment & Services | | 1.7 | |
Diversified Financials | | 1.6 | |
Software | | 1.6 | |
Financials | | 1.3 | |
Restaurants | | 1.2 | |
Multi-Line Retail | | 1.0 | |
Healthcare Providers & Services | | 0.8 | |
Diversified Financial Services | | 0.8 | |
Electronic Components & Equipment | | 0.7 | |
Semiconductors & Semiconductor Equipment | | 0.7 | |
Media | | 0.6 | |
Tobacco | | 0.6 | |
Aerospace & Defense | | 0.5 | |
Financial – Bank & Trust | | 0.5 | |
Commercial Services & Supplies | | 0.3 | |
| | |
|
|
| | | 100.2 | |
Liabilities in excess of other assets | | (0.2 | ) |
| | |
|
|
| | | 100.0 | % |
| | |
|
|
SEE NOTES TO FINANCIAL STATEMENTS.
A71
| | | | | | |
| | | SP STRATEGIC PARTNERS FOCUSED GROWTH PORTFOLIO (continued) | | |
STATEMENT OF ASSETS AND LIABILITIES
December 31, 2008
| | | | |
| ASSETS | | | | |
Investments at value: | | | | |
Unaffiliated investments (cost $34,149,728) | | $ | 31,185,344 | |
Affiliated investments (cost $942,438) | | | 942,438 | |
Receivable for Series shares sold | | | 36,997 | |
Cash | | | 17,169 | |
Dividends and interest receivable | | | 35,200 | |
Prepaid expenses | | | 930 | |
| | |
|
|
|
Total Assets | | | 32,218,078 | |
| | |
|
|
|
| LIABILITIES | | | | |
Payable for investments purchased | | | 80,879 | |
Accrued expenses and other liabilities | | | 48,162 | |
Management fee payable | | | 23,778 | |
Distribution fee payable | | | 2,139 | |
Deferred trustees’ fees | | | 1,792 | |
Administration fee payable | | | 1,284 | |
Shareholder servicing fees payable | | | 879 | |
Transfer agent fees payable | | | 618 | |
Payable for Series shares repurchased | | | 128 | |
| | |
|
|
|
Total Liabilities | | | 159,659 | |
| | |
|
|
|
| NET ASSETS | | $ | 32,058,419 | |
| | |
|
|
|
Net assets were comprised of: | | | | |
Paid-in capital | | $ | 42,768,717 | |
Retained earnings | | | (10,710,298 | ) |
| | |
|
|
|
Net assets, December 31, 2008 | | $ | 32,058,419 | |
| | |
|
|
|
| Class I: | | | | |
Net asset value and redemption price per share, $21,617,006 / 4,520,760 outstanding shares of beneficial interest | | $ | 4.78 | |
| | |
|
|
|
| Class II: | | | | |
Net asset value and redemption price per share, $10,441,413 / 2,266,908 outstanding shares of beneficial interest | | $ | 4.61 | |
| | |
|
|
|
STATEMENT OF OPERATIONS
Year Ended December 31, 2008
| | | | |
| INVESTMENT INCOME | | | | |
Unaffiliated dividend income (net of $16,351 foreign withholding tax) | | $ | 446,514 | |
Affiliated dividend income | | | 29,187 | |
| | |
|
|
|
| | | | 475,701 | |
| | |
|
|
|
| EXPENSES | | | | |
Management fee | | | 459,441 | |
Distribution fee—Class II | | | 49,054 | |
Administration fee—Class II | | | 29,432 | |
Custodian’s fees and expenses | | | 66,000 | |
Shareholders’ reports | | | 55,000 | |
Audit fee | | | 20,000 | |
Trustees’ fees | | | 9,000 | |
Legal fees and expenses | | | 6,000 | |
Transfer agent’s fees and expenses (including affiliated expense of $4,000) (Note 4) | | | 4,000 | |
Insurance expenses | | | 1,000 | |
Miscellaneous | | | 7,382 | |
| | |
|
|
|
Total expenses | | | 706,309 | |
| | |
|
|
|
| NET INVESTMENT LOSS | | | (230,608 | ) |
| | |
|
|
|
| NET REALIZED AND UNREALIZED GAIN (LOSS) ON INVESTMENTS | | | | |
Net realized loss on investment transactions | | | (5,291,643 | ) |
Net change in unrealized depreciation on investments | | | (17,178,750 | ) |
| | |
|
|
|
| NET LOSS ON INVESTMENTS | | | (22,470,393 | ) |
| | |
|
|
|
| NET DECREASE IN NET ASSETS RESULTING FROM OPERATIONS | | $ | (22,701,001 | ) |
| | |
|
|
|
STATEMENT OF CHANGES IN NET ASSETS
| | | | | | | | |
| | | Year Ended December 31,
| |
| | | 2008
| | | 2007
| |
| INCREASE (DECREASE) IN NET ASSETS | | | | | | | | |
| OPERATIONS: | | | | | | | | |
Net investment loss | | $ | (230,608 | ) | | $ | (403,753 | ) |
Net realized gain (loss) on investment transactions | | | (5,291,643 | ) | | | 4,363,534 | |
Net change in unrealized appreciation (depreciation) on investments | | | (17,178,750 | ) | | | 5,320,010 | |
| | |
|
|
| |
|
|
|
NET INCREASE (DECREASE) IN NET ASSETS RESULTING FROM OPERATIONS | | | (22,701,001 | ) | | | 9,279,791 | |
| | |
|
|
| |
|
|
|
| DISTRIBUTIONS: | | | | | | | | |
Class I | | | (2,371,440 | ) | | | (1,477,681 | ) |
Class II | | | (1,588,341 | ) | | | (1,087,456 | ) |
| | |
|
|
| |
|
|
|
TOTAL DISTRIBUTIONS | | | (3,959,781 | ) | | | (2,565,137 | ) |
| | |
|
|
| |
|
|
|
| SERIES SHARE TRANSACTIONS (NOTE 7): | | | | | | | | |
Series shares sold | | | 6,604,302 | | | | 4,576,719 | |
Series shares issued in reinvestment of distributions | | | 3,959,781 | | | | 2,565,137 | |
Series shares repurchased | | | (17,551,936 | ) | | | (18,165,307 | ) |
| | |
|
|
| |
|
|
|
DECREASE IN NET ASSETS RESULTING FROM SERIES SHARE TRANSACTIONS | | | (6,987,853 | ) | | | (11,023,451 | ) |
| | |
|
|
| |
|
|
|
| TOTAL DECREASE IN NET ASSETS | | | (33,648,635 | ) | | | (4,308,797 | ) |
| NET ASSETS: | | | | | | | | |
Beginning of year | | | 65,707,054 | | | | 70,015,851 | |
| | |
|
|
| |
|
|
|
End of year | | $ | 32,058,419 | | | $ | 65,707,054 | |
| | |
|
|
| |
|
|
|
SEE NOTES TO FINANCIAL STATEMENTS.
A72
NOTES TO THE FINANCIAL STATEMENTS OF
THE PRUDENTIAL SERIES FUND
The Prudential Series Fund (“Series Fund”), organized as a Delaware statutory trust, is a diversified open-end management investment company registered under the Investment Company Act of 1940, as amended. On January 2, 2006, each Portfolio of the Series Fund changed its federal income tax status from a regulated investment company to a partnership. As a result of that conversion, the Series Fund was reorganized from a Maryland corporation to a Delaware statutory trust. Pursuant to this reorganization, the Series Fund has been renamed “The Prudential Series Fund.” The Series Fund is composed of twenty-eight Portfolios (“Portfolio” or “Portfolios”), each with a separate series shares. The information presented in these financial statements pertains to thirteen Portfolios: SP Aggressive Growth Asset Allocation Portfolio, SP Balanced Asset Allocation Portfolio, SP Conservative Asset Allocation Portfolio, SP Davis Value Portfolio, SP Growth Asset Allocation Portfolio, SP International Growth Portfolio, SP International Value Portfolio, SP Mid Cap Growth Portfolio, SP PIMCO High Yield Portfolio, SP PIMCO Total Return Portfolio, SP Prudential U.S. Emerging Growth Portfolio, SP Small Cap Value Portfolio and SP Strategic Partners Focused Growth Portfolio.
The Portfolios of the Series Fund have the following as investment objectives:
SP Aggressive Growth Asset Allocation Portfolio: Capital appreciation by investing primarily in large cap equity portfolios, international portfolios, and small/mid cap equity portfolios. The Portfolio will achieve this by investing in certain other Series Fund Portfolios and Advanced Series Trust Portfolios.
SP Balanced Asset Allocation Portfolio: Provide a balance between current income and growth of capital by investing in fixed income portfolios, large cap equity portfolios, small/mid cap equity portfolios, and international equity portfolios. The Portfolio will achieve this by investing in certain other Series Fund Portfolios and Advanced Series Trust Portfolios.
SP Conservative Asset Allocation Portfolio: Provide current income with low to moderate capital appreciation by investing in fixed income portfolios, large cap equity portfolios, and small/mid cap equity portfolios. The Portfolio will achieve this by investing in certain other Series Fund and Advanced Series Trust Portfolios.
SP Davis Value Portfolio: Capital growth through investments primarily in common stock of U.S. companies with market capitalization of at least $5 billion.
SP Growth Asset Allocation Portfolio: Provide long-term growth of capital with consideration also given to current income by investing in large-cap equity portfolios, fixed income portfolios, international equity portfolios and small/mid-cap equity portfolios. The Portfolio will achieve this by investing in certain other Series Fund Portfolios and Advanced Series Trust Portfolios.
SP International Growth Portfolio: Long-term growth of capital by investing primarily in equity-related securities of foreign issuers.
SP International Value Portfolio: Long-term capital appreciation by investing primarily in the stocks and other equity securities of companies in developed countries outside the United States.
SP Mid Cap Growth Portfolio: Long-term growth of capital by investing primarily in common stocks and related securities, such as preferred stocks, convertible securities and depository receipts for those securities.
SP PIMCO High Yield Portfolio: Maximum total return, consistent with preservation of capital and prudent investment management by investing primarily in a diversified portfolio of high yield/high risk securities rated below investment grade but rated at least B by Moody’s or S&P, or, if unrated, determined by Pacific Investment Management Company LLC (“PIMCO”) to be of comparable quality.
SP PIMCO Total Return Portfolio: Maximum total return, consistent with preservation of capital and prudent investment management by investing primarily in a diversified portfolio of fixed income instruments of varying maturities.
SP Prudential U.S. Emerging Growth Portfolio: Long-term capital appreciation by investing primarily in equity securities of small and medium-sized U.S. companies that the Portfolio manager believes have the potential for above-average growth.
B1
SP Small Cap Value Portfolio: Long-term growth of capital by investing primarily in common stocks of companies with small to medium market capitalization.
SP Strategic Partners Focused Growth Portfolio: Long-term capital growth by investing primarily in equity-related securities of U.S. companies that the Portfolio manager believes to have strong capital appreciation potential.
The ability of issuers of debt securities (other than those issued or guaranteed by the U.S. Government) held by the Portfolios to meet their obligations may be affected by the economic or political developments in a specific industry, region or country.
Foreign security and currency transactions may involve certain considerations and risks not typically associated with those of domestic origin as a result of, among other factors, the possibility of political and economic instability or the level of governmental supervision and regulation of foreign securities markets.
| Note 2: | | Accounting Policies |
The following is a summary of significant accounting policies followed by the Series Fund and the Portfolios in preparation of their financial statements.
Securities Valuation: Securities listed on a securities exchange are valued at the last sale price on such exchange on the day of valuation or, if there was no sale on such day, at the mean between the last reported bid and asked prices, or at the last bid price on such day in the absence of an asked price. Securities traded via NASDAQ are valued at the official closing price provided by NASDAQ. Securities that are actively traded in the over-the-counter market, including listed securities for which the primary market is believed by Prudential Investments LLC (“PI” or “Manager”) in consultation with the subadvisors, to be over-the-counter, are valued at market value using prices provided by an independent pricing agent or principal market maker. Options on securities and indices traded on an exchange are valued at the last sale price as of the close of trading on the applicable exchange or, if there was no sale, at the mean between the most recently quoted bid and asked prices on such exchange or at the last bid price in absence of an asked price. Futures contracts and options thereon traded on a commodities exchange or board of trade are valued at the last sale price at the close of trading on such exchange or board of trade or, if there was no sale on the applicable commodities exchange or board of trade on such day, at the mean between the most recently quoted bid and asked prices on such exchange or board of trade or at the last bid price in the absence of an asked price. Prices may be obtained from independent pricing services which use information provided by market makers or estimates of market values obtained from yield data relating to investments or securities with similar characteristics. Securities for which reliable market quotations are not readily available, or whose values have been affected by events occurring after the close of the security’s foreign market and before the Series Fund’s normal pricing time, are valued at fair value in accordance with Board of Trustees’ approved fair valuation procedures. When determining the fair valuation of securities, some of the factors influencing the valuation include, the nature of any restrictions on disposition of the securities; assessment of the general liquidity of the securities; the issuer’s financial condition and the markets in which it does business; the cost of the investment; the size of the holding and the capitalization of the issuer; the prices of any recent transactions or bids/offers for such securities or any comparable securities; any available analyst media or other reports or information deemed reliable by the investment adviser regarding the issuer or the markets or industry in which it operates. Using fair value to price securities may result in a value that is different from a security’s most recent closing price and from the price used by other mutual funds to calculate their net asset values.
Investments in mutual funds are valued at their net asset value as of the close of the New York Stock Exchange on the date of valuation.
Short-term debt securities that are held in the Portfolios which mature in more than 60 days are valued at current market quotations and those short-term debt securities which mature in 60 days or less are valued at amortized cost which approximates market value. The amortized cost method values a security at its cost at the time of purchase and thereafter assumes a constant amortization to maturity of any discount or premium.
The SP PIMCO High Yield Portfolio and the SP PIMCO Total Return Portfolio may hold up to 15% of their net assets in illiquid securities, including those which are restricted as to disposition under securities law (“restricted securities”). Restricted securities, including private placements, are valued pursuant to the valuation procedures noted above.
B2
Repurchase Agreements: In connection with transactions in repurchase agreements with United States financial institutions, it is the Series Fund’s policy that its custodian or designated subcustodians, as the case may be, under triparty repurchase agreements, take possession of the underlying collateral securities, the value of which exceeds the principal amount of the repurchase transaction, including accrued interest. To the extent that any repurchase transaction exceeds one business day, the value of the collateral is marked to market on a daily basis to ensure the adequacy of the collateral. If the seller defaults or the value of the collateral declines, or if bankruptcy proceedings are commenced with respect to the seller of the security, realization of the collateral by the Series Fund may by delayed or limited.
Foreign Currency Translation: The books and records of the Series Fund are maintained in U.S. dollars. Foreign currency amounts are translated into U.S. dollars on the following basis:
(i) market value of investment securities, other assets and liabilities—at the current daily rates of exchange.
(ii) purchases and sales of investment securities, income and expenses—at the rates of exchange prevailing on the respective dates of such transactions.
Although the net assets of the Series Fund are presented at the foreign exchange rates and market values at the close of the period, the Series Fund does not isolate that portion of the results of operations arising as a result of changes in the foreign exchange rates from the fluctuations arising from changes in the market prices of securities held at the end of the period. Similarly, the Series Fund does not isolate the effect of changes in foreign exchange rates from the fluctuations arising from changes in the market prices of portfolio securities sold during the period. Accordingly, these realized foreign currency gains (losses) are included in the reported net realized gains (losses) on investment transactions.
Net realized gains (losses) on foreign currency transactions represent net foreign exchange gains (losses) from the holding of foreign currencies, currency gains (losses) realized between the trade date and settlement date on securities transactions, and the difference between the amounts of dividends, interest and foreign withholding taxes recorded on the Series Fund’s books and the U.S. dollar equivalent amounts actually received or paid. Net unrealized currency gains (losses) from valuing foreign currency denominated assets and liabilities (other than investments) at period end exchange rates are reflected as a component of net unrealized appreciation (depreciation) on investments and foreign currencies.
Forward Currency Contracts: A forward currency contract is a commitment to purchase or sell a foreign currency at a future date at a negotiated forward rate. Certain Portfolios of the Series Fund may enter into forward currency contracts in order to hedge their exposure to changes in foreign currency exchange rates on their foreign portfolio holdings or on specific receivables and payables denominated in a foreign currency. The contracts are valued daily at current forward exchange rates and any unrealized gain (loss) is included in the assets and liabilities in the financial statements. Gain (loss) is realized on the settlement date of the contract equal to the difference between the settlement value of the original and negotiated forward contracts. This gain (loss), if any, is included in net realized gain (loss) on foreign currency transactions. Risks may arise upon entering into these contracts from the potential inability of the counterparties to meet the terms of their contracts.
Short Sales: Certain Portfolios of the Series Fund may sell a security it does not own in anticipation of a decline in the market value of that security (short sale). When a Portfolio makes a short sale, it must borrow the security sold short and deliver it to the broker-dealer through which it made the short sale as collateral for its obligation to deliver the security upon conclusion of the transaction. The Portfolio may have to pay a fee to borrow the particular security and may be obligated to remit any interest or dividends received on such borrowed securities. Dividends declared on short positions open are recorded on the ex-date and interest payable is accrued daily on fixed income securities sold short, both of which are recorded as an expense. A gain, limited to the price at which the Portfolio sold the security short, or a loss, unlimited in magnitude, will be recognized upon the termination of a short sale if the market price at termination is less than or greater than, respectively, the proceeds originally received.
Loan Participations: The SP PIMCO High Yield Portfolio may invest in loan participations. When the Portfolio purchases a loan participation, the Portfolio typically enters into a contractual relationship with the lender or third party selling such participations (“Selling Participant”), but not the borrower. As a result, the Portfolio assumes the credit risk of the borrower, the Selling Participant and any other persons interpositioned between the Portfolio and the borrower. The Portfolio may not directly benefit from the collateral supporting the senior loan in which it has purchased the loan participant.
B3
Options: Certain Portfolios of the Series Fund may either purchase or write options in order to hedge against adverse market movements or fluctuations in value caused by changes in prevailing interest rates or foreign currency exchange rates or currencies with respect to securities which the Portfolio currently owns or intends to purchase. The Portfolio’s principal reason for writing options is to realize, through receipt of premiums, a greater current return than would be realized on the underlying security alone. When the Portfolio purchases an option, it pays a premium and an amount equal to that premium is recorded as an asset. When the Portfolio writes an option, it receives a premium and an amount equal to that premium is recorded as a liability. The asset or liability is adjusted daily to reflect the current market value of the option. If an option expires unexercised, the Portfolio realizes a gain (loss) to the extent of the premium received or paid. If an option is exercised, the premium received or paid is recorded as an adjustment to the proceeds from the sale or the cost basis of the purchase in determining whether the Portfolio has realized a gain (loss). The difference between the premium and the amount received or paid on effecting a closing purchase or sale transaction is also treated as a realized gain (loss). Gains (losses) on purchased options are included in net realized gains (losses) on investment transactions. Gains (losses) on written options are presented separately as net realized gain (loss) on written option transactions.
The Portfolio, as writer of an option, may have no control over whether the contract may be exercised. As a result, the Portfolio bears the market risk of an unfavorable change in the price of the security underlying the written option. The Portfolio, as purchaser of an option, bears the risk of the potential inability of the counterparties to meet the terms of their contracts.
Financial Futures Contracts: A financial futures contract is an agreement to purchase (long) or sell (short) an agreed amount of securities at a set price for delivery on a future date. Upon entering into a financial futures contract, the Portfolio is required to pledge to the broker an amount of cash and/or other assets equal to a certain percentage of the contract amount. This amount is known as the “initial margin”. Subsequent payments, known as “variation margin”, are made or received by the Portfolio each day, depending on the daily fluctuations in the value of the underlying security. Such variation margin is recorded for financial statement purposes on a daily basis as unrealized gain (loss). When the contract expires or is closed, the gain (loss) is realized and is presented in the Statement of Operations as net realized gain (loss) on financial futures contracts.
The Portfolio invests in financial futures contracts in order to hedge its existing portfolio securities, or securities the Portfolio intends to purchase, against fluctuations in value caused by changes in prevailing rates or market conditions. Under a variety of circumstances, the Portfolio may not achieve the anticipated benefits of the financial futures contracts and may realize a loss. The use of futures transactions involves the risk of imperfect correlation in movements in the price of futures contracts and the underlying hedged assets.
Swap Agreements: The Portfolios may enter into credit default, interest rate, total return and other forms of swap agreements. A swap agreement is an agreement to exchange the return generated by one instrument for the return generated by another instrument. In connection with these agreements, securities may be identified as collateral or received as collateral from the counterparty in accordance with the terms of the respective swap agreements to provide or receive assets of value and serve as a recourse in the event of default or bankruptcy/insolvency of either party.
Interest rate swaps represent an agreement between counterparties to exchange cash flows based on the difference between two interest rates, applied to a notional principal amount for a specified period.
Credit default swaps involve one party (the protection buyer) making a stream of payments to another party (the protection seller) in exchange for the right to receive a specified payment in the event of a default or as a result of a default (“credit event”) for the referenced party, typically corporate issues or sovereign issues of an emerging country, on its obligation; or in the event of a write-down, principal shortfall, interest shortfall or default of all or part of the referenced entities comprising a credit index.
A Portfolio may use credit default swaps to provide a measure of protection against defaults of the issuers or to take an active long or short position with respect to the likelihood of a particular issuer’s default. A Portfolio may use credit default swaps on credit indices to hedge a portfolio of credit default swaps or bonds, which is less expensive than it would be to buy many credit default swaps to achieve a similar effect.
As a seller of protection on credit default swap agreements, a Portfolio will generally receive from the buyer of protection an agreed upon payment throughout the term of the swap provided that there is no credit event. As
B4
the seller, a Portfolio would effectively increase investment risk to its portfolio because, in addition to its total net assets, a Portfolio may be subject to investment exposure on the notional amount of the swap.
The maximum amount of the payments that a Portfolio as a seller of protection could be required to pay under a credit default swap agreement would be equal the notional amount of the underlying security or index contract as a result of a credit event. These potential amounts will be partially offset by any recovery values of the respective referenced obligations, or net amounts received from the settlement of buy protection credit default swap agreements entered into by the Portfolio for the same referenced entity or index. As a buyer of protection, the Portfolio generally receives an amount up to the notional value of the swap if a credit event occurs.
Implied credit spreads, represented in absolute terms, utilized in determining the market value of credit default swap agreements on corporate issues or sovereign issues of an emerging country as of period end are disclosed in the footnotes to the Schedules of Investments and serve as an indicator of the current status of the payment/performance risk and represent the likelihood of risk of default for the credit derivative. The implied credit spread of a particular referenced entity reflects the cost of buying /selling protection and may include upfront payments required to enter into the agreement. For credit default swap agreements on asset-backed securities and credit indices, the fair values serve as the indicator of the current status of the payment/performance risk. Wider credit spreads and increasing market value in absolute terms, when compared to the notional amount of the swap, represent a deterioration of the referenced entity’s credit soundness and a greater likelihood of risk of default or other credit event occurring as defined under the terms of the agreement.
Some Portfolios may enter into total return swaps to manage their exposure to a security, commodity or an index. In a total return swap, one party would receive payments based on the market value of the security or the commodity involved, or total return of a specific referenced asset, such as an equity, index or bond, and in return pay a fixed amount.
These swap agreements involve, to varying degrees, elements of credit, market risk and documentation risk. Such risks involve the possibility that there will be no liquid market for these agreements, that the counterparty to the agreement may default on its obligation to perform or disagree as to the meaning of the contractual terms in the agreement, and that there will be unfavorable changes in net interest rates. The swaps are valued daily at current market value and any change in value is included in the net unrealized appreciation or depreciation on investments. Payments received or paid by the Portfolio are recorded as realized gains or losses upon termination or maturity of the swap. Risk of loss may exceed amounts recognized on the Statement of Assets and Liabilities. Swap agreements outstanding at period end, if any, are listed in the footnotes to the Schedule of Investments.
Certain Portfolios have entered into over-the-counter derivative agreements. Such agreements include conditions which, when materialized, give the counterparty the right to cause an early termination of the transactions under those agreements. Any election by the counterparty to early terminate the contract(s) may impact the amounts reported on the financial statements. As of December 31, 2008, the SP PIMCO High Yield and SP PIMCO Total Return Portfolios have met conditions under such agreements that give the counterparty the right to call for an early termination. However, as of the date of issuance of these financial statements no notice of early termination was received.
Forward currency contracts, written options, short sales, swaps and financial futures contracts involve elements of both market and credit risk in excess of the amounts reflected on the Statement of Assets and Liabilities.
Floating-Rate Notes Issued in Conjunction with Securities Held: The Portfolios invest in inverse floating rate securities (“inverse floaters”) that pay interest at a rate that varies inversely with short-term interest rates. Certain of these securities may be leveraged, whereby the interest rate varies inversely at a multiple of the change in short-term rates. As interest rates rise, inverse floaters provide less current income. The price of such securities is more volatile than comparable fixed rate securities.
When the Portfolios enter into agreements to create inverse floaters and floater note securities (also known as Tender Option Bond Transactions), the Portfolios transfer a fixed rate bond to a broker for cash. At the same time the Portfolios buy (receive) a residual interest in a trust (the “trust”) set up by the broker, often referred to as an inverse floating rate obligation (inverse floaters). Generally, the broker deposits a fixed rate bond (the “fixed rate bond”) into the trust with the same CUSIP number as the fixed rate bond sold to the broker by the Portfolio. The trust also issues floating rate notes (“floating rate notes”) which are sold to third parties. The
B5
floating rate notes have interest rates that reset weekly. The inverse floater held by the Portfolio gives the Portfolio the right (1) to cause the holders of the floating rate notes to tender their notes at par, and (2) to have the broker transfer the fixed rate bond held by the trust to the Portfolio thereby collapsing the trust. In accordance with FAS Statement No. 140, the Portfolios account for the transaction described above as funded leverage by including the fixed rate bond in its Portfolio of Investments, and accounts for the floating rate notes as a liability under the caption “payable for floating rate notes issued” in the Portfolio’s “Statement of Assets and Liabilities.”
The Portfolio’s investment policies and restrictions permit investments in inverse floating rate securities. Inverse floaters held by the Portfolio are securities exempt from registration under Rules 144A of the Securities Act of 1933.
Securities Lending: Each Portfolio of the Series Fund may lend its portfolio securities to broker-dealers. The loans are secured by collateral at least equal at all times to the market value of the securities loaned. Loans are subject to termination at the option of the borrower or the Portfolio. Upon termination of the loan, the borrower will return to the Portfolio securities identical to the loaned securities. Should the borrower of the securities fail financially, the Portfolio has the right to repurchase the securities using the collateral in the open market. The Portfolio recognizes income, net of any rebate and securities lending agent fees, for lending its securities in the form of fees or interest on the investment of any cash received as collateral. The Portfolio also continues to receive interest and dividends or amounts equivalent thereto on the securities loaned and recognizes any unrealized gain or loss in the market price of the securities loaned that may occur during the term of the loan.
As a result of the bankruptcy filing by Lehman Brothers Holdings Inc., which was the parent company to the Portfolios’ Securities Lending Counter Party, Lehman Brothers Inc. (Lehman), the Portfolios’ Securities Lending Agent utilized collateral held on behalf of the Portfolios for securities out on loan to compensate the Portfolios for the failure of Lehman to return the securities. Any excess collateral was returned to Lehman.
When-Issued/Delayed Delivery Securities: Securities purchased or sold on a when-issued or delayed-delivery basis may be settled a month or more after trade date; interest income is not accrued until settlement date. At the time a Portfolio enters into such transactions, it instructs the custodian to segregate assets with a current value at least equal to the amount of its when-issued or delayed-delivery purchase commitments.
Dollar Rolls: Certain Portfolios of the Series Fund enter into mortgage dollar rolls in which the Portfolio sells mortgage securities for delivery in the current month, realizing a gain (loss), and simultaneously contracts to repurchase somewhat similar (same type, coupon and maturity) securities on a specified future date. During the roll period, the Portfolio forgoes principal and interest paid on the securities. The Portfolio is compensated by the interest earned on the cash proceeds of the initial sale and by the lower repurchase price at the future date. The difference between the sales proceeds and the lower repurchase price is recorded as a realized gain. The Fund maintains a segregated account, the dollar value of which is at least equal to its obligations, with respect to dollar rolls.
Securities Transactions and Net Investment Income: Securities transactions are recorded on the trade date. Realized gains (losses) on sales of securities are calculated on the identified cost basis. Dividend income is recorded on the ex-dividend date; interest income, which is comprised of four elements: stated coupon, original issue discount, market discount and market premium, is recorded on the accrual basis. Expenses are recorded on the accrual basis. The Series Fund’s expenses are allocated to the respective Portfolios on the basis of relative net assets except for Portfolio specific expenses which are attributable directly to a Portfolio or class level.
For Portfolios with multiple classes of shares, net investment income (loss) (other than administration and distribution fees, which are charged to the respective class) and unrealized and realized gains (losses) are allocated daily to each class of shares based upon the relative proportion of net assets of each class at the beginning of the day.
Custody Fee Credits: The Series Fund has an arrangement with its custodian bank, whereby uninvested monies earn credits which reduce the fees charged by the custodian. Such custody fee credits are presented as a reduction of gross expenses in the accompanying Statements of Operations.
Taxes: For federal income tax purposes, each Portfolio in the Series Fund is treated as a separate taxpaying entity. The Portfolios are treated as partnerships for tax purposes. No provision has been made in the financial
B6
statements for U.S. Federal, state, or local taxes, as any tax liability arising from operations of the Portfolios is the responsibility of their partners. The Portfolios are not generally subject to entity-level taxation. Partners of each Portfolio are subject to taxes on their distributive share of partnership items.
Withholding taxes on foreign dividends, interest and capital gains have been provided for in accordance with the Series Fund’s understanding of the applicable country’s tax rules and regulations.
Distributions: Distributions from each Portfolio are made in cash and automatically reinvested in additional shares of the same Portfolio. The SP PIMCO High Yield and SP PIMCO Total Return Portfolios make distributions, if any, quarterly. All other Portfolios’ distributions are generally made on an annual basis. Distributions are recorded on the ex-date.
Estimates: The preparation of financial statements requires management to make estimates and assumptions that affect the reported amounts and disclosures in the financial statements. Actual results could differ from these estimates.
The Series Fund has a management agreement with PI. Pursuant to this agreement PI has responsibility for all investment advisory services and supervises the subadvisers’ performance of such services. PI has entered into subadvisory agreements with Jennison Associates LLC (“Jennison”), AllianceBernstein LP (“AllianceBernstein”), Davis Selected Advisers, LP (“Davis”), Goldman Sachs Asset Management, L.P. (“GSAM”), LSV Asset Management (“LSV”), Marsico (“Marsico”), Neuberger Berman Management, Inc. (“Neuberger Berman”), Quantitative Management Associates LLC (“QMA”), William Blair & Company LLC (“William Blair”), Pacific Investment Management Company LLC (“PIMCO”), Thornburg Investment Management Inc. (“Thornburg”), and ClearBridge Advisors LLC (“ClearBridge”) (collectively, the “Subadvisers”), under which each provides investment advisory services for certain Portfolios of the Series Fund. PI pays for the services of the Subadvisers, compensation of officers of the Series Fund, occupancy and certain clerical and administrative expenses of the Series Fund. The Portfolios bear all other costs and expenses.
The management fee paid to PI is computed daily and payable monthly, at the annual rates specified below, of the value of each of the Portfolio’s average daily net assets.
| | | | | | |
Portfolio
| | Management Fee
| | | Effective
Management Fee
| |
SP Aggressive Growth Asset Allocation Portfolio | | 0.05 | % | | 0.05 | % |
SP Balanced Asset Allocation Portfolio | | 0.05 | | | 0.05 | |
SP Conservative Asset Allocation Portfolio | | 0.05 | | | 0.05 | |
SP Davis Value Portfolio | | 0.75 | | | 0.75 | |
SP Growth Asset Allocation Portfolio | | 0.05 | | | 0.05 | |
SP International Growth Portfolio | | 0.85 | | | 0.85 | |
SP International Value Portfolio | | 0.90 | | | 0.90 | |
SP Mid Cap Growth Portfolio | | 0.80 | | | 0.80 | |
SP PIMCO High Yield Portfolio | | 0.60 | | | 0.60 | |
SP PIMCO Total Return Portfolio | | 0.60 | | | 0.60 | |
SP Prudential U.S. Emerging Growth Portfolio | | 0.60 | | | 0.60 | |
SP Small Cap Value Portfolio | | 0.90 | | | 0.90 | |
SP Strategic Partners Focused Growth Portfolio | | 0.90 | | | 0.90 | |
At December 31, 2008 the Subadvisers that provide investment advisory services to the Portfolios are as follows. Where more than one Subadviser is listed, each Subadviser provides services to a segment of the Portfolio:
| | |
Portfolio
| | Subadviser(s)
|
SP Aggressive Growth Asset Allocation Portfolio | | QMA |
SP Balanced Asset Allocation Portfolio | | QMA |
SP Conservation Asset Allocation Portfolio | | QMA |
SP Davis Value Portfolio | | Davis |
SP Growth Asset Allocation Portfolio | | QMA |
SP International Growth Portfolio | | William Blair, Marsico |
SP International Value Portfolio | | LSV, Thornburg |
B7
| | |
Portfolio
| | Subadviser(s)
|
SP Mid Cap Growth Portfolio | | Neuberger Berman |
SP PIMCO High Yield Portfolio | | PIMCO |
SP PIMCO Total Return Portfolio | | PIMCO |
SP Prudential U.S. Emerging Growth Portfolio | | Jennison |
SP Small Cap Value Portfolio | | GSAM, ClearBridge |
SP Strategic Partners Focused Growth Portfolio | | AllianceBernstein, Jennison |
The Series Fund has a distribution agreement with Prudential Investment Management Services LLC (“PIMS”) which acts as the distributor of the Class I and Class II shares of the Series Fund. The Series Fund compensates PIMS for distributing and servicing the Series Fund’s Class II shares pursuant to a plan of distribution (the “Class II Plan”), regardless of expenses actually incurred by PIMS. The distribution fees are accrued daily and payable monthly. No distribution or service fees are paid to PIMS as distributor of the Class I shares of the Series Fund. Pursuant to the Class II Plan, the Class II shares of each Portfolio compensate PIMS for distribution-related activities at an annual rate of 0.25% of the average daily net assets of the Class II shares.
The Series Fund has an administration agreement with PI which acts as the administrator of the Class II shares of the Series Fund. The administration fee paid to PI is accrued daily and payable monthly, at the annual rate of 0.15% of the average daily net assets of the Class II shares.
PI has agreed to waive management fees and/or reimburse expenses of each of the following Portfolios for the amount that the aggregate annual ordinary operating expenses (excluding interest, taxes, and brokerage commissions) exceeded the percentage stated below, of the Portfolio’s average daily net assets.
| | | | | | |
Portfolio
| | Class I
Expense Limit
| | | Class II
Expense Limit
| |
SP International Growth Portfolio | | 1.24 | *% | | 1.64 | *% |
SP Mid Cap Growth Portfolio | | 1.00 | * | | N/A | |
SP Small Cap Value Portfolio | | 1.05 | * | | N/A | |
SP Strategic Partners Focused Growth Portfolio | | 1.25 | * | | 1.65 | * |
N/A—Not applicable—Portfolio does not currently have Class II shares.
* Effective July 1, 2008, the expense limitation was removed.
PIMS, PI and Jennison are indirect, wholly-owned subsidiaries of Prudential Financial, Inc. (“Prudential”).
| Note 4: | | Other Transactions with Affiliates |
Prudential Mutual Fund Services LLC (“PMFS”), an affiliate of PI and an indirect, wholly-owned subsidiary of Prudential, serves as the Series Fund’s transfer agent. Transfer agent fees and expenses in the Statement of Operations include certain out-of-pocket expenses paid to non-affiliates, where applicable.
Prudential Investment Management, Inc. (“PIM”), an indirect, wholly-owned subsidiary of Prudential, is the Series Fund’s security lending agent. For the year ended December 31, 2008, PIM was compensated as follows for these services by the Series Fund Portfolios:
| | | |
| | | PIM
|
SP Davis Value Portfolio | | $ | 190,975 |
SP International Growth Portfolio | | | 36,151 |
SP Mid Cap Growth Portfolio | | | 91,610 |
SP Prudential U.S. Emerging Growth Portfolio | | | 138,424 |
SP Small Cap Value Portfolio | | | 377,573 |
For the year ended December 31, 2008, Wachovia Securities, LLC (Wachovia), an affiliate of PI, earned brokerage commissions from transactions executed on behalf of the Series Fund Portfolios as follows:
| | | |
Portfolio
| | Wachovia
|
SP Davis Value Portfolio | | $ | 54 |
SP Prudential U.S. Emerging Growth Portfolio | | | 1,861 |
Certain Portfolios invest in the Taxable Money Market Series, a portfolio of Dryden Core Investment Fund registered under the Investment Company Act of 1940, as amended, and managed by PI.
B8
| Note 5: | | Portfolio Securities |
The aggregate cost of purchases and the proceeds from the sales of securities (excluding government securities and short-term issues) for the year ended December 31, 2008 were as follows:
Cost of Purchases:
| | | |
Portfolio
| | |
SP Aggressive Growth Asset Allocation Portfolio | | $ | 51,326,380 |
SP Balanced Asset Allocation Portfolio | | | 325,100,439 |
SP Conservative Asset Allocation Portfolio | | | 167,444,593 |
SP Davis Value Portfolio | | | 45,225,066 |
SP Growth Asset Allocation Portfolio | | | 287,712,350 |
SP International Growth Portfolio | | | 358,160,245 |
SP International Value Portfolio | | | 113,980,618 |
SP Mid Cap Growth Portfolio | | | 65,533,237 |
SP PIMCO High Yield Portfolio | | | 456,919,599 |
SP PIMCO Total Return Portfolio | | | 10,729,475,180 |
SP Prudential U.S. Emerging Growth Portfolio | | | 96,114,619 |
SP Small Cap Value Portfolio | | | 141,744,519 |
SP Strategic Partners Focused Growth Portfolio | | | 58,013,490 |
Proceeds from Sales:
| | | |
Portfolio
| | |
SP Aggressive Growth Asset Allocation Portfolio | | $ | 55,125,001 |
SP Balanced Asset Allocation Portfolio | | | 429,050,252 |
SP Conservative Asset Allocation Portfolio | | | 219,300,086 |
SP Davis Value Portfolio | | | 75,426,753 |
SP Growth Asset Allocation Portfolio | | | 347,700,027 |
SP International Growth Portfolio | | | 419,749,724 |
SP International Value Portfolio | | | 185,712,723 |
SP Mid Cap Growth Portfolio | | | 73,589,687 |
SP PIMCO High Yield Portfolio | | | 476,115,826 |
SP PIMCO Total Return Portfolio | | | 10,809,985,373 |
SP Prudential U.S. Emerging Growth Portfolio | | | 116,124,006 |
SP Small Cap Value Portfolio | | | 150,232,605 |
SP Strategic Partners Focused Growth Portfolio | | | 69,519,874 |
The SP PIMCO High Yield and SP PIMCO Total Return Portfolios’ written options activity for the year ended December 31, 2008 were as follows:
| | | | | | | | | | | | | | |
| | | SP PIMCO High Yield Bond
| | | SP PIMCO Total Return Bond
| |
| | | Number of
Contracts/
Swap Notional
Amount
| | | Premium
| | | Number of
Contracts/
Swap Notional
Amount
| | | Premium
| |
Balance at beginning of year | | 77,700,000 | | | $ | 1,944,180 | | | 406,200,000 | | | $ | 7,189,460 | |
Written options | | 60,120,000 | | | | 991,503 | | | 234,500,000 | | | | 17,745,502 | |
Expired options | | (32,320,000 | ) | | | (314,573 | ) | | (106,500,000 | ) | | | (1,106,973 | ) |
Closed options | | (57,100,000 | ) | | | (1,304,540 | ) | | (531,100,000 | ) | | | (23,808,589 | ) |
| | |
|
| |
|
|
| |
|
| |
|
|
|
Balance at end of year | | 48,400,000 | | | $ | 1,316,570 | | | 3,100,000 | | | $ | 19,400 | |
| | |
|
| |
|
|
| |
|
| |
|
|
|
After January 2, 2006, all Portfolios are treated as partnerships for tax purposes. The character of the cash distributions made by the partnerships is generally classified as return of capital nontaxable distributions. After each fiscal year each partner will receive information regarding their distributive allocable share of the partnership’s income, gains, losses and deductions.
B9
Prior to January 2, 2006, each Portfolio, which was incorporated as of that date, qualified as a regulated investment company under the Internal Revenue Code and distributed all of its taxable income, including any net realized gains on investments, to shareholders.
With respect to the Portfolios, book cost of assets differs from tax cost of assets as a result of each Portfolio’s adoption of a mark to market method of accounting for tax purposes. Under this method, tax cost of assets will approximate its fair market value.
Management has analyzed the Portfolios’ tax positions taken on federal income tax returns for all open tax years and has concluded that as of December 31, 2008, no provision for income tax would be required in the Portfolios’ financial statements. The Portfolios’ federal and state income tax returns for tax years for which the applicable statutes of limitations have not expired are subject to examination by the Internal Revenue Service and state departments of revenue.
The Series Fund offers Class I and Class II shares. Neither Class I nor Class II shares of a Portfolio are subject to any sales charge or redemption charge and are sold at the net asset value of the Portfolio. Class I shares are sold only to certain separate accounts of Prudential to fund benefits under certain variable life insurance and variable annuity contracts (“contracts”). Class II shares are sold only to separate accounts of non-Prudential insurance companies as investment options under certain contracts. The separate accounts invest in shares of the Series Fund through subaccounts that correspond to the Portfolios. The separate accounts will redeem shares of the Series Fund to the extent necessary to provide benefits under the contracts or for such other purposes as may be consistent with the contracts. As of December 31, 2008, the SP Prudential U.S. Emerging Growth, SP Strategic Partners Focused Growth and SP International Growth Portfolios have Class II shares outstanding.
Transactions in shares of beneficial interest of the SP Prudential U.S. Emerging Growth, SP International Growth Portfolios and SP Strategic Partners Focused Growth were as follows:
| | | | | | | |
| | |
| SP Prudential U.S. Emerging Growth Portfolio: | | | | | | | |
Class I
| | Shares
| | | Amount
| |
Year ended December 31, 2008: | | | | | | | |
Series shares sold | | 951,155 | | | $ | 6,074,026 | |
Series shares issued in reinvestment of distributions | | 3,888,475 | | | | 28,074,791 | |
Series shares repurchased | | (4,826,937 | ) | | | (31,576,609 | ) |
| | |
|
| |
|
|
|
Net increase (decrease) in shares outstanding | | 12,693 | | | $ | 2,572,208 | |
| | |
|
| |
|
|
|
Year ended December 31, 2007: | | | | | | | |
Series shares sold | | 1,555,189 | | | $ | 13,349,158 | |
Series shares issued in reinvestment of distributions | | 2,441,796 | | | | 20,193,651 | |
Series shares repurchased | | (4,874,848 | ) | | | (42,326,327 | ) |
| | |
|
| |
|
|
|
Net increase (decrease) in shares outstanding | | (877,863 | ) | | $ | (8,783,518 | ) |
| | |
|
| |
|
|
|
| | |
Class II
| | | | | | |
Year ended December 31, 2008: | | | | | | | |
Series shares sold | | 516 | | | $ | 2,117 | |
Series shares issued in reinvestment of distributions | | 7,530 | | | | 52,710 | |
Series shares repurchased | | (6,498 | ) | | | (40,442 | ) |
| | |
|
| |
|
|
|
Net increase (decrease) in shares outstanding | | 1,548 | | | $ | 14,385 | |
| | |
|
| |
|
|
|
Year ended December 31, 2007: | | | | | | | |
Series shares sold | | 10 | | | $ | 79 | |
Series shares issued in reinvestment of distributions | | 4,585 | | | | 36,860 | |
Series shares repurchased | | (984 | ) | | | (8,413 | ) |
| | |
|
| |
|
|
|
Net increase (decrease) in shares outstanding | | 3,611 | | | $ | 28,526 | |
| | |
|
| |
|
|
|
B10
| | | | | | | |
| | |
| SP International Growth Portfolio: | | | | | | | |
Class I
| | Shares
| | | Amount
| |
Year ended December 31, 2008: | | | | | | | |
Series shares sold | | 7,707,426 | | | $ | 42,123,871 | |
Series shares issued in reinvestment of distributions | | 11,132,248 | | | | 70,133,161 | |
Series shares repurchased | | (17,448,954 | ) | | | (118,140,650 | ) |
| | |
|
| |
|
|
|
Net increase (decrease) in shares outstanding | | 1,390,720 | | | $ | (5,883,618 | ) |
| | |
|
| |
|
|
|
Year ended December 31, 2007: | | | | | | | |
Series shares sold | | 10,087,889 | | | $ | 91,575,100 | |
Series shares issued in reinvestment of distributions | | 8,319,424 | | | | 69,883,161 | |
Series shares repurchased | | (14,648,601 | ) | | | (134,103,634 | ) |
| | |
|
| |
|
|
|
Net increase (decrease) in shares outstanding | | 3,758,712 | | | $ | 27,354,627 | |
| | |
|
| |
|
|
|
| | |
Class II
| | | | | | |
Year ended December 31, 2008: | | | | | | | |
Series shares sold | | 1,647,667 | | | $ | 11,225,987 | |
Series shares issued in reinvestment of distributions | | 897,109 | | | | 5,535,160 | |
Series shares repurchased | | (3,525,674 | ) | | | (19,551,361 | ) |
| | |
|
| |
|
|
|
Net increase (decrease) in shares outstanding | | (980,898 | ) | | $ | (2,790,214 | ) |
| | |
|
| |
|
|
|
Year ended December 31, 2007: | | | | | | | |
Series shares sold | | 952,660 | | | $ | 9,078,707 | |
Series shares issued in reinvestment of distributions | | 522,747 | | | | 4,307,437 | |
Series shares repurchased | | (618,021 | ) | | | (5,365,352 | ) |
| | |
|
| |
|
|
|
Net increase (decrease) in shares outstanding | | 857,386 | | | $ | 8,020,792 | |
| | |
|
| |
|
|
|
| | | | | | | |
| SP Strategic Partners Focused Growth Portfolio: | | | | | | | |
Class I
| | Shares
| | | Amount
| |
Year ended December 31, 2008: | | | | | | | |
Series shares sold | | 421,146 | | | $ | 2,929,158 | |
Series shares issued in reinvestment of distributions | | 314,098 | | | | 2,371,440 | |
Series shares repurchased | | (847,025 | ) | | | (5,562,995 | ) |
| | |
|
| |
|
|
|
Net increase (decrease) in shares outstanding | | (111,781 | ) | | $ | (262,397 | ) |
| | |
|
| |
|
|
|
Year ended December 31, 2007: | | | | | | | |
Series shares sold | | 311,072 | | | $ | 2,472,505 | |
Series shares issued in reinvestment of distributions | | 179,113 | | | | 1,477,681 | |
Series shares repurchased | | (1,023,282 | ) | | | (8,046,092 | ) |
| | |
|
| |
|
|
|
Net increase (decrease) in shares outstanding | | (533,097 | ) | | $ | (4,095,906 | ) |
| | |
|
| |
|
|
|
| | |
Class II
| | | | | | |
Year ended December 31, 2008: | | | | | | | |
Series shares sold | | 517,775 | | | $ | 3,675,144 | |
Series shares issued in reinvestment of distributions | | 217,879 | | | | 1,588,341 | |
Series shares repurchased | | (1,859,584 | ) | | | (11,988,941 | ) |
| | |
|
| |
|
|
|
Net increase (decrease) in shares outstanding | | (1,123,930 | ) | | $ | (6,725,456 | ) |
| | |
|
| |
|
|
|
Year ended December 31, 2007: | | | | | | | |
Series shares sold | | 269,076 | | | $ | 2,104,214 | |
Series shares issued in reinvestment of distributions | | 135,932 | | | | 1,087,456 | |
Series shares repurchased | | (1,307,927 | ) | | | (10,119,215 | ) |
| | |
|
| |
|
|
|
Net increase (decrease) in shares outstanding | | (902,919 | ) | | $ | (6,927,545 | ) |
| | |
|
| |
|
|
|
B11
The Portfolios, along with other affiliated registered investment companies (the “Funds”), are a party to a Syndicated Credit Agreement (“SCA”) with two banks. The SCA provides for a commitment of $500 million. Interest on any borrowings under the SCA is incurred at contracted market rates and a commitment fee for the unused amount is accrued daily and paid quarterly. Effective October 24, 2008, the Funds renewed the SCA with the banks. The commitment under the renewed SCA continues to be $500 million. The Funds pay a commitment fee of .13 of 1% of the unused portion of the renewed SCA. The expiration date of the renewed SCA will be October 23, 2009. For the period from October 26, 2007 through October 23, 2008, the Funds paid a commitment fee of .06 of 1% of the unused portion of the agreement. The purpose of the SCA is to provide an alternative source of temporary funding for capital share redemptions.
The following Portfolios utilized the line of credit during the year ended December 31, 2008. The average balance is for the number of days the Portfolios had utilized the credit facility.
| | | | | | | | | | |
Portfolio
| | Approximate
Average
Balance
Outstanding
| | Number of
Days
Outstanding
| | Weighted
Average
Interest
Rates
| | | Amount
Outstanding at
December 31,
2008
|
SP Balanced Asset Allocation | | $ | 429,000 | | 2 | | 1.22 | % | | — |
SP International Growth | | | 2,443,870 | | 54 | | 3.38 | | | — |
SP International Value | | | 2,019,529 | | 51 | | 3.37 | | | — |
SP Prudential U.S. Emerging Growth | | | 485,000 | | 1 | | 1.31 | | | — |
| Note 9: | | Ownership and Affiliates |
As of December 31, 2008, all of Class I shares of each Portfolio were owned of record by The Prudential Insurance Company of America (“PICA”) on behalf of the owners of the variable insurance products issued by PICA.
| Note 10: | | New Accounting Pronouncements |
In March 2008, the Financial Accounting Standards Board (“FASB”) released Statement of Financial Accounting Standards No. 161, Disclosures about Derivative Instruments and Hedging Activities (“FAS 161”). FAS 161 requires qualitative disclosures about objectives and strategies for using derivatives, quantitative disclosures about fair value amounts of and gains and losses on derivative instruments, and disclosures about credit-risk-related contingent features in derivative agreements. The application of FAS 161 is required for any reporting period beginning after November 15, 2008. At this time, management is evaluating the implications of FAS 161 and its impact on the financial statements has not yet been determined.
B12
Financial Highlights
| | | | | | | | | | | | | | | | | | | | |
| | | SP Aggressive Growth Asset Allocation Portfolio
| |
| | | Year Ended December 31,
| |
| | | 2008
| | | 2007
| | | 2006
| | | 2005
| | | 2004
| |
Per Share Operating Performance: | | | | | | | | | | | | | | | | | | | | |
Net Asset Value, beginning of year | | $ | 10.75 | | | $ | 10.41 | | | $ | 9.50 | | | $ | 8.98 | | | $ | 7.83 | |
| | |
|
|
| |
|
|
| |
|
|
| |
|
|
| |
|
|
|
Income (Loss) From Investment Operations: | | | | | | | | | | | | | | | | | | | | |
Net investment income | | | .09 | | | | .10 | | | | .10 | | | | .18 | | | | .02 | |
Net realized and unrealized gain (loss) on investments | | | (4.24 | ) | | | .85 | | | | 1.22 | | | | .71 | | | | 1.13 | |
| | |
|
|
| |
|
|
| |
|
|
| |
|
|
| |
|
|
|
Total from investment operations | | | (4.15 | ) | | | .95 | | | | 1.32 | | | | .89 | | | | 1.15 | |
| | |
|
|
| |
|
|
| |
|
|
| |
|
|
| |
|
|
|
Less Dividends and Distributions: | | | | | | | | | | | | | | | | | | | | |
Dividends from net investment income | | | — | | | | — | | | | — | | | | (.02 | ) | | | — | (c) |
Distributions from net realized gains | | | — | | | | — | | | | — | | | | (.35 | ) | | | — | |
Distributions | | | (1.03 | ) | | | (.61 | ) | | | (.41 | ) | | | — | | | | — | |
| | |
|
|
| |
|
|
| |
|
|
| |
|
|
| |
|
|
|
Total dividends and distributions | | | (1.03 | ) | | | (.61 | ) | | | (.41 | ) | | | (.37 | ) | | | — | |
| | |
|
|
| |
|
|
| |
|
|
| |
|
|
| |
|
|
|
Net Asset Value, end of year | | $ | 5.57 | | | $ | 10.75 | | | $ | 10.41 | | | $ | 9.50 | | | $ | 8.98 | |
| | |
|
|
| |
|
|
| |
|
|
| |
|
|
| |
|
|
|
Total Return(a) | | | (42.18 | )% | | | 9.20 | % | | | 14.27 | % | | | 10.48 | % | | | 14.76 | % |
Ratios/Supplemental Data: | | | | | | | | | | | | | | | | | | | | |
Net assets, end of year (in millions) | | $ | 107.6 | | | $ | 205.3 | | | $ | 201.6 | | | $ | 188.2 | | | $ | 136.9 | |
Ratios to average net assets(b): | | | | | | | | | | | | | | | | | | | | |
Expenses | | | .15 | % | | | .11 | % | | | .05 | % | | | .05 | % | | | .05 | % |
Net investment income | | | .98 | % | | | .83 | % | | | 1.00 | % | | | 2.29 | % | | | .27 | % |
Portfolio turnover rate | | | 32 | % | | | 18 | % | | | 28 | % | | | 26 | % | | | 60 | % |
| (a) | Total return is calculated assuming a purchase of a share on the first day and a sale on the last day of each year reported and includes reinvestment of dividends and distributions and does not reflect the effect of insurance contract charges. Total return does not reflect expenses associated with the separate account such as administrative fees, account charges and surrender charges which, if reflected, would reduce the total returns for all years shown. Performance figures may reflect voluntary fee waivers and/or expense reimbursements. In the absence of voluntary fee waivers and/or expense reimbursements, the total return would be lower. Past performance is no guarantee of future results. Total returns may reflect adjustments to conform to generally accepted accounting principles. |
| (b) | Does not include expenses of the underlying portfolios in which the Portfolio invests. |
| (c) | Less than $0.005 per share. |
| | | | | | | | | | | | | | | | | | | | |
| | | SP Balanced Asset Allocation Portfolio
| |
| | | Year Ended December 31,
| |
| | | 2008
| | | 2007
| | | 2006
| | | 2005
| | | 2004
| |
Per Share Operating Performance: | | | | | | | | | | | | | | | | | | | | |
Net Asset Value, beginning of year | | $ | 12.04 | | | $ | 11.59 | | | $ | 10.92 | | | $ | 10.63 | | | $ | 9.66 | |
| | |
|
|
| |
|
|
| |
|
|
| |
|
|
| |
|
|
|
Income From Investment Operations: | | | | | | | | | | | | | | | | | | | | |
Net investment income | | | .25 | | | | .27 | | | | .25 | | | | .27 | | | | .09 | |
Net realized and unrealized gain (loss) on investments | | | (3.43 | ) | | | .81 | | | | .89 | | | | .49 | | | | .97 | |
| | |
|
|
| |
|
|
| |
|
|
| |
|
|
| |
|
|
|
Total from investment operations | | | (3.18 | ) | | | 1.08 | | | | 1.14 | | | | .76 | | | | 1.06 | |
| | |
|
|
| |
|
|
| |
|
|
| |
|
|
| |
|
|
|
Less Dividends and Distributions: | | | | | | | | | | | | | | | | | | | | |
Dividends from net investment income | | | — | | | | — | | | | — | | | | (.10 | ) | | | (.08 | ) |
Distributions from net realized gains | | | — | | | | — | | | | — | | | | (.37 | ) | | | (.01 | ) |
Distributions | | | (1.04 | ) | | | (.63 | ) | | | (.47 | ) | | | — | | | | — | |
| | |
|
|
| |
|
|
| |
|
|
| |
|
|
| |
|
|
|
Total dividends and distributions | | | (1.04 | ) | | | (.63 | ) | | | (.47 | ) | | | (.47 | ) | | | (.09 | ) |
| | |
|
|
| |
|
|
| |
|
|
| |
|
|
| |
|
|
|
Net Asset Value, end of year | | $ | 7.82 | | | $ | 12.04 | | | $ | 11.59 | | | $ | 10.92 | | | $ | 10.63 | |
| | |
|
|
| |
|
|
| |
|
|
| |
|
|
| |
|
|
|
Total Return(a) | | | (28.55 | )% | | | 9.35 | % | | | 10.69 | % | | | 7.60 | % | | | 11.09 | % |
Ratios/Supplemental Data: | | | | | | | | | | | | | | | | | | | | |
Net assets, end of year (in millions) | | $ | 845.0 | | | $ | 1,391.0 | | | $ | 1,406.3 | | | $ | 1,372.0 | | | $ | 837.0 | |
Ratios to average net assets(b): | | | | | | | | | | | | | | | | | | | | |
Expenses | | | .07 | % | | | .06 | % | | | .05 | % | | | .05 | % | | | .05 | % |
Net investment income | | | 2.19 | % | | | 2.01 | % | | | 2.23 | % | | | 3.40 | % | | | 1.37 | % |
Portfolio turnover rate | | | 28 | % | | | 26 | % | | | 27 | % | | | 21 | % | | | 48 | % |
| (a) | Total return is calculated assuming a purchase of a share on the first day and a sale on the last day of each year reported and includes reinvestment of dividends and distributions and does not reflect the effect of insurance contract charges. Total return does not reflect expenses associated with the separate account such as administrative fees, account charges and surrender charges which, if reflected, would reduce the total returns for all years shown. Performance figures may reflect voluntary fee waivers and/or expense reimbursements. In the absence of voluntary fee waivers and/or expense reimbursements, the total return would be lower. Past performance is no guarantee of future results. Total returns may reflect adjustments to conform to generally accepted accounting principles. |
| (b) | Does not include expenses of the underlying portfolios in which the Portfolio invests. |
SEE NOTES TO FINANCIAL STATEMENTS.
C1
Financial Highlights
| | | | | | | | | | | | | | | | | | | | |
| | | SP Conservative Asset Allocation Portfolio
| |
| | | Year Ended December 31,
| |
| | | 2008
| | | 2007
| | | 2006
| | | 2005
| | | 2004
| |
Per Share Operating Performance: | | | | | | | | | | | | | | | | | | | | |
Net Asset Value, beginning of year | | $ | 12.09 | | | $ | 11.66 | | | $ | 11.28 | | | $ | 11.20 | | | $ | 10.48 | |
| | |
|
|
| |
|
|
| |
|
|
| |
|
|
| |
|
|
|
Income (Loss) From Investment Operations: | | | | | | | | | | | | | | | | | | | | |
Net investment income | | | .33 | | | | .36 | | | | .35 | | | | .38 | | | | .14 | |
Net realized and unrealized gain (loss) on investments | | | (2.61 | ) | | | .73 | | | | .59 | | | | .25 | | | | .77 | |
| | |
|
|
| |
|
|
| |
|
|
| |
|
|
| |
|
|
|
Total from investment operations | | | (2.28 | ) | | | 1.09 | | | | .94 | | | | .63 | | | | .91 | |
| | |
|
|
| |
|
|
| |
|
|
| |
|
|
| |
|
|
|
Less Dividends and Distributions: | | | | | | | | | | | | | | | | | | | | |
Dividends from net investment income | | | — | | | | — | | | | — | | | | (.16 | ) | | | (.16 | ) |
Distributions from net realized gains | | | — | | | | — | | | | — | | | | (.39 | ) | | | (.03 | ) |
Distributions | | | (.92 | ) | | | (.66 | ) | | | (.56 | ) | | | — | | | | — | |
| | |
|
|
| |
|
|
| |
|
|
| |
|
|
| |
|
|
|
Total dividends and distributions | | | (.92 | ) | | | (.66 | ) | | | (.56 | ) | | | (.55 | ) | | | (.19 | ) |
| | |
|
|
| |
|
|
| |
|
|
| |
|
|
| |
|
|
|
Net Asset Value, end of year | | $ | 8.89 | | | $ | 12.09 | | | $ | 11.66 | | | $ | 11.28 | | | $ | 11.20 | |
| | |
|
|
| |
|
|
| |
|
|
| |
|
|
| |
|
|
|
Total Return(a) | | | (20.21 | )% | | | 9.39 | % | | | 8.67 | % | | | 5.91 | % | | | 8.89 | % |
Ratios/Supplemental Data: | | | | | | | | | | | | | | | | | | | | |
Net assets, end of year (in millions) | | $ | 421.8 | | | $ | 621.3 | | | $ | 632.8 | | | $ | 642.0 | | | $ | 459.9 | |
Ratios to average net assets(b): | | | | | | | | | | | | | | | | | | | | |
Expenses | | | .08 | % | | | .07 | % | | | .05 | % | | | .05 | % | | | .05 | % |
Net investment income | | | 2.76 | % | | | 2.67 | % | | | 2.94 | % | | | 4.10 | % | | | 1.86 | % |
Portfolio turnover rate | | | 31 | % | | | 31 | % | | | 33 | % | | | 24 | % | | | 47 | % |
| (a) | Total return is calculated assuming a purchase of a share on the first day and a sale on the last day of each year reported and includes reinvestment of dividends and distributions and does not reflect the effect of insurance contract charges. Total return does not reflect expenses associated with the separate account such as administrative fees, account charges and surrender charges which, if reflected, would reduce the total returns for all years shown. Performance figures may reflect voluntary fee waivers and/or expense reimbursements. In the absence of voluntary fee waivers and/or expense reimbursements, the total return would be lower. Past performance is no guarantee of future results. Total returns may reflect adjustments to conform to generally accepted accounting principles. |
| (b) | Does not include expenses of the underlying portfolios in which the Portfolio invests. |
| | | | | | | | | | | | | | | | | | | | |
| | | SP Davis Value Portfolio
| |
| | | Year Ended December 31,
| |
| | | 2008
| | | 2007
| | | 2006
| | | 2005
| | | 2004
| |
Per Share Operating Performance: | | | | | | | | | | | | | | | | | | | | |
Net Asset Value, beginning of year | | $ | 12.00 | | | $ | 11.99 | | | $ | 10.68 | | | $ | 10.98 | | | $ | 9.80 | |
| | |
|
|
| |
|
|
| |
|
|
| |
|
|
| |
|
|
|
Income (Loss) From Investment Operations: | | | | | | | | | | | | | | | | | | | | |
Net investment income | | | .12 | | | | .15 | | | | .09 | | | | .09 | | | | .10 | |
Net realized and unrealized gain (loss) on investments | | | (4.62 | ) | | | .39 | | | | 1.49 | | | | .82 | | | | 1.12 | |
| | |
|
|
| |
|
|
| |
|
|
| |
|
|
| |
|
|
|
Total from investment operations | | | (4.50 | ) | | | .54 | | | | 1.58 | | | | .91 | | | | 1.22 | |
| | |
|
|
| |
|
|
| |
|
|
| |
|
|
| |
|
|
|
Less Dividends and Distributions: | | | | | | | | | | | | | | | | | | | | |
Dividends from net investment income | | | — | | | | — | | | | — | | | | (.10 | ) | | | (.04 | ) |
Distributions from net realized gains | | | — | | | | — | | | | — | | | | (1.11 | ) | | | — | |
Distributions | | | (.78 | ) | | | (.53 | ) | | | (.27 | ) | | | — | | | | — | |
| | |
|
|
| |
|
|
| |
|
|
| |
|
|
| |
|
|
|
Total dividends and distributions | | | (.78 | ) | | | (.53 | ) | | | (.27 | ) | | | (1.21 | ) | | | (.04 | ) |
| | |
|
|
| |
|
|
| |
|
|
| |
|
|
| |
|
|
|
Net Asset Value, end of year | | $ | 6.72 | | | $ | 12.00 | | | $ | 11.99 | | | $ | 10.68 | | | $ | 10.98 | |
| | |
|
|
| |
|
|
| |
|
|
| |
|
|
| |
|
|
|
Total Return(a) | | | (39.88 | )% | | | 4.58 | % | | | 15.02 | % | | | 9.52 | % | | | 12.53 | % |
Ratios/Supplemental Data: | | | | | | | | | | | | | | | | | | | | |
Net assets, end of year (in millions) | | $ | 165.3 | | | $ | 309.0 | | | $ | 328.0 | | | $ | 311.7 | | | $ | 285.5 | |
Ratios to average net assets(b): | | | | | | | | | | | | | | | | | | | | |
Expenses | | | .82 | % | | | .80 | % | | | .81 | % | | | .82 | % | | | .82 | % |
Net investment income | | | 1.13 | % | | | 1.11 | % | | | .81 | % | | | .87 | % | | | .89 | % |
Portfolio turnover rate | | | 19 | % | | | 9 | % | | | 14 | % | | | 14 | % | | | 34 | % |
| (a) | Total return is calculated assuming a purchase of a share on the first day and a sale on the last day of each year reported and includes reinvestment of dividends and distributions. Total return does not reflect expenses associated with the separate account such as administrative fees, account charges and surrender charges which, if reflected, would reduce the total returns for all periods shown. Performance figures may reflect voluntary fee waivers and/or expense reimbursements. In the absence of voluntary fee waivers and/or expense reimbursements, the total return would be lower. Past performance is no guarantee of future results. Total returns may reflect adjustments to conform to generally accepted accounting principles. |
| (b) | Does not include expenses of the underlying portfolio in which the Portfolio invests. |
SEE NOTES TO FINANCIAL STATEMENTS.
C2
Financial Highlights
| | | | | | | | | | | | | | | | | | | | |
| | | SP Growth Asset Allocation Portfolio
| |
| | | Year Ended December 31,
| |
| | | 2008
| | | 2007
| | | 2006
| | | 2005
| | | 2004
| |
Per Share Operating Performance: | | | | | | | | | | | | | | | | | | | | |
Net Asset Value, beginning of year | | $ | 11.59 | | | $ | 11.17 | | | $ | 10.23 | | | $ | 9.80 | | | $ | 8.71 | |
| | |
|
|
| |
|
|
| |
|
|
| |
|
|
| |
|
|
|
Income (Loss) From Investment Operations: | | | | | | | | | | | | | | | | | | | | |
Net investment income | | | .16 | | | | .18 | | | | .16 | | | | .19 | | | | .06 | |
Net realized and unrealized gain (loss) on investments | | | (4.01 | ) | | | .85 | | | | 1.13 | | | | .66 | | | | 1.07 | |
| | |
|
|
| |
|
|
| |
|
|
| |
|
|
| |
|
|
|
Total from investment operations | | | (3.85 | ) | | | 1.03 | | | | 1.29 | | | | .85 | | | | 1.13 | |
| | |
|
|
| |
|
|
| |
|
|
| |
|
|
| |
|
|
|
Less Dividends and Distributions: | | | | | | | | | | | | | | | | | | | | |
Dividends from net investment income | | | — | | | | — | | | | — | | | | (.06 | ) | | | (.04 | ) |
Distributions from net realized gains | | | — | | | | — | | | | — | | | | (.36 | ) | | | — | |
Distributions | | | (1.14 | ) | | | (.61 | ) | | | (.35 | ) | | | — | | | | — | |
| | |
|
|
| |
|
|
| |
|
|
| |
|
|
| |
|
|
|
Total dividends and distributions | | | (1.14 | ) | | | (.61 | ) | | | (.35 | ) | | | (.42 | ) | | | (.04 | ) |
| | |
|
|
| |
|
|
| |
|
|
| |
|
|
| |
|
|
|
Net Asset Value, end of year | | $ | 6.60 | | | $ | 11.59 | | | $ | 11.17 | | | $ | 10.23 | | | $ | 9.80 | |
| | |
|
|
| |
|
|
| |
|
|
| |
|
|
| |
|
|
|
Total Return(a) | | | (36.36 | )% | | | 9.23 | % | | | 12.88 | % | | | 9.24 | % | | | 13.05 | % |
Ratios/Supplemental Data: | | | | | | | | | | | | | | | | | | | | |
Net assets, end of year (in millions) | | $ | 694.8 | | | $ | 1,252.7 | | | $ | 1,283.9 | | | $ | 1,212.0 | | | $ | 662.7 | |
Ratios to average net assets(b): | | | | | | | | | | | | | | | | | | | | |
Expenses | | | .07 | % | | | .06 | % | | | .05 | % | | | .05 | % | | | .05 | % |
Net investment income | | | 1.57 | % | | | 1.32 | % | | | 1.50 | % | | | 2.65 | % | | | .94 | % |
Portfolio turnover rate | | | 29 | % | | | 21 | % | | | 25 | % | | | 18 | % | | | 53 | % |
| (a) | Total return is calculated assuming a purchase of a share on the first day and a sale on the last day of each year reported and includes reinvestment of dividends and distributions and does not reflect the effect of insurance contract charges. Total return does not reflect expenses associated with the separate account such as administrative fees, account charges and surrender charges which, if reflected, would reduce the total returns for all years shown. Performance figures may reflect voluntary fee waivers and/or expense reimbursements. In the absence of voluntary fee waivers and/or expense reimbursements, the total return would be lower. Past performance is no guarantee of future results. Total returns may reflect adjustments to conform to generally accepted accounting principles. |
| (b) | Does not include expenses of the underlying portfolios in which the Portfolio invests. |
SEE NOTES TO FINANCIAL STATEMENTS.
C3
Financial Highlights
| | | | | | | | | | | | | | | | | | | | |
| | | SP International Growth Portfolio
| |
| | | Class I
| |
| | | Year Ended December 31,
| |
| | | 2008
| | | 2007(c)
| | | 2006
| | | 2005
| | | 2004
| |
Per Share Operating Performance: | | | | | | | | | | | | | | | | | | | | |
Net Asset Value, beginning of year | | $ | 8.52 | | | $ | 8.30 | | | $ | 7.55 | | | $ | 6.85 | | | $ | 5.89 | |
| | |
|
|
| |
|
|
| |
|
|
| |
|
|
| |
|
|
|
Income (Loss) From Investment Operations: | | | | | | | | | | | | | | | | | | | | |
Net investment income | | | .10 | | | | .10 | | | | .05 | | | | .04 | | | | .02 | |
Net realized and unrealized gain (loss) on investments | | | (3.74 | ) | | | 1.50 | | | | 1.45 | | | | 1.01 | | | | .95 | |
| | |
|
|
| |
|
|
| |
|
|
| |
|
|
| |
|
|
|
Total from investment operations | | | (3.64 | ) | | | 1.60 | | | | 1.50 | | | | 1.05 | | | | .97 | |
| | |
|
|
| |
|
|
| |
|
|
| |
|
|
| |
|
|
|
Less Dividends and Distributions: | | | | | | | | | | | | | | | | | | | | |
Dividends from net investment income | | | — | | | | — | | | | — | | | | (.04 | ) | | | (.01 | ) |
Distributions from net realized gains | | | — | | | | — | | | | — | | | | (.31 | ) | | | — | |
Distributions | | | (1.43 | ) | | | (1.38 | ) | | | (.75 | ) | | | — | | | | — | |
| | |
|
|
| |
|
|
| |
|
|
| |
|
|
| |
|
|
|
Total dividends and distributions | | | (1.43 | ) | | | (1.38 | ) | | | (.75 | ) | | | (.35 | ) | | | (.01 | ) |
| | |
|
|
| |
|
|
| |
|
|
| |
|
|
| |
|
|
|
Net Asset Value, end of year | | $ | 3.45 | | | $ | 8.52 | | | $ | 8.30 | | | $ | 7.55 | | | $ | 6.85 | |
| | |
|
|
| |
|
|
| |
|
|
| |
|
|
| |
|
|
|
Total Return(a) | | | (50.30 | )% | | | 19.55 | % | | | 21.05 | % | | | 16.39 | % | | | 16.54 | % |
Ratios/Supplemental Data: | | | | | | | | | | | | | | | | | | | | |
Net assets, end of year (in millions) | | $ | 207.5 | | | $ | 500.0 | | | $ | 456.0 | | | $ | 453.6 | | | $ | 249.1 | |
Ratios to average net assets(b): | | | | | | | | | | | | | | | | | | | | |
Expenses | | | .99 | % | | | .94 | % | | | .97 | % | | | .98 | % | | | 1.02 | % |
Net investment income | | | 1.36 | % | | | 1.14 | % | | | .69 | % | | | .64 | % | | | .50 | % |
Portfolio turnover rate | | | 101 | % | | | 81 | % | | | 111 | % | | | 99 | % | | | 137 | % |
| (a) | Total return is calculated assuming a purchase of a share on the first day and a sale on the last day of each year reported and includes reinvestment of dividends and distributions. Total return does not reflect expenses associated with the separate account such as administrative fees, account charges and surrender charges which, if reflected, would reduce the total returns for all periods shown. Performance figures may reflect voluntary fee waivers and/or expense reimbursements. In the absence of voluntary fee waivers and/or expense reimbursements, the total return would be lower. Past performance is no guarantee of future results. Total returns may reflect adjustments to conform to generally accepted accounting principles. |
| (b) | Does not include expenses of the underlying portfolio in which the Portfolio invests. |
| (c) | Calculation based on average shares outstanding during the year. |
| | | | | | | | | | | | | | | | | | | | |
| | | SP International Growth Portfolio
| |
| | | Class II
| |
| | | Year Ended December 31,
| |
| | | 2008
| | | 2007(c)
| | | 2006
| | | 2005
| | | 2004
| |
Per Share Operating Performance: | | | | | | | | | | | | | | | | | | | | |
Net Asset Value, beginning of year | | $ | 8.36 | | | $ | 8.17 | | | $ | 7.45 | | | $ | 6.77 | | | $ | 5.83 | |
| | |
|
|
| |
|
|
| |
|
|
| |
|
|
| |
|
|
|
Income (Loss) From Investment Operations: | | | | | | | | | | | | | | | | | | | | |
Net investment income | | | .07 | | | | .07 | | | | .02 | | | | .03 | | | | .01 | |
Net realized and unrealized gain (loss) on investments | | | (3.65 | ) | | | 1.47 | | | | 1.42 | | | | .98 | | | | .93 | |
| | |
|
|
| |
|
|
| |
|
|
| |
|
|
| |
|
|
|
Total from investment operations | | | (3.58 | ) | | | 1.54 | | | | 1.44 | | | | 1.01 | | | | .94 | |
| | |
|
|
| |
|
|
| |
|
|
| |
|
|
| |
|
|
|
Less Dividends and Distributions: | | | | | | | | | | | | | | | | | | | | |
Dividends from net investment income | | | — | | | | — | | | | — | | | | (.02 | ) | | | — | |
Distributions from net realized gains | | | — | | | | — | | | | — | | | | (.31 | ) | | | — | |
Distributions | | | (1.41 | ) | | | (1.35 | ) | | | (.72 | ) | | | — | | | | — | |
| | |
|
|
| |
|
|
| |
|
|
| |
|
|
| |
|
|
|
Total dividends and distributions | | | (1.41 | ) | | | (1.35 | ) | | | (.72 | ) | | | (.33 | ) | | | — | |
| | |
|
|
| |
|
|
| |
|
|
| |
|
|
| |
|
|
|
Net Asset Value, end of year | | $ | 3.37 | | | $ | 8.36 | | | $ | 8.17 | | | $ | 7.45 | | | $ | 6.77 | |
| | |
|
|
| |
|
|
| |
|
|
| |
|
|
| |
|
|
|
Total Return(a) | | | (50.49 | )% | | | 19.12 | % | | | 20.42 | % | | | 15.79 | % | | | 16.12 | % |
Ratios/Supplemental Data: | | | | | | | | | | | | | | | | | | | | |
Net assets, end of year (in millions) | | $ | 9.4 | | | $ | 31.5 | | | $ | 23.8 | | | $ | 23.1 | | | $ | 139.0 | |
Ratios to average net assets(b): | | | | | | | | | | | | | | | | | | | | |
Expenses | | | 1.39 | % | | | 1.34 | % | | | 1.37 | % | | | 1.38 | % | | | 1.41 | % |
Net investment income (loss) | | | 1.10 | % | | | .70 | % | | | .28 | % | | | .56 | % | | | .21 | % |
Portfolio turnover rate | | | 101 | % | | | 81 | % | | | 111 | % | | | 99 | % | | | 137 | % |
| (a) | Total return is calculated assuming a purchase of a share on the first day and a sale on the last day of each year reported and includes reinvestment of dividends and distributions. Total return does not reflect expenses associated with the separate account such as administrative fees, account charges and surrender charges which, if reflected, would reduce the total returns for all periods shown. Performance figures may reflect voluntary fee waivers and/or expense reimbursements. In the absence of voluntary fee waivers and/or expense reimbursements, the total return would be lower. Past performance is no guarantee of future results. Total returns may reflect adjustments to conform to generally accepted accounting principles. |
| (b) | Does not include expenses of the underlying portfolio in which the Portfolio invests. |
| (c) | Calculation based on average shares outstanding during the year. |
SEE NOTES TO FINANCIAL STATEMENTS.
C4
Financial Highlights
| | | | | | | | | | | | | | | | | | | | |
| | | SP International Value Portfolio
| |
| | | Year Ended December 31,
| |
| | | 2008(d)
| | | 2007
| | | 2006
| | | 2005(d)
| | | 2004
| |
Per Share Operating Performance: | | | | | | | | | | | | | | | | | | | | |
Net Asset Value, beginning of year | | $ | 10.63 | | | $ | 11.40 | | | $ | 9.08 | | | $ | 8.84 | | | $ | 7.67 | |
| | |
|
|
| |
|
|
| |
|
|
| |
|
|
| |
|
|
|
Income (Loss) From Investment Operations: | | | | | | | | | | | | | | | | | | | | |
Net investment income | | | .18 | | | | .24 | | | | .24 | | | | .17 | | | | .04 | |
Net realized and unrealized gain (loss) on investments | | | (4.27 | ) | | | 1.79 | | | | 2.35 | | | | .94 | | | | 1.17 | |
| | |
|
|
| |
|
|
| |
|
|
| |
|
|
| |
|
|
|
Total from investment operations | | | (4.09 | ) | | | 2.03 | | | | 2.59 | | | | 1.11 | | | | 1.21 | |
| | |
|
|
| |
|
|
| |
|
|
| |
|
|
| |
|
|
|
Less Dividends and Distributions: | | | | | | | | | | | | | | | | | | | | |
Dividends from net investment income | | | — | | | | — | | | | — | | | | (.04 | ) | | | (.04 | ) |
Distributions from net realized gains | | | — | | | | — | | | | — | | | | (.83 | ) | | | — | |
Distributions | | | (1.59 | ) | | | (2.80 | ) | | | (.27 | ) | | | — | | | | — | |
| | |
|
|
| |
|
|
| |
|
|
| |
|
|
| |
|
|
|
Total dividends and distributions | | | (1.59 | ) | | | (2.80 | ) | | | (.27 | ) | | | (.87 | ) | | | (.04 | ) |
| | |
|
|
| |
|
|
| |
|
|
| |
|
|
| |
|
|
|
Net Asset Value, end of year | | $ | 4.95 | | | $ | 10.63 | | | $ | 11.40 | | | $ | 9.08 | | | $ | 8.84 | |
| | |
|
|
| |
|
|
| |
|
|
| |
|
|
| |
|
|
|
Total Return(a) | | | (44.06 | )% | | | 18.08 | % | | | 29.09 | % | | | 13.77 | % | | | 15.80 | % |
Ratios/Supplemental Data: | | | | | | | | | | | | | | | | | | | | |
Net assets, end of year (in millions) | | $ | 238.5 | | | $ | 493.6 | | | $ | 487.4 | | | $ | 389.3 | | | $ | 240.7 | |
Ratios to average net assets(b): | | | | | | | | | | | | | | | | | | | | |
Expenses | | | 1.02 | % | | | .99 | % | | | .99 | % | | | 1.06 | % | | | 1.10 | %(c) |
Net investment income | | | 2.32 | % | | | 1.80 | % | | | 2.28 | % | | | 2.08 | % | | | .69 | %(c) |
Portfolio turnover rate | | | 34 | % | | | 46 | % | | | 113 | % | | | 18 | % | | | 159 | % |
| (a) | Total return is calculated assuming a purchase of a share on the first day and a sale on the last day of each year reported and includes reinvestment of dividends and distributions. Total return does not reflect expenses associated with the separate account such as administrative fees, account charges and surrender charges which, if reflected, would reduce the total returns for all periods shown. Performance figures may reflect voluntary fee waivers and/or expense reimbursements. In the absence of voluntary fee waivers and/or expense reimbursements, the total return would be lower. Past performance is no guarantee of future results. Total returns may reflect adjustments to conform to generally accepted accounting principles. |
| (b) | Does not include expenses of the underlying portfolio in which the Portfolio invests. |
| (c) | Net of expense reimbursement. If the investment advisor had not reimbursed expenses, the annual expense and net investment income ratios would have been 1.23% and .55%, respectively, for the year ended December 31, 2004. |
| (d) | Calculated based upon average shares outstanding during the year. |
| | | | | | | | | | | | | | | | | | | | |
| | | SP Mid Cap Growth Portfolio
| |
| | | Year Ended December 31,
| |
| | | 2008
| | | 2007
| | | 2006
| | | 2005
| | | 2004
| |
Per Share Operating Performance: | | | | | | | | | | | | | | | | | | | | |
Net Asset Value, beginning of year | | $ | 7.53 | | | $ | 7.07 | | | $ | 7.21 | | | $ | 6.85 | | | $ | 5.73 | |
| | |
|
|
| |
|
|
| |
|
|
| |
|
|
| |
|
|
|
Income (Loss) From Investment Operations: | | | | | | | | | | | | | | | | | | | | |
Net investment income (loss) | | | (.01 | ) | | | (.02 | ) | | | .02 | | | | (.03 | ) | | | (.03 | ) |
Net realized and unrealized gain (loss) on investments | | | (2.64 | ) | | | 1.16 | | | | (.16 | ) | | | .39 | | | | 1.15 | |
| | |
|
|
| |
|
|
| |
|
|
| |
|
|
| |
|
|
|
Total from investment operations | | | (2.65 | ) | | | 1.14 | | | | (.14 | ) | | | .36 | | | | 1.12 | |
| | |
|
|
| |
|
|
| |
|
|
| |
|
|
| |
|
|
|
Less Distributions: | | | | | | | | | | | | | | | | | | | | |
Distributions | | | (1.45 | ) | | | (.68 | ) | | | — | | | | — | | | | — | |
| | |
|
|
| |
|
|
| |
|
|
| |
|
|
| |
|
|
|
Net Asset Value, end of year | | $ | 3.43 | | | $ | 7.53 | | | $ | 7.07 | | | $ | 7.21 | | | $ | 6.85 | |
| | |
|
|
| |
|
|
| |
|
|
| |
|
|
| |
|
|
|
Total Return(a) | | | (42.56 | )% | | | 16.21 | % | | | (1.94 | )% | �� | | 5.26 | % | | | 19.55 | % |
Ratios/Supplemental Data: | | | | | | | | | | | | | | | | | | | | |
Net assets, end of year (in millions) | | $ | 67.5 | | | $ | 134.8 | | | $ | 133.1 | | | $ | 152.9 | | | $ | 107.5 | |
Ratios to average net assets(b): | | | | | | | | | | | | | | | | | | | | |
Expenses | | | .89 | % | | | .87 | % | | | .91 | % | | | 1.00 | %(c) | | | 1.00 | %(c) |
Net investment income (loss) | | | (.23 | )% | | | (.30 | )% | | | .20 | % | | | (.56 | )%(c) | | | (.68 | )%(c) |
Portfolio turnover rate | | | 66 | % | | | 156 | % | | | 107 | % | | | 94 | % | | | 79 | % |
| (a) | Total return is calculated assuming a purchase of a share on the first day and a sale on the last day of each year reported and includes reinvestment of dividends and distributions. Total return does not reflect expenses associated with the separate account such as administrative fees, account charges and surrender charges which, if reflected, would reduce the total returns for all periods shown. Performance figures may reflect voluntary fee waivers and/or expense reimbursements. In the absence of voluntary fee waivers and/or expense reimbursements, the total return would be lower. Past performance is no guarantee of future results. Total returns may reflect adjustments to conform to generally accepted accounting principles. |
| (b) | Does not include expenses of the underlying portfolio in which the Portfolio invests. |
| (c) | Net of expense reimbursement. If the investment advisor had not reimbursed expenses, the annual expense and net investment loss ratios would have been 1.02% and (.58)%, respectively, for the year ended December 31, 2005 and 1.07% and (.75)%, respectively, for the year ended December 31, 2004. |
SEE NOTES TO FINANCIAL STATEMENTS.
C5
Financial Highlights
| | | | | | | | | | | | | | | | | | | | |
| | | SP PIMCO High Yield Portfolio
| |
| | | Year Ended December 31,
| |
| | | 2008
| | | 2007
| | | 2006
| | | 2005
| | | 2004
| |
Per Share Operating Performance: | | | | | | | | | | | | | | | | | | | | |
Net Asset Value, beginning of year | | $ | 9.83 | | | $ | 10.33 | | | $ | 10.25 | | | $ | 10.67 | | | $ | 10.53 | |
| | |
|
|
| |
|
|
| |
|
|
| |
|
|
| |
|
|
|
Income From Investment Operations: | | | | | | | | | | | | | | | | | | | | |
Net investment income | | | .71 | | | | .77 | | | | .75 | | | | .68 | | | | .69 | |
Net realized and unrealized gain (loss) on investments | | | (3.10 | ) | | | (.39 | ) | | | .18 | | | | (.27 | ) | | | .25 | |
| | |
|
|
| |
|
|
| |
|
|
| |
|
|
| |
|
|
|
Total from investment operations | | | (2.39 | ) | | | .38 | | | | .93 | | | | .41 | | | | .94 | |
| | |
|
|
| |
|
|
| |
|
|
| |
|
|
| |
|
|
|
Less Dividends and Distributions: | | | | | | | | | | | | | | | | | | | | |
Dividends from net investment income | | | — | | | | — | | | | — | | | | (.68 | ) | | | (.70 | ) |
Distributions from net realized gains | | | — | | | | — | | | | — | | | | (.15 | ) | | | (.10 | ) |
Distributions | | | (.74 | ) | | | (.88 | ) | | | (.85 | ) | | | — | | | | — | |
| | |
|
|
| |
|
|
| |
|
|
| |
|
|
| |
|
|
|
Total dividends and distributions | | | (.74 | ) | | | (.88 | ) | | | (.85 | ) | | | (.83 | ) | | | (.80 | ) |
| | |
|
|
| |
|
|
| |
|
|
| |
|
|
| |
|
|
|
Net Asset Value, end of year | | $ | 6.70 | | | $ | 9.83 | | | $ | 10.33 | | | $ | 10.25 | | | $ | 10.67 | |
| | |
|
|
| |
|
|
| |
|
|
| |
|
|
| |
|
|
|
Total Return(a) | | | (25.50 | )% | | | 3.77 | % | | | 9.51 | % | | | 4.03 | % | | | 9.32 | % |
Ratios/Supplemental Data: | | | | | | | | | | | | | | | | | | | | |
Net assets, end of year (in millions) | | $ | 132.0 | | | $ | 206.0 | | | $ | 274.4 | | | $ | 368.6 | | | $ | 312.5 | |
Ratios to average net assets(b): | | | | | | | | | | | | | | | | | | | | |
Expenses | | | .74 | % | | | .69 | % | | | .70 | % | | | .67 | % | | | .68 | % |
Net investment income | | | 7.89 | % | | | 7.14 | % | | | 6.95 | % | | | 6.65 | % | | | 6.68 | % |
Portfolio turnover rate | | | 235 | % | | | 98 | % | | | 59 | % | | | 89 | % | | | 53 | % |
| (a) | Total return is calculated assuming a purchase of a share on the first day and a sale on the last day of each year reported and includes reinvestment of dividends and distributions. Total return does not reflect expenses associated with the separate account such as administrative fees, account charges and surrender charges which, if reflected, would reduce the total returns for all periods shown. Performance figures may reflect voluntary fee waivers and/or expense reimbursements. In the absence of voluntary fee waivers and/or expense reimbursements, the total return would be lower. Past performance is no guarantee of future results. Total returns may reflect adjustments to conform to generally accepted accounting principles. |
| (b) | Does not include expenses of the underlying portfolio in which the Portfolio invests. |
| | | | | | | | | | | | | | | | | | | | |
| | | SP PIMCO Total Return Portfolio
| |
| | | Year Ended December 31,
| |
| | | 2008
| | | 2007
| | | 2006
| | | 2005
| | | 2004
| |
Per Share Operating Performance: | | | | | | | | | | | | | | | | | | | | |
Net Asset Value, beginning of year | | $ | 11.67 | | | $ | 11.14 | | | $ | 11.21 | | | $ | 11.68 | | | $ | 11.54 | |
| | |
|
|
| |
|
|
| |
|
|
| |
|
|
| |
|
|
|
Income From Investment Operations: | | | | | | | | | | | | | | | | | | | | |
Net investment income | | | .64 | | | | .55 | | | | .45 | | | | .37 | | | | .22 | |
Net realized and unrealized gain (loss) on investments | | | (.66 | ) | | | .48 | | | | (.05 | ) | | | (.10 | ) | | | .36 | |
| | |
|
|
| |
|
|
| |
|
|
| |
|
|
| |
|
|
|
Total from investment operations | | | (.02 | ) | | | 1.03 | | | | .40 | | | | .27 | | | | .58 | |
| | |
|
|
| |
|
|
| |
|
|
| |
|
|
| |
|
|
|
Less Dividends and Distributions: | | | | | | | | | | | | | | | | | | | | |
Dividends from net investment income | | | — | | | | — | | | | — | | | | (.54 | ) | | | (.23 | ) |
Distributions from net realized gains | | | — | | | | — | | | | — | | | | (.20 | ) | | | (.21 | ) |
Distributions | | | (.59 | ) | | | (.50 | ) | | | (.47 | ) | | | — | | | | — | |
| | |
|
|
| |
|
|
| |
|
|
| |
|
|
| |
|
|
|
Total dividends and distributions | | | (.59 | ) | | | (.50 | ) | | | (.47 | ) | | | (.74 | ) | | | (.44 | ) |
| | |
|
|
| |
|
|
| |
|
|
| |
|
|
| |
|
|
|
Net Asset Value, end of year | | $ | 11.06 | | | $ | 11.67 | | | $ | 11.14 | | | $ | 11.21 | | | $ | 11.68 | |
| | |
|
|
| |
|
|
| |
|
|
| |
|
|
| |
|
|
|
Total Return(a) | | | (.20 | )% | | | 9.44 | % | | | 3.68 | % | | | 2.39 | % | | | 5.28 | % |
Ratios/Supplemental Data: | | | | | | | | | | | | | | | | | | | | |
Net assets, end of year (in millions) | | $ | 1,041.1 | | | $ | 1,424.8 | | | $ | 1,590.3 | | | $ | 1,538.2 | | | $ | 1,099.0 | |
Ratios to average net assets(b): | | | | | | | | | | | | | | | | | | | | |
Expenses | | | 1.48 | %(c) | | | .67 | %(c) | | | .66 | %(c) | | | .62 | % | | | .65 | % |
Net investment income | | | 5.19 | % | | | 4.65 | % | | | 4.16 | % | | | 3.62 | % | | | 2.01 | % |
Portfolio turnover rate | | | 939 | % | | | 656 | % | | | 539 | % | | | 590 | % | | | 590 | % |
| (a) | Total return is calculated assuming a purchase of a share on the first day and a sale on the last day of each year reported and includes reinvestment of dividends and distributions. Total return does not reflect expenses associated with the separate account such as administrative fees, account charges and surrender charges which, if reflected, would reduce the total returns for all periods shown. Performance figures may reflect voluntary fee waivers and/or expense reimbursements. In the absence of voluntary fee waivers and/or expense reimbursements, the total return would be lower. Past performance is no guarantee of future results. Total returns may reflect adjustments to conform to generally accepted accounting principles. |
| (b) | Does not include expenses of the underlying portfolio in which the Portfolio invests. |
| (c) | The expense ratio reflects the interest and fee expenses related to the interest expenses on investments sold short and liability for the floating rate notes issued in conjunction with the inverse floater securities. The total expense ratio excluding interest and fees is .66%, .64% and .64% for the years ended December 31, 2008, 2007 and 2006, respectively. |
SEE NOTES TO FINANCIAL STATEMENTS.
C6
Financial Highlights
| | | | | | | | | | | | | | | | | | | | |
| | | SP Prudential U.S. Emerging Growth Portfolio
| |
| | | Class I
| |
| | | Year Ended December 31,
| |
| | | 2008
| | | 2007
| | | 2006
| | | 2005
| | | 2004
| |
Per Share Operating Performance: | | | | | | | | | | | | | | | | | | | | |
Net Asset Value, beginning of year | | $ | 8.41 | | | $ | 7.99 | | | $ | 7.87 | | | $ | 8.07 | | | $ | 6.65 | |
| | |
|
|
| |
|
|
| |
|
|
| |
|
|
| |
|
|
|
Income (Loss) From Investment Operations: | | | | | | | | | | | | | | | | | | | | |
Net investment income (loss) | | | .04 | | | | .02 | | | | .03 | | | | (.02 | ) | | | (.05 | ) |
Net realized and unrealized gain (loss) on investments | | | (2.64 | ) | | | 1.31 | | | | .71 | | | | 1.16 | | | | 1.47 | |
| | |
|
|
| |
|
|
| |
|
|
| |
|
|
| |
|
|
|
Total from investment operations | | | (2.60 | ) | | | 1.33 | | | | .74 | | | | 1.14 | | | | 1.42 | |
| | |
|
|
| |
|
|
| |
|
|
| |
|
|
| |
|
|
|
Less Dividends and Distributions: | | | | | | | | | | | | | | | | | | | | |
Dividends from net investment income | | | — | | | | — | | | | — | | | | — | (c) | | | — | |
Distributions from net realized gains | | | — | | | | — | | | | — | | | | (1.34 | ) | | | — | (c) |
Distributions | | | (1.23 | ) | | | (.91 | ) | | | (.62 | ) | | | — | | | | — | |
| | |
|
|
| |
|
|
| |
|
|
| |
|
|
| |
|
|
|
Total dividends and distributions | | | (1.23 | ) | | | (.91 | ) | | | (.62 | ) | | | (1.34 | ) | | | — | (c) |
| | |
|
|
| |
|
|
| |
|
|
| |
|
|
| |
|
|
|
Net Asset Value, end of year | | $ | 4.58 | | | $ | 8.41 | | | $ | 7.99 | | | $ | 7.87 | | | $ | 8.07 | |
| | |
|
|
| |
|
|
| |
|
|
| |
|
|
| |
|
|
|
Total Return(a) | | | (36.23 | )% | | | 16.82 | % | | | 9.59 | % | | | 17.77 | % | | | 21.39 | % |
Ratios/Supplemental Data: | | | | | | | | | | | | | | | | | | | | |
Net assets, end of year (in millions) | | $ | 112.3 | | | $ | 205.8 | | | $ | 202.6 | | | $ | 194.8 | | | $ | 128.3 | |
Ratios to average net assets(b): | | | | | | | | | | | | | | | | | | | | |
Expenses | | | .68 | % | | | .65 | % | | | .67 | % | | | .80 | % | | | .78 | % |
Net investment income (loss) | | | .55 | % | | | .24 | % | | | .32 | % | | | (.28 | )% | | | (.53 | )% |
Portfolio turnover rate | | | 59 | % | | | 54 | % | | | 70 | % | | | 142 | % | | | 212 | % |
| (a) | Total return is calculated assuming a purchase of a share on the first day and a sale on the last day of each year reported and includes reinvestment of dividends and distributions and does not reflect the effect of insurance contract charges. Total return does not reflect expenses associated with the separate account such as administrative fees, account charges and surrender charges which, if reflected, would reduce the total returns for all years shown. Performance figures may reflect voluntary fee waivers and/or expense reimbursements. In the absence of voluntary fee waivers and/or expense reimbursements, the total return would be lower. Past performance is no guarantee of future results. Total returns may reflect adjustments to conform to generally accepted accounting principles. |
| (b) | Does not include expenses of the underlying portfolio in which the Portfolio invests. |
| (c) | Less than $0.005 per share. |
| | | | | | | | | | | | | | | | | | | | |
| | | SP Prudential U.S. Emerging Growth Portfolio
| |
| | | Class II
| |
| | | December 31,
| |
| | | 2008
| | | 2007
| | | 2006
| | | 2005
| | | 2004
| |
Per Share Operating Performance: | | | | | | | | | | | | | | | | | | | | |
Net Asset Value, beginning of year | | $ | 8.17 | | | $ | 7.79 | | | $ | 7.72 | | | $ | 7.96 | | | $ | 6.58 | |
| | |
|
|
| |
|
|
| |
|
|
| |
|
|
| |
|
|
|
Income (Loss) From Investment Operations: | | | | | | | | | | | | | | | | | | | | |
Net investment income (loss) | | | .01 | | | | (.01 | ) | | | (.01 | ) | | | (.05 | ) | | | (.07 | ) |
Net realized and unrealized gain (loss) on investments | | | (2.53 | ) | | | 1.27 | | | | .70 | | | | 1.15 | | | | 1.45 | |
| | |
|
|
| |
|
|
| |
|
|
| |
|
|
| |
|
|
|
Total from investment operations | | | (2.52 | ) | | | 1.26 | | | | .69 | | | | 1.10 | | | | 1.38 | |
| | |
|
|
| |
|
|
| |
|
|
| |
|
|
| |
|
|
|
Less Dividends and Distributions: | | | | | | | | | | | | | | | | | | | | |
Distributions from net realized gains | | | — | | | | — | | | | — | | | | (1.34 | ) | | | — | (c) |
Distributions | | | (1.21 | ) | | | (.88 | ) | | | (.62 | ) | | | — | | | | — | |
| | |
|
|
| |
|
|
| |
|
|
| |
|
|
| |
|
|
|
Total dividends and distributions | | | (1.21 | ) | | | (.88 | ) | | | (.62 | ) | | | (1.34 | ) | | | — | (c) |
| | |
|
|
| |
|
|
| |
|
|
| |
|
|
| |
|
|
|
Net Asset Value, end of year | | $ | 4.44 | | | $ | 8.17 | | | $ | 7.79 | | | $ | 7.72 | | | $ | 7.96 | |
| | |
|
|
| |
|
|
| |
|
|
| |
|
|
| |
|
|
|
Total Return(a): | | | (36.24 | )% | | | 16.34 | % | | | 9.10 | % | | | 17.47 | % | | | 21.01 | % |
Ratios/Supplemental Data: | | | | | | | | | | | | | | | | | | | | |
Net assets, end of year (in millions) | | $ | 0.2 | | | $ | 0.4 | | | $ | 0.3 | | | $ | 0.3 | | | $ | 0.4 | |
Ratios to average net assets(b): | | | | | | | | | | | | | | | | | | | | |
Expenses | | | 1.08 | % | | | 1.05 | % | | | 1.07 | % | | | 1.20 | % | | | 1.18 | % |
Net investment income (loss) | | | .15 | % | | | (.16 | )% | | | (.04 | )% | | | (.70 | )% | | | (.94 | )% |
Portfolio turnover rate | | | 59 | % | | | 54 | % | | | 70 | % | | | 142 | % | | | 212 | % |
| (a) | Total return is calculated assuming a purchase of a share on the first day and a sale on the last day of each year reported and includes reinvestment of dividends and distributions and does not reflect the effect of insurance contract charges. Total return does not reflect expenses associated with the separate account such as administrative fees, account charges and surrender charges which, if reflected, would reduce the total returns for all years shown. Performance figures may reflect voluntary fee waivers and/or expense reimbursements. In the absence of voluntary fee waivers and/or expense reimbursements, the total return would be lower. Past performance is no guarantee of future results. Total returns may reflect adjustments to conform to generally accepted accounting principles. Total returns for periods less than one full year are not annualized. |
| (b) | Does not include expenses of the underlying portfolio in which the Portfolio invests. |
| (c) | Less than $0.005 per share. |
SEE NOTES TO FINANCIAL STATEMENTS.
C7
Financial Highlights
| | | | | | | | | | | | | | | | | | | | |
| | | SP Small Cap Value Portfolio
| |
| | | Year Ended December 31,
| |
| | | 2008
| | | 2007
| | | 2006
| | | 2005
| | | 2004
| |
Per Share Operating Performance: | | | | | | | | | | | | | | | | | | | | |
Net Asset Value, beginning of year | | $ | 12.22 | | | $ | 13.68 | | | $ | 14.27 | | | $ | 15.51 | | | $ | 12.88 | |
| | |
|
|
| |
|
|
| |
|
|
| |
|
|
| |
|
|
|
Income (Loss) From Investment Operations: | | | | | | | | | | | | | | | | | | | | |
Net investment income | | | .12 | | | | .13 | | | | .10 | | | | .07 | | | | .08 | |
Net realized and unrealized gain (loss) on investments | | | (3.47 | ) | | | (.64 | ) | | | 1.78 | | | | .52 | | | | 2.57 | |
| | |
|
|
| |
|
|
| |
|
|
| |
|
|
| |
|
|
|
Total from investment operations | | | (3.35 | ) | | | (.51 | ) | | | 1.88 | | | | .59 | | | | 2.65 | |
| | |
|
|
| |
|
|
| |
|
|
| |
|
|
| |
|
|
|
Less Dividends and Distributions: | | | | | | | | | | | | | | | | | | | | |
Dividends from net investment income | | | — | | | | — | | | | — | | | | (.08 | ) | | | (.02 | ) |
Distributions from net realized gains | | | — | | | | — | | | | — | | | | (1.75 | ) | | | — | (c) |
Distributions | | | (1.27 | ) | | | (.95 | ) | | | (2.47 | ) | | | — | | | | — | |
| | |
|
|
| |
|
|
| |
|
|
| |
|
|
| |
|
|
|
Total dividends and distributions | | | (1.27 | ) | | | (.95 | ) | | | (2.47 | ) | | | (1.83 | ) | | | (.02 | ) |
| | |
|
|
| |
|
|
| |
|
|
| |
|
|
| |
|
|
|
Net Asset Value, end of year | | $ | 7.60 | | | $ | 12.22 | | | $ | 13.68 | | | $ | 14.27 | | | $ | 15.51 | |
| | |
|
|
| |
|
|
| |
|
|
| |
|
|
| |
|
|
|
Total Return(a) | | | (30.50 | )% | | | (3.63 | )% | | | 14.60 | % | | | 4.61 | % | | | 20.69 | % |
Ratios/Supplemental Data: | | | | | | | | | | | | | | | | | | | | |
Net assets, end of year (in millions) | | $ | 202.2 | | | $ | 309.4 | | | $ | 369.0 | | | $ | 350.7 | | | $ | 393.3 | |
Ratios to average net assets(b): | | | | | | | | | | | | | | | | | | | | |
Expenses | | | .98 | % | | | .96 | % | | | .96 | % | | | .97 | % | | | .96 | % |
Net investment income | | | 1.17 | % | | | .81 | % | | | .71 | % | | | .49 | % | | | .69 | % |
Portfolio turnover rate | | | 56 | % | | | 45 | % | | | 55 | % | | | 119 | % | | | 127 | % |
| (a) | Total return is calculated assuming a purchase of a share on the first day and a sale on the last day of each year reported and includes reinvestment of dividends and distributions. Total return does not reflect expenses associated with the separate account such as administrative fees, account charges and surrender charges which, if reflected, would reduce the total returns for all periods shown. Performance figures may reflect voluntary fee waivers and/or expense reimbursements. In the absence of voluntary fee waivers and/or expense reimbursements, the total return would be lower. Past performance is no guarantee of future results. Total returns may reflect adjustments to conform to generally accepted accounting principles. |
| (b) | Does not include expenses of the underlying portfolio in which the Portfolio invests. |
| (c) | Less than $.005 per share. |
SEE NOTES TO FINANCIAL STATEMENTS.
C8
Financial Highlights
| | | | | | | | | | | | | | | | | | | | |
| | | SP Strategic Partners Focused Growth Portfolio
| |
| | | Class I
| |
| | | Year Ended December 31,
| |
| | | 2008(e)
| | | 2007
| | | 2006
| | | 2005
| | | 2004
| |
Per Share Operating Performance: | | | | | | | | | | | | | | | | | | | | |
Net Asset Value, beginning of year | | $ | 8.30 | | | $ | 7.49 | | | $ | 8.07 | | | $ | 7.00 | | | $ | 6.33 | |
| | |
|
|
| |
|
|
| |
|
|
| |
|
|
| |
|
|
|
Income (Loss) From Investment Operations: | | | | | | | | | | | | | | | | | | | | |
Net investment loss | | | (.02 | ) | | | (.04 | ) | | | (.04 | ) | | | (.03 | ) | | | — | (c) |
Net realized and unrealized gain (loss) on investments | | | (2.98 | ) | | | 1.18 | | | | (.02 | ) | | | 1.10 | | | | .67 | |
| | |
|
|
| |
|
|
| |
|
|
| |
|
|
| |
|
|
|
Total from investment operations | | | (3.00 | ) | | | 1.14 | | | | (.06 | ) | | | 1.07 | | | | .67 | |
| | |
|
|
| |
|
|
| |
|
|
| |
|
|
| |
|
|
|
Less Distributions: | | | | | | | | | | | | | | | | | | | | |
Distributions | | | (.52 | ) | | | (.33 | ) | | | (.52 | ) | | | — | | | | — | |
| | |
|
|
| |
|
|
| |
|
|
| |
|
|
| |
|
|
|
Net Asset Value, end of year | | $ | 4.78 | | | $ | 8.30 | | | $ | 7.49 | | | $ | 8.07 | | | $ | 7.00 | |
| | |
|
|
| |
|
|
| |
|
|
| |
|
|
| |
|
|
|
Total Return(a) | | | (38.42 | )% | | | 15.24 | % | | | (.66 | )% | | | 15.29 | % | | | 10.58 | % |
Ratios/Supplemental Data: | | | | | | | | | | | | | | | | | | | | |
Net assets, end of year (in millions) | | $ | 21.6 | | | $ | 38.4 | | | $ | 38.7 | | | $ | 38.3 | | | $ | 30.1 | |
Ratios to average net assets(b): | | | | | | | | | | | | | | | | | | | | |
Expenses | | | 1.23 | % | | | 1.15 | % | | | 1.15 | % | | | 1.07 | %(d) | | | 1.01 | %(d) |
Net investment loss | | | (.30 | )% | | | (.43 | )% | | | (.47 | )% | | | (.44 | )%(d) | | | (.01 | )%(d) |
Portfolio turnover rate | | | 62 | % | | | 120 | % | | | 142 | % | | | 110 | % | | | 84 | % |
| (a) | Total return is calculated assuming a purchase of a share on the first day and a sale on the last day of each year reported and includes reinvestment of dividends and distributions. Total return does not reflect expenses associated with the separate account such as administrative fees, account charges and surrender charges which, if reflected, would reduce the total returns for all periods shown. Performance figures may reflect voluntary fee waivers and/or expense reimbursements. In the absence of voluntary fee waivers and/or expense reimbursements, the total return would be lower. Past performance is no guarantee of future results. Total returns may reflect adjustments to conform to generally accepted accounting principles. |
| (b) | Does not include expenses of the underlying portfolio in which the Portfolio invests. |
| (c) | Less than $.005 per share. |
| (d) | Net of expense reimbursement. If the investment advisor had not reimbursed expenses, the annual expense and net investment loss ratios would have been 1.14% and (.51)%, respectively, for the year ended December 31, 2005 and 1.28% and (.28)%, respectively, for the year ended December 31, 2004. |
| (e) | Calculated based on average shares outstanding during the year. |
| | | | | | | | | | | | | | | | | | | | |
| | | SP Strategic Partners Focused Growth Portfolio
| |
| | | Class II
| |
| | | Year Ended December 31,
| |
| | | 2008(e)
| | | 2007
| | | 2006
| | | 2005
| | | 2004
| |
Per Share Operating Performance: | | | | | | | | | | | | | | | | | | | | |
Net Asset Value, beginning of year | | $ | 8.04 | | | $ | 7.30 | | | $ | 7.91 | | | $ | 6.88 | | | $ | 6.26 | |
| | |
|
|
| |
|
|
| |
|
|
| |
|
|
| |
|
|
|
Income (Loss) From Investment Operations: | | | | | | | | | | | | | | | | | | | | |
Net investment loss | | | (.05 | ) | | | (.10 | ) | | | (.08 | ) | | | (.06 | ) | | | (.01 | ) |
Net realized and unrealized gain (loss) on investments | | | (2.86 | ) | | | 1.17 | | | | (.01 | ) | | | 1.09 | | | | .63 | |
| | |
|
|
| |
|
|
| |
|
|
| |
|
|
| |
|
|
|
Total from investment operations | | | (2.91 | ) | | | 1.07 | | | | (.09 | ) | | | 1.03 | | | | .62 | |
| | |
|
|
| |
|
|
| |
|
|
| |
|
|
| |
|
|
|
Less Distributions: | | | | | | | | | | | | | | | | | | | | |
Distributions | | | (.52 | ) | | | (.33 | ) | | | (.52 | ) | | | — | | | | — | |
| | |
|
|
| |
|
|
| |
|
|
| |
|
|
| |
|
|
|
Net Asset Value, end of year | | $ | 4.61 | | | $ | 8.04 | | | $ | 7.30 | | | $ | 7.91 | | | $ | 6.88 | |
| | |
|
|
| |
|
|
| |
|
|
| |
|
|
| |
|
|
|
Total Return(a) | | | (38.54 | )% | | | 14.68 | % | | | (1.07 | )% | | | 14.97 | % | | | 9.90 | % |
Ratios/Supplemental Data: | | | | | | | | | | | | | | | | | | | | |
Net assets, end of year (in millions) | | $ | 10.4 | | | $ | 27.3 | | | $ | 31.3 | | | $ | 42.8 | | | $ | 32.1 | |
Ratios to average net assets(b): | | | | | | | | | | | | | | | | | | | | |
Expenses | | | 1.63 | % | | | 1.55 | % | | | 1.55 | % | | | 1.47 | % (c) | | | 1.41 | %(c) |
Net investment loss | | | (.70 | )% | | | (.83 | )% | | | (.88 | )% | | | (.84 | )%(c) | | | (.34 | )%(c) |
Portfolio turnover rate | | | 62 | % | | | 120 | % | | | 142 | % | | | 110 | % | | | 84 | % |
| (a) | Total return is calculated assuming a purchase of a share on the first day and a sale on the last day of each year reported and includes reinvestment of dividends and distributions. Total return does not reflect expenses associated with the separate account such as administrative fees, account charges and surrender charges which, if reflected, would reduce the total returns for all periods shown. Performance figures may reflect voluntary fee waivers and/or expense reimbursements. In the absence of voluntary fee waivers and/or expense reimbursements, the total return would be lower. Past performance is no guarantee of future results. Total returns may reflect adjustments to conform to generally accepted accounting principles. |
| (b) | Does not include expenses of the underlying portfolio in which the Portfolio invests. |
| (c) | Net of expense reimbursement. If the investment advisor had not reimbursed expenses, the annual expense and net investment loss ratios would have been 1.54% and (.91)%, respectively, for the year ended December 31, 2005 and 1.68% and (.61)%, respectively, for the year ended December 31, 2004. |
| (e) | Calculated based on average shares outstanding during the year. |
SEE NOTES TO FINANCIAL STATEMENTS.
C9
REPORT OF INDEPENDENT REGISTERED PUBLIC ACCOUNTING FIRM
THE BOARD OF TRUSTEES AND SHAREHOLDERS
THE PRUDENTIAL SERIES FUND:
We have audited the accompanying statements of assets and liabilities of The Prudential Series Fund (comprised of SP Aggressive Growth Asset Allocation Portfolio, SP Balanced Asset Allocation Portfolio, SP Conservative Asset Allocation Portfolio, SP Davis Value Portfolio, SP Growth Asset Allocation Portfolio, SP International Growth Portfolio, SP International Value Portfolio, SP Mid Cap Growth Portfolio, SP PIMCO High Yield Portfolio, SP PIMCO Total Return Portfolio, SP Prudential U.S. Emerging Growth Portfolio, SP Small Cap Value Portfolio and SP Strategic Partners Focused Growth Portfolio, hereafter referred to as the “Funds”), including the portfolios of investments, as of December 31, 2008, and the related statements of operations for the year then ended, the statements of changes in net assets for each of the years in the two-year period then ended and the financial highlights for each of the years in the five-year period then ended. These financial statements and financial highlights are the responsibility of the Funds’ management. Our responsibility is to express an opinion on these financial statements and financial highlights based on our audits.
We conducted our audits in accordance with the standards of the Public Company Accounting Oversight Board (United States). Those standards require that we plan and perform the audit to obtain reasonable assurance about whether the financial statements and financial highlights are free of material misstatement. An audit includes examining, on a test basis, evidence supporting the amounts and disclosures in the financial statements. Our procedures included confirmation of securities owned as of December 31, 2008, by correspondence with the custodian, transfer agent and brokers or by other appropriate auditing procedures where replies from brokers were not received. An audit also includes assessing the accounting principles used and significant estimates made by management, as well as evaluating the overall financial statement presentation. We believe that our audits provide a reasonable basis for our opinion.
In our opinion, the financial statements and financial highlights referred to above present fairly, in all material respects, the financial position of the Funds as of December 31, 2008, and the results of their operations for the year then ended, the changes in their net assets for each of the years in the two-year period then ended and the financial highlights for each of the years in the five-year period then ended, in conformity with U.S. generally accepted accounting principles.

New York, New York
February 26, 2009
D1
INFORMATION ABOUT TRUSTEES AND OFFICERS (Unaudited)
Information about the Trustees and the Officers of the Fund is set forth below. Trustees who are not deemed to be “interested persons” of the Fund, as defined in the 1940 Act, are referred to as “Independent Trustees.” Trustees who are deemed to be “interested persons” of the Fund are referred to as “Interested Trustees.” The Trustees are responsible for the overall supervision of the operations of the Fund and perform the various duties imposed on the directors of investment companies by the 1940 Act.
| | | | |
Independent Trustees (1) |
Name, Address, Age No. of Portfolios Overseen | | Principal Occupation(s) During Past Five Years | | Other Directorships Held |
Saul K. Fenster, Ph.D. (75) No. of Portfolios Overseen: 86 | | Currently President Emeritus of New Jersey Institute of Technology (since 2002); formerly President (1978-2002) of New Jersey Institute of Technology; Commissioner (1998-2002) of the Middle States Association Commission on Higher Education; Commissioner (1985-2002) of the New Jersey Commission on Science and Technology; formerly Director (1998-2005) of Society of Manufacturing Engineering Education Foundation; formerly Director of Prosperity New Jersey; formerly a director or trustee of Liberty Science Center, Research and Development Council of New Jersey, New Jersey State Chamber of Commerce, and National Action Council for Minorities in Engineering. | | Member (since 2006), Board of The Ridgefield Foundation and The Leir Foundation. |
Delayne Dedrick Gold (70) No. of Portfolios Overseen: 86 | | Marketing Consultant (1982-present); formerly Senior Vice President and Member of the Board of Directors, Prudential Bache Securities, Inc. | | |
W. Scott McDonald, Jr. (71) No. of Portfolios Overseen: 86 | | Formerly Management Consultant (1997-2004) and of Counsel (2004-2005) at Kaludis Consulting Group, Inc. (company serving higher education); Formerly principal (1995-1997), Scott McDonald Associates; Chief Operating Officer (1991-1995), Fairleigh Dickinson University; Executive Vice President and Chief Operating Officer (1975-1991), Drew University; interim President (1988-1990), Drew University; formerly Director of School, College and University Underwriters Ltd. | | |
Thomas T. Mooney (67) No. of Portfolios Overseen: 86 | | Formerly Chief Executive Officer, Excell Partners, Inc.; formerly President of the Greater Rochester Metro Chamber of Commerce, Rochester City Manager; formerly Deputy Monroe County Executive. | | |
Thomas M. O’Brien (58) No. of Portfolios Overseen: 86 | | President and COO (since November 2006) and CEO (since April 2007) of State Bancorp, Inc. and State Bank; Vice Chairman (January 1997-April 2000) of North Fork Bank; President and Chief Executive Officer (December 1984-December 1996) of North Side Savings Bank; formerly President and Chief Executive Officer (May 2000-June 2006) Atlantic Bank of New York. | | Formerly Director (December 1996-May 2000) of North Fork Bancorporation, Inc.; Formerly Director (May 2000-April 2006) of Atlantic Bank of New York; Director (since November 2006) of State Bancorp, Inc. (NASDAQ: STBC) and State Bank of Long Island. |
F. Don Schwartz (73) No. of Portfolios Overseen: 86 | | Management Consultant (since April 1985). | | |
| | | | |
Interested Trustee (1) |
Robert F. Gunia (62) No. of Portfolios Overseen: 148 | | Chief Administrative Officer (since September 1999) and Executive Vice President (since December 1996) of Prudential Investments LLC; President (April 1999-December 2008) and Executive Vice President and Chief Operating Officer (since December 2008) of Prudential Investment Management Services LLC; Executive Vice President (since March 1999) and Treasurer (since May 2000) of Prudential Mutual Fund Services LLC; Chief Administrative Officer, Executive Vice President and Director (since May 2003) of AST Investment Services, Inc. | | Director (since May 1989) of The Asia Pacific Fund, Inc. |
1 The year that each Trustee joined the Fund’s Board is as follows: Saul K. Fenster, 1983; Delayne Dedrick Gold, 2001; Robert F. Gunia, 2001; W. Scott McDonald, Jr., 1983; Thomas T. Mooney, 2001; Thomas M. O’Brien, 2003; F. Don Schwartz, 2003.
E1
| | |
Fund Officers (a)(1) |
| Name, Address and Age | | Principal Occupation(s) During the Past Five Years |
| Position with the Fund | | |
Steve Pelletier (55) President and Principal Executive Officer | | President of Prudential Annuities (since September 2008); Chairman and CEO, International Investments, Prudential Financial (since January 1998). |
Kathryn L. Quirk (56) Chief Legal Officer | | Vice President and Corporate Counsel (since September 2004) of Prudential; Executive Vice President, Chief Legal Officer and Secretary (since July 2005) of Prudential Investments LLC (PI) and Prudential Mutual Fund Services LLC (PMFS); Vice President and Corporate Counsel (since June 2005) and Secretary (since February 2006) of AST Investment Services, Inc.; formerly Senior Vice President and Assistant Secretary (November 2004-August 2005) of PI; formerly Assistant Secretary (June 2005-February 2006) of AST Investment Services, Inc.; formerly Managing Director, General Counsel, Chief Compliance Officer, Chief Risk Officer and Corporate Secretary (1997-2002) of Zurich Scudder Investments, Inc. |
Deborah A. Docs (51) Secretary | | Vice President and Corporate Counsel (since January 2001) of Prudential; Vice President (since December 1996) and Assistant Secretary (since March 1999) of PI; formerly Vice President and Assistant Secretary (May 2003-June 2005) of AST Investment Services, Inc. |
Jonathan D. Shain (50) Assistant Secretary | | Vice President and Corporate Counsel (since August 1998) of Prudential; Vice President and Assistant Secretary (since May 2001) of PI; Vice President and Assistant Secretary (since February 2001) of PMFS; formerly Vice President and Assistant Secretary (May 2003-June 2005) of AST Investment Services, Inc. |
Claudia DiGiacomo (34) Assistant Secretary | | Vice President and Corporate Counsel (since January 2005) of Prudential; Vice President and Assistant Secretary of PI (since December 2005); Associate at Sidley Austin Brown & Wood LLP (1999-2004). |
John P. Schwartz (37) Assistant Secretary | | Vice President and Corporate Counsel (since April 2005) of Prudential; Vice President and Assistant Secretary of PI (since December 2005); Associate at Sidley Austin Brown & Wood LLP (1997-2005). |
Andrew R. French (46) Assistant Secretary | | Director and Corporate Counsel (since May 2006) of Prudential; Vice President and Assistant Secretary (since January 2007) of PI; Vice President and Assistant Secretary (since January 2007) of PMFS; formerly Senior Legal Analyst of Prudential Mutual Fund Law Department (1997-2006). |
Timothy J. Knierim (49) Chief Compliance Officer | | Chief Compliance Officer of Prudential Investment Management, Inc.(PIM) (since July 2007); formerly Chief Risk Officer of PIM and PI (2002-2007) and formerly Chief Ethics Officer of PIM and PI (2006-2007). |
Valerie M. Simpson (50) Deputy Chief Compliance Officer | | Chief Compliance Officer (since April 2007) of PI and AST Investment Services, Inc.; formerly Vice President-Financial Reporting (June 1999-March 2006) for Prudential Life and Annuities Finance. |
Theresa C. Thompson (46) Deputy Chief Compliance Officer | | Vice President, Compliance, PI (since April 2004); and Director, Compliance, PI (2001 - 2004). |
Noreen M. Fierro (44) Anti-Money Laundering Compliance Officer | | Vice President, Corporate Compliance (since May 2006) of Prudential; formerly Corporate Vice President, Associate General Counsel (April 2002-May 2005) of UBS Financial Services, Inc., in their Money Laundering Prevention Group; Senior Manager (May 2005-May 2006) of Deloitte Financial Advisory Services, LLP, in their Forensic and Dispute Services, Anti-Money Laundering Group. |
Grace C. Torres (49) Treasurer and Principal Financial and Accounting Officer | | Assistant Treasurer (since March 1999) and Senior Vice President (since September 1999) of PI; Assistant Treasurer (since May 2003) and Vice President (since June 2005) of AST Investment Services, Inc.; Senior Vice President and Assistant Treasurer (since May 2003) of Prudential Annuities Advisory Services, Inc.; formerly Senior Vice President (May 2003-June 2005) of AST Investment Services, Inc. |
M. Sadiq Peshimam (45) Assistant Treasurer | | Vice President (since 2005) and Director (2000-2005) within Prudential Mutual Fund Administration. |
Peter Parrella (50) Assistant Treasurer | | Vice President (since 2007) and Director (2004-2007) within Prudential Mutual Fund Administration; formerly Tax Manager at SSB Citi Fund Management LLC (1997-2004). |
Alan Fu (51) Assistant Treasurer | | Vice President – Tax, The Prudential Insurance Company of America (1999 to October 2003); Vice President and Corporate Counsel – Tax, Prudential Financial, Inc. (since October 2003). |
(a) Excludes interested Board Members who also serve as President or Vice President.
1 The year in which each individual became an Officer of the Fund is as follows: Stephen Pelletier, 2008; Kathryn L. Quirk, 2005; Deborah A. Docs, 2005; Jonathan D. Shain, 2005; Claudia DiGiacomo, 2005; John P. Schwartz, 2006; Andrew R. French, 2006; Timothy J. Knierim, 2007; Valerie M. Simpson, 2007; Theresa C. Thompson, 2008; Noreen M. Fierro, 2006; Grace C. Torres, 1997; Peter Parrella, 2007; M. Sadiq Peshimam, 2006; Alan Fu, 2006.
Explanatory Notes to Tables:
Trustees are deemed to be “Interested”, as defined in the 1940 Act, by reason of their affiliation with Prudential Investments LLC and/or an affiliate of Prudential Investments LLC.
Unless otherwise noted, the address of all Trustees and Officers is c/o Prudential Investments LLC, Gateway Center Three, 100 Mulberry Street, Newark, New Jersey 07102.
There is no set term of office for Trustees or Officers. The Independent Trustees have adopted a retirement policy, which calls for the retirement of Trustees on December 31 of the year in which they reach the age of 75.
“Other Directorships Held” includes only directorships of companies required to register or file reports with the SEC under the Securities Exchange Act of 1934 (that is, “public companies”) or other investment companies registered under the 1940 Act.
“No. of Portfolios Overseen” includes all investment companies managed by Prudential Investments LLC. The investment companies for which PI serves as manager include the JennisonDryden Funds, Strategic Partners Funds, The Prudential Variable Contract Accounts, The Target Portfolio Trust, The Prudential Series Fund, Advanced Series Trust, The High Yield Income Fund, Inc., The High Yield Plus Fund, Inc., Nicholas-Applegate Fund, Inc. and Prudential’s Gibraltar Fund, Inc.
E2
Annuities are issued by Pruco Life Insurance Company, or in New York, Pruco Life Insurance Company of New Jersey, both located at 213 Washington Street, Newark, NJ 07102-2992, and Prudential Annuities Life Assurance Corporation, located at One Corporate Drive, Shelton, CT, 06484. Variable annuities are distributed by Prudential Annuities Distributors, Inc., also located in Shelton, CT. Prudential Annuities is a business unit of Prudential Financial.
Variable life insurance is issued by The Prudential Insurance Company of America, 751 Broad Street, Newark, NJ 07102-3777, Pruco Life Insurance Company, or in New York, Pruco Life Insurance Company of New Jersey, both located at 213 Washington Street, Newark, NJ 07102-2992. Pruco Life Insurance Company is not licensed to do business in New York. Variable life insurance is offered through Pruco Securities LLC, 751 Broad Street, Newark, NJ 07102-3777.
All are Prudential Financial companies and each is solely responsible for its financial condition and contractual obligations.
Life insurance and annuity contracts contain exclusions, limitations, reductions of benefits and terms for keeping them in force. Your licensed financial professional can provide you with costs and complete details. Contract guarantees are based on the claims-paying ability of the issuing company.
The 2008 Audited Financial Statements of Pruco Life Insurance Company, Pruco Life Insurance Company of New Jersey, and The Prudential Insurance Company of America are available. You may call 888-778-2888 to obtain a free copy of the audited financial statements of the insurance company that issued your contract.
To reduce costs, we now generally send only a single copy of prospectuses and shareholder reports to each household (“householding”) in lieu of sending a copy to each Contract Owner who resides in the household. You should be aware that by calling 877-778-5008, you can revoke or “opt out” of householding at any time.
Pru, Prudential, Prudential Financial, Rock Solid, “The Rock,” the Rock Logo and the Rock Prudential Logo are registered service marks of The Prudential Insurance Company of America, Newark, NJ, and its affiliates.
The Prudential Insurance Company of America
751 Broad Street
Newark, NJ 07102-3777
PRST STD POSTAGES & FEES PAID VON HOFFMANN CORPORATION
IFS-A114669 PSF-AR-B Ed.2/2009

| | |
| | |
| ANNUAL REPORT | | December 31, 2008 |
The Prudential Series Fund
| n | | Diversified Conservative Growth Portfolio |

Please note that inside is a Prospectus Supplement dated January 21, 2009. This document is separate from and not part of the annual report.

IFS-A114743
This report is one of several that provide financial information about certain investment choices available on variable life insurance and variable annuity contracts. Based on the variable contract you own or the portfolios you invested in, you may receive additional reports that provide financial information on those investment choices. Please refer to your variable life insurance or variable annuity contract prospectus to determine which portfolios are available to you.
This report must be preceded or accompanied by the current prospectuses for the Prudential Series Fund portfolios and the applicable variable life or annuity contract. The prospectuses contains information on the investment objectives, risks, and charges and expenses of the portfolios and the contract and should be read carefully.
The contract’s prospectus contains hypothetical performance illustrations that show the effect of various assumptions regarding the cost of insurance protection. You may also obtain a personalized illustration of historical performance that reflects the cost of your contract’s insurance protection.
A description of the Fund’s proxy voting policies and procedures is available, without charge, upon request. Owners of variable annuity contracts should call 888-778-2888 and owners of variable life insurance contracts should call 800-778-2255 to obtain descriptions of the Fund’s proxy voting policies and procedures. The description is also available on the website of the Securities and Exchange Commission (the “Commission”) at www.sec.gov. Information regarding how the Fund voted proxies relating to portfolio securities during the most recent 12-month period ended June 30 is available on the website of the Commission at www.sec.gov and on the Fund’s website.
The Fund files with the Commission a complete listing of portfolio holdings as of its first and third quarter-end on Form N-Q. Form N-Q is available on the Commission’s website at www.sec.gov or by visiting the Commission’s Public Reference Room. For more information on the Commission’s Public Reference Room, please visit the Commission’s website or call 800-SEC-0330. Form N-Q is also available on the Fund’s website at www.prudential.com or by calling the telephone numbers referenced above.
The Fund’s Statement of Additional Information contains additional information about the Fund’s Trustees and is available without charge upon request by calling 888-778-2888.
This report may include financial information pertaining to certain portfolios that are not available through the variable life insurance policy or variable annuity contract that you have chosen. Please refer to your variable life insurance or variable annuity prospectus to determine which portfolios are available to you.
| | | | |
The Prudential Series Fund Letter to Contract Owners | | Annual Report | | December 31, 2008 |
Our objective at Prudential is very simple — we strive to help our clients achieve and maintain financial success. Our Prudential Series Fund annual report details this commitment to you as we focus on ways to help you with your financial security. We hope you find it both informative and useful.
While 2008 presented unprecedented challenges to investors, it also proved that Prudential’s strategies around growing and protecting our clients’ wealth have never been more important.
Your financial professional is the best resource to help you understand how market changes affect your investments. Together, you can develop a diversified mix of investments that works best for you and review it periodically to ensure your financial objectives remain on target.
Thank you for selecting Prudential as one of your financial partners. We value your trust and appreciate the opportunity to help you reach your financial goals.
Sincerely,
Steve Pelletier
President,
The Prudential Series Fund | January 30, 2009 |
PRESIDENT
STEVE PELLETIER
| | |
The Prudential Series Fund, Diversified Conservative Growth Portfolio Subadvised by: Eagle Asset Management, EARNEST Partners LLC, Jennison Associates LLC, Pacific Investment Management Company LLC
(PIMCO), Prudential Investment Management, Inc., Quantitative Management Associates LLC | | December 31, 2008 |
Investment Manager’s Report - As of December 31, 2008
Average Annual Total Return Percentages
| | | | | | | | | |
| | | 1-Year | | | 5-Year | | | Since
Inception | |
Portfolio | | -21.56 | % | | 0.82 | % | | 2.87 | % |
S&P 500 Index | | -36.99 | | | -2.19 | | | -2.31 | |
Blended Index | | -13.76 | | | 2.20 | | | 3.14 | |
Past performance does not guarantee future returns. The investment return and principal value of an investment will fluctuate, so that an investor’s shares, when redeemed, may be worth more or less than their original cost. Current performance may be lower or higher than the past performance data quoted.
$10,000 INVESTED SINCE INCEPTION
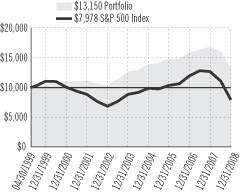
Portfolio inception: 5/3/1999. Portfolio performance is net of investment fees and fund expenses, but not product charges, which, if included, would significantly lower the performance quoted. Unless noted otherwise, Index returns reflect performance beginning the closest month-end date to the Portfolio’s inception. Performance figures may reflect fee waivers and/or expense reimbursements. In the absence of such fee waivers and/or expense reimbursements, total returns would be lower.
For the year ended December 31, 2008, the Diversified Conservative Growth Portfolio (the Portfolio) declined more than its custom blended benchmark (the Custom Index).
The subadvisers for the Portfolio and the approximate allocation to each are as follows: Jennison Large Cap Growth (15%), Jennison Large Cap Value (15%), Eagle Small Cap Growth (5%), EARNEST Partners Small Cap Value (5%), PIMCO Total Return Fixed Income (40%), and Prudential Fixed Income Management High Yield Fixed Income (20%).
Differences in asset allocation between the Portfolio and the Custom Index detracted most from the Portfolio’s relative performance. Specifically, the Portfolio had exposure to high yield corporate (“junk”) bonds, which are rated below investment grade, and an underweight position in investment-grade bonds. Both detracted from its return as high yield bonds underperformed the Custom Index in the risk-averse investment environment, while investment-grade bonds outperformed the Custom Index.
The PIMCO Total Return Fixed Income portion underperformed the Barclays Capital U.S. Aggregate Bond Index (the Index). PIMCO Total Return Bond had a larger exposure than the Index to mortgage pass-through securities of federal agencies, which lagged the U.S. Treasury market in 2008. As the financial system deleveraged—sold positions to pay off debt—large financial institutions shed their most liquid assets (mostly government agency mortgage-backed securities). The PIMCO portion also held financial sector bonds in Lehman Brothers Holdings, which further detracted. Finally, PIMCO Total Return Bond was positioned to benefit from an anticipated normalization in the market for interest rate swaps, which are agreements between two parties to exchange one stream of interest payments for another over a set period of time. But market conditions deteriorated in November, detracting from performance.
The Jennison Large Cap Value portion also hurt performance, mainly due to its holdings in the energy, telecommunications, and consumer discretionary sectors. An underweight in financials benefited relative return. Investors favored companies with more stable balance sheets and consistent earnings. Jennison Large Cap Value’s aggressive risk posture, its overweight in leveraged stocks (companies with above-market debt-to-asset ratios) and high earnings variability (a measure of volatility in corporate earnings and cash flow) combined to negatively affect performance. Stock selection was helpful in healthcare, particularly in a medical services company. The value portion also outperformed in the consumer staples, industrials, and information technology sectors. A smaller exposure to materials was also positive.
Prudential Investments LLC (PI), an indirect, wholly owned subsidiary of Prudential Financial, Inc., serves as the investment manager for the Fund.
S&P 500 Index is an unmanaged, market value-weighted index of 500 stocks generally representative of the broad stock market. Blended Index consists of the Russell 3000 Index (40%), a market cap-weighted index that measures the performance of the 3,000 largest U.S. companies based on total market capitalization, which represents approximately 98% of the investable U.S. equity market, and Barclays Capital U.S. Aggregate Bond Index (60%), an unmanaged index comprised of more than 5,000 government and corporate bonds. These returns do not include the effect of any investment management expenses. These returns would have been lower if they included the effect of these expenses. Investors cannot invest directly in a market index or average. For a complete list of holdings, refer to the Schedule of Investments section of this report.
| | |
The Prudential Series Fund Presentation of Portfolio Holdings — unaudited | | December 31, 2008 |
| | |
| Diversified Conservative Growth | | |
| Five Largest Holdings (% of Net Assets) |
| Federal Home Loan Mortgage Corp. 5.50%, TBA | | 6.1% |
| Federal National Mortgage Assoc. 4.50%, TBA | | 5.1% |
| Federal National Mortgage Assoc. 5.00%, TBA | | 4.9% |
| Government National Mortgage Assoc. 6.00%, TBA | | 4.7% |
| Government National Mortgage Assoc. 6.50%, TBA | | 3.7% |
For a complete list of holdings, please refer to the Schedule of Investments section of this report. Holdings/Issues/Sectors/Industries are subject to change.
| | |
The Prudential Series Fund Fees and Expenses — unaudited | | December 31, 2008 |
As a contract owner investing in Portfolios of the Fund through a variable annuity or variable life contract, you incur ongoing costs, including management fees, and other Portfolio expenses. This example is intended to help you understand your ongoing costs (in dollars) of investing in the Fund and to compare these costs with the ongoing costs of investing in other investment options. This example does not reflect fees and charges under your variable annuity or variable life contract. If contract charges were included, the costs shown below would be higher. Please consult the prospectus for your contract for more information about contract fees and charges.
The example is based on an investment of $1,000 invested at the beginning of the period and held for the entire period July 1, 2008 through December 31, 2008.
Actual Expenses
The first line of the table below provides information about actual account values and actual expenses. You may use this information, together with the amount you invested, to estimate the Portfolio expenses that you paid over the period. Simply divide your account value by $1,000 (for example, an $8,600 account value divided by $1,000 = 8.6), then multiply the result by the number in the first line under the heading entitled “Expenses Paid During the Six-Month Period” to estimate the Portfolio expenses you paid on your account during this period. As noted above, the table does not reflect variable contract fees and charges.
Hypothetical Example for Comparison Purposes
The second line of the table below provides information about hypothetical account values and hypothetical expenses based on the Portfolio’s actual expense ratio and an assumed rate of return of 5% per year before expenses, which is not the Portfolio’s actual return. The hypothetical account values and expenses may not be used to estimate the actual ending account balance or expenses you paid for the period. You may use this information to compare the ongoing costs of investing in the Portfolio and other investment options. To do so, compare this 5% hypothetical example with the 5% hypothetical examples that appear in the shareholder reports of the other investment options.
Please note that the expenses shown in the table are meant to highlight your ongoing Portfolio costs only and do not reflect any contract fees and charges, such as sales charges (loads), insurance charges or administrative charges. Therefore the second line of the table is useful to compare ongoing investment option costs only, and will not help you determine the relative total costs of owning different contracts. In addition, if these contract fee and charges were included, your costs would have been higher.
| | | | | | | | | | | | | | |
| The Prudential Series Fund Portfolios | | Beginning
Account Value
July 1, 2008 | | Ending
Account Value
December 31, 2008 | | Annualized Expense
Ratio based on the
Six-Month period | | | Expenses Paid
During the
Six-Month period |
| Diversified Conservative Growth (Class I) | | Actual | | $ | 1,000.00 | | $ | 816.50 | | 1.25 | % | | $ | 5.71 |
| | Hypothetical | | $ | 1,000.00 | | $ | 1,018.85 | | 1.25 | % | | $ | 6.34 |
Portfolio expenses (net of fee waivers or subsidies, if any) for each share class are equal to the annualized expense ratio for each share class (provided in the table), multiplied by the average account value over the period, multiplied by the 184 days in the six-month period ended December 31, 2008, and divided by the 366 days in the Portfolio's fiscal year ended December 31, 2008 (to reflect the six-month period). Expenses presented in the table include the expenses of any underlying portfolios in which the Portfolio may invest.
| | | | | | |
| | | DIVERSIFIED CONSERVATIVE GROWTH PORTFOLIO | | |
| |
| SCHEDULE OF INVESTMENTS | | December 31, 2008 |
| | | | | |
| LONG-TERM INVESTMENTS — 130.4% | | |
| COMMON STOCKS — 38.9% | | Shares
| | Value
(Note 2)
|
| | | | | | |
Aerospace & Defense — 0.8% | | | | | |
AAR Corp.* | | 3,500 | | $ | 64,435 |
Lockheed Martin Corp. | | 2,200 | | | 184,976 |
Moog, Inc. (Class A Stock)* | | 2,575 | | | 94,168 |
Raytheon Co. | | 3,909 | | | 199,515 |
Teledyne Technologies, Inc.* | | 1,900 | | | 84,645 |
| | | | |
|
|
| | | | | | 627,739 |
| | | | |
|
|
Auto Components — 0.1% | | | | | |
Goodyear Tire & Rubber Co. (The)* | | 13,200 | | | 78,804 |
| | | | |
|
|
Banks — 0.2% | | | | | |
Pacific Capital Bancorp | | 3,300 | | | 55,704 |
United Bankshares, Inc. | | 2,700 | | | 89,694 |
| | | | |
|
|
| | | | | | 145,398 |
| | | | |
|
|
Beverages — 0.6% | | | | | |
Coca-Cola Co. (The) | | 5,900 | | | 267,093 |
PepsiCo, Inc. | | 4,700 | | | 257,419 |
| | | | |
|
|
| | | | | | 524,512 |
| | | | |
|
|
Biotechnology — 2.2% | | | | | |
Celgene Corp.* | | 5,400 | | | 298,512 |
Cubist Pharmaceuticals, Inc.* | | 2,890 | | | 69,822 |
Genentech, Inc.* | | 6,500 | | | 538,915 |
Genzyme Corp.* | | 1,300 | | | 86,281 |
Gilead Sciences, Inc.* | | 16,200 | | | 828,468 |
Myriad Genetics, Inc.* | | 595 | | | 39,425 |
| | | | |
|
|
| | | | | | 1,861,423 |
| | | | |
|
|
Building & Construction — 0.1% | | | | | |
Watsco, Inc. | | 1,400 | | | 53,760 |
| | | | |
|
|
Business Services — 0.2% | | | | | |
ICON PLC, ADR (Ireland)* | | 4,450 | | | 87,620 |
URS Corp.* | | 2,600 | | | 106,002 |
| | | | |
|
|
| | | | | | 193,622 |
| | | | |
|
|
Capital Markets — 1.5% | | | | | |
Bank of New York Mellon Corp. (The) | | 8,526 | | | 241,541 |
Goldman Sachs Group, Inc. (The) | | 4,300 | | | 362,877 |
Jefferies Group, Inc. | | 4,800 | | | 67,488 |
Lazard Ltd. (Class A Stock) (Bermuda) | | 290 | | | 8,625 |
Morgan Stanley | | 11,800 | | | 189,272 |
Schwab, (Charles) Corp. (The) | | 17,700 | | | 286,209 |
TD Ameritrade Holding Corp.* | | 9,300 | | | 132,525 |
| | | | |
|
|
| | | | | | 1,288,537 |
| | | | |
|
|
Chemicals — 0.7% | | | | | |
Huntsman Corp. | | 15,530 | | | 53,423 |
Intrepid Potash, Inc.* | | 3,295 | | | 68,437 |
Monsanto Co. | | 4,300 | | | 302,505 |
Quaker Chemical Corp. | | 1,670 | | | 27,472 |
Scotts Miracle-Gro Co. (The) (Class A Stock) | | 2,500 | | | 74,300 |
Terra Industries, Inc. | | 2,790 | | | 46,509 |
Valspar Corp. (The) | | 2,700 | | | 48,843 |
| | | | |
|
|
| | | | | | 621,489 |
| | | | |
|
|
Commercial Banks — 0.3% | | | | | |
Astoria Financial Corp. | | 4,350 | | | 71,688 |
East West Bancorp, Inc. | | 4,500 | | | 71,865 |
| | | | | |
COMMON STOCKS
(continued) | | Shares
| | Value
(Note 2)
|
| | | | | | |
Commercial Banks (continued) | | | | | |
First Commonwealth Financial Corp. | | 3,420 | | $ | 42,340 |
SunTrust Banks, Inc. | | 1,700 | | | 50,218 |
| | | | |
|
|
| | | | | | 236,111 |
| | | | |
|
|
Commercial Services — 0.4% | | | | | |
American Public Education, Inc.* | | 1,085 | | | 40,351 |
Corrections Corp. of America* | | 4,230 | | | 69,203 |
FTI Consulting, Inc.* | | 2,470 | | | 110,359 |
GEO Group, Inc. (The)* | | 4,590 | | | 82,758 |
| | | | |
|
|
| | | | | | 302,671 |
| | | | |
|
|
Commercial Services & Supplies — 0.7% | | | | | |
Global Payments, Inc. | | 3,300 | | | 108,207 |
Monster Worldwide, Inc.* | | 3,470 | | | 41,952 |
Waste Connections, Inc.* | | 3,570 | | | 112,705 |
Waste Management, Inc. | | 9,600 | | | 318,144 |
| | | | |
|
|
| | | | | | 581,008 |
| | | | |
|
|
Communication Equipment — 1.6% | | | | | |
Cisco Systems, Inc.* | | 18,500 | | | 301,550 |
EMS Technologies, Inc.* | | 6,150 | | | 159,100 |
QUALCOMM, Inc. | | 17,100 | | | 612,693 |
Research In Motion Ltd. (Canada)* | | 7,200 | | | 292,176 |
| | | | |
|
|
| | | | | | 1,365,519 |
| | | | |
|
|
Computer Services & Software — 0.4% | | | | | |
ANSYS, Inc.* | | 4,115 | | | 114,768 |
Compellent Technologies, Inc.* | | 8,660 | | | 84,262 |
Hansen Medical, Inc.* | | 1,310 | | | 9,458 |
Netezza Corp.* | | 6,905 | | | 45,849 |
SRA International, Inc. (Class A Stock)* | | 3,900 | | | 67,275 |
| | | | |
|
|
| | | | | | 321,612 |
| | | | |
|
|
Computers & Peripherals — 1.0% | | | | | |
Apple, Inc.* | | 3,301 | | | 281,740 |
Hewlett-Packard Co. | | 10,500 | | | 381,045 |
International Business Machines Corp. | | 1,700 | | | 143,072 |
| | | | |
|
|
| | | | | | 805,857 |
| | | | |
|
|
Construction — 0.2% | | | | | |
Granite Construction, Inc. | | 1,900 | | | 83,467 |
Texas Industries, Inc. | | 1,445 | | | 49,852 |
| | | | |
|
|
| | | | | | 133,319 |
| | | | |
|
|
Consumer Products & Services — 0.1% | | | | | |
Toro Co. | | 2,500 | | | 82,500 |
| | | | |
|
|
Distribution/Wholesale | | | | | |
MWI Veterinary Supply, Inc.* | | 720 | | | 19,411 |
| | | | |
|
|
Diversified Consumer Services — 0.6% | | | | | |
Career Education Corp.* | | 10,000 | | | 179,400 |
H&R Block, Inc. | | 15,700 | | | 356,704 |
| | | | |
|
|
| | | | | | 536,104 |
| | | | |
|
|
Diversified Financial Services — 0.6% | | | | | |
Eaton Vance Corp. | | 4,000 | | | 84,040 |
JPMorgan Chase & Co. | | 3,200 | | | 100,896 |
Raymond James Financial, Inc. | | 5,075 | | | 86,935 |
SLM Corp.* | | 21,800 | | | 194,020 |
Sterling Financial Corp. | | 2,900 | | | 25,520 |
Student Loan Corp. (The) | | 500 | | | 20,500 |
| | | | |
|
|
| | | | | | 511,911 |
| | | | |
|
|
SEE NOTES TO FINANCIAL STATEMENTS.
A1
| | | | | | |
| | | DIVERSIFIED CONSERVATIVE GROWTH PORTFOLIO (continued) | | |
| |
| SCHEDULE OF INVESTMENTS | | December 31, 2008 |
| | | | | |
COMMON STOCKS
(continued) | | Shares
| | Value
(Note 2)
|
| | | | | | |
Diversified Manufacturing — 0.1% | | | | | |
Ameron International Corp. | | 925 | | $ | 58,201 |
| | | | |
|
|
Education | | | | | |
K12, Inc.* | | 1,070 | | | 20,063 |
| | | | |
|
|
Electric Utilities — 0.2% | | | | | |
Entergy Corp. | | 2,500 | | | 207,825 |
| | | | |
|
|
Electronic Components — 0.1% | | | | | |
Universal Electronics, Inc.* | | 5,720 | | | 92,778 |
| | | | |
|
|
Electronic Equipment & Instruments — 0.3% | | | |
Checkpoint Systems, Inc.* | | 3,700 | | | 36,408 |
Coherent, Inc.* | | 4,050 | | | 86,913 |
FLIR Systems, Inc.* | | 5,300 | | | 162,604 |
| | | | |
|
|
| | | | | | 285,925 |
| | | | |
|
|
Electronics — 0.1% | | | | | |
Dolby Laboratories, Inc. (Class A Stock)* | | 1,395 | | | 45,700 |
| | | | |
|
|
Energy Equipment & Services — 0.5% | | | | | |
National Oilwell Varco, Inc.* | | 5,700 | | | 139,308 |
Schlumberger Ltd. (Netherlands) | | 6,400 | | | 270,912 |
| | | | |
|
|
| | | | | | 410,220 |
| | | | |
|
|
Energy-Other — 0.1% | | | | | |
Headwaters, Inc.* | | 3,469 | | | 23,416 |
McMoRan Exploration Co.* | | 2,585 | | | 25,333 |
Swift Energy Co.* | | 3,400 | | | 57,154 |
| | | | |
|
|
| | | | | | 105,903 |
| | | | |
|
|
Entertainment & Leisure — 0.3% | | | | | |
Bally Technologies, Inc.* | | 4,770 | | | 114,623 |
Life Time Fitness, Inc.* | | 3,400 | | | 44,030 |
Shuffle Master, Inc.* | | 10,800 | | | 53,568 |
WMS Industries, Inc.* | | 2,635 | | | 70,882 |
| | | | |
|
|
| | | | | | 283,103 |
| | | | |
|
|
Environmental Control — 0.1% | | | | | |
Republic Services, Inc. | | 3,375 | | | 83,666 |
| | | | |
|
|
Financial Services — 0.1% | | | | | |
Investment Technology Group, Inc.* | | 2,240 | | | 50,893 |
Lender Processing Services, Inc. | | 1,280 | | | 37,696 |
| | | | |
|
|
| | | | | | 88,589 |
| | | | |
|
|
Food & Staples Retailing — 2.2% | | | | | |
Costco Wholesale Corp. | | 4,100 | | | 215,250 |
CVS Caremark Corp. | | 21,400 | | | 615,036 |
Kroger Co. (The) | | 10,700 | | | 282,587 |
Wal-Mart Stores, Inc. | | 13,100 | | | 734,386 |
| | | | |
|
|
| | | | | | 1,847,259 |
| | | | |
|
|
Food Products — 1.1% | | | | | |
Cadbury PLC (United Kingdom) | | 7,100 | | | 61,810 |
Cadbury PLC, ADR (United Kingdom) | | 7,712 | | | 275,087 |
ConAgra Foods, Inc. | | 16,500 | | | 272,250 |
Tyson Foods, Inc. (Class A Stock) | | 31,600 | | | 276,816 |
| | | | |
|
|
| | | | | | 885,963 |
| | | | |
|
|
Healthcare Equipment & Supplies — 1.3% | | | | | |
Alcon, Inc. (Switzerland) | | 3,900 | | | 347,841 |
Baxter International, Inc. | | 7,900 | | | 423,361 |
| | | | | |
COMMON STOCKS
(continued) | | Shares
| | Value
(Note 2)
|
| | | | | | |
Healthcare Equipment & Supplies (continued) | | | |
Cutera, Inc.* | | 5,135 | | $ | 45,547 |
SurModics, Inc.* | | 1,860 | | | 47,002 |
Thoratec Corp.* | | 6,330 | | | 205,662 |
| | | | |
|
|
| | | | | | 1,069,413 |
| | | | |
|
|
Healthcare Providers & Services — 2.2% | | | | | |
Aetna, Inc. | | 7,800 | | | 222,300 |
Amedisys, Inc.* | | 2,835 | | | 117,199 |
AMERIGROUP Corp.* | | 3,400 | | | 100,368 |
Centene Corp.* | | 4,845 | | | 95,495 |
Covance, Inc.* | | 2,000 | | | 92,060 |
Eclipsys Corp.* | | 10,590 | | | 150,272 |
Healthways, Inc.* | | 4,000 | | | 45,920 |
Lincare Holdings, Inc.* | | 2,025 | | | 54,533 |
Medco Health Solutions, Inc.* | | 6,300 | | | 264,033 |
Omnicare, Inc. | | 9,400 | | | 260,944 |
Pediatrix Medical Group, Inc.* | | 2,200 | | | 69,740 |
Pharmaceutical Product Development, Inc. | | 4,800 | | | 139,248 |
UnitedHealth Group, Inc. | | 7,400 | | | 196,840 |
| | | | |
|
|
| | | | | | 1,808,952 |
| | | | |
|
|
Hotels, Restaurants & Leisure — 0.1% | | | | | |
Brinker International, Inc. | | 3,100 | | | 32,674 |
Sonic Corp.* | | 3,900 | | | 47,463 |
| | | | |
|
|
| | | | | | 80,137 |
| | | | |
|
|
Household Durables — 0.1% | | | | | |
Meritage Homes Corp.* | | 2,100 | | | 25,557 |
Snap-on, Inc. | | 2,100 | | | 82,698 |
| | | | |
|
|
| | | | | | 108,255 |
| | | | |
|
|
Household Products — 0.8% | | | | | |
Colgate-Palmolive Co. | | 6,100 | | | 418,094 |
Kimberly-Clark Corp. | | 4,700 | | | 247,878 |
| | | | |
|
|
| | | | | | 665,972 |
| | | | |
|
|
Independent Power Producers & Energy Traders — 0.4% |
NRG Energy, Inc.* | | 13,400 | | | 312,622 |
| | | | |
|
|
Insurance — 1.1% | | | | | |
Allstate Corp. (The) | | 4,600 | | | 150,696 |
AXIS Capital Holdings Ltd. (Bermuda) | | 5,900 | | | 171,808 |
Berkshire Hathaway, Inc. (Class B Stock)* | | 38 | | | 122,132 |
Delphi Financial Group, Inc. (Class A Stock) | | 3,325 | | | 61,313 |
Loews Corp. | | 6,600 | | | 186,450 |
Protective Life Corp. | | 2,000 | | | 28,700 |
State Auto Financial Corp. | | 2,800 | | | 84,168 |
United Fire & Casualty Co. | | 1,600 | | | 49,712 |
XL Capital Ltd. (Class A Stock) (Cayman Islands) | | 24,800 | | | 91,760 |
| | | | |
|
|
| | | | | | 946,739 |
| | | | |
|
|
Internet — 0.1% | | | | | |
Digital River, Inc.* | | 2,300 | | | 57,040 |
| | | | |
|
|
Internet & Catalog Retail — 0.6% | | | | | |
Amazon.com, Inc.* | | 5,900 | | | 302,552 |
HSN, Inc.* | | 3,940 | | | 28,644 |
SEE NOTES TO FINANCIAL STATEMENTS.
A2
| | | | | | |
| | | DIVERSIFIED CONSERVATIVE GROWTH PORTFOLIO (continued) | | |
| |
| SCHEDULE OF INVESTMENTS | | December 31, 2008 |
| | | | | |
COMMON STOCKS
(continued) | | Shares
| | Value
(Note 2)
|
| | | | | | |
Internet & Catalog Retail (continued) | | | | | |
Ticketmaster* | | 21,490 | | $ | 137,966 |
| | | | |
|
|
| | | | | | 469,162 |
| | | | |
|
|
Internet Software & Services — 1.2% | | | | | |
Google, Inc. (Class A Stock)* | | 1,800 | | | 553,770 |
InterActiveCorp* | | 22,650 | | | 356,284 |
Internet Capital Group, Inc.* | | 2,385 | | | 12,998 |
TIBCO Software, Inc.* | | 17,720 | | | 91,967 |
US Auto Parts Network, Inc.* | | 1,640 | | | 2,280 |
| | | | |
|
|
| | | | | | 1,017,299 |
| | | | |
|
|
IT Services — 0.6% | | | | | |
Infosys Technologies Ltd., ADR (India) | | 5,500 | | | 135,135 |
Visa, Inc. (Class A Stock) | | 7,700 | | | 403,865 |
| | | | |
|
|
| | | | | | 539,000 |
| | | | |
|
|
Life Science Tools & Services — 0.3% | | | | | |
Thermo Fisher Scientific, Inc.* | | 7,000 | | | 238,490 |
| | | | |
|
|
Machinery & Equipment — 0.1% | | | | | |
Bucyrus International, Inc. (Class A Stock) | | 4,000 | | | 74,080 |
| | | | |
|
|
Manufacturing — 0.2% | | | | | |
Harsco Corp. | | 2,900 | | | 80,272 |
Hexcel Corp.* | | 7,000 | | | 51,730 |
| | | | |
|
|
| | | | | | 132,002 |
| | | | |
|
|
Media — 1.3% | | | | | |
Comcast Corp. (Class A Stock) | | 23,650 | | | 399,212 |
Discovery Communications, Inc., (Class A Stock)* | | 8,900 | | | 126,024 |
Liberty Global, Inc. (Class C Stock)* | | 15,983 | | | 242,622 |
Lions Gate Entertainment Corp. (Canada)* | | 9,470 | | | 52,085 |
Sirius XM Radio, Inc.* | | 282,320 | | | 33,879 |
Walt Disney Co. (The) | | 8,700 | | | 197,403 |
Wiley, (John) & Sons, Inc. (Class A Stock) | | 1,935 | | | 68,847 |
| | | | |
|
|
| | | | | | 1,120,072 |
| | | | |
|
|
Medical Supplies & Equipment — 0.3% | | | | | |
Quality Systems, Inc. | | 3,100 | | | 135,222 |
ResMed, Inc.* | | 1,150 | | | 43,102 |
Vital Images, Inc.* | | 2,555 | | | 35,540 |
| | | | |
|
|
| | | | | | 213,864 |
| | | | |
|
|
Metals & Mining — 0.2% | | | | | |
Northwest Pipe Co.* | | 2,370 | | | 100,986 |
Timken Co. | | 3,900 | | | 76,557 |
| | | | |
|
|
| | | | | | 177,543 |
| | | | |
|
|
Multi-Line Retail | | | | | |
Target Corp. | | 900 | | | 31,077 |
| | | | |
|
|
Multi-Utilities — 0.3% | | | | | |
Sempra Energy | | 6,500 | | | 277,095 |
| | | | |
|
|
Office Electronics — 0.2% | | | | | |
Xerox Corp. | | 22,500 | | | 179,325 |
| | | | |
|
|
Office Equipment — 0.1% | | | | | |
School Specialty, Inc.* | | 4,305 | | | 82,312 |
| | | | |
|
|
| | | | | |
COMMON STOCKS
(continued) | | Shares
| | Value
(Note 2)
|
| | | | | | |
Oil & Gas Exploration/Production — 0.1% | | | | | |
Core Laboratories NV (Netherlands) | | 1,210 | | $ | 72,431 |
| | | | |
|
|
Oil, Gas & Consumable Fuels — 3.1% | | | | | |
Apache Corp. | | 1,700 | | | 126,701 |
Cabot Oil & Gas Corp. | | 4,600 | | | 119,600 |
Denbury Resources, Inc.* | | 2,935 | | | 32,050 |
Devon Energy Corp. | | 3,000 | | | 197,130 |
EOG Resources, Inc. | | 2,900 | | | 193,082 |
Hess Corp. | | 2,300 | | | 123,372 |
Lufkin Industries, Inc. | | 2,555 | | | 88,148 |
Occidental Petroleum Corp. | | 7,900 | | | 473,921 |
Petroleo Brasileiro SA, ADR (Brazil) | | 5,500 | | | 134,695 |
Petroleum Development Corp.* | | 705 | | | 16,969 |
Southwestern Energy Co.* | | 5,400 | | | 156,438 |
St. Mary Land & Exploration Co. | | 3,300 | | | 67,023 |
Suncor Energy, Inc. (Canada) | | 6,000 | | | 117,000 |
WGL Holdings, Inc. | | 2,500 | | | 81,725 |
Williams Cos., Inc. | | 16,300 | | | 236,024 |
XTO Energy, Inc. | | 11,300 | | | 398,551 |
| | | | |
|
|
| | | | | | 2,562,429 |
| | | | |
|
|
Paper & Forest Products — 0.1% | | | | | |
Domtar Corp. (Canada)* | | 43,000 | | | 71,810 |
| | | | |
|
|
Pharmaceuticals — 2.5% | | | | | |
Abbott Laboratories | | 7,200 | | | 384,264 |
American Medical Systems Holdings, Inc.* | | 9,355 | | | 84,101 |
BioMarin Pharmaceutical, Inc.* | | 2,430 | | | 43,254 |
Herbalife Ltd. (Cayman Islands) | | 2,000 | | | 43,360 |
Mylan, Inc.* | | 23,600 | | | 233,404 |
Onyx Pharmaceuticals, Inc.* | | 595 | | | 20,325 |
Roche Holding AG, ADR (Switzerland) | | 1,300 | | | 99,515 |
Schering-Plough Corp. | | 16,100 | | | 274,183 |
Shire PLC, ADR (United Kingdom) | | 2,890 | | | 129,414 |
Teva Pharmaceutical Industries Ltd., ADR (Israel) | | 8,700 | | | 370,359 |
Wyeth | | 11,109 | | | 416,699 |
| | | | |
|
|
| | | | | | 2,098,878 |
| | | | |
|
|
Real Estate Investment Trust | | | | | |
Hovnanian Enterprises, Inc. (Class A Stock)* | | 3,700 | | | 6,364 |
| | | | |
|
|
Restaurants — 0.1% | | | | | |
BJ’s Restaurants, Inc.* | | 4,665 | | | 50,242 |
| | | | |
|
|
Retail & Merchandising — 0.3% | | | | | |
Cash America International, Inc. | | 5,423 | | | 148,319 |
Genesco, Inc.* | | 6,295 | | | 106,511 |
| | | | |
|
|
| | | | | | 254,830 |
| | | | |
|
|
Road & Rail — 0.1% | | | | | |
Union Pacific Corp. | | 1,000 | | | 47,800 |
| | | | |
|
|
Semiconductors — 0.1% | | | | | |
Macrovision Solutions Corp.* | | 5,270 | | | 66,666 |
OYO Geospace Corp.* | | 2,745 | | | 47,955 |
| | | | |
|
|
| | | | | | 114,621 |
| | | | |
|
|
Semiconductors & Semiconductor Equipment — 0.4% |
Advanced Energy Industries, Inc.* | | 4,265 | | | 42,437 |
Itron, Inc.* | | 1,760 | | | 112,183 |
SEE NOTES TO FINANCIAL STATEMENTS.
A3
| | | | | | |
| | | DIVERSIFIED CONSERVATIVE GROWTH PORTFOLIO (continued) | | |
| |
| SCHEDULE OF INVESTMENTS | | December 31, 2008 |
| | | | | |
COMMON STOCKS
(continued) | | Shares
| | Value
(Note 2)
|
| | | | | | |
Semiconductors & Semiconductor Equipment (continued) |
Marvell Technology Group Ltd. (Bermuda)* | | 23,900 | | $ | 159,413 |
NVIDIA Corp.* | | 5,800 | | | 46,806 |
Spansion, Inc. (Class A Stock)* | | 40,900 | | | 7,742 |
| | | | |
|
|
| | | | | | 368,581 |
| | | | |
|
|
Software — 1.8% | | | | | |
Adobe Systems, Inc.* | | 9,700 | | | 206,513 |
CA, Inc. | | 21,400 | | | 396,542 |
Factset Research Systems, Inc. | | 1,740 | | | 76,978 |
Microsoft Corp. | | 16,900 | | | 328,536 |
Oracle Corp.* | | 7,200 | | | 127,656 |
Symantec Corp.* | | 29,200 | | | 394,784 |
| | | | |
|
|
| | | | | | 1,531,009 |
| | | | |
|
|
Specialty Retail — 0.2% | | | | | |
Aaron Rents, Inc. | | 2,900 | | | 77,198 |
CarMax, Inc.* | | 8,700 | | | 68,556 |
| | | | |
|
|
| | | | | | 145,754 |
| | | | |
|
|
Technology | | | | | |
Sanmina-SCI Corp.* | | 18,200 | | | 8,554 |
| | | | |
|
|
Telecommunications — 0.1% | | | | | |
Arris Group, Inc.* | | 9,300 | | | 73,935 |
| | | | |
|
|
Textiles, Apparel & Luxury Goods — 0.3% | | | | | |
NIKE, Inc. (Class B Stock) | | 4,200 | | | 214,200 |
Phillips-Van Heusen Corp. | | 2,800 | | | 56,364 |
| | | | |
|
|
| | | | | | 270,564 |
| | | | |
|
|
| | | | | |
COMMON STOCKS
(continued) | | Shares
| | Value
(Note 2)
|
| | | | | | |
Thrifts & Mortgage Finance — 0.2% | | | | | |
People’s United Financial, Inc. | | 7,250 | | $ | 129,267 |
| | | | |
|
|
Utilities — 0.1% | | | | | |
ONEOK, Inc. | | 2,300 | | | 66,976 |
| | | | |
|
|
Wireless Telecommunication Services — 0.4% | | | |
NII Holdings, Inc.* | | 13,100 | | | 238,158 |
Sprint Nextel Corp.* | | 30,226 | | | 55,314 |
Virgin Mobile USA, Inc. (Class A Stock)* | | 23,100 | | | 19,404 |
| | | | |
|
|
| | | | | | 312,876 |
| | | | |
|
|
TOTAL COMMON STOCKS
(cost $34,385,688) | | | 32,493,874 |
| | | | |
|
|
| PREFERRED STOCKS — 0.2% | | | | | |
Diversified Financial Services — 0.1% | | | | | |
SLM Corp., Series C, 7.25% | | 130 | | | 59,881 |
| | | | |
|
|
Pharmaceuticals — 0.1% | | | | | |
Mylan, Inc., 6.5%, CVT | | 150 | | | 98,855 |
| | | | |
|
|
TOTAL PREFERRED STOCKS
(cost $150,358) | | | 158,736 |
| | | | |
|
|
| WARRANT* | | Units
| | |
Telecom | | | | | |
Sirius XM Radio, Inc., expiring 03/15/10(g) (cost $0) | | 100 | | | — |
| | | | |
|
|
| | | | | | | | | | | |
| CORPORATE BONDS — 33.6% | | Moody’s
Ratings†
(Unaudited)
| | Interest
Rate
| | Maturity
Date
| | Principal
Amount
(000)#
| | |
| | | | | | | | | | | | |
Aerospace & Defense — 1.0% | | | | | | | | | | | |
BE Aerospace, Inc., Sr. Unsec’d. Notes | | Ba3 | | 8.50% | | 07/01/18 | | $ | 100 | | 90,000 |
DRS Technologies, Inc., Gtd. Notes | | A3 | | 6.625% | | 02/01/16 | | | 75 | | 75,000 |
DRS Technologies, Inc., Gtd. Notes | | Baa1 | | 7.625% | | 02/01/18 | | | 130 | | 130,000 |
Esterline Technologies Corp., Gtd. Notes | | B1 | | 7.75% | | 06/15/13 | | | 125 | | 108,750 |
L-3 Communications Corp., Gtd. Notes | | Ba3 | | 5.875% | | 01/15/15 | | | 50 | | 45,000 |
L-3 Communications Corp., Gtd. Notes | | Ba3 | | 6.375% | | 10/15/15 | | | 100 | | 93,500 |
L-3 Communications Corp., Gtd. Notes | | Ba3 | | 7.625% | | 06/15/12 | | | 100 | | 97,750 |
Moog, Inc., Sr. Sub. Notes | | Ba3 | | 6.25% | | 01/15/15 | | | 150 | | 120,000 |
Moog, Inc., Sr. Sub. Notes, 144A | | Ba3 | | 7.25% | | 06/15/18 | | | 75 | | 60,000 |
TransDigm, Inc., Gtd. Notes | | B3 | | 7.75% | | 07/15/14 | | | 75 | | 61,500 |
| | | | | | | | | | | |
|
| | | | | | | | | | | | 881,500 |
| | | | | | | | | | | |
|
Airlines — 0.1% | | | | | | | | | | | |
AMR Corp., Sr. Unsec’d. Notes | | CCC+(d) | | 10.40% | | 03/10/11 | | | 100 | | 48,125 |
Continental Airlines, Inc., Pass-Through Certificates | | Ba2 | | 6.748% | | 03/15/17 | | | 22 | | 15,315 |
| | | | | | | | | | | |
|
| | | | | | | | | | | | 63,440 |
| | | | | | | | | | | |
|
Automobile Manufacturers — 0.1% | | | | | | | | | | | |
DaimlerChrysler NA Holding Corp., Gtd. Notes, MTN | | A3 | | 5.75% | | 09/08/11 | | | 100 | | 84,454 |
| | | | | | | | | | | |
|
Automotive — 0.3% | | | | | | | | | | | |
Ford Motor Credit Co. LLC, Sr. Unsec’d. Notes | | Caa1 | | 7.25% | | 10/25/11 | | | 140 | | 102,271 |
Ford Motor Credit Co. LLC, Sr. Unsec’d. Notes | | Caa1 | | 7.875% | | 06/15/10 | | | 80 | | 64,015 |
Lear Corp., Gtd. Notes | | Caa2 | | 8.75% | | 12/01/16 | | | 30 | | 8,700 |
TRW Automotive, Inc., Gtd. Notes, 144A | | B2 | | 7.25% | | 03/15/17 | | | 75 | | 38,250 |
Visteon Corp., Sr. Unsec’d. Notes | | Caa3 | | 7.00% | | 03/10/14 | | | 40 | | 6,000 |
| | | | | | | | | | | |
|
| | | | | | | | | | | | 219,236 |
| | | | | | | | | | | |
|
SEE NOTES TO FINANCIAL STATEMENTS.
A4
| | | | | | |
| | | DIVERSIFIED CONSERVATIVE GROWTH PORTFOLIO (continued) | | |
| |
| SCHEDULE OF INVESTMENTS | | December 31, 2008 |
| | | | | | | | | | | | |
CORPORATE BONDS
(continued) | | Moody’s
Ratings†
(Unaudited)
| | Interest
Rate
| | Maturity
Date
| | Principal
Amount
(000)#
| | Value
(Note 2)
|
| | | | | | | | | | | | | |
Cable — 0.7% | | | | | | | | | | | | |
CCH II LLC/CCH II Capital Corp., Gtd. Notes, 144A | | Caa2 | | 10.25% | | 10/01/13 | | $ | 50 | | $ | 17,000 |
CSC Holdings, Inc., Sr. Unsec’d. Notes | | B1 | | 6.75% | | 04/15/12 | | | 150 | | | 137,250 |
CSC Holdings, Inc., Sr. Unsec’d. Notes | | B1 | | 8.125% | | 07/15/09 | | | 75 | | | 74,625 |
CSC Holdings, Inc., Sr. Unsec’d. Notes | | B1 | | 8.125% | | 08/15/09 | | | 50 | | | 49,750 |
Mediacom Broadband LLC, Sr. Unsec’d. Notes | | B3 | | 8.50% | | 10/15/15 | | | 25 | | | 16,281 |
Shaw Communications, Inc., Sr. Unsec’d. Notes (Canada) | | Ba1 | | 7.20% | | 12/15/11 | | | 59 | | | 55,755 |
Shaw Communications, Inc., Sr. Unsec’d. Notes (Canada) | | Ba1 | | 8.25% | | 04/11/10 | | | 100 | | | 98,500 |
Videotron Ltee, Gtd. Notes, 144A (Canada) | | Ba2 | | 9.125% | | 04/15/18 | | | 125 | | | 116,250 |
| | | | | | | | | | | |
|
|
| | | | | | | | | | | | | 565,411 |
| | | | | | | | | | | |
|
|
Capital Goods — 2.7% | | | | | | | | | | | | |
Actuant Corp., Gtd. Notes | | Ba2 | | 6.875% | | 06/15/17 | | | 50 | | | 37,625 |
ALH Finance LLC, Gtd. Notes | | B3 | | 8.50% | | 01/15/13 | | | 75 | | | 57,750 |
Allied Waste North America, Inc., Sr. Sec’d. Notes | | NR | | 5.75% | | 02/15/11 | | | 60 | | | 56,250 |
Allied Waste North America, Inc., Sr. Sec’d. Notes | | BBB(d) | | 6.125% | | 02/15/14 | | | 125 | | | 113,125 |
Allied Waste North America, Inc., Sr. Sec’d. Notes | | NR | | 6.875% | | 06/01/17 | | | 75 | | | 69,750 |
Allied Waste North America, Inc., Sr. Sec’d. Notes | | NR | | 7.125% | | 05/15/16 | | | 50 | | | 45,500 |
Allied Waste North America, Inc., Sr. Sec’d. Notes | | NR | | 7.875% | | 04/15/13 | | | 50 | | | 47,500 |
Ashtead Capital, Inc., Sec’d. Notes, 144A | | B1 | | 9.00% | | 08/15/16 | | | 100 | | | 51,500 |
Ashtead Holdings PLC, Sec’d. Notes, 144A (United Kingdom) | | B1 | | 8.625% | | 08/01/15 | | | 75 | | | 39,375 |
Baldor Electric Co., Gtd. Notes | | B3 | | 8.625% | | 02/15/17 | | | 120 | | | 89,400 |
Blount, Inc., Gtd. Notes | | B2 | | 8.875% | | 08/01/12 | | | 125 | | | 115,625 |
Columbus Mckinnon Corp., Gtd. Notes | | B1 | | 8.875% | | 11/01/13 | | | 200 | | | 168,000 |
GrafTech Finance, Inc., Gtd. Notes | | Ba3 | | 10.25% | | 02/15/12 | | | 10 | | | 9,100 |
Hertz Corp. (The), Gtd. Notes | | B1 | | 8.875% | | 01/01/14 | | | 270 | | | 166,050 |
Interline Brand, Inc., Gtd. Notes | | B3 | | 8.125% | | 06/15/14 | | | 75 | | | 59,250 |
JohnsonDiversey Holdings, Inc., Disc. Notes | | Caa1 | | 10.67% | | 05/15/13 | | | 75 | | | 52,500 |
JohnsonDiversey, Inc., Gtd. Notes | | B2 | | 9.625% | | 05/15/12 | | | 75 | | | 61,500 |
Mobile Mini, Inc., Gtd. Notes | | B2 | | 6.875% | | 05/01/15 | | | 45 | | | 30,600 |
RBS Global, Inc./Rexnord Corp., Gtd. Notes | | B3 | | 9.50% | | 08/01/14 | | | 110 | | | 81,950 |
Rental Service Corp., Gtd. Notes | | Caa1 | | 9.50% | | 12/01/14 | | | 110 | | | 60,500 |
SPX Corp., Sr. Unsec’d. Notes, 144A | | Ba2 | | 7.625% | | 12/15/14 | | | 250 | | | 217,500 |
Stena AB, Sr. Unsec’d. Notes (Sweden) | | Ba2 | | 7.50% | | 11/01/13 | | | 150 | | | 99,187 |
Terex Corp., Gtd. Notes | | Ba1 | | 7.375% | | 01/15/14 | | | 125 | | | 108,750 |
Terex Corp., Sr. Sub. Notes | | Ba3 | | 8.00% | | 11/15/17 | | | 125 | | | 106,250 |
United Rentals North America, Inc., Gtd. Notes | | B1 | | 6.50% | | 02/15/12 | | | 135 | | | 106,650 |
Valmont Industries, Inc., Gtd. Notes | | Ba2 | | 6.875% | | 05/01/14 | | | 225 | | | 191,250 |
| | | | | | | | | | | |
|
|
| | | | | | | | | | | | | 2,242,437 |
| | | | | | | | | | | |
|
|
Capital Markets — 0.9% | | | | | | | | | | | | |
Goldman Sachs Group, Inc. (The), Sr. Unsec’d. Notes | | A1 | | 6.25% | | 09/01/17 | | | 300 | | | 290,891 |
Morgan Stanley, Sr. Unsec’d. Notes, MTN | | A2 | | 5.75% | | 10/18/16 | | | 500 | | | 420,136 |
Morgan Stanley, Sr. Unsec’d. Notes, MTN | | A2 | | 6.00% | | 04/28/15 | | | 100 | | | 86,273 |
| | | | | | | | | | | |
|
|
| | | | | | | | | | | | | 797,300 |
| | | | | | | | | | | |
|
|
Chemicals — 0.6% | | | | | | | | | | | | |
Huntsman LLC, Sec’d. Notes | | Ba1 | | 11.625% | | 10/15/10 | | | 250 | | | 218,750 |
Koppers, Inc., Sr. Sec’d. Notes | | Ba3 | | 9.875% | | 10/15/13 | | | 152 | | | 139,840 |
Momentive Performance Materials, Inc., Gtd. Notes | | B3 | | 9.75% | | 12/01/14 | | | 50 | | | 21,250 |
Momentive Performance Materials, Inc., Gtd. Notes | | Caa2 | | 11.50% | | 12/01/16 | | | 25 | | | 7,375 |
Mosaic Co. (The), Sr. Unsec’d. Notes, 144A | | Baa3 | | 7.375% | | 12/01/14 | | | 25 | | | 20,500 |
Mosaic Co. (The), Sr. Unsec’d. Notes, 144A | | Baa3 | | 7.625% | | 12/01/16 | | | 25 | | | 20,000 |
Nalco Co., Gtd. Notes | | B1 | | 7.75% | | 11/15/11 | | | 75 | | | 72,000 |
| | | | | | | | | | | |
|
|
| | | | | | | | | | | | | 499,715 |
| | | | | | | | | | | |
|
|
Commercial Banks — 0.6% | | | | | | | | | | | | |
SunTrust Bank/Atlanta GA, FDIC Gtd. Notes | | Aaa | | 3.00% | | 11/16/11 | | | 500 | | | 517,052 |
| | | | | | | | | | | |
|
|
SEE NOTES TO FINANCIAL STATEMENTS.
A5
| | | | | | |
| | | DIVERSIFIED CONSERVATIVE GROWTH PORTFOLIO (continued) | | |
| |
| SCHEDULE OF INVESTMENTS | | December 31, 2008 |
| | | | | | | | | | | | | |
CORPORATE BONDS
(continued) | | Moody’s
Ratings†
(Unaudited)
| | Interest
Rate
| | | Maturity
Date
| | Principal
Amount
(000)#
| | Value
(Note 2)
|
| | | | | | | | | | | | | | |
Consumer — 0.4% | | | | | | | | | | | | | |
Mac-Gray Corp., Gtd. Notes | | B3 | | 7.625% | | | 08/15/15 | | $ | 50 | | $ | 46,000 |
Realogy Corp., Gtd. Notes | | Ca | | 10.50% | | | 04/15/14 | | | 175 | | | 30,188 |
Realogy Corp., Gtd. Notes, PIK | | Ca | | 11.00% | | | 04/15/14 | | | 37 | | | 4,226 |
Service Corp. International, Sr. Unsec’d. Notes | | B1 | | 6.75% | | | 04/01/15 | | | 50 | | | 39,500 |
Service Corp. International, Sr. Unsec’d. Notes | | B1 | | 6.75% | | | 04/01/16 | | | 50 | | | 38,000 |
Service Corp. International, Sr. Unsec’d. Notes | | B1 | | 7.00% | | | 06/15/17 | | | 50 | | | 37,500 |
Service Corp. International, Sr. Unsec’d. Notes | | B1 | | 7.375% | | | 10/01/14 | | | 50 | | | 42,500 |
Stewart Enterprises, Inc., Gtd. Notes | | Ba3 | | 6.25% | | | 02/15/13 | | | 75 | | | 58,125 |
Ticketmaster, Gtd. Notes, 144A | | Ba3 | | 10.75% | | | 08/01/16 | | | 50 | | | 27,000 |
| | | | | | | | | | | | |
|
|
| | | | | | | | | | | | | | 323,039 |
| | | | | | | | | | | | |
|
|
Diversified Financial Services — 1.2% | | | | | | | | | | | | | |
Citigroup, Inc., Jr. Sub. Notes | | Baa2 | | 8.40% | (c) | | 04/29/49 | | | 600 | | | 396,174 |
Merrill Lynch & Co., Inc., Notes, MTN | | Aa3 | | 6.875% | | | 04/25/18 | | | 500 | | | 523,013 |
Petroleum Export Ltd., Sr. Notes, 144A (Cayman Islands) (original cost $33,333; purchased 07/14/05)(f)(g) | | Baa1 | | 4.623% | | | 06/15/10 | | | 33 | | | 32,805 |
Petroleum Export Ltd., Sr. Notes, 144A (Cayman Islands) (original cost $66,666; purchased 07/14/05)(f)(g) | | Baa1 | | 4.633% | | | 06/15/10 | | | 67 | | | 65,616 |
| | | | | | | | | | | | |
|
|
| | | | | | | | | | | | | | 1,017,608 |
| | | | | | | | | | | | |
|
|
Electric — 1.9% | | | | | | | | | | | | | |
AES Corp. (The), Sr. Unsec’d. Notes | | B1 | | 7.75% | | | 03/01/14 | | | 25 | | | 22,000 |
AES Corp. (The), Sr. Unsec’d. Notes | | B1 | | 8.00% | | | 10/15/17 | | | 125 | | | 102,500 |
AES Eastern Energy LP, Pass-Through Certificates | | Ba1 | | 9.00% | | | 01/02/17 | | | 115 | | | 101,889 |
Dynegy Holdings, Inc., Sr. Unsec’d. Notes | | B2 | | 7.50% | | | 06/01/15 | | | 125 | | | 87,500 |
Dynegy Roseton / Danskammer Pass-Through Trust, Series B, Pass-Through Certificates | | Ba3 | | 7.67% | | | 11/08/16 | | | 25 | | | 17,766 |
Energy Future Holdings Corp., Gtd. Notes, PIK, 144A | | B3 | | 11.25% | | | 11/01/17 | | | 75 | | | 36,375 |
Illinois Power Co., Sr. Sec’d. Notes | | Baa3 | | 6.25% | | | 04/01/18 | | | 500 | | | 446,550 |
NRG Energy, Inc., Gtd. Notes | | B1 | | 7.25% | | | 02/01/14 | | | 50 | | | 46,750 |
NRG Energy, Inc., Gtd. Notes | | B1 | | 7.375% | | | 02/01/16 | | | 85 | | | 79,050 |
Orion Power Holdings, Inc., Sr. Unsec’d. Notes | | Ba3 | | 12.00% | | | 05/01/10 | | | 140 | | | 140,000 |
PSE&G Energy Holdings LLC, Sr. Unsec’d. Notes | | Ba3 | | 8.50% | | | 06/15/11 | | | 125 | | | 117,827 |
Reliant Energy Mid-Atlantic Power Holdings LLC, Series B, Pass-Through Certificates(g) | | Ba1 | | 9.237% | | | 07/02/17 | | | 53 | | | 48,275 |
Sithe/Independence Funding Corp., Sr. Sec’d. Notes | | Ba2 | | 9.00% | | | 12/30/13 | | | 84 | | | 71,587 |
Tenaska Alabama Partners LP, Sr. Sec’d. Notes, 144A | | Ba2 | | 7.00% | | | 06/30/21 | | | 89 | | | 69,652 |
Texas Competitive Electric Holdings Co. LLC, Gtd. Notes, 144A | | B3 | | 10.50% | | | 11/01/15 | | | 325 | | | 230,750 |
| | | | | | | | | | | | |
|
|
| | | | | | | | | | | | | | 1,618,471 |
| | | | | | | | | | | | |
|
|
Energy – Other — 0.9% | | | | | | | | | | | | | |
Cie Generale de Geophysique-Veritas, Gtd. Notes (France) | | Ba3 | | 7.50% | | | 05/15/15 | | | 25 | | | 15,500 |
McMoRan Exploration Co., Gtd. Notes | | Caa1 | | 11.875% | | | 11/15/14 | | | 100 | | | 71,000 |
Newfield Exploration Co., Sr. Sub. Notes | | Ba3 | | 6.625% | | | 04/15/16 | | | 50 | | | 39,750 |
Newfield Exploration Co., Sr. Sub. Notes | | Ba3 | | 7.125% | | | 05/15/18 | | | 100 | | | 79,000 |
OPTI Canada, Inc., Sec’d. Notes (Canada) | | B2 | | 7.875% | | | 12/15/14 | | | 100 | | | 51,000 |
OPTI Canada, Inc., Sec’d. Notes (Canada) | | B2 | | 8.25% | | | 12/15/14 | | | 50 | | | 27,000 |
Petrohawk Energy Corp., Gtd. Notes | | B3 | | 9.125% | | | 07/15/13 | | | 50 | | | 40,500 |
Petrohawk Energy Corp., Gtd. Notes, 144A | | B3 | | 7.875% | | | 06/01/15 | | | 75 | | | 55,500 |
Petroplus Finance Ltd., Gtd. Notes, 144A (Bermuda) | | B1 | | 6.75% | | | 05/01/14 | | | 75 | | | 47,625 |
Petroplus Finance Ltd., Gtd. Notes, 144A (Bermuda) | | B1 | | 7.00% | | | 05/01/17 | | | 75 | | | 45,750 |
Pioneer Natural Resources Co., Sr. Unsec’d. Notes | | Ba1 | | 6.65% | | | 03/15/17 | | | 95 | | | 67,792 |
Pioneer Natural Resources Co., Sr. Unsec’d. Notes | | Ba1 | | 6.875% | | | 05/01/18 | | | 100 | | | 69,940 |
Plains Exploration & Production Co., Gtd. Notes | | B1 | | 7.00% | | | 03/15/17 | | | 65 | | | 44,525 |
Plains Exploration & Production Co., Gtd. Notes | | B1 | | 7.625% | | | 06/01/18 | | | 50 | | | 34,250 |
SandRidge Energy, Inc., Gtd. Notes, 144A | | B3 | | 8.00% | | | 06/01/18 | | | 100 | | | 55,500 |
Swift Energy Co., Gtd. Notes | | B1 | | 7.125% | | | 06/01/17 | | | 50 | | | 28,250 |
| | | | | | | | | | | | |
|
|
| | | | | | | | | | | | | | 772,882 |
| | | | | | | | | | | | |
|
|
SEE NOTES TO FINANCIAL STATEMENTS.
A6
| | | | | | |
| | | DIVERSIFIED CONSERVATIVE GROWTH PORTFOLIO (continued) | | |
| |
| SCHEDULE OF INVESTMENTS | | December 31, 2008 |
| | | | | | | | | | | | | |
CORPORATE BONDS
(continued) | | Moody’s
Ratings†
(Unaudited)
| | Interest
Rate
| | | Maturity
Date
| | Principal
Amount
(000)#
| | Value
(Note 2)
|
| | | | | | | | | | | | | | |
Financial – Bank & Trust — 4.9% | | | | | | | | | | | | | |
American Express Bank FSB, Sr. Unsec’d. Notes | | A1 | | 5.50% | | | 04/16/13 | | $ | 1,000 | | $ | 947,240 |
ANZ National International Ltd., Bank Gtd. Notes, 144A (New Zealand) (original cost $499,530; purchased 07/09/08)(f)(g) | | Aa2 | | 6.20% | | | 07/19/13 | | | 500 | | | 483,780 |
Barclays Bank PLC, Sub. Notes, 144A (United Kingdom) (original cost $500,000; purchased 04/18/08)(f)(g) | | Aa2 | | 7.70% | (c) | | 04/29/49 | | | 500 | | | 330,630 |
Deutsche Bank AG, Sr. Unsec’d. Notes (Germany) | | Aa1 | | 4.875% | | | 05/20/13 | | | 900 | | | 883,611 |
Regions Bank, FDIC Gtd. Notes | | Aaa | | 3.25% | | | 12/09/11 | | | 500 | | | 520,180 |
UBS AG, Sr. Unsec’d. Notes (Switzerland) | | Aa2 | | 5.875% | | | 12/20/17 | | | 500 | | | 459,322 |
UBS AG, Sr. Unsec’d. Notes, MTN (Switzerland) | | Aa2 | | 5.75% | | | 04/25/18 | | | 500 | | | 453,798 |
| | | | | | | | | | | | |
|
|
| | | | | | | | | | | | | | 4,078,561 |
| | | | | | | | | | | | |
|
|
Financial Services — 4.4% | | | | | | | | | | | | | |
American Express Co., Sr. Unsec’d. Notes | | A2 | | 7.00% | | | 03/19/18 | | | 200 | | | 202,229 |
Bank of America Corp., Jr. Sub. Notes | | A2 | | 8.00% | (c) | | 12/29/49 | | | 1,500 | | | 1,078,932 |
Bank of America Corp., Jr. Sub. Notes | | A2 | | 8.125% | (c) | | 12/29/49 | | | 300 | | | 224,400 |
Bank of America Corp., Sr. Unsec’d. Notes | | Aa3 | | 1.42% | (c) | | 10/14/16 | | | 400 | | | 286,064 |
Bear Stearns Co., Inc., Sr. Unsec’d. Notes | | Aa2 | | 7.25% | | | 02/01/18 | | | 500 | | | 547,928 |
CitiFinancial, Inc., Sr. Unsec’d. Notes | | A2 | | 6.625% | | | 06/01/15 | | | 100 | | | 92,732 |
Credit Suisse/New York NY, Sr. Unsec’d. Notes, MTN (Switzerland) | | Aa1 | | 5.00% | | | 05/15/13 | | | 700 | | | 673,702 |
General Electric Capital Corp., Sr. Unsec’d. Notes, MTN | | Aaa | | 5.875% | | | 01/14/38 | | | 100 | | | 97,886 |
General Electric Capital Corp., Sub. Notes, 144A (original cost $297,708; purchased 08/30/07)(f)(g) | | Aa1 | | 6.50% | (c) | | 09/15/67 | | | GBP300 | | | 272,167 |
Lehman Brothers Holdings, Inc., Sr. Unsec’d. Notes, MTN(i) | | NR | | 5.625% | | | 01/24/13 | | | 600 | | | 57,000 |
Lehman Brothers Holdings, Inc., Sr. Unsec’d. Notes, MTN(i) | | NR | | 6.875% | | | 05/02/18 | | | 200 | | | 19,000 |
Lender Processing Services, Inc., Gtd. Notes | | Ba2 | | 8.125% | | | 07/01/16 | | | 150 | | | 133,687 |
| | | | | | | | | | | | |
|
|
| | | | | | | | | | | | | | 3,685,727 |
| | | | | | | | | | | | |
|
|
Food — 0.3% | | | | | | | | | | | | | |
ARAMARK Corp., Gtd. Notes | | B3 | | 6.693% | (c) | | 02/01/15 | | | 50 | | | 37,750 |
ARAMARK Corp., Gtd. Notes | | B3 | | 8.50% | | | 02/01/15 | | | 75 | | | 67,875 |
Del Monte Corp., Gtd. Notes | | B2 | | 8.625% | | | 12/15/12 | | | 25 | | | 24,250 |
Dole Foods Co., Inc., Gtd. Notes | | Caa2 | | 7.25% | | | 06/15/10 | | | 25 | | | 17,438 |
National Beef Packaging Co. LLC, Sr. Unsec’d. Notes | | Caa1 | | 10.50% | | | 08/01/11 | | | 50 | | | 35,000 |
New Albertson’s, Inc., Sr. Unsec’d. Notes | | Ba3 | | 8.70% | | | 05/01/30 | | | 15 | | | 9,675 |
Stater Brothers Holdings, Gtd. Notes | | B2 | | 7.75% | | | 04/15/15 | | | 50 | | | 42,000 |
Stater Brothers Holdings, Gtd. Notes | | B2 | | 8.125% | | | 06/15/12 | | | 25 | | | 22,625 |
| | | | | | | | | | | | |
|
|
| | | | | | | | | | | | | | 256,613 |
| | | | | | | | | | | | |
|
|
Gaming — 0.4% | | | | | | | | | | | | | |
CCM Merger, Inc., Notes, 144A | | Caa2 | | 8.00% | | | 08/01/13 | | | 125 | | | 64,375 |
Harrah’s Operating Co., Inc., Gtd. Notes | | Caa3 | | 5.50% | | | 07/01/10 | | | 50 | | | 31,750 |
Harrah’s Operating Co., Inc., Gtd. Notes, 144A | | Caa2 | | 10.75% | | | 02/01/16 | | | 151 | | | 43,035 |
Harrah’s Operating Co., Inc., Sr. Sec’d. Notes, 144A | | B(d) | | 10.00% | | | 12/15/18 | | | 37 | | | 13,505 |
Harrah’s Operating Co., Inc., Gtd. Notes | | Caa3 | | 6.50% | | | 06/01/16 | | | 17 | | | 2,635 |
MGM Mirage, Sr. Sec’d Notes, 144A | | Ba1 | | 13.00% | | | 11/15/13 | | | 100 | | | 95,250 |
Mohegan Tribal Gaming Authority, Sr. Sub. Notes | | B3 | | 8.00% | | | 04/01/12 | | | 70 | | | 42,700 |
Park Place Entertainment Corp., Gtd. Notes | | Caa3 | | 8.125% | | | 05/15/11 | | | 30 | | | 14,700 |
Shingle Springs Tribal Gaming Authority, Sr. Notes, 144A | | B3 | | 9.375% | | | 06/15/15 | | | 75 | | | 37,500 |
Station Casinos, Inc., Sr. Sub. Notes | | Ca | | 6.50% | | | 02/01/14 | | | 50 | | | 2,875 |
Station Casinos, Inc., Sr. Sub. Notes | | Ca | | 6.875% | | | 03/01/16 | | | 50 | | | 2,875 |
Station Casinos, Inc., Sr. Unsec’d. Notes | | Caa3 | | 6.00% | | | 04/01/12 | | | 50 | | | 10,000 |
| | | | | | | | | | | | |
|
|
| | | | | | | | | | | | | | 361,200 |
| | | | | | | | | | | | |
|
|
Healthcare & Pharmaceuticals — 2.0% | | | | | | | | | | | | | |
Accellent, Inc., Gtd. Notes | | Caa3 | | 10.50% | | | 12/01/13 | | | 200 | | | 137,000 |
Bio-Rad Laboratories, Inc., Sr. Sub. Notes | | Ba3 | | 7.50% | | | 08/15/13 | | | 25 | | | 22,188 |
Biomet, Inc., Gtd. Notes | | Caa1 | | 11.625% | | | 10/15/17 | | | 50 | | | 42,750 |
Biomet, Inc., Gtd. Notes, PIK | | B3 | | 10.375% | | | 10/15/17 | | | 225 | | | 177,750 |
Boston Scientific Corp., Sr. Unsec’d. Notes | | Ba2 | | 6.25% | | | 11/15/15 | | | 75 | | | 63,000 |
SEE NOTES TO FINANCIAL STATEMENTS.
A7
| | | | | | |
| | | DIVERSIFIED CONSERVATIVE GROWTH PORTFOLIO (continued) | | |
| |
| SCHEDULE OF INVESTMENTS | | December 31, 2008 |
| | | | | | | | | | | | | |
CORPORATE BONDS
(continued) | | Moody’s
Ratings†
(Unaudited)
| | Interest
Rate
| | | Maturity
Date
| | Principal
Amount
(000)#
| | Value
(Note 2)
|
| | | | | | | | | | | | | | |
Healthcare & Pharmaceuticals (continued) | | | | | | | | | | | | | |
Catalent Pharma Solutions, Inc., Gtd. Notes | | Caa1 | | 9.50% | | | 04/15/15 | | $ | 100 | | $ | 38,000 |
Community Health Systems, Inc., Gtd. Notes | | B3 | | 8.875% | | | 07/15/15 | | | 190 | | | 174,800 |
Elan Finance PLC, Gtd. Notes (Ireland) | | B3 | | 7.75% | | | 11/15/11 | | | 15 | | | 8,850 |
HCA, Inc., Notes, MTN | | Caa1 | | 9.00% | | | 12/15/14 | | | 50 | | | 32,042 |
HCA, Inc., Sr. Sec’d. Notes | | B2 | | 9.25% | | | 11/15/16 | | | 200 | | | 183,500 |
HCA, Inc., Sr. Sec’d. Notes, PIK | | B2 | | 9.625% | | | 11/15/16 | | | 450 | | | 351,000 |
HCA, Inc., Sr. Unsec’d. Notes | | Caa1 | | 6.25% | | | 02/15/13 | | | 125 | | | 78,125 |
Res-Care, Inc., Gtd. Notes | | B1 | | 7.75% | | | 10/15/13 | | | 100 | | | 81,500 |
Select Medical Corp., Gtd. Notes | | B3 | | 7.625% | | | 02/01/15 | | | 20 | | | 10,600 |
Skilled HealthCare Group, Gtd. Notes | | Caa1 | | 11.00% | | | 01/15/14 | | | 103 | | | 96,820 |
Sun Healthcare Group, Inc., Gtd. Notes | | B3 | | 9.125% | | | 04/15/15 | | | 75 | | | 65,625 |
Surgical Care Affiliates, Inc., Sr. Sub. Notes, 144A(g) | | Caa1 | | 10.00% | | | 07/15/17 | | | 75 | | | 39,000 |
Viant Holdings, Inc., Gtd. Notes, 144A(g) | | Caa1 | | 10.125% | | | 07/15/17 | | | 218 | | | 71,940 |
| | | | | | | | | | | | |
|
|
| | | | | | | | | | | | | | 1,674,490 |
| | | | | | | | | | | | |
|
|
Insurance — 1.1% | | | | | | | | | | | | | |
American International Group, Inc., Sr. Unsec’d. Notes, 144A (original cost $400,000; purchased 08/13/08)(f)(g) | | A3 | | 8.25% | | | 08/15/18 | | | 400 | | | 292,768 |
ASIF III Jersey Ltd., Sr. Sec’d. Notes, MTN (Japan) | | Aa3 | | 0.95% | | | 07/15/09 | | | JPY 60,000 | | | 611,755 |
| | | | | | | | | | | | |
|
|
| | | | | | | | | | | | | | 904,523 |
| | | | | | | | | | | | |
|
|
Lodging — | | | | | | | | | | | | | |
Royal Caribbean Cruises Ltd., Sr. Unsec’d. Notes (Liberia) | | Ba1 | | 8.00% | | | 05/15/10 | | | 50 | | | 42,750 |
| | | | | | | | | | | | |
|
|
Media & Entertainment — 1.6% | | | | | | | | | | | | | |
AMC Entertainment, Inc., Gtd. Notes | | Ba3 | | 8.625% | | | 08/15/12 | | | 75 | | | 60,000 |
AMC Entertainment, Inc., Gtd. Notes | | B2 | | 11.00% | | | 02/01/16 | | | 35 | | | 24,456 |
Cinemark, Inc., Sr. Discount Notes, Zero coupon (until 03/15/09) | | B3 | | 2.826% | (t) | | 03/15/14 | | | 25 | | | 20,219 |
Clear Channel Communications, Inc., Sr. Unsec’d. Notes | | Caa1 | | 5.75% | | | 01/15/13 | | | 75 | | | 10,875 |
Clear Channel Communications, Inc., Sr. Unsec’d. Notes | | Caa1 | | 6.875% | | | 06/15/18 | | | 25 | | | 3,000 |
Dex Media West LLC / Dex Media Finance Co., Sr. Sub. Notes | | B2 | | 9.875% | | | 08/15/13 | | | 134 | | | 31,825 |
Dex Media West LLC / Dex Media Finance Co., Sr. Unsec’d. Notes | | B3 | | 8.00% | | | 11/15/13 | | | 70 | | | 12,950 |
DirecTV Holdings LLC / DirecTV Financing Co., Gtd. Notes | | Ba3 | | 8.375% | | | 03/15/13 | | | 50 | | | 49,750 |
Echostar DBS Corp., Gtd. Notes | | Ba3 | | 7.125% | | | 02/01/16 | | | 60 | | | 50,100 |
Idearc, Inc., Gtd. Notes | | Caa2 | | 8.00% | | | 11/15/16 | | | 115 | | | 8,625 |
Lamar Media Corp., Gtd. Notes | | Ba3 | | 6.625% | | | 08/15/15 | | | 125 | | | 90,312 |
LIN Television Corp., Gtd. Notes | | B3 | | 6.50% | | | 05/15/13 | | | 125 | | | 59,187 |
Medianews Group, Inc., Sr. Sub. Notes | | Ca | | 6.875% | | | 10/01/13 | | | 50 | | | 3,188 |
Morris Publishing Group LLC, Gtd. Notes | | Ca | | 7.00% | | | 08/01/13 | | | 25 | | | 2,250 |
Quebecor Media, Inc., Sr. Unsec’d. Notes (Canada) | | B2 | | 7.75% | | | 03/15/16 | | | 175 | | | 118,125 |
R.H. Donnelley Corp., Sr. Unsec’d. Notes | | Caa1 | | 8.875% | | | 01/15/16 | | | 25 | | | 3,750 |
R.H. Donnelley Corp., Sr. Unsec’d. Notes | | Caa1 | | 8.875% | | | 10/15/17 | | | 50 | | | 7,500 |
Sun Media Corp., Gtd. Notes (Canada) | | Ba2 | | 7.625% | | | 02/15/13 | | | 30 | | | 24,150 |
Time Warner, Inc., Gtd. Notes | | Baa2 | | 2.405% | (c) | | 11/13/09 | | | 800 | | | 770,020 |
Univision Communications, Inc., Gtd. Notes, PIK, 144A | | Caa2 | | 9.75% | | | 03/15/15 | | | 95 | | | 11,875 |
| | | | | | | | | | | | |
|
|
| | | | | | | | | | | | | | 1,362,157 |
| | | | | | | | | | | | |
|
|
Metals — 1.0% | | | | | | | | | | | | | |
Aleris International, Inc., Gtd. Notes, PIK | | Caa2 | | 9.00% | | | 12/15/14 | | | 25 | | | 1,500 |
Century Aluminum Co., Gtd. Notes | | B3 | | 7.50% | | | 08/15/14 | | | 25 | | | 14,375 |
FMG Finance Pty Ltd., Sr. Sec’d. Notes, 144A (Australia) | | B1 | | 10.625% | | | 09/01/16 | | | 150 | | | 87,000 |
Freeport-McMoRan Copper & Gold, Inc., Sr. Unsec’d. Notes | | Ba2 | | 7.084% | (c) | | 04/01/15 | | | 50 | | | 33,000 |
Freeport-McMoRan Copper & Gold, Inc., Sr. Unsec’d. Notes | | Ba2 | | 8.375% | | | 04/01/17 | | | 140 | | | 114,800 |
Gerdau Ameristeel Corp. / Gusap Partners, Gtd. Notes (Canada) | | Ba1 | | 10.375% | | | 07/15/11 | | | 145 | | | 146,450 |
Ispat Inland ULC, Gtd. Notes (Canada) | | Baa2 | | 9.75% | | | 04/01/14 | | | 334 | | | 285,878 |
Metals USA, Inc., Sr. Sec’d. Notes | | B3 | | 11.125% | | | 12/01/15 | | | 125 | | | 73,750 |
United States Steel Corp., Sr. Unsec’d. Notes | | Baa3 | | 7.00% | | | 02/01/18 | | | 90 | | | 61,339 |
| | | | | | | | | | | | |
|
|
| | | | | | | | | | | | | | 818,092 |
| | | | | | | | | | | | |
|
|
SEE NOTES TO FINANCIAL STATEMENTS.
A8
| | | | | | |
| | | DIVERSIFIED CONSERVATIVE GROWTH PORTFOLIO (continued) | | |
| |
| SCHEDULE OF INVESTMENTS | | December 31, 2008 |
| | | | | | | | | | | | |
CORPORATE BONDS
(continued) | | Moody’s
Ratings†
(Unaudited)
| | Interest
Rate
| | Maturity
Date
| | Principal
Amount
(000)#
| | Value
(Note 2)
|
| | | | | | | | | | | | | |
Non Captive Finance — 0.2% | | | | | | | | | | | | |
General Motors Acceptance Corp. LLC, Sr. Unsec’d. Notes | | C | | 6.75% | | 12/01/14 | | $ | 300 | | $ | 205,094 |
| | | | | | | | | | | |
|
|
Packaging — 0.9% | | | | | | | | | | | | |
Ball Corp., Gtd. Notes | | Ba1 | | 6.625% | | 03/15/18 | | | 100 | | | 89,500 |
Berry Plastics Holding Corp., Sr. Sec’d. Notes | | Caa1 | | 8.875% | | 09/15/14 | | | 125 | | | 54,375 |
BWAY Corp., Gtd. Notes | | B3 | | 10.00% | | 10/15/10 | | | 55 | | | 46,750 |
Crown Americas LLC/Crown Americas Capital Corp., Gtd. Notes | | B1 | | 7.625% | | 11/15/13 | | | 100 | | | 99,000 |
Crown Americas LLC/Crown Americas Capital Corp., Gtd. Notes | | B1 | | 7.75% | | 11/15/15 | | | 75 | | | 74,625 |
Exopac Holding Corp., Gtd. Notes | | B3 | | 11.25% | | 02/01/14 | | | 75 | | | 43,875 |
Graham Packaging Co., Inc., Gtd. Notes | | Caa1 | | 8.50% | | 10/15/12 | | | 30 | | | 21,375 |
Graham Packaging Co., Inc., Gtd. Notes | | Caa1 | | 9.875% | | 10/15/14 | | | 25 | | | 15,375 |
Greif, Inc., Gtd. Notes | | Ba2 | | 6.75% | | 02/01/17 | | | 175 | | | 154,875 |
Owens-Brockway Glass Container, Inc., Gtd. Notes | | Ba3 | | 8.25% | | 05/15/13 | | | 50 | | | 49,250 |
Silgan Holdings, Inc., Sr. Sub. Notes | | B1 | | 6.75% | | 11/15/13 | | | 90 | | | 77,400 |
| | | | | | | | | | | |
|
|
| | | | | | | | | | | | | 726,400 |
| | | | | | | | | | | |
|
|
Paper — 0.2% | | | | | | | | | | | | |
Domtar Corp., Gtd. Notes | | Ba3 | | 7.875% | | 10/15/11 | | | 75 | �� | | 63,750 |
Graphic Packaging International Corp., Gtd. Notes | | B3 | | 8.50% | | 08/15/11 | | | 50 | | | 41,750 |
Norampac Industries, Inc., Gtd. Notes (Canada) | | Ba3 | | 6.75% | | 06/01/13 | | | 30 | | | 13,500 |
Verso Paper Holdings LLC / Verso Paper, Inc., Gtd. Notes | | B3 | | 11.375% | | 08/01/16 | | | 75 | | | 22,500 |
| | | | | | | | | | | |
|
|
| | | | | | | | | | | | | 141,500 |
| | | | | | | | | | | |
|
|
Pipelines & Other — 1.0% | | | | | | | | | | | | |
El Paso Corp., Sr. Unsec’d. Notes | | Ba3 | | 7.00% | | 05/15/11 | | | 250 | | | 227,446 |
El Paso Corp., Sr. Unsec’d. Notes, MTN | | Ba3 | | 7.80% | | 08/01/31 | | | 100 | | | 65,150 |
Inergy LP Inergy Finance Corp., Gtd. Notes | | B1 | | 8.25% | | 03/01/16 | | | 25 | | | 19,500 |
Markwest Energy Partners LP / Markwest Energy Finance Corp., Gtd. Notes | | B2 | | 8.75% | | 04/15/18 | | | 45 | | | 27,900 |
Targa Resources, Inc., Gtd. Notes | | B3 | | 8.50% | | 11/01/13 | | | 125 | | | 67,500 |
Williams Cos., Inc., Sr. Unsec’d. Notes | | Baa3 | | 8.125% | | 03/15/12 | | | 100 | | | 92,125 |
Williams Cos., Inc., Sr. Unsec’d. Notes, 144A (original cost $350,000;
purchased 09/08/05)(f)(g) | | Baa3 | | 6.375% | | 10/01/10 | | | 350 | | | 326,281 |
| | | | | | | | | | | |
|
|
| | | | | | | | | | | | | 825,902 |
| | | | | | | | | | | |
|
|
Real Estate Investment Trusts — 0.7% | | | | | | | | | | | | |
Felcor Lodging LP, Gtd. Notes | | Ba3 | | 8.50% | | 06/01/11 | | | 50 | | | 37,000 |
Host Marriott LP, Gtd. Notes | | Ba1 | | 7.00% | | 08/15/12 | | | 100 | | | 84,750 |
iStar Financial, Inc., Sr. Unsec’d. Notes | | Ba3 | | 5.80% | | 03/15/11 | | | 100 | | | 35,000 |
Nationwide Health Properties, Inc., Sr. Unsec’d. Notes | | Baa3 | | 6.50% | | 07/15/11 | | | 100 | | | 90,772 |
Omega Healthcare Investors, Inc., Gtd. Notes | | Ba3 | | 7.00% | | 04/01/14 | | | 75 | | | 60,750 |
Omega Healthcare Investors, Inc., Gtd. Notes | | Ba3 | | 7.00% | | 01/15/16 | | | 100 | | | 75,000 |
Senior Housing Properties Trust, Sr. Unsec’d. Notes | | Ba1 | | 8.625% | | 01/15/12 | | | 208 | | | 178,880 |
| | | | | | | | | | | |
|
|
| | | | | | | | | | | | | 562,152 |
| | | | | | | | | | | |
|
|
Retailers — 0.2% | | | | | | | | | | | | |
Neiman Marcus Group, Inc. (The), Gtd. Notes, PIK | | B3 | | 9.00% | | 10/15/15 | | | 70 | | | 30,800 |
Susser Holdings LLC, Gtd. Notes | | B3 | | 10.625% | | 12/15/13 | | | 126 | | | 110,250 |
| | | | | | | | | | | |
|
|
| | | | | | | | | | | | | 141,050 |
| | | | | | | | | | | |
|
|
Technology — 1.2% | | | | | | | | | | | | |
Affiliated Computer Services, Inc., Sr. Unsec’d. Notes | | Ba2 | | 4.70% | | 06/01/10 | | | 255 | | | 237,150 |
Avago Technologies Finance, Gtd. Notes (Singapore) | | B1 | | 10.125% | | 12/01/13 | | | 160 | | | 121,800 |
Avago Technologies Finance, Gtd. Notes (Singapore) | | B3 | | 11.875% | | 12/01/15 | | | 50 | | | 34,750 |
First Data Corp., Gtd. Notes | | B3 | | 9.875% | | 09/24/15 | | | 25 | | | 15,125 |
Freescale Semiconductor, Inc., Gtd. Notes, PIK | | B2 | | 9.125% | | 12/15/14 | | | 225 | | | 51,750 |
Iron Mountain, Inc., Gtd. Notes | | B2 | | 8.625% | | 04/01/13 | | | 145 | | | 136,300 |
Seagate Technology HDD Holdings, Gtd. Notes (Cayman Islands) | | Ba1 | | 6.375% | | 10/01/11 | | | 50 | | | 34,500 |
Seagate Technology HDD Holdings, Gtd. Notes (Cayman Islands) | | Ba1 | | 6.80% | | 10/01/16 | | | 75 | | | 39,000 |
Sensata Technologies BV, Gtd. Notes (Netherlands) | | Caa1 | | 8.00% | | 05/01/14 | | | 150 | | | 67,500 |
Serena Software, Inc., Gtd. Notes | | Caa1 | | 10.375% | | 03/15/16 | | | 95 | | | 48,213 |
SEE NOTES TO FINANCIAL STATEMENTS.
A9
| | | | | | |
| | | DIVERSIFIED CONSERVATIVE GROWTH PORTFOLIO (continued) | | |
| |
| SCHEDULE OF INVESTMENTS | | December 31, 2008 |
| | | | | | | | | | | | | |
CORPORATE BONDS
(continued) | | Moody’s
Ratings†
(Unaudited)
| | Interest
Rate
| | | Maturity
Date
| | Principal
Amount
(000)#
| | Value
(Note 2)
|
| | | | | | | | | | | | | | |
Technology (continued) | | | | | | | | | | | | | |
STATS ChipPAC Ltd., Gtd. Notes (Singapore) | | Ba1 | | 6.75% | | | 11/15/11 | | $ | 50 | | $ | 37,125 |
STATS ChipPAC Ltd., Gtd. Notes (Singapore) | | Ba1 | | 7.50% | | | 07/19/10 | | | 75 | | | 61,687 |
Sungard Data Systems, Inc., Sr. Unsec’d. Notes, 144A | | Caa1 | | 10.625% | | | 05/15/15 | | | 100 | | | 85,500 |
| | | | | | | | | | | | |
|
|
| | | | | | | | | | | | | | 970,400 |
| | | | | | | | | | | | |
|
|
Telecom — 2.1% | | | | | | | | | | | | | |
American Tower Corp., Sr. Unsec’d. Notes | | Ba1 | | 7.125% | | | 10/15/12 | | | 75 | | | 73,875 |
Centennial Cellular Operating Co., Gtd. Notes | | B2 | | 10.125% | | | 06/15/13 | | | 25 | | | 25,250 |
FairPoint Communications, Inc., Sr. Unsec’d. Notes, 144A | | B3 | | 13.125% | | | 04/01/18 | | | 100 | | | 48,000 |
Frontier Communications Corp., Sr. Unsec’d. Notes | | Ba2 | | 9.00% | | | 08/15/31 | | | 15 | | | 9,450 |
Frontier Communications Corp., Sr. Unsec’d. Notes | | Ba2 | | 9.25% | | | 05/15/11 | | | 75 | | | 71,250 |
Hawaiian Telcom Communications, Inc., Gtd. Notes(g)(i) | | C | | 12.50% | | | 05/01/15 | | | 75 | | | 375 |
Level 3 Financing, Inc., Gtd. Notes | | Caa1 | | 12.25% | | | 03/15/13 | | | 125 | | | 75,625 |
Qwest Corp., Sr. Unsec’d. Notes | | Ba1 | | 7.50% | | | 10/01/14 | | | 75 | | | 62,250 |
Qwest Corp., Sr. Unsec’d. Notes | | Ba1 | | 7.625% | | | 06/15/15 | | | 500 | | | 410,000 |
Sprint Capital Corp., Gtd. Notes | | Ba2 | | 8.375% | | | 03/15/12 | | | 1,000 | | | 800,000 |
Sprint Capital Corp., Gtd. Notes | | Ba2 | | 8.75% | | | 03/15/32 | | | 100 | | | 67,500 |
Time Warner Telecom Holdings, Inc., Gtd. Notes | | B3 | | 9.25% | | | 02/15/14 | | | 25 | | | 20,500 |
Windstream Corp., Gtd. Notes | | Ba3 | | 8.625% | | | 08/01/16 | | | 100 | | | 88,500 |
| | | | | | | | | | | | |
|
|
| | | | | | | | | | | | | | 1,752,575 |
| | | | | | | | | | | | |
|
|
TOTAL CORPORATE BONDS
(cost $35,401,686) | | | 28,111,731 |
| | | | | | | | | | | | |
|
|
| U.S. GOVERNMENT MORTGAGE-BACKED OBLIGATIONS — 39.7% | | | | | | | | | |
Federal Home Loan Mortgage Corp. | | 5.00% | | | TBA | | | 2,000 | | | 2,043,750 |
Federal Home Loan Mortgage Corp. | | 5.50% | | | 04/01/38 | | | 854 | | | 875,182 |
Federal Home Loan Mortgage Corp. | | 5.50% | | | TBA | | | 5,000 | | | 5,117,190 |
Federal National Mortgage Assoc. | | 4.00% | | | 06/01/19-03/01/20 | | | 1,867 | | | 1,915,121 |
Federal National Mortgage Assoc. | | 4.488% | (c) | | 05/01/36 | | | 138 | | | 137,351 |
Federal National Mortgage Assoc. | | 4.50% | | | 03/01/35-09/01/35 | | | 1,244 | | | 1,263,883 |
Federal National Mortgage Assoc. | | 4.50% | | | TBA | | | 4,200 | | | 4,291,875 |
Federal National Mortgage Assoc. | | 5.00% | | | 01/01/19-08/01/37 | | | 435 | | | 445,978 |
Federal National Mortgage Assoc. | | 5.00% | | | TBA | | | 4,000 | | | 4,083,752 |
Federal National Mortgage Assoc. | | 5.00% | | | TBA | | | 1,000 | | | 1,017,812 |
Federal National Mortgage Assoc. | | 5.192% | (c) | | 02/01/36 | | | 175 | | | 176,446 |
Federal National Mortgage Assoc. | | 5.50% | | | TBA | | | 200 | | | 205,000 |
Federal National Mortgage Assoc. | | 6.00% | | | 11/01/32 | | | 6 | | | 6,094 |
Federal National Mortgage Assoc. | | 6.259% | (c) | | 08/01/29 | | | 25 | | | 24,458 |
Federal National Mortgage Assoc. | | 6.50% | | | 06/01/18-10/01/32 | | | 248 | | | 260,164 |
Federal National Mortgage Assoc. | | 6.50% | | | TBA | | | 500 | | | 519,219 |
Government National Mortgage Assoc. | | 4.625% | (c) | | 08/20/24 | | | 5 | | | 5,048 |
Government National Mortgage Assoc. | | 5.00% | | | TBA | | | 900 | | | 922,500 |
Government National Mortgage Assoc. | | 5.125% | (c) | | 10/20/27-11/20/29 | | | 38 | | | 37,629 |
Government National Mortgage Assoc. | | 5.375% | (c) | | 04/20/27 | | | 48 | | | 48,252 |
Government National Mortgage Assoc. | | 5.50% | | | 11/15/28-09/15/33 | | | 77 | | | 79,905 |
Government National Mortgage Assoc. | | 5.50% | | | TBA | | | 2,600 | | | 2,677,189 |
Government National Mortgage Assoc. | | 6.00% | | | TBA | | | 3,800 | | | 3,919,936 |
Government National Mortgage Assoc. | | 6.50% | | | TBA | | | 3,000 | | | 3,119,064 |
Government National Mortgage Assoc. | | 8.00% | | | 08/20/31 | | | 3 | | | 3,399 |
Government National Mortgage Assoc. | | 8.50% | | | 02/20/26-04/20/31 | | | 27 | | | 29,658 |
| | | | | | | | | | | | |
|
|
TOTAL U.S. GOVERNMENT MORTGAGE-BACKED OBLIGATIONS
(cost $32,608,478) | | | 33,225,855 |
| | | | | | | | | | | | |
|
|
| U.S. TREASURY OBLIGATIONS — 7.3% | | | | | | | | | | | | | |
U.S. Treasury Bonds | | 4.50% | | | 05/15/38 | | | 100 | | | 136,484 |
U.S. Treasury Inflationary Indexed Bonds, TIPS | | 2.375% | | | 01/15/25 | | | 400 | | | 451,681 |
U.S. Treasury Notes | | 2.00% | | | 11/30/13 | | | 800 | | | 820,750 |
U.S. Treasury Notes | | 4.625% | | | 02/15/17 | | | 1,400 | | | 1,655,718 |
SEE NOTES TO FINANCIAL STATEMENTS.
A10
| | | | | | |
| | | DIVERSIFIED CONSERVATIVE GROWTH PORTFOLIO (continued) | | |
| |
| SCHEDULE OF INVESTMENTS | | December 31, 2008 |
| | | | | | | | | | | | | |
| U.S. TREASURY OBLIGATIONS (continued) | | Moody’s
Ratings†
(Unaudited)
| | Interest
Rate
| | | Maturity
Date
| | Principal
Amount
(000)#
| | Value
(Note 2)
|
| | | | | | | | | | | | | | |
U.S. Treasury Notes | | 8.125% | | | 08/15/19 | | $ | 300 | | $ | 443,391 |
U.S. Treasury Strips, PO | | 4.50% | | | 08/15/21 | | | 300 | | | 196,633 |
U.S. Treasury Strips, PO | | 8.125% | | | 05/15/21 | | | 2,200 | | | 1,456,213 |
U.S. Treasury Strips, PO | | 8.00% | | | 11/15/21 | | | 1,100 | | | 713,171 |
U.S. Treasury Strips, PO | | 8.00% | | | 11/15/21 | | | 300 | | | 194,132 |
| | | | | | | | | | | | |
|
|
TOTAL U.S. TREASURY OBLIGATIONS
(cost $5,569,375) | | | 6,068,173 |
| | | | | | | | | | | | |
|
|
| U.S. GOVERNMENT AGENCY OBLIGATIONS — 0.4% | | | | | | | | | | | |
Federal National Mortgage Assoc. | | 6.318% | | | 06/15/27 | | | 200 | | | 219,369 |
Small Business Administration Participation Certificates, Series 2000-20A, Class 1 | | 7.59% | | | 01/01/20 | | | 108 | | | 114,165 |
Small Business Administration Participation Certificates, Series 2000-P10A, Class 1 | | 8.017% | | | 02/10/10 | | | 43 | | | 44,193 |
| | | | | | | | | | | | |
|
|
TOTAL U.S. GOVERNMENT AGENCY OBLIGATIONS
(cost $360,088) | | | 377,727 |
| | | | | | | | | | | | |
|
|
| COLLATERALIZED MORTGAGE OBLIGATIONS — 4.7% | | | | | | | | | | | |
Bear Stearns Adjustable Rate Mortgage Trust, Series 2005-5, Class A1 | | Aaa | | 2.74% | (c) | | 08/25/35 | | | 286 | | | 239,670 |
Bear Stearns Alt-A Trust, Series 2005-4, Class 23A2 | | Aaa | | 5.360% | (c) | | 05/25/35 | | | 125 | | | 86,643 |
Countrywide Alternative Loan Trust, Series 2006-HY13, Class 4A1 | | AAA(d) | | 5.894% | (c) | | 02/25/37 | | | 195 | | | 105,265 |
Countrywide Alternative Loan Trust, Series 2006-OA11, Class A1B | | Aaa | | 0.661% | (c) | | 09/25/46 | | | 194 | | | 75,721 |
Countrywide Alternative Loan Trust, Series 2007-OA7, Class A1A | | Aaa | | 0.651% | (c) | | 05/25/47 | | | 159 | | | 65,370 |
FHLMC Structured Pass-Through Securities, Series T-61, Class 1A1 | | Aaa | | 3.655% | (c) | | 07/25/44 | | | 370 | | | 333,283 |
Freddie Mac, Series 2266, Class F | | Aaa | | 1.645% | (c) | | 11/15/30 | | | 11 | | | 10,407 |
Freddie Mac, Series 2888, Class ZG | | Aaa | | 4.50% | | | 11/15/19 | | | 120 | | | 113,166 |
Freddie Mac, Series 3010, Class WB | | Aaa | | 4.50% | | | 07/15/20 | | | 1,000 | | | 990,537 |
Government National Mortgage Assoc., Series 2000-15, Class Z | | Aaa | | 7.50% | | | 02/20/30 | | | 195 | | | 211,165 |
Greenpoint Mortgage Funding Trust, Series 2006-AR6, Class A1A | | Aaa | | 0.551% | (c) | | 10/25/46 | | | 116 | | | 92,905 |
Harborview Mortgage Loan Trust, Series 2006-5, Class 2A1A | | Aaa | | 0.761% | (c) | | 07/19/46 | | | 197 | | | 79,925 |
Impac Secured Assets CMN Owner Trust, Series 2006-4, Class A2A | | Aa2 | | 0.551% | (c) | | 01/25/37 | | | 65 | | | 60,010 |
Merrill Lynch Floating Trust, Series 2006-1, Class A1, 144A
(original cost $144,030; purchased 10/31/06)(f)(g) | | Aaa | | 1.265% | (c) | | 06/15/22 | | | 144 | | | 109,255 |
Merrill Lynch Mortgage Investors, Inc., Series 2005-A10, Class A | | Aaa | | 0.681% | (c) | | 02/25/36 | | | 92 | | | 48,912 |
Structured Asset Mortgage Investments, Inc., Series 2005-AR8, Class A1A | | Aaa | | 0.751% | (c) | | 02/25/36 | | | 390 | | | 185,481 |
Thornburg Mortgage Securities Trust, Series 2006-2, Class A1C | | A3 | | 0.591% | (c) | | 03/25/46 | | | 200 | | | 198,072 |
WaMu Mortgage Pass-Through Certificates, Series 2002-AR17, Class 1A | | Aaa | | 3.456% | (c) | | 11/25/42 | | | 57 | | | 46,867 |
WaMu Mortgage Pass-Through Certificates, Series 2003-R1, Class A1 | | Aaa | | 1.011% | (c) | | 12/25/27 | | | 490 | | | 406,070 |
WaMu Mortgage Pass-Through Certificates, Series 2005-AR13, Class A1A1 | | Aaa | | 0.761% | (c) | | 10/25/45 | | | 102 | | | 55,822 |
WaMu Mortgage Pass-Through Certificates, Series 2006-AR17, Class 1A1A | | Aaa | | 3.066% | (c) | | 12/25/46 | | | 141 | | | 60,305 |
WaMu Mortgage Pass-Through Certificates, Series 2006-AR17, Class 2A | | Aaa | | 4.625% | (c) | | 12/25/46 | | | 159 | | | 73,065 |
WaMu Mortgage Pass-Through Certificates, Series 2007-HY1, Class 2A3 | | BB(d) | | 5.863% | (c) | | 02/25/37 | | | 198 | | | 139,025 |
WaMu Mortgage Pass-Through Certificates, Series 2007-HY2, Class 1A1 | | AAA(d) | | 5.606% | (c) | | 12/25/36 | | | 197 | | | 97,620 |
WaMu Mortgage Pass-Through Certificates, Series 2007-OA3, Class 2A1A | | Aaa | | 3.016% | (c) | | 04/25/47 | | | 197 | | | 86,588 |
| | | | | | | | | | | | |
|
|
TOTAL COLLATERALIZED MORTGAGE OBLIGATIONS
(cost $4,894,617) | | | 3,971,149 |
| | | | | | | | | | | | |
|
|
| FOREIGN GOVERNMENT BONDS — 3.2% | | | | | | | | | | | | | |
Bundesrepublik Deutschland, (Germany) | | Aaa | | 4.25% | | | 07/04/39 | | | EUR 300 | | | 473,611 |
Bundesrepublik Deutschland, (Germany) | | Aaa | | 6.25% | | | 01/04/30 | | | EUR 100 | | | 186,068 |
Development Bank of Japan, (Japan) | | Aaa | | 1.75% | | | 06/21/10 | | | JPY 10,000 | | | 112,028 |
France Government Bond, (France) | | Aaa | | 5.75% | | | 10/25/32 | | | EUR 100 | | | 177,134 |
United Kingdom Gilt, (United Kingdom) | | Aaa | | 4.25% | | | 03/07/11 | | | GBP 300 | | | 453,845 |
United Kingdom Gilt, (United Kingdom) | | AAA(d) | | 5.00% | | | 03/07/12 | | | GBP 100 | | | 155,743 |
United Kingdom Gilt, (United Kingdom) | | Aaa | | 5.00% | | | 09/07/14 | | | GBP 700 | | | 1,123,434 |
| | | | | | | | | | | | |
|
|
TOTAL FOREIGN GOVERNMENT BONDS
(cost $2,850,763) | | | 2,681,863 |
| | | | | | | | | | | | |
|
|
SEE NOTES TO FINANCIAL STATEMENTS.
A11
| | | | | | |
| | | DIVERSIFIED CONSERVATIVE GROWTH PORTFOLIO (continued) | | |
| |
| SCHEDULE OF INVESTMENTS | | December 31, 2008 |
| | | | | | | | | | | | | |
| ASSET-BACKED SECURITIES | | Moody’s
Ratings†
(Unaudited)
| | Interest
Rate
| | | Maturity
Date
| | Principal
Amount
(000)#
| | Value
(Note 2)
|
| | | | | | | | | | | | | | |
Asset Backed Securities Corp. Home Equity, Series 2004-HE6, Class A1
(cost $20,700) | | Aaa | | 0.746% | (c) | | 09/25/34 | | $ | 21 | | $ | 16,461 |
| | | | | | | | | | | | |
|
|
| MUNICIPAL BONDS — 0.9% | | | | | | | | | | | | | |
California — 0.1% | | | |
State of California, General Obligation Bonds | | A1 | | 4.50% | | | 08/01/28 | | | 100 | | | 80,967 |
| | | | | | | | | | | | |
|
|
Louisiana — 0.2% | | | |
Tobacco Settlement Financing Corp., Revenue Bonds, Series 2001B | | Baa | | 5.875% | | | 05/15/39 | | | 290 | | | 181,102 |
| | | | | | | | | | | | |
|
|
Massachusetts — 0.3% | | | |
Massachusetts Water Resources Authority, Revenue Bonds, Series J(l) | | Aaa | | 5.00% | (c) | | 08/01/32 | | | 250 | | | 236,740 |
| | | | | | | | | | | | |
|
|
Ohio — 0.3% | | | | | | | | | | | | | |
Buckeye Tobacco Settlement Financing Authority, Revenue Bonds, Series A-2 | | Baa | | 5.875% | | | 06/01/47 | | | 500 | | | 281,285 |
| | | | | | | | | | | | |
|
|
TOTAL MUNICIPAL BONDS
(cost $1,047,605) | | | 780,094 |
| | | | | | | | | | | | |
|
|
| CONVERTIBLE BOND — 0.8% | | | | | | | | | | | | | |
Healthcare & Pharmaceuticals | | | | | | | | | | | | | |
LifePoint Hospitals, Inc., Sr. Unsec’d. Notes (cost $1,000,000) | | B(d) | | 3.50% | | | 05/15/14 | | | 1,000 | | | 676,250 |
| | | | | | | | | | | | |
|
|
| BANK NOTE — 0.7% | | | | | | | | | | | | | |
Chrysler Financial, Term, 144A (original cost $1,031,938; purchased 11/28/07) (cost $1,040,428)(f)(g) | | Caa | | 6.00% | (c) | | 08/03/14 | | | 1,086 | | | 547,004 |
| | | | | | | | | | | | |
|
|
TOTAL LONG-TERM INVESTMENTS
(cost $119,329,786) | | | 109,108,917 |
| | | | | | | | | | | | |
|
|
| SHORT-TERM INVESTMENTS — 8.9% | | | | | | | | | | | | | |
U.S. TREASURY OBLIGATIONS(n) — 1.2% | | | | | | | | | | | | | |
U.S. Treasury Bills | | 0.02% | | | 01/02/09 | | | 380 | | | 380,000 |
U.S. Treasury Bills | | 0.04% | | | 03/26/09 | | | 250 | | | 249,971 |
U.S. Treasury Bills | | 0.11% | | | 01/29/09 | | | 380 | | | 380,000 |
| | | | | | | | | | | | |
|
|
TOTAL U.S. TREASURY OBLIGATIONS
(cost $1,009,982) | | | 1,009,971 |
| | | | | | | | | | | | |
|
|
| OPTIONS PURCHASED* — 0.7% | | | | | | | Contracts/
Notional
Amount
(000)#
| | |
| | | | | | | | | | | | | | |
Call Options — 0.7% | | | | | | | | | | | | | |
2 Year Euro-Schatz,
expiring 02/20/2009, Strike Price $120.00 | | | | | | | | | | EUR 2,200 | | | 153 |
2 Year U.S. Treasury Note Futures,
expiring 01/23/2009, Strike Price $111.00 | | | | | | | | | $ | 1,400 | | | 109 |
5 Year Euro-BOBL,
expiring 02/20/2009, Strike Price $135.00 | | | | | | | | | | EUR 4,100 | | | 285 |
5 Year U.S. Treasury Note Futures,
expiring 01/23/2009, Strike Price $126.00 | | | | | | | | | | 2,200 | | | 172 |
expiring 01/23/2009, Strike Price $142.00 | | | | | | | | | | 4,100 | | | 641 |
Interest Rate Swap Options,
expiring 08/03/2009 @ 3.45% | | | | | | | | | | 700 | | | 23,221 |
expiring 08/03/2009 @ 3.45% | | | | | | | | | | 7,100 | | | 235,529 |
expiring 08/03/2009 @ 3.45% | | | | | | | | | | 9,000 | | | 298,557 |
| | | | | | | | | | | | |
|
|
| | | | | | | | | | | | | | 558,667 |
| | | | | | | | | | | | |
|
|
Put Options | | | | | | | | | | | | | |
5 Year U.S. Treasury Note Futures,
expiring 02/20/2009, Strike Price $85.00 | | | | | | | | | | EUR 3,400 | | | 266 |
10 Year Euro-BUND,
expiring 02/20/2009, Strike Price $100.00 | | | | | | | | | | 800 | | | 111 |
SEE NOTES TO FINANCIAL STATEMENTS.
A12
| | | | | | |
| | | DIVERSIFIED CONSERVATIVE GROWTH PORTFOLIO (continued) | | |
| |
| SCHEDULE OF INVESTMENTS | | December 31, 2008 |
| | | | | | | | | |
| OPTIONS PURCHASED* (continued) | | Contracts/
Notional
Amount
(000)#
| | Value
(Note 2)
| |
| | | | | | | | | | |
FNMA,
expiring 02/05/2009, Strike Price $50.00 | | | | | EUR 500 | | $ | — | |
expiring 02/05/2009, Strike Price $52.00 | | | | $ | 5,000 | | | — | |
expiring 02/11/2009, Strike Price $50.00 | | | | | 3,500 | | | — | |
FNMA Gold,
expiring 02/05/2009, Strike Price $71.25 | | | | | 2,000 | | | — | |
GNMA,
expiring 01/14/2009, Strike Price $54.00 | | | | | 2,600 | | | — | |
expiring 01/14/2009, Strike Price $60.00 | | | | | 1,000 | | | — | |
expiring 01/14/2009, Strike Price $67.00 | | | | | 2,000 | | | — | |
expiring 02/12/2009, Strike Price $77.25 | | | | | 3,200 | | | — | |
| | | | | | | |
|
|
|
| | | | | | | | | 377 | |
| | | | | | | |
|
|
|
TOTAL OPTIONS PURCHASED
(cost $201,672) | | | 559,044 | |
| | | | | | | |
|
|
|
| | |
| | | Principal
Amount
(000)#
| | | |
| REPURCHASE AGREEMENT(m) — 1.0% | | | | | | | | | |
JPMorgan Chase, 0.00%, dated 12/05/08, due 01/09/09 in the amount of $812,250
(cost $812,250; the value of collateral plus interest was $822,383) | | | | $ | 812 | | | 812,250 | |
| | | | | | | |
|
|
|
| | |
| | | Shares
| | | |
| AFFILIATED MONEY MARKET MUTUAL FUND — 6.0% | | | | | | | | | |
Dryden Core Investment Fund — Taxable Money Market Series
(cost $5,033,918) (Note 4)(w) | | | | | 5,033,918 | | | 5,033,918 | |
| | | | | | | |
|
|
|
TOTAL SHORT-TERM INVESTMENTS
(cost $7,057,822) | | | 7,415,183 | |
| | | | | | | |
|
|
|
TOTAL INVESTMENTS, BEFORE OPTIONS WRITTEN AND SECURITIES SOLD SHORT — 139.3%
(cost $126,387,608) | | | 116,524,100 | |
| | | | | | | |
|
|
|
| | | Contracts/
Notional
Amounts
(000)#
| | | |
| OPTIONS WRITTEN — (0.8)% | | | | | | | | | |
Call Options — (0.8)% | | | | | | | | | |
Interest Rate Swap Options,
expiring 08/03/2009 @ 4.15% | | | | $ | 300 | | | (26,150 | ) |
expiring 08/03/2009 @ 4.40% | | | | | 2,400 | | | (297,060 | ) |
expiring 08/03/2009 @ 4.40% | | | | | 3,000 | | | (371,326 | ) |
| | | | | | | |
|
|
|
| | | | | | | | | (694,536 | ) |
| | | | | | | |
|
|
|
| | | | | | | | | | |
Put Options | | | | | | | | | |
Interest Rate Swap Options,
expiring 05/22/2009 @ 2.75% | | | 500 | | | (5,384 | ) |
expiring 05/22/2009 @ 2.75% | | | 500 | | | (5,385 | ) |
| | | | | | | |
|
|
|
| | | | | | | | | (10,769 | ) |
| | | | | | | |
|
|
|
TOTAL OPTIONS WRITTEN
(premiums received $203,446) | | | (705,305 | ) |
| | | | | | | |
|
|
|
SEE NOTES TO FINANCIAL STATEMENTS.
A13
| | | | | | |
| | | DIVERSIFIED CONSERVATIVE GROWTH PORTFOLIO (continued) | | |
| |
| SCHEDULE OF INVESTMENTS | | December 31, 2008 |
| | | | | | | | | | | | | |
| SECURITIES SOLD SHORT — (6.8)% | | Interest
Rate
| | Maturity
Date
| | Principal
Amount
(000)#
| | Value
(Note 2)
| |
| | | | | | | | | | | | | | |
U.S. Treasury Notes | | 2.00% | | 11/30/13 | | | | $ | 800 | | $ | (820,750 | ) |
U.S. Treasury Notes | | 4.625% | | 02/15/17 | | | | | 4,100 | | | (4,848,890 | ) |
| | | | | | | | | | | |
|
|
|
TOTAL SECURITIES SOLD SHORT
(proceeds received $5,572,062) | | | (5,669,640 | ) |
| | | | | | | | | | | |
|
|
|
TOTAL INVESTMENTS, NET OF OPTIONS WRITTEN AND SECURITIES SOLD SHORT — 131.7%
(cost $120,612,100) | | | 110,149,155 | |
LIABILITIES IN EXCESS OF OTHER ASSETS(x) — (31.7)% | | | (26,516,252 | ) |
| | | | | | | | | | | |
|
|
|
NET ASSETS — 100.0% | | $ | 83,632,903 | |
| | | | | | | | | | | |
|
|
|
The following abbreviations are used in portfolio descriptions:
| | |
| 144A | | Security was purchased pursuant to Rule 144A under the Securities Act of 1933 and may not be resold subject to that rule except to qualified institutional buyers. Unless otherwise noted, 144A securities are deemed to be liquid. |
| ADR | | American Depositary Receipt |
| CVT | | Convertible Security |
| FDIC | | Federal Deposit Insurance Corp. |
| FHLMC | | Federal Home Loan Mortgage Corp. |
| FNMA | | Federal National Mortgage Association |
| GNMA | | Government National Mortgage Assoc |
| MTN | | Medium Term Note |
| NR | | Not Rated by Moody’s or Standard & Poor’s |
| PIK | | Payment-in-kind |
| PO | | Principal Only |
| TBA | | To Be Announced |
| TIPS | | Treasury Inflation Protected Securities |
| BRL | | Brazilian Real |
| CNY | | Chinese Yuan |
| EUR | | Euro |
| GBP | | British Pound |
| INR | | Indian Rupee |
| JPY | | Japanese Yen |
| MYR | | Malaysian Ringgit |
| MXN | | Mexican Paso |
| RUB | | Russian Ruble |
| # | Principal amount is shown in U.S. dollars unless otherwise stated. |
| * | Non-income producing security. |
| † | The rating reflected is as of December 31, 2008. Rating of certain bonds may have changed subsequent to that date. |
| (c) | Indicates a variable rate security. |
| (d) | Standard & Poor’s rating. |
| (f) | Private Placement restricted as to resale and does not have a readily available market. The aggregate original cost of such securities is $3,323,205. The aggregate value of $2,460,306 is approximately 2.9% of net assets. |
| (g) | Indicates a security that has been deemed illiquid. |
| (i) | Represents issuer in default on interest payments. Non-income producing security. |
| (l) | Represents all or partial amount utilized in the Municipal Tender Option Bond transaction. The aggregated principal amount of the inverse floaters and the floating rate notes (included in Liabilities) are $125,000 and $125,000, respectively. |
| (m) | Repurchase agreement is collateralized by United States Treasuries or federal agency obligations. |
| (n) | Rates shown are the effective yields at purchase date. |
| (t) | Interest rate is the effective yield as of December 31, 2008. |
| (w) | Prudential Investments LLC, the manager of the Portfolio also serves as manager of the Dryden Core Investment Fund-Taxable Money Market Series. |
SEE NOTES TO FINANCIAL STATEMENTS.
A14
| | | | | | |
| | | DIVERSIFIED CONSERVATIVE GROWTH PORTFOLIO (continued) | | |
| |
| SCHEDULE OF INVESTMENTS | | December 31, 2008 |
| (x) | Liabilities in excess of other assets includes net unrealized appreciation (depreciation) on futures contracts, forward foreign currency exchange contracts, interest rate and credit default swaps and reverse repurchase agreements as follows: |
Future contracts open at December 31, 2008:
| | | | | | | | | | | | | | |
Number of
Contracts
| | Type
| | Expiration
Date
| | Value at
Trade Date
| | Value at
December 31, 2008
| | Unrealized
Appreciation
(Depreciation)
| |
| Long Positions: | | | | | | | | | | | | | | |
| 48 | | 90 Day Euro Dollar | | Jun 09 | | $ | 11,711,075 | | $ | 11,864,400 | | $ | 153,325 | |
| 45 | | 90 Day Euro Dollar | | Sep 09 | | | 10,816,325 | | | 11,108,813 | | | 292,488 | |
| 29 | | 90 Day Euro Dollar | | Mar 10 | | | 7,000,962 | | | 7,139,075 | | | 138,113 | |
| 22 | | 90 Day Euro EURIBOR | | Mar 09 | | | 7,270,027 | | | 7,474,771 | | | 204,744 | |
| 18 | | 90 Day Sterling | | Mar 09 | | | 3,147,414 | | | 3,177,846 | | | 30,432 | |
| 31 | | 90 Day Sterling | | Jun 09 | | | 5,245,227 | | | 5,480,479 | | | 235,252 | |
| 4 | | 90 Day Sterling | | Sep 09 | | | 677,721 | | | 706,332 | | | 28,611 | |
| 33 | | 90 Day Sterling | | Dec 09 | | | 5,609,845 | | | 5,805,294 | | | 195,449 | |
| 44 | | 5 Year U.S. Treasury Note | | Mar 09 | | | 5,188,375 | | | 5,238,406 | | | 50,031 | |
| 8 | | 10 Year Euro-Bund | | Mar 09 | | | 1,362,358 | | | 1,388,268 | | | 25,910 | |
| 1 | | 10 Year UK Gilt | | Mar 09 | | | 167,498 | | | 177,519 | | | 10,021 | |
| | | | | | | | | | | | |
|
|
|
| | | | | | | | | | | | | | 1,364,376 | |
| | | | | | | | | | | | |
|
|
|
| Short Position: | | | | | | | | | | | | | | |
| 41 | | 5 Year Euro-Bobl | | Mar 09 | | | 6,572,595 | | | 6,623,033 | | | (50,438 | ) |
| | | | | | | | | | | | |
|
|
|
| | | | | | | | | | | | | $ | 1,313,938 | (1) |
| | | | | | | | | | | | |
|
|
|
(1) | Cash of $451,500 has been segregated with the broker to cover requirements for open futures contracts at December 31, 2008 |
Forward foreign currency exchange contracts outstanding at December 31, 2008:
| | | | | | | | | | | | |
Purchase Contracts
| | Notional
Amount (000)
| | Value at Settlement
Date Payable
| | Current
Value
| | Unrealized
Appreciation
(Depreciation)
| |
Brazilian Real, | | | | | | | | | | | | |
Expiring 02/03/09 | | BRL 188 | | $ | 84,780 | | $ | 79,629 | | $ | (5,151 | ) |
Expiring 06/02/09 | | BRL 445 | | | 233,864 | | | 181,458 | | | (52,406 | ) |
Chinese Yuan, | | | | | | | | | | | | |
Expiring 05/06/09 | | CNY 3,051 | | | 440,754 | | | 440,347 | | | (407 | ) |
Expiring 07/15/09 | | CNY 3,620 | | | 531,301 | | | 521,125 | | | (10,176 | ) |
Expiring 09/08/09 | | CNY 1,517 | | | 220,000 | | | 218,017 | | | (1,983 | ) |
Euro, Expiring 01/13/09 | | EUR 53 | | | 69,610 | | | 73,628 | | | 4,018 | |
Indian Rupee, Expiring 04/09/09 | | INR 20,067 | | | 399,648 | | | 408,571 | | | 8,923 | |
Malaysian Ringgit, | | | | | | | | | | | | |
Expiring 02/12/09 | | MYR 271 | | | 76,720 | | | 78,185 | | | 1,465 | |
Expiring 04/14/09 | | MYR 212 | | | 60,000 | | | 61,032 | | | 1,032 | |
Russian Ruble, Expiring 05/06/09 | | RUB 16,902 | | | 504,547 | | | 490,159 | | | (14,388 | ) |
| | | | |
|
| |
|
| |
|
|
|
| | | | | $ | 2,621,224 | | $ | 2,552,151 | | $ | (69,073 | ) |
| | | | |
|
| |
|
| |
|
|
|
| | | | |
Sale Contracts
| | Notional
Amount (000)
| | Value at Settlement
Date Receivable
| | Current
Value
| | Unrealized
Appreciation
(Depreciation)
| |
British Pound, Expiring 01/13/09 | | GBP 1,795 | | $ | 2,665,583 | | $ | 2,579,787 | | $ | 85,796 | |
Chinese Yuan, Expiring 07/15/09 | | CNY 6,877 | | | 988,000 | | | 989,943 | | | (1,943 | ) |
Euro, Expiring 01/13/09 | | EUR 24 | | | 30,499 | | | 33,341 | | | (2,842 | ) |
Japanese Yen, Expiring 01/08/09 | | JPY 66,161 | | | 695,617 | | | 729,976 | | | (34,359 | ) |
Russian Ruble, Expiring 05/06/09 | | RUB 16,902 | | | 581,943 | | | 490,159 | | | 91,784 | |
| | | | |
|
| |
|
| |
|
|
|
| | | | | $ | 4,961,642 | | $ | 4,823,206 | | $ | 138,436 | |
| | | | |
|
| |
|
| |
|
|
|
SEE NOTES TO FINANCIAL STATEMENTS.
A15
| | | | | | |
| | | DIVERSIFIED CONSERVATIVE GROWTH PORTFOLIO (continued) | | |
| |
| SCHEDULE OF INVESTMENTS | | December 31, 2008 |
Interest rate swap agreements outstanding at December 31, 2008:
| | | | | | | | | | | | | |
Counterparty
| | Termination
Date
| | Notional
Amount#
(000)
| | Fixed
Rate
| | Floating Rate
| | Unrealized
Appreciation
(Depreciation)
| |
Bank of America Securities LLC(2) | | 12/17/38 | | $ | 600 | | 5.00% | | 3 Month LIBOR | | $ | (261,365 | ) |
Barclays Capital(1) | | 06/17/16 | | | 1,600 | | 4.00% | | 3 Month LIBOR | | | 29,117 | |
Credit Suisse International(2) | | 06/17/24 | | | 4,600 | | 4.00% | | 3 Month LIBOR | | | (82,109 | ) |
Deutsche Bank(2) | | 12/17/28 | | | 300 | | 5.00% | | 3 Month LIBOR | | | (105,204 | ) |
Merrill Lynch & Co.(2) | | 12/17/38 | | | 600 | | 5.00% | | 3 Month LIBOR | | | (258,004 | ) |
Merrill Lynch & Co.(2) | | 12/17/28 | | | 300 | | 5.00% | | 3 Month LIBOR | | | (96,654 | ) |
Morgan Stanley & Co.(1) | | 06/17/14 | | | 3,300 | | 4.00% | | 3 Month LIBOR | | | 49,311 | |
Morgan Stanley & Co.(2) | | 12/17/38 | | | 800 | | 5.00% | | 3 Month LIBOR | | | (313,784 | ) |
Merrill Lynch & Co.(2) | | 05/21/09 | | | 1,400 | | 5.50% | | ICAP CMM FRA Fixing Rate | | | (237,959 | ) |
Merrill Lynch & Co.(1) | | 01/02/12 | | | BRL 300 | | 14.77% | | Brazilian interbank lending rate | | | 4,828 | |
Morgan Stanley & Co.(1) | | 01/02/12 | | | BRL 5,100 | | 10.12% | | Brazilian interbank lending rate | | | (9,302 | ) |
Barclays Capital(1) | | 12/17/10 | | | EUR 100 | | 5.50% | | 6 Month EURIBOR | | | 6,508 | |
Barclays Capital(1) | | 06/15/10 | | | EUR 3,200 | | 4.50% | | 6 Month EURIBOR | | | 75,860 | |
Barclays Capital(2) | | 09/17/18 | | | EUR 200 | | 5.00% | | 6 Month EURIBOR | | | (28,214 | ) |
Barclays Capital(2) | | 09/17/38 | | | EUR 300 | | 5.00% | | 6 Month EURIBOR | | | (95,931 | ) |
Deutsche Bank(1) | | 09/17/18 | | | EUR 300 | | 5.00% | | 6 Month EURIBOR | | | (38,790 | ) |
Deutsche Bank(1) | | 09/17/10 | | | EUR 1,300 | | 5.00% | | 6 Month EURIBOR | | | 64,824 | |
Deutsche Bank(1) | | 06/15/13 | | | EUR 1,500 | | 4.00% | | 6 Month EURIBOR | | | 74,553 | |
Deutsche Bank(1) | | 09/15/10 | | | EUR 2,000 | | 5.50% | | 6 Month EURIBOR | | | 115,618 | |
Goldman Sachs(1) | | 03/18/10 | | | EUR 700 | | 5.00% | | 6 Month EURIBOR | | | 26,594 | |
Goldman Sachs(2) | | 03/18/39 | | | EUR 200 | | 5.00% | | 6 Month EURIBOR | | | (60,977 | ) |
Morgan Stanley & Co.(1) | | 12/17/10 | | | EUR 500 | | 5.50% | | 6 Month EURIBOR | | | 35,259 | |
UBS AG(1) | | 10/15/10 | | | EUR 100 | | 2.15% | | FRC-Excluding Tobacco-Non-Revised Consumer Price Index | | | 5,299 | |
Barclays Capital(2) | | 06/15/37 | | | GBP 200 | | 4.00% | | 6 Month LIBOR | | | (21,449 | ) |
Goldman Sachs(2) | | 12/20/17 | | | GBP 400 | | 5.00% | | 6 Month LIBOR | | | (90,140 | ) |
Goldman Sachs(2) | | 06/15/37 | | | GBP 300 | | 4.00% | | 6 Month LIBOR | | | (31,629 | ) |
Morgan Stanley & Co.(2) | | 06/15/37 | | | GBP 400 | | 4.00% | | 6 Month LIBOR | | | (42,362 | ) |
UBS AG(2) | | 06/17/18 | | | JPY 40,000 | | 1.50% | | 6 Month LIBOR | | | (4,791 | ) |
Merrill Lynch & Co.(1) | | 11/04/16 | | | MXN 11,000 | | 8.17% | | 28 day Mexican interbank rate | | | (4,691 | ) |
| | | | | | | | | | | |
|
|
|
| | | | | | | | | | | | $ | (1,295,584 | ) |
| | | | | | | | | | | |
|
|
|
| (1) | Portfolio pays the floating rate and receives the fixed rate. |
| (2) | Portfolio pays the fixed rate and receives the floating rate. |
| # | Notional Amount is shown in U.S. dollars unless otherwise stated. |
Credit default swap agreements outstanding at December 31, 2008:
| | | | | | | | | | | | |
Counterparty
| | Termination
Date
| | Notional
Amount#
(000)(3)
| | Fixed
Rate
| | Reference Entity/Obligation
| | Unrealized
Appreciation
|
Credit default swaps—Buy Protection(1) | | | | | | | | | | | | |
Barclays Bank PLC | | 03/20/12 | | $ | 100 | | 0.17% | | AIG Corp.,
5.40%, due 02/15/12 | | $ | 22,750 |
Citigroup | | 12/20/16 | | | 400 | | 0.17% | | Bank of America Corp.,
5.62%, due 10/14/16 | | | 26,842 |
Barclays Bank PLC | | 06/20/15 | | | 100 | | 0.15% | | CitiFinancial,
6.625%, due 06/01/15 | | | 9,547 |
Barclays Bank PLC | | 09/20/11 | | | 100 | | 0.58% | | DaimlerChrysler NA Holdings,
5.75%, due 09/08/11 | | | 11,217 |
Barclays Bank PLC | | 12/20/11 | | | 1,200 | | 0.75% | | Dow Jones CDX HVOL7 Index | | | 137,629 |
Barclays Bank PLC | | 06/20/13 | | | 200 | | 5.00% | | Dow Jones CDX HY-10 100 Index | | | 27,366 |
UBS AG | | 06/20/13 | | | 200 | | 5.00% | | Dow Jones CDX HY-10 100 Index | | | 27,476 |
Merrill Lynch & Co. | | 12/20/11 | | | 100 | | 0.00% | | Dow Jones CDX HY-7 Index | | | 38,594 |
Bank of America Securities LLC | | 06/20/12 | | | 392 | | 2.75% | | Dow Jones CDX HY-8 Index | | | 52,640 |
UBS AG | | 06/20/12 | | | 882 | | 2.75% | | Dow Jones CDX HY-8 Index | | | 115,879 |
Morgan Stanley & Co. | | 06/20/12 | | | 1,274 | | 2.75% | | Dow Jones CDX HY-8 Index | | | 193,756 |
Morgan Stanley & Co. | | 12/20/12 | | | 300 | | 0.14% | | Dow Jones CDX IG5 Index | | | 56,614 |
SEE NOTES TO FINANCIAL STATEMENTS.
A16
| | | | | | |
| | | DIVERSIFIED CONSERVATIVE GROWTH PORTFOLIO (continued) | | |
| |
| SCHEDULE OF INVESTMENTS | | December 31, 2008 |
Credit default swap agreements outstanding at December 31, 2008—(continued)
| | | | | | | | | | | | |
Counterparty
| | Termination
Date
| | Notional
Amount#
(000)(3)
| | Fixed
Rate
| | Reference Entity/Obligation
| | Unrealized
Appreciation
|
Credit default swaps—Buy Protection(1) | | | | | | | | | | | | |
Morgan Stanley & Co. | | 12/20/12 | | $ | 1,000 | | 0.14% | | Dow Jones CDX IG5 Index | | $ | 188,708 |
Deutsche Bank | | 06/20/18 | | | 683 | | 1.50% | | Dow Jones CDX NA IG 10 10Y | | | 11,305 |
Goldman Sachs Capital Markets, L.P. | | 06/20/18 | | | 1,171 | | 1.50% | | Dow Jones CDX NA IG 10 10Y | | | 22,417 |
Morgan Stanley & Co. | | 06/20/18 | | | 1,659 | | 1.50% | | Dow Jones CDX NA IG 10 10Y | | | 37,744 |
Deutsche Bank | | 06/20/13 | | | 878 | | 1.55% | | Dow Jones CDX NA IG 10 5Y | | | 23,004 |
Goldman Sachs Capital Markets, L.P. | | 12/20/17 | | | 98 | | 0.80% | | Dow Jones CDX NA IG 9 10Y | | | 3,426 |
Morgan Stanley & Co. | | 12/20/17 | | | 195 | | 0.80% | | Dow Jones CDX NA IG 9 10Y | | | 5,746 |
Barclays Bank PLC | | 12/20/17 | | | 488 | | 0.80% | | Dow Jones CDX NA IG 9 10Y | | | 19,303 |
Barclays Bank PLC | | 03/20/11 | | | 100 | | 0.37% | | iStar Financial, Inc.,
5.80%, due 03/15/11 | | | 59,211 |
Deutsche Bank | | 09/20/11 | | | 100 | | 0.62% | | Nationwide Health,
6.50%, due 07/15/11 | | | 16,024 |
Morgan Stanley & Co. | | 09/20/13 | | | 100 | | 0.58% | | Sealed Air Corp.,
5.625%, due 07/15/13 | | | 16,774 |
Bear Stearns International Ltd. | | 03/20/12 | | | 1,000 | | 0.55% | | Sprint Capital Corp.,
8.375%, due 03/15/12 | | | 262,514 |
Bear Stearns International Ltd. | | 06/20/16 | | | 100 | | 0.63% | | Whirlpool Corp.,
6.50%, due 06/15/16 | | | 13,727 |
Deutsche Bank | | 12/20/13 | | | 400 | | 1.85% | | UBS AG,
2.55%, due 04/18/12 | | | 3,847 |
| | | | | | | | | | | |
|
|
| | | | | | | | | | | | $ | 1,404,060 |
| | | | | | | | | | | |
|
|
| | | | | | | | | | | | | | | | | | | | | |
Counterparty
| | Termination
Date
| | Notional
Amount#
(000)(3)
| | Fixed
Rate
| | Reference Entity/Obligation
| | Fair
Value(4)
| | | Upfront
Premiums
Paid (Received)
| | | Unrealized
Depreciation
| |
| Credit default swaps on credit indices—Sell Protection(2) | | | | | | | | | | | | |
Credit Suisse International | | 05/25/46 | | $ | 1,700 | | 0.11% | | ABX.HE.AAA.06-2 Index | | $ | (859,829 | ) | | $ | (359,421 | ) | | $ | (500,408 | ) |
Citigroup | | 06/20/12 | | | 2,000 | | 2.09% | | Dow Jones CDX HY-8 Index | | | (343,727 | ) | | | — | | | | (343,727 | ) |
Morgan Stanley & Co. | | 12/20/15 | | | 200 | | 0.46% | | Dow Jones CDX IG5 Index | | | (53,928 | ) | | | — | | | | (53,928 | ) |
Morgan Stanley & Co. | | 12/20/15 | | | 700 | | 0.46% | | Dow Jones CDX IG5 Index | | | (188,556 | ) | | | — | | | | (188,556 | ) |
| | | | | | | | | | | |
|
|
| |
|
|
| |
|
|
|
| | | | | | | | | | | | $ | (1,446,040 | ) | | $ | (359,421 | ) | | $ | (1,086,619 | ) |
| | | | | | | | | | | |
|
|
| |
|
|
| |
|
|
|
The Portfolio entered into credit default swap agreements on credit indices as the protection seller to provide a measure of protection against the current portfolio of investments’ exposure to market conditions, or to take an active position with respect to the referenced entity’s credit soundness.
| (1) | If the Portfolio is a buyer of protection, it pays the fixed rate. When a credit event occurs, as defined under the terms of that particular swap agreement, the Portfolio will either (i) receive from the seller of protection an amount equal to the notional amount of the swap and take delivery of the referenced obligation or underlying securities comprising the referenced index or (ii) receive a net settlement amount in the form of cash or securities equal to the notional amount of the swap less the recovery value of the referenced obligation or underlying securities comprising the referenced index. |
| (2) | If the Portfolio is a seller of protection, it receives the fixed rate. When a credit event occurs, as defined under the terms of that particular swap agreement, the Portfolio will either (i) pay to the buyer of protection an amount equal to the notional amount of the swap and take delivery of the referenced obligation or underlying securities comprising the referenced index or (ii) pay a net settlement amount in the form of cash or securities equal to the notional amount of the swap less the recovery value of the referenced obligation or underlying securities comprising the referenced index. |
| (3) | Notional amount represents the maximum potential amount the Portfolio could be required to pay as a seller of credit protection or receive as a buyer of credit protection if a credit event occurs as defined under the terms of that particular swap agreement. |
| (4) | The fair value of credit default swap agreements on asset-backed securities and credit indices serve as an indicator of the current status of the payment/performance risk and represent the likelihood of an expected liability (or profit) for the credit derivative should the notional amount of the swap agreement be closed/sold as of the reporting date. |
| # | Notional Amount is shown in U.S. dollars unless otherwise stated. |
SEE NOTES TO FINANCIAL STATEMENTS.
A17
| | | | | | |
| | | DIVERSIFIED CONSERVATIVE GROWTH PORTFOLIO (continued) | | |
| |
| SCHEDULE OF INVESTMENTS | | December 31, 2008 |
Reverse Repurchase Agreement outstanding at December 31, 2008:
| | | | | | | | | | | | |
Broker
| | Interest
Rate
| | Trade
Date
| | Value at
December 31, 2008
| | Maturity
Date
| | Cost
|
| JPMorgan Chase | | 0.080% | | 12/24/08 | | $ | 816,000 | | 01/09/09 | | $ | 816,000 |
| | | | | | |
|
| | | |
|
|
Various inputs are used in determining the value of the Portfolio’s investments. These inputs are summarized in the three broad levels listed below.
Level 1—quoted prices in active markets for identical securities
Level 2—other significant observable inputs (including quoted prices for similar securities, interest rates, prepayment speeds, credit risk, etc.)
Level 3—significant unobservable inputs (including the Portfolio’s own assumptions in determining the fair value of investments)
The following is a summary of the inputs used as of December 31, 2008 in valuing the Portfolio’s assets carried at fair value:
| | | | | | | | |
Valuation inputs
| | Investments
in Securities
| | | Other Financial
Instruments*
| |
Level 1—Quoted Prices | | $ | 37,686,528 | | | $ | 1,313,938 | |
Level 2—Other Significant Observable Inputs—Long | | | 78,837,572 | | | | (914,079 | ) |
Level 2—Other Significant Observable Inputs—Short | | | (7,190,945 | ) | | | — | |
Level 3—Significant Unobservable Inputs | | | — | | | | 5,299 | |
| | |
|
|
| |
|
|
|
Total | | $ | 109,333,155 | | | $ | 405,158 | |
| | |
|
|
| |
|
|
|
| * | Other financial instruments are derivative instruments not reflected in the Schedule of Investments, such as futures, forwards and swap contracts, which are valued at the unrealized appreciation/depreciation on the instrument. |
The following is a reconciliation of assets in which significant unobservable inputs (Level 3) were used in determining fair value:
| | | | | | | |
| | | Investments in
Securities
| | | Other Financial
Instruments
|
Balance as of 12/31/07 | | $ | 173,663 | | | $ | — |
Accrued discounts/premiums | | | — | | | | — |
Realized gain (loss) | | | — | | | | — |
Change in unrealized appreciation (depreciation) | | | (2,320 | ) | | | 4,169 |
Net purchases (sales) | | | 2,320 | | | | — |
Transfers in and/or out of Level 3 | | | (173,663 | ) | | | 1,130 |
| | |
|
|
| |
|
|
Balance as of 12/31/08 | | $ | — | | | $ | 5,299 |
| | |
|
|
| |
|
|
SEE NOTES TO FINANCIAL STATEMENTS.
A18
| | | | | | |
| | | DIVERSIFIED CONSERVATIVE GROWTH PORTFOLIO (continued) | | |
| |
| SCHEDULE OF INVESTMENTS | | December 31, 2008 |
The industry classification of investments and liabilities in excess of other assets shown as a percentage of net assets as December 31, 2008 were as follows:
| | | |
U.S. Government Mortgage-Backed Obligations | | 39.7 | % |
U.S. Treasury Obligations | | 8.5 | |
Affiliated Money Market Mutual Fund | | 6.0 | |
Financial – Bank & Trust | | 4.9 | |
Collateralized Mortgage Obligations | | 4.7 | |
Financial Services | | 4.5 | |
Foreign Government Bonds | | 3.2 | |
Oil, Gas & Consumable Fuels | | 3.1 | |
Healthcare & Pharmaceuticals | | 2.8 | |
Capital Goods | | 2.7 | |
Pharmaceuticals | | 2.6 | |
Capital Markets | | 2.4 | |
Biotechnology | | 2.2 | |
Food & Staples Retailing | | 2.2 | |
Healthcare Providers & Services | | 2.2 | |
Insurance | | 2.2 | |
Telecom | | 2.1 | |
Diversified Financial Services | | 1.9 | |
Electric | | 1.9 | |
Software | | 1.8 | |
Aerospace & Defense | | 1.8 | |
Communication Equipment | | 1.6 | |
Media & Entertainment | | 1.6 | |
Chemicals | | 1.3 | |
Healthcare Equipment & Supplies | | 1.3 | |
Media | | 1.3 | |
Internet Software & Services | | 1.2 | |
Technology | | 1.2 | |
Food Products | | 1.1 | |
Computers & Peripherals | | 1.0 | |
Energy-Other | | 1.0 | |
Metals | | 1.0 | |
Pipelines & Other | | 1.0 | |
Repurchase Agreements | | 1.0 | |
Commercial Banks | | 0.9 | |
Municipal Bonds | | 0.9 | |
Packaging | | 0.9 | |
Household Products | | 0.8 | |
Bank Notes | | 0.7 | |
Cable | | 0.7 | |
Commercial Services & Supplies | | 0.7 | |
Options Purchased | | 0.7 | |
Real Estate Investment Trusts | | 0.7 | |
Beverages | | 0.6 | |
Diversified Consumer Services | | 0.6 | |
Internet & Catalog Retail | | 0.6 | |
IT Services | | 0.6 | |
Energy Equipment & Services | | 0.5 | |
Commercial Services | | 0.4 | |
Computer Services & Software | | 0.4 | |
Consumer | | 0.4 | |
Gaming | | 0.4 | |
Independent Power Producers & Energy Traders | | 0.4 | |
Semiconductors & Semiconductor Equipment | | 0.4 | |
U.S. Government Agency Obligations | | 0.4 | |
Wireless Telecommunication Services | | 0.4 | |
Automotive | | 0.3 | |
Electronic Equipment & Instruments | | 0.3 | |
| | | |
Entertainment & Leisure | | 0.3 | % |
Food | | 0.3 | |
Life Science Tools & Services | | 0.3 | |
Medical Supplies & Equipment | | 0.3 | |
Multi-Utilities | | 0.3 | |
Retail & Merchandising | | 0.3 | |
Textiles, Apparel & Luxury Goods | | 0.3 | |
Banks | | 0.2 | |
Business Services | | 0.2 | |
Construction | | 0.2 | |
Electric Utilities | | 0.2 | |
Manufacturing | | 0.2 | |
Metals & Mining | | 0.2 | |
Non Captive Finance | | 0.2 | |
Office Electronics | | 0.2 | |
Paper | | 0.2 | |
Retailers | | 0.2 | |
Specialty Retail | | 0.2 | |
Thrifts & Mortgage Finance | | 0.2 | |
Airlines | | 0.1 | |
Auto Components | | 0.1 | |
Automobile Manufacturers | | 0.1 | |
Building & Construction | | 0.1 | |
Consumer Products & Services | | 0.1 | |
Diversified Manufacturing | | 0.1 | |
Electronic Components | | 0.1 | |
Electronics | | 0.1 | |
Environmental Control | | 0.1 | |
Hotels, Restaurants & Leisure | | 0.1 | |
Household Durables | | 0.1 | |
Internet | | 0.1 | |
Machinery & Equipment | | 0.1 | |
Office Equipment | | 0.1 | |
Oil & Gas Exploration/Production | | 0.1 | |
Paper & Forest Products | | 0.1 | |
Restaurants | | 0.1 | |
Road & Rail | | 0.1 | |
Semiconductors | | 0.1 | |
Telecommunications | | 0.1 | |
Utilities | | 0.1 | |
| | |
|
|
| | | 139.3 | |
Options Written and Securities Sold Short | | (7.6 | ) |
Liabilities in excess of other assets | | (31.7 | ) |
| | |
|
|
| | | 100.0 | % |
| | |
|
|
SEE NOTES TO FINANCIAL STATEMENTS.
A19
| | | | | | |
| | | DIVERSIFIED CONSERVATIVE GROWTH PORTFOLIO (continued) | | |
STATEMENT OF ASSETS AND LIABILITIES
December 31, 2008
| | | | |
| ASSETS | | | | |
Investments at value: | | | | |
Unaffiliated investments (cost $121,353,690) | | $ | 111,490,182 | |
Affiliated investments (cost $5,033,918) | | | 5,033,918 | |
Cash | | | 668,123 | |
Foreign currency, at value (cost $999,765) | | | 927,294 | |
Deposit with broker | | | 451,500 | |
Receivable for investments sold | | | 27,231,572 | |
Unrealized appreciation on swap agreements | | | 1,891,831 | |
Dividends and interest receivable | | | 761,654 | |
Unrealized appreciation on foreign currency forward contracts | | | 193,018 | |
Prepaid expenses | | | 1,052 | |
Tax reclaim receivable | | | 284 | |
| | |
|
|
|
Total Assets | | | 148,650,428 | |
| | |
|
|
|
| LIABILITIES | | | | |
Payable for investments purchased | | | 53,598,041 | |
Securities sold short, at value
(proceeds received $5,572,062) | | | 5,669,640 | |
Unrealized depreciation on swap agreements | | | 2,869,974 | |
Reverse repurchase agreement | | | 816,000 | |
Payments received for swap agreements | | | 759,546 | |
Written options outstanding, at value (cost $203,446) | | | 705,305 | |
Accrued expenses and other liabilities | | | 182,739 | |
Payable for floating rate notes issued | | | 125,000 | |
Unrealized depreciation on foreign currency forward contracts | | | 123,655 | |
Interest payable on investments sold short | | | 84,535 | |
Management fee payable | | | 51,266 | |
Payable for Series shares repurchased | | | 17,325 | |
Due to broker-variation margin | | | 11,443 | |
Deferred trustees’ fees | | | 2,970 | |
Transfer agent fees payable | | | 86 | |
| | |
|
|
|
Total Liabilities | | | 65,017,525 | |
| | |
|
|
|
| NET ASSETS | | $ | 83,632,903 | |
| | |
|
|
|
Net assets were comprised of: | | | | |
Paid-in capital | | $ | 99,451,220 | |
Retained earnings | | | (15,818,317 | ) |
| | |
|
|
|
Net assets, December 31, 2008 | | $ | 83,632,903 | |
| | |
|
|
|
Net asset value and redemption price per share, $83,632,903 / 10,055,769 outstanding shares of beneficial interest | | $ | 8.32 | |
| | |
|
|
|
STATEMENT OF OPERATIONS
Year Ended December 31, 2008
| | | | |
| INVESTMENT INCOME | | | | |
Interest income | | $ | 4,169,583 | |
Unaffiliated dividend income (net of $8,840 foreign withholding tax) | | | 516,707 | |
Affiliated dividend income | | | 190,571 | |
| | |
|
|
|
| | | | 4,876,861 | |
| | |
|
|
|
| EXPENSES | | | | |
Management fee | | | 817,303 | |
Custodian’s fees and expenses | | | 261,000 | |
Interest expense (Note 2) | | | 113,364 | |
Audit fee | | | 63,000 | |
Shareholders’ reports | | | 44,000 | |
Trustees’ fees | | | 10,000 | |
Legal fees and expenses | | | 7,000 | |
Insurance expenses | | | 2,000 | |
Transfer agent’s fees and expenses (including affiliated expense of $1,000) (Note 4) | | | 1,000 | |
Commitment fee on syndicated credit agreement | | | 500 | |
Loan interest expense (Note 8) | | | 136 | |
Miscellaneous | | | 7,624 | |
| | |
|
|
|
Total expenses | | | 1,326,927 | |
| | |
|
|
|
| NET INVESTMENT INCOME | | | 3,549,934 | |
| | |
|
|
|
| NET REALIZED AND UNREALIZED GAIN (LOSS) ON INVESTMENTS AND FOREIGN CURRENCIES | | | | |
Net realized loss on: | | | | |
Investment transactions | | | (8,644,119 | ) |
Futures transactions | | | (757,209 | ) |
Options written transactions | | | 638,421 | |
Swap agreement transactions | | | (663,067 | ) |
Foreign currency transactions | | | 1,049,272 | |
| | |
|
|
|
| | | | (8,376,702 | ) |
| | |
|
|
|
Net change in unrealized appreciation (depreciation) on: | | | | |
Investments | | | (20,657,054 | ) |
Futures | | | 1,218,906 | |
Options written | | | (324,059 | ) |
Swap agreements | | | (557,943 | ) |
Short sales | | | 203,303 | |
Foreign currencies | | | (254,510 | ) |
| | |
|
|
|
| | | | (20,371,357 | ) |
| | |
|
|
|
| NET LOSS ON INVESTMENTS AND FOREIGN CURRENCIES | | | (28,748,059 | ) |
| | |
|
|
|
| NET DECREASE IN NET ASSETS RESULTING FROM OPERATIONS | | $ | (25,198,125 | ) |
| | |
|
|
|
STATEMENT OF CHANGES IN NET ASSETS
| | | | | | | | |
| | | Year Ended December 31,
| |
| | | 2008
| | | 2007
| |
| INCREASE (DECREASE) IN NET ASSETS | | | | | | | | |
| OPERATIONS: | | | | | | | | |
Net investment income | | $ | 3,549,934 | | | $ | 4,249,666 | |
Net realized gain (loss) on investments and foreign currency transactions | | | (8,376,702 | ) | | | 7,955,665 | |
Net change in unrealized appreciation (depreciation) on investments and foreign currencies | | | (20,371,357 | ) | | | (4,499,934 | ) |
| | |
|
|
| |
|
|
|
NET INCREASE (DECREASE) IN NET ASSETS RESULTING FROM OPERATIONS | | | (25,198,125 | ) | | | 7,705,397 | |
| | |
|
|
| |
|
|
|
| DISTRIBUTIONS | | | (12,205,331 | ) | | | (9,328,249 | ) |
| | |
|
|
| |
|
|
|
| SERIES SHARE TRANSACTIONS: | | | | | | | | |
Series shares sold [221,329 and 203,407 shares, respectively] | | | 2,270,341 | | | | 2,549,068 | |
Series shares issued in reinvestment of dividends [1,174,719 and 795,247 shares, respectively] | | | 12,205,331 | | | | 9,328,249 | |
Series shares repurchased [2,169,967 and 2,063,447 shares, respectively] | | | (21,629,998 | ) | | | (21,843,596 | ) |
| | |
|
|
| |
|
|
|
DECREASE IN NET ASSETS RESULTING FROM SERIES SHARE TRANSACTIONS | | | (7,154,326 | ) | | | (9,966,279 | ) |
| | |
|
|
| |
|
|
|
| TOTAL DECREASE IN NET ASSETS | | | (44,557,782 | ) | | | (11,589,131 | ) |
| NET ASSETS: | | | | | | | | |
Beginning of year | | | 128,190,685 | | | | 139,779,816 | |
| | |
|
|
| |
|
|
|
End of year | | $ | 83,632,903 | | | $ | 128,190,685 | |
| | |
|
|
| |
|
|
|
SEE NOTES TO FINANCIAL STATEMENTS.
A20
NOTES TO THE FINANCIAL STATEMENTS OF
THE PRUDENTIAL SERIES FUND
The Prudential Series Fund (“Series Fund”), organized as a Delaware statutory trust, is a diversified open-end management investment company registered under the Investment Company Act of 1940, as amended. On January 2, 2006, each Portfolio of the Series Fund changed its federal income tax status from a regulated investment company to a partnership. As a result of that conversion, the Series Fund was reorganized from a Maryland corporation to a Delaware statutory trust. Pursuant to this reorganization, the Series Fund has been renamed “The Prudential Series Fund.” The Series Fund is composed of twenty-eight Portfolios (“Portfolio” or “Portfolios”), each with a separate series shares. The information presented in these financial statements pertains to Diversified Conservative Growth Portfolio.
The Portfolio has the following as investment objectives:
Current income and a reasonable level of capital appreciation by investing primarily in a diversified portfolio of debt and equity securities.
The ability of issuers of debt securities (other than those issued or guaranteed by the U.S. Government) held by the Portfolio to meet their obligations may be affected by the economic or political developments in a specific industry, region or country.
Foreign security and currency transactions may involve certain considerations and risks not typically associated with those of domestic origin as a result of, among other factors, the possibility of political and economic instability or the level of government supervision and regulation of foreign securities markets.
| Note 2: | | Accounting Policies |
The following is a summary of significant accounting policies followed by the Series Fund and the Portfolio in preparation of their financial statements.
Securities Valuation: Securities listed on a securities exchange are valued at the last sale price on such exchange on the day of valuation or, if there was no sale on such day, at the mean between the last reported bid and asked prices, or at the last bid price on such day in the absence of an asked price. Securities traded via NASDAQ are valued at the official closing price provided by NASDAQ. Securities that are actively traded in the over-the-counter market, including listed securities for which the primary market is believed by Prudential Investments LLC (“PI” or “Manager”) in consultation with the subadvisers, to be over-the-counter, are valued at market value using prices provided by an independent pricing agent or principal market maker. Options on securities and indices traded on an exchange are valued at the last sale price as of the close of trading on the applicable exchange or, if there was no sale, at the mean between the most recently quoted bid and asked prices on such exchange, or at the last bid price in the absence of an asked price. Futures contracts and options thereon traded on a commodities exchange or board of trade are valued at the last sale price at the close of trading on such exchange or board of trade or, if there was no sale on the applicable commodities exchange or board of trade on such day, at the mean between the most recently quoted bid and asked prices on such exchange or board of trade or at the last bid price in the absence of an asked price. Prices may be obtained from independent pricing services which use information provided by market makers or estimates of market values obtained from yield data relating to investments or securities with similar characteristics. Securities for which reliable market quotations are not readily available, or whose values have been affected by events occurring after the close of the security’s foreign market and before the Series Fund’s normal pricing time, are valued at fair value in accordance with Board of Trustees approved fair valuation procedures. When determining the fair valuation of securities some of the factors influencing the valuation include, the nature of any restrictions on disposition of the securities; assessment of the general liquidity of the securities; the issuer’s financial condition and the markets in which it does business; the cost of the investment; the size of the holding and the capitalization of the issuer; the prices of any recent transactions or bids/offers for such securities of any comparable securities; any available analyst media or other reports or information deemed reliable by the investment adviser regarding the issuer or the markets or industry in which it operates. Using fair value to price securities may result in a value that is different from a security’s most recent closing price and from the price used by other mutual funds to calculate their net asset values.
B1
Investments in mutual funds are valued at their net asset value as of the close of the New York Stock Exchange on the date of valuation.
Short-term debt securities that are held in the Portfolio which mature in more than 60 days are valued at current market quotations and those short-term debt securities which mature in 60 days or less are valued at amortized cost which approximates market value. The amortized cost method values a security at its cost at the time of purchase and there after assumes a constant amortization to maturity of any discount or premium.
Repurchase Agreements: In connection with transactions in repurchase agreements with United States financial institutions, it is the Series Fund’s policy that its custodian or designated subcustodians, as the case may be, under triparty repurchase agreements, take possession of the underlying collateral securities, the value of which exceeds the principal amount of the repurchase transaction, including accrued interest. To the extent that any repurchase transaction exceeds one business day, the value of the collateral is marked to market on a daily basis to ensure the adequacy of the collateral. If the seller defaults or the value of the collateral declines, or if bankruptcy proceedings are commenced with respect to the seller of the security, realization of the collateral by the Series Fund may by delayed or limited.
Foreign Currency Translation: The books and records of the Series Fund are maintained in U.S. dollars. Foreign currency amounts are translated into U.S. dollars on the following basis:
(i) market value of investment securities, other assets and liabilities – at the current daily rates of exchange.
(ii) purchases and sales of investment securities, income and expenses – at the rates of exchange prevailing on the respective dates of such transactions.
Although the net assets of the Series Fund are presented at the foreign exchange rates and market values at the close of the year, the Series Fund does not isolate that portion of the results of operations arising as a result of changes in the foreign exchange rates from the fluctuations arising from changes in the market prices of securities held at the end of the period. Similarly, the Series Fund does not isolate the effect of changes in foreign exchange rates from the fluctuations arising from changes in the market prices of portfolio securities sold during the period. Accordingly, these realized foreign currency gains (losses) are included in the reported net realized gains (losses) on investment transactions.
Net realized gains (losses) on foreign currency transactions represent net foreign exchange gains (losses) from the holding of foreign currencies, currency gains (losses) realized between the trade date and settlement date on securities transactions, and the difference between the amounts of dividends, interest and foreign withholding taxes recorded on the Series Fund’s books and the U.S. dollar equivalent amounts actually received or paid. Net unrealized currency gains (losses) from valuing foreign currency denominated assets and liabilities (other than investments) at period end exchange rates are reflected as a component of net unrealized appreciation (depreciation) on investments and foreign currencies.
Foreign security and currency transactions may involve certain considerations and risks not typically associated with those of domestic origin as a result of, among other factors, the possibility of political and economic instability or the level of governmental supervision and regulation of foreign securities markets.
Forward Currency Contracts: A forward currency contract is a commitment to purchase or sell a foreign currency at a future date at a negotiated forward rate. The Portfolio may enter into forward currency contracts in order to hedge their exposure to changes in foreign currency exchange rates on their foreign portfolio holdings or on specific receivables and payables denominated in a foreign currency. The contracts are valued daily at current forward exchange rates and any unrealized gain (loss) is included in assets and liabilities on the financial statements. Gain (loss) is realized on the settlement date of the contract equal to the difference between the settlement value of the original and negotiated forward contracts. This gain (loss), if any, is included in net realized gain (loss) on foreign currency transactions. Risks may arise upon entering into these contracts from the potential inability of the counterparties to meet the terms of their contracts.
Floating-Rate Notes Issued in Conjunction with Securities Held: The Portfolio invests in inverse floating rate securities (“inverse floaters”) that pay interest at a rate that varies inversely with short-term interest rates. Certain of these securities may be leveraged, whereby the interest rate varies inversely at a multiple of the change in short-term rates. As interest rates rise, inverse floaters provide less current income. The price of such securities is more volatile than comparable fixed rate securities.
B2
When the Portfolio enters into agreements to create inverse floaters and floater note securities (also known as Tender Option Bond Transactions), the Portfolio transfers a fixed rate bond to a broker for cash. At the same time the Portfolio buys (receives) a residual interest in a trust (the “trust”) set up by the broker, often referred to as an inverse floating rate obligation (inverse floaters). Generally, the broker deposits a fixed rate bond (the “fixed rate bond”) into the trust with the same CUSIP number as the fixed rate bond sold to the broker by the Portfolio. The trust also issues floating rate notes (“floating rate notes”) which sold to third parties. The floating rate notes have interest rates that reset weekly. The inverse floater held by the Portfolio gives the Portfolio the right (1) to cause the holders of the floating rate notes to tender their notes at par, and (2) to have the broker transfer the fixed rate bond held by the trust to the Portfolio thereby collapsing the trust. In accordance with FAS Statement No. 140, the Portfolio’s account for the transaction described above as funded leverage by including the fixed rate bond in its Portfolio of Investments, and accounts for the floating rate notes as a liability under the caption “payable for floating rate notes issued” in the Portfolio’s “Statement of Assets and Liabilities.”
The Portfolio’s investment policies and restrictions permit investments in inverse floating rate securities. Inverse floaters held by the Portfolio are securities exempt from registration under Rules 144A of the Securities Act of 1933.
Short Sales: The Portfolio may sell a security it does not own in anticipation of a decline in the market value of that security (short sale). When a Portfolio makes a short sale, it must borrow the security sold short and deliver it to the broker-dealer through which it made the short sale as collateral for its obligation to deliver the security upon conclusion of the transaction. The Portfolio may have to pay a fee to borrow the particular security and may be obligated to remit any interest or dividends received on such borrowed securities. Dividends declared on short positions open on record date are recorded on the ex-date as an expense. A gain, limited to the price at which the Portfolio sold the security short, or a loss, unlimited in magnitude, will be recognized upon the termination of a short sale if the market price at termination is less than or greater than, respectively, the proceeds originally received. The Portfolio maintains a segregated account of securities or other liquid assets, the dollar value of which is at least equal to its obligation with respect to short sales.
Options: The Portfolio may either purchase or write options in order to hedge against adverse market movements or fluctuations in value caused by changes in prevailing interest rates or foreign currency exchange rates or currencies with respect to securities which the Portfolio currently owns or intends to purchase. The Portfolio’s principal reason for writing options is to realize, through receipt of premiums, a greater current return than would be realized on the underlying security alone. When the Portfolio purchases an option, it pays a premium and an amount equal to that premium is recorded as an asset. When the Portfolio writes an option, it receives a premium and an amount equal to that premium is recorded as a liability. The asset or liability is adjusted daily to reflect the current market value of the option. If an option expires unexercised, the Portfolio realizes a gain (loss) to the extent of the premium received or paid. If an option is exercised, the premium received or paid is recorded as an adjustment to the proceeds from the sale or the cost basis of the purchase in determining whether the Portfolio has realized a gain (loss). The difference between the premium and the amount received or paid on effecting a closing purchase or sale transaction is also treated as a realized gain (loss). Gains (losses) on purchased options are included in net realized gains (losses) on investment transactions. Gains (losses) on written options are presented separately as net realized gains (losses) on written option transactions.
The Portfolio, as writer of an option, may have no control over whether the contract may be exercised. As a result, the Portfolio bears the market risk of an unfavorable change in the price of the security underlying the written option. The Portfolio, as purchaser of an option, bears the risk of the potential inability of the counterparties to meet the terms of their contracts.
Financial Futures Contracts: A financial futures contract is an agreement to purchase (long) or sell (short) an agreed amount of securities at a set price for delivery on a future date. Upon entering into a financial futures contract, the Portfolio is required to pledge to the broker an amount of cash and/or other assets equal to a certain percentage of the contract amount. This amount is known as the “initial margin”. Subsequent payments, known as “variation margin”, are made or received by the Portfolio each day, depending on the daily fluctuations in the value of the underlying security. Such variation margin is recorded for financial statement purposes on a daily basis as unrealized gain (loss). When the contract expires or is closed, the gain (loss) is realized and is presented in the Statement of Operations as net realized gain (loss) on financial futures contracts.
B3
The Portfolio invests in financial futures contracts in order to hedge its existing portfolio securities, or securities the Portfolio intends to purchase, against fluctuations in value caused by changes in prevailing rates or market conditions. Under a variety of circumstances, the Portfolio may not achieve the anticipated benefits of the financial futures contracts and may realize a loss. The use of futures transactions involves the risk of imperfect correlation in movements in the price of futures contracts and the underlying hedged assets.
Swap Agreements: The Portfolios may enter into credit default, interest rate, total return and other forms of swap agreements. A swap agreement is an agreement to exchange the return generated by one instrument for the return generated by another instrument.
Interest rate swaps represent an agreement between counterparties to exchange cash flows based on the difference between two interest rates, applied to a notional principal amount for a specified period.
Credit default swaps involve one party (the protection buyer) making a stream of payments to another party (the protection seller) in exchange for the right to receive a specified payment in the event of a default or as a result of a default (“credit event”) for the referenced party, typically corporate issues or sovereign issues of an emerging country, on its obligation; or in the event of a write-down, principal shortfall, interest shortfall or default of all or part of the referenced entities comprising a credit index.
A Portfolio may use credit default swaps to provide a measure of protection against defaults of the issuers or to take an active long or short position with respect to the likelihood of a particular issuer’s default. A Portfolio may use credit default swaps on credit indices to hedge a portfolio of credit default swaps or bonds, which is less expensive than it would be to buy many credit default swaps to achieve a similar effect.
As a seller of protection on credit default swap agreements, a Portfolio will generally receive from the buyer of protection an agreed upon payment throughout the term of the swap provided that there is no credit event. As the seller, a Portfolio would effectively increase investment risk to its portfolio because, in addition to its total net assets, a Portfolio may be subject to investment exposure on the notional amount of the swap.
The maximum amount of the payments that a Portfolio as a seller of protection could be required to pay under a credit default swap agreement would be equal the notional amount of the underlying security or index contract as a result of a credit event. These potential amounts will be partially offset by any recovery values of the respective referenced obligations, or net amounts received from the settlement of buy protection credit default swap agreements entered into by the Portfolio for the same referenced entity or index. As a buyer of protection, the Portfolio generally receives an amount up to the notional value of the swap if a credit event occurs.
Implied credit spreads, represented in absolute terms, utilized in determining the market value of credit default swap agreements on corporate issues or sovereign issues of an emerging country as of period end are disclosed in the footnotes to the Schedules of Investments and serve as an indicator of the current status of the payment/performance risk and represent the likelihood of risk of default for the credit derivative. The implied credit spread of a particular referenced entity reflects the cost of buying /selling protection and may include upfront payments required to enter into the agreement. For credit default swap agreements on asset-backed securities and credit indices, the fair values serve as the indicator of the current status of the payment/performance risk. Wider credit spreads and increasing market value in absolute terms, when compared to the notional amount of the swap, represent a deterioration of the referenced entity’s credit soundness and a greater likelihood of risk of default or other credit event occurring as defined under the terms of the agreement.
The Portfolio may enter into total return swaps to manage its exposure to a security, commodity or an index. In a total return swap, one party would receive payments based on the market value of the security or the commodity involved, or total return of a specific referenced asset, such as an equity, index or bond, and in return pay a fixed amount.
These swap agreements involve, to varying degrees, elements of credit, market risk and documentation risk. Such risks involve the possibility that there will be no liquid market for these agreements, that the counterparty to the agreement may default on its obligation to perform or disagree as to the meaning of the contractual terms in the agreement, and that there will be unfavorable changes in net interest rates. The swaps are valued daily at current market value and any change in value is included in the net unrealized appreciation or depreciation on investments. Payments received or paid by the Portfolio are recorded as realized gains or losses upon termination or maturity of the swap. Risk of loss may exceed amounts recognized on the Statement of Assets and Liabilities. Swap agreements outstanding at period end, if any, are listed in the footnotes to the Schedule of Investments.
B4
The Portfolio has entered into over-the-counter derivative agreements. Such agreements include conditions which, when materialized, give the counterparty the right to cause an early termination of the transactions under those agreements. Any election by the counterparty to early terminate the contract(s) may impact the amounts reported on the financial statements. As of December 31, 2008, the Portfolio has met conditions under such agreements that give the counterparty the right to call for an early termination. However, as of the date of issuance of these financial statements no notice of early termination was received.
Forward currency contracts, written options, short sales, swaps and financial futures contracts involve elements of both market and credit risk in excess of the amounts reflected on the Statement of Assets and Liabilities.
Securities Lending: The Portfolio may lend its portfolio securities to broker-dealers. The loans are secured by collateral at least equal at all times to the market value of the securities loaned. Loans are subject to termination at the option of the borrower or the Portfolio. Upon termination of the loan, the borrower will return to the lender securities identical to the loaned securities. Should the borrower of the securities fail financially, the Portfolio has the right to repurchase the securities using the collateral in the open market. The Portfolio recognizes income, net of any rebate and securities lending agent fees, for lending its securities in the form of fees or interest on the investment of any cash received as collateral. The Portfolio also continues to receive interest and dividends or amounts equivalent thereto on the securities loaned and recognizes any unrealized gain or loss in the market price of the securities loaned that may occur during the term of the loan.
As a result of the bankruptcy filing by Lehman Brothers Holdings Inc., which was the parent company to the Portfolios’ Securities Lending Counter Party, Lehman Brothers Inc. (Lehman), the Portfolios’ Securities Lending Agent utilized collateral held on behalf of the Portfolios for securities out on loan to compensate the Portfolios for the failure of Lehman to return the securities. Any excess collateral was returned to Lehman.
When-Issued/Delayed Delivery Securities: Securities purchased or sold on a when-issued or delayed delivery basis may be settled a month or more after trade date; interest income is not accrued until settlement date. At the time a Portfolio enters into such transactions, it instructs the custodian to segregate assets with a current value at least equal to the amount of its when-issued or delayed-delivery purchase commitments.
Securities Transactions and Net Investment Income: Securities transactions are recorded on the trade date. Realized gains (losses) on sales of securities are calculated on the identified cost basis. Dividend income is recorded on the ex-dividend date; interest income, which is comprised of four elements: stated coupon, original issue discount, market discount and market premium, is recorded on the accrual basis. Expenses are recorded on the accrual basis. The Series Fund’s expenses are allocated to the respective Portfolios on the basis of relative net assets except for Portfolio specific expenses which are attributable directly to a Portfolio or class level.
Taxes: For federal income tax purposes, the Portfolio is treated as a partnership. No provision has been made in the financial statements for U.S. Federal, state, or local taxes, as any tax liability arising from operations of the Portfolio is the responsibility of its partners. The Portfolio is not generally subject to entity-level taxation. Partners of each Portfolio are subject to taxes on their distributive share of partnership items.
Withholding taxes on foreign dividends, interest and capital gains have been provided for in accordance with the Series Fund’s understanding of the applicable country’s tax rules and regulations.
Distributions: Distributions from the Portfolio are made in cash and automatically reinvested in additional shares of the Portfolio. The Portfolio makes distributions, if any, at least annually. Distributions are recorded on the ex-dividend date.
Estimates: The preparation of financial statements requires management to make estimates and assumptions that affect the reported amounts and disclosures in the financial statements. Actual results could differ from these estimates.
The Series Fund has a management agreement with PI. Pursuant to this agreement PI has responsibility for all investment advisory services and supervises the subadvisers’ performance of such services. PI has entered into subadvisory agreements with Prudential Investment Management, Inc. (“PIM”), Jennison Associates LLC (“Jennison”), Eagle Asset Management (“Eagle”), Pacific Investment Management Company
B5
LLC (“PIMCO”), EARNEST Partners LLC (“EARNEST”) and Quantitative Management Associates LLC (“QMA”) (collectively, the “Subadvisers”), under which each provides investment advisory services for certain Portfolios of the Series Fund. PI pays for the services of the Subadvisers, compensation of officers of the Series Fund, occupancy and certain clerical and administrative expenses of the Series Fund. The Portfolio bears all other costs and expenses.
The management fee paid to PI is computed daily and payable monthly, at the annual rate of .75 of 1% of the Portfolio’s average daily net assets.
The Series Fund has a distribution agreement with Prudential Investment Management Services LLC (“PIMS”) which acts as the distributor of the Class I and Class II shares of the Series Fund. The Series Fund compensates PIMS for distributing and servicing the Series Fund’s Class II shares pursuant to a plan of distribution (the “Class II Plan”), regardless of expenses actually incurred by PIMS. The distribution fees are accrued daily and payable monthly. No distribution or service fees are paid to PIMS as distributor of the Class I shares of the Series Fund.
PIMS, PI, PIM and Jennison are indirect, wholly-owned subsidiaries of Prudential Financial, Inc. (“Prudential”).
| Note 4: | | Other Transactions with Affiliates |
Prudential Mutual Fund Services LLC (“PMFS”), an affiliate of PI and an indirect, wholly-owned subsidiary of Prudential, serves as the Series Fund’s transfer agent. Transfer agent fees and expenses in the Statement of Operations include certain out-of-pocket expenses paid to non-affiliates, where applicable.
For the year ended December 31, 2008, Wachovia Securities LLC, an affiliate of PI, earned brokerage commissions from transactions executed on behalf of the Diversified Conservative Growth Portfolio in the amount of $6.
The Portfolio invests in the Taxable Money Market Series, a portfolio of the Dryden Core Investment Fund registered under the Investment Company Act of 1940, as amended, and managed by PI.
| Note 5: | | Portfolio Securities |
Purchases and sales of portfolio securities (excluding government securities and short-term issues) for the year ended December 31, 2008 were $480,911,382 and $482,341,904 respectively.
The Portfolio’s written options activity for the year ended December 31, 2008 was as follows:
| | | | | | | |
| | | Number of
Contracts/
Swap Notional
Amount $
| | | Premium
| |
Balance at beginning of year | | 17,400,000 | | | $ | 348,366 | |
Written options | | 13,200,000 | | | | 278,646 | |
Expired options | | (900,000 | ) | | | (5,621 | ) |
Excercised options | | — | | | | — | |
Closed options | | (23,000,000 | ) | | | (417,945 | ) |
| | |
|
| |
|
|
|
Balance at end of year | | 6,700,000 | | | $ | 203,446 | |
| | |
|
| |
|
|
|
After January 2, 2006, all Portfolios are treated as partnerships for tax purposes. The character of the cash distributions made by the partnerships is generally classified as return of capital nontaxable distributions. After each fiscal year each partner will receive information regarding their distributive allocable share of the partnership’s income, gains, losses and deductions.
Prior to January 2, 2006, each Portfolio, which was incorporated as of that date, qualified as a regulated investment company under the Internal Revenue Code and distributed all of its taxable income, including any net realized gains on investments, to shareholders.
B6
With respect to the Portfolios, book cost of assets differs from tax cost of assets as a result of each Portfolio’s adoption of a mark to market method of accounting for tax purposes. Under this method, tax cost of assets will approximate its fair market value.
Management has analyzed the Portfolios’ tax positions taken on federal income tax returns for all open tax years and has concluded that as of December 31, 2008, no provision for income tax would be required in the Portfolios’ financial statements. The Portfolios’ federal and state income tax returns for tax years for which the applicable statutes of limitations have not expired are subject to examination by the Internal Revenue Service and state departments of revenue.
The Series Fund offers Class I and Class II shares. Neither Class I nor Class II shares of a Portfolio are subject to any sales charge or redemption charge and are sold at the net asset value of the Portfolio. Class I shares are sold only to certain separate accounts of Prudential to fund benefits under certain variable life insurance and variable annuity contracts (“contracts”). Class II shares are sold only to separate accounts of non-Prudential insurance companies as investment options under certain contracts. The separate accounts invest in shares of the Series Fund through subaccounts that correspond to the Portfolios. The separate accounts will redeem shares of the Series Fund to the extent necessary to provide benefits under the contracts or for such other purposes as may be consistent with the contracts.
The Portfolio, along with other affiliated registered investment companies (the “Funds”), are a party to a syndicated credit agreement (“SCA”) with two banks. The SCA provides for a commitment of $500 million. Interest on any borrowings under the SCA would be incurred at market rates and a commitment fee for the unused amount is accrued daily and paid quarterly. Effective October 24, 2008, the Funds renewed the SCA with the banks. The commitment under the renewed SCA continues to be $500 million. The Funds pay a commitment fee of .13 of 1% of the unused portion of the renewed SCA. The expiration date of the renewed SCA will be October 23, 2009. For the period from October 26, 2007 through October 23, 2008, the Funds paid a commitment fee of .06 of 1% of the unused portion of the agreement. The purpose of the SCA is to provide an alternative source of temporary funding for capital share redemptions.
During the year ended December 31, 2008, the Portfolio utilized the line of credit and had an average balance outstanding of $521,000 with an average interest rate 4.71% for two days.
| Note 9: | | Ownership and Affiliates |
As of December 31, 2008, all of Class I shares of the Portfolio were owned of record by the Prudential Insurance Company of America (“PICA”) on behalf of the owners of the variable insurance products issued by PICA.
| Note 10: | | New Accounting Pronouncements |
In March 2008, Financial Accounting Standards Board (“FASB”) released “Statement of Financial Accounting Standards No. 161, Disclosures about Derivative Instruments and Hedging Activities” (“FAS 161”). FAS 161 requires qualitative disclosures about objectives and strategies for using derivatives, quantitative disclosures about fair value amounts of and gains and losses on derivative instruments, and disclosures about credit-risk-related contingent features in derivative agreements. The application of FAS 161 is required for any reporting period beginning after November 15, 2008. At this time, management is evaluating the implications of FAS 161 and its impact on the financial statements has not yet been determined.
B7
Financial Highlights
| | | | | | | | | | | | | | | | | | | | |
| | | Diversified Conservative Growth Portfolio
| |
| | | Year Ended December 31,
| |
| | | 2008
| | | 2007
| | | 2006
| | | 2005
| | | 2004
| |
Per Share Operating Performance: | | | | | | | | | | | | | | | | | | | | |
Net Asset Value, beginning of year | | $ | 11.84 | | | $ | 12.06 | | | $ | 11.67 | | | $ | 11.28 | | | $ | 10.63 | |
| | |
|
|
| |
|
|
| |
|
|
| |
|
|
| |
|
|
|
Income From Investment Operations: | | | | | | | | | | | | | | | | | | | | |
Net investment income | | | .38 | | | | .45 | | | | .39 | | | | .34 | | | | .26 | |
Net realized and unrealized gain (loss) on investments | | | (2.69 | ) | | | .26 | | | | .43 | | | | .39 | | | | .72 | |
| | |
|
|
| |
|
|
| |
|
|
| |
|
|
| |
|
|
|
Total from investment operations | | | (2.31 | ) | | | .71 | | | | .82 | | | | .73 | | | | .98 | |
| | |
|
|
| |
|
|
| |
|
|
| |
|
|
| |
|
|
|
Less Dividends and Distributions: | | | | | | | | | | | | | | | | | | | | |
Dividends from net investment income | | | — | | | | — | | | | — | | | | (.34 | ) | | | (.33 | ) |
Distributions | | | (1.21 | ) | | | (.93 | ) | | | (.43 | ) | | | — | | | | — | |
| | |
|
|
| |
|
|
| |
|
|
| |
|
|
| |
|
|
|
Total distributions | | | (1.21 | ) | | | (.93 | ) | | | (.43 | ) | | | (.34 | ) | | | (.33 | ) |
| | |
|
|
| |
|
|
| |
|
|
| |
|
|
| |
|
|
|
Net Asset Value, end of year | | $ | 8.32 | | | $ | 11.84 | | | $ | 12.06 | | | $ | 11.67 | | | $ | 11.28 | |
| | |
|
|
| |
|
|
| |
|
|
| |
|
|
| |
|
|
|
Total Return(a) | | | (21.56 | )% | | | 5.91 | % | | | 6.92 | % | | | 7.04 | % | | | 9.56 | % |
Ratios/Supplemental Data: | | | | | | | | | | | | | | | | | | | | |
Net assets, end of year (in millions) | | $ | 83.6 | | | $ | 128.2 | | | $ | 139.8 | | | $ | 151.4 | | | $ | 167.0 | |
Ratios to average net assets(b): | | | | | | | | | | | | | | | | | | | | |
Expenses | | | 1.22 | %(c) | | | 1.14 | %(c) | | | .99 | %(c) | | | .95 | % | | | .97 | % |
Net investment income | | | 3.26 | % | | | 3.16 | % | | | 3.03 | % | | | 2.75 | % | | | 2.29 | % |
Portfolio turnover rate | | | 453 | % | | | 322 | % | | | 286 | % | | | 304 | % | | | 186 | % |
| (a) | Total return is calculated assuming a purchase of a share on the first day and a sale on the last day of each year reported and includes reinvestment of dividends and distributions. Total return does not reflect expenses associated with the separate account such as administrative fees, account charges and surrender charges which, if reflected, would reduce the total returns for all periods shown. Performance figures may reflect voluntary fee waivers and/or expense reimbursements. In the absence of voluntary fee waivers and/or expense reimbursements, the total return would be lower. Past performance is no guarantee of future results. Total returns may reflect adjustments to conform to generally accepted accounting principles. |
| (b) | Does not include expenses of the underlying portfolio in which the Portfolio invests. |
| (c) | The expense ratio reflects the interest and fee expense related to the interest expenses on investments sold short and liability for the floating rate notes issued in conjunction with the inverse floater securities. The total expense ratio excluding interest and fees expense is 1.11%, 1.01% and 0.98% for the years ended December 31, 2008, 2007 and 2006, respectively. |
SEE NOTES TO FINANCIAL STATEMENTS.
C1
Report of Independent Registered Public Accounting Firm
THE BOARD OF TRUSTEES AND SHAREHOLDERS
THE PRUDENTIAL SERIES FUND – DIVERSIFIED CONSERVATIVE GROWTH PORTFOLIO:
We have audited the accompanying statement of assets and liabilities of The Prudential Series Fund – Diversified Conservative Growth Portfolio (hereafter referred to as the “Fund”), including the portfolio of investments, as of December 31, 2008, and the related statement of operations for the year then ended, the statement of changes in net assets for each of the years in the two-year period then ended and the financial highlights for each of the years in the five-year period then ended. These financial statements and financial highlights are the responsibility of the Fund’s management. Our responsibility is to express an opinion on these financial statements and financial highlights based on our audit.
We conducted our audit in accordance with the standards of the Public Company Accounting Oversight Board (United States). Those standards require that we plan and perform the audit to obtain reasonable assurance about whether the financial statements and financial highlights are free of material misstatement. An audit includes examining, on a test basis, evidence supporting the amounts and disclosures in the financial statements. Our procedures included confirmation of securities owned as of December 31, 2008, by correspondence with the custodian, transfer agent, and brokers or by other appropriate auditing procedures where replies from brokers were not received. An audit also includes assessing the accounting principles used and significant estimates made by management, as well as evaluating the overall financial statement presentation. We believe that our audit provides a reasonable basis for our opinion.
In our opinion, the financial statements and financial highlights referred to above present fairly, in all material respects, the financial position of the Fund as of December 31, 2008, and the results of its operations for the year then ended, the changes in its net assets for each of the years in the two-year period then ended and the financial highlights for each of the years in the five-year period then ended, in conformity with U.S. generally accepted accounting principles.
New York, New York
February 26, 2009
D1
INFORMATION ABOUT TRUSTEES AND OFFICERS (Unaudited)
Information about the Trustees and the Officers of the Fund is set forth below. Trustees who are not deemed to be “interested persons” of the Fund, as defined in the 1940 Act, are referred to as “Independent Trustees.” Trustees who are deemed to be “interested persons” of the Fund are referred to as “Interested Trustees.” The Trustees are responsible for the overall supervision of the operations of the Fund and perform the various duties imposed on the directors of investment companies by the 1940 Act.
| | | | |
Independent Trustees (1) |
Name, Address, Age No. of Portfolios Overseen | | Principal Occupation(s) During Past Five Years | | Other Directorships Held |
Saul K. Fenster, Ph.D. (75) No. of Portfolios Overseen: 86 | | Currently President Emeritus of New Jersey Institute of Technology (since 2002); formerly President (1978-2002) of New Jersey Institute of Technology; Commissioner (1998-2002) of the Middle States Association Commission on Higher Education; Commissioner (1985-2002) of the New Jersey Commission on Science and Technology; formerly Director (1998-2005) of Society of Manufacturing Engineering Education Foundation; formerly Director of Prosperity New Jersey; formerly a director or trustee of Liberty Science Center, Research and Development Council of New Jersey, New Jersey State Chamber of Commerce, and National Action Council for Minorities in Engineering. | | Member (since 2006), Board of The Ridgefield Foundation and The Leir Foundation. |
Delayne Dedrick Gold (70) No. of Portfolios Overseen: 86 | | Marketing Consultant (1982-present); formerly Senior Vice President and Member of the Board of Directors, Prudential Bache Securities, Inc. | | |
W. Scott McDonald, Jr. (71) No. of Portfolios Overseen: 86 | | Formerly Management Consultant (1997-2004) and of Counsel (2004-2005) at Kaludis Consulting Group, Inc. (company serving higher education); Formerly principal (1995-1997), Scott McDonald Associates; Chief Operating Officer (1991-1995), Fairleigh Dickinson University; Executive Vice President and Chief Operating Officer (1975-1991), Drew University; interim President (1988-1990), Drew University; formerly Director of School, College and University Underwriters Ltd. | | |
Thomas T. Mooney (67) No. of Portfolios Overseen: 86 | | Formerly Chief Executive Officer, Excell Partners, Inc.; formerly President of the Greater Rochester Metro Chamber of Commerce, Rochester City Manager; formerly Deputy Monroe County Executive. | | |
Thomas M. O’Brien (58) No. of Portfolios Overseen: 86 | | President and COO (since November 2006) and CEO (since April 2007) of State Bancorp, Inc. and State Bank; Vice Chairman (January 1997-April 2000) of North Fork Bank; President and Chief Executive Officer (December 1984-December 1996) of North Side Savings Bank; formerly President and Chief Executive Officer (May 2000-June 2006) Atlantic Bank of New York. | | Formerly Director (December 1996-May 2000) of North Fork Bancorporation, Inc.; Formerly Director (May 2000-April 2006) of Atlantic Bank of New York; Director (since November 2006) of State Bancorp, Inc. (NASDAQ: STBC) and State Bank of Long Island. |
F. Don Schwartz (73) No. of Portfolios Overseen: 86 | | Management Consultant (since April 1985). | | |
| | | | |
Interested Trustee (1) |
Robert F. Gunia (62) No. of Portfolios Overseen: 148 | | Chief Administrative Officer (since September 1999) and Executive Vice President (since December 1996) of Prudential Investments LLC; President (April 1999-December 2008) and Executive Vice President and Chief Operating Officer (since December 2008) of Prudential Investment Management Services LLC; Executive Vice President (since March 1999) and Treasurer (since May 2000) of Prudential Mutual Fund Services LLC; Chief Administrative Officer, Executive Vice President and Director (since May 2003) of AST Investment Services, Inc. | | Director (since May 1989) of The Asia Pacific Fund, Inc. |
1 The year that each Trustee joined the Fund’s Board is as follows: Saul K. Fenster, 1983; Delayne Dedrick Gold, 2001; Robert F. Gunia, 2001; W. Scott McDonald, Jr., 1983; Thomas T. Mooney, 2001; Thomas M. O’Brien, 2003; F. Don Schwartz, 2003.
E1
| | |
Fund Officers (a)(1) |
| Name, Address and Age | | Principal Occupation(s) During the Past Five Years |
| Position with the Fund | | |
Steve Pelletier (55) President and Principal Executive Officer | | President of Prudential Annuities (since September 2008); Chairman and CEO, International Investments, Prudential Financial (since January 1998). |
Kathryn L. Quirk (56) Chief Legal Officer | | Vice President and Corporate Counsel (since September 2004) of Prudential; Executive Vice President, Chief Legal Officer and Secretary (since July 2005) of Prudential Investments LLC (PI) and Prudential Mutual Fund Services LLC (PMFS); Vice President and Corporate Counsel (since June 2005) and Secretary (since February 2006) of AST Investment Services, Inc.; formerly Senior Vice President and Assistant Secretary (November 2004-August 2005) of PI; formerly Assistant Secretary (June 2005-February 2006) of AST Investment Services, Inc.; formerly Managing Director, General Counsel, Chief Compliance Officer, Chief Risk Officer and Corporate Secretary (1997-2002) of Zurich Scudder Investments, Inc. |
Deborah A. Docs (51) Secretary | | Vice President and Corporate Counsel (since January 2001) of Prudential; Vice President (since December 1996) and Assistant Secretary (since March 1999) of PI; formerly Vice President and Assistant Secretary (May 2003-June 2005) of AST Investment Services, Inc. |
Jonathan D. Shain (50) Assistant Secretary | | Vice President and Corporate Counsel (since August 1998) of Prudential; Vice President and Assistant Secretary (since May 2001) of PI; Vice President and Assistant Secretary (since February 2001) of PMFS; formerly Vice President and Assistant Secretary (May 2003-June 2005) of AST Investment Services, Inc. |
Claudia DiGiacomo (34) Assistant Secretary | | Vice President and Corporate Counsel (since January 2005) of Prudential; Vice President and Assistant Secretary of PI (since December 2005); Associate at Sidley Austin Brown & Wood LLP (1999-2004). |
John P. Schwartz (37) Assistant Secretary | | Vice President and Corporate Counsel (since April 2005) of Prudential; Vice President and Assistant Secretary of PI (since December 2005); Associate at Sidley Austin Brown & Wood LLP (1997-2005). |
Andrew R. French (46) Assistant Secretary | | Director and Corporate Counsel (since May 2006) of Prudential; Vice President and Assistant Secretary (since January 2007) of PI; Vice President and Assistant Secretary (since January 2007) of PMFS; formerly Senior Legal Analyst of Prudential Mutual Fund Law Department (1997-2006). |
Timothy J. Knierim (49) Chief Compliance Officer | | Chief Compliance Officer of Prudential Investment Management, Inc.(PIM) (since July 2007); formerly Chief Risk Officer of PIM and PI (2002-2007) and formerly Chief Ethics Officer of PIM and PI (2006-2007). |
Valerie M. Simpson (50) Deputy Chief Compliance Officer | | Chief Compliance Officer (since April 2007) of PI and AST Investment Services, Inc.; formerly Vice President-Financial Reporting (June 1999-March 2006) for Prudential Life and Annuities Finance. |
Theresa C. Thompson (46) Deputy Chief Compliance Officer | | Vice President, Compliance, PI (since April 2004); and Director, Compliance, PI (2001 - 2004). |
Noreen M. Fierro (44) Anti-Money Laundering Compliance Officer | | Vice President, Corporate Compliance (since May 2006) of Prudential; formerly Corporate Vice President, Associate General Counsel (April 2002-May 2005) of UBS Financial Services, Inc., in their Money Laundering Prevention Group; Senior Manager (May 2005-May 2006) of Deloitte Financial Advisory Services, LLP, in their Forensic and Dispute Services, Anti-Money Laundering Group. |
Grace C. Torres (49) Treasurer and Principal Financial and Accounting Officer | | Assistant Treasurer (since March 1999) and Senior Vice President (since September 1999) of PI; Assistant Treasurer (since May 2003) and Vice President (since June 2005) of AST Investment Services, Inc.; Senior Vice President and Assistant Treasurer (since May 2003) of Prudential Annuities Advisory Services, Inc.; formerly Senior Vice President (May 2003-June 2005) of AST Investment Services, Inc. |
M. Sadiq Peshimam (45) Assistant Treasurer | | Vice President (since 2005) and Director (2000-2005) within Prudential Mutual Fund Administration. |
Peter Parrella (50) Assistant Treasurer | | Vice President (since 2007) and Director (2004-2007) within Prudential Mutual Fund Administration; formerly Tax Manager at SSB Citi Fund Management LLC (1997-2004). |
Alan Fu (51) Assistant Treasurer | | Vice President – Tax, The Prudential Insurance Company of America (1999 to October 2003); Vice President and Corporate Counsel – Tax, Prudential Financial, Inc. (since October 2003). |
(a) Excludes interested Board Members who also serve as President or Vice President.
1 The year in which each individual became an Officer of the Fund is as follows: Stephen Pelletier, 2008; Kathryn L. Quirk, 2005; Deborah A. Docs, 2005; Jonathan D. Shain, 2005; Claudia DiGiacomo, 2005; John P. Schwartz, 2006; Andrew R. French, 2006; Timothy J. Knierim, 2007; Valerie M. Simpson, 2007; Theresa C. Thompson, 2008; Noreen M. Fierro, 2006; Grace C. Torres, 1997; Peter Parrella, 2007; M. Sadiq Peshimam, 2006; Alan Fu, 2006.
Explanatory Notes to Tables:
Trustees are deemed to be “Interested”, as defined in the 1940 Act, by reason of their affiliation with Prudential Investments LLC and/or an affiliate of Prudential Investments LLC.
Unless otherwise noted, the address of all Trustees and Officers is c/o Prudential Investments LLC, Gateway Center Three, 100 Mulberry Street, Newark, New Jersey 07102.
There is no set term of office for Trustees or Officers. The Independent Trustees have adopted a retirement policy, which calls for the retirement of Trustees on December 31 of the year in which they reach the age of 75.
“Other Directorships Held” includes only directorships of companies required to register or file reports with the SEC under the Securities Exchange Act of 1934 (that is, “public companies”) or other investment companies registered under the 1940 Act.
“No. of Portfolios Overseen” includes all investment companies managed by Prudential Investments LLC. The investment companies for which PI serves as manager include the JennisonDryden Funds, Strategic Partners Funds, The Prudential Variable Contract Accounts, The Target Portfolio Trust, The Prudential Series Fund, Advanced Series Trust, The High Yield Income Fund, Inc., The High Yield Plus Fund, Inc., Nicholas-Applegate Fund, Inc. and Prudential’s Gibraltar Fund, Inc.
E2
The Prudential Series Fund
Diversified Conservative Growth Portfolio
Approval of New Subadvisory Agreement
At a meeting of the Board of Trustees (the Board) held on November 12, 2008, the Board approved a new subadvisory agreement for the Diversified Conservative Growth Portfolio (the Portfolio), as explained below.
Pursuant to a recommendation by Prudential Investments LLC (PI), the Board approved a new subadvisory agreement between PI and Eagle Asset Management (Eagle) and the termination of the existing subadvisory agreement with RS Investment Management Co. LLC (RS).
In approving the new subadvisory agreement, the Board considered PI’s assertion that it was advisable and recommended to approve a new subadvisory agreement with Eagle with respect to the Portfolio based on the long-term underperformance of the sleeve of the Portfolio managed by RS. The Board considered an analysis prepared by PI’s Strategic Investments Research Group (SIRG) and noted SIRG’s recommendation that the Portfolio would be better served in the future by switching subadvisers.
Nature, quality and extent of services
The Board received and considered information regarding the nature and extent of services provided to the Portfolio by RS under the current subadvisory agreement and those that would be provided by Eagle under the new subadvisory agreement, noting that the nature and extent of services under the existing and new agreements were generally similar in that RS and Eagle were each required to provide day-to-day portfolio management services and comply with all Fund policies and applicable rules and regulations.
With respect to the quality of services, the Board considered, among other things, the background and experience of the Eagle management team. The Board reviewed the qualifications, backgrounds and responsibilities of the portfolio managers who would be responsible for the day-to-day management of the Portfolio. The Board was also provided with information pertaining to the organizational structure, senior management, investment operations, and other relevant information pertaining to Eagle. The Board noted that it received a favorable compliance reports from the Portfolio’s Chief Compliance Officer (CCO) as to Eagle.
The Board concluded that it was satisfied with the nature, extent and quality of the investment subadvisory services anticipated to be provided to the Portfolio by Eagle and that there was a reasonable basis on which to conclude that the Portfolio would benefit from the subadvisory services to be provided by Eagle under the new subadvisory agreement.
Performance
The Board received and considered information regarding the performance of other investment companies managed by Eagle utilizing investment styles and strategies similar to that proposed for the Portfolio. The Board concluded that it was satisfied with the performance record of Eagle.
Investment Subadvisory Fee Rate
The Board considered the proposed subadvisory fee rates payable by PI to Eagle under the proposed new subadvisory agreement, which are lower than the fee rates under the agreement with RS. The Board noted that PI pays the subadvisory fees, and therefore any change in the proposed subadvisory fee rate would not have any impact on the amount of fees paid by the Portfolio. Instead, the decrease will increase the net fee rates retained by PI.
The Board concluded that the proposed subadvisory fee rate under the new subadvisory agreement was reasonable.
Subadviser’s Profitability
Because the engagement of Eagle is new, there is no historical profitability with regard to its arrangements with the Portfolio. As a result, the Board did not consider this factor. The Board noted that profitability would be reviewed annually in connection with the review of advisory agreements.
Economies of Scale
The Board noted that the proposed subadvisory fee schedule for the Portfolio contained breakpoints that reduce the fee rate on assets above specified levels, but did not consider this as a factor, because, as discussed above, PI pays the subadvisory fees.
Other Benefits to the Subadviser or its Affiliates from Serving as Subadviser
The Board considered potential ancillary benefits that might be received by Eagle and its affiliates as a result of its relationships with the Portfolio. The Board concluded that the potential benefits to be derived by Eagle included the ability to use soft dollar credits, brokerage commissions received by affiliates of Eagle, as well as the potential benefits consistent with those generally resulting from an increase in assets under management, specifically, potential access to additional research resources and benefits to the reputation. The Board concluded that the benefits to be derived by Eagle were consistent with the types of benefits generally derived by subadvisers to mutual funds.
After full consideration of these factors, the Board concluded that the approval of the agreement was in the best interest of the Portfolio and its shareholders.
Annuities are issued by Pruco Life Insurance Company, or in New York, Pruco Life Insurance Company of New Jersey, both located at 213 Washington Street, Newark, NJ 07102-2992, and Prudential Annuities Life Assurance Corporation, located at One Corporate Drive, Shelton, CT, 06484. Variable annuities are distributed by Prudential Annuities Distributors, Inc., also located in Shelton, CT. Prudential Annuities is a business unit of Prudential Financial.
Variable life insurance is issued by The Prudential Insurance Company of America, 751 Broad Street, Newark, NJ 07102-3777, Pruco Life Insurance Company, or in New York, Pruco Life Insurance Company of New Jersey, both located at 213 Washington Street, Newark, NJ 07102-2992. Pruco Life Insurance Company is not licensed to do business in New York. Variable life insurance is offered through Pruco Securities LLC, 751 Broad Street, Newark, NJ 07102-3777.
All are Prudential Financial companies and each is solely responsible for its financial condition and contractual obligations.
Life insurance policies and annuity contracts contain exclusions, limitations, reductions of benefits and terms for keeping them in force. Your licensed financial professional can provide you with costs and complete details. Contract guarantees are based on the claims-paying ability of the issuing company.
The Prudential Insurance Company of America
751 Broad Street
Newark, NJ 07102-3777
Presorted
Standard
U.S. Postage
PAID
Prudential
The 2008 Audited Financial Statements of Pruco Life Insurance Company, Pruco Life Insurance Company of New Jersey, and The Prudential Insurance Company of America are available. You may call 888-778-2888 to obtain a free copy of the audited financial statements of the insurance company that issued your contract.
To reduce costs, we now generally send only a single copy of prospectuses and shareholder reports to each household (“householding”) in lieu of sending a copy to each Contract Owner who resides in the household. You should be aware that by calling 877-778-5008, you can revoke or “opt out” of householding at any time.
Pru, Prudential, Prudential Financial, Rock Solid, “The Rock,” the Rock Logo and the Rock Prudential Logo are registered service marks of The Prudential Insurance Company of America, Newark, NJ, and its affiliates.
IFS-A114743 PSF-AR-DCG Ed.2/2009

| | |
| | |
| ANNUAL REPORT | | December 31, 2008 |
The Prudential Series Fund
| n | | Jennison 20/20 Focus Portfolio |


IFS-AI05395
This report is only authorized for distribution when preceded or accompanied by a current prospectus. Investors should carefully consider the contract and the underlying portfolios’ investment objectives, risks, and charges and expenses before investing. The contract prospectus and the underlying portfolio prospectuses contain information on the investment objectives, risks, and charges and expenses, as well as other important information. Read them carefully before investing or sending money.
A description of the Fund’s proxy voting policies and procedures is available, without charge, upon request. Owners of variable annuity contracts should call 888-778-2888 and owners of variable life insurance contracts should call 800-778-2255 to obtain descriptions of the Fund’s proxy voting policies and procedures. The description is also available on the website of the Securities and Exchange Commission (the “Commission”) at www.sec.gov. Information regarding how the Fund voted proxies relating to portfolio securities during the most recent 12-month period ended June 30 is available on the website of the Commission at www.sec.gov and on the Fund’s website.
The Fund files with the Commission a complete listing of portfolio holdings as of its first and third quarter-end on Form N-Q. Form N-Q is available on the Commission’s website at www.sec.gov or by visiting the Commission’s Public Reference Room. For more information on the Commission’s Public Reference Room, please visit the Commission’s website or call 1-800-SEC-0330. Form N-Q is also available on the Fund’s website at www.prudential.com or by calling the telephone numbers referenced above.
Life insurance policies and annuity contracts contain exclusions, limitations, reductions of benefits, and terms for keeping them in force. Your licensed financial professional can provide you with costs and complete details. Contract guarantees are based on the claims-paying ability of the issuing company.
Annuities are issued by Pruco Life Insurance Company, or in New York, Pruco Life Insurance Company of New Jersey, both located at 213 Washington Street, Newark, NJ 07102-2992, and Prudential Annuities Life Assurance Corporation, located at One Corporate Drive, Shelton, CT, 06484. Variable annuities are distributed by Prudential Annuities Distributors, Inc., also located in Shelton, CT. Prudential Annuities is a business unit of Prudential Financial.
Variable life insurance is issued by The Prudential Insurance Company of America, 751 Broad Street, Newark, NJ 07102- 3777, Pruco Life Insurance Company, or in New York, Pruco Life Insurance Company of New Jersey, both located at 213 Washington Street, Newark, NJ 07102-2992. Pruco Life Insurance Company is not licensed to do business in New York. Variable life insurance is offered through Pruco Securities LLC, 751 Broad Street, Newark, NJ 07102-3777.
All are Prudential Financial companies and each is solely responsible for its financial condition and contractual obligations.
Pru, Prudential, Prudential Financial, Rock Solid, “The Rock,” the Rock Logo and the Rock Prudential Logo are registered service marks of The Prudential Insurance Company of America, Newark, NJ, and its affiliates.
The Prudential Series Fund Class II Portfolio’s are available through life insurance contracts issued by various insurance companies other than The Prudential Insurance Company of America and its affiliates and distributed by Prudential Annuities Distributors, Inc., member SIPC, a Prudential Financial Company. Each company is solely responsible for its own financial condition and contractual obligations.
The Fund’s Statement of Additional Information contains additional information about the Fund’s Trustees and is available without charge upon request by calling 800-778-2255.
| | | | |
| The Prudential Series Fund | | Annual Report | | December 31, 2008 |
Table of Contents
| n | | LETTER TO CONTRACT OWNERS |
| n | | FEES AND EXPENSES TABLE |
| | A1 | Schedule of Investments and Financial Statements |
| | B1 | Notes to Financial Statements |
| | D1 | Report of Independent Registered Public Accounting Firm |
| | E1 | Information About Trustees and Officers |
| | | | |
The Prudential Series Fund Letter to Contract Owners | | Annual Report | | December 31, 2008 |
Our objective at Prudential is very simple — we strive to help our clients achieve and maintain financial success. Our Prudential Series Fund annual report details this commitment to you as we focus on ways to help you with your financial security. We hope you find it both informative and useful.
While 2008 presented unprecedented challenges to investors, it also proved that Prudential’s strategies around growing and protecting our clients’ wealth have never been more important.
Your financial professional is the best resource to help you understand how market changes affect your investments. Together, you can develop a diversified mix of investments that works best for you and review it periodically to ensure your financial objectives remain on target.
Thank you for selecting Prudential as one of your financial partners. We value your trust and appreciate the opportunity to help you reach your financial goals.
Sincerely,
Steve Pelletier
President,
The Prudential Series Fund | January 30, 2009 |
PRESIDENT
STEVE PELLETIER
| | |
The Prudential Series Fund, Jennison 20/20 Focus Portfolio Subadvised by: Jennison Associates LLC | | December 31, 2008 |
Investment Manager’s Report - As of December 31, 2008
Average Annual Total Return Percentages
| | | | | | | | | |
| | | 1-Year | | | 5-Year | | | Since
Inception | |
Portfolio: Class I | | -39.15 | % | | 1.60 | % | | 2.01 | % |
Portfolio: Class II | | -39.40 | | | 1.19 | | | 0.31 | |
S&P 500 Index | | -36.99 | | | -2.19 | | | -2.31 | |
Russell 1000® Index | | -37.60 | | | -2.04 | | | -1.96 | |
Past performance does not guarantee future returns. The investment return and principal value of an investment will fluctuate, so that an investor’s shares, when redeemed, may be worth more or less than their original cost. Current performance may be lower or higher than the past performance data quoted.
$10,000 INVESTED SINCE INCEPTION1
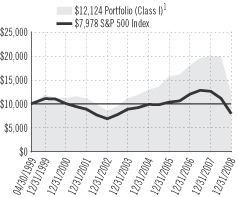
Portfolio Class I inception: 5/3/1999. Portfolio Class II inception: 2/15/2000. Portfolio performance is net of investment fees and fund expenses, but not product charges, which, if included, would significantly lower the performance quoted. Unless noted otherwise, Index returns reflect performance beginning the closest month-end date to the Portfolio’s inception (Class I). The Russell 1000® Index is a trademark/service mark of the Frank Russell Company. Russell® is a trademark of the Frank Russell Company. Performance figures may reflect fee waivers and/or expense reimbursements. In the absence of such fee waivers and/or expense reimbursements, total returns would be lower.
For the year ended December 31, 2008, the Jennison 20/20 Focus Portfolio underperformed its benchmark index (the Index), the Russell 1000® Index.
Risk factors had the largest negative impact on relative performance. As investors moved toward less risky investments throughout the year, the subadviser’s overexposure to leveraged stocks (stocks in companies with above-market debt-to-asset ratios) and high earnings variability (earnings variation, a measure of the volatility in a company's earnings and cash flow) detracted from returns.
Stock selection in the energy, materials, and telecommunication services sectors meaningfully detracted from returns versus the Index. A significant position in a digital wireless communications company with operations in Mexico and Brazil fell in share value, despite the consistent delivery of solid financial results and increasing subscriber growth. The company lost value due to rapid deterioration in the exchange rate for the Brazilian and Mexican currencies. The Portfolio also had a lower total return in the consumer staples and consumer discretionary sectors.
On the positive side, an underweight in financials was a significant source of relative gain. Stock selection in the industrials and information technology sectors and overweights in healthcare and utilities also added to relative performance. A bright spot was an industry-leading tax preparation franchise, which is energized and under new leadership.
Prudential Investments LLC (PI), an indirect, wholly owned subsidiary of Prudential Financial, Inc., serves as the investment manager for the Fund.
| 1 | The graph is based on the performance of Class I shares. Performance of Class II shares will be lower due to differences in the fee structure. Class II shares have associated 12b-1 and administrative fees at an annual rate of 0.25% and 0.15%, respectively, of the average daily net assets of the Class II shares. |
S&P 500 Index is an unmanaged, market value-weighted index of 500 stocks generally representative of the broad stock market. Russell 1000® Index is a market cap-weighted index that measures the performance of the 1,000 largest companies in the Russell 3000 Index, which represents approximately 92% of the total market. These returns do not include the effect of any investment management expenses. These returns would have been lower if they included the effect of these expenses. Investors cannot invest directly in a market index. For a complete list of holdings, refer to the Schedule of Investments section of this report.
| | |
The Prudential Series Fund Presentation of Portfolio Holdings — unaudited | | December 31, 2008 |
| | |
| Jennison 20/20 Focus |
| Five Largest Holdings (% of Net Assets) |
| Gilead Sciences, Inc. | | 3.7% |
| QUALCOMM, Inc. | | 3.1% |
| Google, Inc. (Class A Stock) | | 3.1% |
| Baxter International, Inc. | | 3.1% |
| Genentech, Inc. | | 3.0% |
For average and index definitions, refer to the Glossary of Benchmark Definitions page. Investors cannot invest directly in an index. For a complete list of holdings, please refer to the Schedule of Investments section of this report. Holdings/Issues/Sectors/Industries are subject to change.
| | |
The Prudential Series Fund Fees and Expenses — unaudited | | December 31, 2008 |
As a contract owner investing in Portfolios of the Fund through a variable annuity or variable life contract, you incur ongoing costs, including management fees, and other Portfolio expenses. This example is intended to help you understand your ongoing costs (in dollars) of investing in the Fund and to compare these costs with the ongoing costs of investing in other investment options. This example does not reflect fees and charges under your variable annuity or variable life contract. If contract charges were included, the costs shown below would be higher. Please consult the prospectus for your contract for more information about contract fees and charges.
The example is based on an investment of $1,000 invested at the beginning of the period and held for the entire period July 1, 2008 through December 31, 2008.
Actual Expenses
The first line of the table below provides information about actual account values and actual expenses. You may use this information, together with the amount you invested, to estimate the Portfolio expenses that you paid over the period. Simply divide your account value by $1,000 (for example, an $8,600 account value divided by $1,000 = 8.6), then multiply the result by the number in the first line under the heading entitled “Expenses Paid During the Six-Month Period” to estimate the Portfolio expenses you paid on your account during this period. As noted above, the table does not reflect variable contract fees and charges.
Hypothetical Example for Comparison Purposes
The second line of the table below provides information about hypothetical account values and hypothetical expenses based on the Portfolio’s actual expense ratio and an assumed rate of return of 5% per year before expenses, which is not the Portfolio’s actual return. The hypothetical account values and expenses may not be used to estimate the actual ending account balance or expenses you paid for the period. You may use this information to compare the ongoing costs of investing in the Portfolio and other investment options. To do so, compare this 5% hypothetical example with the 5% hypothetical examples that appear in the shareholder reports of the other investment options.
Please note that the expenses shown in the table are meant to highlight your ongoing Portfolio costs only and do not reflect any contract fees and charges, such as sales charges (loads), insurance charges or administrative charges. Therefore the second line of the table is useful to compare ongoing investment option costs only, and will not help you determine the relative total costs of owning different contracts. In addition, if these contract fee and charges were included, your costs would have been higher.
| | | | | | | | | | | | | | |
| The Prudential Series Fund Portfolios | | Beginning Account Value
July 1, 2008 | | Ending Account Value
December 31, 2008 | | Annualized Expense Ratio based on the
Six-Month period | | | Expenses Paid
During the
Six-Month period* |
| Jennison 20/20 Focus (Class I) | | Actual | | $ | 1,000.00 | | $ | 611.60 | | 0.82 | % | | $ | 3.32 |
| | | Hypothetical | | $ | 1,000.00 | | $ | 1,021.01 | | 0.82 | % | | $ | 4.17 |
| Jennison 20/20 Focus (Class II) | | Actual | | $ | 1,000.00 | | $ | 610.50 | | 1.22 | % | | $ | 4.94 |
| | | Hypothetical | | $ | 1,000.00 | | $ | 1,019.00 | | 1.22 | % | | $ | 6.19 |
* Portfolio expenses (net of fee waivers or subsidies, if any) for each share class are equal to the annualized expense ratio for each share class (provided in the table), multiplied by the average account value over the period, multiplied by the 184 days in the six-month period ended December 31, 2008, and divided by the 366 days in the Portfolio’s fiscal year ended December 31, 2008 (to reflect the six-month period). Expenses presented in the table include the expenses of any underlying portfolios in which the Portfolio may invest.
| | | | | | |
| | | JENNISON 20/20 FOCUS PORTFOLIO | | |
| |
| SCHEDULE OF INVESTMENTS | | December 31, 2008 |
| | | | | |
| LONG-TERM INVESTMENTS — 92.7% |
| COMMON STOCKS — 92.7% | | Shares
| | Value
(Note 2)
|
| | | | | | |
Biotechnology — 9.2% | | | | | |
Celgene Corp.(a) | | 91,600 | | $ | 5,063,648 |
Genentech, Inc.(a) | | 72,800 | | | 6,035,848 |
Gilead Sciences, Inc.(a) | | 147,500 | | | 7,543,149 |
| | | | |
|
|
| | | | | | 18,642,645 |
| | | | |
|
|
Capital Markets — 4.2% | | | | | |
Charles Schwab Corp. (The) | | 256,600 | | | 4,149,222 |
Goldman Sachs Group, Inc. (The) | | 51,900 | | | 4,379,841 |
| | | | |
|
|
| | | | | | 8,529,063 |
| | | | |
|
|
Chemicals — 1.7% | | | | | |
Monsanto Co. | | 48,600 | | | 3,419,010 |
| | | | |
|
|
Commercial Services & Supplies — 2.2% | | | |
Waste Management, Inc. | | 134,700 | | | 4,463,958 |
| | | | |
|
|
Communications Equipment — 7.5% | | | | | |
Cisco Systems, Inc.(a) | | 243,200 | | | 3,964,160 |
QUALCOMM, Inc. | | 178,100 | | | 6,381,323 |
Research In Motion Ltd.(a) | | 121,100 | | | 4,914,238 |
| | | | |
|
|
| | | | | | 15,259,721 |
| | | | |
|
|
Computers & Peripherals — 2.0% | | | | | |
Apple, Inc.(a) | | 48,410 | | | 4,131,794 |
| | | | |
|
|
Consumer Finance — 2.3% | | | | | |
SLM Corp.(a)(b) | | 527,000 | | | 4,690,300 |
| | | | |
|
|
Diversified Consumer Services — 4.5% | | | | | |
Career Education Corp.(a) | | 200,200 | | | 3,591,588 |
H&R Block, Inc. | | 241,100 | | | 5,477,792 |
| | | | |
|
|
| | | | | | 9,069,380 |
| | | | |
|
|
Food & Staples Retailing — 2.1% | | | | | |
CVS/Caremark Corp. | | 144,500 | | | 4,152,930 |
| | | | |
|
|
Food Products — 4.9% | | | | | |
Cadbury Schweppes PLC, ADR (United Kingdom) | | 149,956 | | | 5,348,931 |
ConAgra Foods, Inc. | | 281,500 | | | 4,644,750 |
| | | | |
|
|
| | | | | | 9,993,681 |
| | | | |
|
|
Healthcare Equipment & Supplies — 5.3% | | | |
Alcon, Inc. | | 51,300 | | | 4,575,447 |
Baxter International, Inc. | | 115,900 | | | 6,211,081 |
| | | | |
|
|
| | | | | | 10,786,528 |
| | | | |
|
|
Healthcare Providers & Services — 1.3% | | | | | |
Aetna, Inc. | | 88,010 | | | 2,508,285 |
| | | | |
|
|
Household Products — 2.4% | | | | | |
Colgate-Palmolive Co. | | 71,500 | | | 4,900,610 |
| | | | |
|
|
Independent Power Producers & Energy Traders — 0.9% |
NRG Energy, Inc.(a)(b) | | 77,900 | | | 1,817,407 |
| | | | |
|
|
Insurance — 0.4% | | | | | |
XL Capital Ltd. (Class A Stock) | | 189,700 | | | 701,890 |
| | | | |
|
|
Internet & Catalog Retail — 2.4% | | | | | |
Amazon.com, Inc.(a)(b) | | 95,500 | | | 4,897,240 |
| | | | |
|
|
Internet Software & Services — 4.8% | | | | | |
Google, Inc. (Class A Stock)(a) | | 20,300 | | | 6,245,295 |
IAC/InterActiveCorp(a) | | 227,400 | | | 3,577,002 |
| | | | |
|
|
| | | | | | 9,822,297 |
| | | | |
|
|
| | | | | | |
COMMON STOCKS (continued) | | Shares
| | Value
(Note 2)
| |
| | | | | | | |
IT Services — 2.9% | | | | | | |
Visa, Inc. (Class A Stock)(b) | | 111,500 | | $ | 5,848,175 | |
| | | | |
|
|
|
Media — 3.0% | | | | | | |
Comcast Corp. (Class A Stock) | | 292,500 | | | 4,937,400 | |
Sirius XM Radio, Inc.(a)(b) | | 9,536,640 | | | 1,144,397 | |
| | | | |
|
|
|
| | | | | | 6,081,797 | |
| | | | |
|
|
|
Metals & Mining — 4.7% | | | | | | |
Century Aluminum Co.(a) | | 358,700 | | | 3,587,000 | |
Freeport-McMoRan Copper & Gold, Inc. | | 240,200 | | | 5,870,488 | |
| | | | |
|
|
|
| | | | | | 9,457,488 | |
| | | | |
|
|
|
Multi-Utilities — 2.2% | | | | | | |
Sempra Energy | | 105,100 | | | 4,480,413 | |
| | | | |
|
|
|
Oil, Gas & Consumable Fuels — 10.8% | | | | | | |
Occidental Petroleum Corp. | | 41,700 | | | 2,501,583 | |
Petroleo Brasileiro SA, ADR (Brazil) | | 109,000 | | | 2,669,410 | |
Southwestern Energy Co.(a) | | 163,300 | | | 4,730,801 | |
Suncor Energy, Inc.(b) | | 241,900 | | | 4,717,050 | |
Williams Cos., Inc. | | 331,400 | | | 4,798,672 | |
XTO Energy, Inc. | | 72,200 | | | 2,546,494 | |
| | | | |
|
|
|
| | | | | | 21,964,010 | |
| | | | |
|
|
|
Pharmaceuticals — 4.8% | | | | | | |
Schering-Plough Corp. | | 309,100 | | | 5,263,973 | |
Teva Pharmaceutical Industries Ltd., ADR (Israel)(b) | | 106,100 | | | 4,516,677 | |
| | | | |
|
|
|
| | | | | | 9,780,650 | |
| | | | |
|
|
|
Software — 3.8% | | | | | | |
Adobe Systems, Inc.(a) | | 120,000 | | | 2,554,800 | |
Symantec Corp.(a)(b) | | 386,100 | | | 5,220,072 | |
| | | | |
|
|
|
| | | | | | 7,774,872 | |
| | | | |
|
|
|
Wireless Telecommunication Services — 2.4% | |
NII Holdings, Inc.(a) | | 270,900 | | | 4,924,962 | |
| | | | |
|
|
|
TOTAL LONG-TERM INVESTMENTS
(cost $219,510,115) | | | 188,099,106 | |
| | | | |
|
|
|
| SHORT-TERM INVESTMENT — 22.6% | |
AFFILIATED MONEY MARKET MUTUAL FUND | | | | |
Dryden Core Investment Fund —
Taxable Money Market Series
(cost $45,881,373; includes $35,507,737 of cash collateral received for securities on loan) (Note 4)(c)(d) | | 45,881,373 | | | 45,881,373 | |
| | | | |
|
|
|
TOTAL INVESTMENTS — 115.3%
(cost $265,391,488) | | | 233,980,479 | |
LIABILITIES IN EXCESS OF
OTHER ASSETS — (15.3%) | | | (30,963,796 | ) |
| | | | |
|
|
|
NET ASSETS — 100.0% | | $ | 203,016,683 | |
| | | | |
|
|
|
SEE NOTES TO FINANCIAL STATEMENTS.
A1
| | | | | | |
| | | JENNISON 20/20 FOCUS PORTFOLIO (continued) | | |
| |
| SCHEDULE OF INVESTMENTS | | December 31, 2008 |
The following abbreviation is used in the portfolio descriptions:
| | |
| ADR | | American Depositary Receipt |
| (a) | Non-income producing security. |
| (b) | All or a portion of security is on loan. The aggregate market value of such securities is $27,080,997; cash collateral of $35,507,737 (included in liabilities) was received with which the Portfolio purchased highly liquid short-term investments. |
| (c) | Represents security, or a portion thereof, purchased with cash collateral received for securities on loan. |
| (d) | Prudential Investments LLC, the manager of the Portfolio, also serves as manager of the Dryden Core Investment Fund-Taxable Money Market Series. |
Various inputs are used in determining the value of the Portfolio’s investments. These inputs are summarized in the three broad levels listed below.
Level 1—quoted prices in active markets for identical securities
Level 2—other significant observable inputs (including quoted prices for similar securities, interest rates, prepayment speeds, credit risk, etc.)
Level 3—significant unobservable inputs (including the Portfolio’s own assumptions in determining the fair value of investments)
The following is a summary of the inputs used as of December 31, 2008 in valuing the Portfolio’s assets carried at fair value:
| | | | | |
Valuation inputs
| | Investments in Securities
| | Other Financial
Instruments*
|
Level 1—Quoted Prices | | $ | 233,980,479 | | — |
Level 2—Other Significant Observable Inputs | | | — | | — |
Level 3—Significant Unobservable Inputs | | | — | | — |
| | |
|
| |
|
Total | | $ | 233,980,479 | | — |
| | |
|
| |
|
| * | Other financial instruments are derivative instruments not reflected in the Schedule of Investments, such as futures, forwards and swap contracts, which are valued at the unrealized appreciation/depreciation on the instrument. |
As of December 31, 2007 and December 31, 2008, the Portfolio did not use any Significant Unobservable Inputs (Level 3) in determining the valuation of investments.
The industry classification of portfolio holdings and liabilities in excess of other assets shown as a percentage of net assets as of December 31, 2008 was as follow:
| | | |
Affiliated Money Market Mutual Fund (including 17.5% of collateral received for securities on loan) | | 22.6 | % |
Oil, Gas & Consumable Fuels | | 10.8 | |
Biotechnology | | 9.2 | |
Communications Equipment | | 7.5 | |
Healthcare Equipment & Supplies | | 5.3 | |
Food Products | | 4.9 | |
Internet & Software Services | | 4.8 | |
Pharmaceuticals | | 4.8 | |
Metals & Mining | | 4.7 | |
Diversified Consumer Services | | 4.5 | |
Capital Markets | | 4.2 | |
Software | | 3.8 | |
Media | | 3.0 | |
IT Services | | 2.9 | |
Household Products | | 2.4 | |
Internet & Catalog Retail | | 2.4 | |
Wireless Telecommunication Services | | 2.4 | |
Consumer Finance | | 2.3 | |
Commercial Services & Supplies | | 2.2 | |
Multi-Utilities | | 2.2 | |
Food & Staples Retailing | | 2.1 | |
Computers & Peripherals | | 2.0 | |
Chemicals | | 1.7 | |
Healthcare Providers & Services | | 1.3 | |
Independent Power Producers & Energy Traders | | 0.9 | |
Insurance | | 0.4 | |
| | |
|
|
| | | 115.3 | |
Liabilities in excess of other assets | | (15.3 | ) |
| | |
|
|
| | | 100.0 | % |
| | |
|
|
SEE NOTES TO FINANCIAL STATEMENTS.
A2
| | | | | | |
| | | JENNISON 20/20 FOCUS PORTFOLIO (continued) | | |
STATEMENT OF ASSETS AND LIABILITIES
December 31, 2008
| | | | |
| ASSETS | | | | |
Investments, at value including securities on loan of $27,080,997: | | | | |
Unaffiliated investments (cost $219,510,115) | | $ | 188,099,106 | |
Affiliated investments (cost $45,881,373) | | | 45,881,373 | |
Cash | | | 436,656 | |
Receivable for Series shares sold | | | 5,545,066 | |
Receivable for investments sold | | | 3,420,163 | |
Dividends and interest receivable | | | 204,741 | |
Foreign tax reclaim receivable | | | 17,107 | |
Prepaid expenses | | | 5,194 | |
| | |
|
|
|
Total Assets | | | 243,609,406 | |
| | |
|
|
|
| LIABILITIES | | | | |
Collateral for securities on loan | | | 35,507,737 | |
Payable for investments purchased | | | 4,723,893 | |
Management fee payable | | | 118,840 | |
Payable for Series shares repurchased | | | 118,113 | |
Accrued expenses and other liabilities | | | 74,724 | |
Distribution fee payable | | | 30,130 | |
Administration fee payable | | | 18,078 | |
Affiliated transfer agent fee payable | | | 1,208 | |
| | |
|
|
|
Total Liabilities | | | 40,592,723 | |
| | |
|
|
|
| NET ASSETS | | $ | 203,016,683 | |
| | |
|
|
|
Net assets were comprised of: | | | | |
Paid-in capital | | $ | 300,841,862 | |
Retained earnings | | | (97,825,179 | ) |
| | |
|
|
|
Net assets, December 31, 2008 | | $ | 203,016,683 | |
| | |
|
|
|
| Class I: | | | | |
Net asset value and redemption price per share, $46,700,694 / 5,088,569 outstanding shares of beneficial interest | | $ | 9.18 | |
| | |
|
|
|
| Class II: | | | | |
Net asset value and redemption price per share, | | | | |
$156,315,989 / 17,245,810 outstanding shares of | | | | |
beneficial interest | | $ | 9.06 | |
| | |
|
|
|
STATEMENT OF OPERATIONS
Year Ended December 31, 2008
| | | | |
| INVESTMENT INCOME | | | | |
Unaffiliated dividend income (net of foreign withholding taxes of $52,443) | | $ | 3,407,831 | |
Affiliated dividend income | | | 403,910 | |
Affiliated income from securities loaned, net | | | 362,336 | |
Interest | | | 835 | |
| | |
|
|
|
| | | | 4,174,912 | |
| | |
|
|
|
| EXPENSES | | | | |
Management fee | | | 2,578,142 | |
Distribution fee—Class II | | | 683,719 | |
Administration fee—Class II | | | 410,269 | |
Transfer agent’s fee and expenses (including affiliated expense of $6,800) (Note 4) | | | 67,000 | |
Shareholders’ reports | | | 55,000 | |
Custodian’s fees and expenses | | | 50,000 | |
Audit fee | | | 17,000 | |
Trustees’ fees | | | 13,000 | |
Legal fees and expenses | | | 8,000 | |
Insurance expenses | | | 4,000 | |
Commitment fee on syndicated credit agreement | | | 2,000 | |
Miscellaneous | | | 7,894 | |
| | |
|
|
|
Total expenses | | | 3,896,024 | |
| | |
|
|
|
| NET INVESTMENT INCOME | | | 278,888 | |
| | |
|
|
|
| NET REALIZED AND UNREALIZED GAIN (LOSS) ON INVESTMENTS | | | | |
Net realized loss on investment transactions | | | (66,694,837 | ) |
Net change in unrealized appreciation (depreciation) on investments | | | (83,136,386 | ) |
| | |
|
|
|
| NET LOSS ON INVESTMENTS | | | (149,831,223 | ) |
| | |
|
|
|
| NET DECREASE IN NET ASSETS RESULTING FROM OPERATIONS | | $ | (149,552,335 | ) |
| | |
|
|
|
STATEMENT OF CHANGES IN NET ASSETS
| | | | | | | | |
| | | Year Ended December 31,
| |
| | | 2008
| | | 2007
| |
| INCREASE (DECREASE) IN NET ASSETS | | | | | | | | |
| OPERATIONS: | | | | | | | | |
Net investment income | | $ | 278,888 | | | $ | 391,558 | |
Net realized gain (loss) on investment transactions | | | (66,694,837 | ) | | | 22,867,447 | |
Net change in unrealized appreciation (depreciation) on investments | | | (83,136,386 | ) | | | 7,758,740 | |
| | |
|
|
| |
|
|
|
NET INCREASE (DECREASE) IN NET ASSETS RESULTING FROM OPERATIONS | | | (149,552,335 | ) | | | 31,017,745 | |
| | |
|
|
| |
|
|
|
| DISTRIBUTIONS: | | | | | | | | |
Class I | | | (4,686,743 | ) | | | (8,455,776 | ) |
Class II | | | (18,572,262 | ) | | | (27,025,596 | ) |
| | |
|
|
| |
|
|
|
TOTAL DISTRIBUTIONS | | | (23,259,005 | ) | | | (35,481,372 | ) |
| | |
|
|
| |
|
|
|
| SERIES SHARE TRANSACTIONS (Note 7): | | | | | | | | |
Series shares sold | | | 160,071,162 | | | | 129,279,557 | |
Series shares issued in reinvestment of distributions | | | 23,259,005 | | | | 35,481,372 | |
Series shares repurchased | | | (187,443,418 | ) | | | (91,831,050 | ) |
| | |
|
|
| |
|
|
|
NET INCREASE (DECREASE) IN NET ASSETS RESULTING FROM SERIES SHARE TRANSACTIONS | | | (4,113,251 | ) | | | 72,929,879 | |
| | |
|
|
| |
|
|
|
| TOTAL INCREASE (DECREASE) IN NET ASSETS | | | (176,924,591 | ) | | | 68,466,252 | |
| NET ASSETS: | | | | | | | | |
Beginning of year | | | 379,941,274 | | | | 311,475,022 | |
| | |
|
|
| |
|
|
|
End of year | | $ | 203,016,683 | | | $ | 379,941,274 | |
| | |
|
|
| |
|
|
|
SEE NOTES TO FINANCIAL STATEMENTS.
A3
NOTES TO THE FINANCIAL STATEMENTS OF
THE PRUDENTIAL SERIES FUND
The Prudential Series Fund (“Series Fund”), organized as a Delaware statutory trust, is a diversified open-end management investment company registered under the Investment Company Act of 1940, as amended. On January 2, 2006, each Portfolio of the Series Fund changed its federal income tax status from a regulated investment company to a partnership. As a result of that conversion, the Series Fund was reorganized from a Maryland corporation to a Delaware statutory trust. Pursuant to this reorganization, the Series Fund has been renamed “The Prudential Series Fund.” The Series Fund is composed of twenty-eight Portfolios (“Portfolio” or “Portfolios”), each with separate series shares. The information presented in these financial statements pertains to Jennison 20/20 Focus Portfolio.
The Portfolio has the following as investment objectives:
Long-term growth of capital by investing primarily in up to 40 equity securities of U.S. companies that the Portfolio manager believes to have strong capital appreciation potential.
The ability of issuers of debt securities (other than those issued or guaranteed by the U.S. Government) held by the Portfolio to meet their obligations may be affected by the economic or political developments in a specific industry, region or country.
Foreign security and currency transactions may involve certain considerations and risks not typically associated with those of domestic origin as a result of, among other factors, the possibility of political and economic instability or the level of governmental supervision and regulation of foreign securities markets.
| Note 2: | | Accounting Policies |
The following is a summary of significant accounting policies followed by the Series Fund and the Portfolio in preparation of its financial statements.
Securities Valuation: Securities listed on a securities exchange are valued at the last sale price on such exchange on the day of valuation or, if there was no sale on such day, at the mean between the last reported bid and asked prices, or at the last bid price on such day in the absence of an asked price. Securities traded via NASDAQ are valued at the official closing price provided by NASDAQ. Securities that are actively traded in the over-the-counter market, including listed securities for which the primary market is believed by Prudential Investments LLC (“PI” or “Manager”) in consultation with the subadviser, to be over-the-counter, are valued at market value using prices provided by an independent pricing agent or principal market maker. Options on securities and indices traded on an exchange are valued at the last sale price as of the close of trading on the applicable exchange or, if there was no sale, at the mean between the most recently quoted bid and asked prices on such exchange, or at the last bid price in the absence of an asked price. Futures contracts and options thereon traded on a commodities exchange or board of trade are valued at the last sale price at the close of trading on such exchange or board of trade or, if there was no sale on the applicable commodities exchange or board of trade on such day, at the mean between the most recently quoted bid and asked prices on such exchange or board of trade or at the last bid price in the absence of an asked price. Prices may be obtained from independent pricing services which use information provided by market makers or estimates of market values obtained from yield data relating to investments or securities with similar characteristics. Securities for which reliable market quotations are not readily available, or whose values have been affected by events occurring after the close of the security’s foreign market and before the Series Fund’s normal pricing time, are valued at fair value in accordance with Board of Trustees approved fair valuation procedures. When determining the fair valuation of securities some of the factors influencing the valuation include, the nature of any restrictions on disposition of the securities; assessment of the general liquidity of the securities; the issuer’s financial condition and the markets in which it does business; the cost of the investment; the size of the holding and the capitalization of the issuer; the prices of any recent transactions or bids/offers for such securities of any comparable securities; any available analyst media or other reports or information deemed reliable by the investment adviser regarding the issuer or the markets or industry in which it operates. Using fair value to price securities may result in a value that is different from a security’s most recent closing price and from the price used by other mutual funds to calculate their net asset values.
B1
Investments in mutual funds are valued at their net asset value as of the close of the New York Stock Exchange on the date of valuation.
Short-term debt securities that are held in the Portfolio which mature in more than 60 days are valued at current market quotations and those short-term debt securities which mature in 60 days or less are valued at amortized cost which approximates market value. The amortized cost method values a security at its cost at the time of purchase and thereafter assumes a constant amortization to maturity of any discount or premium.
Foreign Currency Translation: The books and records of the Series Fund are maintained in U.S. dollars. Foreign currency amounts are translated into U.S. dollars on the following basis:
(i) market value of investment securities, other assets and liabilities — at the current daily rates of exchange.
(ii) purchases and sales of investment securities, income and expenses — at the rates of exchange prevailing on the respective dates of such transactions.
Although the net assets of the Series Fund are presented at the foreign exchange rates and market values at the close of the year, the Series Fund does not isolate that portion of the results of operations arising as a result of changes in the foreign exchange rates from the fluctuations arising from changes in the market prices of securities held at the end of the period. Similarly, the Series Fund does not isolate the effect of changes in foreign exchange rates from the fluctuations arising from changes in the market prices of portfolio securities sold during the period. Accordingly, these realized foreign currency gains (losses) are included in the reported net realized gains (losses) on investment transactions.
Net realized gains (losses) on foreign currency transactions represent net foreign exchange gains (losses) from the holding of foreign currencies, currency gains (losses) realized between the trade date and settlement date on securities transactions, and the difference between the amounts of dividends, interest and foreign withholding taxes recorded on the Series Fund’s books and the U.S. dollar equivalent amounts actually received or paid. Net unrealized currency gains (losses) from valuing foreign currency denominated assets and liabilities (other than investments) at period end exchange rates are reflected as a component of net unrealized appreciation (depreciation) on investments and foreign currencies.
Financial Futures Contracts: A financial futures contract is an agreement to purchase (long) or sell (short) an agreed amount of securities at a set price for delivery on a future date. Upon entering into a financial futures contract, the Portfolio is required to pledge to the broker an amount of cash and/or other assets equal to a certain percentage of the contract amount. This amount is known as the “initial margin”. Subsequent payments, known as “variation margin”, are made or received by the Portfolio each day, depending on the daily fluctuations in the value of the underlying security. Such variation margin is recorded for financial statement purposes on a daily basis as unrealized gain (loss). When the contract expires or is closed, the gain (loss) is realized and is presented in the Statement of Operations as net realized gain (loss) on financial futures contracts. The Portfolio invests in financial futures contracts in order to hedge its existing portfolio securities, or securities the Series Fund intends to purchase, against fluctuations in value caused by changes in prevailing rates or market conditions. Under a variety of circumstances, the Series Fund may not achieve the anticipated benefits of the financial futures contracts and may realize a loss. The use of futures transactions involves the risk of imperfect correlation in movements in the price of futures contracts and the underlying hedged assets.
Financial futures contracts involve elements of both market and credit risk in excess of the amounts reflected on the Statement of Assets and Liabilities.
Securities Lending: The Portfolio may lend its portfolio securities to broker-dealers. The loans are secured by collateral at least equal at all times to the market value of the securities loaned. Loans are subject to termination at the option of the borrower or the Portfolio. Upon termination of the loan, the borrower will return to the Portfolio securities identical to the loaned securities. Should the borrower of the securities fail financially, the Portfolio has the right to repurchase the securities using the collateral in the open market. The Portfolio recognizes income, net of any rebate and securities lending agent fees, for lending its securities in the form of fees or interest on the investment of any cash received as collateral. The Portfolio also continues to receive interest and dividends or amounts equivalent thereto on the securities loaned and recognizes any unrealized gain or loss in the market price of the securities loaned that may occur during the term of the loan.
B2
As a result of the bankruptcy filing by Lehman Brothers Holdings Inc., which was the parent company to the Portfolios’ Securities Lending Counter Party, Lehman Brothers Inc. (Lehman), the Portfolios’ Securities Lending Agent utilized collateral held on behalf of the Portfolios for securities out on loan to compensate the Portfolios for the failure of Lehman to return the securities. Any excess collateral was returned to Lehman.
Securities Transactions and Net Investment Income: Securities transactions are recorded on the trade date. Realized gains (losses) on sales of securities are calculated on the identified cost basis. Dividend income is recorded on the ex-dividend date; interest income, which is comprised of four elements: stated coupon, original issue discount, market discount and market premium, is recorded on the accrual basis. Expenses are recorded on the accrual basis. The Series Fund’s expenses are allocated to the respective Portfolios on the basis of relative net assets except for Portfolio specific expenses which are attributable directly to a Portfolio or class level.
For Portfolios with multiple classes of shares, net investment income (loss) (other than administration and distribution fees, which are charged to the respective class) and unrealized and realized gains (losses) are allocated daily to each class of shares based upon the relative proportion of net assets of each class at the beginning of the day.
Taxes: For federal income tax purposes, each Portfolio in the Series Fund is treated as a separate taxpaying entity. The Portfolios are treated as partnerships for tax purposes. No provision has been made in the financial statements for U.S. Federal, state, or local taxes, as any tax liability arising from operations of the Portfolios is the responsibility of their partners. The Portfolios are not generally subject to entity-level taxation. Partners of each Portfolio are subject to taxes on their distributive share of partnership items.
Withholding taxes on foreign dividends, interest and capital gains have been provided for in accordance with the Series Fund’s understanding of the applicable country’s tax rules and regulations.
Distributions: Distributions from each Portfolio are made in cash and automatically reinvested in additional shares of the same Portfolio. The Jennison 20/20 Focus Portfolio makes distributions, if any, at least annually. Distributions are recorded on the ex-date.
Estimates: The preparation of financial statements requires management to make estimates and assumptions that affect the reported amounts and disclosures in the financial statements. Actual results could differ from these estimates.
The Series Fund has a management agreement with PI. Pursuant to this agreement PI has responsibility for all investment advisory services and supervises the subadviser’s performance of such services. PI has entered into a subadvisory agreement with Jennison Associates LLC (“Jennison”) (the “Subadviser”), under which Jennison provides investment advisory services for the Portfolio. PI pays for the services of the Subadviser, compensation of officers of the Series Fund, occupancy and certain clerical and administrative expenses of the Series Fund. The Series Fund bears all other costs and expenses.
The management fee paid to PI is computed daily and payable monthly at an annual rate of .75 of 1% of the Portfolio’s average daily net assets.
The Series Fund has a distribution agreement with Prudential Investment Management Services LLC (“PIMS”), which acts as the distributor of the Class I and Class II shares of the Series Fund. The Series Fund compensates PIMS for distributing and servicing the Series Fund’s Class II shares pursuant to a plan of distribution (the “Class II Plan”), regardless of expenses actually incurred by PIMS. The distribution fees are accrued daily and payable monthly. No distribution or service fees are paid to PIMS as distributor of the Class I shares of the Series Fund. Pursuant to the Class II Plan, the Class II shares of each Portfolio compensate PIMS for distribution-related activities at an annual rate of 0.25% of the average daily net assets of the Class II shares.
The Series Fund has an administration agreement with PI, which acts as the administrator of the Class II shares of the Series Fund. The administration fee paid to PI is accrued daily and payable monthly, at the annual rate of 0.15% of the average daily net assets of the Class II shares.
PIMS, PI and Jennison are indirect, wholly-owned subsidiaries of Prudential Financial, Inc. (“Prudential”).
B3
| Note 4: | | Other Transactions with Affiliates |
Prudential Mutual Fund Services LLC (“PMFS”), an affiliate of PI and an indirect, wholly-owned subsidiary of Prudential, serves as the Series Fund’s transfer agent. Transfer agent fees and expenses in the Statement of Operations include certain out-of-pocket expenses paid to non-affiliates, where applicable.
For the year ended December 31, 2008, Wachovia Securities LLC, an affiliate of PI, earned approximately $13,548 in brokerage commissions from transactions executed on behalf of the Portfolio.
Prudential Investment Management, Inc. (“PIM”) an indirect, wholly-owned subsidiary of Prudential, serves as the Series Fund’s security lending agent. For the year ended December 31, 2008, PIM was compensated $155,492 for these services for the Jennison 20/20 Focus Portfolio. The Portfolio invests in the Taxable Money Market Series, a portfolio of Dryden Core Investment Fund registered under the Investment Company Act of 1940, as amended, and managed by PI.
| Note 5: | | Portfolio Securities |
The aggregate cost of purchases and the proceeds from the sales of securities (excluding government securities and short-term issues) for the year ended December 31, 2008 were $476,714,683 and $411,585,233, respectively.
After January 2, 2006, all Portfolios are treated as partnerships for tax purposes. The character of the cash distributions made by the partnerships is generally classified as return of capital nontaxable distributions. After each fiscal year each partner will receive information regarding their distributive allocable share of the partnership’s income, gains, losses and deductions.
Prior to January 2, 2006, each Portfolio, which was incorporated as of that date, qualified as a regulated investment company under the Internal Revenue Code and distributed all of its taxable income, including any net realized gains on investments, to shareholders.
With respect to the Portfolios, book cost of assets differs from tax cost of assets as a result of each Portfolio’s adoption of a mark to market method of accounting for tax purposes. Under this method, tax cost of assets will approximate its fair market value.
Management has analyzed the Portfolios’ tax positions taken on federal income tax returns for all open tax years and has concluded that as of December 31, 2008, no provision for income tax would be required in the Portfolios’ financial statements. The Portfolios’ federal and state income tax returns for tax years for which the applicable statutes of limitations have not expired are subject to examination by the Internal Revenue Service and state departments of revenue.
The Series Fund offers Class I and Class II shares. Neither Class I nor Class II shares of a Portfolio are subject to any sales charge or redemption charge and are sold at the net asset value of the Portfolio. Class I shares are sold only to certain separate accounts of Prudential to fund benefits under certain variable life insurance and variable annuity contracts (“contracts”). Class II shares are sold only to separate accounts of non-Prudential insurance companies as investment options under certain contracts. The separate accounts invest in shares of the Series Fund through subaccounts that correspond to the Portfolios. The separate accounts will redeem shares of the Series Fund to the extent necessary to provide benefits under the contracts or for such other purposes as may be consistent with the contracts.
B4
Transactions in shares of beneficial interest of the Jennison 20/20 Focus were as follows:
| | | | | | | |
Class I
| | Shares
| | | Amount
| |
Year ended December 31, 2008: | | | | | | | |
Series shares sold | | 449,176 | | | $ | 6,090,576 | |
Series shares issued in reinvestment of distributions | | 301,592 | | | | 4,686,743 | |
Series shares repurchased | | (1,079,530 | ) | | | (14,157,181 | ) |
| | |
|
| |
|
|
|
Net increase (decrease) in shares outstanding | | (328,762 | ) | | $ | (3,379,862 | ) |
| | |
|
| |
|
|
|
Year ended December 31, 2007: | | | | | | | |
Series shares sold | | 165,929 | | | $ | 2,774,313 | |
Series shares issued in reinvestment of distributions | | 528,156 | | | | 8,455,776 | |
Series shares repurchased | | (1,091,749 | ) | | | (18,624,166 | ) |
| | |
|
| |
|
|
|
Net increase (decrease) in shares outstanding | | (397,664 | ) | | $ | (7,394,077 | ) |
| | |
|
| |
|
|
|
Class II
| | | | | | |
Year ended December 31, 2008: | | | | | | | |
Series shares sold | | 11,620,427 | | | $ | 153,980,586 | |
Series shares issued in reinvestment of distributions | | 1,208,345 | | | | 18,572,262 | |
Series shares repurchased | | (14,165,938 | ) | | | (173,286,237 | ) |
| | |
|
| |
|
|
|
Net increase (decrease) in shares outstanding | | (1,337,166 | ) | | $ | (733,389 | ) |
| | |
|
| |
|
|
|
Year ended December 31, 2007: | | | | | | | |
Series shares sold | | 7,494,671 | | | $ | 126,505,244 | |
Series shares issued in reinvestment of distributions | | 1,709,399 | | | | 27,025,596 | |
Series shares repurchased | | (4,436,889 | ) | | | (73,206,884 | ) |
| | |
|
| |
|
|
|
Net increase (decrease) in shares outstanding | | 4,767,181 | | | $ | 80,323,956 | |
| | |
|
| |
|
|
|
The Portfolio, along with other affiliated registered investment companies (the “Funds”), is a party to a Syndicated Credit Agreement (“SCA”) with two banks. The SCA provides for a commitment of $500 million. Interest on any borrowings under the SCA is incurred at contracted market rates and a commitment fee for the unused amount is accrued daily and paid quarterly. Effective October 24, 2008, the Funds renewed the SCA with the banks. The commitment under the renewed SCA continues to be $500 million. The Funds pay a commitment fee of .13 of 1% of the unused portion of the renewed SCA. The expiration date of the renewed SCA will be October 23, 2009. For the period from October 26, 2007 through October 23, 2008, the Funds paid a commitment fee of .06 of 1% of the unused portion of the agreement. The purpose of the SCA is to provide an alternative source of temporary funding for capital share redemptions. The Portfolio did not utilize the line of credit during the year ended December 31, 2008.
| Note 9: | | Ownership and Affiliates |
As of December 31, 2008, all of Class I shares of the Portfolio were owned of record by the Prudential Insurance Company of America (“PICA”) on behalf of the owners of the variable insurance products issued by PICA.
| Note 10: | | New Accounting Pronouncements |
In March 2008, the FASB released Statement of Financial Accounting Standards No. 161, Disclosures about Derivative Instruments and Hedging Activities (“FAS 161”). FAS 161 requires qualitative disclosures about objectives and strategies for using derivatives, quantitative disclosures about fair value amounts of and gains and losses on derivative instruments, and disclosures about credit-risk-related contingent features in derivative agreements. The application of FAS 161 is required for any reporting period beginning after November 15, 2008. At this time, management is evaluating the implications of FAS 161 and its impact on the financial statements has not yet been determined.
B5
Financial Highlights
| | | | | | | | | | | | | | | | | | | | |
| | | Jennison 20/20 Focus Portfolio
| |
| | | Class I
| |
| | | Year Ended December 31,
| |
| | | 2008
| | | 2007(c)
| | | 2006
| | | 2005
| | | 2004
| |
Per Share Operating Performance: | | | | | | | | | | | | | | | | | | | | |
Net Asset Value, beginning of year | | $ | 15.99 | | | $ | 16.01 | | | $ | 15.00 | | | $ | 12.37 | | | $ | 10.68 | |
| | |
|
|
| |
|
|
| |
|
|
| |
|
|
| |
|
|
|
Income From Investment Operations: | | | | | | | | | | | | | | | | | | | | |
Net investment income | | | .06 | | | | .07 | | | | .08 | | | | .06 | | | | .04 | |
Net realized and unrealized gain (loss) on investments | | | (5.94 | ) | | | 1.63 | | | | 1.95 | | | | 2.60 | | | | 1.66 | |
| | |
|
|
| |
|
|
| |
|
|
| |
|
|
| |
|
|
|
Total from investment operations | | | (5.88 | ) | | | 1.70 | | | | 2.03 | | | | 2.66 | | | | 1.70 | |
| | |
|
|
| |
|
|
| |
|
|
| |
|
|
| |
|
|
|
Less Dividends and Distributions: | | | | | | | | | | | | | | | | | | | | |
Dividends from net investment income | | | — | | | | — | | | | — | | | | (.03 | ) | | | (.01 | ) |
Distributions | | | (.93 | ) | | | (1.72 | ) | | | (1.02 | ) | | | — | | | | — | |
| | |
|
|
| |
|
|
| |
|
|
| |
|
|
| |
|
|
|
Total dividends and distributions | | | (.93 | ) | | | (1.72 | ) | | | (1.02 | ) | | | (.03 | ) | | | (.01 | ) |
| | |
|
|
| |
|
|
| |
|
|
| |
|
|
| |
|
|
|
Net Asset Value, end of year | | $ | 9.18 | | | $ | 15.99 | | | $ | 16.01 | | | $ | 15.00 | | | $ | 12.37 | |
| | |
|
|
| |
|
|
| |
|
|
| |
|
|
| |
|
|
|
Total Return(a) | | | (39.15 | )% | | | 10.59 | % | | | 14.13 | % | | | 21.59 | % | | | 15.94 | % |
Ratios/Supplemental Data: | | | | | | | | | | | | | | | | | | | | |
Net assets, end of year (in millions) | | $ | 46.7 | | | $ | 86.6 | | | $ | 93.1 | | | $ | 83.8 | | | $ | 68.4 | |
Ratios to average net assets(b): | | | | | | | | | | | | | | | | | | | | |
Expenses | | | .82 | % | | | .82 | % | | | .82 | % | | | .87 | % | | | .88 | % |
Net investment income | | | .41 | % | | | .41 | % | | | .58 | % | | | .43 | % | | | .29 | % |
Portfolio turnover rate | | | 125 | % | | | 115 | % | | | 119 | % | | | 93 | % | | | 87 | % |
| (a) | Total return is calculated assuming a purchase of a share on the first day and a sale on the last day of each year reported and includes reinvestment of dividends and distributions and does not reflect the effect of insurance contract charges. Total return does not reflect expenses associated with the separate account such as administrative fees, account charges and surrender charges which, if reflected, would reduce the total returns for all years shown. Performance figures may reflect voluntary fee waivers and/or expense reimbursements. In the absence of voluntary fee waivers and/or expense reimbursements, the total return would be lower. Past performance is no guarantee of future results. Total returns may reflect adjustments to conform to generally accepted accounting principles. |
| (b) | Does not include expenses of the underlying portfolios in which the portfolio invests. |
| (c) | Calculated based upon average shares outstanding. |
| | | | | | | | | | | | | | | | | | | | |
| | | Jennison 20/20 Focus Portfolio
| |
| | | Class II
| |
| | | Year Ended December 31,
| |
| | | 2008
| | | 2007(c)
| | | 2006
| | | 2005
| | | 2004
| |
Per Share Operating Performance: | | | | | | | | | | | | | | | | | | | | |
Net Asset Value, beginning of year | | $ | 15.78 | | | $ | 15.81 | | | $ | 14.83 | | | $ | 12.23 | | | $ | 10.60 | |
| | |
|
|
| |
|
|
| |
|
|
| |
|
|
| |
|
|
|
Income From Investment Operations: | | | | | | | | | | | | | | | | | | | | |
Net investment income | | | — | (d) | | | — | (d) | | | .03 | | | | .01 | | | | .01 | |
Net realized and unrealized gain (loss) on investments | | | (5.87 | ) | | | 1.60 | | | | 1.91 | | | | 2.59 | | | | 1.62 | |
| | |
|
|
| |
|
|
| |
|
|
| |
|
|
| |
|
|
|
Total from investment operations | | | (5.87 | ) | | | 1.60 | | | | 1.94 | | | | 2.60 | | | | 1.63 | |
| | |
|
|
| |
|
|
| |
|
|
| |
|
|
| |
|
|
|
Less Distributions: | | | | | | | | | | | | | | | | | | | | |
Distributions | | | (.85 | ) | | | (1.63 | ) | | | (.96 | ) | | | — | | | | — | |
| | |
|
|
| |
|
|
| |
|
|
| |
|
|
| |
|
|
|
Net Asset Value, end of year | | $ | 9.06 | | | $ | 15.78 | | | $ | 15.81 | | | $ | 14.83 | | | $ | 12.23 | |
| | |
|
|
| |
|
|
| |
|
|
| |
|
|
| |
|
|
|
Total Return(a) | | | (39.40 | )% | | | 10.12 | % | | | 13.61 | % | | | 21.26 | % | | | 15.38 | % |
Ratios/Supplemental Data: | | | | | | | | | | | | | | | | | | | | |
Net assets, end of year (in millions) | | $ | 156.3 | | | $ | 293.3 | | | $ | 218.4 | | | $ | 159.3 | | | $ | 101.0 | |
Ratios to average net assets(b): | | | | | | | | | | | | | | | | | | | | |
Expenses | | | 1.22 | % | | | 1.22 | % | | | 1.22 | % | | | 1.27 | % | | | 1.28 | % |
Net investment income (loss) | | | — | %(e) | | | — | %(e) | | | .19 | % | | | .03 | % | | | (.02 | )% |
Portfolio turnover rate | | | 125 | % | | | 115 | % | | | 119 | % | | | 93 | % | | | 87 | % |
| (a) | Total return is calculated assuming a purchase of a share on the first day and a sale on the last day of each year reported and includes reinvestment of dividends and distributions and does not reflect the effect of insurance contract charges. Total return does not reflect expenses associated with the separate account such as administrative fees, account charges and surrender charges which, if reflected, would reduce the total returns for all years shown. Performance figures may reflect voluntary fee waivers and/or expense reimbursements. In the absence of voluntary fee waivers and/or expense reimbursements, the total return would be lower. Past performance is no guarantee of future results. Total returns may reflect adjustments to conform to generally accepted accounting principles. |
| (b) | Does not include expenses of the underlying portfolios in which the portfolio invests. |
| (c) | Calculated based upon average shares outstanding. |
| (d) | Less than $.005 per share. |
SEE NOTES TO FINANCIAL STATEMENTS.
C1
REPORT OF INDEPENDENT REGISTERED PUBLIC ACCOUNTING FIRM
THE BOARD OF TRUSTEES AND SHAREHOLDERS
THE PRUDENTIAL SERIES FUND — JENNISON 20/20 FOCUS PORTFOLIO:
We have audited the accompanying statement of assets and liabilities of The Prudential Series Fund – Jennison 20/20 Focus Portfolio (hereafter referred to as the “Fund”), including the schedule of investments, as of December 31, 2008, and the related statements of operations for the year then ended, changes in net assets for each of the years in the two-year period then ended and the financial highlights for each of the years in the five-year period then ended. These financial statements and financial highlights are the responsibility of the Fund’s management. Our responsibility is to express an opinion on these financial statements and financial highlights based on our audits.
We conducted our audits in accordance with the standards of the Public Company Accounting Oversight Board (United States). Those standards require that we plan and perform the audit to obtain reasonable assurance about whether the financial statements and financial highlights are free of material misstatement. An audit includes examining, on a test basis, evidence supporting the amounts and disclosures in the financial statements. Our procedures included confirmation of securities owned as of December 31, 2008, by correspondence with the custodian, transfer agent and brokers or by other appropriate auditing procedures where replies from brokers were not received. An audit also includes assessing the accounting principles used and significant estimates made by management, as well as evaluating the overall financial statement presentation. We believe that our audits provide a reasonable basis for our opinion.
In our opinion, the financial statements and financial highlights referred to above present fairly, in all material respects, the financial position of the Fund as of December 31, 2008, and the results of their operations for the year then ended, the changes in their net assets for each of the years in the two-year period then ended and the financial highlights for each of the years in the five-year period then ended, in conformity with U.S. generally accepted accounting principles.

New York, New York
February 18, 2009
D1
INFORMATION ABOUT TRUSTEES AND OFFICERS (Unaudited)
Information about the Trustees and the Officers of the Fund is set forth below. Trustees who are not deemed to be “interested persons” of the Fund, as defined in the 1940 Act, are referred to as “Independent Trustees.” Trustees who are deemed to be “interested persons” of the Fund are referred to as “Interested Trustees.” The Trustees are responsible for the overall supervision of the operations of the Fund and perform the various duties imposed on the directors of investment companies by the 1940 Act.
| | | | |
Independent Trustees (1) |
Name, Address, Age No. of Portfolios Overseen | | Principal Occupation(s) During Past Five Years | | Other Directorships Held |
Saul K. Fenster, Ph.D. (75) No. of Portfolios Overseen: 86 | | Currently President Emeritus of New Jersey Institute of Technology (since 2002); formerly President (1978-2002) of New Jersey Institute of Technology; Commissioner (1998-2002) of the Middle States Association Commission on Higher Education; Commissioner (1985-2002) of the New Jersey Commission on Science and Technology; formerly Director (1998-2005) of Society of Manufacturing Engineering Education Foundation; formerly Director of Prosperity New Jersey; formerly a director or trustee of Liberty Science Center, Research and Development Council of New Jersey, New Jersey State Chamber of Commerce, and National Action Council for Minorities in Engineering. | | Member (since 2006), Board of The Ridgefield Foundation and The Leir Foundation. |
Delayne Dedrick Gold (70) No. of Portfolios Overseen: 86 | | Marketing Consultant (1982-present); formerly Senior Vice President and Member of the Board of Directors, Prudential Bache Securities, Inc. | | |
W. Scott McDonald, Jr. (71) No. of Portfolios Overseen: 86 | | Formerly Management Consultant (1997-2004) and of Counsel (2004-2005) at Kaludis Consulting Group, Inc. (company serving higher education); Formerly principal (1995-1997), Scott McDonald Associates; Chief Operating Officer (1991-1995), Fairleigh Dickinson University; Executive Vice President and Chief Operating Officer (1975-1991), Drew University; interim President (1988-1990), Drew University; formerly Director of School, College and University Underwriters Ltd. | | |
Thomas T. Mooney (67) No. of Portfolios Overseen: 86 | | Formerly Chief Executive Officer, Excell Partners, Inc.; formerly President of the Greater Rochester Metro Chamber of Commerce, Rochester City Manager; formerly Deputy Monroe County Executive. | | |
Thomas M. O’Brien (58) No. of Portfolios Overseen: 86 | | President and COO (since November 2006) and CEO (since April 2007) of State Bancorp, Inc. and State Bank; Vice Chairman (January 1997-April 2000) of North Fork Bank; President and Chief Executive Officer (December 1984-December 1996) of North Side Savings Bank; formerly President and Chief Executive Officer (May 2000-June 2006) Atlantic Bank of New York. | | Formerly Director (December 1996-May 2000) of North Fork Bancorporation, Inc.; Formerly Director (May 2000-April 2006) of Atlantic Bank of New York; Director (since November 2006) of State Bancorp, Inc. (NASDAQ: STBC) and State Bank of Long Island. |
F. Don Schwartz (73) No. of Portfolios Overseen: 86 | | Management Consultant (since April 1985). | | |
| | | | |
Interested Trustee (1) |
Robert F. Gunia (62) No. of Portfolios Overseen: 148 | | Chief Administrative Officer (since September 1999) and Executive Vice President (since December 1996) of Prudential Investments LLC; President (April 1999-December 2008) and Executive Vice President and Chief Operating Officer (since December 2008) of Prudential Investment Management Services LLC; Executive Vice President (since March 1999) and Treasurer (since May 2000) of Prudential Mutual Fund Services LLC; Chief Administrative Officer, Executive Vice President and Director (since May 2003) of AST Investment Services, Inc. | | Director (since May 1989) of The Asia Pacific Fund, Inc. |
1 The year that each Trustee joined the Fund’s Board is as follows: Saul K. Fenster, 1983; Delayne Dedrick Gold, 2001; Robert F. Gunia, 2001; W. Scott McDonald, Jr., 1983; Thomas T. Mooney, 2001; Thomas M. O’Brien, 2003; F. Don Schwartz, 2003.
E1
| | |
Fund Officers (a)(1) |
| Name, Address and Age | | Principal Occupation(s) During the Past Five Years |
| Position with the Fund | | |
Steve Pelletier (55) President and Principal Executive Officer | | President of Prudential Annuities (since September 2008); Chairman and CEO, International Investments, Prudential Financial (since January 1998). |
Kathryn L. Quirk (56) Chief Legal Officer | | Vice President and Corporate Counsel (since September 2004) of Prudential; Executive Vice President, Chief Legal Officer and Secretary (since July 2005) of Prudential Investments LLC (PI) and Prudential Mutual Fund Services LLC (PMFS); Vice President and Corporate Counsel (since June 2005) and Secretary (since February 2006) of AST Investment Services, Inc.; formerly Senior Vice President and Assistant Secretary (November 2004-August 2005) of PI; formerly Assistant Secretary (June 2005-February 2006) of AST Investment Services, Inc.; formerly Managing Director, General Counsel, Chief Compliance Officer, Chief Risk Officer and Corporate Secretary (1997-2002) of Zurich Scudder Investments, Inc. |
Deborah A. Docs (51) Secretary | | Vice President and Corporate Counsel (since January 2001) of Prudential; Vice President (since December 1996) and Assistant Secretary (since March 1999) of PI; formerly Vice President and Assistant Secretary (May 2003-June 2005) of AST Investment Services, Inc. |
Jonathan D. Shain (50) Assistant Secretary | | Vice President and Corporate Counsel (since August 1998) of Prudential; Vice President and Assistant Secretary (since May 2001) of PI; Vice President and Assistant Secretary (since February 2001) of PMFS; formerly Vice President and Assistant Secretary (May 2003-June 2005) of AST Investment Services, Inc. |
Claudia DiGiacomo (34) Assistant Secretary | | Vice President and Corporate Counsel (since January 2005) of Prudential; Vice President and Assistant Secretary of PI (since December 2005); Associate at Sidley Austin Brown & Wood LLP (1999-2004). |
John P. Schwartz (37) Assistant Secretary | | Vice President and Corporate Counsel (since April 2005) of Prudential; Vice President and Assistant Secretary of PI (since December 2005); Associate at Sidley Austin Brown & Wood LLP (1997-2005). |
Andrew R. French (46) Assistant Secretary | | Director and Corporate Counsel (since May 2006) of Prudential; Vice President and Assistant Secretary (since January 2007) of PI; Vice President and Assistant Secretary (since January 2007) of PMFS; formerly Senior Legal Analyst of Prudential Mutual Fund Law Department (1997-2006). |
Timothy J. Knierim (49) Chief Compliance Officer | | Chief Compliance Officer of Prudential Investment Management, Inc.(PIM) (since July 2007); formerly Chief Risk Officer of PIM and PI (2002-2007) and formerly Chief Ethics Officer of PIM and PI (2006-2007). |
Valerie M. Simpson (50) Deputy Chief Compliance Officer | | Chief Compliance Officer (since April 2007) of PI and AST Investment Services, Inc.; formerly Vice President-Financial Reporting (June 1999-March 2006) for Prudential Life and Annuities Finance. |
Theresa C. Thompson (46) Deputy Chief Compliance Officer | | Vice President, Compliance, PI (since April 2004); and Director, Compliance, PI (2001 - 2004). |
Noreen M. Fierro (44) Anti-Money Laundering Compliance Officer | | Vice President, Corporate Compliance (since May 2006) of Prudential; formerly Corporate Vice President, Associate General Counsel (April 2002-May 2005) of UBS Financial Services, Inc., in their Money Laundering Prevention Group; Senior Manager (May 2005-May 2006) of Deloitte Financial Advisory Services, LLP, in their Forensic and Dispute Services, Anti-Money Laundering Group. |
Grace C. Torres (49) Treasurer and Principal Financial and Accounting Officer | | Assistant Treasurer (since March 1999) and Senior Vice President (since September 1999) of PI; Assistant Treasurer (since May 2003) and Vice President (since June 2005) of AST Investment Services, Inc.; Senior Vice President and Assistant Treasurer (since May 2003) of Prudential Annuities Advisory Services, Inc.; formerly Senior Vice President (May 2003-June 2005) of AST Investment Services, Inc. |
M. Sadiq Peshimam (45) Assistant Treasurer | | Vice President (since 2005) and Director (2000-2005) within Prudential Mutual Fund Administration. |
Peter Parrella (50) Assistant Treasurer | | Vice President (since 2007) and Director (2004-2007) within Prudential Mutual Fund Administration; formerly Tax Manager at SSB Citi Fund Management LLC (1997-2004). |
Alan Fu (51) Assistant Treasurer | | Vice President – Tax, The Prudential Insurance Company of America (1999 to October 2003); Vice President and Corporate Counsel – Tax, Prudential Financial, Inc. (since October 2003). |
(a) Excludes interested Board Members who also serve as President or Vice President.
1 The year in which each individual became an Officer of the Fund is as follows: Stephen Pelletier, 2008; Kathryn L. Quirk, 2005; Deborah A. Docs, 2005; Jonathan D. Shain, 2005; Claudia DiGiacomo, 2005; John P. Schwartz, 2006; Andrew R. French, 2006; Timothy J. Knierim, 2007; Valerie M. Simpson, 2007; Theresa C. Thompson, 2008; Noreen M. Fierro, 2006; Grace C. Torres, 1997; Peter Parrella, 2007; M. Sadiq Peshimam, 2006; Alan Fu, 2006.
Explanatory Notes to Tables:
Trustees are deemed to be “Interested”, as defined in the 1940 Act, by reason of their affiliation with Prudential Investments LLC and/or an affiliate of Prudential Investments LLC.
Unless otherwise noted, the address of all Trustees and Officers is c/o Prudential Investments LLC, Gateway Center Three, 100 Mulberry Street, Newark, New Jersey 07102.
There is no set term of office for Trustees or Officers. The Independent Trustees have adopted a retirement policy, which calls for the retirement of Trustees on December 31 of the year in which they reach the age of 75.
“Other Directorships Held” includes only directorships of companies required to register or file reports with the SEC under the Securities Exchange Act of 1934 (that is, “public companies”) or other investment companies registered under the 1940 Act.
“No. of Portfolios Overseen” includes all investment companies managed by Prudential Investments LLC. The investment companies for which PI serves as manager include the JennisonDryden Funds, Strategic Partners Funds, The Prudential Variable Contract Accounts, The Target Portfolio Trust, The Prudential Series Fund, Advanced Series Trust, The High Yield Income Fund, Inc., The High Yield Plus Fund, Inc., Nicholas-Applegate Fund, Inc. and Prudential’s Gibraltar Fund, Inc.
E2
The 2008 Audited Financial Statements of Pruco Life Insurance Company, Pruco Life Insurance Company of New Jersey, and The Prudential Insurance Company of America are available. You may call 888-778-2888 to obtain a free copy of the audited financial statements of the insurance company that issued your contract.
To reduce costs, we now generally send only a single copy of prospectuses and shareholder reports to each household (“householding”) in lieu of sending a copy to each Contract Owner who resides in the household. You should be aware that by calling 877-778-5008, you can revoke or “opt out” of householding at any time.
Pru, Prudential, Prudential Financial, Rock Solid, “The Rock,” the Rock Logo and the Rock Prudential Logo are registered service marks of The Prudential Insurance Company of America, Newark, NJ, and its affiliates.
The Prudential Insurance Company of America
751 Broad Street
Newark, NJ 07102-3777
Presorted
Standard
U.S. Postage
PAID
Prudential
IFS-A105395 PSF-AR J2020F Ed.2/2009

Item 2 – Code of Ethics – – See Exhibit (a)
As of the end of the period covered by this report, the registrant has adopted a code of ethics (the “Section 406 Standards for Investment Companies – Ethical Standards for Principal Executive and Financial Officers”) that applies to the registrant’s Principal Executive Officer and Principal Financial Officer; the registrant’s Principal Financial Officer also serves as the Principal Accounting Officer.
The registrant hereby undertakes to provide any person, without charge, upon request, a copy of the code of ethics. To request a copy of the code of ethics, contact the registrant 973-367-7521, and ask for a copy of the Section 406 Standards for Investment Companies - Ethical Standards for Principal Executive and Financial Officers.
Item 3 – Audit Committee Financial Expert –
The registrant’s Board has determined that Mr. Thomas M. O’Brien, member of the Board’s Audit Committee is an “audit committee financial expert,” and that he is “independent,” for purposes of this Item.
Item 4 – Principal Accountant Fees and Services –
(a) Audit Fees
For the fiscal years ended December 31, 2008 and December 31, 2007, KPMG LLP (“KPMG”), the Registrant’s principal accountant, billed the Registrant $688,081 and $653,328, respectively, for professional services rendered for the audit of the Registrant’s annual financial statements or services that are normally provided in connection with statutory and regulatory filings.
(b) Audit-Related Fees
None.
(c) Tax Fees
None.
(d) All Other Fees
Not applicable for the fiscal year ended December 31, 2008. For the fiscal year ended December 31, 2007, KPMG, the Registrant’s principal accountant, billed the Registrant $8,333 for professional services rendered in connection with work performed related to inverse floating rate securities.
(e) (1) Audit Committee Pre-Approval Policies and Procedures
THE PRUDENTIAL MUTUAL FUNDS
AUDIT COMMITTEE POLICY
on
Pre-Approval of Services Provided by the Independent Accountants
The Audit Committee of each Prudential Mutual Fund is charged with the responsibility to monitor the independence of the Fund’s independent accountants. As part of this responsibility, the Audit Committee must pre-approve any independent accounting firm’s engagement to render audit and/or permissible non-audit services, as required by law. In evaluating a proposed engagement of the independent accountants, the Audit Committee will assess the effect that the engagement might reasonably be expected to have on the accountant’s independence. The Committee’s evaluation will be based on:
| | • | a review of the nature of the professional services expected to be provided, |
| | • | a review of the safeguards put into place by the accounting firm to safeguard independence, and |
| | • | periodic meetings with the accounting firm. |
Policy for Audit and Non-Audit Services Provided to the Funds
On an annual basis, the scope of audits for each Fund, audit fees and expenses, and audit-related and non-audit services (and fees proposed in respect thereof) proposed to be performed by the Fund’s independent accountants will be presented by the Treasurer and the independent accountants to the Audit Committee for review and, as appropriate, approval prior to the initiation of such services. Such presentation shall be accompanied by confirmation by both the Treasurer and the independent accountants that the proposed services will not adversely affect the independence of the independent accountants. Proposed services shall be described in sufficient detail to enable the Audit Committee to assess the appropriateness of such services and fees, and the compatibility of the provision of such services with the auditor’s independence. The Committee shall receive periodic reports on the progress of the audit and other services which are approved by the Committee or by the Committee Chair pursuant to authority delegated in this Policy.
The categories of services enumerated under “Audit Services”, “Audit-related Services”, and “Tax Services” are intended to provide guidance to the Treasurer and the independent accountants as to those categories of services which the Committee believes are generally consistent with the independence of the independent accountants and which the Committee (or the Committee Chair) would expect upon the presentation of specific proposals to pre-approve. The enumerated categories are not intended as an exclusive list of audit, audit-related or tax services, which the Committee (or the Committee Chair) would consider for pre-approval.
Audit Services
The following categories of audit services are considered to be consistent with the role of the Fund’s independent accountants:
| | | | |
Ø | | Annual Fund financial statement audits |
| | | | |
Ø | | Seed audits (related to new product filings, as required) |
Ø | | SEC and regulatory filings and consents |
Audit-related Services
The following categories of audit-related services are considered to be consistent with the role of the Fund’s independent accountants:
| | | | |
Ø | | Accounting consultations |
Ø | | Fund merger support services |
Ø | | Agreed Upon Procedure Reports |
Ø | | Attestation Reports |
Ø | | Other Internal Control Reports |
Individual audit-related services that fall within one of these categories and are not presented to the Audit Committee as part of the annual pre-approval process will be subject to pre-approval by the Committee Chair (or any other Committee member on whom this responsibility has been delegated) so long as the estimated fee for those services does not exceed $50,000.
Tax Services
The following categories of tax services are considered to be consistent with the role of the Fund’s independent accountants:
| | | | |
Ø | | Tax compliance services related to the filing or amendment of the following: |
| | ¡ | | Federal, state and local income tax compliance; and, |
| | ¡ | | Sales and use tax compliance |
Ø | | Timely RIC qualification reviews |
Ø | | Tax distribution analysis and planning |
Ø | | Tax authority examination services |
Ø | | Tax appeals support services |
Ø | | Accounting methods studies |
Ø | | Fund merger support services |
Ø | | Tax consulting services and related projects |
Individual tax services that fall within one of these categories and are not presented to the Audit Committee as part of the annual pre-approval process will be subject to pre-approval by the Committee Chair (or any other Committee member on whom this responsibility has been delegated) so long as the estimated fee for those services does not exceed $50,000.
Other Non-audit Services
Certain non-audit services that the independent accountants are legally permitted to render will be subject to pre-approval by the Committee or by one or more Committee members to whom the Committee has delegated this authority and who will report to the full Committee any
pre-approval decisions made pursuant to this Policy. Non-audit services presented for pre-approval pursuant to this paragraph will be accompanied by a confirmation from both the Treasurer and the independent accountants that the proposed services will not adversely affect the independence of the independent accountants.
Proscribed Services
The Fund’s independent accountants will not render services in the following categories of non-audit services:
| | |
Ø | | Bookkeeping or other services related to the accounting records or financial statements of the Fund |
Ø | | Financial information systems design and implementation |
Ø | | Appraisal or valuation services, fairness opinions, or contribution-in-kind reports |
Ø | | Actuarial services |
Ø | | Internal audit outsourcing services |
Ø | | Management functions or human resources |
Ø | | Broker or dealer, investment adviser, or investment banking services |
Ø | | Legal services and expert services unrelated to the audit |
Ø | | Any other service that the Public Company Accounting Oversight Board determines, by regulation, is impermissible. |
Pre-approval of Non-Audit Services Provided to Other Entities Within the Prudential Fund Complex
Certain non-audit services provided to Prudential Investments LLC or any of its affiliates that also provide ongoing services to the Prudential Mutual Funds will be subject to pre-approval by the Audit Committee. The only non-audit services provided to these entities that will require pre-approval are those related directly to the operations and financial reporting of the Funds. Individual projects that are not presented to the Audit Committee as part of the annual pre-approval process will be subject to pre-approval by the Committee Chair (or any other Committee member on whom this responsibility has been delegated) so long as the estimated fee for those services does not exceed $50,000. Services presented for pre-approval pursuant to this paragraph will be accompanied by a confirmation from both the Treasurer and the independent accountants that the proposed services will not adversely affect the independence of the independent accountants.
Although the Audit Committee will not pre-approve all services provided to Prudential Investments LLC and its affiliates, the Committee will receive an annual report from the Fund’s independent accounting firm showing the aggregate fees for all services provided to Prudential Investments and its affiliates.
(e) (2) Percentage of services referred to in 4(b) – 4(d) that were approved by the audit committee –
One hundred percent of the services described in Item 4(d) were approved by the audit committee.
(f) Percentage of hours expended attributable to work performed by other than full time employees of principal accountant if greater than 50%.
The percentage of hours expended on the principal accountant’s engagement to audit the registrant’s financial statements for the most recent fiscal year that were attributed to work performed by persons other than the principal accountant’s full-time, permanent employees was 0%.
(g) Non-Audit Fees
Not applicable to Registrant for the fiscal years 2008 and 2007. The aggregate non-audit fees billed by KPMG for services rendered to the registrant’s investment adviser and any entity controlling, controlled by, or under common control with the investment adviser that provides ongoing services to the registrant for the fiscal years 2008 and 2007 was $0 and $48,867, respectively.
(h) Principal Accountant’s Independence
Not applicable as KPMG has not provided non-audit services to the registrant’s investment adviser and any entity controlling, controlled by, or under common control with the investment adviser that provides ongoing services to the registrant that were not pre-approved pursuant to Rule 2-01(c)(7)(ii) of Regulation S-X.
Item 5 – Audit Committee of Listed Registrants – Not applicable.
Item 6 – Schedule of Investments – The schedule is included as part of the report to shareholders filed under Item 1 of this Form.
Item 7 – Disclosure of Proxy Voting Policies and Procedures for Closed-End Management Investment Companies – Not applicable.
Item 8 – Portfolio Managers of Closed-End Management Investment Companies – Not applicable.
Item 9 – Purchases of Equity Securities by Closed-End Management Investment Company and Affiliated Purchasers – Not applicable.
Item 10 – Submission of Matters to a Vote of Security Holders – Not applicable.
Item 11 – Controls and Procedures
| | (a) | It is the conclusion of the registrant’s principal executive officer and principal financial officer that the effectiveness of the registrant’s current disclosure controls and procedures (such disclosure controls and procedures having been evaluated within 90 days of the date of this filing) provide reasonable assurance that the information required to be disclosed by the registrant has been recorded, processed, summarized and reported within the time period specified in the Commission’s rules and forms and that the information required to be disclosed by the registrant has been accumulated and communicated to the registrant’s principal executive officer and principal financial officer in order to allow timely decisions regarding required disclosure. |
| | (b) | There has been no significant change in the registrant’s internal control over financial reporting that occurred during the registrant’s most recent fiscal quarter of the period covered by this report that has materially affected, or is likely to materially affect, the registrant’s internal control over financial reporting. |
Item 12 – Exhibits
| | (a) | (1) Code of Ethics – Attached hereto as Exhibit EX-99.CODE-ETH |
| | (2) | Certifications pursuant to Section 302 of the Sarbanes-Oxley Act – Attached hereto as Exhibit EX-99.CERT. |
| | (3) | Any written solicitation to purchase securities under Rule 23c-1. – Not applicable. |
| | (b) | Certifications pursuant to Section 906 of the Sarbanes-Oxley Act – Attached hereto as Exhibit EX-99.906CERT. |
SIGNATURES
Pursuant to the requirements of the Securities Exchange Act of 1934 and the Investment Company Act of 1940, the registrant has duly caused this report to be signed on its behalf by the undersigned, thereunto duly authorized.
|
(Registrant) The Prudential Series Fund |
| | | | |
| | |
By (Signature and Title)* | | /s/Deborah A. Docs | | |
| | Deborah A. Docs | | |
| | Secretary | | |
Pursuant to the requirements of the Securities Exchange Act of 1934 and the Investment Company Act of 1940, this report has been signed below by the following persons on behalf of the registrant and in the capacities and on the dates indicated.
| | | | |
| By (Signature and Title)* | | /s/Stephen Pelletier | | |
| | Stephen Pelletier | | |
| | President and Principal Executive Officer | | |
| | | | |
| | |
| By (Signature and Title)* | | /s/Grace C. Torres | | |
| | Grace C. Torres | | |
| | Treasurer and Principal Financial Officer | | |
* Print the name and title of each signing officer under his or her signature.