UNITED STATES
SECURITIES AND EXCHANGE COMMISSION
Washington, D.C. 20549
FORM N-CSR
CERTIFIED SHAREHOLDER REPORT OF REGISTERED
MANAGEMENT INVESTMENT COMPANIES
| | |
| Investment Company Act file number: | | 811-03623 |
| |
| Exact name of registrant as specified in charter: | | The Prudential Series Fund |
| |
| Address of principal executive offices: | | Gateway Center 3, |
| | 100 Mulberry Street, |
| | Newark, New Jersey 07102 |
| |
| Name and address of agent for service: | | Deborah A. Docs |
| | Gateway Center 3, |
| | 100 Mulberry Street, |
| | Newark, New Jersey 07102 |
| |
| Registrant’s telephone number, including area code: | | 973-367-7521 |
| |
| Date of fiscal year end: | | 12/31/2011 |
| |
| Date of reporting period: | | 12/31/2011 |
Item 1 – Reports to Stockholders

THE PRUDENTIAL SERIES FUND
ANNUAL REPORT Ÿ DECEMBER 31, 2011
This report is one of several that provides financial information about certain investment choices available under variable life insurance and variable annuity contracts. Based on the variable contract you own or the portfolios you invested in, you may receive additional reports that provide financial information on those investment choices. Please refer to your variable life insurance or variable annuity contract prospectus to determine which portfolios are available to you.
Please note that this document may include prospectus supplements that are separate from and not a part of the annual report.

This report must be preceded or accompanied by the current prospectuses for the Prudential Series Fund portfolios and the applicable variable life or annuity contract. The prospectuses contain information on the contract and the investment objectives, risks, charges and expenses of the portfolios, and should be read carefully.
A description of the Fund’s proxy voting policies and procedures is available, without charge, upon request. Owners of variable annuity contracts should call (888)778-2888, and owners of variable life insurance contracts should call (800)778-2255 to obtain descriptions of the Fund’s proxy voting policies and procedures. Information regarding how the Fund voted proxies relating to portfolio securities during the most recent 12-month period ended June 30 is available on the website of the Securities and Exchange Commission (the Commission) at www.sec.gov and on the Fund’s website at www.prudential.com.
The Fund files with the Commission a complete listing of portfolio holdings as of its first and third quarter-end on Form N-Q. Form N-Q is available on the Commission’s website at www.sec.gov or by visiting the Commission’s Public Reference Room. For more information on the Commission’s Public Reference Room, please visit the Commission’s website or call (800)SEC-0330. Form N-Q is also available on the Fund’s website or by calling the telephone numbers referenced above, for variable annuity and variable life insurance contract owners.
The Fund’s Statement of Additional Information contains additional information about the Fund’s Trustees and is available without charge upon request by calling (888)778-2888.
This report may include financial information pertaining to certain portfolios that are not available through the variable life insurance policy or variable annuity contract that you have chosen. Please refer to your variable life insurance or variable annuity prospectus to determine which portfolios are available to you.
| | | | |
The Prudential Series Fund Table of Contents | | Annual Report | | December 31, 2011 |
| n | | LETTER TO CONTRACT OWNERS |
| n | | PRESENTATION OF PORTFOLIO HOLDINGS |
| n | | FEES AND EXPENSES TABLE |
| | | | |
| Section A | | Schedule of Investments and Financial Statements |
| | |
| | | Conservative Balanced Portfolio | | A1 |
| | | Diversified Bond Portfolio | | A28 |
| | | Equity Portfolio | | A55 |
| | | Flexible Managed Portfolio | | A59 |
| | | Global Portfolio | | A85 |
| | | Government Income Portfolio | | A93 |
| | | High Yield Bond Portfolio | | A100 |
| | | Jennison Portfolio | | A117 |
| | | Money Market Portfolio | | A121 |
| | | Natural Resources Portfolio | | A126 |
| | | Small Capitalization Stock Portfolio | | A131 |
| | | Stock Index Portfolio | | A142 |
| | | Value Portfolio | | A151 |
| | |
| Section B | | Notes to Financial Statements | | |
| Section C | | Financial Highlights | | |
| Section D | | Report of Independent Registered Public Accounting Firm | | |
| Section E | | Information about Trustees and Officers | | |
This report may include financial information pertaining to certain portfolios that are not available through the variable life insurance policy or variable annuity contract that you have chosen. Please refer to your variable life insurance or variable annuity prospectus to determine which portfolios are available to you.
| | | | |
The Prudential Series Fund Letter to Contract Owners | | Annual Report | | December 31, 2011 |
At Prudential, our primary objective is to help investors achieve and maintain long-term financial success. This Prudential Series Fund annual report outlines our efforts to achieve this goal. We hope you find it informative and useful.
Prudential has been building on a heritage of success for more than 135 years. The quality of our businesses and risk diversification has enabled us to manage effectively through volatile markets over time. We believe the array of our products provides a highly attractive value proposition to clients like you who are focused on financial security.
Your financial professional is the best resource to help you make the most informed investment decisions. Together, you can build a diversified investment portfolio that aligns with your long-term financial goals. Please keep in mind that diversification and asset allocation strategies do not assure a profit or protect against loss in declining markets.
Thank you for selecting Prudential as one of your financial partners. We value your trust and appreciate the opportunity to help you achieve financial security.
Sincerely,

Stephen Pelletier
President,
The Prudential Series Fund | January 31, 2012 |

PRESIDENT
STEPHEN PELLETIER
| | |
The Prudential Series Fund, Conservative Balanced Portfolio | | December 31, 2011 |
Investment Manager’s Report - As of December 31, 2011
| | | | | | | | | | | | |
| Average Annual Total Returns | | 1-Year | | | 5-Year | | | 10-Year | |
Portfolio | | | 4.60 | % | | | 3.19 | % | | | 4.55 | % |
Blended Index | | | 4.47 | | | | 3.02 | | | | 4.30 | |
S&P 500 Index | | | 2.09 | | | | -0.25 | | | | 2.92 | |
Past performance does not guarantee future returns. The investment return and principal value of an investment will fluctuate, so that an investor’s shares, when redeemed, may be worth more or less than their original cost. Current performance may be lower or higher than the past performance data quoted.
Portfolio performance is net of investment fees and fund expenses, but not product charges, which, if included, would significantly lower the performance quoted. Performance figures may reflect fee waivers and/or expense reimbursements. In the absence of such fee waivers and/or expense reimbursements, total returns would be lower.
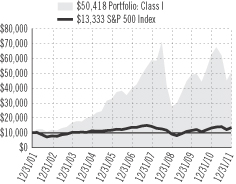
$10,000 INVESTED OVER 10 YEARS

For the year ended December 31, 2011, the Conservative Balanced Portfolio returned 4.60%.
The Portfolio’s investment objective is total investment return consistent with a conservatively managed, diversified portfolio. It invests in stocks, equity-related securities, debt obligations, and money market instruments. The Portfolio is subadvised by Prudential Investment Management, Inc. and Quantitative Management Associates LLC.
The Portfolio’s gain for the year reflected slightly positive equity returns and solid fixed income returns. The Portfolio marginally outperformed the 4.47% return of its benchmark, the Blended Index (defined below). The Portfolio benefited from tactical asset allocation positioning in which it had a larger exposure to stocks than its guideline weight of 50% early in 2011 as the equity market rose. A strategic retreat from equities in May, as stocks pulled back, and a more aggressive stance toward year-end after stocks again rallied, helped performance. The Portfolio uses equity futures contracts to enhance liquidity, and a well-timed purchase of equity futures made a small positive contribution to its performance in 2011.
The U.S. equity market gained early in the period, reaching a peak for the year in April, as measured by the S&P 500 Index. Stocks then declined for five consecutive months due to investor anxiety over the global economic outlook and a worsening sovereign-debt crisis in the euro zone. Yet signs of improving economic conditions in the United States and renewed hopes for a solution to the euro zone turmoil sent stock prices higher in the fourth quarter, enabling the S&P 500 Index to deliver a modest gain for the year including dividends.
In the U.S. bond market, all sectors ended 2011 in the black, although the year was marked by sharp shifts in investor willingness to assume risk. An upbeat first quarter in which risky debt securities performed well gave way to a summer of anxiety that reflected concerns over the global economic outlook and the euro zone crisis. This fueled heavy investor demand for safe haven assets, particularly U.S. Treasury securities. Meanwhile, after efforts to stabilize the U.S. government debt trajectory failed, Standard & Poor’s lowered the long-term U.S. credit rating to AA+ from AAA in August.
Despite the rating cut, investors continued to flee to Treasury securities, driving Treasury yields lower and Treasury prices higher, as bond prices move inversely to yields. The Federal Reserve (the Fed) also tried to apply downward pressure on rates to boost economic growth. For example, it began to sell shorter-term Treasury securities and buy their longer-term counterparts in October. Fed action, coupled with continued strong investor demand for safe haven assets, ultimately helped push Treasury yields back down during the fourth quarter, even as better economic conditions in the United States and renewed hopes for a solution to the euro zone crisis stoked investor appetite for risky assets.
Prudential Investments LLC (PI), an indirect, wholly owned subsidiary of Prudential Financial, Inc., serves as the investment manager for the Fund.
Blended Index consists of S&P 500 Index (50%), Barclays Capital U.S. Aggregate Bond Index (40%), an unmanaged index comprised of more than 5,000 government and corporate bonds, and 3-Month T-Bill Index (10%), an unmanaged market value-weighted index of investment grade fixed rate public obligations of the U.S. Treasury with maturities of three months, excluding zero coupon strips. S&P 500 Index is an unmanaged, market value-weighted index of 500 stocks generally representative of the broad stock market. These returns do not include the effect of any investment management expenses. These returns would have been lower if they included the effect of these expenses. Investors cannot invest directly in a market index. For a complete list of holdings, refer to the Schedule of Investments section of this report.
Prudential Investment Management, Inc., and Quantitative Management Associates LLC are registered investment advisors and Prudential Financial companies.
| | |
The Prudential Series Fund, Diversified Bond Portfolio | | December 31, 2011 |
Investment Manager’s Report - As of December 31, 2011
| | | | | | | | | | | | |
| Average Annual Total Returns | | 1-Year | | | 5-Year | | | 10-Year | |
Portfolio | | | 7.51 | % | | | 7.89 | % | | | 6.77 | % |
Barclays Capital U.S. Aggregate Bond Index | | | 7.84 | | | | 6.50 | | | | 5.78 | |
Past performance does not guarantee future returns. The investment return and principal value of an investment will fluctuate, so that an investor’s shares, when redeemed, may be worth more or less than their original cost. Current performance may be lower or higher than the past performance data quoted.
Portfolio performance is net of investment fees and fund expenses, but not product charges, which, if included, would significantly lower the performance quoted. Performance figures may reflect fee waivers and/or expense reimbursements. In the absence of such fee waivers and/or expense reimbursements, total returns would be lower.
$10,000 INVESTED OVER 10 YEARS
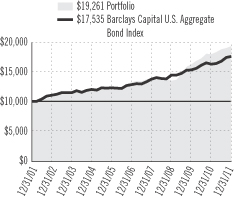
For the year ended December 31, 2011, the Diversified Bond Portfolio returned 7.51%.
The Portfolio’s investment objective is a high level of income over a longer term while providing reasonable safety of capital. The subadviser for the Portfolio is Prudential Investment Management, Inc.
The Portfolio’s gain reflected a favorable environment for investing in bonds. However, the U.S. fixed income market endured sharp shifts in investor willingness to assume risk that largely occurred due to developments in Europe and the United States. Risky debt securities, particularly high yield corporate bonds commonly known as “junk” bonds, performed well for the first quarter, but they soon fell out of favor. An upbeat start to the second quarter gave way to increasing anxiety that turned into a panic in the third quarter, which favored U.S. Treasury securities. This occurred as a prolonged sovereign-debt crisis in the euro zone worsened. In the United States, economic data turned soft. Also a battle over the national budget and debt ceiling produced insufficient savings to stabilize the government debt trajectory. Consequently, Standard & Poor’s lowered the long-term U.S. credit rating to AA+ from AAA in August.
Despite the rating cut, investors continued to flee to the relative safety of Treasury securities, driving Treasury yields lower and Treasury prices higher, as bond prices move inversely to yields. The Federal Reserve also tried to put downward pressure on rates to boost economic growth. For example, it began “Operation Twist” in October in which it sold short-term Treasury securities and purchased their long-term counterparts. Its purchases, along with continued strong investor demand for safe-haven assets, ultimately helped push Treasury yields back down to generational lows late in the year, even as improving economic conditions and renewed hope for a resolution to the euro zone crisis stoked investor appetite for risky assets. All sectors of the U.S. fixed income market finished the year in the black.
The Portfolio slightly lagged its benchmark, the Barclays Capital U.S. Aggregate Bond Index (the Index), which returned 7.84%. It utilized Treasury futures contracts to help position its duration in the U.S. Treasury market longer than that of the Index. Duration measures the approximate price volatility of a bond portfolio for a given change in interest rates and is expressed in years. A longer duration enabled the Portfolio to derive greater benefit as falling rates drove prices of Treasury securities higher. However, tactical bond trading had a net negative impact overall on the Portfolio’s return for the year.
The net impact of its foreign exchange strategy was slightly negative for the year. Compared to the Index, it had an underweight exposure to the U.S. dollar during the third and fourth quarters of 2011 that detracted from its return, as did a non-benchmark exposure to the euro during the final two quarters of the year.
The combined impact of sector allocation and security selection was a net positive overall for the Portfolio’s return in 2011. At the sector-specific level, however, the impact was mixed. The combined effect of sector allocation and security selection in high yield corporate bonds and commercial mortgage-backed securities added to the Portfolio’s return. But, in mortgage-backed securities and emerging market bonds, it detracted from results.
Prudential Investments LLC (PI), an indirect, wholly owned subsidiary of Prudential Financial, Inc., serves as the investment manager for the Fund.
Barclays Capital U.S. Aggregate Bond Index is an unmanaged index comprised of more than 5,000 government and corporate bonds. These returns do not include the effect of any investment management expenses. These returns would have been lower if they included the effect of these expenses. Investors cannot invest directly in a market index. For a complete list of holdings, refer to the Schedule of Investments section of this report.
| | |
The Prudential Series Fund, Equity Portfolio | | December 31, 2011 |
Investment Manager’s Report - As of December 31, 2011
| | | | | | | | | | | | |
| Average Annual Total Returns | | 1-Year | | | 5-Year | | | 10-Year | |
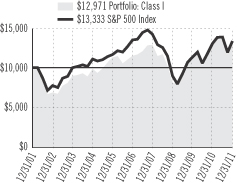
Portfolio: Class I | | | -3.47 | % | | | 0.18 | % | | | 3.59 | % |
Portfolio: Class II | | | -3.87 | | | | -0.22 | | | | 3.18 | |
Russell 1000® Index | | | 1.50 | | | | -0.02 | | | | 3.34 | |
S&P 500 Index | | | 2.09 | | | | -0.25 | | | | 2.92 | |
Past performance does not guarantee future returns. The investment return and principal value of an investment will fluctuate, so that an investor’s shares, when redeemed, may be worth more or less than their original cost. Current performance may be lower or higher than the past performance data quoted.
Portfolio performance is net of investment fees and fund expenses, but not product charges, which, if included, would significantly lower the performance quoted. Performance figures may reflect fee waivers and/or expense reimbursements. In the absence of such fee waivers and/or expense reimbursements, total returns would be lower.
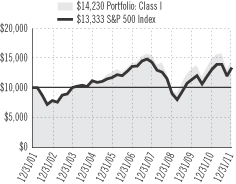
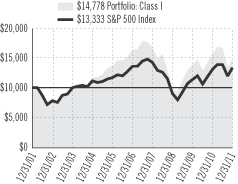
$10,000 INVESTED OVER 10 YEARS1
The Russell 1000® Index is a trademark/service mark of the Frank Russell Company. Russell® is a trademark of the Frank Russell Company.
For the year ended December 31, 2011, the Equity Portfolio Class I shares declined 3.47% and Class II shares declined 3.87%.
The Portfolio’s investment objective is long-term growth of capital. The Portfolio is subadvised by Jennison Associates LLC (Jennison).
After reaching a high in April, U.S. equity markets declined for five consecutive months. But double-digit performance in the fourth quarter drove the S&P 500 Index to a 2.09% gain. Seven out of 10 S&P 500 sectors advanced, although industrials, materials, and financials declined. The Russell 1000® Index (the Index) returned 1.50% for the year, as seven out of the 10 major sectors in the Index also advanced. The exceptions were financials, materials, and industrials. There was, however, significant disparity among sector performance, with utilities climbing nearly 19.0% and financials losing 17.0%.
The Portfolio posted a loss and underperformed the Index largely because of stock selection, most particularly in energy, consumer discretionary, and materials.
Financials and materials sector holdings ranked among the most notable detractors for the year. Concerns about potential litigation against Goldman Sachs related to allegations it misled clients by not disclosing its proprietary interest in certain collateralized debt transactions weighed on its share price. More recently, an unexpectedly large loss in its Investing and Lending Segment and S&P’s downgrade of Goldman’s credit rating caused investor unease. Jennison continues to view Goldman as best in class and, at its current valuation, Jennison believes it offers a compelling risk/reward opportunity amid a lackluster financial market landscape.
A strengthening dollar hurt gold mining stocks in general especially toward the end of the period; Freeport-McMoRan Copper and Gold and Kinross Gold declined in tandem. Jennison continues to like Freeport for its strong management team that has executed well throughout the ups and downs of volatile commodity markets. Jennison likes Kinross for its diverse production base.
Another noteworthy detractor, telecommunications services firm NII Holdings, suffered outsized losses primarily stemming from fears of increasing competition in Brazil, one of its key markets, and ambiguity around its 3G rollout. While Jennison is following recent competitive developments closely, it continues to believe NII has strong long-term growth prospects and very capable management.
Information technology dominated the Portfolio’s key contributors for the year. MasterCard’s revenues and earnings during the reporting period often exceeded consensus forecasts. The company received an additional boost mid-year when the U.S. Federal Reserve decided to limit debit-transaction fees charged by banks less onerously than had been feared. Apple’s financial results beat consensus projections owing in large part to strong sales of iPhones, iPads, and Mac personal computers. IBM climbed on better-than-expected revenue and earnings, including growth across global geographies, and strong cash flow.
Strong gains in healthcare holdings Pfizer and Shire also made noteworthy contributions.
Prudential Investments LLC (PI), an indirect, wholly owned subsidiary of Prudential Financial, Inc., serves as the investment manager for the Fund.
| 1 | The graph is based on the performance of Class I shares. Performance of Class II shares will be lower due to differences in the fee structure. Class II shares have associated 12b-1 and administrative fees at an annual rate of 0.25% and 0.15%, respectively, of the average daily net assets of the Class II shares. |
Russell 1000® Index is an unmanaged market cap-weighted index that measures the performance of the 1,000 largest companies in the Russell 3000 Index, which represents approximately 92% of the total market. S&P 500 Index is an unmanaged, market value-weighted index of 500 stocks generally representative of the broad stock market. These returns do not include the effect of any investment management expenses. These returns would have been lower if they included the effect of these expenses. Investors cannot invest directly in a market index. For a complete list of holdings, refer to the Schedule of Investments section of this report.
Jennison Associates LLC is a registered investment advisor and a Prudential Financial company.
| | |
The Prudential Series Fund, Flexible Managed Portfolio | | December 31, 2011 |
Investment Manager’s Report - As of December 31, 2011
| | | | | | | | | | | | |
| Average Annual Total Returns | | 1-Year | | | 5-Year | | | 10-Year | |
Portfolio | | | 4.34 | % | | | 2.31 | % | | | 4.59 | % |
Blended Index | | | 4.28 | | | | 2.58 | | | | 4.20 | |
S&P 500 Index | | | 2.09 | | | | -0.25 | | | | 2.92 | |
Past performance does not guarantee future returns. The investment return and principal value of an investment will fluctuate, so that an investor’s shares, when redeemed, may be worth more or less than their original cost. Current performance may be lower or higher than the past performance data quoted.
Portfolio performance is net of investment fees and fund expenses, but not product charges, which, if included, would significantly lower the performance quoted. Performance figures may reflect fee waivers and/or expense reimbursements. In the absence of such fee waivers and/or expense reimbursements, total returns would be lower.
$10,000 INVESTED OVER 10 YEARS
For the year ended December 31, 2011, the Flexible Managed Portfolio returned 4.34%.
The Portfolio’s investment objective is total return consistent with an aggressively managed, diversified portfolio. It invests in stocks, equity-related securities, debt obligations, and money market obligations. The Portfolio is subadvised by Prudential Investment Management, Inc. and Quantitative Management Associates LLC.
The Portfolio’s gain for the year reflected slightly positive equity returns and solid fixed income returns. The Portfolio marginally outperformed the 4.28% return of its benchmark, the Blended Index (described below). It benefited from tactical asset allocation positioning in which it had a larger exposure to stocks than its 60% guideline weight for about the first 4.5 months of 2011. A strategic retreat from equities in mid-year was another positive as stocks pulled back. Also, the Portfolio used equity futures contracts to manage liquidity, and a well-timed purchase of equity futures made a small positive contribution to its performance in 2011.
The U.S. equity market gained early in the period, reaching a peak for the year in April, as measured by the S&P 500 Index. Stocks then declined for five consecutive months due to investor anxiety over the global economic outlook and a worsening sovereign-debt crisis in the euro zone. Yet signs of improving economic conditions in the United States and renewed hopes for a solution to the euro zone turmoil sent stock prices higher in the fourth quarter, enabling the S&P 500 Index to deliver a modest gain for the year including dividends.
In the U.S. bond market, all sectors ended 2011 in the black, although the year was marked by sharp shifts in investor willingness to assume risk. An upbeat first quarter in which risky debt securities performed well gave way to a summer of anxiety that reflected concerns over the global economic outlook and the euro zone crisis. This fueled heavy investor demand for safe haven assets, particularly U.S. Treasury securities. Meanwhile, after efforts to stabilize the U.S. government debt trajectory failed, Standard & Poor’s lowered the long-term U.S. credit rating to AA+ from AAA in August.
Despite the rating cut, investors continued to flee to Treasury securities, driving Treasury yields lower and Treasury prices higher, as bond prices move inversely to yields. The Federal Reserve (the Fed) also tried to apply downward pressure on rates to boost economic growth. For example, it began to sell shorter-term Treasury securities and buy their longer-term counterparts in October. Fed action, coupled with continued strong investor demand for safe haven assets, ultimately helped push Treasury yields back down during the fourth quarter, even as better economic conditions in the United States and renewed hopes for a solution to the euro zone crisis stoked investor appetite for risky assets.
Prudential Investments LLC (PI), an indirect, wholly owned subsidiary of Prudential Financial, Inc., serves as the investment manager for the Fund.
Blended Index consists of S&P 500 Index (60%), Barclays Capital U.S. Aggregate Bond Index (35%), an unmanaged index comprised of more than 5,000 government and corporate bonds, and 3-Month T-Bill Index (5%), an unmanaged market value-weighted index of investment grade fixed rate public obligations of the U.S. Treasury with maturities of three months, excluding zero coupon strips. S&P 500 Index is an unmanaged, market value-weighted index of 500 stocks generally representative of the broad stock market. These returns do not include the effect of any investment management expenses. These returns would have been lower if they included the effect of these expenses. Investors cannot invest directly in a market index. For a complete list of holdings, refer to the Schedule of Investments section of this report.
| | |
The Prudential Series Fund, Global Portfolio | | December 31, 2011 |
Investment Manager’s Report - As of December 31, 2011
| | | | | | | | | | | | |
| Average Annual Total Returns | | 1-Year | | | 5-Year | | | 10-Year | |
Portfolio | | | -6.97 | % | | | -2.77 | % | | | 2.87 | % |
MSCI World Index (GD) | | | -5.02 | | | | -1.82 | | | | 4.15 | |
Past performance does not guarantee future returns. The investment return and principal value of an investment will fluctuate, so that an investor’s shares, when redeemed, may be worth more or less than their original cost. Current performance may be lower or higher than the past performance data quoted.
Portfolio performance is net of investment fees and fund expenses, but not product charges, which, if included, would significantly lower the performance quoted. Performance figures may reflect fee waivers and/or expense reimbursements. In the absence of such fee waivers and/or expense reimbursements, total returns would be lower.
$10,000 INVESTED OVER 10 YEARS
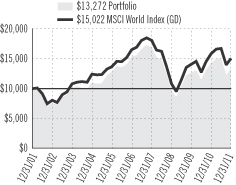
For the year ended December 31, 2011, the Global Portfolio declined by 6.97%.
The investment objective of the Portfolio is long-term growth of capital. The Portfolio is co-managed by four subadvisers: Marsico Capital Management, LLC (U.S. growth stocks), T. Rowe Price Associates, Inc. (U.S. value stocks), William Blair & Company LLC (international growth stocks), and LSV Asset Management (international value stocks). The Portfolio seeks long-term growth of capital by investing in stocks, with about half of its assets invested in companies in the United States and half in companies located abroad.
The Portfolio underperformed its benchmark, the MSCI World Index during the period, largely due to the underperformance of the segments managed by Marsico Capital Management and T. Rowe Price Associates.
Marsico’s large cap segment lagged behind the Russell 1000 Growth Index largely due to the underperformance of positions in the financial services and energy sectors. Within financials, the top detractors were Citigroup, Goldman Sachs, PNC Financial, and Itau Unibanco. Within energy the top detractors were an overweight to Schlumberger and not owning Exxon Mobil, which is held in the Russell 1000 Growth Index. These outweighed the positive impact of the manager’s stock selection in the consumer discretionary sector, where a position in Starbucks contributed meaningfully to results.
T. Rowe Price’s segment underperformed the Russell 1000 Value Index due to negative stock selection in a number of sectors including utilities, consumer staples, telecommunications services, and healthcare. Conversely, the portfolio benefited from an underweight to the bottom-performing financial services sector.
Both of the international subadvisers, William Blair and LSV, outperformed the MSCI EAFE Index during the period. William Blair benefited from strong security selection in the consumer discretionary and financials sectors, while LSV modestly outperformed the index target due to strong stock selection within financial services and overweighting the telecommunications services, sector, which fell significantly less than the overall international market.
The use of derivative instruments is not a principal strategy of the four subadvisers with regard to the Portfolio. The types of derivatives employed most often are equity futures contracts (to help manage cash flows in the Portfolio) and currency forwards and futures contracts (to hedge a portion of currency exposure in the Portfolio). Currency hedging in the segment managed by William Blair had a modestly positive impact on performance during 2011.
Prudential Investments LLC (PI), an indirect, wholly owned subsidiary of Prudential Financial, Inc., serves as the investment manager for the Fund.
MSCI World Index (GD) - The Morgan Stanley Capital International World Index is an unmanaged capitalization weighted index which includes the equity markets of Australia, Austria, Belgium, Canada, Denmark, Finland, France, Germany, Hong Kong, Ireland, Italy, Japan, Malaysia, Netherlands, New Zealand, Norway, Singapore, Spain, Sweden, Switzerland, United Kingdom, and United States. The GD version does not reflect the impact of withholding taxes on reinvested dividends. These returns do not include the effect of any investment management expenses. These returns would have been lower if they included the effect of these expenses. Investors cannot invest directly in a market index. For a complete list of holdings, refer to the Schedule of Investments section of this report.
| | |
The Prudential Series Fund, Government Income Portfolio | | December 31, 2011 |
Investment Manager’s Report - As of December 31, 2011
| | | | | | | | | | | | |
| Average Annual Total Returns | | 1-Year | | | 5-Year | | | 10-Year | |
Portfolio | | | 7.63 | % | | | 6.46 | % | | | 5.58 | % |
Barclays Capital Government Bond Index | | | 7.69 | | | | 6.42 | | | | 5.59 | |
Past performance does not guarantee future returns. The investment return and principal value of an investment will fluctuate, so that an investor’s shares, when redeemed, may be worth more or less than their original cost. Current performance may be lower or higher than the past performance data quoted.
Portfolio performance is net of investment fees and fund expenses, but not product charges, which, if included, would significantly lower the performance quoted. Performance figures may reflect fee waivers and/or expense reimbursements. In the absence of such fee waivers and/or expense reimbursements, total returns would be lower.
$10,000 INVESTED OVER 10 YEARS
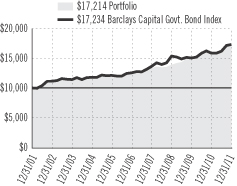
For the year ended December 31, 2011, the Government Income Portfolio returned 7.63%.
The investment objective of the Portfolio is a high level of income over a longer term while providing reasonable safety of capital. The Portfolio subadviser is Prudential Investment Management, Inc.
The Portfolio gained in what proved to be a favorable year for U.S. government securities as well as the remainder of the U.S. fixed income market. However, the market endured sharp shifts in investor willingness to assume risk that occurred largely due to developments in Europe and the United States. Risky debt securities performed well for the first quarter, but they soon fell out of favor. An upbeat start to the second quarter gave way to increasing anxiety that turned into a panic in the third quarter, which heavily favored U.S. Treasury securities.
This flight to quality occurred as a prolonged sovereign-debt crisis in the euro zone went from bad to worse, threatening financial stability in the region, in spite of efforts by European policymakers to improve government finances. In the United States, economic data turned decidedly soft. Also a battle over the national budget and debt ceiling produced insufficient savings to stabilize the government debt trajectory. Consequently, Standard & Poor’s lowered the long-term U.S. credit rating to AA+ from AAA in August.
Despite the rating cut, investors continued to flee from risky assets to the relative safety of Treasury securities, driving Treasury yields sharply lower and Treasury prices higher, as bond prices move inversely to yields. The Federal Reserve (the Fed) also tried to keep downward pressure on rates to boost economic growth. For example, it began “Operation Twist” in October in which it sold short-term Treasury securities and purchased their long-term counterparts. Its purchases, along with continued strong investor demand for safe-haven assets, ultimately helped push Treasury yields back down towards generational lows late in the year, even as improving economic conditions and renewed hope for a resolution to the euro zone crisis stoked investor appetite for risky assets. All sectors of the U.S. fixed income market finished the year in the black.
The largest contributor to the Portfolio’s performance was favorable security selection, particularly among commercial mortgage-backed securities (CMBS) and Treasury securities. Selection in the CMBS sector had a net positive impact, even as a bias in favor of higher-quality CMBS, which helped performance in the third quarter, detracted in the fourth quarter as the sector rallied broadly late in the year. Favorable selection among residential mortgage-backed securities of federal agencies was also a positive for the Portfolio.
The Portfolio used interest-rate swaps and futures contracts to position its duration, a measure of the approximate price volatility of a bond portfolio for a given change in interest rates. The Portfolio’s duration strategy enabled it to benefit moderately as declining bond yields pushed bond prices higher.
During the year, long-term bond yields declined considerably more than short-term bond yields, causing the slope of the Treasury yield curve to flatten. (A yield curve shows the relationship between yields on bonds from the shortest to the longest maturities.) The Portfolio was positioned to benefit from the flattening in the Treasury yield curve.
Prudential Investments LLC (PI), an indirect, wholly owned subsidiary of Prudential Financial, Inc., serves as the investment manager for the Fund.
Barclays Capital Government Bond Index is a weighted unmanaged index comprised of securities issued or backed by the U.S. Government, its agencies, and instrumentalities with a remaining maturity of one to 30 years. These returns do not include the effect of any investment management expenses. These returns would have been lower if they included the effect of these expenses. Investors cannot invest directly in a market index. For a complete list of holdings, refer to the Schedule of Investments section of this report.
| | |
The Prudential Series Fund, High Yield Bond Portfolio | | December 31, 2011 |
Investment Manager’s Report - As of December 31, 2011
| | | | | | | | | | | | |
| Average Annual Total Returns | | 1-Year | | | 5-Year | | | 10-Year | |
Portfolio | | | 5.10 | % | | | 7.07 | % | | | 8.43 | % |
Barclays Capital U.S. High Yield 1% Issuer Capped Index | | | 4.98 | | | | 7.66 | | | | 9.01 | |
Past performance does not guarantee future returns. The investment return and principal value of an investment will fluctuate, so that an investor’s shares, when redeemed, may be worth more or less than their original cost. Current performance may be lower or higher than the past performance data quoted.
Portfolio performance is net of investment fees and fund expenses, but not product charges, which, if included, would significantly lower the performance quoted. Performance figures may reflect fee waivers and/or expense reimbursements. In the absence of such fee waivers and/or expense reimbursements, total returns would be lower.
$10,000 INVESTED OVER 10 YEARS
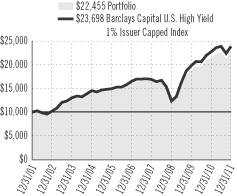
For the year ended December 31, 2011, the High Yield Bond Portfolio returned 5.10%.
The Portfolio’s objective is high total return. The Portfolio subadviser is Prudential Investment Management, Inc.
The Portfolio delivered a gain as nearly all sectors and industries in the U.S. high yield bond arena ended the year in positive territory. High yield bonds benefited from the generally solid credit metrics of companies that issue below investment-grade debt securities, which are commonly called “junk” bonds. Yet high yield bonds and the remainder of the U.S. fixed income market endured sharp shifts in investor willingness to assume risk that were largely driven by developments in Europe and the United States.
High yield bonds performed well in the first quarter as companies reported stronger earnings and many reduced their interest expenses by issuing new high yield bonds with lower rates to refinance existing bonds. The second quarter also began on an upbeat note but soon gave way to investor anxiety that grew increasingly worse during the third quarter. Risk-averse investors fled high yield bonds, driving their prices sharply lower, while prices of ultra-conservative U.S. Treasury securities soared.
The flight to quality occurred as a prolonged sovereign-debt crisis in the euro zone went from bad to worse, threatening financial stability in the region in spite of efforts by European policymakers to improve government finances. In the fourth quarter, however, high yield bond prices began to rebound, as improving economic conditions in the United States and renewed hope for a resolution to the European financial crisis stoked investor appetite for risky assets.
The Portfolio outperformed its benchmark, the Barclays Capital U.S. High Yield 1% Issuer Capped Index (the Index), which returned 4.98% for the year. The Portfolio benefited from strong security selection in the single-B and CCC rating categories of the high yield bond market. Generally, favorable security selection in the metals, capital goods, and media and entertainment industries were the largest drivers of the Portfolio’s performance. But the positive impact was partially offset by poor security selection in the telecommunications industry.
Several holdings materially affected performance. The Portfolio benefited from having larger exposures than the Index to Royalty Pharma AG and HCA, two health care/pharmaceutical companies whose bonds performed well. Also, underweight exposures to Royal Bank of Scotland and Residential Capital aided its performance versus the Index as the euro zone crisis negatively affected the financial sector. However, its overweight positions in Wind Telecom, Hexion LLC, and Alliance Healthcare detracted from performance.
As for sector allocation positioning, the Portfolio benefited from having smaller exposures than the Index to the airline industry and to building materials and construction. Overweight exposures to technology and healthcare were also positives for the Portfolio.
The Portfolio held cash equivalent securities that could be easily sold in order to satisfy shareholder liquidity needs. However, holding these very short-term, low-rate securities detracted from the Portfolio’s performance in a year during which high yield bonds posted mid single-digit returns.
Prudential Investments LLC (PI), an indirect, wholly owned subsidiary of Prudential Financial, Inc., serves as the investment manager for the Fund.
Barclays Capital U.S. High Yield 1% Issuer Capped Index is an unmanaged index that covers the universe of U.S. dollar denominated, non-convertible, fixed-rate, non-investment-grade debt. Issuers are capped at 1% of the Index. Index holdings must have at least one year to final maturity, at least $150 million par amount outstanding, and be publicly issued with a rating of Ba1 or lower. These returns do not include the effect of any investment management expenses. These returns would have been lower if they included the effect of these expenses. Investors cannot invest directly in a market index. For a complete list of holdings, refer to the Schedule of Investments section of this report.
| | |
The Prudential Series Fund, Jennison Portfolio | | December 31, 2011 |
Investment Manager’s Report - As of December 31, 2011
| | | | | | | | | | | | |
| Average Annual Total Returns | | 1-Year | | | 5-Year | | | 10-Year | |
Portfolio: Class I | | | 0.30 | % | | | 2.44 | % | | | 2.64 | % |
Portfolio: Class II | | | -0.09 | | | | 2.04 | | | | 2.22 | |
Russell 1000® Growth Index | | | 2.64 | | | | 2.50 | | | | 2.60 | |
S&P 500 Index | | | 2.09 | | | | -0.25 | | | | 2.92 | |
Past performance does not guarantee future returns. The investment return and principal value of an investment will fluctuate, so that an investor’s shares, when redeemed, may be worth more or less than their original cost. Current performance may be lower or higher than the past performance data quoted.
Portfolio performance is net of investment fees and fund expenses, but not product charges, which, if included, would significantly lower the performance quoted. Performance figures may reflect fee waivers and/or expense reimbursements. In the absence of such fee waivers and/or expense reimbursements, total returns would be lower.
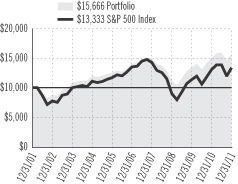
$10,000 INVESTED OVER 10 YEARS1
The Russell 1000® Growth Index is a trademark/service of the Frank Russell Company. Russell® is a trademark of the Frank Russell Company.
For the year ended December 31, 2011, the Jennison Portfolio Class I shares returned 0.30% and Class II shares declined by 0.09%.
The investment objective of the Portfolio is long-term growth of capital. The Portfolio is built from the bottom up, with stocks selected one at a time, based on fundamental analysis of individual companies. The Portfolio’s subadviser is Jennison Associates LLC (Jennison).
Consumer staples holdings generated the Portfolio’s largest returns, although an underweight position in the sector hurt performance relative to the benchmark. Natural foods retailer Whole Foods Market climbed on strong sales trends and market share gains. Estee Lauder’s strong revenue and earnings were fueled by successful new product launches and increased market penetration, particularly in emerging markets.
An overweight position in consumer discretionary worked well, but stock selection in the sector detracted from relative return, as Marriott International’s decline moderated Starbuck’s strong advance. Marriott, one of the world’s leading hoteliers, was hit by concerns that it would be hurt by anemic economic growth. Starbucks benefited from strong domestic and international growth and enthusiasm about its expanded presence in the premium single-cup coffee market.
Stock selection was detrimental in energy, financials, and healthcare. In energy, oil services company Schlumberger was adversely affected by falling energy prices. It continues to develop new products and technologies, providing dominant market share in what Jennison views as important long-term growth markets. In the financials sector, Goldman Sachs’ decline reflected concerns about potential litigation against the company related to allegations it misled clients by not disclosing its proprietary interest in certain collateralized debt transactions. In healthcare, Illumina was hurt by purchasing delays caused by research funding concerns. It develops genotyping, next-generation sequencing, and gene-expression tools to isolate and analyze genetic information. The commercialization of gene-based medicine is still in its early stages, and the opportunity for growth in Illumina’s core business should remain strong despite near-term headwinds.
Stock selection benefited relative return in industrials, where Precision Castparts rose on an improved outlook for its industrial gas turbine operations and solid growth in its investment in cast products and forged products aerospace business.
Several information technology holdings posted substantial gains. MasterCard’s revenues and earnings exceeded consensus forecasts; the company received an additional boost when the Federal Reserve limited debit-transaction fees charged by banks less onerously than had been feared. Apple’s financial results beat consensus forecasts, as sales of iPhones and iPads continued to impress. Detractors of note in the information technology sector included internet protocol routing company Juniper Networks, which was hurt by a deteriorating economy. NetApp’s earnings were in line with consensus projections, but revenues were shy of estimates, and sales guidance came in below consensus forecasts.
The Portfolio no longer holds a position in Marriott International.
Prudential Investments LLC (PI), an indirect, wholly owned subsidiary of Prudential Financial, Inc., serves as the investment manager for the Fund.
| 1 | The graph is based on the performance of Class I shares. Performance of Class II shares will be lower due to differences in the fee structure. Class II shares have associated 12b-1 and administrative fees at an annual rate of 0.25% and 0.15%, respectively, of the average daily net assets of the Class II shares. |
Russell 1000 Growth Index is an unmanaged market cap-weighted index that measures the performance of those Russell 1000 companies with higher price-to-book ratios and higher forecasted growth values. S&P 500 Index is an unmanaged, market value-weighted index of 500 stocks generally representative of the broad stock market. These returns do not include the effect of any investment management expenses. These returns would have been lower if they included the effect of these expenses. Investors cannot invest directly in a market index. For a complete list of holdings, refer to the Schedule of Investments section of this report.
| | |
The Prudential Series Fund, Money Market Portfolio | | December 31, 2011 |
Investment Manager’s Report - As of December 31, 2011
| | | | | | | | | | | | | | | | |
| Average Annual Total Returns | | 7-Day*
Current
Net Yield | | | 1-Year | | | 5-Year | | | 10-Year | |
Portfolio | | | 0.02 | % | | | 0.02 | % | | | 1.61 | % | | | 1.90 | % |
Lipper (VIP) Money Market Funds Avg. | | | N/A | | | | -0.03 | | | | 1.42 | | | | 1.72 | |
Past performance does not guarantee future returns. The investment return and principal value of an investment will fluctuate, so that an investor’s shares, when redeemed, may be worth more or less than their original cost. Current performance may be lower or higher than the past performance data quoted.
The yield quotation more closely reflects the current earnings of the Portfolio than the total return quotation. Portfolio performance is net of investment fees and fund expenses, but not product charges, which, if included, would significantly lower the performance quoted. Performance figures may reflect fee waivers and/or expense reimbursements. In the absence of such fee waivers and/or expense reimbursements, total returns would be lower.
7-DAY CURRENT NET YIELD*
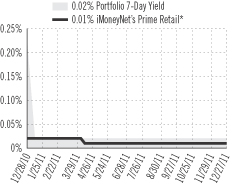
For the year ended December 31, 2011, the Money Market Portfolio returned 0.02%.
The Portfolio performed in line with the return of the Lipper (VIP) Money Market Funds Average in 2011. On December 27, 2011, the Portfolio’s seven-day current yield was 0.02%, compared with 0.02% on December 28, 2010.
The Portfolio’s investment objective is to seek maximum income, stability of capital, and maintenance of liquidity through investment in high quality, short-term debt instruments. The Portfolio is subadvised by Prudential Fixed Income, a unit of Prudential Investment Management, Inc.
The seven-day current yield and total return of the Portfolio remained slightly above zero throughout the period. Yields on all money market funds in the United States were at historically low levels as the Federal Reserve (the Fed) kept its target for the federal funds rate between zero and a quarter percentage point in an effort to help stimulate economic growth in the United States. Moreover, Fed policymakers signaled in August their intent to keep short-term rates near zero at least through mid-2013. (Shortly after the reporting period ended, the Fed announced it expects economic conditions will likely warrant that the federal funds rate remains at exceptionally low levels through at least late 2014.)
The investment environment was largely dominated by growing concerns about an ongoing sovereign-debt crisis in the euro zone rather than developments in the United States, where the economy began to show modest signs of improvement late in the year. Despite repeated efforts, the European Union, European Central Bank, and International Monetary Fund failed to come up with a viable solution to the euro zone crisis, which worsened during the summer of 2011.
The Portfolio adopted an increasingly conservative investment strategy, especially as it pertained to European banks, in which it largely limited its purchases to money market securities that matured in three months or less. It boosted its participation in very short-term transactions known as repurchase agreements, which are collateralized by U.S. Treasury securities or federal agency securities. It also increased its outright purchases of U.S. government securities. Standard & Poor’s affirmed the short-term credit rating of the United States at A-1+ but it downgraded the nation’s long-term rating to AA+ from AAA in August. This occurred after a battle over the budget and debt ceiling produced insufficient savings to stabilize the government debt trajectory.
Prudential Investments LLC (PI), an indirect, wholly owned subsidiary of Prudential Financial, Inc., serves as the investment manager for the Fund.
| * | Source: iMoneyNet, Inc. based on 311 funds in the iMoneyNet Prime Retail universe. Weekly 7-day current net yields of the Money Market Portfolio and the iMoneyNet Prime Retail universe as of 12/27/2011. |
The Lipper Variable Insurance Products (VIP) Funds Average is calculated by Lipper Analytical Services, Inc., and reflects the investment return of certain portfolios underlying variable life and annuity products. These returns are net of investment fees and fund expenses, but not product charges. These returns do not include the effect of any investment management expenses. These returns would have been lower if they included the effect of these expenses. Investors cannot invest directly in a market index or average. For a complete list of holdings, refer to the Schedule of Investments section of this report.
An investment in a Money Market Portfolio is not insured or guaranteed by the Federal Deposit Insurance Corporation or any other government agency. Although the Portfolio seeks to preserve the value of your investment at $10.00 per share, it is possible to lose money by investing in the Portfolio.
| | |
The Prudential Series Fund, Natural Resources Portfolio | | December 31, 2011 |
Investment Manager’s Report - As of December 31, 2011
| | | | | | | | | | | | | | | | |
| Average Annual Total Returns | | 1-Year | | | 5-Year | | | 10-Year | | | Since
Inception | |
Portfolio: Class I | | | -19.03 | % | | | 5.05 | % | | | 17.56 | % | | | N/A | |
Portfolio: Class II | | | -19.35 | | | | 4.63 | | | | N/A | | | | 13.27 | % |
Lipper (VUF) Natural Resources Funds Index | | | -13.07 | | | | 2.14 | | | | N/A | | | | 9.57 | |
S&P 500 Index | | | 2.09 | | | | -0.25 | | | | 2.92 | | | | 3.40 | |
Past performance does not guarantee future returns. The investment return and principal value of an investment will fluctuate, so that an investor’s shares, when redeemed, may be worth more or less than their original cost. Current performance may be lower or higher than the past performance data quoted.
Portfolio (Class II) inception: 4/28/2005. Portfolio performance is net of investment fees and fund expenses, but not product charges, which, if included, would significantly lower the performance quoted. Unless noted otherwise, Index returns reflect performance beginning the closest month-end date to the Portfolio’s inception (Class II). Performance figures may reflect fee waivers and/or expense reimbursements. In the absence of such fee waivers and/or expense reimbursements, total returns would be lower.
$10,000 INVESTED OVER 10 YEARS1
For the year ended December 31, 2011, the Natural Resources Portfolio Class I shares declined by 19.03% and Class II shares declined by 19.35%.
The Portfolio’s subadviser is Jennison Associates LLC (Jennison). The Portfolio’s investment objective is long-term growth of capital.
The Portfolio underperformed the broad market indexes as well the Lipper (VUF) Natural Resources Fund Index (Index), which declined by 13.07%. After reaching a high in April, U.S. equity markets declined for five consecutive months. But double-digit performance in the fourth quarter drove the S&P 500 Index to a 2.09% gain. Seven out of 10 S&P 500 sectors advanced, although industrials, materials, and financials declined.
Much of the Portfolio’s underperformance relative to the broader market reflected the year’s extraordinary commodity price volatility, largely attributable to investor anxiety over the global economic outlook. Performance relative to the Index was hurt by a stock allocation away from the more defensive, large-cap integrated oil and gas producers and a greater weighting in the materials sector.
Among the Portfolio’s detractors for the period, energy sector holdings outnumbered materials sector detractors. Two of the Portfolio’s energy exploration and production (E&P) holdings suffered from unexpected reserve problems. Pacific Rubiales, a Canada-based developer of heavy crude oil and natural gas in Colombia and Peru, faced challenges after disappointing drilling results in the spring. Shares of OGXPetroleo e Gas Participacoes, Brazil’s largest independent E&P Company, suffered as the company fell short of expectations. Nevertheless, Jennison believes the company is on the verge of a multi-year growth trajectory that is currently underappreciated. Alpha Natural Resources, another E&P detractor, experienced merger integration problems from its acquisition of coal-mining giant Massy Energy.
Falling metals prices and a strengthening dollar hurt metals and mining stocks in general, especially toward the end of the period. Freeport-McMoRan Copper & Gold declined in tandem. Jennison continues to like Freeport for its strong management team that has executed well through volatile commodity markets.
Energy names dominated the year’s key contributors, which included E&P names, such as Cabot Oil & Gas and Noble Energy, as well as Petrohawk Energy, a U.S.-based independent natural gas producer acquired for a significant premium by Anglo-Australian mining giant BHP Billiton. Jennison believes Cabot Oil & Gas has a high-quality asset base and further upside potential from its Marcellus Shale holdings. Independent oil and gas company Noble Energy is now the largest natural gas producer in Israel, in addition to onshore U.S. operations and deepwater development projects around the world. Jennison sees Noble as a multi-year growth story with strong prospects.
Randgold Resources, a gold producer, was the only non-energy name among the year’s noteworthy contributors. Jennison regards the company’s successful weathering of a coup in the Ivory Coast as evidence of its solid management.
The Portfolio no longer holds a position in Petrohawk Energy.
Prudential Investments LLC (PI), an indirect, wholly owned subsidiary of Prudential Financial, Inc., serves as the investment manager for the Fund.
| 1 | The graph is based on the performance of Class I shares. Performance of Class II shares will be lower due to differences in the fee structure. Class II shares have associated 12b-1 and administrative fees at an annual rate of 0.25% and 0.15%, respectively, of the average daily net assets of the Class II shares. |
The Lipper Variable Underlying Funds (VUF) Natural Resources Funds Index is calculated by Lipper Analytical Services, Inc. and consists of an equal dollar-weighted composite of the 10 largest funds in the Lipper VUF Natural Resources Fund classification. The index is rebalanced quarterly. Natural Resources Funds are deemed as funds that invest primarily in the equity securities of domestic and foreign companies engaged in natural resources. S&P 500 Index is an unmanaged, market value-weighted index of 500 stocks generally representative of the broad stock market. These returns are net of investment fees and fund expenses, but not product charges. Investors cannot invest directly in a market index or average. For a complete list of holdings, refer to the Schedule of Investments section of this report.
| | |
The Prudential Series Fund, Small Capitalization Stock Portfolio | | December 31, 2011 |
Investment Manager’s Report - As of December 31, 2011
| | | | | | | | | | | | |
| Average Annual Total Returns | | 1-Year | | | 5-Year | | | 10-Year | |
Portfolio | | | 0.56 | % | | | 1.69 | % | | | 6.74 | % |
S&P SmallCap 600 Index | | | 1.02 | | | | 1.94 | | | | 7.09 | |
Past performance does not guarantee future returns. The investment return and principal value of an investment will fluctuate, so that an investor’s shares, when redeemed, may be worth more or less than their original cost. Current performance may be lower or higher than the past performance data quoted.
Portfolio performance is net of investment fees and fund expenses, but not product charges, which, if included, would significantly lower the performance quoted. Performance figures may reflect fee waivers and/or expense reimbursements. In the absence of such fee waivers and/or expense reimbursements, total returns would be lower.
$10,000 INVESTED OVER 10 YEARS
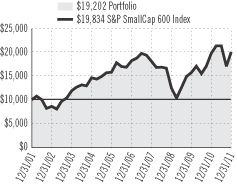
For the year ended December 31, 2011, the Small Capitalization Stock Portfolio returned 0.56%.
The Portfolio’s investment objective is long-term growth of capital. Quantitative Management Associates LLC (QMA) manages the Portfolio, which is an index fund that uses a risk-controlled quantitative approach that seeks to effectively track the performance of its benchmark, the S&P SmallCap 600 Index (the Index). The Index, and therefore the Portfolio, invests in small capitalization stocks which are more volatile than those of large, well-established companies.
The Portfolio’s nearly flat return for 2011, which slightly underperformed the Index, reflected the challenging environment for investing in stocks. The broad U.S. equity market gained early in the period, reaching a peak for the year in April, as measured by the S&P 500 Index. Stocks then declined for five consecutive months due to investor anxiety over the global economic outlook and a worsening sovereign-debt crisis in the euro zone. Yet signs of improving economic conditions in the United States and renewed hopes for a solution to the euro zone turmoil sent stock prices higher in the fourth quarter, enabling the S&P 500 Index to deliver a modest gain for the year including dividends.
In a year marked by economic and political uncertainty, risk-averse investors generally eschewed small- and mid-cap companies for large, well-established companies with strong capital positions, attractive dividend streams, and earnings growth. When stocks surged in the fourth quarter, small-cap stocks led the way. However, for the 12-month period, small-cap stocks underperformed large-caps but outperformed mid-cap stocks, according to the S&P family of indexes.
During the year, the Portfolio had a small exposure to derivative instruments to enhance its liquidity, but the position did not have a material impact on its performance.
Prudential Investments LLC (PI), an indirect, wholly owned subsidiary of Prudential Financial, Inc., serves as the investment manager for the Fund.
S&P SmallCap 600 Index is an unmanaged index representing the aggregate market value of the common equity of 600 small-company stocks. These returns do not include the effect of any investment management expenses. These returns would have been lower if they included the effect of these expenses. Investors cannot invest directly in a market index. For a complete list of holdings, refer to the Schedule of Investments section of this report.
| | |
The Prudential Series Fund, Stock Index Portfolio | | December 31, 2011 |
Investment Manager’s Report - As of December 31, 2011
| | | | | | | | | | | | |
| Average Annual Total Returns | | 1-Year | | | 5-Year | | | 10-Year | |
Portfolio | | | 1.95 | % | | | -0.48 | % | | | 2.65 | % |
S&P 500 Index | | | 2.09 | | | | -0.25 | | | | 2.92 | |
Past performance does not guarantee future returns. The investment return and principal value of an investment will fluctuate, so that an investor’s shares, when redeemed, may be worth more or less than their original cost. Current performance may be lower or higher than the past performance data quoted.
Portfolio performance is net of investment fees and fund expenses, but not product charges, which, if included, would significantly lower the performance quoted. Performance figures may reflect fee waivers and/or expense reimbursements. In the absence of such fee waivers and/or expense reimbursements, total returns would be lower.
$10,000 INVESTED OVER 10 YEARS
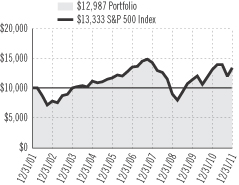
For the year ended December 31, 2011, the Stock Index Portfolio returned 1.95%.
The Portfolio’s investment objective is to achieve investment results that generally correspond to the performance of publicly-traded common stocks. Quantitative Management Associates, LLC (QMA) manages the Portfolio, which is an index fund that uses a risk-controlled quantitative approach that seeks to effectively track the performance of its benchmark, the S&P 500 Index. While Prudential is one of the components of the S&P 500, the Portfolio cannot hold shares of Prudential Financial, Inc. because of compliance restrictions.
Potential tracking error differences, brokerage costs, as well as other costs and expenses of the Portfolio, may cause its return to be lower than that of the S&P 500 Index. It underperformed the S&P 500 Index by a modest amount in 2011.
The U.S. equity market gained early in the period, reaching a peak for the year in April, as measured by the S&P 500 Index. Stocks then declined for five consecutive months due to investor anxiety over the global economic outlook and a worsening sovereign-debt crisis in the euro zone. Yet signs of improving economic conditions in the United States and renewed hopes for a solution to the euro zone turmoil sent stock prices higher in the fourth quarter, enabling the S&P 500 Index to deliver a modest gain for the year including dividends.
In the flight to safety that ensued in 2011, investors favored larger companies with strong capital positions, attractive dividend streams, and continued earnings growth. This preference helped the S&P 500 Index achieve a positive return despite global financial market turbulence. Within the S&P 500 Index, less economically sensitive sectors, including utilities, consumer staples, and healthcare enjoyed double-digit returns. The more economically sensitive sectors, including financials and materials, were the weakest performing with double-digit losses.
The Portfolio uses derivative instruments, though not as a principal investment strategy. It had a small position in futures contracts on the S&P 500 Index to enhance the liquidity of the Portfolio. This exposure did not have a material impact on its performance.
Prudential Investments LLC (PI), an indirect, wholly owned subsidiary of Prudential Financial, Inc., serves as the investment manager for the Fund.
S&P 500 Index is an unmanaged, market value-weighted index of 500 stocks generally representative of the broad stock market. These returns do not include the effect of any investment management expenses. These returns would have been lower if they included the effect of these expenses. Investors cannot invest directly in a market index. For a complete list of holdings, refer to the Schedule of Investments section of this report.
| | |
The Prudential Series Fund, Value Portfolio | | December 31, 2011 |
Investment Manager’s Report - As of December 31, 2011
| | | | | | | | | | | | |
| Average Annual Total Returns | | 1-Year | | | 5-Year | | | 10-Year | |
Portfolio: Class I | | | -5.58 | % | | | -1.90 | % | | | 3.98 | % |
Portfolio: Class II | | | -5.89 | | | | -2.28 | | | | 3.57 | |
Russell 1000® Value Index | | | 0.39 | | | | -2.64 | | | | 3.89 | |
S&P 500 Index | | | 2.09 | | | | -0.25 | | | | 2.92 | |
Past performance does not guarantee future returns. The investment return and principal value of an investment will fluctuate, so that an investor’s shares, when redeemed, may be worth more or less than their original cost. Current performance may be lower or higher than the past performance data quoted.
Portfolio performance is net of investment fees and fund expenses, but not product charges, which, if included, would significantly lower the performance quoted. The Russell 1000® Value Index is a trademark/service mark of the Frank Russell Company. Russell® is a trademark of the Frank Russell Company. Performance figures may reflect fee waivers and/or expense reimbursements. In the absence of such fee waivers and/or expense reimbursements, total returns would be lower.
$10,000 INVESTED OVER 10 YEARS1
For the year ended December 31, 2011, the Value Portfolio Class I shares declined 5.58% and Class II shares declined 5.89%.
The Portfolio’s investment objective is capital appreciation. The Portfolio is subadvised by Jennison Associates LLC (Jennison).
2011 ended on a slightly upward note and pushed most market indexes into positive territory. During the year, large-cap growth companies did the best, while smaller cap and value stocks lagged. For its part, the Russell 1000® Value Index (the Index) had a return of 0.39%. Within the Index, sector disparity was wide, with the defensive utilities, consumer staples, and healthcare sectors doing the best, and materials and financials faring the worst. The Portfolio trailed the Index for the full year largely due to investors seeking the perceived safety of utilities and mega-cap stocks over company fundamentals. Stock selection hindered results in the energy and telecommunications services sectors, but helped results relative to the Index in financials.
Concerns about potential litigation against Goldman Sachs related to allegations it misled clients by not disclosing its proprietary interest in certain collateralized debt transactions weighed on its share price. More recently, an unexpectedly large loss in its Investing and Lending Segment and S&P’s downgrade of Goldman’s credit rating caused investor unease. Jennison continues to view Goldman as best in class and, at its current valuation, offers a compelling risk/reward opportunity amid a lackluster financial market landscape.
Other financial holdings with large declines during the year included Morgan Stanley and Citigroup.
Telecommunications services stock NII Holdings was a notable detractor for the year primarily due to fears of increasing competition in Brazil, one of its key markets, as well as ambiguity concerning its 3G rollout. Jennison has been following recent competitive developments closely, and likes NII’s continued strong growth, and very capable management.
Information technology holding Flextronics and General Motors suffered outsized losses.
Key contributors were found across a diverse group of securities. Tech stock IAC/InterActive led results. The internet company has surpassed consensus expectations on a fairly regular basis and enjoyed faster growth than industry peers.
Within consumer staples, Smithfield Foods and CVS Caremark boosted relative performance, as did energy stock Williams Companies and healthcare position Pfizer.
The Portfolio no longer holds a position in IAC/InterActive.
Prudential Investments LLC (PI), an indirect, wholly owned subsidiary of Prudential Financial, Inc., serves as the investment manager for the Fund.
| 1 | The graph is based on the performance of Class I shares. Performance of Class II shares will be lower due to differences in the fee structure. Class II shares have associated 12b-1 and administrative fees at an annual rate of 0.25% and 0.15%, respectively, of the average daily net assets of the Class II shares. |
Russell 1000 Value Index is an unmanaged market cap-weighted index that measures the performance of those Russell 1000 companies with lower price-to-book ratios and lower forecasted growth values. S&P 500 Index is an unmanaged, market value-weighted index of 500 stocks generally representative of the broad stock market. Investors cannot invest directly in a market index. For a complete list of holdings, refer to the Schedule of Investments section of this report.
| | |
The Prudential Series Fund Presentation of Portfolio Holdings — unaudited | | December 31, 2011 |
| | | | |
Conservative Balanced | |
| Five Largest Holdings | | | (% of Net Assets | ) |
| Exxon Mobil Corp. | | | 1.9% | |
Apple, Inc. | | | 1.8% | |
| International Business Machines Corp. | | | 1.0% | |
| Chevron Corp. | | | 1.0% | |
Microsoft Corp. | | | 0.9% | |
| | | | |
| Diversified Bond | |
| Allocation | | | (% of Net Assets | ) |
| Corporate Bonds | | | 44.7% | |
| Commercial Mortgage-Backed Securities | | | 17.9% | |
| Non-Residential Mortgage-Backed Securities | | | 7.8% | |
| Mortgage-Backed Securities | | | 7.2% | |
| Residential Mortgage-Backed Securities | | | 4.0% | |
| | | | |
| Equity | |
| Five Largest Holdings | | | (% of Net Assets | ) |
| Apple, Inc. | | | 3.4% | |
Anadarko Petroleum Corp. | | | 2.4% | |
American Express Co. | | | 2.2% | |
| National Oilwell Varco, Inc. | | | 2.2% | |
Google, Inc. (Class A Stock) | | | 1.9% | |
| | | | |
| Flexible Managed | |
| Five Largest Holdings | | | (% of Net Assets | ) |
| Apple, Inc. | | | 2.4% | |
| Exxon Mobil Corp. | | | 2.4% | |
Chevron Corp. | | | 1.6% | |
Microsoft Corp. | | | 1.3% | |
AT&T, Inc. | | | 1.3% | |
| | | | |
| Global | |
| Top Five Countries | | | (% of Net Assets | ) |
United States | | | 46.9% | |
| United Kingdom | | | 13.5% | |
Japan | | | 6.5% | |
France | | | 5.0% | |
Germany | | | 4.7% | |
| | | | |
| Government Income | |
| Allocation | | | (% of Net Assets | ) |
| Mortgage-Backed Securities | | | 41.3% | |
| U.S. Treasury Securities | | | 41.3% | |
| Commercial Mortgage-Backed Securities | | | 10.5% | |
| Collateralized Mortgage Obligations | | | 1.9% | |
| U.S. Government Agency Obligations | | | 1.8% | |
| | | | |
| High Yield Bond | |
| Allocation | | | (% of Net Assets | ) |
| Corporate Bonds | | | 91.2% | |
| Bank Loans | | | 3.1% | |
| Collateralized Mortgage Obligations | | | 0.1% | |
| Common Stocks | | | 0.1% | |
| Asset-Backed Securities | | | 0.1% | |
| | | | |
| Jennison | |
| Five Largest Holdings | | | (% of Net Assets | ) |
| Apple, Inc. | | | 6.1% | |
| Amazon.com, Inc. | | | 3.7% | |
Mastercard, Inc. (Class A Stock) | | | 3.0% | |
| Google, Inc. (Class A Stock) | | | 2.6% | |
| Precision Castparts Corp. | | | 2.5% | |
| | | | |
| Natural Resources | |
| Five Largest Holdings | | | (% of Net Assets | ) |
| Noble Energy, Inc. | | | 2.8% | |
| National Oilwell Varco, Inc. | | | 2.8% | |
Concho Resources, Inc. | | | 2.7% | |
| Cameron International Corp. | | | 2.5% | |
| Schlumberger Ltd. | | | 2.3% | |
| | | | |
| Small Capitalization Stock | |
| Five Largest Holdings | | | (% of Net Assets | ) |
| Healthspring, Inc. | | | 0.8% | |
| Salix Pharmaceuticals Ltd. | | | 0.6% | |
BioMed Realty Trust, Inc. | | | 0.6% | |
| Questcor Pharmaceuticals, Inc. | | | 0.6% | |
| iShares S&P SmallCap 600 Index Fund | | | 0.5% | |
| | | | |
| Stock Index | |
| Five Largest Holdings | | | (% of Net Assets | ) |
| Exxon Mobil Corp. | | | 3.5% | |
| Apple, Inc. | | | 3.2% | |
| International Business Machines Corp. | | | 1.9% | |
| Chevron Corp. | | | 1.8% | |
Microsoft Corp. | | | 1.7% | |
| | | | |
| Value | |
| Five Largest Holdings | | | (% of Net Assets | ) |
| Liberty Global, Inc., Ser. C | | | 3.2% | |
| Comcast Corp. (Class A Stock) | | | 3.1% | |
CA, Inc. | | | 2.8% | |
| Mylan, Inc. | | | 2.5% | |
Wells Fargo & Co. | | | 2.5% | |
For a complete list of holdings, please refer to the Schedule of Investments section of this report. Holdings reflect only long-term investments. Holdings/Issues/Industries/Sectors are subject to change.
| | |
The Prudential Series Fund Fees and Expenses — unaudited | | December 31, 2011 |
As a contract owner investing in Portfolios of the Fund through a variable annuity or variable life contract, you incur ongoing costs, including management fees, and other Portfolio expenses. This example is intended to help you understand your ongoing costs (in dollars) of investing in the Fund and to compare these costs with the ongoing costs of investing in other investment options. This example does not reflect fees and charges under your variable annuity or variable life contract. If contract charges were included, the costs shown below would be higher. Please consult the prospectus for your contract for more information about contract fees and charges.
The example is based on an investment of $1,000 invested at the beginning of the period and held for the entire period July 1, 2011 through December 31, 2011.
Actual Expenses
The first line of the table below provides information about actual account values and actual expenses. You may use this information, together with the amount you invested, to estimate the Portfolio expenses that you paid over the period. Simply divide your account value by $1,000 (for example, an $8,600 account value divided by $1,000 = 8.6), then multiply the result by the number in the first line under the heading entitled “Expenses Paid During the Six-Month Period” to estimate the Portfolio expenses you paid on your account during this period. As noted above, the table does not reflect variable contract fees and charges.
Hypothetical Example for Comparison Purposes
The second line of the table below provides information about hypothetical account values and hypothetical expenses based on the Portfolio’s actual expense ratio and an assumed rate of return of 5% per year before expenses, which is not the Portfolio’s actual return. The hypothetical account values and expenses may not be used to estimate the actual ending account balance or expenses you paid for the period. You may use this information to compare the ongoing costs of investing in the Portfolio and other investment options. To do so, compare this 5% hypothetical example with the 5% hypothetical examples that appear in the shareholder reports of the other investment options.
Please note that the expenses shown in the table are meant to highlight your ongoing Portfolio costs only and do not reflect any contract fees and charges, such as sales charges (loads), insurance charges or administrative charges. Therefore the second line of the table is useful to compare ongoing investment option costs only, and will not help you determine the relative total costs of owning different contracts. In addition, if these contract fees and charges were included, your costs would have been higher.
| | | | | | | | | | | | | | | | | | |
| The Prudential Series Fund Portfolios | | Beginning
Account Value
July 1, 2011 | | | Ending
Account Value
December 31, 2011 | | | Annualized Expense
Ratio based on the
Six-Month period | | | Expenses Paid
During the
Six-Month period* | |
| Conservative Balanced (Class I) | | Actual | | $ | 1,000.00 | | | $ | 998.80 | | | | 0.60 | % | | $ | 3.02 | |
| | Hypothetical | | $ | 1,000.00 | | | $ | 1,022.18 | | | | 0.60 | % | | $ | 3.06 | |
| Diversified Bond (Class I) | | Actual | | $ | 1,000.00 | | | $ | 1,030.30 | | | | 0.42 | % | | $ | 2.15 | |
| | Hypothetical | | $ | 1,000.00 | | | $ | 1,023.09 | | | | 0.42 | % | | $ | 2.14 | |
| Equity (Class I) | | Actual | | $ | 1,000.00 | | | $ | 905.00 | | | | 0.48 | % | | $ | 2.30 | |
| | Hypothetical | | $ | 1,000.00 | | | $ | 1,022.79 | | | | 0.48 | % | | $ | 2.45 | |
| Equity (Class II) | | Actual | | $ | 1,000.00 | | | $ | 903.20 | | | | 0.88 | % | | $ | 4.22 | |
| | Hypothetical | | $ | 1,000.00 | | | $ | 1,020.77 | | | | 0.88 | % | | $ | 4.48 | |
| Flexible Managed (Class I) | | Actual | | $ | 1,000.00 | | | $ | 987.00 | | | | 0.63 | % | | $ | 3.16 | |
| | Hypothetical | | $ | 1,000.00 | | | $ | 1,022.03 | | | | 0.63 | % | | $ | 3.21 | |
| Global (Class I) | | Actual | | $ | 1,000.00 | | | $ | 884.10 | | | | 0.86 | % | | $ | 4.08 | |
| | Hypothetical | | $ | 1,000.00 | | | $ | 1,020.87 | | | | 0.86 | % | | $ | 4.38 | |
| Government Income (Class I) | | Actual | | $ | 1,000.00 | | | $ | 1,049.50 | | | | 0.44 | % | | $ | 2.27 | |
| | Hypothetical | | $ | 1,000.00 | | | $ | 1,022.99 | | | | 0.44 | % | | $ | 2.24 | |
| High Yield Bond (Class I) | | Actual | | $ | 1,000.00 | | | $ | 1,006.40 | | | | 0.58 | % | | $ | 2.93 | |
| | Hypothetical | | $ | 1,000.00 | | | $ | 1,022.28 | | | | 0.58 | % | | $ | 2.96 | |
| Jennison (Class I) | | Actual | | $ | 1,000.00 | | | $ | 926.00 | | | | 0.64 | % | | $ | 3.11 | |
| | Hypothetical | | $ | 1,000.00 | | | $ | 1,021.98 | | | | 0.64 | % | | $ | 3.26 | |
| Jennison (Class II) | | Actual | | $ | 1,000.00 | | | $ | 924.10 | | | | 1.04 | % | | $ | 5.04 | |
| | Hypothetical | | $ | 1,000.00 | | | $ | 1,019.96 | | | | 1.04 | % | | $ | 5.30 | |
Money Market
(Class I) | | Actual | | $ | 1,000.00 | | | $ | 1,000.10 | | | | 0.15 | % | | $ | 0.76 | |
| | Hypothetical | | $ | 1,000.00 | | | $ | 1,024.45 | | | | 0.15 | % | | $ | 0.77 | |
| | |
The Prudential Series Fund Fees and Expenses — unaudited (continued) | | December 31, 2011 |
| | | | | | | | | | | | | | | | | | |
| The Prudential Series Fund Portfolios | | Beginning
Account Value
July 1, 2011 | | | Ending
Account Value
December 31, 2011 | | | Annualized Expense
Ratio based on the
Six-Month period | | | Expenses Paid
During the
Six-Month period* | |
| Natural Resources (Class I) | | Actual | | $ | 1,000.00 | | | $ | 818.50 | | | | 0.51 | % | | $ | 2.34 | |
| | | Hypothetical | | $ | 1,000.00 | | | $ | 1,022.63 | | | | 0.51 | % | | $ | 2.60 | |
| Natural Resources (Class II) | | Actual | | $ | 1,000.00 | | | $ | 816.90 | | | | 0.91 | % | | $ | 4.17 | |
| | | Hypothetical | | $ | 1,000.00 | | | $ | 1,020.62 | | | | 0.91 | % | | $ | 4.63 | |
| Small Capitalization Stock (Class I) | | Actual | | $ | 1,000.00 | | | $ | 937.20 | | | | 0.50 | % | | $ | 2.44 | |
| | Hypothetical | | $ | 1,000.00 | | | $ | 1,022.68 | | | | 0.50 | % | | $ | 2.55 | |
| Stock Index (Class I) | | Actual | | $ | 1,000.00 | | | $ | 962.70 | | | | 0.33 | % | | $ | 1.63 | |
| | | Hypothetical | | $ | 1,000.00 | | | $ | 1,023.54 | | | | 0.33 | % | | $ | 1.68 | |
| Value (Class I) | | Actual | | $ | 1,000.00 | | | $ | 889.00 | | | | 0.44 | % | | $ | 2.09 | |
| | | Hypothetical | | $ | 1,000.00 | | | $ | 1,022.99 | | | | 0.44 | % | | $ | 2.24 | |
| Value (Class II) | | Actual | | $ | 1,000.00 | | | $ | 887.70 | | | | 0.84 | % | | $ | 4.00 | |
| | | Hypothetical | | $ | 1,000.00 | | | $ | 1,020.97 | | | | 0.84 | % | | $ | 4.28 | |
* Portfolio expenses (net of fee waivers or subsidies, if any) for each share class are equal to the annualized expense ratio for each share class (provided in the table), multiplied by the average account value over the period, multiplied by the 184 days in the six-month period ended December 31, 2011, and divided by the 365 days in the Portfolio’s fiscal year ended December 31, 2011 (to reflect the six-month period). Expenses presented in the table include the expenses of any underlying portfolios in which the Portfolio may invest.
| | | | | | |
| | | CONSERVATIVE BALANCED PORTFOLIO | | |
| |
| SCHEDULE OF INVESTMENTS | | December 31, 2011 |
| | | | | | | | |
| LONG-TERM INVESTMENTS — 92.6% | | | | |
| COMMON STOCKS — 54.7% | | Shares
| | | Value
(Note 2)
| |
| | | | | | | | | |
Aerospace & Defense — 1.4% | | | | | |
BAE Systems PLC (United Kingdom) | | | 32,880 | | | $ | 145,578 | |
Boeing Co. (The) | | | 75,400 | | | | 5,530,590 | |
European Aeronautic Defence and Space Co. NV (Netherlands) | | | 3,474 | | | | 108,584 | |
General Dynamics Corp. | | | 38,000 | | | | 2,523,580 | |
Goodrich Corp. | | | 12,800 | | | | 1,583,360 | |
Honeywell International, Inc. | | | 80,312 | | | | 4,364,957 | |
L-3 Communications Holdings, Inc. | | | 10,800 | | | | 720,144 | |
Lockheed Martin Corp.(a) | | | 28,300 | | | | 2,289,470 | |
Northrop Grumman Corp. | | | 28,262 | | | | 1,652,762 | |
Precision Castparts Corp. | | | 14,700 | | | | 2,422,413 | |
Raytheon Co. | | | 36,400 | | | | 1,761,032 | |
Rockwell Collins, Inc.(a) | | | 16,300 | | | | 902,531 | |
Safran SA (France) | | | 2,868 | | | | 86,135 | |
Textron, Inc.(a) | | | 28,200 | | | | 521,418 | |
United Technologies Corp. | | | 93,500 | | | | 6,833,915 | |
| | | | | | |
|
|
|
| | | | | | | | 31,446,469 | |
| | | | | | |
|
|
|
Air Freight & Logistics — 0.6% | | | | | |
C.H. Robinson Worldwide, Inc.(a) | | | 16,600 | | | | 1,158,348 | |
Deutsche Post AG (Germany) | | | 8,206 | | | | 126,173 | |
Expeditors International of Washington, Inc. | | | 21,700 | | | | 888,832 | |
FedEx Corp. | | | 32,200 | | | | 2,689,022 | |
United Parcel Service, Inc. (Class B Stock) | | | 100,700 | | | | 7,370,233 | |
| | | | | | |
|
|
|
| | | | | | | | 12,232,608 | |
| | | | | | |
|
|
|
Airlines | | | | | |
All Nippon Airways Co. Ltd. (Japan) | | | 27,000 | | | | 75,419 | |
Deutsche Lufthansa AG (Germany) | | | 1,159 | | | | 13,778 | |
Southwest Airlines Co. | | | 83,700 | | | | 716,472 | |
| | | | | | |
|
|
|
| | | | | | | | 805,669 | |
| | | | | | |
|
|
|
Auto Components — 0.1% | | | | | |
BorgWarner, Inc.*(a) | | | 8,300 | | | | 529,042 | |
Bridgestone Corp. (Japan) | | | 1,400 | | | | 31,740 | |
CIE Generale des Etablissements Michelin (France) (Class B Stock) | | | 1,285 | | | | 75,962 | |
Continental AG (Germany)* | | | 572 | | | | 35,605 | |
Goodyear Tire & Rubber Co. (The)* | | | 28,000 | | | | 396,760 | |
Johnson Controls, Inc. | | | 69,300 | | | | 2,166,318 | |
| | | | | | |
|
|
|
| | | | | | | | 3,235,427 | |
| | | | | | |
|
|
|
Automobiles — 0.3% | | | | | |
Bayerische Motoren Werke AG (Germany) | | | 832 | | | | 55,736 | |
Daimler AG (Germany) | | | 2,422 | | | | 106,328 | |
Ford Motor Co.*(a) | | | 387,785 | | | | 4,172,566 | |
Harley-Davidson, Inc. | | | 25,700 | | | | 998,959 | |
Isuzu Motors Ltd. (Japan) | | | 9,000 | | | | 41,627 | |
Nissan Motor Co. Ltd. (Japan) | | | 7,700 | | | | 69,227 | |
Peugeot SA (France) | | | 1,176 | | | | 18,432 | |
Toyota Motor Corp. (Japan) | | | 3,100 | | | | 103,306 | |
Volkswagen AG (Germany) | | | 68 | | | | 9,122 | |
| | | | | | |
|
|
|
| | | | | | | | 5,575,303 | |
| | | | | | |
|
|
|
| | | | | | | | |
COMMON STOCKS
(continued) | | Shares
| | | Value
(Note 2)
| |
| | | | | | | | | |
Beverages — 1.5% | | | | | |
Anheuser-Busch InBev NV (Belgium) | | | 3,767 | | | $ | 230,632 | |
Beam, Inc. | | | 16,300 | | | | 835,049 | |
Brown-Forman Corp. (Class B Stock) | | | 10,700 | | | | 861,457 | |
Carlsberg A/S (Denmark) (Class B Stock) | | | 55 | | | | 3,878 | |
Coca-Cola Amatil Ltd. (Australia) | | | 2,410 | | | | 28,372 | |
Coca-Cola Co. (The) | | | 234,800 | | | | 16,428,956 | |
Coca-Cola Enterprises, Inc. | | | 33,200 | | | | 855,896 | |
Constellation Brands, Inc.
(Class A Stock)* | | | 17,200 | | | | 355,524 | |
Diageo PLC (United Kingdom) | | | 6,018 | | | | 131,450 | |
Dr Pepper Snapple Group, Inc. | | | 23,300 | | | | 919,884 | |
Heineken NV (Netherlands) | | | 1,486 | | | | 68,795 | |
Molson Coors Brewing Co. (Class B Stock) | | | 16,300 | | | | 709,702 | |
PepsiCo, Inc. | | | 161,407 | | | | 10,709,354 | |
Pernod-Ricard SA (France) | | | 992 | | | | 92,004 | |
SABMiller PLC (United Kingdom) | | | 399 | | | | 14,044 | |
| | | | | | |
|
|
|
| | | | | | | | 32,244,997 | |
| | | | | | |
|
|
|
Biotechnology — 0.7% | | | | | | | | |
Amgen, Inc. | | | 79,287 | | | | 5,091,018 | |
Biogen Idec, Inc.* | | | 24,690 | | | | 2,717,135 | |
Celgene Corp.* | | | 47,800 | | | | 3,231,280 | |
Gilead Sciences, Inc.* | | | 80,400 | | | | 3,290,772 | |
| | | | | | |
|
|
|
| | | | | | | | 14,330,205 | |
| | | | | | |
|
|
|
Building Products | | | | | | | | |
Asahi Glass Co. Ltd. (Japan) | | | 6,000 | | | | 50,357 | |
ASSA Abloy AB (Sweden) (Class B Stock) | | | 374 | | | | 9,380 | |
Masco Corp. | | | 33,500 | | | | 351,080 | |
TOTO Ltd. (Japan) | | | 14,000 | | | | 108,042 | |
| | | | | | |
|
|
|
| | | | | | | | 518,859 | |
| | | | | | |
|
|
|
Capital Markets — 1.0% | | | | | | | | |
3i Group PLC (United Kingdom) | | | 8,093 | | | | 22,749 | |
Ameriprise Financial, Inc. | | | 24,720 | | | | 1,227,101 | |
Bank of New York Mellon Corp. (The) | | | 128,258 | | | | 2,553,617 | |
BlackRock, Inc. (Class A Stock) | | | 10,200 | | | | 1,818,048 | |
Charles Schwab Corp. (The)(a) | | | 104,550 | | | | 1,177,233 | |
Credit Suisse Group AG (Switzerland) | | | 3,142 | | | | 73,825 | |
Deutsche Bank AG (Germany) | | | 3,431 | | | | 130,708 | |
E*Trade Financial Corp.*(a) | | | 25,520 | | | | 203,139 | |
Federated Investors, Inc.
(Class B Stock)(a) | | | 10,800 | | | | 163,620 | |
Franklin Resources, Inc. | | | 14,700 | | | | 1,412,082 | |
Goldman Sachs Group, Inc. (The) | | | 52,900 | | | | 4,783,747 | |
Invesco Ltd. | | | 47,800 | | | | 960,302 | |
Legg Mason, Inc.(a) | | | 14,800 | | | | 355,940 | |
Morgan Stanley | | | 153,180 | | | | 2,317,613 | |
Northern Trust Corp. | | | 24,700 | | | | 979,602 | |
Ratos AB (Sweden) (Class B Stock) | | | 4,029 | | | | 47,274 | |
State Street Corp. | | | 51,500 | | | | 2,075,965 | |
T. Rowe Price Group, Inc.(a) | | | 26,500 | | | | 1,509,175 | |
UBS AG (Switzerland)* | | | 9,787 | | | | 116,489 | |
| | | | | | |
|
|
|
| | | | | | | | 21,928,229 | |
| | | | | | |
|
|
|
SEE NOTES TO FINANCIAL STATEMENTS.
A1
| | | | | | |
| | | CONSERVATIVE BALANCED PORTFOLIO (continued) | | |
| |
| SCHEDULE OF INVESTMENTS | | December 31, 2011 |
| | | | | | | | |
COMMON STOCKS
(continued) | | Shares
| | | Value
(Note 2)
| |
| | | | | | | | | |
Chemicals — 1.2% | | | | | | | | |
Air Products & Chemicals, Inc. | | | 21,600 | | | $ | 1,840,104 | |
Airgas, Inc. | | | 6,700 | | | | 523,136 | |
Arkema SA (France) | | | 225 | | | | 15,929 | |
Asahi Kasei Corp. (Japan) | | | 14,000 | | | | 84,396 | |
BASF SE (Germany) | | | 3,137 | | | | 218,796 | |
CF Industries Holdings, Inc. | | | 7,300 | | | | 1,058,354 | |
Dow Chemical Co. (The) | | | 120,031 | | | | 3,452,092 | |
E.I. du Pont de Nemours & Co. | | | 94,820 | | | | 4,340,860 | |
Eastman Chemical Co. | | | 13,800 | | | | 539,028 | |
Ecolab, Inc. | | | 27,800 | | | | 1,607,118 | |
FMC Corp. | | | 6,900 | | | | 593,676 | |
Incitec Pivot Ltd. (Australia) | | | 11,411 | | | | 36,297 | |
International Flavors & Fragrances, Inc. | | | 8,200 | | | | 429,844 | |
Israel Chemicals Ltd. (Israel) | | | 5,458 | | | | 56,571 | |
K+S AG (Germany) | | | 658 | | | | 29,738 | |
Koninklijke DSM NV (Netherlands) | | | 754 | | | | 34,985 | |
Lanxess AG (Germany) | | | 974 | | | | 50,424 | |
Monsanto Co. | | | 54,694 | | | | 3,832,409 | |
Mosaic Co. (The) | | | 30,600 | | | | 1,543,158 | |
PPG Industries, Inc.(a) | | | 17,000 | | | | 1,419,330 | |
Praxair, Inc. | | | 31,000 | | | | 3,313,900 | |
Sherwin-Williams Co. (The) | | | 8,600 | | | | 767,722 | |
Sigma-Aldrich Corp. | | | 12,400 | | | | 774,504 | |
Syngenta AG (Switzerland) | | | 366 | | | | 107,154 | |
Toray Industries, Inc. (Japan) | | | 4,000 | | | | 28,634 | |
Wacker Chemie AG (Germany)(a) | | | 323 | | | | 25,981 | |
Yara International ASA (Norway) | | | 1,989 | | | | 79,815 | |
| | | | | | |
|
|
|
| | | | | | | | 26,803,955 | |
| | | | | | |
|
|
|
Commercial Banks — 1.5% | | | | | | | | |
Aozora Bank Ltd. (Japan) | | | 22,000 | | | | 60,595 | |
Australia & New Zealand Banking Group Ltd. (Australia) | | | 7,849 | | | | 164,814 | |
Banco Bilbao Vizcaya Argentaria SA (Spain) | | | 8,066 | | | | 69,735 | |
Banco Santander SA (Spain) | | | 14,639 | | | | 111,216 | |
Barclays PLC (United Kingdom) | | | 62,926 | | | | 172,042 | |
BB&T Corp.(a) | | | 71,100 | | | | 1,789,587 | |
Bendigo and Adelaide Bank Ltd. (Australia) | | | 6,544 | | | | 53,746 | |
BNP Paribas SA (France) | | | 3,604 | | | | 141,567 | |
Comerica, Inc.(a) | | | 19,400 | | | | 500,520 | |
Commonwealth Bank of Australia (Australia) | | | 2,745 | | | | 138,189 | |
DnB NOR ASA (Norway) | | | 3,264 | | | | 31,953 | |
Fifth Third Bancorp | | | 95,721 | | | | 1,217,571 | |
First Horizon National Corp.(a) | | | 28,587 | | | | 228,696 | |
HSBC Holdings PLC
(United Kingdom) | | | 25,166 | | | | 191,915 | |
Huntington Bancshares, Inc. | | | 100,136 | | | | 549,747 | |
KeyCorp | | | 105,200 | | | | 808,988 | |
M&T Bank Corp.(a) | | | 12,800 | | | | 977,152 | |
Mitsubishi UFJ Financial Group, Inc. (Japan) | | | 56,300 | | | | 239,185 | |
Mizrahi Tefahot Bank Ltd. (Israel) | | | 2,697 | | | | 21,323 | |
Mizuho Financial Group, Inc. (Japan) | | | 59,700 | | | | 80,665 | |
National Australia Bank Ltd. (Australia) | | | 3,494 | | | | 83,481 | |
| | | | | | | | |
COMMON STOCKS
(continued) | | Shares
| | | Value
(Note 2)
| |
| | | | | | | | | |
Commercial Banks (continued) | | | | | | | | |
Nordea Bank AB (Sweden) | | | 14,649 | | | $ | 113,347 | |
PNC Financial Services Group, Inc. | | | 53,733 | | | | 3,098,782 | |
Raiffeisen International Bank Holding AG (Austria) | | | 1,096 | | | | 28,462 | |
Regions Financial Corp. | | | 142,703 | | | | 613,623 | |
Resona Holdings, Inc. (Japan) | | | 29,900 | | | | 131,689 | |
Shinsei Bank Ltd. (Japan) | | | 9,000 | | | | 9,354 | |
Skandinaviska Enskilda Banken AB (Sweden) (Class A Stock) | | | 13,437 | | | | 78,275 | |
Societe Generale (France) | | | 2,470 | | | | 55,001 | |
Sumitomo Mitsui Financial Group, Inc. (Japan) | | | 7,600 | | | | 211,698 | |
Sumitomo Mitsui Trust Holdings, Inc. (Japan) | | | 29,000 | | | | 85,150 | |
SunTrust Banks, Inc. | | | 55,200 | | | | 977,040 | |
Svenska Handelsbanken AB (Sweden) (Class A Stock) | | | 1,740 | | | | 45,762 | |
Swedbank AB (Sweden) (Class A Stock) | | | 869 | | | | 11,257 | |
U.S. Bancorp | | | 196,685 | | | | 5,320,329 | |
Wells Fargo & Co. | | | 542,364 | | | | 14,947,552 | |
Westpac Banking Corp. (Australia) | | | 4,530 | | | | 92,665 | |
Zions Bancorporation(a) | | | 22,350 | | | | 363,858 | |
| | | | | | |
|
|
|
| | | | | | | | 33,816,531 | |
| | | | | | |
|
|
|
Commercial Services & Supplies — 0.2% | | | | | |
Avery Dennison Corp. | | | 10,200 | | | | 292,536 | |
Cintas Corp.(a) | | | 12,200 | | | | 424,682 | |
Iron Mountain, Inc. | | | 19,900 | | | | 612,920 | |
Pitney Bowes, Inc.(a) | | | 20,700 | | | | 383,778 | |
Republic Services, Inc. (Class A Stock) | | | 32,865 | | | | 905,431 | |
RR Donnelley & Sons Co.(a) | | | 19,200 | | | | 277,056 | |
Securitas AB (Sweden) (Class B Stock) | | | 6,636 | | | | 57,276 | |
Stericycle, Inc.* | | | 9,700 | | | | 755,824 | |
Waste Management, Inc.(a) | | | 48,042 | | | | 1,571,454 | |
| | | | | | |
|
|
|
| | | | | | | | 5,280,957 | |
| | | | | | |
|
|
|
Communications Equipment — 1.1% | | | | | |
Cisco Systems, Inc. | | | 564,600 | | | | 10,207,968 | |
F5 Networks, Inc.* | | | 8,200 | | | | 870,184 | |
Harris Corp.(a) | | | 12,400 | | | | 446,896 | |
JDS Uniphase Corp.* | | | 21,475 | | | | 224,199 | |
Juniper Networks, Inc.* | | | 54,400 | | | | 1,110,304 | |
Motorola Mobility Holdings, Inc.* | | | 28,778 | | | | 1,116,586 | |
Motorola Solutions, Inc. | | | 33,289 | | | | 1,540,948 | |
QUALCOMM, Inc. | | | 172,500 | | | | 9,435,750 | |
Telefonaktiebolaget LM Ericsson (Sweden) (Class B Stock) | | | 1,580 | | | | 16,163 | |
| | | | | | |
|
|
|
| | | | | | | | 24,968,998 | |
| | | | | | |
|
|
|
Computers & Peripherals — 2.5% | | | | | |
Apple, Inc.* | | | 95,800 | | | | 38,799,000 | |
Dell, Inc.* | | | 169,400 | | | | 2,478,322 | |
EMC Corp.* | | | 212,150 | | | | 4,569,711 | |
Hewlett-Packard Co. | | | 208,348 | | | | 5,367,044 | |
Lexmark International, Inc. (Class A Stock) | | | 8,733 | | | | 288,800 | |
SEE NOTES TO FINANCIAL STATEMENTS.
A2
| | | | | | |
| | | CONSERVATIVE BALANCED PORTFOLIO (continued) | | |
| |
| SCHEDULE OF INVESTMENTS | | December 31, 2011 |
| | | | | | | | |
COMMON STOCKS
(continued) | | Shares
| | | Value
(Note 2)
| |
| | | | | | | | | |
Computers & Peripherals (continued) | | | | | |
NetApp, Inc.* | | | 37,100 | | | $ | 1,345,617 | |
SanDisk Corp.*(a) | | | 24,700 | | | | 1,215,487 | |
Toshiba Corp. (Japan) | | | 13,000 | | | | 53,203 | |
Western Digital Corp.* | | | 26,000 | | | | 804,700 | |
| | | | | | |
|
|
|
| | | | | | | | 54,921,884 | |
| | | | | | |
|
|
|
Construction & Engineering — 0.1% | | | | | |
ACS Actividades de Construccion y Servicios SA (Spain) | | | 1,194 | | | | 35,388 | |
Bouygues SA (France) | | | 623 | | | | 19,630 | |
Chiyoda Corp. (Japan) | | | 4,000 | | | | 40,691 | |
Fluor Corp. | | | 17,800 | | | | 894,450 | |
Jacobs Engineering Group, Inc.* | | | 12,700 | | | | 515,366 | |
Leighton Holdings, Ltd. (Australia) | | | 2,314 | | | | 45,063 | |
Quanta Services, Inc.*(a) | | | 22,000 | | | | 473,880 | |
Vinci SA (France) | | | 583 | | | | 25,474 | |
| | | | | | |
|
|
|
| | | | | | | | 2,049,942 | |
| | | | | | |
|
|
|
Construction Materials | | | | | |
Imerys SA (France) | | | 303 | | | | 13,957 | |
Vulcan Materials Co.(a) | | | 13,400 | | | | 527,290 | |
| | | | | | |
|
|
|
| | | | | | | | 541,247 | |
| | | | | | |
|
|
|
Consumer Finance — 0.4% | | | | | |
American Express Co. | | | 106,800 | | | | 5,037,756 | |
Capital One Financial Corp. | | | 46,861 | | | | 1,981,752 | |
Discover Financial Services | | | 56,140 | | | | 1,347,360 | |
SLM Corp. | | | 54,700 | | | | 732,980 | |
| | | | | | |
|
|
|
| | | | | | | | 9,099,848 | |
| | | | | | |
|
|
|
Containers & Packaging — 0.1% | | | | | |
Amcor Ltd. (Australia) | | | 17,851 | | | | 131,640 | |
Ball Corp. | | | 16,200 | | | | 578,502 | |
Bemis Co., Inc. | | | 11,300 | | | | 339,904 | |
Owens-Illinois, Inc.* | | | 18,900 | | | | 366,282 | |
Sealed Air Corp. | | | 17,100 | | | | 294,291 | |
| | | | | | |
|
|
|
| | | | | | | | 1,710,619 | |
| | | | | | |
|
|
|
Distributors | | | | | |
Genuine Parts Co. | | | 16,100 | | | | 985,320 | |
Jardine Cycle & Carriage Ltd. (Singapore) | | | 2,000 | | | | 74,199 | |
| | | | | | |
|
|
|
| | | | | | | | 1,059,519 | |
| | | | | | |
|
|
|
Diversified Consumer Services — 0.1% | | | | | |
Apollo Group, Inc. (Class A Stock)* | | | 12,700 | | | | 684,149 | |
DeVry, Inc. | | | 6,300 | | | | 242,298 | |
H&R Block, Inc. | | | 35,100 | | | | 573,183 | |
| | | | | | |
|
|
|
| | | | | | | | 1,499,630 | |
| | | | | | |
|
|
|
Diversified Financial Services — 1.5% | | | | | |
Bank of America Corp. | | | 1,034,621 | | | | 5,752,493 | |
Citigroup, Inc. | | | 301,385 | | | | 7,929,439 | |
CME Group, Inc. (Class A Stock) | | | 6,840 | | | | 1,666,703 | |
Deutsche Boerse AG (Germany)* | | | 460 | | | | 24,118 | |
Exor SpA (Italy) | | | 1,733 | | | | 34,878 | |
IntercontinentalExchange, Inc.* | | | 7,500 | | | | 904,125 | |
Investor AB (Sweden) (Class B Stock) | | | 370 | | | | 6,903 | |
JPMorgan Chase & Co. | | | 399,045 | | | | 13,268,246 | |
Leucadia National Corp. | | | 19,700 | | | | 447,978 | |
| | | | | | | | |
COMMON STOCKS
(continued) | | Shares
| | | Value
(Note 2)
| |
| | | | | | | | | |
Diversified Financial Services (continued) | | | | | |
London Stock Exchange Group PLC (United Kingdom) | | | 3,961 | | | $ | 48,903 | |
Moody’s Corp.(a) | | | 20,200 | | | | 680,336 | |
NASDAQ OMX Group, Inc. (The)* | | | 16,600 | | | | 406,866 | |
NYSE Euronext | | | 28,900 | | | | 754,290 | |
ORIX Corp. (Japan) | | | 970 | | | | 80,151 | |
Pohjola Bank PLC (Finland) (Class A Stock) | | | 1,983 | | | | 19,274 | |
| | | | | | |
|
|
|
| | | | | | | | 32,024,703 | |
| | | | | | |
|
|
|
Diversified Telecommunication Services — 1.6% | |
AT&T, Inc. | | | 609,168 | | | | 18,421,240 | |
BT Group PLC (United Kingdom) | | | 36,574 | | | | 108,429 | |
CenturyLink, Inc. | | | 62,736 | | | | 2,333,779 | |
France Telecom SA (France) | | | 6,158 | | | | 96,716 | |
Frontier Communications Corp.(a) | | | 101,590 | | | | 523,189 | |
Koninklijke KPN NV (Netherlands) | | | 3,071 | | | | 36,746 | |
Nippon Telegraph & Telephone Corp. (Japan) | | | 2,800 | | | | 143,147 | |
Swisscom AG (Switzerland) | | | 122 | | | | 46,226 | |
Telecom Italia SpA (Italy) | | | 50,437 | | | | 45,172 | |
Telecom Italia SpA (Italy) | | | 53,868 | | | | 57,936 | |
Telefonica SA (Spain) | | | 8,390 | | | | 145,344 | |
Verizon Communications, Inc.(a) | | | 288,876 | | | | 11,589,705 | |
Vivendi SA (France) | | | 8,374 | | | | 183,379 | |
Windstream Corp. | | | 57,357 | | | | 673,371 | |
| | | | | | |
|
|
|
| | | | | | | | 34,404,379 | |
| | | | | | |
|
|
|
Electric Utilities — 1.1% | | | | | |
American Electric Power Co., Inc. | | | 49,160 | | | | 2,030,800 | |
Cheung Kong Infrastructure Holdings Ltd. (Hong Kong) | | | 4,000 | | | | 23,434 | |
Duke Energy Corp.(a) | | | 135,924 | | | | 2,990,328 | |
E.ON AG (Germany) | | | 1,475 | | | | 31,823 | |
Edison International | | | 33,300 | | | | 1,378,620 | |
Enel SpA (Italy) | | | 45,121 | | | | 183,602 | |
Energias de Portugal SA (Portugal) | | | 5,224 | | | | 16,166 | |
Entergy Corp. | | | 18,500 | | | | 1,351,425 | |
Exelon Corp. | | | 67,674 | | | | 2,935,021 | |
FirstEnergy Corp. | | | 43,606 | | | | 1,931,746 | |
Iberdrola SA (Spain) | | | 29,445 | | | | 184,410 | |
NextEra Energy, Inc.(a) | | | 43,100 | | | | 2,623,928 | |
Northeast Utilities | | | 18,200 | | | | 656,474 | |
Pepco Holdings, Inc. | | | 26,800 | | | | 544,040 | |
Pinnacle West Capital Corp. | | | 10,500 | | | | 505,890 | |
PPL Corp. | | | 59,700 | | | | 1,756,374 | |
Progress Energy, Inc. | | | 30,083 | | | | 1,685,250 | |
Red Electrica Corp. SA (Spain) | | | 694 | | | | 29,699 | |
Scottish & Southern Energy PLC (United Kingdom) | | | 3,994 | | | | 80,076 | |
Southern Co.(a) | | | 86,700 | | | | 4,013,343 | |
| | | | | | |
|
|
|
| | | | | | | | 24,952,449 | |
| | | | | | |
|
|
|
Electrical Equipment — 0.3% | | | | | |
ABB Ltd. (Switzerland) | | | 2,613 | | | | 49,183 | |
Cooper Industries PLC (Ireland) | | | 15,300 | | | | 828,495 | |
Emerson Electric Co. | | | 76,800 | | | | 3,578,112 | |
Mitsubishi Electric Corp. (Japan) | | | 11,000 | | | | 105,470 | |
Rockwell Automation, Inc. | | | 15,300 | | | | 1,122,561 | |
SEE NOTES TO FINANCIAL STATEMENTS.
A3
| | | | | | |
| | | CONSERVATIVE BALANCED PORTFOLIO (continued) | | |
| |
| SCHEDULE OF INVESTMENTS | | December 31, 2011 |
| | | | | | | | |
COMMON STOCKS
(continued) | | Shares
| | | Value
(Note 2)
| |
| | | | | | | | | |
Electrical Equipment (continued) | | | | | |
Roper Industries, Inc. | | | 9,900 | | | $ | 860,013 | |
Schneider Electric SA (France) | | | 426 | | | | 22,429 | |
| | | | | | |
|
|
|
| | | | | | | | 6,566,263 | |
| | | | | | |
|
|
|
Electronic Equipment, Instruments & Components — 0.3% | |
Amphenol Corp. (Class A Stock) | | | 18,600 | | | | 844,254 | |
Corning, Inc. | | | 160,300 | | | | 2,080,694 | |
FLIR Systems, Inc. | | | 15,600 | | | | 391,092 | |
Hamamatsu Photonics KK (Japan) | | | 500 | | | | 17,494 | |
Hitachi Ltd. (Japan) | | | 32,000 | | | | 167,961 | |
Jabil Circuit, Inc. | | | 20,000 | | | | 393,200 | |
Molex, Inc. | | | 13,000 | | | | 310,180 | |
TE Connectivity Ltd. | | | 43,600 | | | | 1,343,316 | |
| | | | | | |
|
|
|
| | | | | | | | 5,548,191 | |
| | | | | | |
|
|
|
Energy Equipment & Services — 1.1% | | | | | |
Baker Hughes, Inc. | | | 44,398 | | | | 2,159,519 | |
Cameron International Corp.* | | | 25,000 | | | | 1,229,750 | |
Diamond Offshore Drilling, Inc.(a) | | | 7,900 | | | | 436,554 | |
FMC Technologies, Inc.* | | | 24,400 | | | | 1,274,412 | |
Halliburton Co. | | | 94,100 | | | | 3,247,391 | |
Helmerich & Payne, Inc.(a) | | | 10,700 | | | | 624,452 | |
Nabors Industries Ltd.* | | | 27,700 | | | | 480,318 | |
National Oilwell Varco, Inc. | | | 43,200 | | | | 2,937,168 | |
Noble Corp. | | | 25,700 | | | | 776,654 | |
Petrofac Ltd. (United Kingdom) | | | 2,686 | | | | 60,109 | |
Rowan Cos., Inc.* | | | 13,200 | | | | 400,356 | |
Schlumberger Ltd. | | | 138,518 | | | | 9,462,165 | |
Technip SA (France) | | | 973 | | | | 91,450 | |
Transocean Ltd. (Switzerland) | | | 816 | | | | 31,509 | |
| | | | | | |
|
|
|
| | | | | | | | 23,211,807 | |
| | | | | | |
|
|
|
Food & Staples Retailing — 1.3% | | | | | |
Aeon Co. Ltd. (Japan) | | | 8,700 | | | | 119,474 | |
Costco Wholesale Corp. | | | 44,600 | | | | 3,716,072 | |
CVS Caremark Corp. | | | 138,448 | | | | 5,645,909 | |
Jeronimo Martins SGPS SA
(Portugal)* | | | 960 | | | | 15,891 | |
Koninklijke Ahold NV (Netherlands) | | | 3,328 | | | | 44,817 | |
Kroger Co. (The) | | | 61,946 | | | | 1,500,332 | |
Safeway, Inc. | | | 39,500 | | | | 831,080 | |
Seven & I Holdings Co. Ltd. (Japan) | | | 3,100 | | | | 86,391 | |
SUPERVALU, Inc.(a) | | | 21,410 | | | | 173,849 | |
Sysco Corp.(a) | | | 58,600 | | | | 1,718,738 | |
Tesco PLC (United Kingdom) | | | 13,265 | | | | 83,112 | |
Walgreen Co.(a) | | | 93,500 | | | | 3,091,110 | |
Wal-Mart Stores, Inc. | | | 183,100 | | | | 10,942,056 | |
Whole Foods Market, Inc. | | | 16,300 | | | | 1,134,154 | |
WM Morrison Supermarkets PLC
(United Kingdom) | | | 30,201 | | | | 152,994 | |
Woolworths Ltd. (Australia) | | | 2,982 | | | | 76,555 | |
| | | | | | |
|
|
|
| | | | | | | | 29,332,534 | |
| | | | | | |
|
|
|
Food Products — 1.1% | | | | | |
Archer-Daniels-Midland Co. | | | 69,626 | | | | 1,991,304 | |
Aryzta AG (Switzerland) | | | 1,769 | | | | 85,503 | |
Associated British Foods PLC
(United Kingdom) | | | 4,274 | | | | 73,477 | |
Campbell Soup Co.(a) | | | 18,600 | | | | 618,264 | |
| | | | | | | | |
COMMON STOCKS
(continued) | | Shares
| | | Value
(Note 2)
| |
| | | | | | | | | |
Food Products (continued) | | | | | |
ConAgra Foods, Inc. | | | 43,700 | | | $ | 1,153,680 | |
Danone (France) | | | 472 | | | | 29,671 | |
Dean Foods Co.* | | | 20,800 | | | | 232,960 | |
General Mills, Inc. | | | 65,200 | | | | 2,634,732 | |
Golden Agri-Resources Ltd. (Singapore) | | | 120,000 | | | | 66,150 | |
H.J. Heinz Co.(a) | | | 32,900 | | | | 1,777,916 | |
Hershey Co. (The)(a) | | | 15,700 | | | | 969,946 | |
Hormel Foods Corp. | | | 14,600 | | | | 427,634 | |
J.M. Smucker Co. (The) | | | 12,300 | | | | 961,491 | |
Kellogg Co.(a) | | | 25,600 | | | | 1,294,592 | |
Kraft Foods, Inc. (Class A Stock) | | | 181,553 | | | | 6,782,820 | |
Lindt & Spruengli AG (Switzerland) | | | 1 | | | | 33,418 | |
McCormick & Co., Inc. | | | 12,800 | | | | 645,376 | |
Mead Johnson Nutrition Co. | | | 20,867 | | | | 1,434,189 | |
Nestle SA (Switzerland) | | | 6,246 | | | | 359,080 | |
Sara Lee Corp. | | | 59,700 | | | | 1,129,524 | |
Suedzucker AG (Germany) | | | 191 | | | | 6,093 | |
Tyson Foods, Inc. (Class A Stock) | | | 30,600 | | | | 631,584 | |
Unilever NV CVA (Netherlands) | | | 2,164 | | | | 74,416 | |
Unilever PLC (United Kingdom) | | | 1,108 | | | | 37,219 | |
| | | | | | |
|
|
|
| | | | | | | | 23,451,039 | |
| | | | | | |
|
|
|
Gas Utilities — 0.1% | | | | | |
AGL Resources, Inc. | | | 6,939 | | | | 293,242 | |
Enagas (Spain) | | | 3,593 | | | | 66,452 | |
Gas Natural SDG SA (Spain) | | | 3,581 | | | | 61,479 | |
Hong Kong & China Gas Co. Ltd.
(Hong Kong) | | | 37,000 | | | | 85,752 | |
ONEOK, Inc. | | | 10,900 | | | | 944,921 | |
| | | | | | |
|
|
|
| | | | | | | | 1,451,846 | |
| | | | | | |
|
|
|
Healthcare Equipment & Supplies — 1.0% | | | | | |
Baxter International, Inc. | | | 58,200 | | | | 2,879,736 | |
Becton Dickinson and Co. | | | 22,300 | | | | 1,666,256 | |
Boston Scientific Corp.* | | | 157,667 | | | | 841,942 | |
C.R. Bard, Inc.(a) | | | 9,100 | | | | 778,050 | |
CareFusion Corp.* | | | 25,375 | | | | 644,778 | |
Coloplast A/S (Denmark)
(Class B Stock) | | | 833 | | | | 119,802 | |
Covidien PLC | | | 50,600 | | | | 2,277,506 | |
DENTSPLY International, Inc. | | | 14,400 | | | | 503,856 | |
Edwards Lifesciences Corp.* | | | 11,700 | | | | 827,190 | |
Intuitive Surgical, Inc.*(a) | | | 4,000 | | | | 1,852,040 | |
Medtronic, Inc. | | | 109,200 | | | | 4,176,900 | |
St. Jude Medical, Inc. | | | 33,600 | | | | 1,152,480 | |
Stryker Corp. | | | 34,100 | | | | 1,695,111 | |
Varian Medical Systems, Inc.*(a) | | | 12,000 | | | | 805,560 | |
Zimmer Holdings, Inc.* | | | 19,600 | | | | 1,047,032 | |
| | | | | | |
|
|
|
| | | | | | | | 21,268,239 | |
| | | | | | |
|
|
|
Healthcare Providers & Services — 1.1% | | | | | |
Aetna, Inc. | | | 38,400 | | | | 1,620,096 | |
AmerisourceBergen Corp.
(Class A Stock) | | | 28,000 | | | | 1,041,320 | |
Cardinal Health, Inc. | | | 35,750 | | | | 1,451,808 | |
CIGNA Corp. | | | 29,300 | | | | 1,230,600 | |
Coventry Health Care, Inc.* | | | 17,050 | | | | 517,809 | |
DaVita, Inc.*(a) | | | 9,400 | | | | 712,614 | |
SEE NOTES TO FINANCIAL STATEMENTS.
A4
| | | | | | |
| | | CONSERVATIVE BALANCED PORTFOLIO (continued) | | |
| |
| SCHEDULE OF INVESTMENTS | | December 31, 2011 |
| | | | | | | | |
COMMON STOCKS
(continued) | | Shares
| | | Value
(Note 2)
| |
| | | | | | | | | |
Healthcare Providers & Services (continued) | | | | | |
Express Scripts, Inc.*(a) | | | 49,600 | | | $ | 2,216,624 | |
Fresenius Se & Co. KGaA (Germany) | | | 182 | | | | 16,837 | |
Humana, Inc. | | | 17,200 | | | | 1,506,892 | |
Laboratory Corp. of America
Holdings*(a) | | | 9,600 | | | | 825,312 | |
McKesson Corp. | | | 25,730 | | | | 2,004,624 | |
Medco Health Solutions, Inc.* | | | 40,798 | | | | 2,280,608 | |
Patterson Cos., Inc.(a) | | | 9,000 | | | | 265,680 | |
Quest Diagnostics, Inc. | | | 16,300 | | | | 946,378 | |
Tenet Healthcare Corp.* | | | 44,600 | | | | 228,798 | |
UnitedHealth Group, Inc. | | | 110,600 | | | | 5,605,208 | |
WellPoint, Inc. | | | 37,200 | | | | 2,464,500 | |
| | | | | | |
|
|
|
| | | | | | | | 24,935,708 | |
| | | | | | |
|
|
|
Healthcare Technology | | | | | | | | |
Cerner Corp.* | | | 14,800 | | | | 906,500 | |
| | | | | | |
|
|
|
Hotels, Restaurants & Leisure — 1.1% | |
Carnival Corp. | | | 45,600 | | | | 1,488,384 | |
Chipotle Mexican Grill, Inc.*(a) | | | 3,150 | | | | 1,063,881 | |
Darden Restaurants, Inc. | | | 13,150 | | | | 599,377 | |
Galaxy Entertainment Group Ltd. (Hong Kong)* | | | 37,000 | | | | 67,839 | |
International Game Technology | | | 28,200 | | | | 485,040 | |
Marriott International, Inc.
(Class A Stock) | | | 29,528 | | | | 861,332 | |
McDonald’s Corp. | | | 105,900 | | | | 10,624,947 | |
Sands China Ltd. (Hong Kong)* | | | 53,200 | | | | 150,354 | |
Starbucks Corp. | | | 76,500 | | | | 3,519,765 | |
Starwood Hotels & Resorts Worldwide, Inc. | | | 19,900 | | | | 954,603 | |
Wyndham Worldwide Corp. | | | 17,620 | | | | 666,565 | |
Wynn Macau Ltd. (Macau) | | | 24,400 | | | | 61,262 | |
Wynn Resorts Ltd. | | | 8,200 | | | | 906,018 | |
Yum! Brands, Inc. | | | 47,500 | | | | 2,802,975 | |
| | | | | | |
|
|
|
| | | | | | | | 24,252,342 | |
| | | | | | |
|
|
|
Household Durables — 0.1% | |
D.R. Horton, Inc.(a) | | | 28,700 | | | | 361,907 | |
Harman International Industries, Inc. | | | 6,400 | | | | 243,456 | |
Leggett & Platt, Inc.(a) | | | 17,500 | | | | 403,200 | |
Lennar Corp. (Class A Stock)(a) | | | 17,200 | | | | 337,980 | |
Newell Rubbermaid, Inc. | | | 27,314 | | | | 441,121 | |
Pulte Group, Inc.*(a) | | | 33,522 | | | | 211,524 | |
Sekisui Chemical Co. Ltd. (Japan) | | | 17,000 | | | | 140,249 | |
Whirlpool Corp.(a) | | | 7,326 | | | | 347,619 | |
| | | | | | |
|
|
|
| | | | | | | | 2,487,056 | |
| | | | | | |
|
|
|
Household Products — 1.2% | |
Clorox Co. (The)(a) | | | 13,600 | | | | 905,216 | |
Colgate-Palmolive Co. | | | 49,900 | | | | 4,610,261 | |
Henkel AG & Co. KGaA (Germany) | | | 653 | | | | 31,608 | |
Kimberly-Clark Corp. | | | 40,100 | | | | 2,949,756 | |
Procter & Gamble Co. (The) | | | 282,625 | | | | 18,853,914 | |
Reckitt Benckiser Group PLC
(United Kingdom) | | | 1,735 | | | | 85,683 | |
| | | | | | |
|
|
|
| | | | | | | | 27,436,438 | |
| | | | | | |
|
|
|
| | | | | | | | |
COMMON STOCKS
(continued) | | Shares
| | | Value
(Note 2)
| |
| | | | | | | | | |
Independent Power Producers & Energy Traders — 0.1% | |
AES Corp. (The)* | | | 65,000 | | | $ | 769,600 | |
Constellation Energy Group, Inc. | | | 22,300 | | | | 884,641 | |
EDP Renovaveis SA (Spain)* | | | 2,684 | | | | 16,424 | |
NRG Energy, Inc.* | | | 23,200 | | | | 420,384 | |
| | | | | | |
|
|
|
| | | | | | | | 2,091,049 | |
| | | | | | |
|
|
|
Industrial Conglomerates — 1.4% | |
3M Co. | | | 72,600 | | | | 5,933,598 | |
Danaher Corp. | | | 55,900 | | | | 2,629,536 | |
General Electric Co. | | | 1,085,200 | | | | 19,435,932 | |
Keppel Corp. Ltd. (Singapore) | | | 7,000 | | | | 50,191 | |
Siemens AG (Germany) | | | 1,786 | | | | 170,914 | |
Tyco International Ltd. | | | 47,900 | | | | 2,237,409 | |
| | | | | | |
|
|
|
| | | | | | | | 30,457,580 | |
| | | | | | |
|
|
|
Insurance — 1.9% | |
ACE Ltd. | | | 34,500 | | | | 2,419,140 | |
Aegon NV (Netherlands)* | | | 1,561 | | | | 6,265 | |
Aflac, Inc. | | | 47,800 | | | | 2,067,828 | |
Allianz SE (Germany) | | | 1,665 | | | | 159,270 | |
Allstate Corp. (The) | | | 53,400 | | | | 1,463,694 | |
American International Group,
Inc.*(a) | | | 46,839 | | | | 1,086,665 | |
Aon Corp. | | | 34,300 | | | | 1,605,240 | |
Assurant, Inc. | | | 12,300 | | | | 505,038 | |
Aviva PLC (United Kingdom) | | | 27,910 | | | | 130,378 | |
AXA SA (France) | | | 6,996 | | | | 90,953 | |
Berkshire Hathaway, Inc.
(Class B Stock)* | | | 178,900 | | | | 13,650,070 | |
Chubb Corp. | | | 29,800 | | | | 2,062,756 | |
Cincinnati Financial Corp. | | | 19,237 | | | | 585,959 | |
Delta Lloyd NV (Netherlands) | | | 5,497 | | | | 92,488 | |
Genworth Financial, Inc.
(Class A Stock)* | | | 63,400 | | | | 415,270 | |
Gjensidige Forsikring ASA (Norway) | | | 340 | | | | 3,940 | |
Hannover Rueckversicherung AG (Germany) | | | 864 | | | | 42,856 | |
Hartford Financial Services Group,
Inc. (The) | | | 49,700 | | | | 807,625 | |
Legal & General Group PLC
(United Kingdom) | | | 56,773 | | | | 90,636 | |
Lincoln National Corp.(a) | | | 36,318 | | | | 705,296 | |
Loews Corp. | | | 32,875 | | | | 1,237,744 | |
Mapfre SA (Spain) | | | 4,505 | | | | 14,314 | |
Marsh & McLennan Cos., Inc. | | | 55,900 | | | | 1,767,558 | |
MetLife, Inc. | | | 107,900 | | | | 3,364,322 | |
Muenchener Rueckversicherungs AG (Germany) | | | 107 | | | | 13,126 | |
Old Mutual PLC (United Kingdom) | | | 76,653 | | | | 161,301 | |
Principal Financial Group, Inc. | | | 34,800 | | | | 856,080 | |
Progressive Corp. (The) | | | 68,600 | | | | 1,338,386 | |
Resolution Ltd. (United Kingdom) | | | 7,378 | | | | 28,805 | |
RSA Insurance Group PLC
(United Kingdom) | | | 42,876 | | | | 70,048 | |
SCOR SE (France) | | | 1,109 | | | | 25,922 | |
Swiss Life Holding AG (Switzerland) | | | 579 | | | | 53,258 | |
Swiss Re AG (Switzerland) | | | 231 | | | | 11,773 | |
Torchmark Corp. | | | 13,750 | | | | 596,612 | |
SEE NOTES TO FINANCIAL STATEMENTS.
A5
| | | | | | |
| | | CONSERVATIVE BALANCED PORTFOLIO (continued) | | |
| |
| SCHEDULE OF INVESTMENTS | | December 31, 2011 |
| | | | | | | | |
COMMON STOCKS
(continued) | | Shares
| | | Value
(Note 2)
| |
| | | | | | | | | |
Insurance (continued) | |
Travelers Cos., Inc. (The) | | | 42,735 | | | $ | 2,528,630 | |
Unum Group | | | 34,410 | | | | 725,019 | |
XL Group PLC (Class A Stock) | | | 35,200 | | | | 695,904 | |
Zurich Financial Services AG (Switzerland)* | | | 577 | | | | 130,536 | |
| | | | | | |
|
|
|
| | | | | | | | 41,610,705 | |
| | | | | | |
|
|
|
Internet & Catalog Retail — 0.4% | | | | | |
Amazon.com, Inc.* | | | 36,700 | | | | 6,352,770 | |
Expedia, Inc.(a) | | | 11,150 | | | | 323,573 | |
Netflix, Inc.*(a) | | | 4,600 | | | | 318,734 | |
priceline.com, Inc.* | | | 5,100 | | | | 2,385,321 | |
Tripadvisor, Inc.*(a) | | | 11,150 | | | | 281,091 | |
| | | | | | |
|
|
|
| | | | | | | | 9,661,489 | |
| | | | | | |
|
|
|
Internet Software & Services — 1.1% | | | | | |
Akamai Technologies, Inc.* | | | 19,700 | | | | 635,916 | |
Dena Co. Ltd. (Japan) | | | 700 | | | | 20,999 | |
eBay, Inc.* | | | 116,600 | | | | 3,536,478 | |
Google, Inc. (Class A Stock)* | | | 25,800 | | | | 16,664,220 | |
Gree, Inc. (Japan) | | | 5,000 | | | | 172,275 | |
VeriSign, Inc. | | | 16,900 | | | | 603,668 | |
Yahoo!, Inc.* | | | 131,000 | | | | 2,113,030 | |
| | | | | | |
|
|
|
| | | | | | | | 23,746,586 | |
| | | | | | |
|
|
|
IT Services — 2.1% | | | | | |
Accenture PLC (Ireland)
(Class A Stock) | | | 66,300 | | | | 3,529,149 | |
Automatic Data Processing, Inc. | | | 51,000 | | | | 2,754,510 | |
Cognizant Technology Solutions Corp. (Class A Stock)* | | | 32,100 | | | | 2,064,351 | |
Computer Sciences Corp. | | | 17,000 | | | | 402,900 | |
Fidelity National Information Services, Inc. | | | 28,700 | | | | 763,133 | |
Fiserv, Inc.* | | | 15,100 | | | | 886,974 | |
International Business Machines Corp. | | | 123,100 | | | | 22,635,628 | |
Mastercard, Inc. (Class A Stock) | | | 11,000 | | | | 4,101,020 | |
Otsuka Corp. (Japan) | | | 2,100 | | | | 144,602 | |
Paychex, Inc. | | | 34,000 | | | | 1,023,740 | |
SAIC, Inc.*(a) | | | 29,000 | | | | 356,410 | |
Teradata Corp.* | | | 17,200 | | | | 834,372 | |
Total System Services, Inc. | | | 15,596 | | | | 305,058 | |
Visa, Inc. (Class A Stock) | | | 52,500 | | | | 5,330,325 | |
Western Union Co. (The) | | | 64,510 | | | | 1,177,952 | |
| | | | | | |
|
|
|
| | | | | | | | 46,310,124 | |
| | | | | | |
|
|
|
Leisure Equipment & Products — 0.1% | | | | | |
Hasbro, Inc. | | | 13,600 | | | | 433,704 | |
Mattel, Inc.(a) | | | 37,051 | | | | 1,028,536 | |
Namco Bandai Holdings, Inc. (Japan) | | | 3,300 | | | | 46,990 | |
Nikon Corp. (Japan) | | | 2,700 | | | | 60,124 | |
| | | | | | |
|
|
|
| | | | | | | | 1,569,354 | |
| | | | | | |
|
|
|
Life Sciences Tools & Services — 0.2% | | | | | |
Agilent Technologies, Inc.* | | | 35,514 | | | | 1,240,504 | |
Life Technologies Corp.* | | | 18,301 | | | | 712,092 | |
PerkinElmer, Inc. | | | 12,600 | | | | 252,000 | |
Thermo Fisher Scientific, Inc.* | | | 39,100 | | | | 1,758,327 | |
Waters Corp.* | | | 8,800 | | | | 651,640 | |
| | | | | | |
|
|
|
| | | | | | | | 4,614,563 | |
| | | | | | |
|
|
|
| | | | | | | | |
COMMON STOCKS
(continued) | | Shares
| | | Value
(Note 2)
| |
| | | | | | | | | |
Machinery — 1.1% | | | | | |
Caterpillar, Inc.(a) | | | 65,800 | | | $ | 5,961,480 | |
Cummins, Inc. | | | 19,900 | | | | 1,751,598 | |
Deere & Co. | | | 42,900 | | | | 3,318,315 | |
Dover Corp. | | | 19,600 | | | | 1,137,780 | |
Eaton Corp. | | | 34,800 | | | | 1,514,844 | |
FANUC Corp. (Japan) | | | 1,400 | | | | 214,265 | |
Flowserve Corp. | | | 5,700 | | | | 566,124 | |
Illinois Tool Works, Inc. | | | 51,100 | | | | 2,386,881 | |
Ingersoll-Rand PLC | | | 33,800 | | | | 1,029,886 | |
Joy Global, Inc. | | | 10,300 | | | | 772,191 | |
Kone OYJ (Finland) (Class B Stock) | | | 933 | | | | 48,422 | |
Metso OYJ (Finland) | | | 1,312 | | | | 48,649 | |
PACCAR, Inc.(a) | | | 36,943 | | | | 1,384,254 | |
Pall Corp. | | | 11,700 | | | | 668,655 | |
Parker Hannifin Corp. | | | 16,565 | | | | 1,263,081 | |
Snap-on, Inc. | | | 7,000 | | | | 354,340 | |
Stanley Black & Decker, Inc. | | | 17,197 | | | | 1,162,517 | |
Sumitomo Heavy Industries Ltd. (Japan) | | | 6,000 | | | | 35,001 | |
Volvo AB (Sweden) (Class B Stock) | | | 6,299 | | | | 68,921 | |
Weir Group PLC (The) (United Kingdom) | | | 962 | | | | 30,358 | |
Xylem, Inc. | | | 14,000 | | | | 359,660 | |
Yangzijiang Shipbuilding Holdings Ltd. (Singapore) | | | 103,000 | | | | 72,264 | |
| | | | | | |
|
|
|
| | | | | | | | 24,149,486 | |
| | | | | | |
|
|
|
Marine | | | | | |
AP Moller-Maersk A/S (Denmark) (Class B Stock) | | | 3 | | | | 19,807 | |
| | | | | | |
|
|
|
Media — 1.7% | | | | | |
Cablevision Systems Corp.
(Class A Stock) | | | 23,500 | | | | 334,170 | |
CBS Corp. (Class B Stock) | | | 68,334 | | | | 1,854,585 | |
Comcast Corp. (Class A Stock) | | | 285,190 | | | | 6,761,855 | |
DIRECTV (Class A Stock)*(a) | | | 77,000 | | | | 3,292,520 | |
Discovery Communications, Inc. (Class A Stock)* | | | 28,400 | | | | 1,163,548 | |
Gannett Co., Inc. | | | 24,900 | | | | 332,913 | |
Interpublic Group of Cos., Inc. (The) | | | 48,331 | | | | 470,261 | |
ITV PLC (United Kingdom) | | | 59,791 | | | | 63,281 | |
McGraw-Hill Cos., Inc. (The) | | | 31,400 | | | | 1,412,058 | |
News Corp. (Class A Stock) | | | 233,300 | | | | 4,162,072 | |
Omnicom Group, Inc.(a) | | | 28,700 | | | | 1,279,446 | |
Reed Elsevier NV (Netherlands) | | | 1,732 | | | | 20,190 | |
Scripps Networks Interactive, Inc. (Class A Stock)(a) | | | 9,200 | | | | 390,264 | |
Time Warner Cable, Inc. | | | 32,914 | | | | 2,092,343 | |
Time Warner, Inc.(a) | | | 108,666 | | | | 3,927,189 | |
Viacom, Inc. (Class B Stock) | | | 59,734 | | | | 2,712,521 | |
Walt Disney Co. (The) | | | 188,900 | | | | 7,083,750 | |
Washington Post Co. (The) (Class B Stock)(a) | | | 600 | | | | 226,086 | |
WPP PLC (United Kingdom) | | | 3,740 | | | | 39,234 | |
| | | | | | |
|
|
|
| | | | | | | | 37,618,286 | |
| | | | | | |
|
|
|
SEE NOTES TO FINANCIAL STATEMENTS.
A6
| | | | | | |
| | | CONSERVATIVE BALANCED PORTFOLIO (continued) | | |
| |
| SCHEDULE OF INVESTMENTS | | December 31, 2011 |
| | | | | | | | |
COMMON STOCKS
(continued) | | Shares
| | | Value
(Note 2)
| |
| | | | | | | | | |
Metals & Mining — 0.5% | | | | | |
Alcoa, Inc. | | | 108,640 | | | $ | 939,736 | |
Allegheny Technologies, Inc. | | | 9,900 | | | | 473,220 | |
Anglo American PLC
(United Kingdom) | | | 1,259 | | | | 46,515 | |
Antofagasta PLC (United Kingdom) | | | 300 | | | | 5,661 | |
BHP Billiton Ltd. (Australia) | | | 6,906 | | | | 243,124 | |
BHP Billiton PLC (Australia) | | | 8,584 | | | | 250,287 | |
Cliffs Natural Resources, Inc. | | | 14,800 | | | | 922,780 | |
Daido Steel Co. Ltd. (Japan) | | | 1,000 | | | | 6,275 | |
Freeport-McMoRan Copper & Gold, Inc. | | | 96,688 | | | | 3,557,152 | |
Fresnillo PLC (United Kingdom) | | | 3,686 | | | | 87,410 | |
Iluka Resources Ltd. (Australia) | | | 3,366 | | | | 53,362 | |
Newmont Mining Corp. | | | 50,400 | | | | 3,024,504 | |
Nippon Steel Corp. (Japan) | | | 25,000 | | | | 62,362 | |
Nucor Corp. | | | 32,300 | | | | 1,278,111 | |
OZ Minerals Ltd. (Australia) | | | 2,449 | | | | 25,073 | |
Randgold Resources Ltd.
(United Kingdom) | | | 535 | | | | 54,711 | |
Rio Tinto Ltd. (Australia) | | | 2,403 | | | | 148,204 | |
Rio Tinto PLC (United Kingdom) | | | 4,078 | | | | 197,909 | |
Titanium Metals Corp. | | | 12,900 | | | | 193,242 | |
United States Steel Corp.(a) | | | 14,700 | | | | 388,962 | |
Vedanta Resources PLC (India) | | | 5,517 | | | | 86,964 | |
Voestalpine AG (Austria) | | | 776 | | | | 21,764 | |
Xstrata PLC (United Kingdom) | | | 1,010 | | | | 15,340 | |
| | | | | | |
|
|
|
| | | | | | | | 12,082,668 | |
| | | | | | |
|
|
|
Multiline Retail — 0.5% | | | | | |
Big Lots, Inc.* | | | 7,200 | | | | 271,872 | |
Dollar Tree, Inc.* | | | 10,300 | | | | 856,033 | |
Family Dollar Stores, Inc. | | | 12,900 | | | | 743,814 | |
Isetan Mitsukoshi Holdings, Ltd. (Japan) | | | 1,000 | | | | 10,485 | |
J.C. Penney Co., Inc.(a) | | | 14,400 | | | | 506,160 | |
Kohl’s Corp. | | | 28,600 | | | | 1,411,410 | |
Lifestyle International Holdings Ltd. (Hong Kong) | | | 32,500 | | | | 71,640 | |
Macy’s, Inc. | | | 43,574 | | | | 1,402,211 | |
Nordstrom, Inc. | | | 17,100 | | | | 850,041 | |
PPR (France) | | | 235 | | | | 33,654 | |
Sears Holdings Corp.*(a) | | | 4,442 | | | | 141,167 | |
Target Corp. | | | 70,400 | | | | 3,605,888 | |
| | | | | | |
|
|
|
| | | | | | | | 9,904,375 | |
| | | | | | |
|
|
|
Multi-Utilities — 0.8% | | | | | |
Ameren Corp. | | | 25,700 | | | | 851,441 | |
CenterPoint Energy, Inc. | | | 44,200 | | | | 887,978 | |
Centrica PLC (United Kingdom) | | | 1,632 | | | | 7,332 | |
CMS Energy Corp. | | | 29,000 | | | | 640,320 | |
Consolidated Edison, Inc.(a) | | | 29,900 | | | | 1,854,697 | |
Dominion Resources, Inc. | | | 58,832 | | | | 3,122,803 | |
DTE Energy Co. | | | 16,600 | | | | 903,870 | |
GDF Suez (France) | | | 3,031 | | | | 82,851 | |
Integrys Energy Group, Inc. | | | 8,120 | | | | 439,942 | |
National Grid PLC (United Kingdom) | | | 1,959 | | | | 19,014 | |
NiSource, Inc. | | | 28,000 | | | | 666,680 | |
PG&E Corp. | | | 40,600 | | | | 1,673,532 | |
| | | | | | | | |
COMMON STOCKS
(continued) | | Shares
| | | Value
(Note 2)
| |
| | | | | | | | | |
Multi-Utilities (continued) | | | | | |
Public Service Enterprise Group, Inc. | | | 52,000 | | | $ | 1,716,520 | |
RWE AG (Germany) | | | 2,345 | | | | 82,401 | |
SCANA Corp.(a) | | | 11,300 | | | | 509,178 | |
Sempra Energy | | | 24,419 | | | | 1,343,045 | |
TECO Energy, Inc. | | | 20,500 | | | | 392,370 | |
Wisconsin Energy Corp. | | | 26,200 | | | | 915,952 | |
Xcel Energy, Inc. | | | 49,410 | | | | 1,365,692 | |
| | | | | | |
|
|
|
| | | | | | | | 17,475,618 | |
| | | | | | |
|
|
|
Office Electronics — 0.1% | | | | | |
Canon, Inc. (Japan) | | | 4,000 | | | | 177,212 | |
Xerox Corp. | | | 143,263 | | | | 1,140,373 | |
| | | | | | |
|
|
|
| | | | | | | | 1,317,585 | |
| | | | | | |
|
|
|
Oil, Gas & Consumable Fuels — 5.6% | | | | | |
Alpha Natural Resources, Inc.*(a) | | | 21,808 | | | | 445,537 | |
Anadarko Petroleum Corp. | | | 50,754 | | | | 3,874,053 | |
Apache Corp. | | | 40,114 | | | | 3,633,526 | |
BG Group PLC (United Kingdom) | | | 178 | | | | 3,805 | |
BP PLC (United Kingdom) | | | 49,905 | | | | 356,896 | |
Cabot Oil & Gas Corp. | | | 10,500 | | | | 796,950 | |
Chesapeake Energy Corp.(a) | | | 67,200 | | | | 1,497,888 | |
Chevron Corp. | | | 205,722 | | | | 21,888,821 | |
ConocoPhillips | | | 140,477 | | | | 10,236,559 | |
Consol Energy, Inc. | | | 23,100 | | | | 847,770 | |
Denbury Resources, Inc.* | | | 38,600 | | | | 582,860 | |
Devon Energy Corp. | | | 43,200 | | | | 2,678,400 | |
El Paso Corp. | | | 79,036 | | | | 2,099,987 | |
ENI SpA (Italy) | | | 9,524 | | | | 197,346 | |
EOG Resources, Inc. | | | 27,400 | | | | 2,699,174 | |
EQT Corp. | | | 15,300 | | | | 838,287 | |
Exxon Mobil Corp. | | | 498,299 | | | | 42,235,823 | |
Hess Corp. | | | 30,900 | | | | 1,755,120 | |
Idemitsu Kosan Co. Ltd. (Japan) | | | 300 | | | | 30,947 | |
Japan Petroleum Exploration Co. (Japan) | | | 200 | | | | 7,821 | |
JX Holdings, Inc. (Japan) | | | 12,400 | | | | 74,912 | |
Marathon Oil Corp. | | | 72,682 | | | | 2,127,402 | |
Marathon Petroleum Corp. | | | 36,341 | | | | 1,209,792 | |
Murphy Oil Corp. | | | 19,800 | | | | 1,103,652 | |
Newfield Exploration Co.* | | | 13,900 | | | | 524,447 | |
Noble Energy, Inc. | | | 18,000 | | | | 1,699,020 | |
Occidental Petroleum Corp. | | | 84,100 | | | | 7,880,170 | |
Peabody Energy Corp. | | | 27,600 | | | | 913,836 | |
Pioneer Natural Resources Co. | | | 12,700 | | | | 1,136,396 | |
QEP Resources, Inc. | | | 19,800 | | | | 580,140 | |
Range Resources Corp. | | | 17,300 | | | | 1,071,562 | |
Royal Dutch Shell PLC (Netherlands) (Class B Stock) | | | 9,278 | | | | 353,588 | |
Royal Dutch Shell PLC (United Kingdom) (Class A Stock) | | | 10,290 | | | | 378,892 | |
Santos Ltd. (Australia) | | | 6,689 | | | | 83,740 | |
Southwestern Energy Co.* | | | 35,600 | | | | 1,137,064 | |
Spectra Energy Corp. | | | 66,362 | | | | 2,040,632 | |
Statoil ASA (Norway) | | | 1,688 | | | | 43,323 | |
Sunoco, Inc.(a) | | | 11,500 | | | | 471,730 | |
Tesoro Corp.*(a) | | | 15,000 | | | | 350,400 | |
Total SA (France) | | | 6,568 | | | | 335,774 | |
SEE NOTES TO FINANCIAL STATEMENTS.
A7
| | | | | | |
| | | CONSERVATIVE BALANCED PORTFOLIO (continued) | | |
| |
| SCHEDULE OF INVESTMENTS | | December 31, 2011 |
| | | | | | | | |
COMMON STOCKS
(continued) | | Shares
| | | Value
(Note 2)
| |
| | | | | | | | | |
Oil, Gas & Consumable Fuels (continued) | | | | | |
Valero Energy Corp. | | | 59,400 | | | $ | 1,250,370 | |
Williams Cos., Inc. (The) | | | 60,100 | | | | 1,984,502 | |
Woodside Petroleum Ltd. (Australia) | | | 1,220 | | | | 38,208 | |
| | | | | | |
|
|
|
| | | | | | | | 123,497,122 | |
| | | | | | |
|
|
|
Paper & Forest Products — 0.1% | | | | | |
Holmen AB (Sweden), Ser. B (Class B Stock) | | | 149 | | | | 4,280 | |
International Paper Co. | | | 46,973 | | | | 1,390,401 | |
MeadWestvaco Corp. | | | 16,514 | | | | 494,594 | |
| | | | | | |
|
|
|
| | | | | | | | 1,889,275 | |
| | | | | | |
|
|
|
Personal Products — 0.1% | | | | | |
Avon Products, Inc. | | | 47,100 | | | | 822,837 | |
Estee Lauder Cos., Inc. (The) (Class A Stock) | | | 11,900 | | | | 1,336,608 | |
Kao Corp. (Japan) | | | 3,000 | | | | 81,967 | |
| | | | | | |
|
|
|
| | | | | | | | 2,241,412 | |
| | | | | | |
|
|
|
Pharmaceuticals — 3.5% | | | | | |
Abbott Laboratories | | | 159,800 | | | | 8,985,554 | |
Allergan, Inc. | | | 31,100 | | | | 2,728,714 | |
AstraZeneca PLC (United Kingdom) | | | 6,715 | | | | 310,242 | |
Bayer AG (Germany) | | | 1,889 | | | | 120,775 | |
Bristol-Myers Squibb Co. | | | 174,170 | | | | 6,137,751 | |
Eli Lilly & Co. | | | 104,000 | | | | 4,322,240 | |
Forest Laboratories, Inc.* | | | 29,900 | | | | 904,774 | |
GlaxoSmithKline PLC (United Kingdom) | | | 10,710 | | | | 244,747 | |
Hospira, Inc.* | | | 18,460 | | | | 560,630 | |
Johnson & Johnson | | | 281,448 | | | | 18,457,360 | |
Merck & Co., Inc. | | | 316,533 | | | | 11,933,294 | |
Mylan, Inc.* | | | 48,100 | | | | 1,032,226 | |
Novartis AG (Switzerland) | | | 5,566 | | | | 318,210 | |
Novo Nordisk A/S (Denmark) (Class B Stock) | | | 1,973 | | | | 226,730 | |
Orion OYJ (Finland) (Class B Stock) | | | 1,970 | | | | 38,373 | |
Otsuka Holdings Co. Ltd. (Japan) | | | 200 | | | | 5,623 | |
Perrigo Co. | | | 7,200 | | | | 700,560 | |
Pfizer, Inc. | | | 801,870 | | | | 17,352,467 | |
Roche Holding AG (Switzerland) | | | 1,853 | | | | 314,061 | |
Sanofi (France) | | | 4,020 | | | | 295,263 | |
Shire PLC (United Kingdom) | | | 1,057 | | | | 36,819 | |
Taisho Pharmaceutical Holdings Co. Ltd. (Japan)* | | | 100 | | | | 7,717 | |
Takeda Pharmaceutical Co. Ltd. (Japan) | | | 1,900 | | | | 83,435 | |
Teva Pharmaceutical Industries Ltd. (Israel) | | | 1,317 | | | | 53,012 | |
Watson Pharmaceuticals, Inc.* | | | 12,900 | | | | 778,386 | |
| | | | | | |
|
|
|
| | | | | | | | 75,948,963 | |
| | | | | | |
|
|
|
Professional Services — 0.1% | | | | | |
Dun & Bradstreet Corp. (The) | | | 4,800 | | | | 359,184 | |
Equifax, Inc.(a) | | | 12,700 | | | | 491,998 | |
Robert Half International, Inc. | | | 14,200 | | | | 404,132 | |
| | | | | | |
|
|
|
| | | | | | | | 1,255,314 | |
| | | | | | |
|
|
|
| | | | | | | | |
COMMON STOCKS
(continued) | | Shares
| | | Value
(Note 2)
| |
| | | | | | | | | |
Real Estate Investment Trusts — 1.0% | | | | | |
Apartment Investment & Management Co. (Class A Stock)(a) | | | 13,033 | | | $ | 298,586 | |
AvalonBay Communities, Inc. | | | 9,075 | | | | 1,185,195 | |
Boston Properties, Inc. | | | 14,900 | | | | 1,484,040 | |
Dexus Property Group (Australia) | | | 26,340 | | | | 22,361 | |
Equity Residential | | | 30,100 | | | | 1,716,603 | |
GPT Group (Australia) | | | 18,234 | | | | 57,255 | |
HCP, Inc.(a) | | | 43,400 | | | | 1,798,062 | |
Health Care REIT, Inc.(a) | | | 19,400 | | | | 1,057,882 | |
Host Hotels & Resorts, Inc.(a) | | | 74,882 | | | | 1,106,007 | |
Kimco Realty Corp. | | | 39,000 | | | | 633,360 | |
Mirvac Group (Australia) | | | 16,340 | | | | 19,721 | |
Plum Creek Timber Co., Inc.(a) | | | 15,700 | | | | 573,992 | |
ProLogis, Inc.* | | | 46,377 | | | | 1,325,918 | |
Public Storage(a) | | | 14,300 | | | | 1,922,778 | |
Simon Property Group, Inc. | | | 29,943 | | | | 3,860,850 | |
Stockland (Australia) | | | 33,434 | | | | 109,086 | |
Ventas, Inc. | | | 29,318 | | | | 1,616,301 | |
Vornado Realty Trust | | | 18,525 | | | | 1,423,832 | |
Westfield Retail Trust (Australia) | | | 17,094 | | | | 43,534 | |
Weyerhaeuser Co. | | | 52,698 | | | | 983,872 | |
| | | | | | |
|
|
|
| | | | | | | | 21,239,235 | |
| | | | | | |
|
|
|
Real Estate Management & Development | | | | | |
CBRE Group, Inc. (Class A Stock)* | | | 28,100 | | | | 427,682 | |
Cheung Kong Holdings Ltd.
(Hong Kong) | | | 2,000 | | | | 23,794 | |
Daito Trust Construction Co. Ltd. (Japan) | | | 300 | | | | 25,725 | |
Daiwa House Industry Co. Ltd. (Japan) | | | 10,000 | | | | 119,267 | |
IMMOFINANZ AG (Austria) | | | 4,999 | | | | 15,010 | |
Lend Lease Group (Australia)(b) | | | 10,136 | | | | 74,228 | |
Tokyu Land Corp. (Japan) | | | 24,000 | | | | 90,737 | |
UOL Group Ltd. (Singapore) | | | 23,000 | | | | 70,930 | |
Wheelock & Co. Ltd. (Hong Kong) | | | 11,000 | | | | 27,250 | |
| | | | | | |
|
|
|
| | | | | | | | 874,623 | |
| | | | | | |
|
|
|
Road & Rail — 0.5% | | | | | |
Central Japan Railway Co. (Japan) | | | 15 | | | | 126,673 | |
CSX Corp. | | | 112,600 | | | | 2,371,356 | |
East Japan Railway Co. (Japan) | | | 2,700 | | | | 171,885 | |
Nippon Express Co. Ltd. (Japan) | | | 8,000 | | | | 31,181 | |
Norfolk Southern Corp. | | | 36,900 | | | | 2,688,534 | |
Ryder System, Inc. | | | 4,900 | | | | 260,386 | |
Union Pacific Corp. | | | 50,100 | | | | 5,307,594 | |
West Japan Railway Co. (Japan) | | | 1,000 | | | | 43,458 | |
| | | | | | |
|
|
|
| | | | | | | | 11,001,067 | |
| | | | | | |
|
|
|
Semiconductors & Semiconductor Equipment — 1.3% | |
Advanced Micro Devices, Inc.*(a) | | | 55,700 | | | | 300,780 | |
Altera Corp. | | | 33,200 | | | | 1,231,720 | |
Analog Devices, Inc. | | | 32,400 | | | | 1,159,272 | |
Applied Materials, Inc. | | | 134,600 | | | | 1,441,566 | |
Broadcom Corp. (Class A Stock) | | | 48,750 | | | | 1,431,300 | |
First Solar, Inc.*(a) | | | 5,500 | | | | 185,680 | |
Intel Corp. | | | 534,600 | | | | 12,964,050 | |
KLA-Tencor Corp. | | | 17,100 | | | | 825,075 | |
Linear Technology Corp. | | | 24,400 | | | | 732,732 | |
LSI Corp.* | | | 65,700 | | | | 390,915 | |
SEE NOTES TO FINANCIAL STATEMENTS.
A8
| | | | | | |
| | | CONSERVATIVE BALANCED PORTFOLIO (continued) | | |
| |
| SCHEDULE OF INVESTMENTS | | December 31, 2011 |
| | | | | | | | |
COMMON STOCKS
(continued) | | Shares
| | | Value
(Note 2)
| |
| | | | | | | | | |
Semiconductors & Semiconductor Equipment (continued) | |
Microchip Technology, Inc.(a) | | | 19,400 | | | $ | 710,622 | |
Micron Technology, Inc.* | | | 87,900 | | | | 552,891 | |
Novellus Systems, Inc.* | | | 8,800 | | | | 363,352 | |
NVIDIA Corp.*(a) | | | 61,450 | | | | 851,697 | |
Teradyne, Inc.*(a) | | | 19,800 | | | | 269,874 | |
Texas Instruments, Inc. | | | 118,600 | | | | 3,452,446 | |
Xilinx, Inc. | | | 27,100 | | | | 868,826 | |
| | | | | | |
|
|
|
| | | | | | | | 27,732,798 | |
| | | | | | |
|
|
|
Software — 1.9% | | | | | |
Adobe Systems, Inc.* | | | 51,500 | | | | 1,455,905 | |
Autodesk, Inc.* | | | 24,700 | | | | 749,151 | |
BMC Software, Inc.* | | | 19,900 | | | | 652,322 | |
CA, Inc. | | | 37,064 | | | | 749,249 | |
Citrix Systems, Inc.* | | | 19,100 | | | | 1,159,752 | |
Dassault Systemes SA (France) | | | 120 | | | | 9,618 | |
Electronic Arts, Inc.* | | | 33,600 | | | | 692,160 | |
Intuit, Inc. | | | 31,300 | | | | 1,646,067 | |
Microsoft Corp. | | | 768,000 | | | | 19,937,280 | |
Nice Systems Ltd. (Israel)* | | | 1,535 | | | | 52,201 | |
Oracle Corp. | | | 405,800 | | | | 10,408,770 | |
Red Hat, Inc.* | | | 18,800 | | | | 776,252 | |
Salesforce.com, Inc.* | | | 12,900 | | | | 1,308,834 | |
SAP AG (Germany) | | | 3,428 | | | | 181,238 | |
Symantec Corp.* | | | 77,178 | | | | 1,207,836 | |
| | | | | | |
|
|
|
| | | | | | | | 40,986,635 | |
| | | | | | |
|
|
|
Specialty Retail — 1.1% | | | | | |
Abercrombie & Fitch Co.
(Class A Stock) | | | 8,300 | | | | 405,372 | |
AutoNation, Inc.*(a) | | | 3,874 | | | | 142,834 | |
AutoZone, Inc.* | | | 3,000 | | | | 974,910 | |
Bed Bath & Beyond, Inc.* | | | 25,400 | | | | 1,472,438 | |
Best Buy Co., Inc. | | | 32,925 | | | | 769,457 | |
CarMax, Inc.*(a) | | | 24,000 | | | | 731,520 | |
GameStop Corp. (Class A Stock)*(a) | | | 13,600 | | | | 328,168 | |
Gap, Inc. (The) | | | 37,900 | | | | 703,045 | |
Hennes & Mauritz AB (Sweden) (Class B Stock) | | | 362 | | | | 11,641 | |
Home Depot, Inc. (The) | | | 162,550 | | | | 6,833,602 | |
Inditex SA (Spain) | | | 1,070 | | | | 87,633 | |
Kingfisher PLC (United Kingdom) | | | 18,431 | | | | 71,758 | |
Limited Brands, Inc.(a) | | | 25,706 | | | | 1,037,237 | |
Lowe’s Cos., Inc.(a) | | | 131,700 | | | | 3,342,546 | |
Orchard Supply Hardware Stores Corp. (Class A Stock)* | | | 200 | | | | 449 | |
O’Reilly Automotive, Inc.* | | | 14,600 | | | | 1,167,270 | |
Ross Stores, Inc. | | | 23,800 | | | | 1,131,214 | |
Staples, Inc. | | | 74,049 | | | | 1,028,541 | |
Tiffany & Co. | | | 13,000 | | | | 861,380 | |
TJX Cos., Inc. | | | 39,100 | | | | 2,523,905 | |
Urban Outfitters, Inc.*(a) | | | 11,100 | | | | 305,916 | |
USS Co. Ltd. (Japan) | | | 590 | | | | 53,351 | |
Yamada Denki Co. Ltd. (Japan) | | | 760 | | | | 51,740 | |
| | | | | | |
|
|
|
| | | | | | | | 24,035,927 | |
| | | | | | |
|
|
|
Textiles, Apparel & Luxury Goods — 0.4% | | | | | |
Christian Dior SA (France) | | | 168 | | | | 19,919 | |
Cie Financiere Richemont SA (Switzerland) | | | 1,680 | | | | 84,975 | |
| | | | | | | | |
COMMON STOCKS
(continued) | | Shares
| | | Value
(Note 2)
| |
| | | | | | | | | |
Textiles, Apparel & Luxury Goods (continued) | | | | | |
Coach, Inc. | | | 30,700 | | | $ | 1,873,928 | |
LVMH Moet Hennessy Louis Vuitton SA (France) | | | 622 | | | | 88,069 | |
NIKE, Inc. (Class B Stock) | | | 38,700 | | | | 3,729,519 | |
Ralph Lauren Corp. (Class A Stock) | | | 6,600 | | | | 911,328 | |
Swatch Group AG (The) (Bearer Shares) (Switzerland) | | | 106 | | | | 39,667 | |
Swatch Group AG (The) (Registered Shares) (Switzerland) | | | 883 | | | | 58,848 | |
V.F. Corp.(a) | | | 8,900 | | | | 1,130,211 | |
| | | | | | |
|
|
|
| | | | | | | | 7,936,464 | |
| | | | | | |
|
|
|
Thrifts & Mortgage Finance | | | | | |
Hudson City Bancorp, Inc.(a) | | | 49,900 | | | | 311,875 | |
People’s United Financial, Inc. | | | 36,300 | | | | 466,455 | |
| | | | | | |
|
|
|
| | | | | | | | 778,330 | |
| | | | | | |
|
|
|
Tobacco — 1.1% | | | | | |
Altria Group, Inc. | | | 213,800 | | | | 6,339,170 | |
British American Tobacco PLC (United Kingdom) | | | 3,977 | | | | 188,715 | |
Imperial Tobacco Group PLC (United Kingdom) | | | 4,986 | | | | 188,547 | |
Lorillard, Inc. | | | 14,647 | | | | 1,669,758 | |
Philip Morris International, Inc. | | | 181,400 | | | | 14,236,272 | |
Reynolds American, Inc. | | | 34,800 | | | | 1,441,416 | |
Swedish Match AB (Sweden) | | | 670 | | | | 23,783 | |
| | | | | | |
|
|
|
| | | | | | | | 24,087,661 | |
| | | | | | |
|
|
|
Trading Companies & Distributors — 0.1% | | | | | |
Fastenal Co.(a) | | | 30,100 | | | | 1,312,661 | |
ITOCHU Corp. (Japan) | | | 8,000 | | | | 81,278 | |
Marubeni Corp. (Japan) | | | 10,000 | | | | 60,933 | |
Mitsubishi Corp. (Japan) | | | 3,400 | | | | 68,689 | |
Mitsui & Co. Ltd. (Japan) | | | 3,700 | | | | 57,541 | |
Sumitomo Corp. (Japan) | | | 7,700 | | | | 104,241 | |
Toyota Tsusho Corp. (Japan) | | | 2,900 | | | | 51,278 | |
W.W. Grainger, Inc. | | | 6,200 | | | | 1,160,578 | |
| | | | | | |
|
|
|
| | | | | | | | 2,897,199 | |
| | | | | | |
|
|
|
Transportation Infrastructure | | | | | |
Atlantia SpA (Italy) | | | 710 | | | | 11,367 | |
Kamigumi Co. Ltd. (Japan) | | | 3,000 | | | | 25,880 | |
| | | | | | |
|
|
|
| | | | | | | | 37,247 | |
| | | | | | |
|
|
|
Wireless Telecommunication Services — 0.2% | | | | | |
American Tower Corp. (Class A Stock) | | | 40,500 | | | | 2,430,405 | |
KDDI Corp. (Japan) | | | 19 | | | | 122,190 | |
MetroPCS Communications, Inc.* | | | 29,500 | | | | 256,060 | |
Millicom International Cellular SA (Luxembourg) | | | 185 | | | | 18,535 | |
Softbank Corp. (Japan) | | | 3,300 | | | | 97,195 | |
Sprint Nextel Corp.* | | | 322,977 | | | | 755,766 | |
Vodafone Group PLC (United Kingdom) | | | 112,485 | | | | 312,517 | |
| | | | | | |
|
|
|
| | | | | | | | 3,992,668 | |
| | | | | | |
|
|
|
TOTAL COMMON STOCKS
(cost $840,097,921) | | | | 1,199,361,605 | |
| | | | | | |
|
|
|
SEE NOTES TO FINANCIAL STATEMENTS.
A9
| | | | | | |
| | | CONSERVATIVE BALANCED PORTFOLIO (continued) | | |
| |
| SCHEDULE OF INVESTMENTS | | December 31, 2011 |
| | | | | | | | |
EXCHANGE TRADED FUND | | Shares
| | | Value
(Note 2)
| |
| | | | | | | | | |
iShares MSCI EAFE Index Fund
(cost $452,631) | | | 9,100 | | | $ | 450,723 | |
| | | | | | |
|
|
|
| PREFERRED STOCKS — 0.1% | | | | | |
Automobiles | | | | | |
Bayerische Motoren Werke AG (Germany) | | | 317 | | | | 14,996 | |
Porsche Automobil Holding SE (Germany) | | | 1,428 | | | | 76,422 | |
Volkswagen AG (Germany) | | | 821 | | | | 122,994 | |
| | | | | | |
|
|
|
| | | | | | | | 214,412 | |
| | | | | | |
|
|
|
Banking — 0.1% | | | | | |
Citigroup Capital XIII, 7.875% (Capital Security, fixed to floating preferred)(c) | | | 20,000 | | | | 521,200 | |
| | | | | | | | |
PREFERRED STOCKS
(continued) | | Shares
| | | Value
(Note 2)
| |
| | | | | | | | | |
Banking (continued) | | | | | |
JPMorgan Chase Capital XXVI, 8.000% (Capital Security, fixed to floating preferred)(c) | | | 28,000 | | | $ | 725,200 | |
| | | | | | |
|
|
|
| | | | | | | | 1,246,400 | |
| | | | | | |
|
|
|
Household Products | | | | | |
Henkel AG & Co. KGaA (Germany) | | | 145 | | | | 8,368 | |
| | | | | | |
|
|
|
Multi-Utilities | | | | | |
RWE AG (Germany) | | | 408 | | | | 13,431 | |
| | | | | | |
|
|
|
Specialty Retail | | | | | |
Orchard Supply Hardware Stores Corp., Ser. A* | | | 200 | | | | 449 | |
| | | | | | |
|
|
|
TOTAL PREFERRED STOCKS
(cost $1,478,911) | | | | 1,483,060 | |
| | | | | | |
|
|
|
| | | | | | | | | | | | | | | | |
| ASSET-BACKED SECURITIES — 1.2% | | Moody’s
Ratings
(Unaudited)†
| | Interest
Rate
| | | Maturity
Date
| | Principal
Amount
(000)#
| | | | |
| | | | | | | | | | | | | | | | | |
Non-Residential Mortgage-Backed Securities — 0.8% | | | | | | | | | | | | | | | | |
Apidos CDO (Cayman Islands), Ser. 2006-4A, Class A1, 144A(c) | | Aaa | | | 0.672% | | | 10/27/18 | | $ | 1,000 | | | $ | 952,556 | |
ARES CLO Funds (Cayman Islands), Ser. 2011-16A,
Class A, 144A(c) | | Aaa | | | 2.066% | | | 05/17/21 | | | 500 | | | | 493,465 | |
BA Credit Card Trust, Ser. 2006-C5, Class C5(c) | | A3 | | | 0.678% | | | 01/15/16 | | | 4,159 | | | | 4,101,408 | |
BlackRock Senior Income Series Corp. (Cayman Islands),
Ser. 2005-2A, Class A1, 144A(c) | | Aaa | | | 0.756% | | | 05/25/17 | | | 1,908 | | | | 1,840,350 | |
Chatham Light CLO Ltd. (Cayman Islands), Ser. 2005-2A,
Class A1, 144A(c) | | Aaa | | | 0.682% | | | 08/03/19 | | | 454 | | | | 436,765 | |
Citibank Credit Card Issuance Trust, Ser. 2006-C1, Class C1(c) | | Baa2 | | | 0.685% | | | 02/20/15 | | | 1,500 | | | | 1,486,562 | |
First CLO Ltd. (Cayman Islands), Ser. 2004-1A1, Class A1, 144A(c) | | Aaa | | | 0.772% | | | 07/27/16 | | | 49 | | | | 48,670 | |
Four Corners CLO (Cayman Islands), Ser. 2006-3A,
Class A, 144A(c) | | Aaa | | | 0.666% | | | 07/22/20 | | | 817 | | | | 764,869 | |
Fuel Trust, Sec’d. Notes, 144A | | Baa2 | | | 3.984% | | | 06/15/16 | | | 430 | | | | 429,942 | |
Fuel Trust, Sec’d. Notes, 144A | | Baa2 | | | 4.207% | | | 04/15/16 | | | 1,440 | | | | 1,452,224 | |
Granite Ventures Ltd. (Cayman Islands), Ser. 2005-2A,
Class A1, 144A(c) | | Aaa | | | 0.663% | | | 12/15/17 | | | 1,139 | | | | 1,113,531 | |
Gulf Stream Compass CLO Ltd. (Cayman Islands), Ser. 2004-1A, Class A, 144A(c) | | Aaa | | | 0.763% | | | 07/15/16 | | | 92 | | | | 90,879 | |
Landmark CDO Ltd. (Cayman Islands), Ser. 2006-8A,
Class A1, 144A(c) | | Aaa | | | 0.646% | | | 10/19/20 | | | 1,257 | | | | 1,194,699 | |
LCM LP (Cayman Islands), Ser. 2005-3A, Class A, 144A(c) | | Aaa | | | 0.787% | | | 06/01/17 | | | 500 | | | | 475,000 | |
Mountain Capital CLO Ltd. (Cayman Islands), Ser. 2004-3A, Class A1LA, 144A(c) | | Aaa | | | 0.872% | | | 02/15/16 | | | 165 | | | | 165,026 | |
Mountain Capital CLO Ltd. (Cayman Islands), Ser. 2005-4A,
Class A1L, 144A(c) | | Aaa | | | 0.796% | | | 03/15/18 | | | 395 | | | | 378,922 | |
SVO VOI Mortgage Corp., Ser. 2005-AA, Class A, 144A | | Aaa | | | 5.250% | | | 02/20/21 | | | 224 | | | | 229,052 | |
Trimaran CLO Ltd. (Cayman Islands), Ser. 2006-2A,
Class A1L, 144A(c) | | Aaa | | | 0.679% | | | 11/01/18 | | | 2,100 | | | | 1,994,120 | |
| | | | | | | | | | | | | | |
|
|
|
| | | | | | | | | | | | | | | | 17,648,040 | |
| | | | | | | | | | | | | | |
|
|
|
Residential Mortgage-Backed Securities — 0.4% | | | | | | | | | | | | | | | | |
CDC Mortgage Capital Trust, Ser. 2002-HE3, Class M1(c) | | B2 | | | 1.944% | | | 03/25/33 | | | 533 | | | | 315,672 | |
CDC Mortgage Capital Trust, Ser. 2003-HE1, Class M2(c) | | Ca | | | 3.219% | | | 08/25/33 | | | 42 | | | | 22,861 | |
Countrywide Asset-Backed Certificates, Ser. 2004-1, Class M1(c) | | Baa1 | | | 1.044% | | | 03/25/34 | | | 3,240 | | | | 2,284,019 | |
Credit-Based Asset Servicing and Securitization LLC, Ser. 2005-CB6, Class A3 | | B3 | | | 5.120% | | | 07/25/35 | | | 395 | | | | 324,655 | |
Equity One ABS, Inc., Ser. 2004-3, Class M1 | | Baa1 | | | 5.700% | | | 07/25/34 | | | 868 | | | | 688,542 | |
Fremont Home Loan Trust, Ser. 2004-2, Class M1(c) | | Aa2 | | | 1.149% | | | 07/25/34 | | | 506 | | | | 373,259 | |
SEE NOTES TO FINANCIAL STATEMENTS.
A10
| | | | | | |
| | | CONSERVATIVE BALANCED PORTFOLIO (continued) | | |
| |
| SCHEDULE OF INVESTMENTS | | December 31, 2011 |
| | | | | | | | | | | | | | | | |
ASSET-BACKED SECURITIES
(continued) | | Moody’s
Ratings
(Unaudited)†
| | Interest
Rate
| | | Maturity
Date
| | Principal
Amount
(000)#
| | | Value
(Note 2)
| |
| | | | | | | | | | | | | | | | | |
Residential Mortgage-Backed Securities (continued) | | | | | | | | | | | | | | | | |
HSBC Home Equity Loan Trust, Ser. 2005-2, Class M2(c) | | Aa1 | | | 0.775% | | | 01/20/35 | | $ | 385 | | | $ | 333,864 | |
Long Beach Mortgage Loan Trust, Ser. 2004-2, Class M1(c) | | B1 | | | 0.824% | | | 06/25/34 | | | 1,074 | | | | 764,149 | |
Morgan Stanley ABS Capital I, Ser. 2003-HE1, Class M1(c) | | Ba2 | | | 1.494% | | | 05/25/33 | | | 260 | | | | 196,706 | |
Morgan Stanley ABS Capital I, Ser. 2004-NC1, Class M1(c) | | Baa2 | | | 1.344% | | | 12/27/33 | | | 1,468 | | | | 1,162,585 | |
Morgan Stanley Dean Witter Capital I, Ser. 2002-HE1, Class M1(c) | | Caa3 | | | 1.194% | | | 07/25/32 | | | 782 | | | | 551,063 | |
Morgan Stanley Dean Witter Capital I, Ser. 2002-NC4, Class M1(c) | | B2 | | | 1.569% | | | 09/25/32 | | | 913 | | | | 703,920 | |
Securitized Asset Backed Receivables LLC, Ser. 2004-OP1, Class M1(c) | | Ba3 | | | 1.059% | | | 02/25/34 | | | 1,413 | | | | 1,036,493 | |
Securitized Asset Backed Receivables LLC, Ser. 2006-FR3, Class A3(c) | | Ca | | | 0.544% | | | 05/25/36 | | | 1,400 | | | | 454,089 | |
| | | | | | | | | | | | | | |
|
|
|
| | | | | | | | | | | | | | | | 9,211,877 | |
| | | | | | | | | | | | | | |
|
|
|
TOTAL ASSET-BACKED SECURITIES
(cost $29,377,550) | | | | 26,859,917 | |
| | | | | | | | | | | | | | |
|
|
|
| BANK LOANS(c) — 0.2% | | | | | | | | | | | | | | | | |
Cable | | | | | | | | | | | | | | | | |
Insight Midwest Holding LLC | | Ba3 | | | 1.270% | | | 10/06/13 | | | 678 | | | | 669,448 | |
| | | | | | | | | | | | | | |
|
|
|
Foods | | | | | | | | | | | | | | | | |
Del Monte Foods Co. | | Ba3 | | | 4.500% | | | 03/08/18 | | | 1,025 | | | | 971,045 | |
| | | | | | | | | | | | | | |
|
|
|
Healthcare & Pharmaceutical — 0.1% | | | | | | | | | | | | | | | | |
HCA, Inc. | | Ba3 | | | 3.688% | | | 05/01/18 | | | 370 | | | | 348,567 | |
HCA, Inc. | | Ba3 | | | 3.829% | | | 03/31/17 | | | 886 | | | | 839,351 | |
| | | | | | | | | | | | | | |
|
|
|
| | | | | | | | | | | | | | | | 1,187,918 | |
| | | | | | | | | | | | | | |
|
|
|
Technology — 0.1% | | | | | | | | | | | | | | | | |
First Data Corp. | | B1 | | | 3.044% | | | 09/24/14 | | | 126 | | | | 113,668 | |
First Data Corp. | | B1 | | | 3.044% | | | 09/24/14 | | | 93 | | | | 83,357 | |
First Data Corp. | | B1 | | | 4.294% | | | 03/26/18 | | | 2,055 | | | | 1,717,546 | |
Flextronics International Ltd. (Singapore) | | Ba1 | | | 2.520% | | | 10/01/14 | | | 414 | | | | 404,983 | |
Flextronics International Ltd. (Singapore) | | Ba1 | | | 2.546% | | | 10/01/14 | | | 119 | | | | 117,044 | |
| | | | | | | | | | | | | | |
|
|
|
| | | | | | | | | | | | | | | | 2,436,598 | |
| | | | | | | | | | | | | | |
|
|
|
TOTAL BANK LOANS
(cost $5,707,415) | | | | 5,265,009 | |
| | | | | | | | | | | | | | |
|
|
|
| COLLATERALIZED MORTGAGE OBLIGATIONS — 0.3% | | | | | | | | | | | | | | | | |
Banc of America Alternative Loan Trust, Ser. 2005-12, Class 3CB1 | | Caa2 | | | 6.000% | | | 01/25/36 | | | 2,597 | | | | 1,849,910 | |
Banc of America Mortgage Securities, Inc., Ser. 2005-A, Class 2A1(c) | | B2 | | | 2.875% | | | 02/25/35 | | | 616 | | | | 504,363 | |
Banc of America Mortgage Securities, Inc., Ser. 2005-B, Class 2A1(c) | | Caa1 | | | 2.835% | | | 03/25/35 | | | 640 | | | | 493,754 | |
Chase Mortgage Finance Corp., Ser. 2007-A1, Class 1A5(c) | | Ba2 | | | 2.760% | | | 02/25/37 | | | 1,558 | | | | 1,413,271 | |
Countrywide Alternative Loan Trust, Ser. 2004-18CB, Class 3A1 | | Ba3 | | | 5.250% | | | 09/25/19 | | | 858 | | | | 874,160 | |
JPMorgan Mortgage Trust, Ser. 2007-A1, Class 4A1(c) | | B1 | | | 2.782% | | | 07/25/35 | | | 982 | | | | 864,207 | |
MASTR Alternative Loans Trust, Ser. 2004-4, Class 4A1 | | Baa1 | | | 5.000% | | | 04/25/19 | | | 223 | | | | 228,328 | |
Structured Adjustable Rate Mortgage Loan Trust, Ser. 2004-1,
Class 4A3(c) | | Baa1 | | | 2.480% | | | 02/25/34 | | | 691 | | | | 616,250 | |
Washington Mutual Alternative Mortgage Pass-Through Certificates,
Ser. 2005-1, Class 3A | | CCC(d) | | | 5.000% | | | 03/25/20 | | | 568 | | | | 505,907 | |
| | | | | | | | | | | | | | |
|
|
|
TOTAL COLLATERALIZED MORTGAGE OBLIGATIONS
(cost $8,703,512) | | | | 7,350,150 | |
| | | | | | | | | | | | | | |
|
|
|
| COMMERCIAL MORTGAGE-BACKED SECURITIES — 5.0% | | | | | | | | | | | | | | |
Banc of America Commercial Mortgage, Inc., Ser. 2004-2, Class A4 | | Aaa | | | 4.153% | | | 11/10/38 | | | 3,680 | | | | 3,800,785 | |
Banc of America Commercial Mortgage, Inc., Ser. 2006-4, Class A3A | | Aaa | | | 5.600% | | | 07/10/46 | | | 2,000 | | | | 2,033,582 | |
Banc of America Commercial Mortgage, Inc., Ser. 2007-3, Class A2(c) | | Aaa | | | 5.622% | | | 06/10/49 | | | 3,779 | | | | 3,816,463 | |
SEE NOTES TO FINANCIAL STATEMENTS.
A11
| | | | | | |
| | | CONSERVATIVE BALANCED PORTFOLIO (continued) | | |
| |
| SCHEDULE OF INVESTMENTS | | December 31, 2011 |
| | | | | | | | | | | | | | | | |
COMMERCIAL MORTGAGE-BACKED SECURITIES
(continued) | | Moody’s
Ratings
(Unaudited)†
| | Interest
Rate
| | | Maturity
Date
| | Principal
Amount
(000)#
| | | Value
(Note 2)
| |
| | | | | | | | | | | | | | | | | |
Banc of America Merrill Lynch Commercial Mortgage, Inc.,
Ser. 2006-6, Class A3 | | Aaa | | | 5.369% | | | 10/10/45 | | $ | 3,400 | | | $ | 3,586,306 | |
Bear Stearns Commercial Mortgage Securities, Ser. 2006-PW11, Class A4(c) | | AAA(d) | | | 5.441% | | | 03/11/39 | | | 1,200 | | | | 1,330,325 | |
Citigroup/Deutsche Bank Commercial Mortgage Trust, Ser. 2006-CD2, Class A4(c) | | Aaa | | | 5.344% | | | 01/15/46 | | | 1,000 | | | | 1,081,202 | |
Commercial Mortgage Acceptance Corp., Ser. 1998-C2,
Class F, 144A(c) | | AA-(d) | | | 5.440% | | | 09/15/30 | | | 714 | | | | 742,481 | |
Commercial Mortgage Pass-Thru Certificates, Ser. 2006-C7,
Class A4(c) | | AAA(d) | | | 5.751% | | | 06/10/46 | | | 4,000 | | | | 4,416,992 | |
Commercial Mortgage Pass-Thru Certificates, Ser. 2006-C8,
Class A2B | | Aaa | | | 5.248% | | | 12/10/46 | | | 2,161 | | | | 2,167,505 | |
Credit Suisse First Boston Mortgage Securities Corp., Ser. 2005-C2, Class A4 | | Aa2 | | | 4.832% | | | 04/15/37 | | | 900 | | | | 947,458 | |
Credit Suisse Mortgage Capital Certificates, Ser. 2006-C1,
Class A4(c) | | AAA(d) | | | 5.419% | | | 02/15/39 | | | 4,330 | | | | 4,791,963 | |
CS First Boston Mortgage Securities Corp., Ser. 2004-C4, Class A4 | | Aaa | | | 4.283% | | | 10/15/39 | | | 107 | | | | 107,664 | |
CS First Boston Mortgage Securities Corp., Ser. 2005-C5, Class A4 | | AAA(d) | | | 5.100% | | | 08/15/38 | | | 3,000 | | | | 3,284,139 | |
CW Capital Cobalt Ltd., Ser. 2007-C3, Class A3(c) | | AAA(d) | | | 5.816% | | | 05/15/46 | | | 2,100 | | | | 2,221,498 | |
GMAC Commercial Mortgage Securities, Inc., Ser. 2005-C1,
Class A5 | | AAA(d) | | | 4.697% | | | 05/10/43 | | | 2,610 | | | | 2,824,002 | |
Greenwich Capital Commercial Funding Corp., Ser. 2005-GG5,
Class A5(c) | | Aaa | | | 5.224% | | | 04/10/37 | | | 1,400 | | | | 1,498,956 | |
Greenwich Capital Commercial Funding Corp., Ser. 2007-GG9,
Class A2 | | Aaa | | | 5.381% | | | 03/10/39 | | | 3,107 | | | | 3,124,200 | |
GS Mortgage Securities Corp. II, Ser. 2007-GG10, Class A2(c) | | Aaa | | | 5.778% | | | 08/10/45 | | | 2,004 | | | | 2,037,302 | |
JPMorgan Chase Commercial Mortgage Securities Corp.,
Ser. 2005-LDP1, Class ASB(c) | | Aaa | | | 4.853% | | | 03/15/46 | | | 2,094 | | | | 2,177,785 | |
JPMorgan Chase Commercial Mortgage Securities Corp.,
Ser. 2005-LDP2, Class A3 | | Aaa | | | 4.697% | | | 07/15/42 | | | 452 | | | | 455,835 | |
JPMorgan Chase Commercial Mortgage Securities Corp.,
Ser. 2005-LDP2, Class AM | | Aa2 | | | 4.780% | | | 07/15/42 | | | 1,000 | | | | 1,035,081 | |
JPMorgan Chase Commercial Mortgage Securities Corp.,
Ser. 2005-LDP2, Class ASB | | Aaa | | | 4.659% | | | 07/15/42 | | | 3,803 | | | | 3,956,429 | |
JPMorgan Chase Commercial Mortgage Securities Corp.,
Ser. 2005-LDP4, Class AM(c) | | Aa2 | | | 4.999% | | | 10/15/42 | | | 1,170 | | | | 1,230,867 | |
JPMorgan Chase Commercial Mortgage Securities Corp.,
Ser. 2006-CB16, Class ASB | | Aaa | | | 5.523% | | | 05/12/45 | | | 1,861 | | | | 1,990,103 | |
JPMorgan Chase Commercial Mortgage Securities Corp.,
Ser. 2006-LDP6, Class A4(c) | | Aaa | | | 5.475% | | | 04/15/43 | | | 2,436 | | | | 2,679,710 | |
JPMorgan Chase Commercial Mortgage Securities Corp.,
Ser. 2007-LD11, Class A2(c) | | Aaa | | | 5.802% | | | 06/15/49 | | | 1,991 | | | | 2,013,217 | |
JPMorgan Chase Commercial Mortgage Securities Corp. I/O,
Ser. 2006-LDP6, Class X2(c) | | Aaa | | | 0.223% | | | 04/15/43 | | | 101,779 | | | | 123,866 | |
LB-UBS Commercial Mortgage Trust, Ser. 2004-C6, Class A5(c) | | AAA(d) | | | 4.826% | | | 08/15/29 | | | 4,614 | | | | 4,691,923 | |
LB-UBS Commercial Mortgage Trust, Ser. 2005-C3, Class A5 | | Aaa | | | 4.739% | | | 07/15/30 | | | 695 | | | | 750,183 | |
LB-UBS Commercial Mortgage Trust, Ser. 2005-C7, Class AM(c) | | AA(d) | | | 5.263% | | | 11/15/40 | | | 1,390 | | | | 1,468,114 | |
LB-UBS Commercial Mortgage Trust, Ser. 2006-C1, Class A2 | | AAA(d) | | | 5.084% | | | 02/15/31 | | | 3,037 | | | | 3,068,088 | |
LB-UBS Commercial Mortgage Trust, Ser. 2006-C3, Class A2 | | Aaa | | | 5.532% | | | 03/15/32 | | | 55 | | | | 54,773 | |
LB-UBS Commercial Mortgage Trust, Ser. 2006-C3, Class A4(c) | | Aaa | | | 5.661% | | | 03/15/39 | | | 1,630 | | | | 1,791,740 | |
Merrill Lynch Mortgage Trust, Ser. 2004-KEY2, Class A3 | | Aaa | | | 4.615% | | | 08/12/39 | | | 1,900 | | | | 2,002,136 | |
Merrill Lynch Mortgage Trust, Ser. 2006-C1, Class A4(c) | | AAA(d) | | | 5.666% | | | 05/12/39 | | | 3,400 | | | | 3,791,507 | |
Merrill Lynch/Countrywide Commercial Mortgage Trust, Ser. 2006-2, Class A4 | | Aaa | | | 5.878% | | | 06/12/46 | | | 2,210 | | | | 2,466,733 | |
Merrill Lynch/Countrywide Commercial Mortgage Trust, Ser. 2007-5, Class A3 | | Aaa | | | 5.364% | | | 08/12/48 | | | 440 | | | | 455,499 | |
Merrill Lynch/Countrywide Commercial Mortgage Trust, Ser. 2007-6, Class A2 | | Aaa | | | 5.331% | | | 03/12/51 | | | 4,460 | | | | 4,472,390 | |
Morgan Stanley Capital I, Ser. 2006-HQ8, Class A4(c) | | Aaa | | | 5.417% | | | 03/12/44 | | | 1,500 | | | | 1,642,807 | |
SEE NOTES TO FINANCIAL STATEMENTS.
A12
| | | | | | |
| | | CONSERVATIVE BALANCED PORTFOLIO (continued) | | |
| |
| SCHEDULE OF INVESTMENTS | | December 31, 2011 |
| | | | | | | | | | | | | | | | |
COMMERCIAL MORTGAGE-BACKED SECURITIES
(continued) | | Moody’s
Ratings
(Unaudited)†
| | Interest
Rate
| | | Maturity
Date
| | Principal
Amount
(000)#
| | | Value
(Note 2)
| |
| | | | | | | | | | | | | | | | | |
Morgan Stanley Capital I, Ser. 2006-IQ11, Class A4(c) | | AAA(d) | | | 5.728% | | | 10/15/42 | | $ | 2,600 | | | $ | 2,870,876 | |
Morgan Stanley Capital I, Ser. 2006-IQ12, Class A4 | | AAA(d) | | | 5.332% | | | 12/15/43 | | | 4,080 | | | | 4,560,424 | |
Morgan Stanley Capital I, Ser. 2007-HQ11, Class AAB | | Aaa | | | 5.444% | | | 02/12/44 | | | 4,400 | | | | 4,610,074 | |
Morgan Stanley Capital I, Ser. 2007-T27, Class AAB(c) | | AAA(d) | | | 5.638% | | | 06/11/42 | | | 1,040 | | | | 1,099,864 | |
Wachovia Bank Commercial Mortgage Trust, Ser. 2006-C23, Class A4(c) | | Aaa | | | 5.418% | | | 01/15/45 | | | 1,300 | | | | 1,416,229 | |
Wachovia Bank Commercial Mortgage Trust, Ser. 2006-C25, Class A4(c) | | Aaa | | | 5.737% | | | 05/15/43 | | | 5,188 | | | | 5,741,260 | |
Wachovia Bank Commercial Mortgage Trust, Ser. 2007-C31, Class A4 | | Aa2 | | | 5.509% | | | 04/15/47 | | | 2,000 | | | | 2,108,744 | |
| | | | | | | | | | | | | | |
|
|
|
TOTAL COMMERCIAL MORTGAGE-BACKED SECURITIES
(cost $99,671,124) | | | | 108,539,080 | |
| | | | | | | | | | | | | | |
|
|
|
| CORPORATE BONDS — 10.7% | | | | | | | | | | | | | | | | |
Aerospace & Defense | | | | | | | | | | | | | | | | |
L-3 Communications Corp., Gtd. Notes | | Baa3 | | | 4.750% | | | 07/15/20 | | | 475 | | | | 469,324 | |
| | | | | | | | | | | | | | |
|
|
|
Airlines — 0.2% | | | | | | | | | | | | | | | | |
Continental Airlines, Inc., Pass Through Trust, Pass-thru Certs.,, Pass-thru Certs., Ser. 01A1(e) | | Baa2 | | | 6.703% | | | 06/15/21 | | | 128 | | | | 129,633 | |
Continental Airlines, Inc., Pass Through Trust, Pass-thru Certs.,, Pass-thru Certs., Ser. 981A | | Baa2 | | | 6.648% | | | 09/15/17 | | | 215 | | | | 219,513 | |
Continental Airlines, Inc., Pass Through Trust, Pass-thru Certs.,, Pass-thru Certs., Ser. A(a) | | Baa2 | | | 4.750% | | | 01/12/21 | | | 735 | | | | 746,025 | |
Continental Airlines, Inc., Pass Through Trust, Pass-thru Certs.,, Pass-thru Certs., Ser. A | | Baa2 | | | 7.250% | | | 11/10/19 | | | 672 | | | | 715,651 | |
Delta Air Lines 2011-1 Class A Pass-Through Trust, Pass-thru Certs., Ser. A(a) | | Baa2 | | | 5.300% | | | 04/15/19 | | | 1,140 | | | | 1,151,400 | |
Delta Air Lines, Inc., Pass Through Trust, Pass-thru Certs.,,
Pass-thru Certs., Ser. 071A | | Baa1 | | | 6.821% | | | 08/10/22 | | | 378 | | | | 394,696 | |
Delta Air Lines, Inc., Pass Through Trust, Pass-thru Certs.,,
Pass-thru Certs., Ser. 2A(a) | | Baa2 | | | 4.950% | | | 05/23/19 | | | 662 | | | | 670,768 | |
Southwest Airlines Co., Sr. Unsec’d. Notes | | Baa3 | | | 6.500% | | | 03/01/12 | | | 965 | | | | 972,742 | |
| | | | | | | | | | | | | | |
|
|
|
| | | | | | | | | | | | | | | | 5,000,428 | |
| | | | | | | | | | | | | | |
|
|
|
Automotive | | | | | | | | | | | | | | | | |
Harley-Davidson Funding Corp., Gtd. Notes, 144A, MTN. | | Baa1 | | | 5.750% | | | 12/15/14 | | | 495 | | | | 534,392 | |
Johnson Controls, Inc., Sr. Unsec’d. Notes | | Baa1 | | | 5.500% | | | 01/15/16 | | | 235 | | | | 262,941 | |
| | | | | | | | | | | | | | |
|
|
|
| | | | | | | | | | | | | | | | 797,333 | |
| | | | | | | | | | | | | | |
|
|
|
Banking — 3.0% | | | | | | | | | | | | | | | | |
American Express Co., Sr. Unsec’d. Notes | | A3 | | | 8.125% | | | 05/20/19 | | | 2,000 | | | | 2,585,742 | |
American Express Credit Corp., Sr. Unsec’d. Notes, MTN | | A2 | | | 2.800% | | | 09/19/16 | | | 1,210 | | | | 1,215,929 | |
Banco Bradesco SA (Brazil), Sub. Notes | | A2 | | | 8.750% | | | 10/24/13 | | | 1,690 | | | | 1,850,550 | |
Bank of America Corp., Jr. Sub. Notes, Ser. K(a)(c) | | Ba3 | | | 8.000% | | | 12/29/49 | | | 2,100 | | | | 1,880,424 | |
Bank of America Corp., Sr. Unsec’d. Notes | | Baa1 | | | 4.500% | | | 04/01/15 | | | 185 | | | | 178,522 | |
Bank of America Corp., Sr. Unsec’d. Notes(f) | | Baa1 | | | 6.000% | | | 09/01/17 | | | 1,330 | | | | 1,298,915 | |
Bank of America Corp., Sr. Unsec’d. Notes, Ser. 1 | | Baa1 | | | 3.750% | | | 07/12/16 | | | 790 | | | | 731,476 | |
Bank of America Corp., Sr. Unsec’d. Notes, Ser. L, MTN | | Baa1 | | | 5.650% | | | 05/01/18 | | | 105 | | | | 100,039 | |
Bank of America NA, Sub. Notes | | A3 | | | 5.300% | | | 03/15/17 | | | 850 | | | | 766,624 | |
Bank of America NA, Sub. Notes | | A3 | | | 6.000% | | | 10/15/36 | | | 805 | | | | 669,546 | |
Bank of Montreal (Canada), Covered Notes, 144A | | Aaa | | | 1.300% | | | 10/31/14 | | | 3,000 | | | | 2,994,852 | |
Bank of Nova Scotia (Canada), Covered Notes, 144A | | Aaa | | | 1.250% | | | 11/07/14 | | | 2,750 | | | | 2,738,381 | |
Bear Stearns Cos., Inc. (The), Sr. Unsec’d. Notes | | Aa3 | | | 5.300% | | | 10/30/15 | | | 550 | | | | 591,464 | |
Bear Stearns Cos., Inc. (The), Sr. Unsec’d. Notes | | Aa3 | | | 6.400% | | | 10/02/17 | | | 270 | | | | 301,652 | |
Bear Stearns Cos., Inc. (The), Sr. Unsec’d. Notes | | Aa3 | | | 7.250% | | | 02/01/18 | | | 1,135 | | | | 1,330,618 | |
Capital One Bank Corp., Sub. Notes | | Baa1 | | | 6.500% | | | 06/13/13 | | | 10 | | | | 10,548 | |
Capital One Capital V, Ltd. Gtd. Notes | | Baa3 | | | 10.250% | | | 08/15/39 | | | 555 | | | | 575,813 | |
Capital One Capital VI, Ltd. Gtd. Notes | | Baa3 | | | 8.875% | | | 05/15/40 | | | 1,130 | | | | 1,172,817 | |
Citigroup, Inc., Sr. Unsec’d. Notes | | A3 | | | 4.500% | | | 01/14/22 | | | 2,125 | | | | 2,044,299 | |
SEE NOTES TO FINANCIAL STATEMENTS.
A13
| | | | | | |
| | | CONSERVATIVE BALANCED PORTFOLIO (continued) | | |
| |
| SCHEDULE OF INVESTMENTS | | December 31, 2011 |
| | | | | | | | | | | | | | | | |
CORPORATE BONDS
(continued) | | Moody’s
Ratings
(Unaudited)†
| | Interest
Rate
| | | Maturity
Date
| | Principal
Amount
(000)#
| | | Value
(Note 2)
| |
| | | | | | | | | | | | | | | | | |
Banking (continued) | | | | | | | | | | | | | | | | |
Citigroup, Inc., Sr. Unsec’d. Notes(a) | | A3 | | | 5.375% | | | 08/09/20 | | $ | 595 | | | $ | 611,821 | |
Citigroup, Inc., Sr. Unsec’d. Notes | | A3 | | | 6.875% | | | 03/05/38 | | | 320 | | | | 351,556 | |
Citigroup, Inc., Sr. Unsec’d. Notes | | A3 | | | 8.125% | | | 07/15/39 | | | 850 | | | | 1,040,682 | |
Citigroup, Inc., Sub. Notes(a) | | Baa1 | | | 5.625% | | | 08/27/12 | | | 1,900 | | | | 1,928,696 | |
Citigroup, Inc., Sub. Notes | | Baa1 | | | 6.125% | | | 08/25/36 | | | 725 | | | | 627,132 | |
Citigroup, Inc., Unsec’d. Notes(a) | | A3 | | | 8.500% | | | 05/22/19 | | | 1,195 | | | | 1,406,618 | |
Countrywide Financial Corp., Gtd. Notes, MTN(a)(e) | | Baa1 | | | 5.800% | | | 06/07/12 | | | 1,160 | | | | 1,162,441 | |
DEPFA ACS Bank (Ireland), Covered Notes, 144A | | Aa3 | | | 5.125% | | | 03/16/37 | | | 1,325 | | | | 947,201 | |
Discover Bank, Sub. Notes | | Ba1 | | | 7.000% | | | 04/15/20 | | | 485 | | | | 507,440 | |
Discover Bank, Sub. Notes | | Ba1 | | | 8.700% | | | 11/18/19 | | | 900 | | | | 1,026,167 | |
Goldman Sachs Group, Inc. (The), Sr. Notes | | A1 | | | 6.250% | | | 02/01/41 | | | 220 | | | | 215,826 | |
Goldman Sachs Group, Inc. (The), Sr. Unsec’d. Notes | | A1 | | | 5.250% | | | 07/27/21 | | | 2,305 | | | | 2,248,620 | |
Goldman Sachs Group, Inc. (The), Sr. Unsec’d. Notes | | A1 | | | 5.450% | | | 11/01/12 | | | 580 | | | | 589,848 | |
Goldman Sachs Group, Inc. (The), Sr. Unsec’d. Notes, MTN | | A1 | | | 6.000% | | | 06/15/20 | | | 700 | | | | 717,053 | |
Goldman Sachs Group, Inc. (The), Sub. Notes | | A2 | | | 5.625% | | | 01/15/17 | | | 765 | | | | 750,153 | |
Goldman Sachs Group, Inc. (The), Sub. Notes | | A2 | | | 6.450% | | | 05/01/36 | | | 1,770 | | | | 1,597,108 | |
Goldman Sachs Group, Inc. (The), Sub. Notes | | A2 | | | 6.750% | | | 10/01/37 | | | 113 | | | | 105,148 | |
HSBC Holdings PLC (United Kingdom), Sr. Unsec’d. Notes(a) | | Aa2 | | | 4.875% | | | 01/14/22 | | | 1,730 | | | | 1,828,425 | |
HSBC Holdings PLC (United Kingdom), Sr. Unsec’d. Notes | | Aa2 | | | 5.100% | | | 04/05/21 | | | 920 | | | | 977,586 | |
Huntington BancShares, Inc., Sub. Notes | | Baa2 | | | 7.000% | | | 12/15/20 | | | 150 | | | | 170,000 | |
JPMorgan Chase & Co., Ser. 1(a)(c) | | Baa1 | | | 7.900% | | | 04/29/49 | | | 2,000 | | | | 2,129,380 | |
JPMorgan Chase & Co., Sr. Unsec’d. Notes | | Aa3 | | | 3.150% | | | 07/05/16 | | | 1,935 | | | | 1,944,056 | |
JPMorgan Chase & Co., Sr. Unsec’d. Notes | | Aa3 | | | 4.250% | | | 10/15/20 | | | 2,360 | | | | 2,376,574 | |
JPMorgan Chase Capital XXVII, Ltd. Gtd. Notes, Ser. AA | | A2 | | | 7.000% | | | 11/01/39 | | | 1,500 | | | | 1,509,375 | |
Lloyds TSB Bank PLC (United Kingdom), Gtd. Notes., 144A, MTN | | A1 | | | 5.800% | | | 01/13/20 | | | 1,770 | | | | 1,680,399 | |
Morgan Stanley, Sr. Unsec’d. Notes(a) | | A2 | | | 5.300% | | | 03/01/13 | | | 30 | | | | 30,367 | |
Morgan Stanley, Sr. Unsec’d. Notes | | A2 | | | 5.500% | | | 07/28/21 | | | 635 | | | | 587,143 | |
Morgan Stanley, Sr. Unsec’d. Notes, MTN | | A2 | | | 5.625% | | | 09/23/19 | | | 2,110 | | | | 1,954,027 | |
Morgan Stanley, Sr. Unsec’d. Notes, MTN | | A2 | | | 5.950% | | | 12/28/17 | | | 495 | | | | 471,604 | |
Morgan Stanley, Sr. Unsec’d. Notes, MTN | | A2 | | | 6.625% | | | 04/01/18 | | | 100 | | | | 98,744 | |
Morgan Stanley, Sr. Unsec’d. Notes, Ser. G, MTN | | A2 | | | 5.450% | | | 01/09/17 | | | 2,530 | | | | 2,435,793 | |
MUFG Capital Finance 1 Ltd. (Cayman Islands), Gtd. Notes.(c) | | Ba1 | | | 6.346% | | | 07/25/49 | | | 800 | | | | 812,513 | |
National Bank of Canada (Canada), Covered Notes, 144A | | Aaa | | | 2.200% | | | 10/19/16 | | | 1,045 | | | | 1,053,652 | |
PNC Funding Corp., Gtd. Notes. | | A3 | | | 2.700% | | | 09/19/16 | | | 925 | | | | 941,627 | |
PNC Funding Corp., Gtd. Notes. | | A3 | | | 6.700% | | | 06/10/19 | | | 390 | | | | 475,816 | |
Royal Bank of Scotland Group PLC (United Kingdom),
Sr. Unsec’d. Notes, MTN | | A3 | | | 6.400% | | | 10/21/19 | | | 1,775 | | | | 1,661,734 | |
Royal Bank of Scotland PLC (The) (United Kingdom), Gtd. Notes, Ser. 2 | | A2 | | | 3.400% | | | 08/23/13 | | | 95 | | | | 92,422 | |
Toronto-Dominion Bank (The) (Canada), Covered Notes, 144A(a) | | Aaa | | | 1.625% | | | 09/14/16 | | | 2,600 | | | | 2,565,776 | |
USB Capital XIII Trust, Ltd. Gtd. Notes | | A2 | | | 6.625% | | | 12/15/39 | | | 755 | | | | 767,050 | |
| | | | | | | | | | | | | | |
|
|
|
| | | | | | | | | | | | | | | | 65,435,784 | |
| | | | | | | | | | | | | | |
|
|
|
Brokerage | | | | | | | | | | | | | | | | |
Lehman Brothers Holdings, Inc., Sr. Unsec’d. Notes, MTN(g) | | NR | | | 5.250% | | | 02/06/12 | | | 1,850 | | | | 474,062 | |
Lehman Brothers Holdings, Inc., Sr. Unsec’d. Notes, MTN(g) | | NR | | | 6.875% | | | 05/02/18 | | | 700 | | | | 185,500 | |
| | | | | | | | | | | | | | |
|
|
|
| | | | | | | | | | | | | | | | 659,562 | |
| | | | | | | | | | | | | | |
|
|
|
Cable — 0.4% | | | | | | | | | | | | | | | | |
Charter Communications Operating LLC, Sec’d. Notes, 144A | | Ba2 | | | 8.000% | | | 04/30/12 | | | 1,940 | | | | 1,978,800 | |
Comcast Cable Holdings LLC, Gtd. Notes | | Baa1 | | | 9.875% | | | 06/15/22 | | | 1,440 | | | | 2,063,991 | |
Comcast Corp., Gtd. Notes | | Baa1 | | | 6.400% | | | 05/15/38 | | | 310 | | | | 372,444 | |
Comcast Corp., Gtd. Notes | | Baa1 | | | 6.950% | | | 08/15/37 | | | 290 | | | | 368,969 | |
DIRECTV Holdings LLC/DIRECTV Financing Co., Inc., Gtd. Notes | | Baa2 | | | 3.500% | | | 03/01/16 | | | 605 | | | | 623,709 | |
DIRECTV Holdings LLC/DIRECTV Financing Co., Inc., Gtd. Notes | | Baa2 | | | 3.550% | | | 03/15/15 | | | 165 | | | | 171,744 | |
DIRECTV Holdings LLC/DIRECTV Financing Co., Inc., Gtd. Notes | | Baa2 | | | 4.750% | | | 10/01/14 | | | 1,755 | | | | 1,895,690 | |
Time Warner Cable, Inc., Gtd. Notes | | Baa2 | | | 7.500% | | | 04/01/14 | | | 345 | | | | 386,281 | |
| | | | | | | | | | | | | | |
|
|
|
| | | | | | | | | | | | | | | | 7,861,628 | |
| | | | | | | | | | | | | | |
|
|
|
SEE NOTES TO FINANCIAL STATEMENTS.
A14
| | | | | | |
| | | CONSERVATIVE BALANCED PORTFOLIO (continued) | | |
| |
| SCHEDULE OF INVESTMENTS | | December 31, 2011 |
| | | | | | | | | | | | | | | | |
CORPORATE BONDS
(continued) | | Moody’s
Ratings
(Unaudited)†
| | Interest
Rate
| | | Maturity
Date
| | Principal
Amount
(000)#
| | | Value
(Note 2)
| |
| | | | | | | | | | | | | | | | | |
Capital Goods — 0.2% | | | | | | | | | | | | | | | | |
ERAC USA Finance LLC, Gtd. Notes, 144A
(original cost $459,646; purchased 10/10/07)(e)(h) | | Baa1 | | | 5.800% | | | 10/15/12 | | $ | 460 | | | $ | 475,896 | |
ERAC USA Finance LLC, Gtd. Notes, 144A
(original cost $1,195,904; purchased 10/10/07)(e)(h) | | Baa1 | | | 6.375% | | | 10/15/17 | | | 1,198 | | | | 1,384,352 | |
ERAC USA Finance LLC, Gtd. Notes, 144A
(original cost $386,623; purchased 10/10/07)(e)(h) | | Baa1 | | | 7.000% | | | 10/15/37 | | | 390 | | | | 469,199 | |
General Electric Co., Sr. Unsec’d. Notes | | Aa2 | | | 5.250% | | | 12/06/17 | | | 320 | | | | 367,284 | |
Illinois Tool Works, Inc., Sr. Unsec’d. Notes, 144A | | A1 | | | 4.875% | | | 09/15/41 | | | 180 | | | | 204,811 | |
United Technologies Corp., Sr. Unsec’d. Notes | | A2 | | | 5.375% | | | 12/15/17 | | | 515 | | | | 609,207 | |
Xylem, Inc., Gtd. Notes, 144A | | Baa2 | | | 4.875% | | | 10/01/21 | | | 1,060 | | | | 1,123,341 | |
| | | | | | | | | | | | | | |
|
|
|
| | | | | | | | | | | | | | | | 4,634,090 | |
| | | | | | | | | | | | | | |
|
|
|
Chemicals — 0.2% | | | | | | | | | | | | | | | | |
Dow Chemical Co. (The), Sr. Unsec’d. Notes | | Baa3 | | | 7.600% | | | 05/15/14 | | | 1,600 | | | | 1,809,309 | |
Dow Chemical Co. (The), Sr. Unsec’d. Notes | | Baa3 | | | 9.400% | | | 05/15/39 | | | 35 | | | | 52,609 | |
Ecolab, Inc., Sr. Unsec’d. Notes(a) | | Baa1 | | | 5.500% | | | 12/08/41 | | | 290 | | | | 321,361 | |
ICI Wilmington, Inc., Gtd. Notes | | Baa1 | | | 5.625% | | | 12/01/13 | | | 780 | | | | 825,863 | |
PPG Industries, Inc., Sr. Unsec’d. Notes | | Baa1 | | | 5.500% | | | 11/15/40 | | | 135 | | | | 156,350 | |
Union Carbide Corp., Sr. Unsec’d. Notes | | Baa3 | | | 7.500% | | | 06/01/25 | | | 500 | | | | 590,116 | |
| | | | | | | | | | | | | | |
|
|
|
| | | | | | | | | | | | | | | | 3,755,608 | |
| | | | | | | | | | | | | | |
|
|
|
Consumer — 0.2% | | | | | | | | | | | | | | | | |
Newell Rubbermaid, Inc., Sr. Unsec’d. Notes | | Baa3 | | | 6.250% | | | 04/15/18 | | | 1,600 | | | | 1,818,712 | |
Sealy Mattress Co., Sr. Sec’d. Notes, 144A | | Ba3 | | | 10.875% | | | 04/15/16 | | | 1,104 | | | | 1,206,120 | |
VF Corp., Sr. Unsec’d. Notes | | A3 | | | 3.500% | | | 09/01/21 | | | 520 | | | | 540,176 | |
| | | | | | | | | | | | | | |
|
|
|
| | | | | | | | | | | | | | | | 3,565,008 | |
| | | | | | | | | | | | | | |
|
|
|
Electric — 0.8% | | | | | | | | | | | | | | | | |
Arizona Public Service Co., Sr. Unsec’d. Notes | | Baa2 | | | 6.250% | | | 08/01/16 | | | 170 | | | | 199,499 | |
Baltimore Gas & Electric Co., Sr. Unsec’d. Notes | | Baa2 | | | 6.350% | | | 10/01/36 | | | 530 | | | | 669,447 | |
CenterPoint Energy Houston Electric LLC, Genl. Ref. Mtge., Ser. J2 | | A3 | | | 5.700% | | | 03/15/13 | | | 1,070 | | | | 1,123,086 | |
CenterPoint Energy Houston Electric LLC, Genl. Ref. Mtge., Ser. K2 | | A3 | | | 6.950% | | | 03/15/33 | | | 300 | | | | 409,107 | |
Consolidated Edison Co. of New York, Inc., Sr. Unsec’d. Notes, Ser. 09-C | | A3 | | | 5.500% | | | 12/01/39 | | | 145 | | | | 176,788 | |
Consumers Energy Co., First Mtge. Bonds, Ser. D | | A3 | | | 5.375% | | | 04/15/13 | | | 435 | | | | 457,710 | |
Duke Energy Carolinas LLC, First Mtge. Bonds(a) | | A1 | | | 6.050% | | | 04/15/38 | | | 530 | | | | 693,840 | |
El Paso Electric Co., Sr. Unsec’d. Notes | | Baa2 | | | 6.000% | | | 05/15/35 | | | 845 | | | | 997,848 | |
Empresa Nacional de Electricidad SA (Chile), Sr. Unsec’d. Notes | | Baa2 | | | 8.625% | | | 08/01/15 | | | 1,160 | | | | 1,382,285 | |
ENEL Finance International SA (Luxembourg), Gtd. Notes, 144A | | A3 | | | 6.000% | | | 10/07/39 | | | 1,260 | | | | 1,014,106 | |
Exelon Corp., Sr. Unsec’d. Notes | | Baa1 | | | 4.900% | | | 06/15/15 | | | 195 | | | | 210,108 | |
Exelon Generation Co. LLC, Sr. Unsec’d. Notes | | A3 | | | 6.250% | | | 10/01/39 | | | 1,375 | | | | 1,675,427 | |
Florida Power & Light Co., First Mtge. Bonds | | Aa3 | | | 5.950% | | | 10/01/33 | | | 380 | | | | 486,009 | |
Georgia Power Co., Sr. Unsec’d. Notes, Ser. B | | A3 | | | 5.700% | | | 06/01/17 | | | 470 | | | | 557,706 | |
Iberdrola International BV (Netherlands), Gtd. Notes | | A3 | | | 6.750% | | | 09/15/33 | | | 140 | | | | 148,858 | |
Indiana Michigan Power Co., Sr. Unsec’d. Notes, Ser. INDF | | Baa2 | | | 5.050% | | | 11/15/14 | | | 575 | | | | 626,721 | |
MidAmerican Energy Holdings Co., Sr. Unsec’d. Notes | | Baa1 | | | 5.950% | | | 05/15/37 | | | 325 | | | | 384,054 | |
Nevada Power Co., Genl. Ref. Mtge., Ser. O | | Baa2 | | | 6.500% | | | 05/15/18 | | | 1,210 | | | | 1,451,849 | |
Niagara Mohawk Power Corp., Sr. Unsec’d. Notes, 144A | | A3 | | | 4.881% | | | 08/15/19 | | | 545 | | | | 609,462 | |
NSTAR, Sr. Unsec’d. Notes | | A2 | | | 4.500% | | | 11/15/19 | | | 605 | | | | 669,338 | |
Oncor Electric Delivery Co. LLC, Sr. Sec’d. Notes(a) | | Baa1 | | | 6.375% | | | 01/15/15 | | | 465 | | | | 531,347 | |
Oncor Electric Delivery Co. LLC, Sr. Sec’d. Notes | | Baa1 | | | 7.000% | | | 09/01/22 | | | 30 | | | | 38,429 | |
Public Service Co. of New Mexico, Sr. Unsec’d. Notes | | Baa3 | | | 7.950% | | | 05/15/18 | | | 135 | | | | 157,805 | |
Public Service Electric & Gas Co., Sr. Sec’d. Notes, MTN. | | A2 | | | 5.800% | | | 05/01/37 | | | 515 | | | | 660,358 | |
Southern California Edison Co., Ser. 04-F | | A1 | | | 4.650% | | | 04/01/15 | | | 610 | | | | 673,871 | |
Xcel Energy, Inc., Sr. Unsec’d. Notes(a) | | Baa1 | | | 4.800% | | | 09/15/41 | | | 480 | | | | 523,071 | |
Xcel Energy, Inc., Sr. Unsec’d. Notes | | Baa1 | | | 5.613% | | | 04/01/17 | | | 263 | | | | 298,301 | |
| | | | | | | | | | | | | | |
|
|
|
| | | | | | | | | | | | | | | | 16,826,430 | |
| | | | | | | | | | | | | | |
|
|
|
SEE NOTES TO FINANCIAL STATEMENTS.
A15
| | | | | | |
| | | CONSERVATIVE BALANCED PORTFOLIO (continued) | | |
| |
| SCHEDULE OF INVESTMENTS | | December 31, 2011 |
| | | | | | | | | | | | | | | | |
CORPORATE BONDS
(continued) | | Moody’s
Ratings
(Unaudited)†
| | Interest
Rate
| | | Maturity
Date
| | Principal
Amount
(000)#
| | | Value
(Note 2)
| |
| | | | | | | | | | | | | | | | | |
Energy – Integrated — 0.1% | | | | | | | | | | | | | | | | |
BP Capital Markets PLC (United Kingdom), Gtd. Notes | | A2 | | | 4.500% | | | 10/01/20 | | $ | 480 | | | $ | 528,658 | |
BP Capital Markets PLC (United Kingdom), Gtd. Notes | | A2 | | | 5.250% | | | 11/07/13 | | | 960 | | | | 1,029,661 | |
| | | | | | | | | | | | | | |
|
|
|
| | | | | | | | | | | | | | | | 1,558,319 | |
| | | | | | | | | | | | | | |
|
|
|
Energy – Other — 0.3% | | | | | | | | | | | | | | | | |
Anadarko Petroleum Corp., Sr. Unsec’d. Notes | | Ba1 | | | 6.375% | | | 09/15/17 | | | 1,070 | | | | 1,240,273 | |
Anadarko Petroleum Corp., Sr. Unsec’d. Notes | | Ba1 | | | 6.450% | | | 09/15/36 | | | 305 | | | | 347,731 | |
Anadarko Petroleum Corp., Sr. Unsec’d. Notes | | Ba1 | | | 6.950% | | | 06/15/19 | | | 225 | | | | 268,610 | |
Nabors Industries, Inc., Gtd. Notes, 144A | | Baa2 | | | 4.625% | | | 09/15/21 | | | 890 | | | | 903,977 | |
Pioneer Natural Resources Co., Sr. Unsec’d. Notes(a) | | Ba1 | | | 6.875% | | | 05/01/18 | | | 1,450 | | | | 1,639,915 | |
Transocean, Inc. (Cayman Islands), Gtd. Notes | | Baa3 | | | 7.350% | | | 12/15/41 | | | 140 | | | | 155,516 | |
Weatherford International Ltd. (Bermuda), Gtd. Notes(a) | | Baa2 | | | 5.125% | | | 09/15/20 | | | 685 | | | | 711,837 | |
Weatherford International Ltd. (Bermuda), Gtd. Notes | | Baa2 | | | 6.500% | | | 08/01/36 | | | 25 | | | | 27,227 | |
Woodside Finance Ltd. (Australia), Gtd. Notes, 144A | | Baa1 | | | 5.000% | | | 11/15/13 | | | 1,660 | | | | 1,740,308 | |
| | | | | | | | | | | | | | |
|
|
|
| | | | | | | | | | | | | | | | 7,035,394 | |
| | | | | | | | | | | | | | |
|
|
|
Foods — 0.4% | | | | | | | | | | | | | | | | |
Anheuser-Busch InBev Worldwide, Inc., Gtd. Notes | | Baa1 | | | 8.000% | | | 11/15/39 | | | 1,160 | | | | 1,797,468 | |
Anheuser-Busch InBev Worldwide, Inc., Gtd. Notes | | Baa1 | | | 8.200% | | | 01/15/39 | | | 230 | | | | 362,611 | |
ARAMARK Corp., Gtd. Notes | | B3 | | | 8.500% | | | 02/01/15 | | | 650 | | | | 666,250 | |
Beam, Inc., Sr. Unsec’d. Notes | | Baa2 | | | 6.375% | | | 06/15/14 | | | 708 | | | | 774,155 | |
Bunge Ltd. Finance Corp., Gtd. Notes | | Baa2 | | | 5.350% | | | 04/15/14 | | | 1,000 | | | | 1,048,853 | |
Bunge Ltd. Finance Corp., Gtd. Notes | | Baa2 | | | 8.500% | | | 06/15/19 | | | 860 | | | | 1,046,826 | |
Cargill, Inc., Sr. Unsec’d. Notes, 144A
(original cost $646,913; purchased 11/19/07)(e)(h) | | A2 | | | 6.000% | | | 11/27/17 | | | 650 | | | | 766,273 | |
Delhaize Group SA (Belgium), Gtd. Notes | | Baa3 | | | 6.500% | | | 06/15/17 | | | 460 | | | | 540,649 | |
J.M. Smucker Co. (The), Gtd. Notes | | A3 | | | 3.500% | | | 10/15/21 | | | 410 | | | | 419,450 | |
Kroger Co. (The), Gtd. Notes | | Baa2 | | | 6.750% | | | 04/15/12 | | | 215 | | | | 218,581 | |
Safeway, Inc., Sr. Unsec’d. Notes | | Baa2 | | | 4.750% | | | 12/01/21 | | | 480 | | | | 491,694 | |
Smithfield Foods, Inc., Sr. Sec’d. Notes | | Ba2 | | | 10.000% | | | 07/15/14 | | | 695 | | | | 807,937 | |
Tyson Foods, Inc., Gtd. Notes(a) | | Ba1 | | | 6.850% | | | 04/01/16 | | | 785 | | | | 861,537 | |
| | | | | | | | | | | | | | |
|
|
|
| | | | | | | | | | | | | | | | 9,802,284 | |
| | | | | | | | | | | | | | |
|
|
|
Healthcare & Pharmaceutical — 0.3% | | | | | | | | | | | | | | | | |
Amgen, Inc., Sr. Unsec’d. Notes | | Baa1 | | | 5.150% | | | 11/15/41 | | | 1,590 | | | | 1,648,328 | |
Aristotle Holding, Inc., Gtd. Notes, 144A | | Baa3 | | | 2.750% | | | 11/21/14 | | | 2,060 | | | | 2,084,975 | |
AstraZeneca PLC (United Kingdom), Sr. Unsec’d. Notes | | A1 | | | 6.450% | | | 09/15/37 | | | 480 | | | | 647,435 | |
Genentech, Inc., Sr. Unsec’d. Notes | | AA-(d) | | | 4.750% | | | 07/15/15 | | | 270 | | | | 301,169 | |
Gilead Sciences, Inc., Sr. Unsec’d. Notes | | Baa1 | | | 5.650% | | | 12/01/41 | | | 470 | | | | 520,367 | |
Laboratory Corp. of America Holdings, Sr. Unsec’d. Notes | | Baa2 | | | 5.625% | | | 12/15/15 | | | 560 | | | | 623,418 | |
Merck & Co., Inc., Sr. Unsec’d. Notes | | Aa3 | | | 5.950% | | | 12/01/28 | | | 205 | | | | 256,842 | |
Watson Pharmaceuticals, Inc., Sr. Unsec’d. Notes | | Baa3 | | | 6.125% | | | 08/15/19 | | | 440 | | | | 517,462 | |
| | | | | | | | | | | | | | |
|
|
|
| | | | | | | | | | | | | | | | 6,599,996 | |
| | | | | | | | | | | | | | |
|
|
|
Healthcare Insurance — 0.3% | | | | | | | | | | | | | | | | |
Aetna, Inc., Sr. Unsec’d. Notes | | Baa1 | | | 6.625% | | | 06/15/36 | | | 480 | | | | 596,106 | |
CIGNA Corp., Sr. Unsec’d. Notes | | Baa2 | | | 5.875% | | | 03/15/41 | | | 540 | | | | 571,332 | |
CIGNA Corp., Sr. Unsec’d. Notes | | Baa2 | | | 6.150% | | | 11/15/36 | | | 640 | | | | 686,524 | |
Coventry Health Care, Inc., Sr. Unsec’d. Notes | | Baa3 | | | 6.125% | | | 01/15/15 | | | 1,200 | | | | 1,313,755 | |
UnitedHealth Group, Inc., Sr. Unsec’d. Notes | | A3 | | | 6.000% | | | 06/15/17 | | | 115 | | | | 135,262 | |
UnitedHealth Group, Inc., Sr. Unsec’d. Notes | | A3 | | | 6.500% | | | 06/15/37 | | | 400 | | | | 508,734 | |
UnitedHealth Group, Inc., Sr. Unsec’d. Notes | | A3 | | | 6.625% | | | 11/15/37 | | | 410 | | | | 526,370 | |
WellPoint, Inc., Sr. Unsec’d. Notes | | Baa1 | | | 5.000% | | | 12/15/14 | | | 1,085 | | | | 1,185,458 | |
| | | | | | | | | | | | | | |
|
|
|
| | | | | | | | | | | | | | | | 5,523,541 | |
| | | | | | | | | | | | | | |
|
|
|
Insurance — 0.8% | | | | | | | | | | | | | | | | |
Allied World Assurance Co. Holdings Ltd. (Switzerland), Gtd. Notes | | Baa1 | | | 5.500% | | | 11/15/20 | | | 480 | | | | 480,866 | |
American International Group, Inc., Sr. Unsec’d. Notes | | Baa1 | | | 4.250% | | | 05/15/13 | | | 655 | | | | 654,103 | |
American International Group, Inc., Sr. Unsec’d. Notes | | Baa1 | | | 6.400% | | | 12/15/20 | | | 910 | | | | 918,399 | |
American International Group, Inc., Sr. Unsec’d. Notes | | Baa1 | | | 8.250% | | | 08/15/18 | | | 900 | | | | 952,651 | |
SEE NOTES TO FINANCIAL STATEMENTS.
A16
| | | | | | |
| | | CONSERVATIVE BALANCED PORTFOLIO (continued) | | |
| |
| SCHEDULE OF INVESTMENTS | | December 31, 2011 |
| | | | | | | | | | | | | | | | |
CORPORATE BONDS
(continued) | | Moody’s
Ratings
(Unaudited)†
| | Interest
Rate
| | | Maturity
Date
| | Principal
Amount
(000)#
| | | Value
(Note 2)
| |
| | | | | | | | | | | | | | | | | |
Insurance (continued) | | | | | | | | | | | | | | | | |
Axis Specialty Finance LLC, Gtd. Notes | | Baa1 | | | 5.875% | | | 06/01/20 | | $ | 990 | | | $ | 1,017,820 | |
Chubb Corp. (The)(a)(c) | | A3 | | | 6.375% | | | 03/29/67 | | | 1,260 | | | | 1,244,250 | |
Liberty Mutual Group, Inc., Bonds, 144A | | Baa2 | | | 7.000% | | | 03/15/34 | | | 910 | | | | 966,953 | |
Lincoln National Corp.(c) | | Ba1 | | | 6.050% | | | 04/20/67 | | | 250 | | | | 208,125 | |
Lincoln National Corp., Sr. Unsec’d. Notes | | Baa2 | | | 6.300% | | | 10/09/37 | | | 476 | | | | 490,494 | |
Lincoln National Corp., Sr. Unsec’d. Notes | | Baa2 | | | 7.000% | | | 06/15/40 | | | 660 | | | | 746,155 | |
Lincoln National Corp., Sr. Unsec’d. Notes | | Baa2 | | | 8.750% | | | 07/01/19 | | | 505 | | | | 614,261 | |
MetLife, Inc., Sr. Unsec’d. Notes | | A3 | | | 5.700% | | | 06/15/35 | | | 960 | | | | 1,071,499 | |
MetLife, Inc., Sr. Unsec’d. Notes | | A3 | | | 6.375% | | | 06/15/34 | | | 85 | | | | 100,478 | |
MetLife, Inc., Sr. Unsec’d. Notes(a) | | A3 | | | 6.750% | | | 06/01/16 | | | 270 | | | | 311,050 | |
New York Life Insurance Co., Sub. Notes, 144A | | Aa2 | | | 6.750% | | | 11/15/39 | | | 650 | | | | 830,015 | |
Northwestern Mutual Life Insurance, Notes, 144A(a) | | Aa2 | | | 6.063% | | | 03/30/40 | | | 350 | | | | 420,151 | |
Ohio National Financial Services, Inc., Sr. Notes, 144A | | Baa1 | | | 6.350% | | | 04/01/13 | | | 1,000 | | | | 1,044,837 | |
Ohio National Financial Services, Inc., Sr. Notes, 144A | | Baa1 | | | 6.375% | | | 04/30/20 | | | 640 | | | | 695,992 | |
Pacific Life Insurance Co., Sub. Notes, 144A | | A3 | | | 9.250% | | | 06/15/39 | | | 870 | | | | 1,158,552 | |
Progressive Corp. (The)(c) | | A2 | | | 6.700% | | | 06/15/37 | | | 715 | | | | 722,150 | |
Teachers Insurance & Annuity Association of America, Sub. Notes, 144A | | Aa2 | | | 6.850% | | | 12/16/39 | | | 1,430 | | | | 1,835,265 | |
Unum Group, Sr. Unsec’d. Notes | | Baa3 | | | 5.625% | | | 09/15/20 | | | 315 | | | | 324,346 | |
W.R. Berkley Corp., Sr. Unsec’d. Notes | | Baa2 | | | 5.600% | | | 05/15/15 | | | 705 | | | | 747,931 | |
W.R. Berkley Corp., Sr. Unsec’d. Notes | | Baa2 | | | 6.150% | | | 08/15/19 | | | 575 | | | | 605,513 | |
XL Group PLC (Ireland), Sr. Unsec’d. Notes | | Baa2 | | | 5.250% | | | 09/15/14 | | | 110 | | | | 116,327 | |
| | | | | | | | | | | | | | |
|
|
|
| | | | | | | | | | | | | | | | 18,278,183 | |
| | | | | | | | | | | | | | |
|
|
|
Lodging — 0.2% | | | | | | | | | | | | | | | | |
Host Marriott LP, Gtd. Notes, Ser. O | | Ba1 | | | 6.375% | | | 03/15/15 | | | 750 | | | | 763,125 | |
Starwood Hotels & Resorts Worldwide, Inc., Sr. Unsec’d. Notes | | Ba1 | | | 6.250% | | | 02/15/13 | | | 1,585 | | | | 1,636,512 | |
Starwood Hotels & Resorts Worldwide, Inc., Sr. Unsec’d. Notes(a) | | Ba1 | | | 6.750% | | | 05/15/18 | | | 2,700 | | | | 3,051,000 | |
| | | | | | | | | | | | | | |
|
|
|
| | | | | | | | | | | | | | | | 5,450,637 | |
| | | | | | | | | | | | | | |
|
|
|
Media & Entertainment — 0.4% | | | | | | | | | | | | | | | | |
Gannett Co., Inc., Sr. Unsec’d. Notes | | Ba2 | | | 6.375% | | | 04/01/12 | | | 2,500 | | | | 2,512,500 | |
News America, Inc., Gtd. Notes | | Baa1 | | | 6.150% | | | 03/01/37 | | | 250 | | | | 273,278 | |
News America, Inc., Gtd. Notes(a) | | Baa1 | | | 6.150% | | | 02/15/41 | | | 475 | | | | 547,481 | |
News America, Inc., Gtd. Notes | | Baa1 | | | 6.900% | | | 08/15/39 | | | 35 | | | | 40,459 | |
News America, Inc., Gtd. Notes | | Baa1 | | | 7.625% | | | 11/30/28 | | | 1,265 | | | | 1,527,843 | |
Time Warner, Inc., Gtd. Notes | | Baa2 | | | 6.200% | | | 03/15/40 | | | 175 | | | | 206,133 | |
Time Warner, Inc., Gtd. Notes | | Baa2 | | | 6.250% | | | 03/29/41 | | | 495 | | | | 593,481 | |
Time Warner, Inc., Gtd. Notes | | Baa2 | | | 7.250% | | | 10/15/17 | | | 745 | | | | 892,679 | |
Time Warner, Inc., Gtd. Notes | | Baa2 | | | 7.625% | | | 04/15/31 | | | 155 | | | | 200,087 | |
Time Warner, Inc., Gtd. Notes | | Baa2 | | | 9.150% | | | 02/01/23 | | | 625 | | | | 854,912 | |
Viacom, Inc., Sr. Unsec’d. Notes | | Baa1 | | | 6.750% | | | 10/05/37 | | | 420 | | | | 521,216 | |
| | | | | | | | | | | | | | |
|
|
|
| | | | | | | | | | | | | | | | 8,170,069 | |
| | | | | | | | | | | | | | |
|
|
|
Metals — 0.3% | | | | | | | | | | | | | | | | |
ArcelorMittal (Luxembourg), Sr. Unsec’d. Notes(a) | | Baa3 | | | 6.125% | | | 06/01/18 | | | 860 | | | | 849,303 | |
Newmont Mining Corp., Gtd. Notes | | Baa1 | | | 6.250% | | | 10/01/39 | | | 125 | | | | 148,002 | |
Peabody Energy Corp., Sr. Unsec’d. Notes, 144A | | Ba1 | | | 6.000% | | | 11/15/18 | | | 1,275 | | | | 1,300,500 | |
Rio Tinto Alcan, Inc. (Canada), Sr. Unsec’d. Notes | | A-(d) | | | 4.500% | | | 05/15/13 | | | 255 | | | | 265,635 | |
Southern Copper Corp., Sr. Unsec’d. Notes | | Baa2 | | | 7.500% | | | 07/27/35 | | | 120 | | | | 131,076 | |
Steel Dynamics, Inc., Gtd. Notes | | Ba2 | | | 7.375% | | | 11/01/12 | | | 900 | | | | 937,125 | |
Vale Overseas Ltd. (Cayman Islands), Gtd. Notes(a) | | Baa2 | | | 6.875% | | | 11/10/39 | | | 745 | | | | 853,323 | |
Xstrata Canada Financial Corp. (Canada), Gtd. Notes, 144A | | Baa2 | | | 2.850% | | | 11/10/14 | | | 995 | | | | 1,000,082 | |
| | | | | | | | | | | | | | |
|
|
|
| | | | | | | | | | | | | | | | 5,485,046 | |
| | | | | | | | | | | | | | |
|
|
|
Non-Captive Finance — 0.5% | | | | | | | | | | | | | | | | |
CIT Group, Inc., Sec’d. Notes, 144A | | B2 | | | 7.000% | | | 05/04/15 | | | 250 | | | | 250,313 | |
General Electric Capital Corp., Sr. Unsec’d. Notes, MTN. | | Aa2 | | | 5.875% | | | 01/14/38 | | | 970 | | | | 1,027,799 | |
General Electric Capital Corp., Sr. Unsec’d. Notes, Ser. G, MTN(i) | | Aa2 | | | 6.000% | | | 08/07/19 | | | 3,010 | | | | 3,457,370 | |
SEE NOTES TO FINANCIAL STATEMENTS.
A17
| | | | | | |
| | | CONSERVATIVE BALANCED PORTFOLIO (continued) | | |
| |
| SCHEDULE OF INVESTMENTS | | December 31, 2011 |
| | | | | | | | | | | | | | | | |
CORPORATE BONDS
(continued) | | Moody’s
Ratings
(Unaudited)†
| | Interest
Rate
| | | Maturity
Date
| | Principal
Amount
(000)#
| | | Value
(Note 2)
| |
| | | | | | | | | | | | | | | | | |
Non-Captive Finance (continued) | | | | | | | | | | | | | | | | |
General Electric Capital Corp., Sr. Unsec’d. Notes, Ser. G, MTN | | Aa2 | | | 6.875% | | | 01/10/39 | | $ | 730 | | | $ | 874,563 | |
International Lease Finance Corp., Sr. Unsec’d. Notes | | B1 | | | 5.750% | | | 05/15/16 | | | 230 | | | | 213,335 | |
International Lease Finance Corp., Sr. Unsec’d. Notes, MTN | | B1 | | | 6.375% | | | 03/25/13 | | | 1,750 | | | | 1,741,250 | |
SLM Corp., Sr. Notes, MTN. | | Ba1 | | | 6.250% | | | 01/25/16 | | | 365 | | | | 354,955 | |
SLM Corp., Sr. Unsec’d. Notes, MTN(a) | | Ba1 | | | 8.000% | | | 03/25/20 | | | 1,000 | | | | 1,010,000 | |
SLM Corp., Sr. Unsec’d. Notes, MTN | | Ba1 | | | 8.450% | | | 06/15/18 | | | 1,025 | | | | 1,055,750 | |
| | | | | | | | | | | | | | |
|
|
|
| | | | | | | | | | | | | | | | 9,985,335 | |
| | | | | | | | | | | | | | |
|
|
|
Packaging | | | | | | | | | | | | | | | | |
Sealed Air Corp., Sr. Unsec’d. Notes, 144A | | B1 | | | 6.875% | | | 07/15/33 | | | 450 | | | | 393,750 | |
| | | | | | | | | | | | | | |
|
|
|
Paper — 0.2% | | | | | | | | | | | | | | | | |
Georgia-Pacific LLC, Gtd. Notes, 144A
(original cost $273,386; purchased 10/27/10)(e)(h) | | Baa3 | | | 5.400% | | | 11/01/20 | | | 275 | | | | 304,603 | |
International Paper Co., Sr. Unsec’d. Notes(a) | | Baa3 | | | 6.000% | | | 11/15/41 | | | 740 | | | | 803,354 | |
International Paper Co., Sr. Unsec’d. Notes | | Baa3 | | | 7.950% | | | 06/15/18 | | | 615 | | | | 748,596 | |
Rock-Tenn Co., Gtd. Notes | | Ba2 | | | 9.250% | | | 03/15/16 | | | 1,530 | | | | 1,621,800 | |
| | | | | | | | | | | | | | |
|
|
|
| | | | | | | | | | | | | | | | 3,478,353 | |
| | | | | | | | | | | | | | |
|
|
|
Pipelines & Other — 0.2% | | | | | | | | | | | | | | | | |
Energy Transfer Partners LP, Sr. Unsec’d. Notes | | Baa3 | | | 4.650% | | | 06/01/21 | | | 610 | | | | 597,554 | |
NiSource Finance Corp., Gtd. Notes | | Baa3 | | | 5.450% | | | 09/15/20 | | | 500 | | | | 553,828 | |
ONEOK Partners LP, Gtd. Notes | | Baa2 | | | 6.650% | | | 10/01/36 | | | 130 | | | | 153,741 | |
Sempra Energy, Sr. Unsec’d. Notes | | Baa1 | | | 6.000% | | | 02/01/13 | | | 80 | | | | 83,779 | |
Spectra Energy Capital LLC, Gtd. Notes | | Baa2 | | | 6.200% | | | 04/15/18 | | | 3,310 | | | | 3,753,288 | |
Spectra Energy Capital LLC, Gtd. Notes | | Baa2 | | | 6.250% | | | 02/15/13 | | | 205 | | | | 214,915 | |
| | | | | | | | | | | | | | |
|
|
|
| | | | | | | | | | | | | | | | 5,357,105 | |
| | | | | | | | | | | | | | |
|
|
|
Railroads — 0.1% | | | | | | | | | | | | | | | | |
Burlington Northern Santa Fe LLC, Sr. Unsec’d. Notes | | A3 | | | 6.700% | | | 08/01/28 | | | 735 | | | | 937,359 | |
CSX Corp., Sr. Unsec’d. Notes | | Baa3 | | | 6.150% | | | 05/01/37 | | | 690 | | | | 829,759 | |
Norfolk Southern Corp., Sr. Unsec’d. Notes | | Baa1 | | | 5.590% | | | 05/17/25 | | | 630 | | | | 727,744 | |
Norfolk Southern Corp., Sr. Unsec’d. Notes | | Baa1 | | | 7.800% | | | 05/15/27 | | | 24 | | | | 33,965 | |
| | | | | | | | | | | | | | |
|
|
|
| | | | | | | | | | | | | | | | 2,528,827 | |
| | | | | | | | | | | | | | |
|
|
|
Real Estate Investment Trusts — 0.3% | | | | | | | | | | | | | | | | |
Brandywine Operating Partnership LP, Gtd. Notes | | Baa3 | | | 5.750% | | | 04/01/12 | | | 391 | | | | 393,491 | |
HCP, Inc., Sr. Unsec’d. Notes(a) | | Baa2 | | | 2.700% | | | 02/01/14 | | | 670 | | | | 669,026 | |
Mack-Cali Realty LP, Sr. Unsec’d. Notes | | Baa2 | | | 7.750% | | | 08/15/19 | | | 685 | | | | 816,267 | |
Post Apartment Homes LP, Sr. Unsec’d. Notes | | Baa3 | | | 5.450% | | | 06/01/12 | | | 545 | | | | 551,860 | |
Post Apartment Homes LP, Sr. Unsec’d. Notes | | Baa3 | | | 6.300% | | | 06/01/13 | | | 650 | | | | 679,333 | |
ProLogis LP, Gtd. Notes | | Baa2 | | | 6.875% | | | 03/15/20 | | | 68 | | | | 75,502 | |
Simon Property Group LP, Sr. Unsec’d. Notes | | A3 | | | 2.800% | | | 01/30/17 | | | 550 | | | | 561,788 | |
Simon Property Group LP, Sr. Unsec’d. Notes | | A3 | | | 6.125% | | | 05/30/18 | | | 2,700 | | | | 3,099,613 | |
| | | | | | | | | | | | | | |
|
|
|
| | | | | | | | | | | | | | | | 6,846,880 | |
| | | | | | | | | | | | | | |
|
|
|
Retailers — 0.2% | | | | | | | | | | | | | | | | |
CVS Caremark Corp., Sr. Unsec’d. Notes | | Baa2 | | | 6.125% | | | 09/15/39 | | | 335 | | | | 407,656 | |
Lowe’s Cos., Inc., Sr. Unsec’d. Notes | | A3 | | | 6.500% | | | 03/15/29 | | | 345 | | | | 423,964 | |
Macy’s Retail Holdings, Inc., Gtd. Notes | | Ba1 | | | 5.350% | | | 03/15/12 | | | 330 | | | | 332,263 | |
Macy’s Retail Holdings, Inc., Gtd. Notes(a) | | Ba1 | | | 5.875% | | | 01/15/13 | | | 2,000 | | | | 2,059,098 | |
Nordstrom, Inc., Sr. Unsec’d. Notes | | Baa1 | | | 4.000% | | | 10/15/21 | | | 220 | | | | 229,335 | |
Wal-Mart Stores, Inc., Sr. Unsec’d. Notes(a) | | Aa2 | | | 5.625% | | | 04/15/41 | | | 650 | | | | 840,061 | |
| | | | | | | | | | | | | | |
|
|
|
| | | | | | | | | | | | | | | | 4,292,377 | |
| | | | | | | | | | | | | | |
|
|
|
Technology — 0.2% | | | | | | | | | | | | | | | | |
Arrow Electronics, Inc., Sr. Unsec’d. Notes | | Baa3 | | | 3.375% | | | 11/01/15 | | | 370 | | | | 370,476 | |
Fiserv, Inc., Gtd. Notes | | Baa2 | | | 3.125% | | | 06/15/16 | | | 330 | | | | 336,004 | |
Intuit, Inc., Sr. Unsec’d. Notes | | Baa1 | | | 5.400% | | | 03/15/12 | | | 575 | | | | 579,859 | |
SEE NOTES TO FINANCIAL STATEMENTS.
A18
| | | | | | |
| | | CONSERVATIVE BALANCED PORTFOLIO (continued) | | |
| |
| SCHEDULE OF INVESTMENTS | | December 31, 2011 |
| | | | | | | | | | | | | | | | |
CORPORATE BONDS
(continued) | | Moody’s
Ratings
(Unaudited)†
| | Interest
Rate
| | | Maturity
Date
| | Principal
Amount
(000)#
| | | Value
(Note 2)
| |
| | | | | | | | | | | | | | | | | |
Technology (continued) | | | | | | | | | | | | | | | | |
Seagate Technology International (Cayman Islands), Sec’d. Notes, 144A | | Baa3 | | | 10.000% | | | 05/01/14 | | $ | 1,225 | | | $ | 1,385,781 | |
Xerox Corp., Sr. Unsec’d. Notes | | Baa2 | | | 4.250% | | | 02/15/15 | | | 2,650 | | | | 2,793,090 | |
| | | | | | | | | | | | | | |
|
|
|
| | | | | | | | | | | | | | | | 5,465,210 | |
| | | | | | | | | | | | | | |
|
|
|
Telecommunications — 0.6% | | | | | | | | | | | | | | | | |
America Movil SAB de CV (Mexico), Gtd. Notes | | A2 | | | 6.125% | | | 03/30/40 | | | 560 | | | | 665,816 | |
AT&T Corp., Gtd. Notes | | A2 | | | 8.000% | | | 11/15/31 | | | 18 | | | | 25,426 | |
AT&T, Inc., Sr. Unsec’d. Notes | | A2 | | | 5.350% | | | 09/01/40 | | | 323 | | | | 363,343 | |
AT&T, Inc., Sr. Unsec’d. Notes(a) | | A2 | | | 5.550% | | | 08/15/41 | | | 1,195 | | | | 1,407,013 | |
AT&T, Inc., Sr. Unsec’d. Notes | | A2 | | | 6.550% | | | 02/15/39 | | | 1,115 | | | | 1,418,324 | |
British Telecommunications PLC (United Kingdom), Sr. Unsec’d. Notes | | Baa2 | | | 9.625% | | | 12/15/30 | | | 350 | | | | 493,255 | |
Cellco Partnership/Verizon Wireless Capital LLC, Sr. Unsec’d. Notes | | A2 | | | 8.500% | | | 11/15/18 | | | 2,400 | | | | 3,239,280 | |
Embarq Corp., Sr. Unsec’d. Notes
(original cost $367,380; purchased 05/12/06)(e)(h) | | Baa3 | | | 7.082% | | | 06/01/16 | | | 325 | | | | 352,282 | |
Embarq Corp., Sr. Unsec’d. Notes
(original cost $1,667,844; purchased 05/12/06-04/10/07)(e)(h) | | Baa3 | | | 7.995% | | | 06/01/36 | | | 1,645 | | | | 1,704,529 | |
Telecom Italia Capital SA (Luxembourg), Gtd. Notes | | Baa2 | | | 5.250% | | | 11/15/13 | | | 170 | | | | 163,299 | |
Telecom Italia Capital SA (Luxembourg), Gtd. Notes | | Baa2 | | | 7.175% | | | 06/18/19 | | | 440 | | | | 412,328 | |
Telecom Italia Capital SA (Luxembourg), Gtd. Notes | | Baa2 | | | 7.200% | | | 07/18/36 | | | 1,260 | | | | 1,040,694 | |
Telefonica Emisiones SAU (Spain), Gtd. Notes | | Baa1 | | | 5.877% | | | 07/15/19 | | | 325 | | | | 321,187 | |
Telefonica Emisiones SAU (Spain), Gtd. Notes | | Baa1 | | | 7.045% | | | 06/20/36 | | | 210 | | | | 204,765 | |
US Cellular Corp., Sr. Unsec’d. Notes | | Baa2 | | | 6.700% | | | 12/15/33 | | | 255 | | | | 256,038 | |
Verizon Communications, Inc., Sr. Unsec’d. Notes | | A3 | | | 6.400% | | | 02/15/38 | | | 55 | | | | 69,817 | |
Windstream Corp., Gtd. Notes | | Ba3 | | | 8.125% | | | 08/01/13 | | | 700 | | | | 749,000 | |
| | | | | | | | | | | | | | |
|
|
|
| | | | | | | | | | | | | | | | 12,886,396 | |
| | | | | | | | | | | | | | |
|
|
|
Tobacco — 0.3% | | | | | | | | | | | | | | | | |
Altria Group, Inc., Gtd. Notes | | Baa1 | | | 9.700% | | | 11/10/18 | | | 3,040 | | | | 4,090,056 | |
Altria Group, Inc., Gtd. Notes | | Baa1 | | | 9.950% | | | 11/10/38 | | | 130 | | | | 197,728 | |
Altria Group, Inc., Gtd. Notes | | Baa1 | | | 10.200% | | | 02/06/39 | | | 850 | | | | 1,322,702 | |
Lorillard Tobacco Co., Gtd. Notes | | Baa2 | | | 8.125% | | | 06/23/19 | | | 290 | | | | 345,447 | |
Reynolds American, Inc., Gtd. Notes | | Baa3 | | | 7.250% | | | 06/15/37 | | | 285 | | | | 330,591 | |
| | | | | | | | | | | | | | |
|
|
|
| | | | | | | | | | | | | | | | 6,286,524 | |
| | | | | | | | | | | | | | |
|
|
|
TOTAL CORPORATE BONDS
(cost $221,611,277) | | | | 234,429,421 | |
| | | | | | | | | | | | | | |
|
|
|
| MORTGAGE-BACKED SECURITIES — 11.9% | | | | | | | | | | | | | | | | |
Federal Home Loan Mortgage Corp.(c) | | | 2.386% | | | 06/01/36 | | | 680 | | | | 711,127 | |
Federal Home Loan Mortgage Corp. | | | 3.000% | | | TBA 15 YR | | | 1,500 | | | | 1,548,281 | |
Federal Home Loan Mortgage Corp. | | | 3.500% | | | TBA 15 YR | | | 1,000 | | | | 1,042,344 | |
Federal Home Loan Mortgage Corp. | | | 4.000% | | | 06/01/26-12/01/40 | | | 7,366 | | | | 7,762,682 | |
Federal Home Loan Mortgage Corp. | | | 4.000% | | | TBA 30 YR | | | 2,500 | | | | 2,621,875 | |
Federal Home Loan Mortgage Corp. | | | 4.500% | | | 02/01/19-10/01/41 | | | 27,358 | | | | 29,021,481 | |
Federal Home Loan Mortgage Corp. | | | 4.500% | | | TBA 30 YR | | | 1,000 | | | | 1,059,531 | |
Federal Home Loan Mortgage Corp. | | | 5.000% | | | 07/01/18-05/01/34 | | | 5,920 | | | | 6,400,299 | |
Federal Home Loan Mortgage Corp. | | | 5.000% | | | TBA 30 YR | | | 8,000 | | | | 8,596,249 | |
Federal Home Loan Mortgage Corp.(c) | | | 5.227% | | | 12/01/35 | | | 1,325 | | | | 1,412,073 | |
Federal Home Loan Mortgage Corp. | | | 5.500% | | | 12/01/33-05/01/38 | | | 5,453 | | | | 5,938,975 | |
Federal Home Loan Mortgage Corp. | | | 5.500% | | | TBA 30 YR | | | 8,500 | | | | 9,222,500 | |
Federal Home Loan Mortgage Corp. | | | 6.000% | | | 03/01/32-12/01/33 | | | 1,427 | | | | 1,591,577 | |
Federal Home Loan Mortgage Corp. | | | 6.000% | | | TBA 30 YR | | | 3,000 | | | | 3,294,375 | |
Federal Home Loan Mortgage Corp. | | | 6.500% | | | 12/01/14-09/01/16 | | | 104 | | | | 108,988 | |
Federal Home Loan Mortgage Corp. | | | 7.000% | | | 05/01/31-10/01/32 | | | 735 | | | | 843,533 | |
Federal National Mortgage Association(c) | | | 2.016% | | | 07/01/33 | | | 619 | | | | 647,352 | |
Federal National Mortgage Association | | | 3.500% | | | 06/01/39 | | | 1,882 | | | | 1,937,215 | |
SEE NOTES TO FINANCIAL STATEMENTS.
A19
| | | | | | |
| | | CONSERVATIVE BALANCED PORTFOLIO (continued) | | |
| |
| SCHEDULE OF INVESTMENTS | | December 31, 2011 |
| | | | | | | | | | | | | | | | |
MORTGAGE-BACKED SECURITIES
(continued) | | | | Interest
Rate
| | | Maturity
Date
| | Principal
Amount
(000)#
| | | Value
(Note 2)
| |
| | | | | | | | | | | | | | | | | |
Federal National Mortgage Association | | | 3.500% | | | TBA 15 YR | | $ | 5,000 | | | $ | 5,228,125 | |
Federal National Mortgage Association | | | 4.000% | | | TBA 30 YR | | | 7,500 | | | | 7,878,516 | |
Federal National Mortgage Association | | | 4.000% | | | TBA 30 YR | | | 5,000 | | | | 5,239,063 | |
Federal National Mortgage Association | | | 4.500% | | | 11/01/18-03/01/41 | | | 19,683 | | | | 21,097,923 | |
Federal National Mortgage Association | | | 5.000% | | | 10/01/18-05/01/36 | | | 9,020 | | | | 9,757,074 | |
Federal National Mortgage Association | | | 5.000% | | | TBA 30 YR | | | 3,000 | | | | 3,234,375 | |
Federal National Mortgage Association | | | 5.500% | | | 03/01/16-04/01/37 | | | 18,078 | | | | 19,785,800 | |
Federal National Mortgage Association(c) | | | 5.545% | | | 07/01/37 | | | 778 | | | | 828,263 | |
Federal National Mortgage Association(c) | | | 5.581% | | | 06/01/37 | | | 212 | | | | 226,167 | |
Federal National Mortgage Association | | | 6.000% | | | 04/01/13-06/01/38 | | | 16,081 | | | | 17,853,199 | |
Federal National Mortgage Association | | | 6.000% | | | TBA 30 YR | | | 1,000 | | | | 1,101,094 | |
Federal National Mortgage Association | | | 6.500% | | | 07/01/17-01/01/37 | | | 6,133 | | | | 6,921,884 | |
Federal National Mortgage Association | | | 7.000% | | | 02/01/32-07/01/32 | | | 471 | | | | 547,713 | |
Federal National Mortgage Association | | | 7.500% | | | 05/01/12-05/01/32 | | | 149 | | | | 176,740 | |
Government National Mortgage Association | | | 3.500% | | | TBA 30 YR | | | 4,500 | | | | 4,683,515 | |
Government National Mortgage Association | | | 4.000% | | | 05/20/41 | | | 424 | | | | 454,779 | |
Government National Mortgage Association | | | 4.000% | | | TBA 30 YR | | | 18,500 | | | | 19,844,140 | |
Government National Mortgage Association | | | 4.000% | | | TBA 30 YR | | | 5,000 | | | | 5,347,656 | |
Government National Mortgage Association | | | 4.500% | | | 01/20/41 | | | 2,807 | | | | 3,067,595 | |
Government National Mortgage Association | | | 4.500% | | | TBA 30 YR | | | 17,250 | | | | 18,745,897 | |
Government National Mortgage Association | | | 4.500% | | | TBA 30 YR | | | 1,500 | | | | 1,634,297 | |
Government National Mortgage Association | | | 5.000% | | | TBA 30 YR | | | 6,000 | | | | 6,633,750 | |
Government National Mortgage Association | | | 5.000% | | | TBA 30 YR | | | 4,500 | | | | 4,985,157 | |
Government National Mortgage Association | | | 5.500% | | | 08/15/33-04/15/36 | | | 5,321 | | | | 6,015,950 | |
Government National Mortgage Association | | | 6.000% | | | 11/15/23-07/15/34 | | | 1,752 | | | | 1,994,548 | |
Government National Mortgage Association | | | 6.500% | | | 10/15/23-09/15/36 | | | 3,346 | | | | 3,843,736 | |
Government National Mortgage Association | | | 8.000% | | | 01/15/24-07/15/24 | | | 48 | | | | 56,206 | |
| | | | | | | | | | | | | | |
|
|
|
TOTAL MORTGAGE-BACKED SECURITIES
(cost $250,615,644) | | | | 260,943,619 | |
| | | | | | | | | | | | | | |
|
|
|
| | | Moody’s
Ratings
(Unaudited)†
| | | | | | | | | | | |
| MUNICIPAL BONDS — 0.6% | | | | | | | | | | | | | | | | |
Bay Area Toll Authority, Revenue Bonds, BABs | | Aa3 | | | 6.263% | | | 04/01/49 | | | 1,305 | | | | 1,695,704 | |
Chicago O’Hare International Airport, Revenue Bonds, BABs | | A1 | | | 6.395% | | | 01/01/40 | | | 970 | | | | 1,186,242 | |
Metropolitan Government of Nashville & Davidson County Convention Center Authority, Revenue Bonds, BABs | | Aa2 | | | 6.731% | | | 07/01/43 | | | 945 | | | | 1,133,735 | |
New Jersey State Turnpike Authority, Revenue Bonds,
Ser. F, BABs | | A3 | | | 7.414% | | | 01/01/40 | | | 1,000 | | | | 1,426,270 | |
New York City Transitional Finance Authority, Revenue Bonds, BABs | | Aa1 | | | 5.767% | | | 08/01/36 | | | 1,100 | | | | 1,294,084 | |
Ohio State University (The), Revenue Bonds, BABs | | Aa1 | | | 4.910% | | | 06/01/40 | | | 415 | | | | 475,984 | |
Ohio State Water Development Authority, Revenue Bonds, BABs | | Aaa | | | 4.879% | | | 12/01/34 | | | 275 | | | | 310,819 | |
Oregon State Department of Transportation, Revenue Bonds, Ser. A, BABs | | Aa2 | | | 5.834% | | | 11/15/34 | | | 425 | | | | 520,009 | |
Pennsylvania Turnpike Commission, Revenue Bonds, Ser. B, BABs | | Aa3 | | | 5.511% | | | 12/01/45 | | | 505 | | | | 574,094 | |
Regional Transportation District, Revenue Bonds,
Ser. 2010B, BABs | | Aa2 | | | 5.844% | | | 11/01/50 | | | 625 | | | | 812,138 | |
State of California, General Obligation Unlimited, BABs | | A1 | | | 7.300% | | | 10/01/39 | | | 1,250 | | | | 1,489,312 | |
State of California, General Obligation Unlimited, BABs | | A1 | | | 7.500% | | | 04/01/34 | | | 350 | | | | 418,842 | |
State of California, General Obligation Unlimited, BABs | | A1 | | | 7.550% | | | 04/01/39 | | | 245 | | | | 299,821 | |
State of California, General Obligation Unlimited, BABs | | A1 | | | 7.625% | | | 03/01/40 | | | 205 | | | | 253,591 | |
Texas State Transportation Commission, Revenue Bonds, Ser. B, BABs | | Aaa | | | 5.028% | | | 04/01/26 | | | 305 | | | | 355,066 | |
| | | | | | | | | | | | | | |
|
|
|
TOTAL MUNICIPAL BONDS
(cost $10,072,626) | | | | 12,245,711 | |
| | | | | | | | | | | | | | |
|
|
|
SEE NOTES TO FINANCIAL STATEMENTS.
A20
| | | | | | |
| | | CONSERVATIVE BALANCED PORTFOLIO (continued) | | |
| |
| SCHEDULE OF INVESTMENTS | | December 31, 2011 |
| | | | | | | | | | | | | | | | |
| NON-CORPORATE FOREIGN AGENCIES — 0.7% | | Moody’s
Ratings
(Unaudited)†
| | Interest
Rate
| | | Maturity
Date
| | Principal
Amount
(000)#
| | | Value
(Note 2)
| |
| | | | | | | | | | | | | | | | | |
Commonwealth Bank of Australia (Australia), 144A | | Aaa | | | 2.700% | | | 11/25/14 | | $ | 7,220 | | | $ | 7,501,392 | |
Korea Hydro & Nuclear Power Co. Ltd. (South Korea), Sr. Unsec’d. Notes, 144A | | A1 | | | 6.250% | | | 06/17/14 | | | 800 | | | | 862,976 | |
Kreditanstalt Fuer Wiederaufbau (Germany), Gtd. Notes | | Aaa | | | 2.375% | | | 08/25/21 | | | 730 | | | | 729,072 | |
Pemex Project Funding Master Trust, Gtd. Notes | | Baa1 | | | 8.625% | | | 12/01/23 | | | 350 | | | | 439,250 | |
RSHB Capital SA For OJSC Russian Agricultural Bank (Luxembourg), Sr. Sec’d. Notes, 144A | | Baa1 | | | 6.299% | | | 05/15/17 | | | 2,100 | | | | 2,097,375 | |
Export Development Canada (Canada) | | Aaa | | | 1.250% | | | 10/26/16 | | | 1,530 | | | | 1,547,341 | |
Export-Import Bank of Korea (South Korea) | | A1 | | | 4.000% | | | 01/29/21 | | | 460 | | | | 443,912 | |
Export-Import Bank of Korea (South Korea), Sr. Unsec’d. Notes | | A1 | | | 5.125% | | | 06/29/20 | | | 365 | | | | 382,174 | |
Qatar Government International Bond (Qatar), 144A | | Aa2 | | | 5.250% | | | 01/20/20 | | | 285 | | | | 312,788 | |
Qatar Government International Bond (Qatar), Sr. Unsec’d. Notes, 144A | | Aa2 | | | 6.400% | | | 01/20/40 | | | 180 | | | | 211,500 | |
| | | | | | | | | | | | | | |
|
|
|
TOTAL NON-CORPORATE FOREIGN AGENCIES
(cost $14,109,531) | | | | 14,527,780 | |
| | | | | | | | | | | | | | |
|
|
|
| U.S. GOVERNMENT AGENCY OBLIGATIONS — 0.2% | | | | | | | | | | | | | | | | |
Federal Home Loan Banks | | | 5.500% | | | 07/15/36 | | | 950 | | | | 1,232,252 | |
Federal Home Loan Mortgage Corp.(a) | | | 5.125% | | | 11/17/17 | | | 420 | | | | 505,718 | |
Resolution Funding Corp. Interest Strip, Bonds(j) | | | 1.620% | | | 04/15/18 | | | 2,645 | | | | 2,396,714 | |
Tennessee Valley Authority | | | 5.880% | | | 04/01/36 | | | 85 | | | | 115,923 | |
| | | | | | | | | | | | | | |
|
|
|
TOTAL U.S. GOVERNMENT AGENCY OBLIGATIONS
(cost $3,692,072) | | | | 4,250,607 | |
| | | | | | | | | | | | | | |
|
|
|
| U.S. GOVERNMENT TREASURY OBLIGATIONS — 7.0% | | | | | | | | | | | | | | |
U.S. Treasury Bonds(a) | | | 3.750% | | | 08/15/41 | | | 55 | | | | 64,685 | |
U.S. Treasury Bonds | | | 4.250% | | | 11/15/40 | | | 175 | | | | 223,180 | |
U.S. Treasury Bonds | | | 4.375% | | | 05/15/40 | | | 3,605 | | | | 4,683,118 | |
U.S. Treasury Bonds | | | 4.750% | | | 02/15/41 | | | 8,755 | | | | 12,065,484 | |
U.S. Treasury Bonds | | | 6.500% | | | 11/15/26 | | | 1,395 | | | | 2,116,477 | |
U.S. Treasury Bonds | | | 4.375% | | | 05/15/41 | | | 2,780 | | | | 3,622,254 | |
U.S. Treasury Inflation Indexed Note | | | 1.375% | | | 01/15/20 | | | 9,032 | | | | 10,283,797 | |
U.S. Treasury Notes | | | 1.875% | | | 09/30/17 | | | 5,650 | | | | 5,907,340 | |
U.S. Treasury Notes | | | 1.875% | | | 10/31/17 | | | 11,550 | | | | 12,076,068 | |
U.S. Treasury Notes | | | 3.250% | | | 12/31/16 | | | 7,220 | | | | 8,061,578 | |
U.S. Treasury Notes | | | 3.500% | | | 02/15/18 | | | 6,000 | | | | 6,840,468 | |
U.S. Treasury Notes | | | 4.250% | | | 11/15/17 | | | 6,475 | | | | 7,648,089 | |
U.S. Treasury Notes | | | 4.625% | | | 11/15/16 | | | 4,135 | | | | 4,883,179 | |
U.S. Treasury Notes | | | 4.750% | | | 08/15/17 | | | 2,110 | | | | 2,540,571 | |
U.S. Treasury Notes(a) | | | 0.250% | | | 12/15/14 | | | 4,335 | | | | 4,320,777 | |
U.S. Treasury Notes | | | 2.000% | | | 11/15/21 | | | 4,515 | | | | 4,566,498 | |
U.S. Treasury Notes | | | 3.250% | | | 03/31/17 | | | 1,420 | | | | 1,589,957 | |
U.S. Treasury Strips Coupon(k) | | | 1.530% | | | 02/15/19 | | | 9,905 | | | | 8,918,521 | |
U.S. Treasury Strips Coupon(k) | | | 2.480% | | | 05/15/24 | | | 16,380 | | | | 12,080,741 | |
U.S. Treasury Strips Coupon(k) | | | 2.510% | | | 08/15/24 | | | 11,695 | | | | 8,531,994 | |
U.S. Treasury Strips Coupon(k) | | | 2.520% | | | 11/15/24 | | | 4,145 | | | | 2,995,969 | |
U.S. Treasury Strips Coupon(k) | | | 2.740% | | | 11/15/23 | | | 12,715 | | | | 9,563,091 | |
U.S. Treasury Strips Coupon(k) | | | 2.780% | | | 02/15/24 | | | 10,000 | | | | 7,448,860 | |
U.S. Treasury Strips Coupon(k) | | | 3.040% | | | 05/15/25 | | | 6,000 | | | | 4,247,490 | |
U.S. Treasury Strips Coupon(k) | | | 3.380% | | | 05/15/27 | | | 2,280 | | | | 1,493,747 | |
U.S. Treasury Strips Coupon(k) | | | 4.130% | | | 08/15/33 | | | 8,260 | | | | 4,332,593 | |
U.S. Treasury Strips Principal(j) | | | 0.390% | | | 11/15/14 | | | 2,150 | | | | 2,126,036 | |
| | | | | | | | | | | | | | |
|
|
|
TOTAL U.S. GOVERNMENT TREASURY OBLIGATIONS
(cost $139,508,328) | | | | 153,232,562 | |
| | | | | | | | | | | | | | |
|
|
|
TOTAL LONG-TERM INVESTMENTS
(cost $1,625,098,542) | | | | 2,028,939,244 | |
| | | | | | | | | | | | | | |
|
|
|
SEE NOTES TO FINANCIAL STATEMENTS.
A21
| | | | | | |
| | | CONSERVATIVE BALANCED PORTFOLIO (continued) | | |
| |
| SCHEDULE OF INVESTMENTS | | December 31, 2011 |
| | | | | | | | | | | | | | | | |
| SHORT-TERM INVESTMENTS — 18.5% | | | | Interest
Rate
| | | Maturity
Date
| | Principal
Amount
(000)#
| | | Value
(Note 2)
| |
| | | | | | | | | | | | | | | | | |
U.S. GOVERNMENT TREASURY OBLIGATION — 0.2% | | | | | | | | | | | | | | | | |
U.S. Treasury Bill
(cost $3,849,098)(i)(l) | | | | | 0.047% | | | 06/28/12 | | $ | 3,850 | | | $ | 3,848,864 | |
| | | | | | | | | | | | | | |
|
|
|
| | | | | |
| | | | | | | | | | Shares
| | | | |
AFFILIATED MUTUAL FUNDS — 18.3% | | | | | | | | | | | | | | | | |
Prudential Investment Portfolios 2 — Prudential Core Short-Term Bond Fund
(cost $124,974,009) (Note 4)(m) | | | 12,896,102 | | | | 114,259,463 | |
Prudential Investment Portfolios 2 — Prudential Core Taxable Money Market Fund
(cost $287,158,467; includes $134,741,536 of cash collateral received for securities on loan) (Note 4)(m)(n) | | | 287,158,467 | | | | 287,158,467 | |
| | | | | | | | | | | | | | |
|
|
|
TOTAL AFFILIATED MUTUAL FUNDS
(cost $412,132,476) | | | | 401,417,930 | |
| | | | | | | | | | | | | | |
|
|
|
TOTAL SHORT-TERM INVESTMENTS
(cost $415,981,574) | | | | 405,266,794 | |
| | | | | | | | | | | | | | |
|
|
|
TOTAL INVESTMENTS — 111.1%
(cost $2,041,080,116) | | | | 2,434,206,038 | |
LIABILITIES IN EXCESS OF OTHER ASSETS(o) — (11.1)% | | | | (242,591,242 | ) |
| | | | | | | | | | | | | | |
|
|
|
NET ASSETS — 100.0% | | | $ | 2,191,614,796 | |
| | | | | | | | | | | | | | |
|
|
|
The following abbreviations are used in portfolio descriptions:
| | |
| 144A | | Security was purchased pursuant to Rule 144A under the Securities Act of 1933 and may not be resold subject to that rule except to qualified institutional buyers. Unless otherwise noted, 144A securities are deemed to be liquid. |
| BABs | | Build America Bonds |
| CDO | | Collateralized Debt Obligation |
| CLO | | Collateralized Loan Obligation |
| I/O | | Interest Only |
| LIBOR | | London Interbank Offered Rate |
| MTN | | Medium Term Note |
| NR | | Not Rated by Moody’s or Standard & Poor’s |
| TBA | | To Be Announced |
| * | Non-income producing security. |
| # | Principal amount shown in U.S. dollars unless otherwise stated. |
| † | The ratings reflected are as of December 31, 2011. Ratings of certain bonds may have changed subsequent to that date. |
| (a) | All or a portion of security is on loan. The aggregate market value of such securities, including those sold and pending settlement, is $131,130,353; cash collateral of $134,741,536 (included in liabilities) was received with which the Portfolio purchased highly liquid short-term investments. |
| (b) | Stapled Security — A security contractually bound to one or more other securities to form a single saleable unit which cannot be sold separately. |
| (c) | Indicates a variable rate security. The interest rate shown reflects the rate in effect at December 31, 2011. |
| (d) | Standard & Poor’s Rating. |
| (e) | Indicates a security that has been deemed illiquid. |
| (f) | Represents security, or a portion thereof, segregated as collateral for swap agreements. |
| (g) | Represents issuer in default on interest payments and/or principal repayment; non-income producing security. |
| (h) | Indicates a restricted security; the aggregate original cost of such securities is $4,997,696. The aggregate value of $5,457,134 is approximately 0.2% of net assets. |
| (i) | Represents security, or a portion thereof, segregated as collateral for futures contracts. |
| (j) | Represents zero coupon bond. Rate shown reflects the effective yield at December 31, 2011. |
| (k) | Rate shown reflects the effective yield at December 31, 2011. |
| (l) | Rate quoted represents yield-to-maturity as of purchase date. |
| (m) | Prudential Investments LLC, the manager of the Portfolio, also serves as manager of the Prudential Investment Portfolios 2 — Prudential Core Taxable Money Market Fund and the Prudential Investment Portfolios 2 — Prudential Core Short-Term Bond Fund. |
| (n) | Represents security, or a portion thereof, purchased with cash collateral received for securities on loan. |
SEE NOTES TO FINANCIAL STATEMENTS.
A22
| | | | | | |
| | | CONSERVATIVE BALANCED PORTFOLIO (continued) | | |
| |
| SCHEDULE OF INVESTMENTS | | December 31, 2011 |
| (o) | Includes net unrealized appreciation (depreciation) on the following derivative contracts held at reporting period end: |
Open futures contracts outstanding at December 31, 2011:
| | | | | | | | | | | | | | | | | | |
Number of
Contracts
| | Type
| | Expiration
Date
| | | Value at
Trade Date
| | | Value at
December 31, 2011
| | | Unrealized
Appreciation/
(Depreciation)
| |
| Long Positions: | | | | | | | | | | | | | | | | | | |
| 272 | | 2 Year U.S. Treasury Notes | | | Mar. 2012 | | | $ | 60,001,397 | | | $ | 59,988,750 | | | $ | (12,647 | ) |
| 397 | | 5 Year U.S. Treasury Notes | | | Mar. 2012 | | | | 48,704,931 | | | | 48,933,352 | | | | 228,421 | |
| 405 | | S&P 500 E-mini | | | Mar. 2012 | | | | 24,864,218 | | | | 25,365,150 | | | | 500,932 | |
| 96 | | S&P 500 Index | | | Mar. 2012 | | | | 29,411,501 | | | | 30,062,400 | | | | 650,899 | |
| 6 | | U.S. Ultra Bond | | | Mar. 2012 | | | | 943,273 | | | | 961,125 | | | | 17,852 | |
| | | | | | | | | | | | | | | | |
|
|
|
| | | | | | | | | | | | | | | | | | 1,385,457 | |
| | | | | | | | | | | | | | | | |
|
|
|
| Short Positions: | | | | | | | | | | | | | | | | | | |
| 164 | | 10 Year U.S. Treasury Notes | | | Mar. 2012 | | | | 21,446,298 | | | | 21,504,500 | | | | (58,202 | ) |
| 251 | | U.S. Long Bond | | | Mar. 2012 | | | | 35,992,824 | | | | 36,347,938 | | | | (355,114 | ) |
| | | | | | | | | | | | | | | | |
|
|
|
| | | | | | | | | | | | | | | | | | (413,316 | ) |
| | | | | | | | | | | | | | | | |
|
|
|
| | | | | | | | | | | | | | | | | $ | 972,141 | |
| | | | | | | | | | | | | | | | |
|
|
|
Interest rate swap agreements outstanding at December 31, 2011:
| | | | | | | | | | | | | | | | | | | | | | | | | | |
Counterparty
| | Termination
Date
| | | Notional
Amount
(000)#
| | | Fixed
Rate
| | | Floating Rate
| | Fair
Value
| | | Upfront
Premiums
Paid/
(Received)
| | | Unrealized
Appreciation/
(Depreciation)
| |
Over-the-Counter Swap Agreements: | |
Morgan Stanley Capital Services, Inc. | | | 11/01/14 | | | $ | 2,750 | | | | 0.784% | | | 3 month LIBOR(2) | | $ | (61,101 | ) | | $ | — | | | $ | (61,101 | ) |
Barclays Bank PLC | | | 05/31/16 | | | | 5,400 | | | | 1.175% | | | 3 month LIBOR(1) | | | 10,969 | | | | — | | | | 10,969 | |
Barclays Bank PLC | | | 05/31/16 | | | | 5,400 | | | | 1.180% | | | 3 month LIBOR(1) | | | 11,935 | | | | — | | | | 11,935 | |
Barclays Bank PLC | | | 05/31/16 | | | | 1,360 | | | | 1.220% | | | 3 month LIBOR(1) | | | 5,251 | | | | — | | | | 5,251 | |
Deutsche Bank AG | | | 09/14/16 | | | | 2,860 | | | | 1.206% | | | 3 month LIBOR(2) | | | (15,652 | ) | | | — | | | | (15,652 | ) |
Citibank, NA | | | 07/20/21 | | | | 5,155 | | | | 3.035% | | | 3 month LIBOR(1) | | | 546,324 | | | | — | | | | 546,324 | |
Citibank, NA | | | 11/23/21 | | | | 4,650 | | | | 2.148% | | | 3 month LIBOR(2) | | | (466 | ) | | | — | | | | (466 | ) |
| | | | | | | | | | | | | | | | |
|
|
| |
|
|
| |
|
|
|
| | | | | | | | | | | | | | | | | $ | 497,260 | | | $ | — | | | $ | 497,260 | |
| | | | | | | | | | | | | | | | |
|
|
| |
|
|
| |
|
|
|
| (1) | Portfolio pays the floating rate and receives the fixed rate. |
| (2) | Portfolio pays the fixed rate and receives the floating rate. |
| # | Notional amount is shown in U.S. dollars unless otherwise stated. |
Credit default swap agreements outstanding at December 31, 2011:
| | | | | | | | | | | | | | | | | | | | | | | | | | |
Counterparty
| | Termination
Date
| | | Notional
Amount
(000)#(2)
| | | Fixed
Rate
| | | Reference Entity/Obligation
| | Fair
Value
| | | Upfront
Premiums
Paid/
(Received)
| | | Unrealized
Appreciation/
(Depreciation)
| |
Over-the-Counter Credit Default Swaps on Corporate Issues—Buy Protection(1): | |
JPMorgan Chase Bank | | | 06/20/14 | | | $ | 1,110 | | | | 0.650% | | | Bunge Ltd. Finance Corp. | | $ | 20,579 | | | $ | — | | | $ | 20,579 | |
Deutsche Bank AG | | | 03/20/12 | | | | 2,000 | | | | 5.000% | | | Gannett Co., Inc. | | | (21,836 | ) | | | (4,759 | ) | | | (17,077 | ) |
Morgan Stanley Capital Services, Inc. | | | 03/20/12 | | | | 500 | | | | 5.000% | | | Gannett Co., Inc. | | | (5,459 | ) | | | (1,720 | ) | | | (3,739 | ) |
Deutsche Bank AG | | | 12/20/12 | | | | 2,000 | | | | 1.000% | | | Macy’s Retail Holdings, Inc. | | | (11,444 | ) | | | 24,323 | | | | (35,767 | ) |
Morgan Stanley Capital Services, Inc. | | | 06/20/18 | | | | 1,600 | | | | 1.000% | | | Newell Rubbermaid, Inc. | | | 49,252 | | | | — | | | | 49,252 | |
Morgan Stanley Capital Services, Inc. | | | 06/20/18 | | | | 2,700 | | | | 0.970% | | | Simon Property Group LP | | | 78,221 | | | | — | | | | 78,221 | |
Deutsche Bank AG | | | 06/20/18 | | | | 2,800 | | | | 1.150% | | | Spectra Energy Capital LLC | | | 61,105 | | | | — | | | | 61,105 | |
Deutsche Bank AG | | | 03/20/14 | | | | 1,585 | | | | 7.050% | | | Starwood Hotels & Resorts Worldwide, Inc. | | | (207,576 | ) | | | — | | | | (207,576 | ) |
Merrill Lynch Capital Services, Inc. | | | 06/20/18 | | | | 2,700 | | | | 1.450% | | | Starwood Hotels & Resorts Worldwide, Inc. | | | 68,334 | | | | — | | | | 68,334 | |
| | | | | | | | | | | | | | | | |
|
|
| |
|
|
| |
|
|
|
| | | | | | | | | | | | | | | | | $ | 31,176 | | | $ | 17,844 | | | $ | 13,332 | |
| | | | | | | | | | | | | | | | |
|
|
| |
|
|
| |
|
|
|
| (1) | If the Portfolio is a buyer of protection, it pays the fixed rate. When a credit event occurs, as defined under the terms of that particular swap agreement, the Portfolio will either (i) receive from the seller of protection an amount equal to the notional amount of the swap and make delivery |
SEE NOTES TO FINANCIAL STATEMENTS.
A23
| | | | | | |
| | | CONSERVATIVE BALANCED PORTFOLIO (continued) | | |
| |
| SCHEDULE OF INVESTMENTS | | December 31, 2011 |
| | of the referenced obligation or underlying securities comprising the referenced index or (ii) receive a net settlement amount in the form of cash or securities equal to the notional amount of the swap less the recovery value of the referenced obligation or underlying securities comprising the referenced index. |
| (2) | Notional amount represents the maximum potential amount the Portfolio could be required to pay as a seller of credit protection or receive as a buyer of credit protection if a credit event occurs as defined under the terms of that particular swap agreement. |
| # | Notional amount is shown in U.S. dollars unless otherwise stated. |
Various inputs are used in determining the value of the Portfolio’s investments. These inputs are summarized in the three broad levels listed below.
| Level 1— | quoted prices generally for securities actively traded on a regulated securities exchange and for open-end mutual funds which are traded at daily net asset value. |
| Level 2— | other significant observable inputs (including, but not limited to, quoted prices for similar securities, interest rates, prepayment speeds, foreign currency exchange rates, and amortized cost) generally for debt securities, swaps, forward foreign currency contracts and for foreign stocks priced using vendor modeling tools. |
| Level 3— | significant unobservable inputs for securities valued in accordance with Board approved fair valuation procedures. |
The following is a summary of the inputs used as of December 31, 2011 in valuing such portfolio securities:
| | | | | | | | | | | | |
| | | Level 1
| | | Level 2
| | | Level 3
| |
Investments in Securities | | | | | | | | | | | | |
Common Stocks | | $ | 1,199,361,156 | | | $ | — | | | $ | 449 | |
Exchange Traded Fund | | | 450,723 | | | | — | | | | — | |
Preferred Stocks | | | 1,482,611 | | | | — | | | | 449 | |
Asset-Backed Securities | | | | | | | | | | | | |
Non-Residential Mortgage-Backed Securities | | | — | | | | 17,173,040 | | | | 475,000 | |
Residential Mortgage-Backed Securities | | | — | | | | 9,211,877 | | | | — | |
Bank Loans | | | — | | | | 5,265,009 | | | | — | |
Collateralized Mortgage Obligations | | | — | | | | 7,350,150 | | | | — | |
Commercial Mortgage-Backed Securities | | | — | | | | 108,539,080 | | | | — | |
Corporate Bonds | | | — | | | | 234,429,421 | | | | — | |
Mortgage-Backed Securities | | | — | | | | 260,943,619 | | | | — | |
Municipal Bonds | | | — | | | | 12,245,711 | | | | — | |
Non-Corporate Foreign Agencies | | | — | | | | 14,527,780 | | | | — | |
U.S. Government Agency Obligations | | | — | | | | 4,250,607 | | | | — | |
U.S. Government Treasury Obligations | | | — | | | | 157,081,426 | | | | — | |
Affiliated Mutual Funds | | | 401,417,930 | | | | — | | | | — | |
Other Financial Instruments* | | | | | | | | | | | | |
Futures Contracts | | | 972,141 | | | | — | | | | — | |
Interest Rate Swap Agreements | | | — | | | | 497,260 | | | | — | |
Credit Default Swap Agreements | | | — | | | | 13,332 | | | | — | |
| | |
|
|
| |
|
|
| |
|
|
|
Total | | $ | 1,603,684,561 | | | $ | 831,528,312 | | | $ | 475,898 | |
| | |
|
|
| |
|
|
| |
|
|
|
| * | Other financial instruments are derivative instruments not reflected in the Schedule of Investments, such as futures, forwards and swap contracts, which are recorded at the unrealized appreciation/depreciation on the instrument. |
The industry classification of portfolio holdings and liabilities in excess of other assets shown as a percentage of net assets as of December 31, 2011 were as follows:
| | | | |
Affiliated Mutual Fund (including 6.1% of collateral received for securities on loan) | | | 18.3 | % |
Mortgage-Backed Securities | | | 11.9 | |
U.S. Government Treasury Obligations | | | 7.2 | |
Oil, Gas & Consumable Fuels | | | 5.6 | |
Commercial Mortgage-Backed Securities | | | 5.0 | |
Pharmaceuticals | | | 3.5 | |
Banking | | | 3.1 | |
Insurance | | | 2.7 | |
Computers & Peripherals | | | 2.5 | |
IT Services | | | 2.1 | |
Software | | | 1.9 | |
| | | | |
Media | | | 1.7 | % |
Diversified Telecommunication Services | | | 1.6 | |
Beverages | | | 1.5 | |
Commercial Banks | | | 1.5 | |
Diversified Financial Services | | | 1.5 | |
Aerospace & Defense | | | 1.4 | |
Chemicals | | | 1.4 | |
Industrial Conglomerates | | | 1.4 | |
Tobacco | | | 1.4 | |
Food & Staples Retailing | | | 1.3 | |
Real Estate Investment Trusts | | | 1.3 | |
Semiconductors & Semiconductor Equipment | | | 1.3 | |
Household Products | | | 1.2 | |
Communications Equipment | | | 1.1 | |
Electric Utilities | | | 1.1 | |
SEE NOTES TO FINANCIAL STATEMENTS.
A24
| | | | | | |
| | | CONSERVATIVE BALANCED PORTFOLIO (continued) | | |
| |
| SCHEDULE OF INVESTMENTS | | December 31, 2011 |
| | | | |
Energy Equipment & Services | | | 1.1 | % |
Food Products | | | 1.1 | |
Healthcare Providers & Services | | | 1.1 | |
Hotels, Restaurants & Leisure | | | 1.1 | |
Internet Software & Services | | | 1.1 | |
Machinery | | | 1.1 | |
Specialty Retail | | | 1.1 | |
Capital Markets | | | 1.0 | |
Healthcare Equipment & Supplies | | | 1.0 | |
Electric | | | 0.8 | |
Multi-Utilities | | | 0.8 | |
Non-Residential Mortgage-Backed Securities | | | 0.8 | |
Biotechnology | | | 0.7 | |
Non-Corporate Foreign Agencies | | | 0.7 | |
Air Freight & Logistics | | | 0.6 | |
Municipal Bonds | | | 0.6 | |
Telecommunications | | | 0.6 | |
Metals & Mining | | | 0.5 | |
Multiline Retail | | | 0.5 | |
Non-Captive Finance | | | 0.5 | |
Road & Rail | | | 0.5 | |
Cable | | | 0.4 | |
Consumer Finance | | | 0.4 | |
Foods | | | 0.4 | |
Healthcare & Pharmaceutical | | | 0.4 | |
Internet & Catalog Retail | | | 0.4 | |
Media & Entertainment | | | 0.4 | |
Residential Mortgage-Backed Securities | | | 0.4 | |
Textiles, Apparel & Luxury Goods | | | 0.4 | |
Automobiles | | | 0.3 | |
Collateralized Mortgage Obligations | | | 0.3 | |
Electrical Equipment | | | 0.3 | |
Electronic Equipment, Instruments & Components | | | 0.3 | |
Energy – Other | | | 0.3 | |
| | | | |
Healthcare Insurance | | | 0.3 | % |
Metals | | | 0.3 | |
Technology | | | 0.3 | |
Airlines | | | 0.2 | |
Capital Goods | | | 0.2 | |
Commercial Services & Supplies | | | 0.2 | |
Consumer | | | 0.2 | |
Life Sciences Tools & Services | | | 0.2 | |
Lodging | | | 0.2 | |
Paper | | | 0.2 | |
Pipelines & Other | | | 0.2 | |
Retailers | | | 0.2 | |
U.S. Government Agency Obligations | | | 0.2 | |
Wireless Telecommunication Services | | | 0.2 | |
Auto Components | | | 0.1 | |
Construction & Engineering | | | 0.1 | |
Containers & Packaging | | | 0.1 | |
Diversified Consumer Services | | | 0.1 | |
Energy – Integrated | | | 0.1 | |
Gas Utilities | | | 0.1 | |
Household Durables | | | 0.1 | |
Independent Power Producers & Energy Traders | | | 0.1 | |
Leisure Equipment & Products | | | 0.1 | |
Office Electronics | | | 0.1 | |
Paper & Forest Products | | | 0.1 | |
Personal Products | | | 0.1 | |
Professional Services | | | 0.1 | |
Railroads | | | 0.1 | |
Trading Companies & Distributors | | | 0.1 | |
| | |
|
|
|
| | | | 111.1 | |
Liabilities in excess of other assets | | | (11.1 | ) |
| | |
|
|
|
| | | | 100.0 | % |
| | |
|
|
|
The Portfolio invested in derivative instruments during the reporting period. The primary types of risk associated with these derivative instruments are credit risk, equity risk and interest rate risk. The effect of such derivative instruments on the Portfolio’s financial position and financial performance as reflected in the Statement of Assets and Liabilities and Statement of Operations is presented in the summary below.
Fair values of derivative instruments as of December 31, 2011 as presented in the Statement of Assets and Liabilities:
| | | | | | | | | | | | |
Derivatives not designated as hedging
instruments, carried at fair value
| | Asset Derivatives
| | | Liability Derivatives
| |
| | Balance Sheet Location
| | Fair Value
| | | Balance Sheet Location
| | Fair Value
| |
Credit contracts | | Premium paid for
swap agreements | | $ | 24,323 | | | Premium received for swap agreements | | $ | 6,479 | |
Credit contracts | | Unrealized appreciation on swap agreements | | | 277,491 | | | Unrealized depreciation on swap agreements | | | 264,159 | |
Equity contracts | | Due to broker — variation margin | | | 1,151,831 | * | | — | | | — | |
Interest rate contracts | | Unrealized appreciation on swap agreements | | | 574,479 | | | Unrealized depreciation on swap agreements | | | 77,219 | |
Interest rate contracts | | Due to broker — variation margin | | | 246,273 | * | | Due to broker — variation margin | | | 425,963 | * |
| | | | |
|
|
| | | |
|
|
|
Total | | | | $ | 2,274,397 | | | | | $ | 773,820 | |
| | | | |
|
|
| | | |
|
|
|
| * | Includes cumulative appreciation/depreciation on futures contracts as reported in Schedule of Investments. Only unsettled variation margin receivable (payable) is reported within the Statement of Assets and Liabilities. |
SEE NOTES TO FINANCIAL STATEMENTS.
A25
| | | | | | |
| | | CONSERVATIVE BALANCED PORTFOLIO (continued) | | |
| |
| SCHEDULE OF INVESTMENTS | | December 31, 2011 |
The effects of derivative instruments on the Statement of Operations for the year ended December 31, 2011 are as follows:
| | | | | | | | | | | | | | | | | | | | |
Amount of Realized Gain or (Loss) on Derivatives Recognized in Income
| |
Derivatives not designated as hedging instruments, carried at fair value
| | Futures
| | | Swaps
| | | Rights
| | | Warrants
| | | Total
| |
Credit contracts | | $ | — | | | $ | (84,737 | ) | | $ | — | | | $ | — | | | $ | (84,737 | ) |
Equity contracts | | | 8,197,262 | | | | — | | | | 8,260 | | | | (10,424 | ) | | | 8,195,098 | |
Interest rate contracts | | | (2,677,107 | ) | | | 665,039 | | | | — | | | | — | | | | (2,012,068 | ) |
| | |
|
|
| |
|
|
| |
|
|
| |
|
|
| |
|
|
|
Total | | $ | 5,520,155 | | | $ | 580,302 | | | $ | 8,260 | | | $ | (10,424 | ) | | $ | 6,098,293 | |
| | |
|
|
| |
|
|
| |
|
|
| |
|
|
| |
|
|
|
|
Change in Unrealized Appreciation or (Depreciation) on Derivatives Recognized in Income
| |
Derivatives not designated as hedging instruments, carried at fair value
| | | | | | | | Futures
| | | Swaps
| | | Total
| |
Credit contracts | | | $ | — | | | $ | 413,002 | | | $ | 413,002 | |
Equity contracts | | | | 41,827 | | | | — | | | | 41,827 | |
Interest rate contracts | | | | (1,345,998 | ) | | | 497,260 | | | | (848,738 | ) |
| | | | | | | | | | |
|
|
| |
|
|
| |
|
|
|
Total | | | $ | (1,304,171 | ) | | $ | 910,262 | | | $ | (393,909 | ) |
| | | | | | | | | | |
|
|
| |
|
|
| |
|
|
|
For the year ended December 31, 2011, the Portfolio’s average volume of derivative activities is as follows:
| | |
Futures
Long Position
(Value at Trade Date)
| | Futures
Short Position
(Value at Trade Date)
|
| $224,887,814 | | $82,953,126 |
| | |
Interest Rate Swaps
(Notional Amount in USD (000))
| | Credit Default
Swaps as Buyer
(Notional Amount in USD (000))
|
| $22,826 | | $23,312 |
SEE NOTES TO FINANCIAL STATEMENTS.
A26
| | | | | | |
| | | CONSERVATIVE BALANCED PORTFOLIO (continued) | | |
STATEMENT OF ASSETS AND LIABILITIES
December 31, 2011
| | | | |
| ASSETS | | | | |
Investments, at value including securities on loan of $131,130,353: | | | | |
Unaffiliated investments (cost $1,628,947,640) | | $ | 2,032,788,108 | |
Affiliated investments (cost $412,132,476) | | | 401,417,930 | |
Foreign currency, at value (cost $87,949) | | | 87,875 | |
Cash | | | 80,718 | |
Receivable for investments sold | | | 51,299,662 | |
Dividends and interest receivable | | | 7,178,026 | |
Unrealized appreciation on swap agreements | | | 851,970 | |
Foreign tax reclaim receivable | | | 26,264 | |
Premium paid for swap agreements | | | 24,323 | |
Receivable for Series shares sold | | | 21,935 | |
Prepaid expenses | | | 13,476 | |
| | |
|
|
|
Total Assets | | | 2,493,790,287 | |
| | |
|
|
|
| LIABILITIES | | | | |
Payable for investments purchased | | | 164,952,661 | |
Collateral for securities on loan | | | 134,741,536 | |
Management fee payable | | | 1,018,412 | |
Payable for Series shares repurchased | | | 532,774 | |
Unrealized depreciation on swap agreements | | | 341,378 | |
Accrued expenses and other liabilities | | | 329,569 | |
Due to broker-variation margin | | | 251,756 | |
Premium received for swap agreements | | | 6,479 | |
Affiliated transfer agent fee payable | | | 926 | |
| | |
|
|
|
Total Liabilities | | | 302,175,491 | |
| | |
|
|
|
| NET ASSETS | | $ | 2,191,614,796 | |
| | |
|
|
|
Net assets were comprised of: | | | | |
Paid-in capital | | $ | 1,819,283,952 | |
Retained earnings | | | 372,330,844 | |
| | |
|
|
|
Net assets, December 31, 2011 | | $ | 2,191,614,796 | |
| | |
|
|
|
Net asset value and redemption price per share, $2,191,614,796 / 134,281,948 outstanding shares of beneficial interest | | $ | 16.32 | |
| | |
|
|
|
STATEMENT OF OPERATIONS
Year Ended December 31, 2011
| | | | |
| INVESTMENT INCOME | | | | |
Interest | | $ | 33,061,237 | |
Unaffiliated dividend income (net of foreign withholding taxes of $118,149) | | | 24,995,489 | |
Affiliated dividend income | | | 2,065,123 | |
Affiliated income from securities loaned, net | | | 249,253 | |
| | |
|
|
|
| | | | 60,371,102 | |
| | |
|
|
|
| EXPENSES | | | | |
Management fee | | | 12,227,210 | |
Shareholders’ reports | | | 385,000 | |
Custodian’s fees and expenses | | | 360,000 | |
Audit fee | | | 36,000 | |
Trustees’ fees | | | 31,000 | |
Insurance expenses | | | 29,000 | |
Legal fees and expenses | | | 13,000 | |
Transfer agent’s fee and expenses (including affiliated expense of $5,500) (Note 4) | | | 12,000 | |
Commitment fee on syndicated credit agreement | | | 8,000 | |
Miscellaneous | | | 52,379 | |
| | |
|
|
|
Total expenses | | | 13,153,589 | |
| | |
|
|
|
| NET INVESTMENT INCOME | | | 47,217,513 | |
| | |
|
|
|
| NET REALIZED AND UNREALIZED GAIN (LOSS) ON INVESTMENTS, SWAPS AND FOREIGN CURRENCIES | | | | |
Net realized gain on: | | | | |
Investment transactions (including affiliated: $(1,671,086)) | | | 42,989,678 | |
Futures transactions | | | 5,520,155 | |
Swap agreement transactions | | | 580,302 | |
Foreign currency transactions | | | 23,060 | |
| | |
|
|
|
| | | | 49,113,195 | |
| | |
|
|
|
Net change in unrealized appreciation (depreciation) on: | | | | |
Investments (including affiliated: $(72,670)) | | | 5,116,051 | |
Securities sold short | | | 4,542 | |
Futures | | | (1,304,171 | ) |
Swap agreements | | | 910,262 | |
Foreign currencies | | | (30,037 | ) |
| | |
|
|
|
| | | | 4,696,647 | |
| | |
|
|
|
| NET GAIN ON INVESTMENTS, SWAPS AND FOREIGN CURRENCIES | | | 53,809,842 | |
| | |
|
|
|
| NET INCREASE IN NET ASSETS RESULTING FROM OPERATIONS | | $ | 101,027,355 | |
| | |
|
|
|
STATEMENT OF CHANGES IN NET ASSETS
| | | | | | | | |
| | | Year Ended December 31,
| |
| | | 2011
| | | 2010
| |
| INCREASE (DECREASE) IN NET ASSETS | | | | | | | | |
| OPERATIONS: | | | | | | | | |
Net investment income | | $ | 47,217,513 | | | $ | 50,041,489 | |
Net realized gain on investments, swaps and foreign currencies | | | 49,113,195 | | | | 26,327,189 | |
Net change in unrealized appreciation (depreciation) on investments, swaps and foreign currencies | | | 4,696,647 | | | | 163,178,375 | |
| | |
|
|
| |
|
|
|
NET INCREASE IN NET ASSETS RESULTING FROM OPERATIONS | | | 101,027,355 | | | | 239,547,053 | |
| | |
|
|
| |
|
|
|
| DISTRIBUTIONS | | | (50,030,858 | ) | | | (52,703,504 | ) |
| | |
|
|
| |
|
|
|
| SERIES SHARE TRANSACTIONS: | | | | | | | | |
Series shares sold [648,345 and 812,903 shares, respectively] | | | 10,475,022 | | | | 12,182,009 | |
Series shares issued in reinvestment of distributions [3,117,187 and 3,642,260 shares, respectively] | | | 50,030,858 | | | | 52,703,504 | |
Series shares repurchased [9,540,307 and 10,357,369 shares, respectively] | | | (154,546,244 | ) | | | (155,802,464 | ) |
| | |
|
|
| |
|
|
|
NET DECREASE IN NET ASSETS RESULTING FROM SERIES SHARE TRANSACTIONS | | | (94,040,364 | ) | | | (90,916,951 | ) |
| | |
|
|
| |
|
|
|
| TOTAL INCREASE (DECREASE) IN NET ASSETS | | | (43,043,867 | ) | | | 95,926,598 | |
| NET ASSETS: | | | | | | | | |
Beginning of year | | | 2,234,658,663 | | | | 2,138,732,065 | |
| | |
|
|
| |
|
|
|
End of year | | $ | 2,191,614,796 | | | $ | 2,234,658,663 | |
| | |
|
|
| |
|
|
|
SEE NOTES TO FINANCIAL STATEMENTS.
A27
| | | | | | |
| | | DIVERSIFIED BOND PORTFOLIO | | |
| |
| SCHEDULE OF INVESTMENTS | | December 31, 2011 |
| | | | | | | | | | | | | | | | |
LONG-TERM INVESTMENTS — 91.6% ASSET-BACKED SECURITIES — 11.8% | | Moody’s
Ratings†
(Unaudited)
| | Interest
Rate
| | | Maturity
Date
| | Principal
Amount
(000)#
| | | Value
(Note 2)
| |
| | | | | | | | | | | | | | | | | |
Non-Residential Mortgage-Backed Securities — 7.8% | | | | | | | | | | | | | | | | |
Apidos CDO (Cayman Islands), 144A
Ser. 2006-4A, Class A1(a) | | Aaa | | | 0.672% | | | 10/27/18 | | $ | 2,000 | | | $ | 1,905,112 | |
Ser. 2011-8A, Class A1(a) | | Aaa | | | 2.094% | | | 10/17/21 | | | 4,000 | | | | 3,899,776 | |
ARES CLO Funds (Cayman Islands), 144A
Ser. 2004-8A, Class A1A(a) | | Aaa | | | 0.942% | | | 02/26/16 | | | 583 | | | | 570,334 | |
Ser. 2005-10A, Class A2(a) | | Aaa | | | 0.799% | | | 09/18/17 | | | 672 | | | | 655,572 | |
Ser. 2005-10A, Class A3(a) | | Aaa | | | 0.799% | | | 09/18/17 | | | 572 | | | | 555,433 | |
BA Credit Card Trust, Ser. 2006-C5, Class C5(a) | | A3 | | | 0.678% | | | 01/15/16 | | | 5,750 | | | | 5,670,376 | |
Bank One Issuance Trust, Ser. 2004-C2, Class C2(a) | | Baa2 | | | 1.078% | | | 02/15/17 | | | 2,100 | | | | 2,079,404 | |
Black Diamond CLO Ltd. (Cayman Islands), Ser. 2005-1A, Class A1, 144A(a) | | Aaa | | | 0.833% | | | 06/20/17 | | | 5,121 | | | | 4,795,703 | |
BlackRock Senior Income Series Corp. (Cayman Islands), Ser. 2005-2A, Class A1, 144A(a) | | Aaa | | | 0.756% | | | 05/25/17 | | | 954 | | | | 920,175 | |
Chatham Light CLO Ltd. (Cayman Islands), Ser. 2005-2A, Class A1, 144A(a) | | Aaa | | | 0.682% | | | 08/03/19 | | | 4,539 | | | | 4,367,654 | |
Citibank Credit Card Issuance Trust
Ser. 2003-C4, Class C4 | | Baa2 | | | 5.000% | | | 06/10/15 | | | 6,500 | | | | 6,776,743 | |
Ser. 2005-C2, Class C2(a) | | Baa2 | | | 0.764% | | | 03/24/17 | | | 2,320 | | | | 2,258,517 | |
Ser. 2005-C3, Class C3(a) | | Baa2 | | | 0.688% | | | 07/15/14 | | | 5,280 | | | | 5,267,845 | |
Ser. 2006-C1, Class C1(a) | | Baa2 | | | 0.685% | | | 02/20/15 | | | 6,320 | | | | 6,263,379 | |
COA Tempus CLO Ltd., Ser. 2010-1A, Class A1, 144A(a)(b) | | Aaa | | | 2.309% | | | 04/20/19 | | | 2,000 | | | | 1,991,870 | |
Eaton Vance CDO IV Ltd. (Cayman Islands), Ser. 2007-9A, Class A1A, 144A(a)(b) | | Aaa | | | 0.619% | | | 04/20/19 | | | 1,900 | | | | 1,821,169 | |
First CLO Ltd. (Cayman Islands), Ser. 2004-1A1,
Class A1, 144A(a) | | Aaa | | | 0.772% | | | 07/27/16 | | | 198 | | | | 194,680 | |
Four Corners CLO (Cayman Islands), 144A
Ser. 2005-1A, Class A3(a) | | Aaa | | | 0.874% | | | 03/26/17 | | | 1,582 | | | | 1,519,751 | |
Ser. 2006-3A, Class A(a) | | Aaa | | | 0.666% | | | 07/22/20 | | | 2,042 | | | | 1,912,172 | |
Fuel Trust, 144A
Sec’d. Notes | | Baa2 | | | 3.984% | | | 06/15/16 | | | 1,050 | | | | 1,049,858 | |
Sec’d. Notes | | Baa2 | | | 4.207% | | | 04/15/16 | | | 3,925 | | | | 3,958,320 | |
GE Business Loan Trust, Ser. 2006-1A, Class D, 144A(a) | | Baa3 | | | 1.278% | | | 05/15/34 | | | 252 | | | | 89,261 | |
Granite Ventures Ltd. (Cayman Islands), Ser. 2005-2A, Class A1, 144A(a) | | Aaa | | | 0.663% | | | 12/15/17 | | | 1,495 | | | | 1,461,510 | |
Gulf Stream Compass CLO Ltd. (Cayman Islands), Ser. 2004-1A, Class A, 144A(a) | | Aaa | | | 0.763% | | | 07/15/16 | | | 647 | | | | 636,155 | |
Hewett’s Island CDO Ltd. (Cayman Islands), Ser. 2006-4A, Class A, 144A(a) | | Aaa | | | 0.701% | | | 05/09/18 | | | 2,764 | | | | 2,658,309 | |
Katonah Ltd. (Cayman Islands), Ser. 2005-7A, Class A2, 144A(a) | | Aaa | | | 0.717% | | | 11/15/17 | | | 3,381 | | | | 3,249,047 | |
Landmark CDO Ltd. (Cayman Islands), Ser. 2006-8A, Class A1, 144A(a) | | Aaa | | | 0.646% | | | 10/19/20 | | | 1,451 | | | | 1,378,499 | |
LCM LP (Cayman Islands), 144A
Ser. 2004-2A, Class A(a) | | Aaa | | | 0.736% | | | 10/22/16 | | | 574 | | | | 550,682 | |
Ser. 2005-3A, Class A(a) | | Aaa | | | 0.787% | | | 06/01/17 | | | 2,500 | | | | 2,375,000 | |
Marriott Vacation Club Owner Trust, Ser. 2010-1A, Class A, 144A | | A(c) | | | 3.540% | | | 10/20/32 | | | 5,085 | | | | 5,136,431 | |
MBNA Credit Card Master Note Trust
Ser. 2002-C3, Class C3(a) | | A3 | | | 1.628% | | | 10/15/14 | | | 1,900 | | | | 1,903,589 | |
Ser. 2004-C2, Class C2(a) | | A3 | | | 1.178% | | | 11/15/16 | | | 9,800 | | | | 9,704,937 | |
Ser. 2006-C1, Class C1(a) | | A3 | | | 0.698% | | | 07/15/15 | | | 16,600 | | | | 16,465,822 | |
Mountain Capital CLO Ltd. (Cayman Islands), 144A
Ser. 2004-3A, Class A1LA(a) | | Aaa | | | 0.872% | | | 02/15/16 | | | 251 | | | | 250,840 | |
Ser. 2005-4A, Class A1L(a) | | Aaa | | | 0.796% | | | 03/15/18 | | | 2,963 | | | | 2,841,912 | |
North Westerly CLO BV (Netherlands), Ser. II-A, Class A, 144A(a) | | Aaa | | | 2.103% | | | 09/14/19 | | EUR | 5,229 | | | | 6,225,949 | |
Pacifica CDO Ltd. (Cayman Islands), Ser. 2003-2A,
Class A1, 144A(a) | | Aaa | | | 0.971% | | | 07/10/15 | | | 595 | | | | 585,506 | |
Railcar Leasing LLC, Ser. 1997-1, Class A2, 144A | | Aa2 | | | 7.125% | | | 01/15/13 | | | 961 | | | | 988,115 | |
Stanfield Vantage CLO Ltd. (Cayman Islands), Ser. 2005-1A, Class A1, 144A(a) | | Aaa | | | 0.867% | | | 03/21/17 | | | 1,735 | | | | 1,659,149 | |
SEE NOTES TO FINANCIAL STATEMENTS.
A28
| | | | | | |
| | | DIVERSIFIED BOND PORTFOLIO (continued) | | |
| |
| SCHEDULE OF INVESTMENTS | | December 31, 2011 |
| | | | | | | | | | | | | | | | |
ASSET-BACKED SECURITIES
(continued) | | Moody’s
Ratings†
(Unaudited)
| | Interest
Rate
| | | Maturity
Date
| | Principal
Amount
(000)#
| | | Value
(Note 2)
| |
| | | | | | | | | | | | | | | | | |
Non-Residential Mortgage-Backed Securities (continued) | | | | | | | | | | | | | | | | |
Trimaran CLO Ltd. (Cayman Islands), Ser. 2006-2A, Class A1L, 144A(a) | | Aaa | | | 0.679% | | | 11/01/18 | | $ | 4,500 | | | $ | 4,273,114 | |
Venture CDO Ltd. (Cayman Islands), Ser. 2003-1A,
Class A1, 144A(a)(b) | | Aaa | | | 0.912% | | | 01/21/16 | | | 1,590 | | | | 1,550,372 | |
| | | | | | | | | | | | | | |
|
|
|
| | | | | | | | | | | | | | | | 122,418,042 | |
| | | | | | | | | | | | | | |
|
|
|
Residential Mortgage-Backed Securities — 4.0% | | | | | | | | | | | | | | | | |
ACE Securities Corp., Ser. 2004-FM1, Class M1(a) | | Baa3 | | | 1.194% | | | 09/25/33 | | | 1,841 | | | | 1,402,114 | |
Ameriquest Mortgage Securities, Inc.
Ser. 2001-2, Class M3(a) | | Caa2 | | | 3.219% | | | 10/25/31 | | | 557 | | | | 402,761 | |
Ser. 2004-R8, Class M1(a) | | Baa1 | | | 1.254% | | | 09/25/34 | | | 950 | | | | 721,599 | |
Argent Securities, Inc.
Ser. 2003-W2, Class M4(a) | | Ba2 | | | 5.919% | | | 09/25/33 | | | 2,400 | | | | 1,506,230 | |
Ser. 2004-W6, Class M1(a) | | Baa1 | | | 0.844% | | | 05/25/34 | | | 3,532 | | | | 2,641,941 | |
Ser. 2004-W10, Class A2(a) | | Aaa | | | 0.684% | | | 10/25/34 | | | 1,802 | | | | 1,591,236 | |
Asset Backed Funding Certificates, Ser. 2004-OPT1, Class M1(a) | | Baa3 | | | 1.344% | | | 08/25/33 | | | 2,152 | | | | 1,607,119 | |
Asset Backed Securities Corp. Home Equity
Ser. 2003-HE3, Class M1(a) | | A3 | | | 1.523% | | | 06/15/33 | | | 1,706 | | | | 1,249,749 | |
Ser. 2004-HE1, Class M1(a) | | Ba1 | | | 1.328% | | | 01/15/34 | | | 295 | | | | 236,260 | |
Ser. 2004-HE5, Class M1(a) | | A2 | | | 0.894% | | | 08/25/34 | | | 2,600 | | | | 2,007,767 | |
Bear Stearns Asset Backed Securities Trust
Ser. 2004-HE2, Class M1(a) | | Ba1 | | | 1.194% | | | 03/25/34 | | | 4,784 | | | | 3,698,684 | |
Ser. 2004-HE3, Class M2(a) | | B1 | | | 2.019% | | | 04/25/34 | | | 2,207 | | | | 1,827,048 | |
CDC Mortgage Capital Trust, Ser. 2002-HE3, Class M2(a) | | C | | | 3.669% | | | 03/25/33 | | | 275 | | | | 28,536 | |
Centex Home Equity, Ser. 2004-B, Class AF6 | | Aa3 | | | 4.186% | | | 03/25/34 | | | 1,300 | | | | 1,210,603 | |
Citigroup Mortgage Loan Trust, Inc., Ser. 2004-RES1, Class M3(a) | | C | | | 1.374% | | | 11/25/34 | | | 137 | | | | 64,186 | |
Credit Suisse First Boston Mortgage Securities Corp., Ser. 2002-HE4, Class M2(a) | | C | | | 2.544% | | | 08/25/32 | | | 125 | | | | 63,009 | |
Equity One ABS, Inc., Ser. 2004-3, Class M1 | | Baa1 | | | 5.700% | | | 07/25/34 | | | 1,099 | | | | 871,047 | |
FBR Securitization Trust, Ser. 2005-2, Class M1(a) | | B2 | | | 1.014% | | | 09/25/35 | | | 3,600 | | | | 2,296,051 | |
Fremont Home Loan Trust, Ser. 2003-B, Class M1(a) | | Baa3 | | | 1.344% | | | 12/25/33 | | | 315 | | | | 226,752 | |
GSAMP Trust, Ser. 2004-FM1, Class M1(a) | | Ba3 | | | 1.269% | | | 11/25/33 | | | 3,254 | | | | 2,521,708 | |
HSBC Home Equity Loan Trust
Ser. 2006-1, Class M1(a) | | Aa1 | | | 0.565% | | | 01/20/36 | | | 850 | | | | 753,561 | |
Ser. 2006-2, Class A1(a) | | Aaa | | | 0.435% | | | 03/20/36 | | | 232 | | | | 214,286 | |
Ser. 2006-2, Class A2(a) | | Aaa | | | 0.465% | | | 03/20/36 | | | 282 | | | | 263,226 | |
IXIS Real Estate Capital Trust, Ser. 2006-HE1, Class A4(a) | | Ca | | | 0.594% | | | 03/25/36 | | | 3,200 | | | | 1,044,874 | |
Long Beach Mortgage Loan Trust, Ser. 2004-1, Class M1(a) | | A3 | | | 1.044% | | | 02/25/34 | | | 4,250 | | | | 3,119,798 | |
Mastr Asset Backed Securities Trust, Ser. 2004-WMC1, Class M1(a) | | B3 | | | 1.074% | | | 02/25/34 | | | 3,005 | | | | 2,198,247 | |
Merrill Lynch Mortgage Investors, Inc.
Ser. 2004-HE2, Class M1(a) | | A-(c) | | | 1.094% | | | 08/25/35 | | | 1,000 | | | | 635,852 | |
Ser. 2004-OPT1, Class A1A(a) | | AAA(c) | | | 0.554% | | | 06/25/35 | | | 2,806 | | | | 2,008,824 | |
Morgan Stanley ABS Capital I
Ser. 2002-NC6, Class M2(a) | | Ca | | | 3.444% | | | 11/25/32 | | | 167 | | | | 44,177 | |
Ser. 2003-HE1, Class M1(a) | | Ba2 | | | 1.494% | | | 05/25/33 | | | 1,937 | | | | 1,465,464 | |
Ser. 2003-HE3, Class M1(a) | | Ba3 | | | 1.314% | | | 10/25/33 | | | 1,419 | | | | 1,031,396 | |
Ser. 2004-NC1, Class M1(a) | | Baa2 | | | 1.344% | | | 12/27/33 | | | 1,193 | | | | 944,600 | |
Ser. 2004-OP1, Class M1(a) | | Aa1 | | | 0.874% | | | 11/25/34 | | | 3,688 | | | | 2,666,773 | |
Ser. 2004-WMC1, Class M1(a) | | B1 | | | 1.224% | | | 06/25/34 | | | 2,996 | | | | 2,195,200 | |
Ser. 2004-WMC2, Class M1(a) | | B2 | | | 1.209% | | | 07/25/34 | | | 2,575 | | | | 1,898,054 | |
New Century Home Equity Loan Trust
Ser. 2003-4, Class M1(a) | | A2 | | | 1.419% | | | 10/25/33 | | | 4,376 | | | | 3,447,587 | |
Ser. 2004-4, Class M1(a) | | Ba1 | | | 1.059% | | | 02/25/35 | | | 3,048 | | | | 2,261,709 | |
Residential Asset Mortgage Products, Inc., Ser. 2004-RS12,
Class MII2(a) | | Aa3 | | | 1.094% | | | 12/25/34 | | | 916 | | | | 793,896 | |
Residential Asset Securities Corp., Ser. 2004-KS1, Class AI5 | | Baa2 | | | 5.221% | | | 02/25/34 | | | 1,000 | | | | 944,755 | |
Saxon Asset Securities Trust, Ser. 2002-3, Class M1(a) | | Ba2 | | | 1.419% | | | 12/25/32 | | | 520 | | | | 403,964 | |
SEE NOTES TO FINANCIAL STATEMENTS.
A29
| | | | | | |
| | | DIVERSIFIED BOND PORTFOLIO (continued) | | |
| |
| SCHEDULE OF INVESTMENTS | | December 31, 2011 |
| | | | | | | | | | | | | | | | |
ASSET-BACKED SECURITIES
(continued) | | Moody’s
Ratings†
(Unaudited)
| | Interest
Rate
| | | Maturity
Date
| | Principal
Amount
(000)#
| | | Value
(Note 2)
| |
| | | | | | | | | | | | | | | | | |
Residential Mortgage-Backed Securities (continued) | | | | | | | | | | | | | | | | |
Securitized Asset Backed Receivables LLC Trust
Ser. 2004-NC1, Class M1(a) | | B1 | | | 1.074% | | | 02/25/34 | | $ | 4,452 | | | $ | 3,350,933 | |
Ser. 2006-FR1, Class M1(a) | | C | | | 0.694% | | | 11/25/35 | | | 2,000 | | | | 241,390 | |
Specialty Underwriting & Residential Finance, Ser. 2004-BC1, Class M1(a) | | A1 | | | 1.059% | | | 02/25/35 | | | 79 | | | | 64,063 | |
Structured Asset Investment Loan Trust
Ser. 2004-2, Class A4(a) | | AAA(c) | | | 0.999% | | | 03/25/34 | | | 2,297 | | | | 1,657,407 | |
Ser. 2004-7, Class A8(a) | | AAA(c) | | | 1.494% | | | 08/25/34 | | | 1,400 | | | | 1,028,693 | |
Structured Asset Securities Corp., Ser. 2002-HF2, Class M3(a) | | CC(c) | | | 3.294% | | | 07/25/32 | | | 1,327 | | | | 1,018,425 | |
| | | | | | | | | | | | | | |
|
|
|
| | | | | | | | | | | | | | | | 61,871,554 | |
| | | | | | | | | | | | | | |
|
|
|
TOTAL ASSET-BACKED SECURITIES
(cost $187,078,263) | | | | 184,289,596 | |
| | | | | | | | | | | | | | |
|
|
|
| BANK LOANS — 1.6% | | | | | | | | | | | | | | | | |
Automotive — 0.2% | | | | | | | | | | | | | | | | |
Chrysler Group LLC(a) | | Ba2 | | | 6.000% | | | 05/24/17 | | | 2,488 | | | | 2,348,023 | |
| | | | | | | | | | | | | | |
|
|
|
Cable — 0.1% | | | | | | | | | | | | | | | | |
Insight Midwest Holding LLC(a) | | Ba3 | | | 1.270% | | | 10/06/13 | | | 1,789 | | | | 1,766,599 | |
| | | | | | | | | | | | | | |
|
|
|
Capital Goods — 0.1% | | | | | | | | | | | | | | | | |
Capital Safety Group Ltd.(a) | | B3 | | | 2.010% | | | 06/15/15 | | | 409 | | | | 405,156 | |
Capital Safety Group Ltd.(a) | | B3 | | | 3.014% | | | 06/14/16 | | | 1,091 | | | | 1,079,844 | |
| | | | | | | | | | | | | | |
|
|
|
| | | | | | | | | | | | | | | | 1,485,000 | |
| | | | | | | | | | | | | | |
|
|
|
Consumer | | | | | | | | | | | | | | | | |
Huish Detergents, Inc.(a) | | Ba3 | | | 2.260% | | | 04/26/14 | | | 201 | | | | 177,779 | |
| | | | | | | | | | | | | | |
|
|
|
Electric — 0.1% | | | | | | | | | | | | | | | | |
Texas Competitive Electric Holdings Co. LLC(a) | | B2 | | | 4.891% | | | 10/10/17 | | | 1,860 | | | | 1,175,597 | |
| | | | | | | | | | | | | | |
|
|
|
Foods — 0.2% | | | | | | | | | | | | | | | | |
Del Monte Foods Co.(a) | | Ba3 | | | 4.500% | | | 03/08/18 | | | 1,866 | | | | 1,767,680 | |
OSI Restaurant Partners, Inc.(a) | | B3 | | | 2.617% | | | 06/14/13 | | | 442 | | | | 417,474 | |
OSI Restaurant Partners, Inc.(a) | | B3 | | | 2.743% | | | 06/14/14 | | | 1,012 | | | | 955,781 | |
| | | | | | | | | | | | | | |
|
|
|
| | | | | | | | | | | | | | | | 3,140,935 | |
| | | | | | | | | | | | | | |
|
|
|
Gaming — 0.2% | | | | | | | | | | | | | | | | |
CCM Merger, Inc.(a) | | B3 | | | 7.000% | | | 03/01/17 | | | 2,880 | | | | 2,846,339 | |
| | | | | | | | | | | | | | |
|
|
|
Healthcare & Pharmaceutical — 0.3% | | | | | | | | | | | | | | | | |
HCA, Inc.(a) | | Ba3 | | | 3.688% | | | 05/01/18 | | | 462 | | | | 435,710 | |
HCA, Inc.(a) | | Ba3 | | | 3.829% | | | 03/31/17 | | | 1,108 | | | | 1,049,188 | |
RPI Finance Trust(a) | | Baa2 | | | 4.000% | | | 05/09/18 | | | 3,980 | | | | 3,945,175 | |
| | | | | | | | | | | | | | |
|
|
|
| | | | | | | | | | | | | | | | 5,430,073 | |
| | | | | | | | | | | | | | |
|
|
|
Non-Captive Finance — 0.2% | | | | | | | | | | | | | | | | |
International Lease Finance Corp.(a) | | Ba2 | | | 6.750% | | | 03/17/15 | | | 1,990 | | | | 1,992,458 | |
International Lease Finance Corp.(a) | | Ba3 | | | 7.000% | | | 03/17/16 | | | 1,460 | | | | 1,461,805 | |
| | | | | | | | | | | | | | |
|
|
|
| | | | | | | | | | | | | | | | 3,454,263 | |
| | | | | | | | | | | | | | |
|
|
|
Technology — 0.2% | | | | | | | | | | | | | | | | |
First Data Corp.(a) | | B1 | | | 3.044% | | | 09/24/14 | | | 88 | | | | 79,567 | |
First Data Corp.(a) | | B1 | | | 3.044% | | | 09/24/14 | | | 168 | | | | 151,557 | |
First Data Corp.(a) | | B1 | | | 4.294% | | | 03/26/18 | | | 2,411 | | | | 2,014,814 | |
Flextronics International Ltd. (Singapore)(a) | | Ba1 | | | 2.522% | | | 10/01/14 | | | 410 | | | | 400,502 | |
Flextronics International Ltd. (Singapore)(a) | | Ba1 | | | 2.546% | | | 10/01/14 | | | 118 | | | | 115,749 | |
| | | | | | | | | | | | | | |
|
|
|
| | | | | | | | | | | | | | | | 2,762,189 | |
| | | | | | | | | | | | | | |
|
|
|
TOTAL BANK LOANS
(cost $26,055,501) | | | | 24,586,797 | |
| | | | | | | | | | | | | | |
|
|
|
SEE NOTES TO FINANCIAL STATEMENTS.
A30
| | | | | | |
| | | DIVERSIFIED BOND PORTFOLIO (continued) | | |
| |
| SCHEDULE OF INVESTMENTS | | December 31, 2011 |
| | | | | | | | | | | | | | | | |
| COLLATERALIZED MORTGAGE OBLIGATIONS — 0.3% | | Moody’s
Ratings†
(Unaudited)
| | Interest
Rate
| | | Maturity
Date
| | Principal
Amount
(000)#
| | | Value
(Note 2)
| |
| | | | | | | | | | | | | | | | | |
Countrywide Alternative Loan Trust, Ser. 2004-18CB, Class 3A1 | | Ba3 | | | 5.250% | | | 09/25/19 | | $ | 1,062 | | | $ | 1,081,198 | |
Mastr Alternative Loans Trust, Ser. 2004-4, Class 4A1 | | Baa1 | | | 5.000% | | | 04/25/19 | | | 223 | | | | 228,327 | |
Structured Adjustable Rate Mortgage Loan Trust, Ser. 2004-1,
Class 4A3(a) | | Baa1 | | | 2.480% | | | 02/25/34 | | | 1,935 | | | | 1,725,500 | |
Washington Mutual Alternative Mortgage Pass-Through Certificates, Ser. 2005-1, Class 3A | | CCC(c) | | | 5.000% | | | 03/25/20 | | | 872 | | | | 776,108 | |
| | | | | | | | | | | | | | |
|
|
|
TOTAL COLLATERALIZED MORTGAGE OBLIGATIONS
(cost $4,125,681) | | | | 3,811,133 | |
| | | | | | | | | | | | | | |
|
|
|
| COMMERCIAL MORTGAGE-BACKED SECURITIES — 17.9% | | | | | | | | | | | |
Banc of America Commercial Mortgage, Inc.
Ser. 2006-1, Class A2(a) | | Aaa | | | 5.334% | | | 09/10/45 | | | 237 | | | | 238,130 | |
Ser. 2006-5, Class A2 | | Aaa | | | 5.317% | | | 09/10/47 | | | 2,989 | | | | 3,020,820 | |
Ser. 2006-6, Class A2 | | Aaa | | | 5.309% | | | 10/10/45 | | | 3,458 | | | | 3,454,837 | |
Ser. 2007-1, Class A2 | | Aaa | | | 5.381% | | | 01/15/49 | | | 2,392 | | | | 2,389,316 | |
Ser. 2007-1, Class A3 | | Aaa | | | 5.449% | | | 01/15/49 | | | 3,500 | | | | 3,682,952 | |
Ser. 2007-4, Class A3(a) | | AAA(c) | | | 5.791% | | | 02/10/51 | | | 6,460 | | | | 6,801,747 | |
Ser. 2007-5, Class A3 | | AAA(c) | | | 5.620% | | | 02/10/51 | | | 2,445 | | | | 2,573,739 | |
Bear Stearns Commercial Mortgage Securities
Ser. 2005-PWR9, Class A2 | | Aaa | | | 4.735% | | | 09/11/42 | | | 857 | | | | 871,566 | |
Ser. 2005-T20, Class A2(a) | | Aaa | | | 5.127% | | | 10/12/42 | | | 1,206 | | | | 1,205,770 | |
Ser. 2006-PW13, Class A3 | | AAA(c) | | | 5.518% | | | 09/11/41 | | | 4,024 | | | | 4,221,792 | |
Citigroup Commercial Mortgage Trust
Ser. 2006-C5, Class A2 | | Aaa | | | 5.378% | | | 10/15/49 | | | 3,195 | | | | 3,223,988 | |
Ser. 2007-C6, Class A3(a) | | Aaa | | | 5.697% | | | 12/10/49 | | | 4,850 | | | | 5,144,754 | |
Citigroup/Deutsche Bank Commercial Mortgage Trust
Ser. 2006-CD2, Class A2 | | Aaa | | | 5.408% | | | 01/15/46 | | | 56 | | | | 56,033 | |
Ser. 2006-CD2, Class AAB(a) | | Aaa | | | 5.374% | | | 01/15/46 | | | 2,488 | | | | 2,569,505 | |
Ser. 2007-CD4, Class A3 | | Aaa | | | 5.293% | | | 12/11/49 | | | 2,515 | | | | 2,675,075 | |
Commercial Mortgage Pass-Through Certificates
Ser. 2006-C7, Class A3(a) | | AAA(c) | | | 5.689% | | | 06/10/46 | | | 2,703 | | | | 2,752,525 | |
Ser. 2006-C7, Class A4(a) | | AAA(c) | | | 5.751% | | | 06/10/46 | | | 4,000 | | | | 4,416,992 | |
Ser. 2006-C8, Class A2B | | Aaa | | | 5.248% | | | 12/10/46 | | | 4,325 | | | | 4,337,328 | |
Credit Suisse Mortgage Capital Certificates
Ser. 2006-C1, Class A4(a) | | AAA(c) | | | 5.419% | | | 02/15/39 | | | 4,400 | | | | 4,869,432 | |
Ser. 2006-C5, Class A2 | | Aaa | | | 5.246% | | | 12/15/39 | | | 107 | | | | 106,906 | |
Ser. 2007-C1, Class A2 | | Aaa | | | 5.268% | | | 02/15/40 | | | 2,133 | | | | 2,130,879 | |
Ser. 2007-C4, Class A2(a) | | Aaa | | | 5.795% | | | 09/15/39 | | | 416 | | | | 417,573 | |
Ser. 2007-C4, Class A3(a) | | Aaa | | | 5.795% | | | 09/15/39 | | | 10,550 | | | | 10,994,123 | |
DBUBS Mortgage Trust
Ser. 2011-LC2A, Class A1, 144A | | Aaa | | | 3.527% | | | 07/10/44 | | | 5,579 | | | | 5,785,809 | |
Ser. 2011-LC3A, Class A2 | | Aaa | | | 3.642% | | | 08/10/44 | | | 3,800 | | | | 4,003,087 | |
GE Capital Commercial Mortgage Corp.
Ser. 2006-C1, Class A4(a) | | AAA(c) | | | 5.330% | | | 03/10/44 | | | 6,700 | | | | 7,356,030 | |
Ser. 2007-C1, Class A2 | | Aaa | | | 5.417% | | | 12/10/49 | | | 9,765 | | | | 9,787,958 | |
GMAC Commercial Mortgage Securities, Inc., Ser. 2006-C1,
Class A4(a) | | AAA(c) | | | 5.238% | | | 11/10/45 | | | 1,280 | | | | 1,378,016 | |
Greenwich Capital Commercial Funding Corp.
Ser. 2005-GG3, Class A2 | | Aaa | | | 4.305% | | | 08/10/42 | | | 115 | | | | 115,307 | |
Ser. 2005-GG5, Class A2 | | Aaa | | | 5.117% | | | 04/10/37 | | | 7,244 | | | | 7,275,924 | |
Ser. 2005-GG5, Class A5(a) | | Aaa | | | 5.224% | | | 04/10/37 | | | 4,900 | | | | 5,246,347 | |
Ser. 2007-GG9, Class A2 | | Aaa | | | 5.381% | | | 03/10/39 | | | 3,891 | | | | 3,913,061 | |
GS Mortgage Securities Corp. II
Ser. 2006-GG6, Class A4(a) | | AA-(c) | | | 5.553% | | | 04/10/38 | | | 6,700 | | | | 7,284,475 | |
Ser. 2006-GG8, Class A2 | | Aaa | | | 5.479% | | | 11/10/39 | | | 1,274 | | | | 1,277,818 | |
Ser. 2007-GG10, Class A2(a) | | Aaa | | | 5.778% | | | 08/10/45 | | | 6,605 | | | | 6,713,395 | |
JPMorgan Chase Commercial Mortgage Securities Corp.
Ser. 2005-LDP4, Class AM(a) | | Aa2 | | | 4.999% | | | 10/15/42 | | | 1,820 | | | | 1,914,682 | |
Ser. 2005-LDP5, Class A4(a) | | Aaa | | | 5.206% | | | 12/15/44 | | | 3,350 | | | | 3,705,770 | |
SEE NOTES TO FINANCIAL STATEMENTS.
A31
| | | | | | |
| | | DIVERSIFIED BOND PORTFOLIO (continued) | | |
| |
| SCHEDULE OF INVESTMENTS | | December 31, 2011 |
| | | | | | | | | | | | | | | | |
COMMERCIAL MORTGAGE-BACKED SECURITIES
(continued) | | Moody’s
Ratings†
(Unaudited)
| | Interest
Rate
| | | Maturity
Date
| | Principal
Amount
(000)#
| | | Value
(Note 2)
| |
| | | | | | | | | | | | | | | | | |
Ser. 2006-CB14, Class A4(a) | | Aaa | | | 5.481% | | | 12/12/44 | | $ | 5,000 | | | $ | 5,437,410 | |
Ser. 2006-LDP6, Class A4(a) | | Aaa | | | 5.475% | | | 04/15/43 | | | 1,640 | | | | 1,804,074 | |
Ser. 2006-LDP7, Class A2(a) | | Aaa | | | 5.861% | | | 04/15/45 | | | 251 | | | | 252,091 | |
Ser. 2007-LD11, Class A2(a) | | Aaa | | | 5.802% | | | 06/15/49 | | | 10,543 | | | | 10,659,982 | |
Ser. 2007-LD12, Class A3(a) | | Aaa | | | 5.986% | | | 02/15/51 | | | 9,200 | | | | 9,788,313 | |
Ser. 2007-LDPX, Class A2 | | Aaa | | | 5.434% | | | 01/15/49 | | | 4,150 | | | | 4,386,349 | |
LB-UBS Commercial Mortgage Trust
Ser. 2004-C8, Class A6(a) | | Aaa | | | 4.799% | | | 12/15/29 | | | 4,200 | | | | 4,457,447 | |
Ser. 2005-C7, Class AM(a) | | AA(c) | | | 5.263% | | | 11/15/40 | | | 2,100 | | | | 2,218,014 | |
Ser. 2006-C3, Class A2 | | Aaa | | | 5.532% | | | 03/15/32 | | | 2 | | | | 1,738 | |
Ser. 2006-C6, Class AAB | | Aaa | | | 5.341% | | | 09/15/39 | | | 6,766 | | | | 7,103,436 | |
Ser. 2006-C7, Class A2 | | AAA(c) | | | 5.300% | | | 11/15/38 | | | 1,187 | | | | 1,189,290 | |
Ser. 2007-C1, Class A2 | | AAA(c) | | | 5.318% | | | 02/15/40 | | | 3,075 | | | | 3,076,748 | |
Ser. 2007-C6, Class A2 | | Aaa | | | 5.845% | | | 07/15/40 | | | 3,358 | | | | 3,397,749 | |
Merrill Lynch Mortgage Trust
Ser. 2006-C1, Class A4(a) | | AAA(c) | | | 5.666% | | | 05/12/39 | | | 7,920 | | | | 8,831,980 | |
Ser. 2007-C1, Class A3(a) | | A+(c) | | | 5.834% | | | 06/12/50 | | | 690 | | | | 719,083 | |
Merrill Lynch/Countrywide Commercial Mortgage Trust
Ser. 2006-1, Class A4(a) | | AAA(c) | | | 5.430% | | | 02/12/39 | | | 3,000 | | | | 3,300,468 | |
Ser. 2006-2, Class A4(a) | | Aaa | | | 5.906% | | | 06/12/46 | | | 2,625 | | | | 2,929,944 | |
Ser. 2006-3, Class ASB(a) | | Aaa | | | 5.382% | | | 07/12/46 | | | 1,987 | | | | 2,088,330 | |
Ser. 2006-4, Class A2(a) | | Aaa | | | 5.112% | | | 12/12/49 | | | 1,893 | | | | 1,891,657 | |
Ser. 2007-7, Class A2(a) | | Aaa | | | 5.693% | | | 06/12/50 | | | 120 | | | | 120,424 | |
Ser. 2007-9, Class A2 | | AAA(c) | | | 5.590% | | | 09/12/49 | | | 4,426 | | | | 4,489,940 | |
Morgan Stanley Capital I
Ser. 2006-HQ8, Class A4(a) | | Aaa | | | 5.417% | | | 03/12/44 | | | 10,000 | | | | 10,952,050 | |
Ser. 2006-HQ10, Class A4 | | Aaa | | | 5.328% | | | 11/12/41 | | | 2,500 | | | | 2,729,840 | |
Ser. 2006-IQ12, Class A4 | | AAA(c) | | | 5.332% | | | 12/15/43 | | | 2,475 | | | | 2,766,434 | |
Ser. 2006-T23, Class A3(a) | | AAA(c) | | | 5.811% | | | 08/12/41 | | | 1,318 | | | | 1,350,959 | |
Ser. 2007-IQ14, Class AAB(a) | | Aaa | | | 5.654% | | | 04/15/49 | | | 6,100 | | | | 6,480,054 | |
Wachovia Bank Commercial Mortgage Trust
Ser. 2003-C9, Class A3 | | AAA(c) | | | 4.608% | | | 12/15/35 | | | 709 | | | | 717,282 | |
Ser. 2005-C20, Class AMFX(a) | | Aa1 | | | 5.179% | | | 07/15/42 | | | 3,145 | | | | 3,300,111 | |
Ser. 2006-C23, Class A4(a) | | Aaa | | | 5.418% | | | 01/15/45 | | | 7,838 | | | | 8,538,772 | |
Ser. 2006-C24, Class A3(a) | | Aaa | | | 5.558% | | | 03/15/45 | | | 2,050 | | | | 2,261,451 | |
Ser. 2006-C25, Class A4(a) | | Aaa | | | 5.737% | | | 05/15/43 | | | 6,000 | | | | 6,640,494 | |
Ser. 2006-C28, Class A2 | | Aaa | | | 5.500% | | | 10/15/48 | | | 359 | | | | 359,375 | |
Ser. 2007-C31, Class A4 | | Aa2 | | | 5.509% | | | 04/15/47 | | | 3,300 | | | | 3,479,428 | |
Ser. 2007-C33, Class A2(a) | | Aaa | | | 5.854% | | | 02/15/51 | | | 4,545 | | | | 4,584,088 | |
Ser. 2007-C33, Class A3(a) | | Aaa | | | 5.899% | | | 02/15/51 | | | 4,564 | | | | 4,837,584 | |
Ser. 2007-C34, Class A2 | | Aaa | | | 5.569% | | | 05/15/46 | | | 3,559 | | | | 3,607,483 | |
| | | | | | | | | | | | | | |
|
|
|
TOTAL COMMERCIAL MORTGAGE-BACKED SECURITIES
(cost $258,218,705) | | | | 278,663,333 | |
| | | | | | | | | | | | | | |
|
|
|
| CORPORATE BONDS — 44.7% | | | | | | | | | | | | | | | | |
Aerospace & Defense — 0.2% | | | | | | | | | | | | | | | | |
BE Aerospace, Inc., Sr. Unsec’d. Notes | | Ba2 | | | 8.500% | | | 07/01/18 | | | 1,480 | | | | 1,620,600 | |
L-3 Communications Corp., Gtd. Notes | | Baa3 | | | 4.750% | | | 07/15/20 | | | 700 | | | | 691,635 | |
L-3 Communications Corp., Gtd. Notes, Ser. B | | Ba1 | | | 6.375% | | | 10/15/15 | | | 1,420 | | | | 1,455,500 | |
| | | | | | | | | | | | | | |
|
|
|
| | | | | | | | | | | | | | | | 3,767,735 | |
| | | | | | | | | | | | | | |
|
|
|
Airlines — 0.4% | | | | | | | | | | | | | | | | |
Continental Airlines 2001-1 Class A-1 Pass Through Trust,
Pass-thru Certs., Ser. 01A1(b) | | Baa2 | | | 6.703% | | | 06/15/21 | | | 2 | | | | 2,446 | |
Continental Airlines 2001-1 Class B Pass Through Trust,
Pass-thru Certs., Ser. 011B | | Ba1 | | | 7.373% | | | 12/15/15 | | | 394 | | | | 384,526 | |
Continental Airlines 2007-1 Class A Pass Through Trust,
Pass-thru Certs., Ser. A(d) | | Baa1 | | | 5.983% | | | 04/19/22 | | | 1,720 | | | | 1,790,377 | |
SEE NOTES TO FINANCIAL STATEMENTS.
A32
| | | | | | |
| | | DIVERSIFIED BOND PORTFOLIO (continued) | | |
| |
| SCHEDULE OF INVESTMENTS | | December 31, 2011 |
| | | | | | | | | | | | | | | | |
CORPORATE BONDS
(continued) | | Moody’s
Ratings†
(Unaudited)
| | Interest
Rate
| | | Maturity
Date
| | Principal
Amount
(000)#
| | | Value
(Note 2)
| |
| | | | | | | | | | | | | | | | | |
Airlines (continued) | | | | | | | | | | | | | | | | |
Continental Airlines 2010-1 Class A Pass Through Trust,
Pass-thru Certs., Ser. A(d) | | Baa2 | | | 4.750% | | | 01/12/21 | | $ | 560 | | | $ | 568,400 | |
Delta Air Lines 2007-1 Class A Pass Through Trust, Pass-thru Certs.,
Ser. 071A | | Baa1 | | | 6.821% | | | 08/10/22 | | | 1,403 | | | | 1,464,323 | |
Delta Air Lines 2010-2 Class A Pass Through Trust, Pass-thru Certs.,
Ser. 2A(d) | | Baa2 | | | 4.950% | | | 05/23/19 | | | 767 | | | | 776,932 | |
Delta Air Lines 2011-1 Class A Pass-Through Trust, Pass-thru Certs.,
Ser. A | | Baa2 | | | 5.300% | | | 04/15/19 | | | 850 | | | | 858,500 | |
UAL 2007-1 Pass Through Trust, Pass-thru Certs.,
Ser. 071A, Class A | | Baa2 | | | 6.636% | | | 07/02/22 | | | 1,041 | | | | 1,040,949 | |
| | | | | | | | | | | | | | |
|
|
|
| | | | | | | | | | | | | | | | 6,886,453 | |
| | | | | | | | | | | | | | |
|
|
|
Automotive — 0.2% | | | | | | | | | | | | | | | | |
BorgWarner, Inc., Sr. Unsec’d. Notes | | Baa2 | | | 4.625% | | | 09/15/20 | | | 825 | | | | 876,661 | |
Delphi Corp., Gtd. Notes, 144A(d) | | Ba3 | | | 5.875% | | | 05/15/19 | | | 1,400 | | | | 1,428,000 | |
Harley-Davidson Funding Corp., Gtd. Notes, 144A, MTN | | Baa1 | | | 5.750% | | | 12/15/14 | | | 660 | | | | 712,523 | |
| | | | | | | | | | | | | | |
|
|
|
| | | | | | | | | | | | | | | | 3,017,184 | |
| | | | | | | | | | | | | | |
|
|
|
Banking — 8.5% | | | | | | | | | | | | | | | | |
Alfa MTN Markets Ltd. for ABH Financial Ltd. (Cyprus), Gtd. Notes., 144A, MTN(b) | | Ba1 | | | 8.200% | | | 06/25/12 | | | 1,500 | | | | 1,513,125 | |
American Express Co., Sr. Unsec’d. Notes(e) | | A3 | | | 8.125% | | | 05/20/19 | | | 2,785 | | | | 3,600,646 | |
American Express Credit Corp., Sr. Unsec’d. Notes, MTN | | A2 | | | 2.800% | | | 09/19/16 | | | 3,570 | | | | 3,587,493 | |
Bank of America Corp., Jr. Sub. Notes, Ser. K(a)(d) | | Ba3 | | | 8.000% | | | 12/29/49 | | | 3,500 | | | | 3,134,040 | |
Bank of America Corp., Sr. Unsec’d. Notes, MTN | | Baa1 | | | 5.000% | | | 05/13/21 | | | 860 | | | | 783,318 | |
Bank of America Corp., Sr. Unsec’d. Notes | | Baa1 | | | 6.000% | | | 09/01/17 | | | 4,590 | | | | 4,482,723 | |
Bank of America Corp., Sr. Unsec’d. Notes, Ser. 1 | | Baa1 | | | 3.750% | | | 07/12/16 | | | 1,340 | | | | 1,240,731 | |
Bank of America NA, Sub. Notes | | A3 | | | 5.300% | | | 03/15/17 | | | 790 | | | | 712,510 | |
Barclays Bank PLC (United Kingdom), Sr. Unsec’d. Notes | | Aa3 | | | 6.750% | | | 05/22/19 | | | 1,610 | | | | 1,784,883 | |
Bear Stearns Cos. LLC (The), Sr. Unsec’d. Notes | | Aa3 | | | 7.250% | | | 02/01/18 | | | 1,575 | | | | 1,846,453 | |
Capital One Capital V, Ltd. Gtd. Notes | | Baa3 | | | 10.250% | | | 08/15/39 | | | 2,380 | | | | 2,469,250 | |
Capital One Financial Corp., Sub. Notes | | Baa2 | | | 6.150% | | | 09/01/16 | | | 700 | | | | 728,372 | |
Citigroup, Inc., Sr. Unsec’d. Notes | | A3 | | | 4.500% | | | 01/14/22 | | | 1,000 | | | | 962,023 | |
Citigroup, Inc., Sr. Unsec’d. Notes | | A3 | | | 6.125% | | | 11/21/17 | | | 2,050 | | | | 2,187,824 | |
Citigroup, Inc., Sr. Unsec’d. Notes | | A3 | | | 6.125% | | | 05/15/18 | | | 2,500 | | | | 2,660,892 | |
Citigroup, Inc., Sr. Unsec’d. Notes | | A3 | | | 8.125% | | | 07/15/39 | | | 4,120 | | | | 5,044,248 | |
Citigroup, Inc., Unsec’d. Notes(d) | | A3 | | | 8.500% | | | 05/22/19 | | | 1,375 | | | | 1,618,493 | |
Countrywide Financial Corp., Gtd. Notes, MTN(b)(d) | | Baa1 | | | 5.800% | | | 06/07/12 | | | 3,670 | | | | 3,677,722 | |
Depfa ACS Bank (Ireland), Covered Notes, 144A | | Aa3 | | | 5.125% | | | 03/16/37 | | | 3,065 | | | | 2,191,073 | |
Discover Bank, Sub. Notes | | Ba1 | | | 7.000% | | | 04/15/20 | | | 2,005 | | | | 2,097,767 | |
Goldman Sachs Group, Inc. (The), Sr. Notes | | A1 | | | 6.250% | | | 02/01/41 | | | 2,195 | | | | 2,153,359 | |
Goldman Sachs Group, Inc. (The), Sr. Unsec’d. Notes | | A1 | | | 5.250% | | | 07/27/21 | | | 2,055 | | | | 2,004,735 | |
Goldman Sachs Group, Inc. (The), Sr. Unsec’d. Notes, MTN | | A1 | | | 6.000% | | | 06/15/20 | | | 2,420 | | | | 2,478,956 | |
Goldman Sachs Group, Inc. (The), Sr. Unsec’d. Notes | | A1 | | | 6.150% | | | 04/01/18 | | | 1,355 | | | | 1,398,480 | |
Goldman Sachs Group, Inc. (The), Sr. Unsec’d. Notes | | A1 | | | 6.250% | | | 09/01/17 | | | 3,195 | | | | 3,340,171 | |
Goldman Sachs Group, Inc. (The), Sub. Notes | | A2 | | | 6.750% | | | 10/01/37 | | | 440 | | | | 409,426 | |
Hana Bank (South Korea), Sr. Unsec’d. Notes, 144A | | A1 | | | 4.500% | | | 10/30/15 | | | 4,035 | | | | 4,136,145 | |
HSBC Holdings PLC (United Kingdom), Sub. Notes | | A1 | | | 6.500% | | | 05/02/36 | | | 995 | | | | 1,005,354 | |
HSBC Holdings PLC (United Kingdom), Sub. Notes | | A1 | | | 6.500% | | | 09/15/37 | | | 1,625 | | | | 1,604,023 | |
HSBC Holdings PLC (United Kingdom), Sub. Notes | | A1 | | | 6.800% | | | 06/01/38 | | | 2,650 | | | | 2,744,727 | |
Huntington BancShares, Inc., Sub. Notes | | Baa2 | | | 7.000% | | | 12/15/20 | | | 260 | | | | 294,666 | |
ICICI Bank Ltd. (India), Jr. Sub. Notes, 144A(a) | | Ba2 | | | 7.250% | | | 08/29/49 | | | 2,380 | | | | 2,070,600 | |
ICICI Bank Ltd. (India), Sr. Unsec’d. Notes, 144A, MTN | | Baa2 | | | 4.750% | | | 11/25/16 | | | 4,000 | | | | 3,800,564 | |
JPMorgan Chase & Co., Jr. Sub. Notes, Ser. 1(a)(d) | | Baa1 | | | 7.900% | | | 04/29/49 | | | 6,130 | | | | 6,526,550 | |
JPMorgan Chase & Co., Sr. Unsec’d. Notes(e) | | Aa3 | | | 3.150% | | | 07/05/16 | | | 4,245 | | | | 4,264,866 | |
JPMorgan Chase & Co., Sr. Unsec’d. Notes(d) | | Aa3 | | | 4.250% | | | 10/15/20 | | | 600 | | | | 604,214 | |
JPMorgan Chase & Co., Sr. Unsec’d. Notes(e) | | Aa3 | | | 4.400% | | | 07/22/20 | | | 5,100 | | | | 5,208,202 | |
KeyCorp, Sr. Unsec’d. Notes, MTN | | Baa1 | | | 5.100% | | | 03/24/21 | | | 1,155 | | | | 1,199,421 | |
SEE NOTES TO FINANCIAL STATEMENTS.
A33
| | | | | | |
| | | DIVERSIFIED BOND PORTFOLIO (continued) | | |
| |
| SCHEDULE OF INVESTMENTS | | December 31, 2011 |
| | | | | | | | | | | | | | | | |
CORPORATE BONDS
(continued) | | Moody’s
Ratings†
(Unaudited)
| | Interest
Rate
| | | Maturity
Date
| | Principal
Amount
(000)#
| | | Value
(Note 2)
| |
| | | | | | | | | | | | | | | | | |
Banking (continued) | | | | | | | | | | | | | | | | |
Krung Thai Bank PCL (Thailand), Jr. Sub. Notes(a) | | B2 | | | 7.378% | | | 10/29/49 | | $ | 1,590 | | | $ | 1,472,003 | |
Lloyds TSB Bank PLC (United Kingdom), Gtd. Notes., 144A, MTN | | A1 | | | 5.800% | | | 01/13/20 | | | 2,650 | | | | 2,515,852 | |
Merrill Lynch & Co., Inc., Sr. Unsec’d. Notes, MTN(d) | | Baa1 | | | 6.050% | | | 08/15/12 | | | 1,500 | | | | 1,521,662 | |
Morgan Stanley, Sr. Unsec’d. Notes | | A2 | | | 5.500% | | | 07/28/21 | | | 1,650 | | | | 1,525,648 | |
Morgan Stanley, Sr. Unsec’d. Notes, MTN | | A2 | | | 5.625% | | | 09/23/19 | | | 2,635 | | | | 2,440,218 | |
Morgan Stanley, Sr. Unsec’d. Notes | | A2 | | | 5.750% | | | 01/25/21 | | | 1,920 | | | | 1,790,987 | |
Morgan Stanley, Sr. Unsec’d. Notes, Ser. G, MTN | | A2 | | | 5.450% | | | 01/09/17 | | | 4,035 | | | | 3,884,753 | |
PNC Funding Corp., Gtd. Notes. | | A3 | | | 2.700% | | | 09/19/16 | | | 2,325 | | | | 2,366,792 | |
Royal Bank of Scotland PLC (The) (United Kingdom), Gtd. Notes, Ser. 2 | | A2 | | | 3.400% | | | 08/23/13 | | | 1,720 | | | | 1,673,322 | |
Royal Bank of Scotland PLC (The) (United Kingdom), Sr. Unsec’d. Notes, MTN | | A3 | | | 6.400% | | | 10/21/19 | | | 1,525 | | | | 1,427,687 | |
Santander Holdings USA, Inc., Sr. Unsec’d. Notes | | Baa1 | | | 4.625% | | | 04/19/16 | | | 525 | | | | 504,162 | |
Shinhan Bank (South Korea), Sr. Unsec’d. Notes, 144A(d) | | A1 | | | 4.125% | | | 10/04/16 | | | 2,200 | | | | 2,215,059 | |
State Street Corp., Jr. Sub. Debs. | | Baa1 | | | 4.956% | | | 03/15/18 | | | 3,025 | | | | 3,144,249 | |
Turkiye Garanti Bankasi AS (Turkey), Sr. Unsec’d. Notes, 144A | | Ba1 | | | 6.250% | | | 04/20/21 | | | 1,225 | | | | 1,166,812 | |
US Bancorp, Jr. Sub. Notes | | A2 | | | 3.442% | | | 02/01/16 | | | 4,120 | | | | 4,255,190 | |
USB Capital XIII Trust, Ltd. Gtd. Notes | | A2 | | | 6.625% | | | 12/15/39 | | | 1,975 | | | | 2,006,521 | |
Wells Fargo & Co., Sr. Unsec’d. Notes(d) | | A2 | | | 3.676% | | | 06/15/16 | | | 7,240 | | | | 7,565,786 | |
| | | | | | | | | | | | | | |
|
|
|
| | | | | | | | | | | | | | | | 133,044,748 | |
| | | | | | | | | | | | | | |
|
|
|
Brokerage | | | | | | | | | | | | | | | | |
Lehman Brothers Holdings, Inc., Sr. Unsec’d. Notes, MTN(f) | | NR | | | 6.875% | | | 05/02/18 | | | 2,740 | | | | 726,100 | |
| | | | | | | | | | | | | | |
|
|
|
Building Materials & Construction — 0.7% | | | | | | | | | | | | | | | | |
Country Garden Holdings Co. Ltd. (Cayman Islands), Sr. Unsec’d. Notes, 144A | | Ba3 | | | 11.750% | | | 09/10/14 | | | 500 | | | | 482,500 | |
Country Garden Holdings Co. Ltd. (Cayman Islands), Sr. Unsec’d. Notes, Reg.-S | | Ba3 | | | 11.750% | | | 09/10/14 | | | 3,650 | | | | 3,522,250 | |
Masco Corp., Sr. Unsec’d. Notes | | Ba2 | | | 7.125% | | | 08/15/13 | | | 2,600 | | | | 2,706,943 | |
Toll Brothers Finance Corp., Gtd. Notes(d) | | Ba1 | | | 5.150% | | | 05/15/15 | | | 4,695 | | | | 4,849,987 | |
| | | | | | | | | | | | | | |
|
|
|
| | | | | | | | | | | | | | | | 11,561,680 | |
| | | | | | | | | | | | | | |
|
|
|
Cable — 2.8% | | | | | | | | | | | | | | | | |
Cequel Communications Holdings I LLC and Cequel Capital Corp., Sr. Unsec’d. Notes, 144A | | B3 | | | 8.625% | | | 11/15/17 | | | 2,300 | | | | 2,438,000 | |
Charter Communications Operating LLC, Sec’d. Notes, 144A | | Ba2 | | | 8.000% | | | 04/30/12 | | | 11,930 | | | | 12,168,600 | |
CSC Holdings LLC, Sr. Unsec’d. Notes, 144A | | Ba3 | | | 6.750% | | | 11/15/21 | | | 2,225 | | | | 2,341,813 | |
CSC Holdings LLC, Sr. Unsec’d. Notes | | Ba3 | | | 8.500% | | | 04/15/14 | | | 3,025 | | | | 3,346,406 | |
CSC Holdings LLC, Sr. Unsec’d. Notes | | Ba3 | | | 8.625% | | | 02/15/19 | | | 1,610 | | | | 1,855,525 | |
DIRECTV Holdings LLC/DIRECTV Financing Co., Inc., Gtd. Notes | | Baa2 | | | 3.500% | | | 03/01/16 | | | 2,825 | | | | 2,912,360 | |
DIRECTV Holdings LLC/DIRECTV Financing Co., Inc., Gtd. Notes | | Baa2 | | | 3.550% | | | 03/15/15 | | | 275 | | | | 286,239 | |
DIRECTV Holdings LLC/DIRECTV Financing Co., Inc., Gtd. Notes | | Baa2 | | | 4.750% | | | 10/01/14 | | | 2,800 | | | | 3,024,462 | |
Echostar DBS Corp., Gtd. Notes | | Ba2 | | | 6.625% | | | 10/01/14 | | | 1,000 | | | | 1,067,500 | |
Echostar DBS Corp., Gtd. Notes | | Ba2 | | | 7.000% | | | 10/01/13 | | | 2,000 | | | | 2,135,000 | |
Nara Cable Funding Ltd. (Ireland), Sr. Sec’d. Notes, Reg.-S | | B1 | | | 8.875% | | | 12/01/18 | | EUR | 800 | | | | 911,150 | |
TCI Communications, Inc., Sr. Unsec’d. Notes | | Baa1 | | | 7.875% | | | 02/15/26 | | | 750 | | | | 993,315 | |
Time Warner Cable, Inc., Gtd. Notes | | Baa2 | | | 6.750% | | | 07/01/18 | | | 5,520 | | | | 6,556,187 | |
Time Warner Cable, Inc., Gtd. Notes | | Baa2 | | | 8.250% | | | 02/14/14 | | | 1,115 | | | | 1,256,779 | |
Videotron Ltee (Canada), Gtd. Notes | | Ba1 | | | 9.125% | | | 04/15/18 | | | 1,996 | | | | 2,198,095 | |
| | | | | | | | | | | | | | |
|
|
|
| | | | | | | | | | | | | | | | 43,491,431 | |
| | | | | | | | | | | | | | |
|
|
|
Capital Goods — 1.1% | | | | | | | | | | | | | | | | |
Case New Holland, Inc., Gtd. Notes | | Ba2 | | | 7.750% | | | 09/01/13 | | | 1,000 | | | | 1,062,500 | |
Clean Harbors, Inc., Sr. Sec’d. Notes | | Ba3 | | | 7.625% | | | 08/15/16 | | | 1,350 | | | | 1,434,375 | |
SEE NOTES TO FINANCIAL STATEMENTS.
A34
| | | | | | |
| | | DIVERSIFIED BOND PORTFOLIO (continued) | | |
| |
| SCHEDULE OF INVESTMENTS | | December 31, 2011 |
| | | | | | | | | | | | | | | | |
CORPORATE BONDS
(continued) | | Moody’s
Ratings†
(Unaudited)
| | Interest
Rate
| | | Maturity
Date
| | Principal
Amount
(000)#
| | | Value
(Note 2)
| |
| | | | | | | | | | | | | | | | | |
Capital Goods (continued) | | | | | | | | | | | | | | | | |
Illinois Tool Works, Inc., Sr. Unsec’d. Notes, 144A | | A1 | | | 4.875% | | | 09/15/41 | | $ | 350 | | | $ | 398,243 | |
MHP SA (Luxembourg), Gtd. Notes, 144A | | B3 | | | 10.250% | | | 04/29/15 | | | 3,175 | | | | 2,794,000 | |
Rockwell Automation, Inc., Sr. Unsec’d. Notes | | A3 | | | 5.200% | | | 01/15/98 | | | 6,500 | | | | 6,361,959 | |
Textron, Inc., Sr. Unsec’d. Notes | | Baa3 | | | 7.250% | | | 10/01/19 | | | 2,350 | | | | 2,657,871 | |
Xylem, Inc., Gtd. Notes, 144A | | Baa2 | | | 4.875% | | | 10/01/21 | | | 1,960 | | | | 2,077,122 | |
| | | | | | | | | | | | | | |
|
|
|
| | | | | | | | | | | | | | | | 16,786,070 | |
| | | | | | | | | | | | | | |
|
|
|
Chemicals — 1.3% | | | | | | | | | | | | | | | | |
Agrium, Inc. (Canada), Sr. Unsec’d. Notes | | Baa2 | | | 6.125% | | | 01/15/41 | | | 450 | | | | 558,158 | |
Ashland, Inc., Gtd. Notes | | Baa3 | | | 9.125% | | | 06/01/17 | | | 750 | | | | 836,250 | |
CF Industries, Inc., Gtd. Notes | | Ba1 | | | 6.875% | | | 05/01/18 | | | 785 | | | | 898,825 | |
Dow Chemical Co. (The), Sr. Unsec’d. Notes | | Baa3 | | | 5.900% | | | 02/15/15 | | | 750 | | | | 834,541 | |
Dow Chemical Co. (The), Sr. Unsec’d. Notes | | Baa3 | | | 7.600% | | | 05/15/14 | | | 2,050 | | | | 2,318,177 | |
Dow Chemical Co. (The), Sr. Unsec’d. Notes | | Baa3 | | | 9.400% | | | 05/15/39 | | | 1,252 | | | | 1,881,883 | |
Ecolab, Inc., Sr. Unsec’d. Notes(d) | | Baa1 | | | 5.500% | | | 12/08/41 | | | 525 | | | | 581,775 | |
Lyondell Chemical Co., Sec’d. Notes | | Ba2 | | | 11.000% | | | 05/01/18 | | | 900 | | | | 983,250 | |
Lyondell Chemical Co., Sr. Sec’d. Notes | | Ba2 | | | 8.000% | | | 11/01/17 | | | 605 | | | | 660,962 | |
Nova Chemicals Corp. (Canada), Sr. Unsec’d. Notes | | Ba2 | | | 6.500% | | | 01/15/12 | | | 1,440 | | | | 1,440,443 | |
PPG Industries, Inc., Sr. Unsec’d. Notes | | Baa1 | | | 5.500% | | | 11/15/40 | | | 350 | | | | 405,352 | |
Rockwood Specialties Group, Inc., Gtd. Notes | | B1 | | | 7.500% | | | 11/15/14 | | | 5,175 | | | | 5,239,687 | |
Union Carbide Corp., Sr. Unsec’d. Notes | | Baa3 | | | 7.875% | | | 04/01/23 | | | 3,058 | | | | 3,668,264 | |
| | | | | | | | | | | | | | |
|
|
|
| | | | | | | | | | | | | | | | 20,307,567 | |
| | | | | | | | | | | | | | |
|
|
|
Consumer — 0.5% | | | | | | | | | | | | | | | | |
Realogy Corp., Gtd. Notes | | Caa3 | | | 12.000% | | | 04/15/17 | | | 2 | | | | 1,393 | |
Sealy Mattress Co., Sr. Sec’d. Notes, 144A | | Ba3 | | | 10.875% | | | 04/15/16 | | | 5,783 | | | | 6,317,927 | |
VF Corp., Sr. Unsec’d. Notes | | A3 | | | 3.500% | | | 09/01/21 | | | 1,200 | | | | 1,246,560 | |
| | | | | | | | | | | | | | |
|
|
|
| | | | | | | | | | | | | | | | 7,565,880 | |
| | | | | | | | | | | | | | |
|
|
|
Electric — 2.0% | | | | | | | | | | | | | | | | |
AES Corp. (The), Sr. Unsec’d. Notes | | Ba3 | | | 9.750% | | | 04/15/16 | | | 775 | | | | 887,375 | |
Consumers Energy Co., First Mtge. Bonds, Ser. D | | A3 | | | 5.375% | | | 04/15/13 | | | 1,000 | | | | 1,052,207 | |
Dubai Electricity & Water Authority (United Arab Emirates), Sr. Unsec’d. Notes, 144A | | Ba1 | | | 8.500% | | | 04/22/15 | | | 1,275 | | | | 1,377,000 | |
EDP Finance BV (Netherlands), Sr. Unsec’d. Notes, 144A | | Baa3 | | | 6.000% | | | 02/02/18 | | | 600 | | | | 504,710 | |
El Paso Electric Co., Sr. Unsec’d. Notes | | Baa2 | | | 6.000% | | | 05/15/35 | | | 2,325 | | | | 2,745,558 | |
Empresa Nacional de Electricidad SA (Chile), Sr. Unsec’d. Notes | | Baa2 | | | 8.350% | | | 08/01/13 | | | 625 | | | | 682,826 | |
ENEL Finance International SA (Luxembourg), Gtd. Notes, 144A | | A3 | | | 6.000% | | | 10/07/39 | | | 3,200 | | | | 2,575,507 | |
Enersis SA (Chile), Sr. Unsec’d. Notes | | Baa2 | | | 7.375% | | | 01/15/14 | | | 3,700 | | | | 4,043,271 | |
Exelon Corp., Sr. Unsec’d. Notes | | Baa1 | | | 4.900% | | | 06/15/15 | | | 500 | | | | 538,739 | |
Exelon Generation Co. LLC, Sr. Unsec’d. Notes | | A3 | | | 6.200% | | | 10/01/17 | | | 1,930 | | | | 2,216,323 | |
Exelon Generation Co. LLC, Sr. Unsec’d. Notes | | A3 | | | 6.250% | | | 10/01/39 | | | 1,900 | | | | 2,315,135 | |
Iberdrola International BV (Netherlands), Gtd. Notes | | A3 | | | 6.750% | | | 06/15/12 | | | 750 | | | | 766,958 | |
Iberdrola International BV (Netherlands), Gtd. Notes | | A3 | | | 6.750% | | | 09/15/33 | | | 1,150 | | | | 1,222,760 | |
Mirant Mid Atlantic Pass Through Trust A, Pass-thru Certs., Ser. A | | Ba1 | | | 8.625% | | | 06/30/12 | | | 1,178 | | | | 1,201,108 | |
North American Energy Alliance LLC/North American Energy Alliance Finance Corp., Sec’d. Notes
(original cost $1,563,824; purchased 09/30/09)(b)(g) | | Ba3 | | | 10.875% | | | 06/01/16 | | | 1,600 | | | | 1,696,000 | |
Oncor Electric Delivery Co. LLC, Sr. Sec’d. Notes | | Baa1 | | | 6.800% | | | 09/01/18 | | | 1,460 | | | | 1,775,504 | |
Star Energy Geothermal Wayang Windu Ltd., Reg.-S (Virgin Islands (US)), Sr. Sec’d. Notes | | B2 | | | 11.500% | | | 02/12/15 | | | 800 | | | | 860,000 | |
TransAlta Corp. (Canada), Sr. Unsec’d. Notes | | Baa2 | | | 6.650% | | | 05/15/18 | | | 1,953 | | | | 2,258,578 | |
Xcel Energy, Inc., Sr. Unsec’d. Notes | | Baa1 | | | 5.613% | | | 04/01/17 | | | 1,947 | | | | 2,208,334 | |
| | | | | | | | | | | | | | |
|
|
|
| | | | | | | | | | | | | | | | 30,927,893 | |
| | | | | | | | | | | | | | |
|
|
|
SEE NOTES TO FINANCIAL STATEMENTS.
A35
| | | | | | |
| | | DIVERSIFIED BOND PORTFOLIO (continued) | | |
| |
| SCHEDULE OF INVESTMENTS | | December 31, 2011 |
| | | | | | | | | | | | | | | | |
CORPORATE BONDS
(continued) | | Moody’s
Ratings†
(Unaudited)
| | Interest
Rate
| | | Maturity
Date
| | Principal
Amount
(000)#
| | | Value
(Note 2)
| |
| | | | | | | | | | | | | | | | | |
Energy – Integrated — 0.2% | | | | | | | | | | | | | | | | |
BP Capital Markets PLC (United Kingdom), Gtd. Notes | | A2 | | | 4.500% | | | 10/01/20 | | $ | 870 | | | $ | 958,193 | |
BP Capital Markets PLC (United Kingdom), Gtd. Notes | | A2 | | | 5.250% | | | 11/07/13 | | | 1,510 | | | | 1,619,571 | |
| | | | | | | | | | | | | | |
|
|
|
| | | | | | | | | | | | | | | | 2,577,764 | |
| | | | | | | | | | | | | | |
|
|
|
Energy – Other — 1.4% | | | | | | | | | | | | | | | | |
Alliance Oil Co. Ltd. (Bermuda), Gtd. Notes, 144A(d) | | B+(c) | | | 9.875% | | | 03/11/15 | | | 1,685 | | | | 1,706,063 | |
Anadarko Petroleum Corp., Sr. Unsec’d. Notes | | Ba1 | | | 6.375% | | | 09/15/17 | | | 2,515 | | | | 2,915,222 | |
Anadarko Petroleum Corp., Sr. Unsec’d. Notes | | Ba1 | | | 6.450% | | | 09/15/36 | | | 445 | | | | 507,345 | |
Anadarko Petroleum Corp., Sr. Unsec’d. Notes(d) | | Ba1 | | | 6.950% | | | 06/15/19 | | | 250 | | | | 298,455 | |
Dolphin Energy Ltd. (United Arab Emirates), Sr. Sec’d. Notes, 144A | | A1 | | | 5.888% | | | 06/15/19 | | | 2,777 | | | | 3,013,431 | |
Forest Oil Corp., Gtd. Notes | | B1 | | | 8.500% | | | 02/15/14 | | | 1,000 | | | | 1,090,000 | |
Nabors Industries, Inc., Gtd. Notes, 144A | | Baa2 | | | 4.625% | | | 09/15/21 | | | 1,650 | | | | 1,675,913 | |
Newfield Exploration Co., Sr. Sub. Notes | | Ba2 | | | 6.625% | | | 04/15/16 | | | 1,000 | | | | 1,030,000 | |
Novatek Finance Ltd. (Russia), Sr. Unsec’d. Notes, 144A | | Baa3 | | | 5.326% | | | 02/03/16 | | | 5,175 | | | | 5,213,812 | |
Pioneer Natural Resources Co., Sr. Unsec’d. Notes | | Ba1 | | | 6.875% | | | 05/01/18 | | | 1,750 | | | | 1,979,208 | |
Precision Drilling Corp. (Canada), Gtd. Notes | | Ba1 | | | 6.625% | | | 11/15/20 | | | 1,000 | | | | 1,022,500 | |
Transocean, Inc. (Cayman Islands), Gtd. Notes | | Baa3 | | | 7.350% | | | 12/15/41 | | | 275 | | | | 305,478 | |
Weatherford International Ltd. (Bermuda), Gtd. Notes(d) | | Baa2 | | | 5.125% | | | 09/15/20 | | | 1,165 | | | | 1,210,642 | |
| | | | | | | | | | | | | | |
|
|
|
| | | | | | | | | | | | | | | | 21,968,069 | |
| | | | | | | | | | | | | | |
|
|
|
Foods — 2.3% | | | | | | | | | | | | | | | | |
Anheuser-Busch InBev Worldwide, Inc., Gtd. Notes | | Baa1 | | | 6.875% | | | 11/15/19 | | | 2,200 | | | | 2,762,773 | |
Anheuser-Busch InBev Worldwide, Inc., Gtd. Notes | | Baa1 | | | 7.750% | | | 01/15/19 | | | 1,640 | | | | 2,124,061 | |
ARAMARK Corp., Gtd. Notes | | B3 | | | 5.000% | | | 06/01/12 | | | 1,000 | | | | 1,005,000 | |
ARAMARK Corp., Gtd. Notes | | B3 | | | 8.500% | | | 02/01/15 | | | 5,369 | | | | 5,503,225 | |
ARAMARK Holdings Corp., Sr. Unsec’d. Notes, PIK, 144A | | B3 | | | 8.625% | | | 05/01/16 | | | 1,185 | | | | 1,220,550 | |
Corp. Pesquera Inca SAC (Peru), Gtd. Notes, 144A | | B2 | | | 9.000% | | | 02/10/17 | | | 1,000 | | | | 1,022,500 | |
Dole Food Co., Inc., Sec’d. Notes | | B2 | | | 13.875% | | | 03/15/14 | | | 2,600 | | | | 3,003,000 | |
Ingles Markets, Inc., Sr. Unsec’d. Notes | | B1 | | | 8.875% | | | 05/15/17 | | | 1,500 | | | | 1,623,750 | |
J.M. Smucker Co. (The), Gtd. Notes | | A3 | | | 3.500% | | | 10/15/21 | | | 775 | | | | 792,862 | |
JBS USA LLC/JBS USA Finance, Inc., Sr. Unsec’d. Notes, 144A | | B1 | | | 7.250% | | | 06/01/21 | | | 1,330 | | | | 1,240,225 | |
Safeway, Inc., Sr. Unsec’d. Notes | | Baa2 | | | 4.750% | | | 12/01/21 | | | 875 | | | | 896,317 | |
Smithfield Foods, Inc., Sr. Sec’d. Notes | | Ba2 | | | 10.000% | | | 07/15/14 | | | 4,715 | | | | 5,481,187 | |
Stater Brothers Holdings, Inc., Gtd. Notes | | B2 | | | 7.750% | | | 04/15/15 | | | 2,200 | | | | 2,257,750 | |
SUPERVALU, Inc., Sr. Unsec’d. Notes | | B2 | | | 7.500% | | | 05/15/12 | | | 650 | | | | 658,125 | |
SUPERVALU, Inc., Sr. Unsec’d. Notes(d) | | B2 | | | 7.500% | | | 11/15/14 | | | 2,415 | | | | 2,457,263 | |
Tyson Foods, Inc., Gtd. Notes | | Ba1 | | | 6.850% | | | 04/01/16 | | | 1,000 | | | | 1,097,500 | |
Wendy’s/Arby’s Restaurants LLC, Gtd. Notes | | B3 | | | 10.000% | | | 07/15/16 | | | 2,750 | | | | 3,025,000 | |
| | | | | | | | | | | | | | |
|
|
|
| | | | | | | | | | | | | | | | 36,171,088 | |
| | | | | | | | | | | | | | |
|
|
|
Gaming — 0.8% | | | | | | | | | | | | | | | | |
Ameristar Casinos, Inc., Gtd. Notes(d) | | B3 | | | 7.500% | | | 04/15/21 | | | 1,550 | | | | 1,596,500 | |
Marina District Finance Co., Inc., Sr. Sec’d. Notes(d) | | B2 | | | 9.500% | | | 10/15/15 | | | 1,710 | | | | 1,598,850 | |
MGM Resorts International, Sr. Sec’d. Notes(d) | | Ba2 | | | 10.375% | | | 05/15/14 | | | 1,115 | | | | 1,273,887 | |
MGM Resorts International, Sr. Sec’d. Notes | | Ba2 | | | 13.000% | | | 11/15/13 | | | 3,875 | | | | 4,601,563 | |
Pinnacle Entertainment, Inc., Gtd. Notes(d) | | B1 | | | 8.625% | | | 08/01/17 | | | 2,500 | | | | 2,643,750 | |
Yonkers Racing Corp., Sec’d. Notes, 144A
(original cost $1,087,500; purchased 06/22/11)(b)(g) | | B1 | | | 11.375% | | | 07/15/16 | | | 1,000 | | | | 1,030,000 | |
| | | | | | | | | | | | | | |
|
|
|
| | | | | | | | | | | | | | | | 12,744,550 | |
| | | | | | | | | | | | | | |
|
|
|
Healthcare & Pharmaceutical — 1.0% | | | | | | | | | | | | | | | | |
Amgen, Inc., Sr. Unsec’d. Notes | | Baa1 | | | 5.150% | | | 11/15/41 | | | 2,920 | | | | 3,027,117 | |
Apria Healthcare Group, Inc., Sr. Sec’d. Notes(d) | | B3 | | | 12.375% | | | 11/01/14 | | | 1,650 | | | | 1,513,875 | |
Aristotle Holding, Inc., Gtd. Notes, 144A | | Baa3 | | | 2.750% | | | 11/21/14 | | | 3,750 | | | | 3,795,465 | |
Gilead Sciences, Inc., Sr. Unsec’d. Notes | | Baa1 | | | 5.650% | | | 12/01/41 | | | 825 | | | | 913,409 | |
HCA, Inc., Gtd. Notes(d) | | B3 | | | 8.000% | | | 10/01/18 | | | 2,250 | | | | 2,379,375 | |
HCA, Inc., Sr. Unsec’d. Notes | | B3 | | | 6.375% | | | 01/15/15 | | | 1,000 | | | | 1,018,750 | |
HCA, Inc., Sr. Unsec’d. Notes, MTN | | B3 | | | 9.000% | | | 12/15/14 | | | 320 | | | | 333,600 | |
Mylan, Inc., Gtd. Notes, 144A | | Ba3 | | | 7.625% | | | 07/15/17 | | | 2,030 | | | | 2,215,238 | |
| | | | | | | | | | | | | | |
|
|
|
| | | | | | | | | | | | | | | | 15,196,829 | |
| | | | | | | | | | | | | | |
|
|
|
SEE NOTES TO FINANCIAL STATEMENTS.
A36
| | | | | | |
| | | DIVERSIFIED BOND PORTFOLIO (continued) | | |
| |
| SCHEDULE OF INVESTMENTS | | December 31, 2011 |
| | | | | | | | | | | | | | | | |
CORPORATE BONDS
(continued) | | Moody’s
Ratings†
(Unaudited)
| | Interest
Rate
| | | Maturity
Date
| | Principal
Amount
(000)#
| | | Value
(Note 2)
| |
| | | | | | | | | | | | | | | | | |
Healthcare Insurance — 1.1% | | | | | | | | | | | | | | | | |
Aetna, Inc., Sr. Unsec’d. Notes | | Baa1 | | | 6.750% | | | 12/15/37 | | $ | 1,900 | | | $ | 2,375,764 | |
CIGNA Corp., Sr. Unsec’d. Notes | | Baa2 | | | 4.375% | | | 12/15/20 | | | 745 | | | | 761,153 | |
CIGNA Corp., Sr. Unsec’d. Notes | | Baa2 | | | 5.375% | | | 03/15/17 | | | 2,125 | | | | 2,327,736 | |
CIGNA Corp., Sr. Unsec’d. Notes | | Baa2 | | | 5.875% | | | 03/15/41 | | | 750 | | | | 793,517 | |
Coventry Health Care, Inc., Sr. Unsec’d. Notes | | Baa3 | | | 6.125% | | | 01/15/15 | | | 4,025 | | | | 4,406,554 | |
UnitedHealth Group, Inc., Sr. Unsec’d. Notes | | A3 | | | 6.000% | | | 06/15/17 | | | 2,610 | | | | 3,069,853 | |
UnitedHealth Group, Inc., Sr. Unsec’d. Notes | | A3 | | | 6.500% | | | 06/15/37 | | | 760 | | | | 966,594 | |
UnitedHealth Group, Inc., Sr. Unsec’d. Notes | | A3 | | | 6.625% | | | 11/15/37 | | | 195 | | | | 250,347 | |
UnitedHealth Group, Inc., Sr. Unsec’d. Notes | | A3 | | | 6.875% | | | 02/15/38 | | | 2,000 | | | | 2,682,126 | |
| | | | | | | | | | | | | | |
|
|
|
| | | | | | | | | | | | | | | | 17,633,644 | |
| | | | | | | | | | | | | | |
|
|
|
Insurance — 2.8% | | | | | | | | | | | | | | | | |
Allied World Assurance Co. Holdings Ltd. (Bermuda), Gtd. Notes | | Baa1 | | | 5.500% | | | 11/15/20 | | | 430 | | | | 430,775 | |
Allied World Assurance Co. Holdings Ltd. (Bermuda), Gtd. Notes | | Baa1 | | | 7.500% | | | 08/01/16 | | | 2,475 | | | | 2,793,196 | |
American International Group, Inc., Sr. Unsec’d. Notes(d) | | Baa1 | | | 4.250% | | | 05/15/13 | | | 1,820 | | | | 1,817,508 | |
American International Group, Inc., Sr. Unsec’d. Notes | | Baa1 | | | 5.050% | | | 10/01/15 | | | 315 | | | | 304,992 | |
American International Group, Inc., Sr. Unsec’d. Notes, MTN | | Baa1 | | | 5.850% | | | 01/16/18 | | | 3,700 | | | | 3,618,655 | |
American International Group, Inc., Sr. Unsec’d. Notes | | Baa1 | | | 6.400% | | | 12/15/20 | | | 950 | | | | 958,768 | |
American International Group, Inc., Sr. Unsec’d. Notes | | Baa1 | | | 8.250% | | | 08/15/18 | | | 2,005 | | | | 2,122,295 | |
Axis Capital Holdings Ltd. (Bermuda), Sr. Unsec’d. Notes | | Baa1 | | | 5.750% | | | 12/01/14 | | | 3,350 | | | | 3,522,287 | |
Chubb Corp. (The), Jr. Sub. Notes(a)(d) | | A3 | | | 6.375% | | | 03/29/67 | | | 1,775 | | | | 1,752,813 | |
Endurance Specialty Holdings Ltd. (Bermuda), Sr. Unsec’d. Notes | | Baa1 | | | 7.000% | | | 07/15/34 | | | 1,350 | | | | 1,367,751 | |
Liberty Mutual Group, Inc., Sr. Unsec’d. Notes, 144A | | Baa2 | | | 6.500% | | | 03/15/35 | | | 1,030 | | | | 1,004,134 | |
Lincoln National Corp., Jr. Sub. Notes(a) | | Ba1 | | | 6.050% | | | 04/20/67 | | | 350 | | | | 291,375 | |
Lincoln National Corp., Sr. Unsec’d. Notes | | Baa2 | | | 7.000% | | | 06/15/40 | | | 1,265 | | | | 1,430,129 | |
Lincoln National Corp., Sr. Unsec’d. Notes | | Baa2 | | | 8.750% | | | 07/01/19 | | | 1,265 | | | | 1,538,694 | |
Massachusetts Mutual Life Insurance Co., Sub. Notes, 144A | | A1 | | | 8.875% | | | 06/01/39 | | | 1,200 | | | | 1,755,310 | |
MetLife, Inc., Sr. Unsec’d. Notes(d) | | A3 | | | 7.717% | | | 02/15/19 | | | 2,000 | | | | 2,507,892 | |
Northwestern Mutual Life Insurance, Notes, 144A(d) | | Aa2 | | | 6.063% | | | 03/30/40 | | | 500 | | | | 600,216 | |
Ohio National Financial Services, Inc., Sr. Notes, 144A | | Baa1 | | | 6.375% | | | 04/30/20 | | | 850 | | | | 924,364 | |
Progressive Corp. (The), Jr. Sub. Notes(a) | | A2 | | | 6.700% | | | 06/15/37 | | | 1,015 | | | | 1,025,150 | |
Teachers Insurance & Annuity Association of America, Sub. Notes, 144A | | Aa2 | | | 6.850% | | | 12/16/39 | | | 2,310 | | | | 2,964,659 | |
Unum Group, Sr. Unsec’d. Notes | | Baa3 | | | 5.625% | | | 09/15/20 | | | 500 | | | | 514,836 | |
Willis Group Holdings PLC (Ireland), Gtd. Notes(d) | | Baa3 | | | 4.125% | | | 03/15/16 | | | 1,280 | | | | 1,300,015 | |
XL Capital Finance Europe PLC (United Kingdom), Gtd. Notes | | Baa2 | | | 6.500% | | | 01/15/12 | | | 6,820 | | | | 6,834,097 | |
XL Group PLC (Ireland), Jr. Sub. Notes, Ser. E(a) | | Ba1 | | | 6.500% | | | 12/31/49 | | | 1,880 | | | | 1,471,100 | |
XL Group PLC (Ireland), Sr. Unsec’d. Notes | | Baa2 | | | 5.250% | | | 09/15/14 | | | 140 | | | | 148,052 | |
| | | | | | | | | | | | | | |
|
|
|
| | | | | | | | | | | | | | | | 42,999,063 | |
| | | | | | | | | | | | | | |
|
|
|
Lodging — 0.8% | | | | | | | | | | | | | | | | |
Felcor Lodging LP, Sr. Sec’d. Notes | | B2 | | | 10.000% | | | 10/01/14 | | | 3,938 | | | | 4,312,110 | |
Host Hotels & Resorts LP, Gtd. Notes, Ser. O | | Ba1 | | | 6.375% | | | 03/15/15 | | | 4,715 | | | | 4,797,513 | |
Starwood Hotels & Resorts Worldwide, Inc., Sr. Unsec’d. Notes | | Ba1 | | | 6.250% | | | 02/15/13 | | | 980 | | | | 1,011,850 | |
Wyndham Worldwide Corp., Sr. Unsec’d. Notes | | Baa3 | | | 5.750% | | | 02/01/18 | | | 2,150 | | | | 2,276,035 | |
| | | | | | | | | | | | | | |
|
|
|
| | | | | | | | | | | | | | | | 12,397,508 | |
| | | | | | | | | | | | | | |
|
|
|
Media & Entertainment — 2.9% | | | | | | | | | | | | | | | | |
British Sky Broadcasting Group PLC (United Kingdom), Gtd. Notes, 144A | | Baa1 | | | 6.100% | | | 02/15/18 | | | 210 | | | | 235,233 | |
CBS Corp., Gtd. Notes | | Baa2 | | | 8.200% | | | 05/15/14 | | | 4,800 | | | | 5,442,254 | |
Gannett Co., Inc., Sr. Unsec’d. Notes | | Ba2 | | | 6.375% | | | 04/01/12 | | | 1,100 | | | | 1,105,500 | |
Historic TW, Inc., Gtd. Notes | | Baa2 | | | 6.625% | | | 05/15/29 | | | 225 | | | | 265,234 | |
Intelsat Jackson Holdings SA (Bermuda), Gtd. Notes | | Caa2 | | | 11.250% | | | 06/15/16 | | | 2,000 | | | | 2,101,250 | |
Liberty Interactive LLC, Sr. Unsec’d. Notes | | B3 | | | 5.700% | | | 05/15/13 | | | 800 | | | | 825,000 | |
LIN Television Corp., Gtd. Notes(d) | | Caa1 | | | 6.500% | | | 05/15/13 | | | 1,249 | | | | 1,250,561 | |
LIN Television Corp., Gtd. Notes, Ser. B | | Caa1 | | | 6.500% | | | 05/15/13 | | | 1,840 | | | | 1,842,300 | |
NBCUniversal Media LLC, Sr. Unsec’d. Notes | | Baa2 | | | 4.375% | | | 04/01/21 | | | 1,350 | | | | 1,424,717 | |
News America, Inc., Gtd. Notes | | Baa1 | | | 6.150% | | | 03/01/37 | | | 460 | | | | 502,832 | |
SEE NOTES TO FINANCIAL STATEMENTS.
A37
| | | | | | |
| | | DIVERSIFIED BOND PORTFOLIO (continued) | | |
| |
| SCHEDULE OF INVESTMENTS | | December 31, 2011 |
| | | | | | | | | | | | | | | | |
CORPORATE BONDS
(continued) | | Moody’s
Ratings†
(Unaudited)
| | Interest
Rate
| | | Maturity
Date
| | Principal
Amount
(000)#
| | | Value
(Note 2)
| |
| | | | | | | | | | | | | | | | | |
Media & Entertainment (continued) | | | | | | | | | | | | | | | | |
News America, Inc., Gtd. Notes(d) | | Baa1 | | | 6.150% | | | 02/15/41 | | $ | 1,430 | | | $ | 1,648,205 | |
News America, Inc., Gtd. Notes | | Baa1 | | | 6.900% | | | 08/15/39 | | | 65 | | | | 75,138 | |
News America, Inc., Gtd. Notes | | Baa1 | | | 7.625% | | | 11/30/28 | | | 1,415 | | | | 1,709,010 | |
Nielsen Finance LLC/Nielsen Finance Co., Gtd. Notes | | B2 | | | 11.500% | | | 05/01/16 | | | 2,800 | | | | 3,206,000 | |
Nielsen Finance LLC/Nielsen Finance Co., Gtd. Notes | | B2 | | | 11.625% | | | 02/01/14 | | | 1,400 | | | | 1,608,250 | |
RR Donnelley & Sons Co., Sr. Unsec’d. Notes | | Ba1 | | | 4.950% | | | 04/01/14 | | | 7,000 | | | | 6,842,500 | |
RR Donnelley & Sons Co., Sr. Unsec’d. Notes | | Ba1 | | | 8.600% | | | 08/15/16 | | | 4,750 | | | | 4,755,938 | |
Time Warner Cos., Inc., Gtd. Notes | | Baa2 | | | 6.950% | | | 01/15/28 | | | 2,153 | | | | 2,600,423 | |
Time Warner Cos., Inc., Gtd. Notes | | Baa2 | | | 7.250% | | | 10/15/17 | | | 1,440 | | | | 1,725,447 | |
Viacom, Inc., Sr. Unsec’d. Notes | | Baa1 | | | 4.375% | | | 09/15/14 | | | 860 | | | | 921,274 | |
Viacom, Inc., Sr. Unsec’d. Notes | | Baa1 | | | 6.750% | | | 10/05/37 | | | 1,820 | | | | 2,258,604 | |
Vivendi SA (France), Sr. Unsec’d. Notes, 144A | | Baa2 | | | 5.750% | | | 04/04/13 | | | 2,000 | | | | 2,089,498 | |
| | | | | | | | | | | | | | |
|
|
|
| | | | | | | | | | | | | | | | 44,435,168 | |
| | | | | | | | | | | | | | |
|
|
|
Metals — 2.2% | | | | | | | | | | | | | | | | |
ArcelorMittal (Luxembourg), Sr. Unsec’d. Notes(d) | | Baa3 | | | 6.125% | | | 06/01/18 | | | 1,585 | | | | 1,565,286 | |
Bumi Investment Pte Ltd. (Singapore), Sec’d. Notes, MTN, Reg.-S | | Ba3 | | | 10.750% | | | 10/06/17 | | | 2,660 | | | | 2,660,000 | |
Century Aluminum Co., Sec’d. Notes | | B(c) | | | 8.000% | | | 05/15/14 | | | 2,100 | | | | 2,094,750 | |
Freeport-McMoRan Copper & Gold, Inc., Sr. Unsec’d. Notes | | Baa3 | | | 8.375% | | | 04/01/17 | | | 2,095 | | | | 2,225,938 | |
Indo Integrated Energy II BV (Netherlands), Sr. Sec’d. Notes,
Reg.-S | | B1 | | | 9.750% | | | 11/05/16 | | | 2,025 | | | | 2,161,687 | |
Metals USA, Inc., Sr. Sec’d. Notes | | B3 | | | 11.125% | | | 12/01/15 | | | 7,450 | | | | 7,738,688 | |
Newmont Mining Corp., Gtd. Notes | | Baa1 | | | 6.250% | | | 10/01/39 | | | 2,025 | | | | 2,397,624 | |
Novelis, Inc. (Canada), Gtd. Notes(d) | | B2 | | | 8.375% | | | 12/15/17 | | | 3,525 | | | | 3,745,313 | |
Peabody Energy Corp., Sr. Unsec’d. Notes, 144A | | Ba1 | | | 6.000% | | | 11/15/18 | | | 4,075 | | | | 4,156,500 | |
Steel Dynamics, Inc., Gtd. Notes | | Ba2 | | | 7.375% | | | 11/01/12 | | | 1,590 | | | | 1,655,587 | |
Teck Resources Ltd. (Canada), Sr. Sec’d. Notes | | Baa2 | | | 10.250% | | | 05/15/16 | | | 287 | | | | 330,050 | |
Vale Overseas Ltd. (Cayman Islands), Gtd. Notes | | Baa2 | | | 6.875% | | | 11/21/36 | | | 690 | | | | 785,600 | |
Vale Overseas Ltd. (Cayman Islands), Gtd. Notes(d) | | Baa2 | | | 6.875% | | | 11/10/39 | | | 1,400 | | | | 1,603,560 | |
Xstrata Canada Financial Corp. (Canada), Gtd. Notes, 144A | | Baa2 | | | 2.850% | | | 11/10/14 | | | 1,825 | | | | 1,834,320 | |
| | | | | | | | | | | | | | |
|
|
|
| | | | | | | | | | | | | | | | 34,954,903 | |
| | | | | | | | | | | | | | |
|
|
|
Non-Captive Finance — 2.4% | | | | | | | | | | | | | | | | |
Bosphorus Financial Services Ltd. (Cayman Islands), Sr. Sec’d. Notes, MTN, Reg.-S(a) | | Baa2 | | | 2.257% | | | 02/15/12 | | | 139 | | | | 138,926 | |
CIT Group, Inc., Sec’d. Notes, 144A(d) | | B2 | | | 7.000% | | | 05/04/15 | | | 350 | | | | 350,438 | |
CIT Group, Inc., Sec’d. Notes, 144A(d) | | B2 | | | 7.000% | | | 05/02/17 | | | 3,475 | | | | 3,470,656 | |
GATX Corp., Sr. Unsec’d. Notes | | Baa1 | | | 4.750% | | | 10/01/12 | | | 1,500 | | | | 1,530,287 | |
General Electric Capital Corp., Sr. Unsec’d. Notes, MTN | | Aa2 | | | 5.875% | | | 01/14/38 | | | 1,675 | | | | 1,774,808 | |
General Electric Capital Corp., Sr. Unsec’d. Notes, Ser. G, MTN(h) | | Aa2 | | | 6.000% | | | 08/07/19 | | | 6,315 | | | | 7,253,586 | |
General Electric Capital Corp., Sub. Notes | | Aa3 | | | 5.300% | | | 02/11/21 | | | 1,185 | | | | 1,266,708 | |
HSBC Finance Corp., Sr. Sub. Notes | | Baa1 | | | 6.676% | | | 01/15/21 | | | 295 | | | | 305,147 | |
International Lease Finance Corp., Sr. Sec’d. Notes, 144A | | Ba3 | | | 6.500% | | | 09/01/14 | | | 2,875 | | | | 2,939,687 | |
International Lease Finance Corp., Sr. Unsec’d. Notes | | B1 | | | 5.750% | | | 05/15/16 | | | 1,125 | | | | 1,043,485 | |
International Lease Finance Corp., Sr. Unsec’d. Notes | | B1 | | | 6.250% | | | 05/15/19 | | | 1,400 | | | | 1,293,306 | |
Nelnet, Inc., Jr. Sub. Notes(a) | | Ba2 | | | 3.951% | | | 09/29/36 | | | 6,100 | | | | 5,206,216 | |
Preferred Term Securities X Ltd./Preferred Term Securities X, Inc. (Cayman Islands), Sr. Sec’d. Notes, 144A(a)(b) | | Baa1 | | | 1.078% | | | 07/03/33 | | | 2,374 | | | | 1,305,950 | |
SLM Corp., Sr. Notes, MTN | | Ba1 | | | 6.250% | | | 01/25/16 | | | 1,385 | | | | 1,346,883 | |
SLM Corp., Sr. Unsec’d. Notes, MTN | | Ba1 | | | 5.050% | | | 11/14/14 | | | 4,150 | | | | 4,093,145 | |
SLM Corp., Sr. Unsec’d. Notes, MTN | | Ba1 | | | 8.450% | | | 06/15/18 | | | 3,200 | | | | 3,296,000 | |
Springleaf Finance Corp., Sr. Unsec’d. Notes, MTN | | B3 | | | 6.900% | | | 12/15/17 | | | 2,000 | | | | 1,440,000 | |
| | | | | | | | | | | | | | |
|
|
|
| | | | | | | | | | | | | | | | 38,055,228 | |
| | | | | | | | | | | | | | |
|
|
|
Packaging — 0.7% | | | | | | | | | | | | | | | | |
Greif Luxembourg Finance SCA (Luxembourg), 144A | | Ba2 | | | 7.375% | | | 07/15/21 | | EUR | 1,470 | | | | 1,850,223 | |
Greif, Inc., Sr. Unsec’d. Notes | | Ba2 | | | 7.750% | | | 08/01/19 | | | 1,815 | | | | 1,960,200 | |
SEE NOTES TO FINANCIAL STATEMENTS.
A38
| | | | | | |
| | | DIVERSIFIED BOND PORTFOLIO (continued) | | |
| |
| SCHEDULE OF INVESTMENTS | | December 31, 2011 |
| | | | | | | | | | | | | | | | |
CORPORATE BONDS
(continued) | | Moody’s
Ratings†
(Unaudited)
| | Interest
Rate
| | | Maturity
Date
| | Principal
Amount
(000)#
| | | Value
(Note 2)
| |
| | | | | | | | | | | | | | | | | |
Packaging (continued) | | | | | | | | | | | | | | | | |
Sealed Air Corp., Sr. Unsec’d. Notes, 144A | | B1 | | | 5.625% | | | 07/15/13 | | $ | 6,600 | | | $ | 6,859,123 | |
| | | | | | | | | | | | | | |
|
|
|
| | | | | | | | | | | | | | | | 10,669,546 | |
| | | | | | | | | | | | | | |
|
|
|
Paper — 1.0% | | | | | | | | | | | | | | | | |
International Paper Co., Sr. Unsec’d. Notes(d) | | Baa3 | | | 6.000% | | | 11/15/41 | | | 675 | | | | 732,789 | |
International Paper Co., Sr. Unsec’d. Notes | | Baa3 | | | 7.300% | | | 11/15/39 | | | 1,000 | | | | 1,216,484 | |
International Paper Co., Sr. Unsec’d. Notes | | Baa3 | | | 7.950% | | | 06/15/18 | | | 2,205 | | | | 2,683,990 | |
MeadWestvaco Corp., Sr. Unsec’d. Notes(d) | | Ba1 | | | 7.375% | | | 09/01/19 | | | 4,400 | | | | 5,111,511 | |
Rock-Tenn Co., Gtd. Notes | | Ba2 | | | 9.250% | | | 03/15/16 | | | 1,000 | | | | 1,060,000 | |
Verso Paper Holdings LLC/Verso Paper, Inc., Sr. Sec’d. Notes(d) | | Ba2 | | | 11.500% | | | 07/01/14 | | | 3,863 | | | | 3,940,260 | |
| | | | | | | | | | | | | | |
|
|
|
| | | | | | | | | | | | | | | | 14,745,034 | |
| | | | | | | | | | | | | | |
|
|
|
Pipelines & Other — 0.8% | | | | | | | | | | | | | | | | |
Energy Transfer Partners LP, Sr. Unsec’d. Notes | | Baa3 | | | 4.650% | | | 06/01/21 | | | 1,065 | | | | 1,043,270 | |
ENN Energy Holdings Ltd. (Cayman Islands), Sr. Unsec’d. Notes, 144A(d) | | Baa3 | | | 6.000% | | | 05/13/21 | | | 4,750 | | | | 4,289,293 | |
Kinder Morgan Energy Partners LP, Sr. Unsec’d. Notes | | Baa2 | | | 7.300% | | | 08/15/33 | | | 1,550 | | | | 1,810,042 | |
Mega Advance Investments Ltd. (Virgin Islands (BR)), Gtd. Notes, 144A | | Baa1 | | | 5.000% | | | 05/12/21 | | | 1,250 | | | | 1,271,136 | |
NiSource Finance Corp., Gtd. Notes | | Baa3 | | | 5.450% | | | 09/15/20 | | | 1,345 | | | | 1,489,799 | |
Sempra Energy, Sr. Unsec’d. Notes | | Baa1 | | | 6.500% | | | 06/01/16 | | | 2,275 | | | | 2,653,787 | |
| | | | | | | | | | | | | | |
|
|
|
| | | | | | | | | | | | | | | | 12,557,327 | |
| | | | | | | | | | | | | | |
|
|
|
Railroads — 0.1% | | | | | | | | | | | | | | | | |
Union Pacific Corp., Sr. Unsec’d. Notes | | Baa2 | | | 4.163% | | | 07/15/22 | | | 1,268 | | | | 1,376,250 | |
| | | | | | | | | | | | | | |
|
|
|
Real Estate Investment Trusts — 1.1% | | | | | | | | | | | | | | | | |
Hospitality Properties Trust, Sr. Unsec’d. Notes | | Baa2 | | | 7.875% | | | 08/15/14 | | | 2,900 | | | | 3,151,143 | |
Post Apartment Homes LP, Sr. Unsec’d. Notes | | Baa3 | | | 5.450% | | | 06/01/12 | | | 2,300 | | | | 2,328,952 | |
ProLogis LP, Gtd. Notes | | Baa2 | | | 6.875% | | | 03/15/20 | | | 8 | | | | 8,883 | |
Senior Housing Properties Trust, Sr. Unsec’d. Notes | | Baa3 | | | 8.625% | | | 01/15/12 | | | 3,500 | | | | 3,507,873 | |
Simon Property Group LP, Sr. Unsec’d. Notes | | A3 | | | 2.800% | | | 01/30/17 | | | 100 | | | | 102,143 | |
Simon Property Group LP, Sr. Unsec’d. Notes | | A3 | | | 4.200% | | | 02/01/15 | | | 765 | | | | 811,224 | |
Simon Property Group LP, Sr. Unsec’d. Notes | | A3 | | | 6.750% | | | 05/15/14 | | | 980 | | | | 1,079,218 | |
Simon Property Group LP, Sr. Unsec’d. Notes | | A3 | | | 10.350% | | | 04/01/19 | | | 1,685 | | | | 2,313,000 | |
WEA Finance LLC/WT Finance Aust Pty Ltd., Gtd. Notes, 144A | | A2 | | | 5.750% | | | 09/02/15 | | | 4,000 | | | | 4,251,648 | |
| | | | | | | | | | | | | | |
|
|
|
| | | | | | | | | | | | �� | | | | 17,554,084 | |
| | | | | | | | | | | | | | |
|
|
|
Retailers — 1.1% | | | | | | | | | | | | | | | | |
CVS Caremark Corp., Sr. Unsec’d. Notes | | Baa2 | | | 6.125% | | | 09/15/39 | | | 2,000 | | | | 2,433,766 | |
Macy’s Retail Holdings, Inc., Gtd. Notes | | Ba1 | | | 5.350% | | | 03/15/12 | | | 1,800 | | | | 1,812,343 | |
Macy’s Retail Holdings, Inc., Gtd. Notes | | Ba1 | | | 5.875% | | | 01/15/13 | | | 7,800 | | | | 8,030,482 | |
Susser Holdings LLC/Susser Finance Corp., Gtd. Notes | | B2 | | | 8.500% | | | 05/15/16 | | | 2,565 | | | | 2,766,994 | |
Wal-Mart Stores, Inc., Sr. Unsec’d. Notes(d) | | Aa2 | | | 5.625% | | | 04/15/41 | | | 1,190 | | | | 1,537,957 | |
| | | | | | | | | | | | | | |
|
|
|
| | | | | | | | | | | | | | | | 16,581,542 | |
| | | | | | | | | | | | | | |
|
|
|
Technology — 1.5% | | | | | | | | | | | | | | | | |
Advanced Micro Devices, Inc., Sr. Unsec’d. Notes | | Ba3 | | | 8.125% | | | 12/15/17 | | | 1,530 | | | | 1,587,375 | |
Amphenol Corp., Sr. Unsec’d. Notes | | Baa2 | | | 4.750% | | | 11/15/14 | | | 2,475 | | | | 2,651,888 | |
Arrow Electronics, Inc., Sr. Unsec’d. Notes | | Baa3 | | | 3.375% | | | 11/01/15 | | | 600 | | | | 600,772 | |
Fiserv, Inc., Gtd. Notes | | Baa2 | | | 3.125% | | | 10/01/15 | | | 195 | | | | 199,759 | |
Fiserv, Inc., Gtd. Notes | | Baa2 | | | 3.125% | | | 06/15/16 | | | 545 | | | | 554,915 | |
NXP BV/NXP Funding LLC (Netherlands), Sr. Sec’d. Notes, 144A | | BB(c) | | | 10.000% | | | 07/15/13 | | | 1,789 | | | | 1,936,593 | |
Seagate HDD Cayman (Cayman Islands), Gtd. Notes | | Ba1 | | | 6.875% | | | 05/01/20 | | | 2,875 | | | | 2,954,062 | |
Seagate Technology International (Cayman Islands), Sec’d. Notes, 144A | | Baa3 | | | 10.000% | | | 05/01/14 | | | 2,794 | | | | 3,160,713 | |
SunGard Data Systems, Inc., Gtd. Notes(d) | | Caa1 | | | 7.625% | | | 11/15/20 | | | 1,700 | | | | 1,746,750 | |
SunGard Data Systems, Inc., Gtd. Notes | | Caa1 | | | 10.250% | | | 08/15/15 | | | 2,610 | | | | 2,704,613 | |
SunGard Data Systems, Inc., Gtd. Notes | | Caa1 | | | 10.625% | | | 05/15/15 | | | 2,000 | | | | 2,130,000 | |
Xerox Corp., Sr. Unsec’d. Notes | | Baa2 | | | 4.250% | | | 02/15/15 | | | 2,000 | | | | 2,107,992 | |
SEE NOTES TO FINANCIAL STATEMENTS.
A39
| | | | | | |
| | | DIVERSIFIED BOND PORTFOLIO (continued) | | |
| |
| SCHEDULE OF INVESTMENTS | | December 31, 2011 |
| | | | | | | | | | | | | | | | |
CORPORATE BONDS
(continued) | | Moody’s
Ratings†
(Unaudited)
| | Interest
Rate
| | | Maturity
Date
| | Principal
Amount
(000)#
| | | Value
(Note 2)
| |
| | | | | | | | | | | | | | | | | |
Technology (continued) | | | | | | | | | | | | | | | | |
Xerox Corp., Sr. Unsec’d. Notes | | Baa2 | | | 5.500% | | | 05/15/12 | | $ | 870 | | | $ | 884,425 | |
| | | | | | | | | | | | | | |
|
|
|
| �� | | | | | | | | | | | | | | | 23,219,857 | |
| | | | | | | | | | | | | | |
|
|
|
Telecommunications — 2.3% | | | | | | | | | | | | | | | | |
America Movil SAB de CV (Mexico), Gtd. Notes | | A2 | | | 6.125% | | | 03/30/40 | | | 795 | | | | 945,221 | |
AT&T Corp., Gtd. Notes | | A2 | | | 8.000% | | | 11/15/31 | | | 103 | | | | 145,494 | |
AT&T, Inc., Sr. Unsec’d. Notes | | A2 | | | 5.350% | | | 09/01/40 | | | 483 | | | | 543,327 | |
AT&T, Inc., Sr. Unsec’d. Notes(e) | | A2 | | | 5.550% | | | 08/15/41 | | | 2,410 | | | | 2,837,575 | |
AT&T, Inc., Sr. Unsec’d. Notes | | A2 | | | 6.550% | | | 02/15/39 | | | 1,990 | | | | 2,531,357 | |
British Telecommunications PLC (United Kingdom), Sr. Unsec’d. Notes | | Baa2 | | | 9.625% | | | 12/15/30 | | | 328 | | | | 462,250 | |
CC Holdings GS V LLC/Crown Castle GS III Corp., Sr. Sec’d. Notes, 144A | | Baa3 | | | 7.750% | | | 05/01/17 | | | 3,000 | | | | 3,232,500 | |
Cellco Partnership/Verizon Wireless Capital LLC, Sr. Unsec’d. Notes | | A2 | | | 8.500% | | | 11/15/18 | | | 2,960 | | | | 3,995,112 | |
Digicel Ltd. (Bermuda), Sr. Unsec’d. Notes, 144A | | B1 | | | 12.000% | | | 04/01/14 | | | 1,910 | | | | 2,139,200 | |
Embarq Corp., Sr. Unsec’d. Notes
(original cost $5,906,280; purchased 05/04/11-05/11/11)(b)(g) | | Baa3 | | | 7.082% | | | 06/01/16 | | | 5,225 | | | | 5,663,618 | |
Embarq Corp., Sr. Unsec’d. Notes
(original cost $1,303,800; purchased 04/22/10)(b)(g) | | Baa3 | | | 7.995% | | | 06/01/36 | | | 1,250 | | | | 1,295,235 | |
MetroPCS Wireless, Inc., Gtd. Notes(d) | | B2 | | | 7.875% | | | 09/01/18 | | | 775 | | | | 785,656 | |
Nextel Communications, Inc., Gtd. Notes, Ser. E(d) | | B1 | | | 6.875% | | | 10/31/13 | | | 2,845 | | | | 2,830,775 | |
Qwest Corp., Sr. Unsec’d. Notes(a)(d) | | Baa3 | | | 3.796% | | | 06/15/13 | | | 3,750 | | | | 3,760,549 | |
Qwest Corp., Sr. Unsec’d. Notes | | Baa3 | | | 8.375% | | | 05/01/16 | | | 1,100 | | | | 1,259,910 | |
Telefonica Emisiones SAU (Spain), Gtd. Notes | | Baa1 | | | 5.134% | | | 04/27/20 | | | 1,090 | | | | 1,023,857 | |
Telefonica Emisiones SAU (Spain), Gtd. Notes | | Baa1 | | | 7.045% | | | 06/20/36 | | | 5 | | | | 4,875 | |
Vimpel Communications Via Vip Finance Ireland Ltd. OJSC (Ireland), Unsec’d. Notes, 144A | | Ba3 | | | 7.748% | | | 02/02/21 | | | 1,500 | | | | 1,284,375 | |
Wind Acquisition Finance SA (Luxembourg), Gtd. Notes, 144A | | B3 | | | 11.750% | | | 07/15/17 | | EUR | 450 | | | | 479,033 | |
| | | | | | | | | | | | | | |
|
|
|
| | | | | | | | | | | | | | | | 35,219,919 | |
| | | | | | | | | | | | | | |
|
|
|
Tobacco — 0.5% | | | | | | | | | | | | | | | | |
Altria Group, Inc., Gtd. Notes | | Baa1 | | | 9.950% | | | 11/10/38 | | | 3,715 | | | | 5,650,448 | |
Lorillard Tobacco Co., Gtd. Notes | | Baa2 | | | 3.500% | | | 08/04/16 | | | 515 | | | | 520,914 | |
Lorillard Tobacco Co., Gtd. Notes(d) | | Baa2 | | | 8.125% | | | 06/23/19 | | | 895 | | | | 1,066,122 | |
| | | | | | | | | | | | | | |
|
|
|
| | | | | | | | | | | | | | | | 7,237,484 | |
| | | | | | | | | | | | | | |
|
|
|
TOTAL CORPORATE BONDS
(cost $668,183,849) | | | | 696,377,598 | |
| | | | | | | | | | | | | | |
|
|
|
| FOREIGN AGENCIES — 2.2% | | | | | | | | | | | | | | | | |
Export-Import Bank of Korea (South Korea), Sr. Unsec’d. Notes | | A1 | | | 4.125% | | | 09/09/15 | | | 2,000 | | | | 2,050,524 | |
GAZ Capital SA For Gazprom (Luxembourg), Sr. Unsec’d. Notes, 144A | | Baa1 | | | 4.950% | | | 05/23/16 | | | 1,950 | | | | 1,952,437 | |
GAZ Capital SA For Gazprom (Luxembourg), Sr. Unsec’d. Notes, Reg.-S | | Baa1 | | | 9.250% | | | 04/23/19 | | | 2,055 | | | | 2,443,189 | |
GAZ Capital SA For Gazprom (Luxembourg), Sr. Unsec’d. Notes, 144A | | Baa1 | | | 9.250% | | | 04/23/19 | | | 3,440 | | | | 4,089,816 | |
Gazprom International SA For Gazprom (Luxembourg), Gtd. Notes, 144A | | BBB+(c) | | | 7.201% | | | 02/01/20 | | | 663 | | | | 700,808 | |
IPIC GMTN Ltd. (Cayman Islands), Gtd. Notes, 144A, MTN | | Aa3 | | | 5.500% | | | 03/01/22 | | | 3,625 | | | | 3,625,000 | |
Kazmunaygas National Co. (Kazakhstan), Sr. Unsec’d. Notes, 144A, MTN(d) | | Baa3 | | | 8.375% | | | 07/02/13 | | | 1,200 | | | | 1,257,000 | |
Korea Development Bank (The) (South Korea), Sr. Unsec’d.
Notes(d) | | A1 | | | 3.875% | | | 05/04/17 | | | 1,475 | | | | 1,456,539 | |
Korea Expressway Corp. (South Korea), Sr. Unsec’d. Notes, Ser. G, 144A, MTN | | A1 | | | 4.500% | | | 03/23/15 | | | 1,785 | | | | 1,850,501 | |
Korea Finance Corp. (South Korea), Sr. Unsec’d. Notes | | A1 | | | 3.250% | | | 09/20/16 | | | 2,250 | | | | 2,212,434 | |
SEE NOTES TO FINANCIAL STATEMENTS.
A40
| | | | | | |
| | | DIVERSIFIED BOND PORTFOLIO (continued) | | |
| |
| SCHEDULE OF INVESTMENTS | | December 31, 2011 |
| | | | | | | | | | | | | | | | |
FOREIGN AGENCIES
(continued) | | Moody’s
Ratings†
(Unaudited)
| | Interest
Rate
| | | Maturity
Date
| | Principal
Amount
(000)#
| | | Value
(Note 2)
| |
| | | | | | | | | | | | | | | | | |
Korea Finance Corp. (South Korea), Sr. Unsec’d. Notes | | A1 | | | 4.625% | | | 11/16/21 | | $ | 600 | | | $ | 595,373 | |
Korea Hydro & Nuclear Power Co. Ltd. (South Korea), Sr. Unsec’d. Notes, 144A | | A1 | | | 4.750% | | | 07/13/21 | | | 1,650 | | | | 1,672,326 | |
Korea Hydro & Nuclear Power Co. Ltd. (South Korea), Sr. Unsec’d. Notes, 144A | | A1 | | | 6.250% | | | 06/17/14 | | | 2,730 | | | | 2,944,906 | |
NAK Naftogaz Ukraine (Ukraine), Gtd. Notes | | NR | | | 9.500% | | | 09/30/14 | | | 3,765 | | | | 3,529,688 | |
National Agricultural Cooperative Federation (South Korea), Sr. Unsec’d. Notes, 144A, MTN | | A1 | | | 3.500% | | | 02/08/17 | | | 1,575 | | | | 1,529,224 | |
Petroleos de Venezuela SA (Venezuela), Sr. Unsec’d. Notes, Ser. 2014 | | NR | | | 4.900% | | | 10/28/14 | | | 1,735 | | | | 1,357,638 | |
Qtel International Finance Ltd. (Bermuda), Gtd. Notes, 144A | | A2 | | | 4.750% | | | 02/16/21 | | | 1,295 | | | | 1,304,712 | |
| | | | | | | | | | | | | | |
|
|
|
TOTAL FOREIGN AGENCIES
(cost $34,210,380) | | | | 34,572,115 | |
| | | | | | | | | | | | | | |
|
|
|
| MORTGAGE-BACKED SECURITIES — 7.2% | | | | | | | | | | | | | | | | |
Federal Home Loan Mortgage Corp. | | | | | 4.500% | | | TBA 30 YR | | | 8,000 | | | | 8,476,250 | |
Federal Home Loan Mortgage Corp. | | | | | 5.000% | | | 07/01/19 | | | 401 | | | | 433,899 | |
Federal Home Loan Mortgage Corp. | | | | | 5.500% | | | 10/01/33-06/01/34 | | | 2,741 | | | | 3,031,261 | |
Federal Home Loan Mortgage Corp. | | | | | 5.500% | | | TBA 30 YR | | | 13,000 | | | | 14,105,000 | |
Federal Home Loan Mortgage Corp. | | | | | 6.000% | | | 11/01/33-06/01/34 | | | 2,733 | | | | 3,042,763 | |
Federal Home Loan Mortgage Corp. | | | | | 6.000% | | | TBA 30 YR | | | 1,500 | | | | 1,647,188 | |
Federal Home Loan Mortgage Corp. | | | | | 6.500% | | | 07/01/32-09/01/32 | | | 1,540 | | | | 1,761,405 | |
Federal Home Loan Mortgage Corp. | | | | | 7.000% | | | 10/01/32 | | | 170 | | | | 194,803 | |
Federal National Mortgage Association | | | | | 4.000% | | | 05/01/19 | | | 265 | | | | 282,407 | |
Federal National Mortgage Association | | | | | 4.500% | | | 12/01/18-02/01/35 | | | 2,171 | | | | 2,337,230 | |
Federal National Mortgage Association | | | | | 5.500% | | | 03/01/17-09/01/34 | | | 7,374 | | | | 8,079,722 | |
Federal National Mortgage Association | | | | | 5.500% | | | TBA 30 YR | | | 7,500 | | | | 8,166,796 | |
Federal National Mortgage Association | | | | | 6.000% | | | 09/01/17-11/01/36 | | | 5,465 | | | | 6,079,874 | |
Federal National Mortgage Association | | | | | 6.000% | | | TBA 30 YR | | | 12,000 | | | | 13,213,126 | |
Federal National Mortgage Association | | | | | 6.500% | | | 12/01/14-11/01/33 | | | 3,440 | | | | 3,890,837 | |
Federal National Mortgage Association | | | | | 7.000% | | | 05/01/32-06/01/32 | | | 244 | | | | 283,160 | |
Government National Mortgage Association | | | | | 4.500% | | | TBA 30 YR | | | 1,000 | | | | 1,089,531 | |
Government National Mortgage Association | | | | | 4.500% | | | TBA 30 YR | | | 19,000 | | | | 20,647,654 | |
Government National Mortgage Association | | | | | 5.500% | | | 01/15/33-07/15/35 | | | 5,133 | | | | 5,820,598 | |
Government National Mortgage Association | | | | | 6.000% | | | 12/15/32-11/15/34 | | | 4,214 | | | | 4,800,403 | |
Government National Mortgage Association | | | | | 6.500% | | | 09/15/32-11/15/33 | | | 3,316 | | | | 3,838,243 | |
Government National Mortgage Association | | | | | 7.500% | | | 10/15/25-02/15/26 | | | 78 | | | | 90,923 | |
| | | | | | | | | | | | | | |
|
|
|
TOTAL MORTGAGE-BACKED SECURITIES
(cost $107,105,186) | | | | 111,313,073 | |
| | | | | | | | | | | | | | |
|
|
|
| MUNICIPAL BONDS — 1.2% | | | | | | | | | | | | | | | | |
Bay Area Toll Authority, Revenue Bonds, BABs | | A1 | | | 6.907% | | | 10/01/50 | | | 1,125 | | | | 1,467,000 | |
Chicago O’Hare International Airport, Revenue Bonds, BABs | | A1 | | | 6.395% | | | 01/01/40 | | | 1,380 | | | | 1,687,643 | |
Metropolitan Government of Nashville & Davidson County Convention Center Authority, Revenue Bonds, BABs | | Aa2 | | | 6.731% | | | 07/01/43 | | | 1,375 | | | | 1,649,615 | |
New Jersey State Turnpike Authority, Revenue Bonds, Ser. 2010A, BABs | | A3 | | | 7.102% | | | 01/01/41 | | | 1,175 | | | | 1,614,427 | |
New Jersey State Turnpike Authority, Revenue Bonds, Ser. F, BABs | | A3 | | | 7.414% | | | 01/01/40 | | | 2,050 | | | | 2,923,853 | |
Ohio State University (The), Revenue Bonds, BABs | | Aa1 | | | 4.910% | | | 06/01/40 | | | 695 | | | | 797,130 | |
Ohio State Water Development Authority, Revenue Bonds, BABs | | Aaa | | | 4.879% | | | 12/01/34 | | | 450 | | | | 508,613 | |
Oregon State Department of Transportation, Revenue Bonds, Ser. A, BABs | | Aa2 | | | 5.834% | | | 11/15/34 | | | 615 | | | | 752,483 | |
Pennsylvania Turnpike Commission, Revenue Bonds, Ser. B, BABs | | Aa3 | | | 5.511% | | | 12/01/45 | | | 800 | | | | 909,456 | |
Regional Transportation District, Revenue Bonds, Ser. 2010B, BABs | | Aa2 | | | 5.844% | | | 11/01/50 | | | 1,000 | | | | 1,299,420 | |
SEE NOTES TO FINANCIAL STATEMENTS.
A41
| | | | | | |
| | | DIVERSIFIED BOND PORTFOLIO (continued) | | |
| |
| SCHEDULE OF INVESTMENTS | | December 31, 2011 |
| | | | | | | | | | | | | | | | |
MUNICIPAL BONDS
(continued) | | Moody’s
Ratings†
(Unaudited)
| | Interest
Rate
| | | Maturity
Date
| | Principal
Amount
(000)#
| | | Value
(Note 2)
| |
| | | | | | | | | | | | | | | | | |
State of California, General Obligation Unlimited, BABs | | A1 | | | 7.300% | | | 10/01/39 | | $ | 2,280 | | | $ | 2,716,506 | |
State of California, General Obligation Unlimited, BABs | | A1 | | | 7.625% | | | 03/01/40 | | | 725 | | | | 896,847 | |
Texas State Transportation Commission, Revenue Bonds,
Ser. B, BABs | | Aaa | | | 5.028% | | | 04/01/26 | | | 425 | | | | 494,764 | |
University of California, Revenue Bonds, BABs | | Aa1 | | | 5.770% | | | 05/15/43 | | | 1,400 | | | | 1,608,418 | |
| | | | | | | | | | | | | | |
|
|
|
TOTAL MUNICIPAL BONDS
(cost $15,530,646) | | | | 19,326,175 | |
| | | | | | | | | | | | | | |
|
|
|
| SOVEREIGNS — 2.4% | | | | | | | | | | | | | | |
Argentine Republic Government International Bond (Argentina), Sr. Unsec’d. Notes | | NR | | | 7.820% | | | 12/31/33 | | EUR | 4,437 | | | | 3,503,083 | |
Indonesia Government International Bond (Indonesia), Sr. Unsec’d. Notes, Reg.-S | | Ba1 | | | 4.875% | | | 05/05/21 | | | 1,600 | | | | 1,712,000 | |
Indonesia Government International Bond (Indonesia), Sr. Unsec’d. Notes, Reg.-S | | Ba1 | | | 7.250% | | | 04/20/15 | | | 1,600 | | | | 1,812,000 | |
Indonesia Government International Bond (Indonesia), Sr. Unsec’d. Notes, Reg.-S | | Ba1 | | | 10.375% | | | 05/04/14 | | | 1,400 | | | | 1,636,250 | |
Ireland Government Bond (Ireland), Bonds | | Ba1 | | | 4.500% | | | 04/18/20 | | EUR | 1,850 | | | | 1,833,144 | |
Jamaica Government International Bond (Jamaica), Sr. Unsub. Notes | | B3 | | | 11.000% | | | 07/27/12 | | EUR | 620 | | | | 810,458 | |
Mexican Bonos (Mexico), Bonds, Ser. M 30 | | Baa1 | | | 10.000% | | | 11/20/36 | | MXN | 567 | | | | 5,036,070 | |
Peru Enhanced Pass-Through Finance Ltd. (Cayman Islands), Pass-thru Certs., 144A(i) | | Baa3 | | | 3.350% | | | 05/31/18 | | | 1,285 | | | | 1,054,816 | |
Poland Government International Bond (Poland),
Sr. Unsec’d. Notes, Ser. 3BR | | A2 | | | 1.000% | | | 06/20/12 | | JPY | 500,000 | | | | 6,449,026 | |
Qatar Government International Bond (Qatar), Sr. Unsec’d. Notes, 144A | | Aa2 | | | 5.250% | | | 01/20/20 | | | 815 | | | | 894,462 | |
Qatar Government International Bond (Qatar), Sr. Unsec’d. Notes, 144A | | Aa2 | | | 6.400% | | | 01/20/40 | | | 1,090 | | | | 1,280,750 | |
Republic of Ghana (Ghana), Unsec’d. Notes, 144A(d) | | B(c) | | | 8.500% | | | 10/04/17 | | | 2,000 | | | | 2,190,000 | |
South Africa Government Bond (South Africa), Ser. R213 | | A3 | | | 7.000% | | | 02/28/31 | | ZAR | 69,870 | | | | 7,155,301 | |
Venezuela Government International Bond (Venezuela), Sr. Unsec’d. Notes(d) | | B2 | | | 9.250% | | | 09/15/27 | | | 3,180 | | | | 2,297,550 | |
| | | | | | | | | | | | | | |
|
|
|
TOTAL SOVEREIGNS
(cost $39,495,406) | | | | 37,664,910 | |
| | | | | | | | | | | | | | |
|
|
|
| U.S. GOVERNMENT TREASURY SECURITIES — 2.2% | | | | | | | | | | | | | | |
U.S. Treasury Bonds(d) | | | 3.750% | | | 08/15/41 | | | 2,295 | | | | 2,699,136 | |
U.S. Treasury Bonds | | | 6.500% | | | 11/15/26 | | | 18,920 | | | | 28,705,197 | |
U.S. Treasury Notes | | | 0.500% | | | 10/15/14 | | | 1,500 | | | | 1,506,211 | |
U.S. Treasury Notes | | | 2.000% | | | 11/15/21 | | | 1,950 | | | | 1,972,242 | |
| | | | | | | | | | | | | | |
|
|
|
TOTAL U.S. GOVERNMENT TREASURY SECURITIES
(cost $34,246,467) | | | | 34,882,786 | |
| | | | | | | | | | | | | | |
|
|
|
| | | | | |
| | | | | | | | | | Shares
| | | | |
| PREFERRED STOCK — 0.1% | | | | | | | | | | | | | | | | |
Banking — 0.1% | | | | | | | | | | | | | | | | |
Citigroup Capital XIII, 7.875% (Capital Security, fixed to floating preferred)(a)
(cost $1,125,000) | | | 45,000 | | | | 1,172,700 | |
| | | | | | | | | | | | | | |
|
|
|
TOTAL LONG-TERM INVESTMENTS
(cost $1,375,375,084) | | | | 1,426,660,216 | |
| | | | | | | | | | | | | | |
|
|
|
SEE NOTES TO FINANCIAL STATEMENTS.
A42
| | | | | | |
| | | DIVERSIFIED BOND PORTFOLIO (continued) | | |
| |
| SCHEDULE OF INVESTMENTS | | December 31, 2011 |
| | | | | | | | | | | | | | |
SHORT-TERM INVESTMENTS — 17.8% | | | | | | | | Shares
| | | Value
(Note 2)
| |
AFFILATED MUTUAL FUNDS | | | | | | | | | | | | | | |
Prudential Investment Portfolios 2 — Prudential Core Short-Term Bond Fund (Note 4)(j)
(cost $165,711,329) | | | 16,762,945 | | | $ | 148,519,695 | |
Prudential Investment Portfolios 2 — Prudential Core Taxable Money Market Fund (Note 4)(j)(k)
(cost $128,742,241; includes $87,137,730 of cash collateral received for securities on loan) | | | 128,742,241 | | | | 128,742,241 | |
| | | | | | | | | | | | |
|
|
|
TOTAL SHORT-TERM INVESTMENTS
(cost $294,453,570) | | | | 277,261,936 | |
| | | | | | | | | | | | |
|
|
|
TOTAL INVESTMENTS — 109.4%
(cost $1,669,828,654) | | | | 1,703,922,152 | |
LIABILITIES IN EXCESS OF OTHER ASSETS(l) — (9.4)% | | | | (147,022,963 | ) |
| | | | | | | | | | | | |
|
|
|
NET ASSETS — 100.0% | | | $ | 1,556,899,189 | |
| | | | | | | | | | | | |
|
|
|
The following abbreviations are used in portfolio descriptions:
| | |
| 144A | | Security was purchased pursuant to Rule 144A under the Securities Act of 1933 and may not be resold subject to that rule except to qualified institutional buyers. Unless otherwise noted, 144A securities are deemed to be liquid. |
| Reg.-S | | Regulation S. Security was purchased pursuant to Regulation S and may not be offered, sold or delivered within the United States or to, or for the account or benefit of, U.S. persons, except pursuant to an exemption from, or in a transaction not subject to, the registration requirements of the Securities Act of 1933. |
| BABs | | Build America Bonds |
| BTP | | Buoni del Tesoro Poliennali — Long Term Treasury Bonds |
| CDO | | Collateralized Debt Obligation |
| CLO | | Collateralized Loan Obligation |
| MTN | | Medium Term Note |
| NR | | Not Rated by Moody’s or Standard & Poor’s |
| PIK | | Payment in Kind |
| TBA | | To Be Announced |
| AUD | | Australian Dollar |
| BRL | | Brazilian Real |
| CAD | | Canadian Dollar |
| CLP | | Chilean Peso |
| CNY | | Chinese Yuan Renminbi |
| COP | | Colombian Peso |
| CZK | | Czech Koruna |
| EUR | | Euro |
| GBP | | Pound Sterling |
| HUF | | Hungarian Forint |
| IDR | | Indonesian Rupiah |
| INR | | Indian Rupee |
| JPY | | Japanese Yen |
| KRW | | South Korean Won |
| MXN | | Mexican Peso |
| MYR | | Malaysian Ringgit |
| NOK | | Norwegian Krone |
| NZD | | New Zealand Dollar |
| PEN | | Peruvian Nuevo Sol |
| PHP | | Philippine Peso |
| PLN | | Polish Zloty |
| RON | | Romanian New Lei |
| RUB | | Russian Rouble |
| SEK | | Swedish Krona |
| SGD | | Singapore Dollar |
| THB | | Thai Baht |
| TRY | | Turkish Lira |
| TWD | | New Taiwan Dollar |
| ZAR | | South African Rand |
| BBR | | New Zealand Bank Bill Rate |
| BBSW | | Australian Bank Bill Rate |
| LIBOR | | London Interbank Offered Rate |
SEE NOTES TO FINANCIAL STATEMENTS.
A43
| | | | | | |
| | | DIVERSIFIED BOND PORTFOLIO (continued) | | |
| |
| SCHEDULE OF INVESTMENTS | | December 31, 2011 |
| † | The ratings reflected are as of December 31, 2011. Ratings of certain bonds may have changed subsequent to that date. |
| # | Principal amount is shown in U.S. dollars unless otherwise stated. |
| (a) | Variable rate instrument. The interest rate shown reflects the rate in effect at December 31, 2011. |
| (b) | Indicates a security that has been deemed illiquid. |
| (c) | Standard & Poor’s Rating. |
| (d) | All or a portion of security is on loan. The aggregate market value of such securities, including those sold and pending settlement, is $85,497,038; cash collateral of $87,137,730 (included in liabilities) was received with which the Portfolio purchased highly liquid short-term investments. |
| (e) | Represents security, or a portion thereof, segregated as collateral for swap agreements. |
| (f) | Represents issuer in default on interest payments and/or principal repayment; non-income producing security. |
| (g) | Indicates a restricted security; the aggregate original cost of such securities is $9,861,404. The aggregate value of $9,684,853 is approximately 0.6% of net assets. |
| (h) | Represents security, or a portion thereof, segregated as collateral for futures contracts. |
| (i) | Represents zero coupon bond. Rate shown reflects the effective yield at December 31, 2011. |
| (j) | Prudential Investments LLC, the manager of the Portfolio, also serves as manager of the Prudential Investment Portfolios 2 — Prudential Core Taxable Money Market Fund and the Prudential Investment Portfolios 2 — Prudential Core Short-Term Bond Fund. |
| (k) | Represents security, or a portion thereof, purchased with cash collateral received for securities on loan. |
| (l) | Includes net unrealized appreciation (depreciation) on the following derivative contracts held at reporting period end: |
Open futures contracts outstanding at December 31, 2011:
| | | | | | | | | | | | | | | | | | |
Number of
Contracts
| | Type
| | Expiration
Date
| | | Value at
Trade Date
| | | Value at
December 31, 2011
| | | Unrealized
Appreciation/
(Depreciation)
| |
| Long Positions: | | | | | | | | | | | | | | | | | | |
| 925 | | 2 Year U.S. Treasury Notes | | | Mar. 2012 | | | $ | 204,078,543 | | | $ | 204,005,859 | | | $ | (72,684 | ) |
| 879 | | 5 Year U.S. Treasury Notes | | | Mar. 2012 | | | | 107,751,108 | | | | 108,343,617 | | | | 592,509 | |
| 64 | | 10 Year Euro-BTP | | | Mar. 2012 | | | | 7,821,277 | | | | 7,588,222 | | | | (233,055 | ) |
| 24 | | 10 Year Euro-Bund | | | Mar. 2012 | | | | 4,157,530 | | | | 4,318,850 | | | | 161,320 | |
| 246 | | U.S. Ultra Bond | | | Mar. 2012 | | | | 38,594,115 | | | | 39,406,125 | | | | 812,010 | |
| 411 | | U.S. Long Bond | | | Mar. 2012 | | | | 58,139,085 | | | | 59,517,938 | | | | 1,378,853 | |
| | | | | | | | | | | | | | | | |
|
|
|
| | | | | | | | | | | | | | | | | | 2,638,953 | |
| | | | | | | | | | | | | | | | |
|
|
|
| Short Position: | | | | | | | | | | | | | | | | | | |
| 108 | | 10 Year U.S. Treasury Notes | | | Mar. 2012 | | | | 14,161,367 | | | | 14,161,500 | | | | (133 | ) |
| | | | | | | | | | | | | | | | |
|
|
|
| | | | | | | | | | | | | | | | | $ | 2,638,820 | |
| | | | | | | | | | | | | | | | |
|
|
|
Forward currency contracts outstanding at December 31, 2011:
| | | | | | | | | | | | | | | | | | |
Purchase Contracts
| | Counterparty
| | Notional
Amount (000)
| | | Payable at
Settlement Date
| | | Value at
December 31, 2011
| | | Unrealized
Appreciation/
(Depreciation)
| |
Australian Dollar expiring 01/19/12 | | Citibank NA | | AUD | 9,222 | | | $ | 9,278,004 | | | $ | 9,409,806 | | | $ | 131,802 | |
Australian Dollar expiring 01/19/12 | | Citibank NA | | AUD | 802 | | | | 814,300 | | | | 817,857 | | | | 3,557 | |
Australian Dollar expiring 01/19/12 | | Goldman Sachs Group LP | | AUD | 3,881 | | | | 3,871,000 | | | | 3,960,006 | | | | 89,006 | |
Australian Dollar expiring 01/19/12 | | Goldman Sachs Group LP | | AUD | 3,841 | | | | 3,885,100 | | | | 3,919,255 | | | | 34,155 | |
Australian Dollar expiring 01/19/12 | | JPMorgan Chase & Co. | | AUD | 158 | | | | 155,000 | | | | 161,483 | | | | 6,483 | |
Australian Dollar expiring 01/19/12 | | Morgan Stanley | | AUD | 4,657 | | | | 4,632,300 | | | | 4,752,007 | | | | 119,707 | |
Australian Dollar expiring 01/19/12 | | Morgan Stanley | | AUD | 3,883 | | | | 3,885,300 | | | | 3,962,055 | | | | 76,755 | |
Australian Dollar expiring 01/19/12 | | Morgan Stanley | | AUD | 2,262 | | | | 2,316,000 | | | | 2,308,512 | | | | (7,488 | ) |
Australian Dollar expiring 01/19/12 | | UBS AG | | AUD | 4,679 | | | | 4,632,300 | | | | 4,774,770 | | | | 142,470 | |
Australian Dollar expiring 01/20/12 | | Citibank NA | | AUD | 311 | | | | 309,800 | | | | 317,633 | | | | 7,833 | |
Australian Dollar expiring 01/20/12 | | Morgan Stanley | | AUD | 3,095 | | | | 3,107,400 | | | | 3,157,317 | | | | 49,917 | |
Brazilian Real expiring 01/19/12 | | Citibank NA | | BRL | 8,681 | | | | 4,632,300 | | | | 4,631,294 | | | | (1,006 | ) |
Brazilian Real expiring 01/19/12 | | Citibank NA | | BRL | 7,258 | | | | 3,872,200 | | | | 3,872,392 | | | | 192 | |
Brazilian Real expiring 01/19/12 | | Citibank NA | | BRL | 5,782 | | | | 3,102,600 | | | | 3,084,546 | | | | (18,054 | ) |
Brazilian Real expiring 01/19/12 | | Citibank NA | | BRL | 5,644 | | | | 3,064,800 | | | | 3,010,994 | | | | (53,806 | ) |
Brazilian Real expiring 01/19/12 | | Citibank NA | | BRL | 5,498 | | | | 3,134,700 | | | | 2,933,335 | | | | (201,365 | ) |
Brazilian Real expiring 01/19/12 | | Citibank NA | | BRL | 5,440 | | | | 3,065,100 | | | | 2,902,382 | | | | (162,718 | ) |
SEE NOTES TO FINANCIAL STATEMENTS.
A44
| | | | | | |
| | | DIVERSIFIED BOND PORTFOLIO (continued) | | |
| |
| SCHEDULE OF INVESTMENTS | | December 31, 2011 |
| | | | | | | | | | | | | | | | | | |
Purchase Contracts
| | Counterparty
| | Notional
Amount (000)
| | | Payable at
Settlement Date
| | | Value at
December 31, 2011
| | | Unrealized
Appreciation/
(Depreciation)
| |
Brazilian Real expiring 01/19/12 | | Citibank NA | | BRL | 4,314 | | | $ | 2,330,600 | | | $ | 2,301,496 | | | $ | (29,104 | ) |
Brazilian Real expiring 01/19/12 | | Citibank NA | | BRL | 4,212 | | | | 2,316,000 | | | | 2,246,922 | | | | (69,078 | ) |
Brazilian Real expiring 01/19/12 | | Citibank NA | | BRL | 4,186 | | | | 2,317,300 | | | | 2,233,347 | | | | (83,953 | ) |
Brazilian Real expiring 01/19/12 | | Citibank NA | | BRL | 2,937 | | | | 1,547,000 | | | | 1,566,884 | | | | 19,884 | |
Brazilian Real expiring 01/19/12 | | Citibank NA | | BRL | 2,922 | | | | 1,560,500 | | | | 1,558,912 | | | | (1,588 | ) |
Brazilian Real expiring 01/19/12 | | Citibank NA | | BRL | 2,881 | | | | 1,537,300 | | | | 1,536,966 | | | | (334 | ) |
Brazilian Real expiring 01/19/12 | | Citibank NA | | BRL | 2,874 | | | | 1,537,300 | | | | 1,533,275 | | | | (4,025 | ) |
Brazilian Real expiring 01/19/12 | | Citibank NA | | BRL | 2,859 | | | | 1,552,700 | | | | 1,525,027 | | | | (27,673 | ) |
Brazilian Real expiring 01/19/12 | | Citibank NA | | BRL | 2,842 | | | | 1,532,400 | | | | 1,516,125 | | | | (16,275 | ) |
Brazilian Real expiring 01/19/12 | | Citibank NA | | BRL | 2,839 | | | | 1,542,600 | | | | 1,514,695 | | | | (27,905 | ) |
Brazilian Real expiring 01/19/12 | | Citibank NA | | BRL | 2,719 | | | | 1,539,900 | | | | 1,450,428 | | | | (89,472 | ) |
Brazilian Real expiring 01/19/12 | | Morgan Stanley | | BRL | 5,336 | | | | 3,107,900 | | | | 2,846,576 | | | | (261,324 | ) |
Canadian Dollar expiring 01/18/12 | | Citibank NA | | CAD | 3,273 | | | | 3,200,400 | | | | 3,211,174 | | | | 10,774 | |
Canadian Dollar expiring 01/18/12 | | Citibank NA | | CAD | 3,188 | | | | 3,091,600 | | | | 3,128,299 | | | | 36,699 | |
Canadian Dollar expiring 01/18/12 | | Citibank NA | | CAD | 1,583 | | | | 1,547,000 | | | | 1,553,180 | | | | 6,180 | |
Canadian Dollar expiring 01/18/12 | | JPMorgan Chase & Co. | | CAD | 2,353 | | | | 2,317,300 | | | | 2,308,290 | | | | (9,010 | ) |
Canadian Dollar expiring 01/18/12 | | Morgan Stanley | | CAD | 6,315 | | | | 6,160,651 | | | | 6,196,128 | | | | 35,477 | |
Canadian Dollar expiring 01/18/12 | | Morgan Stanley | | CAD | 4,783 | | | | 4,632,300 | | | | 4,692,805 | | | | 60,505 | |
Canadian Dollar expiring 01/18/12 | | Morgan Stanley | | CAD | 2,457 | | | | 2,366,500 | | | | 2,411,152 | | | | 44,652 | |
Canadian Dollar expiring 01/18/12 | | UBS AG | | CAD | 3,903 | | | | 3,843,200 | | | | 3,829,109 | | | | (14,091 | ) |
Chilean Peso expiring 01/09/12 | | Citibank NA | | CLP | 2,404,986 | | | | 4,632,100 | | | | 4,622,985 | | | | (9,115 | ) |
Chilean Peso expiring 01/09/12 | | Citibank NA | | CLP | 1,584,700 | | | | 3,092,400 | | | | 3,046,190 | | | | (46,210 | ) |
Chilean Peso expiring 01/09/12 | | Citibank NA | | CLP | 1,214,121 | | | | 2,298,600 | | | | 2,333,843 | | | | 35,243 | |
Chilean Peso expiring 01/09/12 | | Citibank NA | | CLP | 1,198,932 | | | | 2,317,000 | | | | 2,304,646 | | | | (12,354 | ) |
Chilean Peso expiring 01/09/12 | | Citibank NA | | CLP | 1,190,465 | | | | 2,327,400 | | | | 2,288,372 | | | | (39,028 | ) |
Chilean Peso expiring 01/09/12 | | Citibank NA | | CLP | 1,182,503 | | | | 2,298,800 | | | | 2,273,066 | | | | (25,734 | ) |
Chilean Peso expiring 01/09/12 | | Citibank NA | | CLP | 1,179,191 | | | | 2,323,300 | | | | 2,266,700 | | | | (56,600 | ) |
Chilean Peso expiring 01/09/12 | | Citibank NA | | CLP | 823,070 | | | | 1,537,300 | | | | 1,582,147 | | | | 44,847 | |
Chilean Peso expiring 01/09/12 | | Citibank NA | | CLP | 814,769 | | | | 1,537,300 | | | | 1,566,190 | | | | 28,890 | |
Chilean Peso expiring 01/09/12 | | Citibank NA | | CLP | 810,180 | | | | 1,532,400 | | | | 1,557,368 | | | | 24,968 | |
Chilean Peso expiring 01/09/12 | | Citibank NA | | CLP | 792,639 | | | | 1,533,300 | | | | 1,523,651 | | | | (9,649 | ) |
Chilean Peso expiring 01/09/12 | | Citibank NA | | CLP | 771,875 | | | | 1,539,900 | | | | 1,483,736 | | | | (56,164 | ) |
Chinese Yuan Renminbi expiring 08/02/12 | | Morgan Stanley | | CNY | 49,235 | | | | 7,782,400 | | | | 7,800,350 | | | | 17,950 | |
Chinese Yuan Renminbi expiring 08/02/12 | | UBS AG | | CNY | 100,235 | | | | 15,790,000 | | | | 15,880,203 | | | | 90,203 | |
Chinese Yuan Renminbi expiring 08/02/12 | | UBS AG | | CNY | 98,787 | | | | 15,496,000 | | | | 15,650,809 | | | | 154,809 | |
Chinese Yuan Renminbi expiring 08/02/12 | | UBS AG | | CNY | 24,658 | | | | 3,895,900 | | | | 3,906,614 | | | | 10,714 | |
Chinese Yuan Renminbi expiring 10/29/12 | | Morgan Stanley | | CNY | 14,861 | | | | 2,351,100 | | | | 2,352,652 | | | | 1,552 | |
Colombian Peso expiring 03/06/12 | | Citibank NA | | COP | 8,988,214 | | | | 4,633,100 | | | | 4,648,201 | | | | 15,101 | |
Colombian Peso expiring 03/06/12 | | Citibank NA | | COP | 7,482,062 | | | | 3,871,000 | | | | 3,869,304 | | | | (1,696 | ) |
Czech Koruna expiring 01/20/12 | | Citibank NA | | CZK | 44,350 | | | | 2,358,331 | | | | 2,245,071 | | | | (113,260 | ) |
Czech Koruna expiring 01/20/12 | | Citibank NA | | CZK | 44,078 | | | | 2,331,400 | | | | 2,231,337 | | | | (100,063 | ) |
Czech Koruna expiring 01/20/12 | | Citibank NA | | CZK | 43,665 | | | | 2,331,200 | | | | 2,210,400 | | | | (120,800 | ) |
Czech Koruna expiring 01/20/12 | | Goldman Sachs Group LP | | CZK | 59,145 | | | | 3,088,200 | | | | 2,994,037 | | | | (94,163 | ) |
Czech Koruna expiring 01/20/12 | | JPMorgan Chase & Co. | | CZK | 88,896 | | | | 4,632,300 | | | | 4,500,119 | | | | (132,181 | ) |
Czech Koruna expiring 01/20/12 | | JPMorgan Chase & Co. | | CZK | 59,956 | | | | 3,097,800 | | | | 3,035,108 | | | | (62,692 | ) |
Czech Koruna expiring 01/20/12 | | UBS AG | | CZK | 86,501 | | | | 4,632,100 | | | | 4,378,889 | | | | (253,211 | ) |
Euro expiring 01/23/12 | | Morgan Stanley | | EUR | 116 | | | | 154,400 | | | | 149,528 | | | | (4,872 | ) |
Euro expiring 01/23/12 | | UBS AG | | EUR | 2,319 | | | | 3,099,400 | | | | 3,001,841 | | | | (97,559 | ) |
Hungarian Forint expiring 01/20/12 | | Citibank NA | | HUF | 1,036,868 | | | | 4,634,500 | | | | 4,251,206 | | | | (383,294 | ) |
Hungarian Forint expiring 01/20/12 | | Citibank NA | | HUF | 712,426 | | | | 3,107,400 | | | | 2,920,977 | | | | (186,423 | ) |
Hungarian Forint expiring 01/20/12 | | Citibank NA | | HUF | 536,116 | | | | 2,331,400 | | | | 2,198,098 | | | | (133,302 | ) |
Hungarian Forint expiring 01/20/12 | | Citibank NA | | HUF | 529,225 | | | | 2,328,000 | | | | 2,169,845 | | | | (158,155 | ) |
Hungarian Forint expiring 01/20/12 | | Citibank NA | | HUF | 526,451 | | | | 2,331,200 | | | | 2,158,472 | | | | (172,728 | ) |
Hungarian Forint expiring 01/20/12 | | Citibank NA | | HUF | 526,356 | | | | 2,316,000 | | | | 2,158,083 | | | | (157,917 | ) |
SEE NOTES TO FINANCIAL STATEMENTS.
A45
| | | | | | |
| | | DIVERSIFIED BOND PORTFOLIO (continued) | | |
| |
| SCHEDULE OF INVESTMENTS | | December 31, 2011 |
| | | | | | | | | | | | | | | | | | |
Purchase Contracts
| | Counterparty
| | Notional
Amount (000)
| | | Payable at
Settlement Date
| | | Value at
December 31, 2011
| | | Unrealized
Appreciation/
(Depreciation)
| |
Hungarian Forint expiring 01/20/12 | | Citibank NA | | HUF | 351,169 | | | $ | 1,544,800 | | | $ | 1,439,810 | | | | $ (104,990 | ) |
Hungarian Forint expiring 01/20/12 | | Citibank NA | | HUF | 346,546 | | | | 1,550,600 | | | | 1,420,854 | | | | (129,746 | ) |
Indian Rupee expiring 03/05/12 | | UBS AG | | INR | 240,299 | | | | 4,634,500 | | | | 4,466,777 | | | | (167,723 | ) |
Indonesian Rupiah expiring 01/19/12 | | UBS AG | | IDR | 41,664,155 | | | | 4,634,500 | | | | 4,585,599 | | | | (48,901 | ) |
Indonesian Rupiah expiring 01/19/12 | | UBS AG | | IDR | 21,132,792 | | | | 2,327,400 | | | | 2,325,896 | | | | (1,504 | ) |
Indonesian Rupiah expiring 01/19/12 | | UBS AG | | IDR | 21,052,671 | | | | 2,317,300 | | | | 2,317,078 | | | | (222 | ) |
Indonesian Rupiah expiring 01/20/12 | | UBS AG | | IDR | 25,434,020 | | | | 2,821,300 | | | | 2,798,988 | | | | (22,312 | ) |
Malaysian Ringgit expiring 03/01/12 | | UBS AG | | MYR | 14,759 | | | | 4,637,500 | | | | 4,639,116 | | | | 1,616 | |
Malaysian Ringgit expiring 03/01/12 | | UBS AG | | MYR | 9,719 | | | | 3,088,000 | | | | 3,055,103 | | | | (32,897 | ) |
Malaysian Ringgit expiring 03/01/12 | | UBS AG | | MYR | 9,667 | | | | 3,088,000 | | | | 3,038,602 | | | | (49,398 | ) |
Mexican Nuevo Peso expiring 01/18/12 | | Citibank NA | | MXN | 65,222 | | | | 4,632,300 | | | | 4,666,224 | | | | 33,924 | |
Mexican Nuevo Peso expiring 01/18/12 | | Citibank NA | | MXN | 62,740 | | | | 4,634,500 | | | | 4,488,641 | | | | (145,859 | ) |
Mexican Nuevo Peso expiring 01/18/12 | | Citibank NA | | MXN | 50,940 | | | | 3,731,506 | | | | 3,644,426 | | | | (87,080 | ) |
Mexican Nuevo Peso expiring 01/18/12 | | Citibank NA | | MXN | 31,678 | | | | 2,335,500 | | | | 2,266,380 | | | | (69,120 | ) |
Mexican Nuevo Peso expiring 01/18/12 | | Citibank NA | | MXN | 21,339 | | | | 1,545,800 | | | | 1,526,647 | | | | (19,153 | ) |
Mexican Nuevo Peso expiring 01/18/12 | | Citibank NA | | MXN | 2,974 | | | | 214,987 | | | | 212,757 | | | | (2,230 | ) |
Mexican Nuevo Peso expiring 01/18/12 | | JPMorgan Chase & Co. | | MXN | 43,454 | | | | 3,100,800 | | | | 3,108,838 | | | | 8,038 | |
Mexican Nuevo Peso expiring 01/18/12 | | JPMorgan Chase & Co. | | MXN | 2,177 | | | | 155,000 | | | | 155,731 | | | | 731 | |
Mexican Nuevo Peso expiring 01/18/12 | | Morgan Stanley | | MXN | 42,038 | | | | 3,091,600 | | | | 3,007,578 | | | | (84,022 | ) |
New Taiwan Dollar expiring 03/02/12 | | UBS AG | | TWD | 92,794 | | | | 3,088,000 | | | | 3,068,283 | | | | (19,717 | ) |
New Zealand Dollar expiring 01/19/12 | | Citibank NA | | NZD | 6,101 | | | | 4,637,500 | | | | 4,742,306 | | | | 104,806 | |
New Zealand Dollar expiring 01/19/12 | | Citibank NA | | NZD | 5,141 | | | | 3,872,200 | | | | 3,995,688 | | | | 123,488 | |
New Zealand Dollar expiring 01/19/12 | | Citibank NA | | NZD | 4,020 | | | | 3,094,600 | | | | 3,125,052 | | | | 30,452 | |
New Zealand Dollar expiring 01/19/12 | | Citibank NA | | NZD | 2,972 | | | | 2,316,000 | | | | 2,310,487 | | | | (5,513 | ) |
New Zealand Dollar expiring 01/19/12 | | Goldman Sachs Group LP | | NZD | 6,146 | | | | 4,632,300 | | | | 4,777,390 | | | | 145,090 | |
New Zealand Dollar expiring 01/19/12 | | Goldman Sachs Group LP | | NZD | 1,052 | | | | 814,300 | | | | 818,034 | | | | 3,734 | |
New Zealand Dollar expiring 01/19/12 | | Morgan Stanley | | NZD | 3,449 | | | | 2,639,052 | | | | 2,680,991 | | | | 41,939 | |
Norwegian Krone expiring 01/20/12 | | Citibank NA | | NOK | 36,242 | | | | 6,183,300 | | | | 6,055,435 | | | | (127,865 | ) |
Norwegian Krone expiring 01/20/12 | | Citibank NA | | NOK | 23,089 | | | | 3,871,000 | | | | 3,857,867 | | | | (13,133 | ) |
Norwegian Krone expiring 01/20/12 | | Citibank NA | | NOK | 22,431 | | | | 3,885,300 | | | | 3,747,866 | | | | (137,434 | ) |
Norwegian Krone expiring 01/20/12 | | Citibank NA | | NOK | 18,211 | | | | 3,099,400 | | | | 3,042,841 | | | | (56,559 | ) |
Norwegian Krone expiring 01/20/12 | | Citibank NA | | NOK | 14,034 | | | | 2,329,600 | | | | 2,344,774 | | | | 15,174 | |
Norwegian Krone expiring 01/20/12 | | Citibank NA | | NOK | 13,492 | | | | 2,328,000 | | | | 2,254,227 | | | | (73,773 | ) |
Norwegian Krone expiring 01/20/12 | | Citibank NA | | NOK | 4,877 | | | | 814,300 | | | | 814,859 | | | | 559 | |
Norwegian Krone expiring 01/20/12 | | Citibank NA | | NOK | 926 | | | | 154,900 | | | | 154,691 | | | | (209 | ) |
Norwegian Krone expiring 01/20/12 | | Goldman Sachs Group LP | | NOK | 17,848 | | | | 3,101,200 | | | | 2,982,160 | | | | (119,040 | ) |
Norwegian Krone expiring 01/20/12 | | Goldman Sachs Group LP | | NOK | 8,949 | | | | 1,552,400 | | | | 1,495,222 | | | | (57,178 | ) |
Norwegian Krone expiring 01/20/12 | | Morgan Stanley | | NOK | 1,776 | | | | 307,061 | | | | 296,795 | | | | (10,266 | ) |
Norwegian Krone expiring 01/20/12 | | UBS AG | | NOK | 66,384 | | | | 11,437,624 | | | | 11,091,664 | | | | (345,960 | ) |
Peruvian Nuevo Sol expiring 01/13/12 | | Citibank NA | | PEN | 8,411 | | | | 3,081,100 | | | | 3,115,679 | | | | 34,579 | |
Peruvian Nuevo Sol expiring 01/13/12 | | Citibank NA | | PEN | 4,291 | | | | 1,537,300 | | | | 1,589,573 | | | | 52,273 | |
Philippine Peso expiring 01/06/12 | | Morgan Stanley | | PHP | 99,619 | | | | 2,310,800 | | | | 2,270,924 | | | | (39,876 | ) |
Philippine Peso expiring 01/06/12 | | UBS AG | | PHP | 133,340 | | | | 3,088,000 | | | | 3,039,640 | | | | (48,360 | ) |
Philippine Peso expiring 01/06/12 | | UBS AG | | PHP | 100,610 | | | | 2,298,600 | | | | 2,293,518 | | | | (5,082 | ) |
Philippine Peso expiring 01/06/12 | | UBS AG | | PHP | 100,092 | | | | 2,299,900 | | | | 2,281,708 | | | | (18,192 | ) |
Philippine Peso expiring 01/06/12 | | UBS AG | | PHP | 99,515 | | | | 2,298,800 | | | | 2,268,564 | | | | (30,236 | ) |
Philippine Peso expiring 01/06/12 | | UBS AG | | PHP | 67,349 | | | | 1,537,300 | | | | 1,535,303 | | | | (1,997 | ) |
Polish Zloty expiring 01/20/12 | | Citibank NA | | PLN | 15,999 | | | | 4,646,600 | | | | 4,627,174 | | | | (19,426 | ) |
Polish Zloty expiring 01/20/12 | | Citibank NA | | PLN | 15,719 | | | | 4,632,300 | | | | 4,546,226 | | | | (86,074 | ) |
Polish Zloty expiring 01/20/12 | | Citibank NA | | PLN | 15,413 | | | | 4,634,500 | | | | 4,457,627 | | | | (176,873 | ) |
Polish Zloty expiring 01/20/12 | | Citibank NA | | PLN | 15,328 | | | | 4,655,800 | | | | 4,433,301 | | | | (222,499 | ) |
Polish Zloty expiring 01/20/12 | | Citibank NA | | PLN | 7,905 | | | | 2,321,000 | | | | 2,286,346 | | | | (34,654 | ) |
Polish Zloty expiring 01/20/12 | | Citibank NA | | PLN | 7,821 | | | | 2,317,200 | | | | 2,261,895 | | | | (55,305 | ) |
Polish Zloty expiring 01/20/12 | | Citibank NA | | PLN | 7,636 | | | | 2,331,200 | | | | 2,208,411 | | | | (122,789 | ) |
Polish Zloty expiring 01/20/12 | | Citibank NA | | PLN | 5,166 | | | | 1,544,800 | | | | 1,494,005 | | | | (50,795 | ) |
Polish Zloty expiring 01/20/12 | | Citibank NA | | PLN | 539 | | | | 154,900 | | | | 155,765 | | | | 865 | |
Polish Zloty expiring 01/20/12 | | JPMorgan Chase & Co. | | PLN | 7,734 | | | | 2,317,300 | | | | 2,236,708 | | | | (80,592 | ) |
Pound Sterling expiring 01/23/12 | | Citibank NA | | GBP | 2,458 | | | | 3,885,300 | | | | 3,817,058 | | | | (68,242 | ) |
Pound Sterling expiring 01/23/12 | | Goldman Sachs Group LP | | GBP | 1,485 | | | | 2,327,400 | | | | 2,305,035 | | | | (22,365 | ) |
SEE NOTES TO FINANCIAL STATEMENTS.
A46
| | | | | | |
| | | DIVERSIFIED BOND PORTFOLIO (continued) | | |
| |
| SCHEDULE OF INVESTMENTS | | December 31, 2011 |
| | | | | | | | | | | | | | | | | | |
Purchase Contracts
| | Counterparty
| | Notional
Amount (000)
| | | Payable at
Settlement Date
| | | Value at
December 31, 2011
| | | Unrealized
Appreciation/
(Depreciation)
| |
Pound Sterling expiring 01/23/12 | | Morgan Stanley | | GBP | 2,972 | | | $ | 4,632,300 | | | $ | 4,614,747 | | | $ | (17,553 | ) |
Romanian New Lei expiring 01/20/12 | | Citibank NA | | RON | 7,418 | | | | 2,276,438 | | | | 2,212,863 | | | | (63,575 | ) |
Russian Rouble expiring 02/06/12 | | Citibank NA | | RUB | 143,549 | | | | 4,632,100 | | | | 4,433,417 | | | | (198,683 | ) |
Russian Rouble expiring 02/06/12 | | Citibank NA | | RUB | 95,966 | | | | 3,134,700 | | | | 2,963,843 | | | | (170,857 | ) |
Russian Rouble expiring 02/06/12 | | Citibank NA | | RUB | 95,935 | | | | 3,089,700 | | | | 2,962,900 | | | | (126,800 | ) |
Russian Rouble expiring 02/06/12 | | UBS AG | | RUB | 73,158 | | | | 2,321,000 | | | | 2,259,438 | | | | (61,562 | ) |
Singapore Dollar expiring 01/19/12 | | Goldman Sachs Group LP | | SGD | 17,929 | | | | 13,878,771 | | | | 13,821,717 | | | | (57,054 | ) |
Singapore Dollar expiring 01/19/12 | | Goldman Sachs Group LP | | SGD | 6,002 | | | | 4,637,500 | | | | 4,627,284 | | | | (10,216 | ) |
Singapore Dollar expiring 01/19/12 | | Goldman Sachs Group LP | | SGD | 5,035 | | | | 3,871,000 | | | | 3,881,963 | | | | 10,963 | |
Singapore Dollar expiring 01/19/12 | | JPMorgan Chase & Co. | | SGD | 6,015 | | | | 4,632,300 | | | | 4,637,013 | | | | 4,713 | |
Singapore Dollar expiring 01/19/12 | | UBS AG | | SGD | 3,963 | | | | 3,089,700 | | | | 3,055,504 | | | | (34,196 | ) |
Singapore Dollar expiring 01/19/12 | | UBS AG | | SGD | 2,970 | | | | 2,317,300 | | | | 2,289,527 | | | | (27,773 | ) |
South African Rand expiring 01/30/12 | | Citibank NA | | ZAR | 25,411 | | | | 3,094,600 | | | | 3,131,012 | | | | 36,412 | |
South African Rand expiring 01/30/12 | | Goldman Sachs Group LP | | ZAR | 18,925 | | | | 2,316,000 | | | | 2,331,852 | | | | 15,852 | |
South African Rand expiring 01/30/12 | | JPMorgan Chase & Co. | | ZAR | 38,953 | | | | 4,632,300 | | | | 4,799,578 | | | | 167,278 | |
South African Rand expiring 01/30/12 | | JPMorgan Chase & Co. | | ZAR | 37,364 | | | | 4,634,500 | | | | 4,603,760 | | | | (30,740 | ) |
South African Rand expiring 01/30/12 | | JPMorgan Chase & Co. | | ZAR | 18,856 | | | | 2,317,300 | | | | 2,323,268 | | | | 5,968 | |
South African Rand expiring 01/30/12 | | UBS AG | | ZAR | 31,663 | | | | 3,885,100 | | | | 3,901,317 | | | | 16,217 | |
South Korean Won expiring 02/07/12 | | UBS AG | | KRW | 3,504,707 | | | | 3,134,100 | | | | 3,033,794 | | | | (100,306 | ) |
South Korean Won expiring 02/27/12 | | UBS AG | | KRW | 5,417,635 | | | | 4,659,530 | | | | 4,683,876 | | | | 24,346 | |
South Korean Won expiring 02/27/12 | | UBS AG | | KRW | 5,314,575 | | | | 4,637,500 | | | | 4,594,774 | | | | (42,726 | ) |
South Korean Won expiring 02/27/12 | | UBS AG | | KRW | 3,489,440 | | | | 3,088,000 | | | | 3,016,834 | | | | (71,166 | ) |
South Korean Won expiring 02/27/12 | | UBS AG | | KRW | 2,677,268 | | | | 2,331,100 | | | | 2,314,662 | | | | (16,438 | ) |
South Korean Won expiring 02/27/12 | | UBS AG | | KRW | 2,616,501 | | | | 2,316,000 | | | | 2,262,125 | | | | (53,875 | ) |
Swedish Krona expiring 01/20/12 | | Citibank NA | | SEK | 48,900 | | | | 7,192,284 | | | | 7,097,641 | | | | (94,643 | ) |
Swedish Krona expiring 01/20/12 | | Citibank NA | | SEK | 32,246 | | | | 4,632,300 | | | | 4,680,380 | | | | 48,080 | |
Swedish Krona expiring 01/20/12 | | Citibank NA | | SEK | 32,120 | | | | 4,632,300 | | | | 4,662,191 | | | | 29,891 | |
Swedish Krona expiring 01/20/12 | | Citibank NA | | SEK | 20,879 | | | | 3,088,000 | | | | 3,030,542 | | | | (57,458 | ) |
Swedish Krona expiring 01/20/12 | | Citibank NA | | SEK | 15,733 | | | | 2,331,100 | | | | 2,283,663 | | | | (47,437 | ) |
Swedish Krona expiring 01/20/12 | | Goldman Sachs Group LP | | SEK | 26,754 | | | | 3,871,000 | | | | 3,883,307 | | | | 12,307 | |
Thai Baht expiring 02/07/12 | | UBS AG | | THB | 120,607 | | | | 3,917,600 | | | | 3,812,079 | | | | (105,521 | ) |
Turkish Lira expiring 01/30/12 | | JPMorgan Chase & Co. | | TRY | 8,711 | | | | 4,632,300 | | | | 4,565,883 | | | | (66,417 | ) |
Turkish Lira expiring 01/30/12 | | JPMorgan Chase & Co. | | TRY | 4,282 | | | | 2,316,000 | | | | 2,244,278 | | | | (71,722 | ) |
Turkish Lira expiring 01/30/12 | | UBS AG | | TRY | 4,286 | | | | 2,317,300 | | | | 2,246,515 | | | | (70,785 | ) |
| | | | | | | | |
|
|
| |
|
|
| |
|
|
|
| | | | | | | | | $ | 535,854,639 | | | $ | 530,006,156 | | | $ | (5,848,483 | ) |
| | | | | | | | |
|
|
| |
|
|
| |
|
|
|
| | | | | |
Sale Contracts
| | Counterparty
| | Notional
Amount (000)
| | | Receivable at
Settlement Date
| | | Value at
December 31, 2011
| | | Unrealized
Appreciation/
(Depreciation)
| |
Australian Dollar expiring 01/19/12 | | Citibank NA | | AUD | 3,106 | | | $ | 3,108,400 | | | $ | 3,168,955 | | | $ | (60,555 | ) |
Australian Dollar expiring 01/19/12 | | Morgan Stanley | | AUD | 7,972 | | | | 7,891,300 | | | | 8,134,727 | | | | (243,427 | ) |
Australian Dollar expiring 01/19/12 | | Morgan Stanley | | AUD | 7,842 | | | | 7,736,500 | | | | 8,001,788 | | | | (265,288 | ) |
Australian Dollar expiring 01/19/12 | | Morgan Stanley | | AUD | 6,260 | | | | 6,217,100 | | | | 6,388,101 | | | | (171,001 | ) |
Australian Dollar expiring 01/19/12 | | Morgan Stanley | | AUD | 3,975 | | | | 3,880,000 | | | | 4,055,931 | | | | (175,931 | ) |
Brazilian Real expiring 01/19/12 | | Citibank NA | | BRL | 15,572 | | | | 8,208,778 | | | | 8,307,721 | | | | (98,943 | ) |
Brazilian Real expiring 01/19/12 | | Citibank NA | | BRL | 8,678 | | | | 4,787,600 | | | | 4,629,477 | | | | 158,123 | |
Brazilian Real expiring 01/19/12 | | Citibank NA | | BRL | 6,863 | | | | 3,724,800 | | | | 3,661,394 | | | | 63,406 | |
Brazilian Real expiring 01/19/12 | | Citibank NA | | BRL | 4,272 | | | | 2,187,910 | | | | 2,279,064 | | | | (91,154 | ) |
Brazilian Real expiring 01/19/12 | | Citibank NA | | BRL | 4,173 | | | | 2,316,600 | | | | 2,226,493 | | | | 90,107 | |
Brazilian Real expiring 01/19/12 | | Citibank NA | | BRL | 3,971 | | | | 2,152,867 | | | | 2,118,516 | | | | 34,351 | |
Brazilian Real expiring 01/19/12 | | Citibank NA | | BRL | 2,812 | | | | 1,544,700 | | | | 1,500,275 | | | | 44,425 | |
Brazilian Real expiring 01/19/12 | | UBS AG | | BRL | 7,288 | | | | 3,872,700 | | | | 3,888,387 | | | | (15,687 | ) |
Brazilian Real expiring 01/19/12 | | UBS AG | | BRL | 5,671 | | | | 3,093,600 | | | | 3,025,260 | | | | 68,340 | |
Brazilian Real expiring 01/19/12 | | UBS AG | | BRL | 4,348 | | | | 2,313,900 | | | | 2,319,570 | | | | (5,670 | ) |
Brazilian Real expiring 01/19/12 | | UBS AG | | BRL | 4,003 | | | | 2,230,023 | | | | 2,135,551 | | | | 94,472 | |
Canadian Dollar expiring 01/18/12 | | Citibank NA | | CAD | 4,813 | | | | 4,647,200 | | | | 4,722,227 | | | | (75,027 | ) |
Canadian Dollar expiring 01/18/12 | | Morgan Stanley | | CAD | 7,318 | | | | 6,973,700 | | | | 7,180,501 | | | | (206,801 | ) |
Canadian Dollar expiring 01/18/12 | | Morgan Stanley | | CAD | 4,798 | | | | 4,662,800 | | | | 4,707,993 | | | | (45,193 | ) |
SEE NOTES TO FINANCIAL STATEMENTS.
A47
| | | | | | |
| | | DIVERSIFIED BOND PORTFOLIO (continued) | | |
| |
| SCHEDULE OF INVESTMENTS | | December 31, 2011 |
| | | | | | | | | | | | | | | | | | |
Sale Contracts
| | Counterparty
| | Notional
Amount (000)
| | | Receivable at
Settlement Date
| | | Value at
December 31, 2011
| | | Unrealized
Appreciation/
(Depreciation)
| |
Chilean Peso expiring 01/09/12 | | Citibank NA | | CLP | 3,662,800 | | | $ | 7,162,300 | | | $ | 7,040,818 | | | $ | 121,482 | |
Chilean Peso expiring 01/09/12 | | Citibank NA | | CLP | 3,595,451 | | | | 6,893,781 | | | | 6,911,357 | | | | (17,576 | ) |
Chilean Peso expiring 01/09/12 | | Citibank NA | | CLP | 3,485,391 | | | | 6,675,076 | | | | 6,699,793 | | | | (24,717 | ) |
Chilean Peso expiring 01/09/12 | | Citibank NA | | CLP | 3,223,788 | | | | 6,187,100 | | | | 6,196,927 | | | | (9,827 | ) |
Chinese Yuan Renminbi expiring 08/02/12 | | Morgan Stanley | | CNY | 67,431 | | | | 10,630,850 | | | | 10,683,159 | | | | (52,309 | ) |
Chinese Yuan Renminbi
expiring 08/02/12 | | Morgan Stanley | | CNY | 14,789 | | | | 2,317,300 | | | | 2,343,020 | | | | (25,720 | ) |
Chinese Yuan Renminbi
expiring 08/02/12 | | UBS AG | | CNY | 67,442 | | | | 10,630,850 | | | | 10,684,844 | | | | (53,994 | ) |
Chinese Yuan Renminbi
expiring 08/02/12 | | UBS AG | | CNY | 24,844 | | | | 3,881,800 | | | | 3,935,955 | | | | (54,155 | ) |
Chinese Yuan Renminbi
expiring 08/02/12 | | UBS AG | | CNY | 19,758 | | | | 3,142,200 | | | | 3,130,281 | | | | 11,919 | |
Chinese Yuan Renminbi
expiring 08/02/12 | | UBS AG | | CNY | 14,634 | | | | 2,331,500 | | | | 2,318,408 | | | | 13,092 | |
Czech Koruna expiring 01/20/12 | | Goldman Sachs Group LP | | CZK | 79,464 | | | | 4,189,400 | | | | 4,022,659 | | | | 166,741 | |
Czech Koruna expiring 01/20/12 | | JPMorgan Chase & Co. | | CZK | 153,189 | | | | 7,736,500 | | | | 7,754,754 | | | | (18,254 | ) |
Czech Koruna expiring 01/20/12 | | JPMorgan Chase & Co. | | CZK | 134,233 | | | | 6,973,700 | | | | 6,795,162 | | | | 178,538 | |
Czech Koruna expiring 01/20/12 | | JPMorgan Chase & Co. | | CZK | 59,705 | | | | 3,033,286 | | | | 3,022,385 | | | | 10,901 | |
Euro expiring 01/23/12 | | Citibank NA | | EUR | 4,425 | | | | 5,987,825 | | | | 5,728,223 | | | | 259,602 | |
Euro expiring 01/23/12 | | Citibank NA | | EUR | 3,933 | | | | 5,269,000 | | | | 5,091,112 | | | | 177,888 | |
Euro expiring 01/23/12 | | Citibank NA | | EUR | 387 | | | | 521,751 | | | | 501,359 | | | | 20,392 | |
Euro expiring 01/23/12 | | Morgan Stanley | | EUR | 3,477 | | | | 4,649,100 | | | | 4,500,344 | | | | 148,756 | |
Euro expiring 01/23/12 | | Morgan Stanley | | EUR | 2,104 | | | | 2,790,100 | | | | 2,723,212 | | | | 66,888 | |
Hungarian Forint expiring 01/20/12 | | Citibank NA | | HUF | 747,705 | | | | 3,174,023 | | | | 3,065,621 | | | | 108,402 | |
Hungarian Forint expiring 01/20/12 | | Citibank NA | | HUF | 728,888 | | | | 3,094,600 | | | | 2,988,475 | | | | 106,125 | |
Hungarian Forint expiring 01/20/12 | | Citibank NA | | HUF | 544,586 | | | | 2,324,600 | | | | 2,232,828 | | | | 91,772 | |
Hungarian Forint expiring 01/20/12 | | Goldman Sachs Group LP | | HUF | 1,480,469 | | | | 6,350,400 | | | | 6,069,987 | | | | 280,413 | |
Hungarian Forint expiring 01/20/12 | | Goldman Sachs Group LP | | HUF | 532,432 | | | | 2,325,600 | | | | 2,182,995 | | | | 142,605 | |
Hungarian Forint expiring 01/20/12 | | JPMorgan Chase & Co. | | HUF | 531,077 | | | | 2,325,600 | | | | 2,177,438 | | | | 148,162 | |
Indian Rupee expiring 03/05/12 | | UBS AG | | INR | 240,299 | | | | 4,454,102 | | | | 4,466,777 | | | | (12,675 | ) |
Indonesian Rupiah expiring 01/20/12 | | UBS AG | | IDR | 25,434,020 | | | | 2,752,600 | | | | 2,798,989 | | | | (46,389 | ) |
Japanese Yen expiring 06/20/12 | | Barclays Bank PLC | | JPY | 500,000 | | | | 6,456,287 | | | | 6,521,063 | | | | (64,776 | ) |
Malaysian Ringgit expiring 03/01/12 | | UBS AG | | MYR | 9,456 | | | | 2,939,900 | | | | 2,972,343 | | | | (32,443 | ) |
Mexican Nuevo Peso expiring 01/18/12 | | Citibank NA | | MXN | 97,319 | | | | 6,962,900 | | | | 6,962,572 | | | | 328 | |
Mexican Nuevo Peso expiring 01/18/12 | | Citibank NA | | MXN | 52,338 | | | | 3,724,800 | | | | 3,744,418 | | | | (19,618 | ) |
Mexican Nuevo Peso expiring 01/18/12 | | Citibank NA | | MXN | 44,037 | | | | 3,099,400 | | | | 3,150,598 | | | | (51,198 | ) |
Mexican Nuevo Peso expiring 01/18/12 | | JPMorgan Chase & Co. | | MXN | 107,100 | | | | 7,771,300 | | | | 7,662,336 | | | | 108,964 | |
Mexican Nuevo Peso expiring 01/18/12 | | JPMorgan Chase & Co. | | MXN | 32,521 | | | | 2,317,200 | | | | 2,326,683 | | | | (9,483 | ) |
New Taiwan Dollar expiring 03/02/12 | | UBS AG | | TWD | 92,794 | | | | 3,074,087 | | | | 3,068,283 | | | | 5,804 | |
New Zealand Dollar expiring 01/19/12 | | Citibank NA | | NZD | 50 | | | | 38,961 | | | | 38,865 | | | | 96 | |
New Zealand Dollar expiring 01/19/12 | | Goldman Sachs Group LP | | NZD | 15,614 | | | | 11,724,300 | | | | 12,136,447 | | | | (412,147 | ) |
New Zealand Dollar expiring 01/19/12 | | Morgan Stanley | | NZD | 4,271 | | | | 3,263,800 | | | | 3,319,499 | | | | (55,699 | ) |
Norwegian Krone expiring 01/20/12 | | Citibank NA | | NOK | 54,593 | | | | 9,129,100 | | | | 9,121,613 | | | | 7,487 | |
Norwegian Krone expiring 01/20/12 | | Citibank NA | | NOK | 50,774 | | | | 8,703,900 | | | | 8,483,447 | | | | 220,453 | |
Norwegian Krone expiring 01/20/12 | | Citibank NA | | NOK | 35,505 | | | | 6,043,800 | | | | 5,932,237 | | | | 111,563 | |
Norwegian Krone expiring 01/20/12 | | Citibank NA | | NOK | 27,256 | | | | 4,647,200 | | | | 4,553,978 | | | | 93,222 | |
Norwegian Krone expiring 01/20/12 | | Citibank NA | | NOK | 23,128 | | | | 3,871,480 | | | | 3,864,303 | | | | 7,177 | |
Norwegian Krone expiring 01/20/12 | | Citibank NA | | NOK | 18,094 | | | | 3,108,400 | | | | 3,023,190 | | | | 85,210 | |
Peruvian Nuevo Sol expiring 01/13/12 | | Citibank NA | | PEN | 12,703 | | | | 4,626,762 | | | | 4,705,252 | | | | (78,490 | ) |
Philippine Peso expiring 01/06/12 | | UBS AG | | PHP | 234,355 | | | | 5,382,526 | | | | 5,342,404 | | | | 40,122 | |
Philippine Peso expiring 01/06/12 | | UBS AG | | PHP | 133,340 | | | | 3,008,570 | | | | 3,039,640 | | | | (31,070 | ) |
Philippine Peso expiring 01/06/12 | | UBS AG | | PHP | 131,993 | | | | 3,107,900 | | | | 3,008,926 | | | | 98,974 | |
Philippine Peso expiring 01/06/12 | | UBS AG | | PHP | 100,836 | | | | 2,350,500 | | | | 2,298,686 | | | | 51,814 | |
Polish Zloty expiring 01/20/12 | | Citibank NA | | PLN | 18,498 | | | | 5,266,800 | | | | 5,349,902 | | | | (83,102 | ) |
Polish Zloty expiring 01/20/12 | | Citibank NA | | PLN | 18,437 | | | | 5,366,700 | | | | 5,332,406 | | | | 34,294 | |
Polish Zloty expiring 01/20/12 | | Citibank NA | | PLN | 14,966 | | | | 4,496,200 | | | | 4,328,580 | | | | 167,620 | |
Polish Zloty expiring 01/20/12 | | Citibank NA | | PLN | 13,372 | | | | 3,885,700 | | | | 3,867,353 | | | | 18,347 | |
SEE NOTES TO FINANCIAL STATEMENTS.
A48
| | | | | | |
| | | DIVERSIFIED BOND PORTFOLIO (continued) | | |
| |
| SCHEDULE OF INVESTMENTS | | December 31, 2011 |
| | | | | | | | | | | | | | | | | | |
Sale Contracts
| | Counterparty
| | Notional
Amount (000)
| | | Receivable at
Settlement Date
| | | Value at
December 31, 2011
| | | Unrealized
Appreciation/
(Depreciation)
| |
Polish Zloty expiring 01/20/12 | | Citibank NA | | PLN | 7,998 | | | $ | 2,329,600 | | | $ | 2,313,326 | | | $ | 16,274 | |
Polish Zloty expiring 01/20/12 | | Citibank NA | | PLN | 7,890 | | | | 2,331,100 | | | | 2,282,086 | | | | 49,014 | |
Polish Zloty expiring 01/20/12 | | Citibank NA | | PLN | 7,779 | | | | 2,331,300 | | | | 2,249,853 | | | | 81,447 | |
Pound Sterling expiring 01/23/12 | | Citibank NA | | GBP | 1,481 | | | | 2,321,000 | | | | 2,300,026 | | | | 20,974 | |
Pound Sterling expiring 01/23/12 | | Morgan Stanley | | GBP | 2,481 | | | | 3,876,000 | | | | 3,852,412 | | | | 23,588 | |
Pound Sterling expiring 01/23/12 | | UBS AG | | GBP | 2,993 | | | | 4,657,300 | | | | 4,646,438 | | | | 10,862 | |
Romanian New Lei expiring 01/20/12 | | JPMorgan Chase & Co. | | RON | 7,418 | | | | 2,239,599 | | | | 2,212,863 | | | | 26,736 | |
Russian Rouble expiring 02/06/12 | | Citibank NA | | RUB | 122,381 | | | | 3,881,100 | | | | 3,779,657 | | | | 101,443 | |
Russian Rouble expiring 02/06/12 | | Citibank NA | | RUB | 117,103 | | | | 3,678,152 | | | | 3,616,661 | | | | 61,491 | |
Russian Rouble expiring 02/06/12 | | Citibank NA | | RUB | 95,966 | | | | 3,004,938 | | | | 2,963,843 | | | | 41,095 | |
Russian Rouble expiring 02/06/12 | | Citibank NA | | RUB | 73,158 | | | | 2,317,214 | | | | 2,259,438 | | | | 57,776 | |
Singapore Dollar expiring 01/19/12 | | JPMorgan Chase & Co. | | SGD | 5,996 | | | | 4,654,900 | | | | 4,622,497 | | | | 32,403 | |
Singapore Dollar expiring 01/19/12 | | Morgan Stanley | | SGD | 6,044 | | | | 4,662,600 | | | | 4,659,364 | | | | 3,236 | |
Singapore Dollar expiring 01/19/12 | | Morgan Stanley | | SGD | 2,028 | | | | 1,547,300 | | | | 1,563,639 | | | | (16,339 | ) |
Singapore Dollar expiring 01/19/12 | | UBS AG | | SGD | 12,007 | | | | 9,143,200 | | | | 9,256,542 | | | | (113,342 | ) |
South African Rand expiring 01/30/12 | | Citibank NA | | ZAR | 13,142 | | | | 1,547,300 | | | | 1,619,310 | | | | (72,010 | ) |
South African Rand expiring 01/30/12 | | JPMorgan Chase & Co. | | ZAR | 61,271 | | | | 7,099,964 | | | | 7,549,442 | | | | (449,478 | ) |
South African Rand expiring 01/30/12 | | JPMorgan Chase & Co. | | ZAR | 38,304 | | | | 4,667,000 | | | | 4,719,517 | | | | (52,517 | ) |
South African Rand expiring 01/30/12 | | UBS AG | | ZAR | 38,898 | | | | 4,667,000 | | | | 4,792,743 | | | | (125,743 | ) |
South Korean Won expiring 02/07/12 | | UBS AG | | KRW | 3,504,707 | | | | 3,070,265 | | | | 3,033,794 | | | | 36,471 | |
South Korean Won expiring 02/27/12 | | Morgan Stanley | | KRW | 5,417,635 | | | | 4,644,152 | | | | 4,683,876 | | | | (39,724 | ) |
South Korean Won expiring 02/27/12 | | UBS AG | | KRW | 7,228,708 | | | | 6,123,429 | | | | 6,249,659 | | | | (126,230 | ) |
South Korean Won expiring 02/27/12 | | UBS AG | | KRW | 6,869,076 | | | | 5,879,800 | | | | 5,938,736 | | | | (58,936 | ) |
Swedish Krona expiring 01/19/12 | | Goldman Sachs Group LP | | SEK | 21,244 | | | | 3,108,400 | | | | 3,083,659 | | | | 24,741 | |
Swedish Krona expiring 01/20/12 | | Citibank NA | | SEK | 13,772 | | | | 2,015,500 | | | | 1,998,922 | | | | 16,578 | |
Swedish Krona expiring 01/20/12 | | UBS AG | | SEK | 46,780 | | | | 6,653,400 | | | | 6,789,910 | | | | (136,510 | ) |
Swedish Krona expiring 01/20/12 | | UBS AG | | SEK | 32,532 | | | | 4,647,200 | | | | 4,721,971 | | | | (74,771 | ) |
Swedish Krona expiring 01/20/12 | | UBS AG | | SEK | 14,067 | | | | 2,015,100 | | | | 2,041,769 | | | | (26,669 | ) |
Thai Baht expiring 02/07/12 | | UBS AG | | THB | 120,607 | | | | 3,859,432 | | | | 3,812,079 | | | | 47,353 | |
Turkish Lira expiring 01/30/12 | | Goldman Sachs Group LP | | TRY | 5,599 | | | | 2,943,200 | | | | 2,934,623 | | | | 8,577 | |
Turkish Lira expiring 01/30/12 | | JPMorgan Chase & Co. | | TRY | 5,875 | | | | 3,096,800 | | | | 3,079,501 | | | | 17,299 | |
Turkish Lira expiring 01/30/12 | | UBS AG | | TRY | 5,784 | | | | 3,104,800 | | | | 3,031,807 | | | | 72,993 | |
| | | | | | | | |
|
|
| |
|
|
| |
|
|
|
| | | | | | | | | $ | 455,841,940 | | | $ | 455,333,800 | | | | 508,140 | |
| | | | | | | | |
|
|
| |
|
|
| |
|
|
|
| | | | | | | | | | | | | | | | | $ | (5,340,343 | ) |
| | | | | | | | | | | | | | | | |
|
|
|
Interest rate swap agreements outstanding at December 31, 2011:
| | | | | | | | | | | | | | | | | | | | | | | | |
Counterparty
| | Termination
Date
| | | Notional
Amount
(000)#
| | | Fixed
Rate
| | Floating Rate
| | Fair
Value
| | | Upfront
Premiums
Paid/
(Received)
| | | Unrealized
Appreciation/
(Depreciation)
| |
Over-the-counter swap agreements: | |
Barclays Bank PLC | | | 05/31/16 | | | $ | 19,585 | | | 1.175% | | 3 month LIBOR(a) | | $ | 39,784 | | | $ | — | | | $ | 39,784 | |
Barclays Bank PLC | | | 05/31/16 | | | | 19,585 | | | 1.180% | | 3 month LIBOR(a) | | | 43,288 | | | | — | | | | 43,288 | |
Barclays Bank PLC | | | 05/31/16 | | | | 4,815 | | | 1.220% | | 3 month LIBOR(a) | | | 18,590 | | | | — | | | | 18,590 | |
Citibank NA | | | 09/07/21 | | | AUD | 8,000 | | | 4.945% | | 6 month BBSW(a) | | | 237,136 | | | | — | | | | 237,136 | |
Barclays Bank PLC | | | 07/05/13 | | | MXN | 199,700 | | | 5.480% | | 28 day Mexican Interbank Rate(a) | | | 124,231 | | | | — | | | | 124,231 | |
Barclays Bank PLC | | | 12/15/16 | | | MXN | 100,000 | | | 5.750% | | 28 day Mexican Interbank Rate(a) | | | (34,792 | ) | | | — | | | | (34,792 | ) |
Barclays Bank PLC | | | 09/20/21 | | | MXN | 58,400 | | | 6.790% | | 28 day Mexican Interbank Rate(a) | | | 17,020 | | | | — | | | | 17,020 | |
Citibank NA | | | 08/18/16 | | | NZD | 13,400 | | | 4.173% | | 3 month BBR(a) | | | 564,207 | | | | — | | | | 564,207 | |
| | | | | | | | | | | | | | |
|
|
| |
|
|
| |
|
|
|
| | | | | | | | | | | | | | | $ | 1,009,464 | | | $ | — | | | $ | 1,009,464 | |
| | | | | | | | | | | | | | |
|
|
| |
|
|
| |
|
|
|
| (a) | Portfolio pays the floating rate and receives the fixed rate. |
| # | Notional amount is shown in U.S. dollars unless otherwise stated. |
SEE NOTES TO FINANCIAL STATEMENTS.
A49
| | | | | | |
| | | DIVERSIFIED BOND PORTFOLIO (continued) | | |
| |
| SCHEDULE OF INVESTMENTS | | December 31, 2011 |
Credit default swap agreements outstanding at December 31, 2011:
| | | | | | | | | | | | | | | | | | | | | | | | | | |
Counterparty
| | Termination
Date
| | | Notional
Amount
(000)#(2)
| | | Fixed
Rate
| | | Reference Entity/Obligation
| | Fair
Value
| | | Upfront
Premiums
Paid/
(Received)
| | | Unrealized
Appreciation/
(Depreciation)
| |
Over-the-counter credit default swaps on corporate issues—Buy Protection(1): | |
Deutsche Bank AG | | | 03/20/18 | | | $ | 3,700 | | | | 3.700% | | | American International Group, Inc. | | $ | 187,228 | | | $ | — | | | $ | 187,228 | |
Citibank NA | | | 06/20/14 | | | | 4,800 | | | | 1.000% | | | CBS Corp. | | | (45,599 | ) | | | 186,220 | | | | (231,819 | ) |
Credit Suisse International | | | 06/20/14 | | | | 2,500 | | | | 1.000% | | | Centex Corp. | | | 115,164 | | | | (8,600 | ) | | | 123,764 | |
Goldman Sachs International, Inc. | | | 03/20/14 | | | | 3,400 | | | | 0.700% | | | Duke Energy Corp. | | | (26,934 | ) | | | — | | | | (26,934 | ) |
Deutsche Bank AG | | | 03/20/12 | | | | 1,100 | | | | 5.000% | | | Gannett Co., Inc. | | | (12,010 | ) | | | (2,618 | ) | | | (9,392 | ) |
Credit Suisse International | | | 12/20/12 | | | | 1,500 | | | | 1.000% | | | GATX Financial Corp. | | | (3,752 | ) | | | 4,876 | | | | (8,628 | ) |
Deutsche Bank AG | | | 12/20/12 | | | | 7,800 | | | | 1.000% | | | Macy’s Retail Holdings, Inc. | | | (44,630 | ) | | | 95,840 | | | | (140,470 | ) |
Deutsche Bank AG | | | 09/20/13 | | | | 2,600 | | | | 1.000% | | | Masco Corp. | | | 48,673 | | | | 42,294 | | | | 6,379 | |
Deutsche Bank AG | | | 06/20/13 | | | | 3,750 | | | | 1.000% | | | Qwest Corp. | | | (901 | ) | | | 27,692 | | | | (28,593 | ) |
Deutsche Bank AG | | | 06/20/14 | | | | 7,000 | | | | 1.000% | | | R.R. Donnelley & Sons Co. | | | 678,809 | | | | 278,463 | | | | 400,346 | |
JPMorgan Chase Bank | | | 09/20/16 | | | | 4,750 | | | | 1.000% | | | R.R. Donnelley & Sons Co. | | | 1,006,320 | | | | 398,727 | | | | 607,593 | |
Deutsche Bank AG | | | 06/20/13 | | | | 6,600 | | | | 1.000% | | | Sealed Air Corp. | | | (26,072 | ) | | | 41,428 | | | | (67,500 | ) |
JPMorgan Chase Bank | | | 06/20/14 | | | | 4,150 | | | | 5.000% | | | SLM Corp. | | | 11,605 | | | | 399,788 | | | | (388,183 | ) |
Deutsche Bank AG | | | 03/20/14 | | | | 980 | | | | 7.050% | | | Starwood Hotels & Resorts Holdings, Inc. | | | (128,344 | ) | | | — | | | | (128,344 | ) |
Credit Suisse International | | | 03/20/15 | | | | 4,695 | | | | 1.000% | | | Toll Brothers Financial Corp. | | | 40,681 | | | | 23,586 | | | | 17,095 | |
JPMorgan Chase Bank | | | 09/20/19 | | | | 4,400 | | | | 1.000% | | | Westvaco Corp. | | | 213,835 | | | | 66,852 | | | | 146,983 | |
Citibank NA | | | 03/20/12 | | | | 6,900 | | | | 5.000% | | | XL Group PLC | | | (80,672 | ) | | | (30,277 | ) | | | (50,395 | ) |
Over-the-counter credit default swap on credit index—Buy Protection(1): | |
Morgan Stanley Capital Services, Inc. | | | 06/20/13 | | | EUR | 3,700 | | | | 1.650% | | | Itraxx Euro Ser. 9 | | | 1,235 | | | | (51,845 | ) | | | 53,080 | |
| | | | | | | | | | | | | | | | |
|
|
| |
|
|
| |
|
|
|
| | | | | | | | | | | | | | | | | $ | 1,934,636 | | | $ | 1,472,426 | | | $ | 462,210 | |
| | | | | | | | | | | | | | | | |
|
|
| |
|
|
| |
|
|
|
| (1) | If the Portfolio is a buyer of protection, it pays the fixed rate. When a credit event occurs, as defined under the terms of that particular swap agreement, the Portfolio will either (i) receive from the seller of protection an amount equal to the notional amount of the swap and make delivery of the referenced obligation or underlying securities comprising the referenced index or (ii) receive a net settlement amount in the form of cash or securities equal to the notional amount of the swap less the recovery value of the referenced obligation or underlying securities comprising the referenced index. |
| (2) | Notional amount represents the maximum potential amount the Portfolio could be required to pay as a seller of credit protection or receive as a buyer of credit protection if a credit event occurs as defined under the terms of that particular swap agreement. |
| # | Notional amount is shown in U.S. dollars unless otherwise stated. |
Various inputs are used in determining the value of the Portfolio’s investments. These inputs are summarized in the three broad levels listed below.
| Level 1— | quoted prices generally for securities actively traded on a regulated securities exchange and for open-end mutual funds which trade at daily net asset value. |
| Level 2— | other significant observable inputs (including, but not limited to, quoted prices for similar securities, interest rates, prepayment speeds, foreign currency exchange rates, and amortized cost) generally for debt securities, swaps, forward foreign currency contracts and for foreign stocks priced using vendor modeling tools. |
| Level 3— | significant unobservable inputs for securities valued in accordance with Board approved fair valuation procedures. |
SEE NOTES TO FINANCIAL STATEMENTS.
A50
| | | | | | |
| | | DIVERSIFIED BOND PORTFOLIO (continued) | | |
| |
| SCHEDULE OF INVESTMENTS | | December 31, 2011 |
The following is a summary of the inputs used as of December 31, 2011 in valuing such portfolio securities:
| | | | | | | | | | | | |
| | | Level 1
| | | Level 2
| | | Level 3
| |
Investments in Securities | | | | | | | | | | | | |
Asset-Backed Securities | | | | | | | | | | | | |
Non-Residential Mortgage-Backed Securities | | $ | — | | | $ | 112,828,978 | | | $ | 9,589,064 | |
Residential Mortgage-Backed Securities | | | — | | | | 61,871,554 | | | | — | |
Bank Loans | | | — | | | | 24,586,797 | | | | — | |
Collateralized Mortgage Obligations | | | — | | | | 3,811,133 | | | | — | |
Commercial Mortgage-Backed Securities | | | — | | | | 278,663,333 | | | | — | |
Corporate Bonds | | | — | | | | 696,377,598 | | | | — | |
Foreign Agencies | | | — | | | | 34,572,115 | | | | — | |
Mortgage-Backed Securities | | | — | | | | 111,313,073 | | | | — | |
Municipal Bonds | | | — | | | | 19,326,175 | | | | — | |
Sovereigns | | | — | | | | 37,664,910 | | | | — | |
U.S. Government Treasury Securities | | | — | | | | 34,882,786 | | | | — | |
Preferred Stock | | | 1,172,700 | | | | — | | | | — | |
Affiliated Mutual Funds | | | 277,261,936 | | | | — | | | | — | |
Other Financial Instruments* | | | | | | | | | | | | |
Futures Contracts | | | 2,638,820 | | | | — | | | | — | |
Forward Currency Contracts | | | — | | | | (5,340,343 | ) | | | — | |
Interest Rate Swap Agreements | | | — | | | | 1,009,464 | | | | — | |
Credit Default Swap Agreements | | | — | | | | 489,144 | | | | (26,934 | ) |
| | |
|
|
| |
|
|
| |
|
|
|
Total | | $ | 281,073,456 | | | $ | 1,412,056,717 | | | $ | 9,562,130 | |
| | |
|
|
| |
|
|
| |
|
|
|
The following is a reconciliation of assets in which significant unobservable inputs (Level 3) were used in determining fair value:
| | | | | | | | | | | | | | | | |
| | | Non-Residential
Mortgage-Backed
Securities
| | | Bank Loans
| | | Sovereigns
| | | Credit Default
Swaps
| |
Balance as of 12/31/10 | | $ | 55,732,296 | | | $ | 7,221,737 | | | $ | 1,185,799 | | | $ | (47,359 | ) |
Realized gain (loss) | | | 102,207 | | | | 335,280 | | | | — | | | | — | ** |
Change in unrealized appreciation (depreciation)*** | | | (1,011,867 | ) | | | (173,080 | ) | | | — | | | | 20,425 | |
Purchases | | | 6,956,783 | | | | — | | | | — | | | | — | |
Sales | | | (9,170,510 | ) | | | (4,282,200 | ) | | | — | | | | — | |
Accrued discount/premium | | | 104,490 | | | | — | | | | — | | | | — | |
Transfers into Level 3 | | | — | | | | — | | | | — | | | | — | |
Transfers out of Level 3 | | | (43,124,335 | ) | | | (3,101,737 | ) | | | (1,185,799 | ) | | | — | |
| | |
|
|
| |
|
|
| |
|
|
| |
|
|
|
Balance as of 12/31/11 | | $ | 9,589,064 | | | $ | — | | | $ | — | | | $ | (26,934 | ) |
| | |
|
|
| |
|
|
| |
|
|
| |
|
|
|
| * | Other financial instruments are derivative instruments not reflected in the Schedule of Investments, such as futures, forwards and swap contracts, which are recorded at the unrealized appreciation/depreciation on the instrument. |
| ** | The realized loss incurred during the period for other financial instruments was $(24,131). |
| *** | Of which, $(765,531) was included in Net Assets relating to securities held at the reporting period end. |
It is the Portfolio’s policy to recognize transfers in and transfers out at the fair value as of the beginning of period. At the reporting period end, there were 19 non-residential mortgage-backed securities, 3 bank loans and 1 sovereign transferred from Level 3 into Level 2 as a result of no longer using a single broker quote.
SEE NOTES TO FINANCIAL STATEMENTS.
A51
| | | | | | |
| | | DIVERSIFIED BOND PORTFOLIO (continued) | | |
| |
| SCHEDULE OF INVESTMENTS | | December 31, 2011 |
The industry classification of portfolio holdings and liabilities in excess of other assets shown as a percentage of net assets as of December 31, 2011 were as follows:
| | | | |
Commercial Mortgage-Backed Securities | | | 17.9 | % |
Affiliated Mutual Funds (including 5.6% of collateral received for securities on loan) | | | 17.8 | |
Banking | | | 8.6 | |
Non-Residential Mortgage-Backed Securities | | | 7.8 | |
Mortgage-Backed Securities | | | 7.2 | |
Residential Mortgage-Backed Securities | | | 4.0 | |
Cable | | | 2.9 | |
Media & Entertainment | | | 2.9 | |
Insurance | | | 2.8 | |
Non-Captive Finance | | | 2.6 | |
Foods | | | 2.5 | |
Sovereigns | | | 2.4 | |
Telecommunications | | | 2.3 | |
Foreign Agencies | | | 2.2 | |
Metals | | | 2.2 | |
U.S. Government Treasury Securities | | | 2.2 | |
Electric | | | 2.1 | |
Technology | | | 1.7 | |
Energy – Other | | | 1.4 | |
Chemicals | | | 1.3 | |
Healthcare & Pharmaceutical | | | 1.3 | |
Capital Goods | | | 1.2 | |
Municipal Bonds | | | 1.2 | |
Healthcare Insurance | | | 1.1 | |
Real Estate Investment Trusts | | | 1.1 | |
Retailers | | | 1.1 | |
Gaming | | | 1.0 | |
Paper | | | 1.0 | |
Lodging | | | 0.8 | |
Pipelines & Other | | | 0.8 | |
Building Materials & Construction | | | 0.7 | |
Packaging | | | 0.7 | |
Consumer | | | 0.5 | |
Tobacco | | | 0.5 | |
Airlines | | | 0.4 | |
Automotive | | | 0.4 | |
Collateralized Mortgage Obligations | | | 0.3 | |
Aerospace & Defense | | | 0.2 | |
Energy – Integrated | | | 0.2 | |
Railroads | | | 0.1 | |
| | |
|
|
|
| | | | 109.4 | |
Liabilities in excess of other assets | | | (9.4 | ) |
| | |
|
|
|
| | | | 100.0 | % |
| | |
|
|
|
SEE NOTES TO FINANCIAL STATEMENTS.
A52
| | | | | | |
| | | DIVERSIFIED BOND PORTFOLIO (continued) | | |
| |
| SCHEDULE OF INVESTMENTS | | December 31, 2011 |
The Portfolio Invested in derivative instruments during the Period. The types of risk associated with these derivative instruments are credit risk, foreign exchange risk and interest rate risk. The effect of such derivative instruments on the Portfolio’s financial performance as reflected in the Statements of Assets and liabilities and Statement of Operations is presented in the summary below.
Fair values of derivative instruments as of December 31, 2011 as presented in the Statement of Assets and Liabilities:
| | | | | | | | | | | | |
Derivatives not designated as hedging
instruments, carried at fair value
| | Asset Derivatives
| | | Liability Derivatives
| |
| | Balance Sheet Location
| | Fair Value
| | | Balance Sheet Location
| | Fair Value
| |
Credit contracts | | Premium paid for swap agreements | | $ | 1,565,766 | | | Premium received for swap agreements | | $ | 93,340 | |
Credit contracts | | Unrealized appreciation on swap agreements | | | 1,542,468 | | | Unrealized depreciation on swap agreements | | | 1,080,258 | |
Foreign exchange contracts | | Unrealized appreciation on forward currency contracts | | | 6,678,348 | | | Unrealized depreciation on forward currency contracts | | | 12,018,691 | |
Interest rate contracts | | Due from broker-variation margin | | | 2,944,692 | * | | Due from broker-variation margin | | | 305,872 | * |
Interest rate contracts | | Unrealized appreciation on swap agreements | | | 1,044,256 | | | Unrealized depreciation on swap agreements | | | 34,792 | |
| | | | |
|
|
| | | |
|
|
|
Total | | | | $ | 13,775,530 | | | | | $ | 13,532,953 | |
| | | | |
|
|
| | | |
|
|
|
| * | Includes cumulative appreciation/depreciation on futures contracts as reported in Schedule of Investments. Only unsettled variation margin receivable (payable) is reported within the Statement of Assets and Liabilities. |
The effects of derivative instruments on the Statement of Operations for the year ended December 31, 2011 are as follows:
| | | | | | | | | | | | | | | | | | | | | | | | |
Amount of Realized Gain or (Loss) on Derivatives Recognized in Income
| |
Derivatives not designated as hedging
instruments, carried at fair value
| | Purchased
Options
| | | Written
Options
| | | Futures
| | | Forward
Currency
Contracts
| | | Swaps
| | | Total
| |
Credit contracts | | $ | — | | | $ | — | | | $ | — | | | $ | — | | | $ | 100,536 | | | $ | 100,536 | |
Foreign exchange contracts | | | — | | | | — | | | | — | | | | 818,563 | | | | — | | | | 818,563 | |
Interest rate contracts | | | (87,617 | ) | | | 1,333,657 | | | | 31,855,652 | | | | — | | | | 6,881,630 | | | | 39,983,323 | |
| | |
|
|
| |
|
|
| |
|
|
| |
|
|
| |
|
|
| |
|
|
|
Total | | $ | (87,617 | ) | | $ | 1,333,657 | | | $ | 31,855,652 | | | $ | 818,563 | | | $ | 6,982,166 | | | $ | 40,902,422 | |
| | |
|
|
| |
|
|
| |
|
|
| |
|
|
| |
|
|
| |
|
|
|
|
Change in Unrealized Appreciation or (Depreciation) on Derivatives Recognized in Income
| |
Derivatives not designated as hedging
instruments, carried at fair value
| | Purchased
Options
| | | Written
Options
| | | Futures
| | | Forward
Currency
Contracts
| | | Swaps
| | | Total
| |
Credit contracts | | $ | — | | | $ | — | | | $ | — | | | $ | — | | | $ | 3,346,193 | | | $ | 3,346,193 | |
Foreign exchange contracts | | | — | | | | — | | | | — | | | | (7,482,695 | ) | | | — | | | | (7,482,695 | ) |
Interest rate contracts | | | (53,547 | ) | | | (1,287,923 | ) | | | 3,151,001 | | | | — | | | | 751,426 | | | | 2,560,957 | |
| | |
|
|
| |
|
|
| |
|
|
| |
|
|
| |
|
|
| |
|
|
|
Total | | $ | (53,547 | ) | | $ | (1,287,923 | ) | | $ | 3,151,001 | | | $ | (7,482,695 | ) | | $ | 4,097,619 | | | $ | (1,575,545 | ) |
| | |
|
|
| |
|
|
| |
|
|
| |
|
|
| |
|
|
| |
|
|
|
For the year ended December 31, 2011, the Portfolio’s average volume of derivative activities is as follows:
| | | | | | |
Futures
Long Position
(Value at Trade Date)
| | Futures
Short Position
(Value at Trade Date)
| | Forward Currency
Contracts—Purchased
(Value at Settlement
Date Payable)
| | Forward Currency
Contracts—Sold
(Value at Settlement
Date Receivable)
|
| $392,483,669 | | $34,658,184 | | $324,436,949 | | $213,696,603 |
| | |
Interest Rate Swaps
(Notional Amount in USD (000))
| | Credit Default
Swaps as Buyer
(Notional Amount in USD (000))
|
| $109,413 | | $105,990 |
SEE NOTES TO FINANCIAL STATEMENTS.
A53
| | | | | | |
| | | DIVERSIFIED BOND PORTFOLIO (continued) | | |
STATEMENT OF ASSETS AND LIABILITIES
December 31, 2011
| | | | |
| ASSETS | | | | |
Investments, at value including securities on loan of $85,497,038: | | | | |
Unaffiliated investments (cost $1,375,375,084) | | $ | 1,426,660,216 | |
Affiliated investments (cost $294,453,570) | | | 277,261,936 | |
Cash | | | 350,286 | |
Foreign currency, at value (cost $850,759) | | | 852,765 | |
Receivable for investments sold | | | 22,651,648 | |
Dividends and interest receivable | | | 15,225,257 | |
Unrealized appreciation on forward currency contracts | | | 6,678,348 | |
Unrealized appreciation on swap agreements | | | 2,586,724 | |
Premium paid for swap agreements | | | 1,565,766 | |
Due from broker—variation margin | | | 477,663 | |
Receivable for Series shares sold | | | 107,097 | |
Prepaid expenses | | | 9,142 | |
| | |
|
|
|
Total Assets | | | 1,754,426,848 | |
| | |
|
|
|
| LIABILITIES | | | | |
Payable for investments purchased | | | 96,034,975 | |
Collateral for securities on loan | | | 87,137,730 | |
Unrealized depreciation on forward currency contracts | | | 12,018,691 | |
Unrealized depreciation on swap agreements | | | 1,115,050 | |
Management fee payable | | | 525,963 | |
Payable for Series shares repurchased | | | 379,701 | |
Accrued expenses and other liabilities | | | 216,855 | |
Premium received for swap agreements | | | 93,340 | |
Deferred trustees’ fees | | | 4,428 | |
Affiliated transfer agent fee payable | | | 926 | |
| | |
|
|
|
Total Liabilities | | | 197,527,659 | |
| | |
|
|
|
| NET ASSETS | | $ | 1,556,899,189 | |
| | |
|
|
|
Net assets were comprised of: | | | | |
Paid-in capital | | $ | 1,449,765,514 | |
Retained earnings | | | 107,133,675 | |
| | |
|
|
|
Net assets, December 31, 2011 | | $ | 1,556,899,189 | |
| | |
|
|
|
Net asset value and redemption price per share, $1,556,899,189 / 132,666,123 outstanding shares of beneficial interest | | $ | 11.74 | |
| | |
|
|
|
STATEMENT OF OPERATIONS
Year Ended December 31, 2011
| | | | |
| INVESTMENT INCOME | | | | |
Interest | | $ | 77,511,985 | |
Affiliated dividend income | | | 2,072,619 | |
Affiliated income from securities loaned, net | | | 153,894 | |
Unaffiliated dividend income | | | 94,746 | |
| | |
|
|
|
| | | | 79,833,244 | |
| | |
|
|
|
| EXPENSES | | | | |
Management fee | | | 6,161,929 | |
Custodian’s fees and expenses | | | 200,000 | |
Shareholders’ reports | | | 65,000 | |
Audit fee | | | 36,000 | |
Trustees’ fees | | | 24,000 | |
Insurance expenses | | | 17,000 | |
Transfer agent’s fee and expenses (including affiliated expense of $5,500) (Note 4) | | | 12,000 | |
Legal fees and expenses | | | 8,000 | |
Commitment fee on syndicated credit agreement | | | 7,000 | |
Miscellaneous | | | 5,531 | |
| | |
|
|
|
Total expenses | | | 6,536,460 | |
| | |
|
|
|
| NET INVESTMENT INCOME | | | 73,296,784 | |
| | |
|
|
|
| NET REALIZED AND UNREALIZED GAIN (LOSS) ON INVESTMENTS, SWAPS AND FOREIGN CURRENCIES | | | | |
Net realized gain (loss) on: | | | | |
Investment transactions | | | 20,453,007 | |
Futures transactions | | | 31,855,652 | |
Swap agreement transactions | | | 6,982,166 | |
Foreign currency transactions | | | (1,040,636 | ) |
Written options transactions | | | 1,333,657 | |
| | |
|
|
|
| | | | 59,583,846 | |
| | |
|
|
|
Net change in unrealized appreciation (depreciation) on: | | | | |
Investments (including affiliated: $(2,170,220)) | | | (20,973,312 | ) |
Futures | | | 3,151,001 | |
Swap agreements | | | 4,097,619 | |
Foreign currencies | | | (7,498,502 | ) |
Written options | | | (1,287,923 | ) |
| | |
|
|
|
| | | | (22,511,117 | ) |
| | |
|
|
|
| NET GAIN ON INVESTMENTS, SWAPS AND FOREIGN CURRENCIES | | | 37,072,729 | |
| | |
|
|
|
| NET INCREASE IN NET ASSETS RESULTING FROM OPERATIONS | | $ | 110,369,513 | |
| | |
|
|
|
STATEMENT OF CHANGES IN NET ASSETS
| | | | | | | | |
| | | Year Ended December 31,
| |
| | | 2011
| | | 2010
| |
| INCREASE (DECREASE) IN NET ASSETS | | | | | | | | |
| OPERATIONS: | | | | | | | | |
Net investment income | | $ | 73,296,784 | | | $ | 65,361,314 | |
Net realized gain on investments, swaps and foreign currencies | | | 59,583,846 | | | | 35,344,819 | |
Net change in unrealized appreciation (depreciation) on investments, swaps and foreign currencies | | | (22,511,117 | ) | | | 44,388,675 | |
| | |
|
|
| |
|
|
|
NET INCREASE IN NET ASSETS RESULTING FROM OPERATIONS | | | 110,369,513 | | | | 145,094,808 | |
| | |
|
|
| |
|
|
|
| DISTRIBUTIONS | | | (101,657,374 | ) | | | (80,204,850 | ) |
| | |
|
|
| |
|
|
|
| SERIES SHARE TRANSACTIONS: | | | | | | | | |
Series shares sold [2,282,678 and 10,945,584 shares, respectively] | | | 26,944,061 | | | | 126,200,132 | |
Series shares issued in reinvestment of distributions [8,678,375 and 7,014,688 shares, respectively] | | | 101,657,374 | | | | 80,204,850 | |
Series shares repurchased [8,765,284 and 9,638,967 shares, respectively] | | | (103,339,982 | ) | | | (111,838,362 | ) |
| | |
|
|
| |
|
|
|
NET INCREASE IN NET ASSETS RESULTING FROM SERIES SHARE TRANSACTIONS | | | 25,261,453 | | | | 94,566,620 | |
| | |
|
|
| |
|
|
|
| TOTAL INCREASE IN NET ASSETS | | | 33,973,592 | | | | 159,456,578 | |
| NET ASSETS: | | | | | | | | |
Beginning of year | | | 1,522,925,597 | | | | 1,363,469,019 | |
| | |
|
|
| |
|
|
|
End of year | | $ | 1,556,899,189 | | | $ | 1,522,925,597 | |
| | |
|
|
| |
|
|
|
SEE NOTES TO FINANCIAL STATEMENTS.
A54
| | | | | | |
| | | EQUITY PORTFOLIO | | |
| |
| SCHEDULE OF INVESTMENTS | | December 31, 2011 |
| | | | | | | | |
| LONG-TERM INVESTMENTS — 98.3% | | | | |
| COMMON STOCKS | | Shares
| | | Value
(Note 2)
| |
| | | | | | | | | |
Aerospace & Defense — 5.0% | | | | | | | | |
Boeing Co. (The) | | | 553,955 | | | $ | 40,632,599 | |
Northrop Grumman Corp. | | | 567,924 | | | | 33,212,195 | |
Precision Castparts Corp.(a) | | | 282,338 | | | | 46,526,479 | |
United Technologies Corp. | | | 414,629 | | | | 30,305,234 | |
| | | | | | |
|
|
|
| | | | | | | | 150,676,507 | |
| | | | | | |
|
|
|
Airlines — 0.7% | | | | | | | | |
United Continental Holdings, Inc.*(a) | | | 1,102,273 | | | | 20,799,891 | |
| | | | | | |
|
|
|
Auto Components — 1.6% | | | | | | | | |
BorgWarner, Inc.*(a) | | | 259,174 | | | | 16,519,751 | |
Lear Corp. | | | 800,756 | | | | 31,870,089 | |
| | | | | | |
|
|
|
| | | | | | | | 48,389,840 | |
| | | | | | |
|
|
|
Automobiles — 1.1% | | | | | | | | |
General Motors Co.* | | | 1,156,694 | | | | 23,446,187 | |
Tesla Motors, Inc.*(a) | | | 326,715 | | | | 9,330,981 | |
| | | | | | |
|
|
|
| | | | | | | | 32,777,168 | |
| | | | | | |
|
|
|
Biotechnology — 1.2% | | | | | | | | |
Celgene Corp.* | | | 535,902 | | | | 36,226,975 | |
| | | | | | |
|
|
|
Capital Markets — 2.2% | | | | | | | | |
Bank of New York Mellon Corp. (The) | | | 678,574 | | | | 13,510,408 | |
Goldman Sachs Group, Inc. (The)(a) | | | 267,715 | | | | 24,209,468 | |
Morgan Stanley(a) | | | 1,810,439 | | | | 27,391,942 | |
| | | | | | |
|
|
|
| | | | | | | | 65,111,818 | |
| | | | | | |
|
|
|
Chemicals — 2.7% | | | | | | | | |
Monsanto Co. | | | 584,920 | | | | 40,985,344 | |
Mosaic Co. (The) | | | 798,881 | | | | 40,287,569 | |
| | | | | | |
|
|
|
| | | | | | | | 81,272,913 | |
| | | | | | |
|
|
|
Commercial Banks — 2.2% | | | | | | | | |
PNC Financial Services Group, Inc. | | | 515,210 | | | | 29,712,161 | |
Wells Fargo & Co. | | | 1,303,960 | | | | 35,937,137 | |
| | | | | | |
|
|
|
| | | | | | | | 65,649,298 | |
| | | | | | |
|
|
|
Communications Equipment — 1.8% | | | | | |
QUALCOMM, Inc. | | | 986,421 | | | | 53,957,229 | |
| | | | | | |
|
|
|
Computers & Peripherals — 5.4% | | | | | |
Apple, Inc.* | | | 251,491 | | | | 101,853,855 | |
EMC Corp.*(a) | | | 1,740,542 | | | | 37,491,275 | |
NetApp, Inc.* | | | 600,781 | | | | 21,790,327 | |
| | | | | | |
|
|
|
| | | | | | | | 161,135,457 | |
| | | | | | |
|
|
|
Consumer Finance — 2.2% | | | | | | | | |
American Express Co. | | | 1,404,966 | | | | 66,272,246 | |
| | | | | | |
|
|
|
Diversified Financial Services — 1.8% | | | | | |
Citigroup, Inc. | | | 975,066 | | | | 25,653,986 | |
JPMorgan Chase & Co. | | | 829,000 | | | | 27,564,250 | |
| | | | | | |
|
|
|
| | | | | | | | 53,218,236 | |
| | | | | | |
|
|
|
Electric Utilities — 1.0% | | | | | | | | |
Exelon Corp. | | | 692,182 | | | | 30,019,933 | |
| | | | | | |
|
|
|
Electronic Equipment & Instruments — 1.3% | | | | | |
Flextronics International Ltd. (Singapore)* | | | 6,579,992 | | | | 37,242,755 | |
| | | | | | |
|
|
|
| | | | | | | | |
COMMON STOCKS
(continued) | | Shares
| | | Value
(Note 2)
| |
| | | | | | | | | |
Energy Equipment & Services — 4.6% | | | | | | | | |
Halliburton Co. | | | 887,495 | | | $ | 30,627,452 | |
National Oilwell Varco, Inc. | | | 960,396 | | | | 65,297,324 | |
Schlumberger Ltd. (Curacao) | | | 603,792 | | | | 41,245,032 | |
| | | | | | |
|
|
|
| | | | | | | | 137,169,808 | |
| | | | | | |
|
|
|
Food & Staples Retailing — 3.7% | | | | | | | | |
Costco Wholesale Corp. | | | 486,995 | | | | 40,576,423 | |
CVS Caremark Corp. | | | 817,329 | | | | 33,330,677 | |
Wal-Mart Stores, Inc. | | | 594,221 | | | | 35,510,647 | |
| | | | | | |
|
|
|
| | | | | | | | 109,417,747 | |
| | | | | | |
|
|
|
Food Products — 6.1% | | | | | | | | |
Bunge Ltd. (Bermuda) | | | 633,757 | | | | 36,250,900 | |
Kraft Foods, Inc. (Class A Stock) | | | 922,233 | | | | 34,454,625 | |
Mead Johnson Nutrition Co. | | | 497,814 | | | | 34,214,756 | |
Smithfield Foods, Inc.*(a) | | | 1,548,970 | | | | 37,608,992 | |
Tyson Foods, Inc. (Class A Stock) | | | 2,001,905 | | | | 41,319,319 | |
| | | | | | |
|
|
|
| | | | | | | | 183,848,592 | |
| | | | | | |
|
|
|
Hotels, Restaurants & Leisure — 2.3% | | | | | | | | |
Chipotle Mexican Grill, Inc.*(a) | | | 76,583 | | | | 25,865,142 | |
Starbucks Corp.(a) | | | 949,002 | | | | 43,663,582 | |
| | | | | | |
|
|
|
| | | | | | | | 69,528,724 | |
| | | | | | |
|
|
|
Independent Power Producers & Energy Traders — 1.3% | |
Calpine Corp.* | | | 2,454,230 | | | | 40,077,576 | |
| | | | | | |
|
|
|
Insurance — 1.0% | | | | | | | | |
MetLife, Inc. | | | 973,474 | | | | 30,352,919 | |
| | | | | | |
|
|
|
Internet & Catalog Retail — 1.9% | | | | | | | | |
Amazon.com, Inc.* | | | 328,207 | | | | 56,812,632 | |
| | | | | | |
|
|
|
Internet Software & Services — 3.7% | | | | | | | | |
Baidu, Inc., ADR (Cayman Islands)* | | | 376,795 | | | | 43,885,314 | |
Google, Inc. (Class A Stock)* | | | 90,025 | | | | 58,147,147 | |
LinkedIn Corp. (Class A Stock)*(a) | | | 153,891 | | | | 9,696,672 | |
| | | | | | |
|
|
|
| | | | | | | | 111,729,133 | |
| | | | | | |
|
|
|
IT Services — 3.1% | | | | | | | | |
International Business Machines Corp. | | | 203,637 | | | | 37,444,772 | |
MasterCard, Inc. (Class A Stock) | | | 149,027 | | | | 55,560,246 | |
| | | | | | |
|
|
|
| | | | | | | | 93,005,018 | |
| | | | | | |
|
|
|
Life Sciences Tools & Services — 0.8% | | | | | |
Agilent Technologies, Inc.* | | | 677,664 | | | | 23,670,804 | |
| | | | | | |
|
|
|
Machinery — 0.9% | | | | | | | | |
Ingersoll-Rand PLC (Ireland)(a) | | | 924,080 | | | | 28,156,718 | |
| | | | | | |
|
|
|
Media — 4.4% | | | | | | | | |
Comcast Corp. (Class A Stock) | | | 1,976,764 | | | | 46,869,075 | |
Liberty Global, Inc. (Class C Stock)* | | | 792,756 | | | | 31,329,717 | |
Viacom, Inc. (Class B Stock) | | | 710,213 | | | | 32,250,772 | |
Walt Disney Co. (The)(a) | | | 569,326 | | | | 21,349,725 | |
| | | | | | |
|
|
|
| | | | | | | | 131,799,289 | |
| | | | | | |
|
|
|
Metals & Mining — 2.3% | |
Freeport-McMoRan Copper & Gold, Inc. | | | 847,809 | | | | 31,190,893 | |
Goldcorp, Inc. (Canada) | | | 351,066 | | | | 15,534,671 | |
Kinross Gold Corp. (Canada) | | | 1,983,500 | | | | 22,611,900 | |
| | | | | | |
|
|
|
| | | | | | | | 69,337,464 | |
| | | | | | |
|
|
|
SEE NOTES TO FINANCIAL STATEMENTS.
A55
| | | | | | |
| | | EQUITY PORTFOLIO (continued) | | |
| |
| SCHEDULE OF INVESTMENTS | | December 31, 2011 |
| | | | | | | | |
COMMON STOCKS
(continued) | | Shares
| | | Value
(Note 2)
| |
| | | | | | | | | |
Oil, Gas & Consumable Fuels — 8.5% | |
Anadarko Petroleum Corp. | | | 950,490 | | | $ | 72,550,902 | |
Marathon Oil Corp. | | | 970,005 | | | | 28,392,046 | |
Marathon Petroleum Corp. | | | 379,315 | | | | 12,627,396 | |
Noble Energy, Inc.(a) | | | 422,056 | | | | 39,837,866 | |
Occidental Petroleum Corp. | | | 442,150 | | | | 41,429,455 | |
Southwestern Energy Co.* | | | 819,620 | | | | 26,178,663 | |
Suncor Energy, Inc. (Canada) | | | 1,181,729 | | | | 34,080,194 | |
| | | | | | |
|
|
|
| | | | | | | | 255,096,522 | |
| | | | | | |
|
|
|
Personal Products — 1.1% | |
Estee Lauder Cos., Inc. (The) (Class A Stock) | | | 301,449 | | | | 33,858,752 | |
| | | | | | |
|
|
|
Pharmaceuticals — 7.1% | |
Allergan, Inc. | | | 413,621 | | | | 36,291,107 | |
Bristol-Myers Squibb Co. | | | 920,327 | | | | 32,432,323 | |
Novo Nordisk A/S, ADR (Denmark) | | | 319,952 | | | | 36,877,668 | |
Pfizer, Inc. | | | 1,798,734 | | | | 38,924,604 | |
Sanofi, ADR (France) | | | 660,780 | | | | 24,144,901 | |
Shire PLC, ADR (United Kingdom) | | | 413,775 | | | | 42,991,222 | |
| | | | | | |
|
|
|
| | | | | | | | 211,661,825 | |
| | | | | | |
|
|
|
Road & Rail — 0.2% | |
Union Pacific Corp. | | | 64,962 | | | | 6,882,074 | |
| | | | | | |
|
|
|
Semiconductors & Semiconductor Equipment — 1.0% | |
Avago Technologies Ltd. (Singapore) | | | 516,432 | | | | 14,904,227 | |
Maxim Integrated Products, Inc. | | | 593,721 | | | | 15,460,495 | |
| | | | | | |
|
|
|
| | | | | | | | 30,364,722 | |
| | | | | | |
|
|
|
Software — 5.5% | |
CA, Inc. | | | 1,982,675 | | | | 40,079,775 | |
Oracle Corp. | | | 1,735,358 | | | | 44,511,933 | |
Red Hat, Inc.* | | | 430,059 | | | | 17,757,136 | |
salesforce.com, Inc.*(a) | | | 265,202 | | | | 26,907,395 | |
VMware, Inc. (Class A Stock)*(a) | | | 427,042 | | | | 35,525,624 | |
| | | | | | |
|
|
|
| | | | | | | | 164,781,863 | |
| | | | | | |
|
|
|
Specialty Retail — 1.0% | |
Staples, Inc. | | | 2,120,704 | | | | 29,456,579 | |
| | | | | | |
|
|
|
Textiles, Apparel & Luxury Goods — 4.5% | |
Coach, Inc. | | | 486,948 | | | | 29,723,306 | |
Lululemon Athletica, Inc.*(a) | | | 323,300 | | | | 15,085,178 | |
LVMH Moet Hennessy Louis Vuitton SA, ADR (France) | | | 479,609 | | | | 13,477,013 | |
NIKE, Inc. (Class B Stock) | | | 477,275 | | | | 45,994,992 | |
Ralph Lauren Corp. | | | 230,405 | | | | 31,814,322 | |
| | | | | | |
|
|
|
| | | | | | | | 136,094,811 | |
| | | | | | |
|
|
|
Wireless Telecommunication Services — 3.1% | |
American Tower Corp. (Class A Stock) | | | 537,230 | | | | 32,239,172 | |
MetroPCS Communications, Inc.* | | | 3,646,134 | | | | 31,648,443 | |
NII Holdings, Inc.*(a) | | | 1,354,933 | | | | 28,860,073 | |
| | | | | | |
|
|
|
| | | | | | | | 92,747,688 | |
| | | | | | |
|
|
|
TOTAL LONG-TERM INVESTMENTS
(cost $2,451,647,418) | | | | 2,948,601,526 | |
| | | | | | |
|
|
|
| | | | | | | | |
| SHORT-TERM INVESTMENT — 8.7% | | | | |
| | | Shares
| | | Value
(Note 2)
| |
| | | | | | | | | |
Affiliated Money Market Mutual Fund | |
Prudential Investment Portfolios 2 — Prudential Core Taxable Money Market Fund
(cost $261,297,640; includes $204,399,512 of cash collateral for securities on loan)(b)(w) (Note 4) | | | 261,297,640 | | | $ | 261,297,640 | |
| | | | | | |
|
|
|
TOTAL INVESTMENTS — 107.0%
(cost $2,712,945,058) | | | | 3,209,899,166 | |
LIABILITIES IN EXCESS OF
OTHER ASSETS — (7.0)% | | | | (210,437,929 | ) |
| | | | | | |
|
|
|
NET ASSETS — 100.0% | | | $ | 2,999,461,237 | |
| | | | | | |
|
|
|
The following abbreviation is used in the Portfolio description:
| | |
| ADR | | American Depositary Receipt |
| * | Non-income producing security. |
| (a) | All or a portion of security is on loan. The aggregate market value of such securities, including those sold and pending settlement, is $198,456,005; cash collateral of $204,399,512 (included with liabilities) was received with which the Portfolio purchased highly liquid short-term investments. |
| (b) | Represents security, or a portion thereof, purchased with cash collateral received for securities on loan. |
| (w) | Prudential Investments LLC, the manager of the Portfolio, also serves as manager of the Prudential Investment Portfolios 2 — Prudential Core Taxable Money Market Fund. |
Various inputs are used in determining the value of the Portfolio’s investments. These inputs are summarized in the three broad levels listed below.
| Level 1— | quoted prices generally for securities actively traded on a regulated securities exchange and for open-end mutual funds which trade at daily net asset value. |
| Level 2— | other significant observable inputs (including, but not limited to, quoted prices for similar securities, interest rates, prepayment speeds, foreign currency exchange rates, and amortized cost) generally for debt securities, swaps, forward foreign currency contracts and for foreign stocks priced using vendor modeling tools. |
| Level 3— | significant unobservable inputs for securities valued in accordance with Board approved fair valuation procedures. |
The following is a summary of the inputs used as of December 31, 2011 in valuing such portfolio securities:
| | | | | | | | | | | | |
| | | Level 1
| | | Level 2
| | | Level 3
| |
Investments in Securities | | | | | |
Common Stocks | | $ | 2,948,601,526 | | | $ | — | | | $ | — | |
Affiliated Money Market Mutual Fund | | | 261,297,640 | | | | — | | | | — | |
| | |
|
|
| |
|
|
| |
|
|
|
Total | | $ | 3,209,899,166 | | | $ | — | | | $ | — | |
| | |
|
|
| |
|
|
| |
|
|
|
SEE NOTES TO FINANCIAL STATEMENTS.
A56
| | | | | | |
| | | EQUITY PORTFOLIO (continued) | | |
| |
| SCHEDULE OF INVESTMENTS | | December 31, 2011 |
The industry classification of investments and liabilities in excess of other assets shown as a percentage of net assets as of December 31, 2011 were as follows:
| | | | |
Affiliated Money Market Mutual Fund (6.8% represents investments purchased with collateral from securities on loan) | | | 8.7 | % |
Oil, Gas & Consumable Fuels | | | 8.5 | |
Pharmaceuticals | | | 7.1 | |
Food Products | | | 6.1 | |
Software | | | 5.5 | |
Computers & Peripherals | | | 5.4 | |
Aerospace & Defense | | | 5.0 | |
Energy Equipment & Services | | | 4.6 | |
Textiles, Apparel & Luxury Goods | | | 4.5 | |
Media | | | 4.4 | |
Internet Software & Services | | | 3.7 | |
Food & Staples Retailing | | | 3.7 | |
IT Services | | | 3.1 | |
Wireless Telecommunication Services | | | 3.1 | |
Chemicals | | | 2.7 | |
Hotels, Restaurants & Leisure | | | 2.3 | |
Metals & Mining | | | 2.3 | |
Consumer Finance | | | 2.2 | |
| | | | |
Commercial Banks | | | 2.2 | % |
Capital Markets | | | 2.2 | |
Internet & Catalog Retail | | | 1.9 | |
Communications Equipment | | | 1.8 | |
Diversified Financial Services | | | 1.8 | |
Auto Components | | | 1.6 | |
Independent Power Producers & Energy Traders | | | 1.3 | |
Electronic Equipment & Instruments | | | 1.3 | |
Biotechnology | | | 1.2 | |
Personal Products | | | 1.1 | |
Automobiles | | | 1.1 | |
Semiconductors & Semiconductor Equipment | | | 1.0 | |
Insurance | | | 1.0 | |
Electric Utilities | | | 1.0 | |
Specialty Retail | | | 1.0 | |
Machinery | | | 0.9 | |
Life Sciences Tools & Services | | | 0.8 | |
Airlines | | | 0.7 | |
Road & Rail | | | 0.2 | |
| | |
|
|
|
| | | | 107.0 | |
Liabilities in excess of other assets | | | (7.0 | ) |
| | |
|
|
|
| | | | 100.0 | % |
| | |
|
|
|
SEE NOTES TO FINANCIAL STATEMENTS.
A57
| | | | | | |
| | | EQUITY PORTFOLIO (continued) | | |
STATEMENT OF ASSETS AND LIABILITIES
December 31, 2011
| | | | |
| ASSETS | | | | |
Investments at value, including securities on loan of $198,456,005: | | | | |
Unaffiliated investments (cost $2,451,647,418) | | $ | 2,948,601,526 | |
Affiliated investments (cost $261,297,640) | | | 261,297,640 | |
Cash | | | 170 | |
Dividends receivable | | | 2,368,520 | |
Receivable for investments sold | | | 708,606 | |
Receivable for Series shares sold | | | 8,816 | |
Prepaid expenses | | | 20,985 | |
| | |
|
|
|
Total Assets | | | 3,213,006,263 | |
| | |
|
|
|
| LIABILITIES | | | | |
Collateral for securities on loan | | | 204,399,512 | |
Payable for investments purchased | | | 6,906,087 | |
Management fee payable | | | 1,156,413 | |
Payable for Series shares repurchased | | | 793,374 | |
Accrued expenses and other liabilities | | | 286,551 | |
Deferred trustees’ fees | | | 1,187 | |
Affiliated transfer agent fees payable | | | 926 | |
Administration fee payable | | | 533 | |
Distribution fee payable | | | 443 | |
| | |
|
|
|
Total Liabilities | | | 213,545,026 | |
| | |
|
|
|
| NET ASSETS | | $ | 2,999,461,237 | |
| | |
|
|
|
Net assets were comprised of: | | | | |
Paid-in capital | | $ | 2,837,948,450 | |
Retained earnings | | | 161,512,787 | |
| | |
|
|
|
Net assets, December 31, 2011 | | $ | 2,999,461,237 | |
| | |
|
|
|
| Class I: | | | | |
Net asset value and redemption price per share, $2,997,491,601 / 126,293,929 outstanding shares of beneficial interest | | $ | 23.73 | |
| | |
|
|
|
| Class II: | | | | |
Net asset value and redemption price per share, $1,969,636 / 82,097 outstanding shares of beneficial interest | | $ | 23.99 | |
| | |
|
|
|
STATEMENT OF OPERATIONS
Year Ended December 31, 2011
| | | | |
| INVESTMENT INCOME | | | | |
Unaffiliated dividend income (net of $217,045 foreign withholding tax) | | $ | 33,936,619 | |
Affiliated income from securities lending, net | | | 438,214 | |
Affiliated dividend income | | | 110,893 | |
| | |
|
|
|
| | | | 34,485,726 | |
| | |
|
|
|
| EXPENSES | | | | |
Management fee | | | 14,621,455 | |
Distribution fee—Class II | | | 5,594 | |
Administration fee—Class II | | | 3,356 | |
Shareholders’ reports | | | 487,000 | |
Custodian’s fees and expenses | | | 390,000 | |
Trustees’ fees | | | 42,000 | |
Insurance expenses | | | 35,000 | |
Audit fee | | | 23,000 | |
Legal fees and expenses | | | 15,000 | |
Commitment fee on syndicated credit agreement | | | 14,000 | |
Transfer agent’s fees and expenses (including affiliated expense of $5,500) (Note 4) | | | 12,000 | |
Miscellaneous | | | 15,490 | |
| | |
|
|
|
Total expenses | | | 15,663,895 | |
| | |
|
|
|
| NET INVESTMENT INCOME | | | 18,821,831 | |
| | |
|
|
|
| NET REALIZED AND UNREALIZED GAIN (LOSS) ON INVESTMENTS AND FOREIGN CURRENCIES | | | | |
Net realized gain (loss) on: | | | | |
Investment transactions | | | 204,340,790 | |
Foreign currency transactions | | | (88,228 | ) |
| | |
|
|
|
| | | | 204,252,562 | |
| | |
|
|
|
Net change in unrealized appreciation (depreciation) on: | | | | |
Investments | | | (327,808,310 | ) |
Foreign currencies | | | (782 | ) |
| | |
|
|
|
| | | | (327,809,092 | ) |
| | |
|
|
|
| NET LOSS ON INVESTMENTS AND FOREIGN CURRENCIES | | | (123,556,530 | ) |
| | |
|
|
|
| NET DECREASE IN NET ASSETS RESULTING FROM OPERATIONS | | $ | (104,734,699 | ) |
| | |
|
|
|
STATEMENT OF CHANGES IN NET ASSETS
| | | | | | | | |
| | | Year Ended December 31,
| |
| | | 2011
| | | 2010
| |
| INCREASE (DECREASE) IN NET ASSETS | | | | | | | | |
| OPERATIONS: | | | | | | | | |
Net investment income | | $ | 18,821,831 | | | $ | 22,114,154 | |
Net realized gain on investment and foreign currency transactions | | | 204,252,562 | | | | 255,826,765 | |
Net change in unrealized appreciation (depreciation) on investments and foreign currencies | | | (327,809,092 | ) | | | 77,326,344 | |
| | |
|
|
| |
|
|
|
NET INCREASE (DECREASE) IN NET ASSETS RESULTING FROM OPERATIONS | | | (104,734,699 | ) | | | 355,267,263 | |
| | |
|
|
| |
|
|
|
| DISTRIBUTIONS | | | | | | | | |
Class I | | | (22,097,344 | ) | | | (24,392,657 | ) |
Class II | | | (4,010 | ) | | | (1,854 | ) |
| | |
|
|
| |
|
|
|
TOTAL DISTRIBUTIONS | | | (22,101,354 | ) | | | (24,394,511 | ) |
| | |
|
|
| |
|
|
|
| SERIES SHARE TRANSACTIONS (Note 7): | | | | | | | | |
Series shares sold | | | 19,970,190 | | | | 22,052,724 | |
Series shares issued in reinvestment of distributions | | | 22,101,354 | | | | 24,394,511 | |
Series shares repurchased | | | (242,019,698 | ) | | | (246,614,547 | ) |
| | |
|
|
| |
|
|
|
NET DECREASE IN NET ASSETS RESULTING FROM SERIES SHARE TRANSACTIONS | | | (199,948,154 | ) | | | (200,167,312 | ) |
| | |
|
|
| |
|
|
|
| TOTAL INCREASE (DECREASE) IN NET ASSETS | | | (326,784,207 | ) | | | 130,705,440 | |
| NET ASSETS: | | | | | | | | |
Beginning of year | | | 3,326,245,444 | | | | 3,195,540,004 | |
| | |
|
|
| |
|
|
|
End of year | | $ | 2,999,461,237 | | | $ | 3,326,245,444 | |
| | |
|
|
| |
|
|
|
SEE NOTES TO FINANCIAL STATEMENTS.
A58
| | | | | | |
| | | FLEXIBLE MANAGED PORTFOLIO | | |
| |
| SCHEDULE OF INVESTMENTS | | December 31, 2011 |
| | | | | | | | |
| LONG-TERM INVESTMENTS — 97.7% | | | | |
| COMMON STOCKS — 64.8% | | Shares
| | | Value
(Note 2)
| |
| | | | | | | | | |
Aerospace & Defense — 1.5% | | | | | | | | |
Alliant Techsystems, Inc. | | | 17,900 | | | $ | 1,023,164 | |
BAE Systems PLC (United Kingdom) | | | 33,670 | | | | 149,076 | |
European Aeronautic Defense and Space Co. NV (Netherlands) | | | 3,410 | | | | 106,583 | |
Exelis, Inc. | | | 203,800 | | | | 1,844,390 | |
General Dynamics Corp. | | | 213,700 | | | | 14,191,817 | |
HEICO Corp. | | | 6,900 | | | | 403,512 | |
L-3 Communications Holdings, Inc. | | | 41,400 | | | | 2,760,552 | |
Northrop Grumman Corp. | | | 149,200 | | | | 8,725,216 | |
Precision Castparts Corp. | | | 11,300 | | | | 1,862,127 | |
Raytheon Co. | | | 28,700 | | | | 1,388,506 | |
Safran SA (France) | | | 2,930 | | | | 87,997 | |
United Technologies Corp. | | | 174,300 | | | | 12,739,587 | |
| | | | | | |
|
|
|
| | | | | | | | 45,282,527 | |
| | | | | | |
|
|
|
Air Freight & Logistics — 0.4% | | | | | | | | |
Deutsche Post AG (Germany) | | | 9,688 | | | | 148,959 | |
United Parcel Service, Inc.
(Class B Stock) | | | 149,200 | | | | 10,919,948 | |
| | | | | | |
|
|
|
| | | | | | | | 11,068,907 | |
| | | | | | |
|
|
|
Airlines | | | | | | | | |
Deutsche Lufthansa AG (Germany) | | | 2,088 | | | | 24,821 | |
| | | | | | |
|
|
|
Auto Components — 0.2% | | | | | | | | |
Bridgestone Corp. (Japan) | | | 3,300 | | | | 74,815 | |
Cie Generale des Etablissements Michelin (France) (Class B Stock) | | | 1,604 | | | | 94,820 | |
Lear Corp. | | | 14,700 | | | | 585,060 | |
NHK Spring Co. Ltd. (Japan) | | | 2,000 | | | | 17,721 | |
Pirelli & C SpA (Italy) | | | 7,621 | | | | 64,162 | |
Toyota Industries Corp. (Japan) | | | 200 | | | | 5,444 | |
TRW Automotive Holdings Corp.* | | | 114,000 | | | | 3,716,400 | |
| | | | | | |
|
|
|
| | | | | | | | 4,558,422 | |
| | | | | | |
|
|
|
Automobiles — 0.6% | | | | | | | | |
Bayerische Motoren Werke AG (Germany) | | | 1,332 | | | | 89,231 | |
Daimler AG (Germany) | | | 2,116 | | | | 92,894 | |
Ford Motor Co.*(a) | | | 809,000 | | | | 8,704,840 | |
General Motors Co.*(a) | | | 410,900 | | | | 8,328,943 | |
Isuzu Motors Ltd. (Japan) | | | 2,000 | | | | 9,251 | |
Nissan Motor Co. Ltd. (Japan) | | | 9,400 | | | | 84,511 | |
Toyota Motor Corp. (Japan) | | | 3,500 | | | | 116,636 | |
Volkswagen AG (Germany) | | | 89 | | | | 11,939 | |
| | | | | | |
|
|
|
| | | | | | | | 17,438,245 | |
| | | | | | |
|
|
|
Beverages — 1.7% | | | | | | | | |
Anheuser-Busch InBev NV (Belgium) | | | 4,410 | | | | 269,999 | |
Coca-Cola Amatil Ltd. (Australia) | | | 6,750 | | | | 79,464 | |
Coca-Cola Co. (The) | | | 231,800 | | | | 16,219,046 | |
Coca-Cola Enterprises, Inc. | | | 361,100 | | | | 9,309,158 | |
Constellation Brands, Inc.
(Class A Stock)* | | | 79,100 | | | | 1,634,997 | |
Diageo PLC (United Kingdom) | | | 7,089 | | | | 154,843 | |
Dr Pepper Snapple Group, Inc.(a) | | | 47,200 | | | | 1,863,456 | |
Heineken NV (Netherlands) | | | 1,755 | | | | 81,248 | |
Molson Coors Brewing Co.
(Class B Stock) | | | 189,600 | | | | 8,255,184 | |
| | | | | | | | |
COMMON STOCKS
(continued) | | Shares
| | | Value
(Note 2)
| |
| | | | | | | | | |
Beverages (continued) | | | | | | | | |
Monster Beverage Corp.* | | | 23,100 | | | $ | 2,128,434 | |
PepsiCo, Inc. | | | 162,420 | | | | 10,776,567 | |
SABMiller PLC (United Kingdom) | | | 1,781 | | | | 62,689 | |
| | | | | | |
|
|
|
| | | | | | | | 50,835,085 | |
| | | | | | |
|
|
|
Biotechnology — 1.1% | | | | | | | | |
Alexion Pharmaceuticals, Inc.* | | | 6,500 | | | | 464,750 | |
Amgen, Inc. | | | 180,708 | | | | 11,603,261 | |
Biogen Idec, Inc.* | | | 52,600 | | | | 5,788,630 | |
Celgene Corp.* | | | 226,400 | | | | 15,304,640 | |
| | | | | | |
|
|
|
| | | | | | | | 33,161,281 | |
| | | | | | |
|
|
|
Building Products — 0.1% | | | | | | | | |
Armstrong World Industries, Inc.*(a) | | | 11,600 | | | | 508,892 | |
Asahi Glass Co. Ltd. (Japan) | | | 5,000 | | | | 41,964 | |
Geberit AG (Switzerland) | | | 51 | | | | 9,828 | |
Lennox International, Inc. | | | 21,600 | | | | 729,000 | |
Owens Corning* | | | 76,400 | | | | 2,194,208 | |
| | | | | | |
|
|
|
| | | | | | | | 3,483,892 | |
| | | | | | |
|
|
|
Capital Markets — 1.4% | | | | | | | | |
3i Group PLC (United Kingdom) | | | 7,016 | | | | 19,721 | |
Bank of New York Mellon Corp. (The) | | | 672,200 | | | | 13,383,502 | |
Deutsche Bank AG (Germany) | | | 4,113 | | | | 156,690 | |
E*Trade Financial Corp.*(a) | | | 43,200 | | | | 343,872 | |
Goldman Sachs Group, Inc. (The) | | | 184,200 | | | | 16,657,206 | |
Morgan Stanley | | | 878,690 | | | | 13,294,580 | |
Ratos AB (Sweden) (Class B Stock) | | | 4,758 | | | | 55,828 | |
UBS AG (Switzerland)* | | | 10,434 | | | | 124,190 | |
| | | | | | |
|
|
|
| | | | | | | | 44,035,589 | |
| | | | | | |
|
|
|
Chemicals — 1.1% | | | | | | | | |
Arkema SA (France) | | | 1,694 | | | | 119,927 | |
Asahi Kasei Corp. (Japan) | | | 13,000 | | | | 78,368 | |
BASF SE (Germany) | | | 3,028 | | | | 211,194 | |
Celanese Corp., Ser. A | | | 12,300 | | | | 544,521 | |
CF Industries Holdings, Inc. | | | 63,400 | | | | 9,191,732 | |
Eastman Chemical Co. | | | 187,300 | | | | 7,315,938 | |
Israel Chemicals Ltd. (Israel) | | | 4,244 | | | | 43,988 | |
K+S AG (Germany) | | | 692 | | | | 31,275 | |
Koninklijke DSM NV (Netherlands) | | | 890 | | | | 41,295 | |
Kuraray Co. Ltd. (Japan) | | | 5,500 | | | | 78,245 | |
Lanxess AG (Germany) | | | 779 | | | | 40,329 | |
LSB Industries, Inc.* | | | 23,500 | | | | 658,705 | |
LyondellBasell Industries NV
(Class A Stock) | | | 35,900 | | | | 1,166,391 | |
Mitsubishi Chemical Holdings Corp. (Japan) | | | 15,500 | | | | 85,384 | |
Mosaic Co. (The) | | | 248,400 | | | | 12,526,812 | |
Rockwood Holdings, Inc.* | | | 31,900 | | | | 1,255,903 | |
Syngenta AG (Switzerland) | | | 557 | | | | 163,074 | |
Ube Industries Ltd. (Japan) | | | 13,000 | | | | 35,637 | |
Wacker Chemie AG (Germany)(a) | | | 264 | | | | 21,235 | |
Yara International ASA (Norway) | | | 1,593 | | | | 63,924 | |
| | | | | | |
|
|
|
| | | | | | | | 33,673,877 | |
| | | | | | |
|
|
|
Commercial Banks — 2.3% | | | | | | | | |
Aozora Bank Ltd. (Japan) | | | 27,000 | | | | 74,367 | |
Australia & New Zealand Banking Group Ltd. (Australia) | | | 11,893 | | | | 249,730 | |
SEE NOTES TO FINANCIAL STATEMENTS.
A59
| | | | | | |
| | | FLEXIBLE MANAGED PORTFOLIO (continued) | | |
| |
| SCHEDULE OF INVESTMENTS | | December 31, 2011 |
| | | | | | | | |
COMMON STOCKS
(continued) | | Shares
| | | Value
(Note 2)
| |
| | | | | | | | | |
Commercial Banks (continued) | | | | | | | | |
Banco Bilbao Vizcaya Argentaria SA (Spain) | | | 10,939 | | | $ | 94,574 | |
Banco Santander SA (Spain) | | | 17,191 | | | | 130,604 | |
Barclays PLC (United Kingdom) | | | 71,618 | | | | 195,806 | |
Bendigo and Adelaide Bank Ltd. (Australia) | | | 5,887 | | | | 48,350 | |
BNP Paribas SA (France) | | | 3,043 | | | | 119,530 | |
Commonwealth Bank of Australia (Australia) | | | 4,299 | | | | 216,421 | |
DBS Group Holdings Ltd. (Singapore) | | | 2,000 | | | | 17,763 | |
DnB NOR ASA (Norway) | | | 2,889 | | | | 28,282 | |
Fifth Third Bancorp | | | 404,200 | | | | 5,141,424 | |
HSBC Holdings PLC
(United Kingdom) | | | 26,175 | | | | 199,609 | |
Huntington Bancshares, Inc. | | | 606,300 | | | | 3,328,587 | |
KeyCorp | | | 82,000 | | | | 630,580 | |
Mitsubishi UFJ Financial Group, Inc. (Japan) | | | 65,500 | | | | 278,271 | |
Mizuho Financial Group, Inc. (Japan) | | | 53,500 | | | | 72,288 | |
National Australia Bank Ltd. (Australia) | | | 3,655 | | | | 87,327 | |
Natixis (France) | | | 33,612 | | | | 84,568 | |
Nordea Bank AB (Sweden) | | | 15,256 | | | | 118,044 | |
PNC Financial Services Group, Inc. | | | 247,100 | | | | 14,250,257 | |
Resona Holdings, Inc. (Japan) | | | 36,500 | | | | 160,757 | |
Shinsei Bank Ltd. (Japan) | | | 21,000 | | | | 21,827 | |
Skandinaviska Enskilda Banken AB (Sweden) (Class A Stock) | | | 12,757 | | | | 74,313 | |
Societe Generale (France) | | | 2,470 | | | | 55,001 | |
Sumitomo Mitsui Financial Group, Inc. (Japan) | | | 9,100 | | | | 253,481 | |
Sumitomo Mitsui Trust Holdings, Inc. (Japan) | | | 41,000 | | | | 120,385 | |
SunTrust Banks, Inc. | | | 166,000 | | | | 2,938,200 | |
Svenska Handelsbanken AB (Sweden) (Class A Stock) | | | 1,613 | | | | 42,422 | |
Swedbank AB (Sweden)
(Class A Stock) | | | 1,662 | | | | 21,529 | |
U.S. Bancorp | | | 196,232 | | | | 5,308,076 | |
Wells Fargo & Co. | | | 1,255,912 | | | | 34,612,935 | |
Westpac Banking Corp. (Australia) | | | 6,709 | | | | 137,239 | |
| | | | | | |
|
|
|
| | | | | | | | 69,112,547 | |
| | | | | | |
|
|
|
Commercial Services & Supplies | | | | | | | | |
Babcock International Group PLC (United Kingdom) | | | 4,836 | | | | 55,238 | |
Copart, Inc.* | | | 11,200 | | | | 536,368 | |
Securitas AB (Sweden)
(Class B Stock) | | | 2,798 | | | | 24,150 | |
| | | | | | |
|
|
|
| | | | | | | | 615,756 | |
| | | | | | |
|
|
|
Communications Equipment — 1.8% | | | | | | | | |
Cisco Systems, Inc. | | | 1,313,900 | | | | 23,755,312 | |
Motorola Solutions, Inc. | | | 154,000 | | | | 7,128,660 | |
QUALCOMM, Inc. | | | 439,000 | | | | 24,013,300 | |
| | | | | | | | |
COMMON STOCKS
(continued) | | Shares
| | | Value
(Note 2)
| |
| | | | | | | | | |
Communications Equipment (continued) | | | | | |
Telefonaktiebolaget LM Ericsson (Sweden) (Class B Stock) | | | 1,413 | | | $ | 14,454 | |
| | | | | | |
|
|
|
| | | | | | | | 54,911,726 | |
| | | | | | |
|
|
|
Computers & Peripherals — 3.2% | | | | | | | | |
Apple, Inc.* | | | 182,000 | | | | 73,710,000 | |
Dell, Inc.* | | | 740,200 | | | | 10,829,126 | |
EMC Corp.* | | | 337,800 | | | | 7,276,212 | |
Hewlett-Packard Co. | | | 100,265 | | | | 2,582,827 | |
SanDisk Corp.* | | | 21,600 | | | | 1,062,936 | |
Toshiba Corp. (Japan) | | | 10,000 | | | | 40,925 | |
Western Digital Corp.* | | | 82,500 | | | | 2,553,375 | |
| | | | | | |
|
|
|
| | | | | | | | 98,055,401 | |
| | | | | | |
|
|
|
Construction & Engineering — 0.1% | | | | | | | | |
ACS Actividades de Construccion y Servicios SA (Spain) | | | 4,596 | | | | 136,217 | |
Balfour Beatty PLC (United Kingdom) | | | 12,829 | | | | 52,757 | |
Chiyoda Corp. (Japan) | | | 5,000 | | | | 50,864 | |
KBR, Inc. | | | 24,400 | | | | 680,028 | |
URS Corp.* | | | 46,400 | | | | 1,629,568 | |
Vinci SA (France) | | | 465 | | | | 20,318 | |
| | | | | | |
|
|
|
| | | | | | | | 2,569,752 | |
| | | | | | |
|
|
|
Consumer Finance — 0.3% | | | | | | | | |
Discover Financial Services | | | 173,000 | | | | 4,152,000 | |
SLM Corp. | | | 477,500 | | | | 6,398,500 | |
| | | | | | |
|
|
|
| | | | | | | | 10,550,500 | |
| | | | | | |
|
|
|
Containers & Packaging — 0.2% | | | | | | | | |
Amcor Ltd. (Australia) | | | 17,581 | | | | 129,649 | |
Crown Holdings, Inc.* | | | 9,300 | | | | 312,294 | |
Owens-Illinois, Inc.* | | | 115,500 | | | | 2,238,390 | |
Sealed Air Corp. | | | 219,700 | | | | 3,781,037 | |
| | | | | | |
|
|
|
| | | | | | | | 6,461,370 | |
| | | | | | |
|
|
|
Distributors — 0.3% | | | | | | | | |
Genuine Parts Co. | | | 120,100 | | | | 7,350,120 | |
Jardine Cycle & Carriage Ltd. (Singapore) | | | 2,000 | | | | 74,199 | |
LKQ Corp.* | | | 19,500 | | | | 586,560 | |
| | | | | | |
|
|
|
| | | | | | | | 8,010,879 | |
| | | | | | |
|
|
|
Diversified Consumer Services — 0.1% | | | | | |
Benesse Holdings, Inc. (Japan) | | | 1,700 | | | | 82,272 | |
Capella Education Co.* | | | 17,300 | | | | 623,665 | |
DeVry, Inc. | | | 91,500 | | | | 3,519,090 | |
| | | | | | |
|
|
|
| | | | | | | | 4,225,027 | |
| | | | | | |
|
|
|
Diversified Financial Services — 1.6% | | | | | |
Bank of America Corp. | | | 704,482 | | | | 3,916,920 | |
Citigroup, Inc. | | | 667,050 | | | | 17,550,085 | |
Deutsche Boerse AG (Germany)* | | | 543 | | | | 28,469 | |
Exor SpA (Italy) | | | 2,198 | | | | 44,236 | |
First Pacific Co. Ltd. (Hong Kong) | | | 4,000 | | | | 4,161 | |
Groupe Bruxelles Lambert SA (Belgium) | | | 216 | | | | 14,400 | |
JPMorgan Chase & Co. | | | 822,594 | | | | 27,351,251 | |
Kinnevik Investment AB (Sweden) (Class B Stock) | | | 1,159 | | | | 22,584 | |
ORIX Corp. (Japan) | | | 880 | | | | 72,714 | |
| | | | | | |
|
|
|
| | | | | | | | 49,004,820 | |
| | | | | | |
|
|
|
SEE NOTES TO FINANCIAL STATEMENTS.
A60
| | | | | | |
| | | FLEXIBLE MANAGED PORTFOLIO (continued) | | |
| |
| SCHEDULE OF INVESTMENTS | | December 31, 2011 |
| | | | | | | | |
COMMON STOCKS
(continued) | | Shares
| | | Value
(Note 2)
| |
| | | | | | | | | |
Diversified Telecommunication Services — 2.1% | | | | | |
AT&T, Inc. | | | 1,284,147 | | | $ | 38,832,605 | |
BT Group PLC (United Kingdom) | | | 55,796 | | | | 165,416 | |
CenturyLink, Inc. | | | 320,400 | | | | 11,918,880 | |
France Telecom SA (France) | | | 4,928 | | | | 77,398 | |
Koninklijke KPN NV (Netherlands) | | | 7,737 | | | | 92,576 | |
Nippon Telegraph & Telephone Corp. (Japan) | | | 3,300 | | | | 168,709 | |
Swisscom AG (Switzerland) | | | 98 | | | | 37,132 | |
Telecom Italia SpA (Italy)
(Risparmio Shares) | | | 58,776 | | | | 52,641 | |
Telecom Italia SpA (Italy) | | | 86,491 | | | | 93,023 | |
Telefonica SA (Spain) | | | 9,951 | | | | 172,386 | |
Verizon Communications, Inc.(a) | | | 218,288 | | | | 8,757,714 | |
Vivendi SA (France) | | | 9,224 | | | | 201,993 | |
Windstream Corp. | | | 173,300 | | | | 2,034,542 | |
| | | | | | |
|
|
|
| | | | | | | | 62,605,015 | |
| | | | | | |
|
|
|
Electric Utilities — 0.9% | | | | | | | | |
American Electric Power Co., Inc. | | | 90,200 | | | | 3,726,162 | |
Cheung Kong Infrastructure Holdings Ltd. (Hong Kong) | | | 2,000 | | | | 11,717 | |
Duke Energy Corp.(a) | | | 236,800 | | | | 5,209,600 | |
E.ON AG (Germany) | | | 1,741 | | | | 37,562 | |
El Paso Electric Co. | | | 15,100 | | | | 523,064 | |
Enel SpA (Italy) | | | 45,657 | | | | 185,783 | |
Energias de Portugal SA (Portugal) | | | 7,446 | | | | 23,042 | |
Entergy Corp. | | | 79,700 | | | | 5,822,085 | |
Exelon Corp. | | | 19,300 | | | | 837,041 | |
FirstEnergy Corp. | | | 4,700 | | | | 208,210 | |
Iberdrola SA (Spain) | | | 17,342 | | | | 108,611 | |
NextEra Energy, Inc.(a) | | | 94,000 | | | | 5,722,720 | |
NV Energy, Inc. | | | 212,300 | | | | 3,471,105 | |
PPL Corp. | | | 28,300 | | | | 832,586 | |
Red Electrica Corp. SA (Spain) | | | 2,320 | | | | 99,283 | |
Scottish & Southern Energy PLC (United Kingdom) | | | 6,364 | | | | 127,592 | |
Terna Rete Elettrica Nazionale SpA (Italy) | | | 14,113 | | | | 47,564 | |
| | | | | | |
|
|
|
| | | | | | | | 26,993,727 | |
| | | | | | |
|
|
|
Electrical Equipment — 0.6% | | | | | | | | |
ABB Ltd. (Switzerland) | | | 2,988 | | | | 56,242 | |
AMETEK, Inc. | | | 38,600 | | | | 1,625,060 | |
Babcock & Wilcox Co. (The)* | | | 9,200 | | | | 222,088 | |
Emerson Electric Co. | | | 333,500 | | | | 15,537,765 | |
EnerSys* | | | 29,000 | | | | 753,130 | |
Mitsubishi Electric Corp. (Japan) | | | 10,000 | | | | 95,882 | |
Schneider Electric SA (France) | | | 525 | | | | 27,641 | |
| | | | | | |
|
|
|
| | | | | | | | 18,317,808 | |
| | | | | | |
|
|
|
Electronic Equipment, Instruments & Components — 0.4% | |
Arrow Electronics, Inc.* | | | 18,600 | | | | 695,826 | |
Avnet, Inc.* | | | 30,100 | | | | 935,809 | |
Corning, Inc. | | | 416,200 | | | | 5,402,276 | |
Hamamatsu Photonics KK (Japan) | | | 1,100 | | | | 38,486 | |
Hitachi Ltd. (Japan) | | | 45,000 | | | | 236,196 | |
Ingram Micro, Inc.* | | | 25,400 | | | | 462,026 | |
Jabil Circuit, Inc. | | | 41,400 | | | | 813,924 | |
| | | | | | | | |
COMMON STOCKS
(continued) | | Shares
| | | Value
(Note 2)
| |
| | | | | | | | | |
Electronic Equipment, Instruments & Components (continued) | |
Keyence Corp. (Japan) | | | 200 | | | $ | 48,227 | |
TE Connectivity Ltd. | | | 68,100 | | | | 2,098,161 | |
Tech Data Corp.* | | | 22,100 | | | | 1,091,961 | |
| | | | | | |
|
|
|
| | | | | | | | 11,822,892 | |
| | | | | | |
|
|
|
Energy Equipment & Services — 1.0% | | | | | | | | |
Halliburton Co. | | | 459,000 | | | | 15,840,090 | |
Helmerich & Payne, Inc.(a) | | | 10,900 | | | | 636,124 | |
National Oilwell Varco, Inc. | | | 79,800 | | | | 5,425,602 | |
Oceaneering International, Inc.(a) | | | 23,800 | | | | 1,097,894 | |
RPC, Inc.(a) | | | 110,900 | | | | 2,023,925 | |
SBM Offshore NV (Netherlands) | | | 1,543 | | | | 31,793 | |
Schlumberger Ltd. | | | 90,500 | | | | 6,182,055 | |
Technip SA (France) | | | 1,091 | | | | 102,541 | |
Transocean Ltd. | | | 963 | | | | 37,185 | |
WorleyParsons Ltd. (Australia) | | | 3,377 | | | | 88,664 | |
| | | | | | |
|
|
|
| | | | | | | | 31,465,873 | |
| | | | | | |
|
|
|
Food & Staples Retailing — 1.9% | | | | | | | | |
Aeon Co. Ltd. (Japan) | | | 8,300 | | | | 113,981 | |
Casino Guichard Perrachon SA (France) | | | 87 | | | | 7,328 | |
CVS Caremark Corp. | | | 402,000 | | | | 16,393,560 | |
Delhaize Group SA (Belgium) | | | 1,820 | | | | 102,242 | |
Koninklijke Ahold NV (Netherlands) | | | 2,756 | | | | 37,114 | |
Kroger Co. (The) | | | 518,200 | | | | 12,550,804 | |
Seven & I Holdings Co. Ltd. (Japan) | | | 4,300 | | | | 119,832 | |
Tesco PLC (United Kingdom) | | | 25,624 | | | | 160,548 | |
Walgreen Co.(a) | | | 52,700 | | | | 1,742,262 | |
Wal-Mart Stores, Inc. | | | 442,500 | | | | 26,443,800 | |
Wesfarmers Ltd. (Australia) | | | 2,047 | | | | 61,763 | |
Woolworths Ltd. (Australia) | | | 1,311 | | | | 33,656 | |
| | | | | | |
|
|
|
| | | | | | | | 57,766,890 | |
| | | | | | |
|
|
|
Food Products — 1.4% | | | | | | | | |
Archer-Daniels-Midland Co. | | | 343,000 | | | | 9,809,800 | |
Aryzta AG (Switzerland) | | | 2,288 | | | | 110,588 | |
Associated British Foods PLC
(United Kingdom) | | | 3,426 | | | | 58,898 | |
Bunge Ltd. | | | 136,900 | | | | 7,830,680 | |
Corn Products International, Inc. | | | 97,500 | | | | 5,127,525 | |
Danone SA (France) | | | 396 | | | | 24,893 | |
Diamond Foods, Inc.(a) | | | 53,500 | | | | 1,726,445 | |
Golden Agri-Resources Ltd. (Singapore) | | | 142,000 | | | | 78,278 | |
Hormel Foods Corp. | | | 19,600 | | | | 574,084 | |
J.M. Smucker Co. (The) | | | 16,800 | | | | 1,313,256 | |
Kellogg Co.(a) | | | 19,500 | | | | 986,115 | |
Lindt & Spruengli AG (Switzerland) | | | 2 | | | | 66,837 | |
Nestle SA (Switzerland) | | | 7,375 | | | | 423,986 | |
Smithfield Foods, Inc.* | | | 109,100 | | | | 2,648,948 | |
Suedzucker AG (Germany) | | | 1,982 | | | | 63,232 | |
Tyson Foods, Inc. (Class A Stock) | | | 495,300 | | | | 10,222,992 | |
Unilever NV (Netherlands) | | | 2,831 | | | | 97,353 | |
Unilever PLC (United Kingdom) | | | 1,672 | | | | 56,164 | |
| | | | | | |
|
|
|
| | | | | | | | 41,220,074 | |
| | | | | | |
|
|
|
SEE NOTES TO FINANCIAL STATEMENTS.
A61
| | | | | | |
| | | FLEXIBLE MANAGED PORTFOLIO (continued) | | |
| |
| SCHEDULE OF INVESTMENTS | | December 31, 2011 |
| | | | | | | | |
COMMON STOCKS
(continued) | | Shares
| | | Value
(Note 2)
| |
| | | | | | | | | |
Gas Utilities | | | | | | | | |
Enagas (Spain) | | | 2,924 | | | $ | 54,079 | |
Gas Natural SDG SA (Spain) | | | 4,504 | | | | 77,325 | |
Hong Kong & China Gas Co. Ltd.
(Hong Kong) | | | 31,000 | | | | 71,846 | |
| | | | | | |
|
|
|
| | | | | | | | 203,250 | |
| | | | | | |
|
|
|
Healthcare Equipment & Supplies — 1.3% | | | | | |
Baxter International, Inc. | | | 158,700 | | | | 7,852,476 | |
Becton, Dickinson & Co. | | | 66,100 | | | | 4,938,992 | |
C.R. Bard, Inc.(a) | | | 10,000 | | | | 855,000 | |
CareFusion Corp.* | | | 50,600 | | | | 1,285,746 | |
Coloplast A/S (Denmark)
(Class B Stock) | | | 983 | | | | 141,375 | |
Covidien PLC | | | 225,200 | | | | 10,136,252 | |
Getinge AB (Sweden) (Class B Stock) | | | 740 | | | | 18,752 | |
Hill-Rom Holdings, Inc. | | | 83,800 | | | | 2,823,222 | |
Stryker Corp. | | | 178,600 | | | | 8,878,206 | |
Zimmer Holdings, Inc.*(a) | | | 57,900 | | | | 3,093,018 | |
| | | | | | |
|
|
|
| | | | | | | | 40,023,039 | |
| | | | | | |
|
|
|
Healthcare Providers & Services — 1.6% | | | | | |
Aetna, Inc. | | | 284,400 | | | | 11,998,836 | |
CIGNA Corp. | | | 47,400 | | | | 1,990,800 | |
Fresenius SE & Co. KGaA (Germany) | | | 137 | | | | 12,674 | |
Humana, Inc. | | | 4,100 | | | | 359,201 | |
Ramsay Health Care Ltd. (Australia) | | | 110 | | | | 2,169 | |
UnitedHealth Group, Inc. | | | 419,000 | | | | 21,234,920 | |
WellPoint, Inc. | | | 205,700 | | | | 13,627,625 | |
| | | | | | |
|
|
|
| | | | | | | | 49,226,225 | |
| | | | | | |
|
|
|
Hotels, Restaurants & Leisure — 0.8% | | | | | | | | |
Brinker International, Inc.(a) | | | 43,600 | | | | 1,166,736 | |
Carnival Corp. | | | 73,500 | | | | 2,399,040 | |
Cracker Barrel Old Country Store, Inc. | | | 11,800 | | | | 594,838 | |
Darden Restaurants, Inc.(a) | | | 52,600 | | | | 2,397,508 | |
Galaxy Entertainment Group Ltd.
(Hong Kong)* | | | 42,000 | | | | 77,007 | |
McDonald’s Corp. | | | 88,700 | | | | 8,899,271 | |
Panera Bread Co. (Class A Stock)* | | | 9,400 | | | | 1,329,630 | |
Sands China Ltd. (Hong Kong)* | | | 33,200 | | | | 93,830 | |
Wyndham Worldwide Corp. | | | 150,500 | | | | 5,693,415 | |
Yum! Brands, Inc. | | | 50,900 | | | | 3,003,609 | |
| | | | | | |
|
|
|
| | | | | | | | 25,654,884 | |
| | | | | | |
|
|
|
Household Durables — 0.3% | | | | | | | | |
Blyth, Inc.(a) | | | 8,900 | | | | 505,520 | |
Harman International Industries, Inc. | | | 74,900 | | | | 2,849,196 | |
Jarden Corp. | | | 31,700 | | | | 947,196 | |
Newell Rubbermaid, Inc. | | | 27,900 | | | | 450,585 | |
Sekisui House Ltd. (Japan) | | | 6,000 | | | | 53,242 | |
Whirlpool Corp.(a) | | | 111,200 | | | | 5,276,440 | |
| | | | | | |
|
|
|
| | | | | | | | 10,082,179 | |
| | | | | | |
|
|
|
Household Products — 1.0% | | | | | | | | |
Colgate-Palmolive Co. | | | 56,400 | | | | 5,210,796 | |
Henkel AG & Co. KGaA (Germany) | | | 925 | | | | 44,774 | |
Kimberly-Clark Corp. | | | 72,100 | | | | 5,303,676 | |
Procter & Gamble Co. (The) | | | 298,905 | | | | 19,939,953 | |
| | | | | | | | |
COMMON STOCKS
(continued) | | Shares
| | | Value
(Note 2)
| |
| | | | | | | | | |
Household Products (continued) | | | | | | | | |
Reckitt Benckiser Group PLC
(United Kingdom) | | | 2,452 | | | $ | 121,092 | |
Spectrum Brands Holdings, Inc.* | | | 19,000 | | | | 520,600 | |
| | | | | | |
|
|
|
| | | | | | | | 31,140,891 | |
| | | | | | |
|
|
|
Independent Power Producers & Energy Traders — 0.4% | |
AES Corp. (The)* | | | 820,600 | | | | 9,715,904 | |
NRG Energy, Inc.* | | | 177,200 | | | | 3,210,864 | |
| | | | | | |
|
|
|
| | | | | | | | 12,926,768 | |
| | | | | | |
|
|
|
Industrial Conglomerates — 1.2% | | | | | | | | |
3M Co. | | | 15,200 | | | | 1,242,296 | |
General Electric Co. | | | 1,953,000 | | | | 34,978,230 | |
Keppel Corp. Ltd. (Singapore) | | | 3,000 | | | | 21,510 | |
Siemens AG (Germany) | | | 2,139 | | | | 204,695 | |
Wendel SA (France) | | | 458 | | | | 30,528 | |
| | | | | | |
|
|
|
| | | | | | | | 36,477,259 | |
| | | | | | |
|
|
|
Insurance — 1.9% | | | | | | | | |
ACE Ltd. | | | 51,800 | | | | 3,632,216 | |
Aflac, Inc. | | | 285,200 | | | | 12,337,752 | |
Allianz SE (Germany) | | | 1,601 | | | | 153,148 | |
American Financial Group, Inc. | | | 51,400 | | | | 1,896,146 | |
Assurant, Inc. | | | 76,900 | | | | 3,157,514 | |
Aviva PLC (United Kingdom) | | | 32,330 | | | | 151,026 | |
AXA SA (France) | | | 11,999 | | | | 155,996 | |
Berkshire Hathaway, Inc.
(Class B Stock)* | | | 147,100 | | | | 11,223,730 | |
Delta Lloyd NV (Netherlands) | | | 5,697 | | | | 95,853 | |
Genworth Financial, Inc.
(Class A Stock)* | | | 155,000 | | | | 1,015,250 | |
Hannover Rueckversicherung AG (Germany) | | | 1,013 | | | | 50,247 | |
HCC Insurance Holdings, Inc. | | | 78,400 | | | | 2,156,000 | |
Legal & General Group PLC
(United Kingdom) | | | 100,022 | | | | 159,682 | |
Loews Corp. | | | 62,600 | | | | 2,356,890 | |
Mapfre SA (Spain) | | | 24,688 | | | | 78,443 | |
MetLife, Inc. | | | 93,400 | | | | 2,912,212 | |
Muenchener Rueckversicherungs AG (Germany) | | | 141 | | | | 17,296 | |
Old Mutual PLC (United Kingdom) | | | 86,392 | | | | 181,795 | |
Primerica, Inc. | | | 18,900 | | | | 439,236 | |
Principal Financial Group, Inc. | | | 19,800 | | | | 487,080 | |
Reinsurance Group of America, Inc. | | | 7,600 | | | | 397,100 | |
RSA Insurance Group PLC
(United Kingdom) | | | 34,553 | | | | 56,451 | |
Sampo OYJ (Finland)
(Class A Stock) | | | 180 | | | | 4,466 | |
Swiss Life Holding AG (Switzerland) | | | 558 | | | | 51,327 | |
Swiss Re AG (Switzerland) | | | 241 | | | | 12,282 | |
Symetra Financial Corp. | | | 77,600 | | | | 703,832 | |
Travelers Cos., Inc. (The) | | | 45,400 | | | | 2,686,318 | |
Unum Group | | | 193,200 | | | | 4,070,724 | |
XL Group PLC | | | 313,300 | | | | 6,193,941 | |
Zurich Financial Services AG (Switzerland) | | | 512 | | | | 115,831 | |
| | | | | | |
|
|
|
| | | | | | | | 56,949,784 | |
| | | | | | |
|
|
|
SEE NOTES TO FINANCIAL STATEMENTS.
A62
| | | | | | |
| | | FLEXIBLE MANAGED PORTFOLIO (continued) | | |
| |
| SCHEDULE OF INVESTMENTS | | December 31, 2011 |
| | | | | | | | |
COMMON STOCKS
(continued) | | Shares
| | | Value
(Note 2)
| |
| | | | | | | | | |
Internet & Catalog Retail — 0.2% | | | | | |
Amazon.com, Inc.* | | | 1,000 | | | $ | 173,100 | |
HSN, Inc. | | | 52,600 | | | | 1,907,276 | |
Liberty Interactive Corp., (Class A Stock)* | | | 14,800 | | | | 239,982 | |
priceline.com, Inc.* | | | 10,400 | | | | 4,864,184 | |
| | | | | | |
|
|
|
| | | | | | | | 7,184,542 | |
| | | | | | |
|
|
|
Internet Software & Services — 0.9% | | | | | |
Akamai Technologies, Inc.* | | | 218,800 | | | | 7,062,864 | |
Dena Co. Ltd. (Japan) | | | 600 | | | | 17,999 | |
Dice Holdings, Inc.* | | | 30,500 | | | | 252,845 | |
Digital River, Inc.* | | | 26,800 | | | | 402,536 | |
eBay, Inc.* | | | 14,800 | | | | 448,884 | |
Google, Inc. (Class A Stock)* | | | 21,500 | | | | 13,886,850 | |
Gree, Inc. (Japan) | | | 5,000 | | | | 172,275 | |
Liquidity Services, Inc.* | | | 7,500 | | | | 276,750 | |
Yahoo!, Inc.* | | | 214,400 | | | | 3,458,272 | |
| | | | | | |
|
|
|
| | | | | | | | 25,979,275 | |
| | | | | | |
|
|
|
IT Services — 2.5% | | | | | |
Accenture PLC (Class A Stock) | | | 193,100 | | | | 10,278,713 | |
Fidelity National Information Services, Inc. | | | 35,500 | | | | 943,945 | |
Fiserv, Inc.*(a) | | | 27,700 | | | | 1,627,098 | |
International Business Machines Corp. | | | 137,100 | | | | 25,209,948 | |
Mastercard, Inc. (Class A Stock) | | | 49,300 | | | | 18,380,026 | |
Otsuka Corp. (Japan) | | | 1,900 | | | | 130,830 | |
SAIC, Inc.*(a) | | | 14,100 | | | | 173,289 | |
Unisys Corp.* | | | 12,800 | | | | 252,288 | |
Visa, Inc. (Class A Stock) | | | 183,000 | | | | 18,579,990 | |
| | | | | | |
|
|
|
| | | | | | | | 75,576,127 | |
| | | | | | |
|
|
|
Leisure Equipment & Products — 0.2% | | | | | |
Hasbro, Inc. | | | 77,500 | | | | 2,471,475 | |
Mattel, Inc.(a) | | | 40,800 | | | | 1,132,608 | |
Namco Bandai Holdings, Inc. (Japan) | | | 12,200 | | | | 173,720 | |
Nikon Corp. (Japan) | | | 3,100 | | | | 69,032 | |
Polaris Industries, Inc. | | | 42,700 | | | | 2,390,346 | |
Sturm Ruger & Co., Inc. | | | 29,700 | | | | 993,762 | |
| | | | | | |
|
|
|
| | | | | | | | 7,230,943 | |
| | | | | | |
|
|
|
Life Sciences Tools & Services — 0.5% | | | | | |
Life Technologies Corp.* | | | 84,100 | | | | 3,272,331 | |
PerkinElmer, Inc. | | | 198,500 | | | | 3,970,000 | |
Thermo Fisher Scientific, Inc.* | | | 198,400 | | | | 8,922,048 | |
| | | | | | |
|
|
|
| | | | | | | | 16,164,379 | |
| | | | | | |
|
|
|
Machinery — 1.8% | | | | | |
AGCO Corp.* | | | 44,100 | | | | 1,894,977 | |
Cummins, Inc. | | | 135,500 | | | | 11,926,710 | |
Deere & Co. | | | 164,800 | | | | 12,747,280 | |
Eaton Corp. | | | 186,700 | | | | 8,127,051 | |
FANUC Corp. (Japan) | | | 1,600 | | | | 244,875 | |
Illinois Tool Works, Inc. | | | 28,100 | | | | 1,312,551 | |
ITT Corp. | | | 101,900 | | | | 1,969,727 | |
Kennametal, Inc.(a) | | | 11,900 | | | | 434,588 | |
Kone OYJ (Finland) (Class B Stock) | | | 1,101 | | | | 57,141 | |
MAN SE (Germany) | | | 429 | | | | 38,145 | |
Metso OYJ (Finland) | | | 1,816 | | | | 67,338 | |
| | | | | | | | |
COMMON STOCKS
(continued) | | Shares
| | | Value
(Note 2)
| |
| | | | | | | | | |
Machinery (continued) | | | | | |
Nabtesco Corp. (Japan) | | | 1,300 | | | $ | 23,696 | |
Parker Hannifin Corp. | | | 159,000 | | | | 12,123,750 | |
SKF AB (Sweden) (Class B Stock) | | | 871 | | | | 18,427 | |
Sumitomo Heavy Industries Ltd. (Japan) | | | 10,000 | | | | 58,334 | |
Volvo AB (Sweden) (Class B Stock) | | | 6,288 | | | | 68,800 | |
Weir Group PLC (The) (United Kingdom) | | | 555 | | | | 17,514 | |
Xylem, Inc. | | | 89,500 | | | | 2,299,255 | |
Yangzijiang Shipbuilding Holdings Ltd. (Singapore) | | | 126,000 | | | | 88,401 | |
| | | | | | |
|
|
|
| | | | | | | | 53,518,560 | |
| | | | | | |
|
|
|
Marine | | | | | |
AP Moeller-Maersk A/S (Denmark) (Class A Stock) | | | 11 | | | | 68,644 | |
AP Moeller-Maersk A/S (Denmark) (Class B Stock) | | | 2 | | | | 13,205 | |
Orient Overseas International Ltd. (Hong Kong) | | | 7,500 | | | | 43,793 | |
| | | | | | |
|
|
|
| | | | | | | | 125,642 | |
| | | | | | |
|
|
|
Media — 1.8% | | | | | |
Comcast Corp. (Class A Stock) | | | 47,173 | | | | 1,118,472 | |
DIRECTV (Class A Stock)*(a) | | | 347,100 | | | | 14,841,996 | |
Hakuhodo DY Holdings, Inc. (Japan) | | | 1,670 | | | | 95,899 | |
ITV PLC (United Kingdom) | | | 73,350 | | | | 77,631 | |
Liberty Media Corp.—Liberty Starz (Class A Stock)* | | | 41,376 | | | | 3,229,397 | |
News Corp. (Class A Stock) | | | 604,300 | | | | 10,780,712 | |
Reed Elsevier NV (Netherlands) | | | 2,813 | | | | 32,792 | |
Time Warner, Inc. | | | 104,500 | | | | 3,776,630 | |
Viacom, Inc. (Class B Stock) | | | 323,200 | | | | 14,676,512 | |
Walt Disney Co. (The) | | | 154,600 | | | | 5,797,500 | |
WPP PLC (United Kingdom) | | | 2,996 | | | | 31,429 | |
| | | | | | |
|
|
|
| | | | | | | | 54,458,970 | |
| | | | | | |
|
|
|
Metals & Mining — 1.0% | | | | | |
Alcoa, Inc. | | | 462,400 | | | | 3,999,760 | |
Anglo American PLC
(United Kingdom) | | | 1,625 | | | | 60,037 | |
BHP Billiton Ltd. (Australia) | | | 8,316 | | | | 292,762 | |
BHP Billiton PLC (United Kingdom) | | | 9,685 | | | | 282,389 | |
Coeur d’Alene Mines Corp.* | | | 142,600 | | | | 3,442,364 | |
Daido Steel Co. Ltd. (Japan) | | | 4,000 | | | | 25,101 | |
Freeport-McMoRan Copper & Gold, Inc. | | | 364,300 | | | | 13,402,597 | |
Iluka Resources Ltd. (Australia) | | | 3,980 | | | | 63,096 | |
Nippon Steel Corp. (Japan) | | | 32,000 | | | | 79,823 | |
Randgold Resources Ltd.
(United Kingdom) | | | 571 | | | | 58,393 | |
Reliance Steel & Aluminum Co. | | | 26,300 | | | | 1,280,547 | |
Rio Tinto Ltd. (Australia) | | | 2,589 | | | | 159,676 | |
Rio Tinto PLC (United Kingdom) | | | 6,181 | | | | 299,969 | |
Salzgitter AG (Germany) | | | 134 | | | | 6,699 | |
Schnitzer Steel Industries, Inc. (Class A Stock) | | | 8,300 | | | | 350,924 | |
Steel Dynamics, Inc. | | | 526,900 | | | | 6,928,735 | |
SEE NOTES TO FINANCIAL STATEMENTS.
A63
| | | | | | |
| | | FLEXIBLE MANAGED PORTFOLIO (continued) | | |
| |
| SCHEDULE OF INVESTMENTS | | December 31, 2011 |
| | | | | | | | |
COMMON STOCKS
(continued) | | Shares
| | | Value
(Note 2)
| |
| | | | | | �� | | | |
Metals & Mining (continued) | | | | | |
Voestalpine AG (Austria) | | | 2,517 | | | $ | 70,593 | |
Xstrata PLC (United Kingdom) | | | 2,192 | | | | 33,293 | |
| | | | | | |
|
|
|
| | | | | | | | 30,836,758 | |
| | | | | | |
|
|
|
Multiline Retail — 0.3% | | | | | |
Dollar Tree, Inc.* | | | 26,400 | | | | 2,194,104 | |
Isetan Mitsukoshi Holdings, Ltd. (Japan) | | | 700 | | | | 7,339 | |
Lifestyle International Holdings Ltd. (Hong Kong) | | | 39,000 | | | | 85,968 | |
Next PLC (United Kingdom) | | | 3,754 | | | | 159,565 | |
PPR (France) | | | 288 | | | | 41,244 | |
Target Corp. | | | 112,500 | | | | 5,762,250 | |
| | | | | | |
|
|
|
| | | | | | | | 8,250,470 | |
| | | | | | |
|
|
|
Multi-Utilities — 0.6% | | | | | |
Centrica PLC (United Kingdom) | | | 1,869 | | | | 8,397 | |
Dominion Resources, Inc. | | | 8,500 | | | | 451,180 | |
GDF Suez (France) | | | 2,315 | | | | 63,279 | |
National Grid PLC (United Kingdom) | | | 7,973 | | | | 77,387 | |
PG&E Corp. | | | 226,100 | | | | 9,319,842 | |
Public Service Enterprise Group, Inc. | | | 85,000 | | | | 2,805,850 | |
RWE AG (Germany) | | | 2,763 | | | | 97,089 | |
Sempra Energy | | | 117,900 | | | | 6,484,500 | |
| | | | | | |
|
|
|
| | | | | | | | 19,307,524 | |
| | | | | | |
|
|
|
Office Electronics — 0.2% | | | | | |
Canon, Inc. (Japan) | | | 4,100 | | | | 181,642 | |
Xerox Corp. | | | 573,200 | | | | 4,562,672 | |
| | | | | | |
|
|
|
| | | | | | | | 4,744,314 | |
| | | | | | |
|
|
|
Oil, Gas & Consumable Fuels — 7.2% | | | | | |
Apache Corp. | | | 165,500 | | | | 14,990,990 | |
BG Group PLC (United Kingdom) | | | 211 | | | | 4,511 | |
BP PLC (United Kingdom) | | | 58,161 | | | | 415,939 | |
Chevron Corp. | | | 448,456 | | | | 47,715,718 | |
ConocoPhillips | | | 332,834 | | | | 24,253,614 | |
Consol Energy, Inc. | | | 56,700 | | | | 2,080,890 | |
CVR Energy, Inc.* | | �� | 27,000 | | | | 505,710 | |
Devon Energy Corp. | | | 106,100 | | | | 6,578,200 | |
ENI SpA (Italy) | | | 7,801 | | | | 161,644 | |
Exxon Mobil Corp. | | | 866,416 | | | | 73,437,420 | |
Hess Corp. | | | 190,400 | | | | 10,814,720 | |
HollyFrontier Corp. | | | 22,200 | | | | 519,480 | |
Idemitsu Kosan Co. Ltd. (Japan) | | | 200 | | | | 20,631 | |
Japan Petroleum Exploration Co. (Japan) | | | 400 | | | | 15,643 | |
JX Holdings, Inc. (Japan) | | | 7,900 | | | | 47,726 | |
Marathon Oil Corp. | | | 299,400 | | | | 8,763,438 | |
Marathon Petroleum Corp. | | | 62,800 | | | | 2,090,612 | |
Murphy Oil Corp. | | | 118,500 | | | | 6,605,190 | |
Occidental Petroleum Corp. | | | 110,900 | | | | 10,391,330 | |
Peabody Energy Corp. | | | 92,900 | | | | 3,075,919 | |
Royal Dutch Shell PLC (United Kingdom) (Class A Stock) | | | 12,090 | | | | 445,170 | |
Royal Dutch Shell PLC (United Kingdom) (Class B Stock) | | | 10,065 | | | | 383,580 | |
Santos Ltd. (Australia) | | | 8,704 | | | | 108,966 | |
Southwestern Energy Co.* | | | 50,300 | | | | 1,606,582 | |
| | | | | | | | |
COMMON STOCKS
(continued) | | Shares
| | | Value
(Note 2)
| |
| | | | | | | | | |
Oil, Gas & Consumable Fuels (continued) | | | | | |
Statoil ASA (Norway) | | | 5,217 | | | $ | 133,896 | |
Total SA (France) | | | 7,887 | | | | 403,205 | |
Valero Energy Corp. | | | 97,100 | | | | 2,043,955 | |
| | | | | | |
|
|
|
| | | | | | | | 217,614,679 | |
| | | | | | |
|
|
|
Paper & Forest Products | | | | | |
Holmen AB (Sweden) (Class B Stock) | | | 397 | | | | 11,405 | |
OJI Paper Co. Ltd. (Japan) | | | 5,000 | | | | 25,659 | |
| | | | | | |
|
|
|
| | | | | | | | 37,064 | |
| | | | | | |
|
|
|
Personal Products — 0.3% | | | | | |
Avon Products, Inc. | | | 339,700 | | | | 5,934,559 | |
Herbalife Ltd. | | | 36,200 | | | | 1,870,454 | |
| | | | | | |
|
|
|
| | | | | | | | 7,805,013 | |
| | | | | | |
|
|
|
Pharmaceuticals — 3.6% | | | | | |
Abbott Laboratories | | | 403,300 | | | | 22,677,559 | |
AstraZeneca PLC (United Kingdom) | | | 7,123 | | | | 329,093 | |
Bayer AG (Germany) | | | 2,257 | | | | 144,303 | |
Bristol-Myers Squibb Co.(a) | | | 103,300 | | | | 3,640,292 | |
Eli Lilly & Co. | | | 223,800 | | | | 9,301,128 | |
GlaxoSmithKline PLC (United Kingdom) | | | 21,453 | | | | 490,249 | |
Hospira, Inc.* | | | 18,600 | | | | 564,882 | |
Johnson & Johnson | | | 290,198 | | | | 19,031,185 | |
Merck & Co., Inc. | | | 644,600 | | | | 24,301,420 | |
Mylan, Inc.* | | | 51,700 | | | | 1,109,482 | |
Novartis AG (Switzerland) | | | 6,572 | | | | 375,723 | |
Novo Nordisk A/S (Denmark) (Class B Stock) | | | 1,864 | | | | 214,204 | |
Orion OYJ (Finland) (Class B Stock) | | | 1,742 | | | | 33,931 | |
Par Pharmaceutical Cos., Inc.* | | | 45,900 | | | | 1,502,307 | |
Pfizer, Inc. | | | 1,002,997 | | | | 21,704,855 | |
Roche Holding AG (Switzerland) | | | 1,889 | | | | 320,163 | |
Sanofi (France) | | | 5,254 | | | | 385,899 | |
Shire PLC (United Kingdom) | | | 853 | | | | 29,713 | |
Taisho Pharmaceutical Holdings Co. Ltd. (Japan)* | | | 100 | | | | 7,717 | |
Takeda Pharmaceutical Co. Ltd. (Japan) | | | 1,600 | | | | 70,261 | |
Teva Pharmaceutical Industries Ltd. (Israel) | | | 1,101 | | | | 44,317 | |
Warner Chilcott PLC (Class A Stock)* | | | 112,500 | | | | 1,702,125 | |
Watson Pharmaceuticals, Inc.* | | | 15,300 | | | | 923,202 | |
| | | | | | |
|
|
|
| | | | | | | | 108,904,010 | |
| | | | | | |
|
|
|
Professional Services — 0.1% | | | | | |
Manpower, Inc. | | | 50,600 | | | | 1,808,950 | |
| | | | | | |
|
|
|
Real Estate Investment Trusts — 0.6% | | | | | |
Annaly Capital Management, Inc. | | | 499,800 | | | | 7,976,808 | |
Ashford Hospitality Trust, Inc. | | | 29,400 | | | | 235,200 | |
Chimera Investment Corp.(a) | | | 375,600 | | | | 942,756 | |
CommonWealth REIT | | | 111,000 | | | | 1,847,040 | |
Corporate Office Properties Trust | | | 14,200 | | | | 301,892 | |
First Industrial Realty Trust, Inc.* | | | 33,600 | | | | 343,728 | |
GPT Group (Australia) | | | 14,547 | | | | 45,678 | |
Hospitality Properties Trust | | | 187,800 | | | | 4,315,644 | |
SEE NOTES TO FINANCIAL STATEMENTS.
A64
| | | | | | |
| | | FLEXIBLE MANAGED PORTFOLIO (continued) | | |
| |
| SCHEDULE OF INVESTMENTS | | December 31, 2011 |
| | | | | | | | |
COMMON STOCKS
(continued) | | Shares
| | | Value
(Note 2)
| |
| | | | | | | | | |
Real Estate Investment Trusts (continued) | | | | | |
Invesco Mortgage Capital, Inc. | | | 53,200 | | | $ | 747,460 | |
Link REIT (The) (Hong Kong) | | | 42,000 | | | | 154,662 | |
Mack-Cali Realty Corp. | | | 16,800 | | | | 448,392 | |
MFA Financial, Inc. | | | 78,100 | | | | 524,832 | |
Redwood Trust, Inc. | | | 24,900 | | | | 253,482 | |
Simon Property Group, Inc. | | | 2,000 | | | | 257,880 | |
Stockland (Australia) | | | 26,528 | | | | 86,554 | |
Unibail-Rodamco SE (France) | | | 401 | | | | 72,088 | |
Westfield Group (Australia) | | | 4,010 | | | | 32,032 | |
Winthrop Realty Trust | | | 31,300 | | | | 318,321 | |
| | | | | | |
|
|
|
| | | | | | | | 18,904,449 | |
| | | | | | |
|
|
|
Real Estate Management & Development — 0.1% | | | | | |
Cheung Kong Holdings Ltd.
(Hong Kong) | | | 1,000 | | | | 11,897 | |
Daito Trust Construction Co. Ltd. (Japan) | | | 2,000 | | | | 171,495 | |
Daiwa House Industry Co. Ltd. (Japan) | | | 14,000 | | | | 166,974 | |
Immofinanz AG (Austria) | | | 7,734 | | | | 23,223 | |
Jones Lang LaSalle, Inc.(a) | | | 44,700 | | | | 2,738,322 | |
Kerry Properties Ltd. (Hong Kong) | | | 13,500 | | | | 44,672 | |
Sun Hung Kai Properties Ltd.
(Hong Kong) | | | 4,000 | | | | 50,138 | |
Tokyu Land Corp. (Japan) | | | 25,000 | | | | 94,517 | |
| | | | | | |
|
|
|
| | | | | | | | 3,301,238 | |
| | | | | | |
|
|
|
Road & Rail — 1.1% | | | | | | | | |
Asciano Ltd. (Australia) | | | 21,370 | | | | 98,358 | |
Central Japan Railway Co. (Japan) | | | 18 | | | | 152,007 | |
CSX Corp. | | | 455,000 | | | | 9,582,300 | |
East Japan Railway Co. (Japan) | | | 2,800 | | | | 178,251 | |
Norfolk Southern Corp. | | | 144,200 | | | | 10,506,412 | |
Union Pacific Corp. | | | 110,300 | | | | 11,685,182 | |
West Japan Railway Co. (Japan) | | | 300 | | | | 13,038 | |
| | | | | | |
|
|
|
| | | | | | | | 32,215,548 | |
| | | | | | |
|
|
|
Semiconductors & Semiconductor Equipment — 1.1% | |
Applied Materials, Inc. | | | 414,300 | | | | 4,437,153 | |
ARM Holdings PLC
(United Kingdom) | | | 3,580 | | | | 32,913 | |
ASM Pacific Technology Ltd.
(Hong Kong) | | | 6,200 | | | | 69,571 | |
Intel Corp. | | | 1,205,600 | | | | 29,235,800 | |
| | | | | | |
|
|
|
| | | | | | | | 33,775,437 | |
| | | | | | |
|
|
|
Software — 2.7% | | | | | | | | |
Activision Blizzard, Inc.(a) | | | 82,900 | | | | 1,021,328 | |
BMC Software, Inc.* | | | 89,000 | | | | 2,917,420 | |
CA, Inc. | | | 174,000 | | | | 3,517,410 | |
FactSet Research Systems, Inc. | | | 4,600 | | | | 401,488 | |
Intuit, Inc. | | | 123,200 | | | | 6,479,088 | |
Konami Corp. (Japan) | | | 500 | | | | 14,973 | |
Microsoft Corp. | | | 1,519,700 | | | | 39,451,412 | |
Oracle Corp. | | | 859,300 | | | | 22,041,045 | |
SAP AG (Germany) | | | 4,011 | | | | 212,062 | |
Symantec Corp.* | | | 326,000 | | | | 5,101,900 | |
| | | | | | |
|
|
|
| | | | | | | | 81,158,126 | |
| | | | | | |
|
|
|
| | | | | | | | |
COMMON STOCKS
(continued) | | Shares
| | | Value
(Note 2)
| |
| | | | | | | | | |
Specialty Retail — 1.5% | | | | | | | | |
ANN, Inc.* | | | 15,100 | | | $ | 374,178 | |
Ascena Retail Group, Inc.*(a) | | | 82,900 | | | | 2,463,788 | |
Bed Bath & Beyond, Inc.* | | | 38,500 | | | | 2,231,845 | |
Express, Inc.* | | | 70,400 | | | | 1,403,776 | |
Finish Line, Inc. (The) (Class A Stock) | | | 62,600 | | | | 1,207,241 | |
Guess?, Inc. | | | 52,900 | | | | 1,577,478 | |
Hennes & Mauritz AB (Sweden)
(Class B Stock) | | | 977 | | | | 31,417 | |
Home Depot, Inc. (The) | | | 283,950 | | | | 11,937,258 | |
Inditex SA (Spain) | | | 1,190 | | | | 97,461 | |
Kingfisher PLC (United Kingdom) | | | 14,618 | | | | 56,913 | |
Limited Brands, Inc.(a) | | | 47,000 | | | | 1,896,450 | |
PetSmart, Inc. | | | 34,100 | | | | 1,748,989 | |
Ross Stores, Inc. | | | 116,400 | | | | 5,532,492 | |
TJX Cos., Inc. | | | 186,300 | | | | 12,025,665 | |
USS Co. Ltd. (Japan) | | | 700 | | | | 63,297 | |
Williams-Sonoma, Inc. | | | 73,300 | | | | 2,822,050 | |
Yamada Denki Co. Ltd. (Japan) | | | 1,190 | | | | 81,013 | |
| | | | | | |
|
|
|
| | | | | | | | 45,551,311 | |
| | | | | | |
|
|
|
Textiles, Apparel & Luxury Goods — 0.5% | |
Burberry Group PLC (United Kingdom) | | | 2,698 | | | | 49,651 | |
Christian Dior SA (France) | | | 183 | | | | 21,697 | |
Cie Financiere Richemont SA (Switzerland) | | | 1,096 | | | | 55,436 | |
Coach, Inc. | | | 209,600 | | | | 12,793,984 | |
Crocs, Inc.* | | | 87,100 | | | | 1,286,467 | |
LVMH Moet Hennessy Louis Vuitton SA (France) | | | 83 | | | | 11,752 | |
Swatch Group AG (The) (Bearer Shares) (Switzerland) | | | 264 | | | | 98,793 | |
Swatch Group AG (The) (Registered Shares) (Switzerland) | | | 1,111 | | | | 74,043 | |
True Religion Apparel, Inc.* | | | 49,600 | | | | 1,715,168 | |
| | | | | | |
|
|
|
| | | | | | | | 16,106,991 | |
| | | | | | |
|
|
|
Tobacco — 0.8% | |
British American Tobacco PLC
(United Kingdom) | | | 5,133 | | | | 243,569 | |
Imperial Tobacco Group PLC
(United Kingdom) | | | 5,142 | | | | 194,446 | |
Japan Tobacco, Inc. (Japan) | | | 1 | | | | 4,703 | |
Lorillard, Inc. | | | 74,200 | | | | 8,458,800 | |
Philip Morris International, Inc. | | | 173,200 | | | | 13,592,736 | |
Reynolds American, Inc. | | | 64,800 | | | | 2,684,016 | |
Swedish Match AB (Sweden) | | | 1,767 | | | | 62,725 | |
| | | | | | |
|
|
|
| | | | | | | | 25,240,995 | |
| | | | | | |
|
|
|
Trading Companies & Distributors — 0.1% | |
ITOCHU Corp. (Japan) | | | 11,000 | | | | 111,758 | |
Marubeni Corp. (Japan) | | | 8,000 | | | | 48,746 | |
Mitsubishi Corp. (Japan) | | | 4,100 | | | | 82,831 | |
Mitsui & Co. Ltd. (Japan) | | | 5,100 | | | | 79,313 | |
Sumitomo Corp. (Japan) | | | 10,600 | | | | 143,500 | |
Toyota Tsusho Corp. (Japan) | | | 4,100 | | | | 72,497 | |
W.W. Grainger, Inc. | | | 16,400 | | | | 3,069,916 | |
| | | | | | |
|
|
|
| | | | | | | | 3,608,561 | |
| | | | | | |
|
|
|
SEE NOTES TO FINANCIAL STATEMENTS.
A65
| | | | | | |
| | | FLEXIBLE MANAGED PORTFOLIO (continued) | | |
| |
| SCHEDULE OF INVESTMENTS | | December 31, 2011 |
| | | | | | | | |
COMMON STOCKS
(continued) | | Shares
| | | Value
(Note 2)
| |
| | | | | | | | | |
Transportation Infrastructure | | | | | | | | |
Atlantia SpA (Italy) | | | 567 | | | $ | 9,078 | |
Kamigumi Co. Ltd. (Japan) | | | 2,000 | | | | 17,253 | |
Transurban Group (Australia)(b) | | | 9,401 | | | | 54,038 | |
| | | | | | |
|
|
|
| | | | | | | | 80,369 | |
| | | | | | |
|
|
|
Water Utilities — 0.2% | |
American Water Works Co., Inc. | | | 162,400 | | | | 5,174,064 | |
| | | | | | |
|
|
|
Wireless Telecommunication Services — 0.1% | |
KDDI Corp. (Japan) | | | 2 | | | | 12,862 | |
MetroPCS Communications, Inc.* | | | 284,900 | | | | 2,472,932 | |
Millicom International Cellular SA (Luxembourg) | | | 219 | | | | 21,941 | |
Mobistar SA (Belgium) | | | 112 | | | | 5,869 | |
Softbank Corp. (Japan) | | | 6,200 | | | | 182,609 | |
StarHub Ltd. (Singapore) | | | 3,000 | | | | 6,731 | |
Vodafone Group PLC
(United Kingdom) | | | 131,333 | | | | 364,882 | |
| | | | | | |
|
|
|
| | | | | | | | 3,067,826 | |
| | | | | | |
|
|
|
TOTAL COMMON STOCKS
(cost $1,734,201,909) | | | | 1,967,689,117 | |
| | | | | | |
|
|
|
| | | | | | | | |
EXCHANGE TRADED FUND
| | Shares
| | | Value
(Note 2)
| |
| | | | | | | | | |
iShares MSCI EAFE Index Fund
(cost $534,053) | | | 10,700 | | | $ | 529,971 | |
| | | | | | |
|
|
|
| PREFERRED STOCKS — 0.1% | | | | | | | | |
Automobiles | | | | | | | | |
Porsche Automobil Holding SE (Germany) | | | 1,769 | | | | 94,672 | |
Volkswagen AG (Germany) | | | 961 | | | | 143,966 | |
| | | | | | |
|
|
|
| | | | | | | | 238,638 | |
| | | | | | |
|
|
|
Banking — 0.1% | | | | | | | | |
Citigroup Capital XIII, 7.875%
(Capital Security, fixed to floating preferred)(c) | | | 22,000 | | | | 573,320 | |
JPMorgan Chase Capital XXVI, 8.000% (Capital Security, fixed to floating preferred)(c) | | | 28,000 | | | | 725,200 | |
| | | | | | |
|
|
|
| | | | | | | | 1,298,520 | |
| | | | | | |
|
|
|
Household Products | | | | | | | | |
Henkel AG & Co. KGaA (Germany) | | | 620 | | | | 35,781 | |
| | | | | | |
|
|
|
Multi-Utilities | | | | | | | | |
RWE AG (Germany) | | | 1,313 | | | | 43,223 | |
| | | | | | |
|
|
|
TOTAL PREFERRED STOCKS
(cost $1,618,614) | | | | 1,616,162 | |
| | | | | | |
|
|
|
| | | | | | | | | | | | | | | | |
| ASSET-BACKED SECURITIES — 1.0% | | Moody’s
Ratings†
(Unaudited)
| | Interest
Rate
| | | Maturity
Date
| | Principal
Amount
(000)#
| | | | |
| | | | | | | | | | | | | | | | | |
Non-Residential Mortgage-Backed Securities — 0.8% | | | | | | | | | | | | | | | | |
Apidos CDO (Cayman Islands), Ser. 2006-4A, Class A1, 144A(c) | | Aaa | | | 0.672% | | | 10/27/18 | | $ | 1,000 | | | | 952,556 | |
ARES CLO Funds (Cayman Islands), Ser. 2011-16A, Class A, 144A(c) | | Aaa | | | 2.066% | | | 05/17/21 | | | 500 | | | | 493,465 | |
BA Credit Card Trust, Ser. 2006-C5, Class C5(c) | | A3 | | | 0.678% | | | 01/15/16 | | | 3,209 | | | | 3,164,563 | |
Bank One Issuance Trust, Ser. 2003-C3, Class C3 | | Baa2 | | | 4.770% | | | 02/16/16 | | | 5,200 | | | | 5,418,881 | |
BlackRock Senior Income Series Corp. (Cayman Islands), Ser. 2005-2A, Class A1, 144A(c) | | Aaa | | | 0.756% | | | 05/25/17 | | | 1,908 | | | | 1,840,350 | |
Chatham Light CLO Ltd. (Cayman Islands), Ser. 2005-2A, Class A1, 144A(c) | | Aaa | | | 0.682% | | | 08/03/19 | | | 454 | | | | 436,765 | |
Citibank Credit Card Issuance Trust, Ser. 2006-C1, Class C1(c) | | Baa2 | | | 0.685% | | | 02/20/15 | | | 1,350 | | | | 1,337,905 | |
First CLO Ltd. (Cayman Islands), Ser. 2004-1A1, Class A1, 144A(c) | | Aaa | | | 0.772% | | | 07/27/16 | | | 49 | | | | 48,670 | |
Four Corners CLO (Cayman Islands), Ser. 2006-3A, Class A, 144A(c) | | Aaa | | | 0.666% | | | 07/22/20 | | | 1,225 | | | | 1,147,303 | |
Fuel Trust, Sec’d. Notes, 144A | | Baa2 | | | 3.984% | | | 06/15/16 | | | 415 | | | | 414,944 | |
Fuel Trust, Sec’d. Notes, 144A | | Baa2 | | | 4.207% | | | 04/15/16 | | | 1,655 | | | | 1,669,049 | |
Granite Ventures Ltd. (Cayman Islands), Ser. 2005-2A, Class A1, 144A(c) | | Aaa | | | 0.663% | | | 12/15/17 | | | 1,139 | | | | 1,113,532 | |
Gulf Stream Compass CLO Ltd. (Cayman Islands), Ser. 2004-1A, Class A, 144A(c) | | Aaa | | | 0.763% | | | 07/15/16 | | | 92 | | | | 90,879 | |
Landmark CDO Ltd. (Cayman Islands), Ser. 2006-8A, Class A1, 144A(c) | | Aaa | | | 0.646% | | | 10/19/20 | | | 1,161 | | | | 1,102,800 | |
LCM LP (Cayman Islands), Ser. 2004-2A, Class A, 144A(c) | | Aaa | | | 0.736% | | | 10/22/16 | | | 574 | | | | 550,682 | |
LCM LP (Cayman Islands), Ser. 2005-3A, Class A, 144A(c) | | Aaa | | | 0.787% | | | 06/01/17 | | | 500 | | | | 475,000 | |
Mountain Capital CLO Ltd. (Cayman Islands), Ser. 2004-3A, Class A1LA, 144A(c) | | Aaa | | | 0.872% | | | 02/15/16 | | | 165 | | | | 165,026 | |
Mountain Capital CLO Ltd. (Cayman Islands), Ser. 2005-4A, Class A1L, 144A(c) | | Aaa | | | 0.796% | | | 03/15/18 | | | 593 | | | | 568,382 | |
SVO VOI Mortgage Corp., Ser. 2005-AA, Class A, 144A | | Aaa | | | 5.250% | | | 02/20/21 | | | 179 | | | | 183,241 | |
Trimaran CLO Ltd. (Cayman Islands), Ser. 2006-2A, Class A1L, 144A(c) | | Aaa | | | 0.679% | | | 11/01/18 | | | 2,500 | | | | 2,373,953 | |
| | | | | | | | | | | | | | |
|
|
|
| | | | | | | | | | | | | | | | 23,547,946 | |
| | | | | | | | | | | | | | |
|
|
|
SEE NOTES TO FINANCIAL STATEMENTS.
A66
| | | | | | |
| | | FLEXIBLE MANAGED PORTFOLIO (continued) | | |
| |
| SCHEDULE OF INVESTMENTS | | December 31, 2011 |
| | | | | | | | | | | | | | | | |
ASSET-BACKED SECURITIES
(continued) | | Moody’s
Ratings†
(Unaudited)
| | Interest
Rate
| | | Maturity
Date
| | Principal
Amount
(000)#
| | | Value
(Note 2)
| |
| | | | | | | | | | | | | | | | | |
Residential Mortgage-Backed Securities — 0.2% | | | | | | | | | | | | | | | | |
CDC Mortgage Capital Trust, Ser. 2002-HE3, Class M1(c) | | B2 | | | 1.944% | | | 03/25/33 | | $ | 423 | | | $ | 250,565 | |
Credit-Based Asset Servicing and Securitization LLC, Ser. 2005-CB6, Class A3 | | B3 | | | 5.120% | | | 07/25/35 | | | 318 | | | | 261,216 | |
Equity One ABS, Inc., Ser. 2004-3, Class M1 | | Baa1 | | | 5.700% | | | 07/25/34 | | | 670 | | | | 530,924 | |
GSAMP Trust, Ser. 2004-HE2, Class A3C(c) | | Aaa | | | 0.874% | | | 09/25/34 | | | 674 | | | | 512,720 | |
HSBC Home Equity Loan Trust, Ser. 2005-2, Class M2(c) | | Aa1 | | | 0.775% | | | 01/20/35 | | | 311 | | | | 269,660 | |
Long Beach Mortgage Loan Trust, Ser. 2004-2, Class M1(c) | | B1 | | | 0.824% | | | 06/25/34 | | | 1,074 | | | | 764,149 | |
Morgan Stanley ABS Capital I, Ser. 2003-HE1, Class M1(c) | | Ba2 | | | 1.494% | | | 05/25/33 | | | 650 | | | | 491,766 | |
Morgan Stanley ABS Capital I, Ser. 2004-HE5, Class M1(c) | | B3 | | | 1.239% | | | 06/25/34 | | | 1,232 | | | | 884,813 | |
Morgan Stanley ABS Capital I, Ser. 2004-NC1, Class M1(c) | | Baa2 | | | 1.344% | | | 12/27/33 | | | 1,193 | | | | 944,600 | |
Morgan Stanley Dean Witter Capital I, Ser. 2002-HE1, Class M1(c) | | Caa3 | | | 1.194% | | | 07/25/32 | | | 720 | | | | 507,558 | |
Morgan Stanley Dean Witter Capital I, Ser. 2002-NC2,
Class M2, 144A(c) | | B(d) | | | 2.619% | | | 04/25/32 | | | 261 | | | | 112,280 | |
Morgan Stanley Dean Witter Capital I, Ser. 2002-NC4, Class M1(c) | | B2 | | | 1.569% | | | 09/25/32 | | | 696 | | | | 536,320 | |
Securitized Asset Backed Receivables LLC Trust, Ser. 2004-OP1,
Class M1(c) | | Ba3 | | | 1.059% | | | 02/25/34 | | | 1,128 | | | | 826,832 | |
Securitized Asset Backed Receivables LLC Trust, Ser. 2006-FR3,
Class A3(c) | | Ca | | | 0.544% | | | 05/25/36 | | | 1,100 | | | | 356,784 | |
| | | | | | | | | | | | | | |
|
|
|
| | | | | | | | | | | | | | | | 7,250,187 | |
| | | | | | | | | | | | | | |
|
|
|
TOTAL ASSET-BACKED SECURITIES
(cost $32,987,959) | | | | 30,798,133 | |
| | | | | | | | | | | | | | |
|
|
|
| BANK LOANS — 0.2% | | | | | | | | | | | | | | | | |
Cable | | | | | | | | | | | | | | | | |
Insight Midwest Holdings LLC(c) | | Ba3 | | | 1.270% | | | 10/06/13 | | | 678 | | | | 669,448 | |
| | | | | | | | | | | | | | |
|
|
|
Foods | | | | | | | | | | | | | | | | |
Del Monte Foods Co.(c). | | Ba3 | | | 4.500% | | | 03/08/18 | | | 1,139 | | | | 1,079,463 | |
| | | | | | | | | | | | | | |
|
|
|
Healthcare & Pharmaceutical — 0.1% | | | | | | | | | | | | | | | | |
HCA, Inc.(c) | | Ba3 | | | 3.688% | | | 05/01/18 | | | 370 | | | | 348,567 | |
HCA, Inc.(c) | | Ba3 | | | 3.829% | | | 03/31/17 | | | 886 | | | | 839,351 | |
| | | | | | | | | | | | | | |
|
|
|
| | | | | | | | | | | | | | | | 1,187,918 | |
| | | | | | | | | | | | | | |
|
|
|
Technology — 0.1% | | | | | | | | | | | | | | | | |
First Data Corp.(c) | | B1 | | | 3.044% | | | 09/24/14 | | | 126 | | | | 113,668 | |
First Data Corp.(c) | | B1 | | | 3.044% | | | 09/24/14 | | | 101 | | | | 90,934 | |
First Data Corp.(c) | | B1 | | | 4.294% | | | 03/26/18 | | | 2,134 | | | | 1,783,606 | |
Flextronics International Ltd. (Singapore)(c) | | Ba1 | | | 2.520% | | | 10/01/14 | | | 539 | | | | 526,478 | |
Flextronics International Ltd. (Singapore)(c) | | Ba1 | | | 2.546% | | | 10/01/14 | | | 155 | | | | 152,157 | |
| | | | | | | | | | | | | | |
|
|
|
| | | | | | | | | | | | | | | | 2,666,843 | |
| | | | | | | | | | | | | | |
|
|
|
TOTAL BANK LOANS
(cost $6,075,372) | | | | 5,603,672 | |
| | | | | | | | | | | | | | |
|
|
|
| COLLATERALIZED MORTGAGE OBLIGATIONS — 0.2% | | | | | | | | | | | | | | | | |
Banc of America Alternative Loan Trust, Ser. 2005-12, Class 3CB1 | | Caa2 | | | 6.000% | | | 01/25/36 | | | 3,116 | | | | 2,219,893 | |
Banc of America Mortgage Securities, Inc., Ser. 2005-A, Class 2A1(c) | | B2 | | | 2.875% | | | 02/25/35 | | | 674 | | | | 551,436 | |
Banc of America Mortgage Securities, Inc., Ser. 2005-B, Class 2A1(c) | | Caa1 | | | 2.835% | | | 03/25/35 | | | 529 | | | | 408,170 | |
Chase Mortgage Finance Corp., Ser. 2007-A1, Class 1A5(c) | | Ba2 | | | 2.760% | | | 02/25/37 | | | 1,614 | | | | 1,463,746 | |
Countrywide Alternative Loan Trust, Ser. 2004-18CB, Class 3A1 | | Ba3 | | | 5.250% | | | 09/25/19 | | | 678 | | | | 690,126 | |
JPMorgan Mortgage Trust, Ser. 2007-A1, Class 4A1(c) | | B1 | | | 2.782% | | | 07/25/35 | | | 1,060 | | | | 932,747 | |
MASTR Alternative Loans Trust, Ser. 2004-4, Class 4A1 | | Baa1 | | | 5.000% | | | 04/25/19 | | | 223 | | | | 228,327 | |
Structured Adjustable Rate Mortgage Loan Trust, Ser. 2004-1,
Class 4A3(c) | | Baa1 | | | 2.480% | | | 02/25/34 | | | 553 | | | | 493,000 | |
Washington Mutual Alternative Mortgage Pass-Through Certificates,
Ser. 2005-1, Class 3A | | CCC(d) | | | 5.000% | | | 03/25/20 | | | 291 | | | | 258,703 | |
| | | | | | | | | | | | | | |
|
|
|
TOTAL COLLATERALIZED MORTGAGE OBLIGATIONS
(cost $8,451,028) | | | | 7,246,148 | |
| | | | | | | | | | | | | | |
|
|
|
SEE NOTES TO FINANCIAL STATEMENTS.
A67
| | | | | | |
| | | FLEXIBLE MANAGED PORTFOLIO (continued) | | |
| |
| SCHEDULE OF INVESTMENTS | | December 31, 2011 |
| | | | | | | | | | | | | | | | |
COMMERCIAL MORTGAGE-BACKED
SECURITIES — 4.3% | | Moody’s
Ratings†
(Unaudited)
| | Interest
Rate
| | | Maturity
Date
| | Principal
Amount
(000)#
| | | Value
(Note 2)
| |
| | | | | | | | | | | | | | | | | |
Banc of America Commercial Mortgage, Inc., Ser. 2004-2, Class A4 | | Aaa | | | 4.153% | | | 11/10/38 | | $ | 2,800 | | | $ | 2,891,902 | |
Banc of America Commercial Mortgage, Inc., Ser. 2006-4, Class A3A | | Aaa | | | 5.600% | | | 07/10/46 | | | 3,700 | | | | 3,762,127 | |
Banc of America Commercial Mortgage, Inc., Ser. 2007-3, Class A2(c) | | Aaa | | | 5.622% | | | 06/10/49 | | | 3,891 | | | | 3,929,691 | |
Banc of America Commercial Mortgage, Inc., Ser. 2007-5, Class A3 | | AAA(d) | | | 5.620% | | | 02/10/51 | | | 1,920 | | | | 2,021,096 | |
Banc of America Merrill Lynch Commercial Mortgage, Inc., Ser. 2006-6,
Class A3 | | Aaa | | | 5.369% | | | 10/10/45 | | | 3,900 | | | | 4,113,704 | |
Banc of America Merrill Lynch Commercial Mortgage, Inc., Ser. 2007-2,
Class A3(c) | | AAA(d) | | | 5.606% | | | 04/10/49 | | | 1,500 | | | | 1,635,413 | |
Bear Stearns Commercial Mortgage Securities, Inc., Ser. 2005-PW10,
Class A4(c) | | AAA(d) | | | 5.405% | | | 12/11/40 | | | 2,000 | | | | 2,201,552 | |
Citigroup/Deutsche Bank Commercial Mortgage Trust, Ser. 2006-CD2,
Class A4(c) | | Aaa | | | 5.344% | | | 01/15/46 | | | 1,200 | | | | 1,297,442 | |
Commercial Mortgage Acceptance Corp., Ser. 1998-C2,
Class F, 144A(c) | | AA-(d) | | | 5.440% | | | 09/15/30 | | | 714 | | | | 742,481 | |
Commercial Mortgage Pass-Thru Certificates, Ser. 2006-C7,
Class A4(c) | | AAA(d) | | | 5.751% | | | 06/10/46 | | | 5,450 | | | | 6,018,151 | |
Commercial Mortgage Pass-Thru Certificates, Ser. 2006-C8,
Class A2B | | Aaa | | | 5.248% | | | 12/10/46 | | | 578 | | | | 579,547 | |
Credit Suisse First Boston Mortgage Securities Corp., Ser. 2004-C3, Class A4 | | Aaa | | | 4.835% | | | 07/15/36 | | | 631 | | | | 642,498 | |
Credit Suisse First Boston Mortgage Securities Corp., Ser. 2004-C4, Class A4 | | Aaa | | | 4.283% | | | 10/15/39 | | | 100 | | | | 100,486 | |
Credit Suisse First Boston Mortgage Securities Corp., Ser. 2005-C2, Class A4 | | Aa2 | | | 4.832% | | | 04/15/37 | | | 1,900 | | | | 2,000,189 | |
Credit Suisse Mortgage Capital Certificates, Ser. 2006-C1,
Class A4(c) | | AAA(d) | | | 5.419% | | | 02/15/39 | | | 2,700 | | | | 2,988,060 | |
CW Capital Cobalt Ltd., Ser. 2007-C2, Class A2 | | Aaa | | | 5.334% | | | 04/15/47 | | | 513 | | | | 523,022 | |
CW Capital Cobalt Ltd., Ser. 2007-C3, Class A3(c) | | AAA(d) | | | 5.816% | | | 05/15/46 | | | 2,200 | | | | 2,327,283 | |
GE Capital Commercial Mortgage Corp., Ser. 2005-C4, Class A4(c) | | Aaa | | | 5.309% | | | 11/10/45 | | | 2,585 | | | | 2,854,902 | |
GE Capital Commercial Mortgage Corp., Ser. 2006-C1, Class A4(c) | | AAA(d) | | | 5.330% | | | 03/10/44 | | | 2,060 | | | | 2,261,705 | |
GMAC Commercial Mortgage Securities, Inc., Ser. 2005-C1, Class A5 | | AAA(d) | | | 4.697% | | | 05/10/43 | | | 2,720 | | | | 2,943,021 | |
Greenwich Capital Commercial Funding Corp., Ser. 2005-GG3,
Class A3 | | Aaa | | | 4.569% | | | 08/10/42 | | | 992 | | | | 1,002,959 | |
Greenwich Capital Commercial Funding Corp., Ser. 2005-GG5,
Class A5(c) | | Aaa | | | 5.224% | | | 04/10/37 | | | 8,050 | | | | 8,618,998 | |
Greenwich Capital Commercial Funding Corp., Ser. 2007-GG9,
Class A2 | | Aaa | | | 5.381% | | | 03/10/39 | | | 3,107 | | | | 3,124,200 | |
GS Mortgage Securities Corp. II, Ser. 2006-GG6, Class AAB(c) | | AAA(d) | | | 5.587% | | | 04/10/38 | | | 5,817 | | | | 6,178,076 | |
GS Mortgage Securities Corp. II, Ser. 2007-GG10, Class A2(c) | | Aaa | | | 5.778% | | | 08/10/45 | | | 2,100 | | | | 2,134,316 | |
JPMorgan Chase Commercial Mortgage Securities Corp.,
Ser. 2005-LDP1, Class ASB(c) | | Aaa | | | 4.853% | | | 03/15/46 | | | 2,199 | | | | 2,286,675 | |
JPMorgan Chase Commercial Mortgage Securities Corp.,
Ser. 2005-LDP2, Class A3 | | Aaa | | | 4.697% | | | 07/15/42 | | | 543 | | | | 547,002 | |
JPMorgan Chase Commercial Mortgage Securities Corp.,
Ser. 2005-LDP2, Class AM | | Aa2 | | | 4.780% | | | 07/15/42 | | | 1,000 | | | | 1,035,081 | |
JPMorgan Chase Commercial Mortgage Securities Corp.,
Ser. 2005-LDP2, Class ASB | | Aaa | | | 4.659% | | | 07/15/42 | | | 3,785 | | | | 3,937,825 | |
JPMorgan Chase Commercial Mortgage Securities Corp.,
Ser. 2005-LDP4, Class AM(c) | | Aa2 | | | 4.999% | | | 10/15/42 | | | 1,270 | | | | 1,336,069 | |
JPMorgan Chase Commercial Mortgage Securities Corp.,
Ser. 2006-CB16, Class ASB | | Aaa | | | 5.523% | | | 05/12/45 | | | 3,629 | | | | 3,880,701 | |
JPMorgan Chase Commercial Mortgage Securities Corp., I/O,
Ser. 2006-LDP6, Class X2(c) | | Aaa | | | 0.051% | | | 04/15/43 | | | 92,527 | | | | 112,605 | |
JPMorgan Chase Commercial Mortgage Securities Corp.,
Ser. 2006-LDP7, Class A3A(c) | | Aaa | | | 5.875% | | | 04/15/45 | | | 563 | | | | 579,019 | |
JPMorgan Chase Commercial Mortgage Securities Corp.,
Ser. 2007-LD12, Class A2 | | Aaa | | | 5.827% | | | 02/15/51 | | | 2,034 | | | | 2,073,402 | |
LB-UBS Commercial Mortgage Trust, Ser. 2004-C6, Class A5(c) | | AAA(d) | | | 4.826% | | | 08/15/29 | | | 3,608 | | | | 3,669,084 | |
SEE NOTES TO FINANCIAL STATEMENTS.
A68
| | | | | | |
| | | FLEXIBLE MANAGED PORTFOLIO (continued) | | |
| |
| SCHEDULE OF INVESTMENTS | | December 31, 2011 |
| | | | | | | | | | | | | | | | |
COMMERCIAL MORTGAGE-BACKED SECURITIES
(continued) | | Moody’s
Ratings†
(Unaudited)
| | Interest
Rate
| | | Maturity
Date
| | Principal
Amount
(000)#
| | | Value
(Note 2)
| |
| | | | | | | | | | | | | | | | | |
LB-UBS Commercial Mortgage Trust, Ser. 2005-C7, Class AM(c) | | AA(d) | | | 5.263% | | | 11/15/40 | | $ | 1,510 | | | $ | 1,594,857 | |
LB-UBS Commercial Mortgage Trust, Ser. 2006-C1, Class A2 | | AAA(d) | | | 5.084% | | | 02/15/31 | | | 3,093 | | | | 3,125,169 | |
LB-UBS Commercial Mortgage Trust, Ser. 2006-C3, Class A2 | | Aaa | | | 5.532% | | | 03/15/32 | | | 55 | | | | 54,773 | |
LB-UBS Commercial Mortgage Trust, Ser. 2006-C3, Class A4(c) | | Aaa | | | 5.661% | | | 03/15/39 | | | 2,676 | | | | 2,941,531 | |
Merrill Lynch Mortgage Trust, Ser. 2004-KEY2, Class A3 | | Aaa | | | 4.615% | | | 08/12/39 | | | 2,000 | | | | 2,107,512 | |
Merrill Lynch Mortgage Trust, Ser. 2008-C1, Class A2 | | Aaa | | | 5.425% | | | 02/12/51 | | | 147 | | | | 149,065 | |
Merrill Lynch/Countrywide Commercial Mortgage Trust, Ser. 2006-2, Class A4(c) | | Aaa | | | 5.906% | | | 06/12/46 | | | 1,795 | | | | 2,003,523 | |
Merrill Lynch/Countrywide Commercial Mortgage Trust, Ser. 2007-6, Class A2 | | Aaa | | | 5.331% | | | 03/12/51 | | | 4,955 | | | | 4,969,322 | |
Morgan Stanley Capital I, Ser. 2006-HQ8, Class A4(c) | | Aaa | | | 5.417% | | | 03/12/44 | | | 1,500 | | | | 1,642,807 | |
Morgan Stanley Capital I, Ser. 2006-IQ11, Class A4(c) | | AAA(d) | | | 5.728% | | | 10/15/42 | | | 2,600 | | | | 2,870,876 | |
Morgan Stanley Capital I, Ser. 2006-IQ12, Class A4 | | AAA(d) | | | 5.332% | | | 12/15/43 | | | 4,720 | | | | 5,275,785 | |
Morgan Stanley Capital I, Ser. 2007-HQ11, Class A31 | | Aaa | | | 5.439% | | | 02/12/44 | | | 1,230 | | | | 1,281,535 | |
Morgan Stanley Capital I, Ser. 2007-HQ11, Class AAB | | Aaa | | | 5.444% | | | 02/12/44 | | | 4,600 | | | | 4,819,622 | |
Morgan Stanley Capital I, Ser. 2007-T27, Class AAB(c) | | AAA(d) | | | 5.638% | | | 06/11/42 | | | 1,105 | | | | 1,168,606 | |
Wachovia Bank Commercial Mortgage Trust, Ser. 2006-C23,
Class A4(c) | | Aaa | | | 5.418% | | | 01/15/45 | | | 5,000 | | | | 5,447,035 | |
Wachovia Bank Commercial Mortgage Trust, Ser. 2006-C25, Class A4(c) | | Aaa | | | 5.737% | | | 05/15/43 | | | 1,000 | | | | 1,106,749 | |
Wachovia Bank Commercial Mortgage Trust, Ser. 2007-C31, Class A4 | | Aa2 | | | 5.509% | | | 04/15/47 | | | 2,300 | | | | 2,425,056 | |
| | | | | | | | | | | | | | |
|
|
|
TOTAL COMMERCIAL MORTGAGE-BACKED SECURITIES
(cost $121,317,986) | | | | 129,334,107 | |
| | | | | | | | | | | | | | |
|
|
|
| CORPORATE BONDS — 8.9% | | | | | | | | | | | | | | | | |
Aerospace & Defense | | | | | | | | | | | | | | | | |
L-3 Communications Corp., Gtd. Notes | | Baa3 | | | 4.750% | | | 07/15/20 | | | 515 | | | | 508,846 | |
| | | | | | | | | | | | | | |
|
|
|
Airlines — 0.2% | | | | | | | | | | | | | | | | |
Continental Airlines 1998-1 Class A Pass Through Trust,
Pass-thru Certs., Ser. 981A | | Baa2 | | | 6.648% | | | 09/15/17 | | | 236 | | | | 240,531 | |
Continental Airlines 2009-2 Class A Pass Through Trust,
Pass-thru Certs., Ser. A | | Baa2 | | | 7.250% | | | 11/10/19 | | | 732 | | | | 779,812 | |
Continental Airlines, Inc., Pass Through Trust, Pass-thru Certs., Ser. 2010-A, Class A(a) | | Baa2 | | | 4.750% | | | 01/12/21 | | | 855 | | | | 867,825 | |
Delta Air Lines 2007-1 Class A Pass Through Trust, Pass-thru Certs., Ser. 071A | | Baa1 | | | 6.821% | | | 08/10/22 | | | 393 | | | | 410,484 | |
Delta Air Lines 2011-1 Class A Pass-Through Trust, Pass-thru Certs., Ser. A(a) | | Baa2 | | | 5.300% | | | 04/15/19 | | | 1,485 | | | | 1,499,850 | |
Delta Air Lines, Inc., Pass Through Trust, Pass-thru Certs., Ser. 2010-2, Class A(a) | | Baa2 | | | 4.950% | | | 05/23/19 | | | 729 | | | | 738,327 | |
Southwest Airlines Co., Sr. Unsec’d. Notes | | Baa3 | | | 6.500% | | | 03/01/12 | | | 1,005 | | | | 1,013,063 | |
| | | | | | | | | | | | | | |
|
|
|
| | | | | | | | | | | | | | | | 5,549,892 | |
| | | | | | | | | | | | | | |
|
|
|
Automotive | | | | | | | | | | | | | | | | |
Harley-Davidson Funding Corp., Gtd. Notes, 144A, MTN | | Baa1 | | | 5.750% | | | 12/15/14 | | | 500 | | | | 539,790 | |
Johnson Controls, Inc., Sr. Unsec’d. Notes | | Baa1 | | | 5.500% | | | 01/15/16 | | | 245 | | | | 274,130 | |
| | | | | | | | | | | | | | |
|
|
|
| | | | | | | | | | | | | | | | 813,920 | |
| | | | | | | | | | | | | | |
|
|
|
Banking — 2.8% | | | | | | | | | | | | | | | | |
American Express Co., Sr. Unsec’d. Notes | | A3 | | | 8.125% | | | 05/20/19 | | | 1,925 | | | | 2,488,777 | |
American Express Credit Corp., Sr. Unsec’d. Notes, MTN | | A2 | | | 2.800% | | | 09/19/16 | | | 2,030 | | | | 2,039,947 | |
Banco Bradesco SA (Brazil), Sub. Notes | | A2 | | | 8.750% | | | 10/24/13 | | | 1,760 | | | | 1,927,200 | |
Bank of America Corp., Jr. Sub. Notes, Ser. K(a)(c) | | Ba3 | | | 8.000% | | | 12/29/49 | | | 2,200 | | | | 1,969,968 | |
Bank of America Corp., Sr. Unsec’d. Notes | | Baa1 | | | 4.500% | | | 04/01/15 | | | 595 | | | | 574,167 | |
Bank of America Corp., Sr. Unsec’d. Notes, MTN | | Baa1 | | | 5.000% | | | 05/13/21 | | | 630 | | | | 573,826 | |
Bank of America Corp., Sr. Unsec’d. Notes | | Baa1 | | | 6.000% | | | 09/01/17 | | | 1,060 | | | | 1,035,226 | |
Bank of America Corp., Sr. Unsec’d. Notes, Ser. 1 | | Baa1 | | | 3.750% | | | 07/12/16 | | | 870 | | | | 805,550 | |
Bank of America Corp., Sub. Notes | | Baa2 | | | 5.750% | | | 08/15/16 | | | 1,775 | | | | 1,648,499 | |
SEE NOTES TO FINANCIAL STATEMENTS.
A69
| | | | | | |
| | | FLEXIBLE MANAGED PORTFOLIO (continued) | | |
| |
| SCHEDULE OF INVESTMENTS | | December 31, 2011 |
| | | | | | | | | | | | | | | | |
CORPORATE BONDS
(continued) | | Moody’s
Ratings†
(Unaudited)
| | Interest
Rate
| | | Maturity
Date
| | Principal
Amount
(000)#
| | | Value
(Note 2)
| |
| | | | | | | | | | | | | | | | | |
Banking (continued) | | | | | | | | | | | | | | | | |
Bank of America NA, Sub. Notes | | A3 | | | 5.300% | | | 03/15/17 | | $ | 930 | | | $ | 838,777 | |
Bank of America NA, Sub. Notes | | A3 | | | 6.000% | | | 10/15/36 | | | 410 | | | | 341,011 | |
Bank of Montreal (Canada), Covered Notes, 144A | | Aaa | | | 1.300% | | | 10/31/14 | | | 3,500 | | | | 3,493,994 | |
Bank of Nova Scotia (Canada), Covered Notes, 144A | | Aaa | | | 1.250% | | | 11/07/14 | | | 3,285 | | | | 3,271,121 | |
Bear Stearns Cos. LLC (The), Sr. Unsec’d. Notes | | Aa3 | | | 5.300% | | | 10/30/15 | | | 515 | | | | 553,825 | |
Bear Stearns Cos. LLC (The), Sr. Unsec’d. Notes | | Aa3 | | | 6.400% | | | 10/02/17 | | | 330 | | | | 368,686 | |
Bear Stearns Cos. LLC (The), Sr. Unsec’d. Notes | | Aa3 | | | 7.250% | | | 02/01/18 | | | 1,175 | | | | 1,377,512 | |
Capital One Bank USA NA, Sub. Notes | | Baa1 | | | 6.500% | | | 06/13/13 | | | 20 | | | | 21,096 | |
Capital One Bank USA NA, Sub. Notes | | Baa1 | | | 8.800% | | | 07/15/19 | | | 1,300 | | | | 1,487,187 | |
Capital One Capital V, Ltd. Gtd. Notes | | Baa3 | | | 10.250% | | | 08/15/39 | | | 620 | | | | 643,250 | |
Capital One Capital VI, Ltd. Gtd. Notes(a) | | Baa3 | | | 8.875% | | | 05/15/40 | | | 1,080 | | | | 1,120,922 | |
Citigroup, Inc., Sr. Unsec’d. Notes(a) | | A3 | | | 3.953% | | | 06/15/16 | | | 1,010 | | | | 1,006,519 | |
Citigroup, Inc., Sr. Unsec’d. Notes | | A3 | | | 4.500% | | | 01/14/22 | | | 1,660 | | | | 1,596,958 | |
Citigroup, Inc., Sr. Unsec’d. Notes | | A3 | | | 4.750% | | | 05/19/15 | | | 2,265 | | | | 2,293,899 | |
Citigroup, Inc., Sr. Unsec’d. Notes(a) | | A3 | | | 5.375% | | | 08/09/20 | | | 920 | | | | 946,009 | |
Citigroup, Inc., Sr. Unsec’d. Notes | | A3 | | | 6.875% | | | 03/05/38 | | | 215 | | | | 236,202 | |
Citigroup, Inc., Sr. Unsec’d. Notes | | A3 | | | 8.125% | | | 07/15/39 | | | 710 | | | | 869,276 | |
Citigroup, Inc., Sub. Notes | | Baa1 | | | 5.000% | | | 09/15/14 | | | 454 | | | | 449,327 | |
Citigroup, Inc., Sub. Notes(a) | | Baa1 | | | 5.625% | | | 08/27/12 | | | 2,800 | | | | 2,842,288 | |
Citigroup, Inc., Sub. Notes | | Baa1 | | | 6.125% | | | 08/25/36 | | | 570 | | | | 493,056 | |
Citigroup, Inc., Unsec’d. Notes(a) | | A3 | | | 8.500% | | | 05/22/19 | | | 1,895 | | | | 2,230,578 | |
Countrywide Financial Corp., Gtd. Notes, MTN(a)(e) | | Baa1 | | | 5.800% | | | 06/07/12 | | | 1,190 | | | | 1,192,504 | |
Depfa ACS Bank (Ireland), Covered Notes, 144A | | Aa3 | | | 5.125% | | | 03/16/37 | | | 1,380 | | | | 986,519 | |
Discover Bank, Sub. Notes | | Ba1 | | | 7.000% | | | 04/15/20 | | | 570 | | | | 596,373 | |
Discover Bank, Sub. Notes | | Ba1 | | | 8.700% | | | 11/18/19 | | | 900 | | | | 1,026,166 | |
Goldman Sachs Group, Inc. (The), Sr. Notes | | A1 | | | 6.250% | | | 02/01/41 | | | 270 | | | | 264,878 | |
Goldman Sachs Group, Inc. (The), Sr. Unsec’d. Notes | | A1 | | | 3.625% | | | 02/07/16 | | | 2,000 | | | | 1,932,446 | |
Goldman Sachs Group, Inc. (The), Sr. Unsec’d. Notes | | A1 | | | 5.250% | | | 07/27/21 | | | 2,055 | | | | 2,004,735 | |
Goldman Sachs Group, Inc. (The), Sr. Unsec’d. Notes | | A1 | | | 5.450% | | | 11/01/12 | | | 600 | | | | 610,187 | |
Goldman Sachs Group, Inc. (The), Sr. Unsec’d. Notes | | A1 | | | 6.000% | | | 06/15/20 | | | 1,000 | | | | 1,024,362 | |
Goldman Sachs Group, Inc. (The), Sub. Notes | | A2 | | | 5.625% | | | 01/15/17 | | | 1,190 | | | | 1,166,904 | |
Goldman Sachs Group, Inc. (The), Sub. Notes | | A2 | | | 6.450% | | | 05/01/36 | | | 1,615 | | | | 1,457,248 | |
Goldman Sachs Group, Inc. (The), Sub. Notes | | A2 | | | 6.750% | | | 10/01/37 | | | 104 | | | | 96,773 | |
HSBC Holdings PLC (United Kingdom), Sr. Unsec’d. Notes(a) | | Aa2 | | | 4.875% | | | 01/14/22 | | | 1,910 | | | | 2,018,666 | |
HSBC Holdings PLC (United Kingdom), Sr. Unsec’d. Notes(a) | | Aa2 | | | 5.100% | | | 04/05/21 | | | 1,025 | | | | 1,089,158 | |
Huntington BancShares, Inc., Sub. Notes | | Baa2 | | | 7.000% | | | 12/15/20 | | | 170 | | | | 192,666 | |
JPMorgan Chase & Co., Jr. Sub. Notes, Ser. 1(a)(c) | | Baa1 | | | 7.900% | | | 04/29/49 | | | 2,000 | | | | 2,129,380 | |
JPMorgan Chase & Co., Sr. Unsec’d. Notes | | Aa3 | | | 3.150% | | | 07/05/16 | | | 3,210 | | | | 3,225,023 | |
JPMorgan Chase & Co., Sr. Unsec’d. Notes(a) | | Aa3 | | | 4.250% | | | 10/15/20 | | | 2,930 | | | | 2,950,577 | |
JPMorgan Chase Capital XXVII, Ltd. Gtd. Notes, Ser. AA | | A2 | | | 7.000% | | | 11/01/39 | | | 1,500 | | | | 1,509,375 | |
Lloyds TSB Bank PLC (United Kingdom), Gtd. Notes., 144A, MTN | | A1 | | | 5.800% | | | 01/13/20 | | | 1,870 | | | | 1,775,337 | |
Lloyds TSB Bank PLC (United Kingdom), Gtd. Notes.(a) | | A1 | | | 6.375% | | | 01/21/21 | | | 1,400 | | | | 1,402,989 | |
Merrill Lynch & Co., Inc., Sr. Unsec’d. Notes, MTN(a) | | Baa1 | | | 6.400% | | | 08/28/17 | | | 35 | | | | 33,891 | |
Morgan Stanley, Sr. Unsec’d. Notes(a) | | A2 | | | 5.300% | | | 03/01/13 | | | 265 | | | | 268,244 | |
Morgan Stanley, Sr. Unsec’d. Notes | | A2 | | | 5.500% | | | 07/28/21 | | | 760 | | | | 702,723 | |
Morgan Stanley, Sr. Unsec’d. Notes | | A2 | | | 5.750% | | | 01/25/21 | | | 1,400 | | | | 1,305,928 | |
Morgan Stanley, Sr. Unsec’d. Notes, MTN | | A2 | | | 5.625% | | | 09/23/19 | | | 1,415 | | | | 1,310,402 | |
Morgan Stanley, Sr. Unsec’d. Notes, MTN | | A2 | | | 5.950% | | | 12/28/17 | | | 510 | | | | 485,895 | |
Morgan Stanley, Sr. Unsec’d. Notes, MTN | | A2 | | | 6.625% | | | 04/01/18 | | | 105 | | | | 103,682 | |
Morgan Stanley, Sr. Unsec’d. Notes, Ser. G, MTN | | A2 | | | 5.450% | | | 01/09/17 | | | 2,345 | | | | 2,257,682 | |
MUFG Capital Finance 1 Ltd. (Cayman Islands), Gtd. Notes.(c) | | Ba1 | | | 6.346% | | | 07/25/49 | | | 800 | | | | 812,513 | |
National Bank of Canada (Canada), Covered Notes, 144A | | Aaa | | | 2.200% | | | 10/19/16 | | | 1,240 | | | | 1,250,266 | |
PNC Funding Corp., Gtd. Notes. | | A3 | | | 2.700% | | | 09/19/16 | | | 1,110 | | | | 1,129,952 | |
PNC Funding Corp., Gtd. Notes. | | A3 | | | 6.700% | | | 06/10/19 | | | 440 | | | | 536,818 | |
Royal Bank of Scotland Group PLC (United Kingdom), Sr. Unsec’d. Notes, MTN | | A3 | | | 6.400% | | | 10/21/19 | | | 1,775 | | | | 1,661,734 | |
Toronto-Dominion Bank (The) (Canada), Covered Notes, 144A(a) | | Aaa | | | 1.625% | | | 09/14/16 | | | 3,000 | | | | 2,960,511 | |
SEE NOTES TO FINANCIAL STATEMENTS.
A70
| | | | | | |
| | | FLEXIBLE MANAGED PORTFOLIO (continued) | | |
| |
| SCHEDULE OF INVESTMENTS | | December 31, 2011 |
| | | | | | | | | | | | | | | | |
CORPORATE BONDS
(continued) | | Moody’s
Ratings†
(Unaudited)
| | Interest
Rate
| | | Maturity
Date
| | Principal
Amount
(000)#
| | | Value
(Note 2)
| |
| | | | | | | | | | | | | | | | | |
Banking (continued) | | | | | | | | | | | | | | | | |
USB Capital XIII Trust, Ltd. Gtd. Notes | | A2 | | | 6.625% | | | 12/15/39 | | $ | 775 | | | $ | 787,369 | |
Wells Fargo Bank NA, Sub. Notes, Ser. AI | | A1 | | | 4.750% | | | 02/09/15 | | | 585 | | | | 610,324 | |
| | | | | | | | | | | | | | |
|
|
|
| | | | | | | | | | | | | | | | 84,414,853 | |
| | | | | | | | | | | | | | |
|
|
|
Brokerage | | | | | | | | | | | | | | | | |
Lehman Brothers Holdings, Inc., Sr. Unsec’d. Notes, MTN(f) | | NR | | | 5.250% | | | 02/06/12 | | | 1,715 | | | | 439,469 | |
Lehman Brothers Holdings, Inc., Sr. Unsec’d. Notes, MTN(f) | | NR | | | 6.875% | | | 05/02/18 | | | 700 | | | | 185,500 | |
| | | | | | | | | | | | | | |
|
|
|
| | | | | | | | | | | | | | | | 624,969 | |
| | | | | | | | | | | | | | |
|
|
|
Cable — 0.2% | | | | | | | | | | | | | | | | |
AT&T Broadband LLC, Gtd. Notes | | Baa1 | | | 9.455% | | | 11/15/22 | | | 255 | | | | 363,349 | |
Charter Communications Operating LLC/Charter Communications Operating Capital, Sec’d. Notes, 144A | | Ba2 | | | 8.000% | | | 04/30/12 | | | 2,130 | | | | 2,172,600 | |
Comcast Corp., Gtd. Notes | | Baa1 | | | 6.400% | | | 05/15/38 | | | 570 | | | | 684,817 | |
Comcast Corp., Gtd. Notes | | Baa1 | | | 6.450% | | | 03/15/37 | | | 155 | | | | 187,898 | |
Comcast Corp., Gtd. Notes | | Baa1 | | | 6.500% | | | 11/15/35 | | | 450 | | | | 542,423 | |
Comcast Corp., Gtd. Notes | | Baa1 | | | 6.950% | | | 08/15/37 | | | 605 | | | | 769,746 | |
DIRECTV Holdings LLC/DIRECTV Financing Co., Inc., Gtd. Notes | | Baa2 | | | 3.500% | | | 03/01/16 | | | 920 | | | | 948,450 | |
DIRECTV Holdings LLC/DIRECTV Financing Co., Inc., Gtd. Notes | | Baa2 | | | 3.550% | | | 03/15/15 | | | 165 | | | | 171,744 | |
Time Warner Cable, Inc., Gtd. Notes | | Baa2 | | | 7.500% | | | 04/01/14 | | | 345 | | | | 386,281 | |
| | | | | | | | | | | | | | |
|
|
|
| | | | | | | | | | | | | | | | 6,227,308 | |
| | | | | | | | | | | | | | |
|
|
|
Capital Goods — 0.1% | | | | | | | | | | | | | | | | |
ERAC USA Finance LLC, Gtd. Notes, 144A
(original cost $459,646; purchased 10/10/07)(e)(g) | | Baa1 | | | 5.800% | | | 10/15/12 | | | 460 | | | | 475,896 | |
ERAC USA Finance LLC, Gtd. Notes, 144A
(original cost $1,299,722; purchased 10/10/07)(e)(g) | | Baa1 | | | 6.375% | | | 10/15/17 | | | 1,302 | | | | 1,504,530 | |
ERAC USA Finance LLC, Gtd. Notes, 144A
(original cost $376,709; purchased 10/10/07)(e)(g) | | Baa1 | | | 7.000% | | | 10/15/37 | | | 380 | | | | 457,168 | |
General Electric Co., Sr. Unsec’d. Notes | | Aa2 | | | 5.250% | | | 12/06/17 | | | 200 | | | | 229,552 | |
Illinois Tool Works, Inc., Sr. Unsec’d. Notes, 144A | | A1 | | | 4.875% | | | 09/15/41 | | | 215 | | | | 244,635 | |
Xylem, Inc., Gtd. Notes, 144A | | Baa2 | | | 4.875% | | | 10/01/21 | | | 1,260 | | | | 1,335,293 | |
| | | | | | | | | | | | | | |
|
|
|
| | | | | | | | | | | | | | | | 4,247,074 | |
| | | | | | | | | | | | | | |
|
|
|
Chemicals — 0.1% | | | | | | | | | | | | | | | | |
Dow Chemical Co. (The), Sr. Unsec’d. Notes | | Baa3 | | | 7.600% | | | 05/15/14 | | | 1,800 | | | | 2,035,473 | |
Dow Chemical Co. (The), Sr. Unsec’d. Notes | | Baa3 | | | 9.400% | | | 05/15/39 | | | 432 | | | | 649,340 | |
Ecolab, Inc., Sr. Unsec’d. Notes(a) | | Baa1 | | | 5.500% | | | 12/08/41 | | | 345 | | | | 382,309 | |
ICI Wilmington, Inc., Gtd. Notes | | Baa1 | | | 5.625% | | | 12/01/13 | | | 720 | | | | 762,335 | |
PPG Industries, Inc., Sr. Unsec’d. Notes | | Baa1 | | | 5.500% | | | 11/15/40 | | | 150 | | | | 173,722 | |
Union Carbide Corp., Sr. Unsec’d. Notes | | Baa3 | | | 7.500% | | | 06/01/25 | | | 460 | | | | 542,907 | |
| | | | | | | | | | | | | | |
|
|
|
| | | | | | | | | | | | | | | | 4,546,086 | |
| | | | | | | | | | | | | | |
|
|
|
Consumer — 0.1% | | | | | | | | | | | | | | | | |
Newell Rubbermaid, Inc., Sr. Unsec’d. Notes | | Baa3 | | | 6.250% | | | 04/15/18 | | | 1,700 | | | | 1,932,382 | |
Sealy Mattress Co., Sr. Sec’d. Notes, 144A | | Ba3 | | | 10.875% | | | 04/15/16 | | | 1,350 | | | | 1,474,875 | |
VF Corp., Sr. Unsec’d. Notes | | A3 | | | 3.500% | | | 09/01/21 | | | 620 | | | | 644,056 | |
| | | | | | | | | | | | | | |
|
|
|
| | | | | | | | | | | | | | | | 4,051,313 | |
| | | | | | | | | | | | | | |
|
|
|
Electric — 0.6% | | | | | | | | | | | | | | | | |
Arizona Public Service Co., Sr. Unsec’d. Notes | | Baa2 | | | 6.250% | | | 08/01/16 | | | 175 | | | | 205,366 | |
Baltimore Gas & Electric Co., Sr. Unsec’d. Notes | | Baa2 | | | 6.350% | | | 10/01/36 | | | 550 | | | | 694,709 | |
Carolina Power & Light Co., First Mtge. Bonds | | A1 | | | 5.250% | | | 12/15/15 | | | 525 | | | | 601,524 | |
CenterPoint Energy Houston Electric LLC, Genl. Ref. Mtge., Ser. J2 | | A3 | | | 5.700% | | | 03/15/13 | | | 740 | | | | 776,714 | |
CenterPoint Energy Houston Electric LLC, Genl. Ref. Mtge., Ser. K2 | | A3 | | | 6.950% | | | 03/15/33 | | | 590 | | | | 804,577 | |
Consolidated Edison Co. of New York, Inc., Sr. Unsec’d. Notes,
Ser. 09-C | | A3 | | | 5.500% | | | 12/01/39 | | | 220 | | | | 268,230 | |
Consumers Energy Co., First Mtge. Bonds, Ser. D | | A3 | | | 5.375% | | | 04/15/13 | | | 325 | | | | 341,967 | |
Duke Energy Carolinas LLC, First Mtge. Bonds(a) | | A1 | | | 6.050% | | | 04/15/38 | | | 550 | | | | 720,022 | |
El Paso Electric Co., Sr. Unsec’d. Notes | | Baa2 | | | 6.000% | | | 05/15/35 | | | 670 | | | | 791,193 | |
SEE NOTES TO FINANCIAL STATEMENTS.
A71
| | | | | | |
| | | FLEXIBLE MANAGED PORTFOLIO (continued) | | |
| |
| SCHEDULE OF INVESTMENTS | | December 31, 2011 |
| | | | | | | | | | | | | | | | |
CORPORATE BONDS
(continued) | | Moody’s
Ratings†
(Unaudited)
| | Interest
Rate
| | | Maturity
Date
| | Principal
Amount
(000)#
| | | Value
(Note 2)
| |
| | | | | | | | | | | | | | | | | |
Electric (continued) | | | | | | | | | | | | | | | | |
Empresa Nacional de Electricidad SA (Chile), Sr. Unsec’d. Notes | | Baa2 | | | 8.625% | | | 08/01/15 | | $ | 1,295 | | | $ | 1,543,154 | |
ENEL Finance International SA (Luxembourg), Gtd. Notes, 144A | | A3 | | | 6.000% | | | 10/07/39 | | | 1,280 | | | | 1,030,203 | |
Exelon Corp., Sr. Unsec’d. Notes | | Baa1 | | | 4.900% | | | 06/15/15 | | | 155 | | | | 167,009 | |
Exelon Generation Co. LLC, Sr. Unsec’d. Notes | | A3 | | | 6.250% | | | 10/01/39 | | | 1,425 | | | | 1,736,351 | |
Florida Power & Light Co., First Mtge. Bonds | | Aa3 | | | 5.950% | | | 10/01/33 | | | 295 | | | | 377,296 | |
Georgia Power Co., Sr. Unsec’d. Notes, Ser. B | | A3 | | | 5.700% | | | 06/01/17 | | | 495 | | | | 587,371 | |
Iberdrola International BV (Netherlands), Gtd. Notes | | A3 | | | 6.750% | | | 09/15/33 | | | 145 | | | | 154,174 | |
Indiana Michigan Power Co., Sr. Unsec’d. Notes, Ser. INDF | | Baa2 | | | 5.050% | | | 11/15/14 | | | 460 | | | | 501,377 | |
Midamerican Energy Holdings Co., Sr. Unsec’d. Notes | | Baa1 | | | 5.950% | | | 05/15/37 | | | 300 | | | | 354,512 | |
National Rural Utilities Cooperative Finance Corp., Sr. Unsec’d. Notes, Ser. C, MTN | | A2 | | | 7.250% | | | 03/01/12 | | | 62 | | | | 62,652 | |
Nevada Power Co., Genl. Ref. Mtge., Ser. O | | Baa2 | | | 6.500% | | | 05/15/18 | | | 1,260 | | | | 1,511,843 | |
Niagara Mohawk Power Corp., Sr. Unsec’d. Notes, 144A | | A3 | | | 4.881% | | | 08/15/19 | | | 610 | | | | 682,150 | |
NSTAR, Sr. Unsec’d. Notes | | A2 | | | 4.500% | | | 11/15/19 | | | 615 | | | | 680,402 | |
Oncor Electric Delivery Co. LLC, Sr. Sec’d. Notes(a) | | Baa1 | | | 6.375% | | | 01/15/15 | | | 345 | | | | 394,225 | |
Oncor Electric Delivery Co. LLC, Sr. Sec’d. Notes | | Baa1 | | | 7.000% | | | 09/01/22 | | | 110 | | | | 140,908 | |
Public Service Co. of New Mexico, Sr. Unsec’d. Notes | | Baa3 | | | 7.950% | | | 05/15/18 | | | 140 | | | | 163,650 | |
Public Service Electric & Gas Co., Sr. Sec’d. Notes, MTN | | A2 | | | 5.800% | | | 05/01/37 | | | 535 | | | | 686,003 | |
Xcel Energy, Inc., Sr. Unsec’d. Notes(a) | | Baa1 | | | 4.800% | | | 09/15/41 | | | 480 | | | | 523,071 | |
Xcel Energy, Inc., Sr. Unsec’d. Notes | | Baa1 | | | 5.613% | | | 04/01/17 | | | 199 | | | | 225,711 | |
| | | | | | | | | | | | | | |
|
|
|
| | | | | | | | | | | | | | | | 16,726,364 | |
| | | | | | | | | | | | | | |
|
|
|
Energy – Integrated — 0.1% | | | | | | | | | | | | | | | | |
BP Capital Markets PLC (United Kingdom), Gtd. Notes | | A2 | | | 4.500% | | | 10/01/20 | | | 535 | | | | 589,233 | |
BP Capital Markets PLC (United Kingdom), Gtd. Notes | | A2 | | | 5.250% | | | 11/07/13 | | | 1,040 | | | | 1,115,467 | |
| | | | | | | | | | | | | | |
|
|
|
| | | | | | | | | | | | | | | | 1,704,700 | |
| | | | | | | | | | | | | | |
|
|
|
Energy – Other — 0.3% | | | | | | | | | | | | | | | | |
Anadarko Petroleum Corp., Sr. Unsec’d. Notes | | Ba1 | | | 6.375% | | | 09/15/17 | | | 1,195 | | | | 1,385,165 | |
Anadarko Petroleum Corp., Sr. Unsec’d. Notes | | Ba1 | | | 6.450% | | | 09/15/36 | | | 325 | | | | 370,533 | |
Anadarko Petroleum Corp., Sr. Unsec’d. Notes | | Ba1 | | | 6.950% | | | 06/15/19 | | | 250 | | | | 298,455 | |
Cameron International Corp., Sr. Unsec’d. Notes | | Baa1 | | | 4.500% | | | 06/01/21 | | | 2,200 | | | | 2,361,676 | |
Nabors Industries, Inc., Gtd. Notes, 144A | | Baa2 | | | 4.625% | | | 09/15/21 | | | 1,070 | | | | 1,086,804 | |
Pioneer Natural Resources Co., Sr. Unsec’d. Notes | | Ba1 | | | 6.875% | | | 05/01/18 | | | 1,500 | | | | 1,696,464 | |
Transocean, Inc. (Cayman Islands), Gtd. Notes | | Baa3 | | | 7.350% | | | 12/15/41 | | | 170 | | | | 188,841 | |
Weatherford International Ltd. (Bermuda), Gtd. Notes(a) | | Baa2 | | | 5.125% | | | 09/15/20 | | | 810 | | | | 841,734 | |
Woodside Finance Ltd. (Australia), Gtd. Notes, 144A | | Baa1 | | | 5.000% | | | 11/15/13 | | | 1,315 | | | | 1,378,617 | |
| | | | | | | | | | | | | | |
|
|
|
| | | | | | | | | | | | | | | | 9,608,289 | |
| | | | | | | | | | | | | | |
|
|
|
Foods — 0.4% | | | | | | | | | | | | | | | | |
Anheuser-Busch InBev Worldwide, Inc., Gtd. Notes | | Baa1 | | | 8.000% | | | 11/15/39 | | | 1,285 | | | | 1,991,160 | |
Anheuser-Busch InBev Worldwide, Inc., Gtd. Notes | | Baa1 | | | 8.200% | | | 01/15/39 | | | 250 | | | | 394,143 | |
ARAMARK Corp., Gtd. Notes | | B3 | | | 8.500% | | | 02/01/15 | | | 850 | | | | 871,250 | |
Beam, Inc., Sr. Unsec’d. Notes | | Baa2 | | | 6.375% | | | 06/15/14 | | | 727 | | | | 794,930 | |
Bunge Ltd. Finance Corp., Gtd. Notes | | Baa2 | | | 5.350% | | | 04/15/14 | | | 1,040 | | | | 1,090,807 | |
Bunge Ltd. Finance Corp., Gtd. Notes(a) | | Baa2 | | | 8.500% | | | 06/15/19 | | | 985 | | | | 1,198,981 | |
Cargill, Inc., Sr. Unsec’d. Notes, 144A
(original cost $666,818; purchased 11/19/07)(e)(g) | | A2 | | | 6.000% | | | 11/27/17 | | | 670 | | | | 789,850 | |
Delhaize Group SA (Belgium), Gtd. Notes | | Baa3 | | | 6.500% | | | 06/15/17 | | | 480 | | | | 564,155 | |
J.M. Smucker Co. (The), Gtd. Notes | | A3 | | | 3.500% | | | 10/15/21 | | | 490 | | | | 501,294 | |
Kroger Co. (The), Gtd. Notes | | Baa2 | | | 6.750% | | | 04/15/12 | | | 45 | | | | 45,750 | |
Safeway, Inc., Sr. Unsec’d. Notes | | Baa2 | | | 4.750% | | | 12/01/21 | | | 570 | | | | 583,886 | |
Smithfield Foods, Inc., Sr. Sec’d. Notes | | Ba2 | | | 10.000% | | | 07/15/14 | | | 1,321 | | | | 1,535,662 | |
Tyson Foods, Inc., Gtd. Notes | | Ba1 | | | 6.850% | | | 04/01/16 | | | 735 | | | | 806,663 | |
| | | | | | | | | | | | | | |
|
|
|
| | | | | | | | | | | | | | | | 11,168,531 | |
| | | | | | | | | | | | | | |
|
|
|
Gaming | | | | | | | | | | | | | | | | |
MGM Resorts International, Sr. Sec’d. Notes | | Ba2 | | | 13.000% | | | 11/15/13 | | | 1,260 | | | | 1,496,250 | |
| | | | | | | | | | | | | | |
|
|
|
SEE NOTES TO FINANCIAL STATEMENTS.
A72
| | | | | | |
| | | FLEXIBLE MANAGED PORTFOLIO (continued) | | |
| |
| SCHEDULE OF INVESTMENTS | | December 31, 2011 |
| | | | | | | | | | | | | | | | |
CORPORATE BONDS
(continued) | | Moody’s
Ratings†
(Unaudited)
| | Interest
Rate
| | | Maturity
Date
| | Principal
Amount
(000)#
| | | Value
(Note 2)
| |
| | | | | | | | | | | | | | | | | |
Healthcare & Pharmaceutical — 0.2% | | | | | | | | | | | | | | | | |
Amgen, Inc., Sr. Unsec’d. Notes | | Baa1 | | | 5.150% | | | 11/15/41 | | $ | 1,910 | | | $ | 1,980,066 | |
Aristotle Holding, Inc., Gtd. Notes, 144A | | Baa3 | | | 2.750% | | | 11/21/14 | | | 2,460 | | | | 2,489,825 | |
Genentech, Inc., Sr. Unsec’d. Notes | | AA-(d) | | | 4.750% | | | 07/15/15 | | | 280 | | | | 312,324 | |
Gilead Sciences, Inc., Sr. Unsec’d. Notes | | Baa1 | | | 5.650% | | | 12/01/41 | | | 565 | | | | 625,547 | |
Laboratory Corp. of America Holdings, Sr. Unsec’d. Notes | | Baa2 | | | 5.625% | | | 12/15/15 | | | 580 | | | | 645,683 | |
Merck & Co., Inc., Sr. Unsec’d. Notes | | Aa3 | | | 5.950% | | | 12/01/28 | | | 165 | | | | 206,726 | |
Watson Pharmaceuticals, Inc., Sr. Unsec’d. Notes | | Baa3 | | | 6.125% | | | 08/15/19 | | | 445 | | | | 523,342 | |
Wyeth, Gtd. Notes | | A1 | | | 6.450% | | | 02/01/24 | | | 60 | | | | 78,395 | |
| | | | | | | | | | | | | | |
|
|
|
| | | | | | | | | | | | | | | | 6,861,908 | |
| | | | | | | | | | | | | | |
|
|
|
Healthcare Insurance — 0.3% | | | | | | | | | | | | | | | | |
Aetna, Inc., Sr. Unsec’d. Notes | | Baa1 | | | 6.500% | | | 09/15/18 | | | 1,570 | | | | 1,915,664 | |
Aetna, Inc., Sr. Unsec’d. Notes | | Baa1 | | | 6.625% | | | 06/15/36 | | | 515 | | | | 639,572 | |
CIGNA Corp., Sr. Unsec’d. Notes | | Baa2 | | | 5.875% | | | 03/15/41 | | | 650 | | | | 687,715 | |
CIGNA Corp., Sr. Unsec’d. Notes | | Baa2 | | | 6.150% | | | 11/15/36 | | | 670 | | | | 718,704 | |
Coventry Health Care, Inc., Sr. Unsec’d. Notes | | Baa3 | | | 6.125% | | | 01/15/15 | | | 1,290 | | | | 1,412,287 | |
UnitedHealth Group, Inc., Sr. Unsec’d. Notes | | A3 | | | 5.950% | | | 02/15/41 | | | 730 | | | | 897,501 | |
UnitedHealth Group, Inc., Sr. Unsec’d. Notes | | A3 | | | 6.000% | | | 06/15/17 | | | 195 | | | | 229,357 | |
UnitedHealth Group, Inc., Sr. Unsec’d. Notes | | A3 | | | 6.500% | | | 06/15/37 | | | 420 | | | | 534,171 | |
UnitedHealth Group, Inc., Sr. Unsec’d. Notes | | A3 | | | 6.625% | | | 11/15/37 | | | 420 | | | | 539,208 | |
WellPoint, Inc., Sr. Unsec’d. Notes | | Baa1 | | | 5.000% | | | 12/15/14 | | | 860 | | | | 939,626 | |
| | | | | | | | | | | | | | |
|
|
|
| | | | | | | | | | | | | | | | 8,513,805 | |
| | | | | | | | | | | | | | |
|
|
|
Insurance — 0.7% | | | | | | | | | | | | | | | | |
Allied World Assurance Co. Holdings Ltd. (Switzerland), Gtd. Notes | | Baa1 | | | 5.500% | | | 11/15/20 | | | 525 | | | | 525,947 | |
American International Group, Inc., Sr. Unsec’d. Notes | | Baa1 | | | 4.250% | | | 05/15/13 | | | 580 | | | | 579,206 | |
American International Group, Inc., Sr. Unsec’d. Notes | | Baa1 | | | 6.400% | | | 12/15/20 | | | 1,055 | | | | 1,064,738 | |
American International Group, Inc., Sr. Unsec’d. Notes | | Baa1 | | | 8.250% | | | 08/15/18 | | | 990 | | | | 1,047,916 | |
AON Corp., Sr. Unsec’d. Notes | | Baa2 | | | 3.125% | | | 05/27/16 | | | 2,655 | | | | 2,685,147 | |
Axis Specialty Finance LLC, Gtd. Notes | | Baa1 | | | 5.875% | | | 06/01/20 | | | 1,030 | | | | 1,058,944 | |
Chubb Corp. (The), Jr. Sub. Notes(c) | | A3 | | | 6.375% | | | 03/29/67 | | | 1,300 | | | | 1,283,750 | |
Liberty Mutual Group, Inc., Bonds, 144A | | Baa2 | | | 7.000% | | | 03/15/34 | | | 850 | | | | 903,198 | |
Lincoln National Corp., Jr. Sub. Notes(c) | | Ba1 | | | 6.050% | | | 04/20/67 | | | 260 | | | | 216,450 | |
Lincoln National Corp., Sr. Unsec’d. Notes | | Baa2 | | | 6.300% | | | 10/09/37 | | | 492 | | | | 506,981 | |
Lincoln National Corp., Sr. Unsec’d. Notes | | Baa2 | | | 7.000% | | | 06/15/40 | | | 705 | | | | 797,029 | |
Lincoln National Corp., Sr. Unsec’d. Notes | | Baa2 | | | 8.750% | | | 07/01/19 | | | 605 | | | | 735,897 | |
MetLife, Inc., Sr. Unsec’d. Notes | | A3 | | | 5.700% | | | 06/15/35 | | | 835 | | | | 931,981 | |
MetLife, Inc., Sr. Unsec’d. Notes | | A3 | | | 6.375% | | | 06/15/34 | | | 400 | | | | 472,837 | |
MetLife, Inc., Sr. Unsec’d. Notes(a) | | A3 | | | 6.750% | | | 06/01/16 | | | 430 | | | | 495,376 | |
New York Life Insurance Co., Sub. Notes, 144A | | Aa2 | | | 6.750% | | | 11/15/39 | | | 660 | | | | 842,784 | |
Northwestern Mutual Life Insurance, Notes, 144A(a) | | Aa2 | | | 6.063% | | | 03/30/40 | | | 370 | | | | 444,160 | |
Ohio National Financial Services, Inc., Sr. Notes, 144A | | Baa1 | | | 6.350% | | | 04/01/13 | | | 1,120 | | | | 1,170,217 | |
Ohio National Financial Services, Inc., Sr. Notes, 144A | | Baa1 | | | 6.375% | | | 04/30/20 | | | 680 | | | | 739,491 | |
Pacific Life Insurance Co., Sub. Notes, 144A | | A3 | | | 9.250% | | | 06/15/39 | | | 995 | | | | 1,325,011 | |
Progressive Corp. (The), Jr. Sub. Notes(c) | | A2 | | | 6.700% | | | 06/15/37 | | | 735 | | | | 742,350 | |
Teachers Insurance & Annuity Association of America, Sub. Notes, 144A | | Aa2 | | | 6.850% | | | 12/16/39 | | | 1,450 | | | | 1,860,933 | |
Unum Group, Sr. Unsec’d. Notes | | Baa3 | | | 5.625% | | | 09/15/20 | | | 350 | | | | 360,385 | |
W.R. Berkley Corp., Sr. Unsec’d. Notes | | Baa2 | | | 5.600% | | | 05/15/15 | | | 555 | | | | 588,797 | |
W.R. Berkley Corp., Sr. Unsec’d. Notes | | Baa2 | | | 6.150% | | | 08/15/19 | | | 460 | | | | 484,410 | |
XL Group PLC (Ireland), Sr. Unsec’d. Notes | | Baa2 | | | 5.250% | | | 09/15/14 | | | 85 | | | | 89,889 | |
| | | | | | | | | | | | | | |
|
|
|
| | | | | | | | | | | | | | | | 21,953,824 | |
| | | | | | | | | | | | | | |
|
|
|
Lodging — 0.2% | | | | | | | | | | | | | | | | |
Host Marriott LP, Gtd. Notes, Ser. O | | Ba1 | | | 6.375% | | | 03/15/15 | | | 750 | | | | 763,125 | |
Starwood Hotels & Resorts Worldwide, Inc., Sr. Unsec’d. Notes | | Ba1 | | | 6.250% | | | 02/15/13 | | | 1,645 | | | | 1,698,463 | |
Starwood Hotels & Resorts Worldwide, Inc., Sr. Unsec’d. Notes(a) | | Ba1 | | | 6.750% | | | 05/15/18 | | | 2,800 | | | | 3,164,000 | |
| | | | | | | | | | | | | | |
|
|
|
| | | | | | | | | | | | | | | | 5,625,588 | |
| | | | | | | | | | | | | | |
|
|
|
SEE NOTES TO FINANCIAL STATEMENTS.
A73
| | | | | | |
| | | FLEXIBLE MANAGED PORTFOLIO (continued) | | |
| |
| SCHEDULE OF INVESTMENTS | | December 31, 2011 |
| | | | | | | | | | | | | | | | |
CORPORATE BONDS
(continued) | | Moody’s
Ratings†
(Unaudited)
| | Interest
Rate
| | | Maturity
Date
| | Principal
Amount
(000)#
| | | Value
(Note 2)
| |
| | | | | | | | | | | | | | | | | |
Media & Entertainment — 0.3% | | | | | | | | | | | | | | | | |
Gannett Co., Inc., Sr. Unsec’d. Notes | | Ba2 | | | 6.375% | | | 04/01/12 | | $ | 2,500 | | | $ | 2,512,500 | |
Historic TW, Inc., Gtd. Notes | | Baa2 | | | 9.150% | | | 02/01/23 | | | 505 | | | | 690,769 | |
News America, Inc., Gtd. Notes | | Baa1 | | | 6.150% | | | 03/01/37 | | | 620 | | | | 677,730 | |
News America, Inc., Gtd. Notes(a) | | Baa1 | | | 6.150% | | | 02/15/41 | | | 1,315 | | | | 1,515,657 | |
News America, Inc., Gtd. Notes | | Baa1 | | | 6.900% | | | 08/15/39 | | | 90 | | | | 104,037 | |
Time Warner Cos., Inc., Gtd. Notes | | Baa2 | | | 7.250% | | | 10/15/17 | | | 790 | | | | 946,599 | |
Time Warner, Inc., Gtd. Notes | | Baa2 | | | 6.200% | | | 03/15/40 | | | 210 | | | | 247,360 | |
Time Warner, Inc., Gtd. Notes(a) | | Baa2 | | | 6.250% | | | 03/29/41 | | | 1,465 | | | | 1,756,463 | |
Time Warner, Inc., Gtd. Notes | | Baa2 | | | 7.625% | | | 04/15/31 | | | 180 | | | | 232,359 | |
Viacom, Inc., Sr. Unsec’d. Notes | | Baa1 | | | 6.750% | | | 10/05/37 | | | 430 | | | | 533,626 | |
| | | | | | | | | | | | | | |
|
|
|
| | | | | | | | | | | | | | | | 9,217,100 | |
| | | | | | | | | | | | | | |
|
|
|
Metals — 0.2% | | | | | | | | | | | | | | | | |
ArcelorMittal (Luxembourg), Sr. Unsec’d. Notes(a) | | Baa3 | | | 6.125% | | | 06/01/18 | | | 1,030 | | | | 1,017,189 | |
Newmont Mining Corp., Gtd. Notes | | Baa1 | | | 6.250% | | | 10/01/39 | | | 880 | | | | 1,041,931 | |
Peabody Energy Corp., Gtd. Notes, 144A | | Ba1 | | | 6.000% | | | 11/15/18 | | | 1,525 | | | | 1,555,500 | |
Rio Tinto Alcan, Inc. (Canada), Sr. Unsec’d. Notes | | A-(d) | | | 4.500% | | | 05/15/13 | | | 115 | | | | 119,796 | |
Southern Copper Corp., Sr. Unsec’d. Notes | | Baa2 | | | 7.500% | | | 07/27/35 | | | 125 | | | | 136,538 | |
Steel Dynamics, Inc., Gtd. Notes | | Ba2 | | | 7.375% | | | 11/01/12 | | | 1,085 | | | | 1,129,756 | |
Vale Overseas Ltd. (Cayman Islands), Gtd. Notes(a) | | Baa2 | | | 6.875% | | | 11/10/39 | | | 815 | | | | 933,501 | |
Xstrata Canada Financial Corp. (Canada), Gtd. Notes, 144A | | Baa2 | | | 2.850% | | | 11/10/14 | | | 1,185 | | | | 1,191,052 | |
| | | | | | | | | | | | | | |
|
|
|
| | | | | | | | | | | | | | | | 7,125,263 | |
| | | | | | | | | | | | | | |
|
|
|
Non-Captive Finance — 0.4% | | | | | | | | | | | | | | | | |
CIT Group, Inc., Sec’d. Notes, 144A(a) | | B2 | | | 7.000% | | | 05/04/15 | | | 350 | | | | 350,438 | |
General Electric Capital Corp., Sr. Unsec’d. Notes, MTN | | Aa2 | | | 4.650% | | | 10/17/21 | | | 1,272 | | | | 1,327,544 | |
General Electric Capital Corp., Sr. Unsec’d. Notes, MTN | | Aa2 | | | 5.875% | | | 01/14/38 | | | 1,060 | | | | 1,123,162 | |
General Electric Capital Corp., Sr. Unsec’d. Notes, Ser. G, MTN(h) | | Aa2 | | | 6.000% | | | 08/07/19 | | | 920 | | | | 1,056,738 | |
General Electric Capital Corp., Sr. Unsec’d. Notes, Ser. G, MTN(a)(h) | | Aa2 | | | 6.875% | | | 01/10/39 | | | 1,625 | | | | 1,946,802 | |
International Lease Finance Corp., Sr. Unsec’d. Notes | | B1 | | | 5.750% | | | 05/15/16 | | | 375 | | | | 347,828 | |
International Lease Finance Corp., Sr. Unsec’d. Notes | | B1 | | | 6.375% | | | 03/25/13 | | | 1,850 | | | | 1,840,750 | |
SLM Corp., Sr. Notes, MTN | | Ba1 | | | 6.250% | | | 01/25/16 | | | 570 | | | | 554,313 | |
SLM Corp., Sr. Unsec’d. Notes, MTN | | Ba1 | | | 8.000% | | | 03/25/20 | | | 1,050 | | | | 1,060,500 | �� |
SLM Corp., Sr. Unsec’d. Notes, MTN | | Ba1 | | | 8.450% | | | 06/15/18 | | | 1,070 | | | | 1,102,100 | |
| | | | | | | | | | | | | | |
|
|
|
| | | | | | | | | | | | | | | | 10,710,175 | |
| | | | | | | | | | | | | | |
|
|
|
Packaging | | | | | | | | | | | | | | | | |
Sealed Air Corp., Sr. Unsec’d. Notes, 144A | | B1 | | | 6.875% | | | 07/15/33 | | | 515 | | | | 450,625 | |
| | | | | | | | | | | | | | |
|
|
|
Paper — 0.1% | | | | | | | | | | | | | | | | |
Georgia-Pacific LLC, Gtd. Notes, 144A
(original cost $288,298; purchased 10/27/10)(e)(g) | | Baa3 | | | 5.400% | | | 11/01/20 | | | 290 | | | | 321,218 | |
International Paper Co., Sr. Unsec’d. Notes(a) | | Baa3 | | | 6.000% | | | 11/15/41 | | | 885 | | | | 960,767 | |
International Paper Co., Sr. Unsec’d. Notes | | Baa3 | | | 7.950% | | | 06/15/18 | | | 685 | | | | 833,802 | |
Rock-Tenn Co., Gtd. Notes | | Ba2 | | | 9.250% | | | 03/15/16 | | | 1,840 | | | | 1,950,400 | |
| | | | | | | | | | | | | | |
|
|
|
| | | | | | | | | | | | | | | | 4,066,187 | |
| | | | | | | | | | | | | | |
|
|
|
Pipelines & Other — 0.2% | | | | | | | | | | | | | | | | |
Energy Transfer Partners LP, Sr. Unsec’d. Notes | | Baa3 | | | 4.650% | | | 06/01/21 | | | 675 | | | | 661,227 | |
NiSource Finance Corp., Gtd. Notes | | Baa3 | | | 5.250% | | | 09/15/17 | | | 245 | | | | 270,446 | |
NiSource Finance Corp., Gtd. Notes | | Baa3 | | | 5.450% | | | 09/15/20 | | | 350 | | | | 387,680 | |
ONEOK Partners LP, Gtd. Notes | | Baa2 | | | 6.650% | | | 10/01/36 | | | 145 | | | | 171,480 | |
Sempra Energy, Sr. Unsec’d. Notes | | Baa1 | | | 6.000% | | | 02/01/13 | | | 90 | | | | 94,251 | |
Spectra Energy Capital LLC, Gtd. Notes | | Baa2 | | | 6.200% | | | 04/15/18 | | | 3,190 | | | | 3,617,218 | |
Spectra Energy Capital LLC, Gtd. Notes | | Baa2 | | | 6.250% | | | 02/15/13 | | | 235 | | | | 246,366 | |
| | | | | | | | | | | | | | |
|
|
|
| | | | | | | | | | | | | | | | 5,448,668 | |
| | | | | | | | | | | | | | |
|
|
|
Railroads — 0.1% | | | | | | | | | | | | | | | | |
Burlington Northern Santa Fe LLC, Sr. Unsec’d. Notes | | A3 | | | 6.700% | | | 08/01/28 | | | 670 | | | | 854,463 | |
CSX Corp., Sr. Unsec’d. Notes | | Baa3 | | | 6.150% | | | 05/01/37 | | | 715 | | | | 859,822 | |
SEE NOTES TO FINANCIAL STATEMENTS.
A74
| | | | | | |
| | | FLEXIBLE MANAGED PORTFOLIO (continued) | | |
| |
| SCHEDULE OF INVESTMENTS | | December 31, 2011 |
| | | | | | | | | | | | | | | | |
CORPORATE BONDS
(continued) | | Moody’s
Ratings†
(Unaudited)
| | Interest
Rate
| | | Maturity
Date
| | Principal
Amount
(000)#
| | | Value
(Note 2)
| |
| | | | | | | | | | | | | | | | | |
Railroads (continued) | | | | | | | | | | | | | | | | |
Norfolk Southern Corp., Sr. Unsec’d. Notes | | Baa1 | | | 5.590% | | | 05/17/25 | | $ | 525 | | | $ | 606,454 | |
Norfolk Southern Corp., Sr. Unsec’d. Notes | | Baa1 | | | 7.800% | | | 05/15/27 | | | 18 | | | | 25,474 | |
| | | | | | | | | | | | | | |
|
|
|
| | | | | | | | | | | | | | | | 2,346,213 | |
| | | | | | | | | | | | | | |
|
|
|
Real Estate Investment Trusts — 0.2% | | | | | | | | | | | | | | | | |
Brandywine Operating Partnership LP, Gtd. Notes | | Baa3 | | | 5.750% | | | 04/01/12 | | | 361 | | | | 363,300 | |
HCP, Inc., Sr. Unsec’d. Notes(a) | | Baa2 | | | 2.700% | | | 02/01/14 | | | 750 | | | | 748,910 | |
Mack-Cali Realty LP, Sr. Unsec’d. Notes | | Baa2 | | | 7.750% | | | 08/15/19 | | | 765 | | | | 911,597 | |
Post Apartment Homes LP, Sr. Unsec’d. Notes | | Baa3 | | | 5.450% | | | 06/01/12 | | | 435 | | | | 440,476 | |
Post Apartment Homes LP, Sr. Unsec’d. Notes | | Baa3 | | | 6.300% | | | 06/01/13 | | | 660 | | | | 689,784 | |
ProLogis LP, Gtd. Notes | | Baa2 | | | 6.875% | | | 03/15/20 | | | 72 | | | | 79,943 | |
Simon Property Group LP, Sr. Unsec’d. Notes | | A3 | | | 2.800% | | | 01/30/17 | | | 690 | | | | 704,788 | |
Simon Property Group LP, Sr. Unsec’d. Notes | | A3 | | | 6.125% | | | 05/30/18 | | | 2,800 | | | | 3,214,414 | |
| | | | | | | | | | | | | | |
|
|
|
| | | | | | | | | | | | | | | | 7,153,212 | |
| | | | | | | | | | | | | | |
|
|
|
Retailers — 0.2% | | | | | | | | | | | | | | | | |
CVS Caremark Corp., Sr. Unsec’d. Notes | | Baa2 | | | 6.125% | | | 09/15/39 | | | 515 | | | | 626,695 | |
Lowe’s Cos., Inc., Sr. Unsec’d. Notes | | A3 | | | 6.500% | | | 03/15/29 | | | 385 | | | | 473,120 | |
Macy’s Retail Holdings, Inc., Gtd. Notes | | Ba1 | | | 5.350% | | | 03/15/12 | | | 390 | | | | 392,674 | |
Macy’s Retail Holdings, Inc., Gtd. Notes | | Ba1 | | | 5.875% | | | 01/15/13 | | | 2,000 | | | | 2,059,098 | |
Nordstrom, Inc., Sr. Unsec’d. Notes | | Baa1 | | | 4.000% | | | 10/15/21 | | | 260 | | | | 271,033 | |
Wal-Mart Stores, Inc., Sr. Unsec’d. Notes(a) | | Aa2 | | | 5.625% | | | 04/15/41 | | | 720 | | | | 930,529 | |
| | | | | | | | | | | | | | |
|
|
|
| | | | | | | | | | | | | | | | 4,753,149 | |
| | | | | | | | | | | | | | |
|
|
|
Technology — 0.2% | | | | | | | | | | | | | | | | |
Arrow Electronics, Inc., Sr. Unsec’d. Notes | | Baa3 | | | 3.375% | | | 11/01/15 | | | 400 | | | | 400,515 | |
Fiserv, Inc., Gtd. Notes | | Baa2 | | | 3.125% | | | 06/15/16 | | | 340 | | | | 346,186 | |
Intuit, Inc., Sr. Unsec’d. Notes | | Baa1 | | | 5.400% | | | 03/15/12 | | | 600 | | | | 605,070 | |
Seagate Technology International (Cayman Islands), Sec’d. Notes, 144A | | Baa3 | | | 10.000% | | | 05/01/14 | | | 1,500 | | | | 1,696,875 | |
Xerox Corp., Sr. Unsec’d. Notes | | Baa2 | | | 4.250% | | | 02/15/15 | | | 2,720 | | | | 2,866,869 | |
| | | | | | | | | | | | | | |
|
|
|
| | | | | | | | | | | | | | | | 5,915,515 | |
| | | | | | | | | | | | | | |
|
|
|
Telecommunications — 0.5% | | | | | | | | | | | | | | | | |
America Movil SAB de CV (Mexico), Gtd. Notes | | A2 | | | 6.125% | | | 03/30/40 | | | 590 | | | | 701,485 | |
AT&T Corp., Gtd. Notes | | A2 | | | 8.000% | | | 11/15/31 | | | 7 | | | | 9,888 | |
AT&T Mobility LLC, Sr. Unsec’d. Notes | | A-(d) | | | 7.125% | | | 12/15/31 | | | 405 | | | | 524,132 | |
AT&T, Inc., Sr. Unsec’d. Notes(a) | | A2 | | | 5.550% | | | 08/15/41 | | | 1,070 | | | | 1,259,836 | |
AT&T, Inc., Sr. Unsec’d. Notes | | A2 | | | 6.550% | | | 02/15/39 | | | 1,720 | | | | 2,187,907 | |
British Telecommunications PLC (United Kingdom), Sr. Unsec’d. Notes | | Baa2 | | | 9.625% | | | 12/15/30 | | | 400 | | | | 563,720 | |
Embarq Corp., Sr. Unsec’d. Notes
(original cost $367,380; purchased 05/04/11-05/11/11)(e)(g) | | Baa3 | | | 7.082% | | | 06/01/16 | | | 325 | | | | 352,282 | |
Embarq Corp., Sr. Unsec’d. Notes
(original cost $1,626,279; purchased 05/12/06-04/10/07)(e)(g) | | Baa3 | | | 7.995% | | | 06/01/36 | | | 1,600 | | | | 1,657,901 | |
Telecom Italia Capital SA (Luxembourg), Gtd. Notes | | Baa2 | | | 5.250% | | | 11/15/13 | | | 320 | | | | 307,387 | |
Telecom Italia Capital SA (Luxembourg), Gtd. Notes | | Baa2 | | | 7.175% | | | 06/18/19 | | | 445 | | | | 417,013 | |
Telecom Italia Capital SA (Luxembourg), Gtd. Notes | | Baa2 | | | 7.200% | | | 07/18/36 | | | 1,030 | | | | 850,726 | |
Telefonica Emisiones SAU (Spain), Gtd. Notes | | Baa1 | | | 5.877% | | | 07/15/19 | | | 390 | | | | 385,425 | |
Telefonica Emisiones SAU (Spain), Gtd. Notes | | Baa1 | | | 7.045% | | | 06/20/36 | | | 210 | | | | 204,765 | |
United States Cellular Corp., Sr. Unsec’d. Notes | | Baa2 | | | 6.700% | | | 12/15/33 | | | 275 | | | | 276,119 | |
Verizon Communications, Inc., Sr. Unsec’d. Notes(a) | | A3 | | | 6.100% | | | 04/15/18 | | | 3,165 | | | | 3,802,320 | |
Windstream Corp., Gtd. Notes | | Ba3 | | | 8.125% | | | 08/01/13 | | | 1,000 | | | | 1,070,000 | |
| | | | | | | | | | | | | | |
|
|
|
| | | | | | | | | | | | | | | | 14,570,906 | |
| | | | | | | | | | | | | | |
|
|
|
Tobacco — 0.2% | | | | | | | | | | | | | | | | |
Altria Group, Inc., Gtd. Notes | | Baa1 | | | 4.750% | | | 05/05/21 | | | 1,000 | | | | 1,101,038 | |
Altria Group, Inc., Gtd. Notes | | Baa1 | | | 9.700% | | | 11/10/18 | | | 1,215 | | | | 1,634,677 | |
Altria Group, Inc., Gtd. Notes | | Baa1 | | | 9.950% | | | 11/10/38 | | | 140 | | | | 212,937 | |
SEE NOTES TO FINANCIAL STATEMENTS.
A75
| | | | | | |
| | | FLEXIBLE MANAGED PORTFOLIO (continued) | | |
| |
| SCHEDULE OF INVESTMENTS | | December 31, 2011 |
| | | | | | | | | | | | | | | | |
CORPORATE BONDS
(continued) | | Moody’s
Ratings†
(Unaudited)
| | Interest
Rate
| | | Maturity
Date
| | Principal
Amount
(000)#
| | | Value
(Note 2)
| |
| | | | | | | | | | | | | | | | | |
Tobacco (continued) | | | | | | | | | | | | | | | | |
Altria Group, Inc., Gtd. Notes | | Baa1 | | | 10.200% | | | 02/06/39 | | $ | 790 | | | $ | 1,229,335 | |
Lorillard Tobacco Co., Gtd. Notes | | Baa2 | | | 3.500% | | | 08/04/16 | | | 465 | | | | 470,340 | |
Lorillard Tobacco Co., Gtd. Notes | | Baa2 | | | 8.125% | | | 06/23/19 | | | 325 | | | | 387,139 | |
Reynolds American, Inc., Gtd. Notes | | Baa3 | | | 7.250% | | | 06/15/37 | | | 320 | | | | 371,190 | |
| | | | | | | | | | | | | | |
|
|
|
| | | | | | | | | | | | | | | | 5,406,656 | |
| | | | | | | | | | | | | | |
|
|
|
TOTAL CORPORATE BONDS
(cost $257,958,889) | | | | 271,807,189 | |
| | | | | | | | | | | | | | |
|
|
|
| MORTGAGE-BACKED SECURITIES — 10.4% | | | | | | | | | | | | | | | | |
Federal Home Loan Mortgage Corp.(c) | | | 2.386% | | | 06/01/36 | | | 1,021 | | | | 1,066,690 | |
Federal Home Loan Mortgage Corp. | | | 3.000% | | | TBA 15 YR | | | 2,500 | | | | 2,580,469 | |
Federal Home Loan Mortgage Corp. | | | 3.500% | | | TBA 15 YR | | | 1,000 | | | | 1,042,344 | |
Federal Home Loan Mortgage Corp. | | | 4.000% | | | 06/01/26-12/01/40 | | | 7,833 | | | | 8,257,566 | |
Federal Home Loan Mortgage Corp. | | | 4.000% | | | TBA 30 YR | | | 3,000 | | | | 3,146,250 | |
Federal Home Loan Mortgage Corp. | | | 4.500% | | | 02/01/19-10/01/41 | | | 31,978 | | | | 33,918,768 | |
Federal Home Loan Mortgage Corp. | | | 4.500% | | | TBA 30 YR | | | 2,000 | | | | 2,119,062 | |
Federal Home Loan Mortgage Corp. | | | 5.000% | | | 07/01/18-05/01/34 | | | 4,807 | | | | 5,197,561 | |
Federal Home Loan Mortgage Corp. | | | 5.000% | | | TBA 30 YR | | | 11,000 | | | | 11,819,843 | |
Federal Home Loan Mortgage Corp.(c) | | | 5.227% | | | 12/01/35 | | | 1,231 | | | | 1,311,659 | |
Federal Home Loan Mortgage Corp. | | | 5.500% | | | 12/01/33-05/01/38 | | | 5,832 | | | | 6,353,906 | |
Federal Home Loan Mortgage Corp. | | | 5.500% | | | TBA 30 YR | | | 12,000 | | | | 13,020,000 | |
Federal Home Loan Mortgage Corp. | | | 6.000% | | | 03/01/32-12/01/33 | | | 1,427 | | | | 1,591,577 | |
Federal Home Loan Mortgage Corp. | | | 6.000% | | | TBA 30 YR | | | 5,500 | | | | 6,039,688 | |
Federal Home Loan Mortgage Corp. | | | 6.500% | | | 12/01/14 | | | 81 | | | | 84,167 | |
Federal Home Loan Mortgage Corp. | | | 7.000% | | | 01/01/31-10/01/32 | | | 692 | | | | 795,704 | |
Federal National Mortgage Association(c) | | | 2.016% | | | 07/01/33 | | | 507 | | | | 530,434 | |
Federal National Mortgage Association | | | 3.000% | | | TBA 15 YR | | | 3,000 | | | | 3,097,969 | |
Federal National Mortgage Association | | | 3.000% | | | TBA 15 YR | | | 500 | | | | 514,766 | |
Federal National Mortgage Association | | | 3.500% | | | 06/01/39 | | | 2,352 | | | | 2,421,518 | |
Federal National Mortgage Association | | | 3.500% | | | TBA 15 YR | | | 8,000 | | | | 8,365,000 | |
Federal National Mortgage Association | | | 4.000% | | | TBA 30 YR | | | 5,000 | | | | 5,252,344 | |
Federal National Mortgage Association | | | 4.000% | | | TBA 30 YR | | | 4,500 | | | | 4,715,156 | |
Federal National Mortgage Association | | | 4.500% | | | 11/01/18-03/01/41 | | | 25,602 | | | | 27,425,561 | |
Federal National Mortgage Association | | | 5.000% | | | 10/01/18-02/01/36 | | | 15,142 | | | | 16,378,122 | |
Federal National Mortgage Association | | | 5.000% | | | TBA 30 YR | | | 4,500 | | | | 4,851,562 | |
Federal National Mortgage Association | | | 5.500% | | | 03/01/16-08/01/37 | | | 20,732 | | | | 22,699,491 | |
Federal National Mortgage Association(c) | | | 5.581% | | | 06/01/37 | | | 394 | | | | 420,607 | |
Federal National Mortgage Association | | | 6.000% | | | 04/01/13-05/01/38 | | | 16,612 | | | | 18,421,389 | |
Federal National Mortgage Association | | | 6.000% | | | TBA 30 YR | | | 2,000 | | | | 2,202,188 | |
Federal National Mortgage Association | | | 6.500% | | | 07/01/17-09/01/37 | | | 6,396 | | | | 7,209,387 | |
Federal National Mortgage Association | | | 7.000% | | | 02/01/32-07/01/32 | | | 440 | | | | 512,070 | |
Federal National Mortgage Association | | | 7.500% | | | 06/01/12-05/01/32 | | | 139 | | | | 166,305 | |
Government National Mortgage Association | | | 3.500% | | | TBA 30 YR | | | 5,500 | | | | 5,724,297 | |
Government National Mortgage Association | | | 4.000% | | | 05/20/41 | | | 1,904 | | | | 2,039,756 | |
Government National Mortgage Association | | | 4.000% | | | TBA 30 YR | | | 22,000 | | | | 23,598,436 | |
Government National Mortgage Association | | | 4.000% | | | TBA 30 YR | | | 4,500 | | | | 4,812,890 | |
Government National Mortgage Association | | | 4.500% | | | 01/20/41 | | | 3,743 | | | | 4,090,126 | |
Government National Mortgage Association | | | 4.500% | | | TBA 30 YR | | | 19,500 | | | | 21,191,014 | |
Government National Mortgage Association | | | 4.500% | | | TBA 30 YR | | | 2,000 | | | | 2,179,062 | |
Government National Mortgage Association | | | 5.000% | | | TBA 30 YR | | | 7,000 | | | | 7,739,374 | |
Government National Mortgage Association | | | 5.000% | | | TBA 30 YR | | | 5,500 | | | | 6,092,970 | |
Government National Mortgage Association | | | 5.500% | | | 11/15/32-02/15/36 | | | 6,293 | | | | 7,108,821 | |
Government National Mortgage Association | | | 6.000% | | | 02/15/33-10/15/34 | | | 2,731 | | | | 3,107,965 | |
Government National Mortgage Association | | | 6.500% | | | 10/15/23-07/15/35 | | | 2,877 | | | | 3,306,642 | |
Government National Mortgage Association | | | 8.000% | | | 01/15/24-04/15/25 | | | 79 | | | | 92,858 | |
| | | | | | | | | | | | | | |
|
|
|
TOTAL MORTGAGE-BACKED SECURITIES
(cost $303,254,736) | | | | 314,613,334 | |
| | | | | | | | | | | | | | |
|
|
|
SEE NOTES TO FINANCIAL STATEMENTS.
A76
| | | | | | |
| | | FLEXIBLE MANAGED PORTFOLIO (continued) | | |
| |
| SCHEDULE OF INVESTMENTS | | December 31, 2011 |
| | | | | | | | | | | | | | | | |
| MUNICIPAL BONDS — 0.4% | | Moody’s
Ratings†
(Unaudited)
| | Interest
Rate
| | | Maturity
Date
| | Principal
Amount
(000)#
| | | Value
(Note 2)
| |
| | | | | | | | | | | | | | | | | |
Bay Area Toll Authority, Revenue Bonds, BABs | | Aa3 | | | 6.263% | | | 04/01/49 | | $ | 1,325 | | | $ | 1,721,692 | |
Chicago O’Hare International Airport, Revenue Bonds, BABs | | A1 | | | 6.395% | | | 01/01/40 | | | 1,030 | | | | 1,259,618 | |
Metropolitan Government of Nashville & Davidson County Convention Center Authority, Revenue Bonds, BABs | | Aa2 | | | 6.731% | | | 07/01/43 | | | 1,000 | | | | 1,199,720 | |
New Jersey State Turnpike Authority, Revenue Bonds, Ser. F, BABs | | A3 | | | 7.414% | | | 01/01/40 | | | 1,070 | | | | 1,526,109 | |
New York City Transitional Finance Authority, Revenue Bonds, BABs | | Aa1 | | | 5.767% | | | 08/01/36 | | | 1,130 | | | | 1,329,377 | |
Ohio State University (The), Revenue Bonds, BABs | | Aa1 | | | 4.910% | | | 06/01/40 | | | 455 | | | | 521,862 | |
Ohio State Water Development Authority, Revenue Bonds, BABs | | Aaa | | | 4.879% | | | 12/01/34 | | | 300 | | | | 339,075 | |
Oregon State Department of Transportation, Revenue Bonds, Ser. A, BABs | | Aa2 | | | 5.834% | | | 11/15/34 | | | 445 | | | | 544,480 | |
Pennsylvania Turnpike Commission, Revenue Bonds, Ser. B, BABs | | Aa3 | | | 5.511% | | | 12/01/45 | | | 550 | | | | 625,251 | |
Regional Transportation District, Revenue Bonds, Ser. 2010B, BABs | | Aa2 | | | 5.844% | | | 11/01/50 | | | 680 | | | | 883,605 | |
State of California, General Obligation Unlimited, BABs | | A1 | | | 7.300% | | | 10/01/39 | | | 1,270 | | | | 1,513,142 | |
State of California, General Obligation Unlimited, BABs | | A1 | | | 7.500% | | | 04/01/34 | | | 475 | | | | 568,428 | |
State of California, General Obligation Unlimited, BABs | | A1 | | | 7.550% | | | 04/01/39 | | | 245 | | | | 299,821 | |
State of California, General Obligation Unlimited, BABs | | A1 | | | 7.625% | | | 03/01/40 | | | 215 | | | | 265,961 | |
Texas State Transportation Commission, Revenue Bonds, Ser. B, BABs | | Aaa | | | 5.028% | | | 04/01/26 | | | 335 | | | | 389,990 | |
| | | | | | | | | | | | | | |
|
|
|
TOTAL MUNICIPAL BONDS
(cost $10,685,018) | | | | 12,988,131 | |
| | | | | | | | | | | | | | |
|
|
|
| NON-CORPORATE FOREIGN AGENCIES — 0.5% | | | | | | | | | | | | | | | | |
Commonwealth Bank of Australia (Australia), Gov’t. Gtd., 144A | | Aaa | | | 2.700% | | | 11/25/14 | | | 7,435 | | | | 7,724,772 | |
Export Development Canada (Canada), Sr. Unsec’d. Notes | | Aaa | | | 1.250% | | | 10/26/16 | | | 1,830 | | | | 1,850,741 | |
Export-Import Bank of Korea (South Korea), Sr. Unsec’d. Notes | | A1 | | | 4.000% | | | 01/29/21 | | | 515 | | | | 496,988 | |
Export-Import Bank of Korea (South Korea), Sr. Unsec’d. Notes | | A1 | | | 5.125% | | | 06/29/20 | | | 400 | | | | 418,821 | |
Korea Hydro & Nuclear Power Co. Ltd. (South Korea), Sr. Unsec’d. Notes, 144A | | A1 | | | 6.250% | | | 06/17/14 | | | 1,000 | | | | 1,078,720 | |
Kreditanstalt Fuer Wiederaufbau (Germany), Gov’t. Gtd. Notes | | Aaa | | | 2.375% | | | 08/25/21 | | | 880 | | | | 878,882 | |
Pemex Project Funding Master Trust, Gtd. Notes | | Baa1 | | | 8.625% | | | 12/01/23 | | | 350 | | | | 439,250 | |
RSHB Capital SA For OJSC Russian Agricultural Bank (Luxembourg),
Sr. Sec’d. Notes, 144A | | Baa1 | | | 6.299% | | | 05/15/17 | | | 2,190 | | | | 2,187,262 | |
| | | | | | | | | | | | | | |
|
|
|
TOTAL NON-CORPORATE FOREIGN AGENCIES
(cost $14,656,348) | | | | 15,075,436 | |
| | | | | | | | | | | | | | |
|
|
|
| NON-CORPORATE SOVEREIGN | | | | | | | | | | | | | | | | |
Qatar Government International Bond (Qatar), Sr. Unsec’d. Notes, 144A | | Aa2 | | | 5.250% | | | 01/20/20 | | | 315 | | | | 345,713 | |
Qatar Government International Bond (Qatar), Sr. Unsec’d. Notes, 144A | | Aa2 | | | 6.400% | | | 01/20/40 | | | 215 | | | | 252,625 | |
| | | | | | | | | | | | | | |
|
|
|
TOTAL NON-CORPORATE SOVEREIGN
(cost $565,133) | | | | 598,338 | |
| | | | | | | | | | | | | | |
|
|
|
| U.S. GOVERNMENT AGENCY OBLIGATIONS — 0.3% | | | | | | | | | | | | | | | | |
Federal Home Loan Banks | | | 5.500% | | | 07/15/36 | | | 1,080 | | | | 1,400,876 | |
Federal Home Loan Mortgage Corp.(a) | | | 5.125% | | | 11/17/17 | | | 630 | | | | 758,578 | |
Federal National Mortgage Association(a) | | | 1.375% | | | 11/15/16 | | | 1,970 | | | | 1,987,399 | |
Resolution Funding Corp. Interest Strip, Bonds(i) | | | 1.620% | | | 04/15/18 | | | 2,615 | | | | 2,369,530 | |
Western Corporate Federal Credit Union, Gtd. Notes. | | | 1.750% | | | 11/02/12 | | | 2,610 | | | | 2,642,690 | |
| | | | | | | | | | | | | | |
|
|
|
TOTAL U.S. GOVERNMENT AGENCY OBLIGATIONS
(cost $8,515,166) | | | | 9,159,073 | |
| | | | | | | | | | | | | | |
|
|
|
| U.S. GOVERNMENT TREASURY OBLIGATIONS — 6.6% | | | | | | | | | | | | | | | | |
U.S. Treasury Bonds | | | 3.125% | | | 11/15/41 | | | 505 | | | | 529,066 | |
U.S. Treasury Bonds(a) | | | 3.750% | | | 08/15/41 | | | 1,920 | | | | 2,258,100 | |
U.S. Treasury Bonds(j) | | | 4.250% | | | 11/15/40 | | | 570 | | | | 726,928 | |
U.S. Treasury Bonds | | | 4.375% | | | 05/15/40 | | | 1,260 | | | | 1,636,818 | |
U.S. Treasury Bonds | | | 4.375% | | | 05/15/41 | | | 3,320 | | | | 4,325,857 | |
SEE NOTES TO FINANCIAL STATEMENTS.
A77
| | | | | | |
| | | FLEXIBLE MANAGED PORTFOLIO (continued) | | |
| |
| SCHEDULE OF INVESTMENTS | | December 31, 2011 |
| | | | | | | | | | | | | | | | | | |
U.S. GOVERNMENT TREASURY OBLIGATIONS
(continued) | | | | Interest
Rate
| | | Maturity
Date
| | | Principal
Amount
(000)#
| | | Value
(Note 2)
| |
| | | | | | | | | | | | | | | | | | | |
U.S. Treasury Bonds | | | 4.750% | | | | 02/15/41 | | | $ | 10,465 | | | $ | 14,422,078 | |
U.S. Treasury Bonds | | | 6.500% | | | | 11/15/26 | | | | 1,670 | | | | 2,533,704 | |
U.S. Treasury Inflation Indexed Bonds | | | 1.375% | | | | 01/15/20 | | | | 5,822 | | | | 6,629,323 | |
U.S. Treasury Notes | | | 0.125% | | | | 08/31/13 | | | | 610 | | | | 608,928 | |
U.S. Treasury Notes(a) | | | 0.250% | | | | 12/15/14 | | | | 4,930 | | | | 4,913,825 | |
U.S. Treasury Notes | | | 1.875% | | | | 09/30/17 | | | | 6,760 | | | | 7,067,898 | |
U.S. Treasury Notes | | | 1.875% | | | | 10/31/17 | | | | 6,975 | | | | 7,292,690 | |
U.S. Treasury Notes(a) | | | 2.000% | | | | 11/15/21 | | | | 5,345 | | | | 5,405,965 | |
U.S. Treasury Notes | | | 2.250% | | | | 11/30/17 | | | | 11,795 | | | | 12,583,791 | |
U.S. Treasury Notes | | | 2.750% | | | | 02/15/19 | | | | 7,385 | | | | 8,088,303 | |
U.S. Treasury Notes | | | 3.000% | | | | 09/30/16 | | | | 6,525 | | | | 7,193,304 | |
U.S. Treasury Notes | | | 3.250% | | | | 12/31/16 | | | | 4,730 | | | | 5,281,338 | |
U.S. Treasury Notes | | | 3.250% | | | | 03/31/17 | | | | 7,685 | | | | 8,604,802 | |
U.S. Treasury Notes | | | 3.500% | | | | 02/15/18 | | | | 6,500 | | | | 7,410,507 | |
U.S. Treasury Notes | | | 4.250% | | | | 11/15/17 | | | | 7,015 | | | | 8,285,922 | |
U.S. Treasury Notes | | | 4.625% | | | | 11/15/16 | | | | 7,655 | | | | 9,040,080 | |
U.S. Treasury Notes | | | 4.750% | | | | 08/15/17 | | | | 2,525 | | | | 3,040,257 | |
U.S. Treasury Strips Coupon(k) | | | 1.570% | | | | 08/15/19 | | | | 7,740 | | | | 6,870,024 | |
U.S. Treasury Strips Coupon(k) | | | 2.480% | | | | 05/15/24 | | | | 18,495 | | | | 13,640,617 | |
U.S. Treasury Strips Coupon(k) | | | 2.510% | | | | 08/15/24 | | | | 6,520 | | | | 4,756,614 | |
U.S. Treasury Strips Coupon(k) | | | 2.520% | | | | 11/15/24 | | | | 4,590 | | | | 3,317,611 | |
U.S. Treasury Strips Coupon(k) | | | 2.550% | | | | 02/15/25 | | | | 4,500 | | | | 3,219,574 | |
U.S. Treasury Strips Coupon(k) | | | 2.610% | | | | 08/15/25 | | | | 1,055 | | | | 739,850 | |
U.S. Treasury Strips Coupon(k) | | | 2.740% | | | | 11/15/23 | | | | 10,490 | | | | 7,889,644 | |
U.S. Treasury Strips Coupon(k) | | | 2.780% | | | | 02/15/24 | | | | 10,000 | | | | 7,448,860 | |
U.S. Treasury Strips Coupon(k) | | | 3.040% | | | | 05/15/25 | | | | 5,000 | | | | 3,539,575 | |
U.S. Treasury Strips Coupon(k) | | | 3.380% | | | | 05/15/27 | | | | 2,280 | | | | 1,493,747 | |
U.S. Treasury Strips Coupon(k) | | | 3.450% | | | | 11/15/27 | | | | 9,450 | | | | 6,073,713 | |
U.S. Treasury Strips Coupon(k) | | | 4.130% | | | | 08/15/33 | | | | 10,730 | | | | 5,628,175 | |
U.S. Treasury Strips Principal(i) | | | 0.390% | | | | 11/15/14 | | | | 7,500 | | | | 7,416,405 | |
| | | | | | | | | | | | | | | | |
|
|
|
TOTAL U.S. GOVERNMENT TREASURY OBLIGATIONS
(cost $186,201,487) | | | | 199,913,893 | |
| | | | | | | | | | | | | | | | |
|
|
|
TOTAL LONG-TERM INVESTMENTS
(cost $2,687,023,698) | | | | 2,966,972,704 | |
| | | | | | | | | | | | | | | | |
|
|
|
| SHORT-TERM INVESTMENTS — 10.6% | | | | | | | | | | | | | | | | | | |
U.S. GOVERNMENT TREASURY OBLIGATION — 0.1% | | | | | | | | | | | | | | | | | | |
U.S. Treasury Bill(l)
(cost $1,599,801) | | | 0.025% | | | | 06/28/12 | | | | 1,600 | | | | 1,599,528 | |
| | | | | | | | | | | | | | | | |
|
|
|
| | | | | |
| | | | | | | | | | | Shares
| | | | |
AFFILIATED MUTUAL FUNDS — 10.5% | | | | | | | | | | | | | | | | | | |
Prudential Investment Portfolios 2 — Prudential Core Short-Term Bond Fund
(cost $144,213,940)(m) | | | | 14,599,845 | | | | 129,354,630 | |
Prudential Investment Portfolios 2 — Prudential Core Taxable Money Market Fund
(cost $190,849,047; includes $121,894,849 of cash collateral received for securities on loan)(m)(n) | | | | 190,849,047 | | | | 190,849,047 | |
| | | | | | | | | | | | | | | | |
|
|
|
TOTAL AFFILIATED MUTUAL FUNDS
(cost $335,062,987) | | | | 320,203,677 | |
| | | | | | | | | | | | | | | | |
|
|
|
TOTAL SHORT-TERM INVESTMENTS
(cost $336,662,788) | | | | 321,803,205 | |
| | | | | | | | | | | | | | | | |
|
|
|
TOTAL INVESTMENTS — 108.3%
(cost $3,023,686,486) | | | | 3,288,775,909 | |
LIABILITIES IN EXCESS OF OTHER ASSETS(o) — (8.3)% | | | | (251,974,519 | ) |
| | | | | | | | | | | | | | | | |
|
|
|
NET ASSETS — 100.0% | | | $ | 3,036,801,390 | |
| | | | | | | | | | | | | | | | |
|
|
|
SEE NOTES TO FINANCIAL STATEMENTS.
A78
| | | | | | |
| | | FLEXIBLE MANAGED PORTFOLIO (continued) | | |
| |
| SCHEDULE OF INVESTMENTS | | December 31, 2011 |
The following abbreviations are used in portfolio descriptions:
| | |
| 144A | | Security was purchased pursuant to Rule 144A under the Securities Act of 1933 and may not be resold subject to that rule except to qualified institutional buyers. Unless otherwise noted, 144A securities are deemed to be liquid. |
| ABS | | Asset-Backed Security |
| BABs | | Build America Bonds |
| CDO | | Collateralized Debt Obligation |
| CLO | | Collateralized Loan Obligation |
| I/O | | Interest Only |
| LIBOR | | London Interbank Offered Rate |
| MTN | | Medium Term Note |
| NR | | Not Rated by Moody’s or Standard & Poor’s |
| TBA | | To Be Announced |
| # | Principal amount is shown in U.S. dollars unless otherwise stated. |
| † | The ratings reflected are as of December 31, 2011. Ratings of certain bonds may have changed subsequent to that date. |
| * | Non-income producing security. |
| (a) | All or a portion of security is on loan. The aggregate market value of such securities, including those sold and pending settlement, is $119,082,965; cash collateral of $121,894,849 (included in liabilities) was received with which the Portfolio purchased highly liquid short-term investments. |
| (b) | Stapled Security — A security contractually bound to one or more other securities to form a single saleable unit which cannot be sold separately. |
| (c) | Variable rate instrument. The interest rate shown reflects the rate in effect at December 31, 2011. |
| (d) | Standard & Poor’s Rating. |
| (e) | Indicates a security that has been deemed illiquid. |
| (f) | Represents issuer in default on interest payments and/or principal repayment; non-income producing security. |
| (g) | Indicates a restricted security; the aggregate original cost of such securities is $5,084,852. The aggregate value of $5,558,845 is approximately 0.2% of net assets. |
| (h) | Represents security, or a portion thereof, segregated as collateral for futures contracts. |
| (i) | Represents zero coupon bond. Rate shown reflects the effective yield at December 31, 2011. |
| (j) | Represents security, or a portion thereof, segregated as collateral for swap agreements. |
| (k) | Rate shown reflects the effective yield at December 31, 2011. |
| (l) | Rate quoted represents yield-to-maturity as of purchase date. |
| (m) | Prudential Investments LLC, the manager of the Portfolio, also serves as manager of the Prudential Investment Portfolios 2 — Prudential Core Taxable Money Market Fund and the Prudential Investment Portfolios 2 — Prudential Core Short-Term Bond Fund. |
| (n) | Represents security, or a portion thereof, purchased with cash collateral received for securities on loan. |
| (o) | Includes net unrealized appreciation (depreciation) on the following derivative contracts held at reporting period end: |
Open futures contracts outstanding at December 31, 2011:
| | | | | | | | | | | | | | | | | | |
Number of
Contracts
| | Type
| | Expiration
Date
| | | Value at
Trade Date
| | | Value at
December 31, 2011
| | | Unrealized
Appreciation/
(Depreciation)
| |
| Long Positions: | | | | | | | | | | | | | | | | | | |
| 304 | | 2 Year U.S. Treasury Notes | | | Mar. 2012 | | | $ | 67,056,311 | | | $ | 67,046,250 | | | $ | (10,061 | ) |
| 205 | | 5 Year U.S. Treasury Notes | | | Mar. 2012 | | | | 25,173,100 | | | | 25,267,851 | | | | 94,751 | |
| 1 | | U.S. Ultra Bond | | | Mar. 2012 | | | | 160,157 | | | | 160,187 | | | | 30 | |
| 269 | | S&P 500 E-mini | | | Mar. 2012 | | | | 16,532,659 | | | | 16,847,470 | | | | 314,811 | |
| | | | | | | | | | | | | | | | |
|
|
|
| | | | | | | | | | | | | | | | | | 399,531 | |
| | | | | | | | | | | | | | | | |
|
|
|
| Short Positions: | | | | | | | | | | | | | | | | | | |
| 116 | | 10 Year U.S. Treasury Notes | | | Mar. 2012 | | | | 15,172,201 | | | | 15,210,500 | | | | (38,299 | ) |
| 262 | | U.S. Long Bond | | | Mar. 2012 | | | | 37,578,489 | | | | 37,940,875 | | | | (362,386 | ) |
| | | | | | | | | | | | | | | | |
|
|
|
| | | | | | | | | | | | | | | | | | (400,685 | ) |
| | | | | | | | | | | | | | | | |
|
|
|
| | | | | | | | | | | | | | | | | $ | (1,154 | ) |
| | | | | | | | | | | | | | | | |
|
|
|
SEE NOTES TO FINANCIAL STATEMENTS.
A79
| | | | | | |
| | | FLEXIBLE MANAGED PORTFOLIO (continued) | | |
| |
| SCHEDULE OF INVESTMENTS | | December 31, 2011 |
Interest rate swap agreements outstanding at December 31, 2011:
| | | | | | | | | | | | | | | | | | | | | | | | | | |
Counterparty
| | Termination
Date
| | | Notional
Amount
(000)#
| | | Fixed
Rate
| | | Floating Rate
| | Fair
Value
| | | Upfront
Premium
Paid/
(Received)
| | | Unrealized
Appreciation/
(Depreciation)
| |
Over-the-Counter Swap Agreements: | | | | | | | | | | | | |
Morgan Stanley Capital Services | | | 11/01/14 | | | $ | 3,285 | | | | 0.784% | | | 3 month LIBOR(2) | | $ | (556 | ) | | $ | — | | | $ | (556 | ) |
Barclays Bank PLC | | | 05/31/16 | | | | 6,455 | | | | 1.175% | | | 3 month LIBOR(1) | | | 13,112 | | | | — | | | | 13,112 | |
Barclays Bank PLC | | | 05/31/16 | | | | 6,455 | | | | 1.180% | | | 3 month LIBOR(1) | | | 14,267 | | | | — | | | | 14,267 | |
Barclays Bank PLC | | | 05/31/16 | | | | 1,605 | | | | 1.220% | | | 3 month LIBOR(1) | | | 6,197 | | | | — | | | | 6,197 | |
Deutsche Bank AG | | | 09/14/16 | | | | 3,300 | | | | 1.206% | | | 3 month LIBOR(2) | | | (18,061 | ) | | | — | | | | (18,061 | ) |
Citibank, NA | | | 07/20/21 | | | | 6,335 | | | | 3.035% | | | 3 month LIBOR(1) | | | 671,380 | | | | — | | | | 671,380 | |
Citibank, NA | | | 11/23/21 | | | | 5,570 | | | | 2.148% | | | 3 month LIBOR(2) | | | (73,191 | ) | | | — | | | | (73,191 | ) |
| | | | | | | | | | | | | | | | |
|
|
| |
|
|
| |
|
|
|
| | | | | | | | | | | | | | | | | $ | 613,148 | | | $ | — | | | $ | 613,148 | |
| | | | | | | | | | | | | | | | |
|
|
| |
|
|
| |
|
|
|
| (1) | Portfolio pays the floating rate and receives the fixed rate. |
| (2) | Portfolio pays the fixed rate and receives the floating rate. |
| # | Notional amount is shown in U.S. dollars unless otherwise stated. |
Credit default swap agreements outstanding at December 31, 2011:
| | | | | | | | | | | | | | | | | | | | | | | | | | |
Counterparty
| | Termination
Date
| | | Notional
Amount
(000)#(2)
| | | Fixed
Rate
| | | Reference Entity/Obligation
| | Fair
Value
| | | Upfront
Premiums
Paid/
(Received)
| | | Unrealized
Appreciation/
(Depreciation)
| |
Over-the-Counter Credit Default Swaps—Buy Protection(1): | | | | | | | | | | | | |
JPMorgan Chase Bank | | | 06/20/14 | | | $ | 1,150 | | | | 0.650% | | | Bunge Ltd. Finance Corp. | | $ | 21,321 | | | $ | — | | | $ | 21,321 | |
Deutsche Bank AG | | | 03/20/12 | | | | 2,000 | | | | 5.000% | | | Gannett Co., Inc. | | | (21,836 | ) | | | (6,671 | ) | | | (15,165 | ) |
Morgan Stanley Capital Services, Inc. | | | 03/20/12 | | | | 500 | | | | 5.000% | | | Gannett Co., Inc. | | | (5,459 | ) | | | (1,720 | ) | | | (3,739 | ) |
Deutsche Bank AG | | | 12/20/12 | | | | 2,000 | | | | 1.000% | | | Macy’s Retail Holdings, Inc. | | | (11,444 | ) | | | 23,182 | | | | (34,626 | ) |
Morgan Stanley Capital Services, Inc. | | | 06/20/18 | | | | 1,700 | | | | 1.000% | | | Newell Rubbermaid, Inc. | | | 52,330 | | | | — | | | | 52,330 | |
Morgan Stanley Capital Services, Inc. | | | 06/20/18 | | | | 2,800 | | | | 0.970% | | | Simon Property Group L.P. | | | 81,118 | | | | — | | | | 81,118 | |
Deutsche Bank AG | | | 06/20/18 | | | | 2,200 | | | | 1.150% | | | Spectra Energy Capital LLC | | | 48,011 | | | | — | | | | 48,011 | |
Merrill Lynch Capital Services, Inc. | | | 06/20/18 | | | | 500 | | | | 1.130% | | | Spectra Energy Capital LLC | | | 11,508 | | | | — | | | | 11,508 | |
Deutsche Bank AG | | | 03/20/14 | | | | 1,645 | | | | 7.050% | | | Starwood Hotels & Resorts Worldwide | | | (215,434 | ) | | | — | | | | (215,434 | ) |
Merrill Lynch Capital Services, Inc. | | | 06/20/18 | | | | 2,800 | | | | 1.450% | | | Starwood Hotels & Resorts Worldwide, Inc. | | | 70,865 | | | | — | | | | 70,865 | |
| | | | | | | | | | | | | | | | |
|
|
| |
|
|
| |
|
|
|
| | | | | | | | | | | | | | | | | $ | 30,980 | | | $ | 14,791 | | | $ | 16,189 | |
| | | | | | | | | | | | | | | | |
|
|
| |
|
|
| |
|
|
|
| (1) | If the Portfolio is a buyer of protection, it pays the fixed rate. When a credit event occurs, as defined under the terms of that particular swap agreement, the Portfolio will either (i) receive from the seller of protection an amount equal to the notional amount of the swap and make delivery of the referenced obligation or underlying securities comprising the referenced index or (ii) receive a net settlement amount in the form of cash or securities equal to the notional amount of the swap less the recovery value of the referenced obligation or underlying securities comprising the referenced index. |
| (2) | Notional amount represents the maximum potential amount the Portfolio could be required to pay as a seller of credit protection or receive as a buyer of credit protection if a credit event occurs as defined under the terms of that particular swap agreement. |
| # | Notional amount is shown in U.S. dollars unless otherwise stated. |
Various inputs are used in determining the value of the Portfolio’s investments. These inputs are summarized in the three broad levels listed below.
| Level 1— | quoted prices generally for securities actively traded on a regulated securities exchange and for open-end mutual funds which trade at daily net asset value. |
| Level 2— | other significant observable inputs (including, but not limited to, quoted prices for similar securities, interest rates, prepayment speeds, foreign currency exchange rates, and amortized cost) generally for debt securities, swaps, forward foreign currency contracts and for foreign stocks priced using vendor modeling tools. |
| Level 3— | significant unobservable inputs for securities valued in accordance with Board approved fair valuation procedures. |
SEE NOTES TO FINANCIAL STATEMENTS.
A80
| | | | | | |
| | | FLEXIBLE MANAGED PORTFOLIO (continued) | | |
| |
| SCHEDULE OF INVESTMENTS | | December 31, 2011 |
The following is a summary of the inputs used as of December 31, 2011 in valuing such portfolio securities:
| | | | | | | | | | | | |
| | | Level 1
| | | Level 2
| | | Level 3
| |
Investments in Securities | | | | | | | | | | | | |
Common Stocks | | $ | 1,967,689,117 | | | $ | — | | | $ | — | |
Exchange Traded Fund | | | 529,971 | | | | | | | | | |
Preferred Stocks | | | 1,616,162 | | | | — | | | | — | |
Asset-Backed Securities | | | | | | | | | | | | |
Non-Residential Mortgage-Backed Securities | | | — | | | | 23,072,946 | | | | 475,000 | |
Residential Mortgage-Backed Securities | | | — | | | | 7,250,187 | | | | — | |
Bank Loans | | | — | | | | 5,603,672 | | | | — | |
Collateralized Mortgage Obligations | | | — | | | | 7,246,148 | | | | — | |
Commercial Mortgage-Backed Securities | | | — | | | | 129,334,107 | | | | — | |
Corporate Bonds | | | — | | | | 271,807,189 | | | | — | |
Mortgage-Backed Securities | | | — | | | | 314,613,334 | | | | — | |
Municipal Bonds | | | — | | | | 12,988,131 | | | | — | |
Non-Corporate Foreign Agencies | | | — | | | | 15,075,436 | | | | — | |
Non-Corporate Sovereign | | | — | | | | 598,338 | | | | — | |
U.S. Government Agency Obligations | | | — | | | | 9,159,073 | | | | — | |
U.S. Government Treasury Obligations | | | — | | | | 201,513,421 | | | | — | |
Affiliated Mutual Funds | | | 320,203,677 | | | | — | | | | — | |
Other Financial Instruments* | | | | | | | | | | | | |
Futures Contracts | | | (1,154 | ) | | | — | | | | — | |
Interest Rate Swap Agreements | | | — | | | | 613,148 | | | | — | |
Credit Default Swap Agreements | | | — | | | | 16,189 | | | | — | |
| | |
|
|
| |
|
|
| |
|
|
|
Total | | $ | 2,290,037,773 | | | $ | 998,891,319 | | | $ | 475,000 | |
| | |
|
|
| |
|
|
| |
|
|
|
| * | Other financial instruments are derivative instruments not reflected in the Schedule of Investments, such as futures, forwards and swap contracts, which are recorded at the unrealized appreciation/depreciation on the instrument. |
The industry classification of portfolio holdings and liabilities in excess of other assets shown as a percentage of net assets as of December 31, 2011 was as follows:
| | | | |
Affiliated Mutual Funds (including 4.0% of collateral received for securities on loan) | | | 10.5 | % |
Mortgage-Backed Securities | | | 10.4 | |
Oil, Gas & Consumable Fuels | | | 7.2 | |
U.S. Government Treasury Obligations | | | 6.7 | |
Commercial Mortgage-Backed Securities | | | 4.3 | |
Pharmaceuticals | | | 3.6 | |
Computers & Peripherals | | | 3.2 | |
Banking | | | 2.9 | |
Software | | | 2.7 | |
Insurance | | | 2.6 | |
IT Services | | | 2.5 | |
Commercial Banks | | | 2.3 | |
Diversified Telecommunication Services | | | 2.1 | |
Food & Staples Retailing | | | 1.9 | |
Communications Equipment | | | 1.8 | |
Machinery | | | 1.8 | |
Media | | | 1.8 | |
Beverages | | | 1.7 | |
Diversified Financial Services | | | 1.6 | |
Healthcare Providers & Services | | | 1.6 | |
Aerospace & Defense | | | 1.5 | |
Specialty Retail | | | 1.5 | |
Capital Markets | | | 1.4 | |
Food Products | | | 1.4 | |
Healthcare Equipment & Supplies | | | 1.3 | |
Chemicals | | | 1.2 | |
Industrial Conglomerates | | | 1.2 | |
| | | | |
Biotechnology | | | 1.1 | % |
Road & Rail | | | 1.1 | |
Semiconductors & Semiconductor Equipment | | | 1.1 | |
Energy Equipment & Services | | | 1.0 | |
Household Products | | | 1.0 | |
Metals & Mining | | | 1.0 | |
Tobacco | | | 1.0 | |
Electric Utilities | | | 0.9 | |
Internet Software & Services | | | 0.9 | |
Hotels, Restaurants & Leisure | | | 0.8 | |
Non-Residential Mortgage-Backed Securities | | | 0.8 | |
Real Estate Investment Trusts | | | 0.8 | |
Automobiles | | | 0.6 | |
Electric | | | 0.6 | |
Electrical Equipment | | | 0.6 | |
Multi-Utilities | | | 0.6 | |
Life Sciences Tools & Services | | | 0.5 | |
Non-Corporate Foreign Agencies | | | 0.5 | |
Telecommunications | | | 0.5 | |
Textiles, Apparel & Luxury Goods | | | 0.5 | |
Air Freight & Logistics | | | 0.4 | |
Electronic Equipment, Instruments & Components | | | 0.4 | |
Foods | | | 0.4 | |
Independent Power Producers & Energy Traders | | | 0.4 | |
Municipal Bonds | | | 0.4 | |
Non-Captive Finance | | | 0.4 | |
Consumer Finance | | | 0.3 | |
Distributors | | | 0.3 | |
Energy – Other | | | 0.3 | |
SEE NOTES TO FINANCIAL STATEMENTS.
A81
| | | | | | |
| | | FLEXIBLE MANAGED PORTFOLIO (continued) | | |
| |
| SCHEDULE OF INVESTMENTS | | December 31, 2011 |
| | | | |
Healthcare & Pharmaceutical | | | 0.3 | % |
Healthcare Insurance | | | 0.3 | |
Household Durables | | | 0.3 | |
Media & Entertainment | | | 0.3 | |
Multiline Retail | | | 0.3 | |
Personal Products | | | 0.3 | |
Technology | | | 0.3 | |
U.S. Government Agency Obligations | | | 0.3 | |
Airlines | | | 0.2 | |
Auto Components | | | 0.2 | |
Cable | | | 0.2 | |
Collateralized Mortgage Obligations | | | 0.2 | |
Containers & Packaging | | | 0.2 | |
Internet & Catalog Retail | | | 0.2 | |
Leisure Equipment & Products | | | 0.2 | |
Lodging | | | 0.2 | |
Metals | | | 0.2 | |
Office Electronics | | | 0.2 | |
Pipelines & Other | | | 0.2 | |
| | | | |
Residential Mortgage-Backed Securities | | | 0.2 | % |
Retailers | | | 0.2 | |
Water Utilities | | | 0.2 | |
Building Products | | | 0.1 | |
Capital Goods | | | 0.1 | |
Construction & Engineering | | | 0.1 | |
Consumer | | | 0.1 | |
Diversified Consumer Services | | | 0.1 | |
Energy – Integrated | | | 0.1 | |
Paper | | | 0.1 | |
Professional Services | | | 0.1 | |
Railroads | | | 0.1 | |
Real Estate Management & Development | | | 0.1 | |
Trading Companies & Distributors | | | 0.1 | |
Wireless Telecommunication Services | | | 0.1 | |
| | |
|
|
|
| | | | 108.3 | |
Liabilities in excess of other assets | | | (8.3 | ) |
| | |
|
|
|
| | | | 100.0 | % |
| | |
|
|
|
The Portfolio invested in derivative instruments during the reporting period. The primary types of risk associated with these derivative instruments are credit risk, equity risk and interest rate risk. The effect of such derivative instruments on the Portfolio’s financial position and financial performance as reflected in the Statement of Assets and Liabilities and Statement of Operations is presented in the summary below.
Fair values of derivative instruments as of December 31, 2011 as presented in the Statement of Assets and Liabilities:
| | | | | | | | | | | | |
Derivatives not designated as hedging
instruments, carried at fair value
| | Asset Derivatives
| | | Liability Derivatives
| |
| | Balance Sheet Location
| | Fair Value
| | | Balance Sheet Location
| | Fair Value
| |
Credit contracts | | Premium paid for swap agreements | | $ | 23,182 | | | Premium received for swap agreements | | $ | 8,391 | |
Credit contracts | | Unrealized appreciation on swap agreements | | | 285,153 | | | Unrealized depreciation on swap agreements | | | 268,964 | |
Interest rate contracts | | Unrealized appreciation on swap agreements | | | 704,956 | | | Unrealized depreciation on swap agreements | | | 91,808 | |
Equity contracts | | Due to broker — variation margin | | | 314,811 | * | | — | | | — | |
Interest rate contracts | | Due to broker — variation margin | | | 94,781 | * | | Due to broker — variation margin | | | 410,746 | * |
| | | | |
|
|
| | | |
|
|
|
Total | | | | $ | 1,422,883 | | | | | $ | 779,909 | |
| | | | |
|
|
| | | |
|
|
|
| * | Includes cumulative appreciation/depreciation on futures contracts as reported in the Schedule of Investments. Only unsettled variation margin receivable (payable) is reported within the Statement of Assets and Liabilities. |
The effects of derivative instruments on the Statement of Operations for the year ended December 31, 2011 are as follows:
| | | | | | | | | | | | | | | | |
Amount of Realized Gain or (Loss) on Derivatives Recognized in Income
| |
Derivatives not designated as hedging instruments, carried at fair value
| | Futures
| | | Swaps
| | | Rights
| | | Total
| |
Credit contracts | | $ | — | | | $ | (58,151 | ) | | $ | — | | | $ | (58,151 | ) |
Equity contracts | | | 6,526,248 | | | | — | | | | 9,676 | | | | 6,535,924 | |
Interest rate contracts | | | 1,170,844 | | | | 840,476 | | | | — | | | | 2,011,320 | |
| | |
|
|
| |
|
|
| |
|
|
| |
|
|
|
Total | | $ | 7,697,092 | | | $ | 782,325 | | | $ | 9,676 | | | $ | 8,489,093 | |
| | |
|
|
| |
|
|
| |
|
|
| |
|
|
|
| | | | | | | | | | | | | | |
|
Change in Unrealized Appreciation or (Depreciation) on Derivatives Recognized in Income
| |
Derivatives not designated as hedging instruments, carried at fair value
| | | | Futures
| | | Swaps
| | | Total
| |
Credit contracts | | $ | — | | | $ | 405,233 | | | $ | 405,233 | |
Equity contracts | | | (432,789 | ) | | | — | | | | (432,789 | ) |
Interest rate contracts | | | (2,341,562 | ) | | | 613,148 | | | | (1,728,414 | ) |
| | |
|
|
| |
|
|
| |
|
|
|
Total | | $ | (2,774,351 | ) | | $ | 1,018,381 | | | $ | (1,755,970 | ) |
| | | | |
|
|
| |
|
|
| |
|
|
|
SEE NOTES TO FINANCIAL STATEMENTS.
A82
| | | | | | |
| | | FLEXIBLE MANAGED PORTFOLIO (continued) | | |
| |
| SCHEDULE OF INVESTMENTS | | December 31, 2011 |
For the year ended December 31, 2011, the Portfolio’s average volume of derivative activities is as follows:
| | |
Futures
Long Position
(Value at Trade Date)
| | Futures
Short Position
(Value at Trade Date)
|
| $202,131,587 | | $86,517,452 |
| | |
Interest Rate Swaps
(Notional Amount in USD (000))
| | Credit Default
Swaps as Buyer
(Notional Amount in USD (000))
|
| $27,719 | | $23,702 |
SEE NOTES TO FINANCIAL STATEMENTS.
A83
| | | | | | |
| | | FLEXIBLE MANAGED PORTFOLIO (continued) | | |
STATEMENT OF ASSETS AND LIABILITIES
December 31, 2011
| | | | |
| ASSETS | | | | |
Investments, at value including securities on loan of $119,082,965: | | | | |
Unaffiliated investments (cost $2,688,623,499) | | $ | 2,968,572,232 | |
Affiliated investments (cost $335,062,987) | | | 320,203,677 | |
Cash | | | 120,788 | |
Foreign currency, at value (cost $93,163) | | | 93,088 | |
Receivable for investments sold | | | 60,802,601 | |
Dividends and interest receivable | | | 9,374,757 | |
Unrealized appreciation on swap agreements | | | 990,109 | |
Foreign tax reclaim receivable | | | 25,606 | |
Premium paid for swap agreements | | | 23,182 | |
Prepaid expenses | | | 18,808 | |
Receivable for Series shares sold | | | 1,514 | |
| | |
|
|
|
Total Assets | | | 3,360,226,362 | |
| | |
|
|
|
| LIABILITIES | | | | |
Payable for investments purchased | | | 198,771,855 | |
Collateral for securities on loan | | | 121,894,849 | |
Management fee payable | | | 1,538,487 | |
Payable for Series shares repurchased | | | 372,874 | |
Unrealized depreciation on swap agreements | | | 360,772 | |
Accrued expenses and other liabilities | | | 342,491 | |
Due to broker—variation margin | | | 134,327 | |
Premium received for swap agreements | | | 8,391 | |
Affiliated transfer agent fee payable | | | 926 | |
| | |
|
|
|
Total Liabilities | | | 323,424,972 | |
| | |
|
|
|
| NET ASSETS | | $ | 3,036,801,390 | |
| | |
|
|
|
Net assets were comprised of: | | | | |
Paid-in capital | | $ | 2,925,314,753 | |
Retained earnings | | | 111,486,637 | |
| | |
|
|
|
Net assets, December 31, 2011 | | $ | 3,036,801,390 | |
| | |
|
|
|
Net asset value and redemption price per share, $3,036,801,390 / 189,970,031 outstanding shares of beneficial interest | | $ | 15.99 | |
| | |
|
|
|
STATEMENT OF OPERATIONS
Year Ended December 31, 2011
| | | | |
| INVESTMENT INCOME | | | | |
Unaffiliated dividend income (net of foreign withholding taxes of $115,211) | | $ | 42,076,259 | |
Interest | | | 36,812,500 | |
Affiliated dividend income | | | 2,231,464 | |
Affiliated income from securities loaned, net | | | 177,258 | |
| | |
|
|
|
| | | | 81,297,481 | |
| | |
|
|
|
| EXPENSES | | | | |
Management fee | | | 18,493,636 | |
Custodian’s fees and expenses | | | 410,000 | |
Shareholders’ reports | | | 290,000 | |
Trustees’ fees | | | 39,000 | |
Insurance expenses | | | 37,000 | |
Audit fee | | | 36,000 | |
Legal fees and expenses | | | 12,000 | |
Transfer agent’s fee and expenses (including affiliated expense of $5,500) (Note 4) | | | 12,000 | |
Commitment fee on syndicated credit agreement | | | 10,000 | |
Miscellaneous | | | 56,690 | |
| | |
|
|
|
Total expenses | | | 19,396,326 | |
| | |
|
|
|
| NET INVESTMENT INCOME | | | 61,901,155 | |
| | |
|
|
|
| NET REALIZED AND UNREALIZED GAIN (LOSS) ON INVESTMENTS, SWAPS AND FOREIGN CURRENCIES | | | | |
Net realized gain on: | | | | |
Investment transactions (including affiliated: $(2,057,740)) | | | 194,355,716 | |
Futures transactions | | | 7,697,092 | |
Swap agreement transactions | | | 782,325 | |
Foreign currency transactions | | | 27,065 | |
| | |
|
|
|
| | | | 202,862,198 | |
| | |
|
|
|
Net change in unrealized appreciation (depreciation) on: | | | | |
Investments (including affiliated: $51,883) | | | (133,376,770 | ) |
Futures | | | (2,774,351 | ) |
Swap agreements | | | 1,018,381 | |
Foreign currencies | | | (48,734 | ) |
| | |
|
|
|
| | | | (135,181,474 | ) |
| | |
|
|
|
| NET GAIN ON INVESTMENTS, SWAPS AND FOREIGN CURRENCIES | | | 67,680,724 | |
| | |
|
|
|
| NET INCREASE IN NET ASSETS RESULTING FROM OPERATIONS | | $ | 129,581,879 | |
| | |
|
|
|
STATEMENT OF CHANGES IN NET ASSETS
| | | | | | | | |
| | | Year Ended December 31,
| |
| | | 2011
| | | 2010
| |
| INCREASE (DECREASE) IN NET ASSETS | | | | | | | | |
| OPERATIONS: | | | | | | | | |
Net investment income | | $ | 61,901,155 | | | $ | 60,267,161 | |
Net realized gain on investment, swap agreement and foreign currency transactions | | | 202,862,198 | | | | 164,747,735 | |
Net change in unrealized appreciation (depreciation) on investments, swaps and foreign currencies | | | (135,181,474 | ) | | | 111,985,470 | |
| | |
|
|
| |
|
|
|
NET INCREASE IN NET ASSETS RESULTING FROM OPERATIONS | | | 129,581,879 | | | | 337,000,366 | |
| | |
|
|
| |
|
|
|
| DISTRIBUTIONS | | | (60,257,696 | ) | | | (65,760,146 | ) |
| | |
|
|
| |
|
|
|
| SERIES SHARE TRANSACTIONS: | | | | | | | | |
Series shares sold [664,274 and 965,601 shares, respectively] | | | 10,513,628 | | | | 14,188,409 | |
Series shares issued in reinvestment of distributions [3,811,366 and 4,680,438 shares, respectively] | | | 60,257,696 | | | | 65,760,146 | |
Series shares repurchased [11,331,831 and 12,309,724 shares, respectively] | | | (180,636,555 | ) | | | (179,839,115 | ) |
| | |
|
|
| |
|
|
|
NET DECREASE IN NET ASSETS RESULTING FROM SERIES SHARE TRANSACTIONS | | | (109,865,231 | ) | | | (99,890,560 | ) |
| | |
|
|
| |
|
|
|
| TOTAL INCREASE (DECREASE) IN NET ASSETS | | | (40,541,048 | ) | | | 171,349,660 | |
| NET ASSETS: | | | | | | | | |
Beginning of year | | | 3,077,342,438 | | | | 2,905,992,778 | |
| | |
|
|
| |
|
|
|
End of year | | $ | 3,036,801,390 | | | $ | 3,077,342,438 | |
| | |
|
|
| |
|
|
|
SEE NOTES TO FINANCIAL STATEMENTS.
A84
| | | | | | |
| | | GLOBAL PORTFOLIO | | |
| |
| SCHEDULE OF INVESTMENTS | | December 31, 2011 |
| | | | | | | | |
| LONG-TERM INVESTMENTS — 97.1% | | | | |
| COMMON STOCKS — 96.8% | | Shares
| | | Value
(Note 2)
| |
| | | | | | | | | |
Australia — 2.4% | | | | | |
Bendigo and Adelaide Bank Ltd. | | | 103,400 | | | $ | 849,231 | |
BHP Billiton PLC | | | 122,408 | | | | 3,569,093 | |
BlueScope Steel Ltd. | | | 218,400 | | | | 90,469 | |
Caltex Australia Ltd. | | | 34,900 | | | | 420,138 | |
Challenger Ltd. | | | 204,700 | | | | 864,685 | |
Downer EDI Ltd.* | | | 214,250 | | | | 701,231 | |
Goodman Fielder Ltd. | | | 628,858 | | | | 279,790 | |
Metcash Ltd. | | | 175,000 | | | | 723,118 | |
National Australia Bank Ltd. | | | 62,400 | | | | 1,490,896 | |
OneSteel Ltd. | | | 447,200 | | | | 320,177 | |
Pacific Brands Ltd. | | | 460,600 | | | | 259,105 | |
Qantas Airways Ltd.* | | | 419,500 | | | | 626,433 | |
Rio Tinto Ltd. | | | 13,100 | | | | 807,939 | |
TABCORP Holdings Ltd. | | | 99,800 | | | | 278,666 | |
Telstra Corp. Ltd. | | | 282,900 | | | | 963,534 | |
Westpac Banking Corp. | | | 55,600 | | | | 1,137,352 | |
| | | | | | |
|
|
|
| | | | | | | | 13,381,857 | |
| | | | | | |
|
|
|
Austria — 0.3% | | | | | |
OMV AG | | | 32,300 | | | | 979,890 | |
Voestalpine AG | | | 14,500 | | | | 406,672 | |
| | | | | | |
|
|
|
| | | | | | | | 1,386,562 | |
| | | | | | |
|
|
|
Belgium — 0.2% | | | | | |
AGFA-Gevaert NV* | | | 86,100 | | | | 137,065 | |
Delhaize Group SA | | | 18,200 | | | | 1,022,418 | |
| | | | | | |
|
|
|
| | | | | | | | 1,159,483 | |
| | | | | | |
|
|
|
Brazil — 0.6% | | | | | |
Petroleo Brasileiro SA | | | 267,200 | | | | 3,294,786 | |
| | | | | | |
|
|
|
Canada — 0.8% | | | | | |
Brookfield Asset Management, Inc. (Class A Stock) | | | 93,105 | | | | 2,558,525 | |
Canadian Pacific Railway Ltd. | | | 24,400 | | | | 1,651,148 | |
Lululemon Athletica, Inc.*(a) | | | 11,244 | | | | 524,645 | |
| | | | | | |
|
|
|
| | | | | | | | 4,734,318 | |
| | | | | | |
|
|
|
China — 1.2% | | | | | |
Baidu, Inc., ADR* | | | 39,408 | | | | 4,589,850 | |
Industrial & Commercial Bank of China (Class H Stock) | | | 2,469,000 | | | | 1,465,518 | |
Youku, Inc., ADR*(a) | | | 39,903 | | | | 625,280 | |
| | | | | | |
|
|
|
| | | | | | | | 6,680,648 | |
| | | | | | |
|
|
|
Denmark — 0.7% | | | | | |
H Lundbeck A/S | | | 49,400 | | | | 928,943 | |
Novo Nordisk A/S (Class B Stock) | | | 26,751 | | | | 3,074,132 | |
| | | | | | |
|
|
|
| | | | | | | | 4,003,075 | |
| | | | | | |
|
|
|
Finland — 0.2% | | | | | |
Nokia OYJ | | | 83,800 | | | | 409,103 | |
Tieto OYJ | | | 56,200 | | | | 800,104 | |
| | | | | | |
|
|
|
| | | | | | | | 1,209,207 | |
| | | | | | |
|
|
|
France — 5.0% | | | | | |
Arkema SA | | | 18,857 | | | | 1,334,987 | |
AXA SA | | | 47,100 | | | | 612,334 | |
BNP Paribas SA | | | 117,864 | | | | 4,629,745 | |
CIE de Saint-Gobain | | | 40,591 | | | | 1,558,444 | |
| | | | | | | | |
| COMMON STOCKS | | | | |
| (continued) | | Shares
| | | Value
(Note 2)
| |
| | | | | | | | | |
France (continued) | | | | | |
CIE Generale des Etablissements Michelin (Class B Stock) | | | 24,312 | | | $ | 1,437,197 | |
CIE Generale d’Optique Essilor International SA | | | 32,411 | | | | 2,288,255 | |
Ciments Francais SA | | | 5,200 | | | | 402,459 | |
Credit Agricole SA | | | 105,684 | | | | 596,366 | |
Dassault Systemes SA | | | 26,596 | | | | 2,131,742 | |
France Telecom SA | | | 31,800 | | | | 499,441 | |
Rallye SA | | | 10,700 | | | | 299,196 | |
Renault SA | | | 12,300 | | | | 426,635 | |
Sanofi | | | 41,490 | | | | 3,047,379 | |
SCOR SE | | | 22,000 | | | | 514,230 | |
Societe Generale | | | 14,658 | | | | 326,397 | |
Thales SA | | | 14,269 | | | | 450,610 | |
Total SA | | | 43,500 | | | | 2,223,840 | |
Total SA, ADR(a) | | | 52,400 | | | | 2,678,164 | |
Valeo SA | | | 17,300 | | | | 687,611 | |
Vivendi SA | | | 86,100 | | | | 1,885,475 | |
| | | | | | |
|
|
|
| | | | | | | | 28,030,507 | |
| | | | | | |
|
|
|
Germany — 4.7% | | | | | |
Allianz SE | | | 12,600 | | | | 1,205,288 | |
Aurubis AG | | | 6,200 | | | | 330,602 | |
BASF SE | | | 14,400 | | | | 1,004,356 | |
Bayer AG | | | 80,535 | | | | 5,149,070 | |
Bayerische Motoren Werke AG | | | 41,376 | | | | 2,771,788 | |
Brenntag AG | | | 14,105 | | | | 1,313,473 | |
Daimler AG | | | 16,000 | | | | 702,414 | |
Deutsche Bank AG | | | 26,100 | | | | 994,310 | |
E.ON AG | | | 26,300 | | | | 567,425 | |
Fresenius Medical Care AG & Co. KGaA | | | 41,668 | | | | 2,831,256 | |
Hannover Rueckversicherung AG | | | 11,800 | | | | 585,304 | |
Merck KGaA | | | 13,600 | | | | 1,355,863 | |
Metro AG | | | 21,300 | | | | 777,402 | |
Muenchener Rueckversicherungs AG | | | 7,200 | | | | 883,215 | |
Rheinmetall AG | | | 13,300 | | | | 589,304 | |
RWE AG | | | 21,600 | | | | 758,998 | |
SAP AG | | | 71,681 | | | | 3,789,774 | |
ThyssenKrupp AG | | | 36,700 | | | | 841,917 | |
| | | | | | |
|
|
|
| | | | | | | | 26,451,759 | |
| | | | | | |
|
|
|
Greece | | | | | |
Alpha Bank AE* | | | 15,700 | | | | 10,932 | |
| | | | | | |
|
|
|
Hong Kong — 1.3% | | | | | |
Cathay Pacific Airways Ltd. | | | 440,000 | | | | 754,616 | |
Chaoda Modern Agriculture Holdings Ltd. | | | 966,070 | | | | 1,244 | |
First Pacific Co. Ltd. | | | 1,227,000 | | | | 1,276,512 | |
Hutchison Port Holdings Trust (Class U Stock) | | | 2,393,000 | | | | 1,483,660 | |
Jardine Cycle & Carriage Ltd. | | | 47,000 | | | | 1,743,680 | |
Kingboard Chemical Holdings Ltd. | | | 180,000 | | | | 533,052 | |
Li & Fung Ltd. | | | 612,000 | | | | 1,133,129 | |
Singamas Container Holdings Ltd. | | | 2,676,000 | | | | 506,492 | |
| | | | | | |
|
|
|
| | | | | | | | 7,432,385 | |
| | | | | | |
|
|
|
SEE NOTES TO FINANCIAL STATEMENTS.
A85
| | | | | | |
| | | GLOBAL PORTFOLIO (continued) | | |
| |
| SCHEDULE OF INVESTMENTS | | December 31, 2011 |
| | | | | | | | |
COMMON STOCKS
(continued) | | Shares
| | | Value
(Note 2)
| |
| | | | | | | | | |
Indonesia — 0.3% | | | | | |
Bank Rakyat Indonesia Persero Tbk PT | | | 2,555,000 | | | $ | 1,901,985 | |
| | | | | | |
|
|
|
Ireland — 0.6% | | | | | |
Accenture PLC (Class A Stock) | | | 67,800 | | | | 3,608,994 | |
Allied Irish Banks PLC* | | | 42,100 | | | | 3,760 | |
Bank of Ireland (Governor & Co.)* | | | 83,300 | | | | 8,840 | |
Irish Life & Permanent Group Holdings PLC* | | | 51,300 | | | | 1,593 | |
| | | | | | |
|
|
|
| | | | | | | | 3,623,187 | |
| | | | | | |
|
|
|
Israel — 0.8% | | | | | |
Bank Hapoalim BM | | | 176,900 | | | | 576,515 | |
Check Point Software Technologies Ltd.*(a) | | | 59,054 | | | | 3,102,697 | |
Elbit Systems Ltd. | | | 11,400 | | | | 468,145 | |
Teva Pharmaceutical Industries Ltd. | | | 12,500 | | | | 503,149 | |
| | | | | | |
|
|
|
| | | | | | | | 4,650,506 | |
| | | | | | |
|
|
|
Italy — 0.8% | | | | | |
Banco Popolare SC | | | 38,200 | | | | 49,440 | |
Enel SpA | | | 323,000 | | | | 1,314,323 | |
ENI SpA | | | 88,000 | | | | 1,823,439 | |
Finmeccanica SpA | | | 43,100 | | | | 159,425 | |
Fondiaria-Sai SpA* | | | 19,900 | | | | 15,968 | |
Telecom Italia SpA | | | 796,300 | | | | 856,436 | |
| | | | | | |
|
|
|
| | | | | | | | 4,219,031 | |
| | | | | | |
|
|
|
Japan — 6.5% | | | | | |
Alpine Electronics, Inc. | | | 22,700 | | | | 244,489 | |
Aoyama Trading Co. Ltd. | | | 52,100 | | | | 978,779 | |
Circle K Sunkus Co. Ltd. | | | 46,900 | | | | 776,894 | |
COMSYS Holdings Corp. | | | 72,800 | | | | 764,225 | |
Daito Trust Construction Co. Ltd. | | | 13,500 | | | | 1,157,594 | |
Fast Retailing Co. Ltd. | | | 15,200 | | | | 2,764,714 | |
Fukuoka Financial Group, Inc. | | | 158,000 | | | | 663,038 | |
Hitachi Capital Corp. | | | 49,400 | | | | 684,810 | |
ITOCHU Corp. | | | 87,400 | | | | 887,967 | |
Itochu Techno-Solutions Corp. | | | 12,500 | | | | 561,095 | |
JX Holdings, Inc. | | | 101,400 | | | | 612,589 | |
KDDI Corp. | | | 230 | | | | 1,479,148 | |
Keihin Corp. | | | 44,800 | | | | 742,689 | |
K’s Holdings Corp. | | | 19,700 | | | | 780,629 | |
Kurabo Industries Ltd. | | | 173,100 | | | | 328,343 | |
Kyowa Exeo Corp. | | | 81,900 | | | | 771,437 | |
Marubeni Corp. | | | 176,000 | | | | 1,072,418 | |
Mitsubishi Corp. | | | 34,500 | | | | 696,992 | |
Mitsubishi UFJ Financial Group, Inc. | | | 140,200 | | | | 595,627 | |
Mitsui & Co. Ltd. | | | 56,300 | | | | 875,550 | |
Mizuho Financial Group, Inc. | | | 801,800 | | | | 1,083,373 | |
Nichii Gakkan Co. | | | 3,200 | | | | 39,039 | |
Nichirei Corp. | | | 83,000 | | | | 402,222 | |
Nippon Electric Glass Co. Ltd. | | | 54,000 | | | | 534,598 | |
Nippon Shokubai Co. Ltd. | | | 68,000 | | | | 730,622 | |
Nippon Telegraph & Telephone Corp. | | | 37,000 | | | | 1,891,581 | |
Nissan Shatai Co. Ltd. | | | 90,000 | | | | 874,627 | |
NTT DoCoMo, Inc. | | | 900 | | | | 1,654,541 | |
ORIX Corp. | | | 30,420 | | | | 2,513,592 | |
Sankyu, Inc. | | | 210,000 | | | | 793,946 | |
Seino Holdings Corp. | | | 65,000 | | | | 504,157 | |
| | | | | | | | |
COMMON STOCKS
(continued) | | Shares
| | | Value
(Note 2)
| |
| | | | | | | | | |
Japan (continued) | | | | | |
Shimachu Co. Ltd. | | | 30,700 | | | $ | 703,982 | |
Softbank Corp. | | | 53,300 | | | | 1,569,847 | |
Sumitomo Corp. | | | 126,900 | | | | 1,717,939 | |
Sumitomo Mitsui Financial Group, Inc. | | | 59,300 | | | | 1,651,802 | |
Sumitomo Mitsui Trust Holdings, Inc. | | | 64,070 | | | | 188,123 | |
Toagosei Co. Ltd. | | | 147,000 | | | | 603,508 | |
Toyo Suisan Kaisha Ltd. | | | 15,000 | | | | 363,453 | |
Toyota Tsusho Corp. | | | 34,300 | | | | 606,500 | |
Yokohama Rubber Co. Ltd. (The) | | | 100,000 | | | | 561,258 | |
| | | | | | |
|
|
|
| | | | | | | | 36,427,737 | |
| | | | | | |
|
|
|
Liechtenstein | | | | | | | | |
Verwaltungs-und Privat-Bank AG | | | 2,578 | | | | 227,802 | |
| | | | | | |
|
|
|
Netherlands — 2.1% | | | | | | | | |
Aegon NV* | | | 56,800 | | | | 227,965 | |
ASM Pacific Technology Ltd. | | | 203,700 | | | | 2,285,743 | |
ASML Holding NV | | | 58,200 | | | | 2,446,185 | |
ING Groep NV CVA* | | | 119,400 | | | | 859,204 | |
Koninklijke Ahold NV | | | 85,400 | | | | 1,150,051 | |
Koninklijke DSM NV | | | 20,400 | | | | 946,535 | |
Koninklijke KPN NV | | | 82,600 | | | | 988,335 | |
Unilever NV CVA | | | 86,345 | | | | 2,969,244 | |
| | | | | | |
|
|
|
| | | | | | | | 11,873,262 | |
| | | | | | |
|
|
|
New Zealand | | | | | | | | |
Air New Zealand Ltd. | | | 737,900 | | | | 516,942 | |
| | | | | | |
|
|
|
Norway — 0.3% | | | | | | | | |
DnB ASA | | | 54,100 | | | | 529,616 | |
Statoil ASA | | | 45,100 | | | | 1,157,503 | |
| | | | | | |
|
|
|
| | | | | | | | 1,687,119 | |
| | | | | | |
|
|
|
Peru — 0.4% | | | | | | | | |
Credicorp Ltd. | | | 21,000 | | | | 2,298,870 | |
| | | | | | |
|
|
|
Portugal | | | | | | | | |
Banco Espirito Santo SA | | | 43,600 | | | | 76,179 | |
| | | | | | |
|
|
|
Singapore — 0.1% | | | | | | | | |
CapitaMalls Asia Ltd. | | | 378,000 | | | | 329,317 | |
| | | | | | |
|
|
|
South Africa — 0.2% | | | | | | | | |
Truworths International Ltd. | | | 147,200 | | | | 1,346,628 | |
| | | | | | |
|
|
|
South Korea — 0.9% | | | | | | | | |
Samsung Electronics Co. Ltd. | | | 5,276 | | | | 4,845,493 | |
| | | | | | |
|
|
|
Spain — 1.0% | | | | | | | | |
Banco Bilbao Vizcaya Argentaria SA | | | 60,800 | | | | 525,651 | |
Banco Espanol de Credito SA | | | 79,800 | | | | 384,721 | |
Banco Santander Chile, ADR(a) | | | 15,611 | | | | 1,181,753 | |
Banco Santander SA | | | 186,100 | | | | 1,413,845 | |
Repsol YPF SA | | | 57,200 | | | | 1,757,124 | |
Telefonica SA | | | 25,100 | | | | 434,820 | |
| | | | | | |
|
|
|
| | | | | | | | 5,697,914 | |
| | | | | | |
|
|
|
Sweden — 0.8% | | | | | | | | |
Atlas Copco AB (Class A Stock) | | | 112,841 | | | | 2,426,670 | |
Boliden AB | | | 91,200 | | | | 1,331,812 | |
Electrolux AB (Class B Stock) | | | 25,100 | | | | 400,094 | |
NCC AB (Class B Stock) | | | 15,700 | | | | 276,037 | |
| | | | | | |
|
|
|
| | | | | | | | 4,434,613 | |
| | | | | | |
|
|
|
SEE NOTES TO FINANCIAL STATEMENTS.
A86
| | | | | | |
| | | GLOBAL PORTFOLIO (continued) | | |
| |
| SCHEDULE OF INVESTMENTS | | December 31, 2011 |
| | | | | | | | |
COMMON STOCKS
(continued) | | Shares
| | | Value
(Note 2)
| |
| | | | | | | | | |
Switzerland — 4.5% | | | | | | | | |
Baloise Holding AG | | | 13,000 | | | $ | 891,302 | |
CIE Financiere Richemont SA | | | 38,454 | | | | 1,945,012 | |
CIE Financiere Richemont SA, ADR | | | 619,111 | | | | 3,107,937 | |
Clariant AG* | | | 42,200 | | | | 416,474 | |
Credit Suisse Group AG* | | | 36,700 | | | | 862,311 | |
Georg Fischer AG* | | | 2,000 | | | | 683,488 | |
Glencore International PLC | | | 395,914 | | | | 2,410,211 | |
Julius Baer Group Ltd. | | | 56,849 | | | | 2,223,605 | |
Kuehne + Nagel International AG | | | 10,762 | | | | 1,208,763 | |
Novartis AG | | | 28,700 | | | | 1,640,786 | |
Partners Group Holding AG | | | 11,595 | | | | 2,023,231 | |
Roche Holding AG | | | 10,000 | | | | 1,694,879 | |
Sika AG | | | 366 | | | | 689,684 | |
Swiss Re AG* | | | 19,300 | | | | 983,595 | |
Syngenta AG | | | 10,096 | | | | 2,955,818 | |
UBS AG* | | | 32,000 | | | | 380,879 | |
Zurich Financial Services AG | | | 6,700 | | | | 1,515,756 | |
| | | | | | |
|
|
|
| | | | | | | | 25,633,731 | |
| | | | | | |
|
|
|
United Kingdom — 13.5% | | | | | | | | |
AMEC PLC | | | 122,127 | | | | 1,721,180 | |
AstraZeneca PLC | | | 55,900 | | | | 2,582,658 | |
Aviva PLC | | | 144,400 | | | | 674,548 | |
Babcock International Group PLC | | | 159,884 | | | | 1,826,231 | |
BAE Systems PLC | | | 256,400 | | | | 1,135,229 | |
Barclays PLC | | | 332,700 | | | | 909,614 | |
Beazley PLC | | | 286,700 | | | | 597,960 | |
Berendsen PLC | | | 24,300 | | | | 164,234 | |
Berkeley Group Holdings PLC* | | | 76,699 | | | | 1,519,877 | |
BG Group PLC | | | 109,722 | | | | 2,345,514 | |
BP PLC | | | 288,000 | | | | 2,059,635 | |
British American Tobacco PLC | | | 77,341 | | | | 3,669,950 | |
British Sky Broadcasting Group PLC | | | 157,176 | | | | 1,787,977 | |
BT Group PLC | | | 602,100 | | | | 1,785,018 | |
Burberry Group PLC | | | 93,972 | | | | 1,729,358 | |
Cable & Wireless Communications PLC | | | 28,000 | | | | 16,611 | |
Centrica PLC | | | 512,815 | | | | 2,303,972 | |
Compass Group PLC | | | 346,240 | | | | 3,285,387 | |
Cookson Group PLC | | | 104,200 | | | | 823,671 | |
Drax Group PLC | | | 63,400 | | | | 536,604 | |
DS Smith PLC | | | 199,700 | | | | 614,061 | |
GlaxoSmithKline PLC | | | 48,600 | | | | 1,110,618 | |
Home Retail Group PLC | | | 259,200 | | | | 335,714 | |
J Sainsbury PLC | | | 204,700 | | | | 962,909 | |
Johnson Matthey PLC | | | 85,034 | | | | 2,424,562 | |
Kesa Electricals PLC | | | 365,500 | | | | 382,006 | |
Legal & General Group PLC | | | 483,800 | | | | 772,373 | |
Logica PLC* | | | 583,800 | | | | 559,393 | |
Marks & Spencer Group PLC | | | 182,600 | | | | 881,920 | |
Marston’s PLC | | | 339,130 | | | | 483,215 | |
Mondi PLC | | | 105,500 | | | | 745,473 | |
Next PLC | | | 48,519 | | | | 2,062,314 | |
Old Mutual PLC | | | 411,400 | | | | 865,708 | |
Pearson PLC | | | 157,307 | | | | 2,955,980 | |
Petrofac Ltd. | | | 122,762 | | | | 2,747,236 | |
Premier Foods PLC* | | | 1,525,600 | | | | 137,653 | |
Prudential PLC | | | 394,113 | | | | 3,907,957 | |
| | | | | | | | |
COMMON STOCKS
(continued) | | Shares
| | | Value
(Note 2)
| |
| | | | | | | | | |
United Kingdom (continued) | | | | | | | | |
Rexam PLC | | | 125,100 | | | $ | 685,415 | |
Rolls-Royce Holdings PLC* | | | 301,026 | | | | 3,489,811 | |
Royal Bank of Scotland Group PLC* | | | 263,527 | | | | 82,587 | |
Royal Dutch Shell PLC (Class B Stock) | | | 122,300 | | | | 4,660,893 | |
Royal Dutch Shell PLC, ADR(a) | | | 32,950 | | | | 2,408,316 | |
RSA Insurance Group PLC | | | 300,200 | | | | 490,450 | |
SSE PLC | | | 136,003 | | | | 2,726,734 | |
Standard Chartered PLC | | | 136,419 | | | | 2,985,066 | |
Thomas Cook Group PLC | | | 164,000 | | | | 37,567 | |
Tullow Oil PLC | | | 94,229 | | | | 2,051,638 | |
Vodafone Group PLC | | | 411,600 | | | | 1,143,546 | |
WM Morrison Supermarkets PLC | | | 320,700 | | | | 1,624,617 | |
| | | | | | |
|
|
|
| | | | | | | | 75,810,960 | |
| | | | | | |
|
|
|
United States — 46.6% | | | | | | | | |
3M Co. | | | 31,600 | | | | 2,582,668 | |
Allergan, Inc. | | | 27,613 | | | | 2,422,765 | |
Allstate Corp. (The) | | | 50,800 | | | | 1,392,428 | |
AMC Networks, Inc. (Class A Stock)* | | | 10,700 | | | | 402,106 | |
American Express Co. | | | 38,650 | | | | 1,823,121 | |
Ameriprise Financial, Inc. | | | 18,000 | | | | 893,520 | |
Amgen, Inc. | | | 25,300 | | | | 1,624,513 | |
Apple, Inc.* | | | 16,019 | | | | 6,487,695 | |
AT&T, Inc. | | | 114,100 | | | | 3,450,384 | |
AutoZone, Inc.* | | | 1,860 | | | | 604,444 | |
Avon Products, Inc. | | | 59,300 | | | | 1,035,971 | |
Baker Hughes, Inc. | | | 38,100 | | | | 1,853,184 | |
Bank of America Corp. | | | 273,400 | | | | 1,520,104 | |
Beam, Inc. | | | 13,650 | | | | 699,290 | |
Biogen Idec, Inc.* | | | 35,717 | | | | 3,930,656 | |
Boeing Co. (The) | | | 12,450 | | | | 913,207 | |
Bristol-Myers Squibb Co. | | | 73,598 | | | | 2,593,593 | |
Cablevision Systems Corp. (Class A Stock) | | | 37,900 | | | | 538,938 | |
Chevron Corp. | | | 48,300 | | | | 5,139,120 | |
Cisco Systems, Inc. | | | 94,800 | | | | 1,713,984 | |
Coach, Inc. | | | 46,789 | | | | 2,856,001 | |
Cognizant Technology Solutions Corp. (Class A Stock)* | | | 3,611 | | | | 232,223 | |
Comcast Corp. (Class A Stock) | | | 46,600 | | | | 1,104,886 | |
Continental Resources, Inc.*(a) | | | 8,794 | | | | 586,648 | |
Covidien PLC | | | 36,600 | | | | 1,647,366 | |
Cummins, Inc. | | | 28,191 | | | | 2,481,372 | |
Danaher Corp. | | | 59,910 | | | | 2,818,166 | |
Deckers Outdoor Corp.* | | | 7,179 | | | | 542,517 | |
Dell, Inc.* | | | 73,400 | | | | 1,073,842 | |
Dollar Tree, Inc.* | | | 9,623 | | | | 799,768 | |
Dow Chemical Co. (The) | | | 63,599 | | | | 1,829,107 | |
Eaton Corp. | | | 57,110 | | | | 2,485,998 | |
Entergy Corp. | | | 27,650 | | | | 2,019,833 | |
EQT Corp. | | | 10,550 | | | | 578,034 | |
Estee Lauder Cos., Inc. (The) (Class A Stock) | | | 33,011 | | | | 3,707,796 | |
Exelon Corp. | | | 57,600 | | | | 2,498,112 | |
Exxon Mobil Corp. | | | 51,300 | | | | 4,348,188 | |
Fifth Third Bancorp | | | 91,800 | | | | 1,167,696 | |
General Electric Co. | | | 161,100 | | | | 2,885,301 | |
SEE NOTES TO FINANCIAL STATEMENTS.
A87
| | | | | | |
| | | GLOBAL PORTFOLIO (continued) | | |
| |
| SCHEDULE OF INVESTMENTS | | December 31, 2011 |
| | | | | | | | |
COMMON STOCKS
(continued) | | Shares
| | | Value
(Note 2)
| |
| | | | | | | | | |
United States (continued) | | | | | | | | |
General Motors Co.*(a) | | | 78,100 | | | $ | 1,583,087 | |
Goldman Sachs Group, Inc. (The) | | | 6,450 | | | | 583,273 | |
Google, Inc. (Class A Stock)* | | | 6,701 | | | | 4,328,176 | |
H&R Block, Inc. | | | 69,000 | | | | 1,126,770 | |
Halliburton Co. | | | 125,322 | | | | 4,324,862 | |
Hewlett-Packard Co. | | | 26,500 | | | | 682,640 | |
Home Depot, Inc. (The) | | | 61,800 | | | | 2,598,072 | |
Honeywell International, Inc. | | | 23,900 | | | | 1,298,965 | |
Illinois Tool Works, Inc. | | | 46,400 | | | | 2,167,344 | |
Ingersoll-Rand PLC(a) | | | 24,600 | | | | 749,562 | |
International Business Machines Corp. | | | 14,125 | | | | 2,597,305 | |
International Paper Co. | | | 67,800 | | | | 2,006,880 | |
Johnson & Johnson | | | 43,150 | | | | 2,829,777 | |
JPMorgan Chase & Co. | | | 109,100 | | | | 3,627,575 | |
Kellogg Co.(a) | | | 25,700 | | | | 1,299,649 | |
KeyCorp | | | 151,700 | | | | 1,166,573 | |
Kimberly-Clark Corp. | | | 13,400 | | | | 985,704 | |
Kohl’s Corp. | | | 27,400 | | | | 1,352,190 | |
Liberty Media Corp.—Liberty Starz, Ser. A (Class A Stock)* | | | 7,358 | | | | 574,292 | |
Lockheed Martin Corp.(a) | | | 9,200 | | | | 744,280 | |
Lowe’s Cos., Inc.(a) | | | 74,800 | | | | 1,898,424 | |
Madison Square Garden, Inc. (Class A Stock)* | | | 13,500 | | | | 386,640 | |
Marsh & McLennan Cos., Inc. | | | 82,500 | | | | 2,608,650 | |
McDonald’s Corp. | | | 49,352 | | | | 4,951,486 | |
Mead Johnson Nutrition Co. | | | 65,807 | | | | 4,522,915 | |
Merck & Co., Inc. | | | 91,800 | | | | 3,460,860 | |
MetLife, Inc. | | | 22,600 | | | | 704,668 | |
Microsoft Corp. | | | 132,500 | | | | 3,439,700 | |
Monsanto Co. | | | 61,925 | | | | 4,339,085 | |
Morgan Stanley | | | 141,100 | | | | 2,134,843 | |
Murphy Oil Corp. | | | 38,650 | | | | 2,154,351 | |
National Oilwell Varco, Inc. | | | 47,352 | | | | 3,219,463 | |
Newfield Exploration Co.* | | | 25,800 | | | | 973,434 | |
NIKE, Inc. (Class B Stock) | | | 50,954 | | | | 4,910,437 | |
NiSource, Inc. | | | 26,900 | | | | 640,489 | |
NRG Energy, Inc.* | | | 76,700 | | | | 1,389,804 | |
Nucor Corp. | | | 18,200 | | | | 720,174 | |
Occidental Petroleum Corp. | | | 49,179 | | | | 4,608,072 | |
O’Reilly Automotive, Inc.* | | | 31,316 | | | | 2,503,714 | |
PepsiCo, Inc. | | | 18,550 | | | | 1,230,792 | |
Pfizer, Inc. | | | 183,400 | | | | 3,968,776 | |
PPG Industries, Inc. | | | 18,971 | | | | 1,583,889 | |
Praxair, Inc. | | | 47,158 | | | | 5,041,190 | |
Precision Castparts Corp. | | | 21,628 | | | | 3,564,078 | |
priceline.com, Inc.* | | | 10,046 | | | | 4,698,614 | |
Procter & Gamble Co. (The) | | | 26,750 | | | | 1,784,492 | |
QUALCOMM, Inc. | | | 54,720 | | | | 2,993,184 | |
Raytheon Co. | | | 26,550 | | | | 1,284,489 | |
Rockwell Automation, Inc.(a) | | | 20,547 | | | | 1,507,533 | |
Schlumberger Ltd. | | | 9,450 | | | | 645,530 | |
SLM Corp. | | | 75,600 | | | | 1,013,040 | |
Sotheby’s | | | 8,730 | | | | 249,067 | |
Southwest Airlines Co. | | | 226,500 | | | | 1,938,840 | |
Spectra Energy Corp. | | | 82,200 | | | | 2,527,650 | |
| | | | | | | | |
COMMON STOCKS
(continued) | | Shares
| | | Value
(Note 2)
| |
| | | | | | | | | |
United States (continued) | | | | | | | | |
Sprint Nextel Corp.* | | | 263,500 | | | $ | 616,590 | |
St Joe Co. (The)*(a) | | | 45,500 | | | | 667,030 | |
Starbucks Corp. | | | 118,344 | | | | 5,445,007 | |
State Street Corp. | | | 33,300 | | | | 1,342,323 | |
TE Connectivity Ltd. | | | 34,500 | | | | 1,062,945 | |
Thermo Fisher Scientific, Inc.* | | | 28,450 | | | | 1,279,396 | |
Tiffany & Co. | | | 12,342 | | | | 817,781 | |
Time Warner, Inc.(a) | | | 219,686 | | | | 7,939,452 | |
Time Warner Cable, Inc. | | | 34,950 | | | | 2,221,772 | |
TJX Cos., Inc. | | | 112,242 | | | | 7,245,221 | |
U.S. Bancorp | | | 173,888 | | | | 4,703,670 | |
Union Pacific Corp. | | | 70,701 | | | | 7,490,064 | |
United States Steel Corp.(a) | | | 14,700 | | | | 388,962 | |
Visa, Inc. (Class A Stock) | | | 46,501 | | | | 4,721,247 | |
Vulcan Materials Co.(a) | | | 40,000 | | | | 1,574,000 | |
Wal-Mart Stores, Inc. | | | 27,700 | | | | 1,655,352 | |
Wells Fargo & Co. | | | 108,896 | | | | 3,001,174 | |
Western Union Co. (The) | | | 96,100 | | | | 1,754,786 | |
Weyerhaeuser Co. | | | 100,700 | | | | 1,880,069 | |
Wynn Resorts Ltd. | | | 39,849 | | | | 4,402,916 | |
Yum! Brands, Inc. | | | 82,484 | | | | 4,867,381 | |
| | | | | | |
|
|
|
| | | | | | | | 262,587,032 | |
| | | | | | |
|
|
|
TOTAL COMMON STOCKS
(cost $539,731,617) | | | | 545,963,827 | |
| | | | | | |
|
|
|
| PREFERRED STOCK — 0.3% | |
United States | | | | | | | | |
Wells Fargo & Co. (cost $1,510,954) | | | 63,000 | | | | 1,791,090 | |
| | | | | | |
|
|
|
TOTAL LONG-TERM INVESTMENTS
(cost $541,242,571) | | | | 547,754,917 | |
| | | | | | |
|
|
|
| SHORT-TERM INVESTMENTS — 8.1% | |
Affiliated Money Market Mutual Fund | | | | | | | | |
Prudential Investment Portfolios 2 — Prudential Core Taxable Money Market Fund (cost $45,663,701; includes $27,538,119 of cash collateral received for securities on loan) (Note 4)(b)(c) | | | 45,663,701 | | | | 45,663,701 | |
| | | | | | |
|
|
|
| | |
| | | Principal
Amount
(000)
| | | | |
U.S. Government Obligation | | | | | | | | |
U.S. Treasury Bill, 0.077%, 08/23/12
(cost $149,925)(d) | | $ | 150 | | | | 149,932 | |
| | | | | | |
|
|
|
TOTAL SHORT-TERM INVESTMENTS
(cost $45,813,626) | | | | 45,813,633 | |
| | | | | | |
|
|
|
TOTAL INVESTMENTS — 105.2%
(cost $587,056,197) | | | | 593,568,550 | |
LIABILITIES IN EXCESS OF
OTHER ASSETS(e) — (5.2)% | | | | (29,390,127 | ) |
| | | | | | |
|
|
|
NET ASSETS — 100.0% | | | $ | 564,178,423 | |
| | | | | | |
|
|
|
SEE NOTES TO FINANCIAL STATEMENTS.
A88
| | | | | | |
| | | GLOBAL PORTFOLIO (continued) | | |
| |
| SCHEDULE OF INVESTMENTS | | December 31, 2011 |
The following abbreviations are used in portfolio descriptions:
| | |
| ADR | | American Depositary Receipt |
| CVA | | Certificate Van Aandelen (Bearer) |
| JPY | | Japanese Yen |
| * | Non-income producing security. |
| (a) | All or a portion of security is on loan. The aggregate market value of such securities, including those sold and pending settlement, is $26,693,249; cash collateral of $27,538,119 (included in liabilities) was received with which the Portfolio purchased highly liquid short-term investments. |
| (b) | Represents security, or a portion thereof, purchased with cash collateral received for securities on loan. |
| (c) | Prudential Investments LLC, the manager of the Portfolio, also serves as manager of the Prudential Investment Portfolios 2 — Prudential Core Taxable Money Market Fund. |
| (d) | Rate quoted represents yield-to-maturity as of purchase date. |
| (e) | Includes net unrealized appreciation (depreciation) on the following derivative contracts held at the reporting period end: |
Forward foreign currency contracts outstanding at December 31, 2011:
| | | | | | | | | | | | | | | | | | | | | | | | |
Purchase Contracts
| | Counterparty
| | | Notional
Amount (000)
| | | Value at
Settlement Date
Payable
| | | Value at
December 31,
2011
| | | Unrealized
Appreciation
| |
Japanese Yen expiring 03/22/12 | | | Bank of New York | | | | JPY | | | | 41,808 | | | $ | 543,759 | | | $ | 544,008 | | | $ | 249 | |
Japanese Yen expiring 03/22/12 | | | Bank of New York | | | | JPY | | | | 37,662 | | | | 482,784 | | | | 490,060 | | | | 7,276 | |
| | | | | | | | | | | | | | |
|
|
| |
|
|
| |
|
|
|
| | | | | | | | | | | | | | | $ | 1,026,543 | | | $ | 1,034,068 | | | $ | 7,525 | |
| | | | | | | | | | | | | | |
|
|
| |
|
|
| |
|
|
|
| | | | | |
Sale Contract
| | Counterparty
| | | Notional
Amount (000)
| | | Value at
Settlement Date
Receivable
| | | Value at
December 31,
2011
| | | Unrealized
Depreciation
| |
Japanese Yen expiring 03/22/12 | | | Bank of New York | | | | JPY | | | | 310,463 | | | $ | 3,998,802 | | | $ | 4,039,763 | | | $ | (40,961 | ) |
| | | | | | | | | | | | | | |
|
|
| |
|
|
| |
|
|
|
| | | | | | | | | | | | | | | | | | | | | | | $ | (33,436 | ) |
| | | | | | | | | | | | | | | | | | | | | | |
|
|
|
Various inputs are used in determining the value of the Portfolio’s investments. These inputs are summarized in the three broad levels listed below.
| Level 1—quoted | prices generally for securities actively traded on a regulated securities exchange and for open-end mutual funds which trade at daily net asset value. |
| Level 2—other | significant observable inputs (including, but not limited to, quoted prices for similar securities, interest rates, prepayment speeds, foreign currency exchange rates, and amortized cost) generally for debt securities, swaps, forward foreign currency contracts and for foreign stocks priced using vendor modeling tools. |
| Level 3—significant | unobservable inputs for securities valued in accordance with Board approved fair valuation procedures. |
The following is a summary of the inputs used as of December 31, 2011 in valuing such portfolio securities:
| | | | | | | | | | | | |
| | | Level 1
| | | Level 2
| | | Level 3
| |
Investments in Securities | | | | | | | | | | | | |
Common Stocks | | | | | | | | | | | | |
Australia | | $ | 13,381,857 | | | $ | — | | | $ | — | |
Austria | | | 1,386,562 | | | | — | | | | — | |
Belgium | | | 1,159,483 | | | | — | | | | — | |
Brazil | | | 3,294,786 | | | | — | | | | — | |
Canada | | | 4,734,318 | | | | — | | | | — | |
China | | | 6,680,648 | | | | — | | | | — | |
Denmark | | | 4,003,075 | | | | — | | | | — | |
Finland | | | 1,209,207 | | | | — | | | | — | |
France | | | 28,030,507 | | | | — | | | | — | |
Germany | | | 26,451,759 | | | | — | | | | — | |
Greece | | | 10,932 | | | | — | | | | — | |
Hong Kong | | | 7,431,141 | | | | — | | | | 1,244 | |
Indonesia | | | 1,901,985 | | | | — | | | | — | |
Ireland | | | 3,623,187 | | | | — | | | | — | |
Israel | | | 4,650,506 | | | | — | | | | — | |
Italy | | | 4,219,031 | | | | — | | | | — | |
Japan | | | 36,427,737 | | | | — | | | | — | |
Liechtenstein | | | 227,802 | | | | — | | | | — | |
Netherlands | | | 11,873,262 | | | | — | | | | — | |
New Zealand | | | 516,942 | | | | — | | | | — | |
Norway | | | 1,687,119 | | | | — | | | | — | |
Peru | | | 2,298,870 | | | | — | | | | — | |
SEE NOTES TO FINANCIAL STATEMENTS.
A89
| | | | | | |
| | | GLOBAL PORTFOLIO (continued) | | |
| |
| SCHEDULE OF INVESTMENTS | | December 31, 2011 |
| | | | | | | | | | | | |
| | | Level 1
| | | Level 2
| | | Level 3
| |
Portugal | | $ | 76,179 | | | $ | — | | | $ | — | |
Singapore | | | 329,317 | | | | — | | | | — | |
South Africa | | | 1,346,628 | | | | — | | | | — | |
South Korea | | | 4,845,493 | | | | — | | | | — | |
Spain | | | 5,697,914 | | | | — | | | | — | |
Sweden | | | 4,434,613 | | | | — | | | | — | |
Switzerland | | | 25,633,731 | | | | — | | | | — | |
United Kingdom | | | 75,810,960 | | | | — | | | | — | |
United States | | | 262,587,032 | | | | — | | | | — | |
Preferred Stock | | | | | | | | | | | | |
United States | | | 1,791,090 | | | | — | | | | — | |
U.S. Government Obligation | | | — | | | | 149,932 | | | | — | |
Affiliated Money Market Mutual Fund | | | 45,663,701 | | | | — | | | | — | |
| | | |
Other Financial Instruments* | | | | | | | | | | | | |
Forward Foreign Currency Contracts | | | — | | | | (33,436 | ) | | | — | |
| | |
|
|
| |
|
|
| |
|
|
|
Total | | $ | 593,417,374 | | | $ | 116,496 | | | $ | 1,244 | |
| | |
|
|
| |
|
|
| |
|
|
|
| * | Other financial instruments are derivative instruments not reflected in the Schedule of Investments, such as futures, forwards and swap contracts, which are recorded at the unrealized appreciation/depreciation on the instrument. |
The industry classification of portfolio holdings and liabilities in excess of other assets shown as a percentage of net assets as of December 31, 2011 was as follows:
| | | | |
Oil, Gas & Consumable Fuels | | | 8.7 | % |
Affiliated Money Market Mutual Fund (including 4.9% of collateral received for securities on loan) | | | 8.1 | |
Commercial Banks | | | 7.0 | |
Pharmaceuticals | | | 6.4 | |
Chemicals | | | 4.2 | |
Hotels, Restaurants & Leisure | | | 4.2 | |
Specialty Retail | | | 4.0 | |
Insurance | | | 3.4 | |
Media | | | 3.2 | |
Textiles, Apparel & Luxury Goods | | | 2.8 | |
Energy Equipment & Services | | | 2.6 | |
IT Services | | | 2.6 | |
Aerospace & Defense | | | 2.4 | |
Diversified Telecommunication | | | 2.3 | |
Software | | | 2.2 | |
Capital Markets | | | 2.1 | |
Machinery | | | 2.0 | |
Metals & Mining | | | 2.0 | |
Diversified Financial Services | | | 1.9 | |
Road & Rail | | | 1.9 | |
Food Products | | | 1.8 | |
Industrial Conglomerates | | | 1.7 | |
Internet Software & Services | | | 1.7 | |
Semiconductors & Semiconductor Equipment | | | 1.7 | |
Electric Utilities | | | 1.6 | |
Food & Staples Retailing | | | 1.6 | |
Computers & Peripherals | | | 1.5 | |
Trading Companies & Distributors | | | 1.3 | |
Wireless Telecommunication Services | | | 1.1 | |
Automobiles | | | 1.0 | |
Biotechnology | | | 1.0 | |
Communications Equipment | | | 0.9 | |
| | | | |
Internet & Catalog Retail | | | 0.9 | % |
Multiline Retail | | | 0.9 | |
Auto Components | | | 0.8 | |
Personal Products | | | 0.8 | |
Real Estate Management & Development | | | 0.8 | |
Airlines | | | 0.7 | |
Healthcare Equipment & Supplies | | | 0.7 | |
Multi-Utilities | | | 0.7 | |
Tobacco | | | 0.7 | |
Consumer Finance | | | 0.6 | |
Distributors | | | 0.6 | |
Commercial Services & Supplies | | | 0.5 | |
Healthcare Providers & Services | | | 0.5 | |
Household Products | | | 0.5 | |
Paper & Forest Products | | | 0.5 | |
Construction Materials | | | 0.4 | |
Electronic Equipment & Instruments | | | 0.4 | |
Household Durables | | | 0.4 | |
Beverages | | | 0.3 | |
Building Products | | | 0.3 | |
Construction & Engineering | | | 0.3 | |
Electrical Equipment | | | 0.3 | |
Independent Power Producers & Energy Traders | | | 0.3 | |
Real Estate Investment Trusts | | | 0.3 | |
Transportation Infrastructure | | | 0.3 | |
Containers & Packaging | | | 0.2 | |
Diversified Consumer Services | | | 0.2 | |
Life Sciences Tools & Services | | | 0.2 | |
Marine | | | 0.2 | |
| | |
|
|
|
| | | | 105.2 | |
Liabilities in excess of other assets | | | (5.2 | ) |
| | |
|
|
|
| | | | 100.0 | % |
| | |
|
|
|
SEE NOTES TO FINANCIAL STATEMENTS.
A90
| | | | | | |
| | | GLOBAL PORTFOLIO (continued) | | |
| |
| SCHEDULE OF INVESTMENTS | | December 31, 2011 |
The Portfolio invested in derivative instruments during the reporting period. The primary types of risk associated with derivative instruments are equity risk and foreign exchange risk. The effect of such derivative instruments on the Portfolio’s financial position and financial performance as reflected in the Statement of Assets and Liabilities and Statement of Operations is presented in the summary below.
Fair values of derivative instruments as of December 31, 2011 as presented in the Statement of Assets and Liabilities:
| | | | | | | | | | | | |
Derivatives not designated as hedging
instruments, carried at fair value
| | Asset Derivatives
| | | Liability Derivatives
| |
| | Balance Sheet Location
| | Fair Value
| | | Balance Sheet Location
| | Fair Value
| |
Foreign exchange contracts | | Unrealized appreciation on forward foreign currency exchange contracts | | $ | 7,525 | | | Unrealized depreciation on forward foreign currency exchange contracts | | $ | 40,961 | |
| | | | |
|
|
| | | |
|
|
|
The effects of derivative instruments on the Statement of Operations for the year ended December 31, 2011 are as follows:
| | | | | | | | | | | | | | | | |
Amount of Realized Gain or (Loss) on Derivatives Recognized in Income
| |
Derivatives not designated as hedging instruments, carried at fair value
| | Rights
| | | Forward
Currency
Contracts
| | | Futures
| | | Total
| |
Equity contracts | | $ | (270,750 | ) | | $ | — | | | $ | (41,519 | ) | | $ | (312,269 | ) |
Foreign exchange contracts | | | — | | | | (854,350 | ) | | | — | | | | (854,350 | ) |
| | |
|
|
| |
|
|
| |
|
|
| |
|
|
|
Total | | $ | (270,750 | ) | | $ | (854,350 | ) | | $ | (41,519 | ) | | $ | (1,166,619 | ) |
| | |
|
|
| |
|
|
| |
|
|
| |
|
|
|
| | | | |
|
Change in Unrealized Appreciation or (Depreciation) on Derivatives Recognized in Income
| |
Derivatives not designated as hedging instruments, carried at fair value
| | Forward
Currency
Contracts
| |
Foreign exchange contracts | | $ | (33,436 | ) |
| | |
|
|
|
For the year ended December 31, 2011, the Portfolio’s average volume of derivative activities are as follows:
| | | | |
Forward Currency
Contracts—Purchased
(Value at Settlement Date Payable)
| | Forward Currency
Contracts—Sold
(Value at Settlement Date Receivable)
| | Futures
Long Position
(Value at Trade Date)
|
| $2,525,966 | | $19,949,102 | | $1,655,359 |
SEE NOTES TO FINANCIAL STATEMENTS.
A91
| | | | | | |
| | | GLOBAL PORTFOLIO (continued) | | |
STATEMENT OF ASSETS AND LIABILITIES
December 31, 2011
| | | | |
| ASSETS | | | | |
Investments, at value including securities on loan of $26,693,249: | | | | |
Unaffiliated investments (cost $541,392,496) | | $ | 547,904,849 | |
Affiliated investments (cost $45,663,701) | | | 45,663,701 | |
Foreign currency, at value (cost $2,804,879) | | | 2,744,038 | |
Receivable for investments sold | | | 1,455,928 | |
Dividends and interest receivable | | | 676,369 | |
Foreign tax reclaim receivable | | | 459,477 | |
Unrealized appreciation on forward foreign currency exchange contracts | | | 7,525 | |
Prepaid expenses | | | 3,934 | |
Receivable for Series shares sold | | | 2,264 | |
| | |
|
|
|
Total Assets | | | 598,918,085 | |
| | |
|
|
|
| LIABILITIES | | | | |
Collateral for securities on loan | | | 27,538,119 | |
Payable for investments purchased | | | 6,339,899 | |
Management fee payable | | | 358,632 | |
Accrued expenses and other liabilities | | | 276,712 | |
Payable for Series shares repurchased | | | 184,413 | |
Unrealized depreciation on forward foreign currency exchange contracts | | | 40,961 | |
Affiliated transfer agent fee payable | | | 926 | |
| | |
|
|
|
Total Liabilities | | | 34,739,662 | |
| | |
|
|
|
| NET ASSETS | | $ | 564,178,423 | |
| | |
|
|
|
Net assets were comprised of: | | | | |
Paid-in capital | | $ | 656,083,801 | |
Retained earnings | | | (91,905,378 | ) |
| | |
|
|
|
Net assets, December 31, 2011 | | $ | 564,178,423 | |
| | |
|
|
|
Net asset value and redemption price per share, $564,178,423 / 33,304,164 outstanding shares of beneficial interest | | $ | 16.94 | |
| | |
|
|
|
STATEMENT OF OPERATIONS
Year Ended December 31, 2011
| | | | |
| INVESTMENT INCOME | | | | |
Unaffiliated dividend income (net of foreign withholding taxes of $1,686,418) | | $ | 14,548,956 | |
Affiliated income from securities loaned, net | | | 249,701 | |
Affiliated dividend income | | | 35,346 | |
Interest | | | 726 | |
| | |
|
|
|
| | | | 14,834,729 | |
| | |
|
|
|
| EXPENSES | | | | |
Management fee | | | 4,669,105 | |
Custodian’s fees and expenses | | | 325,000 | |
Shareholders’ reports | | | 146,000 | |
Audit fee | | | 24,000 | |
Trustees’ fees | | | 16,000 | |
Transfer agent’s fee and expenses (including affiliated expense of $5,500) (Note 4) | | | 12,000 | |
Legal fees and expenses | | | 10,000 | |
Insurance expenses | | | 7,000 | |
Commitment fee on syndicated credit agreement | | | 3,000 | |
Loan interest expense (Note 8) | | | 20 | |
Miscellaneous | | | 41,734 | |
| | |
|
|
|
Total expenses | | | 5,253,859 | |
| | |
|
|
|
| NET INVESTMENT INCOME | | | 9,580,870 | |
| | |
|
|
|
| NET REALIZED AND UNREALIZED GAIN (LOSS) ON INVESTMENTS AND FOREIGN CURRENCIES | | | | |
Net realized gain (loss) on: | | | | |
Investment transactions | | | 26,652,934 | |
Futures transactions | | | (41,519 | ) |
Foreign currency transactions | | | (436,928 | ) |
| | |
|
|
|
| | | | 26,174,487 | |
| | |
|
|
|
Net change in unrealized appreciation (depreciation) on: | | | | |
Investments | | | (78,218,824 | ) |
Foreign currencies | | | (290,483 | ) |
| | |
|
|
|
| | | | (78,509,307 | ) |
| | |
|
|
|
| NET LOSS ON INVESTMENTS AND FOREIGN CURRENCIES | | | (52,334,820 | ) |
| | |
|
|
|
| NET DECREASE IN NET ASSETS RESULTING FROM OPERATIONS | | $ | (42,753,950 | ) |
| | |
|
|
|
STATEMENT OF CHANGES IN NET ASSETS
| | | | | | | | |
| | | Year Ended December 31,
| |
| | | 2011
| | | 2010
| |
| INCREASE (DECREASE) IN NET ASSETS | | | | | | | | |
| OPERATIONS: | | | | | | | | |
Net investment income | | $ | 9,580,870 | | | $ | 9,687,610 | |
Net realized gain on investments and foreign currencies | | | 26,174,487 | | | | 34,990,328 | |
Net change in unrealized appreciation (depreciation) on investments and foreign currencies | | | (78,509,307 | ) | | | 29,124,838 | |
| | |
|
|
| |
|
|
|
NET INCREASE (DECREASE) IN NET ASSETS RESULTING FROM OPERATIONS | | | (42,753,950 | ) | | | 73,802,776 | |
| | |
|
|
| |
|
|
|
| DISTRIBUTIONS | | | (9,684,066 | ) | | | (9,476,827 | ) |
| | |
|
|
| |
|
|
|
| SERIES SHARE TRANSACTIONS: | | | | | | | | |
Series shares sold [843,518 and 619,301 shares, respectively] | | | 15,384,776 | | | | 10,445,077 | |
Series shares issued in reinvestment of distributions [525,167 and 613,784 shares, respectively] | | | 9,684,066 | | | | 9,476,827 | |
Series shares repurchased [3,129,794 and 3,317,264 shares, respectively] | | | (56,971,187 | ) | | | (55,260,539 | ) |
| | |
|
|
| |
|
|
|
NET DECREASE IN NET ASSETS RESULTING FROM SERIES SHARE TRANSACTIONS | | | (31,902,345 | ) | | | (35,338,635 | ) |
| | |
|
|
| |
|
|
|
| TOTAL INCREASE (DECREASE) IN NET ASSETS | | | (84,340,361 | ) | | | 28,987,314 | |
| NET ASSETS: | | | | | | | | |
Beginning of year | | | 648,518,784 | | | | 619,531,470 | |
| | |
|
|
| |
|
|
|
End of year | | $ | 564,178,423 | | | $ | 648,518,784 | |
| | |
|
|
| |
|
|
|
SEE NOTES TO FINANCIAL STATEMENTS.
A92
| | | | | | |
| | | GOVERNMENT INCOME PORTFOLIO | | |
| |
| SCHEDULE OF INVESTMENTS | | December 31, 2011 |
| | | | | | | | | | | | | | | | |
LONG-TERM INVESTMENTS — 99.2% | |
| | Interest
Rate
| | | Maturity Date
| | Principal
Amount
(000)#
| | | Value
(Note 2)
| |
| | | | | | | | | | | | | | | | | |
Asset-Backed Securities — 1.2% | | | | | | | | | | | | | | | | |
Citibank Credit Card Issuance Trust,
Ser. 2007-A8, Class A8 | | | 5.650% | | | 09/20/19 | | $ | 1,500 | | | $ | 1,800,166 | |
Small Business Administration Participation Certificates,
Ser. 1996-20J, Class 1 | | | 7.200% | | | 10/01/16 | | | 1,059 | | | | 1,148,262 | |
Ser. 1997-20A, Class 1 | | | 7.150% | | | 01/01/17 | | | 742 | | | | 810,785 | |
Ser. 1997-20G, Class 1 | | | 6.850% | | | 07/01/17 | | | 411 | | | | 447,819 | |
Ser. 1998-20I, Class 1 | | | 6.000% | | | 09/01/18 | | | 940 | | | | 1,021,333 | |
| | | | | | | | | | | | | | |
|
|
|
| | | | | | | | | | | | | | | | 5,228,365 | |
| | | | | | | | | | | | | | |
|
|
|
Collateralized Mortgage Obligations — 1.9% | | | | | | | | | | | | | | | | |
Federal Home Loan Mortgage Corp.,
Ser. 2002-2496, Class PM | | | 5.500% | | | 09/15/17 | | | 1,420 | | | | 1,527,435 | |
Ser. 2002-2501, Class MC | | | 5.500% | | | 09/15/17 | | | 499 | | | | 533,992 | |
Ser. 2002-2513, Class HC | | | 5.000% | | | 10/15/17 | | | 2,339 | | | | 2,522,569 | |
Ser. 2002-2518, Class PV | | | 5.500% | | | 06/15/19 | | | 1,117 | | | | 1,127,876 | |
Federal National Mortgage Association,
Ser. 2002-18, Class PC | | | 5.500% | | | 04/25/17 | | | 1,067 | | | | 1,104,958 | |
Ser. 2002-57, Class ND | | | 5.500% | | | 09/25/17 | | | 568 | | | | 607,949 | |
Merrill Lynch Mortgage Investors, Inc., Ser. 2003-E, Class A1(a) | | | 0.914% | | | 10/25/28 | | | 92 | | | | 79,979 | |
Structured Adjustable Rate Mortgage Loan Trust, Ser. 2004-1, Class 4A3(a) | | | 2.480% | | | 02/25/34 | | | 318 | | | | 283,475 | |
| | | | | | | | | | | | | | |
|
|
|
| | | | | | | | | | | | | | | | 7,788,233 | |
| | | | | | | | | | | | | | |
|
|
|
Commercial Mortgage-Backed Securities — 10.5% | | | | | | | | | | | | | | | | |
Banc of America Commercial Mortgage, Inc., Ser. 2007-1, Class A2 | | | 5.381% | | | 01/15/49 | | | 1,201 | | | | 1,199,437 | |
Bear Stearns Commercial Mortgage Securities, Inc., Ser. 2005-PW10,
Class A4(a) | | | 5.405% | | | 12/11/40 | | | 2,000 | | | | 2,201,552 | |
Citigroup/Deutsche Bank Commercial Mortgage Trust, Ser. 2007-CD4,
Class A3 | | | 5.293% | | | 12/11/49 | | | 1,800 | | | | 1,914,566 | |
Commercial Mortgage Pass-Thru Certificates, Ser. 2006-C7, Class A4(a) | | | 5.942% | | | 06/10/46 | | | 2,000 | | | | 2,208,496 | |
Credit Suisse First Boston Mortgage Securities Corp., Ser. 2005-C2, Class A4 | | | 4.832% | | | 04/15/37 | | | 2,700 | | | | 2,842,374 | |
CW Capital Cobalt Ltd., Ser. 2007-C3, Class A3(a) | | | 6.010% | | | 05/15/46 | | | 1,300 | | | | 1,375,213 | |
Federal Home Loan Mortgage Corp.,
Ser. 2010-K005, Class A2 | | | 4.317% | | | 11/25/19 | | | 2,600 | | | | 2,886,905 | |
Ser. 2010-K007, Class A2 | | | 4.224% | | | 03/25/20 | | | 3,600 | | | | 3,986,129 | |
Ser. 2010-K009, Class A2 | | | 3.808% | | | 08/25/20 | | | 2,900 | | | | 3,147,477 | |
Ser. 2011-K013, Class A2(a) | | | 3.974% | | | 01/25/21 | | | 3,400 | | | | 3,738,181 | |
Greenwich Capital Commercial Funding Corp., Ser. 2007-GG9, Class A2 | | | 5.381% | | | 03/10/39 | | | 1,876 | | | | 1,886,236 | |
GS Mortgage Securities Corp. II, Ser. 2007-GG10, Class A2(a) | | | 5.778% | | | 08/10/45 | | | 1,909 | | | | 1,940,288 | |
JPMorgan Chase Commercial Mortgage Securities Corp., Ser. 2007-LD11, Class A3(a) | | | 6.005% | | | 06/15/49 | | | 1,000 | | | | 1,052,854 | |
Merrill Lynch Mortgage Trust, Ser. 2006-C1, Class A4(a) | | | 5.854% | | | 05/12/39 | | | 2,000 | | | | 2,230,298 | |
Merrill Lynch/Countrywide Commercial Mortgage Trust, Ser. 2007-9, Class A2 | | | 5.590% | | | 09/12/49 | | | 2,452 | | | | 2,487,501 | |
Morgan Stanley Capital I, Ser. 2006-IQ12, Class A4 | | | 5.332% | | | 12/15/43 | | | 1,800 | | | | 2,011,952 | |
NCUA Gtd. Notes, Ser. 2010-C1, Class A2 | | | 2.900% | | | 10/29/20 | | | 2,000 | | | | 2,111,624 | |
Wachovia Bank Commercial Mortgage Trust,
Ser. 2006-C25, Class A4(a) | | | 5.922% | | | 05/15/43 | | | 2,000 | | | | 2,213,498 | |
Ser. 2006-C27, Class A3(a) | | | 5.765% | | | 07/15/45 | | | 2,000 | | | | 2,212,996 | |
| | | | | | | | | | | | | | |
|
|
|
| | | | | | | | | | | | | | | | 43,647,577 | |
| | | | | | | | | | | | | | |
|
|
|
Corporate Bonds — 1.0% | | | | | | | | | | | | | | | | |
Export Development Canada (Canada) | | | 1.250% | | | 10/26/16 | | | 760 | | | | 768,614 | |
DEPFA ACS Bank (Ireland), Covered Notes, 144A | | | 5.125% | | | 03/16/37 | | | 1,520 | | | | 1,086,601 | |
Kreditanstalt Fuer Wiederaufbau (Germany), Gtd. Notes | | | 2.375% | | | 08/25/21 | | | 660 | | | | 659,161 | |
National Bank of Canada (Canada), Covered Notes, 144A | | | 2.200% | | | 10/19/16 | | | 460 | | | | 463,808 | |
Toronto-Dominion Bank (The) (Canada), Covered Notes, 144A(b) | | | 1.625% | | | 09/14/16 | | | 1,200 | | | | 1,184,205 | |
| | | | | | | | | | | | | | |
|
|
|
| | | | | | | | | | | | | | | | 4,162,389 | |
| | | | | | | | | | | | | | |
|
|
|
Mortgage-Backed Securities — 41.3% | | | | | | | | | | | | | | | | |
Federal Home Loan Mortgage Corp.(a) | | | 2.479% | | | 05/01/34 | | | 728 | | | | 769,892 | |
Federal Home Loan Mortgage Corp. | | | 4.000% | | | 06/01/26-12/01/40 | | | 4,110 | | | | 4,321,805 | |
Federal Home Loan Mortgage Corp.(c) | | | 4.500% | | | TBA 30 Year | | | 9,000 | | | | 9,535,781 | |
SEE NOTES TO FINANCIAL STATEMENTS.
A93
| | | | | | |
| | | GOVERNMENT INCOME PORTFOLIO (continued) | | |
| |
| SCHEDULE OF INVESTMENTS | | December 31, 2011 |
| | | | | | | | | | | | | | | | |
LONG-TERM INVESTMENTS
(continued) | |
| | Interest
Rate
| | | Maturity Date
| | Principal
Amount
(000)#
| | | Value
(Note 2)
| |
| | | | | | | | | | | | | | | | | |
Mortgage-Backed Securities (continued) | | | | | | | | | | | | | | | | |
Federal Home Loan Mortgage Corp. | | | 5.000% | | | 06/01/33-05/01/34 | | $ | 4,800 | | | $ | 5,183,305 | |
Federal Home Loan Mortgage Corp. | | | 5.500% | | | 05/01/37-05/01/38 | | | 2,002 | | | | 2,175,670 | |
Federal Home Loan Mortgage Corp. | | | 5.500% | | | TBA 30 Year | | | 3,000 | | | | 3,255,000 | |
Federal Home Loan Mortgage Corp. | | | 6.000% | | | 09/01/34 | | | 253 | | | | 282,178 | |
Federal Home Loan Mortgage Corp.(c) | | | 6.000% | | | TBA 30 Year | | | 2,000 | | | | 2,196,250 | |
Federal Home Loan Mortgage Corp. | | | 6.500% | | | 03/01/12-09/01/32 | | | 195 | | | | 219,961 | |
Federal Home Loan Mortgage Corp. | | | 7.000% | | | 09/01/12-10/01/32 | | | 78 | | | | 89,922 | |
Federal National Mortgage Association(a) | | | 2.231% | | | 07/01/33 | | | 2,308 | | | | 2,426,066 | |
Federal National Mortgage Association(a) | | | 2.287% | | | 04/01/34 | | | 268 | | | | 281,714 | |
Federal National Mortgage Association(a) | | | 2.356% | | | 06/01/34 | | | 623 | | | | 656,962 | |
Federal National Mortgage Association(a) | | | 2.393% | | | 08/01/33 | | | 1,352 | | | | 1,420,691 | |
Federal National Mortgage Association(a) | | | 2.410% | | | 04/01/34 | | | 529 | | | | 557,327 | |
Federal National Mortgage Association | | | 3.000% | | | TBA 15 Year | | | 1,500 | | | | 1,544,297 | |
Federal National Mortgage Association | | | 3.000% | | | TBA 15 Year | | | 10,500 | | | | 10,842,890 | |
Federal National Mortgage Association | | | 3.500% | | | 06/01/39 | | | 941 | | | | 968,608 | |
Federal National Mortgage Association | | | 3.500% | | | TBA 15 Year | | | 4,500 | | | | 4,705,313 | |
Federal National Mortgage Association | | | 3.500% | | | TBA 30 Year | | | 2,500 | | | | 2,571,094 | |
Federal National Mortgage Association | | | 4.000% | | | TBA 30 Year | | | 18,000 | | | | 18,908,438 | |
Federal National Mortgage Association | | | 4.000% | | | TBA 30 Year | | | 2,000 | | | | 2,095,625 | |
Federal National Mortgage Association | | | 4.500% | | | 05/01/40 | | | 8,498 | | | | 9,121,761 | |
Federal National Mortgage Association | | | 4.500% | | | TBA 30 Year | | | 500 | | | | 532,031 | |
Federal National Mortgage Association | | | 5.000% | | | 07/01/18-05/01/36 | | | 9,089 | | | | 9,826,618 | |
Federal National Mortgage Association | | | 5.000% | | | TBA 30 Year | | | 4,000 | | | | 4,312,500 | |
Federal National Mortgage Association | | | 5.500% | | | 01/01/17-11/01/35 | | | 17,359 | | | | 19,099,484 | |
Federal National Mortgage Association | | | 6.000% | | | 11/01/14-05/01/38 | | | 5,620 | | | | 6,225,587 | |
Federal National Mortgage Association | | | 6.000% | | | TBA 30 Year | | | 1,500 | | | | 1,651,641 | |
Federal National Mortgage Association | | | 6.500% | | | 01/01/15-10/01/37 | | | 3,262 | | | | 3,685,776 | |
Federal National Mortgage Association | | | 7.000% | | | 12/01/31-01/01/36 | | | 581 | | | | 672,153 | |
Federal National Mortgage Association | | | 7.500% | | | 06/01/12-07/01/12 | | | 3 | | | | 3,015 | |
Federal National Mortgage Association | | | 8.000% | | | 03/01/22-02/01/26 | | | 22 | | | | 22,930 | |
Federal National Mortgage Association | | | 9.000% | | | 02/01/25-04/01/25 | | | 92 | | | | 107,061 | |
Government National Mortgage Association(c) | | | 3.500% | | | TBA 30 Year | | | 500 | | | | 520,391 | |
Government National Mortgage Association | | | 4.000% | | | TBA 30 Year | | | 13,000 | | | | 13,944,530 | |
Government National Mortgage Association | | | 4.000% | | | TBA 30 Year | | | 4,000 | | | | 4,278,125 | |
Government National Mortgage Association(c) | | | 4.500% | | | TBA 30 Year | | | 7,500 | | | | 8,171,484 | |
Government National Mortgage Association | | | 4.500% | | | TBA 30 Year | | | 6,000 | | | | 6,520,312 | |
Government National Mortgage Association | | | 5.000% | | | 07/15/33-04/15/34 | | | 1,978 | | | | 2,204,576 | |
Government National Mortgage Association | | | 5.000% | | | TBA 30 Year | | | 2,000 | | | | 2,211,250 | |
Government National Mortgage Association | | | 5.500% | | | 03/15/34-03/15/36 | | | 1,713 | | | | 1,932,496 | |
Government National Mortgage Association | | | 6.500% | | | 07/15/32-08/15/32 | | | 422 | | | | 489,466 | |
Government National Mortgage Association | | | 7.000% | | | 03/15/23-08/15/28 | | | 999 | | | | 1,155,675 | |
Government National Mortgage Association | | | 7.500% | | | 12/15/25-02/15/26 | | | 182 | | | | 213,117 | |
Government National Mortgage Association | | | 8.500% | | | 09/15/24-04/15/25 | | | 254 | | | | 304,893 | |
| | | | | | | | | | | | | | |
|
|
|
| | | | | | | | | | | | | | | | 172,215,661 | |
| | | | | | | | | | | | | | |
|
|
|
Municipal Bond — 0.2% | | | | | | | | | | | | | | | | |
State of Utah, BABs, Ser. D | | | 4.554% | | | 07/01/24 | | | 630 | | | | 742,972 | |
| | | | | | | | | | | | | | |
|
|
|
U.S. Government Agency Obligations — 1.8% | | | | | | | | | | | | | | | | |
Federal Home Loan Mortgage Corp.(b) | | | 5.125% | | | 11/17/17 | | | 1,270 | | | | 1,529,197 | |
Federal National Mortgage Association(b) | | | 1.375% | | | 11/15/16 | | | 785 | | | | 791,933 | |
Financing Corp. FICO, Ser. 1P(d) | | | 1.780% | | | 05/11/18 | | | 4,000 | | | | 3,581,296 | |
Tennessee Valley Authority | | | 5.250% | | | 09/15/39 | | | 870 | | | | 1,110,565 | |
Tennessee Valley Authority | | | 5.500% | | | 06/15/38 | | | 465 | | | | 606,918 | |
| | | | | | | | | | | | | | |
|
|
|
| | | | | | | | | | | | | | | | 7,619,909 | |
| | | | | | | | | | | | | | |
|
|
|
U.S. Treasury Securities — 41.3% | | | | | | | | | | | | | | | | |
U.S. Treasury Bonds(b) | | | 3.750% | | | 08/15/41 | | | 770 | | | | 905,592 | |
U.S. Treasury Bonds | | | 3.875% | | | 08/15/40 | | | 2,245 | | | | 2,691,194 | |
SEE NOTES TO FINANCIAL STATEMENTS.
A94
| | | | | | |
| | | GOVERNMENT INCOME PORTFOLIO (continued) | | |
| |
| SCHEDULE OF INVESTMENTS | | December 31, 2011 |
| | | | | | | | | | | | | | | | |
LONG-TERM INVESTMENTS
(continued) | |
| | Interest
Rate
| | | Maturity
Date
| | Principal
Amount
(000)#
| | | Value
(Note 2)
| |
| | | | | | | | | | | | | | | | | |
U.S. Treasury Securities (continued) | | | | | | | | | | | | | | | | |
U.S. Treasury Bonds | | | 4.375% | | | 05/15/40 | | $ | 2,120 | | | $ | 2,754,011 | |
U.S. Treasury Bonds | | | 4.375% | | | 05/15/41 | | | 1,360 | | | | 1,772,038 | |
U.S. Treasury Bonds(e) | | | 4.750% | | | 02/15/41 | | | 7,285 | | | | 10,039,641 | |
U.S. Treasury Bonds | | | 6.500% | | | 11/15/26 | | | 860 | | | | 1,304,782 | |
U.S. Treasury Bonds | | | 9.250% | | | 02/15/16 | | | 2,925 | | | | 3,948,522 | |
U.S. Treasury Notes | | | 2.000% | | | 11/15/21 | | | 90 | | | | 91,026 | |
U.S. Treasury Notes | | | 3.000% | | | 09/30/16 | | | 2,680 | | | | 2,954,491 | |
U.S. Treasury Notes | | | 3.125% | | | 10/31/16 | | | 12,000 | | | | 13,305,936 | |
U.S. Treasury Notes | | | 3.125% | | | 04/30/17 | | | 4,500 | | | | 5,011,875 | |
U.S. Treasury Notes | | | 3.125% | | | 08/31/13 | | | 3,155 | | | | 3,305,355 | |
U.S. Treasury Notes(e) | | | 3.125% | | | 05/15/21 | | | 17 | | | | 18,982 | |
U.S. Treasury Notes | | | 3.250% | | | 06/30/16 | | | 13,400 | | | | 14,881,330 | |
U.S. Treasury Notes | | | 3.250% | | | 03/31/17 | | | 9,175 | | | | 10,273,137 | |
U.S. Treasury Notes | | | 3.500% | | | 05/31/13 | | | 9,720 | | | | 10,168,034 | |
U.S. Treasury Notes | | | 4.250% | | | 11/15/17 | | | 3,725 | | | | 4,399,866 | |
U.S. Treasury Notes | | | 4.250% | | | 08/15/15 | | | 21,475 | | | | 24,335,534 | |
U.S. Treasury Notes | | | 4.625% | | | 11/15/16 | | | 5,660 | | | | 6,684,109 | |
U.S. Treasury Notes | | | 4.750% | | | 08/15/17 | | | 4,025 | | | | 4,846,349 | |
U.S. Treasury Strips Coupon(f) | | | 0.550% | | | 05/15/15 | | | 12,430 | | | | 12,202,693 | |
U.S. Treasury Strips Coupon(f) | | | 2.480% | | | 05/15/24 | | | 12,105 | | | | 8,927,801 | |
U.S. Treasury Strips Coupon(f) | | | 2.510% | | | 08/15/24 | | | 10,095 | | | | 7,364,726 | |
U.S. Treasury Strips Coupon(f) | | | 2.520% | | | 11/15/24 | | | 1,835 | | | | 1,326,321 | |
U.S. Treasury Strips Coupon(f) | | | 2.780% | | | 02/15/24 | | | 6,500 | | | | 4,841,759 | |
U.S. Treasury Strips Coupon(f) | | | 3.040% | | | 05/15/25 | | | 5,815 | | | | 4,116,526 | |
U.S. Treasury Strips Coupon(f) | | | 3.380% | | | 05/15/27 | | | 5,240 | | | | 3,432,996 | |
U.S. Treasury Strips Coupon(f) | | | 3.450% | | | 11/15/27 | | | 3,700 | | | | 2,378,068 | |
U.S. Treasury Strips Coupon(b)(f) | | | 3.660% | | | 08/15/29 | | | 3,700 | | | | 2,235,991 | |
U.S. Treasury Strips Coupon(f) | | | 4.130% | | | 08/15/33 | | | 2,725 | | | | 1,429,336 | |
| | | | | | | | | | | | | | |
|
|
|
| | | | | | | | | | | | | | | | 171,948,021 | |
| | | | | | | | | | | | | | |
|
|
|
TOTAL LONG-TERM INVESTMENTS
(cost $394,072,166) | | | | 413,353,127 | |
| | | | | | | | | | | | | | |
|
|
|
| | | | | |
| | | | | | | | | | Shares
| | | | |
| SHORT-TERM INVESTMENTS — 25.6% | | | | | | | | | | | | | | | | |
AFFILIATED MUTUAL FUNDS | | | | | | | | | | | | | | | | |
Prudential Investment Portfolios 2 — Prudential Core Short-Term Bond Fund
(cost $53,181,499)(g) | | | 5,389,666 | | | | 47,752,437 | |
Prudential Investment Portfolios 2 — Prudential Core Taxable Money Market Fund
(cost $58,761,472; includes $6,793,055 of cash collateral received for securities on loan) (Note 4)(g)(h) | | | 58,761,472 | | | | 58,761,472 | |
| | | | | | | | | | | | | | |
|
|
|
TOTAL AFFILIATED MUTUAL FUNDS
(cost $111,942,971) | | | | 106,513,909 | |
| | | | | | | | | | | | | | |
|
|
|
TOTAL INVESTMENTS — 124.8%
(cost $506,015,137) | | | | 519,867,036 | |
LIABILITIES IN EXCESS OF OTHER ASSETS(i) — (24.8)% | | | | (103,213,110 | ) |
| | | | | | | | | | | | | | |
|
|
|
NET ASSETS — 100.0% | | | $ | 416,653,926 | |
| | | | | | | | | | | | | | |
|
|
|
The following abbreviations are used in portfolio descriptions:
| | |
| 144A | | Security was purchased pursuant to Rule 144A under the Securities Act of 1933 and may not be resold subject to that rule except to qualified institutional buyers. Unless otherwise noted, 144A securities are deemed to be liquid. |
| BABs | | Build America Bonds |
| FICO | | Financing Corp. |
| TBA | | To Be Announced |
| # | Principal amount shown in U.S. dollars unless otherwise stated. |
| (a) | Indicted a variable rate security. The interest rate shown reflects the rate in effect at December 31, 2011. |
SEE NOTES TO FINANCIAL STATEMENTS.
A95
| | | | | | |
| | | GOVERNMENT INCOME PORTFOLIO (continued) | | |
| |
| SCHEDULE OF INVESTMENTS | | December 31, 2011 |
| (b) | All or a portion of security is on loan. The aggregate market value of such securities, including those sold and pending settlement, is $6,661,741; cash collateral of $6,793,055 (included in liabilities) was received with which the Portfolio purchased highly liquid short-term investments. |
| (c) | All or partial principal amount totaling $19,000,000 represents to-be-announced (“TBA”) securities acquired under mortgage dollar roll agreement. |
| (d) | Represents zero coupon bond. Rate shown reflects the effective yield at December 31, 2011. |
| (e) | Represents security, or a portion thereof, segregated as collateral for futures contracts. |
| (f) | Rate shown reflects the effective yield at December 31, 2011. |
| (g) | Prudential Investments LLC, the manager of the Portfolio, also serves as manager of the Prudential Investment Portfolios 2 — Prudential Core Taxable Money Market Fund and the Prudential Investment Portfolios 2 — Prudential Core Short-Term Bond Fund. |
| (h) | Represents security, or a portion thereof, purchased with cash collateral received for securities on loan. |
| (i) | Includes net unrealized appreciation (depreciation) on the following derivative contracts held at reporting period end: |
Futures contracts outstanding at December 31, 2011:
| | | | | | | | | | | | | | | | | | |
Number of
Contracts
| | Type
| | Expiration
Date
| | | Value at
Trade Date
| | | Value at
December 31, 2011
| | | Unrealized
(Depreciation)
| |
| Long Position: | | | | | | | | | | | | | | | | | | |
| 162 | | 2 Year U.S. Treasury Notes | | | Mar. 2012 | | | $ | 35,736,871 | | | $ | 35,728,594 | | | $ | (8,277 | ) |
| | | | | | | | | | | | | | | | |
|
|
|
| Short Positions: | | | | | | | | | | | | | | | | | | |
| 100 | | 5 Year U.S. Treasury Notes | | | Mar. 2012 | | | | 12,294,088 | | | | 12,325,781 | | | | (31,693 | ) |
| 158 | | 10 Year U.S. Treasury Notes | | | Mar. 2012 | | | | 20,655,477 | | | | 20,717,750 | | | | (62,273 | ) |
| 197 | | U.S. Long Bond | | | Mar. 2012 | | | | 28,258,683 | | | | 28,528,063 | | | | (269,380 | ) |
| | | | | | | | | | | | | | | | |
|
|
|
| | | | | | | | | | | | | | | | | | (363,346 | ) |
| | | | | | | | | | | | | | | | |
|
|
|
| | | | | | | | | | | | | | | | | $ | (371,623 | ) |
| | | | | | | | | | | | | | | | |
|
|
|
Interest rate swap agreements outstanding at December 31, 2011:
| | | | | | | | | | | | | | | | | | | | | | | | |
Counterparty
| | Termination
Date
| | Notional
Amount
(000)#
| | | Fixed
Rate
| | | Floating Rate
| | Fair
Value
| | | Upfront
Premium
Paid/
(Received)
| | | Unrealized
Appreciation/
(Depreciation)
| |
Over-the-counter swap agreements: | |
Barclays Bank PLC | | 05/31/16 | | | 5,255 | | | | 1.180% | | | 3 month LIBOR(1) | | $ | 11,615 | | | $ | — | | | $ | 11,615 | |
Barclays Bank PLC | | 05/31/16 | | | 5,255 | | | | 1.175% | | | 3 month LIBOR(1) | | | 10,675 | | | | — | | | | 10,675 | |
Barclays Bank PLC | | 05/31/16 | | | 1,360 | | | | 1.220% | | | 3 month LIBOR(1) | | | 5,251 | | | | — | | | | 5,251 | |
Deutsche Bank AG | | 09/14/16 | | | 1,320 | | | | 1.206% | | | 3 month LIBOR(1) | | | (7,224 | ) | | | — | | | | (7,224 | ) |
Citibank, NA | | 07/20/21 | | | 4,550 | | | | 3.035% | | | 3 month LIBOR(2) | | | 482,206 | | | | — | | | | 482,206 | |
Citibank, NA | | 11/23/21 | | | 4,560 | | | | 2.148% | | | 3 month LIBOR(2) | | | (59,919 | ) | | | — | | | | (59,919 | ) |
| | | | | | | | | | | | | | |
|
|
| |
|
|
| |
|
|
|
| | | | | | | | | | | | | | | $ | 442,604 | | | $ | — | | | $ | 442,604 | |
| | | | | | | | | | | | | | |
|
|
| |
|
|
| |
|
|
|
| # | Notional amount is shown in U.S. dollars unless otherwise stated. |
| | |
| LIBOR | | London Interbank Offered Rate |
| (1) | Portfolio pays the floating rate and receives the fixed rate. |
| (2) | Portfolio pays the fixed rate and receives the floating rate. |
Various inputs are used in determining the value of the Portfolio’s investments. These inputs are summarized in the three broad levels listed below.
| Level 1— | quoted prices generally for securities actively traded on a regulated securities exchange and for open-end mutual funds which are traded at daily net asset value. |
| Level 2— | other significant observable inputs (including, but not limited to, quoted prices for similar securities, interest rates, prepayment speeds, foreign currency exchange rates, and amortized cost) generally for debt securities, swaps, forward foreign currency contracts and for foreign stocks priced using vendor modeling tools. |
| Level 3— | significant unobservable inputs for securities valued in accordance with Board approved fair valuation procedures. |
SEE NOTES TO FINANCIAL STATEMENTS.
A96
| | | | | | |
| | | GOVERNMENT INCOME PORTFOLIO (continued) | | |
| |
| SCHEDULE OF INVESTMENTS | | December 31, 2011 |
The following is a summary of the inputs used as of December 31, 2011 in valuing such portfolio securities:
| | | | | | | | | | | | |
| | | Level 1
| | | Level 2
| | | Level 3
| |
Investments in Securities | | | | | | | | | | | | |
Asset-Backed Securities | | $ | — | | | $ | 5,228,365 | | | $ | — | |
Collateralized Mortgage Obligations | | | — | | | | 7,788,233 | | | | — | |
Commercial Mortgage-Backed Securities | | | — | | | | 43,647,577 | | | | — | |
Corporate Bonds | | | — | | | | 4,162,389 | | | | — | |
Mortgage-Backed Securities | | | — | | | | 172,215,661 | | | | — | |
Municipal Bond | | | — | | | | 742,972 | | | | — | |
U.S. Government Agency Obligations | | | — | | | | 7,619,909 | | | | — | |
U.S. Treasury Securities | | | — | | | | 171,948,021 | | | | — | |
Affiliated Mutual Funds | | | 106,513,909 | | | | — | | | | — | |
Other Financial Instruments* | | | | | | | | | | | | |
Futures Contracts | | | (371,623 | ) | | | — | | | | — | |
Interest Rate Swaps | | | — | | | | 442,604 | | | | — | |
| | |
|
|
| |
|
|
| |
|
|
|
Total | | $ | 106,142,286 | | | $ | 413,795,731 | | | $ | — | |
| | |
|
|
| |
|
|
| |
|
|
|
| * | Other financial instruments are derivative instruments not reflected in the Schedule of Investments, such as futures, forwards and swap contracts, which are recorded at the unrealized appreciation/depreciation on the instrument. |
The industry classification of portfolio holdings and liabilities in excess of other assets shown as a percentage of net assets as of December 31, 2011 were as follows:
| | | | |
Mortgage-Backed Securities | | | 41.3 | % |
U.S. Treasury Securities | | | 41.3 | |
Affiliated Mutual Funds (including 1.6% of collateral received for securities on loan) | | | 25.6 | |
Commercial Mortgage-Backed Securities | | | 10.5 | |
Collateralized Mortgage Obligations | | | 1.9 | |
U.S. Government Agency Obligations | | | 1.8 | |
Asset-Backed Securities | | | 1.2 | |
Corporate Bonds | | | 1.0 | |
Municipal Bond | | | 0.2 | |
| | |
|
|
|
| | | | 124.8 | |
Liabilities in excess of other assets | | | (24.8 | ) |
| | |
|
|
|
| | | | 100.0 | % |
| | |
|
|
|
The Portfolio invested in derivative instruments during the reporting period. The primary type of risk associated with these derivative instruments is interest rate risk. Detailed discussion about these risks can be found in the Notes to the Financial Statements. The effect of such derivative instruments on the Portfolio’s financial position and financial performance as reflected in the Statement of Assets and Liabilities and Statement of Operations is presented in the summary below.
Fair values of derivative instruments as of December 31, 2011 as presented in the Statement of Assets and Liabilities:
| | | | | | | | | | | | |
Derivatives not designated as hedging
instruments, carried at fair value
| | Asset Derivatives
| | | Liability Derivatives
| |
| | Balance Sheet Location
| | Fair Value
| | | Balance Sheet Location
| | Fair Value
| |
Interest rate contracts | | Due to broker — variation margin | | $ | — | * | | Due to broker — variation margin | | $ | (371,623 | )* |
Interest rate contracts | | Unrealized appreciation on swap agreements | | | 509,747 | | | Unrealized depreciation on swap agreements | | | 67,143 | |
| | | | |
|
|
| | | |
|
|
|
Total | | | | $ | 509,747 | | | | | $ | (304,480 | ) |
| | | | |
|
|
| | | |
|
|
|
| * | Includes cumulative appreciation/depreciation of futures contracts as reported in Schedule of Investments. Only unsettled variation margin receivable (payable) is reported within the Statement of Assets and Liabilities. |
SEE NOTES TO FINANCIAL STATEMENTS.
A97
| | | | | | |
| | | GOVERNMENT INCOME PORTFOLIO (continued) | | |
| |
| SCHEDULE OF INVESTMENTS | | December 31, 2011 |
The effects of derivative instruments on the Statement of Operations for the year ended December 31, 2011 are as follows:
| | | | | | | | | | | | |
Amount of Realized Gain or (Loss) on Derivatives Recognized in Income
| |
Derivatives not designated as hedging instruments, carried at fair value
| | Futures
| | | Swaps
| | | Total
| |
Interest rate contracts | | $ | (5,713,637 | ) | | $ | 762,245 | | | $ | (4,951,392 | ) |
| | |
|
|
| |
|
|
| |
|
|
|
| | | | | | | | | | | | |
Change in Unrealized Appreciation or (Depreciation) on Derivatives Recognized in Income
| |
Derivatives not designated as hedging instruments, carried at fair value
| | Futures
| | | Swaps
| | | Total
| |
Interest rate contracts | | $ | (2,309,044 | ) | | $ | 497,543 | | | $ | (1,811,501 | ) |
| | |
|
|
| |
|
|
| |
|
|
|
For the year ended December 31, 2011, the Portfolio’s average volume of derivative activities are as follows:
| | | | |
Futures
Long Position
(Value at Trade Date)
| | Futures
Short Position
(Value at Trade Date)
| | Interest Rate Swaps
(Notional Amount in USD (000))
|
| $88,500,853 | | $92,673,681 | | $27,949 |
SEE NOTES TO FINANCIAL STATEMENTS.
A98
| | | | | | |
| | | GOVERNMENT INCOME PORTFOLIO (continued) | | |
STATEMENT OF ASSETS AND LIABILITIES
December 31, 2011
| | | | |
| ASSETS | | | | |
Investments, at value including securities on loan of $6,661,741: | | | | |
Unaffiliated investments (cost $394,072,166) | | $ | 413,353,127 | |
Affiliated investments (cost $111,942,971) | | | 106,513,909 | |
Cash | | | 49,355 | |
Receivable for investments sold | | | 93,521,597 | |
Dividends and interest receivable | | | 2,141,035 | |
Unrealized appreciation on swap agreements | | | 509,747 | |
Prepaid expenses | | | 2,396 | |
Receivable for Series shares sold | | | 1,116 | |
| | |
|
|
|
Total Assets | | | 616,092,282 | |
| | |
|
|
|
| LIABILITIES | | | | |
Payable for investments purchased | | | 192,009,459 | |
Collateral for securities on loan | | | 6,793,055 | |
Payable for Series shares repurchased | | | 200,320 | |
Management fee payable | | | 140,611 | |
Due to broker—variation margin | | | 115,071 | |
Accrued expenses and other liabilities | | | 109,862 | |
Unrealized depreciation on swap agreements | | | 67,143 | |
Deferred trustees’ fees | | | 1,909 | |
Affiliated transfer agent fee payable | | | 926 | |
| | |
|
|
|
Total Liabilities | | | 199,438,356 | |
| | |
|
|
|
| NET ASSETS | | $ | 416,653,926 | |
| | |
|
|
|
Net assets were comprised of: | | | | |
Paid-in capital | | $ | 389,440,503 | |
Retained earnings | | | 27,213,423 | |
| | |
|
|
|
Net assets, December 31, 2011 | | $ | 416,653,926 | |
| | |
|
|
|
Net asset value and redemption price per share, $416,653,926 / 33,690,740 outstanding shares of beneficial interest | | $ | 12.37 | |
| | |
|
|
|
STATEMENT OF OPERATIONS
Year Ended December 31, 2011
| | | | |
| INVESTMENT INCOME | | | | |
Interest | | $ | 11,090,912 | |
Affiliated dividend income | | | 770,462 | |
Affiliated income from securities loaned, net | | | 36,358 | |
| | |
|
|
|
| | | | 11,897,732 | |
| | |
|
|
|
| EXPENSES | | | | |
Management fee | | | 1,620,279 | |
Custodian’s fees and expenses | | | 92,000 | |
Shareholders’ reports | | | 51,000 | |
Audit fee | | | 29,000 | |
Trustees’ fees | | | 14,000 | |
Transfer agent’s fee and expenses (including affiliated expense of $5,500) (Note 4) | | | 12,000 | |
Legal fees and expenses | | | 9,000 | |
Insurance expenses | | | 5,000 | |
Commitment fee on syndicated credit agreement | | | 4,000 | |
Miscellaneous | | | 9,700 | |
| | |
|
|
|
Total expenses | | | 1,845,979 | |
| | |
|
|
|
| NET INVESTMENT INCOME | | | 10,051,753 | |
| | |
|
|
|
| NET REALIZED AND UNREALIZED GAIN (LOSS) ON INVESTMENTS | | | | |
Net realized gain (loss) on: | | | | |
Investment transactions | | | 17,444,972 | |
Foreign currency transactions | | | (11 | ) |
Futures transactions | | | (5,713,637 | ) |
Swap agreement transactions | | | 762,245 | |
| | |
|
|
|
| | | | 12,493,569 | |
| | |
|
|
|
Net change in unrealized appreciation (depreciation) on: Investments (including affiliated: $(697,772)) | | | 9,185,328 | |
Futures | | | (2,309,044 | ) |
Swap agreements | | | 497,543 | |
| | |
|
|
|
| | | | 7,373,827 | |
| | |
|
|
|
| NET GAIN ON INVESTMENTS | | | 19,867,396 | |
| | |
|
|
|
| NET INCREASE IN NET ASSETS RESULTING FROM OPERATIONS | | $ | 29,919,149 | |
| | |
|
|
|
STATEMENT OF CHANGES IN NET ASSETS
| | | | | | | | |
| | | Year Ended December 31,
| |
| | | 2011
| | | 2010
| |
| INCREASE (DECREASE) IN NET ASSETS | | | | | | | | |
| OPERATIONS: | | | | | | | | |
Net investment income | | $ | 10,051,753 | | | $ | 11,481,089 | |
Net realized gain on investments | | | 12,493,569 | | | | 8,366,571 | |
Net change in unrealized appreciation (depreciation) on investments | | | 7,373,827 | | | | 6,702,759 | |
| | |
|
|
| |
|
|
|
NET INCREASE IN NET ASSETS RESULTING FROM OPERATIONS | | | 29,919,149 | | | | 26,550,419 | |
| | |
|
|
| |
|
|
|
| DISTRIBUTIONS | | | (18,318,094 | ) | | | (21,211,457 | ) |
| | |
|
|
| |
|
|
|
| SERIES SHARE TRANSACTIONS: | | | | | | | | |
Series shares sold [2,166,785 and 3,844,283 shares, respectively] | | | 26,321,036 | | | | 46,399,951 | |
Series shares issued in reinvestment of distributions [1,519,181 and 1,770,163 shares, respectively] | | | 18,318,094 | | | | 21,211,457 | |
Series shares repurchased [3,193,994 and 4,057,749 shares, respectively] | | | (38,827,001 | ) | | | (49,100,020 | ) |
| | |
|
|
| |
|
|
|
NET INCREASE IN NET ASSETS RESULTING FROM SERIES SHARE TRANSACTIONS | | | 5,812,129 | | | | 18,511,388 | |
| | |
|
|
| |
|
|
|
| TOTAL INCREASE IN NET ASSETS | | | 17,413,184 | | | | 23,850,350 | |
| NET ASSETS: | | | | | | | | |
Beginning of year | | | 399,240,742 | | | | 375,390,392 | |
| | |
|
|
| |
|
|
|
End of year | | $ | 416,653,926 | | | $ | 399,240,742 | |
| | |
|
|
| |
|
|
|
SEE NOTES TO FINANCIAL STATEMENTS.
A99
| | | | | | |
| | | HIGH YIELD BOND PORTFOLIO | | |
| |
| SCHEDULE OF INVESTMENTS | | December 31, 2011 |
| | | | | | | | | | | | | | | | |
LONG-TERM INVESTMENTS — 94.6% ASSET-BACKED SECURITIES — 0.1% | | Moody’s
Ratings†
(Unaudited)
| | Interest
Rate
| | | Maturity
Date
| | Principal
Amount
(000)#
| | | Value
(Note 2)
| |
| | | | | | | | | | | | | | | | | |
Non-Residential Mortgage-Backed Security | | | | | | | | | | | | | | | | |
Primus CLO Ltd. (Cayman Islands), Ser. 2007-2A, Class A, 144A(a) | | Aa1 | | | 0.636% | | | 07/15/21 | | $ | 478 | | | $ | 433,607 | |
| | | | | | | | | | | | | | |
|
|
|
Residential Mortgage-Backed Securities — 0.1% | | | | | | | | | | | | | | | | |
Argent Securities, Inc., Ser. 2003-W8, Class M1(a) | | B2 | | | 1.344% | | | 12/25/33 | | | 137 | | | | 104,188 | |
Credit-Based Asset Servicing and Securitization LLC, Ser. 2007-CB1, Class AF2 | | Ca | | | 5.721% | | | 01/25/37 | | | 583 | | | | 209,075 | |
Morgan Stanley ABS Capital I, Ser. 2007-HE6, Class A2(a) | | Ca | | | 0.434% | | | 05/25/37 | | | 100 | | | | 28,605 | |
Morgan Stanley Mortgage Loan Trust, Ser. 2006-12XS, Class A6A | | Caa3 | | | 5.726% | | | 10/25/36 | | | 436 | | | | 224,438 | |
Structured Asset Securities Corp., Ser. 2005-9XS, Class 2A1(a) | | Caa2 | | | 0.594% | | | 06/25/35 | | | 388 | | | | 230,809 | |
| | | | | | | | | | | | | | |
|
|
|
| | | | | | | | | | | | | | | | 797,115 | |
| | | | | | | | | | | | | | |
|
|
|
TOTAL ASSET-BACKED SECURITIES
(cost $1,390,847) | | | | 1,230,722 | |
| | | | | | | | | | | | | | |
|
|
|
| BANK LOANS — 3.1% | | | | | | | | | | | | | | | | |
Automotive — 0.5% | | | | | | | | | | | | | | | | |
Chrysler Group LLC(a) | | Ba2 | | | 6.000% | | | 05/24/17 | | | 11,045 | | | | 10,425,224 | |
| | | | | | | | | | | | | | |
|
|
|
Capital Goods — 0.1% | | | | | | | | | | | | | | | | |
Capital Safety Group Ltd.(a) | | B3 | | | 2.010% | | | 06/15/15 | | | 176 | | | | 174,357 | |
Capital Safety Group Ltd.(a) | | B3 | | | 3.014% | | | 06/14/16 | | | 924 | | | | 914,643 | |
| | | | | | | | | | | | | | |
|
|
|
| | | | | | | | | | | | | | | | 1,089,000 | |
| | | | | | | | | | | | | | |
|
|
|
Consumer — 0.3% | | | | | | | | | | | | | | | | |
Realogy Corp.(a) | | Caa2 | | | 13.500% | | | 10/15/17 | | | 4,700 | | | | 4,694,125 | |
Visant Corp.(a) | | Ba3 | | | 5.250% | | | 12/22/16 | | | 2,271 | | | | 2,121,697 | |
| | | | | | | | | | | | | | |
|
|
|
| | | | | | | | | | | | | | | | 6,815,822 | |
| | | | | | | | | | | | | | |
|
|
|
Electric — 0.3% | | | | | | | | | | | | | | | | |
Texas Competitive Electric Holdings Co. LLC(a) | | B2 | | | 3.746% | | | 10/10/14 | | | 4,187 | | | | 2,913,955 | |
Texas Competitive Electric Holdings Co. LLC(a) | | B2 | | | 4.891% | | | 10/10/17 | | | 7,221 | | | | 4,563,197 | |
| | �� | | | | | | | | | | | | |
|
|
|
| | | | | | | | | | | | | | | | 7,477,152 | |
| | | | | | | | | | | | | | |
|
|
|
Foods — 0.1% | | | | | | | | | | | | | | | | |
BJ’s Wholesale Club, Inc.(a) | | B3 | | | 10.000% | | | 03/30/19 | | | 3,000 | | | | 3,007,500 | |
| | | | | | | | | | | | | | |
|
|
|
Gaming — 0.3% | | | | | | | | | | | | | | | | |
CCM Merger, Inc.(a) | | B3 | | | 7.000% | | | 03/01/17 | | | 5,190 | | | | 5,129,819 | |
MGM Mirage(a)(b) | | NR | | | 0.000% | | | 02/21/14 | | | 2,000 | | | | 1,956,250 | |
| | | | | | | | | | | | | | |
|
|
|
| | | | | | | | | | | | | | | | 7,086,069 | |
| | | | | | | | | | | | | | |
|
|
|
Technology — 1.5% | | | | | | | | | | | | | | | | |
Blackboard, Inc.(a) | | B1 | | | 7.500% | | | 10/04/18 | | | 9,425 | | | | 8,930,188 | |
First Data Corp.(a) | | B1 | | | 3.044% | | | 09/24/14 | | | 207 | | | | 186,072 | |
First Data Corp.(a) | | B1 | | | 3.044% | | | 09/24/14 | | | 2,462 | | | | 2,215,098 | |
First Data Corp.(a) | | B1 | | | 3.044% | | | 09/24/14 | | | 3,421 | | | | 3,081,391 | |
First Data Corp.(a) | | B1 | | | 4.294% | | | 03/26/18 | | | 12,432 | | | | 10,389,549 | |
Interactive Data Corp.(a) | | Ba3 | | | 4.500% | | | 02/09/18 | | | 4,084 | | | | 4,022,704 | |
NXP BV(a) | | B2 | | | 5.500% | | | 03/03/17 | | | 1,995 | | | | 1,930,162 | |
Sensata Technologies, Inc.(a) | | Ba3 | | | 4.000% | | | 05/12/18 | | | 488 | | | | 482,195 | |
| | | | | | | | | | | | | | |
|
|
|
| | | | | | | | | | | | | | | | 31,237,359 | |
| | | | | | | | | | | | | | |
|
|
|
TOTAL BANK LOANS
(cost $70,291,878) | | | | 67,138,126 | |
| | | | | | | | | | | | | | |
|
|
|
| COLLATERALIZED MORTGAGE OBLIGATIONS — 0.1% | | | | | | | | | | | | | | |
Adjustable Rate Mortgage Trust, Ser. 2005-7, Class 1A1(a) | | Ca | | | 2.760% | | | 10/25/35 | | | 116 | | | | 76,470 | |
American Home Mortgage Assets LLC, Ser. 2006-4, Class 1A12(a) | | Ca | | | 0.504% | | | 10/25/46 | | | 54 | | | | 21,931 | |
American Home Mortgage Assets LLC, Ser. 2006-5, Class A1(a) | | Caa3 | | | 1.128% | | | 11/25/46 | | | 436 | | | | 159,630 | |
American Home Mortgage Assets LLC, Ser. 2007-3, Class 22A1 | | Ca | | | 6.250% | | | 06/25/37 | | | 176 | | | | 76,791 | |
American Home Mortgage Investment Trust, Ser. 2005-2, Class 4A1(a) | | Ba3 | | | 2.301% | | | 09/25/45 | | | 30 | | | | 21,817 | |
Banc of America Alternative Loan Trust, Ser. 2005-4, Class CB6(a) | | Caa1 | | | 0.694% | | | 05/25/35 | | | 80 | | | | 51,816 | |
SEE NOTES TO FINANCIAL STATEMENTS.
A100
| | | | | | |
| | | HIGH YIELD BOND PORTFOLIO (continued) | | |
| |
| SCHEDULE OF INVESTMENTS | | December 31, 2011 |
| | | | | | | | | | | | | | | | |
COLLATERALIZED MORTGAGE OBLIGATIONS
(continued) | | Moody’s
Ratings†
(Unaudited)
| | Interest
Rate
| | | Maturity
Date
| | Principal
Amount
(000)#
| | | Value
(Note 2)
| |
| | | | | | | | | | | | | | | | | |
Banc of America Funding Corp., Ser. 2006-B, Class 2A1(a) | | Caa2 | | | 2.866% | | | 03/20/36 | | $ | 199 | | | $ | 127,154 | |
Bear Stearns Adjustable Rate Mortgage Trust, Ser. 2005-10, Class A2(a) | | CCC(c) | | | 2.706% | | | 10/25/35 | | | 500 | | | | 465,739 | |
Bear Stearns Adjustable Rate Mortgage Trust, Ser. 2007-3, Class 1A1(a) | | CCC(c) | | | 5.131% | | | 05/25/47 | | | 62 | | | | 37,467 | |
Citigroup Mortgage Loan Trust, Inc., Ser. 2007-10, Class 22AA(a)(h) | | D(c) | | | 5.611% | | | 09/25/37 | | | 119 | | | | 67,242 | |
Countrywide Alternative Loan Trust, Ser. 2005-43, Class 4A3(a)(h) | | D(c) | | | 5.302% | | | 10/25/35 | | | 46 | | | | 26,712 | |
Countrywide Alternative Loan Trust, Ser. 2005-62, Class 2A1(a) | | Caa3 | | | 1.208% | | | 12/25/35 | | | 106 | | | | 57,176 | |
Countrywide Alternative Loan Trust, Ser. 2006-HY13, Class 4A1(a) | | CCC(c) | | | 4.796% | | | 02/25/37 | | | 55 | | | | 31,606 | |
Countrywide Alternative Loan Trust, Ser. 2006-OA1, Class 2A1(a) | | Ca | | | 0.495% | | | 03/20/46 | | | 47 | | | | 22,884 | |
Countrywide Alternative Loan Trust, Ser. 2006-OA9, Class 2A1A(a) | | Ca | | | 0.495% | | | 07/20/46 | | | 56 | | | | 18,970 | |
Countrywide Alternative Loan Trust, Ser. 2006-OA11, Class A1B(a) | | Ca | | | 0.484% | | | 09/25/46 | | | 67 | | | | 30,752 | |
Countrywide Home Loan Mortgage Pass-Through Trust, Ser. 2005-2, Class 2A1(a) | | Caa2 | | | 0.614% | | | 03/25/35 | | | 142 | | | | 79,861 | |
Downey Savings & Loan Association Mortgage Loan Trust,
Ser. 2005-AR1, Class 2A1A(a) | | Caa1 | | | 0.535% | | | 03/19/45 | | | 17 | | | | 10,046 | |
First Horizon Alternative Mortgage Securities, Ser. 2006-FA2, Class 1A5 | | Caa3 | | | 6.000% | | | 05/25/36 | | | 101 | | | | 70,917 | |
Harborview Mortgage Loan Trust, Ser. 2006-1, Class 2A1A(a) | | Caa3 | | | 0.525% | | | 03/19/36 | | | 435 | | | | 226,552 | |
Harborview Mortgage Loan Trust, Ser. 2006-5, Class 2A1A(a) | | Caa3 | | | 0.465% | | | 07/19/46 | | | 59 | | | | 29,616 | |
Harborview Mortgage Loan Trust, Ser. 2006-7, Class 2A1B(a) | | C | | | 0.535% | | | 09/19/46 | | | 388 | | | | 58,903 | |
IndyMac Index Mortgage Loan Trust, Ser. 2005-AR13, Class 4A1(a) | | Caa3 | | | 2.442% | | | 08/25/35 | | | 98 | | | | 64,914 | |
IndyMac Index Mortgage Loan Trust, Ser. 2006-AR12, Class A1(a) | | Caa2 | | | 0.484% | | | 09/25/46 | | | 47 | | | | 24,079 | |
JPMorgan Mortgage Trust, Ser. 2007-S3, Class 1A96 | | CC(c) | | | 6.000% | | | 08/25/37 | | | 56 | | | | 46,516 | |
JPMorgan Mortgage Trust, Ser. 2007-S3, Class 1A97 | | CCC(c) | | | 6.000% | | | 08/25/37 | | | 112 | | | | 93,033 | |
MASTR Adjustable Rate Mortgages Trust, Ser. 2006-OA1,
Class 1A1(a) | | Caa2 | | | 0.504% | | | 04/25/46 | | | 33 | | | | 15,443 | |
Residential Accredit Loans, Inc., Ser. 2006-QA2, Class 3A1(a) | | Ca | | | 5.500% | | | 02/25/36 | | | 305 | | | | 156,691 | |
Residential Accredit Loans, Inc., Ser. 2007-QS4, Class 2A1(a) | | Ca | | | 0.624% | | | 03/25/37 | | | 215 | | | | 55,376 | |
Residential Asset Securitization Trust, Ser. 2007-A5, Class 2A3 | | Caa2 | | | 6.000% | | | 05/25/37 | | | 103 | | | | 71,368 | |
Structured Asset Mortgage Investments, Inc., Ser. 2006-AR6,
Class 2A1(a) | | Caa3 | | | 0.484% | | | 07/25/46 | | | 61 | | | | 30,296 | |
SunTrust Alternative Loan Trust, Ser. 2006-1F, Class 3A(a) | | Ca | | | 0.644% | | | 04/25/36 | | | 155 | | | | 48,533 | |
WaMu Mortgage Pass-Through Certificates, Ser. 2007-HY1,
Class 2A3(a) | | CCC(c) | | | 5.446% | | | 02/25/37 | | | 52 | | | | 34,553 | |
WaMu Mortgage Pass-Through Certificates, Ser. 2007-HY1,
Class 4A1(a) | | CCC(c) | | | 2.610% | | | 02/25/37 | | | 59 | | | | 39,072 | |
WaMu Mortgage Pass-Through Certificates, Ser. 2007-OA3,
Class 2A1A(a) | | CCC(c) | | | 0.968% | | | 04/25/47 | | | 60 | | �� | | 37,748 | |
| | | | | | | | | | | | | | |
|
|
|
TOTAL COLLATERALIZED MORTGAGE OBLIGATIONS
(cost $2,908,702) | | | | 2,487,674 | |
| | | | | | | | | | | | | | |
|
|
|
| CORPORATE BONDS — 91.2% | | | | | | | | | | | | | | | | |
Aerospace & Defense — 2.3% | | | | | | | | | | | | | | | | |
Alliant Techsystems, Inc., Gtd. Notes | | Ba3 | | | 6.875% | | | 09/15/20 | | | 2,375 | | | | 2,422,500 | |
BE Aerospace, Inc., Sr. Unsec’d. Notes | | Ba2 | | | 8.500% | | | 07/01/18 | | | 10,650 | | | | 11,661,750 | |
Colt Defense LLC/Colt Finance Corp., Gtd. Notes(d)(e) | | Caa1 | | | 8.750% | | | 11/15/17 | | | 4,325 | | | | 2,962,625 | |
Esterline Technologies Corp., Gtd. Notes | | Ba3 | | | 6.625% | | | 03/01/17 | | | 750 | | | | 776,250 | |
Esterline Technologies Corp., Gtd. Notes | | Ba3 | | | 7.000% | | | 08/01/20 | | | 5,400 | | | | 5,697,000 | |
Hawker Beechcraft Acquisition Co. LLC/Hawker Beechcraft Notes Co., Gtd. Notes(e) | | Ca | | | 8.500% | | | 04/01/15 | | | 2,525 | | | | 467,125 | |
Moog, Inc., Sr. Sub. Notes | | Ba3 | | | 6.250% | | | 01/15/15 | | | 2,500 | | | | 2,525,000 | |
Moog, Inc., Sr. Sub. Notes | | Ba3 | | | 7.250% | | | 06/15/18 | | | 4,525 | | | | 4,773,875 | |
Sterling Merger, Inc., Sr. Unsec’d. Notes, 144A(e) | | Caa1 | | | 11.000% | | | 10/01/19 | | | 4,250 | | | | 4,143,750 | |
TransDigm, Inc., Gtd. Notes | | B3 | | | 7.750% | | | 12/15/18 | | | 12,625 | | | | 13,571,875 | |
| | | | | | | | | | | | | | |
|
|
|
| | | | | | | | | | | | | | | | 49,001,750 | |
| | | | | | | | | | | | | | |
|
|
|
SEE NOTES TO FINANCIAL STATEMENTS.
A101
| | | | | | |
| | | HIGH YIELD BOND PORTFOLIO (continued) | | |
| |
| SCHEDULE OF INVESTMENTS | | December 31, 2011 |
| | | | | | | | | | | | | | | | |
CORPORATE BONDS
(continued) | | Moody’s
Ratings†
(Unaudited)
| | Interest
Rate
| | | Maturity
Date
| | Principal
Amount
(000)#
| | | Value
(Note 2)
| |
| | | | | | | | | | | | | | | | | |
Automotive — 1.2% | | | | | | | | | | | | | | | | |
Chrysler Group LLC, Sr. Sec’d. Notes, 144A(e) | | B2 | | | 8.250% | | | 06/15/21 | | $ | 3,350 | | | $ | 3,048,500 | |
Dana Holding Corp., Sr. Unsec’d. Notes(e) | | B2 | | | 6.500% | | | 02/15/19 | | | 2,600 | | | | 2,626,000 | |
Delphi Corp., Gtd. Notes, 144A(e) | | Ba3 | | | 5.875% | | | 05/15/19 | | | 1,500 | | | | 1,530,000 | |
Delphi Corp., Gtd. Notes, 144A(e) | | Ba3 | | | 6.125% | | | 05/15/21 | | | 200 | | | | 206,000 | |
Ford Motor Credit Co. LLC, Sr. Unsec’d. Notes(e) | | Ba1 | | | 7.000% | | | 04/15/15 | | | 2,950 | | | | 3,171,250 | |
Ford Motor Credit Co. LLC, Sr. Unsec’d. Notes(e) | | Ba1 | | | 8.000% | | | 12/15/16 | | | 1,300 | | | | 1,474,992 | |
Lear Corp., Gtd. Notes | | Ba2 | | | 7.875% | | | 03/15/18 | | | 5,075 | | | | 5,493,687 | |
Lear Corp., Gtd. Notes(e) | | Ba2 | | | 8.125% | | | 03/15/20 | | | 2,075 | | | | 2,282,500 | |
Navistar International Corp., Gtd. Notes(e) | | B1 | | | 8.250% | | | 11/01/21 | | | 3,641 | | | | 3,873,114 | |
TRW Automotive, Inc., Gtd. Notes, 144A | | Ba2 | | | 8.875% | | | 12/01/17 | | | 2,025 | | | | 2,197,125 | |
| | | | | | | | | | | | | | |
|
|
|
| | | | | | | | | | | | | | | | 25,903,168 | |
| | | | | | | | | | | | | | |
|
|
|
Banking — 0.6% | | | | | | | | | | | | | | | | |
Bank of America Corp., Jr. Sub. Notes, Ser. K(a)(e) | | Ba3 | | | 8.000% | | | 12/29/49 | | | 8,845 | | | | 7,920,167 | |
BankAmerica Capital II, Ltd. Gtd. Notes, Ser. 2 | | Ba1 | | | 8.000% | | | 12/15/26 | | | 1,000 | | | | 900,000 | |
HBOS PLC (United Kingdom), Sub. Notes, Ser. G, 144A, MTN | | Baa3 | | | 6.750% | | | 05/21/18 | | | 400 | | | | 320,717 | |
MBNA Capital A, Ltd. Gtd. Notes, Ser. A | | Ba1 | | | 8.278% | | | 12/01/26 | | | 2,750 | | | | 2,550,625 | |
Merrill Lynch & Co., Inc., Sub. Notes(e) | | Baa2 | | | 7.750% | | | 05/14/38 | | | 1,090 | | | | 1,035,633 | |
| | | | | | | | | | | | | | |
|
|
|
| | | | | | | | | | | | | | | | 12,727,142 | |
| | | | | | | | | | | | | | |
|
|
|
Building Materials & Construction — 0.8% | | | | | | | | | | | | | | | | |
Building Materials Corp. of America, Sr. Notes, 144A
(original cost $1,488,750; purchased 09/27/10)(d)(g) | | Ba3 | | | 6.875% | | | 08/15/18 | | | 1,500 | | | | 1,575,000 | |
Building Materials Corp. of America, Sr. Sec’d. Notes, 144A
(original cost $5,975,750; purchased 02/02/10-04/27/11)(d)(g) | | Ba1 | | | 7.000% | | | 02/15/20 | | | 5,825 | | | | 6,261,875 | |
D.R. Horton, Inc., Gtd. Notes | | Ba3 | | | 6.500% | | | 04/15/16 | | | 900 | | | | 932,625 | |
K Hovnanian Enterprises, Inc., Gtd. Notes | | Caa3 | | | 11.875% | | | 10/15/15 | | | 4,575 | | | | 2,470,500 | |
Standard Pacific Corp., Gtd. Notes(e) | | B3 | | | 8.375% | | | 05/15/18 | | | 925 | | | | 878,750 | |
Standard Pacific Corp., Gtd. Notes | | B3 | | | 8.375% | | | 01/15/21 | | | 525 | | | | 494,156 | |
Standard Pacific Corp., Gtd. Notes(e) | | B3 | | | 10.750% | | | 09/15/16 | | | 3,875 | | | | 4,068,750 | |
| | | | | | | | | | | | | | |
|
|
|
| | | | | | | | | | | | | | | | 16,681,656 | |
| | | | | | | | | | | | | | |
|
|
|
Cable — 4.2% | | | | | | | | | | | | | | | | |
AT&T Broadband LLC, Gtd. Notes | | Baa1 | | | 8.375% | | | 03/15/13 | | | 100 | (f) | | | 109 | |
Bresnan Broadband Holdings LLC, Gtd. Notes, 144A | | B3 | | | 8.000% | | | 12/15/18 | | | 1,625 | | | | 1,690,000 | |
Cablevision Systems Corp., Sr. Unsec’d. Notes(e) | | B1 | | | 7.750% | | | 04/15/18 | | | 1,975 | | | | 2,093,500 | |
Cablevision Systems Corp., Sr. Unsec’d. Notes(e) | | B1 | | | 8.625% | | | 09/15/17 | | | 5,025 | | | | 5,565,187 | |
CCH II LLC/CCH II Capital Corp., Gtd. Notes | | B2 | | | 13.500% | | | 11/30/16 | | | 1,519 | | | | 1,754,241 | |
CCO Holdings LLC/CCO Holdings Capital Corp., Gtd. Notes(e) | | B1 | | | 7.875% | | | 04/30/18 | | | 1,350 | | | | 1,439,438 | |
CCO Holdings LLC/CCO Holdings Capital Corp., Gtd. Notes(e) | | B1 | | | 8.125% | | | 04/30/20 | | | 1,600 | | | | 1,752,000 | |
Cequel Communications Holdings I LLC and Cequel Capital Corp.,
Sr. Unsec’d. Notes, 144A | | B3 | | | 8.625% | | | 11/15/17 | | | 6,975 | | | | 7,393,500 | |
CSC Holdings LLC, Sr. Unsec’d. Notes, 144A | | Ba3 | | | 6.750% | | | 11/15/21 | | | 4,375 | | | | 4,604,687 | |
CSC Holdings LLC, Sr. Unsec’d. Notes | | Ba3 | | | 7.625% | | | 07/15/18 | | | 1,850 | | | | 2,035,000 | |
CSC Holdings LLC, Sr. Unsec’d. Notes | | Ba3 | | | 7.875% | | | 02/15/18 | | | 850 | | | | 941,375 | |
CSC Holdings LLC, Sr. Unsec’d. Notes | | Ba3 | | | 8.500% | | | 04/15/14 | | | 3,500 | | | | 3,871,875 | |
CSC Holdings LLC, Sr. Unsec’d. Notes | | Ba3 | | | 8.625% | | | 02/15/19 | | | 1,105 | | | | 1,273,513 | |
DISH DBS Corp., Gtd. Notes(e) | | Ba2 | | | 6.750% | | | 06/01/21 | | | 825 | | | | 888,937 | |
Echostar DBS Corp., Gtd. Notes | | Ba2 | | | 6.625% | | | 10/01/14 | | | 4,925 | | | | 5,257,438 | |
Echostar DBS Corp., Gtd. Notes | | Ba2 | | | 7.000% | | | 10/01/13 | | | 7,075 | | | | 7,552,562 | |
Echostar DBS Corp., Gtd. Notes | | Ba2 | | | 7.750% | | | 05/31/15 | | | 25 | | | | 27,500 | |
ONO Finance II PLC (Ireland), Gtd. Notes, 144A(e) | | Caa1 | | | 10.875% | | | 07/15/19 | | | 1,625 | | | | 1,446,250 | |
Quebecor Media, Inc. (Canada), Sr. Unsec’d. Notes | | B1 | | | 7.750% | | | 03/15/16 | | | 1,130 | | | | 1,161,075 | |
Quebecor Media, Inc. (Canada), Sr. Unsec’d. Notes(e) | | B1 | | | 7.750% | | | 03/15/16 | | | 1,550 | | | | 1,592,625 | |
UPC Holding BV (Netherlands), Sec’d. Notes, 144A | | B2 | | | 9.875% | | | 04/15/18 | | | 16,600 | | | | 17,699,750 | |
UPCB Finance V Ltd. (Cayman Islands), Sr. Sec’d. Notes, 144A | | Ba3 | | | 7.250% | | | 11/15/21 | | | 2,450 | | | | 2,480,625 | |
Videotron Ltee (Canada), Gtd. Notes | | Ba1 | | | 6.375% | | | 12/15/15 | | | 3,450 | | | | 3,510,375 | |
Videotron Ltee (Canada), Gtd. Notes | | Ba1 | | | 6.875% | | | 01/15/14 | | | 153 | | | | 153,382 | |
SEE NOTES TO FINANCIAL STATEMENTS.
A102
| | | | | | |
| | | HIGH YIELD BOND PORTFOLIO (continued) | | |
| |
| SCHEDULE OF INVESTMENTS | | December 31, 2011 |
| | | | | | | | | | | | | | | | |
CORPORATE BONDS
(continued) | | Moody’s
Ratings†
(Unaudited)
| | Interest
Rate
| | | Maturity
Date
| | Principal
Amount
(000)#
| | | Value
(Note 2)
| |
| | | | | | | | | | | | | | | | | |
Cable (continued) | | | | | | | | | | | | | | | | |
Videotron Ltee (Canada), Gtd. Notes | | Ba1 | | | 9.125% | | | 04/15/18 | | $ | 9,200 | | | $ | 10,131,500 | |
Virgin Media Finance PLC (United Kingdom), Gtd. Notes, Ser. 1 | | Ba2 | | | 9.500% | | | 08/15/16 | | | 3,700 | | | | 4,153,250 | |
| | | | | | | | | | | | | | |
|
|
|
| | | | | | | | | | | | | | | | 90,469,694 | |
| | | | | | | | | | | | | | |
|
|
|
Capital Goods — 6.9% | | | | | | | | | | | | | | | | |
Actuant Corp., Gtd. Notes | | Ba3 | | | 6.875% | | | 06/15/17 | | | 4,845 | | | | 4,990,350 | |
Aguila 3 SA (Luxembourg), Sr. Sec’d. Notes, 144A | | B2 | | | 7.875% | | | 01/31/18 | | | 1,725 | | | | 1,673,250 | |
Altra Holdings, Inc., Sec’d. Notes | | B1 | | | 8.125% | | | 12/01/16 | | | 3,800 | | | | 4,037,500 | |
Amsted Industries, Inc., Sr. Notes, 144A
(original cost $4,517,240; purchased 03/12/10)(d)(e)(g) | | B1 | | | 8.125% | | | 03/15/18 | | | 4,550 | | | | 4,823,000 | |
Ashtead Capital, Inc., Sec’d. Notes, 144A | | B2 | | | 9.000% | | | 08/15/16 | | | 10,664 | | | | 11,117,220 | |
Avis Budget Car Rental LLC/Avis Budget Finance, Inc., Gtd. Notes | | B2 | | | 8.250% | | | 01/15/19 | | | 1,125 | | | | 1,116,562 | |
Avis Budget Car Rental LLC/Avis Budget Finance, Inc., Gtd. Notes | | B2 | | | 9.750% | | | 03/15/20 | | | 3,850 | | | | 3,955,875 | |
Case New Holland, Inc., Gtd. Notes | | Ba2 | | | 7.875% | | | 12/01/17 | | | 4,150 | | | | 4,689,500 | |
Clean Harbors, Inc., Sr. Sec’d. Notes | | Ba3 | | | 7.625% | | | 08/15/16 | | | 5,950 | | | | 6,321,875 | |
Dycom Investments, Inc., Gtd. Notes | | Ba3 | | | 7.125% | | | 01/15/21 | | | 3,000 | | | | 3,030,000 | |
Griffon Corp., Gtd. Notes | | B1 | | | 7.125% | | | 04/01/18 | | | 3,775 | | | | 3,737,250 | |
Hertz Corp. (The), Gtd. Notes | | B2 | | | 6.750% | | | 04/15/19 | | | 7,225 | | | | 7,243,063 | |
Hertz Corp. (The), Gtd. Notes | | B2 | | | 7.500% | | | 10/15/18 | | | 2,825 | | | | 2,952,125 | |
Interline Brands, Inc., Gtd. Notes(e) | | B2 | | | 7.000% | | | 11/15/18 | | | 8,270 | | | | 8,559,450 | |
NES Rentals Holdings, Inc., Sec’d. Notes, 144A
(original cost $2,972,490; purchased 04/01/10)(d)(g) | | Caa2 | | | 12.250% | | | 04/15/15 | | | 3,000 | | | | 2,535,000 | |
Park-Ohio Industries, Inc., Gtd. Notes | | B3 | | | 8.125% | | | 04/01/21 | | | 3,175 | | | | 3,127,375 | |
RBS Global, Inc./Rexnord LLC, Gtd. Notes(e) | | Caa1 | | | 8.500% | | | 05/01/18 | | | 8,800 | | | | 9,328,000 | |
RBS Global, Inc./Rexnord LLC, Gtd. Notes(e) | | Caa2 | | | 11.750% | | | 08/01/16 | | | 1,100 | | | | 1,155,000 | |
RSC Equipment Rental, Inc./RSC Holdings III LLC, Gtd. Notes(e) | | Caa1 | | | 8.250% | | | 02/01/21 | | | 3,600 | | | | 3,645,000 | |
RSC Equipment Rental, Inc./RSC Holdings III LLC, Gtd. Notes | | Caa1 | | | 10.250% | | | 11/15/19 | | | 2,425 | | | | 2,643,250 | |
RSC Equipment Rental, Inc./RSC Holdings III LLC,
Sr. Sec’d. Notes, 144A | | B1 | | | 10.000% | | | 07/15/17 | | | 3,987 | | | | 4,644,855 | |
RSC Equipment Rental, Inc./RSC Holdings III LLC,
Sr. Unsec’d. Notes(e) | | Caa1 | | | 9.500% | | | 12/01/14 | | | 1,796 | | | | 1,845,390 | |
SPX Corp., Gtd. Notes(e) | | Ba2 | | | 6.875% | | | 09/01/17 | | | 4,925 | | | | 5,319,000 | |
SPX Corp., Sr. Unsec’d. Notes(e) | | Ba2 | | | 7.625% | | | 12/15/14 | | | 10,280 | | | | 11,308,000 | |
Stena AB (Sweden), Sr. Unsec’d. Notes | | Ba3 | | | 7.000% | | | 12/01/16 | | | 250 | | | | 230,625 | |
Terex Corp., Sr. Sub. Notes(e) | | Caa1 | | | 8.000% | | | 11/15/17 | | | 6,405 | | | | 6,276,900 | |
Trimas Corp., Sec’d. Notes | | B2 | | | 9.750% | | | 12/15/17 | | | 5,375 | | | | 5,831,875 | |
United Rentals North America, Inc., Gtd. Notes(e) | | Caa1 | | | 8.375% | | | 09/15/20 | | | 3,725 | | | | 3,631,875 | |
United Rentals North America, Inc., Gtd. Notes(e) | | B3 | | | 10.875% | | | 06/15/16 | | | 5,950 | | | | 6,604,500 | |
WireCo WorldGroup, Inc., Gtd. Notes, 144A | | B2 | | | 10.000% | | | 05/15/17 | | | 12,975 | | | | 13,039,875 | |
| | | | | | | | | | | | | | |
|
|
|
| | | | | | | | | | | | | | | | 149,413,540 | |
| | | | | | | | | | | | | | |
|
|
|
Chemicals — 3.8% | | | | | | | | | | | | | | | | |
CF Industries, Inc., Gtd. Notes | | Ba1 | | | 6.875% | | | 05/01/18 | | | 3,925 | | | | 4,494,125 | |
Hexion US Finance Corp./Hexion Nova Scotia Finance ULC,
Sec’d. Notes(e) | | Caa1 | | | 9.000% | | | 11/15/20 | | | 14,850 | | | | 12,251,250 | |
Hexion US Finance Corp./Hexion Nova Scotia Finance ULC,
Sr. Sec’d. Notes(e) | | B3 | | | 8.875% | | | 02/01/18 | | | 1,000 | | | | 937,500 | |
Huntsman International LLC, Gtd. Notes(e) | | B1 | | | 5.500% | | | 06/30/16 | | | 2,175 | | | | 2,131,500 | |
Huntsman International LLC, Gtd. Notes(e) | | B3 | | | 8.625% | | | 03/15/21 | | | 1,000 | | | | 1,060,000 | |
Kinove German Bondco GmbH (Germany), Sr. Sec’d. Notes, 144A | | B2 | | | 9.625% | | | 06/15/18 | | | 4,950 | | | | 4,702,500 | |
Koppers, Inc., Gtd. Notes | | B1 | | | 7.875% | | | 12/01/19 | | | 5,075 | | | | 5,379,500 | |
Lyondell Chemical Co., Sec’d. Notes | | Ba2 | | | 11.000% | | | 05/01/18 | | | 7,984 | | | | 8,722,615 | |
LyondellBasell Industries NV (Netherlands), Gtd. Notes, 144A(e) | | Ba2 | | | 6.000% | | | 11/15/21 | | | 3,225 | | | | 3,345,938 | |
Momentive Performance Materials, Inc., Sec’d. Notes(e) | | Caa1 | | | 9.000% | | | 01/15/21 | | | 3,719 | | | | 2,826,440 | |
Nexeo Solutions LLC/Nexeo Solutions Finance Corp.,
Sr. Sub. Notes, 144A | | | | | | | | | | | | | | | | |
(original cost $8,408,563; purchased 02/23/11-11/28/11)(d)(g) | | B3 | | | 8.375% | | | 03/01/18 | | | 8,360 | | | | 8,318,200 | |
Nova Chemicals Corp. (Canada), Sr. Unsec’d. Notes | | Ba2 | | | 8.375% | | | 11/01/16 | | | 8,756 | | | | 9,544,040 | |
SEE NOTES TO FINANCIAL STATEMENTS.
A103
| | | | | | |
| | | HIGH YIELD BOND PORTFOLIO (continued) | | |
| |
| SCHEDULE OF INVESTMENTS | | December 31, 2011 |
| | | | | | | | | | | | | | | | |
CORPORATE BONDS
(continued) | | Moody’s
Ratings†
(Unaudited)
| | Interest
Rate
| | | Maturity
Date
| | Principal
Amount
(000)#
| | | Value
(Note 2)
| |
| | | | | | | | | | | | | | | | | |
Chemicals (continued) | | | | | | | | | | | | | | | | |
Rhodia SA (France), Sr. Unsec’d. Notes, 144A | | Baa2 | | | 6.875% | | | 09/15/20 | | $ | 5,720 | | | $ | 6,234,800 | |
Rockwood Specialties Group, Inc., Gtd. Notes | | B1 | | | 7.500% | | | 11/15/14 | | | 1,225 | | | | 1,240,312 | |
Solutia, Inc., Gtd. Notes(e) | | B1 | | | 7.875% | | | 03/15/20 | | | 4,825 | | | | 5,247,187 | |
Solutia, Inc., Gtd. Notes | | B1 | | | 8.750% | | | 11/01/17 | | | 1,150 | | | | 1,256,375 | |
Texas Petrochemical, Sr. Sec’d. Notes | | B1 | | | 8.250% | | | 10/01/17 | | | 4,550 | | | | 4,550,000 | |
| | | | | | | | | | | | | | |
|
|
|
| | | | | | | | | | | | | | | | 82,242,282 | |
| | | | | | | | | | | | | | |
|
|
|
Consumer — 2.4% | | | | | | | | | | | | | | | | |
American Achievement Corp., Sec’d. Notes, 144A
(original cost $3,617,500; purchased 10/21/10-04/06/11)(d)(g) | | B3 | | | 10.875% | | | 04/15/16 | | | 3,625 | | | | 2,791,250 | |
Goodman Networks, Inc., Sr. Sec’d. Notes, 144A | | B2 | | | 12.125% | | | 07/01/18 | | | 3,650 | | | | 3,485,750 | |
Mac-Gray Corp., Gtd. Notes | | B3 | | | 7.625% | | | 08/15/15 | | | 5,943 | | | | 6,084,146 | |
Phillips-Van Heusen Corp., Sr. Unsec’d. Notes | | Ba3 | | | 7.375% | | | 05/15/20 | | | 2,108 | | | | 2,287,180 | |
Realogy Corp., Gtd. Notes | | Caa3 | | | 12.000% | | | 04/15/17 | | | 520 | | | | 400,298 | |
Realogy Corp., Gtd. Notes | | CC(c) | | | 13.375% | | | 04/15/18 | | | 900 | | | | 543,375 | |
Scotts Miracle-Gro Co. (The), Gtd. Notes | | B1 | | | 7.250% | | | 01/15/18 | | | 2,600 | | | | 2,730,000 | |
Sealy Mattress Co., Sr. Sec’d. Notes, 144A | | Ba3 | | | 10.875% | | | 04/15/16 | | | 4,738 | | | | 5,176,265 | |
Service Corp. International, Sr. Unsec’d. Notes | | Ba3 | | | 7.000% | | | 06/15/17 | | | 4,143 | | | | 4,495,155 | |
Service Corp. International, Sr. Unsec’d. Notes | | Ba3 | | | 7.000% | | | 05/15/19 | | | 3,125 | | | | 3,289,063 | |
Spectrum Brands Holdings, Inc., Sr. Sec’d. Notes | | B1 | | | 9.500% | | | 06/15/18 | | | 1,500 | | | | 1,640,625 | |
Stewart Enterprises, Inc., Gtd. Notes | | B1 | | | 6.500% | | | 04/15/19 | | | 5,690 | | | | 5,718,450 | |
Visant Corp., Gtd. Notes(e) | | Caa1 | | | 10.000% | | | 10/01/17 | | | 15,269 | | | | 13,971,135 | |
| | | | | | | | | | | | | | |
|
|
|
| | | | | | | | | | | | | | | | 52,612,692 | |
| | | | | | | | | | | | | | |
|
|
|
Electric — 3.4% | | | | | | | | | | | | | | | | |
AES Corp. (The), Sr. Unsec’d. Notes, 144A(e) | | Ba3 | | | 7.375% | | | 07/01/21 | | | 4,075 | | | | 4,390,813 | |
AES Corp. (The), Sr. Unsec’d. Notes | | Ba3 | | | 7.750% | | | 10/15/15 | | | 9,265 | | | | 10,075,687 | |
AES Corp. (The), Sr. Unsec’d. Notes | | Ba3 | | | 8.000% | | | 10/15/17 | | | 550 | | | | 605,000 | |
AES Corp. (The), Sr. Unsec’d. Notes(e) | | Ba3 | | | 8.000% | | | 06/01/20 | | | 1,800 | | | | 1,980,000 | |
AES Eastern Energy LP, Pass-thru Certs., Ser. 99-A(d)(h) | | Caa2 | | | 9.000% | | | 01/02/17 | | | 2,384 | | | | 917,879 | |
AES Red Oak LLC, Sr. Sec’d. Notes, Ser. A
(original cost $1,476,319; purchased 10/31/03-03/03/09)(d)(g) | | B2 | | | 8.540% | | | 11/30/19 | | | 1,501 | | | | 1,546,003 | |
Calpine Corp., Sr. Sec’d. Notes, 144A(e) | | B1 | | | 7.250% | | | 10/15/17 | | | 2,025 | | | | 2,126,250 | |
Calpine Corp., Sr. Sec’d. Notes, 144A(e) | | B1 | | | 7.500% | | | 02/15/21 | | | 14,225 | | | | 15,220,750 | |
Covanta Holding Corp., Sr. Unsec’d. Notes | | Ba3 | | | 7.250% | | | 12/01/20 | | | 3,055 | | | | 3,211,291 | |
Energy Future Holdings Corp., Sr. Sec’d. Notes | | Caa3 | | | 9.750% | | | 10/15/19 | | | 425 | | | | 425,000 | |
Mirant Corp., Sr. Notes, 144A(d) | | NR | | | 7.400% | | | 07/15/49 | | | 1,825 | | | | 1,825 | |
Mirant Mid Atlantic Pass Through Trust A, Pass-thru Certs., Ser. A | | Ba1 | | | 8.625% | | | 06/30/12 | | | 43 | | | | 43,440 | |
Mirant Mid Atlantic Pass Through Trust B, Pass-thru Certs., Ser. B | | Ba1 | | | 9.125% | | | 06/30/17 | | | 8,763 | | | | 8,960,498 | |
North American Energy Alliance LLC/North American Energy Alliance Finance Corp., Sec’d. Notes
(original cost $953,933; purchased 09/30/09)(d)(g) | | Ba3 | | | 10.875% | | | 06/01/16 | | | 976 | | | | 1,034,560 | |
NRG Energy, Inc., Gtd. Notes(e) | | B1 | | | 7.375% | | | 01/15/17 | | | 925 | | | | 959,688 | |
NRG Energy, Inc., Gtd. Notes(e) | | B1 | | | 7.625% | | | 01/15/18 | | | 8,125 | | | | 8,125,000 | |
NRG Energy, Inc., Gtd. Notes, 144A(e) | | B1 | | | 7.625% | | | 05/15/19 | | | 1,950 | | | | 1,911,000 | |
NRG Energy, Inc., Gtd. Notes, 144A | | B1 | | | 7.875% | | | 05/15/21 | | | 200 | | | | 195,000 | |
NRG Energy, Inc., Gtd. Notes(e) | | B1 | | | 8.250% | | | 09/01/20 | | | 7,175 | | | | 7,210,875 | |
NSG Holdings LLC/NSG Holdings, Inc., Sr. Sec’d. Notes, 144A | | Ba2 | | | 7.750% | | | 12/15/25 | | | 595 | | | | 609,875 | |
Reliant Energy Mid-Atlantic Power Holdings LLC, Pass-thru Certs.,
Ser. B(d)(e) | | Ba1 | | | 9.237% | | | 07/02/17 | | | 4,120 | | | | 4,037,824 | |
| | | | | | | | | | | | | | |
|
|
|
| | | | | | | | | | | | | | | | 73,588,258 | |
| | | | | | | | | | | | | | |
|
|
|
Energy – Other — 6.1% | | | | | | | | | | | | | | | | |
Cie Generale de Geophysique-Veritas (France), Gtd. Notes(e) | | Ba3 | | | 7.750% | | | 05/15/17 | | | 2,150 | | | | 2,176,875 | |
Cie Generale de Geophysique-Veritas (France), Gtd. Notes | | Ba3 | | | 9.500% | | | 05/15/16 | | | 4,300 | | | | 4,644,000 | |
CITIC Resources Finance 2007 Ltd. (Virgin Islands (BR)), Gtd. Notes, 144A | | Ba3 | | | 6.750% | | | 05/15/14 | | | 25 | | | | 25,438 | |
Clayton Williams Energy, Inc., Gtd. Notes, 144A | | Caa1 | | | 7.750% | | | 04/01/19 | | | 4,475 | | | | 4,273,625 | |
SEE NOTES TO FINANCIAL STATEMENTS.
A104
| | | | | | |
| | | HIGH YIELD BOND PORTFOLIO (continued) | | |
| |
| SCHEDULE OF INVESTMENTS | | December 31, 2011 |
| | | | | | | | | | | | | | | | |
CORPORATE BONDS
(continued) | | Moody’s
Ratings†
(Unaudited)
| | Interest
Rate
| | | Maturity
Date
| | Principal
Amount
(000)#
| | | Value
(Note 2)
| |
| | | | | | | | | | | | | | | | | |
Energy – Other (continued) | | | | | | | | | | | | | | | | |
Denbury Resources, Inc., Gtd. Notes(e) | | B1 | | | 6.375% | | | 08/15/21 | | $ | 4,000 | | | $ | 4,180,000 | |
Denbury Resources, Inc., Gtd. Notes | | B1 | | | 8.250% | | | 02/15/20 | | | 4,043 | | | | 4,518,053 | |
Denbury Resources, Inc., Gtd. Notes | | B1 | | | 9.750% | | | 03/01/16 | | | 4,050 | | | | 4,465,125 | |
Forest Oil Corp., Gtd. Notes(e) | | B1 | | | 7.250% | | | 06/15/19 | | | 7,325 | | | | 7,471,500 | |
Harvest Operations Corp. (Canada), Gtd. Notes, 144A | | Ba1 | | | 6.875% | | | 10/01/17 | | | 11,000 | | | | 11,385,000 | |
Key Energy Services, Inc., Gtd. Notes(e) | | B1 | | | 6.750% | | | 03/01/21 | | | 1,175 | | | | 1,175,000 | |
Linn Energy LLC/Linn Energy Finance Corp., Gtd. Notes, 144A | | B2 | | | 6.500% | | | 05/15/19 | | | 7,900 | | | | 7,840,750 | |
McMoRan Exploration Co., Gtd. Notes | | Caa1 | | | 11.875% | | | 11/15/14 | | | 6,975 | | | | 7,393,500 | |
MEG Energy Corp. (Canada), Gtd. Notes, 144A | | B3 | | | 6.500% | | | 03/15/21 | | | 5,275 | | | | 5,393,687 | |
Newfield Exploration Co., Sr. Sub. Notes | | Ba2 | | | 6.625% | | | 04/15/16 | | | 3,435 | | | | 3,538,050 | |
Newfield Exploration Co., Sr. Sub. Notes(e) | | Ba2 | | | 6.875% | | | 02/01/20 | | | 1,635 | | | | 1,749,450 | |
Newfield Exploration Co., Sr. Sub. Notes | | Ba2 | | | 7.125% | | | 05/15/18 | | | 325 | | | | 346,937 | |
Parker Drilling Co., Gtd. Notes(e) | | B1 | | | 9.125% | | | 04/01/18 | | | 875 | | | | 920,937 | |
Petrohawk Energy Corp., Gtd. Notes | | Baa3 | | | 7.250% | | | 08/15/18 | | | 800 | | | | 900,000 | |
Petrohawk Energy Corp., Gtd. Notes | | Baa3 | | | 7.875% | | | 06/01/15 | | | 3,775 | | | | 4,020,375 | |
Petroplus Finance Ltd. (Bermuda), Sr. Sec’d. Notes, 144A(e) | | Caa2 | | | 6.750% | | | 05/01/14 | | | 2,935 | | | | 1,746,325 | |
Pioneer Natural Resources Co., Gtd. Notes | | Ba1 | | | 5.875% | | | 07/15/16 | | | 1,950 | | | | 2,122,171 | |
Pioneer Natural Resources Co., Sr. Unsec’d. Notes | | Ba1 | | | 6.650% | | | 03/15/17 | | | 7,100 | | | | 7,855,909 | |
Pioneer Natural Resources Co., Sr. Unsec’d. Notes | | Ba1 | | | 6.875% | | | 05/01/18 | | | 4,840 | | | | 5,473,924 | |
Pioneer Natural Resources Co., Sr. Unsec’d. Notes(e) | | Ba1 | | | 7.500% | | | 01/15/20 | | | 3,950 | | | | 4,632,722 | |
Plains Exploration & Production Co., Gtd. Notes | | B1 | | | 6.750% | | | 02/01/22 | | | 2,825 | | | | 2,959,188 | |
Plains Exploration & Production Co., Gtd. Notes | | B1 | | | 7.000% | | | 03/15/17 | | | 615 | | | | 636,525 | |
Plains Exploration & Production Co., Gtd. Notes | | B1 | | | 7.625% | | | 06/01/18 | | | 2,900 | | | | 3,074,000 | |
Plains Exploration & Production Co., Gtd. Notes | | B1 | | | 10.000% | | | 03/01/16 | | | 2,300 | | | | 2,547,250 | |
Precision Drilling Corp. (Canada), Gtd. Notes | | Ba1 | | | 6.625% | | | 11/15/20 | | | 2,500 | | | | 2,556,250 | |
Precision Drilling Corp. (Canada), Gtd. Notes, 144A | | Ba1 | | | 6.500% | | | 12/15/21 | | | 1,075 | | | | 1,096,500 | |
Range Resources Corp., Gtd. Notes | | Ba3 | | | 5.750% | | | 06/01/21 | | | 4,175 | | | | 4,519,437 | |
Range Resources Corp., Gtd. Notes | | Ba3 | | | 6.750% | | | 08/01/20 | | | 2,100 | | | | 2,331,000 | |
Range Resources Corp., Gtd. Notes | | Ba3 | | | 7.500% | | | 10/01/17 | | | 3,450 | | | | 3,665,625 | |
Range Resources Corp., Gtd. Notes | | Ba3 | | | 8.000% | | | 05/15/19 | | | 1,623 | | | | 1,809,645 | |
WPX Energy, Inc., Sr. Unsec’d. Notes, 144A | | Ba1 | | | 5.250% | | | 01/15/17 | | | 3,700 | | | | 3,718,500 | |
WPX Energy, Inc., Sr. Unsec’d. Notes, 144A | | Ba1 | | | 6.000% | | | 01/15/22 | | | 5,150 | | | | 5,272,313 | |
| | | | | | | | | | | | | | |
|
|
|
| | | | | | | | | | | | | | | | 132,435,586 | |
| | | | | | | | | | | | | | |
|
|
|
Foods — 5.3% | | | | | | | | | | | | | | | | |
ARAMARK Corp., Gtd. Notes | | B3 | | | 8.500% | | | 02/01/15 | | | 12,840 | | | | 13,161,000 | |
ARAMARK Holdings Corp., Sr. Unsec’d. Notes, PIK, 144A(e) | | B3 | | | 8.625% | | | 05/01/16 | | | 9,945 | | | | 10,243,350 | |
BI-LO LLC/BI-LO Finance Corp., Sr. Sec’d. Notes, 144A(e) | | B2 | | | 9.250% | | | 02/15/19 | | | 4,475 | | | | 4,609,250 | |
Bumble Bee Acquisition Corp., Sr. Sec’d. Notes, 144A | | B2 | | | 9.000% | | | 12/15/17 | | | 10,324 | | | | 10,478,860 | |
Darling International, Inc., Gtd. Notes | | Ba3 | | | 8.500% | | | 12/15/18 | | | 4,575 | | | | 5,078,250 | |
Dave & Buster’s, Inc., Gtd. Notes | | Caa1 | | | 11.000% | | | 06/01/18 | | | 2,450 | | | | 2,486,750 | |
Del Monte Corp., Gtd. Notes | | B3 | | | 7.625% | | | 02/15/19 | | | 3,450 | | | | 3,312,000 | |
DineEquity, Inc., Gtd. Notes(e) | | B3 | | | 9.500% | | | 10/30/18 | | | 1,500 | | | | 1,610,625 | |
Fiesta Restaurant Group, Sec’d. Notes, 144A | | B2 | | | 8.875% | | | 08/15/16 | | | 4,725 | | | | 4,748,625 | |
Ingles Markets, Inc., Sr. Unsec’d. Notes | | B1 | | | 8.875% | | | 05/15/17 | | | 9,745 | | | | 10,548,963 | |
JBS USA LLC/JBS USA Finance, Inc., Gtd. Notes(d) | | B1 | | | 11.625% | | | 05/01/14 | | | 5,100 | | | | 5,782,125 | |
JBS USA LLC/JBS USA Finance, Inc., Sr. Unsec’d. Notes, 144A | | B1 | | | 7.250% | | | 06/01/21 | | | 5,000 | | | | 4,662,500 | |
Michael Foods, Inc., Gtd. Notes | | Caa1 | | | 9.750% | | | 07/15/18 | | | 11,175 | | | | 11,761,687 | |
OSI Restaurant Partners LLC, Gtd. Notes | | Caa3 | | | 10.000% | | | 06/15/15 | | | 4,000 | | | | 4,135,000 | |
Pilgrim’s Pride Corp., Gtd. Notes | | Caa1 | | | 7.875% | | | 12/15/18 | | | 875 | | | | 822,500 | |
Smithfield Foods, Inc., Sr. Sec’d. Notes | | Ba2 | | | 10.000% | | | 07/15/14 | | | 7,640 | | | | 8,881,500 | |
Stater Brothers Holdings, Inc., Gtd. Notes(e) | | B2 | | | 7.375% | | | 11/15/18 | | | 1,025 | | | | 1,081,375 | |
Stater Brothers Holdings, Inc., Gtd. Notes(e) | | B2 | | | 7.750% | | | 04/15/15 | | | 1,750 | | | | 1,795,937 | |
SUPERVALU, Inc., Sr. Unsec’d. Notes(e) | | B2 | | | 7.500% | | | 11/15/14 | | | 6,299 | | | | 6,409,233 | |
Wendy’s/Arbys’ Restaurants LLC, Gtd. Notes | | B3 | | | 10.000% | | | 07/15/16 | | | 2,100 | | | | 2,310,000 | |
| | | | | | | | | | | | | | |
|
|
|
| | | | | | | | | | | | | | | | 113,919,530 | |
| | | | | | | | | | | | | | |
|
|
|
SEE NOTES TO FINANCIAL STATEMENTS.
A105
| | | | | | |
| | | HIGH YIELD BOND PORTFOLIO (continued) | | |
| |
| SCHEDULE OF INVESTMENTS | | December 31, 2011 |
| | | | | | | | | | | | | | | | |
CORPORATE BONDS
(continued) | | Moody’s
Ratings†
(Unaudited)
| | Interest
Rate
| | | Maturity
Date
| | Principal
Amount
(000)#
| | | Value
(Note 2)
| |
| | | | | | | | | | | | | | | | | |
Gaming — 6.0% | | | | | | | | | | | | | | | | |
Boyd Gaming Corp., Gtd. Notes(e) | | B3 | | | 9.125% | | | 12/01/18 | | $ | 2,000 | | | $ | 1,900,000 | |
Caesars Entertainment Operating Co., Inc., Sec’d. Notes | | Caa3 | | | 12.750% | | | 04/15/18 | | | 12,101 | | | | 9,620,295 | |
CCM Merger, Inc., Notes, 144A
(original cost $16,528,063; purchased 07/14/05-09/19/11)(d)(e)(g) | | Caa3 | | | 8.000% | | | 08/01/13 | | | 18,270 | | | | 17,630,550 | |
Harrah’s Operating Co., Inc., Sec’d. Notes(e) | | CCC(c) | | | 10.000% | | | 12/15/18 | | | 3,213 | | | | 2,088,450 | |
Harrah’s Operating Co., Inc., Sr. Sec’d. Notes | | B3 | | | 11.250% | | | 06/01/17 | | | 6,645 | | | | 7,052,006 | |
Isle of Capri Casinos, Inc., Gtd. Notes(e) | | Caa1 | | | 7.000% | | | 03/01/14 | | | 2,500 | | | | 2,337,500 | |
Isle of Capri Casinos, Inc., Gtd. Notes(e) | | B3 | | | 7.750% | | | 03/15/19 | | | 9,005 | | | | 8,239,575 | |
Marina District Finance Co., Inc., Sr. Sec’d. Notes, 144A(e) | | B2 | | | 9.500% | | | 10/15/15 | | | 7,250 | | | | 6,778,750 | |
Marina District Finance Co., Inc., Sr. Sec’d. Notes, 144A(e) | | B2 | | | 9.875% | | | 08/15/18 | | | 4,717 | | | | 4,304,263 | |
MGM Resorts International, Gtd. Notes | | B3 | | | 6.750% | | | 09/01/12 | | | 400 | | | | 405,000 | |
MGM Resorts International, Gtd. Notes(e) | | B3 | | | 6.750% | | | 04/01/13 | | | 4,000 | | | | 4,025,000 | |
MGM Resorts International, Gtd. Notes(e) | | B3 | | | 7.625% | | | 01/15/17 | | | 2,050 | | | | 1,952,625 | |
MGM Resorts International, Sr. Sec’d. Notes | | Ba2 | | | 9.000% | | | 03/15/20 | | | 2,665 | | | | 2,951,488 | |
MGM Resorts International, Sr. Sec’d. Notes(e) | | Ba2 | | | 10.375% | | | 05/15/14 | | | 3,415 | | | | 3,901,638 | |
MGM Resorts International, Sr. Sec’d. Notes | | Ba2 | | | 11.125% | | | 11/15/17 | | | 5,370 | | | | 6,121,800 | |
MGM Resorts International, Sr. Sec’d. Notes(e) | | Ba2 | | | 13.000% | | | 11/15/13 | | | 14,085 | | | | 16,725,937 | |
MTR Gaming Group, Inc., Sec’d. Notes, PIK, 144A(e) | | B3 | | | 11.500% | | | 08/01/19 | | | 4,025 | | | | 3,431,312 | |
Peninsula Gaming LLC, Gtd. Notes | | Caa1 | | | 10.750% | | | 08/15/17 | | | 630 | | | | 659,925 | |
Peninsula Gaming LLC, Sec’d. Notes | | Ba3 | | | 8.375% | | | 08/15/15 | | | 3,500 | | | | 3,710,000 | |
Pinnacle Entertainment, Inc., Gtd. Notes(e) | | B1 | | | 8.625% | | | 08/01/17 | | | 4,300 | | | | 4,547,250 | |
Scientific Games Corp., Gtd. Notes | | B1 | | | 8.125% | | | 09/15/18 | | | 1,925 | | | | 1,973,125 | |
Scientific Games International, Inc., Gtd. Notes(e) | | B1 | | | 9.250% | | | 06/15/19 | | | 5,130 | | | | 5,437,800 | |
Seminole Indian Tribe of Florida, Notes, 144A | | Ba1 | | | 7.750% | | | 10/01/17 | | | 1,925 | | | | 2,002,000 | |
Station Casinos, Inc., Sr. Sub. Notes(d)(h) | | NR | | | 6.500% | | | 02/01/14 | | | 3,650 | | | | 365 | |
Station Casinos, Inc., Sr. Sub. Notes(d)(h) | | NR | | | 6.625% | | | 03/15/18 | | | 2,200 | | | | 220 | |
Sugarhouse HSP Gaming Prop Mezz LP/Sugarhouse HSP Gaming Finance Corp., Sec’d. Notes, 144A | | B3 | | | 8.625% | | | 04/15/16 | | | 6,125 | | | | 6,278,125 | |
Yonkers Racing Corp., Sec’d. Notes, 144A
(original cost $5,493,500; purchased 07/13/09-07/08/11)(d)(g) | | B1 | | | 11.375% | | | 07/15/16 | | | 5,069 | | | | 5,221,070 | |
| | | | | | | | | | | | | | |
|
|
|
| | | | | | | | | | | | | | | | 129,296,069 | |
| | | | | | | | | | | | | | |
|
|
|
Healthcare & Pharmaceutical — 9.4% | | | | | | | | | | | | | | | | |
Acadia Healthcare Co., Inc., Gtd. Notes, 144A | | B3 | | | 12.875% | | | 11/01/18 | | | 3,750 | | | | 3,712,500 | |
Accellent, Inc., Gtd. Notes | | Caa2 | | | 10.000% | | | 11/01/17 | | | 10,050 | | | | 8,140,500 | |
Accellent, Inc., Sr. Sec’d. Notes(e) | | B1 | | | 8.375% | | | 02/01/17 | | | 5,850 | | | | 5,733,000 | |
Alliance Healthcare Services, Inc., Sr. Unsec’d. Notes | | B-(c) | | | 8.000% | | | 12/01/16 | | | 11,915 | | | | 8,310,712 | |
Apria Healthcare Group, Inc., Sr. Sec’d. Notes | | Ba3 | | | 11.250% | | | 11/01/14 | | | 390 | | | | 402,675 | |
Apria Healthcare Group, Inc., Sr. Sec’d. Notes(e) | | B3 | | | 12.375% | | | 11/01/14 | | | 5,025 | | | | 4,610,437 | |
Biomet, Inc., Gtd. Notes(e) | | B3 | | | 10.000% | | | 10/15/17 | | | 1,324 | | | | 1,429,920 | |
Biomet, Inc., Gtd. Notes, PIK | | B3 | | | 10.375% | | | 10/15/17 | | | 2,850 | | | | 3,085,125 | |
Biomet, Inc., Gtd. Notes(e) | | Caa1 | | | 11.625% | | | 10/15/17 | | | 1,860 | | | | 2,018,100 | |
Capella Healthcare, Inc., Gtd. Notes
(original cost $12,175,463; purchased 06/28/10-12/14/11)(d)(g) | | B3 | | | 9.250% | | | 07/01/17 | | | 11,905 | | | | 12,083,575 | |
Community Health Systems, Inc., Gtd. Notes, 144A(e) | | B3 | | | 8.000% | | | 11/15/19 | | | 7,450 | | | | 7,524,500 | |
Community Health Systems, Inc., Gtd. Notes | | B3 | | | 8.875% | | | 07/15/15 | | | 5,514 | | | | 5,693,205 | |
ConvaTec Healthcare E SA (Luxembourg), Gtd. Notes, 144A(d) | | Caa1 | | | 10.500% | | | 12/15/18 | | | 12,025 | | | | 10,732,312 | |
DaVita, Inc., Gtd. Notes(e) | | B2 | | | 6.375% | | | 11/01/18 | | | 2,655 | | | | 2,718,056 | |
ENDO Pharmaceuticals Holdings, Inc., Gtd. Notes(e) | | Ba3 | | | 7.000% | | | 07/15/19 | | | 525 | | | | 559,125 | |
ENDO Pharmaceuticals Holdings, Inc., Gtd. Notes | | Ba3 | | | 7.250% | | | 01/15/22 | | | 1,725 | | | | 1,834,969 | |
ExamWorks Group, Inc., Gtd. Notes, 144A(e) | | B3 | | | 9.000% | | | 07/15/19 | | | 1,900 | | | | 1,719,500 | |
HCA, Inc., Gtd. Notes(e) | | B3 | | | 7.500% | | | 02/15/22 | | | 3,250 | | | | 3,323,125 | |
HCA, Inc., Gtd. Notes(e) | | B3 | | | 8.000% | | | 10/01/18 | | | 11,800 | | | | 12,478,500 | |
HCA, Inc., Sr. Unsec’d. Notes | | B3 | | | 5.750% | | | 03/15/14 | | | 6,830 | | | | 6,966,600 | |
HCA, Inc., Sr. Unsec’d. Notes | | B3 | | | 6.375% | | | 01/15/15 | | | 7,425 | | | | 7,564,219 | |
HCA, Inc., Sr. Unsec’d. Notes(e) | | B3 | | | 6.500% | | | 02/15/16 | | | 4,310 | | | | 4,374,650 | |
HCA, Inc., Sr. Unsec’d. Notes | | B3 | | | 7.190% | | | 11/15/15 | | | 706 | | | | 706,000 | |
HCA, Inc., Sr. Unsec’d. Notes, MTN | | B3 | | | 9.000% | | | 12/15/14 | | | 4,365 | | | | 4,550,512 | |
SEE NOTES TO FINANCIAL STATEMENTS.
A106
| | | | | | |
| | | HIGH YIELD BOND PORTFOLIO (continued) | | |
| |
| SCHEDULE OF INVESTMENTS | | December 31, 2011 |
| | | | | | | | | | | | | | | | |
CORPORATE BONDS
(continued) | | Moody’s
Ratings†
(Unaudited)
| | Interest
Rate
| | | Maturity
Date
| | Principal
Amount
(000)#
| | | Value
(Note 2)
| |
| | | | | | | | | | | | | | | | | |
Healthcare & Pharmaceutical (continued) | | | | | | | | | | | | | | | | |
Healthsouth Corp., Gtd. Notes(e) | | B2 | | | 7.250% | | | 10/01/18 | | $ | 7,850 | | | $ | 7,791,125 | |
Healthsouth Corp., Gtd. Notes(e) | | B2 | | | 7.750% | | | 09/15/22 | | | 2,200 | | | | 2,164,250 | |
Kindred Healthcare, Inc., Gtd. Notes | | B3 | | | 8.250% | | | 06/01/19 | | | 6,405 | | | | 5,380,200 | |
Kinetic Concepts, Inc./KCI USA, Inc., Gtd. Notes, 144A(e) | | B3 | | | 10.500% | | | 11/01/18 | | | 5,800 | | | | 5,684,000 | |
MedAssets, Inc., Gtd. Notes | | B3 | | | 8.000% | | | 11/15/18 | | | 2,250 | | | | 2,205,000 | |
Mylan, Inc., Gtd. Notes, 144A | | Ba3 | | | 7.625% | | | 07/15/17 | | | 5,975 | | | | 6,520,219 | |
Radnet Management, Inc., Gtd. Notes | | Caa1 | | | 10.375% | | | 04/01/18 | | | 3,750 | | | | 3,300,000 | |
Res-Care, Inc., Gtd. Notes | | B-(c) | | | 10.750% | | | 01/15/19 | | | 4,300 | | | | 4,439,750 | |
Skilled Healthcare Group, Inc., Gtd. Notes | | Caa1 | | | 11.000% | | | 01/15/14 | | | 1,794 | | | | 1,794,000 | |
STHI Holding Corp., Sec’d. Notes, 144A | | B2 | | | 8.000% | | | 03/15/18 | | | 1,225 | | | | 1,258,688 | |
Surgical Care Affiliates, Inc., Sr. Sub. Notes, 144A
(original cost $6,934,250; purchased 06/21/07-01/18/11)(d)(g) | | Caa1 | | | 10.000% | | | 07/15/17 | | | 8,200 | | | | 7,872,000 | |
Tenet Healthcare Corp., Sr. Sec’d. Notes, 144A | | B1 | | | 6.250% | | | 11/01/18 | | | 4,775 | | | | 4,858,563 | |
Valeant Pharmaceuticals International, Gtd. Notes, 144A | | B1 | | | 6.500% | | | 07/15/16 | | | 6,125 | | | | 6,117,344 | |
Valeant Pharmaceuticals International, Gtd. Notes, 144A | | B1 | | | 6.750% | | | 10/01/17 | | | 1,400 | | | | 1,398,250 | |
Valeant Pharmaceuticals International, Gtd. Notes, 144A(e) | | B1 | | | 6.875% | | | 12/01/18 | | | 3,500 | | | | 3,491,250 | |
Valeant Pharmaceuticals International, Gtd. Notes, 144A | | B1 | | | 7.000% | | | 10/01/20 | | | 3,250 | | | | 3,209,375 | |
Warner Chilcott Co. LLC/Warner Chilcott Finance LLC, Gtd. Notes | | B3 | | | 7.750% | | | 09/15/18 | | | 14,575 | | | | 14,884,719 | |
| | | | | | | | | | | | | | |
|
|
|
| | | | | | | | | | | | | | | | 202,640,550 | |
| | | | | | | | | | | | | | |
|
|
|
Lodging — 1.0% | | | | | | | | | | | | | | | | |
Felcor Lodging LP, Sr. Sec’d. Notes(e) | | B2 | | | 6.750% | | | 06/01/19 | | | 3,750 | | | | 3,600,000 | |
Felcor Lodging LP, Sr. Sec’d. Notes | | B2 | | | 10.000% | | | 10/01/14 | | | 2,564 | | | | 2,807,580 | |
Host Hotels & Resorts LP, Gtd. Notes(e) | | Ba1 | | | 6.000% | | | 11/01/20 | | | 850 | | | | 869,125 | |
Host Hotels & Resorts LP, Gtd. Notes | | BB+(c) | | | 6.875% | | | 11/01/14 | | | 540 | | | | 550,800 | |
Host Hotels & Resorts LP, Gtd. Notes, Ser. O | | Ba1 | | | 6.375% | | | 03/15/15 | | | 8,750 | | | | 8,903,125 | |
Royal Caribbean Cruises Ltd. (Liberia), Sr. Unsec’d. Notes | | Ba2 | | | 7.250% | | | 03/15/18 | | | 3,700 | | | | 3,875,750 | |
Royal Caribbean Cruises Ltd. (Liberia), Sr. Unsec’d. Notes | | Ba2 | | | 11.875% | | | 07/15/15 | | | 1,350 | | | | 1,593,000 | |
| | | | | | | | | | | | | | |
|
|
|
| | | | | | | | | | | | | | | | 22,199,380 | |
| | | | | | | | | | | | | | |
|
|
|
Media & Entertainment — 5.9% | | | | | | | | | | | | | | | | |
AMC Entertainment, Inc., Gtd. Notes(e) | | Caa1 | | | 8.000% | | | 03/01/14 | | | 675 | | | | 666,563 | |
AMC Entertainment, Inc., Gtd. Notes | | Caa1 | | | 9.750% | | | 12/01/20 | | | 10,125 | | | | 9,618,750 | |
AMC Networks, Inc., Gtd. Notes, 144A(e) | | B2 | | | 7.750% | | | 07/15/21 | | | 4,100 | | | | 4,458,750 | |
Cedar Fair LP/Canada’s Wonderland Co./Magnum Management Corp., Gtd. Notes | | B2 | | | 9.125% | | | 08/01/18 | | | 4,125 | | | | 4,485,938 | |
Cengage Learning Acquisitions, Inc., Gtd. Notes, 144A | | Caa2 | | | 10.500% | | | 01/15/15 | | | 5,975 | | | | 4,287,062 | |
Clear Channel Communications, Inc., Gtd. Notes(e) | | Ca | | | 10.750% | | | 08/01/16 | | | 2,075 | | | | 1,390,250 | |
Clear Channel Communications, Inc., Sr. Sec’d. Notes | | Caa1 | | | 9.000% | | | 03/01/21 | | | 2,225 | | | | 1,874,562 | |
Clear Channel Communications, Inc., Sr. Unsec’d. Notes | | Ca | | | 5.500% | | | 12/15/16 | | | 2,325 | | | | 1,075,312 | |
Clear Channel Communications, Inc., Sr. Unsec’d. Notes(e) | | Ca | | | 6.875% | | | 06/15/18 | | | 625 | | | | 282,812 | |
Clear Channel Worldwide Holdings, Inc., Gtd. Notes(e) | | B2 | | | 9.250% | | | 12/15/17 | | | 2,900 | | | | 3,117,500 | |
Clear Channel Worldwide Holdings, Inc., Gtd. Notes, Ser. B(e) | | B2 | | | 9.250% | | | 12/15/17 | | | 1,700 | | | | 1,836,000 | |
Cumulus Media, Inc., Gtd. Notes, 144A | | B3 | | | 7.750% | | | 05/01/19 | | | 400 | | | | 355,000 | |
Entercom Radio LLC, Gtd. Notes, 144A | | Caa1 | | | 10.500% | | | 12/01/19 | | | 4,525 | | | | 4,525,000 | |
Intelsat Jackson Holdings SA (Luxembourg), Gtd. Notes, 144A(e) | | B3 | | | 7.250% | | | 04/01/19 | | | 4,150 | | | | 4,212,250 | |
Intelsat Jackson Holdings SA (Luxembourg), Gtd. Notes, 144A | | B3 | | | 7.500% | | | 04/01/21 | | | 4,175 | | | | 4,221,969 | |
Intelsat Jackson Holdings SA (Luxembourg), Gtd. Notes(e) | | B3 | | | 8.500% | | | 11/01/19 | | | 5,375 | | | | 5,697,500 | |
Intelsat Jackson Holdings SA (Luxembourg), Gtd. Notes | | Caa2 | | | 11.250% | | | 06/15/16 | | | 2,750 | | | | 2,889,219 | |
Intelsat Luxembourg SA (Luxembourg), Gtd. Notes(e) | | Caa3 | | | 11.250% | | | 02/04/17 | | | 7,650 | | | | 7,401,375 | |
Intelsat Luxembourg SA (Luxembourg), Gtd. Notes, PIK, 144A | | Caa3 | | | 11.500% | | | 02/04/17 | | | 17,375 | | | | 16,766,875 | |
Lamar Media Corp., Gtd. Notes | | Ba3 | | | 9.750% | | | 04/01/14 | | | 4,800 | | | | 5,376,000 | |
LIN Television Corp., Gtd. Notes(e) | | Caa1 | | | 6.500% | | | 05/15/13 | | | 693 | | | | 693,866 | |
LIN Television Corp., Gtd. Notes, Ser. B | | Caa1 | | | 6.500% | | | 05/15/13 | | | 2,718 | | | | 2,721,398 | |
Morris Publishing Group LLC, Sec’d. Notes | | NR | | | 10.000% | | | 09/01/14 | | | 269 | | | | 228,704 | |
Nielsen Finance LLC/Nielsen Finance Co., Gtd. Notes | | B2 | | | 7.750% | | | 10/15/18 | | | 3,425 | | | | 3,699,000 | |
Nielsen Finance LLC/Nielsen Finance Co., Gtd. Notes | | B2 | | | 11.625% | | | 02/01/14 | | | 3,553 | | | | 4,081,509 | |
Salem Communications Corp., Sec’d. Notes | | B2 | | | 9.625% | | | 12/15/16 | | | 3,533 | | | | 3,727,315 | |
SEE NOTES TO FINANCIAL STATEMENTS.
A107
| | | | | | |
| | | HIGH YIELD BOND PORTFOLIO (continued) | | |
| |
| SCHEDULE OF INVESTMENTS | | December 31, 2011 |
| | | | | | | | | | | | | | | | |
CORPORATE BONDS
(continued) | | Moody’s
Ratings†
(Unaudited)
| | Interest
Rate
| | | Maturity
Date
| | Principal
Amount
(000)#
| | | Value
(Note 2)
| |
| | | | | | | | | | | | | | | | | |
Media & Entertainment (continued) | | | | | | | | | | | | | | | | |
Sinclair Television Group, Inc., Sec’d. Notes, 144A | | B1 | | | 9.250% | | | 11/01/17 | | $ | 5,200 | | | $ | 5,668,000 | |
SSI Investments II/SSI Co.-Issuer LLC, Gtd. Notes | | Caa1 | | | 11.125% | | | 06/01/18 | | | 4,275 | | | | 4,520,812 | |
Universal City Development Partners Ltd./UCDP Finance, Inc., Gtd. Notes | | Baa2 | | | 8.875% | | | 11/15/15 | | | 126 | | | | 139,545 | |
Univision Communications, Inc., Gtd. Notes, 144A(e) | | Caa2 | | | 8.500% | | | 05/15/21 | | | 925 | | | | 841,750 | |
Vail Resorts, Inc., Gtd. Notes | | Ba3 | | | 6.500% | | | 05/01/19 | | | 2,000 | | | | 2,040,000 | |
WMG Acquisition Corp., Gtd. Notes, 144A(e) | | B3 | | | 11.500% | | | 10/01/18 | | | 5,575 | | | | 5,533,188 | |
WMG Acquisition Corp., Sr. Sec’d. Notes, 144A | | Ba2 | | | 9.500% | | | 06/15/16 | | | 1,850 | | | | 2,007,250 | |
WMG Acquisition Corp., Sr. Sec’d. Notes | | Ba2 | | | 9.500% | | | 06/15/16 | | | 6,775 | | | | 7,350,875 | |
| | | | | | | | | | | | | | |
|
|
|
| | | | | | | | | | | | | | | | 127,791,899 | |
| | | | | | | | | | | | | | |
|
|
|
Metals — 4.8% | | | | | | | | | | | | | | | | |
AK Steel Corp., Gtd. Notes(e) | | B2 | | | 7.625% | | | 05/15/20 | | | 2,500 | | | | 2,350,000 | |
Arch Coal, Inc., Gtd. Notes, 144A(e) | | B1 | | | 7.000% | | | 06/15/19 | | | 2,950 | | | | 3,009,000 | |
Arch Coal, Inc., Gtd. Notes, 144A(e) | | B1 | | | 7.250% | | | 06/15/21 | | | 2,950 | | | | 3,031,125 | |
Arch Coal, Inc., Gtd. Notes(e) | | B1 | | | 8.750% | | | 08/01/16 | | | 2,900 | | | | 3,168,250 | |
Calcipar SA (Luxembourg), Sr. Sec’d. Notes, 144A
(original cost $6,738,375; purchased 04/18/11-09/20/11)(d)(g) | | B1 | | | 6.875% | | | 05/01/18 | | | 6,750 | | | | 6,075,000 | |
Consol Energy, Inc., Gtd. Notes | | B1 | | | 8.000% | | | 04/01/17 | | | 1,575 | | | | 1,724,625 | |
FMG Resources (August 2006) Pty Ltd. (Australia), Gtd. Notes, 144A | | B1 | | | 6.375% | | | 02/01/16 | | | 2,200 | | | | 2,134,000 | |
FMG Resources (August 2006) Pty Ltd. (Australia), Gtd. Notes, 144A(e) | | B1 | | | 6.875% | | | 02/01/18 | | | 2,275 | | | | 2,178,312 | |
FMG Resources (August 2006) Pty Ltd. (Australia), Sr. Notes, 144A(e) | | B1 | | | 8.250% | | | 11/01/19 | | | 10,850 | | | | 11,039,875 | |
Freeport-McMoRan Copper & Gold, Inc., Sr. Unsec’d. Notes | | Baa3 | | | 8.375% | | | 04/01/17 | | | 4,370 | | | | 4,643,125 | |
JMC Steel Group, Sr. Notes, 144A
(original cost $6,375,000; purchased 03/04/11)(d)(g) | | B3 | | | 8.250% | | | 03/15/18 | | | 6,375 | | | | 6,215,625 | |
Metals USA, Inc., Sr. Sec’d. Notes | | B3 | | | 11.125% | | | 12/01/15 | | | 13,065 | | | | 13,571,269 | |
Novelis, Inc. (Canada), Gtd. Notes | | B2 | | | 8.750% | | | 12/15/20 | | | 8,562 | | | | 9,182,745 | |
Optima Specialty Steel, Inc., Sr. Sec’d. Notes, 144A | | B2 | | | 12.500% | | | 12/15/16 | | | 3,700 | | | | 3,672,250 | |
Peabody Energy Corp., Sr. Unsec’d. Notes, 144A | | Ba1 | | | 6.000% | | | 11/15/18 | | | 10,800 | | | | 11,016,000 | |
Penn Virginia Resource Partners LP/Penn Virginia Resource Finance Corp., Gtd. Notes | | B2 | | | 8.250% | | | 04/15/18 | | | 1,475 | | | | 1,482,375 | |
Rain CII Carbon LLC and CII Carbon Corp., Sec’d. Notes, 144A(d) | | B1 | | | 8.000% | | | 12/01/18 | | | 3,000 | | | | 3,007,500 | |
Steel Dynamics, Inc., Gtd. Notes | | Ba2 | | | 7.375% | | | 11/01/12 | | | 1,939 | | | | 2,018,984 | |
Thompson Creek Metals Co., Inc. (Canada), Gtd. Notes | | B3 | | | 7.375% | | | 06/01/18 | | | 6,750 | | | | 6,007,500 | |
Westmoreland Coal Co./Westmoreland Partners, Sr. Sec’d. Notes | | Caa2 | | | 10.750% | | | 02/01/18 | | | 7,850 | | | | 7,693,000 | |
| | | | | | | | | | | | | | |
|
|
|
| | | | | | | | | | | | | | | | 103,220,560 | |
| | | | | | | | | | | | | | |
|
|
|
Non-Captive Finance — 4.4% | | | | | | | | | | | | | | | | |
ACE Cash Express, Inc., Sr. Sec’d. Notes, 144A | | B3 | | | 11.000% | | | 02/01/19 | | | 3,800 | | | | 3,486,500 | |
Ally Financial, Inc., Gtd. Notes(e) | | B1 | | | 8.300% | | | 02/12/15 | | | 1,425 | | | | 1,503,375 | |
American General Finance Corp., Sr. Unsec’d. Notes, Ser. H, MTN(e) | | B3 | | | 5.375% | | | 10/01/12 | | | 8,225 | | | | 7,772,625 | |
American General Finance Corp., Sr. Unsec’d. Notes, Ser. I, MTN | | B3 | | | 5.400% | | | 12/01/15 | | | 750 | | | | 545,625 | |
CIT Group, Inc., Sec’d. Notes | | B2 | | | 7.000% | | | 05/01/15 | | | 600 | | | | 601,200 | |
CIT Group, Inc., Sec’d. Notes, 144A | | B2 | | | 7.000% | | | 05/04/15 | | | 1,825 | | | | 1,827,281 | |
CIT Group, Inc., Sec’d. Notes, Ser. A | | B2 | | | 7.000% | | | 05/01/16 | | | 990 | (f) | | | 990 | |
CIT Group, Inc., Sec’d. Notes, 144A(e) | | B2 | | | 7.000% | | | 05/02/16 | | | 15,543 | | | | 15,523,571 | |
CIT Group, Inc., Sec’d. Notes(e) | | B2 | | | 7.000% | | | 05/01/17 | | | 588 | (f) | | | 588 | |
CIT Group, Inc., Sec’d. Notes, 144A(e) | | B2 | | | 7.000% | | | 05/02/17 | | | 17,951 | | | | 17,928,561 | |
Community Choice Financial, Inc., Sr. Sec’d. Notes, 144A | | B3 | | | 10.750% | | | 05/01/19 | | | 2,890 | | | | 2,861,100 | |
GMAC, Inc., Gtd. Notes(e) | | B1 | | | 6.875% | | | 08/28/12 | | | 4,925 | | | | 4,986,562 | |
GMAC, Inc., Gtd. Notes, Ser. 8(e) | | B1 | | | 6.750% | | | 12/01/14 | | | 5,400 | | | | 5,427,000 | |
HSBC Finance Capital Trust IX, Ltd. Gtd. Notes(a) | | Baa1 | | | 5.911% | | | 11/30/35 | | | 100 | | | | 83,000 | |
International Lease Finance Corp., Sr. Sec’d. Notes, 144A | | Ba3 | | | 6.500% | | | 09/01/14 | | | 3,125 | | | | 3,195,312 | |
International Lease Finance Corp., Sr. Sec’d. Notes, 144A | | Ba3 | | | 6.750% | | | 09/01/16 | | | 175 | | | | 179,375 | |
International Lease Finance Corp., Sr. Sec’d. Notes, 144A(e) | | Ba3 | | | 7.125% | | | 09/01/18 | | | 525 | | | | 543,375 | |
International Lease Finance Corp., Sr. Unsec’d. Notes | | B1 | | | 5.750% | | | 05/15/16 | | | 1,075 | | | | 997,108 | |
SEE NOTES TO FINANCIAL STATEMENTS.
A108
| | | | | | |
| | | HIGH YIELD BOND PORTFOLIO (continued) | | |
| |
| SCHEDULE OF INVESTMENTS | | December 31, 2011 |
| | | | | | | | | | | | | | | | |
CORPORATE BONDS
(continued) | | Moody’s
Ratings†
(Unaudited)
| | Interest
Rate
| | | Maturity
Date
| | Principal
Amount
(000)#
| | | Value
(Note 2)
| |
| | | | | | | | | | | | | | | | | |
Non-Captive Finance (continued) | | | | | | | | | | | | | | | | |
International Lease Finance Corp., Sr. Unsec’d. Notes | | B1 | | | 6.250% | | | 05/15/19 | | $ | 4,125 | | | $ | 3,810,634 | |
International Lease Finance Corp., Sr. Unsec’d. Notes, MTN | | B1 | | | 6.375% | | | 03/25/13 | | | 5,400 | | | | 5,373,000 | |
International Lease Finance Corp., Sr. Unsec’d. Notes, MTN(e) | | B1 | | | 6.625% | | | 11/15/13 | | | 1,200 | | | | 1,194,000 | |
International Lease Finance Corp., Sr. Unsec’d. Notes(e) | | B1 | | | 8.250% | | | 12/15/20 | | | 1,000 | | | | 1,010,000 | |
International Lease Finance Corp., Sr. Unsec’d. Notes(e) | | B1 | | | 8.625% | | | 09/15/15 | | | 810 | | | | 830,250 | |
International Lease Finance Corp., Sr. Unsec’d. Notes(e) | | B1 | | | 8.750% | | | 03/15/17 | | | 2,000 | | | | 2,060,000 | |
Jet Equipment Trust, Ser. 94-A, 144A(d) | | NR | | | 10.000% | | | 06/15/12 | | | 96 | | | | 72,162 | |
Jet Equipment Trust, Sr. Unsec’d. Notes, Ser. 95-B, 144A(d)(h) | | NR | | | 7.630% | | | 08/15/12 | | | 11 | | | | 8 | |
KKR Group Finance Co., Gtd. Notes, 144A | | A-(c) | | | 6.375% | | | 09/29/20 | | | 6,000 | | | | 6,161,634 | |
Speedy Cash, Inc., Sr. Sec’d. Notes, 144A | | B3 | | | 10.750% | | | 05/15/18 | | | 975 | | | | 979,875 | |
Springleaf Finance Corp., Sr. Unsec’d. Notes, MTN(e) | | B3 | | | 5.850% | | | 06/01/13 | | | 1,287 | | | | 1,132,560 | |
Springleaf Finance Corp., Sr. Unsec’d. Notes, MTN | | B3 | | | 6.900% | | | 12/15/17 | | | 8,400 | | | | 6,048,000 | |
| | | | | | | | | | | | | | |
|
|
|
| | | | | | | | | | | | | | | | 96,135,271 | |
| | | | | | | | | | | | | | |
|
|
|
Packaging — 2.6% | | | | | | | | | | | | | | | | |
Ardagh Packaging Finance PLC (Ireland), Gtd. Notes, 144A(d)(e) | | B3 | | | 9.125% | | | 10/15/20 | | | 5,450 | | | | 5,395,500 | |
Berry Plastics Corp., Sec’d. Notes(a) | | Caa1 | | | 4.421% | | | 09/15/14 | | | 2,025 | | | | 1,903,500 | |
Berry Plastics Corp., Sr. Sec’d. Notes(e) | | Caa1 | | | 9.750% | | | 01/15/21 | | | 4,875 | | | | 4,862,813 | |
BWAY Holding Co., Gtd. Notes(e) | | B3 | | | 10.000% | | | 06/15/18 | | | 1,000 | | | | 1,065,000 | |
BWAY Parent Co., Inc., Sr. Unsec’d. Notes, PIK | | Caa1 | | | 10.125% | | | 11/01/15 | | | 4,982 | | | | 4,832,553 | |
Exopack Holding Corp., Gtd. Notes, 144A | | Caa1 | | | 10.000% | | | 06/01/18 | | | 4,100 | | | | 4,100,000 | |
Greif, Inc., Sr. Unsec’d. Notes | | Ba2 | | | 6.750% | | | 02/01/17 | | | 4,970 | | | | 5,193,650 | |
Plastipak Holdings, Inc., Gtd. Notes, 144A
(original cost $3,201,500; purchased 03/31/10-05/21/10)(d)(e)(g) | | B3 | | | 8.500% | | | 12/15/15 | | | 3,175 | | | | 3,238,500 | |
Plastipak Holdings, Inc., Sr. Notes, 144A
(original cost $1,993,876; purchased 07/23/09)(d)(g) | | B3 | | | 10.625% | | | 08/15/19 | | | 2,040 | | | | 2,254,200 | |
Reynolds Group Issuer, Inc./Reynolds Group Issuer LLC/Reynolds Group Issuer Lu, Gtd. Notes, 144A(e) | | Caa1 | | | 8.250% | | | 02/15/21 | | | 4,450 | | | | 3,938,250 | |
Reynolds Group Issuer, Inc./Reynolds Group Issuer LLC/Reynolds Group Issuer Lu, Sr. Sec’d. Notes, 144A | | Ba3 | | | 6.875% | | | 02/15/21 | | | 1,575 | | | | 1,567,125 | |
Reynolds Group Issuer, Inc./Reynolds Group Issuer LLC/Reynolds Group Issuer Lu, Sr. Sec’d. Notes, 144A(e) | | Ba3 | | | 7.875% | | | 08/15/19 | | | 1,500 | | | | 1,567,500 | |
Reynolds Group Issuer, Inc./Reynolds Group Issuer LLC/Reynolds Group Issuer Lu, Sr. Sec’d. Notes, 144A | | Ba3 | | | 8.750% | | | 10/15/16 | | | 6,175 | | | | 6,499,187 | |
Reynolds Group Issuer, Inc./Reynolds Group Issuer LLC/Reynolds Group Issuer Lu, Sr. Unsec’d. Notes, 144A(e) | | Caa1 | | | 9.875% | | | 08/15/19 | | | 6,525 | | | | 6,329,250 | |
Sealed Air Corp., Gtd. Notes, 144A(e) | | B1 | | | 8.375% | | | 09/15/21 | | | 2,300 | | | | 2,541,500 | |
| | | | | | | | | | | | | | |
|
|
|
| | | | | | | | | | | | | | | | 55,288,528 | |
| | | | | | | | | | | | | | |
|
|
|
Paper — 0.9% | | | | | | | | | | | | | | | | |
Cascades, Inc. (Canada), Gtd. Notes | | Ba3 | | | 7.750% | | | 12/15/17 | | | 185 | | | | 183,150 | |
Domtar Corp., Gtd. Notes(e) | | Baa3 | | | 10.750% | | | 06/01/17 | | | 1,125 | | | | 1,417,500 | |
Graphic Packaging International, Inc., Gtd. Notes | | B2 | | | 7.875% | | | 10/01/18 | | | 1,375 | | | | 1,464,375 | |
Graphic Packaging International, Inc., Gtd. Notes | | B2 | | | 9.500% | | | 06/15/17 | | | 6,201 | | | | 6,790,095 | |
Longview Fibre Paper & Packaging, Inc., Sr. Sec’d. Notes, 144A
(original cost $2,736,155; purchased 05/17/11-09/22/11)(d)(g) | | B2 | | | 8.000% | | | 06/01/16 | | | 2,760 | | | | 2,760,000 | |
Rock-Tenn Co., Gtd. Notes | | Ba2 | | | 9.250% | | | 03/15/16 | | | 1,295 | | | | 1,372,700 | |
Sappi Papier Holding GmbH (Austria), Sr. Sec’d. Notes, 144A(e) | | Ba2 | | | 6.625% | | | 04/15/21 | | | 1,050 | | | | 900,375 | |
Verso Paper Holdings LLC/Verso Paper, Inc., Sec’d. Notes(e) | | B2 | | | 8.750% | | | 02/01/19 | | | 1,850 | | | | 1,128,500 | |
Verso Paper Holdings LLC/Verso Paper, Inc., Sr. Sec’d. Notes | | Ba2 | | | 11.500% | | | 07/01/14 | | | 3,771 | | | | 3,846,420 | |
| | | | | | | | | | | | | | |
|
|
|
| | | | | | | | | | | | | | | | 19,863,115 | |
| | | | | | | | | | | | | | |
|
|
|
Pipelines & Other — 1.6% | | | | | | | | | | | | | | | | |
AmeriGas Partners LP/AmeriGas Finance Corp., Sr. Unsec’d. Notes | | Ba3 | | | 6.500% | | | 05/20/21 | | | 2,600 | | | | 2,554,500 | |
Energy Transfer Equity LP, Sr. Sec’d. Notes(e) | | Ba2 | | | 7.500% | | | 10/15/20 | | | 4,300 | | | | 4,697,750 | |
Ferrellgas Partners LP/Ferrellgas Partners Finance Corp., Sr. Unsec’d. Notes | | B2 | | | 8.625% | | | 06/15/20 | | | 3,659 | | | | 3,540,082 | |
MarkWest Energy Partners LP/MarkWest Energy Finance Corp.,
Gtd. Notes(e) | | Ba3 | | | 6.500% | | | 08/15/21 | | | 7,125 | | | | 7,418,906 | |
SEE NOTES TO FINANCIAL STATEMENTS.
A109
| | | | | | |
| | | HIGH YIELD BOND PORTFOLIO (continued) | | |
| |
| SCHEDULE OF INVESTMENTS | | December 31, 2011 |
| | | | | | | | | | | | | | | | |
CORPORATE BONDS
(continued) | | Moody’s
Ratings†
(Unaudited)
| | Interest
Rate
| | | Maturity
Date
| | Principal
Amount
(000)#
| | | Value
(Note 2)
| |
Pipelines & Other (continued) | | | | | | | | | | | | | | | | |
| | | | | | | | | | | | | | | | | |
Targa Resources Partners LP/Targa Resources Partners Finance Corp., Gtd. Notes, 144A | | B1 | | | 6.875% | | | 02/01/21 | | $ | 7,000 | | | $ | 7,087,500 | |
Targa Resources Partners LP/Targa Resources Partners Finance Corp., Gtd. Notes | | Ba3 | | | 7.875% | | | 10/15/18 | | | 4,350 | | | | 4,589,250 | |
Targa Resources Partners LP/Targa Resources Partners Finance Corp., Gtd. Notes | | B1 | | | 8.250% | | | 07/01/16 | | | 4,625 | | | | 4,844,688 | |
| | | | | | | | | | | | | | |
|
|
|
| | | | | | | | | | | | | | | | 34,732,676 | |
| | | | | | | | | | | | | | |
|
|
|
Real Estate Investment Trusts — 2.0% | | | | | | | | | | | | | | | | |
AVIV Healthcare Properties LP/AVIV Healthcare Capital Corp.,
Gtd. Notes | | B1 | | | 7.750% | | | 02/15/19 | | | 7,125 | | | | 6,982,500 | |
CNL Lifestyle Properties, Inc., Gtd. Notes | | Ba3 | | | 7.250% | | | 04/15/19 | | | 5,400 | | | | 4,995,000 | |
Kennedy-Wilson, Inc., Gtd. Notes, 144A | | B1 | | | 8.750% | | | 04/01/19 | | | 4,075 | | | | 3,973,125 | |
Omega Healthcare Investors, Inc., Gtd. Notes(e) | | Ba2 | | | 6.750% | | | 10/15/22 | | | 475 | | | | 477,375 | |
Omega Healthcare Investors, Inc., Gtd. Notes | | Ba2 | | | 7.000% | | | 01/15/16 | | | 3,155 | | | | 3,218,100 | |
Omega Healthcare Investors, Inc., Gtd. Notes | | Ba2 | | | 7.500% | | | 02/15/20 | | | 825 | | | | 878,625 | |
Senior Housing Properties Trust, Sr. Unsec’d. Notes | | Baa3 | | | 6.750% | | | 04/15/20 | | | 1,875 | | | | 1,910,842 | |
Senior Housing Properties Trust, Sr. Unsec’d. Notes | | Baa3 | | | 6.750% | | | 12/15/21 | | | 7,250 | | | | 7,368,429 | |
Senior Housing Properties Trust, Sr. Unsec’d. Notes | | Baa3 | | | 8.625% | | | 01/15/12 | | | 13,191 | | | | 13,220,671 | |
| | | | | | | | | | | | | | |
|
|
|
| | | | | | | | | | | | | | | | 43,024,667 | |
| | | | | | | | | | | | | | |
|
|
|
Retailers — 1.6% | | | | | | | | | | | | | | | | |
Academy Ltd./Academy Finance Corp., Gtd. Notes, 144A(e) | | Caa1 | | | 9.250% | | | 08/01/19 | | | 4,000 | | | | 3,950,000 | |
Burlington Coat Factory Warehouse Corp., Gtd. Notes(e) | | Caa1 | | | 10.000% | | | 02/15/19 | | | 2,250 | | | | 2,199,375 | |
Neiman Marcus Group, Inc., Gtd. Notes | | Caa1 | | | 10.375% | | | 10/15/15 | | | 2,000 | | | | 2,077,520 | |
Pantry, Inc., Gtd. Notes(e) | | Caa1 | | | 7.750% | | | 02/15/14 | | | 11,550 | | | | 11,463,375 | |
QVC, Inc., Sr. Sec’d. Notes, 144A | | Ba2 | | | 7.125% | | | 04/15/17 | | | 3,510 | | | | 3,720,600 | |
QVC, Inc., Sr. Sec’d. Notes, 144A | | Ba2 | | | 7.375% | | | 10/15/20 | | | 1,525 | | | | 1,627,937 | |
Rite Aid Corp., Sec’d. Notes | | Caa2 | | | 7.500% | | | 03/01/17 | | | 1,465 | | | | 1,463,169 | |
Rite Aid Corp., Sec’d. Notes(e) | | Caa2 | | | 10.375% | | | 07/15/16 | | | 355 | | | | 377,188 | |
Susser Holdings LLC/Susser Finance Corp., Gtd. Notes | | B2 | | | 8.500% | | | 05/15/16 | | | 5,496 | | | | 5,928,810 | |
Toys “R” Us Property Co. II LLC, Sr. Sec’d. Notes | | Ba1 | | | 8.500% | | | 12/01/17 | | | 1,831 | | | | 1,895,085 | |
| | | | | | | | | | | | | | |
|
|
|
| | | | | | | | | | | | | | | | 34,703,059 | |
| | | | | | | | | | | | | | |
|
|
|
Technology — 9.4% | | | | | | | | | | | | | | | | |
Advanced Micro Devices, Inc., Sr. Unsec’d. Notes(e) | | Ba3 | | | 7.750% | | | 08/01/20 | | | 1,500 | | | | 1,541,250 | |
Advanced Micro Devices, Inc., Sr. Unsec’d. Notes | | Ba3 | | | 8.125% | | | 12/15/17 | | | 2,475 | | | | 2,567,813 | |
Anixter, Inc., Gtd. Notes | | Ba2 | | | 5.950% | | | 03/01/15 | | | 2,500 | | | | 2,531,250 | |
Avaya, Inc., Gtd. Notes | | Caa2 | | | 9.750% | | | 11/01/15 | | | 8,475 | | | | 7,627,500 | |
Avaya, Inc., Gtd. Notes, PIK(e) | | Caa2 | | | 10.125% | | | 11/01/15 | | | 5,095 | | | | 4,585,500 | |
CDW LLC/CDW Finance Corp., Gtd. Notes | | Caa1 | | | 8.500% | | | 04/01/19 | | | 12,950 | | | | 13,047,125 | |
CDW LLC/CDW Finance Corp., Gtd. Notes | | Caa1 | | | 11.000% | | | 10/12/15 | | | 238 | | | | 249,900 | |
CDW LLC/CDW Finance Corp., Gtd. Notes(e) | | CCC+(c) | | | 12.535% | | | 10/12/17 | | | 13,780 | | | | 13,848,900 | |
Commscope, Inc., Gtd. Notes, 144A | | B3 | | | 8.250% | | | 01/15/19 | | | 16,535 | | | | 16,535,000 | |
CoreLogic, Inc., Gtd. Notes, 144A | | Ba3 | | | 7.250% | | | 06/01/21 | | | 5,050 | | | | 4,835,375 | |
DuPont Fabros Technology LP, Gtd. Notes | | Ba1 | | | 8.500% | | | 12/15/17 | | | 6,400 | | | | 6,848,000 | |
First Data Corp., Gtd. Notes | | Caa1 | | | 12.625% | | | 01/15/21 | | | 11,932 | | | | 10,380,840 | |
Freescale Semiconductor, Inc., Gtd. Notes(e) | | Caa1 | | | 8.050% | | | 02/01/20 | | | 8,010 | | | | 7,529,400 | |
Freescale Semiconductor, Inc., Sr. Sec’d. Notes, 144A | | Ba3 | | | 9.250% | | | 04/15/18 | | | 7,225 | | | | 7,721,719 | |
Interactive Data Corp., Gtd. Notes | | Caa1 | | | 10.250% | | | 08/01/18 | | | 8,125 | | | | 8,815,625 | |
Iron Mountain, Inc., Gtd. Notes(e) | | B1 | | | 7.750% | | | 10/01/19 | | | 2,375 | | | | 2,508,594 | |
Lender Processing Services, Inc., Gtd. Notes(e) | | Ba2 | | | 8.125% | | | 07/01/16 | | | 1,936 | | | | 1,902,120 | |
Nortel Networks Ltd. (Canada), Gtd. Notes(h) | | NR | | | 10.125% | | | 07/15/13 | | | 3,050 | | | | 3,332,125 | |
NXP BV/NXP Funding LLC (Netherlands), Sr. Sec’d. Notes, 144A | | B2 | | | 9.750% | | | 08/01/18 | | | 13,075 | | | | 14,251,750 | |
Seagate HDD Cayman (Cayman Islands), Gtd. Notes, 144A | | Ba1 | | | 7.750% | | | 12/15/18 | | | 1,325 | | | | 1,409,469 | |
Seagate Technology International (Cayman Islands),
Sec’d. Notes, 144A | | Baa3 | | | 10.000% | | | 05/01/14 | | | 10,791 | | | | 12,207,319 | |
Sensata Technologies BV (Netherlands), Gtd. Notes, 144A(e) | | B3 | | | 6.500% | | | 05/15/19 | | | 1,325 | | | | 1,308,437 | |
Spansion LLC, Gtd. Notes | | B3 | | | 7.875% | | | 11/15/17 | | | 2,175 | | | | 1,979,250 | |
SEE NOTES TO FINANCIAL STATEMENTS.
A110
| | | | | | |
| | | HIGH YIELD BOND PORTFOLIO (continued) | | |
| |
| SCHEDULE OF INVESTMENTS | | December 31, 2011 |
| | | | | | | | | | | | | | | | |
CORPORATE BONDS
(continued) | | Moody’s
Ratings†
(Unaudited)
| | Interest
Rate
| | | Maturity
Date
| | Principal
Amount
(000)#
| | | Value
(Note 2)
| |
Technology (continued) | | | | | | | | | | | | | | | | |
| | | | | | | | | | | | | | | | | |
SunGard Data Systems, Inc., Gtd. Notes(e) | | Caa1 | | | 10.250% | | | 08/15/15 | | $ | 16,450 | | | $ | 17,046,312 | |
SunGard Data Systems, Inc., Gtd. Notes | | Caa1 | | | 10.625% | | | 05/15/15 | | | 12,150 | | | | 12,939,750 | |
Syniverse Holdings, Inc., Gtd. Notes(e) | | Caa1 | | | 9.125% | | | 01/15/19 | | | 5,730 | | | | 6,045,150 | |
TransUnion LLC/TransUnion Financing Corp., Gtd. Notes(e) | | B3 | | | 11.375% | | | 06/15/18 | | | 8,825 | | | | 10,082,562 | |
Unisys Corp., Sr. Sec’d. Notes, 144A | | Ba1 | | | 12.750% | | | 10/15/14 | | | 1,929 | | | | 2,191,826 | |
Unisys Corp., Sr. Unsec’d. Notes | | B2 | | | 12.500% | | | 01/15/16 | | | 6,250 | | | | 6,671,875 | |
| | | | | | | | | | | | | | |
|
|
|
| | | | | | | | | | | | | | | | 202,541,736 | |
| | | | | | | | | | | | | | |
|
|
|
Telecommunications — 4.6% | | | | | | | | | | | | | | | | |
Brightstar Corp., Gtd. Notes, 144A | | B1 | | | 9.500% | | | 12/01/16 | | | 3,775 | | | | 3,850,500 | |
Clearwire Communications LLC/Clearwire Finance, Inc.,
Sr. Sec’d. Notes, 144A | | B3 | | | 12.000% | | | 12/01/15 | | | 2,300 | | | | 2,202,250 | |
Clearwire Communications LLC/Clearwire Finance, Inc.,
Sr. Sec’d. Notes, 144A(e) | | B3 | | | 12.000% | | | 12/01/15 | | | 12,480 | | | | 11,949,600 | |
Cricket Communications, Inc., Gtd. Notes | | B3 | | | 7.750% | | | 10/15/20 | | | 525 | | | | 459,375 | |
Frontier Communications Corp., Sr. Unsec’d. Notes | | Ba2 | | | 8.250% | | | 05/01/14 | | | 400 | | | | 417,000 | |
Frontier Communications Corp., Sr. Unsec’d. Notes | | Ba2 | | | 8.250% | | | 04/15/17 | | | 175 | | | | 178,938 | |
Frontier Communications Corp., Sr. Unsec’d. Notes(e) | | Ba2 | | | 8.500% | | | 04/15/20 | | | 1,075 | | | | 1,100,531 | |
Frontier Communications Corp., Sr. Unsec’d. Notes | | Ba2 | | | 8.750% | | | 04/15/22 | | | 5,875 | | | | 5,816,250 | |
Level 3 Escrow, Inc., Gtd. Notes, 144A(e) | | B3 | | | 8.125% | | | 07/01/19 | | | 1,275 | | | | 1,255,875 | |
Level 3 Financing, Inc., Gtd. Notes | | B3 | | | 9.250% | | | 11/01/14 | | | 6,593 | | | | 6,741,342 | |
Level 3 Financing, Inc., Gtd. Notes | | B3 | | | 9.375% | | | 04/01/19 | | | 500 | | | | 521,875 | |
MetroPCS Wireless, Inc., Gtd. Notes | | B2 | | | 6.625% | | | 11/15/20 | | | 350 | | | | 326,375 | |
MetroPCS Wireless, Inc., Gtd. Notes(e) | | B2 | | | 7.875% | | | 09/01/18 | | | 4,350 | | | | 4,409,812 | |
NII Capital Corp., Gtd. Notes(e) | | B2 | | | 7.625% | | | 04/01/21 | | | 6,058 | | | | 6,012,565 | |
Northwestern Bell Telephone, Sr. Unsec’d. Notes | | Baa3 | | | 7.750% | | | 05/01/30 | | | 750 | | | | 823,905 | |
Qwest Communications International, Inc., Gtd. Notes | | Baa3 | | | 7.125% | | | 04/01/18 | | | 1,450 | | | | 1,508,000 | |
Qwest Communications International, Inc., Gtd. Notes, Ser. B(e) | | Baa3 | | | 7.500% | | | 02/15/14 | | | 3,000 | | | | 3,011,325 | |
Qwest Corp., Sr. Unsec’d. Notes(e) | | Baa3 | | | 7.625% | | | 06/15/15 | | | 3,444 | | | | 3,816,338 | |
SBA Telecommunications, Inc., Gtd. Notes | | B1 | | | 8.000% | | | 08/15/16 | | | 1,335 | | | | 1,438,462 | |
SBA Telecommunications, Inc., Gtd. Notes | | B1 | | | 8.250% | | | 08/15/19 | | | 1,335 | | | | 1,451,813 | |
Sprint Capital Corp., Gtd. Notes(e) | | B3 | | | 6.875% | | | 11/15/28 | | | 1,500 | | | | 1,070,625 | |
Sprint Capital Corp., Gtd. Notes(e) | | B3 | | | 6.900% | | | 05/01/19 | | | 3,925 | | | | 3,228,312 | |
Sprint Nextel Corp., Gtd. Notes, 144A(e) | | Ba3 | | | 9.000% | | | 11/15/18 | | | 2,275 | | | | 2,388,750 | |
Sprint Nextel Corp., Sr. Unsec’d. Notes(e) | | B3 | | | 6.000% | | | 12/01/16 | | | 1,645 | | | | 1,365,350 | |
Wind Acquisition Finance SA (Luxembourg), Gtd. Notes, 144A(e) | | B3 | | | 11.750% | | | 07/15/17 | | | 10,110 | | | | 9,048,450 | |
Wind Acquisition Finance SA (Luxembourg), Sr. Sec’d. Notes, 144A(e) | | Ba3 | | | 7.250% | | | 02/15/18 | | | 4,400 | | | | 4,004,000 | |
Wind Acquisition Holdings Finance SA (Luxembourg), Sr. Sec’d. Notes, PIK, 144A | | Caa1 | | | 12.250% | | | 07/15/17 | | | 7,512 | | | | 5,502,469 | |
Windstream Corp., Gtd. Notes | | Ba3 | | | 7.000% | | | 03/15/19 | | | 850 | | | | 858,500 | |
Windstream Corp., Gtd. Notes, 144A(e) | | Ba3 | | | 7.500% | | | 06/01/22 | | | 4,675 | | | | 4,663,313 | |
Windstream Corp., Gtd. Notes(e) | | Ba3 | | | 7.500% | | | 04/01/23 | | | 5,600 | | | | 5,530,000 | |
Windstream Corp., Gtd. Notes(e) | | Ba3 | | | 7.750% | | | 10/15/20 | | | 2,525 | | | | 2,610,219 | |
Windstream Corp., Gtd. Notes | | Ba3 | | | 7.875% | | | 11/01/17 | | | 1,640 | | | | 1,775,300 | |
| | | | | | | | | | | | | | |
|
|
|
| | | | | | | | | | | | | | | | 99,337,419 | |
| | | | | | | | | | | | | | |
|
|
|
TOTAL CORPORATE BONDS
(cost $1,954,759,220) | | | | 1,969,770,227 | |
| | | | | | | | | | | | | | |
|
|
|
| | | | | |
| | | | | | | | | | Shares
| | | | |
| COMMON STOCKS — 0.1% | | | | | | | | | | | | | | | | |
Cable | | | | | | | | | | | | | | | | |
Adelphia Recovery Trust*(d) | | | 500,000 | | | | 500 | |
| | | | | | | | | | | | | | |
|
|
|
Electric | | | | | | | | | | | | | | | | |
GenOn Energy, Inc.* | | | 6,350 | | | | 16,573 | |
| | | | | | | | | | | | | | |
|
|
|
SEE NOTES TO FINANCIAL STATEMENTS.
A111
| | | | | | |
| | | HIGH YIELD BOND PORTFOLIO (continued) | | |
| |
| SCHEDULE OF INVESTMENTS | | December 31, 2011 |
| | | | | | | | | | | | | | |
COMMON STOCKS
(continued) | |
| |
| | | | Shares
| | | Value
(Note 2)
| |
| | | | | | | | | | | | | | | |
Media & Entertainment | | | | | | | | | | | | | | |
Dex One Corp.*(e) | | | 182,429 | | | $ | 302,832 | |
Virgin Media, Inc.(e) | | | 8,521 | | | | 182,179 | |
| | | | | | | | | | | | |
|
|
|
| | | | | | | | | | | | | | 485,011 | |
| | | | | | | | | | | | |
|
|
|
Pipelines & Other | | | | | | | | | | | | | | |
SemGroup Corp. (Class A Stock)* | | | 3,493 | | | | 91,028 | |
| | | | | | | | | | | | |
|
|
|
Technology — 0.1% | | | | | | | | | | | | | | |
Xerox Corp. | | | 137,561 | | | | 1,094,986 | |
| | | | | | | | | | | | |
|
|
|
Telecommunications | | | | | | | | | | | | | | |
Netia SA (Poland)* | | | 238,168 | | | | 365,796 | |
| | | | | | | | | | | | |
|
|
|
TOTAL COMMON STOCKS
(cost $27,553,962) | | | | 2,053,894 | |
| | | | | | | | | | | | |
|
|
|
PREFERRED STOCKS | | | | | | | | | | | | | | |
Building Materials & Construction | | | | | | | | | | | | | | |
New Millenium Homes LLC
(cost $0; purchased 09/25/00)*(d)(g) | | | 3,000 | | | | 75,000 | |
| | | | | | | | | | | | |
|
|
|
Cable | | | | | | | | | | | | | | |
Adelphia Communications Corp., PIK, 13.000%*(d) | | | 5,000 | | | | 5 | |
| | | | | | | | | | | | |
|
|
|
TOTAL PREFERRED STOCKS
(cost $4,765) | | | | 75,005 | |
| | | | | | | | | | | | |
|
|
|
| | | | | |
| | | | | | | Expiration
Date
| | Units
| | | | |
| WARRANTS | | | | | | | | | | | | | | |
Media & Entertainment | | | | | | | | | | | | | | |
MediaNews Group, Inc.
(cost $0; purchased 06/30/11)*(d)(g) | | | | | | 03/19/17 | | | 5,557 | | | | 56 | |
| | | | | | | | | | | | |
|
|
|
Pipelines & Other | | | | | | | | | | | | | | |
SemGroup Corp.* | | | | | | 11/30/14 | | | 3,676 | | | | 9,778 | |
| | | | | | | | | | | | |
|
|
|
Telecommunications | | | | | | | | | | | | | | |
Hawaiian Telcom Holdco, Inc.* | | | | | | 10/28/15 | | | 19,187 | | | | 57,561 | |
| | | | | | | | | | | | |
|
|
|
TOTAL WARRANTS
(cost $320,316) | | | | 67,395 | |
| | | | | | | | | | | | |
|
|
|
TOTAL LONG-TERM INVESTMENTS
(cost $2,057,229,690) | | | | 2,042,823,043 | |
| | | | | | | | | | | | |
|
|
|
| | | | | |
| | | | | | | | | Shares
| | | | |
| SHORT-TERM INVESTMENTS — 22.3% | | | | | | | | | | | | | | |
AFFILIATED MUTUAL FUNDS | | | | | | | | | | | | | | |
Prudential Investment Portfolios 2 — Prudential Core Short-Term Bond Fund (Note 4)(i) | | | 513,556 | | | | 4,550,105 | |
Prudential Investment Portfolios 2 — Prudential Core Taxable Money Market Fund
(cost $475,637,076; includes $407,227,152 of cash collateral received for securities on loan) (Note 4)(i)(j) | | | 475,637,076 | | | | 475,637,076 | |
| | | | | | | | | | | | |
|
|
|
TOTAL SHORT-TERM INVESTMENTS
(cost $480,517,809) | | | | 480,187,181 | |
| | | | | | | | | | | | |
|
|
|
TOTAL INVESTMENTS — 116.9%
(cost $2,537,747,499) | | | | 2,523,010,224 | |
LIABILITIES IN EXCESS OF OTHER ASSETS(k) — (16.9)% | | | | (364,610,525 | ) |
| | | | | | | | | | | | |
|
|
|
NET ASSETS — 100.0% | | | $ | 2,158,399,699 | |
| | | |
|
|
|
SEE NOTES TO FINANCIAL STATEMENTS.
A112
| | | | | | |
| | | HIGH YIELD BOND PORTFOLIO (continued) | | |
| |
| SCHEDULE OF INVESTMENTS | | December 31, 2011 |
The following abbreviations are used in portfolio descriptions:
| | |
| 144A | | Security was purchased pursuant to Rule 144A under the Securities Act of 1933 and may not be resold subject to that rule except to qualified institutional buyers. Unless otherwise noted, 144A securities are deemed to be liquid. |
| ABS | | Asset-Backed Security |
| CLO | | Collateralized Loan Obligation |
| MTN | | Medium Term Note |
| NR | | Not Rated by Moody’s or Standard & Poor’s |
| PIK | | Payment-in-Kind |
| * | Non-income producing security. |
| † | The ratings reflected are as of December 31, 2011. Ratings of certain bonds may have changed subsequent to that date. |
| # | Principal amount is shown in U.S. dollars unless otherwise stated. |
| (a) | Variable rate instrument. The interest rate shown reflects the rate in effect at December 31, 2011. |
| (b) | Rate shown reflects the effective yield at December 31, 2011. Rate will be available based on 3 month LIBOR + 500 basis points upon settlement date. |
| (c) | Standard & Poor’s Rating. |
| (d) | Indicates a security that has been deemed illiquid. |
| (e) | All or a portion of security is on loan. The aggregate market value of such securities, including those sold and pending settlement, is $398,054,308; cash collateral of $407,227,152 (included in liabilities) was received with which the Portfolio purchased highly liquid short-term investments. |
| (f) | Amount is actual; not rounded to thousands. |
| (g) | Indicates a restricted security; the aggregate original cost of such securities is $91,586,727. The aggregate value of $92,310,464 is approximately 4.3% of net assets. |
| (h) | Represents issuer in default on interest payments and/or principal repayment; non-income producing security. |
| (i) | Prudential Investments LLC, the manager of the Portfolio, also serves as manager of the Prudential Investment Portfolios 2 — Prudential Core Taxable Money Market Fund and the Prudential Investment Portfolios 2 — Prudential Core Short-Term Bond Fund. |
| (j) | Represents security, or a portion thereof, purchased with cash collateral received for securities on loan. |
| (k) | Includes net unrealized appreciation (depreciation) on the following derivative contracts held at reporting period end: |
Credit default swap agreements outstanding at December 31, 2011:
| | | | | | | | | | | | | | | | | | | | | | | | | | | | |
Counterparty
| | Termination
Date
| | | Notional
Amount
(000)(3)
| | Fixed
Rate
| | | Reference Entity/Obligation
| | Implied
Credit
Spread at
December 31,
2011(4)
(Unaudited)
| | | Fair
Value
| | | Upfront
Premiums
Paid/
(Received)
| | | Unrealized
Appreciation/
(Depreciation)
| |
Over-the-Counter Credit Default Swaps on Corporate Issues—Sell Protection(1): | | | | | | | | | | | | | |
Deutsche Bank AG | | | 12/20/14 | | | $ 9,000 | | | 6.500% | | | Ford Motor Co. | | | 3.070% | | | $ | 503,452 | | | $ | (1,175,000 | ) | | $ | 1,678,452 | |
Goldman Sachs International | | | 02/01/14 | | | 3,150 | | | 7.250% | | | NRG Energy, Inc. | | | 5.555% | | | | (161,298 | ) | | | — | | | | (161,298 | ) |
| | | | | | | | | | | | | | | | | | |
|
|
| |
|
|
| |
|
|
|
| | | | | | | | | | | | | | | | | | | $ | 342,154 | | | $ | (1,175,000 | ) | | $ | 1,517,154 | |
| | | | | | | | | | | | | | | | | | |
|
|
| |
|
|
| |
|
|
|
| | | | | | | | |
Counterparty
| | Termination
Date
| | | Notional
Amount
(000)(3)
| | Fixed
Rate
| | | Reference Entity/Obligation
| | | | | Fair
Value(2)
| | | Upfront
Premiums
Paid/
(Received)
| | | Unrealized
Appreciation/
(Depreciation)
| |
Over-the-Counter Credit Default Swaps on Credit Indices—Sell Protection(1): | | | | | | | | | | | | | |
JPMorgan Chase Bank | | | 12/20/16 | | | $13,720 | | | 5.000% | | | CDX.NA.HY.17.V1 | | | | | | $ | (939,718 | ) | | $ | (1,182,397 | ) | | $ | 242,679 | |
Morgan Stanley Capital Services | | | 12/20/16 | | | 9,800 | | | 5.000% | | | CDX.NA.HY.17.V1 | | | | | | | (687,561 | ) | | | (692,806 | ) | | | 5,245 | |
Morgan Stanley Capital Services | | | 12/20/16 | | | 7,840 | | | 5.000% | | | CDX.NA.HY.17.V1 | | | | | | | (536,982 | ) | | | (585,278 | ) | | | 48,296 | |
| | | | | | | | | | | | | | | | | | |
|
|
| |
|
|
| |
|
|
|
| | | | | | | | | | | | | | | | | | | $ | (2,164,261 | ) | | $ | (2,460,481 | ) | | $ | 296,220 | |
| | | | | | | | | | | | | | | | | | |
|
|
| |
|
|
| |
|
|
|
The Portfolio entered into credit default swaps as the protection seller on corporate issues and credit indices to take an active short position with respect to the likelihood of a particular issuer’s default or the referenced entity’s credit soundness.
| (1) | If the Portfolio is a seller of protection, it receives the fixed rate. When a credit event occurs, as defined under the terms of that particular swap agreement, the Portfolio will either (i) pay to the buyer of protection an amount equal to the notional amount of the swap and take delivery of the referenced obligation or underlying securities comprising the referenced index or (ii) pay a net settlement amount in the form of cash or securities equal to the notional amount of the swap less the recovery value of the referenced obligation or underlying securities comprising the referenced index. |
SEE NOTES TO FINANCIAL STATEMENTS.
A113
| | | | | | |
| | | HIGH YIELD BOND PORTFOLIO (continued) | | |
| |
| SCHEDULE OF INVESTMENTS | | December 31, 2011 |
| (2) | The fair value of credit default swap agreements on asset-backed securities and credit indices serves as an indicator of the current status of the payment/performance risk and represents the likelihood of an expected liability (or profit) for the credit derivative should the notional amount of the swap agreement be closed/sold as of the reporting date. Increasing fair value in absolute terms, represent a deterioration of the referenced entity’s credit soundness and a greater likelihood of risk of default or other credit event occuring as defined under the terms of the agreement. |
| (3) | Notional amount represents the maximum potential amount the Portfolio could be required to pay as a seller of credit protection or receive as a buyer of credit protection if a credit event occurs as defined under the terms of that particular swap agreement. |
| (4) | Implied credit spreads, represented in absolute terms, utilized in determining the fair value of credit default swap agreements on corporate issues or sovereign issues of an emerging country as of the reporting date serve as an indicator of the current status of the payment/performance risk and represent the likelihood of risk of default for the credit derivative. The implied credit spread of a particular referenced entity reflects the cost of buying/selling protection and may include up-front payments required to be made to enter into the agreement. Wider credit spreads represent a deterioration of the referenced entity’s credit soundness and a greater likelihood of risk of default or other credit event occurring as defined under the terms of the agreement. |
Various inputs are used in determining the value of the Portfolio’s investments. These inputs are summarized in the three broad levels listed below.
| Level 1— | quoted prices generally for securities actively traded on a regulated securities exchange and for open-end mutual funds which trade at daily net asset value. |
| Level 2— | other significant observable inputs (including, but not limited to, quoted prices for similar securities, interest rates, prepayment speeds, foreign currency exchange rates, and amortized cost) generally for debt securities, swaps, forward foreign currency contracts and for foreign stocks priced using vendor modeling tools. |
| Level 3— | significant unobservable inputs for securities valued in accordance with Board approved fair valuation procedures. |
The following is a summary of the inputs used as of December 31, 2011 in valuing such portfolio securities:
| | | | | | | | | | | | |
| | | Level 1
| | | Level 2
| | | Level 3
| |
Investments in Securities | | | | | | | | | | | | |
Asset-Backed Securities | | | | | | | | | | | | |
Non-Residential Mortgage-Backed Security | | $ | — | | | $ | — | | | $ | 433,607 | |
Residential Mortgage-Backed Securities | | | — | | | | 797,115 | | | | — | |
Bank Loans | | | — | | | | 67,138,126 | | | | — | |
Collateralized Mortgage Obligations | | | — | | | | 2,487,674 | | | | — | |
Corporate Bonds | | | — | | | | 1,969,695,647 | | | | 74,580 | |
Common Stocks | | | 2,053,394 | | | | — | | | | 500 | |
Preferred Stocks | | | — | | | | — | | | | 75,005 | |
Warrants | | | 57,561 | | | | 9,778 | | | | 56 | |
Affiliated Mutual Funds | | | 480,187,181 | | | | — | | | | — | |
Other Financial Instruments* | | | | | | | | | | | | |
Credit Default Swap Agreements | | | — | | | | 1,813,374 | | | | — | |
| | |
|
|
| |
|
|
| |
|
|
|
Total | | $ | 482,298,136 | | | $ | 2,041,941,714 | | | $ | 583,748 | |
| | |
|
|
| |
|
|
| |
|
|
|
The following is a reconciliation of assets in which significant unobservable inputs (Level 3) were used in determining fair value:
| | | | | | | | | | | | | | | | | | | | | | | | |
| | | Non-Residential
Mortgage-Backed
Security
| | | Bank Loans
| | | Corporate
Bonds
| | | Common
Stocks
| | | Preferred
Stocks
| | | Warrants
| |
Balance as of 12/31/10 | | $ | 420,078 | | | $ | 24,240,043 | | | $ | 79,016 | | | $ | 681 | | | $ | 228,005 | | | $ | 95,935 | |
Realized gain (loss) | | | — | | | | 1,829,195 | | | | (3,948,141 | ) | | | (181 | ) | | | — | | | | — | |
Change in unrealized appreciation (depreciation)** | | | 6,283 | | | | (738,227 | ) | | | 3,864,585 | | | | — | | | | (153,000 | ) | | | 56 | |
Purchases | | | — | | | | — | | | | — | | | | — | | | | — | | | | — | |
Sales | | | — | | | | (24,329,360 | ) | | | (13,527 | ) | | | — | | | | — | | | | — | |
Accrued discount/premium | | | 7,246 | | | | (6,151 | ) | | | 92,062 | | | | — | | | | — | | | | — | |
Transfers into Level 3 | | | — | | | | — | | | | 585 | | | | — | | | | — | | | | — | |
Transfers out of Level 3 | | | — | | | | (995,500 | ) | | | — | | | | — | | | | — | | | | (95,935 | ) |
| | |
|
|
| |
|
|
| |
|
|
| |
|
|
| |
|
|
| |
|
|
|
Balance as of 12/31/11 | | $ | 433,607 | | | $ | — | | | $ | 74,580 | | | $ | 500 | | | $ | 75,005 | | | $ | 56 | |
| | |
|
|
| |
|
|
| |
|
|
| |
|
|
| |
|
|
| |
|
|
|
| * | Other financial instruments are derivative instruments not reflected in the Schedule of Investments, such as futures, forwards and swap contracts, which are recorded at the unrealized appreciation/depreciation on the instrument. |
| ** | Of which, $(230,000) was included in Net Assets relating to securities held at the reporting period end. |
SEE NOTES TO FINANCIAL STATEMENTS.
A114
| | | | | | |
| | | HIGH YIELD BOND PORTFOLIO (continued) | | |
| |
| SCHEDULE OF INVESTMENTS | | December 31, 2011 |
It is the Portfolio’s policy to recognize transfers in and transfers out at the fair value as of the beginning of period. At the reporting period end, there were 2 corporate bonds transferred from Level 2 into Level 3 as a result of the securities being fair valued in accordance with the Board of Trustees’ approval, 2 bank loans transferred from Level 3 into Level 2 as a result of no longer using a single broker quote and 1 warrant transferred from Level 3 into Level 1 as a result of being priced by the primary vendor valuation source.
The industry classification of portfolio holdings and liabilities in excess of other assets shown as a percentage of net assets as of December 31, 2011 were as follows:
| | | | |
Affiliated Mutual Funds (including 18.9% of collateral received for securities on loan) | | | 22.3 | % |
Technology | | | 11.0 | |
Healthcare & Pharmaceutical | | | 9.4 | |
Capital Goods | | | 7.0 | |
Gaming | | | 6.3 | |
Energy – Other | | | 6.1 | |
Media & Entertainment | | | 5.9 | |
Foods | | | 5.4 | |
Metals | | | 4.8 | |
Telecommunications | | | 4.6 | |
Non-Captive Finance | | | 4.4 | |
Cable | | | 4.2 | |
Chemicals | | | 3.8 | |
Electric | | | 3.7 | |
Consumer | | | 2.7 | |
| | | | |
Packaging | | | 2.6 | % |
Aerospace & Defense | | | 2.3 | |
Real Estate Investment Trusts | | | 2.0 | |
Automotive | | | 1.7 | |
Pipelines & Other | | | 1.6 | |
Retailers | | | 1.6 | |
Lodging | | | 1.0 | |
Paper | | | 0.9 | |
Building Materials & Construction | | | 0.8 | |
Banking | | | 0.6 | |
Collateralized Mortgage Obligations | | | 0.1 | |
Residential Mortgage-Backed Securities | | | 0.1 | |
| | |
|
|
|
| | | | 116.9 | |
Liabilities in excess of other assets | | | (16.9 | ) |
| | |
|
|
|
| | | | 100.0 | % |
| | |
|
|
|
The Portfolio invested in derivative instruments during the reporting period. The primary types of risk associated with these derivative instruments are credit risk and equity risk. The effect of such derivative instruments on the Portfolio’s financial position and financial performance as reflected in the Statement of Assets and Liabilities and Statement of Operations is presented in the summary below.
Fair values of derivative instruments as of December 31, 2011 as presented in the Statement of Assets and Liabilities:
| | | | | | | | | | | | |
Derivatives not designated as hedging
instruments, carried at fair value
| | Asset Derivatives
| | | Liability Derivatives
| |
| | Balance Sheet Location
| | Fair Value
| | | Balance Sheet Location
| | Fair Value
| |
Credit contracts | | — | | $ | — | | | Premium received for swap agreements | | $ | 3,635,481 | |
Credit contracts | | Unrealized appreciation on swap agreements | | | 1,974,672 | | | Unrealized depreciation on swap agreements | | | 161,298 | |
Equity contracts | | Unaffiliated investments | | | 67,395 | | | — | | | — | |
| | | | |
|
|
| | | |
|
|
|
Total | | | | $ | 2,042,067 | | | | | $ | 3,796,779 | |
| | | | |
|
|
| | | |
|
|
|
The effects of derivative instruments on the Statement of Operations for the year ended December, 2011 are as follows:
| | | | | | | | | | | | |
Amount of Realized Gain or (Loss) on Derivatives Recognized in Income
| |
Derivatives not designated as hedging instruments, carried at fair value
| | Swaps
| | | | | | | |
Credit contracts | | $ | (430,582 | ) | | | | | | | | |
| | |
|
|
| | | | | | | | |
|
Change in Unrealized Appreciation or (Depreciation) on Derivatives Recognized in Income
| |
Derivatives not designated as hedging instruments, carried at fair value
| | Swaps
| | | Warrants
| | | Total
| |
Credit contracts | | $ | 265,635 | | | $ | — | | | $ | 265,635 | |
Equity contracts | | | — | | | | (44,163 | ) | | | (44,163 | ) |
| | |
|
|
| |
|
|
| |
|
|
|
Total | | $ | 265,635 | | | $ | (44,163 | ) | | $ | 221,472 | |
| | |
|
|
| |
|
|
| |
|
|
|
For the year ended December 31, 2011, the Portfolio’s average notional amount for credit default swaps as writer was $18,422,000.
SEE NOTES TO FINANCIAL STATEMENTS.
A115
| | | | | | |
| | | HIGH YIELD BOND PORTFOLIO (continued) | | |
STATEMENT OF ASSETS AND LIABILITIES
December 31, 2011
| | | | |
| ASSETS | | | | |
Investments, at value including securities on loan of $398,054,308: | | | | |
Unaffiliated investments (cost $2,057,229,690) | | $ | 2,042,823,043 | |
Affiliated investments (cost $480,517,809) | | | 480,187,181 | |
Cash | | | 2,691,383 | |
Dividends and interest receivable | | | 42,923,959 | |
Receivable for investments sold | | | 5,854,132 | |
Unrealized appreciation on swap agreements | | | 1,974,672 | |
Prepaid expenses | | | 14,815 | |
| | |
|
|
|
Total Assets | | | 2,576,469,185 | |
| | |
|
|
|
| LIABILITIES | | | | |
Collateral for securities on loan | | | 407,227,152 | |
Payable for investments purchased | | | 5,622,494 | |
Premium received for swap agreements | | | 3,635,481 | |
Management fee payable | | | 996,159 | |
Payable for Series shares repurchased | | | 241,379 | |
Accrued expenses and other liabilities | | | 180,499 | |
Unrealized depreciation on swap agreements | | | 161,298 | |
Deferred trustees’ fees | | | 4,098 | |
Affiliated transfer agent fee payable | | | 926 | |
| | |
|
|
|
Total Liabilities | | | 418,069,486 | |
| | |
|
|
|
| NET ASSETS | | $ | 2,158,399,699 | |
| | |
|
|
|
Net assets were comprised of: | | | | |
Paid-in capital | | $ | 2,470,841,419 | |
Retained earnings | | | (312,441,720 | ) |
| | |
|
|
|
Net assets, December 31, 2011 | | $ | 2,158,399,699 | |
| | |
|
|
|
Net asset value and redemption price per share, $2,158,399,699 / 437,519,749 outstanding shares of beneficial interest | | $ | 4.93 | |
| | |
|
|
|
STATEMENT OF OPERATIONS
Year Ended December 31, 2011
| | | | |
| INVESTMENT INCOME | | | | |
Interest | | $ | 173,776,503 | |
Affiliated income from securities loaned, net | | | 865,553 | |
Unaffiliated dividend income | | | 556,424 | |
Affiliated dividend income | | | 209,236 | |
| | |
|
|
|
| | | | 175,407,716 | |
| | |
|
|
|
| EXPENSES | | | | |
Management fee | | | 11,893,282 | |
Custodian’s fees and expenses | | | 277,000 | |
Shareholders’ reports | | | 166,000 | |
Audit fee | | | 31,000 | |
Trustees’ fees | | | 29,000 | |
Insurance expenses | | | 25,000 | |
Legal fees and expenses | | | 12,000 | |
Transfer agent’s fee and expenses (including affiliated expense of $5,500) (Note 4) | | | 11,000 | |
Commitment fee on syndicated credit agreement | | | 9,000 | |
Miscellaneous | | | 20,802 | |
| | |
|
|
|
Total expenses | | | 12,474,084 | |
| | |
|
|
|
| NET INVESTMENT INCOME | | | 162,933,632 | |
| | |
|
|
|
| NET REALIZED AND UNREALIZED GAIN (LOSS) ON INVESTMENTS AND SWAPS | | | | |
Net realized gain (loss) on: | | | | |
Investment transactions | | | 41,780,936 | |
Swap agreement transactions | | | (430,582 | ) |
| | |
|
|
|
| | | | 41,350,354 | |
| | |
|
|
|
Net change in unrealized appreciation (depreciation) on: | | | | |
Investments (including affiliated: $(66,593)) | | | (96,313,144 | ) |
Swap agreements | | | 265,635 | |
| | |
|
|
|
| | | | (96,047,509 | ) |
| | |
|
|
|
| NET LOSS ON INVESTMENTS AND SWAPS | | | (54,697,155 | ) |
| | |
|
|
|
| NET INCREASE IN NET ASSETS RESULTING FROM OPERATIONS | | $ | 108,236,477 | |
| | |
|
|
|
STATEMENT OF CHANGES IN NET ASSETS
| | | | | | | | |
| | | Year Ended December 31,
| |
| | | 2011
| | | 2010
| |
| INCREASE (DECREASE) IN NET ASSETS | | | | | | | | |
| OPERATIONS: | | | | | | | | |
Net investment income | | $ | 162,933,632 | | | $ | 172,813,833 | |
Net realized gain on investment and swap agreement transactions | | | 41,350,354 | | | | 103,546,699 | |
Net change in unrealized appreciation (depreciation) on investments and swaps | | | (96,047,509 | ) | | | (9,333,418 | ) |
| | |
|
|
| |
|
|
|
NET INCREASE IN NET ASSETS RESULTING FROM OPERATIONS | | | 108,236,477 | | | | 267,027,114 | |
| | |
|
|
| |
|
|
|
| DISTRIBUTIONS | | | (162,232,130 | ) | | | (170,579,126 | ) |
| | |
|
|
| |
|
|
|
| SERIES SHARE TRANSACTIONS: | | | | | | | | |
Series shares sold [4,310,527 and 7,760,335 shares, respectively] | | | 21,838,181 | | | | 38,142,981 | |
Series shares issued in reinvestment of distributions [32,541,377 and 34,984,970 shares, respectively] | | | 162,232,130 | | | | 170,579,126 | |
Series shares repurchased [22,320,117 and 20,666,560 shares, respectively] | | | (112,834,788 | ) | | | (102,302,303 | ) |
| | |
|
|
| |
|
|
|
NET INCREASE IN NET ASSETS RESULTING FROM SERIES SHARE TRANSACTIONS | | | 71,235,523 | | | | 106,419,804 | |
| | |
|
|
| |
|
|
|
| TOTAL INCREASE IN NET ASSETS | | | 17,239,870 | | | | 202,867,792 | |
| NET ASSETS: | | | | | | | | |
Beginning of year | | | 2,141,159,829 | | | | 1,938,292,037 | |
| | |
|
|
| |
|
|
|
End of year | | $ | 2,158,399,699 | | | $ | 2,141,159,829 | |
| | |
|
|
| |
|
|
|
SEE NOTES TO FINANCIAL STATEMENTS.
A116
| | | | | | |
| | | JENNISON PORTFOLIO | | |
| |
| SCHEDULE OF INVESTMENTS | | December 31, 2011 |
| | | | | | | | |
| LONG-TERM INVESTMENTS — 99.5% | | | | |
| COMMON STOCKS | | Shares
| | | Value
(Note 2)
| |
Aerospace & Defense — 5.2% | | | | | | | | |
Boeing Co. (The) | | | 256,914 | | | $ | 18,844,642 | |
Precision Castparts Corp. | | | 178,386 | | | | 29,396,229 | |
United Technologies Corp. | | | 157,643 | | | | 11,522,127 | |
| | | | | | |
|
|
|
| | | | | | | | 59,762,998 | |
| | | | | | |
|
|
|
Auto Components — 1.0% | | | | | | | | |
BorgWarner, Inc.*(a) | | | 187,277 | | | | 11,937,036 | |
| | | | | | |
|
|
|
Automobiles — 1.7% | | | | | | | | |
Bayerische Motoren Werke AG (Germany) | | | 107,503 | | | | 7,201,650 | |
Harley-Davidson, Inc. | | | 311,132 | | | | 12,093,701 | |
| | | | | | |
|
|
|
| | | | | | | | 19,295,351 | |
| | | | | | |
|
|
|
Biotechnology — 3.6% | | | | | | | | |
Alexion Pharmaceuticals, Inc.* | | | 140,295 | | | | 10,031,092 | |
Celgene Corp.* | | | 343,821 | | | | 23,242,300 | |
Vertex Pharmaceuticals, Inc.* | | | 244,437 | | | | 8,117,753 | |
| | | | | | |
|
|
|
| | | | | | | | 41,391,145 | |
| | | | | | |
|
|
|
Capital Markets — 0.9% | | | | | | | | |
Goldman Sachs Group, Inc. (The) | | | 117,501 | | | | 10,625,615 | |
| | | | | | |
|
|
|
Chemicals — 2.9% | | | | | | | | |
E.I. du Pont de Nemours & Co.(a) | | | 160,091 | | | | 7,328,966 | |
Monsanto Co. | | | 373,913 | | | | 26,200,084 | |
| | | | | | |
|
|
|
| | | | | | | | 33,529,050 | |
| | | | | | |
|
|
|
Communications Equipment — 2.3% | | | | | |
Juniper Networks, Inc.* | | | 207,695 | | | | 4,239,055 | |
QUALCOMM, Inc. | | | 418,649 | | | | 22,900,100 | |
| | | | | | |
|
|
|
| | | | | | | | 27,139,155 | |
| | | | | | |
|
|
|
Computers & Peripherals — 9.0% | | | | | |
Apple, Inc.* | | | 173,428 | | | | 70,238,340 | |
EMC Corp.* | | | 979,905 | | | | 21,107,154 | |
NetApp, Inc.*(a) | | | 358,652 | | | | 13,008,308 | |
| | | | | | |
|
|
|
| | | | | | | | 104,353,802 | |
| | | | | | |
|
|
|
Consumer Finance — 1.8% | | | | | | | | |
American Express Co. | | | 452,232 | | | | 21,331,783 | |
| | | | | | |
|
|
|
Electrical Equipment — 0.3% | | | | | | | | |
Roper Industries, Inc. | | | 34,751 | | | | 3,018,819 | |
| | | | | | |
|
|
|
Energy Equipment & Services — 3.0% | | | | | | | | |
National Oilwell Varco, Inc. | | | 202,206 | | | | 13,747,986 | |
Schlumberger Ltd. | | | 299,392 | | | | 20,451,468 | |
| | | | | | |
|
|
|
| | | | | | | | 34,199,454 | |
| | | | | | |
|
|
|
Food & Staples Retailing — 3.6% | | | | | |
Costco Wholesale Corp. | | | 278,841 | | | | 23,233,032 | |
Whole Foods Market, Inc. | | | 259,960 | | | | 18,088,017 | |
| | | | | | |
|
|
|
| | | | | | | | 41,321,049 | |
| | | | | | |
|
|
|
Food Products — 1.2% | | | | | | | | |
Mead Johnson Nutrition Co. | | | 205,784 | | | | 14,143,534 | |
| | | | | | |
|
|
|
Healthcare Providers & Services — 0.9% | | | | | |
Express Scripts, Inc.*(a) | | | 241,803 | | | | 10,806,176 | |
| | | | | | |
|
|
|
Hotels, Restaurants & Leisure — 6.2% | | | | | |
Chipotle Mexican Grill, Inc.*(a) | | | 47,772 | | | | 16,134,515 | |
Dunkin’ Brands Group, Inc.*(a) | | | 233,198 | | | | 5,825,286 | |
McDonald’s Corp. | | | 215,234 | | | | 21,594,427 | |
| | | | | | | | |
| COMMON STOCKS | | | | |
| (continued) | | Shares
| | | Value
(Note 2)
| |
Hotels, Restaurants & Leisure (continued) | | | | | |
Starbucks Corp. | | | 607,591 | | | $ | 27,955,262 | |
| | | | | | |
|
|
|
| | | | | | | | 71,509,490 | |
| | | | | | |
|
|
|
Internet & Catalog Retail — 4.8% | | | | | | | | |
Amazon.com, Inc.* | | | 244,622 | | | | 42,344,068 | |
priceline.com, Inc.* | | | 27,677 | | | | 12,944,810 | |
| | | | | | |
|
|
|
| | | | | | | | 55,288,878 | |
| | | | | | |
|
|
|
Internet Software & Services — 5.5% | | | | | | | | |
Baidu, Inc. (China), ADR* | | | 178,679 | | | | 20,810,743 | |
Google, Inc. (Class A Stock)* | | | 46,238 | | | | 29,865,124 | |
LinkedIn Corp. (Class A Stock)*(a) | | | 81,435 | | | | 5,131,220 | |
Tencent Holdings Ltd. (China) | | | 341,852 | | | | 6,870,844 | |
Youku, Inc. (China), ADR*(a) | | | 57,591 | | | | 902,451 | |
| | | | | | |
|
|
|
| | | | | | | | 63,580,382 | |
| | | | | | |
|
|
|
IT Services — 7.2% | | | | | | | | |
Cognizant Technology Solutions Corp. (Class A Stock)* | | | 137,923 | | | | 8,869,828 | |
International Business Machines Corp. | | | 154,907 | | | | 28,484,299 | |
Mastercard, Inc. (Class A Stock) | | | 92,966 | | | | 34,659,584 | |
Visa, Inc. (Class A Stock) | | | 114,718 | | | | 11,647,319 | |
| | | | | | |
|
|
|
| | | | | | | | 83,661,030 | |
| | | | | | |
|
|
|
Life Sciences Tools & Services — 1.7% | | | | | |
Agilent Technologies, Inc.* | | | 398,759 | | | | 13,928,652 | |
Illumina, Inc.*(a) | | | 203,035 | | | | 6,188,507 | |
| | | | | | |
|
|
|
| | | | | | | | 20,117,159 | |
| | | | | | |
|
|
|
Media — 1.0% | | | | | | | | |
Walt Disney Co. (The) | | | 323,559 | | | | 12,133,463 | |
| | | | | | |
|
|
|
Oil, Gas & Consumable Fuels — 4.2% | | | | | |
Anadarko Petroleum Corp. | | | 165,680 | | | | 12,646,354 | |
Concho Resources, Inc.* | | | 134,970 | | | | 12,653,438 | |
EOG Resources, Inc. | | | 106,441 | | | | 10,485,503 | |
Occidental Petroleum Corp. | | | 139,111 | | | | 13,034,701 | |
| | | | | | |
|
|
|
| | | | | | | | 48,819,996 | |
| | | | | | |
|
|
|
Personal Products — 1.6% | | | | | | | | |
Estee Lauder Cos., Inc. (The)
(Class A Stock) | | | 169,226 | | | | 19,007,464 | |
| | | | | | |
|
|
|
Pharmaceuticals — 8.4% | | | | | | | | |
Allergan, Inc. | | | 241,775 | | | | 21,213,338 | |
Bristol-Myers Squibb Co. | | | 413,044 | | | | 14,555,671 | |
Johnson & Johnson | | | 204,486 | | | | 13,410,192 | |
NOVO Nordisk A/S (Denmark), ADR | | | 175,806 | | | | 20,263,399 | |
Shire PLC (Ireland), ADR | | | 267,421 | | | | 27,785,042 | |
| | | | | | |
|
|
|
| | | | | | | | 97,227,642 | |
| | | | | | |
|
|
|
Road & Rail — 1.3% | | | | | | | | |
Union Pacific Corp. | | | 145,176 | | | | 15,379,945 | |
| | | | | | |
|
|
|
Semiconductors & Semiconductor Equipment — 2.3% | |
Altera Corp. | | | 200,876 | | | | 7,452,500 | |
ARM Holdings PLC (United Kingdom), ADR(a) | | | 227,122 | | | | 6,284,466 | |
Avago Technologies Ltd. | | | 287,482 | | | | 8,296,730 | |
SEE NOTES TO FINANCIAL STATEMENTS.
A117
| | | | | | |
| | | JENNISON PORTFOLIO (continued) | | |
| |
| SCHEDULE OF INVESTMENTS | | December 31, 2011 |
| | | | | | | | |
| COMMON STOCKS | | | | |
| (continued) | | Shares
| | | Value
(Note 2)
| |
Semiconductors & Semiconductor Equipment (continued) | |
Broadcom Corp. (Class A Stock) | | | 160,702 | | | $ | 4,718,211 | |
| | | | | | |
|
|
|
| | | | | | | | 26,751,907 | |
| | | | | | |
|
|
|
Software — 6.1% | | | | | | | | |
Oracle Corp. | | | 783,048 | | | | 20,085,181 | |
Red Hat, Inc.* | | | 267,966 | | | | 11,064,316 | |
Salesforce.com, Inc.*(a) | | | 206,775 | | | | 20,979,392 | |
VMware, Inc. (Class A Stock)* | | | 222,331 | | | | 18,495,716 | |
| | | | | | |
|
|
|
| | | | | | | | 70,624,605 | |
| | | | | | |
|
|
|
Specialty Retail — 3.0% | | | | | | | | |
Bed Bath & Beyond, Inc.* | | | 211,144 | | | | 12,240,018 | |
Inditex SA (Spain) | | | 93,999 | | | | 7,698,514 | |
Lowe’s Cos., Inc. | | | 219,264 | | | | 5,564,920 | |
Tiffany & Co. | | | 133,427 | | | | 8,840,873 | |
| | | | | | |
|
|
|
| | | | | | | | 34,344,325 | |
| | | | | | |
|
|
|
Textiles, Apparel & Luxury Goods — 6.9% | | | | | |
Burberry Group PLC (United Kingdom) | | | 533,740 | | | | 9,822,367 | |
Coach, Inc. | | | 199,019 | | | | 12,148,120 | |
Lululemon Athletica, Inc.*(a) | | | 233,094 | | | | 10,876,166 | |
LVMH Moet Hennessy Louis Vuitton SA (France) | | | 22,942 | | | | 3,248,372 | |
NIKE, Inc. (Class B Stock) | | | 254,317 | | | | 24,508,529 | |
Ralph Lauren Corp. | | | 135,874 | | | | 18,761,482 | |
| | | | | | |
|
|
|
| | | | | | | | 79,365,036 | |
| | | | | | |
|
|
|
Wireless Telecommunication Services — 1.9% | | | | | |
American Tower Corp. (Class A Stock). | | | 361,664 | | | | 21,703,457 | |
| | | | | | |
|
|
|
TOTAL LONG-TERM INVESTMENTS
(cost $824,552,980) | | | | 1,152,369,746 | |
| | | | | | |
|
|
|
| SHORT-TERM INVESTMENT — 7.7% | |
Affiliated Money Market Mutual Fund | | | | | |
Prudential Investment Portfolios 2 — Prudential Core Taxable Money Market Fund
(cost $89,179,684; includes $82,366,302 of cash collateral received for securities on
loan) (Note 4)(b)(c) | | | 89,179,684 | | | | 89,179,684 | |
| | | | | | |
|
|
|
TOTAL INVESTMENTS — 107.2%
(cost $913,732,664) | | | | 1,241,549,430 | |
LIABILITIES IN EXCESS OF
OTHER ASSETS — (7.2)% | | | | (83,289,995 | ) |
| | | | | | |
|
|
|
NET ASSETS — 100.0% | | | $ | 1,158,259,435 | |
| | | | | | |
|
|
|
The following abbreviation is used in portfolio descriptions:
| | |
| ADR | | American Depositary Receipt |
| * | Non-income producing security. |
| (a) | All or a portion of security is on loan. The aggregate market value of such securities, including those sold and pending settlement, is $80,293,222; cash collateral of $82,366,302 (included in liabilities) was received with which the Portfolio purchased highly liquid short-term investments. |
| (b) | Represents security, or a portion thereof, purchased with cash collateral received for securities on loan. |
| (c) | Prudential Investments LLC, the manager of the Portfolio, also serves as manager of the Prudential Investments Portfolios 2 — Prudential Core Taxable Money Market Fund. |
Various inputs are used in determining the value of the Portfolio’s investments. These inputs are summarized in the three broad levels listed below.
| Level 1— | quoted prices generally for securities actively traded on a regulated securities exchange and for open-end mutual funds which trade at daily net asset value. |
| Level 2— | other significant observable inputs (including, but not limited to, quoted prices for similar securities, interest rates, prepayment speeds, foreign currency exchange rates, and amortized cost) generally for debt securities, swaps, forward foreign currency contracts and for foreign stocks priced using vendor modeling tools. |
| Level 3— | significant unobservable inputs for securities valued in accordance with Board approved fair valuation procedures. |
The following is a summary of the inputs used as of December 31, 2011 in valuing such portfolio securities:
| | | | | | | | | | | | |
| | | Level 1
| | | Level 2
| | | Level 3
| |
Investments in Securities | | | | | | | | | | | | |
Common Stocks | | $ | 1,152,369,746 | | | $ | — | | | $ | — | |
Affiliated Money Market Mutual Fund | | | 89,179,684 | | | | — | | | | — | |
| | |
|
|
| |
|
|
| |
|
|
|
Total | | $ | 1,241,549,430 | | | $ | — | | | $ | — | |
| | |
|
|
| |
|
|
| |
|
|
|
SEE NOTES TO FINANCIAL STATEMENTS.
A118
| | | | | | |
| | | JENNISON PORTFOLIO (continued) | | |
| |
| SCHEDULE OF INVESTMENTS | | December 31, 2011 |
The industry classification of portfolio holdings and liabilities in excess of other assets shown as a percentage of net assets as of December 31, 2011 were as follows:
| | | | |
Computers & Peripherals | | | 9.0 | % |
Pharmaceuticals | | | 8.4 | |
Affiliated Money Market Mutual Fund (including 7.1% of collateral received for securities on loan) | | | 7.7 | |
IT Services | | | 7.2 | |
Textiles, Apparel & Luxury Goods | | | 6.9 | |
Hotels, Restaurants & Leisure | | | 6.2 | |
Software | | | 6.1 | |
Internet Software & Services | | | 5.5 | |
Aerospace & Defense | | | 5.2 | |
Internet & Catalog Retail | | | 4.8 | |
Oil, Gas & Consumable Fuels | | | 4.2 | |
Biotechnology | | | 3.6 | |
Food & Staples Retailing | | | 3.6 | |
Energy Equipment & Services | | | 3.0 | |
Specialty Retail | | | 3.0 | |
Chemicals | | | 2.9 | |
Communications Equipment | | | 2.3 | |
Semiconductors & Semiconductor Equipment | | | 2.3 | |
Wireless Telecommunication Services | | | 1.9 | |
Consumer Finance | | | 1.8 | |
Automobiles | | | 1.7 | |
Life Sciences Tools & Services | | | 1.7 | |
Personal Products | | | 1.6 | |
Road & Rail | | | 1.3 | �� |
Food Products | | | 1.2 | |
Auto Components | | | 1.0 | |
Media | | | 1.0 | |
Capital Markets | | | 0.9 | |
Healthcare Providers & Services | | | 0.9 | |
Electrical Equipment | | | 0.3 | |
| | |
|
|
|
| | | | 107.2 | |
Liabilities in excess of other assets | | | (7.2 | ) |
| | |
|
|
|
| | | | 100.0 | % |
| | |
|
|
|
SEE NOTES TO FINANCIAL STATEMENTS.
A119
| | | | | | |
| | | JENNISON PORTFOLIO (continued) | | |
STATEMENT OF ASSETS AND LIABILITIES
December 31, 2011
| | | | |
| ASSETS | | | | |
Investments, at value including securities on loan of $80,293,222: | | | | |
Unaffiliated investments (cost $824,552,980) | | $ | 1,152,369,746 | |
Affiliated investments (cost $89,179,684) | | | 89,179,684 | |
Foreign currency, at value (cost $330,092) | | | 329,558 | |
Cash | | | 54,494 | |
Dividends and interest receivable | | | 829,850 | |
Foreign tax reclaim receivable | | | 56,860 | |
Prepaid expenses | | | 7,811 | |
Receivable for Series shares sold | | | 1,519 | |
| | |
|
|
|
Total Assets | | | 1,242,829,522 | |
| | |
|
|
|
| LIABILITIES | | | | |
Collateral for securities on loan | | | 82,366,302 | |
Payable for Series shares repurchased | | | 1,102,695 | |
Management fee payable | | | 597,071 | |
Payable for investments purchased | | | 329,558 | |
Accrued expenses and other liabilities | | | 95,882 | |
Shareholder servicing fees payable | | | 65,316 | |
Distribution fee payable | | | 6,962 | |
Administration fee payable | | | 4,177 | |
Deferred trustees’ fees | | | 1,198 | |
Affiliated transfer agent fee payable | | | 926 | |
| | |
|
|
|
Total Liabilities | | | 84,570,087 | |
| | |
|
|
|
| NET ASSETS | | $ | 1,158,259,435 | |
| | |
|
|
|
Net assets were comprised of: | | | | |
Paid-in capital | | $ | 1,516,836,359 | |
Retained earnings | | | (358,576,924 | ) |
| | |
|
|
|
Net assets, December 31, 2011 | | $ | 1,158,259,435 | |
| | |
|
|
|
| Class I: | | | | |
Net asset value and redemption price per share, $1,126,339,813 / 48,432,567 outstanding shares of beneficial interest | | $ | 23.26 | |
| | |
|
|
|
| Class II: | | | | |
Net asset value and redemption price per share, $31,919,622 / 1,394,516 outstanding shares of beneficial interest | | $ | 22.89 | |
| | |
|
|
|
STATEMENT OF OPERATIONS
Year Ended December 31, 2011
| | | | |
| INVESTMENT INCOME | | | | |
Unaffiliated dividend income (net of foreign withholding taxes of $340,956) | | $ | 10,115,642 | |
Affiliated income from securities loaned, net | | | 151,067 | |
Affiliated dividend income | | | 11,139 | |
| | |
|
|
|
| | | | 10,277,848 | |
| | |
|
|
|
| EXPENSES | | | | |
Management fee | | | 7,727,430 | |
Distribution fee—Class II | | | 84,473 | |
Administration fee—Class II | | | 50,684 | |
Shareholders’ reports | | | 222,000 | |
Custodian’s fees and expenses | | | 151,000 | |
Trustees’ fees | | | 23,000 | |
Audit fee | | | 19,000 | |
Insurance expenses | | | 14,000 | |
Transfer agent’s fee and expenses (including affiliated expense of $5,500) (Note 4) | | | 11,000 | |
Legal fees and expenses | | | 11,000 | |
Commitment fee on syndicated credit agreement | | | 8,000 | |
Loan interest expense (Note 8) | | | 2,466 | |
Miscellaneous | | | 19,307 | |
| | |
|
|
|
Total expenses | | | 8,343,360 | |
| | |
|
|
|
| NET INVESTMENT INCOME | | | 1,934,488 | |
| | |
|
|
|
| NET REALIZED AND UNREALIZED GAIN (LOSS) ON INVESTMENTS AND FOREIGN CURRENCIES | | | | |
Net realized gain (loss) on: | | | | |
Investment transactions | | | 127,204,474 | |
Foreign currency transactions | | | (78,769 | ) |
| | |
|
|
|
| | | | 127,125,705 | |
| | |
|
|
|
Net change in unrealized appreciation (depreciation) on: | | | | |
Investments | | | (112,345,128 | ) |
Foreign currencies | | | (320 | ) |
| | |
|
|
|
| | | | (112,345,448 | ) |
| | |
|
|
|
| NET GAIN ON INVESTMENTS AND FOREIGN CURRENCIES | | | 14,780,257 | |
| | |
|
|
|
| NET INCREASE IN NET ASSETS RESULTING FROM OPERATIONS | | $ | 16,714,745 | |
| | |
|
|
|
STATEMENT OF CHANGES IN NET ASSETS
| | | | | | | | |
| | | Year Ended December 31,
| |
| | | 2011
| | | 2010
| |
| INCREASE (DECREASE) IN NET ASSETS | | | | | | | | |
| OPERATIONS: | | | | | | | | |
Net investment income | | $ | 1,934,488 | | | $ | 3,611,532 | |
Net realized gain on investments and foreign currencies | | | 127,125,705 | | | | 114,535,580 | |
Net change in unrealized appreciation (depreciation) on investments and foreign currencies | | | (112,345,448 | ) | | | 27,395,126 | |
| | |
|
|
| |
|
|
|
NET INCREASE IN NET ASSETS RESULTING FROM OPERATIONS | | | 16,714,745 | | | | 145,542,238 | |
| | |
|
|
| |
|
|
|
| DISTRIBUTIONS: | | | | | | | | |
Class I | | | (3,609,872 | ) | | | (5,475,228 | ) |
Class II | | | — | | | | (5,201 | ) |
| | |
|
|
| |
|
|
|
TOTAL DISTRIBUTIONS | | | (3,609,872 | ) | | | (5,480,429 | ) |
| | |
|
|
| |
|
|
|
| SERIES SHARE TRANSACTIONS (Note 7): | | | | | | | | |
Series shares sold | | | 30,590,229 | | | | 49,412,042 | |
Series shares issued in reinvestment of distributions | | | 3,609,872 | | | | 5,480,429 | |
Net asset value of shares issued in merger (Note 10) | | | — | | | | 42,323,832 | |
Series shares repurchased | | | (284,374,219 | ) | | | (160,922,841 | ) |
| | |
|
|
| |
|
|
|
NET DECREASE IN NET ASSETS RESULTING FROM SERIES SHARE TRANSACTIONS | | | (250,174,118 | ) | | | (63,706,538 | ) |
| | |
|
|
| |
|
|
|
| TOTAL INCREASE (DECREASE) IN NET ASSETS | | | (237,069,245 | ) | | | 76,355,271 | |
| NET ASSETS: | | | | | | | | |
Beginning of year | | | 1,395,328,680 | | | | 1,318,973,409 | |
| | |
|
|
| |
|
|
|
End of year | | $ | 1,158,259,435 | | | $ | 1,395,328,680 | |
| | |
|
|
| |
|
|
|
SEE NOTES TO FINANCIAL STATEMENTS.
A120
| | | | | | |
| | | MONEY MARKET PORTFOLIO | | |
| |
| SCHEDULE OF INVESTMENTS | | December 31, 2011 |
| | | | | | | | | | | | | | | | |
| | | | | Interest
Rate
| | Maturity
Date
| | | Principal
Amount
(000)
| | | Value
(Note 2)
| |
| | | | | | | | | | | | | | | | | |
Certificates of Deposit — 10.0% | | | | | | | | | | | | | | | | |
Bank of Nova Scotia(a) | | | | 0.426% | | | 05/10/12 | | | $ | 7,000 | | | $ | 7,000,000 | |
Bank of Tokyo-Mitsubishi UFJ Ltd. | | | | 0.380% | | | 01/23/12 | | | | 5,000 | | | | 5,000,000 | |
Branch Banking & Trust Co. | | | | 0.230% | | | 03/19/12 | | | | 6,000 | | | | 6,000,000 | |
Deutsche Bank AG | | | | 0.300% | | | 01/03/12 | | | | 4,000 | | | | 4,000,000 | |
Deutsche Bank AG | | | | 0.390% | | | 01/17/12 | | | | 5,000 | | | | 5,000,000 | |
DNB NOR Bank ASA | | | | 0.520% | | | 03/12/12 | | | | 6,000 | | | | 6,000,000 | |
Nordea Bank Finland PLC | | | | 0.510% | | | 03/19/12 | | | | 2,000 | | | | 1,999,868 | |
Nordea Bank Finland PLC(a) | | | | 0.682% | | | 02/03/12 | | | | 13,000 | | | | 13,003,056 | |
Norinchukin Bank | | | | 0.310% | | | 01/03/12 | | | | 5,000 | | | | 5,000,000 | |
Rabobank Nederland NV | | | | 0.570% | | | 04/20/12 | | | | 4,000 | | | | 3,999,753 | |
Royal Bank of Canada(a) | | | | 0.328% | | | 02/14/12 | | | | 10,000 | | | | 10,000,000 | |
Royal Bank of Canada | | | | 0.350% | | | 02/22/12 | | | | 3,000 | | | | 3,000,000 | |
State Street Bank and Trust Co. | | | | 0.120% | | | 01/17/12 | | | | 3,000 | | | | 3,000,000 | |
State Street Bank and Trust Co. | | | | 0.130% | | | 01/09/12 | | | | 8,000 | | | | 8,000,000 | |
Sumitomo Mitsui Banking Corp. | | | | 0.210% | | | 01/04/12 | | | | 1,200 | | | | 1,199,991 | |
Sumitomo Mitsui Banking Corp. | | | | 0.320% | | | 01/17/12 | | | | 13,000 | | | | 13,000,000 | |
Svenska Handelsbanken AB | | | | 0.380% | | | 02/03/12 | | | | 6,000 | | | | 6,000,000 | |
Svenska Handelsbanken AB(a) | | | | 0.746% | | | 03/29/12 | | | | 900 | | | | 899,959 | |
| | | | | | | | | | | | | | |
|
|
|
| | | | | | | | | | | | | | | | 102,102,627 | |
| | | | | | | | | | | | | | |
|
|
|
Commercial Paper — 24.0% | | | | | | | | | | | | | | | | |
ABN Amro Funding USA LLC, 144A(b) | | | | 0.478% | | | 01/09/12 | | | | 8,000 | | | | 7,999,151 | |
AXA Financial, Inc., 144A(b) | | | | 0.350% | | | 01/04/12 | | | | 2,500 | | | | 2,499,927 | |
Barclays US Funding Corp.(b) | | | | 0.090% | | | 01/03/12 | | | | 12,000 | | | | 11,999,940 | |
Barclays US Funding Corp.(b) | | | | 0.420% | | | 02/10/12 | | | | 7,000 | | | | 6,996,733 | |
BHP Billiton Finance (USA) Ltd., 144A(b) | | | | 0.200% | | | 02/15/12 | | | | 11,000 | | | | 10,997,250 | |
BHP Billiton Finance (USA) Ltd., 144A(b) | | | | 0.200% | | | 02/16/12 | | | | 2,000 | | | | 1,999,489 | |
BHP Billiton Finance (USA) Ltd., 144A(b) | | | | 0.200% | | | 02/17/12 | | | | 6,000 | | | | 5,998,433 | |
Cargill Global Funding PLC, 144A
(original cost $8,999,240; purchased 12/06/11)(b)(c) | | | | 0.080% | | | 01/13/12 | | | | 9,000 | | | | 8,999,760 | |
Commonwealth Bank of Australia, 144A(b) | | | | 0.300% | | | 01/17/12 | | | | 9,000 | | | | 8,998,800 | |
Commonwealth Bank of Australia, 144A | | | | 0.612% | | | 06/22/12 | | | | 4,000 | | | | 3,998,552 | |
Credit Suisse(b) | | | | 0.420% | | | 01/27/12 | | | | 6,000 | | | | 5,998,180 | |
DNB Bank ASA, 144A | | | | 0.421% | | | 01/19/12 | | | | 6,000 | | | | 6,000,363 | |
DNB Bank ASA, 144A(b) | | | | 0.521% | | | 03/12/12 | | | | 4,000 | | | | 3,995,898 | |
EDF SA, 144A(b) | | | | 0.300% | | | 01/05/12 | | | | 5,000 | | | | 4,999,833 | |
EDF SA, 144A(b) | | | | 0.320% | | | 01/13/12 | | | | 5,000 | | | | 4,999,467 | |
GDF Suez, 144A(b) | | | | 0.220% | | | 01/06/12 | | | | 2,000 | | | | 1,999,939 | |
GDF Suez, 144A(b) | | | | 0.220% | | | 01/09/12 | | | | 2,000 | | | | 1,999,902 | |
GDF Suez, 144A(b) | | | | 0.220% | | | 01/10/12 | | | | 4,000 | | | | 3,999,780 | |
HSBC USA, Inc.(b) | | | | 0.150% | | | 01/12/12 | | | | 5,000 | | | | 4,999,771 | |
IFC(b) | | | | 0.060% | | | 02/06/12 | | | | 20,000 | | | | 19,998,800 | |
ING (U.S.) Funding LLC(b) | | | | 0.260% | | | 01/25/12 | | | | 7,000 | | | | 6,998,787 | |
Nestle Finance International Ltd.(b) | | | | 0.100% | | | 01/19/12 | | | | 3,000 | | | | 2,999,850 | |
New York Life Capital Corp., 144A(b) | | | | 0.130% | | | 02/15/12 | | | | 8,000 | | | | 7,998,700 | |
Old Line Funding LLC, 144A(b) | | | | 0.140% | | | 01/18/12 | | | | 3,000 | | | | 2,999,802 | |
Old Line Funding LLC, 144A(b) | | | | 0.220% | | | 02/02/12 | | | | 4,039 | | | | 4,038,210 | |
Old Line Funding LLC, 144A(b) | | | | 0.220% | | | 02/09/12 | | | | 11,000 | | | | 10,997,378 | |
Old Line Funding LLC, 144A(b) | | | | 0.220% | | | 02/15/12 | | | | 3,000 | | | | 2,999,175 | |
Rabobank USA Financial Corp.(b) | | | | 0.350% | | | 01/13/12 | | | | 11,000 | | | | 10,998,717 | |
Schlumberger Holdings Corp., 144A(b) | | | | 0.060% | | | 01/06/12 | | | | 3,000 | | | | 2,999,975 | |
Schlumberger Holdings Corp., 144A(b) | | | | 0.100% | | | 01/17/12 | | | | 7,000 | | | | 6,999,689 | |
Skandinaviska Enskilda Banken AB, 144A(b) | | | | 0.581% | | | 03/01/12 | | | | 5,000 | | | | 4,995,167 | |
Skandinaviska Enskilda Banken AB, 144A(b) | | | | 0.601% | | | 03/15/12 | | | | 4,000 | | | | 3,995,067 | |
Standard Chartered Bank, 144A(b) | | | | 0.420% | | | 01/17/12 | | | | 2,000 | | | | 1,999,627 | |
Standard Chartered Bank, 144A(b) | | | | 0.471% | | | 02/10/12 | | | | 7,000 | | | | 6,996,344 | |
State Street Corp.(b) | | | | 0.200% | | | 01/03/12 | | | | 2,000 | | | | 1,999,978 | |
Svenska Handelsbanken, Inc., 144A(b) | | | | 0.486% | | | 02/29/12 | | | | 2,000 | | | | 1,998,410 | |
SEE NOTES TO FINANCIAL STATEMENTS.
A121
| | | | | | |
| | | MONEY MARKET PORTFOLIO (continued) | | |
| |
| SCHEDULE OF INVESTMENTS | | December 31, 2011 |
| | | | | | | | | | | | | | | | | | |
| | | | | Interest
Rate
| | | Maturity
Date
| | | Principal
Amount
(000)
| | | Value
(Note 2)
| |
| | | | | | | | | | | | | | | | | | | |
Commercial Paper (continued) | | | | | | | | | | | | | | | | | | |
Swedbank AB(b) | | | | | 0.400% | | | | 01/10/12 | | | $ | 9,000 | | | $ | 8,999,100 | |
Swedbank AB(b) | | | | | 0.430% | | | | 01/13/12 | | | | 10,100 | | | | 10,098,552 | |
US Bank NA(b) | | | | | 0.150% | | | | 01/13/12 | | | | 6,000 | | | | 5,999,700 | |
US Bank NA | | | | | 0.150% | | | | 01/17/12 | | | | 4,000 | | | | 4,000,000 | |
World Bank(b) | | | | | 0.060% | | | | 02/03/12 | | | | 3,000 | | | | 2,999,835 | |
| | | | | | | | | | | | | | | | |
|
|
|
| | | | | | | | | | | | | | | | | | 243,592,031 | |
| | | | | | | | | | | | | | | | |
|
|
|
Other Corporation Obligations — 1.6% | | | | | | | | | | | | | | | | | | |
National Australia Bank Ltd., Sr. Unsec’d. Notes, 144A, MTN(a) | | | | | 0.679% | | | | 02/01/12 | | | | 3,000 | | | | 3,001,058 | |
New York Life Global Funding, Notes, 144A(a) | | | | | 0.538% | | | | 08/22/12 | | | | 1,000 | | | | 1,000,399 | |
Province of Ontario Canada, MTN | | | | | 2.625% | | | | 01/20/12 | | | | 5,031 | | | | 5,037,293 | |
Toyota Motor Credit Corp., Notes, MTN(a) | | | | | 0.650% | | | | 11/09/12 | | | | 3,500 | | | | 3,500,000 | |
Toyota Motor Credit Corp., Sr. Unsec’d. Notes, MTN(a) | | | | | 0.603% | | | | 10/18/12 | | | | 3,500 | | | | 3,500,000 | |
| | | | | | | | | | | | | | | | |
|
|
|
| | | | | | | | | | | | | | | | | | 16,038,750 | |
| | | | | | | | | | | | | | | | |
|
|
|
Other Instruments – Agency Bonds — 2.3% | | | | | | | | | | | | | | | | | | |
Bank of America Corp., FDIC Gtd. Notes, MTN | | | | | 2.100% | | | | 04/30/12 | | | | 2,000 | | | | 2,013,067 | |
Bank of America Corp., FDIC Gtd. Notes, MTN | | | | | 2.375% | | | | 06/22/12 | | | | 2,600 | | | | 2,627,224 | |
Bank of America Corp., FDIC Gtd. Notes, MTN | | | | | 3.125% | | | | 06/15/12 | | | | 5,000 | | | | 5,064,887 | |
General Electric Capital Corp., FDIC Gtd. Notes, MTN | | | | | 2.250% | | | | 03/12/12 | | | | 300 | | | | 301,252 | |
Morgan Stanley, FDIC Gtd. Notes(a) | | | | | 0.724% | | | | 02/10/12 | | | | 1,000 | | | | 1,000,736 | |
Pooled Funding Trust I, FDIC Gtd. Notes, 144A | | | | | 2.740% | | | | 02/15/12 | | | | 3,000 | | | | 3,009,597 | |
Pooled Funding Trust II, FDIC Gtd. Notes, 144A | | | | | 2.625% | | | | 03/30/12 | | | | 9,000 | | | | 9,055,042 | |
| | | | | | | | | | | | | | | | |
|
|
|
| | | | | | | | | | | | | | | | | | 23,071,805 | |
| | | | | | | | | | | | | | | | |
|
|
|
Time Deposits — 1.8% | | | | | | | | | | | | | | | | | | |
Chase Bank USA NA | | | | | 0.010% | | | | 01/03/12 | | | | 11,000 | | | | 11,000,000 | |
U.S. Bank National Association | | | | | 0.150% | | | | 01/03/12 | | | | 7,000 | | | | 7,000,000 | |
| | | | | | | | | | | | | | | | |
|
|
|
| | | | | | | | | | | | | | | | | | 18,000,000 | |
| | | | | | | | | | | | | | | | |
|
|
|
U.S. Government Agencies — 28.6% | | | | | | | | | | | | | | | | | | |
Federal Home Loan Bank(b) | | | | | 0.020% | | | | 03/15/12 | | | | 4,000 | | | | 3,999,835 | |
Federal Home Loan Bank(b) | | | | | 0.030% | | | | 01/20/12 | | | | 4,000 | | | | 3,999,937 | |
Federal Home Loan Bank(b) | | | | | 0.030% | | | | 02/17/12 | | | | 6,000 | | | | 5,999,765 | |
Federal Home Loan Bank(b) | | | | | 0.030% | | | | 03/16/12 | | | | 4,000 | | | | 3,999,750 | |
Federal Home Loan Bank(b) | | | | | 0.030% | | | | 03/19/12 | | | | 3,000 | | | | 2,999,805 | |
Federal Home Loan Bank(b) | | | | | 0.050% | | | | 01/18/12 | | | | 7,000 | | | | 6,999,835 | |
Federal Home Loan Bank(b) | | | | | 0.100% | | | | 04/09/12 | | | | 25,000 | | | | 24,993,125 | |
Federal Home Loan Bank(b) | | | | | 0.110% | | | | 08/01/12 | | | | 9,000 | | | | 8,994,142 | |
Federal Home Loan Bank | | | | | 0.120% | | | | 01/30/12 | | | | 4,000 | | | | 3,999,929 | |
Federal Home Loan Bank(b) | | | | | 0.160% | | | | 05/15/12 | | | | 10,000 | | | | 9,994,000 | |
Federal Home Loan Bank(b) | | | | | 0.160% | | | | 06/15/12 | | | | 11,500 | | | | 11,491,515 | |
Federal Home Loan Bank | | | | | 0.200% | | | | 05/11/12 | | | | 9,000 | | | | 8,999,250 | |
Federal Home Loan Bank | | | | | 0.625% | | | | 01/13/12 | | | | 15,000 | | | | 15,002,574 | |
Federal Home Loan Mortgage Corp.(b) | | | | | 0.030% | | | | 04/25/12 | | | | 5,000 | | | | 4,999,521 | |
Federal Home Loan Mortgage Corp.(b) | | | | | 0.040% | | | | 05/22/12 | | | | 10,000 | | | | 9,998,422 | |
Federal Home Loan Mortgage Corp.(b) | | | | | 0.065% | | | | 06/12/12 | | | | 6,000 | | | | 5,998,234 | |
Federal Home Loan Mortgage Corp.(b) | | | | | 0.080% | | | | 07/11/12 | | | | 4,000 | | | | 3,998,293 | |
Federal Home Loan Mortgage Corp.(b) | | | | | 0.090% | | | | 01/03/12 | | | | 20,000 | | | | 19,999,900 | |
Federal Home Loan Mortgage Corp.(b) | | | | | 0.100% | | | | 04/02/12 | | | | 20,000 | | | | 19,994,889 | |
Federal Home Loan Mortgage Corp.(b) | | | | | 0.100% | | | | 06/06/12 | | | | 4,000 | | | | 3,998,256 | |
Federal Home Loan Mortgage Corp., MTN(a) | | | | | 0.243% | | | | 02/16/12 | | | | 9,000 | | | | 9,000,240 | |
Federal Home Loan Mortgage Corp. | | | | | 1.750% | | | | 06/15/12 | | | | 15,000 | | | | 15,110,844 | |
Federal National Mortgage Association(b) | | | | | 0.030% | | | | 04/16/12 | | | | 11,000 | | | | 10,999,028 | |
Federal National Mortgage Association(b) | | | | | 0.060% | | | | 05/07/12 | | | | 6,000 | | | | 5,998,730 | |
Federal National Mortgage Association(b) | | | | | 0.100% | | | | 02/13/12 | | | | 10,000 | | | | 9,998,806 | |
Federal National Mortgage Association(b) | | | | | 0.100% | | | | 03/01/12 | | | | 6,000 | | | | 5,999,000 | |
Federal National Mortgage Association(b) | | | | | 0.100% | | | | 06/01/12 | | | | 15,000 | | | | 14,993,667 | |
Federal National Mortgage Association(b) | | | | | 0.101% | | | | 04/25/12 | | | | 11,000 | | | | 10,996,486 | |
SEE NOTES TO FINANCIAL STATEMENTS.
A122
| | | | | | |
| | | MONEY MARKET PORTFOLIO (continued) | | |
| |
| SCHEDULE OF INVESTMENTS | | December 31, 2011 |
| | | | | | | | | | | | | | | | |
| | | | | Interest
Rate
| | | Maturity
Date
| | Principal
Amount
(000)
| | | Value
(Note 2)
| |
| | | | | | | | | | | | | | | | | |
U.S. Government Agencies (continued) | | | | | | | | | | | | | | | | |
Federal National Mortgage Association(b) | | | | | 0.150% | | | 01/17/12 | | $ | 20,000 | | | $ | 19,998,667 | |
Federal National Mortgage Association(a) | | | | | 0.312% | | | 08/23/12 | | | 7,000 | | | | 7,003,028 | |
| | | | | | | | | | | | | | |
|
|
|
| | | | | | | | | | | | | | | | 290,559,473 | |
| | | | | | | | | | | | | | |
|
|
|
U.S. Treasury Securities — 7.7% | | | | | | | | | | | | | | | | |
U.S. Treasury Bill(b) | | | | | 0.033% | | | 01/05/12 | | | 23,000 | | | | 22,999,917 | |
U.S. Treasury Bill(b) | | | | | 0.050% | | | 01/12/12 | | | 5,000 | | | | 4,999,924 | |
U.S. Treasury Bill(b) | | | | | 0.060% | | | 01/19/12 | | | 10,000 | | | | 9,999,700 | |
U.S. Treasury Note | | | | | 0.875% | | | 01/31/12 | | | 11,000 | | | | 11,005,058 | |
U.S. Treasury Note | | | | | 1.875% | | | 06/15/12 | | | 5,000 | | | | 5,040,606 | |
U.S. Treasury Note | | | | | 4.125% | | | 08/31/12 | | | 15,000 | | | | 15,398,767 | |
U.S. Treasury Note | | | | | 4.625% | | | 07/31/12 | | | 9,000 | | | | 9,236,639 | |
| | | | | | | | | | | | | | |
|
|
|
| | | | | | | | | | | | | | | | 78,680,611 | |
| | | | | | | | | | | | | | |
|
|
|
Repurchase Agreements(d) — 23.3% | | | | | | | | | | | | | | | | |
Barclays Capital, Inc., 0.030%, dated 12/27/11, due 01/03/12 in the amount of $50,000,292
(cost 50,000,000) | | | | | 0.030% | | | 01/03/12 | | | 50,000 | | | | 50,000,000 | |
BNP Paribas Securities Corp., 0.100%, dated 12/27/11, due 01/03/12 in the amount of $13,000,253
(cost 13,000,000) | | | | | 0.100% | | | 01/03/12 | | | 13,000 | | | | 13,000,000 | |
Credit Suisse Securities Corp., 0.090%, dated 12/14/11, due 01/04/12 in the amount of $13,000,683
(cost 13,000,000)(e) | | | | | 0.090% | | | 01/04/12 | | | 13,000 | | | | 13,000,000 | |
Credit Suisse Securities Corp., 0.150%, dated 12/08/11, due 01/05/12 in the amount of $13,001,517
(cost 13,000,000)(e) | | | | | 0.150% | | | 01/05/12 | | | 13,000 | | | | 13,000,000 | |
Deutsche Bank Securities, Inc., 0.050%, dated 12/28/11, due 01/04/12 in the amount of $7,000,068
(cost 7,000,000) | | | | | 0.050% | | | 01/04/12 | | | 7,000 | | | | 7,000,000 | |
Deutsche Bank Securities, Inc., 0.060%, dated 12/29/11, due 01/05/12 in the amount of $9,000,105
(cost 9,000,000) | | | | | 0.060% | | | 01/05/12 | | | 9,000 | | | | 9,000,000 | |
Deutsche Bank Securities, Inc., 0.080%, dated 12/27/11, due 01/03/12 in the amount of $18,000,280
(cost 18,000,000) | | | | | 0.080% | | | 01/03/12 | | | 18,000 | | | | 18,000,000 | |
Goldman Sachs & Co., 0.090%, dated 12/28/11, due 01/04/12 in the amount of $21,000,368
(cost 21,000,000) | | | | | 0.090% | | | 01/04/12 | | | 21,000 | | | | 21,000,000 | |
Goldman Sachs & Co., 0.100%, dated 12/30/11, due 01/06/12 in the amount of $25,000,486
(cost 25,000,000) | | | | | 0.100% | | | 01/06/12 | | | 25,000 | | | | 25,000,000 | |
Goldman Sachs & Co., 0.140%, dated 12/15/11, due 01/05/12 in the amount of $13,001,062
(cost 13,000,000)(e) | | | | | 0.140% | | | 01/05/12 | | | 13,000 | | | | 13,000,000 | |
HSBC Securities (USA), Inc., 0.050%, dated 12/30/11, due 01/03/12 in the amount of $25,000,139
(cost 25,000,000) | | | | | 0.050% | | | 01/03/12 | | | 25,000 | | | | 25,000,000 | |
RBS Securities, Inc., 0.040%, dated 12/30/11, due 01/03/12 in the amount of $24,059,107
(cost 24,059,000) | | | | | 0.040% | | | 01/03/12 | | | 24,059 | | | | 24,059,000 | |
UBS Securities LLC, 0.020%, dated 12/30/11, due 01/03/12 in the amount of $6,000,013
(cost 6,000,000) | | | | | 0.020% | | | 01/03/12 | | | 6,000 | | | | 6,000,000 | |
| | | | | | | | | | | | | | |
|
|
|
| | | | | | | | | | | | | | | | 237,059,000 | |
| | | | | | | | | | | | | | |
|
|
|
TOTAL INVESTMENTS — 99.3% | | | | | | | | | | | | | | | | |
(amortized cost $1,009,104,297) | | | | 1,009,104,297 | |
OTHER ASSETS IN EXCESS OF LIABILITIES — 0.7% | | | | 6,888,378 | |
| | | | | | | | | | | | | | |
|
|
|
NET ASSETS — 100.0% | | | $ | 1,015,992,675 | |
| | | | | | | | | | | | | | |
|
|
|
SEE NOTES TO FINANCIAL STATEMENTS.
A123
| | | | | | |
| | | MONEY MARKET PORTFOLIO (continued) | | |
| |
| SCHEDULE OF INVESTMENTS | | December 31, 2011 |
The following abbreviations are used in portfolio descriptions:
| | |
| 144A | | Security was purchased pursuant to Rule 144A under the Securities Act of 1933 and may not be resold subject to that rule except to qualified institutional buyers. Unless otherwise noted, 144A securities are deemed to be liquid. |
| FDIC | | Federal Deposit Insurance Corp. |
| FHLMC | | Federal Home Loan Mortgage Corp. |
| FNMA | | Federal National Mortgage Association |
| GNMA | | Government National Mortgage Association |
| MTN | | Medium Term Note |
| (a) | Variable rate instrument. The interest rate shown reflects the rate in effect at December 31, 2011. |
| (b) | Rate quoted represents yield-to-maturity as of purchase date. |
| (c) | Indicates a restricted security; the aggregate original cost of such security is $8,999,240. The aggregate value of $8,999,760 is approximately 0.9% of net assets. |
| (d) | Repurchase agreements are collateralized by FNMA (coupon rates 4.00%-5.50%, maturity dates 10/01/39-09/01/41), FHLMC (coupon rates 4.00%-7.00%, maturity dates 07/01/26-03/01/39), GNMA (coupon rates 3.50%-7.00%, maturity dates 12/15/26-12/15/41) and U.S. Treasury Securities (coupon rates 0.75%-3.63%, maturity dates 10/31/13-01/15/28), with the aggregate value, including accrued interest, of $242,066,064. |
| (e) | Indicates a security that has been deemed illiquid. |
Various inputs are used in determining the value of the Portfolio’s investments. These inputs are summarized in the three broad levels listed below.
| Level 1— | quoted prices generally for securities actively traded on a regulated securities exchange and for open-end mutual funds which trade at daily net asset value. |
| Level 2— | other significant observable inputs (including, but not limited to, quoted prices for similar securities, interest rates, prepayment speeds, foreign currency exchange rates, and amortized cost) generally for debt securities, swaps, forward foreign currency contracts and for foreign stocks priced using vendor modeling tools. |
| Level 3— | significant unobservable inputs for securities valued in accordance with Board approved fair valuation procedures. |
The following is a summary of the inputs used as of December 31, 2011 in valuing such portfolio securities:
| | | | | | | | | | | | |
| | | Level 1
| | | Level 2
| | | Level 3
| |
Investments in Securities | | | | | | | | | | | | |
Certificates of Deposit | | $ | — | | | $ | 102,102,627 | | | $ | — | |
Commercial Paper | | | — | | | | 243,592,031 | | | | — | |
Other Corporation Obligations | | | — | | | | 16,038,750 | | | | — | |
Other Instruments – Agency Bonds | | | — | | | | 23,071,805 | | | | — | |
Time Deposits | | | — | | | | 18,000,000 | | | | — | |
U.S. Government Agencies | | | — | | | | 290,559,473 | | | | — | |
U.S. Treasury Securities | | | — | | | | 78,680,611 | | | | — | |
Repurchase Agreements | | | — | | | | 237,059,000 | | | | — | |
| | |
|
|
| |
|
|
| |
|
|
|
Total | | $ | — | | | $ | 1,009,104,297 | | | $ | — | |
| | |
|
|
| |
|
|
| |
|
|
|
The industry classification of portfolio holdings and other assets in excess of liabilities shown as a percentage of net assets as of December 31, 2011 were as follows:
| | | | |
U.S. Government Agencies | | | 28.6 | % |
Commercial Paper | | | 24.0 | |
Repurchase Agreements | | | 23.3 | |
Certificates of Deposit | | | 10.0 | |
U.S. Treasury Securities | | | 7.7 | |
Other Instruments – Agency Bonds | | | 2.3 | |
Time Deposits | | | 1.8 | |
Other Corporation Obligations | | | 1.6 | |
| | |
|
|
|
| | | | 99.3 | |
Other assets in excess of liabilities | | | 0.7 | |
| | |
|
|
|
| | | | 100.0 | % |
| | |
|
|
|
SEE NOTES TO FINANCIAL STATEMENTS.
A124
| | | | | | |
| | | MONEY MARKET PORTFOLIO (continued) | | |
STATEMENT OF ASSETS AND LIABILITIES
December 31, 2011
| | | | |
| ASSETS | | | | |
Investments, at amortized cost which approximates fair value | | $ | 1,009,104,297 | |
Receivable for Series shares sold | | | 6,734,932 | |
Interest receivable | | | 741,418 | |
Prepaid expenses | | | 6,067 | |
| | |
|
|
|
Total Assets | | | 1,016,586,714 | |
| | |
|
|
|
| LIABILITIES | | | | |
Payable for Series shares repurchased | | | 329,283 | |
Accrued expenses and other liabilities | | | 148,341 | |
Management fee payable | | | 109,167 | |
Payable to custodian | | | 6,322 | |
Affiliated transfer agent fee payable | | | 926 | |
| | |
|
|
|
Total Liabilities | | | 594,039 | |
| | |
|
|
|
| NET ASSETS | | $ | 1,015,992,675 | |
| | |
|
|
|
Net assets were comprised of: | | | | |
Paid-in capital | | $ | 1,015,992,675 | |
| | |
|
|
|
Net assets, December 31, 2011 | | $ | 1,015,992,675 | |
| | |
|
|
|
Net asset value and redemption price per share, $1,015,992,675 / 101,596,279 outstanding shares of beneficial interest | | $ | 10.00 | |
| | |
|
|
|
STATEMENT OF OPERATIONS
Year Ended December 31, 2011
| | | | |
| INVESTMENT INCOME | | | | |
Interest | | $ | 2,142,554 | |
| | |
|
|
|
| EXPENSES | | | | |
Management fee | | | 4,244,233 | |
Custodian’s fees and expenses | | | 142,000 | |
Shareholders’ reports | | | 41,000 | |
Trustees’ fees | | | 20,000 | |
Audit fee | | | 19,000 | |
Insurance expenses | | | 13,000 | |
Transfer agent’s fee and expenses (including affiliated expense of $5,500) (Note 4) | | | 11,000 | |
Legal fees and expenses | | | 8,000 | |
Miscellaneous | | | 12,445 | |
| | |
|
|
|
Total expenses | | | 4,510,678 | |
Less: Management fee waiver (Note 3) | | | (2,580,455 | ) |
| | |
|
|
|
Net expenses | | | 1,930,223 | |
| | |
|
|
|
| NET INVESTMENT INCOME | | | 212,331 | |
| | |
|
|
|
| NET REALIZED GAIN ON INVESTMENT TRANSACTIONS | | | 21,156 | |
| | |
|
|
|
| NET INCREASE IN NET ASSETS RESULTING FROM OPERATIONS | | $ | 233,487 | |
| | |
|
|
|
STATEMENT OF CHANGES IN NET ASSETS
| | | | | | | | |
| | | Year Ended December 31,
| |
| | | 2011
| | | 2010
| |
| INCREASE (DECREASE) IN NET ASSETS | | | | | | | | |
| OPERATIONS: | | | | | | | | |
Net investment income | | $ | 212,331 | | | $ | 358,857 | |
Net realized gain on investment transactions | | | 21,156 | | | | 37,109 | |
| | |
|
|
| |
|
|
|
NET INCREASE IN NET ASSETS RESULTING FROM OPERATIONS | | | 233,487 | | | | 395,966 | |
| | |
|
|
| |
|
|
|
| DISTRIBUTIONS | | | (233,487 | ) | | | (395,966 | ) |
| | |
|
|
| |
|
|
|
| SERIES SHARE TRANSACTIONS: | | | | | | | | |
Series shares sold [20,814,304 and 30,750,286 shares, respectively] | | | 208,143,040 | | | | 307,502,858 | |
Series shares issued in reinvestment of distributions [23,339 and 39,595 shares, respectively] | | | 233,487 | | | | 395,966 | |
Series shares repurchased [31,944,588 and 40,424,384 shares, respectively] | | | (319,445,880 | ) | | | (404,243,840 | ) |
| | |
|
|
| |
|
|
|
NET DECREASE IN NET ASSETS RESULTING FROM SERIES SHARE TRANSACTIONS | | | (111,069,353 | ) | | | (96,345,016 | ) |
| | |
|
|
| |
|
|
|
| CAPITAL CONTRIBUTIONS (Note 7) | | | | | | | | |
Proceeds from regulatory settlement | | | — | | | | 29,738 | |
| | |
|
|
| |
|
|
|
| TOTAL DECREASE IN NET ASSETS | | | (111,069,353 | ) | | | (96,315,278 | ) |
| NET ASSETS: | | | | | | | | |
Beginning of year | | | 1,127,062,028 | | | | 1,223,377,306 | |
| | |
|
|
| |
|
|
|
End of year | | $ | 1,015,992,675 | | | $ | 1,127,062,028 | |
| | |
|
|
| |
|
|
|
SEE NOTES TO FINANCIAL STATEMENTS.
A125
| | | | | | |
| | | NATURAL RESOURCES PORTFOLIO | | |
| |
| SCHEDULE OF INVESTMENTS | | December 31, 2011 |
| | | | | | | | |
| LONG-TERM INVESTMENTS — 98.2% | | | | |
| COMMON STOCKS — 97.9% | | Shares
| | | Value
(Note 2)
| |
| | | | | | | | | |
Chemicals — 1.6% | | | | | |
Celanese Corp., Ser. A | | | 14,925 | | | $ | 660,730 | |
Mosaic Co. (The) | | | 177,070 | | | | 8,929,640 | |
Neo Material Technologies, Inc. (Canada)* | | | 277,051 | | | | 1,993,407 | |
Potash Corp. of Saskatchewan, Inc. | | | 112,897 | | | | 4,660,388 | |
| | | | | | |
|
|
|
| | | | | | | | 16,244,165 | |
| | | | | | |
|
|
|
Construction Materials — 1.7% | | | | | |
Holcim Ltd. (Switzerland) | | | 22,316 | | | | 1,193,846 | |
Indocement Tunggal Prakarsa Tbk PT (Indonesia) | | | 3,831,451 | | | | 7,204,438 | |
Semen Gresik Persero Tbk PT (Indonesia) | | | 6,332,998 | | | | 7,997,003 | |
Vulcan Materials Co.(a) | | | 4,815 | | | | 189,470 | |
| | | | | | |
|
|
|
| | | | | | | | 16,584,757 | |
| | | | | | |
|
|
|
Energy Equipment & Services — 22.5% | | | | | |
Baker Hughes, Inc. | | | 21,184 | | | | 1,030,390 | |
Cameron International Corp.* | | | 497,006 | | | | 24,447,725 | |
Core Laboratories NV(a) | | | 52,391 | | | | 5,969,955 | |
Dresser-Rand Group, Inc.* | | | 200,898 | | | | 10,026,819 | |
Dril-Quip, Inc.* | | | 259,815 | | | | 17,101,023 | |
Ensco PLC (United Kingdom), ADR | | | 202,429 | | | | 9,497,969 | |
FMC Technologies, Inc.*(a) | | | 337,035 | | | | 17,603,338 | |
Halliburton Co. | | | 627,567 | | | | 21,657,337 | |
Helmerich & Payne, Inc. | | | 195,533 | | | | 11,411,306 | |
Key Energy Services, Inc.* | | | 671,621 | | | | 10,389,977 | |
Lufkin Industries, Inc. | | | 129,100 | | | | 8,689,721 | |
Nabors Industries Ltd.* | | | 330,004 | | | | 5,722,269 | |
National Oilwell Varco, Inc. | | | 406,837 | | | | 27,660,848 | |
Noble Corp. | | | 35,922 | | | | 1,085,563 | |
OSX Brasil SA (Brazil), 144A* | | | 409,350 | | | | 2,523,804 | |
Patterson-UTI Energy, Inc. | | | 536,451 | | | | 10,718,291 | |
Rowan Cos., Inc.* | | | 315,790 | | | | 9,577,911 | |
Saipem SpA (Italy) | | | 31,679 | | | | 1,346,865 | |
Schlumberger Ltd. | | | 341,201 | | | | 23,307,440 | |
Technip SA (France) | | | 13,999 | | | | 1,315,741 | |
Tenaris SA (Luxembourg), ADR | | | 32,067 | | | | 1,192,251 | |
Weatherford International Ltd.* | | | 77,771 | | | | 1,138,567 | |
| | | | | | |
|
|
|
| | | | | | | | 223,415,110 | |
| | | | | | |
|
|
|
Food Products — 0.2% | | | | | |
Adecoagro SA* | | | 256,842 | | | | 2,124,083 | |
Agrenco Ltd. (Brazil), 144A* | | | 1,166,700 | | | | 93,824 | |
| | | | | | |
|
|
|
| | | | �� | | | | 2,217,907 | |
| | | | | | |
|
|
|
Metals & Mining — 27.1% | | | | | |
African Rainbow Minerals Ltd. (South Africa) | | | 302,040 | | | | 6,398,082 | |
Agnico-Eagle Mines Ltd. | | | 36,091 | | | | 1,310,825 | |
Alacer Gold Corp.* | | | 818,604 | | | | 8,429,110 | |
Alamos Gold, Inc. (Canada) | | | 385,128 | | | | 6,634,598 | |
Alcoa, Inc. | | | 106,847 | | | | 924,227 | |
AXMIN, Inc. (Canada)* | | | 1,556,200 | | | | 68,740 | |
Barrick Gold Corp. | | | 27,131 | | | | 1,227,678 | |
BHP Billiton Ltd. (Australia), ADR(a) | | | 197,177 | | | | 13,926,612 | |
Cia de Minas Buenaventura SA (Peru), ADR | | | 302,482 | | | | 11,597,160 | |
Cliffs Natural Resources, Inc. | | | 296,419 | | | | 18,481,725 | |
| | | | | | | | |
| COMMON STOCKS | | | | |
| (continued) | | Shares
| | | Value
(Note 2)
| |
| | | | | | | | | |
Metals & Mining (continued) | | | | | |
Detour Gold Corp. (Canada),* | | | 153,028 | | | $ | 3,777,820 | |
Eldorado Gold Corp. (Canada) | | | 1,158,821 | | | | 15,947,652 | |
European Goldfields Ltd. (Canada)* | | | 529,054 | | | | 6,169,484 | |
First Quantum Minerals Ltd. (Canada) | | | 951,315 | | | | 18,722,813 | |
First Uranium Corp. (South Africa), 144A* | | | 400,000 | | | | 64,785 | |
First Uranium Corp. (South Africa)* | | | 61,100 | | | | 9,896 | |
Freeport-McMoRan Copper & Gold, Inc. | | | 437,303 | | | | 16,088,377 | |
Gabriel Resources Ltd. (Canada)*(a) | | | 600,701 | | | | 3,702,972 | |
Gold Reserve, Inc. (NYSE)* | | | 121,100 | | | | 339,080 | |
Gold Reserve, Inc. (TSX)* | | | 124,300 | | | | 348,955 | |
Goldcorp, Inc. | | | 26,892 | | | | 1,189,971 | |
Highland Gold Mining Ltd. (United Kingdom) | | | 195,600 | | | | 571,077 | |
Iamgold Corp. (Canada) | | | 70,974 | | | | 1,127,224 | |
Iluka Resources Ltd. (Australia) | | | 68,939 | | | | 1,092,916 | |
Impala Platinum Holdings Ltd. (South Africa), ADR | | | 341,190 | | | | 7,031,926 | |
Kinross Gold Corp. | | | 825,171 | | | | 9,406,949 | |
Nevsun Resources Ltd. (Canada) | | | 989,556 | | | | 5,497,803 | |
Newcrest Mining Ltd. (Australia) | | | 304,977 | | | | 9,233,126 | |
Newmont Mining Corp. | | | 17,803 | | | | 1,068,358 | |
Northern Dynasty Minerals Ltd.*(a) | | | 399,636 | | | | 2,413,801 | |
Nucor Corp. | | | 30,099 | | | | 1,191,017 | |
Pan American Silver Corp. (Canada) | | | 118,954 | | | | 2,601,517 | |
Pan American Silver Corp. | | | 262,519 | | | | 5,725,539 | |
Pilot Gold, Inc. (Canada)* | | | 110,875 | | | | 140,396 | |
Platinum Group Metals Ltd.* | | | 1,234,422 | | | | 1,073,947 | |
Platmin Ltd., Private Placement (South Africa), 144A
(original cost $1,102,975; purchased 11/27/2007)*(b)(c) | | | 129,100 | | | | 17,108 | |
Quadra FNX Mining Ltd. (Canada)* | | | 222,658 | | | | 3,295,885 | |
Randgold Resources Ltd. (Jersey Islands), ADR | | | 203,703 | | | | 20,798,076 | |
Reliance Steel & Aluminum Co. | | | 175,677 | | | | 8,553,713 | |
Rio Tinto PLC (United Kingdom), ADR(a) | | | 224,655 | | | | 10,990,123 | |
Seabridge Gold, Inc.*(a) | | | 123,150 | | | | 1,983,946 | |
SEMAFO, Inc. (Canada), 144A | | | 1,126,530 | | | | 7,298,256 | |
Silver Wheaton Corp. | | | 312,448 | | | | 9,048,494 | |
Southern Copper Corp. | | | 162,388 | | | | 4,900,870 | |
Tahoe Resources, Inc., 144A* | | | 116,000 | | | | 2,013,134 | |
Tahoe Resources, Inc.* | | | 54,907 | | | | 952,889 | |
Teck Resources Ltd. (Canada) | | | 8,313 | | | | 293,026 | |
United States Steel Corp.(a) | | | 34,287 | | | | 907,234 | |
Vedanta Resources PLC (United Kingdom) | | | 9,960 | | | | 156,998 | |
Walter Energy, Inc. | | | 16,130 | | | | 976,833 | |
Western Areas NL (Australia) | | | 354,812 | | | | 1,847,166 | |
Xstrata PLC (Switzerland) | | | 740,408 | | | | 11,245,481 | |
Yamana Gold, Inc. | | | 70,750 | | | | 1,039,317 | |
| | | | | | |
|
|
|
| | | | | | | | 269,854,707 | |
| | | | | | |
|
|
|
SEE NOTES TO FINANCIAL STATEMENTS.
A126
| | | | | | |
| | | NATURAL RESOURCES PORTFOLIO (continued) | | |
| |
| SCHEDULE OF INVESTMENTS | | December 31, 2011 |
| | | | | | | | |
COMMON STOCKS
(continued) | | Shares
| | | Value
(Note 2)
| |
| | | | | | | | | |
Oil, Gas & Consumable Fuels — 44.8% | | | | | |
Adaro Energy TBK PT (Indonesia) | | | 32,472,696 | | | $ | 6,338,756 | |
Advantage Oil & Gas Ltd. REG D (Canada)* | | | 332,000 | | | | 1,381,772 | |
Anadarko Petroleum Corp. | | | 299,291 | | | | 22,844,882 | |
Apache Corp. | | | 165,409 | | | | 14,982,747 | |
Arch Coal, Inc. | | | 51,431 | | | | 746,264 | |
Bankers Petroleum Ltd. (Canada)*(a) | | | 1,036,124 | | | | 4,515,721 | |
BG Group PLC (United Kingdom) | | | 608,421 | | | | 13,006,142 | |
Bill Barrett Corp.* | | | 205,774 | | | | 7,010,720 | |
Bonavista Energy Corp. (Canada) | | | 173,994 | | | | 4,452,538 | |
Cabot Oil & Gas Corp. | | | 211,260 | | | | 16,034,634 | |
Cairn Energy PLC (United Kingdom)* | | | 1,212,864 | | | | 4,997,093 | |
Cameco Corp. (Canada) | | | 39,474 | | | | 713,341 | |
Canadian Oil Sands Ltd. (Canada) | | | 48,946 | | | | 1,117,050 | |
Carrizo Oil & Gas, Inc.*(a) | | | 250,899 | | | | 6,611,189 | |
Chesapeake Energy Corp. | | | 42,582 | | | | 949,153 | |
Cimarex Energy Co. | | | 190,876 | | | | 11,815,224 | |
Cobalt International Energy, Inc.* | | | 522,811 | | | | 8,114,027 | |
Concho Resources, Inc.* | | | 283,963 | | | | 26,621,531 | |
Consol Energy, Inc. | | | 298,790 | | | | 10,965,593 | |
Denbury Resources, Inc.*(a) | | | 692,281 | | | | 10,453,443 | |
Devon Energy Corp. | | | 19,705 | | | | 1,221,710 | |
Energy XXI Bermuda Ltd.*(a) | | | 148,738 | | | | 4,741,767 | |
EOG Resources, Inc. | | | 144,800 | | | | 14,264,248 | |
EQT Corp. | | | 19,910 | | | | 1,090,869 | |
Far East Energy Corp.* | | | 4,866,388 | | | | 1,021,941 | |
FX Energy, Inc.* | | | 199,243 | | | | 956,366 | |
Hess Corp. | | | 172,087 | | | | 9,774,542 | |
HollyFrontier Corp. | | | 600,973 | | | | 14,062,768 | |
HRT Participacoes EM Petroleo SA (Brazil)* | | | 2,476 | | | | 753,984 | |
HRT Particpacoes EM Petroleo SA (Brazil), 144A* | | | 3,700 | | | | 1,126,712 | |
Kodiak Oil & Gas Corp.* | | | 725,650 | | | | 6,893,675 | |
Kosmos Energy Ltd.* | | | 194,768 | | | | 2,387,856 | |
Laredo Petroleum Holdings, Inc.* | | | 118,753 | | | | 2,648,192 | |
Linc Energy Ltd. (Australia), 144A* | | | 1,570,292 | | | | 1,766,701 | |
Marathon Petroleum Corp. | | | 387,176 | | | | 12,889,089 | |
MEG Energy Corp. (Canada), 144A* | | | 131,600 | | | | 5,369,926 | |
Murphy Oil Corp. | | | 24,339 | | | | 1,356,656 | |
Newfield Exploration Co.* | | | 184,639 | | | | 6,966,429 | |
Niko Resources Ltd. (Canada) | | | 70,958 | | | | 3,359,317 | |
Noble Energy, Inc. | | | 297,508 | | | | 28,081,780 | |
Occidental Petroleum Corp. | | | 221,374 | | | | 20,742,744 | |
OGX Petroleo e Gas Participacoes SA (Brazil)* | | | 1,813,217 | | | | 13,240,057 | |
Oil Search Ltd. (Papua New Guinea) | | | 1,026,146 | | | | 6,559,627 | |
Pacific Rubiales Energy Corp. (Canada) | | | 589,576 | | | | 10,839,518 | |
Pioneer Natural Resources Co. | | | 12,948 | | | | 1,158,587 | |
Plains Exploration & Production Co.* | | | 35,493 | | | | 1,303,303 | |
QGEP Participacoes SA (Brazil)(b) | | | 156,526 | | | | 1,384,629 | |
| | | | | | | | |
COMMON STOCKS
(continued) | | Shares
| | | Value
(Note 2)
| |
| | | | | | | | | |
Oil, Gas & Consumable Fuels (continued) | | | | | |
QGEP Participacoes SA (Brazil), 144A(b) | | | 413,300 | | | $ | 3,656,051 | |
Quicksilver Resources, Inc.*(a) | | | 657,812 | | | | 4,413,919 | |
Range Resources Corp. | | | 17,214 | | | | 1,066,235 | |
Rosetta Resources, Inc.* | | | 206,491 | | | | 8,982,359 | |
Sanchez Energy Corp.*(a) | | | 147,400 | | | | 2,544,124 | |
Southwestern Energy Co.* | | | 496,262 | | | | 15,850,608 | |
Suncor Energy, Inc. | | | 429,597 | | | | 12,385,282 | |
Sunoco, Inc. | | | 28,793 | | | | 1,181,089 | |
Talisman Energy, Inc. | | | 979,875 | | | | 12,493,406 | |
Trident Resources Corp., Private Placement
(original cost $9,770,532; purchased 6/30/2010)*(b)(c) | | | 24,233 | | | | 11,941,108 | |
Ultra Petroleum Corp.* | | | 34,840 | | | | 1,032,309 | |
Whiting Petroleum Corp.* | | | 304,504 | | | | 14,217,292 | |
Williams Cos., Inc. (The) | | | 8,718 | | | | 287,868 | |
Woodside Petroleum Ltd. (Australia) | | | 27,885 | | | | 873,305 | |
Zodiac Exploration, Inc. (Canada)*(b) | | | 4,820,909 | | | | 1,514,297 | |
Zodiac Exploration, Inc.—D Shares (Canada)*(b) | | | 11,600,000 | | | | 3,643,681 | |
| | | | | | |
|
|
|
| | | | | | | | 445,717,746 | |
| | | | | | |
|
|
|
TOTAL COMMON STOCKS
(cost $732,033,341) | | | | 974,034,392 | |
| | | | | | |
|
|
|
| PREFERRED STOCK — 0.3% | | | | | |
Metals & Mining | | | | | | | | |
Iron Co./Manabi, Private Placement, 144A
(original cost $3,660,000; purchased 05/25/2011)*(b)(c) | | | 3,660 | | | | 3,180,742 | |
| | | | | | |
|
|
|
| | |
| | | Units
| | | | |
| RIGHT | | | | | | | | |
Oil, Gas & Consumable Fuels | | | | | | | | |
Trident Resources Corp. CVR, Private Placement
(original cost $0; purchased 06/30/2010)*(b)(c) | | | 9,007 | | | | — | |
| | | | | | |
|
|
|
| WARRANT | | | | | | | | |
Metals & Mining | | | | | | | | |
Crystallex International Corp. (Canada), Private Placement expiring 11/04/14 (original cost $0; purchased 11/04/2009)*(b)(c) | | | 221,350 | | | | — | |
| | | | | | |
|
|
|
TOTAL LONG-TERM INVESTMENTS
(cost $735,693,341) | | | | 977,215,134 | |
| | | | | | |
|
|
|
SEE NOTES TO FINANCIAL STATEMENTS.
A127
| | | | | | |
| | | NATURAL RESOURCES PORTFOLIO (continued) | | |
| |
| SCHEDULE OF INVESTMENTS | | December 31, 2011 |
| | | | | | | | |
SHORT-TERM
INVESTMENT — 6.2% | | Shares
| | | Value
(Note 2)
| |
| | | | | | | | | |
Affiliated Money Market Mutual Fund | | | | | | | | |
Prudential Investment Portfolios 2 — Prudential Core Taxable Money Market Fund
(cost $61,182,312; includes $43,202,233 of cash collateral received for securities on loan) (Note 4)(d)(e) | | | 61,182,312 | | | $ | 61,182,312 | |
| | | | | | |
|
|
|
TOTAL INVESTMENTS — 104.4%
(cost $796,875,653) | | | | 1,038,397,446 | |
LIABILITIES IN EXCESS OF
OTHER ASSETS — (4.4)% | | | | (43,911,158 | ) |
| | | | | | |
|
|
|
NET ASSETS — 100.0% | | | $ | 994,486,288 | |
| | | | | | |
|
|
|
The following abbreviations are used in portfolio descriptions:
| | |
| 144A | | Security was purchased pursuant to Rule 144A under the Securities Act of 1933 and may not be resold subject to that rule except to qualified institutional buyers. Unless otherwise noted, 144A securities are deemed to be liquid. |
| ADR | | American Depositary Receipt |
| CVR | | Contingent Value Rights |
| NYSE | | New York Stock Exchange |
| TSX | | Toronto Stock Exchange |
| * | Non-income producing security. |
| (a) | All or a portion of security is on loan. The aggregate market value of such securities, including those sold and pending settlement, is $42,183,720; cash collateral of $43,202,233 (included in liabilities) was received with which the Portfolio purchased highly liquid short-term investments. |
| (b) | Indicates a security that has been deemed illiquid. |
| (c) | Indicates a restricted security; the aggregate original cost of such securities is $14,533,507. The aggregate value of $15,138,958 is approximately 1.5% of net assets. |
| (d) | Represents security, or a portion thereof, purchased with cash collateral received for securities on loan. |
| (e) | Prudential Investments LLC, the manager of the Portfolio, also serves as manager of the Prudential Investment Portfolios 2-Prudential Core Taxable Money Market Fund. |
Various inputs are used in determining the value of the Portfolio’s investments. These inputs are summarized in the three broad levels listed below.
| Level 1—quoted | prices generally for securities actively traded on a regulated securities exchange and for open-end mutual funds which are trade at daily net asset value. |
| Level 2—other | significant observable inputs (including, but not limited to, quoted prices for similar securities, interest rates, prepayment speeds foreign currency exchange rates, and amortized cost) generally for debt securities, swaps, forward foreign currency contracts and for foreign stocks priced using vendor modeling tools. |
| Level 3—significant | unobservable inputs for securities valued in accordance with Board approved fair valuation procedures. |
The following is a summary of the inputs used as of December 31, 2011 in valuing such portfolio securities:
| | | | | | | | | | | | |
| | | Level 1
| | | Level 2
| | | Level 3
| |
Investments in Securities | | | | | | | | | | | | |
Common Stocks | | $ | 962,076,176 | | | $ | — | | | $ | 11,958,216 | |
Preferred Stock | | | — | | | | — | | | | 3,180,742 | |
Right | | | — | | | | — | | | | — | |
Warrant | | | — | | | | — | | | | — | |
Affiliated Money Market Mutual Fund | | | 61,182,312 | | | | — | | | | — | |
| | |
|
|
| |
|
|
| |
|
|
|
Total | | $ | 1,023,258,488 | | | $ | — | | | $ | 15,138,958 | |
| | |
|
|
| |
|
|
| |
|
|
|
The following is a reconciliation of assets in which significant unobservable inputs (Level 3) were used in determining fair value:
| | | | | | | | |
| | | Common
Stocks
| | | Preferred
Stocks
| |
Balance as of 12/31/10 | | $ | 14,313,416 | | | $ | — | |
Realized gain (loss) | | | — | | | | — | |
Change in unrealized appreciation (depreciation)* | | | (1,658,285 | ) | | | (479,258 | ) |
Purchases | | | — | | | | 3,660,000 | |
Sales | | | — | | | | — | |
Transfers into Level 3 | | | 115,558 | | | | — | |
Transfers out of Level 3 | | | (812,473 | ) | | | — | |
| | |
|
|
| |
|
|
|
Balance as of 12/31/11 | | $ | 11,958,216 | | | $ | 3,180,742 | |
| | |
|
|
| |
|
|
|
| * | Of which $(3,124,960) was included in Net Assets relating to securities held at the reporting period end. |
It is the Portfolio’s policy to recognize transfers in and transfers out at the fair value as of the beginning of period. At the reporting period end, there was one common stock security transferred from Level 3 into Level 1 as a result of the resumption of pricing available on a major exchange and there was one common stock security transferred into Level 3 as a result of the security being delisted from a major exchange.
The industry classification of portfolio holdings and liabilities in excess of other assets shown as a percentage of net assets as of December 31, 2011 were as follows:
| | | | |
Oil, Gas & Consumable Fuels | | | 44.8 | % |
Metals & Mining | | | 27.4 | |
Energy Equipment & Services | | | 22.5 | |
Affiliated Money Market Mutual Fund (including 4.3% of collateral received for securities on loan) | | | 6.2 | |
Construction Materials | | | 1.7 | |
Chemicals | | | 1.6 | |
Food Products | | | 0.2 | |
| | |
|
|
|
| | | | 104.4 | |
Liabilities in excess of other assets | | | (4.4 | ) |
| | |
|
|
|
| | | | 100.0 | % |
| | |
|
|
|
SEE NOTES TO FINANCIAL STATEMENTS.
A128
| | | | | | |
| | | NATURAL RESOURCES PORTFOLIO (continued) | | |
| |
| SCHEDULE OF INVESTMENTS | | December 31, 2011 |
The Portfolio invested in derivative instruments during the reporting period. The primary types of risk associated with derivative instruments is equity risk. The effect of such derivative instruments on the Portfolio’s financial position and financial performance as reflected in the Statement of Assets and Liabilities and Statement of Operations is presented in the summary below.
Fair values of derivative Instruments as of December 31, 2011 as presented in the Statement of Assets and Liabilities:
| | | | | | | | | | | | |
Derivatives not designated as hedging
instruments, carried at fair value
| | Asset Derivatives
| | | Liability Derivatives
| |
| | Balance Sheet Location
| | Fair Value
| | | Balance Sheet Location
| | Fair Value
| |
Equity contracts | | Unaffiliated investments | | $ | — | | | — | | $ | — | |
| | | | |
|
|
| | | |
|
|
|
The effects of derivative instruments on the Statement of Operations for the year ended December 31, 2011 are as follows:
| | | | |
Amount of Realized Gain or (Loss) on Derivatives Recognized in Income
| |
Derivatives not designated as hedging instruments, carried at fair value
| | Rights
| |
Equity contracts | | $ | — | |
| | |
|
|
|
| | | | |
Change in Unrealized Appreciation or (Depreciation) on Derivatives Recognized in Income
| |
Derivatives not designated as hedging instruments, carried at fair value
| | Warrants
| |
Equity contracts | | $ | — | * |
| | |
|
|
|
SEE NOTES TO FINANCIAL STATEMENTS.
A129
| | | | | | |
| | | NATURAL RESOURCES PORTFOLIO (continued) | | |
STATEMENT OF ASSETS AND LIABILITIES
December 31, 2011
| | | | |
| ASSETS | | | | |
Investments, at value including securities on loan of $42,183,720: | | | | |
Unaffiliated investments (cost $735,693,341) | | $ | 977,215,134 | |
Affiliated investments (cost $61,182,312) | | | 61,182,312 | |
Foreign currency, at value (cost $9) | | | 9 | |
Dividends and interest receivable | | | 394,210 | |
Receivable for Series shares sold | | | 39,002 | |
Foreign tax reclaim receivable | | | 34,657 | |
Prepaid expenses | | | 7,611 | |
| | |
|
|
|
Total Assets | | | 1,038,872,935 | |
| | |
|
|
|
| LIABILITIES | | | | |
Collateral for securities on loan | | | 43,202,233 | |
Payable for Series shares repurchased | | | 571,097 | |
Management fee payable | | | 388,273 | |
Accrued expenses and other liabilities | | | 190,098 | |
Distribution fee payable | | | 14,819 | |
Payable to custodian | | | 10,304 | |
Administration fee payable | | | 8,897 | |
Affiliated transfer agent fee payable | | | 926 | |
| | |
|
|
|
Total Liabilities | | | 44,386,647 | |
| | |
|
|
|
| NET ASSETS | | $ | 994,486,288 | |
| | |
|
|
|
Net assets were comprised of: | | | | |
Paid-in capital | | $ | 696,324,948 | |
Retained earnings | | | 298,161,340 | |
| | |
|
|
|
Net assets, December 31, 2011 | | $ | 994,486,288 | |
| | |
|
|
|
| Class I: | | | | |
Net asset value and redemption price per share, $926,581,473 / 24,221,965 outstanding shares of beneficial interest | | $ | 38.25 | |
| | |
|
|
|
| Class II: | | | | |
Net asset value and redemption price per share, $67,904,815 / 1,792,278 outstanding shares of beneficial interest | | $ | 37.89 | |
| | |
|
|
|
STATEMENT OF OPERATIONS
Year Ended December 31, 2011
| | | | |
| INVESTMENT INCOME | | | | |
Unaffiliated dividend income (net of foreign withholding taxes of $482,016) | | $ | 10,200,496 | |
Affiliated income from securities loaned, net | | | 245,184 | |
Affiliated dividend income | | | 40,158 | |
| | |
|
|
|
| | | | 10,485,838 | |
| | |
|
|
|
| EXPENSES | | | | |
Management fee | | | 5,483,148 | |
Distribution fee—Class II | | | 220,893 | |
Administration fee—Class II | | | 132,536 | |
Custodian’s fees and expenses | | | 295,000 | |
Shareholders’ reports | | | 212,000 | |
Trustees’ fees | | | 23,000 | |
Audit fee | | | 19,000 | |
Insurance expenses | | | 13,000 | |
Legal fees and expenses | | | 13,000 | |
Transfer agent’s fee and expenses (including affiliated expense of $5,500) (Note 4) | | | 12,000 | |
Commitment fee on syndicated credit agreement | | | 8,000 | |
Miscellaneous | | | 18,999 | |
| | |
|
|
|
Total expenses | | | 6,450,576 | |
| | |
|
|
|
| NET INVESTMENT INCOME | | | 4,035,262 | |
| | |
|
|
|
| NET REALIZED AND UNREALIZED GAIN (LOSS) ON INVESTMENTS AND FOREIGN CURRENCIES | | | | |
Net realized gain (loss) on: | | | | |
Investment transactions | | | 115,643,731 | |
Foreign currency transactions | | | (700,994 | ) |
| | |
|
|
|
| | | | 114,942,737 | |
| | |
|
|
|
Net change in unrealized appreciation (depreciation) on: | | | | |
Investments | | | (360,408,467 | ) |
Foreign currencies | | | (1,130 | ) |
| | |
|
|
|
| | | | (360,409,597 | ) |
| | |
|
|
|
| NET LOSS ON INVESTMENTS AND FOREIGN CURRENCIES | | | (245,466,860 | ) |
| | |
|
|
|
| NET DECREASE IN NET ASSETS RESULTING FROM OPERATIONS | | $ | (241,431,598 | ) |
| | |
|
|
|
STATEMENT OF CHANGES IN NET ASSETS
| | | | | | | | |
| | | Year Ended December 31,
| |
| | | 2011
| | | 2010
| |
| INCREASE (DECREASE) IN NET ASSETS | | | | | | | | |
| OPERATIONS: | | | | | | | | |
Net investment income | | $ | 4,035,262 | | | $ | 2,137,937 | |
Net realized gain on investments and foreign currencies | | | 114,942,737 | | | | 26,702,014 | |
Net change in unrealized appreciation (depreciation) on investments and foreign currencies | | | (360,409,597 | ) | | | 265,699,126 | |
| | |
|
|
| |
|
|
|
NET INCREASE (DECREASE) IN NET ASSETS RESULTING FROM OPERATIONS | | | (241,431,598 | ) | | | 294,539,077 | |
| | |
|
|
| |
|
|
|
| DISTRIBUTIONS: | | | | | | | | |
Class I | | | (2,137,134 | ) | | | (4,476,261 | ) |
Class II | | | — | | | | (63,676 | ) |
| | |
|
|
| |
|
|
|
TOTAL DISTRIBUTIONS | | | (2,137,134 | ) | | | (4,539,937 | ) |
| | |
|
|
| |
|
|
|
| SERIES SHARE TRANSACTIONS (Note 7): | | | | | | | | |
Series shares sold | | | 55,798,740 | | | | 59,180,958 | |
Series shares issued in reinvestment of distributions | | | 2,137,134 | | | | 4,539,937 | |
Series shares repurchased | | | (181,286,548 | ) | | | (164,454,211 | ) |
| | |
|
|
| |
|
|
|
NET DECREASE IN NET ASSETS RESULTING FROM SERIES SHARE TRANSACTIONS | | | (123,350,674 | ) | | | (100,733,316 | ) |
| | |
|
|
| |
|
|
|
| TOTAL INCREASE (DECREASE) IN NET ASSETS | | | (366,919,406 | ) | | | 189,265,824 | |
| NET ASSETS: | | | | | | | | |
Beginning of year | | | 1,361,405,694 | | | | 1,172,139,870 | |
| | |
|
|
| |
|
|
|
End of year | | $ | 994,486,288 | | | $ | 1,361,405,694 | |
| | |
|
|
| |
|
|
|
SEE NOTES TO FINANCIAL STATEMENTS.
A130
| | | | | | |
| | | SMALL CAPITALIZATION STOCK PORTFOLIO | | |
| |
| SCHEDULE OF INVESTMENTS | | December 31, 2011 |
| | | | | | | | |
| LONG-TERM INVESTMENTS — 98.8% | |
| COMMON STOCKS — 98.3% | | Shares
| | | Value
(Note 2)
| |
| | | | | | | | | |
Aerospace & Defense — 2.3% | | | | | | | | |
AAR Corp. | | | 45,071 | | | $ | 864,011 | |
Aerovironment, Inc.* | | | 20,614 | | | | 648,723 | |
American Science & Engineering, Inc. | | | 10,416 | | | | 709,434 | |
Ceradyne, Inc.* | | | 28,305 | | | | 758,008 | |
Cubic Corp. | | | 18,473 | | | | 805,238 | |
Curtiss-Wright Corp. | | | 54,602 | | | | 1,929,089 | |
GenCorp, Inc.*(a) | | | 68,675 | | | | 365,351 | |
Moog, Inc. (Class A Stock)* | | | 52,794 | | | | 2,319,240 | |
National Presto Industries, Inc.(a) | | | 5,699 | | | | 533,426 | |
Orbital Sciences Corp.* | | | 68,240 | | | | 991,527 | |
Teledyne Technologies, Inc.* | | | 43,196 | | | | 2,369,301 | |
| | | | | | |
|
|
|
| | | | | | | | 12,293,348 | |
| | | | | | |
|
|
|
Air Freight & Logistics — 0.5% | | | | | | | | |
Forward Air Corp. | | | 33,356 | | | | 1,069,060 | |
HUB Group, Inc. (Class A Stock)* | | | 43,870 | | | | 1,422,704 | |
| | | | | | |
|
|
|
| | | | | | | | 2,491,764 | |
| | | | | | |
|
|
|
Airlines — 0.3% | | | | | | | | |
Allegiant Travel Co.*(a) | | | 17,594 | | | | 938,464 | |
SkyWest, Inc. | | | 59,160 | | | | 744,824 | |
| | | | | | |
|
|
|
| | | | | | | | 1,683,288 | |
| | | | | | |
|
|
|
Auto Components — 0.3% | | | | | | | | |
Drew Industries, Inc.*(a) | | | 22,089 | | | | 541,843 | |
Spartan Motors, Inc. | | | 37,683 | | | | 181,255 | |
Standard Motor Products, Inc. | | | 22,499 | | | | 451,105 | |
Superior Industries International, Inc. | | | 27,518 | | | | 455,148 | |
| | | | | | |
|
|
|
| | | | | | | | 1,629,351 | |
| | | | | | |
|
|
|
Automobiles — 0.1% | | | | | | | | |
Winnebago Industries, Inc.* | | | 33,331 | | | | 245,983 | |
| | | | | | |
|
|
|
Beverages — 0.2% | | | | | | | | |
Boston Beer Co., Inc. (The) (Class A Stock)*(a) | | | 9,825 | | | | 1,066,602 | |
| | | | | | |
|
|
|
Biotechnology — 0.7% | | | | | | | | |
ArQule, Inc.* | | | 61,401 | | | | 346,302 | |
Cubist Pharmaceuticals, Inc.*(a) | | | 71,969 | | | | 2,851,412 | |
Emergent Biosolutions, Inc.* | | | 28,757 | | | | 484,268 | |
Savient Pharmaceuticals, Inc.*(a) | | | 80,958 | | | | 180,536 | |
| | | | | | |
|
|
|
| | | | | | | | 3,862,518 | |
| | | | | | |
|
|
|
Building Products — 1.3% | | | | | | | | |
A.O. Smith Corp. | | | 45,484 | | | | 1,824,818 | |
AAON, Inc. | | | 21,884 | | | | 448,403 | |
Apogee Enterprises, Inc. | | | 33,038 | | | | 405,046 | |
Gibraltar Industries, Inc.* | | | 35,368 | | | | 493,737 | |
Griffon Corp. | | | 53,429 | | | | 487,807 | |
NCI Building Systems, Inc.* | | | 22,418 | | | | 243,683 | |
Quanex Building Products Corp. | | | 42,788 | | | | 642,676 | |
Simpson Manufacturing Co., Inc. | | | 47,283 | | | | 1,591,546 | |
Universal Forest Products, Inc. | | | 22,764 | | | | 702,725 | |
| | | | | | |
|
|
|
| | | | | | | | 6,840,441 | |
| | | | | | |
|
|
|
Capital Markets — 1.0% | | | | | | | | |
Calamos Asset Management, Inc. (Class A Stock) | | | 23,500 | | | | 293,985 | |
Financial Engines, Inc.*(a) | | | 45,800 | | | | 1,022,714 | |
| | | | | | | | |
| COMMON STOCKS | |
| (continued) | | Shares
| | | Value
(Note 2)
| |
| | | | | | | | | |
Capital Markets (continued) | | | | | | | | |
Investment Technology Group, Inc.* | | | 46,166 | | | $ | 499,054 | |
Piper Jaffray Cos.* | | | 17,965 | | | | 362,893 | |
Prospect Capital Corp.(a) | | | 127,400 | | | | 1,183,546 | |
Stifel Financial Corp.* | | | 62,630 | | | | 2,007,292 | |
SWS Group, Inc. | | | 32,826 | | | | 225,515 | |
| | | | | | |
|
|
|
| | | | | | | | 5,594,999 | |
| | | | | | |
|
|
|
Chemicals — 2.2% | | | | | | | | |
A. Schulman, Inc. | | | 34,166 | | | | 723,636 | |
American Vanguard Corp. | | | 26,548 | | | | 354,150 | |
Balchem Corp. | | | 33,883 | | | | 1,373,617 | |
Calgon Carbon Corp.* | | | 65,854 | | | | 1,034,566 | |
Hawkins, Inc.(a) | | | 10,500 | | | | 387,030 | |
HB Fuller Co. | | | 57,218 | | | | 1,322,308 | |
Koppers Holdings, Inc. | | | 24,100 | | | | 828,076 | |
Kraton Performance Polymers, Inc.* | | | 37,300 | | | | 757,190 | |
LSB Industries, Inc.* | | | 21,700 | | | | 608,251 | |
OM Group, Inc.* | | | 37,756 | | | | 845,357 | |
PolyOne Corp. | | | 105,302 | | | | 1,216,238 | |
Quaker Chemical Corp. | | | 15,098 | | | | 587,161 | |
Stepan Co. | | | 9,685 | | | | 776,350 | |
Tredegar Corp. | | | 27,135 | | | | 602,940 | |
Zep, Inc. | | | 25,207 | | | | 352,394 | |
| | | | | | |
|
|
|
| | | | | | | | 11,769,264 | |
| | | | | | |
|
|
|
Commercial Banks — 5.5% | | | | | | | | |
Bank of The Ozarks, Inc. | | | 33,236 | | | | 984,783 | |
BBCN Bancorp, Inc.* | | | 90,482 | | | | 855,055 | |
Boston Private Financial Holdings, Inc. | | | 89,302 | | | | 709,058 | |
City Holding Co.(a) | | | 17,244 | | | | 584,399 | |
Columbia Banking System, Inc. | | | 46,208 | | | | 890,428 | |
Community Bank System, Inc. | | | 43,096 | | | | 1,198,069 | |
First Bancorp (Puerto Rico)* | | | 23,372 | | | | 81,568 | |
First Commonwealth Financial Corp. | | | 120,010 | | | | 631,253 | |
First Financial Bancorp | | | 67,803 | | | | 1,128,242 | |
First Financial Bankshares, Inc.(a) | | | 36,639 | | | | 1,224,842 | |
First Midwest Bancorp, Inc. | | | 86,540 | | | | 876,650 | |
FNB Corp. | | | 161,200 | | | | 1,823,172 | |
Glacier Bancorp, Inc.(a) | | | 83,573 | | | | 1,005,383 | |
Hanmi Financial Corp.*(a) | | | 35,335 | | | | 261,479 | |
Home Bancshares, Inc. | | | 26,152 | | | | 677,598 | |
Independent Bank Corp.(a) | | | 25,006 | | | | 682,414 | |
National Penn Bancshares, Inc. | | | 143,076 | | | | 1,207,561 | |
NBT Bancorp, Inc.(a) | | | 38,510 | | | | 852,226 | |
Old National Bancorp | | | 110,247 | | | | 1,284,378 | |
PacWest Bancorp | | | 39,000 | | | | 739,050 | |
Pinnacle Financial Partners, Inc.*(a) | | | 39,771 | | | | 642,302 | |
PrivateBancorp, Inc. | | | 69,249 | | | | 760,354 | |
S&T Bancorp, Inc. | | | 32,873 | | | | 642,667 | |
Simmons First National Corp. (Class A Stock) | | | 20,178 | | | | 548,640 | |
Sterling Bancorp | | | 35,154 | | | | 303,731 | |
Susquehanna Bancshares, Inc. | | | 182,509 | | | | 1,529,425 | |
Texas Capital Bancshares, Inc.*(a) | | | 43,800 | | | | 1,340,718 | |
Tompkins Financial Corp. | | | 9,664 | | | | 372,161 | |
UMB Financial Corp. | | | 37,772 | | | | 1,407,007 | |
Umpqua Holdings Corp. | | | 133,470 | | | | 1,653,693 | |
United Bankshares, Inc.(a) | | | 52,697 | | | | 1,489,744 | |
SEE NOTES TO FINANCIAL STATEMENTS.
A131
| | | | | | |
| | | SMALL CAPITALIZATION STOCK PORTFOLIO (continued) | | |
| |
| SCHEDULE OF INVESTMENTS | | December 31, 2011 |
| | | | | | | | |
| COMMON STOCKS | |
| (continued) | | Shares
| | | Value
(Note 2)
| |
| | | | | | | | | |
Commercial Banks (continued) | | | | | | | | |
United Community Banks, Inc.*(a) | | | 21,587 | | | $ | 150,893 | |
Wilshire Bancorp, Inc.* | | | 67,813 | | | | 246,161 | |
Wintrust Financial Corp.(a) | | | 42,013 | | | | 1,178,465 | |
| | | | | | |
|
|
|
| | | | | | | | 29,963,569 | |
| | | | | | |
|
|
|
Commercial Services & Supplies — 2.5% | | | | | |
ABM Industries, Inc. | | | 56,003 | | | | 1,154,782 | |
Consolidated Graphics, Inc.* | | | 10,457 | | | | 504,864 | |
Encore Capital Group, Inc.* | | | 25,500 | | | | 542,130 | |
G&K Services, Inc. (Class A Stock) | | | 21,919 | | | | 638,062 | |
Geo Group, Inc. (The)* | | | 72,873 | | | | 1,220,623 | |
Healthcare Services Group, Inc. | | | 77,776 | | | | 1,375,857 | |
Interface, Inc. (Class A Stock) | | | 66,802 | | | | 770,895 | |
Mobile Mini, Inc.* | | | 40,697 | | | | 710,163 | |
Portfolio Recovery Associates, Inc.* | | | 20,019 | | | | 1,351,683 | |
Standard Register Co. (The) | | | 13,932 | | | | 32,462 | |
Sykes Enterprises, Inc.* | | | 46,370 | | | | 726,154 | |
Tetra Tech, Inc.* | | | 73,088 | | | | 1,577,970 | |
Unifirst Corp. | | | 17,930 | | | | 1,017,348 | |
United Stationers, Inc. | | | 49,842 | | | | 1,622,855 | |
Viad Corp. | | | 23,447 | | | | 409,854 | |
| | | | | | |
|
|
|
| | | | | | | | 13,655,702 | |
| | | | | | |
|
|
|
Communications Equipment — 1.9% | | | | | | | | |
Arris Group, Inc.* | | | 137,511 | | | | 1,487,869 | |
Bel Fuse, Inc. (Class B Stock) | | | 11,822 | | | | 221,662 | |
Black Box Corp. | | | 20,593 | | | | 577,428 | |
Blue Coat Systems, Inc.* | | | 50,050 | | | | 1,273,772 | |
Comtech Telecommunications Corp. | | | 23,859 | | | | 682,845 | |
Digi International, Inc.* | | | 28,964 | | | | 323,238 | |
Harmonic, Inc.* | | | 134,624 | | | | 678,505 | |
NETGEAR, Inc.* | | | 43,946 | | | | 1,475,267 | |
Oplink Communications, Inc.* | | | 22,300 | | | | 367,281 | |
PC-Tel, Inc. | | | 20,884 | | | | 142,847 | |
Symmetricom, Inc.* | | | 48,447 | | | | 261,129 | |
Tekelec* | | | 71,527 | | | | 781,790 | |
ViaSat, Inc.* | | | 49,415 | | | | 2,279,020 | |
| | | | | | |
|
|
|
| | | | | | | | 10,552,653 | |
| | | | | | |
|
|
|
Computers & Peripherals — 0.6% | | | | | | | | |
Avid Technology, Inc.* | | | 33,147 | | | | 282,744 | |
Intermec, Inc.* | | | 57,976 | | | | 397,715 | |
Intevac, Inc.* | | | 25,744 | | | | 190,506 | |
Novatel Wireless, Inc.* | | | 36,516 | | | | 114,295 | |
Stratasys, Inc.*(a) | | | 24,698 | | | | 751,066 | |
Super Micro Computer, Inc.* | | | 32,200 | | | | 504,896 | |
Synaptics, Inc.* | | | 37,579 | | | | 1,133,007 | |
| | | | | | |
|
|
|
| | | | | | | | 3,374,229 | |
| | | | | | |
|
|
|
Construction & Engineering — 0.8% | | | | | | | | |
Aegion Corp.* | | | 45,237 | | | | 693,936 | |
Comfort Systems USA, Inc. | | | 42,784 | | | | 458,644 | |
Dycom Industries, Inc.* | | | 39,331 | | | | 822,805 | |
EMCOR Group, Inc. | | | 77,825 | | | | 2,086,488 | |
Orion Marine Group, Inc.* | | | 30,100 | | | | 200,165 | |
| | | | | | |
|
|
|
| | | | | | | | 4,262,038 | |
| | | | | | |
|
|
|
Construction Materials — 0.5% | | | | | | | | |
Eagle Materials, Inc. | | | 52,472 | | | | 1,346,431 | |
| | | | | | | | |
| COMMON STOCKS | |
| (continued) | | Shares
| | | Value
(Note 2)
| |
| | | | | | | | | |
Construction Materials (continued) | | | | | | | | |
Headwaters, Inc.* | | | 69,568 | | | $ | 154,441 | |
Texas Industries, Inc.(a) | | | 32,623 | | | | 1,004,136 | |
| | | | | | |
|
|
|
| | | | | | | | 2,505,008 | |
| | | | | | |
|
|
|
Consumer Finance — 1.0% | | | | | | | | |
Cash America International, Inc. | | | 34,244 | | | | 1,596,798 | |
Ezcorp, Inc. (Class A Stock)* | | | 51,211 | | | | 1,350,434 | |
First Cash Financial Services, Inc.* | | | 35,225 | | | | 1,236,045 | |
World Acceptance Corp.*(a) | | | 17,052 | | | | 1,253,322 | |
| | | | | | |
|
|
|
| | | | | | | | 5,436,599 | |
| | | | | | |
|
|
|
Containers & Packaging — 0.1% | | | | | | | | |
Myers Industries, Inc. | | | 38,720 | | | | 477,805 | |
| | | | | | |
|
|
|
Distributors — 0.3% | | | | | |
Pool Corp. | | | 55,555 | | | | 1,672,205 | |
VOXX International Corp.* | | | 21,457 | | | | 181,312 | |
| | | | | | |
|
|
|
| | | | | | | | 1,853,517 | |
| | | | | | |
|
|
|
Diversified Consumer Services — 1.1% | | | | | | | | |
American Public Education, Inc.*(a) | | | 20,933 | | | | 905,980 | |
Capella Education Co.* | | | 16,786 | | | | 605,135 | |
Career Education Corp.* | | | 69,300 | | | | 552,321 | |
Coinstar, Inc.*(a) | | | 36,031 | | | | 1,644,455 | |
Corinthian Colleges, Inc.*(a) | | | 95,200 | | | | 206,584 | |
Hillenbrand, Inc. | | | 73,048 | | | | 1,630,431 | |
Lincoln Educational Services Corp. | | | 25,500 | | | | 201,450 | |
School Specialty, Inc.*(a) | | | 18,097 | | | | 45,243 | |
Universal Technical Institute, Inc.* | | | 24,506 | | | | 313,187 | |
| | | | | | |
|
|
|
| | | | | | | | 6,104,786 | |
| | | | | | |
|
|
|
Diversified Financial Services — 0.1% | | | | | |
Interactive Brokers Group, Inc. (Class A Stock) | | | 45,000 | | | | 672,300 | |
| | | | | | |
|
|
|
Diversified Telecommunication Services — 0.5% | | | | | |
Atlantic Tele-Network, Inc. | | | 10,800 | | | | 421,740 | |
Cbeyond, Inc.* | | | 35,137 | | | | 281,447 | |
Cincinnati Bell, Inc.* | | | 225,800 | | | | 684,174 | |
General Communication, Inc. (Class A Stock)* | | | 40,424 | | | | 395,751 | |
Lumos Networks Corp. | | | 17,321 | | | | 265,704 | |
Neutral Tandem, Inc.* | | | 36,552 | | | | 390,741 | |
| | | | | | |
|
|
|
| | | | | | | | 2,439,557 | |
| | | | | | |
|
|
|
Electric Utilities — 1.4% | | | | | | | | |
ALLETE, Inc. | | | 37,897 | | | | 1,590,916 | |
Central Vermont Public Service Corp. | | | 15,678 | | | | 550,298 | |
El Paso Electric Co. | | | 47,008 | | | | 1,628,357 | |
UIL Holdings Corp. | | | 58,811 | | | | 2,080,145 | |
Unisource Energy Corp. | | | 43,151 | | | | 1,593,135 | |
| | | | | | |
|
|
|
| | | | | | | | 7,442,851 | |
| | | | | | |
|
|
|
Electrical Equipment — 1.7% | | | | | | | | |
AZZ, Inc. | | | 14,721 | | | | 668,922 | |
Belden, Inc. | | | 54,412 | | | | 1,810,831 | |
Brady Corp. (Class A Stock) | | | 61,122 | | | | 1,929,622 | |
Encore Wire Corp. | | | 22,331 | | | | 578,373 | |
EnerSys* | | | 55,600 | | | | 1,443,932 | |
Franklin Electric Co., Inc. | | | 22,000 | | | | 958,320 | |
II-VI, Inc.* | | | 63,762 | | | | 1,170,670 | |
SEE NOTES TO FINANCIAL STATEMENTS.
A132
| | | | | | |
| | | SMALL CAPITALIZATION STOCK PORTFOLIO (continued) | | |
| |
| SCHEDULE OF INVESTMENTS | | December 31, 2011 |
| | | | | | | | |
| COMMON STOCKS | |
| (continued) | | Shares
| | | Value
(Note 2)
| |
| | | | | | | | | |
Electrical Equipment (continued) | | | | | | | | |
Powell Industries, Inc.* | | | 10,472 | | | $ | 327,564 | |
Vicor Corp. | | | 22,231 | | | | 176,959 | |
| | | | | | |
|
|
|
| | | | | | | | 9,065,193 | |
| | | | | | |
|
|
|
Electronic Equipment, Instruments & Components — 4.2% | |
Agilysys, Inc.* | | | 17,232 | | | | 136,994 | |
Anixter International, Inc.* | | | 32,364 | | | | 1,930,189 | |
Badger Meter, Inc. | | | 17,707 | | | | 521,117 | |
Benchmark Electronics, Inc.* | | | 67,010 | | | | 902,625 | |
Brightpoint, Inc.* | | | 79,231 | | | | 852,526 | |
Checkpoint Systems, Inc.* | | | 46,839 | | | | 512,419 | |
Cognex Corp. | | | 49,040 | | | | 1,755,142 | |
CTS Corp. | | | 39,164 | | | | 360,309 | |
Daktronics, Inc. | | | 42,508 | | | | 406,802 | |
DTS, Inc.* | | | 19,385 | | | | 528,047 | |
Electro Scientific Industries, Inc.* | | | 27,641 | | | | 400,242 | |
FARO Technologies, Inc.* | | | 19,484 | | | | 896,264 | |
FEI Co.*(a) | | | 43,912 | | | | 1,790,731 | |
Insight Enterprises, Inc.* | | | 50,935 | | | | 778,796 | |
Littelfuse, Inc. | | | 26,925 | | | | 1,157,236 | |
Measurement Specialties, Inc.* | | | 17,500 | | | | 489,300 | |
Mercury Computer Systems, Inc.* | | | 35,408 | | | | 470,572 | |
Methode Electronics, Inc. | | | 42,166 | | | | 349,556 | |
MTS Systems Corp. | | | 18,335 | | | | 747,151 | |
Newport Corp.* | | | 43,708 | | | | 594,866 | |
OSI Systems, Inc.* | | | 23,000 | | | | 1,121,940 | |
Park Electrochemical Corp. | | | 24,144 | | | | 618,569 | |
Plexus Corp.* | | | 40,320 | | | | 1,103,962 | |
Pulse Electronics Corp. | | | 47,639 | | | | 133,389 | |
RadiSys Corp.* | | | 25,935 | | | | 131,231 | |
Rofin-Sinar Technologies, Inc.* | | | 33,400 | | | | 763,190 | |
Rogers Corp.* | | | 18,931 | | | | 697,797 | |
Scansource, Inc.* | | | 31,833 | | | | 1,145,988 | |
SYNNEX Corp.* | | | 30,050 | | | | 915,323 | |
TTM Technologies, Inc.* | | | 59,489 | | | | 651,999 | |
| | | | | | |
|
|
|
| | | | | | | | 22,864,272 | |
| | | | | | |
|
|
|
Energy Equipment & Services — 2.4% | | | | | | | | |
Basic Energy Services, Inc.* | | | 34,217 | | | | 674,075 | |
Bristow Group, Inc. | | | 42,155 | | | | 1,997,725 | |
Exterran Holdings, Inc.* | | | 68,400 | | | | 622,440 | |
Gulf Island Fabrication, Inc. | | | 16,777 | | | | 490,056 | |
Hornbeck Offshore Services, Inc.*(a) | | | 39,715 | | | | 1,231,959 | |
ION Geophysical Corp.*(a) | | | 147,945 | | | | 906,903 | |
Lufkin Industries, Inc. | | | 35,558 | | | | 2,393,409 | |
Matrix Service Co.* | | | 29,573 | | | | 279,169 | |
OYO Geospace Corp.* | | | 5,400 | | | | 417,582 | |
Pioneer Drilling Co.* | | | 71,617 | | | | 693,253 | |
SEACOR Holdings, Inc.* | | | 25,371 | | | | 2,257,004 | |
Tetra Technologies, Inc.* | | | 89,741 | | | | 838,181 | |
| | | | | | |
|
|
|
| | | | | | | | 12,801,756 | |
| | | | | | |
|
|
|
Food & Staples Retailing — 1.2% | | | | | | | | |
Andersons, Inc. (The) | | | 21,716 | | | | 948,121 | |
Casey’s General Stores, Inc. | | | 44,465 | | | | 2,290,392 | |
Nash Finch Co. | | | 14,132 | | | | 413,785 | |
Spartan Stores, Inc. | | | 26,688 | | | | 493,728 | |
| | | | | | | | |
| COMMON STOCKS | |
| (continued) | | Shares
| | | Value
(Note 2)
| |
| | | | | | | | | |
Food & Staples Retailing (continued) | | | | | | | | |
United Natural Foods, Inc.* | | | 56,993 | | | $ | 2,280,290 | |
| | | | | | |
|
|
|
| | | | | | | | 6,426,316 | |
| | | | | | |
|
|
|
Food Products — 2.4% | | | | | | | | |
B&G Foods, Inc. | | | 55,800 | | | | 1,343,106 | |
Calavo Growers, Inc. | | | 14,690 | | | | 377,239 | |
Cal-Maine Foods, Inc.(a) | | | 16,795 | | | | 614,193 | |
Darling International, Inc.* | | | 136,420 | | | | 1,813,022 | |
Diamond Foods, Inc.(a) | | | 25,657 | | | | 827,951 | |
Hain Celestial Group, Inc. (The)* | | | 51,515 | | | | 1,888,540 | |
J&J Snack Foods Corp. | | | 16,818 | | | | 896,063 | |
Sanderson Farms, Inc.(a) | | | 22,035 | | | | 1,104,615 | |
Seneca Foods Corp. (Class A Stock)* | | | 10,500 | | | | 271,110 | |
Snyders-Lance, Inc. | | | 54,716 | | | | 1,231,110 | |
TreeHouse Foods, Inc.* | | | 41,965 | | | | 2,743,672 | |
| | | | | | |
|
|
|
| | | | | | | | 13,110,621 | |
| | | | | | |
|
|
|
Gas Utilities — 2.2% | | | | | | | | |
Laclede Group, Inc. (The) | | | 26,214 | | | | 1,060,881 | |
New Jersey Resources Corp.(a) | | | 48,504 | | | | 2,386,397 | |
Northwest Natural Gas Co. | | | 31,265 | | | | 1,498,531 | |
Piedmont Natural Gas Co., Inc. | | | 84,203 | | | | 2,861,218 | |
South Jersey Industries, Inc. | | | 35,222 | | | | 2,000,962 | |
Southwest Gas Corp. | | | 53,711 | | | | 2,282,180 | |
| | | | | | |
|
|
|
| | | | | | | | 12,090,169 | |
| | | | | | |
|
|
|
Healthcare Equipment & Supplies — 3.4% | | | | | |
Abaxis, Inc.* | | | 25,212 | | | | 697,616 | |
Align Technology, Inc.* | | | 79,657 | | | | 1,889,862 | |
Analogic Corp. | | | 14,333 | | | | 821,568 | |
Cantel Medical Corp. | | | 15,250 | | | | 425,933 | |
CONMED Corp.* | | | 32,449 | | | | 832,966 | |
CryoLife, Inc.* | | | 31,953 | | | | 153,374 | |
Cyberonics, Inc.* | | | 29,097 | | | | 974,750 | |
Greatbatch, Inc.* | | | 27,344 | | | | 604,302 | |
Haemonetics Corp.* | | | 29,197 | | | | 1,787,440 | |
ICU Medical, Inc.* | | | 14,192 | | | | 638,640 | |
Integra LifeSciences Holdings Corp.* | | | 23,102 | | | | 712,235 | |
Invacare Corp. | | | 37,202 | | | | 568,819 | |
Kensey Nash Corp.* | | | 9,031 | | | | 173,305 | |
Meridian Bioscience, Inc. | | | 48,175 | | | | 907,617 | |
Merit Medical Systems, Inc.* | | | 48,648 | | | | 650,910 | |
Natus Medical, Inc.* | | | 32,925 | | | | 310,483 | |
Neogen Corp.* | | | 27,380 | | | | 838,923 | |
NuVasive, Inc.* | | | 49,300 | | | | 620,687 | |
Palomar Medical Technologies, Inc.* | | | 21,677 | | | | 201,596 | |
SonoSite, Inc.* | | | 16,300 | | | | 877,918 | |
SurModics, Inc.* | | | 16,952 | | | | 248,516 | |
Symmetry Medical, Inc.* | | | 41,577 | | | | 332,200 | |
West Pharmaceutical Services, Inc. | | | 39,417 | | | | 1,495,875 | |
Zoll Medical Corp.*(a) | | | 25,895 | | | | 1,636,046 | |
| | | | | | |
|
|
|
| | | | | | | | 18,401,581 | |
| | | | | | |
|
|
|
Healthcare Providers & Services — 3.9% | | | | | |
Air Methods Corp.*(a) | | | 13,272 | | | | 1,120,820 | |
Almost Family, Inc.* | | | 9,452 | | | | 156,714 | |
Amedisys, Inc.*(a) | | | 33,459 | | | | 365,038 | |
SEE NOTES TO FINANCIAL STATEMENTS.
A133
| | | | | | |
| | | SMALL CAPITALIZATION STOCK PORTFOLIO (continued) | | |
| |
| SCHEDULE OF INVESTMENTS | | December 31, 2011 |
| | | | | | | | |
| COMMON STOCKS | |
| (continued) | | Shares
| | | Value
(Note 2)
| |
| | | | | | | | | |
Healthcare Providers & Services (continued) | |
AMN Healthcare Services, Inc.* | | | 45,999 | | | $ | 203,776 | |
AmSurg Corp.* | | | 36,674 | | | | 954,991 | |
Bio-Reference Labs, Inc.* | | | 29,070 | | | | 472,969 | |
Centene Corp.* | | | 58,908 | | | | 2,332,168 | |
Chemed Corp. | | | 23,211 | | | | 1,188,635 | |
Corvel Corp.* | | | 7,445 | | | | 384,981 | |
Cross Country Healthcare, Inc.* | | | 35,463 | | | | 196,820 | |
Ensign Group, Inc. (The) | | | 19,200 | | | | 470,400 | |
Gentiva Health Services, Inc.* | | | 34,192 | | | | 230,796 | |
Hanger Orthopedic Group, Inc.* | | | 38,809 | | | | 725,340 | |
Healthspring, Inc.* | | | 78,320 | | | | 4,271,573 | |
Healthways, Inc.* | | | 38,086 | | | | 261,270 | |
IPC The Hospitalist Co., Inc.* | | | 19,305 | | | | 882,625 | |
Kindred Healthcare, Inc.* | | | 60,600 | | | | 713,262 | |
Landauer, Inc. | | | 11,068 | | | | 570,002 | |
LHC Group, Inc.* | | | 18,098 | | | | 232,197 | |
Magellan Health Services, Inc.* | | | 32,641 | | | | 1,614,750 | |
Molina Healthcare, Inc.* | | | 33,122 | | | | 739,614 | |
MWI Veterinary Supply, Inc.* | | | 14,856 | | | | 987,033 | |
PharMerica Corp.* | | | 33,995 | | | | 516,044 | |
PSS World Medical, Inc.*(a) | | | 61,491 | | | | 1,487,467 | |
| | | | | | |
|
|
|
| | | | | | | | 21,079,285 | |
| | | | | | |
|
|
|
Healthcare Technology — 0.6% | | | | | | | | |
Computer Programs & Systems, Inc. | | | 12,936 | | | | 661,159 | |
Omnicell, Inc.* | | | 38,822 | | | | 641,339 | |
Quality Systems, Inc. | | | 46,134 | | | | 1,706,497 | |
| | | | | | |
|
|
|
| | | | | | | | 3,008,995 | |
| | | | | | |
|
|
|
Hotels, Restaurants & Leisure — 3.0% | | | | | | | | |
Biglari Holdings, Inc.* | | | 1,676 | | | | 617,170 | |
BJ’s Restaurants, Inc.*(a) | | | 28,172 | | | | 1,276,755 | |
Boyd Gaming Corp.*(a) | | | 61,500 | | | | 458,790 | |
Buffalo Wild Wings, Inc.*(a) | | | 21,465 | | | | 1,449,102 | |
CEC Entertainment, Inc. | | | 22,107 | | | | 761,586 | |
Cracker Barrel Old Country Store, Inc. | | | 26,778 | | | | 1,349,879 | |
DineEquity, Inc.* | | | 18,205 | | | | 768,433 | |
Interval Leisure Group, Inc.* | | | 46,136 | | | | 627,911 | |
Jack In The Box, Inc.* | | | 51,417 | | | | 1,074,615 | |
Marcus Corp. | | | 23,058 | | | | 290,761 | |
Marriott Vacations Worldwide Corp.* | | | 31,300 | | | | 537,108 | |
Monarch Casino & Resort, Inc.* | | | 12,631 | | | | 128,710 | |
Multimedia Games Holding Co., Inc.* | | | 29,799 | | | | 236,604 | |
O’Charleys, Inc.* | | | 20,615 | | | | 113,176 | |
Papa John’s International, Inc.* | | | 21,715 | | | | 818,221 | |
Peet’s Coffee & Tea, Inc.*(a) | | | 15,094 | | | | 946,092 | |
PF Chang’s China Bistro, Inc.(a) | | | 24,814 | | | | 767,001 | |
Pinnacle Entertainment, Inc.* | | | 72,113 | | | | 732,668 | |
Red Robin Gourmet Burgers, Inc.* | | | 12,963 | | | | 359,075 | |
Ruby Tuesday, Inc.* | | | 72,184 | | | | 498,070 | |
Ruth’s Hospitality Group, Inc.* | | | 39,648 | | | | 197,051 | |
Shuffle Master, Inc.* | | | 62,559 | | | | 733,192 | |
Sonic Corp.* | | | 70,314 | | | | 473,213 | |
Texas Roadhouse, Inc. (Class A Stock) | | | 68,930 | | | | 1,027,057 | |
| | | | | | |
|
|
|
| | | | | | | | 16,242,240 | |
| | | | | | |
|
|
|
| | | | | | | | |
| COMMON STOCKS | |
| (continued) | | Shares
| | | Value
(Note 2)
| |
| | | | | | | | | |
Household Durables — 1.2% | | | | | | | | |
Blyth, Inc.(a) | | | 6,083 | | | $ | 345,514 | |
Ethan Allen Interiors, Inc.(a) | | | 30,199 | | | | 716,018 | |
Helen of Troy Ltd.* | | | 36,910 | | | | 1,133,137 | |
iRobot Corp.*(a) | | | 31,600 | | | | 943,260 | |
La-Z-Boy, Inc.* | | | 60,401 | | | | 718,772 | |
M/I Homes, Inc.* | | | 21,370 | | | | 205,152 | |
Meritage Homes Corp.* | | | 32,597 | | | | 755,925 | |
Ryland Group, Inc. (The) | | | 51,900 | | | | 817,944 | |
Standard Pacific Corp.*(a) | | | 115,322 | | | | 366,724 | |
Universal Electronics, Inc.* | | | 17,254 | | | | 291,075 | |
| | | | | | |
|
|
|
| | | | | | | | 6,293,521 | |
| | | | | | |
|
|
|
Household Products — 0.2% | | | | | | | | |
Central Garden and Pet Co. (Class A Stock)* | | | 48,788 | | | | 405,916 | |
WD-40 Co. | | | 18,709 | | | | 756,031 | |
| | | | | | |
|
|
|
| | | | | | | | 1,161,947 | |
| | | | | | |
|
|
|
Industrial Conglomerates — 0.1% | | | | | | | | |
Standex International Corp. | | | 14,770 | | | | 504,691 | |
| | | | | | |
|
|
|
Insurance — 2.9% | | | | | | | | |
AMERISAFE, Inc.* | | | 21,014 | | | | 488,576 | |
Delphi Financial Group, Inc. (Class A Stock) | | | 63,696 | | | | 2,821,733 | |
eHealth, Inc.*(a) | | | 22,991 | | | | 337,968 | |
Employers Holdings, Inc. | | | 40,615 | | | | 734,725 | |
Horace Mann Educators Corp. | | | 46,400 | | | | 636,144 | |
Infinity Property & Casualty Corp. | | | 13,889 | | | | 788,062 | |
Meadowbrook Insurance Group, Inc. | | | 59,200 | | | | 632,256 | |
National Financial Partners Corp.*(a) | | | 47,954 | | | | 648,338 | |
Navigators Group, Inc. (The)* | | | 12,818 | | | | 611,162 | |
Presidential Life Corp. | | | 23,995 | | | | 239,710 | |
ProAssurance Corp. | | | 35,633 | | | | 2,844,226 | |
RLI Corp. | | | 19,505 | | | | 1,421,134 | |
Safety Insurance Group, Inc. | | | 17,760 | | | | 718,925 | |
Selective Insurance Group, Inc. | | | 63,107 | | | | 1,118,887 | |
Stewart Information Services Corp. | | | 22,102 | | | | 255,278 | |
Tower Group, Inc. | | | 46,361 | | | | 935,101 | |
United Fire & Casualty Co. | | | 23,961 | | | | 483,533 | |
| | | | | | |
|
|
|
| | | | | | | | 15,715,758 | |
| | | | | | |
|
|
|
Internet & Catalog Retail — 0.2% | | | | | | | | |
Blue Nile, Inc.*(a) | | | 15,780 | | | | 645,086 | |
Nutrisystem, Inc.(a) | | | 32,428 | | | | 419,294 | |
PetMed Express, Inc.(a) | | | 23,281 | | | | 241,657 | |
| | | | | | |
|
|
|
| | | | | | | | 1,306,037 | |
| | | | | | |
|
|
|
Internet Software & Services — 1.9% | | | | | | | | |
comScore, Inc.* | | | 38,577 | | | | 817,832 | |
DealerTrack Holdings, Inc.* | | | 48,483 | | | | 1,321,647 | |
Digital River, Inc.* | | | 42,900 | | | | 644,358 | |
Infospace, Inc.* | | | 45,612 | | | | 501,276 | |
j2 Global, Inc.(a) | | | 55,278 | | | | 1,555,523 | |
Liquidity Services, Inc.* | | | 23,500 | | | | 867,150 | |
LivePerson, Inc.* | | | 55,000 | | | | 690,250 | |
LogMeIn, Inc.*(a) | | | 24,800 | | | | 956,040 | |
Perficient, Inc.* | | | 34,614 | | | | 346,486 | |
RightNow Technologies, Inc.* | | | 30,000 | | | | 1,281,900 | |
SEE NOTES TO FINANCIAL STATEMENTS.
A134
| | | | | | |
| | | SMALL CAPITALIZATION STOCK PORTFOLIO (continued) | | |
| |
| SCHEDULE OF INVESTMENTS | | December 31, 2011 |
| | | | | | | | |
| COMMON STOCKS | |
| (continued) | | Shares
| | | Value
(Note 2)
| |
| | | | | | | | | |
Internet Software & Services (continued) | |
Stamps.com, Inc.* | | | 14,720 | | | $ | 384,634 | |
United Online, Inc. | | | 103,330 | | | | 562,115 | |
XO Group, Inc.* | | | 32,295 | | | | 269,340 | |
| | | | | | |
|
|
|
| | | | | | | | 10,198,551 | |
| | | | | | |
|
|
|
IT Services — 2.2% | | | | | | | | |
CACI International, Inc. (Class A Stock)*(a) | | | 30,844 | | | | 1,724,797 | |
Cardtronics, Inc.* | | | 51,100 | | | | 1,382,766 | |
CIBER, Inc.* | | | 81,623 | | | | 315,065 | |
CSG Systems International, Inc.* | | | 39,124 | | | | 575,514 | |
Forrester Research, Inc.* | | | 17,162 | | | | 582,478 | |
Heartland Payment Systems, Inc. | | | 46,111 | | | | 1,123,264 | |
Higher One Holdings, Inc.*(a) | | | 36,300 | | | | 669,372 | |
IGate Corp.*(a) | | | 35,000 | | | | 550,550 | |
MAXIMUS, Inc. | | | 39,236 | | | | 1,622,409 | |
NCI, Inc. (Class A Stock)* | | | 9,000 | | | | 104,850 | |
TeleTech Holdings, Inc.* | | | 29,067 | | | | 470,885 | |
Virtusa Corp.* | | | 21,800 | | | | 315,664 | |
Wright Express Corp.* | | | 45,176 | | | | 2,452,153 | |
| | | | | | |
|
|
|
| | | | | | | | 11,889,767 | |
| | | | | | |
|
|
|
Leisure Equipment & Products — 0.7% | | | | | | | | |
Arctic Cat, Inc.* | | | 14,057 | | | | 316,985 | |
Brunswick Corp. | | | 103,829 | | | | 1,875,152 | |
Callaway Golf Co. | | | 73,880 | | | | 408,556 | |
Jakks Pacific, Inc.(a) | | | 30,115 | | | | 424,923 | |
Sturm Ruger & Co., Inc. | | | 22,327 | | | | 747,061 | |
| | | | | | |
|
|
|
| | | | | | | | 3,772,677 | |
| | | | | | |
|
|
|
Life Sciences Tools & Services — 0.4% | | | | | | | | |
Affymetrix, Inc.*(a) | | | 79,700 | | | | 325,973 | |
Cambrex Corp.* | | | 33,032 | | | | 237,170 | |
Enzo Biochem, Inc.* | | | 36,857 | | | | 82,560 | |
eResearchTechnology, Inc.* | | | 50,083 | | | | 234,889 | |
PAREXEL International Corp.* | | | 69,157 | | | | 1,434,316 | |
| | | | | | |
|
|
|
| | | | | | | | 2,314,908 | |
| | | | | | |
|
|
|
Machinery — 3.7% | | | | | | | | |
Actuant Corp. (Class A Stock) | | | 80,564 | | | | 1,827,997 | |
Albany International Corp. (Class A Stock) | | | 32,904 | | | | 760,741 | |
Astec Industries, Inc.* | | | 23,410 | | | | 754,036 | |
Barnes Group, Inc. | | | 54,916 | | | | 1,324,025 | |
Briggs & Stratton Corp.(a) | | | 58,246 | | | | 902,231 | |
Cascade Corp. | | | 10,093 | | | | 476,087 | |
CIRCOR International, Inc. | | | 20,088 | | | | 709,307 | |
EnPro Industries, Inc.*(a) | | | 24,278 | | | | 800,689 | |
ESCO Technologies, Inc. | | | 31,221 | | | | 898,540 | |
Federal Signal Corp.* | | | 70,800 | | | | 293,820 | |
John Bean Technologies Corp. | | | 33,147 | | | | 509,469 | |
Kaydon Corp. | | | 37,467 | | | | 1,142,744 | |
Lindsay Corp. | | | 14,779 | | | | 811,219 | |
Lydall, Inc.* | | | 19,356 | | | | 183,688 | |
Mueller Industries, Inc. | | | 44,549 | | | | 1,711,573 | |
Robbins & Myers, Inc. | | | 53,697 | | | | 2,606,989 | |
Tennant Co. | | | 21,900 | | | | 851,253 | |
Toro Co. (The) | | | 35,783 | | | | 2,170,597 | |
| | | | | | | | |
| COMMON STOCKS | |
| (continued) | | Shares
| | | Value
(Note 2)
| |
| | | | | | | | | |
Machinery (continued) | |
Watts Water Technologies, Inc. (Class A Stock) | | | 34,021 | | | $ | 1,163,858 | |
| | | | | | |
|
|
|
| | | | | | | | 19,898,863 | |
| | | | | | |
|
|
|
Media — 0.7% | | | | | | | | |
Arbitron, Inc. | | | 31,861 | | | | 1,096,337 | |
Digital Generation, Inc.* | | | 32,100 | | | | 382,632 | |
E.W. Scripps Co. (Class A Stock)* | | | 36,201 | | | | 289,970 | |
Harte-Hanks, Inc. | | | 50,900 | | | | 462,681 | |
Live Nation Entertainment, Inc.* | | | 172,176 | | | | 1,430,783 | |
| | | | | | |
|
|
|
| | | | | | | | 3,662,403 | |
| | | | | | |
|
|
|
Metals & Mining — 1.1% | | | | | | | | |
A.M. Castle & Co.* | | | 18,883 | | | | 178,633 | |
AK Steel Holding Corp.(a) | | | 128,200 | | | | 1,058,932 | |
AMCOL International Corp. | | | 29,291 | | | | 786,464 | |
Century Aluminum Co.*(a) | | | 63,363 | | | | 539,219 | |
Haynes International, Inc. | | | 14,100 | | | | 769,860 | |
Kaiser Aluminum Corp.(a) | | | 18,600 | | | | 853,368 | |
Materion Corp.* | | | 23,778 | | | | 577,330 | |
Olympic Steel, Inc. | | | 10,538 | | | | 245,746 | |
RTI International Metals, Inc.*(a) | | | 35,311 | | | | 819,568 | |
| | | | | | |
|
|
|
| | | | | | | | 5,829,120 | |
| | | | | | |
|
|
|
Multiline Retail — 0.2% | | | | | | | | |
Fred’s, Inc. (Class A Stock) | | | 44,766 | | | | 652,688 | |
Tuesday Morning Corp.* | | | 48,832 | | | | 168,471 | |
| | | | | | |
|
|
|
| | | | | | | | 821,159 | |
| | | | | | |
|
|
|
Multi-Utilities — 0.8% | | | | | | | | |
Avista Corp. | | | 67,903 | | | | 1,748,502 | |
CH Energy Group, Inc. | | | 17,385 | | | | 1,014,936 | |
NorthWestern Corp. | | | 42,400 | | | | 1,517,496 | |
| | | | | | |
|
|
|
| | | | | | | | 4,280,934 | |
| | | | | | |
|
|
|
Oil, Gas & Consumable Fuels — 1.7% | | | | | | | | |
Approach Resources, Inc.*(a) | | | 31,100 | | | | 914,651 | |
Contango Oil & Gas Co.*(a) | | | 14,900 | | | | 866,882 | |
GeoResources, Inc.* | | | 23,400 | | | | 685,854 | |
Gulfport Energy Corp.* | | | 52,100 | | | | 1,534,345 | |
Overseas Shipholding Group, Inc.(a) | | | 29,900 | | | | 326,807 | |
Penn Virginia Corp. | | | 52,298 | | | | 276,656 | |
Petroleum Development Corp.*(a) | | | 27,626 | | | | 969,949 | |
Petroquest Energy, Inc.*(a) | | | 65,945 | | | | 435,237 | |
Stone Energy Corp.* | | | 57,094 | | | | 1,506,140 | |
Swift Energy Co.* | | | 49,644 | | | | 1,475,420 | |
| | | | | | |
|
|
|
| | | | | | | | 8,991,941 | |
| | | | | | |
|
|
|
Paper & Forest Products — 1.1% | | | | | | | | |
Buckeye Technologies, Inc. | | | 45,842 | | | | 1,532,957 | |
Clearwater Paper Corp.* | | | 26,480 | | | | 942,953 | |
Deltic Timber Corp. | | | 12,691 | | | | 766,410 | |
KapStone Paper and Packaging Corp.* | | | 45,200 | | | | 711,448 | |
Neenah Paper, Inc. | | | 17,278 | | | | 385,645 | |
Schweitzer-Mauduit International, Inc. | | | 18,888 | | | | 1,255,296 | |
Wausau Paper Corp. | | | 56,267 | | | | 464,765 | |
| | | | | | |
|
|
|
| | | | | | | | 6,059,474 | |
| | | | | | |
|
|
|
SEE NOTES TO FINANCIAL STATEMENTS.
A135
| | | | | | |
| | | SMALL CAPITALIZATION STOCK PORTFOLIO (continued) | | |
| |
| SCHEDULE OF INVESTMENTS | | December 31, 2011 |
| | | | | | | | |
| COMMON STOCKS | |
| (continued) | | Shares
| | | Value
(Note 2)
| |
| | | | | | | | | |
Personal Products — 0.2% | | | | | | | | |
Inter Parfums, Inc. | | | 18,900 | | | $ | 294,084 | |
Medifast, Inc.*(a) | | | 15,800 | | | | 216,776 | |
Prestige Brands Holdings, Inc.* | | | 58,600 | | | | 660,422 | |
| | | | | | |
|
|
|
| | | | | | | | 1,171,282 | |
| | | | | | |
|
|
|
Pharmaceuticals — 2.1% | | | | | | | | |
Hi-Tech Pharmacal Co., Inc.* | | | 12,000 | | | | 466,680 | |
Medicines Co. (The)* | | | 61,900 | | | | 1,153,816 | |
Par Pharmaceutical Cos., Inc.* | | | 41,943 | | | | 1,372,794 | |
Questcor Pharmaceuticals, Inc.* | | | 73,200 | | | | 3,043,656 | |
Salix Pharmaceuticals Ltd.*(a) | | | 68,983 | | | | 3,300,837 | |
ViroPharma, Inc.*(a) | | | 82,337 | | | | 2,255,210 | |
| | | | | | |
|
|
|
| | | | | | | | 11,592,993 | |
| | | | | | |
|
|
|
Professional Services — 0.9% | | | | | | | | |
CDI Corp. | | | 14,488 | | | | 200,079 | |
Dolan Co. (The)* | | | 34,100 | | | | 290,532 | |
Exponent, Inc.* | | | 15,440 | | | | 709,777 | |
Heidrick & Struggles International, Inc. | | | 20,814 | | | | 448,334 | |
Insperity, Inc. | | | 26,079 | | | | 661,103 | |
Kelly Services, Inc. (Class A Stock) | | | 33,039 | | | | 451,973 | |
Navigant Consulting, Inc.* | | | 60,600 | | | | 691,446 | |
On Assignment, Inc.* | | | 42,286 | | | | 472,757 | |
Resources Connection, Inc. | | | 51,200 | | | | 542,208 | |
TrueBlue, Inc.* | | | 46,818 | | | | 649,834 | |
| | | | | | |
|
|
|
| | | | | | | | 5,118,043 | |
| | | | | | |
|
|
|
Real Estate Investment Trusts — 7.7% | | | | | | | | |
Acadia Realty Trust | | | 49,805 | | | | 1,003,073 | |
BioMed Realty Trust, Inc. | | | 179,511 | | | | 3,245,559 | |
Cedar Realty Trust, Inc. | | | 63,266 | | | | 272,676 | |
Colonial Properties Trust(a) | | | 101,839 | | | | 2,124,362 | |
Cousins Properties, Inc. | | | 120,400 | | | | 771,764 | |
Diamondrock Hospitality Co.(a) | | | 195,170 | | | | 1,881,439 | |
EastGroup Properties, Inc. | | | 31,463 | | | | 1,368,011 | |
Entertainment Properties Trust(a) | | | 54,470 | | | | 2,380,884 | |
Extra Space Storage, Inc.(a) | | | 110,008 | | | | 2,665,494 | |
Franklin Street Properties Corp.(a) | | | 83,802 | | | | 833,830 | |
Getty Realty Corp.(a) | | | 31,500 | | | | 439,425 | |
Healthcare Realty Trust, Inc. | | | 90,700 | | | | 1,686,113 | |
Inland Real Estate Corp. | | | 88,435 | | | | 672,990 | |
Kilroy Realty Corp.(a) | | | 68,198 | | | | 2,596,298 | |
Kite Realty Group Trust | | | 72,191 | | | | 325,581 | |
LaSalle Hotel Properties(a) | | | 97,772 | | | | 2,367,060 | |
Lexington Realty Trust(a) | | | 155,816 | | | | 1,167,062 | |
LTC Properties, Inc. | | | 35,526 | | | | 1,096,332 | |
Medical Properties Trust, Inc. | | | 128,966 | | | | 1,272,894 | |
Mid-America Apartment Communities, Inc. | | | 44,116 | | | | 2,759,456 | |
Parkway Properties, Inc. | | | 25,248 | | | | 248,945 | |
Pennsylvania Real Estate Investment Trust | | | 64,522 | | | | 673,610 | |
Post Properties, Inc. | | | 60,661 | | | | 2,652,099 | |
PS Business Parks, Inc. | | | 21,702 | | | | 1,202,942 | |
Saul Centers, Inc. | | | 13,800 | | | | 488,796 | |
Sovran Self Storage, Inc. | | | 32,597 | | | | 1,390,914 | |
Tanger Factory Outlet Centers(a) | | | 101,184 | | | | 2,966,715 | |
Universal Health Realty Income Trust | | | 14,800 | | | | 577,200 | |
| | | | | | | | |
| COMMON STOCKS | |
| (continued) | | Shares
| | | Value
(Note 2)
| |
| | | | | | | | | |
Real Estate Investment Trusts (continued) | |
Urstadt Biddle Properties, Inc. (Class A Stock) | | | 26,950 | | | $ | 487,256 | |
| | | | | | |
|
|
|
| | | | | | | | 41,618,780 | |
| | | | | | |
|
|
|
Real Estate Management & Development — 0.1% | |
Forestar Group, Inc.* | | | 41,256 | | | | 624,203 | |
| | | | | | |
|
|
|
Road & Rail — 0.9% | | | | | | | | |
Arkansas Best Corp. | | | 29,695 | | | | 572,223 | |
Heartland Express, Inc. | | | 66,848 | | | | 955,258 | |
Knight Transportation, Inc. | | | 68,588 | | | | 1,072,716 | |
Old Dominion Freight Line, Inc.* | | | 54,933 | | | | 2,226,434 | |
| | | | | | |
|
|
|
| | | | | | | | 4,826,631 | |
| | | | | | |
|
|
|
Semiconductors & Semiconductor Equipment — 4.7% | |
Advanced Energy Industries, Inc.* | | | 51,397 | | | | 551,490 | |
ATMI, Inc.* | | | 36,806 | | | | 737,224 | |
Brooks Automation, Inc. | | | 75,005 | | | | 770,301 | |
Cabot Microelectronics Corp.* | | | 26,411 | | | | 1,247,920 | |
Ceva, Inc.*(a) | | | 27,500 | | | | 832,150 | |
Cirrus Logic, Inc.* | | | 74,700 | | | | 1,183,995 | |
Cohu, Inc. | | | 27,597 | | | | 313,226 | |
Cymer, Inc.* | | | 35,670 | | | | 1,774,939 | |
Diodes, Inc.* | | | 43,170 | | | | 919,521 | |
DSP Group, Inc.* | | | 26,128 | | | | 136,127 | |
Entropic Communications, Inc.*(a) | | | 98,400 | | | | 502,824 | |
Exar Corp.* | | | 50,523 | | | | 328,400 | |
GT Advanced Technologies, Inc.*(a) | | | 147,900 | | | | 1,070,796 | |
Hittite Microwave Corp.* | | | 32,606 | | | | 1,610,084 | |
Kopin Corp.* | | | 76,896 | | | | 298,356 | |
Kulicke & Soffa Industries, Inc.* | | | 84,332 | | | | 780,071 | |
Micrel, Inc. | | | 57,402 | | | | 580,334 | |
Microsemi Corp.* | | | 101,219 | | | | 1,695,418 | |
MKS Instruments, Inc. | | | 61,185 | | | | 1,702,167 | |
Monolithic Power Systems, Inc.* | | | 34,500 | | | | 519,915 | |
Nanometrics, Inc.* | | | 19,900 | | | | 366,558 | |
Pericom Semiconductor Corp.* | | | 27,660 | | | | 210,493 | |
Power Integrations, Inc. | | | 32,800 | | | | 1,087,648 | |
Rubicon Technology, Inc.*(a) | | | 20,000 | | | | 187,800 | |
Rudolph Technologies, Inc.* | | | 36,394 | | | | 337,008 | |
Sigma Designs, Inc.* | | | 36,758 | | | | 220,548 | |
Standard Microsystems Corp.* | | | 26,576 | | | | 684,864 | |
STR Holdings, Inc.*(a) | | | 46,600 | | | | 383,518 | |
Supertex, Inc.* | | | 13,972 | | | | 263,791 | |
Tessera Technologies, Inc.* | | | 59,977 | | | | 1,004,615 | |
TriQuint Semiconductor, Inc.* | | | 193,176 | | | | 940,767 | |
Ultratech, Inc.* | | | 30,111 | | | | 739,827 | |
Veeco Instruments, Inc.*(a) | | | 45,242 | | | | 941,034 | |
Volterra Semiconductor Corp.* | | | 28,700 | | | | 735,007 | |
| | | | | | |
|
|
|
| | | | | | | | 25,658,736 | |
| | | | | | |
|
|
|
Software — 3.7% | | | | | | | | |
Blackbaud, Inc. | | | 50,583 | | | | 1,401,149 | |
Bottomline Technologies, Inc.* | | | 42,100 | | | | 975,457 | |
CommVault Systems, Inc.* | | | 50,742 | | | | 2,167,698 | |
Ebix, Inc.(a) | | | 36,257 | | | | 801,280 | |
EPIQ Systems, Inc. | | | 37,017 | | | | 444,944 | |
Interactive Intelligence Group, Inc.* | | | 16,679 | | | | 382,283 | |
JDA Software Group, Inc.* | | | 49,589 | | | | 1,606,188 | |
SEE NOTES TO FINANCIAL STATEMENTS.
A136
| | | | | | |
| | | SMALL CAPITALIZATION STOCK PORTFOLIO (continued) | | |
| |
| SCHEDULE OF INVESTMENTS | | December 31, 2011 |
| | | | | | | | |
| COMMON STOCKS | |
| (continued) | | Shares
| | | Value
(Note 2)
| |
| | | | | | | | | |
Software (continued) | |
Manhattan Associates, Inc.* | | | 24,193 | | | $ | 979,333 | |
MicroStrategy, Inc. (Class A Stock)* | | | 9,450 | | | | 1,023,624 | |
Monotype Imaging Holdings, Inc.* | | | 42,100 | | | | 656,339 | |
Netscout Systems, Inc.* | | | 39,995 | | | | 703,912 | |
Opnet Technologies, Inc. | | | 17,400 | | | | 638,058 | |
Progress Software Corp.* | | | 74,747 | | | | 1,446,354 | |
Sourcefire, Inc.*(a) | | | 33,600 | | | | 1,087,968 | |
Synchronoss Technologies, Inc.*(a) | | | 31,100 | | | | 939,531 | |
Take-Two Interactive Software, Inc.* | | | 100,912 | | | | 1,367,358 | |
Taleo Corp. (Class A Stock)* | | | 48,371 | | | | 1,871,474 | |
THQ, Inc.* | | | 78,182 | | | | 59,418 | |
Tyler Technologies, Inc.* | | | 28,527 | | | | 858,948 | |
Websense, Inc.*(a) | | | 45,070 | | | | 844,161 | |
| | | | | | |
|
|
|
| | | | | | | | 20,255,477 | |
| | | | | | |
|
|
|
Specialty Retail — 4.6% | | | | | | | | |
Big 5 Sporting Goods Corp. | | | 24,637 | | | | 257,210 | |
Brown Shoe Co., Inc.(a) | | | 48,034 | | | | 427,503 | |
Buckle, Inc. (The)(a) | | | 31,659 | | | | 1,293,903 | |
Cabela’s, Inc.*(a) | | | 50,292 | | | | 1,278,423 | |
Cato Corp. (The) (Class A Stock) | | | 34,403 | | | | 832,553 | |
Childrens Place Retail Stores, Inc. (The)*(a) | | | 29,065 | | | | 1,543,933 | |
Christopher & Banks Corp. | | | 39,178 | | | | 91,677 | |
Coldwater Creek, Inc.* | | | 95,267 | | | | 112,415 | |
Finish Line, Inc. (The) (Class A Stock) | | | 60,546 | | | | 1,167,630 | |
Genesco, Inc.* | | | 28,222 | | | | 1,742,426 | |
Group 1 Automotive, Inc. | | | 26,564 | | | | 1,376,015 | |
Haverty Furniture Cos., Inc. | | | 21,541 | | | | 236,520 | |
Hibbett Sports, Inc.* | | | 30,996 | | | | 1,400,399 | |
HOT Topic, Inc. | | | 47,903 | | | | 316,639 | |
JOS A. Bank Clothiers, Inc.*(a) | | | 32,531 | | | | 1,586,212 | |
Kirkland’s, Inc.* | | | 18,700 | | | | 248,710 | |
Lithia Motors, Inc. (Class A Stock) | | | 24,930 | | | | 544,970 | |
Lumber Liquidators Holdings, Inc.*(a) | | | 32,322 | | | | 570,807 | |
MarineMax, Inc.*(a) | | | 26,442 | | | | 172,402 | |
Men’s Wearhouse, Inc. (The) | | | 59,667 | | | | 1,933,807 | |
Midas, Inc.* | | | 16,012 | | | | 137,543 | |
Monro Muffler Brake, Inc. | | | 36,072 | | | | 1,399,233 | |
OfficeMax, Inc.* | | | 98,399 | | | | 446,731 | |
PEP Boys-Manny Moe & Jack (The) | | | 61,226 | | | | 673,486 | |
Rue21, Inc.* | | | 18,300 | | | | 395,280 | |
Select Comfort Corp.* | | | 65,400 | | | | 1,418,526 | |
Sonic Automotive, Inc. (Class A Stock) | | | 40,647 | | | | 601,982 | |
Stage Stores, Inc. | | | 35,379 | | | | 491,414 | |
Stein Mart, Inc.* | | | 30,783 | | | | 209,632 | |
Vitamin Shoppe, Inc.* | | | 34,200 | | | | 1,363,896 | |
Zale Corp.* | | | 28,662 | | | | 109,202 | |
Zumiez, Inc.*(a) | | | 25,450 | | | | 706,492 | |
| | | | | | |
|
|
|
| | | | | | | | 25,087,571 | |
| | | | | | |
|
|
|
| | | | | | | | |
| COMMON STOCKS | |
| (continued) | | Shares
| | | Value
(Note 2)
| |
| | | | | | | | | |
Textiles, Apparel & Luxury Goods — 2.5% | |
Carter’s, Inc.* | | | 59,615 | | | $ | 2,373,273 | |
Crocs, Inc.* | | | 105,143 | | | | 1,552,962 | |
Iconix Brand Group, Inc.* | | | 85,731 | | | | 1,396,558 | |
K-Swiss, Inc. (Class A Stock)*(a) | | | 30,978 | | | | 90,456 | |
Liz Claiborne, Inc.*(a) | | | 109,966 | | | | 949,007 | |
Maidenform Brands, Inc.* | | | 27,421 | | | | 501,804 | |
Movado Group, Inc. | | | 20,317 | | | | 369,160 | |
Oxford Industries, Inc. | | | 16,216 | | | | 731,666 | |
Perry Ellis International, Inc.* | | | 14,179 | | | | 201,625 | |
Quiksilver, Inc.* | | | 140,793 | | | | 508,263 | |
Skechers U.S.A., Inc. (Class A Stock)* | | | 43,076 | | | | 522,081 | |
Steven Madden Ltd.* | | | 44,600 | | | | 1,538,700 | |
True Religion Apparel, Inc.* | | | 29,864 | | | | 1,032,697 | |
Wolverine World Wide, Inc. | | | 56,377 | | | | 2,009,276 | |
| | | | | | |
|
|
|
| | | | | | | | 13,777,528 | |
| | | | | | |
|
|
|
Thrifts & Mortgage Finance — 0.9% | | | | | | | | |
Bank Mutual Corp. | | | 52,635 | | | | 167,379 | |
Brookline Bancorp, Inc. | | | 80,332 | | | | 678,002 | |
Dime Community Bancshares, Inc. | | | 31,981 | | | | 402,961 | |
Northwest Bancshares, Inc. | | | 113,600 | | | | 1,413,184 | |
Oritani Financial Corp. | | | 53,100 | | | | 678,087 | |
Provident Financial Services, Inc. | | | 62,500 | | | | 836,875 | |
Trustco Bank Corp. NY | | | 106,595 | | | | 597,998 | |
| | | | | | |
|
|
|
| | | | | | | | 4,774,486 | |
| | | | | | |
|
|
|
Tobacco | | | | | | | | |
Alliance One International, Inc.* | | | 98,938 | | | | 269,111 | |
| | | | | | |
|
|
|
Trading Companies & Distributors — 0.5% | |
Applied Industrial Technologies, Inc. | | | 48,928 | | | | 1,720,798 | |
Kaman Corp. | | | 30,622 | | | | 836,593 | |
Lawson Products, Inc. | | | 4,424 | | | | 68,262 | |
| | | | | | |
|
|
|
| | | | | | | | 2,625,653 | |
| | | | | | |
|
|
|
Water Utilities — 0.1% | | | | | | | | |
American States Water Co.(a) | | | 21,976 | | | | 766,962 | |
| | | | | | |
|
|
|
Wireless Telecommunication Services — 0.1% | | | | | |
NTELOS Holdings Corp. | | | 17,321 | | | | 353,002 | |
USA Mobility, Inc. | | | 25,780 | | | | 357,569 | |
| | | | | | |
|
|
|
| | | | | | | | 710,571 | |
| | | | | | |
|
|
|
TOTAL COMMON STOCKS
(cost $449,033,395) | | | | 532,888,378 | |
| | | | | | |
|
|
|
| EXCHANGE TRADED FUND — 0.5% | |
iShares S&P SmallCap 600 Index Fund(a) (cost $2,521,798) | | | 43,500 | | | | 2,970,180 | |
| | | | | | |
|
|
|
TOTAL LONG-TERM INVESTMENTS
(cost $451,555,193) | | | | 535,858,558 | |
| | | | | | |
|
|
|
SEE NOTES TO FINANCIAL STATEMENTS.
A137
| | | | | | |
| | | SMALL CAPITALIZATION STOCK PORTFOLIO (continued) | | |
| |
| SCHEDULE OF INVESTMENTS | | December 31, 2011 |
| | | | | | | | |
SHORT-TERM
INVESTMENTS — 16.6% | | Shares
| | | Value
(Note 2)
| |
Affiliated Money Market Mutual Fund — 16.4% | |
Prudential Investment Portfolios 2 — Prudential Core Taxable Money Market Fund
(cost $88,748,095; includes $83,630,369 of cash collateral received for securities on loan)(Note 4)(b)(c) | | | 88,748,095 | | | $ | 88,748,095 | |
| | | | | | |
|
|
|
| | | Principal
Amount
(000)
| | | | |
U.S Government Obligation — 0.2% | |
U.S. Treasury Bill,
0.057%, 06/28/12(d)(e)
(cost $1,349,615) | | $ | 1,350 | | | | 1,349,602 | |
| | | | | | |
|
|
|
TOTAL SHORT-TERM INVESTMENTS
(cost $90,097,710) | | | | 90,097,697 | |
| | | | | | |
|
|
|
TOTAL INVESTMENTS — 115.4%
(cost $541,652,903) | | | | 625,956,255 | |
LIABILITIES IN EXCESS OF
OTHER ASSETS(f) — (15.4%) | | | | (83,310,982 | ) |
| | | | | | |
|
|
|
NET ASSETS — 100.0% | | | $ | 542,645,273 | |
| | | | | | |
|
|
|
| * | Non-income producing security. |
| (a) | All or a portion of security is on loan. The aggregate market value of such securities, including those sold and pending settlement is $80,670,743; cash collateral of $83,630,369 (included in liabilities) was received with which the Portfolio purchased highly liquid short-term investments. |
| (b) | Represents security, or a portion thereof, purchased with cash collateral received for securities on loan. |
| (c) | Prudential Investments LLC, the manager of the Portfolio, also serves as manager of the Prudential Investment Portfolio 2 — Prudential Core Taxable Money Market Fund. |
| (d) | Rate quoted represents yield-to-maturity as of purchase date. |
| (e) | Represents security, or a portion thereof, segregated as collateral for futures contracts. |
| (f) | Includes net unrealized appreciation on the following derivative contracts held at reporting period end: |
Open futures contracts outstanding at December 31, 2011:
| | | | | | | | | | | | | | | | | | |
Number of
Contracts
| | Type
| | Expiration
Date
| | | Value at
Trade Date
| | | Value at
December 31, 2011
| | | Unrealized
Appreciation
| |
| Long Position: | | | | | | | | | | | | | | | | | | |
| 95 | | Russell 2000 Mini | | | Mar. 2012 | | | $ | 6,981,621 | | | $ | 7,018,600 | | | $ | 36,979 | |
| | | | | | | | | | | | | | | | |
|
|
|
Various inputs are used in determining the value of the Portfolio’s investments. These inputs are summarized in the three broad levels listed below.
| Level 1—quoted | prices generally for securities actively traded on a regulated securities exchange and for open-end mutual funds which trade at daily net asset value. |
| Level 2—other | significant observable inputs (including, but not limited to, quoted prices for similar securities, interest rates, prepayment speeds, foreign currency exchange rates, and amortized cost) generally for debt securities, swaps, forward foreign currency contracts and for foreign stocks priced using vendor modeling tools. |
| Level 3—significant | unobservable inputs for securities valued in accordance with Board approved fair valuation procedures. |
The following is a summary of the inputs used as of December 31, 2011 in valuing such portfolio securities:
| | | | | | | | | | | | |
| | | Level 1
| | | Level 2
| | | Level 3
| |
Investments in Securities | | | | | | | | | | | | |
Common Stocks | | $ | 532,888,378 | | | $ | — | | | $ | — | |
Exchange Traded Fund | | | 2,970,180 | | | | — | | | | — | |
Affiliated Money Market Mutual Fund | | | 88,748,095 | | | | — | | | | — | |
U.S. Government Obligation | | | — | | | | 1,349,602 | | | | — | |
| | |
|
|
| |
|
|
| |
|
|
|
| | | | 624,606,653 | | | | 1,349,602 | | | | — | |
Other Financial Instruments* | | | | | | | | | | | | |
Futures contracts | | | 36,979 | | | | — | | | | — | |
| | |
|
|
| |
|
|
| |
|
|
|
Total | | $ | 624,643,632 | | | $ | 1,349,602 | | | $ | — | |
| | |
|
|
| |
|
|
| |
|
|
|
| * | Other financial instruments are derivative instruments not reflected in the Schedule of Investments, such as futures, forwards and swap contracts, which are recorded at the unrealized appreciation/depreciation on the instrument. |
SEE NOTES TO FINANCIAL STATEMENTS.
A138
| | | | | | |
| | | SMALL CAPITALIZATION STOCK PORTFOLIO (continued) | | |
| |
| SCHEDULE OF INVESTMENTS | | December 31, 2011 |
The industry classification of portfolio holdings and liabilities in excess of other assets shown as a percentage of net assets as of December 31, 2011 was as follows:
| | | | |
Affiliated Money Market Mutual Fund (including 15.4% of collateral received for securities on loan) | | | 16.4 | % |
Real Estate Investment Trusts | | | 7.7 | |
Commercial Banks | | | 5.5 | |
Semiconductors & Semiconductor Equipment | | | 4.7 | |
Specialty Retail | | | 4.6 | |
Electronic Equipment, Instruments & Components | | | 4.2 | |
Healthcare Providers & Services | | | 3.9 | |
Machinery | | | 3.7 | |
Software | | | 3.7 | |
Healthcare Equipment & Supplies | | | 3.4 | |
Hotels, Restaurants & Leisure | | | 3.0 | |
Insurance | | | 2.9 | |
Commercial Services & Supplies | | | 2.5 | |
Textiles, Apparel & Luxury Goods | | | 2.5 | |
Energy Equipment & Services | | | 2.4 | |
Food Products | | | 2.4 | |
Aerospace & Defense | | | 2.3 | |
Chemicals | | | 2.2 | |
Gas Utilities | | | 2.2 | |
IT Services | | | 2.2 | |
Pharmaceuticals | | | 2.1 | |
Communications Equipment | | | 1.9 | |
Internet Software & Services | | | 1.9 | |
Electrical Equipment | | | 1.7 | |
Oil, Gas & Consumable Fuels | | | 1.7 | |
Electric Utilities | | | 1.4 | |
Building Products | | | 1.3 | |
Food & Staples Retailing | | | 1.2 | |
Household Durables | | | 1.2 | |
Diversified Consumer Services | | | 1.1 | |
Metals and Mining | | | 1.1 | |
Paper & Forest Products | | | 1.1 | |
Capital Markets | | | 1.0 | |
Consumer Finance | | | 1.0 | |
Professional Services | | | 0.9 | |
| | | | |
Road & Rail | | | 0.9 | % |
Thrifts & Mortgage Finance | | | 0.9 | |
Construction & Engineering | | | 0.8 | |
Multi-Utilities | | | 0.8 | |
Biotechnology | | | 0.7 | |
Leisure Equipment & Products | | | 0.7 | |
Media | | | 0.7 | |
Computers & Peripherals | | | 0.6 | |
Healthcare Technology | | | 0.6 | |
Air Freight & Logistics | | | 0.5 | |
Construction Materials | | | 0.5 | |
Diversified Telecommunication Services | | | 0.5 | |
Exchange Traded Fund | | | 0.5 | |
Trading Companies & Distributors | | | 0.5 | |
Life Sciences Tools & Services | | | 0.4 | |
Airlines | | | 0.3 | |
Auto Components | | | 0.3 | |
Distributors | | | 0.3 | |
Beverages | | | 0.2 | |
Household Products | | | 0.2 | |
Internet & Catalog Retail | | | 0.2 | |
Multiline Retail | | | 0.2 | |
Personal Products | | | 0.2 | |
Treasury Bill | | | 0.2 | |
Automobiles | | | 0.1 | |
Containers & Packaging | | | 0.1 | |
Diversified Financial Services | | | 0.1 | |
Industrial Conglomerates | | | 0.1 | |
Real Estate Management & Development | | | 0.1 | |
Water Utilities | | | 0.1 | |
Wireless Telecommunication Services | | | 0.1 | |
| | |
|
|
|
| | | | 115.4 | |
Liabilities in excess of other assets | | | (15.4 | ) |
| | |
|
|
|
| | | | 100.0 | % |
| | |
|
|
|
The Portfolio invested in derivative instruments during the reporting period. The primary type of risk associated with these derivative instruments is equity risk. The effect of such derivative instruments on the Portfolio’s financial position and financial performance as reflected in the Statement of Assets and Liabilities and Statement of Operations is presented in the summary below.
Fair values of derivative instruments as of December 31, 2011 as presented in the Statement of Assets and Liabilities:
| | | | | | | | | | | | |
Derivatives not designated as hedging
instruments, carried at fair value
| | Asset Derivatives
| | | Liability Derivatives
| |
| | Balance Sheet Location
| | Fair Value
| | | Balance Sheet Location
| | Fair Value
| |
Equity contracts | | Due from broker — variation margin | | $ | 36,979 | * | | — | | $ | — | |
| | | | |
|
|
| | | |
|
|
|
| * | Includes cumulative appreciation/depreciation on futures contracts as reported in Schedule of Investments. Only unsettled variation margin receivable (payable) is reported within the Statement of Assets and Liabilities. |
The effects of derivative instruments on the Statement of Operations for the year ended December 31, 2011 are as follows:
| | | | |
Amount of Realized Gain or (Loss) on Derivatives Recognized in Income
| |
Derivatives not designated as hedging instruments, carried at fair value
| | Futures
| |
Equity contracts | | $ | (403,114 | ) |
| | |
|
|
|
SEE NOTES TO FINANCIAL STATEMENTS.
A139
| | | | | | |
| | | SMALL CAPITALIZATION STOCK PORTFOLIO (continued) | | |
| |
| SCHEDULE OF INVESTMENTS | | December 31, 2011 |
| | | | |
Change in Unrealized Appreciation or (Depreciation) on Derivatives Recognized in Income
| |
Derivatives not designated as hedging instruments, carried at fair value
| | Futures
| |
Equity contracts | | $ | 36,979 | |
| | |
|
|
|
For the year ended December 31, 2011, the average value at trade date for futures long positions was $ 11,539,469.
SEE NOTES TO FINANCIAL STATEMENTS.
A140
| | | | | | |
| | | SMALL CAPITALIZATION STOCK PORTFOLIO (continued) | | |
STATEMENT OF ASSETS AND LIABILITIES
December 31, 2011
| | | | |
| ASSETS | | | | |
Investments, at value including securities on loan of $80,670,743: | | | | |
Unaffiliated investments (cost $452,904,808) | | $ | 537,208,160 | |
Affiliated investments (cost $88,748,095) | | | 88,748,095 | |
Cash | | | 19,825 | |
Receivable for investments sold | | | 935,731 | |
Dividends and interest receivable | | | 613,519 | |
Receivable for Series shares sold | | | 150,031 | |
Prepaid expenses | | | 3,665 | |
| | |
|
|
|
Total Assets | | | 627,679,026 | |
| | |
|
|
|
| LIABILITIES | | | | |
Collateral for securities on loan | | | 83,630,369 | |
Payable for investments purchased | | | 900,210 | |
Management fee payable | | | 183,362 | |
Payable for Series shares repurchased | | | 162,109 | |
Accrued expenses and other liabilities | | | 125,588 | |
Due to broker-variation margin | | | 31,189 | |
Affiliated transfer agent fee payable | | | 926 | |
| | |
|
|
|
Total Liabilities | | | 85,033,753 | |
| | |
|
|
|
| NET ASSETS | | $ | 542,645,273 | |
| | |
|
|
|
Net assets were comprised of: | | | | |
Paid-in capital | | $ | 434,864,830 | |
Retained earnings | | | 107,780,443 | |
| | |
|
|
|
Net assets, December 31,2011 | | $ | 542,645,273 | |
| | |
|
|
|
Net asset value and redemption price per share, $542,645,273 / 31,915,133 outstanding shares of beneficial interest | | $ | 17.00 | |
| | |
|
|
|
STATEMENT OF OPERATIONS
Year Ended December 31, 2011
| | | | |
| INVESTMENT INCOME | | | | |
Unaffiliated dividend income | | $ | 5,747,041 | |
Affiliated income from securities loaned, net | | | 390,456 | |
Affiliated dividend income | | | 21,060 | |
Interest | | | 1,590 | |
| | |
|
|
|
| | | | 6,160,147 | |
| | |
|
|
|
| EXPENSES | | | | |
Management fee | | | 2,288,481 | |
Shareholders’ reports | | | 189,000 | |
Custodian’s fees and expenses | | | 117,000 | |
Audit fee | | | 19,000 | |
Trustees’ fees | | | 15,000 | |
Transfer agent’s fee and expenses (including affiliated expense of $5,500) (Note 4) | | | 12,000 | |
Legal fees and expenses | | | 9,000 | |
Insurance expenses | | | 6,000 | |
Commitment fee on syndicated credit agreement | | | 4,000 | |
Miscellaneous | | | 66,937 | |
| | |
|
|
|
Total expenses | | | 2,726,418 | |
| | |
|
|
|
| NET INVESTMENT INCOME | | | 3,433,729 | |
| | |
|
|
|
| NET REALIZED AND UNREALIZED GAIN (LOSS) ON INVESTMENTS | | | | |
Net realized gain (loss) on: | | | | |
Investment transactions | | | 29,013,163 | |
Futures transactions | | | (403,114 | ) |
| | |
|
|
|
| | | | 28,610,049 | |
| | |
|
|
|
Net change in unrealized appreciation (depreciation) on: | | | | |
Investments | | | (29,239,068 | ) |
Futures | | | (145,693 | ) |
| | |
|
|
|
| | | | (29,384,761 | ) |
| | |
|
|
|
| NET LOSS ON INVESTMENTS | | | (774,712 | ) |
| | |
|
|
|
| NET INCREASE IN NET ASSETS RESULTING FROM OPERATIONS | | $ | 2,659,017 | |
| | |
|
|
|
STATEMENT OF CHANGES IN NET ASSETS
| | | | | | | | |
| | | Year Ended December 31,
| |
| | | 2011
| | | 2010
| |
| INCREASE (DECREASE) IN NET ASSETS | | | | | | | | |
| OPERATIONS: | | | | | | | | |
Net investment income | | $ | 3,433,729 | | | $ | 4,601,481 | |
Net realized gain on investments | | | 28,610,049 | | | | 22,819,367 | |
Net change in unrealized appreciation (depreciation) on investments | | | (29,384,761 | ) | | | 93,984,659 | |
| | |
|
|
| |
|
|
|
NET INCREASE IN NET ASSETS RESULTING FROM OPERATIONS | | | 2,659,017 | | | | 121,405,507 | |
| | |
|
|
| |
|
|
|
| DISTRIBUTIONS | | | (12,229,897 | ) | | | (4,329,959 | ) |
| | |
|
|
| |
|
|
|
| SERIES SHARE TRANSACTIONS: | | | | | | | | |
Series shares sold [894,009 and 1,887,105 shares, respectively] | | | 15,341,754 | | | | 29,176,634 | |
Series shares issued in reinvestment of distributions [717,296 and 301,739 shares, respectively] | | | 12,229,897 | | | | 4,329,959 | |
Series shares repurchased [3,850,529 and 3,616,665 shares, respectively] | | | (65,253,551 | ) | | | (52,851,604 | ) |
| | |
|
|
| |
|
|
|
NET DECREASE IN NET ASSETS RESULTING FROM SERIES SHARE TRANSACTIONS | | | (37,681,900 | ) | | | (19,345,011 | ) |
| | |
|
|
| |
|
|
|
| TOTAL INCREASE (DECREASE) IN NET ASSETS | | | (47,252,780 | ) | | | 97,730,537 | |
| NET ASSETS: | | | | | | | | |
Beginning of year | | | 589,898,053 | | | | 492,167,516 | |
| | |
|
|
| |
|
|
|
End of year | | $ | 542,645,273 | | | $ | 589,898,053 | |
| | |
|
|
| |
|
|
|
SEE NOTES TO FINANCIAL STATEMENTS.
A141
| | | | | | |
| | | STOCK INDEX PORTFOLIO | | |
| |
| SCHEDULE OF INVESTMENTS | | December 31, 2011 |
| | | | | | | | |
| LONG-TERM INVESTMENTS — 98.0% | | | | |
| COMMON STOCKS | | Shares
| | | Value
(Note 2)
| |
| | | | | | | | | |
Aerospace & Defense — 2.6% | | | | | | | | |
Boeing Co. (The) | | | 135,736 | | | $ | 9,956,236 | |
General Dynamics Corp. | | | 67,800 | | | | 4,502,598 | |
Goodrich Corp. | | | 23,300 | | | | 2,882,210 | |
Honeywell International, Inc. | | | 144,650 | | | | 7,861,728 | |
L-3 Communications Holdings, Inc. | | | 18,700 | | | | 1,246,916 | |
Lockheed Martin Corp.(a) | | | 49,198 | | | | 3,980,118 | |
Northrop Grumman Corp. | | | 47,726 | | | | 2,791,016 | |
Precision Castparts Corp. | | | 26,800 | | | | 4,416,372 | |
Raytheon Co. | | | 65,318 | | | | 3,160,085 | |
Rockwell Collins, Inc.(a) | | | 29,300 | | | | 1,622,341 | |
Textron, Inc.(a) | | | 44,900 | | | | 830,201 | |
United Technologies Corp. | | | 168,200 | | | | 12,293,738 | |
| | | | | | |
|
|
|
| | | | | | | | 55,543,559 | |
| | | | | | |
|
|
|
Air Freight & Logistics — 1.0% | | | | | | | | |
C.H. Robinson Worldwide, Inc.(a) | | | 30,200 | | | | 2,107,356 | |
Expeditors International of Washington, Inc. | | | 41,600 | | | | 1,703,936 | |
FedEx Corp. | | | 59,740 | | | | 4,988,887 | |
United Parcel Service, Inc. (Class B Stock) | | | 181,200 | | | | 13,262,028 | |
| | | | | | |
|
|
|
| | | | | | | | 22,062,207 | |
| | | | | | |
|
|
|
Airlines — 0.1% | | | | | | | | |
Southwest Airlines Co. | | | 139,337 | | | | 1,192,725 | |
| | | | | | |
|
|
|
Auto Components — 0.3% | | | | | | | | |
BorgWarner, Inc.*(a) | | | 17,400 | | | | 1,109,076 | |
Goodyear Tire & Rubber Co. (The)* | | | 38,600 | | | | 546,962 | |
Johnson Controls, Inc. | | | 128,700 | | | | 4,023,162 | |
| | | | | | |
|
|
|
| | | | | | | | 5,679,200 | |
| | | | | | |
|
|
|
Automobiles — 0.4% | | | | | | | | |
Ford Motor Co.*(a) | | | 715,659 | | | | 7,700,491 | |
Harley-Davidson, Inc.(a) | | | 44,300 | | | | 1,721,941 | |
| | | | | | |
|
|
|
| | | | | | | | 9,422,432 | |
| | | | | | |
|
|
|
Beverages — 2.6% | | | | | | | | |
Beam, Inc. | | | 25,900 | | | | 1,326,857 | |
Brown-Forman Corp. (Class B Stock) | | | 18,500 | | | | 1,489,435 | |
Coca-Cola Co. (The) | | | 421,500 | | | | 29,492,355 | |
Coca-Cola Enterprises, Inc. | | | 60,600 | | | | 1,562,268 | |
Constellation Brands, Inc. (Class A Stock)* | | | 34,100 | | | | 704,847 | |
Dr Pepper Snapple Group, Inc.(a) | | | 38,800 | | | | 1,531,824 | |
Molson Coors Brewing Co. (Class B Stock) | | | 31,100 | | | | 1,354,094 | |
PepsiCo, Inc. | | | 288,139 | | | | 19,118,023 | |
| | | | | | |
|
|
|
| | | | | | | | 56,579,703 | |
| | | | | | |
|
|
|
Biotechnology — 1.2% | | | | | | | | |
Amgen, Inc.(a) | | | 143,594 | | | | 9,220,171 | |
Biogen Idec, Inc.* | | | 45,625 | | | | 5,021,031 | |
Celgene Corp.* | | | 87,000 | | | | 5,881,200 | |
Gilead Sciences, Inc.* | | | 141,100 | | | | 5,775,223 | |
| | | | | | |
|
|
|
| | | | | | | | 25,897,625 | |
| | | | | | |
|
|
|
Building Products | | | | | | | | |
Masco Corp. | | | 54,800 | | | | 574,304 | |
| | | | | | |
|
|
|
| | | | | | | | |
COMMON STOCKS
(continued) | | Shares
| | | Value
(Note 2)
| |
| | | | | | | | | |
Capital Markets — 1.8% | | | | | | | | |
Ameriprise Financial, Inc. | | | 44,000 | | | $ | 2,184,160 | |
Bank of New York Mellon Corp. (The) | | | 235,389 | | | | 4,686,595 | |
BlackRock, Inc. (Class A Stock) | | | 17,800 | | | | 3,172,672 | |
Charles Schwab Corp. (The)(a) | | | 189,300 | | | | 2,131,518 | |
E*Trade Financial Corp.* | | | 43,610 | | | | 347,136 | |
Federated Investors, Inc. (Class B Stock)(a) | | | 15,000 | | | | 227,250 | |
Franklin Resources, Inc.(a) | | | 26,400 | | | | 2,535,984 | |
Goldman Sachs Group, Inc. (The) | | | 94,600 | | | | 8,554,678 | |
Invesco Ltd. | | | 84,800 | | | | 1,703,632 | |
Legg Mason, Inc.(a) | | | 25,900 | | | | 622,895 | |
Morgan Stanley | | | 281,410 | | | | 4,257,733 | |
Northern Trust Corp. | | | 44,200 | | | | 1,752,972 | |
State Street Corp. | | | 93,000 | | | | 3,748,830 | |
T. Rowe Price Group, Inc.(a) | | | 48,100 | | | | 2,739,295 | |
| | | | | | |
|
|
|
| | | | | | | | 38,665,350 | |
| | | | | | |
|
|
|
Chemicals — 2.2% | | | | | | | | |
Air Products & Chemicals, Inc. | | | 40,300 | | | | 3,433,157 | |
Airgas, Inc. | | | 13,200 | | | | 1,030,656 | |
CF Industries Holdings, Inc. | | | 13,400 | | | | 1,942,732 | |
Dow Chemical Co. (The) | | | 213,461 | | | | 6,139,138 | |
E.I. du Pont de Nemours & Co(a) | | | 172,391 | | | | 7,892,060 | |
Eastman Chemical Co. | | | 25,600 | | | | 999,936 | |
Ecolab, Inc. | | | 51,600 | | | | 2,982,996 | |
FMC Corp. | | | 12,600 | | | | 1,084,104 | |
International Flavors & Fragrances, Inc. | | | 16,100 | | | | 843,962 | |
Monsanto Co. | | | 100,096 | | | | 7,013,727 | |
Mosaic Co. (The) | | | 54,200 | | | | 2,733,306 | |
PPG Industries, Inc. | | | 29,100 | | | | 2,429,559 | |
Praxair, Inc. | | | 55,600 | | | | 5,943,640 | |
Sherwin-Williams Co. (The) | | | 15,700 | | | | 1,401,539 | |
Sigma-Aldrich Corp. | | | 20,700 | | | | 1,292,922 | |
| | | | | | |
|
|
|
| | | | | | | | 47,163,434 | |
| | | | | | |
|
|
|
Commercial Banks — 2.6% | | | | | | | | |
BB&T Corp.(a) | | | 134,400 | | | | 3,382,848 | |
Comerica, Inc.(a) | | | 31,550 | | | | 813,990 | |
Fifth Third Bancorp | | | 167,749 | | | | 2,133,767 | |
First Horizon National Corp.(a) | | | 44,745 | | | | 357,960 | |
Huntington Bancshares, Inc. | | | 148,775 | | | | 816,775 | |
KeyCorp | | | 179,700 | | | | 1,381,893 | |
M&T Bank Corp.(a) | | | 23,800 | | | | 1,816,892 | |
PNC Financial Services Group, Inc. | | | 98,993 | | | | 5,708,926 | |
Regions Financial Corp. | | | 245,212 | | | | 1,054,412 | |
SunTrust Banks, Inc. | | | 100,800 | | | | 1,784,160 | |
U.S. Bancorp | | | 358,881 | | | | 9,707,731 | |
Wells Fargo & Co. | | | 980,986 | | | | 27,035,974 | |
Zions Bancorporation.(a) | | | 30,000 | | | | 488,400 | |
| | | | | | |
|
|
|
| | | | | | | | 56,483,728 | |
| | | | | | |
|
|
|
Commercial Services & Supplies — 0.4% | | | | | |
Avery Dennison Corp. | | | 21,600 | | | | 619,488 | |
Cintas Corp.(a) | | | 21,700 | | | | 755,377 | |
Iron Mountain, Inc. | | | 34,100 | | | | 1,050,280 | |
Pitney Bowes, Inc.(a) | | | 37,700 | | | | 698,958 | |
Republic Services, Inc. | | | 58,310 | | | | 1,606,441 | |
SEE NOTES TO FINANCIAL STATEMENTS.
A142
| | | | | | |
| | | STOCK INDEX PORTFOLIO (continued) | | |
| |
| SCHEDULE OF INVESTMENTS | | December 31, 2011 |
| | | | | | | | |
COMMON STOCKS
(continued) | | Shares
| | | Value
(Note 2)
| |
| | | | | | | | | |
Commercial Services & Supplies (continued) | | | | | |
RR Donnelley & Sons Co(a) | | | 38,800 | | | $ | 559,884 | |
Stericycle, Inc.* | | | 14,400 | | | | 1,122,048 | |
Waste Management, Inc. | | | 88,830 | | | | 2,905,629 | |
| | | | | | |
|
|
|
| | | | | | | | 9,318,105 | |
| | | | | | |
|
|
|
Communications Equipment — 2.1% | | | | | | | | |
Cisco Systems, Inc. | | | 1,013,900 | | | | 18,331,312 | |
F5 Networks, Inc.* | | | 14,800 | | | | 1,570,576 | |
Harris Corp.(a) | | | 23,400 | | | | 843,336 | |
JDS Uniphase Corp.* | | | 43,587 | | | | 455,048 | |
Juniper Networks, Inc.* | | | 101,400 | | | | 2,069,574 | |
Motorola Mobility Holdings, Inc.* | | | 49,336 | | | | 1,914,237 | |
Motorola Solutions, Inc. | | | 56,327 | | | | 2,607,377 | |
QUALCOMM, Inc. | | | 312,900 | | | | 17,115,630 | |
| | | | | | |
|
|
|
| | | | | | | | 44,907,090 | |
| | | | | | |
|
|
|
Computers & Peripherals — 4.5% | | | | | | | | |
Apple, Inc.* | | | 172,350 | | | | 69,801,750 | |
Dell, Inc.* | | | 297,200 | | | | 4,348,036 | |
EMC Corp.*.(a) | | | 384,874 | | | | 8,290,186 | |
Hewlett-Packard Co. | | | 369,116 | | | | 9,508,428 | |
Lexmark International, Inc. (Class A Stock) | | | 15,514 | | | | 513,048 | |
NetApp, Inc.* | | | 66,800 | | | | 2,422,836 | |
SanDisk Corp.*.(a) | | | 43,900 | | | | 2,160,319 | |
Western Digital Corp.* | | | 40,600 | | | | 1,256,570 | |
| | | | | | |
|
|
|
| | | | | | | | 98,301,173 | |
| | | | | | |
|
|
|
Construction & Engineering — 0.2% | | | | | |
Fluor Corp. | | | 32,900 | | | | 1,653,225 | |
Jacobs Engineering Group, Inc.* | | | 22,200 | | | | 900,876 | |
Quanta Services, Inc.*(a) | | | 33,000 | | | | 710,820 | |
| | | | | | |
|
|
|
| | | | | | | | 3,264,921 | |
| | | | | | |
|
|
|
Construction Materials | | | | | |
Vulcan Materials Co.(a) | | | 22,300 | | | | 877,505 | |
| | | | | | |
|
|
|
Consumer Finance — 0.8% | | | | | |
American Express Co. | | | 188,900 | | | | 8,910,413 | |
Capital One Financial Corp. | | | 86,369 | | | | 3,652,545 | |
Discover Financial Services | | | 106,505 | | | | 2,556,120 | |
SLM Corp. | | | 102,000 | | | | 1,366,800 | |
| | | | | | |
|
|
|
| | | | | | | | 16,485,878 | |
| | | | | | |
|
|
|
Containers & Packaging — 0.1% | | | | | |
Ball Corp. | | | 32,200 | | | | 1,149,862 | |
Bemis Co., Inc. | | | 17,900 | | | | 538,432 | |
Owens-Illinois, Inc.* | | | 30,400 | | | | 589,152 | |
Sealed Air Corp. | | | 31,620 | | | | 544,180 | |
| | | | | | |
|
|
|
| | | | | | | | 2,821,626 | |
| | | | | | |
|
|
|
Distributors — 0.1% | | | | | |
Genuine Parts Co. | | | 32,025 | | | | 1,959,930 | |
| | | | | | |
|
|
|
Diversified Consumer Services — 0.1% | | | | | |
Apollo Group, Inc. (Class A Stock)* | | | 22,700 | | | | 1,222,849 | |
DeVry, Inc. | | | 10,000 | | | | 384,600 | |
H&R Block, Inc. | | | 63,400 | | | | 1,035,322 | |
| | | | | | |
|
|
|
| | | | | | | | 2,642,771 | |
| | | | | | |
|
|
|
| | | | | | | | |
COMMON STOCKS
(continued) | | Shares
| | | Value
(Note 2)
| |
| | | | | | | | | |
Diversified Financial Services — 2.6% | | | | | |
Bank of America Corp. | | | 1,889,932 | | | $ | 10,508,022 | |
Citigroup, Inc. | | | 543,197 | | | | 14,291,513 | |
CME Group, Inc. | | | 12,520 | | | | 3,050,748 | |
IntercontinentalExchange, Inc.* | | | 14,200 | | | | 1,711,810 | |
JPMorgan Chase & Co. | | | 707,045 | | | | 23,509,246 | |
Leucadia National Corp. | | | 37,600 | | | | 855,024 | |
Moody’s Corp.(a) | | | 38,120 | | | | 1,283,882 | |
NASDAQ OMX Group, Inc. (The)* | | | 25,600 | | | | 627,456 | |
NYSE Euronext | | | 50,600 | | | | 1,320,660 | |
| | | | | | |
|
|
|
| | | | | | | | 57,158,361 | |
| | | | | | |
|
|
|
Diversified Telecommunication Services — 2.8% | | | | | |
AT&T, Inc. | | | 1,099,711 | | | | 33,255,261 | |
CenturyLink, Inc. | | | 113,585 | | | | 4,225,362 | |
Frontier Communications Corp.(a) | | | 177,916 | | | | 916,267 | |
Verizon Communications, Inc.(a). | | | 523,938 | | | | 21,020,393 | |
Windstream Corp. | | | 90,665 | | | | 1,064,407 | |
| | | | | | |
|
|
|
| | | | | | | | 60,481,690 | |
| | | | | | |
|
|
|
Electric Utilities — 2.0% | | | | | |
American Electric Power Co., Inc. | | | 90,040 | | | | 3,719,552 | |
Duke Energy Corp.(a) | | | 250,382 | | | | 5,508,404 | |
Edison International | | | 61,100 | | | | 2,529,540 | |
Entergy Corp. | | | 33,800 | | | | 2,469,090 | |
Exelon Corp. | | | 121,450 | | | | 5,267,287 | |
FirstEnergy Corp. | | | 76,280 | | | | 3,379,204 | |
NextEra Energy, Inc.(a) | | | 78,700 | | | | 4,791,256 | |
Northeast Utilities | | | 33,300 | | | | 1,201,131 | |
Pepco Holdings, Inc. | | | 36,200 | | | | 734,860 | |
Pinnacle West Capital Corp. | | | 20,900 | | | | 1,006,962 | |
PPL Corp. | | | 102,700 | | | | 3,021,434 | |
Progress Energy, Inc. | | | 55,814 | | | | 3,126,700 | |
Southern Co.(a) | | | 159,100 | | | | 7,364,739 | |
| | | | | | |
|
|
|
| | | | | | | | 44,120,159 | |
| | | | | | |
|
|
|
Electrical Equipment — 0.5% | | | | | |
Cooper Industries PLC | | | 27,700 | | | | 1,499,955 | |
Emerson Electric Co. | | | 141,500 | | | | 6,592,485 | |
Rockwell Automation, Inc. | | | 25,900 | | | | 1,900,283 | |
Roper Industries, Inc. | | | 17,100 | | | | 1,485,477 | |
| | | | | | |
|
|
|
| | | | | | | | 11,478,200 | |
| | | | | | |
|
|
|
Electronic Equipment, Instruments & Components — 0.4% | |
Amphenol Corp. (Class A Stock) | | | 33,300 | | | | 1,511,487 | |
Corning, Inc. | | | 293,700 | | | | 3,812,226 | |
FLIR Systems, Inc. | | | 23,500 | | | | 589,145 | |
Jabil Circuit, Inc. | | | 36,400 | | | | 715,624 | |
Molex, Inc. | | | 26,600 | | | | 634,676 | |
TE Connectivity Ltd. | | | 76,600 | | | | 2,360,046 | |
| | | | | | |
|
|
|
| | | | | | | | 9,623,204 | |
| | | | | | |
|
|
|
Energy Equipment & Services — 1.9% | | | | | |
Baker Hughes, Inc. | | | 80,248 | | | | 3,903,263 | |
Cameron International Corp.* | | | 43,800 | | | | 2,154,522 | |
Diamond Offshore Drilling, Inc.(a) | | | 12,500 | | | | 690,750 | |
FMC Technologies, Inc.*(a) | | | 45,600 | | | | 2,381,688 | |
Halliburton Co. | | | 173,500 | | | | 5,987,485 | |
Helmerich & Payne, Inc.(a) | | | 21,100 | | | | 1,231,396 | |
Nabors Industries Ltd.* | | | 56,600 | | | | 981,444 | |
SEE NOTES TO FINANCIAL STATEMENTS.
A143
| | | | | | |
| | | STOCK INDEX PORTFOLIO (continued) | | |
| |
| SCHEDULE OF INVESTMENTS | | December 31, 2011 |
| | | | | | | | |
COMMON STOCKS
(continued) | | Shares
| | | Value
(Note 2)
| |
| | | | | | | | | |
Energy Equipment & Services (continued) | | | | | |
National Oilwell Varco, Inc. | | | 80,000 | | | $ | 5,439,200 | |
Noble Corp. | | | 45,300 | | | | 1,368,966 | |
Rowan Cos., Inc.* | | | 21,500 | | | | 652,095 | |
Schlumberger Ltd. | | | 249,822 | | | | 17,065,341 | |
| | | | | | |
|
|
|
| | | | | | | | 41,856,150 | |
| | | | | | |
|
|
|
Food & Staples Retailing — 2.4% | | | | | |
Costco Wholesale Corp. | | | 81,632 | | | | 6,801,578 | |
CVS Caremark Corp. | | | 248,638 | | | | 10,139,458 | |
Kroger Co. (The) | | | 118,900 | | | | 2,879,758 | |
Safeway, Inc. | | | 66,800 | | | | 1,405,472 | |
SUPERVALU, Inc.(a) | | | 23,408 | | | | 190,073 | |
Sysco Corp.(a) | | | 112,600 | | | | 3,302,558 | |
Walgreen Co.(a) | | | 166,300 | | | | 5,497,878 | |
Wal-Mart Stores, Inc. | | | 326,800 | | | | 19,529,568 | |
Whole Foods Market, Inc. | | | 29,000 | | | | 2,017,820 | |
| | | | | | |
|
|
|
| | | | | | | | 51,764,163 | |
| | | | | | |
|
|
|
Food Products — 1.9% | | | | | |
Archer-Daniels-Midland Co. | | | 126,438 | | | | 3,616,127 | |
Campbell Soup Co.(a) | | | 34,900 | | | | 1,160,076 | |
ConAgra Foods, Inc. | | | 70,300 | | | | 1,855,920 | |
Dean Foods Co.* | | | 20,000 | | | | 224,000 | |
General Mills, Inc. | | | 120,100 | | | | 4,853,241 | |
H.J. Heinz Co.(a) | | | 59,450 | | | | 3,212,678 | |
Hershey Co. (The)(a) | | | 28,900 | | | | 1,785,442 | |
Hormel Foods Corp. | | | 27,600 | | | | 808,404 | |
J.M. Smucker Co. (The) | | | 20,300 | | | | 1,586,851 | |
Kellogg Co. | | | 45,100 | | | | 2,280,707 | |
Kraft Foods, Inc. (Class A Stock) | | | 327,211 | | | | 12,224,603 | |
McCormick & Co., Inc. | | | 24,800 | | | | 1,250,416 | |
Mead Johnson Nutrition Co. | | | 38,493 | | | | 2,645,624 | |
Sara Lee Corp. | | | 110,700 | | | | 2,094,444 | |
Tyson Foods, Inc. (Class A Stock) | | | 56,100 | | | | 1,157,904 | |
| | | | | | |
|
|
|
| | | | | | | | 40,756,437 | |
| | | | | | |
|
|
|
Gas Utilities — 0.1% | | | | | |
AGL Resources, Inc. | | | 16,637 | | | | 703,079 | |
ONEOK, Inc. | | | 18,120 | | | | 1,570,823 | |
| | | | | | |
|
|
|
| | | | | | | | 2,273,902 | |
| | | | | | |
|
|
|
Health Care Equipment & Supplies — 1.8% | | | | | |
Baxter International, Inc. | | | 108,100 | | | | 5,348,788 | |
Becton, Dickinson & Co. | | | 40,500 | | | | 3,026,160 | |
Boston Scientific Corp.* | | | 300,299 | | | | 1,603,597 | |
C.R. Bard, Inc. | | | 16,700 | | | | 1,427,850 | |
CareFusion Corp.* | | | 39,537 | | | | 1,004,635 | |
Covidien PLC | | | 93,700 | | | | 4,217,437 | |
DENTSPLY International, Inc. | | | 24,700 | | | | 864,253 | |
Edwards Lifesciences Corp.* | | | 20,200 | | | | 1,428,140 | |
Intuitive Surgical, Inc.* | | | 7,400 | | | | 3,426,274 | |
Medtronic, Inc. | | | 196,000 | | | | 7,497,000 | |
St. Jude Medical, Inc. | | | 62,700 | | | | 2,150,610 | |
Stryker Corp. | | | 63,700 | | | | 3,166,527 | |
Varian Medical Systems, Inc.*(a) | | | 22,500 | | | | 1,510,425 | |
Zimmer Holdings, Inc.* | | | 35,386 | | | | 1,890,320 | |
| | | | | | |
|
|
|
| | | | | | | | 38,562,016 | |
| | | | | | |
|
|
|
| | | | | | | | |
COMMON STOCKS
(continued) | | Shares
| | | Value
(Note 2)
| |
| | | | | | | | | |
Health Care Providers & Services — 2.1% | | | | | |
Aetna, Inc. | | | 72,348 | | | $ | 3,052,362 | |
AmerisourceBergen Corp. | | | 51,900 | | | | 1,930,161 | |
Cardinal Health, Inc. | | | 65,175 | | | | 2,646,757 | |
CIGNA Corp. | | | 52,100 | | | | 2,188,200 | |
Coventry Health Care, Inc.* | | | 27,650 | | | | 839,730 | |
DaVita, Inc.*(a) | | | 18,400 | | | | 1,394,904 | |
Express Scripts, Inc.*(a) | | | 91,700 | | | | 4,098,073 | |
Humana, Inc. | | | 32,800 | | | | 2,873,608 | |
Laboratory Corp. of America Holdings*(a) | | | 19,400 | | | | 1,667,818 | |
McKesson Corp. | | | 45,707 | | | | 3,561,032 | |
Medco Health Solutions, Inc.* | | | 72,992 | | | | 4,080,253 | |
Patterson Cos., Inc. | | | 15,900 | | | | 469,368 | |
Quest Diagnostics, Inc. | | | 28,100 | | | | 1,631,486 | |
Tenet Healthcare Corp.* | | | 80,000 | | | | 410,400 | |
UnitedHealth Group, Inc. | | | 203,200 | | | | 10,298,176 | |
WellPoint, Inc. | | | 68,700 | | | | 4,551,375 | |
| | | | | | |
|
|
|
| | | | | | | | 45,693,703 | |
| | | | | | |
|
|
|
Health Care Technology — 0.1% | | | | | |
Cerner Corp.* | | | 23,600 | | | | 1,445,500 | |
| | | | | | |
|
|
|
Hotels, Restaurants & Leisure — 2.0% | | | | | |
Carnival Corp. | | | 82,900 | | | | 2,705,856 | |
Chipotle Mexican Grill, Inc.*(a) | | | 5,500 | | | | 1,857,570 | |
Darden Restaurants, Inc.(a) | | | 25,350 | | | | 1,155,453 | |
International Game Technology | | | 56,100 | | | | 964,920 | |
Marriott International, Inc. (Class A Stock) | | | 49,403 | | | | 1,441,086 | |
McDonald’s Corp. | | | 191,800 | | | | 19,243,294 | |
Starbucks Corp. | | | 138,300 | | | | 6,363,183 | |
Starwood Hotels & Resorts Worldwide, Inc. | | | 32,800 | | | | 1,573,416 | |
Wyndham Worldwide Corp. | | | 32,563 | | | | 1,231,858 | |
Wynn Resorts Ltd. | | | 13,100 | | | | 1,447,419 | |
Yum! Brands, Inc. | | | 85,300 | | | | 5,033,553 | |
| | | | | | |
|
|
|
| | | | | | | | 43,017,608 | |
| | | | | | |
|
|
|
Household Durables — 0.2% | | | | | |
D.R. Horton, Inc.(a) | | | 45,200 | | | | 569,972 | |
Harman International Industries, Inc. | | | 14,100 | | | | 536,364 | |
Leggett & Platt, Inc.(a) | | | 28,200 | | | | 649,728 | |
Lennar Corp. (Class A Stock) | | | 25,700 | | | | 505,005 | |
Newell Rubbermaid, Inc. | | | 60,049 | | | | 969,791 | |
Pulte Group, Inc.*(a) | | | 48,385 | | | | 305,310 | |
Whirlpool Corp.(a) | | | 14,607 | | | | 693,102 | |
| | | | | | |
|
|
|
| | | | | | | | 4,229,272 | |
| | | | | | |
|
|
|
Household Products — 2.3% | | | | | |
Clorox Co. (The)(a) | | | 24,400 | | | | 1,624,064 | |
Colgate-Palmolive Co.(a) | | | 89,700 | | | | 8,287,383 | |
Kimberly-Clark Corp. | | | 73,388 | | | | 5,398,421 | |
Procter & Gamble Co. (The)(a) | | | 510,381 | | | | 34,047,517 | |
| | | | | | |
|
|
|
| | | | | | | | 49,357,385 | |
| | | | | | |
|
|
|
Independent Power Producers & Energy Traders — 0.2% | |
AES Corp. (The)* | | | 128,900 | | | | 1,526,176 | |
Constellation Energy Group, Inc. | | | 38,950 | | | | 1,545,146 | |
NRG Energy, Inc.* | | | 45,800 | | | | 829,896 | |
| | | | | | |
|
|
|
| | | | | | | | 3,901,218 | |
| | | | | | |
|
|
|
SEE NOTES TO FINANCIAL STATEMENTS.
A144
| | | | | | |
| | | STOCK INDEX PORTFOLIO (continued) | | |
| |
| SCHEDULE OF INVESTMENTS | | December 31, 2011 |
| | | | | | | | |
COMMON STOCKS
(continued) | | Shares
| | | Value
(Note 2)
| |
| | | | | | | | | |
Industrial Conglomerates — 2.5% | | | | | |
3M Co. | | | 131,300 | | | $ | 10,731,149 | |
Danaher Corp. | | | 101,500 | | | | 4,774,560 | |
General Electric Co. | | | 1,963,600 | | | | 35,168,076 | |
Tyco International Ltd. | | | 87,500 | | | | 4,087,125 | |
| | | | | | |
|
|
|
| | | | | | | | 54,760,910 | |
| | | | | | |
|
|
|
Insurance — 3.4% | | | | | |
ACE Ltd. | | | 64,300 | | | | 4,508,716 | |
Aflac, Inc. | | | 90,500 | | | | 3,915,030 | |
Allstate Corp. (The) | | | 100,288 | | | | 2,748,894 | |
American International Group, Inc.*(a) | | | 76,629 | | | | 1,777,793 | |
Aon Corp. | | | 62,425 | | | | 2,921,490 | |
Assurant, Inc. | | | 20,600 | | | | 845,836 | |
Berkshire Hathaway, Inc. (Class B Stock)* | | | 327,300 | | | | 24,972,990 | |
Chubb Corp. (The) | | | 52,900 | | | | 3,661,738 | |
Cincinnati Financial Corp. | | | 32,528 | | | | 990,803 | |
Genworth Financial, Inc. (Class A Stock)* | | | 103,200 | | | | 675,960 | |
Hartford Financial Services Group, Inc. (The) | | | 86,300 | | | | 1,402,375 | |
Lincoln National Corp.(a) | | | 58,963 | | | | 1,145,061 | |
Loews Corp. | | | 62,026 | | | | 2,335,279 | |
Marsh & McLennan Cos., Inc. | | | 103,400 | | | | 3,269,508 | |
MetLife, Inc. | | | 197,700 | | | | 6,164,286 | |
Principal Financial Group, Inc. | | | 63,600 | | | | 1,564,560 | |
Progressive Corp. (The) | | | 119,800 | | | | 2,337,298 | |
Torchmark Corp. | | | 22,550 | | | | 978,444 | |
Travelers Cos., Inc. (The) | | | 79,498 | | | | 4,703,897 | |
Unum Group | | | 63,456 | | | | 1,337,018 | |
XL Group PLC (Class A Stock) | | | 59,500 | | | | 1,176,315 | |
| | | | | | |
|
|
|
| | | | | | | | 73,433,291 | |
| | | | | | |
|
|
|
Internet & Catalog Retail — 0.8% | | | | | | | | |
Amazon.com, Inc.* | | | 66,700 | | | | 11,545,770 | |
Expedia, Inc.(a) | | | 18,800 | | | | 545,576 | |
Netflix, Inc.*(a) | | | 8,100 | | | | 561,249 | |
priceline.com, Inc.* | | | 9,200 | | | | 4,302,932 | |
TripAdvisor, Inc.*(a) | | | 18,800 | | | | 473,948 | |
| | | | | | |
|
|
|
| | | | | | | | 17,429,475 | |
| | | | | | |
|
|
|
Internet Software & Services — 2.0% | | | | | | | | |
Akamai Technologies, Inc.* | | | 33,500 | | | | 1,081,380 | |
eBay, Inc.* | | | 214,700 | | | | 6,511,851 | |
Google, Inc. (Class A Stock)* | | | 46,650 | | | | 30,131,235 | |
VeriSign, Inc. | | | 27,400 | | | | 978,728 | |
Yahoo!, Inc.* | | | 233,200 | | | | 3,761,516 | |
| | | | | | |
|
|
|
| | | | | | | | 42,464,710 | |
| | | | | | |
|
|
|
IT Services — 3.8% | | | | | | | | |
Accenture PLC (Ireland) (Class A Stock) | | | 119,400 | | | | 6,355,662 | |
Automatic Data Processing, Inc. | | | 92,200 | | | | 4,979,722 | |
Cognizant Technology Solutions Corp. (Class A Stock)* | | | 55,600 | | | | 3,575,636 | |
Computer Sciences Corp. | | | 29,900 | | | | 708,630 | |
Fidelity National Information Services, Inc. | | | 46,100 | | | | 1,225,799 | |
| | | | | | | | |
COMMON STOCKS
(continued) | | Shares
| | | Value
(Note 2)
| |
| | | | | | | | | |
IT Services (continued) | | | | | | | | |
Fiserv, Inc.* | | | 27,900 | | | $ | 1,638,846 | |
International Business Machines Corp. | | | 219,500 | | | | 40,361,660 | |
Mastercard, Inc. (Class A Stock) | | | 19,800 | | | | 7,381,836 | |
Paychex, Inc. | | | 61,250 | | | | 1,844,238 | |
SAIC, Inc.*(a) | | | 54,400 | | | | 668,576 | |
Teradata Corp.* | | | 31,200 | | | | 1,513,512 | |
Total System Services, Inc. | | | 29,993 | | | | 586,663 | |
Visa, Inc. (Class A Stock) | | | 95,000 | | | | 9,645,350 | |
Western Union Co. (The) | | | 115,004 | | | | 2,099,973 | |
| | | | | | |
|
|
|
| | | | | | | | 82,586,103 | |
| | | | | | |
|
|
|
Leisure Equipment & Products — 0.1% | | | | | | | | |
Hasbro, Inc. | | | 27,150 | | | | 865,813 | |
Mattel, Inc.(a) | | | 65,281 | | | | 1,812,201 | |
| | | | | | |
|
|
|
| | | | | | | | 2,678,014 | |
| | | | | | |
|
|
|
Life Sciences Tools & Services — 0.4% | | | | | | | | |
Agilent Technologies, Inc.* | | | 65,682 | | | | 2,294,272 | |
Life Technologies Corp.* | | | 35,430 | | | | 1,378,582 | |
PerkinElmer, Inc. | | | 23,200 | | | | 464,000 | |
Thermo Fisher Scientific, Inc.* | | | 72,900 | | | | 3,278,313 | |
Waters Corp.* | | | 17,700 | | | | 1,310,685 | |
| | | | | | |
|
|
|
| | | | | | | | 8,725,852 | |
| | | | | | |
|
|
|
Machinery — 2.0% | | | | | | | | |
Caterpillar, Inc.(a) | | | 118,500 | | | | 10,736,100 | |
Cummins, Inc. | | | 38,300 | | | | 3,371,166 | |
Deere & Co. | | | 77,800 | | | | 6,017,830 | |
Dover Corp. | | | 36,000 | | | | 2,089,800 | |
Eaton Corp. | | | 64,200 | | | | 2,794,626 | |
Flowserve Corp. | | | 9,400 | | | | 933,608 | |
Illinois Tool Works, Inc. | | | 92,600 | | | | 4,325,346 | |
Ingersoll-Rand PLC.(a) | | | 60,000 | | | | 1,828,200 | |
Joy Global, Inc. | | | 17,700 | | | | 1,326,969 | |
PACCAR, Inc.(a) | | | 66,128 | | | | 2,477,816 | |
Pall Corp. | | | 20,100 | | | | 1,148,715 | |
Parker Hannifin Corp. | | | 31,087 | | | | 2,370,384 | |
Snap-on, Inc. | | | 11,000 | | | | 556,820 | |
Stanley Black & Decker, Inc. | | | 31,535 | | | | 2,131,766 | |
Xylem, Inc. | | | 27,600 | | | | 709,044 | |
| | | | | | |
|
|
|
| | | | | | | | 42,818,190 | |
| | | | | | |
|
|
|
Media — 3.1% | | | | | | | | |
Cablevision Systems Corp. (Class A Stock) | | | 35,800 | | | | 509,076 | |
CBS Corp. (Class B Stock) | | | 122,868 | | | | 3,334,637 | |
Comcast Corp. (Class A Stock) | | | 510,346 | | | | 12,100,304 | |
DIRECTV (Class A Stock)*(a) | | | 138,300 | | | | 5,913,708 | |
Discovery Communications, Inc. (Class A Stock)* | | | 51,500 | | | | 2,109,955 | |
Gannett Co., Inc. | | | 42,900 | | | | 573,573 | |
Interpublic Group of Cos., Inc. (The) | | | 83,162 | | | | 809,166 | |
McGraw-Hill Cos., Inc. (The) | | | 57,100 | | | | 2,567,787 | |
News Corp. (Class A Stock) | | | 413,700 | | | | 7,380,408 | |
Omnicom Group, Inc.(a) | | | 53,100 | | | | 2,367,198 | |
Scripps Networks Interactive, Inc. (Class A Stock)(a) | | | 15,600 | | | | 661,752 | |
Time Warner Cable, Inc. | | | 57,226 | | | | 3,637,857 | |
Time Warner, Inc. | | | 188,140 | | | | 6,799,380 | |
SEE NOTES TO FINANCIAL STATEMENTS.
A145
| | | | | | |
| | | STOCK INDEX PORTFOLIO (continued) | | |
| |
| SCHEDULE OF INVESTMENTS | | December 31, 2011 |
| | | | | | | | |
COMMON STOCKS
(continued) | | Shares
| | | Value
(Note 2)
| |
| | | | | | | | | |
Media (continued) | | | | | | | | |
Viacom, Inc. (Class B Stock) | | | 108,168 | | | $ | 4,911,909 | |
Walt Disney Co. (The)(a) | | | 331,501 | | | | 12,431,287 | |
Washington Post Co. (The) (Class B Stock)(a) | | | 1,000 | | | | 376,810 | |
| | | | | | |
|
|
|
| | | | | | | | 66,484,807 | |
| | | | | | |
|
|
|
Metals & Mining — 0.9% | | | | | | | | |
Alcoa, Inc. | | | 204,576 | | | | 1,769,582 | |
Allegheny Technologies, Inc. | | | 14,040 | | | | 671,112 | |
Cliffs Natural Resources, Inc. | | | 27,000 | | | | 1,683,450 | |
Freeport-McMoRan Copper & Gold, Inc. | | | 177,412 | | | | 6,526,988 | |
Newmont Mining Corp. | | | 91,503 | | | | 5,491,095 | |
Nucor Corp. | | | 58,500 | | | | 2,314,845 | |
Titanium Metals Corp. | | | 8,000 | | | | 119,840 | |
United States Steel Corp.(a) | | | 21,140 | | | | 559,364 | |
| | | | | | |
|
|
|
| | | | | | | | 19,136,276 | |
| | | | | | |
|
|
|
Multiline Retail — 0.8% | | | | | | | | |
Big Lots, Inc.* | | | 11,300 | | | | 426,688 | |
Dollar Tree, Inc.* | | | 20,100 | | | | 1,670,511 | |
Family Dollar Stores, Inc. | | | 23,100 | | | | 1,331,946 | |
J.C. Penney Co., Inc.(a) | | | 22,700 | | | | 797,905 | |
Kohl’s Corp. | | | 49,400 | | | | 2,437,890 | |
Macy’s, Inc. | | | 78,420 | | | | 2,523,556 | |
Nordstrom, Inc. | | | 30,100 | | | | 1,496,271 | |
Sears Holdings Corp.*(a) | | | 5,000 | | | | 158,900 | |
Target Corp. | | | 126,468 | | | | 6,477,691 | |
| | | | | | |
|
|
|
| | | | | | | | 17,321,358 | |
| | | | | | |
|
|
|
Multi-Utilities — 1.4% | | | | | | | | |
Ameren Corp. | | | 45,300 | | | | 1,500,789 | |
CenterPoint Energy, Inc. | | | 72,810 | | | | 1,462,753 | |
CMS Energy Corp. | | | 41,900 | | | | 925,152 | |
Consolidated Edison, Inc.(a) | | | 51,200 | | | | 3,175,936 | |
Dominion Resources, Inc. | | | 105,184 | | | | 5,583,166 | |
DTE Energy Co. | | | 32,000 | | | | 1,742,400 | |
Integrys Energy Group, Inc. | | | 14,150 | | | | 766,647 | |
NiSource, Inc.(a) | | | 51,100 | | | | 1,216,691 | |
PG&E Corp. | | | 73,500 | | | | 3,029,670 | |
Public Service Enterprise Group, Inc. | | | 96,500 | | | | 3,185,465 | |
SCANA Corp.(a) | | | 22,200 | | | | 1,000,332 | |
Sempra Energy | | | 45,654 | | | | 2,510,970 | |
TECO Energy, Inc. | | | 40,400 | | | | 773,256 | |
Wisconsin Energy Corp. | | | 45,200 | | | | 1,580,192 | |
Xcel Energy, Inc. | | | 90,095 | | | | 2,490,226 | |
| | | | | | |
|
|
|
| | | | | | | | 30,943,645 | |
| | | | | | |
|
|
|
Office Electronics — 0.1% | | | | | |
Xerox Corp. | | | 268,511 | | | | 2,137,348 | |
| | | | | | |
|
|
|
Oil, Gas & Consumable Fuels — 10.1% | | | | | |
Alpha Natural Resources, Inc.* | | | 39,605 | | | | 809,130 | |
Anadarko Petroleum Corp. | | | 91,126 | | | | 6,955,648 | |
Apache Corp. | | | 72,850 | | | | 6,598,753 | |
Cabot Oil & Gas Corp. | | | 20,300 | | | | 1,540,770 | |
Chesapeake Energy Corp.(a) | | | 123,900 | | | | 2,761,731 | |
Chevron Corp. | | | 372,892 | | | | 39,675,709 | |
ConocoPhillips | | | 251,079 | | | | 18,296,127 | |
| | | | | | | | |
COMMON STOCKS
(continued) | | Shares
| | | Value
(Note 2)
| |
| | | | | | | | | |
Oil, Gas & Consumable Fuels (continued) | | | | | |
Consol Energy, Inc. | | | 42,500 | | | $ | 1,559,750 | |
Denbury Resources, Inc.* | | | 73,300 | | | | 1,106,830 | |
Devon Energy Corp. | | | 76,500 | | | | 4,743,000 | |
El Paso Corp. | | | 137,911 | | | | 3,664,295 | |
EOG Resources, Inc. | | | 49,500 | | | | 4,876,245 | |
EQT Corp. | | | 26,400 | | | | 1,446,456 | |
Exxon Mobil Corp. | | | 891,654 | | | | 75,576,593 | |
Hess Corp. | | | 57,000 | | | | 3,237,600 | |
Marathon Oil Corp. | | | 136,894 | | | | 4,006,887 | |
Marathon Petroleum Corp. | | | 68,447 | | | | 2,278,601 | |
Murphy Oil Corp. | | | 38,600 | | | | 2,151,564 | |
Newfield Exploration Co.* | | | 23,700 | | | | 894,201 | |
Noble Energy, Inc. | | | 33,100 | | | | 3,124,309 | |
Occidental Petroleum Corp. | | | 151,700 | | | | 14,214,290 | |
Peabody Energy Corp. | | | 51,400 | | | | 1,701,854 | |
Pioneer Natural Resources Co. | | | 21,200 | | | | 1,896,976 | |
QEP Resources, Inc. | | | 33,200 | | | | 972,760 | |
Range Resources Corp. | | | 29,500 | | | | 1,827,230 | |
Southwestern Energy Co.* | | | 67,300 | | | | 2,149,562 | |
Spectra Energy Corp. | | | 121,242 | | | | 3,728,191 | |
Sunoco, Inc.(a) | | | 21,500 | | | | 881,930 | |
Tesoro Corp.*(a) | | | 29,100 | | | | 679,776 | |
Valero Energy Corp. | | | 105,300 | | | | 2,216,565 | |
Williams Cos., Inc. (The) | | | 108,400 | | | | 3,579,368 | |
| | | | | | |
|
|
|
| | | | | | | | 219,152,701 | |
| | | | | | |
|
|
|
Paper & Forest Products — 0.2% | | | | | |
International Paper Co. | | | 82,867 | | | | 2,452,863 | |
MeadWestvaco Corp. | | | 33,989 | | | | 1,017,971 | |
| | | | | | |
|
|
|
| | | | | | | | 3,470,834 | |
| | | | | | |
|
|
|
Personal Products — 0.2% | | | | | |
Avon Products, Inc. | | | 78,700 | | | | 1,374,889 | |
Estee Lauder Cos., Inc. (The) (Class A Stock) | | | 21,100 | | | | 2,369,952 | |
| | | | | | |
|
|
|
| | | | | | | | 3,744,841 | |
| | | | | | |
|
|
|
Pharmaceuticals — 6.2% | | | | | |
Abbott Laboratories | | | 291,100 | | | | 16,368,553 | |
Allergan, Inc. | | | 57,200 | | | | 5,018,728 | |
Bristol-Myers Squibb Co. | | | 318,040 | | | | 11,207,730 | |
Eli Lilly & Co. | | | 189,400 | | | | 7,871,464 | |
Forest Laboratories, Inc.* | | | 52,600 | | | | 1,591,676 | |
Hospira, Inc.* | | | 28,920 | | | | 878,300 | |
Johnson & Johnson | | | 506,771 | | | | 33,234,042 | |
Merck & Co., Inc. | | | 573,504 | | | | 21,621,094 | |
Mylan, Inc.* | | | 76,300 | | | | 1,637,398 | |
Perrigo Co. | | | 15,000 | | | | 1,459,500 | |
Pfizer, Inc. | | | 1,430,873 | | | | 30,964,092 | |
Watson Pharmaceuticals, Inc.* | | | 23,300 | | | | 1,405,922 | |
| | | | | | |
|
|
|
| | | | | | | | 133,258,499 | |
| | | | | | |
|
|
|
Professional Services — 0.1% | | | | | |
Dun & Bradstreet Corp. (The) | | | 8,800 | | | | 658,504 | |
Equifax, Inc.(a) | | | 22,800 | | | | 883,272 | |
Robert Half International, Inc. | | | 27,700 | | | | 788,342 | |
| | | | | | |
|
|
|
| | | | | | | | 2,330,118 | |
| | | | | | |
|
|
|
SEE NOTES TO FINANCIAL STATEMENTS.
A146
| | | | | | |
| | | STOCK INDEX PORTFOLIO (continued) | | |
| |
| SCHEDULE OF INVESTMENTS | | December 31, 2011 |
| | | | | | | | |
COMMON STOCKS
(continued) | | Shares
| | | Value
(Note 2)
| |
| | | | | | | | | |
Real Estate Investment Trusts — 1.7% | | | | | |
Apartment Investment & Management Co. (Class A Stock)(a) | | | 21,974 | | | $ | 503,424 | |
AvalonBay Communities, Inc. | | | 16,018 | | | | 2,091,951 | |
Boston Properties, Inc. | | | 28,100 | | | | 2,798,760 | |
Equity Residential | | | 52,700 | | | | 3,005,481 | |
HCP, Inc.(a) | | | 73,200 | | | | 3,032,676 | |
Health Care REIT, Inc.(a) | | | 31,300 | | | | 1,706,789 | |
Host Hotels & Resorts, Inc. | | | 123,726 | | | | 1,827,433 | |
Kimco Realty Corp. | | | 76,400 | | | | 1,240,736 | |
Plum Creek Timber Co., Inc.(a) | | | 27,000 | | | | 987,120 | |
ProLogis, Inc. | | | 81,228 | | | | 2,322,309 | |
Public Storage(a) | | | 27,100 | | | | 3,643,866 | |
Simon Property Group, Inc. | | | 55,501 | | | | 7,156,299 | |
Ventas, Inc. | | | 51,204 | | | | 2,822,876 | |
Vornado Realty Trust | | | 33,257 | | | | 2,556,133 | |
Weyerhaeuser Co. | | | 99,310 | | | | 1,854,118 | |
| | | | | | |
|
|
|
| | | | | | | | 37,549,971 | |
| | | | | | |
|
|
|
Real Estate Management & Development | | | | | |
CBRE Group, Inc. (Class A Stock)* | | | 51,100 | | | | 777,742 | |
| | | | | | |
|
|
|
Road & Rail — 0.9% | | | | | |
CSX Corp. | | | 207,872 | | | | 4,377,784 | |
Norfolk Southern Corp. | | | 66,600 | | | | 4,852,476 | |
Ryder System, Inc. | | | 10,700 | | | | 568,598 | |
Union Pacific Corp. | | | 90,300 | | | | 9,566,382 | |
| | | | | | |
|
|
|
| | | | | | | | 19,365,240 | |
| | | | | | |
|
|
|
Semiconductors & Semiconductor Equipment — 2.3% | |
Advanced Micro Devices, Inc.*(a) | | | 102,600 | | | | 554,040 | |
Altera Corp. | | | 57,500 | | | | 2,133,250 | |
Analog Devices, Inc. | | | 56,000 | | | | 2,003,680 | |
Applied Materials, Inc. | | | 251,000 | | | | 2,688,210 | |
Broadcom Corp. (Class A Stock) | | | 84,750 | | | | 2,488,260 | |
First Solar, Inc.*(a) | | | 8,600 | | | | 290,336 | |
Intel Corp. | | | 956,400 | | | | 23,192,700 | |
KLA-Tencor Corp. | | | 32,000 | | | | 1,544,000 | |
Linear Technology Corp. | | | 43,500 | | | | 1,306,305 | |
LSI Corp.* | | | 118,000 | | | | 702,100 | |
Microchip Technology, Inc.(a) | | | 28,900 | | | | 1,058,607 | |
Micron Technology, Inc.* | | | 149,600 | | | | 940,984 | |
Novellus Systems, Inc.* | | | 14,600 | | | | 602,834 | |
NVIDIA Corp.*(a) | | | 108,250 | | | | 1,500,345 | |
Teradyne, Inc.*(a) | | | 34,200 | | | | 466,146 | |
Texas Instruments, Inc. | | | 214,700 | | | | 6,249,917 | |
Xilinx, Inc. | | | 44,000 | | | | 1,410,640 | |
| | | | | | |
|
|
|
| | | | | | | | 49,132,354 | |
| | | | | | |
|
|
|
Software — 3.4% | |
Adobe Systems, Inc.*(a) | | | 94,600 | | | | 2,674,342 | |
Autodesk, Inc.* | | | 41,400 | | | | 1,255,662 | |
BMC Software, Inc.* | | | 32,700 | | | | 1,071,906 | |
CA, Inc. | | | 74,773 | | | | 1,511,536 | |
Citrix Systems, Inc.* | | | 35,400 | | | | 2,149,488 | |
Electronic Arts, Inc.* | | | 58,900 | | | | 1,213,340 | |
Intuit, Inc. | | | 56,500 | | | | 2,971,335 | |
Microsoft Corp. | | | 1,383,900 | | | | 35,926,044 | |
Oracle Corp. | | | 735,220 | | | | 18,858,393 | |
Red Hat, Inc.* | | | 35,600 | | | | 1,469,924 | |
| | | | | | | | |
COMMON STOCKS
(continued) | | Shares
| | | Value
(Note 2)
| |
| | | | | | | | | |
Software (continued) | |
Salesforce.com, Inc.*(a) | | | 23,400 | | | $ | 2,374,164 | |
Symantec Corp.* | | | 146,111 | | | | 2,286,637 | |
| | | | | | |
|
|
|
| | | | | | | | 73,762,771 | |
| | | | | | |
|
|
|
Specialty Retail — 2.0% | |
Abercrombie & Fitch Co. (Class A Stock) | | | 15,700 | | | | 766,788 | |
AutoNation, Inc.*(a) | | | 9,689 | | | | 357,233 | |
AutoZone, Inc.* | | | 5,000 | | | | 1,624,850 | |
Bed Bath & Beyond, Inc.* | | | 45,900 | | | | 2,660,823 | |
Best Buy Co., Inc. | | | 58,525 | | | | 1,367,729 | |
CarMax, Inc.*(a) | | | 40,000 | | | | 1,219,200 | |
GameStop Corp. (Class A Stock)*(a) | | | 26,800 | | | | 646,684 | |
Gap, Inc. (The) | | | 67,587 | | | | 1,253,739 | |
Home Depot, Inc. (The) | | | 290,519 | | | | 12,213,419 | |
Limited Brands, Inc.(a) | | | 44,796 | | | | 1,807,519 | |
Lowe’s Cos., Inc.(a) | | | 234,700 | | | | 5,956,686 | |
O’Reilly Automotive, Inc.* | | | 24,500 | | | | 1,958,775 | |
Orchard Supply Hardware Stores Corp. (Class A Stock)* | | | 303 | | | | 679 | |
Ross Stores, Inc. | | | 43,800 | | | | 2,081,814 | |
Staples, Inc. | | | 133,000 | | | | 1,847,370 | |
Tiffany & Co. | | | 20,900 | | | | 1,384,834 | |
TJX Cos., Inc. | | | 72,800 | | | | 4,699,240 | |
Urban Outfitters, Inc.*(a) | | | 19,000 | | | | 523,640 | |
| | | | | | |
|
|
|
| | | | | | | | 42,371,022 | |
| | | | | | |
|
|
|
Textiles, Apparel & Luxury Goods — 0.6% | |
Coach, Inc. | | | 56,800 | | | | 3,467,072 | |
NIKE, Inc. (Class B Stock) | | | 69,300 | | | | 6,678,441 | |
Ralph Lauren Corp. | | | 12,400 | | | | 1,712,192 | |
VF Corp. | | | 15,536 | | | | 1,972,917 | |
| | | | | | |
|
|
|
| | | | | | | | 13,830,622 | |
| | | | | | |
|
|
|
Thrifts & Mortgage Finance — 0.1% | |
Hudson City Bancorp, Inc.(a) | | | 107,200 | | | | 670,000 | |
People’s United Financial, Inc.(a) | | | 64,900 | | | | 833,965 | |
| | | | | | |
|
|
|
| | | | | | | | 1,503,965 | |
| | | | | | |
|
|
|
Tobacco — 2.0% | |
Altria Group, Inc. | | | 376,600 | | | | 11,166,190 | |
Lorillard, Inc. | | | 25,631 | | | | 2,921,934 | |
Philip Morris International, Inc. | | | 323,100 | | | | 25,356,888 | |
Reynolds American, Inc. | | | 64,300 | | | | 2,663,306 | |
| | | | | | |
|
|
|
| | | | | | | | 42,108,318 | |
| | | | | | |
|
|
|
Trading Companies & Distributors — 0.2% | |
Fastenal Co.(a) | | | 51,600 | | | | 2,250,276 | |
W.W. Grainger, Inc. | | | 11,000 | | | | 2,059,090 | |
| | | | | | |
|
|
|
| | | | | | | | 4,309,366 | |
| | | | | | |
|
|
|
Wireless Telecommunication Services — 0.3% | |
American Tower Corp. | | | 72,500 | | | | 4,350,725 | |
MetroPCS Communications, Inc.* | | | 47,100 | | | | 408,828 | |
Sprint Nextel Corp.* | | | 579,622 | | | | 1,356,315 | |
| | | | | | |
|
|
|
| | | | | | | | 6,115,868 | |
| | | | | | |
|
|
|
TOTAL COMMON STOCKS
(cost $1,190,295,768) | | | | 2,119,266,445 | |
| | | | | | |
|
|
|
SEE NOTES TO FINANCIAL STATEMENTS.
A147
| | | | | | |
| | | STOCK INDEX PORTFOLIO (continued) | | |
| |
| SCHEDULE OF INVESTMENTS | | December 31, 2011 |
| | | | | | | | |
PREFERRED STOCK | | Shares
| | | Value
(Note 2)
| |
| | | | | | | | | |
Specialty Retail | | | | | | | | |
Orchard Supply Hardware Stores Corp., Ser. A*
(cost $294) | | | 303 | | | $ | 679 | |
| | | | | | |
|
|
|
TOTAL LONG-TERM INVESTMENTS
(cost $1,190,296,062) | | | | 2,119,267,124 | |
| | | | | | |
|
|
|
| SHORT-TERM INVESTMENTS — 9.9% | |
Affiliated Money Market Mutual Fund — 9.7% | |
Prudential Investment Portfolios 2 — Prudential Core Taxable Money Market Fund
(cost $210,002,906; includes $174,111,005 of cash collateral received for securities on loan)
(Note 4)(b)(c) | | | 210,002,906 | | | | 210,002,906 | |
| | | | | | |
|
|
|
| | |
| | | Principal
Amount
(000)
| | | | |
U.S Government Obligation — 0.2% | | | | | | | | |
U.S. Treasury Bill,
0.06%, 06/28/2012
(cost $3,498,999)(d)(e) | | $ | 3,500 | | | | 3,498,967 | |
| | | | | | |
|
|
|
TOTAL SHORT-TERM INVESTMENTS
(cost $213,501,905) | | | | 213,501,873 | |
| | | | | | |
|
|
|
TOTAL INVESTMENTS — 107.9%
(cost $1,403,797,967) | | | | 2,332,768,997 | |
LIABILITIES IN EXCESS OF
OTHER ASSETS(f) — (7.9%) | | | | (170,357,650 | ) |
| | | | | | |
|
|
|
NET ASSETS — 100.0% | | | $ | 2,162,411,347 | |
| | | | | | |
|
|
|
| * | Non-income producing security. |
| (a) | All or a portion of security is on loan. The aggregate market value of such securities, including those sold and pending settlement, is $169,090,459; cash collateral of $174,111,005 (included in liabilities) was received with which the Portfolio purchased highly liquid short-term investments. |
| (b) | Represents security, or a portion thereof, purchased with cash collateral received for securities on loan. |
| (c) | Prudential Investments LLC, the manager of the Portfolio, also serves as manager of the Prudential Investment Portfolios 2 —Prudential Core Taxable Money Market Fund. |
| (d) | Rate quoted represents yield-to-maturity as of purchase date. |
| (e) | Represents security, or a portion thereof, segregated as collateral for futures contracts. |
| (f) | Includes net unrealized appreciation on the following derivative contracts held at reporting period end: |
Open futures contracts outstanding at December 31, 2011:
| | | | | | | | | | | | | | | | | | |
Number of
Contracts
| | Type
| | Expiration
Date
| | | Value at
Trade Date
| | | Value at
December 31, 2011
| | | Unrealized
Appreciation
| |
| Long Position: | | | | | | | | | | | | | | | | | | |
| 137 | | S&P 500 Index | | | Mar. 2012 | | | $ | 41,953,848 | | | $ | 42,901,550 | | | $ | 947,702 | |
| | | | | | | | | | | | | | | | |
|
|
|
Various inputs are used in determining the value of the Portfolio’s investments. These inputs are summarized in the three broad levels listed below.
| Level 1— | quoted prices generally for securities actively traded on a regulated securities exchange and for open-end mutual funds which trade at daily net asset value. |
| Level 2— | other significant observable inputs (including, but not limited to, quoted prices for similar securities, interest rates, prepayment speeds, foreign currency exchange rates, and amortized cost) generally for debt securities, swaps, forward foreign currency contracts and for foreign stocks priced using vendor modeling tools. |
| Level 3— | significant unobservable inputs for securities valued in accordance with Board approved fair valuation procedures. |
The following is a summary of the inputs used as of December 31, 2011 in valuing such portfolio securities:
| | | | | | | | | | | | |
| | | Level 1
| | | Level 2
| | | Level 3
| |
Investments in Securities | | | | | | | | | | | | |
Common Stocks | | $ | 2,119,265,766 | | | $ | — | | | $ | 679 | |
Preferred Stock | | | — | | | | — | | | | 679 | |
U.S. Government Obligation | | | — | | | | 3,498,967 | | | | — | |
Affiliated Money Market Mutual Fund | | | 210,002,906 | | | | — | | | | — | |
Other Financial Instruments* | | | | | | | | | | | | |
Futures | | | 947,702 | | | | — | | | | — | |
| | |
|
|
| |
|
|
| |
|
|
|
Total | | $ | 2,330,216,374 | | | $ | 3,498,967 | | | $ | 1,358 | |
| | |
|
|
| |
|
|
| |
|
|
|
| * | Other financial instruments are derivative instruments not reflected in the Schedule of Investments, such as futures, forwards and swap contracts, which are recorded at the unrealized appreciation/depreciation on the instrument. |
SEE NOTES TO FINANCIAL STATEMENTS.
A148
| | | | | | |
| | | STOCK INDEX PORTFOLIO (continued) | | |
| |
| SCHEDULE OF INVESTMENTS | | December 31, 2011 |
The industry classification of portfolio holdings and liabilities in excess of other assets shown as a percentage of net assets as of December 31, 2011 was as follows:
| | | | |
Oil, Gas & Consumable Fuels | | | 10.1 | % |
Affiliated Money Market Mutual Fund (including 8.1% of collateral received for securities on loan) | | | 9.7 | |
Pharmaceuticals | | | 6.2 | |
Computers & Peripherals | | | 4.5 | |
IT Services | | | 3.8 | |
Insurance | | | 3.4 | |
Software | | | 3.4 | |
Media | | | 3.1 | |
Diversified Telecommunication Services | | | 2.8 | |
Aerospace & Defense | | | 2.6 | |
Beverages | | | 2.6 | |
Commercial Banks | | | 2.6 | |
Diversified Financial Services | | | 2.6 | |
Industrial Conglomerates | | | 2.5 | |
Food & Staples Retailing | | | 2.4 | |
Household Products | | | 2.3 | |
Semiconductors & Semiconductor Equipment | | | 2.3 | |
Chemicals | | | 2.2 | |
Communications Equipment | | | 2.1 | |
Health Care Providers & Services | | | 2.1 | |
Electric Utilities | | | 2.0 | |
Hotels, Restaurants & Leisure | | | 2.0 | |
Internet Software & Services | | | 2.0 | |
Machinery | | | 2.0 | |
Specialty Retail | | | 2.0 | |
Tobacco | | | 2.0 | |
Energy Equipment & Services | | | 1.9 | |
Food Products | | | 1.9 | |
Capital Markets | | | 1.8 | |
Health Care Equipment & Supplies | | | 1.8 | |
Real Estate Investment Trusts | | | 1.7 | |
Multi-Utilities | | | 1.4 | |
| | | | |
Biotechnology | | | 1.2 | % |
Air Freight & Logistics | | | 1.0 | |
Metals & Mining | | | 0.9 | |
Road & Rail | | | 0.9 | |
Consumer Finance | | | 0.8 | |
Internet & Catalog Retail | | | 0.8 | |
Multiline Retail | | | 0.8 | |
Textiles, Apparel & Luxury Goods | | | 0.6 | |
Electrical Equipment | | | 0.5 | |
Automobiles | | | 0.4 | |
Commercial Services & Supplies | | | 0.4 | |
Electronic Equipment, Instruments & Components | | | 0.4 | |
Life Sciences Tools & Services | | | 0.4 | |
Auto Components | | | 0.3 | |
Wireless Telecommunication Services | | | 0.3 | |
Construction & Engineering | | | 0.2 | |
Household Durables | | | 0.2 | |
Independent Power Producers & Energy Traders | | | 0.2 | |
Paper & Forest Products | | | 0.2 | |
Personal Products | | | 0.2 | |
Trading Companies & Distributors | | | 0.2 | |
U.S Government Obligation | | | 0.2 | |
Airline | | | 0.1 | |
Containers & Packaging | | | 0.1 | |
Distributors | | | 0.1 | |
Diversified Consumer Services | | | 0.1 | |
Gas Utilities | | | 0.1 | |
Health Care Technology | | | 0.1 | |
Leisure Equipment & Products | | | 0.1 | |
Office Electronics | | | 0.1 | |
Professional Services | | | 0.1 | |
Thrifts & Mortgage Finance | | | 0.1 | |
| | |
|
|
|
| | | | 107.9 | |
Liabilities in excess of other assets | | | (7.9 | ) |
| | |
|
|
|
| | | | 100.0 | % |
| | |
|
|
|
The Portfolio invested in derivative instruments during the reporting period. The primary types of risk associated with derivative instruments is equity risk. The effect of such derivative instruments on the Portfolio’s financial position and financial performance as reflected in the Statement of Assets and Liabilities and Statement of Operations is presented in the summary below.
Fair values of derivative instruments as of December 31, 2011 as presented in the Statement of Assets and Liabilities:
| | | | | | | | | | | | |
Derivatives not designated as hedging
instruments, carried at fair value
| | Asset Derivatives
| | | Liability Derivatives
| |
| | Balance Sheet Location
| | Fair Value
| | | Balance Sheet Location
| | Fair Value
| |
Equity contracts | | Due from broker — variation margin | | $ | 947,702 | * | | — | | $ | — | |
| | | | |
|
|
| | | |
|
|
|
| * | Includes cumulative appreciation/depreciation on futures contracts as reported in the Schedule of Investments. Only unsettled variation margin receivable (payable) is reported within the Statement of Assets and Liabilities. |
The effects of derivative instruments on the Statement of Operations for the period ended December 31, 2011 are as follows:
| | | | | | | | | | | | |
Amount of Realized Gain or (Loss) on Derivatives Recognized in Income
| |
Derivatives not designated as hedging instruments, carried at fair value
| | Futures
| | | Warrants
| | | Total
| |
Equity contracts | | $ | 825,369 | | | $ | (18,588 | ) | | $ | 806,781 | |
| | |
|
|
| |
|
|
| |
|
|
|
| | | | |
|
Change in Unrealized Appreciation or (Depreciation) on Derivatives Recognized in Income
| |
Derivatives not designated as hedging instruments, carried at fair value
| | Futures
| |
Equity contracts | | $ | 356,453 | |
| | |
|
|
|
For the year ended December 31, 2011, the average value at trade date for futures long position was $43,234,469
SEE NOTES TO FINANCIAL STATEMENTS.
A149
| | | | | | |
| | | STOCK INDEX PORTFOLIO (continued) | | |
STATEMENT OF ASSETS AND LIABILITIES December 31, 2011
| | | | |
| ASSETS | | | | |
Investments, at value including securities on loan of $169,090,459: | | | | |
Unaffiliated investments (cost $1,193,795,061) | | $ | 2,122,766,091 | |
Affiliated investments (cost $210,002,906) | | | 210,002,906 | |
Dividends and interest receivable | | | 3,245,787 | |
Receivable for investments sold | | | 2,248,564 | |
Prepaid expenses | | | 13,956 | |
Receivable for Series shares sold | | | 4,674 | |
| | |
|
|
|
Total Assets | | | 2,338,281,978 | |
| | |
|
|
|
| LIABILITIES | | | | |
Collateral for securities on loan | | | 174,111,005 | |
Payable for Series shares repurchased | | | 765,796 | |
Management fee payable | | | 547,067 | |
Due to broker-variation margin | | | 164,400 | |
Accrued expenses and other liabilities | | | 155,468 | |
Payable for investments purchased | | | 83,910 | |
Payable to custodian | | | 42,059 | |
Affiliated transfer agent fee payable | | | 926 | |
| | |
|
|
|
Total Liabilities | | | 175,870,631 | |
| | |
|
|
|
| NET ASSETS | | $ | 2,162,411,347 | |
| | |
|
|
|
Net assets were comprised of: | | | | |
Paid-in capital | | $ | 1,236,642,834 | |
Retained earnings | | | 925,768,513 | |
| | |
|
|
|
Net assets, December 31, 2011 | | $ | 2,162,411,347 | |
| | |
|
|
|
Net asset value and redemption price per share, $2,162,411,347 / 68,721,804 outstanding shares of beneficial interest | | $ | 31 .47 | |
| | |
|
|
|
STATEMENT OF OPERATIONS
Year Ended December 31, 2011
| | | | |
| INVESTMENT INCOME | | | | |
Unaffiliated dividend income (net of foreign withholding taxes of $1,261) | | $ | 45,856,840 | |
Affiliated income from securities loaned, net | | | 320,619 | |
Affiliated dividend income | | | 73,948 | |
Interest | | | 4,930 | |
| | |
|
|
|
| | | | 46,256,337 | |
| | |
|
|
|
| EXPENSES | | | | |
Management fee | | | 7,841,258 | |
Custodian’s fees and expenses | | | 242,000 | |
Shareholders’ reports | | | 240,000 | |
Trustees’ fees | | | 31,000 | |
Insurance expenses | | | 25,000 | |
Audit fee | | | 19,000 | |
Legal fees and expenses | | | 13,000 | |
Transfer agent’s fee and expenses (including affiliated expense of $5,500) (Note 4) | | | 12,000 | |
Commitment fee on syndicated credit agreement | | | 9,000 | |
Miscellaneous | | | 15,784 | |
| | |
|
|
|
Total expenses | | | 8,448,042 | |
Less: Management fee waiver (Note 3) | | | (1,120,180 | ) |
| | |
|
|
|
Net expenses | | | 7,327,862 | |
| | |
|
|
|
| NET INVESTMENT INCOME | | | 38,928,475 | |
| | |
|
|
|
| NET REALIZED AND UNREALIZED GAIN (LOSS) ON INVESTMENTS | | | | |
Net realized gain on: | | | | |
Investment transactions | | | 30,219,312 | |
Futures transactions | | | 825,369 | |
| | |
|
|
|
| | | | 31,044,681 | |
| | |
|
|
|
Net change in unrealized appreciation (depreciation) on: | | | | |
Investments | | | (25,929,941 | ) |
Futures | | | 356,453 | |
| | |
|
|
|
| | | | (25,573,488 | ) |
| | |
|
|
|
| NET GAIN ON INVESTMENTS | | | 5,471,193 | |
| | |
|
|
|
| NET INCREASE IN NET ASSETS RESULTING FROM OPERATIONS | | $ | 44,399,668 | |
| | |
|
|
|
STATEMENT OF CHANGES IN NET ASSETS
| | | | | | | | |
| | | Year Ended December 31,
| |
| | | 2011
| | | 2010
| |
| INCREASE (DECREASE) IN NET ASSETS | | | | | | | | |
| OPERATIONS: | | | | | | | | |
Net investment income | | $ | 38,928,475 | | | $ | 36,017,691 | |
Net realized gain (loss) on investments | | | 31,044,681 | | | | 26,323,776 | |
Net change in unrealized appreciation (depreciation) on investments | | | (25,573,488 | ) | | | 229,703,996 | |
| | |
|
|
| |
|
|
|
NET INCREASE IN NET ASSETS RESULTING FROM OPERATIONS | | | 44,399,668 | | | | 292,045,463 | |
| | |
|
|
| |
|
|
|
| DISTRIBUTIONS | | | (36,002,280 | ) | | | (37,719,877 | ) |
| | |
|
|
| |
|
|
|
| SERIES SHARE TRANSACTIONS: | | | | | | | | |
Series shares sold [1,251,307 and 2,969,405 shares, respectively] | | | 39,571,327 | | | | 85,912,285 | |
Series shares issued in reinvestment of distributions [1,145,475 and 1,398,068 shares, respectively] | | | 36,002,280 | | | | 37,719,877 | |
Series shares repurchased [6,278,327 and 6,996,110 shares, respectively] | | | (199,110,942 | ) | | | (198,465,748 | ) |
| | |
|
|
| |
|
|
|
NET DECREASE IN NET ASSETS RESULTING FROM SERIES SHARE TRANSACTIONS | | | (123,537,335 | ) | | | (74,833,586 | ) |
| | |
|
|
| |
|
|
|
| TOTAL INCREASE (DECREASE) IN NET ASSETS | | | (115,139,947 | ) | | | 179,492,000 | |
| NET ASSETS: | | | | | | | | |
Beginning of year | | | 2,277,551,294 | | | | 2,098,059,294 | |
| | |
|
|
| |
|
|
|
End of year | | $ | 2,162,411,347 | | | $ | 2,277,551,294 | |
| | |
|
|
| |
|
|
|
SEE NOTES TO FINANCIAL STATEMENTS.
A150
| | | | | | |
| | | VALUE PORTFOLIO | | |
| |
| SCHEDULE OF INVESTMENTS | | December 31, 2011 |
| | | | | | | | |
| LONG-TERM INVESTMENTS — 98.0% | |
| COMMON STOCKS | | Shares
| | | Value
(Note 2)
| |
| | | | | | | | | |
Aerospace & Defense — 2.8% | | | | | | | | |
Boeing Co. (The) | | | 143,970 | | | $ | 10,560,199 | |
Northrop Grumman Corp. | | | 300,091 | | | | 17,549,322 | |
United Technologies Corp. | | | 84,002 | | | | 6,139,706 | |
| | | | | | |
|
|
|
| | | | | | | | 34,249,227 | |
| | | | | | |
|
|
|
Airlines — 1.4% | | | | | | | | |
United Continental Holdings, Inc.*(a) | | | 930,334 | | | | 17,555,403 | |
| | | | | | |
|
|
|
Auto Components — 2.1% | | | | | | | | |
Lear Corp. | | | 660,497 | | | | 26,287,781 | |
| | | | | | |
|
|
|
Automobiles — 1.3% | | | | | | | | |
General Motors Co.*(a) | | | 800,191 | | | | 16,219,872 | |
| | | | | | |
|
|
|
Capital Markets — 4.9% | | | | | | | | |
Bank of New York Mellon Corp. (The)(a) | | | 567,449 | | | | 11,297,910 | |
Goldman Sachs Group, Inc. (The) | | | 198,928 | | | | 17,989,059 | |
Lazard Ltd. (Class A Stock) | | | 414,102 | | | | 10,812,203 | |
Morgan Stanley(a) | | | 1,332,814 | | | | 20,165,476 | |
| | | | | | |
|
|
|
| | | | | | | | 60,264,648 | |
| | | | | | |
|
|
|
Chemicals — 1.4% | | | | | | | | |
Mosaic Co. (The) | | | 330,731 | | | | 16,678,764 | |
| | | | | | |
|
|
|
Commercial Banks — 4.0% | | | | | | | | |
PNC Financial Services Group, Inc. | | | 321,828 | | | | 18,559,821 | |
Wells Fargo & Co. | | | 1,116,884 | | | | 30,781,323 | |
| | | | | | |
|
|
|
| | | | | | | | 49,341,144 | |
| | | | | | |
|
|
|
Computers & Peripherals — 1.2% | | | | | | | | |
Apple, Inc.* | | | 37,767 | | | | 15,295,635 | |
| | | | | | |
|
|
|
Consumer Finance — 2.8% | | | | | | | | |
American Express Co. | | | 430,425 | | | | 20,303,147 | |
SLM Corp. | | | 1,091,663 | | | | 14,628,284 | |
| | | | | | |
|
|
|
| | | | | | | | 34,931,431 | |
| | | | | | |
|
|
|
Diversified Financial Services — 4.6% | |
Citigroup, Inc. | | | 677,533 | | | | 17,825,893 | |
JPMorgan Chase & Co. | | | 775,035 | | | | 25,769,914 | |
Moody’s Corp.(a) | | | 407,706 | | | | 13,731,538 | |
| | | | | | |
|
|
|
| | | | | | | | 57,327,345 | |
| | | | | | |
|
|
|
Electric Utilities — 1.4% | | | | | | | | |
Exelon Corp.(a) | | | 403,720 | | | | 17,509,336 | |
| | | | | | |
|
|
|
Electronic Equipment & Instruments — 2.4% | |
Flextronics International Ltd.* | | | 5,208,466 | | | | 29,479,918 | |
| | | | | | |
|
|
|
Energy Equipment & Services — 1.5% | |
Halliburton Co. | | | 517,291 | | | | 17,851,712 | |
| | | | | | |
|
|
|
Food & Staples Retailing — 3.6% | | | | | | | | |
CVS Caremark Corp. | | | 630,724 | | | | 25,720,925 | |
Wal-Mart Stores, Inc. | | | 320,866 | | | | 19,174,952 | |
| | | | | | |
|
|
|
| | | | | | | | 44,895,877 | |
| | | | | | |
|
|
|
Food Products — 6.1% | | | | | | | | |
Bunge Ltd.(a) | | | 357,745 | | | | 20,463,014 | |
Kraft Foods, Inc. (Class A Stock) | | | 369,299 | | | | 13,797,011 | |
Smithfield Foods, Inc.*(a) | | | 1,103,025 | | | | 26,781,447 | |
Tyson Foods, Inc. (Class A Stock) | | | 715,792 | | | | 14,773,947 | |
| | | | | | |
|
|
|
| | | | | | | | 75,815,419 | |
| | | | | | |
|
|
|
| | | | | | | | |
COMMON STOCKS
(continued) | | Shares
| | | Value
(Note 2)
| |
| | | | | | | | | |
Healthcare Providers & Services — 1.1% | |
CIGNA Corp. | | | 328,255 | | | $ | 13,786,710 | |
| | | | | | |
|
|
|
Hotels, Restaurants & Leisure — 1.7% | |
International Game Technology | | | 1,252,145 | | | | 21,536,894 | |
| | | | | | |
|
|
|
Independent Power Producers & Energy Traders — 1.9% | |
Calpine Corp.* | | | 1,424,982 | | | | 23,269,956 | |
| | | | | | |
|
|
|
Insurance — 4.8% | |
Arch Capital Group, Ltd.* | | | 281,851 | | | | 10,493,313 | |
Axis Capital Holdings Ltd. | | | 402,425 | | | | 12,861,503 | |
MetLife, Inc. | | | 658,280 | | | | 20,525,170 | |
Travelers Cos., Inc. (The) | | | 257,751 | | | | 15,251,127 | |
| | | | | | |
|
|
|
| | | | | | | | 59,131,113 | |
| | | | | | |
|
|
|
Internet Software & Services — 2.0% | |
Google, Inc. (Class A Stock)* | | | 38,438 | | | | 24,827,104 | |
| | | | | | |
|
|
|
Machinery — 1.3% | |
Ingersoll-Rand PLC | | | 538,777 | | | | 16,416,535 | |
| | | | | | |
|
|
|
Media — 9.8% | |
Comcast Corp. (Class A Stock) | | | 1,621,407 | | | | 38,443,560 | |
Liberty Global, Inc., Ser. C* | | | 1,005,567 | | | | 39,740,008 | |
News Corp. (Class A Stock) | | | 897,420 | | | | 16,009,972 | |
Viacom, Inc. (Class B Stock) | | | 588,924 | | | | 26,743,039 | |
| | | | | | |
|
|
|
| | | | | | | | 120,936,579 | |
| | | | | | |
|
|
|
Metals & Mining — 4.0% | |
Freeport-McMoRan Copper & Gold, Inc. | | | 319,984 | | | | 11,772,211 | |
Goldcorp, Inc. | | | 292,856 | | | | 12,958,878 | |
Newmont Mining Corp. | | | 408,007 | | | | 24,484,500 | |
| | | | | | |
|
|
|
| | | | | | | | 49,215,589 | |
| | | | | | |
|
|
|
Oil, Gas & Consumable Fuels — 12.1% | |
Anadarko Petroleum Corp. | | | 305,485 | | | | 23,317,670 | |
Hess Corp. | | | 269,851 | | | | 15,327,537 | |
Marathon Oil Corp. | | | 713,857 | | | | 20,894,594 | |
Marathon Petroleum Corp. | | | 421,072 | | | | 14,017,487 | |
Noble Energy, Inc. | | | 281,351 | | | | 26,556,721 | |
Occidental Petroleum Corp. | | | 265,989 | | | | 24,923,169 | |
Southwestern Energy Co.* | | | 375,322 | | | | 11,987,785 | |
Suncor Energy, Inc. | | | 458,309 | | | | 13,213,048 | |
| | | | | | |
|
|
|
| | | | | | | | 150,238,011 | |
| | | | | | |
|
|
|
Pharmaceuticals — 6.3% | |
Mylan, Inc.* | | | 1,447,264 | | | | 31,058,285 | |
Pfizer, Inc. | | | 969,586 | | | | 20,981,841 | |
Sanofi (France), ADR | | | 396,368 | | | | 14,483,287 | |
Teva Pharmaceutical Industries Ltd. (Israel), ADR | | | 286,903 | | | | 11,579,405 | |
| | | | | | �� |
|
|
|
| | | | | | | | 78,102,818 | |
| | | | | | |
|
|
|
Road & Rail — 0.4% | |
Union Pacific Corp. | | | 40,869 | | | | 4,329,662 | |
| | | | | | |
|
|
|
Semiconductors & Semiconductor Equipment — 2.0% | |
Marvell Technology Group Ltd.* | | | 826,868 | | | | 11,452,122 | |
Maxim Integrated Products, Inc. | | | 497,922 | | | | 12,965,889 | |
| | | | | | |
|
|
|
| | | | | | | | 24,418,011 | |
| | | | | | |
|
|
|
Software — 4.2% | |
CA, Inc. | | | 1,702,075 | | | | 34,407,446 | |
SEE NOTES TO FINANCIAL STATEMENTS.
A151
| | | | | | |
| | | VALUE PORTFOLIO (continued) | | |
| |
| SCHEDULE OF INVESTMENTS | | December 31, 2011 |
| | | | | | | | |
COMMON STOCKS
(continued) | | Shares
| | | Value
(Note 2)
| |
| | | | | | | | | |
Software (continued) | |
Symantec Corp.* | | | 1,132,467 | | | $ | 17,723,109 | |
| | | | | | |
|
|
|
| | | | | | | | 52,130,555 | |
| | | | | | |
|
|
|
Specialty Retail — 1.4% | |
Staples, Inc. | | | 1,261,893 | | | | 17,527,694 | |
| | | | | | |
|
|
|
Wireless Telecommunication Services — 3.5% | |
MetroPCS Communications, Inc.* | | | 2,492,148 | | | | 21,631,845 | |
NII Holdings, Inc.* | | | 1,010,268 | | | | 21,518,708 | |
| | | | | | |
|
|
|
| | | | | | | | 43,150,553 | |
| | | | | | |
|
|
|
TOTAL LONG-TERM INVESTMENTS
(cost $1,145,365,793) | | | | 1,212,721,296 | |
| | | | | | |
|
|
|
| SHORT-TERM INVESTMENT — 9.4% | |
Affiliated Money Market Mutual Fund | |
Prudential Investment Portfolios 2 — Prudential Core Taxable Money Market Fund
(cost $116,460,092; includes $91,987,963 of cash collateral received for securities on loan)
(Note 4)(b)(c) | | | 116,460,092 | | | | 116,460,092 | |
| | | | | | |
|
|
|
TOTAL INVESTMENTS — 107.4%
(cost $1,261,825,885) | | | | 1,329,181,388 | |
LIABILITIES IN EXCESS OF
OTHER ASSETS — (7.4%) | | | | (91,560,123 | ) |
| | | | | | |
|
|
|
NET ASSETS — 100.0% | | | $ | 1,237,621,265 | |
| | | | | | |
|
|
|
The following abbreviation is used in portfolio descriptions:
| | |
| ADR | | American Depositary Receipt. |
| * | Non-income producing security. |
| (a) | All or a portion of security is on loan. The aggregate market value of such securities, including those sold and pending settlement, is $88,995,539; cash collateral of $91,987,963 (included in liabilities) was received with which the Portfolio purchased highly liquid short-term investments. |
| (b) | Represents security, or a portion thereof, purchased with cash collateral received for securities on loan. |
| (c) | Prudential Investments LLC, the manager of the Portfolio, also serves as manager of the Prudential Investment Portfolios 2 — Prudential Core Taxable Money Market Fund. |
Various inputs are used in determining the value of the Portfolio’s investments. These inputs are summarized in the three broad levels listed below.
| Level 1—quoted | prices generally for securities actively traded on a regulated securities exchange and for open-end mutual funds which trade at daily net asset value. |
| Level 2—other | significant observable inputs (including, but not limited to, quoted prices for similar securities, interest rates, prepayment speeds, foreign currency exchange rates, and |
| | amortized cost) generally for debt securities, swaps, forward foreign currency contracts and for foreign stocks priced using vendor modeling tools. |
| Level 3—significant | unobservable inputs for securities valued in accordance with Board approved fair valuation procedures. |
The following is a summary of the inputs used as of December 31, 2011 in valuing such portfolio securities:
| | | | | | | | | | | | |
| | | Level 1
| | | Level 2
| | | Level 3
| |
Investments in Securities | | | | | | | | | | | | |
Common Stocks | | $ | 1,212,721,296 | | | $ | — | | | $ | — | |
Affiliated Money Market Mutual Fund | | | 116,460,092 | | | | — | | | | — | |
| | |
|
|
| |
|
|
| |
|
|
|
Total | | $ | 1,329,181,388 | | | $ | — | | | $ | — | |
| | |
|
|
| |
|
|
| |
|
|
|
The industry classification of portfolio holdings and liabilities in excess of other assets shown as a percentage of net assets as of December 31, 2011 was as follows:
| | | | |
Oil, Gas & Consumable Fuels | | | 12.1 | % |
Media | | | 9.8 | |
Affiliated Money Market Mutual Fund (including 7.4% of collateral received for securities on loan) | | | 9.4 | |
Pharmaceuticals | | | 6.3 | |
Food Products | | | 6.1 | |
Capital Markets | | | 4.9 | |
Insurance | | | 4.8 | |
Diversified Financial Services | | | 4.6 | |
Software | | | 4.2 | |
Commercial Banks | | | 4.0 | |
Metals & Mining | | | 4.0 | |
Food & Staples Retailing | | | 3.6 | |
Wireless Telecommunication Services | | | 3.5 | |
Aerospace & Defense | | | 2.8 | |
Consumer Finance | | | 2.8 | |
Electronic Equipment & Instruments | | | 2.4 | |
Auto Components | | | 2.1 | |
Internet Software & Services | | | 2.0 | |
Semiconductors & Semiconductor Equipment | | | 2.0 | |
Independent Power Producers & Energy Traders | | | 1.9 | |
Hotels, Restaurants & Leisure | | | 1.7 | |
Energy Equipment & Services | | | 1.5 | |
Airlines | | | 1.4 | |
Chemicals | | | 1.4 | |
Electric Utilities | | | 1.4 | |
Specialty Retail | | | 1.4 | |
Automobiles | | | 1.3 | |
Machinery | | | 1.3 | |
Computers & Peripherals | | | 1.2 | |
Healthcare Providers & Services | | | 1.1 | |
Road & Rail | | | 0.4 | |
| | |
|
|
|
| | | | 107.4 | |
Liabilities in excess of other assets | | | (7.4 | ) |
| | |
|
|
|
| | | | 100.0 | % |
| | |
|
|
|
SEE NOTES TO FINANCIAL STATEMENTS.
A152
| | | | | | |
| | | VALUE PORTFOLIO (continued) | | |
STATEMENT OF ASSETS AND LIABILITIES
December 31, 2011
| | | | |
| ASSETS | | | | |
Investments, at value including securities on loan of $88,995,539: | | | | |
Unaffiliated investments (cost $1,145,365,793) | | $ | 1,212,721,296 | |
Affiliated investments (cost $116,460,092) | | | 116,460,092 | |
Cash | | | 45,350 | |
Dividends and interest receivable | | | 1,015,680 | |
Receivable for investments sold | | | 522,140 | |
Foreign tax reclaim receivable | | | 117,247 | |
Receivable for Series shares sold | | | 9,060 | |
Prepaid expenses | | | 8,718 | |
| | |
|
|
|
Total Assets | | | 1,330,899,583 | |
| | |
|
|
|
| LIABILITIES | | | | |
Collateral for securities on loan | | | 91,987,963 | |
Management fee payable | | | 420,742 | |
Payable for investments purchased | | | 406,782 | |
Payable for Series shares repurchased | | | 253,924 | |
Accrued expenses and other liabilities | | | 205,933 | |
Distribution fee payable | | | 1,280 | |
Affiliated transfer agent fee payable | | | 926 | |
Administration fee payable | | | 768 | |
| | |
|
|
|
Total Liabilities | | | 93,278,318 | |
| | |
|
|
|
| NET ASSETS | | $ | 1,237,621,265 | |
| | |
|
|
|
Net assets were comprised of: | | | | |
Paid-in capital | | $ | 1,385,438,880 | |
Retained earnings | | | (147,817,615 | ) |
| | |
|
|
|
Net assets, December 31, 2011 | | $ | 1,237,621,265 | |
| | |
|
|
|
| Class I: | | | | |
Net asset value and redemption price per share, $1,231,567,784 / 77,298,276 outstanding shares of beneficial interest | | $ | 15 .93 | |
| | |
|
|
|
| Class II: | | | | |
Net asset value and redemption price per share, $6,053,481 / 377,500 outstanding shares of beneficial interest | | $ | 16 .04 | |
| | |
|
|
|
STATEMENT OF OPERATIONS
Year Ended December 31, 2011
| | | | |
| INVESTMENT INCOME | | | | |
Unaffiliated dividend income (net of foreign withholding taxes of $343,923) | | $ | 18,141,797 | |
Affiliated income from securities loaned, net | | | 121,600 | |
Affiliated dividend income | | | 30,640 | |
| | |
|
|
|
| | | | 18,294,037 | |
| | |
|
|
|
| EXPENSES | | | | |
Management fee | | | 5,502,517 | |
Distribution fee—Class II | | | 17,304 | |
Administration fee—Class II | | | 10,382 | |
Shareholders’ reports | | | 176,000 | |
Custodian’s fees and expenses | | | 156,000 | |
Trustees’ fees | | | 25,000 | |
Audit fee | | | 19,000 | |
Insurance expenses | | | 16,000 | |
Legal fees and expenses | | | 12,000 | |
Transfer agent’s fee and expenses (including affiliated expense of $5,500) (Note 4) | | | 12,000 | |
Commitment fee on syndicated credit agreement | | | 7,000 | |
Loan interest expense (Note 8) | | | 81 | |
Miscellaneous | | | 19,428 | |
| | |
|
|
|
Total expenses | | | 5,972,712 | |
| | |
|
|
|
| NET INVESTMENT INCOME | | | 12,321,325 | |
| | |
|
|
|
| NET REALIZED AND UNREALIZED GAIN (LOSS) ON INVESTMENTS AND FOREIGN CURRENCIES | | | | |
Net realized gain (loss) on: | | | | |
Investment transactions | | | 127,553,903 | |
Foreign currency transactions | | | (2,900 | ) |
| | |
|
|
|
| | | | 127,551,003 | |
| | |
|
|
|
Net change in unrealized appreciation (depreciation) on: | | | | |
Investments | | | (211,608,643 | ) |
Foreign currencies | | | (549 | ) |
| | |
|
|
|
| | | | (211,609,192 | ) |
| | |
|
|
|
| NET LOSS ON INVESTMENTS AND FOREIGN CURRENCIES | | | (84,058,189 | ) |
| | |
|
|
|
| NET DECREASE IN NET ASSETS RESULTING FROM OPERATIONS | | $ | (71,736,864 | ) |
| | |
|
|
|
STATEMENT OF CHANGES IN NET ASSETS
| | | | | | | | |
| | | Year Ended December 31,
| |
| | | 2011
| | | 2010
| |
| INCREASE (DECREASE) IN NET ASSETS | | | | | | | | |
| OPERATIONS: | | | | | | | | |
Net investment income | | $ | 12,321,325 | | | $ | 13,964,864 | |
Net realized gain on investments and foreign currencies | | | 127,551,003 | | | | 65,421,490 | |
Net change in unrealized appreciation (depreciation) on investments and foreign currencies | | | (211,609,192 | ) | | | 84,733,453 | |
| | |
|
|
| |
|
|
|
NET INCREASE (DECREASE) IN NET ASSETS RESULTING FROM OPERATIONS | | | (71,736,864 | ) | | | 164,119,807 | |
| | |
|
|
| |
|
|
|
| DISTRIBUTIONS: | | | | | | | | |
Class I | | | (13,916,247 | ) | | | (11,668,725 | ) |
Class II | | | (36,196 | ) | | | (16,864 | ) |
| | |
|
|
| |
|
|
|
| TOTAL DISTRIBUTIONS | | | (13,952,443 | ) | | | (11,685,589 | ) |
| | |
|
|
| |
|
|
|
| SERIES SHARE TRANSACTIONS (Note 7): | | | | | | | | |
Series shares sold | | | 11,696,328 | | | | 23,882,558 | |
Series shares issued in reinvestment of distributions | | | 13,952,443 | | | | 11,685,589 | |
Net asset value of shares issued in merger (Note 10) | | | — | | | | 199,267,637 | |
Series shares repurchased | | | (142,367,941 | ) | | | (132,638,150 | ) |
| | |
|
|
| |
|
|
|
NET INCREASE (DECREASE) IN NET ASSETS RESULTING FROM SERIES SHARE TRANSACTIONS | | | (116,719,170 | ) | | | 102,197,634 | |
| | |
|
|
| |
|
|
|
| TOTAL INCREASE (DECREASE) IN NET ASSETS | | | (202,408,477 | ) | | | 254,631,852 | |
| NET ASSETS: | | | | | | | | |
Beginning of year | | | 1,440,029,742 | | | | 1,185,397,890 | |
| | |
|
|
| |
|
|
|
End of year | | $ | 1,237,621,265 | | | $ | 1,440,029,742 | |
| | |
|
|
| |
|
|
|
SEE NOTES TO FINANCIAL STATEMENTS.
A153
NOTES TO THE FINANCIAL STATEMENTS OF
THE PRUDENTIAL SERIES FUND
The Prudential Series Fund (“Series Fund”), organized as a Delaware statutory trust, is a diversified open-end management investment company registered under the Investment Company Act of 1940 (“1940 Act”), as amended. On January 2, 2006, each Portfolio of the Series Fund changed its federal income tax status from a regulated investment company to a partnership. As a result of that conversion, the Series Fund was reorganized from a Maryland corporation to a Delaware statutory trust. Pursuant to this reorganization, the Series Fund has been renamed “The Prudential Series Fund.” The Series Fund is composed of eighteen Portfolios (“Portfolio” or “Portfolios”), each with separate series shares. The information presented in these financial statements pertains to thirteen Portfolios which are listed below along with each Portfolio’s investment objective.
Conservative Balanced Portfolio: Total investment return consistent with a conservatively managed diversified portfolio.
Diversified Bond Portfolio: High level of income over a longer term while providing reasonable safety of capital.
Equity Portfolio: Long-term growth of capital.
Flexible Managed Portfolio: Total return consistent with an aggressively managed diversified portfolio.
Global Portfolio: Long-term growth of capital.
Government Income Portfolio: High level of income over the long-term consistent with the preservation of capital.
High Yield Bond Portfolio: High total return.
Jennison Portfolio: Long-term growth of capital.
Money Market Portfolio: Maximum current income consistent with the stability of capital and maintenance of liquidity.
Natural Resources Portfolio: Long-term growth of capital.
Small Capitalization Stock Portfolio: Long-term growth of capital.
Stock Index Portfolio: Achieve investment results that generally correspond to the performance of publicly traded common stocks.
Value Portfolio: Capital appreciation.
The ability of issuers of debt securities (other than those issued or guaranteed by the U.S. Government) held by the Portfolios to meet their obligations may be affected by the economic or political developments in a specific industry, region or country. Foreign security and currency transactions may involve certain considerations and risks not typically associated with those of domestic origin as a result of, among other factors, the possibility of political and economic instability or the level of governmental supervision and regulation of foreign securities markets.
| Note 2: | | Accounting Policies |
The following is a summary of significant accounting policies followed by the Series Fund and the Portfolios in preparation of their financial statements.
Securities Valuation: Securities listed on a securities exchange (other than options on securities and indices) are valued at the last sale price on such exchange on the day of valuation or, if there was no sale on such day, at the mean between the last reported bid and asked prices, or at the last bid price on such day in the absence of an asked price. Securities traded via NASDAQ are valued at the NASDAQ official closing price (“NOCP”) on the day of valuation, or if there was no NOCP, at the last sale price. Securities that are actively
B1
traded in the over-the-counter market, including listed securities for which the primary market is believed by Prudential Investments LLC (“PI” or “Manager”) in consultation with the subadvisors, to be over-the-counter, are valued at market value using prices provided by an independent pricing agent or principal market maker. Options on securities and indices traded on an exchange are valued at the last sale price as of the close of trading on the applicable exchange or, if there was no sale, at the mean between the most recently quoted bid and asked prices on such exchange or at the last bid price in the absence of an asked price. Futures contracts and options thereon traded on a commodities exchange or board of trade are valued at the last sale price at the close of trading on such exchange or board of trade or, if there was no sale on the applicable commodities exchange or board of trade on such day, at the mean between the most recently quoted bid and asked prices on such exchange or board of trade or at the last bid price in the absence of an asked price. Prices may be obtained from independent pricing services which use information provided by market makers or estimates of market values obtained from yield data relating to investments or securities with similar characteristics. Securities for which reliable market quotations are not readily available, or whose values have been affected by events occurring after the close of the security’s foreign market and before the Series Fund’s normal pricing time, are valued at fair value in accordance with the Board of Trustees’ approved fair valuation procedures. When determining the fair value of securities, some of the factors influencing the valuation include, the nature of any restrictions on disposition of the securities; assessment of the general liquidity of the securities; the issuer’s financial condition and the markets in which it does business; the cost of the investment; the size of the holding and the capitalization of the issuer; the prices of any recent transactions or bids/offers for such securities or any comparable securities; any available analyst media or other reports or information deemed reliable by the investment advisor regarding the issuer or the markets or industry in which it operates. Using fair value to price securities may result in a value that is different from a security’s most recent closing price and from the price used by other mutual funds to calculate their net asset values.
Investments in open-end, non-exchange-traded mutual funds are valued at their net asset value as of the close of the New York Stock Exchange on the date of valuation.
The Money Market Portfolio values all of its securities of sufficient credit quality at amortized cost, which approximates fair value. Short-term debt securities that are held in the other Portfolios which mature in more than 60 days are valued at fair value and those short-term debt securities of sufficient credit quality which mature in 60 days or less are valued at amortized cost which approximates fair value. The amortized cost method values a security at its cost at the time of purchase and thereafter assumes a constant amortization to maturity of the difference between the principal amount due at maturity and cost.
Each Portfolio may hold up to 15% of its net assets (the Money Market Portfolio may hold up to 10% of its net assets) in illiquid securities, including those which are restricted as to disposition under securities law (“restricted securities”). Restricted securities are valued pursuant to the valuation procedures noted above.
Repurchase Agreements: In connection with transactions in repurchase agreements with United States financial institutions, it is the Series Fund’s policy that its custodian or designated subcustodians, as the case may be, under triparty repurchase agreements, take possession of the underlying collateral securities, the value of which exceeds the principal amount of the repurchase transaction, including accrued interest. To the extent that any repurchase transaction exceeds one business day, the value of the collateral is marked to market on a daily basis to ensure the adequacy of the collateral. If the seller defaults or the value of the collateral declines, or if bankruptcy proceedings are commenced with respect to the seller of the security, realization of the collateral by the Series Fund may by delayed or limited.
Foreign Currency Translation: The books and records of the Series Fund are maintained in U.S. dollars. Foreign currency amounts are translated into U.S. dollars on the following basis:
(i) market value of investment securities, other assets and liabilities — at the current rates of exchange.
(ii) purchases and sales of investment securities, income and expenses — at the rates of exchange prevailing on the respective dates of such transactions.
Although the net assets of the Series Fund are presented at the foreign exchange rates and market values at the close of the period, the Series Fund does not isolate that portion of the results of operations arising as a result of changes in the foreign exchange rates from the fluctuations arising from changes in the market prices of long-term portfolio securities held at the end of the period. Similarly, the Series Fund does not isolate the effect of changes in foreign exchange rates from the fluctuations arising from changes in the market prices of
B2
long-term portfolio securities sold during the period. Accordingly, these realized foreign currency gains or losses are included in the reported net realized gains or losses on investment transactions.
Net realized gains or losses on foreign currency transactions represent net foreign exchange gains or losses from the holding of foreign currencies, currency gains or losses realized between the trade and settlement dates on securities transactions, and the difference between the amounts of dividends, interest and foreign withholding taxes recorded on the Series Fund’s books and the U.S. dollar equivalent amounts actually received or paid. Net unrealized currency gains or losses from valuing foreign currency denominated assets and liabilities (other than investments) at period end exchange rates are reflected as a component of net unrealized appreciation (depreciation) on foreign currencies.
Forward Currency Contracts: A forward currency contract is a commitment to purchase or sell a foreign currency at a future date at a negotiated forward rate between two parties. Certain Portfolios of the Series Fund entered into forward currency contracts in order to hedge their exposure to changes in foreign currency exchange rates on their foreign portfolio holdings or specific receivables and payables denominated in a foreign currency and to gain exposure to certain currencies. The contracts are valued daily at current exchange rates and any unrealized gain or loss is included in net unrealized appreciation or depreciation on foreign currencies. Gain or loss is realized on the settlement date of the contract equal to the difference between the settlement value of the original and negotiated forward contracts. This gain or loss, if any, is included in net realized gain (loss) on foreign currency transactions. Risks may arise upon entering into these contracts from the potential inability of the counterparties to meet the terms of their contracts. Forward currency contracts involve risks from currency exchange rate and credit risk in excess of the amounts reflected on the Statement of Assets and Liabilities. The Portfolio’s maximum risk of loss from counterparty credit risk is the net value of the cash flows to be received from the counterparty at the end of the contract’s life. A master netting arrangement between the Portfolio and the counterparty permits the Portfolio to offset amounts payable by the Portfolio to the same counterparty against amounts to be received; and by the receipt of collateral from the counterparty by the Portfolio to cover the Portfolio’s exposure to the counterparty. However, there is no assurance that such mitigating factors are easily enforceable.
Short Sales: Certain Portfolios of the Series Fund may sell a security they do not own in anticipation of a decline in the market value of that security (short sale). When a Portfolio makes a short sale, it must borrow the security sold short and deliver it to the broker-dealer through which it made the short sale as collateral for its obligation to deliver the security upon conclusion of the transaction. The Portfolio may have to pay a fee to borrow the particular security and may be obligated to remit any interest or dividends received on such borrowed securities. Dividends declared on short positions open are recorded on the ex-date and interest payable is accrued daily on fixed income securities sold short, both of which are recorded as an expense. A gain, limited to the price at which the Portfolio sold the security short, or a loss, unlimited in magnitude, will be recognized upon the termination of a short sale if the market price at termination is less than or greater than, respectively, the proceeds originally received.
Loan Participations: The High Yield Bond and Money Market Portfolios may invest in loan participations. When the Portfolio purchases a loan participation, the Portfolio typically enters into a contractual relationship with the lender or third party selling such participations (“Selling Participant”), but not the borrower. As a result, the Portfolio assumes the credit risk of the borrower and any other persons interpositioned between the Portfolio and the borrower. The Portfolio may not directly benefit from the collateral supporting the senior loan in which it has purchased the loan participation.
Financial Futures Contracts: A financial futures contract is an agreement to purchase (long) or sell (short) an agreed amount of securities at a set price for delivery on a future date. Upon entering into a financial futures contract, the Portfolio is required to pledge to the broker an amount of cash and/or other assets equal to a certain percentage of the contract amount. This amount is known as the “initial margin.” Subsequent payments, known as “variation margin,” are made or received by the Portfolio each day, depending on the daily fluctuations in the value of the underlying security. Such variation margin is recorded for financial statement purposes on a daily basis as unrealized gain (loss). When the contract expires or is closed, the gain (loss) is realized and is presented in the Statement of Operations as net realized gain (loss) on financial futures contracts.
Certain Portfolios of the Series Fund entered into financial futures contracts in order to hedge their existing portfolio securities, or securities the Portfolio intends to purchase, against fluctuations in value caused by changes in prevailing interest rates and to manage yield curve duration. Certain Portfolios entered into equity
B3
index futures contracts to gain market exposure. The Portfolio may not achieve the anticipated benefits of the financial futures contracts and may realize a loss. The use of futures transactions involves the risk of imperfect correlation in movements in the price of futures contracts, interest rates and the underlying hedged assets. Financial futures contracts involve elements of risk in excess of the amounts reflected on the Statement of Assets and Liabilities.
Options: Certain Portfolios of the Series Fund purchased or wrote options in order to hedge against adverse market movements or fluctuations in value caused by changes in prevailing interest rates and foreign currency exchange rates, with respect to securities which the Portfolio currently owns or intends to purchase. Certain Portfolios also used purchased options to gain exposure to certain securities and foreign currencies. The Portfolios’ principal reason for writing options is to realize, through receipt of premiums, a greater current return than would be realized on the underlying security alone. When the Portfolio purchases an option, it pays a premium and an amount equal to that premium is recorded as an asset. When the Portfolio writes an option, it receives a premium and an amount equal to that premium is recorded as a liability. The asset or liability is adjusted daily to reflect the current market value of the option. If an option expires unexercised, the Portfolio realizes a gain or loss to the extent of the premium received or paid. If an option is exercised, the premium received or paid is recorded as an adjustment to the proceeds from the sale or the cost of the purchase in determining whether the Portfolio has realized a gain or loss. The difference between the premium and the amount received or paid at the closing of a purchase or sale transaction is also treated as a realized gain or loss. Gain or loss on purchased options is included in net realized gain or loss on investment transactions. Gain or loss on written options is presented separately as net realized gain or loss on options written. The Portfolio, as writer of an option, may have no control over whether the underlying securities may be sold (called) or purchased (put). As a result, the Portfolio bears the market risk of an unfavorable change in the price of the security underlying the written option. Over-the-counter options involve the risk of the potential inability of the counterparties to meet the terms of their contracts.
With exchange-traded futures and options contracts, there is minimal counterparty credit risk to the Portfolio since the exchanges’ clearinghouse acts as counterparty to all exchange-traded futures and options, and guarantees the futures and options contracts against default.
Swap Agreements: Certain Portfolios of the Series Fund may enter into credit default, interest rate, total return and other forms of swap agreements. A swap agreement is an agreement to exchange the return generated by one instrument for the return generated by another instrument. The swap agreements are valued daily at current market value and any change in value is included in the net unrealized appreciation or depreciation on investments. Payments received or paid by the Portfolio are recorded as realized gains or losses upon termination or maturity of the swap. Risk of loss may exceed amounts recognized on the Statements of Assets and Liabilities. Swap agreements outstanding at period end, if any, are listed on the Schedule of Investments.
Interest Rate Swaps: Interest rate swaps represent agreements between counterparties to exchange cash flows based on the difference between two interest rates, applied to a notional principal amount for a specified period. The Portfolio is subject to interest rate risk exposure in the normal course of pursuing its investment objectives. Certain Portfolios used interest rate swaps to generate steady cash flow by receiving a stream of fixed rate payments and to increase exposure to prevailing market rates by receiving floating rate payments. The Portfolio’s maximum risk of loss from counterparty credit risk is the discounted net value of the cash flows to be received from the counterparty over the contract’s remaining life. This risk may be mitigated by having a master netting arrangement between the Portfolio and the counterparty which may permit the Portfolio to offset amounts payable by the Portfolio to the same counterparty against amounts to be received; and by the receipt of collateral from the counterparty by the Portfolio to cover the Portfolio’s exposure to the counterparty. However, there is no assurance that such mitigating factors are easily enforceable.
Credit Default Swaps: Credit default swaps involve one party (the protection buyer) making a stream of payments to another party (the protection seller) in exchange for the right to receive a specified payment in the event of a default or as a result of a default (“credit event”) for the referenced party, typically corporate issues or sovereign issues of an emerging country, on its obligation; or in the event of a write-down, principal shortfall, interest shortfall or default of all or part of the referenced entities comprising a credit index.
The Portfolio is subject to credit risk in the normal course of pursuing its investment objectives. Certain Portfolios purchased credit default swaps to provide a measure of protection against defaults of the issuers. Certain Portfolios in the Series Fund used credit default swaps on credit indices to hedge a portfolio of credit
B4
default swaps or bonds, which is less expensive than it would be to buy many credit default swaps to achieve a similar effect. Certain Portfolios took an active short position with respect to the likelihood of particular issuer’s default by selling credit default swaps. The Portfolios’ maximum risk of loss from counterparty credit risk for purchased credit default swaps is the notional value of a credit default swap agreement. A master netting arrangement between the Portfolio and the counterparty that permits the Portfolio to offset amounts payable by the Portfolio to the same counterparty against amounts to be received; and by the receipt of collateral from the counterparty by the Portfolio to cover the Portfolio’s exposure to the counterparty. However, there is no assurance that such mitigating factors are easily enforceable.
As a seller of protection on credit default swap agreements, a Portfolio will generally receive from the buyer of protection an agreed upon payment throughout the term of the swap provided that there is no credit event. As the seller, a Portfolio would effectively increase investment risk to its portfolio because, in addition to its total net assets, a Portfolio may be subject to investment exposure on the notional amount of the swap.
The maximum amount of the payment that a Portfolio as a seller of protection could be required to make under a credit default swap agreement would be equal to the notional amount of the underlying security or index contract as a result of a credit event. These potential amounts will be partially offset by any recovery values of the respective referenced obligations, or net amounts received from the settlement of buy protection credit default swap agreements entered into by the Portfolio for the same referenced entity or index. As a buyer of protection, the Portfolio generally receives an amount up to the notional value of the swap if a credit event occurs.
Implied credit spreads, represented in absolute terms, utilized in determining the fair value of credit default swap agreements on corporate issues or sovereign issues of an emerging country as of period end are disclosed in the footnotes to the Schedules of Investments and serve as an indicator of the current status of the payment/performance risk and represent the likelihood or risk of default for the credit derivative. The implied credit spread of a particular referenced entity reflects the cost of buying/selling protection and may include upfront payments required to enter into the agreement. For credit default swap agreements on asset- backed securities and credit indices, the quoted market prices and resulting values serve as the indicator of the current status of the payment and/or performance risk. Wider credit spreads and increasing market value in absolute terms, when compared to the notional amount of the swap, represent a deterioration of the referenced entity’s credit soundness and a greater likelihood or risk of default or other credit event occurring as defined under the terms of the agreement.
In addition to each instrument’s primary underlying risk exposure (e.g. interest rate, credit, equity or foreign exchange, etc.), swap agreements involve, to varying degrees, elements of credit, market and documentation risk. Such risks involve the possibility that there will be no liquid market for these agreements, that the counterparty to the agreement may default on its obligation to perform or disagree as to the meaning of the contractual terms in the agreement, and that there will be unfavorable changes in net interest rates. In connection with these agreements, securities in the portfolio may be identified as collateral or received as collateral from the counterparty in accordance with the terms of the respective swap agreements to provide or receive assets of value and serve as recourse in the event of default or bankruptcy/insolvency of either party. Such over-the-counter derivative agreements include conditions which when materialized, give the counterparty the right to cause an early termination of the transactions under those agreements. Any election by the counterparty for early termination of the contract(s) may impact the amounts reported on financial statements.
As of December 31, 2011, none of the Portfolios have met conditions under such agreements, which give the counterparty the right to call for an early termination.
Forward currency contracts, written options, short sales, swaps and financial futures contracts involve elements of both market and credit risk in excess of the amounts reflected on the Statement of Assets and Liabilities.
Warrants and Rights: Certain Portfolios of the Series Fund hold warrants and rights acquired either through a direct purchase, included as part of a private placement, or pursuant to corporate actions. Warrants and rights entitle the holder to buy a proportionate amount of common stock, or such other security that the issuer may specify, at a specific price and time through the expiration dates. Such warrants and rights are held as long positions by the Portfolio until exercised, sold or expired. Warrants and rights are valued at fair value in accordance with the Board of Trustees’ approved fair valuation procedures.
B5
Securities Lending: Each Portfolio of the Series Fund may lend its portfolio securities to banks and broker-dealers. The loans are secured by collateral at least equal to the market value of the securities loaned. Collateral pledged by each borrower is marked to market daily, based on the previous day’s market value, such that the value of the collateral exceeds the value of the loaned securities. Loans are subject to termination at the option of the borrower or the Portfolio. Upon termination of the loan, the borrower will return to the Portfolio securities identical to the loaned securities. Should the borrower of the securities fail financially, the Portfolio has the right to repurchase the securities using the collateral in the open market. The Portfolio recognizes income, net of any rebate and securities lending agent fees, for lending its securities in the form of fees or interest on the investment of any cash received as collateral. The Portfolio also continues to receive interest and dividends or amounts equivalent thereto on the securities loaned and recognizes any unrealized gain or loss in the market price of the securities loaned that may occur during the term of the loan.
Dollar Rolls: Certain Portfolios of the Series Fund enter into mortgage dollar rolls in which the Portfolio sells mortgage securities for delivery in the current month, realizing a gain (loss), and simultaneously contracts to repurchase somewhat similar (same type, coupon and maturity) securities on a specified future date. During the roll period, the Portfolio forgoes principal and interest paid on the securities. The Portfolio is compensated by the interest earned on the cash proceeds of the initial sale and by the lower repurchase price at the future date. The difference between the sales proceeds and the lower repurchase price is recorded as a realized gain. The Portfolio maintains a segregated account, the dollar value of which is at least equal to its obligations, with respect to dollar rolls.
When-Issued/Delayed Delivery Securities: Securities purchased or sold on a when-issued or delayed delivery basis may be settled a month or more after trade date; interest income is not accrued until settlement date. At the time a Portfolio enters into such transactions, it instructs the custodian to segregate assets with a current value at least equal to the amount of its when-issued or delayed-delivery purchase commitments.
Securities Transactions and Net Investment Income: Securities transactions are recorded on the trade date. Realized gains (losses) on sales of securities are calculated on the identified cost basis. Dividend income is recorded on the ex-dividend date; interest income, which is comprised of four elements: stated coupon, original issue discount, market discount and market premium, is recorded on the accrual basis. Expenses are recorded on the accrual basis. The Series Fund’s expenses are allocated to the respective Portfolios on the basis of relative net assets except for Portfolio specific expenses which are attributable directly to a Portfolio or class level.
For Portfolios with multiple classes of shares, net investment income (loss) (other than administration and distribution fees, which are charged to the respective class) and unrealized and realized gains (losses) are allocated daily to each class of shares based upon the relative proportion of adjusted net assets of each class at the beginning of the day.
Taxes: For federal income tax purposes, each Portfolio in the Series Fund is treated as a separate taxpaying entity. The Portfolios are treated as partnerships for tax purposes. No provision has been made in the financial statements for U.S. federal, state, or local taxes, as any tax liability arising from operations of the Portfolios is the responsibility of their partners. The Portfolios are not generally subject to entity-level taxation. Partners of each Portfolio are subject to taxes on their distributive share of partnership items.
Withholding taxes on foreign dividends, interest and capital gains have been provided for in accordance with the Series Fund’s understanding of the applicable country’s tax rules and regulations.
Distributions: Distributions from each Portfolio are made in cash and automatically reinvested in additional shares of the same Portfolio. The Money Market Portfolio declares and reinvests distributions daily. The Diversified Bond, Government Income and High Yield Bond Portfolios make distributions, if any, quarterly. All other Portfolios’ distributions are generally made on an annual basis. Distributions are recorded on the ex-date.
Estimates: The preparation of financial statements requires management to make estimates and assumptions that affect the reported amounts and disclosures in the financial statements. Actual results could differ from these estimates.
B6
The Series Fund has a management agreement with PI. Pursuant to this agreement PI has responsibility for all investment advisory services and supervises the subadvisors’ performance of such services. PI has entered into subadvisory agreements with Prudential Investment Management, Inc. (“PIM”), Jennison Associates LLC (“Jennison”), LSV Asset Management (“LSV”), Marsico Capital Management LLC (“Marsico”), Quantitative Management Associates LLC (“QMA”), T. Rowe Price Associates, Inc. (“T. Rowe”) and William Blair & Co. LLC (“William Blair”) (collectively, the “Subadvisors”), under which each provides investment advisory services for certain Portfolios of the Series Fund. PI pays for the services of the Subadvisors, compensation of officers of the Series Fund, occupancy and certain clerical and administrative expenses of the Series Fund. The Portfolios bear all other costs and expenses.
The management fee paid to PI is accrued daily and payable monthly, using the value of each of the Portfolio’s average daily net assets, at the respective annual rates specified below.
| | | | | | |
Portfolio
| | Management Fee
| | Effective
Management Fee
| |
Conservative Balanced Portfolio | | 0.55% | | | 0.55 | % |
Diversified Bond Portfolio | | 0.40 | | | 0.40 | |
Equity Portfolio | | 0.45 | | | 0.45 | |
Flexible Managed Portfolio | | 0.60 | | | 0.60 | |
Global Portfolio | | 0.75 | | | 0.75 | |
Government Income Portfolio | | 0.40 | | | 0.40 | |
High Yield Bond Portfolio | | 0.55 | | | 0.55 | |
Jennison Portfolio | | 0.60 | | | 0.60 | |
Money Market Portfolio | | 0.40 | | | 0.16 | * |
Natural Resources Portfolio | | 0.45 | | | 0.45 | |
Small Capitalization Stock Portfolio | | 0.40 | | | 0.40 | |
Stock Index Portfolio | | 0.35% up to $4 billion
0.30% over $4 billion** | | | 0.30 | |
Value Portfolio | | 0.40 | | | 0.40 | |
| | * | In order to support the income yield, PI has voluntarily agreed to limit the management fees of the Money Market Portfolio such that the 1-day annualized yield (excluding capital gain or loss) does not fall below 0.02%. Prior to March 2, 2010, that threshold was 0.05%. The waiver is voluntary and may be modified or terminated by PI at any time without notice. During the year ended December 31, 2011, the total waiver as a result of this voluntary agreement was $2,580,455 or an annualized 0.24% of the Money Market Portfolio’s average daily net assets. |
| | ** | Effective August 1, 2010, PI has voluntarily agreed to waive a portion of its management fee equal to an annual rate of 0.05% of the average daily net assets of the Portfolio. |
At December 31, 2011, the Subadvisors that provide investment advisory services to the Portfolios are listed directly below. Where more than one Subadvisor is listed, each Subadvisor provides services to a segment of the Portfolio:
| | |
Portfolio
| | Subadvisor(s)
|
Conservative Balanced Portfolio | | PIM, QMA |
Diversified Bond Portfolio | | PIM |
Equity Portfolio | | Jennison |
Flexible Managed Portfolio | | PIM, QMA |
Global Portfolio | | LSV, Marsico, QMA, T. Rowe & William Blair |
Government Income Portfolio | | PIM |
High Yield Bond Portfolio | | PIM |
Jennison Portfolio | | Jennison |
Money Market Portfolio | | PIM |
Natural Resources Portfolio | | Jennison |
Small Capitalization Stock Portfolio | | QMA |
Stock Index Portfolio | | QMA |
Value Portfolio | | Jennison |
B7
The Series Fund has a distribution agreement with Prudential Investment Management Services LLC (“PIMS”), which acts as the distributor of the Class I and Class II shares of the Series Fund. The Series Fund compensates PIMS for distributing and servicing the Series Fund’s Class II shares pursuant to a plan of distribution (the “Class II Plan”), regardless of expenses actually incurred by PIMS. The distribution fees are accrued daily and payable monthly. No distribution or service fees are paid to PIMS as distributor of the Class I shares of the Series Fund. Pursuant to the Class II Plan, the Class II shares of each Portfolio compensate PIMS for distribution-related activities at an annual rate of 0.25% of the average daily net assets of the Class II shares.
The Series Fund has an administration agreement with PI, which acts as the administrator of the Class II shares of the Series Fund. The administration fee paid to PI is accrued daily and payable monthly, at the annual rate of 0.15% of the average daily net assets of the Class II shares.
PI has voluntarily agreed to reimburse the Stock Index Portfolio in order to limit operating expenses (excluding distribution and service (12b-1) fees, interest, taxes, brokerage commissions and certain extraordinary expenses) to an annualized rate of 0.75% of the average daily net assets. Effective July 1, 2011, the expense limitation was removed.
PIMS, PI, PIM, QMA and Jennison are indirect, wholly-owned subsidiaries of Prudential Financial, Inc. (“Prudential”).
| Note 4: | | Other Transactions with Affiliates |
Prudential Mutual Fund Services LLC (“PMFS”), an affiliate of PI and an indirect, wholly-owned subsidiary of Prudential, serves as the Series Fund’s transfer agent. Transfer agent’s fees and expenses in the Statement of Operations include certain out-of-pocket expenses paid to non-affiliates, where applicable.
PIM also serves as the Series Fund’s security lending agent. For the year ended December 31, 2011, PIM was compensated as follows for these services by the Series Fund Portfolios:
| | | | |
Portfolio
| | PIM
| |
Conservative Balanced Portfolio | | $ | 74,456 | |
Diversified Bond Portfolio | | | 45,468 | |
Equity Portfolio | | | 132,162 | |
Flexible Managed Portfolio | | | 52,948 | |
Global Portfolio | | | 74,586 | |
Government Income Portfolio | | | 10,854 | |
High Yield Bond Portfolio | | | 258,541 | |
Jennison Portfolio | | | 45,124 | |
Natural Resources Portfolio | | | 73,237 | |
Small Capitalization Stock Portfolio | | | 116,629 | |
Stock Index Portfolio | | | 95,769 | |
Value Portfolio | | | 36,322 | |
Certain Portfolios invest in the Prudential Core Short-Term Bond Fund and in the Prudential Core Taxable Money Market Fund (the “Core Funds”), each a portfolio of the Prudential Investment Portfolios 2, registered under the 1940 Act, as amended, and managed by PI. Earnings from the Core Funds are disclosed on the Statement of Operations as affiliated dividend income.
| Note 5: | | Portfolio Securities |
The aggregate cost of purchases and the proceeds from the sales of securities (excluding government securities and short-term issues) for the year ended December 31, 2011 were as follows:
| | | | | | | | |
Portfolio
| | Cost of Purchases
| | | Proceeds from Sales
| |
Conservative Balanced Portfolio | | $ | 3,351,969,212 | | | $ | 3,435,929,009 | |
Diversified Bond Portfolio | | | 1,783,531,305 | | | | 1,756,877,303 | |
Equity Portfolio | | | 1,570,965,317 | | | | 1,723,757,034 | |
Flexible Managed Portfolio | | | 5,878,694,717 | | | | 5,912,405,949 | |
Global Portfolio | | | 414,793,034 | | | | 444,922,313 | |
B8
| | | | | | | | |
Portfolio
| | Cost of Purchases
| | | Proceeds from Sales
| |
Government Income Portfolio | | $ | 6,125,987,480 | | | $ | 6,128,727,376 | |
High Yield Bond Portfolio | | | 1,506,611,127 | | | | 1,398,195,405 | |
Jennison Portfolio | | | 651,547,997 | | | | 902,176,754 | |
Natural Resources Portfolio | | | 412,456,951 | | | | 538,621,936 | |
Small Capitalization Stock Portfolio | | | 97,969,979 | | | | 136,781,326 | |
Stock Index Portfolio | | | 52,374,307 | | | | 168,357,296 | |
Value Portfolio | | | 584,615,267 | | | | 682,712,419 | |
The Diversified Bond Portfolio’s options written activity for the year ended December 31, 2011 was as follows:
| | | | | | | | |
Diversified Bond Portfolio
| | Contracts
| | | Premiums
| |
Balance as of December 31, 2010 | | | 500 | | | $ | 1,506,673 | |
Options written | | | — | | | | — | |
Options terminated in closing purchase transactions | | | (500 | ) | | | (1,506,673 | ) |
Options expired | | | — | | | | — | |
| | |
|
|
| |
|
|
|
Balance as of December 31, 2011 | | | — | | | $ | — | |
| | |
|
|
| |
|
|
|
After January 2, 2006, all Portfolios are treated as partnerships for tax purposes. The character of the cash distributions made by the partnerships is generally classified as return of capital nontaxable distributions. After each fiscal year each partner will receive information regarding their distributive allocable share of the partnership’s income, gains, losses and deductions.
Prior to January 2, 2006, each Portfolio, which was incorporated as of that date, qualified as a regulated investment company under the Internal Revenue Code and distributed all of its taxable income, including any net realized gains on investments, to shareholders.
With respect to the Portfolios, book cost of assets differs from tax cost of assets as a result of each Portfolio’s adoption of a mark to market method of accounting for tax purposes. Under this method, tax cost of assets will approximate its fair market value.
Management has analyzed the Portfolios’ tax positions taken on federal income tax returns for all open tax years and has concluded that no provision for income tax is required in the Portfolios’ financial statements for the current period. The Portfolios’ federal and state income tax returns for tax years for which the applicable statutes of limitations have not expired are subject to examination by the Internal Revenue Service and state departments of revenue.
The Series Fund offers Class I and Class II shares. Neither Class I nor Class II shares of a Portfolio are subject to any sales charge or redemption charge and are sold at the net asset value of the Portfolio. Class I shares are sold only to certain separate accounts of Prudential to fund benefits under certain variable life insurance and variable annuity contracts (“contracts”). Class II shares are sold only to separate accounts of non-Prudential insurance companies as investment options under certain contracts. The separate accounts invest in shares of the Series Fund through subaccounts that correspond to the Portfolios. The separate accounts will redeem shares of the Series Fund to the extent necessary to provide benefits under the contracts or for such other purposes as may be consistent with the contracts. As of December 31, 2011, the Equity, Jennison, Natural Resources and Value Portfolios have Class II shares outstanding.
During the fiscal year ended December 31, 2010, the Money Market Portfolio received $29,738 related to an unaffiliated-third-party’s settlement of regulatory proceedings involving allegations of improper trading in Portfolio shares. This amount is presented in the Statement of Changes in Net Assets. The Portfolio was not involved in the proceedings or in the calculation of the amount of settlement.
B9
Transactions in shares of beneficial interest of the Equity, Jennison, Natural Resources and Value Portfolios were as follows:
Equity Portfolio:
| | | | | | | | |
Class I
| | Shares
| | | Amount
| |
Year ended December 31, 2011: | | | | | | | | |
Series shares sold | | | 781,393 | | | $ | 19,351,385 | |
Series shares issued in reinvestment of distributions | | | 887,087 | | | | 22,097,344 | |
Series shares repurchased | | | (9,666,900 | ) | | | (241,561,350 | ) |
| | |
|
|
| |
|
|
|
Net increase (decrease) in shares outstanding | | | (7,998,420 | ) | | $ | (200,112,621 | ) |
| | |
|
|
| |
|
|
|
Year ended December 31, 2010: | | | | | | | | |
Series shares sold | | | 915,389 | | | $ | 20,563,535 | |
Series shares issued in reinvestment of distributions | | | 1,145,195 | | | | 24,392,657 | |
Series shares repurchased | | | (11,064,183 | ) | | | (246,443,793 | ) |
| | |
|
|
| |
|
|
|
Net increase (decrease) in shares outstanding | | | (9,003,599 | ) | | $ | (201,487,601 | ) |
| | |
|
|
| |
|
|
|
| | |
Class II
| | | | | | |
Year ended December 31, 2011: | | | | | | | | |
Series shares sold | | | 23,819 | | | $ | 618,805 | |
Series shares issued in reinvestment of distributions | | | 159 | | | | 4,010 | |
Series shares repurchased | | | (18,984 | ) | | | (458,348 | ) |
| | |
|
|
| |
|
|
|
Net increase (decrease) in shares outstanding | | | 4,994 | | | $ | 164,467 | |
| | |
|
|
| |
|
|
|
Year ended December 31, 2010: | | | | | | | | |
Series shares sold | | | 65,768 | | | $ | 1,489,189 | |
Series shares issued in reinvestment of distributions | | | 86 | | | | 1,854 | |
Series shares repurchased | | | (7,367 | ) | | | (170,754 | ) |
| | |
|
|
| |
|
|
|
Net increase (decrease) in shares outstanding | | | 58,487 | | | $ | 1,320,289 | |
| | |
|
|
| |
|
|
|
Jennison Portfolio:
| | | | | | | | |
Class I
| | Shares
| | | Amount
| |
Year ended December 31, 2011: | | | | | | | | |
Series shares sold | | | 960,647 | | | $ | 23,005,710 | |
Series shares issued in reinvestment of distributions | | | 152,637 | | | | 3,609,872 | |
Series shares repurchased | | | (11,249,998 | ) | | | (275,658,994 | ) |
| | |
|
|
| |
|
|
|
Net increase (decrease) in shares outstanding | | | (10,136,714 | ) | | $ | (249,043,412 | ) |
| | |
|
|
| |
|
|
|
Year ended December 31, 2010: | | | | | | | | |
Series shares sold | | | 2,130,137 | | | $ | 45,526,481 | |
Series shares issued in reinvestment of distributions | | | 273,898 | | | | 5,475,228 | |
Series shares issued in merger (Note 10) | | | 1,359,502 | | | | 29,433,212 | |
Series shares repurchased | | | (7,410,225 | ) | | | (154,193,607 | ) |
| | |
|
|
| |
|
|
|
Net increase (decrease) in shares outstanding | | | (3,646,688 | ) | | $ | (73,758,686 | ) |
| | |
|
|
| |
|
|
|
| | |
Class II
| | | | | | |
Year ended December 31, 2011: | | | | | | | | |
Series shares sold | | | 317,015 | | | $ | 7,584,519 | |
Series shares issued in reinvestment of distributions | | | — | | | | — | |
Series shares repurchased | | | (372,193 | ) | | | (8,715,225 | ) |
| | |
|
|
| |
|
|
|
Net increase (decrease) in shares outstanding | | | (55,178 | ) | | $ | (1,130,706 | ) |
| | |
|
|
| |
|
|
|
B10
Jennison Portfolio (cont’d):
| | | | | | | | |
Class II
| | Shares
| | | Amount
| |
Year ended December 31, 2010: | | | | | | | | |
Series shares sold | | | 189,904 | | | $ | 3,885,561 | |
Series shares issued in reinvestment of distributions | | | 264 | | | | 5,201 | |
Series shares issued in merger (Note 10) | | | 605,762 | | | | 12,890,620 | |
Series shares repurchased | | | (330,701 | ) | | | (6,729,234 | ) |
| | |
|
|
| |
|
|
|
Net increase (decrease) in shares outstanding | | | 465,229 | | | $ | 10,052,148 | |
| | |
|
|
| |
|
|
|
Natural Resources Portfolio:
| | | | | | | | |
Class I
| | Shares
| | | Amount
| |
Year ended December 31, 2011: | | | | | | | | |
Series shares sold | | | 412,131 | | | $ | 18,208,621 | |
Series shares issued in reinvestment of distributions | | | 47,177 | | | | 2,137,134 | |
Series shares repurchased | | | (2,846,544 | ) | | | (127,557,784 | ) |
| | |
|
|
| |
|
|
|
Net increase (decrease) in shares outstanding | | | (2,387,236 | ) | | $ | (107,212,029 | ) |
| | |
|
|
| |
|
|
|
Year ended December 31, 2010: | | | | | | | | |
Series shares sold | | | 480,166 | | | $ | 18,914,478 | |
Series shares issued in reinvestment of distributions | | | 126,305 | | | | 4,476,261 | |
Series shares repurchased | | | (3,058,129 | ) | | | (114,388,529 | ) |
| | |
|
|
| |
|
|
|
Net increase (decrease) in shares outstanding | | | (2,451,658 | ) | | $ | (90,997,790 | ) |
| | |
|
|
| |
|
|
|
| | |
Class II
| | | | | | |
Year ended December 31, 2011: | | | | | | | | |
Series shares sold | | | 875,550 | | | $ | 37,590,119 | |
Series shares issued in reinvestment of distributions | | | — | | | | — | |
Series shares repurchased | | | (1,252,490 | ) | | | (53,728,764 | ) |
| | |
|
|
| |
|
|
|
Net increase (decrease) in shares outstanding | | | (376,940 | ) | | $ | (16,138,645 | ) |
| | |
|
|
| |
|
|
|
Year ended December 31, 2010: | | | | | | | | |
Series shares sold | | | 1,032,268 | | | $ | 40,266,480 | |
Series shares issued in reinvestment of distributions | | | 1,807 | | | | 63,676 | |
Series shares repurchased | | | (1,375,362 | ) | | | (50,065,682 | ) |
| | |
|
|
| |
|
|
|
Net increase (decrease) in shares outstanding | | | (341,287 | ) | | $ | (9,735,526 | ) |
| | |
|
|
| |
|
|
|
Value Portfolio:
| | | | | | | | |
Class I
| | Shares
| | | Amount
| |
Year ended December 31, 2011: | | | | | | | | |
Series shares sold | | | 661,360 | | | $ | 11,056,833 | |
Series shares issued in reinvestment of distributions | | | 806,739 | | | | 13,916,247 | |
Series shares repurchased | | | (8,283,301 | ) | | | (141,040,811 | ) |
| | |
|
|
| |
|
|
|
Net increase (decrease) in shares outstanding | | | (6,815,202 | ) | | $ | (116,067,731 | ) |
| | |
|
|
| |
|
|
|
Year ended December 31, 2010: | | | | | | | | |
Series shares sold | | | 1,309,289 | | | $ | 20,376,435 | |
Series shares issued in reinvestment of distributions | | | 788,428 | | | | 11,668,725 | |
Series shares issued in merger (Note 10) | | | 12,308,069 | | | | 199,267,637 | |
Series shares repurchased | | | (8,560,895 | ) | | | (131,705,765 | ) |
| | |
|
|
| |
|
|
|
Net increase (decrease) in shares outstanding | | | 5,844,891 | | | $ | 99,607,032 | |
| | |
|
|
| |
|
|
|
B11
Value Portfolio (cont’d):
| | | | | | | | |
Class II
| | Shares
| | | Amount
| |
Year ended December 31, 2011: | | | | | | | | |
Series shares sold | | | 36,870 | | | $ | 639,495 | |
Series shares issued in reinvestment of distributions | | | 2,080 | | | | 36,196 | |
Series shares repurchased | | | (78,020 | ) | | | (1,327,130 | ) |
| | |
|
|
| |
|
|
|
Net increase (decrease) in shares outstanding | | | (39,070 | ) | | $ | (651,439 | ) |
| | |
|
|
| |
|
|
|
Year ended December 31, 2010: | | | | | | | | |
Series shares sold | | | 228,500 | | | $ | 3,506,123 | |
Series shares issued in reinvestment of distributions | | | 1,131 | | | | 16,864 | |
Series shares repurchased | | | (59,635 | ) | | | (932,385 | ) |
| | |
|
|
| |
|
|
|
Net increase (decrease) in shares outstanding | | | 169,996 | | | $ | 2,590,602 | |
| | |
|
|
| |
|
|
|
The Portfolios (excluding the Money Market Portfolio), along with other affiliated registered investment companies (the “Funds”), are a party to a Syndicated Credit Agreement (“SCA”) with a group of banks. The purpose of the SCA is to provide an alternative source of temporary funding for capital share redemptions. The SCA provides for a commitment of $900 million for the period December 16, 2011 through December 14, 2012. The Funds pay an annualized commitment fee of 0.08% of the unused portion of the SCA. Prior to December 16, 2011, the Funds had another Syndicated Credit Agreement of $750 million commitment with an annualized commitment fee of 0.10% of the unused portion. Interest on any borrowings under the SCA is paid at contracted market rates. The commitment fee for the unused amount is accrued daily and paid quarterly.
The following Portfolios utilized the SCA during the year ended December 31, 2011. The average balance outstanding is for the number of days the Portfolio had utilized the credit facility.
| | | | | | | | | | | | | | | | |
Portfolio
| | Approximate
Average
Balance
Outstanding
| | | Number of
Days
Outstanding
| | | Weighted
Average
Interest
Rates
| | | Amount
Outstanding at
December 31,
2011
| |
Jennison Portfolio | | $ | 1,315,000 | | | | 45 | | | | 1.50 | % | | $ | — | |
Global Portfolio | | | 164,000 | | | | 3 | | | | 1.49 | | | | — | |
Value Portfolio | | | 490,500 | | | | 4 | | | | 1.47 | | | | — | |
| Note 9: | | Ownership and Affiliates |
As of December 31, 2011, all of Class I shares of record of each Portfolio were owned by the Prudential Insurance Company of America (“PICA”) on behalf of the owners of the variable insurance products issued by PICA.
On December 7, 2009, The Board of Trustees of the Series Fund approved an Agreement and Plan of Reorganization (the “Plan”) which provided for the transfer of all the assets of the following portfolios for shares of the acquiring portfolios and the assumption of the liabilities of the portfolios. Shareholders approved the Plan at a meeting on March 25, 2010 and the reorganization took place on April 30, 2010.
The purpose of the transactions was to combine two Portfolios with substantially similar investment objectives, policies and restrictions. The Acquiring Portfolios have a lower contractual investment management fee and annualized operating expense ratio as well as stronger historical investment performance.
B12
The acquisitions were accomplished by a tax-free exchange of the following shares on April 30, 2010:
| | | | | | | | | | | | | | |
Merged Portfolio
| | Shares
| | | Acquiring Portfolio
| | Shares
| | | Value
| |
| SP Strategic Partners Focused Growth Portfolio: | | | | | | Jennison Portfolio: | | | | | | | | |
Class I | | | 4,278,083 | | | Class I | | | 1,359,502 | | | $ | 29,433,212 | |
Class II | | | 1,956,088 | | | Class II | | | 605,762 | | | | 12,890,620 | |
| SP Davis Value Portfolio: | | | | | | Value Portfolio: | | | | | | | | |
Class I | | | 21,777,884 | | | Class I | | | 12,308,069 | | | | 199,267,637 | |
For financial reporting purposes, assets received and shares issued by the Acquiring Portfolios were recorded at fair value; however, the cost basis of the investments received from the Merged Portfolios was carried forward to reflect the tax-free status of the acquisition. The net assets and net unrealized appreciation immediately before the acquisitions were as follows:
| | | | | | | | | | | | | | |
Merged Portfolio
| | Net Assets
| | | Unrealized
Appreciation
| | | Acquiring Portfolio
| | Net Assets
| |
| SP Strategic Partners Focused Growth Portfolio | | $ | 42,323,832 | | | $ | 8,933,329 | | | Jennison Portfolio | | $ | 1,340,557,644 | |
| SP Davis Value Portfolio | | | 199,267,637 | | | | 55,151,182 | | | Value Portfolio | | | 1,242,235,677 | |
Assuming the acquisitions had been completed on January 1, 2010, the Acquiring Portfolios’ results of operations for the year ended December 31, 2010 were as follows:
| | | | |
| Jennison Portfolio | | | | |
Net investment income | | $ | 3,502,824 | (a) |
Net realized and unrealized gain on investments | | | 141,946,189 | (b) |
| | |
|
|
|
| | | $ | 145,449,013 | |
| | |
|
|
|
| Value Portfolio | | | | |
Net investment income | | $ | 14,414,980 | (c) |
Net realized and unrealized loss on investments | | | 160,246,225 | (d) |
| | |
|
|
|
| | | $ | 174,661,205 | |
| | |
|
|
|
| | (a) | $3,611,532, as reported in the Statement of Operations, less $150,491 Net Investment loss from SP Strategic Partners Focused Growth Portfolio pre-merger, plus $41,783 of pro-forma eliminated expenses. |
| | (b) | $141,930,706, as reported in the Statement of Operations, plus $15,483 Net Realized and Unrealized Gain on Investments from SP Strategic Partners Focused Growth Portfolio pre-merger. |
| | (c) | $13,964,864, as reported in the Statement of Operations, plus $223,596 Net Investment Income from SP Davis Value Portfolio pre-merger, plus $226,520 of pro-forma eliminated expenses. |
| | (d) | $150,154,943, as reported in the Statement of Operations, plus $10,091,282 Net Realized and Unrealized Gain on Investments from SP Davis Value Portfolio pre-merger. |
Because both the Acquiring Portfolios and Merged Portfolios sold and redeemed shares throughout the period, it is not practicable to provide pro-forma information on a per-share basis.
Because the combined investment portfolios have been managed as a single integrated portfolio since the acquisitions were completed, it is also not practicable to separate the amounts of revenue and earnings of the Merged Portfolios that have been included in the Acquiring Portfolios’ Statement of Operations since April 30, 2010.
| Note 11: | | New Accounting Pronouncements |
In April 2011, the Financial Accounting Standards Board (“FASB”) issued Accounting Standards Update (“ASU”) No. 2011-03 “Reconsideration of Effective control for Repurchase Agreements”. The objective of ASU 2011-03 is to improve the accounting for repurchase agreements and other agreements that both entitle and obligate a transferor to repurchase or redeem financial assets before their maturity. Under previous guidance, whether or not to account for a transaction as a sale was based on, in part, if the entity maintained effective control over the transferred financial assets. ASU 2011-03 removes the transferor’s ability criterion
B13
from the effective control assessment. This guidance is effective prospectively for interim and annual reporting periods beginning on or after December 15, 2011. At this time, management is evaluating the implications of ASU No. 2011-03 and its impact on the financial statements has not been determined.
In May 2011, the FASB issued ASU No. 2011-04 “Amendments to Achieve Common Fair Value Measurement and Disclosure Requirements in U.S. GAAP and IFRSs”. ASU 2011-04 includes common requirements for measurement of and disclosure about fair value between U.S. GAAP and IFRS. ASU 2011-04 will require reporting entities to disclose quantitative information about the unobservable inputs used in the fair value measurements categorized within Level 3 of the fair value hierarchy. In addition, ASU 2011-04 will require reporting entities to make disclosures about amounts and reasons for all transfers in and out of Level 1 and Level 2 fair value measurements. The new and revised disclosures are effective for interim and annual reporting periods beginning after December 15, 2011. At this time, management is evaluating the implications of ASU No. 2011-04 and its impact on the financial statements has not been determined.
B14
Financial Highlights
| | | | | | | | | | | | | | | | | | | | |
| | | Conservative Balanced Portfolio
| |
| | | Year Ended December 31,
| |
| | | 2011
| | | 2010
| | | 2009
| | | 2008
| | | 2007(a)
| |
Per Share Operating Performance: | | | | | | | | | | | | | | | | | | | | |
Net Asset Value, beginning of year | | $ | 15.96 | | | $ | 14.65 | | | $ | 12.69 | | | $ | 16.69 | | | $ | 16.21 | |
| | |
|
|
| |
|
|
| |
|
|
| |
|
|
| |
|
|
|
Income (Loss) From Investment Operations: | | | | | | | | | | | | | | | | | | | | |
Net investment income | | | .36 | | | | .37 | | | | .39 | | | | .50 | | | | .50 | |
Net realized and unrealized gain (loss) on investments | | | .37 | | | | 1.31 | | | | 2.08 | | | | (3.98 | ) | | | .49 | |
| | |
|
|
| |
|
|
| |
|
|
| |
|
|
| |
|
|
|
Total from investment operations | | | .73 | | | | 1.68 | | | | 2.47 | | | | (3.48 | ) | | | .99 | |
| | |
|
|
| |
|
|
| |
|
|
| |
|
|
| |
|
|
|
Less Distributions | | | (.37 | ) | | | (.37 | ) | | | (.51 | ) | | | (.52 | ) | | | (.51 | ) |
| | |
|
|
| |
|
|
| |
|
|
| |
|
|
| |
|
|
|
Net Asset Value, end of year | | $ | 16.32 | | | $ | 15.96 | | | $ | 14.65 | | | $ | 12.69 | | | $ | 16.69 | |
| | |
|
|
| |
|
|
| |
|
|
| |
|
|
| |
|
|
|
Total Return(b) | | | 4.60 | % | | | 11.74 | % | | | 20.01 | % | | | (21.41 | )% | | | 6.12 | % |
Ratios/Supplemental Data: | | | | | | | | | | | | | | | | | | | | |
Net assets, end of year (in millions) | | $ | 2,191.6 | | | $ | 2,234.7 | | | $ | 2,138.7 | | | $ | 1,957.5 | | | $ | 2,721.9 | |
Ratios to average net assets(c): | | | | | | | | | | | | | | | | | | | | |
Expenses | | | .59 | % | | | .59 | % | | | .59 | % | | | .59 | % | | | .59 | % |
Net investment income | | | 2.12 | % | | | 2.32 | % | | | 2.68 | % | | | 3.12 | % | | | 2.95 | % |
Portfolio turnover rate | | | 215 | % | | | 185 | % | | | 250 | % | | | 336 | % | | | 178 | % |
| | | | | | | | | | | | | | | | | | | | |
| | | Diversified Bond Portfolio
| |
| | | Year Ended December 31,
| |
| | | 2011
| | | 2010
| | | 2009
| | | 2008
| | | 2007
| |
Per Share Operating Performance: | | | | | | | | | | | | | | | | | | | | |
Net Asset Value, beginning of year | | $ | 11.67 | | | $ | 11.16 | | | $ | 9.89 | | | $ | 10.90 | | | $ | 10.85 | |
| | |
|
|
| |
|
|
| |
|
|
| |
|
|
| |
|
|
|
Income (Loss) From Investment Operations: | | | | | | | | | | | | | | | | | | | | |
Net investment income | | | .56 | | | | .52 | | | | .50 | | | | .54 | | | | .58 | |
Net realized and unrealized gain (loss) on investments | | | .30 | | | | .63 | | | | 1.46 | | | | (.90 | ) | | | .02 | |
| | |
|
|
| |
|
|
| |
|
|
| |
|
|
| |
|
|
|
Total from investment operations | | | .86 | | | | 1.15 | | | | 1.96 | | | | (.36 | ) | | | .60 | |
| | |
|
|
| |
|
|
| |
|
|
| |
|
|
| |
|
|
|
Less Distributions | | | (.79 | ) | | | (.64 | ) | | | (.69 | ) | | | (.65 | ) | | | (.55 | ) |
| | |
|
|
| |
|
|
| |
|
|
| |
|
|
| |
|
|
|
Net Asset Value, end of year | | $ | 11.74 | | | $ | 11.67 | | | $ | 11.16 | | | $ | 9.89 | | | $ | 10.90 | |
| | |
|
|
| |
|
|
| |
|
|
| |
|
|
| |
|
|
|
Total Return(b) | | | 7.51 | % | | | 10.57 | % | | | 20.51 | % | | | (3.46 | )% | | | 5.71 | % |
Ratios/Supplemental Data: | | | | | | | | | | | | | | | | | | | | |
Net assets, end of year (in millions) | | $ | 1,556.9 | | | $ | 1,522.9 | | | $ | 1,363.5 | | | $ | 1,134.8 | | | $ | 1,218.3 | |
Ratios to average net assets(c): | | | | | | | | | | | | | | | | | | | | |
Expenses | | | .42 | % | | | .46 | % | | | .44 | % | | | .44 | % | | | .44 | % |
Net investment income | | | 4.76 | % | | | 4.46 | % | | | 4.79 | % | | | 5.07 | % | | | 5.39 | % |
Portfolio turnover rate | | | 167 | % | | | 191 | % | | | 401 | % | | | 723 | % | | | 476 | % |
| (a) | Calculated based on average shares outstanding during the year. |
| (b) | Total return is calculated assuming a purchase of a share on the first day and a sale on the last day of each year reported and includes reinvestment of distributions and does not reflect the effect of insurance contract charges. Total return does not reflect expenses associated with the separate account such as administrative fees, account charges and surrender charges which, if reflected, would reduce the total returns for all years shown. Performance figures may reflect voluntary fee waivers and/or expense reimbursements. In the absence of voluntary fee waivers and/or expense reimbursements, the total return would be lower. Past performance is no guarantee of future results. Total returns may reflect adjustments to conform to generally accepted accounting principles. |
| (c) | Does not include expenses of the underlying portfolios in which the Portfolio invests. |
SEE NOTES TO FINANCIAL STATEMENTS.
C1
Financial Highlights
| | | | | | | | | | | | | | | | | | | | |
| | | Equity Portfolio
| |
| | | Class I
| |
| | | Year Ended December 31,
| |
| | | 2011
| | | 2010
| | | 2009
| | | 2008(c)
| | | 2007
| |
Per Share Operating Performance: | | | | | | | | | | | | | | | | | | | | |
Net Asset Value, beginning of year | | $ | 24.75 | | | $ | 22.30 | | | $ | 16.40 | | | $ | 29.67 | | | $ | 27.45 | |
| | |
|
|
| |
|
|
| |
|
|
| |
|
|
| |
|
|
|
Income (Loss) From Investment Operations: | | | | | | | | | | | | | | | | | | | | |
Net investment income | | | .13 | | | | .15 | | | | .16 | | | | .29 | | | | .35 | |
Net realized and unrealized gain (loss) on investments | | | (.98 | ) | | | 2.48 | | | | 6.04 | | | | (10.52 | ) | | | 2.21 | |
| | |
|
|
| |
|
|
| |
|
|
| |
|
|
| |
|
|
|
Total from investment operations | | | (.85 | ) | | | 2.63 | | | | 6.20 | | | | (10.23 | ) | | | 2.56 | |
| | |
|
|
| |
|
|
| |
|
|
| |
|
|
| |
|
|
|
Less Distributions: | | | (.17 | ) | | | (.18 | ) | | | (.30 | ) | | | (3.04 | ) | | | (.34 | ) |
| | |
|
|
| |
|
|
| |
|
|
| |
|
|
| |
|
|
|
Net Asset Value, end of year | | $ | 23.73 | | | $ | 24.75 | | | $ | 22.30 | | | $ | 16.40 | | | $ | 29.67 | |
| | |
|
|
| |
|
|
| |
|
|
| |
|
|
| |
|
|
|
Total Return(a) | | | (3.47 | )% | | | 11.90 | % | | | 38.17 | % | | | (38.16 | )% | | | 9.32 | % |
Ratios/Supplemental Data: | | | | | | | | | | | | | | | | | | | | |
Net assets, end of year (in millions) | | $ | 2,997.5 | | | $ | 3,324.3 | | | $ | 3,195.1 | | | $ | 2,521.0 | | | $ | 4,423.9 | |
Ratios to average net assets(b): | | | | | | | | | | | | | | | | | | | | |
Expenses | | | .48 | % | | | .48 | % | | | .48 | % | | | .48 | % | | | .47 | % |
Net investment income | | | .58 | % | | | .71 | % | | | .90 | % | | | 1.21 | % | | | 1.16 | % |
Portfolio turnover rate | | | 49 | % | | | 68 | % | | | 98 | % | | | 67 | % | | | 57 | % |
| | | | | | | | | | | | | | | | | | | | |
| | | Equity Portfolio
| |
| | | Class II
| |
| | | Year Ended December 31,
| |
| | | 2011
| | | 2010
| | | 2009
| | | 2008(c)
| | | 2007
| |
Per Share Operating Performance: | | | | | | | | | | | | | | | | | | | | |
Net Asset Value, beginning of year | | $ | 25.00 | | | $ | 22.46 | | | $ | 16.47 | | | $ | 29.81 | | | $ | 27.52 | |
| | |
|
|
| |
|
|
| |
|
|
| |
|
|
| |
|
|
|
Income (Loss) From Investment Operations: | | | | | | | | | | | | | | | | | | | | |
Net investment income | | | .06 | | | | .04 | | | | .09 | | | | .19 | | | | .28 | |
Net realized and unrealized gain (loss) on investments | | | (1.03 | ) | | | 2.54 | | | | 6.07 | | | | (10.61 | ) | | | 2.20 | |
| | |
|
|
| |
|
|
| |
|
|
| |
|
|
| |
|
|
|
Total from investment operations | | | (.97 | ) | | | 2.58 | | | | 6.16 | | | | (10.42 | ) | | | 2.48 | |
| | |
|
|
| |
|
|
| |
|
|
| |
|
|
| |
|
|
|
Less Distributions: | | | (.04 | ) | | | (.04 | ) | | | (.17 | ) | | | (2.92 | ) | | | (.19 | ) |
| | |
|
|
| |
|
|
| |
|
|
| |
|
|
| |
|
|
|
Net Asset Value, end of year | | $ | 23.99 | | | $ | 25.00 | | | $ | 22.46 | | | $ | 16.47 | | | $ | 29.81 | |
| | |
|
|
| |
|
|
| |
|
|
| |
|
|
| |
|
|
|
Total Return(a) | | | (3.87 | )% | | | 11.50 | % | | | 37.58 | % | | | (38.47 | )% | | | 8.91 | % |
Ratios/Supplemental Data: | | | | | | | | | | | | | | | | | | | | |
Net assets, end of year (in millions) | | $ | 2.0 | | | $ | 1.9 | | | $ | .4 | | | $ | .4 | | | $ | 1.3 | |
Ratios to average net assets(b): | | | | | | | | | | | | | | | | | | | | |
Expenses | | | .88 | % | | | .88 | % | | | .88 | % | | | .88 | % | | | .87 | % |
Net investment income | | | .19 | % | | | .34 | % | | | .52 | % | | | .78 | % | | | .74 | % |
Portfolio turnover rate | | | 49 | % | | | 68 | % | | | 98 | % | | | 67 | % | | | 57 | % |
| (a) | Total return is calculated assuming a purchase of a share on the first day and a sale on the last day of each year reported and includes reinvestment of distributions and does not reflect the effect of insurance contract charges. Total return does not reflect expenses associated with the separate account such as administrative fees, account charges and surrender charges which, if reflected, would reduce the total return for all periods shown. Performance figures may reflect voluntary fee waivers and/or expense reimbursements. In the absence of voluntary fee waivers and/or expense reimbursements, the total return would be lower. Past performance is no guarantee of future results. Total returns may reflect adjustments to conform to generally accepted accounting principles. |
| (b) | Does not include expenses of the underlying portfolio in which the Portfolio invests. |
| (c) | Calculation based on average shares outstanding during the year. |
SEE NOTES TO FINANCIAL STATEMENTS.
C2
Financial Highlights
| | | | | | | | | | | | | | | | | | | | |
| | | Flexible Managed Portfolio
| |
| | | Year Ended December 31,
| |
| | | 2011
| | | 2010
| | | 2009
| | | 2008
| | | 2007
| |
Per Share Operating Performance: | | | | | | | | | | | | | | | | | | | | |
Net Asset Value, beginning of year | | $ | 15.63 | | | $ | 14.28 | | | $ | 12.34 | | | $ | 18.30 | | | $ | 18.36 | |
| | |
|
|
| |
|
|
| |
|
|
| |
|
|
| |
|
|
|
Income (Loss) From Investment Operations: | | | | | | | | | | | | | | | | | | | | |
Net investment income | | | .33 | | | | .31 | | | | .34 | | | | .45 | | | | .50 | |
Net realized and unrealized gain (loss) on investments | | | .34 | | | | 1.37 | | | | 2.05 | | | | (4.62 | ) | | | .65 | |
| | |
|
|
| |
|
|
| |
|
|
| |
|
|
| |
|
|
|
Total from investment operations | | | .67 | | | | 1.68 | | | | 2.39 | | | | (4.17 | ) | | | 1.15 | |
| | |
|
|
| |
|
|
| |
|
|
| |
|
|
| |
|
|
|
Less Distributions | | | (.31 | ) | | | (.33 | ) | | | (.45 | ) | | | (1.79 | ) | | | (1.21 | ) |
| | |
|
|
| |
|
|
| |
|
|
| |
|
|
| |
|
|
|
Net Asset Value, end of year | | $ | 15.99 | | | $ | 15.63 | | | $ | 14.28 | | | $ | 12.34 | | | $ | 18.30 | |
| | |
|
|
| |
|
|
| |
|
|
| |
|
|
| |
|
|
|
Total Return(a) | | | 4.34 | % | | | 12.03 | % | | | 19.95 | % | | | (24.82 | )% | | | 6.30 | % |
Ratios/Supplemental Data: | | | | | | | | | | | | | | | | | | | | |
Net assets, end of year (in millions) | | $ | 3,036.8 | | | $ | 3,077.3 | | | $ | 2,906.0 | | | $ | 2,621.6 | | | $ | 3,716.3 | |
Ratios to average net assets(b): | | | | | | | | | | | | | | | | | | | | |
Expenses | | | .63 | % | | | .64 | % | | | .63 | % | | | .64 | % | | | .63 | % |
Net investment income | | | 2.01 | % | | | 2.06 | % | | | 2.50 | % | | | 2.85 | % | | | 2.53 | % |
Portfolio turnover rate | | | 246 | % | | | 205 | % | | | 248 | % | | | 321 | % | | | 212 | % |
| | | | | | | | | | | | | | | | | | | | |
| | | Global Portfolio
| |
| | | Year Ended December 31,
| |
| | | 2011
| | | 2010
| | | 2009
| | | 2008
| | | 2007
| |
Per Share Operating Performance: | | | | | | | | | | | | | | | | | | | | |
Net Asset Value, beginning of year | | $ | 18.49 | | | $ | 16.68 | | | $ | 13.07 | | | $ | 24.62 | | | $ | 22.53 | |
| | |
|
|
| |
|
|
| |
|
|
| |
|
|
| |
|
|
|
Income (Loss) From Investment Operations: | | | | | | | | | | | | | | | | | | | | |
Net investment income | | | .29 | | | | .28 | | | | .28 | | | | .40 | | | | .36 | |
Net realized and unrealized gain (loss) on investments | | | (1.56 | ) | | | 1.79 | | | | 3.75 | | | | (10.38 | ) | | | 2.00 | |
| | |
|
|
| |
|
|
| |
|
|
| |
|
|
| |
|
|
|
Total from investment operations | | | (1.27 | ) | | | 2.07 | | | | 4.03 | | | | (9.98 | ) | | | 2.36 | |
| | |
|
|
| |
|
|
| |
|
|
| |
|
|
| |
|
|
|
Less Distributions | | | (.28 | ) | | | (.26 | ) | | | (.42 | ) | | | (1.57 | ) | | | (.27 | ) |
| | |
|
|
| |
|
|
| |
|
|
| |
|
|
| |
|
|
|
Net Asset Value, end of year | | $ | 16.94 | | | $ | 18.49 | | | $ | 16.68 | | | $ | 13.07 | | | $ | 24.62 | |
| | |
|
|
| |
|
|
| |
|
|
| |
|
|
| |
|
|
|
Total Return(a) | | | (6.97 | )% | | | 12.74 | % | | | 31.39 | % | | | (42.92 | )% | | | 10.48 | % |
Ratios/Supplemental Data: | | | | | | | | | | | | | | | | | | | | |
Net assets, end of year (in millions) | | $ | 564.2 | | | $ | 648.5 | | | $ | 619.5 | | | $ | 512.7 | | | $ | 985.0 | |
Ratios to average net assets(b): | | | | | | | | | | | | | | | | | | | | |
Expenses | | | .84 | % | | | .87 | % | | | .85 | % | | | .84 | % | | | .81 | % |
Net investment income | | | 1.54 | % | | | 1.60 | % | | | 1.77 | % | | | 2.01 | % | | | 1.43 | % |
Portfolio turnover rate | | | 69 | % | | | 69 | % | | | 50 | % | | | 65 | % | | | 48 | % |
| (a) | Total return is calculated assuming a purchase of a share on the first day and a sale on the last day of each year reported and includes reinvestment of distributions and does not reflect the effect of insurance contract charges. Total return does not reflect expenses associated with the separate account such as administrative fees, account charges and surrender charges which, if reflected, would reduce the total returns for all years shown. Performance figures may reflect voluntary fee waivers and/or expense reimbursements. In the absence of voluntary fee waivers and/or expense reimbursements, the total return would be lower. Past performance is no guarantee of future results. Total returns may reflect adjustments to conform to generally accepted accounting principles. |
| (b) | Does not include expenses of the underlying portfolios in which the Portfolio invests. |
SEE NOTES TO FINANCIAL STATEMENTS.
C3
Financial Highlights
| | | | | | | | | | | | | | | | | | | | |
| | | Government Income Portfolio
| |
| | | Year Ended December 31,
| |
| | | 2011
| | | 2010
| | | 2009
| | | 2008
| | | 2007
| |
Per Share Operating Performance: | | | | | | | | | | | | | | | | | | | | |
Net Asset Value, beginning of year | | $ | 12.03 | | | $ | 11.86 | | | $ | 11.40 | | | $ | 11.38 | | | $ | 11.26 | |
| | |
|
|
| |
|
|
| |
|
|
| |
|
|
| |
|
|
|
Income (Loss) From Investment Operations: | | | | | | | | | | | | | | | | | | | | |
Net investment income | | | .30 | | | | .35 | | | | .37 | | | | .45 | | | | .53 | |
Net realized and unrealized gain (loss) on investments | | | .60 | | | | .47 | | | | .49 | | | | .03 | | | | .10 | |
| | |
|
|
| |
|
|
| |
|
|
| |
|
|
| |
|
|
|
Total from investment operations | | | .90 | | | | .82 | | | | .86 | | | | .48 | | | | .63 | |
| | |
|
|
| |
|
|
| |
|
|
| |
|
|
| |
|
|
|
Less Distributions | | | (.56 | ) | | | (.65 | ) | | | (.40 | ) | | | (.46 | ) | | | (.51 | ) |
| | |
|
|
| |
|
|
| |
|
|
| |
|
|
| |
|
|
|
Net Asset Value, end of year | | $ | 12.37 | | | $ | 12.03 | | | $ | 11.86 | | | $ | 11.40 | | | $ | 11.38 | |
| | |
|
|
| |
|
|
| |
|
|
| |
|
|
| |
|
|
|
Total Return(a) | | | 7.63 | % | | | 6.99 | % | | | 7.71 | % | | | 4.30 | % | | | 5.70 | % |
Ratios/Supplemental Data: | | | | | | | | | | | | | | | | | | | | |
Net assets, end of year (in millions) | | $ | 416.7 | | | $ | 399.2 | | | $ | 375.4 | | | $ | 370.5 | | | $ | 340.3 | |
Ratios to average net assets(b): | | | | | | | | | | | | | | | | | | | | |
Expenses | | | .46 | % | | | .50 | % | | | .47 | % | | | .52 | %(c) | | | .52 | % |
Net investment income | | | 2.48 | % | | | 2.87 | % | | | 3.11 | % | | | 3.98 | %(c) | | | 4.62 | % |
Portfolio turnover rate | | | 1554 | % | | | 1122 | % | | | 1179 | % | | | 2707 | % | | | 2377 | % |
| | | | | | | | | | | | | | | | | | | | |
| | | High Yield Bond Portfolio
| |
| | | Year Ended December 31,
| |
| | | 2011
| | | 2010
| | | 2009
| | | 2008
| | | 2007
| |
Per Share Operating Performance: | | | | | | | | | | | | | | | | | | | | |
Net Asset Value, beginning of year | | $ | 5.06 | | | $ | 4.83 | | | $ | 3.61 | | | $ | 5.09 | | | $ | 5.33 | |
| | |
|
|
| |
|
|
| |
|
|
| |
|
|
| |
|
|
|
Income (Loss) From Investment Operations: | | | | | | | | | | | | | | | | | | | | |
Net investment income | | | .38 | | | | .42 | | | | .41 | | | | .41 | | | | .40 | |
Net realized and unrealized gain (loss) on investments | | | (.13 | ) | | | .23 | | | | 1.22 | | | | (1.48 | ) | | | (.26 | ) |
| | |
|
|
| |
|
|
| |
|
|
| |
|
|
| |
|
|
|
Total from investment operations | | | .25 | | | | .65 | | | | 1.63 | | | | (1.07 | ) | | | .14 | |
| | |
|
|
| |
|
|
| |
|
|
| |
|
|
| |
|
|
|
Less Distributions | | | (.38 | ) | | | (.42 | ) | | | (.41 | ) | | | (.41 | ) | | | (.38 | ) |
| | |
|
|
| |
|
|
| |
|
|
| |
|
|
| |
|
|
|
Net Asset Value, end of year | | $ | 4.93 | | | $ | 5.06 | | | $ | 4.83 | | | $ | 3.61 | | | $ | 5.09 | |
| | |
|
|
| |
|
|
| |
|
|
| |
|
|
| |
|
|
|
Total Return(a) | | | 5.10 | % | | | 14.05 | % | | | 47.16 | % | | | (22.28 | )% | | | 2.62 | % |
Ratios/Supplemental Data: | | | | | | | | | | | | | | | | | | | | |
Net assets, end of year (in millions) | | $ | 2,158.4 | | | $ | 2,141.2 | | | $ | 1,938.3 | | | $ | 1,239.9 | | | $ | 1,674.0 | |
Ratios to average net assets(b): | | | | | | | | | | | | | | | | | | | | |
Expenses | | | .58 | % | | | .58 | % | | | .58 | % | | | .58 | % | | | .58 | % |
Net investment income | | | 7.53 | % | | | 8.51 | % | | | 9.75 | % | | | 8.78 | % | | | 7.49 | % |
Portfolio turnover rate | | | 68 | % | | | 89 | % | | | 84 | % | | | 61 | % | | | 58 | % |
| (a) | Total return is calculated assuming a purchase of a share on the first day and a sale on the last day of each year reported and includes reinvestment of distributions and does not reflect the effect of insurance contract charges. Total return does not reflect expenses associated with the separate account such as administrative fees, account charges and surrender charges which, if reflected, would reduce the total returns for all years shown. Performance figures may reflect voluntary fee waivers and/or expense reimbursements. In the absence of voluntary fee waivers and/or expense reimbursements, the total return would be lower. Past performance is no guarantee of future results. Total returns may reflect adjustments to conform to generally accepted accounting principles. |
| (b) | Does not include expenses of the underlying portfolios in which the Portfolio invests. |
| (c) | Includes interest expense of 0.03%. |
SEE NOTES TO FINANCIAL STATEMENTS.
C4
Financial Highlights
| | | | | | | | | | | | | | | | | | | | |
| | | Jennison Portfolio
| |
| | | Class I
| |
| | | Year Ended December 31,
| |
| | | 2011
| | | 2010(a)
| | | 2009(a)
| | | 2008(a)
| | | 2007
| |
Per Share Operating Performance: | | | | | | | | | | | | | | | | | | | | |
Net Asset Value, beginning of year | | $ | 23.26 | | | $ | 20.87 | | | $ | 14.69 | | | $ | 23.53 | | | $ | 21.07 | |
| | |
|
|
| |
|
|
| |
|
|
| |
|
|
| |
|
|
|
Income (Loss) From Investment Operations: | | | | | | | | | | | | | | | | | | | | |
Net investment income | | | .03 | | | | .06 | | | | .08 | | | | .10 | | | | .10 | |
Net realized and unrealized gain (loss) on investments | | | .04 | | | | 2.42 | | | | 6.22 | | | | (8.84 | ) | | | 2.43 | |
| | |
|
|
| |
|
|
| |
|
|
| |
|
|
| |
|
|
|
Total from investment operations | | | .07 | | | | 2.48 | | | | 6.30 | | | | (8.74 | ) | | | 2.53 | |
| | |
|
|
| |
|
|
| |
|
|
| |
|
|
| |
|
|
|
Less Distributions | | | (.07 | ) | | | (.09 | ) | | | (.12 | ) | | | (.10 | ) | | | (.07 | ) |
| | |
|
|
| |
|
|
| |
|
|
| |
|
|
| |
|
|
|
Net Asset Value, end of year | | $ | 23.26 | | | $ | 23.26 | | | $ | 20.87 | | | $ | 14.69 | | | $ | 23.53 | |
| | |
|
|
| |
|
|
| |
|
|
| |
|
|
| |
|
|
|
Total Return(b) | | | .30 | % | | | 11.95 | % | | | 43.03 | % | | | (37.28 | )% | | | 12.00 | % |
Ratios/Supplemental Data: | | | | | | | | | | | | | | | | | | | | |
Net assets, end of year (in millions) | | $ | 1,126.3 | | | $ | 1,362.1 | | | $ | 1,298.7 | | | $ | 1,148.0 | | | $ | 2,100.5 | |
Ratios to average net assets(c): | | | | | | | | | | | | | | | | | | | | |
Expenses | | | .64 | % | | | .64 | % | | | .64 | % | | | .63 | % | | | .62 | % |
Net investment income | | | .16 | % | | | .29 | % | | | .44 | % | | | .52 | % | | | .42 | % |
Portfolio turnover rate | | | 51 | % | | | 67 | % | | | 76 | % | | | 74 | % | | | 69 | % |
| | | | | | | | | | | | | | | | | | | | |
| | | Jennison Portfolio
| |
| | | Class II
| |
| | | Year Ended December 31,
| |
| | | 2011
| | | 2010(a)
| | | 2009(a)
| | | 2008(a)
| | | 2007
| |
Per Share Operating Performance: | | | | | | | | | | | | | | | | | | | | |
Net Asset Value, beginning of year | | $ | 22.91 | | | $ | 20.55 | | | $ | 14.46 | | | $ | 23.17 | | | $ | 20.77 | |
| | |
|
|
| |
|
|
| |
|
|
| |
|
|
| |
|
|
|
Income (Loss) From Investment Operations: | | | | | | | | | | | | | | | | | | | | |
Net investment income (loss) | | | (.07 | ) | | | (.02 | ) | | | .01 | | | | .02 | | | | — | (d) |
Net realized and unrealized gain (loss) on investments | | | .05 | | | | 2.38 | | | | 6.13 | | | | (8.72 | ) | | | 2.40 | |
| | |
|
|
| |
|
|
| |
|
|
| |
|
|
| |
|
|
|
Total from investment operations | | | (.02 | ) | | | 2.36 | | | | 6.14 | | | | (8.70 | ) | | | 2.40 | |
| | |
|
|
| |
|
|
| |
|
|
| |
|
|
| |
|
|
|
Less Distributions | | | — | | | | — | (d) | | | (.05 | ) | | | (.01 | ) | | | — | |
| | |
|
|
| |
|
|
| |
|
|
| |
|
|
| |
|
|
|
Net Asset Value, end of year | | $ | 22.89 | | | $ | 22.91 | | | $ | 20.55 | | | $ | 14.46 | | | $ | 23.17 | |
| | |
|
|
| |
|
|
| |
|
|
| |
|
|
| |
|
|
|
Total Return(b) | | | (.09 | )% | | | 11.50 | % | | | 42.52 | % | | | (37.55 | )% | | | 11.56 | % |
Ratios/Supplemental Data: | | | | | | | | | | | | | | | | | | | | |
Net assets, end of year (in millions) | | $ | 31.9 | | | $ | 33.2 | | | $ | 20.2 | | | $ | 12.2 | | | $ | 21.9 | |
Ratios to average net assets(c): | | | | | | | | | | | | | | | | | | | | |
Expenses | | | 1.04 | % | | | 1.04 | % | | | 1.04 | % | | | 1.03 | % | | | 1.02 | % |
Net investment income (loss) | | | (.24 | )% | | | (.10 | )% | | | .03 | % | | | .12 | % | | | .02 | % |
Portfolio turnover rate | | | 51 | % | | | 67 | % | | | 76 | % | | | 74 | % | | | 69 | % |
| (a) | Calculated based upon average shares outstanding during the year. |
| (b) | Total return is calculated assuming a purchase of a share on the first day and a sale on the last day of each year reported and includes reinvestment of distributions and does not reflect the effect of insurance contract charges. Total return does not reflect expenses associated with the separate account such as administrative fees, account charges and surrender charges which, if reflected, would reduce the total returns for all years shown. Performance figures may reflect voluntary fee waivers and/or expense reimbursements. In the absence of voluntary fee waivers and/or expense reimbursements, the total return would be lower. Past performance is no guarantee of future results. Total returns may reflect adjustments to conform to generally accepted accounting principles. |
| (c) | Does not include expenses of the underlying portfolios in which the Portfolio invests. |
| (d) | Less than $0.005 per share. |
SEE NOTES TO FINANCIAL STATEMENTS.
C5
Financial Highlights
| | | | | | | | | | | | | | | | | | | | |
| | | Money Market Portfolio
| |
| | | Year Ended December 31,
| |
| | | 2011
| | | 2010
| | | 2009
| | | 2008
| | | 2007
| |
Per Share Operating Performance: | | | | | | | | | | | | | | | | | | | | |
Net Asset Value, beginning of year | | $ | 10.00 | | | $ | 10.00 | | | $ | 10.00 | | | $ | 10.00 | | | $ | 10.00 | |
| | |
|
|
| |
|
|
| |
|
|
| |
|
|
| |
|
|
|
Income From Investment Operations: | | | | | | | | | | | | | | | | | | | | |
Net investment income and realized gains | | | — | (a) | | | — | (a) | | | .04 | | | | .26 | | | | .49 | |
Distributions | | | — | (a) | | | — | (a) | | | (.04 | ) | | | (.26 | ) | | | (.49 | ) |
Capital contributions | | | — | | | | — | (a) | | | — | | | | — | | | | — | |
| | |
|
|
| |
|
|
| |
|
|
| |
|
|
| |
|
|
|
Net Asset Value, end of year | | $ | 10.00 | | | $ | 10.00 | | | $ | 10.00 | | | $ | 10.00 | | | $ | 10.00 | |
| | |
|
|
| |
|
|
| |
|
|
| |
|
|
| |
|
|
|
Total Return(b) | | | .02 | % | | | .03 | % | | | .40 | % | | | 2.65 | % | | | 5.06 | % |
Ratios/Supplemental Data: | | | | | | | | | | | | | | | | | | | | |
Net assets, end of year (in millions) | | $ | 1,016.0 | | | $ | 1,127.1 | | | $ | 1,223.4 | | | $ | 1,489.8 | | | $ | 1,289.9 | |
Ratios to average net assets: | | | | | | | | | | | | | | | | | | | | |
Expenses | | | .18 | %(c) | | | .25 | %(c) | | | .39 | %(c) | | | .43 | % | | | .43 | % |
Net investment income | | | .02 | %(c) | | | .03 | %(c) | | | .41 | %(c) | | | 2.59 | % | | | 4.94 | % |
| (a) | Less than $0.005 per share. |
| (b) | Total return is calculated assuming a purchase of a share on the first day and a sale on the last day of each year reported and includes reinvestment of distributions and does not reflect the effect of insurance contract charges. Total return does not reflect expenses associated with the separate account such as administrative fees, account charges and surrender charges which, if reflected, would reduce the total returns for all years shown. Performance figures may reflect voluntary fee waivers and/or expense reimbursements. In the absence of voluntary fee waivers and/or expense reimbursements, the total return would be lower. Past performance is no guarantee of future results. Total returns may reflect adjustments to conform to generally accepted accounting principles. |
| (c) | Net of management fee waiver (Note 3). If the investment manager had not waived expenses, the expense ratio and the net investment income (loss) ratio would have been .42% and (.22)% for the year ended December 31, 2011, .44% and (.16)% for the year ended December 31, 2010 and .43% and .37% for the year ended December 31, 2009, respectively. |
SEE NOTES TO FINANCIAL STATEMENTS.
C6
Financial Highlights
| | | | | | | | | | | | | | | | | | | | |
| | | Natural Resources Portfolio
| |
| | | Class I
| |
| | | Year Ended December 31,
| |
| | | 2011(a)
| | | 2010(a)
| | | 2009(a)
| | | 2008(a)
| | | 2007(a)
| |
Per Share Operating Performance: | | | | | | | | | | | | | | | | | | | | |
Net Asset Value, beginning of year | | $ | 47.33 | | | $ | 37.15 | | | $ | 23.70 | | | $ | 56.28 | | | $ | 45.67 | |
| | |
|
|
| |
|
|
| |
|
|
| |
|
|
| |
|
|
|
Income (Loss) From Investment Operations: | | | | | | | | | | | | | | | | | | | | |
Net investment income | | | .16 | | | | .08 | | | | .15 | | | | .22 | | | | .43 | |
Net realized and unrealized gain (loss) on investments | | | (9.16 | ) | | | 10.26 | | | | 17.34 | | | | (25.97 | ) | | | 21.09 | |
| | |
|
|
| |
|
|
| |
|
|
| |
|
|
| |
|
|
|
Total from investment operations | | | (9.00 | ) | | | 10.34 | | | | 17.49 | | | | (25.75 | ) | | | 21.52 | |
| | |
|
|
| |
|
|
| |
|
|
| |
|
|
| |
|
|
|
Less Distributions | | | (.08 | ) | | | (.16 | ) | | | (4.04 | ) | | | (6.83 | ) | | | (10.91 | ) |
| | |
|
|
| |
|
|
| |
|
|
| |
|
|
| |
|
|
|
Net Asset Value, end of year | | $ | 38.25 | | | $ | 47.33 | | | $ | 37.15 | | | $ | 23.70 | | | $ | 56.28 | |
| | |
|
|
| |
|
|
| |
|
|
| |
|
|
| |
|
|
|
Total Return(b) | | | (19.03 | )% | | | 27.98 | % | | | 77.10 | % | | | (53.00 | )% | | | 48.30 | % |
Ratios/Supplemental Data: | | | | | | | | | | | | | | | | | | | | |
Net assets, end of year (in millions) | | $ | 926.6 | | | $ | 1,259.5 | | | $ | 1,079.6 | | | $ | 677.4 | | | $ | 1,669.9 | |
Ratios to average net assets(c): | | | | | | | | | | | | | | | | | | | | |
Expenses | | | .50 | % | | | .50 | % | | | .53 | % | | | .50 | % | | | .48 | % |
Net investment income | | | .36 | % | | | .22 | % | | | .51 | % | | | .47 | % | | | .80 | % |
Portfolio turnover rate | | | 34 | % | | | 28 | % | | | 27 | % | | | 40 | % | | | 39 | % |
| | | | | | | | | | | | | | | | | | | | |
| | | Natural Resources Portfolio
| |
| | | Class II
| |
| | | Year Ended December 31,
| |
| | | 2011(a)
| | | 2010(a)
| | | 2009(a)
| | | 2008(a)
| | | 2007(a)
| |
Per Share Operating Performance: | | | | | | | | | | | | | | | | | | | | |
Net Asset Value, beginning of year | | $ | 46.98 | | | $ | 36.88 | | | $ | 23.54 | | | $ | 55.92 | | | $ | 45.55 | |
| | |
|
|
| |
|
|
| |
|
|
| |
|
|
| |
|
|
|
Income (Loss) From Investment Operations: | | | | | | | | | | | | | | | | | | | | |
Net investment income (loss) | | | (.02 | ) | | | (.07 | ) | | | .03 | | | | .05 | | | | .28 | |
Net realized and unrealized gain (loss) on investments | | | (9.07 | ) | | | 10.20 | | | | 17.21 | | | | (25.86 | ) | | | 20.92 | |
| | |
|
|
| |
|
|
| |
|
|
| |
|
|
| |
|
|
|
Total from investment operations | | | (9.09 | ) | | | 10.13 | | | | 17.24 | | | | (25.81 | ) | | | 21.20 | |
| | |
|
|
| |
|
|
| |
|
|
| |
|
|
| |
|
|
|
Less Distributions | | | — | | | | (.03 | ) | | | (3.90 | ) | | | (6.57 | ) | | | (10.83 | ) |
| | |
|
|
| |
|
|
| |
|
|
| |
|
|
| |
|
|
|
Net Asset Value, end of year | | $ | 37.89 | | | $ | 46.98 | | | $ | 36.88 | | | $ | 23.54 | | | $ | 55.92 | |
| | |
|
|
| |
|
|
| |
|
|
| |
|
|
| |
|
|
|
Total Return(b) | | | (19.35 | )% | | | 27.48 | % | | | 76.41 | % | | | (53.19 | )% | | | 47.70 | % |
Ratios/Supplemental Data: | | | | | | | | | | | | | | | | | | | | |
Net assets, end of year (in millions) | | $ | 67.9 | | | $ | 101.9 | | | $ | 92.6 | | | $ | 42.3 | | | $ | 47.9 | |
Ratios to average net assets(c): | | | | | | | | | | | | | | | | | | | | |
Expenses | | | .90 | % | | | .90 | % | | | .93 | % | | | .90 | % | | | .88 | % |
Net investment income (loss) | | | (.04 | )% | | | (.18 | )% | | | .10 | % | | | .12 | % | | | .51 | % |
Portfolio turnover rate | | | 34 | % | | | 28 | % | | | 27 | % | | | 40 | % | | | 39 | % |
| (a) | Calculated based on average shares outstanding during the year. |
| (b) | Total return is calculated assuming a purchase of a share on the first day and a sale on the last day of each year reported and includes reinvestment of distributions and does not reflect the effect of insurance contract charges. Total return does not reflect expenses associated with the separate account such as administrative fees, account charges and surrender charges which, if reflected, would reduce the total returns for all years shown. Performance figures may reflect voluntary fee waivers and/or expense reimbursements. In the absence of voluntary fee waivers and/or expense reimbursements, the total return would be lower. Past performance is no guarantee of future results. Total returns may reflect adjustments to conform to generally accepted accounting principles. |
| (c) | Does not include expenses of the underlying portfolios in which the Portfolio invests. |
SEE NOTES TO FINANCIAL STATEMENTS.
C7
Financial Highlights
| | | | | | | | | | | | | | | | | | | | |
| | | Small Capitalization Stock Portfolio
| |
| | | Year Ended December 31,
| |
| | | 2011
| | | 2010
| | | 2009
| | | 2008
| | | 2007
| |
Per Share Operating Performance: | | | | | | | | | | | | | | | | | | | | |
Net Asset Value, beginning of year | | $ | 17.27 | | | $ | 13.83 | | | $ | 12.52 | | | $ | 21.31 | | | $ | 23.29 | |
| | |
|
|
| |
|
|
| |
|
|
| |
|
|
| |
|
|
|
Income (Loss) From Investment Operations: | | | | | | | | | | | | | | | | | | | | |
Net investment income | | | .10 | | | | .13 | | | | .14 | | | | .24 | | | | .21 | |
Net realized and unrealized gain (loss) on investments | | | — | (c) | | | 3.43 | | | | 2.70 | | | | (5.92 | ) | | | (.36 | ) |
| | |
|
|
| |
|
|
| |
|
|
| |
|
|
| |
|
|
|
Total from investment operations | | | .10 | | | | 3.56 | | | | 2.84 | | | | (5.68 | ) | | | (.15 | ) |
| | |
|
|
| |
|
|
| |
|
|
| |
|
|
| |
|
|
|
Less Distributions | | | (.37 | ) | | | (.12 | ) | | | (1.53 | ) | | | (3.11 | ) | | | (1.83 | ) |
| | |
|
|
| |
|
|
| |
|
|
| |
|
|
| |
|
|
|
Net Asset Value, end of year | | $ | 17.00 | | | $ | 17.27 | | | $ | 13.83 | | | $ | 12.52 | | | $ | 21.31 | |
| | |
|
|
| |
|
|
| |
|
|
| |
|
|
| |
|
|
|
Total Return(a) | | | .56 | % | | | 25.93 | % | | | 25.18 | % | | | (31.04 | )% | | | (.53 | )% |
Ratios/Supplemental Data: | | | | | | | | | | | | | | | | | | | | |
Net assets, end of year (in millions) | | $ | 542.6 | | | $ | 589.9 | | | $ | 492.2 | | | $ | 432.5 | | | $ | 699.6 | |
Ratios to average net assets(b): | | | | | | | | | | | | | | | | | | | | |
Expenses | | | .48 | % | | | .49 | % | | | .49 | % | | | .47 | % | | | .46 | % |
Net investment income | | | .60 | % | | | .88 | % | | | 1.03 | % | | | 1.33 | % | | | .86 | % |
Portfolio turnover rate | | | 17 | % | | | 15 | % | | | 14 | % | | | 25 | % | | | 16 | % |
| | | | | | | | | | | | | | | | | | | | |
| | | Stock Index Portfolio
| |
| | | Year Ended December 31,
| |
| | | 2011
| | | 2010
| | | 2009
| | | 2008
| | | 2007
| |
Per Share Operating Performance: | | | | | | | | | | | | | | | | | | | | |
Net Asset Value, beginning of year | | $ | 31.37 | | | $ | 27.89 | | | $ | 22.76 | | | $ | 36.84 | | | $ | 35.64 | |
| | |
|
|
| |
|
|
| |
|
|
| |
|
|
| |
|
|
|
Income (Loss) From Investment Operations: | | | | | | | | | | | | | | | | | | | | |
Net investment income | | | .54 | | | | .48 | | | | .49 | | | | .64 | | | | .68 | |
Net realized and unrealized gain (loss) on investments | | | .07 | | | | 3.51 | | | | 5.32 | | | | (14.02 | ) | | | 1.14 | |
| | |
|
|
| |
|
|
| |
|
|
| |
|
|
| |
|
|
|
Total from investment operations | | | .61 | | | | 3.99 | | | | 5.81 | | | | (13.38 | ) | | | 1.82 | |
| | |
|
|
| |
|
|
| |
|
|
| |
|
|
| |
|
|
|
Less Distributions | | | (.51 | ) | | | (.51 | ) | | | (.68 | ) | | | (.70 | ) | | | (.62 | ) |
| | |
|
|
| |
|
|
| |
|
|
| |
|
|
| |
|
|
|
Net Asset Value, end of year | | $ | 31.47 | | | $ | 31.37 | | | $ | 27.89 | | | $ | 22.76 | | | $ | 36.84 | |
| | |
|
|
| |
|
|
| |
|
|
| |
|
|
| |
|
|
|
Total Return(a) | | | 1.95 | % | | | 14.59 | % | | | 26.07 | % | | | (36.94 | )% | | | 5.10 | % |
Ratios/Supplemental Data: | | | | | | | | | | | | | | | | | | | | |
Net assets, end of year (in millions) | | $ | 2,162.4 | | | $ | 2,277.6 | | | $ | 2,098.1 | | | $ | 1,815.8 | | | $ | 3,122.4 | |
Ratios to average net assets(b): | | | | | | | | | | | | | | | | | | | | |
Expenses | | | .33 | % | | | .36 | % | | | .37 | % | | | .37 | % | | | .37 | % |
Net investment income | | | 1.74 | % | | | 1.70 | % | | | 2.06 | % | | | 2.04 | % | | | 1.73 | % |
Portfolio turnover rate | | | 2 | % | | | 4 | % | | | 5 | % | | | 4 | % | | | 3 | % |
| (a) | Total return is calculated assuming a purchase of a share on the first day and a sale on the last day of each year reported and includes reinvestment of distributions and does not reflect the effect of insurance contract charges. Total return does not reflect expenses associated with the separate account such as administrative fees, account charges and surrender charges which, if reflected, would reduce the total returns for all years shown. Performance figures may reflect voluntary fee waivers and/or expense reimbursements. In the absence of voluntary fee waivers and/or expense reimbursements, the total return would be lower. Past performance is no guarantee of future results. Total returns may reflect adjustments to conform to generally accepted accounting principles. |
| (b) | Does not include expenses of the underlying portfolios in which the Portfolio invests. |
| (c) | Less than $0.005 per share. |
SEE NOTES TO FINANCIAL STATEMENTS.
C8
Financial Highlights
| | | | | | | | | | | | | | | | | | | | |
| | | Value Portfolio
| |
| | | Class I
| |
| | | Year Ended December 31,
| |
| | | 2011
| | | 2010
| | | 2009
| | | 2008
| | | 2007
| |
| | | | | | | | | | | | | | | | | | | | | |
Per Share Operating Performance: | | | | | | | | | | | | | | | | | | | | |
Net Asset Value, beginning of year | | $ | 17.04 | | | $ | 15.10 | | | $ | 10.86 | | | $ | 23.44 | | | $ | 26.21 | |
| | |
|
|
| |
|
|
| |
|
|
| |
|
|
| |
|
|
|
Income (Loss) From Investment Operations: | | | | | | | | | | | | | | | | | | | | |
Net investment income | | | .14 | | | | .17 | | | | .14 | | | | .30 | | | | .39 | |
Net realized and unrealized gain (loss) on investments | | | (1.08 | ) | | | 1.90 | | | | 4.36 | | | | (8.36 | ) | | | .42 | |
| | |
|
|
| |
|
|
| |
|
|
| |
|
|
| |
|
|
|
Total from investment operations | | | (.94 | ) | | | 2.07 | | | | 4.50 | | | | (8.06 | ) | | | .81 | |
| | |
|
|
| |
|
|
| |
|
|
| |
|
|
| |
|
|
|
Less Distributions | | | (.17 | ) | | | (.13 | ) | | | (.26 | ) | | | (4.52 | ) | | | (3.58 | ) |
| | |
|
|
| |
|
|
| |
|
|
| |
|
|
| |
|
|
|
Net Asset Value, end of year | | $ | 15.93 | | | $ | 17.04 | | | $ | 15 .10 | | | $ | 10.86 | | | $ | 23.44 | |
| | |
|
|
| |
|
|
| |
|
|
| |
|
|
| |
|
|
|
Total Return(a) | | | (5.58 | )% | | | 13.86 | % | | | 41.93 | % | | | (42.29 | )% | | | 3.19 | % |
Ratios/Supplemental Data: | | | | | | | | | | | | | | | | | | | | |
Net assets, end of year (in millions) | | $ | 1,231.6 | | | $ | 1,432.9 | | | $ | 1,181.7 | | | $ | 933.1 | | | $ | 1,824.9 | |
Ratios to average net assets(b): | | | | | | | | | | | | | | | | | | | | |
Expenses | | | .43 | % | | | .44 | % | | | .43 | % | | | .43 | % | | | .43 | % |
Net investment income | | | .90 | % | | | 1.08 | % | | | 1.15 | % | | | 1.46 | % | | | 1.35 | % |
Portfolio turnover rate | | | 43 | % | | | 63 | % | | | 51 | % | | | 71 | % | | | 52 | % |
| | | | | | | | | | | | | | | | | | | | |
| | | Value Portfolio
| |
| | | Class II
| |
| | | Year Ended December 31,
| |
| | | 2011
| | | 2010
| | | 2009
| | | 2008
| | | 2007
| |
| | | | | | | | | | | | | | | | | | | | | |
Per Share Operating Performance: | | | | | | | | | | | | | | | | | | | | |
Net Asset Value, beginning of year | | $ | 17.13 | | | $ | 15.16 | | | $ | 10.91 | | | $ | 23.51 | | | $ | 26.26 | |
| | |
|
|
| |
|
|
| |
|
|
| |
|
|
| |
|
|
|
Income (Loss) From Investment Operations: | | | | | | | | | | | | | | | | | | | | |
Net investment income | | | .08 | | | | .12 | | | | .13 | | | | .21 | | | | .29 | |
Net realized and unrealized gain (loss) on investments | | | (1.08 | ) | | | 1.90 | | | | 4.33 | | | | (8.38 | ) | | | .42 | |
| | |
|
|
| |
|
|
| |
|
|
| |
|
|
| |
|
|
|
Total from investment operations | | | (1.00 | ) | | | 2.02 | | | | 4.46 | | | | (8.17 | ) | | | .71 | |
| | |
|
|
| |
|
|
| |
|
|
| |
|
|
| |
|
|
|
Less Distributions | | | (.09 | ) | | | (.05 | ) | | | (.21 | ) | | | (4.43 | ) | | | (3.46 | ) |
| | |
|
|
| |
|
|
| |
|
|
| |
|
|
| |
|
|
|
Net Asset Value, end of year | | $ | 16.04 | | | $ | 17.13 | | | $ | 15.16 | | | $ | 10.91 | | | $ | 23.51 | |
| | |
|
|
| |
|
|
| |
|
|
| |
|
|
| |
|
|
|
Total Return(a) | | | (5.89 | )% | | | 13.39 | % | | | 41.26 | % | | | (42.56 | )% | | | 2.82 | % |
Ratios/Supplemental Data: | | | | | | | | | | | | | | | | | | | | |
Net assets, end of year (in millions) | | $ | 6.0 | | | $ | 7.1 | | | $ | 3.7 | | | $ | 1.7 | | | $ | 2.7 | |
Ratios to average net assets(b): | | | | | | | | | | | | | | | | | | | | |
Expenses | | | .83 | % | | | .84 | % | | | .83 | % | | | .83 | % | | | .83 | % |
Net investment income | | | .50 | % | | | .69 | % | | | .74 | % | | | 1.08 | % | | | .96 | % |
Portfolio turnover rate | | | 43 | % | | | 63 | % | | | 51 | % | | | 71 | % | | | 52 | % |
| (a) | Total return is calculated assuming a purchase of a share on the first day and a sale on the last day of each year reported and includes reinvestment of distributions and does not reflect the effect of insurance contract charges. Total return does not reflect expenses associated with the separate account such as administrative fees, account charges and surrender charges which, if reflected, would reduce the total returns for all years shown. Performance figures may reflect voluntary fee waivers and/or expense reimbursements. In the absence of voluntary fee waivers and/or expense reimbursements, the total return would be lower. Past performance is no guarantee of future results. Total returns may reflect adjustments to conform to generally accepted accounting principles. |
| (b) | Does not include expenses of the underlying portfolios in which the Portfolio invests. |
SEE NOTES TO FINANCIAL STATEMENTS.
C9
REPORT OF INDEPENDENT REGISTERED PUBLIC ACCOUNTING FIRM
The Board of Trustees and Shareholders
The Prudential Series Fund:
We have audited the accompanying statements of assets and liabilities of the Conservative Balanced Portfolio, Diversified Bond Portfolio, Equity Portfolio, Flexible Managed Portfolio, Global Portfolio, Government Income Portfolio, High Yield Bond Portfolio, Jennison Portfolio, Money Market Portfolio, Natural Resources Portfolio, Small Capitalization Stock Portfolio, Stock Index Portfolio and Value Portfolio (hereafter referred to as the “Portfolios”), each a portfolio of The Prudential Series Fund, including the portfolios of investments, as of December 31, 2011, and the related statements of operations for the year then ended, the statements of changes in net assets for each of the years in the two-year period then ended and the financial highlights for each of the years in the five-year period then ended. These financial statements and financial highlights are the responsibility of the Portfolios’ management. Our responsibility is to express an opinion on these financial statements and financial highlights based on our audits.
We conducted our audits in accordance with the standards of the Public Company Accounting Oversight Board (United States). Those standards require that we plan and perform the audit to obtain reasonable assurance about whether the financial statements and financial highlights are free of material misstatement. An audit includes examining, on a test basis, evidence supporting the amounts and disclosures in the financial statements. Our procedures included confirmation of securities owned as of December 31, 2011, by correspondence with the custodian, transfer agent and brokers or by other appropriate auditing procedures where replies from brokers were not received. An audit also includes assessing the accounting principles used and significant estimates made by management, as well as evaluating the overall financial statement presentation. We believe that our audits provide a reasonable basis for our opinion.
In our opinion, the financial statements and financial highlights referred to above present fairly, in all material respects, the financial position of the Portfolios as of December 31, 2011, and the results of their operations, the changes in their net assets and the financial highlights for the periods described in the first paragraph above, in conformity with U.S. generally accepted accounting principles.

New York, New York
February 16, 2012
D1
INFORMATION ABOUT TRUSTEES AND OFFICERS (Unaudited)
Information about the Trustees and the Officers of the Fund is set forth below. Trustees who are not deemed to be “interested persons” of the Fund, as defined in the 1940 Act, are referred to as “Independent Trustees.” Trustees who are deemed to be “interested persons” of the Fund are referred to as “Interested Trustees.” The Trustees are responsible for the overall supervision of the operations of the Fund and perform the various duties imposed on the directors of investment companies by the 1940 Act.
| | | | |
| Independent Trustees(1) | | | | |
Name, Address, Age
No. of Portfolios Overseen | | Principal Occupation(s) During Past Five Years | | Other Directorships Held |
Susan Davenport Austin (44) No. of Portfolios Overseen: 84 | | Senior Vice President and Chief Financial Officer (Since 2007) and Vice President of Strategic Planning and Treasurer (2002-2007) of Sheridan Broadcasting Corporation; President of Sheridan Gospel Network (Since 2004); Vice President, Goldman, Sachs & Co. (2000-2001); Associate Director, Bear, Stearns & Co. Inc (1997-2000); Vice President, Salomon Brothers Inc (1993-1997); President of the Board, The MacDowell Colony (Since 2010); Chairman of the Board of Directors, Broadcast Music, Inc. (Since 2007); Member of the Board of Directors, Hubbard Radio, LLC (Since 2011); formerly Member of the Board of Directors, National Association of Broadcasters (2004-2010). | | None |
Saul K. Fenster, Ph.D. (78) No. of Portfolios Overseen: 84 | | President Emeritus of New Jersey Institute of Technology (since 2002); formerly President (1978-2002) of New Jersey Institute of Technology; Commissioner (1998-2002) of the Middle States Association Commission on Higher Education; Commissioner (1985-2002) of the New Jersey Commission on Science and Technology; formerly Director (1998-2005) of Society of Manufacturing Engineering Education Foundation; formerly Director of Prosperity New Jersey; formerly a director or trustee of Liberty Science Center, Research and Development Council of New Jersey, New Jersey State Chamber of Commerce, and National Action Council for Minorities in Engineering. | | Formerly Director (2000-2006) of IDT Corporation. |
Delayne Dedrick Gold (73) No. of Portfolios Overseen: 84 | | Marketing Consultant (1982-present); formerly Senior Vice President and Member of the Board of Directors, Prudential Bache Securities, Inc. | | None |
W. Scott McDonald, Jr., Ph.D. (74) No. of Portfolios Overseen: 84 | | Formerly Management Consultant (1997-2004) and of Counsel (2004-2005) at Kaludis Consulting Group, Inc. (company serving higher education); formerly principal (1995-1997), Scott McDonald Associates; Chief Operating Officer (1991-1995), Fairleigh Dickinson University; Executive Vice President and Chief Operating Officer (1975-1991), Drew University; interim President (1988-1990), Drew University; formerly Director of School, College and University Underwriters Ltd. | | None |
Thomas T. Mooney (70) No. of Portfolios Overseen: 84 | | Formerly Chief Executive Officer, Excell Partners, Inc. (2005-2007) formerly President of the Greater Rochester Metro Chamber of Commerce (1976-2004) formerly Rochester City Manager (1973); formerly Deputy Monroe County Executive (1974-1976). | | None |
Thomas M. O’Brien (61) No. of Portfolios Overseen: 84 | | President and COO (since November 2006) and CEO (since April 2007) of State Bancorp, Inc. and State Bank; formerly Vice Chairman (January 1997-April 2000) of North Fork Bank; formerly President and Chief Executive Officer (December 1984-December 1996) of North Side Savings Bank; formerly President and Chief Executive Officer (May 2000-June 2006) Atlantic Bank of New York. | | Director (since April 2008) of Federal Home Loan Bank of New York; formerly Director (December 1996-May 2000) of North Fork Bancorporation, Inc.; formerly Director (May 2000-April 2006) of Atlantic Bank of New York; Director (since November 2006) of State Bancorp, Inc. (NASDAQ: STBC) and State Bank of Long Island. |
F. Don Schwartz (76) No. of Portfolios Overseen: 84 | | Independent Management/Marketing Consultant (since 2002); formerly CEO and President of AceCo, Inc. (1985-2001) (consulting firm specializing in universal/variable life and variable annuity products); formerly Vice President of The Equitable Life Assurance Society; formerly Guest Insurance Professor at the American College, Louisiana State University, Alabama State University and the Insurance Marketing Institute; Advisor to several state insurance commissioners; a Chartered Life Underwriter, Chartered Financial Consultant and Fellow of the Life Insurance Management Institute. | | None. |
E1
| | | | |
| Interested Trustees(1) | | | | |
Name, Address, Age
No. of Portfolios Overseen | | Principal Occupation(s) During Past Five Years | | Other Directorships Held |
Stephen Pelletier (58) No. of Portfolios Overseen: 84 | | President of Prudential Annuities (since September 2008); Chairman and CEO, International Investments, Prudential Financial (since January 1998). | | None |
Robert F. Gunia (65) No. of Portfolios Overseen: 84 | | Independent Consultant (since October 2009); formerly Chief Administrative Officer (September 1999-September 2009) and Executive Vice President (December 1996-September 2009) of Prudential Investments LLC; formerly Executive Vice President (March 1999-September 2009) and Treasurer (May 2000-September 2009) of Prudential Mutual Fund Services LLC; formerly President (April 1999-December 2008) and Executive Vice President and Chief Operating Officer (December 2008-December 2009) of Prudential Investment Management Services LLC; formerly Chief Administrative Officer, Executive Vice President and Director (May 2003-September 2009) of AST Investment Services, Inc. | | Director (since May 1989) of The Asia Pacific Fund, Inc. |
Timothy S. Cronin (46) Number of Portfolios Overseen: 84 | | Chief Investment Officer and Strategist of Prudential Annuities (since January 2004); Director of Investment & Research Strategy (since February 1998); President of AST Investment Services, Inc. (since June 2005). | | None. |
(1) The year that each Trustee joined the Fund’s Board is as follows: Susan Davenport Austin, 2011; Timothy S. Cronin, 2011; Saul K. Fenster, 1983; Delayne Dedrick Gold, 2001; Robert F. Gunia, 2001; W. Scott McDonald, Jr., 1983; Thomas T. Mooney, 2001; Thomas M. O’Brien, 2003; Stephen Pelletier, 2011; F. Don Schwartz, 2003.
| | |
| Fund Officers(a)(1) | | |
Name, Address and Age Position with the Fund | | Principal Occupation(s) During the Past Five Years |
Kathryn L. Quirk (59) Chief Legal Officer | | Vice President and Corporate Counsel (since September 2004) of Prudential; Executive Vice President, Chief Legal Officer and Secretary (since July 2005) of PI and Prudential Mutual Fund Services LLC; Vice President and Corporate Counsel (since June 2005) and Secretary (since February 2006) of AST Investment Services, Inc.; formerly Senior Vice President and Assistant Secretary (November 2004-August 2005) of PI; formerly Assistant Secretary (June 2005-February 2006) of AST Investment Services, Inc.; formerly Managing Director, General Counsel, Chief Compliance Officer, Chief Risk Officer and Corporate Secretary (1997-2002) of Zurich Scudder Investments, Inc. |
Deborah A. Docs (54) Secretary | | Vice President and Corporate Counsel (since January 2001) of Prudential; Vice President (since December 1996) and Assistant Secretary (since March 1999) of PI; formerly Vice President and Assistant Secretary (May 2003-June 2005) of AST Investment Services, Inc. |
Jonathan D. Shain (53) Assistant Secretary | | Vice President and Corporate Counsel (since August 1998) of Prudential; Vice President and Assistant Secretary (since May 2001) of PI; Vice President and Assistant Secretary (since February 2001) of PMFS; formerly Vice President and Assistant Secretary (May 2003-June 2005) of AST Investment Services, Inc. |
Claudia DiGiacomo (37) Assistant Secretary | | Vice President and Corporate Counsel (since January 2005) of Prudential; Vice President and Assistant Secretary of PI (since December 2005); Associate at Sidley Austin Brown Wood LLP (1999-2004). |
John P. Schwartz (40) Assistant Secretary | | Vice President and Corporate Counsel (since April 2005) of Prudential; Vice President and Assistant Secretary of PI (since December 2005); Associate at Sidley Austin Brown Wood LLP (1997-2005). |
Andrew R. French (49) Assistant Secretary | | Vice President and Corporate Counsel (since February 2010) of Prudential; formerly Director and Corporate Counsel (2006-2010) of Prudential; Vice President and Assistant Secretary (since January 2007) of PI; Vice President and Assistant Secretary (since January 2007) of PMFS. |
Timothy J. Knierim (53) Chief Compliance Officer | | Chief Compliance Officer of Prudential Investment Management, Inc. (since July 2007); formerly Chief Risk Officer of PIM and PI (2002-2007) and formerly Chief Ethics Officer of PIM and PI (2006-2007). |
Valerie M. Simpson (53) Deputy Chief Compliance Officer | | Chief Compliance Officer (since April 2007) of PI and AST Investment Services, Inc.; formerly Vice President-Financial Reporting (June 1999-March 2006) for Prudential Life and Annuities Finance. |
Theresa C. Thompson (49) Deputy Chief Compliance Officer | | Vice President, Compliance, PI (since April 2004); and Director, Compliance, PI (2001 - 2004). |
Richard W. Kinville (43) Anti-Money Laundering Compliance Officer | | Vice President, Corporate Compliance, Anti-Money Laundering Unit (since January 2005) of Prudential; committee member of the American Council of Life Insurers Anti-Money Laundering and Critical Infrastructure Committee (since January 2007); formerly Investigator and Supervisor in the Special Investigations Unit for the New York Central Mutual Fire Insurance Company (August 1994-January 1999); Investigator in AXA Financial’s Internal Audit Department and Manager in AXA’s Anti-Money Laundering Office (January 1999-January 2005); first chair of the American Council of Life Insurers Anti-Money Laundering and Critical Infrastructure Committee (June 2007-December 2009 ). |
Grace C. Torres (52) Treasurer and Principal Financial and Accounting Officer | | Assistant Treasurer (since March 1999) and Senior Vice President (since September 1999) of PI; Assistant Treasurer (since May 2003) and Vice President (since June 2005) of AST Investment Services, Inc.; Senior Vice President and Assistant Treasurer (since May 2003) of Prudential Annuities Advisory Services, Inc.; formerly Senior Vice President (May 2003-June 2005) of AST Investment Services, Inc. |
E2
| | |
| Fund Officers(a)(1) | | |
Name, Address and Age Position with the Fund | | Principal Occupation(s) During the Past Five Years |
M. Sadiq Peshimam (48) Assistant Treasurer | | Vice President (since 2005) of Prudential Investments LLC. |
Peter Parrella (53) Assistant Treasurer | | Vice President (since 2007) and Director (2004-2007) within Prudential Mutual Fund Administration; formerly Tax Manager at SSB Citi Fund Management LLC (1997-2004). |
Alan Fu (55) Assistant Treasurer | | Vice President and Corporate Counsel - Tax, Prudential Financial, Inc. (since October 2003). |
(a) Excludes Mr. Pelletier and Mr. Cronin, interested Board Members who also serve as President and Vice President, respectively.
(1) The year in which each individual became an Officer of the Fund is as follows: Kathryn L. Quirk, 2005; Deborah A. Docs, 2005; Jonathan D. Shain, 2005; Claudia DiGiacomo, 2005; John P. Schwartz, 2006; Andrew R. French, 2006; Timothy J. Knierim, 2007; Valerie M. Simpson, 2007; Theresa C. Thompson, 2008; Grace C. Torres, 1997; Peter Parrella, 2007; M. Sadiq Peshimam, 2006; Alan Fu, 2006; Richard W. Kinville, 2011.
Explanatory Notes to Tables:
Trustees are deemed to be “Interested”, as defined in the 1940 Act, by reason of their affiliation with Prudential Investments LLC and/or an affiliate of Prudential Investments LLC. Stephen Pelletier and Timothy Cronin are Interested Trustees because they are employed by an affiliate of the Manager of the Fund. Robert F. Gunia will be considered an Interested Trustee for at least two years after his retirement from employment by the Manager and its affiliates (which was on or about October 21, 2009). He will also be an Interested Trustee as long as he holds a beneficial interest in securities issued by the Manager or its affiliates.
Unless otherwise noted, the address of all Trustees and Officers is c/o Prudential Investments LLC, Gateway Center Three, 100 Mulberry Street, Newark, New Jersey 07102.
There is no set term of office for Trustees or Officers. The Independent Trustees have adopted a retirement policy, which calls for the retirement of Trustees on December 31 of the year in which they reach the age of 78, provided that the Board may extend the retirement age on a year-by-year basis for a Trustee.
“Other Directorships Held” includes only directorships of companies required to register or file reports with the SEC under the Securities Exchange Act of 1934 (that is, “public companies”) or other investment companies registered under the 1940 Act.
“No. of Portfolios Overseen” includes all investment companies managed by Prudential Investments LLC (PI) and/or AST Investment Services, Inc. (ASTI) (collectively, the Manager) that are overseen by the Trustee. The investment companies for which PI and/or ASTI serves as Manager include The Prudential Variable Contract Accounts, The Prudential Series Fund, Advanced Series Trust and Prudential’s Gibraltar Fund, Inc.
E3
Annuities are issued by Pruco Life Insurance Company, or in New York, Pruco Life Insurance Company of New Jersey, both located at 213 Washington Street, Newark, NJ 07102-2992, and Prudential Annuities Life Assurance Corporation, located at One Corporate Drive, Shelton, CT, 06484. Variable annuities are distributed by Prudential Annuities Distributors, Inc., also located in Shelton, CT. Prudential Annuities is a business unit of Prudential Financial.
Variable life insurance is issued by The Prudential Insurance Company of America, 751 Broad Street, Newark, NJ 07102-3777, Pruco Life Insurance Company, or in New York, Pruco Life Insurance Company of New Jersey, both located at 213 Washington Street, Newark, NJ 07102-2992. Pruco Life Insurance Company is not licensed to do business in New York. Variable life insurance is offered through Pruco Securities LLC, 751 Broad Street, Newark, NJ 07102-3777.
All are Prudential Financial companies, and each is solely responsible for its financial condition and contractual obligations.
Life insurance and annuity contracts contain exclusions, limitations, reductions of benefits, and terms for keeping them in force. Your licensed financial professional can provide you with costs and complete details. Contract guarantees are based on the claims-paying ability of the issuing company.
| | | | |

The Prudential Insurance Company of America 751 Broad Street Newark, NJ 07102-3777 | | | | PRESORTED STD U.S. POSTAGE PAID HARRISONBURG, VA PERMIT No. 250 ZIP CODE 22801 |
| | | | |
| | | | |
| | | | |
The Audited Financial Statements of Pruco Life Insurance Company, Pruco Life Insurance Company of New Jersey, and The Prudential Insurance Company of America are available upon request. You may call (888)778-2888 to obtain a free copy of the audited financial statements of the insurance company that issued your contract.
To reduce costs, we now generally send only a single copy of prospectuses and shareholder reports to each household (householding) in lieu of sending a copy to each Contract Owner who resides in the household. You should be aware that by calling (877)778-5008, you can revoke, or “opt out,” of householding at any time.
Prudential, the Prudential logo, and the Rock symbol are service marks of Prudential Financial, Inc. and its related entities, registered in many jurisdictions worldwide.
To learn more about Prudential Financial, go to www.prudential.com, or scan the code below.

0172024-00003-00 PSF-AR-A

THE PRUDENTIAL SERIES FUND
ANNUAL REPORT Ÿ DECEMBER 31, 2011
This report is one of several that provides financial information about certain investment choices available under variable life insurance and variable annuity contracts. Based on the variable contract you own or the portfolios you invested in, you may receive additional reports that provide financial information on those investment choices. Please refer to your variable life insurance or variable annuity contract prospectus to determine which portfolios are available to you.
Please note that this document may include prospectus supplements that are separate from and not a part of the annual report.

This report must be preceded or accompanied by the current prospectuses for the Prudential Series Fund portfolios and the applicable variable life or annuity contract. The prospectuses contain information on the investment objectives, risks, and charges and expenses of the portfolios, and the contract and should be read carefully.
A description of the Fund’s proxy voting policies and procedures is available, without charge, upon request. Owners of variable annuity contracts should call (888)778-2888, and owners of variable life insurance contracts should call (800)778-2255 to obtain descriptions of the Fund’s proxy voting policies and procedures. Information regarding how the Fund voted proxies relating to portfolio securities during the most recent 12-month period ended June 30 is available on the website of the Securities and Exchange Commission (the Commission) at www.sec.gov and on the Fund’s website at www.prudential.com.
The Fund files with the Commission a complete listing of portfolio holdings as of its first and third quarter-end on Form N-Q. Form N-Q is available on the Commission’s website at www.sec.gov or by visiting the Commission’s Public Reference Room. For more information on the Commission’s Public Reference Room, please visit the Commission’s website or call (800)SEC-0330. Form N-Q is also available on the Fund’s website or by calling the telephone numbers referenced above, for variable annuity and variable life insurance contract owners.
The Fund’s Statement of Additional Information contains additional information about the Fund’s Trustees and is available without charge upon request by calling (888)778-2888.
This report may include financial information pertaining to certain portfolios that are not available through the variable life insurance policy or variable annuity contract that you have chosen. Please refer to your variable life insurance or variable annuity prospectus to determine which portfolios are available to you.
| | | | |
The Prudential Series Fund Table of Contents | | Annual Report | | December 31, 2011 |
| n | | LETTER TO CONTRACT OWNERS |
| n | | PRESENTATION OF PORTFOLIO HOLDINGS |
| n | | FEES AND EXPENSES TABLE |
| | | | |
| Section A | | Schedule of Investments and Financial Statements |
| | |
| | | SP International Growth Portfolio | | A1 |
| | | SP International Value Portfolio | | A6 |
| | | SP Prudential U.S. Emerging Growth Portfolio | | A12 |
| | | SP Small Cap Value Portfolio | | A16 |
| | |
| Section B | | Notes to Financial Statements | | |
| Section C | | Financial Highlights | | |
| Section D | | Report of Independent Registered Public Accounting Firm | | |
| Section E | | Information about Trustees and Officers | | |
| n | | APPROVAL OF ADVISORY AGREEMENTS |
This report may include financial information pertaining to certain portfolios that are not available through the variable life insurance policy or variable annuity contract that you have chosen. Please refer to your variable life insurance or variable annuity prospectus to determine which portfolios are available to you.
| | | | |
The Prudential Series Fund Letter to Contract Owners | | Annual Report | | December 31, 2011 |
At Prudential, our primary objective is to help investors achieve and maintain long-term financial success. This Prudential Series Fund annual report outlines our efforts to achieve this goal. We hope you find it informative and useful.
Prudential has been building on a heritage of success for more than 135 years. The quality of our businesses and risk diversification has enabled us to manage effectively through volatile markets over time. We believe the array of our products provides a highly attractive value proposition to clients like you who are focused on financial security.
Your financial professional is the best resource to help you make the most informed investment decisions. Together, you can build a diversified investment portfolio that aligns with your long-term financial goals. Please keep in mind that diversification and asset allocation strategies do not assure a profit or protect against loss in declining markets.
Thank you for selecting Prudential as one of your financial partners. We value your trust and appreciate the opportunity to help you achieve financial security.
Sincerely,
Stephen Pelletier
President,
The Prudential Series Fund | January 31, 2012 |
PRESIDENT
STEPHEN PELLETIER
| | |
The Prudential Series Fund, SP International Growth Portfolio | | December 31, 2011 |
Investment Manager’s Report - As of December 31, 2011
| | | | | | | | | | | | |
| Average Annual Total Returns | | 1-Year | | | 5-Year | | | 10-Year | |
Portfolio: Class I | | | -14.91 | % | | | -4.59 | % | | | 3.44 | % |
Portfolio: Class II | | | -15.32 | | | | -4.95 | | | | 3.03 | |
MSCI EAFE® Index (GD) | | | -11.73 | | | | -4.26 | | | | 5.12 | |
Past performance does not guarantee future returns. The investment return and principal value of an investment will fluctuate, so that an investor’s shares, when redeemed, may be worth more or less than their original cost. Current performance may be lower or higher than the past performance data quoted.
Portfolio performance is net of investment fees and fund expenses, but not product charges, which, if included, would significantly lower the performance quoted. Performance figures may reflect fee waivers and/or expense reimbursements. In the absence of such fee waivers and/or expense reimbursements, total returns would be lower.
$10,000 INVESTED OVER 10 YEARS1
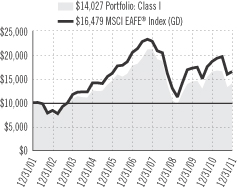
For the year ended December 31, 2011 the SP International Growth Portfolio Class I shares declined by 14.91% and the Class II shares declined 15.32%.
The Portfolio’s assets are subadvised by William Blair & Company and Marsico Capital Management LLC. The Portfolio’s investment manager allocates a portion of the assets to each. The investment objective of the Portfolio is long-term growth of capital by investments in stocks of companies that are economically tied to countries other than the United States.
International markets had a terrible year, with a double digit decline in the MSCI EAFE Index (the Index). The financials and materials sectors declined the most, as the Euro-area financial crisis particularly threatened bond-holding financial institutions and secondarily threatened global economic growth. As economic conditions deteriorated, consumer discretionary and technology stocks also declined sharply. Only the healthcare and consumer staples sectors, relatively buffered from cyclical factors, were positive.
The largest negative impact on performance relative to the Index was country allocation, particularly investments in emerging markets countries, such as India and Brazil, that are not in the Index. Both subadvisers routinely invest in emerging markets stocks, as they have found significant growth opportunities there. Consequently, these allocations were within expectations. Sector allocation further detracted from relative returns.
Given that both subadvisers are looking for companies with higher growth rates, it is not surprising that they were overweight in technology and consumer discretionary companies, as these are often faster growing companies, and underweight in the normally steadier but slower growing healthcare and consumer staples sectors. Although sector allocations detracted from returns, they were in line with historical weightings. Within these country and sector allocations, stock selection, which normally drives performance for these subadvisers, had a positive impact.
Information technology holdings of both subadvisers advanced significantly. The Portfolio also benefited from an underweight in Japan, where growth opportunities have been difficult to find. This underweight added to relative returns in 2011, as the Japanese market slightly underperformed international returns.
At times, William Blair will hedge currencies. In 2011, this had a slight positive impact, as the dollar advanced against most foreign currencies (except for the Yen) by the end of the year.
Note: Pending shareholder approval, Jennison Associates LLC is expected to join William Blair and Marsico as subadviser to the Portfolio on or about May 1, 2012.
Prudential Investments LLC (PI), an indirect, wholly owned subsidiary of Prudential Financial, Inc., serves as the investment manager for the Fund.
| 1 | The graph is based on the performance of Class I shares. Performance of Class II shares will be lower due to differences in the fee structure. Class II shares have associated 12b-1 and administrative fees at an annual rate of 0.25% and 0.15% respectively of the average daily net assets of the Class II shares. |
MSCI EAFE (Morgan Stanley Capital International Europe, Australasia, Far East) Index (GD) is an unmanaged, capitalization-weighted index generally accepted as a benchmark for major overseas markets. The GD version does not reflect the impact of withholding taxes on reinvested dividends. These returns do not include the effect of any investment management expenses. These returns would have been lower if they included the effect of these expenses. Investors cannot invest directly in a market index. For a complete list of holdings, refer to the Schedule of Investments section of this report.
| | |
The Prudential Series Fund, SP International Value Portfolio | | December 31, 2011 |
Investment Manager’s Report - As of December 31, 2011
| | | | | | | | | | | | |
| Average Annual Total Returns | | 1-Year | | | 5-Year | | | 10-Year | |
Portfolio | | | -13.10 | % | | | -3.38 | % | | | 4.21 | % |
MSCI EAFE® Index (GD) | | | -11.73 | | | | -4.26 | | | | 5.12 | |
Past performance does not guarantee future returns. The investment return and principal value of an investment will fluctuate, so that an investor’s shares, when redeemed, may be worth more or less than their original cost. Current performance may be lower or higher than the past performance data quoted.
Portfolio performance is net of investment fees and fund expenses, but not product charges, which, if included, would significantly lower the performance quoted. Performance figures may reflect fee waivers and/or expense reimbursements. In the absence of such fee waivers and/or expense reimbursements, total returns would be lower.
$10,000 INVESTED OVER 10 YEARS
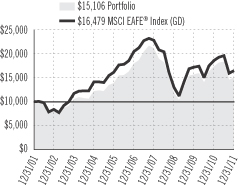
For the year ended December 31, 2011, the SP International Value Portfolio declined by 13.10%.
The Portfolio’s assets are subadvised by LSV Asset Management and Thornburg Investment Management. The Portfolio’s investment manager allocates a portion of the assets to each. LSV uses proprietary quantitative investment models, whereas Thornburg invests opportunistically using traditional fundamental securities analysis. The investment objective of the Portfolio is capital growth.
The MSCI EAFE Index (the Index) declined by 11.73% for the year, net dividends.
Active stock and bond managers generally had weak performance relative to their benchmarks in both domestic and international markets, with indexes outperforming the median fund in many styles of investing. The Index outperformed over half of the funds in the Lipper VP International Core and International Value universes. The Portfolio’s underperformance of the Index was largely the result of Thornburg’s asset selection. LSV performed in line with the Index. The largest negative impact was in Australia, Switzerland, and Ireland, including underweights relative to the Index in strong performers, notably Roche Holdings and Nestle in Switzerland, Elan Corp in Ireland, and the Commonwealth Bank of Australia.
Overweight positions also detracted, specifically in Irish and Swiss financials and Australian materials companies. Across geographic allocations, stock selection hurt performance in the consumer staples, materials, energy, and financials sectors. Geographically, exposure to non-benchmark countries China, Brazil, Turkey, and Russia also detracted from relative performance.
Both LSV and Thornburg may weight sectors differently than the Index (Thornburg more so). In 2011, this had an insignificant, but positive, net impact. The benefits from overweighting energy and underweighting materials more than offset underexposure to the relatively strong consumer staples sector. A small allocation to cash to assist with day-to-day cash flows had a positive impact on performance in this falling market.
From time-to-time, Thornburg will use currency forwards (a form of a derivative security) as a tool to hedge some of the currency risk from investing in non-U.S. stocks. This intermittent hedging strategy is not expected to have a significant impact on the performance of the overall Portfolio. Overall for 2011, foreign exchange hedging had a slightly negative effect on the Portfolio.
Prudential Investments LLC (PI), an indirect, wholly owned subsidiary of Prudential Financial, Inc., serves as the investment manager for the Fund.
MSCI EAFE (Morgan Stanley Capital International Europe, Australasia, Far East) Index (GD) is an unmanaged, capitalization-weighted index generally accepted as a benchmark for major overseas markets. The GD version does not reflect the impact of withholding taxes on reinvested dividends. These returns do not include the effect of any investment management expenses. These returns would have been lower if they included the effect of these expenses. Investors cannot invest directly in a market index. For a complete list of holdings, refer to the Schedule of Investments section of this report.
| | |
The Prudential Series Fund, SP Prudential U.S. Emerging Growth Portfolio | | December 31, 2011 |
Investment Manager’s Report - As of December 31, 2011
| | | | | | | | | | | | |
| Average Annual Total Returns | | 1-Year | | | 5-Year | | | 10-Year | |
Portfolio: Class I | | | 2.22 | % | | | 5.41 | % | | | 7.00 | % |
Portfolio: Class II | | | 1.77 | | | | 5.03 | | | | 6.61 | |
Russell Midcap® Growth Index | | | -1.65 | | | | 2.44 | | | | 5.29 | |
S&P Midcap 400 Index | | | -1.73 | | | | 3.32 | | | | 7.04 | |
Past performance does not guarantee future returns. The investment return and principal value of an investment will fluctuate, so that an investor’s shares, when redeemed, may be worth more or less than their original cost. Current performance may be lower or higher than the past performance data quoted.
Portfolio performance is net of investment fees and fund expenses, but not product charges, which, if included, would significantly lower the performance quoted. Unless noted otherwise, Index returns reflect performance beginning the closest month-end date to the Portfolio’s inception (Class II). The
$10,000 INVESTED OVER 10 YEARS1
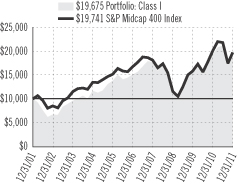
Russell Midcap® Growth Index is a trademark/service mark of the Frank Russell Company. Russell® is a trademark of the Frank Russell Company. Performance figures may reflect fee waivers and/or expense reimbursements. In the absence of such fee waivers and/or expense reimbursements, total returns would be lower.
For the year ended December 31, 2011, the SP Prudential U.S. Emerging Growth Portfolio Class I shares returned 2.22% and Class II shares returned 1.77%
The Portfolio seeks long-term capital appreciation. It is built from the bottom up, with stocks selected one at a time, based on fundamental analysis of individual companies. The Portfolio is subadvised by Jennison Associates LLC.
The Portfolio outperformed its benchmark, the Russell MidCap® Growth Index. Strong stock selection in consumer discretionary, healthcare, industrials, and consumer staples contributed to performance. Stock selection in information technology also contributed to relative returns.
Key individual contributors included three consumer discretionary companies, Dollar Tree, Ross Stores, and TJX.
Dollar Tree, an operator of discount stores in the United States and Canada, repeatedly reported above-consensus earnings, boosted by market share gains and growth in its store base. Ross Stores, a discount retailer, reported better-than-expected third-quarter earnings per share (EPS). High operating margins resulted from improved inventory turnover. TJX, another discount retailer, also had a solid third quarter, with EPS at the high end of its projected range.
In healthcare, Perrigo and Alexion Pharmaceuticals were among the largest contributors. In Jennison’s view, Perrigo is a well-managed over-the-counter pharmaceutical company positioned to grow both organically and through acquisitions. Sales of Alexion’s lead product, Soliris, which treats two rare genetic and potentially life-threatening blood disorders, grew strongly and the company is aggressively pursuing related expansion opportunities.
Alliance Data Systems in information technology also made one of the largest contributions. A provider of customer loyalty programs, database, and other marketing services, Alliance Data had several strong quarters in Jenison’s view, with contributions from all of its key business segments.
Stock selection in telecommunication services and energy detracted from performance. NII Holdings in telecommunication services was the largest individual detractor over the year. Second quarter earnings of the Latin American wireless telecom service provider were weakened by depreciation of the Brazilian real and Mexican peso relative to the U.S. dollar. Cimarex Energy was another detractor and was the most detrimental to returns of companies in its sector. Cimarex reported growth in earnings due to higher oil and natural gas prices, but its bottom line was hurt by a decline in production.
Overweight positions in telecommunication services and information technology further hurt performance. Three of the four largest detractors were in information technology, including Juniper Networks, Broadcom, and NetApp.
Juniper Networks, which makes Internet protocol (IP) routers for private and public access networks, reported third-quarter earnings that met earnings expectations, but U.S. revenues continued to decline, and the company issued disappointing earnings guidance for the fourth quarter. Broadcom, a provider of semiconductors for wired and wireless communications, declined on a number of issues, including possible excess inventory of the iPad2. NetApp’s second-quarter earnings were in line with consensus projections, but revenues were shy of estimates and sales guidance came in below consensus forecasts.
Prudential Investments LLC (PI), an indirect, wholly owned subsidiary of Prudential Financial, Inc., serves as the investment manager for the Fund.
| 1 | The graph is based on the performance of Class I shares. Performance of Class II shares will be lower due to differences in the fee structure. Class II shares have associated 12b-1 and administrative fees at an annual rate of 0.25% and 0.15% respectively of the average daily net assets of the Class II shares. |
Russell Midcap Growth Index is an unmanaged market cap-weighted index that measures the performance of those Russell Midcap companies with higher price-to-book ratios and higher forecasted growth values. S&P Midcap 400 Index is a widely accepted, unmanaged total return index of 400 domestic stocks measuring the performance of the midsize company segment of the U.S. stock market. These returns do not include the effect of any investment management expenses. These returns would have been lower if they included the effect of these expenses. Investors cannot invest directly in a market index. For a complete list of holdings, refer to the Schedule of Investments section of this report.
Jennison Associates LLC is a registered investment advisor and Prudential Financial company.
| | |
The Prudential Series Fund, SP Small Cap Value Portfolio | | December 31, 2011 |
Investment Manager’s Report - As of December 31, 2011
| | | | | | | | | | | | |
| Average Annual Total Returns | | 1-Year | | | 5-Year | | | 10-Year | |
Portfolio | | | -2.77 | % | | | 1.47 | % | | | 5.90 | % |
Russell 2000® Value Index | | | -5.50 | | | | -1.87 | | | | 6.40 | |
Russell 2500™ Index | | | -2.51 | | | | 1.24 | | | | 6.57 | |
Past performance does not guarantee future returns. The investment return and principal value of an investment will fluctuate, so that an investor’s shares, when redeemed, may be worth more or less than their original cost. Current performance may be lower or higher than the past performance data quoted.
Portfolio performance is net of investment fees and fund expenses, but not product charges, which, if included, would significantly lower the performance quoted. The Russell 2000® Value and Russell 2500TM Index are trademark/service marks of the Frank Russell Company. Russell® is a trademark of the Frank Russell Company. Performance figures may reflect fee waivers and/or expense reimbursements. In the absence of such fee waivers and/or expense reimbursements, total returns would be lower.
$10,000 INVESTED OVER 10 YEARS
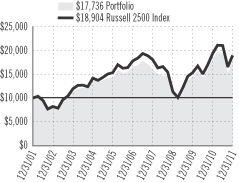
For the year ended December 31, 2011, the SP Small Cap Value Portfolio declined 2.77%.
The Portfolio is subadvised by Goldman Sachs Asset Management, L.P. (Goldman) and ClearBridge Advisors, LLC (ClearBridge) for long-term growth of capital through investments in the equity securities of small capitalization companies. The Portfolio’s investment manager allocates a portion of the assets to each. Each subadviser employs a value investment style. Goldman seeks companies whose intrinsic value is not reflected in the stock price, while ClearBridge uses quantitative and fundamental analysis to select stocks that it believes will outperform other stocks.
The Portfolio’s decline in 2011 reflected the challenging environment for investing in equities, particularly small-cap stocks. The U.S. equity market gained for the first four months of the year, as measured by a key Russell 2000 Value Index. Stocks then fell for five consecutive months due to investor anxiety over the global economic outlook and a worsening sovereign-debt crisis in the euro zone. Yet signs of improving economic conditions in the United States and renewed hopes for a solution to the euro zone turmoil sent stock prices higher in the fourth quarter, enabling the equity market to deliver a modest gain for the year including dividends.
In a year marked by economic and political uncertainty, risk-averse investors generally eschewed small- and mid-cap companies for large, well-established companies with strong capital positions, attractive dividend streams, and earnings growth. When stocks surged in the fourth quarter, small-cap stocks led the way. However, for the year, small-cap stocks underperformed both their mid- and large-cap peers, as measured by Russell U.S. indexes. And in the Russell small-cap universe, the growth investment style declined less than the value investment style.
The Portfolio outperformed the Russell 2000 Value Index (the Index), which declined 5.50% for the year. This was primarily due to assets held by both managers. Specific stock factors made positive contributions. Holdings within the industrial sector, specifically those underweight to commercial services and supply companies, added value. An underweight to consumer discretionary within the household durables industry and an overweight to road and rail, marine/shipping-related, and semiconductors and semiconductor equipment stocks contributed positively to returns. Conversely, certain holdings in the pharmaceutical and managed healthcare industries dampened results.
Risk exposures played a role in performance. The Portfolio was less sensitive to price fluctuations in the broad market than the Index, which contributed to positive performance during the highly volatile market conditions of 2011. However, Clearbridge’s slightly higher beta (which shows how sensitive a portfolio is to market movements) tended to offset the lower beta of Goldman. An underexposure to stocks exhibiting value characteristics and below-market volatility augmented results, although stocks exhibiting lower dividend yield and larger market capitalization detracted.
Overall sector weightings did not have a meaningful impact on performance. That said, the Portfolio’s underexposure to the technology, telecommunication services, and financial sectors added value, while underexposure to more defensive sectors, including utilities and healthcare, detracted.
Prudential Investments LLC (PI), an indirect, wholly owned subsidiary of Prudential Financial, Inc., serves as the investment manager for the Fund.
Russell 2000 Value Index is an unmanaged index that measures the performance of those Russell 2000 companies with lower price-to-book ratios and lower forecasted growth values. Russell 2500 Index is an unmanaged market cap-weighted index that measures the performance of the 2,500 smallest companies in the Russell 3000 Index, which represents approximately 17% of the total market capitalization of the Russell 3000 Index. These returns do not include the effect of any investment management expenses. These returns would have been lower if they included the effect of these expenses. Investors cannot invest directly in a market index. For a complete list of holdings, refer to the Schedule of Investments section of this report.
| | |
Prudential Series Fund Presentation of Portfolio Holdings — unaudited | | December 31, 2011 |
| | | | |
| SP International Growth | |
| Five Largest Holdings | | | (% of Net Assets | ) |
Standard Chartered PLC
(United Kingdom) | | | 2.4% | |
ASML Holding NV (Netherlands) | | | 2.4% | |
Novo Nordisk A/S
(Class B Stock) (Denmark) | | | 2.3% | |
| Julius Baer Group Ltd. (Switzerland) | | | 2.2% | |
| Samsung Electronics Co. Ltd. (South Korea) | | | 2.2% | |
| | | | |
| SP International Value | |
| Five Largest Holdings | | | (% of Net Assets | ) |
Novartis AG (Switzerland) | | | 2.0% | |
| Royal Dutch Shell PLC (Class B Stock) (United Kingdom) | | | 1.9% | |
Vodafone Group PLC
(United Kingdom) | | | 1.4% | |
| British American Tobacco PLC (United Kingdom) | | | 1.3% | |
KDDI Corp. (Japan) | | | 1.3% | |
| | | | |
| SP Prudential U.S. Emerging Growth | |
| Five Largest Holdings | | | (% of Net Assets | ) |
Crown Castle International Corp. | | | 2.5% | |
Dollar Tree, Inc. | | | 2.3% | |
VeriSign, Inc. | | | 2.2% | |
Ecolab, Inc. | | | 2.1% | |
Tim Hortons, Inc. | | | 2.0% | |
| | | | |
| SP Small Cap Value | |
| Five Largest Holdings | | | (% of Net Assets | ) |
iShares Russell 2000 Value
Index Fund | | | 1.8% | |
| Signature Bank | | | 1.6% | |
Meadowbrook Insurance
Group, Inc. | | | 1.4% | |
| El Paso Electric Co. | | | 1.3% | |
| Plantronics, Inc. | | | 1.3% | |
For a complete list of holdings, please refer to the Schedule of Investments section of this report. Holdings reflect only long-term investments. Holdings/Issues/Sectors are subject to change.
| | |
The Prudential Series Fund Fees and Expenses — unaudited | | December 31, 2011 |
As a contract owner investing in Portfolios of the Fund through a variable annuity or variable life contract, you incur ongoing costs, including management fees, and other Portfolio expenses. This example is intended to help you understand your ongoing costs (in dollars) of investing in the Fund and to compare these costs with the ongoing costs of investing in other investment options. This example does not reflect fees and charges under your variable annuity or variable life contract. If contract charges were included, the costs shown below would be higher. Please consult the prospectus for your contract for more information about contract fees and charges.
The example is based on an investment of $1,000 invested at the beginning of the period and held for the entire period July 1, 2011 through December 31, 2011.
Actual Expenses
The first line of the table below provides information about actual account values and actual expenses. You may use this information, together with the amount you invested, to estimate the Portfolio expenses that you paid over the period. Simply divide your account value by $1,000 (for example, an $8,600 account value divided by $1,000 = 8.6), then multiply the result by the number in the first line under the heading entitled “Expenses Paid During the Six-Month Period” to estimate the Portfolio expenses you paid on your account during this period. As noted above, the table does not reflect variable contract fees and charges.
Hypothetical Example for Comparison Purposes
The second line of the table below provides information about hypothetical account values and hypothetical expenses based on the Portfolio’s actual expense ratio and an assumed rate of return of 5% per year before expenses, which is not the Portfolio’s actual return. The hypothetical account values and expenses may not be used to estimate the actual ending account balance or expenses you paid for the period. You may use this information to compare the ongoing costs of investing in the Portfolio and other investment options. To do so, compare this 5% hypothetical example with the 5% hypothetical examples that appear in the shareholder reports of the other investment options.
Please note that the expenses shown in the table are meant to highlight your ongoing Portfolio costs only and do not reflect any contract fees and charges, such as sales charges (loads), insurance charges or administrative charges. Therefore the second line of the table is useful to compare ongoing investment option costs only, and will not help you determine the relative total costs of owning different contracts. In addition, if these contract fee and charges were included, your costs would have been higher.
| | | | | | | | | | | | | | | | | | |
| The Prudential Series Fund Portfolios | | Beginning
Account Value
July 1, 2011 | | | Ending
Account Value
December 31, 2011 | | | Annualized Expense
Ratio based on the
Six-Month period | | | Expenses Paid
During the
Six-Month period* | |
| SP International Growth (Class I) | | Actual | | $ | 1,000.00 | | | $ | 845.00 | | | | 1.34 | % | | $ | 6.23 | |
| | Hypothetical | | $ | 1,000.00 | | | $ | 1,018.45 | | | | 1.34 | % | | $ | 6.82 | |
| SP International Growth (Class II) | | Actual | | $ | 1,000.00 | | | $ | 843.10 | | | | 1.74 | % | | $ | 8.08 | |
| | Hypothetical | | $ | 1,000.00 | | | $ | 1,016.43 | | | | 1.74 | % | | $ | 8.84 | |
| SP International Value (Class I) | | Actual | | $ | 1,000.00 | | | $ | 822.30 | | | | 1.11 | % | | $ | 5.10 | |
| | Hypothetical | | $ | 1,000.00 | | | $ | 1,019.61 | | | | 1.11 | % | | $ | 5.65 | |
| SP Prudential U.S. Emerging Growth (Class I) | | Actual | | $ | 1,000.00 | | | $ | 930.80 | | | | 0.64 | % | | $ | 3.11 | |
| | Hypothetical | | $ | 1,000.00 | | | $ | 1,021.98 | | | | 0.64 | % | | $ | 3.26 | |
| SP Prudential U.S. Emerging Growth (Class II) | | Actual | | $ | 1,000.00 | | | $ | 929.60 | | | | 1.04 | % | | $ | 5.06 | |
| | Hypothetical | | $ | 1,000.00 | | | $ | 1,019.96 | | | | 1.04 | % | | $ | 5.30 | |
| SP Small Cap Value (Class I) | | Actual | | $ | 1,000.00 | | | $ | 916.50 | | | | 1.03 | % | | $ | 4.98 | |
| | Hypothetical | | $ | 1,000.00 | | | $ | 1,020.01 | | | | 1.03 | % | | $ | 5.24 | |
* Portfolio expenses (net of fee waivers or subsidies, if any) for each share class are equal to the annualized expense ratio for each share class (provided in the table), multiplied by the average account value over the period, multiplied by the 184 days in the six-month period ended December 31, 2011, and divided by the 365 days in the Portfolio’s fiscal year ended December 31, 2011 (to reflect the six-month period). Expenses presented in the table include the expenses of any underlying portfolios in which the Portfolio may invest.
| | | | | | |
| | | SP INTERNATIONAL GROWTH PORTFOLIO | | |
| |
| SCHEDULE OF INVESTMENTS | | December 31, 2011 |
| | | | | | | | |
| LONG-TERM INVESTMENTS — 96.7% | | | | |
| COMMON STOCKS | | Shares
| | | Value
(Note 2)
| |
| | | | | | | | | |
Argentina — 1.4% | | | | | | | | |
Arcos Dorados Holdings, Inc. (Class A Stock) | | | 23,036 | | | $ | 472,929 | |
MercadoLibre, Inc. | | | 8,210 | | | | 653,023 | |
| | | | | | |
|
|
|
| | | | | | | | 1,125,952 | |
| | | | | | |
|
|
|
Belgium — 1.5% | | | | | | | | |
Anheuser-Busch InBev NV | | | 20,406 | | | | 1,249,344 | |
| | | | | | |
|
|
|
Brazil — 3.1% | | | | | | | | |
BR Malls Participacoes SA | | | 63,000 | | | | 612,015 | |
OGX Petroleo e Gas Participacoes SA* | | | 153,000 | | | | 1,117,201 | |
Petroleo Brasileiro SA | | | 70,200 | | | | 865,621 | |
| | | | | | |
|
|
|
| | | | | | | | 2,594,837 | |
| | | | | | |
|
|
|
Canada — 3.8% | | | | | | | | |
Brookfield Asset Management, Inc. (Class A Stock) | | | 24,477 | | | | 672,628 | |
Canadian National Railway Co. | | | 15,774 | | | | 1,239,205 | |
Imax Corp.* | | | 16,446 | | | | 301,455 | |
Pacific Rubiales Energy Corp. | | | 23,333 | | | | 428,984 | |
Potash Corp. of Saskatchewan, Inc. | | | 12,171 | | | | 502,419 | |
| | | | | | |
|
|
|
| | | | | | | | 3,144,691 | |
| | | | | | |
|
|
|
Chile — 0.4% | | | | | | | | |
Banco Santander Chile SA, ADR(a) | | | 4,104 | | | | 310,673 | |
| | | | | | |
|
|
|
China — 1.8% | | | | | | | | |
Baidu, Inc., ADR* | | | 9,300 | | | | 1,083,171 | |
Industrial & Commercial Bank of China Ltd.
(Class H Stock) | | | 652,000 | | | | 387,006 | |
| | | | | | |
|
|
|
| | | | | | | | 1,470,177 | |
| | | | | | |
|
|
|
Denmark — 2.9% | | | | | | | | |
Novo Nordisk A/S (Class B Stock) | | | 16,407 | | | | 1,885,435 | |
Novozymes A/S (Class B Stock) | | | 17,033 | | | | 525,822 | |
| | | | | | |
|
|
|
| | | | | | | | 2,411,257 | |
| | | | | | |
|
|
|
France — 6.2% | | | | | | | | |
Arkema SA | | | 4,951 | | | | 350,508 | |
BNP Paribas | | | 25,781 | | | | 1,012,688 | |
Cie de Saint-Gobain | | | 10,677 | | | | 409,931 | |
Cie Generale d’Optique Essilor International SA | | | 8,521 | | | | 601,593 | |
Cie Generale des Etablissements Michelin (Class B Stock) | | | 6,392 | | | | 377,861 | |
Dassault Systemes SA | | | 6,992 | | | | 560,428 | |
Pernod-Ricard SA | | | 5,226 | | | | 484,689 | |
Publicis Groupe SA | | | 10,357 | | | | 476,463 | |
Schneider Electric SA | | | 15,512 | | | | 816,706 | |
| | | | | | |
|
|
|
| | | | | | | | 5,090,867 | |
| | | | | | |
|
|
|
Germany — 7.2% | | | | | | | | |
Adidas AG | | | 10,821 | | | | 703,894 | |
Bayer AG | | | 17,031 | | | | 1,088,891 | |
Bayerische Motoren Werke AG | | | 24,176 | | | | 1,619,556 | |
Brenntag AG | | | 3,708 | | | | 345,293 | |
Fresenius Medical Care AG & Co. KGaA | | | 10,954 | | | | 744,302 | |
Infineon Technologies AG | | | 58,722 | | | | 442,020 | |
SAP AG | | | 18,845 | | | | 996,335 | |
| | | | | | |
|
|
|
| | | | | | | | 5,940,291 | |
| | | | | | |
|
|
|
| | | | | | | | |
COMMON STOCKS
(continued) | | Shares
| | | Value
(Note 2)
| |
| | | | | | | | | |
Hong Kong — 5.3% | | | | | | | | |
ASM Pacific Technology Ltd. | | | 53,500 | | | $ | 600,330 | |
Belle International Holdings Ltd. | | | 341,000 | | | | 594,487 | |
China Unicom Hong Kong Ltd. | | | 590,000 | | | | 1,241,290 | |
CNOOC Ltd. | | | 270,800 | | | | 473,497 | |
Hang Lung Properties Ltd. | | | 229,000 | | | | 651,624 | |
Li & Fung Ltd. | | | 422,000 | | | | 781,340 | |
| | | | | | |
|
|
|
| | | | | | | | 4,342,568 | |
| | | | | | |
|
|
|
India — 0.5% | | | | | | | | |
ICICI Bank Ltd., ADR(a) | | | 16,776 | | | | 443,390 | |
| | | | | | |
|
|
|
Indonesia — 0.6% | | | | | | | | |
Bank Rakyat Indonesia Persero Tbk PT | | | 671,500 | | | | 499,876 | |
| | | | | | |
|
|
|
Ireland — 3.4% | | | | | | | | |
Accenture PLC (Class A Stock) | | | 17,707 | | | | 942,544 | |
Experian PLC | | | 68,475 | | | | 931,014 | |
Shire PLC | | | 27,979 | | | | 974,607 | |
| | | | | | |
|
|
|
| | | | | | | | 2,848,165 | |
| | | | | | |
|
|
|
Israel — 1.1% | | | | | | | | |
Check Point Software Technologies Ltd.*(a) | | | 17,631 | | | | 926,333 | |
| | | | | | |
|
|
|
Italy — 0.2% | | | | | | | | |
Prada SpA* | | | 35,600 | | | | 161,118 | |
| | | | | | |
|
|
|
Japan — 8.3% | | | | | | | | |
Canon, Inc. | | | 16,500 | | | | 730,999 | |
Daito Trust Construction Co. Ltd. | | | 3,600 | | | | 308,692 | |
Fanuc Corp. | | | 6,500 | | | | 994,803 | |
Fast Retailing Co. Ltd. | | | 4,000 | | | | 727,556 | |
Honda Motor Co. Ltd. | | | 22,600 | | | | 689,422 | |
Hoya Corp. | | | 22,500 | | | | 484,669 | |
Marubeni Corp. | | | 79,000 | | | | 481,369 | |
ORIX Corp. | | | 8,000 | | | | 661,037 | |
Rakuten, Inc. | | | 378 | | | | 406,631 | |
Softbank Corp. | | | 14,000 | | | | 412,343 | |
Sumitomo Realty & Development Co. Ltd. | | | 28,000 | | | | 490,373 | |
Yamada Denki Co. Ltd. | | | 6,980 | | | | 475,188 | |
| | | | | | |
|
|
|
| | | | | | | | 6,863,082 | |
| | | | | | |
|
|
|
Luxembourg — 1.4% | | | | | | | | |
Millicom International Cellular SA, SDR | | | 11,922 | | | | 1,194,443 | |
| | | | | | |
|
|
|
Mexico — 0.6% | | | | | | | | |
Wal-Mart de Mexico SAB de CV (Class V Stock) | | | 178,900 | | | | 491,008 | |
| | | | | | |
|
|
|
Netherlands — 4.6% | | | | | | | | |
ASML Holding NV | | | 47,433 | | | | 1,993,641 | |
Sensata Technologies Holding NV* | | | 31,012 | | | | 814,995 | |
Unilever NV, CVA | | | 22,700 | | | | 780,611 | |
Yandex NV* | | | 12,514 | | | | 246,526 | |
| | | | | | |
|
|
|
| | | | | | | | 3,835,773 | |
| | | | | | |
|
|
|
Peru — 0.7% | | | | | | | | |
Credicorp Ltd. | | | 5,521 | | | | 604,384 | |
| | | | | | |
|
|
|
Singapore — 0.7% | | | | | | | | |
CapitaMalls Asia Ltd. | | | 101,000 | | | | 87,992 | |
Jardine Cycle & Carriage Ltd. | | | 12,000 | | | | 445,195 | |
| | | | | | |
|
|
|
| | | | | | | | 533,187 | |
| | | | | | |
|
|
|
SEE NOTES TO FINANCIAL STATEMENTS.
A1
| | | | | | |
| | | SP INTERNATIONAL GROWTH PORTFOLIO (continued) | | |
| |
| SCHEDULE OF INVESTMENTS | | December 31, 2011 |
| | | | | | | | |
COMMON STOCKS
(continued) | | Shares
| | | Value
(Note 2)
| |
| | | | | | | | | |
South Africa — 0.4% | | | | | | | | |
Truworths International Ltd. | | | 38,700 | | | $ | 354,039 | |
| | | | | | |
|
|
|
South Korea — 2.2% | | | | | | | | |
Samsung Electronics Co. Ltd. | | | 1,936 | | | | 1,778,028 | |
| | | | | | |
|
|
|
Spain — 1.0% | | | | | | | | |
Inditex SA | | | 10,106 | | | | 827,681 | |
| | | | | | |
|
|
|
Sweden — 1.4% | | | | | | | | |
Atlas Copco AB (Class A Stock) | | | 29,682 | | | | 638,318 | |
Hennes & Mauritz AB (Class B Stock) | | | 16,069 | | | | 516,716 | |
| | | | | | |
|
|
|
| | | | | | | | 1,155,034 | |
| | | | | | |
|
|
|
Switzerland — 11.0% | | | | | | | | |
Compagnie Financiere Richemont SA (Class A Stock) | | | 10,155 | | | | 513,642 | |
Glencore International PLC | | | 104,085 | | | | 633,640 | |
Julius Baer Group Ltd. | | | 45,937 | | | | 1,796,790 | |
Kuehne & Nagel International AG | | | 2,829 | | | | 317,747 | |
Nestle SA | | | 16,574 | | | | 952,833 | |
Partners Group Holding AG | | | 3,048 | | | | 531,850 | |
Roche Holding AG | | | 8,251 | | | | 1,398,445 | |
Sika AG | | | 96 | | | | 180,901 | |
Swatch Group AG (The) | | | 2,606 | | | | 975,204 | |
Syngenta AG | | | 2,654 | | | | 777,015 | |
Xstrata PLC | | | 66,874 | | | | 1,015,697 | |
| | | | | | |
|
|
|
| | | | | | | | 9,093,764 | |
| | | | | | |
|
|
|
Taiwan — 1.7% | | | | | | | | |
Taiwan Semiconductor Manufacturing Co. Ltd., ADR(a) | | | 110,646 | | | | 1,428,440 | |
| | | | | | |
|
|
|
United Kingdom — 20.8% | | | | | | | | |
AMEC PLC | | | 32,107 | | | | 452,496 | |
ARM Holdings PLC | | | 81,116 | | | | 745,755 | |
Babcock International Group PLC | | | 42,033 | | | | 480,110 | |
Berkeley Group Holdings PLC* | | | 20,164 | | | | 399,572 | |
BG Group PLC | | | 28,846 | | | | 616,637 | |
BHP Billiton PLC | | | 32,181 | | | | 938,313 | |
British American Tobacco PLC | | | 20,333 | | | | 964,832 | |
British Sky Broadcasting Group PLC | | | 105,365 | | | | 1,198,594 | |
Burberry Group PLC | | | 24,705 | | | | 454,644 | |
Centrica PLC | | | 134,818 | | | | 605,710 | |
Compass Group PLC | | | 91,026 | | | | 863,724 | |
Johnson Matthey PLC | | | 22,355 | | | | 637,405 | |
Next PLC | | | 8,737 | | | | 371,369 | |
Pearson PLC | | | 41,356 | | | | 777,127 | |
Petrofac Ltd. | | | 32,274 | | | | 722,246 | |
Prudential PLC | | | 103,612 | | | | 1,027,399 | |
Reed Elsevier PLC | | | 57,415 | | | | 462,765 | |
Rolls-Royce Holdings PLC* | | | 123,286 | | | | 1,429,261 | |
| | | | | | | | |
COMMON STOCKS
(continued) | | Shares
| | | Value
(Note 2)
| |
| | | | | | | | | |
United Kingdom (continued) | | | | | | | | |
Rolls-Royce Holdings PLC
(Class C Stock)* | | | 10,761,861 | | | $ | 16,713 | |
Scottish & Southern Energy PLC | | | 35,755 | | | | 716,855 | |
Standard Chartered PLC | | | 91,940 | | | | 2,011,794 | |
Tullow Oil PLC | | | 60,521 | | | | 1,317,717 | |
| | | | | | |
|
|
|
| | | | | | | | 17,211,038 | |
| | | | | | |
|
|
|
United States — 2.5% | | | | | | | | |
Citigroup, Inc. | | | 26,937 | | | | 708,712 | |
Las Vegas Sands Corp.* | | | 10,960 | | | | 468,321 | |
Wynn Resorts Ltd. | | | 7,927 | | | | 875,854 | |
| | | | | | |
|
|
|
| | | | | | | | 2,052,887 | |
| | | | | | |
|
|
|
TOTAL LONG-TERM INVESTMENTS
(cost $76,537,601) | | | | 79,982,327 | |
| | | | | | |
|
|
|
| SHORT-TERM INVESTMENT — 7.0% | |
Affiliated Money Market Mutual Fund | |
Prudential Investment Portfolios 2 —Prudential Core Taxable Money Market Fund
(cost $5,801,839; includes $3,057,504 of cash collateral for securities on loan) (Note 4)(b)(w) | | | 5,801,839 | | | | 5,801,839 | |
| | | | | | |
|
|
|
TOTAL INVESTMENTS — 103.7%
(cost $82,339,440) | | | | 85,784,166 | |
LIABILITIES IN EXCESS OF
OTHER ASSETS(x) — (3.7)% | | | | (3,097,416 | ) |
| | | | | | |
|
|
|
NET ASSETS — 100.0% | | | $ | 82,686,750 | |
| | | | | | |
|
|
|
The following abbreviations are used in the Portfolio descriptions:
| | |
| ADR | | American Depositary Receipt |
| CVA | | Certificate Van Aandelen (Bearer) |
| SDR | | Special Drawing Rights |
| JPY | | Japanese Yen |
| * | Non-income producing security. |
| (a) | All or a portion of security is on loan. The aggregate market value of such securities, including those sold and pending settlement, is $2,958,657; cash collateral of $3,057,504 (included with liabilities) was received with which the Portfolio purchased highly liquid short-term investments. |
| (b) | Represents security, or a portion thereof, purchased with cash collateral received for securities on loan. |
| (w) | Prudential Investments LLC, the manager of the Portfolio, also serves as manager of the Prudential Investment Portfolios 2 —Prudential Core Taxable Money Market Fund. |
| (x) | Includes net unrealized appreciation (depreciation) on the following derivative contracts held at reporting period end: |
Forward foreign currency exchange contracts outstanding at December 31, 2011:
| | | | | | | | | | | | | | | | | | | | | | | | |
Purchase Contracts
| | Counterparty
| | | Notional
Amount (000)
| | | Value at
Settlement Date
Payable
| | | Current
Value
| | | Unrealized
Appreciation
| |
Japanese Yen, | | | | | | | | | | | | | | | | | | | | | | | | |
Expiring 03/22/12 | | | Bank of New York Mellon | | | | JPY | | | | 10,771 | | | $ | 140,089 | | | $ | 140,156 | | | $ | 67 | |
Expiring 03/22/12 | | | Bank of New York Mellon | | | | JPY | | | | 9,925 | | | | 127,227 | | | | 129,147 | | | | 1,920 | |
| | | | | | | | | | | | | | |
|
|
| |
|
|
| |
|
|
|
| | | | | | | | | | | | | | | $ | 267,316 | | | $ | 269,303 | | | $ | 1,987 | |
| | | | | | | | | | | | | | |
|
|
| |
|
|
| |
|
|
|
SEE NOTES TO FINANCIAL STATEMENTS.
A2
| | | | | | |
| | | SP INTERNATIONAL GROWTH PORTFOLIO (continued) | | |
| |
| SCHEDULE OF INVESTMENTS | | December 31, 2011 |
| | | | | | | | | | | | | | | | | | | | | | | | |
Sale Contracts
| | Counterparty
| | | Notional
Amount (000)
| | | Value at
Settlement Date
Receivable
| | | Current
Value
| | | Unrealized
Depreciation
| |
Japanese Yen, Expiring 03/22/12 | | | Bank of New York Mellon | | | | JPY | | | | 81,613 | | | $ | 1,051,186 | | | $ | 1,061,978 | | | $ | (10,792 | ) |
| | | | | | | | | | | | | | |
|
|
| |
|
|
| |
|
|
|
Various inputs are used in determining the value of the Portfolio’s investments. These inputs are summarized in the three broad levels listed below.
| Level 1—quoted | prices generally for securities actively traded on a regulated securities exchange and for open-end mutual funds which trade at daily net asset value. |
| Level 2—other | significant observable inputs (including, but not limited to, quoted prices for similar securities, interest rates, prepayment speeds, foreign currency exchange rates, and amortized cost) generally for debt securities, swaps, forward foreign currency contracts and for foreign stocks priced using vendor modeling tool. |
| Level 3—significant | unobservable inputs for securities valued in accordance with Board approved fair valuation procedures. |
The following is a summary of the inputs used as of December 31, 2011 in valuing such portfolio securities:
| | | | | | | | | | | | |
| | | Level 1
| | | Level 2
| | | Level 3
| |
Investments in Securities | | | | | | | | | | | | |
Common Stocks: | | | | | | | | | | | | |
Argentina | | $ | 1,125,952 | | | $ | — | | | $ | — | |
Belgium | | | 1,249,344 | | | | — | | | | — | |
Brazil | | | 2,594,837 | | | | — | | | | — | |
Canada | | | 3,144,691 | | | | — | | | | — | |
Chile | | | 310,673 | | | | — | | | | — | |
China | | | 1,470,177 | | | | — | | | | — | |
Denmark | | | 2,411,257 | | | | — | | | | — | |
France | | | 5,090,867 | | | | — | | | | — | |
Germany | | | 5,940,291 | | | | — | | | | — | |
Hong Kong | | | 4,342,568 | | | | — | | | | — | |
India | | | 443,390 | | | | — | | | | — | |
Indonesia | | | 499,876 | | | | — | | | | — | |
Ireland | | | 2,848,165 | | | | — | | | | — | |
Israel | | | 926,333 | | | | — | | | | — | |
Italy | | | 161,118 | | | | — | | | | — | |
Japan | | | 6,863,082 | | | | — | | | | — | |
Luxembourg | | | 1,194,443 | | | | — | | | | — | |
Mexico | | | 491,008 | | | | — | | | | — | |
Netherlands | | | 3,835,773 | | | | — | | | | — | |
Peru | | | 604,384 | | | | — | | | | — | |
Singapore | | | 533,187 | | | | — | | | | — | |
South Africa | | | 354,039 | | | | — | | | | — | |
South Korea | | | 1,778,028 | | | | — | | | | — | |
Spain | | | 827,681 | | | | — | | | | — | |
Sweden | | | 1,155,034 | | | | — | | | | — | |
Switzerland | | | 9,093,764 | | | | — | | | | — | |
Taiwan | | | 1,428,440 | | | | — | | | | — | |
United Kingdom | | | 17,194,325 | | | | 16,713 | | | | — | |
United States | | | 2,052,887 | | | | — | | | | — | |
Affiliated Money Market Mutual Fund | | | 5,801,839 | | | | — | | | | — | |
Other Financial Instuments* | | | | | | | | | | | | |
Foreign Forward Currency Contracts | | | — | | | | (8,805 | ) | | | — | |
| | |
|
|
| |
|
|
| |
|
|
|
Total | | $ | 85,767,453 | | | $ | 7,908 | | | $ | — | |
| | |
|
|
| |
|
|
| |
|
|
|
| * | Other financial instruments are derivative instruments not reflected in the Schedule of Investments, such as futures, forwards and swap contracts, which are recorded at the unrealized appreciation/depreciation on the instrument. |
SEE NOTES TO FINANCIAL STATEMENTS.
A3
| | | | | | |
| | | SP INTERNATIONAL GROWTH PORTFOLIO (continued) | | |
| |
| SCHEDULE OF INVESTMENTS | | December 31, 2011 |
The industry classification of investments and liabilities in excess of other assets shown as a percentage of net assets as of December 31, 2011 were as follows:
| | | | |
Banks | | | 9.3 | % |
Semiconductors | | | 8.4 | |
Oil, Gas & Consumable Fuels | | | 7.9 | |
Retail & Merchandising | | | 7.1 | |
Affiliated Money Market Mutual Fund (3.7% represents investments purchased with collateral from securities on loan) | | | 7.0 | |
Pharmaceuticals | | | 5.2 | |
Chemicals | | | 4.4 | |
Telecommunications | | | 3.4 | |
Real Estate Operation & Development | | | 3.3 | |
Foods | | | 3.1 | |
Metals & Mining | | | 3.1 | |
Software | | | 3.0 | |
Automobile Manufacturers | | | 2.8 | |
Internet | | | 2.4 | |
Media & Entertainment | | | 2.4 | |
Distribution/Wholesale | | | 2.2 | |
Beverages | | | 2.1 | |
Machinery | | | 2.0 | |
Transportation | | | 1.9 | |
Aerospace & Defense | | | 1.7 | |
| | | | |
Commercial Services | | | 1.7 | % |
Hotels, Restaurants & Leisure | | | 1.7 | |
Apparel | | | 1.7 | |
Diversified Financial Services | | | 1.4 | |
Electronic Components | | | 1.4 | |
Insurance | | | 1.2 | |
Agriculture | | | 1.2 | |
Computer Services & Software | | | 1.1 | |
Electrical Equipment | | | 1.0 | |
Healthcare Services | | | 0.9 | |
Office Equipment | | | 0.9 | |
Electric Utilities | | | 0.9 | |
Healthcare Products | | | 0.7 | |
Building Materials | | | 0.7 | |
Biotechnology | | | 0.6 | |
Electronics | | | 0.6 | |
Advertising | | | 0.6 | |
Restaurants | | | 0.6 | |
Media | | | 0.6 | |
Internet Services | | | 0.5 | |
Building & Construction | | | 0.5 | |
Auto Parts & Equipment | | | 0.5 | |
| | |
|
|
|
| | | | 103.7 | |
Liabilities in excess of other assets | | | (3.7 | ) |
| | |
|
|
|
| | | | 100.0 | % |
| | |
|
|
|
The Portfolio invested in derivative instruments during the reporting period. The primary types of risk associated with these derivative instruments are equity risk and foreign exchange risk. The effect of such derivative instruments on the Portfolio’s financial position and financial performance as reflected in the Statement of Assets and Liabilities and Statement of Operations is presented in the summary below.
Fair values of derivative instruments as of December 31, 2011 as presented in the Statement of Assets and Liabilities:
| | | | | | | | | | | | |
Derivatives not accounted for as hedging
instruments, carried at fair value
| | Asset Derivatives
| | | Liability Derivatives
| |
| | Balance Sheet Location
| | Fair Value
| | | Balance Sheet Location
| | Fair Value
| |
Foreign exchange contracts | | Unrealized appreciation on foreign currency forward contracts | | $ | 1,987 | | | Unrealized depreciation on foreign currency forward contracts | | $ | 10,792 | |
| | | | |
|
|
| | | |
|
|
|
The effects of derivative instruments on the Statement of Operations for the year ended December 31, 2011 are as follows:
| | | | | | | | | | | | |
Amount of Realized Gain or (Loss) on Derivatives Recognized in Income
| |
Derivatives not accounted for as hedging instruments, carried at fair value
| | Rights
| | | Forward
Currency
Contracts
| | | Total
| |
Foreign exchange contracts | | $ | — | | | $ | (427,840 | ) | | $ | (427,840 | ) |
Equity contracts | | | 7,132 | | | | — | | | | 7,132 | |
| | |
|
|
| |
|
|
| |
|
|
|
Total | | $ | 7,132 | | | $ | (427,840 | ) | | $ | (420,708 | ) |
| | |
|
|
| |
|
|
| |
|
|
|
|
Change in Unrealized Appreciation or (Depreciation) on Derivatives Recognized in Income
| |
Derivatives not accounted for as hedging instruments, carried at fair value
| | | | | Forward
Currency
Contracts
| | | | |
Foreign exchange contracts | | | | | | $ | (8,596 | ) | | | | |
| | | | | | |
|
|
| | | | |
For the year ended December 31, 2011, the Portfolio’s average value at settlement date payable for forward foreign currency exchange purchase contracts was $2,290,065 and the average value at settlement date receivable for forward foreign currency exchange sale contracts was $10,065,663.
SEE NOTES TO FINANCIAL STATEMENTS.
A4
| | | | | | |
| | | SP INTERNATIONAL GROWTH PORTFOLIO (continued) | | |
STATEMENT OF ASSETS AND LIABILITIES
December 31, 2011
| | | | |
| ASSETS | | | | |
Investments at value, including securities on loan of $2,958,657: | | | | |
Unaffiliated investments (cost $76,537,601) | | $ | 79,982,327 | |
Affiliated investments (cost $5,801,839) | | | 5,801,839 | |
Foreign currency, at value (cost $40,237) | | | 40,188 | |
Receivable for investments sold | | | 496,932 | |
Tax reclaim receivable | | | 286,225 | |
Dividends receivable | | | 58,254 | |
Receivable for Series shares sold | | | 8,659 | |
Unrealized appreciation on foreign currency forward contracts | | | 1,987 | |
Prepaid expenses | | | 3,293 | |
| | |
|
|
|
Total Assets | | | 86,679,704 | |
| | |
|
|
|
| LIABILITIES | | | | |
Collateral for securities on loan | | | 3,057,504 | |
Payable for investments purchased | | | 539,730 | |
Payable to custodian | | | 145,638 | |
Accrued expenses and other liabilities | | | 140,966 | |
Management fee payable | | | 59,999 | |
Payable for Series shares repurchased | | | 34,055 | |
Unrealized depreciation on foreign currency forward contracts | | | 10,792 | |
Administration fee payable | | | 1,819 | |
Distribution fee payable | | | 1,525 | |
Affiliated transfer agent fees payable | | | 926 | |
| | |
|
|
|
Total Liabilities | | | 3,992,954 | |
| | |
|
|
|
| NET ASSETS | | $ | 82,686,750 | |
| | |
|
|
|
Net assets were comprised of: | | | | |
Paid-in capital | | $ | 133,341,409 | |
Retained earnings | | | (50,654,659 | ) |
| | |
|
|
|
Net assets, December 31, 2011 | | $ | 82,686,750 | |
| | |
|
|
|
| Class I: | | | | |
Net asset value and redemption price per share, $75,527,087 / 17,337,514 outstanding shares of beneficial interest | | $ | 4.36 | |
| | |
|
|
|
| Class II: | | | | |
Net asset value and redemption price per share, $7,159,663 / 1,666,692 outstanding shares of beneficial interest | | $ | 4.30 | |
| | |
|
|
|
STATEMENT OF OPERATIONS
Year Ended December 31, 2011
| | | | |
| INVESTMENT INCOME | | | | |
Unaffiliated dividend income (net of $444,705 foreign withholding tax) | | $ | 1,932,373 | |
Affiliated income from securities lending, net | | | 34,120 | |
Affiliated dividend income | | | 6,781 | |
| | |
|
|
|
| | | | 1,973,274 | |
| | |
|
|
|
| EXPENSES | | | | |
Management fee | | | 1,007,816 | |
Distribution fee—Class II | | | 21,762 | |
Administration fee—Class II | | | 13,057 | |
Custodian’s fees and expenses | | | 268,000 | |
Shareholders’ reports | | | 66,000 | |
Audit fee | | | 25,000 | |
Transfer agent’s fees and expenses (including affiliated expense of $5,500) (Note 4) | | | 12,000 | |
Trustees’ fees | | | 11,000 | |
Legal fees and expenses | | | 8,000 | |
Loan interest expense (Note 8) | | | 6,822 | |
Commitment fee on syndicated credit agreement | | | 3,000 | |
Insurance expenses | | | 2,000 | |
Miscellaneous | | | 20,534 | |
| | |
|
|
|
Total expenses | | | 1,464,991 | |
| | |
|
|
|
| NET INVESTMENT INCOME | | | 508,283 | |
| | |
|
|
|
| NET REALIZED AND UNREALIZED GAIN (LOSS) ON INVESTMENTS AND FOREIGN CURRENCIES | | | | |
Net realized gain (loss) on: | | | | |
Investment transactions | | | 20,651,849 | |
Foreign currency transactions | | | (916,059 | ) |
| | |
|
|
|
| | | | 19,735,790 | |
| | |
|
|
|
Net change in unrealized appreciation (depreciation) on: | | | | |
Investments | | | (32,171,474 | ) |
Foreign currencies | | | (160,893 | ) |
| | |
|
|
|
| | | | (32,332,367 | ) |
| | |
|
|
|
| NET LOSS ON INVESTMENTS AND FOREIGN CURRENCIES | | | (12,596,577 | ) |
| | |
|
|
|
| NET DECREASE IN NET ASSETS RESULTING FROM OPERATIONS | | $ | (12,088,294 | ) |
| | |
|
|
|
STATEMENT OF CHANGES IN NET ASSETS
| | | | | | | | |
| | | Year Ended December 31,
| |
| | | 2011
| | | 2010
| |
| INCREASE (DECREASE) IN NET ASSETS | | | | | | | | |
| OPERATIONS: | | | | | | | | |
Net investment income | | $ | 508,283 | | | $ | 1,221,711 | |
Net realized gain on investment and foreign currency transactions | | | 19,735,790 | | | | 25,833,405 | |
Net change in unrealized appreciation (depreciation) on investments and foreign currencies | | | (32,332,367 | ) | | | (5,671,852 | ) |
| | |
|
|
| |
|
|
|
NET INCREASE (DECREASE) IN NET ASSETS RESULTING FROM OPERATIONS | | | (12,088,294 | ) | | | 21,383,264 | |
| | |
|
|
| |
|
|
|
| DISTRIBUTIONS | | | | | | | | |
Class I | | | (1,181,454 | ) | | | (2,389,158 | ) |
Class II | | | (39,406 | ) | | | (122,040 | ) |
| | |
|
|
| |
|
|
|
TOTAL DISTRIBUTIONS | | | (1,220,860 | ) | | | (2,511,198 | ) |
| | |
|
|
| |
|
|
|
| SERIES SHARE TRANSACTIONS (Note 7): | | | | | | | | |
Series shares sold | | | 7,411,046 | | | | 10,982,406 | |
Series shares issued in reinvestment of distributions | | | 1,220,860 | | | | 2,511,198 | |
Series shares repurchased | | | (84,871,319 | ) | | | (33,792,253 | ) |
| | |
|
|
| |
|
|
|
NET DECREASE IN NET ASSETS RESULTING FROM SERIES SHARE TRANSACTIONS | | | (76,239,413 | ) | | | (20,298,649 | ) |
| | |
|
|
| |
|
|
|
| TOTAL DECREASE IN NET ASSETS | | | (89,548,567 | ) | | | (1,426,583 | ) |
| NET ASSETS: | | | | | | | | |
Beginning of year | | | 172,235,317 | | | | 173,661,900 | |
| | |
|
|
| |
|
|
|
End of year | | $ | 82,686,750 | | | $ | 172,235,317 | |
| | |
|
|
| |
|
|
|
SEE NOTES TO FINANCIAL STATEMENTS.
A5
| | | | | | |
| | | SP INTERNATIONAL VALUE PORTFOLIO | | |
| |
| SCHEDULE OF INVESTMENTS | | December 31, 2011 |
| | | | | | | | |
| LONG-TERM INVESTMENTS — 95.2% | |
| COMMON STOCKS — 94.4% | | Shares
| | | Value
(Note 2)
| |
| | | | | | | | | |
Australia — 4.2% | | | | | | | | |
Bendigo and Adelaide Bank Ltd. | | | 32,600 | | | $ | 267,746 | |
BHP Billiton Ltd. | | | 24,342 | | | | 856,953 | |
Caltex Australia Ltd. | | | 42,700 | | | | 514,037 | |
Challenger Ltd. | | | 123,500 | | | | 521,683 | |
Downer EDI Ltd.* | | | 101,900 | | | | 333,514 | |
Echo Entertainment Group Ltd.* | | | 8,986 | | | | 32,995 | |
Emeco Holdings Ltd. | | | 372,800 | | | | 367,954 | |
Goodman Fielder Ltd. | | | 481,242 | | | | 214,113 | |
National Australia Bank Ltd. | | | 41,400 | | | | 989,152 | |
OneSteel Ltd. | | | 269,600 | | | | 193,022 | |
Pacific Brands Ltd. | | | 502,100 | | | | 282,451 | |
Tabcorp Holdings Ltd. | | | 46,800 | | | | 130,677 | |
Telstra Corp. Ltd. | | | 150,200 | | | | 511,569 | |
| | | | | | |
|
|
|
| | | | | | | | 5,215,866 | |
| | | | | | |
|
|
|
Austria — 0.5% | | | | | | | | |
OMV AG | | | 15,300 | | | | 464,159 | |
Voestalpine AG | | | 6,500 | | | | 182,301 | |
| | | | | | |
|
|
|
| | | | | | | | 646,460 | |
| | | | | | |
|
|
|
Belgium — 0.5% | | | | | | | | |
AGFA-Gevaert NV* | | | 84,400 | | | | 134,358 | |
Delhaize Group SA | | | 7,300 | | | | 410,091 | |
Dexia NV/SA* | | | 27,423 | | | | 10,541 | |
| | | | | | |
|
|
|
| | | | | | | | 554,990 | |
| | | | | | |
|
|
|
Brazil — 1.3% | | | | | | | | |
BM&FBOVESPA SA | | | 85,750 | | | | 450,529 | |
Embraer SA, ADR | | | 22,340 | | | | 563,415 | |
Natura Cosmeticos SA | | | 31,700 | | | | 616,240 | |
| | | | | | |
|
|
|
| | | | | | | | 1,630,184 | |
| | | | | | |
|
|
|
Canada — 3.0% | | | | | | | | |
Canadian National Railway Co. | | | 14,760 | | | | 1,161,241 | |
Canadian Natural Resources Ltd. | | | 24,278 | | | | 909,159 | |
Cenovus Energy, Inc. | | | 19,183 | | | | 637,017 | |
Potash Corp. of Saskatchewan, Inc. | | | 22,380 | | | | 923,846 | |
| | | | | | |
|
|
|
| | | | | | | | 3,631,263 | |
| | | | | | |
|
|
|
Cayman Islands — 0.5% | | | | | | | | |
Tencent Holdings Ltd. | | | 28,279 | | | | 568,376 | |
| | | | | | |
|
|
|
China — 2.0% | | | | | | | | |
China Life Insurance Co. Ltd.
(Class H Stock) | | | 200,440 | | | | 495,513 | |
China Merchants Bank Co. Ltd.
(Class H Stock) | | | 403,382 | | | | 815,427 | |
Industrial & Commercial Bank of China Ltd. (Class H Stock) | | | 1,160,520 | | | | 688,847 | |
Sinopharm Group Co. Ltd.
(Class H Stock) | | | 212,698 | | | | 511,027 | |
| | | | | | |
|
|
|
| | | | | | | | 2,510,814 | |
| | | | | | |
|
|
|
Denmark — 1.6% | | | | | | | | |
Danske Bank A/S* | | | 13,800 | | | | 175,284 | |
H. Lundbeck A/S | | | 16,000 | | | | 300,872 | |
Novo Nordisk A/S (Class B Stock) | | | 13,023 | | | | 1,496,558 | |
| | | | | | |
|
|
|
| | | | | | | | 1,972,714 | |
| | | | | | |
|
|
|
| | | | | | | | |
COMMON STOCKS
(continued) | | Shares
| | | Value
(Note 2)
| |
| | | | | | | | | |
Finland — 0.4% | | | | | | | | |
Nokia Oyj | | | 49,100 | | | $ | 239,701 | |
Tieto Oyj | | | 21,500 | | | | 306,090 | |
| | | | | | |
|
|
|
| | | | | | | | 545,791 | |
| | | | | | |
|
|
|
France — 8.0% | | | | | | | | |
Air Liquide SA | | | 9,934 | | | | 1,229,005 | |
AXA SA | | | 19,800 | | | | 257,414 | |
BNP Paribas | | | 9,900 | | | | 388,876 | |
Ciments Francais SA | | | 4,200 | | | | 325,063 | |
Credit Agricole SA | | | 53,627 | | | | 302,613 | |
France Telecom SA | | | 14,600 | | | | 229,303 | |
LVMH Moet Hennessy Louis Vuitton SA | | | 10,155 | | | | 1,437,853 | |
Publicis Groupe SA | | | 19,255 | | | | 885,807 | |
Rallye SA | | | 5,500 | | | | 153,792 | |
Renault SA | | | 5,700 | | | | 197,709 | |
Sanofi | | | 18,907 | | | | 1,388,691 | |
SCOR SE | | | 13,800 | | | | 322,563 | |
Societe Generale | | | 9,318 | | | | 207,489 | |
Thales SA | | | 6,300 | | | | 198,952 | |
Total SA | | | 21,200 | | | | 1,083,802 | |
Valeo SA | | | 6,500 | | | | 258,351 | |
Vallourec SA | | | 5,800 | | | | 376,533 | |
Vivendi SA | | | 27,600 | | | | 604,403 | |
| | | | | | |
|
|
|
| | | | | | | | 9,848,219 | |
| | | | | | |
|
|
|
Germany — 8.6% | | | | | | | | |
Adidas AG | | | 20,658 | | | | 1,343,779 | |
Allianz SE | | | 15,800 | | | | 1,511,393 | |
BASF SE | | | 7,800 | | | | 544,027 | |
Bayer AG | | | 4,300 | | | | 274,924 | |
Deutsche Bank AG | | | 12,200 | | | | 464,773 | |
E.ON AG | | | 12,200 | | | | 263,216 | |
Fresenius Medical Care AG & Co. KGaA | | | 18,730 | | | | 1,272,666 | |
Hannover Rueckversicherung AG | | | 6,900 | | | | 342,254 | |
Merck KGaA | | | 4,900 | | | | 488,510 | |
Muenchener Rueckversicherungs-Gesellschaft AG | | | 3,700 | | | | 453,874 | |
Rheinmetall AG | | | 7,400 | | | | 327,883 | |
RWE AG | | | 6,300 | | | | 221,375 | |
SAP AG | | | 28,076 | | | | 1,484,378 | |
Siemens AG | | | 12,400 | | | | 1,186,638 | |
ThyssenKrupp AG | | | 13,800 | | | | 316,579 | |
| | | | | | |
|
|
|
| | | | | | | | 10,496,269 | |
| | | | | | |
|
|
|
Hong Kong — 2.6% | | | | | | | | |
Chaoda Modern Agriculture Holdings Ltd.(g) | | | 567,462 | | | | 730 | |
CNOOC Ltd. | | | 676,389 | | | | 1,182,675 | |
First Pacific Co. Ltd. | | | 604,000 | | | | 628,373 | |
Hong Kong Exchanges and Clearing Ltd. | | | 65,977 | | | | 1,054,225 | |
Kingboard Chemical Holdings Ltd. | | | 120,000 | | | | 355,368 | |
Solomon Systech International Ltd.* | | | 525,000 | | | | 11,897 | |
| | | | | | |
|
|
|
| | | | | | | | 3,233,268 | |
| | | | | | |
|
|
|
Ireland — 0.6% | | | | | | | | |
Covidien PLC | | | 17,450 | | | | 785,425 | |
Irish Life & Permanent Group Holdings PLC* | | | 45,500 | | | | 1,413 | |
| | | | | | |
|
|
|
| | | | | | | | 786,838 | |
| | | | | | |
|
|
|
SEE NOTES TO FINANCIAL STATEMENTS.
A6
| | | | | | |
| | | SP INTERNATIONAL VALUE PORTFOLIO (continued) | | |
| |
| SCHEDULE OF INVESTMENTS | | December 31, 2011 |
| | | | | | | | |
COMMON STOCKS
(continued) | | Shares
| | | Value
(Note 2)
| |
| | | | | | | | | |
Israel — 2.0% | | | | | | | | |
Bank Hapoalim BM | | | 73,200 | | | $ | 238,558 | |
Check Point Software Technologies Ltd.* | | | 13,469 | | | | 707,661 | |
Elbit Systems Ltd. | | | 6,900 | | | | 283,351 | |
Teva Pharmaceutical Industries Ltd. | | | 500 | | | | 20,126 | |
Teva Pharmaceutical Industries Ltd., ADR | | | 28,809 | | | | 1,162,731 | |
| | | | | | |
|
|
|
| | | | | | | | 2,412,427 | |
| | | | | | |
|
|
|
Italy — 1.5% | | | | | | | | |
Banco Popolare Scarl | | | 23,700 | | | | 30,674 | |
Enel SpA | | | 132,800 | | | | 540,378 | |
ENI SpA | | | 38,600 | | | | 799,826 | |
Finmeccanica SpA | | | 30,000 | | | | 110,969 | |
Fondiaria-Sai SpA* | | | 17,000 | | | | 13,641 | |
Telecom Italia SpA | | | 277,700 | | | | 298,672 | |
| | | | | | |
|
|
|
| | | | | | | | 1,794,160 | |
| | | | | | |
|
|
|
Japan — 17.3% | | | | | | | | |
Aoyama Trading Co. Ltd. | | | 30,100 | | | | 565,475 | |
Canon, Inc. | | | 21,420 | | | | 948,970 | |
Circle K Sunkus Co. Ltd. | | | 18,300 | | | | 303,138 | |
COMSYS Holdings Corp. | | | 30,700 | | | | 322,276 | |
Dai-ichi Life Insurance Co. Ltd. (The) | | | 437 | | | | 429,789 | |
FANUC Corp. | | | 4,749 | | | | 726,818 | |
Fukuoka Financial Group, Inc. | | | 77,000 | | | | 323,126 | |
Fuyo General Lease Co. Ltd. | | | 9,200 | | | | 316,269 | |
Hitachi Capital Corp. | | | 20,000 | | | | 277,251 | |
Itochu Techno-Solutions Corp. | | | 4,300 | | | | 193,017 | |
JX Holdings, Inc. | | | 60,600 | | | | 366,104 | |
K’s Holdings Corp. | | | 13,400 | | | | 530,986 | |
KDDI Corp. | | | 243 | | | | 1,562,752 | |
Keihin Corp. | | | 21,500 | | | | 356,425 | |
Keiyo Bank Ltd. (The) | | | 55,000 | | | | 272,249 | |
Komatsu Ltd. | | | 51,100 | | | | 1,194,347 | |
Kurabo Industries Ltd. | | | 108,000 | | | | 204,859 | |
KYORIN Holdings, Inc. | | | 25,000 | | | | 440,106 | |
Kyowa Exeo Corp. | | | 41,600 | | | | 391,841 | |
Marubeni Corp. | | | 94,000 | | | | 572,769 | |
Miraca Holdings, Inc. | | | 4,900 | | | | 195,121 | |
Mitsubishi Corp. | | | 8,900 | | | | 179,804 | |
Mitsubishi UFJ Financial Group, Inc. | | | 246,590 | | | | 1,047,615 | |
Mitsui & Co. Ltd. | | | 19,800 | | | | 307,920 | |
Mizuho Financial Group, Inc. | | | 287,900 | | | | 389,003 | |
Nichirei Corp. | | | 61,000 | | | | 295,609 | |
Nippon Electric Glass Co. Ltd. | | | 23,000 | | | | 227,699 | |
Nippon Shokubai Co. Ltd. | | | 31,000 | | | | 333,078 | |
Nippon Telegraph & Telephone Corp. | | | 15,500 | | | | 792,419 | |
Nissan Shatai Co. Ltd. | | | 21,000 | | | | 204,079 | |
NTT DoCoMo, Inc. | | | 400 | | | | 735,351 | |
Sankyo Co. Ltd. | | | 5,800 | | | | 293,504 | |
Sankyu, Inc. | | | 91,000 | | | | 344,043 | |
Seino Holdings Co. Ltd. | | | 43,000 | | | | 333,520 | |
Shimachu Co. Ltd. | | | 17,400 | | | | 399,000 | |
Shizuoka Gas Co. Ltd. | | | 48,100 | | | | 305,585 | |
Sumitomo Bakelite Co. Ltd. | | | 35,000 | | | | 195,985 | |
Sumitomo Corp. | | | 52,800 | | | | 714,793 | |
Sumitomo Mitsui Financial Group, Inc. | | | 26,300 | | | | 732,587 | |
Sumitomo Mitsui Trust Holdings, Inc. | | | 41,720 | | | | 122,499 | |
| | | | | | | | |
COMMON STOCKS
(continued) | | Shares
| | | Value
(Note 2)
| |
| | | | | | | | | |
Japan (continued) | | | | | | | | |
Toagosei Co. Ltd. | | | 82,000 | | | $ | 336,651 | |
Toppan Forms Co. Ltd. | | | 50,100 | | | | 382,080 | |
Toyota Motor Corp. | | | 28,080 | | | | 935,757 | |
Toyota Tsusho Corp. | | | 24,500 | | | | 433,214 | |
Tsuruha Holdings, Inc. | | | 8,200 | | | | 458,633 | |
Yokohama Rubber Co. Ltd. (The) | | | 46,700 | | | | 262,107 | |
| | | | | | |
|
|
|
| | | | | | | | 21,256,223 | |
| | | | | | |
|
|
|
Liechtenstein — 0.2% | | | | | | | | |
Verwaltungs-und Privat-Bank AG | | | 2,300 | | | | 203,237 | |
| | | | | | |
|
|
|
Mexico — 0.8% | | | | | | | | |
Wal-Mart de Mexico SAB de CV
(Class V Stock) | | | 340,060 | | | | 933,327 | |
| | | | | | �� |
|
|
|
Netherlands — 3.0% | | | | | | | | |
ING Groep NV, CVA* | | | 62,300 | | | | 448,312 | |
Koninklijke Ahold NV | | | 33,600 | | | | 452,479 | |
Koninklijke DSM NV | | | 9,800 | | | | 454,708 | |
Koninklijke KPN NV | | | 17,600 | | | | 210,589 | |
Koninklijke Philips Electronics NV | | | 13,500 | | | | 284,450 | |
Nutreco NV | | | 3,600 | | | | 236,878 | |
Schlumberger Ltd. | | | 19,100 | | | | 1,304,721 | |
Yandex NV* | | | 16,100 | | | | 317,170 | |
| | | | | | |
|
|
|
| | | | | | | | 3,709,307 | |
| | | | | | |
|
|
|
New Zealand — 0.3% | | | | | | | | |
Air New Zealand Ltd. | | | 580,000 | | | | 406,324 | |
| | | | | | |
|
|
|
Norway — 0.6% | | | | | | | | |
DnB NOR ASA | | | 29,200 | | | | 285,856 | |
Statoil ASA | | | 17,200 | | | | 441,442 | |
| | | | | | |
|
|
|
| | | | | | | | 727,298 | |
| | | | | | |
|
|
|
South Korea — 1.0% | | | | | | | | |
Hyundai Motor Co.* | | | 6,688 | | | | 1,236,583 | |
| | | | | | |
|
|
|
Spain — 1.9% | | | | | | | | |
Banco Bilbao Vizcaya Argentaria SA | | | 32,400 | | | | 280,116 | |
Banco Espanol de Credito SA | | | 40,600 | | | | 195,735 | |
Banco Santander SA | | | 90,700 | | | | 689,069 | |
Repsol YPF SA | | | 27,200 | | | | 835,556 | |
Telefonica SA | | | 18,900 | | | | 327,414 | |
| | | | | | |
|
|
|
| | | | | | | | 2,327,890 | |
| | | | | | |
|
|
|
Sweden — 2.4% | |
Boliden AB | | | 35,600 | | | | 519,874 | |
Electrolux AB (Class B Stock) | | | 14,800 | | | | 235,912 | |
Hennes & Mauritz AB (Class B Stock) | | | 34,874 | | | | 1,121,412 | |
Meda AB | | | 17,700 | | | | 184,149 | |
NCC AB (Class B Stock) | | | 11,400 | | | | 200,435 | |
Svenska Cellulosa AB (Class B Stock) | | | 22,500 | | | | 333,476 | |
Svenska Handelsbanken AB (Class A Stock) | | | 11,600 | | | | 305,084 | |
| | | | | | |
|
|
|
| | | | | | | | 2,900,342 | |
| | | | | | |
|
|
|
Switzerland — 7.2% | |
Baloise Holding AG | | | 6,800 | | | | 466,219 | |
Clariant AG* | | | 30,800 | | | | 303,967 | |
Credit Suisse Group AG* | | | 56,100 | | | | 1,318,138 | |
Georg Fischer AG* | | | 500 | | | | 170,872 | |
Julius Baer Group Ltd.* | | | 16,232 | | | | 634,902 | |
SEE NOTES TO FINANCIAL STATEMENTS.
A7
| | | | | | |
| | | SP INTERNATIONAL VALUE PORTFOLIO (continued) | | |
| |
| SCHEDULE OF INVESTMENTS | | December 31, 2011 |
| | | | | | | | |
COMMON STOCKS
(continued) | | Shares
| | | Value
(Note 2)
| |
| | | | | | | | | |
Switzerland (continued) | |
Nestle SA | | | 26,700 | | | $ | 1,534,973 | |
Novartis AG | | | 43,952 | | | | 2,512,746 | |
Roche Holding AG | | | 2,200 | | | | 372,873 | |
Swatch Group AG (The) | | | 1,050 | | | | 392,926 | |
Swiss Re Ltd.* | | | 8,100 | | | | 412,804 | |
Zurich Financial Services AG* | | | 3,300 | | | | 746,567 | |
| | | | | | |
|
|
|
| | | | | | | | 8,866,987 | |
| | | | | | |
|
|
|
Taiwan — 0.3% | |
HTC Corp. | | | 21,482 | | | | 352,606 | |
| | | | | | |
|
|
|
Turkey — 0.4% | | | | | | | | |
Turkiye Garanti Bankasi A/S | | | 164,300 | | | | 511,879 | |
| | | | | | |
|
|
|
United Kingdom — 21.7% | |
ARM Holdings PLC | | | 67,758 | | | | 622,946 | |
AstraZeneca PLC | | | 28,900 | | | | 1,335,220 | |
Aviva PLC | | | 77,400 | | | | 361,565 | |
BAE Systems PLC | | | 157,100 | | | | 695,571 | |
Barclays PLC | | | 87,400 | | | | 238,955 | |
Beazley PLC | | | 159,400 | | | | 332,455 | |
Berendsen PLC | | | 16,700 | | | | 112,869 | |
BG Group PLC | | | 65,750 | | | | 1,405,530 | |
BP PLC | | | 120,000 | | | | 858,181 | |
British American Tobacco PLC | | | 33,912 | | | | 1,609,177 | |
BT Group PLC | | | 329,000 | | | | 975,371 | |
Cable & Wireless Communications PLC | | | 11,000 | | | | 6,526 | |
Carnival PLC | | | 30,355 | | | | 1,002,217 | |
Cookson Group PLC | | | 60,700 | | | | 479,816 | |
Dairy Crest Group PLC | | | 40,400 | | | | 210,809 | |
Drax Group PLC | | | 33,700 | | | | 285,229 | |
DS Smith PLC | | | 79,800 | | | | 245,378 | |
GlaxoSmithKline PLC | | | 27,200 | | | | 621,580 | |
Home Retail Group PLC | | | 149,600 | | | | 193,761 | |
J Sainsbury PLC | | | 5,000 | | | | 23,520 | |
Kingfisher PLC | | | 264,130 | | | | 1,028,348 | |
Legal & General Group PLC | | | 291,300 | | | | 465,052 | |
Logica PLC | | | 179,700 | | | | 172,187 | |
Marks & Spencer Group PLC | | | 29,500 | | | | 142,479 | |
Marston’s PLC | | | 104,410 | | | | 148,770 | |
Next PLC | | | 14,500 | | | | 616,327 | |
Old Mutual PLC | | | 204,000 | | | | 429,277 | |
Pearson PLC | | | 38,251 | | | | 718,780 | |
Reckitt Benckiser Group PLC | | | 27,273 | | | | 1,346,877 | |
Rexam PLC | | | 71,100 | | | | 389,553 | |
Rolls-Royce Holdings PLC* | | | 40,880 | | | | 473,924 | |
Rolls-Royce Holdings PLC (Class C Stock)*(g) | | | 2,820,720 | | | | 4,380 | |
| | | | | | | | |
COMMON STOCKS
(continued) | | Shares
| | | Value
(Note 2)
| |
| | | | | | | | | |
United Kingdom (continued) | |
Royal Dutch Shell PLC (Class B Stock) | | | 61,600 | | | $ | 2,347,596 | |
RSA Insurance Group PLC | | | 195,300 | | | | 319,070 | |
SABMiller PLC | | | 19,924 | | | | 701,294 | |
Standard Chartered PLC | | | 63,905 | | | | 1,398,344 | |
Tesco PLC | | | 238,321 | | | | 1,493,207 | |
Thomas Cook Group PLC | | | 150,100 | | | | 34,383 | |
Tullett Prebon PLC | | | 57,600 | | | | 241,521 | |
Vodafone Group PLC | | | 638,640 | | | | 1,774,331 | |
WM Morrison Supermarkets PLC | | | 146,400 | | | | 741,640 | |
| | | | | | |
|
|
|
| | | | | | | | 26,604,016 | |
| | | | | | |
|
|
|
TOTAL COMMON STOCKS
(cost $116,174,569) | | | | 115,883,658 | |
| | | | | | |
|
|
|
| PREFERRED STOCK — 0.8% | | | | | | | | |
Germany | | | | | | | | |
Volkswagen AG (PRFC)
(cost $603,017) | | | 6,981 | | | | 1,045,817 | |
| | | | | | |
|
|
|
TOTAL LONG-TERM INVESTMENTS
(cost $116,777,586) | | | | 116,929,475 | |
| | | | | | |
|
|
|
| SHORT-TERM INVESTMENT — 3.2% | |
Affiliated Money Market Mutual Fund | |
Prudential Investment Portfolios 2 —Prudential Core Taxable Money Market Fund
(cost $3,876,634)(w) (Note 4) | | | 3,876,634 | | | | 3,876,634 | |
| | | | | | |
|
|
|
TOTAL INVESTMENTS — 98.4%
(cost $120,654,220) | | | | 120,806,109 | |
OTHER ASSETS IN EXCESS OF
LIABILITIES(x) — 1.6% | | | | 1,966,839 | |
| | | | | | |
|
|
|
NET ASSETS — 100.0% | | | $ | 122,772,948 | |
| | | | | | |
|
|
|
The following abbreviations are used in the Portfolio descriptions:
| | |
| ADR | | American Depositary Receipt |
| CVA | | Certificate Van Aandelen (Bearer) |
| PRFC | | Preference Shares |
| EUR | | Euro |
| * | Non-income producing security. |
| (g) | Indicates a security or securities that have been deemed illiquid. |
| (w) | Prudential Investments LLC, the manager of the Portfolio, also serves as manager of the Prudential Investment Portfolios 2 — Prudential Core Taxable Money Market Fund. |
| (x) | Includes net unrealized appreciation (depreciation) on the following derivative contracts held at reporting period end: |
Forward foreign currency exchange contracts outstanding at December 31, 2011:
| | | | | | | | | | | | | | | | | | | | | | | | |
Sale Contracts
| | Counterparty
| | | Notional
Amount (000)
| | | Value at
Settlement Date
Payable
| | | Current
Value
| | | Unrealized
Appreciation
| |
Euro, | | | | | | | | | | | | | | | | | | | | | | | | |
Expiring 01/23/12 | | | State Street | | | | EUR | | | | 1,763 | | | $ | 2,304,191 | | | $ | 2,282,651 | | | $ | 21,540 | |
Expiring 05/09/12 | | | State Street | | | | EUR | | | | 2,483 | | | | 3,408,947 | | | | 3,218,315 | | | | 190,632 | |
| | | | | | | | | | | | | | |
|
|
| |
|
|
| |
|
|
|
| | | | | | | | | | | | | | | $ | 5,713,138 | | | $ | 5,500,966 | | | $ | 212,172 | |
| | | | | | | | | | | | | | |
|
|
| |
|
|
| |
|
|
|
SEE NOTES TO FINANCIAL STATEMENTS.
A8
| | | | | | |
| | | SP INTERNATIONAL VALUE PORTFOLIO (continued) | | |
| |
| SCHEDULE OF INVESTMENTS | | December 31, 2011 |
Various inputs are used in determining the value of the Portfolio’s investments. These inputs are summarized in the three broad levels listed below.
| Level 1—quoted | prices generally for securities actively traded on a regulated securities exchange and for open-end mutual funds which trade at daily net asset value. |
| Level 2—other | significant observable inputs (including, but not limited to, quoted prices for similar securities, interest rates, prepayment speeds, foreign currency exchange rates, and amortized cost) generally for debt securities, swaps, forward foreign currency contracts and for foreign stocks priced using vendor modeling tool. |
| Level 3—significant | unobservable inputs for securities valued in accordance with Board approved fair valuation procedures. |
The following is a summary of the inputs used as of December 31, 2011 in valuing such portfolio securities:
| | | | | | | | | | | | |
| | | Level 1
| | | Level 2
| | | Level 3
| |
Investments in Securities | | | | | | | | | | | | |
Common Stocks: | | | | | | | | | | | | |
Australia | | $ | 5,215,866 | | | $ | — | | | $ | — | |
Austria | | | 646,460 | | | | — | | | | — | |
Belgium | | | 554,990 | | | | — | | | | — | |
Brazil | | | 1,630,184 | | | | — | | | | — | |
Canada | | | 3,631,263 | | | | — | | | | — | |
Cayman Islands | | | 568,376 | | | | — | | | | — | |
China | | | 2,510,814 | | | | — | | | | — | |
Denmark | | | 1,972,714 | | | | — | | | | — | |
Finland | | | 545,791 | | | | — | | | | — | |
France | | | 9,848,219 | | | | — | | | | — | |
Germany | | | 10,496,269 | | | | — | | | | — | |
Hong Kong | | | 3,232,538 | | | | — | | | | 730 | |
Ireland | | | 786,838 | | | | — | | | | — | |
Israel | | | 2,412,427 | | | | — | | | | — | |
Italy | | | 1,794,160 | | | | — | | | | — | |
Japan | | | 21,256,223 | | | | — | | | | — | |
Liechtenstein | | | 203,237 | | | | — | | | | — | |
Mexico | | | 933,327 | | | | — | | | | — | |
Netherlands | | | 3,709,307 | | | | — | | | | — | |
New Zealand | | | 406,324 | | | | — | | | | — | |
Norway | | | 727,298 | | | | — | | | | — | |
South Korea | | | 1,236,583 | | | | — | | | | — | |
Spain | | | 2,327,890 | | | | — | | | | — | |
Sweden | | | 2,900,342 | | | | — | | | | — | |
Switzerland | | | 8,866,987 | | | | — | | | | — | |
Taiwan | | | 352,606 | | | | — | | | | — | |
Turkey | | | 511,879 | | | | — | | | | — | |
United Kingdom | | | 26,599,636 | | | | 4,380 | | | | — | |
Preferred Stock – Germany | | | 1,045,817 | | | | — | | | | — | |
Affiliated Money Market Mutual Fund | | | 3,876,634 | | | | — | | | | — | |
Other Financial Instuments* | | | | | | | | | | | | |
Foreign Forward Currency Contracts | | | — | | | | 212,172 | | | | — | |
| | |
|
|
| |
|
|
| |
|
|
|
Total | | $ | 120,800,999 | | | $ | 216,552 | | | $ | 730 | |
| | |
|
|
| |
|
|
| |
|
|
|
| * | Other financial instruments are derivative instruments not reflected in the Schedule of Investments, such as futures, forwards and swap contracts, which are recorded at the unrealized appreciation/depreciation on the instrument. |
SEE NOTES TO FINANCIAL STATEMENTS.
A9
| | | | | | |
| | | SP INTERNATIONAL VALUE PORTFOLIO (continued) | | |
| |
| SCHEDULE OF INVESTMENTS | | December 31, 2011 |
The industry classification of investments and other assets in excess of liabilities shown as a percentage of net assets as of December 31, 2011 were as follows:
| | | | |
Banks | | | 10.7 | % |
Oil & Gas | | | 10.7 | |
Pharmaceuticals | | | 9.1 | |
Insurance | | | 6.5 | |
Telecommunications | | | 6.4 | |
Retail | | | 5.5 | |
Food | | | 4.1 | |
Chemicals | | | 3.9 | |
Affiliated Money Market Mutual Fund | | | 3.2 | |
Diversified Financial Services | | | 2.3 | |
Auto Manufacturers | | | 2.1 | |
Aerospace/Defense | | | 1.9 | |
Software | | | 1.8 | |
Distribution/Wholesale | | | 1.7 | |
Holding Companies – Diversified | | | 1.7 | |
Transportation | | | 1.6 | |
Mining | | | 1.4 | |
Household Products/ Wares | | | 1.3 | |
Agriculture | | | 1.3 | |
Apparel | | | 1.1 | |
Media | | | 1.1 | |
Engineering & Construction | | | 1.1 | |
Healthcare – Services | | | 1.0 | |
Machinery – Construction & Mining | | | 1.0 | |
Miscellaneous Manufacturing | | | 1.0 | |
Hotels, Restaurants & Leisure | | | 0.9 | |
Germany | | | 0.8 | |
Electric | | | 0.8 | |
| | | | |
Office Equipment | | | 0.8 | % |
Computers | | | 0.7 | |
Advertising | | | 0.7 | |
Internet | | | 0.7 | |
Auto Parts & Equipment | | | 0.7 | |
Industrial Conglomerates | | | 0.7 | |
Healthcare Products | | | 0.6 | |
Foods | | | 0.6 | |
Machinery & Equipment | | | 0.6 | |
Beverages | | | 0.6 | |
Iron/Steel | | | 0.6 | |
Semiconductors | | | 0.5 | |
Cosmetics/Personal Care | | | 0.5 | |
Forest & Paper Products | | | 0.5 | |
Electronics | | | 0.4 | |
Commercial Services | | | 0.4 | |
Entertainment | | | 0.3 | |
Airlines | | | 0.3 | |
Containers & Packaging | | | 0.3 | |
Trading Companies & Distributors | | | 0.3 | |
Electronic Components & Equipment | | | 0.3 | |
Building Materials | | | 0.3 | |
Gas | | | 0.2 | |
Independent Power Producers & Energy Traders | | | 0.2 | |
Home Furnishings | | | 0.2 | |
Textiles | | | 0.2 | |
Machinery | | | 0.1 | |
Healthcare Technology | | | 0.1 | |
| | |
|
|
|
| | | | 98.4 | |
Other assets in excess of liabilities | | | 1.6 | |
| | |
|
|
|
| | | | 100.0 | % |
| | |
|
|
|
The Portfolio invested in derivative instruments during the reporting period. The primary types of risk associated with these derivative instruments are equity risk and foreign exchange risk. The effect of such derivative instruments on the Portfolio’s financial position and financial performance as reflected in the Statement of Assets and Liabilities and Statement of Operations is presented in the summary below.
Fair values of derivative instruments as of December 31, 2011 as presented in the Statement of Assets and Liabilities:
| | | | | | | | | | | | |
Derivatives not accounted for as hedging
instruments, carried at fair value
| | Asset Derivatives
| | | Liability Derivatives
| |
| | Balance Sheet Location
| | Fair Value
| | | Balance Sheet Location
| | Fair Value
| |
Foreign exchange contracts | | Unrealized appreciation on foreign currency forward contracts | | $ | 212,172 | | | — | | $ | — | |
| | | | |
|
|
| | | |
|
|
|
The effects of derivative instruments on the Statement of Operations for the year ended December 31, 2011 are as follows:
| | | | | | | | | | | | |
Amount of Realized Gain or (Loss) on Derivatives Recognized in Income
| |
Derivatives not accounted for as hedging instruments, carried at fair value
| | Rights
| | | Forward
Currency
Contracts
| | | Total
| |
Foreign exchange contracts | | $ | — | | | $ | (304,136 | ) | | $ | (304,136 | ) |
Equity contracts | | | (318,062 | ) | | | — | | | | (318,062 | ) |
| | |
|
|
| |
|
|
| |
|
|
|
Total | | $ | (318,062 | ) | | $ | (304,136 | ) | | $ | (622,198 | ) |
| | |
|
|
| |
|
|
| |
|
|
|
|
Change in Unrealized Appreciation or (Depreciation) on Derivatives Recognized in Income
| |
Derivatives not accounted for as hedging instruments, carried at fair value
| | | | | Forward
Currency
Contracts
| | | | |
Foreign exchange contracts | | | | | | $ | 506,603 | | | | | |
| | | | | | |
|
|
| | | | |
For the year ended December 31, 2011, the Portfolio’s average value at settlement date payable for forward foreign currency exchange purchase contracts was $1,172,031 and the average value at settlement date receivable for forward foreign currency exchange sale contracts was $4,994,402.
SEE NOTES TO FINANCIAL STATEMENTS.
A10
| | | | | | |
| | | SP INTERNATIONAL VALUE PORTFOLIO (continued) | | |
STATEMENT OF ASSETS AND LIABILITIES
December 31, 2011
| | | | |
| ASSETS | | | | |
Investments at value: | | | | |
Unaffiliated investments (cost $116,777,586) | | $ | 116,929,475 | |
Affiliated investments (cost $3,876,634) | | | 3,876,634 | |
Foreign currency, at value (cost $949,165) | | | 974,461 | |
Cash | | | 61,481 | |
Tax reclaim receivable | | | 543,972 | |
Receivable for investments sold | | | 364,084 | |
Unrealized appreciation on foreign currency forward contracts | | | 212,172 | |
Dividends and interest receivable | | | 160,768 | |
Receivable for Series shares sold | | | 32,048 | |
Prepaid expenses | | | 2,676 | |
| | |
|
|
|
Total Assets | | | 123,157,771 | |
| | |
|
|
|
| LIABILITIES | | | | |
Payable for investments purchased | | | 160,583 | |
Accrued expenses and other liabilities | | | 101,491 | |
Management fee payable | | | 93,618 | |
Payable for Series shares repurchased | | | 28,205 | |
Affiliated transfer agent fees payable | | | 926 | |
| | |
|
|
|
Total Liabilities | | | 384,823 | |
| | |
|
|
|
| NET ASSETS | | $ | 122,772,948 | |
| | |
|
|
|
Net assets were comprised of: | | | | |
Paid-in capital | | $ | 157,596,683 | |
Retained earnings | | | (34,823,735 | ) |
| | |
|
|
|
Net assets, December 31, 2011 | | $ | 122,772,948 | |
| | |
|
|
|
Net asset value and redemption price per share, $122,772,948 / 21,051,992 outstanding shares of beneficial interest | | $ | 5.83 | |
| | |
|
|
|
STATEMENT OF OPERATIONS
Year Ended December 31, 2011
| | | | |
| INVESTMENT INCOME | | | | |
Unaffiliated dividend income (net of $472,328 foreign withholding tax) | | $ | 5,038,879 | |
Affiliated dividend income | | | 4,178 | |
Interest income | | | 212 | |
| | |
|
|
|
| | | | 5,043,269 | |
| | |
|
|
|
| EXPENSES | | | | |
Management fee | | | 1,457,315 | |
Custodian’s fees and expenses | | | 186,000 | |
Shareholders’ reports | | | 30,000 | |
Audit fee | | | 25,000 | |
Transfer agent’s fees and expenses (including affiliated expense of $5,500) (Note 4) | | | 12,000 | |
Trustees’ fees | | | 12,000 | |
Legal fees and expenses | | | 7,000 | |
Loan interest expense (Note 8) | | | 6,187 | |
Commitment fee on syndicated credit agreement | | | 5,000 | |
Insurance expenses | | | 2,000 | |
Miscellaneous | | | 32,749 | |
| | |
|
|
|
Total expenses | | | 1,775,251 | |
| | |
|
|
|
| NET INVESTMENT INCOME | | | 3,268,018 | |
| | |
|
|
|
| NET REALIZED AND UNREALIZED GAIN (LOSS) ON INVESTMENTS AND FOREIGN CURRENCIES | | | | |
Net realized gain on: | | | | |
Investment transactions | | | 12,275,038 | |
Foreign currency transactions | | | 17,738 | |
| | |
|
|
|
| | | | 12,292,776 | |
| | |
|
|
|
Net change in unrealized appreciation (depreciation) on: | | | | |
Investments | | | (28,890,669 | ) |
Foreign currencies | | | 402,609 | |
| | |
|
|
|
| | | | (28,488,060 | ) |
| | |
|
|
|
| NET LOSS ON INVESTMENTS AND FOREIGN CURRENCIES | | | (16,195,284 | ) |
| | |
|
|
|
| NET DECREASE IN NET ASSETS RESULTING FROM OPERATIONS | | $ | (12,927,266 | ) |
| | |
|
|
|
STATEMENT OF CHANGES IN NET ASSETS
| | | | | | | | |
| | | Year Ended December 31,
| |
| | | 2011
| | | 2010
| |
| INCREASE (DECREASE) IN NET ASSETS | | | | | | | | |
| OPERATIONS: | | | | | | | | |
Net investment income | | $ | 3,268,018 | | | $ | 3,543,885 | |
Net realized gain on investment and foreign currency transactions | | | 12,292,776 | | | | 2,325,645 | |
Net change in unrealized appreciation (depreciation) on investments and foreign currencies | | | (28,488,060 | ) | | | 15,412,324 | |
| | |
|
|
| |
|
|
|
NET INCREASE (DECREASE) IN NET ASSETS RESULTING FROM OPERATIONS | | | (12,927,266 | ) | | | 21,281,854 | |
| | |
|
|
| |
|
|
|
| DISTRIBUTIONS | | | (3,540,580 | ) | | | (4,428,920 | ) |
| | |
|
|
| |
|
|
|
| SERIES SHARE TRANSACTIONS: | | | | | | | | |
Series shares sold [1,383,059 and 4,060,251 shares, respectively] | | | 9,482,465 | | | | 25,034,179 | |
Series shares issued in reinvestment of distributions [513,872 and 781,115 shares, respectively] | | | 3,540,580 | | | | 4,428,920 | |
Series shares repurchased [11,625,779 and 6,078,825 shares, respectively] | | | (85,250,253 | ) | | | (38,110,702 | ) |
| | |
|
|
| |
|
|
|
NET DECREASE IN NET ASSETS RESULTING FROM SERIES SHARE TRANSACTIONS | | | (72,227,208 | ) | | | (8,647,603 | ) |
| | |
|
|
| |
|
|
|
| TOTAL INCREASE (DECREASE) IN NET ASSETS | | | (88,695,054 | ) | | | 8,205,331 | |
| NET ASSETS: | | | | | | | | |
Beginning of year | | | 211,468,002 | | | | 203,262,671 | |
| | |
|
|
| |
|
|
|
End of year | | $ | 122,772,948 | | | $ | 211,468,002 | |
| | |
|
|
| |
|
|
|
SEE NOTES TO FINANCIAL STATEMENTS.
A11
| | | | | | |
| | | SP PRUDENTIAL U.S. EMERGING GROWTH PORTFOLIO | | |
| |
| SCHEDULE OF INVESTMENTS | | December 31, 2011 |
| | | | | | | | |
| LONG-TERM INVESTMENTS — 99.7% | |
| COMMON STOCKS | | Shares
| | | Value
(Note 2)
| |
| | | | | | | | | |
Air Freight & Logistics — 0.8% | | | | | | | | |
Expeditors International of Washington, Inc. | | | 39,250 | | | $ | 1,607,680 | |
| | | | | | |
|
|
|
Automobiles — 0.6% | | | | | | | | |
Harley-Davidson, Inc. | | | 30,218 | | | | 1,174,574 | |
| | | | | | |
|
|
|
Biotechnology — 2.9% | | | | | | | | |
Alexion Pharmaceuticals, Inc.* | | | 40,444 | | | | 2,891,746 | |
BioMarin Pharmaceutical, Inc.* | | | 51,378 | | | | 1,766,376 | |
United Therapeutics Corp.*(a) | | | 32,025 | | | | 1,513,181 | |
| | | | | | |
|
|
|
| | | | | | | | 6,171,303 | |
| | | | | | |
|
|
|
Capital Markets — 1.4% | | | | | | | | |
Eaton Vance Corp.(a) | | | 64,953 | | | | 1,535,489 | |
TD Ameritrade Holding Corp. | | | 92,228 | | | | 1,443,368 | |
| | | | | | |
|
|
|
| | | | | | | | 2,978,857 | |
| | | | | | |
|
|
|
Chemicals — 4.9% | | | | | | | | |
Airgas, Inc. | | | 15,138 | | | | 1,181,975 | |
Albemarle Corp. | | | 50,729 | | | | 2,613,051 | |
Ecolab, Inc. | | | 75,466 | | | | 4,362,689 | |
FMC Corp. | | | 26,265 | | | | 2,259,841 | |
| | | | | | |
|
|
|
| | | | | | | | 10,417,556 | |
| | | | | | |
|
|
|
Commercial Banks — 0.9% | | | | | | | | |
First Republic Bank* | | | 59,535 | | | | 1,822,366 | |
| | | | | | |
|
|
|
Commercial Services & Supplies — 1.1% | |
Iron Mountain, Inc. | | | 72,185 | | | | 2,223,298 | |
| | | | | | |
|
|
|
Communications Equipment — 2.6% | | | | | | | | |
F5 Networks, Inc.* | | | 17,104 | | | | 1,815,076 | |
Finisar Corp.*(a) | | | 87,110 | | | | 1,458,657 | |
Juniper Networks, Inc.* | | | 65,968 | | | | 1,346,407 | |
Riverbed Technology, Inc.* | | | 32,798 | | | | 770,753 | |
| | | | | | |
|
|
|
| | | | | | | | 5,390,893 | |
| | | | | | |
|
|
|
Computers & Peripherals — 0.9% | | | | | | | | |
NetApp, Inc.* | | | 53,331 | | | | 1,934,315 | |
| | | | | | |
|
|
|
Electrical Equipment — 3.2% | | | | | | | | |
AMETEK, Inc. | | | 71,187 | | | | 2,996,973 | |
Roper Industries, Inc.(a) | | | 42,665 | | | | 3,706,309 | |
| | | | | | |
|
|
|
| | | | | | | | 6,703,282 | |
| | | | | | |
|
|
|
Electronic Equipment & Instruments — 1.9% | | | | | |
Amphenol Corp. (Class A Stock) | | | 48,421 | | | | 2,197,829 | |
FLIR Systems, Inc.(a) | | | 74,768 | | | | 1,874,434 | |
| | | | | | |
|
|
|
| | | | | | | | 4,072,263 | |
| | | | | | |
|
|
|
Energy Equipment & Services — 2.6% | | | | | | | | |
Cameron International Corp.* | | | 56,608 | | | | 2,784,548 | |
Patterson-UTI Energy, Inc. | | | 72,543 | | | | 1,449,409 | |
Rowan Cos., Inc.* | | | 43,901 | | | | 1,331,517 | |
| | | | | | |
|
|
|
| | | | | | | | 5,565,474 | |
| | | | | | |
|
|
|
Food & Staples Retailing — 0.7% | | | | | | | | |
Whole Foods Market, Inc. | | | 21,780 | | | | 1,515,452 | |
| | | | | | |
|
|
|
Food Products — 3.0% | | | | | | | | |
Bunge Ltd. | | | 36,272 | | | | 2,074,758 | |
J.M. Smucker Co. (The) | | | 30,801 | | | | 2,407,714 | |
Mead Johnson Nutrition Co. | | | 28,117 | | | | 1,932,482 | |
| | | | | | |
|
|
|
| | | | | | | | 6,414,954 | |
| | | | | | |
|
|
|
| | | | | | | | |
COMMON STOCKS
(continued) | | Shares
| | | Value
(Note 2)
| |
| | | | | | | | | |
Healthcare Equipment & Supplies — 1.0% | |
IDEXX Laboratories, Inc.* | | | 15,141 | | | $ | 1,165,251 | |
Neogen Corp.*(a) | | | 29,976 | | | | 918,465 | |
| | | | | | |
|
|
|
| | | | | | | | 2,083,716 | |
| | | | | | |
|
|
|
Healthcare Providers & Services — 5.7% | |
DaVita, Inc.* | | | 51,259 | | | | 3,885,945 | |
Henry Schein, Inc.* | | | 51,499 | | | | 3,318,080 | |
Laboratory Corp. of America Holdings*(a) | | | 27,469 | | | | 2,361,510 | |
Universal Health Services, Inc. (Class B Stock) | | | 65,417 | | | | 2,542,105 | |
| | | | | | |
|
|
|
| | | | | | | | 12,107,640 | |
| | | | | | |
|
|
|
Hotels, Restaurants & Leisure — 4.7% | |
Darden Restaurants, Inc.(a) | | | 54,990 | | | | 2,506,444 | |
Tim Hortons, Inc. | | | 86,253 | | | | 4,176,370 | |
Yum! Brands, Inc. | | | 56,140 | | | | 3,312,822 | |
| | | | | | |
|
|
|
| | | | | | | | 9,995,636 | |
| | | | | | |
|
|
|
Household Products — 1.5% | |
Church & Dwight Co., Inc. | | | 67,396 | | | | 3,084,041 | |
| | | | | | |
|
|
|
Insurance — 0.6% | |
W.R. Berkley Corp. | | | 35,857 | | | | 1,233,122 | |
| | | | | | |
|
|
|
Internet Software & Services — 3.0% | |
Rackspace Hosting, Inc.*(a) | | | 37,272 | | | | 1,603,069 | |
VeriSign, Inc.(a) | | | 130,163 | | | | 4,649,422 | |
| | | | | | |
|
|
|
| | | | | | | | 6,252,491 | |
| | | | | | |
|
|
|
IT Services — 3.3% | |
Alliance Data Systems Corp.*(a) | | | 33,575 | | | | 3,486,428 | |
Gartner, Inc.* | | | 54,324 | | | | 1,888,845 | |
Teradata Corp.*(a) | | | 30,629 | | | | 1,485,813 | |
| | | | | | |
|
|
|
| | | | | | | | 6,861,086 | |
| | | | | | |
|
|
|
Life Sciences Tools & Services — 2.0% | |
Agilent Technologies, Inc.* | | | 63,123 | | | | 2,204,886 | |
Waters Corp.* | | | 27,748 | | | | 2,054,740 | |
| | | | | | |
|
|
|
| | | | | | | | 4,259,626 | |
| | | | | | |
|
|
|
Machinery — 1.9% | |
Colfax Corp.*(a) | | | 34,137 | | | | 972,222 | |
IDEX Corp. | | | 84,597 | | | | 3,139,395 | |
| | | | | | |
|
|
|
| | | | | | | | 4,111,617 | |
| | | | | | |
|
|
|
Metals & Mining — 1.9% | |
Eldorado Gold Corp. | | | 60,306 | | | | 826,795 | |
Reliance Steel & Aluminum Co. | | | 46,358 | | | | 2,257,171 | |
Silver Wheaton Corp. | | | 33,473 | | | | 969,378 | |
| | | | | | |
|
|
|
| | | | | | | | 4,053,344 | |
| | | | | | |
|
|
|
Multiline Retail — 3.5% | |
Dollar Tree, Inc.* | | | 59,340 | | | | 4,931,747 | |
Nordstrom, Inc. | | | 49,470 | | | | 2,459,154 | |
| | | | | | |
|
|
|
| | | | | | | | 7,390,901 | |
| | | | | | |
|
|
|
Oil, Gas & Consumable Fuels — 7.0% | |
Cimarex Energy Co. | | | 23,119 | | | | 1,431,066 | |
Cobalt International Energy, Inc.*(a) | | | 100,123 | | | | 1,553,909 | |
Concho Resources, Inc.* | | | 26,960 | | | | 2,527,500 | |
Denbury Resources, Inc.* | | | 192,409 | | | | 2,905,376 | |
Noble Energy, Inc. | | | 33,484 | | | | 3,160,555 | |
SEE NOTES TO FINANCIAL STATEMENTS.
A12
| | | | | | |
| | | SP PRUDENTIAL U.S. EMERGING GROWTH PORTFOLIO (continued) | | |
| |
| SCHEDULE OF INVESTMENTS | | December 31, 2011 |
| | | | | | | | |
COMMON STOCKS
(continued) | | Shares
| | | Value
(Note 2)
| |
| | | | | | | | | |
Oil, Gas & Consumable Fuels (continued) | |
Southwestern Energy Co.* | | | 96,875 | | | $ | 3,094,187 | |
| | | | | | |
|
|
|
| | | | | | | | 14,672,593 | |
| | | | | | |
|
|
|
Personal Products — 0.8% | |
Herbalife Ltd. | | | 31,695 | | | | 1,637,681 | |
| | | | | | |
|
|
|
Pharmaceuticals — 3.1% | |
Perrigo Co. | | | 37,427 | | | | 3,641,647 | |
Valeant Pharmaceuticals International, Inc.* | | | 64,313 | | | | 3,002,774 | |
| | | | | | |
|
|
|
| | | | | | | | 6,644,421 | |
| | | | | | |
|
|
|
Professional Services — 1.9% | |
IHS, Inc. (Class A Stock)* | | | 26,819 | | | | 2,310,725 | |
Robert Half International, Inc. | | | 59,797 | | | | 1,701,823 | |
| | | | | | |
|
|
|
| | | | | | | | 4,012,548 | |
| | | | | | |
|
|
|
Real Estate Investment Trusts — 1.7% | |
Annaly Capital Management, Inc. | | | 220,969 | | | | 3,526,665 | |
| | | | | | |
|
|
|
Road & Rail — 0.5% | |
JB Hunt Transport Services, Inc. | | | 25,722 | | | | 1,159,291 | |
| | | | | | |
|
|
|
Semiconductors & Semiconductor Equipment — 4.8% | |
Altera Corp. | | | 60,023 | | | | 2,226,853 | |
Broadcom Corp. (Class A Stock) | | | 77,998 | | | | 2,290,021 | |
Maxim Integrated Products, Inc. | | | 101,612 | | | | 2,645,977 | |
Xilinx, Inc. | | | 92,638 | | | | 2,969,974 | |
| | | | | | |
|
|
|
| | | | | | | | 10,132,825 | |
| | | | | | |
|
|
|
Software — 6.4% | |
Activision Blizzard, Inc. | | | 172,605 | | | | 2,126,494 | |
Ariba, Inc.* | | | 75,059 | | | | 2,107,657 | |
Check Point Software Technologies Ltd.*(a) | | | 63,730 | | | | 3,348,374 | |
Intuit, Inc. | | | 49,666 | | | | 2,611,935 | |
Red Hat, Inc.* | | | 43,118 | | | | 1,780,342 | |
Salesforce.com, Inc.*(a) | | | 14,502 | | | | 1,471,373 | |
| | | | | | |
|
|
|
| | | | | | | | 13,446,175 | |
| | | | | | |
|
|
|
Specialty Retail — 7.2% | |
Bed Bath & Beyond, Inc.* | | | 62,681 | | | | 3,633,618 | |
O’Reilly Automotive, Inc.* | | | 38,153 | | | | 3,050,332 | |
Ross Stores, Inc. | | | 85,084 | | | | 4,044,043 | |
TJX Cos., Inc. | | | 49,573 | | | | 3,199,937 | |
Williams-Sonoma, Inc. | | | 32,599 | | | | 1,255,061 | |
| | | | | | |
|
|
|
| | | | | | | | 15,182,991 | |
| | | | | | |
|
|
|
Textiles, Apparel & Luxury Goods — 2.5% | |
Deckers Outdoor Corp.*(a) | | | 23,968 | | | | 1,811,262 | |
PVH Corp. | | | 49,362 | | | | 3,479,527 | |
| | | | | | |
|
|
|
| | | | | | | | 5,290,789 | |
| | | | | | |
|
|
|
Trading Companies & Distributors — 1.1% | |
Fastenal Co.(a) | | | 53,835 | | | | 2,347,744 | |
| | | | | | |
|
|
|
Wireless Telecommunication Services — 6.1% | |
American Tower Corp. (Class A Stock). | | | 65,902 | | | | 3,954,779 | |
Crown Castle International Corp.* | | | 117,744 | | | | 5,274,931 | |
NII Holdings, Inc.* | | | 175,760 | | | | 3,743,688 | |
| | | | | | |
|
|
|
| | | | | | | | 12,973,398 | |
| | | | | | |
|
|
|
TOTAL LONG-TERM INVESTMENTS
(cost $159,761,433) | | | | 210,452,608 | |
| | | | | | |
|
|
|
| | | | | | | | |
SHORT-TERM
INVESTMENT — 15.7% | | Shares
| | | Value
(Note 2)
| |
| | | | | | | | | |
Affiliated Money Market Mutual Fund | |
Prudential Investment Portfolios 2 — Prudential Core Taxable Money Market Fund
(cost $33,260,261; includes $32,527,951 of cash collateral received for securities on loan) (Note 4)(b)(c) | | | 33,260,261 | | | $ | 33,260,261 | |
| | | | | | |
|
|
|
TOTAL INVESTMENTS — 115.4%
(cost $193,021,694) | | | | 243,712,869 | |
LIABILITIES IN EXCESS OF
OTHER ASSETS — (15.4)% | | | | (32,612,219 | ) |
| | | | | | |
|
|
|
NET ASSETS — 100.0% | | | $ | 211,100,650 | |
| | | | | | |
|
|
|
| * | Non-income producing security. |
| (a) | All or a portion of security is on loan. The aggregate market value of such securities, including those sold and pending settlement, is $31,500,144; cash collateral of $32,527,951 (included in liabilities) was received with which the Portfolio purchased highly liquid short-term investments. |
| (b) | Represents security, or a portion thereof, purchased with cash collateral received for securities on loan. |
| (c) | Prudential Investment LLC, the manager of the Portfolio, also serves as manager of the Prudential Investment Portfolios 2 — Prudential Core Taxable Money Market Fund. |
Various inputs are used in determining the value of the Portfolio’s investments. These inputs are summarized in the three broad levels listed below.
| Level 1—quoted | prices generally for securities actively traded on a regulated securities exchange and for open-end mutual funds which trade at daily net asset value. |
| Level 2—other | significant observable inputs (including, but not limited to, quoted prices for similar securities, interest rates, prepayment speeds, foreign currency exchange rates, and amortized cost) generally for debt securities, swaps, forward foreign currency contracts and for foreign stocks priced using vendor modeling tools. |
| Level 3—significant | unobservable inputs for securities valued in accordance with Board approved fair valuation procedures. |
The following is a summary of the inputs used as of December 31, 2011 in valuing such portfolio securities:
| | | | | | | | | | | | |
| | | Level 1
| | | Level 2
| | | Level 3
| |
Investments in Securities | | | | | | | | | | | | |
Common Stocks | | $ | 210,452,608 | | | $ | — | | | $ | — | |
Affiliated Money Market Mutual Fund | | | 33,260,261 | | | | — | | | | — | |
| | |
|
|
| |
|
|
| |
|
|
|
Total | | $ | 243,712,869 | | | $ | — | | | $ | — | |
| | |
|
|
| |
|
|
| |
|
|
|
SEE NOTES TO FINANCIAL STATEMENTS.
A13
| | | | | | |
| | | SP PRUDENTIAL U.S. EMERGING GROWTH PORTFOLIO (continued) | | |
| |
| SCHEDULE OF INVESTMENTS | | December 31, 2011 |
The industry classification of portfolio holdings and liabilities in excess of other assets shown as a percentage of net assets as of December 31, 2011 were as follows:
| | | | |
Affiliated Money Market Mutual Fund (including 15.4% of collateral received for securities on loan) | | | 15.7 | % |
Specialty Retail | | | 7.2 | |
Oil, Gas & Consumable Fuels | | | 7.0 | |
Software | | | 6.4 | |
Wireless Telecommunication Services | | | 6.1 | |
Healthcare Providers & Services | | | 5.7 | |
Chemicals | | | 4.9 | |
Semiconductors & Semiconductor Equipment | | | 4.8 | |
Hotels, Restaurants & Leisure | | | 4.7 | |
Multiline Retail | | | 3.5 | |
IT Services | | | 3.3 | |
Electrical Equipment | | | 3.2 | |
Pharmaceuticals | | | 3.1 | |
Food Products | | | 3.0 | |
Internet Software & Services | | | 3.0 | |
Biotechnology | | | 2.9 | |
Communications Equipment | | | 2.6 | |
Energy Equipment & Services | | | 2.6 | |
Textiles, Apparel & Luxury Goods | | | 2.5 | |
Life Sciences Tools & Services | | | 2.0 | |
Electronic Equipment & Instruments | | | 1.9 | |
Machinery | | | 1.9 | |
Metals & Mining | | | 1.9 | |
Professional Services | | | 1.9 | |
Real Estate Investment Trusts | | | 1.7 | |
Household Products | | | 1.5 | |
Capital Markets | | | 1.4 | |
Commercial Services & Supplies | | | 1.1 | |
Trading Companies & Distributors | | | 1.1 | |
Healthcare Equipment & Supplies | | | 1.0 | |
Commercial Banks | | | 0.9 | |
Computers & Peripherals | | | 0.9 | |
Air Freight & Logistics | | | 0.8 | |
Personal Products | | | 0.8 | |
Food & Staples Retailing | | | 0.7 | |
Automobiles | | | 0.6 | |
Insurance | | | 0.6 | |
Road & Rail | | | 0.5 | |
| | |
|
|
|
| | | | 115.4 | |
Liabilities in excess of other assets | | | (15.4 | ) |
| | |
|
|
|
| | | | 100.0 | % |
| | |
|
|
|
SEE NOTES TO FINANCIAL STATEMENTS.
A14
| | | | | | |
| | | SP PRUDENTIAL U.S. EMERGING GROWTH PORTFOLIO (continued) | | |
STATEMENT OF ASSETS AND LIABILITIES
December 31, 2011
| | | | |
| ASSETS | | | | |
Investments, at value including securities on loan of $31,500,144: | | | | |
Unaffiliated investments (cost $159,761,433) | | $ | 210,452,608 | |
Affiliated investments (cost $33,260,261) | | | 33,260,261 | |
Dividends and interest receivable | | | 203,723 | |
Receivable for investments sold | | | 29,866 | |
Receivable for Series shares sold | | | 3,200 | |
Prepaid expenses | | | 1,804 | |
| | |
|
|
|
Total Assets | | | 243,951,462 | |
| | |
|
|
|
| LIABILITIES | | | | |
Collateral for securities on loan | | | 32,527,951 | |
Payable for Series shares repurchased | | | 139,506 | |
Management fee payable | | | 108,389 | |
Accrued expenses and other liabilities | | | 70,287 | |
Deferred trustees’ fees | | | 3,571 | |
Affiliated transfer agent fee payable | | | 926 | |
Payable to custodian | | | 81 | |
Distribution fee payable | | | 63 | |
Administration fee payable | | | 38 | |
| | |
|
|
|
Total Liabilities | | | 32,850,812 | |
| | |
|
|
|
| NET ASSETS | | $ | 211,100,650 | |
| | |
|
|
|
Net assets were comprised of: | | | | |
Paid-in capital | | $ | 164,727,620 | |
Retained earnings | | | 46,373,030 | |
| | |
|
|
|
Net assets, December 31, 2011 | | $ | 211,100,650 | |
| | |
|
|
|
| Class I: | | | | |
Net asset value and redemption price per share, $210,804,391 / 27,029,172 outstanding shares of beneficial interest | | $ | 7.80 | |
| | |
|
|
|
| Class II: | | | | |
Net asset value and redemption price per share, $296,259 / 39,351 outstanding shares of beneficial interest | | $ | 7.53 | |
| | |
|
|
|
STATEMENT OF OPERATIONS
Year Ended December 31, 2011
| | | | |
| INVESTMENT INCOME | | | | |
Unaffiliated dividend income (net of foreign withholding taxes of $13,587) | | $ | 2,333,983 | |
Affiliated income from securities loaned, net | | | 64,723 | |
Affiliated dividend income | | | 3,689 | |
| | |
|
|
|
| | | | 2,402,395 | |
| | |
|
|
|
| EXPENSES | | | | |
Management fee | | | 1,390,421 | |
Distribution fee—Class II | | | 769 | |
Administration fee—Class II | | | 461 | |
Custodian’s fees and expenses | | | 25,000 | |
Shareholders’ reports | | | 25,000 | |
Audit fee | | | 19,000 | |
Transfer agent’s fee and expenses (including affiliated expense of $5,500) (Note 4) | | | 12,000 | |
Trustees’ fees | | | 10,000 | |
Legal fees and expenses | | | 5,000 | |
Commitment fee on syndicated credit agreement | | | 3,000 | |
Insurance expenses | | | 3,000 | |
Loan interest expense (Note 8) | | | 169 | |
Miscellaneous | | | 1,174 | |
| | |
|
|
|
Total expenses | | | 1,494,994 | |
| | |
|
|
|
| NET INVESTMENT INCOME | | | 907,401 | |
| | |
|
|
|
| NET REALIZED AND UNREALIZED GAIN (LOSS) ON INVESTMENTS | | | | |
Net realized gain on investment transactions | | | 15,648,254 | |
Net change in unrealized appreciation (depreciation) on investments | | | (11,164,890 | ) |
| | |
|
|
|
| NET GAIN ON INVESTMENTS | | | 4,483,364 | |
| | |
|
|
|
| NET INCREASE IN NET ASSETS RESULTING FROM OPERATIONS | | $ | 5,390,765 | |
| | |
|
|
|
STATEMENT OF CHANGES IN NET ASSETS
| | | | | | | | |
| | | Year Ended December 31,
| |
| | | 2011
| | | 2010
| |
| INCREASE (DECREASE) IN NET ASSETS | | | | | | | | |
| OPERATIONS: | | | | | | | | |
Net investment income | | $ | 907,401 | | | $ | 1,360,578 | |
Net realized gain on investments | | | 15,648,254 | | | | 22,125,238 | |
Net change in unrealized appreciation (depreciation) on investments | | | (11,164,890 | ) | | | 11,739,681 | |
| | |
|
|
| |
|
|
|
NET INCREASE IN NET ASSETS RESULTING FROM OPERATIONS | | | 5,390,765 | | | | 35,225,497 | |
| | |
|
|
| |
|
|
|
| DISTRIBUTIONS: | | | | | | | | |
Class I | | | (3,329,895 | ) | | | (802,873 | ) |
Class II | | | (3,362 | ) | | | (618 | ) |
| | |
|
|
| |
|
|
|
| TOTAL DISTRIBUTIONS | | | (3,333,257 | ) | | | (803,491 | ) |
| | |
|
|
| |
|
|
|
| SERIES SHARE TRANSACTIONS (Note 7): | | | | | | | | |
Series shares sold | | | 8,188,427 | | | | 8,450,511 | |
Series shares issued in reinvestment of distributions | | | 3,333,257 | | | | 803,491 | |
Net asset value of shares issued in merger (Note 10) | | | — | | | | 87,093,383 | |
Series shares repurchased | | | (45,226,491 | ) | | | (30,651,077 | ) |
| | |
|
|
| |
|
|
|
NET INCREASE (DECREASE) IN NET ASSETS RESULTING FROM SERIES SHARE TRANSACTIONS | | | (33,704,807 | ) | | | 65,696,308 | |
| | |
|
|
| |
|
|
|
| TOTAL INCREASE (DECREASE) IN NET ASSETS | | | (31,647,299 | ) | | | 100,118,314 | |
| NET ASSETS: | | | | | | | | |
Beginning of year | | | 242,747,949 | | | | 142,629,635 | |
| | |
|
|
| |
|
|
|
End of year | | $ | 211,100,650 | | | $ | 242,747,949 | |
| | |
|
|
| |
|
|
|
SEE NOTES TO FINANCIAL STATEMENTS.
A15
| | | | | | |
| | | SP SMALL CAP VALUE PORTFOLIO | | |
| |
| SCHEDULE OF INVESTMENTS | | December 31, 2011 |
| | | | | | | | |
| LONG-TERM INVESTMENTS — 98.4% | |
| COMMON STOCKS — 95.9% | | Shares
| | | Value
(Note 2)
| |
| | | | | | | | | |
Aerospace & Defense — 0.9% | | | | | | | | |
AAR Corp. | | | 17,939 | | | $ | 343,891 | |
Kaman Corp. | | | 22,348 | | | | 610,547 | |
Triumph Group, Inc.(a) | | | 10,095 | | | | 590,053 | |
| | | | | | |
|
|
|
| | | | | | | | 1,544,491 | |
| | | | | | |
|
|
|
Airlines — 0.2% | | | | | | | | |
JetBlue Airways Corp.*(a) | | | 78,840 | | | | 409,968 | |
| | | | | | |
|
|
|
Auto Components — 0.9% | | | | | | | | |
Cooper Tire & Rubber Co. | | | 29,310 | | | | 410,633 | |
Dana Holding Corp.*(a) | | | 16,682 | | | | 202,687 | |
Superior Industries International, Inc. | | | 26,550 | | | | 439,137 | |
Visteon Corp.* | | | 9,264 | | | | 462,644 | |
| | | | | | |
|
|
|
| | | | | | | | 1,515,101 | |
| | | | | | |
|
|
|
Automotive Parts — 0.3% | | | | | | | | |
Tenneco, Inc.* | | | 19,360 | | | | 576,541 | |
| | | | | | |
|
|
|
Banks — 1.5% | | | | | | | | |
Bridge Capital Holdings*(a) | | | 8,108 | | | | 84,323 | |
Dime Community Bancshares, Inc. | | | 15,375 | | | | 193,725 | |
East West Bancorp, Inc. | | | 10,078 | | | | 199,041 | |
Hancock Holding Co. | | | 22,578 | | | | 721,819 | |
Independent Bank Corp. | | | 7,943 | | | | 216,764 | |
Lakeland Financial Corp. | | | 8,606 | | | | 222,637 | |
Pinnacle Financial Partners, Inc.*(a) | | | 19,557 | | | | 315,846 | |
Sierra Bancorp | | | 4,927 | | | | 43,358 | |
Trico Bancshares | | | 11,556 | | | | 164,326 | |
UMB Financial Corp. | | | 14,924 | | | | 555,919 | |
| | | | | | |
|
|
|
| | | | | | | | 2,717,758 | |
| | | | | | |
|
|
|
Building Materials — 0.5% | | | | | | | | |
Comfort Systems USA, Inc. | | | 50,878 | | | | 545,412 | |
Universal Forest Products, Inc. | | | 11,033 | | | | 340,589 | |
| | | | | | |
|
|
|
| | | | | | | | 886,001 | |
| | | | | | |
|
|
|
Building Products — 0.6% | | | | | | | | |
Gibraltar Industries, Inc.* | | | 61,460 | | | | 857,981 | |
Simpson Manufacturing Co., Inc. | | | 6,780 | | | | 228,215 | |
| | | | | | |
|
|
|
| | | | | | | | 1,086,196 | |
| | | | | | |
|
|
|
Capital Markets — 3.3% | | | | | | | | |
Affiliated Managers Group, Inc.* | | | 12,180 | | | | 1,168,671 | |
Artio Global Investors, Inc. | | | 68,709 | | | | 335,300 | |
Cohen & Steers, Inc.(a) | | | 14,523 | | | | 419,715 | |
Greenhill & Co., Inc. | | | 9,560 | | | | 347,697 | |
HFF, Inc. (Class A Stock)* | | | 101,740 | | | | 1,050,974 | |
Raymond James Financial, Inc. | | | 25,560 | | | | 791,338 | |
Stifel Financial Corp.*(a) | | | 42,087 | | | | 1,348,888 | |
Waddell & Reed Financial, Inc.
(Class A Stock) | | | 15,650 | | | | 387,650 | |
| | | | | | |
|
|
|
| | | | | | | | 5,850,233 | |
| | | | | | |
|
|
|
Chemicals — 2.3% | | | | | | | | |
Ferro Corp.* | | | 46,250 | | | | 226,162 | |
Fuller (H.B.) Co. | | | 20,805 | | | | 480,804 | |
Grace, (W.R.) & Co.* | | | 7,814 | | | | 358,819 | |
Koppers Holdings, Inc. | | | 19,470 | | | | 668,989 | |
Minerals Technologies, Inc. | | | 12,421 | | | | 702,159 | |
PolyOne Corp. | | | 93,576 | | | | 1,080,803 | |
Schulman, (A.), Inc. | | | 19,140 | | | | 405,385 | |
| | | | | | | | |
COMMON STOCKS
(continued) | | Shares
| | | Value
(Note 2)
| |
| | | | | | | | | |
Chemicals (continued) | | | | | | | | |
Tronox, Inc.* | | | 1,066 | | | $ | 127,920 | |
| | | | | | |
|
|
|
| | | | | | | | 4,051,041 | |
| | | | | | |
|
|
|
Clothing & Apparel — 0.6% | | | | | | | | |
Deckers Outdoor Corp.* | | | 4,717 | | | | 356,464 | |
G-III Apparel Group Ltd.* | | | 8,440 | | | | 210,240 | |
Iconix Brand Group, Inc.* | | | 30,657 | | | | 499,403 | |
| | | | | | |
|
|
|
| | | | | | | | 1,066,107 | |
| | | | | | |
|
|
|
Commercial Banks — 7.2% | | | | | | | | |
Bancorp, Inc. (The)* | | | 189,249 | | | | 1,368,270 | |
BancorpSouth, Inc. | | | 29,077 | | | | 320,429 | |
CoBiz Financial, Inc. | | | 19,180 | | | | 110,669 | |
Community Bank System, Inc. | | | 11,661 | | | | 324,176 | |
Cullen/Frost Bankers, Inc.(a) | | | 13,320 | | | | 704,761 | |
First Midwest Bancorp, Inc. | | | 35,588 | | | | 360,506 | |
First Republic Bank* | | | 13,850 | | | | 423,949 | |
First Security Group, Inc.* | | | 14,146 | | | | 35,082 | |
FirstMerit Corp.(a) | | | 48,380 | | | | 731,989 | |
FNB Corp. | | | 41,950 | | | | 474,454 | |
Heritage Financial Corp.(a) | | | 10,211 | | | | 128,250 | |
IBERIABANK Corp. | | | 25,619 | | | | 1,263,017 | |
PrivateBancorp, Inc. | | | 28,482 | | | | 312,732 | |
Sandy Spring Bancorp, Inc. | | | 9,339 | | | | 163,899 | |
Signature Bank*(a) | | | 46,128 | | | | 2,767,219 | |
Simmons First National Corp.
(Class A Stock) | | | 5,968 | | | | 162,270 | |
SVB Financial Group* | | | 24,830 | | | | 1,184,143 | |
Tompkins Financial Corp. | | | 7,319 | | | | 281,855 | |
Umpqua Holdings Corp. | | | 27,530 | | | | 341,097 | |
Webster Financial Corp. | | | 26,168 | | | | 533,566 | |
Wintrust Financial Corp.(a) | | | 28,470 | | | | 798,583 | |
| | | | | | |
|
|
|
| | | | | | | | 12,790,916 | |
| | | | | | |
|
|
|
Commercial Services — 1.1% | | | | | | | | |
Convergys Corp.* | | | 43,057 | | | | 549,838 | |
Monro Muffler Brake, Inc. | | | 9,772 | | | | 379,056 | |
On Assignment, Inc.* | | | 35,310 | | | | 394,766 | |
Team Health Holdings, Inc.* | | | 28,372 | | | | 626,170 | |
| | | | | | |
|
|
|
| | | | | | | | 1,949,830 | |
| | | | | | |
|
|
|
Commercial Services & Supplies — 0.7% | | | | | | | | |
EnergySolutions, Inc.* | | | 66,948 | | | | 206,869 | |
PHH Corp.* | | | 9,717 | | | | 103,972 | |
TMS International Corp.
(Class A Stock)* | | | 41,000 | | | | 405,080 | |
United Stationers, Inc. | | | 14,380 | | | | 468,213 | |
| | | | | | |
|
|
|
| | | | | | | | 1,184,134 | |
| | | | | | |
|
|
|
Communication Equipment — 2.1% | | | | | | | | |
Bel Fuse, Inc. (Class B Stock) | | | 9,530 | | | | 178,688 | |
Black Box Corp. | | | 14,560 | | | | 408,262 | |
Digi International, Inc.* | | | 62,044 | | | | 692,411 | |
InterDigital, Inc. | | | 5,550 | | | | 241,814 | |
Plantronics, Inc. | | | 63,244 | | | | 2,254,016 | |
| | | | | | |
|
|
|
| | | | | | | | 3,775,191 | |
| | | | | | |
|
|
|
Computer Hardware — 0.5% | | | | | | | | |
Electronics for Imaging, Inc.* | | | 33,310 | | | | 474,668 | |
SEE NOTES TO FINANCIAL STATEMENTS.
A16
| | | | | | |
| | | SP SMALL CAP VALUE PORTFOLIO (continued) | | |
| |
| SCHEDULE OF INVESTMENTS | | December 31, 2011 |
| | | | | | | | |
COMMON STOCKS
(continued) | | Shares
| | | Value
(Note 2)
| |
| | | | | | | | | |
Computer Hardware (continued) | | | | | | | | |
MTS Systems Corp. | | | 10,171 | | | $ | 414,468 | |
| | | | | | |
|
|
|
| | | | | | | | 889,136 | |
| | | | | | |
|
|
|
Computer Services & Software — 0.9% | | | | | | | | |
Mentor Graphics Corp.* | | | 37,408 | | | | 507,253 | |
Monotype Imaging Holdings, Inc.* | | | 22,231 | | | | 346,581 | |
NetScout Systems, Inc.* | | | 25,362 | | | | 446,371 | |
Parametric Technology Corp.* | | | 21,062 | | | | 384,592 | |
| | | | | | |
|
|
|
| | | | | | | | 1,684,797 | |
| | | | | | |
|
|
|
Computers & Peripherals — 0.1% | | | | | | | | |
Rimage Corp. | | | 14,940 | | | | 168,075 | |
| | | | | | |
|
|
|
Construction & Engineering — 1.1% | | | | | | | | |
EMCOR Group, Inc. | | | 30,853 | | | | 827,169 | |
Granite Construction, Inc. | | | 5,140 | | | | 121,921 | |
Meritage Homes Corp.* | | | 15,108 | | | | 350,354 | |
Michael Baker Corp.* | | | 4,998 | | | | 98,011 | |
Tutor Perini Corp.* | | | 37,990 | | | | 468,797 | |
| | | | | | |
|
|
|
| | | | | | | | 1,866,252 | |
| | | | | | |
|
|
|
Consumer Finance — 0.2% | | | | | | | | |
First Cash Financial Services, Inc.* | | | 8,033 | | | | 281,878 | |
| | | | | | |
|
|
|
Consumer Products & Services — 0.2% | | | | | | | | |
Elizabeth Arden, Inc.* | | | 11,068 | | | | 409,959 | |
| | | | | | |
|
|
|
Containers & Packaging — 0.5% | | | | | | | | |
AptarGroup, Inc. | | | 11,810 | | | | 616,128 | |
Myers Industries, Inc. | | | 26,630 | | | | 328,614 | |
| | | | | | |
|
|
|
| | | | | | | | 944,742 | |
| | | | | | |
|
|
|
Distribution/Wholesale — 0.7% | | | | | | | | |
ScanSource, Inc.* | | | 12,946 | | | | 466,056 | |
Watsco, Inc.(a) | | | 11,096 | | | | 728,563 | |
| | | | | | |
|
|
|
| | | | | | | | 1,194,619 | |
| | | | | | |
|
|
|
Diversified Consumer Services — 0.7% | | | | | | | | |
Sotheby’s | | | 9,060 | | | | 258,482 | |
Steiner Leisure Ltd. (Bahamas)* | | | 20,690 | | | | 939,119 | |
| | | | | | |
|
|
|
| | | | | | | | 1,197,601 | |
| | | | | | |
|
|
|
Diversified Financial Services — 0.4% | | | | | | | | |
Boston Private Financial Holdings, Inc. | | | 29,907 | | | | 237,461 | |
KBW, Inc. | | | 10,376 | | | | 157,508 | |
Manning & Napier, Inc. | | | 10,122 | | | | 126,424 | |
MarketAxess Holdings, Inc. | | | 5,053 | | | | 152,146 | |
| | | | | | |
|
|
|
| | | | | | | | 673,539 | |
| | | | | | |
|
|
|
Electric Utilities — 2.9% | | | | | | | | |
Allete, Inc. | | | 6,001 | | | | 251,922 | |
Atlantic Power Corp. (Canada)* | | | 10,867 | | | | 155,398 | |
Cleco Corp. | | | 32,062 | | | | 1,221,562 | |
IDACORP, Inc. | | | 14,562 | | | | 617,574 | |
MGE Energy, Inc. | | | 22,207 | | | | 1,038,621 | |
MYR Group, Inc.* | | | 17,593 | | | | 336,730 | |
NorthWestern Corp. | | | 7,273 | | | | 260,301 | |
Portland General Electric Co. | | | 22,785 | | | | 576,233 | |
UniSource Energy Corp. | | | 19,678 | | | | 726,512 | |
| | | | | | |
|
|
|
| | | | | | | | 5,184,853 | |
| | | | | | |
|
|
|
Electrical Equipment — 0.7% | | | | | | | | |
Acuity Brands, Inc. | | | 6,568 | | | | 348,104 | |
| | | | | | | | |
COMMON STOCKS
(continued) | | Shares
| | | Value
(Note 2)
| |
| | | | | | | | | |
Electrical Equipment (continued) | | | | | | | | |
EnerSys* | | | 11,945 | | | $ | 310,212 | |
GrafTech International Ltd.* | | | 23,430 | | | | 319,819 | |
Regal-Beloit Corp. | | | 5,926 | | | | 302,048 | |
| | | | | | |
|
|
|
| | | | | | | | 1,280,183 | |
| | | | | | |
|
|
|
Electronic Components & Equipment — 1.2% | |
AVX Corp. | | | 60,660 | | | | 774,022 | |
Littelfuse, Inc. | | | 9,714 | | | | 417,508 | |
Park Electrochemical Corp. | | | 36,596 | | | | 937,589 | |
| | | | | | |
|
|
|
| | | | | | | | 2,129,119 | |
| | | | | | |
|
|
|
Electronics — 0.4% | | | | | | | | |
Belden, Inc. | | | 12,356 | | | | 411,208 | |
Checkpoint Systems, Inc.* | | | 32,012 | | | | 350,211 | |
| | | | | | |
|
|
|
| | | | | | | | 761,419 | |
| | | | | | |
|
|
|
Energy Equipment & Services — 1.9% | | | | | | | | |
Cal Dive International, Inc.* | | | 110,880 | | | | 249,480 | |
Gulf Island Fabrication, Inc. | | | 15,780 | | | | 460,934 | |
Key Energy Services, Inc.* | | | 53,732 | | | | 831,234 | |
Matrix Service Co.* | | | 75,660 | | | | 714,231 | |
Natural Gas Services Group, Inc.* | | | 26,400 | | | | 381,744 | |
TETRA Technologies, Inc.* | | | 36,910 | | | | 344,739 | |
Tidewater, Inc. | | | 9,620 | | | | 474,266 | |
| | | | | | |
|
|
|
| | | | | | | | 3,456,628 | |
| | | | | | |
|
|
|
Entertainment & Leisure — 1.2% | | | | | | | | |
Ascent Capital Group, Inc. (Class A Stock)* | | | 11,425 | | | | 579,476 | |
Gaylord Entertainment Co.*(a) | | | 11,693 | | | | 282,269 | |
Polaris Industries, Inc. | | | 8,564 | | | | 479,413 | |
Six Flags Entertainment Corp. | | | 13,917 | | | | 573,937 | |
Vail Resorts, Inc. | | | 7,073 | | | | 299,612 | |
| | | | | | |
|
|
|
| | | | | | | | 2,214,707 | |
| | | | | | |
|
|
|
Environmental Control — 0.2% | | | | | | | | |
Darling International, Inc.* | | | 21,474 | | | | 285,389 | |
| | | | | | |
|
|
|
Environmental Services — 0.2% | | | | | | | | |
Waste Connections, Inc. | | | 10,753 | | | | 356,354 | |
| | | | | | |
|
|
|
Financial – Bank & Trust — 2.6% | | | | | | | | |
Bank of the Ozarks, Inc. | | | 27,649 | | | | 819,240 | |
Columbia Banking System, Inc. | | | 17,236 | | | | 332,138 | |
First Financial Bankshares, Inc.(a) | | | 16,425 | | | | 549,088 | |
Glacier Bancorp, Inc.(a) | | | 38,598 | | | | 464,334 | |
Northwest Bancshares, Inc. | | | 28,467 | | | | 354,129 | |
Prosperity Bancshares, Inc. | | | 17,146 | | | | 691,841 | |
Provident Financial Services, Inc. | | | 19,485 | | | | 260,904 | |
SCBT Financial Corp. | | | 11,440 | | | | 331,874 | |
Southcoast Financial Corp.* | | | 7,400 | | | | 9,398 | |
Summit State Bank | | | 6,996 | | | | 36,379 | |
Texas Capital Bancshares, Inc.*(a) | | | 17,123 | | | | 524,135 | |
WSFS Financial Corp. | | | 4,781 | | | | 171,925 | |
| | | | | | |
|
|
|
| | | | | | | | 4,545,385 | |
| | | | | | |
|
|
|
Financial Services — 1.9% | |
BGC Partners, Inc. (Class A Stock) | | | 18,319 | | | | 108,815 | |
Brookline Bancorp, Inc. | | | 34,629 | | | | 292,269 | |
First of Long Island Corp. (The) | | | 5,334 | | | | 140,391 | |
Home BancShares, Inc. | | | 10,745 | | | | 278,403 | |
SEE NOTES TO FINANCIAL STATEMENTS.
A17
| | | | | | |
| | | SP SMALL CAP VALUE PORTFOLIO (continued) | | |
| |
| SCHEDULE OF INVESTMENTS | | December 31, 2011 |
| | | | | | | | |
COMMON STOCKS
(continued) | | Shares
| | | Value
(Note 2)
| |
| | | | | | | | | |
Financial Services (continued) | |
Knight Capital Group, Inc.
(Class A Stock)* | | | 31,237 | | | $ | 369,221 | |
MB Financial, Inc. | | | 28,344 | | | | 484,682 | |
Ocwen Financial Corp.* | | | 44,786 | | | | 648,501 | |
Piper Jaffray Cos.* | | | 4,083 | | | | 82,477 | |
RSC Holdings, Inc.*(a) | | | 55,012 | | | | 1,017,722 | |
| | | | | | |
|
|
|
| | | | | | | | 3,422,481 | |
| | | | | | |
|
|
|
Food & Staples Retailing — 0.8% | |
Pantry, Inc. (The)* | | | 81,589 | | | | 976,621 | |
Weis Markets, Inc. | | | 12,280 | | | | 490,463 | |
| | | | | | |
|
|
|
| | | | | | | | 1,467,084 | |
| | | | | | |
|
|
|
Foods — 0.7% | |
Hain Celestial Group, Inc. (The)* | | | 18,492 | | | | 677,917 | |
TreeHouse Foods, Inc.* | | | 8,726 | | | | 570,506 | |
| | | | | | |
|
|
|
| | | | | | | | 1,248,423 | |
| | | | | | |
|
|
|
Gas Utilities — 0.8% | |
Laclede Group, Inc. (The) | | | 6,300 | | | | 254,961 | |
New Jersey Resources Corp.(a) | | | 8,720 | | | | 429,024 | |
Northwest Natural Gas Co. | | | 10,660 | | | | 510,934 | |
WGL Holdings, Inc. | | | 5,630 | | | | 248,958 | |
| | | | | | |
|
|
|
| | | | | | | | 1,443,877 | |
| | | | | | |
|
|
|
Healthcare Products — 0.5% | |
PSS World Medical, Inc.*(a) | | | 21,605 | | | | 522,625 | |
West Pharmaceutical Services, Inc. | | | 10,672 | | | | 405,002 | |
| | | | | | |
|
|
|
| | | | | | | | 927,627 | |
| | | | | | |
|
|
|
Healthcare Providers & Services — 2.4% | |
Cross Country Healthcare, Inc.* | | | 35,000 | | | | 194,250 | |
HealthSouth Corp.*(a) | | | 57,865 | | | | 1,022,475 | |
ICON PLC, ADR (Ireland)* | | | 37,778 | | | | 646,382 | |
LifePoint Hospitals, Inc.* | | | 22,110 | | | | 821,386 | |
Lincare Holdings, Inc.(a) | | | 32,265 | | | | 829,533 | |
Magellan Health Services, Inc.* | | | 4,560 | | | | 225,583 | |
MedQuist Holdings, Inc.* | | | 13,980 | | | | 134,488 | |
Select Medical Holdings Corp.* | | | 36,180 | | | | 306,806 | |
| | | | | | |
|
|
|
| | | | | | | | 4,180,903 | |
| | | | | | |
|
|
|
Healthcare Services | |
Amedisys, Inc.*(a) | | | 7,178 | | | | 78,312 | |
| | | | | | |
|
|
|
Hotels, Restaurants & Leisure — 0.5% | |
DineEquity, Inc.* | | | 3,311 | | | | 139,757 | |
Orient-Express Hotels Ltd. (Class A Stock) (Bermuda)* | | | 13,081 | | | | 97,715 | |
P.F. Chang’s China Bistro, Inc. | | | 18,890 | | | | 583,890 | |
| | | | | | |
|
|
|
| | | | | | | | 821,362 | |
| | | | | | |
|
|
|
Household Durables — 0.6% | |
Ryland Group, Inc. (The) | | | 20,620 | | | | 324,971 | |
Tempur-Pedic International, Inc.* | | | 7,474 | | | | 392,609 | |
Toll Brothers, Inc.*(a) | | | 15,290 | | | | 312,222 | |
| | | | | | |
|
|
|
| | | | | | | | 1,029,802 | |
| | | | | | |
|
|
|
Household Products — 0.5% | |
Central Garden & Pet Co.
(Class A Stock)* | | | 56,280 | | | | 468,249 | |
| | | | | | | | |
COMMON STOCKS
(continued) | | Shares
| | | Value
(Note 2)
| |
| | | | | | | | | |
Household Products (continued) | |
Harman International Industries, Inc. | | | 9,568 | | | $ | 363,967 | |
| | | | | | |
|
|
|
| | | | | | | | 832,216 | |
| | | | | | |
|
|
|
Insurance — 5.8% | |
Allied World Assurance Co. Holdings AG (Switzerland) | | | 31,140 | | | | 1,959,640 | |
Alterra Capital Holdings Ltd. (Bermuda) | | | 26,348 | | | | 622,603 | |
American Equity Investment Life Holding Co.(a) | | | 81,854 | | | | 851,282 | |
Arch Capital Group Ltd. (Bermuda)* | | | 25,140 | | | | 935,962 | |
Aspen Insurance Holdings Ltd. (Bermuda) | | | 10,288 | | | | 272,632 | |
Donegal Group, Inc. (Class A Stock) | | | 6,931 | | | | 98,143 | |
EMC Insurance Group, Inc. | | | 18,100 | | | | 372,317 | |
Enstar Group Ltd. (Bermuda)* | | | 3,310 | | | | 325,042 | |
Meadowbrook Insurance Group, Inc. | | | 237,371 | | | | 2,535,122 | |
ProAssurance Corp. | | | 12,366 | | | | 987,054 | |
RLI Corp. | | | 8,089 | | | | 589,365 | |
Symetra Financial Corp. | | | 22,602 | | | | 205,000 | |
Tower Group, Inc. | | | 28,810 | | | | 581,098 | |
| | | | | | |
|
|
|
| | | | | | | | 10,335,260 | |
| | | | | | |
|
|
|
Internet & Catalog Retail — 0.3% | |
HSN, Inc. | | | 15,067 | | | | 546,329 | |
| | | | | | |
|
|
|
Internet Software & Services — 0.1% | |
Blue Coat Systems, Inc.* | | | 5,249 | | | | 133,587 | |
| | | | | | |
|
|
|
Investment Companies — 0.2% | |
Solar Capital Ltd. | | | 9,679 | | | | 213,809 | |
Solar Senior Capital Ltd. | | | 7,242 | | | | 114,062 | |
| | | | | | |
|
|
|
| | | | | | | | 327,871 | |
| | | | | | |
|
|
|
Leisure Equipment & Products — 0.1% | |
Callaway Golf Co. | | | 41,145 | | | | 227,532 | |
| | | | | | |
|
|
|
Machinery — 3.5% | |
Albany International Corp.
(Class A Stock) | | | 19,830 | | | | 458,470 | |
Altra Holdings, Inc.* | | | 71,773 | | | | 1,351,486 | |
Kaydon Corp. | | | 17,740 | | | | 541,070 | |
Oshkosh Corp.* | | | 34,050 | | | | 727,989 | |
RBC Bearings, Inc.* | | | 38,652 | | | | 1,611,788 | |
Snap-on, Inc. | | | 18,870 | | | | 955,199 | |
WABCO Holdings, Inc.* | | | 13,150 | | | | 570,710 | |
| | | | | | |
|
|
|
| | | | | | | | 6,216,712 | |
| | | | | | |
|
|
|
Machinery & Equipment — 1.2% | |
Actuant Corp. (Class A Stock) | | | 11,754 | | | | 266,698 | |
Applied Industrial Technologies, Inc. | | | 11,893 | | | | 418,277 | |
Graco, Inc. | | | 11,665 | | | | 476,982 | |
Robbins & Myers, Inc. | | | 13,008 | | | | 631,538 | |
Tennant Co. | | | 9,618 | | | | 373,852 | |
| | | | | | |
|
|
|
| | | | | | | | 2,167,347 | |
| | | | | | |
|
|
|
Manufacturing — 1.1% | | | | | | | | |
A.O. Smith Corp. | | | 15,193 | | | | 609,543 | |
AZZ, Inc. | | | 8,968 | | | | 407,506 | |
Carlisle Cos., Inc. | | | 21,468 | | | | 951,033 | |
| | | | | | |
|
|
|
| | | | | | | | 1,968,082 | |
| | | | | | |
|
|
|
SEE NOTES TO FINANCIAL STATEMENTS.
A18
| | | | | | |
| | | SP SMALL CAP VALUE PORTFOLIO (continued) | | |
| |
| SCHEDULE OF INVESTMENTS | | December 31, 2011 |
| | | | | | | | |
COMMON STOCKS
(continued) | | Shares
| | | Value
(Note 2)
| |
| | | | | | | | | |
Marine — 0.6% | | | | | | | | |
Diana Shipping, Inc. (Marshall Islands)* | | | 37,280 | | | $ | 278,854 | |
Kirby Corp.* | | | 12,590 | | | | 828,926 | |
| | | | | | |
|
|
|
| | | | | | | | 1,107,780 | |
| | | | | | |
|
|
|
Metals & Mining — 2.3% | | | | | | | | |
Carpenter Technology Corp. | | | 13,750 | | | | 707,850 | |
Commercial Metals Co. | | | 19,734 | | | | 272,921 | |
Haynes International, Inc. | | | 12,600 | | | | 687,960 | |
Horsehead Holding Corp.* | | | 30,050 | | | | 270,750 | |
Kaiser Aluminum Corp. | | | 18,799 | | | | 862,498 | |
Metals USA Holdings Corp.* | | | 23,534 | | | | 264,758 | |
Olympic Steel, Inc. | | | 23,143 | | | | 539,695 | |
Schnitzer Steel Industries, Inc.
(Class A Stock) | | | 7,621 | | | | 322,216 | |
Stillwater Mining Co.* | | | 12,957 | | | | 135,530 | |
| | | | | | |
|
|
|
| | | | | | | | 4,064,178 | |
| | | | | | |
|
|
|
Oil Field Equipment & Services — 0.2% | | | | | | | | |
Thermon Group Holdings, Inc.* | | | 23,076 | | | | 406,599 | |
| | | | | | |
|
|
|
Oil, Gas & Consumable Fuels — 4.4% | | | | | | | | |
Approach Resources, Inc.*(a) | | | 33,440 | | | | 983,470 | |
Bill Barrett Corp.* | | | 25,270 | | | | 860,949 | |
Carrizo Oil & Gas, Inc.* | | | 26,420 | | | | 696,167 | |
Magnum Hunter Resources Corp.*(a) | | | 120,224 | | | | 648,007 | |
Oil States International, Inc.* | | | 4,799 | | | | 366,500 | |
Petroleum Development Corp.*(a) | | | 17,153 | | | | 602,242 | |
Petroquest Energy, Inc.*(a) | | | 32,580 | | | | 215,028 | |
Rex Energy Corp.* | | | 24,282 | | | | 358,402 | |
Rosetta Resources, Inc.*(a) | | | 20,600 | | | | 896,100 | |
Southwest Gas Corp. | | | 50,512 | | | | 2,146,255 | |
| | | | | | |
|
|
|
| | | | | | | | 7,773,120 | |
| | | | | | |
|
|
|
Paper & Forest Products — 0.5% | | | | | | | | |
Louisiana-Pacific Corp.* | | | 108,920 | | | | 878,984 | |
| | | | | | |
|
|
|
Pharmaceuticals — 0.4% | | | | | | | | |
Herbalife Ltd. (Cayman Islands) | | | 8,685 | | | | 448,754 | |
Medicis Pharmaceutical Corp.
(Class A Stock) | | | 8,098 | | | | 269,258 | |
| | | | | | |
|
|
|
| | | | | | | | 718,012 | |
| | | | | | |
|
|
|
Professional Services — 0.6% | | | | | | | | |
CDI Corp. | | | 380 | | | | 5,248 | |
Hudson Highland Group, Inc.* | | | 48,890 | | | | 234,183 | |
Korn/Ferry International* | | | 11,470 | | | | 195,678 | |
TrueBlue, Inc.* | | | 41,710 | | | | 578,935 | |
| | | | | | |
|
|
|
| | | | | | | | 1,014,044 | |
| | | | | | |
|
|
|
Real Estate Investment Trusts — 10.4% | | | | | | | | |
Acadia Realty Trust | | | 24,762 | | | | 498,707 | |
American Campus Communities, Inc.(a) | | | 31,496 | | | | 1,321,572 | |
BioMed Realty Trust, Inc.(a) | | | 99,865 | | | | 1,805,559 | |
Campus Crest Communities, Inc.(a) | | | 49,250 | | | | 495,455 | |
Cogdell Spencer, Inc. | | | 61,440 | | | | 261,120 | |
Coresite Realty Corp. | | | 38,560 | | | | 687,139 | |
Corporate Office Properties Trust | | | 10,650 | | | | 226,419 | |
Cousins Properties, Inc. | | | 54,773 | | | | 351,095 | |
CreXus Investment Corp. | | | 25,293 | | | | 262,541 | |
CubeSmart | | | 43,005 | | | | 457,573 | |
CYS Investments, Inc.(a) | | | 67,594 | | | | 888,185 | |
| | | | | | | | |
COMMON STOCKS
(continued) | | Shares
| | | Value
(Note 2)
| |
| | | | | | | | | |
Real Estate Investment Trusts (continued) | | | | | | | | |
DiamondRock Hospitality Co. | | | 19,972 | | | $ | 192,530 | |
DuPont Fabros Technology, Inc.(a) | | | 21,003 | | | | 508,693 | |
EastGroup Properties, Inc. | | | 10,840 | | | | 471,323 | |
Entertainment Properties Trust | | | 22,070 | | | | 964,680 | |
Hersha Hospitality Trust | | | 78,860 | | | | 384,837 | |
Hudson Pacific Properties, Inc. | | | 21,663 | | | | 306,748 | |
LaSalle Hotel Properties | | | 31,629 | | | | 765,738 | |
MFA Financial, Inc. | | | 114,278 | | | | 767,948 | |
Mid-America Apartment Communities, Inc. | | | 21,834 | | | | 1,365,717 | |
National Health Investors, Inc. | | | 11,480 | | | | 504,890 | |
National Retail Properties, Inc. | | | 29,563 | | | | 779,872 | |
Omega Healthcare Investors, Inc. | | | 14,375 | | | | 278,156 | |
Parkway Properties, Inc. | | | 23,229 | | | | 229,038 | |
Pebblebrook Hotel Trust | | | 83,823 | | | | 1,607,725 | |
PS Business Parks, Inc. | | | 15,244 | | | | 844,975 | |
Retail Opportunity Investments Corp.(a) | | | 36,835 | | | | 436,126 | |
Saul Centers, Inc. | | | 4,380 | | | | 155,140 | |
Senior Housing Properties Trust | | | 8,040 | | | | 180,418 | |
Two Harbors Investment Corp. | | | 36,691 | | | | 339,025 | |
Washington Real Estate Investment Trust | | | 5,460 | | | | 149,331 | |
| | | | | | |
|
|
|
| | | | | | | | 18,488,275 | |
| | | | | | |
|
|
|
Real Estate Management & Development — 0.9% | |
CBRE Group, Inc.* | | | 37,090 | | | | 564,510 | |
Jones Lang LaSalle, Inc.(a) | | | 13,950 | | | | 854,577 | |
Kennedy-Wilson Holdings, Inc. | | | 9,215 | | | | 97,495 | |
| | | | | | |
|
|
|
| | | | | | | | 1,516,582 | |
| | | | | | |
|
|
|
Retail & Merchandising — 1.8% | | | | | | | | |
Cash America International, Inc.(a) | | | 4,461 | | | | 208,017 | |
EZCORP, Inc. (Class A Stock)* | | | 10,516 | | | | 277,307 | |
GNC Holdings, Inc. (Class A Stock)* | | | 15,598 | | | | 451,562 | |
Nu Skin Enterprises, Inc.
(Class A Stock) | | | 13,313 | | | | 646,612 | |
Susser Holdings Corp.* | | | 4,657 | | | | 105,341 | |
Vera Bradley, Inc.*(a) | | | 13,403 | | | | 432,247 | |
Vitamin Shoppe, Inc.* | | | 5,885 | | | | 234,694 | |
World Fuel Services Corp.(a) | | | 20,997 | | | | 881,454 | |
| | | | | | |
|
|
|
| | | | | | | | 3,237,234 | |
| | | | | | |
|
|
|
Road & Rail — 1.6% | | | | | | | | |
Genesee & Wyoming, Inc.
(Class A Stock)* | | | 19,020 | | | | 1,152,232 | |
Landstar System, Inc. | | | 10,850 | | | | 519,932 | |
Old Dominion Freight Line, Inc.*(a) | | | 28,065 | | | | 1,137,474 | |
| | | | | | |
|
|
|
| | | | | | | | 2,809,638 | |
| | | | | | |
|
|
|
Semiconductors & Semiconductor Equipment — 3.5% | |
Cabot Microelectronics Corp.* | | | 13,842 | | | | 654,034 | |
Exar Corp.* | | | 83,410 | | | | 542,165 | |
Fairchild Semiconductor International, Inc.* | | | 40,590 | | | | 488,704 | |
Micrel, Inc. | | | 23,102 | | | | 233,561 | |
MKS Instruments, Inc. | | | 23,357 | | | | 649,792 | |
ON Semiconductor Corp.* | | | 126,200 | | | | 974,264 | |
Semtech Corp.* | | | 31,192 | | | | 774,185 | |
Standard Microsystems Corp.* | | | 25,665 | | | | 661,387 | |
SEE NOTES TO FINANCIAL STATEMENTS.
A19
| | | | | | |
| | | SP SMALL CAP VALUE PORTFOLIO (continued) | | |
| |
| SCHEDULE OF INVESTMENTS | | December 31, 2011 |
| | | | | | | | |
COMMON STOCKS
(continued) | | Shares
| | | Value
(Note 2)
| |
| | | | | | | | | |
Semiconductors & Semiconductor Equipment (continued) | |
Teradyne, Inc.*(a) | | | 84,730 | | | $ | 1,154,870 | |
| | | | | | |
|
|
|
| | | | | | | | 6,132,962 | |
| | | | | | |
|
|
|
Software — 0.6% | | | | | | | | |
EPIQ Systems, Inc. | | | 19,710 | | | | 236,914 | |
SS&C Technologies Holdings, Inc.*(a) | | | 42,950 | | | | 775,677 | |
| | | | | | |
|
|
|
| | | | | | | | 1,012,591 | |
| | | | | | |
|
|
|
Specialty Retail — 2.2% | | | | | | | | |
ANN, Inc.* | | | 10,041 | | | | 248,816 | |
Cato Corp. (The) (Class A Stock) | | | 22,180 | | | | 536,756 | |
Children’s Place Retail Stores, Inc. (The)*(a) | | | 31,264 | | | | 1,660,744 | |
Finish Line, Inc. (The) (Class A Stock) | | | 4,802 | | | | 92,607 | |
Francesca’s Holdings Corp.*(a) | | | 7,259 | | | | 125,581 | |
Jos. A. Bank Clothiers, Inc.*(a) | | | 12,881 | | | | 628,077 | |
MarineMax, Inc.* | | | 51,000 | | | | 332,520 | |
Mattress Firm Holding Corp.*(a) | | | 11,754 | | | | 272,575 | |
| | | | | | |
|
|
|
| | | | | | | | 3,897,676 | |
| | | | | | |
|
|
|
Telecommunications — 1.4% | | | | | | | | |
ADTRAN, Inc. | | | 12,218 | | | | 368,495 | |
Anixter International, Inc.* | | | 10,949 | | | | 652,998 | |
Knology, Inc.*(a) | | | 37,582 | | | | 533,664 | |
Premiere Global Services, Inc.* | | | 62,738 | | | | 531,391 | |
SYNNEX Corp.* | | | 14,275 | | | | 434,817 | |
| | | | | | |
|
|
|
| | | | | | | | 2,521,365 | |
| | | | | | |
|
|
|
Textiles, Apparel & Luxury Goods — 1.6% | |
Fossil, Inc.* | | | 4,190 | | | | 332,519 | |
G & K Services, Inc. (Class A Stock) | | | 16,829 | | | | 489,892 | |
Hanesbrands, Inc.* | | | 38,580 | | | | 843,359 | |
Steven Madden Ltd.* | | | 12,866 | | | | 443,877 | |
Warnaco Group, Inc. (The)* | | | 13,105 | | | | 655,774 | |
| | | | | | |
|
|
|
| | | | | | | | 2,765,421 | |
| | | | | | |
|
|
|
Thrifts & Mortgage Finance — 0.8% | | | | | | | | |
BankUnited, Inc. | | | 19,100 | | | | 420,009 | |
Flushing Financial Corp. | | | 23,255 | | | | 293,711 | |
People’s United Financial, Inc.(a) | | | 40,370 | | | | 518,754 | |
Westfield Financial, Inc. | | | 37,620 | | | | 276,883 | |
| | | | | | |
|
|
|
| | | | | | | | 1,509,357 | |
| | | | | | |
|
|
|
Trading Companies & Distributors — 0.3% | |
Beacon Roofing Supply, Inc.* | | | 29,160 | | | | 589,907 | |
| | | | | | |
|
|
|
Transportation — 0.6% | | | | | | | | |
Forward Air Corp. | | | 18,034 | | | | 577,990 | |
Heartland Express, Inc. | | | 34,747 | | | | 496,534 | |
| | | | | | |
|
|
|
| | | | | | | | 1,074,524 | |
| | | | | | |
|
|
|
Utilities — 1.4% | | | | | | | | |
Avista Corp. | | | 7,931 | | | | 204,223 | |
El Paso Electric Co. | | | 66,426 | | | | 2,300,997 | |
| | | | | | |
|
|
|
| | | | | | | | 2,505,220 | |
| | | | | | �� |
|
|
|
TOTAL COMMON STOCKS
(cost $139,714,714) | | | | 170,326,419 | |
| | | | | | |
|
|
|
| | | | | | | | |
EXCHANGE TRADED
FUNDS — 2.2% | | Shares
| | | Value
(Note 2)
| |
| | | | | | | | | |
iShares Nasdaq Biotechnology Index Fund(a) | | | 7,500 | | | $ | 782,625 | |
iShares Russell 2000 Value Index Fund(a) | | | 47,367 | | | | 3,109,170 | |
| | | | | | |
|
|
|
TOTAL EXCHANGE TRADED FUNDS
(cost $3,477,493) | | | | | | | 3,891,795 | |
| | | | | | |
|
|
|
| UNAFFILIATED MUTUAL FUNDS — 0.3% | | | | | |
Apollo Investment Corp. | | | 18,369 | | | | 118,296 | |
Golub Capital BDC, Inc. | | | 10,989 | | | | 170,330 | |
PennantPark Investment Corp. | | | 25,547 | | | | 257,769 | |
| | | | | | |
|
|
|
TOTAL UNAFFILIATED MUTUAL FUNDS
(cost $562,240) | | | | 546,395 | |
| | | | | | |
|
|
|
| WARRANTS* | | | | | | | | |
Oil, Gas & Consumable Fuels | | | | | | | | |
Magnum Hunter Resources Corp., expiring 10/14/13
(cost $0) | | | 4,411 | | | | — | |
| | | | | | |
|
|
|
TOTAL LONG-TERM INVESTMENTS
(cost $143,754,447) | | | | 174,764,609 | |
| | | | | | |
|
|
|
| SHORT-TERM INVESTMENT — 17.8% | |
Affiliated Money Market Mutual Fund | | | | | |
Prudential Investment Portfolios 2 —Prudential Core Taxable Money Market Fund
(cost $31,592,258; includes $28,901,792 of cash collateral for securities on loan)(b)(w) (Note 4) | | | 31,592,258 | | | | 31,592,258 | |
| | | | | | |
|
|
|
TOTAL INVESTMENTS — 116.2%
(cost $175,346,705) | | | | 206,356,867 | |
LIABILITIES IN EXCESS OF
OTHER ASSETS — (16.2)% | | | | (28,823,361 | ) |
| | | | | | |
|
|
|
NET ASSETS — 100.0% | | | $ | 177,533,506 | |
| | | | | | |
|
|
|
The following abbreviation is used in the Portfolio descriptions:
| | |
| ADR | | American Depositary Receipt |
| * | Non-income producing security. |
| (a) | All or a portion of security is on loan. The aggregate market value of such securities, including those sold and pending settlement, is $27,881,343; cash collateral of $28,901,792 (included with liabilities) was received with which the Portfolio purchased highly liquid short-term investments. |
| (b) | Represents security, or a portion thereof, purchased with cash collateral received for securities on loan. |
| (w) | Prudential Investments LLC, the co-manager of the Portfolio, also serves as manager of the Prudential Investment Portfolios 2 — Prudential Core Taxable Money Market Fund. |
SEE NOTES TO FINANCIAL STATEMENTS.
A20
| | | | | | |
| | | SP SMALL CAP VALUE PORTFOLIO (continued) | | |
| |
| SCHEDULE OF INVESTMENTS | | December 31, 2011 |
Various inputs are used in determining the value of the Portfolio’s investments. These inputs are summarized in the three broad levels listed below.
| Level 1— | quoted prices generally for securities actively traded on a regulated securities exchange and for open-end mutual funds which trade at daily net asset value. |
| Level 2— | other significant observable inputs (including, but not limited to, quoted prices for similar securities, interest rates, prepayment speeds, foreign currency exchange rates, and amortized cost) generally for debt securities, swaps, forward foreign currency contracts and for foreign stocks priced using vendor modeling tool. |
| Level 3— | significant unobservable inputs for securities valued in accordance with Board approved fair valuation procedures. |
The following is a summary of the inputs used as of December 31, 2011 in valuing such portfolio securities:
| | | | | | | | | | | | |
| | | Level 1
| | | Level 2
| | | Level 3
| |
Investments in Securities | | | | | | | | | | | | |
Common Stocks | | $ | 170,326,419 | | | $ | — | | | $ | — | |
Exchange Traded Funds | | | 3,891,795 | | | | — | | | | — | |
Unaffiliated Mutual Funds | | | 546,395 | | | | — | | | | — | |
Affiliated Money Market Mutual Fund | | | 31,592,258 | | | | — | | | | — | |
| | |
|
|
| |
|
|
| |
|
|
|
Total | | $ | 206,356,867 | | | $ | — | | | $ | — | |
| | |
|
|
| |
|
|
| |
|
|
|
The industry classification of investments and liabilities in excess of other assets shown as a percentage of net assets as of December 31, 2011 were as follows:
| | | | |
Affiliated Money Market Mutual Fund (16.3% represents investments purchased with collateral from securities on loan) | | | 17.8 | % |
Real Estate Investment Trusts | | | 10.4 | |
Commercial Banks | | | 7.2 | |
Insurance | | | 5.8 | |
Oil, Gas & Consumable Fuels | | | 4.4 | |
Machinery | | | 3.5 | |
Semiconductors & Semiconductor Equipment | | | 3.5 | |
Capital Markets | | | 3.3 | |
Electric Utilities | | | 2.9 | |
Financial – Bank & Trust | | | 2.6 | |
Healthcare Providers & Services | | | 2.4 | |
Metals & Mining | | | 2.3 | |
Chemicals | | | 2.3 | |
Specialty Retail | | | 2.2 | |
Exchange Traded Funds | | | 2.2 | |
Communication Equipment | | | 2.1 | |
Energy Equipment & Services | | | 1.9 | |
Financial Services | | | 1.9 | |
Retail & Merchandising | | | 1.8 | |
Road & Rail | | | 1.6 | |
Textiles, Apparel & Luxury Goods | | | 1.6 | |
Banks | | | 1.5 | |
Telecommunications | | | 1.4 | |
Utilities | | | 1.4 | |
Entertainment & Leisure | | | 1.2 | |
Machinery & Equipment | | | 1.2 | |
Electronic Components & Equipment | | | 1.2 | |
Manufacturing | | | 1.1 | |
Commercial Services | | | 1.1 | |
Construction & Engineering | | | 1.1 | |
Computer Services & Software | | | 0.9 | |
Aerospace & Defense | | | 0.9 | |
Real Estate Management & Development | | | 0.9 | |
Auto Components | | | 0.9 | |
Thrifts & Mortgage Finance | | | 0.8 | |
Food & Staples Retailing | | | 0.8 | |
Gas Utilities | | | 0.8 | |
Electrical Equipment | | | 0.7 | |
| | | | |
Foods | | | 0.7 | % |
Diversified Consumer Services | | | 0.7 | |
Distribution/Wholesale | | | 0.7 | |
Commercial Services & Supplies | | | 0.7 | |
Marine | | | 0.6 | |
Building Products | | | 0.6 | |
Transportation | | | 0.6 | |
Clothing & Apparel | | | 0.6 | |
Household Durables | | | 0.6 | |
Professional Services | | | 0.6 | |
Software | | | 0.6 | |
Containers & Packaging | | | 0.5 | |
Healthcare Products | | | 0.5 | |
Computer Hardware | | | 0.5 | |
Building Materials | | | 0.5 | |
Paper & Forest Products | | | 0.5 | |
Household Products | | | 0.5 | |
Hotels, Restaurants & Leisure | | | 0.5 | |
Electronics | | | 0.4 | |
Pharmaceuticals | | | 0.4 | |
Diversified Financial Services | | | 0.4 | |
Trading Companies & Distributors | | | 0.3 | |
Automotive Parts | | | 0.3 | |
Unaffiliated Mutual Funds | | | 0.3 | |
Internet & Catalog Retail | | | 0.3 | |
Airlines | | | 0.2 | |
Consumer Products & Services | | | 0.2 | |
Oil Field Equipment & Services | | | 0.2 | |
Environmental Services | | | 0.2 | |
Investment Companies | | | 0.2 | |
Environmental Control | | | 0.2 | |
Consumer Finance | | | 0.2 | |
Leisure Equipment & Products | | | 0.1 | |
Computers & Peripherals | | | 0.1 | |
Internet Software & Services | | | 0.1 | |
| | |
|
|
|
| | | | 116.2 | |
Liabilities in excess of other assets | | | (16.2 | ) |
| | |
|
|
|
| | | | 100.0 | % |
| | |
|
|
|
SEE NOTES TO FINANCIAL STATEMENTS.
A21
| | | | | | |
| | | SP SMALL CAP VALUE PORTFOLIO (continued) | | |
STATEMENT OF ASSETS AND LIABILITIES
December 31, 2011
| | | | |
| ASSETS | | | | |
Investments at value, including securities on loan of $27,881,343: | | | | |
Unaffiliated investments (cost $143,754,447) | | $ | 174,764,609 | |
Affiliated investments (cost $31,592,258) | | | 31,592,258 | |
Receivable for investments sold | | | 292,163 | |
Dividends receivable | | | 276,810 | |
Receivable for Series shares sold | | | 628 | |
Prepaid expenses | | | 3,821 | |
| | |
|
|
|
Total Assets | | | 206,930,289 | |
| | |
|
|
|
| LIABILITIES | | | | |
Collateral for securities on loan | | | 28,901,792 | |
Payable for investments purchased | | | 218,264 | |
Management fee payable | | | 134,794 | |
Payable for Series shares repurchased | | | 74,054 | |
Accrued expenses and other liabilities | | | 65,641 | |
Deferred trustees’ fees | | | 1,312 | |
Affiliated transfer agent fees payable | | | 926 | |
| | |
|
|
|
Total Liabilities | | | 29,396,783 | |
| | |
|
|
|
| NET ASSETS | | $ | 177,533,506 | |
| | |
|
|
|
Net assets were comprised of: | | | | |
Paid-in capital | | $ | 166,153,225 | |
Retained earnings | | | 11,380,281 | |
| | |
|
|
|
Net assets, December 31, 2011 | | $ | 177,533,506 | |
| | |
|
|
|
Net asset value and redemption price per share, $177,533,506 / 14,974,377 outstanding shares of beneficial interest | | $ | 11.86 | |
| | |
|
|
|
STATEMENT OF OPERATIONS
Year Ended December 31, 2011
| | | | |
| INVESTMENT INCOME | | | | |
Unaffiliated dividend income (net of $619 foreign withholding tax) | | $ | 2,707,311 | |
Affiliated income from securities lending, net | | | 98,076 | |
Affiliated dividend income | | | 6,733 | |
| | |
|
|
|
| | | | 2,812,120 | |
| | |
|
|
|
| EXPENSES | | | | |
Management fee | | | 1,805,739 | |
Custodian’s fees and expenses | | | 92,000 | |
Audit fee | | | 23,000 | |
Shareholders’ reports | | | 21,000 | |
Trustees’ fees | | | 12,000 | |
Transfer agent’s fees and expenses (including affiliated expense of $5,500) (Note 4) | | | 11,000 | |
Legal fees and expenses | | | 8,000 | |
Commitment fee on syndicated credit agreement | | | 4,000 | |
Insurance expenses | | | 2,000 | |
Loan interest expense (Note 8) | | | 1,087 | |
Miscellaneous | | | 10,090 | |
| | |
|
|
|
Total expenses | | | 1,989,916 | |
| | |
|
|
|
| NET INVESTMENT INCOME | | | 822,204 | |
| | |
|
|
|
| NET REALIZED AND UNREALIZED GAIN (LOSS) ON INVESTMENTS | | | | |
Net realized gain on investment transactions | | | 19,724,100 | |
Net change in unrealized appreciation (depreciation) on investments | | | (23,357,774 | ) |
| | |
|
|
|
| NET LOSS ON INVESTMENTS | | | (3,633,674 | ) |
| | |
|
|
|
| NET DECREASE IN NET ASSETS RESULTING FROM OPERATIONS | | $ | (2,811,470 | ) |
| | |
|
|
|
STATEMENT OF CHANGES IN NET ASSETS
| | | | | | | | |
| | | Year Ended December 31,
| |
| | | 2011
| | | 2010
| |
INCREASE (DECREASE) IN NET ASSETS | | | | | | | | |
| OPERATIONS: | | | | | | | | |
Net investment income | | $ | 822,204 | | | $ | 1,317,394 | |
Net realized gain on investment transactions | | | 19,724,100 | | | | 16,187,070 | |
Net change in unrealized appreciation (depreciation) on investments | | | (23,357,774 | ) | | | 32,605,529 | |
| | |
|
|
| |
|
|
|
NET INCREASE (DECREASE) IN NET ASSETS RESULTING FROM OPERATIONS | | | (2,811,470 | ) | | | 50,109,993 | |
| | |
|
|
| |
|
|
|
| DISTRIBUTIONS | | | (1,316,520 | ) | | | (1,372,937 | ) |
| | |
|
|
| |
|
|
|
| SERIES SHARE TRANSACTIONS: | | | | | | | | |
Series shares sold [631,174 and 1,142,327 shares, respectively] | | | 7,810,364 | | | | 12,196,190 | |
Series shares issued in reinvestment of distributions [107,471 and 134,866 shares, respectively] | | | 1,316,520 | | | | 1,372,937 | |
Series shares repurchased [4,714,520 and 3,572,385 shares, respectively] | | | (60,179,414 | ) | | | (37,617,557 | ) |
| | |
|
|
| |
|
|
|
NET DECREASE IN NET ASSETS RESULTING FROM SERIES SHARE TRANSACTIONS | | | (51,052,530 | ) | | | (24,048,430 | ) |
| | |
|
|
| |
|
|
|
| TOTAL INCREASE (DECREASE) IN NET ASSETS | | | (55,180,520 | ) | | | 24,688,626 | |
| NET ASSETS: | | | | | | | | |
Beginning of year | | | 232,714,026 | | | | 208,025,400 | |
| | |
|
|
| |
|
|
|
End of year | | $ | 177,533,506 | | | $ | 232,714,026 | |
| | |
|
|
| |
|
|
|
SEE NOTES TO FINANCIAL STATEMENTS.
A22
NOTES TO THE FINANCIAL STATEMENTS OF
THE PRUDENTIAL SERIES FUND
The Prudential Series Fund (“Series Fund”), organized as a Delaware statutory trust, is a diversified open-end management investment company registered under the Investment Company Act of 1940 (“1940 Act”), as amended. On January 2, 2006, each Portfolio of the Series Fund changed its federal income tax status from a regulated investment company to a partnership. As a result of that conversion, the Series Fund was reorganized from a Maryland corporation to a Delaware statutory trust. Pursuant to this reorganization, the Series Fund has been renamed “The Prudential Series Fund.” The Series Fund is composed of eighteen Portfolios (“Portfolio” or “Portfolios”), each with separate series shares. The information presented in these financial statements pertains to four Portfolios which are listed below along with each Portfolio’s investment objective.
SP International Growth Portfolio: Long-term growth of capital.
SP International Value Portfolio: Long-term capital appreciation.
SP Prudential U.S. Emerging Growth Portfolio: Long-term capital appreciation.
SP Small Cap Value Portfolio: Long-term growth of capital.
The ability of issuers of debt securities (other than those issued or guaranteed by the U.S. Government) held by the Portfolios to meet their obligations may be affected by the economic or political developments in a specific industry, region or country. Foreign security and currency transactions may involve certain considerations and risks not typically associated with those of domestic origin as a result of, among other factors, the possibility of political and economic instability or the level of governmental supervision and regulation of foreign securities markets.
| Note 2: | | Accounting Policies |
The following is a summary of significant accounting policies followed by the Series Fund and the Portfolios in preparation of their financial statements.
Securities Valuation: Securities listed on a securities exchange are valued at the last sale price on such exchange on the day of valuation or, if there was no sale on such day, at the mean between the last reported bid and asked prices, or at the last bid price on such day in the absence of an asked price. Securities traded via NASDAQ are valued at the official NASDAQ closing price (“NCOP”) on the day of valuation, or if there was no NCOP, at the last sale price. Securities that are actively traded in the over-the-counter market, including listed securities for which the primary market is believed by Prudential Investments LLC (“PI” or “Manager”) in consultation with the subadvisers, to be over-the-counter, are valued at market value using prices provided by an independent pricing agent or principal market maker. Options on securities and indices traded on an exchange are valued at the last sale price as of the close of trading on the applicable exchange or, if there was no sale, at the mean between the most recently quoted bid and asked prices on such exchange or at the last bid price in absence of an asked price. Futures contracts and options thereon traded on a commodities exchange or board of trade are valued at the last sale price at the close of trading on such exchange or board of trade or, if there was no sale on the applicable commodities exchange or board of trade on such day, at the mean between the most recently quoted bid and asked prices on such exchange or board of trade or at the last bid price in the absence of an asked price. Prices may be obtained from independent pricing services which use information provided by market makers or estimates of market values obtained from yield data relating to investments or securities with similar characteristics. Securities for which reliable market quotations are not readily available, or whose values have been affected by events occurring after the close of the security’s foreign market and before the Series Fund’s normal pricing time, are valued at fair value in accordance with Board of Trustees’ approved fair valuation procedures. When determining the fair value of securities, some of the factors influencing the valuation include, the nature of any restrictions on disposition of the securities; assessment of the general liquidity of the securities; the issuer’s financial condition and the markets in which it does business; the cost of the investment; the size of the holding and the capitalization of the issuer; the prices of any recent transactions or bids/offers for such securities or any comparable securities; any available analyst media or other reports or information deemed reliable by the investment adviser
B1
regarding the issuer or the markets or industry in which it operates. Using fair value to price securities may result in a value that is different from a security’s most recent closing price and from the price used by other mutual funds to calculate their net asset values.
Investments in open end, non exchange-traded mutual funds are valued at their net asset value as of the close of the New York Stock Exchange on the date of valuation.
Short-term debt securities of sufficient credit quality, which mature in sixty days or less, are valued at amortized cost, which approximates fair value. The amortized cost method values a security at its cost at the time of purchase and thereafter assuming a constant amortization to maturity of the difference between the principal amount due at maturity and cost. Short-term debt securities, which mature in more than sixty days are valued at fair value.
Each Portfolio may hold up to 15% of their net assets in illiquid securities, including those which are restricted as to disposition under securities law (“restricted securities”). Restricted securities are valued pursuant to the valuation procedures noted above.
Repurchase Agreements: In connection with transactions in repurchase agreements with United States financial institutions, it is the Series Fund’s policy that its custodian or designated subcustodians, as the case may be, under triparty repurchase agreements, take possession of the underlying collateral securities, the value of which exceeds the principal amount of the repurchase transaction, including accrued interest. To the extent that any repurchase transaction exceeds one business day, the value of the collateral is marked to market on a daily basis to ensure the adequacy of the collateral. If the seller defaults or the value of the collateral declines, or if bankruptcy proceedings are commenced with respect to the seller of the security, realization of the collateral by the Series Fund may by delayed or limited.
Foreign Currency Translation: The books and records of the Series Fund are maintained in U.S. dollars. Foreign currency amounts are translated into U.S. dollars on the following basis:
(i) market value of investment securities, other assets and liabilities — at the current daily rates of exchange.
(ii) purchases and sales of investment securities, income and expenses — at the rates of exchange prevailing on the respective dates of such transactions.
Although the net assets of the Series Fund are presented at the foreign exchange rates and market values at the close of the period, the Series Fund does not isolate that portion of the results of operations arising as a result of changes in the foreign exchange rates from the fluctuations arising from changes in the market prices of securities held at the end of the period. Similarly, the Series Fund does not isolate the effect of changes in foreign exchange rates from the fluctuations arising from changes in the market prices of portfolio securities sold during the period. Accordingly, these realized foreign currency gains (losses) are included in the reported net realized gains (losses) on investment transactions.
Net realized gains (losses) on foreign currency transactions represent net foreign exchange gains (losses) from the holding of foreign currencies, currency gains (losses) realized between the trade date and settlement date on securities transactions, and the difference between the amounts of dividends, interest and foreign withholding taxes recorded on the Series Fund’s books and the U.S. dollar equivalent amounts actually received or paid. Net unrealized currency gains (losses) from valuing foreign currency denominated assets and liabilities (other than investments) at period end exchange rates are reflected as a component of net unrealized appreciation (depreciation) on investments and foreign currencies.
Forward Currency Contracts: A forward currency contract is a commitment to purchase or sell a foreign currency at a future date at a negotiated forward rate between two parties. Certain Portfolios of the Series Fund entered into forward currency contracts in order to hedge their exposure to changes in foreign currency exchange rates on their foreign portfolio holdings or specific receivables and payables denominated in a foreign currency and to gain exposure to certain currencies. The contracts are valued daily at current exchange rates and any unrealized gain or loss is included in net unrealized appreciation or depreciation on foreign currencies. Gain or loss is realized on the settlement date of the contract equal to the difference between the settlement value of the original and negotiated forward contracts. This gain or loss, if any, is included in net realized gain (loss) on foreign currency transactions. Risks may arise upon entering into these contracts from the potential inability of the counterparties to meet the terms of their contracts. Forward currency contracts involve risks from currency exchange rate and credit risk in excess of the amounts
B2
reflected on the Statement of Assets and Liabilities. The Portfolio’s maximum risk of loss from counterparty credit risk is the net value of the cash flows to be received from the counterparty at the end of the contract’s life. A master netting arrangement between the Portfolio and the counterparty permits the Portfolio to offset amounts payable by the Portfolio to the same counterparty against amounts to be received; and by the receipt of collateral from the counterparty by the Portfolio to cover the Portfolio’s exposure to the counterparty. However, there is no assurance that such mitigating factors are easily enforceable.
Warrants and Rights: Certain Portfolios of the Series Fund hold warrants and rights acquired either through a direct purchase, included as part of a private placement, or pursuant to corporate actions. Warrants and rights entitle the holder to buy a proportionate amount of common stock, or such other security that the issuer may specify, at a specific price and time through the expiration dates. Such warrants and rights are held as long positions by the Portfolio until exercised, sold or expired. Warrants and rights are valued at fair value in accordance with the Board of Trustees’ approved fair valuation procedures.
Securities Lending: Each Portfolio of the Series Fund may lend its portfolio securities to banks and broker-dealers. The loans are secured by collateral at least equal to the market value of the securities loaned. Collateral pledged by each borrower is marked to market daily, based on the previous day’s market value, such that the value of the collateral exceeds the value of the loaned securities. Loans are subject to termination at the option of the borrower or Portfolio. Upon termination of the loan, the borrower will return to the Portfolio securities identical to the loaned securities. Should the borrower of the securities fail financially, the Portfolio has the right to repurchase the securities using the collateral in the open market. The Portfolio recognizes income, net of any rebate and securities lending agent fees, for lending its securities in the form of fees or interest on the investment of any cash received as collateral. The Portfolio also continues to receive interest and dividends or amounts equivalent thereto on the securities loaned and recognizes any unrealized gain or loss in the market price of the securities loaned that may occur during the term of the loan.
Securities Transactions and Net Investment Income: Securities transactions are recorded on the trade date. Realized gains (losses) on sales of securities are calculated on the identified cost basis. Dividend income is recorded on the ex-dividend date; interest income, which is comprised of four elements: stated coupon, original issue discount, market discount and market premium, is recorded on the accrual basis. Expenses are recorded on the accrual basis. The Series Fund’s expenses are allocated to the respective Portfolios on the basis of relative net assets except for Portfolio specific expenses which are attributable directly to a Portfolio or class level.
For Portfolios with multiple classes of shares, net investment income (loss) (other than administration and distribution fees, which are charged to the respective class) and unrealized and realized gains (losses) are allocated daily to each class of shares based upon the relative proportion of adjusted net assets of each class at the beginning of the day.
When-Issued/Delayed Delivery Securities: Securities purchased or sold on a when-issued or delayed-delivery basis may be settled a month or more after trade date; interest income is not accrued until settlement date. At the time a Portfolio enters into such transactions, it instructs the custodian to segregate assets with a current value at least equal to the amount of its when-issued or delayed-delivery purchase commitments.
Taxes: For federal income tax purposes, each Portfolio in the Series Fund is treated as a separate taxpaying entity. The Portfolios are treated as partnerships for tax purposes. No provision has been made in the financial statements for U.S. federal, state, or local taxes, as any tax liability arising from operations of the Portfolios is the responsibility of their partners. The Portfolios are not generally subject to entity-level taxation. Partners of each Portfolio are subject to taxes on their distributive share of partnership items.
Withholding taxes on foreign dividends, interest and capital gains have been provided for in accordance with the Series Fund’s understanding of the applicable country’s tax rules and regulations.
Distributions: Distributions from each Portfolio are made in cash and automatically reinvested in additional shares of the same Portfolio. The Portfolios’ distributions are generally made on an annual basis. Distributions are recorded on the ex-date.
Estimates: The preparation of financial statements requires management to make estimates and assumptions that affect the reported amounts and disclosures in the financial statements. Actual results could differ from these estimates.
B3
The Series Fund has a management agreement with PI. Pursuant to this agreement PI has responsibility for all investment advisory services and supervises the subadvisors’ performance of such services. PI has entered into subadvisory agreements with Jennison Associates LLC (“Jennison”), Goldman Sachs Asset Management, L.P. (“GSAM”), LSV Asset Management (“LSV”), Marsico Capital Management LLC (“Marsico”), William Blair & Company LLC (“William Blair”), Thornburg Investment Management (“Thornburg”), and ClearBridge Advisors LLC (“ClearBridge”) (collectively, the “Subadvisors”), under which each provides investment advisory services for certain Portfolios of the Series Fund. PI pays for the services of the Subadvisors, compensation of officers of the Series Fund, occupancy and certain clerical and administrative expenses of the Series Fund. The Portfolios bear all other costs and expenses.
The management fee paid to PI is accrued daily and payable monthly, using the value of each of the Portfolio’s average daily net assets, at the respective annual rate specified below.
| | | | | | | | |
Portfolio
| | Management Fee
| | | Effective
Management Fee
| |
SP International Growth Portfolio | | | 0.85 | % | | | 0.85 | % |
SP International Value Portfolio | | | 0.90 | | | | 0.90 | |
SP Prudential U.S. Emerging Growth Portfolio | | | 0.60 | | | | 0.60 | |
SP Small Cap Value Portfolio | | | 0.90 | | | | 0.90 | |
At December 31, 2011 the Subadvisors that provide investment advisory services to the Portfolios are listed directly below. Where more than one Subadvisor is listed, each Subadvisor provides services to a segment of the Portfolio:
| | |
Portfolio
| | Subadvisor(s)
|
SP International Growth Portfolio | | William Blair, Marsico |
SP International Value Portfolio | | LSV, Thornburg |
SP Prudential U.S. Emerging Growth Portfolio | | Jennison |
SP Small Cap Value Portfolio | | GSAM, ClearBridge |
The Series Fund has a distribution agreement with Prudential Investment Management Services LLC (“PIMS”) which acts as the distributor of the Class I and Class II shares of the Series Fund. The Series Fund compensates PIMS for distributing and servicing the Series Fund’s Class II shares pursuant to a plan of distribution (the “Class II Plan”), regardless of expenses actually incurred by PIMS. The distribution fees are accrued daily and payable monthly. No distribution or service fees are paid to PIMS as distributor of the Class I shares of the Series Fund. Pursuant to the Class II Plan, the Class II shares of each Portfolio compensate PIMS for distribution-related activities at an annual rate of 0.25% of the average daily net assets of the Class II shares.
The Series Fund has an administration agreement with PI which acts as the administrator of the Class II shares of the Series Fund. The administration fee paid to PI is accrued daily and payable monthly, at the annual rate of 0.15% of the average daily net assets of the Class II shares.
PIMS, PI, and Jennison are indirect, wholly-owned subsidiaries of Prudential Financial, Inc. (“Prudential”).
| Note 4: | | Other Transactions with Affiliates |
Prudential Mutual Fund Services LLC (“PMFS”), an affiliate of PI and an indirect, wholly-owned subsidiary of Prudential, serves as the Series Fund’s transfer agent. Transfer agent fees and expenses in the Statements of Operations include certain out-of-pocket expenses paid to non-affiliates, where applicable.
Prudential Investment Management, Inc. (“PIM”), an indirect, wholly-owned subsidiary of Prudential, is the Series Fund’s security lending agent. For the year ended December 31, 2011, PIM was compensated as follows for these services by the Series Fund Portfolios:
| | | | |
| | | PIM
| |
SP International Growth Portfolio | | $ | 10,736 | |
SP Prudential U.S. Emerging Growth Portfolio | | | 19,314 | |
SP Small Cap Value Portfolio | | | 29,417 | |
B4
Certain Portfolios invest in the Prudential Core Taxable Money Market Fund (the “Core Fund”), a portfolio of Prudential Investment Portfolios 2. The Core Fund is a money market mutual fund registered under 1940 Act, as amended, and managed by PI. Earnings from the Core Fund are disclosed on the Statement of Operations as affiliated dividend income.
| Note 5: | | Portfolio Securities |
Purchases and sales of portfolio securities, other than short-term investments and U.S. Government securities, for the year ended December 31, 2011, were as follows:
| | | | | | | | |
Portfolio
| | Cost of
Purchases
| | | Proceeds from
Sales
| |
SP International Growth Portfolio | | $ | 134,750,858 | | | $ | 211,681,303 | |
SP International Value Portfolio | | | 30,282,109 | | | | 104,751,788 | |
SP Prudential U.S. Emerging Growth Portfolio | | | 91,776,668 | | | | 123,796,735 | |
SP Small Cap Value Portfolio | | | 71,900,757 | | | | 120,604,412 | |
After January 2, 2006, all Portfolios are treated as partnerships for tax purposes. The character of the cash distributions paid by the partnerships is generally classified as return of capital nontaxable distributions. After each fiscal year each partner will receive information regarding their distributive allocable share of the partnership’s income, gains, losses and deductions.
Prior to January 2, 2006, was incorporated as of that date, qualified as a regulated investment company under the Internal Revenue Code and distributed all of its taxable income, including any net realized gains on investments, to shareholders.
With respect to the Portfolios, book cost of assets differs from tax cost of assets as a result of each Portfolio’s adoption of a mark to market method of accounting for tax purposes. Under this method, tax cost of assets will approximate its fair market value.
Management has analyzed the Portfolio’s tax positions taken on federal income tax returns for all open tax years and has concluded that no provision for income tax would be required in the Portfolio’s financial statements. The Portfolios’ federal and state income tax returns for tax years for which the applicable statues of limitations have not expired are subject to examination by the Internal Revenue Service and state departments of revenue.
The Series Fund offers Class I and Class II shares. Neither Class I nor Class II shares of a Portfolio are subject to any sales charge or redemption charge and are sold at the net asset value of the Portfolio. Class I shares are sold only to certain separate accounts of Prudential to fund benefits under certain variable life insurance and variable annuity contracts (“contracts”). Class II shares are sold only to separate accounts of non-Prudential insurance companies as investment options under certain contracts. The separate accounts invest in shares of the Series Fund through subaccounts that correspond to the Portfolio. The separate accounts will redeem shares of the Series Fund to the extent necessary to provide benefits under the contracts or for such other purposes as may be consistent with the contracts. As of December 31, 2011, the SP International Growth and SP Prudential U.S. Emerging Growth Portfolios have Class II shares outstanding.
B5
Transactions in shares of beneficial interest of the SP International Growth and SP Prudential U.S. Emerging Growth Series Funds were as follows:
SP International Growth Portfolio:
| | | | | | | | |
Class I
| | Shares
| | | Amount
| |
Year ended December 31, 2011: | | | | | | | | |
Series shares sold | | | 1,440,458 | | | $ | 7,230,093 | |
Series shares issued in reinvestment of distributions | | | 235,819 | | | | 1,181,454 | |
Series shares repurchased | | | (15,563,232 | ) | | | (83,117,046 | ) |
| | |
|
|
| |
|
|
|
Net increase (decrease) in shares outstanding | | | (13,886,955 | ) | | $ | (74,705,499 | ) |
| | |
|
|
| |
|
|
|
Year ended December 31, 2010: | | | | | | | | |
Series shares sold | | | 2,187,399 | | | $ | 10,261,944 | |
Series shares issued in reinvestment of distributions | | | 577,091 | | | | 2,389,158 | |
Series shares repurchased | | | (6,676,025 | ) | | | (30,838,048 | ) |
| | |
|
|
| |
|
|
|
Net increase (decrease) in shares outstanding | | | (3,911,535 | ) | | $ | (18,186,946 | ) |
| | |
|
|
| |
|
|
|
| | |
Class II
| | | | | | |
Year ended December 31, 2011: | | | | | | | | |
Series shares sold | | | 38,157 | | | $ | 180,953 | |
Series shares issued in reinvestment of distributions | | | 7,961 | | | | 39,406 | |
Series shares repurchased | | | (359,810 | ) | | | (1,754,273 | ) |
| | |
|
|
| |
|
|
|
Net increase (decrease) in shares outstanding | | | (313,692 | ) | | $ | (1,533,914 | ) |
| | |
|
|
| |
|
|
|
Year ended December 31, 2010: | | | | | | | | |
Series shares sold | | | 156,320 | | | $ | 720,462 | |
Series shares issued in reinvestment of distributions | | | 29,912 | | | | 122,040 | |
Series shares repurchased | | | (660,258 | ) | | | (2,954,205 | ) |
| | |
|
|
| |
|
|
|
Net increase (decrease) in shares outstanding | | | (474,026 | ) | | $ | (2,111,703 | ) |
| | |
|
|
| |
|
|
|
SP Prudential U.S. Emerging Growth Portfolio:
| | | | | | | | |
Class I
| | Shares
| | | Amount
| |
Year ended December 31, 2011: | | | | | | | | |
Series shares sold | | | 1,028,266 | | | $ | 8,188,427 | |
Series shares issued in reinvestment of distributions | | | 417,280 | | | | 3,329,895 | |
Series shares repurchased | | | (5,737,435 | ) | | | (45,214,307 | ) |
| | |
|
|
| |
|
|
|
Net increase (decrease) in shares outstanding | | | (4,291,889 | ) | | $ | (33,695,985 | ) |
| | |
|
|
| |
|
|
|
Year ended December 31, 2010: | | | | | | | | |
Series shares sold | | | 1,199,031 | | | $ | 8,449,288 | |
Series shares issued in reinvestment of distributions | | | 119,475 | | | | 802,873 | |
Series shares issued in merger (Note 10) | | | 12,441,912 | | | | 87,093,383 | |
Series shares repurchased | | | (4,501,221 | ) | | | (30,617,709 | ) |
| | |
|
|
| |
|
|
|
Net increase (decrease) in shares outstanding | | | 9,259,197 | | | $ | 65,727,835 | |
| | |
|
|
| |
|
|
|
| | |
Class II
| | | | | | |
Year ended December 31, 2011: | | | | | | | | |
Series shares issued in reinvestment of distributions | | | 436 | | | $ | 3,362 | |
Series shares repurchased | | | (1,605 | ) | | | (12,184 | ) |
| | |
|
|
| |
|
|
|
Net increase (decrease) in shares outstanding | | | (1,169 | ) | | $ | (8,822 | ) |
| | |
|
|
| |
|
|
|
Year ended December 31, 2010: | | | | | | | | |
Series shares sold | | | 198 | | | $ | 1,223 | |
Series shares issued in reinvestment of distributions | | | 95 | | | | 618 | |
Series shares repurchased | | | (5,286 | ) | | | (33,368 | ) |
| | |
|
|
| |
|
|
|
Net increase (decrease) in shares outstanding | | | (4,993 | ) | | $ | (31,527 | ) |
| | |
|
|
| |
|
|
|
B6
The Portfolios, along with other affiliated registered investment companies, was a party to a Syndicated Credit Agreement (“SCA”) with a group of banks. The purpose of the SCA was to provide an alternative source of temporary funding for capital share redemptions. The SCA provides for a commitment of $900 million for the period December 16, 2011 through December 14, 2012. The Portfolios pay an annualized commitment fee of 0.08% of the unused portion of the SCA. Prior to December 16, 2011, the Portfolios had another Syndicated Credit Agreement of a $750 million commitment with an annualized commitment fee of 0.10% of the unused portion. Interest on any borrowings under the SCA is paid at contracted market rates. The commitment fee for the unused amount is accrued daily and paid quarterly.
The following Portfolios utilized the line of credit during the year ended December 31, 2011. The average balance is for the number of days the Portfolios had utilized the credit facility.
| | | | | | | | | | | | | | | | |
Portfolio
| | Approximate
Average
Balance
Outstanding
| | | Number of
Days
Outstanding
| | | Weighted
Average
Interest
Rate
| | | Outstanding
Borrowings at
December 31,
2011
| |
SP International Growth | | $ | 5,090,624 | | | | 33 | | | | 1.46 | % | | $ | — | |
SP International Value | | | 5,867,346 | | | | 26 | | | | 1.46 | % | | | — | |
SP Prudential U.S. Emerging Growth | | | 274,467 | | | | 15 | | | | 1.48 | % | | | — | |
SP Small Cap Value | | | 2,436,091 | | | | 11 | | | | 1.46 | % | | | — | |
| Note 9: | | Ownership and Affiliates |
As of December 31, 2011, all of Class I shares of record of each Portfolio were owned by The Prudential Insurance Company of America (“PICA”) on behalf of the owners of the variable insurance products issued by PICA.
On December 7, 2009, The Board of Trustees of the Fund approved an Agreement and Plan of Reorganization (the “Plan”) which provided for the transfer of all the assets of the following portfolio for shares of the acquiring portfolio and the assumption of the liabilities of the portfolio. Shareholders approved the Plan at a meeting on March 25, 2010 and the reorganization took place on April 30, 2010.
The purpose of the transaction was to combine two Portfolios with the same Investment Manager and with substantially similar investment objectives, policies and restrictions. The Acquiring Portfolio had a lower contractual investment management fee and annualized operating expense ratio as well as stronger historical investment performance.
The acquisitions were accomplished by a tax-free exchange of the following shares on April 30, 2010:
| | | | | | | | | | | | | | |
Merged Portfolio
| | Shares
| | | Acquiring Portfolio
| | Shares
| | | Value
| |
SP Mid Cap Growth
Portfolio | | | 17,418,677 | | | SP Prudential U.S. Emerging Growth Portfolio | | | 12,441,912 | | | $ | 87,093,383 | |
For financial reporting purposes, assets received and shares issued by the SP Prudential U.S. Emerging Growth Portfolio were recorded at fair value; however, the cost basis of the investments received from the SP Mid Cap Growth Portfolio was carried forward to reflect the tax-free status of the acquisition. The net assets and net unrealized depreciation immediately before the acquisition were as follows:
| | | | | | | | | | | | | | |
Merged Portfolio
| | Net Assets
| | | Unrealized
Appreciation
| | | Acquiring Portfolio
| | Net Assets
| |
| SP Mid Cap Growth Portfolio | | $ | 87,093,383 | | | $ | 20,508,236 | | | SP Prudential U.S. Emerging Growth Portfolio | | $ | 150,463,756 | |
B7
Assuming the acquisition had been completed on January 1, 2010, the SP Prudential U.S. Emerging Growth Portfolio’s results of operations for the year ended December 31, 2010 were as follows:
| | | | |
Net investment income | | $ | 1,150,672 | (a) |
Net realized and unrealized gain on investments | | | 42,736,685 | (b) |
| | |
|
|
|
| | | $ | 43,887,357 | |
| | |
|
|
|
| | (a) | $1,360,578 as reported in the Statement of Operations, plus $(267,235) Net Investment Loss from SP Mid Cap Growth Portfolio pre-merger, plus $57,329 of pro-forma eliminated expenses. |
| | (b) | $33,864,919 as reported in the Statement of Operations, plus $8,871,766 Net Realized and Unrealized Gain on Investments from SP Mid Cap Growth Portfolio pre-merger. |
Because both the SP Prudential U.S. Emerging Growth Portfolio and SP Mid Cap Growth Portfolio sold and redeemed shares throughout the period, it is not practicable to provide pro-forma information on a per-share basis.
Because the combined investment portfolios have been managed as a single integrated portfolio since the acquisitions were completed, it is also not practicable to separate the amounts of revenue and earnings of the SP Mid Cap Growth Portfolio that have been included in SP Prudential U.S. Emerging Growth Portfolio’s Statement of Operations since April 30, 2010.
| Note 11: | | New Accounting Pronouncement |
In April 2011, the Financial Accounting Standards Board (“FASB”) issued Accounting Standards Update (“ASU”) No. 2011-03 “Reconsideration of Effective control for Repurchase Agreements”. The objective of ASU 2011-03 is to improve the accounting for repurchase agreements and other agreements that both entitle and obligate a transferor to repurchase or redeem financial assets before their maturity. Under previous guidance, whether or not to account for a transaction as a sale was based on, in part, if the entity maintained effective control over the transferred financial assets. ASU 2011-03 removes the transferor’s ability criterion from the effective control assessment. This guidance is effective prospectively for interim and annual reporting periods beginning on or after December 15, 2011. At this time, management is evaluating the implications of ASU No. 2011-03 and its impact on the financial statements has not been determined.
In May 2011, the FASB issued ASU No. 2011-04 “Amendments to Achieve Common Fair Value Measurement and Disclosure Requirements in U.S. GAAP and IFRSs”. ASU 2011-04 includes common requirements for measurement of and disclosure about fair value between U.S. GAAP and IFRS. ASU 2011-04 will require reporting entities to disclose quantitative information about the unobservable inputs used in the fair value measurements categorized within Level 3 of the fair value hierarchy. In addition, ASU 2011-04 will require reporting entities to make disclosures about amounts and reasons for all transfers in and out of Level 1 and Level 2 fair value measurements. The new and revised disclosures are effective for interim and annual reporting periods beginning after December 15, 2011. At this time, management is evaluating the implications of ASU No. 2011-04 and its impact on the financial statements has not been determined.
B8
Financial Highlights
| | | | | | | | | | | | | | | | | | | | |
| | | SP International Growth Portfolio
| |
| | | Class I
| |
| | | Year Ended December 31,
| |
| | | 2011(c)
| | | 2010(c)
| | | 2009(c)
| | | 2008
| | | 2007(c)
| |
Per Share Operating Performance: | | | | | | | | | | | | | | | | | | | | |
Net Asset Value, beginning of year | | $ | 5.19 | | | $ | 4.63 | | | $ | 3.45 | | | $ | 8.52 | | | $ | 8.30 | |
| | |
|
|
| |
|
|
| |
|
|
| |
|
|
| |
|
|
|
Income (Loss) From Investment Operations: | | | | | | | | | | | | | | | | | | | | |
Net investment income | | | .02 | | | | .04 | | | | .05 | | | | .10 | | | | .10 | |
Net realized and unrealized gain (loss) on investments | | | (.79 | ) | | | .59 | | | | 1.22 | | | | (3.74 | ) | | | 1.50 | |
| | |
|
|
| |
|
|
| |
|
|
| |
|
|
| |
|
|
|
Total from investment operations | | | (.77 | ) | | | .63 | | | | 1.27 | | | | (3.64 | ) | | | 1.60 | |
| | |
|
|
| |
|
|
| |
|
|
| |
|
|
| |
|
|
|
Less Distributions: | | | (.06 | ) | | | (.07 | ) | | | (.09 | ) | | | (1.43 | ) | | | (1.38 | ) |
| | |
|
|
| |
|
|
| |
|
|
| |
|
|
| |
|
|
|
Net Asset Value, end of year | | $ | 4.36 | | | $ | 5.19 | | | $ | 4.63 | | | $ | 3.45 | | | $ | 8.52 | |
| | |
|
|
| |
|
|
| |
|
|
| |
|
|
| |
|
|
|
Total Return(a) | | | (14.91 | )% | | | 14.01 | % | | | 37.15 | % | | | (50.30 | )% | | | 19.55 | % |
Ratios/Supplemental Data: | | | | | | | | | | | | | | | | | | | | |
Net assets, end of year (in millions) | | $ | 75.5 | | | $ | 162.1 | | | $ | 162.5 | | | $ | 207.5 | | | $ | 500.0 | |
Ratios to average net assets(b): | | | | | | | | | | | | | | | | | | | | |
Expenses | | | 1.21 | % | | | 1.10 | % | | | .99 | % | | | .99 | % | | | .94 | % |
Net investment income | | | .47 | % | | | .77 | % | | | 1.18 | % | | | 1.36 | % | | | 1.14 | % |
Portfolio turnover rate | | | 118 | % | | | 141 | % | | | 89 | % | | | 101 | % | | | 81 | % |
| | | | | | | | | | | | | | | | | | | | |
| | | SP International Growth Portfolio
| |
| | | Class II
| |
| | | Year Ended December 31,
| |
| | | 2011(c)
| | | 2010(c)
| | | 2009(c)
| | | 2008
| | | 2007(c)
| |
Per Share Operating Performance: | | | | | | | | | | | | | | | | | | | | |
Net Asset Value, beginning of year | | $ | 5.10 | | | $ | 4.54 | | | $ | 3.37 | | | $ | 8.36 | | | $ | 8.17 | |
| | |
|
|
| |
|
|
| |
|
|
| |
|
|
| |
|
|
|
Income (Loss) From Investment Operations: | | | | | | | | | | | | | | | | | | | | |
Net investment income (loss) | | | — | (d) | | | .02 | | | | .03 | | | | .07 | | | | .07 | |
Net realized and unrealized gain (loss) on investments | | | (.78 | ) | | | .59 | | | | 1.19 | | | | (3.65 | ) | | | 1.47 | |
| | |
|
|
| |
|
|
| |
|
|
| |
|
|
| |
|
|
|
Total from investment operations | | | (.78 | ) | | | .61 | | | | 1.22 | | | | (3.58 | ) | | | 1.54 | |
| | |
|
|
| |
|
|
| |
|
|
| |
|
|
| |
|
|
|
Less Distributions: | | | (.02 | ) | | | (.05 | ) | | | (.05 | ) | | | (1.41 | ) | | | (1.35 | ) |
| | |
|
|
| |
|
|
| |
|
|
| |
|
|
| |
|
|
|
Net Asset Value, end of year | | $ | 4.30 | | | $ | 5.10 | | | $ | 4.54 | | | $ | 3.37 | | | $ | 8.36 | |
| | |
|
|
| |
|
|
| |
|
|
| |
|
|
| |
|
|
|
Total Return(a) | | | (15.32 | )% | | | 13.81 | % | | | 36.44 | % | | | (50.49 | )% | | | 19.12 | % |
Ratios/Supplemental Data: | | | | | | | | | | | | | | | | | | | | |
Net assets, end of year (in millions) | | $ | 7.2 | | | $ | 10.1 | | | $ | 11.1 | | | $ | 9.4 | | | $ | 31.5 | |
Ratios to average net assets(b): | | | | | | | | | | | | | | | | | | | | |
Expenses | | | 1.61 | % | | | 1.50 | % | | | 1.39 | % | | | 1.39 | % | | | 1.34 | % |
Net investment income (loss) | | | (.09 | )% | | | .39 | % | | | .70 | % | | | 1.10 | % | | | .70 | % |
Portfolio turnover rate | | | 118 | % | | | 141 | % | | | 89 | % | | | 101 | % | | | 81 | % |
| (a) | Total return is calculated assuming a purchase of a share on the first day and a sale on the last day of each year reported and includes reinvestment of distributions and does not reflect the effect of insurance contract charges. Total return does not reflect expenses associated with the separate account such as administrative fees, account charges and surrender charges which, if reflected, would reduce the total return for all periods shown. Performance figures may reflect voluntary fee waivers and/or expense reimbursements. In the absence of voluntary fee waivers and/or expense reimbursements, the total return would be lower. Past performance is no guarantee of future results. Total returns may reflect adjustments to conform to generally accepted accounting principles. |
| (b) | Does not include expenses of the underlying portfolio in which the Portfolio invests. |
| (c) | Calculation based on average shares outstanding during the year. |
SEE NOTES TO FINANCIAL STATEMENTS.
C1
Financial Highlights
| | | | | | | | | | | | | | | | | | | | |
| | | SP International Value Portfolio
| |
| | | Year Ended December 31,
| |
| | | 2011
| | | 2010
| | | 2009
| | | 2008(c)
| | | 2007
| |
Per Share Operating Performance: | | | | | | | | | | | | | | | | | | | | |
Net Asset Value, beginning of year | | $ | 6.87 | | | $ | 6.35 | | | $ | 4.95 | | | $ | 10.63 | | | $ | 11.40 | |
| | |
|
|
| |
|
|
| |
|
|
| |
|
|
| |
|
|
|
Income (Loss) From Investment Operations: | | | | | | | | | | | | | | | | | | | | |
Net investment income | | | .20 | | | | .12 | | | | .14 | | | | .18 | | | | .24 | |
Net realized and unrealized gain (loss) on investments | | | (1.07 | ) | | | .54 | | | | 1.43 | | | | (4.27 | ) | | | 1.79 | |
| | |
|
|
| |
|
|
| |
|
|
| |
|
|
| |
|
|
|
Total from investment operations | | | (.87 | ) | | | .66 | | | | 1.57 | | | | (4.09 | ) | | | 2.03 | |
| | |
|
|
| |
|
|
| |
|
|
| |
|
|
| |
|
|
|
Less Distributions: | | | (.17 | ) | | | (.14 | ) | | | (.17 | ) | | | (1.59 | ) | | | (2.80 | ) |
| | |
|
|
| |
|
|
| |
|
|
| |
|
|
| |
|
|
|
Net Asset Value, end of year | | $ | 5.83 | | | $ | 6.87 | | | $ | 6.35 | | | $ | 4.95 | | | $ | 10.63 | |
| | |
|
|
| |
|
|
| |
|
|
| |
|
|
| |
|
|
|
Total Return(a) | | | (13.10 | )% | | | 10.81 | % | | | 32.35 | % | | | (44.06 | )% | | | 18.08 | % |
Ratios/Supplemental Data: | | | | | | | | | | | | | | | | | | | | |
Net assets, end of year (in millions) | | $ | 122.8 | | | $ | 211.5 | | | $ | 203.3 | | | $ | 238.5 | | | $ | 493.6 | |
Ratios to average net assets(b): | | | | | | | | | | | | | | | | | | | | |
Expenses | | | 1.10 | % | | | 1.05 | % | | | 1.03 | % | | | 1.02 | % | | | .99 | % |
Net investment income | | | 2.02 | % | | | 1.76 | % | | | 1.82 | % | | | 2.32 | % | | | 1.80 | % |
Portfolio turnover rate | | | 19 | % | | | 25 | % | | | 67 | % | | | 34 | % | | | 46 | % |
| (a) | Total return is calculated assuming a purchase of a share on the first day and a sale on the last day of each year reported and includes reinvestment of distributions and does not reflect the effect of insurance contract charges. Total return does not reflect expenses associated with the separate account such as administrative fees, account charges and surrender charges which, if reflected, would reduce the total return for all periods shown. Performance figures may reflect voluntary fee waivers and/or expense reimbursements. In the absence of voluntary fee waivers and/or expense reimbursements, the total return would be lower. Past performance is no guarantee of future results. Total returns may reflect adjustments to conform to generally accepted accounting principles. |
| (b) | Does not include expenses of the underlying portfolio in which the Portfolio invests. |
| (c) | Calculated based upon average shares outstanding during the year. |
SEE NOTES TO FINANCIAL STATEMENTS.
C2
Financial Highlights
| | | | | | | | | | | | | | | | | | | | |
| | | SP Prudential U.S. Emerging Growth Portfolio
| |
| | | Class I
| |
| | | Year Ended December 31,
| |
| | | 2011
| | | 2010
| | | 2009
| | | 2008
| | | 2007
| |
Per Share Operating Performance: | | | | | | | | | | | | | | | | | | | | |
Net Asset Value, beginning of year | | $ | 7.74 | | | $ | 6.45 | | | $ | 4.58 | | | $ | 8.41 | | | $ | 7.99 | |
| | |
|
|
| |
|
|
| |
|
|
| |
|
|
| |
|
|
|
Income (Loss) From Investment Operations: | | | | | | | | | | | | | | | | | | | | |
Net investment income | | | .04 | | | | .03 | | | | .04 | | | | .04 | | | | .02 | |
Net realized and unrealized gain (loss) on investments | | | .13 | | | | 1.28 | | | | 1.87 | | | | (2.64 | ) | | | 1.31 | |
| | |
|
|
| |
|
|
| |
|
|
| |
|
|
| |
|
|
|
Total from investment operations | | | .17 | | | | 1.31 | | | | 1.91 | | | | (2.60 | ) | | | 1.33 | |
| | |
|
|
| |
|
|
| |
|
|
| |
|
|
| |
|
|
|
Less Distributions | | | (.11 | ) | | | (.02 | ) | | | (.04 | ) | | | (1.23 | ) | | | (.91 | ) |
| | |
|
|
| |
|
|
| |
|
|
| |
|
|
| |
|
|
|
Net Asset Value, end of year | | $ | 7.80 | | | $ | 7.74 | | | $ | 6.45 | | | $ | 4.58 | | | $ | 8.41 | |
| | |
|
|
| |
|
|
| |
|
|
| |
|
|
| |
|
|
|
Total Return(a) | | | 2.22 | % | | | 20.43 | % | | | 41.89 | % | | | (36.23 | )% | | | 16.82 | % |
Ratios/Supplemental Data: | | | | | | | | | | | | | | | | | | | | |
Net assets, end of year (in millions) | | $ | 210.8 | | | $ | 242.4 | | | $ | 142.3 | | | $ | 112.3 | | | $ | 205.8 | |
Ratios to average net assets(b): | | | | | | | | | | | | | | | | | | | | |
Expenses | | | .64 | % | | | .70 | % | | | .71 | % | | | .68 | % | | | .65 | % |
Net investment income | | | .39 | % | | | .69 | % | | | .66 | % | | | .55 | % | | | .24 | % |
Portfolio turnover rate | | | 40 | % | | | 73 | % | | | 50 | % | | | 59 | % | | | 54 | % |
| | | | | | | | | | | | | | | | | | | | |
| | | SP Prudential U.S. Emerging Growth Portfolio
| |
| | | Class II
| |
| | | Year Ended December 31,
| |
| | | 2011
| | | 2010
| | | 2009
| | | 2008
| | | 2007
| |
Per Share Operating Performance: | | | | | | | | | | | | | | | | | | | | |
Net Asset Value, beginning of year | | $ | 7.48 | | | $ | 6.25 | | | $ | 4.44 | | | $ | 8.17 | | | $ | 7.79 | |
| | |
|
|
| |
|
|
| |
|
|
| |
|
|
| |
|
|
|
Income (Loss) From Investment Operations: | | | | | | | | | | | | | | | | | | | | |
Net investment income (loss) | | | — | (c) | | | .01 | | | | .01 | | | | .01 | | | | (.01 | ) |
Net realized and unrealized gain (loss) on investments | | | .13 | | | | 1.24 | | | | 1.81 | | | | (2.53 | ) | | | 1.27 | |
| | |
|
|
| |
|
|
| |
|
|
| |
|
|
| |
|
|
|
Total from investment operations | | | .13 | | | | 1.25 | | | | 1.82 | | | | (2.52 | ) | | | 1.26 | |
| | |
|
|
| |
|
|
| |
|
|
| |
|
|
| |
|
|
|
Less Distributions | | | (.08 | ) | | | (.02 | ) | | | (.01 | ) | | | (1.21 | ) | | | (.88 | ) |
| | |
|
|
| |
|
|
| |
|
|
| |
|
|
| |
|
|
|
Net Asset Value, end of year | | $ | 7.53 | | | $ | 7.48 | | | $ | 6.25 | | | $ | 4.44 | | | $ | 8.17 | |
| | |
|
|
| |
|
|
| |
|
|
| |
|
|
| |
|
|
|
Total Return(a) | | | 1.77 | % | | | 19.96 | % | | | 41.14 | % | | | (36.24 | )% | | | 16.34 | % |
Ratios/Supplemental Data: | | | | | | | | | | | | | | | | | | | | |
Net assets, end of year (in millions) | | $ | .3 | | | $ | .3 | | | $ | .3 | | | $ | .2 | | | $ | .4 | |
Ratios to average net assets(b): | | | | | | | | | | | | | | | | | | | | |
Expenses | | | 1.04 | % | | | 1.10 | % | | | 1.11 | % | | | 1.08 | % | | | 1.05 | % |
Net investment income (loss) | | | (.01 | )% | | | .24 | % | | | .25 | % | | | .15 | % | | | (.16 | )% |
Portfolio turnover rate | | | 40 | % | | | 73 | % | | | 50 | % | | | 59 | % | | | 54 | % |
| (a) | Total return is calculated assuming a purchase of a share on the first day and a sale on the last day of each year reported and includes reinvestment of distributions and does not reflect the effect of insurance contract charges. Total return does not reflect expenses associated with the separate account such as administrative fees, account charges and surrender charges which, if reflected, would reduce the total returns for all years shown. Performance figures may reflect voluntary fee waivers and/or expense reimbursements. In the absence of voluntary fee waivers and/or expense reimbursements, the total return would be lower. Past performance is no guarantee of future results. Total returns may reflect adjustments to conform to generally accepted accounting principles. |
| (b) | Does not include expenses of the underlying portfolios in which the Portfolio invests. |
| (c) | Less than $0.005 per share. |
SEE NOTES TO FINANCIAL STATEMENTS.
C3
Financial Highlights
| | | | | | | | | | | | | | | | | | | | |
| | | SP Small Cap Value Portfolio
| |
| | | Year Ended December 31,
| |
| | | 2011
| | | 2010
| | | 2009
| | | 2008
| | | 2007
| |
Per Share Operating Performance: | | | | | | | | | | | | | | | | | | | | |
Net Asset Value, beginning of year | | $ | 12.28 | | | $ | 9.79 | | | $ | 7.60 | | | $ | 12.22 | | | $ | 13.68 | |
| | |
|
|
| |
|
|
| |
|
|
| |
|
|
| |
|
|
|
Income (Loss) From Investment Operations: | | | | | | | | | | | | | | | | | | | | |
Net investment income | | | .07 | | | | .07 | | | | .07 | | | | .12 | | | | .13 | |
Net realized and unrealized gain (loss) on investments | | | (.41 | ) | | | 2.49 | | | | 2.24 | | | | (3.47 | ) | | | (.64 | ) |
| | |
|
|
| |
|
|
| |
|
|
| |
|
|
| |
|
|
|
Total from investment operations | | | (.34 | ) | | | 2.56 | | | | 2.31 | | | | (3.35 | ) | | | (.51 | ) |
| | |
|
|
| |
|
|
| |
|
|
| |
|
|
| |
|
|
|
Less Distributions: | | | (.08 | ) | | | (.07 | ) | | | (.12 | ) | | | (1.27 | ) | | | (.95 | ) |
| | |
|
|
| |
|
|
| |
|
|
| |
|
|
| |
|
|
|
Net Asset Value, end of year | | $ | 11.86 | | | $ | 12.28 | | | $ | 9.79 | | | $ | 7.60 | | | $ | 12.22 | |
| | |
|
|
| |
|
|
| |
|
|
| |
|
|
| |
|
|
|
Total Return(a) | | | (2.77 | )% | | | 26.27 | % | | | 30.80 | % | | | (30.50 | )% | | | (3.63 | )% |
Ratios/Supplemental Data: | | | | | | | | | | | | | | | | | | | | |
Net assets, end of year (in millions) | | $ | 177.5 | | | $ | 232.7 | | | $ | 208.0 | | | $ | 202.2 | | | $ | 309.4 | |
Ratios to average net assets(b): | | | | | | | | | | | | | | | | | | | | |
Expenses | | | .99 | % | | | 1.00 | % | | | 1.00 | % | | | .98 | % | | | .96 | % |
Net investment income | | | .41 | % | | | .62 | % | | | .70 | % | | | 1.17 | % | | | .81 | % |
Portfolio turnover rate | | | 36 | % | | | 39 | % | | | 52 | % | | | 56 | % | | | 45 | % |
| (a) | Total return is calculated assuming a purchase of a share on the first day and a sale on the last day of each year reported and includes reinvestment of distributions and does not reflect the effect of insurance contract charges. Total return does not reflect expenses associated with the separate account such as administrative fees, account charges and surrender charges which, if reflected, would reduce the total return for all periods shown. Performance figures may reflect voluntary fee waivers and/or expense reimbursements. In the absence of voluntary fee waivers and/or expense reimbursements, the total return would be lower. Past performance is no guarantee of future results. Total returns may reflect adjustments to conform to generally accepted accounting principles. |
| (b) | Does not include expenses of the underlying portfolio in which the Portfolio invests. |
SEE NOTES TO FINANCIAL STATEMENTS.
C4
REPORT OF INDEPENDENT REGISTERED PUBLIC ACCOUNTING FIRM
THE BOARD OF TRUSTEES AND SHAREHOLDERS
THE PRUDENTIAL SERIES FUND:
We have audited the accompanying statements of assets and liabilities of the SP International Growth Portfolio, SP International Value Portfolio, SP Prudential U.S. Emerging Growth Portfolio, and SP Small Cap Value Portfolio (hereafter referred to as the “Portfolios”), each a portfolio of The Prudential Series Fund, including the portfolios of investments, as of December 31, 2011, and the related statements of operations for the year then ended, the statements of changes in net assets for each of the years in the two-year period then ended and the financial highlights for each of the years in the five-year period then ended. These financial statements and financial highlights are the responsibility of the Portfolios’ management. Our responsibility is to express an opinion on these financial statements and financial highlights based on our audits.
We conducted our audits in accordance with the standards of the Public Company Accounting Oversight Board (United States). Those standards require that we plan and perform the audit to obtain reasonable assurance about whether the financial statements and financial highlights are free of material misstatement. An audit includes examining, on a test basis, evidence supporting the amounts and disclosures in the financial statements. Our procedures included confirmation of securities owned as of December 31, 2011, by correspondence with the custodian, transfer agent and brokers or by other appropriate auditing procedures where replies from brokers were not received. An audit also includes assessing the accounting principles used and significant estimates made by management, as well as evaluating the overall financial statement presentation. We believe that our audits provide a reasonable basis for our opinion.
In our opinion, the financial statements and financial highlights referred to above present fairly, in all material respects, the financial position of the Portfolios as of December 31, 2011, and the results of their operations, the changes in their net assets and the financial highlights for the periods described in the first paragraph above, in conformity with U.S. generally accepted accounting principles.
New York, New York
February 17, 2012
D1
INFORMATION ABOUT TRUSTEES AND OFFICERS (Unaudited)
Information about the Trustees and the Officers of the Fund is set forth below. Trustees who are not deemed to be “interested persons” of the Fund, as defined in the 1940 Act, are referred to as “Independent Trustees.” Trustees who are deemed to be “interested persons” of the Fund are referred to as “Interested Trustees.” The Trustees are responsible for the overall supervision of the operations of the Fund and perform the various duties imposed on the directors of investment companies by the 1940 Act.
| | | | |
| Independent Trustees(1) | | | | |
Name, Address, Age
No. of Portfolios Overseen | | Principal Occupation(s) During Past Five Years | | Other Directorships Held |
Susan Davenport Austin (44) No. of Portfolios Overseen: 84 | | Senior Vice President and Chief Financial Officer (Since 2007) and Vice President of Strategic Planning and Treasurer (2002-2007) of Sheridan Broadcasting Corporation; President of Sheridan Gospel Network (Since 2004); Vice President, Goldman, Sachs & Co. (2000-2001); Associate Director, Bear, Stearns & Co. Inc (1997-2000); Vice President, Salomon Brothers Inc (1993-1997); President of the Board, The MacDowell Colony (Since 2010); Chairman of the Board of Directors, Broadcast Music, Inc. (Since 2007); Member of the Board of Directors, Hubbard Radio, LLC (Since 2011); formerly Member of the Board of Directors, National Association of Broadcasters (2004-2010). | | None |
Saul K. Fenster, Ph.D. (78) No. of Portfolios Overseen: 84 | | President Emeritus of New Jersey Institute of Technology (since 2002); formerly President (1978-2002) of New Jersey Institute of Technology; Commissioner (1998-2002) of the Middle States Association Commission on Higher Education; Commissioner (1985-2002) of the New Jersey Commission on Science and Technology; formerly Director (1998-2005) of Society of Manufacturing Engineering Education Foundation; formerly Director of Prosperity New Jersey; formerly a director or trustee of Liberty Science Center, Research and Development Council of New Jersey, New Jersey State Chamber of Commerce, and National Action Council for Minorities in Engineering. | | Formerly Director (2000-2006) of IDT Corporation. |
Delayne Dedrick Gold (73) No. of Portfolios Overseen: 84 | | Marketing Consultant (1982-present); formerly Senior Vice President and Member of the Board of Directors, Prudential Bache Securities, Inc. | | None |
W. Scott McDonald, Jr., Ph.D. (74) No. of Portfolios Overseen: 84 | | Formerly Management Consultant (1997-2004) and of Counsel (2004-2005) at Kaludis Consulting Group, Inc. (company serving higher education); formerly principal (1995-1997), Scott McDonald Associates; Chief Operating Officer (1991-1995), Fairleigh Dickinson University; Executive Vice President and Chief Operating Officer (1975-1991), Drew University; interim President (1988-1990), Drew University; formerly Director of School, College and University Underwriters Ltd. | | None |
Thomas T. Mooney (70) No. of Portfolios Overseen: 84 | | Formerly Chief Executive Officer, Excell Partners, Inc. (2005-2007) formerly President of the Greater Rochester Metro Chamber of Commerce (1976-2004) formerly Rochester City Manager (1973); formerly Deputy Monroe County Executive (1974-1976). | | None |
Thomas M. O’Brien (61) No. of Portfolios Overseen: 84 | | President and COO (since November 2006) and CEO (since April 2007) of State Bancorp, Inc. and State Bank; formerly Vice Chairman (January 1997-April 2000) of North Fork Bank; formerly President and Chief Executive Officer (December 1984-December 1996) of North Side Savings Bank; formerly President and Chief Executive Officer (May 2000-June 2006) Atlantic Bank of New York. | | Director (since April 2008) of Federal Home Loan Bank of New York; formerly Director (December 1996-May 2000) of North Fork Bancorporation, Inc.; formerly Director (May 2000-April 2006) of Atlantic Bank of New York; Director (since November 2006) of State Bancorp, Inc. (NASDAQ: STBC) and State Bank of Long Island. |
F. Don Schwartz (76) No. of Portfolios Overseen: 84 | | Independent Management/Marketing Consultant (since 2002); formerly CEO and President of AceCo, Inc. (1985-2001) (consulting firm specializing in universal/variable life and variable annuity products); formerly Vice President of The Equitable Life Assurance Society; formerly Guest Insurance Professor at the American College, Louisiana State University, Alabama State University and the Insurance Marketing Institute; Advisor to several state insurance commissioners; a Chartered Life Underwriter, Chartered Financial Consultant and Fellow of the Life Insurance Management Institute. | | None. |
E1
| | | | |
| Interested Trustees(1) | | | | |
Name, Address, Age
No. of Portfolios Overseen | | Principal Occupation(s) During Past Five Years | | Other Directorships Held |
Stephen Pelletier (58) No. of Portfolios Overseen: 84 | | President of Prudential Annuities (since September 2008); Chairman and CEO, International Investments, Prudential Financial (since January 1998). | | None |
Robert F. Gunia (65) No. of Portfolios Overseen: 84 | | Independent Consultant (since October 2009); formerly Chief Administrative Officer (September 1999-September 2009) and Executive Vice President (December 1996-September 2009) of Prudential Investments LLC; formerly Executive Vice President (March 1999-September 2009) and Treasurer (May 2000-September 2009) of Prudential Mutual Fund Services LLC; formerly President (April 1999-December 2008) and Executive Vice President and Chief Operating Officer (December 2008-December 2009) of Prudential Investment Management Services LLC; formerly Chief Administrative Officer, Executive Vice President and Director (May 2003-September 2009) of AST Investment Services, Inc. | | Director (since May 1989) of The Asia Pacific Fund, Inc. |
Timothy S. Cronin (46) Number of Portfolios Overseen: 84 | | Chief Investment Officer and Strategist of Prudential Annuities (since January 2004); Director of Investment & Research Strategy (since February 1998); President of AST Investment Services, Inc. (since June 2005). | | None. |
(1) The year that each Trustee joined the Fund’s Board is as follows: Susan Davenport Austin, 2011; Timothy S. Cronin, 2011; Saul K. Fenster, 1983; Delayne Dedrick Gold, 2001; Robert F. Gunia, 2001; W. Scott McDonald, Jr., 1983; Thomas T. Mooney, 2001; Thomas M. O’Brien, 2003; Stephen Pelletier, 2011; F. Don Schwartz, 2003.
| | |
| Fund Officers(a)(1) | | |
Name, Address and Age Position with the Fund | | Principal Occupation(s) During the Past Five Years |
Kathryn L. Quirk (59) Chief Legal Officer | | Vice President and Corporate Counsel (since September 2004) of Prudential; Executive Vice President, Chief Legal Officer and Secretary (since July 2005) of PI and Prudential Mutual Fund Services LLC; Vice President and Corporate Counsel (since June 2005) and Secretary (since February 2006) of AST Investment Services, Inc.; formerly Senior Vice President and Assistant Secretary (November 2004-August 2005) of PI; formerly Assistant Secretary (June 2005-February 2006) of AST Investment Services, Inc.; formerly Managing Director, General Counsel, Chief Compliance Officer, Chief Risk Officer and Corporate Secretary (1997-2002) of Zurich Scudder Investments, Inc. |
Deborah A. Docs (54) Secretary | | Vice President and Corporate Counsel (since January 2001) of Prudential; Vice President (since December 1996) and Assistant Secretary (since March 1999) of PI; formerly Vice President and Assistant Secretary (May 2003-June 2005) of AST Investment Services, Inc. |
Jonathan D. Shain (53) Assistant Secretary | | Vice President and Corporate Counsel (since August 1998) of Prudential; Vice President and Assistant Secretary (since May 2001) of PI; Vice President and Assistant Secretary (since February 2001) of PMFS; formerly Vice President and Assistant Secretary (May 2003-June 2005) of AST Investment Services, Inc. |
Claudia DiGiacomo (37) Assistant Secretary | | Vice President and Corporate Counsel (since January 2005) of Prudential; Vice President and Assistant Secretary of PI (since December 2005); Associate at Sidley Austin Brown Wood LLP (1999-2004). |
John P. Schwartz (40) Assistant Secretary | | Vice President and Corporate Counsel (since April 2005) of Prudential; Vice President and Assistant Secretary of PI (since December 2005); Associate at Sidley Austin Brown Wood LLP (1997-2005). |
Andrew R. French (49) Assistant Secretary | | Vice President and Corporate Counsel (since February 2010) of Prudential; formerly Director and Corporate Counsel (2006-2010) of Prudential; Vice President and Assistant Secretary (since January 2007) of PI; Vice President and Assistant Secretary (since January 2007) of PMFS. |
Timothy J. Knierim (53) Chief Compliance Officer | | Chief Compliance Officer of Prudential Investment Management, Inc. (since July 2007); formerly Chief Risk Officer of PIM and PI (2002-2007) and formerly Chief Ethics Officer of PIM and PI (2006-2007). |
Valerie M. Simpson (53) Deputy Chief Compliance Officer | | Chief Compliance Officer (since April 2007) of PI and AST Investment Services, Inc.; formerly Vice President-Financial Reporting (June 1999-March 2006) for Prudential Life and Annuities Finance. |
Theresa C. Thompson (49) Deputy Chief Compliance Officer | | Vice President, Compliance, PI (since April 2004); and Director, Compliance, PI (2001 - 2004). |
Richard W. Kinville (43) Anti-Money Laundering Compliance Officer | | Vice President, Corporate Compliance, Anti-Money Laundering Unit (since January 2005) of Prudential; committee member of the American Council of Life Insurers Anti-Money Laundering and Critical Infrastructure Committee (since January 2007); formerly Investigator and Supervisor in the Special Investigations Unit for the New York Central Mutual Fire Insurance Company (August 1994-January 1999); Investigator in AXA Financial’s Internal Audit Department and Manager in AXA’s Anti-Money Laundering Office (January 1999-January 2005); first chair of the American Council of Life Insurers Anti-Money Laundering and Critical Infrastructure Committee (June 2007-December 2009 ). |
Grace C. Torres (52) Treasurer and Principal Financial and Accounting Officer | | Assistant Treasurer (since March 1999) and Senior Vice President (since September 1999) of PI; Assistant Treasurer (since May 2003) and Vice President (since June 2005) of AST Investment Services, Inc.; Senior Vice President and Assistant Treasurer (since May 2003) of Prudential Annuities Advisory Services, Inc.; formerly Senior Vice President (May 2003-June 2005) of AST Investment Services, Inc. |
E2
| | |
| Fund Officers(a)(1) | | |
Name, Address and Age Position with the Fund | | Principal Occupation(s) During the Past Five Years |
M. Sadiq Peshimam (48) Assistant Treasurer | | Vice President (since 2005) of Prudential Investments LLC. |
Peter Parrella (53) Assistant Treasurer | | Vice President (since 2007) and Director (2004-2007) within Prudential Mutual Fund Administration; formerly Tax Manager at SSB Citi Fund Management LLC (1997-2004). |
Alan Fu (55) Assistant Treasurer | | Vice President and Corporate Counsel - Tax, Prudential Financial, Inc. (since October 2003). |
(a) Excludes Mr. Pelletier and Mr. Cronin, interested Board Members who also serve as President and Vice President, respectively.
(1) The year in which each individual became an Officer of the Fund is as follows: Kathryn L. Quirk, 2005; Deborah A. Docs, 2005; Jonathan D. Shain, 2005; Claudia DiGiacomo, 2005; John P. Schwartz, 2006; Andrew R. French, 2006; Timothy J. Knierim, 2007; Valerie M. Simpson, 2007; Theresa C. Thompson, 2008; Grace C. Torres, 1997; Peter Parrella, 2007; M. Sadiq Peshimam, 2006; Alan Fu, 2006; Richard W. Kinville, 2011.
Explanatory Notes to Tables:
Trustees are deemed to be “Interested”, as defined in the 1940 Act, by reason of their affiliation with Prudential Investments LLC and/or an affiliate of Prudential Investments LLC. Stephen Pelletier and Timothy Cronin are Interested Trustees because they are employed by an affiliate of the Manager of the Fund. Robert F. Gunia will be considered an Interested Trustee for at least two years after his retirement from employment by the Manager and its affiliates (which was on or about October 21, 2009). He will also be an Interested Trustee as long as he holds a beneficial interest in securities issued by the Manager or its affiliates.
Unless otherwise noted, the address of all Trustees and Officers is c/o Prudential Investments LLC, Gateway Center Three, 100 Mulberry Street, Newark, New Jersey 07102.
There is no set term of office for Trustees or Officers. The Independent Trustees have adopted a retirement policy, which calls for the retirement of Trustees on December 31 of the year in which they reach the age of 78, provided that the Board may extend the retirement age on a year-by-year basis for a Trustee.
“Other Directorships Held” includes only directorships of companies required to register or file reports with the SEC under the Securities Exchange Act of 1934 (that is, “public companies”) or other investment companies registered under the 1940 Act.
“No. of Portfolios Overseen” includes all investment companies managed by Prudential Investments LLC (PI) and/or AST Investment Services, Inc. (ASTI) (collectively, the Manager) that are overseen by the Trustee. The investment companies for which PI and/or ASTI serves as Manager include The Prudential Variable Contract Accounts, The Prudential Series Fund, Advanced Series Trust and Prudential’s Gibraltar Fund, Inc.
E3
Board Consideration of New Subadvisory Agreement: SP International Growth Portfolio:
The Boards of Trustees of The Prudential Series Fund (the “Trust”) consists of ten (10) individuals, seven (7) of whom are Independent Trustees. The SP International Growth Portfolio (the “Portfolio”) is a series of the Trust. The Board of Trustees is responsible for the oversight of the Portfolio and its operations, and performs the various duties imposed on the trustees of investment companies by the Investment Company Act of 1940, as amended (the “1940 Act”). The Independent Trustees have retained independent legal counsel to assist them in connection with their duties. The Chairman of each Board of Trustees is an Independent Trustee. The Boards of Trustees have established four standing committees in connection with the governance of the Trust: the Audit Committee, the Governance Committee, the Compliance Committee, and the Investment Review and Risk Committee. Each committee is chaired by an Independent Trustee.
Board Consideration of New Subadvisory Agreement
At an in-person meeting of the Board held on December 7, 2011, at which all of the Trustees of the Trust were in attendance, including all of the Independent Trustees, the Board approved, based upon the recommendation of Prudential Investments LLC (the “Manager”) a new subadvisory agreement between Jennison Associates LLC (“Jennison”) and the Manager. The Board of Trustees also approved submitting the new subadvisory agreement (the “New Subadvisory Agreement”) to Portfolio shareholders for their approval. Before approving the New Subadvisory Agreement, the Trustees reviewed investment performance and organizational materials regarding Jennison and its proposed portfolio management team and received a formal presentation from the Manager.
At the meeting, the Board received and considered a presentation by the Manager that detailed the reasons why it recommended that the Board appoint Jennison as an additional subadviser for the Portfolio. The Manager recommended that the Board approve a new agreement with Jennison to assume responsibility for managing a portion of the Portfolio’s assets. In approving the agreement, the Trustees, including the Independent Trustees advised by independent legal counsel, considered the factors they deemed relevant, including the nature, quality and extent of services provided, the performance of the Portfolio, the profitability of the Manager and its affiliates, expenses and fees, and the potential for economies of scale that may be shared with the Portfolio and its shareholders.
Nature, quality and extent of services
The Board received and considered information regarding the nature and extent of services provided to the Portfolio by Marsico and William Blair (the Portfolio’s existing subadvisers) under the current subadvisory agreements and those that would be provided by Jennison under the New Subadvisory Agreement, noting that the nature and extent of services under the existing and new agreements were generally similar in that Marsico, William Blair and Jennison were each required to provide day-to-day portfolio management services and comply with all Portfolio policies and applicable rules and regulations.
With respect to the quality of services, the Board considered, among other things, the background and experience of the Jennison management team. The Board met with representatives from Jennison and reviewed the qualifications, backgrounds and responsibilities of the portfolio managers who would be responsible for the day-to-day management of the Portfolio. The Board was also provided with information pertaining to the organizational structure, senior management, investment operations, and other relevant information pertaining to Jennison. The Board noted that because Jennison already provided subadvisory services to several other portfolios of the Trust, it was generally familiar with Jennison’s organizational, compliance and management structure. The Board noted that it received a favorable report from the Chief Compliance Officer of the Trust regarding Jennison’s compliance policies and procedures.
The Board concluded that it was satisfied with the nature, extent and quality of the investment subadvisory services anticipated to be provided to the Portfolio by Jennison and that there was a reasonable basis on which to conclude that the Portfolio would benefit from the subadvisory services to be provided by Jennison under the new subadvisory agreement.
Performance
The Board received and considered information regarding the performance of other Trust portfolios managed by Jennison, and other accounts managed by the Jennison portfolio managers that used international growth investment strategies. The Board concluded that it was satisfied with these performance records.
Investment Subadvisory Fee Rate
The Board considered the proposed subadvisory fee rate payable by the Manager to Jennison under the proposed New Subadvisory Agreement. Based on the recent asset levels for the Portfolio, the Board noted that the effective subadvisory fee rate to be paid to Jennison under the proposed subadvisory arrangements were lower than the effective subadvisory fee rate paid to Marsico, but higher than the effective subadvisory fee rate paid to William Blair under the current subadvisory arrangements. The Board also noted that the Manager pays the subadvisory fees, and therefore any change in the proposed subadvisory fee rates would not have any impact on the amount of fees paid by the Portfolio. The Board indicated that the net investment management fees to be retained by the Manager under the proposed subadvisory arrangements would be reviewed in connection with future annual reviews of the Trust’s advisory agreements. Overall, the Board concluded that the proposed subadvisory fee rate under the New Subadvisory Agreement was reasonable.
Profitability
Because the engagement of Jennison with respect to the Portfolio was new, there is no historical profitability with regard to the proposed subadvisory arrangements with the Portfolio. As a result, the Board did not consider this factor. The Board noted that profitability would be reviewed annually in connection with any proposed future renewal of the Trust’s investment management agreements or the subadvisory agreement for the Portfolio.
Economies of Scale
The Board noted that the proposed subadvisory fee schedule for the Portfolio contained breakpoints that reduce the fee rate on assets above specified levels. The Board also noted that it would consider economies of scale in connection with the annual approval review of advisory agreements.
Other Benefits to the Subadviser or its Affiliates from Serving as Subadviser
The Board considered potential ancillary benefits that might be received by Jennison and its affiliates as a result of its relationships with the Portfolio. The Board concluded that the potential benefits to be derived by Jennison included the ability to use soft dollar credits, brokerage commissions received by affiliates of Jennison, as well as the potential benefits consistent with those generally resulting from an increase in assets under management, specifically, potential access to additional research resources and benefits to Jennison’s reputation. The Board concluded that the benefits to be derived by Jennison were consistent with the types of benefits generally derived by subadvisers to mutual funds.
Conclusion
After full consideration of these factors, the Board concluded that the approval of the New Subadvisory Agreement was in the best interests of the Portfolio and its shareholders and recommended that shareholders of the Portfolio vote to approve the New Subadvisory Agreement.*
| * | Note: A shareholder meeting to consider the New Subadvisory Agreement is scheduled for March 15, 2012. |
Annuities are issued by Pruco Life Insurance Company, or in New York, Pruco Life Insurance Company of New Jersey, both located at 213 Washington Street, Newark, NJ 07102-2992, and Prudential Annuities Life Assurance Corporation, located at One Corporate Drive, Shelton, CT, 06484. Variable annuities are distributed by Prudential Annuities Distributors, Inc., also located in Shelton, CT. Prudential Annuities is a business unit of Prudential Financial.
Variable life insurance is issued by The Prudential Insurance Company of America, 751 Broad Street, Newark, NJ 07102-3777, Pruco Life Insurance Company, or in New York, Pruco Life Insurance Company of New Jersey, both located at 213 Washington Street, Newark, NJ 07102-2992. Pruco Life Insurance Company is not licensed to do business in New York. Variable life insurance is offered through Pruco Securities LLC, 751 Broad Street, Newark, NJ 07102-3777.
All are Prudential Financial companies, and each is solely responsible for its financial condition and contractual obligations.
Life insurance and annuity contracts contain exclusions, limitations, reductions of benefits, and terms for keeping them in force. Your licensed financial professional can provide you with costs and complete details. Contract guarantees are based on the claims-paying ability of the issuing company.
| | | | |

The Prudential Insurance Company of America 751 Broad Street Newark, NJ 07102-3777 | | | | PRESORTED STD U.S. POSTAGE PAID HARRISONBURG, VA PERMIT No. 250 ZIP CODE 22801 |
| | | | |
| | | | |
| | | | |
The Audited Financial Statements of Pruco Life Insurance Company, Pruco Life Insurance Company of New Jersey, and The Prudential Insurance Company of America are available upon request. You may call (888)778-2888 to obtain a free copy of the audited financial statements of the insurance company that issued your contract.
To reduce costs, we now generally send only a single copy of prospectuses and shareholder reports to each household (householding) in lieu of sending a copy to each Contract Owner who resides in the household. You should be aware that by calling (877)778-5008, you can revoke, or “opt out,” of householding at any time.
Prudential Investments, Prudential, the Prudential logo, and the Rock symbol are service marks of Prudential Financial, Inc. and its related entities, registered in many jurisdictions worldwide.
To learn more about Prudential Financial, go to www.prudential.com, or scan the code below.

0172280-00003-00 PSF-AR-B

THE PRUDENTIAL SERIES FUND
ANNUAL REPORT Ÿ DECEMBER 31, 2011
Jennison 20/20 Focus Portfolio
This report is one of several that provides financial information about certain investment choices available under variable life insurance and variable annuity contracts. Based on the variable contract you own or the portfolios you invested in, you may receive additional reports that provide financial information on those investment choices. Please refer to your variable life insurance or variable annuity contract prospectus to determine which portfolios are available to you.
Please note that this document may include prospectus supplements that are separate from and not a part of the annual report.

This report must be preceded or accompanied by the current prospectuses for the Prudential Series Fund portfolios and the applicable variable life or annuity contract. The prospectuses contain information on the investment objectives, risks, and charges and expenses of the portfolios, and the contract and should be read carefully.
A description of the Fund’s proxy voting policies and procedures is available, without charge, upon request. Owners of variable annuity contracts should call (888)778-2888, and owners of variable life insurance contracts should call (800)778-2255 to obtain descriptions of the Fund’s proxy voting policies and procedures. Information regarding how the Fund voted proxies relating to portfolio securities during the most recent 12-month period ended June 30 is available on the website of the Securities and Exchange Commission (the Commission) at www.sec.gov and on the Fund’s website at www.prudential.com.
The Fund files with the Commission a complete listing of portfolio holdings as of its first and third quarter-end on Form N-Q. Form N-Q is available on the Commission’s website at www.sec.gov or by visiting the Commission’s Public Reference Room. For more information on the Commission’s Public Reference Room, please visit the Commission’s website or call (800)SEC-0330. Form N-Q is also available on the Fund’s website or by calling the telephone numbers referenced above, for variable annuity and variable life insurance contract owners.
The Fund’s Statement of Additional Information contains additional information about the Fund’s Trustees and is available without charge upon request by calling (888)778-2888.
This report may include financial information pertaining to certain portfolios that are not available through the variable life insurance policy or variable annuity contract that you have chosen. Please refer to your variable life insurance or variable annuity prospectus to determine which portfolios are available to you.
| | | | |
The Prudential Series Fund Table of Contents | | Annual Report | | December 31, 2011 |
| n | | LETTER TO CONTRACT OWNERS |
| n | | PRESENTATION OF PORTFOLIO HOLDINGS |
| n | | FEES AND EXPENSES TABLE |
| | |
| Section A | | Schedule of Investments and Financial Statements |
| Section B | | Notes to Financial Statements |
| Section C | | Financial Highlights |
| Section D | | Report of Independent Registered Public Accounting Firm |
| Section E | | Information about Trustees and Officers |
| | | | |
The Prudential Series Fund Letter to Contract Owners | | Annual Report | | December 31, 2011 |
At Prudential, our primary objective is to help investors achieve and maintain long-term financial success. This Prudential Series Fund annual report outlines our efforts to achieve this goal. We hope you find it informative and useful.
Prudential has been building on a heritage of success for more than 135 years. The quality of our businesses and risk diversification has enabled us to manage effectively through volatile markets over time. We believe the array of our products provides a highly attractive value proposition to clients like you who are focused on financial security.
Your financial professional is the best resource to help you make the most informed investment decisions. Together, you can build a diversified investment portfolio that aligns with your long-term financial goals. Please keep in mind that diversification and asset allocation strategies do not assure a profit or protect against loss in declining markets.
Thank you for selecting Prudential as one of your financial partners. We value your trust and appreciate the opportunity to help you achieve financial security.
Sincerely,
Stephen Pelletier
President,
The Prudential Series Fund | January 31, 2012 |
PRESIDENT
STEPHEN PELLETIER
| | |
The Prudential Series Fund, Jennison 20/20 Focus Portfolio | | December 31, 2011 |
Investment Manager’s Report - As of December 31, 2011
| | | | | | | | | | | | |
| Average Annual Total Returns | | 1-Year | | | 5-Year | | | 10-Year | |
Portfolio: Class I | | | -4.17 | % | | | 1.88 | % | | | 5.91 | % |
Portfolio: Class II | | | -4.51 | | | | 1.49 | | | | 5.49 | |
Russell 1000® Index | | | 1.50 | | | | -0.02 | | | | 3.34 | |
S&P 500 Index | | | 2.09 | | | | -0.25 | | | | 2.92 | |
Past performance does not guarantee future returns. The investment return and principal value of an investment will fluctuate, so that an investor’s shares, when redeemed, may be worth more or less than their original cost. Current performance may be lower or higher than the past performance data quoted.
Portfolio performance is net of investment fees and fund expenses, but not product charges, which, if included, would significantly lower the performance quoted. The Russell 1000® Index is a trademark/service mark of the Frank Russell Company. Russell® is a trademark of the Frank Russell Company. Performance figures may reflect fee waivers and/or expense reimbursements. In the absence of such
$10,000 INVESTED OVER 10 YEARS
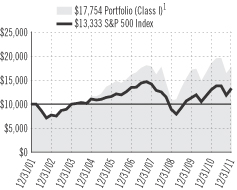
fee waivers and/or expense reimbursements, total returns would be lower.
For the year ended December 31, 2011, The Jennison 20/20 Focus Portfolio Class I shares declined by 4.17% and Class II shares declined by 4.51%.
The Portfolio is subadvised by Jennison Associates LLC (Jennison). The Portfolio’s investment objective is long-term growth of capital. The Jennison 20/20 Focus Portfolio is concentrated, holding up to 45 stocks, consisting of approximately 20 growth and 20 value stocks. The key component of the investment philosophy is portfolio construction through a bottom-up stock selection process. In a concentrated portfolio, prudent stock selection is especially important. The portfolio managers purchase stocks in which they have a high level of conviction for outperformance in the intermediate and long term, with limited downside potential in the short term.
The Portfolio underperformed the S&P 500 Index during the year.
The Growth segment trailed the return of the Russell 1000 Growth Index and the S&P 500 largely due to stock selection in energy, information technology, and financials. In energy, oil services company Schlumberger was adversely affected by falling energy prices, though it continues to develop new products and technologies. It provides dominant market share in what Jennison considers important long-term growth markets.
Stock selection and an underweight position in healthcare was also a source of relative weakness, driven mostly by Express Scripts. Other key detractors were found in the information technology sector and included Salesforce.com, Oracle, and EMC Corp. The Portfolio’s industrials positions added to relative gains, led by Precision Castparts. Its shares rose on an improved outlook for its industrial gas turbine operations and solid growth in its investment cast products and forged products aerospace business.
Despite relative weakness in the sector, information technology positions Apple and Baidu were notable contributors, while consumer discretionary stock Starbucks also enjoyed outsized gains.
The Value segment trailed the Russell 1000 Value Index. In Jennison’s view, investors’ desire for perceived safety, rather than a focus on fundamentals, was rewarded as macro-economic concerns appeared to take precedence. Stock selection hindered results in the materials, energy and information technology sectors, while it helped performance relative to the Russell 1000 Value Index in financials.
General Motors was the largest detractor from performance due to its oversized pension liability relative to its market capitalization, and the fact that low interest rates make the pension liability even higher. Given the deteriorating situation in Europe, consumers are increasingly wary of buying expensive discretionary goods, which also weighed on share price. Nevertheless, Jennison continues to view General Motors as attractively valued, given the company’s strong balance sheet and track record of capital management.
Materials holdings Freeport-McMoRan Copper & Gold and Mosaic Co. also experienced large declines, while Flextronics International from the information technology sector also detracted. Consumer stocks — staples and discretionary — dominated positive contributors and included H&R Block, Tyson Foods, Kraft Foods, and Viacom. Shares of H&R Block appreciated considerably earlier this year, primarily on solid trends during tax season.
The Portfolio no longer holds positions in Express Scripts and EMC Corp.
Prudential Investments LLC (PI), an indirect, wholly owned subsidiary of Prudential Financial, Inc., serves as the investment manager for the Fund.
| 1 | The graph is based on the performance of Class I shares. Performance of Class II shares will be lower due to differences in the fee structure. Class II shares have associated 12b-1 and administrative fees at an annual rate of 0.25% and 0.15%, respectively, of the average daily net assets of the Class II shares. |
Russell 1000® Index is an unmanaged market cap-weighted index that measures the performance of the 1,000 largest companies in the Russell 3000 Index, which represents approximately 92% of the total market. S&P 500 Index is an unmanaged, market value-weighted index of 500 stocks generally representative of the broad stock market. These returns do not include the effect of any investment management expenses. These returns would have been lower if they included the effect of these expenses. Investors cannot invest directly in a market index. For a complete list of holdings, refer to the Schedule of Investments section of this report.
Jennison Associates LLC is a registered investment advisor and a Prudential Financial company
| | |
The Prudential Series Fund Presentation of Portfolio Holdings — unaudited | | December 31, 2011 |
| | | | |
| Jennison 20/20 Focus | | | | |
| Five Largest Holdings | | | (% of Net Assets | ) |
| Apple, Inc. | | | 4.4% | |
| Precision Castparts Corp. | | | 3.1% | |
| Anadarko Petroleum Corp. | | | 3.0% | |
| Mosaic Co. (The) | | | 2.9% | |
| International Game Technology | | | 2.9% | |
For a complete list of holdings, please refer to the Schedule of Investments section of this report. Holdings reflect only long-term investments. Holdings/Issues/Sectors/Industries are subject to change.
| | |
The Prudential Series Fund Fees and Expenses — unaudited | | December 31, 2011 |
As a contract owner investing in Portfolios of the Fund through a variable annuity or variable life contract, you incur ongoing costs, including management fees, and other Portfolio expenses. This example is intended to help you understand your ongoing costs (in dollars) of investing in the Fund and to compare these costs with the ongoing costs of investing in other investment options. This example does not reflect fees and charges under your variable annuity or variable life contract. If contract charges were included, the costs shown below would be higher. Please consult the prospectus for your contract for more information about contract fees and charges.
The example is based on an investment of $1,000 invested at the beginning of the period and held for the entire period July 1, 2011 through December 31, 2011.
Actual Expenses
The first line of the table below provides information about actual account values and actual expenses. You may use this information, together with the amount you invested, to estimate the Portfolio expenses that you paid over the period. Simply divide your account value by $1,000 (for example, an $8,600 account value divided by $1,000 = 8.6), then multiply the result by the number in the first line under the heading entitled “Expenses Paid During the Six-Month Period” to estimate the Portfolio expenses you paid on your account during this period. As noted above, the table does not reflect variable contract fees and charges.
Hypothetical Example for Comparison Purposes
The second line of the table below provides information about hypothetical account values and hypothetical expenses based on the Portfolio’s actual expense ratio and an assumed rate of return of 5% per year before expenses, which is not the Portfolio’s actual return. The hypothetical account values and expenses may not be used to estimate the actual ending account balance or expenses you paid for the period. You may use this information to compare the ongoing costs of investing in the Portfolio and other investment options. To do so, compare this 5% hypothetical example with the 5% hypothetical examples that appear in the shareholder reports of the other investment options.
Please note that the expenses shown in the table are meant to highlight your ongoing Portfolio costs only and do not reflect any contract fees and charges, such as sales charges (loads), insurance charges or administrative charges. Therefore the second line of the table is useful to compare ongoing investment option costs only, and will not help you determine the relative total costs of owning different contracts. In addition, if these contract fee and charges were included, your costs would have been higher.
| | | | | | | | | | | | | | | | | | |
| The Prudential Series Fund Portfolios | | Beginning Account Value
July 1, 2011 | | | Ending Account Value
December 31, 2011 | | | Annualized Expense Ratio based on the
Six-Month period | | | Expenses Paid
During the
Six-Month period* | |
| Jennison 20/20 Focus (Class I) | | Actual | | $ | 1,000.00 | | | $ | 904.10 | | | | 0.81 | % | | $ | 3.89 | |
| | | Hypothetical | | $ | 1,000.00 | | | $ | 1,021.12 | | | | 0.81 | % | | $ | 4.13 | |
| Jennison 20/20 Focus (Class II) | | Actual | | $ | 1,000.00 | | | $ | 902.50 | | | | 1.21 | % | | $ | 5.80 | |
| | | Hypothetical | | $ | 1,000.00 | | | $ | 1,019.11 | | | | 1.21 | % | | $ | 6.16 | |
* Portfolio expenses (net of fee waivers or subsidies, if any) for each share class are equal to the annualized expense ratio for each share class (provided in the table), multiplied by the average account value over the period, multiplied by the 184 days in the six-month period ended December 31, 2011, and divided by the 365 days in the Portfolio’s fiscal year ended December 31, 2011 (to reflect the six-month period). Expenses presented in the table include the expenses of any underlying portfolios in which the Portfolio may invest.
| | | | | | |
| | | JENNISON 20/20 FOCUS PORTFOLIO | | |
| |
| SCHEDULE OF INVESTMENTS | | December 31, 2011 |
| | | | | | | | |
| LONG-TERM INVESTMENTS — 97.1% | |
| COMMON STOCKS | | Shares
| | | Value
(Note 2)
| |
| | | | | | | | | |
Aerospace & Defense — 3.1% | |
Precision Castparts Corp. | | | 84,161 | | | $ | 13,868,891 | |
| | | | | | |
|
|
|
Auto Components — 2.7% | |
Lear Corp. | | | 304,256 | | | | 12,109,389 | |
| | | | | | |
|
|
|
Automobiles — 2.1% | | | | | | | | |
General Motors Co.*(a) | | | 455,340 | | | | 9,229,742 | |
| | | | | | |
|
|
|
Biotechnology — 2.2% | | | | | | | | |
Celgene Corp.* | | | 145,773 | | | | 9,854,255 | |
| | | | | | |
|
|
|
Chemicals — 5.3% | | | | | | | | |
Monsanto Co. | | | 148,471 | | | | 10,403,363 | |
Mosaic Co. (The) | | | 256,342 | | | | 12,927,327 | |
| | | | | | |
|
|
|
| | | | | | | | 23,330,690 | |
| | | | | | |
|
|
|
Communications Equipment — 1.9% | |
QUALCOMM, Inc. | | | 155,491 | | | | 8,505,358 | |
| | | | | | |
|
|
|
Computers & Peripherals — 4.4% | |
Apple, Inc.* | | | 48,121 | | | | 19,489,005 | |
| | | | | | |
|
|
|
Electronic Equipment & Instruments — 2.4% | |
Flextronics International Ltd.* | | | 1,903,259 | | | | 10,772,446 | |
| | | | | | |
|
|
|
Energy Equipment & Services — 3.8% | |
National Oilwell Varco, Inc. | | | 123,511 | | | | 8,397,513 | |
Schlumberger Ltd. | | | 122,836 | | | | 8,390,927 | |
| | | | | | |
|
|
|
| | | | | | | | 16,788,440 | |
| | | | | | |
|
|
|
Food Products — 8.1% | | | | | | | | |
Bunge Ltd. | | | 204,655 | | | | 11,706,266 | |
Kraft Foods, Inc. (Class A Stock) | | | 328,773 | | | | 12,282,959 | |
Tyson Foods, Inc. (Class A Stock) | | | 576,832 | | | | 11,905,813 | |
| | | | | | |
|
|
|
| | | | | | | | 35,895,038 | |
| | | | | | |
|
|
|
Hotels, Restaurants & Leisure — 5.4% | |
International Game Technology | | | 732,328 | | | | 12,596,042 | |
Starbucks Corp. | | | 243,721 | | | | 11,213,603 | |
| | | | | | |
|
|
|
| | | | | | | | 23,809,645 | |
| | | | | | |
|
|
|
Insurance — 2.6% | | | | | | | | |
MetLife, Inc. | | | 372,768 | | | | 11,622,906 | |
| | | | | | |
|
|
|
Internet & Catalog Retail — 2.5% | |
Amazon.com, Inc.* | | | 62,832 | | | | 10,876,219 | |
| | | | | | |
|
|
|
Internet Software & Services — 5.1% | |
Baidu, Inc. (China), ADR* | | | 84,402 | | | | 9,830,301 | |
Google, Inc. (Class A Stock)* | | | 19,366 | | | | 12,508,499 | |
| | | | | | |
|
|
|
| | | | | | | | 22,338,800 | |
| | | | | | |
|
|
|
IT Services — 2.0% | | | | | | | | |
Mastercard, Inc. (Class A Stock) | | | 23,325 | | | | 8,696,027 | |
| | | | | | |
|
|
|
Media — 7.5% | | | | | | | | |
Comcast Corp. (Class A Stock) | | | 463,060 | | | | 10,979,153 | |
Liberty Global, Inc., Ser. C* | | | 269,875 | | | | 10,665,460 | |
Viacom, Inc. (Class B Stock) | | | 254,233 | | | | 11,544,720 | |
| | | | | | |
|
|
|
| | | | | | | | 33,189,333 | |
| | | | | | |
|
|
|
Metals & Mining — 5.0% | |
Freeport-McMoRan Copper & Gold, Inc. | | | 301,681 | | | | 11,098,844 | |
Goldcorp, Inc. | | | 242,868 | | | | 10,746,909 | |
| | | | | | |
|
|
|
| | | | | | | | 21,845,753 | |
| | | | | | |
|
|
|
| | | | | | | | |
COMMON STOCKS
(continued) | | Shares
| | | Value
(Note 2)
| |
| | | | | | | | | |
Oil, Gas & Consumable Fuels — 8.0% | |
Anadarko Petroleum Corp. | | | 174,859 | | | $ | 13,346,988 | |
Southwestern Energy Co.* | | | 310,326 | | | | 9,911,812 | |
Suncor Energy, Inc. | | | 416,296 | | | | 12,001,814 | |
| | | | | | |
|
|
|
| | | | | | | | 35,260,614 | |
| | | | | | |
|
|
|
Personal Products — 2.4% | |
Estee Lauder Cos., Inc.
(The) (Class A Stock) | | | 95,112 | | | | 10,682,980 | |
| | | | | | |
|
|
|
Pharmaceuticals — 4.9% | |
Allergan, Inc. | | | 123,307 | | | | 10,818,956 | |
Shire PLC (Ireland), ADR | | | 101,927 | | | | 10,590,215 | |
| | | | | | |
|
|
|
| | | | | | | | 21,409,171 | |
| | | | | | |
|
|
|
Software — 4.1% | |
Oracle Corp. | | | 376,158 | | | | 9,648,453 | |
Salesforce.com, Inc.* | | | 83,503 | | | | 8,472,214 | |
| | | | | | |
|
|
|
| | | | | | | | 18,120,667 | |
| | | | | | |
|
|
|
Specialty Retail — 2.6% | |
Staples, Inc. | | | 822,369 | | | | 11,422,705 | |
| | | | | | |
|
|
|
Textiles, Apparel & Luxury Goods — 3.6% | |
Lululemon Athletica, Inc.*(a) | | | 163,118 | | | | 7,611,086 | |
Ralph Lauren Corp. | | | 61,413 | | | | 8,479,907 | |
| | | | | | |
|
|
|
| | | | | | | | 16,090,993 | |
| | | | | | |
|
|
|
Wireless Telecommunication Services — 5.4% | |
American Tower Corp. | | | 140,044 | | | | 8,404,040 | |
MetroPCS Communications, Inc.* | | | 1,147,727 | | | | 9,962,270 | |
NII Holdings, Inc.* | | | 251,708 | | | | 5,361,381 | |
| | | | | | |
|
|
|
| | | | | | | | 23,727,691 | |
| | | | | | |
|
|
|
TOTAL LONG-TERM INVESTMENTS
(cost $373,710,685) | | | | 428,936,758 | |
| | | | | | |
|
|
|
| SHORT-TERM INVESTMENT — 6.2% | |
Affiliated Money Market Mutual Fund | |
Prudential Investment Portfolios 2 — Prudential Core Taxable Money Market Fund
(cost $27,507,632; includes $14,222,457 of cash collateral received for securities on loan)(Note 4)(b)(c) | | | 27,507,632 | | | | 27,507,632 | |
| | | | | | |
|
|
|
TOTAL INVESTMENTS — 103.3%
(cost $401,218,317) | | | | 456,444,390 | |
LIABILITIES IN EXCESS OF
OTHER ASSETS — (3.3)% | | | | (14,708,774 | ) |
| | | |
|
|
|
NET ASSETS — 100.0% | | | $ | 441,735,616 | |
| | | | | | |
|
|
|
The following abbreviation is used in portfolio descriptions:
| | |
| ADR | | American Depositary Receipt |
| * | Non-income producing security. |
| (a) | All or a portion of security is on loan. The aggregate market value of such securities, including those sold and pending settlement, is $13,862,452; cash collateral of $14,222,457 (included in liabilities) was received with which the Portfolio purchased highly liquid short-term investments. |
SEE NOTES TO FINANCIAL STATEMENTS.
A1
| | | | | | |
| | | JENNISON 20/20 FOCUS PORTFOLIO (continued) | | |
| |
| SCHEDULE OF INVESTMENTS | | December 31, 2011 |
| (b) | Represents security, or a portion thereof, purchased with cash collateral received for securities on loan. |
| (c) | Prudential Investments LLC, the manager of the Portfolio, also serves as manager of the Prudential Investment Portfolios 2 — Prudential Core Taxable Money Market Fund. |
Various inputs are used in determining the value of the Portfolio's investments. These inputs are summarized in the three broad levels listed below.
| Level 1— | quoted prices generally for securities actively traded on a regulated securities exchange and for open-end mutual funds which trade at daily net asset value. |
| Level 2— | other significant observable inputs (including, but not limited to, quoted prices for similar securities, interest rates, prepayment speeds, foreign currency exchange rates, and amortized cost) generally for debt securities, swaps, forward foreign currency contracts and for foreign stocks priced using vendor modeling tools. |
| Level 3— | significant unobservable inputs for securities valued in accordance with Board approved fair valuation procedures. |
The following is a summary of the inputs used as of December 31, 2011 in valuing such portfolio securities:
| | | | | | | | | | | | |
| | | Level 1
| | | Level 2
| | | Level 3
| |
Investments in Securities | | | | | | | | | | | | |
Common Stocks | | $ | 428,936,758 | | | $ | — | | | $ | — | |
Affiliated Money Market Mutual Fund | | | 27,507,632 | | | | — | | | | — | |
| | |
|
|
| |
|
|
| |
|
|
|
Total | | $ | 456,444,390 | | | $ | — | | | $ | — | |
| | |
|
|
| |
|
|
| |
|
|
|
The industry classification of portfolio holdings and liabilities in excess of other assets shown as a percentage of net assets as of December 31, 2011 were as follows:
| | | | |
Food Products | | | 8.1 | % |
Oil, Gas & Consumable Fuels | | | 8.0 | |
Media | | | 7.5 | |
Affiliated Money Market Mutual Fund (including 3.2% of collateral received from securities on loan) | | | 6.2 | |
Hotels, Restaurants & Leisure | | | 5.4 | |
Wireless Telecommunication Services | | | 5.4 | |
Chemicals | | | 5.3 | |
Internet Software & Services | | | 5.1 | |
Metals & Mining | | | 5.0 | |
Pharmaceuticals | | | 4.9 | |
Computers & Peripherals | | | 4.4 | |
Software | | | 4.1 | |
Energy Equipment & Services | | | 3.8 | |
Textiles, Apparel & Luxury Goods | | | 3.6 | |
Aerospace & Defense | | | 3.1 | |
Auto Components | | | 2.7 | |
Insurance | | | 2.6 | |
Specialty Retail | | | 2.6 | |
Internet & Catalog Retail | | | 2.5 | |
Electronic Equipment & Instruments | | | 2.4 | |
Personal Products | | | 2.4 | |
Biotechnology | | | 2.2 | |
Automobiles | | | 2.1 | |
IT Services | | | 2.0 | |
Communications Equipment | | | 1.9 | |
| | |
|
|
|
| | | | 103.3 | |
Liabilities in excess of other assets | | | (3.3 | ) |
| | |
|
|
|
| | | | 100.0 | % |
| | |
|
|
|
SEE NOTES TO FINANCIAL STATEMENTS.
A2
| | | | | | |
| | | JENNISON 20/20 FOCUS PORTFOLIO (continued) | | |
STATEMENT OF ASSETS AND LIABILITIES
December 31, 2011
| | | | |
| ASSETS | | | | |
Investments, at value including securities on loan of $13,862,452: | | | | |
Unaffiliated investments (cost $373,710,685) | | $ | 428,936,758 | |
Affiliated investments (cost $27,507,632) | | | 27,507,632 | |
Cash | | | 117,031 | |
Dividends and interest receivable | | | 383,620 | |
Receivable for Series shares sold | | | 169,298 | |
Foreign tax reclaim receivable | | | 40,376 | |
Prepaid expenses | | | 3,534 | |
| | |
|
|
|
Total Assets | | | 457,158,249 | |
| | |
|
|
|
| LIABILITIES | | | | |
Collateral for securities on loan | | | 14,222,457 | |
Payable for investments purchased | | | 627,870 | |
Management fee payable | | | 282,059 | |
Payable for Series shares repurchased | | | 94,546 | |
Distribution fee payable | | | 81,425 | |
Administration fee payable | | | 48,855 | |
Accrued expenses and other liabilities | | | 64,495 | |
Affiliated transfer agent fee payable | | | 926 | |
| | |
|
|
|
Total Liabilities | | | 15,422,633 | |
| | |
|
|
|
| NET ASSETS | | $ | 441,735,616 | |
| | |
|
|
|
Net assets were comprised of: | | | | |
Paid-in capital | | $ | 370,992,924 | |
Retained earnings | | | 70,742,692 | |
| | |
|
|
|
Net assets, December 31, 2011 | | $ | 441,735,616 | |
| | |
|
|
|
| Class I: | | | | |
Net asset value and redemption price per share, $58,745,982 / 3,944,024 outstanding shares of beneficial interest | | $ | 14.89 | |
| | |
|
|
|
| Class II: | | | | |
Net asset value and redemption price per share, $382,989,634 / 26,192,350 outstanding shares of beneficial interest | | $ | 14.62 | |
| | |
|
|
|
STATEMENT OF OPERATIONS
Year Ended December 31, 2011
| | | | |
| INVESTMENT INCOME | | | | |
Unaffiliated dividend income (net of foreign withholding taxes of $17,954) | | $ | 5,225,977 | |
Affiliated income from securities loaned, net | | | 32,931 | |
Affiliated dividend income | | | 27,777 | |
| | |
|
|
|
| | | | 5,286,685 | |
| | |
|
|
|
| EXPENSES | | | | |
Management fee | | | 3,820,151 | |
Distribution fee—Class II | | | 1,110,537 | |
Administration fee—Class II | | | 666,323 | |
Shareholders' reports | | | 105,000 | |
Custodian's fees and expenses | | | 60,000 | |
Audit fee | | | 19,000 | |
Trustees' fees | | | 15,000 | |
Transfer agent's fee and expenses (including affiliated expense of $5,500) (Note 4) | | | 12,000 | |
Legal fees and expenses | | | 9,000 | |
Insurance expenses | | | 5,000 | |
Commitment fee on syndicated credit agreement | | | 4,000 | |
Loan interest expense (Note 8) | | | 204 | |
Miscellaneous | | | 12,226 | |
| | |
|
|
|
Total expenses | | | 5,838,441 | |
| | |
|
|
|
| NET INVESTMENT LOSS | | | (551,756 | ) |
| | |
|
|
|
| NET REALIZED AND UNREALIZED GAIN (LOSS) ON INVESTMENTS AND FOREIGN CURRENCIES | | | | |
Net realized gain on: | | | | |
Investment transactions | | | 49,185,600 | |
Foreign currency transactions | | | 93 | |
| | |
|
|
|
| | | | 49,185,693 | |
| | |
|
|
|
Net change in unrealized appreciation (depreciation) on: | | | | |
Investments | | | (62,861,003 | ) |
Foreign currencies | | | (220 | ) |
| | |
|
|
|
| | | | (62,861,223 | ) |
| | |
|
|
|
| NET LOSS ON INVESTMENTS AND FOREIGN CURRENCIES | | | (13,675,530 | ) |
| | |
|
|
|
| NET DECREASE IN NET ASSETS RESULTING FROM OPERATIONS | | $ | (14,227,286 | ) |
| | |
|
|
|
STATEMENT OF CHANGES IN NET ASSETS
| | | | | | | | |
| | | Year Ended December 31,
| |
| | | 2011
| | | 2010
| |
| INCREASE (DECREASE) IN NET ASSETS | | | | | | | | |
| OPERATIONS: | | | | | | | | |
Net investment income (loss) | | $ | (551,756 | ) | | $ | 53,554 | |
Net realized gain on investments and foreign currency transactions | | | 49,185,693 | | | | 34,547,946 | |
Net change in unrealized appreciation (depreciation) on investments and foreign currencies | | | (62,861,223 | ) | | | 21,264,852 | |
| | |
|
|
| |
|
|
|
NET INCREASE (DECREASE) IN NET ASSETS RESULTING FROM OPERATIONS | | | (14,227,286 | ) | | | 55,866,352 | |
| | |
|
|
| |
|
|
|
| DISTRIBUTIONS: | | | | | | | | |
Class I | | | (53,655 | ) | | | — | |
Class II | | | — | | | | — | |
| | |
|
|
| |
|
|
|
TOTAL DISTRIBUTIONS | | | (53,655 | ) | | | — | |
| | |
|
|
| |
|
|
|
| SERIES SHARE TRANSACTIONS (Note 7): | | | | | | | | |
Series shares sold | | | 121,911,715 | | | | 229,942,326 | |
Series shares issued in reinvestment of distributions | | | 53,655 | | | | — | |
Series shares repurchased | | | (208,992,204 | ) | | | (98,141,605 | ) |
| | |
|
|
| |
|
|
|
NET INCREASE (DECREASE) IN NET ASSETS RESULTING FROM SERIES SHARE TRANSACTIONS | | | (87,026,834 | ) | | | 131,800,721 | |
| | |
|
|
| |
|
|
|
| TOTAL INCREASE (DECREASE) IN NET ASSETS | | | (101,307,775 | ) | | | 187,667,073 | |
| NET ASSETS: | | | | | | | | |
Beginning of year | | | 543,043,391 | | | | 355,376,318 | |
| | |
|
|
| |
|
|
|
End of year | | $ | 441,735,616 | | | $ | 543,043,391 | |
| | |
|
|
| |
|
|
|
SEE NOTES TO FINANCIAL STATEMENTS.
A3
NOTES TO THE FINANCIAL STATEMENTS OF
THE PRUDENTIAL SERIES FUND
The Prudential Series Fund (“Series Fund”), organized as a Delaware statutory trust, is a diversified open-end management investment company registered under the Investment Company Act of 1940 (“1940 Act”), as amended. On January 2, 2006, each Portfolio of the Series Fund changed its federal income tax status from a regulated investment company to a partnership. As a result of that conversion, the Series Fund was reorganized from a Maryland corporation to a Delaware statutory trust. Pursuant to this reorganization, the Series Fund has been renamed “The Prudential Series Fund.” The Series Fund is composed of eighteen Portfolios (“Portfolio” or “Portfolios”), each with separate series shares. The information presented in these financial statements pertains to Jennison 20/20 Focus Portfolio.
The Portfolio’s investment objective is long-term growth of capital.
The ability of issuers of debt securities (other than those issued or guaranteed by the U.S. Government) held by the Portfolio to meet their obligations may be affected by the economic or political developments in a specific industry, region or country. Foreign security and currency transactions may involve certain considerations and risks not typically associated with those of domestic origin as a result of, among other factors, the possibility of political and economic instability or the level of governmental supervision and regulation of foreign securities markets.
| Note 2: | | Accounting Policies |
The following is a summary of significant accounting policies followed by the Series Fund and the Portfolio in preparation of its financial statements.
Securities Valuation: Securities listed on a securities exchange (other than options on securities and indices) are valued at the last sale price on such exchange on the day of valuation or, if there was no sale on such day, at the mean between the last reported bid and asked prices, or at the last bid price on such day in the absence of an asked price. Securities traded via NASDAQ are valued at the NASDAQ official closing price (“NOCP”) on the day of valuation, or if there was no NOCP, at the last sale price. Securities that are actively traded in the over-the-counter market, including listed securities for which the primary market is believed by Prudential Investments LLC (“PI” or “Manager”) in consultation with the subadviser, to be over-the-counter, are valued at market value using prices provided by an independent pricing agent or principal market maker. Options on securities and indices traded on an exchange are valued at the last sale price as of the close of trading on the applicable exchange or, if there was no sale, at the mean between the most recently quoted bid and asked prices on such exchange, or at the last bid price in the absence of an asked price. Futures contracts and options thereon traded on a commodities exchange or board of trade are valued at the last sale price at the close of trading on such exchange or board of trade or, if there was no sale on the applicable commodities exchange or board of trade on such day, at the mean between the most recently quoted bid and asked prices on such exchange or board of trade or at the last bid price in the absence of an asked price. Prices may be obtained from independent pricing services which use information provided by market makers or estimates of market values obtained from yield data relating to investments or securities with similar characteristics. Securities for which reliable market quotations are not readily available, or whose values have been affected by events occurring after the close of the security’s foreign market and before the Series Fund’s normal pricing time, are valued at fair value in accordance with the Board of Trustees’ approved fair valuation procedures. When determining the fair valuation of securities, some of the factors influencing the valuation include, the nature of any restrictions on disposition of the securities; assessment of the general liquidity of the securities; the issuer’s financial condition and the markets in which it does business; the cost of the investment; the size of the holding and the capitalization of the issuer; the prices of any recent transactions or bids/offers for such securities or any comparable securities; any available analyst media or other reports or information deemed reliable by the investment adviser regarding the issuer or the markets or industry in which it operates. Using fair value to price securities may result in a value that is different from a security’s most recent closing price and from the price used by other mutual funds to calculate their net asset values.
Investments in open-end, non exchange-traded mutual funds are valued at their net asset value as of the close of the New York Stock Exchange on the date of valuation.
B1
Short-term debt securities of sufficient credit quality, which mature in sixty days or less, are valued at amortized cost, which approximates fair value. The amortized cost method values a security at its cost at the time of purchase and thereafter assumes a constant amortization to maturity of the difference between the principal amount due at maturity and cost. Short-term debt securities which mature in more than sixty days are valued at fair value.
Foreign Currency Translation: The books and records of the Series Fund are maintained in U.S. dollars. Foreign currency amounts are translated into U.S. dollars on the following basis:
(i) market value of investment securities, other assets and liabilities — at the current rates of exchange.
(ii) purchases and sales of investment securities, income and expenses — at the rates of exchange prevailing on the respective dates of such transactions.
Although the net assets of the Series Fund are presented at the foreign exchange rates and market values at the close of the period, the Series Fund does not isolate that portion of the results of operations arising as a result of changes in the foreign exchange rates from the fluctuations arising from changes in the market prices of long-term portfolio securities held at the end of the period. Similarly, the Series Fund does not isolate the effect of changes in foreign exchange rates from the fluctuations arising from changes in the market prices of long-term portfolio securities sold during the period. Accordingly, these realized foreign currency gains or losses are included in the reported net realized gains or losses on investment transactions.
Net realized gains or losses on foreign currency transactions represent net foreign exchange gains or losses from holdings of foreign currencies, currency gains or losses realized between the trade and settlement dates on security transactions, and the difference between the amounts of dividends, interest and foreign withholding taxes recorded on the Series Fund’s books and the U.S. dollar equivalent amounts actually received or paid. Net unrealized currency gains or losses from valuing foreign currency denominated assets and liabilities (other than investments) at period end exchange rates are reflected as a component of net unrealized appreciation (depreciation) foreign currencies.
Securities Lending: The Portfolio may lend its portfolio securities to banks and broker-dealers. The loans are secured by collateral at least equal to the market value of the securities loaned. Collateral pledged by each borrower is marked to market daily, based on the previous day’s market value, such that the value of the collateral exceeds the value of the loan securities. Loans are subject to termination at the option of the borrower or the Portfolio. Upon termination of the loan, the borrower will return to the Portfolio securities identical to the loaned securities. Should the borrower of the securities fail financially, the Portfolio has the right to repurchase the securities using the collateral in the open market. The Portfolio recognizes income, net of any rebate and securities lending agent fees, for lending its securities in the form of fees or interest on the investment of any cash received as collateral. The Portfolio also continues to receive interest and dividends or amounts equivalent thereto, on the securities loaned and recognizes any unrealized gain or loss in the market price of the securities loaned that may occur during the term of the loan.
Securities Transactions and Net Investment Income: Securities transactions are recorded on the trade date. Realized gains or losses on sales of securities are calculated on the identified cost basis. Dividend income is recorded on the ex-dividend date and interest income, which is comprised of four elements: stated coupon, original issue discount, market discount and market premium, is recorded on the accrual basis. Expenses are recorded on the accrual basis. The Series Fund’s expenses are allocated to the respective Portfolios on the basis of relative net assets except for Portfolio specific expenses which are attributable directly to a Portfolio or class level.
For Portfolios with multiple classes of shares, net investment income or loss (other than administration and distribution fees, which are charged to the respective class) and unrealized and realized gains or losses are allocated daily to each class of shares based upon the relative proportion of adjusted net assets of each class at the beginning of the day.
Taxes: For federal income tax purposes, each Portfolio in the Series Fund is treated as a separate taxpaying entity. The Portfolios are treated as partnerships for tax purposes. No provision has been made in the financial statements for U.S. Federal, state, or local taxes, as any tax liability arising from operations of the Portfolios is the responsibility of their partners. The Portfolios are not generally subject to entity-level taxation. Partners of each Portfolio are subject to taxes on their distributive share of partnership items.
B2
Withholding taxes on foreign dividends, interest and capital gains have been provided for in accordance with the Series Fund’s understanding of the applicable country’s tax rules and regulations.
Distributions: Distributions from each Portfolio are made in cash and automatically reinvested in additional shares of the same Portfolio. The Jennison 20/20 Focus Portfolio makes distributions, if any, at least annually. Distributions are recorded on the ex-date.
Estimates: The preparation of the financial statements requires management to make estimates and assumptions that affect the reported amounts and disclosures in the financial statements. Actual results could differ from those estimates.
The Series Fund has a management agreement with PI. Pursuant to this agreement PI has responsibility for all investment advisory services and supervises the subadviser’s performance of such services. PI has entered into a subadvisory agreement with Jennison Associates LLC (“Jennison”) (the “Subadviser”), under which Jennison provides investment advisory services for the Portfolio. PI pays for the services of the Subadviser, compensation of officers of the Series Fund, occupancy and certain clerical and administrative expenses of the Series Fund. The Portfolio bears all other costs and expenses.
The management fee paid to PI is computed daily and payable monthly at an annual rate of .75% of the Portfolio’s average daily net assets.
The Series Fund has a distribution agreement with Prudential Investment Management Services LLC (“PIMS”), which acts as the distributor of the Class I and Class II shares of the Series Fund. The Series Fund compensates PIMS for distributing and servicing the Series Fund’s Class II shares pursuant to a plan of distribution (the “Class II Plan”), regardless of expenses actually incurred by PIMS. The distribution fees are accrued daily and payable monthly. No distribution or service fees are paid to PIMS as distributor of the Class I shares of the Series Fund. Pursuant to the Class II Plan, the Class II shares of each Portfolio compensate PIMS for distribution-related activities at an annual rate of .25% of the average daily net assets of the Class II shares.
The Series Fund has an administration agreement with PI, which acts as the administrator of the Class II shares of the Series Fund. The administration fee paid to PI is accrued daily and payable monthly, at the annual rate of .15% of the average daily net assets of the Class II shares.
PIMS, PI and Jennison are indirect, wholly-owned subsidiaries of Prudential Financial, Inc. (“Prudential”).
| Note 4: | | Other Transactions with Affiliates |
Prudential Mutual Fund Services LLC (“PMFS”), an affiliate of PI and an indirect, wholly-owned subsidiary of Prudential, serves as the Series Fund’s transfer agent. Transfer agent fees and expenses in the Statement of Operations include certain out-of-pocket expenses paid to non-affiliates, where applicable.
Prudential Investment Management, Inc. (“PIM”) an indirect, wholly-owned subsidiary of Prudential, serves as the Series Fund’s security lending agent. For the year ended December 31, 2011, PIM was compensated $9,824 for these services by the Jennison 20/20 Focus Portfolio.
The Portfolio invests in the Prudential Core Taxable Money Market Fund (the “Core Fund”), a portfolio of the Prudential Investment Portfolios 2, registered under the 1940 Act, as amended, and managed by PI. Earnings from the Core Fund are disclosed on the Statement of Operations as affiliated dividend income.
| Note 5: | | Portfolio Securities |
The aggregate cost of purchases and the proceeds from the sales of securities (excluding government securities and short-term issues) for the year ended December 31, 2011 were $414,045,310 and $510,582,824, respectively.
After January 2, 2006, all Portfolios are treated as partnerships for tax purposes. The character of the cash distributions made by the partnerships is generally classified as return of capital nontaxable distributions. After
B3
each fiscal year each partner will receive information regarding their distributive allocable share of the partnership’s income, gains, losses and deductions.
Prior to January 2, 2006, each Portfolio, which was incorporated as of that date, qualified as a regulated investment company under the Internal Revenue Code and distributed all of its taxable income, including any net realized gains on investments, to shareholders.
With respect to the Portfolios, book cost of assets differs from tax cost of assets as a result of each Portfolio’s adoption of a mark to market method of accounting for tax purposes. Under this method, tax cost of assets will approximate its fair market value.
Management has analyzed the Portfolios’ tax positions taken on federal income tax returns for all open tax years and has concluded that no provision for income tax is required in the Portfolios’ financial statements for the current period. The Portfolios’ federal and state income tax returns for tax years for which the applicable statutes of limitations have not expired are subject to examination by the Internal Revenue Service and state departments of revenue.
��
The Series Fund offers Class I and Class II shares. Neither Class I nor Class II shares of a Portfolio are subject to any sales charge or redemption charge and are sold at the net asset value of the Portfolio. Class I shares are sold only to certain separate accounts of Prudential to fund benefits under certain variable life insurance and variable annuity contracts (“contracts”). Class II shares are sold only to separate accounts of non-Prudential insurance companies as investment options under certain contracts. The separate accounts invest in shares of the Series Fund through subaccounts that correspond to the Portfolios. The separate accounts will redeem shares of the Series Fund to the extent necessary to provide benefits under the contracts or for such other purposes as may be consistent with the contracts.
Transactions in shares of beneficial interest of the Jennison 20/20 Focus Portfolio were as follows:
| | | | | | | | |
Class I
| | Shares
| | | Amount
| |
Year ended December 31, 2011: | | | | | | | | |
Series shares sold | | | 369,922 | | | $ | 5,796,412 | |
Series shares issued in reinvestment of distributions | | | 3,407 | | | | 53,655 | |
Series shares repurchased | | | (730,650 | ) | | | (11,394,573 | ) |
| | |
|
|
| |
|
|
|
Net increase (decrease) in shares outstanding. | | | (357,321 | ) | | $ | (5,544,506 | ) |
| | |
|
|
| |
|
|
|
Year ended December 31, 2010: | | | | | | | | |
Series shares sold | | | 292,710 | | | $ | 4,148,442 | |
Series shares repurchased | | | (883,082 | ) | | | (12,391,656 | ) |
| | |
|
|
| |
|
|
|
Net increase (decrease) in shares outstanding. | | | (590,372 | ) | | $ | (8,243,214 | ) |
| | |
|
|
| |
|
|
|
| | |
Class II
| | | | | | |
Year ended December 31, 2011: | | | | | | | | |
Series shares sold | | | 7,525,972 | | | $ | 116,115,303 | |
Series shares repurchased | | | (12,435,137 | ) | | | (197,597,631 | ) |
| | |
|
|
| |
|
|
|
Net increase (decrease) in shares outstanding. | | | (4,909,165 | ) | | $ | (81,482,328 | ) |
| | |
|
|
| |
|
|
|
Year ended December 31, 2010: | | | | | | | | |
Series shares sold | | | 17,285,111 | | | $ | 225,793,884 | |
Series shares repurchased | | | (6,166,456 | ) | | | (85,749,949 | ) |
| | |
|
|
| |
|
|
|
Net increase (decrease) in shares outstanding. | | | 11,118,655 | | | $ | 140,043,935 | |
| | |
|
|
| |
|
|
|
The Portfolio, along with other affiliated registered investment companies (the “Funds”), is a party to a Syndicated Credit Agreement (“SCA”) with a group of banks. The purpose of the SCA is to provide an alternative source of temporary funding for capital share redemptions. The SCA provides for a commitment of $900 million for the period December 16, 2011 through December 14, 2012. The Funds pay an annualized commitment fee of 0.08% of the unused portion of the SCA. Prior to December 16, 2011, the Funds had
B4
another Syndicated Credit Agreement of $750 million commitment with an annualized commitment fee of 0.10% of the unused portion. Interest on any borrowings under the SCA is paid at contracted market rates. The commitment fee for the unused amount is accrued daily and paid quarterly.
The Portfolio utilized the SCA during the year ended December 31, 2011. The average daily balance for the 10 days that the Portfolio had loans outstanding during the year was $503,400, borrowed at a weighted average interest rate of 1.46%. At December 31, 2011, the Portfolio did not have an outstanding loan amount.
| Note 9: | | Ownership and Affiliates |
As of December 31, 2011, all of Class I shares of the Portfolio were owned of record by the Prudential Insurance Company of America (“PICA”) on behalf of the owners of the variable insurance products issued by PICA.
| Note 10: | | New Accounting Pronouncements |
In April 2011, the Financial Accounting Standards Board (“FASB”) issued Accounting Standards Update (“ASU”) No. 2011-03 “Reconsideration of Effective control for Repurchase Agreements”. The objective of ASU 2011-03 is to improve the accounting for repurchase agreements and other agreements that both entitle and obligate a transferor to repurchase or redeem financial assets before their maturity. Under previous guidance, whether or not to account for a transaction as a sale was based on, in part, if the entity maintained effective control over the transferred financial assets. ASU 2011-03 removes the transferor’s ability criterion from the effective control assessment. This guidance is effective prospectively for interim and annual reporting periods beginning on or after December 15, 2011. At this time, management is evaluating the implications of ASU No. 2011-03 and its impact on the financial statements has not been determined.
In May 2011, the FASB issued ASU No. 2011-04 “Amendments to Achieve Common Fair Value Measurement and Disclosure Requirements in U.S. GAAP and IFRSs”. ASU 2011-04 includes common requirements for measurement of and disclosure about fair value between U.S. GAAP and IFRS. ASU 2011-04 will require reporting entities to disclose quantitative information about the unobservable inputs used in the fair value measurements categorized within Level 3 of the fair value hierarchy. In addition, ASU 2011-04 will require reporting entities to make disclosures about amounts and reasons for all transfers in and out of Level 1 and Level 2 fair value measurements. The new and revised disclosures are effective for interim and annual reporting periods beginning after December 15, 2011. At this time, management is evaluating the implications of ASU No. 2011-04 and its impact on the financial statements has not been determined.
B5
Financial Highlights
| | | | | | | | | | | | | | | | | | | | |
| | | Class I
| |
| | | Year Ended December 31,
| |
| | | 2011(c)
| | | 2010(c)
| | | 2009
| | | 2008
| | | 2007(c)
| |
Per Share Operating Performance: | | | | | | | | | | | | | | | | | | | | |
Net Asset Value, beginning of year | | $ | 15.55 | | | $ | 14.42 | | | $ | 9.18 | | | $ | 15.99 | | | $ | 16.01 | |
| | |
|
|
| |
|
|
| |
|
|
| |
|
|
| |
|
|
|
Income (Loss) From Investment Operations: | | | | | | | | | | | | | | | | | | | | �� |
Net investment income | | | .04 | | | | .05 | | | | .03 | | | | .06 | | | | .07 | |
Net realized and unrealized gain (loss) on investments | | | (.69 | ) | | | 1.08 | | | | 5.26 | | | | (5.94 | ) | | | 1.63 | |
| | |
|
|
| |
|
|
| |
|
|
| |
|
|
| |
|
|
|
Total from investment operations | | | (.65 | ) | | | 1.13 | | | | 5.29 | | | | (5.88 | ) | | | 1.70 | |
| | |
|
|
| |
|
|
| |
|
|
| |
|
|
| |
|
|
|
Less Distributions: | | | (.01 | ) | | | — | | | | (.05 | ) | | | (.93 | ) | | | (1.72 | ) |
| | |
|
|
| |
|
|
| |
|
|
| |
|
|
| |
|
|
|
Net Asset Value, end of year | | $ | 14.89 | | | $ | 15.55 | | | $ | 14.42 | | | $ | 9.18 | | | $ | 15.99 | |
| | |
|
|
| |
|
|
| |
|
|
| |
|
|
| |
|
|
|
Total Return(a): | | | (4.17 | )% | | | 7.84 | % | | | 57.83 | % | | | (39.15 | )% | | | 10.59 | % |
Ratios/Supplemental Data: | | | | | | | | | | | | | | | | | | | | |
Net assets, end of year (in millions) | | $ | 58.7 | | | $ | 66.8 | | | $ | 70.5 | | | $ | 46.7 | | | $ | 86.6 | |
Ratios to average net assets(b): | | | | | | | | | | | | | | | | | | | | |
Expenses | | | .80 | % | | | .80 | % | | | .81 | % | | | .82 | % | | | .82 | % |
Net investment income | | | .24 | % | | | .36 | % | | | .27 | % | | | .41 | % | | | .41 | % |
Portfolio turnover rate | | | 83 | % | | | 112 | % | | | 106 | % | | | 125 | % | | | 115 | % |
| | | | | | | | | | | | | | | | | | | | |
| | | Class II
| |
| | | Year Ended December 31,
| |
| | | 2011(c)
| | | 2010(c)
| | | 2009
| | | 2008
| | | 2007(c)
| |
Per Share Operating Performance: | | | | | | | | | | | | | | | | | | | | |
Net Asset Value, beginning of year | | $ | 15.31 | | | $ | 14.25 | | | $ | 9.06 | | | $ | 15.78 | | | $ | 15.81 | |
| | |
|
|
| |
|
|
| |
|
|
| |
|
|
| |
|
|
|
Income (Loss) From Investment Operations: | | | | | | | | | | | | | | | | | | | | |
Net investment loss | | | (.03 | ) | | | (.01 | ) | | | (.01 | ) | | | — | (d) | | | — | (d) |
Net realized and unrealized gain (loss) on investments | | | (.66 | ) | | | 1.07 | | | | 5.20 | | | | (5.87 | ) | | | 1.60 | |
| | |
|
|
| |
|
|
| |
|
|
| |
|
|
| |
|
|
|
Total from investment operations | | | (.69 | ) | | | 1.06 | | | | 5.19 | | | | (5.87 | ) | | | 1.60 | |
| | |
|
|
| |
|
|
| |
|
|
| |
|
|
| |
|
|
|
Less Distributions: | | | — | | | | — | | | | — | (d) | | | (.85 | ) | | | (1.63 | ) |
| | |
|
|
| |
|
|
| |
|
|
| |
|
|
| |
|
|
|
Net Asset Value, end of year | | $ | 14.62 | | | $ | 15.31 | | | $ | 14.25 | | | $ | 9.06 | | | $ | 15.78 | |
| | |
|
|
| |
|
|
| |
|
|
| |
|
|
| |
|
|
|
Total Return(a): | | | (4.51 | )% | | | 7.44 | % | | | 57.29 | % | | | (39.40 | )% | | | 10.12 | % |
Ratios/Supplemental Data: | | | | | | | | | | | | | | | | | | | | |
Net assets, end of year (in millions) | | $ | 383.0 | | | $ | 476.2 | | | $ | 284.9 | | | $ | 156.3 | | | $ | 293.3 | |
Ratios to average net assets(b): | | | | | | | | | | | | | | | | | | | | |
Expenses | | | 1.20 | % | | | 1.20 | % | | | 1.21 | % | | | 1.22 | % | | | 1.22 | % |
Net investment loss | | | (.16 | )% | | | (.05 | )% | | | (.13 | )% | | | — | %(e) | | | — | %(e) |
Portfolio turnover rate | | | 83 | % | | | 112 | % | | | 106 | % | | | 125 | % | | | 115 | % |
| (a) | Total return is calculated assuming a purchase of a share on the first day and a sale on the last day of each year reported and includes reinvestment of distributions and does not reflect the effect of insurance contract charges. Total return does not reflect expenses associated with the separate account such as administrative fees, account charges and surrender charges which, if reflected, would reduce the total returns for all years shown. Performance figures may reflect voluntary fee waivers and/or expense reimbursements. In the absence of voluntary fee waivers and/or expense reimbursements, the total return would be lower. Past performance is no guarantee of future results. Total returns may reflect adjustments to conform to generally accepted accounting principles. |
| (b) | Does not include expenses of the underlying portfolios in which the Portfolio invests. |
| (c) | Calculated based upon average shares outstanding |
| (d) | Less Than $0.005 per share. |
SEE NOTES TO FINANCIAL STATEMENTS.
C1
REPORT OF INDEPENDENT REGISTERED PUBLIC ACCOUNTING FIRM
THE BOARD OF TRUSTEES AND SHAREHOLDERS
THE PRUDENTIAL SERIES FUND:
We have audited the accompanying statement of assets and liabilities of The Prudential Series Fund — Jennison 20/20 Focus Portfolio (hereafter referred to as the “Portfolio”), including the portfolio of investments, as of December 31, 2011, and the related statement of operations for the year then ended, the statement of changes in net assets for each of the years in the two-year period then ended and the financial highlights for each of the years in the five-year period then ended. These financial statements and financial highlights are the responsibility of the Fund’s management. Our responsibility is to express an opinion on these financial statements and financial highlights based on our audits.
We conducted our audits in accordance with the standards of the Public Company Accounting Oversight Board (United States). Those standards require that we plan and perform the audit to obtain reasonable assurance about whether the financial statements and financial highlights are free of material misstatement. An audit includes examining, on a test basis, evidence supporting the amounts and disclosures in the financial statements. Our procedures included confirmation of securities owned as of December 31, 2011, by correspondence with the custodian, transfer agent and brokers or by other appropriate auditing procedures where replies from brokers were not received. An audit also includes assessing the accounting principles used and significant estimates made by management, as well as evaluating the overall financial statement presentation. We believe that our audits provide a reasonable basis for our opinion.
In our opinion, the financial statements and financial highlights referred to above present fairly, in all material respects, the financial position of the Portfolio as of December 31, 2011, and the results of their operations, the changes in their net assets and the financial highlights for the periods described in the first paragraph above, in conformity with U.S. generally accepted accounting principles.

New York, New York
February 16, 2012
D1
INFORMATION ABOUT TRUSTEES AND OFFICERS (Unaudited)
Information about the Trustees and the Officers of the Fund is set forth below. Trustees who are not deemed to be “interested persons” of the Fund, as defined in the 1940 Act, are referred to as “Independent Trustees.” Trustees who are deemed to be “interested persons” of the Fund are referred to as “Interested Trustees.” The Trustees are responsible for the overall supervision of the operations of the Fund and perform the various duties imposed on the directors of investment companies by the 1940 Act.
| | | | |
| Independent Trustees(1) | | | | |
Name, Address, Age
No. of Portfolios Overseen | | Principal Occupation(s) During Past Five Years | | Other Directorships Held |
Susan Davenport Austin (44) No. of Portfolios Overseen: 84 | | Senior Vice President and Chief Financial Officer (Since 2007) and Vice President of Strategic Planning and Treasurer (2002-2007) of Sheridan Broadcasting Corporation; President of Sheridan Gospel Network (Since 2004); Vice President, Goldman, Sachs & Co. (2000-2001); Associate Director, Bear, Stearns & Co. Inc (1997-2000); Vice President, Salomon Brothers Inc (1993-1997); President of the Board, The MacDowell Colony (Since 2010); Chairman of the Board of Directors, Broadcast Music, Inc. (Since 2007); Member of the Board of Directors, Hubbard Radio, LLC (Since 2011); formerly Member of the Board of Directors, National Association of Broadcasters (2004-2010). | | None |
Saul K. Fenster, Ph.D. (78) No. of Portfolios Overseen: 84 | | President Emeritus of New Jersey Institute of Technology (since 2002); formerly President (1978-2002) of New Jersey Institute of Technology; Commissioner (1998-2002) of the Middle States Association Commission on Higher Education; Commissioner (1985-2002) of the New Jersey Commission on Science and Technology; formerly Director (1998-2005) of Society of Manufacturing Engineering Education Foundation; formerly Director of Prosperity New Jersey; formerly a director or trustee of Liberty Science Center, Research and Development Council of New Jersey, New Jersey State Chamber of Commerce, and National Action Council for Minorities in Engineering. | | Formerly Director (2000-2006) of IDT Corporation. |
Delayne Dedrick Gold (73) No. of Portfolios Overseen: 84 | | Marketing Consultant (1982-present); formerly Senior Vice President and Member of the Board of Directors, Prudential Bache Securities, Inc. | | None |
W. Scott McDonald, Jr., Ph.D. (74) No. of Portfolios Overseen: 84 | | Formerly Management Consultant (1997-2004) and of Counsel (2004-2005) at Kaludis Consulting Group, Inc. (company serving higher education); formerly principal (1995-1997), Scott McDonald Associates; Chief Operating Officer (1991-1995), Fairleigh Dickinson University; Executive Vice President and Chief Operating Officer (1975-1991), Drew University; interim President (1988-1990), Drew University; formerly Director of School, College and University Underwriters Ltd. | | None |
Thomas T. Mooney (70) No. of Portfolios Overseen: 84 | | Formerly Chief Executive Officer, Excell Partners, Inc. (2005-2007) formerly President of the Greater Rochester Metro Chamber of Commerce (1976-2004) formerly Rochester City Manager (1973); formerly Deputy Monroe County Executive (1974-1976). | | None |
Thomas M. O’Brien (61) No. of Portfolios Overseen: 84 | | President and COO (since November 2006) and CEO (since April 2007) of State Bancorp, Inc. and State Bank; formerly Vice Chairman (January 1997-April 2000) of North Fork Bank; formerly President and Chief Executive Officer (December 1984-December 1996) of North Side Savings Bank; formerly President and Chief Executive Officer (May 2000-June 2006) Atlantic Bank of New York. | | Director (since April 2008) of Federal Home Loan Bank of New York; formerly Director (December 1996-May 2000) of North Fork Bancorporation, Inc.; formerly Director (May 2000-April 2006) of Atlantic Bank of New York; Director (since November 2006) of State Bancorp, Inc. (NASDAQ: STBC) and State Bank of Long Island. |
F. Don Schwartz (76) No. of Portfolios Overseen: 84 | | Independent Management/Marketing Consultant (since 2002); formerly CEO and President of AceCo, Inc. (1985-2001) (consulting firm specializing in universal/variable life and variable annuity products); formerly Vice President of The Equitable Life Assurance Society; formerly Guest Insurance Professor at the American College, Louisiana State University, Alabama State University and the Insurance Marketing Institute; Advisor to several state insurance commissioners; a Chartered Life Underwriter, Chartered Financial Consultant and Fellow of the Life Insurance Management Institute. | | None. |
E1
| | | | |
| Interested Trustees(1) | | | | |
Name, Address, Age
No. of Portfolios Overseen | | Principal Occupation(s) During Past Five Years | | Other Directorships Held |
Stephen Pelletier (58) No. of Portfolios Overseen: 84 | | President of Prudential Annuities (since September 2008); Chairman and CEO, International Investments, Prudential Financial (since January 1998). | | None |
Robert F. Gunia (65) No. of Portfolios Overseen: 84 | | Independent Consultant (since October 2009); formerly Chief Administrative Officer (September 1999-September 2009) and Executive Vice President (December 1996-September 2009) of Prudential Investments LLC; formerly Executive Vice President (March 1999-September 2009) and Treasurer (May 2000-September 2009) of Prudential Mutual Fund Services LLC; formerly President (April 1999-December 2008) and Executive Vice President and Chief Operating Officer (December 2008-December 2009) of Prudential Investment Management Services LLC; formerly Chief Administrative Officer, Executive Vice President and Director (May 2003-September 2009) of AST Investment Services, Inc. | | Director (since May 1989) of The Asia Pacific Fund, Inc. |
Timothy S. Cronin (46) Number of Portfolios Overseen: 84 | | Chief Investment Officer and Strategist of Prudential Annuities (since January 2004); Director of Investment & Research Strategy (since February 1998); President of AST Investment Services, Inc. (since June 2005). | | None. |
(1) The year that each Trustee joined the Fund’s Board is as follows: Susan Davenport Austin, 2011; Timothy S. Cronin, 2011; Saul K. Fenster, 1983; Delayne Dedrick Gold, 2001; Robert F. Gunia, 2001; W. Scott McDonald, Jr., 1983; Thomas T. Mooney, 2001; Thomas M. O’Brien, 2003; Stephen Pelletier, 2011; F. Don Schwartz, 2003.
| | |
| Fund Officers(a)(1) | | |
Name, Address and Age Position with the Fund | | Principal Occupation(s) During the Past Five Years |
Kathryn L. Quirk (59) Chief Legal Officer | | Vice President and Corporate Counsel (since September 2004) of Prudential; Executive Vice President, Chief Legal Officer and Secretary (since July 2005) of PI and Prudential Mutual Fund Services LLC; Vice President and Corporate Counsel (since June 2005) and Secretary (since February 2006) of AST Investment Services, Inc.; formerly Senior Vice President and Assistant Secretary (November 2004-August 2005) of PI; formerly Assistant Secretary (June 2005-February 2006) of AST Investment Services, Inc.; formerly Managing Director, General Counsel, Chief Compliance Officer, Chief Risk Officer and Corporate Secretary (1997-2002) of Zurich Scudder Investments, Inc. |
Deborah A. Docs (54) Secretary | | Vice President and Corporate Counsel (since January 2001) of Prudential; Vice President (since December 1996) and Assistant Secretary (since March 1999) of PI; formerly Vice President and Assistant Secretary (May 2003-June 2005) of AST Investment Services, Inc. |
Jonathan D. Shain (53) Assistant Secretary | | Vice President and Corporate Counsel (since August 1998) of Prudential; Vice President and Assistant Secretary (since May 2001) of PI; Vice President and Assistant Secretary (since February 2001) of PMFS; formerly Vice President and Assistant Secretary (May 2003-June 2005) of AST Investment Services, Inc. |
Claudia DiGiacomo (37) Assistant Secretary | | Vice President and Corporate Counsel (since January 2005) of Prudential; Vice President and Assistant Secretary of PI (since December 2005); Associate at Sidley Austin Brown Wood LLP (1999-2004). |
John P. Schwartz (40) Assistant Secretary | | Vice President and Corporate Counsel (since April 2005) of Prudential; Vice President and Assistant Secretary of PI (since December 2005); Associate at Sidley Austin Brown Wood LLP (1997-2005). |
Andrew R. French (49) Assistant Secretary | | Vice President and Corporate Counsel (since February 2010) of Prudential; formerly Director and Corporate Counsel (2006-2010) of Prudential; Vice President and Assistant Secretary (since January 2007) of PI; Vice President and Assistant Secretary (since January 2007) of PMFS. |
Timothy J. Knierim (53) Chief Compliance Officer | | Chief Compliance Officer of Prudential Investment Management, Inc. (since July 2007); formerly Chief Risk Officer of PIM and PI (2002-2007) and formerly Chief Ethics Officer of PIM and PI (2006-2007). |
Valerie M. Simpson (53) Deputy Chief Compliance Officer | | Chief Compliance Officer (since April 2007) of PI and AST Investment Services, Inc.; formerly Vice President-Financial Reporting (June 1999-March 2006) for Prudential Life and Annuities Finance. |
Theresa C. Thompson (49) Deputy Chief Compliance Officer | | Vice President, Compliance, PI (since April 2004); and Director, Compliance, PI (2001 - 2004). |
Richard W. Kinville (43) Anti-Money Laundering Compliance Officer | | Vice President, Corporate Compliance, Anti-Money Laundering Unit (since January 2005) of Prudential; committee member of the American Council of Life Insurers Anti-Money Laundering and Critical Infrastructure Committee (since January 2007); formerly Investigator and Supervisor in the Special Investigations Unit for the New York Central Mutual Fire Insurance Company (August 1994-January 1999); Investigator in AXA Financial’s Internal Audit Department and Manager in AXA’s Anti-Money Laundering Office (January 1999-January 2005); first chair of the American Council of Life Insurers Anti-Money Laundering and Critical Infrastructure Committee (June 2007-December 2009 ). |
Grace C. Torres (52) Treasurer and Principal Financial and Accounting Officer | | Assistant Treasurer (since March 1999) and Senior Vice President (since September 1999) of PI; Assistant Treasurer (since May 2003) and Vice President (since June 2005) of AST Investment Services, Inc.; Senior Vice President and Assistant Treasurer (since May 2003) of Prudential Annuities Advisory Services, Inc.; formerly Senior Vice President (May 2003-June 2005) of AST Investment Services, Inc. |
E2
| | |
| Fund Officers(a)(1) | | |
Name, Address and Age Position with the Fund | | Principal Occupation(s) During the Past Five Years |
M. Sadiq Peshimam (48) Assistant Treasurer | | Vice President (since 2005) of Prudential Investments LLC. |
Peter Parrella (53) Assistant Treasurer | | Vice President (since 2007) and Director (2004-2007) within Prudential Mutual Fund Administration; formerly Tax Manager at SSB Citi Fund Management LLC (1997-2004). |
Alan Fu (55) Assistant Treasurer | | Vice President and Corporate Counsel - Tax, Prudential Financial, Inc. (since October 2003). |
(a) Excludes Mr. Pelletier and Mr. Cronin, interested Board Members who also serve as President and Vice President, respectively.
(1) The year in which each individual became an Officer of the Fund is as follows: Kathryn L. Quirk, 2005; Deborah A. Docs, 2005; Jonathan D. Shain, 2005; Claudia DiGiacomo, 2005; John P. Schwartz, 2006; Andrew R. French, 2006; Timothy J. Knierim, 2007; Valerie M. Simpson, 2007; Theresa C. Thompson, 2008; Grace C. Torres, 1997; Peter Parrella, 2007; M. Sadiq Peshimam, 2006; Alan Fu, 2006; Richard W. Kinville, 2011.
Explanatory Notes to Tables:
Trustees are deemed to be “Interested”, as defined in the 1940 Act, by reason of their affiliation with Prudential Investments LLC and/or an affiliate of Prudential Investments LLC. Stephen Pelletier and Timothy Cronin are Interested Trustees because they are employed by an affiliate of the Manager of the Fund. Robert F. Gunia will be considered an Interested Trustee for at least two years after his retirement from employment by the Manager and its affiliates (which was on or about October 21, 2009). He will also be an Interested Trustee as long as he holds a beneficial interest in securities issued by the Manager or its affiliates.
Unless otherwise noted, the address of all Trustees and Officers is c/o Prudential Investments LLC, Gateway Center Three, 100 Mulberry Street, Newark, New Jersey 07102.
There is no set term of office for Trustees or Officers. The Independent Trustees have adopted a retirement policy, which calls for the retirement of Trustees on December 31 of the year in which they reach the age of 78, provided that the Board may extend the retirement age on a year-by-year basis for a Trustee.
“Other Directorships Held” includes only directorships of companies required to register or file reports with the SEC under the Securities Exchange Act of 1934 (that is, “public companies”) or other investment companies registered under the 1940 Act.
“No. of Portfolios Overseen” includes all investment companies managed by Prudential Investments LLC (PI) and/or AST Investment Services, Inc. (ASTI) (collectively, the Manager) that are overseen by the Trustee. The investment companies for which PI and/or ASTI serves as Manager include The Prudential Variable Contract Accounts, The Prudential Series Fund, Advanced Series Trust and Prudential’s Gibraltar Fund, Inc.
E3
Annuities are issued by Pruco Life Insurance Company, or in New York, Pruco Life Insurance Company of New Jersey, both located at 213 Washington Street, Newark, NJ 07102-2992, and Prudential Annuities Life Assurance Corporation, located at One Corporate Drive, Shelton, CT, 06484. Variable annuities are distributed by Prudential Annuities Distributors, Inc., also located in Shelton, CT. Prudential Annuities is a business unit of Prudential Financial.
Variable life insurance is issued by The Prudential Insurance Company of America, 751 Broad Street, Newark, NJ 07102-3777, Pruco Life Insurance Company, or in New York, Pruco Life Insurance Company of New Jersey, both located at 213 Washington Street, Newark, NJ 07102-2992. Pruco Life Insurance Company is not licensed to do business in New York. Variable life insurance is offered through Pruco Securities LLC, 751 Broad Street, Newark, NJ 07102-3777.
All are Prudential Financial companies, and each is solely responsible for its financial condition and contractual obligations.
Life insurance and annuity contracts contain exclusions, limitations, reductions of benefits, and terms for keeping them in force. Your licensed financial professional can provide you with costs and complete details. Contract guarantees are based on the claims-paying ability of the issuing company.
| | | | |

The Prudential Insurance Company of America 751 Broad Street Newark, NJ 07102-3777 | | | | Presorted Standard U.S. Postage PAID Prudential |
| | | | |
| | | | |
| | | | |
The Audited Financial Statements of Pruco Life Insurance Company, Pruco Life Insurance Company of New Jersey, and The Prudential Insurance Company of America are available upon request. You may call (888)778-2888 to obtain a free copy of the audited financial statements of the insurance company that issued your contract.
To reduce costs, we now generally send only a single copy of prospectuses and shareholder reports to each household (householding) in lieu of sending a copy to each Contract Owner who resides in the household. You should be aware that by calling (877)778-5008, you can revoke, or “opt out,” of householding at any time.
Prudential Investments, Prudential, the Prudential logo, and the Rock symbol are service marks of Prudential Financial, Inc. and its related entities, registered in many jurisdictions worldwide.
To learn more about Prudential Financial, go to www.prudential.com, or scan the code below.

0172223-00003-00 PSF-AR-20/20 Focus
Item 2 – Code of Ethics — See Exhibit (a)
As of the end of the period covered by this report, the registrant has adopted a code of ethics (the “Section 406 Standards for Investment Companies – Ethical Standards for Principal Executive and Financial Officers”) that applies to the registrant’s Principal Executive Officer and Principal Financial Officer; the registrant’s Principal Financial Officer also serves as the Principal Accounting Officer.
The registrant hereby undertakes to provide any person, without charge, upon request, a copy of the code of ethics. To request a copy of the code of ethics, contact the registrant 973-367-7521, and ask for a copy of the Section 406 Standards for Investment Companies - Ethical Standards for Principal Executive and Financial Officers.
Item 3 – Audit Committee Financial Expert –
The registrant’s Board has determined that Mr. Thomas M. O’Brien, member of the Board’s Audit Committee is an “audit committee financial expert,” and that he is “independent,” for purposes of this Item.
Item 4 – Principal Accountant Fees and Services –
(a) Audit Fees
For the fiscal years ended December 31, 2011 and December 31, 2010, KPMG LLP (“KPMG”), the Registrant’s principal accountant, billed the Registrant $438,000 and $447,500, respectively, for professional services rendered for the audit of the Registrant’s annual financial statements or services that are normally provided in connection with statutory and regulatory filings.
(b) Audit-Related Fees
None.
(c) Tax Fees
None.
(d) All Other Fees
None.
(e) (1) Audit Committee Pre-Approval Policies and Procedures
THE PRUDENTIAL MUTUAL FUNDS
AUDIT COMMITTEE POLICY
on
Pre-Approval of Services Provided by the Independent Accountants
The Audit Committee of each Prudential Mutual Fund is charged with the responsibility to monitor the independence of the Fund’s independent accountants. As part of this responsibility, the Audit Committee must pre-approve any independent accounting firm’s engagement to render audit and/or permissible non-audit services, as required by law. In evaluating a proposed engagement of the independent accountants, the Audit Committee will assess the effect that the engagement might reasonably be expected to have on the accountant’s independence. The Committee’s evaluation will be based on:
| | • | | a review of the nature of the professional services expected to be provided, |
| | • | | a review of the safeguards put into place by the accounting firm to safeguard independence, and |
| | • | | periodic meetings with the accounting firm. |
Policy for Audit and Non-Audit Services Provided to the Funds
On an annual basis, the scope of audits for each Fund, audit fees and expenses, and audit-related and non-audit services (and fees proposed in respect thereof) proposed to be performed by the Fund’s independent accountants will be presented by the Treasurer and the independent accountants to the Audit Committee for review and, as appropriate, approval prior to the initiation of such services. Such presentation shall be accompanied by confirmation by both the Treasurer and the independent accountants that the proposed services will not adversely affect the independence of the independent accountants. Proposed services shall be described in sufficient detail to enable the Audit Committee to assess the appropriateness of such services and fees, and the compatibility of the provision of such services with the auditor’s independence. The Committee shall receive periodic reports on the progress of the audit and other services which are approved by the Committee or by the Committee Chair pursuant to authority delegated in this Policy.
The categories of services enumerated under “Audit Services”, “Audit-related Services”, and “Tax Services” are intended to provide guidance to the Treasurer and the independent accountants as to those categories of services which the Committee believes are generally consistent with the independence of the independent accountants and which the Committee (or the Committee Chair) would expect upon the presentation of specific proposals to pre-approve. The enumerated categories are not intended as an exclusive list of audit, audit-related or tax services, which the Committee (or the Committee Chair) would consider for pre-approval.
Audit Services
The following categories of audit services are considered to be consistent with the role of the Fund’s independent accountants:
| | • | | Annual Fund financial statement audits |
| | • | | Seed audits (related to new product filings, as required) |
| | • | | SEC and regulatory filings and consents |
Audit-related Services
The following categories of audit-related services are considered to be consistent with the role of the Fund’s independent accountants:
| | • | | Accounting consultations |
| | • | | Fund merger support services |
| | • | | Agreed Upon Procedure Reports |
| | • | | Other Internal Control Reports |
Individual audit-related services that fall within one of these categories and are not presented to the Audit Committee as part of the annual pre-approval process will be subject to pre-approval by the Committee Chair (or any other Committee member on whom this responsibility has been delegated) so long as the estimated fee for those services does not exceed $50,000.
Tax Services
The following categories of tax services are considered to be consistent with the role of the Fund’s independent accountants:
| | • | | Tax compliance services related to the filing or amendment of the following: |
| | • | | Federal, state and local income tax compliance; and, |
| | • | | Sales and use tax compliance |
| | • | | Timely RIC qualification reviews |
| | • | | Tax distribution analysis and planning |
| | • | | Tax authority examination services |
| | • | | Tax appeals support services |
| | • | | Accounting methods studies |
| | • | | Fund merger support services |
| | • | | Tax consulting services and related projects |
Individual tax services that fall within one of these categories and are not presented to the Audit Committee as part of the annual pre-approval process will be subject to pre-approval by the Committee Chair (or any other Committee member on whom this responsibility has been delegated) so long as the estimated fee for those services does not exceed $50,000.
Other Non-audit Services
Certain non-audit services that the independent accountants are legally permitted to render will be subject to pre-approval by the Committee or by one or more Committee members to whom the Committee has delegated this authority and who will report to the full Committee any pre-approval decisions made pursuant to this Policy. Non-audit services presented for pre-approval pursuant to this paragraph will be accompanied by a confirmation from both the Treasurer and the independent accountants that the proposed services will not adversely affect the independence of the independent accountants.
Proscribed Services
The Fund’s independent accountants will not render services in the following categories of non-audit services:
| | • | | Bookkeeping or other services related to the accounting records or financial statements of the Fund |
| | • | | Financial information systems design and implementation |
| | • | | Appraisal or valuation services, fairness opinions, or contribution-in-kind reports |
| | • | | Internal audit outsourcing services |
| | • | | Management functions or human resources |
| | • | | Broker or dealer, investment adviser, or investment banking services |
| | • | | Legal services and expert services unrelated to the audit |
| | • | | Any other service that the Public Company Accounting Oversight Board determines, by regulation, is impermissible. |
Pre-approval of Non-Audit Services Provided to Other Entities Within the Prudential Fund Complex
Certain non-audit services provided to Prudential Investments LLC or any of its affiliates that also provide ongoing services to the Prudential Mutual Funds will be subject to pre-approval by the Audit Committee. The only non-audit services provided to these entities that will require pre-approval are those related directly to the operations and financial reporting of the Funds. Individual projects that are not presented to the Audit Committee as part of the annual pre-approval process will be subject to pre-approval by the Committee Chair (or any other Committee member on whom this responsibility has been delegated) so long as the estimated fee for those services does not exceed $50,000. Services presented for pre-approval pursuant to this paragraph will be accompanied by a confirmation from both the Treasurer and the independent accountants that the proposed services will not adversely affect the independence of the independent accountants.
Although the Audit Committee will not pre-approve all services provided to Prudential Investments LLC and its affiliates, the Committee will receive an annual report from the Fund’s independent accounting firm showing the aggregate fees for all services provided to Prudential Investments and its affiliates.
| (e) | (2) Percentage of services referred to in 4(b) – 4(d) that were approved by the audit committee – |
Not applicable.
| (f) | Percentage of hours expended attributable to work performed by other than full time employees of principal accountant if greater than 50%. |
The percentage of hours expended on the principal accountant’s engagement to audit the registrant’s financial statements for the most recent fiscal year that were attributed to work performed by persons other than the principal accountant’s full-time, permanent employees was 0%.
Not applicable to Registrant for the fiscal years 2011 and 2010. The aggregate non-audit fees billed by KPMG for services rendered to the registrant’s investment adviser and any entity controlling, controlled by, or under common control with the investment adviser that provides ongoing services to the registrant for the fiscal years 2011 and 2010 was $0 and $0, respectively.
| (h) | Principal Accountant’s Independence |
Not applicable as KPMG has not provided non-audit services to the registrant’s investment adviser and any entity controlling, controlled by, or under common control with the investment adviser that provides ongoing services to the registrant that were not pre-approved pursuant to Rule 2-01(c)(7)(ii) of Regulation S-X.
| Item 5 | – Audit Committee of Listed Registrants – Not applicable. |
| Item 6 | – Schedule of Investments – The schedule is included as part of the report to shareholders filed under Item 1 of this Form. |
| Item 7 | – Disclosure of Proxy Voting Policies and Procedures for Closed-End Management Investment Companies – Not applicable. |
| Item 8 | – Portfolio Managers of Closed-End Management Investment Companies – Not applicable. |
| Item 9 | – Purchases of Equity Securities by Closed-End Management Investment Company and Affiliated Purchasers – Not applicable. |
| Item 10 | – Submission of Matters to a Vote of Security Holders – Not applicable. |
Item 11 – Controls and Procedures
| | (a) | It is the conclusion of the registrant’s principal executive officer and principal financial officer that the effectiveness of the registrant’s current disclosure controls and procedures (such disclosure controls and procedures having been evaluated within 90 days of the date of this filing) provide reasonable assurance that the information required to be disclosed by the registrant has been recorded, processed, summarized and reported within the time period specified in the Commission’s rules and forms and that the information required to be disclosed by the registrant has been accumulated and communicated to the registrant’s principal executive officer and principal financial officer in order to allow timely decisions regarding required disclosure. |
| | (b) | There has been no significant change in the registrant’s internal control over financial reporting that occurred during the registrant’s most recent fiscal quarter of the period covered by this report that has materially affected, or is likely to materially affect, the registrant’s internal control over financial reporting. |
| | | | | | |
| | (a) | | (1) | | Code of Ethics – Attached hereto as Exhibit EX-99.CODE-ETH |
| | | |
| | | | (2) | | Certifications pursuant to Section 302 of the Sarbanes-Oxley Act – Attached hereto as Exhibit EX-99.CERT. |
| | | |
| | | | (3) | | Any written solicitation to purchase securities under Rule 23c-1. – Not applicable. |
| | |
| | (b) | | Certifications pursuant to Section 906 of the Sarbanes-Oxley Act – Attached hereto as Exhibit EX-99.906CERT. |
SIGNATURES
Pursuant to the requirements of the Securities Exchange Act of 1934 and the Investment Company Act of 1940, the registrant has duly caused this report to be signed on its behalf by the undersigned, thereunto duly authorized.
| | |
| Registrant: | | The Prudential Series Fund |
| |
| By: | | /s/ Deborah A. Docs |
| | Deborah A. Docs |
| | Secretary |
| |
| Date: | | February 15, 2012 |
Pursuant to the requirements of the Securities Exchange Act of 1934 and the Investment Company Act of 1940, this report has been signed below by the following persons on behalf of the registrant and in the capacities and on the dates indicated.
| | |
| By: | | /s/ Stephen Pelletier |
| | Stephen Pelletier |
| | President and Principal Executive Officer |
| |
| Date: | | February 15, 2012 |
| |
| By: | | /s/ Grace C. Torres |
| | Grace C. Torres |
| | Treasurer and Principal Financial Officer |
| |
| Date: | | February 15, 2012 |