UNITED STATES
SECURITIES AND EXCHANGE COMMISSION
Washington, D.C. 20549
FORM N-CSR
CERTIFIED SHAREHOLDER REPORT OF REGISTERED
MANAGEMENT INVESTMENT COMPANIES
| | |
| Investment Company Act file number: | | 811-03623 |
| |
| Exact name of registrant as specified in charter: | | The Prudential Series Fund |
| |
| Address of principal executive offices: | | Gateway Center 3, 100 Mulberry Street, Newark, New Jersey 07102 |
| |
| Name and address of agent for service: | | Deborah A. Docs Gateway Center 3, 100 Mulberry Street, Newark, New Jersey 07102 |
| |
| Registrant’s telephone number, including area code: | | 973-367-7521 |
| |
| Date of fiscal year end: | | 12/31/2014 |
| |
| Date of reporting period: | | 12/31/2014 |
Item 1 — Reports to Stockholders —

THE PRUDENTIAL SERIES FUND
ANNUAL REPORT Ÿ DECEMBER 31, 2014
Based on the variable contract you own or the portfolios you invested in, you may receive additional reports that provide financial information on those investment choices. Please refer to your variable annuity or variable life insurance contract prospectus to determine which portfolios are available to you.
The views expressed in this report and information about the Fund’s portfolio holdings are for the period covered by this report and are subject to change thereafter.
Please note that this document may include prospectus supplements that are separate from and not a part of this report. Please refer to your variable annuity or variable life insurance contract prospectus to determine which supplements are applicable to you.

For information regarding enrollment in the e-Delivery program, please see the inside front cover of this report.
Conservative Balanced Portfolio
Diversified Bond Portfolio
Equity Portfolio
Flexible Managed Portfolio
Global Portfolio
Government Income Portfolio
High Yield Bond Portfolio
Jennison Portfolio
Money Market Portfolio
Natural Resources Portfolio
Small Capitalization Stock Portfolio
Stock Index Portfolio
Value Portfolio

By enrolling in e-Delivery, you’ll gain secure, online access to important documents with the flexibility to choose which documents you receive in the mail… and which ones you don’t!
Individual Annuity Contract Owners - Get started by visiting www.prudentialannuities.com/investor/edelivery and follow the instructions on the screen, or scan the code below.

Individual Life Insurance Contract Owners - To receive your reports online, go to www.prudential.com/edelivery, or scan the code below.

Group Variable Universal Life Contract Owners - To receive your reports online, go to www.prudential.com/gulgvul, or scan the code.

Save paper and reduce clutter.
Receive Prospectuses and Reports electronically by enrolling today!
| | | | |
The Prudential Series Fund Table of Contents | | Annual Report | | December 31, 2014 |
| n | | LETTER TO CONTRACT OWNERS |
| n | | INVESTMENT MANAGER’S REPORT |
| n | | PRESENTATION OF PORTFOLIO HOLDINGS |
This report may include financial information pertaining to certain portfolios that are not available through the variable life insurance policy or variable annuity contract that you have chosen. Please refer to your variable life insurance or variable annuity prospectus to determine which portfolios are available to you.
| | | | |
The Prudential Series Fund Letter to Contract Owners | | Annual Report | | December 31, 2014 |
At Prudential, our primary objective is to help investors achieve and maintain long-term financial success. This Prudential Series Fund annual report outlines our efforts to achieve this goal. We hope you find it informative and useful.
Prudential has been building on a heritage of success for more than 135 years. The quality of our businesses and risk diversification has enabled us to manage effectively through volatile markets over time. We believe the array of our products provides a highly attractive value proposition to clients like you who are focused on financial security.
Your financial professional is the best resource to help you make the most informed investment decisions. Together, you can build a diversified investment portfolio that aligns with your long-term financial goals. Please keep in mind that diversification and asset allocation strategies do not assure a profit or protect against loss in declining markets.
Thank you for selecting Prudential as one of your financial partners. We value your trust and appreciate the opportunity to help you achieve financial security.
Sincerely,

Robert F. O’Donnell
President,
The Prudential Series Fund | January 30, 2015 |
| | |
The Prudential Series Fund, Conservative Balanced Portfolio | | December 31, 2014 |
Investment Manager’s Report - As of December 31, 2014 (Unaudited)
| | | | | | | | | | | | |
| Average Annual Total Returns | | 1-Year | | | 5-Year | | | 10-Year | |
Portfolio | | | 8.77 | % | | | 10.43 | % | | | 6.50 | % |
Blended Index | | | 9.21 | | | | 9.61 | | | | 6.14 | |
S&P 500 Index | | | 13.66 | | | | 15.44 | | | | 7.67 | |
Past performance does not guarantee future returns. The investment return and principal value of an investment will fluctuate, so that an investor’s shares, when redeemed, may be worth more or less than their original cost. Current performance may be lower or higher than the past performance data quoted.
Portfolio performance is net of investment fees and fund expenses, but not contract charges, which, if included, would significantly lower the performance quoted. Performance figures may reflect fee waivers and/or expense reimbursements. In the absence of such fee waivers and/or expense reimbursements, total returns would be lower.
$10,000 INVESTED OVER 10 YEARS
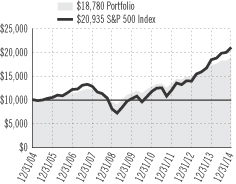
For the year ended December 31, 2014, the Conservative Balanced Portfolio returned 8.77%.
The net assets of the Portfolio at December 31, 2014 were $2,574.4 million.
The Portfolio’s investment objective is total investment return consistent with a conservatively managed diversified portfolio. The Portfolio’s subadvisers are Prudential Investment Management Inc. and Quantitative Management Associates LLC.
The Portfolio’s custom blended Index (the Index) returned 9.21%. Despite many investors’ expectation of a correction in stock prices in 2014, periodic chaos in global affairs, and a scare related to the Ebola virus, the S&P 500 Index delivered returns above 13%. The Barclays U.S. Aggregate Bond Index gained more than 5%, led by a strong and unexpected performance by long duration U.S. Treasury bonds.
The U.S. economy finally gained some traction, moving above the 2% average annual growth rate that had prevailed since 2009. Reduced fiscal drag; recovery in housing, autos, and other consumer goods; a highly stimulative Federal Reserve policy; contributions from a revived U.S. energy sector; and inventory accumulation resulted in a robust annualized 5.0% rate of growth in the third quarter of the year.
Strong U.S. stock market gains drove the Portfolio’s return, despite a weak year for international stocks. On average, it held major overweights of U.S. stocks, with less aggressive positions in international markets. Stock returns were driven by rising price-earnings (P/E) multiples and solid earnings growth. Investors cannot count on multiples increasing indefinitely, but today’s levels are roughly in line with historical averages and well below levels that have led to bear markets.
The Portfolio’s performance was driven by an overweight allocation of U.S. equities versus bonds and solid returns from holdings in its active equity and fixed income segments. In the equity segment, QMA emphasized U.S. stocks. The Portfolio held only 1% in emerging markets, which declined in 2014. In bonds the Portfolio outperformed due to solid asset selection rather than large macro positions.
Prudential Investments LLC (PI), an indirect, wholly owned subsidiary of Prudential Financial, Inc., serves as the investment manager for the Portfolio.
Blended Index consists of S&P 500 Index (50%), Barclays U.S. Aggregate Bond Index (40%), an unmanaged index comprised of more than 5,000 government and corporate bonds, and 3-Month T-Bill Index (10%), an unmanaged market value-weighted index of investment grade fixed rate public obligations of the U.S. Treasury with maturities of three months, excluding zero coupon strips. S&P 500 Index is an unmanaged, market value-weighted index of 500 stocks generally representative of the broad stock market. These returns do not include the effect of any investment management expenses. These returns would have been lower if they included the effect of these expenses. Investors cannot invest directly in a market index. For a complete list of holdings, refer to the Schedule of Investments section of this report.
Prudential Investment Management, Inc., and Quantitative Management Associates LLC are registered investment advisers and are Prudential Financial companies.
1
| | |
| The Prudential Series Fund, Diversified Bond Portfolio | | December 31, 2014 |
Investment Manager’s Report - As of December 31, 2014 (Unaudited)
| | | | | | | | | | | | |
| Average Annual Total Returns | | 1-Year | | | 5-Year | | | 10-Year | |
Portfolio | | | 7.09 | % | | | 6.95 | % | | | 6.43 | % |
Barclays U.S. Aggregate Bond Index | | | 5.97 | | | | 4.45 | | | | 4.71 | |
Past performance does not guarantee future returns. The investment return and principal value of an investment will fluctuate, so that an investor’s shares, when redeemed, may be worth more or less than their original cost. Current performance may be lower or higher than the past performance data quoted.
Portfolio performance is net of investment fees and fund expenses, but not contract charges, which, if included, would significantly lower the performance quoted. Performance figures may reflect fee waivers and/or expense reimbursements. In the absence of such fee waivers and/or expense reimbursements, total returns would be lower.
$10,000 INVESTED OVER 10 YEARS
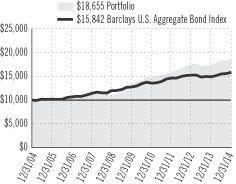
For the year ended December 31, 2014, the Diversified Bond Portfolio returned 7.09%.
The net assets of the Portfolio at December 31, 2014 were $1,067.9 million.
The Portfolio’s investment objective is a high level of income over a longer term while providing reasonable safety of capital. The Portfolio’s subadviser is Prudential Investment Management, Inc.
The fixed income markets recorded positive returns overall during 2014, as long-term interest rates declined. After cresting in early January on fears of the Federal Reserve’s (“Fed”) taper and eventual rate hikes, yields on longer-term Treasuries trended down for the rest of the year. The 30-year Treasury yield fell 122 basis points (bps) to 2.75% (a basis point is one hundredth of a percentage point), while the bellwether 10-year Treasury yield fell 86 bps to 2.17%. Meanwhile, the Treasury yield curve flattened, as shorter-term yields edged up. By the end of the period, the yield on a two-year Treasury had risen 28 bps to 0.67%.
During the first half of the year, the fixed income markets posted modest gains, despite mixed U.S. economic data, weaker economic growth in China, and geopolitical turmoil in the Middle East and Russia/Ukraine. Divergence between central bank policy in the U.S. and the rest of the world, combined with a rising tide of geopolitical risk, contributed to a growing sense of unease during the second half of the year. U.S. economic growth strengthened, while growth outside the U.S. generally flagged as commodity prices fell and inflationary pressures dissipated. At the same time, the value of the U.S. dollar surged relative to most world currencies. Risk aversion increased and spreads widened on investment-grade corporate bonds, high-yield corporate bonds, and emerging markets debt, causing them to underperform U.S. Treasury securities of comparable maturity. (Spreads are the amount of extra yield that bonds provide over similar-duration Treasuries.) Energy was the key story within investment-grade corporate bonds, as oil field services investment-grade issues dropped significantly in price. Midstream investment-grade bonds also lost ground. Meanwhile, municipal securities recorded solid gains, with BBB-rated municipals generating a double-digit return.
For the year, the Barclays U.S. Aggregate Bond Index (the “Index”) gained 5.97%. Relative to the Index, issue selection was the largest contributor to Portfolio performance. More specifically, the Portfolio benefited from its holdings of commercial mortgage-backed securities (CMBS), asset-backed securities, and emerging markets debt. Sector allocations also boosted returns, with the Portfolio’s overweight relative to the Index in CMBS being the primary contributor. An underweight in energy was advantageous, as many energy names weakened amid the drop in crude oil prices. In addition, the Portfolio’s duration and yield curve strategy added significantly to performance, driven by a longer duration bias and a yield curve flattening position.
Detracting slightly was an underweight relative to the Index in mortgage-backed securities and an overweight position in corporate credit. The Portfolio was also hurt by issue selection among high yield bonds.
Prudential Investments LLC (PI), an indirect, wholly owned subsidiary of Prudential Financial, Inc., serves as the investment manager for the Portfolio.
Barclays U.S. Aggregate Bond Index is an unmanaged index comprised of more than 5,000 government and corporate bonds. These returns do not include the effect of any investment management expenses. These returns would have been lower if they included the effect of these expenses. Investors cannot invest directly in a market index. For a complete list of holdings, refer to the Schedule of Investments section of this report.
Prudential Investment Management, Inc. is a registered investment adviser and a Prudential Financial company.
2
| | |
| The Prudential Series Fund, Equity Portfolio | | December 31, 2014 |
Investment Manager’s Report - As of December 31, 2014 (Unaudited)
| | | | | | | | | | | | |
| Average Annual Total Returns | | 1-Year | | | 5-Year | | | 10-Year | |
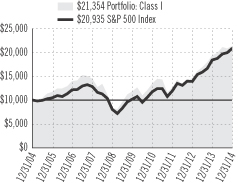
Portfolio: Class I | | | 7.71 | % | | | 12.05 | % | | | 7.55 | % |
Portfolio: Class II | | | 7.27 | | | | 11.60 | | | | 7.12 | |
Russell 1000® Index | | | 13.24 | | | | 15.64 | | | | 7.96 | |
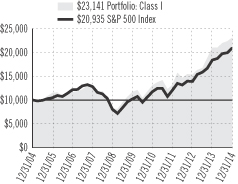
S&P 500 Index | | | 13.66 | | | | 15.44 | | | | 7.67 | |
Past performance does not guarantee future returns. The investment return and principal value of an investment will fluctuate, so that an investor’s shares, when redeemed, may be worth more or less than their original cost. Current performance may be lower or higher than the past performance data quoted.
Portfolio performance is net of investment fees and fund expenses, but not contract charges, which, if included, would significantly lower the performance quoted. Performance figures may reflect fee waivers and/or expense reimbursements. In the absence of such fee waivers and/or expense reimbursements, total returns would be lower.
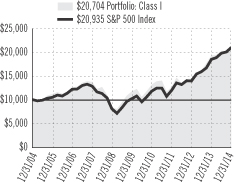
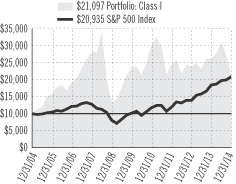
$10,000 INVESTED OVER 10 YEARS1
The Russell 1000® Index is a trademark/service mark of the Frank Russell Company. Russell® is a trademark of the Frank Russell Company.
For the year ended December 31, 2014, the Equity Portfolio Class I returned 7.71% and Class II returned 7.27%.
The net assets of the Portfolio at December 31, 2014 were $4,019.8 million.
The Portfolio’s investment objective is long-term growth of capital. The Portfolio’s subadviser is Jennison Associates LLC (Jennison).
The Portfolio underperformed the 13.24% return of the Russell 1000 Index.
Faced with a challenging backdrop for consumers, stock selection in both staples and discretionary was mostly responsible for the performance shortfall relative to the S&P 500. A number of holdings in those areas fell short of expectations.
In staples, Avon and Whole Foods were notable detractors. Revenue and sales were disappointing for Avon Products. Whole Foods was eliminated, as its investment in more competitive pricing was limiting upside profit.
In consumer discretionary, JC Penney and ASOS drove underperformance. JC Penney did not respond favorably to improving fundamentals and an announced restructuring. London-based global online apparel retailer ASOS experienced disappointing financial results. The pound sterling’s appreciation against the US dollar also created currency-translation issues for the UK-based company. Both positions were eliminated.
Security choices in information technology (IT) also detracted from relative return. Amazon.com lagged, as it has been increasing its business investment to drive unit growth not only in its core retail business but through the proliferation of digital commerce via the mobile market. Jennison continues to like its long-term revenue growth, margin-expansion potential, and Amazon Web Services cloud infrastructure opportunities.
Despite relative underperformance in the sector, IT positions Apple and Facebook were strong contributors. Apple’s fundamental strength reflects expanding global acceptance of its platform. Jennison expects that product updates will sustain attractive revenue growth in the medium term. Jennison believes that as Facebook solidifies its dominant position, it will continue to increase its appeal to both users and advertisers.
In aggregate, health care positions were the most significant contributors to Portfolio return. Pharmaceutical name Allergan advanced on a takeover bid and the strength of its business, which has been enhanced by efforts to manage spending more efficiently and redeploy cash in ways that benefit shareholders. (Allergan was acquired by Actavis in November.)
Stock selection in the telecom services and industrials sectors added to relative gain. United Continental Holdings was a standout in the latter group. Airlines overall outperformed the industrials sector and the overall market. Earnings, revenue, and guidance were solid as cost cuts and higher pricing took hold. United further announced a share buyback and appears on track to achieve several key revenue initiatives, including improvements to capacity management on Asian flights.
Prudential Investments LLC (PI), an indirect, wholly owned subsidiary of Prudential Financial, Inc., serves as the investment manager for the Portfolio.
| 1 | The graph is based on the performance of Class I shares. Performance of Class II shares will be lower due to differences in the fee structure. Class II shares have associated 12b-1 and administrative fees at an annual rate of 0.25% and 0.15%, respectively, of the average daily net assets of the Class II shares. |
Russell 1000® Index is an unmanaged market cap-weighted index that measures the performance of the 1,000 largest companies in the Russell 3000 Index, which represents approximately 92% of the total market. S&P 500 Index is an unmanaged, market value-weighted index of 500 stocks generally representative of the broad stock market. These returns do not include the effect of any investment management expenses. These returns would have been lower if they included the effect of these expenses. Investors cannot invest directly in a market index. For a complete list of holdings, refer to the Schedule of Investments section of this report.
Jennison Associates LLC is a registered investment adviser and a Prudential Financial company.
3
| | |
| The Prudential Series Fund, Flexible Managed Portfolio | | December 31, 2014 |
Investment Manager’s Report - As of December 31, 2014 (Unaudited)
| | | | | | | | | | | | |
| Average Annual Total Returns | | 1-Year | | | 5-Year | | | 10-Year | |
Portfolio | | | 11.05 | % | | | 12.07 | % | | | 7.08 | % |
Blended Index | | | 10.29 | | | | 10.94 | | | | 6.59 | |
S&P 500 Index | | | 13.66 | | | | 15.44 | | | | 7.67 | |
Past performance does not guarantee future returns. The investment return and principal value of an investment will fluctuate, so that an investor’s shares, when redeemed, may be worth more or less than their original cost. Current performance may be lower or higher than the past performance data quoted.
Portfolio performance is net of investment fees and fund expenses, but not contract charges, which, if included, would significantly lower the performance quoted. Performance figures may reflect fee waivers and/or expense reimbursements. In the absence of such fee waivers and/or expense reimbursements, total returns would be lower.
$10,000 INVESTED OVER 10 YEARS
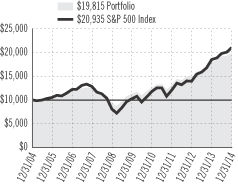
For the year ending December 31, 2014, the Flexible Managed Portfolio returned 11.05%.
The net assets of the Portfolio at December 31, 2014 were $3,943.8 million.
The Portfolio’s investment objective is total investment return consistent with an aggressively managed diversified portfolio. The Portfolio’s subadvisers are Prudential Investment Management Inc. and Quantitative Management Associates LLC.
The Portfolio’s Blended Index (the Index) returned 10.29%. Despite many investors’ expectation of a correction in stock prices in 2014, periodic chaos in global affairs, and a scare related to the Ebola virus, the S&P 500 Index delivered returns above 13%. The Barclays U.S. Aggregate Bond Index gained more than 5%, led by an unexpectedly strong performance by long duration U.S. Treasury bonds.
The U.S. economy finally gained some traction, moving above the 2% average annual growth rate that had prevailed since 2009. Reduced fiscal drag; recovery in housing, autos, and other consumer goods; a highly stimulative Federal Reserve policy; contributions from a revived U.S. energy sector; and inventory accumulation resulted in a robust annualized 5.0% rate of growth in the third quarter of the year.
Strong U.S. stock market gains drove the Portfolio’s return, despite a weak year for international stocks. On average, it held major overweights of U.S. stocks, with less aggressive positions in international markets. Stock returns were driven by rising price-to-earnings (P/E) multiples and solid earnings growth. Investors cannot count on multiples increasing indefinitely, but today’s levels are roughly in line with historical averages and well below levels that have led to bear markets.
The Portfolio’s outperformance of the Index was driven by an overweight allocation to U.S. stocks versus bonds and solid returns from holdings in its active stock and bond segments. In the stock segment, QMA emphasized domestic stocks. The Portfolio held only 1% in emerging markets, which declined in 2014. The Portfolio’s bonds outperformed their target due to solid selection of individual issues rather than from large macro positions.
Prudential Investments LLC (PI), an indirect, wholly owned subsidiary of Prudential Financial, Inc., serves as the investment manager for the Portfolio.
Blended Index consists of S&P 500 Index (60%), Barclays U.S. Aggregate Bond Index (35%), an unmanaged index comprised of more than 5,000 government and corporate bonds, and 3-Month T-Bill Index (5%), an unmanaged market value-weighted index of investment grade fixed rate public obligations of the U.S. Treasury with maturities of three months, excluding zero coupon strips. S&P 500 Index is an unmanaged, market value-weighted index of 500 stocks generally representative of the broad stock market. These returns do not include the effect of any investment management expenses. These returns would have been lower if they included the effect of these expenses. Investors cannot invest directly in a market index. For a complete list of holdings, refer to the Schedule of Investments section of this report.
Prudential Investment Management, Inc., and Quantitative Management Associates LLC are registered investment advisers and are Prudential Financial companies.
4
| | |
| The Prudential Series Fund, Global Portfolio | | December 31, 2014 |
Investment Manager’s Report - As of December 31, 2014 (Unaudited)
| | | | | | | | | | | | |
| Average Annual Total Returns | | 1-Year | | | 5-Year | | | 10-Year | |
Portfolio | | | 3.25 | % | | | 10.13 | % | | | 6.42 | % |
MSCI World Index (GD) | | | 5.50 | | | | 10.81 | | | | 6.61 | |
Past performance does not guarantee future returns. The investment return and principal value of an investment will fluctuate, so that an investor’s shares, when redeemed, may be worth more or less than their original cost. Current performance may be lower or higher than the past performance data quoted.
Portfolio performance is net of investment fees and fund expenses, but not contract charges, which, if included, would significantly lower the performance quoted. Performance figures may reflect fee waivers and/or expense reimbursements. In the absence of such fee waivers and/or expense reimbursements, total returns would be lower.
$10,000 INVESTED OVER 10 YEARS
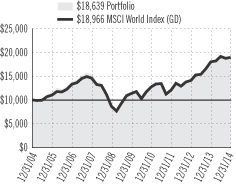
For the year ended December 31, 2014, the Global Portfolio returned 3.25%.
The net assets of the Portfolio at December 31, 2014 were $719.2 million.
The Portfolio’s investment objective is long-term growth of capital by investing in stocks, with about half of its assets invested in companies in the United States and half in companies located abroad. The Portfolio’s subadvisers are: Brown Advisory (Brown), LLC, (U.S. growth stocks), T. Rowe Price Associates, Inc. (U.S. value stocks), William Blair & Company LLC (international growth stocks), LSV Asset Management (international value stocks), and Quantitative Management Associates LLC.
The MSCI World Index (GD) (the Index) rose by 5.50%.The domestic market had a strong year, supported by accelerating economic growth, falling unemployment, and reviving manufacturing. Among shares of larger firms, the difference between growth and value returns was not great. The returns on foreign stocks were reduced for U.S. dollar-based investors by the rise of the dollar against most major foreign currencies. Japan benefited from continued economic stimulus, whereas the euro zone was late to appreciate the need for stimulus.
The Brown Domestic Large-Cap Growth segment had the largest negative impact on Portfolio performance in 2014 due to weak stock selection in the technology and consumer discretionary sectors. An underweight in Apple was among the largest detractors from performance relative to its benchmark, partially caused by Brown’s risk guideline limiting its exposure in any one security to 5% of its portfolio. Apple performed well for the year and now makes up more than 6% of the benchmark.
On the positive side, the International Growth segment of the Portfolio, managed by William Blair & Company, outperformed its benchmark. Results were driven primarily by strong stock selection in the consumer staples and financial sectors. The Portfolio also benefited from its underweight in the materials and energy sectors, both of which declined even in local currencies when the price of oil fell significantly.
None of the five subadvisers use derivative instruments as a principal investment strategy. The types of derivatives employed most often are stock futures contracts (to help manage cash flows in the Portfolio) and currency forwards and futures contracts (to hedge a portion of the Portfolio’s currency exposure). Derivatives were used, none of which had a material impact on performance.
Prudential Investments LLC (PI), an indirect, wholly owned subsidiary of Prudential Financial, Inc., serves as the investment manager for the Portfolio.
MSCI World Index (GD) - The Morgan Stanley Capital International World Index is an unmanaged capitalization weighted index which includes the equity markets of Australia, Austria, Belgium, Canada, Denmark, Finland, France, Germany, Hong Kong, Ireland, Italy, Japan, Malaysia, Netherlands, New Zealand, Norway, Singapore, Spain, Sweden, Switzerland, United Kingdom, and United States. The GD version does not reflect the impact of withholding taxes on reinvested dividends. These returns do not include the effect of any investment management expenses. These returns would have been lower if they included the effect of these expenses. Investors cannot invest directly in a market index. For a complete list of holdings, refer to the Schedule of Investments section of this report.
Quantitative Management Associates LLC is a registered investment adviser and a Prudential Financial company.
5
| | |
| The Prudential Series Fund, Government Income Portfolio | | December 31, 2014 |
Investment Manager’s Report - As of December 31, 2014 (Unaudited)
| | | | | | | | | | | | |
| Average Annual Total Returns | | 1-Year | | | 5-Year | | | 10-Year | |
Portfolio | | | 5.86 | % | | | 4.29 | % | | | 4.53 | % |
Barclays Government Bond Index | | | 4.92 | | | | 3.70 | | | | 4.29 | |
Past performance does not guarantee future returns. The investment return and principal value of an investment will fluctuate, so that an investor’s shares, when redeemed, may be worth more or less than their original cost. Current performance may be lower or higher than the past performance data quoted.
Portfolio performance is net of investment fees and fund expenses, but not contract charges, which, if included, would significantly lower the performance quoted. Performance figures may reflect fee waivers and/or expense reimbursements. In the absence of such fee waivers and/or expense reimbursements, total returns would be lower.
$10,000 INVESTED OVER 10 YEARS
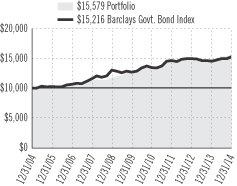
For the year ended December 31, 2014, the Government Income Portfolio returned 5.86%.
The net assets of the Portfolio at December 31, 2014 were $339.2 million.
The Portfolio’s investment objective is a high level of income over the long term consistent with the preservation of capital. The Portfolio’s subadviser is Prudential Investment Management, Inc.
The fixed income markets overall recorded positive returns during 2014. The U.S. economy performed much as expected, with economic growth continuing for the year overall and the Federal Reserve (“Fed”) tapering its quantitative easing bond-buying program. After cresting in early January on fears of the Fed taper and eventual rate hikes, yields on longer-term Treasuries trended down for the rest of the year. The 30-year Treasury yield fell 122 basis points (bps) (a basis point is one hundredth of a percentage point) to 2.75%, while the bellwether 10-year Treasury yield fell 86 bps to 2.17%. Meanwhile, the Treasury yield curve flattened, as shorter-term yields edged up. By the end of the period, the yield on a two-year Treasury had risen 28 bps to 0.67%.
The Portfolio outperformed its benchmark, the Barclays Government Bond Index (the Index). Sector allocation was a strong driver of performance. Although U.S. Treasuries performed well during the period, the high-quality commercial mortgage-backed securities (“CMBS”) in which the Fund invests contributed positively.
Security selection also added to returns, most notably within mortgage-backed securities and, to a lesser extent, CMBS.
The Portfolio’s investment in the Prudential Core Short-Term Bond Fund also benefited performance, as the Fund’s net asset value rose throughout much of the year.
While the impact of the Portfolio’s duration strategy was largely neutral, its yield curve positioning helped performance. More specifically, the Portfolio benefited from its curve flattening position as yields of five years and less rose and yields beyond five years fell.
These positive factors were modestly offset by security selection within non-agency mortgage-backed securities and municipal bonds.
Tactical duration strategies and yield curve positioning that were partially implemented via interest rate swaps (derivatives) modestly benefited performance. (Duration measures the approximate price change of a bond portfolio for a given change in interest rates.)
Prudential Investments LLC (PI), an indirect, wholly owned subsidiary of Prudential Financial, Inc., serves as the investment manager for the Portfolio.
Barclays Government Bond Index is a weighted unmanaged index comprised of securities issued or backed by the U.S. Government, its agencies, and instrumentalities with a remaining maturity of one to 30 years. These returns do not include the effect of any investment management expenses. These returns would have been lower if they included the effect of these expenses. Investors cannot invest directly in a market index. For a complete list of holdings, refer to the Schedule of Investments section of this report.
Prudential Investment Management, Inc. is a registered investment adviser and a Prudential Financial company.
6
| | |
The Prudential Series Fund, High Yield Bond Portfolio | | December 31, 2014 |
Investment Manager’s Report - As of December 31, 2014 (Unaudited)
| | | | | | | | | | | | |
| Average Annual Total Returns | | 1-Year | | | 5-Year | | | 10-Year | |
Portfolio | | | 2.71 | % | | | 8.61 | % | | | 7.30 | % |
Barclays U.S. High Yield 1% Issuer Capped Index | | | 2.42 | | | | 8.91 | | | | 7.64 | |
Past performance does not guarantee future returns. The investment return and principal value of an investment will fluctuate, so that an investor’s shares, when redeemed, may be worth more or less than their original cost. Current performance may be lower or higher than the past performance data quoted.
Portfolio performance is net of investment fees and fund expenses, but not contract charges, which, if included, would significantly lower the performance quoted. Performance figures may reflect fee waivers and/or expense reimbursements. In the absence of such fee waivers and/or expense reimbursements, total returns would be lower.
$10,000 INVESTED OVER 10 YEARS
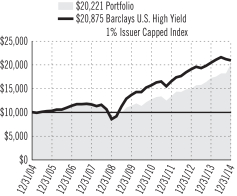
For the year ended December 31, 2014, the High Yield Bond Portfolio returned 2.71%.
The net assets of the Portfolio at December 31, 2014 were $3,245.9 million.
The Portfolio’s objective is high total return. The Portfolio’s subadviser is Prudential Investment Management, Inc.
The high-yield bond market performed well during the first half of 2014 despite headwinds from geopolitical risks and concerns over global growth. During the second half of the year, high-yield bonds experienced heightened price volatility as deterioration in a few specific sectors weighed on the entire asset class. Specifically, WTI and Brent crude prices, which were trading above $100 a barrel during the summer, dropped to near $55 by year’s end, causing a selloff in energy-related securities as investors questioned the sector’s fundamentals. Risk aversion increased and high yield bond spreads widened. (Spreads are the amount of extra yield that high-yield bonds provide over similar-duration Treasuries.) Credit spreads, which had narrowed to 365 basis points (bps) (a basis point is one hundredth of a percentage point) earlier in the year, widened to 594 bps in mid December but ended the year at 523 bps. Meanwhile, the average yield on the high yield index increased 100 bps during the year to 6.65%.
Riskier high-yield bonds underperformed during the period overall, as investors discriminated between healthy and weak credits. For the year, lower credit quality CCC-rated issues returned -1.21%, B-rated issues returned 1.47%, and BB-rated issues returned 5.38%.
Demand from retail investors weakened during the second half of the year. According to Lipper, U.S. high-yield mutual funds saw outflows of $1.3 billion in assets during the fourth quarter, following $24.2 billion in outflows during the third quarter. For 2014 as a whole, outflows from high-yield mutual funds totaled $20.6 billion.
New issue volume also weakened. After averaging $35 billion in new issuance every month during the first half of the year, activity dropped approximately 30% and averaged about $25 billion in the second half of the year. For 2014, total new issuance was $356 billion, slightly behind the record-setting pace of 2013.
The Portfolio outperformed its benchmark, the Barclays U.S. High Yield 1% Issuer Capped Index (the Index), which returned 2.42% during the period. Sector allocations and issue selection contributed positively to the Portfolio’s results.
Relative to its sector positioning, the Portfolio benefited from underweights in energy and metals as well as an overweight in technology. An overweight position in the gaming sector and underweight positions in the financials and cable sectors slightly dampened performance.
Individual issue selection was also positive, led by the Portfolio’s holdings in the gaming, cable, and retailing sectors. The Portfolio’s picks in chemicals, telecommunications, and electric utilities detracted somewhat from relative returns.
The Portfolio makes use of derivatives, including credit default swaps, to increase or hedge exposure to individual issuers and the broader market. Cash held for liquidity purposes in short-term, low-rate securities created a drag on performance during the year. Use of the CDX, a credit default swap index, provided market exposure during periods of lower liquidity, partially offsetting the drag from cash. Derivatives did not have a material impact on performance.
Prudential Investments LLC (PI), an indirect, wholly owned subsidiary of Prudential Financial, Inc., serves as the investment manager for the Portfolio.
Barclays U.S. High Yield 1% Issuer Capped Index is an unmanaged index that covers the universe of U.S. dollar denominated, non-convertible, fixed-rate, non-investment-grade debt. Issuers are capped at 1% of the Index. Index holdings must have at least one year to final maturity, at least $150 million par amount outstanding, and be publicly issued with a rating of Ba1 or lower. These returns do not include the effect of any investment management expenses. These returns would have been lower if they included the effect of these expenses. Investors cannot invest directly in a market index. For a complete list of holdings, refer to the Schedule of Investments section of this report.
Prudential Investment Management, Inc. is a registered investment adviser and a Prudential Financial company.
7
| | |
| The Prudential Series Fund, Jennison Portfolio | | December 31, 2014 |
Investment Manager’s Report - As of December 31, 2014 (Unaudited)
| | | | | | | | | | | | |
| Average Annual Total Returns | | 1-Year | | | 5-Year | | | 10-Year | |
Portfolio: Class I | | | 9.99 | % | | | 14.58 | % | | | 8.75 | % |
Portfolio: Class II | | | 9.58 | | | | 14.13 | | | | 8.31 | |
Russell 1000® Growth Index | | | 13.05 | | | | 15.81 | | | | 8.49 | |
S&P 500 Index | | | 13.66 | | | | 15.44 | | | | 7.67 | |
Past performance does not guarantee future returns. The investment return and principal value of an investment will fluctuate, so that an investor’s shares, when redeemed, may be worth more or less than their original cost. Current performance may be lower or higher than the past performance data quoted.
Portfolio performance is net of investment fees and fund expenses, but not contract charges, which, if included, would significantly lower the performance quoted. Performance figures may reflect fee waivers and/or expense reimbursements. In the absence of such fee waivers and/or expense reimbursements, total returns would be lower.
$10,000 INVESTED OVER 10 YEARS1
The Russell 1000® Growth Index is a trademark/service of the Frank Russell Company. Russell® is a trademark of the Frank Russell Company.
For the year ended December 31, 2014, the Jennison Portfolio Class I returned 9.99% and Class II returned 9.58%. The net assets of the Portfolio at December 31, 2014 were $1,623.7 million.
The Portfolio’s investment objective is long-term growth of capital. The Portfolio’s subadviser is Jennison Associates LLC (Jennison).
Faced with a challenging consumer environment, the Portfolio’s consumer holdings in the aggregate underperformed the Russell 1000 Growth Index (the Index) consumer names. Amazon.com’s earnings were constrained by increased business investment designed to drive unit growth in its core retail business and through digital commerce via the mobile market. Whole Foods Market was hurt by intensifying competition in the organic and natural foods market. The Portfolio no longer holds a position in Whole Foods. Weakness in Industria de Diseño Textil, or Inditex, best known for its brand, Zara, reflected currency translation issues due to the euro’s strength relative to many other currencies (Inditex is based in Spain). Underlying growth at the company remains strong.
More than offsetting these declines were strong gains in other consumer holdings, including global athletic apparel companies Under Armour and NIKE, hotel operator Marriott International, media conglomerate Disney, and electric car innovator Tesla Motors.
Health care positions were the most significant contributors to Portfolio return. Meaningful scientific advances coupled with increased research and development and clinical trial activity have led to numerous drug introductions and improvement in the treatment of serious diseases. Biotech companies held in the Portfolio benefited from their innovative drugs for blood disorders and autoimmune diseases (Alexion Pharmaceuticals’ Soliris), cancer (Celgene’s Revlimid and Abraxane), cystic fibrosis (Vertex Pharmaceuticals’ Kalydeco), multiple sclerosis (Biogen Idec’s Tecfidera), and hepatitis C (Gilead Sciences’ Sovaldi and Harvoni).
The Portfolio’s strength in the health care sector extended beyond biotechnology. In pharmaceuticals, Allergan advanced on a takeover bid and the strength of its business, which was enhanced by efforts to manage spending more efficiently and redeploy cash in ways that benefit shareholders. (Allergan was acquired by Actavis in November.) Illumina’s gain reflected increasing demand for its next-generation gene-sequencing technology.
Information technology positions were likewise strong contributors to return although Portfolio positions lagged the returns of the benchmark sector largely on weakness in select cloud-based companies. Apple’s strong revenue and earnings reflected expanding global acceptance of its platform. Jennison expects that product updates, especially iPhone 6, will sustain attractive revenue growth in the medium term.
Internet-based social platform Facebook reported strong revenue and earnings as well as healthy measures of growth in users and user engagement. The company has successfully implemented its mobile interface, and revenue generation of both mobile and desktop applications has improved.
Twitter’s revenue and earnings exceeded expectations, but user growth decelerated, in part because of slower-than-expected improvements in new user onboarding and access. Jennison believes the company’s communication platform complements traditional media outlets and that income-generation opportunities are substantial.
Next-generation security software vendor FireEye declined with a broad sell-off of high-multiple software growth stocks despite its strong billings, new customer, and revenue growth. The company’s behavioral analysis technology and real-time threat detection and prevention platform are able to identify highly sophisticated malware.
Prudential Investments LLC (PI), an indirect, wholly owned subsidiary of Prudential Financial, Inc., serves as the investment manager for the Portfolio.
| 1 | The graph is based on the performance of Class I shares. Performance of Class II shares will be lower due to differences in the fee structure. Class II shares have associated 12b-1 and administrative fees at an annual rate of 0.25% and 0.15%, respectively, of the average daily net assets of the Class II shares. |
Russell 1000 Growth Index is an unmanaged market cap-weighted index that measures the performance of those Russell 1000 companies with higher price-to-book ratios and higher forecasted growth values. S&P 500 Index is an unmanaged, market value-weighted index of 500 stocks generally representative of the broad stock market. These returns do not include the effect of any investment management expenses. These returns would have been lower if they included the effect of these expenses. Investors cannot invest directly in a market index. For a complete list of holdings, refer to the Schedule of Investments section of this report.
Jennison Associates LLC is a registered investment adviser and a Prudential Financial company.
8
| | |
| The Prudential Series Fund, Money Market Portfolio | | December 31, 2014 |
Investment Manager’s Report - As of December 31, 2014 (Unaudited)
| | | | | | | | | | | | | | | | |
Average Annual Total
Returns | | 7-Day*
Current
Net Yield | | | 1-Year | | | 5-Year | | | 10-Year | |
Portfolio | | | 0.00 | % | | | 0.00 | % | | | 0.01 | % | | | 1.56 | % |
Lipper (VIP) Money Market Funds Avg. | | | N/A | | | | -0.04 | | | | -0.03 | | | | 1.42 | |
Past performance does not guarantee future returns. The investment return and principal value of an investment will fluctuate, so that an investor’s shares, when redeemed, may be worth more or less than their original cost. Current performance may be lower or higher than the past performance data quoted.
The yield quotation more closely reflects the current earnings of the Portfolio than the total return quotation. Portfolio performance is net of investment fees and fund expenses, but not contract charges, which, if included, would significantly lower the performance quoted. Performance figures may reflect fee waivers and/or expense reimbursements. In the absence of such fee waivers and/or expense reimbursements, total returns would be lower.
7-DAY CURRENT NET YIELD*
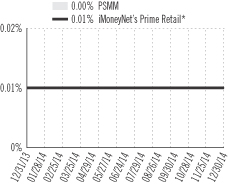
For the year ended December 31, 2014, the Money Market Portfolio returned 0.00%.
The net assets of the Portfolio at December 31, 2014 were $823.6 million.
The Portfolio’s investment objective is to seek maximum current income consistent with the stability of capital and maintenance of liquidity. The Portfolio’s subadviser is Prudential Investment Management, Inc.
The seven-day current yield and total return of the Portfolio remained near zero during the period. Throughout the year, the yields on all money market funds in the United States stayed at historically low levels, as the Federal Reserve (“Fed”) maintained its efforts to keep rates low in support of its dual mandate of maximum employment and price stability.
During the year, the U.S. economy was a beacon of hope, as global economies struggled with lower demand and disinflationary forces. Despite a soft patch during the first quarter due to harsh winter weather, the U.S. economy expanded in the second and third quarters, driven by an increase in business investment and a rise in consumer confidence resulting from steady improvement in the labor markets as well as lower energy prices.
As the U.S. economy strengthened, the Fed began slowly reducing the pace of its asset purchases, known as quantitative easing, and ended the program in October. In the fourth quarter, the Fed altered its forward guidance to suggest that monetary policy would remain highly accommodative and said it would keep federal funds target rate between 0% and 0.25% for the foreseeable future. However, toward the end of the year, the Fed appeared more confident in the broad economic expansion and indicated the normalization of monetary policy could happen sooner rather than later, leading to speculation that the Fed would start raising interest rates in mid 2015.
The three month London Interbank offered rate (“LIBOR”), the rate that banks pay one another to borrow in U.S. dollars, remained low during the year, averaging 0.23% and moving in an extremely narrow range of between 0.22% and 0.26%. However, one-year LIBOR rose, reflecting expectations of higher interest rates, and peaked at 0.63% at the end of 2014.
A flat yield curve and scarce supply of eligible securities provided few investment opportunities. Corporations took advantage of low interest rates to issue debt with maturities of longer than one year. Furthermore, regulatory forces compelled borrowers to avoid short term funding. Meanwhile, demand was strong for a limited number of shorter-term issues, which pushed yields lower. As corporate spreads (the difference in yield between corporate bonds and government bonds of similar maturities) remained narrow, the Portfolio favored government-issued debt, agency securities, and repurchase agreements. The Portfolio maintained a conservative investment approach by limiting the majority of its investments to less than three months and utilizing LIBOR-based securities to add relative value when appropriate. It kept its exposure to financial issuers in relatively short maturities as yields fell with the return of investor confidence to this sector.
Prudential Investments LLC (PI), an indirect, wholly owned subsidiary of Prudential Financial, Inc., serves as the investment manager for the Portfolio.
| * | Source: iMoneyNet, Inc. based on 249 funds in the iMoneyNet Prime Retail universe. Weekly 7-day current net yields of the Money Market Portfolio and the iMoneyNet Prime Retail universe as of 12/30/2014. |
The Lipper Variable Insurance Products (VIP) Funds Average is calculated by Lipper Analytical Services, Inc., and reflects the investment return of certain portfolios underlying variable life and annuity products. Returns for the Lipper Average reflect the deduction of operating expenses. Investors cannot invest directly in a market index or average. For a complete list of holdings, refer to the Schedule of Investments section of this report.
An investment in the Money Market Portfolio is not insured or guaranteed by the Federal Deposit Insurance Corporation or any other government agency. Although the Portfolio seeks to preserve the value of your investment at $10.00 per share, it is possible to lose money by investing in the Portfolio.
Prudential Investment Management, Inc. is a registered investment adviser and a Prudential Financial company.
9
| | |
| The Prudential Series Fund, Natural Resources Portfolio | | December 31, 2014 |
Investment Manager’s Report - As of December 31, 2014 (Unaudited)
| | | | | | | | | | | | | | | | |
| Average Annual Total Returns | | 1-Year | | | 5-Year | | | 10-Year | | | Since
Inception | |
Portfolio: Class I | | | -19.47 | % | | | -2.15 | % | | | 7.75 | % | | | N/A | |
Portfolio: Class II | | | -19.79 | | | | -2.55 | | | | N/A | | | | 7.23 | % |
Lipper (VUF) Natural Resources Funds Index | | | -15.00 | | | | 0.71 | | | | 6.13 | | | | 6.41 | |
S&P 500 Index | | | 13.66 | | | | 15.44 | | | | 7.67 | | | | 8.40 | |
Past performance does not guarantee future returns. The investment return and principal value of an investment will fluctuate, so that an investor’s shares, when redeemed, may be worth more or less than their original cost. Current performance may be lower or higher than the past performance data quoted.
Portfolio (Class II) inception: 4/28/2005. Portfolio performance is net of investment fees and fund expenses, but not contract charges, which, if included, would significantly lower the performance quoted. Unless noted otherwise, Index returns reflect performance beginning the closest month-end date to the Portfolio’s inception (Class II). Performance figures may reflect fee waivers and/or expense reimbursements. In the absence of such fee waivers and/or expense reimbursements, total returns would be lower.
$10,000 INVESTED OVER 10 YEARS1
For the year ended December 31, 2014, the Natural Resources Portfolio Class I returned -19.47% and Class II
returned -19.79%.
The net assets of the Portfolio at December 31, 2014 were $632.5 million.
The Portfolio’s investment objective is long-term growth of capital. The Portfolio’s subadviser is Jennison Associates LLC (Jennison).
Natural resources stocks reversed gains from early in the year, ending 2014 broadly lower. In the second half of the reporting period, oil prices moved sharply and steadily downward to multi-year lows. Commodity prices were broadly hampered by global macroeconomic weak spots and the strengthening U.S. dollar. Energy stocks were particularly hard hit by declining oil prices.
The Portfolio underperformed its broad benchmark the S&P 500 Index, as well as the narrower Lipper (VUF) Natural Resources Funds Index (the Index) primarily due to its holdings in the energy sector. The Portfolio’s energy equipment and services holdings and oil, gas, and consumable fuels shares posted losses. In materials, the metals and mining shares also ended lower. Conversely chemicals, in which the Portfolio had a small weighting, rose. Within energy, stock selection and allocations were negative relative to the Index, particularly in the oil, gas, and consumable fuels group. Stock selection detracted in materials, and allocations in metals and mining also had a negative impact on relative performance.
Among top absolute contributors, shares of oil and natural gas producer Cheniere Energy rose strongly on prospects for becoming the first large-scale U.S. exporter of liquefied natural gas (“LNG”), as the company received a construction permit for its second proposed Corpus Christi LNG export facility. Also, the company has signed a long-term take or pay contract with a Portuguese utility company. Despite the downward direction of oil prices, independent producer EOG Resources posted gains on the strength of its assets in high-growth locations. Jennison has a favorable view of the company’s asset portfolio, balance sheet, and execution. Shares of rotating equipment provider Dresser-Rand Group rose on news that Germany-based Siemens, a global energy and infrastructure technology company, made an offer to acquire it. The Portfolio no longer holds shares of Dresser-Rand.
Oil and gas exploration and production companies, and many related equipment and services providers, were widely affected by the severe declines in oil prices. Offshore drilling contractor Noble Energy, independent U.S. oil and gas producer Laredo Petroleum, and Rosetta Resources, an onshore producer with assets primarily in southern Texas, were among the major detractors to the Portfolio’s relative returns.
As the Portfolio used few derivatives during the reporting period, derivatives had no meaningful impact on performance.
Prudential Investments LLC (PI), an indirect, wholly owned subsidiary of Prudential Financial, Inc., serves as the investment manager for the Portfolio.
| 1 | The graph is based on the performance of Class I shares. Performance of Class II shares will be lower due to differences in the fee structure. Class II shares have associated 12b-1 and administrative fees at an annual rate of 0.25% and 0.15%, respectively, of the average daily net assets of the Class II shares. |
The Lipper Variable Underlying Funds (VUF) Natural Resources Funds Index is calculated by Lipper Analytical Services, Inc. and consists of an equal dollar-weighted composite of the 10 largest funds in the Lipper VUF Natural Resources Fund classification. The index is rebalanced quarterly. Natural Resources Funds are deemed as funds that invest primarily in the equity securities of domestic and foreign companies engaged in natural resources. Returns for the Lipper Average reflect the deduction of operating expenses. S&P 500 Index is an unmanaged, market value-weighted index of 500 stocks generally representative of the broad stock market. These returns are net of investment fees and fund expenses, but not product charges. These returns would have been lower if they included the effect of these expenses. Investors cannot invest directly in a market index or average. For a complete list of holdings, refer to the Schedule of Investments section of this report.
Jennison Associates LLC is a registered investment adviser and a Prudential Financial company.
10
| | |
The Prudential Series Fund, Small Capitalization Stock Portfolio | | December 31, 2014 |
Investment Manager’s Report - As of December 31, 2014 (Unaudited)
| | | | | | | | | | | | |
| Average Annual Total Returns | | 1-Year | | | 5-Year | | | 10-Year | |
Portfolio | | | 5.39 | % | | | 16.89 | % | | | 8.71 | % |
S&P SmallCap 600 Index | | | 5.76 | | | | 17.27 | | | | 9.02 | |
Past performance does not guarantee future returns. The investment return and principal value of an investment will fluctuate, so that an investor’s shares, when redeemed, may be worth more or less than their original cost. Current performance may be lower or higher than the past performance data quoted.
Portfolio performance is net of investment fees and fund expenses, but not contract charges, which, if included, would significantly lower the performance quoted. Performance figures may reflect fee waivers and/or expense reimbursements. In the absence of such fee waivers and/or expense reimbursements, total returns would be lower.
$10,000 INVESTED OVER 10 YEARS
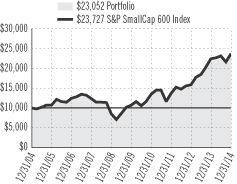
For the year ended December 31, 2014, the Small Capitalization Stock Portfolio returned 5.39%.
The net assets of the Portfolio at December 31, 2014 were $750.9 million.
The Portfolio’s investment objective is long-term growth of capital. The Portfolio’s subadviser is Quantitative Management Associates LLC (QMA).
U.S. economic indicators continued to improve over the course of the year and the stock markets responded accordingly. A highlight was the resurgence in consumer activity and confidence as gasoline prices dropped and employment improved. However, the housing market had sporadic returns and remained sluggish, a fact attributed to tight credit markets according to Federal Reserve Chairwoman Janet Yellen.
Manufacturing also softened towards the end of the year although the U.S. Purchasing Manager’s Index (PMI) remained comfortably above the critical 50 reading, denoting the line between expansion and contraction, and leading the way among developed economies. Strong economic results helped the Federal Reserve become one of the few central banks in the world moving towards a tighter monetary policy. Both large- and mid-cap stocks outperformed small-caps.
Potential tracking error differences, brokerage costs, as well as other costs and expenses of the Portfolio, may cause its return to be lower than that of the S&P Small Cap 600 Index. The Portfolio underperformed the 5.76% return of the Index.
During the year, the Portfolio had a small exposure to derivative instruments to help enhance its liquidity, but the position did not have a material impact on its performance.
Prudential Investments LLC (PI), an indirect, wholly owned subsidiary of Prudential Financial, Inc., serves as the investment manager for the Portfolio.
S&P SmallCap 600 Index is an unmanaged index representing the aggregate market value of the common equity of 600 small-company stocks. These returns do not include the effect of any investment management expenses. These returns would have been lower if they included the effect of these expenses. Investors cannot invest directly in a market index. For a complete list of holdings, refer to the Schedule of Investments section of this report.
Quantitative Management Associates LLC is a registered investment adviser and a Prudential Financial company.
11
| | |
| The Prudential Series Fund, Stock Index Portfolio | | December 31, 2014 |
Investment Manager’s Report - As of December 31, 2014 (Unaudited)
| | | | | | | | | | | | |
| Average Annual Total Returns | | 1-Year | | | 5-Year | | | 10-Year | |
Portfolio | | | 13.31 | % | | | 15.09 | % | | | 7.38 | % |
S&P 500 Index | | | 13.66 | | | | 15.44 | | | | 7.67 | |
Past performance does not guarantee future returns. The investment return and principal value of an investment will fluctuate, so that an investor’s shares, when redeemed, may be worth more or less than their original cost. Current performance may be lower or higher than the past performance data quoted.
Portfolio performance is net of investment fees and fund expenses, but not contract charges, which, if included, would significantly lower the performance quoted. Performance figures may reflect fee waivers and/or expense reimbursements. In the absence of such fee waivers and/or expense reimbursements, total returns would be lower.
$10,000 INVESTED OVER 10 YEARS
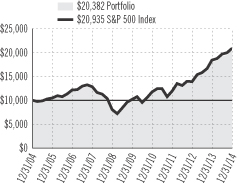
For the year ended December 31, 2014, the Stock Index Portfolio returned 13.31%.
The net assets of the Portfolio at December 31, 2014 were $3,312.7 million.
The Portfolio’s investment objective is to achieve investment results that generally correspond to the performance of publicly traded common stocks. Quantitative Management Associates LLC (QMA) subadvises the Portfolio, which is an index fund that uses a risk-controlled quantitative approach that seeks to effectively track the performance of its benchmark, the S&P 500 Index (the Index). While Prudential Financial, Inc. (Prudential) is one of the components to the S&P 500, the Portfolio cannot hold shares of Prudential because of compliance restrictions.
Potential tracking error (the difference between the return of the portfolio and the return of benchmark) differences, brokerage costs, as well as other costs and expenses of the Portfolio, may cause its return to be lower than that of the Index. In 2014, the Portfolio underperformed the Index, which returned 13.66%.
Stocks performed strongly during the year. Investors were decidedly cautious, focusing on geopolitical concerns, such as Russia’s conflict in the Ukraine and terrorism in the Middle East, slowing economies in Europe and China, and the prospect of rising interest rates in the U.S. Due to reduced investor risk tolerance, high quality, lower risk names generally outperformed. Large-cap stocks outperformed small-caps, low beta (a measure of the risk of the portfolio that comes from its exposure to a specific benchmark. Low beta stocks are considered to be less risky than high beta stocks) outperformed high beta, and companies exhibiting higher quality characteristics and strong and improving earnings trends outperformed lower quality companies. Investors did not overpay for these characteristics as valuations remained attractive.
The Portfolio uses derivative instruments, though not as a principal investment strategy. The Portfolio had a small position in futures contracts on the S&P 500 Index to help enhance liquidity. This exposure slightly detracted from the Portfolio’s performance.
Prudential Investments LLC (PI), an indirect, wholly owned subsidiary of Prudential Financial, Inc., serves as the investment manager for the Portfolio.
S&P 500 Index is an unmanaged, market value-weighted index of 500 stocks generally representative of the broad stock market. These returns do not include the effect of any investment management expenses. These returns would have been lower if they included the effect of these expenses. Investors cannot invest directly in a market index. For a complete list of holdings, refer to the Schedule of Investments section of this report.
Quantitative Management Associates LLC is a registered investment adviser and a Prudential Financial company.
12
| | |
| The Prudential Series Fund, Value Portfolio | | December 31, 2014 |
Investment Manager’s Report - As of December 31, 2014 (Unaudited)
| | | | | | | | | | | | |
| Average Annual Total Returns | | 1-Year | | | 5-Year | | | 10-Year | |
Portfolio: Class I | | | 10.10 | % | | | 12.55 | % | | | 7.88 | % |
Portfolio: Class II | | | 9.66 | | | | 12.10 | | | | 7.45 | |
Russell 1000® Value Index | | | 13.45 | | | | 15.42 | | | | 7.30 | |
S&P 500 Index | | | 13.66 | | | | 15.44 | | | | 7.67 | |
Past performance does not guarantee future returns. The investment return and principal value of an investment will fluctuate, so that an investor’s shares, when redeemed, may be worth more or less than their original cost. Current performance may be lower or higher than the past performance data quoted.
Portfolio performance is net of investment fees and fund expenses, but not contract charges, which, if included, would significantly lower the performance quoted. The Russell 1000® Value Index is a trademark/service mark of the Frank Russell Company. Russell® is a trademark of the Frank Russell Company. Performance figures may reflect fee waivers and/or expense reimbursements. In the absence of such fee waivers and/or expense reimbursements, total returns would be lower.
$10,000 INVESTED OVER 10 YEARS1
For the year ended December 31, 2014, the Value Portfolio Class I returned 10.10% and Class II returned 9.66%.
The net assets of the Portfolio at December 31, 2014 were $1,603.2 million.
The Portfolio’s investment objective is capital appreciation. The Portfolio’s subadviser is Jennison Associates LLC (Jennison).
The Portfolio’s Class I and Class II shares underperformed the benchmark, the Russell 1000 Value Index (the Index), which returned 13.45%. Consumer staples detracted the most from relative results due primarily to stock selection, although an underweight to the sector also hurt. Utilities had a negative effect on relative performance for the same reasons. Avon Products and NRG Energy drove respective results in those sectors. Revenue and sales were disappointing for Avon Products. NRG shares have been weighed down by declining gas prices and concerns over the cash flow impact of two new initiatives — carbon capture and electric vehicle charging.
Stock selection in consumer discretionary also fell short of expectations, driven by JC Penney, and the position was sold.
Energy positions underperformed their benchmark peers; Noble and Denbury Resources were especially weak. The Portfolio no longer holds a position in Denbury. In light of declines in the price of oil, Jennison has spent considerable time evaluating the Portfolio’s positions in the sector and made adjustments accordingly.
Security choices in industrials were the primary source of relative gain, driven by United Continental Holdings. Airlines overall outperformed the industrials sector and the overall market. Earnings, revenue, and guidance were solid, as cost cuts and higher pricing took hold. United further announced a share buyback and appears on track to achieve several key revenue initiatives, including improvements to capacity management on Asian flights.
Relative gain in health care was driven by advances in Actavis and HCA Holdings. Actavis reported good revenue and earnings and raised its sales and profit guidance. After major acquisitions, it has grown in size and scope, and is now, in Jennison’s opinion, a formidable brand/generic hybrid pharmaceutical company with a global scope. HCA Holdings, an operator of hospitals and freestanding surgery centers, benefited from better-than-anticipated utilization as a result of the Affordable Care Act. In Jennison’s opinion, the stock is attractive based on its industry-leading scale, which drives cost synergies, significant levels of cash flow, and a large market share in fast-growing Texas and Florida.
IT holdings Flextronics and Applied Materials were also standout performers. Flextronics, a global electronics manufacturer, enjoyed growth in its industrial and high reliability solutions businesses. Applied Materials benefited from solid earnings and margins. Jennison believes the new management team is executing well on improving margins, increasing growth in their Services business Applied Global Services-AGS, and gaining market share in their Solar & Display businesses.
Prudential Investments LLC (PI), an indirect, wholly owned subsidiary of Prudential Financial, Inc., serves as the investment manager for the Portfolio.
| 1 | The graph is based on the performance of Class I shares. Performance of Class II shares will be lower due to differences in the fee structure. Class II shares have associated 12b-1 and administrative fees at an annual rate of 0.25% and 0.15%, respectively, of the average daily net assets of the Class II shares. |
Russell 1000 Value Index is an unmanaged market cap-weighted index that measures the performance of those Russell 1000 companies with lower price-to-book ratios and lower forecasted growth values. S&P 500 Index is an unmanaged, market value-weighted index of 500 stocks generally representative of the broad stock market. Investors cannot invest directly in a market index. For a complete list of holdings, refer to the Schedule of Investments section of this report.
Jennison Associates LLC is a registered investment adviser and a Prudential Financial company.
13
| | |
The Prudential Series Fund Presentation of Portfolio Holdings — unaudited | | December 31, 2014 |
| | | | |
| Conservative Balanced | |
| Five Largest Holdings | | | (% of Net Assets | ) |
| Apple, Inc. | | | 1.9% | |
Exxon Mobil Corp. | | | 1.2% | |
Microsoft Corp. | | | 1.1% | |
| U.S. Treasury Notes, 1.500%, 01/31/19 | | | 1.0% | |
| Johnson & Johnson | | | 0.9% | |
| | | | |
| Diversified Bond | |
Allocation | | | (% of Net Assets | ) |
| Banking | | | 12.2% | |
| Commercial Mortgage-Backed Securities | | | 10.0% | |
| Residential Mortgage-Backed Securities | | | 5.7% | |
Sovereign Bonds | | | 5.1% | |
| Collateralized Loan Obiligations | | | 4.5% | |
| | | | |
| Equity | |
| Five Largest Holdings | | | (% of Net Assets | ) |
| Apple, Inc. | | | 3.4% | |
Facebook, Inc., (Class A Stock) | | | 2.8% | |
Celgene Corp. | | | 2.6% | |
Actavis PLC | | | 2.4% | |
| Applied Materials, Inc. | | | 2.3% | |
| | | | |
| Flexible Managed | |
| Five Largest Holdings | | | (% of Net Assets | ) |
Apple, Inc. | | | 2.0% | |
| Microsoft Corp. | | | 1.6% | |
Exxon Mobil Corp. | | | 1.4% | |
| General Electric Co. | | | 1.3% | |
| JPMorgan Chase & Co. | | | 1.2% | |
| | | | |
| Global | |
| Top Five Countries | | | (% of Net Assets | ) |
United States | | | 55.7% | |
| Japan | | | 8.7% | |
United Kingdom | | | 6.1% | |
| Switzerland | | | 3.2% | |
| France | | | 3.1% | |
| | | | |
| Government Income | |
| Allocation | | | (% of Net Assets | ) |
| U.S. Government Agency Obligations | | | 47.2% | |
| U.S. Treasury Obligations | | | 22.7% | |
| Commercial Mortgage-Backed Securities | | | 20.2% | |
| Collateralized Loan Obiligations | | | 3.1% | |
| Foregin Government Agencies | | | 0.8% | |
| | | | |
| High Yield Bond | |
Allocation | | | (% of Net Assets | ) |
| Technology | | | 11.2% | |
| Capital Goods | | | 7.7% | |
| Healthcare & Pharmaceutical | | | 7.6% | |
| Electric | | | 6.5% | |
| Gaming | | | 6.4% | |
| | | | |
| Jennison | |
| Five Largest Holdings | | | (% of Net Assets | ) |
| Apple, Inc. | | | 5.5% | |
| Facebook, Inc. (Class A Stock) | | | 3.6% | |
| MasterCard, Inc. (Class A Stock) | | | 3.6% | |
| Visa, Inc. (Class A Stock) | | | 2.7% | |
| Biogen Idec, Inc. | | | 2.6% | |
| | | | |
| Natural Resources | |
| Five Largest Holdings | | | (% of Net Assets | ) |
| Schlumberger Ltd. | | | 4.4% | |
| Anadarko Petroleum Corp. | | | 4.0% | |
| Concho Resources, Inc. | | | 3.5% | |
| Noble Energy, Inc. | | | 3.5% | |
| EOG Resources, Inc. | | | 3.4% | |
| | | | |
| Small Capitalization Stock | |
| Five Largest Holdings | | | (% of Net Assets | ) |
| iShares Core S&P Small-Cap ETF | | | 0.7% | |
| West Pharmaceutical Services, Inc. | | | 0.5% | |
| Teledyne Technologies, Inc. | | | 0.5% | |
| MAXIMUS, Inc. | | | 0.5% | |
| Toro Co. (The) | | | 0.5% | |
| | | | |
| Stock Index | |
| Five Largest Holdings | | | (% of Net Assets | ) |
| Apple, Inc. | | | 3.4% | |
Exxon Mobil Corp. | | | 2.1% | |
| Microsoft Corp. | | | 2.0% | |
| Johnson & Johnson | | | 1.6% | |
| Berkshire Hathaway, Inc. | | | 1.4% | |
| | | | |
| Value | |
| Five Largest Holdings | | | (% of Net Assets | ) |
| JPMorgan Chase & Co. | | | 3.0% | |
Wells Fargo & Co. | | | 2.9% | |
| Citigroup, Inc. | | | 2.4% | |
| FirstEnergy Corp. | | | 2.4% | |
| United Continental Holdings, Inc. | | | 2.4% | |
For a complete list of holdings, please refer to the Schedule of Investments section of this report. Holdings reflect only long-term investments. Holdings/Issues/Industries/Sectors are subject to change.
| | |
The Prudential Series Fund Fees and Expenses — unaudited | | December 31, 2014 |
As a contract owner investing in Portfolios of the Fund through a variable annuity or variable life contract, you incur ongoing costs, including management fees, and other Portfolio expenses. This example is intended to help you understand your ongoing costs (in dollars) of investing in the Fund and to compare these costs with the ongoing costs of investing in other investment options. This example does not reflect fees and charges under your variable annuity or variable life contract. If contract charges were included, the costs shown below would be higher. Please consult the prospectus for your contract for more information about contract fees and charges.
The example is based on an investment of $1,000 invested at the beginning of the period and held for the entire period July 1, 2014 through December 31, 2014.
Actual Expenses
The first line of the table below provides information about actual account values and actual expenses. You may use this information, together with the amount you invested, to estimate the Portfolio expenses that you paid over the period. Simply divide your account value by $1,000 (for example, an $8,600 account value divided by $1,000 = 8.6), then multiply the result by the number in the first line under the heading entitled “Expenses Paid During the Six-Month Period” to estimate the Portfolio expenses you paid on your account during this period. As noted above, the table does not reflect variable contract fees and charges.
Hypothetical Example for Comparison Purposes
The second line of the table below provides information about hypothetical account values and hypothetical expenses based on the Portfolio’s actual expense ratio and an assumed rate of return of 5% per year before expenses, which is not the Portfolio’s actual return. The hypothetical account values and expenses may not be used to estimate the actual ending account balance or expenses you paid for the period. You may use this information to compare the ongoing costs of investing in the Portfolio and other investment options. To do so, compare this 5% hypothetical example with the 5% hypothetical examples that appear in the shareholder reports of the other investment options.
Please note that the expenses shown in the table are meant to highlight your ongoing Portfolio costs only and do not reflect any contract fees and charges, such as sales charges (loads), insurance charges or administrative charges. Therefore the second line of the table is useful to compare ongoing investment option costs only, and will not help you determine the relative total costs of owning different contracts. In addition, if these contract fees and charges were included, your costs would have been higher.
| | | | | | | | | | | | | | | | | | |
| The Prudential Series Fund Portfolios | | Beginning
Account Value
July 1, 2014 | | | Ending
Account Value
December 31, 2014 | | | Annualized Expense
Ratio based on the
Six-Month period | | | Expenses Paid
During the
Six-Month period* | |
| Conservative Balanced (Class I) | | Actual | | $ | 1,000.00 | | | $ | 1,033.10 | | | | 0.58 | % | | $ | 2.97 | |
| | Hypothetical | | $ | 1,000.00 | | | $ | 1,022.28 | | | | 0.58 | % | | $ | 2.96 | |
| Diversified Bond (Class I) | | Actual | | $ | 1,000.00 | | | $ | 1,015.70 | | | | 0.44 | % | | $ | 2.24 | |
| | Hypothetical | | $ | 1,000.00 | | | $ | 1,022.99 | | | | 0.44 | % | | $ | 2.24 | |
| Equity (Class I) | | Actual | | $ | 1,000.00 | | | $ | 1,025.30 | | | | 0.47 | % | | $ | 2.40 | |
| | Hypothetical | | $ | 1,000.00 | | | $ | 1,022.84 | | | | 0.47 | % | | $ | 2.40 | |
| Equity (Class II) | | Actual | | $ | 1,000.00 | | | $ | 1,023.00 | | | | 0.87 | % | | $ | 4.44 | |
| | Hypothetical | | $ | 1,000.00 | | | $ | 1,020.82 | | | | 0.87 | % | | $ | 4.43 | |
| Flexible Managed (Class I) | | Actual | | $ | 1,000.00 | | | $ | 1,037.60 | | | | 0.62 | % | | $ | 3.18 | |
| | Hypothetical | | $ | 1,000.00 | | | $ | 1,022.08 | | | | 0.62 | % | | $ | 3.16 | |
| Global (Class I) | | Actual | | $ | 1,000.00 | | | $ | 987.30 | | | | 0.81 | % | | $ | 4.06 | |
| | Hypothetical | | $ | 1,000.00 | | | $ | 1,021.12 | | | | 0.81 | % | | $ | 4.13 | |
| Government Income (Class I) | | Actual | | $ | 1,000.00 | | | $ | 1,019.70 | | | | 0.47 | % | | $ | 2.39 | |
| | Hypothetical | | $ | 1,000.00 | | | $ | 1,022.84 | | | | 0.47 | % | | $ | 2.40 | |
| High Yield Bond (Class I) | | Actual | | $ | 1,000.00 | | | $ | 976.30 | | | | 0.57 | % | | $ | 2.84 | |
| | Hypothetical | | $ | 1,000.00 | | | $ | 1,022.33 | | | | 0.57 | % | | $ | 2.91 | |
| Jennison (Class I) | | Actual | | $ | 1,000.00 | | | $ | 1,052.60 | | | | 0.63 | % | | $ | 3.26 | |
| | Hypothetical | | $ | 1,000.00 | | | $ | 1,022.03 | | | | 0.63 | % | | $ | 3.21 | |
| Jennison (Class II) | | Actual | | $ | 1,000.00 | | | $ | 1,050.70 | | | | 1.03 | % | | $ | 5.32 | |
| | Hypothetical | | $ | 1,000.00 | | | $ | 1,020.01 | | | | 1.03 | % | | $ | 5.24 | |
Money Market
(Class I) | | Actual | | $ | 1,000.00 | | | $ | 1,000.00 | | | | 0.16 | % | | $ | 0.81 | |
| | Hypothetical | | $ | 1,000.00 | | | $ | 1,024.40 | | | | 0.16 | % | | $ | 0.82 | |
| | |
The Prudential Series Fund Fees and Expenses — unaudited (continued) | | December 31, 2014 |
| | | | | | | | | | | | | | | | | | |
| The Prudential Series Fund Portfolios | | Beginning
Account Value
July 1, 2014 | | | Ending
Account Value
December 31, 2014 | | | Annualized Expense
Ratio based on the
Six-Month period | | | Expenses Paid
During the
Six-Month period* | |
| Natural Resources (Class I) | | Actual | | $ | 1,000.00 | | | $ | 680.60 | | | | 0.45 | % | | $ | 1.91 | |
| | Hypothetical | | $ | 1,000.00 | | | $ | 1,022.94 | | | | 0.45 | % | | $ | 2.29 | |
| Natural Resources (Class II) | | Actual | | $ | 1,000.00 | | | $ | 679.10 | | | | 0.85 | % | | $ | 3.60 | |
| | Hypothetical | | $ | 1,000.00 | | | $ | 1,020.92 | | | | 0.85 | % | | $ | 4.33 | |
| Small Capitalization Stock (Class I) | | Actual | | $ | 1,000.00 | | | $ | 1,022.60 | | | | 0.41 | % | | $ | 2.09 | |
| | Hypothetical | | $ | 1,000.00 | | | $ | 1,023.14 | | | | 0.41 | % | | $ | 2.09 | |
| Stock Index (Class I) | | Actual | | $ | 1,000.00 | | | $ | 1,059.50 | | | | 0.32 | % | | $ | 1.66 | |
| | Hypothetical | | $ | 1,000.00 | | | $ | 1,023.59 | | | | 0.32 | % | | $ | 1.63 | |
| Value (Class I) | | Actual | | $ | 1,000.00 | | | $ | 1,012.60 | | | | 0.42 | % | | $ | 2.13 | |
| | Hypothetical | | $ | 1,000.00 | | | $ | 1,023.09 | | | | 0.42 | % | | $ | 2.14 | |
| Value (Class II) | | Actual | | $ | 1,000.00 | | | $ | 1,010.70 | | | | 0.82 | % | | $ | 4.16 | |
| | Hypothetical | | $ | 1,000.00 | | | $ | 1,021.07 | | | | 0.82 | % | | $ | 4.18 | |
* Portfolio expenses (net of fee waivers or subsidies, if any) for each share class are equal to the annualized expense ratio for each share class (provided in the table), multiplied by the average account value over the period, multiplied by the 184 days in the six-month period ended December 31, 2014, and divided by the 365 days in the Portfolio’s fiscal year ended December 31, 2014 (to reflect the six-month period). Expenses presented in the table include the expenses of any underlying portfolios in which the Portfolio may invest.
| | | | | | |
| | | CONSERVATIVE BALANCED PORTFOLIO | | |
| |
| SCHEDULE OF INVESTMENTS | | December 31, 2014 |
| | | | | | | | |
| LONG-TERM INVESTMENTS — 88.6% | | | | |
| COMMON STOCKS — 57.7% | | Shares
| | | Value
(Note 2)
| |
Aerospace & Defense — 1.5% | |
BAE Systems PLC (United Kingdom) | | | 22,952 | | | $ | 167,853 | |
Boeing Co. (The) | | | 51,200 | | | | 6,654,976 | |
General Dynamics Corp. | | | 24,100 | | | | 3,316,642 | |
Honeywell International, Inc. | | | 59,812 | | | | 5,976,415 | |
L-3 Communications Holdings, Inc. | | | 6,800 | | | | 858,228 | |
Lockheed Martin Corp. | | | 20,500 | | | | 3,947,685 | |
Northrop Grumman Corp. | | | 15,962 | | | | 2,352,639 | |
Precision Castparts Corp. | | | 11,000 | | | | 2,649,680 | |
Raytheon Co. | | | 23,600 | | | | 2,552,812 | |
Rockwell Collins, Inc. | | | 10,500 | | | | 887,040 | |
Safran SA (France) | | | 3,993 | | | | 246,348 | |
Textron, Inc. | | | 21,500 | | | | 905,365 | |
Thales SA (France) | | | 687 | | | | 37,172 | |
United Technologies Corp. | | | 64,900 | | | | 7,463,500 | |
| | | | | | |
|
|
|
| | | | | | | | 38,016,355 | |
| | | | | | |
|
|
|
Air Freight & Logistics — 0.4% | |
C.H. Robinson Worldwide, Inc. | | | 11,500 | | | | 861,235 | |
Deutsche Post AG (Germany) | | | 7,040 | | | | 228,532 | |
Expeditors International of Washington, Inc. | | | 15,200 | | | | 678,072 | |
FedEx Corp. | | | 20,200 | | | | 3,507,932 | |
Royal Mail PLC (United Kingdom) | | | 4,839 | | | | 32,247 | |
United Parcel Service, Inc. (Class B Stock) | | | 53,700 | | | | 5,969,829 | |
| | | | | | |
|
|
|
| | | | | | | | 11,277,847 | |
| | | | | | |
|
|
|
Airlines — 0.3% | |
Delta Air Lines, Inc. | | | 63,900 | | | | 3,143,241 | |
Deutsche Lufthansa AG (Germany) | | | 25,980 | | | | 430,515 | |
easyJet PLC (United Kingdom) | | | 1,145 | | | | 29,632 | |
International Consolidated Airlines Group SA (United Kingdom)* | | | 7,130 | | | | 53,113 | |
Ryanair Holdings PLC (Ireland) ADR* | | | 9,900 | | | | 705,573 | |
Southwest Airlines Co. | | | 52,600 | | | | 2,226,032 | |
| | | | | | |
|
|
|
| | | | | | | | 6,588,106 | |
| | | | | | |
|
|
|
Auto Components — 0.2% | |
BorgWarner, Inc. | | | 17,500 | | | | 961,625 | |
Bridgestone Corp. (Japan) | | | 4,700 | | | | 163,005 | |
Continental AG (Germany) | | | 817 | | | | 172,325 | |
Delphi Automotive PLC (United Kingdom) | | | 23,100 | | | | 1,679,832 | |
Goodyear Tire & Rubber Co. (The) | | | 19,900 | | | | 568,543 | |
Johnson Controls, Inc. | | | 50,500 | | | | 2,441,170 | |
Koito Manufacturing Co. Ltd. (Japan) | | | 1,300 | | | | 39,769 | |
NGK Spark Plug Co. Ltd. (Japan) | | | 1,300 | | | | 39,501 | |
NOK Corp. (Japan) | | | 5,900 | | | | 150,176 | |
Sumitomo Electric Industries Ltd. (Japan) | | | 5,500 | | | | 68,691 | |
Sumitomo Rubber Industries Ltd. (Japan) | | | 2,300 | | | | 34,192 | |
Toyota Industries Corp. (Japan) | | | 1,200 | | | | 61,502 | |
| | | | | | |
|
|
|
| | | | | | | | 6,380,331 | |
| | | | | | |
|
|
|
| | | | | | | | |
COMMON STOCKS
(continued) | | Shares
| | | Value
(Note 2)
| |
Automobiles — 0.5% | |
Bayerische Motoren Werke AG (Germany) | | | 3,734 | | | $ | 402,968 | |
Daimler AG (Germany) | | | 7,564 | | | | 628,222 | |
Fiat Chrysler Automobiles NV (United Kingdom)* | | | 6,368 | | | | 73,995 | |
Ford Motor Co. | | | 293,885 | | | | 4,555,217 | |
Fuji Heavy Industries Ltd. (Japan) | | | 17,500 | | | | 619,255 | |
General Motors Co. | | | 102,500 | | | | 3,578,275 | |
Harley-Davidson, Inc. | | | 16,700 | | | | 1,100,697 | |
Isuzu Motors Ltd. (Japan) | | | 4,500 | | | | 54,811 | |
Mazda Motor Corp. (Japan) | | | 4,000 | | | | 96,062 | |
Nissan Motor Co. Ltd. (Japan) | | | 17,800 | | | | 155,248 | |
Peugeot SA (France)* | | | 51,647 | | | | 632,801 | |
Renault SA (France) | | | 1,421 | | | | 103,501 | |
Toyota Motor Corp. (Japan) | | | 20,800 | | | | 1,296,202 | |
Volkswagen AG (Germany) | | | 212 | | | | 45,962 | |
| | | | | | |
|
|
|
| | | | | | | | 13,343,216 | |
| | | | | | |
|
|
|
Banks — 3.8% | |
Aozora Bank Ltd. (Japan) | | | 153,000 | | | | 473,618 | |
Australia & New Zealand Banking Group Ltd. (Australia) | | | 20,417 | | | | 531,249 | |
Banco Santander SA (Spain) | | | 159,262 | | | | 1,336,708 | |
Bank Hapoalim BM (Israel) | | | 131,802 | | | | 619,750 | |
Bank of America Corp. | | | 803,021 | | | | 14,366,046 | |
Bank of Queensland Ltd. (Australia) | | | 6,514 | | | | 64,175 | |
BB&T Corp. | | | 54,900 | | | | 2,135,061 | |
BNP Paribas SA (France) | | | 2,155 | | | | 127,219 | |
Citigroup, Inc. | | | 231,785 | | | | 12,541,886 | |
Comerica, Inc. | | | 14,200 | | | | 665,128 | |
Commonwealth Bank of Australia (Australia) | | | 18,612 | | | | 1,293,139 | |
Credit Agricole SA (France) | | | 54,118 | | | | 698,585 | |
Danske Bank A/S (Denmark) | | | 8,801 | | | | 237,943 | |
DBS Group Holdings Ltd. (Singapore) | | | 12,363 | | | | 191,396 | |
DNB ASA (Norway) | | | 35,326 | | | | 521,080 | |
Fifth Third Bancorp | | | 62,321 | | | | 1,269,790 | |
HSBC Holdings PLC (United Kingdom) | | | 137,639 | | | | 1,300,658 | |
Huntington Bancshares, Inc. | | | 59,636 | | | | 627,371 | |
JPMorgan Chase & Co. | | | 285,745 | | | | 17,881,922 | |
KeyCorp | | | 66,500 | | | | 924,350 | |
Lloyds Banking Group PLC (United Kingdom)* | | | 35,216 | | | | 41,423 | |
M&T Bank Corp.(a) | | | 10,100 | | | | 1,268,762 | |
Mitsubishi UFJ Financial Group, Inc. (Japan) | | | 192,200 | | | | 1,055,991 | |
Mizuho Financial Group, Inc. (Japan) | | | 165,100 | | | | 276,758 | |
Natixis SA (France) | | | 104,922 | | | | 692,342 | |
Oversea-Chinese Banking Corp. Ltd. (Singapore) | | | 21,499 | | | | 169,154 | |
PNC Financial Services Group, Inc. (The) | | | 41,033 | | | | 3,743,441 | |
Regions Financial Corp. | | | 103,603 | | | | 1,094,048 | |
Resona Holdings, Inc. (Japan) | | | 15,800 | | | | 79,814 | |
SEE NOTES TO FINANCIAL STATEMENTS.
A1
| | | | | | |
| | | CONSERVATIVE BALANCED PORTFOLIO (continued) | | |
| |
| SCHEDULE OF INVESTMENTS | | December 31, 2014 |
| | | | | | | | |
COMMON STOCKS
(continued) | | Shares
| | | Value
(Note 2)
| |
Banks (continued) | |
Skandinaviska Enskilda Banken AB (Sweden) (Class A Stock) | | | 58,333 | | | $ | 740,745 | |
Sumitomo Mitsui Financial Group, Inc. (Japan) | | | 21,300 | | | | 770,053 | |
Sumitomo Mitsui Trust Holdings, Inc. (Japan) | | | 24,000 | | | | 91,927 | |
SunTrust Banks, Inc. | | | 40,800 | | | | 1,709,520 | |
Svenska Handelsbanken AB (Sweden) (Class A Stock) | | | 13,463 | | | | 629,905 | |
Swedbank AB (Sweden) (Class A Stock) | | | 6,481 | | | | 160,800 | |
U.S. Bancorp | | | 136,585 | | | | 6,139,496 | |
United Overseas Bank Ltd. (Singapore) | | | 11,000 | | | | 202,995 | |
Wells Fargo & Co. | | | 361,264 | | | | 19,804,492 | |
Westpac Banking Corp. (Australia) | | | 5,742 | | | | 154,436 | |
Zions Bancorporation | | | 14,650 | | | | 417,671 | |
| | | | | | |
|
|
|
| | | | | | | | 97,050,847 | |
| | | | | | |
|
|
|
Beverages — 1.2% | |
Anheuser-Busch InBev NV (Belgium) | | | 8,118 | | | | 913,613 | |
Brown-Forman Corp. (Class B Stock) | | | 12,350 | | | | 1,084,824 | |
Carlsberg A/S (Denmark) (Class B Stock) | | | 1,776 | | | | 136,397 | |
Coca-Cola Co. (The) | | | 299,901 | | | | 12,661,820 | |
Coca-Cola Enterprises, Inc. | | | 16,900 | | | | 747,318 | |
Constellation Brands, Inc. (Class A Stock)* | | | 12,800 | | | | 1,256,576 | |
Diageo PLC (United Kingdom) | | | 3,087 | | | | 88,434 | |
Dr. Pepper Snapple Group, Inc. | | | 14,900 | | | | 1,068,032 | |
Heineken Holding NV (Netherlands) | | | 609 | | | | 38,124 | |
Molson Coors Brewing Co. (Class B Stock) | | | 12,200 | | | | 909,144 | |
Monster Beverage Corp.* | | | 11,000 | | | | 1,191,850 | |
PepsiCo, Inc. | | | 114,707 | | | | 10,846,694 | |
Pernod Ricard SA (France) | | | 1,556 | | | | 172,931 | |
| | | | | | |
|
|
|
| | | | | | | | 31,115,757 | |
| | | | | | |
|
|
|
Biotechnology — 1.6% | |
Actelion Ltd. (Switzerland)* | | | 4,803 | | | | 552,927 | |
Alexion Pharmaceuticals, Inc.* | | | 15,300 | | | | 2,830,959 | |
Amgen, Inc. | | | 58,187 | | | | 9,268,607 | |
Biogen Idec, Inc.* | | | 18,190 | | | | 6,174,595 | |
Celgene Corp.* | | | 61,000 | | | | 6,823,460 | |
CSL Ltd. (Australia) | | | 2,686 | | | | 188,680 | |
Gilead Sciences, Inc.* | | | 115,000 | | | | 10,839,900 | |
Regeneron Pharmaceuticals, Inc.* | | | 5,700 | | | | 2,338,425 | |
Vertex Pharmaceuticals, Inc.* | | | 18,200 | | | | 2,162,160 | |
| | | | | | |
|
|
|
| | | | | | | | 41,179,713 | |
| | | | | | |
|
|
|
Building Products — 0.1% | |
Allegion PLC | | | 7,933 | | | | 439,964 | |
Assa Abloy AB (Sweden) (Class B Stock) | | | 2,450 | | | | 129,401 | |
Daikin Industries Ltd. (Japan) | | | 1,700 | | | | 109,011 | |
Geberit AG (Switzerland) | | | 271 | | | | 91,680 | |
Masco Corp. | | | 25,800 | | | | 650,160 | |
| | | | | | |
|
|
|
| | | | | | | | 1,420,216 | |
| | | | | | |
|
|
|
| | | | | | | | |
COMMON STOCKS
(continued) | | Shares
| | | Value
(Note 2)
| |
Capital Markets — 1.3% | |
3i Group PLC (United Kingdom) | | | 6,935 | | | $ | 48,356 | |
Aberdeen Asset Management PLC (United Kingdom) | | | 6,669 | | | | 44,562 | |
Affiliated Managers Group, Inc.* | | | 4,400 | | | | 933,856 | |
Ameriprise Financial, Inc. | | | 14,220 | | | | 1,880,595 | |
Bank of New York Mellon Corp. (The) | | | 85,758 | | | | 3,479,202 | |
BlackRock, Inc. | | | 9,750 | | | | 3,486,210 | |
Charles Schwab Corp. (The) | | | 86,950 | | | | 2,625,020 | |
E*TRADE Financial Corp.* | | | 21,120 | | | | 512,266 | |
Franklin Resources, Inc. | | | 30,400 | | | | 1,683,248 | |
Goldman Sachs Group, Inc. (The) | | | 31,400 | | | | 6,086,262 | |
Invesco Ltd. | | | 32,600 | | | | 1,288,352 | |
Investec PLC (South Africa) | | | 79,426 | | | | 665,454 | |
Legg Mason, Inc. | | | 8,100 | | | | 432,297 | |
Macquarie Group Ltd. (Australia) | | | 2,050 | | | | 96,672 | |
Morgan Stanley | | | 117,380 | | | | 4,554,344 | |
Northern Trust Corp. | | | 16,800 | | | | 1,132,320 | |
Partners Group Holding AG (Switzerland) | | | 126 | | | | 36,658 | |
State Street Corp. | | | 32,200 | | | | 2,527,700 | |
T. Rowe Price Group, Inc. | | | 20,300 | | | | 1,742,958 | |
| | | | | | |
|
|
|
| | | | | | | | 33,256,332 | |
| | | | | | |
|
|
|
Chemicals — 1.4% | |
Air Products & Chemicals, Inc. | | | 14,700 | | | | 2,120,181 | |
Airgas, Inc. | | | 5,500 | | | | 633,490 | |
Asahi Kasei Corp. (Japan) | | | 21,000 | | | | 191,571 | |
BASF SE (Germany) | | | 1,528 | | | | 128,170 | |
CF Industries Holdings, Inc. | | | 3,900 | | | | 1,062,906 | |
Daicel Corp. (Japan) | | | 64,000 | | | | 747,551 | |
Dow Chemical Co. (The) | | | 85,131 | | | | 3,882,825 | |
E.I. du Pont de Nemours & Co. | | | 69,120 | | | | 5,110,733 | |
Eastman Chemical Co. | | | 11,500 | | | | 872,390 | |
Ecolab, Inc. | | | 20,500 | | | | 2,142,660 | |
FMC Corp. | | | 10,600 | | | | 604,518 | |
Givaudan SA (Switzerland)* | | | 49 | | | | 87,899 | |
International Flavors & Fragrances, Inc. | | | 6,600 | | | | 668,976 | |
K+S AG (Germany) | | | 24,671 | | | | 680,802 | |
Kuraray Co. Ltd. (Japan) | | | 2,500 | | | | 28,405 | |
LyondellBasell Industries NV (Class A Stock) | | | 32,300 | | | | 2,564,297 | |
Monsanto Co. | | | 36,994 | | | | 4,419,673 | |
Mosaic Co. (The) | | | 24,800 | | | | 1,132,120 | |
Nitto Denko Corp. (Japan) | | | 1,100 | | | | 61,463 | |
PPG Industries, Inc. | | | 10,600 | | | | 2,450,190 | |
Praxair, Inc. | | | 22,200 | | | | 2,876,232 | |
Sherwin-Williams Co. (The) | | | 6,400 | | | | 1,683,456 | |
Sigma-Aldrich Corp. | | | 9,000 | | | | 1,235,430 | |
Sumitomo Chemical Co. Ltd. (Japan) | | | 12,000 | | | | 47,241 | |
Yara International ASA (Norway) | | | 15,101 | | | | 672,484 | |
| | | | | | |
|
|
|
| | | | | | | | 36,105,663 | |
| | | | | | |
|
|
|
Commercial Services & Supplies — 0.3% | |
ADT Corp. (The)(a) | | | 13,500 | | | | 489,105 | |
Cintas Corp. | | | 7,500 | | | | 588,300 | |
Dai Nippon Printing Co. Ltd. (Japan) | | | 4,000 | | | | 36,026 | |
SEE NOTES TO FINANCIAL STATEMENTS.
A2
| | | | | | |
| | | CONSERVATIVE BALANCED PORTFOLIO (continued) | | |
| |
| SCHEDULE OF INVESTMENTS | | December 31, 2014 |
| | | | | | | | |
COMMON STOCKS
(continued) | | Shares
| | | Value
(Note 2)
| |
Commercial Services & Supplies (continued) | |
Pitney Bowes, Inc. | | | 15,200 | | | $ | 370,424 | |
Republic Services, Inc. | | | 19,565 | | | | 787,491 | |
Secom Co. Ltd. (Japan) | | | 1,500 | | | | 86,182 | |
Securitas AB (Sweden) (Class B Stock) | | | 20,463 | | | | 247,555 | |
Stericycle, Inc.* | | | 6,600 | | | | 865,128 | |
Toppan Printing Co. Ltd. (Japan) | | | 7,000 | | | | 45,482 | |
Tyco International PLC | | | 33,300 | | | | 1,460,538 | |
Waste Management, Inc. | | | 33,442 | | | | 1,716,244 | |
| | | | | | |
|
|
|
| | | | | | | | 6,692,475 | |
| | | | | | |
|
|
|
Communications Equipment — 0.9% | |
Cisco Systems, Inc. | | | 389,400 | | | | 10,831,161 | |
F5 Networks, Inc.* | | | 6,200 | | | | 808,883 | |
Harris Corp. | | | 7,800 | | | | 560,196 | |
Juniper Networks, Inc. | | | 31,700 | | | | 707,544 | |
Motorola Solutions, Inc. | | | 16,889 | | | | 1,132,914 | |
Nokia OYJ (Finland) | | | 13,848 | | | | 109,522 | |
QUALCOMM, Inc. | | | 127,700 | | | | 9,491,941 | |
| | | | | | |
|
|
|
| | | | | | | | 23,642,161 | |
| | | | | | |
|
|
|
Construction & Engineering — 0.1% | |
ACS Actividades de Construccion y Servicios SA (Spain) | | | 7,520 | | | | 262,111 | |
Ferrovial SA (Spain) | | | 3,030 | | | | 59,898 | |
Fluor Corp. | | | 12,200 | | | | 739,686 | |
Hochtief AG (Germany) | | | 9,493 | | | | 669,717 | |
Jacobs Engineering Group, Inc.* | | | 10,600 | | | | 473,714 | |
Leighton Holdings Ltd. (Australia) | | | 27,923 | | | | 508,436 | |
Quanta Services, Inc.* | | | 17,100 | | | | 485,469 | |
Skanska AB (Sweden) (Class B Stock) | | | 2,746 | | | | 58,958 | |
Taisei Corp. (Japan) | | | 8,000 | | | | 45,376 | |
| | | | | | |
|
|
|
| | | | | | | | 3,303,365 | |
| | | | | | |
|
|
|
Construction Materials — 0.1% | |
HeidelbergCement AG (Germany) | | | 1,014 | | | | 71,568 | |
Martin Marietta Materials, Inc. | | | 4,900 | | | | 540,568 | |
Taiheiyo Cement Corp. (Japan) | | | 9,000 | | | | 28,237 | |
Vulcan Materials Co. | | | 10,400 | | | | 683,592 | |
| | | | | | |
|
|
|
| | | | | | | | 1,323,965 | |
| | | | | | |
|
|
|
Consumer Finance — 0.5% | |
American Express Co. | | | 68,700 | | | | 6,391,848 | |
Capital One Financial Corp. | | | 42,761 | | | | 3,529,920 | |
Discover Financial Services | | | 35,040 | | | | 2,294,770 | |
Navient Corp. | | | 31,000 | | | | 669,910 | |
| | | | | | |
|
|
|
| | | | | | | | 12,886,448 | |
| | | | | | |
|
|
|
Containers & Packaging — 0.1% | |
Avery Dennison Corp. | | | 7,400 | | | | 383,912 | |
Ball Corp. | | | 10,400 | | | | 708,968 | |
MeadWestvaco Corp. | | | 12,614 | | | | 559,935 | |
Owens-Illinois, Inc.* | | | 12,600 | | | | 340,074 | |
Sealed Air Corp. | | | 16,400 | | | | 695,852 | |
| | | | | | |
|
|
|
| | | | | | | | 2,688,741 | |
| | | | | | |
|
|
|
Distributors — 0.1% | |
Genuine Parts Co. | | | 12,000 | | | | 1,278,840 | |
| | | | | | |
|
|
|
| | | | | | | | |
COMMON STOCKS
(continued) | | Shares
| | | Value
(Note 2)
| |
Diversified Consumer Services | |
H&R Block, Inc. | | | 21,300 | | | $ | 717,384 | |
| | | | | | |
|
|
|
Diversified Financial Services — 1.2% | |
Berkshire Hathaway, Inc. (Class B Stock)* | | | 139,500 | | | | 20,945,925 | |
CME Group, Inc. | | | 24,200 | | | | 2,145,330 | |
Industrivarden AB (Sweden) (Class C Stock) | | | 15,408 | | | | 267,454 | |
Intercontinental Exchange, Inc. | | | 8,771 | | | | 1,923,393 | |
Investment AB Kinnevik (Sweden) (Class B Stock) | | | 18,816 | | | | 611,882 | |
Investor AB (Sweden) (Class B Stock) | | | 8,535 | | | | 310,314 | |
Leucadia National Corp. | | | 22,900 | | | | 513,418 | |
McGraw Hill Financial, Inc. | | | 20,900 | | | | 1,859,682 | |
Moody’s Corp. | | | 14,200 | | | | 1,360,502 | |
NASDAQ OMX Group, Inc. (The) | | | 9,200 | | | | 441,232 | |
ORIX Corp. (Japan) | | | 9,500 | | | | 119,537 | |
| | | | | | |
|
|
|
| | | | | | | | 30,498,669 | |
| | | | | | |
|
|
|
Diversified Telecommunication Services — 1.4% | |
AT&T, Inc. | | | 396,368 | | | | 13,314,001 | |
Belgacom SA (Belgium) | | | 2,066 | | | | 74,962 | |
BT Group PLC (United Kingdom) | | | 57,227 | | | | 355,956 | |
CenturyLink, Inc. | | | 43,836 | | | | 1,735,029 | |
Frontier Communications Corp. | | | 71,890 | | | | 479,506 | |
Koninklijke KPN NV (Netherlands) | | | 37,893 | | | | 119,642 | |
Level 3 Communications, Inc.* | | | 20,400 | | | | 1,007,352 | |
Nippon Telegraph & Telephone Corp. (Japan) | | | 12,000 | | | | 612,992 | |
Orange SA (France) | | | 54,037 | | | | 918,994 | |
PCCW Ltd. (Hong Kong) | | | 875,000 | | | | 595,779 | |
Spark New Zealand Ltd. (New Zealand) | | | 13,409 | | | | 32,506 | |
Telecom Italia SpA (Italy) | | | 103,104 | | | | 86,200 | |
Telefonica SA (Spain) | | | 69,721 | | | | 1,001,023 | |
Telekom Austria AG (Austria) | | | 2,889 | | | | 19,294 | |
Verizon Communications, Inc. | | | 316,076 | | | | 14,786,035 | |
Windstream Holdings, Inc. | | | 41,957 | | | | 345,726 | |
| | | | | | |
|
|
|
| | | | | | | | 35,484,997 | |
| | | | | | |
|
|
|
Electric Utilities — 1.1% | |
American Electric Power Co., Inc. | | | 37,260 | | | | 2,262,427 | |
Cheung Kong Infrastructure Holdings Ltd. (Hong Kong) | | | 49,000 | | | | 360,335 | |
Chubu Electric Power Co., Inc. (Japan)* | | | 4,800 | | | | 56,405 | |
Chugoku Electric Power Co., Inc. (The) (Japan) | | | 2,200 | | | | 28,764 | |
Duke Energy Corp. | | | 54,361 | | | | 4,541,318 | |
Edison International | | | 25,200 | | | | 1,650,096 | |
EDP-Energias de Portugal SA (Portugal) | | | 16,785 | | | | 65,087 | |
Electricite de France SA (France) | | | 3,109 | | | | 85,586 | |
Entergy Corp. | | | 13,800 | | | | 1,207,224 | |
Exelon Corp. | | | 65,113 | | | | 2,414,390 | |
FirstEnergy Corp. | | | 31,906 | | | | 1,244,015 | |
Fortum OYJ (Finland) | | | 31,609 | | | | 686,282 | |
Hokuriku Electric Power Co. (Japan) | | | 2,200 | | | | 28,095 | |
SEE NOTES TO FINANCIAL STATEMENTS.
A3
| | | | | | |
| | | CONSERVATIVE BALANCED PORTFOLIO (continued) | | |
| |
| SCHEDULE OF INVESTMENTS | | December 31, 2014 |
| | | | | | | | |
COMMON STOCKS
(continued) | | Shares
| | | Value
(Note 2)
| |
Electric Utilities (continued) | |
Kansai Electric Power Co., Inc. (The) (Japan)* | | | 5,300 | | | $ | 50,419 | |
Kyushu Electric Power Co., Inc. (Japan)* | | | 3,200 | | | | 32,049 | |
NextEra Energy, Inc. | | | 33,300 | | | | 3,539,457 | |
Northeast Utilities | | | 24,000 | | | | 1,284,480 | |
Pepco Holdings, Inc. | | | 18,300 | | | | 492,819 | |
Pinnacle West Capital Corp. | | | 8,700 | | | | 594,297 | |
Power Assets Holdings Ltd. (Hong Kong) | | | 19,000 | | | | 183,692 | |
PPL Corp. | | | 51,000 | | | | 1,852,830 | |
Red Electrica Corp. SA (Spain) | | | 785 | | | | 69,199 | |
Shikoku Electric Power Co., Inc. (Japan)* | | | 2,300 | | | | 27,898 | |
Southern Co. (The) | | | 67,900 | | | | 3,334,569 | |
SSE PLC (United Kingdom) | | | 7,068 | | | | 178,588 | |
Tohoku Electric Power Co., Inc. (Japan) | | | 3,300 | | | | 38,400 | |
Tokyo Electric Power Co., Inc. (Japan)* | | | 10,900 | | | | 44,334 | |
Xcel Energy, Inc. | | | 38,310 | | | | 1,376,095 | |
| | | | | | |
|
|
|
| | | | | | | | 27,729,150 | |
| | | | | | |
|
|
|
Electrical Equipment — 0.3% | |
AMETEK, Inc. | | | 18,800 | | | | 989,444 | |
Eaton Corp. PLC | | | 36,137 | | | | 2,455,871 | |
Emerson Electric Co. | | | 52,900 | | | | 3,265,517 | |
Fuji Electric Co. Ltd. (Japan) | | | 7,000 | | | | 27,908 | |
Mitsubishi Electric Corp. (Japan) | | | 52,000 | | | | 617,659 | |
Rockwell Automation, Inc. | | | 10,600 | | | | 1,178,720 | |
| | | | | | |
|
|
|
| | | | | | | | 8,535,119 | |
| | | | | | |
|
|
|
Electronic Equipment, Instruments & Components — 0.3% | |
Amphenol Corp. (Class A Stock) | | | 24,000 | | | | 1,291,440 | |
Corning, Inc. | | | 97,800 | | | | 2,242,554 | |
FLIR Systems, Inc. | | | 10,800 | | | | 348,948 | |
Hitachi Ltd. (Japan) | | | 35,000 | | | | 258,327 | |
Hoya Corp. (Japan) | | | 3,200 | | | | 108,239 | |
Keyence Corp. (Japan) | | | 300 | | | | 133,678 | |
Murata Manufacturing Co. Ltd. (Japan) | | | 1,500 | | | | 163,682 | |
Omron Corp. (Japan) | | | 16,700 | | | | 747,083 | |
TDK Corp. (Japan) | | | 1,600 | | | | 94,233 | |
TE Connectivity Ltd. (Switzerland) | | | 31,400 | | | | 1,986,050 | |
| | | | | | |
|
|
|
| | | | | | | | 7,374,234 | |
| | | | | | |
|
|
|
Energy Equipment & Services — 0.7% | |
Baker Hughes, Inc. | | | 32,998 | | | | 1,850,198 | |
Cameron International Corp.* | | | 15,600 | | | | 779,220 | |
Diamond Offshore Drilling, Inc.(a) | | | 4,700 | | | | 172,537 | |
Ensco PLC (Class A Stock) | | | 18,200 | | | | 545,090 | |
FMC Technologies, Inc.* | | | 18,000 | | | | 843,120 | |
Halliburton Co. | | | 64,500 | | | | 2,536,785 | |
Helmerich & Payne, Inc. | | | 8,600 | | | | 579,812 | |
Nabors Industries Ltd. | | | 21,900 | | | | 284,262 | |
National Oilwell Varco, Inc. | | | 32,600 | | | | 2,136,278 | |
Noble Corp. PLC | | | 18,800 | | | | 311,516 | |
Schlumberger Ltd. | | | 98,818 | | | | 8,440,045 | |
Transocean Ltd.(a) | | | 26,300 | | | | 482,079 | |
Transocean Ltd. (SWX) | | | 2,615 | | | | 47,985 | |
| | | | | | |
|
|
|
| | | | | | | | 19,008,927 | |
| | | | | | |
|
|
|
| | | | | | | | |
COMMON STOCKS
(continued) | | Shares
| | | Value
(Note 2)
| |
Food & Staples Retailing — 1.4% | |
Carrefour SA (France) | | | 4,565 | | | $ | 138,920 | |
Casino Guichard Perrachon SA (France) | | | 3,866 | | | | 355,536 | |
Costco Wholesale Corp. | | | 33,700 | | | | 4,776,975 | |
CVS Health Corp. | | | 88,348 | | | | 8,508,796 | |
Delhaize Group SA (Belgium) | | | 2,703 | | | | 196,847 | |
J. Sainsbury PLC (United Kingdom)(a) | | | 161,327 | | | | 616,058 | |
Koninklijke Ahold NV (Netherlands) | | | 6,712 | | | | 119,292 | |
Kroger Co. (The) | | | 37,346 | | | | 2,397,987 | |
Lawson, Inc. (Japan) | | | 900 | | | | 54,385 | |
Safeway, Inc. | | | 17,900 | | | | 628,648 | |
Sysco Corp. | | | 45,000 | | | | 1,786,050 | |
Wal-Mart Stores, Inc. | | | 120,300 | | | | 10,331,364 | |
Walgreens Boots Alliance, Inc. | | | 66,700 | | | | 5,082,540 | |
Wesfarmers Ltd. (Australia) | | | 8,099 | | | | 274,213 | |
Whole Foods Market, Inc. | | | 27,400 | | | | 1,381,508 | |
WM Morrison Supermarkets PLC (United Kingdom) | | | 172,713 | | | | 492,797 | |
| | | | | | |
|
|
|
| | | | | | | | 37,141,916 | |
| | | | | | |
|
|
|
Food Products — 1.0% | |
Archer-Daniels-Midland Co. | | | 48,926 | | | | 2,544,152 | |
Campbell Soup Co. | | | 14,200 | | | | 624,800 | |
Chocoladefabriken Lindt & Sprungli AG (Switzerland) | | | 1 | | | | 57,702 | |
ConAgra Foods, Inc. | | | 32,100 | | | | 1,164,588 | |
General Mills, Inc. | | | 46,400 | | | | 2,474,512 | |
Golden Agri-Resources Ltd. (Singapore) | | | 50,000 | | | | 17,305 | |
Hershey Co. (The) | | | 11,400 | | | | 1,184,802 | |
Hormel Foods Corp. | | | 10,700 | | | | 557,470 | |
J.M. Smucker Co. (The) | | | 8,000 | | | | 807,840 | |
Kellogg Co. | | | 19,400 | | | | 1,269,536 | |
Keurig Green Mountain, Inc. | | | 9,500 | | | | 1,257,752 | |
Kraft Foods Group, Inc. | | | 45,017 | | | | 2,820,765 | |
McCormick & Co., Inc. | | | 10,300 | | | | 765,290 | |
Mead Johnson Nutrition Co. | | | 15,267 | | | | 1,534,944 | |
Mondelez International, Inc. (Class A Stock) | | | 127,753 | | | | 4,640,628 | |
Nestle SA (Switzerland) | | | 19,945 | | | | 1,454,011 | |
NH Foods Ltd. (Japan) | | | 1,000 | | | | 21,878 | |
Tate & Lyle PLC (United Kingdom) | | | 3,418 | | | | 32,025 | |
Tyson Foods, Inc. (Class A Stock) | | | 22,500 | | | | 902,025 | |
Unilever NV (United Kingdom) | | | 28,299 | | | | 1,106,996 | |
Unilever PLC (United Kingdom) | | | 9,426 | | | | 382,962 | |
Wilmar International Ltd. (Singapore) | | | 301,000 | | | | 733,427 | |
| | | | | | |
|
|
|
| | | | | | | | 26,355,410 | |
| | | | | | |
|
|
|
Gas Utilities | |
AGL Resources, Inc. | | | 8,939 | | | | 487,265 | |
Enagas SA (Spain) | | | 4,075 | | | | 128,530 | |
Snam SpA (Italy) | | | 26,639 | | | | 131,843 | |
| | | | | | |
|
|
|
| | | | | | | | 747,638 | |
| | | | | | |
|
|
|
Health Care Equipment & Supplies — 1.2% | |
Abbott Laboratories | | | 114,000 | | | | 5,132,280 | |
Baxter International, Inc. | | | 41,100 | | | | 3,012,219 | |
SEE NOTES TO FINANCIAL STATEMENTS.
A4
| | | | | | |
| | | CONSERVATIVE BALANCED PORTFOLIO (continued) | | |
| |
| SCHEDULE OF INVESTMENTS | | December 31, 2014 |
| | | | | | | | |
COMMON STOCKS
(continued) | | Shares
| | | Value
(Note 2)
| |
Health Care Equipment & Supplies (continued) | |
Becton, Dickinson & Co. | | | 14,700 | | | $ | 2,045,652 | |
Boston Scientific Corp.* | | | 100,567 | | | | 1,332,513 | |
C.R. Bard, Inc. | | | 5,900 | | | | 983,058 | |
CareFusion Corp.* | | | 15,775 | | | | 936,088 | |
Covidien PLC | | | 34,300 | | | | 3,508,204 | |
DENTSPLY International, Inc. | | | 11,200 | | | | 596,624 | |
Edwards Lifesciences Corp.* | | | 8,200 | | | | 1,044,516 | |
Intuitive Surgical, Inc.* | | | 2,800 | | | | 1,481,032 | |
Medtronic, Inc. | | | 74,300 | | | | 5,364,460 | |
St. Jude Medical, Inc. | | | 21,500 | | | | 1,398,145 | |
Stryker Corp. | | | 23,000 | | | | 2,169,590 | |
Varian Medical Systems, Inc.*(a) | | | 8,200 | | | | 709,382 | |
Zimmer Holdings, Inc. | | | 13,300 | | | | 1,508,486 | |
| | | | | | |
|
|
|
| | | | | | | | 31,222,249 | |
| | | | | | |
|
|
|
Health Care Providers & Services — 1.3% | |
Aetna, Inc. | | | 27,069 | | | | 2,404,539 | |
Alfresa Holdings Corp. (Japan) | | | 1,200 | | | | 14,491 | |
AmerisourceBergen Corp. | | | 16,400 | | | | 1,478,624 | |
Anthem, Inc. | | | 20,800 | | | | 2,613,936 | |
Cardinal Health, Inc. | | | 25,750 | | | | 2,078,798 | |
Cigna Corp. | | | 20,400 | | | | 2,099,364 | |
DaVita HealthCare Partners, Inc.* | | | 13,200 | | | | 999,768 | |
Express Scripts Holding Co.* | | | 56,549 | | | | 4,788,004 | |
Fresenius SE & Co. KGaA (Germany) | | | 2,724 | | | | 141,632 | |
Humana, Inc. | | | 11,700 | | | | 1,680,471 | |
Laboratory Corp. of America Holdings* | | | 6,700 | | | | 722,930 | |
McKesson Corp. | | | 17,630 | | | | 3,659,635 | |
Medipal Holdings Corp. (Japan) | | | 38,900 | | | | 454,340 | |
Patterson Cos., Inc. | | | 6,500 | | | | 312,650 | |
Quest Diagnostics, Inc.(a) | | | 11,300 | | | | 757,778 | |
Sonic Healthcare Ltd. (Australia) | | | 2,778 | | | | 41,794 | |
Suzuken Co. Ltd. (Japan) | | | 900 | | | | 24,861 | |
Tenet Healthcare Corp.*(a) | | | 7,550 | | | | 382,559 | |
UnitedHealth Group, Inc. | | | 74,200 | | | | 7,500,878 | |
Universal Health Services, Inc. (Class B Stock) | | | 7,100 | | | | 789,946 | |
| | | | | | |
|
|
|
| | | | | | | | 32,946,998 | |
| | | | | | |
|
|
|
Health Care Technology — 0.1% | |
Cerner Corp.* | | | 22,900 | | | | 1,480,714 | |
| | | | | | |
|
|
|
Hotels, Restaurants & Leisure — 1.0% | |
Carnival Corp. | | | 34,000 | | | | 1,541,220 | |
Chipotle Mexican Grill, Inc.* | | | 2,450 | | | | 1,677,049 | |
Darden Restaurants, Inc.(a) | | | 9,850 | | | | 577,506 | |
Marriott International, Inc. (Class A Stock) | | | 16,628 | | | | 1,297,483 | |
McDonald’s Corp. | | | 74,900 | | | | 7,018,130 | |
Merlin Entertainments PLC (United Kingdom) | | | 71,641 | | | | 443,290 | |
Oriental Land Co. Ltd. (Japan) | | | 1,800 | | | | 415,105 | |
Royal Caribbean Cruises Ltd. | | | 12,500 | | | | 1,030,375 | |
Sodexo SA (France) | | | 698 | | | | 68,323 | |
Starbucks Corp. | | | 57,000 | | | | 4,676,850 | |
Starwood Hotels & Resorts Worldwide, Inc. | | | 14,000 | | | | 1,134,980 | |
| | | | | | | | |
COMMON STOCKS
(continued) | | Shares
| | | Value
(Note 2)
| |
Hotels, Restaurants & Leisure (continued) | |
Tabcorp Holdings Ltd. (Australia) | | | 84,990 | | | $ | 286,902 | |
Tatts Group Ltd. (Australia) | | | 10,669 | | | | 30,007 | |
Whitbread PLC (United Kingdom) | | | 767 | | | | 56,763 | |
Wyndham Worldwide Corp. | | | 9,620 | | | | 825,011 | |
Wynn Resorts Ltd. | | | 6,200 | | | | 922,312 | |
Yum! Brands, Inc. | | | 33,300 | | | | 2,425,905 | |
| | | | | | |
|
|
|
| | | | | | | | 24,427,211 | |
| | | | | | |
|
|
|
Household Durables — 0.3% | |
D.R. Horton, Inc. | | | 24,000 | | | | 606,960 | |
Garmin Ltd.(a) | | | 9,300 | | | | 491,319 | |
Harman International Industries, Inc. | | | 5,500 | | | | 586,905 | |
Leggett & Platt, Inc. | | | 10,500 | | | | 447,405 | |
Lennar Corp. (Class A Stock) | | | 14,100 | | | | 631,821 | |
Mohawk Industries, Inc.* | | | 4,900 | | | | 761,264 | |
Newell Rubbermaid, Inc. | | | 21,114 | | | | 804,232 | |
Panasonic Corp. (Japan) | | | 72,400 | | | | 852,759 | |
Persimmon PLC (United Kingdom)* | | | 4,080 | | | | 99,650 | |
PulteGroup, Inc. | | | 25,222 | | | | 541,264 | |
Sekisui Chemical Co. Ltd. (Japan) | | | 3,000 | | | | 36,093 | |
Sony Corp. (Japan) | | | 29,400 | | | | 600,032 | |
Whirlpool Corp. | | | 6,026 | | | | 1,167,477 | |
| | | | | | |
|
|
|
| | | | | | | | 7,627,181 | |
| | | | | | |
|
|
|
Household Products — 1.1% | |
Clorox Co. (The) | | | 10,000 | | | | 1,042,100 | |
Colgate-Palmolive Co. | | | 65,900 | | | | 4,559,621 | |
Henkel AG & Co. KGaA (Germany) | | | 8,150 | | | | 789,480 | |
Kimberly-Clark Corp. | | | 28,400 | | | | 3,281,336 | |
Procter & Gamble Co. (The) | | | 206,425 | | | | 18,803,253 | |
Svenska Cellulosa AB SCA (Sweden) (Class B Stock) | | | 4,247 | | | | 91,560 | |
| | | | | | |
|
|
|
| | | | | | | | 28,567,350 | |
| | | | | | |
|
|
|
Independent Power & Renewable Electricity Producers — 0.1% | |
AES Corp. | | | 51,100 | | | | 703,647 | |
Electric Power Development Co. Ltd. (Japan) | | | 900 | | | | 30,412 | |
NRG Energy, Inc. | | | 26,100 | | | | 703,395 | |
| | | | | | |
|
|
|
| | | | | | | | 1,437,454 | |
| | | | | | |
|
|
|
Industrial Conglomerates — 1.3% | |
3M Co. | | | 49,400 | | | | 8,117,408 | |
Danaher Corp. | | | 46,300 | | | | 3,968,373 | |
General Electric Co. | | | 767,700 | | | | 19,399,779 | |
Hopewell Holdings Ltd. (Hong Kong) | | | 106,000 | | | | 385,854 | |
Hutchison Whampoa Ltd. (Hong Kong) | | | 13,000 | | | | 148,610 | |
Keppel Corp. Ltd. (Singapore) | | | 61,000 | | | | 406,588 | |
NWS Holdings Ltd. (Hong Kong) | | | 11,000 | | | | 20,177 | |
Roper Industries, Inc. | | | 7,700 | | | | 1,203,895 | |
Siemens AG (Germany) | | | 5,816 | | | | 652,579 | |
| | | | | | |
|
|
|
| | | | | | | | 34,303,263 | |
| | | | | | |
|
|
|
Insurance — 1.6% | |
ACE Ltd. | | | 25,500 | | | | 2,929,440 | |
Aflac, Inc. | | | 34,700 | | | | 2,119,823 | |
AIA Group Ltd. (Hong Kong) | | | 5,200 | | | | 28,680 | |
Allianz SE (Germany) | | | 3,336 | | | | 552,531 | |
Allstate Corp. (The) | | | 33,300 | | | | 2,339,325 | |
SEE NOTES TO FINANCIAL STATEMENTS.
A5
| | | | | | |
| | | CONSERVATIVE BALANCED PORTFOLIO (continued) | | |
| |
| SCHEDULE OF INVESTMENTS | | December 31, 2014 |
| | | | | | | | |
COMMON STOCKS
(continued) | | Shares
| | | Value
(Note 2)
| |
Insurance (continued) | |
American International Group, Inc. | | | 108,139 | | | $ | 6,056,865 | |
Aon PLC | | | 22,200 | | | | 2,105,226 | |
Assurant, Inc. | | | 5,500 | | | | 376,365 | |
AXA SA (France) | | | 32,922 | | | | 758,625 | |
Baloise Holding AG (Switzerland) | | | 3,970 | | | | 507,412 | |
Chubb Corp. (The) | | | 18,600 | | | | 1,924,542 | |
Cincinnati Financial Corp. | | | 11,237 | | | | 582,414 | |
CNP Assurances (France) | | | 1,259 | | | | 22,320 | |
Genworth Financial, Inc. (Class A Stock)* | | | 37,200 | | | | 316,200 | |
Hannover Rueck SE (Germany) | | | 1,811 | | | | 163,373 | |
Hartford Financial Services Group, Inc. (The) | | | 33,900 | | | | 1,413,291 | |
Insurance Australia Group Ltd. (Australia) | | | 17,358 | | | | 88,136 | |
Legal & General Group PLC (United Kingdom) | | | 163,963 | | | | 633,087 | |
Lincoln National Corp. | | | 19,918 | | | | 1,148,671 | |
Loews Corp. | | | 23,275 | | | | 978,015 | |
Marsh & McLennan Cos., Inc. | | | 41,400 | | | | 2,369,736 | |
MetLife, Inc. | | | 86,400 | | | | 4,673,376 | |
Muenchener Rueckversicherungs AG (Germany) | | | 1,062 | | | | 211,485 | |
NN Group NV (Netherlands)* | | | 895 | | | | 26,719 | |
Principal Financial Group, Inc. | | | 20,800 | | | | 1,080,352 | |
Progressive Corp. (The) | | | 40,800 | | | | 1,101,192 | |
Prudential PLC (United Kingdom) | | | 18,497 | | | | 427,642 | |
Suncorp Group Ltd. (Australia) | | | 45,247 | | | | 516,892 | |
Swiss Life Holding AG (Switzerland)* | | | 1,871 | | | | 442,214 | |
Swiss Re AG (Switzerland)* | | | 1,279 | | | | 107,144 | |
Tokio Marine Holdings, Inc. (Japan) | | | 5,000 | | | | 162,388 | |
Torchmark Corp. | | | 9,725 | | | | 526,803 | |
Travelers Cos., Inc. (The) | | | 25,735 | | | | 2,724,050 | |
UnipolSai SpA (Italy) | | | 7,610 | | | | 20,489 | |
Unum Group | | | 21,410 | | | | 746,781 | |
XL Group PLC (Ireland) | | | 19,800 | | | | 680,526 | |
| | | | | | |
|
|
|
| | | | | | | | 40,862,130 | |
| | | | | | |
|
|
|
Internet & Catalog Retail — 0.6% | |
Amazon.com, Inc.* | | | 28,900 | | | | 8,969,115 | |
Expedia, Inc. | | | 7,950 | | | | 678,612 | |
Netflix, Inc.* | | | 4,650 | | | | 1,588,487 | |
Priceline Group, Inc. (The)* | | | 4,010 | | | | 4,572,242 | |
TripAdvisor, Inc.*(a) | | | 8,450 | | | | 630,877 | |
| | | | | | |
|
|
|
| | | | | | | | 16,439,333 | |
| | | | | | |
|
|
|
Internet Software & Services — 1.8% | |
Akamai Technologies, Inc.* | | | 13,800 | | | | 868,848 | |
eBay, Inc.* | | | 85,600 | | | | 4,803,872 | |
Facebook, Inc. (Class A Stock)* | | | 159,200 | | | | 12,420,784 | |
Google, Inc. (Class A Stock)* | | | 21,750 | | | | 11,541,855 | |
Google, Inc. (Class C Stock)* | | | 21,770 | | | | 11,459,728 | |
VeriSign, Inc.*(a) | | | 8,500 | | | | 484,500 | |
Yahoo!, Inc.* | | | 68,900 | | | | 3,480,139 | |
| | | | | | |
|
|
|
| | | | | | | | 45,059,726 | |
| | | | | | |
|
|
|
| | | | | | | | |
COMMON STOCKS
(continued) | | Shares
| | | Value
(Note 2)
| |
IT Services — 1.8% | |
Accenture PLC (Class A Stock) | | | 47,900 | | | $ | 4,277,949 | |
Alliance Data Systems Corp.*(a) | | | 4,600 | | | | 1,315,830 | |
Automatic Data Processing, Inc. | | | 36,500 | | | | 3,043,005 | |
Cap Gemini SA (France) | | | 10,878 | | | | 777,966 | |
Cognizant Technology Solutions Corp. (Class A Stock)* | | | 46,300 | | | | 2,438,158 | |
Computer Sciences Corp. | | | 11,400 | | | | 718,770 | |
Fidelity National Information Services, Inc. | | | 21,700 | | | | 1,349,740 | |
Fiserv, Inc.* | | | 18,900 | | | | 1,341,333 | |
International Business Machines Corp. | | | 70,700 | | | | 11,343,108 | |
MasterCard, Inc. (Class A Stock) | | | 75,100 | | | | 6,470,616 | |
Paychex, Inc. | | | 24,800 | | | | 1,145,016 | |
Teradata Corp.*(a) | | | 11,400 | | | | 497,952 | |
Total System Services, Inc. | | | 12,096 | | | | 410,780 | |
Visa, Inc. (Class A Stock)(a) | | | 37,400 | | | | 9,806,280 | |
Western Union Co. (The)(a) | | | 39,210 | | | | 702,251 | |
Xerox Corp. | | | 80,663 | | | | 1,117,989 | |
| | | | | | |
|
|
|
| | | | | | | | 46,756,743 | |
| | | | | | |
|
|
|
Leisure Products — 0.1% | |
Bandai Namco Holdings, Inc. (Japan) | | | 13,500 | | | | 285,812 | |
Hasbro, Inc.(a) | | | 8,600 | | | | 472,914 | |
Mattel, Inc. | | | 26,151 | | | | 809,243 | |
Shimano, Inc. (Japan) | | | 600 | | | | 77,713 | |
| | | | | | |
|
|
|
| | | | | | | | 1,645,682 | |
| | | | | | |
|
|
|
Life Sciences Tools & Services — 0.2% | |
Agilent Technologies, Inc. | | | 25,114 | | | | 1,028,167 | |
PerkinElmer, Inc. | | | 8,600 | | | | 376,078 | |
QIAGEN NV* | | | 1,701 | | | | 39,622 | |
Thermo Fisher Scientific, Inc. | | | 30,300 | | | | 3,796,287 | |
Waters Corp.* | | | 6,700 | | | | 755,224 | |
| | | | | | |
|
|
|
| | | | | | | | 5,995,378 | |
| | | | | | |
|
|
|
Machinery — 0.9% | |
Amada Co. Ltd. (Japan) | | | 2,600 | | | | 22,279 | |
Atlas Copco AB (Sweden) (Class B Stock) | | | 2,796 | | | | 71,572 | |
Caterpillar, Inc. | | | 47,600 | | | | 4,356,828 | |
Cummins, Inc. | | | 13,200 | | | | 1,903,044 | |
Deere & Co. | | | 27,300 | | | | 2,415,231 | |
Dover Corp. | | | 12,800 | | | | 918,016 | |
FANUC Corp. (Japan) | | | 1,400 | | | | 230,833 | |
Flowserve Corp. | | | 10,700 | | | | 640,181 | |
IHI Corp. (Japan) | | | 11,000 | | | | 55,709 | |
Illinois Tool Works, Inc. | | | 28,000 | | | | 2,651,600 | |
Ingersoll-Rand PLC | | | 20,300 | | | | 1,286,817 | |
Joy Global, Inc. | | | 7,400 | | | | 344,248 | |
Kawasaki Heavy Industries Ltd. (Japan) | | | 10,000 | | | | 45,475 | |
Kone OYJ (Finland) (Class B Stock) | | | 13,529 | | | | 615,946 | |
MAN SE (Germany) | | | 473 | | | | 52,678 | |
NSK Ltd. (Japan) | | | 35,000 | | | | 413,236 | |
PACCAR, Inc. | | | 27,343 | | | | 1,859,597 | |
Pall Corp. | | | 8,100 | | | | 819,801 | |
Parker Hannifin Corp. | | | 11,665 | | | | 1,504,202 | |
SEE NOTES TO FINANCIAL STATEMENTS.
A6
| | | | | | |
| | | CONSERVATIVE BALANCED PORTFOLIO (continued) | | |
| |
| SCHEDULE OF INVESTMENTS | | December 31, 2014 |
| | | | | | | | |
COMMON STOCKS
(continued) | | Shares
| | | Value
(Note 2)
| |
Machinery (continued) | |
Pentair PLC (United Kingdom) | | | 14,777 | | | $ | 981,488 | |
Snap-on, Inc. | | | 4,700 | | | | 642,678 | |
Stanley Black & Decker, Inc. | | | 11,897 | | | | 1,143,064 | |
Sumitomo Heavy Industries Ltd. (Japan) | | | 36,000 | | | | 193,643 | |
THK Co. Ltd. (Japan) | | | 1,500 | | | | 36,048 | |
Vallourec SA (France) | | | 4,842 | | | | 131,226 | |
Wartsila OYJ Abp (Finland) | | | 2,017 | | | | 90,278 | |
Xylem, Inc. | | | 13,500 | | | | 513,945 | |
Yangzijiang Shipbuilding Holdings Ltd. (China) | | | 25,000 | | | | 22,655 | |
| | | | | | |
|
|
|
| | | | | | | | 23,962,318 | |
| | | | | | |
|
|
|
Marine | |
A.P. Moeller – Maersk A/S (Denmark) (Class A Stock) | | | 28 | | | | 53,582 | |
A.P. Moeller – Maersk A/S (Denmark) (Class B Stock) | | | 325 | | | | 646,409 | |
Kuehne + Nagel International AG (Switzerland) | | | 388 | | | | 52,704 | |
Mitsui OSK Lines Ltd. (Japan) | | | 8,000 | | | | 23,702 | |
Nippon Yusen K.K. (Japan) | | | 12,000 | | | | 33,894 | |
| | | | | | |
|
|
|
| | | | | | | | 810,291 | |
| | | | | | |
|
|
|
Media — 2.0% | |
Altice SA (Luxembourg)* | | | 948 | | | | 74,862 | |
Cablevision Systems Corp. (Class A Stock)(a) | | | 14,900 | | | | 307,536 | |
CBS Corp. (Class B Stock) | | | 37,034 | | | | 2,049,462 | |
Comcast Corp. (Class A Stock) | | | 196,990 | | | | 11,427,390 | |
Dentsu, Inc. (Japan) | | | 1,500 | | | | 63,062 | |
DIRECTV* | | | 38,100 | | | | 3,303,270 | |
Discovery Communications, Inc. (Class A Stock)* | | | 11,200 | | | | 385,840 | |
Discovery Communications, Inc. (Class C Stock)*(a) | | | 21,300 | | | | 718,236 | |
Gannett Co., Inc. | | | 16,600 | | | | 530,038 | |
Hakuhodo DY Holdings, Inc. (Japan) | | | 3,100 | | | | 29,667 | |
Interpublic Group of Cos., Inc. (The) | | | 30,731 | | | | 638,283 | |
Lagardere SCA (France) | | | 1,567 | | | | 40,808 | |
News Corp. (Class A Stock)* | | | 35,775 | | | | 561,310 | |
Omnicom Group, Inc. | | | 19,000 | | | | 1,471,930 | |
Publicis Groupe SA (France) | | | 2,912 | | | | 208,836 | |
Reed Elsevier NV (United Kingdom) | | | 2,200 | | | | 52,537 | |
Reed Elsevier PLC (United Kingdom) | | | 8,468 | | | | 144,650 | |
RTL Group SA (Germany) | | | 287 | | | | 27,367 | |
Scripps Networks Interactive, Inc. (Class A Stock)(a) | | | 8,000 | | | | 602,160 | |
Sky PLC (United Kingdom) | | | 7,608 | | | | 106,180 | |
Time Warner Cable, Inc. | | | 21,414 | | | | 3,256,213 | |
Time Warner, Inc. | | | 65,366 | | | | 5,583,564 | |
Twenty-First Century Fox, Inc. (Class A Stock) | | | 142,700 | | | | 5,480,393 | |
Viacom, Inc. (Class B Stock) | | | 28,934 | | | | 2,177,283 | |
Walt Disney Co. (The) | | | 120,200 | | | | 11,321,638 | |
Wolters Kluwer NV (Netherlands) | | | 2,201 | | | | 67,164 | |
| | | | | | |
|
|
|
| | | | | | | | 50,629,679 | |
| | | | | | |
|
|
|
| | | | | | | | |
COMMON STOCKS
(continued) | | Shares
| | | Value
(Note 2)
| |
Metals & Mining — 0.4% | |
Alcoa, Inc. | | | 88,140 | | | $ | 1,391,731 | |
Allegheny Technologies, Inc. | | | 7,700 | | | | 267,729 | |
Anglo American PLC (United Kingdom) | | | 3,215 | | | | 59,492 | |
Antofagasta PLC (United Kingdom) | | | 26,301 | | | | 306,459 | |
BHP Billiton Ltd. (Australia) | | | 23,042 | | | | 544,774 | |
BHP Billiton PLC (Australia) | | | 29,888 | | | | 640,541 | |
Fortescue Metals Group Ltd. (Australia)(a) | | | 117,795 | | | | 258,636 | |
Freeport-McMoRan, Inc. | | | 78,788 | | | | 1,840,488 | |
JFE Holdings, Inc. (Japan) | | | 6,300 | | | | 140,496 | |
Kobe Steel Ltd. (Japan) | | | 404,000 | | | | 695,889 | |
Maruichi Steel Tube Ltd. (Japan) | | | 700 | | | | 14,898 | |
Mitsubishi Materials Corp. (Japan) | | | 15,000 | | | | 49,761 | |
Newmont Mining Corp. | | | 36,100 | | | | 682,290 | |
Nippon Steel & Sumitomo Metal Corp. (Japan) | | | 54,000 | | | | 133,954 | |
Nucor Corp. | | | 24,100 | | | | 1,182,105 | |
Rio Tinto PLC (United Kingdom) | | | 8,804 | | | | 405,839 | |
Sumitomo Metal Mining Co. Ltd. (Japan) | | | 4,000 | | | | 59,660 | |
Voestalpine AG (Austria) | | | 12,686 | | | | 501,264 | |
| | | | | | |
|
|
|
| | | | | | | | 9,176,006 | |
| | | | | | |
|
|
|
Multi-Utilities — 0.7% | |
AGL Energy Ltd. (Australia) | | | 4,844 | | | | 52,834 | |
Ameren Corp. | | | 18,800 | | | | 867,244 | |
CenterPoint Energy, Inc. | | | 31,100 | | | | 728,673 | |
Centrica PLC (United Kingdom) | | | 36,698 | | | | 158,955 | |
CMS Energy Corp. | | | 21,500 | | | | 747,125 | |
Consolidated Edison, Inc. | | | 22,100 | | | | 1,458,821 | |
Dominion Resources, Inc. | | | 44,232 | | | | 3,401,441 | |
DTE Energy Co. | | | 13,500 | | | | 1,165,995 | |
E.ON SE (Germany) | | | 5,537 | | | | 94,637 | |
Integrys Energy Group, Inc. | | | 6,120 | | | | 476,442 | |
National Grid PLC (United Kingdom) | | | 72,609 | | | | 1,030,272 | |
NiSource, Inc. | | | 23,600 | | | | 1,001,112 | |
PG&E Corp. | | | 36,300 | | | | 1,932,612 | |
Public Service Enterprise Group, Inc. | | | 38,000 | | | | 1,573,580 | |
SCANA Corp. | | | 11,300 | | | | 682,520 | |
Sempra Energy | | | 17,719 | | | | 1,973,188 | |
TECO Energy, Inc. | | | 17,200 | | | | 352,428 | |
Wisconsin Energy Corp.(a) | | | 17,400 | | | | 917,676 | |
| | | | | | |
|
|
|
| | | | | | | | 18,615,555 | |
| | | | | | |
|
|
|
Multiline Retail — 0.4% | |
Dollar General Corp.* | | | 22,900 | | | | 1,619,030 | |
Dollar Tree, Inc.* | | | 15,800 | | | | 1,112,004 | |
Family Dollar Stores, Inc. | | | 7,400 | | | | 586,154 | |
Kohl’s Corp. | | | 15,700 | | | | 958,328 | |
Macy’s, Inc. | | | 27,374 | | | | 1,799,840 | |
Nordstrom, Inc. | | | 11,100 | | | | 881,229 | |
Target Corp. | | | 48,000 | | | | 3,643,680 | |
| | | | | | |
|
|
|
| | | | | | | | 10,600,265 | |
| | | | | | |
|
|
|
SEE NOTES TO FINANCIAL STATEMENTS.
A7
| | | | | | |
| | | CONSERVATIVE BALANCED PORTFOLIO (continued) | | |
| |
| SCHEDULE OF INVESTMENTS | | December 31, 2014 |
| | | | | | | | |
COMMON STOCKS
(continued) | | Shares
| | | Value
(Note 2)
| |
Oil, Gas & Consumable Fuels — 4.0% | |
Anadarko Petroleum Corp. | | | 38,354 | | | $ | 3,164,205 | |
Apache Corp. | | | 29,114 | | | | 1,824,574 | |
BP PLC (United Kingdom) | | | 109,674 | | | | 696,165 | |
Cabot Oil & Gas Corp. | | | 31,900 | | | | 944,559 | |
Chesapeake Energy Corp. | | | 37,600 | | | | 735,832 | |
Chevron Corp. | | | 144,822 | | | | 16,246,132 | |
Cimarex Energy Co. | | | 6,800 | | | | 720,800 | |
ConocoPhillips | | | 93,177 | | | | 6,434,804 | |
CONSOL Energy, Inc. | | | 17,400 | | | | 588,294 | |
Denbury Resources, Inc.(a) | | | 26,600 | | | | 216,258 | |
Devon Energy Corp. | | | 29,500 | | | | 1,805,695 | |
Eni SpA (Italy) | | | 45,369 | | | | 794,708 | |
EOG Resources, Inc. | | | 41,500 | | | | 3,820,905 | |
EQT Corp. | | | 11,600 | | | | 878,120 | |
Exxon Mobil Corp. | | | 324,099 | | | | 29,962,953 | |
Hess Corp. | | | 20,200 | | | | 1,491,164 | |
Kinder Morgan, Inc. | | | 128,298 | | | | 5,428,288 | |
Marathon Oil Corp. | | | 51,682 | | | | 1,462,084 | |
Marathon Petroleum Corp. | | | 21,841 | | | | 1,971,369 | |
Murphy Oil Corp. | | | 13,300 | | | | 671,916 | |
Newfield Exploration Co.* | | | 10,200 | | | | 276,624 | |
Noble Energy, Inc. | | | 27,800 | | | | 1,318,554 | |
Occidental Petroleum Corp. | | | 59,100 | | | | 4,764,051 | |
ONEOK, Inc. | | | 15,900 | | | | 791,661 | |
Phillips 66 | | | 42,338 | | | | 3,035,635 | |
Pioneer Natural Resources Co. | | | 11,350 | | | | 1,689,447 | |
QEP Resources, Inc. | | | 13,000 | | | | 262,860 | |
Range Resources Corp. | | | 13,000 | | | | 694,850 | |
Royal Dutch Shell PLC (Netherlands) (Class A Stock) | | | 46,602 | | | | 1,555,246 | |
Royal Dutch Shell PLC (Netherlands) (Class B Stock) | | | 32,840 | | | | 1,134,659 | |
Showa Shell Sekiyu K.K. (Japan) | | | 2,500 | | | | 24,626 | |
Southwestern Energy Co.* | | | 27,200 | | | | 742,288 | |
Spectra Energy Corp. | | | 51,162 | | | | 1,857,181 | |
Statoil ASA (Norway) | | | 8,169 | | | | 143,830 | |
Tesoro Corp. | | | 9,600 | | | | 713,760 | |
Total SA (France) | | | 16,650 | | | | 853,015 | |
Valero Energy Corp. | | | 40,400 | | | | 1,999,800 | |
Williams Cos., Inc. (The) | | | 50,100 | | | | 2,251,494 | |
Woodside Petroleum Ltd. (Australia) | | | 5,323 | | | | 164,626 | |
| | | | | | |
|
|
|
| | | | | | | | 104,133,032 | |
| | | | | | |
|
|
|
Paper & Forest Products — 0.1% | |
International Paper Co. | | | 32,173 | | | | 1,723,829 | |
UPM-Kymmene OYJ (Finland) | | | 3,925 | | | | 64,324 | |
| | | | | | |
|
|
|
| | | | | | | | 1,788,153 | |
| | | | | | |
|
|
|
Personal Products — 0.1% | |
Avon Products, Inc. | | | 32,200 | | | | 302,358 | |
Estee Lauder Cos., Inc. (The) (Class A Stock) | | | 17,000 | | | | 1,295,400 | |
| | | | | | |
|
|
|
| | | | | | | | 1,597,758 | |
| | | | | | |
|
|
|
Pharmaceuticals — 3.7% | |
AbbVie, Inc. | | | 121,400 | | | | 7,944,416 | |
Actavis PLC* | | | 20,089 | | | | 5,171,109 | |
Allergan, Inc. | | | 22,900 | | | | 4,868,311 | |
AstraZeneca PLC (United Kingdom) | | | 9,362 | | | | 661,246 | |
| | | | | | | | |
COMMON STOCKS
(continued) | | Shares
| | | Value
(Note 2)
| |
Pharmaceuticals (continued) | |
Bayer AG (Germany) | | | 3,490 | | | $ | 475,718 | |
Bristol-Myers Squibb Co. | | | 126,370 | | | | 7,459,621 | |
Eli Lilly & Co. | | | 75,100 | | | | 5,181,149 | |
GlaxoSmithKline PLC (United Kingdom) | | | 47,462 | | | | 1,018,233 | |
Hospira, Inc.* | | | 13,260 | | | | 812,175 | |
Johnson & Johnson | | | 214,248 | | | | 22,403,913 | |
Mallinckrodt PLC* | | | 8,800 | | | | 871,464 | |
Merck & Co., Inc. | | | 219,333 | | | | 12,455,921 | |
Merck KGaA (Germany) | | | 916 | | | | 86,203 | |
Mylan, Inc.* | | | 28,900 | | | | 1,629,093 | |
Novartis AG (Switzerland) | | | 24,132 | | | | 2,238,086 | |
Novo Nordisk A/S (Denmark) (Class B Stock) | | | 4,633 | | | | 195,975 | |
Otsuka Holdings Co. Ltd. (Japan) | | | 22,000 | | | | 659,587 | |
Perrigo Co. PLC | | | 10,400 | | | | 1,738,464 | |
Pfizer, Inc. | | | 481,870 | | | | 15,010,250 | |
Roche Holding AG (Switzerland) | | | 6,720 | | | | 1,820,732 | |
Sanofi (France) | | | 8,625 | | | | 786,347 | |
Shire PLC (Ireland) | | | 525 | | | | 37,223 | |
Teva Pharmaceutical Industries Ltd. (Israel) | | | 13,487 | | | | 773,141 | |
Zoetis, Inc. | | | 37,700 | | | | 1,622,231 | |
| | | | | | |
|
|
|
| | | | | | | | 95,920,608 | |
| | | | | | |
|
|
|
Professional Services — 0.1% | |
Adecco SA (Switzerland)* | | | 671 | | | | 46,124 | |
Capita PLC (United Kingdom) | | | 4,883 | | | | 81,877 | |
Dun & Bradstreet Corp. (The) | | | 2,900 | | | | 350,784 | |
Equifax, Inc. | | | 9,500 | | | | 768,265 | |
Nielsen NV(a) | | | 24,600 | | | | 1,100,358 | |
Robert Half International, Inc. | | | 11,000 | | | | 642,180 | |
| | | | | | |
|
|
|
| | | | | | | | 2,989,588 | |
| | | | | | |
|
|
|
Real Estate Investment Trusts (REITs) — 1.4% | |
American Tower Corp. | | | 30,100 | | | | 2,975,385 | |
Apartment Investment & Management Co. (Class A Stock) | | | 10,833 | | | | 402,446 | |
AvalonBay Communities, Inc. | | | 10,175 | | | | 1,662,493 | |
Boston Properties, Inc. | | | 11,600 | | | | 1,492,804 | |
CapitaCommercial Trust (Singapore) | | | 27,000 | | | | 35,647 | |
CapitaMall Trust (Singapore) | | | 18,000 | | | | 27,637 | |
Crown Castle International Corp. | | | 25,600 | | | | 2,014,720 | |
Equity Residential | | | 27,800 | | | | 1,997,152 | |
Essex Property Trust, Inc. | | | 4,900 | | | | 1,012,340 | |
Federation Centres (Australia) | | | 310,281 | | | | 722,416 | |
General Growth Properties, Inc. | | | 47,500 | | | | 1,336,175 | |
GPT Group (The) (Australia) | | | 12,319 | | | | 43,598 | |
HCP, Inc. | | | 35,700 | | | | 1,571,871 | |
Health Care REIT, Inc. | | | 25,100 | | | | 1,899,317 | |
Host Hotels & Resorts, Inc. | | | 57,382 | | | | 1,363,970 | |
Intu Properties PLC (United Kingdom) | | | 133,377 | | | | 689,552 | |
Iron Mountain, Inc. | | | 13,602 | | | | 525,853 | |
Kimco Realty Corp. | | | 31,300 | | | | 786,882 | |
Land Securities Group PLC (United Kingdom) | | | 5,791 | | | | 104,097 | |
Link REIT (The) (Hong Kong) | | | 108,500 | | | | 679,292 | |
SEE NOTES TO FINANCIAL STATEMENTS.
A8
| | | | | | |
| | | CONSERVATIVE BALANCED PORTFOLIO (continued) | | |
| |
| SCHEDULE OF INVESTMENTS | | December 31, 2014 |
| | | | | | | | |
COMMON STOCKS
(continued) | | Shares
| | | Value
(Note 2)
| |
Real Estate Investment Trusts (REITs) (continued) | |
Macerich Co. (The) | | | 11,000 | | | $ | 917,510 | |
Plum Creek Timber Co., Inc. | | | 13,300 | | | | 569,107 | |
Prologis, Inc. | | | 38,777 | | | | 1,668,574 | |
Public Storage | | | 11,200 | | | | 2,070,320 | |
Simon Property Group, Inc. | | | 23,843 | | | | 4,342,049 | |
Ventas, Inc.(a) | | | 22,418 | | | | 1,607,371 | |
Vornado Realty Trust | | | 13,625 | | | | 1,603,799 | |
Weyerhaeuser Co. | | | 39,998 | | | | 1,435,528 | |
| | | | | | |
|
|
|
| | | | | | | | 35,557,905 | |
| | | | | | |
|
|
|
Real Estate Management & Development — 0.1% | |
CBRE Group, Inc. (Class A Stock)* | | | 21,100 | | | | 722,675 | |
Cheung Kong Holdings Ltd. (Hong Kong) | | | 17,000 | | | | 284,696 | |
Daiwa House Industry Co. Ltd. (Japan) | | | 4,300 | | | | 81,232 | |
Deutsche Wohnen AG (Germany) | | | 3,763 | | | | 88,768 | |
Henderson Land Development Co. Ltd. (Hong Kong) | | | 15,400 | | | | 107,034 | |
Hysan Development Co. Ltd. (Hong Kong) | | | 148,000 | | | | 656,825 | |
Lend Lease Group (Australia) | | | 4,503 | | | | 59,975 | |
New World Development Co. Ltd. (Hong Kong) | | | 155,000 | | | | 177,942 | |
Sino Land Co. Ltd. (Hong Kong) | | | 22,000 | | | | 35,317 | |
Swire Properties Ltd. (Hong Kong) | | | 8,800 | | | | 25,893 | |
Wheelock & Co. Ltd. (Hong Kong) | | | 6,000 | | | | 27,858 | |
| | | | | | |
|
|
|
| | | | | | | | 2,268,215 | |
| | | | | | |
|
|
|
Road & Rail — 0.6% | |
Asciano Ltd. (Australia) | | | 7,275 | | | | 35,628 | |
Central Japan Railway Co. (Japan) | | | 1,000 | | | | 149,876 | |
ComfortDelGro Corp. Ltd. (Singapore) | | | 15,000 | | | | 29,354 | |
CSX Corp. | | | 75,800 | | | | 2,746,234 | |
DSV A/S (Denmark) | | | 1,318 | | | | 40,132 | |
Hankyu Hanshin Holdings, Inc. (Japan) | | | 9,000 | | | | 48,277 | |
Kansas City Southern | | | 8,500 | | | | 1,037,255 | |
MTR Corp. Ltd. (Hong Kong) | | | 10,500 | | | | 42,958 | |
Norfolk Southern Corp. | | | 23,500 | | | | 2,575,835 | |
Ryder System, Inc. | | | 4,100 | | | | 380,685 | |
Union Pacific Corp. | | | 68,400 | | | | 8,148,492 | |
West Japan Railway Co. (Japan) | | | 3,900 | | | | 184,385 | |
| | | | | | |
|
|
|
| | | | | | | | 15,419,111 | |
| | | | | | |
|
|
|
Semiconductors & Semiconductor Equipment — 1.3% | |
Altera Corp. | | | 24,000 | | | | 886,560 | |
Analog Devices, Inc. | | | 23,900 | | | | 1,326,928 | |
Applied Materials, Inc. | | | 91,300 | | | | 2,275,196 | |
Avago Technologies Ltd. (Singapore) | | | 19,500 | | | | 1,961,505 | |
Broadcom Corp. (Class A Stock) | | | 41,350 | | | | 1,791,695 | |
First Solar, Inc.* | | | 6,000 | | | | 267,570 | |
Infineon Technologies AG (Germany) | | | 8,178 | | | | 86,539 | |
Intel Corp. | | | 372,800 | | | | 13,528,912 | |
KLA-Tencor Corp. | | | 12,700 | | | | 893,064 | |
Lam Research Corp. | | | 12,450 | | | | 987,783 | |
| | | | | | | | |
COMMON STOCKS
(continued) | | Shares
| | | Value
(Note 2)
| |
Semiconductors & Semiconductor Equipment (continued) | |
Linear Technology Corp. | | | 18,500 | | | $ | 843,600 | |
Microchip Technology, Inc. | | | 15,700 | | | | 708,227 | |
Micron Technology, Inc.* | | | 81,200 | | | | 2,842,812 | |
NVIDIA Corp. | | | 37,150 | | | | 744,858 | |
Rohm Co. Ltd. (Japan) | | | 700 | | | | 42,177 | |
Texas Instruments, Inc. | | | 80,900 | | | | 4,325,318 | |
Xilinx, Inc. | | | 20,600 | | | | 891,774 | |
| | | | | | |
|
|
|
| | | | | | | | 34,404,518 | |
| | | | | | |
|
|
|
Software — 2.1% | |
Adobe Systems, Inc.* | | | 35,800 | | | | 2,602,660 | |
Autodesk, Inc.* | | | 17,400 | | | | 1,045,044 | |
CA, Inc. | | | 24,164 | | | | 735,794 | |
Citrix Systems, Inc.* | | | 12,700 | | | | 810,260 | |
Electronic Arts, Inc.* | | | 23,900 | | | | 1,123,659 | |
Intuit, Inc. | | | 21,900 | | | | 2,018,961 | |
Microsoft Corp. | | | 630,200 | | | | 29,272,790 | |
Nexon Co. Ltd. (Japan) | | | 21,000 | | | | 195,764 | |
Oracle Corp. | | | 246,500 | | | | 11,085,105 | |
Red Hat, Inc.* | | | 14,600 | | | | 1,009,444 | |
salesforce.com, inc.* | | | 43,700 | | | | 2,591,847 | |
Symantec Corp. | | | 52,278 | | | | 1,341,192 | |
| | | | | | |
|
|
|
| | | | | | | | 53,832,520 | |
| | | | | | |
|
|
|
Specialty Retail — 1.3% | |
ABC-Mart, Inc. (Japan) | | | 400 | | | | 19,355 | |
AutoNation, Inc.* | | | 6,174 | | | | 372,971 | |
AutoZone, Inc.*(a) | | | 2,550 | | | | 1,578,731 | |
Bed Bath & Beyond, Inc.* | | | 15,000 | | | | 1,142,550 | |
Best Buy Co., Inc. | | | 22,525 | | | | 878,025 | |
CarMax, Inc.*(a) | | | 16,800 | | | | 1,118,544 | |
Dixons Carphone PLC (United Kingdom) | | | 80,040 | | | | 576,847 | |
GameStop Corp. (Class A Stock)(a) | | | 8,800 | | | | 297,440 | |
Gap, Inc. (The) | | | 21,200 | | | | 892,732 | |
Hennes & Mauritz AB (Sweden) (Class B Stock) | | | 1,714 | | | | 71,208 | |
Home Depot, Inc. (The) | | | 101,850 | | | | 10,691,195 | |
L Brands, Inc. | | | 18,606 | | | | 1,610,349 | |
Lowe’s Cos., Inc. | | | 74,800 | | | | 5,146,240 | |
Nitori Holdings Co. Ltd. (Japan) | | | 500 | | | | 26,864 | |
O’Reilly Automotive, Inc.* | | | 7,900 | | | | 1,521,698 | |
PetSmart, Inc. | | | 7,600 | | | | 617,842 | |
Ross Stores, Inc. | | | 15,900 | | | | 1,498,734 | |
Staples, Inc. | | | 46,749 | | | | 847,092 | |
Tiffany & Co. | | | 8,800 | | | | 940,368 | |
TJX Cos., Inc. (The) | | | 52,500 | | | | 3,600,450 | |
Tractor Supply Co. | | | 10,700 | | | | 843,374 | |
Urban Outfitters, Inc.* | | | 8,000 | | | | 281,040 | |
| | | | | | |
|
|
|
| | | | | | | | 34,573,649 | |
| | | | | | |
|
|
|
Technology Hardware, Storage & Peripherals — 2.6% | |
Apple, Inc. | | | 449,940 | | | | 49,664,377 | |
Brother Industries Ltd. (Japan) | | | 15,900 | | | | 288,225 | |
EMC Corp. | | | 155,650 | | | | 4,629,031 | |
FUJIFILM Holdings Corp. (Japan) | | | 6,900 | | | | 210,544 | |
Hewlett-Packard Co. | | | 142,748 | | | | 5,728,477 | |
NEC Corp. (Japan) | | | 19,000 | | | | 55,214 | |
NetApp, Inc. | | | 24,400 | | | | 1,011,380 | |
SEE NOTES TO FINANCIAL STATEMENTS.
A9
| | | | | | |
| | | CONSERVATIVE BALANCED PORTFOLIO (continued) | | |
| |
| SCHEDULE OF INVESTMENTS | | December 31, 2014 |
| | | | | | | | |
COMMON STOCKS
(continued) | | Shares
| | | Value
(Note 2)
| |
Technology Hardware, Storage & Peripherals (continued) | |
Ricoh Co. Ltd. (Japan) | | | 5,100 | | | $ | 51,556 | |
SanDisk Corp.(a) | | | 17,400 | | | | 1,704,852 | |
Seagate Technology PLC | | | 24,700 | | | | 1,642,550 | |
Seiko Epson Corp. (Japan) | | | 15,400 | | | | 644,401 | |
Western Digital Corp. | | | 17,100 | | | | 1,892,970 | |
| | | | | | |
|
|
|
| | | | | | | | 67,523,577 | |
| | | | | | |
|
|
|
Textiles, Apparel & Luxury Goods — 0.5% | |
Burberry Group PLC (United Kingdom) | | | 3,265 | | | | 82,839 | |
Coach, Inc. | | | 21,400 | | | | 803,784 | |
Fossil Group, Inc.* | | | 3,500 | | | | 387,590 | |
Luxottica Group SpA (Italy) | | | 1,233 | | | | 67,592 | |
Michael Kors Holdings Ltd.* | | | 15,600 | | | | 1,171,560 | |
NIKE, Inc. (Class B Stock) | | | 53,800 | | | | 5,172,870 | |
Pandora A/S (Denmark) | | | 9,001 | | | | 729,595 | |
PVH Corp. | | | 6,300 | | | | 807,471 | |
Ralph Lauren Corp. | | | 4,800 | | | | 888,768 | |
Swatch Group AG (The) (Switzerland) | | | 363 | | | | 31,400 | |
Under Armour, Inc. (Class A Stock)*(a) | | | 13,000 | | | | 882,700 | |
VF Corp. | | | 26,600 | | | | 1,992,340 | |
| | | | | | |
|
|
|
| | | | | | | | 13,018,509 | |
| | | | | | |
|
|
|
Thrifts & Mortgage Finance | |
Hudson City Bancorp, Inc. | | | 34,300 | | | | 347,116 | |
People’s United Financial, Inc.(a) | | | 22,000 | | | | 333,960 | |
| | | | | | |
|
|
|
| | | | | | | | 681,076 | |
| | | | | | |
|
|
|
Tobacco — 0.9% | |
Altria Group, Inc. | | | 151,200 | | | | 7,449,624 | |
British American Tobacco PLC (United Kingdom) | | | 13,676 | | | | 741,117 | |
Imperial Tobacco Group PLC (United Kingdom) | | | 17,347 | | | | 763,607 | |
Japan Tobacco, Inc. (Japan) | | | 17,100 | | | | 470,640 | |
Lorillard, Inc. | | | 27,841 | | | | 1,752,313 | |
Philip Morris International, Inc. | | | 118,900 | | | | 9,684,405 | |
Reynolds American, Inc. | | | 23,200 | | | | 1,491,064 | |
| | | | | | |
|
|
|
| | | | | | | | 22,352,770 | |
| | | | | | |
|
|
|
| | | | | | | | |
COMMON STOCKS
(continued) | | Shares
| | | Value
(Note 2)
| |
Trading Companies & Distributors — 0.2% | |
Bunzl PLC (United Kingdom) | | | 2,739 | | | $ | 74,877 | |
Fastenal Co.(a) | | | 21,000 | | | | 998,760 | |
ITOCHU Corp. (Japan) | | | 8,600 | | | | 91,806 | |
Marubeni Corp. (Japan) | | | 11,800 | | | | 70,604 | |
Mitsubishi Corp. (Japan) | | | 42,800 | | | | 783,245 | |
Mitsui & Co. Ltd. (Japan) | | | 11,200 | | | | 150,003 | |
Sumitomo Corp. (Japan) | | | 8,100 | | | | 83,193 | |
United Rentals, Inc.* | | | 7,500 | | | | 765,075 | |
W.W. Grainger, Inc. | | | 4,700 | | | | 1,197,983 | |
| | | | | | |
|
|
|
| | | | | | | | 4,215,546 | |
| | | | | | |
|
|
|
Transportation Infrastructure | |
Hutchison Port Holdings Trust (Singapore) | | | 42,000 | | | | 28,980 | |
| | | | | | |
|
|
|
Water Utilities | |
Severn Trent PLC (United Kingdom) | | | 5,743 | | | | 179,120 | |
| | | | | | |
|
|
|
Wireless Telecommunication Services | |
KDDI Corp. (Japan) | | | 4,200 | | | | 263,861 | |
Millicom International Cellular SA (Luxembourg) SDR | | | 485 | | | | 35,936 | |
Vodafone Group PLC (United Kingdom) | | | 191,822 | | | | 657,688 | |
| | | | | | |
|
|
|
| | | | | | | | 957,485 | |
| | | | | | |
|
|
|
TOTAL COMMON STOCKS
(cost $704,927,077) | | | | 1,485,151,468 | |
| | | | | | |
|
|
|
| EXCHANGE TRADED FUND | |
iShares MSCI EAFE Index Fund(a)
(cost $1,028,152) | | | 16,250 | | | | 988,650 | |
| | | | | | |
|
|
|
| PREFERRED STOCKS | |
Automobiles | |
Bayerische Motoren Werke AG (Germany) (PRFC) | | | 392 | | | | 32,027 | |
Volkswagen AG (Germany) (PRFC) | | | 2,197 | | | | 488,296 | |
| | | | | | |
|
|
|
| | | | | | | | 520,323 | |
| | | | | | |
|
|
|
Banking | |
Citigroup Capital XIII 7.875%, (Capital Security, fixed to floating preferred)(b) | | | 20,000 | | | | 531,600 | |
| | | | | | |
|
|
|
TOTAL PREFERRED STOCKS
(cost $1,108,715) | | | | 1,051,923 | |
| | | | | | |
|
|
|
| | | | | | | | | | | | | | |
| ASSET-BACKED SECURITIES — 2.1% | | Interest
Rate
| | | Maturity
Date
| | Principal
Amount
(000)#
| | | Value
(Note 2)
| |
Collateralized Debt Obligation | | | | | | | | | | | | | | |
Cent CDO XI Ltd. (Cayman Islands), Series 2006-11A, Class A1, 144A | | | 0.494% | (b) | | 04/25/19 | | | 388 | | | $ | 384,317 | |
| | | | | | | | | | | | |
|
|
|
Collateralized Loan Obligations — 1.3% | | | | | | | | | | | | | | |
ACAS CLO Ltd. (Cayman Islands), Series 2013-1A, Class A, 144A | | | 1.411% | (b) | | 04/20/25 | | | 2,100 | | | | 2,064,439 | |
ACAS CLO Ltd. (Cayman Islands), Series 2013-1A, Class B2, 144A | | | 3.360% | | | 04/20/25 | | | 250 | | | | 241,526 | |
Anchorage Capital CLO Ltd. (Cayman Islands), Series 2013-1A, Class A1, 144A | | | 1.419% | (b) | | 07/13/25 | | | 2,400 | | | | 2,358,497 | |
Anchorage Capital CLO Ltd. (Cayman Islands), Series 2014-3A, Class A1, 144A | | | 1.766% | (b) | | 04/28/26 | | | 400 | | | | 397,030 | |
Anchorage Capital CLO Ltd. (Cayman Islands), Series 2014-5A, Class A, 144A | | | 1.833% | | | 10/15/26 | | | 2,000 | | | | 1,993,387 | |
SEE NOTES TO FINANCIAL STATEMENTS.
A10
| | | | | | |
| | | CONSERVATIVE BALANCED PORTFOLIO (continued) | | |
| |
| SCHEDULE OF INVESTMENTS | | December 31, 2014 |
| | | | | | | | | | | | | | |
ASSET-BACKED SECURITIES
(continued) | | Interest
Rate
| | | Maturity
Date
| | Principal
Amount
(000)#
| | | Value
(Note 2)
| |
Collateralized Loan Obligations (continued) | | | | | | | | | | | | | | |
Atlas Senior Loan Fund VI Ltd. (Cayman Islands), Series 2014-6A, Class A, 144A | | | 1.796% | (b) | | 10/15/26 | | | 600 | | | $ | 596,249 | |
Battalion CLO VII Ltd. (Cayman Islands), Series 2014-7A, Class A1, 144A | | | 1.800% | (b) | | 10/17/26 | | | 250 | | | | 249,135 | |
Benefit Street Partners CLO II Ltd. (Cayman Islands), Series 2013-IIA, Class A1, 144A | | | 1.431% | (b) | | 07/15/24 | | | 1,000 | | | | 982,819 | |
Brookside Mill CLO Ltd. (Cayman Islands), Series 2013-1A, Class A1, 144A | | | 1.378% | (b) | | 04/17/25 | | | 2,200 | | | | 2,160,458 | |
Catamaran CLO Ltd. (Cayman Islands), Series 2014-1A, Class A1, 144A | | | 1.781% | (b) | | 04/20/26 | | | 1,650 | | | | 1,641,778 | |
Catamaran CLO Ltd. (Cayman Islands), Series 2014-2A, Class A1, 144A | | | 1.780% | (b) | | 10/18/26 | | | 250 | | | | 248,071 | |
Four Corners CLO III Ltd. (Cayman Islands), Series 2006-3A, Class A, 144A | | | 0.482% | (b) | | 07/22/20 | | | 262 | | | | 260,262 | |
Fraser Sullivan CLO I Ltd. (Cayman Islands), Series 2006-1A, Class B, 144A | | | 0.711% | (b) | | 03/15/20 | | | 1,000 | | | | 995,796 | |
Galaxy XVIII CLO Ltd. (Cayman Islands), Series 2014-18A, Class A, 144A | | | 1.704% | (b) | | 10/15/26 | | | 750 | | | | 742,829 | |
ICG US CLO Ltd. (Cayman Islands), Series 2014-3A, Class A1B, 144A | | | 3.320% | | | 01/25/27 | | | 750 | | | | 738,075 | |
ING IM CLO Ltd. (Cayman Islands), Series 2013-1A, Class A1, 144A | | | 1.371% | (b) | | 04/15/24 | | | 1,500 | | | | 1,473,007 | |
KVK CLO Ltd. (Cayman Islands), Series 2014-1A, Class A1, 144A | | | 1.822% | (b) | | 05/15/26 | | | 250 | | | | 249,117 | |
Magnetite Ltd. (Cayman Islands), Series 2012-6A, Class A, 144A | | | 1.741% | (b) | | 09/15/23 | | | 300 | | | | 299,286 | |
Magnetite Ltd. (Cayman Islands), Series 2014-8A, Class A, 144A | | | 1.711% | (b) | | 04/15/26 | | | 1,750 | | | | 1,735,491 | |
Magnetite Ltd. (Cayman Islands), Series 2014-9A, Class A1, 144A | | | 1.700% | (b) | | 07/25/26 | | | 3,000 | | | | 2,965,031 | |
Magnetite Ltd. (Cayman Islands), Series 2014-11A, Class A1, 144A | | | 1.685% | (b) | | 01/18/27 | | | 500 | | | | 494,517 | |
Marine Park CLO Ltd. (Cayman Islands), Series 2012-1A, Class A1A, 144A | | | 1.702% | (b) | | 05/18/23 | | | 500 | | | | 498,156 | |
Mayport CLO Ltd. (Cayman Islands), Series 2006-1A, Class A1L, 144A | | | 0.483% | (b) | | 02/22/20 | | | 1 | | | | 1,428 | |
OZLM Funding IV Ltd. (Cayman Islands), Series 2013-4A, Class A1, 144A | | | 1.382% | (b) | | 07/22/25 | | | 1,000 | | | | 980,862 | |
Seneca Park CLO Ltd. (Cayman Islands), Series 2014- 1A, Class A, 144A | | | 1.704% | (b) | | 07/17/26 | | | 500 | | | | 498,631 | |
Seneca Park CLO Ltd. (Cayman Islands), Series 2014-1A, Class B2, 144A | | | 4.350% | | | 07/17/26 | | | 500 | | | | 503,092 | |
Sheridan Square CLO Ltd. (Cayman Islands), Series 2013-1A, Class A1, 144A | | | 1.281% | (b) | | 04/15/25 | | | 2,600 | | | | 2,545,177 | |
Slater Mill Loan Fund LP (Cayman Islands), Series 2012-1A, Class B, 144A | | | 2.882% | (b) | | 08/17/22 | | | 500 | | | | 501,395 | |
Sound Point CLO Ltd. (Cayman Islands), Series 2012-1A, Class B, 144A | | | 2.931% | (b) | | 10/20/23 | | | 900 | | | | 903,586 | |
THL Credit Wind River Ltd. (Cayman Islands), Series 2014-3A, Class A, 144A | | | 1.863% | (b) | | 01/22/27 | | | 1,750 | | | | 1,743,000 | |
Tyron Park CLO Ltd. (Cayman Islands), Series 2013-1A, Class A1, 144A | | | 1.351% | (b) | | 07/15/25 | | | 2,200 | | | | 2,155,467 | |
Washington Mill CLO Ltd. (Cayman Islands), Series 2014-1A, Class A1, 144A | | | 1.731% | (b) | | 04/20/26 | | | 1,300 | | | | 1,290,239 | |
Washington Mill CLO Ltd. (Cayman Islands), Series 2014-1A, Class B2, 144A | | | 4.250% | | | 04/20/26 | | | 500 | | | | 503,086 | |
| | | | | | | | | | | | |
|
|
|
| | | | | | | | | | | | | | 35,010,919 | |
| | | | | | | | | | | | |
|
|
|
Non-Residential Mortgage-Backed Securities — 0.5% | | | | | | | | | | | | | | |
American Express Credit Account Secured Note Trust, Series 2012-4, Class C, 144A | | | 0.961% | (b) | | 05/15/20 | | | 2,700 | | | | 2,715,204 | |
Ford Credit Auto Owner Trust, Series 2014-1, Class A, 144A | | | 2.260% | | | 11/15/25 | | | 1,500 | | | | 1,508,007 | |
Ford Credit Auto Owner Trust, Series 2014-2, Class A, 144A | | | 2.310% | | | 04/15/26 | | | 2,400 | | | | 2,406,182 | |
SVO VOI Mortgage LLC, Series 2012-AA, Class A, 144A | | | 2.000% | | | 09/20/29 | | | 954 | | | | 949,045 | |
Synchrony Credit Card Master Note Trust, Series 2012-4, Class B | | | 1.011% | (b) | | 06/15/18 | | | 4,500 | | | | 4,501,453 | |
| | | | | | | | | | | | |
|
|
|
| | | | | | | | | | | | | | 12,079,891 | |
| | | | | | | | | | | | |
|
|
|
Residential Mortgage-Backed Securities — 0.3% | | | | | | | | | | | | | | |
CDC Mortgage Capital Trust, Series 2002-HE3, Class M1 | | | 1.820% | (b) | | 03/25/33 | | | 307 | | | | 290,592 | |
Credit-Based Asset Servicing & Securitization LLC, Series 2005-CB6, Class A3 | | | 4.123% | (b) | | 07/25/35 | | | 375 | | | | 363,840 | |
CWABS, Inc., Series 2004-1, Class M1 | | | 0.920% | (b) | | 03/25/34 | | | 2,703 | | | | 2,577,328 | |
Equity One Mortgage Pass-Through Trust, Series 2004-3, Class M1 | | | 5.037% | (b) | | 07/25/34 | | | 460 | | | | 440,198 | |
Fremont Home Loan Trust, Series 2004-2, Class M1 | | | 1.025% | (b) | | 07/25/34 | | | 506 | | | | 454,965 | |
Long Beach Mortgage Loan Trust, Series 2004-2, Class M1 | | | 0.965% | (b) | | 06/25/34 | | | 657 | | | | 633,573 | |
Morgan Stanley ABS Capital I, Inc. Trust, Series 2003-HE1, Class M1 | | | 1.370% | (b) | | 05/25/33 | | | 160 | | | | 150,460 | |
Morgan Stanley ABS Capital I, Inc. Trust, Series 2004-NC1, Class M1 | | | 1.220% | (b) | | 12/25/33 | | | 920 | | | | 888,743 | |
Morgan Stanley Dean Witter Capital I, Inc. Trust, Series 2002-HE1, Class M1 | | | 1.070% | (b) | | 07/25/32 | | | 403 | | | | 385,953 | |
SEE NOTES TO FINANCIAL STATEMENTS.
A11
| | | | | | |
| | | CONSERVATIVE BALANCED PORTFOLIO (continued) | | |
| |
| SCHEDULE OF INVESTMENTS | | December 31, 2014 |
| | | | | | | | | | | | | | |
ASSET-BACKED SECURITIES
(continued) | | Interest
Rate
| | | Maturity
Date
| | Principal
Amount
(000)#
| | | Value
(Note 2)
| |
Residential Mortgage-Backed Securities (continued) | | | | | | | | | | | | | | |
Morgan Stanley Dean Witter Capital I, Inc. Trust, Series 2002-NC4, Class M1 | | | 1.445% | (b) | | 09/25/32 | | | 609 | | | $ | 599,946 | |
Securitized Asset-Backed Receivables LLC Trust, Series 2004-OP1, Class M1 | | | 0.935% | (b) | | 02/25/34 | | | 1,006 | | | | 944,391 | |
| | | | | | | | | | | | |
|
|
|
| | | | | | | | | | | | | | 7,729,989 | |
| | | | | | | | | | | | |
|
|
|
TOTAL ASSET-BACKED SECURITIES
(cost $54,784,572) | | | | 55,205,116 | |
| | | | | | | | | | | | |
|
|
|
| BANK LOANS(b) — 0.3% | | | | | | | | | | | | | | |
Automotive | | | | | | | | | | | | | | |
Schaeffler AG (Germany) | | | 4.250% | | | 05/15/20 | | | 600 | | | | 597,000 | |
| | | | | | | | | | | | |
|
|
|
Cable | | | | | | | | | | | | | | |
Virgin Media Investment Holdings Ltd. (United Kingdom) | | | 3.500% | | | 06/07/20 | | | 1,000 | | | | 981,250 | |
| | | | | | | | | | | | |
|
|
|
Foods — 0.1% | | | | | | | | | | | | | | |
ARAMARK Corp. | | | 3.250% | | | 09/07/19 | | | 437 | | | | 429,589 | |
Big Heart Pet Brands, Inc. | | | 3.500% | | | 03/09/20 | | | 767 | | | | 733,973 | |
| | | | | | | | | | | | |
|
|
|
| | | | | | | | | | | | | | 1,163,562 | |
| | | | | | | | | | | | |
|
|
|
Healthcare & Pharmaceutical — 0.1% | | | | | | | | | | | | | | |
Biomet, Inc. | | | 3.733% | | | 07/25/17 | | | 750 | | | | 745,625 | |
Grifols Worldwide Operations USA, Inc. | | | 3.255% | | | 02/26/21 | | | 248 | | | | 244,403 | |
RPI Finance Trust (Luxembourg) | | | 3.250% | | | 11/09/18 | | | 875 | | | | 872,045 | |
| | | | | | | | | | | | |
|
|
|
| | | | | | | | | | | | | | 1,862,073 | |
| | | | | | | | | | | | |
|
|
|
Technology — 0.1% | | | | | | | | | | | | | | |
Avago Technologies Finance Pte Ltd. | | | 3.750% | | | 05/06/21 | | | 821 | | | | 816,428 | |
First Data Corp. | | | 3.755% | | | 03/26/18 | | | 1,055 | | | | 1,031,773 | |
Trans Union LLC | | | 4.000% | | | 04/09/21 | | | 397 | | | | 390,549 | |
| | | | | | | | | | | | |
|
|
|
| | | | | | | | | | | | | | 2,238,750 | |
| | | | | | | | | | | | |
|
|
|
TOTAL BANK LOANS
(cost $6,897,918) | | | | 6,842,635 | |
| | | | | | | | | | | | |
|
|
|
| COMMERCIAL MORTGAGE-BACKED SECURITIES — 3.6% | | | | | | | | | | | | | | |
Banc of America Commercial Mortgage Trust, Series 2006-6, Class A3 | | | 5.369% | | | 10/10/45 | | | 3,400 | | | | 3,449,960 | |
Banc of America Commercial Mortgage Trust, Series 2007-2, Class A1A | | | 5.561% | (b) | | 04/10/49 | | | 3,016 | | | | 3,226,564 | |
Citigroup Commercial Mortgage Trust, Series 2007-C6, Class A4 | | | 5.710% | (b) | | 12/10/49 | | | 800 | | | | 867,508 | |
Citigroup Commercial Mortgage Trust, Series 2013-GC11, Class A3 | | | 2.815% | | | 04/10/46 | | | 900 | | | | 888,991 | |
Citigroup Commercial Mortgage Trust, Series 2014-GC21, Class A4 | | | 3.575% | | | 05/10/47 | | | 2,090 | | | | 2,174,981 | |
COBALT CMBS Commercial Mortgage Trust, Series 2006-C1, Class A4 | | | 5.223% | | | 08/15/48 | | | 918 | | | | 967,339 | |
Commercial Mortgage Pass-Through Certificates, Series 2012-CR5, Class A3 | | | 2.540% | | | 12/10/45 | | | 1,000 | | | | 971,095 | |
Commercial Mortgage Pass-Through Certificates, Series 2013-CR7, Class A3 | | | 2.929% | | | 03/10/46 | | | 1,400 | | | | 1,401,816 | |
Commercial Mortgage Pass-Through Certificates, Series 2014-CR15, Class A2 | | | 2.928% | | | 02/10/47 | | | 2,000 | | | | 2,058,624 | |
Commercial Mortgage Pass-Through Certificates, Series 2014-CR18, Class A4 | | | 3.550% | | | 07/15/47 | | | 2,100 | | | | 2,174,592 | |
Commercial Mortgage Pass-Through Certificates, Series 2014-LC17, Class A4 | | | 3.648% | | | 10/10/47 | | | 5,000 | | | | 5,221,290 | |
Commercial Mortgage Pass-Through Certificates, Series 2014-UBS3, Class A2 | | | 2.844% | | | 06/10/47 | | | 1,700 | | | | 1,748,768 | |
Commercial Mortgage Trust, Series 2005-GG5, Class A5 | | | 5.224% | (b) | | 04/10/37 | | | 1,400 | | | | 1,415,141 | |
Commercial Mortgage Trust, Series 2005-GG5, Class AM | | | 5.277% | (b) | | 04/10/37 | | | 3,500 | | | | 3,576,307 | |
Commercial Mortgage Trust, Series 2007-GG9, Class A2 | | | 5.381% | | | 03/10/39 | | | 1,116 | | | | 1,119,335 | |
Credit Suisse Commercial Mortgage Trust, Series 2006-C1, Class A4 | | | 5.467% | (b) | | 02/15/39 | | | 2,810 | | | | 2,890,984 | |
Credit Suisse Commercial Mortgage Trust, Series 2006-C1, Class AM | | | 5.467% | (b) | | 02/15/39 | | | 530 | | | | 551,289 | |
Credit Suisse First Boston Mortgage Securities Corp., Series 2005-C2, Class A4 | | | 4.832% | | | 04/15/37 | | | 769 | | | | 770,523 | |
SEE NOTES TO FINANCIAL STATEMENTS.
A12
| | | | | | |
| | | CONSERVATIVE BALANCED PORTFOLIO (continued) | | |
| |
| SCHEDULE OF INVESTMENTS | | December 31, 2014 |
| | | | | | | | | | | | | | |
COMMERCIAL MORTGAGE-BACKED SECURITIES
(continued) | | Interest
Rate
| | | Maturity
Date
| | Principal
Amount
(000)#
| | | Value
(Note 2)
| |
Federal National Mortgage Assoc., Series 2014-M2, Class A2 | | | 3.513% | (b) | | 12/25/23 | | | 1,925 | | | $ | 2,051,831 | |
FHLMC Multifamily Structured Pass-Through Certificates, Series K017, Class A2 | | | 2.873% | | | 12/25/21 | | | 3,500 | | | | 3,606,148 | |
FHLMC Multifamily Structured Pass-Through Certificates, Series K020, Class A2 | | | 2.373% | | | 05/25/22 | | | 1,000 | | | | 995,267 | |
FHLMC Multifamily Structured Pass-Through Certificates, Series K020, Class X1, I/O | | | 1.465% | (b) | | 05/25/22 | | | 20,995 | | | | 1,808,434 | |
FHLMC Multifamily Structured Pass-Through Certificates, Series K021, Class X1, I/O | | | 1.506% | (b) | | 06/25/22 | | | 5,797 | | | | 515,611 | |
FHLMC Multifamily Structured Pass-Through Certificates, Series K029, Class A2 | | | 3.320% | (b) | | 02/25/23 | | | 5,300 | | | | 5,578,685 | |
FHLMC Multifamily Structured Pass-Through Certificates, Series K034, Class A2 | | | 3.531% | (b) | | 07/25/23 | | | 1,800 | | | | 1,921,869 | |
FHLMC Multifamily Structured Pass-Through Certificates, Series K501, Class X1A, I/O | | | 1.685% | (b) | | 08/25/16 | | | 4,986 | | | | 94,192 | |
FHLMC Multifamily Structured Pass-Through Certificates, Series K710, Class X1, I/O | | | 1.778% | (b) | | 05/25/19 | | | 16,694 | | | | 1,103,917 | |
FHLMC Multifamily Structured Pass-Through Certificates, Series K711, Class X1, I/O | | | 1.707% | (b) | | 07/25/19 | | | 17,278 | | | | 1,108,915 | |
JPMBB Commercial Mortgage Securities Trust, Series 2014-C25, Class A4A1 | | | 3.408% | | | 11/15/47 | | | 1,100 | | | | 1,127,734 | |
JPMorgan Chase Commercial Mortgage Securities Trust, Series 2005-LDP2, Class A3 | | | 4.697% | | | 07/15/42 | | | 1 | | | | 1,290 | |
JPMorgan Chase Commercial Mortgage Securities Trust, Series 2005-LDP2, Class AM | | | 4.780% | | | 07/15/42 | | | 1,000 | | | | 1,007,794 | |
JPMorgan Chase Commercial Mortgage Securities Trust, Series 2005-LDP4, Class AM | | | 4.999% | (b) | | 10/15/42 | | | 1,170 | | | | 1,193,473 | |
JPMorgan Chase Commercial Mortgage Securities Trust, Series 2006-CB16, Class ASB | | | 5.523% | | | 05/12/45 | | | 572 | | | | 585,616 | |
JPMorgan Chase Commercial Mortgage Securities Trust, Series 2007-LD11, Class A2 | | | 5.772% | (b) | | 06/15/49 | | | 29 | | | | 29,043 | |
JPMorgan Chase Commercial Mortgage Securities Trust, Series 2012-CBX, Class A3 | | | 3.139% | | | 06/15/45 | | | 1,691 | | | | 1,748,467 | |
JPMorgan Chase Commercial Mortgage Securities Trust, Series 2012-LC9, Class A4 | | | 2.611% | | | 12/15/47 | | | 1,500 | | | | 1,470,684 | |
JPMorgan Chase Commercial Mortgage Securities Trust, Series 2013-C10, Class A4 | | | 2.875% | | | 12/15/47 | | | 3,200 | | | | 3,189,360 | |
JPMorgan Chase Commercial Mortgage Securities Trust, Series 2013-C16, Class A2 | | | 3.070% | | | 12/15/46 | | | 1,700 | | | | 1,761,999 | |
JPMorgan Chase Commercial Mortgage Securities Trust, Series 2013-LC11, Class A4 | | | 2.694% | | | 04/15/46 | | | 1,100 | | | | 1,075,330 | |
LB-UBS Commercial Mortgage Trust, Series 2005-C3, Class A5 | | | 4.739% | | | 07/15/30 | | | 352 | | | | 353,717 | |
LB-UBS Commercial Mortgage Trust, Series 2005-C7, Class AM | | | 5.263% | (b) | | 11/15/40 | | | 1,390 | | | | 1,433,656 | |
Merrill Lynch Mortgage Trust, Series 2006-C1, Class AM | | | 5.677% | (b) | | 05/12/39 | | | 780 | | | | 818,919 | |
ML-CFC Commercial Mortgage Trust, Series 2006-1, Class AM | | | 5.517% | (b) | | 02/12/39 | | | 440 | | | | 458,237 | |
ML-CFC Commercial Mortgage Trust, Series 2006-2, Class A4 | | | 5.869% | (b) | | 06/12/46 | | | 2,137 | | | | 2,242,343 | |
ML-CFC Commercial Mortgage Trust, Series 2007-6, Class A2 | | | 5.331% | | | 03/12/51 | | | 1,732 | | | | 1,753,154 | |
Morgan Stanley Bank of America Merrill Lynch Trust, Series 2013-C8, Class A3 | | | 2.863% | | | 12/15/48 | | | 1,200 | | | | 1,190,281 | |
Morgan Stanley Capital I Trust, Series 2006-IQ11, Class A4 | | | 5.656% | (b) | | 10/15/42 | | | 2,136 | | | | 2,194,672 | |
Morgan Stanley Capital I Trust, Series 2007-HQ11, Class AAB | | | 5.444% | | | 02/12/44 | | | 1,698 | | | | 1,708,543 | |
Morgan Stanley Capital I Trust, Series 2007-T27, Class AAB | | | 5.651% | (b) | | 06/11/42 | | | 234 | | | | 234,210 | |
UBS-Barclays Commercial Mortgage Trust, Series 2012-C4, Class A4 | | | 2.792% | | | 12/10/45 | | | 1,400 | | | | 1,386,020 | |
UBS-Barclays Commercial Mortgage Trust, Series 2013-C5, Class A3 | | | 2.920% | | | 03/10/46 | | | 3,200 | | | | 3,199,235 | |
UBS-Barclays Commercial Mortgage Trust, Series 2013-C6, Class A3 | | | 2.971% | | | 04/10/46 | | | 1,500 | | | | 1,503,116 | |
Wachovia Bank Commercial Mortgage Trust, Series 2006-C25, Class A4 | | | 5.723% | (b) | | 05/15/43 | | | 3,075 | | | | 3,189,474 | |
Wachovia Bank Commercial Mortgage Trust, Series 2007-C34, Class A1A | | | 5.608% | (b) | | 05/15/46 | | | 4,211 | | | | 4,483,641 | |
| | | | | | | | | | | | |
|
|
|
TOTAL COMMERCIAL MORTGAGE-BACKED SECURITIES
(cost $93,325,081) | | | | 93,599,984 | |
| | | | | | | | | | | | |
|
|
|
SEE NOTES TO FINANCIAL STATEMENTS.
A13
| | | | | | |
| | | CONSERVATIVE BALANCED PORTFOLIO (continued) | | |
| |
| SCHEDULE OF INVESTMENTS | | December 31, 2014 |
| | | | | | | | | | | | | | |
| CORPORATE BONDS — 8.8% | | Interest
Rate
| | | Maturity
Date
| | Principal
Amount
(000)#
| | | Value
(Note 2)
| |
Airlines — 0.1% | | | | | | | | | | | | | | |
Continental Airlines, Inc., Pass-Through Trust, Pass-Through Certificates, Series 1998-1, Class A | | | 6.648% | | | 09/15/17 | | | 103 | | | $ | 106,250 | |
Continental Airlines, Inc., Pass-Through Trust, Pass-Through Certificates, Series 2001-1, Class A-1(d) | | | 6.703% | | | 06/15/21 | | | 124 | | | | 134,321 | |
Continental Airlines, Inc., Pass-Through Trust, Pass-Through Certificates, Series 2009-2, Class A | | | 7.250% | | | 11/10/19 | | | 562 | | | | 648,674 | |
Continental Airlines, Inc., Pass-Through Trust, Pass-Through Certificates, Series 2010-1, Class A(a) | | | 4.750% | | | 01/12/21 | | | 610 | | | | 649,530 | |
Continental Airlines, Inc., Pass-Through Trust, Pass-Through Certificates, Series 2012-2, Class A | | | 4.000% | | | 10/29/24 | | | 383 | | | | 389,184 | |
Delta Air Lines, Inc., Pass-Through Trust, Pass-Through Certificates, Series 2007-1 Class A | | | 6.821% | | | 08/10/22 | | | 315 | | | | 364,844 | |
Delta Air Lines, Inc., Pass-Through Trust, Pass-Through Certificates, Series 2010-2, Class A | | | 4.950% | | | 05/23/19 | | | 471 | | | | 504,396 | |
Delta Air Lines, Inc., Pass-Through Trust, Pass-Through Certificates, Series 2011-1, Class A | | | 5.300% | | | 04/15/19 | | | 776 | | | | 844,004 | |
| | | | | | | | | | | | |
|
|
|
| | | | | | | | | | | | | | 3,641,203 | |
| | | | | | | | | | | | |
|
|
|
Automotive — 0.2% | | | | | | | | | | | | | | |
Ford Motor Credit Co. LLC, Sr. Unsec’d. Notes | | | 4.207% | | | 04/15/16 | | | 1,890 | | | | 1,956,235 | |
General Motors Co., Sr. Unsec’d. Notes | | | 6.250% | | | 10/02/43 | | | 1,065 | | | | 1,272,249 | |
Harley-Davidson Financial Services, Inc., Gtd. Notes, MTN, 144A | | | 2.700% | | | 03/15/17 | | | 380 | | | | 389,369 | |
Jaguar Land Rover Automotive Plc (United Kingdom), Gtd. Notes, 144A | | | 4.250% | | | 11/15/19 | | | 535 | | | | 539,012 | |
Johnson Controls, Inc., Sr. Unsec’d. Notes | | | 5.500% | | | 01/15/16 | | | 235 | | | | 246,098 | |
| | | | | | | | | | | | |
|
|
|
| | | | | | | | | | | | | | 4,402,963 | |
| | | | | | | | | | | | |
|
|
|
Banking — 2.6% | | | | | | | | | | | | | | |
American Express Co., Jr. Sub. Notes(a) | | | 5.200% | (b) | | 12/31/49 | | | 475 | | | | 482,406 | |
Banco Santander Chile (Chile), Sr. Unsec’d. Notes, 144A | | | 3.875% | | | 09/20/22 | | | 530 | | | | 524,426 | |
Bank of America Corp., Series K, Jr. Sub. Notes | | | 8.000% | (b) | | 12/29/49 | | | 2,100 | | | | 2,254,875 | |
Bank of America Corp., Sr. Unsec’d. Notes | | | 5.700% | | | 01/24/22 | | | 1,290 | | | | 1,494,384 | |
Bank of America Corp., Sr. Unsec’d. Notes | | | 6.000% | | | 09/01/17 | | | 1,330 | | | | 1,466,528 | |
Bank of America Corp., Sr. Unsec’d. Notes, MTN | | | 3.300% | | | 01/11/23 | | | 360 | | | | 360,028 | |
Bank of America Corp., Sr. Unsec’d. Notes, MTN | | | 4.000% | | | 04/01/24 | | | 745 | | | | 775,713 | |
Bank of America Corp., Sr. Unsec’d. Notes, MTN(a) | | | 4.125% | | | 01/22/24 | | | 2,740 | | | | 2,877,425 | |
Bank of America Corp., Sr. Unsec’d. Notes, MTN | | | 4.500% | | | 04/01/15 | | | 185 | | | | 186,738 | |
Bank of America Corp., Sr. Unsec’d. Notes, MTN | | | 5.650% | | | 05/01/18 | | | 105 | | | | 116,652 | |
Bank of America NA, Sub. Notes | | | 5.300% | | | 03/15/17 | | | 850 | | | | 913,040 | |
Bank of America NA, Sub. Notes | | | 6.000% | | | 10/15/36 | | | 805 | | | | 1,008,312 | |
Bank of Nova Scotia (Canada), Covered Bonds, 144A | | | 1.650% | | | 10/29/15 | | | 1,265 | | | | 1,275,975 | |
Bear Stearns Cos. LLC (The), Sr. Unsec’d. Notes | | | 5.300% | | | 10/30/15 | | | 550 | | | | 570,160 | |
Bear Stearns Cos. LLC (The), Sr. Unsec’d. Notes | | | 6.400% | | | 10/02/17 | | | 270 | | | | 302,376 | |
Bear Stearns Cos. LLC (The), Sr. Unsec’d. Notes | | | 7.250% | | | 02/01/18 | | | 1,135 | | | | 1,308,144 | |
Capital One Financial Corp., Sr. Unsec’d. Notes | | | 3.750% | | | 04/24/24 | | | 2,170 | | | | 2,216,870 | |
Citigroup, Inc., Sr. Unsec’d. Notes(a) | | | 3.875% | | | 10/25/23 | | | 1,730 | | | | 1,798,165 | |
Citigroup, Inc., Sr. Unsec’d. Notes(a) | | | 4.500% | | | 01/14/22 | | | 1,125 | | | | 1,229,353 | |
Citigroup, Inc., Sr. Unsec’d. Notes | | | 6.875% | | | 03/05/38 | | | 36 | | | | 49,048 | |
Citigroup, Inc., Sr. Unsec’d. Notes | | | 8.125% | | | 07/15/39 | | | 850 | | | | 1,301,294 | |
Citigroup, Inc., Sr. Unsec’d. Notes | | | 8.500% | | | 05/22/19 | | | 1,195 | | | | 1,489,050 | |
Citigroup, Inc., Sub. Notes | | | 6.125% | | | 08/25/36 | | | 725 | | | | 864,251 | |
Compass Bank, Sr. Unsec’d. Notes | | | 1.850% | | | 09/29/17 | | | 1,050 | | | | 1,045,522 | |
Discover Bank, Sr. Unsec’d. Notes | | | 4.250% | | | 03/13/26 | | | 595 | | | | 616,776 | |
Discover Bank, Sub. Notes | | | 7.000% | | | 04/15/20 | | | 485 | | | | 571,593 | |
Discover Financial Services, Sr. Unsec’d. Notes | | | 3.850% | | | 11/21/22 | | | 900 | | | | 915,662 | |
Goldman Sachs Group, Inc. (The), Sr. Unsec’d. Notes | | | 5.250% | | | 07/27/21 | | | 2,305 | | | | 2,601,566 | |
Goldman Sachs Group, Inc. (The), Sr. Unsec’d. Notes | | | 5.750% | | | 01/24/22 | | | 1,250 | | | | 1,445,984 | |
Goldman Sachs Group, Inc. (The), Sr. Unsec’d. Notes | | | 6.250% | | | 02/01/41 | | | 220 | | | | 278,112 | |
Goldman Sachs Group, Inc. (The), Sub. Notes | | | 5.625% | | | 01/15/17 | | | 765 | | | | 820,537 | |
Goldman Sachs Group, Inc. (The), Sub. Notes(a) | | | 6.750% | | | 10/01/37 | | | 1,100 | | | | 1,383,112 | |
SEE NOTES TO FINANCIAL STATEMENTS.
A14
| | | | | | |
| | | CONSERVATIVE BALANCED PORTFOLIO (continued) | | |
| |
| SCHEDULE OF INVESTMENTS | | December 31, 2014 |
| | | | | | | | | | | | | | |
CORPORATE BONDS
(continued) | | Interest
Rate
| | | Maturity
Date
| | Principal
Amount
(000)#
| | | Value
(Note 2)
| |
Banking (continued) | | | | | | | | | | | | | | |
HSBC Holdings PLC (United Kingdom), Sr. Unsec’d. Notes | | | 4.875% | | | 01/14/22 | | | 1,230 | | | $ | 1,371,018 | |
HSBC Holdings PLC (United Kingdom), Sr. Unsec’d. Notes | | | 5.100% | | | 04/05/21 | | | 920 | | | | 1,039,966 | |
Huntington Bancshares, Inc., Sub. Notes(a) | | | 7.000% | | | 12/15/20 | | | 150 | | | | 180,530 | |
Intesa Sanpaolo SpA (Italy), Gtd. Notes | | | 3.125% | | | 01/15/16 | | | 1,145 | | | | 1,163,097 | |
JPMorgan Chase & Co., Jr. Sub. Notes(a) | | | 6.100% | (b) | | 12/31/49 | | | 1,175 | | | | 1,172,062 | |
JPMorgan Chase & Co., Jr. Sub. Notes | | | 7.900% | (b) | | 04/29/49 | | | 2,000 | | | | 2,152,600 | |
JPMorgan Chase & Co., Sr. Unsec’d. Notes | | | 4.250% | | | 10/15/20 | | | 1,660 | | | | 1,784,666 | |
JPMorgan Chase & Co., Sub. Notes | | | 5.625% | | | 08/16/43 | | | 185 | | | | 215,137 | |
Lloyds Bank PLC (United Kingdom), Gtd. Notes, MTN, 144A | | | 5.800% | | | 01/13/20 | | | 1,770 | | | | 2,045,315 | |
Morgan Stanley, Jr. Sub. Notes(a) | | | 5.450% | (b) | | 12/31/49 | | | 640 | | | | 641,152 | |
Morgan Stanley, Sr. Unsec’d. Notes(a) | | | 6.375% | | | 07/24/42 | | | 640 | | | | 849,942 | |
Morgan Stanley, Sr. Unsec’d. Notes, MTN | | | 5.450% | | | 01/09/17 | | | 1,530 | | | | 1,642,782 | |
Morgan Stanley, Sr. Unsec’d. Notes, MTN | | | 5.500% | | | 07/28/21 | | | 1,535 | | | | 1,742,042 | |
Morgan Stanley, Sr. Unsec’d. Notes, MTN(a) | | | 5.625% | | | 09/23/19 | | | 2,110 | | | | 2,381,755 | |
Morgan Stanley, Sr. Unsec’d. Notes, MTN | | | 6.625% | | | 04/01/18 | | | 100 | | | | 113,904 | |
MUFG Capital Finance 1 Ltd. (Japan), Gtd. Notes | | | 6.346% | (b) | | 07/29/49 | | | 800 | | | | 852,130 | |
Northern Trust Corp., Sub. Notes | | | 3.950% | | | 10/30/25 | | | 750 | | | | 780,568 | |
People’s United Financial, Inc., Sr. Unsec’d. Notes | | | 3.650% | | | 12/06/22 | | | 1,195 | | | | 1,204,662 | |
PNC Bank NA, Sub. Notes | | | 3.800% | | | 07/25/23 | | | 480 | | | | 494,783 | |
PNC Funding Corp., Gtd. Notes | | | 6.700% | | | 06/10/19 | | | 390 | | | | 461,771 | |
Royal Bank of Canada (Canada), Covered Bonds(a) | | | 2.200% | | | 09/23/19 | | | 2,240 | | | | 2,256,397 | |
Santander Holdings USA, Inc., Sr. Unsec’d. Notes | | | 3.000% | | | 09/24/15 | | | 780 | | | | 789,349 | |
Sumitomo Mitsui Banking Corp. (Japan), Gtd. Notes | | | 2.450% | | | 01/10/19 | | | 925 | | | | 929,187 | |
US Bancorp, Sub. Notes, MTN | | | 2.950% | | | 07/15/22 | | | 915 | | | | 901,983 | |
Wells Fargo & Co., Sub. Notes, MTN(a) | | | 4.650% | | | 11/04/44 | | | 910 | | | | 938,994 | |
Westpac Banking Corp. (Australia), Covered Bonds, 144A | | | 2.000% | | | 05/21/19 | | | 4,105 | | | | 4,090,238 | |
| | | | | | | | | | | | |
|
|
|
| | | | | | | | | | | | | | 66,740,107 | |
| | | | | | | | | | | | |
|
|
|
Brokerage — 0.1% | | | | | |
Jefferies Group LLC, Sr. Unsec’d. Notes | | | 6.500% | | | 01/20/43 | | | 465 | | | | 474,338 | |
Lehman Brothers Holdings, Inc., Sr. Unsec’d. Notes(e) | | | 5.250% | | | 02/06/12 | | | 1,850 | | | | 270,562 | |
Lehman Brothers Holdings, Inc., Sr. Unsec’d. Notes(e) | | | 6.875% | | | 05/02/18 | | | 700 | | | | 104,125 | |
Nomura Holdings, Inc. (Japan), Sr. Unsec’d. Notes, MTN | | | 2.000% | | | 09/13/16 | | | 680 | | | | 685,486 | |
| | | | | | | | | | | | |
|
|
|
| | | | | | | | | | | | | | 1,534,511 | |
| | | | | | | | | | | | |
|
|
|
Building Materials & Construction — 0.1% | | | | | |
Building Materials Corp. of America, Sr. Unsec’d. Notes, 144A (original cost $635,000; purchased 10/27/14)(c)(d) | | | 5.375% | | | 11/15/24 | | | 635 | | | | 633,412 | |
D.R. Horton, Inc., Gtd. Notes(a) | | | 3.625% | | | 02/15/18 | | | 375 | | | | 379,688 | |
Odebrecht Finance Ltd. (Brazil), Gtd. Notes, 144A (original cost $530,000; purchased 06/19/14)(c)(d) | | | 5.250% | | | 06/27/29 | | | 530 | | | | 463,485 | |
| | | | | | | | | | | | |
|
|
|
| | | | | | | | | | | | | | 1,476,585 | |
| | | | | | | | | | | | |
|
|
|
Cable — 0.3% | | | | | |
Cablevision Systems Corp., Sr. Unsec’d. Notes | | | 8.625% | | | 09/15/17 | | | 900 | | | | 1,001,250 | |
CCO Holdings LLC/CCO Holdings Capital Corp., Gtd. Notes(a) | | | 7.250% | | | 10/30/17 | | | 1,150 | | | | 1,196,575 | |
Comcast Cable Holdings LLC, Gtd. Notes | | | 9.875% | | | 06/15/22 | | | 1,440 | | | | 1,991,748 | |
DIRECTV Holdings LLC/DIRECTV Financing Co., Inc., Gtd. Notes | | | 3.500% | | | 03/01/16 | | | 605 | | | | 620,781 | |
DIRECTV Holdings LLC/DIRECTV Financing Co., Inc., Gtd. Notes | | | 3.550% | | | 03/15/15 | | | 165 | | | | 165,979 | |
DIRECTV Holdings LLC/DIRECTV Financing Co., Inc., Gtd. Notes(a) | | | 5.150% | | | 03/15/42 | | | 520 | | | | 537,347 | |
Time Warner Cable, Inc., Gtd. Notes | | | 5.850% | | | 05/01/17 | | | 1,240 | | | | 1,353,521 | |
Videotron Ltd. (Canada), Gtd. Notes | | | 5.000% | | | 07/15/22 | | | 850 | | | | 864,875 | |
| | | | | | | | | | | | |
|
|
|
| | | | | | | | | | | | | | 7,732,076 | |
| | | | | | | | | | | | |
|
|
|
Capital Goods — 0.3% | | | | | |
Actuant Corp., Gtd. Notes | | | 5.625% | | | 06/15/22 | | | 1,040 | | | | 1,079,000 | |
Case New Holland Industrial, Inc., Gtd. Notes | | | 7.875% | | | 12/01/17 | | | 1,100 | | | | 1,210,000 | |
ERAC USA Finance LLC, Gtd. Notes, 144A (original cost $1,195,904; purchased 10/10/07)(c)(d) | | | 6.375% | | | 10/15/17 | | | 1,198 | | | | 1,345,117 | |
SEE NOTES TO FINANCIAL STATEMENTS.
A15
| | | | | | |
| | | CONSERVATIVE BALANCED PORTFOLIO (continued) | | |
| |
| SCHEDULE OF INVESTMENTS | | December 31, 2014 |
| | | | | | | | | | | | | | |
CORPORATE BONDS
(continued) | | Interest
Rate
| | | Maturity
Date
| | Principal
Amount
(000)#
| | | Value
(Note 2)
| |
Capital Goods (continued) | | | | | |
ERAC USA Finance LLC, Gtd. Notes, 144A (original cost $386,623; purchased 10/10/07)(c)(d) | | | 7.000% | | | 10/15/37 | | | 390 | | | $ | 525,569 | |
General Electric Co., Sr. Unsec’d. Notes | | | 4.125% | | | 10/09/42 | | | 180 | | | | 186,338 | |
General Electric Co., Sr. Unsec’d. Notes | | | 4.500% | | | 03/11/44 | | | 260 | | | | 285,798 | |
Penske Truck Leasing Co. LP/PTL Finance Corp., Unsec’d. Notes, 144A (original cost $419,593; purchased 05/08/12)(c)(d) | | | 3.125% | | | 05/11/15 | | | 420 | | | | 423,402 | |
SPX Corp., Gtd. Notes(a) | | | 6.875% | | | 09/01/17 | | | 810 | | | | 884,925 | |
United Rentals North America, Inc., Gtd. Notes | | | 7.375% | | | 05/15/20 | | | 725 | | | | 783,000 | |
Xylem, Inc., Sr. Unsec’d. Notes | | | 4.875% | | | 10/01/21 | | | 1,060 | | | | 1,145,161 | |
| | | | | | | | | | | | |
|
|
|
| | | | | | | | | | | | | | 7,868,310 | |
| | | | | | | | | | | | |
|
|
|
Chemicals — 0.2% | | | | | |
CF Industries, Inc., Gtd. Notes(a) | | | 5.375% | | | 03/15/44 | | | 445 | | | | 480,108 | |
Dow Chemical Co. (The), Sr. Unsec’d. Notes | | | 4.625% | | | 10/01/44 | | | 5 | | | | 5,063 | |
Dow Chemical Co. (The), Sr. Unsec’d. Notes | | | 9.400% | | | 05/15/39 | | | 30 | | | | 48,676 | |
Koppers, Inc., Gtd. Notes | | | 7.875% | | | 12/01/19 | | | 1,050 | | | | 1,077,563 | |
LyondellBasell Industries NV, Sr. Unsec’d. Notes | | | 5.000% | | | 04/15/19 | | | 800 | | | | 872,611 | |
Monsanto Co., Sr. Unsec’d. Notes | | | 4.200% | | | 07/15/34 | | | 150 | | | | 156,300 | |
Monsanto Co., Sr. Unsec’d. Notes | | | 4.400% | | | 07/15/44 | | | 180 | | | | 186,758 | |
Mosaic Co. (The), Sr. Unsec’d. Notes | | | 5.450% | | | 11/15/33 | | | 265 | | | | 299,823 | |
Mosaic Co. (The), Sr. Unsec’d. Notes | | | 5.625% | | | 11/15/43 | | | 860 | | | | 985,573 | |
Union Carbide Corp., Sr. Unsec’d. Notes | | | 7.500% | | | 06/01/25 | | | 500 | | | | 647,178 | |
| | | | | | | | | | | | |
|
|
|
| | | | | | | | | | | | | | 4,759,653 | |
| | | | | | | | | | | | |
|
|
|
Consumer — 0.1% | | | | | |
Newell Rubbermaid, Inc., Sr. Unsec’d. Notes | | | 6.250% | | | 04/15/18 | | | 1,600 | | | | 1,804,254 | |
| | | | | | | | | | | | |
|
|
|
Electric — 0.5% | | | | | |
Arizona Public Service Co., Sr. Unsec’d. Notes | | | 6.250% | | | 08/01/16 | | | 170 | | | | 184,113 | |
Baltimore Gas & Electric Co., Sr. Unsec’d. Notes(a) | | | 6.350% | | | 10/01/36 | | | 530 | | | | 723,542 | |
Berkshire Hathaway Energy Co., Sr. Unsec’d. Notes | | | 6.125% | | | 04/01/36 | | | 340 | | | | 427,153 | |
CenterPoint Energy Houston Electric LLC, Gen. Ref. Mtge., Series K2 | | | 6.950% | | | 03/15/33 | | | 300 | | | | 418,793 | |
Consolidated Edison Co. of New York, Inc., Sr. Unsec’d. Notes, Series 09-C | | | 5.500% | | | 12/01/39 | | | 145 | | | | 174,046 | |
Dominion Gas Holdings LLC, Sr. Unsec’d. Notes(a) | | | 4.800% | | | 11/01/43 | | | 45 | | | | 48,495 | |
Duke Energy Carolinas LLC, First Mortgage | | | 6.050% | | | 04/15/38 | | | 530 | | | | 689,179 | |
Dynegy Finance I, Inc./Dynegy Finance II, Inc., Sr. Sec’d. Notes, 144A | | | 6.750% | | | 11/01/19 | | | 345 | | | | 351,038 | |
Dynegy Finance I, Inc./Dynegy Finance II, Inc., Sr. Sec’d. Notes, 144A | | | 7.375% | | | 11/01/22 | | | 255 | | | | 259,463 | |
El Paso Electric Co., Sr. Unsec’d. Notes | | | 6.000% | | | 05/15/35 | | | 845 | | | | 1,058,997 | |
Empresa Nacional de Electricidad SA (Chile), Sr. Unsec’d. Notes | | | 8.625% | | | 08/01/15 | | | 1,160 | | | | 1,206,610 | |
Exelon Corp., Sr. Unsec’d. Notes | | | 4.900% | | | 06/15/15 | | | 195 | | | | 198,487 | |
Exelon Generation Co. LLC, Sr. Unsec’d. Notes(a) | | | 6.250% | | | 10/01/39 | | | 1,375 | | | | 1,651,473 | |
FirstEnergy Transmission LLC, Sr. Unsec’d. Notes, 144A | | | 5.450% | | | 07/15/44 | | | 265 | | | | 285,634 | |
Florida Power & Light Co., First Mortgage | | | 5.950% | | | 10/01/33 | | | 380 | | | | 501,182 | |
Iberdrola International BV (Spain), Gtd. Notes | | | 6.750% | | | 09/15/33 | | | 140 | | | | 173,689 | |
Niagara Mohawk Power Corp. (United Kingdom), Sr. Unsec’d. Notes, 144A | | | 4.881% | | | 08/15/19 | | | 545 | | | | 602,769 | |
Northeast Utilities, Sr. Unsec’d. Notes | | | 4.500% | | | 11/15/19 | | | 605 | | | | 657,962 | |
Oncor Electric Delivery Co. LLC, Sr. Sec’d. Notes | | | 6.375% | | | 01/15/15 | | | 465 | | | | 465,668 | |
Public Service Co. of New Mexico, Sr. Unsec’d. Notes | | | 7.950% | | | 05/15/18 | | | 135 | | | | 158,876 | |
Public Service Electric & Gas Co., Sr. Sec’d. Notes, MTN | | | 5.800% | | | 05/01/37 | | | 515 | | | | 666,681 | |
Xcel Energy, Inc., Sr. Unsec’d. Notes | | | 4.800% | | | 09/15/41 | | | 480 | | | | 535,392 | |
Xcel Energy, Inc., Sr. Unsec’d. Notes | | | 5.613% | | | 04/01/17 | | | 263 | | | | 287,020 | |
| | | | | | | | | | | | |
|
|
|
| | | | | | | | | | | | | | 11,726,262 | |
| | | | | | | | | | | | |
|
|
|
Energy – Integrated | | | | | | | | | | | | | | |
Reliance Holding USA, Inc. (India), Gtd. Notes, 144A | | | 5.400% | | | 02/14/22 | | | 650 | | | | 704,150 | |
| | | | | | | | | | | | |
|
|
|
Energy – Other — 0.2% | | | | | | | | | | | | | | |
Anadarko Petroleum Corp., Sr. Unsec’d. Notes | | | 4.677% | (f) | | 10/10/36 | | | 1,000 | | | | 379,274 | |
Anadarko Petroleum Corp., Sr. Unsec’d. Notes | | | 6.450% | | | 09/15/36 | | | 305 | | | | 366,517 | |
Anadarko Petroleum Corp., Sr. Unsec’d. Notes | | | 6.950% | | | 06/15/19 | | | 225 | | | | 262,879 | |
Nabors Industries, Inc., Gtd. Notes | | | 4.625% | | | 09/15/21 | | | 890 | | | | 836,192 | |
SEE NOTES TO FINANCIAL STATEMENTS.
A16
| | | | | | |
| | | CONSERVATIVE BALANCED PORTFOLIO (continued) | | |
| |
| SCHEDULE OF INVESTMENTS | | December 31, 2014 |
| | | | | | | | | | | | | | |
CORPORATE BONDS
(continued) | | Interest
Rate
| | | Maturity
Date
| | Principal
Amount
(000)#
| | | Value
(Note 2)
| |
Energy – Other (continued) | | | | | | | | | | | | | | |
Newfield Exploration Co., Sr. Sub. Notes(a) | | | 6.875% | | | 02/01/20 | | | 225 | | | $ | 228,375 | |
Pacific Rubiales Energy Corp. (Colombia), Gtd. Notes, 144A | | | 5.375% | | | 01/26/19 | | | 350 | | | | 301,525 | |
Phillips 66, Gtd. Notes | | | 2.950% | | | 05/01/17 | | | 415 | | | | 428,605 | |
Pioneer Natural Resources Co., Sr. Unsec’d. Notes | | | 6.875% | | | 05/01/18 | | | 1,450 | | | | 1,623,166 | |
Transocean, Inc., Gtd. Notes | | | 2.500% | | | 10/15/17 | | | 510 | | | | 450,863 | |
Weatherford International Ltd., Gtd. Notes | | | 5.125% | | | 09/15/20 | | | 685 | | | | 672,984 | |
| | | | | | | | | | | | |
|
|
|
| | | | | | | | | | | | | | 5,550,380 | |
| | | | | | | | | | | | |
|
|
|
Foods — 0.2% | | | | | | | | | | | | | | |
Anheuser-Busch InBev Worldwide, Inc. (Belgium), Gtd. Notes | | | 8.000% | | | 11/15/39 | | | 1,160 | | | | 1,774,110 | |
Bunge Ltd. Finance Corp., Gtd. Notes | | | 8.500% | | | 06/15/19 | | | 860 | | | | 1,053,964 | |
Constellation Brands, Inc., Gtd. Notes | | | 4.750% | | | 11/15/24 | | | 925 | | | | 936,563 | |
Delhaize Group SA (Belgium), Gtd. Notes | | | 6.500% | | | 06/15/17 | | | 460 | | | | 507,447 | |
Tyson Foods, Inc., Gtd. Notes | | | 6.600% | | | 04/01/16 | | | 785 | | | | 836,813 | |
| | | | | | | | | | | | |
|
|
|
| | | | | | | | | | | | | | 5,108,897 | |
| | | | | | | | | | | | |
|
|
|
Gaming | | | | | | | | | | | | | | |
GLP Capital LP/GLP Financing II, Inc., Gtd. Notes(a) | | | 4.875% | | | 11/01/20 | | | 800 | | | | 810,000 | |
| | | | | | | | | | | | |
|
|
|
Healthcare & Pharmaceutical — 0.7% | | | | | | | | | | | | | | |
Actavis Funding SCS, Gtd. Notes | | | 4.850% | | | 06/15/44 | | | 445 | | | | 451,558 | |
Actavis, Inc., Gtd. Notes | | | 6.125% | | | 08/15/19 | | | 440 | | | | 499,066 | |
Amgen, Inc., Sr. Unsec’d. Notes | | | 5.150% | | | 11/15/41 | | | 1,365 | | | | 1,538,560 | |
AstraZeneca PLC (United Kingdom), Sr. Unsec’d. Notes | | | 6.450% | | | 09/15/37 | | | 480 | | | | 646,799 | |
Bayer US Finance LLC (Germany), Gtd. Notes, 144A | | | 3.375% | | | 10/08/24 | | | 390 | | | | 396,853 | |
Becton Dickinson & Co., Sr. Unsec’d. Notes | | | 3.734% | | | 12/15/24 | | | 805 | | | | 828,808 | |
CHS/Community Health Systems, Inc., Sr. Sec’d. Notes(a) | | | 5.125% | | | 08/15/18 | | | 900 | | | | 931,500 | |
Fresenius Medical Care U.S. Finance II, Inc. (Germany), Gtd. Notes, 144A | | | 4.125% | | | 10/15/20 | | | 535 | | | | 537,675 | |
Gilead Sciences, Inc., Sr. Unsec’d. Notes | | | 3.500% | | | 02/01/25 | | | 1,145 | | | | 1,175,228 | |
Gilead Sciences, Inc., Sr. Unsec’d. Notes | | | 5.650% | | | 12/01/41 | | | 140 | | | | 173,345 | |
HCA, Inc., Sr. Sec’d. Notes(a) | | | 4.250% | | | 10/15/19 | | | 445 | | | | 451,675 | |
HCA, Inc., Sr. Sec’d. Notes(a) | | | 5.000% | | | 03/15/24 | | | 900 | | | | 924,750 | |
HCA, Inc., Sr. Sec’d. Notes(a) | | | 5.250% | | | 04/15/25 | | | 350 | | | | 365,750 | |
Laboratory Corp. of America Holdings, Sr. Unsec’d. Notes(a) | | | 3.750% | | | 08/23/22 | | | 150 | | | | 153,462 | |
Laboratory Corp. of America Holdings, Sr. Unsec’d. Notes | | | 5.625% | | | 12/15/15 | | | 560 | | | | 582,550 | |
Medtronic, Inc., Sr. Unsec’d. Notes, 144A | | | 3.500% | | | 03/15/25 | | | 2,515 | | | | 2,572,770 | |
Medtronic, Inc., Sr. Unsec’d. Notes, 144A | | | 4.375% | | | 03/15/35 | | | 1,065 | | | | 1,129,812 | |
Mylan, Inc., Gtd. Notes | | | 1.800% | | | 06/24/16 | | | 355 | | | | 357,141 | |
Novartis Capital Corp. (Switzerland), Gtd. Notes | | | 4.400% | | | 05/06/44 | | | 1,010 | | | | 1,131,848 | |
Roche Holdings, Inc. (Switzerland), Gtd. Notes, 144A | | | 2.875% | | | 09/29/21 | | | 4,385 | | | | 4,439,786 | |
Zoetis, Inc., Sr. Unsec’d. Notes | | | 4.700% | | | 02/01/43 | | | 90 | | | | 91,600 | |
| | | | | | | | | | | | |
|
|
|
| | | | | | | | | | | | | | 19,380,536 | |
| | | | | | | | | | | | |
|
|
|
Healthcare Insurance — 0.2% | | | | | | | | | | | | | | |
Aetna, Inc., Sr. Unsec’d. Notes | | | 6.625% | | | 06/15/36 | | | 480 | | | | 639,714 | |
Anthem, Inc., Sr. Unsec’d. Notes | | | 4.625% | | | 05/15/42 | | | 330 | | | | 346,288 | |
Anthem, Inc., Sr. Unsec’d. Notes | | | 4.650% | | | 01/15/43 | | | 260 | | | | 270,598 | |
Cigna Corp., Sr. Unsec’d. Notes | | | 5.875% | | | 03/15/41 | | | 540 | | | | 672,300 | |
Cigna Corp., Sr. Unsec’d. Notes | | | 6.150% | | | 11/15/36 | | | 640 | | | | 797,692 | |
UnitedHealth Group, Inc., Sr. Unsec’d. Notes | | | 6.000% | | | 06/15/17 | | | 115 | | | | 127,510 | |
UnitedHealth Group, Inc., Sr. Unsec’d. Notes | | | 6.500% | | | 06/15/37 | | | 400 | | | | 535,993 | |
UnitedHealth Group, Inc., Sr. Unsec’d. Notes | | | 6.625% | | | 11/15/37 | | | 410 | | | | 559,951 | |
| | | | | | | | | | | | |
|
|
|
| | | | | | | | | | | | | | 3,950,046 | |
| | | | | | | | | | | | |
|
|
|
Insurance — 0.8% | | | | | | | | | | | | | | |
Allied World Assurance Co. Holdings Ltd., Gtd. Notes | | | 5.500% | | | 11/15/20 | | | 480 | | | | 535,401 | |
Allstate Corp. (The), Sr. Unsec’d. Notes | | | 4.500% | | | 06/15/43 | | | 125 | | | | 137,919 | |
American International Group, Inc., Sr. Unsec’d. Notes | | | 4.500% | | | 07/16/44 | | | 670 | | | | 707,862 | |
American International Group, Inc., Sr. Unsec’d. Notes | | | 6.400% | | | 12/15/20 | | | 910 | | | | 1,085,148 | |
Axis Specialty Finance LLC, Gtd. Notes(a) | | | 5.875% | | | 06/01/20 | | | 990 | | | | 1,121,452 | |
SEE NOTES TO FINANCIAL STATEMENTS.
A17
| | | | | | |
| | | CONSERVATIVE BALANCED PORTFOLIO (continued) | | |
| |
| SCHEDULE OF INVESTMENTS | | December 31, 2014 |
| | | | | | | | | | | | | | |
CORPORATE BONDS
(continued) | | Interest
Rate
| | | Maturity
Date
| | Principal
Amount
(000)#
| | | Value
(Note 2)
| |
Insurance (continued) | | | | | | | | | | | | | | |
Chubb Corp. (The), Jr. Sub. Notes | | | 6.375% | (b) | | 03/29/67 | | | 1,260 | | | $ | 1,350,783 | |
Dai-ichi Life Insurance Co. Ltd. (The) (Japan), Jr. Sub. Notes, 144A | | | 5.100% | (b) | | 12/29/49 | | | 375 | | | | 390,469 | |
Hartford Financial Services Group, Inc. (The), Sr. Unsec’d. Notes | | | 5.125% | | | 04/15/22 | | | 635 | | | | 713,796 | |
Liberty Mutual Group, Inc., Gtd. Notes, 144A | | | 6.500% | | | 05/01/42 | | | 215 | | | | 262,909 | |
Liberty Mutual Group, Inc., Sr. Unsec’d. Notes, 144A | | | 7.000% | | | 03/15/34 | | | 910 | | | | 1,156,020 | |
Lincoln National Corp., Jr. Sub. Notes | | | 6.050% | (b) | | 04/20/67 | | | 250 | | | | 250,000 | |
Lincoln National Corp., Sr. Unsec’d. Notes | | | 6.300% | | | 10/09/37 | | | 476 | | | | 603,920 | |
Lincoln National Corp., Sr. Unsec’d. Notes | | | 7.000% | | | 06/15/40 | | | 660 | | | | 915,308 | |
Lincoln National Corp., Sr. Unsec’d. Notes | | | 8.750% | | | 07/01/19 | | | 505 | | | | 631,013 | |
Markel Corp., Sr. Unsec’d. Notes | | | 5.000% | | | 03/30/43 | | | 165 | | | | 175,213 | |
MetLife, Inc., Sr. Unsec’d. Notes(a) | | | 5.700% | | | 06/15/35 | | | 960 | | | | 1,196,340 | |
MetLife, Inc., Sr. Unsec’d. Notes | | | 6.375% | | | 06/15/34 | | | 85 | | | | 113,266 | |
MetLife, Inc., Sr. Unsec’d. Notes | | | 6.750% | | | 06/01/16 | | | 270 | | | | 291,086 | |
New York Life Insurance Co., Sub. Notes, 144A(a) | | | 6.750% | | | 11/15/39 | | | 650 | | | | 904,723 | |
Nippon Life Insurance Co. (Japan), Sub. Notes, 144A(a) | | | 5.100% | (b) | | 10/16/44 | | | 1,505 | | | | 1,572,725 | |
Northwestern Mutual Life Insurance Co. (The), Sub. Notes, 144A | | | 6.063% | | | 03/30/40 | | | 350 | | | | 452,417 | |
Ohio National Financial Services, Inc., Sr. Unsec’d. Notes, 144A | | | 6.375% | | | 04/30/20 | | | 640 | | | | 734,780 | |
Pacific Life Insurance Co., Sub. Notes, 144A | | | 9.250% | | | 06/15/39 | | | 695 | | | | 1,093,237 | |
Principal Financial Group, Inc., Gtd. Notes | | | 4.625% | | | 09/15/42 | | | 105 | | | | 110,215 | |
Progressive Corp. (The), Jr. Sub. Notes | | | 6.700% | (b) | | 06/15/37 | | | 715 | | | | 773,451 | |
Teachers Insurance & Annuity Association of America, Sub. Notes, 144A | | | 6.850% | | | 12/16/39 | | | 1,430 | | | | 1,953,135 | |
Unum Group, Sr. Unsec’d. Notes | | | 5.625% | | | 09/15/20 | | | 315 | | | | 354,704 | |
W.R. Berkley Corp., Sr. Unsec’d. Notes | | | 5.600% | | | 05/15/15 | | | 705 | | | | 717,335 | |
W.R. Berkley Corp., Sr. Unsec’d. Notes | | | 6.150% | | | 08/15/19 | | | 575 | | | | 648,978 | |
| | | | | | | | | | | | |
|
|
|
| | | | | | | | | | | | | | 20,953,605 | |
| | | | | | | | | | | | |
|
|
|
Lodging — 0.2% | | | | | | | | | | | | | | |
Choice Hotels International, Inc., Gtd. Notes | | | 5.750% | | | 07/01/22 | | | 955 | | | | 1,024,238 | |
Marriott International, Inc., Sr. Unsec’d. Notes | | | 3.000% | | | 03/01/19 | | | 490 | | | | 502,999 | |
Marriott International, Inc., Sr. Unsec’d. Notes | | | 3.250% | | | 09/15/22 | | | 805 | | | | 808,234 | |
Starwood Hotels & Resorts Worldwide, Inc., Sr. Unsec’d. Notes(a) | | | 6.750% | | | 05/15/18 | | | 2,700 | | | | 3,073,302 | |
Wyndham Worldwide Corp., Sr. Unsec’d. Notes | | | 2.500% | | | 03/01/18 | | | 405 | | | | 404,308 | |
| | | | | | | | | | | | |
|
|
|
| | | | | | | | | | | | | | 5,813,081 | |
| | | | | | | | | | | | |
|
|
|
Media & Entertainment — 0.2% | | | | | | | | | | | | | | |
21st Century Fox America, Inc., Gtd. Notes | | | 6.150% | | | 03/01/37 | | | 250 | | | | 313,327 | |
21st Century Fox America, Inc., Gtd. Notes | | | 6.900% | | | 08/15/39 | | | 35 | | | | 47,449 | |
21st Century Fox America, Inc., Gtd. Notes | | | 7.625% | | | 11/30/28 | | | 1,265 | | | | 1,677,333 | |
CBS Corp., Gtd. Notes
(original cost $120,159; purchased 07/16/12)(c)(d) | | | 4.850% | | | 07/01/42 | | | 115 | | | | 116,553 | |
DISH DBS Corp., Gtd. Notes(a) | | | 7.125% | | | 02/01/16 | | | 850 | | | | 893,563 | |
Historic TW, Inc., Gtd. Notes | | | 9.150% | | | 02/01/23 | | | 625 | | | | 850,066 | |
Myriad International Holdings BV (South Africa), Gtd. Notes, RegS | | | 6.375% | | | 07/28/17 | | | 750 | | | | 817,500 | |
Time Warner, Inc., Gtd. Notes | | | 6.200% | | | 03/15/40 | | | 175 | | | | 213,047 | |
Time Warner, Inc., Gtd. Notes | | | 6.250% | | | 03/29/41 | | | 495 | | | | 614,661 | |
Time Warner, Inc., Gtd. Notes | | | 7.625% | | | 04/15/31 | | | 75 | | | | 104,560 | |
Viacom, Inc., Sr. Unsec’d. Notes (original cost $44,077; purchased 07/25/13)(c)(d) | | | 4.500% | | | 02/27/42 | | | 50 | | | | 48,746 | |
Viacom, Inc., Sr. Unsec’d. Notes (original cost $141,597; purchased 02/11/14)(c)(d) | | | 4.875% | | | 06/15/43 | | | 150 | | | | 146,597 | |
Viacom, Inc., Sr. Unsec’d. Notes (original cost $322,897; purchased 08/12/13)(c)(d) | | | 5.850% | | | 09/01/43 | | | 325 | | | | 361,423 | |
| | | | | | | | | | | | |
|
|
|
| | | | | | | | | | | | | | 6,204,825 | |
| | | | | | | | | | | | |
|
|
|
Metals — 0.1% | | | | | |
BHP Billiton Finance USA Ltd. (Australia), Gtd. Notes(a) | | | 5.000% | | | 09/30/43 | | | 700 | | | | 793,465 | |
Glencore Finance Canada Ltd. (Switzerland), Gtd. Notes, 144A | | | 2.050% | | | 10/23/15 | | | 905 | | | | 910,889 | |
Newmont Mining Corp., Gtd. Notes | | | 6.250% | | | 10/01/39 | | | 15 | | | | 15,215 | |
Southern Copper Corp., Sr. Unsec’d. Notes | | | 7.500% | | | 07/27/35 | | | 370 | | | | 416,247 | |
| | | | | | | | | | | | |
|
|
|
| | | | | | | | | | | | | | 2,135,816 | |
| | | | | | | | | | | | |
|
|
|
Non-Captive Finance — 0.3% | | | | | |
AerCap Ireland Capital Ltd./AerCap Global Aviation Trust (Netherlands), Gtd. Notes, 144A | | | 3.750% | | | 05/15/19 | | | 600 | | | | 594,000 | |
SEE NOTES TO FINANCIAL STATEMENTS.
A18
| | | | | | |
| | | CONSERVATIVE BALANCED PORTFOLIO (continued) | | |
| |
| SCHEDULE OF INVESTMENTS | | December 31, 2014 |
| | | | | | | | | | | | | | |
CORPORATE BONDS
(continued) | | Interest
Rate
| | | Maturity
Date
| | Principal
Amount
(000)#
| | | Value
(Note 2)
| |
Non-Captive Finance (continued) | | | | | |
General Electric Capital Corp., Sr. Unsec’d. Notes, MTN(a) | | | 5.875% | | | 01/14/38 | | | 580 | | | $ | 733,909 | |
General Electric Capital Corp., Sr. Unsec’d. Notes, MTN | | | 6.000% | | | 08/07/19 | | | 3,010 | | | | 3,501,151 | |
General Electric Capital Corp., Sr. Unsec’d. Notes, MTN | | | 6.875% | | | 01/10/39 | | | 1,085 | | | | 1,534,740 | |
International Lease Finance Corp., Sr. Unsec’d. Notes | | | 5.750% | | | 05/15/16 | | | 230 | | | | 238,625 | |
Navient Corp., Sr. Unsec’d. Notes, MTN | | | 8.450% | | | 06/15/18 | | | 295 | | | | 328,925 | |
| | | | | | | | | | | | |
|
|
|
| | | | | | | | | | | | | | 6,931,350 | |
| | | | | | | | | | | | |
|
|
|
Packaging | | | | | |
Crown Americas LLC/Crown Americas Capital Corp. IV, Gtd. Notes | | | 4.500% | | | 01/15/23 | | | 1,000 | | | | 970,000 | |
| | | | | | | | | | | | |
|
|
|
Paper — 0.1% | | | | | |
Georgia-Pacific LLC, Gtd. Notes, 144A (original cost $273,386; purchased 10/27/10)(c)(d) | | | 5.400% | | | 11/01/20 | | | 275 | | | | 309,441 | |
International Paper Co., Sr. Unsec’d. Notes | | | 6.000% | | | 11/15/41 | | | 1,270 | | | | 1,486,827 | |
International Paper Co., Sr. Unsec’d. Notes | | | 7.950% | | | 06/15/18 | | | 460 | | | | 542,300 | |
Rock-Tenn Co., Gtd. Notes | | | 4.900% | | | 03/01/22 | | | 675 | | | | 725,078 | |
| | | | | | | | | | | | |
|
|
|
| | | | | | | | | | | | | | 3,063,646 | |
| | | | | | | | | | | | |
|
|
|
Pipelines & Other — 0.1% | | | | | |
Energy Transfer Partners LP, Sr. Unsec’d. Notes | | | 4.650% | | | 06/01/21 | | | 610 | | | | 637,655 | |
Enterprise Products Operating LLC, Gtd. Notes | | | 3.750% | | | 02/15/25 | | | 1,055 | | | | 1,059,017 | |
Kinder Morgan Energy Partners LP, Gtd. Notes | | | 5.950% | | | 02/15/18 | | | 530 | | | | 585,122 | |
NiSource Finance Corp., Gtd. Notes | | | 5.450% | | | 09/15/20 | | | 500 | | | | 562,656 | |
ONEOK Partners LP, Gtd. Notes | | | 6.650% | | | 10/01/36 | | | 130 | | | | 149,614 | |
Targa Resources Partners LP/Targa Resources Partners Finance Corp., Gtd. Notes, 144A | | | 4.125% | | | 11/15/19 | | | 650 | | | | 625,625 | |
| | | | | | | | | | | | |
|
|
|
| | | | | | | | | | | | | | 3,619,689 | |
| | | | | | | | | | | | |
|
|
|
Railroads — 0.1% | | | | | |
Burlington Northern Santa Fe LLC, Sr. Unsec’d. Notes | | | 3.450% | | | 09/15/21 | | | 1,180 | | | | 1,231,325 | |
Burlington Northern Santa Fe LLC, Sr. Unsec’d. Notes | | | 6.700% | | | 08/01/28 | | | 735 | | | | 931,124 | |
CSX Corp., Sr. Unsec’d. Notes | | | 6.150% | | | 05/01/37 | | | 690 | | | | 892,445 | |
Norfolk Southern Corp., Sr. Unsec’d. Notes | | | 5.590% | | | 05/17/25 | | | 120 | | | | 142,645 | |
| | | | | | | | | | | | |
|
|
|
| | | | | | | | | | | | | | 3,197,539 | |
| | | | | | | | | | | | |
|
|
|
Real Estate Investment Trusts — 0.2% | | | | | |
Mack-Cali Realty LP, Sr. Unsec’d. Notes | | | 7.750% | | | 08/15/19 | | | 685 | | | | 809,984 | |
Prologis LP, Gtd. Notes | | | 6.875% | | | 03/15/20 | | | 68 | | | | 79,873 | |
Simon Property Group LP, Sr. Unsec’d. Notes | | | 2.800% | | | 01/30/17 | | | 235 | | | | 241,992 | |
Simon Property Group LP, Sr. Unsec’d. Notes | | | 3.375% | | | 03/15/22 | | | 190 | | | | 195,591 | |
Simon Property Group LP, Sr. Unsec’d. Notes | | | 6.125% | | | 05/30/18 | | | 2,925 | | | | 3,328,922 | |
| | | | | | | | | | | | |
|
|
|
| | | | | | | | | | | | | | 4,656,362 | |
| | | | | | | | | | | | |
|
|
|
Retailers — 0.1% | | | | | |
CVS Health Corp., Sr. Unsec’d. Notes | | | 5.300% | | | 12/05/43 | | | 170 | | | | 203,222 | |
Home Depot, Inc. (The), Sr. Unsec’d. Notes | | | 4.400% | | | 03/15/45 | | | 565 | | | | 617,498 | |
L Brands, Inc., Gtd. Notes(a) | | | 5.625% | | | 02/15/22 | | | 1,300 | | | | 1,397,500 | |
Lowe’s Cos., Inc., Sr. Unsec’d. Notes | | | 6.500% | | | 03/15/29 | | | 345 | | | | 437,089 | |
Macy’s Retail Holdings, Inc., Gtd. Notes(a) | | | 3.875% | | | 01/15/22 | | | 300 | | | | 311,811 | |
Target Corp., Sr. Unsec’d. Notes | | | 3.500% | | | 07/01/24 | | | 265 | | | | 275,116 | |
| | | | | | | | | | | | |
|
|
|
| | | | | | | | | | | | | | 3,242,236 | |
| | | | | | | | | | | | |
|
|
|
Technology — 0.1% | | | | | |
Arrow Electronics, Inc., Sr. Unsec’d. Notes | | | 3.375% | | | 11/01/15 | | | 370 | | | | 376,670 | |
Oracle Corp., Sr. Unsec’d. Notes | | | 4.300% | | | 07/08/34 | | | 700 | | | | 749,470 | |
Seagate HDD Cayman, Gtd. Notes, 144A | | | 3.750% | | | 11/15/18 | | | 455 | | | | 466,944 | |
| | | | | | | | | | | | |
|
|
|
| | | | | | | | | | | | | | 1,593,084 | |
| | | | | | | | | | | | |
|
|
|
Telecommunications — 0.5% | | | | | |
America Movil SAB de CV (Mexico), Gtd. Notes | | | 6.125% | | | 03/30/40 | | | 400 | | | | 473,284 | |
AT&T Corp., Gtd. Notes | | | 8.000% | | | 11/15/31 | | | 18 | | | | 26,523 | |
AT&T, Inc., Sr. Unsec’d. Notes(a) | | | 4.800% | | | 06/15/44 | | | 400 | | | | 407,582 | |
SEE NOTES TO FINANCIAL STATEMENTS.
A19
| | | | | | |
| | | CONSERVATIVE BALANCED PORTFOLIO (continued) | | |
| |
| SCHEDULE OF INVESTMENTS | | December 31, 2014 |
| | | | | | | | | | | | | | |
CORPORATE BONDS
(continued) | | Interest
Rate
| | | Maturity
Date
| | Principal
Amount
(000)#
| | | Value
(Note 2)
| |
Telecommunications (continued) | | | | | |
AT&T, Inc., Sr. Unsec’d. Notes | | | 5.350% | | | 09/01/40 | | | 1,133 | | | $ | 1,226,836 | |
British Telecommunications PLC (United Kingdom), Sr. Unsec’d. Notes | | | 9.625% | | | 12/15/30 | | | 350 | | | | 549,518 | |
Embarq Corp., Sr. Unsec’d. Notes (original cost $367,380; purchased 05/04/11-05/11/11)(c)(d) | | | 7.082% | | | 06/01/16 | | | 325 | | | | 350,225 | |
Embarq Corp., Sr. Unsec’d. Notes (original cost $364,974; purchased 05/12/06)(c)(d) | | | 7.995% | | | 06/01/36 | | | 365 | | | | 407,888 | |
Sprint Communications, Inc., Sr. Unsec’d. Notes | | | 6.000% | | | 12/01/16 | | | 950 | | | | 993,724 | |
Verizon Communications, Inc., Sr. Unsec’d. Notes(a) | | | 3.500% | | | 11/01/24 | | | 1,220 | | | | 1,198,649 | |
Verizon Communications, Inc., Sr. Unsec’d. Notes | | | 6.400% | | | 02/15/38 | | | 55 | | | | 67,862 | |
Verizon Communications, Inc., Sr. Unsec’d. Notes(a) | | | 6.400% | | | 09/15/33 | | | 701 | | | | 863,480 | |
Verizon Communications, Inc., Sr. Unsec’d. Notes(a) | | | 6.550% | | | 09/15/43 | | | 1,935 | | | | 2,479,023 | |
Verizon Communications, Inc., Sr. Unsec’d. Notes, 144A(a) | | | 4.862% | | | 08/21/46 | | | 1,053 | | | | 1,081,670 | |
Verizon Communications, Inc., Sr. Unsec’d. Notes, 144A(a) | | | 5.012% | | | 08/21/54 | | | 2,349 | | | | 2,430,156 | |
| | | | | | | | | | | | |
|
|
|
| | | | | | | | | | | | | | 12,556,420 | |
| | | | | | | | | | | | |
|
|
|
Tobacco — 0.2% | | | | | |
Altria Group, Inc., Gtd. Notes | | | 4.000% | | | 01/31/24 | | | 1,585 | | | | 1,652,491 | |
Altria Group, Inc., Gtd. Notes | | | 9.700% | | | 11/10/18 | | | 354 | | | | 449,512 | |
Altria Group, Inc., Gtd. Notes | | | 9.950% | | | 11/10/38 | | | 42 | | | | 71,847 | |
Altria Group, Inc., Gtd. Notes | | | 10.200% | | | 02/06/39 | | | 274 | | | | 477,073 | |
Imperial Tobacco Finance PLC (United Kingdom), Gtd. Notes, 144A | | | 2.050% | | | 02/11/18 | | | 1,680 | | | | 1,670,587 | |
Lorillard Tobacco Co., Gtd. Notes | | | 8.125% | | | 06/23/19 | | | 290 | | | | 351,575 | |
| | | | | | | | | | | | |
|
|
|
| | | | | | | | | | | | | | 4,673,085 | |
| | | | | | | | | | | | |
|
|
|
TOTAL CORPORATE BONDS
(cost $208,640,435) | | | | 226,800,671 | |
| | | | | | | | | | | | |
|
|
|
| MUNICIPAL BONDS — 0.6% | | | | | | | | | | | | | | |
California — 0.2% | | | | | | | | | | | | | | |
Bay Area Toll Authority, Revenue Bonds, BABs | | | 6.263% | | | 04/01/49 | | | 1,305 | | | | 1,841,524 | |
State of California, GO, BABs | | | 7.300% | | | 10/01/39 | | | 1,250 | | | | 1,834,175 | |
State of California, GO, BABs | | | 7.500% | | | 04/01/34 | | | 350 | | | | 523,775 | |
State of California, GO, BABs | | | 7.550% | | | 04/01/39 | | | 245 | | | | 377,653 | |
State of California, GO, BABs | | | 7.625% | | | 03/01/40 | | | 205 | | | | 314,665 | |
| | | | | | | | | | | | |
|
|
|
| | | | | | | | | | | | | | 4,891,792 | |
| | | | | | | | | | | | |
|
|
|
Colorado | | | | | | | | | | | | | | |
Regional Transportation District, Revenue Bonds, Series 2010-B, BABs | | | 5.844% | | | 11/01/50 | | | 565 | | | | 785,599 | |
| | | | | | | | | | | | |
|
|
|
Illinois — 0.1% | | | | | | | | | | | | | | |
Chicago O’Hare International Airport, Revenue Bonds, BABs | | | 6.395% | | | 01/01/40 | | | 970 | | | | 1,312,216 | |
State of Illinois, GO, Taxable Series | | | 4.421% | | | 01/01/15 | | | 630 | | | | 630,000 | |
| | | | | | | | | | | | |
|
|
|
| | | | | | | | | | | | | | 1,942,216 | |
| | | | | | | | | | | | |
|
|
|
New Jersey — 0.1% | | | | | | | | | | | | | | |
New Jersey State Turnpike Authority, Revenue Bonds, Series F, BABs | | | 7.414% | | | 01/01/40 | | | 1,000 | | | | 1,507,980 | |
| | | | | | | | | | | | |
|
|
|
New York — 0.1% | | | | | | | | | | | | | | |
New York City Transitional Finance Authority, Revenue Bonds, BABs | | | 5.767% | | | 08/01/36 | | | 1,100 | | | | 1,378,498 | |
| | | | | | | | | | | | |
|
|
|
Ohio | | | | | | | | | | | | | | |
Ohio State University (The), Revenue Bonds, BABs | | | 4.910% | | | 06/01/40 | | | 415 | | | | 506,599 | |
Ohio State Water Development Authority, Revenue Bonds, BABs | | | 4.879% | | | 12/01/34 | | | 275 | | | | 308,651 | |
| | | | | | | | | | | | |
|
|
|
| | | | | | | | | | | | | | 815,250 | |
| | | | | | | | | | | | |
|
|
|
Oregon | | | | | | | | | | | | | | |
Oregon State Department of Transportation Highway, Revenue Bonds, Series A, BABs | | | 5.834% | | | 11/15/34 | | | 425 | | | | 551,599 | |
| | | | | | | | | | | | |
|
|
|
Pennsylvania | | | | | | | | | | | | | | |
Pennsylvania Turnpike Commission, Revenue Bonds, Series B, BABs | | | 5.511% | | | 12/01/45 | | | 505 | | | | 623,190 | |
| | | | | | | | | | | | |
|
|
|
SEE NOTES TO FINANCIAL STATEMENTS.
A20
| | | | | | |
| | | CONSERVATIVE BALANCED PORTFOLIO (continued) | | |
| |
| SCHEDULE OF INVESTMENTS | | December 31, 2014 |
| | | | | | | | | | | | | | |
MUNICIPAL BONDS
(continued) | | Interest
Rate
| | | Maturity
Date
| | Principal
Amount
(000)#
| | | Value
(Note 2)
| |
Tennessee — 0.1% | | | | | | | | | | | | | | |
Metropolitan Government of Nashville & Davidson County Convention Center Authority, Revenue Bonds, BABs | | | 6.731% | | | 07/01/43 | | | 945 | | | $ | 1,270,458 | |
| | | | | | | | | | | | |
|
|
|
Texas | | | | | | | | | | | | | | |
Texas State Transportation Commission, Revenue Bonds, Series B, BABs | | | 5.028% | | | 04/01/26 | | | 305 | | | | 355,542 | |
| | | | | | | | | | | | |
|
|
|
TOTAL MUNICIPAL BONDS
(cost $10,635,438) | | | | 14,122,124 | |
| | | | | | | | | | | | |
|
|
|
| NON-CORPORATE FOREIGN AGENCIES — 0.8% | | | | | | | | | | | | | | |
CDP Financial, Inc. (Canada), Sr. Unsec’d. Notes, 144A | | | 3.150% | | | 07/24/24 | | | 1,300 | | | | 1,325,419 | |
Comision Federal de Electricidad (Mexico), Sr. Unsec’d. Notes, 144A | | | 4.875% | | | 01/15/24 | | | 490 | | | | 512,050 | |
Export-Import Bank of Korea (South Korea), Sr. Unsec’d. Notes | | | 5.125% | | | 06/29/20 | | | 365 | | | | 411,348 | |
Gazprom OAO Via Gaz Capital SA (Russia), Sr. Unsec’d. Notes, 144A | | | 9.250% | | | 04/23/19 | | | 695 | | | | 708,553 | |
International Bank for Reconstruction & Development (Supranational Bank), Sr. Unsec’d. Notes(a) | | | 2.250% | | | 06/24/21 | | | 3,295 | | | | 3,321,854 | |
KFW (Germany), Gov’t. Gtd. Notes, MTN(a) | | | 2.750% | | | 10/01/20 | | | 2,645 | | | | 2,762,808 | |
Kommunalbanken AS (Norway), Sr. Unsec’d. Notes, 144A | | | 1.125% | | | 05/23/18 | | | 2,634 | | | | 2,604,947 | |
Petrobras Global Finance BV (Brazil), Gtd. Notes | | | 2.000% | | | 05/20/16 | | | 1,400 | | | | 1,337,210 | |
Petroleos Mexicanos (Mexico), Gtd. Notes(a) | | | 3.500% | | | 01/30/23 | | | 795 | | | | 760,417 | |
Petroleos Mexicanos (Mexico), Gtd. Notes | | | 4.875% | | | 01/18/24 | | | 425 | | | | 441,575 | |
Petroleos Mexicanos (Mexico), Gtd. Notes | | | 5.500% | | | 01/21/21 | | | 2,240 | | | | 2,424,800 | |
Petroleos Mexicanos (Mexico), Gtd. Notes | | | 6.625% | | | 06/15/35 | | | 513 | | | | 592,515 | |
Petroleos Mexicanos (Mexico), Gtd. Notes | | | 8.625% | | | 12/01/23 | | | 350 | | | | 433,650 | |
Russian Agricultural Bank OJSC via RSHB Capital SA (Russia), Sr. Unsec’d. Notes, 144A | | | 6.299% | | | 05/15/17 | | | 760 | | | | 671,840 | |
Sinopec Group Overseas Development 2014 Ltd. (China), Gtd. Notes, 144A | | | 1.750% | | | 04/10/17 | | | 1,235 | | | | 1,229,109 | |
State Grid Overseas Investment 2014 Ltd. (China), Gtd. Notes, 144A | | | 2.750% | | | 05/07/19 | | | 500 | | | | 502,101 | |
| | | | | | | | | | | | |
|
|
|
TOTAL NON-CORPORATE FOREIGN AGENCIES
(cost $20,204,225) | | | | 20,040,196 | |
| | | | | | | | | | | | |
|
|
|
| NON-CORPORATE SOVEREIGNS — 0.4% | | | | | | | | | | | | | | |
Brazilian Government International Bond (Brazil), Sr. Unsec’d. Notes | | | 4.250% | | | 01/07/25 | | | 970 | | | | 970,000 | |
Colombia Government International Bond (Colombia), Sr. Unsec’d. Notes | | | 4.000% | | | 02/26/24 | | | 1,120 | | | | 1,145,200 | |
Hungary Government International Bond (Hungary), Sr. Unsec’d. Notes | | | 4.000% | | | 03/25/19 | | | 442 | | | | 454,155 | |
Indonesia Government International Bond (Indonesia),
Sr. Unsec’d. Notes, 144A(a) | | | 5.875% | | | 03/13/20 | | | 870 | | | | 963,525 | |
Indonesia Government International Bond (Indonesia),
Sr. Unsec’d. Notes, 144A | | | 6.875% | | | 01/17/18 | | | 845 | | | | 954,850 | |
Mexico Government International Bond (Mexico), Sr. Unsec’d. Notes | | | 3.625% | | | 03/15/22 | | | 600 | | | | 612,900 | |
Mexico Government International Bond (Mexico), Sr. Unsec’d. Notes, MTN | | | 4.750% | | | 03/08/44 | | | 846 | | | | 881,955 | |
Panama Government International Bond (Panama), Sr. Unsec’d. Notes | | | 4.000% | | | 09/22/24 | | | 395 | | | | 405,863 | |
Panama Government International Bond (Panama), Sr. Unsec’d. Notes(a) | | | 5.200% | | | 01/30/20 | | | 475 | | | | 523,688 | |
Province of British Columbia (Canada), Sr. Unsec’d. Notes | | | 2.000% | | | 10/23/22 | | | 1,975 | | | | 1,931,921 | |
Romanian Government International Bond (Romania),
Sr. Unsec’d. Notes, 144A | | | 4.875% | | | 01/22/24 | | | 140 | | | | 152,600 | |
Slovenia Government International Bond (Slovenia),
Sr. Unsec’d. Notes, 144A(a) | | | 4.125% | | | 02/18/19 | | | 200 | | | | 209,504 | |
Turkey Government International Bond (Turkey), Sr. Unsec’d. Notes | | | 7.000% | | | 06/05/20 | | | 610 | | | | 709,276 | |
| | | | | | | | | | | | |
|
|
|
TOTAL NON-CORPORATE SOVEREIGNS
(cost $9,552,987) | | | | 9,915,437 | |
| | | | | | | | | | | | |
|
|
|
| RESIDENTIAL MORTGAGE-BACKED SECURITIES — 0.4% | | | | | | | | | | | | | | |
Alternative Loan Trust, Series 2004-18CB, Class 3A1 | | | 5.250% | | | 09/25/19 | | | 349 | | | | 356,882 | |
Banc of America Alternative Loan Trust, Series 2005-12, Class 3CB1 | | | 6.000% | | | 01/25/36 | | | 1,547 | | | | 1,309,549 | |
Bank of America Mortgage Trust, Series 2005-A, Class 2A1 | | | 2.720% | (b) | | 02/25/35 | | | 355 | | | | 343,226 | |
Bank of America Mortgage Trust, Series 2005-B, Class 2A1 | | | 2.656% | (b) | | 03/25/35 | | | 404 | | | | 366,067 | |
Chase Mortgage Finance Trust, Series 2007-A1, Class 1A5 | | | 2.535% | (b) | | 02/25/37 | | | 782 | | | | 761,069 | |
Fannie Mae Connecticut Avenue Securities, Series 2014-C04, Class 1M1 | | | 2.105% | | | 11/25/24 | | | 3,893 | | | | 3,897,236 | |
SEE NOTES TO FINANCIAL STATEMENTS.
A21
| | | | | | |
| | | CONSERVATIVE BALANCED PORTFOLIO (continued) | | |
| |
| SCHEDULE OF INVESTMENTS | | December 31, 2014 |
| | | | | | | | | | | | | | |
RESIDENTIAL MORTGAGE-BACKED SECURITIES
(continued) | | Interest
Rate
| | | Maturity
Date
| | Principal
Amount
(000)#
| | | Value
(Note 2)
| |
Freddie Mac Structured Agency Credit Risk Debt Notes, Series 2014-DN4, Class M1 | | | 1.570% | | | 10/25/24 | | | 922 | | | $ | 921,902 | |
JPMorgan Mortgage Trust, Series 2007-A1, Class 4A1 | | | 2.489% | (b) | | 07/25/35 | | | 426 | | | | 428,627 | |
MASTR Alternative Loan Trust, Series 2004-4, Class 4A1 | | | 5.000% | | | 04/25/19 | | | 86 | | | | 87,421 | |
Structured Adjustable Rate Mortgage Loan Trust, Series 2004-1, Class 4A3 | | | 2.573% | (b) | | 02/25/34 | | | 473 | | | | 471,925 | |
Washington Mutual Mortgage Pass-Through Certificates, Series 2005-1, Class 3A | | | 5.000% | | | 03/25/20 | | | 233 | | | | 233,993 | |
| | | | | | | | | | | | |
|
|
|
TOTAL RESIDENTIAL MORTGAGE-BACKED SECURITIES
(cost $9,456,281) | | | | 9,177,897 | |
| | | | | | | | | | | | |
|
|
|
| U.S. GOVERNMENT AGENCY OBLIGATIONS — 8.9% | |
Federal Home Loan Banks | | | 0.375% | | | 08/28/15 | | | 375 | | | | 375,325 | |
Federal Home Loan Banks(g) | | | 5.500% | | | 07/15/36 | | | 950 | | | | 1,302,855 | |
Federal Home Loan Mortgage Corp. | | | 0.750% | | | 01/12/18 | | | 455 | | | | 448,470 | |
Federal Home Loan Mortgage Corp. | | | 2.125% | (b) | | 06/01/36 | | | 299 | | | | 319,261 | |
Federal Home Loan Mortgage Corp. | | | 2.348% | (b) | | 12/01/35 | | | 350 | | | | 373,456 | |
Federal Home Loan Mortgage Corp.(a) | | | 2.375% | | | 01/13/22 | | | 4,140 | | | | 4,182,617 | |
Federal Home Loan Mortgage Corp. | | | 2.500% | | | TBA | | | 1,000 | | | | 1,017,078 | |
Federal Home Loan Mortgage Corp. | | | 3.000% | | | 10/01/28-01/01/43 | | | 4,221 | | | | 4,356,438 | |
Federal Home Loan Mortgage Corp. | | | 3.000% | | | TBA | | | 2,000 | | | | 2,015,234 | |
Federal Home Loan Mortgage Corp. | | | 3.500% | | | TBA | | | 500 | | | | 527,813 | |
Federal Home Loan Mortgage Corp. | | | 3.500% | | | TBA | | | 7,500 | | | | 7,779,492 | |
Federal Home Loan Mortgage Corp. | | | 4.000% | | | 06/01/26-12/01/40 | | | 4,422 | | | | 4,727,730 | |
Federal Home Loan Mortgage Corp. | | | 4.000% | | | TBA | | | 4,500 | | | | 4,784,678 | |
Federal Home Loan Mortgage Corp. | | | 4.500% | | | 02/01/19-10/01/41 | | | 12,162 | | | | 13,170,749 | |
Federal Home Loan Mortgage Corp. | | | 5.000% | | | 07/01/18-05/01/39 | | | 3,854 | | | | 4,193,480 | |
Federal Home Loan Mortgage Corp. | | | 5.500% | | | 12/01/33-07/01/38 | | | 3,451 | | | | 3,860,022 | |
Federal Home Loan Mortgage Corp. | | | 6.000% | | | 03/01/32-08/01/39 | | | 1,360 | | | | 1,549,496 | |
Federal Home Loan Mortgage Corp. | | | 6.500% | | | 09/01/16 | | | 2 | | | | 2,182 | |
Federal Home Loan Mortgage Corp. | | | 7.000% | | | 05/01/31-10/01/31 | | | 331 | | | | 377,922 | |
Federal National Mortgage Assoc. | | | 1.750% | | | 06/20/19 | | | 1,180 | | | | 1,185,815 | |
Federal National Mortgage Assoc.(a) | | | 1.750% | | | 11/26/19 | | | 1,345 | | | | 1,345,807 | |
Federal National Mortgage Assoc. | | | 1.784% | (b) | | 07/01/33 | | | 432 | | | | 455,393 | |
Federal National Mortgage Assoc. | | | 1.809% | (b) | | 06/01/37 | | | 74 | | | | 74,864 | |
Federal National Mortgage Assoc. | | | 1.875% | | | 02/19/19 | | | 175 | | | | 177,655 | |
Federal National Mortgage Assoc. | | | 1.917% | (b) | | 07/01/37 | | | 585 | | | | 622,757 | |
Federal National Mortgage Assoc. | | | 2.500% | | | 01/01/28 | | | 1,736 | | | | 1,770,988 | |
Federal National Mortgage Assoc. | | | 2.500% | | | TBA | | | 6,000 | | | | 6,097,032 | |
Federal National Mortgage Assoc. | | | 2.625% | | | 09/06/24 | | | 2,110 | | | | 2,136,841 | |
Federal National Mortgage Assoc. | | | 3.000% | | | TBA | | | 10,500 | | | | 10,913,848 | |
Federal National Mortgage Assoc. | | | 3.000% | | | TBA | | | 20,500 | | | | 20,685,382 | |
Federal National Mortgage Assoc. | | | 3.500% | | | TBA | | | 500 | | | | 528,203 | |
Federal National Mortgage Assoc. | | | 3.500% | | | 06/01/39-03/01/43 | | | 18,107 | | | | 18,915,738 | |
Federal National Mortgage Assoc. | | | 3.500% | | | TBA | | | 7,500 | | | | 7,818,165 | |
Federal National Mortgage Assoc. | | | 4.000% | | | TBA | | | 11,000 | | | | 11,739,793 | |
Federal National Mortgage Assoc. | | | 4.000% | | | TBA | | | 7,000 | | | | 7,451,637 | |
Federal National Mortgage Assoc. | | | 4.500% | | | 11/01/18-03/01/41 | | | 8,784 | | | | 9,574,319 | |
Federal National Mortgage Assoc. | | | 4.500% | | | TBA | | | 4,000 | | | | 4,341,875 | |
Federal National Mortgage Assoc. | | | 4.500% | | | TBA | | | 3,000 | | | | 3,250,781 | |
Federal National Mortgage Assoc. | | | 5.000% | | | 10/01/18-05/01/36 | | | 2,767 | | | | 3,052,110 | |
Federal National Mortgage Assoc. | | | 5.000% | | | TBA | | | 3,500 | | | | 3,866,885 | |
Federal National Mortgage Assoc. | | | 5.500% | | | 03/01/16-04/01/37 | | | 5,158 | | | | 5,776,375 | |
Federal National Mortgage Assoc. | | | 6.000% | | | 09/01/17-06/01/38 | | | 5,835 | | | | 6,645,360 | |
Federal National Mortgage Assoc. | | | 6.500% | | | 07/01/17-01/01/37 | | | 2,190 | | | | 2,501,440 | |
Federal National Mortgage Assoc. | | | 7.000% | | | 02/01/32-07/01/32 | | | 229 | | | | 265,677 | |
Federal National Mortgage Assoc. | | | 7.500% | | | 05/01/32 | | | 42 | | | | 44,031 | |
Government National Mortgage Assoc. | | | 3.000% | | | TBA | | | 2,000 | | | | 2,045,250 | |
Government National Mortgage Assoc. | | | 3.000% | | | TBA | | | 2,000 | | | | 2,045,250 | |
Government National Mortgage Assoc. | | | 3.500% | | | TBA | | | 500 | | | | 524,844 | |
SEE NOTES TO FINANCIAL STATEMENTS.
A22
| | | | | | |
| | | CONSERVATIVE BALANCED PORTFOLIO (continued) | | |
| |
| SCHEDULE OF INVESTMENTS | | December 31, 2014 |
| | | | | | | | | | | | | | |
U.S. GOVERNMENT AGENCY OBLIGATIONS
(continued) | | Interest
Rate
| | | Maturity
Date
| | Principal
Amount
(000)#
| | | Value
(Note 2)
| |
Government National Mortgage Assoc. | | | 3.500% | | | TBA | | | 10,500 | | | $ | 11,021,719 | |
Government National Mortgage Assoc. | | | 3.500% | | | 05/20/43 | | | 1,000 | | | | 1,051,178 | |
Government National Mortgage Assoc. | | | 4.000% | | | 06/15/40-05/20/41 | | | 496 | | | | 533,112 | |
Government National Mortgage Assoc. | | | 4.000% | | | TBA | | | 10,500 | | | | 11,257,846 | |
Government National Mortgage Assoc. | | | 4.500% | | | TBA | | | 1,000 | | | | 1,092,617 | |
Government National Mortgage Assoc. | | | 4.500% | | | 01/20/41-03/20/41 | | | 5,362 | | | | 5,886,278 | |
Government National Mortgage Assoc. | | | 5.500% | | | 08/15/33-04/15/36 | | | 2,551 | | | | 2,873,780 | |
Government National Mortgage Assoc. | | | 6.000% | | | 11/15/23-07/15/34 | | | 938 | | | | 1,079,467 | |
Government National Mortgage Assoc. | | | 6.500% | | | 10/15/23-09/15/36 | | | 1,761 | | | | 2,025,041 | |
Government National Mortgage Assoc. | | | 8.000% | | | 01/15/24-07/15/24 | | | 26 | | | | 29,009 | |
Hashemite Kingdom of Jordan, USAID Bond (Jordan), U.S. Gov’t. Gtd. Notes | | | 2.503% | | | 10/30/20 | | | 566 | | | | 575,430 | |
Tennessee Valley Authority, Sr. Unsec’d. Notes | | | 5.880% | | | 04/01/36 | | | 85 | | | | 115,947 | |
Ukraine Government USAID Bonds, U.S. Gov’t. Gtd. Notes | | | 1.844% | | | 05/16/19 | | | 1,230 | | | | 1,238,303 | |
| | | | | | | | | | | | |
|
|
|
TOTAL U.S. GOVERNMENT AGENCY OBLIGATIONS
(cost $224,225,269) | | | | 229,998,140 | |
| | | | | | | | | | | | |
|
|
|
| U.S. TREASURY OBLIGATIONS — 5.0% | |
U.S. Treasury Bonds | | | 2.875% | | | 05/15/43 | | | 1,175 | | | | 1,201,804 | |
U.S. Treasury Bonds | | | 3.375% | | | 05/15/44 | | | 3,470 | | | | 3,906,460 | |
U.S. Treasury Inflation Indexed Bonds, TIPS | | | 0.125% | | | 04/15/19 | | | 17,977 | | | | 17,779,147 | |
U.S. Treasury Inflation Indexed Bonds, TIPS | | | 1.375% | | | 01/15/20 | | | 9,471 | | | | 9,940,693 | |
U.S. Treasury Notes | | | 0.875% | | | 07/31/19 | | | 4,980 | | | | 4,825,540 | |
U.S. Treasury Notes | | | 1.000% | | | 12/15/17-09/30/19 | | | 11,670 | | | | 11,408,192 | |
U.S. Treasury Notes | | | 1.250% | | | 11/30/18 | | | 6,845 | | | | 6,796,873 | |
U.S. Treasury Notes | | | 1.375% | | | 02/28/19 | | | 2,030 | | | | 2,019,056 | |
U.S. Treasury Notes(h) | | | 1.500% | | | 12/31/18 | | | 2,320 | | | | 2,323,081 | |
U.S. Treasury Notes | | | 1.500% | | | 01/31/19-10/31/19 | | | 47,835 | | | | 47,748,451 | |
U.S. Treasury Notes(a) | | | 1.500% | | | 11/30/19 | | | 3,045 | | | | 3,025,731 | |
U.S. Treasury Notes | | | 1.625% | | | 04/30/19-12/31/19 | | | 3,150 | | | | 3,147,417 | |
U.S. Treasury Notes | | | 1.750% | | | 05/15/23 | | | 1,560 | | | | 1,518,928 | |
U.S. Treasury Notes | | | 2.875% | | | 03/31/18 | | | 8,335 | | | | 8,768,679 | |
U.S. Treasury Notes | | | 3.125% | | | 05/15/19-05/15/21 | | | 2,105 | | | | 2,245,954 | |
U.S. Treasury Strips Principal(a) | | | 3.470% | (f) | | 05/15/44 | | | 5,180 | | | | 2,240,708 | |
| | | | | | | | | | | | |
|
|
|
TOTAL U.S. TREASURY OBLIGATIONS
(cost $127,465,366) | | | | 128,896,714 | |
| | | | | | | | | | | | |
|
|
|
TOTAL LONG-TERM INVESTMENTS
(cost $1,472,251,516) | | | | 2,281,790,955 | |
| | | | | | | | | | | | |
|
|
|
| SHORT-TERM INVESTMENTS — 19.1% | | | | | | | | | | | | | | |
| | | | |
| | | | | | | | Shares
| | | | |
| AFFILIATED MUTUAL FUNDS — 18.8% | | | | | | | | | | | | | | |
Prudential Investment Portfolios 2 — Prudential Core Short-Term Bond Fund
(cost $99,814,390)(Note 4)(j) | | | 10,420,082 | | | | 97,323,569 | |
Prudential Investment Portfolios 2 — Prudential Core Taxable Money Market Fund
(cost $386,939,168; includes $80,403,099 of cash collateral for securities on loan)(Note 4)(j)(k) | | | 386,939,168 | | | | 386,939,168 | |
| | | | | | | | | | | | |
|
|
|
TOTAL AFFILIATED MUTUAL FUNDS
(cost $486,753,558) | | | | 484,262,737 | |
| | | | | | | | | | | | |
|
|
|
| | | | |
| | | | | | | | Principal
Amount
(000)#
| | | | |
| U.S. TREASURY OBLIGATION — 0.3% | | | | | | | | | | | | | | |
U.S. Treasury Bill(g)
(cost $6,549,511) | | | 0.046% | (i) | | 03/19/15 | | | 6,550 | | | | 6,549,725 | |
| | | | | | | | | | | | |
|
|
|
SEE NOTES TO FINANCIAL STATEMENTS.
A23
| | | | | | |
| | | CONSERVATIVE BALANCED PORTFOLIO (continued) | | |
| |
| SCHEDULE OF INVESTMENTS | | December 31, 2014 |
| | | | | | | | | | | | | | |
OPTIONS PURCHASED* | | | | | | | Notional
Amount
(000)#
| | | Value
(Note 2)
| |
Call Options | | | | | | | | | | | | | | |
2 Year U.S. Treasury Notes Futures, expiring 01/23/15, Strike Price $109.38 | | | 42,000 | | | $ | 32,813 | |
2 Year U.S. Treasury Notes Futures, expiring 01/23/15, Strike Price $110.00 | | | 42,000 | | | | 3,281 | |
| | | | | | | | | | | | |
|
|
|
TOTAL OPTIONS PURCHASED
(cost $59,806) | | | | 36,094 | |
| | | | | | | | | | | | |
|
|
|
TOTAL SHORT-TERM INVESTMENTS
(cost $493,362,875) | | | | 490,848,556 | |
| | | | | | | | | | | | |
|
|
|
TOTAL INVESTMENTS, BEFORE SECURITY SOLD SHORT & OPTION WRITTEN — 107.7%
(cost $1,965,614,391) | | | | 2,772,639,511 | |
| | | | | | | | | | | | |
|
|
|
| | | | |
| | | Interest
Rate
| | | Maturity
Date
| | Principal
Amount
(000)#
| | | | |
| SECURITY SOLD SHORT — (0.1)% | | | | | | | | | | | |
U.S. GOVERNMENT AGENCY OBLIGATION | | | | | | | | | | | | | | |
Federal National Mortgage Assoc.,
(proceeds received $3,629,336) | | | 3.500% | | | TBA | | | 3,500 | | | | (3,639,044 | ) |
| | | | | | | | | | | | |
|
|
|
| | | | |
| | | | | | | | Notional
Amount
(000)#
| | | | |
| OPTION WRITTEN* | | | | | | | | | | | | | | |
Call Option | | | | | | | | | | | | | | |
2 Year U.S. Treasury Notes Futures, expiring 01/23/15, Strike Price $109.63
(premiums received $38,632) | | | 84,000 | | | | (13,125 | ) |
| | | | | | | | | | | | |
|
|
|
TOTAL INVESTMENTS, NET OF SECURITY SOLD SHORT & OPTION WRITTEN — 107.6%
(cost $1,961,946,423) | | | | 2,768,987,342 | |
LIABILITIES IN EXCESS OF OTHER ASSETS(l) — (7.6)% | | | | (194,632,116 | ) |
| | | | | | | | | | | | |
|
|
|
NET ASSETS — 100.0% | | | $ | 2,574,355,226 | |
| | | | | | | | | | | | |
|
|
|
See the Glossary for abbreviations used in the Portfolio descriptions.
| * | Non-income producing security. |
| # | Principal or notional amount is shown in U.S. dollars unless otherwise stated. |
| (a) | All or a portion of security is on loan. The aggregate market value of such securities, including those sold and pending settlement, is $78,183,937; cash collateral of $80,403,099 (included with liabilities) was received with which the Portfolio purchased highly liquid short-term investments. Securities on loan are subject to contractual netting arrangements. |
| (b) | Variable rate instrument. The interest rate shown reflects the rate in effect at December 31, 2014. |
| (c) | Indicates a restricted security; the aggregate original cost of the restricted securities is $4,801,590. The aggregate value of $5,131,858 is approximately 0.2% of net assets. |
| (d) | Indicates a security or securities that has been deemed illiquid. |
| (e) | Represents issuer in default on interest payments and/or principal re-payments;.non-income producing security. Such securities may be post maturity. |
| (f) | Represents zero coupon bond or principal only securities. Rate represents yield to maturity at purchase date. |
| (g) | Represents security, or a portion thereof, segregated as collateral for futures contracts. |
| (h) | Represents security, or a portion thereof, segregated as collateral for swap agreements. |
| (i) | Rate quoted represents yield-to-maturity as of purchase date. |
| (j) | Prudential Investments LLC, the manager of the Portfolio, also serves as manager of the Prudential Investment Portfolios 2 — Prudential Core Taxable Money Market Fund and the Prudential Investment Portfolios 2 — Prudential Core Short-Term Bond Fund. |
| (k) | Represents security, or a portion thereof, purchased with cash collateral received for securities on loan. |
SEE NOTES TO FINANCIAL STATEMENTS.
A24
| | | | | | |
| | | CONSERVATIVE BALANCED PORTFOLIO (continued) | | |
| |
| SCHEDULE OF INVESTMENTS | | December 31, 2014 |
| (l) | Includes net unrealized appreciation (depreciation) on the following derivative contracts held at reporting period end: |
Futures contracts outstanding at December 31, 2014:
| | | | | | | | | | | | | | | | | | |
Number of
Contracts
| | Type
| | Expiration
Date
| | | Value at
Trade Date
| | | Value at
December 31, 2014
| | | Unrealized
Appreciation
(Depreciation)(1)
| |
| Long Positions: | | | | | | | | | | | | | | | | | | |
| 430 | | 2 Year U.S. Treasury Notes | | | Mar. 2015 | | | $ | 94,000,860 | | | $ | 93,995,312 | | | $ | (5,548 | ) |
| 154 | | 10 Year U.S. Treasury Notes | | | Mar. 2015 | | | | 19,513,784 | | | | 19,526,719 | | | | 12,935 | |
| 13 | | MSCI EAFE Mini Futures | | | Mar. 2015 | | | | 1,132,071 | | | | 1,142,635 | | | | 10,564 | |
| 865 | | S&P 500 E-Mini Futures | | | Mar. 2015 | | | | 85,743,205 | | | | 88,766,300 | | | | 3,023,095 | |
| 79 | | S&P 500 Index Futures | | | Mar. 2015 | | | | 38,990,454 | | | | 40,534,900 | | | | 1,544,446 | |
| 131 | | U.S. Ultra Bonds | | | Mar. 2015 | | | | 20,998,889 | | | | 21,639,562 | | | | 640,673 | |
| | | | | | | | | | | | | | | | |
|
|
|
| | | | | | | | | | | | | | | | | | 5,226,165 | |
| | | | | | | | | | | | | | | | |
|
|
|
| Short Positions: | | | | | | | | | | | | | | | | | | |
| 116 | | 5 Year U.S. Treasury Notes | | | Mar. 2015 | | | | 13,844,601 | | | | 13,795,844 | | | | 48,757 | |
| 73 | | U.S. Long Bonds | | | Mar. 2015 | | | | 10,474,295 | | | | 10,553,062 | | | | (78,767 | ) |
| | | | | | | | | | | | | | | | |
|
|
|
| | | | | | | | | | | | | | | | | | (30,010 | ) |
| | | | | | | | | | | | | | | | |
|
|
|
| | | | | | | | | | | | | | | | | $ | 5,196,155 | |
| | | | | | | | | | | | | | | | |
|
|
|
| (1) | A U.S. Treasury obligation with a market value of $6,549,725 has been segregated with Goldman Sachs & Co. and a U.S. Government Agency obligation with a market value of $699,427 has been segregated with Citigroup Global Markets to cover requirements for open contracts at December 31, 2014. |
Interest rate swap agreements outstanding at December 31, 2014:
| | | | | | | | | | | | | | | | | | | | | | | | | | |
Notional
Amount
(000)#
| | | Termination
Date
| | | Fixed
Rate
| | | Floating Rate
| | Fair
Value
| | | Upfront
Premiums
Paid
(Received)
| | | Unrealized
Appreciation
| | | Counterparty
|
| Over-the-counter swap agreements: |
| | 2,634 | | | | 05/17/18 | | | | 0.989% | | | 3 Month LIBOR(2) | | $ | 33,052 | | | $ | — | | | $ | 33,052 | | | Credit Suisse First Boston Corp. |
| | | | | | | | | | | | | | |
|
|
| |
|
|
| |
|
|
| | |
| | | | | | | | | | | | | | | | | | | | | | | | |
Notional
Amount
(000)#
| | | Termination
Date
| | | Fixed
Rate
| | | Floating Rate
| | Value at
Trade Date
| | | Value at
December 31, 2014
| | | Unrealized
Appreciation
(Depreciation)
| |
| Exchange-traded swap agreements: | |
| | 1,945 | | | | 06/30/16 | | | | 0.618% | | | 3 Month LIBOR(2) | | $ | 155 | | | $ | 973 | | | $ | 818 | |
| | 11,110 | | | | 06/30/16 | | | | 0.655% | | | 3 Month LIBOR(2) | | | (849 | ) | | | (581 | ) | | | 268 | |
| | 3,220 | | | | 06/30/16 | | | | 0.655% | | | 3 Month LIBOR(2) | | | 158 | | | | (175 | ) | | | (333 | ) |
| | 28,410 | | | | 08/29/16 | | | | 0.710% | | | 3 Month LIBOR(2) | | | 158 | | | | 8,945 | | | | 8,787 | |
| | 21,970 | | | | 05/31/19 | | | | 1.730% | | | 3 Month LIBOR(2) | | | 1,708 | | | | 22,081 | | | | 20,373 | |
| | 22,550 | | | | 08/29/19 | | | | 1.804% | | | 3 Month LIBOR(1) | | | 189 | | | | 93,742 | | | | 93,553 | |
| | 7,270 | | | | 10/31/21 | | | | 2.152% | | | 3 Month LIBOR(2) | | | 194 | | | | (26,776 | ) | | | (26,970 | ) |
| | 6,130 | | | | 08/29/24 | | | | 2.560% | | | 3 Month LIBOR(2) | | | 137 | | | | (159,687 | ) | | | (159,824 | ) |
| | | | | | | | | | | | | | |
|
|
| |
|
|
| |
|
|
|
| | | | | | | | | | | | | | | $ | 1,850 | | | $ | (61,478 | ) | | $ | (63,328 | ) |
| | | | | | | | | | | | | | |
|
|
| |
|
|
| |
|
|
|
| (1) | Portfolio pays the floating rate and receives the fixed rate. |
| (2) | Portfolio pays the fixed rate and receives the floating rate. |
Credit default swap agreements outstanding at December 31, 2014:
| | | | | | | | | | | | | | | | | | | | | | | | |
Reference Entity/Obligation
| | Termination
Date
| | | Fixed
Rate
| | | Notional
Amount
(000)#(3)
| | | Value at
Trade
Date
| | | Value at
December 31,
2014(4)
| | | Unrealized
Appreciation
(Depreciation)
| |
Exchange-Traded credit default swaps on credit indices—Buy Protection(1): | | | | | | | | | | | | | |
CDX.NA.HY.22.V2 | | | 06/20/19 | | | | 5.000% | | | | 6,930 | | | $ | (492,332 | ) | | $ | (472,106 | ) | | $ | 20,226 | |
CDX.NA.IG.22.V1 | | | 06/20/19 | | | | 1.000% | | | | 41,000 | | | | (626,651 | ) | | | (739,551 | ) | | | (112,900 | ) |
CDX.NA.IG.23.V1 | | | 12/20/19 | | | | 1.000% | | | | 19,000 | | | | (302,121 | ) | | | (303,362 | ) | | | (1,241 | ) |
| | | | | | | | | | | | | | |
|
|
| |
|
|
| |
|
|
|
| | | | | | | | | | | | | | | $ | (1,421,104 | ) | | $ | (1,515,019 | ) | | $ | (93,915 | ) |
| | | | | | | | | | | | | | |
|
|
| |
|
|
| |
|
|
|
SEE NOTES TO FINANCIAL STATEMENTS.
A25
| | | | | | |
| | | CONSERVATIVE BALANCED PORTFOLIO (continued) | | |
| |
| SCHEDULE OF INVESTMENTS | | December 31, 2014 |
Credit default swap agreements outstanding at December 31, 2014 (continued):
| | | | | | | | | | | | | | | | | | | | | | | | | | |
| | | | | | | |
Reference Entity/
Obligation
| | Termination
Date
| | | Fixed
Rate
| | | Notional
Amount
(000)#(3)
| | | Fair
Value(4)
| | | Upfront
Premiums
Paid
(Received)
| | | Unrealized
Appreciation
| | | Counterparty
|
Over-the-counter credit default swaps on credit indices—Sell Protection(2): | | | | | | | |
CDX.NA.HY.17.V6 | | | 12/20/16 | | | | 5.000% | | | | 1,188 | | | $ | 61,352 | | | $ | 49,486 | | | $ | 11,866 | | | Credit Suisse First Boston Corp. |
CDX.NA.HY.17.V6 | | | 12/20/16 | | | | 5.000% | | | | 3,088 | | | | 159,514 | | | | 132,523 | | | | 26,991 | | | Deutsche Bank AG |
CDX.NA.HY.17.V6 | | | 12/20/16 | | | | 5.000% | | | | 4,275 | | | | 220,865 | | | | 187,328 | | | | 33,537 | | | Deutsche Bank AG |
| | | | | | | | | | | | | | |
|
|
| |
|
|
| |
|
|
| | |
| | | | | | | | | | | | | | | $ | 441,731 | | | $ | 369,337 | | | | $72,394 | | | |
| | | | | | | | | | | | | | |
|
|
| |
|
|
| |
|
|
| | |
A U.S. Treasury obligation with a market value of $1,652,191 has been segregated with Citigroup Global Markets to cover requirements for open exchange-traded interest rate and credit default swap contracts at December 31, 2014.
The Portfolio entered into credit default swap (“CDS”) to provide a measure of protection against defaults or to take an active long or short position with respect to the likelihood of a particular issuer’s default or the reference entity’s credit soundness. CDS contracts generally trade based on a spread which represents the cost a protection buyer has to pay the protection seller. The protection buyer is said to be short the credit as the value of the contract rises the more the credit deteriorates. The value of the CDS contract increases for the protection buyer if the spread increases.
| (1) | If the Portfolio is a buyer of protection, it pays the fixed rate. When a credit event occurs, as defined under the terms of that particular swap agreement, the Portfolio will either (i) receive from the seller of protection an amount equal to the notional amount of the swap and make delivery of the referenced obligation or underlying securities comprising the referenced index or (ii) receive a net settlement amount in the form of cash or securities equal to the notional amount of the swap less the recovery value of the referenced obligation or underlying securities comprising the referenced index. |
| (2) | If the Portfolio is a seller of protection, it receives the fixed rate. When a credit event occurs, as defined under the terms of that particular swap agreement, the Portfolio will either (i) pay to the buyer of protection an amount equal to the notional amount of the swap and take delivery of the referenced obligation or underlying securities comprising the referenced index or (ii) pay a net settlement amount in the form of cash or securities equal to the notional amount of the swap less the recovery value of the referenced obligation or underlying securities comprising the referenced index. |
| (3) | Notional amount represents the maximum potential amount the Portfolio could be required to pay as a seller of credit protection or receive as a buyer of credit protection if a credit event occurs as defined under the terms of that particular swap agreement. |
| (4) | The fair value of credit default swap agreements on credit indices serves as an indicator of the current status of the payment/performance risk and represents the likelihood of an expected liability (or profit) for the credit derivative should the notional amount of the swap agreement be closed/sold as of the reporting date. Increasing fair value in absolute terms, when compared to the notional amount of the swap, represents a deterioration of the referenced entity’s credit soundness and a greater likelihood of risk of default or other credit event occurring as defined under the terms of the agreement. |
Various inputs are used in determining the value of the Portfolio’s investments. These inputs are summarized in the three broad levels listed below.
| Level 1— | quoted prices generally in active markets for identical securities. |
| Level 2— | quoted prices for similar securities, interest rates and yield curves, prepayment speeds, foreign currency exchange rates and other significant observable inputs. |
| Level 3— | significant unobservable inputs for securities valued in accordance with Board approved fair valuation procedures. |
The following is a summary of the inputs used as of December 31, 2014 in valuing such portfolio securities:
| | | | | | | | | | | | |
| | | Level 1
| | | Level 2
| | | Level 3
| |
Investments in Securities | | | | | | | | | | | | |
Common Stocks | | $ | 1,397,364,979 | | | $ | 87,786,489 | | | $ | — | |
Exchange Traded Fund | | | 988,650 | | | | — | | | | — | |
Preferred Stocks | | | 531,600 | | | | 520,323 | | | | — | |
Asset-Backed Securities | | | | | | | | | | | | |
Collateralized Debt Obligation | | | — | | | | 384,317 | | | | — | |
Collateralized Loan Obligations | | | — | | | | 32,529,844 | | | | 2,481,075 | |
Non-Residential Mortgage-Backed Securities | | | — | | | | 12,079,891 | | | | — | |
Residential Mortgage-Backed Securities | | | — | | | | 7,729,989 | | | | — | |
Bank Loans | | | — | | | | 6,842,635 | | | | — | |
Commercial Mortgage-Backed Securities | | | — | | | | 93,599,984 | | | | — | |
Corporate Bonds | | | — | | | | 223,159,468 | | | | 3,641,203 | |
Municipal Bonds | | | — | | | | 14,122,124 | | | | — | |
Non-Corporate Foreign Agencies | | | — | | | | 20,040,196 | | | | — | |
SEE NOTES TO FINANCIAL STATEMENTS.
A26
| | | | | | |
| | | CONSERVATIVE BALANCED PORTFOLIO (continued) | | |
| |
| SCHEDULE OF INVESTMENTS | | December 31, 2014 |
| | | | | | | | | | | | |
| | | Level 1
| | | Level 2
| | | Level 3
| |
Investments in Securities (continued) | | | | | | | | | | | | |
Non-Corporate Sovereigns | | $ | — | | | $ | 9,915,437 | | | $ | — | |
Residential Mortgage-Backed Securities | | | — | | | | 9,177,897 | | | | — | |
U.S. Government Agency Obligations | | | — | | | | 229,998,140 | | | | — | |
U.S. Treasury Obligations | | | — | | | | 135,446,439 | | | | — | |
Affiliated Mutual Funds | | | 484,262,737 | | | | — | | | | — | |
Options Purchased | | | 36,094 | | | | — | | | | — | |
U.S. Government Agency Obligation Security Sold Short | | | — | | | | (3,639,044 | ) | | | — | |
Option Written | | | (13,125 | ) | | | — | | | | — | |
Other Financial Instruments* | | | | | | | | | | | | |
Futures Contracts | | | 5,196,155 | | | | — | | | | — | |
Over-the-counter interest rate swaps | | | — | | | | 33,052 | | | | — | |
Exchange-traded interest rate swaps | | | — | | | | (63,328 | ) | | | — | |
Exchange-traded credit default swaps | | | — | | | | (93,915 | ) | | | — | |
Over-the-counter credit default swaps | | | — | | | | 441,731 | | | | — | |
| | |
|
|
| |
|
|
| |
|
|
|
Total | | $ | 1,888,367,090 | | | $ | 880,011,669 | | | $ | 6,122,278 | |
| | |
|
|
| |
|
|
| |
|
|
|
| * | Other financial instruments are derivative instruments not reflected in the Schedule of Investments, such as futures, forwards and exchange-traded swap contracts, which are recorded at the unrealized appreciation/depreciation on the instrument, and over-the-counter swap contracts which are recorded at fair value. |
The industry classification of investments and liabilities in excess of other assets shown as a percentage of net assets as of December 31, 2014 was as follows (Unaudited):
| | | | |
Affiliated Mutual Funds (including 3.1% of collateral for securities on loan) | | | 18.8 | % |
U.S. Government Agency Obligations | | | 8.9 | |
U.S. Treasury Obligations | | | 5.3 | |
Oil, Gas & Consumable Fuels | | | 4.0 | |
Banks | | | 3.8 | |
Pharmaceuticals | | | 3.7 | |
Commercial Mortgage-Backed Securities | | | 3.6 | |
Technology Hardware, Storage & Peripherals | | | 2.6 | |
Banking | | | 2.6 | |
Insurance | | | 2.4 | |
Software | | | 2.1 | |
Media | | | 2.0 | |
IT Services | | | 1.8 | |
Internet Software & Services | | | 1.8 | |
Biotechnology | | | 1.6 | |
Chemicals | | | 1.6 | |
Real Estate Investment Trusts (REITs) | | | 1.6 | |
Aerospace & Defense | | | 1.5 | |
Food & Staples Retailing | | | 1.4 | |
Diversified Telecommunication Services | | | 1.4 | |
Collateralized Loan Obligations | | | 1.3 | |
Specialty Retail | | | 1.3 | |
Semiconductors & Semiconductor Equipment | | | 1.3 | |
Industrial Conglomerates | | | 1.3 | |
Capital Markets | | | 1.3 | |
Health Care Providers & Services | | | 1.3 | |
Health Care Equipment & Supplies | | | 1.2 | |
Beverages | | | 1.2 | |
Diversified Financial Services | | | 1.2 | |
Household Products | | | 1.1 | |
Electric Utilities | | | 1.1 | |
Tobacco | | | 1.1 | |
Food Products | | | 1.0 | |
Hotels, Restaurants & Leisure | | | 1.0 | |
Machinery | | | 0.9 | |
Communications Equipment | | | 0.9 | |
| | | | |
Healthcare & Pharmaceutical | | | 0.8 | % |
Non-Corporate Foreign Agencies | | | 0.8 | |
Energy Equipment & Services | | | 0.7 | |
Multi-Utilities | | | 0.7 | |
Residential Mortgage-Backed Securities | | | 0.7 | |
Internet & Catalog Retail | | | 0.6 | |
Road & Rail | | | 0.6 | |
Municipal Bonds | | | 0.6 | |
Automobiles | | | 0.5 | |
Textiles, Apparel & Luxury Goods | | | 0.5 | |
Consumer Finance | | | 0.5 | |
Telecommunications | | | 0.5 | |
Non-Residential Mortgage-Backed Securities | | | 0.5 | |
Electric | | | 0.5 | |
Air Freight & Logistics | | | 0.4 | |
Multiline Retail | | | 0.4 | |
Airlines | | | 0.4 | |
Non-Corporate Sovereigns | | | 0.4 | |
Metals & Mining | | | 0.4 | |
Cable | | | 0.3 | |
Electrical Equipment | | | 0.3 | |
Capital Goods | | | 0.3 | |
Household Durables | | | 0.3 | |
Electronic Equipment, Instruments & Components | | | 0.3 | |
Non-Captive Finance | | | 0.3 | |
Commercial Services & Supplies | | | 0.3 | |
Foods | | | 0.3 | |
Auto Components | | | 0.2 | |
Media & Entertainment | | | 0.2 | |
Life Sciences Tools & Services | | | 0.2 | |
Lodging | | | 0.2 | |
Energy – Other | | | 0.2 | |
Automotive | | | 0.2 | |
Trading Companies & Distributors | | | 0.2 | |
Healthcare Insurance | | | 0.2 | |
Technology | | | 0.2 | |
Pipelines & Other | | | 0.1 | |
SEE NOTES TO FINANCIAL STATEMENTS.
A27
| | | | | | |
| | | CONSERVATIVE BALANCED PORTFOLIO (continued) | | |
| |
| SCHEDULE OF INVESTMENTS | | December 31, 2014 |
| | | | |
Industry table (cont.)
| | | |
Construction & Engineering | | | 0.1 | % |
Retailers | | | 0.1 | |
Railroads | | | 0.1 | |
Paper | | | 0.1 | |
Professional Services | | | 0.1 | |
Containers & Packaging | | | 0.1 | |
Real Estate Management & Development | | | 0.1 | |
Metals | | | 0.1 | |
Consumer | | | 0.1 | |
Paper & Forest Products | | | 0.1 | |
Leisure Products | | | 0.1 | |
Personal Products | | | 0.1 | |
| | | | |
Brokerage | | | 0.1 | % |
Health Care Technology | | | 0.1 | |
Building Materials & Construction | | | 0.1 | |
Independent Power & Renewable Electricity Producers | | | 0.1 | |
Building Products | | | 0.1 | |
Construction Materials | | | 0.1 | |
Distributors | | | 0.1 | |
| | |
|
|
|
| | | | 107.7 | |
Security Sold Short | | | (0.1 | ) |
Liabilities in excess of other assets | | | (7.6 | ) |
| | |
|
|
|
| | | | 100.0 | % |
| | |
|
|
|
The Portfolio invested in derivative instruments during the reporting period. The primary types of risk associated with these derivative instruments are credit risk, equity risk and interest rate risk. The effect of such derivative instruments on the Portfolio’s financial position and financial performance as reflected in the Statement of Assets and Liabilities and Statement of Operations is presented in the summary below.
Fair values of derivative instruments as of December 31, 2014 as presented in the Statement of Assets and Liabilities:
| | | | | | | | | | | | |
Derivatives not accounted for as hedging
instruments, carried at fair value
| | Asset Derivatives
| | | Liability Derivatives
| |
| | Balance Sheet Location
| | Fair Value
| | | Balance Sheet Location
| | Fair Value
| |
Credit contracts | | Premiums paid for swap agreements | | $ | 369,337 | | | — | | $ | — | |
Credit contracts | | Due from/to broker — variation margin swaps | | | 20,226 | * | | Due from/to broker — variation margin swaps | | | 114,141 | * |
Credit contracts | | Unrealized appreciation on over-the-counter swap agreements | | | 72,394 | | | — | | | — | |
Equity Contracts | | Due from/to broker — variation margin futures | | | 4,578,105 | * | | — | | | — | |
Interest rate contracts | | Due from/to broker — variation margin futures | | | 702,365 | * | | Due from/to broker — variation margin futures | | | 84,315 | * |
Interest rate contracts | | Due from/to broker — variation margin swaps | | | 123,799 | * | | Due from/to broker —variation margin swaps | | | 187,127 | * |
Interest rate contracts | | Unrealized appreciation on over-the-counter swap agreements | | | 33,052 | | | — | | | — | |
Interest rate contracts | | Unaffiliated investments | | | 36,094 | | | Option written outstanding, at value | | | 13,125 | |
| | | | |
|
|
| | | |
|
|
|
Total | | | | $ | 5,935,372 | | | | | $ | 398,708 | |
| | | | |
|
|
| | | |
|
|
|
| * | Includes cumulative appreciation/depreciation as reported in schedule of open futures and exchange-traded swap contracts. Only unsettled variation margin receivable (payable) is reported within the Statement of Assets and Liabilities. |
The effects of derivative instruments on the Statement of Operations for the year ended December 31, 2014 are as follows:
| | | | | | | | | | | | | | | | | | | | | | | | |
Amount of Realized Gain or (Loss) on Derivatives Recognized in Income
| |
Derivatives not accounted for as hedging
instruments, carried at fair value
| | Rights*
| | | Options
Purchased*
| | | Options
Written
| | | Futures
| | | Swaps
| | | Total
| |
Credit contracts | | $ | — | | | $ | — | | | $ | — | | | $ | — | | | $ | (684,351 | ) | | $ | (684,351 | ) |
Equity contracts | | | 13,236 | | | | — | | | | — | | | | 12,605,835 | | | | — | | | | 12,619,071 | |
Interest rate contracts | | | — | | | | (211,635 | ) | | | (74,983 | ) | | | 149,183 | | | | 292,479 | | | | 155,044 | |
| | |
|
|
| |
|
|
| |
|
|
| |
|
|
| |
|
|
| |
|
|
|
| | | $ | 13,236 | | | $ | (211,635 | ) | | $ | (74,983 | ) | | $ | 12,755,018 | | | $ | (391,872 | ) | | $ | 12,089,764 | |
| | |
|
|
| |
|
|
| |
|
|
| |
|
|
| |
|
|
| |
|
|
|
| * | Included in net realized gain (loss) on investment transactions in the Statement of Operations. |
SEE NOTES TO FINANCIAL STATEMENTS.
A28
| | | | | | |
| | | CONSERVATIVE BALANCED PORTFOLIO (continued) | | |
| |
| SCHEDULE OF INVESTMENTS | | December 31, 2014 |
| | | | | | | | | | | | | | | | | | | | | | |
|
Change in Unrealized Appreciation or (Depreciation) on Derivatives Recognized in Income
| |
Derivatives not accounted for as hedging
instruments, carried at fair value
| | Options
Purchased*
| | | Options
Written
| | | Futures
| | | Swaps
| | | Total
| |
Credit contracts | | $ | — | | | $ | — | | | $ | — | | | $ | 11,244 | | | $ | 11,244 | |
Equity contracts | | | — | | | | — | | | | 1,972,196 | | | | — | | | | 1,972,196 | |
Interest rate contracts | | | 58,325 | | | | 25,507 | | | | 1,233,867 | | | | 134,970 | | | | 1,452,669 | |
| | |
|
|
| |
|
|
| |
|
|
| |
|
|
| |
|
|
|
Total | | $ | 58,325 | | | $ | 25,507 | | | $ | 3,206,063 | | | $ | 146,214 | | | $ | 3,436,109 | |
| | |
|
|
| |
|
|
| |
|
|
| |
|
|
| |
|
|
|
| * | Included in net change in unrealized appreciation (depreciation) on investments in the Statement of Operations. |
For the year ended December 31, 2014, the Portfolio’s average volume of derivative activities is as follows:
| | | | | | |
Options Purchased
(Cost)
| | Options Written
(Notional Amount in USD (000))
| | Futures
Long Position
(Value at Trade Date)
| | Futures
Short Position
(Value at Trade Date)
|
| $323,375 | | $56,136 | | $199,358,384 | | $26,996,591 |
| | | | |
Interest Rate Swaps
(Notional Amount in USD (000))
| | Credit Default
Swaps as Buyer
(Notional Amount in USD (000))
| | Credit Default
Swaps as Writer
(Notional Amount in USD (000))
|
| $75,875 | | $49,704 | | $8,809 |
Offsetting of over-the-counter (OTC) derivative assets and liabilities:
The Portfolio invested in OTC derivatives during the reporting period that are either offset in accordance with current requirements or are subject to enforceable master netting arrangements or similar agreements that permit offsetting. The information about offsetting and related netting arrangements for OTC derivatives, where the legal right to set-off exists, is presented in the summary below.
| | | | | | | | | | | | | | | | |
Counterparty
| | Gross amounts of
recognized assets(1)
| | | Gross amounts
available for offset
| | | Collateral
Received(3)
| | | Net Amount
| |
Credit Suisse First Boston Corp. | | $ | 94,404 | | | $ | — | | | $ | — | | | $ | 94,404 | |
Deutsche Bank AG | | | 380,379 | | | | — | | | | (518,142 | ) | | | — | |
| | |
|
|
| | | | | | | | | | | | |
| | | $ | 474,783 | | | | | | | | | | | | | |
| | |
|
|
| | | | | | | | | | | | |
| | | | | | | | | | | | | | | | |
Counterparty
| | Gross amounts of
recognized liabilities(2)
| | | Gross amounts
available for offset
| | | Collateral
Pledged(3)
| | | Net Amount
| |
Credit Suisse First Boston Corp. | | $ | — | | | $ | — | | | $ | — | | | $ | — | |
Deutsche Bank AG | | | — | | | | — | | | | — | | | | — | |
| | |
|
|
| | | | | | | | | | | | |
| | | $ | — | | | | | | | | | | | | | |
| | |
|
|
| | | | | | | | | | | | |
| (1) | Includes unrealized appreciation on swaps and forwards, premiums paid on swap agreements and market value of purchased options. |
| (2) | Includes unrealized depreciation on swaps and forwards, premiums received on swap agreements and market value of written options. |
| (3) | Amounts shown reflect actual collateral received or pledged by the Portfolio. Such amounts are applied up to 100% of the Portfolio’s OTC derivative exposure by counterparty. |
SEE NOTES TO FINANCIAL STATEMENTS.
A29
| | | | | | |
| | | CONSERVATIVE BALANCED PORTFOLIO (continued) | | |
STATEMENT OF ASSETS AND LIABILITIES
December 31, 2014
| | | | |
| ASSETS | | | | |
Investments at value, including securities on loan of $78,183,937: | | | | |
Unaffiliated investments (cost $1,478,860,833) | | $ | 2,288,376,774 | |
Affiliated investments (cost $486,753,558) | | | 484,262,737 | |
Foreign currency, at value (cost $502,187) | | | 495,000 | |
Receivable for investments sold | | | 113,491,435 | |
Dividends and interest receivable | | | 6,962,384 | |
Premium paid for swap agreements | | | 369,337 | |
Tax reclaim receivable | | | 252,957 | |
Unrealized appreciation on over-the-counter swap agreements | | | 105,446 | |
Due from broker—variation margin futures | | | 58,010 | |
Receivable for Series shares sold | | | 11,844 | |
Prepaid expenses | | | 18,360 | |
| | |
|
|
|
Total Assets | | | 2,894,404,284 | |
| | |
|
|
|
| LIABILITIES | | | | |
Payable for investments purchased | | | 231,133,318 | |
Payable to broker for collateral for securities on loan | | | 80,403,099 | |
Securities sold short, at value
(proceeds received $3,629,336) | | | 3,639,044 | |
Due to broker—variation margin futures | | | 1,537,855 | |
Management fee payable | | | 1,204,527 | |
Payable to custodian | | | 1,103,005 | |
Payable for Series shares repurchased | | | 687,373 | |
Accrued expenses and other liabilities | | | 303,910 | |
Due to broker—variation margin swaps | | | 22,876 | |
Options written outstanding, at value (premiums received $38,632) | | | 13,125 | |
Affiliated transfer agent fee payable | | | 926 | |
| | |
|
|
|
Total Liabilities | | | 320,049,058 | |
| | |
|
|
|
| NET ASSETS | | $ | 2,574,355,226 | |
| | |
|
|
|
Net assets were comprised of: | | | | |
Paid-in capital | | $ | 1,436,989,603 | |
Retained earnings | | | 1,137,365,623 | |
| | |
|
|
|
Net assets, December 31, 2014 | | $ | 2,574,355,226 | |
| | |
|
|
|
Net asset value and redemption price per share $2,574,355,226 / 114,690,795 outstanding shares of beneficial interest | | $ | 22.45 | |
| | |
|
|
|
STATEMENT OF OPERATIONS
Year Ended December 31, 2014
| | | | |
| NET INVESTMENT INCOME | | | | |
| INCOME | | | | |
Unaffiliated dividend income (net of foreign withholding taxes of $529,667) | | $ | 32,168,877 | |
Interest income | | | 22,736,691 | |
Affiliated dividend income | | | 1,773,351 | |
Affiliated income from securities loaned, net | | | 181,272 | |
| | |
|
|
|
Total income | | | 56,860,191 | |
| | |
|
|
|
| EXPENSES | | | | |
Management fee | | | 13,915,506 | |
Custodian’s fees and expenses | | | 444,000 | |
Shareholders’ reports | | | 200,000 | |
Audit fee | | | 44,000 | |
Insurance expenses | | | 34,000 | |
Trustees’ fees | | | 30,000 | |
Legal fees and expenses | | | 16,000 | |
Transfer agent’s fees and expenses (including affiliated expense of $5,600) | | | 12,000 | |
Commitment fee on syndicated credit agreement | | | 4,000 | |
Miscellaneous | | | 48,873 | |
| | |
|
|
|
Total expenses | | | 14,748,379 | |
| | |
|
|
|
| NET INVESTMENT INCOME | | | 42,111,812 | |
| | |
|
|
|
| REALIZED AND UNREALIZED GAIN (LOSS) ON INVESTMENT AND FOREIGN CURRENCY TRANSACTIONS | | | | |
Net realized gain (loss) on: | | | | |
Investment transactions | | | 108,285,865 | |
Futures transactions | | | 12,755,018 | |
Options written transactions | | | (74,983 | ) |
Swap agreement transactions | | | (391,872 | ) |
Foreign currency transactions | | | (85,034 | ) |
| | |
|
|
|
| | | | 120,488,994 | |
| | |
|
|
|
Net change in unrealized appreciation (depreciation) on: | | | | |
Investments (including affiliated $307,770) | | | 47,128,881 | |
Futures | | | 3,206,063 | |
Securities sold short | | | (1,231 | ) |
Options written | | | 25,507 | |
Swap agreements | | | 146,214 | |
Foreign currencies | | | (48,845 | ) |
| | |
|
|
|
| | | | 50,456,589 | |
| | |
|
|
|
| NET GAIN ON INVESTMENT AND FOREIGN CURRENCY TRANSACTIONS | | | 170,945,583 | |
| | |
|
|
|
| NET INCREASE IN NET ASSETS RESULTING FROM OPERATIONS | | $ | 213,057,395 | |
| | |
|
|
|
STATEMENT OF CHANGES IN NET ASSETS
| | | | | | | | |
| | | Year Ended December 31,
| |
| | | 2014
| | | 2013
| |
| INCREASE (DECREASE) IN NET ASSETS | | | | | | | | |
| OPERATIONS | | | | | | | | |
Net investment income | | $ | 42,111,812 | | | $ | 44,219,234 | |
Net realized gain on investment and foreign currency transactions | | | 120,488,994 | | | | 99,020,902 | |
Net change in unrealized appreciation (depreciation) on investments and foreign currencies | | | 50,456,589 | | | | 214,601,177 | |
| | |
|
|
| |
|
|
|
| NET INCREASE IN NET ASSETS RESULTING FROM OPERATIONS | | | 213,057,395 | | | | 357,841,313 | |
| | |
|
|
| |
|
|
|
| SERIES SHARE TRANSACTIONS | | | | | | | | |
Series shares sold [657,128 and 937,002 shares, respectively] | | | 14,068,708 | | | | 18,092,234 | |
Series shares repurchased [7,335,062 and 8,251,336 shares, respectively] | | | (157,169,187 | ) | | | (158,563,701 | ) |
| | |
|
|
| |
|
|
|
NET DECREASE IN NET ASSETS FROM SERIES SHARE TRANSACTIONS | | | (143,100,479 | ) | | | (140,471,467 | ) |
| | |
|
|
| |
|
|
|
| TOTAL INCREASE | | | 69,956,916 | | | | 217,369,846 | |
| NET ASSETS: | | | | | | | | |
Beginning of year | | | 2,504,398,310 | | | | 2,287,028,464 | |
| | |
|
|
| |
|
|
|
End of year | | $ | 2,574,355,226 | | | $ | 2,504,398,310 | |
| | |
|
|
| |
|
|
|
SEE NOTES TO FINANCIAL STATEMENTS.
A30
| | | | | | |
| | | DIVERSIFIED BOND PORTFOLIO | | |
| |
| SCHEDULE OF INVESTMENTS | | December 31, 2014 |
| | | | | | | | | | | | | | | | | | |
LONG-TERM INVESTMENTS — 84.8% ASSET-BACKED SECURITIES — 10.5% | | | | Interest
Rate
| | | Maturity
Date
| | Principal
Amount
(000)#
| | | Value
(Note 2)
| |
Collateralized Loan Obligations — 4.5% | | | | | | | | | | | | | | | | | | |
A Voce CLO Ltd. (Cayman Islands), Series 2014-1A, Class A1A, 144A | | | | | 1.684% | (a) | | 07/15/26 | | | | | 500 | | | $ | 494,914 | |
ACAS CLO Ltd. (Cayman Islands), Series 2013-1A, Class A, 144A | | | | | 1.411% | (a) | | 04/20/25 | | | | | 3,300 | | | | 3,244,119 | |
ACAS CLO Ltd. (Cayman Islands), Series 2013-1A, Class B2, 144A | | | | | 3.360% | | | 04/20/25 | | | | | 500 | | | | 483,052 | |
Anchorage Capital CLO Ltd., Series 2014-5A, 144A | | | | | 1.833% | (a) | | 10/15/26 | | | | | 1,750 | | | | 1,744,214 | |
Battalion CLO Ltd. (Cayman Islands), Series 2013-4A, Class A1, 144A | | | | | 1.632% | (a) | | 10/22/25 | | | | | 1,300 | | | | 1,286,681 | |
Battalion CLO VII Ltd. (Cayman Islands), Series 2014-7A, Class A1, 144A | | | | | 1.800% | (a) | | 10/17/26 | | | | | 2,750 | | | | 2,740,481 | |
Benefit Street Partners CLO II Ltd. (Cayman Islands), Series 2013-IIA, Class A1, 144A | | | | | 1.431% | (a) | | 07/15/24 | | | | | 900 | | | | 884,537 | |
Benefit Street Partners CLO V Ltd. (Cayman Islands), Series 2014-VA, Class A, 144A | | | | | 1.600% | (a) | | 10/20/26 | | | | | 1,250 | | | | 1,245,749 | |
Black Diamond CLO Delaware Corp. (Cayman Islands), Series 2005-1A, Class A1, 144A | | | | | 0.517% | (a) | | 06/20/17 | | | | | 852 | | | | 850,531 | |
Blue Hill CLO Ltd. (Cayman Islands), Series 2013-1A, Class A, 144A | | | | | 1.711% | (a) | | 01/15/26 | | | | | 700 | | | | 694,752 | |
Brookside Mill CLO Ltd. (Cayman Islands), Series 2013-1A, Class A1, 144A | | | | | 1.378% | (a) | | 04/17/25 | | | | | 2,600 | | | | 2,553,268 | |
Carlyle Global Market Strategies CLO Ltd. (Cayman Islands), Series 2014-3A, Class A1A, 144A | | | | | 1.694% | (a) | | 07/27/26 | | | | | 250 | | | | 249,048 | |
ECP CLO Ltd. (Cayman Islands), Series 2014-6A, Class A1A, 144A | | | | | 1.685% | (a) | | 07/15/26 | | | | | 1,500 | | | | 1,484,483 | |
Flagship VII Ltd. (Cayman Islands), Series 2013-7A, Class A1, 144A | | | | | 1.701% | (a) | | 01/20/26 | | | | | 2,500 | | | | 2,479,109 | |
Flatiron CLO Ltd. (Cayman Islands), Series 2013-1A, Class A1, 144A | | | | | 1.628% | (a) | | 01/17/26 | | | | | 1,250 | | | | 1,236,436 | |
Four Corners CLO III Ltd. (Cayman Islands), Series 2006-3A, Class A, 144A | | | | | 0.482% | (a) | | 07/22/20 | | | | | 654 | | | | 650,656 | |
Fraser Sullivan CLO I Ltd. (Cayman Islands), Series 2006-1A, Class B, 144A | | | | | 0.711% | (a) | | 03/15/20 | | | | | 1,500 | | | | 1,493,694 | |
ING Investment Management CLO Ltd. (Cayman Islands), Series 2013-1A, Class A1, 144A | | | | | 1.370% | (a) | | 04/15/24 | | | | | 4,200 | | | | 4,124,420 | |
KVK CLO Ltd. (Cayman Islands), Series 2014-2A, Class A, 144A | | | | | 1.781% | (a) | | 07/15/26 | | | | | 250 | | | | 248,623 | |
Magnetite VIII Ltd. (Cayman Islands), Series 2014-9A, Class A1, 144A | | | | | 1.700% | (a) | | 07/25/26 | | | | | 1,250 | | | | 1,235,429 | |
OCP CLO Ltd. (Cayman Islands), Series 2012-2A, Class A2, 144A | | | | | 1.713% | (a) | | 11/22/23 | | | | | 500 | | | | 499,251 | |
OCP CLO Ltd. (Cayman Islands), Series 2013-4A, Class A2, 144A | | | | | 2.033% | (a) | | 10/24/25 | | | | | 2,200 | | | | 2,101,675 | |
Regatta V Funding Ltd. (Cayman Islands), Series 2014-1A, Class A1A, 144A | | | | | 1.793% | (a) | | 10/25/26 | | | | | 4,000 | | | | 3,977,594 | |
Shackleton CLO Ltd. (Cayman Islands), Series 2013-3A, Class B2, 144A | | | | | 3.440% | | | 04/15/25 | | | | | 700 | | | | 679,358 | |
Sheridan Square CLO Ltd. (Cayman Islands), Series 2013-1A, Class A1, 144A | | | | | 1.281% | (a) | | 04/15/25 | | | | | 7,300 | | | | 7,146,074 | |
Sound Point CLO Ltd. (Cayman Islands), Series 2014-2A, Class B, 144A | | | | | 1.593% | (a) | | 10/20/26 | | | | | 750 | | | | 738,594 | |
THL Credit Wind River CLO Ltd. (Cayman Islands), Series 2013-2A, Class A1, 144A | | | | | 1.681% | (a) | | 01/18/26 | | | | | 3,300 | | | | 3,270,869 | |
Tyron Park CLO Ltd. (Cayman Islands), Series 2013-1A, Class A1, 144A | | | | | 1.351% | (a) | | 07/15/25 | | | | | 300 | | | | 293,927 | |
| | | | | | | | | | | | | | | | |
|
|
|
| | | | | | | | | | | | | | | | | | 48,131,538 | |
| | | | | | | | | | | | | | | | |
|
|
|
Non-Residential Mortgage-Backed Securities — 0.3% | | | | | | | | | | | | | | | | | | |
GE Business Loan Trust, Series 2006-1A, Class D, 144A | | | | | 1.161% | (a) | | 05/15/34 | | | | | 156 | | | | 131,598 | |
Marriott Vacation Club Owner Trust, Series 2010-1A, Class A, 144A | | | | | 3.540% | | | 10/20/32 | | | | | 2,278 | | | | 2,356,822 | |
SVO VOI Mortgage LLC, Series 2012-AA, Class A, 144A | | | | | 2.000% | | | 09/20/29 | | | | | 1,306 | | | | 1,298,693 | |
| | | | | | | | | | | | | | | | |
|
|
|
| | | | | | | | | | | | | | | | | | 3,787,113 | |
| | | | | | | | | | | | | | | | |
|
|
|
Residential Mortgage-Backed Securities — 5.7% | | | | | | | | | | | | | | | | | | |
ABFC Trust, Series 2004-OPT1, Class M1 | | | | | 1.220% | (a) | | 08/25/33 | | | | | 1,321 | | | | 1,250,661 | |
ACE Securities Corp. Home Equity Loan Trust, Series 2004-FM1, Class M1 | | | | | 1.070% | (a) | | 09/25/33 | | | | | 1,393 | | | | 1,306,242 | |
SEE NOTES TO FINANCIAL STATEMENTS.
A31
| | | | | | |
| | | DIVERSIFIED BOND PORTFOLIO (continued) | | |
| |
| SCHEDULE OF INVESTMENTS | | December 31, 2014 |
| | | | | | | | | | | | | | | | | | |
ASSET-BACKED SECURITIES
(continued) | | | | Interest
Rate
| | | Maturity
Date
| | Principal
Amount
(000)#
| | | Value
(Note 2)
| |
Residential Mortgage-Backed Securities (continued) | | | | | | | | | | | | | | | | | | |
Alternative Loan Trust, Series 2004-18CB, Class 3A1 | | | | | 5.250% | | | 09/25/19 | | | | | 432 | | | $ | 441,407 | |
Ameriquest Mortgage Securities, Inc. Asset-Backed Pass-Through Certificates, Series 2004-R8, Class M1 | | | | | 1.130% | (a) | | 09/25/34 | | | | | 950 | | | | 947,299 | |
Ameriquest Mortgage Securities, Inc. Floating Rate Mortgage Pass-Through Certificates, Series 2001-2, Class M3 | | | | | 3.095% | (a) | | 10/25/31 | | | | | 416 | | | | 394,932 | |
Argent Securities, Inc., Series 2003-W2, Class M4 | | | | | 5.795% | (a) | | 09/25/33 | | | | | 2,400 | | | | 2,250,187 | |
Argent Securities, Inc., Series 2004-W10, Class A2 | | | | | 0.950% | (a) | | 10/25/34 | | | | | 1,802 | | | | 1,750,384 | |
Argent Securities, Inc., Asset-Backed Pass-Through Certificates, Series 2004-W6, Class M1 | | | | | 0.995% | (a) | | 05/25/34 | | | | | 1,676 | | | | 1,631,137 | |
Asset-Backed Securities Corp. Home Equity Loan Trust, Series 2003-HE3, Class M1 | | | | | 1.406% | (a) | | 06/15/33 | | | | | 1,202 | | | | 1,144,990 | |
Asset-Backed Securities Corp. Home Equity Loan Trust, Series 2004-HE1, Class M1 | | | | | 1.211% | (a) | | 01/15/34 | | | | | 211 | | | | 203,071 | |
Asset-Backed Securities Corp. Home Equity Loan Trust, Series 2004-HE5, Class M1 | | | | | 1.070% | (a) | | 08/25/34 | | | | | 1,847 | | | | 1,785,307 | |
Bear Stearns Asset-Backed Securities Trust, Series 2004-HE2, Class M1 | | | | | 1.070% | (a) | | 03/25/34 | | | | | 3,974 | | | | 3,750,227 | |
Bear Stearns Asset-Backed Securities Trust, Series 2004-HE3, Class M2 | | | | | 1.895% | (a) | | 04/25/34 | | | | | 1,935 | | | | 1,764,831 | |
CDC Mortgage Capital Trust, Series 2002-HE3, Class M2 | | | | | 3.545% | (a) | | 03/25/33 | | | | | 189 | | | | 23,846 | |
Centex Home Equity Loan Trust, Series 2004-B, Class AF6 | | | | | 4.686% | | | 03/25/34 | | | | | 1,094 | | | | 1,119,453 | |
Credit Suisse First Boston Mortgage Securities Corp., Series 2002-HE4, Class M2 | | | | | 2.420% | (a) | | 08/25/32 | | | | | 67 | | | | 58,631 | |
Equity One Mortgage Pass-Through Trust, Series 2004-3, Class M1 | | | | | 5.037% | | | 07/25/34 | | | | | 582 | | | | 556,878 | |
FBR Securitization Trust, Series 2005-2, Class M1 | | | | | 0.890% | (a) | | 09/25/35 | | | | | 3,600 | | | | 3,575,351 | |
Fremont Home Loan Trust, Series 2003-B, Class M1 | | | | | 1.220% | (a) | | 12/25/33 | | | | | 205 | | | | 195,436 | |
GSAMP Trust, Series 2004-FM1, Class M1 | | | | | 1.145% | (a) | | 11/25/33 | | | | | 1,942 | | | | 1,882,511 | |
HSBC Home Equity Loan Trust, Series 2006-1, Class M1 | | | | | 0.446% | (a) | | 01/20/36 | | | | | 420 | | | | 417,332 | |
HSBC Home Equity Loan Trust, Series 2006-2, Class A1 | | | | | 0.316% | (a) | | 03/20/36 | | | | | 110 | | | | 109,192 | |
HSBC Home Equity Loan Trust, Series 2006-2, Class A2 | | | | | 0.346% | (a) | | 03/20/36 | | | | | 134 | | | | 132,607 | |
Long Beach Mortgage Loan Trust, Series 2004-1, Class M1 | | | | | 0.920% | (a) | | 02/25/34 | | | | | 4,250 | | | | 4,039,158 | |
MASTR Alternative Loan Trust, Series 2004-4, Class 4A1 | | | | | 5.000% | | | 04/25/19 | | | | | 86 | | | | 87,421 | |
MASTR Asset-Backed Securities Trust, Series 2004-WMC1, Class M1 | | | | | 0.950% | (a) | | 02/25/34 | | | | | 2,104 | | | | 1,999,644 | |
Merrill Lynch Mortgage Investors Trust, Series 2004-HE2, Class M1 | | | | | 1.370% | (a) | | 08/25/35 | | | | | 664 | | | | 634,924 | |
Merrill Lynch Mortgage Investors Trust, Series 2004-OPT1, Class A1A | | | | | 0.690% | (a) | | 06/25/35 | | | | | 1,776 | | | | 1,683,149 | |
Morgan Stanley ABS Capital I, Inc. Trust, Series 2003-HE1, Class M1 | | | | | 1.370% | (a) | | 05/25/33 | | | | | 1,196 | | | | 1,120,928 | |
Morgan Stanley ABS Capital I, Inc. Trust, Series 2003-HE3, Class M1 | | | | | 1.190% | (a) | | 10/25/33 | | | | | 939 | | | | 876,653 | |
Morgan Stanley ABS Capital I, Inc. Trust, Series 2004-NC1, Class M1 | | | | | 1.220% | (a) | | 12/27/33 | | | | | 748 | | | | 722,103 | |
Morgan Stanley ABS Capital I, Inc. Trust, Series 2004-OP1, Class M1 | | | | | 1.040% | (a) | | 11/25/34 | | | | | 3,688 | | | | 3,311,021 | |
Morgan Stanley ABS Capital I, Inc. Trust, Series 2004-WMC1, Class M1 | | | | | 1.100% | (a) | | 06/25/34 | | | | | 2,111 | | | | 1,977,031 | |
Morgan Stanley ABS Capital I, Inc. Trust, Series 2004-WMC2, Class M1 | | | | | 1.085% | (a) | | 07/25/34 | | | | | 1,674 | | | | 1,596,574 | |
New Century Home Equity Loan Trust, Series 2003-4, Class M1 | | | | | 1.295% | (a) | | 10/25/33 | | | | | 2,930 | | | | 2,816,644 | |
New Century Home Equity Loan Trust, Series 2004-4, Class M1 | | | | | 0.935% | (a) | | 02/25/35 | | | | | 3,048 | | | | 2,818,389 | |
Residential Asset Mortgage Products, Inc., Series 2004-RS12, Class MII2 | | | | | 1.370% | (a) | | 12/25/34 | | | | | 259 | | | | 256,573 | |
Residential Asset Securities Corp., Series 2004-KS1, Class AI5 | | | | | 5.221% | | | 02/25/34 | | | | | 1,000 | | | | 1,039,831 | |
Saxon Asset Securities Trust, Series 2002-3, Class M1 | | | | | 1.295% | (a) | | 12/25/32 | | | | | 199 | | | | 184,973 | |
Securitized Asset-Backed Receivables LLC Trust, Series 2004-NC1, Class M1 | | | | | 0.950% | (a) | | 02/25/34 | | | | | 3,221 | | | | 2,988,304 | |
Specialty Underwriting & Residential Finance Trust, Series 2004-BC1, Class M1 | | | | | 0.935% | (a) | | 02/25/35 | | | | | 76 | | | | 70,037 | |
Structured Adjustable Rate Mortgage Loan Trust, Series 2004-1, Class 4A3 | | | | | 2.573% | (a) | | 02/25/34 | | | | | 1,324 | | | | 1,321,390 | |
Structured Asset Investment Loan Trust, Series 2004-2, Class A4 | | | | | 0.875% | (a) | | 03/25/34 | | | | | 2,297 | | | | 2,120,688 | |
SEE NOTES TO FINANCIAL STATEMENTS.
A32
| | | | | | |
| | | DIVERSIFIED BOND PORTFOLIO (continued) | | |
| |
| SCHEDULE OF INVESTMENTS | | December 31, 2014 |
| | | | | | | | | | | | | | | | | | |
ASSET-BACKED SECURITIES
(continued) | | | | Interest
Rate
| | | Maturity
Date
| | Principal
Amount
(000)#
| | | Value
(Note 2)
| |
Residential Mortgage-Backed Securities (continued) | | | | | | | | | | | | | | | | | | |
Structured Asset Investment Loan Trust, Series 2004-7, Class A8 | | | | | 1.370% | (a) | | 08/25/34 | | | | | 1,400 | | | $ | 1,276,983 | |
Structured Asset Securities Corp. Mortgage Pass-Through Certificates, Series 2002-HF2, Class M3 | | | | | 3.170% | (a) | | 07/25/32 | | | | | 827 | | | | 769,115 | |
Washington Mutual Mortgage Pass-Through Certificates, Series 2005-1, Class 3A | | | | | 5.000% | | | 03/25/20 | | | | | 358 | | | | 358,966 | |
| | | | | | | | | | | | | | | | |
|
|
|
| | | | | | | | | | | | | | | | | | 60,762,411 | |
| | | | | | | | | | | | | | | | |
|
|
|
TOTAL ASSET-BACKED SECURITIES
(cost $105,060,919) | | | | 112,681,062 | |
| | | | | | | | | | | | | | | | |
|
|
|
| BANK LOANS(a) — 3.6% | | | | | | | | | | | | | | | | | | |
Automotive — 0.1% | | | | | | | | | | | | | | | | | | |
Chrysler Group LLC | | | | | 3.500% | | | 05/24/17 | | | | | 1,342 | | | | 1,336,339 | |
| | | | | | | | | | | | | | | | |
|
|
|
Chemicals — 0.2% | | | | | | | | | | | | | | | | | | |
Axalta Coating Systems US Holdings | | | | | 3.750% | | | 02/01/20 | | | | | 713 | | | | 693,511 | |
CeramTec GmbH (Germany) | | | | | 4.750% | | | 08/30/20 | | EUR | | | 900 | | | | 1,089,502 | |
| | | | | | | | | | | | | | | | |
|
|
|
| | | | | | | | | | | | | | | | | | 1,783,013 | |
| | | | | | | | | | | | | | | | |
|
|
|
Financials — 0.2% | | | | | | | | | | | | | | | | | | |
Scandlines GmbH (Germany) | | | | | 4.522% | | | 11/04/20 | | EUR | | | 2,000 | | | | 2,422,459 | |
| | | | | | | | | | | | | | | | |
|
|
|
Foods — 0.2% | | | | | | | | | | | | | | | | | | |
Pinnacle Foods Finance LLC | | | | | 3.000% | | | 04/29/20 | | | | | 697 | | | | 674,762 | |
US Foods, Inc.
(original cost $993,706; purchased 08/15/14)(b)(c) | | | | | 4.500% | | | 03/29/19 | | | | | 995 | | | | 987,985 | |
| | | | | | | | | | | | | | | | |
|
|
|
| | | | | | | | | | | | | | | | | | 1,662,747 | |
| | | | | | | | | | | | | | | | |
|
|
|
Gaming — 0.2% | | | | | | | | | | | | | | | | | | |
CCM Merger, Inc.
(original cost $2,375,921; purchased 07/30/14)(b)(c) | | | | | 4.500% | | | 08/06/21 | | | | | 2,394 | | | | 2,357,967 | |
| | | | | | | | | | | | | | | | |
|
|
|
Healthcare & Pharmaceutical — 1.3% | | | | | | | | | | | | | | | | | | |
Alere, Inc. | | | | | 3.200% | | | 06/30/16 | | | | | 441 | | | | 436,885 | |
Biomet, Inc., Term Loan | | | | | 3.733% | | | 07/25/17 | | | | | 2,800 | | | | 2,783,668 | |
Capsugel Holdings US, Inc. | | | | | 3.500% | | | 08/01/18 | | | | | 933 | | | | 912,371 | |
Davita Healthcare Partners, Inc. | | | | | 3.500% | | | 06/24/21 | | | | | 1,493 | | | | 1,473,577 | |
Grifols SA | | | | | 3.255% | | | 02/26/21 | | | | | 1,492 | | | | 1,469,726 | |
Mallinckrodt International Finance | | | | | 3.500% | | | 03/19/21 | | | | | 1,521 | | | | 1,494,092 | |
Endo Luxembourg Finance | | | | | 3.250% | | | 03/01/21 | | | | | 1,687 | | | | 1,632,414 | |
Ortho Clinical Diagnostics | | | | | 4.750% | | | 06/30/21 | | | | | 498 | | | | 488,275 | |
Quintiles Transnational Corp. | | | | | 3.750% | | | 06/08/18 | | | | | 1,451 | | | | 1,430,514 | |
RPI Finance Trust (Luxembourg) | | | | | 3.250% | | | 05/09/18 | | | | | 2,316 | | | | 2,306,440 | |
| | | | | | | | | | | | | | | | |
|
|
|
| | | | | | | | | | | | | | | | | | 14,427,962 | |
| | | | | | | | | | | | | | | | |
|
|
|
Leisure | | | | | | | | | | | | | | | | | | |
Activision Blizzard, Inc. | | | | | 3.250% | | | 10/12/20 | | | | | 500 | | | | 498,375 | |
| | | | | | | | | | | | | | | | |
|
|
|
Media & Entertainment — 0.1% | | | | | | | | | | | | | | | | | | |
CBS Outdoor Americas CAP Co. | | | | | 3.000% | | | 02/01/21 | | | | | 1,000 | | | | 974,000 | |
| | | | | | | | | | | | | | | | |
|
|
|
Retailers — 0.3% | | | | | | | | | | | | | | | | | | |
Alliance Boots Holdings Ltd. (United Kingdom) | | | | | 3.985% | | | 07/09/17 | | GBP | | | 2,000 | | | | 3,113,310 | |
| | | | | | | | | | | | | | | | |
|
|
|
Technology — 0.9% | | | | | | | | | | | | | | | | | | |
Avago Technologies Finance Pte Ltd. | | | | | 3.750% | | | 05/06/21 | | | | | 398 | | | | 395,844 | |
BMC Software Finance, Inc. | | | | | 5.000% | | | 09/10/20 | | | | | 497 | | | | 481,542 | |
First Data Corp. | | | | | 3.755% | | | 03/26/18 | | | | | 2,411 | | | | 2,357,399 | |
First Data Corp. | | | | | 4.255% | | | 03/24/21 | | | | | 183 | | | | 180,036 | |
Freescale Semiconductor, Inc. | | | | | 4.250% | | | 02/28/20 | | | | | 1,720 | | | | 1,673,080 | |
Interactive Data Corp. | | | | | 4.750% | | | 05/03/21 | | | | | 1,194 | | | | 1,183,552 | |
RBS WorldPay, Inc. (United Kingdom) | | | | | 5.750% | | | 11/29/19 | | GBP | | | 900 | | | | 1,395,229 | |
TransUnion LLC/TransUnion Financing Corp. | | | | | 4.000% | | | 04/09/21 | | | | | 199 | | | | 195,274 | |
SEE NOTES TO FINANCIAL STATEMENTS.
A33
| | | | | | |
| | | DIVERSIFIED BOND PORTFOLIO (continued) | | |
| |
| SCHEDULE OF INVESTMENTS | | December 31, 2014 |
| | | | | | | | | | | | | | | | | | |
BANK LOANS(a)
(continued) | | | | Interest
Rate
| | | Maturity
Date
| | Principal
Amount
(000)#
| | | Value
(Note 2)
| |
Technology (continued) | | | | | | | | | | | | | | | | | | |
Vantiv LLC | | | | | 2.255% | | | 06/13/19 | | | | | 1,463 | | | $ | 1,435,078 | |
| | | | | | | | | | | | | | | | |
|
|
|
| | | | | | | | | | | | | | | | | | 9,297,034 | |
| | | | | | | | | | | | | | | | |
|
|
|
Telecommunications — 0.1% | | | | | | | | | | | | | | | | | | |
SBA SNR Fin Li LLC | | | | | 3.250% | | | 03/24/21 | | | | | 1,144 | | | | 1,117,646 | |
| | | | | | | | | | | | | | | | |
|
|
|
TOTAL BANK LOANS
(cost $39,613,801) | | | | 38,990,852 | |
| | | | | | | | | | | | | | | | |
|
|
|
| COMMERCIAL MORTGAGE-BACKED SECURITIES — 10.0% | | | | | | | | | | | | | |
Banc of America Commercial Mortgage Trust, Series 2006-3, Class A4 | | | | | 5.889% | | | 07/10/44 | | | | | 1,493 | | | | 1,571,688 | |
Banc of America Commercial Mortgage Trust, Series 2006-5, Class A2 | | | | | 5.317% | | | 09/10/47 | | | | | 1,239 | | | | 1,238,377 | |
Banc of America Commercial Mortgage Trust, Series 2006-6, Class A2 | | | | | 5.309% | | | 10/10/45 | | | | | 334 | | | | 333,745 | |
Banc of America Commercial Mortgage Trust, Series 2006-6, Class A4 | | | | | 5.356% | | | 10/10/45 | | | | | 800 | | | | 837,282 | |
Banc of America Commercial Mortgage Trust, Series 2007-2, Class A1A | | | | | 5.561% | (a) | | 04/10/49 | | | | | 1,367 | | | | 1,462,709 | |
Banc of America Commercial Mortgage Trust, Series 2007-5, Class A3 | | | | | 5.620% | | | 02/10/51 | | | | | 58 | | | | 57,784 | |
Citigroup Commercial Mortgage Trust, Series 2007-C6, Class A4 | | | | | 5.710% | (a) | | 12/10/49 | | | | | 1,590 | | | | 1,724,172 | |
Citigroup Commercial Mortgage Trust, Series 2013-GC11, Class A3 | | | | | 2.815% | | | 04/10/46 | | | | | 2,800 | | | | 2,765,750 | |
Citigroup Commercial Mortgage Trust, Series 2014-GC21, Class A4 | | | | | 3.575% | | | 05/10/47 | | | | | 3,200 | | | | 3,330,115 | |
Citigroup/Deutsche Bank Commercial Mortgage Trust, Series 2006-CD2, Class AAB | | | | | 5.329% | (a) | | 01/15/46 | | | | | 176 | | | | 175,821 | |
Citigroup/Deutsche Bank Commercial Mortgage Trust, Series 2007-CD4, Class A3 | | | | | 5.293% | | | 12/11/49 | | | | | 235 | | | | 236,622 | |
COMM Mortgage Trust, Series 2014-UBS4, Class A4 | | | | | 3.420% | | | 08/10/47 | | | | | 3,200 | | | | 3,281,235 | |
Commercial Mortgage Pass-Through Certificates, Series 2007-GG9, Class A2 | | | | | 5.381% | | | 03/10/39 | | | | | 1,398 | | | | 1,401,967 | |
Commercial Mortgage Pass-Through Certificates, Series 2012-CR5, Class A3 | | | | | 2.540% | | | 12/10/45 | | | | | 2,000 | | | | 1,942,190 | |
Commercial Mortgage Pass-Through Certificates, Series 2013-CR7, Class A3 | | | | | 2.929% | | | 03/10/46 | | | | | 3,900 | | | | 3,905,058 | |
Credit Suisse Commercial Mortgage Trust, Series 2006-C1, Class AM | | | | | 5.467% | (a) | | 02/15/39 | | | | | 970 | | | | 1,008,963 | |
FHLMC Multifamily Structured Pass-Through Certificates, Series K008, Class X1, I/O | | | | | 1.654% | (a) | | 06/25/20 | | | | | 9,470 | | | | 641,486 | |
FHLMC Multifamily Structured Pass-Through Certificates, Series K020, Class X1, I/O | | | | | 1.465% | (a) | | 05/25/22 | | | | | 28,808 | | | | 2,481,340 | |
FHLMC Multifamily Structured Pass-Through Certificates, Series K021, Class X1, I/O | | | | | 1.506% | (a) | | 06/25/22 | | | | | 16,408 | | | | 1,459,441 | |
FHLMC Multifamily Structured Pass-Through Certificates, Series K025, Class X1, I/O | | | | | 0.900% | (a) | | 10/25/22 | | | | | 11,205 | | | | 628,576 | |
FHLMC Multifamily Structured Pass-Through Certificates, Series K036, Class X1, I/O | | | | | 0.800% | (a) | | 10/25/23 | | | | | 13,171 | | | | 742,775 | |
FHLMC Multifamily Structured Pass-Through Certificates, Series K501, Class X1A, I/O | | | | | 1.685% | (a) | | 08/25/16 | | | | | 9,737 | | | | 183,969 | |
FHLMC Multifamily Structured Pass-Through Certificates, Series K710, Class X1, I/O | | | | | 1.778% | (a) | | 05/25/19 | | | | | 23,076 | | | | 1,526,003 | |
FHLMC Multifamily Structured Pass-Through Certificates, Series K711, Class X1, I/O | | | | | 1.707% | (a) | | 07/25/19 | | | | | 27,645 | | | | 1,774,263 | |
GS Mortgage Securities Trust, Series 2013-GC12, Class A3 | | | | | 2.860% | | | 06/10/46 | | | | | 4,600 | | | | 4,560,109 | |
JPMorgan Chase Commercial Mortgage Securities Trust, Series 2005-LDP4, Class AM | | | | | 4.999% | (a) | | 10/15/42 | | | | | 1,820 | | | | 1,856,513 | |
JPMorgan Chase Commercial Mortgage Securities Trust, Series 2007-LD11, Class A2 | | | | | 5.772% | (a) | | 06/15/49 | | | | | 154 | | | | 153,784 | |
SEE NOTES TO FINANCIAL STATEMENTS.
A34
| | | | | | |
| | | DIVERSIFIED BOND PORTFOLIO (continued) | | |
| |
| SCHEDULE OF INVESTMENTS | | December 31, 2014 |
| | | | | | | | | | | | | | | | | | |
COMMERCIAL MORTGAGE-BACKED SECURITIES
(continued) | | | | Interest
Rate
| | | Maturity
Date
| | Principal
Amount
(000)#
| | | Value
(Note 2)
| |
JPMorgan Chase Commercial Mortgage Securities Trust, Series 2007-LD12, Class A3 | | | | | 5.939% | (a) | | 02/15/51 | | | | | 490 | | | $ | 490,440 | |
JPMorgan Chase Commercial Mortgage Securities Trust, Series 2012-LC9, Class A4 | | | | | 2.611% | | | 12/15/47 | | | | | 2,000 | | | | 1,960,912 | |
JPMorgan Chase Commercial Mortgage Securities Trust, Series 2013-C10, Class A4 | | | | | 2.875% | | | 12/15/47 | | | | | 4,600 | | | | 4,584,705 | |
JPMorgan Chase Commercial Mortgage Securities Trust, Series 2013-LC11, Class A4 | | | | | 2.694% | | | 04/15/46 | | | | | 4,600 | | | | 4,496,836 | |
JPMorgan Chase Commercial Mortgage Securities Trust, Series 2014-C21, Class A4 | | | | | 3.493% | | | 08/15/47 | | | | | 3,200 | | | | 3,283,530 | |
LB-UBS Commercial Mortgage Trust, Series 2005-C7, Class AM | | | | | 5.263% | (a) | | 11/15/40 | | | | | 2,100 | | | | 2,165,955 | |
LB-UBS Commercial Mortgage Trust, Series 2006-C7, Class A2 | | | | | 5.300% | | | 11/15/38 | | | | | 880 | | | | 891,752 | |
Merrill Lynch Mortgage Trust, Series 2007-C1, Class A3 | | | | | 5.835% | (a) | | 06/12/50 | | | | | 198 | | | | 198,338 | |
Morgan Stanley Bank of America Merrill Lynch Trust, Series 2013-C8, Class A3 | | | | | 2.863% | | | 12/15/48 | | | | | 1,700 | | | | 1,686,232 | |
Morgan Stanley Bank of America Merrill Lynch Trust, Series 2013-C9, Class A3 | | | | | 2.834% | | | 05/15/46 | | | | | 2,300 | | | | 2,271,498 | |
Morgan Stanley Bank of America Merrill Lynch Trust, Series 2013-C10, Class A3 | | | | | 3.968% | (a) | | 07/15/46 | | | | | 4,800 | | | | 5,173,829 | |
Morgan Stanley Bank of America Merrill Lynch Trust, Series 2013-C12, Class A3 | | | | | 3.973% | | | 10/15/46 | | | | | 3,600 | | | | 3,868,988 | |
Morgan Stanley Bank of America Merrill Lynch Trust, Series 2013-C13, Class A3 | | | | | 3.766% | | | 11/15/46 | | | | | 4,000 | | | | 4,218,420 | |
Morgan Stanley Capital I Trust, Series 2006-T23, Class A3 | | | | | 5.807% | (a) | | 08/12/41 | | | | | 1,002 | | | | 1,001,275 | |
Morgan Stanley Capital I Trust, Series 2007-IQ14, Class AAB | | | | | 5.654% | (a) | | 04/15/49 | | | | | 2,835 | | | | 2,901,453 | |
UBS-Barclays Commercial Mortgage Trust, Series 2012-C4, Class A4 | | | | | 2.792% | | | 12/10/45 | | | | | 2,300 | | | | 2,277,032 | |
UBS-Barclays Commercial Mortgage Trust, Series 2013-C5, Class A3 | | | | | 2.920% | | | 03/10/46 | | | | | 4,600 | | | | 4,598,901 | |
UBS-Barclays Commercial Mortgage Trust, Series 2013-C6, Class A3 | | | | | 2.971% | | | 04/10/46 | | | | | 3,800 | | | | 3,807,893 | |
Wachovia Bank Commercial Mortgage Trust, Series 2005-C20, Class AMFX | | | | | 5.179% | (a) | | 07/15/42 | | | | | 3,145 | | | | 3,211,438 | |
Wachovia Bank Commercial Mortgage Trust, Series 2007-C31, Class A4(d) | | | | | 5.509% | | | 04/15/47 | | | | | 5,150 | | | | 5,424,212 | |
Wachovia Bank Commercial Mortgage Trust, Series 2007-C32, Class A1A | | | | | 5.716% | (a) | | 06/15/49 | | | | | 2,710 | | | | 2,912,561 | |
Wells Fargo Commercial Mortgage Trust, Series 2014-LC16, Class A4 | | | | | 3.548% | | | 08/15/50 | | | | | 4,300 | | | | 4,458,825 | |
| | | | | | | | | | | | | | | | |
|
|
|
TOTAL COMMERCIAL MORTGAGE-BACKED SECURITIES
(cost $108,867,974) | | | | 107,166,762 | |
| | | | | | | | | | | | | | | | |
|
|
|
| CORPORATE BONDS — 45.2% | | | | | | | | | | | | | | | | | | |
Aerospace & Defense — 0.3% | | | | | | | | | | | | | | | | | | |
Textron, Inc., Sr. Unsec’d. Notes | | | | | 7.250% | | | 10/01/19 | | | | | 2,350 | | | | 2,789,567 | |
| | | | | | | | | | | | | | | | |
|
|
|
Airlines — 0.6% | | | | | | | | | | | | | | | | | | |
Continental Airlines, Inc., Pass-Through Trust, Pass-Through Certificates, Series 2001-1, Class A-1 | | | | | 6.703% | | | 06/15/21 | | | | | 2 | | | | 2,534 | |
Continental Airlines, Inc., Pass-Through Trust, Pass-Through Certificates, Series 2001-1, Class B | | | | | 7.373% | | | 12/15/15 | | | | | 394 | | | | 414,817 | |
Continental Airlines, Inc., Pass-Through Trust, Pass-Through Certificates, Series 2007-1, Class A | | | | | 5.983% | | | 04/19/22 | | | | | 1,527 | | | | 1,676,272 | |
Continental Airlines, Inc., Pass-Through Trust, Pass-Through Certificates, Series 2010-1, Class A(d) | | | | | 4.750% | | | 01/12/21 | | | | | 465 | | | | 494,880 | |
Delta Air Lines, Inc., Pass-Through Trust, Pass-Through Certificates., Series 2007-1 Class A | | | | | 6.821% | | | 08/10/22 | | | | | 1,167 | | | | 1,353,571 | |
Delta Air Lines, Inc., Pass-Through Trust, Pass-Through Certificates., Series 2010-2, Class A | | | | | 4.950% | | | 05/23/19 | | | | | 546 | | | | 584,228 | |
Delta Air Lines, Inc., Pass-Through Trust, Pass-Through Certificates., Series 2011-1, Class A | | | | | 5.300% | | | 04/15/19 | | | | | 579 | | | | 629,301 | |
SEE NOTES TO FINANCIAL STATEMENTS.
A35
| | | | | | |
| | | DIVERSIFIED BOND PORTFOLIO (continued) | | |
| |
| SCHEDULE OF INVESTMENTS | | December 31, 2014 |
| | | | | | | | | | | | | | | | | | |
CORPORATE BONDS
(continued) | | | | Interest
Rate
| | | Maturity
Date
| | Principal
Amount
(000)#
| | | Value
(Note 2)
| |
Airlines (continued) | | | | | | | | | | | | | | | | | | |
United Airlines Pass-Through Trust, Pass-Through Certificates, Series 2007-071A, Class A | | | | | 6.636% | | | 07/02/22 | | | | | 853 | | | $ | 921,247 | |
| | | | | | | | | | | | | | | | |
|
|
|
| | | | | | | | | | | | | | | | | | 6,076,850 | |
| | | | | | | | | | | | | | | | |
|
|
|
Automotive — 1.1% | | | | | | | | | | | | | | | | | | |
Ford Motor Co., Sr. Unsec’d. Notes | | | | | 4.750% | | | 01/15/43 | | | | | 750 | | | | 791,340 | |
Ford Motor Credit Co. LLC, Sr. Unsec’d. Notes | | | | | 1.700% | | | 05/09/16 | | | | | 4,620 | | | | 4,636,355 | |
Ford Motor Credit Co. LLC, Sr. Unsec’d. Notes | | | | | 2.375% | | | 01/16/18 | | | | | 2,225 | | | | 2,237,894 | |
Ford Motor Credit Co. LLC, Sr. Unsec’d. Notes | | | | | 3.984% | | | 06/15/16 | | | | | 375 | | | | 388,275 | |
General Motors Co., Sr. Unsec’d. Notes | | | | | 4.875% | | | 10/02/23 | | | | | 1,350 | | | | 1,444,500 | |
General Motors Co., Sr. Unsec’d. Notes | | | | | 6.250% | | | 10/02/43 | | | | | 1,885 | | | | 2,251,821 | |
| | | | | | | | | | | | | | | | |
|
|
|
| | | | | | | | | | | | | | | | | | 11,750,185 | |
| | | | | | | | | | | | | | | | |
|
|
|
Banking — 12.1% | | | | | | | | | | | | | | | | | | |
American Express Co., Jr. Sub. Notes(d) | | | | | 5.200% | (a) | | 05/29/49 | | | | | 655 | | | | 665,213 | |
Bank of America Corp., Jr. Sub Notes, Series K | | | | | 8.000% | (a) | | 12/29/49 | | | | | 3,500 | | | | 3,758,125 | |
Bank of America Corp., Sr. Unsec’d. Notes | | | | | 4.000% | | | 04/01/24 | | | | | 1,150 | | | | 1,197,409 | |
Bank of America Corp., Sr. Unsec’d. Notes | | | | | 5.700% | | | 01/24/22 | | | | | 1,775 | | | | 2,056,226 | |
Bank of America Corp., Sr. Unsec’d. Notes | | | | | 6.000% | | | 09/01/17 | | | | | 4,590 | | | | 5,061,177 | |
Bank of America Corp., Sr. Unsec’d. Notes, MTN | | | | | 3.300% | | | 01/11/23 | | | | | 4,275 | | | | 4,275,329 | |
Bank of America Corp., Sr. Unsec’d. Notes, MTN(d) | | | | | 4.125% | | | 01/22/24 | | | | | 3,750 | | | | 3,938,081 | |
Bank of America Corp., Sr. Unsec’d. Notes, Series 1 | | | | | 3.750% | | | 07/12/16 | | | | | 1,340 | | | | 1,387,917 | |
Bank of America NA, Sub. Notes | | | | | 5.300% | | | 03/15/17 | | | | | 790 | | | | 848,590 | |
Barclays Bank PLC (United Kingdom), Sr. Unsec’d. Notes(d) | | | | | 3.750% | | | 05/15/24 | | | | | 3,375 | | | | 3,478,785 | |
Branch Banking & Trust Co., Sr. Unsec’d. Notes | | | | | 2.850% | | | 04/01/21 | | | | | 3,700 | | | | 3,721,527 | |
Capital One Financial Corp., Sr. Unsec’d. Notes | | | | | 3.750% | | | 04/24/24 | | | | | 2,400 | | | | 2,451,838 | |
Capital One Financial Corp., Sr. Unsec’d. Notes | | | | | 5.250% | | | 02/21/17 | | | | | 2,460 | | | | 2,649,452 | |
Capital One Financial Corp., Sub. Notes | | | | | 6.150% | | | 09/01/16 | | | | | 700 | | | | 752,246 | |
Citigroup, Inc., Sr. Unsec’d. Notes | | | | | 6.125% | | | 11/21/17 | | | | | 2,050 | | | | 2,285,922 | |
Citigroup, Inc., Sr. Unsec’d. Notes(d) | | | | | 8.125% | | | 07/15/39 | | | | | 4,120 | | | | 6,307,448 | |
Citigroup, Inc., Sr. Unsec’d. Notes | | | | | 8.500% | | | 05/22/19 | | | | | 1,375 | | | | 1,713,342 | |
Credit Suisse/New York NY (Switzerland), Sr. Unsec’d. Notes, MTN(d)(e) | | | | | 3.625% | | | 09/09/24 | | | | | 1,050 | | | | 1,068,101 | |
Deutsche Bank AG (Germany), Sr. Unsec’d. Notes | | | | | 3.700% | | | 05/30/24 | | | | | 1,650 | | | | 1,674,366 | |
Discover Bank, Sr. Unsec’d. Notes | | | | | 4.250% | | | 03/13/26 | | | | | 1,150 | | | | 1,192,089 | |
Discover Bank, Sub. Notes | | | | | 7.000% | | | 04/15/20 | | | | | 2,005 | | | | 2,362,979 | |
Fifth Third Bank, Sr. Unsec’d. Notes | | | | | 1.450% | | | 02/28/18 | | | | | 3,275 | | | | 3,238,271 | |
Fifth Third Bank, Sr. Unsec’d. Notes | | | | | 2.375% | | | 04/25/19 | | | | | 425 | | | | 426,935 | |
Goldman Sachs Group, Inc. (The), Sr. Unsec’d. Notes(e) | | | | | 5.750% | | | 01/24/22 | | | | | 4,200 | | | | 4,858,505 | |
Goldman Sachs Group, Inc. (The), Sr. Unsec’d. Notes(d) | | | | | 6.150% | | | 04/01/18 | | | | | 1,355 | | | | 1,520,878 | |
Goldman Sachs Group, Inc. (The), Sr. Unsec’d. Notes | | | | | 6.250% | | | 09/01/17 | | | | | 3,195 | | | | 3,554,917 | |
Goldman Sachs Group, Inc. (The), Sr. Unsec’d. Notes | | | | | 6.250% | | | 02/01/41 | | | | | 2,195 | | | | 2,774,796 | |
Goldman Sachs Group, Inc. (The), Sr. Unsec’d. Notes, Series D | | | | | 6.000% | | | 06/15/20 | | | | | 2,420 | | | | 2,797,588 | |
Goldman Sachs Group, Inc. (The), Sub. Notes | | | | | 6.750% | | | 10/01/37 | | | | | 440 | | | | 553,245 | |
Huntington Bancshares, Inc., Sub. Notes(d) | | | | | 7.000% | | | 12/15/20 | | | | | 260 | | | | 312,918 | |
ICICI Bank Ltd. (India), Jr. Sub. Notes, 144A | | | | | 7.250% | (a) | | 08/29/49 | | | | | 2,380 | | | | 2,388,925 | |
ING Bank NV (Netherlands), Unsec’d. Notes, 144A | | | | | 2.000% | | | 09/25/15 | | | | | 770 | | | | 776,012 | |
Intesa Sanpaolo SpA (Italy), Bank Gtd. Notes | | | | | 3.125% | | | 01/15/16 | | | | | 1,625 | | | | 1,650,683 | |
JPMorgan Chase & Co., Jr. Sub. Notes, Series 1 | | | | | 7.900% | (a) | | 04/29/49 | | | | | 6,130 | | | | 6,597,719 | |
JPMorgan Chase & Co., Jr. Sub. Notes, Series X(d) | | | | | 6.100% | (a) | | 10/29/49 | | | | | 1,450 | | | | 1,446,375 | |
JPMorgan Chase & Co., Sr. Unsec’d. Notes | | | | | 3.150% | | | 07/05/16 | | | | | 2,245 | | | | 2,307,719 | |
JPMorgan Chase & Co., Sr. Unsec’d. Notes | | | | | 3.250% | | | 09/23/22 | | | | | 500 | | | | 502,912 | |
JPMorgan Chase & Co., Sr. Unsec’d. Notes | | | | | 4.250% | | | 10/15/20 | | | | | 600 | | | | 645,060 | |
JPMorgan Chase & Co., Sr. Unsec’d. Notes(e) | | | | | 4.400% | | | 07/22/20 | | | | | 5,100 | | | | 5,528,283 | |
JPMorgan Chase & Co., Sub. Notes | | | | | 5.625% | | | 08/16/43 | | | | | 675 | | | | 784,959 | |
KeyCorp, Sr. Unsec’d. Notes, MTN(d) | | | | | 5.100% | | | 03/24/21 | | | | | 1,155 | | | | 1,303,531 | |
Lloyds Bank PLC (United Kingdom), Bank Gtd. Notes, MTN, 144A | | | | | 5.800% | | | 01/13/20 | | | | | 2,650 | | | | 3,062,194 | |
Mizuho Bank Ltd. (Japan), Gtd. Notes, 144A | | | | | 1.850% | | | 03/21/18 | | | | | 1,125 | | | | 1,118,882 | |
SEE NOTES TO FINANCIAL STATEMENTS.
A36
| | | | | | |
| | | DIVERSIFIED BOND PORTFOLIO (continued) | | |
| |
| SCHEDULE OF INVESTMENTS | | December 31, 2014 |
| | | | | | | | | | | | | | | | | | |
CORPORATE BONDS
(continued) | | | | Interest
Rate
| | | Maturity
Date
| | Principal
Amount
(000)#
| | | Value
(Note 2)
| |
Banking (continued) | | | | | | | | | | | | | | | | | | |
Morgan Stanley, Jr. Sub. Notes, Series H(d) | | | | | 5.450% | (a) | | 12/31/49 | | | | | 975 | | | $ | 976,755 | |
Morgan Stanley, Sr. Unsec’d. Notes | | | | | 5.750% | | | 01/25/21 | | | | | 1,920 | | | | 2,204,066 | |
Morgan Stanley, Sr. Unsec’d. Notes, GMTN | | | | | 5.450% | | | 01/09/17 | | | | | 4,035 | | | | 4,332,436 | |
Morgan Stanley, Sr. Unsec’d. Notes, GMTN | | | | | 5.500% | | | 07/28/21 | | | | | 3,830 | | | | 4,346,594 | |
Morgan Stanley, Sr. Unsec’d. Notes, MTN(d) | | | | | 5.625% | | | 09/23/19 | | | | | 2,635 | | | | 2,974,372 | |
Morgan Stanley, Sub. Notes, GMTN | | | | | 4.350% | | | 09/08/26 | | | | | 750 | | | | 754,481 | |
Northern Trust Corp., Sub. Notes | | | | | 3.950% | | | 10/30/25 | | | | | 3,025 | | | | 3,148,290 | |
People’s United Bank, Sub. Notes | | | | | 4.000% | | | 07/15/24 | | | | | 550 | | | | 557,091 | |
People’s United Financial, Inc., Sr. Unsec’d. Notes | | | | | 3.650% | | | 12/06/22 | | | | | 1,675 | | | | 1,688,542 | |
PNC Financial Services Group, Inc. (The), Sub. Notes(d) | | | | | 3.900% | | | 04/29/24 | | | | | 975 | | | | 990,960 | |
Royal Bank of Scotland Group PLC (The) (United Kingdom),
Sr. Unsec’d. Notes | | | | | 2.550% | | | 09/18/15 | | | | | 625 | | | | 631,257 | |
Santander Holdings USA, Inc., Sr. Unsec’d. Notes | | | | | 3.000% | | | 09/24/15 | | | | | 950 | | | | 961,387 | |
Santander Holdings USA, Inc., Sr. Unsec’d. Notes(d) | | | | | 4.625% | | | 04/19/16 | | | | | 525 | | | | 546,893 | |
State Street Corp., Jr. Sub. Debs. | | | | | 4.956% | | | 03/15/18 | | | | | 3,025 | | | | 3,276,223 | |
Sumitomo Mitsui Banking Corp. (Japan), Bank Gtd. Notes | | | | | 2.450% | | | 01/10/19 | | | | | 625 | | | | 627,829 | |
| | | | | | | | | | | | | | | | |
|
|
|
| | | | | | | | | | | | | | | | | | 129,014,645 | |
| | | | | | | | | | | | | | | | |
|
|
|
Brokerage — 0.2% | | | | | | | | | | | | | | | | | | |
Jefferies Group LLC, Sr. Unsec’d. Notes | | | | | 6.500% | | | 01/20/43 | | | | | 650 | | | | 663,053 | |
Lehman Brothers Holdings, Inc., Sr. Unsec’d. Notes(f) | | | | | 6.875% | | | 05/02/18 | | | | | 2,740 | | | | 407,575 | |
Nomura Holdings, Inc. (Japan), Sr. Unsec’d. Notes, MTN | | | | | 2.000% | | | 09/13/16 | | | | | 950 | | | | 957,663 | |
| | | | | | | | | | | | | | | | |
|
|
|
| | | | | | | | | | | | | | | | | | 2,028,291 | |
| | | | | | | | | | | | | | | | |
|
|
|
Building Materials & Construction — 0.9% | | | | | | | | | | | | | | | | | | |
Cemex Espana Luxembourg (Mexico), Sr. Sec’d. Notes, RegS | | | | | 9.875% | | | 04/30/19 | | | | | 1,233 | | | | 1,353,217 | |
Cemex Finance LLC (Mexico), Sr. Sec’d. Notes, 144A | | | | | 9.875% | | | 04/30/19 | | | | | 1,360 | | | | 1,492,600 | |
Cemex SAB de CV (Mexico), Sr. Sec’d. Notes, 144A | | | | | 4.750% | | | 01/11/22
| | EUR | | | 900 | | | | 1,065,906 | |
Mohawk Industries, Inc., Sr. Unsec’d. Notes | | | | | 3.850% | | | 02/01/23 | | | | | 294 | | | | 294,118 | |
Odebrecht Finance Ltd. (Brazil), Gtd. Notes, 144A (original cost $1,275,000; purchased 06/19/14)(b)(c) | | | | | 5.250% | | | 06/27/29 | | | | | 1,275 | | | | 1,114,988 | |
Toll Brothers Finance Corp., Gtd. Notes | | | | | 5.150% | | | 05/15/15 | | | | | 4,695 | | | | 4,741,950 | |
| | | | | | | | | | | | | | | | |
|
|
|
| | | | | | | | | | | | | | | | | | 10,062,779 | |
| | | | | | | | | | | | | | | | |
|
|
|
Cable — 1.7% | | | | | | | | | | | | | | | | | | |
British Sky Broadcasting Group PLC (United Kingdom),
Gtd. Notes, 144A | | | | | 6.100% | | | 02/15/18 | | | | | 210 | | | | 233,713 | |
CCO Holdings LLC/CCO Holdings Capital Corp., Gtd. Notes | | | | | 7.000% | | | 01/15/19 | | | | | 2,000 | | | | 2,075,000 | |
CCO Holdings LLC/CCO Holdings Capital Corp., Gtd. Notes | | | | | 7.375% | | | 06/01/20 | | | | | 1,100 | | | | 1,166,000 | |
CCO Holdings LLC/CCO Holdings Capital Corp., Gtd. Notes | | | | | 8.125% | | | 04/30/20 | | | | | 1,000 | | | | 1,052,500 | |
CSC Holdings LLC, Sr. Unsec’d. Notes | | | | | 6.750% | | | 11/15/21 | | | | | 2,225 | | | | 2,458,625 | |
CSC Holdings LLC, Sr. Unsec’d. Notes | | | | | 8.625% | | | 02/15/19 | | | | | 1,610 | | | | 1,871,625 | |
DIRECTV Holdings LLC/DIRECTV Financing Co., Inc., Gtd. Notes | | | | | 3.500% | | | 03/01/16 | | | | | 2,825 | | | | 2,898,687 | |
DIRECTV Holdings LLC/DIRECTV Financing Co., Inc., Gtd. Notes | | | | | 3.550% | | | 03/15/15 | | | | | 275 | | | | 276,632 | |
NBCUniversal Media LLC, Gtd. Notes | | | | | 4.450% | | | 01/15/43 | | | | | 290 | | | | 307,288 | |
TCI Communications, Inc., Sr. Unsec’d. Notes | | | | | 7.875% | | | 02/15/26 | | | | | 750 | | | | 1,046,106 | |
Time Warner Cable, Inc., Gtd. Notes | | | | | 6.750% | | | 07/01/18 | | | | | 2,620 | | | | 3,004,818 | |
Virgin Media Secured Finance PLC (United Kingdom),
Sr. Sec’d. Notes, 144A | | | | | 6.000% | | | 04/15/21 | | GBP | | | 1,050 | | | | 1,722,452 | |
| | | | | | | | | | | | | | | | |
|
|
|
| | | | | | | | | | | | | | | | | | 18,113,446 | |
| | | | | | | | | | | | | | | | |
|
|
|
Capital Goods — 1.7% | | | | | | | | | | | | | | | | | | |
Ashtead Capital, Inc. (United Kingdom), Sec’d. Notes, 144A | | | | | 6.500% | | | 07/15/22 | | | | | 1,375 | | | | 1,460,937 | |
ERAC USA Finance LLC, Gtd. Notes, 144A
(original cost $1,098,609; purchased 05/30/13)(b)(c) | | | | | 6.700% | | | 06/01/34 | | | | | 920 | | | | 1,183,482 | |
ERAC USA Finance LLC, Gtd. Notes, 144A
(original cost $996,365; purchased 05/14/13)(b)(c) | | | | | 7.000% | | | 10/15/37 | | | | | 770 | | | | 1,037,662 | |
General Electric Co., Sr. Unsec’d. Notes | | | | | 4.125% | | | 10/09/42 | | | | | 500 | | | | 517,606 | |
General Electric Co., Sr. Unsec’d. Notes | | | | | 4.500% | | | 03/11/44 | | | | | 740 | | | | 813,424 | |
SEE NOTES TO FINANCIAL STATEMENTS.
A37
| | | | | | |
| | | DIVERSIFIED BOND PORTFOLIO (continued) | | |
| |
| SCHEDULE OF INVESTMENTS | | December 31, 2014 |
| | | | | | | | | | | | | | | | | | |
CORPORATE BONDS
(continued) | | | | Interest
Rate
| | | Maturity
Date
| | Principal
Amount
(000)#
| | | Value
(Note 2)
| |
Capital Goods (continued) | | | | | | | | | | | | | | | | | | |
Hertz Corp. (The), Gtd. Notes | | | | | 6.750% | | | 04/15/19 | | | | | 1,500 | | | $ | 1,545,000 | |
Ingersoll-Rand Global Holding Co. Ltd., Gtd. Notes | | | | | 5.750% | | | 06/15/43 | | | | | 425 | | | | 500,915 | |
Penske Truck Leasing Co. LP/PTL Finance Corp., Sr. Unsec’d. Notes, 144A (original cost $2,022,003; purchased 09/24/12)(b)(c) | | | | | 2.500% | | | 03/15/16 | | | | | 2,025 | | | | 2,052,868 | |
Penske Truck Leasing Co. LP/PTL Finance Corp., Unsec’d. Notes, 144A (original cost $674,345; purchased 05/08/12)(b)(c) | | | | | 3.125% | | | 05/11/15 | | | | | 675 | | | | 680,467 | |
Pentair Finance SA, Gtd. Notes | | | | | 1.875% | | | 09/15/17 | | | | | 625 | | | | 624,244 | |
Rockwell Automation, Inc., Sr. Unsec’d. Notes | | | | | 5.200% | | | 01/15/98 | | | | | 1,100 | | | | 1,164,830 | |
United Rentals North America, Inc., Gtd. Notes(d) | | | | | 7.625% | | | 04/15/22 | | | | | 2,700 | | | | 2,968,650 | |
United Technologies Corp., Sr. Unsec’d. Notes(d) | | | | | 4.500% | | | 06/01/42 | | | | | 1,675 | | | | 1,823,722 | |
Xylem, Inc., Sr. Unsec’d. Notes | | | | | 4.875% | | | 10/01/21 | | | | | 1,960 | | | | 2,117,468 | |
| | | | | | | | | | | | | | | | |
|
|
|
| | | | | | | | | | | | | | | | | | 18,491,275 | |
| | | | | | | | | | | | | | | | |
|
|
|
Chemicals — 1.6% | | | | | | | | | | | | | | | | | | |
Agrium, Inc. (Canada), Sr. Unsec’d. Notes | | | | | 4.900% | | | 06/01/43 | | | | | 870 | | | | 901,185 | |
Agrium, Inc. (Canada), Sr. Unsec’d. Notes | | | | | 5.250% | | | 01/15/45 | | | | | 420 | | | | 453,648 | |
Agrium, Inc. (Canada), Sr. Unsec’d. Notes | | | | | 6.125% | | | 01/15/41 | | | | | 450 | | | | 533,886 | |
Ashland, Inc., Gtd. Notes(d) | | | | | 4.750% | | | 08/15/22 | | | | | 875 | | | | 875,000 | |
CF Industries, Inc., Gtd. Notes | | | | | 4.950% | | | 06/01/43 | | | | | 675 | | | | 672,870 | |
CF Industries, Inc., Gtd. Notes | | | | | 5.375% | | | 03/15/44 | | | | | 700 | | | | 755,227 | |
CF Industries, Inc., Gtd. Notes | | | | | 6.875% | | | 05/01/18 | | | | | 380 | | | | 431,995 | |
CF Industries, Inc., Gtd. Notes | | | | | 7.125% | | | 05/01/20 | | | | | 300 | | | | 357,410 | |
Dow Chemical Co. (The), Sr. Unsec’d. Notes | | | | | 4.625% | | | 10/01/44 | | | | | 125 | | | | 126,587 | |
Dow Chemical Co. (The), Sr. Unsec’d. Notes | | | | | 9.400% | | | 05/15/39 | | | | | 1,002 | | | | 1,625,778 | |
LyondellBasell Industries NV, Sr. Unsec’d. Notes | | | | | 6.000% | | | 11/15/21 | | | | | 3,550 | | | | 4,085,904 | |
Mexichem SAB de CV (Mexico), Gtd. Notes, 144A | | | | | 6.750% | | | 09/19/42 | | | | | 1,065 | | | | 1,104,938 | |
Monsanto Co., Sr. Unsec’d. Notes | | | | | 4.200% | | | 07/15/34 | | | | | 225 | | | | 234,450 | |
Monsanto Co., Sr. Unsec’d. Notes | | | | | 4.400% | | | 07/15/44 | | | | | 275 | | | | 285,324 | |
Mosaic Co. (The), Sr. Unsec’d. Notes | | | | | 5.450% | | | 11/15/33 | | | | | 465 | | | | 526,104 | |
Mosaic Co. (The), Sr. Unsec’d. Notes | | | | | 5.625% | | | 11/15/43 | | | | | 155 | | | | 177,632 | |
Union Carbide Corp., Sr. Unsec’d. Notes | | | | | 7.875% | | | 04/01/23 | | | | | 3,058 | | | | 3,854,673 | |
| | | | | | | | | | | | | | | | |
|
|
|
| | | | | | | | | | | | | | | | | | 17,002,611 | |
| | | | | | | | | | | | | | | | |
|
|
|
Consumer — 0.2% | | | | | | | | | | | | | | | | | | |
Service Corp. International, Sr. Unsec’d. Notes | | | | | 7.625% | | | 10/01/18 | | | | | 2,000 | | | | 2,230,800 | |
| | | | | | | | | | | | | | | | |
|
|
|
Electric — 3.5% | | | | | | | | | | | | | | | | | | |
AES Corp. (The), Sr. Unsec’d. Notes | | | | | 8.000% | | | 10/15/17 | | | | | 4,000 | | | | 4,490,000 | |
Baltimore Gas & Electric Co., Sr. Unsec’d. Notes | | | | | 3.350% | | | 07/01/23 | | | | | 550 | | | | 563,751 | |
Calpine Corp., Sr. Unsec’d. Notes(d) | | | | | 5.375% | | | 01/15/23 | | | | | 800 | | | | 808,000 | |
Calpine Corp., Sr. Unsec’d. Notes | | | | | 5.750% | | | 01/15/25 | | | | | 850 | | | | 860,625 | |
Covanta Holding Corp., Sr. Unsec’d. Notes | | | | | 7.250% | | | 12/01/20 | | | | | 2,500 | | | | 2,656,250 | |
Duke Energy Corp., Sr. Unsec’d. Notes | | | | | 2.100% | | | 06/15/18 | | | | | 3,775 | | | | 3,809,485 | |
El Paso Electric Co., Sr. Unsec’d. Notes | | | | | 6.000% | | | 05/15/35 | | | | | 2,325 | | | | 2,913,809 | |
Enel Finance International NV (Netherlands), Gtd. Notes, 144A | | | | | 6.000% | | | 10/07/39 | | | | | 1,450 | | | | 1,703,789 | |
Exelon Corp., Sr. Unsec’d. Notes | | | | | 4.900% | | | 06/15/15 | | | | | 500 | | | | 508,942 | |
Exelon Generation Co. LLC, Sr. Unsec’d. Notes(d) | | | | | 6.200% | | | 10/01/17 | | | | | 1,930 | | | | 2,144,664 | |
Exelon Generation Co. LLC, Sr. Unsec’d. Notes | | | | | 6.250% | | | 10/01/39 | | | | | 1,900 | | | | 2,282,035 | |
FirstEnergy Corp., Series A, Sr. Unsec’d. Notes | | | | | 2.750% | | | 03/15/18 | | | | | 1,800 | | | | 1,813,912 | |
FirstEnergy Transmission LLC, Sr. Unsec’d. Notes, 144A | | | | | 5.450% | | | 07/15/44 | | | | | 400 | | | | 431,146 | |
Iberdrola International BV (Spain), Gtd. Notes | | | | | 6.750% | | | 09/15/33 | | | | | 1,150 | | | | 1,426,729 | |
NRG Energy, Inc., Gtd. Notes(d) | | | | | 6.625% | | | 03/15/23 | | | | | 2,750 | | | | 2,860,000 | |
Pacific Gas & Electric Co., Sr. Unsec’d. Notes | | | | | 4.600% | | | 06/15/43 | | | | | 1,950 | | | | 2,080,225 | |
South Carolina Electric & Gas Co., First Mortgage | | | | | 4.600% | | | 06/15/43 | | | | | 2,025 | | | | 2,204,617 | |
TransAlta Corp. (Canada), Sr. Unsec’d. Notes | | | | | 6.650% | | | 05/15/18 | | | | | 1,953 | | | | 2,191,430 | |
Xcel Energy, Inc., Sr. Unsec’d. Notes | | | | | 5.613% | | | 04/01/17 | | | | | 1,947 | | | | 2,124,820 | |
| | | | | | | | | | | | | | | | |
|
|
|
| | | | | | | | | | | | | | | | | | 37,874,229 | |
| | | | | | | | | | | | | | | | |
|
|
|
SEE NOTES TO FINANCIAL STATEMENTS.
A38
| | | | | | |
| | | DIVERSIFIED BOND PORTFOLIO (continued) | | |
| |
| SCHEDULE OF INVESTMENTS | | December 31, 2014 |
| | | | | | | | | | | | | | | | | | |
CORPORATE BONDS
(continued) | | | | Interest
Rate
| | | Maturity
Date
| | Principal
Amount
(000)#
| | | Value
(Note 2)
| |
Energy – Integrated — 0.7% | | | | | | | | | | | | | | | | | | |
Lukoil International Finance BV (Netherlands), Gtd. Notes, 144A | | | | | 7.250% | | | 11/05/19 | | | | | 1,300 | | | $ | 1,229,740 | |
Pacific Rubiales Energy Corp. (Colombia), Gtd. Notes, 144A(d) | | | | | 5.375% | | | 01/26/19 | | | | | 870 | | | | 749,505 | |
Pacific Rubiales Energy Corp. (Colombia), Gtd. Notes, 144A | | | | | 7.250% | | | 12/12/21 | | | | | 1,040 | | | | 904,800 | |
Pacific Rubiales Energy Corp. (Colombia), Sr. Unsec’d. Notes, RegS | | | | | 7.250% | | | 12/12/21 | | | | | 1,540 | | | | 1,339,800 | |
Reliance Holding USA, Inc. (India), Gtd. Notes, 144A | | | | | 5.400% | | | 02/14/22 | | | | | 510 | | | | 552,487 | |
Rosneft Finance SA (Russia), Gtd. Notes, 144A | | | | | 6.625% | | | 03/20/17 | | | | | 585 | | | | 544,050 | |
Sasol Financing International PLC (South Africa), Gtd. Notes | | | | | 4.500% | | | 11/14/22 | | | | | 2,725 | | | | 2,702,928 | |
| | | | | | | | | | | | | | | | |
|
|
|
| | | | | | | | | | | | | | | | | | 8,023,310 | |
| | | | | | | | | | | | | | | | |
|
|
|
Energy – Other — 1.3% | | | | | | | | | | | | | | | | | | |
Afren PLC (United Kingdom), Sr. Sec’d. Notes, RegS | | | | | 11.500% | | | 02/01/16 | | | | | 600 | | | | 498,000 | |
Anadarko Petroleum Corp., Sr. Unsec’d. Notes | | | | | 4.677% | (g) | | 10/10/36 | | | | | 2,000 | | | | 758,548 | |
Anadarko Petroleum Corp., Sr. Unsec’d. Notes | | | | | 6.375% | | | 09/15/17 | | | | | 3,265 | | | | 3,630,033 | |
Anadarko Petroleum Corp., Sr. Unsec’d. Notes | | | | | 6.450% | | | 09/15/36 | | | | | 340 | | | | 408,576 | |
Anadarko Petroleum Corp., Sr. Unsec’d. Notes | | | | | 6.950% | | | 06/15/19 | | | | | 250 | | | | 292,088 | |
Cameron International Corp., Sr. Unsec’d. Notes | | | | | 7.000% | | | 07/15/38 | | | | | 450 | | | | 552,476 | |
Nabors Industries, Inc., Gtd. Notes | | | | | 4.625% | | | 09/15/21 | | | | | 1,650 | | | | 1,550,244 | |
Noble Energy, Inc., Sr. Unsec’d. Notes | | | | | 6.000% | | | 03/01/41 | | | | | 1,530 | | | | 1,681,525 | |
Pioneer Natural Resources Co., Sr. Unsec’d. Notes | | | | | 6.875% | | | 05/01/18 | | | | | 1,750 | | | | 1,958,994 | |
Precision Drilling Corp. (Canada), Gtd. Notes | | | | | 6.625% | | | 11/15/20 | | | | | 1,000 | | | | 900,000 | |
Transocean, Inc., Gtd. Notes | | | | | 2.500% | | | 10/15/17 | | | | | 725 | | | | 640,932 | |
Weatherford International Ltd., Gtd. Notes | | | | | 5.125% | | | 09/15/20 | | | | | 1,165 | | | | 1,144,565 | |
| | | | | | | | | | | | | | | | |
|
|
|
| | | | | | | | | | | | | | | | | | 14,015,981 | |
| | | | | | | | | | | | | | | | |
|
|
|
Foods — 0.9% | | | | | | | | | | | | | | | | | | |
Aramark Corp., Gtd. Notes | | | | | 5.750% | | | 03/15/20 | | | | | 1,350 | | | | 1,393,875 | |
BRF SA (Brazil), Sr. Unsec’d. Notes, 144A | | | | | 3.950% | | | 05/22/23 | | | | | 1,655 | | | | 1,530,047 | |
BRF SA (Brazil), Sr. Unsec’d. Notes, 144A | | | | | 4.750% | | | 05/22/24 | | | | | 775 | | | | 752,719 | |
Coca-Cola Icecek A/S (Turkey), Sr. Unsec’d. Notes, 144A | | | | | 4.750% | | | 10/01/18 | | | | | 375 | | | | 399,229 | |
Corp. Pesquera Inca SAC (Peru), Gtd. Notes, 144A | | | | | 9.000% | | | 02/10/17 | | | | | 1,000 | | | | 990,000 | |
JBS Finance II Ltd. (Brazil), Gtd. Notes, 144A | | | | | 8.250% | | | 01/29/18 | | | | | 1,200 | | | | 1,227,000 | |
JBS USA LLC/JBS USA Finance, Inc. (Brazil), Gtd. Notes, 144A (original cost $1,226,925; purchased 12/08/11)(b)(c) | | | | | 7.250% | | | 06/01/21 | | | | | 1,330 | | | | 1,369,900 | |
Minerva Luxembourg SA (Brazil), Gtd. Notes, 144A | | | | | 12.250% | | | 02/10/22 | | | | | 725 | | | | 834,475 | |
Tyson Foods, Inc., Gtd. Notes | | | | | 6.600% | | | 04/01/16 | | | | | 1,000 | | | | 1,066,004 | |
| | | | | | | | | | | | | | | | |
|
|
|
| | | | | | | | | | | | | | | | | | 9,563,249 | |
| | | | | | | | | | | | | | | | |
|
|
|
Gaming — 0.2% | | | | | | | | | | | | | | | | | | |
Pinnacle Entertainment, Inc., Gtd. Notes | | | | | 7.500% | | | 04/15/21 | | | | | 1,550 | | | | 1,615,859 | |
| | | | | | | | | | | | | | | | |
|
|
|
Healthcare & Pharmaceutical — 2.5% | | | | | | | | | | | | | | | | | | |
Actavis Funding SSC, Gtd. Notes | | | | | 4.850% | | | 06/15/44 | | | | | 680 | | | | 690,021 | |
Amgen, Inc., Sr. Unsec’d. Notes | | | | | 5.150% | | | 11/15/41 | | | | | 2,635 | | | | 2,970,040 | |
CHS/Community Health Systems, Inc., Gtd. Notes | | | | | 8.000% | | | 11/15/19 | | | | | 3,400 | | | | 3,629,500 | |
ConvaTec Finance International SA (Luxembourg), Sr. Unsec’d. Notes, 144A | | | | | 8.250% | | | 01/15/19 | | | | | 2,300 | | | | 2,334,500 | |
Gilead Sciences, Inc., Sr. Unsec’d. Notes | | | | | 5.650% | | | 12/01/41 | | | | | 250 | | | | 309,545 | |
HCA, Inc., Gtd. Notes | | | | | 8.000% | | | 10/01/18 | | | | | 2,250 | | | | 2,576,250 | |
Laboratory Corp. of America Holdings, Sr. Unsec’d. Notes(d) | | | | | 3.750% | | | 08/23/22 | | | | | 225 | | | | 230,193 | |
LifePoint Hospitals, Inc., Gtd. Notes | | | | | 6.625% | | | 10/01/20 | | | | | 1,000 | | | | 1,055,000 | |
Medtronic, Inc., 144A | | | | | 4.375% | | | 03/15/35 | | | | | 1,450 | | | | 1,538,241 | |
Medtronic, Inc., Sr. Unsec’d. Notes, 144A | | | | | 3.500% | | | 03/15/25 | | | | | 3,435 | | | | 3,513,902 | |
Merck & Co, Inc., Sr. Unsec’d. Notes(d) | | | | | 4.150% | | | 05/18/43 | | | | | 2,075 | | | | 2,207,615 | |
Pfizer, Inc., Sr. Unsec’d. Notes(d) | | | | | 4.300% | | | 06/15/43 | | | | | 1,550 | | | | 1,659,962 | |
Tenet Healthcare Corp., Sr. Unsec’d. Notes(d) | | | | | 8.000% | | | 08/01/20 | | | | | 1,570 | | | | 1,656,350 | |
Valeant Pharmaceuticals International, Gtd. Notes, 144A | | | | | 6.750% | | | 08/15/18 | | | | | 2,000 | | | | 2,127,540 | |
| | | | | | | | | | | | | | | | |
|
|
|
| | | | | | | | | | | | | | | | | | 26,498,659 | |
| | | | | | | | | | | | | | | | |
|
|
|
SEE NOTES TO FINANCIAL STATEMENTS.
A39
| | | | | | |
| | | DIVERSIFIED BOND PORTFOLIO (continued) | | |
| |
| SCHEDULE OF INVESTMENTS | | December 31, 2014 |
| | | | | | | | | | | | | | | | | | |
CORPORATE BONDS
(continued) | | | | Interest
Rate
| | | Maturity
Date
| | Principal
Amount
(000)#
| | | Value
(Note 2)
| |
Healthcare Insurance — 1.3% | | | | | | | | | | | | | | | | | | |
Aetna, Inc., Sr. Unsec’d. Notes | | | | | 6.750% | | | 12/15/37 | | | | | 1,900 | | | $ | 2,505,860 | |
Anthem, Inc., Sr. Unsec’d. Notes | | | | | 4.650% | | | 01/15/43 | | | | | 385 | | | | 400,693 | |
Cigna Corp., Sr. Unsec’d. Notes | | | | | 4.375% | | | 12/15/20 | | | | | 745 | | | | 800,125 | |
Cigna Corp., Sr. Unsec’d. Notes | | | | | 5.375% | | | 03/15/17 | | | | | 2,125 | | | | 2,295,557 | |
Cigna Corp., Sr. Unsec’d. Notes | | | | | 5.875% | | | 03/15/41 | | | | | 750 | | | | 933,750 | |
Coventry Health Care, Inc., Sr. Unsec’d. Notes | | | | | 6.125% | | | 01/15/15 | | | | | 4,025 | | | | 4,030,639 | |
UnitedHealth Group, Inc., Sr. Unsec’d. Notes(d) | | | | | 4.250% | | | 03/15/43 | | | | | 1,200 | | | | 1,258,038 | |
UnitedHealth Group, Inc., Sr. Unsec’d. Notes | | | | | 6.500% | | | 06/15/37 | | | | | 760 | | | | 1,018,387 | |
UnitedHealth Group, Inc., Sr. Unsec’d. Notes | | | | | 6.625% | | | 11/15/37 | | | | | 195 | | | | 266,318 | |
| | | | | | | | | | | | | | | | |
|
|
|
| | | | | | | | | | | | | | | | | | 13,509,367 | |
| | | | | | | | | | | | | | | | |
|
|
|
Insurance — 3.5% | | | | | | | | | | | | | | | | | | |
Allied World Assurance Co. Ltd., Gtd. Notes | | | | | 5.500% | | | 11/15/20 | | | | | 430 | | | | 479,630 | |
Allied World Assurance Co. Ltd., Gtd. Notes | | | | | 7.500% | | | 08/01/16 | | | | | 2,475 | | | | 2,701,844 | |
American International Group, Inc., Sr. Unsec’d. Notes | | | | | 4.500% | | | 07/16/44 | | | | | 1,075 | | | | 1,135,749 | |
American International Group, Inc., Sr. Unsec’d. Notes | | | | | 5.050% | | | 10/01/15 | | | | | 315 | | | | 324,558 | |
American International Group, Inc., Sr. Unsec’d. Notes | | | | | 6.400% | | | 12/15/20 | | | | | 950 | | | | 1,132,847 | |
American International Group, Inc., Sr. Unsec’d. Notes, MTN | | | | | 5.850% | | | 01/16/18 | | | | | 3,700 | | | | 4,136,970 | |
Berkshire Hathaway, Inc., Sr. Unsec’d. Notes(d) | | | | | 3.000% | | | 02/11/23 | | | | | 1,850 | | | | 1,867,390 | |
Berkshire Hathaway, Inc., Sr. Unsec’d. Notes(d) | | | | | 4.500% | | | 02/11/43 | | | | | 1,350 | | | | 1,476,375 | |
Chubb Corp. (The), Jr. Sub. Notes(d) | | | | | 6.375% | (a) | | 03/29/67 | | | | | 1,775 | | | | 1,902,889 | |
Dai-ichi Life Insurance Co. Ltd. (The) (Japan), Sub. Notes, 144A | | | | | 5.100% | (a) | | 10/29/49 | | | | | 515 | | | | 536,244 | |
Endurance Specialty Holdings Ltd., Sr. Unsec’d. Notes | | | | | 7.000% | | | 07/15/34 | | | | | 1,350 | | | | 1,683,007 | |
Hartford Financial Services Group, Inc., Sr. Unsec’d. Notes | | | | | 5.125% | | | 04/15/22 | | | | | 500 | | | | 562,044 | |
Liberty Mutual Group, Inc., Sr. Unsec’d. Notes, 144A | | | | | 6.500% | | | 03/15/35 | | | | | 1,030 | | | | 1,258,419 | |
Lincoln National Corp., Jr. Sub. Notes | | | | | 6.050% | (a) | | 04/20/67 | | | | | 350 | | | | 350,000 | |
Lincoln National Corp., Sr. Unsec’d. Notes | | | | | 7.000% | | | 06/15/40 | | | | | 1,265 | | | | 1,754,340 | |
Lincoln National Corp., Sr. Unsec’d. Notes | | | | | 8.750% | | | 07/01/19 | | | | | 1,265 | | | | 1,580,655 | |
Markel Corp., Sr. Unsec’d. Notes | | | | | 5.000% | | | 03/30/43 | | | | | 350 | | | | 371,663 | |
Massachusetts Mutual Life Insurance Co., Sub. Notes, 144A | | | | | 8.875% | | | 06/01/39 | | | | | 1,200 | | | | 1,936,196 | |
Nippon Life Insurance Co. (Japan), Sub. Notes, 144A | | | | | 5.100% | (a) | | 10/16/44 | | | | | 2,075 | | | | 2,168,375 | |
Northwestern Mutual Life Insurance Co. (The), Sub. Notes, 144A | | | | | 6.063% | | | 03/30/40 | | | | | 500 | | | | 646,311 | |
Ohio National Financial Services, Inc., Sr. Unsec’d. Notes, 144A | | | | | 6.375% | | | 04/30/20 | | | | | 850 | | | | 975,879 | |
Principal Financial Group, Inc., Gtd. Notes | | | | | 4.625% | | | 09/15/42 | | | | | 150 | | | | 157,450 | |
Progressive Corp. (The), Jr. Sub. Notes | | | | | 6.700% | (a) | | 06/15/37 | | | | | 1,015 | | | | 1,097,976 | |
Teachers Insurance & Annuity Association of America, Sub. Notes, 144A | | | | | 6.850% | | | 12/16/39 | | | | | 2,310 | | | | 3,155,065 | |
Unum Group, Sr. Unsec’d. Notes | | | | | 5.625% | | | 09/15/20 | | | | | 500 | | | | 563,022 | |
Willis Group Holdings PLC, Gtd. Notes | | | | | 4.125% | | | 03/15/16 | | | | | 1,280 | | | | 1,319,236 | |
XLIT Ltd. (Ireland), Jr. Sub. Notes, Series E | | | | | 6.500% | (a) | | 10/29/49 | | | | | 1,880 | | | | 1,795,400 | |
| | | | | | | | | | | | | | | | |
|
|
|
| | | | | | | | | | | | | | | | | | 37,069,534 | |
| | | | | | | | | | | | | | | | |
|
|
|
Lodging — 0.4% | | | | | | | | | | | | | | | | | | |
Marriott International, Inc., Sr. Unsec’d. Notes | | | | | 3.250% | | | 09/15/22 | | | | | 1,325 | | | | 1,330,324 | |
Wyndham Worldwide Corp., Sr. Unsec’d. Notes | | | | | 2.950% | | | 03/01/17 | | | | | 2,420 | | | | 2,471,386 | |
| | | | | | | | | | | | | | | | |
|
|
|
| | | | | | | | | | | | | | | | | | 3,801,710 | |
| | | | | | | | | | | | | | | | |
|
|
|
Media & Entertainment — 1.9% | | | | | | | | | | | | | | | | | | |
21st Century Fox America, Inc., Gtd. Notes | | | | | 6.150% | | | 03/01/37 | | | | | 460 | | | | 576,521 | |
21st Century Fox America, Inc., Gtd. Notes | | | | | 6.900% | | | 08/15/39 | | | | | 65 | | | | 88,119 | |
21st Century Fox America, Inc., Gtd. Notes | | | | | 7.625% | | | 11/30/28 | | | | | 1,415 | | | | 1,876,226 | |
AMC Networks, Inc., Gtd. Notes | | | | | 7.750% | | | 07/15/21 | | | | | 3,750 | | | | 4,012,500 | |
Cedar Fair LP/Canada’s Wonderland Co./Magnum Management Corp., Gtd. Notes, 144A(d) | | | | | 5.375% | | | 06/01/24 | | | | | 425 | | | | 422,875 | |
Gannett Co., Inc., Gtd. Notes, 144A(d) | | | | | 4.875% | | | 09/15/21 | | | | | 475 | | | | 471,438 | |
Historic TW, Inc., Gtd. Notes | | | | | 6.625% | | | 05/15/29 | | | | | 1,837 | | | | 2,328,708 | |
Liberty Interactive LLC, Sr. Unsec’d. Notes(d) | | | | | 8.250% | | | 02/01/30 | | | | | 2,250 | | | | 2,430,000 | |
Myriad International Holdings BV (South Africa), Gtd. Notes, 144A | | | | | 6.000% | | | 07/18/20 | | | | | 1,035 | | | | 1,130,738 | |
RR Donnelley & Sons Co., Sr. Unsec’d. Notes | | | | | 8.600% | | | 08/15/16 | | | | | 4,750 | | | | 5,201,250 | |
SEE NOTES TO FINANCIAL STATEMENTS.
A40
| | | | | | |
| | | DIVERSIFIED BOND PORTFOLIO (continued) | | |
| |
| SCHEDULE OF INVESTMENTS | | December 31, 2014 |
| | | | | | | | | | | | | | | | | | |
CORPORATE BONDS
(continued) | | | | Interest
Rate
| | | Maturity
Date
| | Principal
Amount
(000)#
| | | Value
(Note 2)
| |
Media & Entertainment (continued) | | | | | | | | | | | | | | | | | | |
Time Warner Cos., Inc., Gtd. Notes | | | | | 7.250% | | | 10/15/17 | | | | | 1,440 | | | $ | 1,650,243 | |
Viacom, Inc., Sr. Unsec’d. Notes (original cost $82,665; purchased 07/25/13-11/25/13)(b)(c) | | | | | 4.500% | | | 02/27/42 | | | | | 95 | | | | 92,617 | |
Viacom, Inc., Sr. Unsec’d. Notes (original cost $432,485; purchased 08/06/13-02/11/14)(b)(c) | | | | | 4.875% | | | 06/15/43 | | | | | 475 | | | | 464,224 | |
| | | | | | | | | | | | | | | | |
|
|
|
| | | | | | | | | | | | | | | | | | 20,745,459 | |
| | | | | | | | | | | | | | | | |
|
|
|
Metals — 1.0% | | | | | | | | | | | | | | | | | | |
Alcoa, Inc., Sr. Unsec’d. Notes | | | | | 5.125% | | | 10/01/24 | | | | | 425 | | | | 450,402 | |
BHP Billiton Finance USA Ltd. (Australia), Gtd. Notes | | | | | 5.000% | | | 09/30/43 | | | | | 1,250 | | | | 1,416,901 | |
CITIC Pacific Ltd. (China), Sr. Unsec’d. Notes, MTN | | | | | 6.875% | | | 01/21/18 | | | | | 1,100 | | | | 1,214,774 | |
FMG Resources (August 2006) Pty Ltd. (Australia), Gtd. Notes, 144A(d) | | | | | 6.000% | | | 04/01/17 | | | | | 1,000 | | | | 956,250 | |
Goldcorp, Inc. (Canada), Sr. Unsec’d. Notes | | | | | 3.625% | | | 06/09/21 | | | | | 825 | | | | 826,327 | |
Newmont Mining Corp., Gtd. Notes | | | | | 6.250% | | | 10/01/39 | | | | | 75 | | | | 76,077 | |
Peabody Energy Corp., Gtd. Notes(d) | | | | | 6.000% | | | 11/15/18 | | | | | 4,075 | | | | 3,698,063 | |
Southern Copper Corp., Sr. Unsec’d. Notes(d) | | | | | 6.750% | | | 04/16/40 | | | | | 990 | | | | 1,038,510 | |
Southern Copper Corp., Sr. Unsec’d. Notes | | | | | 7.500% | | | 07/27/35 | | | | | 550 | | | | 618,746 | |
Vedanta Resources PLC (India), Sr. Unsec’d. Notes, 144A | | | | | 6.000% | | | 01/31/19 | | | | | 400 | | | | 390,000 | |
| | | | | | | | | | | | | | | | |
|
|
|
| | | | | | | | | | | | | | | | | | 10,686,050 | |
| | | | | | | | | | | | | | | | |
|
|
|
Non-Captive Finance — 1.4% | | | | | | | | | | | | | | | | | | |
CIT Group, Inc., Sr. Unsec’d. Notes | | | | | 5.000% | | | 08/15/22 | | | | | 1,350 | | | | 1,387,125 | |
CIT Group, Inc., Sr. Unsec’d. Notes, 144A | | | | | 5.500% | | | 02/15/19 | | | | | 4,000 | | | | 4,220,000 | |
General Electric Capital Corp., Sr. Unsec’d. Notes, MTN(d) | | | | | 5.875% | | | 01/14/38 | | | | | 675 | | | | 854,119 | |
General Electric Capital Corp., Sub. Notes(d) | | | | | 5.300% | | | 02/11/21 | | | | | 1,185 | | | | 1,353,255 | |
HSBC Finance Corp., Sub. Notes | | | | | 6.676% | | | 01/15/21 | | | | | 295 | | | | 350,005 | |
International Lease Finance Corp., Sr. Unsec’d. Notes | | | | | 5.750% | | | 05/15/16 | | | | | 1,125 | | | | 1,167,187 | |
International Lease Finance Corp., Sr. Unsec’d. Notes | | | | | 6.250% | | | 05/15/19 | | | | | 1,400 | | | | 1,529,500 | |
Preferred Term Securities X Ltd./Preferred Term Securities X, Inc. (Cayman Islands), Sr. Sec’d. Notes, 144A(c) | | | | | 0.955% | (a) | | 07/03/33 | | | | | 568 | | | | 534,001 | |
Schahin II Finance Co. SPV Ltd. (Brazil), Sr. Sec’d. Notes, 144A (original cost $1,741,109; purchased 03/27/12-07/24/12)(b)(c)(d) | | | | | 5.875% | | | 09/25/22 | | | | | 1,709 | | | | 1,373,394 | |
SLM Corp., Sr. Unsec’d. Notes, MTN | | | | | 6.000% | | | 01/25/17 | | | | | 1,075 | | | | 1,126,062 | |
Trust F/1401 (Mexico), Sr. Unsec’d. Notes, 144A | | | | | 5.250% | | | 12/15/24 | | | | | 1,235 | | | | 1,272,173 | |
| | | | | | | | | | | | | | | | |
|
|
|
| | | | | | | | | | | | | | | | | | 15,166,821 | |
| | | | | | | | | | | | | | | | |
|
|
|
Packaging — 0.4% | | | | | | | | | | | | | | | | | | |
Ball Corp., Gtd. Notes(d) | | | | | 6.750% | | | 09/15/20 | | | | | 345 | | | | 358,800 | |
Greif Luxembourg Finance, Sr. Unsec’d. Notes, MTN, 144A | | | | | 7.375% | | | 07/15/21 | | EUR | | | 1,470 | | | | 2,098,958 | |
Greif, Inc., Sr. Unsec’d. Notes | | | | | 7.750% | | | 08/01/19 | | | | | 1,815 | | | | 2,050,950 | |
| | | | | | | | | | | | | | | | |
|
|
|
| | | | | | | | | | | | | | | | | | 4,508,708 | |
| | | | | | | | | | | | | | | | |
|
|
|
Paper — 0.5% | | | | | | | | | | | | | | | | | | |
International Paper Co., Sr. Unsec’d. Notes | | | | | 6.000% | | | 11/15/41 | | | | | 675 | | | | 790,243 | |
International Paper Co., Sr. Unsec’d. Notes | | | | | 7.300% | | | 11/15/39 | | | | | 1,000 | | | | 1,325,910 | |
International Paper Co., Sr. Unsec’d. Notes | | | | | 7.950% | | | 06/15/18 | | | | | 1,640 | | | | 1,933,419 | |
Rock-Tenn Co., Gtd. Notes | | | | | 4.450% | | | 03/01/19 | | | | | 1,165 | | | | 1,240,057 | |
| | | | | | | | | | | | | | | | |
|
|
|
| | | | | | | | | | | | | | | | | | 5,289,629 | |
| | | | | | | | | | | | | | | | |
|
|
|
Pipelines & Other — 0.7% | | | | | | | | | | | | | | | | | | |
AGL Capital Corp., Gtd. Notes | | | | | 4.400% | | | 06/01/43 | | | | | 1,050 | | | | 1,106,436 | |
Fermaca Enterprises S de RL de CV (Mexico), Sr. Sec’d. Notes, 144A (original cost $455,119; purchased 07/22/14)(b)(c) | | | | | 6.375% | | | 03/30/38 | | | | | 435 | | | | 442,612 | |
NiSource Finance Corp., Gtd. Notes | | | | | 4.800% | | | 02/15/44 | | | | | 300 | | | | 319,634 | |
NiSource Finance Corp., Gtd. Notes | | | | | 5.450% | | | 09/15/20 | | | | | 1,345 | | | | 1,513,545 | |
ONEOK Partners LP, Gtd. Notes | | | | | 2.000% | | | 10/01/17 | | | | | 750 | | | | 745,813 | |
Sempra Energy, Sr. Unsec’d. Notes | | | | | 6.500% | | | 06/01/16 | | | | | 2,275 | | | | 2,443,054 | |
Western Gas Partners LP, Sr. Unsec’d. Notes | | | | | 5.450% | | | 04/01/44 | | | | | 575 | | | | 605,528 | |
| | | | | | | | | | | | | | | | |
|
|
|
| | | | | | | | | | | | | | | | | | 7,176,622 | |
| | | | | | | | | | | | | | | | |
|
|
|
SEE NOTES TO FINANCIAL STATEMENTS.
A41
| | | | | | |
| | | DIVERSIFIED BOND PORTFOLIO (continued) | | |
| |
| SCHEDULE OF INVESTMENTS | | December 31, 2014 |
| | | | | | | | | | | | | | | | | | |
CORPORATE BONDS
(continued) | | | | Interest
Rate
| | | Maturity
Date
| | Principal
Amount
(000)#
| | | Value
(Note 2)
| |
Real Estate Investment Trusts — 0.2% | | | | | | | | | | | | | | | | | | |
ProLogis LP, Gtd. Notes | | | | | 6.875% | | | 03/15/20 | | | | | 8 | | | $ | 9,397 | |
Simon Property Group LP, Sr. Unsec’d. Notes | | | | | 3.375% | | | 03/15/22 | | | | | 325 | | | | 334,563 | |
Simon Property Group LP, Sr. Unsec’d. Notes | | | | | 6.125% | | | 05/30/18 | | | | | 40 | | | | 45,523 | |
Simon Property Group LP, Sr. Unsec’d. Notes | | | | | 10.350% | | | 04/01/19 | | | | | 1,685 | | | | 2,203,960 | |
| | | | | | | | | | | | | | | | |
|
|
|
| | | | | | | | | | | | | | | | | | 2,593,443 | |
| | | | | | | | | | | | | | | | |
|
|
|
Retailers — 0.2% | | | | | | | | | | | | | | | | | | |
Limited Brands, Inc., Gtd. Notes | | | | | 5.625% | | | 02/15/22 | | | | | 2,200 | | | | 2,365,000 | |
| | | | | | | | | | | | | | | | |
|
|
|
Technology — 1.5% | | | | | | | | | | | | | | | | | | |
Arrow Electronics, Inc., Sr. Unsec’d. Notes | | | | | 3.375% | | | 11/01/15 | | | | | 600 | | | | 610,817 | |
Avaya, Inc., Sec’d. Notes, 144A(d) | | | | | 10.500% | | | 03/01/21 | | | | | 200 | | | | 171,000 | |
Brightstar Corp., Gtd. Notes, 144A
(original cost $2,126,719; purchased 08/06/14)(b)(c) | | | | | 9.500% | | | 12/01/16 | | | | | 2,000 | | | | 2,097,500 | |
CDW LLC/CDW Finance Corp., Gtd. Notes | | | | | 8.500% | | | 04/01/19 | | | | | 1,222 | | | | 1,287,682 | |
First Data Corp., Gtd. Notes | | | | | 11.250% | | | 01/15/21 | | | | | 1,750 | | | | 1,986,250 | |
NXP BV/NXP Funding LLC (Netherlands), Gtd. Notes, 144A | | | | | 3.750% | | | 06/01/18 | | | | | 1,925 | | | | 1,925,000 | |
Oracle Corp., Sr. Unsec’d. Notes | | | | | 4.300% | | | 07/08/34 | | | | | 1,070 | | | | 1,145,619 | |
Seagate HDD Cayman, Gtd. Notes | | | | | 6.875% | | | 05/01/20 | | | | | 2,610 | | | | 2,740,500 | |
SunGard Data Systems, Inc., Gtd. Notes(d) | | | | | 7.625% | | | 11/15/20 | | | | | 1,700 | | | | 1,802,000 | |
Xerox Corp., Sr. Unsec’d. Notes | | | | | 4.250% | | | 02/15/15 | | | | | 2,000 | | | | 2,007,902 | |
| | | | | | | | | | | | | | | | |
|
|
|
| | | | | | | | | | | | | | | | | | 15,774,270 | |
| | | | | | | | | | | | | | | | |
|
|
|
Telecommunications — 2.2% | | | | | | | | | | | | | | | | | | |
America Movil SAB de CV (Mexico), Gtd. Notes | | | | | 6.125% | | | 03/30/40 | | | | | 655 | | | | 775,003 | |
AT&T Corp., Gtd. Notes | | | | | 8.000% | | | 11/15/31 | | | | | 103 | | | | 151,772 | |
AT&T, Inc., Sr. Unsec’d. Notes(d) | | | | | 4.800% | | | 06/15/44 | | | | | 1,975 | | | | 2,012,438 | |
AT&T, Inc., Sr. Unsec’d. Notes | | | | | 5.350% | | | 09/01/40 | | | | | 483 | | | | 523,003 | |
Bharti Airtel International Netherlands BV (India), Gtd. Notes, 144A | | | | | 5.125% | | | 03/11/23 | | | | | 1,305 | | | | 1,392,800 | |
Bharti Airtel International Netherlands BV (India), Gtd. Notes, 144A | | | | | 5.350% | | | 05/20/24 | | | | | 690 | | | | 746,525 | |
British Telecommunications PLC (United Kingdom), Sr. Unsec’d. Notes | | | | | 9.625% | | | 12/15/30 | | | | | 328 | | | | 514,977 | |
Eileme 2 AB (Sweden), Sr. Sec’d. Notes, RegS | | | | | 11.750% | | | 01/31/20 | | EUR | | | 1,400 | | | | 1,931,245 | |
Embarq Corp., Sr. Unsec’d. Notes
(original cost $584,102; purchased 04/22/10)(b)(c) | | | | | 7.995% | | | 06/01/36 | | | | | 560 | | | | 625,800 | |
Sprint Capital Corp., Gtd. Notes(d) | | | | | 6.900% | | | 05/01/19 | | | | | 1,300 | | | | 1,326,000 | |
Sprint Communications, Inc., Gtd. Notes, 144A | | | | | 9.000% | | | 11/15/18 | | | | | 1,575 | | | | 1,791,405 | |
Verizon Communications, Inc., Sr. Unsec’d. Notes | | | | | 4.750% | | | 11/01/41 | | | | | 745 | | | | 763,752 | |
Verizon Communications, Inc., Sr. Unsec’d. Notes(d) | | | | | 6.400% | | | 09/15/33 | | | | | 1,228 | | | | 1,512,629 | |
Verizon Communications, Inc., Sr. Unsec’d. Notes(d) | | | | | 6.550% | | | 09/15/43 | | | | | 2,365 | | | | 3,029,917 | |
Verizon Communications, Inc., Sr. Unsec’d. Notes, 144A(d) | | | | | 4.862% | | | 08/21/46 | | | | | 1,679 | | | | 1,724,714 | |
Verizon Communications, Inc., Sr. Unsec’d. Notes, 144A | | | | | 5.012% | | | 08/21/54 | | | | | 3,362 | | | | 3,478,154 | |
Vimpel Communications Via VIP Finance Ireland Ltd. OJSC (Russia), Sr. Unsec’d. Notes, 144A | | | | | 7.748% | | | 02/02/21 | | | | | 1,300 | | | | 1,080,300 | |
Vimpel Communications Via VIP Finance Ireland Ltd. OJSC (Russia), Sr. Unsec’d. Notes, 144A | | | | | 9.125% | | | 04/30/18 | | | | | 200 | | | | 188,000 | |
| | | | | | | | | | | | | | | | |
|
|
|
| | | | | | | | | | | | | | | | | | 23,568,434 | |
| | | | | | | | | | | | | | | | |
|
|
|
Tobacco — 0.5% | | | | | | | | | | | | | | | | | | |
Altria Group, Inc., Gtd. Notes | | | | | 9.950% | | | 11/10/38 | | | | | 873 | | | | 1,493,400 | |
Imperial Tobacco Finance PLC (United Kingdom), Gtd. Notes, 144A | | | | | 2.050% | | | 02/11/18 | | | | | 2,375 | | | | 2,361,693 | |
Lorillard Tobacco Co., Gtd. Notes | | | | | 3.500% | | | 08/04/16 | | | | | 515 | | | | 530,175 | |
Lorillard Tobacco Co., Gtd. Notes | | | | | 8.125% | | | 06/23/19 | | | | | 895 | | | | 1,085,033 | |
| | | | | | | | | | | | | | | | |
|
|
|
| | | | | | | | | | | | | | | | | | 5,470,301 | |
| | | | | | | | | | | | | | | | |
|
|
|
TOTAL CORPORATE BONDS
(cost $453,608,895) | | | | 482,877,084 | |
| | | | | | | | | | | | | | | | |
|
|
|
SEE NOTES TO FINANCIAL STATEMENTS.
A42
| | | | | | |
| | | DIVERSIFIED BOND PORTFOLIO (continued) | | |
| |
| SCHEDULE OF INVESTMENTS | | December 31, 2014 |
| | | | | | | | | | | | | | | | | | |
| FOREIGN AGENCIES — 2.3% | |
| | Interest
Rate
| | | Maturity
Date
| | Principal
Amount
(000)#
| | | Value
(Note 2)
| |
CNOOC Finance 2013 Ltd. (China), Gtd. Notes | | | | | 3.000% | | | 05/09/23 | | | | | 750 | | | $ | 709,805 | |
Comision Federal de Electricidad (Mexico), Sr. Unsec’d. Notes, 144A | | | | | 4.875% | | | 01/15/24 | | | | | 875 | | | | 914,375 | |
Ecopetrol SA (Colombia), Sr. Unsec’d. Notes | | | | | 4.125% | | | 01/16/25 | | | | | 100 | | | | 95,000 | |
Ecopetrol SA (Colombia), Sr. Unsec’d. Notes(d) | | | | | 5.875% | | | 05/28/45 | | | | | 525 | | | | 485,625 | |
Export Credit Bank of Turkey (Turkey), Sr. Unsec’d. Notes, 144A | | | | | 5.375% | | | 11/04/16 | | | | | 790 | | | | 826,435 | |
Gazprom OAO Via Gaz Capital SA (Russia),
Sr. Unsec’d. Notes, RegS | | | | | 9.250% | | | 04/23/19 | | | | | 1,080 | | | | 1,101,060 | |
Gazprom OAO Via Gaz Capital SA (Russia),
Sr. Unsec’d. Notes, 144A | | | | | 6.510% | | | 03/07/22 | | | | | 975 | | | | 872,869 | |
KazMunayGas National Co. JSC (Kazakhstan),
Sr. Unsec’d. Notes, MTN, 144A | | | | | 5.750% | | | 04/30/43 | | | | | 1,075 | | | | 903,000 | |
KazMunayGas National Co. JSC (Kazakhstan),
Sr. Unsec’d. Notes, 144A | | | | | 7.000% | | | 05/05/20 | | | | | 475 | | | | 493,644 | |
KazMunayGas National Co. JSC (Kazakhstan),
Sr. Unsec’d. Notes, MTN, 144A | | | | | 9.125% | | | 07/02/18 | | | | | 1,835 | | | | 2,007,582 | |
Korea Finance Corp. (South Korea), Sr. Unsec’d. Notes | | | | | 4.625% | | | 11/16/21 | | | | | 600 | | | | 664,849 | |
Korea Gas Corp. (South Korea), Sr. Unsec’d. Notes, RegS(d) | | | | | 4.250% | | | 11/02/20 | | | | | 1,750 | | | | 1,900,843 | |
Korea Hydro & Nuclear Power Co. Ltd. (South Korea),
Sr. Unsec’d. Notes, 144A | | | | | 4.750% | | | 07/13/21 | | | | | 1,650 | | | | 1,851,603 | |
Majapahit Holding BV (Indonesia), Gtd. Notes, RegS | | | | | 7.750% | | | 10/17/16 | | | | | 2,500 | | | | 2,740,625 | |
Majapahit Holding BV (Indonesia), Gtd. Notes, RegS | | | | | 7.750% | | | 01/20/20 | | | | | 1,500 | | | | 1,736,250 | |
Petrobras International Finance Co. (Brazil), Gtd. Notes(d) | | | | | 5.375% | | | 01/27/21 | | | | | 345 | | | | 319,667 | |
Petroleos Mexicanos (Mexico), Gtd. Notes(d) | | | | | 3.500% | | | 01/30/23 | | | | | 1,125 | | | | 1,076,062 | |
Petroleos Mexicanos (Mexico), Gtd. Notes(d) | | | | | 4.875% | | | 01/24/22 | | | | | 2,100 | | | | 2,199,561 | |
Petroleos Mexicanos (Mexico), Gtd. Notes | | | | | 6.500% | | | 06/02/41 | | | | | 745 | | | | 854,887 | |
Power Sector Assets & Liabilities Management Corp. (Philippines), Gov’t. Gtd. Notes, RegS | | | | | 7.390% | | | 12/02/24 | | | | | 1,000 | | | | 1,303,000 | |
Westpac Banking Corp. (Australia), 144A | | | | | 2.000% | | | 05/21/19 | | | | | 1,750 | | | | 1,743,707 | |
| | | | | | | | | | | | | | | | |
|
|
|
TOTAL FOREIGN AGENCIES
(cost $24,910,136) | | | | 24,800,449 | |
| | | | | | | | | | | | | | | | |
|
|
|
| MUNICIPAL BONDS — 2.0% | | | | | | | | | | | | | | | | | | |
California — 0.7% | | | | | | | | | | | | | | | | | | |
Bay Area Toll Authority, Revenue Bonds, BABs | | | | | 6.907% | | | 10/01/50 | | | | | 1,125 | | | | 1,660,792 | |
State of California, General Obligation Unlimited, BABs | | | | | 7.300% | | | 10/01/39 | | | | | 2,280 | | | | 3,345,535 | |
State of California, General Obligation Unlimited, BABs | | | | | 7.625% | | | 03/01/40 | | | | | 725 | | | | 1,112,839 | |
University of California, Revenue Bonds, BABs | | | | | 5.770% | | | 05/15/43 | | | | | 1,400 | | | | 1,795,430 | |
| | | | | | | | | | | | | | | | |
|
|
|
| | | | | | | | | | | | | | | | | | 7,914,596 | |
| | | | | | | | | | | | | | | | |
|
|
|
Colorado — 0.1% | | | | | | | | | | | | | | | | | | |
Regional Transportation District, Revenue Bonds,
Series 2010-B, BABs | | | | | 5.844% | | | 11/01/50 | | | | | 770 | | | | 1,070,639 | |
| | | | | | | | | | | | | | | | |
|
|
|
Illinois — 0.2% | | | | | | | | | | | | | | | | | | |
Chicago O’Hare International Airport, Revenue Bonds, BABs | | | | | 6.395% | | | 01/01/40 | | | | | 1,380 | | | | 1,866,864 | |
| | | | | | | | | | | | | | | | |
|
|
|
New Jersey — 0.5% | | | | | | | | | | | | | | | | | | |
New Jersey State Turnpike Authority, Revenue Bonds,
Series A, BABs | | | | | 7.102% | | | 01/01/41 | | | | | 1,175 | | | | 1,716,769 | |
New Jersey State Turnpike Authority, Revenue Bonds,
Series F, BABs | | | | | 7.414% | | | 01/01/40 | | | | | 2,050 | | | | 3,091,359 | |
| | | | | | | | | | | | | | | | |
|
|
|
| | | | | | | | | | | | | | | | | | 4,808,128 | |
| | | | | | | | | | | | | | | | |
|
|
|
Ohio — 0.1% | | | | | | | | | | | | | | | | | | |
Ohio State University (The), Revenue Bonds, BABs | | | | | 4.910% | | | 06/01/40 | | | | | 695 | | | | 848,400 | |
Ohio State Water Development Authority, Revenue Bonds, BABs | | | | | 4.879% | | | 12/01/34 | | | | | 450 | | | | 505,067 | |
| | | | | | | | | | | | | | | | |
|
|
|
| | | | | | | | | | | | | | | | | | 1,353,467 | |
| | | | | | | | | | | | | | | | |
|
|
|
Oregon — 0.1% | | | | | | | | | | | | | | | | | | |
Oregon State Department of Transportation, Revenue Bonds,
Series A, BABs | | | | | 5.834% | | | 11/15/34 | | | | | 615 | | | | 798,196 | |
| | | | | | | | | | | | | | | | |
|
|
|
SEE NOTES TO FINANCIAL STATEMENTS.
A43
| | | | | | |
| | | DIVERSIFIED BOND PORTFOLIO (continued) | | |
| |
| SCHEDULE OF INVESTMENTS | | December 31, 2014 |
| | | | | | | | | | | | | | | | | | |
MUNICIPAL BONDS
(continued) | | | | Interest
Rate
| | | Maturity
Date
| | Principal
Amount
(000)#
| | | Value
(Note 2)
| |
Pennsylvania — 0.1% | | | | | | | | | | | | | | | | | | |
Pennsylvania Turnpike Commission, Revenue Bonds, Series B, BABs | | | | | 5.511% | | | 12/01/45 | | | | | 800 | | | $ | 987,232 | |
| | | | | | | | | | | | | | | | |
|
|
|
Tennessee — 0.2% | | | | | | | | | | | | | | | | | | |
Metropolitan Government of Nashville & Davidson County Convention Center Authority, Revenue Bonds, BABs | | | | | 6.731% | | | 07/01/43 | | | | | 1,375 | | | | 1,848,550 | |
| | | | | | | | | | | | | | | | |
|
|
|
Texas | | | | | | | | | | | | | | | | | | |
Texas State Transportation Commission, Revenue Bonds, Series B, BABs | | | | | 5.028% | | | 04/01/26 | | | | | 425 | | | | 495,427 | |
| | | | | | | | | | | | | | | | |
|
|
|
TOTAL MUNICIPAL BONDS
(cost $15,299,109) | | | | 21,143,099 | |
| | | | | | | | | | | | | | | | |
|
|
|
| SOVEREIGNS — 5.1% | | | | | | | | | | | | | | | | | | |
Brazilian Government International Bond (Brazil), Unsec’d. Notes | | | | | 11.000% | | | 06/26/17 | | EUR | | | 2,200 | | | | 3,211,312 | |
Colombia Government International Bond (Colombia),
Sr. Unsec’d. Notes | | | | | 4.000% | | | 02/26/24 | | | | | 2,000 | | | | 2,045,000 | |
Hellenic Republic Government Bond (Greece), Sr. Unsec’d. Notes | | | | | 4.750% | | | 04/17/19 | | EUR | | | 800 | | | | 770,794 | |
Hellenic Republic Government Bond (Greece), Sr. Unsec’d. Notes, Series 9BR | | | | | 5.800% | | | 07/14/15 | | JPY | | | 76,200 | | | | 601,177 | |
Hellenic Republic Government Bond (Greece), Sr. Unsec’d. Notes, Series 9RG | | | | | 5.800% | | | 07/14/15 | | JPY | | | 107,100 | | | | 844,962 | |
Hellenic Republic Government International Bond (Greece),
Sr. Unsec’d. Notes, MTN | | | | | 3.800% | | | 08/08/17 | | JPY | | | 680,000 | | | | 4,664,699 | |
Hungary Government International Bond (Hungary),
Sr. Unsec’d. Notes | | | | | 4.125% | | | 02/19/18 | | | | | 2,020 | | | | 2,094,902 | |
Hungary Government International Bond (Hungary),
Sr. Unsec’d. Notes | | | | | 5.375% | | | 02/21/23 | | | | | 436 | | | | 469,790 | |
Hungary Government International Bond (Hungary),
Sr. Unsec’d. Notes | | | | | 6.000% | | | 01/11/19 | | EUR | | | 715 | | | | 1,003,791 | |
Hungary Government International Bond (Hungary),
Sr. Unsec’d. Notes | | | | | 6.375% | | | 03/29/21 | | | | | 776 | | | | 887,066 | |
Hungary Government International Bond (Hungary),
Sr. Unsec’d. Notes(d) | | | | | 7.625% | | | 03/29/41 | | | | | 462 | | | | 614,229 | |
Indonesia Government International Bond (Indonesia),
Sr. Unsec’d. Notes, 144A | | | | | 2.875% | | | 07/08/21 | | EUR | | | 825 | | | | 1,010,773 | |
Indonesia Government International Bond (Indonesia),
Sr. Unsec’d. Notes, RegS | | | | | 5.875% | | | 03/13/20 | | | | | 2,245 | | | | 2,486,337 | |
Italy Buoni Poliennali del Tesoro (Italy),
Sr. Unsec’d Notes | | | | | 6.500% | | | 11/01/27 | | EUR | | | 3,545 | | | | 6,249,840 | |
Italy Government International Bond (Italy),
Sr. Unsec’d. Notes, RegS | | | | | 3.450% | | | 03/24/17 | | JPY | | | 170,000 | | | | 1,498,451 | |
Italy Government International Bond (Italy),
Sr. Unsec’d. Notes, RegS | | | | | 4.500% | | | 06/08/15 | | JPY | | | 130,000 | | | | 1,099,527 | |
Mexico Government International Bond (Mexico),
Sr. Unsec’d. Notes | | | | | 2.750% | | | 04/22/23 | | EUR | | | 2,350 | | | | 2,961,067 | |
Mexico Government International Bond (Mexico),
Sr. Unsec’d. Notes, MTN | | | | | 4.750% | | | 03/08/44 | | | | | 1,062 | | | | 1,107,135 | |
Panama Government International Bond (Panama),
Sr. Unsec’d. Notes(d) | | | | | 5.200% | | | 01/30/20 | | | | | 1,115 | | | | 1,229,288 | |
Peru Enhanced Pass-Through Finance Ltd. (Peru), Pass-Through Certificates, 144A | | | | | 3.975% | (g) | | 05/31/18 | | | | | 692 | | | | 655,474 | |
Philippine Government International Bond (Philippines),
Sr. Unsec’d. Notes | | | | | 6.250% | | | 03/15/16 | | EUR | | | 850 | | | | 1,093,508 | |
Portugal Government International Bond (Portugal),
Sr. Unsec’d. Notes, RegS | | | | | 3.500% | | | 03/25/15 | | | | | 2,200 | | | | 2,215,930 | |
Portugal Government International Bond (Portugal),
Unsec’d. Notes, 144A | | | | | 5.125% | | | 10/15/24 | | | | | 800 | | | | 840,414 | |
Portugal Obrigacoes do Tesouro OT (Portugal),
Sr. Unsec’d. Notes, RegS | | | | | 4.750% | | | 06/14/19 | | EUR | | | 4,410 | | | | 6,077,572 | |
SEE NOTES TO FINANCIAL STATEMENTS.
A44
| | | | | | |
| | | DIVERSIFIED BOND PORTFOLIO (continued) | | |
| |
| SCHEDULE OF INVESTMENTS | | December 31, 2014 |
| | | | | | | | | | | | | | | | | | |
SOVEREIGNS
(continued) | | | | Interest
Rate
| | | Maturity
Date
| | Principal
Amount
(000)#
| | | Value
(Note 2)
| |
Qatar Government International Bond (Qatar),
Sr. Unsec’d. Notes, 144A | | | | | 5.750% | | | 01/20/42 | | | | | 900 | | | $ | 1,059,750 | |
Republic of Brazil (Brazil), Sr. Unsec’d. Notes | | | | | 8.250% | | | 01/20/34 | | | | | 510 | | | | 699,975 | |
Republic of Indonesia (Indonesia), Sr. Unsec’d. Notes, RegS | | | | | 4.875% | | | 05/05/21 | | | | | 1,600 | | | | 1,690,000 | |
Romanian Government International Bond (Romania),
Sr. Unsec’d. Notes, 144A | | | | | 4.875% | | | 01/22/24 | | | | | 1,370 | | | | 1,493,300 | |
Slovenia Government International Bond (Slovenia), Bonds, 144A | | | | | 4.125% | | | 02/18/19 | | | | | 300 | | | | 314,256 | |
Slovenia Government International Bond (Slovenia),
Sr. Unsec’d Notes, RegS | | | | | 4.750% | | | 05/10/18 | | | | | 1,300 | | | | 1,391,000 | |
Turkey Government International Bond (Turkey), Sr. Unsec’d. Notes | | | | | 7.000% | | | 06/05/20 | | | | | 1,510 | | | | 1,755,749 | |
| | | | | | | | | | | | | | | | |
|
|
|
TOTAL SOVEREIGNS
(cost $54,927,644) | | | | 54,137,068 | |
| | | | | | | | | | | | | | | | |
|
|
|
| U.S. GOVERNMENT AGENCY OBLIGATIONS — 1.8% | | | | | | | | | | | | | | | | | | |
Federal Home Loan Mortgage Corp. | | | | | 5.000% | | | 07/01/19 | | | | | 121 | | | | 128,152 | |
Federal Home Loan Mortgage Corp. | | | | | 5.500% | | | 10/01/33-06/01/34 | | | | | 1,614 | | | | 1,817,561 | |
Federal Home Loan Mortgage Corp. | | | | | 6.000% | | | 11/01/33-06/01/34 | | | | | 1,164 | | | | 1,322,296 | |
Federal Home Loan Mortgage Corp. | | | | | 6.500% | | | 07/01/32-09/01/32 | | | | | 852 | | | | 988,268 | |
Federal Home Loan Mortgage Corp. | | | | | 7.000% | | | 10/01/32 | | | | | 111 | | | | 121,195 | |
Federal National Mortgage Assoc. | | | | | 4.000% | | | 05/01/19 | | | | | 81 | | | | 85,742 | |
Federal National Mortgage Assoc. | | | | | 4.500% | | | 12/01/18-02/01/35 | | | | | 592 | | | | 624,102 | |
Federal National Mortgage Assoc. | | | | | 5.500% | | | 03/01/17-06/01/34 | | | | | 2,447 | | | | 2,677,494 | |
Federal National Mortgage Assoc. | | | | | 6.000% | | | 09/01/17-11/01/36 | | | | | 2,148 | | | | 2,457,383 | |
Federal National Mortgage Assoc. | | | | | 6.500% | | | 07/01/15-11/01/33 | | | | | 1,614 | | | | 1,854,052 | |
Federal National Mortgage Assoc. | | | | | 7.000% | | | 05/01/32-06/01/32 | | | | | 177 | | | | 202,145 | |
Government National Mortgage Assoc. | | | | | 5.500% | | | 01/15/33-07/15/35 | | | | | 1,954 | | | | 2,191,681 | |
Government National Mortgage Assoc. | | | | | 6.000% | | | 12/15/32-11/15/34 | | | | | 2,276 | | | | 2,636,268 | |
Government National Mortgage Assoc. | | | | | 6.500% | | | 09/15/32-11/15/33 | | | | | 1,552 | | | | 1,774,902 | |
Government National Mortgage Assoc. | | | | | 7.500% | | | 10/15/25-02/15/26 | | | | | 58 | | | | 67,649 | |
| | | | | | | | | | | | | | | | |
|
|
|
TOTAL U.S. GOVERNMENT AGENCY OBLIGATIONS
(cost $17,103,818) | | | | 18,948,890 | |
| | | | | | | | | | | | | | | | |
|
|
|
| U.S. TREASURY OBLIGATIONS — 4.2% | | | | | | | | | | | | | | | | | | |
U.S. Treasury Bonds(d) | | | | | 2.250% | | | 11/15/24 | | | | | 4,680 | | | | 4,711,445 | |
U.S. Treasury Bonds | | | | | 2.875% | | | 05/15/43 | | | | | 2,670 | | | | 2,730,908 | |
U.S. Treasury Notes(d) | | | | | 1.000% | | | 09/15/17 | | | | | 4,450 | | | | 4,452,434 | |
U.S. Treasury Notes(e) | | | | | 1.500% | | | 05/31/19 | | | | | 6,340 | | | | 6,324,150 | |
U.S. Treasury Notes | | | | | 1.500% | | | 10/31/19 | | | | | 250 | | | | 248,477 | |
U.S. Treasury Notes(d) | | | | | 1.500% | | | 11/30/19 | | | | | 990 | | | | 983,735 | |
U.S. Treasury Notes | | | | | 1.625% | | | 12/31/19 | | | | | 885 | | | | 883,687 | |
U.S. Treasury Notes(h) | | | | | 1.750% | | | 09/30/19 | | | | | 14,385 | | | | 14,469,282 | |
U.S. Treasury Notes | | | | | 3.375% | | | 05/15/44 | | | | | 9,290 | | | | 10,458,505 | |
| | | | | | | | | | | | | | | | |
|
|
|
TOTAL U.S. TREASURY OBLIGATIONS
(cost $44,154,336) | | | | 45,262,623 | |
| | | | | | | | | | | | | | | | |
|
|
|
| | | | | | |
| | | | | | | | | | | | Shares
| | | | |
| PREFERRED STOCK — 0.1% | | | | | | | | | | | | | | | | | | |
Banking | | | | | | | | | | | | | | | | | | |
Citigroup Capital XIII, 7.875%, (Capital Security, fixed to floating preferred)
(cost $1,125,000) | | | 45,000 | | | | 1,196,100 | |
| | | | | | | | | | | | | | | | |
|
|
|
TOTAL LONG-TERM INVESTMENTS
(cost $864,671,632) | | | | 907,203,989 | |
| | | | | | | | | | | | | | | | |
|
|
|
| SHORT-TERM INVESTMENTS — 19.6% | | | | | | | | | | | | | | | | | | |
AFFILIATED MUTUAL FUNDS — 19.5% | | | | | | | | | | | | | | | | | | |
Prudential Investment Portfolios 2 — Prudential Core Short-Term Bond Fund
(cost $104,944,786)(Note 4)(i) | | | 10,735,681 | | | | 100,271,259 | |
SEE NOTES TO FINANCIAL STATEMENTS.
A45
| | | | | | |
| | | DIVERSIFIED BOND PORTFOLIO (continued) | | |
| |
| SCHEDULE OF INVESTMENTS | | December 31, 2014 |
| | | | | | | | | | | | | | | | |
SHORT-TERM INVESTMENTS
(continued) | | | | | | | | | | Shares
| | | Value
(Note 2)
| |
AFFILIATED MUTUAL FUNDS (continued) | | | | | | | | | | | | | | | | |
Prudential Investment Portfolios 2 — Prudential Core Taxable Money Market Fund
(cost $107,580,283; includes $66,800,717 of cash collateral for securities on loan)(Note 4)(i)(j) | | | 107,580,283 | | | $ | 107,580,283 | |
| | | | | | | | | | | | | | |
|
|
|
TOTAL AFFILIATED MUTUAL FUNDS
(cost $212,525,069) | | | | 207,851,542 | |
| | | | | | | | | | | | | | |
|
|
|
| | | | | | |
| | | | | | | | | | | Notional
Amount
(000)#
| | | | |
| OPTIONS PURCHASED* — 0.1% | | | | | | | | | | | | | | | | |
Call Options | | | | | | | | | | | | | | | | |
2 Year U.S. Treasury Notes Futures, expiring 01/23/15, Strike Price $109.38 | | | 196,600 | | | | 153,594 | |
2 Year U.S. Treasury Notes Futures, expiring 01/23/15, Strike Price $110.00 | | | 196,600 | | | | 15,359 | |
10 Year U.S. Treasury Notes Futures, expiring 01/23/15, Strike Price $127.00 | | | 4,100 | | | | 21,141 | |
10 Year U.S. Treasury Notes Futures, expiring 01/23/15, Strike Price $131.00 | | | 4,100 | | | | 641 | |
30 Year U.S. Ultra Treasury Bonds, expiring 01/23/15, Strike Price $165.00 | | | 2,800 | | | | 52,937 | |
30 Year U.S. Ultra Treasury Bonds, expiring 01/23/15, Strike Price $171.00 | | | 800 | | | | 2,375 | |
30 Year U.S. Ultra Treasury Bonds, expiring 01/23/15, Strike Price $175.00 | | | 2,000 | | | | 1,250 | |
| | | | | | | | | | | | | | |
|
|
|
| | | | | | | | | | | | | | | | 247,297 | |
| | | | | | | | | | | | | | |
|
|
|
Put Options — 0.1% | | | | | | | | | | | | | | | | |
90 Day Euro Dollar, expiring 12/14/15, Strike Price $98.75 | | | 17,250 | | | | 18,544 | |
90 Day Euro Dollar, expiring 12/14/15, Strike Price $98.88 | | | 17,250 | | | | 23,719 | |
90 Day Euro Dollar, expiring 12/14/15, Strike Price $99.13 | | | 17,250 | | | | 40,106 | |
90 Day Euro Dollar, expiring 12/14/15, Strike Price $99.25 | | | 17,250 | | | | 51,750 | |
Eurodollars 1 Year Mid-Curve Futures, expiring 03/13/15, Strike Price $98.50 | | | 86,500 | | | | 34,600 | |
Eurodollars 1 Year Mid-Curve Futures, expiring 03/13/15, Strike Price $98.88 | | | 86,500 | | | | 144,887 | |
| | | | | | | | | | | | | | |
|
|
|
| | | | | | | | | | | | | | | | 313,606 | |
| | | | | | | | | | | | | | |
|
|
|
TOTAL OPTIONS PURCHASED
(cost $636,464) | | | | 560,903 | |
| | | | | | | | | | | | | | |
|
|
|
TOTAL SHORT-TERM INVESTMENTS
(cost $213,161,533) | | | | 208,412,445 | |
| | | | | | | | | | | | | | |
|
|
|
TOTAL INVESTMENTS, BEFORE OPTIONS WRITTEN — 104.4%
(cost $1,077,833,165) | | | | 1,115,616,434 | |
| | | | | | | | | | | | | | |
|
|
|
| OPTIONS WRITTEN* | | | | | | | | | | | | | | | | |
Call Options | | | | | | | | | | | | | | | | |
2 Year U.S. Treasury Notes Futures, expiring 01/23/15, Strike Price $109.63 | | | 393,200 | | | | (61,438 | ) |
10 Year U.S. Treasury Notes Futures, expiring 01/23/15, Strike Price $129.00 | | | 8,200 | | | | (7,687 | ) |
30 Year U.S. Ultra Treasury Bonds, expiring 01/23/15, Strike Price $168.00 | | | 1,600 | | | | (12,750 | ) |
30 Year U.S. Ultra Treasury Bonds, expiring 01/23/15, Strike Price $170.00 | | | 4,000 | | | | (16,875 | ) |
| | | | | | | | | | | | | | |
|
|
|
| | | | | | | | | | | | | | | | (98,750 | ) |
| | | | | | | | | | | | | | |
|
|
|
Put Options | | | | | | | | | | | | | | | | |
90 Day Euro Dollar, expiring 12/14/15, Strike Price $99.00 | | | 69,000 | | | | (124,200 | ) |
Eurodollars 1 Year Mid-Curve Futures, expiring 03/13/15, Strike Price $98.63 | | | 86,500 | | | | (58,388 | ) |
Eurodollars 1 Year Mid-Curve Futures, expiring 03/13/15, Strike Price $98.75 | | | 86,500 | | | | (95,150 | ) |
| | | | | | | | | | | | | | |
|
|
|
| | | | | | | | | | | | | | | | (277,738 | ) |
| | | | | | | | | | | | | | |
|
|
|
TOTAL OPTIONS WRITTEN
(premiums received $455,618) | | | | (376,488 | ) |
| | | | | | | | | | | | | | |
|
|
|
TOTAL INVESTMENTS, NET OF OPTIONS WRITTEN — 104.4%
(cost $1,077,377,547) | | | | 1,115,239,946 | |
LIABILITIES IN EXCESS OF OTHER ASSETS(k) — (4.4)% | | | | (47,367,933 | ) |
| | | | | | | | | | | | | | |
|
|
|
NET ASSETS — 100.0% | | | $ | 1,067,872,013 | |
| | | | | | | | | | | | | | |
|
|
|
SEE NOTES TO FINANCIAL STATEMENTS.
A46
| | | | | | |
| | | DIVERSIFIED BOND PORTFOLIO (continued) | | |
| |
| SCHEDULE OF INVESTMENTS | | December 31, 2014 |
See the Glossary for abbreviations used in the Portfolio descriptions.
| * | Non-income producing security. |
| # | Principal or notional amount is shown in U.S. dollars unless otherwise stated. |
| (a) | Variable rate instrument. The interest rate shown reflects the rate in effect at December 31, 2014. |
| (b) | Indicates a restricted security; the aggregate original cost of the restricted securities is $16,085,073. The aggregate value of $15,881,466 is approximately 1.5% of net assets. |
| (c) | Indicates a security or securities that have been deemed illiquid. |
| (d) | All or a portion of security is on loan. The aggregate market value of such securities, including those sold and pending settlement, is $65,304,385; cash collateral of $66,800,717 (included in liabilities) was received with which the Portfolio purchased highly liquid short-term investments. Securities on loan are subject to contractual netting arrangements. |
| (e) | Represents security, or a portion thereof, segregated as collateral for swap agreements. |
| (f) | Represents issuer in default on interest payments and/or principal repayments; non-income producing security. |
| (g) | Represents zero coupon bond or step coupon bond. Rate quoted represents yield to maturity at purchase date. |
| (h) | Represents security, or a portion thereof, segregated as collateral for futures contracts. |
| (i) | Prudential Investments LLC, the manager of the Portfolio, also serves as manager of the Prudential Investment Portfolios 2 — Prudential Core Taxable Money Market Fund and the Prudential Investment Portfolios 2 — Prudential Core Short-Term Bond Fund. |
| (j) | Represents security, or a portion thereof, purchased with cash collateral received for securities on loan. |
| (k) | Includes net unrealized appreciation (depreciation) on the following derivative contracts held at reporting period end: |
Futures contracts outstanding at December 31, 2014:
| | | | | | | | | | | | | | | | | | |
Number of
Contracts
| | Type
| | Expiration
Date
| | | Value at
Trade Date
| | | Value at
December 31, 2014
| | | Unrealized
Appreciation
(Depreciation)(1)
| |
| Long Positions: | | | | | | | | | | | | | | | | | | |
| 26 | | 2 Year U.S. Treasury Notes | | | Mar. 2015 | | | $ | 5,684,694 | | | $ | 5,683,438 | | | $ | (1,256 | ) |
| 2,070 | | 5 Year U.S. Treasury Notes | | | Mar. 2015 | | | | 246,185,367 | | | | 246,184,453 | | | | (914 | ) |
| 521 | | 10 Year U.S. Treasury Notes | | | Mar. 2015 | | | | 65,673,951 | | | | 66,061,172 | | | | 387,221 | |
| 184 | | U.S. Ultra Treasury Bonds | | | Mar. 2015 | | | | 29,419,464 | | | | 30,394,500 | | | | 975,036 | |
| | | | | | | | | | | | | | | | |
|
|
|
| | | | | | | | | | | | | | | | | $ | 1,360,087 | |
| | | | | | | | | | | | | | | | |
|
|
|
| (1) | A U.S. Treasury obligation with a market value of $3,218,749 has been segregated with Citigroup Global Markets to cover requirements for open contracts at December 31, 2014. |
Forward foreign currency exchange contracts outstanding at December 31, 2014:
| | | | | | | | | | | | | | | | | | |
Purchase Contracts
| | Counterparty
| | Notional
Amount (000)
| | | Value at
Settlement Date
Payable
| | | Current
Value
| | | Unrealized
Appreciation
(Depreciation)
| |
Australian Dollar, | | | | | | | | | | | | | | | | | | |
Expiring 01/16/15 | | BNP Paribas | | AUD | 1,235 | | | $ | 1,079,000 | | | $ | 1,006,794 | | | $ | (72,206 | ) |
Expiring 01/16/15 | | JPMorgan Chase | | AUD | 1,222 | | | | 1,075,400 | | | | 996,836 | | | | (78,564 | ) |
Brazilian Real, | | | | | | | | | | | | | | | | | | |
Expiring 03/11/15 | | Barclays Capital Group | | BRL | 4,104 | | | | 1,561,441 | | | | 1,514,509 | | | | (46,932 | ) |
Expiring 03/11/15 | | Citigroup Global Markets | | BRL | 1,178 | | | | 426,200 | | | | 434,828 | | | | 8,628 | |
British Pound, | | | | | | | | | | | | | | | | | | |
Expiring 01/28/15 | | JPMorgan Chase | | GBP | 670 | | | | 1,072,700 | | | | 1,043,743 | | | | (28,957 | ) |
Expiring 01/28/15 | | UBS AG | | GBP | 998 | | | | 1,613,001 | | | | 1,555,686 | | | | (57,315 | ) |
Canadian Dollar, | | | | | | | | | | | | | | | | | | |
Expiring 01/16/15 | | Citigroup Global Markets | | CAD | 2,988 | | | | 2,654,776 | | | | 2,570,747 | | | | (84,029 | ) |
Expiring 01/16/15 | | Citigroup Global Markets | | CAD | 1,204 | | | | 1,075,400 | | | | 1,035,816 | | | | (39,584 | ) |
Expiring 01/16/15 | | JPMorgan Chase | | CAD | 1,226 | | | | 1,068,300 | | | | 1,054,957 | | | | (13,343 | ) |
Expiring 01/16/15 | | UBS AG | | CAD | 1,210 | | | | 1,078,500 | | | | 1,040,949 | | | | (37,551 | ) |
Chilean Peso, | | | | | | | | | | | | | | | | | | |
Expiring 01/12/15 | | Citigroup Global Markets | | CLP | 633,382 | | | | 1,079,200 | | | | 1,042,128 | | | | (37,072 | ) |
Expiring 01/15/15 | | Citigroup Global Markets | | CLP | 628,012 | | | | 1,075,400 | | | | 1,032,918 | | | | (42,482 | ) |
Expiring 01/15/15 | | Citigroup Global Markets | | CLP | 623,470 | | | | 1,074,300 | | | | 1,025,447 | | | | (48,853 | ) |
SEE NOTES TO FINANCIAL STATEMENTS.
A47
| | | | | | |
| | | DIVERSIFIED BOND PORTFOLIO (continued) | | |
| |
| SCHEDULE OF INVESTMENTS | | December 31, 2014 |
Forward foreign currency exchange contracts outstanding at December 31, 2014 (continued):
| | | | | | | | | | | | | | | | | | |
Purchase Contracts
| | Counterparty
| | Notional
Amount (000)
| | | Value at
Settlement Date
Payable
| | | Current
Value
| | | Unrealized
Appreciation
(Depreciation)
| |
Chinese Renminbi, | | | | | | | | | | | | | | | | | | |
Expiring 01/15/15 | | Citigroup Global Markets | | CNH | 18,969 | | | $ | 3,065,860 | | | $ | 3,051,683 | | | $ | (14,177 | ) |
Expiring 01/15/15 | | Citigroup Global Markets | | CNH | 9,919 | | | | 1,613,000 | | | | 1,595,795 | | | | (17,205 | ) |
Expiring 01/15/15 | | Citigroup Global Markets | | CNH | 6,655 | | | | 1,079,200 | | | | 1,070,714 | | | | (8,486 | ) |
Expiring 01/15/15 | | Hong Kong & Shanghai Bank | | CNH | 18,798 | | | | 3,038,380 | | | | 3,024,111 | | | | (14,269 | ) |
Expiring 01/15/15 | | JPMorgan Chase | | CNH | 37,956 | | | | 6,135,243 | | | | 6,106,232 | | | | (29,011 | ) |
Expiring 01/15/15 | | UBS AG | | CNH | 22,618 | | | | 3,655,659 | | | | 3,638,726 | | | | (16,933 | ) |
Euro, | | | | | | | | | | | | | | | | | | |
Expiring 01/28/15 | | Bank of America | | EUR | 13,427 | | | | 17,041,210 | | | | 16,251,735 | | | | (789,475 | ) |
Indian Rupee, | | | | | | | | | | | | | | | | | | |
Expiring 01/28/15 | | Barclays Capital Group | | INR | 197,575 | | | | 3,177,629 | | | | 3,110,951 | | | | (66,678 | ) |
Malaysian Ringgit, | | | | | | | | | | | | | | | | | | |
Expiring 01/09/15 | | Citigroup Global Markets | | MYR | 2,131 | | | | 645,312 | | | | 608,925 | | | | (36,387 | ) |
Expiring 01/09/15 | | Goldman Sachs & Co. | | MYR | 3,196 | | | | 967,911 | | | | 913,388 | | | | (54,523 | ) |
Mexican Peso, | | | | | | | | | | | | | | | | | | |
Expiring 01/22/15 | | Citigroup Global Markets | | MXN | 3,113 | | | | 213,900 | | | | 210,696 | | | | (3,204 | ) |
Expiring 01/22/15 | | JPMorgan Chase | | MXN | 674 | | | | 49,308 | | | | 45,642 | | | | (3,666 | ) |
Expiring 01/22/15 | | JPMorgan Chase | | MXN | 4,611 | | | | 320,500 | | | | 312,109 | | | | (8,391 | ) |
Expiring 01/22/15 | | Toronto Dominion | | MXN | 51,542 | | | | 3,787,117 | | | | 3,488,694 | | | | (298,423 | ) |
New Zealand Dollar, | | | | | | | | | | | | | | | | | | |
Expiring 01/16/15 | | Barclays Capital Group | | NZD | 2,790 | | | | 2,211,024 | | | | 2,172,552 | | | | (38,472 | ) |
Norwegian Krone, | | | | | | | | | | | | | | | | | | |
Expiring 01/26/15 | | JPMorgan Chase | | NOK | 210 | | | | 31,625 | | | | 28,126 | | | | (3,499 | ) |
Philippine Peso, | | | | | | | | | | | | | | | | | | |
Expiring 02/12/15 | | Barclays Capital Group | | PHP | 95,137 | | | | 2,114,164 | | | | 2,122,100 | | | | 7,936 | |
Polish Zloty, | | | | | | | | | | | | | | | | | | |
Expiring 01/26/15 | | Deutsche Bank AG | | PLN | 2,072 | | | | 608,134 | | | | 584,447 | | | | (23,687 | ) |
Russian Ruble, | | | | | | | | | | | | | | | | | | |
Expiring 02/09/15 | | Credit Suisse First Boston Corp. | | RUB | 34,831 | | | | 622,309 | | | | 559,755 | | | | (62,554 | ) |
Singapore Dollar, | | | | | | | | | | | | | | | | | | |
Expiring 01/23/15 | | Deutsche Bank AG | | SGD | 1,372 | | | | 1,079,199 | | | | 1,034,902 | | | | (44,297 | ) |
Expiring 01/23/15 | | Goldman Sachs & Co. | | SGD | 1,369 | | | | 1,078,400 | | | | 1,032,918 | | | | (45,482 | ) |
Expiring 01/23/15 | | Toronto Dominion | | SGD | 2,790 | | | | 2,185,490 | | | | 2,105,171 | | | | (80,319 | ) |
South African Rand, | | | | | | | | | | | | | | | | | | |
Expiring 01/23/15 | | Deutsche Bank AG | | ZAR | 1,070 | | | | 94,622 | | | | 92,152 | | | | (2,470 | ) |
Turkish Lira, | | | | | | | | | | | | | | | | | | |
Expiring 01/20/15 | | Barclays Capital Group | | TRY | 2,424 | | | | 1,070,800 | | | | 1,033,264 | | | | (37,536 | ) |
Expiring 01/20/15 | | Citigroup Global Markets | | TRY | 8,106 | | | | 3,583,544 | | | | 3,455,266 | | | | (128,278 | ) |
Expiring 01/20/15 | | JPMorgan Chase | | TRY | 3,460 | | | | 1,508,159 | | | | 1,474,845 | | | | (33,314 | ) |
| | | | | | | | |
|
|
| |
|
|
| |
|
|
|
| | | | | | | | | $ | 76,911,317 | | | $ | 74,480,257 | | | $ | (2,431,060 | ) |
| | | | | | | | |
|
|
| |
|
|
| |
|
|
|
| | | | | | | | | | | | | | | | | | |
Sale Contracts
| | Counterparty
| | Notional
Amount (000)
| | | Value at
Settlement Date
Receivable
| | | Current
Value
| | | Unrealized
Appreciation
(Depreciation)
| |
Australian Dollar, | | | | | | | | | | | | | | | | | | |
Expiring 01/16/15 | | Citigroup Global Markets | | AUD | 339 | | | $ | 294,285 | | | $ | 276,677 | | | $ | 17,608 | |
Expiring 01/16/15 | | Citigroup Global Markets | | AUD | 1,239 | | | | 1,071,800 | | | | 1,010,624 | | | | 61,176 | |
Expiring 01/16/15 | | Citigroup Global Markets | | AUD | 1,253 | | | | 1,070,100 | | | | 1,021,331 | | | | 48,769 | |
Brazilian Real, | | | | | | | | | | | | | | | | | | |
Expiring 03/11/15 | | Citigroup Global Markets | | BRL | 1,143 | | | | 427,800 | | | | 421,857 | | | | 5,943 | |
British Pound, | | | | | | | | | | | | | | | | | | |
Expiring 01/28/15 | | Bank of America | | GBP | 1,274 | | | | 2,053,628 | | | | 1,985,662 | | | | 67,966 | |
Expiring 01/28/15 | | JPMorgan Chase | | GBP | 1,690 | | | | 2,669,000 | | | | 2,633,554 | | | | 35,446 | |
Expiring 01/28/15 | | JPMorgan Chase | | GBP | 4,250 | | | | 6,830,287 | | | | 6,621,884 | | | | 208,403 | |
SEE NOTES TO FINANCIAL STATEMENTS.
A48
| | | | | | |
| | | DIVERSIFIED BOND PORTFOLIO (continued) | | |
| |
| SCHEDULE OF INVESTMENTS | | December 31, 2014 |
Forward foreign currency exchange contracts outstanding at December 31, 2014 (continued):
| | | | | | | | | | | | | | | | | | |
Sale Contracts
| | Counterparty
| | Notional
Amount (000)
| | | Value at
Settlement Date
Receivable
| | | Current
Value
| | | Unrealized
Appreciation
(Depreciation)
| |
Canadian Dollar, | | | | | | | | | | | | | | | | | | |
Expiring 01/16/15 | | Goldman Sachs & Co. | | CAD | 1,102 | | | $ | 963,700 | | | $ | 948,011 | | | $ | 15,689 | |
Expiring 01/16/15 | | JPMorgan Chase | | CAD | 1,220 | | | | 1,071,800 | | | | 1,049,730 | | | | 22,070 | |
Expiring 01/16/15 | | JPMorgan Chase | | CAD | 1,226 | | | | 1,068,300 | | | | 1,054,804 | | | | 13,496 | |
Expiring 01/16/15 | | UBS AG | | CAD | 3,066 | | | | 2,697,400 | | | | 2,637,760 | | | | 59,640 | |
Chilean Peso, | | | | | | | | | | | | | | | | | | |
Expiring 01/15/15 | | Citigroup Global Markets | | CLP | 902,980 | | | | 1,498,100 | | | | 1,485,169 | | | | 12,931 | |
Expiring 01/15/15 | | Citigroup Global Markets | | CLP | 955,396 | | | | 1,605,600 | | | | 1,571,380 | | | | 34,220 | |
Chinese Renminbi, | | | | | | | | | | | | | | | | | | |
Expiring 01/15/15 | | Barclays Capital Group | | CNH | 3,513 | | | | 567,797 | | | | 565,204 | | | | 2,593 | |
Expiring 01/15/15 | | Citigroup Global Markets | | CNH | 16,559 | | | | 2,678,400 | | | | 2,663,908 | | | | 14,492 | |
Expiring 01/15/15 | | Deutsche Bank AG | | CNH | 6,698 | | | | 1,082,598 | | | | 1,077,566 | | | | 5,032 | |
Expiring 01/15/15 | | Deutsche Bank AG | | CNH | 15,906 | | | | 2,563,900 | | | | 2,558,969 | | | | 4,931 | |
Expiring 01/15/15 | | Deutsche Bank AG | | CNH | 72,232 | | | | 11,672,500 | | | | 11,620,581 | | | | 51,919 | |
Hungarian Forint, | | | | | | | | | | | | | | | | | | |
Expiring 01/22/15 | | JPMorgan Chase | | HUF | 219,665 | | | | 913,338 | | | | 839,137 | | | | 74,201 | |
Indian Rupee, | | | | | | | | | | | | | | | | | | |
Expiring 01/28/15 | | UBS AG | | INR | 100,273 | | | | 1,606,300 | | | | 1,578,866 | | | | 27,434 | |
Expiring 01/28/15 | | UBS AG | | INR | 100,388 | | | | 1,607,100 | | | | 1,580,665 | | | | 26,435 | |
Japanese Yen, | | | | | | | | | | | | | | | | | | |
Expiring 01/28/15 | | Toronto Dominion | | JPY | 162,438 | | | | 1,503,292 | | | | 1,356,471 | | | | 146,821 | |
Malaysian Ringgit, | | | | | | | | | | | | | | | | | | |
Expiring 01/09/15 | | UBS AG | | MYR | 5,402 | | | | 1,606,200 | | | | 1,543,953 | | | | 62,247 | |
Mexican Peso, | | | | | | | | | | | | | | | | | | |
Expiring 01/22/15 | | Citigroup Global Markets | | MXN | 13,704 | | | | 968,100 | | | | 927,565 | | | | 40,535 | |
Expiring 01/22/15 | | Deutsche Bank AG | | MXN | 14,947 | | | | 1,076,100 | | | | 1,011,725 | | | | 64,375 | |
Expiring 01/22/15 | | Deutsche Bank AG | | MXN | 39,457 | | | | 2,891,200 | | | | 2,670,697 | | | | 220,503 | |
New Zealand Dollar, | | | | | | | | | | | | | | | | | | |
Expiring 01/16/15 | | Deutsche Bank AG | | NZD | 1,398 | | | | 1,070,100 | | | | 1,088,702 | | | | (18,602 | ) |
Expiring 01/16/15 | | UBS AG | | NZD | 1,397 | | | | 1,071,800 | | | | 1,087,626 | | | | (15,826 | ) |
Philippine Peso, | | | | | | | | | | | | | | | | | | |
Expiring 02/12/15 | | UBS AG | | PHP | 96,057 | | | | 2,142,700 | | | | 2,142,617 | | | | 83 | |
Polish Zloty, | | | | | | | | | | | | | | | | | | |
Expiring 01/26/15 | | Barclays Capital Group | | PLN | 4,386 | | | | 1,310,665 | | | | 1,237,187 | | | | 73,478 | |
Singapore Dollar, | | | | | | | | | | | | | | | | | | |
Expiring 01/23/15 | | Deutsche Bank AG | | SGD | 1,383 | | | | 1,070,800 | | | | 1,043,260 | | | | 27,540 | |
Expiring 01/23/15 | | Goldman Sachs & Co. | | SGD | 4,152 | | | | 3,215,400 | | | | 3,132,357 | | | | 83,043 | |
South African Rand, | | | | | | | | | | | | | | | | | | |
Expiring 01/23/15 | | Citigroup Global Markets | | ZAR | 3,953 | | | | 354,792 | | | | 340,415 | | | | 14,377 | |
Turkish Lira, | | | | | | | | | | | | | | | | | | |
Expiring 01/20/15 | | Credit Suisse First Boston Corp. | | TRY | 55,105 | | | | 24,125,975 | | | | 23,488,804 | | | | 637,171 | |
Expiring 01/23/15 | | JPMorgan Chase | | TRY | 4,127 | | | | 1,819,201 | | | | 1,757,957 | | | | 61,244 | |
| | | | | | | | |
|
|
| |
|
|
| |
|
|
|
| | | | | | | | | $ | 90,240,058 | | | $ | 88,032,675 | | | $ | 2,207,383 | |
| | | | | | | | |
|
|
| |
|
|
| |
|
|
|
| | | | | | | | | | | | | | | | | $ | (223,677 | ) |
| | | | | | | | | | | | | | | | |
|
|
|
Interest rate swap agreements outstanding at December 31, 2014:
| | | | | | | | | | | | | | | | | | | | | | | | | | |
Notional
Amount
(000)#
| | | Termination
Date
| | | Fixed
Rate
| | | Floating
Rate
| | Fair
Value
| | | Upfront
Premiums
Paid
(Received)
| | | Unrealized
Appreciation
(Depreciation)
| | | Counterparty
|
| Over-the-counter swap agreements: |
| AUD | 1,270 | | | | 12/19/32 | | | | 4.423% | | | 6 Month BBSW(2) | | $ | 124,091 | | | $ | — | | | $ | 124,091 | | | Barclays Capital Group |
| AUD | 1,620 | | | | 12/20/32 | | | | 4.420% | | | 6 Month BBSW(2) | | | 157,594 | | | | — | | | | 157,594 | | | Citigroup Global Markets |
| BRL | 7,942 | | | | 01/01/17 | | | | 8.330% | | | 1 Day Brazil Interbank Rate(2) | | | (355,302 | ) | | | — | | | | (355,302 | ) | | Citigroup Global Markets |
| BRL | 13,135 | | | | 01/01/17 | | | | 9.130% | | | 1 Day Brazil Interbank Rate(2) | | | (397,175 | ) | | | — | | | | (397,175 | ) | | Barclays Capital Group |
SEE NOTES TO FINANCIAL STATEMENTS.
A49
| | | | | | |
| | | DIVERSIFIED BOND PORTFOLIO (continued) | | |
| |
| SCHEDULE OF INVESTMENTS | | December 31, 2014 |
Interest rate swap agreements outstanding at December 31, 2014 (continued):
| | | | | | | | | | | | | | | | | | | | | | | | | | |
Notional
Amount
(000)#
| | | Termination
Date
| | | Fixed
Rate
| | | Floating
Rate
| | Fair
Value
| | | Upfront
Premiums
Paid
(Received)
| | | Unrealized
Appreciation
(Depreciation)
| | | Counterparty
|
| Over-the-counter swap agreements (cont’d): |
| BRL | 37,393 | | | | 01/02/17 | | | | 10.580% | | | 1 Day Brazil Interbank Rate(2) | | $ | (579,307 | ) | | $ | — | | | $ | (579,307 | ) | | Hong Kong & Shanghai Bank |
| BRL | 18,086 | | | | 01/01/18 | | | | 11.770% | | | 1 Day Brazil Interbank Rate(2) | | | (152,761 | ) | | | — | | | | (152,761 | ) | | Deutsche Bank AG |
| BRL | 7,343 | | | | 01/01/21 | | | | 12.640% | | | 1 Day Brazil Interbank Rate(2) | | | 156,747 | | | | — | | | | 156,747 | | | Deutsche Bank AG |
| BRL | 7,360 | | | | 01/01/21 | | | | 11.300% | | | 1 Day Brazil Interbank Rate(2) | | | (115,793 | ) | | | — | | | | (115,793 | ) | | Barclays Bank PLC |
| MXN | 76,000 | | | | 06/20/18 | | | | 6.020% | | | 28 Day Mexican Interbank Rate(2) | | | 200,106 | | | | — | | | | 200,106 | | | Credit Suisse First Boston Corp. |
| MXN | 73,100 | | | | 11/09/18 | | | | 5.410% | | | 28 Day Mexican Interbank Rate(2) | | | 77,488 | | | | — | | | | 77,488 | | | Deutsche Bank AG |
| MXN | 20,100 | | | | 04/28/23 | | | | 5.100% | | | 28 Day Mexican Interbank Rate(2) | | | (79,609 | ) | | | — | | | | (79,609 | ) | | Barclays Capital Group |
| | RUB 65,000 | | | | 05/20/23 | | | | 7.250% | | | 3 Month MOSPRIME(2) | | | (269,140 | ) | | | — | | | | (269,140 | ) | | Credit Suisse First Boston Corp. |
| | 25,690 | | | | 11/15/19 | | | | 1.334% | | | 3 Month LIBOR(1) | | | 458,998 | | | | — | | | | 458,998 | | | Citigroup Global Markets |
| ZAR | 10,000 | | | | 09/03/33 | | | | 8.970% | | | 3 Month JIBAR(2) | | | 48,632 | | | | — | | | | 48,632 | | | Hong Kong & Shanghai Bank |
| | | | | | | | | | | | | | |
|
|
| |
|
|
| |
|
|
| | |
| | | | | | | | | | | | | | | $ | (725,431 | ) | | $ | — | | | $ | (725,431 | ) | | |
| | | | | | | | | | | | | | |
|
|
| |
|
|
| |
|
|
| | |
| | | | | | | | | | | | | | | | | | | | | | | | |
Notional
Amount
(000)#
| | | Termination
Date
| | | Fixed
Rate
| | | Floating
Rate
| | Value at
Trade Date
| | | Value at
December 31, 2014
| | | Unrealized
Appreciation
(Depreciation)
| |
| Exchange-traded swap agreements: | |
| AUD | 2,300 | | | | 03/07/29 | | | | 4.743% | | | 6 Month BBSW(2) | | $ | (23,575 | ) | | $ | 289,388 | | | $ | 312,963 | |
| EUR | 8,050 | | | | 08/04/16 | | | | 0.078% | | | 1 Day EUROIS(1) | | | 2,317 | | | | (28,404 | ) | | | (30,721 | ) |
| EUR | 6,100 | | | | 08/01/19 | | | | 0.346% | | | 1 Day EUROIS(1) | | | 8,259 | | | | (125,330 | ) | | | (133,589 | ) |
| EUR | 8,050 | | | | 08/04/24 | | | | 1.054% | | | 1 Day EUROIS(1) | | | (38,513 | ) | | | (605,467 | ) | | | (566,954 | ) |
| GBP | 1,490 | | | | 11/03/24 | | | | 1.960% | | | 6 Month GBP LIBOR(1) | | | 868 | | | | (112,780 | ) | | | (113,648 | ) |
| MXN | 65,000 | | | | 12/02/15 | | | | 5.080% | | | 28 Day Mexican Interbank Rate(2) | | | (8,519 | ) | | | 57,201 | | | | 65,720 | |
| MXN | 70,000 | | | | 04/18/19 | | | | 5.480% | | | 28 Day Mexican Interbank Rate(2) | | | (15,163 | ) | | | 56,968 | | | | 72,131 | |
| MXN | 48,200 | | | | 05/25/22 | | | | 6.370% | | | 28 Day Mexican Interbank Rate(2) | | | (20,475 | ) | | | 112,161 | | | | 132,636 | |
| MXN | 38,000 | | | | 08/13/24 | | | | 6.120% | | | 28 Day Mexican Interbank Rate(2) | | | (3,150 | ) | | | 11,478 | | | | 14,628 | |
| MXN | 13,900 | | | | 07/27/34 | | | | 6.720% | | | 28 Day Mexican Interbank Rate(2) | | | 1,499 | | | | (18,998 | ) | | | (20,497 | ) |
| | 27,365 | | | | 06/30/16 | | | | 0.618% | | | 3 Month LIBOR(1) | | | 218 | | | | 13,691 | | | | 13,473 | |
| | 124,560 | | �� | | 06/30/16 | | | | 0.655% | | | 3 Month LIBOR(1) | | | (15,650 | ) | | | (6,520 | ) | | | 9,130 | |
| | 34,630 | | | | 06/30/16 | | | | 0.655% | | | 3 Month LIBOR(1) | | | 236 | | | | (1,880 | ) | | | (2,116 | ) |
| | 15,400 | | | | 08/27/16 | | | | 0.698% | | | 3 Month LIBOR(1) | | | 188 | | | | 8,081 | | | | 7,893 | |
| | 5,000 | | | | 09/30/16 | | | | 0.711% | | | 6 Month LIBOR(1) | | | 162 | | | | 5,152 | | | | 4,990 | |
| | 32,800 | | | | 09/30/16 | | | | 0.759% | | | 3 Month LIBOR(1) | | | 232 | | | | 6,713 | | | | 6,481 | |
| | 10,050 | | | | 09/30/16 | | | | 0.877% | | | 3 Month LIBOR(1) | | | 175 | | | | (18,082 | ) | | | (18,257 | ) |
| | 13,200 | | | | 11/10/16 | | | | 0.739% | | | 6 Month LIBOR(1) | | | 183 | | | | 20,844 | | | | 20,661 | |
| | 6,815 | | | | 12/24/17 | | | | 1.384% | | | 3 Month LIBOR(1) | | | 995 | | | | (19,638 | ) | | | (20,633 | ) |
| | 5,150 | | | | 02/28/19 | | | | 1.625% | | | 6 Month LIBOR(1) | | | 173 | | | | (3,004 | ) | | | (3,177 | ) |
| | 19,300 | | | | 02/28/19 | | | | 1.806% | | | 3 Month LIBOR(1) | | | 42,047 | | | | (152,617 | ) | | | (194,664 | ) |
| | 7,450 | | | | 11/06/19 | | | | 1.753% | | | 6 Month LIBOR(1) | | | 184 | | | | (1,418 | ) | | | (1,602 | ) |
| | 9,010 | | | | 12/02/19 | | | | 1.639% | | | 6 Month LIBOR(1) | | | 191 | | | | 52,291 | | | | 52,100 | |
| | 16,250 | | | | 07/31/21 | | | | 2.290% | | | 3 Month LIBOR(1) | | | 247 | | | | (299,837 | ) | | | (300,084 | ) |
| ZAR | 20,000 | | | | 10/22/23 | | | | 7.625% | | | 3 Month JIBAR(2) | | | 318 | | | | (21,875 | ) | | | (22,193 | ) |
| ZAR | 38,300 | | | | 11/14/23 | | | | 8.190% | | | 3 Month JIBAR(2) | | | (17,452 | ) | | | 76,961 | | | | 94,413 | |
| | | | | | | | | | | | | | |
|
|
| |
|
|
| |
|
|
|
| | | | | | | | | | | | | | | $ | (84,005 | ) | | $ | (704,921 | ) | | $ | (620,916 | ) |
| | | | | | | | | | | | | | |
|
|
| |
|
|
| |
|
|
|
| (1) | Portfolio pays the fixed rate and receives the floating rate. |
| (2) | Portfolio pays the floating rate and receives the fixed rate. |
SEE NOTES TO FINANCIAL STATEMENTS.
A50
| | | | | | |
| | | DIVERSIFIED BOND PORTFOLIO (continued) | | |
| |
| SCHEDULE OF INVESTMENTS | | December 31, 2014 |
Credit default swap agreements outstanding at December 31, 2014:
| | | | | | | | | | | | | | | | | | | | | | | | | | | | | | |
Reference Entity/Obligation
| | Termination
Date
| | | Fixed
Rate
| | | Notional
Amount
(000)#(4)
| | | Implied
Credit
Spread at
December 31,
2014(5)
| | | Fair
Value
| | | Upfront
Premiums
Paid
(Received)
| | | Unrealized
Depreciation
| | | Counterparty
|
Over-the-counter credit default swaps on corporate issues—Buy Protection(1): | | | |
American International Group, Inc. | | | 03/20/18 | | | | 3.700% | | | | 3,700 | | | | 0.289 | % | | $ | (408,094 | ) | | $ | — | | | $ | (408,094 | ) | | Deutsche Bank AG |
R.R. Donnelley & Sons Co. | | | 09/20/16 | | | | 1.000% | | | | 4,750 | | | | 0.658 | % | | | (36,179 | ) | | | 229,661 | | | | (265,840 | ) | | JPMorgan Chase |
Toll Brothers Financial Corp. | | | 03/20/15 | | | | 1.000% | | | | 4,695 | | | | 0.578 | % | | | (9,906 | ) | | | 8,900 | | | | (18,806 | ) | | Credit Suisse First Boston Corp. |
Westvaco Corp. | | | 09/20/19 | | | | 1.000% | | | | 4,400 | | | | 0.190 | % | | | (70,278 | ) | | | 49,517 | | | | (119,795 | ) | | JPMorgan Chase |
| | | | | | | | | | | | | | | | | | |
|
|
| |
|
|
| |
|
|
| | |
| | | | | | | | | | | | | | | | | | | $ | (524,457 | ) | | $ | 288,078 | | | $ | (812,535 | ) | | |
| | | | | | | | | | | | | | | | | | |
|
|
| |
|
|
| |
|
|
| | |
| | | | | | | | | | | | | | | | | | | | | | | | | | |
Reference Entity/Obligation
| | Termination
Date
| | | Fixed
Rate
| | | Notional
Amount
(000)#(4)
| | | Fair
Value(3)
| | | Upfront
Premiums
Paid
(Received)
| | | Unrealized
Appreciation
| | | Counterparty
|
Over-the-counter credit default swaps on credit indices—Sell Protection(2): | | | |
CDX.NA.HY.17.V5 | | | 12/20/16 | | | | 5.000% | | | | 6,650 | | | $ | 343,569 | | | $ | 278,931 | | | $ | 64,638 | | | Credit Suisse First Boston Corp. |
CDX.NA.HY.17.V5 | | | 12/20/16 | | | | 5.000% | | | | 12,825 | | | | 662,597 | | | | 586,032 | | | | 76,565 | | | Deutsche Bank AG |
CDX.NA.HY.17.V5 | | | 12/20/16 | | | | 5.000% | | | | 18,525 | | | | 957,084 | | | | 800,177 | | | | 156,907 | | | Deutsche Bank AG |
CDX.NA.HY.17.V5 | | | 12/20/16 | | | | 5.000% | | | | 11,875 | | | | 613,515 | | | | 520,355 | | | | 93,160 | | | Deutsche Bank AG |
| | | | | | | | | | | | | | |
|
|
| |
|
|
| |
|
|
| | |
| | | | | | | | | | | | | | | $ | 2,576,765 | | | $ | 2,185,495 | | | $ | 391,270 | | | |
| | | | | | | | | | | | | | |
|
|
| |
|
|
| |
|
|
| | |
| | | | | | | | | | | | | | | | | | | | | | | | |
Reference Entity/ Obligation
| | Termination
Date
| | | Fixed
Rate
| | | Notional
Amount
(000)#(4)
| | | Value at
Trade Date
| | | Value at
December 31,
2014(3)
| | | Unrealized
Appreciation
(Depreciation)
| |
Exchange-Traded credit default swaps on credit indices—Buy Protection(1): | |
CDX.NA.IG.22.V1 | | | 06/20/19 | | | | 1.000 | % | | | 140,000 | | | $ | (2,140,293 | ) | | $ | (2,525,295 | ) | | $ | (385,002 | ) |
ITRAXX.XO.22.V1 | | | 12/20/19 | | | | 5.000 | % | | | EUR 10,700 | | | | (984,857 | ) | | | (866,607 | ) | | | 118,250 | |
| | | | | | | | | | | | | | |
|
|
| |
|
|
| |
|
|
|
| | | | | | | | | | | | | | | $ | (3,125,150 | ) | | $ | (3,391,902 | ) | | $ | (266,752 | ) |
| | | | | | | | | | | | | | |
|
|
| |
|
|
| |
|
|
|
A U.S. Treasury obligation with a market value of $4,578,525 has been segregated with Citigroup Global Markets to cover requirements for open exchanged-traded interest rate and credit default swap contracts at December 31, 2014.
The Portfolio entered into credit default swaps (“CDS”) to provide a measure of protection against defaults or to take an active long or short position with respect to the likelihood of a particular issuer’s default or the reference entity’s credit soundness. CDS contracts generally trade based on a spread which represents the cost a protection buyer has to pay the protection seller. The protection buyer is said to be short the credit as the value of the contract rises the more the credit deteriorates. The value of the CDS contract increases for the protection buyer if the spread increases.
| (1) | If the Portfolio is a buyer of protection, it pays the fixed rate. When a credit event occurs, as defined under the terms of that particular swap agreement, the Portfolio will either (i) receive from the seller of protection an amount equal to the notional amount of the swap and make delivery of the referenced obligation or underlying securities comprising the referenced index or (ii) receive a net settlement amount in the form of cash or securities equal to the notional amount of the swap less the recovery value of the referenced obligation or underlying securities comprising the referenced index. |
| (2) | If the Portfolio is a seller of protection, it receives the fixed rate. When a credit event occurs, as defined under the terms of that particular swap agreement, the Portfolio will either (i) pay the buyer of protection an amount equal to the notional amount of the swap and take delivery of the referenced obligation or underlying securities comprising the referenced obligation or (ii) pay a net settlement amount in the form of cash or securities equal to the notional amount of the swap less the recovery value of the referenced obligation or underlying securities comprising the referenced index. |
| (3) | The fair value of credit default swap agreements on credit indices serves as an indicator of the current status of the payment/performance risk and represents the likelihood of an expected liability (or profit) for the credit derivative should the notional amount of the swap agreement be closed/sold as of the reporting date. Increasing fair value in absolute terms when compared to the notional amount of the swap, represents a deterioration of the referenced entity’s credit soundness and a greater likelihood of risk of default or other credit event occurring as defined under the terms of the agreement. |
| (4) | Notional amount represents the maximum potential amount the Portfolio could be required to pay as a seller of credit protection or receive as a buyer of credit protection if a credit event occurs as defined under the terms of that particular swap agreement. |
SEE NOTES TO FINANCIAL STATEMENTS.
A51
| | | | | | |
| | | DIVERSIFIED BOND PORTFOLIO (continued) | | |
| |
| SCHEDULE OF INVESTMENTS | | December 31, 2014 |
| (5) | Implied credit spreads, represented in absolute terms, utilized in determining the fair value of credit default swap agreements on corporate issues or sovereign issues of an emerging country as of period end serve as an indicator of the current status of the payment/performance risk and represent the likelihood of risk of default for the credit derivative. The implied credit spread of a particular referenced entity reflects the cost of buying/selling protection and may include up-front payments required to be made to enter into the agreement. Wider credit spreads represent a deterioration of the referenced entity’s credit soundness and a greater likelihood of risk of default or other credit event occurring as defined under the terms of the agreement. |
Currency swap agreements outstanding at December 31, 2014:
| | | | | | | | | | | | | | | | | | | | | | | | | | | | | | |
Notional
Amount
(000)#
| | | Fund
Receives
| | | Notional
Amount
(000)#
| | Fund Pays
| | Counterparty
| | Termination
Date
| | Fair
Value
| | | Upfront
Premiums
Paid
(Received)
| | | Unrealized
Appreciation
(Depreciation)
| |
| Over-the-counter swap agreements: | | | | | | | | | | | | |
| | 22,206 | | | | 3 Month LIBOR | | | | EUR | | | 16,740 | | 3 Month EURIBOR
minus 26.25 bps | | Barclays Capital Group | | 01/25/15 | | $ | 1,966,201 | | | $ | — | | | $ | 1,966,201 | |
| | 502 | | | | 3 Month LIBOR | | | | JPY | | | 50,000 | | 3 Month JPY
LIBOR minus
54.00 bps | | Barclays Capital Group | | 10/12/16 | | | 86,286 | | | | — | | | | 86,286 | |
| | 18,547 | | | | 3 Month LIBOR | | | | EUR | | | 13,940 | | 3 Month EURIBOR
minus 26.00 bps | | Citigroup Global Markets | | 01/25/15 | | | 1,693,003 | | | | — | | | | 1,693,003 | |
| | 956 | | | | 3 Month LIBOR | | | | JPY | | | 93,235 | | 3 Month JPY
LIBOR minus
32.75 bps | | Citigroup Global Markets | | 05/02/15 | | | 179,168 | | | | — | | | | 179,168 | |
| | 384 | | |
| 3 Month LIBOR
plus 333 bps |
| | | JPY | | | 30,000 | | 4.500% | | Citigroup Global Markets | | 06/08/15 | | | 128,713 | | | | (15,095 | ) | | | 143,808 | |
| | 1,284 | | |
| 3 Month LIBOR
plus 313 bps |
| | | JPY | | | 100,000 | | 4.500% | | Citigroup Global Markets | | 06/08/15 | | | 431,867 | | | | (56,202 | ) | | | 488,069 | |
| | 1,541 | | |
| 3 Month LIBOR
plus 432 bps |
| | | JPY | | | 120,000 | | 3.450% | | Citigroup Global Markets | | 03/24/17 | | | 582,302 | | | | 7,475 | | | | 574,827 | |
| | 5,882 | | | | 3 Month LIBOR | | | | JPY | | | 600,000 | | 3 Month JPY
LIBOR minus
31.25 bps | | Deutsche Bank AG | | 05/14/17 | | | 871,363 | | | | — | | | | 871,363 | |
| | 1,040 | | | | 3 Month LIBOR | | | | EUR | | | 780 | | 3 Month EURIBOR
minus 25.75 bps | | Hong Kong & Shanghai Bank | | 01/17/15 | | | 96,229 | | | | — | | | | 96,229 | |
| | 8,984 | | | | 3 Month LIBOR | | | | EUR | | | 6,770 | | 3 Month EURIBOR
minus 26.00 bps | | Hong Kong & Shanghai Bank | | 01/25/15 | | | 798,504 | | | | — | | | | 798,504 | |
| TRY | 20,000 | | | | 8.68% | | | | | | | 9,749 | | 3 Month LIBOR | | Hong Kong & Shanghai Bank | | 09/05/15 | | | (940,132 | ) | | | — | | | | (940,132 | ) |
| TRY | 23,640 | | | | 8.69% | | | | | | | 11,376 | | 3 Month LIBOR | | Hong Kong & Shanghai Bank | | 09/09/15 | | | (971,920 | ) | | | — | | | | (971,920 | ) |
| | 1,157 | | | | 3 Month LIBOR | | | | EUR | | | 900 | | 3 Month EURIBOR
minus 31.75 bps | | Hong Kong & Shanghai Bank | | 09/28/17 | | | 73,805 | | | | — | | | | 73,805 | |
| JPY | 265,000 | | |
| 3 Month JPY
LIBOR minus
43.35 bps |
| | | USD | | | 2,250 | | 3 Month LIBOR | | JPMorgan Chase | | 11/26/16 | | | (40,980 | ) | | | — | | | | (40,980 | ) |
| JPY | 1,060,000 | | |
| 3 Month JPY
LIBOR minus
42.10 bps |
| | | USD | | | 8,979 | | 3 Month LIBOR | | JPMorgan Chase | | 11/28/16 | | | (142,535 | ) | | | — | | | | (142,535 | ) |
| | 2,250 | | | | 3 Month LIBOR | | | | JPY | | | 265,000 | | 3 Month JPY
LIBOR minus
69.88 bps | | JPMorgan Chase | | 11/26/24 | | | 44,578 | | | | — | | | | 44,578 | |
| | 8,979 | | | | 3 Month LIBOR | | | | JPY | | | 1,060,000 | | 3 Month JPY
LIBOR minus
67.32 bps | | JPMorgan Chase | | 11/28/24 | | | 134,808 | | | | — | | | | 134,808 | |
| | | |
|
|
| |
|
|
| |
|
|
|
| | | | | | | | | | | | | | | | | | | | | $ | 4,991,260 | | | $ | (63,822 | ) | | $ | 5,055,082 | |
| | | |
|
|
| |
|
|
| |
|
|
|
Various inputs are used in determining the value of the Portfolio’s investments. These inputs are summarized in the three broad levels listed below.
| Level 1— | quoted prices generally in active markets for identical securities. |
| Level 2— | quoted prices for similar securities, interest rates and yield curves, prepayment speeds, foreign currency exchange rates and other significant observable inputs. |
| Level 3— | significant unobservable inputs for securities valued in accordance with Board approved fair valuation procedures. |
SEE NOTES TO FINANCIAL STATEMENTS.
A52
| | | | | | |
| | | DIVERSIFIED BOND PORTFOLIO (continued) | | |
| |
| SCHEDULE OF INVESTMENTS | | December 31, 2014 |
The following is a summary of the inputs used as of December 31, 2014 in valuing such portfolio securities:
| | | | | | | | | | | | |
| | | Level 1
| | | Level 2
| | | Level 3
| |
Investments in Securities | | | | | | | | | | | | |
Asset-Backed Securities | | | | | | | | | | | | |
Collateralized Loan Obligations | | $ | — | | | $ | 48,131,538 | | | $ | — | |
Non-Residential Mortgage-Backed Securities | | | — | | | | 3,787,113 | | | | — | |
Residential Mortgage-Backed Securities | | | — | | | | 60,762,411 | | | | — | |
Bank Loans | | | — | | | | 34,245,128 | | | | 4,745,724 | |
Commercial Mortgage-Backed Securities | | | — | | | | 107,166,762 | | | | — | |
Corporate Bonds | | | — | | | | 476,266,233 | | | | 6,610,851 | |
Foreign Agencies | | | — | | | | 24,800,449 | | | | — | |
Municipal Bonds | | | — | | | | 21,143,099 | | | | — | |
Sovereigns | | | — | | | | 54,137,068 | | | | — | |
U.S. Government Agency Obligations | | | — | | | | 18,948,890 | | | | — | |
U.S. Treasury Obligations | | | — | | | | 45,262,623 | | | | — | |
Preferred Stock | | | 1,196,100 | | | | — | | | | — | |
Affiliated Mutual Funds | | | 207,851,542 | | | | — | | | | — | |
Options Purchased | | | 560,903 | | | | — | | | | — | |
Options Written | | | (376,488 | ) | | | — | | | | — | |
Other Financial Instruments* | | | | | | | | | | | | |
Futures Contracts | | | 1,360,087 | | | | — | | | | — | |
Forward Foreign Currency Exchange Contracts | | | — | | | | (223,677 | ) | | | — | |
Over-the-counter interest rate swaps | | | — | | | | (725,431 | ) | | | — | |
Exchange-traded interest rate swaps | | | — | | | | (620,916 | ) | | | — | |
Over-the-counter credit default swaps | | | — | | | | 2,052,308 | | | | — | |
Exchange-traded credit default swaps | | | — | | | | (266,752 | ) | | | — | |
Currency Swap Agreements | | | — | | | | 4,991,260 | | | | — | |
| | |
|
|
| |
|
|
| |
|
|
|
Total | | $ | 210,592,144 | | | $ | 899,858,106 | | | $ | 11,356,575 | |
| | |
|
|
| |
|
|
| |
|
|
|
The following is a reconciliation of assets in which significant unobservable inputs (Level 3) were used in determining fair value:
| | | | | | | | | | | | | | | | |
| | | Collateralized
Loan Obligations
| | | Bank
Loans
| | | Corporate
Bonds
| | | Credit Default
Swaps
| |
Balance as of 12/31/13 | | $ | 2,490,000 | | | $ | 3,303,636 | | | $ | 7,438,596 | | | $ | (5,934 | ) |
Realized gain (loss) | | | — | | | | 5,249 | | | | — | | | | — | ** |
Change in unrealized appreciation (depreciation)*** | | | — | | | | (283,791 | ) | | | 180,205 | | | | 5,934 | |
Purchases | | | — | | | | 1,695,750 | | | | — | | | | — | |
Sales | | | — | | | | (13,749 | ) | | | (1,007,163 | ) | | | — | |
Accrued discount/premium | | | — | | | | 38,629 | | | | (787 | ) | | | — | |
Transfer into Level 3 | | | — | | | | — | | | | — | | | | — | |
Transfer out of Level 3 | | | (2,490,000 | ) | | | — | | | | — | | | | — | |
| | |
|
|
| |
|
|
| |
|
|
| |
|
|
|
Balance as of 12/31/14 | | $ | — | | | $ | 4,745,724 | | | $ | 6,610,851 | | | $ | — | |
| | |
|
|
| |
|
|
| |
|
|
| |
|
|
|
| * | Other financial instruments are derivative instruments not reflected in the Schedule of Investments, such as futures, forwards and exchange-traded swap contracts, which are recorded at the unrealized appreciation/depreciation on the instrument, and over-the-counter swap contracts which are recorded at fair value. |
| ** | The realized loss incurred during the period for other financial instruments was $(6,016). |
| *** | Of which, $(103,586) was relating to securities held at the reporting period end. |
It is the Portfolio’s policy to recognize transfers in and transfers out at the fair value as of the beginning of period. At the reporting period end, 1 Collateralized Loan Obligation transferred out of Level 3 as a result of being valued by an independent pricing source.
Level 3 securities as presented in the table above are being fair valued using pricing methodologies approved by the Board of Trustees, which contain unobservable inputs. Such methodologies include, but are not limited to, using prices provided by a single broker/dealer, the cost of the investment and prices of any recent transactions or bids/offers for such securities or any comparable securities.
SEE NOTES TO FINANCIAL STATEMENTS.
A53
| | | | | | |
| | | DIVERSIFIED BOND PORTFOLIO (continued) | | |
| |
| SCHEDULE OF INVESTMENTS | | December 31, 2014 |
The industry classification of investments and liabilities in excess of other assets shown as a percentage of net assets as of December 31, 2014 was as follows (Unaudited):
| | | | |
Affiliated Mutual Funds (including 6.3% of collateral for securities on loan) | | | 19.5 | % |
Banking | | | 12.2 | |
Commercial Mortgage-Backed Securities | | | 10.0 | |
Residential Mortgage-Backed Securities | | | 5.7 | |
Sovereigns | | | 5.1 | |
Collateralized Loan Obligations | | | 4.5 | |
U.S. Treasury Obligations | | | 4.2 | |
Healthcare & Pharmaceutical | | | 3.8 | |
Electric | | | 3.5 | |
Insurance | | | 3.5 | |
Technology | | | 2.4 | |
Foreign Agencies | | | 2.3 | |
Telecommunications | | | 2.3 | |
Media & Entertainment | | | 2.0 | |
Municipal Bonds | | | 2.0 | |
U.S. Government Agency Obligations | | | 1.8 | |
Chemicals | | | 1.8 | |
Capital Goods | | | 1.7 | |
Cable | | | 1.7 | |
Non-Captive Finance | | | 1.4 | |
Energy – Other | | | 1.3 | |
Healthcare Insurance | | | 1.3 | |
Automotive | | | 1.2 | |
Foods | | | 1.1 | |
| | | | |
Metals | | | 1.0 | % |
Building Materials & Construction | | | 0.9 | |
Energy – Integrated | | | 0.7 | |
Pipelines & Other | | | 0.7 | |
Airlines | | | 0.6 | |
Retailers | | | 0.5 | |
Tobacco | | | 0.5 | |
Paper | | | 0.5 | |
Packaging | | | 0.4 | |
Gaming | | | 0.4 | |
Lodging | | | 0.4 | |
Non-Residential Mortgage-Backed Securities | | | 0.3 | |
Aerospace & Defense | | | 0.3 | |
Real Estate Investment Trusts | | | 0.2 | |
Financials | | | 0.2 | |
Consumer | | | 0.2 | |
Brokerage | | | 0.2 | |
Options Purchased | | | 0.1 | |
Options Written | | | — | ** |
| | |
|
|
|
| | | | 104.4 | |
Liabilities in excess of other assets | | | (4.4 | ) |
| | |
|
|
|
| | | | 100.0 | % |
| | |
|
|
|
The Portfolio invested in derivative instruments during the reporting period. The primary types of risk associated with these derivative instruments are credit risk, foreign exchange risk and interest rate risk. The effect of such derivative instruments on the Portfolio’s financial position and financial performance as reflected in the Statement of Assets and Liabilities and Statement of Operations is presented in the summary below.
Fair values of derivative instruments as of December 31, 2014 as presented in the Statement of Assets and Liabilities:
| | | | | | | | | | | | |
Derivatives not designated as hedging
instruments, carried at fair value
| | Asset Derivatives
| | | Liability Derivatives
| |
| | Balance Sheet Location
| | Fair Value
| | | Balance Sheet Location
| | Fair Value
| |
Credit contracts | | Due from/to broker — variation margin swaps | | $ | 118,250 | * | | Due from/to broker — variation margin swaps | | $ | 385,002 | * |
Credit contracts | | Premiums paid for swap agreements | | | 2,473,573 | | | — | | | — | |
Credit contracts | | Unrealized appreciation on swap agreements | | | 391,270 | | | Unrealized depreciation on swap agreements | | | 812,535 | |
Foreign exchange contracts | | Unrealized appreciation on forward currency contracts | | | 2,258,375 | | | Unrealized depreciation on forward currency contracts | | | 2,482,052 | |
Interest rate contracts | | Due from/to broker — variation margin futures | | | 1,362,257 | * | | Due from/to broker — variation margin futures | | | 2,170 | * |
Interest rate contracts | | Due from/to broker — variation margin swaps | | | 807,219 | * | | Due from/to broker — variation margin swaps | | | 1,428,135 | * |
Interest rate contracts | | Premiums paid for swap agreements | | | 7,475 | | | Premiums received for swap agreements | | | 71,297 | |
Interest rate contracts | | Unaffiliated investments | | | 560,903 | | | Options written outstanding, at value | | | 376,488 | |
Interest rate contracts | | Unrealized appreciation on swap agreements | | | 8,374,305 | | | Unrealized depreciation on swap agreements | | | 4,044,654 | |
| | | | |
|
|
| | | |
|
|
|
Total | | | | $ | 16,353,627 | | | | | $ | 9,602,333 | |
| | | | |
|
|
| | | |
|
|
|
| * | Includes cumulative appreciation/depreciation as reported in the schedule of open futures and exchange-traded swap contracts. Only unsettled variation margin receivable (payable) is reported within the Statement of Assets and Liabilities. |
SEE NOTES TO FINANCIAL STATEMENTS.
A54
| | | | | | |
| | | DIVERSIFIED BOND PORTFOLIO (continued) | | |
| |
| SCHEDULE OF INVESTMENTS | | December 31, 2014 |
The effects of derivative instruments on the Statement of Operations for the period ended December 31, 2014 are as follows:
| | | | | | | | | | | | | | | | | | | | | | | | |
Amount of Realized Gain or (Loss) on Derivatives Recognized in Income
| |
Derivatives not designated as hedging
instruments, carried at fair value
| | Options
Purchased*
| | | Options
Written
| | | Futures
| | | Forward
Currency
Contracts**
| | | Swaps
| | | Total
| |
Credit contracts | | $ | — | | | $ | — | | | $ | — | | | $ | — | | | $ | (3,820,533 | ) | | $ | (3,820,533 | ) |
Foreign exchange contracts | | | — | | | | — | | | | — | | | | (4,275,385 | ) | | | — | | | | (4,275,385 | ) |
Interest rate contracts | | | 227,647 | | | | 1,330,804 | | | | 11,798,002 | | | | — | | | | 7,569,203 | | | | 20,925,656 | |
| | |
|
|
| |
|
|
| |
|
|
| |
|
|
| |
|
|
| |
|
|
|
Total | | $ | 227,647 | | | $ | 1,330,804 | | | $ | 11,798,002 | | | $ | (4,275,385 | ) | | $ | 3,748,670 | | | $ | 12,829,738 | |
| | |
|
|
| |
|
|
| |
|
|
| |
|
|
| |
|
|
| |
|
|
|
| * | Included in net realized gain (loss) on investment transactions in the Statement of Operations. |
| ** | Included in net realized gain (loss) on foreign currency transactions in the Statement of Operations. |
| | | | | | | | | | | | | | | | | | | | | | | | |
Change in Unrealized Appreciation or (Depreciation) on Derivatives Recognized in Income
| |
Derivatives not designated as hedging
instruments, carried at fair value
| | Options
Purchased*
| | | Options
Written
| | | Futures
| | | Forward
and Cross
Currency
Contracts**
| | | Swaps
| | | Total
| |
Credit contracts | | $ | — | | | $ | — | | | $ | — | | | $ | — | | | $ | 1,054,334 | | | $ | 1,054,334 | |
Foreign exchange contracts | | | — | | | | — | | | | — | | | | (1,264,115 | ) | | | — | | | | (1,264,115 | ) |
Interest rate contracts | | | (75,561 | ) | | | 79,130 | | | | 7,035,847 | | | | — | | | | 4,828,759 | | | | 11,868,175 | |
| | |
|
|
| |
|
|
| |
|
|
| |
|
|
| |
|
|
| |
|
|
|
Total | | $ | (75,561 | ) | | $ | 79,130 | | | $ | 7,035,847 | | | $ | (1,264,115 | ) | | $ | 5,883,093 | | | $ | 11,658,394 | |
| | |
|
|
| |
|
|
| |
|
|
| |
|
|
| |
|
|
| |
|
|
|
| * | Included in net unrealized appreciation (depreciation) on investment transactions in the Statement of Operations. |
| ** | Included in net unrealized appreciation (depreciation) on foreign currency transactions in the Statement of Operations. |
For the year ended December 31, 2014, the Portfolio’s average volume of derivative activities is as follows:
| | | | | | | | |
Options Purchased
(Cost)
| | Options Written
(Notional Amount in
USD (000))
| | Futures
Long Positions
(Value at Trade Date)
| | Futures
Short Positions
(Value at Trade Date)
| | Forward Currency
Contracts—Purchased
(Value at Settlement
Date Payable)
|
| $1,049,812 | | $336,092 | | $334,902,652 | | $36,931,563 | | $179,113,300 |
| | | | | | | | |
Forward Currency
Contracts—Sold
(Value at Settlement
Date Receivable)
| | Cross Currency
Exchange Contracts
(Notional Amount in
USD (000))
| | Interest Rate Swaps
(Notional Amount in
USD (000))
| | Credit Default
Swaps as Buyer
(Notional Amount in
USD (000))
| | Credit Default
Swaps as Writer
(Notional Amount in
USD (000))
|
| $150,491,222 | | $5,564 | | $402,655 | | $231,179 | | $50,085 |
|
Currency Swaps
(Notional Amount in USD (000))
|
| $95,016 |
SEE NOTES TO FINANCIAL STATEMENTS.
A55
| | | | | | |
| | | DIVERSIFIED BOND PORTFOLIO (continued) | | |
| |
| SCHEDULE OF INVESTMENTS | | December 31, 2014 |
Offsetting of over-the-counter (OTC) derivative assets and liabilities:
The Portfolio invested in OTC derivatives during the reporting period that are either offset in accordance with current requirements or are subject to enforceable master netting arrangements or similar agreements that permit offsetting. The information about offsetting and related netting arrangements for OTC derivatives, where the legal right to set-off exists, is presented in the summary below.
| | | | | | | | | | | | | | | | |
Counterparty
| | Gross amounts of
recognized assets(1)
| | | Gross amounts
available for offset
| | | Collateral
Received(3)
| | | Net Amount
| |
Bank of America | | $ | 67,966 | | | $ | (67,966 | ) | | $ | — | | | $ | — | |
Barclays Capital Group | | | 2,260,585 | | | | (782,195 | ) | | | (1,314,051 | ) | | | 164,339 | |
BNP Paribas | | | — | | | | — | | | | — | | | | — | |
Citigroup Global Markets | | | 3,961,621 | | | | (886,356 | ) | | | (2,854,000 | ) | | | 221,265 | |
Credit Suisse First Boston Corp. | | | 1,189,746 | | | | (350,500 | ) | | | (612,529 | ) | | | 226,717 | |
Deutsche Bank AG | | | 3,713,094 | | | | (649,911 | ) | | | (3,476,748 | ) | | | — | |
Goldman Sachs & Co. | | | 98,732 | | | | (98,732 | ) | | | — | | | | — | |
Hong Kong & Shanghai Bank | | | 1,017,170 | | | | (1,017,170 | ) | | | — | | | | — | |
JPMorgan Chase | | | 873,424 | | | | (767,895 | ) | | | — | | | | 105,529 | |
Toronto Dominion | | | 146,821 | | | | (146,821 | ) | | | — | | | | — | |
UBS AG | | | 175,839 | | | | (127,625 | ) | | | — | | | | 48,214 | |
| | |
|
|
| | | | | | | | | | | | |
| | | $ | 13,504,998 | | | | | | | | | | | | | |
| | |
|
|
| | | | | | | | | | | | |
| | | | | | | | | | | | | | | | |
Counterparty
| | Gross amounts of
recognized liabilities(2)
| | | Gross amounts
available for offset
| | | Collateral
Pledged(3)
| | | Net Amount
| |
Bank of America | | $ | (789,475 | ) | | $ | 67,966 | | | $ | 652,308 | | | $ | (69,201 | ) |
Barclays Capital Group | | | (782,195 | ) | | | 782,195 | | | | — | | | | — | |
BNP Paribas | | | (72,206 | ) | | | — | | | | 308,537 | | | | — | |
Citigroup Global Markets | | | (886,356 | ) | | | 886,356 | | | | — | | | | — | |
Credit Suisse First Boston Corp. | | | (350,500 | ) | | | 350,500 | | | | — | | | | — | |
Deutsche Bank AG | | | (649,911 | ) | | | 649,911 | | | | — | | | | — | |
Goldman Sachs & Co. | | | (100,005 | ) | | | 98,732 | | | | — | | | | (1,273 | ) |
Hong Kong & Shanghai Bank | | | (2,505,628 | ) | | | 1,017,170 | | | | 1,734,381 | | | | — | |
JPMorgan Chase | | | (767,895 | ) | | | 767,895 | | | | — | | | | — | |
Toronto Dominion | | | (378,742 | ) | | | 146,821 | | | | — | | | | (231,921 | ) |
UBS AG | | | (127,625 | ) | | | 127,625 | | | | — | | | | — | |
| | |
|
|
| | | | | | | | | | | | |
| | | $ | (7,410,538 | ) | | | | | | | | | | | | |
| | |
|
|
| | | | | | | | | | | | |
| (1) | Includes unrealized appreciation on swaps and forwards, premiums paid on swap agreements and market value of purchased options. |
| (2) | Includes unrealized depreciation on swaps and forwards, premiums received on swap agreements and market value of written options. |
| (3) | Amounts shown reflect actual collateral received or pledged by the Portfolio. Such amounts are applied up to 100% of the Portfolio’s OTC derivative exposure by counterparty. |
SEE NOTES TO FINANCIAL STATEMENTS.
A56
| | | | | | |
| | | DIVERSIFIED BOND PORTFOLIO (continued) | | |
STATEMENT OF ASSETS AND LIABILITIES
December 31, 2014
| | | | |
| ASSETS | | | | |
Investments at value, including securities on loan of $65,304,385: | | | | |
Unaffiliated investments (cost $865,308,096) | | $ | 907,764,892 | |
Affiliated investments (cost $212,525,069) | | | 207,851,542 | |
Cash | | | 375,987 | |
Foreign currency, at value (cost $3,237,737) | | | 3,237,206 | |
Dividends and interest receivable | | | 9,737,023 | |
Unrealized appreciation on over-the-counter swap agreements | | | 8,765,575 | |
Premium paid for swap agreements | | | 2,481,048 | |
Unrealized appreciation on forward foreign currency exchange contracts | | | 2,258,375 | |
Receivable for Series shares sold | | | 505,324 | |
Due from broker-variation margin futures | | | 495,062 | |
Receivable for investments sold | | | 45,842 | |
Tax reclaim receivable | | | 2,300 | |
Prepaid expenses | | | 8,448 | |
| | |
|
|
|
Total Assets | | | 1,143,528,624 | |
| | |
|
|
|
| LIABILITIES | | | | |
Payable to broker for collateral for securities on loan | | | 66,800,717 | |
Unrealized depreciation on over-the-counter swap agreements | | | 4,857,189 | |
Unrealized depreciation on forward foreign currency exchange contracts | | | 2,482,052 | |
Options written outstanding, at value (premiums received $455,618) | | | 376,488 | |
Management fee payable | | | 362,628 | |
Payable for investments purchased | | | 330,175 | |
Accrued expenses | | | 182,130 | |
Payable for Series shares repurchased | | | 161,884 | |
Premium received for swap agreements | | | 71,297 | |
Due to broker-variation margin swaps | | | 28,692 | |
Deferred trustees’ fees | | | 2,433 | |
Affiliated transfer agent fee payable | | | 926 | |
| | |
|
|
|
Total Liabilities | | | 75,656,611 | |
| | |
|
|
|
| NET ASSETS | | $ | 1,067,872,013 | |
| | |
|
|
|
Net assets were comprised of: | | | | |
Paid-in capital | | $ | 967,430,105 | |
Retained earnings | | | 100,441,908 | |
| | |
|
|
|
Net assets, December 31, 2014 | | $ | 1,067,872,013 | |
| | |
|
|
|
Net asset value and redemption price per share $1,067,872,013 / 91,577,056 outstanding shares of beneficial interest | | $ | 11.66 | |
| | |
|
|
|
STATEMENT OF OPERATIONS
Year Ended December 31, 2014
| | | | |
| NET INVESTMENT INCOME | | | | |
| INCOME | | | | |
Interest income (net of foreign withholding taxes of $23,111) | | $ | 43,932,870 | |
Affiliated dividend income | | | 1,311,372 | |
Affiliated income from securities loaned, net | | | 87,801 | |
Unaffiliated dividend income | | | 86,067 | |
| | |
|
|
|
Total income | | | 45,418,110 | |
| | |
|
|
|
| EXPENSES | | | | |
Management fee | | | 4,356,571 | |
Custodian’s fees and expenses | | | 221,000 | |
Shareholders’ reports | | | 104,000 | |
Audit fee | | | 50,000 | |
Insurance expenses | | | 17,000 | |
Trustees’ fees | | | 15,000 | |
Commitment fee on syndicated credit agreement | | | 15,000 | |
Transfer agent’s fees and expenses (including affiliated expense of $5,600) | | | 12,000 | |
Legal fees and expenses | | | 12,000 | |
Loan interest expense | | | 4,216 | |
Miscellaneous | | | 14,611 | |
| | |
|
|
|
Total expenses | | | 4,821,398 | |
| | |
|
|
|
| NET INVESTMENT INCOME | | | 40,596,712 | |
| | |
|
|
|
| REALIZED AND UNREALIZED GAIN (LOSS) ON INVESTMENT AND FOREIGN CURRENCY TRANSACTIONS | | | | |
Net realized gain (loss) on: | | | | |
Investment transactions | | | 7,354,116 | |
Futures transactions | | | 11,798,002 | |
Options written transactions | | | 1,330,804 | |
Swap agreement transactions | | | 3,748,670 | |
Foreign currency transactions | | | (4,861,173 | ) |
| | |
|
|
|
| | | | 19,370,419 | |
| | |
|
|
|
Net change in unrealized appreciation (depreciation) on: | | | | |
Investments (including affiliated: $1,442,452) | | | 4,381,251 | |
Futures | | | 7,035,847 | |
Options written | | | 79,130 | |
Swap agreements | | | 5,883,093 | |
Foreign currencies | | | (1,345,527 | ) |
| | |
|
|
|
| | | | 16,033,794 | |
| | |
|
|
|
| NET GAIN ON INVESTMENT AND FOREIGN CURRENCY TRANSACTIONS | | | 35,404,213 | |
| | |
|
|
|
| NET INCREASE IN NET ASSETS RESULTING FROM OPERATIONS | | $ | 76,000,925 | |
| | |
|
|
|
STATEMENT OF CHANGES IN NET ASSETS
| | | | | | | | |
| | | Year Ended December 31,
| |
| | | 2014
| | | 2013
| |
INCREASE (DECREASE) IN NET ASSETS
OPERATIONS | | | | | | | | |
Net investment income | | $ | 40,596,712 | | | $ | 51,213,022 | |
Net realized gain (loss) on investment and foreign currency transactions | | | 19,370,419 | | | | (9,582,132 | ) |
Net change in unrealized appreciation (depreciation) on investments and foreign currencies | | | 16,033,794 | | | | (51,666,169 | ) |
| | |
|
|
| |
|
|
|
NET INCREASE (DECREASE) IN NET ASSETS RESULTING FROM OPERATIONS | | | 76,000,925 | | | | (10,035,279 | ) |
| | |
|
|
| |
|
|
|
| DISTRIBUTIONS | | | (11,827,554 | ) | | | (84,677,590 | ) |
| | |
|
|
| |
|
|
|
| SERIES SHARE TRANSACTIONS | | | | | | | | |
Series shares sold [2,077,773 and 2,523,548 shares, respectively] | | | 23,745,718 | | | | 29,114,479 | |
Series shares issued in reinvestment of distributions [1,060,767 and 7,523,922 shares, respectively] | | | 11,827,554 | | | | 84,677,590 | |
Series shares repurchased [20,335,487 and 11,154,465 shares, respectively] | | | (229,380,709 | ) | | | (127,474,174 | ) |
| | |
|
|
| |
|
|
|
NET DECREASE IN NET ASSETS FROM SERIES SHARE TRANSACTIONS | | | (193,807,437 | ) | | | (13,682,105 | ) |
| | |
|
|
| |
|
|
|
| TOTAL DECREASE | | | (129,634,066 | ) | | | (108,394,974 | ) |
| NET ASSETS: | | | | | | | | |
Beginning of year | | | 1,197,506,079 | | | | 1,305,901,053 | |
| | |
|
|
| |
|
|
|
End of year | | $ | 1,067,872,013 | | | $ | 1,197,506,079 | |
| | |
|
|
| |
|
|
|
SEE NOTES TO FINANCIAL STATEMENTS.
A57
| | | | | | |
| | | EQUITY PORTFOLIO | | |
| |
| SCHEDULE OF INVESTMENTS | | December 31, 2014 |
| | | | | | | | |
| LONG-TERM INVESTMENTS — 97.4% | | | | |
| COMMON STOCKS | | Shares
| | | Value
(Note 2)
| |
Aerospace & Defense — 1.7% | | | | | | | | |
Boeing Co. (The) | | | 526,863 | | | $ | 68,481,653 | |
| | | | | | |
|
|
|
Airlines — 1.6% | | | | | | | | |
United Continental Holdings, Inc.* | | | 962,224 | | | | 64,363,163 | |
| | | | | | |
|
|
|
Auto Components — 1.2% | | | | | | | | |
Lear Corp. | | | 507,344 | | | | 49,760,300 | |
| | | | | | |
|
|
|
Automobiles — 1.6% | | | | | | | | |
General Motors Co. | | | 923,660 | | | | 32,244,971 | |
Tesla Motors, Inc.*(a) | | | 151,223 | | | | 33,633,507 | |
| | | | | | |
|
|
|
| | | | | | | | 65,878,478 | |
| | | | | | |
|
|
|
Banks — 6.3% | | | | | | | | |
Bank of America Corp. | | | 2,415,132 | | | | 43,206,712 | |
Citigroup, Inc. | | | 975,066 | | | | 52,760,821 | |
JPMorgan Chase & Co. | | | 869,336 | | | | 54,403,047 | |
PNC Financial Services Group, Inc. (The) | | | 451,475 | | | | 41,188,064 | |
Wells Fargo & Co. | | | 1,093,957 | | | | 59,970,723 | |
| | | | | | |
|
|
|
| | | | | | | | 251,529,367 | |
| | | | | | |
|
|
|
Biotechnology — 6.1% | | | | | | | | |
Alexion Pharmaceuticals, Inc.* | | | 204,893 | | | | 37,911,352 | |
Biogen Idec, Inc.* | | | 193,219 | | | | 65,588,190 | |
Celgene Corp.* | | | 918,312 | | | | 102,722,380 | |
Gilead Sciences, Inc.* | | | 393,529 | | | | 37,094,043 | |
| | | | | | |
|
|
|
| | | | | | | | 243,315,965 | |
| | | | | | |
|
|
|
Capital Markets — 3.0% | | | | | | | | |
Goldman Sachs Group, Inc. (The) | | | 207,328 | | | | 40,186,386 | |
Morgan Stanley | | | 2,114,441 | | | | 82,040,311 | |
| | | | | | |
|
|
|
| | | | | | | | 122,226,697 | |
| | | | | | |
|
|
|
Chemicals — 1.2% | | | | | | | | |
FMC Corp. | | | 532,322 | | | | 30,358,323 | |
Monsanto Co. | | | 134,042 | | | | 16,013,998 | |
| | | | | | |
|
|
|
| | | | | | | | 46,372,321 | |
| | | | | | |
|
|
|
Communications Equipment — 0.8% | | | | | | | | |
Brocade Communications Systems, Inc. | | | 2,772,634 | | | | 32,827,987 | |
| | | | | | |
|
|
|
Consumer Finance — 1.9% | | | | | | | | |
Capital One Financial Corp. | | | 464,458 | | | | 38,341,008 | |
SLM Corp. | | | 3,725,236 | | | | 37,960,155 | |
| | | | | | |
|
|
|
| | | | | | | | 76,301,163 | |
| | | | | | |
|
|
|
Diversified Financial Services — 0.7% | | | | | |
Voya Financial, Inc. | | | 622,810 | | | | 26,394,688 | |
| | | | | | |
|
|
|
Diversified Telecommunication Services — 0.6% | | | | | |
CenturyLink, Inc. | | | 580,271 | | | | 22,967,126 | |
| | | | | | |
|
|
|
Electric Utilities — 1.2% | | | | | |
FirstEnergy Corp. | | | 1,224,023 | | | | 47,724,657 | |
| | | | | | |
|
|
|
Electrical Equipment — 1.0% | | | | | |
Eaton Corp. PLC | | | 578,802 | | | | 39,335,384 | |
| | | | | | |
|
|
|
Electronic Equipment, Instruments & Components — 0.8% | |
Flextronics International Ltd.* | | | 2,704,678 | | | | 30,238,300 | |
| | | | | | |
|
|
|
Energy Equipment & Services — 1.5% | | | | | |
Halliburton Co. | | | 717,100 | | | | 28,203,543 | |
| | | | | | | | |
COMMON STOCKS
(continued) | | Shares
| | | Value
(Note 2)
| |
Energy Equipment & Services (continued) | | | | | |
Schlumberger Ltd. | | | 351,539 | | | $ | 30,024,946 | |
| | | | | | |
|
|
|
| | | | | | | | 58,228,489 | |
| | | | | | |
|
|
|
Food & Staples Retailing — 1.2% | | | | | | | | |
Costco Wholesale Corp. | | | 342,759 | | | | 48,586,088 | |
| | | | | | |
|
|
|
Food Products — 3.0% | | | | | | | | |
Bunge Ltd. | | | 425,616 | | | | 38,692,750 | |
Mondelez International, Inc.
(Class A Stock) | | | 2,238,738 | | | | 81,322,158 | |
| | | | | | |
|
|
|
| | | | | | | | 120,014,908 | |
| | | | | | |
|
|
|
Hotels, Restaurants & Leisure — 3.4% | | | | | |
Carnival Corp. | | | 1,075,377 | | | | 48,746,840 | |
Marriott International, Inc.
(Class A Stock) | | | 540,209 | | | | 42,152,508 | |
Starbucks Corp. | | | 543,281 | | | | 44,576,206 | |
| | | | | | |
|
|
|
| | | | | | | | 135,475,554 | |
| | | | | | |
|
|
|
Independent Power & Renewable Electricity Producers — 0.7% | |
NRG Energy, Inc. | | | 1,056,845 | | | | 28,481,973 | |
| | | | | | |
|
|
|
Industrial Conglomerates — 0.8% | | | | | | | | |
Siemens AG (Germany), ADR(a) | | | 303,416 | | | | 33,982,592 | |
| | | | | | |
|
|
|
Insurance — 1.7% | | | | | | | | |
MetLife, Inc. | | | 855,760 | | | | 46,288,058 | |
Travelers Cos., Inc. (The) | | | 223,666 | | | | 23,675,046 | |
| | | | | | |
|
|
|
| | | | | | | | 69,963,104 | |
| | | | | | |
|
|
|
Internet & Catalog Retail — 4.1% | | | | | | | | |
Amazon.com, Inc.* | | | 184,080 | | | | 57,129,228 | |
Netflix, Inc.* | | | 107,201 | | | | 36,620,934 | |
Priceline Group, Inc. (The)* | | | 43,052 | | | | 49,088,321 | |
TripAdvisor, Inc.* | | | 303,125 | | | | 22,631,312 | |
| | | | | | |
|
|
|
| | | | | | | | 165,469,795 | |
| | | | | | |
|
|
|
Internet Software & Services — 7.7% | | | | | | | | |
Alibaba Group Holding Ltd. (China), ADR*(a) | | | 618,967 | | | | 64,335,430 | |
Facebook, Inc. (Class A Stock)* | | | 1,424,115 | | | | 111,109,452 | |
Google, Inc. (Class A Stock)* | | | 58,977 | | | | 31,296,735 | |
Google, Inc. (Class C Stock)* | | | 59,398 | | | | 31,267,107 | |
LendingClub Corp.*(a) | | | 43,935 | | | | 1,111,556 | |
LinkedIn Corp. (Class A Stock)*(a) | | | 190,737 | | | | 43,814,196 | |
Twitter, Inc* | | | 730,787 | | | | 26,213,330 | |
| | | | | | |
|
|
|
| | | | | | | | 309,147,806 | |
| | | | | | |
|
|
|
IT Services — 2.9% | | | | | | | | |
FleetCor Technologies, Inc.* | | | 267,564 | | | | 39,789,442 | |
MasterCard, Inc. (Class A Stock) | | | 879,235 | | | | 75,754,888 | |
| | | | | | |
|
|
|
| | | | | | | | 115,544,330 | |
| | | | | | |
|
|
|
Life Sciences Tools & Services — 0.9% | | | | | |
Illumina, Inc.* | | | 206,378 | | | | 38,093,251 | |
| | | | | | |
|
|
|
Machinery — 1.0% | | | | | | | | |
SPX Corp. | | | 478,749 | | | | 41,134,114 | |
| | | | | | |
|
|
|
Media — 3.0% | | | | | | | | |
Comcast Corp. (Class A Stock) | | | 852,659 | | | | 49,462,749 | |
Walt Disney Co. (The) | | | 756,470 | | | | 71,251,909 | |
| | | | | | |
|
|
|
| | | | | | | | 120,714,658 | |
| | | | | | |
|
|
|
SEE NOTES TO FINANCIAL STATEMENTS.
A58
| | | | | | |
| | | EQUITY PORTFOLIO (continued) | | |
| |
| SCHEDULE OF INVESTMENTS | | December 31, 2014 |
| | | | | | | | |
COMMON STOCKS
(continued) | | Shares
| | | Value
(Note 2)
| |
Multiline Retail — 1.2% | | | | | | | | |
Target Corp. | | | 628,113 | | | $ | 47,680,058 | |
| | | | | | |
|
|
|
Oil, Gas & Consumable Fuels — 5.9% | | | | | |
Chevron Corp. | | | 357,838 | | | | 40,142,267 | |
Concho Resources, Inc.* | | | 269,601 | | | | 26,892,700 | |
Marathon Oil Corp. | | | 1,177,401 | | | | 33,308,674 | |
Marathon Petroleum Corp. | | | 334,175 | | | | 30,162,636 | |
Noble Energy, Inc. | | | 666,719 | | | | 31,622,482 | |
Occidental Petroleum Corp. | | | 410,422 | | | | 33,084,117 | |
Suncor Energy, Inc. (Canada) | | | 1,262,075 | | | | 40,084,840 | |
| | | | | | |
|
|
|
| | | | | | | | 235,297,716 | |
| | | | | | |
|
|
|
Personal Products — 0.5% | | | | | | | | |
Avon Products, Inc. | | | 2,311,950 | | | | 21,709,211 | |
| | | | | | |
|
|
|
Pharmaceuticals — 6.8% | | | | | | | | |
Actavis PLC* | | | 379,024 | | | | 97,564,568 | |
Bayer AG (Germany), ADR | | | 310,713 | | | | 42,517,967 | |
Bristol-Myers Squibb Co. | | | 871,686 | | | | 51,455,625 | |
Shire PLC (Ireland), ADR | | | 140,369 | | | | 29,834,027 | |
Teva Pharmaceutical Industries Ltd. (Israel), ADR | | | 873,714 | | | | 50,247,292 | |
| | | | | | |
|
|
|
| | | | | | | | 271,619,479 | |
| | | | | | |
|
|
|
Road & Rail — 2.0% | | | | | | | | |
Canadian Pacific Railway Ltd. (Canada) | | | 277,016 | | | | 53,378,213 | |
Hertz Global Holdings, Inc.* | | | 1,134,552 | | | | 28,295,727 | |
| | | | | | |
|
|
|
| | | | | | | | 81,673,940 | |
| | | | | | |
|
|
|
Semiconductors & Semiconductor Equipment — 2.3% | |
Applied Materials, Inc. | | | 3,737,875 | | | | 93,147,845 | |
| | | | | | |
|
|
|
Software — 5.6% | | | | | | | | |
Adobe Systems, Inc.* | | | 525,404 | | | | 38,196,871 | |
Microsoft Corp. | | | 1,027,543 | | | | 47,729,372 | |
Red Hat, Inc.* | | | 507,601 | | | | 35,095,533 | |
salesforce.com, Inc.* | | | 860,932 | | | | 51,061,877 | |
Splunk, Inc.*(a) | | | 471,387 | | | | 27,788,264 | |
Workday, Inc. (Class A Stock)*(a) | | | 286,207 | | | | 23,357,353 | |
| | | | | | |
|
|
|
| | | | | | | | 223,229,270 | |
| | | | | | |
|
|
|
Specialty Retail — 1.8% | | | | | | | | |
Inditex SA (Spain), ADR | | | 2,909,759 | | | | 41,318,578 | |
Tiffany & Co. | | | 306,838 | | | | 32,788,708 | |
| | | | | | |
|
|
|
| | | | | | | | 74,107,286 | |
| | | | | | |
|
|
|
Technology Hardware, Storage & Peripherals — 6.3% | |
Apple, Inc. | | | 1,223,254 | | | | 135,022,777 | |
EMC Corp. | | | 1,423,673 | | | | 42,340,035 | |
Hewlett-Packard Co. | | | 1,334,678 | | | | 53,560,628 | |
NCR Corp.* | | | 791,732 | | | | 23,071,070 | |
| | | | | | |
|
|
|
| | | | | | | | 253,994,510 | |
| | | | | | |
|
|
|
Textiles, Apparel & Luxury Goods — 2.5% | | | | | |
Burberry Group PLC (United Kingdom) | | | 1,110,620 | | | | 28,178,403 | |
NIKE, Inc. (Class B Stock) | | | 757,417 | | | | 72,825,644 | |
| | | | | | |
|
|
|
| | | | | | | | 101,004,047 | |
| | | | | | |
|
|
|
| | | | | | | | |
COMMON STOCKS
(continued) | | Shares
| | | Value
(Note 2)
| |
Wireless Telecommunication Services — 0.9% | | | | | |
SBA Communications Corp.
(Class A Stock)* | | | 337,009 | | | $ | 37,327,117 | |
| | | | | | |
|
|
|
TOTAL LONG-TERM INVESTMENTS
(cost $2,720,111,496) | | | | 3,913,344,390 | |
| | | | | | |
|
|
|
| SHORT-TERM INVESTMENT — 6.5% | | | | | |
AFFILIATED MONEY MARKET MUTUAL FUND | |
Prudential Investment Portfolios 2 —Prudential Core Taxable Money Market Fund(cost $262,415,177; includes $166,375,351 of cash collateral for securities on loan) (Note 4)(b)(c) | | | 262,415,177 | | | | 262,415,177 | |
| | | | | | |
|
|
|
TOTAL INVESTMENTS — 103.9%
(cost $2,982,526,673) | | | | 4,175,759,567 | |
LIABILITIES IN EXCESS OF
OTHER ASSETS — (3.9)% | | | | (155,961,644 | ) |
| | | | | | |
|
|
|
NET ASSETS — 100.0% | | | $ | 4,019,797,923 | |
| | | | | | |
|
|
|
See the Glossary for abbreviations used in the Portfolio descriptions.
| * | Non-income producing security. |
| (a) | All or a portion of security is on loan. The aggregate market value of such securities, including those sold and pending settlement, is $160,971,207; cash collateral of $166,375,351 (included in liabilities) was received with which the Portfolio purchased highly liquid short-term investments. Securities on loan are subject to contractual netting arrangements. |
| (b) | Represents security, or a portion thereof, purchased with cash collateral received for securities on loan. |
| (c) | Prudential Investments LLC, the manager of the Portfolio, also serves as manager of the Prudential Investment Portfolios 2 —Prudential Core Taxable Money Market Fund. |
Various inputs are used in determining the value of the Portfolio’s investments. These inputs are summarized in the three broad levels listed below.
| Level 1— | quoted prices generally in active markets for identical securities. |
| Level 2— | quoted prices for similar securities, interest rates and yield curves, prepayment speeds, foreign currency exchange rates and other significant observable inputs. |
| Level 3— | significant unobservable inputs for securities valued in accordance with Board approved fair valuation procedures. |
SEE NOTES TO FINANCIAL STATEMENTS.
A59
| | | | | | |
| | | EQUITY PORTFOLIO (continued) | | |
| |
| SCHEDULE OF INVESTMENTS | | December 31, 2014 |
The following is a summary of the inputs used as of December 31, 2014 in valuing such portfolio securities:
| | | | | | | | | | | | |
| | | Level 1
| | | Level 2
| | | Level 3
| |
Investments in Securities | | | | | | | | | | | | |
Common Stocks | | | | | | | | | | | | |
Aerospace & Defense | | $ | 68,481,653 | | | $ | — | | | $ | — | |
Airlines | | | 64,363,163 | | | | — | | | | — | |
Auto Components | | | 49,760,300 | | | | — | | | | — | |
Automobiles | | | 65,878,478 | | | | — | | | | — | |
Banks | | | 251,529,367 | | | | — | | | | — | |
Biotechnology | | | 243,315,965 | | | | — | | | | — | |
Capital Markets | | | 122,226,697 | | | | — | | | | — | |
Chemicals | | | 46,372,321 | | | | — | | | | — | |
Communications Equipment | | | 32,827,987 | | | | — | | | | — | |
Consumer Finance | | | 76,301,163 | | | | — | | | | — | |
Diversified Financial Services | | | 26,394,688 | | | | — | | | | — | |
Diversified Telecommunication Services | | | 22,967,126 | | | | — | | | | — | |
Electric Utilities | | | 47,724,657 | | | | — | | | | — | |
Electrical Equipment | | | 39,335,384 | | | | — | | | | — | |
Electronic Equipment, Instruments & Components | | | 30,238,300 | | | | — | | | | — | |
Energy Equipment & Services | | | 58,228,489 | | | | — | | | | — | |
Food & Staples Retailing | | | 48,586,088 | | | | — | | | | — | |
Food Products | | | 120,014,908 | | | | — | | | | — | |
Hotels, Restaurants & Leisure | | | 135,475,554 | | | | — | | | | — | |
Independent Power & Renewable Electricity Producers | | | 28,481,973 | | | | — | | | | — | |
Industrial Conglomerates | | | 33,982,592 | | | | — | | | | — | |
Insurance | | | 69,963,104 | | | | — | | | | — | |
Internet & Catalog Retail | | | 165,469,795 | | | | — | | | | — | |
Internet Software & Services | | | 309,147,806 | | | | — | | | | — | |
IT Services | | | 115,544,330 | | | | — | | | | — | |
Life Sciences Tools & Services | | | 38,093,251 | | | | — | | | | — | |
Machinery | | | 41,134,114 | | | | — | | | | — | |
Media | | | 120,714,658 | | | | — | | | | — | |
Multiline Retail | | | 47,680,058 | | | | — | | | | — | |
Oil, Gas & Consumable Fuels | | | 235,297,716 | | | | — | | | | — | |
Personal Products | | | 21,709,211 | | | | — | | | | — | |
Pharmaceuticals | | | 271,619,479 | | | | — | | | | — | |
Road & Rail | | | 81,673,940 | | | | — | | | | — | |
Semiconductors & Semiconductor Equipment | | | 93,147,845 | | | | — | | | | — | |
Software | | | 223,229,270 | | | | — | | | | — | |
Specialty Retail | | | 74,107,286 | | | | — | | | | — | |
Technology Hardware, Storage & Peripherals | | | 253,994,510 | | | | — | | | | — | |
Textiles, Apparel & Luxury Goods | | | 72,825,644 | | | | 28,178,403 | | | | — | |
Wireless Telecommunication Services | | | 37,327,117 | | | | — | | | | — | |
Affiliated Money Market Mutual Fund | | | 262,415,177 | | | | — | | | | — | |
| | |
|
|
| |
|
|
| |
|
|
|
Total | | $ | 4,147,581,164 | | | $ | 28,178,403 | | | $ | — | |
| | |
|
|
| |
|
|
| |
|
|
|
SEE NOTES TO FINANCIAL STATEMENTS.
A60
| | | | | | |
| | | EQUITY PORTFOLIO (continued) | | |
| |
| SCHEDULE OF INVESTMENTS | | December 31, 2014 |
The industry classification of investments and liabilities in excess of other assets shown as a percentage of net assets as of December 31, 2014 was as follows (Unaudited):
| | | | |
Internet Software & Services | | | 7.7 | % |
Pharmaceuticals | | | 6.8 | |
Affiliated Money Market Mutual Fund (including 4.1% of collateral for securities on loan) | | | 6.5 | |
Technology Hardware, Storage & Peripherals | | | 6.3 | |
Banks | | | 6.3 | |
Biotechnology | | | 6.1 | |
Oil, Gas & Consumable Fuels | | | 5.9 | |
Software | | | 5.6 | |
Internet & Catalog Retail | | | 4.1 | |
Hotels, Restaurants & Leisure | | | 3.4 | |
Capital Markets | | | 3.0 | |
Media | | | 3.0 | |
Food Products | | | 3.0 | |
IT Services | | | 2.9 | |
Textiles, Apparel & Luxury Goods | | | 2.5 | |
Semiconductors & Semiconductor Equipment | | | 2.3 | |
Road & Rail | | | 2.0 | |
Consumer Finance | | | 1.9 | |
Specialty Retail | | | 1.8 | |
Insurance | | | 1.7 | |
Aerospace & Defense | | | 1.7 | |
| | | | |
Automobiles | | | 1.6 | % |
Airlines | | | 1.6 | |
Energy Equipment & Services | | | 1.5 | |
Auto Components | | | 1.2 | |
Food & Staples Retailing | | | 1.2 | |
Electric Utilities | | | 1.2 | |
Multiline Retail | | | 1.2 | |
Chemicals | | | 1.2 | |
Machinery | | | 1.0 | |
Electrical Equipment | | | 1.0 | |
Life Sciences Tools & Services | | | 0.9 | |
Wireless Telecommunication Services | | | 0.9 | |
Industrial Conglomerates | | | 0.8 | |
Communications Equipment | | | 0.8 | |
Electronic Equipment, Instruments & Components | | | 0.8 | |
Independent Power & Renewable Electricity Producers | | | 0.7 | |
Diversified Financial Services | | | 0.7 | |
Diversified Telecommunication Services | | | 0.6 | |
Personal Products | | | 0.5 | |
| | |
|
|
|
| | | | 103.9 | |
Liabilities in excess of other assets | | | (3.9 | ) |
| | |
|
|
|
| | | | 100.0 | % |
| | |
|
|
|
SEE NOTES TO FINANCIAL STATEMENTS.
A61
| | | | | | |
| | | EQUITY PORTFOLIO (continued) | | |
STATEMENT OF ASSETS AND LIABILITIES
December 31, 2014
| | | | |
| ASSETS | | | | |
Investments at value, including securities on loan of $160,971,207: | | | | |
Unaffiliated investments (cost $2,720,111,496) | | $ | 3,913,344,390 | |
Affiliated investments (cost $262,415,177) | | | 262,415,177 | |
Cash | | | 20,954 | |
Receivable for investments sold | | | 12,726,871 | |
Dividends receivable | | | 3,295,048 | |
Tax reclaim receivable | | | 1,893,059 | |
Receivable for Series shares sold | | | 1,424 | |
Prepaid expenses | | | 32,029 | |
| | |
|
|
|
Total Assets | | | 4,193,728,952 | |
| | |
|
|
|
| LIABILITIES | | | | |
Payable to broker for collateral for securities on loan | | | 166,375,351 | |
Payable for investments purchased | | | 5,243,514 | |
Management fee payable | | | 1,536,457 | |
Payable for Series shares reacquired | | | 487,209 | |
Accrued expenses | | | 286,499 | |
Affiliated transfer agent fee payable | | | 926 | |
Deferred trustees’ fees | | | 604 | |
Distribution fee payable | | | 469 | |
| | |
|
|
|
Total Liabilities | | | 173,931,029 | |
| | |
|
|
|
| NET ASSETS | | $ | 4,019,797,923 | |
| | |
|
|
|
Net assets were comprised of: | | | | |
Paid-in capital | | $ | 2,153,051,496 | |
Retained earnings | | | 1,866,746,427 | |
| | |
|
|
|
Net assets, December 31, 2014 | | $ | 4,019,797,923 | |
| | |
|
|
|
| Class I: | | | | |
Net asset value and redemption price per share, $4,017,593,708 / 104,202,346 outstanding shares of beneficial interest | | $ | 38.56 | |
| | |
|
|
|
| Class II: | | | | |
Net asset value and redemption price per share, $2,204,215 / 57,015 outstanding shares of beneficial interest | | $ | 38.66 | |
| | |
|
|
|
STATEMENT OF OPERATIONS
Year Ended December 31, 2014
| | | | |
| NET INVESTMENT INCOME | | | | |
| INCOME | | | | |
Unaffiliated dividend income (net of $1,113,394 foreign withholding tax) | | $ | 38,807,187 | |
Affiliated income from securities lending, net | | | 589,730 | |
Affiliated dividend income | | | 118,263 | |
| | |
|
|
|
Total income | | | 39,515,180 | |
| | |
|
|
|
| EXPENSES | | | | |
Management fee | | | 17,908,918 | |
Distribution fee—Class II | | | 5,984 | |
Administration fee—Class II | | | 3,590 | |
Custodian’s fees and expenses | | | 441,000 | |
Reports to shareholders | | | 207,000 | |
Insurance fees | | | 49,000 | |
Trustees’ fees | | | 42,000 | |
Audit fee | | | 25,000 | |
Legal fees and expenses | | | 19,000 | |
Transfer agent’s fees and expenses (including affiliated expense of $5,600) | | | 12,000 | |
Miscellaneous | | | 21,110 | |
| | |
|
|
|
Total expenses | | | 18,734,602 | |
| | |
|
|
|
| NET INVESTMENT INCOME | | | 20,780,578 | |
| | |
|
|
|
| REALIZED AND UNREALIZED GAIN (LOSS) ON INVESTMENTS AND FOREIGN CURRENCIES | | | | |
Net realized gain (loss) on: | | | | |
Investment transactions | | | 365,924,279 | |
Foreign currency transactions | | | (34,946 | ) |
| | |
|
|
|
| | | | 365,889,333 | |
| | |
|
|
|
Net change in unrealized appreciation (depreciation) on: | |
Investments | | | (92,042,018 | ) |
Foreign currencies | | | (146,844 | ) |
| | |
|
|
|
| | | | (92,188,862 | ) |
| | |
|
|
|
| NET GAIN ON INVESTMENTS AND FOREIGN CURRENCY TRANSACTIONS | | | 273,700,471 | |
| | |
|
|
|
| NET INCREASE IN NET ASSETS RESULTING FROM OPERATIONS | | $ | 294,481,049 | |
| | |
|
|
|
STATEMENT OF CHANGES IN NET ASSETS
| | | | | | | | |
| | | Year Ended December 31,
| |
| | | 2014
| | | 2013
| |
| INCREASE (DECREASE) IN NET ASSETS | | | | | | | | |
| OPERATIONS | | | | | | | | |
Net investment income | | $ | 20,780,578 | | | $ | 30,516,315 | |
Net realized gain on investment and foreign currency transactions | | | 365,889,333 | | | | 417,610,720 | |
Net change in unrealized appreciation (depreciation) on investments and foreign currencies | | | (92,188,862 | ) | | | 579,405,992 | |
| | |
|
|
| |
|
|
|
NET INCREASE IN NET ASSETS RESULTING FROM OPERATIONS | | | 294,481,049 | | | | 1,027,533,027 | |
| | |
|
|
| |
|
|
|
| SERIES SHARE TRANSACTIONS (Note 7) | | | | | | | | |
Series shares sold | | | 12,816,469 | | | | 15,823,185 | |
Series shares repurchased | | | (260,744,091 | ) | | | (238,940,216 | ) |
| | |
|
|
| |
|
|
|
NET DECREASE IN NET ASSETS FROM SERIES SHARE TRANSACTIONS | | | (247,927,622 | ) | | | (223,117,031 | ) |
| | |
|
|
| |
|
|
|
| TOTAL INCREASE | | | 46,553,427 | | | | 804,415,996 | |
| NET ASSETS: | | | | | | | | |
Beginning of year | | | 3,973,244,496 | | | | 3,168,828,500 | |
| | |
|
|
| |
|
|
|
End of year | | $ | 4,019,797,923 | | | $ | 3,973,244,496 | |
| | |
|
|
| |
|
|
|
SEE NOTES TO FINANCIAL STATEMENTS.
A62
| | | | | | |
| | | FLEXIBLE MANAGED PORTFOLIO | | |
| |
| SCHEDULE OF INVESTMENTS | | December 31, 2014 |
| | | | | | | | |
| LONG-TERM INVESTMENTS — 95.1% | |
| COMMON STOCKS — 69.6% | | Shares
| | | Value
(Note 2)
| |
Aerospace & Defense — 1.3% | | | | | | | | |
BAE Systems PLC (United Kingdom) | | | 33,033 | | | $ | 241,577 | |
General Dynamics Corp. | | | 138,100 | | | | 19,005,322 | |
Honeywell International, Inc. | | | 23,300 | | | | 2,328,136 | |
L-3 Communications Holdings, Inc. | | | 7,200 | | | | 908,712 | |
Safran SA (France) | | | 3,828 | | | | 236,169 | |
Spirit AeroSystems Holdings, Inc. (Class A Stock)* | | | 115,200 | | | | 4,958,208 | |
Thales SA (France) | | | 12,856 | | | | 695,604 | |
United Technologies Corp. | | | 196,300 | | | | 22,574,500 | |
| | | | | | |
|
|
|
| | | | | | | | 50,948,228 | |
| | | | | | |
|
|
|
Air Freight & Logistics — 0.7% | | | | | | | | |
C.H. Robinson Worldwide, Inc. | | | 80,300 | | | | 6,013,667 | |
Deutsche Post AG (Germany) | | | 10,295 | | | | 334,196 | |
FedEx Corp. | | | 121,100 | | | | 21,030,226 | |
Royal Mail PLC (United Kingdom) | | | 6,986 | | | | 46,555 | |
| | | | | | |
|
|
|
| | | | | | | | 27,424,644 | |
| | | | | | |
|
|
|
Airlines — 0.8% | | | | | | | | |
Deutsche Lufthansa AG (Germany) | | | 21,319 | | | | 353,277 | |
easyJet PLC (United Kingdom) | | | 6,381 | | | | 165,135 | |
International Consolidated Airlines Group SA (United Kingdom)* | | | 10,892 | | | | 81,138 | |
Ryanair Holdings PLC (Ireland) ADR* | | | 11,200 | | | | 798,224 | |
Southwest Airlines Co. | | | 433,900 | | | | 18,362,648 | |
United Continental Holdings, Inc.* | | | 179,500 | | | | 12,006,755 | |
| | | | | | |
|
|
|
| | | | | | | | 31,767,177 | |
| | | | | | |
|
|
|
Auto Components — 0.7% | | | | | | | | |
Bridgestone Corp. (Japan) | | | 6,800 | | | | 235,837 | |
Continental AG (Germany) | | | 1,160 | | | | 244,671 | |
Delphi Automotive PLC (United Kingdom) | | | 121,000 | | | | 8,799,120 | |
Johnson Controls, Inc. | | | 309,700 | | | | 14,970,898 | |
Koito Manufacturing Co. Ltd. (Japan) | | | 1,000 | | | | 30,592 | |
NGK Spark Plug Co. Ltd. (Japan) | | | 2,000 | | | | 60,771 | |
NOK Corp. (Japan) | | | 4,700 | | | | 119,631 | |
Sumitomo Electric Industries Ltd. (Japan) | | | 8,000 | | | | 99,914 | |
Sumitomo Rubber Industries Ltd. (Japan) | | | 1,800 | | | | 26,759 | |
Tenneco, Inc.* | | | 46,300 | | | | 2,621,043 | |
Toyota Industries Corp. (Japan) | | | 6,600 | | | | 338,262 | |
| | | | | | |
|
|
|
| | | | | | | | 27,547,498 | |
| | | | | | |
|
|
|
Automobiles — 0.3% | | | | | | | | |
Bayerische Motoren Werke AG (Germany) | | | 5,907 | | | | 637,475 | |
Daimler AG (Germany) | | | 12,168 | | | | 1,010,604 | |
Fiat Chrysler Automobiles NV (United Kingdom)* | | | 9,150 | | | | 106,321 | |
Ford Motor Co. | | | 167,800 | | | | 2,600,900 | |
Fuji Heavy Industries Ltd. (Japan) | | | 32,900 | | | | 1,164,199 | |
Isuzu Motors Ltd. (Japan) | | | 6,000 | | | | 73,082 | |
Mazda Motor Corp. (Japan) | | | 2,000 | | | | 48,031 | |
| | | | | | | | |
COMMON STOCKS
(continued) | | Shares
| | | Value
(Note 2)
| |
Automobiles (continued) | | | | | | | | |
Nissan Motor Co. Ltd. (Japan) | | | 26,100 | | | $ | 227,638 | |
Peugeot SA (France)* | | | 57,600 | | | | 705,740 | |
Renault SA (France) | | | 1,999 | | | | 145,600 | |
Thor Industries, Inc. | | | 54,900 | | | | 3,067,263 | |
Toyota Motor Corp. (Japan) | | | 30,000 | | | | 1,869,522 | |
Volkswagen AG (Germany) | | | 301 | | | | 65,258 | |
| | | | | | |
|
|
|
| | | | | | | | 11,721,633 | |
| | | | | | |
|
|
|
Banks — 4.5% | | | | | | | | |
Aozora Bank Ltd. (Japan) | | | 220,000 | | | | 681,020 | |
Australia & New Zealand Banking Group Ltd. (Australia) | | | 29,473 | | | | 766,886 | |
Banco Santander SA (Spain) | | | 209,701 | | | | 1,760,050 | |
Bank Hapoalim BM (Israel) | | | 150,172 | | | | 706,128 | |
Bank of America Corp. | | | 1,149,500 | | | | 20,564,555 | |
Bank of Queensland Ltd. (Australia) | | | 20,761 | | | | 204,536 | |
BNP Paribas SA (France) | | | 3,281 | | | | 193,691 | |
CIT Group, Inc. | | | 87,600 | | | | 4,189,908 | |
Citigroup, Inc. | | | 677,350 | | | | 36,651,408 | |
Commonwealth Bank of Australia (Australia) | | | 22,626 | | | | 1,572,027 | |
Credit Agricole SA (France) | | | 60,134 | | | | 776,243 | |
Danske Bank A/S (Denmark) | | | 21,008 | | | | 567,969 | |
DBS Group Holdings Ltd. (Singapore) | | | 18,284 | | | | 283,061 | |
DNB ASA (Norway) | | | 50,843 | | | | 749,966 | |
Fulton Financial Corp. | | | 99,500 | | | | 1,229,820 | |
HSBC Holdings PLC (United Kingdom) | | | 201,268 | | | | 1,901,938 | |
Intesa Sanpaolo SpA (Italy) | | | 9,749 | | | | 24,021 | |
JPMorgan Chase & Co. | | | 751,594 | | | | 47,034,753 | |
KeyCorp | | | 1,006,400 | | | | 13,988,960 | |
Lloyds Banking Group PLC (United Kingdom)* | | | 27,715 | | | | 32,600 | |
Mitsubishi UFJ Financial Group, Inc. (Japan) | | | 257,800 | | | | 1,416,412 | |
Mizuho Financial Group, Inc. (Japan) | | | 244,000 | | | | 409,018 | |
Natixis (France) | | | 113,436 | | | | 748,523 | |
Oversea-Chinese Banking Corp. Ltd. (Singapore) | | | 31,000 | | | | 243,907 | |
PNC Financial Services Group, Inc. (The) | | | 83,100 | | | | 7,581,213 | |
Regions Financial Corp. | | | 631,000 | | | | 6,663,360 | |
Resona Holdings, Inc. (Japan) | | | 91,200 | | | | 460,697 | |
Skandinaviska Enskilda Banken AB (Sweden) (Class A Stock) | | | 63,024 | | | | 800,314 | |
Sumitomo Mitsui Financial Group, Inc. (Japan) | | | 30,700 | | | | 1,109,889 | |
Sumitomo Mitsui Trust Holdings, Inc. (Japan) | | | 35,000 | | | | 134,060 | |
Svenska Handelsbanken AB (Sweden) (Class A Stock) | | | 19,910 | | | | 931,547 | |
Swedbank AB (Sweden)
(Class A Stock) | | | 9,663 | | | | 239,748 | |
United Overseas Bank Ltd. (Singapore) | | | 33,000 | | | | 608,984 | |
SEE NOTES TO FINANCIAL STATEMENTS.
A63
| | | | | | |
| | | FLEXIBLE MANAGED PORTFOLIO (continued) | | |
| |
| SCHEDULE OF INVESTMENTS | | December 31, 2014 |
| | | | | | | | |
COMMON STOCKS
(continued) | | Shares
| | | Value
(Note 2)
| |
Banks (continued) | | | | | | | | |
Wells Fargo & Co. | | | 394,112 | | | $ | 21,605,220 | |
Westpac Banking Corp. (Australia) | | | 8,263 | | | | 222,240 | |
Yamaguchi Financial Group, Inc. (Japan) | | | 2,000 | | | | 20,554 | |
| | | | | | |
|
|
|
| | | | | | | | 177,075,226 | |
| | | | | | |
|
|
|
Beverages — 1.7% | | | | | | | | |
Anheuser-Busch InBev NV (Belgium) | | | 13,999 | | | | 1,575,471 | |
Carlsberg A/S (Denmark)
(Class B Stock) | | | 1,092 | | | | 83,865 | |
Coca-Cola Enterprises, Inc. | | | 228,800 | | | | 10,117,536 | |
Diageo PLC (United Kingdom) | | | 2,432 | | | | 69,670 | |
Monster Beverage Corp.* | | | 159,200 | | | | 17,249,320 | |
PepsiCo, Inc. | | | 378,420 | | | | 35,783,395 | |
Pernod Ricard SA (France) | | | 2,247 | | | | 249,727 | |
| | | | | | |
|
|
|
| | | | | | | | 65,128,984 | |
| | | | | | |
|
|
|
Biotechnology — 2.4% | | | | | | | | |
Actelion Ltd. (Switzerland) | | | 4,955 | | | | 570,425 | |
Alexion Pharmaceuticals, Inc.* | | | 100,300 | | | | 18,558,509 | |
Amgen, Inc. | | | 115,708 | | | | 18,431,128 | |
Biogen Idec, Inc.* | | | 84,700 | | | | 28,751,415 | |
Celgene Corp.* | | | 30,700 | | | | 3,434,102 | |
CSL Ltd. (Australia) | | | 4,901 | | | | 344,274 | |
Gilead Sciences, Inc.* | | | 269,200 | | | | 25,374,792 | |
| | | | | | |
|
|
|
| | | | | | | | 95,464,645 | |
| | | | | | |
|
|
|
Building Products | | | | | | | | |
Assa Abloy AB (Sweden)
(Class B Stock) | | | 3,537 | | | | 186,812 | |
Daikin Industries Ltd. (Japan) | | | 4,400 | | | | 282,146 | |
Geberit AG (Switzerland) | | | 1,256 | | | | 424,908 | |
| | | | | | |
|
|
|
| | | | | | | | 893,866 | |
| | | | | | |
|
|
|
Capital Markets — 1.7% | |
3i Group PLC (United Kingdom) | | | 10,246 | | | | 71,443 | |
Aberdeen Asset Management PLC (United Kingdom) | | | 52,251 | | | | 349,139 | |
Bank of New York Mellon Corp. (The) | | | 376,800 | | | | 15,286,776 | |
Daiwa Securities Group, Inc. (Japan) | | | 11,000 | | | | 86,132 | |
Franklin Resources, Inc. | | | 229,800 | | | | 12,724,026 | |
Goldman Sachs Group, Inc. (The) | | | 130,300 | | | | 25,256,049 | |
Investec PLC (South Africa) | | | 83,607 | | | | 700,484 | |
Macquarie Group Ltd. (Australia) | | | 3,790 | | | | 178,725 | |
Partners Group Holding AG (Switzerland) | | | 584 | | | | 169,907 | |
State Street Corp. | | | 143,000 | | | | 11,225,500 | |
UBS Group AG (Switzerland) | | | 797 | | | | 13,700 | |
Waddell & Reed Financial, Inc. (Class A Stock) | | | 51,500 | | | | 2,565,730 | |
| | | | | | |
|
|
|
| | | | | | | | 68,627,611 | |
| | | | | | |
|
|
|
Chemicals — 1.9% | |
Asahi Kasei Corp. (Japan) | | | 26,000 | | | | 237,183 | |
BASF SE (Germany) | | | 2,199 | | | | 184,455 | |
Cabot Corp. | | | 57,200 | | | | 2,508,792 | |
Celanese Corp. Series A | | | 196,700 | | | | 11,794,132 | |
| | | | | | | | |
COMMON STOCKS
(continued) | | Shares
| | | Value
(Note 2)
| |
Chemicals (continued) | |
Daicel Corp. (Japan) | | | 87,000 | | | $ | 1,016,202 | |
Dow Chemical Co. (The) | | | 269,900 | | | | 12,310,139 | |
Eastman Chemical Co. | | | 16,100 | | | | 1,221,346 | |
Givaudan SA (Switzerland) | | | 25 | | | | 44,846 | |
K+S AG (Germany) | | | 27,359 | | | | 754,978 | |
Kaneka Corp. (Japan) | | | 3,000 | | | | 16,075 | |
Kuraray Co. Ltd. (Japan) | | | 3,600 | | | | 40,902 | |
LyondellBasell Industries NV (Netherlands) (Class A Stock) | | | 231,800 | | | | 18,402,602 | |
Nitto Denko Corp. (Japan) | | | 1,600 | | | | 89,401 | |
Novozymes A/S (Denmark) | | | 317 | | | | 13,344 | |
Sherwin-Williams Co. (The) | | | 53,700 | | | | 14,125,248 | |
Westlake Chemical Corp. | | | 173,800 | | | | 10,617,442 | |
Yara International ASA (Norway) | | | 18,067 | | | | 804,567 | |
| | | | | | |
|
|
|
| | | | | | | | 74,181,654 | |
| | | | | | |
|
|
|
Commercial Services & Supplies — 0.1% | |
Dai Nippon Printing Co. Ltd. (Japan) | | | 6,000 | | | | 54,039 | |
Pitney Bowes, Inc. | | | 86,400 | | | | 2,105,568 | |
Secom Co. Ltd. (Japan) | | | 2,200 | | | | 126,400 | |
Securitas AB (Sweden)
(Class B Stock) | | | 27,965 | | | | 338,312 | |
Toppan Printing Co. Ltd. (Japan) | | | 6,000 | | | | 38,985 | |
| | | | | | |
|
|
|
| | | | | | | | 2,663,304 | |
| | | | | | |
|
|
|
Communications Equipment — 1.6% | |
Cisco Systems, Inc. | | | 963,900 | | | | 26,810,879 | |
F5 Networks, Inc.* | | | 18,000 | | | | 2,348,370 | |
QUALCOMM, Inc. | | | 430,600 | | | | 32,006,498 | |
| | | | | | |
|
|
|
| | | | | | | | 61,165,747 | |
| | | | | | |
|
|
|
Construction & Engineering — 0.1% | |
ACS Actividades de Construccion y Servicios SA (Spain) | | | 20,089 | | | | 700,205 | |
Ferrovial SA (Spain) | | | 999 | | | | 19,749 | |
Hochtief AG (Germany) | | | 9,818 | | | | 692,646 | |
Leighton Holdings Ltd. (Australia) | | | 40,305 | | | | 733,895 | |
Obayashi Corp. (Japan) | | | 7,000 | | | | 45,123 | |
Quanta Services, Inc.* | | | 87,500 | | | | 2,484,125 | |
Skanska AB (Sweden)
(Class B Stock) | | | 2,906 | | | | 62,393 | |
Taisei Corp. (Japan) | | | 11,000 | | | | 62,392 | |
| | | | | | |
|
|
|
| | | | | | | | 4,800,528 | |
| | | | | | |
|
|
|
Construction Materials | |
HeidelbergCement AG (Germany) | | | 3,959 | | | | 279,427 | |
Taiheiyo Cement Corp. (Japan) | | | 12,000 | | | | 37,648 | |
| | | | | | |
|
|
|
| | | | | | | | 317,075 | |
| | | | | | |
|
|
|
Consumer Finance — 0.5% | |
Capital One Financial Corp. | | | 232,700 | | | | 19,209,385 | |
Synchrony Financial* | | | 64,800 | | | | 1,927,800 | |
| | | | | | |
|
|
|
| | | | | | | | 21,137,185 | |
| | | | | | |
|
|
|
Diversified Consumer Services — 0.1% | |
H&R Block, Inc. | | | 95,700 | | | | 3,223,176 | |
| | | | | | |
|
|
|
Diversified Financial Services — 1.4% | |
Berkshire Hathaway, Inc. (Class B Stock)* | | | 289,500 | | | | 43,468,425 | |
SEE NOTES TO FINANCIAL STATEMENTS.
A64
| | | | | | |
| | | FLEXIBLE MANAGED PORTFOLIO (continued) | | |
| |
| SCHEDULE OF INVESTMENTS | | December 31, 2014 |
| | | | | | | | |
COMMON STOCKS
(continued) | | Shares
| | | Value
(Note 2)
| |
Diversified Financial Services (continued) | |
CME Group, Inc. | | | 101,000 | | | $ | 8,953,650 | |
Industrivarden AB (Sweden)
(Class C Stock) | | | 31,730 | | | | 550,775 | |
Investment AB Kinnevik (Sweden) | | | 21,448 | | | | 697,472 | |
Investor AB (Sweden)
(Class B Stock) | | | 19,476 | | | | 708,105 | |
ORIX Corp. (Japan) | | | 14,000 | | | | 176,159 | |
| | | | | | |
|
|
|
| | | | | | | | 54,554,586 | |
| | | | | | |
|
|
|
Diversified Telecommunication Services — 1.2% | |
AT&T, Inc. | | | 630,947 | | | | 21,193,510 | |
Belgacom SA (Belgium) | | | 1,626 | | | | 58,997 | |
BT Group PLC (United Kingdom) | | | 140,631 | | | | 874,736 | |
Koninklijke KPN NV (Netherlands) | | | 34,210 | | | | 108,013 | |
Nippon Telegraph & Telephone Corp. (Japan) | | | 16,900 | | | | 863,296 | |
Orange SA (France) | | | 66,947 | | | | 1,138,552 | |
PCCW Ltd. (Hong Kong) | | | 942,000 | | | | 641,399 | |
Spark New Zealand Ltd.
(New Zealand) | | | 82,292 | | | | 199,489 | |
Telecom Italia SpA (Italy) | | | 853,845 | | | | 713,855 | |
Telefonica SA (Spain) | | | 43,853 | | | | 629,622 | |
Telekom Austria AG (Austria) | | | 7,232 | | | | 48,297 | |
Verizon Communications, Inc. | | | 412,188 | | | | 19,282,155 | |
Vivendi SA (France) | | | 11,168 | | | | 277,978 | |
| | | | | | |
|
|
|
| | | | | | | | 46,029,899 | |
| | | | | | |
|
|
|
Electric Utilities — 0.8% | |
American Electric Power Co., Inc. | | | 77,500 | | | | 4,705,800 | |
AusNet Services (Australia) | | | 18,046 | | | | 19,496 | |
Cheung Kong Infrastructure Holdings Ltd. (Hong Kong) | | | 52,000 | | | | 382,396 | |
Chubu Electric Power Co., Inc. (Japan)* | | | 6,300 | | | | 74,032 | |
Chugoku Electric Power Co., Inc. (The) (Japan) | | | 3,000 | | | | 39,223 | |
Contact Energy Ltd.
(New Zealand) | | | 3,837 | | | | 19,055 | |
EDP-Energias de Portugal SA (Portugal) | | | 116,565 | | | | 451,999 | |
Electricite de France (France) | | | 2,447 | | | | 67,362 | |
Fortum OYJ (Finland) | | | 34,195 | | | | 742,428 | |
Hokuriku Electric Power Co. (Japan) | | | 1,700 | | | | 21,710 | |
Kansai Electric Power Co., Inc. (The) (Japan)* | | | 7,000 | | | | 66,592 | |
Kyushu Electric Power Co., Inc. (Japan)* | | | 4,400 | | | | 44,067 | |
Power Assets Holdings Ltd.
(Hong Kong) | | | 18,000 | | | | 174,024 | |
PPL Corp. | | | 467,200 | | | | 16,973,376 | |
Red Electrica Corp. SA (Spain) | | | 1,128 | | | | 99,435 | |
Shikoku Electric Power Co., Inc. (Japan)* | | | 1,800 | | | | 21,833 | |
Southern Co. (The) | | | 138,200 | | | | 6,787,002 | |
SSE PLC (United Kingdom) | | | 10,001 | | | | 252,697 | |
Tohoku Electric Power Co., Inc. (Japan) | | | 4,600 | | | | 53,528 | |
| | | | | | | | |
COMMON STOCKS
(continued) | | Shares
| | | Value
(Note 2)
| |
Electric Utilities (continued) | |
Tokyo Electric Power Co., Inc. (Japan)* | | | 14,900 | | | $ | 60,603 | |
| | | | | | |
|
|
|
| | | | | | | | 31,056,658 | |
| | | | | | |
|
|
|
Electrical Equipment — 0.6% | |
Acuity Brands, Inc. | | | 15,800 | | | | 2,213,106 | |
AMETEK, Inc. | | | 103,600 | | | | 5,452,468 | |
Babcock & Wilcox Co. (The) | | | 29,000 | | | | 878,700 | |
Eaton Corp. PLC | | | 140,700 | | | | 9,561,972 | |
Emerson Electric Co. | | | 101,100 | | | | 6,240,903 | |
Fuji Electric Co. Ltd. (Japan) | | | 6,000 | | | | 23,921 | |
Mitsubishi Electric Corp. (Japan) | | | 76,000 | | | | 902,733 | |
| | | | | | |
|
|
|
| | | | | | | | 25,273,803 | |
| | | | | | |
|
|
|
Electronic Equipment, Instruments & Components — 0.4% | |
Arrow Electronics, Inc.* | | | 62,800 | | | | 3,635,492 | |
Citizen Holdings Co. Ltd. (Japan) | | | 2,700 | | | | 20,775 | |
Hexagon AB (Sweden)
(Class B Stock) | | | 2,669 | | | | 82,338 | |
Hitachi Ltd. (Japan) | | | 51,000 | | | | 376,419 | |
Hoya Corp. (Japan) | | | 4,400 | | | | 148,829 | |
Ingram Micro, Inc. (Class A Stock)* | | | 158,700 | | | | 4,386,468 | |
Jabil Circuit, Inc. | | | 144,900 | | | | 3,163,167 | |
Keyence Corp. (Japan) | | | 500 | | | | 222,797 | |
Murata Manufacturing Co. Ltd. (Japan) | | | 3,300 | | | | 360,099 | |
Omron Corp. (Japan) | | | 18,000 | | | | 805,239 | |
TDK Corp. (Japan) | | | 1,300 | | | | 76,564 | |
Tech Data Corp.* | | | 37,500 | | | | 2,371,125 | |
| | | | | | |
|
|
|
| | | | | | | | 15,649,312 | |
| | | | | | |
|
|
|
Energy Equipment & Services — 0.9% | |
Helmerich & Payne, Inc. | | | 103,400 | | | | 6,971,228 | |
National Oilwell Varco, Inc. | | | 201,200 | | | | 13,184,636 | |
Noble Corp. PLC(a) | | | 831,700 | | | | 13,781,269 | |
Transocean Ltd. | | | 3,652 | | | | 67,014 | |
| | | | | | |
|
|
|
| | | | | | | | 34,004,147 | |
| | | | | | |
|
|
|
Food & Staples Retailing — 2.2% | |
Carrefour SA (France) | | | 5,959 | | | | 181,341 | |
Casino Guichard Perrachon SA (France) | | | 4,192 | | | | 385,516 | |
Costco Wholesale Corp. | | | 92,000 | | | | 13,041,000 | |
CVS Health Corp. | | | 200,600 | | | | 19,319,786 | |
Delhaize Group SA (Belgium) | | | 1,068 | | | | 77,778 | |
J. Sainsbury PLC (United Kingdom) | | | 145,840 | | | | 556,918 | |
Koninklijke Ahold NV (Netherlands) | | | 45,084 | | | | 801,274 | |
Kroger Co. (The) | | | 356,700 | | | | 22,903,707 | |
Lawson, Inc. (Japan) | | | 700 | | | | 42,300 | |
Metcash Ltd. (Australia) | | | 6,319 | | | | 9,523 | |
Olam International Ltd. (Singapore) | | | 8,000 | | | | 12,141 | |
Wal-Mart Stores, Inc. | | | 344,500 | | | | 29,585,660 | |
Wesfarmers Ltd. (Australia) | | | 11,657 | | | | 394,679 | |
WM Morrison Supermarkets PLC (United Kingdom) | | | 269,123 | | | | 767,880 | |
| | | | | | |
|
|
|
| | | | | | | | 88,079,503 | |
| | | | | | |
|
|
|
Food Products — 1.6% | |
Archer-Daniels-Midland Co. | | | 345,800 | | | | 17,981,600 | |
Bunge Ltd. | | | 54,600 | | | | 4,963,686 | |
SEE NOTES TO FINANCIAL STATEMENTS.
A65
| | | | | | |
| | | FLEXIBLE MANAGED PORTFOLIO (continued) | | |
| |
| SCHEDULE OF INVESTMENTS | | December 31, 2014 |
| | | | | | | | |
COMMON STOCKS
(continued) | | Shares
| | | Value
(Note 2)
| |
Food Products (continued) | |
ConAgra Foods, Inc. | | | 96,400 | | | $ | 3,497,392 | |
Golden Agri-Resources Ltd. (Singapore) | | | 1,172,000 | | | | 405,627 | |
Hormel Foods Corp. | | | 19,800 | | | | 1,031,580 | |
Kellogg Co. | | | 129,800 | | | | 8,494,112 | |
Kraft Foods Group, Inc. | | | 73,400 | | | | 4,599,244 | |
Lindt & Spruengli AG (Switzerland) | | | 1 | | | | 57,702 | |
Nestle SA (Switzerland) | | | 24,764 | | | | 1,805,321 | |
Nippon Meat Packers, Inc. (Japan) | | | 12,000 | | | | 262,539 | |
Pilgrim’s Pride Corp.*(a) | | | 148,300 | | | | 4,862,757 | |
Sanderson Farms, Inc.(a) | | | 12,900 | | | | 1,083,922 | |
Tate & Lyle PLC (United Kingdom) | | | 8,075 | | | | 75,659 | |
Tyson Foods, Inc. (Class A Stock) | | | 244,200 | | | | 9,789,978 | |
Unilever NV (United Kingdom) | | | 31,430 | | | | 1,229,474 | |
Unilever PLC (United Kingdom) | | | 13,566 | | | | 551,163 | |
Wilmar International Ltd. (Singapore) | | | 299,000 | | | | 728,554 | |
| | | | | | |
|
|
|
| | | | | | | | 61,420,310 | |
| | | | | | |
|
|
|
Gas Utilities — 0.3% | |
AGL Resources, Inc. | | | 175,900 | | | | 9,588,309 | |
Enagas SA (Spain) | | | 1,942 | | | | 61,253 | |
Snam SpA (Italy) | | | 22,558 | | | | 111,645 | |
| | | | | | |
|
|
|
| | | | | | | | 9,761,207 | |
| | | | | | |
|
|
|
Health Care Equipment & Supplies — 1.0% | |
Abbott Laboratories | | | 372,100 | | | | 16,751,942 | |
Baxter International, Inc. | | | 21,700 | | | | 1,590,393 | |
Boston Scientific Corp.* | | | 288,700 | | | | 3,825,275 | |
C.R. Bard, Inc. | | | 89,500 | | | | 14,912,490 | |
Intuitive Surgical, Inc.* | | | 3,200 | | | | 1,692,608 | |
Sonova Holding AG (Switzerland) | | | 202 | | | | 29,676 | |
| | | | | | |
|
|
|
| | | | | | | | 38,802,384 | |
| | | | | | |
|
|
|
Health Care Providers & Services — 2.1% | |
Aetna, Inc. | | | 206,000 | | | | 18,298,980 | |
Alfresa Holdings Corp. (Japan) | | | 1,900 | | | | 22,944 | |
Anthem, Inc. | | | 97,100 | | | | 12,202,557 | |
Cigna Corp. | | | 85,100 | | | | 8,757,641 | |
Express Scripts Holding Co.* | | | 130,700 | | | | 11,066,369 | |
Fresenius Medical Care AG & Co. KGaA (Germany) | | | 941 | | | | 70,234 | |
Fresenius SE & Co. KGaA (Germany) | | | 3,983 | | | | 207,093 | |
Medipal Holdings Corp. (Japan) | | | 50,700 | | | | 592,160 | |
Sonic Healthcare Ltd. (Australia) | | | 3,921 | | | | 58,990 | |
Suzuken Co. Ltd. (Japan) | | | 700 | | | | 19,336 | |
UnitedHealth Group, Inc. | | | 271,500 | | | | 27,445,935 | |
Universal Health Services, Inc.
(Class B Stock) | | | 19,600 | | | | 2,180,696 | |
| | | | | | |
|
|
|
| | | | | | | | 80,922,935 | |
| | | | | | |
|
|
|
Health Care Technology — 0.2% | |
Cerner Corp.*(a) | | | 142,500 | | | | 9,214,050 | |
| | | | | | |
|
|
|
Hotels, Restaurants & Leisure — 1.6% | |
Chipotle Mexican Grill, Inc.* | | | 6,100 | | | | 4,175,511 | |
Las Vegas Sands Corp. | | | 248,600 | | | | 14,458,576 | |
Marriott Vacations Worldwide Corp. | | | 41,300 | | | | 3,078,502 | |
McDonald’s Corp. | | | 282,000 | | | | 26,423,400 | |
| | | | | | | | |
COMMON STOCKS
(continued) | | Shares
| | | Value
(Note 2)
| |
Hotels, Restaurants & Leisure (continued) | |
Merlin Entertainments PLC
(United Kingdom) | | | 117,113 | | | $ | 724,655 | |
Oriental Land Co. Ltd. (Japan) | | | 2,000 | | | | 461,228 | |
Sodexo SA (France) | | | 3,939 | | | | 385,567 | �� |
Tabcorp Holdings Ltd. (Australia) | | | 7,837 | | | | 26,456 | |
Tatts Group Ltd. (Australia) | | | 15,401 | | | | 43,315 | |
Whitbread PLC (United Kingdom) | | | 1,821 | | | | 134,766 | |
Wyndham Worldwide Corp. | | | 56,300 | | | | 4,828,288 | |
Yum! Brands, Inc. | | | 91,600 | | | | 6,673,060 | |
| | | | | | |
|
|
|
| | | | | | | | 61,413,324 | |
| | | | | | |
|
|
|
Household Durables — 0.1% | |
Panasonic Corp. (Japan) | | | 91,800 | | | | 1,081,261 | |
Persimmon PLC (United Kingdom) | | | 11,131 | | | | 271,863 | |
Sekisui Chemical Co. Ltd. (Japan) | | | 5,000 | | | | 60,155 | |
Sony Corp. (Japan) | | | 41,200 | | | | 840,861 | |
Whirlpool Corp. | | | 16,500 | | | | 3,196,710 | |
| | | | | | |
|
|
|
| | | | | | | | 5,450,850 | |
| | | | | | |
|
|
|
Household Products — 0.9% | |
Colgate-Palmolive Co. | | | 191,500 | | | | 13,249,885 | |
Henkel AG & Co. KGaA (Germany) | | | 8,575 | | | | 830,650 | |
Kimberly-Clark Corp. | | | 97,900 | | | | 11,311,366 | |
Procter & Gamble Co. (The) | | | 87,405 | | | | 7,961,721 | |
Svenska Cellulosa AB SCA (Sweden) (Class B Stock) | | | 6,210 | | | | 133,880 | |
| | | | | | |
|
|
|
| | | | | | | | 33,487,502 | |
| | | | | | |
|
|
|
Independent Power & Renewable Electricity Producers — 0.2% | |
AES Corp. | | | 612,300 | | | | 8,431,371 | |
Electric Power Development Co. Ltd. (Japan) | | | 1,200 | | | | 40,549 | |
| | | | | | |
|
|
|
| | | | | | | | 8,471,920 | |
| | | | | | |
|
|
|
Industrial Conglomerates — 1.5% | |
Carlisle Cos., Inc. | | | 57,900 | | | | 5,224,896 | |
General Electric Co. | | | 2,046,700 | | | | 51,720,109 | |
Hopewell Holdings Ltd. (Hong Kong) | | | 136,000 | | | | 495,057 | |
Hutchison Whampoa Ltd. (Hong Kong) | | | 22,000 | | | | 251,495 | |
Keppel Corp. Ltd. (Singapore) | | | 46,000 | | | | 306,607 | |
NWS Holdings Ltd. (Hong Kong) | | | 16,000 | | | | 29,348 | |
Roper Industries, Inc. | | | 8,600 | | | | 1,344,610 | |
Siemens AG (Germany) | | | 8,036 | | | | 901,673 | |
| | | | | | |
|
|
|
| | | | | | | | 60,273,795 | |
| | | | | | |
|
|
|
Insurance — 1.8% | |
Aflac, Inc. | | | 289,000 | | | | 17,655,010 | |
AIA Group Ltd. (Hong Kong) | | | 7,400 | | | | 40,814 | |
Allianz SE (Germany) | | | 4,823 | | | | 798,817 | |
American Financial Group, Inc. | | | 55,800 | | | | 3,388,176 | |
American International Group, Inc. | | | 230,600 | | | | 12,915,906 | |
AXA SA (France) | | | 48,141 | | | | 1,109,318 | |
Baloise Holding AG (Switzerland) | | | 5,739 | | | | 733,511 | |
CNP Assurances (France) | | | 1,812 | | | | 32,124 | |
Genworth Financial, Inc.
(Class A Stock)* | | | 951,300 | | | | 8,086,050 | |
Hannover Rueck SE (Germany) | | | 3,503 | | | | 316,011 | |
SEE NOTES TO FINANCIAL STATEMENTS.
A66
| | | | | | |
| | | FLEXIBLE MANAGED PORTFOLIO (continued) | | |
| |
| SCHEDULE OF INVESTMENTS | | December 31, 2014 |
| | | | | | | | |
COMMON STOCKS
(continued) | | Shares
| | | Value
(Note 2)
| |
Insurance (continued) | |
Insurance Australia Group Ltd. (Australia) | | | 24,982 | | | $ | 126,847 | |
Legal & General Group PLC
(United Kingdom) | | | 243,947 | | | | 941,918 | |
Lincoln National Corp. | | | 17,400 | | | | 1,003,458 | |
MetLife, Inc. | | | 118,500 | | | | 6,409,665 | |
NN Group NV (Netherlands)* | | | 8,274 | | | | 247,008 | |
PartnerRe Ltd. | | | 20,100 | | | | 2,294,013 | |
Prudential PLC (United Kingdom) | | | 27,111 | | | | 626,793 | |
Suncorp Group Ltd. (Australia) | | | 66,408 | | | | 758,631 | |
Swiss Life Holding AG (Switzerland) | | | 3,295 | | | | 778,779 | |
Swiss Re AG (Switzerland) | | | 2,399 | | | | 200,968 | |
Tokio Marine Holdings, Inc. (Japan) | | | 1,900 | | | | 61,708 | |
UnipolSai SpA (Italy) | | | 32,183 | | | | 86,648 | |
Unum Group | | | 345,300 | | | | 12,044,064 | |
| | | | | | |
|
|
|
| | | | | | | | 70,656,237 | |
| | | | | | |
|
|
|
Internet & Catalog Retail — 0.3% | |
Priceline Group, Inc. (The)* | | | 6,100 | | | | 6,955,281 | |
TripAdvisor, Inc.*(a) | | | 64,900 | | | | 4,845,434 | |
| | | | | | |
|
|
|
| | | | | | | | 11,800,715 | |
| | | | | | |
|
|
|
Internet Software & Services — 1.6% | |
Akamai Technologies, Inc.* | | | 18,400 | | | | 1,158,464 | |
Facebook, Inc. (Class A Stock)* | | | 62,300 | | | | 4,860,646 | |
Google, Inc. (Class A Stock)* | | | 43,600 | | | | 23,136,776 | |
Google, Inc. (Class C Stock)* | | | 65,700 | | | | 34,584,480 | |
Mixi, Inc. (Japan) | | | 400 | | | | 14,748 | |
United Internet AG (Germany) | | | 1,291 | | | | 58,153 | |
| | | | | | |
|
|
|
| | | | | | | | 63,813,267 | |
| | | | | | |
|
|
|
IT Services — 2.0% | |
Broadridge Financial Solutions, Inc. | | | 124,400 | | | | 5,744,792 | |
Cap Gemini SA (France) | | | 11,638 | | | | 832,319 | |
Cognizant Technology Solutions Corp. (Class A Stock)* | | | 330,500 | | | | 17,404,130 | |
Computer Sciences Corp. | | | 20,600 | | | | 1,298,830 | |
DST Systems, Inc. | | | 68,300 | | | | 6,430,445 | |
Fiserv, Inc.* | | | 161,100 | | | | 11,433,267 | |
Fujitsu Ltd. (Japan) | | | 20,000 | | | | 106,633 | |
iGATE Corp.* | | | 27,700 | | | | 1,093,596 | |
International Business Machines Corp. | | | 84,100 | | | | 13,493,004 | |
MasterCard, Inc. (Class A Stock) | | | 112,500 | | | | 9,693,000 | |
Nomura Research Institute Ltd. (Japan) | | | 1,200 | | | | 36,702 | |
Syntel, Inc.* | | | 49,400 | | | | 2,222,012 | |
Visa, Inc. (Class A Stock) | | | 35,200 | | | | 9,229,440 | |
| | | | | | |
|
|
|
| | | | | | | | 79,018,170 | |
| | | | | | |
|
|
|
Leisure Products — 0.2% | |
Namco Bandai Holdings, Inc. (Japan) | | | 16,800 | | | | 355,678 | |
Polaris Industries, Inc. | | | 36,900 | | | | 5,580,756 | |
Sankyo Co. Ltd. (Japan) | | | 500 | | | | 17,152 | |
Shimano, Inc. (Japan) | | | 800 | | | | 103,617 | |
| | | | | | |
|
|
|
| | | | | | | | 6,057,203 | |
| | | | | | |
|
|
|
| | | | | | | | |
COMMON STOCKS
(continued) | | Shares
| | | Value
(Note 2)
| |
Life Sciences Tools & Services | |
QIAGEN NV* | | | 2,456 | | | $ | 57,208 | |
| | | | | | |
|
|
|
Machinery — 1.2% | |
Amada Co. Ltd. (Japan) | | | 3,800 | | | | 32,561 | |
Atlas Copco AB (Sweden)
(Class B Stock) | | | 4,036 | | | | 103,313 | |
Cummins, Inc. | | | 25,800 | | | | 3,719,586 | |
Dover Corp. | | | 79,800 | | | | 5,723,256 | |
FANUC Corp. (Japan) | | | 2,100 | | | | 346,249 | |
IHI Corp. (Japan) | | | 10,000 | | | | 50,645 | |
Illinois Tool Works, Inc. | | | 107,700 | | | | 10,199,190 | |
Kone OYJ (Class B Stock) (Finland) | | | 20,242 | | | | 921,575 | |
Kubota Corp. (Japan) | | | 12,000 | | | | 174,177 | |
Lincoln Electric Holdings, Inc. | | | 40,600 | | | | 2,805,054 | |
MAN SE (Germany) | | | 372 | | | | 41,429 | |
Minebea Co. Ltd. (Japan) | | | 3,000 | | | | 44,304 | |
NSK Ltd. (Japan) | | | 12,000 | | | | 141,681 | |
Oshkosh Corp. | | | 106,200 | | | | 5,166,630 | |
Parker Hannifin Corp. | | | 106,900 | | | | 13,784,755 | |
Sumitomo Heavy Industries Ltd. (Japan) | | | 39,000 | | | | 209,780 | |
THK Co. Ltd. (Japan) | | | 1,200 | | | | 28,838 | |
Timken Co. (The) | | | 92,100 | | | | 3,930,828 | |
Vallourec SA (France) | | | 5,452 | | | | 147,759 | |
Wartsila OYJ Abp (Finland) | | | 3,164 | | | | 141,615 | |
Yangzijiang Shipbuilding Holdings Ltd. (China) | | | 307,000 | | | | 278,208 | |
| | | | | | |
|
|
|
| | | | | | | | 47,991,433 | |
| | | | | | |
|
|
|
Marine | |
A.P. Moeller – Maersk A/S (Denmark) (Class A Stock) | | | 41 | | | | 78,458 | |
A.P. Moeller – Maersk A/S (Denmark) (Class B Stock) | | | 337 | | | | 670,277 | |
Kuehne + Nagel International AG (Switzerland) | | | 2,071 | | | | 281,315 | |
Mitsui OSK Lines Ltd. (Japan) | | | 11,000 | | | | 32,590 | |
Nippon Yusen K.K. (Japan) | | | 17,000 | | | | 48,017 | |
| | | | | | |
|
|
|
| | | | | | | | 1,110,657 | |
| | | | | | |
|
|
|
Media — 2.0% | |
Altice SA (Luxembourg)* | | | 922 | | | | 72,809 | |
Comcast Corp. (Class A Stock) | | | 451,473 | | | | 26,189,949 | |
Dentsu, Inc. (Japan) | | | 2,300 | | | | 96,695 | |
DIRECTV* | | | 187,800 | | | | 16,282,260 | |
Discovery Communications, Inc.
(Class C Stock)* | | | 230,200 | | | | 7,762,344 | |
Hakuhodo DY Holdings, Inc. (Japan) | | | 2,400 | | | | 22,968 | |
Lagardere SCA (France) | | | 1,236 | | | | 32,188 | |
Publicis Groupe SA (France) | | | 5,001 | | | | 358,649 | |
Reed Elsevier PLC
(United Kingdom) | | | 12,188 | | | | 208,196 | |
RTL Group SA (Germany) | | | 397 | | | | 37,856 | |
Sky PLC (United Kingdom) | | | 10,982 | | | | 153,269 | |
Thomson Reuters Corp. | | | 34,700 | | | | 1,399,798 | |
Walt Disney Co. (The) | | | 269,300 | | | | 25,365,367 | |
Wolters Kluwer NV (Netherlands) | | | 5,359 | | | | 163,531 | |
| | | | | | |
|
|
|
| | | | | | | | 78,145,879 | |
| | | | | | |
|
|
|
SEE NOTES TO FINANCIAL STATEMENTS.
A67
| | | | | | |
| | | FLEXIBLE MANAGED PORTFOLIO (continued) | | |
| |
| SCHEDULE OF INVESTMENTS | | December 31, 2014 |
| | | | | | | | |
COMMON STOCKS
(continued) | | Shares
| | | Value
(Note 2)
| |
Metals & Mining — 0.5% | |
Antofagasta PLC (United Kingdom) | | | 54,958 | | | $ | 640,370 | |
BHP Billiton Ltd. (Australia) | | | 46,427 | | | | 1,097,657 | |
BHP Billiton PLC (Australia) | | | 31,175 | | | | 668,123 | |
Century Aluminum Co.* | | | 39,100 | | | | 954,040 | |
Fortescue Metals Group Ltd. (Australia)(a) | | | 200,628 | | | | 440,507 | |
Freeport-McMoRan, Inc. | | | 285,200 | | | | 6,662,272 | |
JFE Holdings, Inc. (Japan) | | | 3,100 | | | | 69,133 | |
Kobe Steel Ltd. (Japan) | | | 339,000 | | | | 583,927 | |
Mitsubishi Materials Corp. (Japan) | | | 11,000 | | | | 36,492 | |
Nippon Steel & Sumitomo Metal Corp. (Japan) | | | 80,000 | | | | 198,451 | |
Rio Tinto PLC (United Kingdom) | | | 5,358 | | | | 246,988 | |
Southern Copper Corp. | | | 240,800 | | | | 6,790,560 | |
Sumitomo Metal Mining Co. Ltd. (Japan) | | | 58,000 | | | | 865,064 | |
Voestalpine AG (Austria) | | | 18,095 | | | | 714,991 | |
Worthington Industries, Inc. | | | 40,200 | | | | 1,209,618 | |
| | | | | | |
|
|
|
| | | | | | | | 21,178,193 | |
| | | | | | |
|
|
|
Multi-Utilities — 0.6% | |
AGL Energy Ltd. (Australia) | | | 6,971 | | | | 76,033 | |
Centrica PLC (United Kingdom) | | | 51,880 | | | | 224,715 | |
Consolidated Edison, Inc. | | | 43,800 | | | | 2,891,238 | |
E.ON SE (Germany) | | | 18,473 | | | | 315,736 | |
National Grid PLC (United Kingdom) | | | 88,696 | | | | 1,258,536 | |
Public Service Enterprise Group, Inc. | | | 355,900 | | | | 14,737,819 | |
SCANA Corp. | | | 48,700 | | | | 2,941,480 | |
| | | | | | |
|
|
|
| | | | | | | | 22,445,557 | |
| | | | | | |
|
|
|
Multiline Retail — 0.2% | |
Big Lots, Inc.(a) | | | 57,900 | | | | 2,317,158 | |
Dollar Tree, Inc.* | | | 96,000 | | | | 6,756,480 | |
Takashimaya Co. Ltd. (Japan) | | | 3,000 | | | | 23,954 | |
| | | | | | |
|
|
|
| | | | | | | | 9,097,592 | |
| | | | | | |
|
|
|
Oil, Gas & Consumable Fuels — 4.4% | |
Anadarko Petroleum Corp. | | | 202,100 | | | | 16,673,250 | |
Apache Corp. | | | 95,700 | | | | 5,997,519 | |
BP PLC (United Kingdom) | | | 191,288 | | | | 1,214,217 | |
California Resources Corp.* | | | 59,840 | | | | 329,719 | |
Chevron Corp. | | | 180,956 | | | | 20,299,644 | |
ConocoPhillips(a) | | | 225,734 | | | | 15,589,190 | |
Continental Resources, Inc.*(a) | | | 60,200 | | | | 2,309,272 | |
Devon Energy Corp. | | | 41,000 | | | | 2,509,610 | |
Eni SpA (Italy) | | | 32,382 | | | | 567,221 | |
EQT Corp. | | | 48,700 | | | | 3,686,590 | |
Exxon Mobil Corp. | | | 575,116 | | | | 53,169,474 | |
ONEOK, Inc. | | | 120,700 | | | | 6,009,653 | |
Phillips 66 | | | 265,600 | | | | 19,043,520 | |
Royal Dutch Shell PLC (Netherlands) (Class A Stock) | | | 61,506 | | | | 2,052,637 | |
Royal Dutch Shell PLC (Netherlands) (Class B Stock) | | | 39,136 | | | | 1,352,193 | |
Showa Shell Sekiyu K.K. (Japan) | | | 2,000 | | | | 19,701 | |
SM Energy Co. | | | 39,400 | | | | 1,520,052 | |
| | | | | | | | |
COMMON STOCKS
(continued) | | Shares
| | | Value
(Note 2)
| |
Oil, Gas & Consumable Fuels (continued) | |
Statoil ASA (Norway) | | | 29,923 | | | $ | 526,849 | |
Targa Resources Corp. | | | 10,700 | | | | 1,134,735 | |
Total SA (France) | | | 33,527 | | | | 1,717,660 | |
Valero Energy Corp. | | | 344,900 | | | | 17,072,550 | |
Western Refining, Inc. | | | 38,800 | | | | 1,465,864 | |
Woodside Petroleum Ltd. (Australia) | | | 7,835 | | | | 242,316 | |
| | | | | | |
|
|
|
| | | | | | | | 174,503,436 | |
| | | | | | |
|
|
|
Paper & Forest Products | |
UPM-Kymmene OYJ (Finland) | | | 31,584 | | | | 517,605 | |
| | | | | | |
|
|
|
Personal Products | |
Avon Products, Inc. | | | 181,800 | | | | 1,707,102 | |
| | | | | | |
|
|
|
Pharmaceuticals — 4.6% | |
AbbVie, Inc. | | | 376,400 | | | | 24,631,616 | |
Allergan, Inc. | | | 41,700 | | | | 8,865,003 | |
AstraZeneca PLC (United Kingdom) | | | 13,228 | | | | 934,305 | |
Bayer AG (Germany) | | | 6,588 | | | | 898,002 | |
Bristol-Myers Squibb Co. | | | 402,500 | | | | 23,759,575 | |
Eli Lilly & Co. | | | 62,900 | | | | 4,339,471 | |
GlaxoSmithKline PLC (United Kingdom) | | | 79,961 | | | | 1,715,454 | |
Johnson & Johnson | | | 273,098 | | | | 28,557,858 | |
Merck & Co., Inc. | | | 517,800 | | | | 29,405,862 | |
Merck KGaA (Germany) | | | 2,282 | | | | 214,756 | |
Mylan, Inc.* | | | 111,200 | | | | 6,268,344 | |
Novartis AG (Switzerland) | | | 32,251 | | | | 2,991,070 | |
Novo Nordisk A/S (Denmark)
(Class B Stock) | | | 4,080 | | | | 172,583 | |
Otsuka Holdings Co. Ltd. (Japan) | | | 28,100 | | | | 842,472 | |
Pfizer, Inc. | | | 1,339,397 | | | | 41,722,217 | |
Roche Holding AG (Switzerland) | | | 9,700 | | | | 2,628,140 | |
Sanofi (France) | | | 9,630 | | | | 877,974 | |
Shire PLC (Ireland) | | | 2,088 | | | | 148,040 | |
Teva Pharmaceutical Industries Ltd. (Israel) | | | 22,458 | | | | 1,287,402 | |
| | | | | | |
|
|
|
| | | | | | | | 180,260,144 | |
| | | | | | |
|
|
|
Professional Services | |
Capita PLC (United Kingdom) | | | 7,028 | | | | 117,844 | |
| | | | | | |
|
|
|
Real Estate Investment Trusts (REITs) — 1.1% | |
American Capital Agency Corp. | | | 300,000 | | | | 6,549,000 | |
Annaly Capital Management, Inc. | | | 1,110,100 | | | | 12,000,181 | |
CapitaCommercial Trust (Singapore) | | | 21,000 | | | | 27,725 | |
CapitaMall Trust (Singapore) | | | 25,000 | | | | 38,384 | |
Chambers Street Properties(a) | | | 249,900 | | | | 2,014,194 | |
Federation Centres Ltd. (Australia) | | | 316,717 | | | | 737,401 | |
Fonciere Des Regions (France) | | | 298 | | | | 27,543 | |
Franklin Street Properties Corp. | | | 89,800 | | | | 1,101,846 | |
GPT Group (Australia) | | | 17,850 | | | | 63,172 | |
Hospitality Properties Trust | | | 201,500 | | | | 6,246,500 | |
Intu Properties PLC (United Kingdom) | | | 144,554 | | | | 747,337 | |
Invesco Mortgage Capital, Inc. | | | 198,000 | | | | 3,061,080 | |
Land Securities Group PLC (United Kingdom) | | | 8,020 | | | | 144,165 | |
SEE NOTES TO FINANCIAL STATEMENTS.
A68
| | | | | | |
| | | FLEXIBLE MANAGED PORTFOLIO (continued) | | |
| |
| SCHEDULE OF INVESTMENTS | | December 31, 2014 |
| | | | | | | | |
COMMON STOCKS
(continued) | | Shares
| | | Value
(Note 2)
| |
Real Estate Investment Trusts (REITs) (continued) | |
Link REIT (The) (Hong Kong) | | | 161,000 | | | $ | 1,007,982 | |
Prologis, Inc. | | | 183,400 | | | | 7,891,702 | |
Resource Capital Corp. | | | 186,300 | | | | 938,952 | |
Simon Property Group, Inc. | | | 11,900 | | | | 2,167,109 | |
| | | | | | |
|
|
|
| | | | | | | | 44,764,273 | |
| | | | | | |
|
|
|
Real Estate Management & Development — 0.6% | |
CBRE Group, Inc.
(Class A Stock)* | | | 371,800 | | | | 12,734,150 | |
Cheung Kong Holdings Ltd. (Hong Kong) | | | 37,000 | | | | 619,632 | |
Deutsche Wohnen AG (Germany) | | | 21,280 | | | | 501,991 | |
Henderson Land Development Co. Ltd. (Hong Kong) | | | 73,100 | | | | 508,065 | |
Hysan Development Co. Ltd. (Hong Kong) | | | 152,000 | | | | 674,577 | |
Jones Lang LaSalle, Inc. | | | 57,700 | | | | 8,650,961 | |
Kerry Properties Ltd. (Hong Kong) | | | 7,000 | | | | 25,252 | |
Lend Lease Group (Australia) | | | 5,666 | | | | 75,465 | |
New World Development Co. Ltd. (Hong Kong) | | | 342,000 | | | | 392,619 | |
Swire Pacific Ltd. (Hong Kong) (Class A Stock) | | | 6,500 | | | | 84,373 | |
Swire Properties Ltd. (Hong Kong) | | | 12,400 | | | | 36,486 | |
Swiss Prime Site AG (Switzerland) | | | 605 | | | | 44,423 | |
| | | | | | |
|
|
|
| | | | | | | | 24,347,994 | |
| | | | | | |
|
|
|
Road & Rail — 1.2% | |
Asciano Ltd. (Australia) | | | 10,266 | | | | 50,275 | |
Aurizon Holdings Ltd. (Australia) | | | 20,678 | | | | 77,383 | |
Central Japan Railway Co. (Japan) | | | 1,500 | | | | 224,815 | |
ComfortDelGro Corp. Ltd. (Singapore) | | | 21,000 | | | | 41,095 | |
CSX Corp. | | | 141,400 | | | | 5,122,922 | |
Hankyu Hanshin Holdings, Inc. (Japan) | | | 12,000 | | | | 64,369 | |
MTR Corp. Ltd. (Hong Kong) | | | 14,500 | | | | 59,323 | |
Norfolk Southern Corp. | | | 138,100 | | | | 15,137,141 | |
Union Pacific Corp. | | | 233,000 | | | | 27,757,290 | |
West Japan Railway Co. (Japan) | | | 1,700 | | | | 80,373 | |
| | | | | | |
|
|
|
| | | | | | | | 48,614,986 | |
| | | | | | |
|
|
|
Semiconductors & Semiconductor Equipment — 2.1% | |
ASM Pacific Technology Ltd.
(Hong Kong) | | | 2,500 | | | | 23,804 | |
Broadcom Corp. (Class A Stock) | | | 119,500 | | | | 5,177,935 | |
Infineon Technologies AG (Germany) | | | 27,184 | | | | 287,658 | |
Integrated Device Technology, Inc.* | | | 117,300 | | | | 2,299,080 | |
Intel Corp. | | | 1,165,400 | | | | 42,292,366 | |
Rohm Co. Ltd. (Japan) | | | 1,000 | | | | 60,253 | |
Skyworks Solutions, Inc. | | | 161,600 | | | | 11,749,936 | |
Texas Instruments, Inc. | | | 415,700 | | | | 22,225,400 | |
| | | | | | |
|
|
|
| | | | | | | | 84,116,432 | |
| | | | | | |
|
|
|
Software — 3.1% | |
Manhattan Associates, Inc.* | | | 59,900 | | | | 2,439,128 | |
| | | | | | | | |
COMMON STOCKS
(continued) | | Shares
| | | Value
(Note 2)
| |
Software (continued) | |
Microsoft Corp. | | | 1,386,100 | | | $ | 64,384,345 | |
Nexon Co. Ltd. (Japan) | | | 17,700 | | | | 165,001 | |
Oracle Corp. | | | 796,400 | | | | 35,814,108 | |
Solera Holdings, Inc. | | | 28,700 | | | | 1,468,866 | |
Symantec Corp. | | | 555,400 | | | | 14,248,787 | |
Synopsys, Inc.* | | | 47,900 | | | | 2,082,213 | |
| | | | | | |
|
|
|
| | | | | | | | 120,602,448 | |
| | | | | | |
|
|
|
Specialty Retail — 2.1% | |
ABC-Mart, Inc. (Japan) | | | 300 | | | | 14,517 | |
Dixons Carphone PLC (United Kingdom) | | | 115,538 | | | | 832,680 | |
DSW, Inc. (Class A Stock) | | | 58,700 | | | | 2,189,510 | |
Finish Line, Inc. (The)
(Class A Stock) | | | 32,800 | | | | 797,368 | |
Gap, Inc. (The) | | | 359,000 | | | | 15,117,490 | |
Hennes & Mauritz AB
(Class B Stock) (Sweden) | | | 10,100 | | | | 419,605 | |
Home Depot, Inc. (The) | | | 160,000 | | | | 16,795,200 | |
Lowe’s Cos., Inc. | | | 262,800 | | | | 18,080,640 | |
Nitori Holdings Co. Ltd. (Japan) | | | 700 | | | | 37,610 | |
Ross Stores, Inc. | | | 187,500 | | | | 17,673,750 | |
TJX Cos., Inc. (The) | | | 168,500 | | | | 11,555,730 | |
| | | | | | |
|
|
|
| | | | | | | | 83,514,100 | |
| | | | | | |
|
|
|
Technology Hardware, Storage & Peripherals — 2.9% | |
Apple, Inc. | | | 716,500 | | | | 79,087,270 | |
Brother Industries Ltd. (Japan) | | | 28,300 | | | | 513,004 | |
EMC Corp. | | | 159,400 | | | | 4,740,556 | |
FUJIFILM Holdings Corp. (Japan) | | | 11,300 | | | | 344,803 | |
Hewlett-Packard Co. | | | 741,900 | | | | 29,772,447 | |
NEC Corp. (Japan) | | | 28,000 | | | | 81,368 | |
Nokia OYJ (Finland) | | | 16,587 | | | | 131,184 | |
Ricoh Co. Ltd. (Japan) | | | 7,500 | | | | 75,818 | |
Seiko Epson Corp. (Japan) | | | 22,100 | | | | 924,757 | |
| | | | | | |
|
|
|
| | | | | | | | 115,671,207 | |
| | | | | | |
|
|
|
Textiles, Apparel & Luxury Goods — 0.6% | |
Luxottica Group SpA (Italy) | | | 1,775 | | | | 97,303 | |
Michael Kors Holdings Ltd.* | | | 207,400 | | | | 15,575,740 | |
NIKE, Inc. (Class B Stock) | | | 46,400 | | | | 4,461,360 | |
Pandora A/S (Denmark) | | | 10,759 | | | | 872,094 | |
Steven Madden Ltd.* | | | 47,900 | | | | 1,524,657 | |
Swatch Group AG (The) (Switzerland) | | | 438 | | | | 37,888 | |
| | | | | | |
|
|
|
| | | | | | | | 22,569,042 | |
| | | | | | |
|
|
|
Tobacco — 0.9% | |
Altria Group, Inc. | | | 218,600 | | | | 10,770,422 | |
British American Tobacco PLC
(United Kingdom) | | | 19,617 | | | | 1,063,066 | |
Imperial Tobacco Group PLC
(United Kingdom) | | | 25,924 | | | | 1,141,163 | |
Japan Tobacco, Inc. (Japan) | | | 32,100 | | | | 883,482 | |
Philip Morris International, Inc. | | | 247,800 | | | | 20,183,310 | |
| | | | | | |
|
|
|
| | | | | | | | 34,041,443 | |
| | | | | | |
|
|
|
Trading Companies & Distributors — 0.2% | |
Bunzl PLC (United Kingdom) | | | 3,549 | | | | 97,020 | |
ITOCHU Corp. (Japan) | | | 15,800 | | | | 168,667 | |
SEE NOTES TO FINANCIAL STATEMENTS.
A69
| | | | | | |
| | | FLEXIBLE MANAGED PORTFOLIO (continued) | | |
| |
| SCHEDULE OF INVESTMENTS | | December 31, 2014 |
| | | | | | | | |
COMMON STOCKS
(continued) | | Shares
| | | Value
(Note 2)
| |
Trading Companies & Distributors (continued) | |
Marubeni Corp. (Japan) | | | 17,000 | | | $ | 101,718 | |
Mitsubishi Corp. (Japan) | | | 45,200 | | | | 827,166 | |
Mitsui & Co. Ltd. (Japan) | | | 18,300 | | | | 245,094 | |
MRC Global, Inc.* | | | 137,100 | | | | 2,077,065 | |
Sumitomo Corp. (Japan) | | | 57,100 | | | | 586,456 | |
United Rentals, Inc.* | | | 33,300 | | | | 3,396,933 | |
Wolseley PLC (United Kingdom) | | | 1,340 | | | | 76,610 | |
| | | | | | |
|
|
|
| | | | | | | | 7,576,729 | |
| | | | | | |
|
|
|
Transportation Infrastructure | |
Hutchison Port Holdings Trust (Singapore) | | | 61,000 | | | | 42,090 | |
Kamigumi Co. Ltd. (Japan) | | | 2,000 | | | | 17,816 | |
| | | | | | |
|
|
|
| | | | | | | | 59,906 | |
| | | | | | |
|
|
|
Water Utilities | |
Severn Trent PLC (United Kingdom) | | | 21,263 | | | | 663,178 | |
| | | | | | |
|
|
|
Wireless Telecommunication Services | |
KDDI Corp. (Japan) | | | 6,200 | | | | 389,509 | |
Millicom International Cellular SA, (Luxembourg), SDR | | | 681 | | | | 50,459 | |
| | | | | | | | |
COMMON STOCKS
(continued) | | Shares
| | | Value
(Note 2)
| |
Wireless Telecommunication Services (continued) | |
Vodafone Group PLC
(United Kingdom) | | | 282,414 | | | $ | 968,294 | |
| | | | | | |
|
|
|
| | | | | | | | 1,408,262 | |
| | | | | | |
|
|
|
TOTAL COMMON STOCKS
(cost $2,120,222,134) | | | | 2,744,382,608 | |
| | | | | | |
|
|
|
| EXCHANGE TRADED FUND — 0.1% | |
iShares MSCI EAFE Index Fund(a) (cost $1,507,469) | | | 25,300 | | | | 1,539,252 | |
| | | | | | |
|
|
|
| PREFERRED STOCKS | | | | | | | | |
Automobiles | | | | | | | | |
Bayerische Motoren Werke AG (Germany) (PRFC) | | | 548 | | | | 44,772 | |
Volkswagen AG (Germany) (PRFC) | | | 2,540 | | | | 564,530 | |
| | | | | | |
|
|
|
| | | | | | | | 609,302 | |
| | | | | | |
|
|
|
Banks | | | | | |
Citigroup Capital XIII, 7.875%, (Capital Security, fixed to floating preferred)(b) | | | 22,000 | | | | 584,760 | |
| | | | | | |
|
|
|
TOTAL PREFERRED STOCKS
(cost $1,184,178) | | | | 1,194,062 | |
| | | | | | |
|
|
|
| | | | | | | | | | | | | | |
| ASSET-BACKED SECURITIES — 1.7% | | Interest
Rate
| | | Maturity
Date
| | Principal
Amount
(000)#
| | | | |
Collateralized Debt Obligation | | | | | | | | | | | | | | |
Cent CDO XI Ltd. (Cayman Islands), Series 2006-11A, Class A1, 144A | | | 0.494% | (b) | | 04/25/19 | | | 465 | | | | 461,180 | |
| | | | | | | | | | | | |
|
|
|
Collateralized Loan Obligations — 1.5% | | | | | | | | | | | | | | |
ACAS CLO Ltd. (Cayman Islands), Series 2013-1A, Class A, 144A | | | 1.411% | (b) | | 04/20/25 | | | 2,550 | | | | 2,506,819 | |
ACAS CLO Ltd. (Cayman Islands), Series 2013-1A, Class B2, 144A | | | 3.360% | | | 04/20/25 | | | 500 | | | | 483,052 | |
American Express Credit Account Secured Note Trust, Series 2012-4,
Class C, 144A | | | 0.961% | (b) | | 05/15/20 | | | 3,900 | | | | 3,921,961 | |
Anchorage Capital CLO Ltd. (Cayman Islands), Series 2013-1A,
Class A1, 144A | | | 1.419% | (b) | | 07/13/25 | | | 2,700 | | | | 2,653,309 | |
Anchorage Capital CLO Ltd. (Cayman Islands), Series 2014-3A,
Class A1, 144A | | | 1.766% | (b) | | 04/28/26 | | | 1,500 | | | | 1,488,862 | |
Anchorage Capital CLO Ltd. (Cayman Islands), Series 2014-5A,
Class A, 144A | | | 1.833% | (b) | | 10/15/26 | | | 2,500 | | | | 2,491,734 | |
Atlas Senior Loan Fund Ltd. (Cayman Islands), Series 2014-6A,
Class A, 144A | | | 1.796% | (b) | | 10/15/26 | | | 750 | | | | 745,311 | |
Battalion CLO VII Ltd. (Cayman Islands), Series 2014-7A, Class A1, 144A | | | 1.800% | (b) | | 10/17/26 | | | 250 | | | | 249,135 | |
Benefit Street Partners CLO II Ltd. (Cayman Islands), Series 2013-IIA,
Class A1, 144A | | | 1.431% | (b) | | 07/15/24 | | | 1,200 | | | | 1,179,382 | |
Brookside Mill CLO Ltd. (Cayman Islands), Series 2013-1A, Class A1, 144A | | | 1.378% | (b) | | 04/17/25 | | | 2,100 | | | | 2,062,255 | |
Catamaran CLO Ltd. (Cayman Islands), Series 2014-1A, Class A1, 144A | | | 1.781% | (b) | | 04/20/26 | | | 2,200 | | | | 2,189,037 | |
Catamaran CLO Ltd. (Cayman Islands), Series 2014-1A, Class A2, 144A | | | 2.031% | (b) | | 04/20/26 | | | 450 | | | | 431,691 | |
Catamaran CLO Ltd. (Cayman Islands), Series 2014-2A, Class A1, 144A | | | 1.780% | (b) | | 10/18/26 | | | 500 | | | | 496,143 | |
Flagship VII Ltd. (Cayman Islands), Series 2013-7A, Class A1, 144A | | | 1.701% | (b) | | 01/20/26 | | | 2,300 | | | | 2,280,781 | |
Four Corners CLO III Ltd. (Cayman Islands), Series 2006-3A, Class A, 144A | | | 0.482% | (b) | | 07/22/20 | | | 393 | | | | 390,393 | |
Fraser Sullivan CLO I Ltd. (Cayman Islands), Series 2006-1A, Class B, 144A | | | 0.711% | (b) | | 03/15/20 | | | 1,000 | | | | 995,796 | |
Galaxy XVIII CLO Ltd. (Cayman Islands), Series 2014-18A, Class A, 144A | | | 1.704% | (b) | | 10/15/26 | | | 1,250 | | | | 1,238,048 | |
GE Capital Credit Card Master Note Trust, Series 2012-4, Class B | | | 1.011% | (b) | | 06/15/18 | | | 5,500 | | | | 5,501,777 | |
ICG U.S. CLO Ltd. (Cayman Islands), Series 2014-3A, Class A1B, 144A | | | 3.320% | | | 01/25/27 | | | 1,000 | | | | 984,100 | |
ING IM CLO Ltd. (Cayman Islands), Series 2013-1A, Class A1, 144A | | | 1.371% | (b) | | 04/15/24 | | | 1,850 | | | | 1,816,709 | |
SEE NOTES TO FINANCIAL STATEMENTS.
A70
| | | | | | |
| | | FLEXIBLE MANAGED PORTFOLIO (continued) | | |
| |
| SCHEDULE OF INVESTMENTS | | December 31, 2014 |
| | | | | | | | | | | | | | |
ASSET-BACKED SECURITIES
(continued) | | Interest
Rate
| | | Maturity
Date
| | Principal
Amount
(000)#
| | | Value
(Note 2)
| |
Collateralized Loan Obligations (continued) | | | | | | | | | | | | | | |
KVK CLO Ltd. (Cayman Islands), Series 2014-1A, Class A1, 144A | | | 1.822% | (b) | | 05/15/26 | | | 300 | | | $ | 298,941 | |
Magnetite CLO Ltd. (Cayman Islands), Series 2014-9A, Class A1, 144A | | | 1.700% | (b) | | 07/25/26 | | | 3,750 | | | | 3,706,288 | |
Magnetite VIII Ltd. (Cayman Islands), Series 2014-8A, Class A, 144A | | | 1.711% | (b) | | 04/15/26 | | | 2,300 | | | | 2,280,932 | |
Magnetite XI Ltd. (Cayman Islands), Series 2014-11A, Class A1, 144A | | | 1.685% | (b) | | 01/18/27 | | | 500 | | | | 494,517 | |
Marine Park CLO Ltd. (Cayman Islands), Series 2012-1A, Class A1A, 144A | | | 1.702% | (b) | | 05/18/23 | | | 600 | | | | 597,787 | |
Mayport CLO Ltd. (Cayman Islands), Series 2006-1A, Class A1L, 144A | | | 0.483% | (b) | | 02/22/20 | | | 2 | | | | 1,784 | |
OZLM Funding IV Ltd. (Cayman Islands), Series 2013-4A, Class A1, 144A | | | 1.382% | (b) | | 07/22/25 | | | 1,200 | | | | 1,177,034 | |
Seneca Park CLO Ltd. (Cayman Islands), Series 2014-1A, Class A, 144A | | | 1.704% | (b) | | 07/17/26 | | | 800 | | | | 797,810 | |
Seneca Park CLO Ltd. (Cayman Islands), Series 2014-1A, Class B2, 144A | | | 4.350% | | | 07/17/26 | | | 500 | | | | 503,092 | |
Sheridan Square CLO Ltd. (Cayman Islands), Series 2013-1A,
Class A1, 144A | | | 1.281% | (b) | | 04/15/25 | | | 3,200 | | | | 3,132,525 | |
Slater Mill Loan Fund LP (Cayman Islands), Series 2012-1A, Class B, 144A | | | 2.882% | (b) | | 08/17/22 | | | 500 | | | | 501,395 | |
Sound Point CLO Ltd. (Cayman Islands), Series 2012-1A, Class B, 144A | | | 2.931% | (b) | | 10/20/23 | | | 1,100 | | | | 1,104,383 | |
SVO VOI Mortgage LLC, Series 2012-AA, Class A, 144A | | | 2.000% | | | 09/20/29 | | | 1,155 | | | | 1,148,844 | |
THL Credit Wind River CLO Ltd. (Cayman Islands), Series 2014-3A,
Class A, 144A | | | 1.863% | (b) | | 01/22/27 | | | 2,250 | | | | 2,241,000 | |
Tyron Park CLO Ltd. (Cayman Islands), Series 2013-1A, Class A1, 144A | | | 1.351% | (b) | | 07/15/25 | | | 2,700 | | | | 2,645,346 | |
Washington Mill CLO Ltd. (Cayman Islands), Series 2014-1A,
Class A1, 144A | | | 1.731% | (b) | | 04/20/26 | | | 1,850 | | | | 1,836,109 | |
Washington Mill CLO Ltd. (Cayman Islands), Series 2014-1A,
Class B2, 144A | | | 4.250% | | | 04/20/26 | | | 500 | | | | 503,086 | |
| | | | | | | | | | | | |
|
|
|
| | | | | | | | | | | | | | 57,077,168 | |
| | | | | | | | | | | | |
|
|
|
Non-Residential Mortgage-Backed Securities — 0.1% | | | | | | | | | | | | | | |
Ford Credit Auto Owner Trust, Series 2014-REV1, Class A, 144A | | | 2.260% | | | 11/15/25 | | | 2,000 | | | | 2,010,676 | |
Ford Credit Auto Owner Trust, Series 2014-REV2, Class A, 144A | | | 2.310% | | | 04/15/26 | | | 3,200 | | | | 3,208,243 | |
| | | | | | | | | | | | |
|
|
|
| | | | | | | | | | | | | | 5,218,919 | |
| | | | | | | | | | | | |
|
|
|
Residential Mortgage-Backed Securities — 0.1% | | | | | | | | | | | | | | |
CDC Mortgage Capital Trust, Series 2002-HE3, Class M1 | | | 1.820% | (b) | | 03/25/33 | | | 244 | | | | 230,657 | |
Credit-Based Asset Servicing & Securitization LLC, Series 2005-CB6,
Class A3 | | | 4.123% | (b) | | 07/25/35 | | | 302 | | | | 292,745 | |
Equity One Mortgage Pass-Through Trust, Series 2004-3, Class M1 | | | 5.037% | (b) | | 07/25/34 | | | 355 | | | | 339,430 | |
GSAMP Trust, Series 2004-HE2, Class A3C | | | 1.330% | (b) | | 09/25/34 | | | 674 | | | | 655,953 | |
Long Beach Mortgage Loan Trust, Series 2004-2, Class M1 | | | 0.965% | (b) | | 06/25/34 | | | 657 | | | | 633,573 | |
Morgan Stanley ABS Capital I, Inc. Trust, Series 2003-HE1, Class M1 | | | 1.370% | (b) | | 05/25/33 | | | 401 | | | | 376,150 | |
Morgan Stanley ABS Capital I, Inc. Trust, Series 2004-HE5, Class M1 | | | 1.115% | (b) | | 06/25/34 | | | 884 | | | | 829,318 | |
Morgan Stanley ABS Capital I, Inc. Trust, Series 2004-NC1, Class M1 | | | 1.220% | (b) | | 12/27/33 | | | 748 | | | | 722,104 | |
Morgan Stanley Dean Witter Capital I, Inc. Trust, Series 2002-HE1,
Class M1 | | | 1.070% | (b) | | 07/25/32 | | | 372 | | | | 355,484 | |
Morgan Stanley Dean Witter Capital I, Inc. Trust, Series 2002-NC4,
Class M1 | | | 1.445% | (b) | | 09/25/32 | | | 464 | | | | 457,102 | |
Securitized Asset-Backed Receivables LLC Trust, Series 2004-OP1, Class M1 | | | 0.935% | (b) | | 02/25/34 | | | 802 | | | | 753,360 | |
| | | | | | | | | | | | |
|
|
|
| | | | | | | | | | | | | | 5,645,876 | |
| | | | | | | | | | | | |
|
|
|
TOTAL ASSET-BACKED SECURITIES
(cost $68,297,256) | | | | 68,403,143 | |
| | | | | | | | | | | | |
|
|
|
| BANK LOANS(b) — 0.2% | | | | | | | | | | | | | | |
Automotive | | | | | | | | | | | | | | |
Schaeffler AG | | | 4.250% | | | 05/15/20 | | | 750 | | | | 746,250 | |
| | | | | | | | | | | | |
|
|
|
Cable | | | | | | | | | | | | | | |
Virgin Media Investment Holdings Ltd. (United Kingdom) | | | 3.500% | | | 06/07/20 | | | 1,000 | | | | 981,250 | |
| | | | | | | | | | | | |
|
|
|
Foods | | | | | | | | | | | | | | |
ARAMARK Corp. | | | 3.250% | | | 09/07/19 | | | 534 | | | | 525,053 | |
Big Heart Pet Brands, Inc. | | | 3.500% | | | 03/09/20 | | | 852 | | | | 815,922 | |
| | | | | | | | | | | | |
|
|
|
| | | | | | | | | | | | | | 1,340,975 | |
| | | | | | | | | | | | |
|
|
|
SEE NOTES TO FINANCIAL STATEMENTS.
A71
| | | | | | |
| | | FLEXIBLE MANAGED PORTFOLIO (continued) | | |
| |
| SCHEDULE OF INVESTMENTS | | December 31, 2014 |
| | | | | | | | | | | | | | |
BANK LOANS(b)
(continued) | | Interest
Rate
| | | Maturity
Date
| | Principal
Amount
(000)#
| | | Value
(Note 2)
| |
Healthcare & Pharmaceutical — 0.1% | | | | | | | | | | | | | | |
Biomet, Inc. | | | 3.733% | | | 07/25/17 | | | 1,000 | | | $ | 994,167 | |
Grifols Worldwide Operations USA, Inc. | | | 3.255% | | | 02/26/21 | | | 248 | | | | 244,403 | |
RPI Finance Trust (Luxembourg) | | | 3.250% | | | 11/09/18 | | | 1,037 | | | | 1,033,535 | |
| | | | | | | | | | | | |
|
|
|
| | | | | | | | | | | | | | 2,272,105 | |
| | | | | | | | | | | | |
|
|
|
Technology — 0.1% | | | | | | | | | | | | | | |
Avago Technologies Finance Pte Ltd. | | | 3.750% | | | 05/06/21 | | | 1,095 | | | | 1,088,571 | |
First Data Corp. | | | 3.755% | | | 03/26/18 | | | 1,134 | | | | 1,109,064 | |
TransUnion LLC | | | 4.000% | | | 04/09/21 | | | 496 | | | | 488,186 | |
| | | | | | | | | | | | |
|
|
|
| | | | | | | | | | | | | | 2,685,821 | |
| | | | | | | | | | | | |
|
|
|
TOTAL BANK LOANS
(cost $8,088,020) | | | | 8,026,401 | |
| | | | | | | | | | | | |
|
|
|
| COLLATERALIZED MORTGAGE OBLIGATIONS — 0.3% | | | | | | | | | | | | | | |
Alternative Loan Trust, Series 2004-18CB, Class 3A1 | | | 5.250% | | | 09/25/19 | | | 276 | | | | 281,749 | |
Banc of America Alternative Loan Trust, Series 2005-12, Class 3CB1 | | | 6.000% | | | 01/25/36 | | | 1,857 | | | | 1,571,458 | |
Bank of America Mortgage Trust, Series 2005-A, Class 2A1 | | | 2.720% | (b) | | 02/25/35 | | | 388 | | | | 375,261 | |
Bank of America Mortgage Trust, Series 2005-B, Class 2A1 | | | 2.656% | (b) | | 03/25/35 | | | 334 | | | | 302,615 | |
Chase Mortgage Finance Trust, Series 2007-A1, Class 1A5 | | | 2.535% | (b) | | 02/25/37 | | | 810 | | | | 788,250 | |
Fannie Mae Connecticut Avenue Securities, Series 2014-CO4, Class 1M1 | | | 2.105% | (b) | | 11/25/24 | | | 4,866 | | | | 4,871,545 | |
Freddie Mac Structured Agency Credit Risk Debt Notes, Series 2014-DN4, Class M1 | | | 1.570% | (b) | | 10/25/24 | | | 996 | | | | 995,852 | |
JPMorgan Mortgage Trust, Series 2007-A1, Class 4A1 | | | 2.489% | (b) | | 07/25/35 | | | 460 | | | | 462,622 | |
MASTR Alternative Loan Trust, Series 2004-4, Class 4A1 | | | 5.000% | | | 04/25/19 | | | 86 | | | | 87,421 | |
Structured Adjustable Rate Mortgage Loan Trust, Series 2004-1, Class 4A3 | | | 2.573% | (b) | | 02/25/34 | | | 378 | | | | 377,540 | |
Washington Mutual Mortgage Pass-Through Certificates, Series 2005-1, Class 3A | | | 5.000% | | | 03/25/20 | | | 119 | | | | 119,655 | |
| | | | | | | | | | | | |
|
|
|
TOTAL COLLATERALIZED MORTGAGE OBLIGATIONS
(cost $10,410,433) | | | | 10,233,968 | |
| | | | | | | | | | | | |
|
|
|
| COMMERCIAL MORTGAGE-BACKED SECURITIES — 3.2% | | | | | | | | | | | | | | |
Banc of America Commercial Mortgage Trust, Series 2006-6, Class A3 | | | 5.369% | | | 10/10/45 | | | 3,900 | | | | 3,957,307 | |
Banc of America Commercial Mortgage Trust, Series 2007-2, Class A1A | | | 5.561% | (b) | | 04/10/49 | | | 5,307 | | | | 5,678,753 | |
Banc of America Commercial Mortgage Trust, Series 2007-2, Class A3 | | | 5.585% | (b) | | 04/10/49 | | | 1,500 | | | | 1,520,496 | |
Banc of America Commercial Mortgage Trust, Series 2007-5, Class A3 | | | 5.620% | | | 02/10/51 | | | 45 | | | | 45,377 | |
Citigroup Commercial Mortgage Trust, Series 2007-C6, Class A4 | | | 5.710% | (b) | | 12/10/49 | | | 1,000 | | | | 1,084,385 | |
Citigroup Commercial Mortgage Trust, Series 2013-GC11, Class A3 | | | 2.815% | | | 04/10/46 | | | 1,100 | | | | 1,086,545 | |
Citigroup Commercial Mortgage Trust, Series 2014-GC21, Class A4 | | | 3.575% | | | 05/10/47 | | | 2,750 | | | | 2,861,818 | |
Citigroup Commercial Mortgage Trust, Series 2014-GC23, Class A3 | | | 3.356% | | | 07/10/47 | | | 2,800 | | | | 2,869,362 | |
COBALT CMBS Commercial Mortgage Trust, Series 2006-C1, Class A4 | | | 5.223% | | | 08/15/48 | | | 1,107 | | | | 1,166,497 | |
Commercial Mortgage Pass-Through Certificates, Series 2012-CR5,
Class A3 | | | 2.540% | | | 12/10/45 | | | 1,000 | | | | 971,095 | |
Commercial Mortgage Pass-Through Certificates, Series 2013-CR7,
Class A3 | | | 2.929% | | | 03/10/46 | | | 1,700 | | | | 1,702,205 | |
Commercial Mortgage Pass-Through Certificates, Series 2014-CR15,
Class A2 | | | 2.928% | | | 02/10/47 | | | 2,700 | | | | 2,779,142 | |
Commercial Mortgage Trust, Series 2005-GG5, Class A5 | | | 5.224% | (b) | | 04/10/37 | | | 8,050 | | | | 8,137,061 | |
Commercial Mortgage Trust, Series 2005-GG5, Class AM | | | 5.277% | (b) | | 04/10/37 | | | 4,500 | | | | 4,598,109 | |
Commercial Mortgage Trust, Series 2007-GG9, Class A2 | | | 5.381% | | | 03/10/39 | | | 1,116 | | | | 1,119,335 | |
Commercial Mortgage Trust, Series 2014-CCRE20, Class A3 | | | 3.326% | | | 11/10/47 | | | 5,000 | | | | 5,075,255 | |
Commercial Mortgage Trust, Series 2014-CR18, Class A4 | | | 3.550% | | | 07/15/47 | | | 2,800 | | | | 2,899,456 | |
Commercial Mortgage Trust, Series 2014-UBS3, Class A2 | | | 2.844% | | | 06/10/47 | | | 2,300 | | | | 2,365,980 | |
Credit Suisse Commercial Mortgage Trust, Series 2006-C1, Class A4 | | | 5.467% | (b) | | 02/15/39 | | | 2,700 | | | | 2,777,814 | |
Credit Suisse Commercial Mortgage Trust, Series 2006-C1, Class AM | | | 5.467% | (b) | | 02/15/39 | | | 640 | | | | 665,708 | |
Credit Suisse First Boston Mortgage Securities Corp., Series 2005-C2,
Class A4 | | | 4.832% | | | 04/15/37 | | | 1,624 | | | | 1,626,660 | |
Federal National Mortgage Assoc., Series 2014-M2, Class A2 | | | 3.513% | (b) | | 12/25/23 | | | 2,515 | | | | 2,680,703 | |
SEE NOTES TO FINANCIAL STATEMENTS.
A72
| | | | | | |
| | | FLEXIBLE MANAGED PORTFOLIO (continued) | | |
| |
| SCHEDULE OF INVESTMENTS | | December 31, 2014 |
| | | | | | | | | | | | | | |
COMMERCIAL MORTGAGE-BACKED SECURITIES
(continued) | | Interest
Rate
| | | Maturity
Date
| | Principal
Amount
(000)#
| | | Value
(Note 2)
| |
FHLMC Multifamily Structured Pass-Through Certificates, Series K017,
Class A2 | | | 2.873% | | | 12/25/21 | | | 3,500 | | | $ | 3,606,148 | |
FHLMC Multifamily Structured Pass-Through Certificates, Series K020,
Class A2 | | | 2.373% | | | 05/25/22 | | | 2,000 | | | | 1,990,534 | |
FHLMC Multifamily Structured Pass-Through Certificates, Series K020,
Class X1, I/O | | | 1.465% | (b) | | 05/25/22 | | | 25,390 | | | | 2,186,944 | |
FHLMC Multifamily Structured Pass-Through Certificates, Series K021,
Class X1, I/O | | | 1.506% | (b) | | 06/25/22 | | | 7,173 | | | | 637,959 | |
FHLMC Multifamily Structured Pass-Through Certificates, Series K029,
Class A2 | | | 3.320% | (b) | | 02/25/23 | | | 5,800 | | | | 6,104,976 | |
FHLMC Multifamily Structured Pass-Through Certificates, Series K034,
Class A2 | | | 3.531% | (b) | | 07/25/23 | | | 2,400 | | | | 2,562,492 | |
FHLMC Multifamily Structured Pass-Through Certificates, Series K501,
Class X1A, I/O | | | 1.685% | (b) | | 08/25/16 | | | 6,154 | | | | 116,268 | |
FHLMC Multifamily Structured Pass-Through Certificates, Series K710,
Class X1, I/O | | | 1.778% | (b) | | 05/25/19 | | | 19,640 | | | | 1,298,726 | |
FHLMC Multifamily Structured Pass-Through Certificates, Series K711,
Class X1, I/O | | | 1.707% | (b) | | 07/25/19 | | | 20,734 | | | | 1,330,697 | |
GE Capital Commercial Mortgage Corp., Series 2005-C4, Class A4 | | | 5.313% | (b) | | 11/10/45 | | | 2,585 | | | | 2,625,137 | |
GE Capital Commercial Mortgage Corp., Series 2006-C1, Class A4 | | | 5.274% | (b) | | 03/10/44 | | | 1,980 | | | | 2,029,060 | |
GS Mortgage Securities Trust, Series 2006-GG6, Class AAB | | | 5.553% | (b) | | 04/10/38 | | | 1,232 | | | | 1,243,834 | |
JPMBB Commercial Mortgage Securities Trust, Series 2014-C25,
Class A4A1 | | | 3.408% | | | 11/15/47 | | | 1,400 | | | | 1,435,298 | |
JPMorgan Chase Commercial Mortgage Securities Trust, Series 2005-LDP2, Class A3 | | | 4.697% | | | 07/15/42 | | | 2 | | | | 1,547 | |
JPMorgan Chase Commercial Mortgage Securities Trust, Series 2005-LDP2, Class AM | | | 4.780% | | | 07/15/42 | | | 1,000 | | | | 1,007,794 | |
JPMorgan Chase Commercial Mortgage Securities Trust, Series 2005-LDP4, Class AM | | | 4.999% | (b) | | 10/15/42 | | | 1,270 | | | | 1,295,479 | |
JPMorgan Chase Commercial Mortgage Securities Trust, Series 2006-CB16, Class ASB | | | 5.523% | | | 05/12/45 | | | 1,116 | | | | 1,141,952 | |
JPMorgan Chase Commercial Mortgage Securities Trust, Series 2012-CBX, Class A3 | | | 3.139% | | | 06/15/45 | | | 1,973 | | | | 2,039,878 | |
JPMorgan Chase Commercial Mortgage Securities Trust, Series 2012-LC9, Class A4 | | | 2.611% | | | 12/15/47 | | | 1,700 | | | | 1,666,775 | |
JPMorgan Chase Commercial Mortgage Securities Trust, Series 2013-C10, Class A4 | | | 2.875% | | | 12/15/47 | | | 3,900 | | | | 3,887,032 | |
JPMorgan Chase Commercial Mortgage Securities Trust, Series 2013-C16, Class A2 | | | 3.070% | | | 12/15/46 | | | 2,700 | | | | 2,798,469 | |
JPMorgan Chase Commercial Mortgage Securities Trust, Series 2013-LC11, Class A4 | | | 2.694% | | | 04/15/46 | | | 1,400 | | | | 1,368,602 | |
LB-UBS Commercial Mortgage Trust, Series 2005-C7, Class AM | | | 5.263% | (b) | | 11/15/40 | | | 1,510 | | | | 1,557,425 | |
Merrill Lynch Mortgage Trust, Series 2006-C1, Class AM | | | 5.677% | (b) | | 05/12/39 | | | 930 | | | | 976,403 | |
ML-CFC Commercial Mortgage Trust, Series 2006-1, Class AM | | | 5.517% | (b) | | 02/12/39 | | | 530 | | | | 551,967 | |
ML-CFC Commercial Mortgage Trust, Series 2006-2, Class A4 | | | 5.869% | (b) | | 06/12/46 | | | 1,736 | | | | 1,821,270 | |
ML-CFC Commercial Mortgage Trust, Series 2007-6, Class A2 | | | 5.331% | | | 03/12/51 | | | 1,925 | | | | 1,947,949 | |
Morgan Stanley Bank of America Merrill Lynch Trust, Series 2013-C8, Class A3 | | | 2.863% | | | 12/15/48 | | | 1,500 | | | | 1,487,852 | |
Morgan Stanley Capital I Trust, Series 2006-IQ11, Class A4 | | | 5.656% | (b) | | 10/15/42 | | | 2,136 | | | | 2,194,672 | |
Morgan Stanley Capital I Trust, Series 2007-HQ11, Class A31 | | | 5.439% | | | 02/12/44 | | | 212 | | | | 213,054 | |
Morgan Stanley Capital I Trust, Series 2007-HQ11, Class AAB | | | 5.444% | | | 02/12/44 | | | 1,775 | | | | 1,786,204 | |
Morgan Stanley Capital I Trust, Series 2007-T27, Class AAB | | | 5.651% | (b) | | 06/11/42 | | | 249 | | | | 248,848 | |
UBS-Barclays Commercial Mortgage Trust, Series 2012-C4, Class A4 | | | 2.792% | | | 12/10/45 | | | 1,700 | | | | 1,683,024 | |
UBS-Barclays Commercial Mortgage Trust, Series 2013-C5, Class A3 | | | 2.920% | | | 03/10/46 | | | 3,900 | | | | 3,899,068 | |
UBS-Barclays Commercial Mortgage Trust, Series 2013-C6, Class A3 | | | 2.971% | | | 04/10/46 | | | 1,800 | | | | 1,803,739 | |
Wachovia Bank Commercial Mortgage Trust, Series 2006-C25, Class A4 | | | 5.723% | (b) | | 05/15/43 | | | 584 | | | | 605,459 | |
Wachovia Bank Commercial Mortgage Trust, Series 2007-C31, Class A4(a) | | | 5.509% | | | 04/15/47 | | | 4,500 | | | | 4,739,602 | |
SEE NOTES TO FINANCIAL STATEMENTS.
A73
| | | | | | |
| | | FLEXIBLE MANAGED PORTFOLIO (continued) | | |
| |
| SCHEDULE OF INVESTMENTS | | December 31, 2014 |
| | | | | | | | | | | | | | |
COMMERCIAL MORTGAGE-BACKED SECURITIES
(continued) | | Interest
Rate
| | | Maturity
Date
| | Principal
Amount
(000)#
| | | Value
(Note 2)
| |
Wachovia Bank Commercial Mortgage Trust, Series 2007-C34, Class A1A | | | 5.608% | (b) | | 05/15/46 | | | 1,321 | | | $ | 1,406,633 | |
| | | | | | | | | | | | |
|
|
|
TOTAL COMMERCIAL MORTGAGE-BACKED SECURITIES
(cost $127,802,592) | | | | 126,967,833 | |
| | | | | | | | | | | | |
|
|
|
| CORPORATE BONDS — 7.6% | | | | | | | | | | | | | | |
Airlines — 0.1% | | | | | | | | | | | | | | |
Continental Airlines, Inc., Pass-Through Trust, Pass-Through Certificates, Series 1998-1, Class A | | | 6.648% | | | 09/15/17 | | | 112 | | | | 116,423 | |
Continental Airlines, Inc., Pass-Through Trust, Pass-Through Certificates, Series 2009-2, Class A | | | 7.250% | | | 11/10/19 | | | 612 | | | | 706,831 | |
Continental Airlines, Inc., Pass-Through Trust, Pass-Through Certificates, Series 2010-1, Class A(a) | | | 4.750% | | | 01/12/21 | | | 709 | | | | 755,575 | |
Continental Airlines, Inc., Pass-Through Trust, Pass-Through Certificates, Series 2012-2, Class A | | | 4.000% | | | 10/29/24 | | | 667 | | | | 677,469 | |
Delta Air Lines, Inc., Pass-Through Trust, Pass-Through Certificates,
Series 2007-1 Class A | | | 6.821% | | | 08/10/22 | | | 327 | | | | 379,438 | |
Delta Air Lines, Inc., Pass-Through Trust, Pass-Through Certificates,
Series 2010-2, Class A | | | 4.950% | | | 05/23/19 | | | 519 | | | | 555,199 | |
Delta Air Lines, Inc., Pass-Through Trust, Pass-Through Certificates,
Series 2011-1, Class A | | | 5.300% | | | 04/15/19 | | | 1,011 | | | | 1,099,426 | |
| | | | | | | | | | | | |
|
|
|
| | | | | | | | | | | | | | 4,290,361 | |
| | | | | | | | | | | | |
|
|
|
Automotive — 0.1% | | | | | | | | | | | | | | |
Ford Motor Credit Co. LLC, Sr. Unsec’d. Notes | | | 4.207% | | | 04/15/16 | | | 2,090 | | | | 2,163,244 | |
General Motors Co., Sr. Unsec’d. Notes | | | 6.250% | | | 10/02/43 | | | 1,395 | | | | 1,666,467 | |
Harley-Davidson Financial Services, Inc., Gtd. Notes, MTN, 144A | | | 2.700% | | | 03/15/17 | | | 450 | | | | 461,095 | |
Jaguar Land Rover Automotive PLC (United Kingdom), Gtd. Notes, 144A | | | 4.250% | | | 11/15/19 | | | 715 | | | | 720,362 | |
Johnson Controls, Inc., Sr. Unsec’d. Notes | | | 5.500% | | | 01/15/16 | | | 245 | | | | 256,570 | |
| | | | | | | | | | | | |
|
|
|
| | | | | | | | | | | | | | 5,267,738 | |
| | | | | | | | | | | | |
|
|
|
Banking — 2.4% | | | | | | | | | | | | | | |
American Express Co., Jr. Sub. Notes(a) | | | 5.200% | (b) | | 12/31/49 | | | 605 | | | | 614,433 | |
American Express Co., Sr. Unsec’d. Notes | | | 2.650% | | | 12/02/22 | | | 2,213 | | | | 2,170,468 | |
Banco Santander Chile (Chile), Sr. Unsec’d. Notes, 144A | | | 3.875% | | | 09/20/22 | | | 645 | | | | 638,217 | |
Bank of America Corp., Series K, Jr. Sub. Notes | | | 8.000% | (b) | | 12/29/49 | | | 2,200 | | | | 2,362,250 | |
Bank of America Corp., Sr. Unsec’d. Notes, MTN | | | 3.300% | | | 01/11/23 | | | 780 | | | | 780,060 | |
Bank of America Corp., Sr. Unsec’d. Notes, MTN(a) | | | 4.125% | | | 01/22/24 | | | 3,820 | | | | 4,011,592 | |
Bank of America Corp., Sr. Unsec’d. Notes, MTN | | | 4.500% | | | 04/01/15 | | | 595 | | | | 600,591 | |
Bank of America Corp., Sr. Unsec’d. Notes, MTN | | | 5.000% | | | 05/13/21 | | | 630 | | | | 702,987 | |
Bank of America Corp., Sr. Unsec’d. Notes | | | 5.700% | | | 01/24/22 | | | 1,770 | | | | 2,050,434 | |
Bank of America Corp., Sr. Unsec’d. Notes | | | 6.000% | | | 09/01/17 | | | 1,075 | | | | 1,185,352 | |
Bank of America Corp., Sr. Unsec’d. Notes, | | | 4.000% | | | 04/01/24 | | | 975 | | | | 1,015,194 | |
Bank of America Corp., Sr. Unsec’d. Notes, Series 1 | | | 3.750% | | | 07/12/16 | | | 870 | | | | 901,110 | |
Bank of America Corp., Sub. Notes | | | 5.750% | | | 08/15/16 | | | 1,775 | | | | 1,889,647 | |
Bank of America NA, Sub. Notes | | | 5.300% | | | 03/15/17 | | | 930 | | | | 998,973 | |
Bank of America NA, Sub. Notes | | | 6.000% | | | 10/15/36 | | | 410 | | | | 513,550 | |
Bank of Nova Scotia (Canada), Covered Notes, 144A | | | 1.650% | | | 10/29/15 | | | 1,535 | | | | 1,548,318 | |
Bear Stearns Cos. LLC, Sr. Unsec’d. Notes | | | 5.300% | | | 10/30/15 | | | 515 | | | | 533,877 | |
Bear Stearns Cos. LLC, Sr. Unsec’d. Notes | | | 6.400% | | | 10/02/17 | | | 330 | | | | 369,570 | |
Bear Stearns Cos. LLC, Sr. Unsec’d. Notes | | | 7.250% | | | 02/01/18 | | | 1,175 | | | | 1,354,246 | |
Capital One Bank USA NA, Sub. Notes | | | 3.375% | | | 02/15/23 | | | 1,560 | | | | 1,551,328 | |
Capital One Financial Corp., Sr. Unsec’d. Notes(a) | | | 3.750% | | | 04/24/24 | | | 2,590 | | | | 2,645,941 | |
Citigroup, Inc., Sr. Unsec’d. Notes | | | 3.875% | | | 10/25/23 | | | 1,900 | | | | 1,974,864 | |
Citigroup, Inc., Sr. Unsec’d. Notes | | | 3.953% | | | 06/15/16 | | | 1,010 | | | | 1,048,452 | |
Citigroup, Inc., Sr. Unsec’d. Notes(a) | | | 4.500% | | | 01/14/22 | | | 2,450 | | | | 2,677,257 | |
Citigroup, Inc., Sr. Unsec’d. Notes | | | 6.875% | | | 03/05/38 | | | 24 | | | | 32,699 | |
Citigroup, Inc., Sr. Unsec’d. Notes | | | 8.125% | | | 07/15/39 | | | 710 | | | | 1,086,963 | |
Citigroup, Inc., Sr. Unsec’d. Notes | | | 8.500% | | | 05/22/19 | | | 1,895 | | | | 2,361,297 | |
Citigroup, Inc., Sub. Notes | | | 6.125% | | | 08/25/36 | | | 570 | | | | 679,481 | |
SEE NOTES TO FINANCIAL STATEMENTS.
A74
| | | | | | |
| | | FLEXIBLE MANAGED PORTFOLIO (continued) | | |
| |
| SCHEDULE OF INVESTMENTS | | December 31, 2014 |
| | | | | | | | | | | | |
CORPORATE BONDS
(continued) | | Interest
Rate
| | Maturity
Date
| | Principal
Amount
(000)#
| | | Value
(Note 2)
| |
Banking (continued) | | | | | | | | | | | | |
Compass Bank, Sr. Unsec’d. Notes | | 1.850% | | 09/29/17 | | | 1,270 | | | $ | 1,264,583 | |
Discover Bank, Sr. Unsec’d. Notes | | 4.250% | | 03/13/26 | | | 970 | | | | 1,005,501 | |
Discover Bank, Sub. Notes | | 7.000% | | 04/15/20 | | | 570 | | | | 671,770 | |
Discover Financial Services, Sr. Unsec’d. Notes | | 3.850% | | 11/21/22 | | | 900 | | | | 915,662 | |
Goldman Sachs Group, Inc. (The), Sr. Unsec’d. Notes | | 3.625% | | 02/07/16 | | | 2,000 | | | | 2,052,116 | |
Goldman Sachs Group, Inc. (The), Sr. Unsec’d. Notes | | 5.250% | | 07/27/21 | | | 2,055 | | | | 2,319,400 | |
Goldman Sachs Group, Inc. (The), Sr. Unsec’d. Notes(a) | | 5.750% | | 01/24/22 | | | 3,620 | | | | 4,187,569 | |
Goldman Sachs Group, Inc. (The), Sr. Unsec’d. Notes | | 6.250% | | 02/01/41 | | | 270 | | | | 341,319 | |
Goldman Sachs Group, Inc. (The), Sub. Notes | | 5.625% | | 01/15/17 | | | 1,190 | | | | 1,276,390 | |
Goldman Sachs Group, Inc. (The), Sub. Notes(a) | | 6.750% | | 10/01/37 | | | 104 | | | | 130,767 | |
HSBC Holdings PLC (United Kingdom), Sr. Unsec’d. Notes | | 4.875% | | 01/14/22 | | | 1,910 | | | | 2,128,980 | |
HSBC Holdings PLC (United Kingdom), Sr. Unsec’d. Notes | | 5.100% | | 04/05/21 | | | 1,025 | | | | 1,158,658 | |
Huntington Bancshares, Inc., Sub. Notes(a) | | 7.000% | | 12/15/20 | | | 170 | | | | 204,600 | |
Intesa Sanpaolo SpA (Italy), Gtd. Notes | | 3.125% | | 01/15/16 | | | 1,395 | | | | 1,417,048 | |
JPMorgan Chase & Co., Jr. Sub. Notes(a) | | 6.100%(b) | | 12/31/49 | | | 1,275 | | | | 1,271,813 | |
JPMorgan Chase & Co., Jr. Sub. Notes | | 7.900%(b) | | 04/29/49 | | | 2,000 | | | | 2,152,600 | |
JPMorgan Chase & Co., Sr. Unsec’d. Notes | | 4.250% | | 10/15/20 | | | 2,930 | | | | 3,150,043 | |
JPMorgan Chase & Co., Sub. Notes | | 5.625% | | 08/16/43 | | | 490 | | | | 569,823 | |
Lloyds Bank PLC (United Kingdom), Gtd. Notes | | 6.375% | | 01/21/21 | | | 1,400 | | | | 1,682,796 | |
Lloyds Bank PLC (United Kingdom), Gtd. Notes, MTN, 144A | | 5.800% | | 01/13/20 | | | 1,870 | | | | 2,160,869 | |
Merrill Lynch & Co., Inc., Sr. Unsec’d. Notes, MTN | | 6.400% | | 08/28/17 | | | 20 | | | | 22,283 | |
Morgan Stanley, Jr. Sub. Notes(a) | | 5.450%(b) | | 12/31/49 | | | 840 | | | | 841,512 | |
Morgan Stanley, Sr. Unsec’d. Notes, MTN | | 5.450% | | 01/09/17 | | | 1,345 | | | | 1,444,145 | |
Morgan Stanley, Sr. Unsec’d. Notes, MTN | | 5.500% | | 07/28/21 | | | 2,360 | | | | 2,678,319 | |
Morgan Stanley, Sr. Unsec’d. Notes, MTN(a) | | 5.625% | | 09/23/19 | | | 1,415 | | | | 1,597,244 | |
Morgan Stanley, Sr. Unsec’d. Notes | | 5.750% | | 01/25/21 | | | 1,400 | | | | 1,607,131 | |
Morgan Stanley, Sr. Unsec’d. Notes(a) | | 6.375% | | 07/24/42 | | | 780 | | | | 1,035,867 | |
Morgan Stanley, Sr. Unsec’d. Notes, MTN | | 6.625% | | 04/01/18 | | | 105 | | | | 119,599 | |
MUFG Capital Finance 1 Ltd. (Japan), Gtd. Notes | | 6.346%(b) | | 07/29/49 | | | 800 | | | | 852,130 | |
Northern Trust Corp., Sub. Notes | | 3.950% | | 10/30/25 | | | 990 | | | | 1,030,349 | |
People’s United Bank, Sub. Notes | | 4.000% | | 07/15/24 | | | 465 | | | | 470,995 | |
People’s United Financial, Inc., Sr. Unsec’d. Notes | | 3.650% | | 12/06/22 | | | 1,455 | | | | 1,466,764 | |
PNC Bank NA, Sub. Notes | | 3.800% | | 07/25/23 | | | 270 | | | | 278,315 | |
PNC Funding Corp., Gtd. Notes | | 6.700% | | 06/10/19 | | | 440 | | | | 520,972 | |
Royal Bank of Canada (Canada), Covered Notes(a) | | 2.200% | | 09/23/19 | | | 2,940 | | | | 2,961,521 | |
Royal Bank of Scotland Group PLC (The) (United Kingdom),
Sr. Unsec’d. Notes | | 2.550% | | 09/18/15 | | | 455 | | | | 459,555 | |
Santander Holdings USA, Inc., Sr. Unsec’d. Notes | | 3.000% | | 09/24/15 | | | 955 | | | | 966,447 | |
Sumitomo Mitsui Banking Corp. (Japan), Gtd. Notes | | 2.450% | | 01/10/19 | | | 1,210 | | | | 1,215,478 | |
US Bancorp, Sub. Notes, MTN | | 2.950% | | 07/15/22 | | | 1,120 | | | | 1,104,067 | |
Wells Fargo & Co., Sub. Notes(a) | | 4.650% | | 11/04/44 | | | 1,165 | | | | 1,202,118 | |
Westpac Banking Corp. (Australia), Covered Notes, 144A | | 2.000% | | 05/21/19 | | | 5,315 | | | | 5,295,887 | |
| | | | | | | | | | |
|
|
|
| | | | | | | | | | | | 95,532,156 | |
| | | | | | | | | | |
|
|
|
Brokerage | | | | | | | | | | | | |
Jefferies Group LLC, Sr. Unsec’d. Notes | | 6.500% | | 01/20/43 | | | 560 | | | | 571,245 | |
Lehman Brothers Holdings, Inc., Sr. Unsec’d. Notes(c) | | 6.875% | | 02/06/12 | | | 1,715 | | | | 250,819 | |
Lehman Brothers Holdings, Inc., Sr. Unsec’d. Notes(c) | | 6.875% | | 05/02/18 | | | 700 | | | | 104,125 | |
Nomura Holdings, Inc. (Japan), Sr. Unsec’d. Notes, MTN | | 2.000% | | 09/13/16 | | | 820 | | | | 826,615 | |
| | | | | | | | | | |
|
|
|
| | | | | | | | | | | | 1,752,804 | |
| | | | | | | | | | |
|
|
|
Building Materials & Construction — 0.1% | | | | | | | | | | | | |
Building Materials Corp. of America, Sr. Unsec’d. Notes, 144A (original cost $800,000; purchased 10/27/14)(d) | | 5.375% | | 11/15/24 | | | 800 | | | | 798,000 | |
D.R. Horton, Inc., Gtd. Notes(a) | | 3.625% | | 02/15/18 | | | 450 | | | | 455,625 | |
Odebrecht Finance Ltd. (Brazil), Gtd. Notes, 144A (original cost $740,000; purchased 06/19/14)(d)(e) | | 5.250% | | 06/27/29 | | | 740 | | | | 647,130 | |
Owens Corning, Inc., Gtd. Notes | | 4.200% | | 12/15/22 | | | 775 | | | | 786,531 | |
| | | | | | | | | | |
|
|
|
| | | | | | | | | | | | 2,687,286 | |
| | | | | | | | | | |
|
|
|
SEE NOTES TO FINANCIAL STATEMENTS.
A75
| | | | | | |
| | | FLEXIBLE MANAGED PORTFOLIO (continued) | | |
| |
| SCHEDULE OF INVESTMENTS | | December 31, 2014 |
| | | | | | | | | | | | | | |
CORPORATE BONDS
(continued) | | Interest
Rate
| | | Maturity
Date
| | Principal
Amount
(000)#
| | | Value
(Note 2)
| |
Cable — 0.2% | | | | | | | | | | | | | | |
Cablevision Systems Corp., Sr. Unsec’d. Notes | | | 8.625% | | | 09/15/17 | | | 1,000 | | | $ | 1,112,500 | |
CCO Holdings LLC/CCO Holdings Capital Corp., Gtd. Notes(a) | | | 7.250% | | | 10/30/17 | | | 1,400 | | | | 1,456,700 | |
Comcast Cable Communications Holdings, Inc., Gtd. Notes | | | 9.455% | | | 11/15/22 | | | 255 | | | | 366,599 | |
Comcast Corp., Gtd. Notes | | | 6.400% | | | 05/15/38 | | | 530 | | | | 707,659 | |
DIRECTV Holdings LLC/DIRECTV Financing Co., Inc., Gtd. Notes | | | 3.500% | | | 03/01/16 | | | 920 | | | | 943,997 | |
DIRECTV Holdings LLC/DIRECTV Financing Co., Inc., Gtd. Notes | | | 3.550% | | | 03/15/15 | | | 165 | | | | 165,979 | |
DIRECTV Holdings LLC/DIRECTV Financing Co., Inc., Gtd. Notes | | | 5.150% | | | 03/15/42 | | | 860 | | | | 888,690 | |
DISH DBS Corp., Gtd. Notes(a) | | | 7.125% | | | 02/01/16 | | | 1,000 | | | | 1,051,250 | |
Time Warner Cable, Inc., Gtd. Notes | | | 5.850% | | | 05/01/17 | | | 1,710 | | | | 1,866,549 | |
Videotron Ltd. (Canada), Gtd. Notes | | | 5.000% | | | 07/15/22 | | | 1,040 | | | | 1,058,200 | |
| | | | | | | | | | | | |
|
|
|
| | | | | | | | | | | | | | 9,618,123 | |
| | | | | | | | | | | | |
|
|
|
Capital Goods — 0.3% | | | | | | | | | | | | | | |
Actuant Corp., Gtd. Notes | | | 5.625% | | | 06/15/22 | | | 1,205 | | | | 1,250,187 | |
Case New Holland Industrial, Inc., Gtd. Notes | | | 7.875% | | | 12/01/17 | | | 1,255 | | | | 1,380,500 | |
ERAC USA Finance LLC, Gtd. Notes, 144A
(original cost $1,299,722; purchased 10/10/07)(d)(e) | | | 6.375% | | | 10/15/17 | | | 1,302 | | | | 1,461,888 | |
ERAC USA Finance LLC, Gtd. Notes, 144A
(original cost $501,539; purchased 05/30/13)(d)(e) | | | 6.700% | | | 06/01/34 | | | 420 | | | | 540,285 | |
ERAC USA Finance LLC, Gtd. Notes, 144A
(original cost $376,709; purchased 10/10/07)(d)(e) | | | 7.000% | | | 10/15/37 | | | 380 | | | | 512,093 | |
General Electric Co., Sr. Unsec’d. Notes | | | 4.125% | | | 10/09/42 | | | 190 | | | | 196,690 | |
General Electric Co., Sr. Unsec’d. Notes | | | 4.500% | | | 03/11/44 | | | 280 | | | | 307,782 | |
Penske Truck Leasing Co. LP/PTL Finance Corp., Sr. Unsec’d. Notes, 144A (original cost $1,887,203; purchased 09/24/12)(d)(e) | | | 2.500% | | | 03/15/16 | | | 1,890 | | | | 1,916,010 | |
Penske Truck Leasing Co. LP/PTL Finance Corp., Unsec’d. Notes, 144A (original cost $499,515; purchased 05/08/12)(d)(e) | | | 3.125% | | | 05/11/15 | | | 500 | | | | 504,050 | |
SPX Corp., Gtd. Notes(a) | | | 6.875% | | | 09/01/17 | | | 950 | | | | 1,037,875 | |
United Rentals North America, Inc., Gtd. Notes | | | 7.375% | | | 05/15/20 | | | 1,000 | | | | 1,080,000 | |
United Technologies Corp., Sr. Unsec’d. Notes(a) | | | 4.500% | | | 06/01/42 | | | 1,445 | | | | 1,573,300 | |
Xylem, Inc., Sr. Unsec’d. Notes | | | 4.875% | | | 10/01/21 | | | 1,260 | | | | 1,361,230 | |
| | | | | | | | | | | | |
|
|
|
| | | | | | | | | | | | | | 13,121,890 | |
| | | | | | | | | | | | |
|
|
|
Chemicals — 0.2% | | | | | | | | | | | | | | |
Agrium, Inc. (Canada), Sr. Unsec’d. Notes | | | 3.150% | | | 10/01/22 | | | 780 | | | | 761,412 | |
CF Industries, Inc., Gtd. Notes(a) | | | 5.375% | | | 03/15/44 | | | 585 | | | | 631,154 | |
Dow Chemical Co. (The), Sr. Unsec’d. Notes | | | 4.625% | | | 10/01/44 | | | 45 | | | | 45,571 | |
Dow Chemical Co. (The), Sr. Unsec’d. Notes | | | 9.400% | | | 05/15/39 | | | 347 | | | | 563,019 | |
Koppers, Inc., Gtd. Notes | | | 7.875% | | | 12/01/19 | | | 1,300 | | | | 1,334,125 | |
LyondellBasell Industries NV, Sr. Unsec’d. Notes | | | 5.000% | | | 04/15/19 | | | 1,000 | | | | 1,090,764 | |
Monsanto Co., Sr. Unsec’d. Notes | | | 4.200% | | | 07/15/34 | | | 195 | | | | 203,190 | |
Monsanto Co., Sr. Unsec’d. Notes | | | 4.400% | | | 07/15/44 | | | 235 | | | | 243,823 | |
Mosaic Co. (The), Sr. Unsec’d. Notes | | | 5.450% | | | 11/15/33 | | | 345 | | | | 390,335 | |
Mosaic Co. (The), Sr. Unsec’d. Notes | | | 5.625% | | | 11/15/43 | | | 1,135 | | | | 1,300,727 | |
Union Carbide Corp., Sr. Unsec’d. Notes | | | 7.500% | | | 06/01/25 | | | 460 | | | | 595,404 | |
| | | | | | | | | | | | |
|
|
|
| | | | | | | | | | | | | | 7,159,524 | |
| | | | | | | | | | | | |
|
|
|
Consumer — 0.1% | | | | | | | | | | | | | | |
Newell Rubbermaid, Inc., Sr. Unsec’d. Notes | | | 6.250% | | | 04/15/18 | | | 1,700 | | | | 1,917,020 | |
| | | | | | | | | | | | |
|
|
|
Electric — 0.4% | | | | | | | | | | | | | | |
Arizona Public Service Co., Sr. Unsec’d. Notes | | | 6.250% | | | 08/01/16 | | | 175 | | | | 189,528 | |
Baltimore Gas & Electric Co., Sr. Unsec’d. Notes(a) | | | 6.350% | | | 10/01/36 | | | 550 | | | | 750,846 | |
Berkshire Hathaway Energy Co., Sr. Unsec’d. Notes | | | 6.125% | | | 04/01/36 | | | 310 | | | | 389,463 | |
CenterPoint Energy Houston Electric LLC, Gen. Ref. Mtge. | | | 6.950% | | | 03/15/33 | | | 590 | | | | 823,627 | |
Consolidated Edison Co. of New York, Inc., Sr. Unsec’d. Notes, Series 09-C | | | 5.500% | | | 12/01/39 | | | 220 | | | | 264,069 | |
Duke Energy Carolinas LLC, First Mortgage | | | 6.050% | | | 04/15/38 | | | 550 | | | | 715,185 | |
Duke Energy Carolinas LLC, First Ref. Mortgage | | | 4.000% | | | 09/30/42 | | | 570 | | | | 584,906 | |
Dynegy Finance I, Inc./Dynegy Finance II, Inc., Sr. Sec’d. Notes, 144A | | | 7.375% | | | 11/01/22 | | | 345 | | | | 351,038 | |
Dynegy Finance I, Inc./Dynegy Finance II, Inc., Sr. Sec’d. Notes, 144A | | | 6.750% | | | 11/01/19 | | | 455 | | | | 462,963 | |
El Paso Electric Co., Sr. Unsec’d. Notes | | | 6.000% | | | 05/15/35 | | | 670 | | | | 839,678 | |
SEE NOTES TO FINANCIAL STATEMENTS.
A76
| | | | | | |
| | | FLEXIBLE MANAGED PORTFOLIO (continued) | | |
| |
| SCHEDULE OF INVESTMENTS | | December 31, 2014 |
| | | | | | | | | | | | | | |
CORPORATE BONDS
(continued) | | Interest
Rate
| | | Maturity
Date
| | Principal
Amount
(000)#
| | | Value
(Note 2)
| |
Electric (continued) | | | | | | | | | | | | | | |
Empresa Nacional de Electricidad SA (Chile), Sr. Unsec’d. Notes | | | 8.625% | | | 08/01/15 | | | 1,295 | | | $ | 1,347,034 | |
Exelon Corp., Sr. Unsec’d. Notes | | | 4.900% | | | 06/15/15 | | | 155 | | | | 157,772 | |
Exelon Generation Co. LLC, Sr. Unsec’d. Notes | | | 6.250% | | | 10/01/39 | | | 1,425 | | | | 1,711,526 | |
FirstEnergy Transmission LLC, Sr. Unsec’d. Notes, 144A | | | 5.450% | | | 07/15/44 | | | 355 | | | | 382,642 | |
Florida Power & Light Co., First Mortgage | | | 5.950% | | | 10/01/33 | | | 295 | | | | 389,076 | |
Iberdrola International BV (Spain), Gtd. Notes | | | 6.750% | | | 09/15/33 | | | 145 | | | | 179,892 | |
Nevada Power Co., Gen. Ref. Mtge. | | | 6.500% | | | 05/15/18 | | | 1,260 | | | | 1,451,548 | |
Niagara Mohawk Power Corp. (United Kingdom), Sr. Unsec’d. Notes, 144A | | | 4.881% | | | 08/15/19 | | | 610 | | | | 674,659 | |
Northeast Utilities, Sr. Unsec’d. Notes | | | 4.500% | | | 11/15/19 | | | 615 | | | | 668,837 | |
Oncor Electric Delivery Co. LLC, Sr. Sec’d. Notes | | | 6.375% | | | 01/15/15 | | | 345 | | | | 345,495 | |
Public Service Co. of New Mexico, Sr. Unsec’d. Notes | | | 7.950% | | | 05/15/18 | | | 140 | | | | 164,761 | |
Public Service Electric & Gas Co, Sr. Sec’d. Notes, MTN | | | 5.800% | | | 05/01/37 | | | 535 | | | | 692,572 | |
Xcel Energy, Inc., Sr. Unsec’d. Notes | | | 4.800% | | | 09/15/41 | | | 480 | | | | 535,392 | |
Xcel Energy, Inc., Sr. Unsec’d. Notes | | | 5.613% | | | 04/01/17 | | | 199 | | | | 217,175 | |
| | | | | | | | | | | | |
|
|
|
| | | | | | | | | | | | | | 14,289,684 | |
| | | | | | | | | | | | |
|
|
|
Energy – Integrated | | | | | | | | | | | | | | |
Pacific Rubiales Energy Corp. (Colombia), Gtd. Notes, 144A | | | 5.375% | | | 01/26/19 | | | 460 | | | | 396,290 | |
Reliance Holding USA, Inc. (India), Gtd. Notes, 144A | | | 5.400% | | | 02/14/22 | | | 800 | | | | 866,646 | |
| | | | | | | | | | | | |
|
|
|
| | | | | | | | | | | | | | 1,262,936 | |
| | | | | | | | | | | | |
|
|
|
Energy – Other — 0.3% | | | | | | | | | | | | | | |
Anadarko Petroleum Corp., Sr. Unsec’d. Notes | | | 4.677% | (f) | | 10/10/36 | | | 2,000 | | | | 758,548 | |
Anadarko Petroleum Corp., Sr. Unsec’d. Notes | | | 6.375% | | | 09/15/17 | | | 1,195 | | | | 1,328,603 | |
Anadarko Petroleum Corp., Sr. Unsec’d. Notes | | | 6.450% | | | 09/15/36 | | | 325 | | | | 390,551 | |
Anadarko Petroleum Corp., Sr. Unsec’d. Notes | | | 6.950% | | | 06/15/19 | | | 250 | | | | 292,088 | |
Cameron International Corp., Sr. Unsec’d. Notes | | | 4.500% | | | 06/01/21 | | | 2,200 | | | | 2,328,304 | |
Dominion Gas Holdings LLC, Sr. Unsec’d. Notes(a) | | | 4.800% | | | 11/01/43 | | | 65 | | | | 70,049 | |
Nabors Industries, Inc., Gtd. Notes | | | 4.625% | | | 09/15/21 | | | 1,070 | | | | 1,005,310 | |
Newfield Exploration Co., Sr. Sub. Notes(a) | | | 6.875% | | | 02/01/20 | | | 375 | | | | 380,625 | |
Phillips 66, Gtd. Notes | | | 2.950% | | | 05/01/17 | | | 490 | | | | 506,064 | |
Pioneer Natural Resources Co., Sr. Unsec’d. Notes | | | 6.875% | | | 05/01/18 | | | 1,500 | | | | 1,679,137 | |
Transocean, Inc., Gtd. Notes | | | 2.500% | | | 10/15/17 | | | 620 | | | | 548,107 | |
Weatherford International Ltd., Gtd. Notes | | | 5.125% | | | 09/15/20 | | | 810 | | | | 795,792 | |
| | | | | | | | | | | | |
|
|
|
| | | | | | | | | | | | | | 10,083,178 | |
| | | | | | | | | | | | |
|
|
|
Foods — 0.2% | | | | | | | | | | | | | | |
Anheuser-Busch InBev Worldwide, Inc. (Belgium), Gtd. Notes | | | 8.000% | | | 11/15/39 | | | 1,285 | | | | 1,965,285 | |
Anheuser-Busch InBev Worldwide, Inc. (Belgium), Gtd. Notes | | | 8.200% | | | 01/15/39 | | | 250 | | | | 385,955 | |
Bunge Ltd. Finance Corp., Gtd. Notes | | | 8.500% | | | 06/15/19 | | | 985 | | | | 1,207,157 | |
Constellation Brands, Inc., Gtd. Notes | | | 4.250% | | | 05/01/23 | | | 1,400 | | | | 1,389,500 | |
Delhaize Group SA (Belgium), Gtd. Notes | | | 6.500% | | | 06/15/17 | | | 480 | | | | 529,510 | |
Tyson Foods, Inc., Gtd. Notes | | | 6.600% | | | 04/01/16 | | | 735 | | | | 783,513 | |
| | | | | | | | | | | | |
|
|
|
| | | | | | | | | | | | | | 6,260,920 | |
| | | | | | | | | | | | |
|
|
|
Gaming | | | | | | | | | | | | | | |
GLP Capital LP/GLP Financing II, Inc., Gtd. Notes(a) | | | 4.375% | | | 11/01/18 | | | 1,000 | | | | 1,022,500 | |
| | | | | | | | | | | | |
|
|
|
Healthcare & Pharmaceutical — 0.6% | | | | | | | | | | | | | | |
Actavis Funding SCS, Gtd. Notes | | | 4.850% | | | 06/15/44 | | | 545 | | | | 553,031 | |
Actavis, Inc., Gtd. Notes | | | 6.125% | | | 08/15/19 | | | 445 | | | | 504,738 | |
Amgen, Inc., Sr. Unsec’d. Notes | | | 5.150% | | | 11/15/41 | | | 1,640 | | | | 1,848,526 | |
Bayer U.S. Finance LLC (Germany), Gtd. Notes, 144A | | | 3.375% | | | 10/08/24 | | | 500 | | | | 508,786 | |
Becton Dickinson and Co., Sr. Unsec’d. Notes | | | 3.734% | | | 12/15/24 | | | 1,025 | | | | 1,055,314 | |
CHS/Community Health Systems, Inc., Sr. Sec’d. Notes(a) | | | 5.125% | | | 08/15/18 | | | 1,100 | | | | 1,138,500 | |
Fresenius Medical Care U.S. Finance II, Inc. (Germany), Gtd. Notes, 144A | | | 4.125% | | | 10/15/20 | | | 665 | | | | 668,325 | |
Gilead Sciences, Inc., Sr. Unsec’d. Notes | | | 3.500% | | | 02/01/25 | | | 1,460 | | | | 1,498,544 | |
Gilead Sciences, Inc., Sr. Unsec’d. Notes | | | 5.650% | | | 12/01/41 | | | 185 | | | | 229,063 | |
HCA, Inc., Sr. Sec’d. Notes(a) | | | 4.250% | | | 10/15/19 | | | 555 | | | | 563,325 | |
HCA, Inc., Sr. Sec’d. Notes(a) | | | 5.000% | | | 03/15/24 | | | 1,100 | | | | 1,130,250 | |
SEE NOTES TO FINANCIAL STATEMENTS.
A77
| | | | | | |
| | | FLEXIBLE MANAGED PORTFOLIO (continued) | | |
| |
| SCHEDULE OF INVESTMENTS | | December 31, 2014 |
| | | | | | | | | | | | | | |
CORPORATE BONDS
(continued) | | Interest
Rate
| | | Maturity
Date
| | Principal
Amount
(000)#
| | | Value
(Note 2)
| |
Healthcare & Pharmaceutical (continued) | | | | | | | | | | | | | | |
HCA, Inc., Sr. Sec’d. Notes(a) | | | 5.250% | | | 04/15/25 | | | 400 | | | $ | 418,000 | |
Laboratory Corp. of America Holdings, Sr. Unsec’d. Notes(a) | | | 3.750% | | | 08/23/22 | | | 180 | | | | 184,154 | |
Laboratory Corp. of America Holdings, Sr. Unsec’d. Notes | | | 5.625% | | | 12/15/15 | | | 580 | | | | 603,355 | |
Medtronic, Inc., Sr. Unsec’d. Notes, 144A | | | 3.500% | | | 03/15/25 | | | 3,205 | | | | 3,278,619 | |
Medtronic, Inc., Sr. Unsec’d. Notes, 144A | | | 4.375% | | | 03/15/35 | | | 1,355 | | | | 1,437,460 | |
Mylan, Inc., Gtd. Notes | | | 1.800% | | | 06/24/16 | | | 425 | | | | 427,563 | |
Novartis Capital Corp. (Switzerland), Gtd. Notes | | | 4.400% | | | 05/06/44 | | | 1,325 | | | | 1,484,851 | |
Roche Holdings, Inc. (Switzerland), Gtd. Notes, 144A(a) | | | 2.875% | | | 09/29/21 | | | 5,305 | | | | 5,371,281 | |
Wyeth LLC, Gtd. Notes | | | 6.450% | | | 02/01/24 | | | 60 | | | | 75,277 | |
Zoetis, Inc., Sr. Unsec’d. Notes | | | 4.700% | | | 02/01/43 | | | 120 | | | | 122,133 | |
| | | | | | | | | | | | |
|
|
|
| | | | | | | | | | | | | | 23,101,095 | |
| | | | | | | | | | | | |
|
|
|
Healthcare Insurance — 0.1% | | | | | | | | | | | | | | |
Aetna, Inc., Sr. Unsec’d. Notes | | | 6.625% | | | 06/15/36 | | | 515 | | | | 686,360 | |
Anthem, Inc., Sr. Unsec’d. Notes | | | 4.625% | | | 05/15/42 | | | 390 | | | | 409,250 | |
Anthem, Inc., Sr. Unsec’d. Notes | | | 4.650% | | | 01/15/43 | | | 360 | | | | 374,674 | |
Cigna Corp., Sr. Unsec’d. Notes | | | 5.875% | | | 03/15/41 | | | 650 | | | | 809,250 | |
Cigna Corp., Sr. Unsec’d. Notes | | | 6.150% | | | 11/15/36 | | | 670 | | | | 835,084 | |
UnitedHealth Group, Inc., Sr. Unsec’d. Notes | | | 3.950% | | | 10/15/42 | | | 260 | | | | 258,443 | |
UnitedHealth Group, Inc., Sr. Unsec’d. Notes | | | 6.000% | | | 06/15/17 | | | 195 | | | | 216,213 | |
UnitedHealth Group, Inc., Sr. Unsec’d. Notes | | | 6.500% | | | 06/15/37 | | | 420 | | | | 562,793 | |
UnitedHealth Group, Inc., Sr. Unsec’d. Notes | | | 6.625% | | | 11/15/37 | | | 420 | | | | 573,608 | |
| | | | | | | | | | | | |
|
|
|
| | | | | | | | | | | | | | 4,725,675 | |
| | | | | | | | | | | | |
|
|
|
Insurance — 0.7% | | | | | | | | | | | | | | |
Allied World Assurance Co. Holdings Ltd., Gtd. Notes | | | 5.500% | | | 11/15/20 | | | 525 | | | | 585,595 | |
Allstate Corp. (The), Sr. Unsec’d. Notes | | | 4.500% | | | 06/15/43 | | | 150 | | | | 165,503 | |
American International Group, Inc., Sr. Unsec’d. Notes | | | 4.500% | | | 07/16/44 | | | 570 | | | | 602,211 | |
American International Group, Inc., Sr. Unsec’d. Notes | | | 6.400% | | | 12/15/20 | | | 2,425 | | | | 2,891,740 | |
Aon Corp. (United Kingdom), Gtd. Notes | | | 3.125% | | | 05/27/16 | | | 2,655 | | | | 2,724,367 | |
Axis Specialty Finance LLC, Gtd. Notes | | | 5.875% | | | 06/01/20 | | | 1,030 | | | | 1,166,763 | |
Chubb Corp. (The), Jr. Sub. Notes | | | 6.375% | (b) | | 03/29/67 | | | 1,300 | | | | 1,393,665 | |
Dai-ichi Life Insurance Co. Ltd. (The) (Japan), Jr. Sub. Notes, 144A | | | 5.100% | (b) | | 12/29/49 | | | 480 | | | | 499,800 | |
Hartford Financial Services Group, Inc., Sr. Unsec’d. Notes | | | 5.125% | | | 04/15/22 | | | 755 | | | | 848,686 | |
Liberty Mutual Group, Inc., Gtd. Notes, 144A | | | 6.500% | | | 05/01/42 | | | 365 | | | | 446,334 | |
Liberty Mutual Group, Inc., Sr. Unsec’d. Notes, 144A | | | 7.000% | | | 03/15/34 | | | 850 | | | | 1,079,799 | |
Lincoln National Corp., Jr. Sub. Notes | | | 6.050% | (b) | | 04/20/67 | | | 260 | | | | 260,000 | |
Lincoln National Corp., Sr. Unsec’d. Notes | | | 6.300% | | | 10/09/37 | | | 492 | | | | 624,220 | |
Lincoln National Corp., Sr. Unsec’d. Notes | | | 7.000% | | | 06/15/40 | | | 705 | | | | 977,715 | |
Lincoln National Corp., Sr. Unsec’d. Notes | | | 8.750% | | | 07/01/19 | | | 605 | | | | 755,966 | |
Markel Corp., Sr. Unsec’d. Notes | | | 5.000% | | | 03/30/43 | | | 200 | | | | 212,379 | |
MetLife, Inc., Sr. Unsec’d. Notes(a) | | | 5.700% | | | 06/15/35 | | | 835 | | | | 1,040,567 | |
MetLife, Inc., Sr. Unsec’d. Notes | | | 6.375% | | | 06/15/34 | | | 400 | | | | 533,016 | |
New York Life Insurance Co., Sub. Notes, 144A(a) | | | 6.750% | | | 11/15/39 | | | 660 | | | | 918,642 | |
Nippon Life Insurance Co. (Japan), Sub. Notes, 144A(a) | | | 5.100% | (b) | | 10/16/44 | | | 1,925 | | | | 2,011,625 | |
Northwestern Mutual Life Insurance Co. (The), Sub. Notes, 144A | | | 6.063% | | | 03/30/40 | | | 370 | | | | 478,270 | |
Ohio National Financial Services, Inc., Sr. Unsec’d. Notes, 144A | | | 6.375% | | | 04/30/20 | | | 680 | | | | 780,703 | |
Pacific Life Insurance Co., Sub. Notes, 144A | | | 9.250% | | | 06/15/39 | | | 910 | | | | 1,431,433 | |
Principal Financial Group, Inc., Gtd. Notes | | | 4.625% | | | 09/15/42 | | | 130 | | | | 136,457 | |
Progressive Corp. (The), Jr. Sub. Notes | | | 6.700%(b) | | | 06/15/37 | | | 735 | | | | 795,086 | |
Teachers Insurance & Annuity Association of America, Sub. Notes, 144A | | | 6.850% | | | 12/16/39 | | | 1,450 | | | | 1,980,452 | |
Unum Group, Sr. Unsec’d. Notes | | | 5.625% | | | 09/15/20 | | | 350 | | | | 394,115 | |
W.R. Berkley Corp., Sr. Unsec’d. Notes | | | 5.600% | | | 05/15/15 | | | 555 | | | | 564,711 | |
W.R. Berkley Corp., Sr. Unsec’d. Notes | | | 6.150% | | | 08/15/19 | | | 460 | | | | 519,182 | |
| | | | | | | | | | | | |
|
|
|
| | | | | | | | | | | | | | 26,819,002 | |
| | | | | | | | | | | | |
|
|
|
Lodging — 0.2% | | | | | | | | | | | | | | |
Choice Hotels International, Inc., Gtd. Notes | | | 5.750% | | | 07/01/22 | | | 1,000 | | | | 1,072,500 | |
Marriott International, Inc., Sr. Unsec’d. Notes | | | 3.000% | | | 03/01/19 | | | 580 | | | | 595,386 | |
SEE NOTES TO FINANCIAL STATEMENTS.
A78
| | | | | | |
| | | FLEXIBLE MANAGED PORTFOLIO (continued) | | |
| |
| SCHEDULE OF INVESTMENTS | | December 31, 2014 |
| | | | | | | | | | | | |
CORPORATE BONDS
(continued) | | Interest
Rate
| | Maturity
Date
| | Principal
Amount
(000)#
| | | Value
(Note 2)
| |
Lodging (continued) | | | | | | | | | | | | |
Marriott International, Inc., Sr. Unsec’d. Notes | | 3.250% | | 09/15/22 | | | 980 | | | $ | 983,938 | |
Starwood Hotels & Resorts Worldwide, Inc., Sr. Unsec’d. Notes(a) | | 6.750% | | 05/15/18 | | | 2,800 | | | | 3,187,128 | |
Wyndham Worldwide Corp., Sr. Unsec’d. Notes | | 2.500% | | 03/01/18 | | | 490 | | | | 489,162 | |
| | | | | | | | | | |
|
|
|
| | | | | | | | | | | | 6,328,114 | |
| | | | | | | | | | |
|
|
|
Media & Entertainment — 0.2% | | | | | | | | | | | | |
21st Century Fox America, Inc., Gtd. Notes | | 6.150% | | 03/01/37 | | | 515 | | | | 645,453 | |
21st Century Fox America, Inc., Gtd. Notes | | 6.150% | | 02/15/41 | | | 1,315 | | | | 1,673,535 | |
21st Century Fox America, Inc., Gtd. Notes | | 6.900% | | 08/15/39 | | | 90 | | | | 122,011 | |
CBS Corp., Gtd. Notes
(original cost $161,953; purchased 07/16/12)(d)(e) | | 4.850% | | 07/01/42 | | | 155 | | | | 157,093 | |
Historic TW, Inc., Gtd. Notes | | 9.150% | | 02/01/23 | | | 505 | | | | 686,853 | |
Myriad International Holdings BV (South Africa), Gtd. Notes, RegS | | 6.375% | | 07/28/17 | | | 1,300 | | | | 1,417,000 | |
Time Warner, Inc., Gtd. Notes | | 6.200% | | 03/15/40 | | | 210 | | | | 255,657 | |
Time Warner, Inc., Gtd. Notes | | 6.250% | | 03/29/41 | | | 1,465 | | | | 1,819,148 | |
Time Warner, Inc., Gtd. Notes | | 7.625% | | 04/15/31 | | | 90 | | | | 125,472 | |
Viacom, Inc., Sr. Unsec’d. Notes (original cost $44,077; purchased 07/25/13)(d)(e) | | 4.500% | | 02/27/42 | | | 50 | | | | 48,746 | |
Viacom, Inc., Sr. Unsec’d. Notes (original cost $188,796; purchased 02/11/14)(d)(e) | | 4.875% | | 06/15/43 | | | 200 | | | | 195,463 | |
Viacom, Inc., Sr. Unsec’d. Notes (original cost $422,250; purchased 08/12/13)(d)(e) | | 5.850% | | 09/01/43 | | | 425 | | | | 472,630 | |
| | | | | | | | | | |
|
|
|
| | | | | | | | | | | | 7,619,061 | |
| | | | | | | | | | |
|
|
|
Metals — 0.1% | | | | | | | | | | | | |
BHP Billiton Finance USA Ltd. (Australia), Gtd. Notes | | 5.000% | | 09/30/43 | | | 920 | | | | 1,042,839 | |
Glencore Finance Canada Ltd. (Switzerland), Gtd. Notes, 144A | | 2.050% | | 10/23/15 | | | 1,110 | | | | 1,117,223 | |
Glencore Finance Canada Ltd. (Switzerland), Gtd. Notes, 144A | | 2.700% | | 10/25/17 | | | 1,220 | | | | 1,234,283 | |
Newmont Mining Corp., Gtd. Notes | | 6.250% | | 10/01/39 | | | 35 | | | | 35,502 | |
Southern Copper Corp., Sr. Unsec’d. Notes | | 7.500% | | 07/27/35 | | | 425 | | | | 478,122 | |
| | | | | | | | | | |
|
|
|
| | | | | | | | | | | | 3,907,969 | |
| | | | | | | | | | |
|
|
|
Non-Captive Finance — 0.2% | | | | | | | | | | | | |
AerCap Ireland Capital Ltd./AerCap Global Aviation Trust (Netherlands), Gtd. Notes, 144A | | 3.750% | | 05/15/19 | | | 775 | | | | 767,250 | |
General Electric Capital Corp., Sr. Unsec’d. Notes, MTN(a) | | 5.875% | | 01/14/38 | | | 1,040 | | | | 1,315,975 | |
General Electric Capital Corp., Sr. Unsec’d. Notes, MTN | | 6.000% | | 08/07/19 | | | 920 | | | | 1,070,119 | |
General Electric Capital Corp., Sr. Unsec’d. Notes, MTN | | 6.875% | | 01/10/39 | | | 2,270 | | | | 3,210,931 | |
International Lease Finance Corp., Sr. Unsec’d. Notes | | 5.750% | | 05/15/16 | | | 375 | | | | 389,063 | |
Navient LLC, Sr. Unsec’d. Notes, MTN | | 8.450% | | 06/15/18 | | | 240 | | | | 267,600 | |
| | | | | | | | | | |
|
|
|
| | | | | | | | | | | | 7,020,938 | |
| | | | | | | | | | |
|
|
|
Packaging | | | | | | | | | | | | |
Crown Americas LLC/Crown Americas Capital Corp. IV, Gtd. Notes | | 4.500% | | 01/15/23 | | | 1,100 | | | | 1,067,000 | |
| | | | | | | | | | |
|
|
|
Paper — 0.1% | | | | | | | | | | | | |
Georgia-Pacific LLC, Gtd. Notes, 144A (original cost $288,298; purchased 10/27/10)(d)(e) | | 5.400% | | 11/01/20 | | | 290 | | | | 326,319 | |
International Paper Co., Sr. Unsec’d. Notes | | 6.000% | | 11/15/41 | | | 1,595 | | | | 1,867,315 | |
International Paper Co., Sr. Unsec’d. Notes | | 7.950% | | 06/15/18 | | | 510 | | | | 601,246 | |
Rock-Tenn Co., Gtd. Notes | | 4.900% | | 03/01/22 | | | 800 | | | | 859,351 | |
| | | | | | | | | | |
|
|
|
| | | | | | | | | | | | 3,654,231 | |
| | | | | | | | | | |
|
|
|
Pipelines & Other — 0.1% | | | | | | | | | | | | |
Energy Transfer Partners LP, Sr. Unsec’d. Notes | | 4.650% | | 06/01/21 | | | 675 | | | | 705,602 | |
Enterprise Products Operating LLC, Gtd. Notes | | 3.750% | | 02/15/25 | | | 1,345 | | | | 1,350,122 | |
Kinder Morgan Energy Partners LP, Sr. Unsec’d. Notes | | 5.950% | | 02/15/18 | | | 510 | | | | 563,042 | |
NiSource Finance Corp., Gtd. Notes | | 5.250% | | 09/15/17 | | | 245 | | | | 267,912 | |
NiSource Finance Corp., Gtd. Notes | | 5.450% | | 09/15/20 | | | 350 | | | | 393,859 | |
ONEOK Partners LP, Gtd. Notes | | 6.650% | | 10/01/36 | | | 145 | | | | 166,877 | |
Targa Resources Partners LP/Targa Resources Partners Finance Corp., Gtd. Notes, 144A | | 4.125% | | 11/15/19 | | | 775 | | | | 745,937 | |
| | | | | | | | | | |
|
|
|
| | | | | | | | | | | | 4,193,351 | |
| | | | | | | | | | |
|
|
|
SEE NOTES TO FINANCIAL STATEMENTS.
A79
| | | | | | |
| | | FLEXIBLE MANAGED PORTFOLIO (continued) | | |
| |
| SCHEDULE OF INVESTMENTS | | December 31, 2014 |
| | | | | | | | | | | | | | |
CORPORATE BONDS
(continued) | | Interest
Rate
| | | Maturity
Date
| | Principal
Amount
(000)#
| | | Value
(Note 2)
| |
Railroads | | | | | | | | | | | | | | |
Burlington Northern Santa Fe LLC, Sr. Unsec’d. Notes | | | 6.700% | | | 08/01/28 | | | 670 | | | $ | 848,780 | |
CSX Corp., Sr. Unsec’d. Notes | | | 6.150% | | | 05/01/37 | | | 715 | | | | 924,780 | |
Norfolk Southern Corp., Sr. Unsec’d. Notes | | | 5.590% | | | 05/17/25 | | | 100 | | | | 118,870 | |
| | | | | | | | | | | | |
|
|
|
| | | | | | | | | | | | | | 1,892,430 | |
| | | | | | | | | | | | |
|
|
|
Real Estate Investment Trusts (REITs) — 0.1% | | | | | | | | | | | | | | |
Mack-Cali Realty LP, Sr. Unsec’d. Notes | | | 7.750% | | | 08/15/19 | | | 765 | | | | 904,583 | |
ProLogis LP, Gtd. Notes | | | 6.875% | | | 03/15/20 | | | 72 | | | | 84,572 | |
Simon Property Group LP, Sr. Unsec’d. Notes | | | 2.800% | | | 01/30/17 | | | 295 | | | | 303,777 | |
Simon Property Group LP, Sr. Unsec’d. Notes | | | 3.375% | | | 03/15/22 | | | 230 | | | | 236,767 | |
Simon Property Group LP, Sr. Unsec’d. Notes | | | 6.125% | | | 05/30/18 | | | 3,080 | | | | 3,505,326 | |
| | | | | | | | | | | | |
|
|
|
| | | | | | | | | | | | | | 5,035,025 | |
| | | | | | | | | | | | |
|
|
|
Retailers — 0.1% | | | | | | | | | | | | | | |
CVS Health Corp., Sr. Unsec’d. Notes | | | 5.300% | | | 12/05/43 | | | 225 | | | | 268,970 | |
Home Depot, Inc. (The), Sr. Unsec’d. Notes | | | 4.400% | | | 03/15/45 | | | 755 | | | | 825,152 | |
L Brands, Inc., Gtd. Notes(a) | | | 5.625% | | | 02/15/22 | | | 1,450 | | | | 1,558,750 | |
Lowe’s Cos., Inc., Sr. Unsec’d. Notes | | | 6.500% | | | 03/15/29 | | | 385 | | | | 487,766 | |
Macy’s Retail Holdings, Inc., Gtd. Notes(a) | | | 3.875% | | | 01/15/22 | | | 360 | | | | 374,173 | |
Target Corp., Sr. Unsec’d. Notes | | | 3.500% | | | 07/01/24 | | | 345 | | | | 358,170 | |
| | | | | | | | | | | | |
|
|
|
| | | | | | | | | | | | | | 3,872,981 | |
| | | | | | | | | | | | |
|
|
|
Technology — 0.1% | | | | | | | | | | | | | | |
Arrow Electronics, Inc., Sr. Unsec’d. Notes | | | 3.375% | | | 11/01/15 | | | 400 | | | | 407,211 | |
Fiserv, Inc., Gtd. Notes | | | 3.125% | | | 06/15/16 | | | 2,410 | | | | 2,474,338 | |
Oracle Corp., Sr. Unsec’d. Notes(a) | | | 4.300% | | | 07/08/34 | | | 920 | | | | 985,018 | |
Seagate HDD Cayman, Gtd. Notes, 144A | | | 3.750% | | | 11/15/18 | | | 605 | | | | 620,881 | |
| | | | | | | | | | | | |
|
|
|
| | | | | | | | | | | | | | 4,487,448 | |
| | | | | | | | | | | | |
|
|
|
Telecommunications — 0.5% | | | | | | | | | | | | | | |
America Movil SAB de CV (Mexico), Gtd. Notes | | | 6.125% | | | 03/30/40 | | | 480 | | | | 567,941 | |
AT&T Corp., Gtd. Notes | | | 8.000% | | | 11/15/31 | | | 7 | | | | 10,315 | |
AT&T, Inc., Sr. Unsec’d. Notes(a) | | | 4.800% | | | 06/15/44 | | | 1,305 | | | | 1,329,738 | |
AT&T, Inc., Sr. Unsec’d. Notes | | | 5.350% | | | 09/01/40 | | | 815 | | | | 882,499 | |
British Telecommunications PLC (United Kingdom), Sr. Unsec’d. Notes | | | 9.625% | | | 12/15/30 | | | 400 | | | | 628,020 | |
Embarq Corp., Sr. Unsec’d. Notes
(original cost $367,380; purchased 05/04/11-05/11/11)(d)(e) | | | 7.082% | | | 06/01/16 | | | 325 | | | | 350,225 | |
Embarq Corp., Sr. Unsec’d. Notes
(original cost $479,966; purchased 05/12/06)(d)(e) | | | 7.995% | | | 06/01/36 | | | 480 | | | | 536,400 | |
Sprint Communications, Inc., Sr. Unsec’d. Notes | | | 6.000% | | | 12/01/16 | | | 1,075 | | | | 1,124,477 | |
Verizon Communications, Inc., Sr. Unsec’d. Notes(a) | | | 6.400% | | | 09/15/33 | | | 930 | | | | 1,145,558 | |
Verizon Communications, Inc., Sr. Unsec’d. Notes | | | 6.550% | | | 09/15/43 | | | 1,740 | | | | 2,229,199 | |
Verizon Communications, Inc., Sr. Unsec’d. Notes(a) | | | 3.500% | | | 11/01/24 | | | 1,270 | | | | 1,247,774 | |
Verizon Communications, Inc., Sr. Unsec’d. Notes | | | 6.350% | | | 04/01/19 | | | 3,165 | | | | 3,667,485 | |
Verizon Communications, Inc., Sr. Unsec’d. Notes, 144A(a) | | | 4.862% | | | 08/21/46 | | | 1,256 | | | | 1,290,197 | |
Verizon Communications, Inc., Sr. Unsec’d. Notes, 144A(a) | | | 5.012% | | | 08/21/54 | | | 3,127 | | | | 3,235,035 | |
| | | | | | | | | | | | |
|
|
|
| | | | | | | | | | | | | | 18,244,863 | |
| | | | | | | | | | | | |
|
|
|
Tobacco — 0.1% | | | | | | | | | | | | | | |
Altria Group, Inc., Gtd. Notes(a) | | | 4.000% | | | 01/31/24 | | | 1,500 | | | | 1,563,871 | |
Altria Group, Inc., Gtd. Notes | | | 9.950% | | | 11/10/38 | | | 46 | | | | 78,690 | |
Altria Group, Inc., Gtd. Notes | | | 10.200% | | | 02/06/39 | | | 254 | | | | 442,250 | |
Imperial Tobacco Finance PLC (United Kingdom), Gtd. Notes, 144A | | | 2.050% | | | 02/11/18 | | | 2,050 | | | | 2,038,514 | |
Lorillard Tobacco Co., Gtd. Notes | | | 3.500% | | | 08/04/16 | | | 465 | | | | 478,702 | |
Lorillard Tobacco Co., Gtd. Notes | | | 8.125% | | | 06/23/19 | | | 325 | | | | 394,006 | |
| | | | | | | | | | | | |
|
|
|
| | | | | | | | | | | | | | 4,996,033 | |
| | | | | | | | | | | | |
|
|
|
TOTAL CORPORATE BONDS
(cost $279,703,191) | | | | 301,231,336 | |
| | | | | | | | | | | | |
|
|
|
SEE NOTES TO FINANCIAL STATEMENTS.
A80
| | | | | | |
| | | FLEXIBLE MANAGED PORTFOLIO (continued) | | |
| |
| SCHEDULE OF INVESTMENTS | | December 31, 2014 |
| | | | | | | | | | | | | | |
| FOREIGN AGENCIES — 0.6% | | Interest
Rate
| | | Maturity
Date
| | Principal
Amount
(000)#
| | | Value
(Note 2)
| |
CDP Financial, Inc. (Canada), Sr. Unsec’d. Notes, 144A | | | 3.150% | | | 07/24/24 | | | 800 | | | $ | 815,642 | |
Comision Federal de Electricidad (Mexico), Sr. Unsec’d. Notes, 144A | | | 4.875% | | | 01/15/24 | | | 645 | | | | 674,025 | |
Export-Import Bank of Korea (South Korea), Sr. Unsec’d. Notes | | | 5.125% | | | 06/29/20 | | | 400 | | | | 450,792 | |
Gazprom OAO Via Gaz Capital SA (Russia), Sr. Unsec’d. Notes, 144A | | | 9.250% | | | 04/23/19 | | | 930 | | | | 948,135 | |
Hashemite Kingdom of Jordan Government USAID Bond, U.S. Gov’t. Gtd. Notes | | | 2.503% | | | 10/30/20 | | | 1,378 | | | | 1,400,959 | |
KFW (Germany), Gov’t. Gtd. Notes, GMTN | | | 2.750% | | | 10/01/20 | | | 3,525 | | | | 3,682,003 | |
Kommunalbanken AS (Norway), Sr. Unsec’d. Notes, 144A | | | 1.125% | | | 05/23/18 | | | 3,158 | | | | 3,123,167 | |
Pemex Project Funding Master Trust (Mexico), Gtd. Notes | | | 6.625% | | | 06/15/35 | | | 1,624 | | | | 1,875,720 | |
Pemex Project Funding Master Trust (Mexico), Sr. Unsec’d. Notes | | | 8.625% | | | 12/01/23 | | | 350 | | | | 433,650 | |
Petrobras Global Finance BV (Brazil), Gtd. Notes | | | 2.000% | | | 05/20/16 | | | 1,665 | | | | 1,590,325 | |
Petroleos Mexicanos (Mexico), Gtd. Notes(a) | | | 3.500% | | | 01/30/23 | | | 970 | | | | 927,805 | |
Petroleos Mexicanos (Mexico), Gtd. Notes | | | 4.875% | | | 01/18/24 | | | 510 | | | | 529,890 | |
Petroleos Mexicanos (Mexico), Gtd. Notes | | | 5.500% | | | 01/21/21 | | | 2,730 | | | | 2,955,225 | |
Russian Agricultural Bank OJSC via RSHB Capital SA (Russia), Sr. Unsec’d. Notes, 144A | | | 6.299% | | | 05/15/17 | | | 1,030 | | | | 910,520 | |
Sinopec Group Overseas Development 2014 Ltd. (China), Gtd. Notes, 144A | | | 1.750% | | | 04/10/17 | | | 1,620 | | | | 1,612,273 | |
State Grid Overseas Investment 2014 Ltd. (China), Gtd. Notes, 144A | | | 2.750% | | | 05/07/19 | | | 665 | | | | 667,794 | |
Ukraine Government USAID Bonds, U.S. Gov’t. Gtd. Notes | | | 1.844% | | | 05/16/19 | | | 1,605 | | | | 1,615,834 | |
| | | | | | | | | | | | |
|
|
|
TOTAL FOREIGN AGENCIES
(cost $24,401,801) | | | | 24,213,759 | |
| | | | | | | | | | | | |
|
|
|
| MUNICIPAL BONDS — 0.4% | | | | | | | | | | | | | | |
California — 0.1% | | | | | | | | | | | | | | |
Bay Area Toll Authority, Revenue Bonds, BABs | | | 6.263% | | | 04/01/49 | | | 1,325 | | | | 1,869,747 | |
State of California, GO, BABs | | | 7.300% | | | 10/01/39 | | | 1,270 | | | | 1,863,522 | |
State of California, GO, BABs | | | 7.500% | | | 04/01/34 | | | 475 | | | | 710,837 | |
State of California, GO, BABs | | | 7.550% | | | 04/01/39 | | | 245 | | | | 377,653 | |
State of California, GO, BABs | | | 7.625% | | | 03/01/40 | | | 215 | | | | 330,014 | |
| | | | | | | | | | | | |
|
|
|
| | | | | | | | | | | | | | 5,151,773 | |
| | | | | | | | | | | | |
|
|
|
Colorado | | | | | | | | | | | | | | |
Regional Transportation District, Revenue Bonds, Series 2010-B, BABs | | | 5.844% | | | 11/01/50 | | | 680 | | | | 945,499 | |
| | | | | | | | | | | | |
|
|
|
Illinois — 0.1% | | | | | | | | | | | | | | |
Chicago O’Hare International Airport, Revenue Bonds, BABs | | | 6.395% | | | 01/01/40 | | | 1,030 | | | | 1,393,384 | |
State of Illinois, GO, Taxable Series | | | 4.421% | | | 01/01/15 | | | 740 | | | | 740,000 | |
| | | | | | | | | | | | |
|
|
|
| | | | | | | | | | | | | | 2,133,384 | |
| | | | | | | | | | | | |
|
|
|
New Jersey — 0.1% | | | | | | | | | | | | | | |
New Jersey State Turnpike Authority, Revenue Bonds, Series F, BABs | | | 7.414% | | | 01/01/40 | | | 1,070 | | | | 1,613,539 | |
| | | | | | | | | | | | |
|
|
|
New York — 0.1% | | | | | | | | | | | | | | |
New York City Transitional Finance Authority, Revenue Bonds, BABs | | | 5.767% | | | 08/01/36 | | | 1,130 | | | | 1,416,093 | |
| | | | | | | | | | | | |
|
|
|
Ohio | | | | | | | | | | | | | | |
Ohio State University (The), Revenue Bonds, BABs | | | 4.910% | | | 06/01/40 | | | 455 | | | | 555,428 | |
Ohio State Water Development Authority, Revenue Bonds, BABs | | | 4.879% | | | 12/01/34 | | | 300 | | | | 336,711 | |
| | | | | | | | | | | | |
|
|
|
| | | | | | | | | | | | | | 892,139 | |
| | | | | | | | | | | | |
|
|
|
Oregon | | | | | | | | | | | | | | |
Oregon State Department of Transportation Highway, Revenue Bonds, Series A, BABs | | | 5.834% | | | 11/15/34 | | | 445 | | | | 577,557 | |
| | | | | | | | | | | | |
|
|
|
Pennsylvania | | | | | | | | | | | | | | |
Pennsylvania Turnpike Commission, Revenue Bonds, Series B, BABs | | | 5.511% | | | 12/01/45 | | | 550 | | | | 678,722 | |
| | | | | | | | | | | | |
|
|
|
Tennessee | | | | | | | | | | | | | | |
Metropolitan Government of Nashville & Davidson County Convention Center Authority, Revenue Bonds, BABs | | | 6.731% | | | 07/01/43 | | | 1,000 | | | | 1,344,400 | |
| | | | | | | | | | | | |
|
|
|
Texas | | | | | | | | | | | | | | |
Texas State Transportation Commission, Revenue Bonds, Series B, BABs | | | 5.028% | | | 04/01/26 | | | 335 | | | | 390,513 | |
| | | | | | | | | | | | |
|
|
|
TOTAL MUNICIPAL BONDS
(cost $11,417,427) | | | | 15,143,619 | |
| | | | | | | | | | | | |
|
|
|
SEE NOTES TO FINANCIAL STATEMENTS.
A81
| | | | | | |
| | | FLEXIBLE MANAGED PORTFOLIO (continued) | | |
| |
| SCHEDULE OF INVESTMENTS | | December 31, 2014 |
| | | | | | | | | | | | |
| SOVEREIGN BONDS — 0.3% | | Interest
Rate
| | Maturity
Date
| | Principal
Amount
(000)#
| | | Value
(Note 2)
| |
Brazilian Government International Bond (Brazil), Sr. Unsec’d. Notes | | 4.250% | | 01/07/25 | | | 1,275 | | | $ | 1,275,000 | |
Colombia Government International Bond (Colombia), Sr. Unsec’d. Notes | | 4.000% | | 02/26/24 | | | 1,475 | | | | 1,508,187 | |
Hungary Government International Bond (Hungary), Sr. Unsec’d. Notes | | 4.000% | | 03/25/19 | | | 580 | | | | 595,950 | |
Indonesia Government International Bond (Indonesia), Sr. Unsec’d. Notes, 144A | | 5.875% | | 03/13/20 | | | 1,135 | | | | 1,257,012 | |
Indonesia Government International Bond (Indonesia), Sr. Unsec’d. Notes, 144A | | 6.875% | | 01/17/18 | | | 1,120 | | | | 1,265,600 | |
Mexico Government International Bond (Mexico), Sr. Unsec’d. Notes | | 3.625% | | 03/15/22 | | | 700 | | | | 715,050 | |
Mexico Government International Bond (Mexico), Sr. Unsec’d. Notes, MTN | | 4.750% | | 03/08/44 | | | 1,006 | | | | 1,048,755 | |
Panama Government International Bond (Panama), Sr. Unsec’d. Notes | | 4.000% | | 09/22/24 | | | 515 | | | | 529,163 | |
Panama Government International Bond (Panama), Sr. Unsec’d. Notes(a) | | 5.200% | | 01/30/20 | | | 620 | | | | 683,550 | |
Province of British Columbia (Canada), Sr. Unsec’d. Notes | | 2.000% | | 10/23/22 | | | 1,620 | | | | 1,584,665 | |
Romanian Government International Bond (Romania), Sr. Unsec’d. Notes, 144A | | 4.875% | | 01/22/24 | | | 190 | | | | 207,100 | |
Slovenia Government International Bond (Slovenia), Sr. Unsec’d.
Notes, 144A(a) | | 4.125% | | 02/18/19 | | | 200 | | | | 209,504 | |
Turkey Government International Bond (Turkey), Sr. Unsec’d. Notes | | 7.000% | | 06/05/20 | | | 810 | | | | 941,826 | |
| | | | | | | | | | |
|
|
|
TOTAL SOVEREIGN BONDS
(cost $11,396,337) | | | | 11,821,362 | |
| | | | | | | | | | |
|
|
|
| U.S. GOVERNMENT AGENCY OBLIGATIONS — 7.4% | | | | | | | | | | | | |
Federal Home Loan Bank | | 0.375% | | 08/28/15 | | | 460 | | | | 460,399 | |
Federal Home Loan Bank | | 5.500% | | 07/15/36 | | | 1,080 | | | | 1,481,140 | |
Federal Home Loan Mortgage Corp.(g) | | 0.750% | | 01/12/18 | | | 685 | | | | 675,170 | |
Federal Home Loan Mortgage Corp. | | 2.125%(b) | | 06/01/36 | | | 449 | | | | 478,892 | |
Federal Home Loan Mortgage Corp. | | 2.348%(b) | | 12/01/35 | | | 325 | | | | 346,899 | |
Federal Home Loan Mortgage Corp. | | 2.375% | | 01/13/22 | | | 6,020 | | | | 6,081,970 | |
Federal Home Loan Mortgage Corp. | | 2.500% | | 01/20/30 | | | 1,000 | | | | 1,017,078 | |
Federal Home Loan Mortgage Corp. | | 3.000% | | 10/01/28-01/01/43 | | | 5,154 | | | | 5,314,455 | |
Federal Home Loan Mortgage Corp. | | 3.500% | | TBA | | | 1,000 | | | | 1,055,625 | |
Federal Home Loan Mortgage Corp. | | 3.500% | | 02/12/43 | | | 9,500 | | | | 9,854,023 | |
Federal Home Loan Mortgage Corp. | | 4.000% | | 06/01/26-12/01/40 | | | 5,536 | | | | 5,918,382 | |
Federal Home Loan Mortgage Corp. | | 4.000% | | TBA | | | 6,000 | | | | 6,379,570 | |
Federal Home Loan Mortgage Corp. | | 4.500% | | 02/01/19-10/01/41 | | | 14,617 | | | | 15,838,927 | |
Federal Home Loan Mortgage Corp. | | 5.000% | | 07/01/18-06/01/39 | | | 4,571 | | | | 4,995,487 | |
Federal Home Loan Mortgage Corp. | | 5.500% | | 12/01/33-07/01/38 | | | 4,797 | | | | 5,366,859 | |
Federal Home Loan Mortgage Corp. | | 6.000% | | 03/01/32-08/01/39 | | | 2,288 | | | | 2,597,609 | |
Federal Home Loan Mortgage Corp. | | 7.000% | | 01/01/31-10/01/32 | | | 322 | | | | 370,171 | |
Federal National Mortgage Assoc. | | 1.750% | | 06/20/19 | | | 1,930 | | | | 1,939,511 | |
Federal National Mortgage Assoc.(a) | | 1.750% | | 11/26/19 | | | 2,525 | | | | 2,526,515 | |
Federal National Mortgage Assoc. | | 1.784%(b) | | 07/01/33 | | | 354 | | | | 373,145 | |
Federal National Mortgage Assoc. | | 1.809%(b) | | 06/01/37 | | | 139 | | | | 139,225 | |
Federal National Mortgage Assoc.(g) | | 1.875% | | 02/19/19 | | | 230 | | | | 233,490 | |
Federal National Mortgage Assoc. | | 2.500% | | 01/01/28 | | | 2,604 | | | | 2,656,481 | |
Federal National Mortgage Assoc. | | 2.500% | | TBA | | | 7,500 | | | | 7,621,290 | |
Federal National Mortgage Assoc.(h) | | 2.625% | | 09/06/24 | | | 2,485 | | | | 2,516,612 | |
Federal National Mortgage Assoc. | | 3.000% | | TBA | | | 16,000 | | | | 16,630,626 | |
Federal National Mortgage Assoc. | | 3.000% | | 12/01/42 | | | 2,259 | | | | 2,289,583 | |
Federal National Mortgage Assoc. | | 3.000% | | TBA | | | 24,500 | | | | 24,721,553 | |
Federal National Mortgage Assoc. | | 3.500% | | TBA | | | 8,500 | | | | 8,860,587 | |
Federal National Mortgage Assoc. | | 3.500% | | 06/01/39-03/01/43 | | | 22,146 | | | | 23,134,698 | |
Federal National Mortgage Assoc. | | 4.000% | | TBA | | | 14,500 | | | | 15,475,182 | |
Federal National Mortgage Assoc. | | 4.000% | | TBA | | | 10,500 | | | | 11,177,455 | |
Federal National Mortgage Assoc. | | 4.500% | | 11/01/18-07/01/42 | | | 11,621 | | | | 12,670,127 | |
Federal National Mortgage Assoc. | | 4.500% | | TBA | | | 4,000 | | | | 4,341,875 | |
Federal National Mortgage Assoc. | | 4.500% | | TBA | | | 5,000 | | | | 5,417,969 | |
Federal National Mortgage Assoc. | | 5.000% | | 10/01/18-02/01/36 | | | 8,555 | | | | 9,456,149 | |
Federal National Mortgage Assoc. | | 5.500% | | 03/01/16-08/01/37 | | | 6,454 | | | | 7,235,830 | |
Federal National Mortgage Assoc. | | 6.000% | | 09/01/17-05/01/38 | | | 5,737 | | | | 6,528,384 | |
SEE NOTES TO FINANCIAL STATEMENTS.
A82
| | | | | | |
| | | FLEXIBLE MANAGED PORTFOLIO (continued) | | |
| |
| SCHEDULE OF INVESTMENTS | | December 31, 2014 |
| | | | | | | | | | | | |
U.S. GOVERNMENT AGENCY OBLIGATIONS
(continued) | | Interest
Rate
| | Maturity
Date
| | Principal
Amount
(000)#
| | | Value
(Note 2)
| |
Federal National Mortgage Assoc. | | 6.500% | | 07/01/17-09/01/37 | | | 2,115 | | | $ | 2,422,566 | |
Federal National Mortgage Assoc. | | 7.000% | | 02/01/32-07/01/32 | | | 218 | | | | 252,387 | |
Federal National Mortgage Assoc. | | 7.500% | | 05/01/32 | | | 42 | | | | 44,031 | |
Financing Corp., Strips Principal, Series A-P | | 1.280%(f) | | 10/06/17 | | | 1,570 | | | | 1,514,637 | |
Financing Corp., Strips Principal, Series B-P | | 1.280%(f) | | 10/06/17 | | | 2,140 | | | | 2,069,078 | |
Government National Mortgage Assoc. | | 3.000% | | TBA | | | 2,500 | | | | 2,556,562 | |
Government National Mortgage Assoc. | | 3.000% | | TBA | | | 3,000 | | | | 3,067,875 | |
Government National Mortgage Assoc. | | 3.500% | | TBA | | | 14,000 | | | | 14,695,625 | |
Government National Mortgage Assoc. | | 3.500% | | 05/20/43 | | | 1,000 | | | | 1,051,178 | |
Government National Mortgage Assoc. | | 4.000% | | 06/15/40-05/20/41 | | | 1,515 | | | | 1,628,944 | |
Government National Mortgage Assoc. | | 4.000% | | TBA | | | 12,500 | | | | 13,402,197 | |
Government National Mortgage Assoc. | | 4.500% | | TBA | | | 2,000 | | | | 2,185,234 | |
Government National Mortgage Assoc. | | 4.500% | | TBA | | | 2,000 | | | | 2,185,234 | |
Government National Mortgage Assoc. | | 4.500% | | 01/20/41-02/20/41 | | | 5,092 | | | | 5,589,189 | |
Government National Mortgage Assoc. | | 5.500% | | 11/15/32-02/15/36 | | | 2,819 | | | | 3,174,922 | |
Government National Mortgage Assoc. | | 6.000% | | 02/15/33-10/15/34 | | | 1,288 | | | | 1,477,484 | |
Government National Mortgage Assoc. | | 6.500% | | 10/15/23-07/15/35 | | | 1,543 | | | | 1,770,413 | |
Government National Mortgage Assoc. | | 8.000% | | 01/15/24-04/15/25 | | | 42 | | | | 47,876 | |
| | | | | | | | | | |
|
|
|
TOTAL U.S. GOVERNMENT AGENCY OBLIGATIONS
(cost $286,432,883) | | | | 293,314,375 | |
| | | | | | | | | | |
|
|
|
| U.S. TREASURY OBLIGATIONS — 3.7% | | | | | | | | | | | | |
U.S. Treasury Bonds | | 2.875% | | 05/15/43 | | | 1,085 | | | | 1,109,751 | |
U.S. Treasury Bonds | | 3.375% | | 05/15/44 | | | 3,145 | | | | 3,540,581 | |
U.S. Treasury Inflation Indexed Bonds, TIPS | | 1.375% | | 01/15/20 | | | 6,105 | | | | 6,408,146 | |
U.S. Treasury Inflation Indexed Bonds, TIPS | | 0.125% | | 04/15/19 | | | 26,844 | | | | 26,548,456 | |
U.S. Treasury Notes | | 1.000% | | 12/15/17-09/30/19 | | | 14,205 | | | | 13,885,051 | |
U.S. Treasury Notes | | 1.250% | | 11/30/18 | | | 3,455 | | | | 3,430,708 | |
U.S. Treasury Notes | | 1.375% | | 06/30/18 | | | 6,900 | | | | 6,913,476 | |
U.S. Treasury Notes | | 1.500% | | 12/31/18-10/31/19 | | | 53,890 | | | | 53,822,529 | |
U.S. Treasury Notes(a) | | 1.500% | | 11/30/19 | | | 2,180 | | | | 2,166,205 | |
U.S. Treasury Notes | | 1.625% | | 04/30/19-12/31/19 | | | 2,910 | | | | 2,910,406 | |
U.S. Treasury Notes | | 1.750% | | 05/15/23 | | | 1,000 | | | | 973,672 | |
U.S. Treasury Notes | | 2.250% | | 03/31/21 | | | 110 | | | | 112,303 | |
U.S. Treasury Notes | | 2.375% | | 05/31/18 | | | 9,210 | | | | 9,546,736 | |
U.S. Treasury Notes | | 2.875% | | 03/31/18 | | | 6,430 | | | | 6,764,559 | |
U.S. Treasury Notes | | 3.125% | | 05/15/21 | | | 130 | | | | 139,506 | |
U.S. Treasury Strips Principal(a) | | 3.470%(f) | | 05/15/44 | | | 14,555 | | | | 6,296,042 | |
| | | | | | | | | | |
|
|
|
TOTAL U.S. TREASURY OBLIGATIONS
(cost $142,902,270) | | | | 144,568,127 | |
| | | | | | | | | | |
|
|
|
TOTAL LONG-TERM INVESTMENTS
(cost $3,093,765,991) | | | | 3,751,039,845 | |
| | | | | | | | | | |
|
|
|
| | | | |
| SHORT-TERM INVESTMENTS — 10.8% | | | | | | Shares
| | | | |
AFFILIATED MUTUAL FUNDS — 10.7% | |
Prudential Investment Portfolios 2 — Prudential Core Short-Term Bond Fund
(cost $133,374,308) (Note 4)(i) | | | 13,562,345 | | | | 126,672,300 | |
Prudential Investment Portfolios 2 — Prudential Core Taxable Money Market Fund
(cost $294,529,119; includes $86,514,898 of cash collateral for securities on loan) (Note 4)(i)(j) | | | 294,529,119 | | | | 294,529,119 | |
| | | | | | | | | | |
|
|
|
TOTAL AFFILIATED MUTUAL FUNDS
(cost $427,903,427) | | | | 421,201,419 | |
| | | | | | | | | | |
|
|
|
SEE NOTES TO FINANCIAL STATEMENTS.
A83
| | | | | | |
| | | FLEXIBLE MANAGED PORTFOLIO (continued) | | |
| |
| SCHEDULE OF INVESTMENTS | | December 31, 2014 |
| | | | | | | | | | | | |
| OPTIONS PURCHASED* | | | | | | Notional
Amount
(000)#
| | | Value
(Note 2)
| |
Call Options | | | | | | | | | | | | |
2 Year U.S. Treasury Notes Futures, expiring 01/23/15, Strike Price $109.38 | | | 54,400 | | | $ | 42,500 | |
2 Year U.S. Treasury Notes Futures, expiring 01/23/15, Strike Price $110.00 | | | 54,400 | | | | 4,250 | |
| | | | | | | | | | |
|
|
|
TOTAL OPTIONS PURCHASED
(cost $77,463) | | | | 46,750 | |
| | | | | | | | | | |
|
|
|
| | | | |
| U.S. TREASURY OBLIGATION — 0.1% | | Interest
Rate
| | Maturity
Date
| | Principal
Amount
(000)#
| | | | |
U.S. Treasury Bill
(cost $4,949,665)(g) | | 0.032%(k) | | 03/19/15 | | | 4,950 | | | | 4,949,792 | |
| | | | | | | | | | |
|
|
|
TOTAL SHORT-TERM INVESTMENTS
(cost $432,930,555) | | | | 426,197,961 | |
| | | | | | | | | | |
|
|
|
TOTAL INVESTMENTS, BEFORE SECURITY SOLD SHORT & OPTION WRITTEN — 105.9%
(cost $3,526,696,546) | | | | 4,177,237,806 | |
| | | | | | | | | | |
|
|
|
| SECURITY SOLD SHORT | | | | | | | | | | | | |
U.S. GOVERNMENT AGENCY OBLIGATION | | | | | | | | | | | | |
Federal National Mortgage Assoc. (proceeds received $1,555,430) | | 3.500% | | TBA | | | 1,500 | | | | (1,559,590 | ) |
| | | | | | | | | | |
|
|
|
| | | | |
| OPTION WRITTEN* | | | | | | Notional
Amount
(000)#
| | | | |
Call Option | | | | | | | | | | | | |
2 Year U.S. Treasury Notes Futures, expiring 01/23/15, Strike Price $109.63
(premiums received $50,037) | | | 108,800 | | | | (17,000 | ) |
| | | | | | | | | | |
|
|
|
TOTAL INVESTMENTS, NET OF SECURITY SOLD SHORT & OPTION WRITTEN — 105.9%
(cost $3,525,091,079) | | | | 4,175,661,216 | |
LIABILITIES IN EXCESS OF OTHER ASSETS(l) — (5.9)% | | | | (231,849,606 | ) |
| | | | | | | | | | |
|
|
|
NET ASSETS — 100.0% | | | $ | 3,943,811,610 | |
| | | | | | | | | | |
|
|
|
See the Glossary for abbreviations used in the Portfolio descriptions.
| # | Principal or notional amount is shown in U.S. dollars unless otherwise stated. |
| * | Non-income producing security. |
| (a) | All or a portion of security is on loan. The aggregate market value of such securities, including those sold and pending settlement, is $84,082,109; cash collateral of $86,514,898 (included in liabilities) was received with which the Portfolio purchased highly liquid short-term investments. Securities on loan are subject to contractual netting arrangements. |
| (b) | Variable rate instrument. The interest rate shown reflects the rate in effect at December 31, 2014. |
| (c) | Represents issuer in default on interest payments. Non-income producing security. Such securities may be post maturity. |
| (d) | Indicates a restricted security; the aggregate original cost of the restricted securities is $8,057,408. The aggregate value of $8,466,332 is approximately 0.2% of net assets. |
| (e) | Indicates a security or securities that has been deemed illiquid. |
| (f) | Represents zero coupon bond or principal only securities. Rate represents yield to maturity at purchase date. |
| (g) | Represents security, or a portion thereof, segregated as collateral for futures contracts. |
| (h) | Represents security, or a portion thereof, segregated as collateral for swap agreements. |
| (i) | Prudential Investments LLC, the manager of the Portfolio, also serves as manager of the Prudential Investment Portfolios 2 — Prudential Core Taxable Money Market Fund and the Prudential Investment Portfolios 2 — Prudential Core Short-Term Bond Fund. |
| (j) | Represents security, or a portion thereof, purchased with cash collateral received for securities on loan. |
| (k) | Rate quoted represents yield-to-maturity as of purchase date. |
SEE NOTES TO FINANCIAL STATEMENTS.
A84
| | | | | | |
| | | FLEXIBLE MANAGED PORTFOLIO (continued) | | |
| |
| SCHEDULE OF INVESTMENTS | | December 31, 2014 |
| (l) | Includes net unrealized appreciation (depreciation) on the following derivative contracts held at reporting period end: |
Futures contracts outstanding at December 31, 2014:
| | | | | | | | | | | | | | | | | | | | |
Number of
Contracts
| | | Type
| | Expiration
Date
| | | Value at
Trade Date
| | | Value at
December 31, 2014
| | | Unrealized
Appreciation
(Depreciation)(1)
| |
| | Long Positions: | | | | | | | | | | | | | | | | | | | |
| | 532 | | | 2 Year U.S. Treasury Notes | | | Mar. 2015 | | | $ | 116,293,418 | | | $ | 116,291,875 | | | $ | (1,543 | ) |
| | 189 | | | 10 Year U.S. Treasury Notes | | | Mar. 2015 | | | | 23,942,711 | | | | 23,964,610 | | | | 21,899 | |
| | 13 | | | MSCI EAFE Index Mini | | | Mar. 2015 | | | | 1,132,070 | | | | 1,142,635 | | | | 10,565 | |
| | 970 | | | S&P 500 E-Mini Futures | | | Mar. 2015 | | | | 96,199,071 | | | | 99,541,400 | | | | 3,342,329 | |
| | 132 | | | U.S. Ultra Bonds | | | Mar. 2015 | | | | 21,198,211 | | | | 21,804,750 | | | | 606,539 | |
| | | | | | | | | | | | | | | | | | |
|
|
|
| | | | | | | | | | | | | | | | | | | | 3,979,789 | |
| | | | | | | | | | | | | | | | | | |
|
|
|
| | Short Positions: | | | | | | | | | | | | | | | | | | | |
| | 20 | | | 5 Year U.S. Treasury Notes | | | Mar. 2015 | | | | 2,374,503 | | | | 2,378,594 | | | | (4,091 | ) |
| | 30 | | | U.S. Long Bonds | | | Mar. 2015 | | | | 4,303,611 | | | | 4,336,875 | | | | (33,264 | ) |
| | | | | | | | | | | | | | | | | | |
|
|
|
| | | | | | | | | | | | | | | | | | | | (37,355 | ) |
| | | | | | | | | | | | | | | | | | |
|
|
|
| | | | | | | | | | | | | | | | | | | $ | 3,942,434 | |
| | | | | | | | | | | | | | | | | | |
|
|
|
| (1) | A U.S. Treasury Obligation with a market value of $4,949,792 has been segregated with Goldman Sachs & Co. and U.S. Government Agency Obligations with a combined market value of $827,446 have been segregated with Citigroup Global Markets to cover requirements for open futures contracts at December 31, 2014. |
Interest rate swap agreements outstanding at December 31, 2014:
| | | | | | | | | | | | | | | | | | | | | | | | | | |
Notional
Amount
(000)#
| | | Termination
Date
| | | Fixed
Rate
| | | Floating Rate
| | Fair
Value
| | | Upfront
Premiums
Paid
(Received)
| | | Unrealized
Appreciation
| | | Counterparty
|
| Over-the-counter swap agreements: |
| | 3,158 | | | | 05/17/18 | | | | 0.989% | | | 3 Month LIBOR(1) | | $ | 39,627 | | | $ | — | | | $ | 39,627 | | | Credit Suisse First Boston Corp. |
| | | | | | | | | | | | | | |
|
|
| |
|
|
| |
|
|
| | |
| | | | | | | | | | | | | | | | | | | | | | | | |
Notional
Amount
(000)#
| | | Termination
Date
| | | Fixed
Rate
| | | Floating Rate
| | Value at
Trade Date
| | | Value at
December 31, 2014
| | | Unrealized
Appreciation
(Depreciation)
| |
| Exchange-traded swap agreements: | | | | | |
| | 3,670 | | | | 06/30/16 | | | | 0.618% | | | 3 Month LIBOR(1) | | $ | 159 | | | $ | 1,836 | | | $ | 1,677 | |
| | 20,700 | | | | 06/30/16 | | | | 0.655% | | | 3 Month LIBOR(1) | | | (2,123 | ) | | | (1,083 | ) | | | 1,040 | |
| | 5,800 | | | | 06/30/16 | | | | 0.655% | | | 3 Month LIBOR(1) | | | 164 | | | | (315 | ) | | | (479 | ) |
| | 37,290 | | | | 08/29/16 | | | | 0.710% | | | 3 Month LIBOR(1) | | | 181 | | | | 11,742 | | | | 11,561 | |
| | 28,000 | | | | 05/31/19 | | | | 1.730% | | | 3 Month LIBOR(1) | | | 2,095 | | | | 28,141 | | | | 26,046 | |
| | 29,600 | | | | 08/29/19 | | | | 1.804% | | | 3 Month LIBOR(2) | | | 221 | | | | 123,050 | | | | 122,829 | |
| | 9,270 | | | | 10/31/21 | | | | 2.152% | | | 3 Month LIBOR(1) | | | 205 | | | | (34,143 | ) | | | (34,348 | ) |
| | 8,040 | | | | 08/29/24 | | | | 2.560% | | | 3 Month LIBOR(1) | | | 152 | | | | (209,443 | ) | | | (209,595 | ) |
| | | | | | | | | | | | | | |
|
|
| |
|
|
| |
|
|
|
| | | | | | | | | | | | | | | $ | 1,054 | | | $ | (80,215 | ) | | $ | (81,269 | ) |
| | | | | | | | | | | | | | |
|
|
| |
|
|
| |
|
|
|
| (1) | Portfolio pays the fixed rate and receives the floating rate. |
| (2) | Portfolio pays the floating rate and receives the fixed rate. |
Credit default swap agreements outstanding at December 31, 2014:
| | | | | | | | | | | | | | | | | | | | | | | | |
Reference Entity/ Obligation
| | Termination
Date
| | | Fixed
Rate
| | | Notional
Amount
(000)#(3)
| | | Value at
Trade
Date
| | | Value at
December 31,
2014
| | | Unrealized
Appreciation
(Depreciation)
| |
Exchange-traded credit default swaps on credit indices—Buy Protection(1): | |
CDX.NA.HY.22.V2 | | | 06/20/19 | | | | 5.000% | | | | 8,910 | | | $ | (632,898 | ) | | $ | (606,994 | ) | | $ | 25,904 | |
CDX.NA.IG.22.V1 | | | 06/20/19 | | | | 1.000% | | | | 40,000 | | | | (611,363 | ) | | | (721,513 | ) | | | (110,150 | ) |
CDX.NA.IG.23.V1 | | | 12/20/19 | | | | 1.000% | | | | 18,500 | | | | (293,896 | ) | | | (295,379 | ) | | | (1,483 | ) |
| | | | | | | | | | | | | | | | | | | | | | |
|
|
|
| | | | | | | | | | | | | | | | | | | | | | | $ | (85,729 | ) |
| | | | | | | | | | | | | | | | | | | | | | |
|
|
|
SEE NOTES TO FINANCIAL STATEMENTS.
A85
| | | | | | |
| | | FLEXIBLE MANAGED PORTFOLIO (continued) | | |
| |
| SCHEDULE OF INVESTMENTS | | December 31, 2014 |
Credit default swap agreements outstanding at December 31, 2014 (continued):
| | | | | | | | | | | | | | | | | | | | | | | | | | |
Reference Entity/
Obligation
| | Termination
Date
| | | Fixed
Rate
| | | Notional
Amount
(000)#(3)
| | | Fair
Value(4)
| | | Upfront
Premiums
Paid
(Received)
| | | Unrealized
Appreciation
| | | Counterparty
|
Over-the-counter credit default swaps on credit indices—Sell Protection(2): |
CDX.NA.HY.17.V5 | | | 12/20/16 | | | | 5.000% | | | | 1,425 | | | $ | 73,622 | | | $ | 59,771 | | | $ | 13,851 | | | Credit Suisse First Boston Corp. |
CDX.NA.HY.17.V5 | | | 12/20/16 | | | | 5.000% | | | | 3,800 | | | | 196,325 | | | | 164,139 | | | | 32,186 | | | Deutsche Bank AG |
CDX.NA.HY.17.V5 | | | 12/20/16 | | | | 5.000% | | | | 5,225 | | | | 269,946 | | | | 228,956 | | | | 40,990 | | | Deutsche Bank AG |
| | | | | | | | | | | | | | |
|
|
| |
|
|
| |
|
|
| | |
| | | | | | | | | | | | | | | $ | 539,893 | | | $ | 452,866 | | | $ | 87,027 | | | |
| | | | | | | | | | | | | | |
|
|
| |
|
|
| |
|
|
| | |
The Portfolio entered into credit default swaps (“CDS”) to provide a measure of protection against defaults or to take an active long or short position with respect to the likelihood of a particular issuer’s default or the reference entity’s credit soundness. CDS contracts generally trade based on a spread which represents the cost a protection buyer has to pay the protection seller. The protection buyer is said to be short the credit as the value of the contract rises the more the credit deteriorates. The value of the CDS contract increases for the protection buyer if the spread increases.
A U.S. Government Agency Obligation with a market value of $1,792,516 has been segregated with Citigroup Global Markets to cover requirements for open interest rate and credit default exchange-traded swap contracts at December 31, 2014.
| (1) | If the Portfolio is a buyer of protection, it pays the fixed rate. When a credit event occurs, as defined under the terms of that particular swap agreement, the Series will either (i) receive from the seller of protection an amount equal to the notional amount of the swap and make delivery of the referenced obligation or underlying securities comprising the referenced index or (ii) receive a net settlement amount in the form of cash or securities equal to the notional amount of the swap less the recovery value of the referenced obligation or underlying securities comprising the referenced index. |
| (2) | If the Portfolio is a seller of protection, it receives the fixed rate. When a credit event occurs, as defined under the terms of that particular swap agreement, the Portfolio will either (i) pay to the buyer of protection an amount equal to the notional amount of the swap and take delivery of the referenced obligation or underlying securities comprising the referenced index or (ii) pay a net settlement amount in the form of cash or securities equal to the notional amount of the swap less the recovery value of the referenced obligation or underlying securities comprising the referenced index. |
| (3) | Notional amount represents the maximum potential amount the Portfolio could be required to pay as a seller of credit protection or receive as a buyer of credit protection if a credit event occurs as defined under the terms of that particular swap agreement. |
| (4) | The fair value of credit default swap agreements on asset-backed securities and credit indices serves as an indicator of the current status of the payment/performance risk and represents the likelihood of an expected liability (or profit) for the credit derivative should the notional amount of the swap agreement be closed/sold as the reporting date. Increasing fair value in absolute terms, when compared to the notional amount of the swap, represents a deterioration of the referenced entity’s credit soundness and a greater likelihood of risk of default or other credit event occurring as defined under the terms of the agreement. |
Various inputs are used in determining the value of the Portfolio’s investments. These inputs are summarized in the three broad levels listed below.
| Level 1— | quoted prices generally in active markets for identical securities. |
| Level 2— | quoted prices for similar securities, interest rates and yield curves, prepayment speeds, foreign currency exchange rates and other significant observable inputs. |
| Level 3— | significant unobservable inputs for securities valued in accordance with Board approved fair valuation procedures. |
The following is a summary of the inputs used as of December 31, 2014 in valuing such portfolio securities:
| | | | | | | | | | | | |
| | | Level 1
| | | Level 2
| | | Level 3
| |
Investments in Securities | | | | | | | | | | | | |
Common Stocks | | $ | 2,617,521,334 | | | $ | 126,861,274 | | | $ | — | |
Exchange Traded Fund | | | 1,539,252 | | | | — | | | | — | |
Preferred Stocks | | | 584,760 | | | | 609,302 | | | | — | |
Asset-Backed Securities | | | | | | | | | | | | |
Collateralized Debt Obligation | | | — | | | | 461,180 | | | | — | |
Collateralized Loan Obligations | | | — | | | | 53,852,068 | | | | 3,225,100 | |
Non-Residential Mortgage-Backed Securities | | | — | | | | 5,218,919 | | | | — | |
Residential Mortgage-Backed Securities | | | — | | | | 5,645,876 | | | | — | |
Bank Loans | | | — | | | | 8,026,401 | | | | — | |
Collateralized Mortgage Obligations | | | — | | | | 10,233,968 | | | | — | |
Commercial Mortgage-Backed Securities | | | — | | | | 126,967,833 | | | | — | |
Corporate Bonds | | | — | | | | 296,940,975 | | | | 4,290,361 | |
Foreign Agencies | | | — | | | | 24,213,759 | | | | — | |
SEE NOTES TO FINANCIAL STATEMENTS.
A86
| | | | | | |
| | | FLEXIBLE MANAGED PORTFOLIO (continued) | | |
| |
| SCHEDULE OF INVESTMENTS | | December 31, 2014 |
| | | | | | | | | | | | |
| | | Level 1
| | | Level 2
| | | Level 3
| |
Investments in Securities (continued) | | | | | | | | | | | | |
Municipal Bonds | | $ | — | | | $ | 15,143,619 | | | $ | — | |
Sovereign Bonds | | | — | | | | 11,821,362 | | | | — | |
U.S. Government Agency Obligations | | | — | | | | 293,314,375 | | | | — | |
U.S. Treasury Obligations | | | — | | | | 149,517,919 | | | | — | |
Affiliated Mutual Funds | | | 421,201,419 | | | | — | | | | — | |
Options Purchased | | | 46,750 | | | | — | | | | — | |
U.S. Government Agency Obligation Security Sold Short | | | — | | | | (1,559,590 | ) | | | — | |
Option Written | | | (17,000 | ) | | | — | | | | — | |
Other Financial Instruments* | | | | | | | | | | | | |
Futures Contracts | | | 3,942,434 | | | | — | | | | — | |
Over-the-counter interest rate swaps | | | — | | | | 39,627 | | | | — | |
Exchange-traded interest rate swaps | | | — | | | | (81,269 | ) | | | — | |
Exchange-traded credit default swaps | | | — | | | | (85,729 | ) | | | — | |
Over-the-counter credit default swaps | | | — | | | | 539,893 | | | | — | |
| | |
|
|
| |
|
|
| |
|
|
|
Total | | $ | 3,044,818,949 | | | $ | 1,127,681,762 | | | $ | 7,515,461 | |
| | |
|
|
| |
|
|
| |
|
|
|
| * | Other financial instruments are derivative instruments not reflected in the Schedule of Investments, such as futures, forwards and exchange-traded swap contracts, which are recorded at the unrealized appreciation/depreciation on the instrument, and over-the-counter swap contracts which are recorded at fair value. |
The industry classification of investments and liabilities in excess of other assets shown as a percentage of net assets as of December 31, 2014 was as follows (Unaudited):
| | | | |
Affiliated Mutual Funds (including 2.2% of collateral for securities on loan) | | | 10.7 | % |
U.S. Government Agency Obligations | | | 7.4 | |
Pharmaceuticals | | | 4.6 | |
Banks | | | 4.5 | |
Oil, Gas & Consumable Fuels | | | 4.4 | |
U.S. Treasury Obligations | | | 3.8 | |
Commercial Mortgage-Backed Securities | | | 3.2 | |
Software | | | 3.1 | |
Technology Hardware, Storage & Peripherals | | | 2.9 | |
Insurance | | | 2.5 | |
Banking | | | 2.4 | |
Biotechnology | | | 2.4 | |
Food & Staples Retailing | | | 2.2 | |
Semiconductors & Semiconductor Equipment | | | 2.1 | |
Specialty Retail | | | 2.1 | |
Chemicals | | | 2.1 | |
Health Care Providers & Services | | | 2.1 | |
IT Services | | | 2.0 | |
Media | | | 2.0 | |
Capital Markets | | | 1.7 | |
Beverages | | | 1.7 | |
Internet Software & Services | | | 1.6 | |
Food Products | | | 1.6 | |
Hotels, Restaurants & Leisure | | | 1.6 | |
Communications Equipment | | | 1.6 | |
Industrial Conglomerates | | | 1.5 | |
Collateralized Loan Obligations | | | 1.5 | |
Diversified Financial Services | | | 1.4 | |
Aerospace & Defense | | | 1.3 | |
Real Estate Investment Trusts (REITs) | | | 1.2 | |
Road & Rail | | | 1.2 | |
Machinery | | | 1.2 | |
Diversified Telecommunication Services | | | 1.2 | |
Tobacco | | | 1.0 | |
Health Care Equipment & Supplies | | | 1.0 | |
| | | | |
Airlines | | | 0.9 | % |
Energy Equipment & Services | | | 0.9 | |
Household Products | | | 0.9 | |
Electric Utilities | | | 0.8 | |
Auto Components | | | 0.7 | |
Air Freight & Logistics | | | 0.7 | |
Healthcare & Pharmaceutical | | | 0.7 | |
Electrical Equipment | | | 0.6 | |
Real Estate Management & Development | | | 0.6 | |
Foreign Agencies | | | 0.6 | |
Textiles, Apparel & Luxury Goods | | | 0.6 | |
Multi-Utilities | | | 0.6 | |
Metals & Mining | | | 0.5 | |
Consumer Finance | | | 0.5 | |
Telecommunications | | | 0.5 | |
Electronic Equipment, Instruments & Components | | | 0.4 | |
Municipal Bonds | | | 0.4 | |
Electric | | | 0.4 | |
Capital Goods | | | 0.3 | |
Automobiles | | | 0.3 | |
Sovereign Bonds | | | 0.3 | |
Internet & Catalog Retail | | | 0.3 | |
Collateralized Mortgage Obligations | | | 0.3 | |
Energy – Other | | | 0.3 | |
Gas Utilities | | | 0.3 | |
Cable | | | 0.2 | |
Health Care Technology | | | 0.2 | |
Multiline Retail | | | 0.2 | |
Independent Power & Renewable Electricity Producers | | | 0.2 | |
Media & Entertainment | | | 0.2 | |
Foods | | | 0.2 | |
Trading Companies & Distributors | | | 0.2 | |
Technology | | | 0.2 | |
Non-Captive Finance | | | 0.2 | |
Lodging | | | 0.2 | |
Leisure Products | | | 0.2 | |
SEE NOTES TO FINANCIAL STATEMENTS.
A87
| | | | | | |
| | | FLEXIBLE MANAGED PORTFOLIO (continued) | | |
| |
| SCHEDULE OF INVESTMENTS | | December 31, 2014 |
| | | | |
Industry table (cont.)
| |
| |
Automotive | | | 0.1 | % |
Residential Mortgage-Backed Securities | | | 0.1 | |
Household Durables | | | 0.1 | |
Non-Residential Mortgage-Backed Securities | | | 0.1 | |
Construction & Engineering | | | 0.1 | |
Healthcare Insurance | | | 0.1 | |
Pipelines & Other | | | 0.1 | |
Metals | | | 0.1 | |
Retailers | | | 0.1 | |
| | | | |
Paper | | | 0.1 | % |
Diversified Consumer Services | | | 0.1 | |
Building Materials & Construction | | | 0.1 | |
Commercial Services & Supplies | | | 0.1 | |
Consumer | | | 0.1 | |
Exchange Traded Fund | | | 0.1 | |
| | |
|
|
|
| | | | 105.9 | |
Liabilities in excess of other assets | | | (5.9 | ) |
| | |
|
|
|
| | | | 100.0 | % |
| | |
|
|
|
The Portfolio invested in derivative instruments during the reporting period. The primary types of risk associated with these derivative instruments are credit risk, equity risk and interest rate risk. The effect of such derivative instruments on the Portfolio’s financial position and financial performance as reflected in the Statement of Assets and Liabilities and Statement of Operations is presented in the summary below.
Fair values of derivative instruments as of December 31, 2014 as presented in the Statement of Assets and Liabilities:
| | | | | | | | | | | | |
Derivatives not designated as hedging
instruments, carried at fair value
| | Asset Derivatives
| | | Liability Derivatives
| |
| | Balance Sheet Location
| | Fair Value
| | | Balance Sheet Location
| | Fair Value
| |
Credit contracts | | Premiums paid for swap agreements | | $ | 452,866 | | | — | | $ | — | |
Credit contracts | | Unrealized appreciation on over-the-counter swap agreements | | | 87,027 | | | — | | | — | |
Credit contracts | | Due from/to broker — variation margin swaps | | | 25,904 | * | | Due from/to broker — variation margin swaps | | | 111,633 | * |
Equity contracts | | Due from/to broker — variation margin futures | | | 3,352,894 | * | | — | | | — | |
Interest rate contracts | | Due from/to broker — variation margin futures | | | 628,438 | * | | Due from/to broker — variation margin futures | | | 38,898 | * |
Interest rate contracts | | Unaffiliated Investments | | | 46,750 | | | Options written outstanding, at value | | | 17,000 | |
Interest rate contracts | | Unrealized appreciation on over-the-counter swap agreements | | | 39,627 | | | — | | | — | |
Interest rate contracts | | Due from/to broker — variation margin swaps | | | 163,153 | * | | Due from/to broker — variation margin swaps | | | 244,422 | * |
| | | | |
|
|
| | | |
|
|
|
Total | | | | $ | 4,796,659 | | | | | $ | 411,953 | |
| | | | |
|
|
| | | |
|
|
|
| * | Includes cumulative appreciation/depreciation as reported in the schedule of open futures and exchange-traded swap contracts. Only unsettled variation margin receivable (payable) is reported within the Statement of Assets and Liabilities. |
The effects of derivative instruments on the Statement of Operations for the year ended December 31, 2014 are as follows:
| | | | | | | | | | | | | | | | | | | | | | | | |
Amount of Realized Gain or (Loss) on Derivatives Recognized in Income
| |
Derivatives not accounted as hedging
instruments, carried at fair value
| | Rights*
| | | Options
Purchased*
| | | Options
Written
| | | Futures
| | | Swaps
| | | Total
| |
Credit contracts | | $ | — | | | $ | — | | | $ | — | | | $ | — | | | $ | (498,124 | ) | | $ | (498,124 | ) |
Equity contracts | | | 10,630 | | | | — | | | | — | | | | 8,522,142 | | | | — | | | | 8,532,772 | |
Interest rate contracts | | | — | | | | (284,568 | ) | | | (94,855 | ) | | | 684,241 | | | | 153,039 | | | | 457,857 | |
| | |
|
|
| |
|
|
| |
|
|
| |
|
|
| |
|
|
| |
|
|
|
Total | | $ | 10,630 | | | $ | (284,568 | ) | | $ | (94,855 | ) | | $ | 9,206,383 | | | $ | (345,085 | ) | | $ | 8,492,505 | |
| | |
|
|
| |
|
|
| |
|
|
| |
|
|
| |
|
|
| |
|
|
|
| * | Included in net realized gain (loss) on investment transactions in the Statement of Operations. |
SEE NOTES TO FINANCIAL STATEMENTS.
A88
| | | | | | |
| | | FLEXIBLE MANAGED PORTFOLIO (continued) | | |
| |
| SCHEDULE OF INVESTMENTS | | December 31, 2014 |
| | | | | | | | | | | | | | | | | | | | |
Change in Unrealized Appreciation or (Depreciation) on Derivatives Recognized in Income
| |
Derivatives not accounted as hedging
instruments, carried at fair value
| | Option
Purchased**
| | | Options
Written
| | | Futures
| | | Swaps
| | | Total
| |
Credit contracts | | $ | — | | | $ | — | | | $ | — | | | $ | (88,942 | ) | | $ | (88,942 | ) |
Equity Contracts | | | — | | | | — | | | | 2,047,031 | | | | — | | | | 2,047,031 | |
Interest rate contracts | | | 77,030 | | | | 33,037 | | | | 1,333,973 | | | | 169,210 | | | | 1,613,250 | |
| | |
|
|
| |
|
|
| |
|
|
| |
|
|
| |
|
|
|
Total | | $ | 77,030 | | | $ | 33,037 | | | $ | 3,381,004 | | | $ | 80,268 | | | $ | 3,571,339 | |
| | |
|
|
| |
|
|
| |
|
|
| |
|
|
| |
|
|
|
| ** | Included in net change in unrealized appreciation (depreciation) on investments in the Statement of Operations. |
For the year ended December 31, 2014, the Portfolio’s average volume of derivative activities is as follows:
| | | | | | |
Options Purchased
(Cost)
| | Options Written
(Notional Amount in USD (000))
| | Futures
Long Position
(Value at Trade Date)
| | Futures
Short Position
(Value at Trade Date)
|
| $424,315 | | $73,264 | | $196,651,922 | | $25,540,894 |
| | | | |
Interest Rate Swaps
(Notional Amount in USD (000))
| | Credit Default
Swaps as Buyer
(Notional Amount in USD (000))
| | Credit Default
Swaps as Writer
(Notional Amount in USD (000))
|
| $100,772 | | $49,224 | | $10,494 |
Offsetting of over-the-counter (OTC) derivative assets and liabilities:
The Portfolio invested in OTC derivatives during the reporting period that are either offset in accordance with current requirements or are subject to enforceable master netting arrangements or similar agreements that permit offsetting. The information about offsetting and related netting arrangements for OTC derivatives, where the legal right to set-off exists, is presented in the summary below.
| | | | | | | | | | | | | | | | |
Counterparty
| | Gross Amounts of
Recognized Assets(1)
| | | Gross Amounts
Available for Offset
| | | Collateral
Received(3)
| | | Net Amount
| |
Credit Suisse First Boston Corp. | | $ | 113,249 | | | $ | — | | | $ | (477,602 | ) | | $ | — | |
Deutsche Bank AG | | | 466,271 | | | | — | | | | (605,895 | ) | | | — | |
| | |
|
|
| | | | | | | | | | | | |
| | | $ | 579,520 | | | | | | | | | | | | | |
| | |
|
|
| | | | | | | | | | | | |
| | | | |
Counterparty
| | Gross Amounts of
Recognized Liabilities(2)
| | | Gross Amounts
Available for Offset
| | | Collateral
Pledged(3)
| | | Net Amount
| |
Credit Suisse First Boston Corp. | | $ | — | | | $ | — | | | $ | — | | | $ | — | |
Deutsche Bank AG | | | — | | | | — | | | | — | | | | — | |
| | |
|
|
| | | | | | | | | | | | |
| | | $ | — | | | | | | | | | | | | | |
| | |
|
|
| | | | | | | | | | | | |
| (1) | Includes unrealized appreciation on swaps and forwards, premiums paid on swap agreements and market value of purchased options. |
| (2) | Includes unrealized depreciation on swaps and forwards, premiums received on swap agreements and market value of written options. |
| (3) | Amounts shown reflect actual collateral received or pledged by the Portfolio. Such amounts are applied up to 100% of the Portfolio’s OTC derivative exposure by counterparty. |
SEE NOTES TO FINANCIAL STATEMENTS.
A89
| | | | | | |
| | | FLEXIBLE MANAGED PORTFOLIO (continued) | | |
STATEMENT OF ASSETS AND LIABILITIES
December 31, 2014
| | | | |
| ASSETS | | | | |
Investments at value, including securities on loan of $84,082,109: | | | | |
Unaffiliated investments (cost $3,098,793,119) | | $ | 3,756,036,387 | |
Affiliated investments (cost $427,903,427) | | | 421,201,419 | |
Cash | | | 176,311 | |
Foreign currency, at value (cost $634,047) | | | 626,816 | |
Receivable for investments sold | | | 136,037,749 | |
Dividends receivable | | | 10,252,706 | |
Premium paid for swap agreements | | | 452,866 | |
Tax reclaim receivable | | | 235,747 | |
Unrealized appreciation on over-the-counter swap agreements | | | 126,654 | |
Due from broker—variation margin futures | | | 92,258 | |
Receivable for Series shares sold | | | 705 | |
Prepaid expenses | | | 30,376 | |
| | |
|
|
|
Total Assets | | | 4,325,269,994 | |
| | |
|
|
|
| LIABILITIES | | | | |
Payable for investments purchased | | | 289,345,427 | |
Payable to broker for collateral for securities on loan | | | 86,514,898 | |
Management fee payable | | | 2,011,041 | |
Securities sold short, at value
(proceeds received $1,555,430) | | | 1,559,590 | |
Due to broker—variation margin futures | | | 1,185,505 | |
Payable for Series shares repurchased | | | 469,030 | |
Accrued expenses | | | 326,939 | |
Due to broker—variation margin swaps | | | 28,028 | |
Options written outstanding, at value (premiums received $50,037) | | | 17,000 | |
Affiliated transfer agent fee payable | | | 926 | |
| | |
|
|
|
Total Liabilities | | | 381,458,384 | |
| | |
|
|
|
| NET ASSETS | | $ | 3,943,811,610 | |
| | |
|
|
|
Net assets were comprised of: | | | | |
Paid-in capital | | $ | 2,450,598,698 | |
Retained earnings | | | 1,493,212,912 | |
| | |
|
|
|
Net assets, December 31, 2014 | | $ | 3,943,811,610 | |
| | |
|
|
|
Net asset value and redemption price per share $3,943,811,610 / 166,337,144 outstanding shares of beneficial interest | | $ | 23.71 | |
| | |
|
|
|
STATEMENT OF OPERATIONS
Year Ended December 31, 2014
| | | | |
| NET INVESTMENT INCOME | | | | |
| INCOME | | | | |
Unaffiliated dividend income (net of foreign withholding taxes of $482,253) | | $ | 56,509,785 | |
Interest income | | | 29,095,335 | |
Affiliated dividend income | | | 1,960,207 | |
Affiliated income from securities loaned, net | | | 199,487 | |
| | |
|
|
|
Total income | | | 87,764,814 | |
| | |
|
|
|
| EXPENSES | | | | |
Management fee | | | 23,006,041 | |
Custodian’s fees and expenses | | | 544,000 | |
Shareholders’ reports | | | 196,000 | |
Insurance expenses | | | 51,000 | |
Trustees’ fees | | | 41,000 | |
Audit fee | | | 39,000 | |
Legal fees and expenses | | | 19,000 | |
Transfer agent’s fees and expenses (including affiliated expense of $5,600) | | | 12,000 | |
Commitment fee on syndicated credit agreement | | | 5,000 | |
Miscellaneous | | | 53,745 | |
| | |
|
|
|
Total expenses | | | 23,966,786 | |
| | |
|
|
|
| NET INVESTMENT INCOME | | | 63,798,028 | |
| | |
|
|
|
| REALIZED AND UNREALIZED GAIN (LOSS) ON INVESTMENT AND FOREIGN CURRENCY TRANSACTIONS | | | | |
Net realized gain (loss) on: | | | | |
Investment transactions | | | 387,662,375 | |
Futures transactions | | | 9,206,383 | |
Options written transactions | | | (94,855 | ) |
Swap agreement transactions | | | (345,085 | ) |
Foreign currency transactions | | | (69,788 | ) |
| | |
|
|
|
| | | | 396,359,030 | |
| | |
|
|
|
Net change in unrealized appreciation (depreciation) on: | | | | |
Investments (including affiliated: $400,580) | | | (60,892,589 | ) |
Futures | | | 3,381,004 | |
Securities Sold Short | | | 9,161 | |
Options written | | | 33,037 | |
Swap agreements | | | 80,268 | |
Foreign currencies | | | (45,012 | ) |
| | |
|
|
|
| | | | (57,434,131 | ) |
| | |
|
|
|
| NET GAIN ON INVESTMENT AND FOREIGN CURRENCY TRANSACTIONS | | | 338,924,899 | |
| | |
|
|
|
| NET INCREASE IN NET ASSETS RESULTING FROM OPERATIONS | | $ | 402,722,927 | |
| | |
|
|
|
STATEMENT OF CHANGES IN NET ASSETS
| | | | | | | | |
| | | Year Ended December 31,
| |
| | | 2014
| | | 2013
| |
| INCREASE (DECREASE) IN NET ASSETS | | | | | | | | |
| OPERATIONS | | | | | | | | |
Net investment income | | $ | 63,798,028 | | | $ | 65,087,964 | |
Net realized gain on investment and foreign currency transactions | | | 396,359,030 | | | | 322,966,584 | |
Net change in unrealized appreciation (depreciation) on investments and foreign currencies | | | (57,434,131 | ) | | | 253,490,603 | |
| | |
|
|
| |
|
|
|
NET INCREASE IN NET ASSETS RESULTING FROM OPERATIONS | | | 402,722,927 | | | | 641,545,151 | |
| | |
|
|
| |
|
|
|
| SERIES SHARE TRANSACTIONS | | | | | | | | |
Series shares sold [562,392 and 651,459 shares, respectively] | | | 12,588,751 | | | | 12,747,246 | |
Series shares repurchased [8,998,418 and 9,694,842 shares, respectively] | | | (202,125,849 | ) | | | (189,432,596 | ) |
| | |
|
|
| |
|
|
|
NET DECREASE IN NET ASSETS FROM SERIES SHARE TRANSACTIONS | | | (189,537,098 | ) | | | (176,685,350 | ) |
| | |
|
|
| |
|
|
|
| TOTAL INCREASE | | | 213,185,829 | | | | 464,859,801 | |
| NET ASSETS: | | | | | | | | |
Beginning of year | | | 3,730,625,781 | | | | 3,265,765,980 | |
| | |
|
|
| |
|
|
|
End of year | | $ | 3,943,811,610 | | | $ | 3,730,625,781 | |
| | |
|
|
| |
|
|
|
SEE NOTES TO FINANCIAL STATEMENTS.
A90
| | | | | | |
| | | GLOBAL PORTFOLIO | | |
| |
| SCHEDULE OF INVESTMENTS | | December 31, 2014 |
| | | | | | | | |
| LONG-TERM INVESTMENTS — 96.7% | | | | |
| COMMON STOCKS | | Shares
| | | Value
(Note 2)
| |
Australia — 1.0% | | | | | | | | |
Arrium Ltd. | | | 894,400 | | | $ | 154,767 | |
Ausdrill Ltd. | | | 123,200 | | | | 39,187 | |
Bendigo & Adelaide Bank Ltd. | | | 67,200 | | | | 698,742 | |
Bradken Ltd. | | | 98,900 | | | | 378,137 | |
Challenger Ltd. | | | 150,800 | | | | 796,607 | |
Downer EDI Ltd. | | | 182,200 | | | | 696,277 | |
Fortescue Metals Group Ltd. | | | 188,800 | | | | 414,537 | |
Lend Lease Group | | | 114,600 | | | | 1,526,343 | |
Metcash Ltd. | | | 276,300 | | | | 416,408 | |
Mineral Resources Ltd. | | | 49,900 | | | | 305,372 | |
National Australia Bank Ltd. | | | 31,100 | | | | 848,106 | |
Pacific Brands Ltd. | | | 460,600 | | | | 202,497 | |
Primary Health Care Ltd. | | | 139,400 | | | | 533,382 | |
| | | | | | |
|
|
|
| | | | | | | | 7,010,362 | |
| | | | | | |
|
|
|
Austria — 0.2% | | | | | | | | |
OMV AG | | | 24,300 | | | | 645,246 | |
Voestalpine AG | | | 14,500 | | | | 572,941 | |
| | | | | | |
|
|
|
| | | | | | | | 1,218,187 | |
| | | | | | |
|
|
|
Belgium — 0.2% | | | | | | | | |
AGFA-Gevaert NV* | | | 86,100 | | | | 217,748 | |
Delhaize Group SA | | | 21,500 | | | | 1,565,749 | |
| | | | | | |
|
|
|
| | | | | | | | 1,783,497 | |
| | | | | | |
|
|
|
Brazil — 0.2% | | | | | | | | |
Kroton Educacional SA | | | 196,700 | | | | 1,146,960 | |
| | | | | | |
|
|
|
Canada — 2.0% | | | | | | | | |
Alimentation Couche-Tard, Inc. Series B | | | 80,861 | | | | 3,388,812 | |
Brookfield Asset Management, Inc. (Class A Stock) | | | 70,288 | | | | 3,523,537 | |
Canadian Natural Resources Ltd. | | | 17,750 | | | | 548,120 | |
Canadian Pacific Railway Ltd. | | | 16,450 | | | | 3,169,751 | |
CI Financial Corp. | | | 56,490 | | | | 1,570,031 | |
Suncor Energy, Inc. | | | 72,300 | | | | 2,296,325 | |
| | | | | | |
|
|
|
| | | | | | | | 14,496,576 | |
| | | | | | |
|
|
|
China — 1.6% | | | | | | | | |
Alibaba Group Holding Ltd., ADR*(a) | | | 16,888 | | | | 1,755,339 | |
Baidu, Inc., ADR* | | | 9,235 | | | | 2,105,303 | |
China Overseas Land & Investment Ltd. | | | 510,000 | | | | 1,508,698 | |
Lenovo Group Ltd. | | | 1,630,000 | | | | 2,128,150 | |
NetEase, Inc., ADR | | | 14,824 | | | | 1,469,651 | |
Poly Property Group Co. Ltd. | | | 846,000 | | | | 344,883 | |
Shougang Fushan Resources Group Ltd. | | | 1,160,000 | | | | 252,803 | |
Tencent Holdings Ltd. | | | 139,300 | | | | 2,015,522 | |
| | | | | | |
|
|
|
| | | | | | | | 11,580,349 | |
| | | | | | |
|
|
|
Denmark — 0.8% | | | | | | | | |
A.P. Moeller – Maersk A/S
(Class B Stock) | | | 400 | | | | 795,581 | |
Coloplast A/S (Class B Stock) | | | 30,211 | | | | 2,528,192 | |
Novo Nordisk A/S (Class B Stock) | | | 57,372 | | | | 2,426,823 | |
| | | | | | |
|
|
|
| | | | | | | | 5,750,596 | |
| | | | | | |
|
|
|
Finland — 0.5% | | | | | | | | |
Sampo OYJ (Class A Stock) | | | 55,384 | | | | 2,592,776 | |
| | | | | | | | |
COMMON STOCKS
(continued) | | Shares
| | | Value
(Note 2)
| |
Finland (continued) | | | | | | | | |
Tieto OYJ | | | 25,300 | | | $ | 655,650 | |
| | | | | | |
|
|
|
| | | | | | | | 3,248,426 | |
| | | | | | |
|
|
|
France — 3.1% | | | | | | | | |
Alstom SA* | | | 26,800 | | | | 864,372 | |
Arkema SA | | | 7,200 | | | | 476,186 | |
AXA SA | | | 37,000 | | | | 852,595 | |
BNP Paribas SA | | | 16,000 | | | | 944,548 | |
Cap Gemini SA | | | 41,279 | | | | 2,952,165 | |
Cie Generale des Etablissements Michelin | | | 12,000 | | | | 1,083,203 | |
CNP Assurances | | | 34,000 | | | | 602,759 | |
Credit Agricole SA | | | 78,500 | | | | 1,013,322 | |
Electricite de France SA | | | 53,100 | | | | 1,461,762 | |
Renault SA | | | 12,300 | | | | 895,889 | |
Sanofi | | | 18,100 | | | | 1,650,190 | |
SCOR SE | | | 22,000 | | | | 666,609 | |
Societe Generale SA | | | 16,000 | | | | 669,604 | |
Thales SA | | | 27,900 | | | | 1,509,595 | |
Total SA | | | 82,104 | | | | 4,206,365 | |
Valeo SA | | | 17,694 | | | | 2,201,674 | |
| | | | | | |
|
|
|
| | | | | | | | 22,050,838 | |
| | | | | | |
|
|
|
Germany — 2.7% | | | | | | | | |
Allianz SE | | | 9,800 | | | | 1,623,141 | |
Aurubis AG | | | 6,200 | | | | 346,582 | |
BASF SE | | | 8,700 | | | | 729,766 | |
Bayerische Motoren Werke AG | | | 26,231 | | | | 2,830,811 | |
Continental AG | | | 15,643 | | | | 3,299,474 | |
Daimler AG | | | 23,700 | | | | 1,968,386 | |
Deutsche Bank AG | | | 13,700 | | | | 410,239 | |
E.ON SE | | | 46,000 | | | | 786,220 | |
Freenet AG | | | 29,700 | | | | 844,441 | |
Hannover Rueck SE | | | 9,800 | | | | 884,074 | |
Merck KGaA | | | 9,000 | | | | 846,978 | |
Muenchener Rueckversicherungs AG | | | 5,700 | | | | 1,135,087 | |
Rational AG | | | 3,191 | | | | 999,854 | |
Rheinmetall AG | | | 13,300 | | | | 579,071 | |
Stada Arzneimittel AG | | | 14,500 | | | | 439,971 | |
Volkswagen AG | | | 7,400 | | | | 1,604,350 | |
| | | | | | |
|
|
|
| | | | | | | | 19,328,445 | |
| | | | | | |
|
|
|
Hong Kong — 1.0% | | | | | | | | |
AIA Group Ltd. | | | 454,600 | | | | 2,507,332 | |
Cheung Kong Holdings Ltd. | | | 46,000 | | | | 770,354 | |
China Resources Cement Holdings Ltd. | | | 739,000 | | | | 476,261 | |
First Pacific Co. Ltd. | | | 528,000 | | | | 521,400 | |
Huabao International Holdings Ltd. | | | 1,045,000 | | | | 851,611 | |
Kingboard Chemical Holdings Ltd. | | | 216,000 | | | | 362,690 | |
Singamas Container Holdings Ltd. | | | 2,676,000 | | | | 443,883 | |
Skyworth Digital Holdings Ltd. | | | 1,072,000 | | | | 580,122 | |
Yue Yuen Industrial Holdings Ltd. | | | 220,500 | | | | 792,875 | |
| | | | | | |
|
|
|
| | | | | | | | 7,306,528 | |
| | | | | | |
|
|
|
India — 0.9% | | | | | | | | |
HDFC Bank Ltd., ADR | | | 77,974 | | | | 3,957,181 | |
Tata Motors Ltd., ADR | | | 62,361 | | | | 2,636,623 | |
| | | | | | |
|
|
|
| | | | | | | | 6,593,804 | |
| | | | | | |
|
|
|
SEE NOTES TO FINANCIAL STATEMENTS.
A91
| | | | | | |
| | | GLOBAL PORTFOLIO (continued) | | |
| |
| SCHEDULE OF INVESTMENTS | | December 31, 2014 |
| | | | | | | | |
COMMON STOCKS
(continued) | | Shares
| | | Value
(Note 2)
| |
Indonesia — 0.4% | | | | | | | | |
PT Bank Rakyat Indonesia (Persero) Tbk | | | 2,938,800 | | | $ | 2,762,415 | |
| | | | | | |
|
|
|
Ireland — 0.7% | | | | | | | | |
Permanent TSB Group Holdings PLC* | | | 51,300 | | | | 3,849 | |
Ryanair Holdings PLC, ADR* | | | 36,610 | | | | 2,609,195 | |
Smurfit Kappa Group PLC | | | 35,200 | | | | 791,594 | |
XL Group PLC | | | 57,352 | | | | 1,971,188 | |
| | | | | | |
|
|
|
| | | | | | | | 5,375,826 | |
| | | | | | |
|
|
|
Israel — 1.1% | | | | | | | | |
Bank Hapoalim BM | | | 128,000 | | | | 601,873 | |
Check Point Software Technologies Ltd.*(a) | | | 25,690 | | | | 2,018,463 | |
Elbit Systems Ltd. | | | 11,400 | | | | 694,812 | |
Teva Pharmaceutical Industries Ltd., ADR | | | 61,795 | | | | 3,553,830 | |
Teva Pharmaceutical Industries Ltd. | | | 16,300 | | | | 934,396 | |
| | | | | | |
|
|
|
| | | | | | | | 7,803,374 | |
| | | | | | |
|
|
|
Italy — 0.7% | | | | | | | | |
Enel SpA | | | 242,800 | | | | 1,082,288 | |
Eni SpA | | | 70,800 | | | | 1,240,171 | |
Intesa Sanpaolo SpA | | | 1,036,787 | | | | 3,007,625 | |
| | | | | | |
|
|
|
| | | | | | | | 5,330,084 | |
| | | | | | |
|
|
|
Japan — 8.7% | | | | | | | | |
Alfresa Holdings Corp. | | | 33,600 | | | | 405,752 | |
Alpine Electronics, Inc. | | | 22,700 | | | | 372,672 | |
Aoyama Trading Co. Ltd. | | | 39,100 | | | | 854,332 | |
Aozora Bank Ltd. | | | 231,000 | | | | 715,071 | |
Asahi Kasei Corp. | | | 76,000 | | | | 693,305 | |
Astellas Pharma, Inc. | | | 203,200 | | | | 2,828,971 | |
Autobacs Seven Co. Ltd. | | | 42,000 | | | | 594,251 | |
Bank of Yokohama Ltd. (The) | | | 96,000 | | | | 521,403 | |
Calsonic Kansei Corp. | | | 105,000 | | | | 581,982 | |
Daihatsu Motor Co. Ltd. | | | 47,500 | | | | 620,390 | |
Daikin Industries Ltd. | | | 44,800 | | | | 2,872,759 | |
Daito Trust Construction Co. Ltd. | | | 12,300 | | | | 1,395,286 | |
FANUC Corp. | | | 15,300 | | | | 2,522,670 | |
Fuji Heavy Industries Ltd. | | | 80,274 | | | | 2,840,574 | |
Fukuoka Financial Group, Inc. | | | 85,700 | | | | 441,824 | |
Heiwa Corp. | | | 24,700 | | | | 492,145 | |
Hogy Medical Co. Ltd. | | | 11,400 | | | | 519,899 | |
Hoya Corp. | | | 59,900 | | | | 2,026,108 | |
ITOCHU Corp. | | | 76,300 | | | | 814,510 | |
JX Holdings, Inc. | | | 101,400 | | | | 394,609 | |
Kao Corp. | | | 61,400 | | | | 2,421,282 | |
KDDI Corp. | | | 13,200 | | | | 829,277 | |
Keihin Corp. | | | 37,200 | | | | 552,146 | |
Keyence Corp. | | | 5,100 | | | | 2,272,533 | |
KYORIN Holdings, Inc. | | | 37,400 | | | | 693,070 | |
Kyowa Exeo Corp. | | | 66,900 | | | | 713,468 | |
Marubeni Corp. | | | 109,700 | | | | 656,376 | |
Medipal Holdings Corp. | | | 21,900 | | | | 255,785 | |
Mitsubishi Corp. | | | 50,200 | | | | 918,666 | |
Mitsubishi UFJ Financial Group, Inc. | | | 243,500 | | | | 1,337,845 | |
| | | | | | | | |
COMMON STOCKS
(continued) | | Shares
| | | Value
(Note 2)
| |
Japan (continued) | | | | | | | | |
Mitsui & Co. Ltd. | | | 59,300 | | | $ | 794,213 | |
Mizuho Financial Group, Inc. | | | 597,700 | | | | 1,001,926 | |
Murata Manufacturing Co. Ltd. | | | 16,800 | | | | 1,833,233 | |
Nippon Telegraph & Telephone Corp. | | | 37,000 | | | | 1,890,057 | |
Nishi-Nippon City Bank Ltd. (The) | | | 167,000 | | | | 480,517 | |
Nissan Motor Co. Ltd. | | | 101,600 | | | | 886,132 | |
Nitori Holdings Co. Ltd. | | | 25,500 | | | | 1,370,077 | |
NTT DOCOMO, Inc. | | | 64,300 | | | | 936,405 | |
ORIX Corp. | | | 189,400 | | | | 2,383,182 | |
Otsuka Holdings Co. Ltd. | | | 20,400 | | | | 611,617 | |
Recruit Holdings Co. Ltd.* | | | 14,600 | | | | 419,302 | |
Resona Holdings, Inc. | | | 266,300 | | | | 1,345,215 | |
Ricoh Co. Ltd. | | | 42,700 | | | | 431,657 | |
Sankyu, Inc. | | | 151,000 | | | | 612,897 | |
Secom Co. Ltd. | | | 31,700 | | | | 1,821,311 | |
Seino Holdings Co. Ltd. | | | 65,000 | | | | 655,174 | |
Shimachu Co. Ltd. | | | 30,700 | | | | 744,052 | |
SKY Perfect JSAT Holdings, Inc. | | | 107,500 | | | | 634,342 | |
SMC Corp. | | | 7,500 | | | | 1,966,681 | |
Sumitomo Corp. | | | 84,300 | | | | 865,819 | |
Sumitomo Metal Mining Co. Ltd. | | | 38,000 | | | | 566,766 | |
Sumitomo Mitsui Financial Group, Inc. | | | 102,086 | | | | 3,690,687 | |
Toagosei Co. Ltd. | | | 147,000 | | | | 583,121 | |
Toho Holdings Co. Ltd. | | | 41,200 | | | | 599,898 | |
Toyo Tire & Rubber Co. Ltd. | | | 35,200 | | | | 690,755 | |
Tsumura & Co. | | | 22,900 | | | | 506,391 | |
West Japan Railway Co. | | | 9,800 | | | | 463,327 | |
Yokohama Rubber Co. Ltd. (The) | | | 90,000 | | | | 819,480 | |
| | | | | | |
|
|
|
| | | | | | | | 62,763,195 | |
| | | | | | |
|
|
|
Liechtenstein | | | | | | | | |
Verwaltungs-und Privat-Bank AG | | | 2,100 | | | | 179,541 | |
| | | | | | |
|
|
|
Macau — 0.2% | | | | | | | | |
MGM China Holdings Ltd. | | | 623,200 | | | | 1,573,527 | |
| | | | | | |
|
|
|
Netherlands — 1.7% | | | | | | | | |
Aegon NV | | | 95,000 | | | | 714,019 | |
ING Groep NV, CVA* | | | 58,400 | | | | 754,510 | |
Koninklijke Ahold NV | | | 78,461 | | | | 1,394,481 | |
Koninklijke Philips NV | | | 28,400 | | | | 823,205 | |
NXP Semiconductors NV* | | | 21,625 | | | | 1,652,150 | |
Royal Dutch Shell PLC
(Class A Stock), ADR | | | 26,250 | | | | 1,757,437 | |
Royal Dutch Shell PLC
(Class A Stock) | | | 42,408 | | | | 1,413,427 | |
Royal Dutch Shell PLC
(Class B Stock) | | | 106,900 | | | | 3,693,515 | |
| | | | | | |
|
|
|
| | | | | | | | 12,202,744 | |
| | | | | | |
|
|
|
New Zealand — 0.2% | | | | | | | | |
Air New Zealand Ltd. | | | 737,900 | | | | 1,417,332 | |
| | | | | | |
|
|
|
Norway — 0.7% | | | | | | | | |
DNB ASA | | | 50,500 | | | | 744,907 | |
Fred Olsen Energy ASA | | | 17,100 | | | | 156,474 | |
Marine Harvest ASA | | | 85,500 | | | | 1,173,951 | |
Statoil ASA | | | 36,600 | | | | 644,410 | |
Telenor ASA | | | 80,749 | | | | 1,633,440 | |
SEE NOTES TO FINANCIAL STATEMENTS.
A92
| | | | | | |
| | | GLOBAL PORTFOLIO (continued) | | |
| |
| SCHEDULE OF INVESTMENTS | | December 31, 2014 |
| | | | | | | | |
COMMON STOCKS
(continued) | | Shares
| | | Value
(Note 2)
| |
Norway (continued) | | | | | | | | |
Yara International ASA | | | 23,200 | | | $ | 1,033,152 | |
| | | | | | |
|
|
|
| | | | | | | | 5,386,334 | |
| | | | | | |
|
|
|
Singapore — 0.3% | | | | | | | | |
DBS Group Holdings Ltd. | | | 119,000 | | | | 1,842,278 | |
| | | | | | |
|
|
|
South Africa — 0.7% | | | | | | | | |
Bidvest Group Ltd. | | | 70,608 | | | | 1,845,967 | |
Discovery Ltd. | | | 243,150 | | | | 2,328,046 | |
Mondi PLC | | | 49,500 | | | | 804,153 | |
| | | | | | |
|
|
|
| | | | | | | | 4,978,166 | |
| | | | | | |
|
|
|
Spain — 0.7% | | | | | | | | |
ACS Actividades de Construccion y Servicios SA | | | 11,500 | | | | 400,834 | |
Amadeus IT Holding SA
(Class A Stock) | | | 50,848 | | | | 2,025,145 | |
Banco Santander SA | | | 94,600 | | | | 793,991 | |
Gas Natural SDG SA | | | 13,900 | | | | 349,177 | |
Repsol SA | | | 57,200 | | | | 1,070,835 | |
Telefonica SA | | | 25,100 | | | | 360,375 | |
| | | | | | |
|
|
|
| | | | | | | | 5,000,357 | |
| | | | | | |
|
|
|
Sweden — 1.2% | | | | | | | | |
Atlas Copco AB (Class A Stock) | | | 86,484 | | | | 2,406,475 | |
Boliden AB | | | 45,100 | | | | 720,915 | |
Hexagon AB (Class B Stock) | | | 22,142 | | | | 683,071 | |
Nordea Bank AB | | | 86,400 | | | | 1,000,148 | |
Oriflame Cosmetics SA, SDR | | | 13,600 | | | | 188,437 | |
Securitas AB (Class B Stock) | | | 46,500 | | | | 562,543 | |
Swedbank AB (Class A Stock) | | | 40,800 | | | | 1,012,286 | |
Telefonaktiebolaget LM Ericsson (Class B Stock) | | | 77,900 | | | | 943,221 | |
TeliaSonera AB | | | 154,700 | | | | 994,623 | |
| | | | | | |
|
|
|
| | | | | | | | 8,511,719 | |
| | | | | | |
|
|
|
Switzerland — 3.2% | | | | | | | | |
Actelion Ltd.* | | | 19,369 | | | | 2,229,780 | |
Adecco SA* | | | 18,031 | | | | 1,239,438 | |
Baloise Holding AG | | | 11,400 | | | | 1,457,052 | |
Credit Suisse Group AG* | | | 62,600 | | | | 1,572,590 | |
Geberit AG | | | 7,971 | | | | 2,696,612 | |
Georg Fischer AG* | | | 2,000 | | | | 1,261,861 | |
Helvetia Holding AG | | | 1,400 | | | | 665,209 | |
Novartis AG | | | 7,200 | | | | 667,753 | |
Partners Group Holding AG | | | 8,755 | | | | 2,547,156 | |
Roche Holding AG | | | 3,644 | | | | 987,314 | |
Sika AG Series BR | | | 81 | | | | 238,945 | |
Swiss Life Holding AG* | | | 7,800 | | | | 1,843,544 | |
Swiss Re AG* | | | 23,900 | | | | 2,002,144 | |
TE Connectivity Ltd. | | | 27,300 | | | | 1,726,725 | |
Zurich Insurance Group AG* | | | 5,800 | | | | 1,812,514 | |
| | | | | | |
|
|
|
| | | | | | | | 22,948,637 | |
| | | | | | |
|
|
|
Taiwan — 0.2% | | | | | | | | |
MediaTek, Inc. | | | 105,000 | | | | 1,526,430 | |
| | | | | | |
|
|
|
United Kingdom — 6.1% | | | | | | | | |
3i Group PLC | | | 94,600 | | | | 659,626 | |
Alent PLC | | | 54 | | | | 269 | |
Anglo American PLC | | | 47,800 | | | | 884,515 | |
| | | | | | | | |
COMMON STOCKS
(continued) | | Shares
| | | Value
(Note 2)
| |
United Kingdom (continued) | | | | | | | | |
ARM Holdings PLC | | | 46,659 | | | $ | 716,795 | |
AstraZeneca PLC | | | 43,667 | | | | 3,084,239 | |
Aviva PLC | | | 129,800 | | | | 975,239 | |
BAE Systems PLC | | | 227,200 | | | | 1,661,561 | |
Barclays PLC | | | 287,100 | | | | 1,079,306 | |
Beazley PLC | | | 129,500 | | | | 576,527 | |
Bellway PLC | | | 25,400 | | | | 761,790 | |
BG Group PLC | | | 93,162 | | | | 1,246,669 | |
BP PLC | | | 395,000 | | | | 2,507,297 | |
BT Group PLC | | | 198,000 | | | | 1,231,575 | |
Carillion PLC | | | 145,900 | | | | 755,999 | |
Centrica PLC | | | 220,400 | | | | 954,650 | |
Compass Group PLC | | | 236,341 | | | | 4,039,758 | |
Debenhams PLC | | | 301,400 | | | | 351,644 | |
GlaxoSmithKline PLC | | | 64,600 | | | | 1,385,905 | |
Home Retail Group PLC | | | 107,200 | | | | 345,479 | |
HSBC Holdings PLC | | | 167,100 | | | | 1,579,058 | |
IG Group Holdings PLC | | | 2,288 | | | | 25,567 | |
InterContinental Hotels Group PLC | | | 53,638 | | | | 2,158,202 | |
Intermediate Capital Group PLC | | | 108,800 | | | | 777,258 | |
J. Sainsbury PLC | | | 259,000 | | | | 989,042 | |
National Express Group PLC | | | 163,900 | | | | 630,315 | |
Old Mutual PLC | | | 282,100 | | | | 831,397 | |
Petrofac Ltd. | | | 34,000 | | | | 370,395 | |
Premier Foods PLC* | | | 357,756 | | | | 176,650 | |
Reckitt Benckiser Group PLC | | | 10,285 | | | | 833,024 | |
Reed Elsevier PLC | | | 176,989 | | | | 3,023,328 | |
Rio Tinto Ltd. | | | 23,400 | | | | 1,097,014 | |
St. James’s Place PLC | | | 173,843 | | | | 2,191,972 | |
Tate & Lyle PLC | | | 81,200 | | | | 760,802 | |
Tesco PLC | | | 272,000 | | | | 793,072 | |
Vesuvius PLC | | | 81,100 | | | | 560,908 | |
WM Morrison Supermarkets PLC | | | 380,500 | | | | 1,085,669 | |
Wolseley PLC | | | 2,906 | | | | 166,142 | |
WPP PLC | | | 109,674 | | | | 2,280,309 | |
| | | | | | |
|
|
|
| | | | | | | | 43,548,967 | |
| | | | | | |
|
|
|
United States — 55.7% | | | | | | | | |
3M Co. | | | 25,175 | | | | 4,136,756 | |
AES Corp. | | | 214,000 | | | | 2,946,780 | |
Allstate Corp. (The) | | | 40,100 | | | | 2,817,025 | |
American Express Co. | | | 26,550 | | | | 2,470,212 | |
Ameriprise Financial, Inc. | | | 15,650 | | | | 2,069,713 | |
Amgen, Inc. | | | 18,050 | | | | 2,875,184 | |
Amphenol Corp. (Class A Stock) | | | 119,622 | | | | 6,436,860 | |
Anadarko Petroleum Corp. | | | 5,150 | | | | 424,875 | |
ANSYS, Inc.* | | | 44,428 | | | | 3,643,096 | |
Apache Corp. | | | 53,800 | | | | 3,371,646 | |
Apple, Inc. | | | 65,834 | | | | 7,266,757 | |
AT&T, Inc. | | | 56,250 | | | | 1,889,438 | |
Avon Products, Inc. | | | 81,600 | | | | 766,224 | |
Baker Hughes, Inc. | | | 25,600 | | | | 1,435,392 | |
Bank of America Corp. | | | 303,200 | | | | 5,424,248 | |
Boeing Co. (The) | | | 16,600 | | | | 2,157,668 | |
Bristol-Myers Squibb Co. | | | 67,062 | | | | 3,958,670 | |
Carnival Corp. | | | 100,700 | | | | 4,564,731 | |
Celanese Corp., Series A | | | 73,800 | | | | 4,425,048 | |
Charles Schwab Corp. (The) | | | 375,039 | | | | 11,322,427 | |
SEE NOTES TO FINANCIAL STATEMENTS.
A93
| | | | | | |
| | | GLOBAL PORTFOLIO (continued) | | |
| |
| SCHEDULE OF INVESTMENTS | | December 31, 2014 |
| | | | | | | | |
COMMON STOCKS
(continued) | | Shares
| | | Value
(Note 2)
| |
United States (continued) | | | | | | | | |
Chevron Corp. | | | 28,850 | | | $ | 3,236,393 | |
Cisco Systems, Inc. | | | 86,100 | | | | 2,394,871 | |
Cognizant Technology Solutions Corp. (Class A Stock)* | | | 83,863 | | | | 4,416,226 | |
Colfax Corp.* | | | 27,809 | | | | 1,434,110 | |
Comcast Corp. (Class A Stock) | | | 39,250 | | | | 2,276,893 | |
CONSOL Energy, Inc. | | | 23,900 | | | | 808,059 | |
Core Laboratories NV | | | 37,493 | | | | 4,511,908 | |
Costco Wholesale Corp. | | | 36,188 | | | | 5,129,649 | |
Covance, Inc.* | | | 30,406 | | | | 3,157,359 | |
Covidien PLC | | | 13,150 | | | | 1,344,982 | |
Danaher Corp. | | | 87,019 | | | | 7,458,398 | |
DaVita HealthCare Partners, Inc.* | | | 79,394 | | | | 6,013,302 | |
Discovery Communications, Inc. (Class A Stock)* | | | 62,940 | | | | 2,168,283 | |
Discovery Communications, Inc. (Class C Stock)* | | | 96,978 | | | | 3,270,098 | |
Ecolab, Inc. | | | 58,036 | | | | 6,065,923 | |
Emerson Electric Co. | | | 17,600 | | | | 1,086,448 | |
Entergy Corp. | | | 30,800 | | | | 2,694,384 | |
EQT Corp. | | | 20,050 | | | | 1,517,785 | |
Estee Lauder Cos., Inc. (The)
(Class A Stock) | | | 85,375 | | | | 6,505,575 | |
Exelon Corp. | | | 62,750 | | | | 2,326,770 | |
Express Scripts Holding Co.* | | | 115,858 | | | | 9,809,697 | |
Exxon Mobil Corp. | | | 38,600 | | | | 3,568,570 | |
Fastenal Co.(a) | | | 127,539 | | | | 6,065,755 | |
Fifth Third Bancorp | | | 62,100 | | | | 1,265,288 | |
FirstEnergy Corp. | | | 24,400 | | | | 951,356 | |
FMC Technologies, Inc.* | | | 122,876 | | | | 5,755,512 | |
Fossil Group, Inc.* | | | 15,375 | | | | 1,702,628 | |
General Electric Co. | | | 209,350 | | | | 5,290,274 | |
General Motors Co. | | | 65,650 | | | | 2,291,842 | |
Genpact Ltd.* | | | 231,640 | | | | 4,384,945 | |
Gilead Sciences, Inc.* | | | 72,126 | | | | 6,798,597 | |
Google, Inc. (Class A Stock)* | | | 7,460 | | | | 3,958,724 | |
Google, Inc. (Class C Stock)* | | | 7,460 | | | | 3,926,944 | |
Hess Corp. | | | 27,800 | | | | 2,052,196 | |
Honeywell International, Inc. | | | 24,700 | | | | 2,468,024 | |
Illinois Tool Works, Inc. | | | 19,750 | | | | 1,870,325 | |
Ingersoll-Rand PLC | | | 19,200 | | | | 1,217,088 | |
International Paper Co. | | | 39,150 | | | | 2,097,657 | |
Intuitive Surgical, Inc.* | | | 15,638 | | | | 8,271,564 | |
Invesco Ltd. | | | 45,500 | | | | 1,798,160 | |
Johnson & Johnson | | | 37,950 | | | | 3,968,431 | |
JPMorgan Chase & Co. | | | 116,450 | | | | 7,287,441 | |
Kellogg Co. | | | 21,600 | | | | 1,413,504 | |
Kohl’s Corp. | | | 46,450 | | | | 2,835,308 | |
Lockheed Martin Corp. | | | 5,100 | | | | 982,107 | |
Lowe’s Cos., Inc. | | | 72,250 | | | | 4,970,800 | |
Marsh & McLennan Cos., Inc. | | | 72,700 | | | | 4,161,348 | |
Mead Johnson Nutrition Co. | | | 72,894 | | | | 7,328,763 | |
Medtronic, Inc. | | | 22,700 | | | | 1,638,940 | |
Merck & Co., Inc. | | | 82,900 | | | | 4,707,891 | |
MetLife, Inc. | | | 58,750 | | | | 3,177,787 | |
Microsoft Corp. | | | 89,400 | | | | 4,152,630 | |
Morgan Stanley | | | 131,550 | | | | 5,104,140 | |
National Instruments Corp. | | | 103,259 | | | | 3,210,322 | |
| | | | | | | | |
COMMON STOCKS
(continued) | | Shares
| | | Value
(Note 2)
| |
United States (continued) | | | | | | | | |
Navient Corp. | | | 25,200 | | | $ | 544,572 | |
NetSuite, Inc.*(a) | | | 24,735 | | | | 2,700,320 | |
News Corp. (Class A Stock)* | | | 50,500 | | | | 792,345 | |
NRG Energy, Inc. | | | 117,150 | | | | 3,157,192 | |
PepsiCo, Inc. | | | 30,750 | | | | 2,907,720 | |
Pfizer, Inc. | | | 163,350 | | | | 5,088,352 | |
PG&E Corp. | | | 78,400 | | | | 4,174,016 | |
Philip Morris International, Inc. | | | 25,600 | | | | 2,085,120 | |
PNC Financial Services Group, Inc. | | | 20,900 | | | | 1,906,707 | |
Procter & Gamble Co. (The) | | | 36,950 | | | | 3,365,775 | |
QUALCOMM, Inc. | | | 119,216 | | | | 8,861,325 | |
Raytheon Co. | | | 20,450 | | | | 2,212,077 | |
Republic Services, Inc. | | | 26,300 | | | | 1,058,575 | |
salesforce.com, inc.* | | | 98,313 | | | | 5,830,944 | |
Schlumberger Ltd. | | | 75,698 | | | | 6,465,366 | |
Southwest Airlines Co. | | | 103,450 | | | | 4,378,004 | |
Spectra Energy Corp. | | | 27,000 | | | | 980,100 | |
Starbucks Corp. | | | 93,312 | | | | 7,656,250 | |
Stericycle, Inc.* | | | 57,913 | | | | 7,591,236 | |
T-Mobile U.S., Inc.* | | | 12,100 | | | | 325,974 | |
Texas Instruments, Inc. | | | 44,450 | | | | 2,376,519 | |
Thermo Fisher Scientific, Inc. | | | 30,200 | | | | 3,783,758 | |
Time Warner Cable, Inc. | | | 16,650 | | | | 2,531,799 | |
Time Warner, Inc. | | | 42,250 | | | | 3,608,995 | |
TripAdvisor, Inc.* | | | 39,688 | | | | 2,963,106 | |
U.S. Bancorp | | | 75,450 | | | | 3,391,477 | |
Union Pacific Corp. | | | 21,500 | | | | 2,561,295 | |
United Technologies Corp. | | | 45,300 | | | | 5,209,500 | |
Viacom, Inc. (Class B Stock) | | | 10,800 | | | | 812,700 | |
Visa, Inc. (Class A Stock)(a) | | | 35,400 | | | | 9,281,880 | |
Vulcan Materials Co. | | | 24,750 | | | | 1,626,818 | |
Wal-Mart Stores, Inc. | | | 10,100 | | | | 867,388 | |
Wells Fargo & Co. | | | 67,400 | | | | 3,694,868 | |
Western Union Co. (The) | | | 125,300 | | | | 2,244,123 | |
Weyerhaeuser Co. | | | 77,350 | | | | 2,776,091 | |
Whole Foods Market, Inc. | | | 164,264 | | | | 8,282,191 | |
| | | | | | |
|
|
|
| | | | | | | | 400,799,202 | |
| | | | | | |
|
|
|
TOTAL LONG-TERM INVESTMENTS
(cost $556,988,871) | | | | 695,464,696 | |
| | | | | | |
|
|
|
| SHORT-TERM INVESTMENT — 6.1% | | | | | |
AFFILIATED MONEY MARKET MUTUAL FUND | | | | | |
Prudential Investment Portfolios 2 — Prudential Core Taxable Money Market Fund (cost $43,801,082; includes $19,928,813 of cash collateral for securities on loan)
(Note 4)(b)(c) | | | 43,801,082 | | | | 43,801,082 | |
| | | | | | |
|
|
|
TOTAL INVESTMENTS — 102.8%
(cost $600,789,953) | | | | 739,265,778 | |
LIABILITIES IN EXCESS OF
OTHER ASSETS — (2.8)% | | | | (20,092,707 | ) |
| | | | | | |
|
|
|
NET ASSETS — 100.0% | | | $ | 719,173,071 | |
| | | | | | |
|
|
|
See the Glossary for abbreviations used in the Portfolio descriptions.
SEE NOTES TO FINANCIAL STATEMENTS.
A94
| | | | | | |
| | | GLOBAL PORTFOLIO (continued) | | |
| |
| SCHEDULE OF INVESTMENTS | | December 31, 2014 |
| * | Non-income producing security. |
| (a) | All or a portion of security is on loan. The aggregate market value of such securities, including those sold and pending settlement, is $19,352,676; cash collateral of $19,928,813 (included in liabilities) was received with which the Portfolio purchased highly liquid short-term investments. Securities on loan are subject to contractual netting arrangements. |
| (b) | Prudential Investments LLC, the manager of the Portfolio, also serves as manager of the Prudential Investment Portfolios 2 — Prudential Core Taxable Money Market Fund. |
| (c) | Represents security, or a portion thereof, purchased with cash collateral received for securities on loan. |
Various inputs are used in determining the value of the Portfolio’s investments. These inputs are summarized in the three broad levels listed below.
| Level 1— | quoted prices generally in active markets for identical securities. |
| Level 2— | quoted prices for similar securities, interest rates and yield curves, prepayment speeds, foreign currency exchange rates and other significant observable inputs. |
| Level 3— | significant unobservable inputs for securities valued in accordance with Board approved fair valuation procedures. |
The following is a summary of the inputs used as of December 31, 2014 in valuing such portfolio securities:
| | | | | | | | | | | | |
| | | Level 1
| | | Level 2
| | | Level 3
| |
Investments in Securities | | | | | | | | | | | | |
Common Stocks | | | | | | | | | | | | |
Australia | | $ | — | | | $ | 7,010,362 | | | $ | — | |
Austria | | | — | | | | 1,218,187 | | | | — | |
Belgium | | | 217,748 | | | | 1,565,749 | | | | — | |
Brazil | | | 1,146,960 | | | | — | | | | — | |
Canada | | | 14,496,576 | | | | — | | | | — | |
China | | | 5,583,096 | | | | 5,997,253 | | | | — | |
Denmark | | | — | | | | 5,750,596 | | | | — | |
Finland | | | — | | | | 3,248,426 | | | | — | |
France | | | — | | | | 22,050,838 | | | | — | |
Germany | | | — | | | | 19,328,445 | | | | — | |
Hong Kong | | | — | | | | 7,306,528 | | | | — | |
India | | | 6,593,804 | | | | — | | | | — | |
Indonesia | | | — | | | | 2,762,415 | | | | — | |
Ireland | | | 4,580,383 | | | | 795,443 | | | | — | |
Israel | | | 5,572,293 | | | | 2,231,081 | | | | — | |
Italy | | | — | | | | 5,330,084 | | | | — | |
Japan | | | 419,302 | | | | 62,343,893 | | | | — | |
Liechtenstein | | | 179,541 | | | | — | | | | — | |
Macau | | | — | | | | 1,573,527 | | | | — | |
Netherlands | | | 3,409,587 | | | | 8,793,157 | | | | — | |
New Zealand | | | — | | | | 1,417,332 | | | | — | |
Norway | | | — | | | | 5,386,334 | | | | — | |
Singapore | | | — | | | | 1,842,278 | | | | — | |
South Africa | | | — | | | | 4,978,166 | | | | — | |
Spain | | | — | | | | 5,000,357 | | | | — | |
Sweden | | | — | | | | 8,511,719 | | | | — | |
Switzerland | | | 1,726,725 | | | | 21,221,912 | | | | — | |
Taiwan | | | — | | | | 1,526,430 | | | | — | |
United Kingdom | | | — | | | | 43,548,967 | | | | — | |
United States | | | 400,799,202 | | | | — | | | | — | |
Affiliated Money Market Mutual Fund | | | 43,801,082 | | | | — | | | | — | |
| | |
|
|
| |
|
|
| |
|
|
|
Total | | $ | 488,526,299 | | | $ | 250,739,479 | | | $ | — | |
| | |
|
|
| |
|
|
| |
|
|
|
SEE NOTES TO FINANCIAL STATEMENTS.
A95
| | | | | | |
| | | GLOBAL PORTFOLIO (continued) | | |
| |
| SCHEDULE OF INVESTMENTS | | December 31, 2014 |
The industry classification of investments and liabilities in excess of other assets shown as a percentage of net assets as of December 31, 2014 was as follows (Unaudited):
| | | | |
Banks | | | 7.8 | % |
Affiliated Money Market Mutual Fund (including 2.8% of collateral for securities on loan) | | | 6.1 | |
Insurance | | | 5.3 | |
Pharmaceuticals | | | 5.3 | |
Oil, Gas & Consumable Fuels | | | 5.1 | |
Capital Markets | | | 3.9 | |
IT Services | | | 3.6 | |
Food & Staples Retailing | | | 3.3 | |
Media | | | 3.0 | |
Hotels, Restaurants & Leisure | | | 2.8 | |
Industrial Conglomerates | | | 2.8 | |
Electronic Equipment, Instruments & Components | | | 2.6 | |
Energy Equipment & Services | | | 2.6 | |
Software | | | 2.5 | |
Health Care Providers & Services | | | 2.5 | |
Aerospace & Defense | | | 2.3 | |
Automobiles | | | 2.3 | |
Chemicals | | | 2.1 | |
Internet Software & Services | | | 2.1 | |
Machinery | | | 2.1 | |
Health Care Equipment & Supplies | | | 2.0 | |
Biotechnology | | | 1.7 | |
Communications Equipment | | | 1.7 | |
Commercial Services & Supplies | | | 1.7 | |
Food Products | | | 1.5 | |
Personal Products | | | 1.4 | |
Technology Hardware, Storage & Peripherals | | | 1.4 | |
Trading Companies & Distributors | | | 1.4 | |
Auto Components | | | 1.3 | |
Real Estate Management & Development | | | 1.3 | |
Airlines | | | 1.2 | |
Electric Utilities | | | 1.2 | |
Specialty Retail | | | 1.2 | |
| | | | |
Diversified Telecommunication Services | | | 1.1 | % |
Road & Rail | | | 1.1 | |
Life Sciences Tools & Services | | | 1.0 | |
Semiconductors & Semiconductor Equipment | | | 0.9 | |
Building Products | | | 0.8 | |
Independent Power & Renewable Electricity Producers | | | 0.8 | |
Multi-Utilities | | | 0.8 | |
Metals & Mining | | | 0.7 | |
Household Products | | | 0.6 | |
Diversified Financial Services | | | 0.5 | |
Internet & Catalog Retail | | | 0.5 | |
Beverages | | | 0.4 | |
Consumer Finance | | | 0.4 | |
Multiline Retail | | | 0.4 | |
Paper & Forest Products | | | 0.4 | |
Real Estate Investment Trusts (REITs) | | | 0.4 | |
Wireless Telecommunication Services | | | 0.4 | |
Construction & Engineering | | | 0.3 | |
Construction Materials | | | 0.3 | |
Electrical Equipment | | | 0.3 | |
Textiles, Apparel & Luxury Goods | | | 0.3 | |
Tobacco | | | 0.3 | |
Diversified Consumer Services | | | 0.2 | |
Household Durables | | | 0.2 | |
Professional Services | | | 0.2 | |
Containers & Packaging | | | 0.1 | |
Leisure Products | | | 0.1 | |
Marine | | | 0.1 | |
Oil & Gas Exploration & Production | | | 0.1 | |
| | |
|
|
|
| | | | 102.8 | |
Liabilities in excess of other assets | | | (2.8 | ) |
| | |
|
|
|
| | | | 100.0 | % |
| | |
|
|
|
The Portfolio invested in derivative instruments during the reporting period. The primary type of risk associated with these derivative instruments is equity risk. The effect of such derivative instruments on the Portfolio’s financial position and financial performance as reflected in the Statement of Assets and Liabilities and Statement of Operations is presented in the summary below:
The Portfolio did not hold any derivative instruments as of December 31, 2014 accordingly, no derivative positions were presented in the Statement of Assets and Liabilities.
The effects of derivative instruments on the Statement of Operations for the year ended December 31, 2014 are as follows:
| | | | |
Amount of Realized Gain or (Loss) on Derivatives Recognized in Income
| |
Derivatives not accounted for as hedging instruments, carried at fair value
| | Rights*
| |
Equity contracts | | $ | 22,194 | |
| | |
|
|
|
| * | Included in net realized gain (loss) on investment transactions in the Statement of Operations. |
| | | | |
Change in Unrealized Appreciation or (Depreciation) on Derivatives Recognized in Income
| |
Derivatives not accounted for as hedging instruments, carried at fair value
| | Rights*
| |
Equity contracts | | $ | (1,657 | ) |
| | |
|
|
|
| * | Included in net change in unrealized appreciation (depreciation) on investment transactions in the Statement of Operations. |
SEE NOTES TO FINANCIAL STATEMENTS.
A96
| | | | | | |
| | | GLOBAL PORTFOLIO (continued) | | |
STATEMENT OF ASSETS AND LIABILITIES
December 31, 2014
| | | | |
| ASSETS | |
Investments at value, including securities on loan of $19,352,676: | | | | |
Unaffiliated investments (cost $556,988,871) | | $ | 695,464,696 | |
Affiliated investments (cost $43,801,082) | | | 43,801,082 | |
Cash | | | 360 | |
Foreign currency, at value (cost $1,393,454) | | | 1,329,521 | |
Receivable for investments sold | | | 2,173,998 | |
Tax reclaim receivable | | | 1,180,584 | |
Dividends receivable | | | 593,920 | |
Receivable for Series shares sold | | | 2,417 | |
Prepaid expenses | | | 6,030 | |
| | |
|
|
|
Total Assets | | | 744,552,608 | |
| | |
|
|
|
| LIABILITIES | | | | |
Payable to broker for collateral for securities on loan | | | 19,928,813 | |
Payable for investments purchased | | | 4,673,910 | |
Management fee payable | | | 454,204 | |
Accrued expenses | | | 188,781 | |
Payable for Series shares repurchased | | | 132,903 | |
Affiliated transfer agent fee payable | | | 926 | |
| | |
|
|
|
Total Liabilities | | | 25,379,537 | |
| | |
|
|
|
| NET ASSETS | | $ | 719,173,071 | |
| | |
|
|
|
Net assets were comprised of: | | | | |
Paid-in capital | | $ | 538,510,059 | |
Retained earnings | | | 180,663,012 | |
| | |
|
|
|
Net assets, December 31, 2014 | | $ | 719,173,071 | |
| | |
|
|
|
Net asset value and redemption price per share $719,173,071 / 27,964,466 outstanding shares of beneficial interest | | $ | 25.72 | |
| | |
|
|
|
STATEMENT OF OPERATIONS
Year Ended December 31, 2014
| | | | |
| NET INVESTMENT INCOME | | | | |
| INCOME | | | | |
Unaffiliated dividend income (net of foreign withholding taxes of $962,474) | | $ | 16,794,078 | |
Affiliated dividend income | | | 24,175 | |
Affiliated income from securities loaned, net | | | 21,635 | |
| | |
|
|
|
Total income | | | 16,839,888 | |
| | |
|
|
|
| EXPENSES | | | | |
Management fee | | | 5,578,237 | |
Custodian’s fees and expenses | | | 323,000 | |
Shareholders’ reports | | | 85,000 | |
Audit fee | | | 26,000 | |
Trustees’ fees | | | 16,000 | |
Transfer agent’s fees and expenses (including affiliated expense of $5,600) | | | 12,000 | |
Legal fees and expenses | | | 11,000 | |
Insurance expenses | | | 10,000 | |
Commitment fee on syndicated credit agreement | | | 2,000 | |
Miscellaneous | | | 47,648 | |
| | |
|
|
|
Total expenses | | | 6,110,885 | |
Less: Management fee waiver | | | (74,376 | ) |
| | |
|
|
|
Net expenses | | | 6,036,509 | |
| | |
|
|
|
| NET INVESTMENT INCOME | | | 10,803,379 | |
| | |
|
|
|
REALIZED AND UNREALIZED GAIN (LOSS) ON
INVESTMENT AND FOREIGN CURRENCY TRANSACTIONS | |
Net realized gain (loss) on: | | | | |
Investment transactions | | | 38,780,578 | |
Foreign currency transactions | | | (310,017 | ) |
| | |
|
|
|
| | | | 38,470,561 | |
| | |
|
|
|
Net change in unrealized appreciation (depreciation) on: | |
Investments | | | (25,239,765 | ) |
Foreign currencies | | | (265,179 | ) |
| | |
|
|
|
| | | | (25,504,944 | ) |
| | |
|
|
|
| NET GAIN ON INVESTMENT AND FOREIGN CURRENCY TRANSACTIONS | | | 12,965,617 | |
| | |
|
|
|
| NET INCREASE IN NET ASSETS RESULTING FROM OPERATIONS | | $ | 23,768,996 | |
| | |
|
|
|
STATEMENT OF CHANGES IN NET ASSETS
| | | | | | | | |
| | | Year Ended December 31,
| |
| | | 2014
| | | 2013
| |
INCREASE (DECREASE) IN NET ASSETS
OPERATIONS | | | | | | | | |
Net investment income | | $ | 10,803,379 | | | $ | 8,723,957 | |
Net realized gain on investment and foreign currency transactions | | | 38,470,561 | | | | 65,395,026 | |
Net change in unrealized appreciation (depreciation) on investments and foreign currencies | | | (25,504,944 | ) | | | 88,778,751 | |
| | |
|
|
| |
|
|
|
NET INCREASE IN NET ASSETS RESULTING FROM OPERATIONS | | | 23,768,996 | | | | 162,897,734 | |
| | |
|
|
| |
|
|
|
| SERIES SHARE TRANSACTIONS | | | | | | | | |
Series shares sold [941,874 and 782,060 shares, respectively] | | | 23,729,047 | | | | 17,649,736 | |
Series shares repurchased [2,863,482 and 2,132,268 shares, respectively] | | | (72,868,700 | ) | | | (47,193,527 | ) |
| | |
|
|
| |
|
|
|
NET DECREASE IN NET ASSETS FROM SERIES SHARE TRANSACTIONS | | | (49,139,653 | ) | | | (29,543,791 | ) |
| | |
|
|
| |
|
|
|
| TOTAL INCREASE (DECREASE) | | | (25,370,657 | ) | | | 133,353,943 | |
| NET ASSETS: | | | | | | | | |
Beginning of year | | | 744,543,728 | | | | 611,189,785 | |
| | |
|
|
| |
|
|
|
End of year | | $ | 719,173,071 | | | $ | 744,543,728 | |
| | |
|
|
| |
|
|
|
SEE NOTES TO FINANCIAL STATEMENTS.
A97
| | | | | | |
| | | GOVERNMENT INCOME PORTFOLIO | | |
| |
| SCHEDULE OF INVESTMENTS | | December 31, 2014 |
| | | | | | | | | | | | | | |
LONG-TERM INVESTMENTS — 96.0% ASSET-BACKED SECURITIES — 4.2% | | Interest
Rate
| | | Maturity
Date
| | Principal
Amount
(000)#
| | | Value
(Note 2)
| |
Collateralized Loan Obligations — 3.1% | | | | | | | | | | | | | | |
Anchorage Capital CLO Ltd., Series 2014-5A, Class A, 144A | | | 1.833% | (a) | | 10/15/26 | | | 750 | | | $ | 747,520 | |
Ares CLO Ltd., Series 2014-31A, Class A1, 144A | | | 1.678% | (a) | | 08/28/25 | | | 1,000 | | | | 995,318 | |
Battalion CLO VII Ltd., Series 2014-7A, Class A1, 144A | | | 1.800% | (a) | | 10/17/26 | | | 750 | | | | 747,404 | |
Galaxy CLO Ltd., Series 2014-18A, Class A, 144A | | | 1.704% | (a) | | 10/15/26 | | | 3,250 | | | | 3,218,925 | |
Magnetite VIII Ltd., Series 2014-8A, Class A, 144A | | | 1.711% | (a) | | 04/15/26 | | | 260 | | | | 257,844 | |
Silver Spring Ltd., Series 2014-1A, Class A, 144A | | | 1.721% | (a) | | 10/15/26 | | | 1,500 | | | | 1,483,925 | |
Voya CLO Ltd., Series 2014-3A, Class A1, 144A | | | 1.649% | (a) | | 07/25/26 | | | 3,000 | | | | 2,965,204 | |
| | | | | | | | | | | | |
|
|
|
| | | | | | | | | | | | | | 10,416,140 | |
| | | | | | | | | | | | |
|
|
|
Collateralized Mortgage Obligations — 0.4% | | | | | | | | | | | | | | |
Federal Home Loan Mortgage Corp., REMICS, Series 2002-2496, Class PM | | | 5.500% | | | 09/15/17 | | | 299 | | | | 313,730 | |
Federal Home Loan Mortgage Corp., REMICS, Series 2002-2501, Class MC | | | 5.500% | | | 09/15/17 | | | 97 | | | | 100,800 | |
Federal Home Loan Mortgage Corp., REMICS, Series 2002-2513, Class HC | | | 5.000% | | | 10/15/17 | | | 596 | | | | 622,366 | |
Federal National Mortgage Assoc., REMICS, Series 2002-57, Class ND | | | 5.500% | | | 09/25/17 | | | 115 | | | | 119,535 | |
Merrill Lynch Mortgage Investors, Inc., Series 2003-E, Class A1 | | | 0.790% | (a) | | 10/25/28 | | | 49 | | | | 48,562 | |
Structured Adjustable Rate Mortgage Loan Trust, Series 2004-1, Class 4A3 | | | 2.573% | (a) | | 02/25/34 | | | 218 | | | | 217,086 | |
| | | | | | | | | | | | |
|
|
|
| | | | | | | | | | | | | | 1,422,079 | |
| | | | | | | | | | | | |
|
|
|
Non-Residential Mortgage-Backed Securities — 0.7% | | | | | | | | | | | | | | |
Citibank Credit Card Issuance Trust, Series 2007-A8, Class A8 | | | 5.650% | | | 09/20/19 | | | 1,500 | | | | 1,663,770 | |
Small Business Administration Participation Certificates, Series 1996-20J, Class 1 | | | 7.200% | | | 10/01/16 | | | 241 | | | | 249,627 | |
Small Business Administration Participation Certificates, Series 1997-20A, Class 1 | | | 7.150% | | | 01/01/17 | | | 181 | | | | 187,967 | |
Small Business Administration Participation Certificates, Series 1997-20G, Class 1 | | | 6.850% | | | 07/01/17 | | | 106 | | | | 109,913 | |
Small Business Administration Participation Certificates, Series 1998-20I, Class 1 | | | 6.000% | | | 09/01/18 | | | 309 | | | | 322,717 | |
| | | | | | | | | | | | |
|
|
|
| | | | | | | | | | | | | | 2,533,994 | |
| | | | | | | | | | | | |
|
|
|
TOTAL ASSET-BACKED SECURITIES
(cost $14,198,400) | | | | 14,372,213 | |
| | | | | | | | | | | | |
|
|
|
| COMMERCIAL MORTGAGE-BACKED SECURITIES — 20.2% | | | | | | | | | | | | | | |
Citigroup/Deutsche Bank Commercial Mortgage Trust, Series 2007-CD4, Class A3 | | | 5.293% | | | 12/11/49 | | | 168 | | | | 169,352 | |
COBALT CMBS Commercial Mortgage Trust, Series 2006-C1, Class A4 | | | 5.223% | | | 08/15/48 | | | 1,800 | | | | 1,896,743 | |
Commercial Mortgage Pass-Through Certificates, Series 2012-CR5, Class A3 | | | 2.540% | | | 12/10/45 | | | 1,000 | | | | 971,095 | |
Commercial Mortgage Trust, Series 2005-GG5, Class AM | | | 5.277% | (a) | | 04/10/37 | | | 1,500 | | | | 1,532,703 | |
Commercial Mortgage Trust, Series 2007-GG9, Class A2 | | | 5.381% | | | 03/10/39 | | | 674 | | | | 675,799 | |
Credit Suisse Commercial Mortgage Trust, Series 2006-C1, Class AM | | | 5.467% | (a) | | 02/15/39 | | | 200 | | | | 208,034 | |
Federal National Mortgage Assoc., Series 2012-M13, Class A2 | | | 2.377% | | | 05/25/22 | | | 1,850 | | | | 1,831,261 | |
Federal National Mortgage Assoc., Series 2012-M2, Class A2 | | | 2.717% | | | 02/25/22 | | | 200 | | | | 203,045 | |
Federal National Mortgage Assoc., Series 2014-M2, Class A2 | | | 3.513% | | | 12/25/23 | | | 2,650 | | | | 2,824,598 | |
FHLMC Multifamily Structured Pass-Through Certificates, Series K003, Class A5 | | | 5.085% | | | 03/25/19 | | | 250 | | | | 280,661 | |
FHLMC Multifamily Structured Pass-Through Certificates, Series K004, Class A2 | | | 4.186% | | | 08/25/19 | | | 4,825 | | | | 5,269,489 | |
FHLMC Multifamily Structured Pass-Through Certificates, Series K005,
Class A2 | | | 4.317% | | | 11/25/19 | | | 1,100 | | | | 1,209,960 | |
FHLMC Multifamily Structured Pass-Through Certificates, Series K008,
Class X1, I/O | | | 1.654% | (a) | | 06/25/20 | | | 18,941 | | | | 1,282,972 | |
FHLMC Multifamily Structured Pass-Through Certificates, Series K019,
Class X1, I/O | | | 1.732% | (a) | | 03/25/22 | | | 18,489 | | | | 1,837,460 | |
FHLMC Multifamily Structured Pass-Through Certificates, Series K020,
Class X1, I/O | | | 1.465% | (a) | | 05/25/22 | | | 9,277 | | | | 799,075 | |
FHLMC Multifamily Structured Pass-Through Certificates, Series K021,
Class X1, I/O | | | 1.506% | (a) | | 06/25/22 | | | 9,825 | | | | 873,917 | |
SEE NOTES TO FINANCIAL STATEMENTS.
A98
| | | | | | |
| | | GOVERNMENT INCOME PORTFOLIO (continued) | | |
| |
| SCHEDULE OF INVESTMENTS | | December 31, 2014 |
| | | | | | | | | | | | | | |
COMMERCIAL MORTGAGE-BACKED SECURITIES
(continued) | | Interest
Rate
| | | Maturity
Date
| | Principal
Amount
(000)#
| | | Value
(Note 2)
| |
FHLMC Multifamily Structured Pass-Through Certificates, Series K024,
Class A2 | | | 2.573% | | | 09/25/22 | | | 2,000 | | | $ | 2,005,802 | |
FHLMC Multifamily Structured Pass-Through Certificates, Series K025,
Class X1, I/O | | | 0.900% | (a) | | 10/25/22 | | | 27,665 | | | | 1,551,972 | |
FHLMC Multifamily Structured Pass-Through Certificates, Series K026,
Class A2 | | | 2.510% | | | 11/25/22 | | | 3,600 | | | | 3,590,986 | |
FHLMC Multifamily Structured Pass-Through Certificates, Series K029,
Class A2 | | | 3.320% | | | 02/25/23 | | | 3,600 | | | | 3,789,295 | |
FHLMC Multifamily Structured Pass-Through Certificates, Series K032,
Class A2 | | | 3.310% | (a) | | 05/25/23 | | | 2,730 | | | | 2,869,519 | |
FHLMC Multifamily Structured Pass-Through Certificates, Series K033,
Class A2 | | | 3.060% | | | 07/25/23 | | | 3,600 | | | | 3,716,381 | |
FHLMC Multifamily Structured Pass-Through Certificates, Series K034, Class A2 | | | 3.531% | | | 07/25/23 | | | 5,200 | | | | 5,552,066 | |
FHLMC Multifamily Structured Pass-Through Certificates, Series K036,
Class X1, I/O | | | 0.800% | (a) | | 10/25/23 | | | 27,958 | | | | 1,576,645 | |
FHLMC Multifamily Structured Pass-Through Certificates, Series K501,
Class X1A, I/O | | | 1.685% | (a) | | 08/25/16 | | | 3,350 | | | | 63,285 | |
FHLMC Multifamily Structured Pass-Through Certificates, Series K710,
Class X1, I/O | | | 1.778% | (a) | | 05/25/19 | | | 8,347 | | | | 551,958 | |
FHLMC Multifamily Structured Pass-Through Certificates, Series K711,
Class X1, I/O | | | 1.707% | (a) | | 07/25/19 | | | 7,898 | | | | 506,932 | |
FHLMC Multifamily Structured Pass-Through Certificates, Series KSMC, Class A2 | | | 2.615% | | | 01/25/23 | | | 3,600 | | | | 3,601,073 | |
JPMorgan Chase Commercial Mortgage Securities Corp., Series 2007-LD11, Class A3 | | | 5.787% | (a) | | 06/15/49 | | | 1,000 | | | | 1,013,024 | |
JPMorgan Chase Commercial Mortgage Securities Trust, Series 2013-LC11, Class A4 | | | 2.694% | | | 04/15/46 | | | 1,700 | | | | 1,661,874 | |
JPMorgan Chase Commercial Mortgage Securities Trust, Series 2014-C23, Class A3 | | | 3.368% | | | 09/15/47 | | | 1,700 | | | | 1,756,397 | |
Morgan Stanley Capital I Trust, Series 2005-IQ10, Class A4B | | | 5.252% | (a) | | 09/15/42 | | | 800 | | | | 818,871 | |
NCUA Guaranteed Notes, Series 2010-C1, Class A2 | | | 2.900% | | | 10/29/20 | | | 2,600 | | | | 2,669,688 | |
UBS-Barclays Commercial Mortgage Trust, Series 2012-C4, Class A4 | | | 2.792% | | | 12/10/45 | | | 1,300 | | | | 1,287,018 | |
Wachovia Bank Commercial Mortgage Trust, Series 2005-C20, Class AMFX | | | 5.179% | (a) | | 07/15/42 | | | 1,800 | | | | 1,838,025 | |
Wachovia Bank Commercial Mortgage Trust, Series 2006-C23, Class A5 | | | 5.416% | (a) | | 01/15/45 | | | 1,500 | | | | 1,553,997 | |
Wachovia Bank Commercial Mortgage Trust, Series 2006-C25, Class A5 | | | 5.723% | (a) | | 05/15/43 | | | 2,000 | | | | 2,094,274 | |
Wachovia Bank Commercial Mortgage Trust, Series 2006-C27, Class A3 | | | 5.765% | (a) | | 07/15/45 | | | 2,333 | | | | 2,444,008 | |
| | | | | | | | | | | | |
|
|
|
TOTAL COMMERCIAL MORTGAGE-BACKED SECURITIES
(cost $68,392,446) | | | | 68,379,254 | |
| | | | | | | | | | | | |
|
|
|
| | | | | | | | | | | | | | | |
| CORPORATE BOND — 0.7% | | | | | | | | | | | | | | |
Province of British Columbia, Sr. Unsec’d. Notes
(cost $2,239,253)(b) | | | 2.000% | | | 10/23/22 | | | 2,405 | | | | 2,352,542 | |
| | | | | | | | | | | | |
|
|
|
| FOREIGN GOVERNMENT AGENCIES — 0.8% | | | | | | | | | | | | | | |
CDP Financial, Inc. (Canada), Sr. Unsec’d. Notes, 144A | | | 3.150% | | | 07/24/24 | | | 1,410 | | | | 1,437,570 | |
KFW, Gov’t. Gtd., GMTN(b) | | | 2.750% | | | 10/01/20 | | | 1,320 | | | | 1,378,793 | |
| | | | | | | | | | | | |
|
|
|
TOTAL FOREIGN GOVERNMENT AGENCIES
(cost $2,768,198) | | | | 2,816,363 | |
| | | | | | | | | | | | |
|
|
|
| MUNICIPAL BOND — 0.2% | | | | | | | | | | | | | | |
Utah | | | | | | | | | | | | | | |
State of Utah, BABs, Series D
(cost $630,000) | | | 4.554% | | | 07/01/24 | | | 630 | | | | 708,315 | |
| | | | | | | | | | | | |
|
|
|
| U.S. GOVERNMENT AGENCY OBLIGATIONS — 47.2% | | | | | | | | | | | | | | |
Federal Home Loan Mortgage Corp. | | | 0.750% | | | 01/12/18 | | | 1,380 | | | | 1,360,196 | |
Federal Home Loan Mortgage Corp. | | | 2.354% | (a) | | 05/01/34 | | | 423 | | | | 451,946 | |
Federal Home Loan Mortgage Corp.(c) | | | 2.500% | | | TBA | | | 500 | | | | 508,539 | |
SEE NOTES TO FINANCIAL STATEMENTS.
A99
| | | | | | |
| | | GOVERNMENT INCOME PORTFOLIO (continued) | | |
| |
| SCHEDULE OF INVESTMENTS | | December 31, 2014 |
| | | | | | | | | | | | | | |
U.S. GOVERNMENT AGENCY OBLIGATIONS
(continued) | | Interest
Rate
| | | Maturity
Date
| | Principal
Amount
(000)#
| | | Value
(Note 2)
| |
Federal Home Loan Mortgage Corp. | | | 3.000% | | | 06/01/29 | | | 948 | | | $ | 986,764 | |
Federal Home Loan Mortgage Corp.(c) | | | 3.000% | | | TBA | | | 2,000 | | | | 2,015,234 | |
Federal Home Loan Mortgage Corp.(c) | | | 3.500% | | | TBA | | | 1,000 | | | | 1,055,625 | |
Federal Home Loan Mortgage Corp.(c) | | | 3.500% | | | TBA | | | 4,000 | | | | 4,149,062 | |
Federal Home Loan Mortgage Corp. | | | 4.000% | | | 06/01/26-12/01/40 | | | 3,651 | | | | 3,899,738 | |
Federal Home Loan Mortgage Corp. | | | 4.500% | | | 09/01/39 | | | 3,609 | | | | 3,912,448 | |
Federal Home Loan Mortgage Corp. | | | 5.000% | | | 06/01/33-05/01/34 | | | 1,620 | | | | 1,794,486 | |
Federal Home Loan Mortgage Corp. | | | 5.500% | | | 05/01/37-05/01/38 | | | 1,068 | | | | 1,194,220 | |
Federal Home Loan Mortgage Corp. | | | 6.000% | | | 09/01/34-08/01/39 | | | 776 | | | | 878,957 | |
Federal Home Loan Mortgage Corp. | | | 6.500% | | | 09/01/32 | | | 108 | | | | 124,063 | |
Federal National Mortgage Assoc.(b) | | | 0.875% | | | 05/21/18 | | | 580 | | | | 570,356 | |
Federal National Mortgage Assoc. | | | 1.750% | | | 06/20/19 | | | 3,690 | | | | 3,708,184 | |
Federal National Mortgage Assoc.(b) | | | 1.750% | | | 11/26/19 | | | 745 | | | | 745,447 | |
Federal National Mortgage Assoc. | | | 1.875% | | | 02/19/19 | | | 90 | | | | 91,366 | |
Federal National Mortgage Assoc. | | | 1.988% | (a) | | 04/01/34 | | | 170 | | | | 180,513 | |
Federal National Mortgage Assoc. | | | 2.183% | (a) | | 07/01/33 | | | 1,202 | | | | 1,273,028 | |
Federal National Mortgage Assoc. | | | 2.195% | (a) | | 04/01/34 | | | 316 | | | | 336,780 | |
Federal National Mortgage Assoc. | | | 2.225% | (a) | | 06/01/34 | | | 287 | | | | 304,291 | |
Federal National Mortgage Assoc. | | | 2.392% | (a) | | 08/01/33 | | | 833 | | | | 880,889 | |
Federal National Mortgage Assoc.(c) | | | 2.500% | | | TBA | | | 5,500 | | | | 5,588,946 | |
Federal National Mortgage Assoc. | | | 2.625% | | | 09/06/24 | | | 1,950 | | | | 1,974,806 | |
Federal National Mortgage Assoc.(c) | | | 3.000% | | | TBA | | | 4,000 | | | | 4,157,656 | |
Federal National Mortgage Assoc. | | | 3.000% | | | 08/01/28 | | | 2,166 | | | | 2,255,116 | |
Federal National Mortgage Assoc.(c) | | | 3.000% | | | TBA | | | 9,000 | | | | 9,081,387 | |
Federal National Mortgage Assoc. | | | 3.500% | | | 03/01/27-06/01/39 | | | 1,615 | | | | 1,701,566 | |
Federal National Mortgage Assoc.(c) | | | 3.500% | | | TBA | | | 6,000 | | | | 6,238,361 | |
Federal National Mortgage Assoc.(c) | | | 3.500% | | | TBA | | | 12,500 | | | | 13,030,275 | |
Federal National Mortgage Assoc.(c) | | | 4.000% | | | TBA | | | 13,000 | | | | 13,874,301 | |
Federal National Mortgage Assoc.(c) | | | 4.000% | | | TBA | | | 2,500 | | | | 2,661,299 | |
Federal National Mortgage Assoc. | | | 4.000% | | | 09/01/40 | | | 3,694 | | | | 3,949,391 | |
Federal National Mortgage Assoc.(c) | | | 4.500% | | | TBA | | | 6,000 | | | | 6,512,813 | |
Federal National Mortgage Assoc.(c) | | | 4.500% | | | TBA | | | 6,500 | | | | 7,043,360 | |
Federal National Mortgage Assoc. | | | 4.500% | | | 05/01/40 | | | 4,128 | | | | 4,513,285 | |
Federal National Mortgage Assoc. | | | 5.000% | | | 07/01/18-05/01/36 | | | 2,856 | | | | 3,124,663 | |
Federal National Mortgage Assoc.(c) | | | 5.000% | | | TBA | | | 3,500 | | | | 3,866,885 | |
Federal National Mortgage Assoc. | | | 5.500% | | | 01/01/17-11/01/35 | | | 6,984 | | | | 7,865,473 | |
Federal National Mortgage Assoc. | | | 6.000% | | | 05/01/21-05/01/38 | | | 1,488 | | | | 1,693,087 | |
Federal National Mortgage Assoc. | | | 6.500% | | | 01/01/15-10/01/37 | | | 1,591 | | | | 1,845,856 | |
Federal National Mortgage Assoc. | | | 7.000% | | | 12/01/31-01/01/36 | | | 235 | | | | 274,101 | |
Federal National Mortgage Assoc. | | | 8.000% | | | 03/01/22-02/01/26 | | | 10 | | | | 10,520 | |
Federal National Mortgage Assoc. | | | 9.000% | | | 02/01/25-04/01/25 | | | 35 | | | | 40,124 | |
Financing Corp. Strips Principal, Series 4-P | | | 1.390% | (d) | | 10/06/17 | | | 2,700 | | | | 2,604,790 | |
Financing Corp. Strips Principal, Series D-P | | | 2.224% | (d) | | 09/26/19 | | | 1,370 | | | | 1,249,777 | |
Government National Mortgage Assoc.(c) | | | 3.000% | | | TBA | | | 3,000 | | | | 3,067,875 | |
Government National Mortgage Assoc.(c) | | | 3.500% | | | TBA | | | 3,000 | | | | 3,149,063 | |
Government National Mortgage Assoc. | | | 3.500% | | | 10/20/43 | | | 1,977 | | | | 2,077,533 | |
Government National Mortgage Assoc. | | | 4.000% | | | 06/15/40-06/20/44 | | | 2,478 | | | | 2,660,630 | |
Government National Mortgage Assoc.(c) | | | 4.000% | | | TBA | | | 3,000 | | | | 3,216,527 | |
Government National Mortgage Assoc.(c) | | | 4.500% | | | TBA | | | 2,000 | | | | 2,185,234 | |
Government National Mortgage Assoc. | | | 4.500% | | | 02/20/41-03/20/41 | | | 2,877 | | | | 3,156,956 | |
Government National Mortgage Assoc. | | | 5.000% | | | 07/15/33-04/15/34 | | | 847 | | | | 941,237 | |
Government National Mortgage Assoc. | | | 5.500% | | | 03/15/34-03/15/36 | | | 767 | | | | 865,031 | |
Government National Mortgage Assoc. | | | 6.500% | | | 07/15/32-08/15/32 | | | 241 | | | | 279,581 | |
Government National Mortgage Assoc. | | | 7.000% | | | 03/15/23-08/15/28 | | | 533 | | | | 593,472 | |
Government National Mortgage Assoc. | | | 7.500% | | | 12/15/25-02/15/26 | | | 83 | | | | 94,434 | |
Government National Mortgage Assoc. | | | 8.500% | | | 09/15/24-04/15/25 | | | 173 | | | | 197,932 | |
Hashemite Kingdom of Jordan, USAID Bond (Jordan), U.S. Gov’t. Gtd. Notes | | | 2.503% | | | 10/30/20 | | | 937 | | | | 952,611 | |
Ukraine Government USAID Bonds, U.S. Gov’t. Gtd. Notes | | | 1.844% | | | 05/16/19 | | | 565 | | | | 568,814 | |
SEE NOTES TO FINANCIAL STATEMENTS.
A100
| | | | | | |
| | | GOVERNMENT INCOME PORTFOLIO (continued) | | |
| |
| SCHEDULE OF INVESTMENTS | | December 31, 2014 |
| | | | | | | | | | | | | | |
U.S. GOVERNMENT AGENCY OBLIGATIONS
(continued) | | Interest
Rate
| | | Maturity
Date
| | Principal
Amount
(000)#
| | | Value
(Note 2)
| |
Westpac Banking Corp., 144A(b) | | | 2.000% | | | 05/21/19 | | | 610 | | | $ | 607,806 | |
| | | | | | | | | | | | |
|
|
|
TOTAL U.S. GOVERNMENT AGENCY OBLIGATIONS
(cost $156,858,203) | | | | 160,194,706 | |
| | | | | | | | | | | | |
|
|
|
| U.S. TREASURY OBLIGATIONS — 22.7% | | | | | | | | | | | | | | |
U.S. Treasury Bonds | | | 2.250% | | | 11/15/24 | | | 655 | | | | 659,401 | |
U.S. Treasury Bonds | | | 2.875% | | | 05/15/43 | | | 415 | | | | 424,467 | |
U.S. Treasury Bonds | | | 3.000% | | | 11/15/44 | | | 2,100 | | | | 2,206,970 | |
U.S. Treasury Inflation Indexed Bonds, TIPS | | | 0.125% | | | 04/15/19 | | | 10,417 | | | | 10,302,685 | |
U.S. Treasury Notes | | | 1.250% | | | 11/30/18 | | | 8,865 | | | | 8,802,670 | |
U.S. Treasury Notes(e) | | | 1.500% | | | 12/31/18 | | | 16,585 | | | | 16,607,025 | |
U.S. Treasury Notes | | | 1.500% | | | 01/31/19-05/31/19 | | | 2,465 | | | | 2,464,244 | |
U.S. Treasury Notes(b) | | | 1.500% | | | 11/30/19 | | | 1,015 | | | | 1,008,577 | |
U.S. Treasury Notes | | | 1.625% | | | 12/31/19 | | | 910 | | | | 908,650 | |
U.S. Treasury Notes | | | 2.375% | | | 05/31/18-08/15/24 | | | 6,270 | | | | 6,478,401 | |
U.S. Treasury Notes | | | 2.875% | | | 03/31/18 | | | 6,660 | | | | 7,006,526 | |
U.S. Treasury Notes | | | 3.125% | | | 08/15/44 | | | 350 | | | | 376,797 | |
U.S. Treasury Notes | | | 3.375% | | | 05/15/44 | | | 155 | | | | 174,496 | |
U.S. Treasury Strips Coupon | | | 1.863% | (d) | | 05/15/22 | | | 8,820 | | | | 7,542,555 | |
U.S. Treasury Strips Coupon | | | 2.037% | (d) | | 02/15/22 | | | 2,280 | | | | 1,963,522 | |
U.S. Treasury Strips Coupon(f) | | | 2.404% | (d) | | 08/15/21 | | | 3,370 | | | | 2,947,190 | |
U.S. Treasury Strips Coupon(b) | | | 4.138% | (d) | | 02/15/42 | | | 5,000 | | | | 2,297,816 | |
U.S. Treasury Strips Principal(b) | | | 3.591% | (d) | | 05/15/44 | | | 3,515 | | | | 1,520,480 | |
U.S. Treasury Strips Principal | | | 3.874% | (d) | | 02/15/44 | | | 7,565 | | | | 3,298,453 | |
| | | | | | | | | | | | |
|
|
|
TOTAL U.S. TREASURY OBLIGATIONS
(cost $75,110,578) | | | | 76,990,925 | |
| | | | | | | | | | | | |
|
|
|
TOTAL LONG-TERM INVESTMENTS
(cost $320,197,078) | | | | 325,814,318 | |
| | | | | | | | | | | | |
|
|
|
| | | | |
| SHORT-TERM INVESTMENTS — 33.8% | | | | | | | Shares
| | | | |
AFFILIATED MUTUAL FUNDS — 33.8% | |
Prudential Investment Portfolios 2 — Prudential Core Short-Term Bond Fund
(cost $55,240,720)(Note 4)(g) | | | 5,613,042 | | | | 52,425,815 | |
Prudential Investment Portfolios 2 — Prudential Core Taxable Money Market Fund
(cost $62,007,278; includes $9,678,833 of cash collateral for securities on loan) (Note 4)(g)(h) | | | 62,007,278 | | | | 62,007,278 | |
| | | | | | | | | | | | |
|
|
|
TOTAL AFFILIATED MUTUAL FUNDS
(cost $117,247,998) | | | | 114,433,093 | |
| | | | | | | | | | | | |
|
|
|
| | | | |
| | | | | | | | Notional
Amount
(000)#
| | | | |
| OPTIONS PURCHASED* | | | | | | | | | | | | | | |
Call Options | | | | | | | | | | | | | | |
2 Year U.S. Treasury Notes Futures, expiring 01/23/15, Strike Price $109.38 | | | 38,200 | | | | 29,844 | |
2 Year U.S. Treasury Notes Futures, expiring 01/23/15, Strike Price $110.00 | | | 38,200 | | | | 2,984 | |
| | | | | | | | | | | | |
|
|
|
TOTAL OPTIONS PURCHASED
(cost $54,395) | | | | 32,828 | |
| | | | | | | | | | | | |
|
|
|
TOTAL SHORT-TERM INVESTMENTS
(cost $117,302,393) | | | | 114,465,921 | |
| | | | | | | | | | | | |
|
|
|
TOTAL INVESTMENTS, BEFORE OPTION WRITTEN — 129.8%
(cost $437,499,471) | | | | 440,280,239 | |
| | | | | | | | | | | | |
|
|
|
SEE NOTES TO FINANCIAL STATEMENTS.
A101
| | | | | | |
| | | GOVERNMENT INCOME PORTFOLIO (continued) | | |
| |
| SCHEDULE OF INVESTMENTS | | December 31, 2014 |
| | | | | | | | | | | | |
| OPTION WRITTEN* | | | | | | Notional
Amount
(000)#
| | | Value
(Note 2)
| |
Call Option | | | | | | | | | | | | |
2 Year U.S. Treasury Notes Futures, expiring 01/23/15, Strike Price $109.63 (Premiums received $35,136) | | | 76,400 | | | $ | (11,937 | ) |
| | | | | | | | | | |
|
|
|
TOTAL INVESTMENTS, NET OF OPTION WRITTEN — 129.8%
(cost $437,464,335) | | | | 440,268,302 | |
LIABILITIES IN EXCESS OF OTHER ASSETS(j) — (29.8)% | | | | (101,087,771 | ) |
| | | | | | | | | | |
|
|
|
NET ASSETS — 100.0% | | | $ | 339,180,531 | |
| | | | | | | | | | |
|
|
|
See the Glossary for abbreviations used in the Portfolio descriptions.
| # | Principal or notional amount shown in U.S. dollars unless otherwise stated. |
| (a) | Variable rate instrument. The interest rate shown reflects the rate in effect at December 31, 2014. |
| (b) | All or a portion of security is on loan. The aggregate market value of such securities, including those sold and pending settlement, is $9,495,771; cash collateral of $9,678,833 (included in liabilities) was received with which the Portfolio purchased highly liquid short-term investments. Securities on loan are subject to contractual netting arrangements. |
| (c) | All or partial principal amount of $87,000,000 represents to-be announced (“TBA”) securities acquired under mortgage dollar roll agreement. |
| (d) | Represents zero coupon bond or principal only securities. Rate represents yield to maturity at purchase date. |
| (e) | Represents security, or a portion thereof, segregated as collateral for swap agreements. |
| (f) | Represents security, or a portion thereof, segregated as collateral for futures contracts. |
| (g) | Prudential Investments LLC, the manager of the Portfolio, also serves as manager of the Prudential Investment Portfolios 2 — Prudential Core Taxable Money Market Fund and the Prudential Investment Portfolios 2 — Prudential Core Short-Term Bond Fund. |
| (h) | Represents security, or a portion thereof, purchased with cash collateral received for securities on loan. |
| (j) | Includes net unrealized appreciation (depreciation) on the following derivative contracts held at reporting period end: |
Futures contracts outstanding at December 31, 2014:
| | | | | | | | | | | | | | | | | | |
Number of
Contracts
| | Type
| | Expiration
Date
| | | Value at
Trade Date
| | | Value at
December 31, 2014
| | | Unrealized
Appreciation
(Depreciation)(1)
| |
| Long Positions: | | | | | | | | | | | | | | | | | | |
| 343 | | 2 Year U.S. Treasury Notes | | | Mar. 2015 | | | $ | 74,996,918 | | | $ | 74,977,656 | | | $ | (19,262 | ) |
| 70 | | 5 Year U.S. Treasury Notes | | | Mar. 2015 | | | | 8,323,302 | | | | 8,325,078 | | | | 1,776 | |
| 85 | | 10 Year U.S. Treasury Notes | | | Mar. 2015 | | | | 10,775,593 | | | | 10,777,734 | | | | 2,141 | |
| 67 | | U.S. Ultra Bonds | | | Mar. 2015 | | | | 10,817,611 | | | | 11,067,563 | | | | 249,952 | |
| | | | | | | | | | | | | | | | |
|
|
|
| | | | | | | | | | | | | | | | | | 234,607 | |
| | | | | | | | | | | | | | | | |
|
|
|
| Short Position: | | | | | | | | | | | | | | | | | | |
| 71 | | U.S. Long Bonds | | | Mar. 2015 | | | | 10,261,490 | | | | 10,263,937 | | | | (2,447 | ) |
| | | | | | | | | | | | | | | | |
|
|
|
| | | | | | | | | | | | | | | | | $ | 232,160 | |
| | | | | | | | | | | | | | | | |
|
|
|
| (1) | A U.S. Treasury security with a market value of $493,239 has been segregated with Citigroup Global Markets to cover requirements for open contracts at December 31, 2014. |
Interest rate swap agreements outstanding at December 31, 2014:
| | | | | | | | | | | | | | | | | | | | | | | | | | |
Notional
Amount
(000)#
| | | Termination
Date
| | | Fixed
Rate
| | | Floating Rate
| | Fair
Value
| | | Upfront
Premiums
Paid
(Received)
| | | Unrealized
Appreciation
(Depreciation)
| | | Counterparty
|
| Over-the-counter swap agreements: |
| | 1,360 | | | | 11/30/16 | | | | 0.945% | | | 3 Month
LIBOR(1) | | $ | (3,404 | ) | | $ | — | | | $ | (3,404 | ) | | Citigroup Global Markets |
| | 4,700 | | | | 02/15/19 | | | | 1.656% | | | 3 Month
LIBOR(1) | | | (39,903 | ) | | | — | | | | (39,903 | ) | | Citigroup Global Markets |
| | 4,700 | | | | 02/15/19 | | | | 1.794% | | | 3 Month
LIBOR(2) | | | 68,402 | | | | — | | | | 68,402 | | | JPMorgan Chase |
| | | | | | | | | | | | | | |
|
|
| |
|
|
| |
|
|
| | |
| | | | | | | | | | | | | | | $ | 25,095 | | | $ | — | | | $ | 25,095 | | | |
| | | | | | | | | | | | | | |
|
|
| |
|
|
| |
|
|
| | |
SEE NOTES TO FINANCIAL STATEMENTS.
A102
| | | | | | |
| | | GOVERNMENT INCOME PORTFOLIO (continued) | | |
| |
| SCHEDULE OF INVESTMENTS | | December 31, 2014 |
Interest rate swap agreements outstanding at December 31, 2014 (continued):
| | | | | | | | | | | | | | | | | | | | | | | | |
Notional
Amount
(000)#
| | | Termination
Date
| | | Fixed
Rate
| | | Floating Rate
| | Value at
Trade Date
| | | Value at
December 31, 2014
| | | Unrealized
Appreciation
(Depreciation)
| |
| Exchange-traded swap agreements: | | | | | |
| | 100 | | | | 02/21/16 | | | | 0.429% | | | 3 Month LIBOR(1) | | $ | 150 | | | $ | 71 | | | $ | (79 | ) |
| | 5,820 | | | | 06/30/16 | | | | 0.618% | | | 3 Month LIBOR(1) | | | 165 | | | | 2,912 | | | | 2,747 | |
| | 22,440 | | | | 06/30/16 | | | | 0.655% | | | 3 Month LIBOR(1) | | | (2,351 | ) | | | (1,175 | ) | | | 1,176 | |
| | 6,240 | | | | 06/30/16 | | | | 0.655% | | | 3 Month LIBOR(1) | | | 165 | | | | (339 | ) | | | (504 | ) |
| | 13,540 | | | | 08/29/16 | | | | 0.710% | | | 3 Month LIBOR(1) | | | 121 | | | | 4,263 | | | | 4,142 | |
| | 19,075 | | | | 05/31/19 | | | | 1.730% | | | 3 Month LIBOR(1) | | | 1,517 | | | | 19,171 | | | | 17,654 | |
| | 10,750 | | | | 08/29/19 | | | | 1.804% | | | 3 Month LIBOR(2) | | | 136 | | | | 44,689 | | | | 44,553 | |
| | 7,855 | | | | 09/17/21 | | | | 2.358% | | | 3 Month LIBOR(2) | | | 197 | | | | 172,206 | | | | 172,009 | |
| | 6,285 | | | | 10/31/21 | | | | 2.152% | | | 3 Month LIBOR(1) | | | 187 | | | | (23,149 | ) | | | (23,336 | ) |
| | 5,100 | | | | 01/13/22 | | | | 2.351% | | | 3 Month LIBOR(1) | | | 181 | | | | (102,421 | ) | | | (102,602 | ) |
| | 4,850 | | | | 01/13/22 | | | | 2.480% | | | 3 Month LIBOR(1) | | | 180 | | | | (139,180 | ) | | | (139,360 | ) |
| | 1,710 | | | | 01/22/22 | | | | 2.467% | | | 3 Month LIBOR(1) | | | 160 | | | | (47,427 | ) | | | (47,587 | ) |
| | 8,720 | | | | 12/20/23 | | | | 2.932% | | | 3 Month LIBOR(1) | | | 220 | | | | (516,814 | ) | | | (517,034 | ) |
| | 11,725 | | | | 08/18/24 | | | | 2.750% | | | 3 Month LIBOR(2) | | | 168 | | | | 502,899 | | | | 502,731 | |
| | 2,920 | | | | 08/29/24 | | | | 2.560% | | | 3 Month LIBOR(1) | | | 112 | | | | (76,066 | ) | | | (76,178 | ) |
| | 11,600 | | | | 09/17/24 | | | | 2.732% | | | 3 Month LIBOR(1) | | | 243 | | | | (476,432 | ) | | | (476,675 | ) |
| | 4,230 | | | | 09/17/29 | | | | 3.070% | | | 3 Month LIBOR(2) | | | 192 | | | | 304,782 | | | | 304,590 | |
| | | | | | | | | | | | | | |
|
|
| |
|
|
| |
|
|
|
| | | | | | | | | | | | | | | $ | 1,743 | | | $ | (332,010 | ) | | $ | (333,753 | ) |
| | | | | | | | | | | | | | |
|
|
| |
|
|
| |
|
|
|
A U.S. Treasury security with a market value of $690,916 has been segregated with Citigroup Global Markets to cover requirements for open exchange-traded interest rate swap contracts at December 31, 2014.
| (1) | The Portfolio pays the fixed rate and receives the floating rate. |
| (2) | The Portfolio pays the floating rate and receives the fixed rate. |
Various inputs are used in determining the value of the Portfolio’s investments. These inputs are summarized in the three broad levels listed below.
| Level 1— | quoted prices generally in active markets for identical securities. |
| Level 2— | quoted prices for similar securities, interest rates and yield curves, prepayment speeds, foreign currency exchange rates and other significant observable inputs. |
| Level 3— | significant unobservable inputs for securities valued in accordance with Board approved fair valuation procedures. |
The following is a summary of the inputs used as of December 31, 2014 in valuing such portfolio securities:
| | | | | | | | | | | | |
| | | Level 1
| | | Level 2
| | | Level 3
| |
Investments in Securities | | | | | | | | | | | | |
Asset-Backed Securities | | | | | | | | | | | | |
Collateralized Loan Obligations | | $ | — | | | $ | 10,416,140 | | | $ | — | |
Collateralized Mortgage Obligations | | | — | | | | 1,422,079 | | | | — | |
Non-Residential Mortgage-Backed Securities | | | — | | | | 2,533,994 | | | | — | |
Commercial Mortgage-Backed Securities | | | — | | | | 68,379,254 | | | | — | |
Corporate Bond | | | — | | | | 2,352,542 | | | | — | |
Foreign Government Agencies | | | — | | | | 2,816,363 | | | | — | |
Municipal Bond | | | — | | | | 708,315 | | | | — | |
U.S. Government Agency Obligations | | | — | | | | 160,194,706 | | | | — | |
U.S. Treasury Obligations | | | — | | | | 76,990,925 | | | | — | |
Affiliated Mutual Funds | | | 114,433,093 | | | | — | | | | — | |
Options Purchased | | | 32,828 | | | | — | | | | — | |
Option Written | | | (11,937 | ) | | | — | | | | — | |
Other Financial Instruments* | | | | | | | | | | | | |
Futures Contracts | | | 232,160 | | | | — | | | | — | |
Over-the-counter interest rate swaps | | | — | | | | 25,095 | | | | — | |
Exchange-traded interest rate swaps | | | — | | | | (333,753 | ) | | | — | |
| | |
|
|
| |
|
|
| |
|
|
|
Total | | $ | 114,686,144 | | | $ | 325,505,660 | | | $ | — | |
| | |
|
|
| |
|
|
| |
|
|
|
| * | Other financial instruments are derivative instruments not reflected in the Schedule of Investments, such as futures, forwards and exchange-traded swap contracts, which are recorded at the unrealized appreciation/depreciation on the instrument, and over-the-counter swap contracts which are recorded at fair value. |
SEE NOTES TO FINANCIAL STATEMENTS.
A103
| | | | | | |
| | | GOVERNMENT INCOME PORTFOLIO (continued) | | |
| |
| SCHEDULE OF INVESTMENTS | | December 31, 2014 |
The industry classification of investments and liabilities in excess of other assets shown as a percentage of net assets as of December 31, 2014 was as follows (Unaudited):
| | | | |
U.S. Government Agency Obligations | | | 47.2 | % |
Affiliated Mutual Funds | | | 33.8 | |
U.S. Treasury Obligations | | | 22.7 | |
Commercial Mortgage-Backed Securities | | | 20.2 | |
Collateralized Loan Obligations | | | 3.1 | |
Foreign Government Agencies | | | 0.8 | |
Non-Residential Mortgage-Backed Securities | | | 0.7 | |
Corporate Bond | | | 0.7 | |
Collateralized Mortgage Obligations | | | 0.4 | |
| | | | |
Municipal Bond | | | 0.2 | % |
Options Purchased | | | — | ** |
Option Written | | | — | ** |
| | |
|
|
|
| | | | 129.8 | |
Liabilities in excess of other assets | | | (29.8 | ) |
| | |
|
|
|
| | | | 100.0 | % |
| | |
|
|
|
The Portfolio invested in derivative instruments during the reporting period. The primary type of risk associated with these derivative instruments is interest rate risk. The effect of such derivative instruments on the Portfolio’s financial position and financial performance as reflected in the Statement of Assets and Liabilities and Statement of Operations is presented in the summary below.
Fair values of derivative instruments as of December 31, 2014 as presented in the Statement of Assets and Liabilities:
| | | | | | | | | | | | |
Derivatives not designated as hedging
instruments, carried at fair value
| | Asset Derivatives
| | | Liability Derivatives
| |
| | Balance Sheet Location
| | Fair Value
| | | Balance Sheet Location
| | Fair Value
| |
Interest rate contracts | | Due from broker —
variation margin futures | | $ | 253,869 | * | | Due from broker —
variation margin futures | | $ | 21,709 | * |
Interest rate contracts | | Due from broker —
variation margin swaps | | | 1,049,602 | * | | Due from broker —
variation margin swaps | | | 1,383,355 | * |
Interest rate contracts | | Unrealized appreciation on
swap agreements | | | 68,402 | | | Unrealized depreciation on
swap agreements | | | 43,307 | |
Interest rate contracts | | Unaffiliated investments | | | 32,828 | | | Option written outstanding, at value | | | 11,937 | |
| | | | |
|
|
| | | |
|
|
|
Total | | | | $ | 1,404,701 | | | | | $ | 1,460,308 | |
| | | | |
|
|
| | | |
|
|
|
| * | Includes cumulative appreciation/depreciation as reported in the schedule of open futures contracts and exchange-traded swap contracts. Only unsettled variation margin receivable (payable) is reported within the Statement of Assets and Liabilities. |
The effects of derivative instruments on the Statement of Operations for the year ended December 31, 2014 are as follows:
| | | | | | | | | | | | | | | | | | | | |
Amount of Realized Gain or (Loss) on Derivatives Recognized in Income
| |
Derivatives not designated as hedging
instruments, carried at fair value
| | Options
Purchased*
| | | Option
Written
| | | Futures
| | | Swaps
| | | Total
| |
Interest rate contracts | | $ | (232,641 | ) | | $ | (60,430) | | | $ | 411,559 | | | $ | (896,250 | ) | | $ | (777,762 | ) |
| | |
|
|
| |
|
|
| |
|
|
| |
|
|
| |
|
|
|
| * | Included in net realized gain (loss) on investment transactions in the Statement of Operations. |
| | | | | | | | | | | | | | | | | | | | | | |
|
Change in Unrealized Appreciation or (Depreciation) on Derivatives Recognized in Income
| |
Derivatives not designated as hedging
instruments, carried at fair value
| | Options
Purchased*
| | | Option
Written
| | | Futures
| | | Swaps
| | | Total
| |
Interest rate contracts | | $ | 62,526 | | | $ | 23,199 | | | $ | 1,067,196 | | | $ | (1,624,660 | ) | | $ | (471,739 | ) |
| | |
|
|
| |
|
|
| |
|
|
| |
|
|
| |
|
|
|
| * | Included in net change in unrealized appreciation (depreciation) on investments in the Statement of Operations. |
For the year ended December 31, 2014, the Portfolio’s average volume of derivative activities is as follows:
| | | | |
Options Purchased
(Cost)
| | Options Written
(Notional Amount in USD (000))
| | Futures
Long Position
(Value at Trade Date)
|
| $314,548 | | $52,436 | | $89,304,834 |
| | |
Futures
Short Position
(Value at Trade Date)
| | Interest Rate Swaps
(Notional Amount in USD (000))
|
| $17,730,843 | | $135,097 |
SEE NOTES TO FINANCIAL STATEMENTS.
A104
| | | | | | |
| | | GOVERNMENT INCOME PORTFOLIO (continued) | | |
| |
| SCHEDULE OF INVESTMENTS | | December 31, 2014 |
Offsetting of over-the-counter (OTC) derivative assets and liabilities:
The Portfolio invested in OTC derivatives during the reporting period that are either offset in accordance with current requirements or are subject to enforceable master netting arrangements or similar agreements that permit offsetting. The information about offsetting and related netting arrangements for OTC derivatives, where the legal right to set-off exists, is presented in the summary below.
| | | | | | | | | | | | | | | | |
Counterparty
| | Gross Amounts of
Recognized Assets(1)
| | | Gross Amounts
Available for Offset
| | | Collateral
Received(3)
| | | Net Amount
| |
Citigroup Global Markets | | $ | — | | | $ | — | | | $ | — | | | $ | — | |
JPMorgan Chase | | | 68,402 | | | | — | | | | — | | | | 68,402 | |
| | |
|
|
| | | | | | | | | | | | |
| | | $ | 68,402 | | | | | | | | | | | | | |
| | |
|
|
| | | | | | | | | | | | |
| | | | |
Counterparty
| | Gross Amounts of
Recognized Liabilities(2)
| | | Gross Amounts
Available for Offset
| | | Collateral
Pledged(3)
| | | Net Amount
| |
Citigroup Global Markets | | $ | (43,307 | ) | | $ | — | | | $ | — | | | $ | (43,307 | ) |
JPMorgan Chase | | | — | | | | — | | | | — | | | | — | |
| | |
|
|
| | | | | | | | | | | | |
| | | $ | (43,307 | ) | | | | | | | | | | | | |
| | |
|
|
| | | | | | | | | | | | |
| (1) | Includes unrealized appreciation on swaps and forwards, premiums paid on swap agreements and market value of purchased options. |
| (2) | Includes unrealized depreciation on swaps and forwards, premiums received on swap agreements and market value of written options. |
| (3) | Amounts shown reflect actual collateral received or pledged by the Portfolio. Such amounts are applied up to 100% of the Portfolio’s OTC derivative exposure by counterparty. |
SEE NOTES TO FINANCIAL STATEMENTS.
A105
| | | | | | |
| | | GOVERNMENT INCOME PORTFOLIO (continued) | | |
STATEMENT OF ASSETS AND LIABILITIES
December 31, 2014
| | | | |
| ASSETS | | | | |
Investments at value, including securities on loan of $9,495,771: | | | | |
Unaffiliated investments (cost $320,251,473) | | $ | 325,847,146 | |
Affiliated investments (cost $117,247,998) | | | 114,433,093 | |
Receivable for investments sold | | | 117,464,769 | |
Dividends receivable | | | 1,012,785 | |
Unrealized appreciation on over-the-counter swap agreements | | | 68,402 | |
Due from broker—variation margin swaps | | | 31,838 | |
Receivable for Series shares sold | | | 769 | |
Prepaid expenses | | | 2,657 | |
| | |
|
|
|
Total Assets | | | 558,861,459 | |
| | |
|
|
|
| LIABILITIES | | | | |
Payable for investments purchased | | | 208,639,349 | |
Payable to broker for collateral for securities on loan | | | 9,678,833 | |
Payable to custodian | | | 1,005,806 | |
Management fee payable | | | 115,275 | |
Accrued expenses | | | 108,163 | |
Payable for Series shares repurchased | | | 72,779 | |
Unrealized depreciation on over-the-counter swap agreements | | | 43,307 | |
Option written outstanding, at value
(premiums received $35,136) | | | 11,937 | |
Due to broker—variation margin futures | | | 4,553 | |
Affiliated transfer agent fee payable | | | 926 | |
| | |
|
|
|
Total Liabilities | | | 219,680,928 | |
| | |
|
|
|
| NET ASSETS | | $ | 339,180,531 | |
| | |
|
|
|
Net assets were comprised of: | | | | |
Paid-in capital | | $ | 326,291,161 | |
Retained earnings | | | 12,889,370 | |
| | |
|
|
|
Net assets, December 31, 2014 | | $ | 339,180,531 | |
| | |
|
|
|
Net asset value and redemption price per share $339,180,531 / 28,454,702 outstanding shares of beneficial interest | | $ | 11.92 | |
| | |
|
|
|
STATEMENT OF OPERATIONS
Year Ended December 31, 2014
| | | | |
| NET INVESTMENT INCOME | | | | |
| INCOME | | | | |
Interest income | | $ | 6,759,710 | |
Affiliated dividend income | | | 722,747 | |
Affiliated income from securities loaned, net | | | 35,816 | |
| | |
|
|
|
Total income | | | 7,518,273 | |
| | |
|
|
|
| EXPENSES | | | | |
Management fee | | | 1,363,330 | |
Custodian’s fees and expenses | | | 85,000 | |
Shareholders’ reports | | | 84,000 | |
Audit fee | | | 33,000 | |
Trustees’ fees | | | 13,000 | |
Transfer agent’s fees and expenses (including affiliated expense of $5,600) | | | 12,000 | |
Legal fees and expenses | | | 11,000 | |
Insurance expenses | | | 5,000 | |
Commitment fee on syndicated credit agreement | | | 2,000 | |
Miscellaneous | | | 8,580 | |
| | |
|
|
|
Total expenses | | | 1,616,910 | |
| | |
|
|
|
| NET INVESTMENT INCOME | | | 5,901,363 | |
| | |
|
|
|
| REALIZED AND UNREALIZED GAIN (LOSS) ON INVESTMENTS | | | | |
Net realized gain (loss) on: | | | | |
Investment transactions | | | 8,017,354 | |
Futures transactions | | | 411,559 | |
Options written transactions | | | (60,430 | ) |
Swap agreement transactions | | | (896,250 | ) |
| | |
|
|
|
| | | | 7,472,233 | |
| | |
|
|
|
Net change in unrealized appreciation (depreciation) on: | | | | |
Investments (including affiliated $166,788) | | | 6,529,006 | |
Futures | | | 1,067,196 | |
Options written | | | 23,199 | |
Swap agreements | | | (1,624,660 | ) |
| | |
|
|
|
| | | | 5,994,741 | |
| | |
|
|
|
| NET GAIN ON INVESTMENT TRANSACTIONS | | | 13,466,974 | |
| | |
|
|
|
| NET INCREASE IN NET ASSETS RESULTING FROM OPERATIONS | | $ | 19,368,337 | |
| | |
|
|
|
STATEMENT OF CHANGES IN NET ASSETS
| | | | | | | | |
| | | Year Ended December 31,
| |
| | | 2014
| | | 2013
| |
| INCREASE (DECREASE) IN NET ASSETS | | | | | | | | |
| OPERATIONS | | | | | | | | |
Net investment income | | $ | 5,901,363 | | | $ | 6,413,372 | |
Net realized gain (loss) on investment transactions | | | 7,472,234 | | | | (2,399,719 | ) |
Net change in unrealized appreciation (depreciation) on investments and foreign currencies | | | 5,994,740 | | | | (12,420,842 | ) |
| | |
|
|
| |
|
|
|
NET INCREASE (DECREASE) IN NET ASSETS RESULTING FROM OPERATIONS | | | 19,368,337 | | | | (8,407,189 | ) |
| | |
|
|
| |
|
|
|
| DIVIDENDS FROM NET INVESTMENT INCOME | | | (1,210,720 | ) | | | (17,437,795 | ) |
| | |
|
|
| |
|
|
|
| SERIES SHARE TRANSACTIONS | | | | | | | | |
Series shares sold [449,768 and 353,311 shares, respectively] | | | 5,246,081 | | | | 4,141,803 | |
Series shares issued in reinvestment of distributions [105,280 and 1,506,594 shares, respectively] | | | 1,210,720 | | | | 17,437,795 | |
Series shares repurchased [2,279,485 and 3,202,620 shares, respectively] | | | (26,512,995 | ) | | | (37,560,842 | ) |
| | |
|
|
| |
|
|
|
| NET DECREASE IN NET ASSETS FROM SERIES SHARE TRANSACTIONS | | | (20,056,194 | ) | | | (15,981,244 | ) |
| | |
|
|
| |
|
|
|
| TOTAL DECREASE | | | (1,898,577 | ) | | | (41,826,228 | ) |
| NET ASSETS: | | | | | | | | |
Beginning of year | | | 341,079,108 | | | | 382,905,336 | |
| | |
|
|
| |
|
|
|
End of year | | $ | 339,180,531 | | | $ | 341,079,108 | |
| | |
|
|
| |
|
|
|
SEE NOTES TO FINANCIAL STATEMENTS.
A106
| | | | | | |
| | | HIGH YIELD BOND PORTFOLIO | | |
| |
| SCHEDULE OF INVESTMENTS | | December 31, 2014 |
| | | | | | | | | | | | | | |
LONG-TERM INVESTMENTS — 93.1% ASSET-BACKED SECURITIES — 0.4% | | Interest
Rate
| | | Maturity
Date
| | Principal
Amount
(000)#
| | | Value
(Note 2)
| |
Collateralized Loan Obligations — 0.4% | | | | | | | | | | | | | | |
Primus CLO II Ltd. (Cayman Islands), Series 2007-2A, Class A, 144A | | | 0.463% | (a) | | 07/15/21 | | | 455 | | | $ | 449,654 | |
Slater Mill Loan Fund LP (Cayman Islands), Series 2012-1A, Class D, 144A | | | 4.482% | (a) | | 08/17/22 | | | 13,000 | | | | 12,812,169 | |
| | | | | | | | | | | | |
|
|
|
| | | | | | | | | | | | | | 13,261,823 | |
| | | | | | | | | | | | |
|
|
|
Residential Mortgage-Backed Securities | | | | | | | | | | | | | | |
Argent Securities, Inc./Asset-Backed Pass-Through Certificate, Series 2003-W8, Class M1 | | | 1.220% | (a) | | 12/25/33 | | | 103 | | | | 99,535 | |
Credit-Based Asset Servicing and Securitization LLC, Series 2007-CB1, Class AF2 | | | 4.099% | (a) | | 01/25/37 | | | 526 | | | | 283,636 | |
Morgan Stanley Mortgage Loan Trust, Series 2006-12XS, Class A6A | | | 5.726% | | | 10/25/36 | | | 349 | | | | 219,245 | |
Structured Asset Securities Corp. Mortgage Loan Trust, Series 2005-9XS, Class 2A1 | | | 0.470% | (a) | | 06/25/35 | | | 267 | | | | 233,210 | |
| | | | | | | | | | | | |
|
|
|
| | | | | | | | | | | | | | 835,626 | |
| | | | | | | | | | | | |
|
|
|
TOTAL ASSET-BACKED SECURITIES
(cost $12,729,793) | | | | 14,097,449 | |
| | | | | | | | | | | | |
|
|
|
| BANK LOANS(a) — 1.9% | | | | | | | | | | | | | | |
Capital Goods — 0.4% | | | | | | | | | | | | | | |
CPM Holdings, Inc. | | | 10.250% | | | 03/01/18 | | | 7,750 | | | | 7,750,000 | |
Neff Rental LLC | | | 7.250% | | | 06/09/21 | | | 4,415 | | | | 4,326,828 | |
| | | | | | | | | | | | |
|
|
|
| | | | | | | | | | | | | | 12,076,828 | |
| | | | | | | | | | | | |
|
|
|
Chemicals — 0.2% | | | | | | | | | | | | | | |
Solenis International LP | | | 7.750% | | | 07/31/22 | | | 7,500 | | | | 7,287,502 | |
| | | | | | | | | | | | |
|
|
|
Energy – Other — 0.1% | | | | | | | | | | | | | | |
American Energy Marcellus LLC | | | 8.500% | | | 08/04/21 | | | 3,675 | | | | 3,105,375 | |
Fieldwood Energy LLC | | | 8.375% | | | 09/30/20 | | | 3,000 | | | | 2,178,000 | |
| | | | | | | | | | | | |
|
|
|
| | | | | | | | | | | | | | 5,283,375 | |
| | | | | | | | | | | | |
|
|
|
Gaming — 0.2% | | | | | | | | | | | | | | |
CCM Merger, Inc.
(original cost $4,291,204; purchased 07/30/14)(b)(c) | | | 4.500% | | | 08/06/21 | | | 4,324 | | | | 4,258,777 | |
Golden Nugget, Inc. | | | 5.500% | | | 11/21/19 | | | 1,485 | | | | 1,468,294 | |
Yonkers Racing Corp. | | | 8.750% | | | 08/20/20 | | | 1,180 | | | | 796,500 | |
| | | | | | | | | | | | |
|
|
|
| | | | | | | | | | | | | | 6,523,571 | |
| | | | | | | | | | | | |
|
|
|
Healthcare & Pharmaceutical | | | | | | | | | | | | | | |
Radnet Mgmt., Inc. | | | 8.000% | | | 03/25/21 | | | 1,000 | | | | 990,000 | |
| | | | | | | | | | | | |
|
|
|
Lodging — 0.1% | | | | | | | | | | | | | | |
Four Seasons Holdings, Inc. (Canada) | | | 6.250% | | | 12/28/20 | | | 1,750 | | | | 1,736,875 | |
| | | | | | | | | | | | |
|
|
|
Retailers | | | | | | | | | | | | | | |
Advantage Sales & Marketing, Inc. | | | 7.500% | | | 07/25/22 | | | 1,000 | | | | 984,500 | |
| | | | | | | | | | | | |
|
|
|
Technology — 0.9% | | | | | | | | | | | | | | |
BMC Software Finance, Inc. | | | 5.000% | | | 09/10/20 | | | 4,974 | | | | 4,815,421 | |
Evergreen Skills Lux Sarl (Luxembourg) | | | 9.250% | | | 04/28/22 | | | 16,200 | | | | 15,228,000 | |
Kronos, Inc. | | | 9.750% | | | 04/30/20 | | | 7,956 | | | | 8,075,542 | |
| | | | | | | | | | | | |
|
|
|
| | | | | | | | | | | | | | 28,118,963 | |
| | | | | | | | | | | | |
|
|
|
TOTAL BANK LOANS
(cost $65,659,892) | | | | 63,001,614 | |
| | | | | | | | | | | | |
|
|
|
| COLLATERALIZED MORTGAGE OBLIGATIONS — 0.1% | | | | | | | | | | | | | | |
Adjustable Rate Mortgage Trust, Series 2005-7, Class 1A1 | | | 2.471% | (a) | | 10/25/35 | | | 94 | | | | 82,546 | |
American Home Mortgage Assets Trust, Series 2006-4, Class 1A12 | | | 0.380% | (a) | | 10/25/46 | | | 40 | | | | 26,771 | |
American Home Mortgage Assets Trust, Series 2006-5, Class A1 | | | 1.033% | (a) | | 11/25/46 | | | 352 | | | | 192,337 | |
American Home Mortgage Investment Trust, Series 2005-2, Class 4A1 | | | 1.827% | (a) | | 09/25/45 | | | 18 | | | | 17,640 | |
Banc of America Alternative Loan Trust, Series 2005-4, Class CB6 | | | 0.570% | (a) | | 05/25/35 | | | 40 | | | | 30,848 | |
Banc of America Funding Trust, Series 2006-B, Class 2A1 | | | 2.634% | (a) | | 03/20/36 | | | 118 | | | | 101,786 | |
SEE NOTES TO FINANCIAL STATEMENTS.
A107
| | | | | | |
| | | HIGH YIELD BOND PORTFOLIO (continued) | | |
| |
| SCHEDULE OF INVESTMENTS | | December 31, 2014 |
| | | | | | | | | | | | | | |
COLLATERALIZED MORTGAGE OBLIGATIONS
(continued) | | Interest
Rate
| | | Maturity
Date
| | Principal
Amount
(000)#
| | | Value
(Note 2)
| |
Bear Stearns ARM Trust, Series 2005-10, Class A2 | | | 2.710% | (a) | | 10/25/35 | | | 45 | | | $ | 44,487 | |
Citigroup Mortgage Loan Trust, Series 2007-10, Class 22AA | | | 2.745% | (a) | | 09/25/37 | | | 77 | | | | 68,785 | |
Countrywide Alternative Loan Trust, Series 2005-43, Class 4A3 | | | 5.220% | (a) | | 10/25/35 | | | 29 | | | | 24,609 | |
Countrywide Alternative Loan Trust, Series 2006-HY13, Class 4A1 | | | 2.662% | (a) | | 02/25/37 | | | 36 | | | | 32,090 | |
Countrywide Alternative Loan Trust, Series 2006-OA9, Class 2A1A | | | 0.375% | (a) | | 07/20/46 | | | 32 | | | | 22,348 | |
Countrywide Alternative Loan Trust, Series 2006-OA11, Class A1B | | | 0.360% | (a) | | 09/25/46 | | | 43 | | | | 36,371 | |
Countrywide Home Loan Mortgage Pass-Through Trust, Series 2005-2, Class 2A1 | | | 0.490% | (a) | | 03/25/35 | | | 97 | | | | 92,523 | |
First Horizon Alternative Mortgage Securities Trust, Series 2006-FA2, Class 1A5 | | | 6.000% | | | 05/25/36 | | | 63 | | | | 54,181 | |
HarborView Mortgage Loan Trust, Series 2006-1, Class 2A1A | | | 0.404% | (a) | | 03/19/36 | | | 309 | | | | 226,141 | |
HarborView Mortgage Loan Trust, Series 2006-5, Class 2A1A | | | 0.344% | (a) | | 07/19/46 | | | 48 | | | | 30,815 | |
HarborView Mortgage Loan Trust, Series 2006-7, Class 2A1B | | | 0.414% | (a) | | 09/19/46 | | | 51 | | | | 5,266 | |
IndyMac INDX Mortgage Loan Trust, Series 2006-AR12, Class A1 | | | 0.360% | (a) | | 09/25/46 | | | 36 | | | | 30,742 | |
JP Morgan Mortgage Trust, Series 2007-S3, Class 1A96 | | | 6.000% | | | 08/25/37 | | | 30 | | | | 26,939 | |
MASTR Adjustable Rate Mortgages Trust, Series 2006-OA1, Class 1A1 | | | 0.380% | (a) | | 04/25/46 | | | 25 | | | | 18,984 | |
Residential Accredit Loans, Inc., Series 2006-QA2, Class 3A1 | | | 5.500% | | | 02/25/36 | | | 193 | | | | 152,873 | |
Residential Accredit Loans, Inc., Series 2007-QS4, Class 2A1 | | | 0.500% | (a) | | 03/25/37 | | | 158 | | | | 57,469 | |
Residential Asset Securitization Trust, Series 2007-A5, Class 2A3 | | | 6.000% | | | 05/25/37 | | | 59 | | | | 52,262 | |
Structured Asset Mortgage Investments II Trust, Series 2006-AR6, Class 2A1 | | | 0.360% | (a) | | 07/25/46 | | | 49 | | | | 39,068 | |
SunTrust Alternative Loan Trust, Series 2006-1F, Class 3A | | | 0.520% | (a) | | 04/25/36 | | | 111 | | | | 45,295 | |
WaMu Mortgage Pass-Through Certificates Trust, Series 2007-HY1, Class 2A3 | | | 2.301% | (a) | | 02/25/37 | | | 31 | | | | 26,851 | |
WaMu Mortgage Pass-Through Certificates Trust, Series 2007-HY1, Class 4A1 | | | 2.362% | (a) | | 02/25/37 | | | 39 | | | | 34,503 | |
WaMu Mortgage Pass-Through Certificates Trust, Series 2007-OA3, Class 2A1A | | | 0.873% | (a) | | 04/25/47 | | | 43 | | | | 37,410 | |
| | | | | | | | | | | | |
|
|
|
TOTAL COLLATERALIZED MORTGAGE OBLIGATIONS
(cost $1,421,811) | | | | 1,611,940 | |
| | | | | | | | | | | | |
|
|
|
| CORPORATE BONDS — 90.6% | | | | | | | | | | | | | | |
Aerospace & Defense — 1.9% | | | | | | | | | | | | | | |
Alliant Techsystems, Inc., Gtd. Notes | | | 6.875% | | | 09/15/20 | | | 2,475 | | | | 2,635,875 | |
Alliant Techsystems, Inc., Gtd. Notes, 144A | | | 5.250% | | | 10/01/21 | | | 2,965 | | | | 2,987,237 | |
Bombardier, Inc. (Canada), Sr. Unsec’d. Notes, 144A(d) | | | 5.750% | | | 03/15/22 | | | 2,450 | | | | 2,480,625 | |
Bombardier, Inc. (Canada), Sr. Unsec’d. Notes, 144A(d) | | | 6.000% | | | 10/15/22 | | | 3,425 | | | | 3,459,250 | |
Bombardier, Inc. (Canada), Sr. Unsec’d. Notes, 144A(d) | | | 6.125% | | | 01/15/23 | | | 4,850 | | | | 4,947,000 | |
Bombardier, Inc. (Canada), Sr. Unsec’d. Notes, 144A(d) | | | 7.750% | | | 03/15/20 | | | 2,476 | | | | 2,686,460 | |
Esterline Technologies Corp., Gtd. Notes | | | 7.000% | | | 08/01/20 | | | 5,400 | | | | 5,670,000 | |
KLX, Inc., Gtd. Notes, 144A | | | 5.875% | | | 12/01/22 | | | 5,850 | | | | 5,908,500 | |
LMI Aerospace, Inc., Sec’d. Notes, 144A | | | 7.375% | | | 07/15/19 | | | 4,225 | | | | 4,119,375 | |
Sequa Corp., Gtd. Notes, 144A
(original cost $8,703,219; purchased 12/10/12-12/17/13)(b)(c)(d) | | | 7.000% | | | 12/15/17 | | | 8,659 | | | | 7,793,100 | |
TransDigm, Inc., Gtd. Notes(d) | | | 6.000% | | | 07/15/22 | | | 6,150 | | | | 6,134,625 | |
TransDigm, Inc., Gtd. Notes | | | 6.500% | | | 07/15/24 | | | 6,150 | | | | 6,180,750 | |
TransDigm, Inc., Gtd. Notes(d) | | | 7.500% | | | 07/15/21 | | | 5,245 | | | | 5,585,925 | |
| �� | | | | | | | | | | | |
|
|
|
| | | | | | | | | | | | | | 60,588,722 | |
| | | | | | | | | | | | |
|
|
|
Automotive — 2.2% | | | | | | | | | | | | | | |
American Axle & Manufacturing, Inc., Gtd. Notes(d) | | | 6.250% | | | 03/15/21 | | | 4,875 | | | | 5,118,750 | |
American Axle & Manufacturing, Inc., Gtd. Notes(d) | | | 6.625% | | | 10/15/22 | | | 5,000 | | | | 5,300,000 | |
American Axle & Manufacturing, Inc., Gtd. Notes | | | 7.750% | | | 11/15/19 | | | 675 | | | | 756,000 | |
Chrysler Group LLC/CG Co.-Issuer, Inc., Sec’d. Notes | | | 8.000% | | | 06/15/19 | | | 3,100 | | | | 3,258,875 | |
Chrysler Group LLC/CG Co.-Issuer, Inc., Sec’d. Notes | | | 8.250% | | | 06/15/21 | | | 9,500 | | | | 10,521,250 | |
Dana Holding Corp., Sr. Unsec’d. Notes | | | 5.375% | | | 09/15/21 | | | 4,050 | | | | 4,171,500 | |
Dana Holding Corp., Sr. Unsec’d. Notes | | | 6.750% | | | 02/15/21 | | | 6,909 | | | | 7,306,267 | |
General Motors Co., Sr. Unsec’d. Notes | | | 4.875% | | | 10/02/23 | | | 5,275 | | | | 5,644,250 | |
General Motors Financial Co., Inc., Gtd. Notes | | | 3.250% | | | 05/15/18 | | | 1,150 | | | | 1,151,437 | |
SEE NOTES TO FINANCIAL STATEMENTS.
A108
| | | | | | |
| | | HIGH YIELD BOND PORTFOLIO (continued) | | |
| |
| SCHEDULE OF INVESTMENTS | | December 31, 2014 |
| | | | | | | | | | | | | | |
CORPORATE BONDS
(continued) | | Interest
Rate
| | | Maturity
Date
| | Principal
Amount
(000)#
| | | Value
(Note 2)
| |
Automotive (continued) | | | | | | | | | | | | | | |
Jaguar Land Rover Automotive PLC (United Kingdom), Gtd. Notes, 144A | | | 5.625% | | | 02/01/23 | | | 650 | | | $ | 684,125 | |
Lear Corp., Gtd. Notes | | | 4.750% | | | 01/15/23 | | | 775 | | | | 773,063 | |
Lear Corp., Gtd. Notes | | | 5.250% | | | 01/15/25 | | | 11,450 | | | | 11,593,125 | |
Meritor, Inc., Gtd. Notes | | | 6.250% | | | 02/15/24 | | | 3,775 | | | | 3,831,625 | |
Meritor, Inc., Gtd. Notes(d) | | | 6.750% | | | 06/15/21 | | | 5,075 | | | | 5,303,375 | |
Schaeffler Holding Finance BV (Germany), Sr. Sec’d. Notes, PIK, 144A(d) | | | 6.750% | | | 11/15/22 | | | 1,800 | | | | 1,881,000 | |
Titan International, Inc., Sr. Sec’d. Notes | | | 6.875% | | | 10/01/20 | | | 5,350 | | | | 4,708,000 | |
| | | | | | | | | | | | |
|
|
|
| | | | | | | | | | | | | | 72,002,642 | |
| | | | | | | | | | | | |
|
|
|
Banking — 1.2% | | | | | | | | | | | | | | |
Ally Financial, Inc., Gtd. Notes | | | 8.000% | | | 03/15/20 | | | 6,811 | | | | 8,036,980 | |
Ally Financial, Inc., Sr. Unsec’d. Notes | | | 3.750% | | | 11/18/19 | | | 8,775 | | | | 8,643,375 | |
Bank of America Corp., Series K, Jr. Sub. Notes | | | 8.000% | (a) | | 12/29/49 | | | 730 | | | | 783,838 | |
Bank of America Corp., Series U, Jr. Sub. Notes(d) | | | 5.200% | (a) | | 12/31/49 | | | 2,925 | | | | 2,701,969 | |
Citigroup, Inc., Jr. Sub. Notes(d) | | | 5.800% | (a) | | 12/31/49 | | | 9,515 | | | | 9,515,000 | |
HBOS PLC (United Kingdom), Sub. Notes, GMTN, 144A | | | 6.750% | | | 05/21/18 | | | 400 | | | | 445,798 | |
Morgan Stanley, Series H, Jr. Sub. Notes | | | 5.450% | (a) | | 12/31/49 | | | 4,975 | | | | 4,983,955 | |
Wells Fargo & Co., Series S, Jr. Sub. Notes | | | 5.900% | (a) | | 12/31/49 | | | 4,975 | | | | 5,012,312 | |
| | | | | | | | | | | | |
|
|
|
| | | | | | | | | | | | | | 40,123,227 | |
| | | | | | | | | | | | |
|
|
|
Building Materials & Construction — 3.1% | | | | | | | | | | | | | | |
Beazer Homes USA, Inc., Gtd. Notes | | | 5.750% | | | 06/15/19 | | | 4,375 | | | | 4,200,000 | |
Beazer Homes USA, Inc., Gtd. Notes(d) | | | 7.250% | | | 02/01/23 | | | 1,425 | | | | 1,382,250 | |
Beazer Homes USA, Inc., Gtd. Notes | | | 7.500% | | | 09/15/21 | | | 7,625 | | | | 7,663,125 | |
Beazer Homes USA, Inc., Gtd. Notes(d) | | | 9.125% | | | 05/15/19 | | | 5,000 | | | | 5,225,000 | |
Brookfield Residential Properties, Inc./Brookfield Residential US Corp. (Canada), Gtd. Notes, 144A(d) | | | 6.125% | | | 07/01/22 | | | 5,175 | | | | 5,382,000 | |
Building Materials Corp. of America, Sr. Unsec’d. Notes, 144A(c) | | | 5.375% | | | 11/15/24 | | | 6,250 | | | | 6,234,375 | |
Building Materials Corp. of America, Sr. Unsec’d. Notes, 144A
(original cost $2,215,000; purchased 04/19/13)(b)(c) | | | 6.750% | | | 05/01/21 | | | 2,000 | | | | 2,115,000 | |
Cemex Finance LLC (Mexico), Sr. Sec’d. Notes, 144A | | | 9.375% | | | 10/12/22 | | | 5,975 | | | | 6,662,125 | |
Cemex SAB de CV (Mexico), Sr. Sec’d. Notes, 144A | | | 5.700% | | | 01/11/25 | | | 6,475 | | | | 6,280,750 | |
D.R. Horton, Inc., Gtd. Notes | | | 4.750% | | | 02/15/23 | | | 8,825 | | | | 8,780,875 | |
D.R. Horton, Inc., Gtd. Notes | | | 6.500% | | | 04/15/16 | | | 900 | | | | 949,500 | |
HD Supply, Inc., Sr. Sec’d. Notes, 144A | | | 5.250% | | | 12/15/21 | | | 4,725 | | | | 4,807,687 | |
KB Home, Gtd. Notes(d) | | | 7.000% | | | 12/15/21 | | | 2,725 | | | | 2,866,359 | |
KB Home, Gtd. Notes(d) | | | 7.500% | | | 09/15/22 | | | 5,425 | | | | 5,750,500 | |
Masco Corp., Sr. Unsec’d. Notes | | | 5.950% | | | 03/15/22 | | | 1,675 | | | | 1,859,250 | |
Standard Pacific Corp., Gtd. Notes(d) | | | 6.250% | | | 12/15/21 | | | 800 | | | | 820,000 | |
Standard Pacific Corp., Gtd. Notes | | | 8.375% | | | 05/15/18 | | | 925 | | | | 1,045,250 | |
Standard Pacific Corp., Gtd. Notes(d) | | | 8.375% | | | 01/15/21 | | | 525 | | | | 594,563 | |
Standard Pacific Corp., Gtd. Notes(d) | | | 10.750% | | | 09/15/16 | | | 3,875 | | | | 4,388,438 | |
Taylor Morrison Communities, Inc./Monarch Communities, Inc., Gtd. Notes, 144A | | | 5.625% | | | 03/01/24 | | | 2,150 | | | | 2,074,750 | |
Taylor Morrison Communities, Inc./Monarch Communities, Inc., Gtd. Notes, 144A(c)(d) | | | 7.750% | | | 04/15/20 | | | 5,892 | | | | 6,245,520 | |
Taylor Morrison Communities, Inc./Monarch Communities, Inc., Gtd. Notes, 144A(c) | | | 7.750% | | | 04/15/20 | | | 1,762 | | | | 1,867,720 | |
Toll Brothers Finance Corp., Gtd. Notes | | | 4.000% | | | 12/31/18 | | | 825 | | | | 829,125 | |
WCI Communities, Inc., Gtd. Notes | | | 6.875% | | | 08/15/21 | | | 8,570 | | | | 8,591,425 | |
William Lyon Homes, Inc., Gtd. Notes, 144A(d) | | | 7.000% | | | 08/15/22 | | | 4,825 | | | | 4,873,250 | |
| | | | | | | | | | | | |
|
|
|
| | | | | | | | | | | | | | 101,488,837 | |
| | | | | | | | | | | | |
|
|
|
Cable — 3.7% | | | | | | | | | | | | | | |
Cablevision Systems Corp., Sr. Unsec’d. Notes(d) | | | 7.750% | | | 04/15/18 | | | 1,375 | | | | 1,512,500 | |
Cablevision Systems Corp., Sr. Unsec’d. Notes | | | 8.625% | | | 09/15/17 | | | 9,975 | | | | 11,097,187 | |
CCO Holdings LLC/CCO Holdings Capital Corp., Gtd. Notes | | | 5.125% | | | 02/15/23 | | | 568 | | | | 555,220 | |
CCO Holdings LLC/CCO Holdings Capital Corp., Gtd. Notes | | | 5.250% | | | 03/15/21 | | | 635 | | | | 639,763 | |
CCO Holdings LLC/CCO Holdings Capital Corp., Gtd. Notes(d) | | | 5.250% | | | 09/30/22 | | | 2,200 | | | | 2,194,500 | |
SEE NOTES TO FINANCIAL STATEMENTS.
A109
| | | | | | |
| | | HIGH YIELD BOND PORTFOLIO (continued) | | |
| |
| SCHEDULE OF INVESTMENTS | | December 31, 2014 |
| | | | | | | | | | | | | | |
CORPORATE BONDS
(continued) | | Interest
Rate
| | | Maturity
Date
| | Principal
Amount
(000)#
| | | Value
(Note 2)
| |
Cable (continued) | | | | | | | | | | | | | | |
CCO Holdings LLC/CCO Holdings Capital Corp., Gtd. Notes(d) | | | 5.750% | | | 09/01/23 | | | 7,625 | | | $ | 7,720,312 | |
CCO Holdings LLC/CCO Holdings Capital Corp., Gtd. Notes | | | 5.750% | | | 01/15/24 | | | 3,900 | | | | 3,939,000 | |
CCO Holdings LLC/CCO Holdings Capital Corp., Gtd. Notes | | | 8.125% | | | 04/30/20 | | | 1,600 | | | | 1,684,000 | |
CCOH Safari LLC, Gtd. Notes | | | 5.500% | | | 12/01/22 | | | 8,325 | | | | 8,449,875 | |
CCOH Safari LLC, Gtd. Notes | | | 5.750% | | | 12/01/24 | | | 4,600 | | | | 4,651,750 | |
Cequel Communications Holdings I LLC/Cequel Capital Corp., Sr. Unsec’d. Notes, 144A | | | 5.125% | | | 12/15/21 | | | 8,505 | | | | 8,249,850 | |
Cequel Communications Holdings I LLC/Cequel Capital Corp., Sr. Unsec’d. Notes, 144A | | | 5.125% | | | 12/15/21 | | | 6,125 | | | | 5,941,250 | |
Cequel Communications Holdings I LLC/Cequel Capital Corp., Sr. Unsec’d. Notes, 144A | | | 6.375% | | | 09/15/20 | | | 5,375 | | | | 5,563,125 | |
CSC Holdings LLC, Sr. Unsec’d. Notes | | | 6.750% | | | 11/15/21 | | | 4,530 | | | | 5,005,650 | |
CSC Holdings LLC, Sr. Unsec’d. Notes | | | 7.875% | | | 02/15/18 | | | 850 | | | | 954,125 | |
DISH DBS Corp., Gtd. Notes | | | 5.875% | | | 07/15/22 | | | 3,275 | | | | 3,356,875 | |
DISH DBS Corp., Gtd. Notes, 144A | | | 5.875% | | | 11/15/24 | | | 4,000 | | | | 4,020,000 | |
Intelsat Jackson Holdings SA (Luxembourg), Gtd. Notes(d) | | | 5.500% | | | 08/01/23 | | | 12,000 | | | | 11,926,800 | |
Mediacom Broadband LLC/Mediacom Broadband Corp., Gtd. Notes | | | 5.500% | | | 04/15/21 | | | 7,500 | | | | 7,537,500 | |
ONO Finance II PLC (Spain), Gtd. Notes, 144A | | | 10.875% | | | 07/15/19 | | | 1,625 | | | | 1,722,500 | |
Quebecor Media, Inc. (Canada), Sr. Unsec’d. Notes(d) | | | 5.750% | | | 01/15/23 | | | 11,408 | | | | 11,664,680 | |
Unitymedia KabelBW GmbH (Germany), Gtd. Notes, 144A | | | 6.125% | | | 01/15/25 | | | 3,575 | | | | 3,691,188 | |
Videotron Ltd. (Canada), Gtd. Notes | | | 5.000% | | | 07/15/22 | | | 3,825 | | | | 3,891,937 | |
Virgin Media Secured Finance PLC (United Kingdom),
Sr. Sec’d. Notes, 144A | | | 5.375% | | | 04/15/21 | | | 4,000 | | | | 4,130,000 | |
| | | | | | | | | | | | |
|
|
|
| | | | | | | | | | | | | | 120,099,587 | |
| | | | | | | | | | | | |
|
|
|
Capital Goods — 7.3% | | | | | | | | | | | | | | |
ADS Waste Holdings, Inc., Gtd. Notes | | | 8.250% | | | 10/01/20 | | | 3,675 | | | | 3,675,000 | |
AECOM Technology Corp., Gtd. Notes, 144A | | | 5.875% | | | 10/15/24 | | | 10,200 | | | | 10,429,500 | |
Apex Tool Group LLC, Gtd. Notes, 144A
(original cost $1,880,000; purchased 09/17/14)(b)(c) | | | 7.000% | | | 02/01/21 | | | 2,000 | | | | 1,710,000 | |
Ashtead Capital, Inc. (United Kingdom), Sec’d. Notes, 144A | | | 6.500% | | | 07/15/22 | | | 8,925 | | | | 9,482,812 | |
Belden, Inc., Gtd. Notes, 144A | | | 5.500% | | | 09/01/22 | | | 4,025 | | | | 3,994,813 | |
BlueLine Rental Finance Corp., Sec’d. Notes, 144A
(original cost $4,268,531; purchased 01/16/14-07/01/14)(b)(c) | | | 7.000% | | | 02/01/19 | | | 4,125 | | | | 4,228,125 | |
Case New Holland Industrial, Inc., Gtd. Notes | | | 7.875% | | | 12/01/17 | | | 4,150 | | | | 4,565,000 | |
CBRE Services, Inc., Gtd. Notes | | | 5.000% | | | 03/15/23 | | | 1,200 | | | | 1,226,280 | |
Clean Harbors, Inc., Gtd. Notes | | | 5.250% | | | 08/01/20 | | | 6,850 | | | | 6,884,250 | |
Cleaver-Brooks, Inc., Sr. Sec’d. Notes, 144A
(original cost $5,912,938; purchased 04/08/13-12/11/14)(b)(c) | | | 8.750% | | | 12/15/19 | | | 5,475 | | | | 5,762,438 | |
CNH Industrial Capital LLC, Gtd. Notes | | | 3.625% | | | 04/15/18 | | | 2,950 | | | | 2,905,750 | |
Dycom Investments, Inc., Gtd. Notes | | | 7.125% | | | 01/15/21 | | | 5,225 | | | | 5,486,250 | |
EnPro Industries, Inc., Gtd. Notes, 144A | | | 5.875% | | | 09/15/22 | | | 4,475 | | | | 4,519,750 | |
Gates Global LLC/Gates Global Co., Gtd. Notes, 144A(b)(d) | | | 6.000% | | | 07/15/22 | | | 9,350 | | | | 8,954,495 | |
General Cable Corp., Gtd. Notes | | | 5.750% | (a) | | 10/01/22 | | | 3,225 | | | | 2,354,250 | |
Greystar Real Estate Partners LLC, Sr. Sec’d. Notes, 144A
(original cost $5,875,000; purchased 11/10/14)(b)(c) | | | 8.250% | | | 12/01/22 | | | 5,875 | | | | 5,977,812 | |
Griffon Corp., Gtd. Notes | | | 5.250% | | | 03/01/22 | | | 13,235 | | | | 12,391,269 | |
H&E Equipment Services, Inc., Gtd. Notes(d) | | | 7.000% | | | 09/01/22 | | | 12,295 | | | | 12,648,481 | |
International Wire Group Holdings, Inc., Sec’d. Notes, 144A(d) | | | 8.500% | | | 10/15/17 | | | 6,250 | | | | 6,546,875 | |
Jurassic Holdings III, Inc., Sec’d. Notes, 144A | | | 6.875% | | | 02/15/21 | | | 7,775 | | | | 7,230,750 | |
Laureate Education, Inc., Gtd. Notes, 144A(d) | | | 9.750% | | | 09/01/19 | | | 12,425 | | | | 12,797,750 | |
Light Tower Rentals, Inc., Sr. Sec’d. Notes, 144A(d) | | | 8.125% | | | 08/01/19 | | | 4,250 | | | | 3,304,375 | |
Manitowoc Co., Inc. (The), Gtd. Notes | | | 5.875% | | | 10/15/22 | | | 2,550 | | | | 2,588,250 | |
Modular Space Corp., Sec’d. Notes, 144A
(original cost $2,550,000; purchased 02/19/14)(b)(c) | | | 10.250% | | | 01/31/19 | | | 2,550 | | | | 2,205,750 | |
NES Rentals Holdings, Inc., Sec’d. Notes, 144A
(original cost $7,395,938; purchased 04/12/13-11/10/14)(b)(c) | | | 7.875% | | | 05/01/18 | | | 7,275 | | | | 7,347,750 | |
Rexel SA (France), Sr. Unsec’d. Notes, 144A | | | 6.125% | | | 12/15/19 | | | 3,600 | | | | 3,708,000 | |
SEE NOTES TO FINANCIAL STATEMENTS.
A110
| | | | | | |
| | | HIGH YIELD BOND PORTFOLIO (continued) | | |
| |
| SCHEDULE OF INVESTMENTS | | December 31, 2014 |
| | | | | | | | | | | | | | |
CORPORATE BONDS
(continued) | | Interest
Rate
| | | Maturity
Date
| | Principal
Amount
(000)#
| | | Value
(Note 2)
| |
Capital Goods (continued) | | | | | | | | | | | | | | |
Safway Group Holding LLC/Safway Finance Corp., Sec’d. Notes, 144A | | | 7.000% | | | 05/15/18 | | | 1,450 | | | $ | 1,377,500 | |
Signode Industrial Group Lux SA/Signode Industrial Group US, Inc., Sr. Unsec’d. Notes, 144A (original cost $12,829,344; purchased 04/07/14-07/11/14)(b)(c)(d) | | | 6.375% | | | 05/01/22 | | | 12,750 | | | | 12,431,250 | |
Terex Corp., Gtd. Notes(d) | | | 6.000% | | | 05/15/21 | | | 8,889 | | | | 9,066,780 | |
Terex Corp., Gtd. Notes(d) | | | 6.500% | | | 04/01/20 | | | 2,175 | | | | 2,251,125 | |
Unifrax I LLC/Unifrax Holding Co., Gtd. Notes, 144A
(original cost $3,045,000; purchased 10/10/13)(b)(c) | | | 7.500% | | | 02/15/19 | | | 3,000 | | | | 2,955,000 | |
United Rentals North America, Inc., Gtd. Notes(d) | | | 5.750% | | | 11/15/24 | | | 5,150 | | | | 5,304,500 | |
United Rentals North America, Inc., Gtd. Notes | | | 6.125% | | | 06/15/23 | | | 2,600 | | | | 2,730,000 | |
United Rentals North America, Inc., Gtd. Notes(d) | | | 7.375% | | | 05/15/20 | | | 2,625 | | | | 2,835,000 | |
United Rentals North America, Inc., Gtd. Notes | | | 7.625% | | | 04/15/22 | | | 12,640 | | | | 13,897,680 | |
United Rentals North America, Inc., Gtd. Notes(d) | | | 8.375% | | | 09/15/20 | | | 2,750 | | | | 2,949,375 | |
United Rentals North America, Inc., Sr. Unsec’d. Notes | | | 8.250% | | | 02/01/21 | | | 7,025 | | | | 7,657,250 | |
Vander Intermediate Holding II Corp., Sr. Unsec’d. Notes, PIK, 144A(d) | | | 9.750% | | | 02/01/19 | | | 7,915 | | | | 8,192,025 | |
WireCo WorldGroup, Inc., Gtd. Notes | | | 9.500% | | | 05/15/17 | | | 10,800 | | | | 10,881,000 | |
| | | | | | | | | | | | |
|
|
|
| | | | | | | | | | | | | | 235,454,260 | |
| | | | | | | | | | | | |
|
|
|
Chemicals — 3.4% | | | | | | | | | | | | | | |
Axalta Coating Systems US Holdings Inc./Axalta Coating Systems Dutch Holding B BV, Gtd. Notes, 144A(d) | | | 7.375% | | | 05/01/21 | | | 8,945 | | | | 9,481,700 | |
Axiall Corp., Gtd. Notes | | | 4.875% | | | 05/15/23 | | | 2,175 | | | | 2,052,656 | |
Chemtura Corp., Gtd. Notes(d) | | | 5.750% | | | 07/15/21 | | | 8,375 | | | | 8,165,625 | |
Eagle Spinco, Inc., Gtd. Notes(d) | | | 4.625% | | | 02/15/21 | | | 2,625 | | | | 2,487,188 | |
Hexion US Finance Corp., Sr. Sec’d. Notes(d) | | | 6.625% | | | 04/15/20 | | | 11,585 | | | | 11,353,300 | |
Hexion US Finance Corp./Hexion Nova Scotia Finance ULC, Sec’d. Notes | | | 9.000% | | | 11/15/20 | | | 23,835 | | | | 17,042,025 | |
Hexion US Finance Corp./Hexion Nova Scotia Finance ULC, Sr. Sec’d. Notes | | | 8.875% | | | 02/01/18 | | | 9,275 | | | | 8,254,750 | |
Huntsman International LLC, Gtd. Notes, 144A(d) | | | 5.125% | | | 11/15/22 | | | 5,075 | | | | 4,998,875 | |
Koppers, Inc., Gtd. Notes | | | 7.875% | | | 12/01/19 | | | 12,902 | | | | 13,240,677 | |
Rentech Nitrogen Partners LP/Rentech Nitrogen Finance Corp., Sec’d. Notes, 144A | | | 6.500% | | | 04/15/21 | | | 7,575 | | | | 6,741,750 | |
Taminco Global Chemical Corp. (Belgium), Sec’d. Notes, 144A | | | 9.750% | | | 03/31/20 | | | 7,805 | | | | 8,546,475 | |
TPC Group, Inc., Sr. Sec’d. Notes, 144A
(original cost $12,099,538; purchased 12/11/12-10/21/14)(b)(c) | | | 8.750% | | | 12/15/20 | | | 11,720 | | | | 11,397,700 | |
Tronox Finance LLC, Gtd. Notes(d) | | | 6.375% | | | 08/15/20 | | | 6,481 | | | | 6,497,203 | |
| | | | | | | | | | | | |
|
|
|
| | | | | | | | | | | | | | 110,259,924 | |
| | | | | | | | | | | | |
|
|
|
Consumer — 2.2% | | | | | | | | | | | | | | |
Acosta, Inc., Sr. Unsec’d. Notes, 144A | | | 7.750% | | | 10/01/22 | | | 7,550 | | | | 7,644,375 | |
Big Heart Pet Brands, Gtd. Notes(d) | | | 7.625% | | | 02/15/19 | | | 3,084 | | | | 3,030,030 | |
Brand Energy & Infrastructure Services, Inc., Gtd. Notes, 144A
(original cost $5,325,000; purchased 11/22/13)(b)(c) | | | 8.500% | | | 12/01/21 | | | 5,325 | | | | 4,792,500 | |
Carlson Wagonlit BV (Netherlands), Sr. Sec’d. Notes, 144A
(original cost $3,100,000; purchased 05/09/12)(b)(c) | | | 6.875% | | | 06/15/19 | | | 3,100 | | | | 3,239,500 | |
First Quality Finance Co., Inc., Sr. Unsec’d. Notes, 144A(d) | | | 4.625% | | | 05/15/21 | | | 5,805 | | | | 5,311,575 | |
Gibson Brands, Inc., Sr. Sec’d. Notes, 144A(b) | | | 8.875% | | | 08/01/18 | | | 2,525 | | | | 2,424,000 | |
Hearthside Group Holdings LLC/Hearthside Finance Co., Gtd. Notes, 144A | | | 6.500% | | | 05/01/22 | | | 5,475 | | | | 5,338,125 | |
PVH Corp., Sr. Unsec’d. Notes(d) | | | 4.500% | | | 12/15/22 | | | 2,950 | | | | 2,913,125 | |
Service Corp. International, Sr. Unsec’d. Notes(d) | | | 5.375% | | | 05/15/24 | | | 8,650 | | | | 8,823,000 | |
Service Corp. International, Sr. Unsec’d. Notes | | | 4.500% | | | 11/15/20 | | | 2,325 | | | | 2,284,312 | |
Service Corp. International, Sr. Unsec’d. Notes | | | 5.375% | | | 01/15/22 | | | 925 | | | | 948,125 | |
Service Corp. International, Sr. Unsec’d. Notes | | | 7.000% | (a) | | 06/15/17 | | | 4,143 | | | | 4,453,725 | |
Spectrum Brands, Inc., Gtd. Notes | | | 6.375% | | | 11/15/20 | | | 4,200 | | | | 4,378,500 | |
Springs Industries, Inc., Sr. Sec’d. Notes(d) | | | 6.250% | | | 06/01/21 | | | 2,950 | | | | 2,935,250 | |
Sun Products Corp. (The), Sr. Unsec’d. Notes, 144A(d) | | | 7.750% | | | 03/15/21 | | | 8,095 | | | | 6,840,275 | |
Visant Corp., Gtd. Notes | | | 10.000% | | | 10/01/17 | | | 1,369 | | | | 1,187,608 | |
West Corp., Gtd. Notes, 144A(d) | | | 5.375% | | | 07/15/22 | | | 5,450 | | | | 5,218,375 | |
| | | | | | | | | | | | |
|
|
|
| | | | | | | | | | | | | | 71,762,400 | |
| | | | | | | | | | | | |
|
|
|
SEE NOTES TO FINANCIAL STATEMENTS.
A111
| | | | | | |
| | | HIGH YIELD BOND PORTFOLIO (continued) | | |
| |
| SCHEDULE OF INVESTMENTS | | December 31, 2014 |
| | | | | | | | | | | | | | |
CORPORATE BONDS
(continued) | | Interest
Rate
| | | Maturity
Date
| | Principal
Amount
(000)#
| | | Value
(Note 2)
| |
Electric — 6.5% | | | | | | | | | | | | | | |
AES Corp., Sr. Unsec’d. Notes | | | 4.875% | | | 05/15/23 | | | 2,175 | | | $ | 2,158,688 | |
AES Corp., Sr. Unsec’d. Notes(d) | | | 5.500% | | | 03/15/24 | | | 2,400 | | | | 2,435,520 | |
AES Corp., Sr. Unsec’d. Notes(d) | | | 7.375% | | | 07/01/21 | | | 8,275 | | | | 9,350,750 | |
AES Corp., Sr. Unsec’d. Notes | | | 8.000% | | | 10/15/17 | | | 1,100 | | | | 1,234,750 | |
AES Corp., Sr. Unsec’d. Notes | | | 8.000% | | | 06/01/20 | | | 3,625 | | | | 4,141,562 | |
Calpine Corp., Sr. Sec’d. Notes, 144A(d) | | | 6.000% | | | 01/15/22 | | | 2,100 | | | | 2,236,500 | |
Calpine Corp., Sr. Sec’d. Notes, 144A | | | 7.875% | | | 01/15/23 | | | 7,479 | | | | 8,245,597 | |
Calpine Corp., Sr. Unsec’d. Notes(d) | | | 5.375% | | | 01/15/23 | | | 11,610 | | | | 11,726,100 | |
Calpine Corp., Sr. Unsec’d. Notes(d) | | | 5.750% | | | 01/15/25 | | | 7,075 | | | | 7,163,437 | |
Covanta Holding Corp., Sr. Unsec’d. Notes | | | 5.875% | | | 03/01/24 | | | 3,150 | | | | 3,205,125 | |
Covanta Holding Corp., Sr. Unsec’d. Notes(d) | | | 6.375% | | | 10/01/22 | | | 3,750 | | | | 3,975,000 | |
Covanta Holding Corp., Sr. Unsec’d. Notes | | | 7.250% | | | 12/01/20 | | | 3,055 | | | | 3,245,938 | |
DPL, Inc., Sr. Unsec’d. Notes | | | 6.500% | | | 10/15/16 | | | 730 | | | | 770,150 | |
DPL, Inc., Sr. Unsec’d. Notes | | | 7.250% | | | 10/15/21 | | | 15,875 | | | | 16,192,500 | |
DPL, Inc., Sr. Unsec’d. Notes, 144A | | | 6.750% | | | 10/01/19 | | | 4,250 | | | | 4,292,500 | |
Dynegy Finance I, Inc./Dynegy Finance II, Inc., Sr. Sec’d. Notes, 144A | | | 7.375% | | | 11/01/22 | | | 30,605 | | | | 31,140,587 | |
Dynegy Finance I, Inc./Dynegy Finance II, Inc., Sr. Sec’d. Notes, 144A(d) | | | 7.625% | | | 11/01/24 | | | 15,730 | | | | 16,044,600 | |
Dynegy, Inc., Gtd. Notes | | | 5.875% | | | 06/01/23 | | | 7,310 | | | | 6,944,500 | |
GenOn Americas Generation LLC, Sr. Unsec’d. Notes | | | 8.500% | | | 10/01/21 | | | 1,000 | | | | 860,000 | |
GenOn Energy, Inc., Sr. Unsec’d. Notes(d) | | | 9.500% | | | 10/15/18 | | | 3,350 | | | | 3,333,250 | |
GenOn Energy, Inc., Sr. Unsec’d. Notes | | | 9.875% | | | 10/15/20 | | | 9,750 | | | | 9,603,750 | |
InterGen NV (Netherlands), Sr. Sec’d. Notes, 144A
(original cost $3,831,009; purchased 06/07/13)(b)(c) | | | 7.000% | | | 06/30/23 | | | 3,900 | | | | 3,705,000 | |
Mirant Corp., Bonds, 144A(b) | | | 7.400% | (a)(e) | | 07/15/49 | | | 1,825 | | | | 1,825 | |
Mirant Mid Atlantic LLC, Series B, Pass-Through Certificates | | | 9.125% | | | 06/30/17 | | | 5,307 | | | | 5,704,924 | |
NRG Energy, Inc., Gtd. Notes | | | 6.250% | | | 07/15/22 | | | 9,018 | | | | 9,220,905 | |
NRG Energy, Inc., Gtd. Notes | | | 7.625% | | | 01/15/18 | | | 7,070 | | | | 7,759,325 | |
NRG Energy, Inc., Gtd. Notes(d) | | | 7.875% | | | 05/15/21 | | | 4,240 | | | | 4,568,600 | |
NRG Energy, Inc., Gtd. Notes | | | 8.250% | | | 09/01/20 | | | 4,950 | | | | 5,284,125 | |
NRG Energy, Inc., Gtd. Notes, 144A(d) | | | 6.250% | | | 05/01/24 | | | 13,100 | | | | 13,329,250 | |
NRG REMA LLC, Series B, Pass-Through Certificates(b) | | | 9.237% | | | 07/02/17 | | | 1,693 | | | | 1,710,421 | |
NRG REMA LLC, Series C, Pass-Through Certificates | | | 9.681% | | | 07/02/26 | | | 5,910 | | | | 6,264,600 | |
RJS Power Holdings LLC, Gtd. Notes, 144A | | | 5.125% | | | 07/15/19 | | | 5,625 | | | | 5,554,688 | |
| | | | | | | | | | | | |
|
|
|
| | | | | | | | | | | | | | 211,404,467 | |
| | | | | | | | | | | | |
|
|
|
Energy – Integrated — 0.1% | | | | | | | | | | | | | | |
Pacific Rubiales Energy Corp. (Colombia), Gtd. Notes, 144A | | | 5.375% | | | 01/26/19 | | | 5,000 | | | | 4,307,500 | |
| | | | | | | | | | | | |
|
|
|
Energy – Other — 4.5% | | | | | | | | | | | | | | |
Antero Resources Corp., Gtd. Notes, 144A(d) | | | 5.125% | | | 12/01/22 | | | 1,975 | | | | 1,861,438 | |
Bonanza Creek Energy, Inc., Gtd. Notes | | | 5.750% | | | 02/01/23 | | | 3,325 | | | | 2,626,750 | |
Bonanza Creek Energy, Inc., Gtd. Notes | | | 6.750% | | | 04/15/21 | | | 1,675 | | | | 1,474,000 | |
Bristow Group, Inc., Gtd. Notes | | | 6.250% | | | 10/15/22 | | | 4,375 | | | | 4,353,125 | |
California Resources Corp., Gtd. Notes, 144A(d) | | | 5.500% | | | 09/15/21 | | | 4,675 | | | | 3,997,125 | |
California Resources Corp., Gtd. Notes, 144A(d) | | | 6.000% | | | 11/15/24 | | | 5,875 | | | | 4,964,375 | |
CGG SA (France), Gtd. Notes | | | 6.500% | | | 06/01/21 | | | 2,125 | | | | 1,615,000 | |
CGG SA (France), Gtd. Notes(d) | | | 6.875% | | | 01/15/22 | | | 1,355 | | | | 1,029,800 | |
CGG SA (France), Gtd. Notes(d) | | | 7.750% | | | 05/15/17 | | | 928 | | | | 798,080 | |
Compressco Partners LP/Compressco Finance, Inc., Gtd. Notes, 144A | | | 7.250% | | | 08/15/22 | | | 5,725 | | | | 4,923,500 | |
Concho Resources, Inc., Gtd. Notes | | | 5.500% | | | 04/01/23 | | | 4,325 | | | | 4,345,328 | |
Denbury Resources, Inc., Gtd. Notes(d) | | | 6.375% | | | 08/15/21 | | | 2,565 | | | | 2,436,750 | |
EP Energy LLC/EP Energy Finance, Inc., Gtd. Notes(d) | | | 9.375% | | | 05/01/20 | | | 4,826 | | | | 4,874,260 | |
EP Energy LLC/Everest Acquisition Finance, Inc., Sec’d. Notes(d) | | | 6.875% | | | 05/01/19 | | | 1,800 | | | | 1,827,000 | |
Halcon Resources Corp., Gtd. Notes(d) | | | 9.250% | | | 02/15/22 | | | 2,700 | | | | 1,991,250 | |
Halcon Resources Corp., Gtd. Notes(d) | | | 9.750% | | | 07/15/20 | | | 10,150 | | | | 7,612,500 | |
Hercules Offshore, Inc., Gtd. Notes, 144A | | | 8.750% | | | 07/15/21 | | | 1,350 | | | | 621,000 | |
Hilcorp Energy I LP/Hilcorp Finance Co., Sr. Unsec’d. Notes, 144A
(original cost $2,707,250; purchased 03/19/13)(b)(c)(d) | | | 7.625% | | | 04/15/21 | | | 2,450 | | | | 2,462,250 | |
SEE NOTES TO FINANCIAL STATEMENTS.
A112
| | | | | | |
| | | HIGH YIELD BOND PORTFOLIO (continued) | | |
| |
| SCHEDULE OF INVESTMENTS | | December 31, 2014 |
| | | | | | | | | | | | | | |
CORPORATE BONDS
(continued) | | Interest
Rate
| | | Maturity
Date
| | Principal
Amount
(000)#
| | | Value
(Note 2)
| |
Energy – Other (continued) | | | | | | | | | | | | | | |
Hilcorp Energy I LP/Hilcorp Finance Co., Sr. Unsec’d. Notes, 144A
(original cost $1,653,750; purchased 03/15/13)(b)(c)(d) | | | 8.000% | | | 02/15/20 | | | 1,500 | | | $ | 1,530,000 | |
Hornbeck Offshore Services, Inc., Gtd. Notes(d) | | | 5.875% | | | 04/01/20 | | | 3,622 | | | | 3,205,470 | |
Jupiter Resources, Inc. (Canada), Sr. Unsec’d. Notes, 144A | | | 8.500% | | | 10/01/22 | | | 6,325 | | | | 4,759,562 | |
MEG Energy Corp. (Canada), Gtd. Notes, 144A(d) | | | 6.500% | | | 03/15/21 | | | 7,695 | | | | 7,021,687 | |
MEG Energy Corp. (Canada), Gtd. Notes, 144A(d) | | | 7.000% | | | 03/31/24 | | | 1,525 | | | | 1,380,125 | |
Memorial Resource Development Corp., Gtd. Notes, 144A(d) | | | 5.875% | | | 07/01/22 | | | 4,925 | | | | 4,457,125 | |
Newfield Exploration Co., Sr. Sub. Notes(d) | | | 6.875% | | | 02/01/20 | | | 5,044 | | | | 5,119,660 | |
Newfield Exploration Co., Sr. Unsec’d. Notes | | | 5.750% | | | 01/30/22 | | | 1,875 | | | | 1,856,250 | |
Parker Drilling Co., Gtd. Notes | | | 6.750% | | | 07/15/22 | | | 2,070 | | | | 1,552,500 | |
Parker Drilling Co., Gtd. Notes | | | 7.500% | | | 08/01/20 | | | 1,975 | | | | 1,580,000 | |
PHI, Inc., Gtd. Notes | | | 5.250% | | | 03/15/19 | | | 3,525 | | | | 2,996,250 | |
Pioneer Energy Services Corp., Gtd. Notes | | | 6.125% | | | 03/15/22 | | | 2,400 | | | | 1,824,000 | |
Precision Drilling Corp. (Canada), Gtd. Notes | | | 6.500% | | | 12/15/21 | | | 2,075 | | | | 1,758,563 | |
Precision Drilling Corp. (Canada), Gtd. Notes | | | 6.625% | | | 11/15/20 | | | 2,500 | | | | 2,250,000 | |
QEP Resources, Inc., Sr. Unsec’d. Notes(d) | | | 5.250% | | | 05/01/23 | | | 6,075 | | | | 5,680,125 | |
QEP Resources, Inc., Sr. Unsec’d. Notes | | | 5.375% | | | 10/01/22 | | | 2,300 | | | | 2,173,500 | |
Range Resources Corp., Gtd. Notes | | | 5.000% | | | 08/15/22 | | | 2,000 | | | | 2,000,000 | |
Samson Investment Co., Gtd. Notes(c) | | | 9.750% | (a) | �� | 02/15/20 | | | 11,525 | | | | 4,775,672 | |
Sanchez Energy Corp., Gtd. Notes(d) | | | 7.750% | | | 06/15/21 | | | 2,160 | | | | 2,008,800 | |
Sanchez Energy Corp., Gtd. Notes, 144A(d) | | | 6.125% | | | 01/15/23 | | | 1,375 | | | | 1,155,000 | |
SESI LLC, Gtd. Notes | | | 6.375% | | | 05/01/19 | | | 3,050 | | | | 2,958,500 | |
Seventy Seven Energy, Inc. | | | 6.500% | | | 07/15/22 | | | 2,275 | | | | 1,330,875 | |
Triangle USA Petroleum Corp., Sr. Unsec’d. Notes, 144A | | | 6.750% | | | 07/15/22 | | | 3,600 | | | | 2,376,000 | |
Tullow Oil PLC (United Kingdom), Gtd. Notes, 144A | | | 6.000% | | | 11/01/20 | | | 6,900 | | | | 5,727,000 | |
Ultra Petroleum Corp., Sr. Unsec’d. Notes, 144A | | | 5.750% | | | 12/15/18 | | | 550 | | | | 507,375 | |
Western Refining, Inc., Gtd. Notes | | | 6.250% | | | 04/01/21 | | | 6,608 | | | | 6,442,800 | |
WPX Energy, Inc., Sr. Unsec’d. Notes(d) | | | 6.000% | | | 01/15/22 | | | 14,303 | | | | 13,766,637 | |
| | | | | | | | | | | | |
|
|
|
| | | | | | | | | | | | | | 146,007,007 | |
| | | | | | | | | | | | |
|
|
|
Foods — 3.8% | | | | | | | | | | | | | | |
Aramark Services Inc., Gtd. Notes | | | 5.750% | | | 03/15/20 | | | 2,785 | | | | 2,875,513 | |
B&G Foods, Inc., Gtd. Notes(d) | | | 4.625% | | | 06/01/21 | | | 4,025 | | | | 3,928,802 | |
BC ULC/New Red Finance, Inc. (Canada), Sec’d. Notes, 144A(d) | | | 6.000% | | | 04/01/22 | | | 6,875 | | | | 7,046,875 | |
CEC Entertainment, Inc.(d) | | | 8.000% | | | 02/15/22 | | | 11,540 | | | | 11,193,800 | |
Cott Beverages, Inc. (Canada), 144A(d) | | | 6.750% | | | 01/01/20 | | | 6,350 | | | | 6,350,000 | |
Darling Ingredients, Inc., Gtd. Notes(d) | | | 5.375% | | | 01/15/22 | | | 4,800 | | | | 4,728,000 | |
DS Sevices of America, Inc. (Canada), 144A | | | 10.000% | | | 09/01/21 | | | 5,655 | | | | 6,531,525 | |
HJ Heinz Co., Sec’d. Notes(d) | | | 4.250% | | | 10/15/20 | | | 2,450 | | | | 2,474,500 | |
Ingles Market, Inc., Sr. Unsec’d. Notes | | | 5.750% | | | 06/15/23 | | | 4,550 | | | | 4,568,700 | |
JBS USA LLC/JBS USA Finance, Inc. (Brazil), Gtd. Notes, 144A
(original cost $3,017,471; purchased 05/20/11-06/15/11)(b)(c) | | | 7.250% | | | 06/01/21 | | | 3,085 | | | | 3,177,550 | |
JBS USA LLC/JBS USA Finance, Inc. (Brazil), Gtd. Notes, 144A
(original cost $9,130,750; purchased 09/13/13-10/15/13)(b)(c) | | | 7.250% | | | 06/01/21 | | | 9,125 | | | | 9,398,750 | |
JBS USA LLC/JBS USA Finance, Inc. (Brazil), Sr. Unsec’d. Notes, 144A (original cost $6,273,813; purchased 06/11/14-07/10/14)(b)(c)(d) | | | 5.875% | | | 07/15/24 | | | 6,275 | | | | 6,165,187 | |
Landry’s, Inc., Sr. Unsec’d. Notes, 144A
(original cost $8,800,500; purchased 04/19/12-06/25/13)(b)(c) | | | 9.375% | | | 05/01/20 | | | 8,650 | | | | 9,169,000 | |
PF Chang’s China Bistro, Inc., Gtd. Notes, 144A(d) | | | 10.250% | | | 06/30/20 | | | 9,900 | | | | 9,875,250 | |
Post Holdings, Inc., Gtd. Notes(d) | | | 7.375% | | | 02/15/22 | | | 7,350 | | | | 7,350,000 | |
Post Holdings, Inc., Gtd. Notes, 144A(d) | | | 6.000% | | | 12/15/22 | | | 175 | | | | 164,063 | |
Post Holdings, Inc., Gtd. Notes, 144A(d) | | | 6.750% | | | 12/01/21 | | | 3,375 | | | | 3,273,750 | |
Roundy’s Supermarkets, Inc., Sec’d. Notes, 144A(d) | | | 10.250% | | | 12/15/20 | | | 5,250 | | | | 4,567,500 | |
Smithfield Foods, Inc., Sr. Unsec’d. Notes | | | 6.625% | | | 08/15/22 | | | 4,375 | | | | 4,571,875 | |
Smithfield Foods, Inc., Sr. Unsec’d. Notes, 144A | | | 5.250% | | | 08/01/18 | | | 1,350 | | | | 1,373,625 | |
Smithfield Foods, Inc., Sr. Unsec’d. Notes, 144A(d) | | | 5.875% | | | 08/01/21 | | | 5,125 | | | | 5,227,500 | |
SUPERVALU, Inc., Sr. Unsec’d. Notes(d) | | | 7.750% | | | 11/15/22 | | | 2,725 | | | | 2,670,500 | |
Tops Holding Corp./Tops Markets LLC, Sr. Sec’d. Notes(c) | | | 8.875% | | | 12/15/17 | | | 5,281 | | | | 5,386,620 | |
SEE NOTES TO FINANCIAL STATEMENTS.
A113
| | | | | | |
| | | HIGH YIELD BOND PORTFOLIO (continued) | | |
| |
| SCHEDULE OF INVESTMENTS | | December 31, 2014 |
| | | | | | | | | | | | | | |
CORPORATE BONDS
(continued) | | Interest
Rate
| | | Maturity
Date
| | Principal
Amount
(000)#
| | | Value
(Note 2)
| |
Foods (continued) | | | | | | | | | | | | | | |
TreeHouse Foods, Inc., Gtd. Notes | | | 4.875% | | | 03/15/22 | | | 2,875 | | | $ | 2,910,938 | |
| | | | | | | | | | | | |
|
|
|
| | | | | | | | | | | | | | 124,979,823 | |
| | | | | | | | | | | | |
|
|
|
Gaming — 6.2% | | | | | | | | | | | | | | |
Affinity Gaming LLC/Affinity Gaming Finance Corp., Gtd. Notes | | | 9.000% | | | 05/15/18 | | | 9,625 | | | | 9,240,000 | |
Boyd Gaming Corp., Gtd. Notes | | | 9.000% | | | 07/01/20 | | | 5,209 | | | | 5,339,225 | |
Boyd Gaming Corp., Gtd. Notes | | | 9.125% | | | 12/01/18 | | | 7,760 | | | | 7,954,000 | |
Caesars Entertainment Operating Co., Inc., Sr. Sec’d. Notes | | | 9.000% | | | 02/15/20 | | | 2,700 | | | | 1,998,000 | |
Caesars Entertainment Operating Co., Inc., Sr. Sec’d. Notes | | | 11.250% | | | 06/01/17 | | | 4,870 | | | | 3,569,710 | |
Caesars Entertainment Resort Properties LLC, Sr. Sec’d. Notes, 144A(d) | | | 8.000% | | | 10/01/20 | | | 8,600 | | | | 8,428,000 | |
CCM Merger, Inc., Gtd. Notes, 144A
(original cost $12,251,245; purchased 03/14/12-05/21/14)(b)(c) | | | 9.125% | | | 05/01/19 | | | 12,112 | | | | 12,717,600 | |
GLP Capital LP/GLP Financing II, Inc., Gtd. Notes(d) | | | 4.875% | | | 11/01/20 | | | 2,875 | | | | 2,910,938 | |
Golden Nugget Escrow, Inc., Sr. Unsec’d. Notes, 144A(d) | | | 8.500% | | | 12/01/21 | | | 11,875 | | | | 11,370,312 | |
Isle of Capri Casinos, Inc., Gtd. Notes(d) | | | 7.750% | | | 03/15/19 | | | 8,857 | | | | 9,166,995 | |
Isle of Capri Casinos, Inc., Gtd. Notes(d) | | | 8.875% | | | 06/15/20 | | | 4,598 | | | | 4,781,920 | |
MCE Finance Ltd. (Macau), Gtd. Notes, 144A | | | 5.000% | | | 02/15/21 | | | 6,575 | | | | 6,147,625 | |
MGM Resorts International, Gtd. Notes(d) | | | 6.000% | | | 03/15/23 | | | 5,850 | | | | 5,879,250 | |
MGM Resorts International, Gtd. Notes(d) | | | 6.625% | | | 12/15/21 | | | 18,915 | | | | 19,860,750 | |
MGM Resorts International, Gtd. Notes(d) | | | 6.750% | | | 10/01/20 | | | 825 | | | | 866,250 | |
MGM Resorts International, Gtd. Notes(d) | | | 7.625% | | | 01/15/17 | | | 650 | | | | 700,375 | |
MGM Resorts International, Gtd. Notes(d) | | | 8.625% | | | 02/01/19 | | | 3,100 | | | | 3,514,625 | |
MTR Gaming Group, Inc., Sec’d. Notes | | | 11.500% | | | 08/01/19 | | | 9,043 | | | | 9,788,913 | |
Penn National Gaming, Inc., Sr. Unsec’d. Notes(d) | | | 5.875% | | | 11/01/21 | | | 11,725 | | | | 10,904,250 | |
Pinnacle Entertainment, Inc., Gtd. Notes | | | 6.375% | | | 08/01/21 | | | 3,779 | | | | 3,892,370 | |
Pinnacle Entertainment, Inc., Gtd. Notes(d) | | | 7.750% | | | 04/01/22 | | | 6,775 | | | | 7,046,000 | |
Scientific Games International, Inc., 144A(d) | | | 7.000% | | | 01/01/22 | | | 4,500 | | | | 4,556,250 | |
Scientific Games International, Inc., 144A | | | 10.000% | | | 12/01/22 | | | 16,975 | | | | 15,553,344 | |
Scientific Games International, Inc., Gtd. Notes(d) | | | 6.250% | | | 09/01/20 | | | 5,750 | | | | 4,025,000 | |
Scientific Games International, Inc., Gtd. Notes, 144A(d) | | | 6.625% | | | 05/15/21 | | | 9,675 | | | | 6,748,313 | |
Station Casinos LLC, Gtd. Notes(d) | | | 7.500% | | | 03/01/21 | | | 8,835 | | | | 9,055,875 | |
Sugarhouse HSP Gaming Prop Mezz LP/Sugarhouse HSP Gaming Finance Corp.,
Sr. Sec’d. Notes, 144A(c) | | | 6.375% | | | 06/01/21 | | | 12,100 | | | | 11,011,000 | |
Wynn Macau Ltd. (Macau), Sr. Unsec’d. Notes, 144A(d) | | | 5.250% | | | 10/15/21 | | | 3,850 | | | | 3,619,000 | |
| | | | | | | | | | | | |
|
|
|
| | | | | | | | | | | | | | 200,645,890 | |
| | | | | | | | | | | | |
|
|
|
Healthcare & Pharmaceutical — 7.6% | | | | | | | | | | | | | | |
Acadia Healthcare Co., Inc., Gtd. Notes | | | 6.125% | | | 03/15/21 | | | 2,500 | | | | 2,550,000 | |
Acadia Healthcare Co., Inc., Gtd. Notes | | | 12.875% | | | 11/01/18 | | | 4,220 | | | | 4,747,500 | |
Amsurg Corp., Gtd. Notes, 144A(d) | | | 5.625% | | | 07/15/22 | | | 3,450 | | | | 3,536,250 | |
Biomet, Inc., Gtd. Notes | | | 6.500% | | | 08/01/20 | | | 6,875 | | | | 7,356,250 | |
Capella Healthcare, Inc., Gtd. Notes | | | 9.250% | | | 07/01/17 | | | 7,280 | | | | 7,562,100 | |
Capsugel SA, Sr. Unsec’d. Notes, PIK, 144A(d) | | | 7.000% | | | 05/15/19 | | | 6,250 | | | | 6,312,500 | |
Catamaran Corp., Gtd. Notes | | | 4.750% | | | 03/15/21 | | | 2,200 | | | | 2,200,000 | |
CHS/Community Health Systems, Inc., Gtd. Notes(d) | | | 6.875% | | | 02/01/22 | | | 7,150 | | | | 7,574,531 | |
CHS/Community Health Systems, Inc., Gtd. Notes | | | 7.125% | | | 07/15/20 | | | 1,750 | | | | 1,865,938 | |
CHS/Community Health Systems, Inc., Gtd. Notes | | | 8.000% | | | 11/15/19 | | | 16,905 | | | | 18,046,087 | |
ConvaTec Finance International SA (Luxembourg), Sr. Unsec’d. Notes, PIK, 144A | | | 8.250% | | | 01/15/19 | | | 3,575 | | | | 3,628,625 | |
ConvaTec Healthcare E SA (Luxembourg), Gtd. Notes, 144A | | | 10.500% | | | 12/15/18 | | | 11,383 | | | | 12,009,065 | |
Emdeon, Inc., Gtd. Notes | | | 11.000% | | | 12/31/19 | | | 11,300 | | | | 12,288,750 | |
Endo Finance Co., Gtd. Notes, 144A(d) | | | 5.750% | | | 01/15/22 | | | 2,450 | | | | 2,450,000 | |
Grifols Worldwide Operations Ltd. (Spain), Sr. Unsec’d. Notes, 144A(d) | | | 5.250% | | | 04/01/22 | | | 4,375 | | | | 4,474,312 | |
HCA Holdings, Inc., Sr. Unsec’d. Notes | | | 7.750% | | | 05/15/21 | | | 6,000 | | | | 6,390,000 | |
HCA, Inc., Gtd. Notes(d) | | | 5.875% | | | 05/01/23 | | | 11,965 | | | | 12,608,119 | |
HCA, Inc., Gtd. Notes | | | 7.190% | | | 11/15/15 | | | 2,116 | | | | 2,203,285 | |
HCA, Inc., Gtd. Notes | | | 8.000% | | | 10/01/18 | | | 16,250 | | | | 18,606,250 | |
HCA, Inc., Sr. Sec’d. Notes | | | 5.000% | | | 03/15/24 | | | 3,625 | | | | 3,724,688 | |
HealthSouth Corp., Gtd. Notes | | | 7.750% | | | 09/15/22 | | | 1,600 | | | | 1,696,000 | |
SEE NOTES TO FINANCIAL STATEMENTS.
A114
| | | | | | |
| | | HIGH YIELD BOND PORTFOLIO (continued) | | |
| |
| SCHEDULE OF INVESTMENTS | | December 31, 2014 |
| | | | | | | | | | | | | | |
CORPORATE BONDS
(continued) | | Interest
Rate
| | | Maturity
Date
| | Principal
Amount
(000)#
| | | Value
(Note 2)
| |
Healthcare & Pharmaceutical (continued) | | | | | | | | | | | | | | |
Kindred Escrow Corp., 144A(d) | | | 8.000% | | | 01/15/20 | | | 4,725 | | | $ | 5,020,312 | |
Kindred Escrow Corp., 144A(d) | | | 8.750% | | | 01/15/23 | | | 2,625 | | | | 2,825,156 | |
Kindred Healthcare, Inc., Gtd. Notes, 144A(d) | | | 6.375% | | | 04/15/22 | | | 3,506 | | | | 3,339,465 | |
LifePoint Hospitals, Inc., Gtd. Notes | | | 5.500% | | | 12/01/21 | | | 4,100 | | | | 4,192,250 | |
Mallinckrodt International Finance SA, Gtd. Notes(b) | | | 4.750% | | | 04/15/23 | | | 5,175 | | | | 4,968,000 | |
Mallinckrodt International Finance SA/Mallinckrodt CB LLC, Gtd. Notes, 144A | | | 5.750% | | | 08/01/22 | | | 250 | | | | 256,875 | |
MedAssets, Inc., Gtd. Notes | | | 8.000% | | | 11/15/18 | | | 5,800 | | | | 6,032,000 | |
Ortho Clinical Diagnostics, Sr. Unsec’d. Notes, 144A | | | 6.625% | | | 05/15/22 | | | 20,100 | | | | 18,064,875 | |
Select Medical Corp., Gtd. Notes | | | 6.375% | | | 06/01/21 | | | 6,175 | | | | 6,267,625 | |
STHI Holding Corp., Sec’d. Notes, 144A
(original cost $1,225,000; purchased 03/11/11)(b)(c)(d) | | | 8.000% | | | 03/15/18 | | | 1,225 | | | | 1,280,125 | |
Tenet Healthcare Corp., Sr. Sec’d. Notes(d) | | | 4.375% | | | 10/01/21 | | | 6,345 | | | | 6,297,412 | |
Tenet Healthcare Corp., Sr. Sec’d. Notes(d) | | | 4.500% | | | 04/01/21 | | | 1,075 | | | | 1,077,688 | |
Tenet Healthcare Corp., Sr. Sec’d. Notes(d) | | | 4.750% | | | 06/01/20 | | | 2,975 | | | | 3,019,625 | |
Tenet Healthcare Corp., Sr. Sec’d. Notes(d) | | | 6.250% | | | 11/01/18 | | | 1,875 | | | | 2,034,375 | |
Tenet Healthcare Corp., Sr. Unsec’d. Notes(d) | | | 6.750% | | | 02/01/20 | | | 4,500 | | | | 4,736,250 | |
Tenet Healthcare Corp., Sr. Unsec’d. Notes(d) | | | 8.125% | | | 04/01/22 | | | 10,750 | | | | 12,013,125 | |
Tenet Healthcare Corp., Sr. Unsec’d. Notes, 144A(d) | | | 5.000% | | | 03/01/19 | | | 3,075 | | | | 3,078,844 | |
Valeant Pharmaceuticals International, Gtd. Notes, 144A | | | 6.375% | | | 10/15/20 | | | 7,660 | | | | 8,004,700 | |
Valeant Pharmaceuticals International, Gtd. Notes, 144A | | | 6.875% | | | 12/01/18 | | | 5,004 | | | | 5,161,626 | |
Valeant Pharmaceuticals International, Gtd. Notes, 144A | | | 7.000% | | | 10/01/20 | | | 1,975 | | | | 2,083,625 | |
Valeant Pharmaceuticals International, Inc., Gtd. Notes, 144A(d) | | | 5.625% | | | 12/01/21 | | | 1,825 | | | | 1,838,688 | |
Valeant Pharmaceuticals International, Inc., Gtd. Notes, 144A | | | 7.500% | | | 07/15/21 | | | 2,375 | | | | 2,565,000 | |
| | | | | | | | | | | | |
|
|
|
| | | | | | | | | | | | | | 245,987,891 | |
| | | | | | | | | | | | |
|
|
|
Lodging — 0.8% | | | | | | | | | | | | | | |
Hilton Worldwide Fin LLC | | | 5.625% | | | 10/15/21 | | | 13,400 | | | | 14,003,000 | |
Royal Caribbean Cruises Ltd., Sr. Unsec’d. Notes | | | 7.250% | | | 03/15/18 | | | 3,700 | | | | 4,125,500 | |
Viking Cruises Ltd., Sr. Unsec’d. Notes, 144A
(original cost $6,405,750; purchased 07/17/14)(b)(c) | | | 8.500% | | | 10/15/22 | | | 5,850 | | | | 6,332,625 | |
| | | | | | | | | | | | |
|
|
|
| | | | | | | | | | | | | | 24,461,125 | |
| | | | | | | | | | | | |
|
|
|
Media & Entertainment — 3.0% | | | | | | | | | | | | | | |
AMC Entertainment, Inc., Gtd. Notes | | | 9.750% | | | 12/01/20 | | | 11,234 | | | | 12,216,975 | |
AMC Networks, Inc., Gtd. Notes | | | 7.750% | | | 07/15/21 | | | 1,775 | | | | 1,899,250 | |
Belo Corp., Sr. Unsec’d. Notes | | | 7.750% | | | 06/01/27 | | | 4,000 | | | | 4,380,000 | |
Carmike Cinemas, Inc., Sec’d. Notes | | | 7.375% | | | 05/15/19 | | | 4,550 | | | | 4,834,375 | |
CBS Outdoor Americas Capital LLC/CBS Outdoor Americas Capital Corp., Gtd. Notes, 144A | | | 5.625% | | | 02/15/24 | | | 2,275 | | | | 2,286,375 | |
Cedar Fair LP/Canada’s Wonderland Co./Magnum Management Corp.,
Gtd. Notes | | | 5.250% | | | 03/15/21 | | | 2,300 | | | | 2,311,500 | |
Cedar Fair LP/Canada’s Wonderland Co./Magnum Management Corp.,
Gtd. Notes, 144A(d) | | | 5.375% | | | 06/01/24 | | | 2,100 | | | | 2,089,500 | |
Cinemark USA, Inc., Gtd. Notes(d) | | | 5.125% | | | 12/15/22 | | | 5,850 | | | | 5,718,375 | |
Clear Channel Worldwide Holdings, Inc., Gtd. Notes | | | 6.500% | | | 11/15/22 | | | 2,970 | | | | 3,021,975 | |
Clear Channel Worldwide Holdings, Inc., Series A, Gtd. Notes(d) | | | 7.625% | | | 03/15/20 | | | 2,700 | | | | 2,801,250 | |
Entercom Radio LLC, Gtd. Notes | | | 10.500% | | | 12/01/19 | | | 4,075 | | | | 4,421,375 | |
Gannett Co., Inc., Gtd. Notes, 144A(d) | | | 5.500% | | | 09/15/24 | | | 2,250 | | | | 2,255,625 | |
Gray Television, Inc., Gtd. Notes(d) | | | 7.500% | | | 10/01/20 | | | 7,130 | | | | 7,343,900 | |
Inmarsat Finance PLC (United Kingdom), Gtd. Notes, 144A | | | 4.875% | | | 05/15/22 | | | 3,600 | | | | 3,564,000 | |
Intelsat Jackson Holdings SA (Luxembourg), Gtd. Notes | | | 7.250% | | | 10/15/20 | | | 5,700 | | | | 6,020,625 | |
LIN Television Corp., Gtd. Notes | | | 6.375% | | | 01/15/21 | | | 2,000 | | | | 1,995,000 | |
Live Nation Entertainment, Inc., Gtd. Notes, 144A | | | 5.375% | | | 06/15/22 | | | 2,400 | | | | 2,400,000 | |
McGraw-Hill Global Education Holdings LLC/McGraw-Hill Global Education Finance,
Sr. Sec’d. Notes(d) | | | 9.750% | (a) | | 04/01/21 | | | 3,230 | | | | 3,569,150 | |
Mood Media Corp. (Canada), Gtd. Notes, 144A(d) | | | 9.250% | | | 10/15/20 | | | 3,700 | | | | 3,052,500 | |
NAI Entertainment Holdings/NAI Entertainment Holdings Finance Corp.,
Sr. Sec’d. Notes, 144A
(original cost $2,300,000; purchased 07/30/13)(b)(c) | | | 5.000% | | | 08/01/18 | | | 2,300 | | | | 2,357,500 | |
SEE NOTES TO FINANCIAL STATEMENTS.
A115
| | | | | | |
| | | HIGH YIELD BOND PORTFOLIO (continued) | | |
| |
| SCHEDULE OF INVESTMENTS | | December 31, 2014 |
| | | | | | | | | | | | | | |
CORPORATE BONDS
(continued) | | Interest
Rate
| | | Maturity
Date
| | Principal
Amount
(000)#
| | | Value
(Note 2)
| |
Media & Entertainment (continued) | | | | | | | | | | | | | | |
National CineMedia LLC, Sr. Sec’d. Notes | | | 6.000% | | | 04/15/22 | | | 4,350 | | | $ | 4,350,000 | |
Nielsen Finance LLC/Nielsen Finance Co., Gtd. Notes, 144A | | | 5.000% | | | 04/15/22 | | | 250 | | | | 251,250 | |
R.R. Donnelley & Sons Co., Sr. Unsec’d. Notes(d) | | | 6.000% | | | 04/01/24 | | | 3,425 | | | | 3,373,625 | |
R.R. Donnelley & Sons Co., Sr. Unsec’d. Notes(d) | | | 6.500% | | | 11/15/23 | | | 2,560 | | | | 2,624,000 | |
Sinclair Television Group, Inc., Gtd. Notes(d) | | | 5.375% | | | 04/01/21 | | | 4,850 | | | | 4,813,625 | |
Sinclair Television Group, Inc., Sr. Unsec’d. Notes(d) | | | 6.125% | | | 10/01/22 | | | 2,825 | | | | 2,874,437 | |
Telesat Canada/Telesat LLC (Canada), Gtd. Notes, 144A | | | 6.000% | | | 05/15/17 | | | 975 | | | | 994,500 | |
| | | | | | | | | | | �� | |
|
|
|
| | | | | | | | | | | | | | 97,820,687 | |
| | | | | | | | | | | | |
|
|
|
Metals — 2.9% | | | | | | | | | | | | | | |
AK Steel Corp., Gtd. Notes(d) | | | 7.625% | | | 05/15/20 | | | 2,000 | | | | 1,860,000 | |
AK Steel Corp., Gtd. Notes(d) | | | 7.625% | | | 10/01/21 | | | 5,125 | | | | 4,702,187 | |
AK Steel Corp., Sr. Sec’d. Notes(d) | | | 8.750% | | | 12/01/18 | | | 4,200 | | | | 4,410,000 | |
ArcelorMittal (Luxembourg), Sr. Unsec’d. Notes(d) | | | 6.000% | (a) | | 03/01/21 | | | 6,700 | | | | 6,968,000 | |
ArcelorMittal (Luxembourg), Sr. Unsec’d. Notes | | | 6.125% | | | 06/01/18 | | | 10,175 | | | | 10,849,094 | |
ArcelorMittal (Luxembourg), Sr. Unsec’d. Notes(d) | | | 6.750% | (a) | | 02/25/22 | | | 10,400 | | | | 11,102,000 | |
Arch Coal, Inc., Gtd. Notes | | | 7.250% | | | 10/01/20 | | | 1,225 | | | | 398,125 | |
Arch Coal, Inc., Gtd. Notes(d) | | | 9.875% | | | 06/15/19 | | | 2,525 | | | | 858,500 | |
AuRico Gold, Inc. (Canada), Sec’d. Notes, 144A | | | 7.750% | | | 04/01/20 | | | 1,400 | | | | 1,288,000 | |
CONSOL Energy, Inc., Gtd. Notes, 144A | | | 5.875% | | | 04/15/22 | | | 5,775 | | | | 5,370,750 | |
Eldorado Gold Corp. (Canada), Sr. Unsec’d. Notes, 144A(d) | | | 6.125% | | | 12/15/20 | | | 4,841 | | | | 4,695,770 | |
First Quantum Minerals Ltd. (Canada), Gtd. Notes, 144A | | | 6.750% | | | 02/15/20 | | | 5,750 | | | | 5,203,750 | |
First Quantum Minerals Ltd. (Canada), Gtd. Notes, 144A(d) | | | 7.000% | | | 02/15/21 | | | 5,841 | | | | 5,256,900 | |
First Quantum Minerals Ltd. (Canada), Gtd. Notes, 144A(d) | | | 7.250% | | | 05/15/22 | | | 3,600 | | | | 3,240,000 | |
FMG Resources (August 2006) Pty Ltd. (Australia), Gtd. Notes, 144A(d) | | | 6.000% | | | 04/01/17 | | | 4,000 | | | | 3,825,000 | |
FMG Resources (August 2006) Pty Ltd. (Australia), Gtd. Notes, 144A(d) | | | 6.875% | | | 02/01/18 | | | 1,422 | | | | 1,290,667 | |
GrafTech International Ltd., Gtd. Notes(d) | | | 6.375% | | | 11/15/20 | | | 2,650 | | | | 2,199,500 | |
JMC Steel Group, Inc., Sr. Unsec’d. Notes, 144A
(original cost $4,984,000; purchased 11/04/14-11/26/14)(b)(c)(d) | | | 8.250% | | | 03/15/18 | | | 4,900 | | | | 4,655,000 | |
Lundin Mining Corp. (Canada), Sr. Sec’d. Notes, 144A | | | 7.875% | | | 11/01/22 | | | 4,000 | | | | 4,000,000 | |
New Gold, Inc. (Canada), Sr. Unsec’d. Notes, 144A(d) | | | 6.250% | | | 11/15/22 | | | 8,367 | | | | 8,199,660 | |
Peabody Energy Corp., Gtd. Notes(d) | | | 6.000% | | | 11/15/18 | | | 3,250 | | | | 2,949,375 | |
Peabody Energy Corp., Gtd. Notes(d) | | | 6.250% | | | 11/15/21 | | | 1,125 | | | | 961,875 | |
| | | | | | | | | | | | |
|
|
|
| | | | | | | | | | | | | | 94,284,153 | |
| | | | | | | | | | | | |
|
|
|
Non-Captive Finance — 3.0% | | | | | | | | | | | | | | |
AerCap Ireland Capital Ltd./AerCap Global Aviation Trust (Netherlands), Gtd. Notes, 144A | | | 3.750% | | | 05/15/19 | | | 1,600 | | | | 1,584,000 | |
AerCap Ireland Capital Ltd./AerCap Global Aviation Trust (Netherlands), Gtd. Notes, 144A | | | 4.500% | | | 05/15/21 | | | 3,875 | | | | 3,923,437 | |
Aston Escrow Corp., Sr. Sec’d. Notes, 144A
(original cost $17,825,000; purchased 07/22/14)(b)(c) | | | 9.500% | | | 08/15/21 | | | 17,825 | | | | 16,488,125 | |
CIT Group, Inc., Sr. Unsec’d. Notes | | | 5.000% | | | 05/15/17 | | | 950 | | | | 985,625 | |
CIT Group, Inc., Sr. Unsec’d. Notes(d) | | | 5.000% | | | 08/15/22 | | | 22,600 | | | | 23,221,500 | |
CIT Group, Inc., Sr. Unsec’d. Notes | | | 5.250% | | | 03/15/18 | | | 2,575 | | | | 2,684,437 | |
CIT Group, Inc., Sr. Unsec’d. Notes(d) | | | 5.375% | | | 05/15/20 | | | 750 | | | | 792,675 | |
CIT Group, Inc., Sr. Unsec’d. Notes, 144A | | | 5.500% | | | 02/15/19 | | | 1,775 | | | | 1,872,625 | |
Community Choice Financial, Inc., Sr. Sec’d. Notes | | | 10.750% | | | 05/01/19 | | | 610 | | | | 396,500 | |
HSBC Finance Capital Trust IX (United Kingdom), Gtd. Notes | | | 5.911% | (a) | | 11/30/35 | | | 100 | | | | 101,250 | |
International Lease Finance Corp., Sr. Sec’d. Notes, 144A | | | 7.125% | | | 09/01/18 | | | 525 | | | | 588,000 | |
International Lease Finance Corp., Sr. Unsec’d. Notes | | | 3.875% | | | 04/15/18 | | | 6,950 | | | | 6,950,000 | |
International Lease Finance Corp., Sr. Unsec’d. Notes | | | 6.250% | | | 05/15/19 | | | 2,120 | | | | 2,316,100 | |
International Lease Finance Corp., Sr. Unsec’d. Notes(d) | | | 8.250% | | | 12/15/20 | | | 1,125 | | | | 1,355,625 | |
International Lease Finance Corp., Sr. Unsec’d. Notes(d) | | | 8.625% | | | 01/15/22 | | | 1,525 | | | | 1,891,000 | |
International Lease Finance Corp., Sr. Unsec’d. Notes | | | 8.875% | | | 09/01/17 | | | 1,200 | | | | 1,353,000 | |
International Lease Finance Corp. E-Capital Trust II Ltd., Ltd.
Gtd. Notes, 144A | | | 6.250% | (a) | | 12/21/65 | | | 4,250 | | | | 4,101,250 | |
Jet Equipment Trust 1994-A, Equipment Trust, 144A(b) | | | 10.000% | (a)(e) | | 06/15/15 | | | 45 | | | | 35,718 | |
Jet Equipment Trust 1994-A, Sr. Unsec’d. Notes, 144A | | | 7.630% | (a)(e) | | 08/15/12 | | | 11 | | | | — | (f) |
National Financial Partners Corp., Sr. Unsec’d. Notes, 144A | | | 9.000% | | | 07/15/21 | | | 2,375 | | | | 2,487,813 | |
SEE NOTES TO FINANCIAL STATEMENTS.
A116
| | | | | | |
| | | HIGH YIELD BOND PORTFOLIO (continued) | | |
| |
| SCHEDULE OF INVESTMENTS | | December 31, 2014 |
| | | | | | | | | | | | | | |
CORPORATE BONDS
(continued) | | Interest
Rate
| | | Maturity
Date
| | Principal
Amount
(000)#
| | | Value
(Note 2)
| |
Non-Captive Finance (continued) | | | | | | | | | | | | | | |
Navient Corp., Sr. Unsec’d. Notes(d) | | | 5.000% | | | 10/26/20 | | | 1,500 | | | $ | 1,471,875 | |
Navient LLC, Sr. Unsec’d. Notes, MTN | | | 8.000% | | | 03/25/20 | | | 1,800 | | | | 1,993,500 | |
OneMain Fin Holdings, Inc., 144A | | | 6.750% | | | 12/15/19 | | | 3,225 | | | | 3,289,500 | |
OneMain Fin Holdings, Inc., 144A(d) | | | 7.250% | | | 12/15/21 | | | 5,875 | | | | 6,021,875 | |
Springleaf Finance Corp., Gtd. Notes | | | 6.000% | | | 06/01/20 | | | 9,525 | | | | 9,429,750 | |
Springleaf Finance Corp., Gtd. Notes | | | 8.250% | | | 10/01/23 | | | 1,125 | | | | 1,260,000 | |
| | | | | | | | | | | | |
|
|
|
| | | | | | | | | | | | | | 96,595,180 | |
| | | | | | | | | | | | |
|
|
|
Packaging — 3.3% | | | | | | | | | | | | | | |
Ardagh Finance Holdings SA (Luxembourg),
Sr. Unsec’d. Notes, PIK, 144A(d) | | | 8.625% | | | 06/15/19 | | | 8,377 | | | | 8,251,193 | |
Ardagh Packaging Finance PLC (Ireland), Gtd. Notes, 144A | | | 9.125% | | | 10/15/20 | | | 5,950 | | | | 6,336,750 | |
Ardagh Packaging Finance PLC/Ardagh Holdings USA, Inc. (Ireland), Gtd. Notes, 144A(d) | | | 6.000% | | | 06/30/21 | | | 1,725 | | | | 1,647,375 | |
Ardagh Packaging Finance PLC/Ardagh Holdings USA, Inc. (Ireland), Gtd. Notes, 144A(d) | | | 6.250% | | | 01/31/19 | | | 5,875 | | | | 5,742,812 | |
Ardagh Packaging Finance PLC/Ardagh Holdings USA, Inc. (Ireland), Gtd. Notes, 144A(d) | | | 6.750% | | | 01/31/21 | | | 3,635 | | | | 3,616,825 | |
Ardagh Packaging Finance PLC/Ardagh Holdings USA, Inc. (Ireland), Gtd. Notes, 144A | | | 9.125% | | | 10/15/20 | | | 1,350 | | | | 1,431,000 | |
Ardagh Packaging Finance PLC/Ardagh Holdings USA, Inc. (Ireland), Sr. Unsec’d. Notes, 144A | | | 7.000% | | | 11/15/20 | | | 988 | | | | 998,118 | |
Berry Plastics Corp., Sec’d. Notes(d) | | | 9.750% | | | 01/15/21 | | | 4,875 | | | | 5,423,438 | |
Beverage Packaging Holdings Luxembourg II SA/Beverage Packaging Holdings II,
Gtd. Notes, 144A | | | 6.000% | | | 06/15/17 | | | 5,150 | | | | 5,021,250 | |
Coveris Holdings SA, Gtd. Notes, 144A | | | 7.875% | | | 11/01/19 | | | 6,900 | | | | 7,107,000 | |
Greif, Inc., Sr. Unsec’d. Notes | | | 6.750% | | | 02/01/17 | | | 4,970 | | | | 5,317,900 | |
PaperWorks Industries, Inc., Sr. Sec’d. Notes, 144A | | | 9.500% | | | 08/15/19 | | | 2,250 | | | | 2,250,000 | |
Plastipak Holdings, Inc., Sr. Unsec’d. Notes, 144A
(original cost $3,075,000; purchased 09/25/13)(b)(c) | | | 6.500% | | | 10/01/21 | | | 3,075 | | | | 3,059,625 | |
Reynolds Group Issuer, Inc./Reynolds Group Issuer LLC, Gtd. Notes | | | 9.000% | | | 04/15/19 | | | 9,975 | | | | 10,324,125 | |
Reynolds Group Issuer, Inc./Reynolds Group Issuer LLC, Gtd. Notes | | | 9.875% | | | 08/15/19 | | | 11,900 | | | | 12,614,000 | |
Reynolds Group Issuer, Inc./Reynolds Group Issuer LLC, Sr. Sec’d. Notes(d) | | | 5.750% | | | 10/15/20 | | | 7,280 | | | | 7,462,000 | |
Reynolds Group Issuer, Inc./Reynolds Group Issuer LLC, Sr. Sec’d. Notes | | | 6.875% | | | 02/15/21 | | | 1,575 | | | | 1,643,906 | |
Reynolds Group Issuer, Inc./Reynolds Group Issuer LLC, Sr. Sec’d. Notes | | | 7.875% | | | 08/15/19 | | | 4,925 | | | | 5,189,719 | |
Sealed Air Corp., Gtd. Notes, 144A(d) | | | 5.250% | | | 04/01/23 | | | 3,500 | | | | 3,570,000 | |
Sealed Air Corp., Gtd. Notes, 144A(d) | | | 6.500% | | | 12/01/20 | | | 1,400 | | | | 1,533,000 | |
Sealed Air Corp., Gtd. Notes, 144A(d) | | | 8.375% | | | 09/15/21 | | | 4,000 | | | | 4,470,000 | |
Sealed Air Corp., Sr. Unsec’d. Notes, 144A | | | 4.875% | | | 12/01/22 | | | 3,200 | | | | 3,176,000 | |
| | | | | | | | | | | | |
|
|
|
| | | | | | | | | | | | | | 106,186,036 | |
| | | | | | | | | | | | |
|
|
|
Paper — 0.4% | | | | | | | | | | | | | | |
Domtar Corp., Gtd. Notes | | | 10.750% | | | 06/01/17 | | | 1,125 | | | | 1,337,144 | |
Smurfit Kappa Acquisitions (Ireland), Sr. Sec’d. Notes, 144A | | | 4.875% | | | 09/15/18 | | | 5,750 | | | | 5,951,250 | |
Tembec Industries, Inc. (Canada), Sr. Sec’d. Notes, 144A(d) | | | 9.000% | | | 12/15/19 | | | 4,275 | | | | 4,205,531 | |
| | | | | | | | | | | | |
|
|
|
| | | | | | | | | | | | | | 11,493,925 | |
| | | | | | | | | | | | |
|
|
|
Pipelines & Other — 2.6% | | | | | | | | | | | | | | |
AmeriGas Finance LLC/AmeriGas Finance Corp., Gtd. Notes(d) | | | 7.000% | | | 05/20/22 | | | 5,635 | | | | 5,832,225 | |
AmeriGas Partners LP/AmeriGas Finance Corp., Sr. Unsec’d. Notes | | | 6.500% | | | 05/20/21 | | | 1,240 | | | | 1,271,000 | |
Crestwood Midstream Partners LP/Crestwood Midstream Finance Corp., Gtd. Notes | | | 6.000% | | | 12/15/20 | | | 2,900 | | | | 2,776,750 | |
Energy Transfer Equity LP, Sr. Sec’d. Notes | | | 7.500% | | | 10/15/20 | | | 4,300 | | | | 4,773,000 | |
Ferrellgas LP/Ferrellgas Finance Corp., Sr. Unsec’d. Notes | | | 6.500% | | | 05/01/21 | | | 4,175 | | | | 4,070,625 | |
Ferrellgas LP/Ferrellgas Finance Corp., Sr. Unsec’d. Notes(d) | | | 6.750% | | | 01/15/22 | | | 5,345 | | | | 5,224,737 | |
Ferrellgas Partners LP/Ferrellgas Partners Finance Corp., Sr. Unsec’d. Notes | | | 8.625% | | | 06/15/20 | | | 3,659 | | | | 3,668,148 | |
Global Partners LP/GLP Finance Corp., Gtd. Notes, 144A | | | 6.250% | | | 07/15/22 | | | 2,275 | | | | 2,206,750 | |
SEE NOTES TO FINANCIAL STATEMENTS.
A117
| | | | | | |
| | | HIGH YIELD BOND PORTFOLIO (continued) | | |
| |
| SCHEDULE OF INVESTMENTS | | December 31, 2014 |
| | | | | | | | | | | | | | |
CORPORATE BONDS
(continued) | | Interest
Rate
| | | Maturity
Date
| | Principal
Amount
(000)#
| | | Value
(Note 2)
| |
Pipelines & Other (continued) | | | | | | | | | | | | | | |
Kinder Morgan, Inc., Sr. Unsec’d. Notes, 144A | | | 5.000% | | | 02/15/21 | | | 2,775 | | | $ | 2,886,982 | |
Kinder Morgan, Inc., Sr. Unsec’d. Notes, 144A(d) | | | 5.625% | | | 11/15/23 | | | 5,725 | | | | 6,128,189 | |
Regency Energy Partners LP/Regency Energy Finance Corp., Gtd. Notes | | | 5.500% | | | 04/15/23 | | | 3,275 | | | | 3,160,375 | |
Regency Energy Partners LP/Regency Energy Finance Corp., Gtd. Notes | | | 5.750% | | | 09/01/20 | | | 4,050 | | | | 4,060,125 | |
Rockies Express Pipeline LLC, Sr. Unsec’d. Notes, 144A
(original cost $1,717,000; purchased 02/25/14)(b)(c)(d) | | | 3.900% | | | 04/15/15 | | | 1,700 | | | | 1,691,500 | |
Rockies Express Pipeline LLC, Sr. Unsec’d. Notes, 144A
(original cost $3,353,375; purchased 02/21/14-02/25/14)(b)(c)(d) | | | 5.625% | | | 04/15/20 | | | 3,475 | | | | 3,414,188 | |
Rockies Express Pipeline LLC, Sr. Unsec’d. Notes, 144A
(original cost $5,464,483; purchased 01/10/13-06/13/13)(b)(c) | | | 6.000% | | | 01/15/19 | | | 5,522 | | | | 5,535,805 | |
Selectica, Inc. (Escrow Shares) | | | —% | (a)(e) | | 12/31/49 | | | 1,350 | | | | — | (f) |
Suburban Propane Partners LP/Suburban Energy Finance Corp., Sr. Unsec’d. Notes | | | 5.500% | | | 06/01/24 | | | 5,700 | | | | 5,500,500 | |
Suburban Propane Partners LP/Suburban Energy Finance Corp., Sr. Unsec’d. Notes | | | 7.375% | | | 08/01/21 | | | 2,200 | | | | 2,304,500 | |
Targa Resources Partners LP/Targa Resources Partners Finance Corp., Gtd. Notes | | | 4.250% | | | 11/15/23 | | | 2,825 | | | | 2,570,750 | |
Targa Resources Partners LP/Targa Resources Partners Finance Corp., Gtd. Notes | | | 6.875% | | | 02/01/21 | | | 5,475 | | | | 5,598,187 | |
Tesoro Logistics LP/Tesoro Logistics Finance Corp., Gtd. Notes | | | 5.875% | | | 10/01/20 | | | 2,847 | | | | 2,854,118 | |
Tesoro Logistics LP/Tesoro Logistics Finance Corp., Gtd. Notes | | | 6.125% | | | 10/15/21 | | | 3,025 | | | | 3,017,438 | |
Tesoro Logistics LP/Tesoro Logistics Finance Corp., Gtd. Notes, 144A | | | 6.250% | | | 10/15/22 | | | 5,325 | | | | 5,311,687 | |
| | | | | | | | | | | | |
|
|
|
| | | | | | | | | | | | | | 83,857,579 | |
| | | | | | | | | | | | |
|
|
|
Real Estate Investment Trusts — 1.5% | | | | | | | | | | | | | | |
Aviv Healthcare Properties LP/Aviv Healthcare Capital Corp., Gtd. Notes | | | 7.750% | | | 02/15/19 | | | 15,525 | | | | 16,177,050 | |
CTR Partnership LP/Caretrust Capital Corp., Gtd. Notes | | | 5.875% | | | 06/01/21 | | | 2,125 | | | | 2,151,563 | |
CyrusOne LP/CyrusOne Finance Corp., Gtd. Notes | | | 6.375% | | | 11/15/22 | | | 375 | | | | 400,313 | |
DuPont Fabros Technology LP, Gtd. Notes | | | 5.875% | | | 09/15/21 | | | 4,125 | | | | 4,202,344 | |
Felcor Lodging LP, Sr. Sec’d. Notes | | | 5.625% | | | 03/01/23 | | | 2,425 | | | | 2,400,750 | |
Felcor Lodging LP, Sr. Sec’d. Notes | | | 6.750% | | | 06/01/19 | | | 2,775 | | | | 2,882,392 | |
MPT Operating Partnership LP/MPT Finance Corp., Gtd. Notes | | | 5.500% | | | 05/01/24 | | | 3,275 | | | | 3,414,187 | |
Omega Healthcare Investors, Inc., Gtd. Notes | | | 6.750% | | | 10/15/22 | | | 475 | | | | 503,500 | |
Omega Healthcare Investors, Inc., Gtd. Notes | | | 7.500% | | | 02/15/20 | | | 825 | | | | 862,125 | |
RHP Hotel Properties LP/RHP Finance Corp., Gtd. Notes | | | 5.000% | | | 04/15/21 | | | 2,800 | | | | 2,786,000 | |
Sabra Health Care LP/Sabra Capital Corp., Gtd. Notes | | | 5.375% | | | 06/01/23 | | | 4,300 | | | | 4,386,000 | |
Sabra Health Care LP/Sabra Capital Corp., Gtd. Notes(d) | | | 5.500% | | | 02/01/21 | | | 2,950 | | | | 3,068,000 | |
Senior Housing Properties Trust, Sr. Unsec’d. Notes | | | 6.750% | | | 12/15/21 | | | 5,875 | | | | 6,782,987 | |
| | | | | | | | | | | | |
|
|
|
| | | | | | | | | | | | | | 50,017,211 | |
| | | | | | | | | | | | |
|
|
|
Retailers — 3.1% | | | | | | | | | | | | | | |
Academy Ltd./Academy Finance Corp., Gtd. Notes, 144A | | | 9.250% | | | 08/01/19 | | | 6,375 | | | | 6,693,750 | |
Claire’s Stores, Inc., Gtd. Notes, 144A(d) | | | 7.750% | | | 06/01/20 | | | 2,350 | | | | 1,327,750 | |
Claire’s Stores, Inc., Sr. Sec’d. Notes, 144A(d) | | | 6.125% | | | 03/15/20 | | | 3,000 | | | | 2,655,000 | |
Claire’s Stores, Inc., Sr. Sec’d. Notes, 144A(d) | | | 9.000% | | | 03/15/19 | | | 8,800 | | | | 8,668,000 | |
CST Brands, Inc., Gtd. Notes | | | 5.000% | | | 05/01/23 | | | 3,400 | | | | 3,434,000 | |
Dufry Finance SCA (Switzerland), Gtd. Notes, 144A | | | 5.500% | | | 10/15/20 | | | 9,550 | | | | 9,934,005 | |
Hot Topic, Inc., Sr. Sec’d. Notes, 144A
(original cost $9,346,625; purchased 06/06/13-12/03/14)(b)(c)(d) | | | 9.250% | | | 06/15/21 | | | 9,150 | | | | 9,790,500 | |
HT Intermediate Holdings Corp., Sr. Unsec’d. Notes, PIK, 144A | | | 12.000% | | | 05/15/19 | | | 1,000 | | | | 1,020,000 | |
L Brands, Inc., Gtd. Notes | | | 5.625% | | | 02/15/22 | | | 7,385 | | | | 7,938,875 | |
L Brands, Inc., Gtd. Notes(d) | | | 5.625% | | | 10/15/23 | | | 3,450 | | | | 3,726,000 | |
Men’s Wearhouse, Inc. (The), Gtd. Notes, 144A(d) | | | 7.000% | | | 07/01/22 | | | 6,300 | | | | 6,473,250 | |
Michaels FinCo Holdings LLC/Michaels FinCo, Inc.,
Sr. Unsec’d. Notes, PIK, 144A(d) | | | 7.500% | | | 08/01/18 | | | 1,848 | | | | 1,880,340 | |
Murphy Oil USA, Inc., Gtd. Notes | | | 6.000% | | | 08/15/23 | | | 2,000 | | | | 2,090,000 | |
Neiman Marcus Group Ltd., Inc., Gtd. Notes, 144A(d) | | | 8.000% | | | 10/15/21 | | | 12,304 | | | | 13,011,480 | |
Pantry Inc. (The), Gtd. Notes | | | 8.375% | | | 08/01/20 | | | 17,125 | | | | 18,751,875 | |
Toys “R” Us Property Co. II LLC, Sr. Sec’d. Notes(d) | | | 8.500% | | | 12/01/17 | | | 2,661 | | | | 2,641,043 | |
| | | | | | | | | | | | |
|
|
|
| | | | | | | | | | | | | | 100,035,868 | |
| | | | | | | | | | | | |
|
|
|
SEE NOTES TO FINANCIAL STATEMENTS.
A118
| | | | | | |
| | | HIGH YIELD BOND PORTFOLIO (continued) | | |
| |
| SCHEDULE OF INVESTMENTS | | December 31, 2014 |
| | | | | | | | | | | | | | |
CORPORATE BONDS
(continued) | | Interest
Rate
| | | Maturity
Date
| | Principal
Amount
(000)#
| | | Value
(Note 2)
| |
Technology — 10.3% | | | | | | | | | | | | | | |
Activision Blizzard, Inc., Gtd. Notes, 144A | | | 5.625% | | | 09/15/21 | | | 750 | | | $ | 787,500 | |
Advanced Micro Devices, Inc., Sr. Unsec’d. Notes | | | 6.750% | | | 03/01/19 | | | 6,600 | | | | 6,204,000 | |
Alcatel-Lucent USA, Inc. (France), Gtd. Notes, 144A(d) | | | 6.750% | | | 11/15/20 | | | 5,375 | | | | 5,673,312 | |
Ancestry.com, Inc., Gtd. Notes | | | 11.000% | | | 12/15/20 | | | 1,750 | | | | 1,970,938 | |
Ancestry.com, Inc., Sr. Unsec’d. Notes, PIK, 144A | | | 9.625% | | | 10/15/18 | | | 5,355 | | | | 5,247,900 | |
Audatex North America, Inc., Gtd. Notes, 144A | | | 6.000% | | | 06/15/21 | | | 11,675 | | | | 12,025,250 | |
Avaya, Inc., Sec’d. Notes, 144A(d) | | | 10.500% | | | 03/01/21 | | | 20,675 | | | | 17,677,125 | |
Avaya, Inc., Sr. Sec’d. Notes, 144A(d) | | | 7.000% | | | 04/01/19 | | | 3,905 | | | | 3,807,375 | |
BMC Software Finance, Inc., Sr. Unsec’d. Notes, 144A | | | 8.125% | | | 07/15/21 | | | 12,535 | | | | 11,782,900 | |
BMC Software Finance, Inc., Sr. Unsec’d. Notes, PIK, 144A(d) | | | 9.000% | | | 10/15/19 | | | 17,060 | | | | 14,501,000 | |
Brightstar Corp., Gtd. Notes, 144A
(original cost $3,345,000; purchased 11/23/10)(b)(c) | | | 9.500% | | | 12/01/16 | | | 3,345 | | | | 3,508,069 | |
Brightstar Corp., Sr. Unsec’d. Notes, 144A
(original cost $9,408,490; purchased 07/26/13-08/09/13)(b)(c) | | | 7.250% | | | 08/01/18 | | | 9,500 | | | | 10,141,250 | |
CDW LLC/CDW Finance Corp., Gtd. Notes | | | 5.500% | | | 12/01/24 | | | 16,125 | | | | 16,145,156 | |
CDW LLC/CDW Finance Corp., Gtd. Notes | | | 8.500% | | | 04/01/19 | | | 5,951 | | | | 6,270,866 | |
Ceridian HCM Holding, Inc., Sr. Unsec’d. Notes, 144A (original cost $1,950,000; purchased 03/21/13)(b)(c)(d) | | | 11.000% | | | 03/15/21 | | | 1,950 | | | | 2,133,125 | |
CommScope Holding Co., Inc., Sr. Unsec’d. Notes, PIK, 144A(d) | | | 6.625% | | | 06/01/20 | | | 22,980 | | | | 23,669,400 | |
CommScope, Inc., Gtd. Notes, 144A | | | 5.500% | | | 06/15/24 | | | 3,350 | | | | 3,299,750 | |
CoreLogic, Inc., Gtd. Notes | | | 7.250% | | | 06/01/21 | | | 4,400 | | | | 4,620,000 | |
First Data Corp., Gtd. Notes(d) | | | 10.625% | | | 06/15/21 | | | 9,444 | | | | 10,695,330 | |
First Data Corp., Gtd. Notes | | | 11.250% | | | 01/15/21 | | | 4,650 | | | | 5,277,750 | |
First Data Corp., Gtd. Notes(d) | | | 11.750% | | | 08/15/21 | | | 25,331 | | | | 29,067,322 | |
First Data Corp., Gtd. Notes | | | 12.625% | | | 01/15/21 | | | 20,687 | | | | 24,565,812 | |
First Data Corp., Sr. Sec’d. Notes, 144A | | | 6.750% | | | 11/01/20 | | | 132 | | | | 140,910 | |
Freescale Semiconductor, Inc., Gtd. Notes(d) | | | 8.050% | | | 02/01/20 | | | 1,429 | | | | 1,507,595 | |
Freescale Semiconductor, Inc., Sr. Sec’d. Notes, 144A(d) | | | 6.000% | | | 01/15/22 | | | 6,180 | | | | 6,458,100 | |
Infor Software Parent LLC/Infor Software Parent, Inc.,
Gtd. Notes, PIK, 144A(c)(d) | | | 7.125% | | | 05/01/21 | | | 2,150 | | | | 2,107,000 | |
Interactive Data Corp., Gtd. Notes, 144A | | | 5.875% | | | 04/15/19 | | | 500 | | | | 486,250 | |
Interactive Data Corp., Sr. Unsec’d. Notes, PIK, 144A | | | 8.250% | | | 12/15/17 | | | 9,154 | | | | 9,176,885 | |
Iron Mountain, Inc., Gtd. Notes(d) | | | 6.000% | | | 08/15/23 | | | 7,050 | | | | 7,332,000 | |
NCR Corp., Gtd. Notes | | | 5.875% | | | 12/15/21 | | | 3,200 | | | | 3,288,000 | |
Nortel Networks Ltd. (Canada), Gtd. Notes | | | 10.125% | (a)(e) | | 07/15/13 | | | 3,050 | | | | 3,391,219 | |
Nuance Communications, Inc., Gtd. Notes, 144A | | | 5.375% | | | 08/15/20 | | | 11,075 | | | | 11,102,687 | |
NXP BV/NXP Funding LLC (Netherlands), Gtd. Notes, 144A | | | 5.750% | | | 02/15/21 | | | 4,660 | | | | 4,893,000 | |
Sensata Technologies BV (Netherlands), Gtd. Notes, 144A(d) | | | 4.875% | | | 10/15/23 | | | 6,075 | | | | 6,044,625 | |
Sensata Technologies BV (Netherlands), Gtd. Notes, 144A(d) | | | 6.500% | | | 05/15/19 | | | 3,531 | | | | 3,663,413 | |
Sophia LP/Sophia Finance, Inc., Gtd. Notes, 144A | | | 9.750% | | | 01/15/19 | | | 12,360 | | | | 13,194,300 | |
Sungard Availability Services Capital, Inc., Gtd. Notes, 144A(a) | | | 8.750% | | | 04/01/22 | | | 4,925 | | | | 2,905,750 | |
SunGard Data Systems, Inc., Gtd. Notes(d) | | | 6.625% | | | 11/01/19 | | | 7,100 | | | | 7,171,000 | |
SunGard Data Systems, Inc., Gtd. Notes(d) | | | 7.375% | | | 11/15/18 | | | 246 | | | | 255,840 | |
SunGard Data Systems, Inc., Gtd. Notes | | | 7.625% | | | 11/15/20 | | | 713 | | | | 755,780 | |
Syniverse Holdings, Inc., Gtd. Notes | | | 9.125% | | | 01/15/19 | | | 4,830 | | | | 5,047,350 | |
TransUnion Holding Co., Inc., Sr. Unsec’d. Notes | | | 8.125% | | | 06/15/18 | | | 750 | | | | 768,750 | |
TransUnion Holding Co., Inc., Sr. Unsec’d. Notes, PIK | | | 9.625% | | | 06/15/18 | | | 18,100 | | | | 18,512,680 | |
Zebra Technologies Corp., Sr. Unsec’d. Notes, 144A(d) | | | 7.250% | | | 10/15/22 | | | 6,775 | | | | 7,113,750 | |
| | | | | | | | | | | | |
|
|
|
| | | | | | | | | | | | | | 334,388,014 | |
| | | | | | | | | | | | |
|
|
|
Telecommunications — 4.8% | | | | | | | | | | | | | | |
CenturyLink, Inc., Series G, Sr. Unsec’d. Notes | | | 6.875% | | | 01/15/28 | | | 4,000 | | | | 4,000,000 | |
CenturyLink, Inc., Series Q, Sr. Unsec’d. Notes(d) | | | 6.150% | | | 09/15/19 | | | 3,031 | | | | 3,273,480 | |
CenturyLink, Inc., Series W, Sr. Unsec’d. Notes(d) | | | 6.750% | | | 12/01/23 | | | 1,280 | | | | 1,401,600 | |
Crown Castle International Corp., Sr. Unsec’d. Notes(d) | | | 5.250% | | | 01/15/23 | | | 5,150 | | | | 5,253,000 | |
Digicel Group Ltd. (Jamaica), Sr. Unsec’d. Notes, 144A | | | 7.125% | | | 04/01/22 | | | 3,600 | | | | 3,348,000 | |
Digicel Group Ltd. (Jamaica), Sr. Unsec’d. Notes, 144A | | | 8.250% | | | 09/30/20 | | | 6,100 | | | | 5,917,000 | |
Eileme 2 AB (Poland), Sr. Sec’d. Notes, 144A | | | 11.625% | | | 01/31/20 | | | 6,315 | | | | 7,072,800 | |
Frontier Communications Corp., Sr. Unsec’d. Notes(d) | | | 6.250% | | | 09/15/21 | | | 1,525 | | | | 1,532,625 | |
SEE NOTES TO FINANCIAL STATEMENTS.
A119
| | | | | | |
| | | HIGH YIELD BOND PORTFOLIO (continued) | | |
| |
| SCHEDULE OF INVESTMENTS | | December 31, 2014 |
| | | | | | | | | | | | | | |
CORPORATE BONDS
(continued) | | Interest
Rate
| | | Maturity
Date
| | Principal
Amount
(000)#
| | | Value
(Note 2)
| |
Telecommunications (continued) | | | | | | | | | | | | | | |
Frontier Communications Corp., Sr. Unsec’d. Notes | | | 7.125% | | | 01/15/23 | | | 1,950 | | | $ | 1,984,125 | |
Frontier Communications Corp., Sr. Unsec’d. Notes(d) | | | 8.500% | | | 04/15/20 | | | 250 | | | | 278,750 | |
Frontier Communications Corp., Sr. Unsec’d. Notes(d) | | | 8.750% | | | 04/15/22 | | | 4,400 | | | | 4,917,000 | |
Level 3 Financing, Inc., Gtd. Notes | | | 7.000% | | | 06/01/20 | | | 3,625 | | | | 3,819,844 | |
Level 3 Financing, Inc., Gtd. Notes(d) | | | 8.125% | | | 07/01/19 | | | 1,275 | | | | 1,354,688 | |
Level 3 Financing, Inc., Gtd. Notes | | | 8.625% | | | 07/15/20 | | | 2,250 | | | | 2,427,188 | |
Northwestern Bell Telephone, Sr. Unsec’d. Notes | | | 7.750% | | | 05/01/30 | | | 750 | | | | 885,558 | |
SBA Communications Corp., Sr. Unsec’d. Notes, 144A(d) | | | 4.875% | | | 07/15/22 | | | 2,500 | | | | 2,406,250 | |
SoftBank Corp. (Japan), Gtd. Notes, 144A(d) | | | 4.500% | | | 04/15/20 | | | 2,565 | | | | 2,526,525 | |
Sprint Capital Corp., Gtd. Notes | | | 6.875% | | | 11/15/28 | | | 16,670 | | | | 14,669,600 | |
Sprint Capital Corp., Gtd. Notes | | | 6.900% | | | 05/01/19 | | | 14,940 | | | | 15,238,800 | |
Sprint Communications, Inc., Gtd. Notes, 144A | | | 9.000% | | | 11/15/18 | | | 2,656 | | | | 3,020,934 | |
Sprint Communications, Inc., Sr. Unsec’d. Notes(d) | | | 6.000% | | | 11/15/22 | | | 1,325 | | | | 1,219,000 | |
Sprint Communications, Inc., Sr. Unsec’d. Notes | | | 7.000% | | | 08/15/20 | | | 2,075 | | | | 2,075,000 | |
Sprint Communications, Inc., Sr. Unsec’d. Notes(d) | | | 9.125% | | | 03/01/17 | | | 2,250 | | | | 2,474,887 | |
Sprint Corp., Gtd. Notes(d) | | | 7.125% | | | 06/15/24 | | | 9,650 | | | | 8,974,500 | |
Sprint Corp., Gtd. Notes | | | 7.875% | | | 09/15/23 | | | 6,305 | | | | 6,224,296 | |
T-Mobile USA, Inc., Gtd. Notes(d) | | | 6.375% | | | 03/01/25 | | | 7,350 | | | | 7,467,600 | |
T-Mobile USA, Inc., Gtd. Notes(d) | | | 6.464% | | | 04/28/19 | | | 695 | | | | 722,800 | |
T-Mobile USA, Inc., Gtd. Notes | | | 6.633% | | | 04/28/21 | | | 5,650 | | | | 5,798,312 | |
Telecom Italia SpA (Italy), Sr. Unsec’d. Notes, 144A(d) | | | 5.303% | | | 05/30/24 | | | 8,525 | | | | 8,631,562 | |
Wind Acquisition Finance SA (Italy), Gtd. Notes, 144A(d) | | | 7.375% | | | 04/23/21 | | | 13,425 | | | | 12,670,515 | |
Wind Acquisition Finance SA (Italy), Sr. Sec’d. Notes, 144A | | | 6.500% | | | 04/30/20 | | | 1,500 | | | | 1,533,750 | |
Windstream Corp., Gtd. Notes | | | 6.375% | | | 08/01/23 | | | 6,675 | | | | 6,241,125 | |
Windstream Corp., Gtd. Notes | | | 7.500% | | | 06/01/22 | | | 925 | | | | 922,688 | |
Windstream Corp., Gtd. Notes | | | 7.500% | | | 04/01/23 | | | 5,085 | | | | 5,059,575 | |
Windstream Corp., Gtd. Notes(d) | | | 7.750% | | | 10/15/20 | | | 1,510 | | | | 1,555,300 | |
| | | | | | | | | | | | |
|
|
|
| | | | | | | | | | | | | | 156,898,677 | |
| | | | | | | | | | | | |
|
|
|
Tobacco — 0.2% | | | | | | | | | | | | | | |
Vector Group Ltd., Gtd. Notes | | | 7.750% | | | 02/15/21 | | | 6,705 | | | | 7,057,013 | |
| | | | | | | | | | | | |
|
|
|
Transportation — 1.0% | | | | | | | | | | | | | | |
Avis Budget Car Rental LLC/Avis Budget Finance, Inc., Gtd. Notes | | | 9.750% | | | 03/15/20 | | | 3,850 | | | | 4,196,500 | |
Avis Budget Car Rental LLC/Avis Budget Finance, Inc., Gtd. Notes, 144A | | | 5.125% | | | 06/01/22 | | | 6,650 | | | | 6,716,500 | |
Hertz Corp. (The), Gtd. Notes | | | 5.875% | | | 10/15/20 | | | 1,375 | | | | 1,385,313 | |
Hertz Corp. (The), Gtd. Notes | | | 6.750% | | | 04/15/19 | | | 4,200 | | | | 4,326,000 | |
Kenan Advantage Group, Inc. (The), Sr. Unsec’d. Notes, 144A
(original cost $9,469,750; purchased 12/07/12-12/12/13)(b)(c) | | | 8.375% | | | 12/15/18 | | | 9,270 | | | | 9,548,100 | |
Navios Maritime Holdings, Inc./Navios Maritime Finance II US, Inc., Sr. Sec’d. Notes, 144A(d) | | | 7.375% | | | 01/15/22 | | | 5,850 | | | | 5,352,750 | |
| | | | | | | | | | | | |
|
|
|
| | | | | | | | | | | | | | 31,525,163 | |
| | | | | | | | | | | | |
|
|
|
TOTAL CORPORATE BONDS
(cost $2,966,911,375) | | | | 2,939,732,808 | |
| | | | | | | | | | | | |
|
|
|
| | | | |
| | | | | | | | Shares
| | | | |
| COMMON STOCKS | | | | | | | | | | | | | | |
Cable | | | | | | | | | | | | | | |
Adelphia Recovery Trust*(b) | | | 500,000 | | | | 500 | |
| | | | | | | | | | | | |
|
|
|
Media | | | | | | | | | | | | | | |
DEX Media, Inc.*(d) | | | 36,485 | | | | 327,270 | |
| | | | | | | | | | | | |
|
|
|
Telecommunications | | | | | | | | | | | | | | |
Netia SA (Poland)* | | | 227,114 | | | | 357,938 | |
| | | | | | | | | | | | |
|
|
|
TOTAL COMMON STOCKS
(cost $24,646,419) | | | | 685,708 | |
| | | | | | | | | | | | |
|
|
|
SEE NOTES TO FINANCIAL STATEMENTS.
A120
| | | | | | |
| | | HIGH YIELD BOND PORTFOLIO (continued) | | |
| |
| SCHEDULE OF INVESTMENTS | | December 31, 2014 |
| | | | | | | | | | | | |
| PREFERRED STOCKS — 0.1% | | | | | | Shares
| | | Value
(Note 2)
| |
Banking 0.1% | | | | | | | | | | | | |
Goldman Sachs Group, Inc. (The) | | | 87,000 | | | $ | 2,255,040 | |
| | | | | | | | | | |
|
|
|
Building Materials & Construction | | | | | | | | | | | | |
New Millennium Homes LLC
(original cost $0; purchased 09/25/00)*(b)(c) | | | 3,000 | | | | 174,000 | |
| | | | | | | | | | |
|
|
|
Cable | | | | | | | | | | | | |
Adelphia Communications Corp. (Class A Stock)* | | | 5,000 | | | | 5 | |
| | | | | | | | | | |
|
|
|
TOTAL PREFERRED STOCKS
(cost $2,179,765) | | | | 2,429,045 | |
| | | | | | | | | | |
|
|
|
| | | | |
| | | | | | | Units
| | | | |
| WARRANTS* | | | | | | | | | | | | |
Media & Entertainment | | | | | | | | | | | | |
MediaNews Group, Inc., expiring 03/19/17
(original cost $0; purchased 06/30/11)(b) | | | 5,557 | | | | 56 | |
| | | | | | | | | | |
|
|
|
Telecommunications | | | | | | | | | | | | |
Hawaiian Telcom Holdco, Inc., expiring 10/28/15 | | | 19,187 | | | | 264,397 | |
| | | | | | | | | | |
|
|
|
TOTAL WARRANTS
(cost $113,781) | | | | 264,453 | |
| | | | | | | | | | |
|
|
|
TOTAL LONG-TERM INVESTMENTS
(cost $3,073,662,836) | | | | 3,021,823,017 | |
| | | | | | | | | | |
|
|
|
| | | | |
| SHORT-TERM INVESTMENTS — 22.4% | | | | | | Shares
| | | | |
AFFILIATED MUTUAL FUNDS | | | | | | | | | | | | |
Prudential Investment Portfolios 2 — Prudential Core Short-Term Bond Fund
(cost $5,076,947)(Note 4)(g) | | | 534,840 | | | | 4,995,410 | |
Prudential Investment Portfolios 2 — Prudential Core Taxable Money Market Fund
(cost $723,318,088; includes $557,109,329 of cash collateral for securities on loan)(Note 4)(g)(h) | | | 723,318,088 | | | | 723,318,088 | |
| | | | | | | | | | |
|
|
|
TOTAL SHORT-TERM INVESTMENTS
(cost $728,395,035) | | | | 728,313,498 | |
| | | | | | | | | | |
|
|
|
TOTAL INVESTMENTS — 115.5%
(cost $3,802,057,871) | | | | 3,750,136,515 | |
LIABILITIES IN EXCESS OF OTHER ASSETS(i) — (15.5)% | | | | (504,275,079 | ) |
| | | | | | | | | | |
|
|
|
NET ASSETS — 100.0% | | | $ | 3,245,861,436 | |
| | | | | | | | | | |
|
|
|
See the Glossary for abbreviations used in the Portfolio descriptions.
| # | Principal amount is shown in U.S. dollars unless otherwise stated. |
| * | Non-income producing security. |
| (a) | Variable rate instrument. The interest rate shown reflects the rate in effect at December 31, 2014. |
| (b) | Indicates a security or securities that has been deemed illiquid. |
| (c) | Indicates a restricted security; the aggregate cost of the securities is $207,025,973. The aggregate value of $204,649,632 is approximately 6.3% of net assets. |
| (d) | All or a portion of security is on loan. The aggregate market value of such securities, including those sold and pending settlement, is $544,041,505; cash collateral of $557,109,329 (included in liabilities) was received with which the Portfolio purchased highly liquid short-term investments. Securities on loan are subject to contractual netting arrangements. |
| (e) | Represents issuer in default on interest payments. Non-income producing security. Such security may be post maturity. |
SEE NOTES TO FINANCIAL STATEMENTS.
A121
| | | | | | |
| | | HIGH YIELD BOND PORTFOLIO (continued) | | |
| |
| SCHEDULE OF INVESTMENTS | | December 31, 2014 |
| (g) | Prudential Investments LLC, the manager of the Portfolio, also serves as manager of the Prudential Investment Portfolios 2 — Prudential Core Taxable Money Market Fund and the Prudential Investment Portfolios 2 — Prudential Core Short-Term Bond Fund. |
| (h) | Represents security, or a portion thereof, purchased with cash collateral received for securities on loan. |
| (i) | Includes net unrealized appreciation (depreciation) on the following derivative contracts held at reporting period end: |
Credit default swap agreements outstanding at December 31, 2014:
| | | | | | | | | | | | | | | | | | | | | | | | | | | | |
Reference Entity/Obligation
| | Termination
Date
| | | Fixed
Rate
| | | Notional
Amount
(000)#(2)
| | | Implied
Credit
Spread at
December 31,
2014(3)
| | | Fair
Value
| | | Upfront
Premiums
Paid
(Received)
| | | Unrealized
Appreciation
(Depreciation)
| | Counterparty
|
Over-the-counter credit default swaps on corporate issues—Sell Protection(1): |
NRG Energy, Inc. | | | 03/20/16 | | | | 4.100% | | | | 3,150 | | | | 6.130 | % | | $ | 138,842 | | | $ | — | | | $ 138,842 | | Goldman Sachs & Co. |
| | | | | | | | | | | | | | | | | | |
|
|
| |
|
|
| |
| | |
The Portfolio entered into credit default swaps (“CDS”) to provide a measure of protection against defaults or to take an active long or short position with respect to the likelihood of a particular issuer’s default or the reference entity’s credit soundness. CDS contracts generally trade based on a spread which represents the cost a protection buyer has to pay the protection seller. The protection buyer is said to be short the credit as the value of the contract rises the more the credit deteriorates. The value of the CDS contract increases for the protection buyer if the spread increases.
| (1) | If the Portfolio is a seller of protection, it receives the fixed rate. When a credit event occurs, as defined under the terms of that particular swap agreements, the Portfolio will either (i) pay to buyer of protection an amount equal to the notional amount of the swap and take delivery of the referenced obligation or underlying securities comprising the referenced index or (ii) pay a net settlement amount in the form of cash or securities equal to the notional amount of the swap less the recovery value of the referenced obligation or underlying securities comprising the referenced index. |
| (2) | Notional amount represents the maximum potential amount the Portfolio could be required to pay as a seller of credit protection or receive as a buyer of credit protection if a credit event occurs as defined under the terms of that particular swap agreement. |
| (3) | Implied credit spreads, represented in absolute terms, utilized in determining the fair value of credit default swap agreements on corporate or sovereign issues of an emerging country as of the reporting date serve as an indicator of the current status of the payment/performance risk and represent the likelihood of risk of default for the credit derivative. The implied credit spread of a particular referenced entity reflects the cost of buying/selling protection and may include up-front payments required to be made to enter into the agreement. Wider credit spreads represent a deterioration of the referenced entity’s credit soundness and a greater likelihood of risk of default or other credit event occurring as defined under the terms of the agreement. |
Various inputs are used in determining the value of the Portfolio’s investments. These inputs are summarized in the three broad levels listed below.
| Level 1— | quoted prices generally in active markets for identical securities. |
| Level 2— | quoted prices for similar securities, interest rates and yield curves, prepayment speeds, foreign currency exchange rates and other significant observable inputs. |
| Level 3— | significant unobservable inputs for securities valued in accordance with Board approved fair valuation procedures. |
The following is a summary of the inputs used as of December 31, 2014 in valuing such portfolio securities:
| | | | | | | | | | | | |
| | | Level 1
| | | Level 2
| | | Level 3
| |
Investments in Securities | | | | | | | | | | | | |
Asset-Backed Securities | | | | | | | | | | | | |
Collateralized Loan Obligations | | $ | — | | | $ | 13,261,823 | | | $ | — | |
Residential Mortgage-Backed Securities | | | — | | | | 835,626 | | | | — | |
Bank Loans | | | — | | | | 47,401,411 | | | | 15,600,203 | |
Collateralized Mortgage Obligations | | | — | | | | 1,611,940 | | | | — | |
Corporate Bonds | | | — | | | | 2,927,725,741 | | | | 12,007,067 | |
Common Stocks | | | 685,208 | | | | — | | | | 500 | |
Preferred Stocks | | | 2,255,040 | | | | — | | | | 174,005 | |
Warrants | | | 264,397 | | | | — | | | | 56 | |
Affiliated Money Market Mutual Funds | | | 728,313,498 | | | | — | | | | — | |
SEE NOTES TO FINANCIAL STATEMENTS.
A122
| | | | | | |
| | | HIGH YIELD BOND PORTFOLIO (continued) | | |
| |
| SCHEDULE OF INVESTMENTS | | December 31, 2014 |
| | | | | | | | | | | | |
| | | Level 1
| | | Level 2
| | | Level 3
| |
Other Financial Instruments* | | | | | | | | | | | | |
Credit Default Swap Agreements | | | | | | | | | | | | |
Over-the-counter credit default swaps on corporate issues—Sell Protection | | $ | — | | | $ | 138,842 | | | $ | — | |
| | |
|
|
| |
|
|
| |
|
|
|
Total | | $ | 731,518,143 | | | $ | 2,990,975,383 | | | $ | 27,781,831 | |
| | |
|
|
| |
|
|
| |
|
|
|
| * | Other financial instruments are derivative instruments not reflected in the Schedule of Investments, such as futures, forwards and exchange-traded swap contracts, which are recorded at the unrealized appreciation/depreciation on the instrument, and over-the-counter swap contracts which are recorded at fair value. |
The following is a reconciliation of assets in which significant unobservable inputs (Level 3) were used in determining fair value:
| | | | | | | | | | | | | | | | | | | | |
| | | Bank
Loans
| | | Corporate
Bonds
| | | Common
Stock
| | | Preferred
Stocks
| | | Warrants
| |
Balance as of 12/31/13 | | $ | 17,060,000 | | | $ | 8,930,787 | | | $ | 500 | | | $ | 282,005 | | | $ | 56 | |
Realized gain (loss) | | | (79,330 | ) | | | (37,229 | ) | | | — | | | | — | | | | — | |
Change in unrealized appreciation (depreciation)** | | | (699,001 | ) | | | 235,999 | | | | — | | | | (108,000 | ) | | | — | |
Purchases | | | 6,282,500 | | | | 1,746,656 | | | | — | | | | — | | | | — | |
Sales | | | (6,985,110 | ) | | | (4,017,447 | ) | | | — | | | | — | | | | — | |
Accrued discount/premium | | | 21,144 | | | | (68,468 | ) | | | — | | | | — | | | | — | |
Transfer into Level 3 | | | — | | | | 7,569,760 | | | | — | | | | — | | | | — | |
Transfer out of Level 3 | | | — | | | | (2,352,991 | ) | | | — | | | | — | | | | — | |
| | |
|
|
| |
|
|
| |
|
|
| |
|
|
| |
|
|
|
Balance as of 12/31/14 | | $ | 15,600,203 | | | $ | 12,007,067 | | | $ | 500 | | | $ | 174,005 | | | $ | 56 | |
| | |
|
|
| |
|
|
| |
|
|
| |
|
|
| |
|
|
|
| * | Other financial instruments are derivative instruments not reflected in the Schedule of Investments, such as futures, forwards and exchange-traded swap contracts, which are recorded at the unrealized appreciation/depreciation on the instrument, and over-the-counter swap contracts which are recorded at fair value |
| ** | Of which, $571,002 was relating to securities held at the reporting period end. |
| | It is the Portfolio’s policy to recognize transfers in and transfers out at the fair value as of the beginning of period. At the reporting period end, 1 Corporate Bond transferred out of Level 3 as a result of no longer using a single broker quote and being priced by the primary valuation vendor source and 1 Corporate Bond transferred into Level 3 as a result of being valued using a single broker quote. |
| | Included in the table above, under Level 3, are securities that were fair valued using pricing methodologies approved by the Board of Trustees, which contain unobservable inputs. Such methodologies include, but are not limited to, using prices provided by a single broker/dealer, the cost of the investment, and prices of any recent transactions or bids/offers for such securities or any comparable securities. |
The industry classification of investments and liabilities in excess of other assets shown as a percentage of net assets as of December 31, 2014 was as follows (Unaudited):
| | | | |
Affiliated Money Market Mutual Funds (including 17.2% of collateral for securities on loan) | | | 22.4 | % |
Technology | | | 11.2 | |
Capital Goods | | | 7.7 | |
Healthcare & Pharmaceutical | | | 7.6 | |
Electric | | | 6.5 | |
Gaming | | | 6.4 | |
Telecommunications | | | 4.8 | |
Energy – Other | | | 4.6 | |
Foods | | | 3.8 | |
Cable | | | 3.7 | |
Chemicals | | | 3.6 | |
Packaging | | | 3.3 | |
Building Materials & Construction | | | 3.1 | |
Retailers | | | 3.1 | |
Media & Entertainment | | | 3.0 | |
Non-Captive Finance | | | 3.0 | |
Metals | | | 2.9 | |
| | | | |
Pipelines & Other | | | 2.6 | % |
Automotive | | | 2.2 | |
Consumer | | | 2.2 | |
Aerospace & Defense | | | 1.9 | |
Real Estate Investment Trusts | | | 1.5 | |
Banking | | | 1.3 | |
Transportation | | | 1.0 | |
Lodging | | | 0.9 | |
Collateralized Loan Obligations | | | 0.4 | |
Paper | | | 0.4 | |
Tobacco | | | 0.2 | |
Energy – Integrated | | | 0.1 | |
Collateralized Mortgage Obligations | | | 0.1 | |
| | |
|
|
|
| | | | 115.5 | |
Liabilities in excess of other assets | | | (15.5 | ) |
| | |
|
|
|
| | | | 100.0 | % |
| | |
|
|
|
SEE NOTES TO FINANCIAL STATEMENTS.
A123
| | | | | | |
| | | HIGH YIELD BOND PORTFOLIO (continued) | | |
| |
| SCHEDULE OF INVESTMENTS | | December 31, 2014 |
The Portfolio invested in derivative instruments during the reporting period. The primary types of risk associated with these derivative instruments are credit risk and equity risk. The effect of such derivative instruments on the Portfolio’s financial position and financial performance as reflected in the Statement of Assets and Liabilities and Statement of Operations is presented in the summary below.
Fair values of derivative instruments as of December 31, 2014 as presented in the Statement of Assets and Liabilities:
| | | | | | | | | | | | |
Derivatives not accounted for as hedging
instruments, carried at fair value
| | Asset Derivatives
| | | Liability Derivatives
| |
| | Balance Sheet Location
| | Fair Value
| | | Balance Sheet Location
| | Fair Value
| |
Credit contracts | | Unrealized appreciation on over-the-counter swap agreements | | $ | 138,842 | | | — | | $ | — | |
Equity contracts | | Unaffiliated investments | | | 264,453 | | | — | | | — | |
| | | | |
|
|
| | | |
|
|
|
Total | | | | $ | 403,295 | | | | | $ | — | |
| | | | |
|
|
| | | |
|
|
|
The effects of derivative instruments on the Statement of Operations for the year ended December 31, 2014 are as follows:
| | | | | | | | | | | | |
Amount of Realized Gain or (Loss) on Derivatives Recognized in Income
| |
Derivatives not accounted for as hedging instruments, carried at fair value
| | Swaps
| | | Warrants*
| | | Total
| |
Credit contracts | | $ | 5,755,486 | | | $ | — | | | $ | 5,755,486 | |
Equity contracts | | | — | | | | (55,812 | ) | | | (55,812 | ) |
| | |
|
|
| |
|
|
| |
|
|
|
| | | $ | 5,755,486 | | | $ | (55,812 | ) | | $ | 5,699,674 | |
| | |
|
|
| |
|
|
| |
|
|
|
| * | Included in net realized gain (loss) on investment transactions in the Statement of Operations. |
| | | | | | | | | | | | |
Change in Unrealized Appreciation or (Depreciation) on Derivatives Recognized in Income
| |
Derivatives not accounted for as hedging instruments, carried at fair value
| | Swaps
| | | Warrants*
| | | Total
| |
Credit contracts | | $ | (6,176,050 | ) | | $ | — | | | $ | (6,176,050 | ) |
Equity contracts | | | — | | | | 26,200 | | | | 26,200 | |
| | |
|
|
| |
|
|
| |
|
|
|
| | | $ | (6,176,050 | ) | | $ | 26,200 | | | $ | (6,149,850 | ) |
| | |
|
|
| |
|
|
| |
|
|
|
| * | Included in net change in unrealized appreciation (depreciation) on investments in the Statement of Operations. |
For the year ended December 31, 2014, the Portfolio’s average notional amount for credit default swaps as writer was $71,647,000.
Offsetting of over-the-counter (OTC) derivative assets and liabilities:
The Portfolio invested in OTC derivatives during the reporting period that are either offset in accordance with current requirements or are subject to enforceable master netting arrangements or similar agreements that permit offsetting. The information about offsetting and related netting arrangements for OTC derivatives, where the legal right to set-off exists, is presented in the summary below.
| | | | | | | | | | | | | | | | |
Counterparty
| | Gross amounts of
recognized assets(1)
| | | Gross amounts
available for offset
| | | Collateral
Received(3)
| | | Net Amount
| |
Goldman Sachs & Co. | | $ | 138,842 | | | $ | — | | | $ | (241,553 | ) | | $ | — | |
| | |
|
|
| | | | | | | | | | | | |
| | | $ | 138,842 | | | | | | | | | | | | | |
| | |
|
|
| | | | | | | | | | | | |
| | | | |
Counterparty
| | Gross amounts of
recognized
liabilities(2)
| | | Gross amounts
available for offset
| | | Collateral
Pledged(3)
| | | Net Amount
| |
Goldman Sachs & Co. | | $ | — | | | $ | — | | | $ | — | | | $ | — | |
| | |
|
|
| | | | | | | | | | | | |
| | | $ | — | | | | | | | | | | | | | |
| | |
|
|
| | | | | | | | | | | | |
| (1) | Includes unrealized appreciation on swaps and forwards, premiums paid on swap agreements and market value of purchased options. |
| (2) | Includes unrealized depreciation on swaps and forwards, premiums received on swap agreements and market value of written options. |
| (3) | Amounts shown reflect actual collateral received or pledged by the Portfolio. Such amounts are applied up to 100% of the Portfolio’s OTC derivative exposure by counterparty. |
SEE NOTES TO FINANCIAL STATEMENTS.
A124
| | | | | | |
| | | HIGH YIELD BOND PORTFOLIO (continued) | | |
STATEMENT OF ASSETS AND LIABILITIES
December 31, 2014
| | | | |
| ASSETS | | | | |
Investments at value, including securities on loan of $544,041,505: | | | | |
Unaffiliated investments (cost $3,073,662,836) | | $ | 3,021,823,017 | |
Affiliated investments (cost $728,395,035) | | | 728,313,498 | |
Cash | | | 558,025 | |
Foreign currency, at value (cost $52,546) | | | 46,800 | |
Dividends and interest receivable | | | 54,286,890 | |
Receivable for investments sold | | | 1,940,452 | |
Unrealized appreciation on over-the-counter swap agreements | | | 138,842 | |
Receivable for Series shares sold | | | 47,604 | |
Prepaid expenses | | | 27,412 | |
| | |
|
|
|
Total Assets | | | 3,807,182,540 | |
| | |
|
|
|
| LIABILITIES | | | | |
Payable to broker for collateral for securities on loan | | | 557,109,329 | |
Payable for investments purchased | | | 2,383,734 | |
Management fee payable | | | 1,486,822 | |
Accrued expenses | | | 212,979 | |
Payable for Series shares repurchased | | | 125,230 | |
Deferred trustees’ fees | | | 2,084 | |
Affiliated transfer agent fee payable | | | 926 | |
| | |
|
|
|
Total Liabilities | | | 561,321,104 | |
| | |
|
|
|
| NET ASSETS | | $ | 3,245,861,436 | |
| | |
|
|
|
Net assets were comprised of: | | | | |
Paid-in capital | | $ | 3,489,945,072 | |
Retained earnings | | | (244,083,636 | ) |
| | |
|
|
|
Net assets, December 31, 2014 | | $ | 3,245,861,436 | |
| | |
|
|
|
Net asset value and redemption price per share $3,245,861,436 / 634,916,961 outstanding shares of beneficial interest | | $ | 5.11 | |
| | |
|
|
|
STATEMENT OF OPERATIONS
Year Ended December 31, 2014
| | | | |
| NET INVESTMENT INCOME | | | | |
| INCOME | | | | |
Interest income | | $ | 207,499,786 | |
Affiliated income from securities loaned, net | | | 1,365,249 | |
Affiliated dividend income | | | 223,428 | |
Unaffiliated dividend income (net of foreign withholding taxes of $5,963) | | | 100,834 | |
| | |
|
|
|
Total income | | | 209,189,297 | |
| | |
|
|
|
| EXPENSES | | | | |
Management fee | | | 17,634,158 | |
Custodian’s fees and expenses | | | 363,000 | |
Shareholders’ reports | | | 104,000 | |
Audit fee | | | 43,000 | |
Insurance expenses | | | 42,000 | |
Trustees’ fees | | | 35,000 | |
Legal fees and expenses | | | 16,000 | |
Transfer agent’s fees and expenses (including affiliated expense of $5,600) | | | 12,000 | |
Commitment fee on syndicated credit agreement | | | 5,000 | |
Miscellaneous | | | 20,104 | |
| | |
|
|
|
Total expenses | | | 18,274,262 | |
| | |
|
|
|
| NET INVESTMENT INCOME | | | 190,915,035 | |
| | |
|
|
|
| REALIZED AND UNREALIZED GAIN (LOSS) ON INVESTMENT AND FOREIGN CURRENCY TRANSACTIONS | | | | |
Net realized gain (loss) on: | | | | |
Investment transactions | | | 18,391,754 | |
Swap agreement transactions | | | 5,755,486 | |
Foreign currency transactions | | | (28 | ) |
| | |
|
|
|
| | | | 24,147,212 | |
| | |
|
|
|
Net change in unrealized appreciation (depreciation) on: | | | | |
Investments (including affiliated: $15,798) | | | (120,066,582 | ) |
Swap agreements | | | (6,176,050 | ) |
Foreign currencies | | | (7,722 | ) |
| | |
|
|
|
| | | | (126,250,354 | ) |
| | |
|
|
|
| NET LOSS ON INVESTMENT AND FOREIGN CURRENCY TRANSACTIONS | | | (102,103,142 | ) |
| | |
|
|
|
| NET INCREASE IN NET ASSETS RESULTING FROM OPERATIONS | | $ | 88,811,893 | |
| | |
|
|
|
STATEMENT OF CHANGES IN NET ASSETS
| | | | | | | | |
| | | Year Ended December 31,
| |
| | | 2014
| | | 2013
| |
INCREASE (DECREASE) IN NET ASSETS
OPERATIONS | | | | | | | | |
Net investment income | | $ | 190,915,035 | | | $ | 183,087,862 | |
Net realized gain on investment and foreign currency transactions | | | 24,147,212 | | | | 53,328,223 | |
Net change in unrealized appreciation (depreciation) on investments and foreign currencies | | | (126,250,354 | ) | | | (36,487,575 | ) |
| | |
|
|
| |
|
|
|
NET INCREASE IN NET ASSETS RESULTING FROM OPERATIONS | | | 88,811,893 | | | | 199,928,510 | |
| | |
|
|
| |
|
|
|
| DISTRIBUTIONS | | | (195,015,297 | ) | | | (184,894,260 | ) |
| | |
|
|
| |
|
|
|
| SERIES SHARE TRANSACTIONS | | | | | | | | |
Series shares sold [46,491,364 and 19,157,710 shares, respectively] | | | 242,512,118 | | | | 102,403,661 | |
Series shares issued in reinvestment of distributions [37,178,309 and 35,311,797 shares, respectively] | | | 195,015,297 | | | | 184,894,260 | |
Series shares repurchased [19,914,504 and 23,256,125 shares, respectively] | | | (105,962,476 | ) | | | (123,671,701 | ) |
| | |
|
|
| |
|
|
|
NET INCREASE IN NET ASSETS FROM SERIES SHARE TRANSACTIONS | | | 331,564,939 | | | | 163,626,220 | |
| | |
|
|
| |
|
|
|
| TOTAL INCREASE | | | 225,361,535 | | | | 178,660,470 | |
| NET ASSETS: | | | | | | | | |
Beginning of year | | | 3,020,499,901 | | | | 2,841,839,431 | |
| | |
|
|
| |
|
|
|
End of year | | $ | 3,245,861,436 | | | $ | 3,020,499,901 | |
| | |
|
|
| |
|
|
|
SEE NOTES TO FINANCIAL STATEMENTS.
A125
| | | | | | |
| | | JENNISON PORTFOLIO | | |
| |
| SCHEDULE OF INVESTMENTS | | December 31, 2014 |
| | | | | | | | |
| LONG-TERM INVESTMENTS — 99.5% | | | | |
| COMMON STOCKS | | Shares
| | | Value
(Note 2)
| |
Aerospace & Defense — 3.3% | |
Boeing Co. (The) | | | 224,078 | | | $ | 29,125,658 | |
Precision Castparts Corp. | | | 101,371 | | | | 24,418,247 | |
| | | | | | |
|
|
|
| | | | | | | | 53,543,905 | |
| | | | | | |
|
|
|
Automobiles — 1.0% | |
Tesla Motors, Inc.*(a) | | | 74,201 | | | | 16,503,044 | |
| | | | | | |
|
|
|
Biotechnology — 9.5% | |
Alexion Pharmaceuticals, Inc.* | | | 136,720 | | | | 25,297,302 | |
Biogen Idec, Inc.* | | | 125,306 | | | | 42,535,122 | |
Celgene Corp.* | | | 352,550 | | | | 39,436,243 | |
Gilead Sciences, Inc.* | | | 234,877 | | | | 22,139,506 | |
Incyte Corp. Ltd.*(a) | | | 115,158 | | | | 8,419,201 | |
Vertex Pharmaceuticals, Inc.* | | | 143,584 | | | | 17,057,779 | |
| | | | | | |
|
|
|
| | | | | | | | 154,885,153 | |
| | | | | | |
|
|
|
Capital Markets — 1.6% | |
Morgan Stanley | | | 685,802 | | | | 26,609,118 | |
| | | | | | |
|
|
|
Chemicals — 1.9% | |
Monsanto Co. | | | 256,431 | | | | 30,635,812 | |
| | | | | | |
|
|
|
Diversified Financial Services — 1.0% | |
McGraw Hill Financial, Inc. | | | 175,799 | | | | 15,642,595 | |
| | | | | | |
|
|
|
Energy Equipment & Services — 1.1% | |
Schlumberger Ltd. | | | 207,921 | | | | 17,758,533 | |
| | | | | | |
|
|
|
Food & Staples Retailing — 1.9% | |
Costco Wholesale Corp. | | | 216,919 | | | | 30,748,268 | |
| | | | | | |
|
|
|
Food Products — 2.1% | |
Mead Johnson Nutrition Co. | | | 130,981 | | | | 13,168,830 | |
Mondelez International, Inc.
(Class A Stock) | | | 588,668 | | | | 21,383,365 | |
| | | | | | |
|
|
|
| | | | | | | | 34,552,195 | |
| | | | | | |
|
|
|
Health Care Equipment & Supplies — 1.8% | |
Abbott Laboratories | | | 634,694 | | | | 28,573,924 | |
| | | | | | |
|
|
|
Hotels, Restaurants & Leisure — 4.7% | |
Chipotle Mexican Grill, Inc.* | | | 29,466 | | | | 20,169,772 | |
Dunkin’ Brands Group, Inc. | | | 107,416 | | | | 4,581,292 | |
Marriott International, Inc.
(Class A Stock) | | | 335,520 | | | | 26,180,626 | |
Starbucks Corp. | | | 301,851 | | | | 24,766,874 | |
| | | | | | |
|
|
|
| | | | | | | | 75,698,564 | |
| | | | | | |
|
|
|
Internet & Catalog Retail — 6.6% | |
Amazon.com, Inc.* | | | 131,022 | | | | 40,662,678 | |
Netflix, Inc.* | | | 63,282 | | | | 21,617,764 | |
Priceline Group, Inc. (The)* | | | 27,379 | | | | 31,217,810 | |
TripAdvisor, Inc.* | | | 179,199 | | | | 13,378,997 | |
| | | | | | |
|
|
|
| | | | | | | | 106,877,249 | |
| | | | | | |
|
|
|
Internet Software & Services — 11.4% | |
Alibaba Group Holding Ltd. (China), ADR*(a) | | | 296,459 | | | | 30,813,948 | |
Facebook, Inc. (Class A Stock)* | | | 756,850 | | | | 59,049,437 | |
Google, Inc. (Class A Stock)* | | | 42,073 | | | | 22,326,458 | |
Google, Inc. (Class C Stock)* | | | 42,299 | | | | 22,266,194 | |
LendingClub Corp.*(a) | | | 35,245 | | | | 891,698 | |
LinkedIn Corp. (Class A Stock)* | | | 128,345 | | | | 29,482,130 | |
Tencent Holdings Ltd. (China) | | | 204,782 | | | | 2,962,977 | |
Twitter, Inc.* | | | 462,675 | | | | 16,596,152 | |
| | | | | | |
|
|
|
| | | | | | | | 184,388,994 | |
| | | | | | |
|
|
|
| | | | | | | | |
COMMON STOCKS
(continued) | | Shares
| | | Value
(Note 2)
| |
IT Services — 7.6% | |
FleetCor Technologies, Inc.* | | | 142,456 | | | $ | 21,184,632 | |
MasterCard, Inc. (Class A Stock) | | | 683,733 | | | | 58,910,435 | |
Visa, Inc. (Class A Stock)(a) | | | 167,867 | | | | 44,014,727 | |
| | | | | | |
|
|
|
| | | | | | | | 124,109,794 | |
| | | | | | |
|
|
|
Life Sciences Tools & Services — 1.6% | |
Illumina, Inc.* | | | 142,597 | | | | 26,320,554 | |
| | | | | | |
|
|
|
Media — 3.6% | |
Twenty-First Century Fox, Inc. (Class A Stock) | | | 620,821 | | | | 23,842,631 | |
Walt Disney Co. (The) | | | 361,781 | | | | 34,076,152 | |
| | | | | | |
|
|
|
| | | | | | | | 57,918,783 | |
| | | | | | |
|
|
|
Oil, Gas & Consumable Fuels — 2.3% | |
Concho Resources, Inc.* | | | 203,157 | | | | 20,264,911 | |
EOG Resources, Inc. | | | 187,568 | | | | 17,269,386 | |
| | | | | | |
|
|
|
| | | | | | | | 37,534,297 | |
| | | | | | |
|
|
|
Pharmaceuticals — 7.2% | |
Actavis PLC* | | | 109,073 | | | | 28,076,481 | |
Bristol-Myers Squibb Co. | | | 605,782 | | | | 35,759,311 | |
Novo Nordisk A/S (Denmark), ADR | | | 659,277 | | | | 27,900,603 | |
Perrigo Co. PLC | | | 34,621 | | | | 5,787,246 | |
Shire PLC (Ireland), ADR | | | 90,427 | | | | 19,219,355 | |
| | | | | | |
|
|
|
| | | | | | | | 116,742,996 | |
| | | | | | |
|
|
|
Real Estate Investment Trusts (REITs) — 1.2% | |
American Tower Corp. | | | 193,429 | | | | 19,120,457 | |
| | | | | | |
|
|
|
Road & Rail — 3.2% | |
Canadian Pacific Railway Ltd. (Canada) | | | 125,823 | | | | 24,244,834 | |
Union Pacific Corp. | | | 234,496 | | | | 27,935,508 | |
| | | | | | |
|
|
|
| | | | | | | | 52,180,342 | |
| | | | | | |
|
|
|
Semiconductors & Semiconductor Equipment — 1.1% | |
ARM Holdings PLC (United Kingdom), ADR | | | 388,430 | | | | 17,984,309 | |
| | | | | | |
|
|
|
Software — 7.9% | |
Adobe Systems, Inc.* | | | 350,470 | | | | 25,479,169 | |
FireEye, Inc.*(a) | | | 235,845 | | | | 7,447,985 | |
Red Hat, Inc.* | | | 347,689 | | | | 24,039,217 | |
salesforce.com, Inc.* | | | 523,708 | | | | 31,061,121 | |
Splunk, Inc.* | | | 243,224 | | | | 14,338,055 | |
VMware, Inc. (Class A Stock)*(a) | | | 134,613 | | | | 11,108,265 | |
Workday, Inc. (Class A Stock)*(a) | | | 190,021 | | | | 15,507,614 | |
| | | | | | |
|
|
|
| | | | | | | | 128,981,426 | |
| | | | | | |
|
|
|
Specialty Retail — 5.4% | |
Inditex SA (Spain) | | | 842,647 | | | | 24,036,899 | |
O’Reilly Automotive, Inc.* | | | 120,134 | | | | 23,140,211 | |
Tiffany & Co. | | | 228,716 | | | | 24,440,592 | |
TJX Cos., Inc. (The) | | | 234,699 | | | | 16,095,657 | |
| | | | | | |
|
|
|
| | | | | | | | 87,713,359 | |
| | | | | | |
|
|
|
Technology Hardware, Storage & Peripherals — 5.5% | |
Apple, Inc. | | | 808,003 | | | | 89,187,371 | |
| | | | | | |
|
|
|
Textiles, Apparel & Luxury Goods — 5.0% | |
Luxottica Group SpA (Italy) | | | 277,586 | | | | 15,216,986 | |
Michael Kors Holdings Ltd.* | | | 118,871 | | | | 8,927,212 | |
SEE NOTES TO FINANCIAL STATEMENTS.
A126
| | | | | | |
| | | JENNISON PORTFOLIO (continued) | | |
| |
| SCHEDULE OF INVESTMENTS | | December 31, 2014 |
| | | | | | | | |
COMMON STOCKS
(continued) | | Shares
| | | Value
(Note 2)
| |
Textiles, Apparel & Luxury Goods (continued) | |
NIKE, Inc. (Class B Stock) | | | 399,202 | | | $ | 38,383,272 | |
Under Armour, Inc. (Class A Stock)*(a) | | | 283,625 | | | | 19,258,138 | |
| | | | | | |
|
|
|
| | | | | | | | 81,785,608 | |
| | | | | | |
|
|
|
TOTAL LONG-TERM INVESTMENTS
(cost $889,734,603) | | | | 1,615,996,650 | |
| | | | | | |
|
|
|
| SHORT-TERM INVESTMENT — 8.3% | |
AFFILIATED MONEY MARKET MUTUAL FUND | | | | | |
Prudential Investment Portfolios 2 — Prudential Core Taxable Money Market Fund (cost $134,115,966; includes $134,115,965 of cash collateral for securities on loan)
(Note 4)(b)(c) | | | 134,115,966 | | | | 134,115,966 | |
| | | | | | |
|
|
|
TOTAL INVESTMENTS — 107.8%
(cost $1,023,850,569) | | | | 1,750,112,616 | |
LIABILITIES IN EXCESS OF
OTHER ASSETS — (7.8)% | | | | (126,392,142 | ) |
| | | | | | |
|
|
|
NET ASSETS 100.0% | | | $ | 1,623,720,474 | |
| | | | | | |
|
|
|
See the Glossary for abbreviations used in the Portfolio descriptions.
| * | Non-income producing security. |
| (a) | All or a portion of security is on loan. The aggregate market value of such securities, including those sold and pending settlement, is $129,921,856; cash collateral of $134,115,965 (included in liabilities) was received with which the Portfolio purchased highly liquid short-term investments. Securities on loan are subject to contractual netting arrangements. |
| (b) | Represents security, or a portion thereof, purchased with cash collateral received for securities on loan. |
| (c) | Prudential Investments LLC, the manager of the Portfolio, also serves as manager of the Prudential Investment Portfolios 2 — Prudential Core Taxable Money Market Fund. |
Various inputs are used in determining the value of the Portfolio’s investments. These inputs are summarized in the three broad levels listed below.
| Level 1— | quoted prices generally in active markets for identical securities. |
| Level 2— | quoted prices for similar securities, interest rates and yield curves, prepayment speeds, foreign currency exchange rates and other significant observable inputs. |
| Level 3— | significant unobservable inputs for securities valued in accordance with Board approved fair valuation procedures. |
The following is a summary of the inputs used as of December 31, 2014 in valuing such portfolio securities:
| | | | | | | | | | | | |
| | | Level 1
| | | Level 2
| | | Level 3
| |
Investments in Securities | | | | | | | | | | | | |
Common Stocks | | | | | | | | | | | | |
Aerospace & Defense | | $ | 53,543,905 | | | $ | — | | | $ | — | |
Automobiles | | | 16,503,044 | | | | — | | | | — | |
Biotechnology | | | 154,885,153 | | | | — | | | | — | |
Capital Markets | | | 26,609,118 | | | | — | | | | — | |
Chemicals | | | 30,635,812 | | | | — | | | | — | |
Diversified Financial Services | | | 15,642,595 | | | | — | | | | — | |
Energy Equipment & Services | | | 17,758,533 | | | | — | | | | — | |
Food & Staples Retailing | | | 30,748,268 | | | | — | | | | — | |
Food Products | | | 34,552,195 | | | | — | | | | — | |
Health Care Equipment & Supplies | | | 28,573,924 | | | | — | | | | — | |
Hotels, Restaurants & Leisure | | | 75,698,564 | | | | — | | | | — | |
Internet & Catalog Retail | | | 106,877,249 | | | | — | | | | — | |
Internet Software & Services | | | 181,426,017 | | | | 2,962,977 | | | | — | |
IT Services | | | 124,109,794 | | | | — | | | | — | |
Life Sciences Tools & Services | | | 26,320,554 | | | | — | | | | — | |
Media | | | 57,918,783 | | | | — | | | | — | |
Oil, Gas & Consumable Fuels | | | 37,534,297 | | | | — | | | | — | |
Pharmaceuticals | | | 116,742,996 | | | | — | | | | — | |
Real Estate Investment Trusts (REITs) | | | 19,120,457 | | | | — | | | | — | |
Road & Rail | | | 52,180,342 | | | | — | | | | — | |
Semiconductors & Semiconductor Equipment | | | 17,984,309 | | | | — | | | | — | |
Software | | | 128,981,426 | | | | — | | | | — | |
Specialty Retail | | | 63,676,460 | | | | 24,036,899 | | | | — | |
Technology Hardware, Storage & Peripherals | | | 89,187,371 | | | | — | | | | — | |
Textiles, Apparel & Luxury Goods | | | 66,568,622 | | | | 15,216,986 | | | | — | |
Affiliated Money Market Mutual Fund | | | 134,115,966 | | | | — | | | | — | |
| | |
|
|
| |
|
|
| |
|
|
|
Total | | $ | 1,707,895,754 | | | $ | 42,216,862 | | | $ | — | |
| | |
|
|
| |
|
|
| |
|
|
|
SEE NOTES TO FINANCIAL STATEMENTS.
A127
| | | | | | |
| | | JENNISON PORTFOLIO (continued) | | |
| |
| SCHEDULE OF INVESTMENTS | | December 31, 2014 |
The industry classification of investments and liabilities in excess of other assets shown as a percentage of net assets as of December 31, 2014 was as follows (Unaudited):
| | | | |
Internet Software & Services | | | 11.4 | % |
Biotechnology | | | 9.5 | |
Affiliated Money Market Mutual Fund (including 8.3% of collateral for securities on loan) | | | 8.3 | |
Software | | | 7.9 | |
IT Services | | | 7.6 | |
Pharmaceuticals | | | 7.2 | |
Internet & Catalog Retail | | | 6.6 | |
Technology Hardware, Storage & Peripherals | | | 5.5 | |
Specialty Retail | | | 5.4 | |
Textiles, Apparel & Luxury Goods | | | 5.0 | |
Hotels, Restaurants & Leisure | | | 4.7 | |
Media | | | 3.6 | |
Aerospace & Defense | | | 3.3 | |
Road & Rail | | | 3.2 | |
| | | | |
Oil, Gas & Consumable Fuels | | | 2.3 | % |
Food Products | | | 2.1 | |
Food & Staples Retailing | | | 1.9 | |
Chemicals | | | 1.9 | |
Health Care Equipment & Supplies | | | 1.8 | |
Capital Markets | | | 1.6 | |
Life Sciences Tools & Services | | | 1.6 | |
Real Estate Investment Trusts (REITs) | | | 1.2 | |
Semiconductors & Semiconductor Equipment | | | 1.1 | |
Energy Equipment & Services | | | 1.1 | |
Automobiles | | | 1.0 | |
Diversified Financial Services | | | 1.0 | |
| | |
|
|
|
| | | | 107.8 | |
Liabilities in excess of other assets | | | (7.8 | ) |
| | |
|
|
|
| | | | 100.0 | % |
| | |
|
|
|
SEE NOTES TO FINANCIAL STATEMENTS.
A128
| | | | | | |
| | | JENNISON PORTFOLIO (continued) | | |
STATEMENT OF ASSETS AND LIABILITIES
December 31, 2014
| | | | |
| ASSETS | | | | |
Investments at value, including securities on loan of $129,921,856: | | | | |
Unaffiliated investments (cost $889,734,603) | | $ | 1,615,996,650 | |
Affiliated investments (cost $134,115,966) | | | 134,115,966 | |
Receivable for investments sold | | | 10,185,937 | |
Dividends receivable | | | 1,362,926 | |
Tax reclaim receivable | | | 266,962 | |
Receivable for Series shares sold | | | 186,227 | |
Prepaid expenses | | | 12,475 | |
| | |
|
|
|
Total Assets | | | 1,762,127,143 | |
| | |
|
|
|
| LIABILITIES | | | | |
Payable to broker for collateral for securities on loan | | | 134,115,965 | |
Payable to custodian | | | 1,411,358 | |
Loan payable (Note 8) | | | 1,211,000 | |
Management fee payable | | | 831,979 | |
Payable for Series shares repurchased | | | 534,513 | |
Accrued expenses | | | 157,286 | |
Payable for investments purchased | | | 128,016 | |
Distribution fee payable | | | 9,331 | |
Administration fee payable | | | 5,687 | |
Affiliated transfer agent fee payable | | | 926 | |
Deferred trustees’ fees | | | 608 | |
| | |
|
|
|
Total Liabilities | | | 138,406,669 | |
| | |
|
|
|
| NET ASSETS | | $ | 1,623,720,474 | |
| | |
|
|
|
Net assets were comprised of: | | | | |
Paid-in capital | | $ | 1,198,898,438 | |
Retained earnings | | | 424,822,036 | |
| | |
|
|
|
Net assets, December 31, 2014 | | $ | 1,623,720,474 | |
| | |
|
|
|
| Class I: | | | | |
Net asset value and redemption price per share $1,579,974,976 / 38,673,369 outstanding shares of beneficial interest | | $ | 40.85 | |
| | |
|
|
|
| Class II: | | | | |
Net asset value and redemption price per share $43,745,498 / 1,099,163 outstanding shares of beneficial interest | | $ | 39.80 | |
| | |
|
|
|
STATEMENT OF OPERATIONS
Year Ended December 31, 2014
| | | | |
| NET INVESTMENT INCOME | | | | |
| INCOME | | | | |
Unaffiliated dividend income (net of foreign withholding taxes of $245,955) | | $ | 11,969,261 | |
Affiliated income from securities loaned, net | | | 341,192 | |
Affiliated dividend income | | | 11,527 | |
| | |
|
|
|
Total income | | | 12,321,980 | |
| | |
|
|
|
| EXPENSES | | | | |
Management fee | | | 9,545,443 | |
Distribution fee—Class II | | | 102,575 | |
Administration fee—Class II | | | 61,545 | |
Custodian’s fees and expenses | | | 202,000 | |
Shareholders’ reports | | | 130,000 | |
Audit fee | | | 26,000 | |
Trustees’ fees | | | 23,000 | |
Insurance expenses | | | 20,000 | |
Legal fees and expenses | | | 12,000 | |
Transfer agent’s fees and expenses (including affiliated expense of $5,600) | | | 12,000 | |
Commitment fee on syndicated credit agreement | | | 5,000 | |
Interest expense | | | 809 | |
Miscellaneous | | | 18,460 | |
| | |
|
|
|
Total expenses | | | 10,158,832 | |
| | |
|
|
|
| NET INVESTMENT INCOME | | | 2,163,148 | |
| | |
|
|
|
| REALIZED AND UNREALIZED GAIN (LOSS) ON INVESTMENT AND FOREIGN CURRENCY TRANSACTIONS | | | | |
Net realized gain (loss) on: | | | | |
Investment transactions | | | 141,652,113 | |
Foreign currency transactions | | | (16,354 | ) |
| | |
|
|
|
| | | | 141,635,759 | |
| | |
|
|
|
Net change in unrealized appreciation (depreciation) on: | | | | |
Investments | | | 7,692,022 | |
Foreign currencies | | | (20,852 | ) |
| | |
|
|
|
| | | | 7,671,170 | |
| | |
|
|
|
| NET GAIN ON INVESTMENT AND FOREIGN CURRENCY TRANSACTIONS | | | 149,306,929 | |
| | |
|
|
|
| NET INCREASE IN NET ASSETS RESULTING FROM OPERATIONS | | $ | 151,470,077 | |
| | |
|
|
|
STATEMENT OF CHANGES IN NET ASSETS
| | | | | | | | |
| | | Year Ended December 31,
| |
| | | 2014
| | | 2013
| |
| INCREASE (DECREASE) IN NET ASSETS | | | | | | | | |
| OPERATIONS | | | | | | | | |
Net investment income | | $ | 2,163,148 | | | $ | 2,402,557 | |
Net realized gain on investment and foreign currency transactions | | | 141,635,759 | | | | 132,807,455 | |
Net change in unrealized appreciation (depreciation) on investments and foreign currencies | | | 7,671,170 | | | | 313,910,851 | |
| | |
|
|
| |
|
|
|
NET INCREASE IN NET ASSETS RESULTING FROM OPERATIONS | | | 151,470,077 | | | | 449,120,863 | |
| | |
|
|
| |
|
|
|
| SERIES SHARE TRANSACTIONS (Note 7) | | | | | | | | |
Series shares sold | | | 26,462,176 | | | | 24,077,738 | |
Series shares repurchased | | | (146,401,640 | ) | | | (127,868,729 | ) |
| | |
|
|
| |
|
|
|
NET DECREASE IN NET ASSETS FROM SERIES SHARE TRANSACTIONS | | | (119,939,464 | ) | | | (103,790,991 | ) |
| | |
|
|
| |
|
|
|
| TOTAL INCREASE | | | 31,530,613 | | | | 345,329,872 | |
| NET ASSETS: | | | | | | | | |
Beginning of year | | | 1,592,189,861 | | | | 1,246,859,989 | |
| | |
|
|
| |
|
|
|
End of year | | $ | 1,623,720,474 | | | $ | 1,592,189,861 | |
| | |
|
|
| |
|
|
|
SEE NOTES TO FINANCIAL STATEMENTS.
A129
| | | | | | |
| | | MONEY MARKET PORTFOLIO | | |
| |
| SCHEDULE OF INVESTMENTS | | December 31, 2014 |
| | | | | | | | | | | | | | |
| CERTIFICATES OF DEPOSIT — 22.1% | | Interest
Rate
| | | Maturity
Date
| | Principal
Amount
(000)#
| | | Value
(Note 2)
| |
Bank of America NA | | | 0.180% | | | 02/02/15 | | | 2,000 | | | $ | 2,000,000 | |
Bank of America NA | | | 0.250% | | | 03/20/15 | | | 3,000 | | | | 3,000,000 | |
Bank of America NA | | | 0.250% | | | 05/12/15 | | | 5,000 | | | | 5,000,000 | |
Bank of America NA | | | 0.260% | | | 02/02/15 | | | 5,500 | | | | 5,500,000 | |
Bank of America NA | | | 0.260% | | | 03/09/15 | | | 2,000 | | | | 2,000,000 | |
Bank of Montreal | | | 0.242% | (a) | | 07/06/15 | | | 1,000 | | | | 1,000,006 | |
Bank of Nova Scotia | | | 0.242% | (a) | | 08/03/15 | | | 2,000 | | | | 2,000,000 | |
Bank of Nova Scotia | | | 0.265% | (a) | | 06/29/15 | | | 2,000 | | | | 2,000,000 | |
Bank of Tokyo-Mitsubishi UFJ Ltd. | | | 0.210% | | | 02/25/15 | | | 7,000 | | | | 7,000,000 | |
BNP Paribas SA | | | 0.482% | (a) | | 04/10/15 | | | 8,000 | | | | 8,000,000 | |
Branch Banking & Trust Co. | | | 0.160% | | | 01/28/15 | | | 6,000 | | | | 6,000,000 | |
Branch Banking & Trust Co. | | | 0.160% | | | 02/03/15 | | | 3,000 | | | | 3,000,000 | |
Canadian Imperial Bank of Commerce | | | 0.232% | (a) | | 05/06/15 | | | 2,000 | | | | 2,000,000 | |
Canadian Imperial Bank of Commerce | | | 0.232% | (a) | | 06/17/15 | | | 3,000 | | | | 3,000,000 | |
Canadian Imperial Bank of Commerce | | | 0.244% | (a) | | 08/28/15 | | | 2,000 | | | | 2,000,000 | |
Citibank NA | | | 0.180% | | | 02/03/15 | | | 3,500 | | | | 3,500,000 | |
Citibank NA | | | 0.240% | | | 02/04/15 | | | 4,000 | | | | 4,000,000 | |
Citibank NA | | | 0.250% | | | 03/03/15 | | | 4,000 | | | | 4,000,000 | |
Citibank NA | | | 0.250% | | | 03/11/15 | | | 5,000 | | | | 5,000,478 | |
Citibank NA | | | 0.250% | | | 05/05/15 | | | 3,000 | | | | 3,000,000 | |
HSBC Bank USA NA | | | 0.253% | (a) | | 10/28/15 | | | 3,000 | | | | 3,000,000 | |
Mizuho Bank Ltd. | | | 0.200% | | | 01/02/15 | | | 2,000 | | | | 2,000,000 | |
Natixis | | | 0.240% | | | 01/02/15 | | | 4,000 | | | | 4,000,000 | |
Natixis | | | 0.550% | | | 01/22/15 | | | 4,000 | | | | 4,000,604 | |
Norinchukin Bank | | | 0.200% | | | 02/11/15 | | | 4,000 | | | | 4,000,000 | |
Norinchukin Bank | | | 0.230% | | | 01/14/15 | | | 2,000 | | | | 2,000,000 | |
Rabobank Nederland | | | 0.280% | (a) | | 04/14/15 | | | 3,000 | | | | 3,000,000 | |
Rabobank Nederland | | | 0.283% | (a) | | 02/25/15 | | | 5,000 | | | | 5,000,383 | |
Rabobank Nederland | | | 0.286% | (a) | | 05/29/15 | | | 6,000 | | | | 6,000,100 | |
Royal Bank of Canada | | | 0.241% | (a) | | 02/12/15 | | | 1,000 | | | | 1,000,000 | |
Royal Bank of Canada | | | 0.268% | (a) | | 12/11/15 | | | 5,000 | | | | 5,000,000 | |
Skandinaviska Enskilda Banken AB | | | 0.269% | (a) | | 07/10/15 | | | 4,000 | | | | 4,000,000 | |
Standard Chartered Bank | | | 0.290% | | | 03/03/15 | | | 6,000 | | | | 6,000,000 | |
State Street Bank & Trust Co. | | | 0.240% | (a) | | 03/12/15 | | | 2,000 | | | | 2,000,000 | |
State Street Bank & Trust Co. | | | 0.281% | (a) | | 10/01/15 | | | 6,000 | | | | 6,000,000 | |
Sumitomo Mitsui Banking Corp. | | | 0.260% | | | 04/10/15 | | | 8,000 | | | | 8,000,000 | |
Svenska Handelsbanken AB | | | 0.205% | | | 02/27/15 | | | 3,200 | | | | 3,200,051 | |
Svenska Handelsbanken AB | | | 0.220% | | | 01/28/15 | | | 3,000 | | | | 3,000,011 | |
Toronto-Dominion Bank (The) | | | 0.247% | (a) | | 10/06/15 | | | 10,000 | | | | 10,000,000 | |
U.S. Bank NA | | | 0.175% | (a) | | 02/26/15 | | | 5,000 | | | | 5,000,000 | |
U.S. Bank NA | | | 0.233% | (a) | | 10/30/15 | | | 5,000 | | | | 5,000,000 | |
Wells Fargo Bank NA | | | 0.208% | (a) | | 02/06/15 | | | 3,200 | | | | 3,199,994 | |
Wells Fargo Bank NA | | | 0.215% | (a) | | 02/20/15 | | | 5,000 | | | | 5,000,087 | |
Wells Fargo Bank NA | | | 0.220% | (a) | | 02/28/15 | | | 3,000 | | | | 3,000,010 | |
Wells Fargo Bank NA | | | 0.232% | (a) | | 03/17/15 | | | 1,000 | | | | 1,000,000 | |
Wells Fargo Bank NA | | | 0.241% | (a) | | 05/12/15 | | | 3,000 | | | | 3,000,000 | |
Wells Fargo Bank NA | | | 0.252% | (a) | | 08/20/15 | | | 3,000 | | | | 3,000,000 | |
| | | | | | | | | | | | |
|
|
|
| | | | | | | | | | | | | | 182,401,724 | |
| | | | | | | | | | | | |
|
|
|
| COMMERCIAL PAPER — 25.8% | | | | | | | | | | | | | | |
ABN AMRO Funding USA LLC, 144A | | | 0.260% | (b) | | 02/10/15 | | | 3,000 | | | | 2,999,133 | |
ABN AMRO Funding USA LLC, 144A | | | 0.341% | (b) | | 01/05/15 | | | 1,000 | | | | 999,962 | |
Caisse Centrale Desjardins du Quebec, 144A | | | 0.231% | (a) | | 10/22/15 | | | 10,000 | | | | 10,000,000 | |
CDP Financial, Inc., 144A | | | 0.150% | (b) | | 01/05/15 | | | 8,000 | | | | 7,999,867 | |
CDP Financial, Inc., 144A | | | 0.180% | (b) | | 02/27/15 | | | 3,000 | | | | 2,999,145 | |
CDP Financial, Inc., 144A | | | 0.180% | (b) | | 03/16/15 | | | 2,000 | | | | 1,999,260 | |
CDP Financial, Inc., 144A | | | 0.190% | (b) | | 03/13/15 | | | 8,000 | | | | 7,997,002 | |
Commonwealth Bank of Australia, 144A | | | 0.244% | (a) | | 04/23/15 | | | 8,000 | | | | 8,000,000 | |
CPPIB Capital, Inc., 144A | | | 0.140% | (b) | | 01/13/15 | | | 4,300 | | | | 4,299,799 | |
SEE NOTES TO FINANCIAL STATEMENTS.
A130
| | | | | | |
| | | MONEY MARKET PORTFOLIO (continued) | | |
| |
| SCHEDULE OF INVESTMENTS | | December 31, 2014 |
| | | | | | | | | | | | | | |
COMMERCIAL PAPER
(continued) | | Interest
Rate
| | | Maturity
Date
| | Principal
Amount
(000)#
| | | Value
(Note 2)
| |
CPPIB Capital, Inc., 144A | | | 0.140% | (b) | | 02/18/15 | | | 15,000 | | | $ | 14,997,200 | |
CPPIB Capital, Inc., 144A | | | 0.150% | (b) | | 01/02/15 | | | 1,000 | | | | 999,996 | |
DNB Bank ASA, 144A | | | 0.230% | (b) | | 04/20/15 | | | 1,100 | | | | 1,099,234 | |
DNB Bank ASA, 144A | | | 0.244% | (a) | | 01/16/15 | | | 7,000 | | | | 7,000,000 | |
Eli Lilly & Co., 144A | | | 0.200% | (b) | | 03/25/15 | | | 4,000 | | | | 3,998,156 | |
General Electric Capital Corp. | | | 0.200% | (b) | | 01/27/15 | | | 2,000 | | | | 1,999,711 | |
General Electric Capital Corp. | | | 0.200% | (b) | | 03/05/15 | | | 3,000 | | | | 2,998,950 | |
General Electric Capital Corp. | | | 0.200% | (b) | | 04/20/15 | | | 3,000 | | | | 2,998,183 | |
General Electric Capital Corp. | | | 0.210% | (b) | | 02/02/15 | | | 3,224 | | | | 3,223,398 | |
GlaxoSmithKline Finance PLC, 144A | | | 0.160% | (b) | | 01/22/15 | | | 8,000 | | | | 7,999,253 | |
HSBC Bank PLC, 144A | | | 0.223% | (a) | | 01/30/15 | | | 5,000 | | | | 5,000,000 | |
HSBC Bank PLC, 144A | | | 0.228% | (a) | | 05/07/15 | | | 3,000 | | | | 3,000,000 | |
HSBC Bank PLC, 144A | | | 0.233% | (a) | | 02/12/15 | | | 2,000 | | | | 2,000,000 | |
HSBC USA, Inc. | | | 0.240% | (b) | | 04/27/15 | | | 7,000 | | | | 6,994,587 | |
ING (U.S.) Funding LLC | | | 0.210% | (b) | | 02/27/15 | | | 8,500 | | | | 8,497,174 | |
JPMorgan Securities LLC | | | 0.200% | (b) | | 02/02/15 | | | 1,000 | | | | 999,822 | |
JPMorgan Securities LLC, 144A | | | 0.200% | (b) | | 02/17/15 | | | 4,000 | | | | 3,998,956 | |
JPMorgan Securities LLC, 144A | | | 0.210% | (b) | | 03/11/15 | | | 4,000 | | | | 3,998,390 | |
JPMorgan Securities LLC, 144A | | | 0.345% | (a) | | 10/20/15 | | | 3,000 | | | | 3,000,000 | |
JPMorgan Securities LLC, 144A | | | 0.354% | (a) | | 09/02/15 | | | 2,000 | | | | 2,000,000 | |
JPMorgan Securities LLC, 144A | | | 0.357% | (a) | | 08/07/15 | | | 4,000 | | | | 4,000,000 | |
Nordea Bank AB, 144A | | | 0.220% | (b) | | 03/13/15 | | | 2,500 | | | | 2,498,915 | |
PNC Bank NA | | | 0.281% | (b) | | 07/01/15 | | | 1,000 | | | | 998,592 | |
PNC Bank NA | | | 0.310% | | | 03/27/15 | | | 6,000 | | | | 6,000,000 | |
PNC Bank NA | | | 0.310% | | | 05/20/15 | | | 2,000 | | | | 2,000,000 | |
PSP Capital, Inc., 144A | | | 0.150% | (b) | | 01/16/15 | | | 4,000 | | | | 3,999,750 | |
PSP Capital, Inc., 144A | | | 0.150% | (b) | | 02/13/15 | | | 4,000 | | | | 3,999,283 | |
PSP Capital, Inc., 144A | | | 0.160% | (b) | | 02/05/15 | | | 7,000 | | | | 6,998,911 | |
Schlumberger Investment SA, 144A | | | 0.200% | (b) | | 03/16/15 | | | 2,000 | | | | 1,999,178 | |
Skandinaviska Enskilda Banken AB, 144A | | | 0.255% | (b) | | 04/16/15 | | | 4,000 | | | | 3,997,025 | |
Skandinaviska Enskilda Banken AB, 144A | | | 0.260% | (b) | | 04/14/15 | | | 4,000 | | | | 3,997,025 | |
Standard Chartered Bank, 144A | | | 0.270% | (b) | | 04/27/15 | | | 3,000 | | | | 2,997,390 | |
State Street Corp. | | | 0.160% | (b) | | 01/05/15 | | | 5,000 | | | | 4,999,911 | |
State Street Corp. | | | 0.160% | (b) | | 01/28/15 | | | 3,000 | | | | 2,999,640 | |
State Street Corp. | | | 0.170% | (b) | | 03/09/15 | | | 5,000 | | | | 4,998,418 | |
Svenska Handelsbanken AB, 144A | | | 0.210% | (b) | | 01/16/15 | | | 2,000 | | | | 1,999,825 | |
Swedbank AB | | | 0.230% | (b) | | 01/05/15 | | | 4,000 | | | | 3,999,898 | |
Swedbank AB | | | 0.245% | (b) | | 01/22/15 | | | 5,000 | | | | 4,999,286 | |
Toyota Motor Credit Corp. | | | 0.130% | (b) | | 02/03/15 | | | 5,000 | | | | 4,999,404 | |
Toyota Motor Credit Corp. | | | 0.231% | (a) | | 04/09/15 | | | 3,000 | | | | 3,000,000 | |
Westpac Banking Corp., 144A | | | 0.243% | (a) | | 04/29/15 | | | 3,000 | | | | 3,000,000 | |
| | | | | | | | | | | | |
|
|
|
| | | | | | | | | | | | | | 212,579,629 | |
| | | | | | | | | | | | |
|
|
|
| OTHER CORPORATE OBLIGATIONS — 7.5% | |
Bank of Montreal, Sr. Unsec’d. Notes, MTN | | | 0.709% | (a) | | 09/11/15 | | | 3,200 | | | | 3,209,673 | |
Bank of New York Mellon Corp. (The), Sr. Unsec’d. Notes, MTN | | | 1.200% | | | 02/20/15 | | | 2,500 | | | | 2,502,701 | |
Commonwealth Bank of Australia, Sr. Unsec’d. Notes | | | 1.950% | | | 03/16/15 | | | 1,000 | | | | 1,003,213 | |
Commonwealth Bank of Australia, Unsec’d. Notes, MTN, 144A | | | 0.513% | (a) | | 01/29/15 | | | 2,000 | | | | 2,000,470 | |
General Electric Capital Corp., Sr. Unsec’d. Notes, MTN | | | 2.150% | | | 01/09/15 | | | 5,000 | | | | 5,002,135 | |
International Bank for Reconstruction & Development, Sr. Unsec’d. Notes | | | 0.161% | (a) | | 01/14/15 | | | 7,000 | | | | 7,000,015 | |
International Bank for Reconstruction & Development, Sr. Unsec’d. Notes, MTN | | | 0.157% | (a) | | 08/07/15 | | | 3,000 | | | | 3,000,000 | |
International Finance Corp., Sr. Unsec’d. Notes | | | 0.170% | (a) | | 08/27/15 | | | 7,000 | | | | 6,999,566 | |
International Finance Corp., Sr. Unsec’d. Notes, MTN | | | 0.170% | (a) | | 01/28/15 | | | 6,000 | | | | 6,000,046 | |
MetLife Institutional Funding II, Sec’d. Notes, 144A | | | 0.601% | (a) | | 01/06/15 | | | 2,700 | | | | 2,700,140 | |
Metropolitan Life Global Funding I, Sr. Sec’d. Notes, 144A | | | 2.000% | | | 01/09/15 | | | 4,000 | | | | 4,001,515 | |
National Australia Bank Ltd., Sr. Unsec’d. Notes, MTN | | | 2.000% | | | 03/09/15 | | | 2,500 | | | | 2,508,178 | |
Royal Bank of Canada, Sr. Unsec’d. Notes, MTN | | | 0.461% | (a) | | 01/06/15 | | | 7,000 | | | | 7,000,237 | |
Toyota Motor Credit Corp., Sr. Unsec’d. Notes, MTN | | | 0.234% | (a) | | 08/26/15 | | | 6,000 | | | | 6,000,000 | |
Wells Fargo Bank NA, Sr. Unsec’d. Notes | | | 0.511% | (a) | | 07/20/15 | | | 3,000 | | | | 3,004,185 | |
| | | | | | | | | | | | |
|
|
|
| | | | | | | | | | | | | | 61,932,074 | |
| | | | | | | | | | | | |
|
|
|
SEE NOTES TO FINANCIAL STATEMENTS.
A131
| | | | | | |
| | | MONEY MARKET PORTFOLIO (continued) | | |
| |
| SCHEDULE OF INVESTMENTS | | December 31, 2014 |
| | | | | | | | | | | | | | | | |
| TIME DEPOSITS — 1.5% | | Interest
Rate
| | | Maturity
Date
| | | Principal
Amount
(000)#
| | | Value
(Note 2)
| |
Australia & New Zealand Banking Group Ltd.(c) | | | 0.250% | | | | 01/26/15 | | | | 7,000 | | | $ | 7,000,000 | |
Credit Agricole SA | | | 0.050% | | | | 01/02/15 | | | | 5,000 | | | | 5,000,000 | |
| | | | | | | | | | | | | | |
|
|
|
| | | | | | | | | | | | | | | | 12,000,000 | |
| | | | | | | | | | | | | | |
|
|
|
| U.S. GOVERNMENT AGENCY OBLIGATIONS — 37.7% | |
Federal Farm Credit Bank | | | 0.138% | (a) | | | 02/03/16 | | | | 3,000 | | | | 3,000,171 | |
Federal Farm Credit Bank | | | 0.155% | (a) | | | 10/01/15 | | | | 3,000 | | | | 3,000,795 | |
Federal Farm Credit Bank | | | 0.200% | (a) | | | 06/26/15-07/27/15 | | | | 9,000 | | | | 9,003,229 | |
Federal Home Loan Bank | | | 0.053% | (b) | | | 01/02/15 | | | | 1,409 | | | | 1,408,998 | |
Federal Home Loan Bank | | | 0.060% | (b) | | | 01/07/15 | | | | 8,000 | | | | 7,999,920 | |
Federal Home Loan Bank | | | 0.066% | (b) | | | 01/21/15 | | | | 16,000 | | | | 15,999,422 | |
Federal Home Loan Bank | | | 0.070% | | | | 04/29/15 | | | | 6,000 | | | | 5,999,397 | |
Federal Home Loan Bank | | | 0.071% | (b) | | | 01/23/15-02/05/15 | | | | 51,000 | | | | 50,997,398 | |
Federal Home Loan Bank | | | 0.077% | (b) | | | 01/16/15 | | | | 24,575 | | | | 24,574,210 | |
Federal Home Loan Bank | | | 0.083% | (b) | | | 02/06/15 | | | | 13,000 | | | | 12,998,920 | |
Federal Home Loan Bank | | | 0.087% | (b) | | | 02/04/15 | | | | 21,100 | | | | 21,098,260 | |
Federal Home Loan Bank | | | 0.096% | (b) | | | 02/13/15-02/18/15 | | | | 15,000 | | | | 14,998,153 | |
Federal Home Loan Bank | | | 0.101% | (b) | | | 03/06/15 | | | | 5,000 | | | | 4,999,125 | |
Federal Home Loan Bank | | | 0.104% | (a) | | | 04/02/15 | | | | 4,000 | | | | 3,999,975 | |
Federal Home Loan Bank | | | 0.106% | (a) | | | 05/12/15 | | | | 2,000 | | | | 1,999,951 | |
Federal Home Loan Bank | | | 0.110% | (b) | | | 03/04/15 | | | | 12,000 | | | | 11,997,727 | |
Federal Home Loan Bank | | | 0.112% | (b) | | | 02/11/15 | | | | 15,000 | | | | 14,998,080 | |
Federal Home Loan Bank | | | 0.114% | (a) | | | 02/23/15 | | | | 3,000 | | | | 3,000,000 | |
Federal Home Loan Bank | | | 0.119% | (b) | | | 03/11/15-03/13/15 | | | | 11,000 | | | | 10,997,507 | |
Federal Home Loan Bank | | | 0.120% | (a) | | | 03/26/15-05/28/15 | | | | 11,000 | | | | 10,999,908 | |
Federal Home Loan Bank | | | 0.122% | (a) | | | 07/10/15 | | | | 5,000 | | | | 5,000,000 | |
Federal Home Loan Bank | | | 0.125% | (a) | | | 06/25/15 | | | | 5,000 | | | | 4,999,902 | |
Federal Home Loan Bank | | | 0.127% | (a) | | | 08/10/15 | | | | 5,000 | | | | 4,999,929 | |
Federal Home Loan Bank | | | 0.136% | (a) | | | 09/14/15 | | | | 5,000 | | | | 5,000,483 | |
Federal Home Loan Bank | | | 0.138% | (a) | | | 12/24/15 | | | | 5,000 | | | | 4,998,867 | |
Federal Home Loan Bank | | | 0.180% | (b) | | | 03/20/15 | | | | 10,000 | | | | 9,996,165 | |
Federal Home Loan Mortgage Corp. | | | 0.071% | (b) | | | 02/06/15 | | | | 3,000 | | | | 2,999,790 | |
Federal Home Loan Mortgage Corp. | | | 0.122% | (a) | | | 02/18/16 | | | | 9,000 | | | | 8,998,449 | |
Federal Home Loan Mortgage Corp. | | | 0.141% | (a) | | | 10/16/15 | | | | 3,000 | | | | 3,000,334 | |
Federal Home Loan Mortgage Corp. | | | 0.152% | (a) | | | 07/17/15 | | | | 9,000 | | | | 9,001,500 | |
Federal National Mortgage Assoc. | | | 0.070% | (b) | | | 01/20/15 | | | | 13,000 | | | | 12,999,528 | |
Federal National Mortgage Assoc. | | | 0.127% | (a) | | | 08/05/15 | | | | 4,000 | | | | 4,000,251 | |
| | | | | | | | | | | | | | |
|
|
|
| | | | | | | | | | | | | | | | 310,066,344 | |
| | | | | | | | | | | | | | |
|
|
|
| U.S. TREASURY OBLIGATIONS — 6.0% | |
U.S. Treasury Bills | | | 0.047% | (b) | | | 01/08/15 | | | | 3,000 | | | | 2,999,973 | |
U.S. Treasury Notes | | | 0.125% | | | | 04/30/15 | | | | 5,000 | | | | 5,000,498 | |
U.S. Treasury Notes | | | 0.250% | | | | 02/15/15 | | | | 9,000 | | | | 9,001,997 | |
U.S. Treasury Notes | | | 2.500% | | | | 03/31/15-04/30/15 | | | | 26,000 | | | | 26,178,026 | |
U.S. Treasury Notes | | | 4.000% | | | | 02/15/15 | | | | 6,000 | | | | 6,028,874 | |
| | | | | | | | | | | | | | |
|
|
|
| | | | | | | | | | | | | | | | 49,209,368 | |
| | | | | | | | | | | | | | |
|
|
|
TOTAL INVESTMENTS — 100.6%
(amortized cost $828,189,139) | | | | 828,189,139 | |
LIABILITIES IN EXCESS OF OTHER ASSETS — (0.6)% | | | | (4,601,784 | ) |
| | | | | | | | | | | | | | |
|
|
|
NET ASSETS — 100.0% | | | $ | 823,587,355 | |
| | | | | | | | | | | | | | |
|
|
|
See the Glossary for abbreviations used in the Portfolio descriptions.
| # | Principal amount is shown in U.S. dollars unless otherwise stated. |
| (a) | Variable rate instrument. The interest rate shown reflects the rate in effect at December 31, 2014. |
| (b) | Rate quoted represents yield-to-maturity as of purchase date. |
| (c) | Indicates a security that has been deemed illiquid. |
SEE NOTES TO FINANCIAL STATEMENTS.
A132
| | | | | | |
| | | MONEY MARKET PORTFOLIO (continued) | | |
| |
| SCHEDULE OF INVESTMENTS | | December 31, 2014 |
Various inputs are used in determining the value of the Portfolio’s investments. These inputs are summarized in the three broad levels listed below.
| Level 1— | quoted prices generally in active markets for identical securities. |
| Level 2— | quoted prices for similar securities, interest rates and yield curves, prepayment speeds, foreign currency exchange rates and other significant observable inputs. |
| Level 3— | significant unobservable inputs for securities valued in accordance with Board approved fair valuation procedures. The following is a summary of the inputs used as of December 31, 2014 in valuing such portfolio securities: |
| | | | | | | | | | | | |
| | | Level 1
| | | Level 2
| | | Level 3
| |
Investments in Securities | | | | | | | | | | | | |
Certificates of Deposit | | $ | — | | | $ | 182,401,724 | | | $ | — | |
Commercial Paper | | | — | | | | 212,579,629 | | | | — | |
Other Corporate Obligations | | | — | | | | 61,932,074 | | | | — | |
Time Deposits | | | — | | | | 12,000,000 | | | | — | |
U.S. Government Agency Obligations | | | — | | | | 310,066,344 | | | | — | |
U.S. Treasury Obligations | | | — | | | | 49,209,368 | | | | — | |
| | |
|
|
| |
|
|
| |
|
|
|
Total | | $ | — | | | $ | 828,189,139 | | | $ | — | |
| | |
|
|
| |
|
|
| |
|
|
|
The industry classification of investments and liabilities in excess of other assets shown as a percentage of net assets as of December 31, 2014 was as follows (Unaudited):
| | | | |
U.S. Government Agency Obligations | | | 37.7 | % |
Commercial Paper | | | 25.8 | |
Certificates of Deposit | | | 22.1 | |
Other Corporate Obligations | | | 7.5 | |
U.S. Treasury Obligations | | | 6.0 | |
| | | | |
Time Deposits | | | 1.5 | % |
| | |
|
|
|
| | | | 100.6 | |
Liabilities in excess of other assets | | | (0.6 | ) |
| | |
|
|
|
| | | | 100.0 | % |
| | |
|
|
|
SEE NOTES TO FINANCIAL STATEMENTS.
A133
| | | | | | |
| | | MONEY MARKET PORTFOLIO (continued) | | |
STATEMENT OF ASSETS AND LIABILITIES
December 31, 2014
| | | | |
| ASSETS | | | | |
Investments, at amortized cost which approximates fair value: | | $ | 828,189,139 | |
Cash | | | 1,981 | |
Interest receivable | | | 516,960 | |
Receivable for Series shares sold | | | 161,393 | |
Prepaid expenses | | | 6,583 | |
| | |
|
|
|
Total Assets | | | 828,876,056 | |
| | |
|
|
|
| LIABILITIES | | | | |
Payable for investments purchased | | | 4,999,125 | |
Accrued expenses | | | 134,026 | |
Management fee payable | | | 104,719 | |
Payable for Series shares repurchased | | | 49,905 | |
Affiliated transfer agent fee payable | | | 926 | |
| | |
|
|
|
Total Liabilities | | | 5,288,701 | |
| | |
|
|
|
| NET ASSETS | | $ | 823,587,355 | |
| | |
|
|
|
Net assets were comprised of: | | | | |
Paid-in capital | | $ | 823,587,355 | |
| | |
|
|
|
Net assets, December 31, 2014 | | $ | 823,587,355 | |
| | |
|
|
|
Net asset value and redemption price per share $823,587,355 / 82,355,753 outstanding shares of beneficial interest | | $ | 10.00 | |
| | |
|
|
|
STATEMENT OF OPERATIONS
Year Ended December 31, 2014
| | | | |
| NET INVESTMENT INCOME | | | | |
| INCOME | | | | |
Interest income | | $ | 1,330,181 | |
| | |
|
|
|
| EXPENSES | | | | |
Management fee | | | 3,383,905 | |
Custodian’s fees and expenses | | | 123,000 | |
Shareholders’ reports | | | 101,000 | |
Audit fee | | | 26,000 | |
Trustees’ fees | | | 17,000 | |
Insurance expenses | | | 12,000 | |
Transfer agent’s fees and expenses (including affiliated expense of $5,600) | | | 12,000 | |
Legal fees and expenses | | | 11,000 | |
Miscellaneous | | | 8,964 | |
| | |
|
|
|
Total expenses | | | 3,694,869 | |
Less: Management fee waiver | | | (2,364,760 | ) |
| | |
|
|
|
Net expenses | | | 1,330,109 | |
| | |
|
|
|
| NET INVESTMENT INCOME | | | 72 | |
| | |
|
|
|
| REALIZED GAIN ON INVESTMENTS | | | | |
Net realized gain on investment transactions | | | 7,039 | |
| | |
|
|
|
| NET INCREASE IN NET ASSETS RESULTING FROM OPERATIONS | | $ | 7,111 | |
| | |
|
|
|
STATEMENT OF CHANGES IN NET ASSETS
| | | | | | | | |
| | | Year Ended December 31,
| |
| | | 2014
| | | 2013
| |
| INCREASE (DECREASE) IN NET ASSETS | | | | | | | | |
| OPERATIONS | | | | | | | | |
Net investment income | | $ | 72 | | | $ | — | |
Net realized gain on investment transactions | | | 7,039 | | | | 14,454 | |
| | |
|
|
| |
|
|
|
NET INCREASE IN NET ASSETS RESULTING FROM OPERATIONS | | | 7,111 | | | | 14,454 | |
| | |
|
|
| |
|
|
|
Dividends from net investment income | | | (7,111 | ) | | | (14,454 | ) |
| | |
|
|
| |
|
|
|
| SERIES SHARE TRANSACTIONS | | | | | | | | |
Series shares sold [22,388,218 and 15,412,796 shares, respectively] | | | 223,882,182 | | | | 154,127,954 | |
Series shares issued in reinvestment of distributions [711 and 1,445 shares, respectively] | | | 7,111 | | | | 14,454 | |
Series shares repurchased [26,634,487 and 19,157,649 shares, respectively] | | | (266,344,871 | ) | | | (191,576,491 | ) |
| | |
|
|
| |
|
|
|
NET DECREASE IN NET ASSETS FROM SERIES SHARE TRANSACTIONS | | | (42,455,578 | ) | | | (37,434,083 | ) |
| | |
|
|
| |
|
|
|
| TOTAL DECREASE | | | (42,455,578 | ) | | | (37,434,083 | ) |
| NET ASSETS: | | | | | | | | |
Beginning of year | | | 866,042,933 | | | | 903,477,016 | |
| | |
|
|
| |
|
|
|
End of year | | $ | 823,587,355 | | | $ | 866,042,933 | |
| | |
|
|
| |
|
|
|
SEE NOTES TO FINANCIAL STATEMENTS.
A134
| | | | | | |
| | | NATURAL RESOURCES PORTFOLIO | | |
| |
| SCHEDULE OF INVESTMENTS | | December 31, 2014 |
| | | | | | | | |
| LONG-TERM INVESTMENTS — 95.8% | |
| COMMON STOCKS — 95.7% | | Shares
| | | Value
(Note 2)
| |
Aluminum — 1.1% | | | | | | | | |
Alcoa, Inc. | | | 21,638 | | | $ | 341,664 | |
Constellium NV (Netherlands) (Class A Stock)* | | | 376,130 | | | | 6,179,816 | |
Norsk Hydro ASA (Norway) | | | 57,684 | | | | 324,936 | |
| | | | | | |
|
|
|
| | | | | | | | 6,846,416 | |
| | | | | | |
|
|
|
Coal & Consumable Fuels — 1.8% | | | | | | | | |
CONSOL Energy, Inc. | | | 341,538 | | | | 11,547,400 | |
| | | | | | |
|
|
|
Diversified Metals & Mining — 7.5% | | | | | | | | |
African Rainbow Minerals Ltd. (South Africa) | | | 286,406 | | | | 2,932,895 | |
Anglo American PLC (United Kingdom) | | | 13,916 | | | | 257,508 | |
BHP Billiton Ltd. (Australia), ADR(a) | | | 161,294 | | | | 7,632,432 | |
First Quantum Minerals Ltd. (Canada) | | | 559,594 | | | | 7,952,227 | |
Freeport-McMoRan Copper & Gold, Inc. | | | 175,557 | | | | 4,101,011 | |
Glencore PLC (Switzerland) | | | 2,211,779 | | | | 10,209,215 | |
Ivanhoe Mines Ltd. (Canada)* | | | 357,087 | | | | 313,504 | |
Ivanhoe Mines Ltd. (Canada) (Class A Stock), 144A*(b) | | | 433,900 | | | | 384,676 | |
Northern Dynasty Minerals Ltd. (Canada)*(a) | | | 399,636 | | | | 162,052 | |
Rio Tinto PLC (United Kingdom), ADR(a) | | | 224,785 | | | | 10,353,597 | |
Southern Copper Corp. | | | 109,359 | | | | 3,083,924 | |
| | | | | | |
|
|
|
| | | | | | | | 47,383,041 | |
| | | | | | |
|
|
|
Fertilizers & Agricultural Chemicals — 1.2% | |
Potash Corp. of Saskatchewan, Inc. (Canada) | | | 217,312 | | | | 7,675,460 | |
| | | | | | |
|
|
|
Gold — 5.9% | | | | | | | | |
Agnico Eagle Mines Ltd. (Canada) | | | 141,352 | | | | 3,518,251 | |
Alacer Gold Corp. | | | 727,441 | | | | 1,458,889 | |
Algold Resources Ltd. (Canada),
144A*(b) | | | 29,193 | | | | 6,031 | |
Axmin, Inc. (Canada)* | | | 155,620 | | | | 2,009 | |
B2Gold Corp. (Canada)*(a) | | | 2,155,332 | | | | 3,524,816 | |
Barrick Gold Corp. (Canada)(a) | | | 340,897 | | | | 3,664,643 | |
Eldorado Gold Corp. (Canada) | | | 1,487,941 | | | | 9,067,501 | |
Goldcorp, Inc. (Canada) | | | 15,139 | | | | 280,374 | |
Guyana Goldfields Inc., Reg. D (Canada), Private Placement (original cost $629,040; purchased 6/24/2014)*(c) | | | 365,319 | | | | 886,727 | |
Guyana Goldfields, Inc. (Canada), 144A*(b) | | | 726,972 | | | | 1,764,556 | |
Kinross Gold Corp. (Canada)* | | | 846,489 | | | | 2,387,099 | |
Newmont Mining Corp. | | | 17,388 | | | | 328,633 | |
Randgold Resources Ltd. (United Kingdom), ADR(a) | | | 158,208 | | | | 10,664,801 | |
| | | | | | |
|
|
|
| | | | | | | | 37,554,330 | |
| | | | | | |
|
|
|
Integrated Oil & Gas — 6.0% | | | | | | | | |
Chevron Corp. | | | 1,719 | | | | 192,837 | |
Hess Corp. | | | 107,065 | | | | 7,903,538 | |
Occidental Petroleum Corp. | | | 135,993 | | | | 10,962,396 | |
| | | | | | | | |
COMMON STOCKS
(continued) | | Shares
| | | Value
(Note 2)
| |
Integrated Oil & Gas (continued) | | | | | | | | |
Royal Dutch Shell PLC (Netherlands) (Class A Stock), ADR | | | 4,309 | | | $ | 288,488 | |
Suncor Energy, Inc. (Canada) | | | 585,451 | | | | 18,605,633 | |
| | | | | | |
|
|
|
| | | | | | | | 37,952,892 | |
| | | | | | |
|
|
|
Oil & Gas Drilling — 2.3% | | | | | | | | |
Ensco PLC (Class A Stock) | | | 4,603 | | | | 137,860 | |
Helmerich & Payne, Inc. | | | 43,771 | | | | 2,951,041 | |
Independence Contract Drilling Inc.* | | | 336,881 | | | | 1,758,519 | |
Patterson-UTI Energy, Inc. | | | 360,405 | | | | 5,979,119 | |
Rowan Cos. PLC (Class A Stock) | | | 159,273 | | | | 3,714,246 | |
| | | | | | |
|
|
|
| | | | | | | | 14,540,785 | |
| | | | | | |
|
|
|
Oil & Gas Equipment & Services — 18.7% | |
Baker Hughes, Inc. | | | 6,110 | | | | 342,588 | |
Cameron International Corp.* | | | 387,800 | | | | 19,370,610 | |
Core Laboratories NV(a) | | | 73,141 | | | | 8,801,788 | |
Dril-Quip, Inc.* | | | 230,659 | | | | 17,698,465 | |
FMC Technologies, Inc.* | | | 110,644 | | | | 5,182,565 | |
Halliburton Co. | | | 410,444 | | | | 16,142,762 | |
National Oilwell Varco, Inc. | | | 228,218 | | | | 14,955,125 | |
Schlumberger Ltd. | | | 324,753 | | | | 27,737,154 | |
Superior Energy Services, Inc. | | | 390,426 | | | | 7,867,084 | |
Tenaris SA (Luxembourg), ADR | | | 6,752 | | | | 203,978 | |
| | | | | | |
|
|
|
| | | | | | | | 118,302,119 | |
| | | | | | |
|
|
|
Oil & Gas Exploration & Production — 39.6% | |
Africa Oil Corp. (Canada)*(a) | | | 353,810 | | | | 733,932 | |
Africa Oil Corp., Reg. D (Canada)* | | | 42,762 | | | | 88,704 | |
Anadarko Petroleum Corp. | | | 305,164 | | | | 25,176,030 | |
Antero Resources Corp*(a) | | | 153,140 | | | | 6,214,421 | |
Apache Corp. | | | 4,853 | | | | 304,137 | |
Bankers Petroleum Ltd. (Canada)* | | | 718,499 | | | | 2,016,101 | |
Bonanza Creek Energy, Inc.* | | | 129,895 | | | | 3,117,480 | |
Cabot Oil & Gas Corp. | | | 11,460 | | | | 339,331 | |
Canadian Natural Resources Ltd. (Canada) | | | 155,758 | | | | 4,809,807 | |
Chesapeake Energy Corp. | | | 18,166 | | | | 355,509 | |
Cimarex Energy Co. | | | 111,386 | | | | 11,806,916 | |
Cobalt International Energy, Inc.* | | | 378,694 | | | | 3,366,590 | |
Concho Resources, Inc.* | | | 222,602 | | | | 22,204,549 | |
ConocoPhillips | | | 5,324 | | | | 367,675 | |
Continental Resources, Inc.*(a) | | | 6,705 | | | | 257,204 | |
Crew Energy Inc (Canada)* | | | 438,928 | | | | 2,236,576 | |
Denbury Resources, Inc.(a) | | | 86,783 | | | | 705,546 | |
Devon Energy Corp. | | | 308,900 | | | | 18,907,769 | |
EOG Resources, Inc. | | | 234,735 | | | | 21,612,051 | |
EQT Corp. | | | 4,227 | | | | 319,984 | |
Genel Energy PLC (United Kingdom)* | | | 294,586 | | | | 3,196,650 | |
Gulfport Energy Corp.* | | | 161,551 | | | | 6,743,139 | |
Kosmos Energy Ltd.* | | | 331,163 | | | | 2,778,458 | |
Laredo Petroleum, Inc.* | | | 528,375 | | | | 5,468,681 | |
Lekoil Ltd. (Nigeria)* | | | 820,280 | | | | 356,379 | |
Lekoil Ltd., Reg. D (Nigeria)* | | | 2,947,579 | | | | 1,280,607 | |
Marathon Oil Corp. | | | 429,803 | | | | 12,159,127 | |
MEG Energy Corp. (Canada)* | | | 196,260 | | | | 3,302,533 | |
MEG Energy Corp. (Canada),
144A*(b) | | | 131,600 | | | | 2,214,478 | |
Mobius Resources Inc., Reg. D (Canada)* | | | 773,332 | | | | 109,829 | |
SEE NOTES TO FINANCIAL STATEMENTS.
A135
| | | | | | |
| | | NATURAL RESOURCES PORTFOLIO (continued) | | |
| |
| SCHEDULE OF INVESTMENTS | | December 31, 2014 |
| | | | | | | | |
COMMON STOCKS
(continued) | | Shares
| | | Value
(Note 2)
| |
Oil & Gas Exploration & Production (continued) | |
Mobius Resources, Inc. (Canada)* | | | 321,393 | | | $ | 45,645 | |
Newfield Exploration Co.* | | | 116,440 | | | | 3,157,853 | |
Noble Energy, Inc. | | | 462,052 | | | | 21,915,126 | |
Nuvista Energy Ltd (Canada)* | | | 383,330 | | | | 2,444,892 | |
Oasis Petroleum, Inc.*(a) | | | 174,409 | | | | 2,884,725 | |
Oil Search Ltd. (Australia) | | | 661,043 | | | | 4,238,998 | |
PDC Energy, Inc.* | | | 214,453 | | | | 8,850,475 | |
Pioneer Natural Resources Co. | | | 42,227 | | | | 6,285,489 | |
Range Resources Corp. | | | 213,500 | | | | 11,411,575 | |
Rice Energy, Inc.* | | | 270,745 | | | | 5,677,523 | |
Rosetta Resources, Inc.* | | | 309,143 | | | | 6,896,980 | |
Seven Generations Energy Ltd. (Canada), 144A*(a)(b) | | | 129,839 | | | | 1,954,626 | |
Seven Generations Energy Ltd. (Canada) (Class A Stock)*(a) | | | 53,477 | | | | 805,055 | |
Southwestern Energy Co.* | | | 114,777 | | | | 3,132,264 | |
Tullow Oil PLC (United Kingdom) | | | 307,426 | | | | 1,981,166 | |
Whiting Petroleum Corp.* | | | 189,346 | | | | 6,248,418 | |
Woodside Petroleum Ltd. (Australia) | | | 4,863 | | | | 150,400 | |
| | | | | | |
|
|
|
| | | | | | | | 250,631,403 | |
| | | | | | |
|
|
|
Oil & Gas Refining & Marketing — 6.0% | |
Marathon Petroleum Corp. | | | 227,486 | | | | 20,532,886 | |
Phillips 66 | | | 178,318 | | | | 12,785,401 | |
Valero Energy Corp. | | | 7,250 | | | | 358,875 | |
Western Refining, Inc. | | | 115,345 | | | | 4,357,734 | |
| | | | | | |
|
|
|
| | | | | | | | 38,034,896 | |
| | | | | | |
|
|
|
Oil & Gas Storage & Transportation — 1.7% | |
Cheniere Energy, Inc.* | | | 85,836 | | | | 6,042,854 | |
Kinder Morgan, Inc.(a) | | | 5,421 | | | | 229,363 | |
Williams Cos., Inc. (The) | | | 106,498 | | | | 4,786,020 | |
| | | | | | |
|
|
|
| | | | | | | | 11,058,237 | |
| | | | | | |
|
|
|
Packaged Foods & Meats — 0.4% | |
Adecoagro SA (Luxembourg)* | | | 289,976 | | | | 2,322,708 | |
| | | | | | |
|
|
|
Precious Metals & Minerals — 0.1% | |
Platinum Group Metals Ltd. (Canada)* | | | 1,234,422 | | | | 601,040 | |
Sedibelo Platinum Mines (South Africa), Private Placement (original cost $1,102,975; purchased 11/27/07)*(b)(c) | | | 129,100 | | | | 11,973 | |
| | | | | | |
|
|
|
| | | | | | | | 613,013 | |
| | | | | | |
|
|
|
Silver — 1.2% | |
Silver Wheaton Corp. (Canada) | | | 224,465 | | | | 4,563,373 | |
Tahoe Resources, Inc.* | | | 82,808 | | | | 1,151,101 | |
Tahoe Resources, Inc., 144A*(b) | | | 116,000 | | | | 1,612,498 | |
| | | | | | |
|
|
|
| | | | | | | | 7,326,972 | |
| | | | | | |
|
|
|
Specialty Chemicals — 0.9% | |
Ashland, Inc. | | | 1,239 | | | | 148,383 | |
Flotek Industries, Inc.*(a) | | | 260,973 | | | | 4,888,024 | |
PPG Industries, Inc. | | | 1,532 | | | | 354,122 | |
| | | | | | |
|
|
|
| | | | | | | | 5,390,529 | |
| | | | | | |
|
|
|
Steel — 1.3% | |
ArcelorMittal (Luxembourg),
ADR(a) | | | 29,587 | | | | 326,345 | |
Nucor Corp. | | | 7,433 | | | | 364,589 | |
| | | | | | | | |
COMMON STOCKS
(continued) | | Shares
| | | Value
(Note 2)
| |
Steel (continued) | |
Reliance Steel & Aluminum Co. | | | 119,054 | | | $ | 7,294,438 | |
| | | | | | |
|
|
|
| | | | | | | | 7,985,372 | |
| | | | | | |
|
|
|
TOTAL COMMON STOCKS
(cost $533,094,897) | | | | 605,165,573 | |
| | | | | | |
|
|
|
| CONVERTIBLE PREFERRED STOCKS* — 0.1% | |
Steel | |
Manabi SA (Brazil) (Class A Preferred), Private Placement (original cost $4,587,721; purchased 05/25/11),
144A(b)(c) | | | 3,660 | | | | 505,080 | |
Manabi SA (Brazil) (Class B Preferred), Private Placement (original cost $1,848,551; purchased 08/21/12),
144A(b)(c) | | | 1,464 | | | | 202,032 | |
| | | | | | |
|
|
|
TOTAL CONVERTIBLE PREFERRED STOCKS
(cost $6,436,272) | | | | 707,112 | |
| | | | | | |
|
|
|
| | |
| | | Units
| | | | |
| RIGHTS* | |
Oil, Gas & Consumable Fuels | |
Trident Resources Corp. CVR (Canada), Private Placement expiring 06/30/15
(original cost $0; purchased
06/30/10)(b)(c) | | | 9,007 | | | | — | (d) |
| | | | | | |
|
|
|
| WARRANTS* | |
Gold | |
Algold Resources Ltd. (Canada), Private Placement expiring 06/23/15
(original cost $0; purchased 12/23/13),
144A(b)(c) | | | 14,596 | | | | 502 | |
Crystallex International Corp. (Canada), Private Placement expiring 11/04/19
(original cost $0; purchased
11/04/09)(b)(c) | | | 221,350 | | | | — | (d) |
| | | | | | |
|
|
|
TOTAL WARRANTS
(cost $0) | | | | | | | 502 | |
| | | | | | |
|
|
|
TOTAL LONG-TERM INVESTMENTS
(cost $539,531,169) | | | | | | | 605,873,187 | |
| | | | | | |
|
|
|
| | |
| | | Shares
| | | | |
| SHORT-TERM INVESTMENT — 11.0% | |
AFFILIATED MONEY MARKET MUTUAL FUND | |
Prudential Investment Portfolios 2 — Prudential Core Taxable Money Market Fund (cost $69,668,225; includes $42,659,785 of cash collateral for securities on loan)(Note 4)(e)(f) | | | 69,668,225 | | | | 69,668,225 | |
| | | | | | |
|
|
|
TOTAL INVESTMENTS — 106.8%
(cost $609,199,394) | | | | 675,541,412 | |
LIABILITIES IN EXCESS OF OTHER ASSETS — (6.8)% | | | | (43,064,940 | ) |
| | | | | | |
|
|
|
NET ASSETS 100.0% | | | $ | 632,476,472 | |
| | | | | | |
|
|
|
SEE NOTES TO FINANCIAL STATEMENTS.
A136
| | | | | | |
| | | NATURAL RESOURCES PORTFOLIO (continued) | | |
| |
| SCHEDULE OF INVESTMENTS | | December 31, 2014 |
See the Glossary for abbreviations used in the Portfolio descriptions.
| * | Non-income producing security. |
| (a) | All or a portion of security is on loan. The aggregate market value of such securities, including those sold and pending settlement, is $40,944,930; cash collateral of $42,659,785 (included in liabilities) was received with which the Portfolio purchased highly liquid short-term investments. Securities on loan are subject to contractual netting arrangements. |
| (b) | Indicates a security that has been deemed illiquid. |
| (c) | Indicates a restricted security; the aggregate original cost of such securities is $8,168,287. The aggregate value of, $1,606,314, is approximately 0.3% of net assets. |
| (e) | Prudential Investments LLC, the manager of the Portfolio, also serves as manager of the Prudential Investment Portfolios 2 — Prudential Core Taxable Money Market Fund. |
| (f) | Represents security, or a portion thereof, purchased with cash collateral received for securities on loan. |
Various inputs are used in determining the value of the Portfolio’s investments. These inputs are summarized in the three broad levels listed below.
| Level 1— | quoted prices generally in active markets for identical securities. |
| Level 2— | quoted prices for similar securities, interest rates and yield curves, prepayment speeds, foreign currency exchange rates and other significant observable inputs. |
| Level 3— | significant unobservable inputs for securities valued in accordance with Board approved fair valuation procedures. |
The following is a summary of the inputs used as of December 31, 2014 in valuing such portfolio securities:
| | | | | | | | | | | | |
| | | Level 1
| | | Level 2
| | | Level 3
| |
Investments in Securities | | | | | | | | | | | | |
Common Stocks | | | | | | | | | | | | |
Aluminum | | $ | 6,521,480 | | | $ | 324,936 | | | $ | — | |
Coal & Consumable Fuels | | | 11,547,400 | | | | — | | | | — | |
Diversified Metals & Mining | | | 33,598,747 | | | | 13,784,294 | | | | — | |
Fertilizers & Agricultural Chemicals | | | 7,675,460 | | | | — | | | | — | |
Gold | | | 34,903,047 | | | | 2,651,283 | | | | — | |
Integrated Oil & Gas | | | 37,952,892 | | | | — | | | | — | |
Oil & Gas Drilling | | | 14,540,785 | | | | — | | | | — | |
Oil & Gas Equipment & Services | | | 118,302,119 | | | | — | | | | — | |
Oil & Gas Exploration & Production | | | 235,504,649 | | | | 15,126,754 | | | | — | |
Oil & Gas Refining & Marketing | | | 38,034,896 | | | | — | | | | — | |
Oil & Gas Storage & Transportation | | | 11,058,237 | | | | — | | | | — | |
Packaged Foods & Meats | | | 2,322,708 | | | | — | | | | — | |
Precious Metals & Minerals | | | 601,040 | | | | — | | | | 11,973 | |
Silver | | | 5,714,474 | | | | 1,612,498 | | �� | | — | |
Specialty Chemicals | | | 5,390,529 | | | | — | | | | — | |
Steel | | | 7,985,372 | | | | — | | | | — | |
Convertible Preferred Stocks | | | | | | | | | | | | |
Steel | | | — | | | | — | | | | 707,112 | |
Rights | | | | | | | | | | | | |
Oil, Gas & Consumable Fuels | | | — | | | | — | | | | — | ** |
Warrants | | | | | | | | | | | | |
Gold | | | — | | | | 502 | | | | — | ** |
Affiliated Money Market Mutual Fund | | | 69,668,225 | | | | — | | | | — | |
| | |
|
|
| |
|
|
| |
|
|
|
Total | | $ | 641,322,060 | | | $ | 33,500,267 | | | $ | 719,085 | |
| | |
|
|
| |
|
|
| |
|
|
|
SEE NOTES TO FINANCIAL STATEMENTS.
A137
| | | | | | |
| | | NATURAL RESOURCES PORTFOLIO (continued) | | |
| |
| SCHEDULE OF INVESTMENTS | | December 31, 2014 |
The following is a reconciliation of assets in which significant unobservable inputs (Level 3) were used in determining fair value:
| | | | | | | | | | | | | | | | |
| | | Common
Stock
| | | Convertible
Preferred
Stocks
| | | Rights
| | | Warrants
| |
Balance as of 12/31/13 | | $ | 13,044 | | | $ | 5,002,366 | | | $ | — | ** | | $ | — | ** |
Realized gain (loss) | | | — | | | | — | | | | — | | | | — | |
Change in unrealized appreciation (depreciation)* | | | (1,071 | ) | | | (4,295,254 | ) | | | — | | | | — | |
Purchases | | | — | | | | — | | | | — | | | | — | |
Sales | | | — | | | | | | | | — | | | | — | |
Accrued discount/premium | | | — | | | | — | | | | — | | | | — | |
Transfer into Level 3 | | | — | | | | — | | | | — | | | | — | |
Transfer out of Level 3 | | | — | | | | — | | | | — | | | | — | |
| | |
|
|
| |
|
|
| |
|
|
| |
|
|
|
Balance as of 12/31/14 | | $ | 11,973 | | | $ | 707,112 | | | $ | — | ** | | $ | — | ** |
| | |
|
|
| |
|
|
| |
|
|
| |
|
|
|
| * | Of which, $(4,296,325) was relating to securities held at the reporting period end. |
Level 3 securities as presented in the table above are being fair valued using pricing methodologies approved by the Board. One common stock was fair valued using last traded price adjusted for daily changes in indices deemed directly or indirectly correlated to the security. There were two convertible preferred stocks that were fair valued using a discount approach to address that lack of liquidity at such securities. For equity rights received through a bankruptcy distribution, the fair value is determined to be the residual value of the original bonds and other factors impacting the values of securities being issued pursuant to the reorganization. For certain warrants received in a private placement offering, the Manager has determined the fair value using the Black Scholes method with adjustment for volatility factor which is deemed to be a significant unobservable input. For the common stock, convertible preferred stocks and rights, the securities were private placement and therefore, the prices were a significant unobservable input.
The industry classification of investments and liabilities in excess of other assets shown as a percentage of net assets as of December 31, 2014 was as follows (Unaudited):
| | | | |
Oil & Gas Exploration & Production | | | 39.6 | % |
Oil & Gas Equipment & Services | | | 18.7 | |
Affiliated Money Market Mutual Fund (including 6.7% of collateral for securities on loan) | | | 11.0 | |
Diversified Metals & Mining | | | 7.5 | |
Oil & Gas Refining & Marketing | | | 6.0 | |
Integrated Oil & Gas | | | 6.0 | |
Gold | | | 5.9 | |
Oil & Gas Drilling | | | 2.3 | |
Coal & Consumable Fuels | | | 1.8 | |
Oil & Gas Storage & Transportation | | | 1.7 | |
| | | | |
Steel | | | 1.4 | % |
Fertilizers & Agricultural Chemicals | | | 1.2 | |
Silver | | | 1.2 | |
Aluminum | | | 1.1 | |
Specialty Chemicals | | | 0.9 | |
Packaged Foods & Meats | | | 0.4 | |
Precious Metals & Minerals | | | 0.1 | |
| | |
|
|
|
| | | | 106.8 | |
Liabilities in excess of other assets | | | (6.8 | ) |
| | |
|
|
|
| | | | 100.0 | % |
| | |
|
|
|
The Portfolio invested in derivative instruments during the reporting period. The primary type of risk associated with these derivative instruments is equity risk. The effect of such derivative instruments on the Portfolio’s financial position and financial performance as reflected in the Statement of Assets and Liabilities and Statement of Operations is presented in the summary below.
Fair values of derivative instruments as of December 31, 2014 as presented in the Statement of Assets and Liabilities:
| | | | | | | | | | | | |
Derivatives not designated as hedging
instruments, carried at fair value
| | Asset Derivatives
| | | Liability Derivatives
| |
| | Balance Sheet Location
| | Fair Value
| | | Balance Sheet Location
| | Fair Value
| |
Equity contract | | Unaffiliated Investments | | $ | 502 | | | — | | $ | — | |
| | | | |
|
|
| | | |
|
|
|
The effects of derivative instruments on the Statement of Operations for the year ended December 31, 2014 are as follows:
For the year ended December 31, 2014, the Portfolio did not have any realized gain or (loss) on derivatives recognized in income on the Statement of Operations.
| | |
Change in Unrealized Appreciation or (Depreciation) on Derivatives Recognized in Income
|
Derivatives not designated as hedging instruments, carried at fair value
| | Warrants*
|
Equity contracts | | $502 |
| | |
|
| * | Included in net change in unrealized (depreciation) on investments in the Statement of Operations. |
SEE NOTES TO FINANCIAL STATEMENTS.
A138
| | | | | | |
| | | NATURAL RESOURCES PORTFOLIO (continued) | | |
STATEMENT OF ASSETS AND LIABILITIES
December 31, 2014
| | | | |
| ASSETS | | | | |
Investments at value, including securities on loan of $40,944,930: | | | | |
Unaffiliated investments (cost $539,531,169) | | $ | 605,873,187 | |
Affiliated investments (cost $69,668,225) | | | 69,668,225 | |
Cash | | | 23,129 | |
Dividends receivable | | | 272,626 | |
Tax reclaim receivable | | | 218,057 | |
Receivable for Series shares sold | | | 4,075 | |
Prepaid expenses | | | 7,523 | |
| | |
|
|
|
Total Assets | | | 676,066,822 | |
| | |
|
|
|
| LIABILITIES | | | | |
Payable to broker for collateral for securities on loan | | | 42,659,785 | |
Payable for Series shares repurchased | | | 533,850 | |
Management fee payable | | | 214,888 | |
Accrued expenses | | | 166,365 | |
Distribution fee payable | | | 9,081 | |
Administration fee payable | | | 5,455 | |
Affiliated transfer agent fee payable | | | 926 | |
| | |
|
|
|
Total Liabilities | | | 43,590,350 | |
| | |
|
|
|
| NET ASSETS | | $ | 632,476,472 | |
| | |
|
|
|
Net assets were comprised of: | | | | |
Paid-in capital | | $ | 510,264,969 | |
Retained earnings | | | 122,211,503 | |
| | |
|
|
|
Net assets, December 31, 2014 | | $ | 632,476,472 | |
| | |
|
|
|
| Class I: | | | | |
Net asset value and redemption price per share $588,974,551 / 19,714,898 outstanding shares of beneficial interest | | $ | 29.87 | |
| | |
|
|
|
| Class II: | | | | |
Net asset value and redemption price per share $43,501,921 / 1,482,111 outstanding shares of beneficial interest | | $ | 29.35 | |
| | |
|
|
|
STATEMENT OF OPERATIONS
Year Ended December 31, 2014
| | | | |
| NET INVESTMENT INCOME | | | | |
| INCOME | | | | |
Unaffiliated dividend income (net of foreign withholding taxes of $293,483) | | $ | 8,539,784 | |
Affiliated income from securities loaned, net | | | 164,527 | |
Affiliated dividend income | | | 32,068 | |
| | |
|
|
|
Total income | | | 8,736,379 | |
| | |
|
|
|
| EXPENSES | | | | |
Management fee | | | 3,796,593 | |
Distribution fee—Class II | | | 130,749 | |
Administration fee—Class II | | | 78,450 | |
Custodian’s fees and expenses | | | 131,000 | |
Shareholders’ reports | | | 131,000 | |
Audit fee | | | 30,000 | |
Trustees’ fees | | | 17,000 | |
Insurance expenses | | | 12,000 | |
Transfer agent’s fees and expenses (including affiliated expense of $5,600) | | | 12,000 | |
Legal fees and expenses | | | 10,000 | |
Commitment fee on syndicated credit agreement | | | 2,000 | |
Miscellaneous | | | 53,331 | |
| | |
|
|
|
Total expenses | | | 4,404,123 | |
Less: Management fee waiver | | | (421,844 | ) |
| | |
|
|
|
Net expenses | | | 3,982,279 | |
| | |
|
|
|
| NET INVESTMENT INCOME | | | 4,754,100 | |
| | |
|
|
|
| REALIZED AND UNREALIZED GAIN (LOSS) ON INVESTMENT AND FOREIGN CURRENCY TRANSACTIONS | | | | |
Net realized gain on: | | | | |
Investment transactions | | | 39,019,781 | |
Foreign currency transactions | | | 5,224 | |
| | |
|
|
|
| | | | 39,025,005 | |
| | |
|
|
|
Net change in unrealized depreciation on: | | | | |
Investments | | | (199,647,339 | ) |
Foreign currencies | | | (17,467 | ) |
| | |
|
|
|
| | | | (199,664,806 | ) |
| | |
|
|
|
| NET LOSS ON INVESTMENT AND FOREIGN CURRENCY TRANSACTIONS | | | (160,639,801 | ) |
| | |
|
|
|
| NET DECREASE IN NET ASSETS RESULTING FROM OPERATIONS | | $ | (155,885,701 | ) |
| | |
|
|
|
STATEMENT OF CHANGES IN NET ASSETS
| | | | | | | | |
| | | Year Ended December 31,
| |
| | | 2014
| | | 2013
| |
| INCREASE (DECREASE) IN NET ASSETS | | | | | | | | |
| OPERATIONS: | | | | | | | | |
Net investment income | | $ | 4,754,100 | | | $ | 4,450,112 | |
Net realized gain on investment and foreign currency transactions | | | 39,025,005 | | | | 11,477,058 | |
Net change in unrealized appreciation (depreciation) on investments and foreign currencies | | | (199,664,806 | ) | | | 66,874,621 | |
| | |
|
|
| |
|
|
|
NET INCREASE (DECREASE) IN NET ASSETS RESULTING FROM OPERATIONS | | | (155,885,701 | ) | | | 82,801,791 | |
| | |
|
|
| |
|
|
|
| SERIES SHARE TRANSACTIONS (Note 7) | | | | | | | | |
Series shares sold | | | 36,365,649 | | | | 22,409,085 | |
Series shares repurchased | | | (94,184,529 | ) | | | (122,377,266 | ) |
| | |
|
|
| |
|
|
|
NET DECREASE IN NET ASSETS FROM SERIES SHARE TRANSACTIONS | | | (57,818,880 | ) | | | (99,968,181 | ) |
| | |
|
|
| |
|
|
|
| TOTAL DECREASE | | | (213,704,581 | ) | | | (17,166,390 | ) |
| NET ASSETS: | | | | | | | | |
Beginning of year | | | 846,181,053 | | | | 863,347,443 | |
| | |
|
|
| |
|
|
|
End of year | | $ | 632,476,472 | | | $ | 846,181,053 | |
| | |
|
|
| |
|
|
|
SEE NOTES TO FINANCIAL STATEMENTS.
A139
| | | | | | |
| | | SMALL CAPITALIZATION STOCK PORTFOLIO | | |
| |
| SCHEDULE OF INVESTMENTS | | December 31, 2014 |
| | | | | | | | |
| LONG-TERM INVESTMENTS — 98.5% | | | | |
| COMMON STOCKS — 97.8% | | Shares
| | | Value
(Note 2)
| |
Aerospace & Defense — 2.6% | | | | | | | | |
AAR Corp. | | | 39,871 | | | $ | 1,107,616 | |
Aerovironment, Inc.* | | | 21,314 | | | | 580,807 | |
American Science & Engineering, Inc. | | | 8,316 | | | | 431,600 | |
Cubic Corp. | | | 23,073 | | | | 1,214,563 | |
Curtiss-Wright Corp. | | | 50,902 | | | | 3,593,172 | |
Engility Holdings, Inc.* | | | 18,600 | | | | 796,080 | |
GenCorp, Inc.*(a) | | | 62,275 | | | | 1,139,632 | |
Moog, Inc. (Class A Stock)* | | | 43,094 | | | | 3,190,249 | |
National Presto Industries, Inc.(a) | | | 5,199 | | | | 301,750 | |
Orbital Sciences Corp.* | | | 64,140 | | | | 1,724,725 | |
TASER International, Inc.*(a) | | | 55,600 | | | | 1,472,288 | |
Teledyne Technologies, Inc.* | | | 38,696 | | | | 3,975,627 | |
| | | | | | |
|
|
|
| | | | | | | | 19,528,109 | |
| | | | | | |
|
|
|
Air Freight & Logistics — 0.7% | | | | | | | | |
Atlas Air Worldwide Holdings, Inc.* | | | 26,200 | | | | 1,291,660 | |
Forward Air Corp. | | | 32,256 | | | | 1,624,735 | |
Hub Group, Inc. (Class A Stock)* | | | 36,770 | | | | 1,400,201 | |
UTi Worldwide, Inc.*(a) | | | 97,000 | | | | 1,170,790 | |
| | | | | | |
|
|
|
| | | | | | | | 5,487,386 | |
| | | | | | |
|
|
|
Airlines — 0.4% | | | | | | | | |
Allegiant Travel Co. | | | 14,494 | | | | 2,178,883 | |
SkyWest, Inc. | | | 53,860 | | | | 715,261 | |
| | | | | | |
|
|
|
| | | | | | | | 2,894,144 | |
| | | | | | |
|
|
|
Auto Components — 0.6% | | | | | | | | |
Dorman Products, Inc.*(a) | | | 32,500 | | | | 1,568,775 | |
Drew Industries, Inc.* | | | 25,089 | | | | 1,281,295 | |
Standard Motor Products, Inc. | | | 21,999 | | | | 838,602 | |
Superior Industries International, Inc. | | | 24,318 | | | | 481,253 | |
| | | | | | |
|
|
|
| | | | | | | | 4,169,925 | |
| | | | | | |
|
|
|
Automobiles — 0.1% | | | | | | | | |
Winnebago Industries, Inc. | | | 28,631 | | | | 623,011 | |
| | | | | | |
|
|
|
Banks — 7.8% | | | | | | | | |
Bank of the Ozarks, Inc. | | | 68,472 | | | | 2,596,458 | |
Banner Corp. | | | 20,700 | | | | 890,514 | |
BBCN Bancorp, Inc. | | | 83,982 | | | | 1,207,661 | |
Boston Private Financial Holdings, Inc. | | | 87,302 | | | | 1,175,958 | |
Cardinal Financial Corp. | | | 33,800 | | | | 670,254 | |
Central Pacific Financial Corp. | | | 27,700 | | | | 595,550 | |
City Holding Co. | | | 16,144 | | | | 751,180 | |
Columbia Banking System, Inc. | | | 56,508 | | | | 1,560,186 | |
Community Bank System, Inc. | | | 42,996 | | | | 1,639,437 | |
CVB Financial Corp. | | | 101,600 | | | | 1,627,632 | |
First BanCorp* | | | 110,372 | | | | 647,884 | |
First Commonwealth Financial Corp. | | | 96,210 | | | | 887,056 | |
First Financial Bancorp | | | 64,803 | | | | 1,204,688 | |
First Financial Bankshares, Inc.(a) | | | 67,878 | | | | 2,028,195 | |
First Midwest Bancorp, Inc. | | | 79,740 | | | | 1,364,351 | |
FNB Corp. | | | 183,400 | | | | 2,442,888 | |
Glacier Bancorp, Inc. | | | 79,473 | | | | 2,206,965 | |
Hanmi Financial Corp. | | | 33,636 | | | | 733,601 | |
Home BancShares, Inc. | | | 62,304 | | | | 2,003,697 | |
Independent Bank Corp. | | | 25,406 | | | | 1,087,631 | |
LegacyTexas Financial Group, Inc. | | | 38,400 | | | | 915,840 | |
MB Financial, Inc. | | | 68,183 | | | | 2,240,493 | |
| | | | | | | | |
COMMON STOCKS
(continued) | | Shares
| | | Value
(Note 2)
| |
Banks (continued) | | | | | | | | |
National Penn Bancshares, Inc. | | | 130,676 | | | $ | 1,375,365 | |
NBT Bancorp, Inc. | | | 46,210 | | | | 1,213,937 | |
OFG Bancorp | | | 47,300 | | | | 787,545 | |
Old National Bancorp | | | 112,347 | | | | 1,671,723 | |
Pinnacle Financial Partners, Inc. | | | 35,071 | | | | 1,386,707 | |
PrivateBancorp, Inc. | | | 74,449 | | | | 2,486,597 | |
S&T Bancorp, Inc. | | | 31,573 | | | | 941,191 | |
Simmons First National Corp. (Class A Stock) | | | 16,778 | | | | 682,026 | |
Sterling Bancorp | | | 88,558 | | | | 1,273,464 | |
Susquehanna Bancshares, Inc. | | | 191,709 | | | | 2,574,652 | |
Texas Capital Bancshares, Inc.* | | | 48,400 | | | | 2,629,572 | |
Tompkins Financial Corp. | | | 12,564 | | | | 694,789 | |
UMB Financial Corp. | | | 39,972 | | | | 2,274,007 | |
United Bankshares, Inc. | | | 67,397 | | | | 2,524,018 | |
United Community Banks, Inc. | | | 47,787 | | | | 905,086 | |
Westamerica Bancorporation(a) | | | 27,400 | | | | 1,343,148 | |
Wilshire Bancorp, Inc. | | | 74,613 | | | | 755,830 | |
Wintrust Financial Corp. | | | 49,513 | | | | 2,315,228 | |
| | | | | | |
|
|
|
| | | | | | | | 58,313,004 | |
| | | | | | |
|
|
|
Beverages — 0.4% | | | | | | | | |
Boston Beer Co., Inc. (The)
(Class A Stock)*(a) | | | 9,425 | | | | 2,728,915 | |
| | | | | | |
|
|
|
Biotechnology — 0.7% | | | | | | | | |
Acorda Therapeutics, Inc.*(a) | | | 44,300 | | | | 1,810,541 | |
Emergent Biosolutions, Inc.* | | | 31,057 | | | | 845,682 | |
Ligand Pharmaceuticals, Inc.*(a) | | | 19,300 | | | | 1,026,953 | |
Momenta Pharmaceuticals, Inc.* | | | 49,000 | | | | 589,960 | |
Repligen Corp.* | | | 32,500 | | | | 643,500 | |
Spectrum Pharmaceuticals, Inc.* | | | 61,200 | | | | 424,116 | |
| | | | | | |
|
|
|
| | | | | | | | 5,340,752 | |
| | | | | | |
|
|
|
Building Products — 1.0% | | | | | | | | |
AAON, Inc. | | | 44,389 | | | | 993,870 | |
American Woodmark Corp.* | | | 13,100 | | | | 529,764 | |
Apogee Enterprises, Inc. | | | 30,638 | | | | 1,298,132 | |
Gibraltar Industries, Inc.* | | | 30,268 | | | | 492,157 | |
Griffon Corp. | | | 43,429 | | | | 577,606 | |
PGT, Inc.* | | | 49,600 | | | | 477,648 | |
Quanex Building Products Corp. | | | 39,788 | | | | 747,218 | |
Simpson Manufacturing Co., Inc. | | | 43,983 | | | | 1,521,812 | |
Universal Forest Products, Inc. | | | 21,164 | | | | 1,125,925 | |
| | | | | | |
|
|
|
| | | | | | | | 7,764,132 | |
| | | | | | |
|
|
|
Capital Markets — 1.9% | | | | | | | | |
Calamos Asset Management, Inc. (Class A Stock) | | | 18,000 | | | | 239,760 | |
Evercore Partners, Inc. (Class A Stock) | | | 38,100 | | | | 1,995,297 | |
Financial Engines, Inc.(a) | | | 55,000 | | | | 2,010,250 | |
FXCM, Inc. (Class A Stock) | | | 44,800 | | | | 742,336 | |
Greenhill & Co., Inc. | | | 28,000 | | | | 1,220,800 | |
HFF, Inc. (Class A Stock) | | | 34,800 | | | | 1,250,016 | |
Investment Technology Group, Inc.* | | | 36,866 | | | | 767,550 | |
Piper Jaffray Cos.*(a) | | | 17,265 | | | | 1,002,924 | |
Stifel Financial Corp.* | | | 69,930 | | | | 3,567,828 | |
Virtus Investment Partners, Inc. | | | 7,510 | | | | 1,280,380 | |
| | | | | | |
|
|
|
| | | | | | | | 14,077,141 | |
| | | | | | |
|
|
|
SEE NOTES TO FINANCIAL STATEMENTS.
A140
| | | | | | |
| | | SMALL CAPITALIZATION STOCK PORTFOLIO (continued) | | |
| |
| SCHEDULE OF INVESTMENTS | | December 31, 2014 |
| | | | | | | | |
COMMON STOCKS
(continued) | | Shares
| | | Value
(Note 2)
| |
Chemicals — 2.4% | | | | | | | | |
A. Schulman, Inc. | | | 30,966 | | | $ | 1,255,052 | |
American Vanguard Corp. | | | 26,648 | | | | 309,650 | |
Balchem Corp. | | | 32,583 | | | | 2,171,331 | |
Calgon Carbon Corp.* | | | 56,254 | | | | 1,168,958 | |
Flotek Industries, Inc.*(a) | | | 53,100 | | | | 994,563 | |
FutureFuel Corp. | | | 23,200 | | | | 302,064 | |
H.B. Fuller Co. | | | 53,218 | | | | 2,369,797 | |
Hawkins, Inc. | | | 10,000 | | | | 433,300 | |
Innophos Holdings, Inc. | | | 23,000 | | | | 1,344,350 | |
Intrepid Potash, Inc.*(a) | | | 59,400 | | | | 824,472 | |
Koppers Holdings, Inc. | | | 21,700 | | | | 563,766 | |
Kraton Performance Polymers, Inc.* | | | 34,800 | | | | 723,492 | |
LSB Industries, Inc.* | | | 20,500 | | | | 644,520 | |
OM Group, Inc. | | | 32,556 | | | | 970,169 | |
Quaker Chemical Corp. | | | 14,098 | | | | 1,297,580 | |
Rayonier Advanced Materials, Inc. | | | 45,100 | | | | 1,005,730 | |
Stepan Co. | | | 20,370 | | | | 816,430 | |
Tredegar Corp. | | | 26,935 | | | | 605,768 | |
Zep, Inc. | | | 23,807 | | | | 360,676 | |
| | | | | | |
|
|
|
| | | | | | | | 18,161,668 | |
| | | | | | |
|
|
|
Commercial Services & Supplies — 2.6% | |
ABM Industries, Inc. | | | 54,903 | | | | 1,572,971 | |
Brady Corp. (Class A Stock) | | | 50,322 | | | | 1,375,803 | |
Brink’s Co. (The) | | | 51,400 | | | | 1,254,674 | |
G&K Services, Inc. (Class A Stock) | | | 21,119 | | | | 1,496,281 | |
Healthcare Services Group, Inc.(a) | | | 74,876 | | | | 2,315,915 | |
Interface, Inc. | | | 69,902 | | | | 1,151,286 | |
Matthews International Corp. (Class A Stock) | | | 31,300 | | | | 1,523,371 | |
Mobile Mini, Inc. | | | 48,897 | | | | 1,980,817 | |
Tetra Tech, Inc. | | | 66,188 | | | | 1,767,220 | |
UniFirst Corp. | | | 16,630 | | | | 2,019,714 | |
United Stationers, Inc. | | | 41,142 | | | | 1,734,547 | |
US Ecology, Inc. | | | 23,000 | | | | 922,760 | |
Viad Corp. | | | 21,147 | | | | 563,779 | |
| | | | | | |
|
|
|
| | | | | | | | 19,679,138 | |
| | | | | | |
|
|
|
Communications Equipment — 1.2% | | | | | | | | |
ADTRAN, Inc. | | | 57,500 | | | | 1,253,500 | |
Bel Fuse, Inc. (Class B Stock) | | | 11,322 | | | | 309,543 | |
Black Box Corp. | | | 16,393 | | | | 391,793 | |
CalAmp Corp.*(a) | | | 38,000 | | | | 695,400 | |
Comtech Telecommunications Corp. | | | 16,959 | | | | 534,548 | |
Digi International, Inc.* | | | 25,664 | | | | 238,419 | |
Harmonic, Inc.* | | | 92,124 | | | | 645,789 | |
Ixia* | | | 60,300 | | | | 678,375 | |
NETGEAR, Inc.* | | | 36,646 | | | | 1,303,865 | |
ViaSat, Inc.*(a) | | | 45,615 | | | | 2,875,113 | |
| | | | | | |
|
|
|
| | | | | | | | 8,926,345 | |
| | | | | | |
|
|
|
Construction & Engineering — 0.8% | | | | | | | | |
Aegion Corp.* | | | 39,537 | | | | 735,784 | |
Comfort Systems USA, Inc. | | | 39,384 | | | | 674,254 | |
Dycom Industries, Inc.* | | | 36,031 | | | | 1,264,328 | |
EMCOR Group, Inc. | | | 68,625 | | | | 3,053,126 | |
Orion Marine Group, Inc.* | | | 28,700 | | | | 317,135 | |
| | | | | | |
|
|
|
| | | | | | | | 6,044,627 | |
| | | | | | |
|
|
|
| | | | | | | | |
COMMON STOCKS
(continued) | | Shares
| | | Value
(Note 2)
| |
Construction Materials — 0.2% | | | | | | | | |
Headwaters, Inc.* | | | 77,768 | | | $ | 1,165,742 | |
| | | | | | |
|
|
|
Consumer Finance — 1.2% | | | | | | | | |
Cash America International, Inc. | | | 30,644 | | | | 693,167 | |
Encore Capital Group, Inc.*(a) | | | 25,400 | | | | 1,127,760 | |
Enova International, Inc.* | | | 28,039 | | | | 624,148 | |
EZCORP, Inc. (Class A Stock)*(a) | | | 51,111 | | | | 600,554 | |
First Cash Financial Services, Inc.* | | | 30,025 | | | | 1,671,492 | |
Green Dot Corp. (Class A Stock)* | | | 38,200 | | | | 782,718 | |
PRA Group, Inc.*(a) | | | 53,067 | | | | 3,074,171 | |
World Acceptance Corp.*(a) | | | 9,552 | | | | 758,907 | |
| | | | | | |
|
|
|
| | | | | | | | 9,332,917 | |
| | | | | | |
|
|
|
Containers & Packaging — 0.1% | |
Myers Industries, Inc. | | | 26,220 | | | | 461,472 | |
| | | | | | |
|
|
|
Distributors — 0.4% | | | | | | | | |
Pool Corp. | | | 46,055 | | | | 2,921,729 | |
VOXX International Corp.* | | | 20,657 | | | | 180,956 | |
| | | | | | |
|
|
|
| | | | | | | | 3,102,685 | |
| | | | | | |
|
|
|
Diversified Consumer Services — 0.5% | |
American Public Education, Inc.* | | | 18,333 | | | | 675,938 | |
Capella Education Co. | | | 11,586 | | | | 891,658 | |
Career Education Corp.* | | | 62,200 | | | | 432,912 | |
Regis Corp.* | | | 47,300 | | | | 792,748 | |
Strayer Education, Inc.*(a) | | | 11,600 | | | | 861,648 | |
Universal Technical Institute, Inc. | | | 22,306 | | | | 219,491 | |
| | | | | | |
|
|
|
| | | | | | | | 3,874,395 | |
| | | | | | |
|
|
|
Diversified Financial Services — 0.6% | |
Interactive Brokers Group, Inc. (Class A Stock) | | | 62,000 | | | | 1,807,920 | |
MarketAxess Holdings, Inc. | | | 39,600 | | | | 2,839,716 | |
| | | | | | |
|
|
|
| | | | | | | | 4,647,636 | |
| | | | | | |
|
|
|
Diversified Telecommunication Services — 0.6% | |
8x8, Inc.* | | | 93,800 | | | | 859,208 | |
Atlantic Tele-Network, Inc. | | | 10,600 | | | | 716,454 | |
Cincinnati Bell, Inc.* | | | 221,400 | | | | 706,266 | |
Consolidated Communications Holdings, Inc. | | | 49,700 | | | | 1,383,151 | |
General Communication, Inc. (Class A Stock)* | | | 32,224 | | | | 443,080 | |
Lumos Networks Corp. | | | 19,421 | | | | 326,661 | |
| | | | | | |
|
|
|
| | | | | | | | 4,434,820 | |
| | | | | | |
|
|
|
Electric Utilities — 0.9% | |
ALLETE, Inc. | | | 40,697 | | | | 2,244,033 | |
El Paso Electric Co. | | | 42,808 | | | | 1,714,888 | |
UIL Holdings Corp. | | | 59,911 | | | | 2,608,525 | |
| | | | | | |
|
|
|
| | | | | | | | 6,567,446 | |
| | | | | | |
|
|
|
Electrical Equipment — 1.1% | |
AZZ, Inc. | | | 27,142 | | | | 1,273,503 | |
Encore Wire Corp. | | | 19,831 | | | | 740,291 | |
EnerSys | | | 48,100 | | | | 2,968,732 | |
Franklin Electric Co., Inc. | | | 41,900 | | | | 1,572,507 | |
General Cable Corp. | | | 51,400 | | | | 765,860 | |
Powell Industries, Inc. | | | 9,772 | | | | 479,512 | |
Vicor Corp.* | | | 17,531 | | | | 212,125 | |
| | | | | | |
|
|
|
| | | | | | | | 8,012,530 | |
| | | | | | |
|
|
|
SEE NOTES TO FINANCIAL STATEMENTS.
A141
| | | | | | |
| | | SMALL CAPITALIZATION STOCK PORTFOLIO (continued) | | |
| |
| SCHEDULE OF INVESTMENTS | | December 31, 2014 |
| | | | | | | | |
COMMON STOCKS
(continued) | | Shares
| | | Value
(Note 2)
| |
Electronic Equipment, Instruments & Components — 4.1% | |
Agilysys, Inc.* | | | 14,932 | | | $ | 187,994 | |
Anixter International, Inc.* | | | 28,864 | | | | 2,553,309 | |
Badger Meter, Inc. | | | 15,307 | | | | 908,471 | |
Benchmark Electronics, Inc.* | | | 55,910 | | | | 1,422,350 | |
Checkpoint Systems, Inc.* | | | 43,839 | | | | 601,910 | |
Coherent, Inc.* | | | 26,600 | | | | 1,615,152 | |
CTS Corp. | | | 35,264 | | | | 628,757 | |
Daktronics, Inc. | | | 40,908 | | | | 511,759 | |
DTS, Inc.* | | | 18,085 | | | | 556,114 | |
Electro Scientific Industries, Inc. | | | 28,041 | | | | 217,598 | |
Fabrinet (Thailand)* | | | 30,900 | | | | 548,166 | |
FARO Technologies, Inc.* | | | 18,284 | | | | 1,146,041 | |
II-VI, Inc.* | | | 54,662 | | | | 746,136 | |
Insight Enterprises, Inc.* | | | 43,335 | | | | 1,121,943 | |
Littelfuse, Inc. | | | 23,825 | | | | 2,303,163 | |
Mercury Systems, Inc.* | | | 33,508 | | | | 466,431 | |
Methode Electronics, Inc. | | | 40,466 | | | | 1,477,414 | |
MTS Systems Corp. | | | 16,035 | | | | 1,203,106 | |
Newport Corp.* | | | 42,108 | | | | 804,684 | |
OSI Systems, Inc.* | | | 19,800 | | | | 1,401,246 | |
Park Electrochemical Corp. | | | 22,144 | | | | 552,050 | |
Plexus Corp.* | | | 35,620 | | | | 1,467,900 | |
Rofin-Sinar Technologies, Inc.* | | | 29,700 | | | | 854,469 | |
Rogers Corp.* | | | 19,431 | | | | 1,582,461 | |
Sanmina Corp.* | | | 87,300 | | | | 2,054,169 | |
ScanSource, Inc.* | | | 30,233 | | | | 1,214,157 | |
SYNNEX Corp.(a) | | | 29,550 | | | | 2,309,628 | |
TTM Technologies, Inc.*(a) | | | 55,789 | | | | 420,091 | |
| | | | | | |
|
|
|
| | | | | | | | 30,876,669 | |
| | | | | | |
|
|
|
Energy Equipment & Services — 1.9% | |
Basic Energy Services, Inc.* | | | 36,817 | | | | 258,087 | |
Bristow Group, Inc. | | | 37,255 | | | | 2,451,006 | |
C&J Energy Services, Inc.* | | | 48,300 | | | | 638,043 | |
Era Group, Inc.* | | | 20,371 | | | | 430,847 | |
Exterran Holdings, Inc. | | | 72,200 | | | | 2,352,276 | |
Geospace Technologies Corp.* | | | 13,910 | | | | 368,615 | |
Gulf Island Fabrication, Inc. | | | 14,077 | | | | 272,953 | |
GulfMark Offshore, Inc. (Class A Stock) | | | 27,400 | | | | 669,108 | |
Hornbeck Offshore Services, Inc.* | | | 34,215 | | | | 854,349 | |
ION Geophysical Corp.* | | | 134,445 | | | | 369,724 | |
Matrix Service Co.* | | | 27,973 | | | | 624,357 | |
Newpark Resources, Inc.* | | | 88,000 | | | | 839,520 | |
Paragon Offshore PLC(a) | | | 89,700 | | | | 248,469 | |
Pioneer Energy Services Corp.* | | | 66,317 | | | | 367,396 | |
SEACOR Holdings, Inc.*(a) | | | 18,671 | | | | 1,378,107 | |
Tesco Corp. | | | 36,600 | | | | 469,212 | |
TETRA Technologies, Inc.*(a) | | | 83,841 | | | | 560,058 | |
U.S. Silica Holdings, Inc.(a) | | | 57,000 | | | | 1,464,330 | |
| | | | | | |
|
|
|
| | | | | | | | 14,616,457 | |
| | | | | | |
|
|
|
Food & Staples Retailing — 0.8% | |
Andersons, Inc. (The) | | | 28,524 | | | | 1,515,765 | |
Casey’s General Stores, Inc. | | | 40,965 | | | | 3,699,959 | |
SpartanNash Co. | | | 39,706 | | | | 1,037,915 | |
| | | | | | |
|
|
|
| | | | | | | | 6,253,639 | |
| | | | | | |
|
|
|
| | | | | | | | |
COMMON STOCKS
(continued) | | Shares
| | | Value
(Note 2)
| |
Food Products — 1.7% | |
B&G Foods, Inc. | | | 56,800 | | | $ | 1,698,320 | |
Cal-Maine Foods, Inc.(a) | | | 31,790 | | | | 1,240,764 | |
Calavo Growers, Inc. | | | 16,390 | | | | 775,247 | |
Darling Ingredients, Inc.* | | | 174,320 | | | | 3,165,651 | |
Diamond Foods, Inc.*(a) | | | 28,449 | | | | 803,115 | |
J&J Snack Foods Corp. | | | 15,818 | | | | 1,720,524 | |
Sanderson Farms, Inc.(a) | | | 21,735 | | | | 1,826,283 | |
Seneca Foods Corp. (Class A Stock)* | | | 7,500 | | | | 202,725 | |
Snyder’s-Lance, Inc. | | | 55,016 | | | | 1,680,739 | |
| | | | | | |
|
|
|
| | | | | | | | 13,113,368 | |
| | | | | | |
|
|
|
Gas Utilities — 2.0% | |
Laclede Group, Inc. (The) | | | 45,814 | | | | 2,437,305 | |
New Jersey Resources Corp. | | | 44,804 | | | | 2,742,005 | |
Northwest Natural Gas Co. | | | 28,765 | | | | 1,435,374 | |
Piedmont Natural Gas Co., Inc. | | | 82,903 | | | | 3,267,207 | |
South Jersey Industries, Inc. | | | 35,622 | | | | 2,099,204 | |
Southwest Gas Corp. | | | 49,311 | | | | 3,047,913 | |
| | | | | | |
|
|
|
| | | | | | | | 15,029,008 | |
| | | | | | |
|
|
|
Health Care Equipment & Supplies — 3.9% | |
Abaxis, Inc. | | | 22,412 | | | | 1,273,674 | |
ABIOMED, Inc.*(a) | | | 39,000 | | | | 1,484,340 | |
Analogic Corp. | | | 13,133 | | | | 1,111,183 | |
AngioDynamics, Inc.* | | | 27,000 | | | | 513,270 | |
Anika Therapeutics, Inc.* | | | 15,400 | | | | 627,396 | |
Cantel Medical Corp. | | | 37,362 | | | | 1,616,280 | |
CONMED Corp. | | | 29,149 | | | | 1,310,539 | |
CryoLife, Inc. | | | 26,353 | | | | 298,579 | |
Cyberonics, Inc.* | | | 27,797 | | | | 1,547,737 | |
Cynosure, Inc. (Class A Stock)* | | | 22,990 | | | | 630,386 | |
Greatbatch, Inc.* | | | 26,544 | | | | 1,308,619 | |
Haemonetics Corp.* | | | 54,294 | | | | 2,031,681 | |
ICU Medical, Inc.* | | | 14,392 | | | | 1,178,705 | |
Integra LifeSciences Holdings Corp.* | | | 26,802 | | | | 1,453,472 | |
Invacare Corp. | | | 30,702 | | | | 514,566 | |
Masimo Corp.* | | | 50,400 | | | | 1,327,536 | |
Meridian Bioscience, Inc. | | | 43,975 | | | | 723,829 | |
Merit Medical Systems, Inc.* | | | 45,748 | | | | 792,813 | |
Natus Medical, Inc.* | | | 34,425 | | | | 1,240,677 | |
Neogen Corp.* | | | 39,020 | | | | 1,935,002 | |
NuVasive, Inc.* | | | 49,900 | | | | 2,353,284 | |
SurModics, Inc.* | | | 13,252 | | | | 292,869 | |
West Pharmaceutical Services, Inc. | | | 75,234 | | | | 4,005,458 | |
| | | | | | |
|
|
|
| | | | | | | | 29,571,895 | |
| | | | | | |
|
|
|
Health Care Providers & Services — 3.3% | |
Air Methods Corp.*(a) | | | 37,816 | | | | 1,665,039 | |
Almost Family, Inc.* | | | 8,252 | | | | 238,895 | |
Amedisys, Inc.* | | | 35,159 | | | | 1,031,917 | |
AMN Healthcare Services, Inc.* | | | 49,099 | | | | 962,340 | |
Amsurg Corp.* | | | 50,974 | | | | 2,789,807 | |
Bio-Reference Laboratories, Inc.* | | | 26,170 | | | | 840,842 | |
Chemed Corp. | | | 18,011 | | | | 1,903,222 | |
CorVel Corp.* | | | 9,490 | | | | 353,218 | |
Cross Country Healthcare, Inc.* | | | 31,063 | | | | 387,666 | |
Ensign Group, Inc. (The) | | | 21,300 | | | | 945,507 | |
ExamWorks Group, Inc.* | | | 34,300 | | | | 1,426,537 | |
Gentiva Health Services, Inc.* | | | 32,992 | | | | 628,498 | |
SEE NOTES TO FINANCIAL STATEMENTS.
A142
| | | | | | |
| | | SMALL CAPITALIZATION STOCK PORTFOLIO (continued) | | |
| |
| SCHEDULE OF INVESTMENTS | | December 31, 2014 |
| | | | | | | | |
COMMON STOCKS
(continued) | | Shares
| | | Value
(Note 2)
| |
Health Care Providers & Services (continued) | |
Hanger, Inc.* | | | 37,409 | | | $ | 819,257 | |
Healthways, Inc.*(a) | | | 36,986 | | | | 735,282 | |
IPC Healthcare, Inc.*(a) | | | 18,305 | | | | 840,016 | |
Kindred Healthcare, Inc.(a) | | | 73,500 | | | | 1,336,230 | |
Landauer, Inc. | | | 10,168 | | | | 347,136 | |
LHC Group, Inc.* | | | 12,898 | | | | 402,160 | |
Magellan Health, Inc.* | | | 29,341 | | | | 1,761,340 | |
Molina Healthcare, Inc.* | | | 33,322 | | | | 1,783,727 | |
MWI Veterinary Supply, Inc.*(a) | | | 13,696 | | | | 2,327,087 | |
PharMerica Corp.* | | | 31,895 | | | | 660,545 | |
Providence Service Corp. (The)* | | | 12,600 | | | | 459,144 | |
| | | | | | |
|
|
|
| | | | | | | | 24,645,412 | |
| | | | | | |
|
|
|
Health Care Technology — 1.0% | |
Computer Programs & Systems, Inc. | | | 11,036 | | | | 670,437 | |
HealthStream, Inc.* | | | 22,600 | | | | 666,248 | |
MedAssets, Inc.* | | | 63,700 | | | | 1,258,712 | |
Medidata Solutions, Inc.*(a) | | | 57,400 | | | | 2,740,850 | |
Omnicell, Inc.* | | | 37,722 | | | | 1,249,353 | |
Quality Systems, Inc. | | | 46,434 | | | | 723,906 | |
| | | | | | |
|
|
|
| | | | | | | | 7,309,506 | |
| | | | | | |
|
|
|
Hotels, Restaurants & Leisure — 4.0% | |
Biglari Holdings, Inc.* | | | 1,836 | | | | 733,500 | |
BJ’s Restaurants, Inc.* | | | 22,972 | | | | 1,153,424 | |
Bob Evans Farms, Inc. | | | 25,000 | | | | 1,279,500 | |
Boyd Gaming Corp.* | | | 82,100 | | | | 1,049,238 | |
Buffalo Wild Wings, Inc.*(a) | | | 20,065 | | | | 3,619,325 | |
Cracker Barrel Old Country Store, Inc. | | | 25,378 | | | | 3,572,207 | |
DineEquity, Inc. | | | 17,505 | | | | 1,814,218 | |
Interval Leisure Group, Inc. | | | 41,736 | | | | 871,865 | |
Jack in the Box, Inc. | | | 40,917 | | | | 3,271,723 | |
Marcus Corp. (The) | | | 19,358 | | | | 358,317 | |
Marriott Vacations Worldwide Corp. | | | 30,100 | | | | 2,243,654 | |
Monarch Casino & Resort, Inc.* | | | 10,531 | | | | 174,709 | |
Papa John’s International, Inc. | | | 31,530 | | | | 1,759,374 | |
Pinnacle Entertainment, Inc.* | | | 63,213 | | | | 1,406,489 | |
Red Robin Gourmet Burgers, Inc.* | | | 14,863 | | | | 1,144,080 | |
Ruby Tuesday, Inc.* | | | 65,084 | | | | 445,175 | |
Ruth’s Hospitality Group, Inc. | | | 37,048 | | | | 555,720 | |
Scientific Games Corp. (Class A Stock)*(a) | | | 51,700 | | | | 658,141 | |
Sonic Corp. | | | 53,414 | | | | 1,454,463 | |
Texas Roadhouse, Inc. | | | 66,130 | | | | 2,232,549 | |
| | | | | | |
|
|
|
| | | | | | | | 29,797,671 | |
| | | | | | |
|
|
|
Household Durables — 1.5% | |
Ethan Allen Interiors, Inc. | | | 27,499 | | | | 851,644 | |
Helen of Troy Ltd.* | | | 28,310 | | | | 1,841,849 | |
iRobot Corp.*(a) | | | 31,200 | | | | 1,083,264 | |
La-Z-Boy, Inc. | | | 54,601 | | | | 1,465,491 | |
M/I Homes, Inc.* | | | 25,970 | | | | 596,271 | |
Meritage Homes Corp.* | | | 39,297 | | | | 1,414,299 | |
Ryland Group, Inc. (The) | | | 48,900 | | | | 1,885,584 | |
Standard Pacific Corp.* | | | 159,722 | | | | 1,164,373 | |
Universal Electronics, Inc.* | | | 16,754 | | | | 1,089,513 | |
| | | | | | |
|
|
|
| | | | | | | | 11,392,288 | |
| | | | | | |
|
|
|
| | | | | | | | |
COMMON STOCKS
(continued) | | Shares
| | | Value
(Note 2)
| |
Household Products — 0.2% | |
Central Garden & Pet Co. (Class A Stock)* | | | 44,988 | | | $ | 429,635 | |
WD-40 Co. | | | 14,609 | | | | 1,242,934 | |
| | | | | | |
|
|
|
| | | | | | | | 1,672,569 | |
| | | | | | |
|
|
|
Insurance — 2.6% | |
American Equity Investment Life Holding Co. | | | 80,000 | | | | 2,335,200 | |
AMERISAFE, Inc. | | | 19,914 | | | | 843,557 | |
eHealth, Inc.* | | | 18,791 | | | | 468,272 | |
Employers Holdings, Inc. | | | 33,215 | | | | 780,885 | |
HCI Group, Inc. | | | 9,700 | | | | 419,428 | |
Horace Mann Educators Corp. | | | 44,400 | | | | 1,473,192 | |
Infinity Property & Casualty Corp. | | | 12,189 | | | | 941,722 | |
Meadowbrook Insurance Group, Inc. | | | 48,500 | | | | 410,310 | |
Montpelier Re Holdings Ltd. (Bermuda) | | | 39,000 | | | | 1,396,980 | |
Navigators Group, Inc. (The)* | | | 11,518 | | | | 844,730 | |
ProAssurance Corp. | | | 60,666 | | | | 2,739,070 | |
RLI Corp. | | | 39,310 | | | | 1,941,914 | |
Safety Insurance Group, Inc. | | | 13,360 | | | | 855,174 | |
Selective Insurance Group, Inc. | | | 59,807 | | | | 1,624,956 | |
Stewart Information Services Corp. | | | 23,402 | | | | 866,810 | |
United Fire Group, Inc. | | | 22,261 | | | | 661,819 | |
Universal Insurance Holdings, Inc. | | | 30,800 | | | | 629,860 | |
| | | | | | |
|
|
|
| | | | | | | | 19,233,879 | |
| | | | | | |
|
|
|
Internet & Catalog Retail — 0.3% | |
Blue Nile, Inc.* | | | 12,480 | | | | 449,405 | |
FTD Cos., Inc.* | | | 20,206 | | | | 703,573 | |
Nutrisystem, Inc. | | | 30,528 | | | | 596,822 | |
PetMed Express, Inc.(a) | | | 21,181 | | | | 304,371 | |
| | | | | | |
|
|
|
| | | | | | | | 2,054,171 | |
| | | | | | |
|
|
|
Internet Software & Services — 1.9% | |
Blucora, Inc.*(a) | | | 43,012 | | | | 595,716 | |
comScore, Inc.* | | | 36,277 | | | | 1,684,341 | |
Dealertrack Technologies, Inc.*(a) | | | 46,883 | | | | 2,077,386 | |
Dice Holdings, Inc.* | | | 37,200 | | | | 372,372 | |
Digital River, Inc.* | | | 33,600 | | | | 830,928 | |
j2 Global, Inc.(a) | | | 48,078 | | | | 2,980,836 | |
Liquidity Services, Inc.*(a) | | | 25,200 | | | | 205,884 | |
LivePerson, Inc.* | | | 51,600 | | | | 727,560 | |
LogMeIn, Inc.* | | | 25,800 | | | | 1,272,972 | |
Monster Worldwide, Inc.* | | | 92,900 | | | | 429,198 | |
NIC, Inc. | | | 64,100 | | | | 1,153,159 | |
Perficient, Inc.* | | | 36,314 | | | | 676,530 | |
QuinStreet, Inc.* | | | 36,100 | | | | 219,127 | |
Stamps.com, Inc.* | | | 15,420 | | | | 740,006 | |
XO Group, Inc.* | | | 25,295 | | | | 460,622 | |
| | | | | | |
|
|
|
| | | | | | | | 14,426,637 | |
| | | | | | |
|
|
|
IT Services — 2.3% | |
CACI International, Inc. (Class A Stock)* | | | 25,244 | | | | 2,175,528 | |
Cardtronics, Inc.* | | | 47,100 | | | | 1,817,118 | |
Ciber, Inc.* | | | 73,923 | | | | 262,427 | |
CSG Systems International, Inc. | | | 36,324 | | | | 910,643 | |
ExlService Holdings, Inc.* | | | 32,900 | | | | 944,559 | |
SEE NOTES TO FINANCIAL STATEMENTS.
A143
| | | | | | |
| | | SMALL CAPITALIZATION STOCK PORTFOLIO (continued) | | |
| |
| SCHEDULE OF INVESTMENTS | | December 31, 2014 |
| | | | | | | | |
COMMON STOCKS
(continued) | | Shares
| | | Value
(Note 2)
| |
IT Services (continued) | |
Forrester Research, Inc. | | | 11,562 | | | $ | 455,080 | |
Heartland Payment Systems, Inc. | | | 38,411 | | | | 2,072,273 | |
iGATE Corp.* | | | 37,600 | | | | 1,484,448 | |
ManTech International Corp. (Class A Stock) | | | 24,800 | | | | 749,704 | |
MAXIMUS, Inc. | | | 69,772 | | | | 3,826,296 | |
Sykes Enterprises, Inc.* | | | 40,770 | | | | 956,872 | |
TeleTech Holdings, Inc.* | | | 18,667 | | | | 442,035 | |
Virtusa Corp.* | | | 28,400 | | | | 1,183,428 | |
| | | | | | |
|
|
|
| | | | | | | | 17,280,411 | |
| | | | | | |
|
|
|
Leisure Products — 0.2% | |
Arctic Cat, Inc. | | | 13,657 | | | | 484,824 | |
Callaway Golf Co. | | | 81,480 | | | | 627,396 | |
Sturm Ruger & Co., Inc. | | | 20,627 | | | | 714,313 | |
| | | | | | |
|
|
|
| | | | | | | | 1,826,533 | |
| | | | | | |
|
|
|
Life Sciences Tools & Services — 0.8% | |
Affymetrix, Inc.*(a) | | | 77,300 | | | | 762,951 | |
Albany Molecular Research, Inc.*(a) | | | 25,100 | | | | 408,628 | |
Cambrex Corp.* | | | 32,432 | | | | 701,180 | |
Luminex Corp.* | | | 40,300 | | | | 756,028 | |
PAREXEL International Corp.* | | | 58,257 | | | | 3,236,759 | |
| | | | | | |
|
|
|
| | | | | | | | 5,865,546 | |
| | | | | | |
|
|
|
Machinery — 3.6% | |
Actuant Corp. (Class A Stock) | | | 68,864 | | | | 1,875,855 | |
Albany International Corp. (Class A Stock) | | | 30,304 | | | | 1,151,249 | |
Astec Industries, Inc. | | | 20,010 | | | | 786,593 | |
Barnes Group, Inc. | | | 51,816 | | | | 1,917,710 | |
Briggs & Stratton Corp. | | | 48,046 | | | | 981,099 | |
CIRCOR International, Inc. | | | 18,788 | | | | 1,132,541 | |
EnPro Industries, Inc.* | | | 25,378 | | | | 1,592,723 | |
ESCO Technologies, Inc. | | | 27,821 | | | | 1,026,595 | |
Federal Signal Corp. | | | 65,900 | | | | 1,017,496 | |
Hillenbrand, Inc. | | | 66,548 | | | | 2,295,906 | |
John Bean Technologies Corp. | | | 30,847 | | | | 1,013,632 | |
Lindsay Corp.(a) | | | 12,979 | | | | 1,112,820 | |
Lydall, Inc.* | | | 18,156 | | | | 595,880 | |
Mueller Industries, Inc. | | | 60,098 | | | | 2,051,746 | |
Standex International Corp. | | | 13,570 | | | | 1,048,418 | |
Tennant Co. | | | 19,500 | | | | 1,407,315 | |
Titan International, Inc. | | | 56,700 | | | | 602,721 | |
Toro Co. (The) | | | 58,966 | | | | 3,762,621 | |
Watts Water Technologies, Inc. (Class A Stock) | | | 30,121 | | | | 1,910,876 | |
| | | | | | |
|
|
|
| | | | | | | | 27,283,796 | |
| | | | | | |
|
|
|
Marine — 0.2% | |
Matson, Inc. | | | 45,500 | | | | 1,570,660 | |
| | | | | | |
|
|
|
Media — 0.3% | |
EW Scripps Co. (The) (Class A Stock)*(a) | | | 31,401 | | | | 701,812 | |
Harte-Hanks, Inc. | | | 45,000 | | | | 348,300 | |
Scholastic Corp. | | | 28,400 | | | | 1,034,328 | |
Sizmek, Inc.* | | | 22,700 | | | | 142,102 | |
| | | | | | |
|
|
|
| | | | | | | | 2,226,542 | |
| | | | | | |
|
|
|
| | | | | | | | |
COMMON STOCKS
(continued) | | Shares
| | | Value
(Note 2)
| |
Metals & Mining — 1.4% | |
A.M. Castle & Co.*(a) | | | 17,983 | | | $ | 143,504 | |
AK Steel Holding Corp.*(a) | | | 186,900 | | | | 1,110,186 | |
Century Aluminum Co.*(a) | | | 54,563 | | | | 1,331,337 | |
Globe Specialty Metals, Inc. | | | 67,900 | | | | 1,169,917 | |
Haynes International, Inc. | | | 13,200 | | | | 640,200 | |
Kaiser Aluminum Corp. | | | 18,900 | | | | 1,350,027 | |
Materion Corp. | | | 21,378 | | | | 753,147 | |
Olympic Steel, Inc. | | | 9,638 | | | | 171,364 | |
RTI International Metals, Inc.* | | | 32,411 | | | | 818,702 | |
Stillwater Mining Co.*(a) | | | 127,200 | | | | 1,874,928 | |
SunCoke Energy, Inc. | | | 69,900 | | | | 1,351,866 | |
| | | | | | |
|
|
|
| | | | | | | | 10,715,178 | |
| | | | | | |
|
|
|
Multi-Utilities — 0.6% | |
Avista Corp. | | | 60,703 | | | | 2,145,851 | |
NorthWestern Corp. | | | 48,600 | | | | 2,749,788 | |
| | | | | | |
|
|
|
| | | | | | | | 4,895,639 | |
| | | | | | |
|
|
|
Multiline Retail — 0.2% | |
Fred’s, Inc. (Class A Stock) | | | 36,666 | | | | 638,355 | |
Tuesday Morning Corp.*(a) | | | 46,332 | | | | 1,005,404 | |
| | | | | | |
|
|
|
| | | | | | | | 1,643,759 | |
| | | | | | |
|
|
|
Oil, Gas & Consumable Fuels — 1.5% | |
Approach Resources, Inc.*(a) | | | 38,100 | | | | 243,459 | |
Arch Coal, Inc.(a) | | | 222,200 | | | | 395,516 | |
Bill Barrett Corp.*(a) | | | 52,400 | | | | 596,836 | |
Bonanza Creek Energy, Inc.* | | | 32,600 | | | | 782,400 | |
Carrizo Oil & Gas, Inc.* | | | 44,900 | | | | 1,867,840 | |
Cloud Peak Energy, Inc.* | | | 64,500 | | | | 592,110 | |
Comstock Resources, Inc.(a) | | | 47,100 | | | | 320,751 | |
Contango Oil & Gas Co.* | | | 16,800 | | | | 491,232 | |
Green Plains, Inc. | | | 36,300 | | | | 899,514 | |
Northern Oil & Gas, Inc.*(a) | | | 60,400 | | | | 341,260 | |
PDC Energy, Inc.* | | | 37,926 | | | | 1,565,206 | |
Penn Virginia Corp.*(a) | | | 73,798 | | | | 492,971 | |
PetroQuest Energy, Inc.* | | | 62,045 | | | | 232,048 | |
Rex Energy Corp.*(a) | | | 51,000 | | | | 260,100 | |
Stone Energy Corp.*(a) | | | 59,394 | | | | 1,002,571 | |
Swift Energy Co.*(a) | | | 46,244 | | | | 187,288 | |
Synergy Resources Corp.* | | | 71,200 | | | | 892,848 | |
| | | | | | |
|
|
|
| | | | | | | | 11,163,950 | |
| | | | | | |
|
|
|
Paper & Forest Products — 1.4% | |
Boise Cascade Co.* | | | 41,800 | | | | 1,552,870 | |
Clearwater Paper Corp.* | | | 20,680 | | | | 1,417,614 | |
Deltic Timber Corp. | | | 11,791 | | | | 806,504 | |
KapStone Paper & Packaging Corp. | | | 89,500 | | | | 2,623,245 | |
Neenah Paper, Inc. | | | 17,678 | | | | 1,065,453 | |
P.H. Glatfelter Co. | | | 45,400 | | | | 1,160,878 | |
Schweitzer-Mauduit International, Inc. | | | 32,276 | | | | 1,365,275 | |
Wausau Paper Corp. | | | 52,667 | | | | 598,824 | |
| | | | | | |
|
|
|
| | | | | | | | 10,590,663 | |
| | | | | | |
|
|
|
Personal Products — 0.1% | |
Inter Parfums, Inc. | | | 18,000 | | | | 494,100 | |
Medifast, Inc.* | | | 11,900 | | | | 399,245 | |
| | | | | | |
|
|
|
| | | | | | | | 893,345 | |
| | | | | | |
|
|
|
SEE NOTES TO FINANCIAL STATEMENTS.
A144
| | | | | | |
| | | SMALL CAPITALIZATION STOCK PORTFOLIO (continued) | | |
| |
| SCHEDULE OF INVESTMENTS | | December 31, 2014 |
| | | | | | | | |
COMMON STOCKS
(continued) | | Shares
| | | Value
(Note 2)
| |
Pharmaceuticals — 1.6% | |
Akorn, Inc.*(a) | | | 78,900 | | | $ | 2,856,180 | |
Depomed, Inc.*(a) | | | 62,000 | | | | 998,820 | |
Impax Laboratories, Inc.*(a) | | | 70,200 | | | | 2,223,936 | |
Lannett Co., Inc.* | | | 28,000 | | | | 1,200,640 | |
Medicines Co. (The)* | | | 69,300 | | | | 1,917,531 | |
Prestige Brands Holdings, Inc.* | | | 55,200 | | | | 1,916,544 | |
Sagent Pharmaceuticals, Inc.* | | | 23,900 | | | | 600,129 | |
| | | | | | |
|
|
|
| | | | | | | | 11,713,780 | |
| | | | | | |
|
|
|
Professional Services — 1.5% | |
CDI Corp. | | | 15,288 | | | | 270,750 | |
Exponent, Inc. | | | 13,640 | | | | 1,125,300 | |
Heidrick & Struggles International, Inc. | | | 17,314 | | | | 399,088 | |
Insperity, Inc. | | | 23,879 | | | | 809,259 | |
Kelly Services, Inc. (Class A Stock) | | | 31,139 | | | | 529,986 | |
Korn/Ferry International* | | | 53,200 | | | | 1,530,032 | |
Navigant Consulting, Inc.* | | | 51,200 | | | | 786,944 | |
On Assignment, Inc.* | | | 49,986 | | | | 1,659,035 | |
Resources Connection, Inc. | | | 40,100 | | | | 659,645 | |
TrueBlue, Inc.* | | | 44,918 | | | | 999,426 | |
WageWorks, Inc.*(a) | | | 34,800 | | | | 2,247,036 | |
| | | | | | |
|
|
|
| | | | | | | | 11,016,501 | |
| | | | | | |
|
|
|
Real Estate Investment Trusts (REITs) — 8.2% | |
Acadia Realty Trust | | | 71,505 | | | | 2,290,305 | |
Agree Realty Corp. | | | 18,300 | | | | 568,947 | |
American Assets Trust, Inc. | | | 39,300 | | | | 1,564,533 | |
Associated Estates Realty Corp. | | | 61,000 | | | | 1,415,810 | |
Aviv REIT, Inc. | | | 26,000 | | | | 896,480 | |
Capstead Mortgage Corp. | | | 101,400 | | | | 1,245,192 | |
CareTrust REIT, Inc. | | | 28,255 | | | | 348,384 | |
Cedar Realty Trust, Inc. | | | 72,566 | | | | 532,635 | |
Chesapeake Lodging Trust | | | 58,200 | | | | 2,165,622 | |
CoreSite Realty Corp. | | | 23,000 | | | | 898,150 | |
Cousins Properties, Inc. | | | 217,800 | | | | 2,487,276 | |
DiamondRock Hospitality Co. | | | 207,070 | | | | 3,079,131 | |
EastGroup Properties, Inc. | | | 33,863 | | | | 2,144,205 | |
Education Realty Trust, Inc. | | | 50,333 | | | | 1,841,685 | |
EPR Properties | | | 60,570 | | | | 3,490,649 | |
Franklin Street Properties Corp. | | | 93,802 | | | | 1,150,951 | |
Geo Group, Inc. (The) | | | 78,473 | | | | 3,167,170 | |
Getty Realty Corp. | | | 27,600 | | | | 502,596 | |
Government Properties Income Trust | | | 74,300 | | | | 1,709,643 | |
Healthcare Realty Trust, Inc. | | | 104,000 | | | | 2,841,280 | |
Inland Real Estate Corp. | | | 93,135 | | | | 1,019,828 | |
Kite Realty Group Trust(a) | | | 88,172 | | | | 2,534,063 | |
Lexington Realty Trust(a) | | | 220,616 | | | | 2,422,364 | |
LTC Properties, Inc. | | | 37,026 | | | | 1,598,412 | |
Medical Properties Trust, Inc. | | | 181,566 | | | | 2,501,980 | |
Parkway Properties, Inc. | | | 88,948 | | | | 1,635,754 | |
Pennsylvania Real Estate Investment Trust | | | 72,922 | | | | 1,710,750 | |
Post Properties, Inc. | | | 57,661 | | | | 3,388,737 | |
PS Business Parks, Inc. | | | 20,602 | | | | 1,638,683 | |
Retail Opportunity Investments Corp. | | | 98,200 | | | | 1,648,778 | |
Sabra Health Care REIT, Inc. | | | 57,800 | | | | 1,755,386 | |
Saul Centers, Inc.(a) | | | 11,900 | | | | 680,561 | |
Sovran Self Storage, Inc. | | | 35,797 | | | | 3,122,214 | |
| | | | | | | | |
COMMON STOCKS
(continued) | | Shares
| | | Value
(Note 2)
| |
Real Estate Investment Trusts (REITs) (continued) | |
Universal Health Realty Income Trust | | | 13,700 | | | $ | 659,244 | |
Urstadt Biddle Properties, Inc. (Class A Stock) | | | 29,250 | | | | 639,990 | |
| | | | | | |
|
|
|
| | | | | | | | 61,297,388 | |
| | | | | | |
|
|
|
Real Estate Management & Development — 0.1% | |
Forestar Group, Inc.*(a) | | | 36,856 | | | | 567,582 | |
| | | | | | |
|
|
|
Road & Rail — 1.0% | |
ArcBest Corp.(a) | | | 25,595 | | | | 1,186,840 | |
Celadon Group, Inc. | | | 23,100 | | | | 524,139 | |
Heartland Express, Inc. | | | 58,548 | | | | 1,581,382 | |
Knight Transportation, Inc. | | | 64,388 | | | | 2,167,300 | |
Roadrunner Transportation Systems, Inc.* | | | 29,400 | | | | 686,490 | |
Saia, Inc.* | | | 26,200 | | | | 1,450,432 | |
| | | | | | |
|
|
|
| | | | | | | | 7,596,583 | |
| | | | | | |
|
|
|
Semiconductors & Semiconductor Equipment — 3.4% | |
Advanced Energy Industries, Inc.* | | | 39,697 | | | | 940,819 | |
Brooks Automation, Inc. | | | 70,505 | | | | 898,939 | |
Cabot Microelectronics Corp.* | | | 25,311 | | | | 1,197,717 | |
CEVA, Inc.* | | | 21,300 | | | | 386,382 | |
Cirrus Logic, Inc.* | | | 66,700 | | | | 1,572,119 | |
Cohu, Inc. | | | 26,897 | | | | 320,074 | |
Diodes, Inc.* | | | 38,870 | | | | 1,071,646 | |
DSP Group, Inc.* | | | 20,628 | | | | 224,226 | |
Entropic Communications, Inc.* | | | 90,900 | | | | 229,977 | |
Exar Corp.* | | | 49,723 | | | | 507,175 | |
Kopin Corp.* | | | 63,196 | | | | 228,770 | |
Kulicke & Soffa Industries, Inc. (Singapore)* | | | 81,132 | | | | 1,173,169 | |
Micrel, Inc. | | | 47,202 | | | | 684,901 | |
Microsemi Corp.* | | | 100,619 | | | | 2,855,567 | |
MKS Instruments, Inc. | | | 56,185 | | | | 2,056,371 | |
Monolithic Power Systems, Inc. | | | 38,200 | | | | 1,900,068 | |
Nanometrics, Inc.* | | | 25,500 | | | | 428,910 | |
Pericom Semiconductor Corp.* | | | 20,760 | | | | 281,090 | |
Power Integrations, Inc. | | | 31,300 | | | | 1,619,462 | |
Rudolph Technologies, Inc.*(a) | | | 34,694 | | | | 354,920 | |
Synaptics, Inc.* | | | 39,079 | | | | 2,690,198 | |
Tessera Technologies, Inc. | | | 49,577 | | | | 1,772,873 | |
Ultratech, Inc.*(a) | | | 29,811 | | | | 553,292 | |
Veeco Instruments, Inc.*(a) | | | 42,542 | | | | 1,483,865 | |
| | | | | | |
|
|
|
| | | | | | | | 25,432,530 | |
| | | | | | |
|
|
|
Software — 2.6% | |
Blackbaud, Inc. | | | 49,083 | | | | 2,123,331 | |
Bottomline Technologies (de), Inc.* | | | 40,500 | | | | 1,023,840 | |
Ebix, Inc.(a) | | | 30,657 | | | | 520,863 | |
Epiq Systems, Inc. | | | 32,617 | | | | 557,098 | |
Interactive Intelligence Group, Inc.* | | | 17,779 | | | | 851,614 | |
Manhattan Associates, Inc.* | | | 79,072 | | | | 3,219,812 | |
MicroStrategy, Inc. (Class A Stock)* | | | 9,660 | | | | 1,568,784 | |
Monotype Imaging Holdings, Inc. | | | 41,500 | | | | 1,196,445 | |
NetScout Systems, Inc.*(a) | | | 39,695 | | | | 1,450,455 | |
Progress Software Corp.* | | | 53,147 | | | | 1,436,032 | |
Synchronoss Technologies, Inc.* | | | 38,100 | | | | 1,594,866 | |
Take-Two Interactive Software, Inc.*(a) | | | 89,112 | | | | 2,497,809 | |
SEE NOTES TO FINANCIAL STATEMENTS.
A145
| | | | | | |
| | | SMALL CAPITALIZATION STOCK PORTFOLIO (continued) | | |
| |
| SCHEDULE OF INVESTMENTS | | December 31, 2014 |
| | | | | | | | |
COMMON STOCKS
(continued) | | Shares
| | | Value
(Note 2)
| |
Software (continued) | |
Tangoe, Inc.* | | | 38,600 | | | $ | 502,958 | |
VASCO Data Security International, Inc.* | | | 31,100 | | | | 877,331 | |
| | | | | | |
|
|
|
| | | | | | | | 19,421,238 | |
| | | | | | |
|
|
|
Specialty Retail — 4.3% | |
Aeropostale, Inc.*(a) | | | 82,300 | | | | 190,936 | |
Barnes & Noble, Inc.*(a) | | | 45,200 | | | | 1,049,544 | |
Big 5 Sporting Goods Corp. | | | 19,137 | | | | 279,974 | |
Brown Shoe Co., Inc. | | | 46,334 | | | | 1,489,638 | |
Buckle, Inc. (The)(a) | | | 29,759 | | | | 1,562,943 | |
Cato Corp. (The) (Class A Stock) | | | 27,203 | | | | 1,147,423 | |
Children’s Place, Inc. (The) | | | 22,465 | | | | 1,280,505 | |
Christopher & Banks Corp.* | | | 39,078 | | | | 223,135 | |
Finish Line, Inc. (The) (Class A Stock) | | | 50,746 | | | | 1,233,635 | |
Francesca’s Holdings Corp.*(a) | | | 44,500 | | | | 743,150 | |
Genesco, Inc.* | | | 25,522 | | | | 1,955,496 | |
Group 1 Automotive, Inc. | | | 22,664 | | | | 2,031,148 | |
Haverty Furniture Cos., Inc. | | | 21,541 | | | | 474,117 | |
Hibbett Sports, Inc.*(a) | | | 26,496 | | | | 1,283,201 | |
Kirkland’s, Inc.* | | | 15,600 | | | | 368,784 | |
Lithia Motors, Inc. (Class A Stock) | | | 24,230 | | | | 2,100,499 | |
Lumber Liquidators Holdings, Inc.*(a) | | | 28,722 | | | | 1,904,556 | |
MarineMax, Inc.* | | | 26,142 | | | | 524,147 | |
Men’s Wearhouse, Inc. (The) | | | 48,367 | | | | 2,135,403 | |
Monro Muffler Brake, Inc. | | | 33,472 | | | | 1,934,682 | |
Outerwall, Inc.*(a) | | | 20,031 | | | | 1,506,732 | |
Pep Boys-Manny Moe & Jack (The)* | | | 55,926 | | | | 549,193 | |
Select Comfort Corp.* | | | 56,400 | | | | 1,524,492 | |
Sonic Automotive, Inc. (Class A Stock) | | | 35,147 | | | | 950,375 | |
Stage Stores, Inc. | | | 33,679 | | | | 697,155 | |
Stein Mart, Inc. | | | 29,683 | | | | 433,965 | |
Vitamin Shoppe, Inc.* | | | 32,800 | | | | 1,593,424 | |
Zumiez, Inc.* | | | 22,950 | | | | 886,559 | |
| | | | | | |
|
|
|
| | | | | | | | 32,054,811 | |
| | | | | | |
|
|
|
Technology Hardware, Storage & Peripherals — 0.6% | |
Electronics For Imaging, Inc.* | | | 49,900 | | | | 2,137,217 | |
QLogic Corp.* | | | 92,600 | | | | 1,233,432 | |
Super Micro Computer, Inc.* | | | 37,100 | | | | 1,294,048 | |
| | | | | | |
|
|
|
| | | | | | | | 4,664,697 | |
| | | | | | |
|
|
|
Textiles, Apparel & Luxury Goods — 2.0% | |
Crocs, Inc.* | | | 86,943 | | | | 1,085,918 | |
G-III Apparel Group Ltd.* | | | 20,300 | | | | 2,050,503 | |
Iconix Brand Group, Inc.* | | | 50,831 | | | | 1,717,580 | |
Movado Group, Inc. | | | 19,217 | | | | 545,186 | |
Oxford Industries, Inc. | | | 15,416 | | | | 851,117 | |
Perry Ellis International, Inc.* | | | 12,579 | | | | 326,174 | |
Quiksilver, Inc.*(a) | | | 128,593 | | | | 284,191 | |
Skechers U.S.A., Inc. (Class A Stock)*(a) | | | 43,476 | | | | 2,402,049 | |
Steven Madden Ltd.* | | | 59,900 | | | | 1,906,617 | |
Unifi, Inc.* | | | 14,600 | | | | 434,058 | |
Wolverine World Wide, Inc. | | | 107,454 | | | | 3,166,669 | |
| | | | | | |
|
|
|
| | | | | | | | 14,770,062 | |
| | | | | | |
|
|
|
| | | | | | | | |
COMMON STOCKS
(continued) | | Shares
| | | Value
(Note 2)
| |
Thrifts & Mortgage Finance — 0.8% | |
Bank Mutual Corp. | | | 45,135 | | | $ | 309,626 | |
BofI Holding, Inc.*(a) | | | 13,800 | | | | 1,073,778 | |
Brookline Bancorp, Inc. | | | 71,532 | | | | 717,466 | |
Dime Community Bancshares, Inc. | | | 31,581 | | | | 514,138 | |
Northwest Bancshares, Inc. | | | 100,500 | | | | 1,259,265 | |
Oritani Financial Corp. | | | 39,200 | | | | 603,680 | |
Provident Financial Services, Inc. | | | 56,800 | | | | 1,025,808 | |
TrustCo Bank Corp. NY | | | 99,895 | | | | 725,238 | |
| | | | | | |
|
|
|
| | | | | | | | 6,228,999 | |
| | | | | | |
|
|
|
Tobacco — 0.2% | |
Alliance One International, Inc.* | | | 86,138 | | | | 136,098 | |
Universal Corp.(a) | | | 24,500 | | | | 1,077,510 | |
| | | | | | |
|
|
|
| | | | | | | | 1,213,608 | |
| | | | | | |
|
|
|
Trading Companies & Distributors — 0.6% | |
Aceto Corp. | | | 28,800 | | | | 624,960 | |
Applied Industrial Technologies, Inc.(a) | | | 43,728 | | | | 1,993,559 | |
DXP Enterprises, Inc.* | | | 13,700 | | | | 692,261 | |
Kaman Corp. | | | 28,822 | | | | 1,155,474 | |
Veritiv Corp.* | | | 8,700 | | | | 451,269 | |
| | | | | | |
|
|
|
| | | | | | | | 4,917,523 | |
| | | | | | |
|
|
|
Water Utilities — 0.2% | |
American States Water Co. | | | 40,652 | | | | 1,530,954 | |
| | | | | | |
|
|
|
Wireless Telecommunication Services — 0.1% | |
NTELOS Holdings Corp. | | | 16,621 | | | | 69,642 | |
Spok Holdings, Inc. | | | 22,680 | | | | 393,725 | |
| | | | | | |
|
|
|
| | | | | | | | 463,367 | |
| | | | | | |
|
|
|
TOTAL COMMON STOCKS
(cost $444,523,245) | | | | | | | 734,176,754 | |
| | | | | | |
|
|
|
| EXCHANGE TRADED FUND — 0.7% | |
iShares Core S&P Small-Cap
ETF(a)
(cost $3,696,185) | | | 45,700 | | | | 5,212,542 | |
| | | | | | |
|
|
|
TOTAL LONG-TERM INVESTMENTS
(cost $448,219,430) | | | | | | | 739,389,296 | |
| | | | | | |
|
|
|
| SHORT-TERM INVESTMENTS — 14.1% | |
AFFILIATED MONEY MARKET MUTUAL FUND — 14.0% | |
Prudential Investment Portfolios 2 — Prudential Core Taxable Money Market Fund (cost $105,314,175; includes $97,161,380 of cash collateral for securities on loan)(Note 4)(b)(c) | | | 105,314,175 | | | | 105,314,175 | |
| | | | | | |
|
|
|
SEE NOTES TO FINANCIAL STATEMENTS.
A146
| | | | | | |
| | | SMALL CAPITALIZATION STOCK PORTFOLIO (continued) | | |
| |
| SCHEDULE OF INVESTMENTS | | December 31, 2014 |
| | | | | | | | |
| | | Principal
Amount
(000)#
| | | Value
(Note 2)
| |
| U.S. TREASURY OBLIGATION — 0.1% | |
U.S. Treasury Bill, 0.035%, 03/19/15
(cost $749,928)(d)(e) | | | 750 | | | $ | 749,968 | |
| | | | | | |
|
|
|
TOTAL SHORT-TERM INVESTMENTS
(cost $106,064,103) | | | | 106,064,143 | |
| | | | | | |
|
|
|
TOTAL INVESTMENTS — 112.6%
(cost $554,283,533) | | | | 845,453,439 | |
LIABILITIES IN EXCESS OF
OTHER ASSETS(f) — (12.6)% | | | | (94,516,529 | ) |
| | | | | | |
|
|
|
NET ASSETS — 100.0% | | | $ | 750,936,910 | |
| | | | | | |
|
|
|
See the Glossary for abbreviations used in the Portfolio descriptions.
| * | Non-income producing security. |
| # | Principal amount shown in U.S. dollars unless otherwise stated. |
| (a) | All or a portion of security is on loan. The aggregate market value of such securities, including those sold and pending settlement, is $94,147,155; cash collateral of $97,161,380 (included with liabilities) was received with which the Portfolio purchased highly liquid short-term investments. Securities on loan are subject to contractual netting arrangements. |
| (b) | Prudential Investments LLC, the manager of the Portfolio, also serves as manager of the Prudential Investment Portfolios 2 — Prudential Core Taxable Money Market Fund. |
| (c) | Represents security, or a portion thereof, purchased with cash collateral received for securities on loan. |
| (d) | Rate quoted represents yield-to-maturity as of purchase date. |
| (e) | Represents security, or a portion thereof, segregated as collateral for futures contracts. |
| (f) | Includes net unrealized appreciation (depreciation) on the following derivative contracts held at reporting period end: |
Futures contracts outstanding at December 31, 2014:
| | | | | | | | | | | | | | | | | | |
Number of
Contracts
| | Type
| | Expiration
Date
| | | Value at
Trade Date
| | | Value at
December 31, 2014
| | | Unrealized
Appreciation(1)
| |
| Long Position: | | | | | | | | | | | | | | | | | | |
| 95 | | Russell 2000 Mini Index | | | Mar. 2015 | | | $ | 10,931,280 | | | $ | 11,406,650 | | | $ | 475,370 | |
| | | | | | | | | | | | | | | | |
|
|
|
| (1) | A U.S. Treasury obligation with a market value of $749,968 has been segregated with UBS AG to cover requirements for open contracts at December 31, 2014. |
Various inputs are used in determining the value of the Portfolio’s investments. These inputs are summarized in the three broad levels listed below.
| Level 1— | quoted prices generally in active markets for identical securities. |
| Level 2— | quoted prices for similar securities, interest rates and yield curves, prepayment speeds, foreign currency exchange rates and other significant observable inputs. |
| Level 3— | significant unobservable inputs for securities valued in accordance with Board approved fair valuation procedures. |
The following is a summary of the inputs used as of December 31, 2014 in valuing such portfolio securities:
| | | | | | | | | | | | |
| | | Level 1
| | | Level 2
| | | Level 3
| |
Investments in Securities | | | | | | | | | | | | |
Common Stocks | | | | | | | | | | | | |
Aerospace & Defense | | $ | 19,528,109 | | | $ | — | | | $ | — | |
Air Freight & Logistics | | | 5,487,386 | | | | — | | | | — | |
Airlines | | | 2,894,144 | | | | — | | | | — | |
Auto Components | | | 4,169,925 | | | | — | | | | — | |
Automobiles | | | 623,011 | | | | — | | | | — | |
Banks | | | 58,313,004 | | | | — | | | | — | |
Beverages | | | 2,728,915 | | | | — | | | | — | |
Biotechnology | | | 5,340,752 | | | | — | | | | — | |
Building Products | | | 7,764,132 | | | | — | | | | — | |
Capital Markets | | | 14,077,141 | | | | — | | | | — | |
Chemicals | | | 18,161,668 | | | | — | | | | — | |
Commercial Services & Supplies | | | 19,679,138 | | | | — | | | | — | |
Communications Equipment | | | 8,926,345 | | | | — | | | | — | |
Construction & Engineering | | | 6,044,627 | | | | — | | | | — | |
Construction Materials | | | 1,165,742 | | | | — | | | | — | |
Consumer Finance | | | 9,332,917 | | | | — | | | | — | |
Containers & Packaging | | | 461,472 | | | | — | | | | — | |
Distributors | | | 3,102,685 | | | | — | | | | — | |
Diversified Consumer Services | | | 3,874,395 | | | | — | | | | — | |
Diversified Financial Services | | | 4,647,636 | | | | — | | | | — | |
SEE NOTES TO FINANCIAL STATEMENTS.
A147
| | | | | | |
| | | SMALL CAPITALIZATION STOCK PORTFOLIO (continued) | | |
| |
| SCHEDULE OF INVESTMENTS | | December 31, 2014 |
| | | | | | | | | | | | |
| | | Level 1
| | | Level 2
| | | Level 3
| |
Investments in Securities (continued) | | | | | | | | | | | | |
Common Stocks (continued) | | | | | | | | | | | | |
Diversified Telecommunication Services | | $ | 4,434,820 | | | $ | — | | | $ | — | |
Electric Utilities | | | 6,567,446 | | | | — | | | | — | |
Electrical Equipment | | | 8,012,530 | | | | — | | | | — | |
Electronic Equipment, Instruments & Components | | | 30,876,669 | | | | — | | | | — | |
Energy Equipment & Services | | | 14,616,457 | | | | — | | | | — | |
Food & Staples Retailing | | | 6,253,639 | | | | — | | | | — | |
Food Products | | | 13,113,368 | | | | — | | | | — | |
Gas Utilities | | | 15,029,008 | | | | — | | | | — | |
Health Care Equipment & Supplies | | | 29,571,895 | | | | — | | | | — | |
Health Care Providers & Services | | | 24,645,412 | | | | — | | | | — | |
Health Care Technology | | | 7,309,506 | | | | — | | | | — | |
Hotels, Restaurants & Leisure | | | 29,797,671 | | | | — | | | | — | |
Household Durables | | | 11,392,288 | | | | — | | | | — | |
Household Products | | | 1,672,569 | | | | — | | | | — | |
Insurance | | | 19,233,879 | | | | — | | | | — | |
Internet & Catalog Retail | | | 2,054,171 | | | | — | | | | — | |
Internet Software & Services | | | 14,426,637 | | | | — | | | | — | |
IT Services | | | 17,280,411 | | | | — | | | | — | |
Leisure Products | | | 1,826,533 | | | | — | | | | — | |
Life Sciences Tools & Services | | | 5,865,546 | | | | — | | | | — | |
Machinery | | | 27,283,796 | | | | — | | | | — | |
Marine | | | 1,570,660 | | | | — | | | | — | |
Media | | | 2,226,542 | | | | — | | | | — | |
Metals & Mining | | | 10,715,178 | | | | — | | | | — | |
Multi-Utilities | | | 4,895,639 | | | | — | | | | — | |
Multiline Retail | | | 1,643,759 | | | | — | | | | — | |
Oil, Gas & Consumable Fuels | | | 11,163,950 | | | | — | | | | — | |
Paper & Forest Products | | | 10,590,663 | | | | — | | | | — | |
Personal Products | | | 893,345 | | | | — | | | | — | |
Pharmaceuticals | | | 11,713,780 | | | | — | | | | — | |
Professional Services | | | 11,016,501 | | | | — | | | | — | |
Real Estate Investment Trusts (REITs) | | | 61,297,388 | | | | — | | | | — | |
Real Estate Management & Development | | | 567,582 | | | | — | | | | — | |
Road & Rail | | | 7,596,583 | | | | — | | | | — | |
Semiconductors & Semiconductor Equipment | | | 25,432,530 | | | | — | | | | — | |
Software | | | 19,421,238 | | | | — | | | | — | |
Specialty Retail | | | 32,054,811 | | | | — | | | | — | |
Technology Hardware, Storage & Peripherals | | | 4,664,697 | | | | — | | | | — | |
Textiles, Apparel & Luxury Goods | | | 14,770,062 | | | | — | | | | — | |
Thrifts & Mortgage Finance | | | 6,228,999 | | | | — | | | | — | |
Tobacco | | | 1,213,608 | | | | — | | | | — | |
Trading Companies & Distributors | | | 4,917,523 | | | | — | | | | — | |
Water Utilities | | | 1,530,954 | | | | — | | | | — | |
Wireless Telecommunication Services | | | 463,367 | | | | — | | | | — | |
Exchange Traded Fund | | | 5,212,542 | | | | — | | | | — | |
Affiliated Money Market Mutual Fund | | | 105,314,175 | | | | — | | | | — | |
U.S. Treasury Obligation | | | — | | | | 749,968 | | | | — | |
Other Financial Instruments* | | | | | | | | | | | | |
Futures Contracts | | | 475,370 | | | | — | | | | — | |
| | |
|
|
| |
|
|
| |
|
|
|
Total | | $ | 845,178,841 | | | $ | 749,968 | | | $ | — | |
| | |
|
|
| |
|
|
| |
|
|
|
| * | Other financial instruments are derivative instruments not reflected in the Schedule of Investments, such as futures, forwards and exchange-traded swap contracts, which are recorded at the unrealized appreciation/depreciation on the instrument, and over-the-counter swap contracts which are recorded at fair value. |
SEE NOTES TO FINANCIAL STATEMENTS.
A148
| | | | | | |
| | | SMALL CAPITALIZATION STOCK PORTFOLIO (continued) | | |
| |
| SCHEDULE OF INVESTMENTS | | December 31, 2014 |
The industry classification of investments and liabilities in excess of other assets shown as a percentage of net assets as of December 31, 2014 was as follows (Unaudited):
| | | | |
Affiliated Money Market Mutual Fund (including 12.9% of collateral for securities on loan) | | | 14.0 | % |
Real Estate Investment Trusts (REITs) | | | 8.2 | |
Banks | | | 7.8 | |
Specialty Retail | | | 4.3 | |
Electronic Equipment, Instruments & Components | | | 4.1 | |
Hotels, Restaurants & Leisure | | | 4.0 | |
Health Care Equipment & Supplies | | | 3.9 | |
Machinery | | | 3.6 | |
Semiconductors & Semiconductor Equipment | | | 3.4 | |
Health Care Providers & Services | | | 3.3 | |
Commercial Services & Supplies | | | 2.6 | |
Aerospace & Defense | | | 2.6 | |
Software | | | 2.6 | |
Insurance | | | 2.6 | |
Chemicals | | | 2.4 | |
IT Services | | | 2.3 | |
Gas Utilities | | | 2.0 | |
Textiles, Apparel & Luxury Goods | | | 2.0 | |
Energy Equipment & Services | | | 1.9 | |
Internet Software & Services | | | 1.9 | |
Capital Markets | | | 1.9 | |
Food Products | | | 1.7 | |
Pharmaceuticals | | | 1.6 | |
Household Durables | | | 1.5 | |
Oil, Gas & Consumable Fuels | | | 1.5 | |
Professional Services | | | 1.5 | |
Metals & Mining | | | 1.4 | |
Paper & Forest Products | | | 1.4 | |
Consumer Finance | | | 1.2 | |
Communications Equipment | | | 1.2 | |
Electrical Equipment | | | 1.1 | |
Building Products | | | 1.0 | |
Road & Rail | | | 1.0 | |
Health Care Technology | | | 1.0 | |
Electric Utilities | | | 0.9 | |
| | | | |
Food & Staples Retailing | | | 0.8 | % |
Thrifts & Mortgage Finance | | | 0.8 | |
Construction & Engineering | | | 0.8 | |
Life Sciences Tools & Services | | | 0.8 | |
Air Freight & Logistics | | | 0.7 | |
Biotechnology | | | 0.7 | |
Exchange Traded Fund | | | 0.7 | |
Trading Companies & Distributors | | | 0.6 | |
Multi-Utilities | | | 0.6 | |
Technology Hardware, Storage & Peripherals | | | 0.6 | |
Diversified Financial Services | | | 0.6 | |
Diversified Telecommunication Services | | | 0.6 | |
Auto Components | | | 0.6 | |
Diversified Consumer Services | | | 0.5 | |
Distributors | | | 0.4 | |
Airlines | | | 0.4 | |
Beverages | | | 0.4 | |
Media | | | 0.3 | |
Internet & Catalog Retail | | | 0.3 | |
Leisure Products | | | 0.2 | |
Household Products | | | 0.2 | |
Multiline Retail | | | 0.2 | |
Marine | | | 0.2 | |
Water Utilities | | | 0.2 | |
Tobacco | | | 0.2 | |
Construction Materials | | | 0.2 | |
Personal Products | | | 0.1 | |
U.S. Treasury Obligation | | | 0.1 | |
Automobiles | | | 0.1 | |
Real Estate Management & Development | | | 0.1 | |
Wireless Telecommunication Services | | | 0.1 | |
Containers & Packaging | | | 0.1 | |
| | |
|
|
|
| | | | 112.6 | |
Liabilities in excess of other assets | | | (12.6 | ) |
| | |
|
|
|
| | | | 100.0 | % |
| | |
|
|
|
The Portfolio invested in derivative instruments during the reporting period. The primary types of risk associated with these derivative instruments is equity risk. The effect of such derivative instruments on the Portfolio’s financial position and financial performance as reflected in the Statement of Assets and Liabilities and Statement of Operations is presented in the summary below.
Fair values of derivative instruments as of December 31, 2014 as presented in the Statement of Assets and Liabilities:
| | | | | | | | | | | | |
Derivatives not accounted for as hedging
instruments, carried at fair value
| | Asset Derivatives
| | | Liability Derivatives
| |
| | Balance Sheet Location
| | Fair Value
| | | Balance Sheet Location
| | Fair Value
| |
Equity contracts | | Due from/to broker —variation margin futures | | $ | 475,370 | * | | — | | $ | — | |
| | | | |
|
|
| | | |
|
|
|
| * | Includes cumulative appreciation/depreciation as reported in the schedule of open futures. Only unsettled variation margin receivable (payable) is reported within the Statement of Assets and Liabilities. |
SEE NOTES TO FINANCIAL STATEMENTS.
A149
| | | | | | |
| | | SMALL CAPITALIZATION STOCK PORTFOLIO (continued) | | |
| |
| SCHEDULE OF INVESTMENTS | | December 31, 2014 |
The effects of derivative instruments on the Statement of Operations for the year ended December 31, 2014 are as follows:
| | | | |
Amount of Realized Gain or (Loss) on Derivatives Recognized in Income
| |
Derivatives not accounted for as hedging instruments, carried at fair value
| | Futures
| |
Equity contracts | | $ | (29,126 | ) |
| | |
|
|
|
|
Change in Unrealized Appreciation or (Depreciation) on Derivatives Recognized in Income
| |
Derivatives not accounted for as hedging instruments, carried at fair value
| | Futures
| |
Equity contracts | | $ | 118,108 | |
| | |
|
|
|
As of December 31, 2014, the Portfolio’s average volume at trade date for futures long positions was $10,879,824.
SEE NOTES TO FINANCIAL STATEMENTS.
A150
| | | | | | |
| | | SMALL CAPITALIZATION STOCK PORTFOLIO (continued) | | |
STATEMENT OF ASSETS AND LIABILITIES
December 31, 2014
| | | | |
| ASSETS | | | | |
Investments at value, including securities on loan of $94,147,155: | | | | |
Unaffiliated investments (cost $448,969,358) | | $ | 740,139,264 | |
Affiliated investments (cost $105,314,175) | | | 105,314,175 | |
Receivable for investments sold | | | 5,326,159 | |
Dividends and interest receivable | | | 1,006,517 | |
Receivable for Series shares sold | | | 49,810 | |
Prepaid expenses | | | 5,982 | |
| | |
|
|
|
Total Assets | | | 851,841,907 | |
| | |
|
|
|
| LIABILITIES | | | | |
Payable to broker for collateral for securities on loan | | | 97,161,380 | |
Payable for investments purchased | | | 3,083,325 | |
Management fee payable | | | 219,519 | |
Payable for Series shares repurchased | | | 140,756 | |
Accrued expenses | | | 125,026 | |
Payable to custodian | | | 98,024 | |
Due to broker-variation margin futures | | | 76,041 | |
Affiliated transfer agent fee payable | | | 926 | |
| | |
|
|
|
Total Liabilities | | | 100,904,997 | |
| | |
|
|
|
| NET ASSETS | | $ | 750,936,910 | |
| | |
|
|
|
Net assets were comprised of: | | | | |
Paid-in capital | | $ | 322,275,261 | |
Retained earnings | | | 428,661,649 | |
| | |
|
|
|
Net assets, December 31, 2014 | | $ | 750,936,910 | |
| | |
|
|
|
Net asset value and redemption price per share $750,936,910 / 27,234,949 outstanding shares of beneficial interest | | $ | 27.57 | |
| | |
|
|
|
STATEMENT OF OPERATIONS
Year Ended December 31, 2014
| | | | |
| NET INVESTMENT INCOME | | | | |
| INCOME | | | | |
Unaffiliated dividend income (net of foreign withholding taxes of $1,178) | | $ | 9,491,159 | |
Affiliated income from securities loaned, net | | | 584,470 | |
Affiliated dividend income | | | 11,568 | |
Interest income | | | 295 | |
| | |
|
|
|
Total income | | | 10,087,492 | |
| | |
|
|
|
| EXPENSES | | | | |
Management fee | | | 2,962,166 | |
Custodian’s fees and expenses | | | 128,000 | |
Shareholders’ reports | | | 96,000 | |
Audit fee | | | 25,000 | |
Trustees’ fees | | | 16,000 | |
Transfer agent’s fees and expenses (including affiliated expense of $5,600) | | | 12,000 | |
Legal fees and expenses | | | 11,000 | |
Insurance expenses | | | 10,000 | |
Commitment fee on syndicated credit agreement | | | 3,000 | |
Miscellaneous | | | 79,602 | |
| | |
|
|
|
Total expenses | | | 3,342,768 | |
Less: Management fee waiver | | | (370,271 | ) |
| | |
|
|
|
Net expenses | | | 2,972,497 | |
| | |
|
|
|
| NET INVESTMENT INCOME | | | 7,114,995 | |
| | |
|
|
|
| REALIZED AND UNREALIZED GAIN (LOSS) ON INVESTMENTS | | | | |
Net realized gain (loss) on: | | | | |
Investment transactions | | | 56,983,199 | |
Futures transactions | | | (29,126 | ) |
| | |
|
|
|
| | | | 56,954,073 | |
| | |
|
|
|
Net change in unrealized appreciation (depreciation) on: | | | | |
Investments | | | (26,050,627 | ) |
Futures | | | 118,108 | |
| | |
|
|
|
| | | | (25,932,519 | ) |
| | |
|
|
|
| NET GAIN ON INVESTMENT TRANSACTIONS | | | 31,021,554 | |
| | |
|
|
|
| NET INCREASE IN NET ASSETS RESULTING FROM OPERATIONS | | $ | 38,136,549 | |
| | |
|
|
|
STATEMENT OF CHANGES IN NET ASSETS
| | | | | | | | |
| | | Year Ended December 31,
| |
| | | 2014
| | | 2013
| |
| INCREASE (DECREASE) IN NET ASSETS | | | | | | | | |
| OPERATIONS | | | | | | | | |
Net investment income | | $ | 7,114,995 | | | $ | 6,238,439 | |
Net realized gain on investment transactions | | | 56,954,073 | | | | 53,723,040 | |
Net change in unrealized appreciation (depreciation) on investments | | | (25,932,519 | ) | | | 171,173,752 | |
| | |
|
|
| |
|
|
|
NET INCREASE IN NET ASSETS RESULTING FROM OPERATIONS | | | 38,136,549 | | | | 231,135,231 | |
| | |
|
|
| |
|
|
|
| SERIES SHARE TRANSACTIONS | | | | | | | | |
Series shares sold [439,963 and 1,159,772 shares, respectively] | | | 11,510,506 | | | | 25,996,841 | |
Series shares repurchased [2,647,810 and 2,883,214 shares, respectively] | | | (68,806,270 | ) | | | (65,438,115 | ) |
| | |
|
|
| |
|
|
|
NET DECREASE IN NET ASSETS FROM SERIES SHARE TRANSACTIONS | | | (57,295,764 | ) | | | (39,441,274 | ) |
| | |
|
|
| |
|
|
|
| TOTAL INCREASE (DECREASE) | | | (19,159,215 | ) | | | 191,693,957 | |
| NET ASSETS: | | | | | | | | |
Beginning of year | | | 770,096,125 | | | | 578,402,168 | |
| | |
|
|
| |
|
|
|
End of year | | $ | 750,936,910 | | | $ | 770,096,125 | |
| | |
|
|
| |
|
|
|
SEE NOTES TO FINANCIAL STATEMENTS.
A151
| | | | | | |
| | | STOCK INDEX PORTFOLIO | | |
| |
| SCHEDULE OF INVESTMENTS | | December 31, 2014 |
| | | | | | | | |
| LONG-TERM INVESTMENTS — 96.8% | |
| COMMON STOCKS | | Shares
| | | Value
(Note 2)
| |
Aerospace & Defense — 2.6% | |
Boeing Co. (The) | | | 117,136 | | | $ | 15,225,337 | |
General Dynamics Corp. | | | 56,200 | | | | 7,734,244 | |
Honeywell International, Inc. | | | 137,050 | | | | 13,694,036 | |
L-3 Communications Holdings, Inc. | | | 15,200 | | | | 1,918,392 | |
Lockheed Martin Corp. | | | 47,298 | | | | 9,108,176 | |
Northrop Grumman Corp. | | | 36,726 | | | | 5,413,045 | |
Precision Castparts Corp. | | | 25,300 | | | | 6,094,264 | |
Raytheon Co. | | | 54,318 | | | | 5,875,578 | |
Rockwell Collins, Inc. | | | 24,000 | | | | 2,027,520 | |
Textron, Inc. | | | 49,400 | | | | 2,080,234 | |
United Technologies Corp. | | | 149,000 | | | | 17,135,000 | |
| | | | | | |
|
|
|
| | | | | | | | 86,305,826 | |
| | | | | | |
|
|
|
Air Freight & Logistics — 0.8% | |
C.H. Robinson Worldwide, Inc. | | | 26,100 | | | | 1,954,629 | |
Expeditors International of Washington, Inc. | | | 35,600 | | | | 1,588,116 | |
FedEx Corp. | | | 47,140 | | | | 8,186,332 | |
United Parcel Service, Inc. (Class B Stock) | | | 123,300 | | | | 13,707,261 | |
| | | | | | |
|
|
|
| | | | | | | | 25,436,338 | |
| | | | | | |
|
|
|
Airlines — 0.4% | |
Delta Air Lines, Inc. | | | 147,300 | | | | 7,245,687 | |
Southwest Airlines Co. | | | 120,037 | | | | 5,079,966 | |
| | | | | | |
|
|
|
| | | | | | | | 12,325,653 | |
| | | | | | |
|
|
|
Auto Components — 0.4% | |
BorgWarner, Inc. | | | 40,000 | | | | 2,198,000 | |
Delphi Automotive PLC (United Kingdom) | | | 52,400 | | | | 3,810,528 | |
Goodyear Tire & Rubber Co. (The) | | | 50,000 | | | | 1,428,500 | |
Johnson Controls, Inc. | | | 116,900 | | | | 5,650,946 | |
| | | | | | |
|
|
|
| | | | | | | | 13,087,974 | |
| | | | | | |
|
|
|
Automobiles — 0.6% | |
Ford Motor Co. | | | 677,459 | | | | 10,500,615 | |
General Motors Co. | | | 231,900 | | | | 8,095,629 | |
Harley-Davidson, Inc. | | | 38,100 | | | | 2,511,171 | |
| | | | | | |
|
|
|
| | | | | | | | 21,107,415 | |
| | | | | | |
|
|
|
Banks — 5.9% | |
Bank of America Corp. | | | 1,837,082 | | | | 32,865,397 | |
BB&T Corp.(a) | | | 126,100 | | | | 4,904,029 | |
Citigroup, Inc. | | | 532,622 | | | | 28,820,176 | |
Comerica, Inc. | | | 31,850 | | | | 1,491,854 | |
Fifth Third Bancorp | | | 145,649 | | | | 2,967,598 | |
Huntington Bancshares, Inc. | | | 144,675 | | | | 1,521,981 | |
JPMorgan Chase & Co. | | | 656,845 | | | | 41,105,360 | |
KeyCorp | | | 152,900 | | | | 2,125,310 | |
M&T Bank Corp.(a) | | | 23,400 | | | | 2,939,508 | |
PNC Financial Services Group, Inc. (The) | | | 94,393 | | | | 8,611,473 | |
Regions Financial Corp. | | | 241,312 | | | | 2,548,255 | |
SunTrust Banks, Inc. | | | 92,900 | | | | 3,892,510 | |
U.S. Bancorp | | | 316,381 | | | | 14,221,326 | |
Wells Fargo & Co. | | | 829,636 | | | | 45,480,646 | |
Zions Bancorporation | | | 35,400 | | | | 1,009,254 | |
| | | | | | |
|
|
|
| | | | | | | | 194,504,677 | |
| | | | | | |
|
|
|
| | | | | | | | |
COMMON STOCKS
(continued) | | Shares
| | | Value
(Note 2)
| |
Beverages — 2.1% | |
Brown-Forman Corp. (Class B Stock) | | | 28,550 | | | $ | 2,507,832 | |
Coca-Cola Co. (The) | | | 689,850 | | | | 29,125,467 | |
Coca-Cola Enterprises, Inc. | | | 40,700 | | | | 1,799,754 | |
Constellation Brands Inc. (Class A Stock)* | | | 29,300 | | | | 2,876,381 | |
Dr. Pepper Snapple Group, Inc. | | | 34,600 | | | | 2,480,128 | |
Molson Coors Brewing Co. (Class B Stock) | | | 28,200 | | | | 2,101,464 | |
Monster Beverage Corp.* | | | 25,200 | | | | 2,730,420 | |
PepsiCo, Inc. | | | 263,614 | | | | 24,927,340 | |
| | | | | | |
|
|
|
| | | | | | | | 68,548,786 | |
| | | | | | |
|
|
|
Biotechnology — 2.8% | |
Alexion Pharmaceuticals, Inc.* | | | 34,600 | | | | 6,402,038 | |
Amgen, Inc. | | | 133,794 | | | | 21,312,046 | |
Biogen Idec, Inc.* | | | 41,375 | | | | 14,044,744 | |
Celgene Corp.* | | | 140,200 | | | | 15,682,772 | |
Gilead Sciences, Inc.* | | | 265,300 | | | | 25,007,178 | |
Regeneron Pharmaceuticals, Inc.* | | | 13,100 | | | | 5,374,275 | |
Vertex Pharmaceuticals, Inc.* | | | 40,600 | | | | 4,823,280 | |
| | | | | | |
|
|
|
| | | | | | | | 92,646,333 | |
| | | | | | |
|
|
|
Building Products — 0.1% | |
Allegion PLC | | | 16,833 | | | | 933,558 | |
Masco Corp. | | | 62,200 | | | | 1,567,440 | |
| | | | | | |
|
|
|
| | | | | | | | 2,500,998 | |
| | | | | | |
|
|
|
Capital Markets — 2.2% | |
Affiliated Managers Group, Inc.* | | | 9,800 | | | | 2,079,952 | |
Ameriprise Financial, Inc. | | | 32,700 | | | | 4,324,575 | |
Bank of New York Mellon Corp. (The) | | | 198,089 | | | | 8,036,471 | |
BlackRock, Inc. | | | 22,200 | | | | 7,937,832 | |
Charles Schwab Corp. (The) | | | 202,800 | | | | 6,122,532 | |
E*TRADE Financial Corp.* | | | 51,810 | | | | 1,256,652 | |
Franklin Resources, Inc. | | | 69,500 | | | | 3,848,215 | |
Goldman Sachs Group, Inc. (The) | | | 72,200 | | | | 13,994,526 | |
Invesco Ltd. | | | 75,600 | | | | 2,987,712 | |
Legg Mason, Inc. | | | 18,000 | | | | 960,660 | |
Morgan Stanley | | | 267,510 | | | | 10,379,388 | |
Northern Trust Corp. | | | 39,400 | | | | 2,655,560 | |
State Street Corp. | | | 74,525 | | | | 5,850,212 | |
T. Rowe Price Group, Inc. | | | 46,500 | | | | 3,992,490 | |
| | | | | | |
|
|
|
| | | | | | | | 74,426,777 | |
| | | | | | |
|
|
|
Chemicals — 2.3% | |
Air Products & Chemicals, Inc. | | | 34,100 | | | | 4,918,243 | |
Airgas, Inc. | | | 11,800 | | | | 1,359,124 | |
CF Industries Holdings, Inc. | | | 9,000 | | | | 2,452,860 | |
Dow Chemical Co. (The) | | | 196,211 | | | | 8,949,184 | |
E.I. du Pont de Nemours & Co. | | | 159,991 | | | | 11,829,734 | |
Eastman Chemical Co. | | | 26,100 | | | | 1,979,946 | |
Ecolab, Inc. | | | 47,100 | | | | 4,922,892 | |
FMC Corp. | | | 24,000 | | | | 1,368,720 | |
International Flavors & Fragrances, Inc. | | | 14,200 | | | | 1,439,312 | |
LyondellBasell Industries NV (Class A Stock) | | | 74,800 | | | | 5,938,372 | |
SEE NOTES TO FINANCIAL STATEMENTS.
A152
| | | | | | |
| | | STOCK INDEX PORTFOLIO (continued) | | |
| |
| SCHEDULE OF INVESTMENTS | | December 31, 2014 |
| | | | | | | | |
COMMON STOCKS
(continued) | | Shares
| | | Value
(Note 2)
| |
Chemicals (continued) | |
Monsanto Co. | | | 84,596 | | | $ | 10,106,684 | |
Mosaic Co. (The) | | | 56,400 | | | | 2,574,660 | |
PPG Industries, Inc. | | | 24,100 | | | | 5,570,715 | |
Praxair, Inc. | | | 51,000 | | | | 6,607,560 | |
Sherwin-Williams Co. (The) | | | 14,800 | | | | 3,892,992 | |
Sigma-Aldrich Corp. | | | 21,100 | | | | 2,896,397 | |
| | | | | | |
|
|
|
| | | | | | | | 76,807,395 | |
| | | | | | |
|
|
|
Commercial Services & Supplies — 0.4% | |
ADT Corp. (The)(a) | | | 31,400 | | | | 1,137,622 | |
Cintas Corp. | | | 17,200 | | | | 1,349,168 | |
Pitney Bowes, Inc. | | | 37,800 | | | | 921,186 | |
Republic Services, Inc. | | | 45,635 | | | | 1,836,809 | |
Stericycle, Inc.* | | | 14,800 | | | | 1,939,984 | |
Tyco International PLC | | | 74,200 | | | | 3,254,412 | |
Waste Management, Inc. | | | 76,830 | | | | 3,942,915 | |
| | | | | | |
|
|
|
| | | | | | | | 14,382,096 | |
| | | | | | |
|
|
|
Communications Equipment — 1.6% | |
Cisco Systems, Inc. | | | 891,275 | | | | 24,790,814 | |
F5 Networks, Inc.* | | | 13,000 | | | | 1,696,045 | |
Harris Corp. | | | 18,300 | | | | 1,314,306 | |
Juniper Networks, Inc. | | | 74,000 | | | | 1,651,680 | |
Motorola Solutions, Inc. | | | 39,527 | | | | 2,651,471 | |
QUALCOMM, Inc. | | | 292,950 | | | | 21,774,974 | |
| | | | | | |
|
|
|
| | | | | | | | 53,879,290 | |
| | | | | | |
|
|
|
Construction & Engineering — 0.1% | |
Fluor Corp. | | | 27,500 | | | | 1,667,325 | |
Jacobs Engineering Group, Inc.* | | | 23,500 | | | | 1,050,215 | |
Quanta Services, Inc.* | | | 42,900 | | | | 1,217,931 | |
| | | | | | |
|
|
|
| | | | | | | | 3,935,471 | |
| | | | | | |
|
|
|
Construction Materials — 0.1% | |
Martin Marietta Materials, Inc. | | | 10,200 | | | | 1,125,264 | |
Vulcan Materials Co. | | | 23,200 | | | | 1,524,936 | |
| | | | | | |
|
|
|
| | | | | | | | 2,650,200 | |
| | | | | | |
|
|
|
Consumer Finance — 0.9% | |
American Express Co. | | | 157,500 | | | | 14,653,800 | |
Capital One Financial Corp. | | | 98,969 | | | | 8,169,891 | |
Discover Financial Services | | | 80,605 | | | | 5,278,821 | |
Navient Corp. | | | 77,000 | | | | 1,663,970 | |
| | | | | | |
|
|
|
| | | | | | | | 29,766,482 | |
| | | | | | |
|
|
|
Containers & Packaging — 0.2% | |
Avery Dennison Corp. | | | 16,900 | | | | 876,772 | |
Ball Corp. | | | 24,300 | | | | 1,656,531 | |
MeadWestvaco Corp. | | | 29,889 | | | | 1,326,773 | |
Owens-Illinois, Inc.* | | | 30,300 | | | | 817,797 | |
Sealed Air Corp. | | | 37,020 | | | | 1,570,758 | |
| | | | | | |
|
|
|
| | | | | | | | 6,248,631 | |
| | | | | | |
|
|
|
Distributors — 0.1% | |
Genuine Parts Co. | | | 26,825 | | | | 2,858,740 | |
| | | | | | |
|
|
|
Diversified Consumer Services — 0.1% | |
H&R Block, Inc. | | | 49,200 | | | | 1,657,056 | |
| | | | | | |
|
|
|
Diversified Financial Services — 2.0% | |
Berkshire Hathaway, Inc. (Class B Stock)* | | | 319,300 | | | | 47,942,895 | |
| | | | | | | | |
COMMON STOCKS
(continued) | | Shares
| | | Value
(Note 2)
| |
Diversified Financial Services (continued) | |
CME Group, Inc. | | | 55,200 | | | $ | 4,893,480 | |
Intercontinental Exchange, Inc. | | | 19,698 | | | | 4,319,575 | |
Leucadia National Corp. | | | 55,900 | | | | 1,253,278 | |
McGrawHill Financial, Inc. | | | 47,400 | | | | 4,217,652 | |
Moody’s Corp. | | | 33,320 | | | | 3,192,389 | |
NASDAQ OMX Group, Inc. (The) | | | 21,100 | | | | 1,011,956 | |
| | | | | | |
|
|
|
| | | | | | | | 66,831,225 | |
| | | | | | |
|
|
|
Diversified Telecommunication Services — 2.2% | |
AT&T, Inc. | | | 906,311 | | | | 30,442,986 | |
CenturyLink, Inc. | | | 100,285 | | | | 3,969,280 | |
Frontier Communications Corp. | | | 172,916 | | | | 1,153,350 | |
Level 3 Communications, Inc.*(a) | | | 46,600 | | | | 2,301,108 | |
Verizon Communications, Inc. | | | 723,638 | | | | 33,851,786 | |
Windstream Holdings, Inc. | | | 96,265 | | | | 793,224 | |
| | | | | | |
|
|
|
| | | | | | | | 72,511,734 | |
| | | | | | |
|
|
|
Electric Utilities — 1.8% | |
American Electric Power Co., Inc. | | | 86,040 | | | | 5,224,349 | |
Duke Energy Corp. | | | 124,048 | | | | 10,362,970 | |
Edison International | | | 56,900 | | | | 3,725,812 | |
Entergy Corp. | | | 31,400 | | | | 2,746,872 | |
Exelon Corp. | | | 150,073 | | | | 5,564,707 | |
FirstEnergy Corp. | | | 73,480 | | | | 2,864,985 | |
NextEra Energy, Inc. | | | 76,375 | | | | 8,117,899 | |
Northeast Utilities | | | 55,200 | | | | 2,954,304 | |
Pepco Holdings, Inc. | | | 43,800 | | | | 1,179,534 | |
Pinnacle West Capital Corp. | | | 19,300 | | | | 1,318,383 | |
PPL Corp. | | | 118,800 | | | | 4,316,004 | |
Southern Co. (The) | | | 156,500 | | | | 7,685,715 | |
Xcel Energy, Inc. | | | 88,295 | | | | 3,171,556 | |
| | | | | | |
|
|
|
| | | | | | | | 59,233,090 | |
| | | | | | |
|
|
|
Electrical Equipment — 0.6% | |
AMETEK, Inc. | | | 43,200 | | | | 2,273,616 | |
Eaton Corp. PLC | | | 84,761 | | | | 5,760,358 | |
Emerson Electric Co. | | | 122,300 | | | | 7,549,579 | |
Rockwell Automation, Inc. | | | 24,300 | | | | 2,702,160 | |
| | | | | | |
|
|
|
| | | | | | | | 18,285,713 | |
| | | | | | |
|
|
|
Electronic Equipment, Instruments & Components — 0.4% | |
Amphenol Corp. (Class A Stock) | | | 55,200 | | | | 2,970,312 | |
Corning, Inc. | | | 224,800 | | | | 5,154,664 | |
FLIR Systems, Inc. | | | 25,100 | | | | 810,981 | |
TE Connectivity Ltd. (Switzerland) | | | 71,500 | | | | 4,522,375 | |
| | | | | | |
|
|
|
| | | | | | | | 13,458,332 | |
| | | | | | |
|
|
|
Energy Equipment & Services — 1.3% | |
Baker Hughes, Inc. | | | 76,048 | | | | 4,264,011 | |
Cameron International Corp.* | | | 35,400 | | | | 1,768,230 | |
Diamond Offshore Drilling, Inc.(a) | | | 11,900 | | | | 436,849 | |
Ensco PLC (Class A Stock) | | | 41,600 | | | | 1,245,920 | |
FMC Technologies, Inc.* | | | 41,800 | | | | 1,957,912 | |
Halliburton Co. | | | 150,000 | | | | 5,899,500 | |
Helmerich & Payne, Inc. | | | 20,000 | | | | 1,348,400 | |
Nabors Industries Ltd. | | | 50,600 | | | | 656,788 | |
National Oilwell Varco, Inc. | | | 75,700 | | | | 4,960,621 | |
Noble Corp. PLC | | | 46,700 | | | | 773,819 | |
Schlumberger Ltd. | | | 226,472 | | | | 19,342,974 | |
Transocean Ltd.(a) | | | 61,000 | | | | 1,118,130 | |
| | | | | | |
|
|
|
| | | | | | | | 43,773,154 | |
| | | | | | |
|
|
|
SEE NOTES TO FINANCIAL STATEMENTS.
A153
| | | | | | |
| | | STOCK INDEX PORTFOLIO (continued) | | |
| |
| SCHEDULE OF INVESTMENTS | | December 31, 2014 |
| | | | | | | | |
COMMON STOCKS
(continued) | | Shares
| | | Value
(Note 2)
| |
Food & Staples Retailing — 2.4% | |
Costco Wholesale Corp. | | | 76,622 | | | $ | 10,861,168 | |
CVS Health Corp. | | | 202,938 | | | | 19,544,959 | |
Kroger Co. (The) | | | 86,100 | | | | 5,528,481 | |
Safeway, Inc. | | | 40,200 | | | | 1,411,824 | |
Sysco Corp. | | | 102,500 | | | | 4,068,225 | |
Wal-Mart Stores, Inc. | | | 276,100 | | | | 23,711,468 | |
Walgreens Boots Alliance, Inc. | | | 153,700 | | | | 11,711,940 | |
Whole Foods Market, Inc. | | | 63,600 | | | | 3,206,712 | |
| | | | | | |
|
|
|
| | | | | | | | 80,044,777 | |
| | | | | | |
|
|
|
Food Products — 1.6% | |
Archer-Daniels-Midland Co. | | | 115,238 | | | | 5,992,376 | |
Campbell Soup Co. | | | 31,300 | | | | 1,377,200 | |
ConAgra Foods, Inc. | | | 73,900 | | | | 2,681,092 | |
General Mills, Inc. | | | 107,800 | | | | 5,748,974 | |
Hershey Co. (The) | | | 26,300 | | | | 2,733,359 | |
Hormel Foods Corp. | | | 23,600 | | | | 1,229,560 | |
J.M. Smucker Co. (The) | | | 18,200 | | | | 1,837,836 | |
Kellogg Co. | | | 44,700 | | | | 2,925,168 | |
Keurig Green Mountain, Inc. | | | 21,800 | | | | 2,886,211 | |
Kraft Foods Group, Inc. | | | 104,537 | | | | 6,550,289 | |
McCormick & Co., Inc. | | | 23,000 | | | | 1,708,900 | |
Mead Johnson Nutrition Co. | | | 35,593 | | | | 3,578,520 | |
Mondelez International, Inc. (Class A Stock) | | | 295,511 | | | | 10,734,437 | |
Tyson Foods, Inc. (Class A Stock) | | | 51,100 | | | | 2,048,599 | |
| | | | | | |
|
|
|
| | | | | | | | 52,032,521 | |
| | | | | | |
|
|
|
Gas Utilities | |
AGL Resources, Inc. | | | 20,937 | | | | 1,141,276 | |
| | | | | | |
|
|
|
Health Care Equipment & Supplies — 2.2% | |
Abbott Laboratories | | | 263,350 | | | | 11,856,017 | |
Baxter International, Inc. | | | 94,600 | | | | 6,933,234 | |
Becton, Dickinson and Co. | | | 33,800 | | | | 4,703,608 | |
Boston Scientific Corp.* | | | 231,299 | | | | 3,064,712 | |
C.R. Bard, Inc. | | | 13,500 | | | | 2,249,370 | |
CareFusion Corp.* | | | 35,837 | | | | 2,126,567 | |
Covidien PLC | | | 78,900 | | | | 8,069,892 | |
DENTSPLY International, Inc. | | | 24,800 | | | | 1,321,096 | |
Edwards Lifesciences Corp.* | | | 18,600 | | | | 2,369,268 | |
Intuitive Surgical, Inc.* | | | 6,550 | | | | 3,464,557 | |
Medtronic, Inc. | | | 171,500 | | | | 12,382,300 | |
St. Jude Medical, Inc. | | | 50,400 | | | | 3,277,512 | |
Stryker Corp. | | | 52,400 | | | | 4,942,892 | |
Varian Medical Systems, Inc.*(a) | | | 18,100 | | | | 1,565,831 | |
Zimmer Holdings, Inc. | | | 29,586 | | | | 3,355,644 | |
| | | | | | |
|
|
|
| | | | | | | | 71,682,500 | |
| | | | | | |
|
|
|
Health Care Providers & Services — 2.2% | |
Aetna, Inc. | | | 62,257 | | | | 5,530,289 | |
AmerisourceBergen Corp. | | | 38,700 | | | | 3,489,192 | |
Anthem, Inc. | | | 48,300 | | | | 6,069,861 | |
Cardinal Health, Inc. | | | 58,975 | | | | 4,761,052 | |
Cigna Corp. | | | 47,200 | | | | 4,857,352 | |
DaVita HealthCare Partners, Inc.* | | | 30,600 | | | | 2,317,644 | |
Express Scripts Holding Co.* | | | 130,826 | | | | 11,077,038 | |
Humana, Inc. | | | 27,000 | | | | 3,878,010 | |
Laboratory Corp. of America Holdings* | | | 15,100 | | | | 1,629,290 | |
| | | | | | | | |
COMMON STOCKS
(continued) | | Shares
| | | Value
(Note 2)
| |
Health Care Providers & Services (continued) | |
McKesson Corp. | | | 40,507 | | | $ | 8,408,443 | |
Patterson Cos., Inc. | | | 15,200 | | | | 731,120 | |
Quest Diagnostics, Inc.(a) | | | 25,500 | | | | 1,710,030 | |
Tenet Healthcare Corp.*(a) | | | 17,200 | | | | 871,524 | |
UnitedHealth Group, Inc. | | | 170,700 | | | | 17,256,063 | |
Universal Health Services, Inc. (Class B Stock) | | | 17,000 | | | | 1,891,420 | |
| | | | | | |
|
|
|
| | | | | | | | 74,478,328 | |
| | | | | | |
|
|
|
Health Care Technology — 0.1% | |
Cerner Corp.* | | | 53,100 | | | | 3,433,446 | |
| | | | | | |
|
|
|
Hotels, Restaurants & Leisure — 1.6% | |
Carnival Corp. | | | 77,700 | | | | 3,522,141 | |
Chipotle Mexican Grill, Inc.* | | | 5,500 | | | | 3,764,805 | |
Darden Restaurants, Inc.(a) | | | 23,150 | | | | 1,357,284 | |
Marriott International, Inc. (Class A Stock) | | | 38,603 | | | | 3,012,192 | |
McDonald’s Corp. | | | 172,600 | | | | 16,172,620 | |
Royal Caribbean Cruises Ltd. | | | 26,200 | | | | 2,159,666 | |
Starbucks Corp. | | | 130,400 | | | | 10,699,320 | |
Starwood Hotels & Resorts Worldwide, Inc. | | | 31,800 | | | | 2,578,026 | |
Wyndham Worldwide Corp. | | | 22,863 | | | | 1,960,731 | |
Wynn Resorts Ltd. | | | 14,300 | | | | 2,127,268 | |
Yum! Brands, Inc. | | | 77,600 | | | | 5,653,160 | |
| | | | | | |
|
|
|
| | | | | | | | 53,007,213 | |
| | | | | | |
|
|
|
Household Durables — 0.4% | |
D.R. Horton, Inc. | | | 57,900 | | | | 1,464,291 | |
Garmin Ltd.(a) | | | 21,200 | | | | 1,119,996 | |
Harman International Industries, Inc. | | | 12,100 | | | | 1,291,191 | |
Leggett & Platt, Inc. | | | 23,800 | | | | 1,014,118 | |
Lennar Corp. (Class A Stock) | | | 31,100 | | | | 1,393,591 | |
Mohawk Industries, Inc.* | | | 10,900 | | | | 1,693,424 | |
Newell Rubbermaid, Inc. | | | 47,749 | | | | 1,818,760 | |
PulteGroup, Inc. | | | 61,385 | | | | 1,317,322 | |
Whirlpool Corp. | | | 14,107 | | | | 2,733,090 | |
| | | | | | |
|
|
|
| | | | | | | | 13,845,783 | |
| | | | | | |
|
|
|
Household Products — 1.9% | |
Clorox Co. (The) | | | 22,500 | | | | 2,344,725 | |
Colgate-Palmolive Co. | | | 150,300 | | | | 10,399,257 | |
Kimberly-Clark Corp. | | | 65,388 | | | | 7,554,929 | |
Procter & Gamble Co. (The) | | | 472,906 | | | | 43,077,008 | |
| | | | | | |
|
|
|
| | | | | | | | 63,375,919 | |
| | | | | | |
|
|
|
Independent Power & Renewable Electricity Producers — 0.1% | |
AES Corp. | | | 116,200 | | | | 1,600,074 | |
NRG Energy, Inc. | | | 59,000 | | | | 1,590,050 | |
| | | | | | |
|
|
|
| | | | | | | | 3,190,124 | |
| | | | | | |
|
|
|
Industrial Conglomerates — 2.3% | |
3M Co. | | | 113,200 | | | | 18,601,024 | |
Danaher Corp. | | | 107,000 | | | | 9,170,970 | |
General Electric Co. | | | 1,756,975 | | | | 44,398,758 | |
Roper Industries, Inc. | | | 17,500 | | | | 2,736,125 | |
| | | | | | |
|
|
|
| | | | | | | | 74,906,877 | |
| | | | | | |
|
|
|
SEE NOTES TO FINANCIAL STATEMENTS.
A154
| | | | | | |
| | | STOCK INDEX PORTFOLIO (continued) | | |
| |
| SCHEDULE OF INVESTMENTS | | December 31, 2014 |
| | | | | | | | |
COMMON STOCKS
(continued) | | Shares
| | | Value
(Note 2)
| |
Insurance — 2.5% | |
ACE Ltd. | | | 59,100 | | | $ | 6,789,408 | |
Aflac, Inc. | | | 79,700 | | | | 4,868,873 | |
Allstate Corp. (The) | | | 76,888 | | | | 5,401,382 | |
American International Group, Inc. | | | 249,829 | | | | 13,992,922 | |
Aon PLC | | | 51,525 | | | | 4,886,116 | |
Assurant, Inc. | | | 14,400 | | | | 985,392 | |
Chubb Corp. (The) | | | 42,900 | | | | 4,438,863 | |
Cincinnati Financial Corp. | | | 27,428 | | | | 1,421,593 | |
Genworth Financial, Inc. (Class A Stock)* | | | 98,200 | | | | 834,700 | |
Hartford Financial Services Group, Inc. (The) | | | 79,600 | | | | 3,318,524 | |
Lincoln National Corp. | | | 47,563 | | | | 2,742,958 | |
Loews Corp. | | | 54,226 | | | | 2,278,577 | |
Marsh & McLennan Cos., Inc. | | | 96,500 | | | | 5,523,660 | |
MetLife, Inc. | | | 198,300 | | | | 10,726,047 | |
Principal Financial Group, Inc. | | | 49,700 | | | | 2,581,418 | |
Progressive Corp. (The) | | | 97,800 | | | | 2,639,622 | |
Torchmark Corp. | | | 24,175 | | | | 1,309,560 | |
Travelers Cos., Inc. (The) | | | 60,198 | | | | 6,371,958 | |
Unum Group | | | 47,456 | | | | 1,655,265 | |
XL Group PLC (Ireland) | | | 47,200 | | | | 1,622,264 | |
| | | | | | |
|
|
|
| | | | | | | | 84,389,102 | |
| | | | | | |
|
|
|
Internet & Catalog Retail — 1.1% | |
Amazon.com, Inc.* | | | 65,900 | | | | 20,452,065 | |
Expedia, Inc. | | | 17,400 | | | | 1,485,264 | |
Netflix, Inc.* | | | 10,300 | | | | 3,518,583 | |
Priceline Group, Inc. (The)* | | | 9,170 | | | | 10,455,726 | |
TripAdvisor, Inc.* | | | 20,200 | | | | 1,508,132 | |
| | | | | | |
|
|
|
| | | | | | | | 37,419,770 | |
| | | | | | |
|
|
|
Internet Software & Services — 3.1% | |
Akamai Technologies, Inc.* | | | 33,300 | | | | 2,096,568 | |
eBay, Inc.* | | | 197,800 | | | | 11,100,536 | |
Facebook, Inc. (Class A Stock)* | | | 364,600 | | | | 28,446,092 | |
Google, Inc. (Class A Stock)* | | | 50,085 | | | | 26,578,106 | |
Google, Inc. (Class C Stock)* | | | 49,985 | | | | 26,312,104 | |
VeriSign, Inc.*(a) | | | 21,500 | | | | 1,225,500 | |
Yahoo!, Inc.* | | | 156,900 | | | | 7,925,019 | |
| | | | | | |
|
|
|
| | | | | | | | 103,683,925 | |
| | | | | | |
|
|
|
IT Services — 3.2% | |
Accenture PLC (Class A Stock) | | | 110,300 | | | | 9,850,893 | |
Alliance Data Systems Corp.*(a) | | | 10,400 | | | | 2,974,920 | |
Automatic Data Processing, Inc. | | | 84,300 | | | | 7,028,091 | |
Cognizant Technology Solutions Corp. (Class A Stock)* | | | 107,600 | | | | 5,666,216 | |
Computer Sciences Corp. | | | 25,900 | | | | 1,632,995 | |
Fidelity National Information Services, Inc. | | | 50,600 | | | | 3,147,320 | |
Fiserv, Inc.* | | | 43,600 | | | | 3,094,292 | |
International Business Machines Corp. | | | 162,225 | | | | 26,027,379 | |
MasterCard, Inc. (Class A Stock) | | | 172,400 | | | | 14,853,984 | |
Paychex, Inc. | | | 57,050 | | | | 2,633,999 | |
Teradata Corp.*(a) | | | 27,500 | | | | 1,201,200 | |
Total System Services, Inc. | | | 29,893 | | | | 1,015,166 | |
Visa, Inc. (Class A Stock)(a) | | | 86,000 | | | | 22,549,200 | |
| | | | | | | | |
COMMON STOCKS
(continued) | | Shares
| | | Value
(Note 2)
| |
IT Services (continued) | |
Western Union Co. (The) | | | 93,704 | | | $ | 1,678,239 | |
Xerox Corp. | | | 190,511 | | | | 2,640,482 | |
| | | | | | |
|
|
|
| | | | | | | | 105,994,376 | |
| | | | | | |
|
|
|
Leisure Products — 0.1% | |
Hasbro, Inc.(a) | | | 19,450 | | | | 1,069,556 | |
Mattel, Inc. | | | 59,381 | | | | 1,837,545 | |
| | | | | | |
|
|
|
| | | | | | | | 2,907,101 | |
| | | | | | |
|
|
|
Life Sciences Tools & Services — 0.4% | |
Agilent Technologies, Inc. | | | 58,282 | | | | 2,386,065 | |
PerkinElmer, Inc. | | | 20,000 | | | | 874,600 | |
Thermo Fisher Scientific, Inc. | | | 69,900 | | | | 8,757,771 | |
Waters Corp.* | | | 15,000 | | | | 1,690,800 | |
| | | | | | |
|
|
|
| | | | | | | | 13,709,236 | |
| | | | | | |
|
|
|
Machinery — 1.5% | |
Caterpillar, Inc. | | | 108,500 | | | | 9,931,005 | |
Cummins, Inc. | | | 30,100 | | | | 4,339,517 | |
Deere & Co. | | | 62,450 | | | | 5,524,952 | |
Dover Corp. | | | 29,300 | | | | 2,101,396 | |
Flowserve Corp. | | | 24,600 | | | | 1,471,818 | |
Illinois Tool Works, Inc. | | | 63,975 | | | | 6,058,432 | |
Ingersoll-Rand PLC | | | 46,800 | | | | 2,966,652 | |
Joy Global, Inc. | | | 17,700 | | | | 823,404 | |
PACCAR, Inc. | | | 62,028 | | | | 4,218,524 | |
Pall Corp. | | | 18,800 | | | | 1,902,748 | |
Parker Hannifin Corp. | | | 26,087 | | | | 3,363,919 | |
Pentair PLC (United Kingdom) | | | 34,107 | | | | 2,265,387 | |
Snap-on, Inc. | | | 10,200 | | | | 1,394,748 | |
Stanley Black & Decker, Inc. | | | 27,435 | | | | 2,635,955 | |
Xylem, Inc. | | | 33,000 | | | | 1,256,310 | |
| | | | | | |
|
|
|
| | | | | | | | 50,254,767 | |
| | | | | | |
|
|
|
Media — 3.5% | |
Cablevision Systems Corp. (Class A Stock)(a) | | | 35,900 | | | | 740,976 | |
CBS Corp. (Class B Stock) | | | 84,768 | | | | 4,691,061 | |
Comcast Corp. (Class A Stock) | | | 452,146 | | | | 26,228,989 | |
DIRECTV* | | | 87,825 | | | | 7,614,428 | |
Discovery Communications, Inc. (Class A Stock)* | | | 28,800 | | | | 992,160 | |
Discovery Communications, Inc. (Class C Stock)*(a) | | | 47,800 | | | | 1,611,816 | |
Gannett Co., Inc. | | | 43,300 | | | | 1,382,569 | |
Interpublic Group of Cos., Inc. (The) | | | 75,162 | | | | 1,561,115 | |
News Corp. (Class A Stock)* | | | 88,525 | | | | 1,388,957 | |
Omnicom Group, Inc. | | | 44,200 | | | | 3,424,174 | |
Scripps Networks Interactive, Inc. (Class A Stock)(a) | | | 18,800 | | | | 1,415,076 | |
Time Warner Cable, Inc. | | | 49,026 | | | | 7,454,894 | |
Time Warner, Inc. | | | 150,215 | | | | 12,831,365 | |
Twenty-First Century Fox, Inc. (Class A Stock) | | | 329,000 | | | | 12,635,245 | |
Viacom, Inc. (Class B Stock) | | | 66,943 | | | | 5,037,461 | |
Walt Disney Co. (The) | | | 275,776 | | | | 25,975,341 | |
| | | | | | |
|
|
|
| | | | | | | | 114,985,627 | |
| | | | | | |
|
|
|
SEE NOTES TO FINANCIAL STATEMENTS.
A155
| | | | | | |
| | | STOCK INDEX PORTFOLIO (continued) | | |
| |
| SCHEDULE OF INVESTMENTS | | December 31, 2014 |
| | | | | | | | |
COMMON STOCKS
(continued) | | Shares
| | | Value
(Note 2)
| |
Metals & Mining — 0.4% | |
Alcoa, Inc. | | | 207,276 | | | $ | 3,272,888 | |
Allegheny Technologies, Inc. | | | 20,940 | | | | 728,084 | |
Freeport-McMoRan, Inc. | | | 184,912 | | | | 4,319,544 | |
Newmont Mining Corp. | | | 87,603 | | | | 1,655,697 | |
Nucor Corp. | | | 56,800 | | | | 2,786,040 | |
| | | | | | |
|
|
|
| | | | | | | | 12,762,253 | |
| | | | | | |
|
|
|
Multiline Retail — 0.7% | |
Dollar General Corp.* | | | 53,600 | | | | 3,789,520 | |
Dollar Tree, Inc.* | | | 36,400 | | | | 2,561,832 | |
Family Dollar Stores, Inc. | | | 16,800 | | | | 1,330,728 | |
Kohl’s Corp. | | | 35,800 | | | | 2,185,232 | |
Macy’s, Inc. | | | 63,320 | | | | 4,163,290 | |
Nordstrom, Inc. | | | 25,000 | | | | 1,984,750 | |
Target Corp. | | | 111,268 | | | | 8,446,354 | |
| | | | | | |
|
|
|
| | | | | | | | 24,461,706 | |
| | | | | | |
|
|
|
Multi-Utilities — 1.2% | |
Ameren Corp. | | | 43,200 | | | | 1,992,816 | |
CenterPoint Energy, Inc. | | | 79,210 | | | | 1,855,890 | |
CMS Energy Corp. | | | 48,100 | | | | 1,671,475 | |
Consolidated Edison, Inc. | | | 51,200 | | | | 3,379,712 | |
Dominion Resources, Inc. | | | 102,084 | | | | 7,850,260 | |
DTE Energy Co. | | | 30,900 | | | | 2,668,833 | |
Integrys Energy Group, Inc. | | | 12,550 | | | | 977,018 | |
NiSource, Inc. | | | 54,900 | | | | 2,328,858 | |
PG&E Corp. | | | 83,900 | | | | 4,466,836 | |
Public Service Enterprise Group, Inc. | | | 89,500 | | | | 3,706,195 | |
SCANA Corp. | | | 25,600 | | | | 1,546,240 | |
Sempra Energy | | | 40,454 | | | | 4,504,957 | |
TECO Energy, Inc. | | | 40,700 | | | | 833,943 | |
Wisconsin Energy Corp.(a) | | | 39,600 | | | | 2,088,504 | |
| | | | | | |
|
|
|
| | | | | | | | 39,871,537 | |
| | | | | | |
|
|
|
Oil, Gas & Consumable Fuels — 6.9% | |
Anadarko Petroleum Corp. | | | 89,326 | | | | 7,369,395 | |
Apache Corp. | | | 67,150 | | | | 4,208,290 | |
Cabot Oil & Gas Corp. | | | 73,900 | | | | 2,188,179 | |
Chesapeake Energy Corp. | | | 90,600 | | | | 1,773,042 | |
Chevron Corp. | | | 331,942 | | | | 37,237,254 | |
Cimarex Energy Co. | | | 15,700 | | | | 1,664,200 | |
ConocoPhillips | | | 215,529 | | | | 14,884,433 | |
CONSOL Energy, Inc. | | | 40,200 | | | | 1,359,162 | |
Denbury Resources, Inc.(a) | | | 60,900 | | | | 495,117 | |
Devon Energy Corp. | | | 68,200 | | | | 4,174,522 | |
EOG Resources, Inc. | | | 95,900 | | | | 8,829,513 | |
EQT Corp. | | | 27,100 | | | | 2,051,470 | |
Exxon Mobil Corp. | | | 744,804 | | | | 68,857,130 | |
Hess Corp. | | | 46,375 | | | | 3,423,402 | |
Kinder Morgan, Inc. | | | 294,543 | | | | 12,462,114 | |
Marathon Oil Corp. | | | 119,194 | | | | 3,371,998 | |
Marathon Petroleum Corp. | | | 50,447 | | | | 4,553,346 | |
Murphy Oil Corp. | | | 29,500 | | | | 1,490,340 | |
Newfield Exploration Co.* | | | 23,700 | | | | 642,744 | |
Noble Energy, Inc. | | | 62,900 | | | | 2,983,347 | |
Occidental Petroleum Corp. | | | 137,000 | | | | 11,043,570 | |
ONEOK, Inc. | | | 36,240 | | | | 1,804,390 | |
Phillips 66 | | | 99,164 | | | | 7,110,059 | |
| | | | | | | | |
COMMON STOCKS
(continued) | | Shares
| | | Value
(Note 2)
| |
Oil, Gas & Consumable Fuels (continued) | |
Pioneer Natural Resources Co. | | | 25,000 | | | $ | 3,721,250 | |
QEP Resources, Inc. | | | 29,800 | | | | 602,556 | |
Range Resources Corp. | | | 29,500 | | | | 1,576,775 | |
Southwestern Energy Co.* | | | 61,700 | | | | 1,683,793 | |
Spectra Energy Corp. | | | 117,142 | | | | 4,252,255 | |
Tesoro Corp. | | | 22,600 | | | | 1,680,310 | |
Valero Energy Corp. | | | 94,600 | | | | 4,682,700 | |
Williams Cos., Inc. (The) | | | 118,200 | | | | 5,311,908 | |
| | | | | | |
|
|
|
| | | | | | | | 227,488,564 | |
| | | | | | |
|
|
|
Paper & Forest Products — 0.1% | |
International Paper Co. | | | 75,567 | | | | 4,048,880 | |
| | | | | | |
|
|
|
Personal Products — 0.1% | |
Avon Products, Inc. | | | 76,700 | | | | 720,213 | |
Estee Lauder Cos., Inc. (The) (Class A Stock) | | | 39,300 | | | | 2,994,660 | |
| | | | | | |
|
|
|
| | | | | | | | 3,714,873 | |
| | | | | | |
|
|
|
Pharmaceuticals — 6.1% | |
AbbVie, Inc. | | | 279,600 | | | | 18,297,024 | |
Actavis PLC* | | | 46,521 | | | | 11,974,971 | |
Allergan, Inc. | | | 52,550 | | | | 11,171,605 | |
Bristol-Myers Squibb Co. | | | 289,540 | | | | 17,091,546 | |
Eli Lilly & Co. | | | 173,100 | | | | 11,942,169 | |
Hospira, Inc.* | | | 29,820 | | | | 1,826,475 | |
Johnson & Johnson | | | 492,596 | | | | 51,510,764 | |
Mallinckrodt PLC* | | | 19,800 | | | | 1,960,794 | |
Merck & Co., Inc. | | | 504,203 | | | | 28,633,688 | |
Mylan, Inc.* | | | 66,800 | | | | 3,765,516 | |
Perrigo Co. PLC | | | 23,400 | | | | 3,911,544 | |
Pfizer, Inc. | | | 1,108,523 | | | | 34,530,491 | |
Zoetis, Inc. | | | 87,600 | | | | 3,769,428 | |
| | | | | | |
|
|
|
| | | | | | | | 200,386,015 | |
| | | | | | |
|
|
|
Professional Services — 0.2% | |
Dun & Bradstreet Corp. (The) | | | 6,500 | | | | 786,240 | |
Equifax, Inc. | | | 21,500 | | | | 1,738,705 | |
Nielsen NV(a) | | | 56,500 | | | | 2,527,245 | |
Robert Half International, Inc. | | | 24,000 | | | | 1,401,120 | |
| | | | | | |
|
|
|
| | | | | | | | 6,453,310 | |
| | | | | | |
|
|
|
Real Estate Investment Trusts (REITs) — 2.3% | |
American Tower Corp. | | | 69,600 | | | | 6,879,960 | |
Apartment Investment & Management Co. (Class A Stock) | | | 25,574 | | | | 950,074 | |
AvalonBay Communities, Inc. | | | 23,018 | | | | 3,760,911 | |
Boston Properties, Inc. | | | 26,800 | | | | 3,448,892 | |
Crown Castle International Corp. | | | 58,300 | | | | 4,588,210 | |
Equity Residential | | | 63,300 | | | | 4,547,472 | |
Essex Property Trust, Inc. | | | 11,500 | | | | 2,375,900 | |
General Growth Properties, Inc. | | | 109,600 | | | | 3,083,048 | |
HCP, Inc. | | | 80,200 | | | | 3,531,206 | |
Health Care REIT, Inc. | | | 56,700 | | | | 4,290,489 | |
Host Hotels & Resorts, Inc. | | | 132,326 | | | | 3,145,389 | |
Iron Mountain, Inc. | | | 32,730 | | | | 1,265,342 | |
Kimco Realty Corp. | | | 72,100 | | | | 1,812,594 | |
Macerich Co. (The) | | | 25,600 | | | | 2,135,296 | |
Plum Creek Timber Co., Inc. | | | 30,900 | | | | 1,322,211 | |
SEE NOTES TO FINANCIAL STATEMENTS.
A156
| | | | | | |
| | | STOCK INDEX PORTFOLIO (continued) | | |
| |
| SCHEDULE OF INVESTMENTS | | December 31, 2014 |
| | | | | | | | |
COMMON STOCKS
(continued) | | Shares
| | | Value
(Note 2)
| |
Real Estate Investment Trusts (REITs) (continued) | |
Prologis, Inc. | | | 89,128 | | | $ | 3,835,178 | |
Public Storage | | | 25,400 | | | | 4,695,190 | |
Simon Property Group, Inc. | | | 54,701 | | | | 9,961,599 | |
Ventas, Inc.(a) | | | 51,404 | | | | 3,685,667 | |
Vornado Realty Trust | | | 30,557 | | | | 3,596,864 | |
Weyerhaeuser Co. | | | 92,110 | | | | 3,305,828 | |
| | | | | | |
|
|
|
| | | | | | | | 76,217,320 | |
| | | | | | |
|
|
|
Real Estate Management & Development — 0.1% | |
CBRE Group, Inc. (Class A Stock)* | | | 49,300 | | | | 1,688,525 | |
| | | | | | |
|
|
|
Road & Rail — 1.0% | |
CSX Corp. | | | 175,672 | | | | 6,364,597 | |
Kansas City Southern | | | 19,700 | | | | 2,403,991 | |
Norfolk Southern Corp. | | | 54,100 | | | | 5,929,901 | |
Ryder System, Inc. | | | 9,400 | | | | 872,790 | |
Union Pacific Corp. | | | 156,800 | | | | 18,679,584 | |
| | | | | | |
|
|
|
| | | | | | | | 34,250,863 | |
| | | | | | |
|
|
|
Semiconductors & Semiconductor Equipment — 2.4% | |
Altera Corp. | | | 54,000 | | | | 1,994,760 | |
Analog Devices, Inc. | | | 54,900 | | | | 3,048,048 | |
Applied Materials, Inc. | | | 210,800 | | | | 5,253,136 | |
Avago Technologies Ltd. (Singapore) | | | 45,200 | | | | 4,546,668 | |
Broadcom Corp. (Class A Stock) | | | 96,150 | | | | 4,166,179 | |
First Solar, Inc.* | | | 13,400 | | | | 597,573 | |
Intel Corp. | | | 857,100 | | | | 31,104,159 | |
KLA-Tencor Corp. | | | 29,500 | | | | 2,074,440 | |
Lam Research Corp. | | | 28,750 | | | | 2,281,025 | |
Linear Technology Corp. | | | 41,700 | | | | 1,901,520 | |
Microchip Technology, Inc.(a) | | | 35,100 | | | | 1,583,361 | |
Micron Technology, Inc.* | | | 189,200 | | | | 6,623,892 | |
NVIDIA Corp. | | | 96,450 | | | | 1,933,823 | |
Texas Instruments, Inc. | | | 187,400 | | | | 10,019,341 | |
Xilinx, Inc. | | | 46,900 | | | | 2,030,301 | |
| | | | | | |
|
|
|
| | | | | | | | 79,158,226 | |
| | | | | | |
|
|
|
Software — 3.7% | |
Adobe Systems, Inc.* | | | 82,175 | | | | 5,974,122 | |
Autodesk, Inc.* | | | 39,700 | | | | 2,384,382 | |
CA, Inc. | | | 56,873 | | | | 1,731,783 | |
Citrix Systems, Inc.* | | | 28,900 | | | | 1,843,820 | |
Electronic Arts, Inc.* | | | 54,600 | | | | 2,567,019 | |
Intuit, Inc. | | | 49,600 | | | | 4,572,624 | |
Microsoft Corp. | | | 1,445,000 | | | | 67,120,250 | |
Oracle Corp. | | | 568,495 | | | | 25,565,220 | |
Red Hat, Inc.* | | | 33,300 | | | | 2,302,362 | |
salesforce.com, inc.* | | | 100,700 | | | | 5,972,517 | |
Symantec Corp. | | | 122,711 | | | | 3,148,151 | |
| | | | | | |
|
|
|
| | | | | | | | 123,182,250 | |
| | | | | | |
|
|
|
Specialty Retail — 2.3% | |
AutoNation, Inc.* | | | 13,689 | | | | 826,952 | |
AutoZone, Inc.* | | | 5,700 | | | | 3,528,927 | |
Bed Bath & Beyond, Inc.* | | | 34,400 | | | | 2,620,248 | |
Best Buy Co., Inc. | | | 50,625 | | | | 1,973,362 | |
CarMax, Inc.*(a) | | | 38,200 | | | | 2,543,356 | |
| | | | | | | | |
COMMON STOCKS
(continued) | | Shares
| | | Value
(Note 2)
| |
Specialty Retail (continued) | |
GameStop Corp. (Class A Stock)(a) | | | 19,800 | | | $ | 669,240 | |
Gap, Inc. (The) | | | 47,887 | | | | 2,016,522 | |
Home Depot, Inc. (The) | | | 233,669 | | | | 24,528,235 | |
L. Brands, Inc. | | | 43,396 | | | | 3,755,924 | |
Lowe’s Cos., Inc. | | | 173,025 | | | | 11,904,120 | |
O’Reilly Automotive, Inc.* | | | 18,500 | | | | 3,563,470 | |
PetSmart, Inc. | | | 17,800 | | | | 1,447,051 | |
Ross Stores, Inc. | | | 36,800 | | | | 3,468,768 | |
Staples, Inc. | | | 110,800 | | | | 2,007,696 | |
Tiffany & Co. | | | 18,700 | | | | 1,998,282 | |
TJX Cos., Inc. (The) | | | 121,600 | | | | 8,339,328 | |
Tractor Supply Co. | | | 24,600 | | | | 1,938,972 | |
Urban Outfitters, Inc.* | | | 19,000 | | | | 667,470 | |
| | | | | | |
|
|
|
| | | | | | | | 77,797,923 | |
| | | | | | |
|
|
|
Technology Hardware, Storage & Peripherals — 4.6% | |
Apple, Inc. | | | 1,033,305 | | | | 114,056,206 | |
EMC Corp. | | | 357,274 | | | | 10,625,329 | |
Hewlett-Packard Co. | | | 325,966 | | | | 13,081,015 | |
NetApp, Inc. | | | 56,400 | | | | 2,337,780 | |
SanDisk Corp.(a) | | | 39,200 | | | | 3,840,816 | |
Seagate Technology PLC | | | 57,100 | | | | 3,797,150 | |
Western Digital Corp. | | | 38,500 | | | | 4,261,950 | |
| | | | | | |
|
|
|
| | | | | | | | 152,000,246 | |
| | | | | | |
|
|
|
Textiles, Apparel & Luxury Goods — 0.8% | |
Coach, Inc. | | | 49,000 | | | | 1,840,440 | |
Fossil Group, Inc.* | | | 8,300 | | | | 919,142 | |
Michael Kors Holdings Ltd.* | | | 35,800 | | | | 2,688,580 | |
NIKE, Inc. (Class B Stock) | | | 123,300 | | | | 11,855,295 | |
PVH Corp. | | | 14,400 | | | | 1,845,648 | |
Ralph Lauren Corp. | | | 10,600 | | | | 1,962,696 | |
Under Armour, Inc. (Class A Stock)*(a) | | | 29,000 | | | | 1,969,100 | |
VF Corp. | | | 60,244 | | | | 4,512,276 | |
| | | | | | |
|
|
|
| | | | | | | | 27,593,177 | |
| | | | | | |
|
|
|
Thrifts & Mortgage Finance — 0.1% | |
Hudson City Bancorp, Inc. | | | 81,400 | | | | 823,768 | |
People’s United Financial,
Inc.(a) | | | 56,100 | | | | 851,598 | |
| | | | | | |
|
|
|
| | | | | | | | 1,675,366 | |
| | | | | | |
|
|
|
Tobacco — 1.4% | |
Altria Group, Inc. | | | 347,500 | | | | 17,121,325 | |
Lorillard, Inc. | | | 63,593 | | | | 4,002,543 | |
Philip Morris International, Inc. | | | 272,800 | | | | 22,219,560 | |
Reynolds American, Inc. | | | 53,800 | | | | 3,457,726 | |
| | | | | | |
|
|
|
| | | | | | | | 46,801,154 | |
| | | | | | |
|
|
|
Trading Companies & Distributors — 0.2% | |
Fastenal Co.(a) | | | 47,600 | | | | 2,263,856 | |
United Rentals, Inc.* | | | 16,800 | | | | 1,713,768 | |
W.W. Grainger, Inc. | | | 10,700 | | | | 2,727,323 | |
| | | | | | |
|
|
|
| | | | | | | | 6,704,947 | |
| | | | | | |
|
|
|
TOTAL LONG-TERM INVESTMENTS
(cost $1,155,566,742) | | | | 3,207,909,189 | |
| | | | | | |
|
|
|
SEE NOTES TO FINANCIAL STATEMENTS.
A157
| | | | | | |
| | | STOCK INDEX PORTFOLIO (continued) | | |
| |
| SCHEDULE OF INVESTMENTS | | December 31, 2014 |
| | | | | | | | |
SHORT-TERM
INVESTMENTS — 5.1% | | Shares
| | | Value
(Note 2)
| |
AFFILIATED MONEY MARKET MUTUAL FUND — 4.9% | |
Prudential Investment Portfolios 2 — Prudential Core Taxable Money Market Fund (cost $161,927,049; includes $65,419,511 of cash collateral for securities on loan) (Note 4)(b)(c) | | | 161,927,049 | | | $ | 161,927,049 | |
| | | | | | |
|
|
|
| | |
| | | Principal
Amount
(000)#
| | | | |
| U.S. TREASURY OBLIGATION — 0.2% | |
U.S. Treasury Bills, 0.020%, 03/19/15
(cost $5,999,434)(d)(e) | | | 6,000 | | | | 5,999,748 | |
| | | | | | |
|
|
|
TOTAL SHORT-TERM INVESTMENTS | | | | | |
(cost $167,926,483) | | | | | | | 167,926,797 | |
| | | | | | |
|
|
|
TOTAL INVESTMENTS — 101.9% | | | | | | | | |
(cost $1,323,493,225) | | | | | | | 3,375,835,986 | |
LIABILITIES IN EXCESS OF OTHER ASSETS(f) — (1.9)% | | | | | | | (63,162,188 | ) |
| | | | | | |
|
|
|
NET ASSETS — 100.0% | | | | | | $ | 3,312,673,798 | |
| | | | | | |
|
|
|
See the Glossary for abbreviations used in the Portfolio descriptions.
| # | Principal amount shown in U.S. dollars unless otherwise stated. |
| * | Non-income producing security. |
| (a) | All or a portion of security is on loan. The aggregate market value of such securities, including those sold and pending settlement, is $63,204,983; cash collateral of $65,419,511 (included with liabilities) was received with which the Portfolio’s purchased highly liquid short-term investments. Securities on loan are subject to contractual netting arrangements. |
| (b) | Represents security, or a portion thereof, purchased with cash collateral received for securities on loan. |
| (c) | Prudential Investments LLC, the manager of the Portfolio, also serves as manager of the Prudential Investment Portfolios 2 — Prudential Core Taxable Money Market Fund. |
| (d) | Rate quoted represents yield-to-maturity as of purchase date. |
| (e) | Represents security, or a portion thereof, segregated as collateral for futures contracts. |
| (f) | Includes net unrealized appreciation (depreciation) on the following derivative contracts held at reporting period end: |
Futures contracts outstanding at December 31, 2014:
| | | | | | | | | | | | | | | | | | |
Number of
Contracts
| | Type
| | Expiration
Date
| | | Value at
Trade Date
| | | Value at
December 31, 2014
| | | Unrealized
Appreciation(1)
| |
| Long Positions: | | | | | | | | | | | | | | | | | | |
| 21 | | S&P 500 E-mini | | | Mar. 2015 | | | $ | 2,072,733 | | | $ | 2,155,020 | | | $ | 82,287 | |
| 200 | | S&P 500 Index | | | Mar. 2015 | | | | 98,684,431 | | | | 102,620,000 | | | | 3,935,569 | |
| | | | | | | | | | | | | | | | |
|
|
|
| | | | $ | 4,017,856 | |
| | | | | | | | | | | | | | | | |
|
|
|
| (1) | A U.S. Treasury Obligation security with a market value of $5,999,748 has been segregated with UBS AG to cover requirements for open contracts at December 31, 2014. |
Various inputs are used in determining the value of the Portfolio’s investments. These inputs are summarized in the three broad levels listed below.
| Level 1— | quoted prices generally in active markets for identical securities. |
| Level 2— | quoted prices for similar securities, interest rates and yield curves, prepayment speeds, foreign currency exchange rates and other significant observable inputs. |
| Level 3— | significant unobservable inputs for securities valued in accordance with Board approved fair valuation procedures. |
The following is a summary of the inputs used as of December 31, 2014 in valuing such portfolio securities:
| | | | | | | | | | | | |
| | | Level 1
| | | Level 2
| | | Level 3
| |
Investments in Securities | | | | | | | | | | | | |
Common Stocks | | | | | | | | | | | | |
Aerospace & Defense | | $ | 86,305,826 | | | $ | — | | | $ | — | |
Air Freight & Logistics | | | 25,436,338 | | | | — | | | | — | |
Airlines | | | 12,325,653 | | | | — | | | | — | |
Auto Components | | | 13,087,974 | | | | — | | | | — | |
Automobiles | | | 21,107,415 | | | | — | | | | — | |
Banks | | | 194,504,677 | | | | — | | | | — | |
Beverages | | | 68,548,786 | | | | — | | | | — | |
Biotechnology | | | 92,646,333 | | | | — | | | | — | |
Building Products | | | 2,500,998 | | | | — | | | | — | |
Capital Markets | | | 74,426,777 | | | | — | | | | — | |
Chemicals | | | 76,807,395 | | | | — | | | | — | |
Commercial Services & Supplies | | | 14,382,096 | | | | — | | | | — | |
SEE NOTES TO FINANCIAL STATEMENTS.
A158
| | | | | | |
| | | STOCK INDEX PORTFOLIO (continued) | | |
| |
| SCHEDULE OF INVESTMENTS | | December 31, 2014 |
| | | | | | | | | | | | |
| | | Level 1
| | | Level 2
| | | Level 3
| |
Investments in Securities (continued) | | | | | | | | | | | | |
Common Stocks (continued) | | | | | | | | | | | | |
Communications Equipment | | $ | 53,879,290 | | | $ | — | | | $ | — | |
Construction & Engineering | | | 3,935,471 | | | | — | | | | — | |
Construction Materials | | | 2,650,200 | | | | — | | | | — | |
Consumer Finance | | | 29,766,482 | | | | — | | | | — | |
Containers & Packaging | | | 6,248,631 | | | | — | | | | — | |
Distributors | | | 2,858,740 | | | | — | | | | — | |
Diversified Consumer Services | | | 1,657,056 | | | | — | | | | — | |
Diversified Financial Services | | | 66,831,225 | | | | — | | | | — | |
Diversified Telecommunication Services | | | 72,511,734 | | | | — | | | | — | |
Electric Utilities | | | 59,233,090 | | | | — | | | | — | |
Electrical Equipment | | | 18,285,713 | | | | — | | | | — | |
Electronic Equipment, Instruments & Components | | | 13,458,332 | | | | — | | | | — | |
Energy Equipment & Services | | | 43,773,154 | | | | — | | | | — | |
Food & Staples Retailing | | | 80,044,777 | | | | — | | | | — | |
Food Products | | | 52,032,521 | | | | — | | | | — | |
Gas Utilities | | | 1,141,276 | | | | — | | | | — | |
Health Care Equipment & Supplies | | | 71,682,500 | | | | — | | | | — | |
Health Care Providers & Services | | | 74,478,328 | | | | — | | | | — | |
Health Care Technology | | | 3,433,446 | | | | — | | | | — | |
Hotels, Restaurants & Leisure | | | 53,007,213 | | | | — | | | | — | |
Household Durables | | | 13,845,783 | | | | — | | | | — | |
Household Products | | | 63,375,919 | | | | — | | | | — | |
Independent Power & Renewable Electricity Producers | | | 3,190,124 | | | | — | | | | — | |
Industrial Conglomerates | | | 74,906,877 | | | | — | | | | — | |
Insurance | | | 84,389,102 | | | | — | | | | — | |
Internet & Catalog Retail | | | 37,419,770 | | | | — | | | | — | |
Internet Software & Services | | | 103,683,925 | | | | — | | | | — | |
IT Services | | | 105,994,376 | | | | — | | | | — | |
Leisure Products | | | 2,907,101 | | | | — | | | | — | |
Life Sciences Tools & Services | | | 13,709,236 | | | | — | | | | — | |
Machinery | | | 50,254,767 | | | | — | | | | — | |
Media | | | 114,985,627 | | | | — | | | | — | |
Metals & Mining | | | 12,762,253 | | | | — | | | | — | |
Multiline Retail | | | 24,461,706 | | | | — | | | | — | |
Multi-Utilities | | | 39,871,537 | | | | — | | | | — | |
Oil, Gas & Consumable Fuels | | | 227,488,564 | | | | — | | | | — | |
Paper & Forest Products | | | 4,048,880 | | | | — | | | | — | |
Personal Products | | | 3,714,873 | | | | — | | | | — | |
Pharmaceuticals | | | 200,386,015 | | | | — | | | | — | |
Professional Services | | | 6,453,310 | | | | — | | | | — | |
Real Estate Investment Trusts (REITs) | | | 76,217,320 | | | | — | | | | — | |
Real Estate Management & Development | | | 1,688,525 | | | | — | | | | — | |
Road & Rail | | | 34,250,863 | | | | — | | | | — | |
Semiconductors & Semiconductor Equipment | | | 79,158,226 | | | | — | | | | — | |
Software | | | 123,182,250 | | | | — | | | | — | |
Specialty Retail | | | 77,797,923 | | | | — | | | | — | |
Technology Hardware, Storage & Peripherals | | | 152,000,246 | | | | — | | | | — | |
Textiles, Apparel & Luxury Goods | | | 27,593,177 | | | | — | | | | — | |
Thrifts & Mortgage Finance | | | 1,675,366 | | | | — | | | | — | |
Tobacco | | | 46,801,154 | | | | — | | | | — | |
Trading Companies & Distributors | | | 6,704,947 | | | | — | | | | — | |
Affiliated Money Market Mutual Fund | | | 161,927,049 | | | | — | | | | — | |
U.S. Treasury Obligation | | | — | | | | 5,999,748 | | | | — | |
Other Financial Instruments* | | | | | | | | | | | | |
Futures Contracts | | | 4,017,856 | | | | — | | | | — | |
| | |
|
|
| |
|
|
| |
|
|
|
Total | | $ | 3,373,854,094 | | | $ | 5,999,748 | | | $ | — | |
| | |
|
|
| |
|
|
| |
|
|
|
| * | Other financial instruments are derivative instruments not reflected in the Schedule of Investments, such as futures, forwards and exchange-traded swap contracts, which are recorded at the unrealized appreciation/depreciation on the instrument, and over-the-counter swap contracts which are recorded at fair value. |
SEE NOTES TO FINANCIAL STATEMENTS.
A159
| | | | | | |
| | | STOCK INDEX PORTFOLIO (continued) | | |
| |
| SCHEDULE OF INVESTMENTS | | December 31, 2014 |
The industry classification of investments and liabilities in excess of other assets shown as a percentage of net assets as of December 31, 2014 was as follows (Unaudited):
| | | | |
Oil, Gas & Consumable Fuels | | | 6.9 | % |
Pharmaceuticals | | | 6.1 | |
Banks | | | 5.9 | |
Affiliated Money Market Mutual Fund (including 2.0% of collateral for securities on loan) | | | 4.9 | |
Technology Hardware, Storage & Peripherals | | | 4.6 | |
Software | | | 3.7 | |
Media | | | 3.5 | |
IT Services | | | 3.2 | |
Internet Software & Services | | | 3.1 | |
Biotechnology | | | 2.8 | |
Aerospace & Defense | | | 2.6 | |
Insurance | | | 2.5 | |
Food & Staples Retailing | | | 2.4 | |
Semiconductors & Semiconductor Equipment | | | 2.4 | |
Specialty Retail | | | 2.3 | |
Chemicals | | | 2.3 | |
Real Estate Investment Trusts (REITs) | | | 2.3 | |
Industrial Conglomerates | | | 2.3 | |
Health Care Providers & Services | | | 2.2 | |
Capital Markets | | | 2.2 | |
Diversified Telecommunication Services | | | 2.2 | |
Health Care Equipment & Supplies | | | 2.2 | |
Beverages | | | 2.1 | |
Diversified Financial Services | | | 2.0 | |
Household Products | | | 1.9 | |
Electric Utilities | | | 1.8 | |
Communications Equipment | | | 1.6 | |
Hotels, Restaurants & Leisure | | | 1.6 | |
Food Products | | | 1.6 | |
Machinery | | | 1.5 | |
Tobacco | | | 1.4 | |
Energy Equipment & Services | | | 1.3 | |
Multi-Utilities | | | 1.2 | |
Internet & Catalog Retail | | | 1.1 | |
| | | | |
Road & Rail | | | 1.0 | % |
Consumer Finance | | | 0.9 | |
Textiles, Apparel & Luxury Goods | | | 0.8 | |
Air Freight & Logistics | | | 0.8 | |
Multiline Retail | | | 0.7 | |
Automobiles | | | 0.6 | |
Electrical Equipment | | | 0.6 | |
Commercial Services & Supplies | | | 0.4 | |
Household Durables | | | 0.4 | |
Life Sciences Tools & Services | | | 0.4 | |
Electronic Equipment, Instruments & Components | | | 0.4 | |
Auto Components | | | 0.4 | |
Metals & Mining | | | 0.4 | |
Airlines | | | 0.4 | |
Trading Companies & Distributors | | | 0.2 | |
Professional Services | | | 0.2 | |
Containers & Packaging | | | 0.2 | |
U.S. Treasury Obligation | | | 0.2 | |
Paper & Forest Products | | | 0.1 | |
Construction & Engineering | | | 0.1 | |
Personal Products | | | 0.1 | |
Health Care Technology | | | 0.1 | |
Independent Power & Renewable Electricity Producers | | | 0.1 | |
Leisure Products | | | 0.1 | |
Distributors | | | 0.1 | |
Construction Materials | | | 0.1 | |
Building Products | | | 0.1 | |
Real Estate Management & Development | | | 0.1 | |
Thrifts & Mortgage Finance | | | 0.1 | |
Diversified Consumer Services | | | 0.1 | |
| | |
|
|
|
| | | | 101.9 | |
Liabilities in excess of other assets | | | (1.9 | ) |
| | |
|
|
|
| | | | 100.0 | % |
| | |
|
|
|
SEE NOTES TO FINANCIAL STATEMENTS.
A160
| | | | | | |
| | | STOCK INDEX PORTFOLIO (continued) | | |
| |
| SCHEDULE OF INVESTMENTS | | December 31, 2014 |
The Portfolio invested in derivative instruments during the reporting period. The primary type of risk associated with these derivative instruments is equity risk. The effect of such derivative instruments on the Portfolio’s financial position and financial performance as reflected in the Statement of Assets and Liabilities and Statement of Operations is presented in the summary below.
Fair values of derivative instruments as of December 31, 2014 as presented in the Statement of Assets and Liabilities:
| | | | | | | | | | | | |
Derivatives not accounted for as hedging
instruments, carried at fair value
| | Asset Derivatives
| | | Liability Derivatives
| |
| | Balance Sheet Location
| | Fair Value
| | | Balance Sheet Location
| | Fair Value
| |
Equity contracts | | Due from/to broker — variation margin futures | | $ | 4,017,856 | * | | — | | $ | — | |
| | | | |
|
|
| | | |
|
|
|
| * | Includes cumulative appreciation/depreciation as reported in schedule of open futures. Only unsettled variation margin receivable (payable) is reported within the Statement of Assets and Liabilities. |
The effects of derivative instruments on the Statement of Operations for the year ended December 31, 2014 are as follows:
| | | | |
Amount of Realized Gain or (Loss) on Derivatives Recognized in Income
| |
Derivatives not accounted for as hedging instruments, carried at fair value
| | Futures
| |
Equity contracts | | $ | 12,948,593 | |
| | |
|
|
|
|
Change in Unrealized Appreciation or (Depreciation) on Derivatives Recognized in Income
| |
Derivatives not accounted for as hedging instruments, carried at fair value
| | Futures
| |
Equity contracts | | $ | 1,339,538 | |
| | |
|
|
|
For the year ended December 31, 2014, the Fund’s average value at trade date for futures long positions was $95,195,846.
SEE NOTES TO FINANCIAL STATEMENTS.
A161
| | | | | | |
| | | STOCK INDEX PORTFOLIO (continued) | | |
STATEMENT OF ASSETS AND LIABILITIES
December 31, 2014
| | | | |
| ASSETS | |
Investments at value, including securities on loan of $63,204,983: | | | | |
Unaffiliated investments (cost $1,161,566,176) | | $ | 3,213,908,937 | |
Affiliated investments (cost $161,927,049) | | | 161,927,049 | |
Dividends and interest receivable | | | 4,316,297 | |
Receivable for investments sold | | | 583,775 | |
Receivable for Series shares sold | | | 63,878 | |
Tax reclaim receivable | | | 2,435 | |
Prepaid expenses | | | 23,918 | |
| | |
|
|
|
Total Assets | | | 3,380,826,289 | |
| | |
|
|
|
| LIABILITIES | | | | |
Payable to broker for collateral for securities on loan | | | 65,419,511 | |
Due to broker—variation margin futures | | | 1,240,515 | |
Management fee payable | | | 843,238 | |
Payable for Series shares repurchased | | | 242,819 | |
Accrued expenses | | | 192,089 | |
Payable for investments purchased | | | 155,159 | |
Payable to custodian | | | 58,234 | |
Affiliated transfer agent fee payable | | | 926 | |
| | |
|
|
|
Total Liabilities | | | 68,152,491 | |
| | |
|
|
|
| NET ASSETS | | $ | 3,312,673,798 | |
| | |
|
|
|
Net assets were comprised of: | | | | |
Paid-in capital | | $ | 1,212,702,596 | |
Retained earnings | | | 2,099,971,202 | |
| | |
|
|
|
Net assets, December 31, 2014 | | $ | 3,312,673,798 | |
| | |
|
|
|
Net asset value and redemption price per share $3,312,673,798 / 67,151,072 outstanding shares of beneficial interest | | $ | 49.33 | |
| | |
|
|
|
STATEMENT OF OPERATIONS
Year Ended December 31, 2014
| | | | |
| NET INVESTMENT INCOME | | | | |
| INCOME | | | | |
Unaffiliated dividend income (net of foreign withholding taxes of $6,110) | | $ | 60,919,160 | |
Affiliated income from securities loaned, net | | | 217,848 | |
Affiliated dividend income | | | 142,886 | |
Interest income | | | 2,308 | |
| | |
|
|
|
Total income | | | 61,282,202 | |
| | |
|
|
|
| EXPENSES | | | | |
Management fee | | | 10,765,929 | |
Custodian’s fees and expenses | | | 311,000 | |
Shareholders’ reports | | | 100,000 | |
Insurance expenses | | | 39,000 | |
Trustees’ fees | | | 33,000 | |
Audit fee | | | 26,000 | |
Legal fees and expenses | | | 17,000 | |
Transfer agent’s fees and expenses (including affiliated expense of $5,600) | | | 12,000 | |
Commitment fee on syndicated credit agreement | | | 5,000 | |
Miscellaneous | | | 15,817 | |
| | |
|
|
|
Total expenses | | | 11,324,746 | |
Less: Management fee waiver | | | (1,537,990 | ) |
| | |
|
|
|
Net expenses | | | 9,786,756 | |
| | |
|
|
|
| NET INVESTMENT INCOME | | | 51,495,446 | |
| | |
|
|
|
| REALIZED AND UNREALIZED GAIN ON INVESTMENTS | |
Net realized gain on: | | | | |
Investment transactions | | | 28,994,342 | |
Futures transactions | | | 12,948,593 | |
| | |
|
|
|
| | | | 41,942,935 | |
| | |
|
|
|
Net change in unrealized appreciation (depreciation) on: | |
Investments | | | 294,385,967 | |
Futures | | | 1,339,538 | |
| | |
|
|
|
| | | | 295,725,505 | |
| | |
|
|
|
| NET GAIN ON INVESTMENT TRANSACTIONS | | | 337,668,440 | |
| | |
|
|
|
| NET INCREASE IN NET ASSETS RESULTING FROM OPERATIONS | | $ | 389,163,886 | |
| | |
|
|
|
STATEMENT OF CHANGES IN NET ASSETS
| | | | | | | | |
| | | Year Ended December 31,
| |
| | | 2014
| | | 2013
| |
| INCREASE (DECREASE) IN NET ASSETS | | | | | | | | |
| OPERATIONS | | | | | | | | |
Net investment income | | $ | 51,495,446 | | | $ | 46,538,020 | |
Net realized gain on investment transactions | | | 41,942,935 | | | | 77,667,845 | |
Net change in unrealized appreciation (depreciation) on investments | | | 295,725,505 | | | | 599,872,780 | |
| | |
|
|
| |
|
|
|
NET INCREASE IN NET ASSETS RESULTING FROM OPERATIONS | | | 389,163,886 | | | | 724,078,645 | |
| | |
|
|
| |
|
|
|
| DISTRIBUTIONS | | | (225,034,357 | ) | | | — | |
| | |
|
|
| |
|
|
|
| SERIES SHARE TRANSACTIONS | | | | | | | | |
Series shares sold [5,571,572 and 952,181 shares, respectively] | | | 260,144,327 | | | | 39,860,195 | |
Series shares issued in reinvestment of distributions [4,895,244 and 0 shares, respectively] | | | 225,034,357 | | | | — | |
Series shares repurchased [4,786,716 and 5,120,314 shares, respectively] | | | (227,184,200 | ) | | | (213,653,470 | ) |
| | |
|
|
| |
|
|
|
NET INCREASE (DECREASE) IN NET ASSETS FROM SERIES SHARE TRANSACTIONS | | | 257,994,484 | | | | (173,793,275 | ) |
| | |
|
|
| |
|
|
|
| TOTAL INCREASE | | | 422,124,013 | | | | 550,285,370 | |
| NET ASSETS: | | | | | | | | |
Beginning of year | | | 2,890,549,785 | | | | 2,340,264,415 | |
| | |
|
|
| |
|
|
|
End of year | | $ | 3,312,673,798 | | | $ | 2,890,549,785 | |
| | |
|
|
| |
|
|
|
SEE NOTES TO FINANCIAL STATEMENTS.
A162
| | | | | | |
| | | VALUE PORTFOLIO | | |
| |
| SCHEDULE OF INVESTMENTS | | December 31, 2014 |
| | | | | | | | |
| LONG-TERM INVESTMENTS — 96.1% | | | | |
| COMMON STOCKS | | Shares
| | | Value
(Note 2)
| |
Aerospace & Defense — 1.8% | | | | | | | | |
Boeing Co. (The) | | | 223,684 | | | $ | 29,074,446 | |
| | | | | | |
|
|
|
Airlines — 2.4% | | | | | | | | |
United Continental Holdings, Inc.* | | | 571,123 | | | | 38,202,417 | |
| | | | | | |
|
|
|
Auto Components — 2.0% | | | | | | | | |
Lear Corp. | | | 325,943 | | | | 31,968,489 | |
| | | | | | |
|
|
|
Automobiles — 1.3% | | | | | | | | |
General Motors Co. | | | 618,842 | | | | 21,603,774 | |
| | | | | | |
|
|
|
Banks — 11.8% | | | | | | | | |
Bank of America Corp. | | | 1,948,329 | | | | 34,855,606 | |
Citigroup, Inc. | | | 709,419 | | | | 38,386,662 | |
JPMorgan Chase & Co. | | | 759,535 | | | | 47,531,700 | |
PNC Financial Services Group, Inc. (The) | | | 236,738 | | | | 21,597,608 | |
Wells Fargo & Co. | | | 861,891 | | | | 47,248,865 | |
| | | | | | |
|
|
|
| | | | | | | | 189,620,441 | |
| | | | | | |
|
|
|
Biotechnology — 1.5% | | | | | | | | |
Celgene Corp.* | | | 210,854 | | | | 23,586,128 | |
| | | | | | |
|
|
|
Capital Markets — 4.1% | | | | | | | | |
Goldman Sachs Group, Inc. (The) | | | 185,453 | | | | 35,946,355 | |
Morgan Stanley | | | 766,950 | | | | 29,757,660 | |
| | | | | | |
|
|
|
| | | | | | | | 65,704,015 | |
| | | | | | |
|
|
|
Chemicals — 1.1% | | | | | | | | |
FMC Corp. | | | 312,689 | | | | 17,832,654 | |
| | | | | | |
|
|
|
Communications Equipment — 1.5% | | | | | |
Brocade Communications Systems, Inc. | | | 2,018,678 | | | | 23,901,148 | |
| | | | | | |
|
|
|
Consumer Finance — 4.5% | | | | | | | | |
Capital One Financial Corp. | | | 274,366 | | | | 22,648,913 | |
Navient Corp. | | | 1,092,354 | | | | 23,605,770 | |
SLM Corp. | | | 2,584,809 | | | | 26,339,204 | |
| | | | | | |
|
|
|
| | | | | | | | 72,593,887 | |
| | | | | | |
|
|
|
Diversified Financial Services — 1.3% | |
Voya Financial, Inc. | | | 502,949 | | | | 21,314,979 | |
| | | | | | |
|
|
|
Diversified Telecommunication Services — 2.1% | |
CenturyLink, Inc. | | | 364,697 | | | | 14,434,707 | |
Vivendi SA (France) | | | 769,143 | | | | 19,144,426 | |
| | | | | | |
|
|
|
| | | | | | | | 33,579,133 | |
| | | | | | |
|
|
|
Electric Utilities — 2.4% | | | | | | | | |
FirstEnergy Corp. | | | 983,979 | | | | 38,365,341 | |
| | | | | | |
|
|
|
Electrical Equipment — 1.2% | | | | | | | | |
Eaton Corp. PLC | | | 278,485 | | | | 18,925,841 | |
| | | | | | |
|
|
|
Electronic Equipment, Instruments & Components — 1.5% | |
Flextronics International Ltd.* | | | 2,168,516 | | | | 24,244,009 | |
| | | | | | |
|
|
|
Energy Equipment & Services — 1.3% | | | | | |
Halliburton Co. | | | 513,346 | | | | 20,189,898 | |
| | | | | | |
|
|
|
Food Products — 3.2% | | | | | | | | |
Bunge Ltd. | | | 238,685 | | | | 21,698,853 | |
Mondelez International, Inc. (Class A Stock) | | | 815,078 | | | | 29,607,709 | |
| | | | | | |
|
|
|
| | | | | | | | 51,306,562 | |
| | | | | | |
|
|
|
| | | | | | | | |
COMMON STOCKS
(continued) | | Shares
| | | Value
(Note 2)
| |
Health Care Providers & Services — 2.7% | | | | | |
Cigna Corp. | | | 246,153 | | | $ | 25,331,605 | |
HCA Holdings, Inc.* | | | 243,502 | | | | 17,870,612 | |
| | | | | | |
|
|
|
| | | | | | | | 43,202,217 | |
| | | | | | |
|
|
|
Hotels, Restaurants & Leisure — 4.4% | | | | | |
Carnival Corp. | | | 714,382 | | | | 32,382,936 | |
Hyatt Hotels Corp. (Class A Stock)* | | | 357,843 | | | | 21,545,727 | |
International Game Technology | | | 942,126 | | | | 16,251,674 | |
| | | | | | |
|
|
|
| | | | | | | | 70,180,337 | |
| | | | | | |
|
|
|
Independent Power & Renewable Electricity Producers — 1.4% | |
NRG Energy, Inc. | | | 849,587 | | | | 22,896,370 | |
| | | | | | |
|
|
|
Industrial Conglomerates — 1.4% | | | | | |
Siemens AG (Germany), ADR | | | 195,046 | | | | 21,845,152 | |
| | | | | | |
|
|
|
Insurance — 3.5% | | | | | |
MetLife, Inc. | | | 619,016 | | | | 33,482,575 | |
Travelers Cos., Inc. (The) | | | 216,668 | | | | 22,934,308 | |
| | | | | | |
|
|
|
| | | | | | | | 56,416,883 | |
| | | | | | |
|
|
|
Internet Software & Services — 0.9% | | | | | |
Google, Inc. (Class A Stock)* | | | 26,028 | | | | 13,812,018 | |
| | | | | | |
|
|
|
Machinery — 1.4% | | | | | |
SPX Corp. | | | 268,787 | | | | 23,094,179 | |
| | | | | | |
|
|
|
Media — 3.5% | | | | | |
Comcast Corp. (Class A Stock) | | | 499,574 | | | | 28,980,288 | |
Liberty Global PLC (United Kingdom) (Series C)* | | | 563,947 | | | | 27,244,279 | |
| | | | | | |
|
|
|
| | | | | | | | 56,224,567 | |
| | | | | | |
|
|
|
Multiline Retail — 1.7% | | | | | |
Target Corp. | | | 357,291 | | | | 27,121,960 | |
| | | | | | |
|
|
|
Oil, Gas & Consumable Fuels — 8.6% | | | | | |
Anadarko Petroleum Corp. | | | 204,597 | | | | 16,879,252 | |
Chevron Corp. | | | 186,245 | | | | 20,892,964 | |
Marathon Oil Corp. | | | 828,482 | | | | 23,437,756 | |
Marathon Petroleum Corp. | | | 148,180 | | | | 13,374,727 | |
Noble Energy, Inc. | | | 439,314 | | | | 20,836,663 | |
Occidental Petroleum Corp. | | | 231,947 | | | | 18,697,248 | |
Suncor Energy, Inc. (Canada) | | | 730,914 | | | | 23,228,447 | |
| | | | | | |
|
|
|
| | | | | | | | 137,347,057 | |
| | | | | | |
|
|
|
Personal Products — 0.7% | | | | | |
Avon Products, Inc. | | | 1,250,184 | | | | 11,739,228 | |
| | | | | | |
|
|
|
Pharmaceuticals — 8.7% | | | | | |
Actavis, Inc.* | | | 120,886 | | | | 31,117,265 | |
Bayer AG (Germany), ADR | | | 164,132 | | | | 22,459,823 | |
Merck & Co., Inc. | | | 462,272 | | | | 26,252,427 | |
Mylan, Inc.*(a) | | | 581,603 | | | | 32,784,961 | |
Teva Pharmaceutical Industries Ltd. (Israel), ADR | | | 475,545 | | | | 27,348,593 | |
| | | | | | |
|
|
|
| | | | | | | | 139,963,069 | |
| | | | | | |
|
|
|
Road & Rail — 2.6% | | | | | |
Hertz Global Holdings, Inc.* | | | 884,454 | | | | 22,058,283 | |
Union Pacific Corp. | | | 165,834 | | | | 19,755,804 | |
| | | | | | |
|
|
|
| | | | | | | | 41,814,087 | |
| | | | | | |
|
|
|
SEE NOTES TO FINANCIAL STATEMENTS.
A163
| | | | | | |
| | | VALUE PORTFOLIO (continued) | | |
| |
| SCHEDULE OF INVESTMENTS | | December 31, 2014 |
| | | | | | | | |
COMMON STOCKS
(continued) | | Shares
| | | Value
(Note 2)
| |
Semiconductors & Semiconductor Equipment — 1.9% | |
Applied Materials, Inc. | | | 1,230,850 | | | $ | 30,672,782 | |
| | | | | | |
|
|
|
Software — 1.8% | | | | | | | | |
Microsoft Corp. | | | 624,863 | | | | 29,024,886 | |
| | | | | | |
|
|
|
Technology Hardware, Storage & Peripherals — 5.9% | |
Apple, Inc. | | | 160,276 | | | | 17,691,265 | |
EMC Corp. | | | 808,337 | | | | 24,039,942 | |
Hewlett-Packard Co. | | | 840,836 | | | | 33,742,749 | |
NCR Corp.* | | | 636,739 | | | | 18,554,574 | |
| | | | | | |
|
|
|
| | | | | | | | 94,028,530 | |
| | | | | | |
|
|
|
TOTAL LONG-TERM INVESTMENTS
(cost $1,078,167,765) | | | | 1,541,396,484 | |
| | | | | | |
|
|
|
| | | | | | | | |
SHORT-TERM
INVESTMENT — 3.8% | | Shares
| | | Value
(Note 2)
| |
AFFILIATED MONEY MARKET MUTUAL FUND | |
Prudential Investment Portfolios 2 — Prudential Core Taxable Money Market Fund (cost $60,772,823; includes $330,421 of cash collateral for securities on loan) (Note 4)(b)(c) | | | 60,772,823 | | | $ | 60,772,823 | |
| | | | | | |
|
|
|
TOTAL INVESTMENTS — 99.9%
(cost $1,138,940,588) | | | | 1,602,169,307 | |
OTHER ASSETS IN EXCESS OF
LIABILITIES — 0.1% | | | | 1,014,144 | |
| | | | | | |
|
|
|
NET ASSETS — 100.0% | | | $ | 1,603,183,451 | |
| | | | | | |
|
|
|
See the Glossary for abbreviations used in the Portfolio descriptions.
| * | Non-income producing security. |
| (a) | All or a portion of security is on loan. The aggregate market value of such securities, including those sold and pending settlement, is $315,672; cash collateral of $330,421 (included in liabilities) was received with which the Portfolio purchased highly liquid short-term investments. Securities on loan are subject to contractual netting arrangements. |
| (b) | Represents security, or a portion thereof, purchased with cash collateral received for securities on loan. |
| (c) | Prudential Investments LLC, the manager of the Portfolio, also serves as manager of the Prudential Investment Portfolios 2 — Prudential Core Taxable Money Market Fund. |
Various inputs are used in determining the value of the Portfolio’s investments. These inputs are summarized in the three broad levels listed below.
| Level 1— | quoted prices generally in active markets for identical securities. |
| Level 2— | quoted prices for similar securities, interest rates and yield curves, prepayment speeds, foreign currency exchange rates and other significant observable inputs. |
| Level 3— | significant unobservable inputs for securities valued in accordance with Board approved fair valuation procedures. |
The following is a summary of the inputs used as of December 31, 2014 in valuing such portfolio securities:
| | | | | | | | | | | | |
| | | Level 1
| | | Level 2
| | | Level 3
| |
Investments in Securities | | | | | | | | | | | | |
Common Stocks | | | | | | | | | | | | |
Aerospace & Defense | | $ | 29,074,446 | | | $ | — | | | $ | — | |
Airlines | | | 38,202,417 | | | | — | | | | — | |
Auto Components | | | 31,968,489 | | | | — | | | | — | |
Automobiles | | | 21,603,774 | | | | — | | | | — | |
Banks | | | 189,620,441 | | | | — | | | | — | |
Biotechnology | | | 23,586,128 | | | | — | | | | — | |
Capital Markets | | | 65,704,015 | | | | — | | | | — | |
Chemicals | | | 17,832,654 | | | | — | | | | — | |
Communications Equipment | | | 23,901,148 | | | | — | | | | — | |
Consumer Finance | | | 72,593,887 | | | | — | | | | — | |
Diversified Financial Services | | | 21,314,979 | | | | — | | | | — | |
Diversified Telecommunication Services | | | 14,434,707 | | | | 19,144,426 | | | | — | |
Electric Utilities | | | 38,365,341 | | | | — | | | | — | |
Electrical Equipment | | | 18,925,841 | | | | — | | | | — | |
Electronic Equipment, Instruments & Components | | | 24,244,009 | | | | — | | | | — | |
Energy Equipment & Services | | | 20,189,898 | | | | — | | | | — | |
Food Products | | | 51,306,562 | | | | — | | | | — | |
Health Care Providers & Services | | | 43,202,217 | | | | — | | | | — | |
Hotels, Restaurants & Leisure | | | 70,180,337 | | | | — | | | | — | |
Independent Power & Renewable Electricity Producers | | | 22,896,370 | | | | — | | | | — | |
Industrial Conglomerates | | | 21,845,152 | | | | — | | | | — | |
Insurance | | | 56,416,883 | | | | — | | | | — | |
SEE NOTES TO FINANCIAL STATEMENTS.
A164
| | | | | | |
| | | VALUE PORTFOLIO (continued) | | |
| |
| SCHEDULE OF INVESTMENTS | | December 31, 2014 |
| | | | | | | | | | | | |
| | | Level 1
| | | Level 2
| | | Level 3
| |
Investments in Securities (continued) | | | | | | | | | | | | |
Common Stocks (continued) | | | | | | | | | | | | |
Internet Software & Services | | $ | 13,812,018 | | | $ | — | | | $ | — | |
Machinery | | | 23,094,179 | | | | — | | | | — | |
Media | | | 56,224,567 | | | | — | | | | — | |
Multiline Retail | | | 27,121,960 | | | | — | | | | — | |
Oil, Gas & Consumable Fuels | | | 137,347,057 | | | | — | | | | — | |
Personal Products | | | 11,739,228 | | | | — | | | | — | |
Pharmaceuticals | | | 139,963,069 | | | | — | | | | — | |
Road & Rail | | | 41,814,087 | | | | — | | | | — | |
Semiconductors & Semiconductor Equipment | | | 30,672,782 | | | | — | | | | — | |
Software | | | 29,024,886 | | | | — | | | | — | |
Technology Hardware, Storage & Peripherals | | | 94,028,530 | | | | — | | | | — | |
Affiliated Money Market Mutual Fund | | | 60,772,823 | | | | — | | | | — | |
| | |
|
|
| |
|
|
| |
|
|
|
Total | | $ | 1,583,024,881 | | | $ | 19,144,426 | | | $ | — | |
| | |
|
|
| |
|
|
| |
|
|
|
The industry classification of investments and other assets in excess of liabilities shown as a percentage of net assets as of December 31, 2014 was as follows (Unaudited):
| | | | |
Banks | | | 11.8 | % |
Pharmaceuticals | | | 8.7 | |
Oil, Gas & Consumable Fuels | | | 8.6 | |
Technology Hardware, Storage & Peripherals | | | 5.9 | |
Consumer Finance | | | 4.5 | |
Hotels, Restaurants & Leisure | | | 4.4 | |
Capital Markets | | | 4.1 | |
Affiliated Money Market Mutual Fund (including 0.0%* of collateral for securities on loan) | | | 3.8 | |
Insurance | | | 3.5 | |
Media | | | 3.5 | |
Food Products | | | 3.2 | |
Health Care Providers & Services | | | 2.7 | |
Road & Rail | | | 2.6 | |
Electric Utilities | | | 2.4 | |
Airlines | | | 2.4 | |
Diversified Telecommunication Services | | | 2.1 | |
Auto Components | | | 2.0 | |
Semiconductors & Semiconductor Equipment | | | 1.9 | |
Aerospace & Defense | | | 1.8 | |
| | | | |
Software | | | 1.8 | % |
Multiline Retail | | | 1.7 | |
Electronic Equipment, Instruments & Components | | | 1.5 | |
Communications Equipment | | | 1.5 | |
Biotechnology | | | 1.5 | |
Machinery | | | 1.4 | |
Independent Power & Renewable Electricity Producers | | | 1.4 | |
Industrial Conglomerates | | | 1.4 | |
Automobiles | | | 1.3 | |
Diversified Financial Services | | | 1.3 | |
Energy Equipment & Services | | | 1.3 | |
Electrical Equipment | | | 1.2 | |
Chemicals | | | 1.1 | |
Internet Software & Services | | | 0.9 | |
Personal Products | | | 0.7 | |
| | |
|
|
|
| | | | 99.9 | |
Other assets in excess of liabilities | | | 0.1 | |
| | |
|
|
|
| | | | 100.0 | % |
| | |
|
|
|
SEE NOTES TO FINANCIAL STATEMENTS.
A165
| | | | | | |
| | | VALUE PORTFOLIO (continued) | | |
STATEMENT OF ASSETS AND LIABILITIES
December 31, 2014
| | | | |
| ASSETS | | | | |
Investments at value, including securities on loan of $315,672: | | | | |
Unaffiliated investments (cost $1,078,167,765) | | $ | 1,541,396,484 | |
Affiliated investments (cost $60,772,823) | | | 60,772,823 | |
Receivable for investments sold | | | 3,183,153 | |
Dividends receivable | | | 1,120,336 | |
Tax reclaim receivable | | | 532,472 | |
Receivable for Series shares sold | | | 1,877 | |
Prepaid expenses | | | 12,823 | |
| | |
|
|
|
Total Assets | | | 1,607,019,968 | |
| | |
|
|
|
| LIABILITIES | | | | |
Payable for investments purchased | | | 2,486,541 | |
Management fee payable | | | 542,826 | |
Payable to broker for collateral for securities on loan | | | 330,421 | |
Payable for Series shares repurchased | | | 317,586 | |
Accrued expenses | | | 149,103 | |
Payable to custodian | | | 4,760 | |
Distribution fee payable | | | 2,246 | |
Administration fee payable | | | 1,347 | |
Affiliated transfer agent fee payable | | | 926 | |
Deferred trustees’ fees | | | 761 | |
| | |
|
|
|
Total Liabilities | | | 3,836,517 | |
| | |
|
|
|
| NET ASSETS | | $ | 1,603,183,451 | |
| | |
|
|
|
Net assets were comprised of: | | | | |
Paid-in capital | | $ | 1,031,169,164 | |
Retained earnings | | | 572,014,287 | |
| | |
|
|
|
Net assets, December 31, 2014 | | $ | 1,603,183,451 | |
| | |
|
|
|
| Class I: | | | | |
Net asset value and redemption price per share $1,592,552,629 / 60,148,344 outstanding shares of beneficial interest | | $ | 26.48 | |
| | |
|
|
|
| Class II: | | | | |
Net asset value and redemption price per share $10,630,822 / 401,893 outstanding shares of beneficial interest | | $ | 26.45 | |
| | |
|
|
|
STATEMENT OF OPERATIONS
Year Ended December 31, 2014
| | | | |
| NET INVESTMENT INCOME | | | | |
| INCOME | | | | |
Unaffiliated dividend income (net of foreign withholding taxes of $542,156) | | $ | 24,161,185 | |
Affiliated income from securities loaned, net | | | 83,268 | |
Affiliated dividend income | | | 57,989 | |
| | |
|
|
|
Total income | | | 24,302,442 | |
| | |
|
|
|
| EXPENSES | | | | |
Management fee | | | 6,369,263 | |
Distribution fee—Class II | | | 20,931 | |
Administration fee—Class II | | | 12,559 | |
Custodian’s fees and expenses | | | 140,000 | |
Shareholders’ reports | | | 100,000 | |
Trustees’ fees | | | 23,000 | |
Audit fee | | | 23,000 | |
Insurance expenses | | | 21,000 | |
Legal fees and expenses | | | 13,000 | |
Transfer agent’s fees and expenses (including affiliated expense of $5,600) | | | 11,000 | |
Commitment fee on syndicated credit agreement | | | 3,000 | |
Interest expense | | | 198 | |
Miscellaneous | | | 4,051 | |
| | |
|
|
|
Total expenses | | | 6,741,002 | |
Less: Management fee waiver | | | (391,488 | ) |
| | |
|
|
|
Net expenses | | | 6,349,514 | |
| | |
|
|
|
| NET INVESTMENT INCOME | | | 17,952,928 | |
| | |
|
|
|
| REALIZED AND UNREALIZED GAIN (LOSS) ON INVESTMENT AND FOREIGN CURRENCY TRANSACTIONS | | | | |
Net realized gain on: | | | | |
Investment transactions | | | 109,073,304 | |
Foreign currency transactions | | | 5,195 | |
| | |
|
|
|
| | | | 109,078,499 | |
| | |
|
|
|
Net change in unrealized appreciation (depreciation) on: | | | | |
Investments | | | 26,185,947 | |
Foreign currencies | | | (14,412 | ) |
| | |
|
|
|
| | | | 26,171,535 | |
| | |
|
|
|
| NET GAIN ON INVESTMENT AND FOREIGN CURRENCY TRANSACTIONS | | | 135,250,034 | |
| | |
|
|
|
| NET INCREASE IN NET ASSETS RESULTING FROM OPERATIONS | | $ | 153,202,962 | |
| | |
|
|
|
STATEMENT OF CHANGES IN NET ASSETS
| | | | | | | | |
| | | Year Ended December 31,
| |
| | | 2014
| | | 2013
| |
| INCREASE (DECREASE) IN NET ASSETS | | | | | | | | |
| OPERATIONS | | | | | | | | |
Net investment income | | $ | 17,952,928 | | | $ | 15,219,628 | |
Net realized gain on investment and foreign currency transactions | | | 109,078,499 | | | | 184,051,019 | |
Net change in unrealized appreciation (depreciation) on investments and foreign currencies | | | 26,171,535 | | | | 206,906,734 | |
| | |
|
|
| |
|
|
|
NET INCREASE IN NET ASSETS RESULTING FROM OPERATIONS | | | 153,202,962 | | | | 406,177,381 | |
| | |
|
|
| |
|
|
|
| SERIES SHARE TRANSACTIONS (NOTE 7) | | | | | | | | |
Series shares sold | | | 11,406,469 | | | | 25,700,974 | |
Series shares repurchased | | | (137,573,230 | ) | | | (125,239,881 | ) |
| | |
|
|
| |
|
|
|
NET DECREASE IN NET ASSETS FROM SERIES SHARE TRANSACTIONS | | | (126,166,761 | ) | | | (99,538,907 | ) |
| | |
|
|
| |
|
|
|
| TOTAL INCREASE | | | 27,036,201 | | | | 306,638,474 | |
| NET ASSETS: | | | | | | | | |
Beginning of year | | | 1,576,147,250 | | | | 1,269,508,776 | |
| | |
|
|
| |
|
|
|
End of year | | $ | 1,603,183,451 | | | $ | 1,576,147,250 | |
| | |
|
|
| |
|
|
|
SEE NOTES TO FINANCIAL STATEMENTS.
A166
| | | | | | |
| | | GLOSSARY | | |
| |
| SCHEDULE OF INVESTMENTS | | December 31, 2014 |
The following abbreviations are used in the preceding Portfolios’ descriptions:
Currency
| | |
| AUD | | Australian Dollar |
| BRL | | Brazilian Real |
| CAD | | Canadian Dollar |
| CLP | | Chilean Peso |
| CNH | | Chinese Renminbi |
| EUR | | Euro |
| GBP | | British Pound |
| HUF | | Hungarian Forint |
| INR | | Indian Rupee |
| JPY | | Japanese Yen |
| MXN | | Mexican Peso |
| MYR | | Malaysian Ringgit |
| NOK | | Norwegian Krone |
| NZD | | New Zealand Dollar |
| PHP | | Philippine Peso |
| PLN | | Polish Zloty |
| RUB | | Russian Ruble |
| SGD | | Singapore Dollar |
| TRY | | Turkish Lira |
| USD | | United States Dollar |
| ZAR | | South African Rand |
Index
| | |
| CDX | | Credit Derivative Index |
Other
| | |
| 144A | | Security was purchased pursuant to Rule 144A under the Securities Act of 1933 and may not be resold subject to that rule except to qualified institutional buyers. Unless otherwise noted, 144A securities are deemed to be liquid. |
| Reg. D | | Security was purchased pursuant to Regulation D under the Securities Act of 1933, providing exemption from the registration requirements. Unless otherwise noted, Regulation D securities are deemed to be liquid. |
| RegS | | Regulation S. Security was purchased pursuant to Regulation S and may not be offered, sold or delivered within the United States or to, or for the account or benefit of, U.S. persons, except pursuant to an exemption from, or in a transaction not subject to, the registration requirements of the Securities Act of 1933. |
| ABS | | Asset-Backed Security |
| ADR | | American Depositary Receipt |
| BABs | | Build America Bonds |
| BBSW | | Australian Bank Bill Swap Reference Rate |
| bps | | Basis Points |
| CDO | | Collateralized Debt Obligation |
| CLO | | Collateralized Loan Obligation |
| CMBS | | Collateralized Mortgage-Backed Security |
| CVA | | Certificate Van Aandelen (Bearer) |
| CVR | | Contingent Value Rights |
| EAFE | | Europe, Australasia and Far East |
| ETF | | Exchange Traded Fund |
| EURIBOR | | Euro Interbank Offered Rate |
| EUROIS | | Euro Overnight Index Swap |
| FHLMC | | Federal Home Loan Mortgage Corp. |
| GMTN | | Global Medium Term Note |
| GO | | General Obligation |
| I/O | | Interest Only |
| JIBAR | | Johannesburg Interbank Agreed Rate |
| LIBOR | | London Interbank Offered Rate |
| MOSPRIME | | Moscow Prime Offered Rate |
| MSCI | | Morgan Stanley Capital International |
SEE NOTES TO FINANCIAL STATEMENTS.
A167
| | | | | | |
| | | GLOSSARY (continued) | | |
| |
| SCHEDULE OF INVESTMENTS | | December 31, 2014 |
| | |
| MTN | | Medium Term Note |
| PIK | | Payment-in-Kind |
| PRFC | | Preference Shares |
| REIT | | Real Estate Investment Trust |
| REMICS | | Real Estate Mortgage Investment Conduit Service |
| SDR | | Swedish Depositary Receipt |
| SWX | | Swiss Exchange |
| TBA | | To Be Announced |
| TIPS | | Treasury Inflation Protected Securities |
| USAID | | United States Agency for International Development |
SEE NOTES TO FINANCIAL STATEMENTS.
A168
NOTES TO THE FINANCIAL STATEMENTS OF
THE PRUDENTIAL SERIES FUND
The Prudential Series Fund (“Series Fund”), organized as a Delaware statutory trust, is a diversified open-end management investment company registered under the Investment Company Act of 1940, as amended (“1940 Act”). The Series Fund is composed of eighteen Portfolios (“Portfolio” or “Portfolios”), each with separate series shares. The information presented in these financial statements pertains to the thirteen Portfolios which are listed below along with each Portfolio’s investment objective.
Conservative Balanced Portfolio: Total investment return consistent with a conservatively managed diversified portfolio.
Diversified Bond Portfolio: High level of income over a longer term while providing reasonable safety of capital.
Equity Portfolio: Long-term growth of capital.
Flexible Managed Portfolio: Total return consistent with an aggressively managed diversified portfolio.
Global Portfolio: Long-term growth of capital.
Government Income Portfolio: High level of income over the long-term consistent with the preservation of capital.
High Yield Bond Portfolio: High total return.
Jennison Portfolio: Long-term growth of capital.
Money Market Portfolio: Maximum current income consistent with the stability of capital and maintenance of liquidity.
Natural Resources Portfolio: Long-term growth of capital.
Small Capitalization Stock Portfolio: Long-term growth of capital.
Stock Index Portfolio: Achieve investment results that generally correspond to the performance of publicly traded common stocks.
Value Portfolio: Capital appreciation.
| Note 2: | | Accounting Policies |
The Series Fund follows investment company accounting and reporting guidance of the Financial Accounting Standards Board (“FASB”) Accounting Standard Codification Topic 946 Financial Services — Investment Companies. The following accounting policies conform to U.S. generally accepted accounting principles. The Series Fund and the Portfolios consistently follow such policies in the preparation of their financial statements.
Securities Valuation: Each Portfolio holds securities and other assets that are fair valued at the close of each day the New York Stock Exchange (“NYSE”) is open for trading. Fair value is the price that would be received to sell an asset or paid to transfer a liability in an orderly transaction between market participants on the measurement date. The Board of Trustees (the “Board”) has adopted Valuation Procedures for security valuation under which fair valuation responsibilities have been delegated to Prudential Investments LLC (“PI” or “Manager”). Under the current Valuation Procedures, the established Valuation Committee is responsible for supervising the valuation of portfolio securities and other assets. The Valuation Procedures permit a Portfolio to utilize independent pricing vendor services, quotations from market makers, and alternative valuation methods when market quotations are either not readily available or not deemed representative of fair value. A record of the Valuation Committee’s actions is subject to the Board’s review, approval, and ratification at its next regularly-scheduled quarterly meeting.
Various inputs determine how each Portfolio’s investments are valued, all of which are categorized according to the three broad levels (Level 1, 2, or 3) detailed in the table following each Portfolio’s Schedule of Investments.
B1
Common and preferred stocks, exchange-traded funds, and derivative instruments such as futures or options that are traded on a national securities exchange are valued at the last sale price as of the close of trading on the applicable exchange where the security principally trades. Securities traded via NASDAQ are valued at the NASDAQ official closing price. To the extent these securities are valued at the last sale price or NASDAQ official closing price; they are classified as Level 1 in the fair value hierarchy.
In the event that no sale or official closing price on valuation date exists, these securities are generally valued at the mean between the last reported bid and ask prices, or at the last bid price in the absence of an ask price. These securities are classified as Level 2 in the fair value hierarchy, as the inputs are observable and considered to be significant to the valuation.
Common and preferred stocks traded on foreign securities exchanges are valued using pricing vendor services that provide model prices derived using adjustment factors based on information such as local closing price, relevant general and sector indices, currency fluctuations, depositary receipts, and futures, as applicable. Securities valued using such model prices are classified as Level 2 in the fair value hierarchy, as the adjustment factors are observable and considered to be significant to the valuation. Such securities are valued using model prices to the extent that the valuation meets the established confidence level for each security. If the confidence level is not met or the vendor does not provide a model price, securities are valued in accordance with exchange-traded common and preferred stocks discussed above.
Investments in open-end, non-exchange-traded mutual funds are valued at their net asset values as of the close of the NYSE on the date of valuation. These securities are classified as Level 1 in the fair value hierarchy since they may be purchased or sold at their net asset values on the date of valuation.
Fixed income securities traded in the over-the-counter market are generally valued at prices provided by approved independent pricing vendors. The pricing vendors provide these prices after evaluating observable inputs including, but not limited to yield curves, yield spreads, credit ratings, deal terms, tranche level attributes, default rates, cash flows, prepayment speeds, broker/dealer quotations, and reported trades. Securities valued using such vendor prices are classified as Level 2 in the fair value hierarchy.
The Money Market Portfolio values all of its securities of sufficient credit quality, at amortized cost, which approximates fair value. The amortized cost method involves valuing a security at its cost on the date of purchase and thereafter assuming a constant amortization to maturity of the difference between the principal amount due at maturity and cost. These securities are categorized as Level 2 in the fair value hierarchy.
Over-the-counter derivative instruments are generally valued using pricing vendor services, which derive the valuation based on inputs such as underlying asset prices, indices, spreads, interest rates, and exchange rates. These instruments are categorized as Level 2 in the fair value hierarchy.
Centrally cleared swaps listed or traded on a multilateral or trade facility platform, such as a registered exchange, are valued at the daily settlement price determined by the respective exchange. These securities are classified as Level 2 in the fair value hierarchy, as the daily settlement price is not public.
Securities and other assets that cannot be priced according to the methods described above are valued based on pricing methodologies approved by the Board. In the event that significant unobservable inputs are used when determining such valuations, the securities will be classified as Level 3 in the fair value hierarchy.
When determining the fair value of securities, some of the factors influencing the valuation include: the nature of any restrictions on disposition of the securities; assessment of the general liquidity of the securities; the issuer’s financial condition and the markets in which it does business; the cost of the investment; the size of the holding and the capitalization of the issuer; the prices of any recent transactions or bids/offers for such securities or any comparable securities; any available analyst media or other reports or information deemed reliable by the investment adviser regarding the issuer or the markets or industry in which it operates. Using fair value to price securities may result in a value that is different from a security’s most recent closing price and from the price used by other mutual funds to calculate their net asset values.
Restricted and Illiquid Securities: Subject to guidelines adopted by the Board, each Portfolio may invest up to 15% of their net assets (the Money Market Portfolio may invest up to 5% of its net assets) in illiquid securities, including those which are restricted as to disposition under securities law (“restricted securities”). Restricted securities are valued pursuant to the valuation procedures noted above. Illiquid securities are those that, because of the absence of a readily available market or due to legal or contractual restrictions on resale, cannot be sold within seven days in the ordinary course of business at approximately the amount at which the
B2
Portfolio has valued the investment. Therefore, the Portfolio may find it difficult to sell illiquid securities at the time considered most advantageous by its Subadviser and may incur expenses that would not be incurred in the sale of securities that were freely marketable. Certain securities that would otherwise be considered illiquid because of legal restrictions on resale to the general public may be traded among qualified institutional
buyers under Rule 144A of the Securities Act of 1933. These Rule 144A securities, as well as commercial paper that is sold in private placements under Section 4(2) of the Securities Act, may be deemed liquid by the Portfolio’s Subadviser under the guidelines adopted by the Board of the Portfolio. However, the liquidity of the Portfolio’s investments in Rule 144A securities could be impaired if trading does not develop or declines.
Repurchase Agreements: In connection with transactions in repurchase agreements with United States financial institutions, it is each Portfolio’s policy that its custodian or designated subcustodians, as the case may be, under triparty repurchase agreements, take possession of the underlying collateral securities, the value of which exceeds the principal amount of the repurchase transaction, including accrued interest. To the extent that any repurchase transaction exceeds one business day, the value of the collateral is marked to market on a daily basis to ensure the adequacy of the collateral. If the seller defaults or the value of the collateral declines, or if bankruptcy proceedings are commenced with respect to the seller of the security, realization of the collateral by the Portfolio may be delayed or limited.
Foreign Currency Translation: The books and records of the Portfolios are maintained in U.S. dollars. Foreign currency amounts are translated into U.S. dollars on the following basis:
(i) market value of investment securities, other assets and liabilities — at the current rates of exchange;
(ii) purchases and sales of investment securities, income and expenses — at the rates of exchange prevailing on the respective dates of such transactions.
Although the net assets of the Portfolios are presented at the foreign exchange rates and market values at the close of the period, the Portfolios do not isolate that portion of the results of operations arising as a result of changes in the foreign exchange rates from the fluctuations arising from changes in the market prices of long-term portfolio securities held at the end of the period. Similarly, the Portfolios do not isolate the effect of changes in foreign exchange rates from the fluctuations arising from changes in the market prices of long-term portfolio securities sold during the period. Accordingly, these realized foreign currency gains or losses are included in the reported net realized gains or losses on investment transactions.
Net realized gains or losses on foreign currency transactions represent net foreign exchange gains or losses from holdings of foreign currencies, forward currency contracts, disposition of foreign currencies, currency gains or losses realized between the trade and settlement dates on securities transactions, and the difference between the amounts of dividends, interest and foreign withholding taxes recorded on the Portfolios’ books and the U.S. dollar equivalent amounts actually received or paid. Net unrealized currency gains or losses from valuing foreign currency denominated assets and liabilities (other than investments) at period end exchange rates are reflected as a component of net unrealized appreciation (depreciation) on foreign currencies.
Concentration of Risk: The ability of debt securities issuers (other than those issued or guaranteed by the U.S. Government) held by the Portfolios to meet their obligations may be affected by the economic or political developments in a specific industry, region or country. Foreign security and currency transactions may involve certain considerations and risks not typically associated with those of domestic origin as a result of, among other factors, the possibility of political or economic instability or the level of governmental supervision and regulation of foreign securities markets.
Forward Currency Contracts: A forward currency contract is a commitment between two parties to purchase or sell a foreign currency at a future date at a negotiated forward rate. Certain Portfolios entered into forward currency contracts in order to hedge their exposure to changes in foreign currency exchange rates on their foreign portfolio holdings or specific receivables and payables denominated in a foreign currency. The contracts are valued daily at current exchange rates and any unrealized gain or loss is included in net unrealized appreciation or depreciation on foreign currencies. Gain or loss is realized on the settlement date of the contract equal to the difference between the settlement value of the original and negotiated forward contracts. This gain or loss, if any, is included in net realized gain (loss) on foreign currency transactions. Risks may arise upon entering into these contracts from the potential inability of the counterparties to meet the terms of their contracts. Forward currency contracts involve risks from currency exchange rate and credit
B3
risk in excess of the amounts reflected on the Statement of Assets and Liabilities. A Portfolio’s maximum risk of loss from counterparty credit risk is the net value of the cash flows to be received from the counterparty at the end of the contract’s life.
Cross Currency Exchange Contracts: A cross currency contract is a forward contract where a specified amount of one foreign currency will be exchanged for a specified amount of another foreign currency.
Short Sales: Certain Portfolios may sell a security they do not own in anticipation of a decline in the market value of that security (short sale). When a Portfolio makes a short sale, it must borrow the security sold short and deliver it to the broker-dealer through which it made the short sale as collateral for its obligation to deliver the security upon conclusion of the transaction. The Portfolio may have to pay a fee to borrow the particular security and may be obligated to remit any interest or dividends received on such borrowed securities. Dividends declared on short positions open are recorded on the ex-date and interest payable is accrued daily on fixed income securities sold short, both of which are recorded as an expense. A gain, limited to the price at which the Portfolio sold the security short, or a loss, unlimited in magnitude, will be recognized upon the termination of a short sale if the market price at termination is less than or greater than, respectively, the proceeds originally received.
Loan Participations: Certain Portfolios may invest in loan participations. When the Portfolio purchases a loan participation, the Portfolio typically enters into a contractual relationship with the lender or third party selling such participations (“Selling Participant”), but not the borrower. As a result, the Portfolio assumes the credit risk of the borrower and any other persons interpositioned between the Portfolio and the borrower. The Portfolio may not directly benefit from the collateral supporting the senior loan in which it has purchased the loan participation.
Financial Futures Contracts: A financial futures contract is an agreement to purchase (long) or sell (short) an agreed amount of securities at a set price for delivery on a future date. Upon entering into a financial futures contract, the Portfolio is required to pledge to the broker an amount of cash and/or other assets equal to a certain percentage of the contract amount. This amount is known as the “initial margin.” Subsequent payments, known as “variation margin,” are made or received by the Portfolio each day, depending on the daily fluctuations in the value of the underlying security. Such variation margin is recorded for financial statement purposes on a daily basis as unrealized gain or loss. When the contract expires or is closed, the gain or loss is realized and is presented in the Statement of Operations as net realized gain or loss on financial futures contracts.
Certain Portfolios invested in financial futures contracts in order to hedge their existing portfolio securities, or securities the Portfolio intends to purchase, against fluctuations in value caused by changes in prevailing interest rates, the value of equities or foreign currency exchange rates. The Portfolio may also use futures to gain additional market exposure. The Portfolio may not achieve the anticipated benefits of the financial futures contracts and may realize a loss. The use of futures transactions involves the risk of imperfect correlation in movements in the price of futures contracts, interest rates and the underlying hedged assets. With exchange-traded futures contracts, there is minimal counterparty credit risk to the Portfolio since the exchanges’ clearinghouse acts as counterparty to all exchange-traded futures and guarantees the futures contracts against default.
Options: Certain Portfolios purchased and wrote options in order to hedge against adverse market movements or fluctuations in value caused by changes in prevailing interest rates and foreign currency exchange rates, with respect to securities which the Portfolio currently owns or intends to purchase. The Portfolios’ principal reason for writing options is to realize, through receipt of premiums, a greater current return than would be realized on the underlying security alone. When the Portfolio purchases an option, it pays a premium and an amount equal to that premium is recorded as an asset. When the Portfolio writes an option, it receives a premium and an amount equal to that premium is recorded as a liability. The asset or liability is adjusted daily to reflect the current market value of the option. If an option expires unexercised, the Portfolio realizes a gain or loss to the extent of the premium received or paid. If an option is exercised, the premium received or paid is recorded as an adjustment to the proceeds from the sale or the cost of the purchase in determining whether the Portfolio has realized a gain or loss. The difference between the premium and the amount received or paid at the closing of a purchase or sale transaction is also treated as a realized gain or loss. Gain or loss on purchased options is included in net realized gain or loss on investment transactions. Gain or loss on written options is presented separately as net realized gain or loss on options written. The Portfolio, as writer of an option, may have no control over whether the underlying securities may
B4
be sold (called) or purchased (put). As a result, the Portfolio bears the market risk of an unfavorable change in the price of the security underlying the written option. The Portfolio, as a purchaser of an over-the-counter option, bears the risk of the potential inability of the counterparties to meet the terms of their contracts. With exchange-traded options contracts, there is minimal counterparty credit risk to the Portfolio since the exchanges’ clearinghouse acts as counterparty to all exchange-traded options, and guarantees the options contracts against default.
Swap Agreements: Certain Portfolios entered into credit default, interest rate, total return and other forms of swap agreements. A swap agreement is an agreement to exchange the return generated by one instrument for the return generated by another instrument. Swap agreements are negotiated in the over-the-counter market and may be executed either directly with a counterparty (“OTC-traded”) or through a central clearing facility, such as a registered commodities exchange (“Exchange-traded”). Swap agreements are valued daily at current market value and any change in value is included in the net unrealized appreciation or depreciation on investments. Exchange-traded swaps pay or receive an amount, known as “variation margin”, based on daily changes in the valuation of the swap contract. Payments received or paid by the Portfolio are recorded as realized gains or losses upon termination or maturity of the swap. Risk of loss may exceed amounts recognized on the Statements of Assets and Liabilities. Swap agreements outstanding at period end, if any, are listed on the Schedule of Investments.
Interest Rate Swaps: Interest rate swaps represent agreements between counterparties to exchange cash flows based on the difference between two interest rates, applied to a notional principal amount for a specified period. Certain Portfolios used interest rate swaps to either maintain their ability to generate steady cash flow by receiving a stream of fixed rate payments or to increase exposure to prevailing market rates by receiving floating rate payments using interest rate swap contracts. Certain Portfolios are subject to interest rate risk exposure in the normal course of pursuing their investment objectives. A Portfolio’s maximum risk of loss from counterparty credit risk is the discounted net value of the cash flows to be received from the counterparty over the contract’s remaining life.
Credit Default Swaps: Credit default swaps (“CDS”) involve one party (the protection buyer) making a stream of payments to another party (the protection seller) in exchange for the right to receive a specified payment in the event of a default or as a result of a default (collectively a “credit event”) for the referenced entity (typically corporate issues or sovereign issues of an emerging country) on its obligation; or in the event of a write-down, principal shortfall, interest shortfall or default of all or part of the referenced entities comprising a credit index.
Certain Portfolios are subject to credit risk in the normal course of pursuing their investment objectives. Certain Portfolios may enter into credit default swaps to provide a measure of protection against defaults or to take an active long or short position with respect to the likelihood of a particular issuer’s default or the reference entity’s credit soundness. CDS contracts generally trade based on a spread which represents the cost a protection buyer has to pay the protection seller. The protection buyer is said to be short the credit as the value of the contract rises the more the credit deteriorates. The value of the CDS contract increases for the protection buyer if the spread increases. A Portfolios’ maximum risk of loss from counterparty credit risk for purchased credit default swaps is the inability of the counterparty to honor the contract up to the notional value due to a credit event.
As a seller of protection on credit default swap agreements, the Portfolio generally receives an agreed upon payment from the buyer of protection throughout the term of the swap, provided no credit event occurs. As the seller, the Portfolio effectively increases its investment risk because, in addition to its total net assets, the Portfolio may be subject to investment exposure on the notional amount of the swap.
The maximum amount of the payment that a Portfolio as a seller of protection could be required to make under a credit default swap agreement would be equal to the notional amount of the underlying security or index contract as a result of a credit event. These potential amounts will be partially offset by any recovery values of the respective referenced obligations, or net amounts received from the settlement of buy protection credit default swap agreements which the Portfolio entered into for the same referenced entity or index. As a buyer of protection, the Portfolio generally receives an amount up to the notional value of the swap if a credit event occurs.
Implied credit spreads, represented in absolute terms, utilized in determining the market value of credit default swap agreements on corporate or sovereign issues of an emerging country as of period end are disclosed in the footnotes to the Schedule of Investments, if applicable. These spreads serve as indicators of the current
B5
status of the payment/performance risk and represent the likelihood of default risk for the credit derivative. The implied credit spread of a particular referenced entity reflects the cost of buying/selling protection and may include upfront payments required to enter into the agreement. For credit default swap agreements on asset-backed securities and credit indices, the quoted market prices and resulting values serve as indicators of the current status of the payment/performance risk. Wider credit spreads and increased market value in absolute terms, when compared to the notional amount of the swap, represent a deterioration of the referenced entity’s credit soundness and a greater likelihood of risk of default or other credit event occurring as defined under the terms of the agreement.
Currency Swaps: Certain Portfolios entered into currency swap agreements primarily to gain yield exposure on foreign bonds. Currency swap agreements involve two parties exchanging two different currencies with an agreement to reverse the exchange at a later date at specified exchange rates.
Master Netting Arrangements: Certain Portfolios are subject to various Master Agreements, or netting arrangements, with select counterparties. These are arrangements which a sub-adviser may have negotiated and entered into on behalf of the Portfolio. For multi-sleeve Portfolios, different sub-advisors who manage their respective sleeve, may enter into such agreements with the same counterparty and are disclosed separately for each sleeve when presenting information about offsetting and related netting arrangements for OTC derivatives under the FASB Accounting Standards Update (“ASU”) 2013-01 disclosure. A master netting arrangement between the Portfolio and the counterparty permits the Portfolio to offset amounts payable by the Portfolio to the same counterparty against amounts to be received; and by the receipt of collateral from the counterparty by the Portfolio to cover the Portfolio’s exposure to the counterparty. However, there is no assurance that such mitigating factors are easily enforceable. The right to set-off exists when all the conditions are met such that each of the parties owes the other determinable amounts, the reporting party has the right to set-off the amount owed with the amount owed by the other party, the reporting party intends to set-off and the right of set-off is enforceable by law. During the reporting period, there were no instances where the right of set-off existed and management has not elected to offset.
Certain Portfolios are parties to ISDA (International Swaps and Derivatives Association, Inc.) Master Agreements with certain counterparties that govern over-the-counter derivative and foreign exchange contracts entered into from time to time. The Master Agreements may contain provisions regarding, among other things, the parties’ general obligations, representations, agreements, collateral requirements, events of default and early termination. With respect to certain counterparties, in accordance with the terms of the Master Agreements, collateral posted to the Portfolio is held in a segregated account by the Portfolio’s custodian, and with respect to those amounts which can be sold or re-pledged, are presented in the Schedule of Investments. Collateral pledged by the Portfolio is segregated by the Portfolio’s custodian and identified in the Schedule of Investments. Collateral can be in the form of cash or debt securities issued by the U.S. Government or related agencies or other securities as agreed to by the Portfolio and the applicable counterparty. Collateral requirements are determined based on the Portfolio’s net position with each counterparty. Termination events applicable to the Portfolio may occur upon a decline in the Portfolio’s net assets below a specified threshold over a certain period of time. Termination events applicable to counterparties may occur upon a decline in the counterparty’s long-term and short-term credit ratings below a specified level. In each case, upon occurrence, the other party may elect to terminate early and cause settlement of all derivative and foreign exchange contracts outstanding, including the payment of any losses and costs resulting from such early termination, as reasonably determined by the terminating party. Any decision by one or more of the Portfolio’s counterparties to elect early termination could impact the Portfolio’s future derivative activity.
In addition to each instrument’s primary underlying risk exposure (e.g. interest rate, credit, equity or foreign exchange, etc.), swap agreements involve, to varying degrees, elements of credit, market and documentation risk. Such risks involve the possibility that no liquid market for these agreements will exist, the counterparty to the agreement may default on its obligation to perform or disagree on the contractual terms of the agreement, and changes in net interest rates will be unfavorable. In connection with these agreements, securities in the portfolio may be identified or received as collateral from the counterparty in accordance with the terms of the respective swap agreements to provide or receive assets of value and to serve as recourse in the event of default or bankruptcy/insolvency of either party. Such over-the-counter derivative agreements include conditions which, when materialized, give the counterparty the right to cause an early termination of the transactions under those agreements. Any election by the counterparty for early termination of the contract(s) may impact the amounts reported on financial statements.
B6
As of December 31, 2014, none of the Portfolios have met conditions under such agreements which give the counterparty the right to call for an early termination.
Forward currency contracts, written options, short sales, swaps and financial futures contracts involve elements of both market and credit risk in excess of the amounts reflected on the Statement of Assets and Liabilities. Such risks may be mitigated by engaging in master netting arrangements.
Warrants and Rights: Certain Portfolios hold warrants and rights acquired either through a direct purchase, included as part of a private placement, or pursuant to corporate actions. Warrants and rights entitle the holder to buy a proportionate amount of common stock, or such other security that the issuer may specify, at a specific price and time through the expiration dates. Such warrants and rights are held as long positions by the Portfolio until exercised, sold or expired. Warrants and rights are valued at fair value in accordance with the Board approved fair valuation procedures.
Securities Lending: Each Portfolio may lend its portfolio securities to banks and broker-dealers. The loans are secured by collateral at least equal to the market value of the securities loaned. Collateral pledged by each borrower is invested in a highly liquid short-term money market and is marked to market daily, based on the previous day’s market value, such that the value of the collateral exceeds the value of the loaned securities. Loans are subject to termination at the option of the borrower or the Portfolio. Upon termination of the loan, the borrower will return to the Portfolio securities identical to the loaned securities. Should the borrower of the securities fail financially, the Portfolio has the right to repurchase the securities in the open market using the collateral. The Portfolio recognizes income, net of any rebate and securities lending agent fees, for lending its securities, and any interest on the investment of cash received as collateral. The Portfolio also continues to receive interest and dividends or amounts equivalent thereto, on the securities loaned and recognizes any unrealized gain or loss in the market price of the securities loaned that may occur during the term of the loan.
Dollar Rolls: Certain Portfolios enter into mortgage dollar rolls in which the Portfolio sells mortgage securities for delivery in the current month, realizing a gain (loss), and simultaneously contracts to repurchase somewhat similar (same type, coupon and maturity) securities on a specified future date. During the roll period, the Portfolio forgoes principal and interest paid on the securities. The Portfolio is compensated by the interest earned on the cash proceeds of the initial sale and by the lower repurchase price at the future date. The difference between the sales proceeds and the lower repurchase price is recorded as a realized gain. The Portfolio maintains a segregated account, the dollar value of which is at least equal to its obligations, with respect to dollar rolls.
When-Issued/Delayed Delivery Securities: Securities purchased or sold on a when-issued or delayed delivery basis may be settled a month or more after trade date; interest income is not accrued until settlement date. At the time a Portfolio enters into such transactions, it instructs the custodian to segregate assets with a current value at least equal to the amount of its when-issued or delayed-delivery purchase commitments.
Securities Transactions and Net Investment Income: Securities transactions are recorded on the trade date. Realized gains or losses from investment and currency transactions are calculated on the identified cost basis. Dividend income is recorded on the ex-dividend date. Interest income, including amortization of premium and accretion of discount on debt securities, as required, is recorded on the accrual basis. Expenses are recorded on the accrual basis, which may require the use of certain estimates by management that may differ from actual.
For Portfolios with multiple classes of shares, net investment income or loss (other than administration and distribution fees, which are charged to the respective class) and unrealized and realized gains or losses are allocated daily to each class of shares based upon the relative proportion of adjusted net assets of each class at the beginning of the day.
Taxes: For federal income tax purposes, each Portfolio is treated as a separate taxpaying entity. The Portfolios are treated as partnerships for tax purposes. No provision has been made in the financial statements for U.S. federal, state, or local taxes, as any tax liability arising from operations of the Portfolios is the responsibility of the Portfolios’ shareholders (Participating Insurance Companies). The Portfolios are not generally subject to entity-level taxation. Shareholders of each Portfolio are subject to taxes on their distributive share of partnership items.
Withholding taxes on foreign dividends, interest and capital gains have been provided for in accordance with the Portfolio’s understanding of the applicable country’s tax rules and regulations.
B7
Distributions: Distributions from each Portfolio are made in cash and automatically reinvested in additional shares of the same Portfolio. The Money Market Portfolio declares and reinvests distributions, if any, daily. Distributions are recorded on the ex-date.
Estimates: The preparation of financial statements requires management to make estimates and assumptions that affect the reported amounts and disclosures in the financial statements. Actual results could differ from these estimates.
The Series Fund has a management agreement with PI. Pursuant to this agreement PI has responsibility for all investment advisory services and supervises the subadvisors’ performance of such services. PI has entered into subadvisory agreements with Prudential Investment Management, Inc. (“PIM”), Jennison Associates LLC (“Jennison”), Brown Advisory, LLC (“Brown”), LSV Asset Management (“LSV”), Quantitative Management Associates LLC (“QMA”), T. Rowe Price Associates, Inc. (“T. Rowe”) and William Blair & Co. LLC (“William Blair”) (collectively, the “Subadvisors”), under which each provides investment advisory services for certain Portfolios of the Series Fund. PI pays for the services of the Subadvisors, cost of compensation of officers of the Series Fund, occupancy and certain clerical and administrative expenses of the Series Fund. The Portfolios bear all other costs and expenses.
The management fee paid to PI is accrued daily and payable monthly, using the value of each of the Portfolio’s average daily net assets, at the respective annual rates specified below.
| | | | | | |
Portfolio
| | Management Fee
| | Effective
Management Fee
| |
Conservative Balanced Portfolio | | 0.55% | | | 0.55 | % |
Diversified Bond Portfolio | | 0.40 | | | 0.40 | |
Equity Portfolio | | 0.45 | | | 0.45 | |
Flexible Managed Portfolio | | 0.60 | | | 0.60 | |
Global Portfolio | | 0.75 | | | 0.74 | *** |
Government Income Portfolio | | 0.40 | | | 0.40 | |
High Yield Bond Portfolio | | 0.55 | | | 0.55 | |
Jennison Portfolio | | 0.60 | | | 0.60 | |
Money Market Portfolio | | 0.40 | | | 0.12 | * |
Natural Resources Portfolio | | 0.45 | | | 0.40 | ***** |
Small Capitalization Stock Portfolio | | 0.40 | | | 0.35 | ***** |
Stock Index Portfolio | | 0.35% up to $4 billion
0.30% over $4 billion | | | 0.30 | ** |
Value Portfolio | | 0.40 | | | 0.38 | **** |
| | * | In order to support the income yield, PI has voluntarily agreed to limit the management fees of the Money Market Portfolio such that the 1-day annualized yield of the Portfolio (excluding capital gain or loss) does not fall below 0.00%. Prior to July 1, 2012, PI had voluntarily agreed to limit the management fees of the Money Market Portfolio such that the 1-day annualized yield of the Portfolio (excluding capital gain or loss) did not fall below 0.02%. The waiver is voluntary and may be modified or terminated by PI at any time without notice. During the year ended December 31, 2014, the total waiver as a result of this voluntary agreement was $2,364,760 or an annualized 0.28% of the Money Market Portfolio’s average daily net assets. |
| | ** | PI had voluntarily agreed, through June 30, 2014, to waive a portion of its management fee equal to an annual rate of 0.05% of the average daily net assets of the Portfolio. Effective July 1, 2014, PI has contractually agreed, through June 30, 2015, to waive a portion of its management fee equal to an annual rate of 0.05% of the average daily net assets of the Portfolio. |
| | *** | PI has contractually agreed, through June 30, 2015, to waive a portion of its management fee equal to an annual rate of 0.01% of the average daily net assets of the Portfolio. |
| | **** | PI had contractually agreed, through June 30, 2014, to waive a portion of its management fee equal to an annual rate of 0.05% of the average daily net assets of the Portfolio. |
| | ***** | PI has contractually agreed, through June 30, 2015, to waive a portion of its management fee equal to an annual rate of 0.05% of the average daily net assets of the Portfolio. |
B8
At December 31, 2014, the Subadvisors that provide investment advisory services to the Portfolios are listed directly below. Where more than one Subadvisor is listed, each Subadvisor provides services to a segment of the Portfolio:
| | |
Portfolio
| | Subadvisor(s)
|
Conservative Balanced Portfolio | | PIM, QMA |
Diversified Bond Portfolio | | PIM |
Equity Portfolio | | Jennison |
Flexible Managed Portfolio | | PIM, QMA |
Global Portfolio | | Brown, LSV, QMA, T. Rowe & William Blair |
Government Income Portfolio | | PIM |
High Yield Bond Portfolio | | PIM |
Jennison Portfolio | | Jennison |
Money Market Portfolio | | PIM |
Natural Resources Portfolio | | Jennison |
Small Capitalization Stock Portfolio | | QMA |
Stock Index Portfolio | | QMA |
Value Portfolio | | Jennison |
The Series Fund has a distribution agreement, pursuant to Rule 12b-1 under the 1940 Act, with Prudential Investment Management Services LLC (“PIMS”), which acts as the distributor of the Class I and Class II shares of the Series Fund. The Series Fund compensates PIMS for distributing and servicing the Series Fund’s Class II shares pursuant to a plan of distribution (the “Class II Plan”), regardless of expenses actually incurred by PIMS. The distribution fees are accrued daily and payable monthly. No distribution or service fees are paid to PIMS as distributor of the Class I shares of the Series Fund. Pursuant to the Class II Plan, the Class II shares of each Portfolio compensate PIMS for distribution-related activities at an annual rate of 0.25% of the average daily net assets of the Class II shares.
The Series Fund has an administration agreement with PI, which acts as the administrator of the Class II shares of the Series Fund. The administration fee paid to PI is accrued daily and payable monthly, at the annual rate of 0.15% of the average daily net assets of the Class II shares.
PIMS, PI, PIM, QMA and Jennison are indirect, wholly-owned subsidiaries of Prudential Financial, Inc. (“Prudential”).
Certain Portfolios have entered into a brokerage commission recapture agreement with certain registered broker-dealers. Under the brokerage commission recapture program, a portion of the commission is returned to the Portfolio on whose behalf the trades were made. Commission recapture is paid solely to those Portfolios generating the applicable trades. Such amounts are included with realized gain or loss on investment transactions presented in the Statement of Operations. For the year ended December 31, 2014, brokerage commission recaptured under these agreements was as follows:
| | | | |
Portfolio
| | Amount
| |
Equity Portfolio | | | $437,725 | |
Global Portfolio | | | 20,640 | |
Jennison Portfolio | | | 88,171 | |
Natural Resources Portfolio | | | 46,261 | |
Value Portfolio | | | 159,764 | |
| Note 4: | | Other Transactions with Affiliates |
Prudential Mutual Fund Services LLC (“PMFS”), an affiliate of PI and an indirect, wholly-owned subsidiary of Prudential, serves as the Series Fund’s transfer agent. Transfer agent’s fees and expenses in the Statement of Operations include certain out-of-pocket expenses paid to non-affiliates, where applicable.
B9
PIM also serves as the Series Fund’s security lending agent. For the year ended December 31, 2014, PIM was compensated for these services as follows:
| | | | |
Portfolio
| | Amount
| |
Conservative Balanced Portfolio | | $ | 54,146 | |
Diversified Bond Portfolio | | | 26,226 | |
Equity Portfolio | | | 175,533 | |
Flexible Managed Portfolio | | | 59,587 | |
Global Portfolio | | | 6,447 | |
Government Income Portfolio | | | 10,484 | |
High Yield Bond Portfolio | | | 407,802 | |
Jennison Portfolio | | | 101,914 | |
Natural Resources Portfolio | | | 49,144 | |
Small Capitalization Stock Portfolio | | | 174,582 | |
Stock Index Portfolio | | | 65,071 | |
Value Portfolio | | | 24,872 | |
Certain Portfolios invest in the Prudential Core Short-Term Bond Fund, pursuant to an exemptive order received from the Securities and Exchange Commission, and in the Prudential Core Taxable Money Market Fund (the “Core Funds”), each a portfolio of the Prudential Investment Portfolios 2, registered under the 1940 Act, and managed by PI. Earnings from the Core Funds are disclosed on the Statement of Operations as affiliated dividend income.
| Note 5: | | Portfolio Securities |
The aggregate cost of purchases and the proceeds from the sales of securities (excluding government securities and short-term issues) for the year ended December 31, 2014 were as follows:
| | | | | | | | |
Portfolio
| | Cost of Purchases
| | | Proceeds from Sales
| |
Conservative Balanced Portfolio | | $ | 2,472,277,634 | | | $ | 2,516,413,550 | |
Diversified Bond Portfolio | | | 215,829,643 | | | | 441,314,280 | |
Equity Portfolio | | | 1,985,014,118 | | | | 2,192,706,456 | |
Flexible Managed Portfolio | | | 5,285,342,776 | | | | 5,406,609,988 | |
Global Portfolio | | | 268,094,938 | | | | 304,352,638 | |
Government Income Portfolio | | | 2,582,450,103 | | | | 2,584,443,780 | |
High Yield Bond Portfolio | | | 1,710,965,528 | | | | 1,465,228,676 | |
Jennison Portfolio | | | 547,869,040 | | | | 661,002,438 | |
Natural Resources Portfolio | | | 195,673,027 | | | | 246,889,683 | |
Small Capitalization Stock Portfolio | | | 106,802,321 | | | | 154,651,344 | |
Stock Index Portfolio | | | 200,276,711 | | | | 135,614,691 | |
Value Portfolio | | | 578,169,151 | | | | 738,922,867 | |
Options written transactions, during the year ended December 31, 2014, were as follows:
| | | | | | | | |
Conservative Balanced Portfolio
| | Notional
Amount
(000)
| | | Premiums
| |
Balance as of December 31, 2013 | | | — | | | $ | — | |
Options written | | | 389,400 | | | | 608,279 | |
Options terminated in closing purchase transactions | | | (203,100 | ) | | | (371,827 | ) |
Options expired | | | (102,300 | ) | | | (197,820 | ) |
| | |
|
|
| |
|
|
|
Balance as of December 31, 2014 | | | 84,000 | | | $ | 38,632 | |
| | |
|
|
| |
|
|
|
| | |
Diversified Bond Portfolio
| | Notional
Amount
(000)
| | | Premiums
| |
Balance as of December 31, 2013 | | | — | | | $ | — | |
Options written | | | 1,653,280 | | | | 2,431,026 | |
Options terminated in closing purchase transactions | | | (266,980 | ) | | | (345,091 | ) |
Options expired | | | (737,300 | ) | | | (1,630,317 | ) |
| | |
|
|
| |
|
|
|
Balance as of December 31, 2014 | | | 649,000 | | | $ | 455,618 | |
| | |
|
|
| |
|
|
|
B10
| | | | | | | | |
Flexible Managed Portfolio
| | Notional
Amount
(000)
| | | Premiums
| |
Balance as of December 31, 2013 | | | — | | | $ | — | |
Options written | | | 507,440 | | | | 791,646 | |
Options terminated in closing purchase transactions | | | (265,640 | ) | | | (484,762 | ) |
Options expired | | | (133,000 | ) | | | (256,847 | ) |
| | |
|
|
| |
|
|
|
Balance as of December 31, 2014 | | | 108,800 | | | $ | 50,037 | |
| | |
|
|
| |
|
|
|
| | |
Government Income Portfolio
| | Notional
Amount
(000)
| | | Premiums
| |
Balance as of December 31, 2013 | | | — | | | $ | — | |
Options written | | | 364,080 | | | | 567,303 | |
Options terminated in closing purchase transactions | | | (192,380 | ) | | | (348,297 | ) |
Options expired | | | (95,300 | ) | | | (183,870 | ) |
| | |
|
|
| |
|
|
|
Balance as of December 31, 2014 | | | 76,400 | | | $ | 35,136 | |
| | |
|
|
| |
|
|
|
All Portfolios are treated as partnerships for tax purposes. The character of the cash distributions made by the partnerships is generally classified as return of capital nontaxable distributions. After each fiscal year each partner will receive information regarding their distributive allocable share of the partnership’s income, gains, losses and deductions.
With respect to the Portfolios, book cost of assets differs from tax cost of assets as a result of each Portfolio’s adoption of a mark to market method of accounting for tax purposes. Under this method, tax cost of assets will approximate its fair market value. The Portfolios generally attempt to manage their diversification in a manner that supports the diversification requirements of the underlying separate accounts.
Management has analyzed the Portfolios’ tax positions taken on federal, state and local income tax returns for all open tax years and has concluded that no provision for income tax is required in the Portfolios’ financial statements for the current period. The Portfolios’ federal, state and local income tax returns for tax years for which the applicable statutes of limitations have not expired are subject to examination by the Internal Revenue Service and state departments of revenue.
The Series Fund offers Class I and Class II shares. Neither Class I nor Class II shares of a Portfolio are subject to any sales charge or redemption charge and are sold at the net asset value of the Portfolio. Class I shares are sold only to certain separate accounts of Prudential to fund benefits under certain variable life insurance and variable annuity contracts (“contracts”). Class II shares are sold only to separate accounts of non-Prudential insurance companies as investment options under certain contracts. The separate accounts invest in shares of the Series Fund through subaccounts that correspond to the Portfolios. The separate accounts will redeem shares of the Series Fund to the extent necessary to provide benefits under the contracts or for such other purposes as may be consistent with the contracts. As of December 31, 2014, the Equity, Jennison, Natural Resources and Value Portfolios have Class II shares outstanding.
B11
Transactions in shares of beneficial interest of the Equity, Jennison, Natural Resources and Value Portfolios were as follows:
Equity Portfolio:
| | | | | | | | |
Class I
| | Shares
| | | Amount
| |
Year ended December 31, 2014: | | | | | | | | |
Series shares sold | | | 334,797 | | | $ | 12,282,548 | |
Series shares repurchased | | | (7,032,156 | ) | | | (259,927,615 | ) |
| | |
|
|
| |
|
|
|
Net increase (decrease) in shares outstanding | | | (6,697,359 | ) | | $ | (247,645,067 | ) |
| | |
|
|
| |
|
|
|
Year ended December 31, 2013: | | | | | | | | |
Series shares sold | | | 497,608 | | | $ | 15,342,872 | |
Series shares repurchased | | | (7,725,116 | ) | | | (238,388,587 | ) |
| | |
|
|
| |
|
|
|
Net increase (decrease) in shares outstanding | | | (7,227,508 | ) | | $ | (223,045,715 | ) |
| | |
|
|
| |
|
|
|
| | |
Class II
| | | | | | |
Year ended December 31, 2014: | | | | | | | | |
Series shares sold | | | 14,613 | | | $ | 533,921 | |
Series shares repurchased | | | (21,926 | ) | | | (816,476 | ) |
| | |
|
|
| |
|
|
|
Net increase (decrease) in shares outstanding | | | (7,313 | ) | | $ | (282,555 | ) |
| | |
|
|
| |
|
|
|
Year ended December 31, 2013: | | | | | | | | |
Series shares sold | | | 14,609 | | | $ | 480,313 | |
Series shares repurchased | | | (17,287 | ) | | | (551,629 | ) |
| | |
|
|
| |
|
|
|
Net increase (decrease) in shares outstanding | | | (2,678 | ) | | $ | (71,316 | ) |
| | |
|
|
| |
|
|
|
Jennison Portfolio:
| | | | | | | | |
Class I
| | Shares
| | | Amount
| |
Year ended December 31, 2014: | | | | | | | | |
Shares sold | | | 437,648 | | | $ | 16,981,425 | |
Shares repurchased | | | (3,542,532 | ) | | | (136,572,954 | ) |
| | |
|
|
| |
|
|
|
Net increase (decrease) in shares outstanding | | | (3,104,884 | ) | | $ | (119,591,529 | ) |
| | |
|
|
| |
|
|
|
Year ended December 31, 2013: | | | | | | | | |
Series shares sold | | | 600,416 | | | $ | 18,575,262 | |
Series shares repurchased | | | (3,796,246 | ) | | | (117,710,464 | ) |
| | |
|
|
| |
|
|
|
Net increase (decrease) in shares outstanding | | | (3,195,830 | ) | | $ | (99,135,202 | ) |
| | |
|
|
| |
|
|
|
| | |
Class II
| | | | | | |
Year ended December 31, 2014: | | | | | | | | |
Shares sold | | | 251,796 | | | $ | 9,480,751 | |
Shares repurchased | | | (262,299 | ) | | | (9,828,686 | ) |
| | |
|
|
| |
|
|
|
Net increase (decrease) in shares outstanding | | | (10,503 | ) | | $ | (347,935 | ) |
| | |
|
|
| |
|
|
|
Year ended December 31, 2013: | | | | | | | | |
Series shares sold | | | 178,735 | | | $ | 5,502,476 | |
Series shares repurchased | | | (337,133 | ) | | | (10,158,265 | ) |
| | |
|
|
| |
|
|
|
Net increase (decrease) in shares outstanding | | | (158,398 | ) | | $ | (4,655,789 | ) |
| | |
|
|
| |
|
|
|
B12
Natural Resources Portfolio:
| | | | | | | | |
Class I
| | Shares
| | | Amount
| |
Year ended December 31, 2014: | | | | | | | | |
Shares sold | | | 439,890 | | | $ | 17,269,602 | |
Shares repurchased | | | (1,968,633 | ) | | | (74,412,547 | ) |
| | |
|
|
| |
|
|
|
Net increase (decrease) in shares outstanding | | | (1,528,743 | ) | | $ | (57,142,945 | ) |
| | |
|
|
| |
|
|
|
Year ended December 31, 2013: | | | | | | | | |
Series shares sold | | | 352,213 | | | $ | 12,346,615 | |
Series shares repurchased | | | (2,823,203 | ) | | | (99,674,548 | ) |
| | |
|
|
| |
|
|
|
Net increase (decrease) in shares outstanding | | | (2,470,990 | ) | | $ | (87,327,933 | ) |
| | |
|
|
| |
|
|
|
| | |
Class II
| | | | | | |
Year ended December 31, 2014: | | | | | | | | |
Shares sold | | | 534,762 | | | $ | 19,096,047 | |
Shares repurchased | | | (522,704 | ) | | | (19,771,982 | ) |
| | |
|
|
| |
|
|
|
Net increase (decrease) in shares outstanding | | | 12,058 | | | $ | (675,935 | ) |
| | |
|
|
| |
|
|
|
Year ended December 31, 2013: | | | | | | | | |
Series shares sold | | | 287,501 | | | $ | 10,062,470 | |
Series shares repurchased | | | (643,622 | ) | | | (22,702,718 | ) |
| | |
|
|
| |
|
|
|
Net increase (decrease) in shares outstanding | | | (356,121 | ) | | $ | (12,640,248 | ) |
| | |
|
|
| |
|
|
|
Value Portfolio:
| | | | | | | | |
Class I
| | Shares
| | | Amount
| |
Year ended December 31, 2014: | | | | | | | | |
Shares sold | | | 321,290 | | | $ | 8,064,035 | |
Shares repurchased | | | (5,408,640 | ) | | | (136,662,414 | ) |
| | |
|
|
| |
|
|
|
Net increase (decrease) in shares outstanding | | | (5,087,350 | ) | | $ | (128,598,379 | ) |
| | |
|
|
| |
|
|
|
Year ended December 31, 2013: | | | | | | | | |
Series shares sold | | | 1,155,615 | | | $ | 25,006,947 | |
Series shares repurchased | | | (5,836,962 | ) | | | (123,779,113 | ) |
| | |
|
|
| |
|
|
|
Net increase (decrease) in shares outstanding | | | (4,681,347 | ) | | $ | (98,772,166 | ) |
| | |
|
|
| |
|
|
|
| | |
Class II
| | | | | | |
Year ended December 31, 2014: | | | | | | | | |
Shares sold | | | 129,503 | | | $ | 3,342,434 | |
Shares repurchased | | | (35,694 | ) | | | (910,816 | ) |
| | |
|
|
| |
|
|
|
Net increase (decrease) in shares outstanding | | | 93,809 | | | $ | 2,431,618 | |
| | |
|
|
| |
|
|
|
Year ended December 31, 2013: | | | | | | | | |
Series shares sold | | | 32,096 | | | $ | 694,027 | |
Series shares repurchased | | | (67,319 | ) | | | (1,460,768 | ) |
| | |
|
|
| |
|
|
|
Net increase (decrease) in shares outstanding | | | (35,223 | ) | | $ | (766,741 | ) |
| | |
|
|
| |
|
|
|
The Portfolios (excluding the Money Market Portfolio), along with other affiliated registered investment companies (the “Funds”), are a party to a Syndicated Credit Agreement (“SCA”) with a group of banks. The purpose of the SCA is to provide an alternative source of temporary funding for capital share redemptions. The SCA provides for a commitment of $900 million for the period October 9, 2014 through October 8, 2015. The Funds pay an annualized commitment fee of .075% of the unused portion of the SCA. Prior to October 9, 2014, the Funds had another SCA that provided a commitment of $900 million and the Funds paid an
B13
annualized commitment fee of .08% of the unused portion of the SCA. Interest on any borrowings under the SCA is paid at contracted market rates. The commitment fee for the unused amount is accrued daily and paid quarterly.
The following Portfolios utilized the SCA during the year ended December 31, 2014. The average balance outstanding is for the number of days the Portfolios had utilized the credit facility.
| | | | | | | | | | | | | | | | | | | | |
Portfolio
| | Approximate
Average
Balance
Outstanding
| | | Number of
Days
Outstanding
| | | Weighted
Average
Interest
Rates
| | | Maximum
Balance
Outstanding
| | | Amount
Outstanding at
December 31,
2014
| |
Diversified Bond Portfolio | | $ | 12,017,889 | | | | 9 | | | | 1.40 | % | | $ | 20,171,000 | | | $ | — | |
Jennison Portfolio | | | 505,610 | | | | 41 | | | | 1.40 | % | | | 1,841,000 | | | | 1,211,000 | |
Value Portfolio | | | 421,500 | | | | 12 | | | | 1.40 | % | | | 1,258,000 | | | | — | |
| Note 9: | | Ownership and Affiliates |
As of December 31, 2014, all of Class I shares of record of each Portfolio were owned by the Prudential Insurance Company of America (“PICA”), or subsidiaries thereof, on behalf of the owners of the variable insurance products issued by PICA. PICA is an indirect, wholly-owned subsidiary of Prudential.
B14
Financial Highlights
| | | | | | | | | | | | | | | | | | | | |
| | | Conservative Balanced Portfolio
| |
| | | Year Ended December 31,
| |
| | | 2014(a)
| | | 2013(a)
| | | 2012
| | | 2011
| | | 2010
| |
Per Share Operating Performance: | | | | | | | | | | | | | | | | | | | | |
Net Asset Value, beginning of year | | $ | 20.63 | | | $ | 17.77 | | | $ | 16.32 | | | $ | 15.96 | | | $ | 14.65 | |
| | |
|
|
| |
|
|
| |
|
|
| |
|
|
| |
|
|
|
Income (Loss) From Investment Operations: | | | | | | | | | | | | | | | | | | | | |
Net investment income | | | .36 | | | | .35 | | | | .38 | | | | .36 | | | | .37 | |
Net realized and unrealized gain on investments | | | 1.46 | | | | 2.51 | | | | 1.43 | | | | .37 | | | | 1.31 | |
| | |
|
|
| |
|
|
| |
|
|
| |
|
|
| |
|
|
|
Total from investment operations | | | 1.82 | | | | 2.86 | | | | 1.81 | | | | .73 | | | | 1.68 | |
| | |
|
|
| |
|
|
| |
|
|
| |
|
|
| |
|
|
|
Less Distributions | | | — | | | | — | | | | (.36 | ) | | | (.37 | ) | | | (.37 | ) |
| | |
|
|
| |
|
|
| |
|
|
| |
|
|
| |
|
|
|
Net Asset Value, end of year | | $ | 22.45 | | | $ | 20.63 | | | $ | 17.77 | | | $ | 16.32 | | | $ | 15.96 | |
| | |
|
|
| |
|
|
| |
|
|
| |
|
|
| |
|
|
|
Total Return(b) | | | 8.82 | % | | | 16.09 | % | | | 11.23 | % | | | 4.60 | % | | | 11.74 | % |
Ratios/Supplemental Data: | | | | | | | | | | | | | | | | | | | | |
Net assets, end of year (in millions) | | $ | 2,574.4 | | | $ | 2,504.4 | | | $ | 2,287.0 | | | $ | 2,191.6 | | | $ | 2,234.7 | |
Ratios to average net assets(c): | | | | | | | | | | | | | | | | | | | | |
Expenses after waivers and/or expense reimbursement | | | .58 | % | | | .58 | % | | | .58 | % | | | .59 | % | | | .59 | % |
Expenses before waivers and/or expense reimbursement | | | .58 | % | | | .58 | % | | | .58 | % | | | .59 | % | | | .59 | % |
Net investment income | | | 1.66 | % | | | 1.84 | % | | | 2.11 | % | | | 2.12 | % | | | 2.32 | % |
Portfolio turnover rate | | | 134 | % | | | 196 | % | | | 188 | % | | | 215 | % | | | 185 | % |
| |
| | | Diversified Bond Portfolio
| |
| | | Year Ended December 31,
| |
| | | 2014(a)
| | | 2013
| | | 2012(a)
| | | 2011
| | | 2010
| |
Per Share Operating Performance: | | | | | | | | | | | | | | | | | | | | |
Net Asset Value, beginning of year | | $ | 11.01 | | | $ | 11.88 | | | $ | 11.74 | | | $ | 11.67 | | | $ | 11.16 | |
| | |
|
|
| |
|
|
| |
|
|
| |
|
|
| |
|
|
|
Income (Loss) From Investment Operations: | | | | | | | | | | | | | | | | | | | | |
Net investment income | | | .43 | | | | .48 | | | | .54 | | | | .56 | | | | .52 | |
Net realized and unrealized gain (loss) on investments | | | .34 | | | | (.56 | ) | | | .66 | | | | .30 | | | | .63 | |
| | |
|
|
| |
|
|
| |
|
|
| |
|
|
| |
|
|
|
Total from investment operations | | | .77 | | | | (.08 | ) | | | 1.20 | | | | .86 | | | | 1.15 | |
| | |
|
|
| |
|
|
| |
|
|
| |
|
|
| |
|
|
|
Less Distributions | | | (.12 | ) | | | (.79 | ) | | | (1.06 | ) | | | (.79 | ) | | | (.64 | ) |
| | |
|
|
| |
|
|
| |
|
|
| |
|
|
| |
|
|
|
Net Asset Value, end of year | | $ | 11.66 | | | $ | 11.01 | | | $ | 11.88 | | | $ | 11.74 | | | $11.67 | | |
| | |
|
|
| |
|
|
| |
|
|
| |
|
|
| |
|
|
|
Total Return(b) | | | 7.09 | % | | | (.71 | )% | | | 10.68 | % | | | 7.51 | % | | | 10.57 | % |
Ratios/Supplemental Data: | | | | | | | | | | | | | | | | | | | | |
Net assets, end of year (in millions) | | $ | 1,067.9 | | | $ | 1,197.5 | | | $ | 1,305.9 | | | $ | 1,556.9 | | | $ | 1,522.9 | |
Ratios to average net assets(c): | | | | | | | | | | | | | | | | | | | | |
Expenses after waivers and/or expense reimbursement | | | .44 | % | | | .44 | % | | | .44 | % | | | .42 | % | | | .46 | % |
Expenses before waivers and/or expense reimbursement | | | .44 | % | | | .44 | % | | | .44 | % | | | .42 | % | | | .46 | % |
Net investment income | | | 3.73 | % | | | 4.10 | % | | | 4.57 | % | | | 4.76 | % | | | 4.46 | % |
Portfolio turnover rate | | | 50 | % | | | 111 | % | | | 144 | % | | | 167 | % | | | 191 | % |
| (a) | Calculated based on average shares outstanding during the year. |
| (b) | Total return is calculated assuming a purchase of a share on the first day and a sale on the last day of each year reported and includes reinvestment of distributions and does not reflect the effect of insurance contract charges. Total return does not reflect expenses associated with the separate account such as administrative fees, account charges and surrender charges which, if reflected, would reduce the total returns for all years shown. Performance figures may reflect fee waivers and/or expense reimbursements. In the absence of fee waivers and/or expense reimbursements, the total return would be lower. Past performance is no guarantee of future results. Total returns may reflect adjustments to conform to generally accepted accounting principles. |
| (c) | Does not include expenses of the underlying portfolios in which the Portfolio invests. |
SEE NOTES TO FINANCIAL STATEMENTS.
C1
Financial Highlights
| | | | | | | | | | | | | | | | | | | | |
| | | Equity Portfolio
| |
| | | Class I
| |
| | | Year Ended December 31,
| |
| | | 2014(c)
| | | 2013
| | | 2012(c)
| | | 2011
| | | 2010
| |
Per Share Operating Performance: | | | | | | | | | | | | | | | | | | | | |
Net Asset Value, beginning of year | | $ | 35.81 | | | $ | 26.81 | | | $ | 23.73 | | | $ | 24.75 | | | $ | 22.30 | |
| | |
|
|
| |
|
|
| |
|
|
| |
|
|
| |
|
|
|
Income (Loss) From Investment Operations: | | | | | | | | | | | | | | | | | | | | |
Net investment income | | | .19 | | | | .27 | | | | .27 | | | | .13 | | | | .15 | |
Net realized and unrealized gain (loss) on investments | | | 2.56 | | | | 8.73 | | | | 2.96 | | | | (.98 | ) | | | 2.48 | |
| | |
|
|
| |
|
|
| |
|
|
| |
|
|
| |
|
|
|
Total from investment operations | | | 2.75 | | | | 9.00 | | | | 3.23 | | | | (.85 | ) | | | 2.63 | |
| | |
|
|
| |
|
|
| |
|
|
| |
|
|
| |
|
|
|
Less Distributions: | | | — | | | | — | | | | (.15 | ) | | | (.17 | ) | | | (.18 | ) |
| | |
|
|
| |
|
|
| |
|
|
| |
|
|
| |
|
|
|
Net Asset Value, end of year | | $ | 38.56 | | | $ | 35.81 | | | $ | 26.81 | | | $ | 23.73 | | | $ | 24.75 | |
| | |
|
|
| |
|
|
| |
|
|
| |
|
|
| |
|
|
|
Total Return(a) | | | 7.68 | % | | | 33.57 | % | | | 13.69 | % | | | (3.47 | )% | | | 11.90 | % |
Ratios/Supplemental Data: | | | | | | | | | | | | | | | | | | | | |
Net assets, end of year (in millions) | | $ | 4,017.6 | | | $ | 3,970.9 | | | $ | 3,167.0 | | | $ | 2,997.5 | | | $ | 3,324.3 | |
Ratios to average net assets(b): | | | | | | | | | | | | | | | | | | | | |
Expenses after waivers and/or expense reimbursements | | | .47 | % | | | .47 | % | | | .47 | % | | | .48 | % | | | .48 | % |
Expenses before waivers and/or expense reimbursements | | | .47 | % | | | .47 | % | | | .47 | % | | | .48 | % | | | .48 | % |
Net investment income | | | .52 | % | | | .86 | % | | | 1.04 | % | | | .58 | % | | | .71 | % |
Portfolio turnover rate | | | 51 | % | | | 45 | % | | | 48 | % | | | 49 | % | | | 68 | % |
| |
| | | Equity Portfolio
| |
| | | Class II
| |
| | | Year Ended December 31,
| |
| | | 2014(c)
| | | 2013
| | | 2012(c)
| | | 2011
| | | 2010
| |
Per Share Operating Performance: | | | | | | | | | | | | | | | | | | | | |
Net Asset Value, beginning of year | | $ | 36.05 | | | $ | 27.10 | | | $ | 23.99 | | | $ | 25.00 | | | $ | 22.46 | |
| | |
|
|
| |
|
|
| |
|
|
| |
|
|
| |
|
|
|
Income (Loss) From Investment Operations: | | | | | | | | | | | | | | | | | | | | |
Net investment income | | | .04 | | | | .13 | | | | .17 | | | | .06 | | | | .04 | |
Net realized and unrealized gain (loss) on investments | | | 2.57 | | | | 8.82 | | | | 3.00 | | | | (1.03 | ) | | | 2.54 | |
| | |
|
|
| |
|
|
| |
|
|
| |
|
|
| |
|
|
|
Total from investment operations | | | 2.61 | | | | 8.95 | | | | 3.17 | | | | (.97 | ) | | | 2.58 | |
| | |
|
|
| |
|
|
| |
|
|
| |
|
|
| |
|
|
|
Less Distributions: | | | — | | | | — | | | | (.06 | ) | | | (.04 | ) | | | (.04 | ) |
| | |
|
|
| |
|
|
| |
|
|
| |
|
|
| |
|
|
|
Net Asset Value, end of year | | $ | 38.66 | | | $ | 36.05 | | | $ | 27.10 | | | $ | 23.99 | | | $ | 25.00 | |
| | |
|
|
| |
|
|
| |
|
|
| |
|
|
| |
|
|
|
Total Return(a) | | | 7.24 | % | | | 33.03 | % | | | 13.23 | % | | | (3.87 | )% | | | 11.50 | % |
Ratios/Supplemental Data: | | | | | | | | | | | | | | | | | | | | |
Net assets, end of year (in millions) | | $ | 2.2 | | | $ | 2.3 | | | $ | 1.8 | | | $ | 2.0 | | | $ | 1.9 | |
Ratios to average net assets(b): | | | | | | | | | | | | | | | | | | | | |
Expenses after waivers and/or expense reimbursements | | | .87 | % | | | .87 | % | | | .87 | % | | | .88 | % | | | .88 | % |
Expenses before waivers and/or expense reimbursements | | | .87 | % | | | .87 | % | | | .87 | % | | | .88 | % | | | .88 | % |
Net investment income | | | .11 | % | | | .47 | % | | | .63 | % | | | .19 | % | | | .34 | % |
Portfolio turnover rate | | | 51 | % | | | 45 | % | | | 48 | % | | | 49 | % | | | 68 | % |
| (a) | Total return is calculated assuming a purchase of a share on the first day and a sale on the last day of each year reported and includes reinvestment of distributions and does not reflect the effect of insurance contract charges. Total return does not reflect expenses associated with the separate account such as administrative fees, account charges and surrender charges which, if reflected, would reduce the total return for all periods shown. Performance figures may reflect fee waivers and/or expense reimbursements. In the absence of fee waivers and/or expense reimbursements, the total return would be lower. Past performance is no guarantee of future results. Total returns may reflect adjustments to conform to generally accepted accounting principles. |
| (b) | Does not include expenses of the underlying portfolio in which the Portfolio invests. |
| (c) | Calculated based on average shares outstanding during the year. |
SEE NOTES TO FINANCIAL STATEMENTS.
C2
Financial Highlights
| | | | | | | | | | | | | | | | | | | | |
| | | Flexible Managed Portfolio
| |
| | | Year Ended December 31,
| |
| | | 2014(a)
| | | 2013(a)
| | | 2012
| | | 2011
| | | 2010
| |
Per Share Operating Performance: | | | | | | | | | | | | | | | | | | | | |
Net Asset Value, beginning of year | | $ | 21.35 | | | $ | 17.77 | | | $ | 15.99 | | | $ | 15.63 | | | $ | 14.28 | |
| | |
|
|
| |
|
|
| |
|
|
| |
|
|
| |
|
|
|
Income (Loss) From Investment Operations: | | | | | | | | | | | | | | | | | | | | |
Net investment income | | | .37 | | | | .36 | | | | .37 | | | | .33 | | | | .31 | |
Net realized and unrealized gain on investments | | | 1.99 | | | | 3.22 | | | | 1.74 | | | | .34 | | | | 1.37 | |
| | |
|
|
| |
|
|
| |
|
|
| |
|
|
| |
|
|
|
Total from investment operations | | | 2.36 | | | | 3.58 | | | | 2.11 | | | | .67 | | | | 1.68 | |
| | |
|
|
| |
|
|
| |
|
|
| |
|
|
| |
|
|
|
Less Distributions | | | — | | | | — | | | | (.33 | ) | | | (.31 | ) | | | (.33 | ) |
| | |
|
|
| |
|
|
| |
|
|
| |
|
|
| |
|
|
|
Net Asset Value, end of year | | $ | 23.71 | | | $ | 21.35 | | | $ | 17.77 | | | $ | 15.99 | | | $ | 15.63 | |
| | |
|
|
| |
|
|
| |
|
|
| |
|
|
| |
|
|
|
Total Return(b) | | | 11.05 | % | | | 20.15 | % | | | 13.37 | % | | | 4.34 | % | | | 12.03 | % |
Ratios/Supplemental Data: | | | | | | | | | | | | | | | | | | | | |
Net assets, end of year (in millions) | | $ | 3,943.8 | | | $ | 3,730.6 | | | $ | 3,265.8 | | | $ | 3,036.8 | | | $ | 3,077.3 | |
Ratios to average net assets(c): | | | | | | | | | | | | | | | | | | | | |
Expenses after waivers and/or expense reimbursement | | | .63 | % | | | .63 | % | | | .63 | % | | | .63 | % | | | .64 | % |
Expenses before waivers and/or expense reimbursement | | | .63 | % | | | .63 | % | | | .63 | % | | | .63 | % | | | .64 | % |
Net investment income | | | 1.66 | % | | | 1.86 | % | | | 2.05 | % | | | 2.01 | % | | | 2.06 | % |
Portfolio turnover rate(d) | | | 161 | % | | | 210 | % | | | 214 | % | | | 246 | % | | | 205 | % |
| |
| | | Global Portfolio
| |
| | | Year Ended December 31,
| |
| | | 2014(a)
| | | 2013
| | | 2012
| | | 2011
| | | 2010
| |
Per Share Operating Performance: | | | | | | | | | | | | | | | | | | | | |
Net Asset Value, beginning of year | | $ | 24.91 | | | $ | 19.57 | | | $ | 16.94 | | | $ | 18.49 | | | $ | 16.68 | |
| | |
|
|
| |
|
|
| |
|
|
| |
|
|
| |
|
|
|
Income (Loss) From Investment Operations: | | | | | | | | | | | | | | | | | | | | |
Net investment income | | | .37 | | | | .31 | | | | .36 | | | | .29 | | | | .28 | |
Net realized and unrealized gain (loss) on investments | | | .44 | | | | 5.03 | | | | 2.57 | | | | (1.56 | ) | | | 1.79 | |
| | |
|
|
| |
|
|
| |
|
|
| |
|
|
| |
|
|
|
Total from investment operations | | | .81 | | | | 5.34 | | | | 2.93 | | | | (1.27 | ) | | | 2.07 | |
| | |
|
|
| |
|
|
| |
|
|
| |
|
|
| |
|
|
|
Less Distributions | | | — | | | | — | | | | (.30 | ) | | | (.28 | ) | | | (.26 | ) |
| | |
|
|
| |
|
|
| |
|
|
| |
|
|
| |
|
|
|
Net Asset Value, end of year | | $ | 25.72 | | | $ | 24.91 | | | $ | 19.57 | | | $ | 16.94 | | | $ | 18.49 | |
| | |
|
|
| |
|
|
| |
|
|
| |
|
|
| |
|
|
|
Total Return(b) | | | 3.25 | % | | | 27.29 | % | | | 17.52 | % | | | (6.97 | )% | | | 12.74 | % |
Ratios/Supplemental Data: | | | | | | | | | | | | | | | | | | | | |
Net assets, end of year (in millions) | | $ | 719.2 | | | $ | 744.5 | | | $ | 611.2 | | | $ | 564.2 | | | $ | 648.5 | |
Ratios to average net assets(c): | | | | | | | | | | | | | | | | | | | | |
Expenses after waivers and/or expense reimbursements | | | .81 | % | | | .84 | % | | | .84 | % | | | .84 | % | | | .87 | % |
Expenses before waivers and/or expense reimbursements | | | .82 | % | | | .84 | % | | | .84 | % | | | .84 | % | | | .87 | % |
Net investment income | | | 1.45 | % | | | 1.29 | % | | | 1.82 | % | | | 1.54 | % | | | 1.60 | % |
Portfolio turnover rate | | | 37 | % | | | 70 | % | | | 57 | % | | | 69 | % | | | 69 | % |
| (a) | Calculated based on average shares outstanding during the year. |
| (b) | Total return is calculated assuming a purchase of a share on the first day and a sale on the last day of each year reported and includes reinvestment of distributions and does not reflect the effect of insurance contract charges. Total return does not reflect expenses associated with the separate account such as administrative fees, account charges and surrender charges which, if reflected, would reduce the total returns for all years shown. Performance figures may reflect fee waivers and/or expense reimbursements. In the absence of fee waivers and/or expense reimbursements, the total return would be lower. Past performance is no guarantee of future results. Total returns may reflect adjustments to conform to generally accepted accounting principles. |
| (c) | Does not include expenses of the underlying portfolios in which the Portfolio invests. |
| (d) | The Portfolio accounts for mortgage dollar roll transactions as purchases and sales which, as a result, can increase its portfolio turnover rate. |
SEE NOTES TO FINANCIAL STATEMENTS.
C3
Financial Highlights
| | | | | | | | | | | | | | | | | | | | |
| | | Government Income Portfolio
| |
| | | Year Ended December 31,
| |
| | | 2014
| | | 2013
| | | 2012
| | | 2011
| | | 2010
| |
Per Share Operating Performance: | | | | | | | | | | | | | | | | | | | | |
Net Asset Value, beginning of year | | $ | 11.30 | | | $ | 12.15 | | | $ | 12.37 | | | $ | 12.03 | | | $ | 11.86 | |
| | |
|
|
| |
|
|
| |
|
|
| |
|
|
| |
|
|
|
Income (Loss) From Investment Operations: | | | | | | | | | | | | | | | | | | | | |
Net investment income | | | .21 | | | | .21 | | | | .25 | | | | .30 | | | | .35 | |
Net realized and unrealized gain (loss) on investments | | | .45 | | | | (.49 | ) | | | .19 | | | | .60 | | | | .47 | |
| | |
|
|
| |
|
|
| |
|
|
| |
|
|
| |
|
|
|
Total from investment operations | | | .66 | | | | (.28 | ) | | | .44 | | | | .90 | | | | .82 | |
| | |
|
|
| |
|
|
| |
|
|
| |
|
|
| |
|
|
|
Less Distributions | | | (.04 | ) | | | (.57 | ) | | | (.66 | ) | | | (.56 | ) | | | (.65 | ) |
| | |
|
|
| |
|
|
| |
|
|
| |
|
|
| |
|
|
|
Net Asset Value, end of year | | $ | 11.92 | | | $ | 11.30 | | | $ | 12.15 | | | $ | 12.37 | | | $ | 12.03 | |
| | |
|
|
| |
|
|
| |
|
|
| |
|
|
| |
|
|
|
Total Return(a) | | | 5.86 | % | | | (2.34 | )% | | | 3.63 | % | | | 7.63 | % | | | 6.99 | % |
Ratios/Supplemental Data: | | | | | | | | | | | | | | | | | | | | |
Net assets, end of year (in millions) | | $ | 339.2 | | | $ | 341.1 | | | $ | 382.9 | | | $ | 416.7 | | | $ | 399.2 | |
Ratios to average net assets(b): | | | | | | | | | | | | | | | | | | | | |
Expenses after waivers and/or expense reimbursements | | | .47 | % | | | .49 | % | | | .48 | % | | | .46 | % | | | .50 | % |
Expenses before waivers and/or expense reimbursement | | | .47 | % | | | .49 | % | | | .48 | % | | | .46 | % | | | .50 | % |
Net investment income | | | 1.73 | % | | | 1.78 | % | | | 1.96 | % | | | 2.48 | % | | | 2.87 | % |
Portfolio turnover rate(c) | | | 830 | % | | | 1135 | % | | | 1154 | % | | | 1554 | % | | | 1122 | % |
| |
| | | High Yield Bond Portfolio
| |
| | | Year Ended December 31,
| |
| | | 2014
| | | 2013
| | | 2012
| | | 2011
| | | 2010
| |
Per Share Operating Performance: | | | | | | | | | | | | | | | | | | | | |
Net Asset Value, beginning of year | | $ | 5.29 | | | $ | 5.26 | | | $ | 4.93 | | | $ | 5.06 | | | $ | 4.83 | |
| | |
|
|
| |
|
|
| |
|
|
| |
|
|
| |
|
|
|
Income (Loss) From Investment Operations: | | | | | | | | | | | | | | | | | | | | |
Net investment income | | | .32 | | | | .34 | | | | .35 | | | | .38 | | | | .42 | |
Net realized and unrealized gain (loss) on investments | | | (.18 | ) | | | .03 | | | | .34 | | | | (.13 | ) | | | .23 | |
| | |
|
|
| |
|
|
| |
|
|
| |
|
|
| |
|
|
|
Total from investment operations | | | .14 | | | | .37 | | | | .69 | | | | .25 | | | | .65 | |
| | |
|
|
| |
|
|
| |
|
|
| |
|
|
| |
|
|
|
Less Distributions | | | (.32 | ) | | | (.34 | ) | | | (.36 | ) | | | (.38 | ) | | | (.42 | ) |
| | |
|
|
| |
|
|
| |
|
|
| |
|
|
| |
|
|
|
Net Asset Value, end of year | | $ | 5.11 | | | $ | 5.29 | | | $ | 5.26 | | | $ | 4.93 | | | $ | 5.06 | |
| | |
|
|
| |
|
|
| |
|
|
| |
|
|
| |
|
|
|
Total Return(a) | | | 2.71 | % | | | 7.26 | % | | | 14.43 | % | | | 5.10 | % | | | 14.05 | % |
Ratios/Supplemental Data: | | | | | | | | | | | | | | | | | | | | |
Net assets, end of year (in millions) | | $ | 3,245.9 | | | $ | 3,020.5 | | | $ | 2,841.8 | | | $ | 2,158.4 | | | $ | 2,141.2 | |
Ratios to average net assets(b): | | | | | | | | | | | | | | | | | | | | |
Expenses after waivers and/or expense reimbursements | | | .57 | % | | | .57 | % | | | .57 | % | | | .58 | % | | | .58 | % |
Expenses before waivers and/or expense reimbursements | | | .57 | % | | | .57 | % | | | .57 | % | | | .58 | % | | | .58 | % |
Net investment income | | | 5.95 | % | | | 6.34 | % | | | 6.95 | % | | | 7.53 | % | | | 8.51 | % |
Portfolio turnover rate | | | 48 | % | | | 54 | % | | | 53 | % | | | 68 | % | | | 89 | % |
| (a) | Total return is calculated assuming a purchase of a share on the first day and a sale on the last day of each year reported and includes reinvestment of distributions and does not reflect the effect of insurance contract charges. Total return does not reflect expenses associated with the separate account such as administrative fees, account charges and surrender charges which, if reflected, would reduce the total returns for all years shown. Performance figures may reflect fee waivers and/or expense reimbursements. In the absence of fee waivers and/or expense reimbursements, the total return would be lower. Past performance is no guarantee of future results. Total returns may reflect adjustments to conform to generally accepted accounting principles. |
| (b) | Does not include expenses of the underlying portfolios in which the Portfolio invests. |
| (c) | The Portfolio accounts for mortgage dollar roll transactions as purchases and sales which, as a result, can increase its portfolio turnover rate. |
SEE NOTES TO FINANCIAL STATEMENTS.
C4
Financial Highlights
| | | | | | | | | | | | | | | | | | | | |
| | | Jennison Portfolio
| |
| | | Class I
| |
| | | Year Ended December 31,
| |
| | | 2014
| | | 2013(a)
| | | 2012(a)
| | | 2011
| | | 2010(a)
| |
Per Share Operating Performance: | | | | | | | | | | | | | | | | | | | | |
Net Asset Value, beginning of year | | $ | 37.15 | | | $ | 26.98 | | | $ | 23.26 | | | $ | 23.26 | | | $ | 20.87 | |
| | |
|
|
| |
|
|
| |
|
|
| |
|
|
| |
|
|
|
Income (Loss) From Investment Operations: | | | | | | | | | | | | | | | | | | | | |
Net investment income | | | .06 | | | | .06 | | | | .11 | | | | .03 | | | | .06 | |
Net realized and unrealized gain on investments | | | 3.64 | | | | 10.11 | | | | 3.65 | | | | .04 | | | | 2.42 | |
| | |
|
|
| |
|
|
| |
|
|
| |
|
|
| |
|
|
|
Total from investment operations | | | 3.70 | | | | 10.17 | | | | 3.76 | | | | .07 | | | | 2.48 | |
| | |
|
|
| |
|
|
| |
|
|
| |
|
|
| |
|
|
|
Less Distributions | | | — | | | | — | | | | (.04 | ) | | | (.07 | ) | | | (.09 | ) |
| | |
|
|
| |
|
|
| |
|
|
| |
|
|
| |
|
|
|
Net Asset Value, end of year | | $ | 40.85 | | | $ | 37.15 | | | $ | 26.98 | | | $ | 23.26 | | | $ | 23.26 | |
| | |
|
|
| |
|
|
| |
|
|
| |
|
|
| |
|
|
|
Total Return(b) | | | 9.96 | % | | | 37.69 | % | | | 16.18 | % | | | .30 | % | | | 11.95 | % |
Ratios/Supplemental Data: | | | | | | | | | | | | | | | | | | | | |
Net assets, end of year (in millions) | | $ | 1,580.0 | | | $ | 1,551.9 | | | $ | 1,213.3 | | | $ | 1,126.3 | | | $ | 1,362.1 | |
Ratios to average net assets(c): | | | | | | | | | | | | | | | | | | | | |
Expenses after waivers and/or expense reimbursement | | | .63 | % | | | .63 | % | | | .63 | % | | | .64 | % | | | .64 | % |
Expenses before waivers and/or expense reimbursement | | | .63 | % | | | .63 | % | | | .63 | % | | | .64 | % | | | .64 | % |
Net investment income | | | .15 | % | | | .18 | % | | | .42 | % | | | .16 | % | | | .29 | % |
Portfolio turnover rate | | | 34 | % | | | 40 | % | | | 45 | % | | | 51 | % | | | 67 | % |
| |
| | | Jennison Portfolio
| |
| | | Class II
| |
| | | Year Ended December 31,
| |
| | | 2014
| | | 2013(a)
| | | 2012(a)
| | | 2011
| | | 2010(a)
| |
Per Share Operating Performance: | | | | | | | | | | | | | | | | | | | | |
Net Asset Value, beginning of year | | $ | 36.33 | | | $ | 26.49 | | | $ | 22.89 | | | $ | 22.91 | | | $ | 20.55 | |
| | |
|
|
| |
|
|
| |
|
|
| |
|
|
| |
|
|
|
Income (Loss) From Investment Operations: | | | | | | | | | | | | | | | | | | | | |
Net investment income (loss) | | | (.10 | ) | | | (.07 | ) | | | — | (d) | | | (.07 | ) | | | (.02 | ) |
Net realized and unrealized gain on investments | | | 3.57 | | | | 9.91 | | | | 3.60 | | | | .05 | | | | 2.38 | |
| | |
|
|
| |
|
|
| |
|
|
| |
|
|
| |
|
|
|
Total from investment operations | | | 3.47 | | | | 9.84 | | | | 3.60 | | | | (.02 | ) | | | 2.36 | |
| | |
|
|
| |
|
|
| |
|
|
| |
|
|
| |
|
|
|
Less Distributions | | | — | | | | — | | | | — | | | | — | | | | — | (d) |
| | |
|
|
| |
|
|
| |
|
|
| |
|
|
| |
|
|
|
Net Asset Value, end of year | | $ | 39.80 | | | $ | 36.33 | | | $ | 26.49 | | | $ | 22.89 | | | $ | 22.91 | |
| | |
|
|
| |
|
|
| |
|
|
| |
|
|
| |
|
|
|
Total Return(b) | | | 9.55 | % | | | 37.15 | % | | | 15.73 | % | | | (.09 | )% | | | 11.50 | % |
Ratios/Supplemental Data: | | | | | | | | | | | | | | | | | | | | |
Net assets, end of year (in millions) | | $ | 43.7 | | | $ | 40.3 | | | $ | 33.6 | | | $ | 31.9 | | | $ | 33.2 | |
Ratios to average net assets(c): | | | | | | | | | | | | | | | | | | | | |
Expenses after waivers and/or expense reimbursement | | | 1.03 | % | | | 1.03 | % | | | 1.03 | % | | | 1.04 | % | | | 1.04 | % |
Expenses before waivers and/or expense reimbursement | | | 1.03 | % | | | 1.03 | % | | | 1.03 | % | | | 1.04 | % | | | 1.04 | % |
Net investment income (loss) | | | (.25 | )% | | | (.22 | )% | | | .02 | % | | | (.24 | )% | | | (.10 | )% |
Portfolio turnover rate | | | 34 | % | | | 40 | % | | | 45 | % | | | 51 | % | | | 67 | % |
| (a) | Calculated based upon average shares outstanding during the year. |
| (b) | Total return is calculated assuming a purchase of a share on the first day and a sale on the last day of each year reported and includes reinvestment of distributions and does not reflect the effect of insurance contract charges. Total return does not reflect expenses associated with the separate account such as administrative fees, account charges and surrender charges which, if reflected, would reduce the total returns for all years shown. Performance figures may reflect fee waivers and/or expense reimbursements. In the absence of fee waivers and/or expense reimbursements, the total return would be lower. Past performance is no guarantee of future results. Total returns may reflect adjustments to conform to generally accepted accounting principles. |
| (c) | Does not include expenses of the underlying portfolios in which the Portfolio invests. |
| (d) | Less than $0.005 per share. |
SEE NOTES TO FINANCIAL STATEMENTS.
C5
Financial Highlights
| | | | | | | | | | | | | | | | | | | | |
| | | Money Market Portfolio
| |
| | | Year Ended December 31,
| |
| | | 2014
| | | 2013
| | | 2012
| | | 2011
| | | 2010
| |
Per Share Operating Performance: | | | | | | | | | | | | | | | | | | | | |
Net Asset Value, beginning of year | | $ | 10.00 | | | $ | 10.00 | | | $ | 10.00 | | | $ | 10.00 | | | $ | 10.00 | |
| | |
|
|
| |
|
|
| |
|
|
| |
|
|
| |
|
|
|
Income From Investment Operations: | | | | | | | | | | | | | | | | | | | | |
Net investment income and realized gains | | | — | (a) | | | — | (a) | | | — | (a) | | | — | (a) | | | — | (a) |
Distributions | | | — | (a) | | | — | (a) | | | — | (a) | | | — | (a) | | | — | (a) |
Capital contributions(c) | | | — | | | | — | | | | — | | | | — | | | | — | (a) |
| | |
|
|
| |
|
|
| |
|
|
| |
|
|
| |
|
|
|
Net Asset Value, end of year | | $ | 10.00 | | | $ | 10.00 | | | $ | 10.00 | | | $ | 10.00 | | | $ | 10.00 | |
| | |
|
|
| |
|
|
| |
|
|
| |
|
|
| |
|
|
|
Total Return(b) | | | — | %(d) | | | — | %(d) | | | .01 | % | | | .02 | % | | | .03 | % |
Ratios/Supplemental Data: | | | | | | | | | | | | | | | | | | | | |
Net assets, end of year (in millions) | | $ | 823.6 | | | $ | 866.0 | | | $ | 903.5 | | | $ | 1,016.0 | | | $ | 1,127.1 | |
Ratios to average net assets: | | | | | | | | | | | | | | | | | | | | |
Expenses after waivers and/or expense reimbursements | | | .16 | % | | | .17 | % | | | .21 | % | | | .18 | % | | | .25 | % |
Expenses before waivers and/or expense reimbursements | | | .44 | % | | | .44 | % | | | .44 | % | | | .42 | % | | | .44 | % |
Net investment income | | | .00 | %(d) | | | .00 | %(d) | | | .01 | % | | | .02 | % | | | .03 | % |
| (a) | Less than $.005 per share. |
| (b) | Total return is calculated assuming a purchase of a share on the first day and a sale on the last day of each year reported and includes reinvestment of distributions and does not reflect the effect of insurance contract charges. Total return does not reflect expenses associated with the separate account such as administrative fees, account charges and surrender charges which, if reflected, would reduce the total returns for all years shown. Performance figures may reflect fee waivers and/or expense reimbursements. In the absence of fee waivers and/or expense reimbursements, the total return would be lower. Past performance is no guarantee of future results. Total returns may reflect adjustments to conform to generally accepted accounting principles. |
| (c) | The Portfolio received payments related to an unaffiliated-third party’s settlement of regulatory proceedings involving allegations of improper trading in Portfolio shares during the fiscal year ended December 31, 2010. The Portfolio was not involved in the proceedings or in the calculation of the amount of settlement. |
SEE NOTES TO FINANCIAL STATEMENTS.
C6
Financial Highlights
| | | | | | | | | | | | | | | | | | | | |
| | | Natural Resources Portfolio
| |
| | | Class I
| |
| | | Year Ended December 31,
| |
| | | 2014(a)
| | | 2013(a)
| | | 2012
| | | 2011(a)
| | | 2010(a)
| |
Per Share Operating Performance: | | | | | | | | | | | | | | | | | | | | |
Net Asset Value, beginning of year | | $ | 37.29 | | | $ | 33.83 | | | $ | 38.25 | | | $ | 47.33 | | | $ | 37.15 | |
| | |
|
|
| |
|
|
| |
|
|
| |
|
|
| |
|
|
|
Income (Loss) From Investment Operations: | | | | | | | | | | | | | | | | | | | | |
Net investment income | | | .23 | | | | .20 | | | | .25 | | | | .16 | | | | .08 | |
Net realized and unrealized gain (loss) on investments | | | (7.65 | ) | | | 3.26 | | | | (1.49 | ) | | | (9.16 | ) | | | 10.26 | |
| | |
|
|
| |
|
|
| |
|
|
| |
|
|
| |
|
|
|
Total from investment operations | | | (7.42 | ) | | | 3.46 | | | | (1.24 | ) | | | (9.00 | ) | | | 10.34 | |
| | |
|
|
| |
|
|
| |
|
|
| |
|
|
| |
|
|
|
Less Distributions | | | — | | | | — | | | | (3.18 | ) | | | (.08 | ) | | | (.16 | ) |
| | |
|
|
| |
|
|
| |
|
|
| |
|
|
| |
|
|
|
Net Asset Value, end of year | | $ | 29.87 | | | $ | 37.29 | | | $ | 33.83 | | | $ | 38.25 | | | $ | 47.33 | |
| | |
|
|
| |
|
|
| |
|
|
| |
|
|
| |
|
|
|
Total Return(b) | | | (19.90 | )% | | | 10.23 | % | | | (2.47 | )% | | | (19.03 | )% | | | 27.98 | % |
Ratios/Supplemental Data: | | | | | | | | | | | | | | | | | | | | |
Net assets, end of year (in millions) | | $ | 589.0 | | | $ | 792.1 | | | $ | 802.2 | | | $ | 926.6 | | | $ | 1,259.5 | |
Ratios to average net assets(c): | | | | | | | | | | | | | | | | | | | | |
Expenses after waivers and/or expense reimbursement | | | .45 | % | | | .48 | % | | | .50 | % | | | .50 | % | | | .50 | % |
Expenses before waivers and/or expense reimbursement | | | .50 | % | | | .51 | % | | | .50 | % | | | .50 | % | | | .50 | % |
Net investment income | | | .59 | % | | | .55 | % | | | .71 | % | | | .36 | % | | | .22 | % |
Portfolio turnover rate | | | 24 | % | | | 22 | % | | | 26 | % | | | 34 | % | | | 28 | % |
| |
| | | Natural Resources Portfolio
| |
| | | Class II
| |
| | | Year Ended December 31,
| |
| | | 2014(a)
| | | 2013(a)
| | | 2012
| | | 2011(a)
| | | 2010(a)
| |
Per Share Operating Performance: | | | | | | | | | | | | | | | | | | | | |
Net Asset Value, beginning of year | | $ | 36.78 | | | $ | 33.50 | | | $ | 37.89 | | | $ | 46.98 | | | $ | 36.88 | |
| | |
|
|
| |
|
|
| |
|
|
| |
|
|
| |
|
|
|
Income (Loss) From Investment Operations: | | | | | | | | | | | | | | | | | | | | |
Net investment income (loss) | | | .07 | | | | .05 | | | | .12 | | | | (.02 | ) | | | (.07 | ) |
Net realized and unrealized gain (loss) on investments | | | (7.50 | ) | | | 3.23 | | | | (1.51 | ) | | | (9.07 | ) | | | 10.20 | |
| | |
|
|
| |
|
|
| |
|
|
| |
|
|
| |
|
|
|
Total from investment operations | | | (7.43 | ) | | | 3.28 | | | | (1.39 | ) | | | (9.09 | ) | | | 10.13 | |
| | |
|
|
| |
|
|
| |
|
|
| |
|
|
| |
|
|
|
Less Distributions | | | — | | | | — | | | | (3.00 | ) | | | — | | | | (.03 | ) |
| | |
|
|
| |
|
|
| |
|
|
| |
|
|
| |
|
|
|
Net Asset Value, end of year | | $ | 29.35 | | | $ | 36.78 | | | $ | 33.50 | | | $ | 37.89 | | | $ | 46.98 | |
| | |
|
|
| |
|
|
| |
|
|
| |
|
|
| |
|
|
|
Total Return(b) | | | (20.20 | )% | | | 9.79 | % | | | (2.94 | )% | | | (19.35 | )% | | | 27.48 | % |
Ratios/Supplemental Data: | | | | | | | | | | | | | | | | | | | | |
Net assets, end of year (in millions) | | $ | 43.5 | | | $ | 54.1 | | | $ | 61.2 | | | $ | 67.9 | | | $ | 101.9 | |
Ratios to average net assets(c): | | | | | | | | | | | | | | | | | | | | |
Expenses after waivers and/or expense reimbursement | | | .85 | % | | | .88 | % | | | .90 | % | | | .90 | % | | | .90 | % |
Expenses before waivers and/or expense reimbursement | | | .90 | % | | | .91 | % | | | .90 | % | | | .90 | % | | | .90 | % |
Net investment income (loss) | | | .19 | % | | | .15 | % | | | .31 | % | | | (.04 | )% | | | (.18 | )% |
Portfolio turnover rate | | | 24 | % | | | 22 | % | | | 26 | % | | | 34 | % | | | 28 | % |
| (a) | Calculated based upon average shares outstanding during the year. |
| (b) | Total return is calculated assuming a purchase of a share on the first day and a sale on the last day of each year reported and includes reinvestment of distributions and does not reflect the effect of insurance contract charges. Total return does not reflect expenses associated with the separate account such as administrative fees, account charges and surrender charges which, if reflected, would reduce the total returns for all years shown. Performance figures may reflect fee waivers and/or expense reimbursements. In the absence of fee waivers and/or expense reimbursements, the total return would be lower. Past performance is no guarantee of future results. Total returns may reflect adjustments to conform to generally accepted accounting principles. |
| (c) | Does not include expenses of the underlying portfolios in which the Portfolio invests. |
SEE NOTES TO FINANCIAL STATEMENTS.
C7
Financial Highlights
| | | | | | | | | | | | | | | | | | | | |
| | | Small Capitalization Stock Portfolio
| |
| | | Year Ended December 31,
| |
| | | 2014(d)
| | | 2013
| | | 2012
| | | 2011
| | | 2010
| |
Per Share Operating Performance: | | | | | | | | | | | | | | | | | | | | |
Net Asset Value, beginning of year | | $ | 26.16 | | | $ | 18.56 | | | $ | 17.00 | | | $ | 17.27 | | | $ | 13.83 | |
| | |
|
|
| |
|
|
| |
|
|
| |
|
|
| |
|
|
|
Income (Loss) From Investment Operations: | | | | | | | | | | | | | | | | | | | | |
Net investment income | | | .25 | | | | .22 | | | | .26 | | | | .10 | | | | .13 | |
Net realized and unrealized gain (loss) on investments | | | 1.16 | | | | 7.38 | | | | 2.35 | | | | — | (c) | | | 3.43 | |
| | |
|
|
| |
|
|
| |
|
|
| |
|
|
| |
|
|
|
Total from investment operations | | | 1.41 | | | | 7.60 | | | | 2.61 | | | | .10 | | | | 3.56 | |
| | |
|
|
| |
|
|
| |
|
|
| |
|
|
| |
|
|
|
Less Distributions | | | — | | | | — | | | | (1.05 | ) | | | (.37 | ) | | | (.12 | ) |
| | |
|
|
| |
|
|
| |
|
|
| |
|
|
| |
|
|
|
Net Asset Value, end of year | | $ | 27.57 | | | $ | 26.16 | | | $ | 18.56 | | | $ | 17.00 | | | $ | 17.27 | |
| | |
|
|
| |
|
|
| |
|
|
| |
|
|
| |
|
|
|
Total Return(a) | | | 5.39 | % | | | 40.95 | % | | | 16.03 | % | | | .56 | % | | | 25.93 | % |
Ratios/Supplemental Data: | | | | | | | | | | | | | | | | | | | | |
Net assets, end of year (in millions) | | $ | 750.9 | | | $ | 770.1 | | | $ | 578.4 | | | $ | 542.6 | | | $ | 589.9 | |
Ratios to average net assets(b): | | | | | | | | | | | | | | | | | | | | |
Expenses after waivers and/or expense reimbursements | | | .40 | % | | | .42 | % | | | .46 | % | | | .48 | % | | | .49 | % |
Expenses before waivers and/or expense reimbursements | | | .45 | % | | | .45 | % | | | .46 | % | | | .48 | % | | | .49 | % |
Net investment income | | | .96 | % | | | .92 | % | | | 1.43 | % | | | .60 | % | | | .88 | % |
Portfolio turnover rate | | | 15 | % | | | 14 | % | | | 10 | % | | | 17 | % | | | 15 | % |
| |
| | | Stock Index Portfolio
| |
| | | Year Ended December 31,
| |
| | | 2014(d)
| | | 2013(d)
| | | 2012
| | | 2011
| | | 2010
| |
Per Share Operating Performance: | | | | | | | | | | | | | | | | | | | | |
Net Asset Value, beginning of year | | $ | 47.02 | | | $ | 35.65 | | | $ | 31.47 | | | $ | 31.37 | | | $ | 27.89 | |
| | |
|
|
| |
|
|
| |
|
|
| |
|
|
| |
|
|
|
Income (Loss) From Investment Operations: | | | | | | | | | | | | | | | | | | | | |
Net investment income | | | .79 | | | | .73 | | | | .68 | | | | .54 | | | | .48 | |
Net realized and unrealized gain on investments | | | 5.20 | | | | 10.64 | | | | 4.19 | | | | .07 | | | | 3.51 | |
| | |
|
|
| |
|
|
| |
|
|
| |
|
|
| |
|
|
|
Total from investment operations | | | 5.99 | | | | 11.37 | | | | 4.87 | | | | .61 | | | | 3.99 | |
| | |
|
|
| |
|
|
| |
|
|
| |
|
|
| |
|
|
|
Less Distributions | | | (3.68 | ) | | | — | | | | (.69 | ) | | | (.51 | ) | | | (.51 | ) |
| | |
|
|
| |
|
|
| |
|
|
| |
|
|
| |
|
|
|
Net Asset Value, end of year | | $ | 49.33 | | | $ | 47.02 | | | $ | 35.65 | | | $ | 31.47 | | | $ | 31.37 | |
| | |
|
|
| |
|
|
| |
|
|
| |
|
|
| |
|
|
|
Total Return(a) | | | 13.31 | % | | | 31.89 | % | | | 15.68 | % | | | 1.95 | % | | | 14.59 | % |
Ratios/Supplemental Data: | | | | | | | | | | | | | | | | | | | | |
Net assets, end of year (in millions) | | $ | 3,312.7 | | | $ | 2,890.5 | | | $ | 2,340.3 | | | $ | 2,162.4 | | | $ | 2,277.6 | |
Ratios to average net assets(b): | | | | | | | | | | | | | | | | | | | | |
Expenses after waivers and/or expense reimbursements | | | .32 | % | | | .32 | % | | | .32 | % | | | .33 | % | | | .36 | % |
Expenses before waivers and/or expense reimbursements | | | .37 | % | | | .37 | % | | | .37 | % | | | .38 | % | | | .38 | % |
Net investment income | | | 1.67 | % | | | 1.77 | % | | | 1.97 | % | | | 1.74 | % | | | 1.70 | % |
Portfolio turnover rate | | | 5 | % | | | 3 | % | | | 2 | % | | | 2 | % | | | 4 | % |
| (a) | Total return is calculated assuming a purchase of a share on the first day and a sale on the last day of each year reported and includes reinvestment of distributions and does not reflect the effect of insurance contract charges. Total return does not reflect expenses associated with the separate account such as administrative fees, account charges and surrender charges which, if reflected, would reduce the total returns for all years shown. Performance figures may reflect fee waivers and/or expense reimbursements. In the absence of fee waivers and/or expense reimbursements, the total return would be lower. Past performance is no guarantee of future results. Total returns may reflect adjustments to conform to generally accepted accounting principles. |
| (b) | Does not include expenses of the underlying portfolios in which the Portfolio invests. |
| (c) | Less than $0.005 per share. |
| (d) | Calculated based on average shares outstanding during the year. |
SEE NOTES TO FINANCIAL STATEMENTS.
C8
Financial Highlights
| | | | | | | | | | | | | | | | | | | | |
| | | Value Portfolio
| |
| | | Class I
| |
| | | Year Ended December 31,
| |
| | | 2014(a)
| | | 2013
| | | 2012
| | | 2011
| | | 2010
| |
Per Share Operating Performance: | | | | | | | | | | | | | | | | | | | | |
Net Asset Value, beginning of year | | $ | 24.05 | | | $ | 18.07 | | | $ | 15.93 | | | $ | 17.04 | | | $ | 15.10 | |
| | |
|
|
| |
|
|
| |
|
|
| |
|
|
| |
|
|
|
Income (Loss) From Investment Operations: | | | | | | | | | | | | | | | | | | | | |
Net investment income | | | .29 | | | | .22 | | | | .22 | | | | .14 | | | | .17 | |
Net realized and unrealized gain (loss) on investments | | | 2.14 | | | | 5.76 | | | | 2.09 | | | | (1.08 | ) | | | 1.90 | |
| | |
|
|
| |
|
|
| |
|
|
| |
|
|
| |
|
|
|
Total from investment operations | | | 2.43 | | | | 5.98 | | | | 2.31 | | | | (.94 | ) | | | 2.07 | |
| | |
|
|
| |
|
|
| |
|
|
| |
|
|
| |
|
|
|
Less Distributions | | | — | | | | — | | | | (.17 | ) | | | (.17 | ) | | | (.13 | ) |
| | |
|
|
| |
|
|
| |
|
|
| |
|
|
| |
|
|
|
Net Asset Value, end of year | | $ | 26.48 | | | $ | 24.05 | | | $ | 18.07 | | | $ | 15.93 | | | $ | 17.04 | |
| | |
|
|
| |
|
|
| |
|
|
| |
|
|
| |
|
|
|
Total Return(b) | | | 10.10 | % | | | 33.09 | % | | | 14.62 | % | | | (5.58 | )% | | | 13.86 | % |
Ratios/Supplemental Data: | | | | | | | | | | | | | | | | | | | | |
Net assets, end of year (in millions) | | $ | 1,592.6 | | | $ | 1,568.7 | | | $ | 1,263.3 | | | $ | 1,231.6 | | | $ | 1,432.9 | |
Ratios to average net assets(c): | | | | | | | | | | | | | | | | | | | | |
Expenses after waivers and/or expense reimbursement | | | .40 | % | | | .40 | % | | | .43 | % | | | .43 | % | | | .44 | % |
Expenses before waivers and/or expense reimbursement | | | .42 | % | | | .43 | % | | | .43 | % | | | .43 | % | | | .44 | % |
Net investment income | | | 1.13 | % | | | 1.06 | % | | | 1.36 | % | | | .90 | % | | | 1.08 | % |
Portfolio turnover rate | | | 37 | % | | | 41 | % | | | 28 | % | | | 43 | % | | | 63 | % |
| |
| | | Value Portfolio
| |
| | | Class II
| |
| | | Year Ended December 31,
| |
| | | 2014(a)
| | | 2013
| | | 2012
| | | 2011
| | | 2010
| |
Per Share Operating Performance: | | | | | | | | | | | | | | | | | | | | |
Net Asset Value, beginning of year | | $ | 24.12 | | | $ | 18.20 | | | $ | 16.04 | | | $ | 17.13 | | | $ | 15.16 | |
| | |
|
|
| |
|
|
| |
|
|
| |
|
|
| |
|
|
|
Income (Loss) From Investment Operations: | | | | | | | | | | | | | | | | | | | | |
Net investment income | | | .18 | | | | .16 | | | | .17 | | | | .08 | | | | .12 | |
Net realized and unrealized gain (loss) on investments | | | 2.15 | | | | 5.76 | | | | 2.08 | | | | (1.08 | ) | | | 1.90 | |
| | |
|
|
| |
|
|
| |
|
|
| |
|
|
| |
|
|
|
Total from investment operations | | | 2.33 | | | | 5.92 | | | | 2.25 | | | | (1.00 | ) | | | 2.02 | |
| | |
|
|
| |
|
|
| |
|
|
| |
|
|
| |
|
|
|
Less Distributions | | | — | | | | — | | | | (.09 | ) | | | (.09 | ) | | | (.05 | ) |
| | |
|
|
| |
|
|
| |
|
|
| |
|
|
| |
|
|
|
Net Asset Value, end of year | | $ | 26.45 | | | $ | 24.12 | | | $ | 18.20 | | | $ | 16.04 | | | $ | 17.13 | |
| | |
|
|
| |
|
|
| |
|
|
| |
|
|
| |
|
|
|
Total Return(b) | | | 9.66 | % | | | 32.53 | % | | | 14.14 | % | | | (5.89 | )% | | | 13.39 | % |
Ratios/Supplemental Data: | | | | | | | | | | | | | | | | | | | | |
Net assets, end of year (in millions) | | $ | 10.6 | | | $ | 7.4 | | | $ | 6.2 | | | $ | 6.0 | | | $ | 7.1 | |
Ratios to average net assets(c): | | | | | | | | | | | | | | | | | | | | |
Expenses after waivers and/or expense reimbursement | | | .80 | % | | | .80 | % | | | .83 | % | | | .83 | % | | | .84 | % |
Expenses before waivers and/or expense reimbursement | | | .82 | % | | | .83 | % | | | .83 | % | | | .83 | % | | | .84 | % |
Net investment income | | | .73 | % | | | .66 | % | | | .95 | % | | | .50 | % | | | .69 | % |
Portfolio turnover rate | | | 37 | % | | | 41 | % | | | 28 | % | | | 43 | % | | | 63 | % |
| (a) | Calculated based on average shares outstanding during the year. |
| (b) | Total return is calculated assuming a purchase of a share on the first day and a sale on the last day of each year reported and includes reinvestment of distributions and does not reflect the effect of insurance contract charges. Total return does not reflect expenses associated with the separate account such as administrative fees, account charges and surrender charges which, if reflected, would reduce the total returns for all years shown. Performance figures may reflect fee waivers and/or expense reimbursements. In the absence of fee waivers and/or expense reimbursements, the total return would be lower. Past performance is no guarantee of future results. Total returns may reflect adjustments to conform to generally accepted accounting principles. |
| (c) | Does not include expenses of the underlying portfolios in which the Portfolio invests. |
SEE NOTES TO FINANCIAL STATEMENTS.
C9
REPORT OF INDEPENDENT REGISTERED PUBLIC ACCOUNTING FIRM
THE BOARD OF TRUSTEES AND SHAREHOLDERS
THE PRUDENTIAL SERIES FUND:
We have audited the accompanying statements of assets and liabilities of the Conservative Balanced Portfolio, Diversified Bond Portfolio, Equity Portfolio, Flexible Managed Portfolio, Global Portfolio, Government Income Portfolio, High Yield Bond Portfolio, Jennison Portfolio, Money Market Portfolio, Natural Resources Portfolio, Small Capitalization Stock Portfolio, Stock Index Portfolio and Value Portfolio (hereafter referred to as the “Portfolios”), each a portfolio of The Prudential Series Fund, including the schedules of investments, as of December 31, 2014, and the related statements of operations for the year then ended, the statements of changes in net assets for each of the years in the two-year period then ended, and the financial highlights for each of the years in the five-year period then ended. These financial statements and financial highlights are the responsibility of the Portfolios’ management. Our responsibility is to express an opinion on these financial statements and financial highlights based on our audits.
We conducted our audits in accordance with the standards of the Public Company Accounting Oversight Board (United States). Those standards require that we plan and perform the audit to obtain reasonable assurance about whether the financial statements and financial highlights are free of material misstatement. An audit includes examining, on a test basis, evidence supporting the amounts and disclosures in the financial statements. Our procedures included confirmation of securities owned as of December 31, 2014, by correspondence with the custodian, transfer agent and brokers or by other appropriate auditing procedures when replies from brokers were not received. An audit also includes assessing the accounting principles used and significant estimates made by management, as well as evaluating the overall financial statement presentation. We believe that our audits provide a reasonable basis for our opinion.
In our opinion, the financial statements and financial highlights referred to above present fairly, in all material respects, the financial position of the Portfolios as of December 31, 2014, and the results of their operations, the changes in their net assets and the financial highlights for the periods described in the first paragraph above, in conformity with U.S. generally accepted accounting principles.
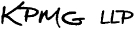
New York, New York
February 17, 2015
D1
INFORMATION ABOUT TRUSTEES AND OFFICERS (Unaudited)
Information about the Trustees and the Officers of the Fund is set forth below. Trustees who are not deemed to be “interested persons” of the Fund, as defined in the Investment Company Act of 1940, are referred to as “Independent Trustees.” Trustees who are deemed to be “interested persons” of the Fund are referred to as “Interested Trustees.” The Trustees are responsible for the overall supervision of the operations of the Fund and perform the various duties imposed on the directors of investment companies by the Investment Company Act of 1940.
| | | | |
| Independent Trustees | | | | |
Name, Age
Number of Portfolios in Fund Complex†
Overseen by Trustee | | Principal Occupation(s) During Past Five Years | | Other Directorships Held by Trustee** |
Susan Davenport Austin* (47) Trustee Since 2011 No. of Portfolios Overseen: 111 | | Senior Managing Director of Brock Capital (Since 2014); Vice Chairman (Since 2013), Senior Vice President and Chief Financial Officer (2007-2012) and Vice President of Strategic Planning and Treasurer (2002-2007) of Sheridan Broadcasting Corporation; Formerly President of Sheridan Gospel Network (2004-2014); Vice President, Goldman, Sachs & Co. (2000-2001); Associate Director, Bear, Stearns & Co. Inc. (1997-2000); Vice President, Salomon Brothers Inc. (1993-1997); President of the Board, The MacDowell Colony (Since 2010); Presiding Director (Since 2014) and Chairman (2011-2014) of the Board of Directors, Broadcast Music, Inc.; Member of the Board of Directors, Hubbard Radio, LLC (Since 2011); President, Candide Business Advisors, Inc. (Since 2011); formerly Member of the Board of Directors, National Association of Broadcasters (2004-2010). | | None. |
Sherry S. Barrat* (65) Trustee Since 2013 No. of Portfolios Overseen: 111 | | Formerly, Vice Chairman of Northern Trust Corporation (financial services and banking institution) (2011-June 2012); formerly, President, Personal Financial Services, Northern Trust Corporation (2006-2010); formerly, Chairman & CEO, Western US Region, Northern Trust Corporation (1999-2005); formerly, President & CEO, Palm Beach/Martin County Region, Northern Trust. | | Director of NextEra Energy, Inc. (formerly, FPL Group, Inc.) (1998-Present); Director of Arthur J. Gallagher & Company (Since July 2013). |
Kay Ryan Booth* (64) Trustee Since 2013 No. of Portfolios Overseen: 111 | | Partner of Trinity Private Equity Group (Since September 2014); formerly, Managing Director of Cappello Waterfield & Co. LLC (2011-May 2014); formerly, Vice Chair, Global Research, J.P. Morgan (financial services and investment banking institution) (June 2008-January 2009); formerly, Global Director of Equity Research, Bear Stearns & Co., Inc. (financial services and investment banking institution) (1995-2008); formerly, Associate Director of Equity Research, Bear Stearns & Co., Inc. (1987-1995). | | None. |
Delayne Dedrick Gold* (76) Trustee Since 2001 No. of Portfolios Overseen: 111 | | Marketing Consultant (1982-present); formerly Senior Vice President and Member of the Board of Directors, Prudential Bache Securities, Inc. | | None. |
Robert F. Gunia* (68) Trustee Since 2001 No. of Portfolios Overseen: 111 | | Independent Consultant (Since October 2009); formerly Chief Administrative Officer (September 1999-September 2009) and Executive Vice President (December 1996-September 2009) of Prudential Investments LLC; formerly Executive Vice President (March 1999-September 2009) and Treasurer (May 2000-September 2009) of Prudential Mutual Fund Services LLC; formerly President (April 1999-December 2008) and Executive Vice President and Chief Operating Officer (December 2008-December 2009) of Prudential Investment Management Services LLC; formerly Chief Administrative Officer, Executive Vice President and Director (May 2003-September 2009) of AST Investment Services, Inc. | | Director (Since May 1989) of The Asia-Pacific Fund, Inc. |
W. Scott McDonald, Jr., PhD* (77) Trustee Since 1983 No. of Portfolios Overseen: 111 | | Formerly Management Consultant (1997-2004) and of Counsel (2004-2005) at Kaludis Consulting Group, Inc. (company serving higher education); formerly principal (1995-1997), Scott McDonald Associates; Chief Operating Officer (1991-1995), Fairleigh Dickinson University; Executive Vice President and Chief Operating Officer (1975-1991), Drew University; interim President (1988-1990), Drew University; formerly Director of School, College and University Underwriters Ltd. | | None. |
E1
| | | | |
| Independent Trustees | | | | |
Name, Age
Number of Portfolios in Fund Complex†
Overseen by Trustee | | Principal Occupation(s) During Past Five Years | | Other Directorships Held by Trustee** |
Thomas T. Mooney* (73) Trustee Since 2001 No. of Portfolios Overseen: 111 | | Formerly Chief Executive Officer, Excell Partners, Inc. (2005-2007); founding partner of High Technology of Rochester and the Lennox Technology Center; formerly President of the Greater Rochester Metro Chamber of Commerce (1976-2004) formerly Rochester City Manager (1973); formerly Deputy Monroe County Executive (1974-1976). | | None. |
Thomas M. O’Brien* (64) Trustee Since 2003 No. of Portfolios Overseen: 111 | | Director, Sun Bancorp, Inc. (NASDAQ: SNBC) and Sun National Bank (Since July 2014); Consultant, Valley National Bancorp, Inc. and Valley National Bank (January 2012-June 2012); Formerly President and COO (November 2006-December 2011) and CEO (April 2007-December 2011) of State Bancorp, Inc. and State Bank; formerly Vice Chairman (January 1997-April 2000) of North Fork Bank; formerly President and Chief Executive Officer (December 1984-December 1996) of North Side Savings Bank; formerly President and Chief Executive Officer (May 2000-June 2006) Atlantic Bank of New York. | | Formerly Director, BankUnited, Inc. and BankUnited N.A. (NYSE: BKU) (May 2012-April 2014); formerly Director (April 2008-January 2012) of Federal Home Loan Bank of New York; formerly Director (December 1996-May 2000) of North Fork Bancorporation, Inc.; formerly Director (May 2000-April 2006) of Atlantic Bank of New York; Director (November 2006-January 2012) of State Bancorp, Inc. (NASDAQ: STBC) and State Bank of Long Island. |
| | | | |
| Interested Trustees | | | | |
Name, Age
Number of Portfolios in Fund Complex†
Overseen by Trustee | | Principal Occupation(s) During Past Five Years | | Other Directorships Held by Trustee** |
Robert F. O’Donnell* (46) Trustee & President Since 2012 No. of Portfolios Overseen: 111 | | President of Prudential Annuities (Since April 2012); Senior Vice President, Head of Product, Investment Management & Marketing for Prudential Annuities (October 2008-April 2012); Senior Vice President, Head of Product (July 2004-October 2008). | | None. |
Timothy S. Cronin* (49) Trustee Since 2011 No. of Portfolios Overseen: 111 | | Chief Investment Officer and Strategist of Prudential Annuities (Since January 2004); Director of Investment & Research Strategy (Since February 1998); President of AST Investment Services, Inc. (Since June 2005). | | None. |
Bruce W. Ferris* (59) Trustee Since 2013 No. of Portfolios Overseen: 111 | | Senior Vice President, Sales and Distribution, Product, Marketing, Prudential Annuities (Since May 2006); Vice President-Sales, The Hartford Insurance Company (October 1994-April 2005); Sales Manager, Aetna Investment Services (October 1993-September 1994). | | None. |
* The address of each Trustee is c/o Prudential Investments LLC, Gateway Center Three, 100 Mulberry Street, Newark, New Jersey 07102.
** Includes only directorships of companies required to register or file reports with the Securities and Exchange Commission (SEC) under the Securities Exchange Act of 1934 (that is, “public companies”) or other investment companies registered under the Investment Company Act of 1940.
† The Fund Complex consists of all investment companies managed by PI. The Funds for which PI serves as manager include the Prudential Investments Mutual Funds, Target Mutual Funds, The Prudential Variable Contract Accounts 2, 10 and 11, Prudential Short Duration High Yield Fund, Inc., Prudential Global Short Duration High Yield Fund, Inc., The Prudential Series Fund, Advanced Series Trust, and Prudential’s Gibraltar Fund, Inc.
| | |
| Fund Officers(1) | | |
Name, Age
Position with the Fund | | Principal Occupation(s) During the Past Five Years |
Raymond A. O’Hara* (59) Chief Legal Officer Since 2012 | | Vice President and Corporate Counsel (since July 2010) of Prudential Insurance Company of America (Prudential); Vice President (March 2011-Present) of Pruco Life Insurance Company and Pruco Life Insurance Company of New Jersey; Vice President and Corporate Counsel (March 2011-Present) of Prudential Annuities Life Assurance Corporation; Chief Legal Officer of Prudential Investments LLC (since June 2012); Chief Legal Officer of Prudential Mutual Fund Services LLC (since June 2012) and Corporate Counsel of AST Investment Services, Inc. (since June 2012); formerly Assistant Vice President and Corporate Counsel (September 2008-July 2010) of The Hartford Financial Services Group, Inc.; formerly Associate (September 1980-December 1987) and Partner (January 1988-August 2008) of Blazzard & Hasenauer, P.C. (formerly, Blazzard, Grodd & Hasenauer, P.C.). |
Chad A. Earnst* (39) Chief Compliance Officer Since 2014 | | Chief Compliance Officer (September 2014-Present) of Prudential Investments LLC; Chief Compliance Officer (September 2014-Present) of the Prudential Investments Funds, Target Funds, Advanced Series Trust, The Prudential Series Fund, Prudential’s Gibraltar Fund, Inc., Prudential Global Short Duration High Yield Income Fund, Inc., Prudential Short Duration High Yield Fund, Inc. and Prudential Jennison MLP Income Fund, Inc.; formerly Assistant Director (March 2010-August 2014) of the Asset Management Unit, Division of Enforcement, U.S. Securities & Exchange Commission; Assistant Regional Director (January 2010-August 2014), Branch Chief (June 2006-December 2009) and Senior Counsel (April 2003-May 2006) of the Miami Regional Office, Division of Enforcement, U.S. Securities & Exchange Commission. |
E2
| | |
| Fund Officers(1) | | |
Name, Age
Position with the Fund | | Principal Occupation(s) During the Past Five Years |
Bradley C. Tobin* (40) Vice President Since 2014 | | Vice President of Prudential Annuities (since March 2012), Vice President of AST Investment Services, Inc. (since April 2011). |
Deborah A. Docs* (56) Secretary Since 2005 | | Vice President and Corporate Counsel (since January 2001) of Prudential; Vice President (since December 1996) and Assistant Secretary (since March 1999) of Prudential Investments LLC; formerly Vice President and Assistant Secretary (May 2003-June 2005) of AST Investment Services, Inc. |
Jonathan D. Shain* (56) Assistant Secretary Since 2005 | | Vice President and Corporate Counsel (since August 1998) of Prudential; Vice President and Assistant Secretary (since May 2001) of Prudential Investments LLC; Vice President and Assistant Secretary (since February 2001) of Prudential Mutual Fund Services LLC; formerly Vice President and Assistant Secretary (May 2003-June 2005) of AST Investment Services, Inc. |
Claudia DiGiacomo* (40) Assistant Secretary Since 2005 | | Vice President and Corporate Counsel (since January 2005) of Prudential; Vice President and Assistant Secretary of Prudential Investments LLC (since December 2005); Associate at Sidley Austin Brown & Wood LLP (1999-2004). |
Andrew R. French* (52) Assistant Secretary Since 2006 | | Vice President and Corporate Counsel (since February 2010) of Prudential; formerly Director and Corporate Counsel (2006-2010) of Prudential; Vice President and Assistant Secretary (since January 2007) of Prudential Investments LLC; Vice President and Assistant Secretary (since January 2007) of Prudential Mutual Fund Services LLC. |
Amanda S. Ryan (36) Assistant Secretary Since 2012 | | Director and Corporate Counsel (since March 2012) of Prudential; Director and Assistant Secretary (since June 2012) of Prudential Investments LLC; Associate at Ropes & Gray LLP (2008-2012). |
Kathleen DeNicholas* (40) Assistant Secretary Since 2013 | | Vice President and Corporate Counsel (since May 2013) of Prudential; Managing Counsel at The Bank of New York Mellon Corporation (2011-2013); formerly Senior Counsel (2007-2011) and Assistant General Counsel (2001-2007) of The Dreyfus Corporation; Chief Legal Officer and Secretary of MBSC Securities Corporation (2011-2013); Vice President and Assistant Secretary of The Dreyfus Family of Funds (2010-2012). |
M. Sadiq Peshimam* (50) Treasurer and Principal Financial & Accounting Officer Since 2014 | | Assistant Treasurer of funds in the Prudential Mutual Fund Complex (2006-2014); Vice President (since 2005) of Prudential Investments LLC. |
Peter Parrella* (56) Assistant Treasurer Since 2007 | | Vice President (since 2007) and Director (2004-2007) within Prudential Mutual Fund Administration; formerly Tax Manager at SSB Citi Fund Management LLC (1997-2004). |
Lana Lomuti* (47) Assistant Treasurer Since 2014 | | Vice President (since 2007) and Director (2005-2007), within Prudential Mutual Fund Administration; formerly Assistant Treasurer (December 2007-February 2014) of The Greater China Fund, Inc. |
Linda McMullin* (53) Assistant Treasurer Since 2014 | | Vice President (since 2011) and Director (2008-2011) within Prudential Mutual Fund Administration. |
Alan Fu* (58) Assistant Treasurer Since 2006 | | Vice President and Corporate Counsel – Tax, Prudential Financial, Inc. (since October 2003). |
Theresa C. Thompson* (52) Deputy Chief Compliance Officer Since 2008 | | Vice President, Compliance, Prudential Investments LLC (since April 2004); and Director, Compliance, Prudential Investments LLC (2001-2004). |
Richard W. Kinville* (46) Anti-Money Laundering Compliance Officer Since 2011 | | Vice President, Corporate Compliance, Anti-Money Laundering Unit (since January 2005) of Prudential; committee member of the American Council of Life Insurers Anti-Money Laundering and Critical Infrastructure Committee (since January 2007); formerly Investigator and Supervisor in the Special Investigations Unit for the New York Central Mutual Fire Insurance Company (August 1994-January 1999); Investigator in AXA Financial’s Internal Audit Department and Manager in AXA’s Anti-Money Laundering Office (January 1999-January 2005); first chair of the American Council of Life Insurers Anti-Money Laundering and Critical Infrastructure Committee (June 2007-December 2009). |
* The address for each officer is c/o Prudential Investments LLC, 100 Mulberry Street, Gateway Center Three, Newark, New Jersey 07102.
(1) Excludes Messrs. O’Donnell and Cronin, interested Trustees who serve as President and Vice President, respectively. Biographical and other information with respect to Messrs. O’Donnell and Cronin appears under “Interested Trustees,” above.
E3
This report must be preceded or accompanied by the current prospectuses for the Prudential Series Fund portfolios and the applicable variable annuity or variable life contract. The prospectuses contain information on the contract and the investment objectives, risks, charges and expenses of the portfolios, and should be read carefully.
A description of the Fund’s proxy voting policies and procedures is available, without charge, upon request by calling the appropriate phone number listed below. Information regarding how the Fund voted proxies relating to portfolio securities during the most recent 12-month period ended June 30 is available on the website of the Securities and Exchange Commission (the Commission) at www.sec.gov and on the Fund’s website at www.prudential.com/variableinsuranceportfolios.
The Fund files with the Commission a complete listing of portfolio holdings as of its first and third quarter-end on Form N-Q. Form N-Q is available on the Commission’s website at www.sec.gov or by visiting the Commission’s Public Reference Room. For more information on the Commission’s Public Reference Room, please visit the Commission’s website or call (800)SEC-0330. Form N-Q is also available on the Fund’s website or by calling the telephone number referenced below.
The Fund’s Statement of Additional Information contains additional information about the Fund’s Trustees and is available without charge upon request by calling the appropriate phone number listed below.
This report may include financial information pertaining to certain portfolios that are not available through the variable annuity contract or the variable life insurance policy that you have chosen. Please refer to your variable product prospectus to determine which portfolios are available to you.
To contact your client services representative, please call the phone number listed below. Thank you.
Owners of Individual Annuity contracts should call (888) 778-2888.
Owners of Individual Life Insurance contracts should call (800) 778-2255.
Owners of Group Variable Universal Life Insurance contracts should call (800) 562-9874.
Owners of Group Variable Universal Life Insurance contracts through AICPA should call (800) 223-7473.
The Prudential Series Fund is distributed by Prudential Investment Management Services LLC (PIMS), Three Gateway Center, 14th Floor, Newark, NJ 07102-4077, member SIPC, a Prudential Financial company and solely responsible for its own financial condition and contractual obligations.
Annuity and life insurance contracts contain exclusions, limitations, reductions of benefits, and terms for keeping them in force. Your licensed financial professional can provide you with costs and complete details. Contract guarantees are based on the claims-paying ability of the issuing company.
| | | | |

The Prudential Insurance Company of America 751 Broad Street Newark, NJ 07102-3777 | | | | PRESORTED STD U.S. POSTAGE PAID HARRISONBURG, VA PERMIT No. 250 ZIP CODE 22801 |
| | | | |
| | | | |
| | | | |
The Audited Financial Statements of Pruco Life Insurance Company, Pruco Life Insurance Company of New Jersey, Prudential Annuities Life Assurance Corporation, and The Prudential Insurance Company of America are available upon request. You may call (800)778-2255 to obtain a free copy of the audited financial statements of the insurance company that issued your contract.
To reduce costs, we now generally send only a single copy of prospectuses and shareholder reports to each household (householding) in lieu of sending a copy to each Contract Owner who resides in the household. Householding is not yet available on all products. You should be aware that by calling (877)778-5008, you can revoke, or “opt out,” of householding at any time, which may increase the volume of mail you will receive.
©2015 Prudential Financial, Inc. and its related entities. Prudential, the Prudential logo, the Rock symbol, and Bring Your Challenges are service marks of Prudential Financial, Inc. and its related entities, registered in many jurisdictions worldwide.
0239280-00004-00 PSF-AR-A

THE PRUDENTIAL SERIES FUND
ANNUAL REPORT Ÿ DECEMBER 31, 2014
Based on the variable contract you own or the portfolios you invested in, you may receive additional reports that provide financial information on those investment choices. Please refer to your variable annuity or variable life insurance contract prospectus to determine which portfolios are available to you.
The views expressed in this report and information about the Fund’s portfolio holdings are for the period covered by this report and are subject to change thereafter.
Please note that this document may include prospectus supplements that are separate from and not a part of this report. Please refer to your variable annuity or variable life insurance contract prospectus to determine which supplements are applicable to you.

For information regarding enrollment in the e-Delivery program, please see the inside front cover of this report.
SP International Growth Portfolio
SP International Value Portfolio
SP Prudential U.S. Emerging Growth Portfolio
SP Small Cap Value Portfolio
By enrolling in e-Delivery, you’ll gain secure, online access to important documents with the flexibility to choose which documents you receive in the mail… and which ones you don’t!
Individual Annuity Contract Owners - Get started by visiting www.prudentialannuities.com/investor/edelivery and follow the instructions on the screen, or scan the code below.
Individual Life Insurance Contract Owners - To receive your reports online, go to www.prudential.com/edelivery, or scan the code below.
Group Variable Universal Life Contract Owners - To receive your reports online, go to www.prudential.com/gulgvul, or scan the code.
Save paper and reduce clutter.
Receive Prospectuses and Reports electronically by enrolling today!
| | | | |
The Prudential Series Fund Table of Contents | | Annual Report | | December 31, 2014 |
| n | | LETTER TO CONTRACT OWNERS |
| n | | INVESTMENT MANAGER’S REPORT |
| n | | PRESENTATION OF PORTFOLIO HOLDINGS |
| | | | |
| Section A | | Schedule of Investments and Financial Statements |
| | |
| | | SP International Growth Portfolio | | A1 |
| | | SP International Value Portfolio | | A7 |
| | | SP Prudential U.S. Emerging Growth Portfolio | | A13 |
| | | SP Small Cap Value Portfolio | | A18 |
| | |
| Section B | | Notes to Financial Statements | | |
| Section C | | Financial Highlights | | |
| Section D | | Report of Independent Registered Public Accounting Firm | | |
| Section E | | Information about Trustees and Officers | | |
| n | | APPROVAL OF ADVISORY AGREEMENTS |
This report may include financial information pertaining to certain portfolios that are not available through the variable life insurance policy or variable annuity contract that you have chosen. Please refer to your variable life insurance or variable annuity prospectus to determine which portfolios are available to you.
| | | | |
The Prudential Series Fund Letter to Contract Owners | | Annual Report | | December 31, 2014 |
At Prudential, our primary objective is to help investors achieve and maintain long-term financial success. This Prudential Series Fund annual report outlines our efforts to achieve this goal. We hope you find it informative and useful.
Prudential has been building on a heritage of success for more than 135 years. The quality of our businesses and risk diversification has enabled us to manage effectively through volatile markets over time. We believe the array of our products provides a highly attractive value proposition to clients like you who are focused on financial security.
Your financial professional is the best resource to help you make the most informed investment decisions. Together, you can build a diversified investment portfolio that aligns with your long-term financial goals. Please keep in mind that diversification and asset allocation strategies do not assure a profit or protect against loss in declining markets.
Thank you for selecting Prudential as one of your financial partners. We value your trust and appreciate the opportunity to help you achieve financial security.
Sincerely,
Robert F. O’Donnell
President,
The Prudential Series Fund | January 30, 2015 |
| | |
The Prudential Series Fund, SP International Growth Portfolio | | December 31, 2014 |
Investment Manager’s Report - As of December 31, 2014 (Unaudited)
| | | | | | | | | | | | |
| Average Annual Total Returns | | 1-Year | | | 5-Year | | | 10-Year | |
Portfolio: Class I | | | -5.71 | % | | | 5.88 | % | | | 4.33 | % |
Portfolio: Class II | | | -6.12 | | | | 5.50 | | | | 3.90 | |
MSCI EAFE® Index (GD) | | | -4.48 | | | | 5.81 | | | | 4.91 | |
Past performance does not guarantee future returns. The investment return and principal value of an investment will fluctuate, so that an investor’s shares, when redeemed, may be worth more or less than their original cost. Current performance may be lower or higher than the past performance data quoted.
Portfolio performance is net of investment fees and fund expenses, but not contract charges, which, if included, would significantly lower the performance quoted. Performance figures may reflect fee waivers and/or expense reimbursements. In the absence of such fee waivers and/or expense reimbursements, total returns would be lower.
$10,000 INVESTED OVER 10 YEARS1
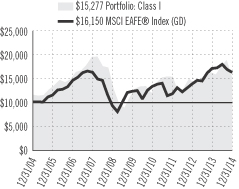
For the year ended December 31, 2014 the SP International Growth Portfolio Class I returned -5.71% and the Class II
returned -6.12%.
The net assets of the Portfolio at December 31, 2014 were $81.4 million.
The Portfolio’s investment objective is long-term growth of capital. The Portfolio’s subadvisers are William Blair & Company, Jennison Associates LLC, and Neuberger Berman Management LLC.
The MSCI EAFE (GD) Index (the Index) declined by 4.48% for the year. Losses were common among developed market countries due to the decline in foreign currencies, including the euro, versus the U.S. dollar. The dollar continues to advance due to a stronger U.S. economy and the ending of U.S. quantitative easing. Investors anticipated interest rates hikes in 2015, while weaker areas of the world are forecasted to either continue or to expand monetary policy. In terms of economic sectors, health care and utilities had positive returns, even in dollars, while the technology sector’s decline in dollars was relatively modest. The materials and energy sectors trailed as the price of oil dropped precipitously at the end of the year.
The Portfolio’s assets in the consumer discretionary sector had the largest negative impact on its performance relative to the Index, as Europe’s economy struggled and growth continued to slow in China and the rest of Asia. When the economies in these continents turn around, consumers are expected to spend more, but as of year-end, that was not the case. Since consumer discretionary stocks have high growth potential in an economic turnaround, it is not surprising that the subadvisers invested in this sector.
Allocations to emerging markets countries, which are not in the Index, mitigated the negative returns. Specifically, allocations to China, South Africa, Indonesia, Philippines, and India all significantly enhanced the Portfolio’s returns as emerging markets rebounded following a poor 2013. All three subadvisers routinely invest in emerging markets stocks, as they have found significant growth opportunities there.
In addition, allocations to various economic sectors also contributed to the Portfolio’s relative performance. International technology and health care stocks benefited, while the drop in oil prices led to declines in materials and energy prices. All three subadvisers are looking for companies with higher growth rates and strong balance sheets, so they were overweight in the technology sector and underweight in energy companies, which tend to have lower growth rates and more leveraged balance sheets.
From a country perspective, both William Blair and Jennison showed strong stock selection in Japan and China, also helping returns.
Prudential Investments LLC (PI), an indirect, wholly owned subsidiary of Prudential Financial, Inc., serves as the investment manager for the Portfolio.
| 1 | The graph is based on the performance of Class I shares. Performance of Class II shares will be lower due to differences in the fee structure. Class II shares have associated 12b-1 and administrative fees at an annual rate of 0.25% and 0.15% respectively of the average daily net assets of the Class II shares. |
MSCI EAFE (Morgan Stanley Capital International Europe, Australasia, Far East) Index (GD) is an unmanaged, capitalization-weighted index generally accepted as a benchmark for major overseas markets. The GD version does not reflect the impact of withholding taxes on reinvested dividends. These returns do not include the effect of any investment management expenses. These returns would have been lower if they included the effect of these expenses. Investors cannot invest directly in a market index. For a complete list of holdings, refer to the Schedule of Investments section of this report.
Jennison Associates LLC is a registered investment adviser and a Prudential Financial company.
1
| | |
| The Prudential Series Fund, SP International Value Portfolio | | December 31, 2014 |
Investment Manager’s Report - As of December 31, 2014 (Unaudited)
| | | | | | | | | | | | |
| Average Annual Total Returns | | 1-Year | | | 5-Year | | | 10-Year | |
Portfolio | | | -6.04 | % | | | 4.90 | % | | | 5.02 | % |
MSCI EAFE® Index (GD) | | | -4.48 | | | | 5.81 | | | | 4.91 | |
Past performance does not guarantee future returns. The investment return and principal value of an investment will fluctuate, so that an investor’s shares, when redeemed, may be worth more or less than their original cost. Current performance may be lower or higher than the past performance data quoted.
Portfolio performance is net of investment fees and fund expenses, but not contract charges, which, if included, would significantly lower the performance quoted. Performance figures may reflect fee waivers and/or expense reimbursements. In the absence of such fee waivers and/or expense reimbursements, total returns would be lower.
$10,000 INVESTED OVER 10 YEARS
For the year ended December 31, 2014, the SP International Value Portfolio returned -6.04%.
The net assets of the Portfolio at December 31, 2014 were $83.3 million.
The Portfolio’s investment objective is long-term growth of capital. The Portfolio’s subadvisers are LSV Asset Management (LSV) and Lazard Asset Management, LLC. Thornburg Investment Management subadvised the Portfolio until its replacement by Lazard Asset Management, LLC in November.
The MSCI EAFE Index (GD) (the “Index”) fell by 4.48%. International investors in the value style had a more difficult time outperforming the Index than did international growth managers. The period was shaped by the steep fall in oil prices and the strengthening U.S. dollar, which had a negative impact on emerging economies, as well as by the increasing divergence in monetary policies among various countries’ central banks. In addition to the setbacks in the energy sector (which fell 18%), the Index’s slide was dominated by its financials sector; it makes up a quarter of the Index by capitalization and fell more than five percentage points. Most value managers were overweight in these sectors.
The Portfolio’s underperformance of the Index was largely due to mixed stock selection results. Its strength in the industrials sector was shown particularly by outperforming the Index in road & rail and airlines stocks. Gains in health care were largely driven by holdings in the pharmaceuticals industry. Conversely, the Portfolio’s relative performance was hindered by its stock selection in the consumer discretionary, consumer staples, materials, and utilities sectors. From a regional perspective, holdings in Western Europe, notably France, Germany, and the United Kingdom also detracted from relative performance.
A small, yet consistent, allocation to cash, held to assist with day-to-day cash flow management, had a slight negative impact on performance during the period.
From time-to-time, Thornburg would use currency forwards (a form of a derivative security) as a tool to hedge some of the currency risk from investing in non-U.S. stocks. This intermittent hedging strategy is not expected to have a significant impact on the performance of the overall Portfolio. Overall for 2014, foreign exchange hedging had a positive effect on the Portfolio.
Prudential Investments LLC (PI), an indirect, wholly owned subsidiary of Prudential Financial, Inc., serves as the investment manager for the Portfolio.
MSCI EAFE (Morgan Stanley Capital International Europe, Australasia, Far East) Index (GD) is an unmanaged, capitalization-weighted index generally accepted as a benchmark for major overseas markets. The GD version does not reflect the impact of withholding taxes on reinvested dividends. These returns do not include the effect of any investment management expenses. These returns would have been lower if they included the effect of these expenses. Investors cannot invest directly in a market index. For a complete list of holdings, refer to the Schedule of Investments section of this report.
2
| | |
The Prudential Series Fund, SP Prudential U.S. Emerging Growth Portfolio | | December 31, 2014 |
Investment Manager’s Report - As of December 31, 2014 (Unaudited)
| | | | | | | | | | | | |
| Average Annual Total Returns | | 1-Year | | | 5-Year | | | 10-Year | |
Portfolio: Class I | | | 9.51 | % | | | 15.15 | % | | | 10.69 | % |
Portfolio: Class II | | | 9.15 | | | | 14.68 | | | | 10.28 | |
Russell Midcap® Growth Index | | | 11.90 | | | | 16.94 | | | | 9.43 | |
S&P Midcap 400 Index | | | 9.77 | | | | 16.54 | | | | 9.71 | |
Past performance does not guarantee future returns. The investment return and principal value of an investment will fluctuate, so that an investor’s shares, when redeemed, may be worth more or less than their original cost. Current performance may be lower or higher than the past performance data quoted.
Portfolio performance is net of investment fees and fund expenses, but not contract charges, which, if included, would significantly lower the performance quoted. Unless noted otherwise, Index returns reflect performance beginning the closest month-end date to the Portfolio’s inception (Class II). The Russell Midcap® Growth Index is a trademark/service mark of the Frank Russell Company. Russell® is a
trademark of the Frank Russell Company. Performance figures may reflect fee waivers and/or expense reimbursements. In the absence of such fee waivers and/or expense reimbursements, total returns would be lower.
$10,000 INVESTED OVER 10 YEARS1
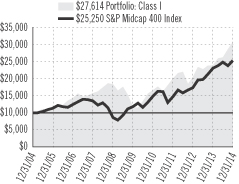
For the year ended December 31, 2014, the SP Prudential U.S. Emerging Growth Portfolio Class I returned 9.51% and Class II returned 9.15%.
The net assets of the Portfolio at December 31, 2014 were $250.0 million.
The Portfolio’s investment objective is long-term capital appreciation. The Portfolio’s subadviser is Jennison Associates LLC.
The Portfolio underperformed its benchmark, the Russell Midcap Growth Index (the Index), which advanced 11.90%. Stock selection in the energy and materials sectors detracted the most from relative results.
Energy names dominated the Portfolio’s largest detractors, including Noble Energy (NBL), Denbury Resources, Laredo Petroleum, and Whiting Petroleum. Laredo and Whiting were hurt primarily by their higher degree of financial leverage. Company-specific issues affected shares of exploration and production companies Denbury Resources and NBL. Denbury Resources reported disappointing production growth and lowered guidance for the year, as well as delayed plans for the formation of a master limited partnership. The Portfolio no longer holds a position in Denbury Resources. In addition to suffering the effects of the collapse in oil prices, Noble Energy has experienced delays with an agreement that, if signed, could lessen some of the seasonal swings experienced in NBL’s Israel gas production. This would likely help pricing given that Noble’s export agreements are higher than domestic prices. The Portfolio maintains a position in the stock.
The Portfolio’s investment process has not changed with the recent volatility in the energy sector. Jennison has met individually with the energy companies owned by the Portfolio, or have identified as potential candidates, in an attempt to identify the best long-term opportunities. The Portfolio’s current energy exposure is neutral to the Index and production cuts are being closely monitored.
Stock selection in consumer discretionary and information technology drove absolute and relative gain. Electronic Arts, F5 Networks, and Red Hat were standouts in information technology. Electronic Arts is moving faster than expected into digital downloads, which, in Jennison’s opinion, should drive future revenue growth.
Dollar Tree, O’Reilly Automotive, and L Brands led performance in the consumer discretionary sector. Consumer discretionary lagged over the last few quarters and the Portfolio benefited from a rebound in several companies, especially in retail, toward the end of the year. Within consumer discretionary, the Portfolio remains underweight relative to the Index, although less so than for most of 2014. Jennison believes the favorable U.S. economic outlook and lower energy prices are supportive of a number of key holdings in retailing, but the Portfolio’s underweight is largely due to under-exposure to media, where threats continue from the shift in user viewing habits and advertising spending away from traditional broadcast/cable TV.
United Continental holdings also performed well as airlines significantly outperformed the industrials sector and the overall market. Earnings, revenue, and guidance were solid as cost cuts and higher pricing took hold. United further announced a share buyback and appears on track to achieve several key revenue initiatives, including improvements to capacity management on Asian flights.
Prudential Investments LLC (PI), an indirect, wholly owned subsidiary of Prudential Financial, Inc., serves as the investment manager for the Portfolio.
| 1 | The graph is based on the performance of Class I shares. Performance of Class II shares will be lower due to differences in the fee structure. Class II shares have associated 12b-1 and administrative fees at an annual rate of 0.25% and 0.15% respectively of the average daily net assets of the Class II shares. |
Russell Midcap Growth Index is an unmanaged market cap-weighted index that measures the performance of those Russell Midcap companies with higher price-to-book ratios and higher forecasted growth values. S&P Midcap 400 Index is a widely accepted, unmanaged total return index of 400 domestic stocks measuring the performance of the midsize company segment of the U.S. stock market. These returns do not include the effect of any investment management expenses. These returns would have been lower if they included the effect of these expenses. Investors cannot invest directly in a market index. For a complete list of holdings, refer to the Schedule of Investments section of this report.
Jennison Associates LLC is a registered investment adviser and Prudential Financial company.
3
| | |
The Prudential Series Fund, SP Small Cap Value Portfolio | | December 31, 2014 |
Investment Manager’s Report - As of December 31, 2014 (Unaudited)
| | | | | | | | | | | | |
| Average Annual Total Returns | | 1-Year | | | 5-Year | | | 10-Year | |
Portfolio | | | 4.94 | % | | | 15.50 | % | | | 8.00 | % |
Russell 2000® Value Index | | | 4.22 | | | | 14.26 | | | | 6.89 | |
Russell 2500™ Index | | | 7.07 | | | | 16.36 | | | | 8.72 | |
Past performance does not guarantee future returns. The investment return and principal value of an investment will fluctuate, so that an investor’s shares, when redeemed, may be worth more or less than their original cost. Current performance may be lower or higher than the past performance data quoted.
Portfolio performance is net of investment fees and fund expenses, but not contract charges, which, if included, would significantly lower the performance quoted. The Russell 2000® Value and Russell 2500TM Index are trademark/service marks of the Frank Russell Company. Russell® is a trademark of the Frank Russell Company. Performance figures may reflect fee waivers and/or expense reimbursements. In the absence of such fee waivers and/or expense reimbursements, total returns would be lower.
$10,000 INVESTED OVER 10 YEARS
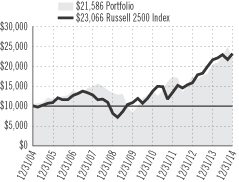
For the year ended December 31, 2014, the SP Small Cap Value Portfolio returned 4.94%.
The net assets of the Portfolio at December 31, 2014 were $217.1 million.
The Portfolio’s investment objective is long-term growth of capital. The Portfolio’s subadvisers are Goldman Sachs Asset Management, L.P. (Goldman) and ClearBridge Advisors, LLC (ClearBridge).
The Russell 2000 Value Index (the Index) rose 4.22%. In the U.S. market, large cap stocks substantially outperformed shares of smaller firms, in part because small caps began the year with higher prices (valuations). Among Russell small cap indexes, value shares slightly trailed growth. In an improving economy small cap and growth stocks often lead, but this was dampened by the relatively high valuations of smaller firms at the start of the period and by continuing uncertainty about future growth. About 40% of the Index comprises the financials sector, which outperformed and posted a respectable annual return. However, the Index was constrained by the sharply negative return of its energy sector, driven by the precipitous fall in the prices of carbon fuels, and by smaller declines in health care and materials.
Good broad-based stock selection within sectors was the main reason for the Portfolio’s relative outperformance in 2014. Stocks that contributed the most to the year’s gains were in the industrials (especially commercial services and supplies), consumer staples, and technology sectors. Sector allocation, however, detracted from relative results as the Portfolio’s underexposure to utilities and REITs (Real Estate Investment Trusts) served as a headwind, as investors moved to these investments because of their historically higher income in the form of interest and dividends.
The Portfolio also benefited from an overweight compared with the Index in the larger companies within its universe, those with a weighted-average market capitalization above $1.5 billion. Investors substantially preferred the relative safety and liquidity of these shares over the smaller end of the capitalization range.
Of the two subadvisers, ClearBridge trailed the Index, especially in the fourth quarter. While stock selection was a modest advantage for ClearBridge in 2014, its large underweights in REITs and utilities hurt its relative performance.
Prudential Investments LLC (PI), an indirect, wholly owned subsidiary of Prudential Financial, Inc., serves as the investment manager for the Portfolio.
Russell 2000 Value Index is an unmanaged index that measures the performance of those Russell 2000 companies with lower price-to-book ratios and lower forecasted growth values. Russell 2500 Index is an unmanaged market cap-weighted index that measures the performance of the 2,500 smallest companies in the Russell 3000 Index, which represents approximately 17% of the total market capitalization of the Russell 3000 Index. These returns do not include the effect of any investment management expenses. These returns would have been lower if they included the effect of these expenses. Investors cannot invest directly in a market index. For a complete list of holdings, refer to the Schedule of Investments section of this report.
4
| | |
Prudential Series Fund Presentation of Portfolio Holdings — unaudited | | December 31, 2014 |
| | | | |
| SP International Growth | |
| Five Largest Holdings | | | (% of Net Assets | ) |
Tencent Holdings Ltd. | | | 2.4% | |
Continental AG | | | 2.2% | |
St. James's Place PLC | | | 2.1% | |
| Alibaba Group Holding Ltd., ADR | | | 1.9% | |
Bayer AG. | | | 1.9% | |
| | | | |
| SP International Value | |
| Five Largest Holdings | | | (% of Net Assets | ) |
Novartis AG | | | 2.1% | |
Royal Dutch Shell PLC
(Class B Stock) | | | 1.7% | |
KDDI Corp. | | | 1.6% | |
| Lloyds Banking Group PLC | | | 1.3% | |
| Sumitomo Mitsui Financial Group, Inc. | | | 1.3% | |
| | | | |
| SP Prudential U.S. Emerging Growth | |
| Five Largest Holdings | | | (% of Net Assets | ) |
| SBA Communications Corp. (Class A Stock) | | | 2.7% | |
Dollar Tree, Inc., Multiline Retail | | | 2.3% | |
| Crown Castle Intl Corp, Real Estate Investment Trusts (REITs) | | | 2.1% | |
| Red Hat, Inc., Software | | | 2.0% | |
Vantiv, Inc., IT Services | | | 1.9% | |
| | | | |
| SP Small Cap Value | |
| Five Largest Holdings | | | (% of Net Assets | ) |
| Pebblebrook Hotel Trust | | | 1.5% | |
| iShares Russell 2000 Value Index Fund | | | 1.4% | |
| Wintrust Financial Corp. | | | 1.4% | |
| SVB Financial Group | | | 1.3% | |
| Iberiabank Corp. | | | 1.3% | |
For a complete list of holdings, please refer to the Schedule of Investments section of this report. Holdings reflect only long-term investments. Holdings/Issues/Sectors are subject to change.
| | |
The Prudential Series Fund Fees and Expenses — unaudited | | December 31, 2014 |
As a contract owner investing in Portfolios of the Fund through a variable annuity or variable life contract, you incur ongoing costs, including management fees, and other Portfolio expenses. This example is intended to help you understand your ongoing costs (in dollars) of investing in the Fund and to compare these costs with the ongoing costs of investing in other investment options. This example does not reflect fees and charges under your variable annuity or variable life contract. If contract charges were included, the costs shown below would be higher. Please consult the prospectus for your contract for more information about contract fees and charges.
The example is based on an investment of $1,000 invested at the beginning of the period and held for the entire period July 1, 2014 through December 31, 2014.
Actual Expenses
The first line of the table below provides information about actual account values and actual expenses. You may use this information, together with the amount you invested, to estimate the Portfolio expenses that you paid over the period. Simply divide your account value by $1,000 (for example, an $8,600 account value divided by $1,000 = 8.6), then multiply the result by the number in the first line under the heading entitled “Expenses Paid During the Six-Month Period” to estimate the Portfolio expenses you paid on your account during this period. As noted above, the table does not reflect variable contract fees and charges.
Hypothetical Example for Comparison Purposes
The second line of the table below provides information about hypothetical account values and hypothetical expenses based on the Portfolio’s actual expense ratio and an assumed rate of return of 5% per year before expenses, which is not the Portfolio’s actual return. The hypothetical account values and expenses may not be used to estimate the actual ending account balance or expenses you paid for the period. You may use this information to compare the ongoing costs of investing in the Portfolio and other investment options. To do so, compare this 5% hypothetical example with the 5% hypothetical examples that appear in the shareholder reports of the other investment options.
Please note that the expenses shown in the table are meant to highlight your ongoing Portfolio costs only and do not reflect any contract fees and charges, such as sales charges (loads), insurance charges or administrative charges. Therefore the second line of the table is useful to compare ongoing investment option costs only, and will not help you determine the relative total costs of owning different contracts. In addition, if these contract fee and charges were included, your costs would have been higher.
| | | | | | | | | | | | | | | | | | |
| The Prudential Series Fund Portfolios | | Beginning
Account Value
July 1, 2014 | | | Ending
Account Value
December 31, 2014 | | | Annualized Expense
Ratio based on the
Six-Month period | | | Expenses Paid
During the
Six-Month period* | |
| SP International Growth (Class I) | | Actual | | $ | 1,000.00 | | | $ | 944.40 | | | | 1.23 | % | | $ | 6.03 | |
| | Hypothetical | | $ | 1,000.00 | | | $ | 1,019.00 | | | | 1.23 | % | | $ | 6.26 | |
| SP International Growth (Class II) | | Actual | | $ | 1,000.00 | | | $ | 943.40 | | | | 1.63 | % | | $ | 7.98 | |
| | Hypothetical | | $ | 1,000.00 | | | $ | 1,016.99 | | | | 1.63 | % | | $ | 8.29 | |
SP International Value (Class I) | | Actual | | $ | 1,000.00 | | | $ | 920.00 | | | | 1.46 | % | | $ | 7.07 | |
| | Hypothetical | | $ | 1,000.00 | | | $ | 1,017.85 | | | | 1.46 | % | | $ | 7.43 | |
| SP Prudential U.S. Emerging Growth (Class I) | | Actual | | $ | 1,000.00 | | | $ | 1,054.20 | | | | 0.69 | % | | $ | 3.57 | |
| | Hypothetical | | $ | 1,000.00 | | | $ | 1,021.73 | | | | 0.69 | % | | $ | 3.52 | |
| SP Prudential U.S. Emerging Growth (Class II) | | Actual | | $ | 1,000.00 | | | $ | 1,052.00 | | | | 1.09 | % | | $ | 5.64 | |
| | Hypothetical | | $ | 1,000.00 | | | $ | 1,019.71 | | | | 1.09 | % | | $ | 5.55 | |
| SP Small Cap Value (Class I) | | Actual | | $ | 1,000.00 | | | $ | 999.50 | | | | 1.02 | % | | $ | 5.14 | |
| | Hypothetical | | $ | 1,000.00 | | | $ | 1,020.06 | | | | 1.02 | % | | $ | 5.19 | |
* Portfolio expenses (net of fee waivers or subsidies, if any) for each share class are equal to the annualized expense ratio for each share class (provided in the table), multiplied by the average account value over the period, multiplied by the 184 days in the six-month period ended December 31, 2014, and divided by the 365 days in the Portfolio’s fiscal year ended December 31, 2014 (to reflect the six-month period). Expenses presented in the table include the expenses of any underlying portfolios in which the Portfolio may invest.
| | | | | | |
| | | SP INTERNATIONAL GROWTH PORTFOLIO | | |
| |
| SCHEDULE OF INVESTMENTS | | December 31, 2014 |
| | | | | | | | |
| LONG-TERM INVESTMENTS — 98.5% | | | | |
| COMMON STOCKS — 97.6% | | Shares
| | | Value
(Note 2)
| |
Australia — 0.5% | | | | | | | | |
Brambles Ltd. | | | 32,575 | | | $ | 280,609 | |
Insurance Australia Group Ltd. | | | 23,200 | | | | 117,798 | |
| | | | | | |
|
|
|
| | | | | | | | 398,407 | |
| | | | | | |
|
|
|
Austria — 0.4% | | | | | | | | |
Andritz AG | | | 5,360 | | | | 294,673 | |
| | | | | | |
|
|
|
Belgium — 0.2% | | | | | | | | |
Colruyt SA | | | 4,410 | | | | 205,019 | |
| | | | | | |
|
|
|
Brazil — 1.3% | | | | | | | | |
Cielo SA | | | 32,804 | | | | 514,236 | |
Estacio Participacoes SA | | | 42,034 | | | | 376,665 | |
Kroton Educacional SA | | | 23,200 | | | | 135,279 | |
| | | | | | |
|
|
|
| | | | | | | | 1,026,180 | |
| | | | | | |
|
|
|
Canada — 4.9% | | | | | | | | |
Alimentation Couche-Tard, Inc. (Class B Stock) | | | 21,311 | | | | 893,125 | |
Bank of Nova Scotia (The) | | | 2,208 | | | | 126,022 | |
Brookfield Asset Management, Inc. (Class A Stock) | | | 8,293 | | | | 415,728 | |
Canadian Pacific Railway Ltd. | | | 7,626 | | | | 1,469,454 | |
Cenovus Energy, Inc. | | | 6,904 | | | | 142,442 | |
CI Financial Corp. | | | 6,780 | | | | 188,437 | |
Home Capital Group, Inc. | | | 1,900 | | | | 78,482 | |
Shawcor Ltd. | | | 6,045 | | | | 220,613 | |
Suncor Energy, Inc. | | | 15,365 | | | | 488,009 | |
| | | | | | |
|
|
|
| | | | | | | | 4,022,312 | |
| | | | | | |
|
|
|
China — 8.1% | | | | | | | | |
Alibaba Group Holding Ltd., ADR*(a) | | | 14,879 | | | | 1,546,523 | |
Baidu, Inc., ADR* | | | 4,841 | | | | 1,103,603 | |
China Overseas Land & Investment Ltd. | | | 60,000 | | | | 177,494 | |
Lenovo Group Ltd. | | | 192,000 | | | | 250,678 | |
NetEase, Inc., ADR | | | 1,753 | | | | 173,792 | |
PICC Property & Casualty Co. Ltd. (Class H Stock) | | | 167,000 | | | | 322,264 | |
Tencent Holdings Ltd. | | | 137,070 | | | | 1,983,256 | |
Vipshop Holdings Ltd., ADS*(a) | | | 52,440 | | | | 1,024,678 | |
| | | | | | |
|
|
|
| | | | | | | | 6,582,288 | |
| | | | | | |
|
|
|
Denmark — 2.5% | | | | | | | | |
Coloplast A/S (Class B Stock) | | | 3,565 | | | | 298,335 | |
Jyske Bank A/S* | | | 6,047 | | | | 305,654 | |
Novo Nordisk A/S (Class B Stock) | | | 33,001 | | | | 1,395,935 | |
| | | | | | |
|
|
|
| | | | | | | | 1,999,924 | |
| | | | | | |
|
|
|
Finland — 0.4% | | | | | | | | |
Sampo OYJ (Class A Stock) | | | 6,535 | | | | 305,933 | |
| | | | | | |
|
|
|
France — 5.1% | | | | | | | | |
Arkema SA | | | 3,257 | | | | 215,408 | |
BNP Paribas SA | | | 4,415 | | | | 260,636 | |
Cap Gemini SA | | | 4,881 | | | | 349,076 | |
Dassault Systemes SA | | | 12,275 | | | | 748,536 | |
Pernod Ricard SA | | | 2,270 | | | | 252,283 | |
Publicis Groupe SA | | | 4,790 | | | | 343,518 | |
Rexel SA | | | 18,995 | | | | 340,318 | |
Sanofi | | | 4,510 | | | | 411,180 | |
Schneider Electric SE | | | 4,680 | | | | 340,842 | |
| | | | | | | | |
COMMON STOCKS
(continued) | | Shares
| | | Value
(Note 2)
| |
France (continued) | | | | | | | | |
Sodexo | | | 4,580 | | | $ | 448,311 | |
Total SA | | | 5,145 | | | | 263,589 | |
Valeo SA | | | 1,486 | | | | 184,904 | |
| | | | | | |
|
|
|
| | | | | | | | 4,158,601 | |
| | | | | | |
|
|
|
Germany — 7.5% | | | | | | | | |
Bayer AG | | | 11,214 | | | | 1,528,567 | |
Bayerische Motoren Werke AG | | | 2,576 | | | | 277,998 | |
Brenntag AG | | | 6,585 | | | | 368,169 | |
Continental AG | | | 8,510 | | | | 1,794,958 | |
Deutsche Boerse AG | | | 4,595 | | | | 326,530 | |
KUKA AG | | | 2,926 | | | | 206,963 | |
Linde AG | | | 1,875 | | | | 345,380 | |
Rational AG | | | 377 | | | | 118,128 | |
SAP SE, ADR(a) | | | 4,880 | | | | 339,892 | |
Wirecard AG | | | 18,466 | | | | 805,196 | |
| | | | | | |
|
|
|
| | | | | | | | 6,111,781 | |
| | | | | | |
|
|
|
Hong Kong — 0.7% | | | | | | | | |
AIA Group Ltd. | | | 53,600 | | | | 295,629 | |
Jardine Matheson Holdings Ltd. | | | 4,532 | | | | 276,679 | |
| | | | | | |
|
|
|
| | | | | | | | 572,308 | |
| | | | | | |
|
|
|
India — 1.0% | | | | | | | | |
HDFC Bank Ltd., ADR | | | 9,200 | | | | 466,900 | |
Tata Motors Ltd., ADR | | | 7,374 | | | | 311,773 | |
| | | | | | |
|
|
|
| | | | | | | | 778,673 | |
| | | | | | |
|
|
|
Indonesia — 1.1% | | | | | | | | |
Bank Mandiri Persero Tbk PT | | | 220,912 | | | | 192,114 | |
Bank Rakyat Indonesia Persero Tbk PT | | | 346,800 | | | | 325,985 | |
Tower Bersama Infrastructure Tbk PT | | | 205,203 | | | | 160,493 | |
Tower Bersama Infrastructure Tbk PT, 144A(g) | | | 256,930 | | | | 200,949 | |
| | | | | | |
|
|
|
| | | | | | | | 879,541 | |
| | | | | | |
|
|
|
Ireland — 2.0% | | | | | | | | |
DCC PLC | | | 1,600 | | | | 88,085 | |
Ryanair Holdings PLC, ADR* | | | 4,320 | | | | 307,886 | |
Shire PLC | | | 17,357 | | | | 1,230,615 | |
| | | | | | |
|
|
|
| | | | | | | | 1,626,586 | |
| | | | | | |
|
|
|
Israel — 2.1% | | | | | | | | |
Bezeq Israeli Telecommunication Corp. Ltd. | | | 229,594 | | | | 407,258 | |
Check Point Software Technologies Ltd.*(a) | | | 11,531 | | | | 905,991 | |
Teva Pharmaceutical Industries Ltd., ADR | | | 7,291 | | | | 419,305 | |
| | | | | | |
|
|
|
| | | | | | | | 1,732,554 | |
| | | | | | |
|
|
|
Italy — 4.2% | | | | | | | | |
Anima Holding SpA* | | | 44,807 | | | | 225,415 | |
Anima Holding SpA, 144A*(g) | | | 43,922 | | | | 220,962 | |
Azimut Holding SpA | | | 44,547 | | | | 967,760 | |
Brembo SpA | | | 10,742 | | | | 360,037 | |
Brunello Cucinelli SpA(a) | | | 15,228 | | | | 340,137 | |
Intesa Sanpaolo SpA | | | 122,333 | | | | 354,877 | |
Luxottica Group SpA | | | 17,591 | | | | 964,321 | |
| | | | | | |
|
|
|
| | | | | | | | 3,433,509 | |
| | | | | | |
|
|
|
SEE NOTES TO FINANCIAL STATEMENTS.
A1
| | | | | | |
| | | SP INTERNATIONAL GROWTH PORTFOLIO (continued) | | |
| |
| SCHEDULE OF INVESTMENTS | | December 31, 2014 |
| | | | | | | | |
COMMON STOCKS
(continued) | | Shares
| | | Value
(Note 2)
| |
Japan — 17.2% | | | | | | | | |
Astellas Pharma, Inc. | | | 24,000 | | | $ | 334,130 | |
Daikin Industries Ltd. | | | 5,300 | | | | 339,858 | |
Daito Trust Construction Co. Ltd. | | | 1,400 | | | | 158,813 | |
FANUC Corp. | | | 8,995 | | | | 1,483,099 | |
Fuji Heavy Industries Ltd. | | | 38,996 | | | | 1,379,912 | |
Hoya Corp. | | | 7,100 | | | | 240,156 | |
Kansai Paint Co. Ltd. | | | 33,600 | | | | 520,530 | |
Kao Corp. | | | 7,200 | | | | 283,929 | |
Keyence Corp. | | | 1,400 | | | | 623,833 | |
Minebea Co. Ltd. | | | 53,843 | | | | 795,148 | |
Miraca Holdings, Inc. | | | 6,000 | | | | 258,113 | |
Murata Manufacturing Co. Ltd. | | | 11,666 | | | | 1,273,006 | |
Nidec Corp. | | | 10,093 | | | | 651,863 | |
Nihon Kohden Corp. | | | 4,200 | | | | 206,961 | |
Nitori Holdings Co. Ltd. | | | 3,000 | | | | 161,186 | |
Ono Pharmaceutical Co. Ltd. | | | 6,472 | | | | 573,002 | |
ORIX Corp. | | | 22,400 | | | | 281,855 | |
Pigeon Corp. | | | 14,545 | | | | 848,062 | |
Recruit Holdings Co. Ltd.* | | | 1,800 | | | | 51,695 | |
Santen Pharmaceutical Co. Ltd. | | | 4,700 | | | | 253,023 | |
Secom Co. Ltd. | | | 3,900 | | | | 224,073 | |
SMC Corp. | | | 3,000 | | | | 786,672 | |
SoftBank Corp. | | | 5,300 | | | | 315,473 | |
Sugi Holdings Co. Ltd. | | | 4,700 | | | | 191,852 | |
Sumitomo Mitsui Financial Group, Inc. | | | 8,500 | | | | 307,298 | |
Sundrug Co. Ltd. | | | 3,300 | | | | 134,898 | |
Toyota Motor Corp. | | | 8,500 | | | | 529,698 | |
Unicharm Corp. | | | 32,950 | | | | 789,782 | |
| | | | | | |
|
|
|
| | | | | | | | 13,997,920 | |
| | | | | | |
|
|
|
Macau — 0.2% | | | | | | | | |
MGM China Holdings Ltd. | | | 73,600 | | | | 185,834 | |
| | | | | | |
|
|
|
Mexico — 0.5% | | | | | | | | |
Alsea SAB de CV* | | | 117,779 | | | | 325,466 | |
Alsea SAB de CV, 144A*(g) | | | 20,763 | | | | 57,376 | |
| | | | | | |
|
|
|
| | | | | | | | 382,842 | |
| | | | | | |
|
|
|
Netherlands — 1.9% | | | | | | | | |
Akzo Nobel NV | | | 5,407 | | | | 374,111 | |
ASML Holding NV | | | 4,860 | | | | 525,112 | |
Koninklijke Ahold NV | | | 17,255 | | | | 306,672 | |
NXP Semiconductors NV* | | | 2,552 | | | | 194,973 | |
Royal Dutch Shell PLC (Class A Stock) | | | 5,015 | | | | 167,146 | |
| | | | | | |
|
|
|
| | | | | | | | 1,568,014 | |
| | | | | | |
|
|
|
Norway — 0.4% | | | | | | | | |
DnB ASA | | | 11,155 | | | | 164,543 | |
Telenor ASA | | | 9,528 | | | | 192,738 | |
| | | | | | |
|
|
|
| | | | | | | | 357,281 | |
| | | | | | |
|
|
|
Philippines — 0.9% | | | | | | | | |
Universal Robina Corp. | | | 162,333 | | | | 707,753 | |
| | | | | | |
|
|
|
Singapore — 0.2% | | | | | | | | |
United Overseas Bank Ltd. | | | 10,400 | | | | 191,922 | |
| | | | | | |
|
|
|
South Africa — 2.0% | | | | | | | | |
Aspen Pharmacare Holdings Ltd.* | | | 29,951 | | | | 1,044,873 | |
Aspen Pharmacare Holdings Ltd., 144A*(g) | | | 2,865 | | | | 99,949 | |
| | | | | | | | |
COMMON STOCKS
(continued) | | Shares
| | | Value
(Note 2)
| |
South Africa (continued) | | | | | | | | |
Bidvest Group Ltd. (The) | | | 8,331 | | | $ | 217,805 | |
Discovery Ltd. | | | 28,690 | | | | 274,693 | |
| | | | | | |
|
|
|
| | | | | | | | 1,637,320 | |
| | | | | | |
|
|
|
South Korea — 1.7% | | | | | | | | |
NAVER Corp.* | | | 1,484 | | | | 950,406 | |
Samsung Electronics Co. Ltd. | | | 395 | | | | 474,886 | |
| | | | | | |
|
|
|
| | | | | | | | 1,425,292 | |
| | | | | | |
|
|
|
Spain — 2.0% | | | | | | | | |
Amadeus IT Holding SA (Class A Stock) | | | 6,000 | | | | 238,965 | |
Inditex SA | | | 48,177 | | | | 1,374,271 | |
| | | | | | |
|
|
|
| | | | | | | | 1,613,236 | |
| | | | | | |
|
|
|
Sweden — 2.8% | | | | | | | | |
Assa Abloy AB (Class B Stock) | | | 15,664 | | | | 827,318 | |
Atlas Copco AB (Class A Stock) | | | 10,204 | | | | 283,933 | |
Hexagon AB (Class B Stock) | | | 16,413 | | | | 506,333 | |
Nordea Bank AB | | | 23,045 | | | | 266,764 | |
Telefonaktiebolaget LM Ericsson (Class B Stock) | | | 33,150 | | | | 401,384 | |
| | | | | | |
|
|
|
| | | | | | | | 2,285,732 | |
| | | | | | |
|
|
|
Switzerland — 7.2% | | | | | | | | |
Actelion Ltd.* | | | 2,290 | | | | 263,627 | |
Adecco SA* | | | 2,127 | | | | 146,209 | |
Cie Financiere Richemont SA | | | 1,470 | | | | 130,328 | |
Geberit AG | | | 941 | | | | 318,343 | |
Givaudan SA* | | | 313 | | | | 561,477 | |
Julius Baer Group Ltd.* | | | 5,690 | | | | 259,794 | |
Novartis AG | | | 13,525 | | | | 1,254,356 | |
Partners Group Holding AG | | | 2,037 | | | | 592,639 | |
Roche Holding AG | | | 4,913 | | | | 1,331,139 | |
SGS SA | | | 235 | | | | 479,863 | |
Sika AG | | | 10 | | | | 29,500 | |
Sonova Holding AG | | | 1,840 | | | | 270,315 | |
UBS Group AG* | | | 14,490 | | | | 249,079 | |
| | | | | | |
|
|
|
| | | | | | | | 5,886,669 | |
| | | | | | |
|
|
|
Taiwan — 0.2% | | | | | | | | |
MediaTek, Inc. | | | 12,000 | | | | 174,449 | |
| | | | | | |
|
|
|
Thailand — 1.7% | | | | | | | | |
CP ALL PCL | | | 442,910 | | | | 572,148 | |
Home Product Center PCL | | | 2,125,222 | | | | 532,920 | |
Minor International PCL | | | 258,931 | | | | 255,783 | |
| | | | | | |
|
|
|
| | | | | | | | 1,360,851 | |
| | | | | | |
|
|
|
United Kingdom — 13.6% | | | | | | | | |
Amlin PLC | | | 57,179 | | | | 424,144 | |
ARM Holdings PLC | | | 64,426 | | | | 989,739 | |
Ashtead Group PLC | | | 51,540 | | | | 915,347 | |
AstraZeneca PLC | | | 2,976 | | | | 210,198 | |
Barclays PLC | | | 85,365 | | | | 320,916 | |
BG Group PLC | | | 10,993 | | | | 147,105 | |
BTG PLC* | | | 40,721 | | | | 502,614 | |
Bunzl PLC | | | 18,642 | | | | 509,621 | |
Burberry Group PLC | | | 40,384 | | | | 1,024,614 | |
Compass Group PLC | | | 27,886 | | | | 476,653 | |
Howden Joinery Group PLC | | | 48,030 | | | | 299,647 | |
SEE NOTES TO FINANCIAL STATEMENTS.
A2
| | | | | | |
| | | SP INTERNATIONAL GROWTH PORTFOLIO (continued) | | |
| |
| SCHEDULE OF INVESTMENTS | | December 31, 2014 |
| | | | | | | | |
COMMON STOCKS
(continued) | | Shares
| | | Value
(Note 2)
| |
United Kingdom (continued) | | | | | | | | |
InterContinental Hotels Group PLC | | | 6,329 | | | $ | 254,656 | |
Just Eat PLC* | | | 30,796 | | | | 148,652 | |
Just Eat PLC, 144A*(g) | | | 74,390 | | | | 359,080 | |
Prudential PLC | | | 16,240 | | | | 375,461 | |
Reckitt Benckiser Group PLC | | | 1,169 | | | | 94,682 | |
Reed Elsevier PLC | | | 52,156 | | | | 890,929 | |
SABMiller PLC | | | 4,785 | | | | 249,448 | |
Spectris PLC | | | 4,300 | | | | 140,431 | |
St. James’s Place PLC | | | 137,198 | | | | 1,729,918 | |
TalkTalk Telecom Group PLC | | | 81,685 | | | | 384,457 | |
Travis Perkins PLC | | | 11,385 | | | | 327,707 | |
Wolseley PLC | | | 295 | | | | 16,866 | |
WPP PLC | | | 12,958 | | | | 269,419 | |
| | | | | | |
|
|
|
| | | | | | | | 11,062,304 | |
| | | | | | |
|
|
|
United States — 3.1% | | | | | | | | |
AON PLC | | | 4,660 | | | | 441,908 | |
Jazz Pharmaceuticals PLC* | | | 7,239 | | | | 1,185,241 | |
Nielsen NV(a) | | | 8,720 | | | | 390,046 | |
Stratasys Ltd.*(a) | | | 6,320 | | | | 525,255 | |
| | | | | | |
|
|
|
| | | | | | | | 2,542,450 | |
| | | | | | |
|
|
|
TOTAL COMMON STOCKS
(cost $70,094,958) | | | | 79,508,158 | |
| | | | | | |
|
|
|
| PREFERRED STOCKS — 0.9% | | | | | | | | |
Germany | | | | | | | | |
Henkel AG & Co. KGaA (PRFC) | | | 3,490 | | | | 375,937 | |
Volkswagen AG (PRFC) | | | 1,420 | | | | 315,603 | |
| | | | | | |
|
|
|
TOTAL PREFERRED STOCKS
(cost $653,127) | | | | 691,540 | |
| | | | | | |
|
|
|
| | | Units
| | | | |
| WARRANTS* | | | | | | | | |
Thailand | | | | | | | | |
Minor International PCL(g)
(cost $ — ) | | | 13,111 | | | | 1,937 | |
| | | | | | |
|
|
|
TOTAL LONG-TERM INVESTMENTS
(cost $70,748,085) | | | | 80,201,635 | |
| | | | | | |
|
|
|
| | | | | | | | |
| | | Shares
| | | Value
(Note 2)
| |
| SHORT-TERM INVESTMENT — 5.8% | | | | | |
AFFILIATED MONEY MARKET MUTUAL FUND | |
Prudential Investment Portfolios 2 — Prudential Core Taxable Money Market Fund (cost $4,753,274; includes $3,358,338 of cash collateral for securities on loan) (Note 4)(b)(w) | | | 4,753,274 | | | $ | 4,753,274 | |
| | | | | | |
|
|
|
TOTAL INVESTMENTS — 104.3%
(cost $75,501,359) | | | | 84,954,909 | |
LIABILITIES IN EXCESS OF
OTHER ASSETS — (4.3)% | | | | (3,514,770 | ) |
| | | | | | |
|
|
|
NET ASSETS — 100.0% | | | $ | 81,440,139 | |
| | | | | | |
|
|
|
See the Glossary for abbreviations used in the Portfolio descriptions.
| * | Non-income producing security. |
| (a) | All or a portion of security is on loan. The aggregate market value of such securities, including those sold and pending settlement, is $3,256,716; cash collateral of $3,358,338 (included in liabilities) was received with which the Fund purchased highly liquid short-term investments. |
| (b) | Represents security, or a portion thereof, purchased with cash collateral received for securities on loan. |
| (g) | Indicates a security or securities that has been deemed illiquid. |
| (w) | Prudential Investments LLC, the manager of the Portfolio, also serves as manager of the Prudential Investment Portfolios 2 — Prudential Core Taxable Money Market Fund. |
SEE NOTES TO FINANCIAL STATEMENTS.
A3
| | | | | | |
| | | SP INTERNATIONAL GROWTH PORTFOLIO (continued) | | |
| |
| SCHEDULE OF INVESTMENTS | | December 31, 2014 |
Various inputs are used in determining the value of the Portfolio’s investments. These inputs are summarized in the three broad levels listed below.
| Level 1— | quoted prices generally in active markets for identical securities. |
| Level 2— | quoted prices for similar securities, interest rates and yield curves, prepayment speeds, foreign currency exchange rates and other significant observable inputs. |
| Level 3— | significant unobservable inputs for securities valued in accordance with Board approved fair valuation procedures. |
The following is a summary of the inputs used as of December 31, 2014 in valuing such portfolio securities:
| | | | | | | | | | | | |
| | | Level 1
| | | Level 2
| | | Level 3
| |
Investments in Securities | | | | | | | | | |
Common Stocks | | | | | | | | | | | | |
Australia | | $ | — | | | $ | 398,407 | | | $ | — | |
Austria | | | — | | | | 294,673 | | | | — | |
Belgium | | | — | | | | 205,019 | | | | — | |
Brazil | | | 1,026,180 | | | | — | | | | — | |
Canada | | | 4,022,312 | | | | — | | | | — | |
China | | | 3,848,596 | | | | 2,733,692 | | | | — | |
Denmark | | | — | | | | 1,999,924 | | | | — | |
Finland | | | — | | | | 305,933 | | | | — | |
France | | | — | | | | 4,158,601 | | | | — | |
Germany | | | 339,892 | | | | 5,771,889 | | | | — | |
Hong Kong | | | 276,679 | | | | 295,629 | | | | — | |
India | | | 778,673 | | | | — | | | | — | |
Indonesia | | | — | | | | 879,541 | | | | — | |
Ireland | | | 307,886 | | | | 1,318,700 | | | | — | |
Israel | | | 1,325,296 | | | | 407,258 | | | | — | |
Italy | | | — | | | | 3,433,509 | | | | — | |
Japan | | | 51,695 | | | | 13,946,225 | | | | — | |
Macau | | | — | | | | 185,834 | | | | — | |
Mexico | | | 325,466 | | | | 57,376 | | | | — | |
Netherlands | | | 194,973 | | | | 1,373,041 | | | | — | |
Norway | | | — | | | | 357,281 | | | | — | |
Philippines | | | — | | | | 707,753 | | | | — | |
Singapore | | | — | | | | 191,922 | | | | — | |
South Africa | | | — | | | | 1,637,320 | | | | — | |
South Korea | | | — | | | | 1,425,292 | | | | — | |
Spain | | | — | | | | 1,613,236 | | | | — | |
Sweden | | | — | | | | 2,285,732 | | | | — | |
Switzerland | | | 249,079 | | | | 5,637,590 | | | | — | |
Taiwan | | | — | | | | 174,449 | | | | — | |
Thailand | | | 1,360,851 | | | | — | | | | — | |
United Kingdom | | | 148,652 | | | | 10,913,652 | | | | — | |
United States | | | 2,542,450 | | | | — | | | | — | |
Preferred Stocks | | | | | | | | | | | | |
Germany | | | — | | | | 691,540 | | | | — | |
Warrants | | | | | | | | | | | | |
Thailand | | | — | | | | 1,937 | | | | — | |
Affiliated Money Market Mutual Fund | | | 4,753,274 | | | | — | | | | — | |
| | |
|
|
| |
|
|
| |
|
|
|
Total | | $ | 21,551,954 | | | $ | 63,402,955 | | | $ | — | |
| | |
|
|
| |
|
|
| |
|
|
|
Fair Value of Level 2 investments at 12/31/13 was $78,768,941. An amount of $930,898 was transferred from Level 1 into Level 2 at 12/31/14 as a result of fair valuing such foreign securities using third party vendor modeling tools. Such fair values are used to reflect the impact of significant market movements between the time at which the fund normally values its securities and the earlier closing of foreign markets. It is the Portfolio’s policy to recognize transfers in and transfers out at the fair value as of the beginning of period.
SEE NOTES TO FINANCIAL STATEMENTS.
A4
| | | | | | |
| | | SP INTERNATIONAL GROWTH PORTFOLIO (continued) | | |
| |
| SCHEDULE OF INVESTMENTS | | December 31, 2014 |
The industry classification of investments and liabilities in excess of other assets shown as a percentage of net assets as of December 31, 2014 was as follows (unaudited):
| | | | |
Pharmaceuticals | | | 14.5 | % |
Internet Software & Services | | | 7.6 | |
Affiliated Money Market Mutual Fund (including 4.1% of collateral for securities on loan) | | | 5.8 | |
Insurance | | | 5.2 | |
Machinery | | | 5.0 | |
Banks | | | 3.9 | |
Electronic Equipment, Instruments & Components | | | 3.5 | |
Automobiles | | | 3.4 | |
Capital Markets | | | 3.3 | |
Textiles, Apparel & Luxury Goods | | | 3.1 | |
Trading Companies & Distributors | | | 3.0 | |
Specialty Retail | | | 3.0 | |
Auto Components | | | 2.8 | |
Food & Staples Retailing | | | 2.8 | |
Household Products | | | 2.6 | |
Chemicals | | | 2.5 | |
Hotels, Restaurants & Leisure | | | 2.5 | |
Software | | | 2.4 | |
IT Services | | | 2.4 | |
Semiconductors & Semiconductor Equipment | | | 2.2 | |
Media | | | 1.8 | |
Building Products | | | 1.8 | |
Road & Rail | | | 1.8 | |
Technology Hardware, Storage & Peripherals | | | 1.5 | |
| | | | |
Oil, Gas & Consumable Fuels | | | 1.5 | % |
Professional Services | | | 1.4 | |
Internet & Catalog Retail | | | 1.3 | |
Electrical Equipment | | | 1.2 | |
Diversified Telecommunication Services | | | 1.2 | |
Health Care Equipment & Supplies | | | 1.0 | |
Real Estate Management & Development | | | 0.9 | |
Food Products | | | 0.9 | |
Wireless Telecommunication Services | | | 0.9 | |
Diversified Financial Services | | | 0.7 | |
Industrial Conglomerates | | | 0.7 | |
Diversified Consumer Services | | | 0.7 | |
Commercial Services & Supplies | | | 0.7 | |
Beverages | | | 0.6 | |
Communications Equipment | | | 0.5 | |
Airlines | | | 0.4 | |
Personal Products | | | 0.3 | |
Biotechnology | | | 0.3 | |
Health Care Providers & Services | | | 0.3 | |
Energy Equipment & Services | | | 0.3 | |
Thrifts & Mortgage Finance | | | 0.1 | |
| | |
|
|
|
| | | | 104.3 | |
Liabilities in excess of other assets | | | (4.3 | ) |
| | |
|
|
|
| | | | 100.0 | % |
| | |
|
|
|
The Portfolio invested in derivative instruments during the reporting period. The primary types of risk associated with these derivative instruments are foreign exchange and equity risk.
The effect of such derivative instruments on the Portfolio’s financial position and financial performance as reflected in the Statement of Assets and Liabilities and Statement of Operations is presented in the summary below.
Fair values of derivative instruments as of December 31, 2014 as presented in the Statement of Assets and Liabilities:
| | | | | | | | | | | | |
Derivatives not accounted for as hedging instruments, carried at fair value
| | Asset Derivatives
| | | Liability Derivatives
| |
| | Balance Sheet Location
| | Fair Value
| | | Balance Sheet Location
| | Fair Value
| |
Equity contracts | | Unaffiliated investments | | $ | 1,937 | | | — | | $ | — | |
| | | | |
|
|
| | | |
|
|
|
The effects of derivative instruments on the Statement of Operations for the year ended December 31, 2014 are as follows:
| | | | | | | | | | | | |
Amount of Realized Gain or (Loss) on Derivatives Recognized in Income
| |
Derivatives not accounted for as hedging instruments, carried at fair value
| | Rights(1)
| | | Forward
Currency
Contracts(2)
| | | Total
| |
Foreign exchange contracts | | $ | — | | | $ | 1,201 | | | $ | 1,201 | |
Equity contracts | | | 16,228 | | | | — | | | | 16,228 | |
| | |
|
|
| |
|
|
| |
|
|
|
Total | | $ | 16,228 | | | $ | 1,201 | | | $ | 17,429 | |
| | |
|
|
| |
|
|
| |
|
|
|
|
Change in Unrealized Appreciation or (Depreciation) on Derivatives Recognized in Income
| |
Derivatives not accounted for as hedging instruments, carried at fair value
| | Warrants(3)
| | | Forward
Currency
Contracts(4)
| | | Total
| |
Foreign exchange contracts | | $ | — | | | $ | 514 | | | $ | 514 | |
Equity contracts | | | 1,937 | | | | — | | | | 1,937 | |
| | |
|
|
| |
|
|
| |
|
|
|
Total | | $ | 1,937 | | | $ | 514 | | | $ | 2,451 | |
| | |
|
|
| |
|
|
| |
|
|
|
| (1) | Included in net realized gain (loss) on investment transactions in the Statement of Operations. |
| (2) | Included in net realized gain (loss) on foreign currency transactions in the Statement of Operations. |
| (3) | Included in net change in unrealized appreciation (depreciation) on investments in the Statement of Operations. |
| (4) | Included in net change in unrealized appreciation (depreciation) on foreign currencies in the Statement of Operations. |
SEE NOTES TO FINANCIAL STATEMENTS.
A5
| | | | | | |
| | | SP INTERNATIONAL GROWTH PORTFOLIO (continued) | | |
STATEMENT OF ASSETS AND LIABILITIES
December 31, 2014
| | | | |
| ASSETS | | | | |
Investments at value, including securities on loan of $3,256,716: | | | | |
Unaffiliated investments (cost $70,748,085) | | $ | 80,201,635 | |
Affiliated investments (cost $4,753,274) | | | 4,753,274 | |
Foreign currency, at value (cost $5,900) | | | 5,696 | |
Tax reclaim receivable | | | 400,385 | |
Receivable for investments sold | | | 342,662 | |
Receivable for Series shares sold | | | 27,084 | |
Dividends receivable | | | 2,401 | |
Prepaid expenses | | | 876 | |
| | |
|
|
|
Total assets | | | 85,734,013 | |
| | |
|
|
|
| LIABILITIES | | | | |
Payable to broker for collateral for securities on loan | | | 3,358,338 | |
Payable for investments purchased | | | 733,535 | |
Accrued expenses | | | 135,438 | |
Management fee payable | | | 58,752 | |
Payable for Series shares reacquired | | | 4,114 | |
Distribution fee payable | | | 1,501 | |
Administration fee payable | | | 1,270 | |
Affiliated transfer agent fee payable | | | 926 | |
| | |
|
|
|
Total liabilities | | | 4,293,874 | |
| | |
|
|
|
| NET ASSETS | | $ | 81,440,139 | |
| | |
|
|
|
Net assets were comprised of: | | | | |
Paid-in capital | | $ | 104,448,493 | |
Retained earnings | | | (23,008,354 | ) |
| | |
|
|
|
Net assets, December 31, 2014 | | $ | 81,440,139 | |
| | |
|
|
|
| Class I: | | | | |
Net asset value and redemption price per share, $74,490,384 / 12,543,631 outstanding shares of beneficial interest | | $ | 5.94 | |
| | |
|
|
|
| Class II: | | | | |
Net asset value and redemption price per share, $6,949,755 / 1,192,572 outstanding shares of
beneficial interest | | $ | 5.83 | |
| | |
|
|
|
STATEMENT OF OPERATIONS
Year Ended December 31, 2014
| | | | |
| NET INVESTMENT INCOME | | | | |
| INCOME | | | | |
Unaffiliated dividend income (net of $173,666 foreign withholding tax) | | $ | 1,560,170 | |
Affiliated income from securities lending, net | | | 10,191 | |
Affiliated dividend income | | | 1,876 | |
| | |
|
|
|
Total income | | | 1,572,237 | |
| | |
|
|
|
| EXPENSES | | | | |
Management fee | | | 748,917 | |
Distribution fee—Class II | | | 19,838 | |
Administration fee—Class II | | | 11,903 | |
Custodian’s fees and expenses | | | 190,000 | |
Reports to shareholders | | | 59,000 | |
Audit fee | | | 28,000 | |
Transfer agent’s fees and expenses (including affiliated expense of $5,600) | | | 11,000 | |
Trustees’ fees | | | 11,000 | |
Legal fees and expenses | | | 10,000 | |
Commitment fee on syndicated credit agreement | | | 5,000 | |
Insurance fees | | | 1,000 | |
Loan interest expense | | | 144 | |
Miscellaneous | | | 33,756 | |
| | |
|
|
|
Total expenses | | | 1,129,558 | |
Less: Management fee waiver | | | (10,770 | ) |
| | |
|
|
|
Net expenses | | | 1,118,788 | |
| | |
|
|
|
| NET INVESTMENT INCOME | | | 453,449 | |
| | |
|
|
|
| REALIZED AND UNREALIZED GAIN (LOSS) ON INVESTMENTS AND FOREIGN CURRENCIES | | | | |
Net realized gain (loss) on: | | | | |
Investment transactions | | | 4,373,765 | |
Foreign currency transactions | | | (39,606 | ) |
| | |
|
|
|
| | | | 4,334,159 | |
| | |
|
|
|
Net change in unrealized appreciation (depreciation) on: | | | | |
Investments | | | (10,089,790 | ) |
Foreign currencies | | | (47,859 | ) |
| | |
|
|
|
| | | | (10,137,649 | ) |
| | |
|
|
|
| NET LOSS ON INVESTMENTS AND FOREIGN CURRENCIES | | | (5,803,490 | ) |
| | |
|
|
|
| NET DECREASE IN NET ASSETS RESULTING FROM OPERATIONS | | $ | (5,350,041 | ) |
| | |
|
|
|
STATEMENT OF CHANGES IN NET ASSETS
| | | | | | | | |
| | | Year Ended December 31,
| |
| | | 2014
| | | 2013
| |
| INCREASE (DECREASE) IN NET ASSETS | | | | | | | | |
| OPERATIONS | | | | | | | | |
Net investment income | | $ | 453,449 | | | $ | 300,660 | |
Net realized gain on investment and foreign currency transactions | | | 4,334,159 | | | | 10,287,070 | |
Net change in unrealized appreciation (depreciation) on investments and foreign currencies | | | (10,137,649 | ) | | | 5,250,619 | |
| | |
|
|
| |
|
|
|
NET INCREASE (DECREASE) IN NET ASSETS RESULTING FROM OPERATIONS | | | (5,350,041 | ) | | | 15,838,349 | |
| | |
|
|
| |
|
|
|
| SERIES SHARE TRANSACTIONS (NOTE 7) | | | | | | | | |
Series shares sold | | | 4,090,920 | | | | 6,792,290 | |
Series shares repurchased | | | (13,294,205 | ) | | | (16,145,802 | ) |
| | |
|
|
| |
|
|
|
NET DECREASE IN NET ASSETS FROM SERIES SHARE TRANSACTIONS | | | (9,203,285 | ) | | | (9,353,512 | ) |
| | |
|
|
| |
|
|
|
| TOTAL INCREASE (DECREASE) | | | (14,553,326 | ) | | | 6,484,837 | |
| NET ASSETS: | | | | | | | | |
Beginning of year | | | 95,993,465 | | | | 89,508,628 | |
| | |
|
|
| |
|
|
|
End of year | | $ | 81,440,139 | | | $ | 95,993,465 | |
| | |
|
|
| |
|
|
|
SEE NOTES TO FINANCIAL STATEMENTS.
A6
| | | | | | |
| | | SP INTERNATIONAL VALUE PORTFOLIO | | |
| |
| SCHEDULE OF INVESTMENTS | | December 31, 2014 |
| | | | | | | | |
| LONG-TERM INVESTMENTS — 97.1% | | | | |
| COMMON STOCKS | | Shares
| | | Value
(Note 2)
| |
Australia — 4.6% | | | | | | | | |
Ansell Ltd. | | | 16,315 | | | $ | 298,509 | |
Arrium Ltd. | | | 539,200 | | | | 93,303 | |
Ausdrill Ltd. | | | 62,500 | | | | 19,880 | |
Australia & New Zealand Banking Group Ltd. | | | 7,900 | | | | 205,558 | |
Bendigo & Adelaide Bank Ltd. | | | 32,600 | | | | 338,973 | |
Caltex Australia Ltd. | | | 12,062 | | | | 334,685 | |
Challenger Ltd. | | | 60,800 | | | | 321,178 | |
Downer EDI Ltd. | | | 65,200 | | | | 249,162 | |
Fortescue Metals Group Ltd. | | | 50,000 | | | | 109,782 | |
Independence Group NL | | | 70,900 | | | | 253,884 | |
Lend Lease Group | | | 28,600 | | | | 380,920 | |
Mineral Resources Ltd. | | | 25,100 | | | | 153,604 | |
National Australia Bank Ltd. | | | 14,800 | | | | 403,600 | |
Pacific Brands Ltd. | | | 311,300 | | | | 136,859 | |
Primary Health Care Ltd. | | | 35,100 | | | | 134,302 | |
Toll Holdings Ltd. | | | 82,500 | | | | 392,990 | |
| | | | | | |
|
|
|
| | | | | | | | 3,827,189 | |
| | | | | | |
|
|
|
Austria — 0.9% | | | | | | | | |
OMV AG | | | 8,300 | | | | 220,393 | |
UNIQA Insurance Group AG | | | 24,414 | | | | 229,126 | |
Voestalpine AG | | | 6,500 | | | | 256,836 | |
| | | | | | |
|
|
|
| | | | | | | | 706,355 | |
| | | | | | |
|
|
|
Belgium — 2.3% | | | | | | | | |
AGFA-Gevaert NV* | | | 84,400 | | | | 213,448 | |
Anheuser-Busch InBev NV | | | 8,298 | | | | 933,871 | |
bpost SA | | | 11,100 | | | | 278,839 | |
Delhaize Group SA | | | 6,400 | | | | 466,083 | |
| | | | | | |
|
|
|
| | | | | | | | 1,892,241 | |
| | | | | | |
|
|
|
Brazil — 0.3% | | | | | | | | |
Estacio Participacoes SA | | | 24,902 | | | | 223,146 | |
| | | | | | |
|
|
|
Canada — 1.1% | | | | | | | | |
MacDonald, Dettwiler & Associates Ltd. | | | 5,652 | | | | 461,919 | |
Rogers Communications, Inc. (Class B Stock) | | | 12,164 | | | | 472,928 | |
| | | | | | |
|
|
|
| | | | | | | | 934,847 | |
| | | | | | |
|
|
|
Denmark — 0.8% | | | | | | | | |
A.P. Moeller-Maersk A/S (Class B Stock) | | | 100 | | | | 198,895 | |
Carlsberg A/S (Class B Stock) | | | 3,165 | | | | 243,071 | |
TDC A/S | | | 33,100 | | | | 252,451 | |
| | | | | | |
|
|
|
| | | | | | | | 694,417 | |
| | | | | | |
|
|
|
Finland — 1.2% | | | | | | | | |
Sampo OYJ (Class A Stock) | | | 13,195 | | | | 617,718 | |
Tieto OYJ | | | 13,600 | | | | 352,444 | |
| | | | | | |
|
|
|
| | | | | | | | 970,162 | |
| | | | | | |
|
|
|
France — 8.0% | | | | | | | | |
Airbus Group NV | | | 7,746 | | | | 382,948 | |
Alstom SA* | | | 11,700 | | | | 377,357 | |
AXA SA | | | 10,900 | | | | 251,170 | |
BNP Paribas SA | | | 14,374 | | | | 848,558 | |
Cap Gemini SA | | | 7,263 | | | | 519,430 | |
Cie Generale des Etablissements Michelin | | | 3,800 | | | | 343,014 | |
| | | | | | | | |
COMMON STOCKS
(continued) | | Shares
| | | Value
(Note 2)
| |
France (continued) | | | | | | | | |
CNP Assurances | | | 7,300 | | | $ | 129,416 | |
Credit Agricole SA | | | 16,000 | | | | 206,537 | |
Electricite de France SA | | | 22,500 | | | | 619,390 | |
Renault SA | | | 3,400 | | | | 247,644 | |
Sanofi | | | 3,500 | | | | 319,097 | |
SCOR SE | | | 6,700 | | | | 203,013 | |
Societe Generale SA | | | 3,200 | | | | 133,921 | |
Thales SA | | | 8,700 | | | | 470,734 | |
Total SA | | | 9,600 | | | | 491,829 | |
Valeo SA | | | 6,165 | | | | 767,114 | |
Vinci SA | | | 6,038 | | | | 329,691 | |
| | | | | | |
|
|
|
| | | | | | | | 6,640,863 | |
| | | | | | |
|
|
|
Germany — 7.8% | | | | | | | | |
Allianz SE | | | 2,900 | | | | 480,317 | |
BASF SE | | | 5,900 | | | | 494,899 | |
Bayer AG | | | 7,090 | | | | 966,429 | |
Bayerische Motoren Werke AG | | | 2,707 | | | | 292,135 | |
Continental AG | | | 1,100 | | | | 232,016 | |
Daimler AG | | | 10,900 | | | | 905,291 | |
Deutsche Bank AG | | | 9,300 | | | | 278,483 | |
E.ON SE | | | 12,200 | | | | 208,519 | |
Freenet AG | | | 13,900 | | | | 395,210 | |
Hannover Rueck SE | | | 4,200 | | | | 378,889 | |
Merck KGaA | | | 3,700 | | | | 348,202 | |
Muenchener Rueckversicherungs-Gesellshaft AG | | | 2,000 | | | | 398,276 | |
Rheinmetall AG | | | 4,000 | | | | 174,157 | |
RTL Group SA | | | 2,154 | | | | 205,398 | |
Stada Arzneimittel AG | | | 4,800 | | | | 145,646 | |
Volkswagen AG | | | 1,600 | | | | 346,887 | |
Wincor Nixdorf AG | | | 5,700 | | | | 275,266 | |
| | | | | | |
|
|
|
| | | | | | | | 6,526,020 | |
| | | | | | |
|
|
|
Greece — 0.3% | | | | | | | | |
Hellenic Telecommunications Organization SA* | | | 8,374 | | | | 91,568 | |
Piraeus Bank SA* | | | 167,572 | | | | 182,341 | |
| | | | | | |
|
|
|
| | | | | | | | 273,909 | |
| | | | | | |
|
|
|
Hong Kong — 1.6% | | | | | | | | |
Cheung Kong Holdings Ltd. | | | 8,000 | | | | 133,975 | |
China Resources Cement Holdings Ltd. | | | 407,000 | | | | 262,298 | |
First Pacific Co. Ltd. | | | 134,000 | | | | 132,325 | |
Huabao International Holdings Ltd. | | | 469,000 | | | | 382,206 | |
Kingboard Chemical Holdings Ltd. | | | 102,000 | | | | 171,270 | |
Skyworth Digital Holdings Ltd. | | | 472,000 | | | | 255,427 | |
| | | | | | |
|
|
|
| | | | | | | | 1,337,501 | |
| | | | | | |
|
|
|
Ireland — 2.3% | | | | | | | | |
C&C Group PLC | | | 57,500 | | | | 251,872 | |
James Hardie Industries PLC, CDI | | | 25,857 | | | | 276,030 | |
Permanent TSB Group Holdings PLC* | | | 45,500 | | | | 3,414 | |
Ryanair Holdings PLC, ADR* | | | 5,610 | | | | 399,825 | |
Shire PLC | | | 7,553 | | | | 535,509 | |
Smurfit Kappa Group PLC | | | 18,700 | | | | 420,535 | |
| | | | | | |
|
|
|
| | | | | | | | 1,887,185 | |
| | | | | | |
|
|
|
SEE NOTES TO FINANCIAL STATEMENTS.
A7
| | | | | | |
| | | SP INTERNATIONAL VALUE PORTFOLIO (continued) | | |
| |
| SCHEDULE OF INVESTMENTS | | December 31, 2014 |
| | | | | | | | |
COMMON STOCKS
(continued) | | Shares
| | | Value
(Note 2)
| |
Israel — 1.9% | | | | | | | | |
Bank Hapoalim BM | | | 26,000 | | | $ | 122,255 | |
Elbit Systems Ltd. | | | 3,300 | | | | 201,130 | |
Teva Pharmaceutical Industries Ltd., ADR | | | 17,114 | | | | 984,226 | |
Teva Pharmaceutical Industries Ltd. | | | 5,400 | | | | 309,555 | |
| | | | | | |
|
|
|
| | | | | | | | 1,617,166 | |
| | | | | | |
|
|
|
Italy — 1.8% | | | | | | | | |
Atlantia SpA | | | 20,690 | | | | 480,877 | |
Azimut Holding SpA | | | 12,370 | | | | 268,732 | |
Enel SpA | | | 88,200 | | | | 393,154 | |
Eni SpA | | | 18,400 | | | | 322,304 | |
| | | | | | |
|
|
|
| | | | | | | | 1,465,067 | |
| | | | | | |
|
|
|
Japan — 19.7% | | | | | | | | |
AEON Financial Service Co. Ltd. | | | 9,400 | | | | 185,659 | |
Anritsu Corp. | | | 26,000 | | | | 180,871 | |
Aoyama Trading Co. Ltd. | | | 14,700 | | | | 321,194 | |
Aozora Bank Ltd. | | | 46,000 | | | | 142,395 | |
Asics Corp. | | | 8,400 | | | | 202,233 | |
Central Glass Co. Ltd. | | | 56,000 | | | | 203,093 | |
Daikin Industries Ltd. | | | 9,800 | | | | 628,416 | |
Daiwa House Industry Co. Ltd. | | | 37,400 | | | | 706,533 | |
Don Quijote Holdings Co. Ltd. | | | 10,600 | | | | 728,718 | |
Fukuoka Financial Group, Inc. | | | 25,300 | | | | 130,433 | |
Fuyo General Lease Co. Ltd. | | | 3,400 | | | | 117,388 | |
Hogy Medical Co. Ltd. | | | 2,800 | | | | 127,694 | |
Japan Tobacco, Inc. | | | 12,700 | | | | 349,539 | |
KDDI Corp. | | | 21,500 | | | | 1,350,717 | |
Keihin Corp. | | | 11,700 | | | | 173,659 | |
Keiyo Bank Ltd. (The) | | | 55,000 | | | | 306,931 | |
KYORIN Holdings, Inc. | | | 15,300 | | | | 283,528 | |
Kyowa Exeo Corp. | | | 28,200 | | | | 300,744 | |
Makita Corp. | | | 5,300 | | | | 238,828 | |
Marubeni Corp. | | | 42,000 | | | | 251,302 | |
Medipal Holdings Corp. | | | 12,500 | | | | 145,996 | |
Miraca Holdings, Inc. | | | 3,100 | | | | 133,359 | |
Mitsubishi Corp. | | | 8,900 | | | | 162,871 | |
Mitsubishi UFJ Financial Group, Inc. | | | 94,000 | | | | 516,458 | |
Mitsui & Co. Ltd. | | | 30,900 | | | | 413,848 | |
Mizuho Financial Group, Inc. | | | 258,400 | | | | 433,157 | |
Nichirei Corp. | | | 46,800 | | | | 211,782 | |
Nikkiso Co. Ltd. | | | 15,700 | | | | 145,261 | |
Nippon Telegraph & Telephone Corp. | | | 11,100 | | | | 567,017 | |
Nissan Motor Co. Ltd. | | | 41,500 | | | | 361,953 | |
NTT DoCoMo, Inc. | | | 20,600 | | | | 299,999 | |
Otsuka Holdings Co. Ltd. | | | 5,900 | | | | 176,889 | |
Paramount Bed Holdings Co. Ltd. | | | 4,800 | | | | 126,522 | |
Resona Holdings, Inc. | | | 110,400 | | | | 557,686 | |
Sankyu, Inc. | | | 30,000 | | | | 121,768 | |
Seino Holdings Co. Ltd. | | | 13,000 | | | | 131,035 | |
Seven & I Holdings Co. Ltd. | | | 13,500 | | | | 485,613 | |
Shimachu Co. Ltd. | | | 6,300 | | | | 152,688 | |
Sky Perfect JSAT Holdings, Inc. | | | 25,400 | | | | 149,882 | |
SoftBank Corp. | | | 9,300 | | | | 553,567 | |
Sumitomo Corp. | | | 38,400 | | | | 394,394 | |
Sumitomo Mitsui Financial Group, Inc. | | | 28,800 | | | | 1,041,198 | |
| | | | | | | | |
COMMON STOCKS
(continued) | | Shares
| | | Value
(Note 2)
| |
Japan (continued) | | | | | | | | |
Suzuken Co. Ltd. | | | 9,600 | | | $ | 265,184 | |
Toagosei Co. Ltd. | | | 82,000 | | | | 325,278 | |
Toho Holdings Co. Ltd. | | | 7,400 | | | | 107,749 | |
Tokai Rika Co. Ltd. | | | 11,300 | | | | 237,199 | |
Toppan Forms Co. Ltd. | | | 31,400 | | | | 315,169 | |
Tsumura & Co. | | | 6,400 | | | | 141,524 | |
United Arrows Ltd. | | | 8,700 | | | | 242,966 | |
West Japan Railway Co. | | | 3,100 | | | | 146,563 | |
Yokohama Rubber Co. Ltd. (The) | | | 46,700 | | | | 425,219 | |
| | | | | | |
|
|
|
| | | | | | | | 16,419,669 | |
| | | | | | |
|
|
|
Liechtenstein — 0.2% | | | | | | | | |
VP Bank AG | | | 2,300 | | | | 196,641 | |
| | | | | | |
|
|
|
Netherlands — 5.5% | | | | | | | | |
Aegon NV | | | 17,300 | | | | 130,027 | |
ING Groep NV, CVA* | | | 21,400 | | | | 276,481 | |
Koninklijke Ahold NV | | | 29,900 | | | | 531,410 | |
Koninklijke KPN NV* | | | 97,612 | | | | 308,196 | |
NXP Semiconductor NV* | | | 5,635 | | | | 431,730 | |
Royal Dutch Shell PLC (Class A Stock) | | | 31,026 | | | | 1,035,429 | |
Royal Dutch Shell PLC (Class B Stock) | | | 40,400 | | | | 1,395,865 | |
Wolters Kluwer NV | | | 16,126 | | | | 492,090 | |
| | | | | | |
|
|
|
| | | | | | | | 4,601,228 | |
| | | | | | |
|
|
|
New Zealand — 0.4% | | | | | | | | |
Air New Zealand Ltd. | | | 191,700 | | | | 368,211 | |
| | | | | | |
|
|
|
Norway — 1.2% | | | | | | | | |
DNB ASA | | | 13,600 | | | | 200,609 | |
Marine Harvest ASA | | | 28,500 | | | | 391,317 | |
Statoil ASA | | | 11,100 | | | | 195,436 | |
Yara International ASA | | | 5,600 | | | | 249,381 | |
| | | | | | |
|
|
|
| | | | | | | | 1,036,743 | |
| | | | | | |
|
|
|
Philippines — 0.5% | | | | | | | | |
Alliance Global Group, Inc. | | | 753,900 | | | | 376,600 | |
| | | | | | |
|
|
|
Singapore — 0.8% | | | | | | | | |
DBS Group Holdings Ltd. | | | 41,000 | | | | 634,734 | |
| | | | | | |
|
|
|
South Africa — 0.3% | | | | | | | | |
Mondi PLC | | | 16,900 | | | | 274,549 | |
| | | | | | |
|
|
|
Spain — 1.8% | | | | | | | | |
Banco Santander SA | | | 43,300 | | | | 363,423 | |
Gas Natural SDG SA | | | 4,600 | | | | 115,555 | |
Mediaset Espana Comunicacion SA* | | | 29,578 | | | | 371,857 | |
Red Electrica Corp. SA | | | 3,982 | | | | 351,020 | |
Repsol SA | | | 17,100 | | | | 320,127 | |
| | | | | | |
|
|
|
| | | | | | | | 1,521,982 | |
| | | | | | |
|
|
|
Sweden — 3.7% | | | | | | | | |
Assa Abloy AB (Class B Stock) | | | 11,018 | | | | 581,932 | |
Boliden AB | | | 11,800 | | | | 188,621 | |
Nordea Bank AB | | | 28,700 | | | | 332,225 | |
Oriflame Cosmetics SA, SDR | | | 6,300 | | | | 87,291 | |
Securitas AB (Class B Stock) | | | 34,700 | | | | 419,790 | |
Swedbank AB (Class A Stock) | | | 28,270 | | | | 701,405 | |
Telefonaktiebolaget LM Ericsson
(Class B Stock) | | | 32,700 | | | | 395,935 | |
TeliaSonera AB | | | 62,800 | | | | 403,764 | |
| | | | | | |
|
|
|
| | | | | | | | 3,110,963 | |
| | | | | | |
|
|
|
SEE NOTES TO FINANCIAL STATEMENTS.
A8
| | | | | | |
| | | SP INTERNATIONAL VALUE PORTFOLIO (continued) | | |
| |
| SCHEDULE OF INVESTMENTS | | December 31, 2014 |
| | | | | | | | |
COMMON STOCKS
(continued) | | Shares
| | | Value
(Note 2)
| |
Switzerland — 7.4% | | | | | | | | |
Baloise Holding AG | | | 3,200 | | | $ | 408,997 | |
Cembra Money Bank AG | | | 3,500 | | | | 192,373 | |
Credit Suisse Group AG* | | | 24,400 | | | | 612,959 | |
GAM Holding AG* | | | 13,214 | | | | 237,561 | |
Georg Fischer AG* | | | 500 | | | | 315,465 | |
Glencore PLC* | | | 107,590 | | | | 496,618 | |
Helvetia Holding AG | | | 400 | | | | 190,060 | |
Lonza Group AG* | | | 700 | | | | 78,814 | |
Novartis AG | | | 18,483 | | | | 1,714,178 | |
Swatch Group AG (The) | | | 733 | | | | 325,640 | |
Swiss Life Holding AG* | | | 1,700 | | | | 401,798 | |
Swiss Re AG* | | | 5,500 | | | | 460,744 | |
Zurich Insurance Group AG* | | | 2,200 | | | | 687,505 | |
| | | | | | |
|
|
|
| | | | | | | | 6,122,712 | |
| | | | | | |
|
|
|
Taiwan — 0.7% | | | | | | | | |
Taiwan Semiconductor Manufacturing Co. Ltd., ADR | | | 24,846 | | | | 556,054 | |
| | | | | | |
|
|
|
Thailand — 0.3% | | | | | | | | |
Krung Thai Bank PCL | | | 390,100 | | | | 269,157 | |
| | | | | | |
|
|
|
Turkey — 0.4% | | | | | | | | |
Turkcell Iletisim Hizmetleri A/S* | | | 53,232 | | | | 324,848 | |
| | | | | | |
|
|
|
United Kingdom — 19.3% | | | | | | | | |
3i Group PLC | | | 40,000 | | | | 278,912 | |
Anglo American PLC | | | 37,948 | | | | 702,208 | |
AstraZeneca PLC | | | 6,100 | | | | 430,848 | |
Aviva PLC | | | 38,300 | | | | 287,763 | |
BAE Systems PLC | | | 74,600 | | | | 545,566 | |
Barclays PLC | | | 87,400 | | | | 328,566 | |
Beazley PLC | | | 54,900 | | | | 244,412 | |
Bellway PLC | | | 9,500 | | | | 284,921 | |
BP PLC | | | 116,500 | | | | 739,494 | |
British American Tobacco PLC | | | 13,587 | | | | 736,294 | |
BT Group PLC | | | 109,200 | | | | 679,232 | |
Carillion PLC | | | 65,500 | | | | 339,397 | |
Centrica PLC | | | 63,800 | | | | 276,346 | |
Dairy Crest Group PLC | | | 40,400 | | | | 312,930 | |
Direct Line Insurance Group PLC | | | 84,381 | | | | 381,706 | |
GlaxoSmithKline PLC | | | 21,300 | | | | 456,963 | |
Home Retail Group PLC | | | 49,500 | | | | 159,526 | |
HSBC Holdings PLC | | | 51,500 | | | | 486,664 | |
Informa PLC | | | 71,835 | | | | 524,634 | |
International Consolidated Airlines Group SA* | | | 69,568 | | | | 523,713 | |
| | | | | | | | |
COMMON STOCKS
(continued) | | Shares
| | | Value
(Note 2)
| |
United Kingdom (continued) | | | | | | | | |
J Sainsbury PLC | | | 83,800 | | | $ | 320,007 | |
Legal & General Group PLC | | | 4,800 | | | | 18,534 | |
Lloyds Banking Group PLC* | | | 925,650 | | | | 1,088,807 | |
Marston’s PLC | | | 59,800 | | | | 133,309 | |
Old Mutual PLC | | | 83,400 | | | | 245,794 | |
Petrofac Ltd. | | | 11,200 | | | | 122,013 | |
Provident Financial PLC | | | 9,006 | | | | 343,775 | |
Prudential PLC | | | 41,170 | | | | 951,831 | |
Reed Elsevier PLC | | | 38,219 | | | | 652,857 | |
Rexam PLC | | | 88,754 | | | | 624,829 | |
Rio Tinto Ltd. | | | 3,700 | | | | 173,459 | |
Rolls-Royce Holdings PLC* | | | 19,678 | | | | 264,352 | |
Taylor Wimpey PLC | | | 209,789 | | | | 447,568 | |
Tesco PLC | | | 103,300 | | | | 301,192 | |
Tullett Prebon PLC | | | 57,600 | | | | 253,892 | |
Unilever PLC | | | 9,901 | | | | 402,260 | |
Vesuvius PLC | | | 40,500 | | | | 280,108 | |
William Hill PLC | | | 56,053 | | | | 314,968 | |
WM Morrison Supermarkets PLC | | | 146,400 | | | | 417,719 | |
| | | | | | |
|
|
|
| | | | | | | | 16,077,369 | |
| | | | | | |
|
|
|
TOTAL LONG-TERM INVESTMENTS
(cost $81,583,114) | | | | 80,887,528 | |
| | | | | | |
|
|
|
| SHORT-TERM INVESTMENT — 1.8% | | | | | |
AFFILIATED MONEY MARKET MUTUAL FUND | | | | | |
Prudential Investment Portfolios 2 — Prudential Core Taxable Money Market Fund (cost $1,495,949) (Note 4)(a) | | | 1,495,949 | | | | 1,495,949 | |
| | | | | | |
|
|
|
TOTAL INVESTMENTS — 98.9%
(cost $83,079,063) | | | | 82,383,477 | |
OTHER ASSETS IN EXCESS OF LIABILITIES —1.1% | | | | 877,399 | |
| | | | | | |
|
|
|
NET ASSETS — 100.0% | | | $ | 83,260,876 | |
| | | | | | |
|
|
|
See the Glossary for abbreviations used in the Portfolio descriptions.
| * | Non-income producing security. |
| (a) | Prudential Investments LLC, the manager of the Fund, also serves as manager of the Prudential Investment Portfolios 2 — Prudential Core Taxable Money Market Fund. |
Various inputs are used in determining the value of the Fund’s investments. These inputs are summarized in the three broad levels listed below.
| Level 1— | quoted prices generally in active markets for identical securities. |
| Level 2— | quoted prices for similar securities, interest rates and yield curves, prepayment speeds, foreign currency exchange rates and other significant observable inputs. |
| Level 3— | significant unobservable inputs for securities valued in accordance with Board approved fair valuation procedures. |
SEE NOTES TO FINANCIAL STATEMENTS.
A9
| | | | | | |
| | | SP INTERNATIONAL VALUE PORTFOLIO (continued) | | |
| |
| SCHEDULE OF INVESTMENTS | | December 31, 2014 |
The following is a summary of the inputs used as of December 31, 2014 in valuing such portfolio securities:
| | | | | | | | | | | | |
| | | Level 1
| | | Level 2
| | | Level 3
| |
Investments in Securities | | | | | | | | | | | | |
Common Stocks | | | | | | | | | | | | |
Australia | | $ | — | | | $ | 3,827,189 | | | $ | — | |
Austria | | | — | | | | 706,355 | | | | — | |
Belgium | | | 213,448 | | | | 1,678,793 | | | | — | |
Brazil | | | 223,146 | | | | — | | | | — | |
Canada | | | 934,847 | | | | — | | | | — | |
Denmark | | | — | | | | 694,417 | | | | — | |
Finland | | | — | | | | 970,162 | | | | — | |
France | | | — | | | | 6,640,863 | | | | — | |
Germany | | | — | | | | 6,526,020 | | | | — | |
Greece | | | — | | | | 273,909 | | | | — | |
Hong Kong | | | — | | | | 1,337,501 | | | | — | |
Ireland | | | 655,111 | | | | 1,232,074 | | | | — | |
Israel | | | 984,226 | | | | 632,940 | | | | — | |
Italy | | | — | | | | 1,465,067 | | | | — | |
Japan | | | — | | | | 16,419,669 | | | | — | |
Liechtenstein | | | 196,641 | | | | — | | | | — | |
Netherlands | | | 431,730 | | | | 4,169,498 | | | | — | |
New Zealand | | | — | | | | 368,211 | | | | — | |
Norway | | | — | | | | 1,036,743 | | | | — | |
Philippines | | | — | | | | 376,600 | | | | — | |
Singapore | | | — | | | | 634,734 | | | | — | |
South Africa | | | — | | | | 274,549 | | | | — | |
Spain | | | — | | | | 1,521,982 | | | | — | |
Sweden | | | — | | | | 3,110,963 | | | | — | |
Switzerland | | | — | | | | 6,122,712 | | | | — | |
Taiwan | | | 556,054 | | | | — | | | | — | |
Thailand | | | 269,157 | | | | — | | | | — | |
Turkey | | | — | | | | 324,848 | | | | — | |
United Kingdom | | | — | | | | 16,077,369 | | | | — | |
Affiliated Money Market Mutual Fund | | | 1,495,949 | | | | — | | | | — | |
| | |
|
|
| |
|
|
| |
|
|
|
Total | | $ | 5,960,309 | | | $ | 76,423,168 | | | $ | — | |
| | |
|
|
| |
|
|
| |
|
|
|
The industry classification of investments and other assets in excess of liabilities shown as a percentage of net assets as of December 31, 2014 was as follows (unaudited):
| | | | |
Banks | | | 12.3 | % |
Insurance | | | 8.5 | |
Pharmaceuticals | | | 8.2 | |
Oil, Gas & Consumable Fuels | | | 6.1 | |
Wireless Telecommunication Services | | | 4.1 | |
Food & Staples Retailing | | | 3.0 | |
Media | | | 3.0 | |
Aerospace & Defense | | | 2.8 | |
Diversified Telecommunication Services | | | 2.8 | |
Metals & Mining | | | 2.7 | |
Auto Components | | | 2.6 | |
Automobiles | | | 2.6 | |
Capital Markets | | | 2.5 | |
Affiliated Money Market Mutual Fund | | | 1.8 | |
Chemicals | | | 1.7 | |
Beverages | | | 1.7 | |
Building Products | | | 1.7 | |
Electric Utilities | | | 1.6 | |
Food Products | | | 1.6 | |
Airlines | | | 1.6 | |
Trading Companies & Distributors | | | 1.5 | |
Real Estate Management & Development | | | 1.4 | |
| | | | |
Commercial Services & Supplies | | | 1.4 | % |
Tobacco | | | 1.3 | |
Containers & Packaging | | | 1.3 | |
Construction & Engineering | | | 1.2 | |
Semiconductors & Semiconductor Equipment | | | 1.2 | |
Household Durables | | | 1.2 | |
IT Services | | | 1.0 | |
Machinery | | | 1.0 | |
Health Care Providers & Services | | | 0.9 | |
Multiline Retail | | | 0.9 | |
Specialty Retail | | | 0.9 | |
Consumer Finance | | | 0.9 | |
Health Care Equipment & Supplies | | | 0.8 | |
Air Freight & Logistics | | | 0.8 | |
Industrial Conglomerates | | | 0.7 | |
Diversified Financial Services | | | 0.7 | |
Construction Materials | | | 0.6 | |
Textiles, Apparel & Luxury Goods | | | 0.6 | |
Transportation Infrastructure | | | 0.6 | |
Multi-Utilities | | | 0.6 | |
Hotels, Restaurants & Leisure | | | 0.5 | |
Road & Rail | | | 0.5 | |
SEE NOTES TO FINANCIAL STATEMENTS.
A10
| | | | | | |
| | | SP INTERNATIONAL VALUE PORTFOLIO (continued) | | |
| |
| SCHEDULE OF INVESTMENTS | | December 31, 2014 |
| | | | |
Industry table (con’t.)
| |
| |
Communications Equipment | | | 0.5 | % |
Electrical Equipment | | | 0.4 | |
Electronic Equipment, Instruments & Components | | | 0.4 | |
Technology Hardware, Storage & Peripherals | | | 0.3 | |
Paper & Forest Products | | | 0.3 | |
Diversified Consumer Services | | | 0.3 | |
Health Care Technology | | | 0.3 | |
Marine | | | 0.2 | |
Internet & Catalog Retail | | | 0.2 | |
| | | | |
Distributors | | | 0.2 | % |
Energy Equipment & Services | | | 0.1 | |
Gas Utilities | | | 0.1 | |
Personal Products | | | 0.1 | |
Life Sciences Tools & Services | | | 0.1 | |
| | |
|
|
|
| | | | 98.9 | |
Other assets in excess of liabilities | | | 1.1 | |
| | |
|
|
|
| | | | 100.0 | % |
| | |
|
|
|
The Portfolio invested in derivative instruments during the reporting period. The primary types of risk associated with these derivative instruments are foreign exchange and equity risk.
The effect of such derivative instruments on the Portfolio’s financial position and financial performance as reflected in the Statement of Assets and Liabilities and Statement of Operations is presented in the summary below.
The Portfolio did not hold any derivative instruments as of December 31, 2014 accordingly, no derivative positions were presented in the Statement of Assets and Liabilities.
The effects of derivative instruments on the Statement of Operations for the year ended December 31, 2014 are as follows:
| | | | | | | | | | | | |
Amount of Realized Gain or (Loss) on Derivatives Recognized in Income
| |
Derivatives not accounted for as hedging instruments, carried at fair value
| | Rights(1)
| | | Forward
Currency
Contracts(2)
| | | Total
| |
Foreign exchange contracts | | $ | — | | | $ | 324,619 | | | $ | 324,619 | |
Equity contracts | | | 10,469 | | | | — | | | | 10,469 | |
| | |
|
|
| |
|
|
| |
|
|
|
Total | | $ | 10,469 | | | $ | 324,619 | | | $ | 335,088 | |
| | |
|
|
| |
|
|
| |
|
|
|
|
Change in Unrealized Appreciation or (Depreciation) on Derivatives Recognized in Income
| |
Derivatives not accounted for as hedging instruments, carried at fair value
| | Rights(3)
| | | Forward
Currency
Contracts(4)
| | | Total
| |
Foreign exchange contracts | | $ | — | | | $ | (201,889 | ) | | $ | (201,889 | ) |
Equity contracts | | | (329 | ) | | | — | | | | (329 | ) |
| | |
|
|
| |
|
|
| |
|
|
|
Total | | $ | (329 | ) | | $ | (201,889 | ) | | $ | (202,218 | ) |
| | |
|
|
| |
|
|
| |
|
|
|
| (1) | Included in net realized gain (loss) on investment transactions in the Statement of Operations. |
| (2) | Included in net realized gain (loss) on foreign currency transactions in the Statement of Operations. |
| (3) | Included in net change in unrealized appreciation (depreciation) on investments in the Statement of Operations. |
| (4) | Included in net change in unrealized appreciation (depreciation) on foreign currencies in the Statement of Operations. |
For the year ended December 31, 2014, the Portfolio’s average value at settlement date for foreign currency exchange purchase and sale contracts was $3,588,934 and $10,948,699, respectively.
SEE NOTES TO FINANCIAL STATEMENTS.
A11
| | | | | | |
| | | SP INTERNATIONAL VALUE PORTFOLIO (continued) | | |
STATEMENT OF ASSETS AND LIABILITIES
December 31, 2014
| | | | |
| ASSETS | | | | |
Investments at value: | | | | |
Unaffiliated investments (cost $81,583,114) | | $ | 80,887,528 | |
Affiliated investments (cost $1,495,949) | | | 1,495,949 | |
Foreign currency, at value (cost $291,439) | | | 285,746 | |
Dividends receivable | | | 759,186 | |
Receivable for investments sold | | | 275,970 | |
Tax reclaim receivable | | | 60,032 | |
Receivable for Series shares sold | | | 5,095 | |
Prepaid expenses | | | 1,213 | |
| | |
|
|
|
Total assets | | | 83,770,719 | |
| | |
|
|
|
| LIABILITIES | | | | |
Payable for investments purchased | | | 282,205 | |
Accrued expenses | | | 138,299 | |
Management fee payable | | | 64,493 | |
Payable to custodian | | | 23,047 | |
Affiliated transfer agent fee payable | | | 926 | |
Payable for Series shares reacquired | | | 873 | |
| | |
|
|
|
Total liabilities | | | 509,843 | |
| | |
|
|
|
| NET ASSETS | | $ | 83,260,876 | |
| | |
|
|
|
Net assets were comprised of: | | | | |
Paid-in capital | | $ | 81,757,191 | |
Retained earnings | | | 1,503,685 | |
| | |
|
|
|
Net assets, December 31, 2014 | | $ | 83,260,876 | |
| | |
|
|
|
| Class I: | | | | |
Net asset value and redemption price per share,
$83,260,876 / 11,151,436 outstanding shares of beneficial interest | | $ | 7.47 | |
| | |
|
|
|
STATEMENT OF OPERATIONS
Year Ended December 31, 2014
| | | | |
| NET INVESTMENT INCOME | | | | |
| INCOME | | | | |
Unaffiliated dividend income (net of $349,830 foreign withholding tax) | | $ | 3,928,583 | |
Affiliated dividend income | | | 4,164 | |
| | |
|
|
|
Total income | | | 3,932,747 | |
| | |
|
|
|
| EXPENSES | | | | |
Management fee | | | 1,045,911 | |
Custodian’s fees and expenses | | | 240,000 | |
Reports to shareholders | | | 45,000 | |
Audit fee | | | 30,000 | |
Commitment fee on syndicated credit agreement | | | 19,000 | |
Transfer agent’s fees and expenses (including affiliated expense of $5,600) | | | 12,000 | |
Trustees’ fees | | | 11,000 | |
Legal fees and expenses | | | 9,000 | |
Interest expense | | | 8,019 | |
Insurance fees | | | 2,000 | |
Miscellaneous | | | 44,933 | |
| | |
|
|
|
Total expenses | | | 1,466,863 | |
| | |
|
|
|
| NET INVESTMENT INCOME | | | 2,465,884 | |
| | |
|
|
|
REALIZED AND UNREALIZED GAIN (LOSS) ON
INVESTMENTS AND FOREIGN CURRENCIES | | | | |
Net realized gain on: | | | | |
Investment transactions | | | 25,075,672 | |
Foreign currency transactions | | | 654,012 | |
| | |
|
|
|
| | | | 25,729,684 | |
| | |
|
|
|
Net change in unrealized appreciation (depreciation) on: | | | | |
Investments | | | (32,421,508 | ) |
Foreign currencies | | | (313,636 | ) |
| | |
|
|
|
| | | | (32,735,144 | ) |
| | |
|
|
|
| NET LOSS ON INVESTMENTS AND FOREIGN CURRENCIES | | | (7,005,460 | ) |
| | |
|
|
|
| NET DECREASE IN NET ASSETS RESULTING FROM OPERATIONS | | $ | (4,539,576 | ) |
| | |
|
|
|
STATEMENT OF CHANGES IN NET ASSETS
| | | | | | | | |
| | | Year Ended December 31,
| |
| | | 2014
| | | 2013
| |
| INCREASE (DECREASE) IN NET ASSETS | | | | | | | | |
| OPERATIONS | | | | | | | | |
Net investment income | | $ | 2,465,884 | | | $ | 2,169,272 | |
Net realized gain on investment and foreign currency transactions | | | 25,729,684 | | | | 6,402,464 | |
Net change in unrealized appreciation (depreciation) on investments and foreign currencies | | | (32,735,144 | ) | | | 16,001,291 | |
| | |
|
|
| |
|
|
|
NET INCREASE (DECREASE) IN NET ASSETS RESULTING FROM OPERATIONS | | | (4,539,576 | ) | | | 24,573,027 | |
| | |
|
|
| |
|
|
|
| SERIES SHARE TRANSACTIONS | | | | | | | | |
Series shares sold [787,399 and 872,737 shares, respectively] | | | 6,161,658 | | | | 6,158,434 | |
Series shares repurchased [7,784,512 and 1,567,209 shares, respectively] | | | (62,618,227 | ) | | | (11,229,049 | ) |
| | |
|
|
| |
|
|
|
NET DECREASE IN NET ASSETS FROM SERIES SHARE TRANSACTIONS | | | (56,456,569 | ) | | | (5,070,615 | ) |
| | |
|
|
| |
|
|
|
| TOTAL INCREASE (DECREASE) | | | (60,996,145 | ) | | | 19,502,412 | |
| NET ASSETS: | | | | | | | | |
Beginning of year | | | 144,257,021 | | | | 124,754,609 | |
| | |
|
|
| |
|
|
|
End of year | | $ | 83,260,876 | | | $ | 144,257,021 | |
| | |
|
|
| |
|
|
|
SEE NOTES TO FINANCIAL STATEMENTS.
A12
| | | | | | |
| | | SP PRUDENTIAL U.S. EMERGING GROWTH PORTFOLIO | | |
| |
| SCHEDULE OF INVESTMENTS | | December 31, 2014 |
| | | | | | | | |
| LONG-TERM INVESTMENTS — 98.1% | | | | |
| COMMON STOCKS | | Shares
| | | Value
(Note 2)
| |
Airlines — 2.4% | | | | | | | | |
Spirit Airlines, Inc.* | | | 30,990 | | | $ | 2,342,224 | |
United Continental Holdings, Inc.* | | | 55,946 | | | | 3,742,228 | |
| | | | | | |
|
|
|
| | | | | | | | 6,084,452 | |
| | | | | | |
|
|
|
Auto Components — 0.8% | | | | | | | | |
Delphi Automotive PLC (United Kingdom) | | | 28,167 | | | | 2,048,304 | |
| | | | | | |
|
|
|
Banks — 0.9% | | | | | | | | |
First Republic Bank | | | 40,956 | | | | 2,134,627 | |
| | | | | | |
|
|
|
Beverages — 0.9% | | | | | | | | |
Constellation Brands, Inc. (Class A Stock)* | | | 23,992 | | | | 2,355,295 | |
| | | | | | |
|
|
|
Biotechnology — 2.9% | | | | | | | | |
BioMarin Pharmaceutical, Inc.* | | | 24,834 | | | | 2,244,994 | |
Incyte Corp. Ltd.* | | | 38,106 | | | | 2,785,930 | |
Vertex Pharmaceuticals, Inc.* | | | 17,808 | | | | 2,115,590 | |
| | | | | | |
|
|
|
| | | | | | | | 7,146,514 | |
| | | | | | |
|
|
|
Capital Markets — 0.5% | | | | | | | | |
Artisan Partners Asset Management, Inc. (Class A Stock) | | | 26,492 | | | | 1,338,641 | |
| | | | | | |
|
|
|
Chemicals — 3.5% | | | | | | | | |
Airgas, Inc. | | | 24,371 | | | | 2,807,052 | |
Albemarle Corp.(a) | | | 6,076 | | | | 365,350 | |
Eastman Chemical Co. | | | 32,925 | | | | 2,497,691 | |
FMC Corp. | | | 53,480 | | | | 3,049,964 | |
| | | | | | |
|
|
|
| | | | | | | | 8,720,057 | |
| | | | | | |
|
|
|
Commercial Services & Supplies — 2.2% | | | | | |
Copart, Inc.* | | | 51,162 | | | | 1,866,901 | |
Stericycle, Inc.* | | | 27,346 | | | | 3,584,514 | |
| | | | | | |
|
|
|
| | | | | | | | 5,451,415 | |
| | | | | | |
|
|
|
Communications Equipment — 0.9% | | | | | |
F5 Networks, Inc.* | | | 17,818 | | | | 2,324,625 | |
| | | | | | |
|
|
|
Construction & Engineering — 1.0% | | | | | |
Quanta Services, Inc.* | | | 89,722 | | | | 2,547,208 | |
| | | | | | |
|
|
|
Consumer Finance — 0.8% | | | | | | | | |
SLM Corp. | | | 187,602 | | | | 1,911,664 | |
| | | | | | |
|
|
|
Electrical Equipment — 1.0% | | | | | | | | |
AMETEK, Inc. | | | 48,074 | | | | 2,530,135 | |
| | | | | | |
|
|
|
Electronic Equipment, Instruments & Components — 1.6% | |
Amphenol Corp. (Class A Stock) | | | 74,008 | | | | 3,982,370 | |
| | | | | | |
|
|
|
Energy Equipment & Services — 0.9% | |
Cameron International Corp.* | | | 45,806 | | | | 2,288,010 | |
| | | | | | |
|
|
|
Food & Staples Retailing — 1.7% | | | | | | | | |
Kroger Co. (The) | | | 38,743 | | | | 2,487,688 | |
Sprouts Farmers Market, Inc.* | | | 47,985 | | | | 1,630,530 | |
| | | | | | |
|
|
|
| | | | | | | | 4,118,218 | |
| | | | | | |
|
|
|
Food Products — 2.8% | | | | | | | | |
Hain Celestial Group, Inc. (The)* | | | 70,608 | | | | 4,115,740 | |
Keurig Green Mountain, Inc. | | | 5,260 | | | | 696,398 | |
Mead Johnson Nutrition Co. | | | 20,684 | | | | 2,079,569 | |
| | | | | | |
|
|
|
| | | | | | | | 6,891,707 | |
| | | | | | |
|
|
|
| | | | | | | | |
COMMON STOCKS
(continued) | | Shares
| | | Value
(Note 2)
| |
Health Care Equipment & Supplies — 1.7% | |
Align Technology, Inc.* | | | 30,389 | | | $ | 1,699,049 | |
Cooper Cos., Inc. (The) | | | 15,100 | | | | 2,447,559 | |
| | | | | | |
|
|
|
| | | | | | | | 4,146,608 | |
| | | | | | |
|
|
|
Health Care Providers & Services — 6.4% | | | | | |
Catamaran Corp.* | | | 79,794 | | | | 4,129,340 | |
Centene Corp.* | | | 25,284 | | | | 2,625,743 | |
Envision Healthcare Holdings, Inc.* | | | 65,938 | | | | 2,287,389 | |
Henry Schein, Inc.* | | | 30,984 | | | | 4,218,472 | |
Universal Health Services, Inc. (Class B Stock) | | | 25,181 | | | | 2,801,638 | |
| | | | | | |
|
|
|
| | | | | | | | 16,062,582 | |
| | | | | | |
|
|
|
Hotels, Restaurants & Leisure — 2.7% | | | | | |
Hilton Worldwide Holdings, Inc.* | | | 47,510 | | | | 1,239,536 | |
Norwegian Cruise Line Holdings Ltd.* | | | 38,791 | | | | 1,813,867 | |
Starwood Hotels & Resorts Worldwide, Inc. | | | 46,095 | | | | 3,736,922 | |
| | | | | | |
|
|
|
| | | | | | | | 6,790,325 | |
| | | | | | |
|
|
|
Household Products — 1.0% | | | | | | | | |
Church & Dwight Co., Inc. | | | 30,604 | | | | 2,411,901 | |
| | | | | | |
|
|
|
Independent Power & Renewable Electricity Producers — 0.5% | |
Abengoa Yield PLC (Spain) | | | 48,973 | | | | 1,337,942 | |
| | | | | | |
|
|
|
Industrial Conglomerates — 1.8% | | | | | | | | |
Roper Industries, Inc. | | | 28,382 | | | | 4,437,526 | |
| | | | | | |
|
|
|
Insurance — 1.0% | | | | | | | | |
W.R. Berkley Corp. | | | 47,897 | | | | 2,455,200 | |
| | | | | | |
|
|
|
Internet & Catalog Retail — 0.9% | | | | | | | | |
TripAdvisor, Inc.*(a) | | | 14,632 | | | | 1,092,425 | |
Vipshop Holdings Ltd. (China), ADR*(a) | | | 33,299 | | | | 650,662 | |
Wayfair, Inc. (Class A Stock)*(a) | | | 25,770 | | | | 511,535 | |
| | | | | | |
|
|
|
| | | | | | | | 2,254,622 | |
| | | | | | |
|
|
|
Internet Software & Services — 1.5% | | | | | | | | |
LendingClub Corp.*(a) | | | 5,368 | | | | 135,811 | |
LinkedIn Corp. (Class A Stock)* | | | 11,390 | | | | 2,616,397 | |
Twitter, Inc.* | | | 25,559 | | | | 916,801 | |
| | | | | | |
|
|
|
| | | | | | | | 3,669,009 | |
| | | | | | |
|
|
|
IT Services — 2.5% | | | | | | | | |
FleetCor Technologies, Inc.* | | | 9,842 | | | | 1,463,604 | |
Vantiv, Inc. (Class A Stock)* | | | 138,176 | | | | 4,686,930 | |
| | | | | | |
|
|
|
| | | | | | | | 6,150,534 | |
| | | | | | |
|
|
|
Life Sciences Tools & Services — 0.8% | | | | | |
Illumina, Inc.* | | | 11,079 | | | | 2,044,962 | |
| | | | | | |
|
|
|
Machinery — 3.2% | | | | | | | | |
Flowserve Corp. | | | 51,171 | | | | 3,061,561 | |
IDEX Corp. | | | 29,878 | | | | 2,325,703 | |
Pall Corp. | | | 26,852 | | | | 2,717,691 | |
| | | | | | |
|
|
|
| | | | | | | | 8,104,955 | |
| | | | | | |
|
|
|
Metals & Mining — 0.9% | | | | | | | | |
Reliance Steel & Aluminum Co. | | | 35,826 | | | | 2,195,059 | |
| | | | | | |
|
|
|
Multiline Retail — 2.3% | | | | | | | | |
Dollar Tree, Inc.* | | | 82,920 | | | | 5,835,910 | |
| | | | | | |
|
|
|
SEE NOTES TO FINANCIAL STATEMENTS.
A13
| | | | | | |
| | | SP PRUDENTIAL U.S. EMERGING GROWTH PORTFOLIO (continued) | | |
| |
| SCHEDULE OF INVESTMENTS | | December 31, 2014 |
| | | | | | | | |
COMMON STOCKS
(continued) | | Shares
| | | Value
(Note 2)
| |
Oil, Gas & Consumable Fuels — 4.2% | | | | | | | | |
Concho Resources, Inc.* | | | 34,642 | | | $ | 3,455,539 | |
Laredo Petroleum, Inc.* | | | 68,792 | | | | 711,997 | |
Marathon Petroleum Corp. | | | 20,126 | | | | 1,816,573 | |
Noble Energy, Inc. | | | 50,911 | | | | 2,414,709 | |
Whiting Petroleum Corp.* | | | 64,654 | | | | 2,133,582 | |
| | | | | | |
|
|
|
| | | | | | | | 10,532,400 | |
| | | | | | |
|
|
|
Pharmaceuticals — 3.9% | | | | | | | | |
Endo International PLC* | | | 29,968 | | | | 2,161,292 | |
Jazz Pharmaceuticals PLC* | | | 11,295 | | | | 1,849,331 | |
Pacira Pharmaceuticals, Inc.* | | | 13,311 | | | | 1,180,153 | |
Perrigo Co. PLC | | | 20,632 | | | | 3,448,845 | |
Salix Pharmaceuticals Ltd.* | | | 10,367 | | | | 1,191,583 | |
| | | | | | |
|
|
|
| | | | | | | | 9,831,204 | |
| | | | | | |
|
|
|
Professional Services — 2.6% | | | | | | | | |
IHS, Inc. (Class A Stock)* | | | 31,393 | | | | 3,575,035 | |
Towers Watson & Co. (Class A Stock) | | | 26,279 | | | | 2,973,994 | |
| | | | | | |
|
|
|
| | | | | | | | 6,549,029 | |
| | | | | | |
|
|
|
Real Estate Investment Trusts (REITs) — 3.8% | |
Crown Castle International Corp. | | | 67,721 | | | | 5,329,643 | |
MFA Financial, Inc. | | | 240,375 | | | | 1,920,596 | |
Starwood Property Trust, Inc. | | | 98,223 | | | | 2,282,702 | |
| | | | | | |
|
|
|
| | | | | | | | 9,532,941 | |
| | | | | | |
|
|
|
Real Estate Management & Development — 1.0% | |
CBRE Group, Inc. (Class A Stock)* | | | 70,327 | | | | 2,408,700 | |
| | | | | | |
|
|
|
Road & Rail — 1.5% | | | | | | | | |
Kansas City Southern | | | 14,687 | | | | 1,792,254 | |
Old Dominion Freight Line, Inc.* | | | 25,803 | | | | 2,003,345 | |
| | | | | | |
|
|
|
| | | | | | | | 3,795,599 | |
| | | | | | |
|
|
|
Semiconductors & Semiconductor Equipment — 2.7% | |
Analog Devices, Inc. | | | 37,397 | | | | 2,076,282 | |
Applied Materials, Inc. | | | 78,197 | | | | 1,948,669 | |
Xilinx, Inc. | | | 62,807 | | | | 2,718,915 | |
| | | | | | |
|
|
|
| | | | | | | | 6,743,866 | |
| | | | | | |
|
|
|
Software — 9.8% | | | | | | | | |
Activision Blizzard, Inc. | | | 85,968 | | | | 1,732,255 | |
Check Point Software Technologies Ltd. (Israel)*(a) | | | 52,067 | | | | 4,090,904 | |
Electronic Arts, Inc.* | | | 87,240 | | | | 4,101,589 | |
Intuit, Inc. | | | 40,427 | | | | 3,726,965 | |
Red Hat, Inc.* | | | 72,361 | | | | 5,003,040 | |
ServiceNow, Inc.* | | | 37,104 | | | | 2,517,506 | |
Splunk, Inc.* | | | 36,056 | | | | 2,125,501 | |
Ultimate Software Group, Inc. (The)* | | | 8,168 | | | | 1,199,185 | |
| | | | | | |
|
|
|
| | | | | | | | 24,496,945 | |
| | | | | | |
|
|
|
Specialty Retail — 8.7% | | | | | | | | |
GNC Holdings, Inc.
(Class A Stock) | | | 61,344 | | | | 2,880,714 | |
L Brands, Inc. | | | 38,489 | | | | 3,331,223 | |
O’Reilly Automotive, Inc.* | | | 15,361 | | | | 2,958,836 | |
Ross Stores, Inc. | | | 47,835 | | | | 4,508,927 | |
Signet Jewelers Ltd. | | | 20,585 | | | | 2,708,368 | |
| | | | | | | | |
COMMON STOCKS
(continued) | | Shares
| | | Value
(Note 2)
| |
Specialty Retail (continued) | | | | | | | | |
Tiffany & Co. | | | 19,925 | | | $ | 2,129,186 | |
Ulta Salon Cosmetics & Fragrance, Inc.* | | | 25,533 | | | | 3,264,139 | |
| | | | | | |
|
|
|
| | | | | | | | 21,781,393 | |
| | | | | | |
|
|
|
Technology Hardware, Storage & Peripherals — 1.0% | |
SanDisk Corp. | | | 25,187 | | | | 2,467,822 | |
| | | | | | |
|
|
|
Textiles, Apparel & Luxury Goods — 3.0% | |
Burberry Group PLC (United Kingdom) | | | 77,880 | | | | 1,975,954 | |
Kate Spade & Co.* | | | 48,285 | | | | 1,545,603 | |
PVH Corp. | | | 25,833 | | | | 3,311,016 | |
Under Armour, Inc.
(Class A Stock)* | | | 10,826 | | | | 735,085 | |
| | | | | | |
|
|
|
| | | | | | | | 7,567,658 | |
| | | | | | |
|
|
|
Trading Companies & Distributors — 1.2% | |
WESCO International, Inc.*(a) | | | 38,974 | | | | 2,970,208 | |
| | | | | | |
|
|
|
Wireless Telecommunication Services — 2.7% | |
SBA Communications Corp.
(Class A Stock)* | | | 61,633 | | | | 6,826,471 | |
| | | | | | |
|
|
|
TOTAL LONG-TERM INVESTMENTS
(cost $166,315,665) | | | | 245,274,613 | |
| | | | | | |
|
|
|
| SHORT-TERM INVESTMENT — 5.1% | |
AFFILIATED MONEY MARKET MUTUAL FUND | |
Prudential Investment Portfolios 2 — Prudential Core Taxable Money Market Fund (cost $12,762,443; includes $9,202,022 of cash collateral for securities on loan)(b)(w) (Note 4) | | | 12,762,443 | | | | 12,762,443 | |
| | | | | | |
|
|
|
TOTAL INVESTMENTS — 103.2%
(cost $179,078,108) | | | | 258,037,056 | |
LIABILITIES IN EXCESS OF
OTHER ASSETS — (3.2)% | | | | (8,032,377 | ) |
| | | | | | |
|
|
|
NET ASSETS — 100.0% | | | $ | 250,004,679 | |
| | | | | | |
|
|
|
See the Glossary for abbreviations used in the Portfolio descriptions.
| * | Non-income producing security. |
| (a) | All or a portion of security is on loan. The aggregate market value of such securities, including those sold and pending settlement, is $8,944,508; cash collateral of $9,202,022 (included in liabilities) was received with which the Portfolio purchased highly liquid short-term investments. Securities on loan are subject to contractual netting arrangements. |
| (b) | Represents security, or a portion thereof, purchased with cash collateral received for securities on loan. |
| (w) | Prudential Investments LLC, the manager of the Portfolio, also serves as manager of the Prudential Investment Portfolios 2 — Prudential Core Taxable Money Market Fund. |
SEE NOTES TO FINANCIAL STATEMENTS.
A14
| | | | | | |
| | | SP PRUDENTIAL U.S. EMERGING GROWTH PORTFOLIO (continued) | | |
| |
| SCHEDULE OF INVESTMENTS | | December 31, 2014 |
Various inputs are used in determining the value of the Portfolio’s investments. These inputs are summarized in the three broad levels listed below.
| Level 1— | quoted prices generally in active markets for identical securities. |
| Level 2— | quoted prices for similar securities, interest rates and yield curves, prepayment speeds, foreign currency exchange rates and other significant observable inputs. |
| Level 3— | significant unobservable inputs for securities valued in accordance with Board approved fair valuation procedures. |
The following is a summary of the inputs used as of December 31, 2014 in valuing such portfolio securities:
| | | | | | | | | | | | |
| | | Level 1
| | | Level 2
| | | Level 3
| |
Investments in Securities | | | | | | | | | | | | |
Common Stocks | | | | | | | | | | | | |
Airlines | | $ | 6,084,452 | | | $ | — | | | $ | — | |
Auto Components | | | 2,048,304 | | | | — | | | | — | |
Banks | | | 2,134,627 | | | | — | | | | — | |
Beverages | | | 2,355,295 | | | | — | | | | — | |
Biotechnology | | | 7,146,514 | | | | — | | | | — | |
Capital Markets | | | 1,338,641 | | | | — | | | | — | |
Chemicals | | | 8,720,057 | | | | — | | | | — | |
Commercial Services & Supplies | | | 5,451,415 | | | | — | | | | — | |
Communications Equipment | | | 2,324,625 | | | | — | | | | — | |
Construction & Engineering | | | 2,547,208 | | | | — | | | | — | |
Consumer Finance | | | 1,911,664 | | | | — | | | | — | |
Electrical Equipment | | | 2,530,135 | | | | — | | | | — | |
Electronic Equipment, Instruments & Components | | | 3,982,370 | | | | — | | | | — | |
Energy Equipment & Services | | | 2,288,010 | | | | — | | | | — | |
Food & Staples Retailing | | | 4,118,218 | | | | — | | | | — | |
Food Products | | | 6,891,707 | | | | — | | | | — | |
Health Care Equipment & Supplies | | | 4,146,608 | | | | — | | | | — | |
Health Care Providers & Services | | | 16,062,582 | | | | — | | | | — | |
Hotels, Restaurants & Leisure | | | 6,790,325 | | | | — | | | | — | |
Household Products | | | 2,411,901 | | | | — | | | | — | |
Independent Power & Renewable Electricity Producers | | | 1,337,942 | | | | — | | | | — | |
Industrial Conglomerates | | | 4,437,526 | | | | — | | | | — | |
Insurance | | | 2,455,200 | | | | — | | | | — | |
Internet & Catalog Retail | | | 2,254,622 | | | | — | | | | — | |
Internet Software & Services | | | 3,669,009 | | | | — | | | | — | |
IT Services | | | 6,150,534 | | | | — | | | | — | |
Life Sciences Tools & Services | | | 2,044,962 | | | | — | | | | — | |
Machinery | | | 8,104,955 | | | | — | | | | — | |
Metals & Mining | | | 2,195,059 | | | | — | | | | — | |
Multiline Retail | | | 5,835,910 | | | | — | | | | — | |
Oil, Gas & Consumable Fuels | | | 10,532,400 | | | | — | | | | — | |
Pharmaceuticals | | | 9,831,204 | | | | — | | | | — | |
Professional Services | | | 6,549,029 | | | | — | | | | — | |
Real Estate Investment Trusts (REITs) | | | 9,532,941 | | | | — | | | | — | |
Real Estate Management & Development | | | 2,408,700 | | | | — | | | | — | |
Road & Rail | | | 3,795,599 | | | | — | | | | — | |
Semiconductors & Semiconductor Equipment | | | 6,743,866 | | | | — | | | | — | |
Software | | | 24,496,945 | | | | — | | | | — | |
Specialty Retail | | | 21,781,393 | | | | — | | | | — | |
Technology Hardware, Storage & Peripherals | | | 2,467,822 | | | | — | | | | — | |
Textiles, Apparel & Luxury Goods | | | 5,591,704 | | | | 1,975,954 | | | | — | |
Trading Companies & Distributors | | | 2,970,208 | | | | — | | | | — | |
Wireless Telecommunication Services | | | 6,826,471 | | | | — | | | | — | |
Affiliated Money Market Mutual Fund | | | 12,762,443 | | | | — | | | | — | |
| | |
|
|
| |
|
|
| |
|
|
|
Total | | $ | 256,061,102 | | | $ | 1,975,954 | | | $ | — | |
| | |
|
|
| |
|
|
| |
|
|
|
SEE NOTES TO FINANCIAL STATEMENTS.
A15
| | | | | | |
| | | SP PRUDENTIAL U.S. EMERGING GROWTH PORTFOLIO (continued) | | |
| |
| SCHEDULE OF INVESTMENTS | | December 31, 2014 |
The industry classification of investments and liabilities in excess of other assets shown as a percentage of net assets as of December 31, 2014 was as follows (Unaudited):
| | | | |
Software | | | 9.8 | % |
Specialty Retail | | | 8.7 | |
Health Care Providers & Services | | | 6.4 | |
Affiliated Money Market Mutual Fund (including 3.7% of collateral for securities on loan) | | | 5.1 | |
Oil, Gas & Consumable Fuels | | | 4.2 | |
Pharmaceuticals | | | 3.9 | |
Real Estate Investment Trusts (REITs) | | | 3.8 | |
Chemicals | | | 3.5 | |
Machinery | | | 3.2 | |
Textiles, Apparel & Luxury Goods | | | 3.0 | |
Biotechnology | | | 2.9 | |
Food Products | | | 2.8 | |
Wireless Telecommunication Services | | | 2.7 | |
Hotels, Restaurants & Leisure | | | 2.7 | |
Semiconductors & Semiconductor Equipment | | | 2.7 | |
Professional Services | | | 2.6 | |
IT Services | | | 2.5 | |
Airlines | | | 2.4 | |
Multiline Retail | | | 2.3 | |
Commercial Services & Supplies | | | 2.2 | |
Industrial Conglomerates | | | 1.8 | |
Health Care Equipment & Supplies | | | 1.7 | |
Food & Staples Retailing | | | 1.7 | |
Electronic Equipment, Instruments & Components | | | 1.6 | |
| | | | |
Road & Rail | | | 1.5 | % |
Internet Software & Services | | | 1.5 | |
Trading Companies & Distributors | | | 1.2 | |
Construction & Engineering | | | 1.0 | |
Electrical Equipment | | | 1.0 | |
Technology Hardware, Storage & Peripherals | | | 1.0 | |
Insurance | | | 1.0 | |
Household Products | | | 1.0 | |
Real Estate Management & Development | | | 1.0 | |
Beverages | | | 0.9 | |
Communications Equipment | | | 0.9 | |
Energy Equipment & Services | | | 0.9 | |
Internet & Catalog Retail | | | 0.9 | |
Metals & Mining | | | 0.9 | |
Banks | | | 0.9 | |
Auto Components | | | 0.8 | |
Life Sciences Tools & Services | | | 0.8 | |
Consumer Finance | | | 0.8 | |
Capital Markets | | | 0.5 | |
Independent Power & Renewable Electricity Producers | | | 0.5 | |
| | |
|
|
|
| | | | 103.2 | |
Liabilities in excess of other assets | | | (3.2 | ) |
| | |
|
|
|
| | | | 100.0 | % |
| | |
|
|
|
SEE NOTES TO FINANCIAL STATEMENTS.
A16
| | | | | | |
| | | SP PRUDENTIAL U.S. EMERGING GROWTH PORTFOLIO (continued) | | |
STATEMENT OF ASSETS AND LIABILITIES
as of December 31, 2014
| | | | |
| ASSETS | | | | |
Investments at value, including securities on loan of $8,944,508: | | | | |
Unaffiliated investments (cost $166,315,665) | | $ | 245,274,613 | |
Affiliated investments (cost $12,762,443) | | | 12,762,443 | |
Cash | | | 646 | |
Receivable for investments sold | | | 1,322,725 | |
Dividends receivable | | | 185,801 | |
Receivable for Series shares sold | | | 5,437 | |
Tax reclaim receivable | | | 2,979 | |
Prepaid expenses | | | 2,253 | |
| | |
|
|
|
Total Assets | | | 259,556,897 | |
| | |
|
|
|
| LIABILITIES | | | | |
Payable to broker for collateral for securities on loan | | | 9,202,022 | |
Payable for Series shares repurchased | | | 142,673 | |
Management fee payable | | | 126,864 | |
Accrued expenses | | | 77,617 | |
Deferred trustees’ fees | | | 1,817 | |
Affiliated transfer agent fee payable | | | 926 | |
Distribution fee payable | | | 187 | |
Administration fee payable | | | 112 | |
| | |
|
|
|
Total Liabilities | | | 9,552,218 | |
| | |
|
|
|
| NET ASSETS | | $ | 250,004,679 | |
| | |
|
|
|
Net assets were comprised of: | | | | |
Paid-in capital | | $ | 103,960,938 | |
Retained earnings | | | 146,043,741 | |
| | |
|
|
|
Net assets, December 31, 2014 | | $ | 250,004,679 | |
| | |
|
|
|
| Class I: | | | | |
Net asset value and redemption price per share $249,116,834 / 21,000,026 outstanding shares of beneficial interest | | $ | 11.86 | |
| | |
|
|
|
| Class II: | | | | |
Net asset value and redemption price per share $887,845 / 78,351 outstanding shares of beneficial interest | | $ | 11.33 | |
| | |
|
|
|
STATEMENT OF OPERATIONS
Year Ended December 31, 2014
| | | | |
| NET INVESTMENT INCOME | | | | |
| INCOME | | | | |
Unaffiliated dividend income (net of foreign withholding taxes of $3,593) | | ,$ | 2,174,633 | |
Affiliated income from securities loaned, net | | | 32,578 | |
Affiliated dividend income | | | 7,392 | |
| | |
|
|
|
Total income | | | 2,214,603 | |
| | |
|
|
|
| EXPENSES | | | | |
Management fee | | | 1,476,673 | |
Distribution fee—Class II | | | 2,068 | |
Administration fee—Class II | | | 1,241 | |
Custodian’s fees and expenses | | | 60,000 | |
Shareholders’ reports | | | 60,000 | |
Audit fee | | | 25,000 | |
Trustees’ fees | | | 14,000 | |
Transfer agent’s fees and expenses (including affiliated expense of $5,600) | | | 12,000 | |
Legal fees and expenses | | | 10,000 | |
Insurance expenses | | | 3,000 | |
Commitment fee on syndicated credit agreement | | | 2,000 | |
Miscellaneous | | | 9,462 | |
| | |
|
|
|
Total expenses | | | 1,675,444 | |
| | |
|
|
|
| NET INVESTMENT INCOME | | | 539,159 | |
| | |
|
|
|
| REALIZED AND UNREALIZED GAIN (LOSS) ON INVESTMENT AND FOREIGN CURRENCY TRANSACTIONS | | | | |
Net realized gain (loss) on: | | | | |
Investment transactions | | | 34,102,823 | |
Foreign currency transactions | | | (642 | ) |
| | |
|
|
|
| | | | 34,102,181 | |
| | |
|
|
|
Net change in unrealized appreciation (depreciation) on: | | | | |
Investments | | | (12,120,338 | ) |
Foreign currencies | | | 55 | |
| | |
|
|
|
| | | | (12,120,283 | ) |
| | |
|
|
|
| NET GAIN ON INVESTMENT AND FOREIGN CURRENCY TRANSACTIONS | | | 21,981,898 | |
| | |
|
|
|
| NET INCREASE IN NET ASSETS RESULTING FROM OPERATIONS | | $ | 22,521,057 | |
| | |
|
|
|
STATEMENT OF CHANGES IN NET ASSETS
| | | | | | | | |
| | | Year Ended December 31,
| |
| | | 2014
| | | 2013
| |
| INCREASE (DECREASE) IN NET ASSETS | | | | | | | | |
| OPERATIONS | | | | | | | | |
Net investment income | | $ | 539,159 | | | $ | 198,770 | |
Net realized gain on investment and foreign currency transactions | | | 34,102,181 | | | | 23,218,743 | |
Net change in unrealized appreciation (depreciation) on investments and foreign currencies | | | (12,120,283 | ) | | | 35,765,499 | |
| | |
|
|
| |
|
|
|
NET INCREASE IN NET ASSETS RESULTING FROM OPERATIONS | | | 22,521,057 | | | | 59,183,012 | |
| | |
|
|
| |
|
|
|
| SERIES SHARE TRANSACTIONS (Note 7) | | | | | | | | |
Series shares sold | | | 4,977,132 | | | | 6,115,312 | |
Series shares repurchased | | | (30,013,613 | ) | | | (34,115,247 | ) |
| | |
|
|
| |
|
|
|
NET DECREASE IN NET ASSETS FROM SERIES SHARE TRANSACTIONS | | | (25,036,481 | ) | | | (27,999,935 | ) |
| | |
|
|
| |
|
|
|
| TOTAL INCREASE (DECREASE) | | | (2,515,424 | ) | | | 31,183,077 | |
| NET ASSETS: | | | | | | | | |
Beginning of year | | | 252,520,103 | | | | 221,337,026 | |
| | |
|
|
| |
|
|
|
End of year | | $ | 250,004,679 | | | $ | 252,520,103 | |
| | |
|
|
| |
|
|
|
SEE NOTES TO FINANCIAL STATEMENTS.
A17
| | | | | | |
| | | SP SMALL CAP VALUE PORTFOLIO | | |
| |
| SCHEDULE OF INVESTMENTS | | December 31, 2014 |
| | | | | | | | |
| LONG-TERM INVESTMENTS — 98.9% | | | | |
| COMMON STOCKS — 97.5% | | Shares
| | | Value
(Note 2)
| |
Aerospace & Defense — 2.1% | | | | | | | | |
Cubic Corp. | | | 4,485 | | | $ | 236,090 | |
Curtiss-Wright Corp. | | | 8,663 | | | | 611,521 | |
Esterline Technologies Corp.*(a) | | | 13,697 | | | | 1,502,287 | |
Moog, Inc. (Class A Stock)* | | | 11,859 | | | | 877,922 | |
Teledyne Technologies, Inc.* | | | 3,992 | | | | 410,138 | |
Triumph Group, Inc. | | | 14,020 | | | | 942,425 | |
| | | | | | |
|
|
|
| | | | | | | | 4,580,383 | |
| | | | | | |
|
|
|
Air Freight & Logistics — 0.3% | | | | | | | | |
Forward Air Corp. | | | 12,416 | | | | 625,394 | |
| | | | | | |
|
|
|
Auto Components — 1.1% | | | | | | | | |
American Axle & Manufacturing Holdings, Inc.* | | | 24,920 | | | | 562,943 | |
Dana Holding Corp. | | | 31,450 | | | | 683,723 | |
Superior Industries International, Inc. | | | 28,100 | | | | 556,099 | |
Tenneco, Inc.* | | | 8,697 | | | | 492,337 | |
| | | | | | |
|
|
|
| | | | | | | | 2,295,102 | |
| | | | | | |
|
|
|
Banks — 15.5% | | | | | | | | |
BancorpSouth, Inc. | | | 44,317 | | | | 997,576 | |
Bank of the Ozarks, Inc. | | | 33,525 | | | | 1,271,268 | |
BankUnited, Inc. | | | 44,370 | | | | 1,285,399 | |
Banner Corp.(g) | | | 13,240 | | | | 569,585 | |
Boston Private Financial Holdings, Inc. | | | 42,035 | | | | 566,211 | |
Bridge Capital Holdings* | | | 7,620 | | | | 170,536 | |
CoBiz Financial, Inc. | | | 15,903 | | | | 208,806 | |
Community Bank System, Inc. | | | 14,914 | | | | 568,671 | |
ConnectOne Bancorp, Inc. | | | 7,142 | | | | 135,698 | |
First Financial Bankshares, Inc.(a) | | | 21,048 | | | | 628,914 | |
First Midwest Bancorp, Inc. | | | 21,076 | | | | 360,610 | |
First of Long Island Corp. (The) | | | 5,916 | | | | 167,837 | |
First Republic Bank | | | 20,400 | | | | 1,063,248 | |
FirstMerit Corp. | | | 102,440 | | | | 1,935,092 | |
Flushing Financial Corp. | | | 16,838 | | | | 341,306 | |
Glacier Bancorp, Inc. | | | 27,171 | | | | 754,539 | |
Heritage Financial Corp. | | | 9,049 | | | | 158,810 | |
Home BancShares, Inc. | | | 17,716 | | | | 569,747 | |
Iberiabank Corp. | | | 43,840 | | | | 2,843,024 | |
Independent Bank Corp. | | | 10,720 | | | | 458,923 | |
Independent Bank Group, Inc. | | | 4,968 | | | | 194,050 | |
Lakeland Financial Corp. | | | 6,125 | | | | 266,254 | |
MB Financial, Inc. | | | 27,880 | | | | 916,137 | |
PacWest Bancorp | | | 18,837 | | | | 856,330 | |
Pinnacle Financial Partners, Inc. | | | 17,223 | | | | 680,997 | |
PrivateBancorp, Inc. | | | 37,340 | | | | 1,247,156 | |
Prosperity Bancshares, Inc. | | | 12,137 | | | | 671,904 | |
Sandy Spring Bancorp, Inc. | | | 7,829 | | | | 204,180 | |
Sierra Bancorp | | | 3,589 | | | | 63,023 | |
Signature Bank* | | | 20,168 | | | | 2,540,361 | |
South State Corp. | | | 9,521 | | | | 638,669 | |
Southcoast Financial Corp.* | | | 3,566 | | | | 25,140 | |
Southwest Bancorp, Inc. | | | 12,930 | | | | 224,465 | |
Summit State Bank | | | 4,086 | | | | 56,060 | |
SVB Financial Group* | | | 24,650 | | | | 2,861,125 | |
Texas Capital Bancshares, Inc.* | | | 11,309 | | | | 614,418 | |
Tompkins Financial Corp. | | | 16,909 | | | | 935,068 | |
| | | | | | | | |
COMMON STOCKS
(continued) | | Shares
| | | Value
(Note 2)
| |
Banks (continued) | | | | | | | | |
Trico Bancshares | | | 7,909 | | | $ | 195,352 | |
UMB Financial Corp. | | | 14,857 | | | | 845,215 | |
ViewPoint Financial Group, Inc. | | | 25,507 | | | | 608,342 | |
Webster Financial Corp. | | | 32,583 | | | | 1,059,925 | |
Wintrust Financial Corp. | | | 63,700 | | | | 2,978,612 | |
| | | | | | |
|
|
|
| | | | | | | | 33,738,583 | |
| | | | | | |
|
|
|
Biotechnology — 0.4% | | | | | | | | |
Infinity Pharmaceuticals, Inc.* | | | 30,467 | | | | 514,588 | |
TESARO, Inc.* | | | 7,019 | | | | 261,036 | |
| | | | | | |
|
|
|
| | | | | | | | 775,624 | |
| | | | | | |
|
|
|
Building Products — 0.4% | | | | | | | | |
Continental Building Products, Inc.* | | | 17,767 | | | | 315,009 | |
Gibraltar Industries, Inc.* | | | 18,090 | | | | 294,143 | |
NCI Building Systems, Inc.* | | | 17,740 | | | | 328,545 | |
| | | | | | |
|
|
|
| | | | | | | | 937,697 | |
| | | | | | |
|
|
|
Capital Markets — 3.8% | | | | | | | | |
Affiliated Managers Group, Inc.* | | | 11,770 | | | | 2,498,065 | |
Apollo Investment Corp. | | | 8,901 | | | | 66,045 | |
Cohen & Steers, Inc.(a) | | | 4,656 | | | | 195,924 | |
Golub Capital BDC, Inc. | | | 9,470 | | | | 169,797 | |
Greenhill & Co., Inc. | | | 15,496 | | | | 675,626 | |
HFF, Inc. (Class A Stock) | | | 15,043 | | | | 540,345 | |
Moelis & Co. | | | 6,002 | | | | 209,650 | |
New Mountain Finance Corp. | | | 14,682 | | | | 219,349 | |
OM Asset Management PLC (United Kingdom)* | | | 31,896 | | | | 517,991 | |
Raymond James Financial, Inc. | | | 28,470 | | | | 1,631,046 | |
Stifel Financial Corp.* | | | 18,027 | | | | 919,737 | |
Virtus Investment Partners, Inc. | | | 3,187 | | | | 543,352 | |
| | | | | | |
|
|
|
| | | | | | | | 8,186,927 | |
| | | | | | |
|
|
|
Chemicals — 2.5% | | | | | | | | |
Axiall Corp. | | | 4,197 | | | | 178,246 | |
H.B. Fuller Co. | | | 8,309 | | | | 370,000 | |
Koppers Holdings, Inc. | | | 33,470 | | | | 869,550 | |
Kraton Performance Polymers, Inc.* | | | 28,990 | | | | 602,702 | |
Methanex Corp. (Canada) | | | 12,290 | | | | 563,251 | |
Minerals Technologies, Inc. | | | 3,728 | | | | 258,910 | |
PolyOne Corp. | | | 34,325 | | | | 1,301,261 | |
Quaker Chemical Corp. | | | 5,530 | | | | 508,981 | |
Tronox Ltd. (Class A Stock) | | | 2,644 | | | | 63,139 | |
WR Grace & Co.* | | | 6,592 | | | | 628,811 | |
| | | | | | |
|
|
|
| | | | | | | | 5,344,851 | |
| | | | | | |
|
|
|
Commercial Services & Supplies — 1.4% | | | | | |
ACCO Brands Corp.* | | | 103,352 | | | | 931,201 | |
Ceco Environmental Corp. | | | 18,451 | | | | 286,728 | |
G&K Services, Inc. (Class A Stock) | | | 6,523 | | | | 462,155 | |
Herman Miller, Inc. | | | 8,120 | | | | 238,972 | |
Mobile Mini, Inc. | | | 15,742 | | | | 637,708 | |
Progressive Waste Solutions Ltd. (Canada) | | | 18,648 | | | | 560,932 | |
| | | | | | |
|
|
|
| | | | | | | | 3,117,696 | |
| | | | | | |
|
|
|
SEE NOTES TO FINANCIAL STATEMENTS.
A18
| | | | | | |
| | | SP SMALL CAP VALUE PORTFOLIO (continued) | | |
| |
| SCHEDULE OF INVESTMENTS | | December 31, 2014 |
| | | | | | | | |
COMMON STOCKS
(continued) | | Shares
| | | Value
(Note 2)
| |
Communications Equipment — 2.7% | | | | | | | | |
ADTRAN, Inc. | | | 16,186 | | | $ | 352,855 | |
Bel Fuse, Inc. (Class B Stock) | | | 12,120 | | | | 331,361 | |
Black Box Corp. | | | 9,690 | | | | 231,591 | |
Digi International, Inc.* | | | 110,908 | | | | 1,030,335 | |
Extreme Networks, Inc.* | | | 59,195 | | | | 208,958 | |
InterDigital, Inc. | | | 22,100 | | | | 1,169,090 | |
JDS Uniphase Corp.* | | | 31,803 | | | | 436,337 | |
Plantronics, Inc. | | | 31,430 | | | | 1,666,419 | |
RADWARE Ltd. (Israel)* | | | 23,938 | | | | 527,115 | |
| | | | | | |
|
|
|
| | | | | | | | 5,954,061 | |
| | | | | | |
|
|
|
Construction & Engineering — 1.3% | | | | | | | | |
Comfort Systems USA, Inc. | | | 18,011 | | | | 308,349 | |
EMCOR Group, Inc. | | | 38,321 | | | | 1,704,901 | |
MYR Group, Inc.* | | | 14,238 | | | | 390,121 | |
Tutor Perini Corp.* | | | 13,100 | | | | 315,317 | |
| | | | | | |
|
|
|
| | | | | | | | 2,718,688 | |
| | | | | | |
|
|
|
Consumer Finance — 0.2% | | | | | | | | |
First Cash Financial Services, Inc.* | | | 6,819 | | | | 379,614 | |
| | | | | | |
|
|
|
Containers & Packaging — 0.7% | | | | | | | | |
Berry Plastics Group, Inc.* | | | 29,476 | | | | 929,968 | |
Graphic Packaging Holding Co.* | | | 38,349 | | | | 522,313 | |
| | | | | | |
|
|
|
| | | | | | | | 1,452,281 | |
| | | | | | |
|
|
|
Distributors — 0.2% | | | | | | | | |
Core-Mark Holding Co., Inc. | | | 7,087 | | | | 438,898 | |
| | | | | | |
|
|
|
Diversified Consumer Services — 0.1% | | | | | |
Sotheby’s | | | 6,670 | | | | 288,011 | |
| | | | | | |
|
|
|
Diversified Financial Services — 0.2% | | | | | | | | |
MarketAxess Holdings, Inc. | | | 6,565 | | | | 470,776 | |
| | | | | | |
|
|
|
Diversified Telecommunication Services — 0.2% | | | | | |
Premiere Global Services, Inc.* | | | 47,836 | | | | 508,018 | |
| | | | | | |
|
|
|
Electric Utilities — 3.0% | | | | | | | | |
ALLETE, Inc. | | | 26,951 | | | | 1,486,078 | |
Cleco Corp. | | | 16,220 | | | | 884,639 | |
IDACORP, Inc. | | | 16,751 | | | | 1,108,749 | |
MGE Energy, Inc. | | | 8,205 | | | | 374,230 | |
Otter Tail Corp. | | | 2,110 | | | | 65,325 | |
PNM Resources, Inc. | | | 21,901 | | | | 648,927 | |
Portland General Electric Co. | | | 53,741 | | | | 2,033,022 | |
| | | | | | |
|
|
|
| | | | | | | | 6,600,970 | |
| | | | | | |
|
|
|
Electrical Equipment — 0.2% | | | | | | | | |
Thermon Group Holdings, Inc.* | | | 16,411 | | | | 396,982 | |
| | | | | | |
|
|
|
Electronic Equipment, Instruments & Components — 2.8% | |
Anixter International, Inc.* | | | 7,896 | | | | 698,480 | |
AVX Corp. | | | 112,850 | | | | 1,579,900 | |
Belden, Inc. | | | 7,459 | | | | 587,844 | |
CTS Corp. | | | 21,646 | | | | 385,948 | |
Littelfuse, Inc. | | | 4,585 | | | | 443,232 | |
Newport Corp.* | | | 26,915 | | | | 514,346 | |
Park Electrochemical Corp. | | | 78,296 | | | | 1,951,919 | |
| | | | | | |
|
|
|
| | | | | | | | 6,161,669 | |
| | | | | | |
|
|
|
Energy Equipment & Services — 2.0% | | | | | |
C&J Energy Services, Inc.* | | | 22,860 | | | | 301,981 | |
Forum Energy Technologies, Inc.* | | | 24,022 | | | | 497,976 | |
| | | | | | | | |
COMMON STOCKS
(continued) | | Shares
| | | Value
(Note 2)
| |
Energy Equipment & Services (continued) | | | | | |
Frank’s International NV(a) | | | 25,380 | | | $ | 422,069 | |
Gulf Island Fabrication, Inc. | | | 31,340 | | | | 607,682 | |
Key Energy Services, Inc.* | | | 85,020 | | | | 141,983 | |
Matrix Service Co.* | | | 7,410 | | | | 165,391 | |
McDermott International, Inc.*(a) | | | 80,790 | | | | 235,099 | |
Natural Gas Services Group, Inc.* | | | 17,620 | | | | 405,965 | |
Newpark Resources, Inc.* | | | 20,311 | | | | 193,767 | |
TETRA Technologies, Inc.*(a) | | | 129,623 | | | | 865,882 | |
Tidewater, Inc. | | | 16,190 | | | | 524,718 | |
| | | | | | |
|
|
|
| | | | | | | | 4,362,513 | |
| | | | | | |
|
|
|
Food & Staples Retailing — 0.6% | | | | | | | | |
Weis Markets, Inc. | | | 28,400 | | | | 1,358,088 | |
| | | | | | |
|
|
|
Food Products — 0.6% | | | | | | | | |
B&G Foods, Inc. | | | 8,029 | | | | 240,067 | |
Freshpet, Inc.*(a) | | | 3,475 | | | | 59,283 | |
Hain Celestial Group, Inc. (The)* | | | 12,858 | | | | 749,493 | |
J&J Snack Foods Corp. | | | 1,631 | | | | 177,404 | |
| | | | | | |
|
|
|
| | | | | | | | 1,226,247 | |
| | | | | | |
|
|
|
Gas Utilities — 1.3% | | | | | | | | |
Laclede Group, Inc. (The) | | | 5,540 | | | | 294,728 | |
New Jersey Resources Corp. | | | 12,179 | | | | 745,355 | |
Northwest Natural Gas Co. | | | 3,430 | | | | 171,157 | |
Southwest Gas Corp. | | | 21,160 | | | | 1,307,899 | |
WGL Holdings, Inc. | | | 5,690 | | | | 310,788 | |
| | | | | | |
|
|
|
| | | | | | | | 2,829,927 | |
| | | | | | |
|
|
|
Health Care Equipment & Supplies — 0.7% | | | | | |
Endologix, Inc.* | | | 26,392 | | | | 403,534 | |
Integra LifeSciences Holdings Corp.* | | | 10,844 | | | | 588,070 | |
Tornier NV* | | | 18,453 | | | | 470,551 | |
| | | | | | |
|
|
|
| | | | | | | | 1,462,155 | |
| | | | | | |
|
|
|
Health Care Providers & Services — 1.7% | | | | | |
Adeptus Health, Inc.* | | | 6,644 | | | | 248,486 | |
Air Methods Corp.*(a) | | | 14,724 | | | | 648,298 | |
Brookdale Senior Living, Inc.* | | | 7,190 | | | | 263,657 | |
Cross Country Healthcare, Inc.* | | | 53,925 | | | | 672,984 | |
HealthSouth Corp. | | | 23,957 | | | | 921,386 | |
LifePoint Hospitals, Inc.* | | | 10,760 | | | | 773,752 | |
Surgical Care Affiliates, Inc.* | | | 5,396 | | | | 181,575 | |
| | | | | | |
|
|
|
| | | | | | | | 3,710,138 | |
| | | | | | |
|
|
|
Health Care Technology — 0.7% | | | | | | | | |
Allscripts Healthcare Solutions, Inc.* | | | 86,650 | | | | 1,106,521 | |
Quality Systems, Inc. | | | 24,170 | | | | 376,810 | |
| | | | | | |
|
|
|
| | | | | | | | 1,483,331 | |
| | | | | | |
|
|
|
Hotels, Restaurants & Leisure — 1.9% | | | | | |
Bloomin’ Brands, Inc.* | | | 20,563 | | | | 509,140 | |
Diamond Resorts International, Inc.* | | | 24,617 | | | | 686,814 | |
DineEquity, Inc. | | | 5,156 | | | | 534,368 | |
Jack in the Box, Inc. | | | 10,578 | | | | 845,817 | |
Krispy Kreme Doughnuts, Inc.* | | | 9,973 | | | | 196,867 | |
Marriott Vacations Worldwide Corp. | | | 7,067 | | | | 526,774 | |
Vail Resorts, Inc. | | | 9,451 | | | | 861,270 | |
| | | | | | |
|
|
|
| | | | | | | | 4,161,050 | |
| | | | | | |
|
|
|
SEE NOTES TO FINANCIAL STATEMENTS.
A19
| | | | | | |
| | | SP SMALL CAP VALUE PORTFOLIO (continued) | | |
| |
| SCHEDULE OF INVESTMENTS | | December 31, 2014 |
| | | | | | | | |
COMMON STOCKS
(continued) | | Shares
| | | Value
(Note 2)
| |
Household Durables — 1.1% | | | | | | | | |
Meritage Homes Corp.* | | | 12,008 | | | $ | 432,168 | |
Ryland Group, Inc. (The)(a) | | | 26,960 | | | | 1,039,578 | |
Standard Pacific Corp.* | | | 54,326 | | | | 396,036 | |
WCI Communities, Inc.* | | | 18,890 | | | | 369,866 | |
William Lyon Homes
(Class A Stock)* | | | 10,086 | | | | 204,443 | |
| | | | | | |
|
|
|
| | | | | | | | 2,442,091 | |
| | | | | | |
|
|
|
Household Products — 0.6% | | | | | | | | |
Spectrum Brands Holdings, Inc. | | | 13,548 | | | | 1,296,273 | |
| | | | | | |
|
|
|
Independent Power & Renewable Electricity Producers — 0.4% | |
Dynegy, Inc.* | | | 24,968 | | | | 757,779 | |
| | | | | | |
|
|
|
Industrial Conglomerates — 0.5% | | | | | | | | |
Carlisle Cos., Inc. | | | 12,343 | | | | 1,113,832 | |
| | | | | | |
|
|
|
Insurance — 5.2% | | | | | | | | |
Allied World Assurance Co. Holdings AG | | | 58,420 | | | | 2,215,286 | |
American Equity Investment Life Holding Co. | | | 43,169 | | | | 1,260,103 | |
AMERISAFE, Inc. | | | 6,007 | | | | 254,456 | |
Axis Capital Holdings Ltd. | | | 29,450 | | | | 1,504,600 | |
CNO Financial Group, Inc. | | | 68,998 | | | | 1,188,146 | |
Endurance Specialty Holdings Ltd. | | | 8,937 | | | | 534,790 | |
Enstar Group Ltd.*(g) | | | 3,310 | | | | 506,066 | |
Fidelity & Guaranty Life | | | 9,873 | | | | 239,618 | |
Maiden Holdings Ltd. | | | 52,066 | | | | 665,924 | |
Meadowbrook Insurance Group,
Inc.(a) | | | 18,559 | | | | 157,009 | |
National General Holdings Corp. | | | 13,262 | | | | 246,806 | |
ProAssurance Corp. | | | 35,717 | | | | 1,612,623 | |
RLI Corp. | | | 8,439 | | | | 416,887 | |
Symetra Financial Corp. | | | 16,406 | | | | 378,158 | |
| | | | | | |
|
|
|
| | | | | | | | 11,180,472 | |
| | | | | | |
|
|
|
Internet & Catalog Retail — 0.2% | | | | | | | | |
HSN, Inc. | | | 6,853 | | | | 520,828 | |
| | | | | | |
|
|
|
Internet Software & Services — 0.2% | | | | | | | | |
Everyday Health, Inc.* | | | 32,201 | | | | 474,965 | |
| | | | | | |
|
|
|
IT Services — 0.3% | | | | | | | | |
Convergys Corp. | | | 33,415 | | | | 680,664 | |
| | | | | | |
|
|
|
Leisure Products — 0.1% | | | | | | | | |
Brunswick Corp. | | | 4,969 | | | | 254,711 | |
| | | | | | |
|
|
|
Machinery — 4.2% | | | | | | | | |
Actuant Corp. (Class A Stock) | | | 31,437 | | | | 856,344 | |
Alamo Group, Inc. | | | 2,853 | | | | 138,199 | |
Altra Industrial Motion Corp. | | | 5,090 | | | | 144,505 | |
Barnes Group, Inc. | | | 12,607 | | | | 466,585 | |
CIRCOR International, Inc. | | | 6,466 | | | | 389,770 | |
Clarcor, Inc. | | | 9,457 | | | | 630,215 | |
Graco, Inc. | | | 5,629 | | | | 451,333 | |
Harsco Corp. | | | 65,090 | | | | 1,229,550 | |
Manitowoc Co., Inc. (The) | | | 41,820 | | | | 924,222 | |
RBC Bearings, Inc. | | | 24,996 | | | | 1,612,992 | |
Snap-on, Inc. | | | 5,600 | | | | 765,744 | |
Standex International Corp. | | | 4,026 | | | | 311,049 | |
| | | | | | | | |
COMMON STOCKS
(continued) | | Shares
| | | Value
(Note 2)
| |
Machinery (continued) | | | | | | | | |
Watts Water Technologies, Inc.
(Class A Stock) | | | 10,101 | | | $ | 640,807 | |
Woodward, Inc. | | | 11,885 | | | | 585,099 | |
| | | | | | |
|
|
|
| | | | | | | | 9,146,414 | |
| | | | | | |
|
|
|
Marine — 0.2% | | | | | | | | |
Diana Shipping, Inc. (Greece)*(a) | | | 56,420 | | | | 378,578 | |
| | | | | | |
|
|
|
Media — 0.8% | | | | | | | | |
Carmike Cinemas, Inc.* | | | 14,858 | | | | 390,320 | |
Live Nation Entertainment, Inc.* | | | 36,517 | | | | 953,459 | |
Nexstar Broadcasting Group, Inc.
(Class A Stock) | | | 6,931 | | | | 358,956 | |
Townsquare Media, Inc.* | | | 7,803 | | | | 103,000 | |
| | | | | | |
|
|
|
| | | | | | | | 1,805,735 | |
| | | | | | |
|
|
|
Metals & Mining — 2.5% | | | | | | | | |
AK Steel Holding Corp.*(a) | | | 73,741 | | | | 438,022 | |
Carpenter Technology Corp.(a) | | | 10,070 | | | | 495,947 | |
Commercial Metals Co. | | | 34,238 | | | | 557,737 | |
Globe Specialty Metals, Inc. | | | 12,350 | | | | 212,790 | |
Haynes International, Inc. | | | 13,044 | | | | 632,634 | |
Horsehead Holding Corp.*(a) | | | 63,360 | | | | 1,002,989 | |
Kaiser Aluminum Corp. | | | 11,056 | | | | 789,730 | |
RTI International Metals, Inc.* | | | 18,150 | | | | 458,469 | |
Steel Dynamics, Inc. | | | 31,250 | | | | 616,875 | |
TimkenSteel Corp. | | | 3,792 | | | | 140,418 | |
| | | | | | |
|
|
|
| | | | | | | | 5,345,611 | |
| | | | | | |
|
|
|
Multiline Retail — 1.0% | | | | | | | | |
Burlington Stores, Inc.* | | | 45,979 | | | | 2,172,968 | |
| | | | | | |
|
|
|
Multi-Utilities — 0.7% | | | | | | | | |
Black Hills Corp. | | | 10,627 | | | | 563,656 | |
NorthWestern Corp. | | | 16,889 | | | | 955,580 | |
| | | | | | |
|
|
|
| | | | | | | | 1,519,236 | |
| | | | | | |
|
|
|
Oil, Gas & Consumable Fuels — 2.6% | | | | | | | | |
Bill Barrett Corp.*(a) | | | 28,480 | | | | 324,387 | |
Carrizo Oil & Gas, Inc.* | | | 23,800 | | | | 990,080 | |
Cloud Peak Energy, Inc.* | | | 35,300 | | | | 324,054 | |
Jones Energy, Inc. (Class A Stock)* | | | 19,440 | | | | 221,810 | |
Laredo Petroleum, Inc.*(a) | | | 37,606 | | | | 389,222 | |
Parsley Energy, Inc.
(Class A Stock)* | | | 47,940 | | | | 765,123 | |
Rex Energy Corp.*(a) | | | 78,774 | | | | 401,747 | |
Rice Energy, Inc.*(a) | | | 42,921 | | | | 900,053 | |
RSP Permian, Inc.*(a) | | | 15,169 | | | | 381,349 | |
SM Energy Co. | | | 18,018 | | | | 695,135 | |
WPX Energy, Inc.* | | | 19,490 | | | | 226,669 | |
| | | | | | |
|
|
|
| | | | | | | | 5,619,629 | |
| | | | | | |
|
|
|
Paper & Forest Products — 0.7% | | | | | | | | |
Boise Cascade Co.* | | | 25,590 | | | | 950,668 | |
KapStone Paper and Packaging Corp. | | | 19,148 | | | | 561,228 | |
| | | | | | |
|
|
|
| | | | | | | | 1,511,896 | |
| | | | | | |
|
|
|
Pharmaceuticals — 0.5% | | | | | | | | |
Catalent, Inc.* | | | 19,862 | | | | 553,752 | |
Prestige Brands Holdings, Inc.* | | | 12,669 | | | | 439,868 | |
| | | | | | |
|
|
|
| | | | | | | | 993,620 | |
| | | | | | |
|
|
|
SEE NOTES TO FINANCIAL STATEMENTS.
A20
| | | | | | |
| | | SP SMALL CAP VALUE PORTFOLIO (continued) | | |
| |
| SCHEDULE OF INVESTMENTS | | December 31, 2014 |
| | | | | | | | |
COMMON STOCKS
(continued) | | Shares
| | | Value
(Note 2)
| |
Professional Services — 0.8% | | | | | | | | |
Korn/Ferry International* | | | 17,600 | | | $ | 506,176 | |
On Assignment, Inc.* | | | 7,204 | | | | 239,101 | |
TrueBlue, Inc.* | | | 46,704 | | | | 1,039,164 | |
| | | | | | |
|
|
|
| | | | | | | | 1,784,441 | |
| | | | | | |
|
|
|
Real Estate Investment Trusts (REITs) — 10.5% | | | | | |
Acadia Realty Trust | | | 35,484 | | | | 1,136,552 | |
American Campus Communities, Inc. | | | 9,472 | | | | 391,762 | |
Apollo Commercial Real Estate Finance, Inc. | | | 41,323 | | | | 676,044 | |
Biomed Realty Trust, Inc. | | | 21,350 | | | | 459,879 | |
Blackstone Mortgage Trust, Inc.
(Class A Stock) | | | 27,945 | | | | 814,317 | |
CBL & Associates Properties, Inc. | | | 42,742 | | | | 830,050 | |
Chesapeake Lodging Trust | | | 42,728 | | | | 1,589,909 | |
Corporate Office Properties Trust | | | 16,750 | | | | 475,197 | |
Cousins Properties, Inc. | | | 68,473 | | | | 781,962 | |
CubeSmart | | | 58,030 | | | | 1,280,722 | |
DuPont Fabros Technology, Inc. | | | 23,655 | | | | 786,292 | |
EastGroup Properties, Inc. | | | 16,400 | | | | 1,038,448 | |
Empire State Realty Trust, Inc.
(Class A Stock) | | | 22,750 | | | | 399,945 | |
First Potomac Realty Trust | | | 41,630 | | | | 514,547 | |
Hersha Hospitality Trust | | | 40,340 | | | | 283,590 | |
Highwoods Properties, Inc. | | | 23,246 | | | | 1,029,333 | |
Hudson Pacific Properties, Inc. | | | 31,362 | | | | 942,742 | |
MFA Financial, Inc. | | | 86,302 | | | | 689,553 | |
Mid-America Apartment Communities, Inc. | | | 6,540 | | | | 488,407 | |
National Health Investors, Inc. | | | 17,325 | | | | 1,212,057 | |
Pebblebrook Hotel Trust | | | 69,241 | | | | 3,159,467 | |
PS Business Parks, Inc. | | | 11,598 | | | | 922,505 | |
Strategic Hotels & Resorts, Inc.* | | | 98,444 | | | | 1,302,414 | |
Terreno Realty Corp. | | | 37,339 | | | | 770,304 | |
Two Harbors Investment Corp. | | | 54,481 | | | | 545,900 | |
Washington Real Estate Investment Trust | | | 8,450 | | | | 233,727 | |
| | | | | | |
|
|
|
| | | | | | | | 22,755,625 | |
| | | | | | |
|
|
|
Real Estate Management & Development — 0.8% | |
CBRE Group, Inc. (Class A Stock)* | | | 9,200 | | | | 315,100 | |
Jones Lang LaSalle, Inc. | | | 3,720 | | | | 557,740 | |
Kennedy-Wilson Holdings, Inc. | | | 37,648 | | | | 952,494 | |
| | | | | | |
|
|
|
| | | | | | | | 1,825,334 | |
| | | | | | |
|
|
|
Regional Banks — 0.2% | | | | | | | | |
Great Western Bancorp,Inc.* | | | 19,088 | | | | 435,016 | |
| | | | | | |
|
|
|
Road & Rail — 0.7% | | | | | | | | |
Old Dominion Freight Line, Inc.* | | | 18,027 | | | | 1,399,616 | |
| | | | | | |
|
|
|
Semiconductors & Semiconductor Equipment — 6.1% | |
Cabot Microelectronics Corp.* | | | 13,430 | | | | 635,508 | |
Entegris, Inc.* | | | 60,272 | | | | 796,193 | |
Exar Corp.* | | | 132,290 | | | | 1,349,358 | |
Fairchild Semiconductor International, Inc.* | | | 33,013 | | | | 557,260 | |
Intersil Corp. (Class A Stock) | | | 60,964 | | | | 882,149 | |
MKS Instruments, Inc. | | | 21,294 | | | | 779,360 | |
| | | | | | | | |
COMMON STOCKS
(continued) | | Shares
| | | Value
(Note 2)
| |
Semiconductors & Semiconductor Equipment (continued) | |
ON Semiconductor Corp.* | | | 164,810 | | | $ | 1,669,525 | |
Rudolph Technologies, Inc.* | | | 179,060 | | | | 1,831,784 | |
Semtech Corp.* | | | 19,513 | | | | 537,973 | |
Silicon Laboratories, Inc.* | | | 11,231 | | | | 534,820 | |
Teradyne, Inc. | | | 96,706 | | | | 1,913,812 | |
Veeco Instruments, Inc.*(a) | | | 48,058 | | | | 1,676,263 | |
| | | | | | |
|
|
|
| | | | | | | | 13,164,005 | |
| | | | | | |
|
|
|
Software — 1.2% | | | | | | | | |
Bottomline Technologies (DE), Inc.* | | | 15,148 | | | | 382,941 | |
Gigamon, Inc.* | | | 3,534 | | | | 62,658 | |
Monotype Imaging Holdings, Inc. | | | 14,789 | | | | 426,367 | |
Pegasystems, Inc. | | | 11,875 | | | | 246,644 | |
PTC, Inc.* | | | 13,478 | | | | 493,969 | |
SS&C Technologies Holdings, Inc. | | | 5,634 | | | | 329,533 | |
Verint Systems, Inc.* | | | 10,995 | | | | 640,788 | |
| | | | | | |
|
|
|
| | | | | | | | 2,582,900 | |
| | | | | | |
|
|
|
Specialty Retail — 3.0% | | | | | | | | |
Asbury Automotive Group, Inc.* | | | 5,033 | | | | 382,105 | |
Boot Barn Holdings, Inc.* | | | 5,170 | | | | 94,094 | |
Cato Corp. (The) (Class A Stock) | | | 7,940 | | | | 334,909 | |
Express, Inc.* | | | 8,145 | | | | 119,650 | |
Genesco, Inc.* | | | 763 | | | | 58,461 | |
GNC Holdings, Inc. (Class A Stock) | | | 26,255 | | | | 1,232,935 | |
Lithia Motors, Inc. (Class A Stock) | | | 8,839 | | | | 766,253 | |
MarineMax, Inc.* | | | 64,950 | | | | 1,302,248 | |
Monro Muffler Brake, Inc.(a) | | | 5,306 | | | | 306,687 | |
Office Depot, Inc.* | | | 73,811 | | | | 632,929 | |
Pier 1 Imports, Inc. | | | 87,330 | | | | 1,344,882 | |
| | | | | | |
|
|
|
| | | | | | | | 6,575,153 | |
| | | | | | |
|
|
|
Technology Hardware, Storage & Peripherals — 0.2% | |
Electronics For Imaging, Inc.* | | | 9,809 | | | | 420,119 | |
| | | | | | |
|
|
|
Textiles, Apparel & Luxury Goods — 0.9% | |
Carter’s, Inc. | | | 8,144 | | | | 711,052 | |
Movado Group, Inc. | | | 35,640 | | | | 1,011,107 | |
Steven Madden Ltd.* | | | 9,855 | | | | 313,685 | |
| | | | | | |
|
|
|
| | | | | | | | 2,035,844 | |
| | | | | | |
|
|
|
Thrifts & Mortgage Finance — 1.4% | |
Brookline Bancorp, Inc. | | | 17,161 | | | | 172,125 | |
Dime Community Bancshares, Inc. | | | 11,015 | | | | 179,324 | |
Oritani Financial Corp. | | | 15,102 | | | �� | 232,571 | |
Provident Financial Services, Inc. | | | 21,848 | | | | 394,575 | |
Radian Group, Inc.(a) | | | 66,433 | | | | 1,110,760 | |
Westfield Financial, Inc. | | | 86,160 | | | | 632,414 | |
WSFS Financial Corp. | | | 3,403 | | | | 261,657 | |
| | | | | | |
|
|
|
| | | | | | | | 2,983,426 | |
| | | | | | |
|
|
|
Trading Companies & Distributors — 1.3% | |
Applied Industrial Technologies, Inc. | | | 11,495 | | | | 524,057 | |
Kaman Corp. | | | 17,461 | | | | 700,011 | |
Rush Enterprises, Inc. (Class A Stock)* | | | 28,740 | | | | 921,117 | |
WESCO International, Inc.*(a) | | | 9,431 | | | | 718,737 | |
| | | | | | |
|
|
|
| | | | | | | | 2,863,922 | |
| | | | | | |
|
|
|
TOTAL COMMON STOCKS
(cost $152,028,949) | | | | | | | 211,606,377 | |
| | | | | | |
|
|
|
SEE NOTES TO FINANCIAL STATEMENTS.
A21
| | | | | | |
| | | SP SMALL CAP VALUE PORTFOLIO (continued) | | |
| |
| SCHEDULE OF INVESTMENTS | | December 31, 2014 |
| | | | | | | | |
EXCHANGE TRADED
FUND — 1.4% | | Shares
| | | Value
(Note 2)
| |
iShares Russell 2000 Value Index Fund(a)
(cost $2,704,549) | | | 29,979 | | | $ | 3,048,265 | |
| | | | | | |
|
|
|
TOTAL LONG-TERM INVESTMENTS
(cost $154,733,498) | | | | 214,654,642 | |
| | | | | | |
|
|
|
| SHORT-TERM INVESTMENT — 8.2% | |
AFFILIATED MONEY MARKET MUTUAL FUND | |
Prudential Investment Portfolios 2 —Prudential Core Taxable Money Market Fund (cost $17,767,420; includes $15,765,250 of cash collateral for securities on loan)(b)(w) (Note 4) | | | 17,767,420 | | | | 17,767,420 | |
| | | | | | |
|
|
|
TOTAL INVESTMENTS — 107.1%
(cost $172,500,918) | | | | 232,422,062 | |
LIABILITIES IN EXCESS OF
OTHER ASSETS — (7.1)% | | | | (15,340,587 | ) |
| | | | | | |
|
|
|
NET ASSETS — 100.0% | | | $ | 217,081,475 | |
| | | | | | |
|
|
|
See the Glossary for abbreviations used in the Portfolio descriptions.
| * | Non-income producing security. |
| (a) | All or a portion of security is on loan. The aggregate market value of such securities, including those sold and pending settlement, is $15,305,111; cash collateral of $15,765,250 (included in liabilities) was received with which the Portfolio purchased highly liquid short-term investments. Securities on loan are subject to contractual netting arrangements. |
| (b) | Represents security, or a portion thereof, purchased with cash collateral received for securities on loan. |
| (g) | Indicates a security or securities that has been deemed illiquid. |
| (w) | Prudential Investments LLC, the manager of the Portfolio, also serves as manager of the Prudential Investment Portfolios 2 —Prudential Core Taxable Money Market Fund. |
Various inputs are used in determining the value of the Portfolio’s investments. These inputs are summarized in the three broad levels listed below.
| Level 1— | quoted prices generally in active markets for identical securities. |
| Level 2— | quoted prices for similar securities, interest rates and yield curves, prepayment speeds, foreign currency exchange rates and other significant observable inputs. |
| Level 3— | significant unobservable inputs for securities valued in accordance with Board approved fair valuation procedures. |
The following is a summary of the inputs used as of December 31, 2014 in valuing such portfolio securities:
| | | | | | | | | | | | |
| | | Level 1
| | | Level 2
| | | Level 3
| |
Investments in Securities | | | | | | | | | | | | |
Common Stocks | | | | | | | | | | | | |
Aerospace & Defense | | $ | 4,580,383 | | | $ | — | | | $ | — | |
Air Freight & Logistics | | | 625,394 | | | | — | | | | — | |
Auto Components | | | 2,295,102 | | | | — | | | | — | |
Banks | | | 33,738,583 | | | | — | | | | — | |
Biotechnology | | | 775,624 | | | | — | | | | — | |
Building Products | | | 937,697 | | | | — | | | | — | |
Capital Markets | | | 8,186,927 | | | | — | | | | — | |
Chemicals | | | 5,344,851 | | | | — | | | | — | |
Commercial Services & Supplies | | | 3,117,696 | | | | — | | | | — | |
Communications Equipment | | | 5,954,061 | | | | — | | | | — | |
Construction & Engineering | | | 2,718,688 | | | | — | | | | — | |
Consumer Finance | | | 379,614 | | | | — | | | | — | |
Containers & Packaging | | | 1,452,281 | | | | — | | | | — | |
Distributors | | | 438,898 | | | | — | | | | — | |
Diversified Consumer Services | | | 288,011 | | | | — | | | | — | |
Diversified Financial Services | | | 470,776 | | | | — | | | | — | |
Diversified Telecommunication Services | | | 508,018 | | | | — | | | | — | |
Electric Utilities | | | 6,600,970 | | | | — | | | | — | |
Electrical Equipment | | | 396,982 | | | | — | | | | — | |
Electronic Equipment, Instruments & Components | | | 6,161,669 | | | | — | | | | — | |
Energy Equipment & Services | | | 4,362,513 | | | | — | | | | — | |
Food & Staples Retailing | | | 1,358,088 | | | | — | | | | — | |
Food Products | | | 1,226,247 | | | | — | | | | — | |
Gas Utilities | | | 2,829,927 | | | | — | | | | — | |
Health Care Equipment & Supplies | | | 1,462,155 | | | | — | | | | — | |
Health Care Providers & Services | | | 3,710,138 | | | | — | | | | — | |
SEE NOTES TO FINANCIAL STATEMENTS.
A22
| | | | | | |
| | | SP SMALL CAP VALUE PORTFOLIO (continued) | | |
| |
| SCHEDULE OF INVESTMENTS | | December 31, 2014 |
| | | | | | | | | | | | |
| | | Level 1
| | | Level 2
| | | Level 3
| |
Investments in Securities (continued) | | | | | | | | | | | | |
Health Care Technology | | $ | 1,483,331 | | | $ | — | | | $ | — | |
Hotels, Restaurants & Leisure | | | 4,161,050 | | | | — | | | | — | |
Household Durables | | | 2,442,091 | | | | — | | | | — | |
Household Products | | | 1,296,273 | | | | — | | | | — | |
Independent Power & Renewable Electricity Producers | | | 757,779 | | | | — | | | | — | |
Industrial Conglomerates | | | 1,113,832 | | | | — | | | | — | |
Insurance | | | 11,180,472 | | | | — | | | | — | |
Internet & Catalog Retail | | | 520,828 | | | | — | | | | — | |
Internet Software & Services | | | 474,965 | | | | — | | | | — | |
IT Services | | | 680,664 | | | | — | | | | — | |
Leisure Products | | | 254,711 | | | | — | | | | — | |
Machinery | | | 9,146,414 | | | | — | | | | — | |
Marine | | | 378,578 | | | | — | | | | — | |
Media | | | 1,805,735 | | | | — | | | | — | |
Metals & Mining | | | 5,345,611 | | | | — | | | | — | |
Multiline Retail | | | 2,172,968 | | | | — | | | | — | |
Multi-Utilities | | | 1,519,236 | | | | — | | | | — | |
Oil, Gas & Consumable Fuels | | | 5,619,629 | | | | — | | | | — | |
Paper & Forest Products | | | 1,511,896 | | | | — | | | | — | |
Pharmaceuticals | | | 993,620 | | | | — | | | | — | |
Professional Services | | | 1,784,441 | | | | — | | | | — | |
Real Estate Investment Trusts (REITs) | | | 22,755,625 | | | | — | | | | — | |
Real Estate Management & Development | | | 1,825,334 | | | | — | | | | — | |
Regional Banks | | | 435,016 | | | | — | | | | — | |
Road & Rail | | | 1,399,616 | | | | — | | | | — | |
Semiconductors & Semiconductor Equipment | | | 13,164,005 | | | | — | | | | — | |
Software | | | 2,582,900 | | | | — | | | | — | |
Specialty Retail | | | 6,575,153 | | | | — | | | | — | |
Technology Hardware, Storage & Peripherals | | | 420,119 | | | | — | | | | — | |
Textiles, Apparel & Luxury Goods | | | 2,035,844 | | | | — | | | | — | |
Thrifts & Mortgage Finance | | | 2,983,426 | | | | — | | | | — | |
Trading Companies & Distributors | | | 2,863,922 | | | | — | | | | — | |
Exchange Traded Fund | | | 3,048,265 | | | | — | | | | — | |
Affiliated Money Market Mutual Fund | | | 17,767,420 | | | | — | | | | — | |
| | |
|
|
| |
|
|
| |
|
|
|
Total | | $ | 232,422,062 | | | $ | — | | | $ | — | |
| | |
|
|
| |
|
|
| |
|
|
|
The industry classification of investments and liabilities in excess of other assets shown as a percentage of net assets as of December 31, 2014 was as follows (unaudited):
| | | | |
Banks | | | 15.5 | % |
Real Estate Investment Trusts (REITs) | | | 10.5 | |
Affiliated Money Market Mutual Fund (including 7.3% of collateral for securities on loan) | | | 8.2 | |
Semiconductors & Semiconductor Equipment | | | 6.1 | |
Insurance | | | 5.2 | |
Machinery | | | 4.2 | |
Capital Markets | | | 3.8 | |
Electric Utilities | | | 3.0 | |
Specialty Retail | | | 3.0 | |
Electronic Equipment, Instruments & Components | | | 2.8 | |
Communications Equipment | | | 2.7 | |
Oil, Gas & Consumable Fuels | | | 2.6 | |
Metals & Mining | | | 2.5 | |
Chemicals | | | 2.5 | |
Aerospace & Defense | | | 2.1 | |
Energy Equipment & Services | | | 2.0 | |
Hotels, Restaurants & Leisure | | | 1.9 | |
Health Care Providers & Services | | | 1.7 | |
Commercial Services & Supplies | | | 1.4 | |
| | | | |
Exchange Traded Fund | | | 1.4 | % |
Thrifts & Mortgage Finance | | | 1.4 | |
Trading Companies & Distributors | | | 1.3 | |
Gas Utilities | | | 1.3 | |
Construction & Engineering | | | 1.3 | |
Software | | | 1.2 | |
Household Durables | | | 1.1 | |
Auto Components | | | 1.1 | |
Multiline Retail | | | 1.0 | |
Textiles, Apparel & Luxury Goods | | | 0.9 | |
Real Estate Management & Development | | | 0.8 | |
Media | | | 0.8 | |
Professional Services | | | 0.8 | |
Multi-Utilities | | | 0.7 | |
Paper & Forest Products | | | 0.7 | |
Health Care Technology | | | 0.7 | |
Health Care Equipment & Supplies | | | 0.7 | |
Containers & Packaging | | | 0.7 | |
Road & Rail | | | 0.7 | |
Food & Staples Retailing | | | 0.6 | |
Household Products | | | 0.6 | |
SEE NOTES TO FINANCIAL STATEMENTS.
A23
| | | | | | |
| | | SP SMALL CAP VALUE PORTFOLIO (continued) | | |
| |
| SCHEDULE OF INVESTMENTS | | December 31, 2014 |
| | | | |
Industry table (con’t.)
| |
| |
Food Products | | | 0.6 | % |
Industrial Conglomerates | | | 0.5 | |
Pharmaceuticals | | | 0.5 | |
Building Products | | | 0.4 | |
Biotechnology | | | 0.4 | |
Independent Power & Renewable Electricity Producers | | | 0.4 | |
IT Services | | | 0.3 | |
Air Freight & Logistics | | | 0.3 | |
Internet & Catalog Retail | | | 0.2 | |
Diversified Telecommunication Services | | | 0.2 | |
Internet Software & Services | | | 0.2 | |
Diversified Financial Services | | | 0.2 | |
| | | | |
Distributors | | | 0.2 | % |
Regional Banks | | | 0.2 | |
Technology Hardware, Storage & Peripherals | | | 0.2 | |
Electrical Equipment | | | 0.2 | |
Consumer Finance | | | 0.2 | |
Marine | | | 0.2 | |
Diversified Consumer Services | | | 0.1 | |
Leisure Products | | | 0.1 | |
| | |
|
|
|
| | | | 107.1 | |
Liabilities in excess of other assets | | | (7.1 | ) |
| | |
|
|
|
| | | | 100.0 | % |
| | |
|
|
|
SEE NOTES TO FINANCIAL STATEMENTS.
A24
| | | | | | |
| | | SP SMALL CAP VALUE PORTFOLIO (continued) | | |
STATEMENT OF ASSETS AND LIABILITIES
December 31, 2014
| | | | |
| ASSETS | | | | |
Investments at value, including securities on loan of $15,305,111: | | | | |
Unaffiliated investments (cost $154,733,498) | | $ | 214,654,642 | |
Affiliated investments (cost $17,767,420) | | | 17,767,420 | |
Receivable for investments sold | | | 1,357,734 | |
Dividends receivable | | | 458,534 | |
Receivable for Series shares sold | | | 4,678 | |
Tax reclaim receivable | | | 3,786 | |
Prepaid expenses | | | 1,794 | |
| | |
|
|
|
Total assets | | | 234,248,588 | |
| | |
|
|
|
| LIABILITIES | | | | |
Payable to broker for collateral for securities on loan | | | 15,765,250 | |
Payable for investments purchased | | | 1,117,612 | |
Management fee payable | | | 161,456 | |
Accrued expenses | | | 76,134 | |
Payable for Series shares reacquired | | | 45,069 | |
Affiliated transfer agent fee payable | | | 926 | |
Deferred trustees’ fees | | | 666 | |
| | |
|
|
|
Total liabilities | | | 17,167,113 | |
| | |
|
|
|
| NET ASSETS | | $ | 217,081,475 | |
| | |
|
|
|
Net assets were comprised of: | | | | |
Paid-in capital | | $ | 104,479,830 | |
Retained earnings | | | 112,601,645 | |
| | |
|
|
|
Net assets, December 31, 2014 | | $ | 217,081,475 | |
| | |
|
|
|
| Class I: | | | | |
Net asset value and redemption price per share, $217,081,475 / 10,986,074 outstanding shares of beneficial interest | | $ | 19.76 | |
| | |
|
|
|
STATEMENT OF OPERATIONS
Year Ended December 31, 2014
| | | | |
| NET INVESTMENT INCOME | | | | |
| INCOME | | | | |
Unaffiliated dividend income (net of $4,814 foreign withholding tax) | | $ | 3,327,529 | |
Affiliated income from securities lending, net | | | 48,444 | |
Affiliated dividend income | | | 3,507 | |
| | |
|
|
|
Total income | | | 3,379,480 | |
| | |
|
|
|
| EXPENSES | | | | |
Management fee | | | 1,965,596 | |
Custodian’s fees and expenses | | | 85,000 | |
Reports to shareholders | | | 41,000 | |
Audit fee | | | 24,000 | |
Trustees’ fees | | | 12,000 | |
Transfer agent’s fees and expenses (including affiliated expense of $5,600) | | | 12,000 | |
Legal fees and expenses | | | 11,000 | |
Insurance fees | | | 3,000 | |
Miscellaneous | | | 24,262 | |
| | |
|
|
|
Total expenses | | | 2,177,858 | |
Less: Management fee waiver | | | (11,588 | ) |
| | |
|
|
|
Net expenses | | | 2,166,270 | |
| | |
|
|
|
| NET INVESTMENT INCOME | | | 1,213,210 | |
| | |
|
|
|
| REALIZED AND UNREALIZED GAIN (LOSS) ON INVESTMENTS | | | | |
Net realized gain on investment transactions | | | 23,150,781 | |
| | |
|
|
|
Net change in unrealized appreciation (depreciation) on: | | | | |
Investments | | | (13,960,854 | ) |
Foreign currencies | | | (207 | ) |
| | |
|
|
|
| | | | (13,961,061 | ) |
| | |
|
|
|
| NET GAIN ON INVESTMENTS AND FOREIGN CURRENCIES | | | 9,189,720 | |
| | |
|
|
|
| NET INCREASE IN NET ASSETS RESULTING FROM OPERATIONS | | $ | 10,402,930 | |
| | |
|
|
|
STATEMENT OF CHANGES IN NET ASSETS
| | | | | | | | |
| | | Year Ended December 31,
| |
| | | 2014
| | | 2013
| |
| INCREASE (DECREASE) IN NET ASSETS | | | | | | | | |
| OPERATIONS | | | | | | | | |
Net investment income | | $ | 1,213,210 | | | $ | 1,065,586 | |
Net realized gain on investment transactions | | | 23,150,781 | | | | 28,973,275 | |
Net change in unrealized appreciation (depreciation) on investments and foreign currencies | | | (13,961,061 | ) | | | 34,404,209 | |
| | |
|
|
| |
|
|
|
NET INCREASE IN NET ASSETS RESULTING FROM OPERATIONS | | | 10,402,930 | | | | 64,443,070 | |
| | |
|
|
| |
|
|
|
| SERIES SHARE TRANSACTIONS | | | | | | | | |
Series shares sold [247,570 and 622,114 shares, respectively] | | | 4,704,300 | | | | 10,373,241 | |
Series shares repurchased [1,385,973 and 1,613,558 shares, respectively] | | | (26,343,584 | ) | | | (26,139,642 | ) |
| | |
|
|
| |
|
|
|
NET DECREASE IN NET ASSETS FROM SERIES SHARE TRANSACTIONS | | | (21,639,284 | ) | | | (15,766,401 | ) |
| | |
|
|
| |
|
|
|
| TOTAL INCREASE (DECREASE) | | | (11,236,354 | ) | | | 48,676,669 | |
| NET ASSETS: | | | | | | | | |
Beginning of year | | | 228,317,829 | | | | 179,641,160 | |
| | |
|
|
| |
|
|
|
End of year | | $ | 217,081,475 | | | $ | 228,317,829 | |
| | |
|
|
| |
|
|
|
SEE NOTES TO FINANCIAL STATEMENTS.
A25
| | | | | | |
| | | GLOSSARY | | |
| |
| SCHEDULE OF INVESTMENTS | | December 31, 2014 |
The following abbreviations are used in the preceding Portfolios’ descriptions:
| | |
| 144A | | Security was purchased pursuant to Rule 144A under the Security Act of 1933 and may not be resold subject to that rule except to qualified institutional buyers. Unless otherwise noted, 144A securities are deemed to be liquid. |
| ADR | | American Depositary Receipt |
| ADS | | American Depositary Security |
| CDI | | CREST Depository Interest |
| CVA | | Certificate Van Aandelen (Bearer) |
| PRFC | | Preference Shares |
SEE NOTES TO FINANCIAL STATEMENTS.
A26
NOTES TO THE FINANCIAL STATEMENTS OF
THE PRUDENTIAL SERIES FUND
The Prudential Series Fund (“Series Fund”), organized as a Delaware statutory trust, is a diversified open-end management investment company registered under the Investment Company Act of 1940, as amended, (“1940 Act”). The Series Fund is composed of eighteen Portfolios (“Portfolio” or “Portfolios”), each with separate series shares. The information presented in these financial statements pertains to the four Portfolios which are listed below along with each Portfolio’s investment objective.
SP International Growth Portfolio: Long-term growth of capital.
SP International Value Portfolio: Long-term capital appreciation.
SP Prudential U.S. Emerging Growth Portfolio: Long-term capital appreciation.
SP Small Cap Value Portfolio: Long-term growth of capital.
| Note 2: | | Accounting Policies |
The Series Fund follows investment company accounting and reporting guidance of the Financial Accounting Standards Board (FASB) Accounting Standard Codification Topic 946 Financial Services — Investment Companies. The following accounting policies conform to U.S. generally accepted accounting principles. The Series Fund and the Portfolios consistently follow such policies in the preparation of their financial statements.
Securities Valuation: Each Portfolio holds securities and other assets that are fair valued at the close of each day the New York Stock Exchange (“NYSE”) is open for trading. Fair value is the price that would be received to sell an asset or paid to transfer a liability in an orderly transaction between market participants on the measurement date. The Board of Trustees (the “Board”) has adopted Valuation Procedures for security valuation under which fair valuation responsibilities have been delegated to Prudential Investments LLC (“PI” or “Manager”). Under the current Valuation Procedures, the established Valuation Committee is responsible for supervising the valuation of portfolio securities and other assets. The Valuation Procedures permit a Portfolio to utilize independent pricing vendor services, quotations from market makers, and alternative valuation methods when market quotations are either not readily available or not deemed representative of fair value. A record of the Valuation Committee’s actions is subject to the Board’s review, approval, and ratification at its next regularly-scheduled quarterly meeting.
Various inputs determine how each Portfolio’s investments are valued, all of which are categorized according to the three broad levels (Level 1, 2, or 3) detailed in the table following each Portfolio’s Schedule of Investments.
Common and preferred stocks, exchange-traded funds, and derivative instruments such as futures or options that are traded on a national securities exchange are valued at the last sale price as of the close of trading on the applicable exchange where the security principally trades. Securities traded via NASDAQ are valued at the NASDAQ official closing price. To the extent these securities are valued at the last sale price or NASDAQ official closing price, they are classified as Level 1 in the fair value hierarchy.
In the event that no sale or official closing price on valuation date exists, these securities are generally valued at the mean between the last reported bid and ask prices, or at the last bid price in the absence of an ask price. These securities are classified as Level 2 in the fair value hierarchy, as the inputs are observable and considered to be significant to the valuation.
Common and preferred stocks traded on foreign securities exchanges are valued using pricing vendor services that provide model prices derived using adjustment factors based on information such as local closing price, relevant general and sector indices, currency fluctuations, depositary receipts, and futures, as applicable. Securities valued using such model prices are classified as Level 2 in the fair value hierarchy, as the adjustment factors are observable and considered to be significant to the valuation. Such securities are valued using model prices to the extent that the valuation meets the established confidence level for each security. If the confidence level is not met or the vendor does not provide a model price, securities are valued in accordance with exchange-traded common and preferred stocks discussed above.
B1
Investments in open-end, non-exchange-traded mutual funds are valued at their net asset values as of the close of the NYSE on the date of valuation. These securities are classified as Level 1 in the fair value hierarchy since they may be purchased or sold at their net asset values on the date of valuation.
Fixed income securities traded in the over-the-counter market are generally valued at prices provided by approved independent pricing vendors. The pricing vendors provide these prices after evaluating observable inputs including, but not limited to yield curves, yield spreads, credit ratings, deal terms, tranche level attributes, default rates, cash flows, prepayment speeds, broker/dealer quotations, and reported trades. Securities valued using such vendor prices are classified as Level 2 in the fair value hierarchy.
Over-the-counter derivative instruments are generally valued using pricing vendor services, which derive the valuation based on inputs such as underlying asset prices, indices, spreads, interest rates, and exchange rates. These instruments are categorized as Level 2 in the fair value hierarchy.
Centrally cleared swaps listed or traded on a multilateral or trade facility platform, such as a registered exchange, are valued at the daily settlement price determined by the respective exchange. These securities are classified as Level 2 in the fair value hierarchy, as the daily settlement price is not public.
Securities and other assets that cannot be priced according to the methods described above are valued based on pricing methodologies approved by the Board. In the event that significant unobservable inputs are used when determining such valuations, the securities will be classified as Level 3 in the fair value hierarchy.
When determining the fair value of securities, some of the factors influencing the valuation include: the nature of any restrictions on disposition of the securities; assessment of the general liquidity of the securities; the issuer’s financial condition and the markets in which it does business; the cost of the investment; the size of the holding and the capitalization of the issuer; the prices of any recent transactions or bids/offers for such securities or any comparable securities; any available analyst media or other reports or information deemed reliable by the investment adviser regarding the issuer or the markets or industry in which it operates. Using fair value to price securities may result in a value that is different from a security’s most recent closing price and from the price used by other mutual funds to calculate their net asset values.
Restricted and Illiquid Securities: Subject to guidelines adopted by the Board, each Portfolio may hold up to 15% of its net assets in illiquid securities, including those which are restricted as to disposition under securities law (“restricted securities”). Restricted securities are valued pursuant to the valuation procedures noted above. Illiquid securities are those that, because of the absence of a readily available market or due to legal or contractual restrictions on resale, cannot be sold within seven days in the ordinary course of business at approximately the amount at which the Portfolio has valued the investment. Therefore, the Portfolio may find it difficult to sell illiquid securities at the time considered most advantageous by its Subadvisor and may incur expenses that would not be incurred in the sale of securities that were freely marketable. Certain securities that would otherwise be considered illiquid because of legal restrictions on resale to the general public may be traded among qualified institutional buyers under Rule 144A of the Securities Act of 1933. These Rule 144A securities, as well as commercial paper that is sold in private placements under Section 4(2) of the Securities Act, may be deemed liquid by the Portfolio’s Subadvisor under the guidelines adopted by the Board. However, the liquidity of the Portfolio’s investments in Rule 144A securities could be impaired if trading does not develop or declines.
Foreign Currency Translation: The books and records of the Portfolios are maintained in U.S. dollars. Foreign currency amounts are translated into U.S. dollars on the following basis:
(i) market value of investment securities, other assets and liabilities — at the current daily rates of exchange;
(ii) purchases and sales of investment securities, income and expenses — at the rates of exchange prevailing on the respective dates of such transactions.
Although the net assets of the Portfolios are presented at the foreign exchange rates and market values at the close of the period, the Portfolios do not isolate that portion of the results of operations arising as a result of changes in the foreign exchange rates from the fluctuations arising from changes in the market prices of long-term securities held at the end of the period. Similarly, the Portfolios do not isolate the effect of changes in foreign exchange rates from the fluctuations arising from changes in the market prices of long-term portfolio securities sold during the period. Accordingly, these realized foreign currency gains or losses are included in the reported net realized gains or losses on investment transactions.
B2
Net realized gains or losses on foreign currency transactions represent net foreign exchange gains or losses from holdings of foreign currencies, forward currency contracts, disposition of foreign currencies, currency gains or losses realized between the trade and settlement dates on securities transactions, and the difference between the amounts of interest, dividends and foreign withholding taxes recorded on the Portfolios’ books and the U.S. dollar equivalent amounts actually received or paid. Net unrealized currency gains or losses from valuing foreign currency denominated assets and liabilities (other than investments) at period end exchange rates are reflected as a component of net unrealized appreciation (depreciation) on foreign currencies.
Concentration of Risk: The ability of debt securities issuers (other than those issued or guaranteed by the U.S. Government) held by the Portfolios to meet their obligations may be affected by the economic or political developments in a specific industry, region or country. Foreign security and currency transactions may involve certain considerations and risks not typically associated with those of domestic origin as a result of, among other factors, the possibility of political and economic instability or the level of governmental supervision and regulation of foreign securities markets.
Forward Currency Contracts: A forward currency contract is a commitment between two parties to purchase or sell a foreign currency at a future date at a negotiated forward rate. Certain Portfolios of the Series Fund entered into forward currency contracts in order to hedge their exposure to changes in foreign currency exchange rates on their foreign portfolio holdings or specific receivables and payables denominated in a foreign currency and to gain exposure to certain currencies. The contracts are valued daily at current exchange rates and any unrealized gain or loss is included in net unrealized appreciation or depreciation on foreign currencies. Gain or loss is realized on the settlement date of the contract equal to the difference between the settlement value of the original and negotiated forward contracts. This gain or loss, if any, is included in net realized gain (loss) on foreign currency transactions. Upon entering into these contracts, risks may arise from the potential inability of the counterparties to meet the terms of their contracts. Forward currency contracts involve risks from currency exchange rate and credit risk in excess of the amounts reflected on the Statement of Assets and Liabilities. A Portfolio’s maximum risk of loss from counterparty credit risk is the net value of the cash flows to be received from the counterparty at the end of the contract’s life.
Master Netting Arrangements: Certain Portfolios are subject to various Master Agreements, or netting arrangements, with select counterparties. These are agreements which a sub-advisor may have negotiated and entered into on behalf of the Portfolio. For multi-sleeve Portfolios, different sub-advisors who manage their respective sleeve, may enter into such agreements with the same counterparty and are disclosed separately for each sleeve when presenting information about offsetting and related netting arrangements for over-the-counter (“OTC”) derivatives under FASB Accounting Standards Update (“ASU”) 2013-01 disclosure. A master netting arrangement between the Portfolio and the counterparty permits the Portfolio to offset amounts payable by the Portfolio to the same counterparty against amounts to be received; and by the receipt of collateral from the counterparty by the Portfolio to cover the Portfolio’s exposure to the counterparty. However, there is no assurance that such mitigating factors are easily enforceable. The right to set-off exists when all the conditions are met such that each of the parties owes the other determinable amounts, the reporting party has the right to set-off the amount owed with the amount owed by the other party, the reporting party intends to set-off and the right of set-off is enforceable by law. During the reporting period, there were no instances where the right of set-off existed and management has not elected to offset.
Warrants and Rights: Certain Portfolios hold warrants and rights acquired either through a direct purchase, included as part of a private placement, or pursuant to corporate actions. Warrants and rights entitle the holder to buy a proportionate amount of common stock, or such other security that the issuer may specify, at a specific price and time through the expiration dates. The Portfolio holds such warrants and rights as long positions until exercised, sold or expired. Warrants and rights are valued at fair value in accordance with the Board approved fair valuation procedures.
Securities Lending: Each Portfolio may lend its portfolio securities to banks and broker-dealers. The loans are secured by collateral at least equal to the market value of the securities loaned. Collateral pledged by each borrower is invested in a highly liquid short-term money market fund and is marked to market daily, based on the previous day’s market value, such that the value of the collateral exceeds the value of the loaned securities. Loans are subject to termination at the option of the borrower or the Portfolio. Upon termination of the loan, the borrower will return to the Portfolio securities identical to the loaned securities. Should the borrower of the securities fail financially, the Portfolio has the right to repurchase the securities in
B3
the open market using the collateral. The Portfolio recognizes income, net of any rebate and securities lending agent fees, for lending its securities, and any interest on the investment of cash received as collateral. The Portfolio also continues to receive interest and dividends or amounts equivalent thereto, on the securities loaned and recognizes any unrealized gain or loss in the market price of the securities loaned that may occur during the term of the loan.
Securities Transactions and Net Investment Income: Securities transactions are recorded on the trade date. Realized gains or losses from investment and currency transactions are calculated on the identified cost basis. Dividend income is recorded on the ex-dividend date. Interest income, including amortization of premium and accretion of discount on debt securities, as required, is recorded on an accrual basis. Expenses are recorded on an accrual basis, which may require the use of certain estimates by management, that may differ from actual.
For Portfolios with multiple classes of shares, net investment income or loss (other than administration and distribution fees which are charged directly to the respective class) and unrealized and realized gains or losses are allocated daily to each class of shares based upon the relative proportion of adjusted net assets of each class at the beginning of the day.
Delayed-Delivery Transactions: Certain Portfolios may purchase or sell securities on a when-issued or delayed-delivery basis. These transactions involve a commitment by the Portfolio to purchase or sell securities for a predetermined price or yield, with payment and delivery taking place beyond the customary settlement period. When delayed-delivery purchases are outstanding, the Portfolio will set aside and maintain an amount of liquid assets sufficient to meet the purchase price in a segregated account until the settlement date. When purchasing a security on a delayed-delivery basis, the Portfolio assumes the rights and risks of ownership of the security, including the risk of price and yield fluctuations, and takes such fluctuations into account when determining its net asset value. The Portfolio may dispose of or renegotiate a delayed-delivery transaction subsequent to establishment, and may sell when-issued securities before they are delivered, which may result in a capital gain or loss. When selling a security on a delayed-delivery basis, the Portfolio forfeits its eligibility to realize future gains and losses with respect to the security.
Taxes: For federal income tax purposes, each Portfolio is treated as a separate taxpaying entity. The Portfolios are treated as partnerships for tax purposes. No provision has been made in the financial statements for U.S. federal, state, or local taxes, as any tax liability arising from operations of the Portfolios is the responsibility of the Portfolios’ shareholders (Participating Insurance Companies). The Portfolios are not generally subject to entity-level taxation. Shareholders of each Portfolio are subject to taxes on their distributive share of partnership items.
Withholding taxes on foreign dividends, interest and capital gains have been provided for in accordance with the Portfolio’s understanding of the applicable country’s tax rules and regulations. Such taxes are accrued net of reclaimable amounts at the time the related income/gain is recorded.
Distributions: Distributions from each Portfolio are made in cash and automatically reinvested in additional shares of the same Portfolio. Distributions are recorded on the ex-date.
Estimates: The preparation of financial statements requires management to make estimates and assumptions that affect the reported amounts and disclosures in the financial statements. Actual results could differ from these estimates.
The Series Fund has a management agreement with PI. Pursuant to this agreement PI has responsibility for all investment advisory services and supervises the subadvisors’ performance of such services. PI has entered into subadvisory agreements with Jennison Associates LLC (“Jennison”), Goldman Sachs Asset Management, L.P. (“GSAM”), LSV Asset Management (“LSV”), Neuberger Berman Management, LLC (“Neuberger Berman”), William Blair & Company LLC (“William Blair”), Lazard Asset Management LLC (“Lazard”), and ClearBridge Advisors LLC (“ClearBridge”) (collectively, the “Subadvisors”), under which each provides investment advisory services for certain Portfolios of the Series Fund. PI pays for the services of the Subadvisors, cost of compensation of officers of the Series Fund, occupancy and certain clerical and administrative expenses of the Series Fund. The Portfolios bear all other costs and expenses.
B4
The management fee paid to PI is accrued daily and payable monthly, using the value of each of the Portfolio’s average daily net assets, at the respective annual rate specified below.
| | | | | | | | |
Portfolio
| | Management Fee
| | | Effective
Management Fee
| |
SP International Growth Portfolio | | | 0.85 | % | | | 0.84 | %* |
SP International Value Portfolio | | | 0.90 | | | | 0.90 | |
SP Prudential U.S. Emerging Growth Portfolio | | | 0.60 | | | | 0.60 | |
SP Small Cap Value Portfolio | | | 0.90 | | | | 0.89 | ** |
| | * | PI has contractually agreed, through June 30, 2015, to waive a portion of its management fee equal to an annual rate of 0.01% of the average net assets of the Portfolio. In addition, PI has contractually agreed, through May 1, 2015, to waive a portion of its management fee equal to an annual rate of 0.003% of the average net assets of the Portfolio. |
| | ** | PI has contractually agreed, through May 1, 2015, to waive a portion of its management fee equal to an annual rate of 0.008% of the average net assets of the Portfolio. |
At December 31, 2014 the Subadvisors that provide investment advisory services to the Portfolios are listed directly below. Where more than one Subadvisor is listed, each Subadvisor provides services to a segment of the Portfolio:
| | |
Portfolio
| | Subadvisor(s)
|
SP International Growth Portfolio | | William Blair, Neuberger Berman, Jennison |
SP International Value Portfolio | | LSV, Lazard* |
SP Prudential U.S. Emerging Growth Portfolio | | Jennison |
SP Small Cap Value Portfolio | | GSAM, ClearBridge |
| | * | Effective November 24, 2014, Lazard replaced Thornburg Investment Management, Inc. |
The Series Fund has a distribution agreement, pursuant to Rule 12b-1 under the 1940 Act, with Prudential Investment Management Services LLC (“PIMS”), which acts as the distributor of the Class I and Class II shares of the Series Fund. The Series Fund compensates PIMS for distributing and servicing the Series Fund’s Class II shares pursuant to a plan of distribution (the “Class II Plan”), regardless of expenses actually incurred by PIMS. The distribution fees are accrued daily and payable monthly. No distribution or service fees are paid to PIMS as distributor of the Class I shares of the Series Fund. Pursuant to the Class II Plan, the Class II shares of each Portfolio compensate PIMS for distribution-related activities at an annual rate of 0.25% of the average daily net assets of the Class II shares.
The Series Fund has an administration agreement with PI, which acts as the administrator of the Class II shares of the Series Fund. The administration fee paid to PI is accrued daily and payable monthly, at the annual rate of 0.15% of the average daily net assets of the Class II shares.
PIMS, PI, and Jennison are indirect, wholly-owned subsidiaries of Prudential Financial, Inc. (“Prudential”).
The Portfolios have entered into a brokerage commission recapture agreement with certain registered broker-dealers. Under the brokerage commission recapture program, a portion of the commission is returned to the Portfolio on whose behalf the trades were made. Commission recapture is paid solely to those Portfolios generating the applicable trades. Such amounts are included within realized gain or loss on investment transactions presented in the Statement of Operations. For the year ended December 31, 2014, broker commission recaptured under these agreements was as follows:
| | | | |
Portfolio
| | Amount
| |
SP International Growth Portfolio | | $ | 2,408 | |
SP International Value Portfolio | | | 4,155 | |
SP Prudential U.S. Emerging Growth Portfolio | | | 16,016 | |
SP Small Cap Value Portfolio | | | 8,599 | |
| Note 4: | | Other Transactions with Affiliates |
Prudential Mutual Fund Services LLC (“PMFS”), an affiliate of PI and an indirect, wholly-owned subsidiary of Prudential, serves as the Series Fund’s transfer agent. Transfer agent’s fees and expenses in the Statements of Operations include certain out-of-pocket expenses paid to non-affiliates, where applicable.
B5
Prudential Investment Management, Inc. (“PIM”), an indirect, wholly-owned subsidiary of Prudential, serves as the Series Fund’s security lending agent. For the year ended December 31, 2014, PIM was compensated for these services as follows:
| | | | |
| | Amount
| |
SP International Growth Portfolio | | $ | 3,044 | |
SP Prudential U.S. Emerging Growth Portfolio | | | 9,731 | |
SP Small Cap Value Portfolio | | | 14,478 | |
Certain Portfolios invest in the Prudential Core Taxable Money Market Fund (the “Core Fund”), a portfolio of Prudential Investment Portfolios 2. The Core Fund is a money market mutual fund registered under the 1940 Act, and managed by PI. Earnings from the Core Fund are disclosed on the Statement of Operations as affiliated dividend income.
| Note 5: | | Portfolio Securities |
Purchases and sales of portfolio securities, other than short-term investments and U.S. Government securities, for the year ended December 31, 2014, were as follows:
| | | | | | | | |
Portfolio
| | Cost of Purchases
| | | Proceeds from Sales
| |
SP International Growth Portfolio | | $ | 47,675,985 | | | $ | 55,814,796 | |
SP International Value Portfolio | | | 79,213,076 | | | | 131,950,605 | |
SP Prudential U.S. Emerging Growth Portfolio | | | 108,362,884 | | | | 134,091,355 | |
SP Small Cap Value Portfolio | | | 88,015,224 | | | | 107,448,998 | |
All Portfolios are treated as a partnership for tax purposes. The character of the cash distributions made by the partnerships is generally classified as return of capital nontaxable distributions. After each fiscal year each partner will receive information regarding their distributive allocable share of the partnership’s income, gains, losses and deductions.
With respect to the Portfolios, book cost of assets differs from tax cost of assets as a result of each Portfolio’s adoption of a mark to market method of accounting for tax purposes. Under this method, tax cost of assets will approximate its fair market value. The Portfolios generally attempt to manage their diversification in a manner that supports the diversification requirements of the underlying separate accounts.
Management has analyzed the Portfolios’ tax positions taken on federal, state and local income tax returns for all open tax years and has concluded that no provision for income tax would be required in the Portfolio’s financial statements for the current period. The Portfolios’ federal, state and local income tax returns for tax years for which the applicable statutes of limitations have not expired are subject to examination by the Internal Revenue Service and state departments of revenue.
The Series Fund offers Class I and Class II shares. Neither Class I nor Class II shares of a Portfolio are subject to any sales charge or redemption charge and are sold at the net asset value of the Portfolio. Class I shares are sold only to certain separate accounts of Prudential to fund benefits under certain variable life insurance and variable annuity contracts (“contracts”). Class II shares are sold only to separate accounts of non-Prudential insurance companies as investment options under certain contracts. The separate accounts invest in shares of the Series Fund through subaccounts that correspond to the Portfolio. The separate accounts will redeem shares of the Series Fund to the extent necessary to provide benefits under the contracts or for such other purposes as may be consistent with the contracts. As of December 31, 2014, the SP International Growth and SP Prudential U.S. Emerging Growth Portfolios have Class II shares outstanding.
B6
Transactions in shares of beneficial interest of the SP International Growth and SP Prudential U.S. Emerging Growth Portfolios were as follows:
SP International Growth Portfolio:
| | | | | | | | |
Class I
| | Shares
| | | Amount
| |
Year ended December 31, 2014: | | | | | | | | |
Series shares sold | | | 624,079 | | | $ | 3,816,899 | |
Series shares repurchased | | | (1,856,721 | ) | | | (11,353,391 | ) |
| | |
|
|
| |
|
|
|
Net increase (decrease) in shares outstanding | | | (1,232,642 | ) | | $ | (7,536,492 | ) |
| | |
|
|
| |
|
|
|
Year ended December 31, 2013: | | | | | | | | |
Series shares sold | | | 1,005,050 | | | $ | 5,635,828 | |
Series shares repurchased | | | (2,492,981 | ) | | | (14,075,216 | ) |
| | |
|
|
| |
|
|
|
Net increase (decrease) in shares outstanding | | | (1,487,931 | ) | | $ | (8,439,388 | ) |
| | |
|
|
| |
|
|
|
| | |
Class II
| | | | | | |
Year ended December 31, 2014: | | | | | | | | |
Series shares sold | | | 45,381 | | | $ | 274,021 | |
Series shares repurchased | | | (324,195 | ) | | | (1,940,814 | ) |
| | |
|
|
| |
|
|
|
Net increase (decrease) in shares outstanding | | | (278,814 | ) | | $ | (1,666,793 | ) |
| | |
|
|
| |
|
|
|
Year ended December 31, 2013: | | | | | | | | |
Series shares sold | | | 206,283 | | | $ | 1,156,462 | |
Series shares repurchased | | | (373,137 | ) | | | (2,070,586 | ) |
| | |
|
|
| |
|
|
|
Net increase (decrease) in shares outstanding | | | (166,854 | ) | | | (914,124 | ) |
| | |
|
|
| |
|
|
|
SP Prudential U.S. Emerging Growth Portfolio:
| | | | | | | | |
Class I
| | Shares
| | | Amount
| |
Year ended December 31, 2014: | | | | | | | | |
Shares sold | | | 425,884 | | | $ | 4,700,683 | |
Shares repurchased | | | (2,688,562 | ) | | | (29,861,411 | ) |
| | |
|
|
| |
|
|
|
Net increase (decrease) in shares outstanding | | | (2,262,678 | ) | | $ | (25,160,728 | ) |
| | |
|
|
| |
|
|
|
Year ended December 31, 2013: | | | | | | | | |
Series shares sold | | | 607,127 | | | $ | 5,854,481 | |
Series shares repurchased | | | (3,549,073 | ) | | | (34,069,600 | ) |
| | |
|
|
| |
|
|
|
Net increase (decrease) in shares outstanding | | | (2,941,946 | ) | | $ | (28,215,119 | ) |
| | |
|
|
| |
|
|
|
| | |
Class II
| | | | | | |
Year ended December 31, 2014: | | | | | | | | |
Shares sold | | | 26,631 | | | $ | 276,449 | |
Shares repurchased | | | (14,285 | ) | | | (152,202 | ) |
| | |
|
|
| |
|
|
|
Net increase (decrease) in shares outstanding | | | 12,346 | | | $ | 124,247 | |
| | |
|
|
| |
|
|
|
Year ended December 31, 2013: | | | | | | | | |
Series shares sold | | | 27,432 | | | $ | 260,831 | |
Series shares repurchased | | | (4,849 | ) | | | (45,647 | ) |
| | |
|
|
| |
|
|
|
Net increase (decrease) in shares outstanding | | | 22,583 | | | $ | 215,184 | |
| | |
|
|
| |
|
|
|
B7
The Portfolios, along with other affiliated registered investment companies (the “Funds”), are a party to a Syndicated Credit Agreement (“SCA”) with a group of banks. The purpose of the SCA is to provide an alternative source of temporary funding for capital share redemptions. The SCA provides for a commitment of $900 million for the period October 9, 2014 through October 8, 2015. The Funds pay an annualized commitment fee of .075% of the unused portion of the SCA. Prior to October 9, 2014, the Funds had another SCA that provided a commitment of $900 million and the Funds paid an annualized commitment fee of .08% of the unused portion of the SCA. Interest on any borrowings under the SCA is paid at contracted market rates. The commitment fee for the unused amount is accrued daily and paid quarterly.
The following Portfolio utilized the line of credit during the year ended December 31, 2014. The average balance outstanding is for the number of days the Portfolio had utilized the credit facility.
| | | | | | | | | | | | | | | | | | | | |
Portfolio
| | Approximate
Average
Balance
Outstanding
| | | Number of
Days
Outstanding
| | | Weighted
Average
Interest
Rate
| | | Maximum
Balance
Outstanding
| | | Outstanding
Borrowings at
December 31,
2014
| |
SP International Growth | | $ | 115,600 | | | | 32 | | | | 1.40 | % | | $ | 258,000 | | | | — | |
SP International Value | | | 17,121,200 | | | | 12 | | | | 1.40 | % | | | 47,261,000 | | | | — | |
| Note 9: | | Ownership and Affiliates |
As of December 31, 2014, all of Class I shares of record of each Portfolio were owned by The Prudential Insurance Company of America (“PICA”), or subsidiaries thereof, on behalf of the owners of the variable insurance products issued by PICA. PICA is an indirect, wholly-owned Subsidiary of Prudential.
A special meeting of shareholders of the SP International Value Portfolio will be held on or about March 13, 2015 where shareholders of the SP International Value Portfolio will be asked to approve or disapprove a plan of reorganization of the SP International Value Portfolio. Under the plan, the SP International Value Portfolio would be acquired by the AST International Value Portfolio of the Advanced Series Trust. It is expected that the reorganization, if approved, would be completed on or about April 27, 2015.
B8
Financial Highlights
| | | | | | | | | | | | | | | | | | | | |
| | | SP International Growth Portfolio
| |
| | | Class I
| |
| | | Year Ended December 31,
| |
| | | 2014(c)
| | | 2013(c)
| | | 2012(c)
| | | 2011(c)
| | | 2010(c)
| |
Per Share Operating Performance: | | | | | | | | | | | | | | | | | | | | |
Net Asset Value, beginning of year | | $ | 6.30 | | | $ | 5.30 | | | $ | 4.36 | | | $ | 5.19 | | | $ | 4.63 | |
| | |
|
|
| |
|
|
| |
|
|
| |
|
|
| |
|
|
|
Income (Loss) From Investment Operations: | | | | | | | | | | | | | | | | | | | | |
Net investment income | | | .03 | | | | .02 | | | | .08 | | | | .02 | | | | .04 | |
Net realized and unrealized gain (loss) on investments | | | (.39 | ) | | | .98 | | | | .89 | | | | (.79 | ) | | | .59 | |
| | |
|
|
| |
|
|
| |
|
|
| |
|
|
| |
|
|
|
Total from investment operations | | | (.36 | ) | | | 1.00 | | | | .97 | | | | (.77 | ) | | | .63 | |
| | |
|
|
| |
|
|
| |
|
|
| |
|
|
| |
|
|
|
| Less Distributions: | | | — | | | | — | | | | (.03 | ) | | | (.06 | ) | | | (.07 | ) |
| | |
|
|
| |
|
|
| |
|
|
| |
|
|
| |
|
|
|
Net Asset Value, end of year | | $ | 5.94 | | | $ | 6.30 | | | $ | 5.30 | | | $ | 4.36 | | | $ | 5.19 | |
| | |
|
|
| |
|
|
| |
|
|
| |
|
|
| |
|
|
|
Total Return(a) | | | (5.71 | )% | | | 18.87 | % | | | 22.40 | % | | | (14.91 | )% | | | 14.01 | % |
Ratios/Supplemental Data: | | | | | | | | | | | | | | | | | | | | |
Net assets, end of year (in millions) | | $ | 74.5 | | | $ | 86.9 | | | $ | 80.9 | | | $ | 75.5 | | | $ | 162.1 | |
Ratios to average net assets(b): | | | | | | | | | | | | | | | | | | | | |
Expenses after waivers and/or expense reimbursements | | | 1.23 | % | | | 1.30 | % | | | 1.19 | % | | | 1.21 | % | | | 1.10 | % |
Expenses before waivers and/or expense reimbursements | | | 1.24 | % | | | 1.31 | % | | | 1.19 | % | | | 1.21 | % | | | 1.10 | % |
Net investment income | | | .55 | % | | | .37 | % | | | 1.59 | % | | | .47 | % | | | .77 | % |
Portfolio turnover rate | | | 55 | % | | | 103 | % | | | 111 | % | | | 118 | % | | | 141 | % |
| |
| | | SP International Growth Portfolio
| |
| | | Class II
| |
| | | Year Ended December 31,
| |
| | | 2014(c)
| | | 2013(c)
| | | 2012(c)
| | | 2011(c)
| | | 2010(c)
| |
Per Share Operating Performance: | | | | | | | | | | | | | | | | | | | | |
Net Asset Value, beginning of year | | $ | 6.21 | | | $ | 5.24 | | | $ | 4.30 | | | $ | 5.10 | | | $ | 4.54 | |
| | |
|
|
| |
|
|
| |
|
|
| |
|
|
| |
|
|
|
Income (Loss) From Investment Operations: | | | | | | | | | | | | | | | | | | | | |
Net investment income (loss) | | | .01 | | | | — | (d) | | | .06 | | | | — | (d) | | | .02 | |
Net realized and unrealized gain (loss) on investments | | | (.39 | ) | | | .97 | | | | .88 | | | | (.78 | ) | | | .59 | |
| | |
|
|
| |
|
|
| |
|
|
| |
|
|
| |
|
|
|
Total from investment operations | | | (.38 | ) | | | .97 | | | | .94 | | | | (.78 | ) | | | .61 | |
| | |
|
|
| |
|
|
| |
|
|
| |
|
|
| |
|
|
|
| Less Distributions: | | | — | | | | — | | | | — | | | | (.02 | ) | | | (.05 | ) |
| | |
|
|
| |
|
|
| |
|
|
| |
|
|
| |
|
|
|
Net Asset Value, end of year | | $ | 5.83 | | | $ | 6.21 | | | $ | 5.24 | | | $ | 4.30 | | | $ | 5.10 | |
| | |
|
|
| |
|
|
| |
|
|
| |
|
|
| |
|
|
|
Total Return(a) | | | (6.12 | )% | | | 18.51 | % | | | 21.86 | % | | | (15.32 | )% | | | 13.81 | % |
Ratios/Supplemental Data: | | | | | | | | | | | | | | | | | | | | |
Net assets, end of year (in millions) | | $ | 6.9 | | | $ | 9.1 | | | $ | 8.6 | | | $ | 7.2 | | | $ | 10.1 | |
Ratios to average net assets(b): | | | | | | | | | | | | | | | | | | | | |
Expenses after waivers and/or expense reimbursements | | | 1.63 | % | | | 1.70 | % | | | 1.59 | % | | | 1.61 | % | | | 1.50 | % |
Expenses before waivers and/or expense reimbursements | | | 1.64 | % | | | 1.71 | % | | | 1.59 | % | | | 1.61 | % | | | 1.50 | % |
Net investment income (loss) | | | .17 | % | | | (.03 | )% | | | 1.16 | % | | | (.09 | )% | | | .39 | % |
Portfolio turnover rate | | | 55 | % | | | 103 | % | | | 111 | % | | | 118 | % | | | 141 | % |
| (a) | Total return is calculated assuming a purchase of a share on the first day and a sale on the last day of each year reported and includes reinvestment of distributions and does not reflect the effect of insurance contract charges. Total return does not reflect expenses associated with the separate account such as administrative fees, account charges and surrender charges which, if reflected, would reduce the total return for all periods shown. Performance figures may reflect fee waivers and/or expense reimbursements. In the absence of fee waivers and/or expense reimbursements, the total return would be lower. Past performance is no guarantee of future results. Total returns may reflect adjustments to conform to generally accepted accounting principles. |
| (b) | Does not include expenses of the underlying portfolio in which the Portfolio invests. |
| (c) | Calculation based on average shares outstanding during the year. |
SEE NOTES TO FINANCIAL STATEMENTS.
C1
Financial Highlights
| | | | | | | | | | | | | | | | | | | | |
| | | SP International Value Portfolio
| |
| | | Year Ended December 31,
| |
| | | 2014(c)
| | | 2013(c)
| | | 2012(c)
| | | 2011(c)
| | | 2010(c)
| |
Per Share Operating Performance: | | | | | | | | | | | | | | | | | | | | |
Net Asset Value, beginning of year | | $ | 7.95 | | | $ | 6.62 | | | $ | 5.83 | | | $ | 6.87 | | | $ | 6.35 | |
| | |
|
|
| |
|
|
| |
|
|
| |
|
|
| |
|
|
|
Income (Loss) From Investment Operations: | | | | | | | | | | | | | | | | | | | | |
Net investment income | | | .17 | | | | .12 | | | | .16 | | | | .20 | | | | .12 | |
Net realized and unrealized gain (loss) on investments | | | (.65 | ) | | | 1.21 | | | | .80 | | | | (1.07 | ) | | | .54 | |
| | |
|
|
| |
|
|
| |
|
|
| |
|
|
| |
|
|
|
Total from investment operations | | | (.48 | ) | | | 1.33 | | | | .96 | | | | (.87 | ) | | | .66 | |
| | |
|
|
| |
|
|
| |
|
|
| |
|
|
| |
|
|
|
| Less Distributions: | | | — | | | | — | | | | (.17 | ) | | | (.17 | ) | | | (.14 | ) |
| | |
|
|
| |
|
|
| |
|
|
| |
|
|
| |
|
|
|
Net Asset Value, end of year | | $ | 7.47 | | | $ | 7.95 | | | $ | 6.62 | | | $ | 5.83 | | | $ | 6.87 | |
| | |
|
|
| |
|
|
| |
|
|
| |
|
|
| |
|
|
|
Total Return(a) | | | (6.04 | )% | | | 20.09 | % | | | 16.92 | % | | | (13.10 | )% | | | 10.81 | % |
Ratios/Supplemental Data: | | | | | | | | | | | | | | | | | | | | |
Net assets, end of year (in millions) | | $ | 83.3 | | | $ | 144.3 | | | $ | 124.8 | | | $ | 122.8 | | | $ | 211.5 | |
Ratios to average net assets(b): | | | | | | | | | | | | | | | | | | | | |
Expenses after waivers and/or expense reimbursements | | | 1.26 | % | | | 1.15 | % | | | 1.13 | % | | | 1.10 | % | | | 1.05 | % |
Expenses before waivers and/or expense reimbursements | | | 1.26 | % | | | 1.15 | % | | | 1.13 | % | | | 1.10 | % | | | 1.05 | % |
Net investment income | | | 2.12 | % | | | 1.62 | % | | | 2.40 | % | | | 2.02 | % | | | 1.76 | % |
Portfolio turnover rate | | | 70 | % | | | 25 | % | | | 17 | % | | | 19 | % | | | 25 | % |
| (a) | Total return is calculated assuming a purchase of a share on the first day and a sale on the last day of each year reported and includes reinvestment of distributions and does not reflect the effect of insurance contract charges. Total return does not reflect expenses associated with the separate account such as administrative fees, account charges and surrender charges which, if reflected, would reduce the total return for all periods shown. Performance figures may reflect fee waivers and/or expense reimbursements. In the absence of fee waivers and/or expense reimbursements, the total return would be lower. Past performance is no guarantee of future results. Total returns may reflect adjustments to conform to generally accepted accounting principles. |
| (b) | Does not include expenses of the underlying portfolio in which the Portfolio invests. |
| (c) | Calculation based on average shares outstanding during the year. |
SEE NOTES TO FINANCIAL STATEMENTS.
C2
Financial Highlights
| | | | | | | | | | | | | | | | | | | | |
| | | SP Prudential U.S. Emerging Growth Portfolio
| |
| | | Class I
| |
| | | Year Ended December 31,
| |
| | | 2014(d)
| | | 2013(d)
| | | 2012
| | | 2011
| | | 2010
| |
Per Share Operating Performance: | | | | | | | | | | | | | | | | | | | | |
Net Asset Value, beginning of year | | $ | 10.83 | | | $ | 8.43 | | | $ | 7.80 | | | $ | 7.74 | | | $ | 6.45 | |
| | |
|
|
| |
|
|
| |
|
|
| |
|
|
| |
|
|
|
Income From Investment Operations: | | | | | | | | | | | | | | | | | | | | |
Net investment income | | | .02 | | | | .01 | | | | .06 | | | | .04 | | | | .03 | |
Net realized and unrealized gain on investments | | | 1.01 | | | | 2.39 | | | | 1.21 | | | | .13 | | | | 1.28 | |
| | |
|
|
| |
|
|
| |
|
|
| |
|
|
| |
|
|
|
Total from investment operations | | | 1.03 | | | | 2.40 | | | | 1.27 | | | | .17 | | | | 1.31 | |
| | |
|
|
| |
|
|
| |
|
|
| |
|
|
| |
|
|
|
Less Distributions | | | — | | | | — | | | | (.64 | ) | | | (.11 | ) | | | (.02 | ) |
| | |
|
|
| |
|
|
| |
|
|
| |
|
|
| |
|
|
|
Net Asset Value, end of year | | $ | 11.86 | | | $ | 10.83 | | | $ | 8.43 | | | $ | 7.80 | | | $ | 7.74 | |
| | |
|
|
| |
|
|
| |
|
|
| |
|
|
| |
|
|
|
Total Return(a) | | | 9.51 | % | | | 28.47 | % | | | 16.88 | % | | | 2.22 | % | | | 20.43 | % |
Ratios/Supplemental Data: | | | | | | | | | | | | | | | | | | | | |
Net assets, end of year (in millions) | | $ | 249.1 | | | $ | 251.8 | | | $ | 221.0 | | | $ | 210.8 | | | $ | 242.4 | |
Ratios to average net assets(b): | | | | | | | | | | | | | | | | | | | | |
Expenses after waivers and/or expense reimbursement | | | .68 | % | | | .68 | % | | | .67 | % | | | .64 | % | | | .70 | % |
Expenses before waivers and/or expense reimbursement | | | .68 | % | | | .68 | % | | | .67 | % | | | .64 | % | | | .70 | % |
Net investment income | | | .22 | % | | | .08 | % | | | .73 | % | | | .39 | % | | | .69 | % |
Portfolio turnover rate | | | 45 | % | | | 38 | % | | | 44 | % | | | 40 | % | | | 73 | % |
| |
| | | SP Prudential U.S. Emerging Growth Portfolio
| |
| | | Class II
| |
| | | Year Ended December 31,
| |
| | | 2014(d)
| | | 2013(d)
| | | 2012
| | | 2011
| | | 2010
| |
Per Share Operating Performance: | | | | | | | | | | | | | | | | | | | | |
Net Asset Value, beginning of year | | $ | 10.38 | | | $ | 8.12 | | | $ | 7.53 | | | $ | 7.48 | | | $ | 6.25 | |
| | |
|
|
| |
|
|
| |
|
|
| |
|
|
| |
|
|
|
Income (Loss) From Investment Operations: | | | | | | | | | | | | | | | | | | | | |
Net investment income (loss) | | | (.02 | ) | | | (.03 | ) | | | .04 | | | | — | (c) | | | .01 | |
Net realized and unrealized gain on investments | | | .97 | | | | 2.29 | | | | 1.16 | | | | .13 | | | | 1.24 | |
| | |
|
|
| |
|
|
| |
|
|
| |
|
|
| |
|
|
|
Total from investment operations | | | .95 | | | | 2.26 | | | | 1.20 | | | | .13 | | | | 1.25 | |
| | |
|
|
| |
|
|
| |
|
|
| |
|
|
| |
|
|
|
Less Distributions | | | — | | | | — | | | | (.61 | ) | | | (.08 | ) | | | (.02 | ) |
| | |
|
|
| |
|
|
| |
|
|
| |
|
|
| |
|
|
|
Net Asset Value, end of year | | $ | 11.33 | | | $ | 10.38 | | | $ | 8.12 | | | $ | 7.53 | | | $ | 7.48 | |
| | |
|
|
| |
|
|
| |
|
|
| |
|
|
| |
|
|
|
Total Return(a) | | | 9.15 | % | | | 27.83 | % | | | 16.44 | % | | | 1.77 | % | | | 19.96 | % |
Ratios/Supplemental Data: | | | | | | | | | | | | | | | | | | | | |
Net assets, end of year (in millions) | | $ | 1.0 | | | $ | .7 | | | $ | .4 | | | $ | .3 | | | $ | .3 | |
Ratios to average net assets(b): | | | | | | | | | | | | | | | | | | | | |
Expenses after waivers and/or expense reimbursement | | | 1.08 | % | | | 1.08 | % | | | 1.07 | % | | | 1.04 | % | | | 1.10 | % |
Expenses before waivers and/or expense reimbursement | | | 1.08 | % | | | 1.08 | % | | | 1.07 | % | | | 1.04 | % | | | 1.10 | % |
Net investment income (loss) | | | (.19 | )% | | | (.32 | )% | | | .38 | % | | | (.01 | )% | | | .24 | % |
Portfolio turnover rate | | | 45 | % | | | 38 | % | | | 44 | % | | | 40 | % | | | 73 | % |
| (a) | Total return is calculated assuming a purchase of a share on the first day and a sale on the last day of each year reported and includes reinvestment of distributions and does not reflect the effect of insurance contract charges. Total return does not reflect expenses associated with the separate account such as administrative fees, account charges and surrender charges which, if reflected, would reduce the total returns for all years shown. Performance figures may reflect fee waivers and/or expense reimbursements. In the absence of fee waivers and/or expense reimbursements, the total return would be lower. Past performance is no guarantee of future results. Total returns may reflect adjustments to conform to generally accepted accounting principles. |
| (b) | Does not include expenses of the underlying portfolios in which the Portfolio invests. |
| (c) | Less than $.005 per share. |
| (d) | Calculated based on average shares outstanding during the year. |
SEE NOTES TO FINANCIAL STATEMENTS.
C3
Financial Highlights
| | | | | | | | | | | | | | | | | | | | |
| | | SP Small Cap Value Portfolio
| |
| | | Year Ended December 31,
| |
| | | 2014
| | | 2013
| | | 2012
| | | 2011
| | | 2010
| |
Per Share Operating Performance: | | | | | | | | | | | | | | | | | | | | |
Net Asset Value, beginning of year | | $ | 18.83 | | | $ | 13.70 | | | $ | 11.86 | | | $ | 12.28 | | | $ | 9.79 | |
| | |
|
|
| |
|
|
| |
|
|
| |
|
|
| |
|
|
|
Income (Loss) From Investment Operations: | | | | | | | | | | | | | | | | | | | | |
Net investment income | | | .14 | | | | .10 | | | | .16 | | | | .07 | | | | .07 | |
Net realized and unrealized gain (loss) on investments | | | .79 | | | | 5.03 | | | | 1.74 | | | | (.41 | ) | | | 2.49 | |
| | |
|
|
| |
|
|
| |
|
|
| |
|
|
| |
|
|
|
Total from investment operations | | | .93 | | | | 5.13 | | | | 1.90 | | | | (.34 | ) | | | 2.56 | |
| | |
|
|
| |
|
|
| |
|
|
| |
|
|
| |
|
|
|
| Less Distributions: | | | — | | | | — | | | | (.06 | ) | | | (.08 | ) | | | (.07 | ) |
| | |
|
|
| |
|
|
| |
|
|
| |
|
|
| |
|
|
|
Net Asset Value, end of year | | $ | 19.76 | | | $ | 18.83 | | | $ | 13.70 | | | $ | 11.86 | | | $ | 12.28 | |
| | |
|
|
| |
|
|
| |
|
|
| |
|
|
| |
|
|
|
Total Return(a) | | | 4.94 | % | | | 37.45 | % | | | 16.06 | % | | | (2.77 | )% | | | 26.27 | % |
Ratios/Supplemental Data: | | | | | | | | | | | | | | | | | | | | |
Net assets, end of year (in millions) | | $ | 217.1 | | | $ | 228.3 | | | $ | 179.6 | | | $ | 177.5 | | | $ | 232.7 | |
Ratios to average net assets(b): | | | | | | | | | | | | | | | | | | | | |
Expenses after waivers and/or expense reimbursements | | | .99 | % | | | 1.01 | % | | | 1.01 | % | | | .99 | % | | | 1.00 | % |
Expenses before waivers and/or expense reimbursements | | | 1.00 | % | | | 1.01 | % | | | 1.01 | % | | | .99 | % | | | 1.00 | % |
Net investment income | | | .56 | % | | | .52 | % | | | 1.14 | % | | | .41 | % | | | .62 | % |
Portfolio turnover rate | | | 41 | % | | | 56 | % | | | 39 | % | | | 36 | % | | | 39 | % |
| (a) | Total return is calculated assuming a purchase of a share on the first day and a sale on the last day of each year reported and includes reinvestment of distributions and does not reflect the effect of insurance contract charges. Total return does not reflect expenses associated with the separate account such as administrative fees, account charges and surrender charges which, if reflected, would reduce the total return for all periods shown. Performance figures may reflect fee waivers and/or expense reimbursements. In the absence of fee waivers and/or expense reimbursements, the total return would be lower. Past performance is no guarantee of future results. Total returns may reflect adjustments to conform to generally accepted accounting principles. |
| (b) | Does not include expenses of the underlying portfolio in which the Portfolio invests. |
SEE NOTES TO FINANCIAL STATEMENTS.
C4
REPORT OF INDEPENDENT REGISTERED PUBLIC ACCOUNTING FIRM
THE BOARD OF TRUSTEES AND SHAREHOLDERS
THE PRUDENTIAL SERIES FUND:
We have audited the accompanying statements of assets and liabilities of SP International Growth Portfolio, SP International Value Portfolio, SP Prudential U.S. Emerging Growth Portfolio and SP Small Cap Value Portfolio (hereafter referred to as the “Portfolios”), each a portfolio of the Prudential Series Fund, including the schedules of investments, as of December 31, 2014, and the related statements of operations for the year then ended, the statements of changes in net assets for each of the years in the two-year period then ended, and the financial highlights for each of the years in the five-year period then ended. These financial statements and financial highlights are the responsibility of the Portfolios’ management. Our responsibility is to express an opinion on these financial statements and financial highlights based on our audits.
We conducted our audits in accordance with the standards of the Public Company Accounting Oversight Board (United States). Those standards require that we plan and perform the audit to obtain reasonable assurance about whether the financial statements and financial highlights are free of material misstatement. An audit includes examining, on a test basis, evidence supporting the amounts and disclosures in the financial statements. Our procedures included confirmation of securities owned as of December 31, 2014, by correspondence with the custodian, transfer agent and brokers or by other appropriate auditing procedures when replies from brokers were not received. An audit also includes assessing the accounting principles used and significant estimates made by management, as well as evaluating the overall financial statement presentation. We believe that our audits provide a reasonable basis for our opinion.
In our opinion, the financial statements and financial highlights referred to above present fairly, in all material respects, the financial position of the Portfolios as of December 31, 2014, and the results of their operations, the changes in their net assets and the financial highlights for the periods described in the first paragraph above, in conformity with U.S. generally accepted accounting principles.

New York, New York
February 17, 2015
D1
INFORMATION ABOUT TRUSTEES AND OFFICERS (Unaudited)
Information about the Trustees and the Officers of the Fund is set forth below. Trustees who are not deemed to be “interested persons” of the Fund, as defined in the Investment Company Act of 1940, are referred to as “Independent Trustees.” Trustees who are deemed to be “interested persons” of the Fund are referred to as “Interested Trustees.” The Trustees are responsible for the overall supervision of the operations of the Fund and perform the various duties imposed on the directors of investment companies by the Investment Company Act of 1940.
| | | | |
| Independent Trustees | | | | |
Name, Age
Number of Portfolios in Fund Complex†
Overseen by Trustee | | Principal Occupation(s) During Past Five Years | | Other Directorships Held by Trustee** |
Susan Davenport Austin* (47) Trustee Since 2011 No. of Portfolios Overseen: 111 | | Senior Managing Director of Brock Capital (Since 2014); Vice Chairman (Since 2013), Senior Vice President and Chief Financial Officer (2007-2012) and Vice President of Strategic Planning and Treasurer (2002-2007) of Sheridan Broadcasting Corporation; Formerly President of Sheridan Gospel Network (2004-2014); Vice President, Goldman, Sachs & Co. (2000-2001); Associate Director, Bear, Stearns & Co. Inc. (1997-2000); Vice President, Salomon Brothers Inc. (1993-1997); President of the Board, The MacDowell Colony (Since 2010); Presiding Director (Since 2014) and Chairman (2011-2014) of the Board of Directors, Broadcast Music, Inc.; Member of the Board of Directors, Hubbard Radio, LLC (Since 2011); President, Candide Business Advisors, Inc. (Since 2011); formerly Member of the Board of Directors, National Association of Broadcasters (2004-2010). | | None. |
Sherry S. Barrat* (65) Trustee Since 2013 No. of Portfolios Overseen: 111 | | Formerly, Vice Chairman of Northern Trust Corporation (financial services and banking institution) (2011-June 2012); formerly, President, Personal Financial Services, Northern Trust Corporation (2006-2010); formerly, Chairman & CEO, Western US Region, Northern Trust Corporation (1999-2005); formerly, President & CEO, Palm Beach/Martin County Region, Northern Trust. | | Director of NextEra Energy, Inc. (formerly, FPL Group, Inc.) (1998-Present); Director of Arthur J. Gallagher & Company (Since July 2013). |
Kay Ryan Booth* (64) Trustee Since 2013 No. of Portfolios Overseen: 111 | | Partner of Trinity Private Equity Group (Since September 2014); formerly, Managing Director of Cappello Waterfield & Co. LLC (2011-May 2014); formerly, Vice Chair, Global Research, J.P. Morgan (financial services and investment banking institution) (June 2008-January 2009); formerly, Global Director of Equity Research, Bear Stearns & Co., Inc. (financial services and investment banking institution) (1995-2008); formerly, Associate Director of Equity Research, Bear Stearns & Co., Inc. (1987-1995). | | None. |
Delayne Dedrick Gold* (76) Trustee Since 2001 No. of Portfolios Overseen: 111 | | Marketing Consultant (1982-present); formerly Senior Vice President and Member of the Board of Directors, Prudential Bache Securities, Inc. | | None. |
Robert F. Gunia* (68) Trustee Since 2001 No. of Portfolios Overseen: 111 | | Independent Consultant (Since October 2009); formerly Chief Administrative Officer (September 1999-September 2009) and Executive Vice President (December 1996-September 2009) of Prudential Investments LLC; formerly Executive Vice President (March 1999-September 2009) and Treasurer (May 2000-September 2009) of Prudential Mutual Fund Services LLC; formerly President (April 1999-December 2008) and Executive Vice President and Chief Operating Officer (December 2008-December 2009) of Prudential Investment Management Services LLC; formerly Chief Administrative Officer, Executive Vice President and Director (May 2003-September 2009) of AST Investment Services, Inc. | | Director (Since May 1989) of The Asia-Pacific Fund, Inc. |
W. Scott McDonald, Jr., PhD* (77) Trustee Since 1983 No. of Portfolios Overseen: 111 | | Formerly Management Consultant (1997-2004) and of Counsel (2004-2005) at Kaludis Consulting Group, Inc. (company serving higher education); formerly principal (1995-1997), Scott McDonald Associates; Chief Operating Officer (1991-1995), Fairleigh Dickinson University; Executive Vice President and Chief Operating Officer (1975-1991), Drew University; interim President (1988-1990), Drew University; formerly Director of School, College and University Underwriters Ltd. | | None. |
E1
| | | | |
| Independent Trustees | | | | |
Name, Age
Number of Portfolios in Fund Complex†
Overseen by Trustee | | Principal Occupation(s) During Past Five Years | | Other Directorships Held by Trustee** |
Thomas T. Mooney* (73) Trustee Since 2001 No. of Portfolios Overseen: 111 | | Formerly Chief Executive Officer, Excell Partners, Inc. (2005-2007); founding partner of High Technology of Rochester and the Lennox Technology Center; formerly President of the Greater Rochester Metro Chamber of Commerce (1976-2004) formerly Rochester City Manager (1973); formerly Deputy Monroe County Executive (1974-1976). | | None. |
Thomas M. O’Brien* (64) Trustee Since 2003 No. of Portfolios Overseen: 111 | | Director, Sun Bancorp, Inc. (NASDAQ: SNBC) and Sun National Bank (Since July 2014); Consultant, Valley National Bancorp, Inc. and Valley National Bank (January 2012-June 2012); Formerly President and COO (November 2006-December 2011) and CEO (April 2007-December 2011) of State Bancorp, Inc. and State Bank; formerly Vice Chairman (January 1997-April 2000) of North Fork Bank; formerly President and Chief Executive Officer (December 1984-December 1996) of North Side Savings Bank; formerly President and Chief Executive Officer (May 2000-June 2006) Atlantic Bank of New York. | | Formerly Director, BankUnited, Inc. and BankUnited N.A. (NYSE: BKU) (May 2012-April 2014); formerly Director (April 2008-January 2012) of Federal Home Loan Bank of New York; formerly Director (December 1996-May 2000) of North Fork Bancorporation, Inc.; formerly Director (May 2000-April 2006) of Atlantic Bank of New York; Director (November 2006-January 2012) of State Bancorp, Inc. (NASDAQ: STBC) and State Bank of Long Island. |
| | | | |
| Interested Trustees | | | | |
Name, Age
Number of Portfolios in Fund Complex†
Overseen by Trustee | | Principal Occupation(s) During Past Five Years | | Other Directorships Held by Trustee** |
Robert F. O’Donnell* (46) Trustee & President Since 2012 No. of Portfolios Overseen: 111 | | President of Prudential Annuities (Since April 2012); Senior Vice President, Head of Product, Investment Management & Marketing for Prudential Annuities (October 2008-April 2012); Senior Vice President, Head of Product (July 2004-October 2008). | | None. |
Timothy S. Cronin* (49) Trustee Since 2011 No. of Portfolios Overseen: 111 | | Chief Investment Officer and Strategist of Prudential Annuities (Since January 2004); Director of Investment & Research Strategy (Since February 1998); President of AST Investment Services, Inc. (Since June 2005). | | None. |
Bruce W. Ferris* (59) Trustee Since 2013 No. of Portfolios Overseen: 111 | | Senior Vice President, Sales and Distribution, Product, Marketing, Prudential Annuities (Since May 2006); Vice President-Sales, The Hartford Insurance Company (October 1994-April 2005); Sales Manager, Aetna Investment Services (October 1993-September 1994). | | None. |
* The address of each Trustee is c/o Prudential Investments LLC, Gateway Center Three, 100 Mulberry Street, Newark, New Jersey 07102.
** Includes only directorships of companies required to register or file reports with the Securities and Exchange Commission (SEC) under the Securities Exchange Act of 1934 (that is, “public companies”) or other investment companies registered under the Investment Company Act of 1940.
† The Fund Complex consists of all investment companies managed by PI. The Funds for which PI serves as manager include the Prudential Investments Mutual Funds, Target Mutual Funds, The Prudential Variable Contract Accounts 2, 10 and 11, Prudential Short Duration High Yield Fund, Inc., Prudential Global Short Duration High Yield Fund, Inc., The Prudential Series Fund, Advanced Series Trust, and Prudential’s Gibraltar Fund, Inc.
| | |
| Fund Officers(1) | | |
Name, Age
Position with the Fund | | Principal Occupation(s) During the Past Five Years |
Raymond A. O’Hara* (59) Chief Legal Officer Since 2012 | | Vice President and Corporate Counsel (since July 2010) of Prudential Insurance Company of America (Prudential); Vice President (March 2011-Present) of Pruco Life Insurance Company and Pruco Life Insurance Company of New Jersey; Vice President and Corporate Counsel (March 2011-Present) of Prudential Annuities Life Assurance Corporation; Chief Legal Officer of Prudential Investments LLC (since June 2012); Chief Legal Officer of Prudential Mutual Fund Services LLC (since June 2012) and Corporate Counsel of AST Investment Services, Inc. (since June 2012); formerly Assistant Vice President and Corporate Counsel (September 2008-July 2010) of The Hartford Financial Services Group, Inc.; formerly Associate (September 1980-December 1987) and Partner (January 1988-August 2008) of Blazzard & Hasenauer, P.C. (formerly, Blazzard, Grodd & Hasenauer, P.C.). |
Chad A. Earnst* (39) Chief Compliance Officer Since 2014 | | Chief Compliance Officer (September 2014-Present) of Prudential Investments LLC; Chief Compliance Officer (September 2014-Present) of the Prudential Investments Funds, Target Funds, Advanced Series Trust, The Prudential Series Fund, Prudential’s Gibraltar Fund, Inc., Prudential Global Short Duration High Yield Income Fund, Inc., Prudential Short Duration High Yield Fund, Inc. and Prudential Jennison MLP Income Fund, Inc.; formerly Assistant Director (March 2010-August 2014) of the Asset Management Unit, Division of Enforcement, U.S. Securities & Exchange Commission; Assistant Regional Director (January 2010-August 2014), Branch Chief (June 2006-December 2009) and Senior Counsel (April 2003-May 2006) of the Miami Regional Office, Division of Enforcement, U.S. Securities & Exchange Commission. |
E2
| | |
| Fund Officers(1) | | |
Name, Age
Position with the Fund | | Principal Occupation(s) During the Past Five Years |
Bradley C. Tobin* (40) Vice President Since 2014 | | Vice President of Prudential Annuities (since March 2012), Vice President of AST Investment Services, Inc. (since April 2011). |
Deborah A. Docs* (56) Secretary Since 2005 | | Vice President and Corporate Counsel (since January 2001) of Prudential; Vice President (since December 1996) and Assistant Secretary (since March 1999) of Prudential Investments LLC; formerly Vice President and Assistant Secretary (May 2003-June 2005) of AST Investment Services, Inc. |
Jonathan D. Shain* (56) Assistant Secretary Since 2005 | | Vice President and Corporate Counsel (since August 1998) of Prudential; Vice President and Assistant Secretary (since May 2001) of Prudential Investments LLC; Vice President and Assistant Secretary (since February 2001) of Prudential Mutual Fund Services LLC; formerly Vice President and Assistant Secretary (May 2003-June 2005) of AST Investment Services, Inc. |
Claudia DiGiacomo* (40) Assistant Secretary Since 2005 | | Vice President and Corporate Counsel (since January 2005) of Prudential; Vice President and Assistant Secretary of Prudential Investments LLC (since December 2005); Associate at Sidley Austin Brown & Wood LLP (1999-2004). |
Andrew R. French* (52) Assistant Secretary Since 2006 | | Vice President and Corporate Counsel (since February 2010) of Prudential; formerly Director and Corporate Counsel (2006-2010) of Prudential; Vice President and Assistant Secretary (since January 2007) of Prudential Investments LLC; Vice President and Assistant Secretary (since January 2007) of Prudential Mutual Fund Services LLC. |
Amanda S. Ryan (36) Assistant Secretary Since 2012 | | Director and Corporate Counsel (since March 2012) of Prudential; Director and Assistant Secretary (since June 2012) of Prudential Investments LLC; Associate at Ropes & Gray LLP (2008-2012). |
Kathleen DeNicholas* (40) Assistant Secretary Since 2013 | | Vice President and Corporate Counsel (since May 2013) of Prudential; Managing Counsel at The Bank of New York Mellon Corporation (2011-2013); formerly Senior Counsel (2007-2011) and Assistant General Counsel (2001-2007) of The Dreyfus Corporation; Chief Legal Officer and Secretary of MBSC Securities Corporation (2011-2013); Vice President and Assistant Secretary of The Dreyfus Family of Funds (2010-2012). |
M. Sadiq Peshimam* (50) Treasurer and Principal Financial & Accounting Officer Since 2014 | | Assistant Treasurer of funds in the Prudential Mutual Fund Complex (2006-2014); Vice President (since 2005) of Prudential Investments LLC. |
Peter Parrella* (56) Assistant Treasurer Since 2007 | | Vice President (since 2007) and Director (2004-2007) within Prudential Mutual Fund Administration; formerly Tax Manager at SSB Citi Fund Management LLC (1997-2004). |
Lana Lomuti* (47) Assistant Treasurer Since 2014 | | Vice President (since 2007) and Director (2005-2007), within Prudential Mutual Fund Administration; formerly Assistant Treasurer (December 2007-February 2014) of The Greater China Fund, Inc. |
Linda McMullin* (53) Assistant Treasurer Since 2014 | | Vice President (since 2011) and Director (2008-2011) within Prudential Mutual Fund Administration. |
Alan Fu* (58) Assistant Treasurer Since 2006 | | Vice President and Corporate Counsel – Tax, Prudential Financial, Inc. (since October 2003). |
Theresa C. Thompson* (52) Deputy Chief Compliance Officer Since 2008 | | Vice President, Compliance, Prudential Investments LLC (since April 2004); and Director, Compliance, Prudential Investments LLC (2001-2004). |
Richard W. Kinville* (46) Anti-Money Laundering Compliance Officer Since 2011 | | Vice President, Corporate Compliance, Anti-Money Laundering Unit (since January 2005) of Prudential; committee member of the American Council of Life Insurers Anti-Money Laundering and Critical Infrastructure Committee (since January 2007); formerly Investigator and Supervisor in the Special Investigations Unit for the New York Central Mutual Fire Insurance Company (August 1994-January 1999); Investigator in AXA Financial’s Internal Audit Department and Manager in AXA’s Anti-Money Laundering Office (January 1999-January 2005); first chair of the American Council of Life Insurers Anti-Money Laundering and Critical Infrastructure Committee (June 2007-December 2009). |
* The address for each officer is c/o Prudential Investments LLC, 100 Mulberry Street, Gateway Center Three, Newark, New Jersey 07102.
(1) Excludes Messrs. O’Donnell and Cronin, interested Trustees who serve as President and Vice President, respectively. Biographical and other information with respect to Messrs. O’Donnell and Cronin appears under “Interested Trustees,” above.
E3
Approval of New Subadvisory Agreement: SP International Value Portfolio
Approval of a New Subadvisory Agreement
As required by the Investment Company Act of 1940, as amended (the 1940 Act), the Board of Trustees (the Board) of The Prudential Series Fund considered a proposed subadvisory agreement (the Subadvisory Agreement) between Prudential Investments LLC (PI or the Manager) and Lazard for the SP International Value Portfolio (the Portfolio). The Subadvisory Agreement relates to the appointment of Lazard to replace Thornburg Investment Management, Inc. (Thornburg) as a subadviser for the Portfolio. The Board, including a majority of the trustees who were not parties to the Subadvisory Agreement and were not interested persons of those parties, as defined in the 1940 Act (the Independent Trustees), met on September 17-18, 2014 (the Board Meeting) and approved the Subadvisory Agreement for an initial two year period, after concluding that approval of the Subadvisory Agreement was in the best interests of the Portfolio and its beneficial shareholders.
In advance of the Board Meeting, the Board requested and received materials relating to the Subadvisory Agreement, and had the opportunity to ask questions and request further information in connection with its consideration.
In approving the Subadvisory Agreement, the Board, including the Independent Trustees advised by independent legal counsel, considered the factors it deemed relevant, including the nature, quality and extent of services to be provided to the Portfolio by Lazard; comparable performance information; the fees paid by the Manager to Lazard; the potential for economies of scale that may be shared with the Portfolio and its shareholders; and other benefits to Lazard. In connection with its deliberations, the Board considered information provided by the Manager and Lazard at or in advance of the Board Meeting. In its deliberations, the Board did not identify any single factor which alone was responsible for the Board’s decision to approve the Subadvisory Agreement with respect to the Portfolio.
The Board determined that the overall arrangements between the Manager and Lazard are appropriate in light of the services to be performed and the fee arrangement under the Subadvisory Agreement and such other matters as the Board considered relevant in the exercise of its business judgment.
The material factors and conclusions that formed the basis for the Board’s reaching its determinations to approve the Subadvisory Agreement are separately discussed below.
Nature, Quality and Extent of Services
The Board received and considered information regarding the nature and extent of services provided to the International Value Portfolios by Thornburg and those that would be provided by Lazard under the proposed Subadvisory Agreement, noting that the nature and extent of services under the existing and new subadvisory agreements were generally similar in that Thornburg and Lazard were each required to provide day-to-day portfolio management services and comply with all portfolio policies and applicable rules and regulations.
With respect to the quality of services, the Board considered, among other things, the background and experience of the portfolio managers of Lazard. The Board was also provided with information pertaining to the organizational structure, senior management, investment operations, and other relevant information pertaining to Lazard. The Board noted that it received a favorable compliance report from the Chief Compliance Officer of The Prudential Series Fund as to Lazard.
The Board concluded that, based on the nature of the proposed services to be rendered, the background information that it reviewed about Lazard, it was reasonable to expect that it would be satisfied with the nature, extent and quality of investment subadvisory services to be provided to the Portfolio by Lazard.
Performance
The Board received and considered information regarding the investment performance of other accounts managed by Lazard utilizing an investment strategy similar to the strategy proposed for the Portfolio. The Board concluded that it was satisfied with the performance of Lazard.
Fee Rates
The Board considered the proposed contractual and effective subadvisory fee rates to be paid by the Manager to Lazard under the Subadvisory Agreement. The Board considered that based on the portion of the net assets managed by Thornburg as of August 14, 2014,
the effective subadvisory fee rate that would be paid to Lazard under the Subadvisory Agreement (i.e., 0.311%) was higher than the effective subadvisory fee rate paid to under Thornburg under the current subadvisory arrangements (i.e., 0.304%).
The Board noted that the subadvisory fees are paid by the Manager to the relevant subadviser(s) for a portfolio, and therefore any change in the subadvisory fee rate for the Portfolio will not change the investment management fee paid by the Portfolio or its shareholders. Instead, the increase in the effective subadvisory fee rate for the Portfolio will decrease the net investment management fee retained by the Manager. The Board also noted that it would review the management fee paid to the Manager by the Portfolio in connection with future annual reviews of advisory agreements. The Board concluded that the proposed subadvisory fees were reasonable.
Profitability
Because the engagement of Lazard is new, there was no historical profitability information with respect to the proposed subadvisory arrangement for the Portfolio. As a result, the Board did not consider this factor. The Board noted that it would consider profitability information as part of future annual reviews of advisory agreements.
Economies of Scale
The Board noted that the proposed subadvisory fee schedules for the Portfolio contained breakpoints that reduced the fee rates on assets above specified levels. The Board noted that it would consider economies of scale in connection with the annual reviews of advisory agreements.
Other Benefits to Lazard
The Board considered potential “fall-out” or ancillary benefits anticipated to be received by Lazard in connection with the Portfolio. The Board concluded that any potential benefits to be derived by Lazard were consistent with those generally derived by other subadvisers to other portfolios of The Prudential Series Fund, and that those benefits are reviewed on an annual basis. The Board concluded that any potential benefits to be derived by Lazard included potential access to additional research resources, larger assets under management and reputational benefits, which were consistent with those generally derived by subadvisers to mutual funds. The Board noted that it would review ancillary benefits in connection with future annual reviews of advisory agreements.
***
After full consideration of these factors, the Board concluded that approving the Subadvisory Agreement was in the best interests of the Portfolio and its beneficial shareholders.
This report must be preceded or accompanied by the current prospectuses for the Prudential Series Fund portfolios and the applicable variable annuity or variable life contract. The prospectuses contain information on the contract and the investment objectives, risks, charges and expenses of the portfolios, and should be read carefully.
A description of the Fund’s proxy voting policies and procedures is available, without charge, upon request by calling the appropriate phone number listed below. Information regarding how the Fund voted proxies relating to portfolio securities during the most recent 12-month period ended June 30 is available on the website of the Securities and Exchange Commission (the Commission) at www.sec.gov and on the Fund’s website at www.prudential.com/variableinsuranceportfolios.
The Fund files with the Commission a complete listing of portfolio holdings as of its first and third quarter-end on Form N-Q. Form N-Q is available on the Commission’s website at www.sec.gov or by visiting the Commission’s Public Reference Room. For more information on the Commission’s Public Reference Room, please visit the Commission’s website or call (800)SEC-0330. Form N-Q is also available on the Fund’s website or by calling the telephone number referenced below.
The Fund’s Statement of Additional Information contains additional information about the Fund’s Trustees and is available without charge upon request by calling the appropriate phone number listed below.
This report may include financial information pertaining to certain portfolios that are not available through the variable annuity contract or the variable life insurance policy that you have chosen. Please refer to your variable product prospectus to determine which portfolios are available to you.
To contact your client services representative, please call the phone number listed below. Thank you.
Owners of Individual Annuity contracts should call (888) 778-2888.
Owners of Individual Life Insurance contracts should call (800) 778-2255.
Owners of Group Variable Universal Life Insurance contracts should call (800) 562-9874.
Owners of Group Variable Universal Life Insurance contracts through AICPA should call (800) 223-7473.
The Prudential Series Fund is distributed by Prudential Investment Management Services LLC (PIMS), Three Gateway Center, 14th Floor, Newark, NJ 07102-4077, member SIPC, a Prudential Financial company and solely responsible for its own financial condition and contractual obligations.
Annuity and life insurance contracts contain exclusions, limitations, reductions of benefits, and terms for keeping them in force. Your licensed financial professional can provide you with costs and complete details. Contract guarantees are based on the claims-paying ability of the issuing company.
| | | | |

The Prudential Insurance Company of America 751 Broad Street Newark, NJ 07102-3777 | | | | PRESORTED STD U.S. POSTAGE PAID HARRISONBURG, VA PERMIT No. 250 ZIP CODE 22801 |
| | | | |
| | | | |
| | | | |
The Audited Financial Statements of Pruco Life Insurance Company, Pruco Life Insurance Company of New Jersey, and The Prudential Insurance Company of America are available upon request. You may call (888)778-2888 to obtain a free copy of the audited financial statements of the insurance company that issued your contract.
©2015 Prudential Financial, Inc. and its related entities. Prudential Investments, Prudential, the Prudential logo, and the Rock symbol, and Bring Your Challenges are service marks of Prudential Financial, Inc. and its related entities, registered in many jurisdictions worldwide.
0239311-00003-00 PSF-AR-B

THE PRUDENTIAL SERIES FUND
ANNUAL REPORT Ÿ DECEMBER 31, 2014
Based on the variable contract you own or the portfolios you invested in, you may receive additional reports that provide financial information on those investment choices. Please refer to your variable annuity or variable life insurance contract prospectus to determine which portfolios are available to you.
The views expressed in this report and information about the Fund’s portfolio holdings are for the period covered by this report and are subject to change thereafter.
Please note that this document may include prospectus supplements that are separate from and not a part of this report. Please refer to your variable life insurance contract prospectus to determine which supplements are applicable to you.

For information regarding enrollment in the e-Delivery program, please see the inside front cover of this report.
Jennison 20/20 Focus Portfolio
By enrolling in e-Delivery, you’ll gain secure, online access to important documents with the flexibility to choose which documents you receive in the mail… and which ones you don’t!
Individual Annuity Contract Owners - Get started by visiting www.prudentialannuities.com/investor/edelivery and follow the instructions on the screen, or scan the code below.
Individual Life Insurance Contract Owners - To receive your reports online, go to www.prudential.com/edelivery, or scan the code below.
Group Variable Universal Life Contract Owners - To receive your reports online, go to www.prudential.com/gulgvul, or scan the code.
Save paper and reduce clutter.
Receive Prospectuses and Reports electronically by enrolling today!
| | | | |
The Prudential Series Fund Table of Contents | | Annual Report | | December 31, 2014 |
| n | | LETTER TO CONTRACT OWNERS |
| n | | INVESTMENT MANAGER’S REPORT |
| n | | PRESENTATION OF PORTFOLIO HOLDINGS |
| | |
| Section A | | Schedule of Investments and Financial Statements |
| Section B | | Notes to Financial Statements |
| Section C | | Financial Highlights |
| Section D | | Report of Independent Registered Public Accounting Firm |
| Section E | | Information about Trustees and Officers |
| | | | |
The Prudential Series Fund Letter to Contract Owners | | Annual Report | | December 31, 2014 |
At Prudential, our primary objective is to help investors achieve and maintain long-term financial success. This Prudential Series Fund annual report outlines our efforts to achieve this goal. We hope you find it informative and useful.
Prudential has been building on a heritage of success for more than 135 years. The quality of our businesses and risk diversification has enabled us to manage effectively through volatile markets over time. We believe the array of our products provides a highly attractive value proposition to clients like you who are focused on financial security.
Your financial professional is the best resource to help you make the most informed investment decisions. Together, you can build a diversified investment portfolio that aligns with your long-term financial goals. Please keep in mind that diversification and asset allocation strategies do not assure a profit or protect against loss in declining markets.
Thank you for selecting Prudential as one of your financial partners. We value your trust and appreciate the opportunity to help you achieve financial security.
Sincerely,
Robert F. O’Donnell
President,
The Prudential Series Fund | January 30, 2015 |
| | |
| The Prudential Series Fund, Jennison 20/20 Focus Portfolio | | December 31, 2014 |
Investment Manager’s Report - As of December 31, 2014 (Unaudited)
| | | | | | | | | | | | |
| Average Annual Total Returns | | 1-Year | | | 5-Year | | | 10-Year | |
Portfolio: Class I | | | 7.15 | % | | | 9.81 | % | | | 8.94 | % |
Portfolio: Class II | | | 6.70 | | | | 9.38 | | | | 8.52 | |
Russell 1000® Index | | | 13.24 | | | | 15.64 | | | | 7.96 | |
S&P 500 Index | | | 13.66 | | | | 15.44 | | | | 7.67 | |
Past performance does not guarantee future returns. The investment return and principal value of an investment will fluctuate, so that an investor’s shares, when redeemed, may be worth more or less than their original cost. Current performance may be lower or higher than the past performance data quoted.
Portfolio performance is net of investment fees and fund expenses, but not contract charges, which, if included, would significantly lower the performance quoted. The Russell 1000® Index is a trademark/service mark of the Frank Russell Company. Russell® is a trademark of the Frank Russell Company. Performance figures may reflect fee waivers and/or expense reimbursements. In the absence of such fee waivers and/or expense reimbursements, total returns would be lower.
$10,000 INVESTED OVER 10 YEARS
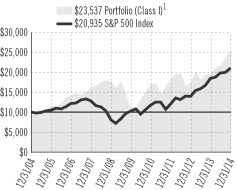
For the year ended December 31, 2014, the Jennison 20/20 Focus Portfolio’s Class I returned 7.15% and Class II returned 6.70%. The net assets of the Portfolio at December 31, 2014 were $240.1 million.
The Portfolio’s investment objective is long-term growth of capital. The Portfolio is subadvised by Jennison Associates LLC.
The Portfolio underperformed the S&P 500 (the Index), which returned 13.66%.
In the growth segment, stock selection in health care, led by Allergan and Illumina, as well as an overweight to the sector drove performance. Allergan advanced on a takeover bid and the strength of its business. (Allergan was acquired by Actavis in November.) Illumina’s gain reflected increasing demand for its next-generation gene-sequencing technology.
Other notable contributors to the growth sleeve’s total return included Apple and Facebook. Apple’s strong revenue and earnings reflected expanding global acceptance of its platform. Jennison expects that product updates, especially iPhone 6, will sustain attractive revenue growth in the medium term. Internet-based social platform Facebook reported strong revenue and earnings.
Conversely a combination of stock selection in and a substantial overweight to consumer discretionary was the largest source of relative weakness for the growth sleeve. Amazon.com’s earnings were constrained by increased business investment that is designed to drive unit growth in its core retail business and through digital commerce via the mobile market. Weakness in Industria de Diseño Textil, reflected currency translation issues due to the euro’s strength relative to many other currencies. The holding was sold.
Despite relative strength in the sector, Bristol-Myers Squibb was a detractor in health care. Shares fell on what the market regarded as disappointing initial safety and efficacy data from a Phase II study of experimental nivolumab (a PD-1 antibody) and approved melanoma treatment Yervoy in the treatment of non-small cell lung cancer (NSCLC). While Jennison likes Bristol’s overall immune-oncology program, the position was sold.
In the value segment, stock selection proved detrimental in most sectors, especially in energy and consumer staples. Avon was a laggard in the latter group although Jennison still considers Avon shares to be attractively valued.
Cobalt International, Noble Energy, and Halliburton drove results in energy. These holdings lagged as renewed fears of a global slowdown caused a sharp increase in the U.S. dollar and a rapid decline in many commodity prices, including oil and natural gas. Jennison still expects Halliburton to benefit from internal efficiency initiatives and its global operating footprint. Noble Energy should see sustained benefits from its balanced portfolio of assets, prudent cost management, and efficient use of capital. Cobalt was sold during the period.
The information technology sector contributed the most to the value sleeve’s relative gain due to a large overweight position and stock selection. Applied Materials and Flextronics were standouts. Jennison believes that Applied Materials is positioned to benefit from increased spending and the completion of its merger with Tokyo Electron. Flextronics International enjoyed strength across business segments and made continued progress in improving its efficiencies and productivity. Jennison expects potentially strong growth in its industrial and high reliability solutions businesses.
Prudential Investments LLC (PI), an indirect, wholly owned subsidiary of Prudential Financial, Inc., serves as the investment manager for the Portfolio.
| 1 | The graph is based on the performance of Class I shares. Performance of Class II shares will be lower due to differences in the fee structure. Class II shares have associated 12b-1 and administrative fees at an annual rate of 0.25% and 0.15%, respectively, of the average daily net assets of the Class II shares. |
Russell 1000® Index is an unmanaged market cap-weighted index that measures the performance of the 1,000 largest companies in the Russell 3000 Index, which represents approximately 92% of the total market. S&P 500 Index is an unmanaged, market value-weighted index of 500 stocks generally representative of the broad stock market. These returns do not include the effect of any investment management expenses. These returns would have been lower if they included the effect of these expenses. Investors cannot invest directly in a market index. For a complete list of holdings, refer to the Schedule of Investments section of this report.
Jennison Associates LLC is a registered investment adviser and a Prudential Financial company.
1
| | |
The Prudential Series Fund Presentation of Portfolio Holdings — unaudited | | December 31, 2014 |
| | | | |
| Jennison 20/20 Focus | |
| Five Largest Holdings | | | (% of Net Assets | ) |
| Apple, Inc. | | | 4.4% | |
| Facebook, Inc. (Class A Stock) | | | 4.4% | |
| Celgene Corp. | | | 3.7% | |
| MasterCard, Inc. (Class A Stock) | | | 3.6% | |
| Biogen Idec, Inc | | | 3.4% | |
For a complete list of holdings, please refer to the Schedule of Investments section of this report. Holdings reflect only long-term investments. Holdings/Issues/Sectors/Industries are subject to change.
| | |
The Prudential Series Fund Fees and Expenses — unaudited | | December 31, 2014 |
As a contract owner investing in Portfolios of the Fund through a variable annuity or variable life contract, you incur ongoing costs, including management fees, and other Portfolio expenses. This example is intended to help you understand your ongoing costs (in dollars) of investing in the Fund and to compare these costs with the ongoing costs of investing in other investment options. This example does not reflect fees and charges under your variable annuity or variable life contract. If contract charges were included, the costs shown below would be higher. Please consult the prospectus for your contract for more information about contract fees and charges.
The example is based on an investment of $1,000 invested at the beginning of the period and held for the entire period July 1, 2014 through December 31, 2014.
Actual Expenses
The first line of the table below provides information about actual account values and actual expenses. You may use this information, together with the amount you invested, to estimate the Portfolio expenses that you paid over the period. Simply divide your account value by $1,000 (for example, an $8,600 account value divided by $1,000 = 8.6), then multiply the result by the number in the first line under the heading entitled “Expenses Paid During the Six-Month Period” to estimate the Portfolio expenses you paid on your account during this period. As noted above, the table does not reflect variable contract fees and charges.
Hypothetical Example for Comparison Purposes
The second line of the table below provides information about hypothetical account values and hypothetical expenses based on the Portfolio’s actual expense ratio and an assumed rate of return of 5% per year before expenses, which is not the Portfolio’s actual return. The hypothetical account values and expenses may not be used to estimate the actual ending account balance or expenses you paid for the period. You may use this information to compare the ongoing costs of investing in the Portfolio and other investment options. To do so, compare this 5% hypothetical example with the 5% hypothetical examples that appear in the shareholder reports of the other investment options.
Please note that the expenses shown in the table are meant to highlight your ongoing Portfolio costs only and do not reflect any contract fees and charges, such as sales charges (loads), insurance charges or administrative charges. Therefore the second line of the table is useful to compare ongoing investment option costs only, and will not help you determine the relative total costs of owning different contracts. In addition, if these contract fee and charges were included, your costs would have been higher.
| | | | | | | | | | | | | | | | | | |
| The Prudential Series Fund Portfolios | | Beginning Account Value July 1, 2014 | | | Ending Account Value December 31, 2014 | | | Annualized Expense Ratio based on the
Six-Month period | | | Expenses Paid
During the
Six-Month period* | |
| Jennison 20/20 Focus (Class I) | | Actual | | $ | 1,000.00 | | | $ | 1,002.70 | | | | 0.83 | % | | $ | 4.19 | |
| | | Hypothetical | | $ | 1,000.00 | | | $ | 1,021.02 | | | | 0.83 | % | | $ | 4.23 | |
| Jennison 20/20 Focus (Class II) | | Actual | | $ | 1,000.00 | | | $ | 1,000.50 | | | | 1.23 | % | | $ | 6.20 | |
| | | Hypothetical | | $ | 1,000.00 | | | $ | 1,019.00 | | | | 1.23 | % | | $ | 6.26 | |
* Portfolio expenses (net of fee waivers or subsidies, if any) for each share class are equal to the annualized expense ratio for each share class (provided in the table), multiplied by the average account value over the period, multiplied by the 184 days in the six-month period ended December 31, 2014, and divided by the 365 days in the Portfolio’s fiscal year ended December 31, 2014 (to reflect the six-month period). Expenses presented in the table include the expenses of any underlying portfolios in which the Portfolio may invest.
| | | | | | |
| | | JENNISON 20/20 FOCUS PORTFOLIO | | |
| |
| SCHEDULE OF INVESTMENTS | | as of December 31, 2014 |
| | | | | | | | |
| LONG-TERM INVESTMENTS — 97.2% | | | | |
| COMMON STOCKS | | Shares
| | | Value
(Note 2)
| |
Aerospace & Defense — 1.2% | | | | | | | | |
Boeing Co. (The) | | | 21,541 | | | $ | 2,799,899 | |
| | | | | | |
|
|
|
Automobiles — 1.7% | | | | | | | | |
Tesla Motors, Inc.*(a) | | | 18,272 | | | | 4,063,875 | |
| | | | | | |
|
|
|
Banks — 2.1% | | | | | | | | |
JPMorgan Chase & Co. | | | 81,146 | | | | 5,078,117 | |
| | | | | | |
|
|
|
Biotechnology — 7.1% | | | | | | | | |
Biogen Idec, Inc.* | | | 23,704 | | | | 8,046,323 | |
Celgene Corp.* | | | 79,673 | | | | 8,912,222 | |
| | | | | | |
|
|
|
| | | | | | | | 16,958,545 | |
| | | | | | |
|
|
|
Chemicals — 3.5% | | | | | | | | |
FMC Corp. | | | 49,572 | | | | 2,827,091 | |
Monsanto Co. | | | 47,640 | | | | 5,691,551 | |
| | | | | | |
|
|
|
| | | | | | | | 8,518,642 | |
| | | | | | |
|
|
|
Consumer Finance — 1.8% | | | | | | | | |
SLM Corp. | | | 422,862 | | | | 4,308,964 | |
| | | | | | |
|
|
|
Electric Utilities — 2.0% | | | | | | | | |
FirstEnergy Corp. | | | 124,019 | | | | 4,835,501 | |
| | | | | | |
|
|
|
Electrical Equipment — 1.8% | | | | | | | | |
Eaton Corp. PLC | | | 65,235 | | | | 4,433,371 | |
| | | | | | |
|
|
|
Energy Equipment & Services — 1.3% | | | | | |
Halliburton Co. | | | 78,930 | | | | 3,104,317 | |
| | | | | | |
|
|
|
Food & Staples Retailing — 2.4% | | | | | | | | |
Costco Wholesale Corp. | | | 39,966 | | | | 5,665,180 | |
| | | | | | |
|
|
|
Food Products — 5.0% | | | | | | | | |
Bunge Ltd. | | | 57,484 | | | | 5,225,871 | |
Mondelez International, Inc.
(Class A Stock) | | | 185,801 | | | | 6,749,221 | |
| | | | | | |
|
|
|
| | | | | | | | 11,975,092 | |
| | | | | | |
|
|
|
Hotels, Restaurants & Leisure — 2.2% | | | | | |
Carnival Corp. | | | 117,998 | | | | 5,348,849 | |
| | | | | | |
|
|
|
Insurance — 2.3% | | | | | | | | |
MetLife, Inc. | | | 100,080 | | | | 5,413,327 | |
| | | | | | |
|
|
|
Internet & Catalog Retail — 3.4% | | | | | | | | |
Amazon.com, Inc.* | | | 15,787 | | | | 4,899,495 | |
Netflix, Inc.* | | | 9,323 | | | | 3,184,830 | |
| | | | | | |
|
|
|
| | | | | | | | 8,084,325 | |
| | | | | | |
|
|
|
Internet Software & Services — 12.4% | | | | | |
Alibaba Group Holding Ltd. (China), ADR*(a) | | | 66,347 | | | | 6,896,107 | |
Facebook, Inc. (Class A Stock)* | | | 135,398 | | | | 10,563,752 | |
Google, Inc. (Class A Stock)* | | | 5,535 | | | | 2,937,203 | |
Google, Inc. (Class C Stock)* | | | 5,574 | | | | 2,934,154 | |
LendingClub Corp.*(a) | | | 3,057 | | | | 77,342 | |
LinkedIn Corp. (Class A Stock)* | | | 27,791 | | | | 6,383,871 | |
| | | | | | |
|
|
|
| | | | | | | | 29,792,429 | |
| | | | | | |
|
|
|
IT Services — 4.6% | | | | | | | | |
FleetCor Technologies, Inc.* | | | 16,054 | | | | 2,387,390 | |
MasterCard, Inc. (Class A Stock) | | | 99,249 | | | | 8,551,294 | |
| | | | | | |
|
|
|
| | | | | | | | 10,938,684 | |
| | | | | | |
|
|
|
| | | | | | | | |
COMMON STOCKS
(Continued) | | Shares
| | | Value
(Note 2)
| |
Machinery — 1.1% | | | | | | | | |
SPX Corp. | | | 30,091 | | | $ | 2,585,419 | |
| | | | | | |
|
|
|
Media — 5.7% | | | | | | | | |
Comcast Corp.
(Class A Stock) | | | 100,404 | | | | 5,824,436 | |
Walt Disney Co. (The) | | | 83,966 | | | | 7,908,758 | |
| | | | | | |
|
|
|
| | | | | | | | 13,733,194 | |
| | | | | | |
|
|
|
Multiline Retail — 2.1% | | | | | | | | |
Target Corp. | | | 65,794 | | | | 4,994,422 | |
| | | | | | |
|
|
|
Oil, Gas & Consumable Fuels — 2.8% | | | | | |
Anadarko Petroleum Corp. | | | 39,762 | | | | 3,280,365 | |
Noble Energy, Inc. | | | 73,502 | | | | 3,486,200 | |
| | | | | | |
|
|
|
| | | | | | | | 6,766,565 | |
| | | | | | |
|
|
|
Pharmaceuticals — 10.7% | | | | | | | | |
Actavis PLC* | | | 21,080 | | | | 5,426,203 | |
Allergan, Inc. | | | 35,445 | | | | 7,535,252 | |
Bayer AG (Germany), ADR | | | 36,888 | | | | 5,047,754 | |
Shire PLC (Ireland), ADR | | | 35,992 | | | | 7,649,740 | |
| | | | | | |
|
|
|
| | | | | | | | 25,658,949 | |
| | | | | | |
|
|
|
Road & Rail — 1.8% | | | | | | | | |
Canadian Pacific Railway Ltd. (Canada) | | | 22,923 | | | | 4,417,033 | |
| | | | | | |
|
|
|
Semiconductors & Semiconductor Equipment — 2.8% | |
Applied Materials, Inc. | | | 271,897 | | | | 6,775,673 | |
| | | | | | |
|
|
|
Software — 4.8% | | | | | | | | |
Microsoft Corp. | | | 89,567 | | | | 4,160,387 | |
salesforce.com, inc.* | | | 123,529 | | | | 7,326,505 | |
| | | | | | |
|
|
|
| | | | | | | | 11,486,892 | |
| | | | | | |
|
|
|
Specialty Retail — 1.7% | | | | | | | | |
Inditex SA (Spain), ADR | | | 296,319 | | | | 4,207,730 | |
| | | | | | |
|
|
|
Technology Hardware, Storage & Peripherals — 6.4% | |
Apple, Inc. | | | 96,027 | | | | 10,599,460 | |
Hewlett-Packard Co. | | | 120,920 | | | | 4,852,520 | |
| | | | | | |
|
|
|
| | | | | | | | 15,451,980 | |
| | | | | | |
|
|
|
Textiles, Apparel & Luxury Goods — 2.5% | |
Under Armour, Inc.
(Class A Stock)*(a) | | | 88,755 | | | | 6,026,464 | |
| | | | | | |
|
|
|
TOTAL LONG-TERM INVESTMENTS
(cost $178,298,381) | | | | 233,423,438 | |
| | | | | | |
|
|
|
| SHORT-TERM INVESTMENT — 7.3% | | | | | |
AFFILIATED MONEY MARKET MUTUAL FUND | |
Prudential Investment Portfolios 2 —Prudential Core Taxable Money Market Fund (cost $17,551,955; includes $10,810,754 of cash collateral for securities on loan)
(Note 4)(b)(c) | | | 17,551,955 | | | | 17,551,955 | |
| | | | | | |
|
|
|
TOTAL INVESTMENTS — 104.5%
(cost $195,850,336) | | | | 250,975,393 | |
LIABILITIES IN EXCESS OF
OTHER ASSETS — (4.5)% | | | | (10,832,544 | ) |
| | | | | | |
|
|
|
NET ASSETS — 100.0% | | | $ | 240,142,849 | |
| | | | | | |
|
|
|
SEE NOTES TO FINANCIAL STATEMENTS.
A1
| | | | | | |
| | | JENNISON 20/20 FOCUS PORTFOLIO (continued) | | |
| |
| SCHEDULE OF INVESTMENTS | | as of December 31, 2014 |
The following abbreviations is used in the Portfolio descriptions:
| | |
| ADR | | American Depositary Receipt |
| * | | Non-income producing security. |
| (a) | All or a portion of security is on loan. The aggregate market value of such securities, including those sold and pending settlement, is $10,547,982; cash collateral of $10,810,754 (included in liabilities) was received with which the Portfolio purchased highly liquid short-term investments. Securities on loan are subject to contractual netting arrangements. |
| (b) | Represents security, or a portion thereof, purchased with cash collateral received for securities on loan. |
| (c) | Prudential Investments LLC, the manager of the Portfolio, also serves as manager of the Prudential Investment Portfolios 2 — Prudential Core Taxable Money Market Fund. |
Various inputs are used in determining the value of the Portfolio’s investments. These inputs are summarized in the three broad levels listed below.
| Level 1— | quoted prices generally in active markets for identical securities. |
| Level 2— | quoted prices for similar securities, interest rates and yield curves, prepayment speeds, foreign currency exchange rates and other significant observable inputs. |
| Level 3— | significant unobservable inputs for securities valued in accordance with Board approved fair valuation procedures. |
The following is a summary of the inputs used as of December 31, 2014 in valuing such portfolio securities:
| | | | | | | | | | | | |
| | | Level 1
| | | Level 2
| | | Level 3
| |
Investments in Securities | | | | | | | | | | | | |
Common Stocks | | | | | | | | | | | | |
Aerospace & Defense | | $ | 2,799,899 | | | $ | — | | | $ | — | |
Automobiles | | | 4,063,875 | | | | — | | | | — | |
Banks | | | 5,078,117 | | | | — | | | | — | |
Biotechnology | | | 16,958,545 | | | | — | | | | — | |
Chemicals | | | 8,518,642 | | | | — | | | | — | |
Consumer Finance | | | 4,308,964 | | | | — | | | | — | |
Electric Utilities | | | 4,835,501 | | | | — | | | | — | |
Electrical Equipment | | | 4,433,371 | | | | — | | | | — | |
Energy Equipment & Services | | | 3,104,317 | | | | — | | | | — | |
Food & Staples Retailing | | | 5,665,180 | | | | — | | | | — | |
Food Products | | | 11,975,092 | | | | — | | | | — | |
Hotels, Restaurants & Leisure | | | 5,348,849 | | | | — | | | | — | |
Insurance | | | 5,413,327 | | | | — | | | | — | |
Internet & Catalog Retail | | | 8,084,325 | | | | — | | | | — | |
Internet Software & Services | | | 29,792,429 | | | | — | | | | — | |
IT Services | | | 10,938,684 | | | | — | | | | — | |
Machinery | | | 2,585,419 | | | | — | | | | — | |
Media | | | 13,733,194 | | | | — | | | | — | |
Multiline Retail | | | 4,994,422 | | | | — | | | | — | |
Oil, Gas & Consumable Fuels | | | 6,766,565 | | | | — | | | | — | |
Pharmaceuticals | | | 25,658,949 | | | | — | | | | — | |
Road & Rail | | | 4,417,033 | | | | — | | | | — | |
Semiconductors & Semiconductor Equipment | | | 6,775,673 | | | | — | | | | — | |
Software | | | 11,486,892 | | | | — | | | | — | |
Specialty Retail | | | 4,207,730 | | | | — | | | | — | |
Technology Hardware, Storage & Peripherals | | | 15,451,980 | | | | — | | | | — | |
Textiles, Apparel & Luxury Goods | | | 6,026,464 | | | | — | | | | — | |
Affiliated Money Market Mutual Fund | | | 17,551,955 | | | | — | | | | — | |
| | |
|
|
| |
|
|
| |
|
|
|
Total | | $ | 250,975,393 | | | $ | — | | | $ | — | |
| | |
|
|
| |
|
|
| |
|
|
|
SEE NOTES TO FINANCIAL STATEMENTS.
A2
| | | | | | |
| | | JENNISON 20/20 FOCUS PORTFOLIO (continued) | | |
| |
| SCHEDULE OF INVESTMENTS | | as of December 31, 2014 |
The industry classification of investments and liabilities in excess of other assets shown as a percentage of net assets as of December 31, 2014 was as follows (Unaudited):
| | | | |
Internet Software & Services | | | 12.4 | % |
Pharmaceuticals | | | 10.7 | |
Affiliated Money Market Mutual Fund
(including 4.5% of collateral for securities on loan) | | | 7.3 | |
Biotechnology | | | 7.1 | |
Technology Hardware, Storage & Peripherals | | | 6.4 | |
Media | | | 5.7 | |
Food Products | | | 5.0 | |
Software | | | 4.8 | |
IT Services | | | 4.6 | |
Chemicals | | | 3.5 | |
Internet & Catalog Retail | | | 3.4 | |
Semiconductors & Semiconductor Equipment | | | 2.8 | |
Oil, Gas & Consumable Fuels | | | 2.8 | |
Textiles, Apparel & Luxury Goods | | | 2.5 | |
Food & Staples Retailing | | | 2.4 | |
Insurance | | | 2.3 | |
| | | | |
Hotels, Restaurants & Leisure | | | 2.2 | % |
Banks | | | 2.1 | |
Multiline Retail | | | 2.1 | |
Electric Utilities | | | 2.0 | |
Electrical Equipment | | | 1.8 | |
Road & Rail | | | 1.8 | |
Consumer Finance | | | 1.8 | |
Specialty Retail | | | 1.7 | |
Automobiles | | | 1.7 | |
Energy Equipment & Services | | | 1.3 | |
Aerospace & Defense | | | 1.2 | |
Machinery | | | 1.1 | |
| | |
|
|
|
| | | | 104.5 | |
Liabilities in excess of other assets | | | (4.5 | ) |
| | |
|
|
|
| | | | 100.0 | % |
| | |
|
|
|
SEE NOTES TO FINANCIAL STATEMENTS.
A3
| | | | | | |
| | | JENNISON 20/20 FOCUS PORTFOLIO (continued) | | |
STATEMENT OF ASSETS & LIABILITIES
as of December 31, 2014
| | | | |
| ASSETS | | | | |
Investments at value, including securities on loan of $10,547,982: | | | | |
Unaffiliated investments (cost $178,298,381) | | $ | 233,423,438 | |
Affiliated investments (cost $17,551,955) | | | 17,551,955 | |
Receivable for investments sold | | | 2,597,265 | |
Dividends receivable | | | 194,956 | |
Receivable for Series shares sold | | | 100,634 | |
Tax reclaim receivable | | | 22,861 | |
Prepaid expenses | | | 1,983 | |
| | |
|
|
|
Total Assets | | | 253,893,092 | |
| | |
|
|
|
| LIABILITIES | | | | |
Payable to broker for collateral for securities on loan | | | 10,810,754 | |
Payable for investments purchased | | | 2,398,046 | |
Payable for Series shares repurchased | | | 197,399 | |
Management fee payable | | | 153,702 | |
Payable to custodian | | | 67,190 | |
Accrued expenses | | | 63,092 | |
Distribution fee payable | | | 36,877 | |
Administration fee payable | | | 22,257 | |
Affiliated transfer agent fee payable | | | 926 | |
| | |
|
|
|
Total Liabilities | | | 13,750,243 | |
| | |
|
|
|
| NET ASSETS | | $ | 240,142,849 | |
| | |
|
|
|
Net assets were comprised of: | | | | |
Paid-in capital | | $ | 82,050,220 | |
Retained earnings | | | 158,092,629 | |
| | |
|
|
|
Net assets, December 31, 2014 | | $ | 240,142,849 | |
| | |
|
|
|
| Class I: | | | | |
Net asset value and redemption price per share $67,196,617 / 3,031,678 outstanding shares of beneficial interest | | $ | 22.16 | |
| | |
|
|
|
| Class II: | | | | |
Net asset value and redemption price per share $172,946,232 / 8,047,895 outstanding shares of beneficial interest | | $ | 21.49 | |
| | |
|
|
|
STATEMENT OF OPERATIONS
Year Ended December 31, 2014
| | | | |
| NET INVESTMENT LOSS | | | | |
Income | | | | |
Unaffiliated dividend income (net of foreign withholding taxes of $103,442) | | $ | 2,180,578 | |
Affiliated income from securities loaned, net | | | 29,103 | |
Affiliated dividend income | | | 7,896 | |
| | |
|
|
|
Total income | | | 2,217,577 | |
| | |
|
|
|
| EXPENSES | | | | |
Management fee | | | 1,839,946 | |
Distribution fee—Class II | | | 441,763 | |
Administration fee—Class II | | | 265,058 | |
Shareholders’ reports | | | 63,000 | |
Custodian’s fees and expenses | | | 54,000 | |
Audit fee | | | 26,000 | |
Transfer agent’s fees and expenses (including affiliated expense of $5,600) | | | 12,000 | |
Trustees’ fees | | | 12,000 | |
Legal fees and expenses | | | 10,000 | |
Insurance expenses | | | 3,000 | |
Commitment fee on syndicated credit agreement | | | 2,000 | |
Miscellaneous | | | 11,796 | |
| | |
|
|
|
Total expenses | | | 2,740,563 | |
| | |
|
|
|
| NET INVESTMENT LOSS | | | (522,986 | ) |
| | |
|
|
|
| REALIZED AND UNREALIZED GAIN (LOSS) ON INVESTMENT AND FOREIGN CURRENCY TRANSACTIONS | | | | |
Net realized gain (loss) on: | | | | |
Investment transactions | | | 20,235,017 | |
Foreign currency transactions | | | (216 | ) |
| | |
|
|
|
| | | | 20,234,801 | |
| | |
|
|
|
Net change in unrealized appreciation (depreciation) on: | | | | |
Investments | | | (3,561,378 | ) |
Foreign currencies | | | (96 | ) |
| | |
|
|
|
| | | | (3,561,474 | ) |
| | |
|
|
|
| NET GAIN ON INVESTMENT AND FOREIGN CURRENCY TRANSACTIONS | | | 16,673,327 | |
| | |
|
|
|
| NET INCREASE IN NET ASSETS RESULTING FROM OPERATIONS | | $ | 16,150,341 | |
| | |
|
|
|
STATEMENT OF CHANGES IN NET ASSETS
| | | | | | | | |
| | | Year Ended December 31,
| |
| | | 2014
| | | 2013
| |
INCREASE (DECREASE) IN NET ASSETS
OPERATIONS | | | | | | | | |
Net investment income (loss) | | $ | (522,986 | ) | | $ | 406,955 | |
Net realized gain on investment and foreign currency transactions | | | 20,234,801 | | | | 41,444,921 | |
Net change in unrealized appreciation (depreciation) on investments and foreign currencies | | | (3,561,474 | ) | | | 17,543,929 | |
| | |
|
|
| |
|
|
|
NET INCREASE IN NET ASSETS RESULTING FROM OPERATIONS | | | 16,150,341 | | | | 59,395,805 | |
| | |
|
|
| |
|
|
|
| SERIES SHARE TRANSACTIONS (Note 7) | | | | | | | | |
Series shares sold | | | 26,707,454 | | | | 19,773,001 | |
Series shares repurchased | | | (49,979,063 | ) | | | (45,776,645 | ) |
| | |
|
|
| |
|
|
|
NET DECREASE IN NET ASSETS FROM SERIES SHARE TRANSACTIONS | | | (23,271,609 | ) | | | (26,003,644 | ) |
| | |
|
|
| |
|
|
|
| TOTAL INCREASE (DECREASE) | | | (7,121,268 | ) | | | 33,392,161 | |
| NET ASSETS: | | | | | | | | |
Beginning of year | | | 247,264,117 | | | | 213,871,956 | |
| | |
|
|
| |
|
|
|
End of year | | $ | 240,142,849 | | | $ | 247,264,117 | |
| | |
|
|
| |
|
|
|
SEE NOTES TO FINANCIAL STATEMENTS.
A4
NOTES TO THE FINANCIAL STATEMENTS OF
THE PRUDENTIAL SERIES FUND
The Prudential Series Fund (“Series Fund”), organized as a Delaware statutory trust, is a diversified open-end management investment company registered under the Investment Company Act of 1940, as amended (“1940 Act”). The Series Fund is composed of eighteen Portfolios (“Portfolio” or “Portfolios”), each with separate series shares. The information presented in these financial statements pertains to Jennison 20/20 Focus Portfolio.
The Portfolio’s investment objective is long-term growth of capital.
| Note 2: | | Accounting Policies |
The Series Fund follows investment company accounting and reporting guidance of the Financial Accounting Standards Board (FASB) Accounting Standard Codification Topic 946 Financial Services — Investment Companies. The following accounting policies conform to U.S. generally accepted accounting principles. The Series Fund and the Portfolio consistently follow such policies in the preparation of their financial statements.
Securities Valuation: The Portfolio holds securities and other assets that are fair valued at the close of each day the New York Stock Exchange (“NYSE”) is open for trading. Fair value is the price that would be received to sell an asset or paid to transfer a liability in an orderly transaction between market participants on the measurement date. The Board of Trustees (the “Board”) has adopted Valuation Procedures for security valuation under which fair valuation responsibilities have been delegated to Prudential Investments LLC (“PI” or “Manager”). Under the current Valuation Procedures, the established Valuation Committee is responsible for supervising the valuation of portfolio securities and other assets. The Valuation Procedures permit the Portfolio to utilize independent pricing vendor services, quotations from market makers, and alternative valuation methods when market quotations are either not readily available or not deemed representative of fair value. A record of the Valuation Committee’s actions is subject to the Board’s review, approval, and ratification at its next regularly-scheduled quarterly meeting.
Various inputs determine how the Portfolio’s investments are valued, all of which are categorized according to the three broad levels (Level 1, 2, or 3) detailed in the table following the Schedule of Investments.
Common and preferred stocks, exchange-traded funds, and derivative instruments such as futures or options that are traded on a national securities exchange are valued at the last sale price as of the close of trading on the applicable exchange where the security principally trades. Securities traded via NASDAQ are valued at the NASDAQ official closing price. To the extent these securities are valued at the last sale price or NASDAQ official closing price; they are classified as Level 1 in the fair value hierarchy.
In the event that no sale or official closing price on valuation date exists, these securities are generally valued at the mean between the last reported bid and ask prices, or at the last bid price in the absence of an ask price. These securities are classified as Level 2 in the fair value hierarchy, as the inputs are observable and considered to be significant to the valuation.
Common and preferred stocks traded on foreign securities exchanges are valued using pricing vendor services that provide model prices derived using adjustment factors based on information such as local closing price, relevant general and sector indices, currency fluctuations, depositary receipts, and futures, as applicable. Securities valued using such model prices are classified as Level 2 in the fair value hierarchy, as the adjustment factors are observable and considered to be significant to the valuation. Such securities are valued using model prices to the extent that the valuation meets the established confidence level for each security. If the confidence level is not met or the vendor does not provide a model price, securities are valued in accordance with exchange-traded common and preferred stocks discussed above.
Investments in open-end, non-exchange-traded mutual funds are valued at their net asset values as of the close of the NYSE on the date of valuation. These securities are classified as Level 1 in the fair value hierarchy since they may be purchased or sold at their net asset values on the date of valuation.
Fixed income securities traded in the over-the-counter market are generally valued at prices provided by approved independent pricing vendors. The pricing vendors provide these prices after evaluating observable
B1
inputs including, but not limited to yield curves, yield spreads, credit ratings, deal terms, tranche level attributes, default rates, cash flows, prepayment speeds, broker/dealer quotations, and reported trades. Securities valued using such vendor prices are classified as Level 2 in the fair value hierarchy.
Over-the-counter derivative instruments are generally valued using pricing vendor services, which derive the valuation based on inputs such as underlying asset prices, indices, spreads, interest rates, and exchange rates. These instruments are categorized as Level 2 in the fair value hierarchy.
Centrally cleared swaps listed or traded on a multilateral or trade facility platform, such as a registered exchange, are valued at the daily settlement price determined by the respective exchange. These securities are classified as Level 2 in the fair value hierarchy, as the daily settlement price is not public.
Securities and other assets that cannot be priced according to the methods described above are valued based on pricing methodologies approved by the Board. In the event that significant unobservable inputs are used when determining such valuations, the securities will be classified as Level 3 in the fair value hierarchy.
When determining the fair value of securities, some of the factors influencing the valuation include: the nature of any restrictions on disposition of the securities; assessment of the general liquidity of the securities; the issuer’s financial condition and the markets in which it does business; the cost of the investment; the size of the holding and the capitalization of the issuer; the prices of any recent transactions or bids/offers for such securities or any comparable securities; any available analyst media or other reports or information deemed reliable by the investment adviser regarding the issuer or the markets or industry in which it operates. Using fair value to price securities may result in a value that is different from a security’s most recent closing price and from the price used by other mutual funds to calculate their net asset values.
Foreign Currency Translation: The books and records of the Portfolio are maintained in U.S. dollars. Foreign currency amounts are translated into U.S. dollars on the following basis:
(i) market value of investment securities, other assets and liabilities — at the current rates of exchange;
(ii) purchases and sales of investment securities, income and expenses — at the rates of exchange prevailing on the respective dates of such transactions.
Although the net assets of the Portfolio are presented at the foreign exchange rates and market values at the close of the period, the Portfolio does not isolate that portion of the results of operations arising as a result of changes in the foreign exchange rates from the fluctuations arising from changes in the market prices of securities held at the end of the period. Similarly, the Portfolio does not isolate the effect of changes in foreign exchange rates from the fluctuations arising from changes in the market prices of portfolio securities sold during the period. Accordingly, these realized foreign currency gains or losses are included in the reported net realized gains or losses on investment transactions.
Net realized gains or losses on foreign currency transactions represent net foreign exchange gains or losses from holdings of foreign currencies, forward currency contracts, disposition of foreign currencies, currency gains or losses realized between the trade and settlement dates on securities transactions, and the difference between the amounts of interest, dividends and foreign withholding taxes recorded on the Portfolio’s books and the U.S. dollar equivalent amounts actually received or paid. Net unrealized currency gains or losses from valuing foreign currency denominated assets and liabilities (other than investments) at period end exchange rates are reflected as a component of net unrealized appreciation (depreciation) on foreign currencies.
Concentration of Risk: The ability of debt securities issuers (other than those issued or guaranteed by the U.S. Government) held by the Portfolio to meet their obligations may be affected by the economic or political developments in a specific industry, region or country. Foreign security and currency transactions may involve certain considerations and risks not typically associated with those of domestic origin as a result of, among other factors, the possibility of political or economic instability or the level of governmental supervision and regulation of foreign securities markets.
Master Netting Arrangements: The Portfolio may be subject to various Master Agreements, or netting arrangements, with select counterparties. These are agreements which a sub-adviser may have negotiated and entered into on behalf of the Portfolio. For multi-sleeve Portfolios, different sub-advisers who manage their respective sleeve, may enter into such agreements with the same counterparty and are disclosed separately for each sleeve when presenting information about offsetting and related netting arrangements for OTC derivatives under the ASU 2013-01 disclosure. A master netting arrangement between the Portfolio and
B2
the counterparty permits the Portfolio to offset amounts payable by the Portfolio to the same counterparty against amounts to be received; and by the receipt of collateral from the counterparty by the Portfolio to cover the Portfolio’s exposure to the counterparty. However, there is no assurance that such mitigating factors are easily enforceable. The right to set-off exists when all the conditions are met such that each of the parties owes the other determinable amounts, the reporting party has the right to set-off the amount owed with the amount owed by the other party, the reporting party intends to set-off and the right of set-off is enforceable by law. During the reporting period, there were no instances where the right of set-off existed and management has not elected to offset.
Securities Lending: The Portfolio may lend its portfolio securities to banks and broker-dealers. The loans are secured by collateral at least equal to the market value of the securities loaned. Collateral pledged by each borrower is invested in a highly liquid short-term money market fund and is marked to market daily, based on the previous day’s market value, such that the value of the collateral exceeds the value of the loaned securities. Loans are subject to termination at the option of the borrower or the Portfolio. Upon termination of the loan, the borrower will return to the Portfolio securities identical to the loaned securities. Should the borrower of the securities fail financially, the Portfolio has the right to repurchase the securities in the open market using the collateral. The Portfolio recognizes income, net of any rebate and securities lending agent fees, for lending its securities in the form of fees or interest on the investment of any cash received as collateral. The Portfolio also continues to receive interest and dividends or amounts equivalent thereto, on the securities loaned and recognizes any unrealized gain or loss in the market price of the securities loaned that may occur during the term of the loan.
Securities Transactions and Net Investment Income: Securities transactions are recorded on the trade date. Realized gains or losses from investment and currency transactions are calculated on the identified cost basis. Dividend income is recorded on the ex-dividend date and interest income, including amortization of premium and accretion of discount on debt securities, is recorded on the accrual basis. Expenses are recorded on the accrual basis which may require the use of certain estimates by management, that may differ from actual.
Net investment income or loss (other than administration and distribution fees, which are charged to the respective class) and unrealized and realized gains or losses are allocated daily to each class of shares based upon the relative proportion of adjusted net assets of each class at the beginning of the day.
Taxes: For federal income tax purposes, each Portfolio in the Series Fund is treated as a separate taxpaying entity. The Portfolios are treated as partnerships for tax purposes. No provision has been made in the financial statements for U.S. Federal, state, or local taxes, as any tax liability arising from operations of the Portfolios is the responsibility of the Portfolios’ shareholders (Participating Insurance Companies). The Portfolios are not generally subject to entity-level taxation. Shareholders of each Portfolio are subject to taxes on their distributive share of partnership items.
Withholding taxes on foreign dividends, interest and capital gains have been provided for in accordance with the Portfolios’ understanding of the applicable country’s tax rules and regulations.
Distributions: Distributions from each Portfolio are made in cash and automatically reinvested in additional shares of the same Portfolio. Distributions are recorded on the ex-date.
Estimates: The preparation of the financial statements requires management to make estimates and assumptions that affect the reported amounts and disclosures in the financial statements. Actual results could differ from those estimates.
The Portfolio has a management agreement with PI. Pursuant to this agreement PI has responsibility for all investment advisory services and supervises the subadviser’s performance of such services. PI has entered into a subadvisory agreement with Jennison Associates LLC (“Jennison”) (the “Subadviser”), under which Jennison provides investment advisory services for the Portfolio. PI pays for the services of the Subadviser, cost of compensation of officers of the Portfolio, occupancy and certain clerical and administrative expenses of the Portfolio. The Portfolio bears all other costs and expenses.
The management fee paid to PI is accrued daily and payable monthly at an annual rate of .75% of the Portfolio’s average daily net assets.
B3
The Portfolio has a distribution agreement, pursuant to Rule 12b-1 under the 1940 Act, with Prudential Investment Management Services LLC (“PIMS”), which acts as the distributor of the Class I and Class II shares of the Portfolio. The Portfolio compensates PIMS for distributing and servicing the Portfolio’s Class II shares pursuant to a plan of distribution (the “Class II Plan”), regardless of expenses actually incurred by PIMS. The distribution fees are accrued daily and payable monthly. No distribution or service fees are paid to PIMS as distributor of the Class I shares of the Portfolio. Pursuant to the Class II Plan, the Class II shares of the Portfolio compensate PIMS for distribution-related activities at an annual rate of .25% of the average daily net assets of the Class II shares.
The Portfolio has an administration agreement with PI, which acts as the administrator of the Class II shares of the Portfolio. The administration fee paid to PI is accrued daily and payable monthly, at the annual rate of .15% of the average daily net assets of the Class II shares.
PIMS, PI and Jennison are indirect, wholly-owned subsidiaries of Prudential Financial, Inc. (“Prudential”).
The Portfolio has entered into a brokerage commission recapture agreement with certain registered broker-dealers. Under the brokerage commission recapture program, a portion of the commission is returned to the Portfolio on whose behalf the trades were made. Commission recapture is paid solely to those Portfolios generating the applicable trades. Such amounts are included with realized gain or loss on investment transactions presented in the Statement of Operations. For the year ended December 31, 2014, brokerage commission recaptured under these agreements was $27,961.
| Note 4: | | Other Transactions with Affiliates |
Prudential Mutual Fund Services LLC (“PMFS”), an affiliate of PI and an indirect, wholly-owned subsidiary of Prudential, serves as the Portfolio’s transfer agent. Transfer agent’s fees and expenses in the Statement of Operations include certain out-of-pocket expenses paid to non-affiliates, where applicable. Prudential Investment Management, Inc. (“PIM”), an indirect, wholly-owned subsidiary of Prudential, serves as the Portfolio’s security lending agent. For the year ended December 31, 2014, PIM was compensated $8,693 for these services by the Jennison 20/20 Focus Portfolio.
The Portfolio invests in the Prudential Core Taxable Money Market Fund (the “Core Fund”), a portfolio of the Prudential Investment Portfolios 2, registered under the 1940 Act and managed by PI. Earnings from the Core Fund are disclosed on the Statement of Operations as affiliated dividend income.
| Note 5: | | Portfolio Securities |
The aggregate cost of purchases and the proceeds from the sales of securities (excluding government securities and short-term issues) for the year ended December 31, 2014 were $232,278,407 and $254,999,041, respectively.
The Portfolio is treated as a partnership for tax purposes. The character of the cash distributions made by the partnership is generally classified as return of capital nontaxable distributions. After each fiscal year each partner will receive information regarding their distributive allocable share of the partnership’s income, gains, losses and deductions.
With respect to the Portfolio, book cost of assets differs from tax cost of assets as a result of the Portfolio’s adoption of a mark to market method of accounting for tax purposes. Under this method, tax cost of assets will approximate its fair market value.
Management has analyzed the Portfolio’s tax positions taken on federal, state and local income tax returns for all open tax years and has concluded that no provision for income tax is required in the Portfolio’s financial statements for the current reporting period. The Portfolio’s federal, state and local income tax returns for tax years for which the applicable statutes of limitations have not expired are subject to examination by the Internal Revenue Service and state departments of revenue.
The Series Fund offers Class I and Class II shares. Neither Class I nor Class II shares of a Portfolio are subject to any sales charge or redemption charge and are sold at the net asset value of the Portfolio. Class I
B4
shares are sold only to certain separate accounts of Prudential to fund benefits under certain variable life insurance and variable annuity contracts (“contracts”). Class II shares are sold only to separate accounts of non-Prudential insurance companies as investment options under certain contracts. The separate accounts invest in shares of the Series Fund through subaccounts that correspond to the Portfolios. The separate accounts will redeem shares of the Series Fund to the extent necessary to provide benefits under the contracts or for such other purposes as may be consistent with the contracts.
Transactions in shares of beneficial interest of the Jennison 20/20 Focus Portfolio were as follows:
| | | | | | | | |
Class I
| | Shares
| | | Amount
| |
Year ended December 31, 2014: | | | | |
Series shares sold | | | 132,072 | | | $ | 2,848,455 | |
Series shares repurchased | | | (422,009 | ) | | | (9,119,394 | ) |
| | |
|
|
| |
|
|
|
Net increase (decrease) in shares outstanding | | | (289,937 | ) | | $ | (6,270,939 | ) |
| | |
|
|
| |
|
|
|
Year ended December 31, 2013: | | | | |
Series shares sold | | | 145,480 | | | $ | 2,652,652 | |
Series shares repurchased | | | (533,701 | ) | | | (9,716,573 | ) |
| | |
|
|
| |
|
|
|
Net increase (decrease) in shares outstanding | | | (388,221 | ) | | $ | (7,063,921 | ) |
| | |
|
|
| |
|
|
|
| |
Class II
| | | |
Year ended December 31, 2014: | | | | |
Series shares sold | | | 1,141,073 | | | $ | 23,858,999 | |
Series shares repurchased | | | (1,955,942 | ) | | | (40,859,669 | ) |
| | |
|
|
| |
|
|
|
Net increase (decrease) in shares outstanding | | | (814,869 | ) | | $ | (17,000,670 | ) |
| | |
|
|
| |
|
|
|
Year ended December 31, 2013: | | | | |
Series shares sold | | | 954,246 | | | $ | 17,120,349 | |
Series shares repurchased | | | (2,029,408 | ) | | | (36,060,072 | ) |
| | |
|
|
| |
|
|
|
Net increase (decrease) in shares outstanding | | | (1,075,162 | ) | | $ | (18,939,723 | ) |
| | |
|
|
| |
|
|
|
The Portfolio, along with other affiliated registered investment companies (the “Funds”), is a party to a Syndicated Credit Agreement (“SCA”) with a group of banks. The purpose of the SCA is to provide an alternative source of temporary funding for capital share redemptions. The SCA provides for a commitment of $900 million for the period October 9, 2014 through October 8, 2015. The Funds pay an annualized commitment fee of .075% of the unused portion of the SCA. Prior to October 9, 2014, the Funds had another SCA that provided a commitment of $900 million and the Funds paid an annualized commitment fee of .08% of the unused portion of the SCA. Interest on any borrowings under the SCA is paid at contracted market rates. The commitment fee for the unused amount is accrued daily and paid quarterly.
The Portfolio did not utilize the SCA during the year ended December 31, 2014.
| Note 9: | | Ownership and Affiliates |
As of December 31, 2014, all of Class I shares of record of the Portfolio were owned by the Prudential Insurance Company of America (“PICA”), or subsidiaries thereof, on behalf of the owners of the variable insurance products issued by PICA. PICA is an indirect, wholly-owned subsidiary of Prudential.
B5
Financial Highlights
| | | | | | | | | | | | | | | | | | | | |
| | | Jennison 20/20 Focus Portfolio
| |
| | | Class I
| |
| | | Year Ended December 31,
| |
| | | 2014(c)
| | | 2013(c)
| | | 2012(c)
| | | 2011(c)
| | | 2010(c)
| |
Per Share Operating Performance: | | | | | | | | | | | | | | | | | | | | |
Net Asset Value, beginning of year | | $ | 20.69 | | | $ | 15.93 | | | $ | 14.89 | | | $ | 15.55 | | | $ | 14.42 | |
| | |
|
|
| |
|
|
| |
|
|
| |
|
|
| |
|
|
|
Income (Loss) From Investment Operations: | | | | | | | | | | | | | | | | | | | | |
Net investment income | | | .02 | | | | .09 | | | | .05 | | | | .04 | | | | .05 | |
Net realized and unrealized gain (loss) on investments | | | 1.45 | | | | 4.67 | | | | 1.55 | | | | (.69 | ) | | | 1.08 | |
| | |
|
|
| |
|
|
| |
|
|
| |
|
|
| |
|
|
|
Total from investment operations | | | 1.47 | | | | 4.76 | | | | 1.60 | | | | (.65 | ) | | | 1.13 | |
| | |
|
|
| |
|
|
| |
|
|
| |
|
|
| |
|
|
|
Less Distributions | | | — | | | | — | | | | (.56 | ) | | | (.01 | ) | | | — | |
| | |
|
|
| |
|
|
| |
|
|
| |
|
|
| |
|
|
|
Net Asset Value, end of year | | $ | 22.16 | | | $ | 20.69 | | | $ | 15.93 | | | $ | 14.89 | | | $ | 15.55 | |
| | |
|
|
| |
|
|
| |
|
|
| |
|
|
| |
|
|
|
Total Return(a) | | | 7.10 | % | | | 29.88 | % | | | 11.04 | % | | | (4.17 | )% | | | 7.84 | % |
Ratios/Supplemental Data: | | | | | | | | | | | | | | | | | | | | |
Net assets, end of year (in millions) | | $ | 67.2 | | | $ | 68.7 | | | $ | 59.1 | | | $ | 58.7 | | | $ | 66.8 | |
Ratios to average net assets(b): | | | | | | | | | | | | | | | | | | | | |
Expenses after waivers and/or expense reimbursement | | | .83 | % | | | .84 | % | | | .80 | % | | | .80 | % | | | .80 | % |
Expenses before waivers and/or expense reimbursement | | | .83 | % | | | .84 | % | | | .80 | % | | | .80 | % | | | .80 | % |
Net investment income | | | .08 | % | | | .46 | % | | | .32 | % | | | .24 | % | | | .36 | % |
Portfolio turnover rate | | | 97 | % | | | 78 | % | | | 75 | % | | | 83 | % | | | 112 | % |
| |
| | | Jennison 20/20 Focus Portfolio
| |
| | | Class II
| |
| | | Year Ended December 31,
| |
| | | 2014(c)
| | | 2013(c)
| | | 2012(c)
| | | 2011(c)
| | | 2010(c)
| |
Per Share Operating Performance: | | | | | | | | | | | | | | | | | | | | |
Net Asset Value, beginning of year | | $ | 20.14 | | | $ | 15.57 | | | $ | 14.62 | | | $ | 15.31 | | | $ | 14.25 | |
| | |
|
|
| |
|
|
| |
|
|
| |
|
|
| |
|
|
|
Income (Loss) From Investment Operations: | | | | | | | | | | | | | | | | | | | | |
Net investment income (loss) | | | (.07 | ) | | | .01 | | | | (.03 | ) | | | (.03 | ) | | | (.01 | ) |
Net realized and unrealized gain (loss) on investments | | | 1.42 | | | | 4.56 | | | | 1.54 | | | | (.66 | ) | | | 1.07 | |
| | |
|
|
| |
|
|
| |
|
|
| |
|
|
| |
|
|
|
Total from investment operations | | | 1.35 | | | | 4.57 | | | | 1.51 | | | | (.69 | ) | | | 1.06 | |
| | |
|
|
| |
|
|
| |
|
|
| |
|
|
| |
|
|
|
Less Distributions | | | — | | | | — | | | | (.56 | ) | | | — | | | | — | |
| | |
|
|
| |
|
|
| |
|
|
| |
|
|
| |
|
|
|
Net Asset Value, end of year | | $ | 21.49 | | | $ | 20.14 | | | $ | 15.57 | | | $ | 14.62 | | | $ | 15.31 | |
| | |
|
|
| |
|
|
| |
|
|
| |
|
|
| |
|
|
|
Total Return(a) | | | 6.70 | % | | | 29.35 | % | | | 10.62 | % | | | (4.51 | )% | | | 7.44 | % |
Ratios/Supplemental Data: | | | | | | | | | | | | | | | | | | | | |
Net assets, end of year (in millions) | | $ | 172.9 | | | $ | 178.5 | | | $ | 154.8 | | | $ | 383.0 | | | $ | 476.2 | |
Ratios to average net assets(b): | | | | | | | | | | | | | | | | | | | | |
Expenses after waivers and/or expense reimbursement | | | 1.23 | % | | | 1.24 | % | | | 1.20 | % | | | 1.20 | % | | | 1.20 | % |
Expenses before waivers and/or expense reimbursement | | | 1.23 | % | | | 1.24 | % | | | 1.20 | % | | | 1.20 | % | | | 1.20 | % |
Net investment income (loss) | | | (.33 | )% | | | .07 | % | | | (.18 | )% | | | (.16 | )% | | | (.05 | )% |
Portfolio turnover rate | | | 97 | % | | | 78 | % | | | 75 | % | | | 83 | % | | | 112 | % |
| (a) | Total return is calculated assuming a purchase of a share on the first day and a sale on the last day of each year reported and includes reinvestment of distributions and does not reflect the effect of insurance contract charges. Total return does not reflect expenses associated with the separate account such as administrative fees, account charges and surrender charges which, if reflected, would reduce the total returns for all years shown. Performance figures may reflect fee waivers and/or expense reimbursements. In the absence of fee waivers and/or expense reimbursements, the total return would be lower. Past performance is no guarantee of future results. Total returns may reflect adjustments to conform to generally accepted accounting principles. |
| (b) | Does not include expenses of the underlying portfolios in which the Portfolio invests. |
| (c) | Calculated based upon average shares outstanding during the year. |
SEE NOTES TO FINANCIAL STATEMENTS.
C1
REPORT OF INDEPENDENT REGISTERED PUBLIC ACCOUNTING FIRM
THE BOARD OF TRUSTEES AND SHAREHOLDERS
THE PRUDENTIAL SERIES FUND:
We have audited the accompanying statement of assets and liabilities of Jennison 20/20 Focus Portfolio (hereafter referred to as the “Portfolio”), a portfolio of The Prudential Series Fund, including the schedule of investments, as of December 31, 2014, and the related statement of operations for the year then ended, the statements of changes in net assets for each of the years in the two-year period then ended, and the financial highlights for each of the years in the five-year period then ended. These financial statements and financial highlights are the responsibility of the Portfolio’s management. Our responsibility is to express an opinion on these financial statements and financial highlights based on our audits.
We conducted our audits in accordance with the standards of the Public Company Accounting Oversight Board (United States). Those standards require that we plan and perform the audit to obtain reasonable assurance about whether the financial statements and financial highlights are free of material misstatement. An audit includes examining, on a test basis, evidence supporting the amounts and disclosures in the financial statements. Our procedures included confirmation of securities owned as of December 31, 2014, by correspondence with the custodian, transfer agent and brokers or by other appropriate auditing procedures when replies from brokers were not received. An audit also includes assessing the accounting principles used and significant estimates made by management, as well as evaluating the overall financial statement presentation. We believe that our audits provide a reasonable basis for our opinion.
In our opinion, the financial statements and financial highlights referred to above present fairly, in all material respects, the financial position of the Portfolio as of December 31, 2014, and the results of its operations, the changes in its net assets and the financial highlights for the periods described in the first paragraph above, in conformity with U.S. generally accepted accounting principles.

New York, New York
February 12, 2015
D1
INFORMATION ABOUT TRUSTEES AND OFFICERS (Unaudited)
Information about the Trustees and the Officers of the Fund is set forth below. Trustees who are not deemed to be “interested persons” of the Fund, as defined in the Investment Company Act of 1940, are referred to as “Independent Trustees.” Trustees who are deemed to be “interested persons” of the Fund are referred to as “Interested Trustees.” The Trustees are responsible for the overall supervision of the operations of the Fund and perform the various duties imposed on the directors of investment companies by the Investment Company Act of 1940.
| | | | |
| Independent Trustees | | | | |
Name, Age
Number of Portfolios in Fund Complex†
Overseen by Trustee | | Principal Occupation(s) During Past Five Years | | Other Directorships Held by Trustee** |
Susan Davenport Austin* (47) Trustee Since 2011 No. of Portfolios Overseen: 111 | | Senior Managing Director of Brock Capital (Since 2014); Vice Chairman (Since 2013), Senior Vice President and Chief Financial Officer (2007-2012) and Vice President of Strategic Planning and Treasurer (2002-2007) of Sheridan Broadcasting Corporation; Formerly President of Sheridan Gospel Network (2004-2014); Vice President, Goldman, Sachs & Co. (2000-2001); Associate Director, Bear, Stearns & Co. Inc. (1997-2000); Vice President, Salomon Brothers Inc. (1993-1997); President of the Board, The MacDowell Colony (Since 2010); Presiding Director (Since 2014) and Chairman (2011-2014) of the Board of Directors, Broadcast Music, Inc.; Member of the Board of Directors, Hubbard Radio, LLC (Since 2011); President, Candide Business Advisors, Inc. (Since 2011); formerly Member of the Board of Directors, National Association of Broadcasters (2004-2010). | | None. |
Sherry S. Barrat* (65) Trustee Since 2013 No. of Portfolios Overseen: 111 | | Formerly, Vice Chairman of Northern Trust Corporation (financial services and banking institution) (2011-June 2012); formerly, President, Personal Financial Services, Northern Trust Corporation (2006-2010); formerly, Chairman & CEO, Western US Region, Northern Trust Corporation (1999-2005); formerly, President & CEO, Palm Beach/Martin County Region, Northern Trust. | | Director of NextEra Energy, Inc. (formerly, FPL Group, Inc.) (1998-Present); Director of Arthur J. Gallagher & Company (Since July 2013). |
Kay Ryan Booth* (64) Trustee Since 2013 No. of Portfolios Overseen: 111 | | Partner of Trinity Private Equity Group (Since September 2014); formerly, Managing Director of Cappello Waterfield & Co. LLC (2011-May 2014); formerly, Vice Chair, Global Research, J.P. Morgan (financial services and investment banking institution) (June 2008-January 2009); formerly, Global Director of Equity Research, Bear Stearns & Co., Inc. (financial services and investment banking institution) (1995-2008); formerly, Associate Director of Equity Research, Bear Stearns & Co., Inc. (1987-1995). | | None. |
Delayne Dedrick Gold* (76) Trustee Since 2001 No. of Portfolios Overseen: 111 | | Marketing Consultant (1982-present); formerly Senior Vice President and Member of the Board of Directors, Prudential Bache Securities, Inc. | | None. |
Robert F. Gunia* (68) Trustee Since 2001 No. of Portfolios Overseen: 111 | | Independent Consultant (Since October 2009); formerly Chief Administrative Officer (September 1999-September 2009) and Executive Vice President (December 1996-September 2009) of Prudential Investments LLC; formerly Executive Vice President (March 1999-September 2009) and Treasurer (May 2000-September 2009) of Prudential Mutual Fund Services LLC; formerly President (April 1999-December 2008) and Executive Vice President and Chief Operating Officer (December 2008-December 2009) of Prudential Investment Management Services LLC; formerly Chief Administrative Officer, Executive Vice President and Director (May 2003-September 2009) of AST Investment Services, Inc. | | Director (Since May 1989) of The Asia-Pacific Fund, Inc. |
W. Scott McDonald, Jr., PhD* (77) Trustee Since 1983 No. of Portfolios Overseen: 111 | | Formerly Management Consultant (1997-2004) and of Counsel (2004-2005) at Kaludis Consulting Group, Inc. (company serving higher education); formerly principal (1995-1997), Scott McDonald Associates; Chief Operating Officer (1991-1995), Fairleigh Dickinson University; Executive Vice President and Chief Operating Officer (1975-1991), Drew University; interim President (1988-1990), Drew University; formerly Director of School, College and University Underwriters Ltd. | | None. |
E1
| | | | |
| Independent Trustees | | | | |
Name, Age
Number of Portfolios in Fund Complex†
Overseen by Trustee | | Principal Occupation(s) During Past Five Years | | Other Directorships Held by Trustee** |
Thomas T. Mooney* (73) Trustee Since 2001 No. of Portfolios Overseen: 111 | | Formerly Chief Executive Officer, Excell Partners, Inc. (2005-2007); founding partner of High Technology of Rochester and the Lennox Technology Center; formerly President of the Greater Rochester Metro Chamber of Commerce (1976-2004) formerly Rochester City Manager (1973); formerly Deputy Monroe County Executive (1974-1976). | | None. |
Thomas M. O’Brien* (64) Trustee Since 2003 No. of Portfolios Overseen: 111 | | Director, Sun Bancorp, Inc. (NASDAQ: SNBC) and Sun National Bank (Since July 2014); Consultant, Valley National Bancorp, Inc. and Valley National Bank (January 2012-June 2012); Formerly President and COO (November 2006-December 2011) and CEO (April 2007-December 2011) of State Bancorp, Inc. and State Bank; formerly Vice Chairman (January 1997-April 2000) of North Fork Bank; formerly President and Chief Executive Officer (December 1984-December 1996) of North Side Savings Bank; formerly President and Chief Executive Officer (May 2000-June 2006) Atlantic Bank of New York. | | Formerly Director, BankUnited, Inc. and BankUnited N.A. (NYSE: BKU) (May 2012-April 2014); formerly Director (April 2008-January 2012) of Federal Home Loan Bank of New York; formerly Director (December 1996-May 2000) of North Fork Bancorporation, Inc.; formerly Director (May 2000-April 2006) of Atlantic Bank of New York; Director (November 2006-January 2012) of State Bancorp, Inc. (NASDAQ: STBC) and State Bank of Long Island. |
| | | | |
| Interested Trustees | | | | |
Name, Age
Number of Portfolios in Fund Complex†
Overseen by Trustee | | Principal Occupation(s) During Past Five Years | | Other Directorships Held by Trustee** |
Robert F. O’Donnell* (46) Trustee & President Since 2012 No. of Portfolios Overseen: 111 | | President of Prudential Annuities (Since April 2012); Senior Vice President, Head of Product, Investment Management & Marketing for Prudential Annuities (October 2008-April 2012); Senior Vice President, Head of Product (July 2004-October 2008). | | None. |
Timothy S. Cronin* (49) Trustee Since 2011 No. of Portfolios Overseen: 111 | | Chief Investment Officer and Strategist of Prudential Annuities (Since January 2004); Director of Investment & Research Strategy (Since February 1998); President of AST Investment Services, Inc. (Since June 2005). | | None. |
Bruce W. Ferris* (59) Trustee Since 2013 No. of Portfolios Overseen: 111 | | Senior Vice President, Sales and Distribution, Product, Marketing, Prudential Annuities (Since May 2006); Vice President-Sales, The Hartford Insurance Company (October 1994-April 2005); Sales Manager, Aetna Investment Services (October 1993-September 1994). | | None. |
* The address of each Trustee is c/o Prudential Investments LLC, Gateway Center Three, 100 Mulberry Street, Newark, New Jersey 07102.
** Includes only directorships of companies required to register or file reports with the Securities and Exchange Commission (SEC) under the Securities Exchange Act of 1934 (that is, “public companies”) or other investment companies registered under the Investment Company Act of 1940.
† The Fund Complex consists of all investment companies managed by PI. The Funds for which PI serves as manager include the Prudential Investments Mutual Funds, Target Mutual Funds, The Prudential Variable Contract Accounts 2, 10 and 11, Prudential Short Duration High Yield Fund, Inc., Prudential Global Short Duration High Yield Fund, Inc., The Prudential Series Fund, Advanced Series Trust, and Prudential’s Gibraltar Fund, Inc.
| | |
| Fund Officers(1) | | |
Name, Age
Position with the Fund | | Principal Occupation(s) During the Past Five Years |
Raymond A. O’Hara* (59) Chief Legal Officer Since 2012 | | Vice President and Corporate Counsel (since July 2010) of Prudential Insurance Company of America (Prudential); Vice President (March 2011-Present) of Pruco Life Insurance Company and Pruco Life Insurance Company of New Jersey; Vice President and Corporate Counsel (March 2011-Present) of Prudential Annuities Life Assurance Corporation; Chief Legal Officer of Prudential Investments LLC (since June 2012); Chief Legal Officer of Prudential Mutual Fund Services LLC (since June 2012) and Corporate Counsel of AST Investment Services, Inc. (since June 2012); formerly Assistant Vice President and Corporate Counsel (September 2008-July 2010) of The Hartford Financial Services Group, Inc.; formerly Associate (September 1980-December 1987) and Partner (January 1988-August 2008) of Blazzard & Hasenauer, P.C. (formerly, Blazzard, Grodd & Hasenauer, P.C.). |
Chad A. Earnst* (39) Chief Compliance Officer Since 2014 | | Chief Compliance Officer (September 2014-Present) of Prudential Investments LLC; Chief Compliance Officer (September 2014-Present) of the Prudential Investments Funds, Target Funds, Advanced Series Trust, The Prudential Series Fund, Prudential’s Gibraltar Fund, Inc., Prudential Global Short Duration High Yield Income Fund, Inc., Prudential Short Duration High Yield Fund, Inc. and Prudential Jennison MLP Income Fund, Inc.; formerly Assistant Director (March 2010-August 2014) of the Asset Management Unit, Division of Enforcement, U.S. Securities & Exchange Commission; Assistant Regional Director (January 2010-August 2014), Branch Chief (June 2006-December 2009) and Senior Counsel (April 2003-May 2006) of the Miami Regional Office, Division of Enforcement, U.S. Securities & Exchange Commission. |
E2
| | |
| Fund Officers(1) | | |
Name, Age
Position with the Fund | | Principal Occupation(s) During the Past Five Years |
Bradley C. Tobin* (40) Vice President Since 2014 | | Vice President of Prudential Annuities (since March 2012), Vice President of AST Investment Services, Inc. (since April 2011). |
Deborah A. Docs* (56) Secretary Since 2005 | | Vice President and Corporate Counsel (since January 2001) of Prudential; Vice President (since December 1996) and Assistant Secretary (since March 1999) of Prudential Investments LLC; formerly Vice President and Assistant Secretary (May 2003-June 2005) of AST Investment Services, Inc. |
Jonathan D. Shain* (56) Assistant Secretary Since 2005 | | Vice President and Corporate Counsel (since August 1998) of Prudential; Vice President and Assistant Secretary (since May 2001) of Prudential Investments LLC; Vice President and Assistant Secretary (since February 2001) of Prudential Mutual Fund Services LLC; formerly Vice President and Assistant Secretary (May 2003-June 2005) of AST Investment Services, Inc. |
Claudia DiGiacomo* (40) Assistant Secretary Since 2005 | | Vice President and Corporate Counsel (since January 2005) of Prudential; Vice President and Assistant Secretary of Prudential Investments LLC (since December 2005); Associate at Sidley Austin Brown & Wood LLP (1999-2004). |
Andrew R. French* (52) Assistant Secretary Since 2006 | | Vice President and Corporate Counsel (since February 2010) of Prudential; formerly Director and Corporate Counsel (2006-2010) of Prudential; Vice President and Assistant Secretary (since January 2007) of Prudential Investments LLC; Vice President and Assistant Secretary (since January 2007) of Prudential Mutual Fund Services LLC. |
Amanda S. Ryan (36) Assistant Secretary Since 2012 | | Director and Corporate Counsel (since March 2012) of Prudential; Director and Assistant Secretary (since June 2012) of Prudential Investments LLC; Associate at Ropes & Gray LLP (2008-2012). |
Kathleen DeNicholas* (40) Assistant Secretary Since 2013 | | Vice President and Corporate Counsel (since May 2013) of Prudential; Managing Counsel at The Bank of New York Mellon Corporation (2011-2013); formerly Senior Counsel (2007-2011) and Assistant General Counsel (2001-2007) of The Dreyfus Corporation; Chief Legal Officer and Secretary of MBSC Securities Corporation (2011-2013); Vice President and Assistant Secretary of The Dreyfus Family of Funds (2010-2012). |
M. Sadiq Peshimam* (50) Treasurer and Principal Financial & Accounting Officer Since 2014 | | Assistant Treasurer of funds in the Prudential Mutual Fund Complex (2006-2014); Vice President (since 2005) of Prudential Investments LLC. |
Peter Parrella* (56) Assistant Treasurer Since 2007 | | Vice President (since 2007) and Director (2004-2007) within Prudential Mutual Fund Administration; formerly Tax Manager at SSB Citi Fund Management LLC (1997-2004). |
Lana Lomuti* (47) Assistant Treasurer Since 2014 | | Vice President (since 2007) and Director (2005-2007), within Prudential Mutual Fund Administration; formerly Assistant Treasurer (December 2007-February 2014) of The Greater China Fund, Inc. |
Linda McMullin* (53) Assistant Treasurer Since 2014 | | Vice President (since 2011) and Director (2008-2011) within Prudential Mutual Fund Administration. |
Alan Fu* (58) Assistant Treasurer Since 2006 | | Vice President and Corporate Counsel – Tax, Prudential Financial, Inc. (since October 2003). |
Theresa C. Thompson* (52) Deputy Chief Compliance Officer Since 2008 | | Vice President, Compliance, Prudential Investments LLC (since April 2004); and Director, Compliance, Prudential Investments LLC (2001-2004). |
Richard W. Kinville* (46) Anti-Money Laundering Compliance Officer Since 2011 | | Vice President, Corporate Compliance, Anti-Money Laundering Unit (since January 2005) of Prudential; committee member of the American Council of Life Insurers Anti-Money Laundering and Critical Infrastructure Committee (since January 2007); formerly Investigator and Supervisor in the Special Investigations Unit for the New York Central Mutual Fire Insurance Company (August 1994-January 1999); Investigator in AXA Financial’s Internal Audit Department and Manager in AXA’s Anti-Money Laundering Office (January 1999-January 2005); first chair of the American Council of Life Insurers Anti-Money Laundering and Critical Infrastructure Committee (June 2007-December 2009). |
* The address for each officer is c/o Prudential Investments LLC, 100 Mulberry Street, Gateway Center Three, Newark, New Jersey 07102.
(1) Excludes Messrs. O’Donnell and Cronin, interested Trustees who serve as President and Vice President, respectively. Biographical and other information with respect to Messrs. O’Donnell and Cronin appears under “Interested Trustees,” above.
E3
This report must be preceded or accompanied by the current prospectuses for the Prudential Series Fund portfolios and the applicable variable annuity or variable life contract. The prospectuses contain information on the contract and the investment objectives, risks, charges and expenses of the portfolios, and should be read carefully.
A description of the Fund’s proxy voting policies and procedures is available, without charge, upon request by calling the appropriate phone number listed below. Information regarding how the Fund voted proxies relating to portfolio securities during the most recent 12-month period ended June 30 is available on the website of the Securities and Exchange Commission (the Commission) at www.sec.gov and on the Fund’s website at www.prudential.com/variableinsuranceportfolios.
The Fund files with the Commission a complete listing of portfolio holdings as of its first and third quarter-end on Form N-Q. Form N-Q is available on the Commission’s website at www.sec.gov or by visiting the Commission’s Public Reference Room. For more information on the Commission’s Public Reference Room, please visit the Commission’s website or call (800)SEC-0330. Form N-Q is also available on the Fund’s website or by calling the telephone number referenced below.
The Fund’s Statement of Additional Information contains additional information about the Fund’s Trustees and is available without charge upon request by calling the appropriate phone number listed below.
This report may include financial information pertaining to certain portfolios that are not available through the variable annuity contract or the variable life insurance policy that you have chosen. Please refer to your variable product prospectus to determine which portfolios are available to you.
To contact your client services representative, please call the phone number listed below. Thank you.
Owners of Individual Annuity contracts should call (888) 778-2888.
Owners of Individual Life Insurance contracts should call (800) 778-2255.
Owners of Group Variable Universal Life Insurance contracts should call (800) 562-9874.
Owners of Group Variable Universal Life Insurance contracts through AICPA should call (800) 223-7473.
The Prudential Series Fund is distributed by Prudential Investment Management Services LLC (PIMS), Three Gateway Center, 14th Floor, Newark, NJ 07102-4077, member SIPC, a Prudential Financial company and solely responsible for its own financial condition and contractual obligations.
Annuity and life insurance contracts contain exclusions, limitations, reductions of benefits, and terms for keeping them in force. Your licensed financial professional can provide you with costs and complete details. Contract guarantees are based on the claims-paying ability of the issuing company.
| | | | |

The Prudential Insurance Company of America 751 Broad Street Newark, NJ 07102-3777 | | | | Presorted Standard U.S. Postage PAID Prudential |
| | | | |
| | | | |
| | | | |
The Audited Financial Statements of Pruco Life Insurance Company, Pruco Life Insurance Company of New Jersey, and The Prudential Insurance Company of America are available upon request. You may call (800)778-2255 to obtain a free copy of the audited financial statements of the insurance company that issued your contract.
To reduce costs, we now generally send only a single copy of prospectuses and shareholder reports to each household (householding) in lieu of sending a copy to each Contract Owner who resides in the household. You should be aware that by calling (877)778-5008, you can revoke, or “opt out,” of householding at any time.
©2015 Prudential Financial, Inc. and its related entities. Prudential Investments, Prudential, the Prudential logo, the Rock symbol, and Bring Your Challenges are service marks of Prudential Financial, Inc. and its related entities, registered in many jurisdictions worldwide.
0239275-00003-00 PSF-AR-20/20 Focus
Item 2 — Code of Ethics — See Exhibit (a)
As of the end of the period covered by this report, the registrant has adopted a code of ethics (the “Section 406 Standards for Investment Companies – Ethical Standards for Principal Executive and Financial Officers”) that applies to the registrant’s Principal Executive Officer and Principal Financial Officer; the registrant’s Principal Financial Officer also serves as the Principal Accounting Officer.
The registrant hereby undertakes to provide any person, without charge, upon request, a copy of the code of ethics. To request a copy of the code of ethics, contact the registrant 973-367-7521, and ask for a copy of the Section 406 Standards for Investment Companies — Ethical Standards for Principal Executive and Financial Officers.
Item 3 — Audit Committee Financial Expert —
The registrant’s Board has determined that Mr. Thomas M. O’Brien, member of the Board’s Audit Committee is an “audit committee financial expert,” and that he is “independent,” for purposes of this Item.
Item 4 — Principal Accountant Fees and Services —
(a) Audit Fees
For the fiscal years ended December 31, 2014 and December 31, 2013, KPMG LLP (“KPMG”), the Registrant’s principal accountant, billed the Registrant $558,800 and $475,500, respectively, for professional services rendered for the audit of the Registrant’s annual financial statements or services that are normally provided in connection with statutory and regulatory filings.
(b) Audit-Related Fees
None.
(c) Tax Fees
None.
(d) All Other Fees
None.
(e) (1) Audit Committee Pre-Approval Policies and Procedures
THE PRUDENTIAL MUTUAL FUNDS
AUDIT COMMITTEE POLICY
on
Pre-Approval of Services Provided by the Independent Accountants
The Audit Committee of each Prudential Mutual Fund is charged with the responsibility to monitor the independence of the Fund’s independent accountants. As part of this responsibility, the Audit Committee must pre-approve any independent accounting firm’s engagement to render audit and/or permissible non-audit services, as required by law. In evaluating a proposed engagement of the independent accountants, the Audit Committee will assess the effect that the engagement might reasonably be expected to have on the accountant’s independence. The Committee’s evaluation will be based on:
| | • | | a review of the nature of the professional services expected to be provided, |
| | • | | a review of the safeguards put into place by the accounting firm to safeguard independence, and |
| | • | | periodic meetings with the accounting firm. |
Policy for Audit and Non-Audit Services Provided to the Funds
On an annual basis, the scope of audits for each Fund, audit fees and expenses, and audit-related and non-audit services (and fees proposed in respect thereof) proposed to be performed by the Fund’s independent accountants will be presented by the Treasurer and the independent accountants to the Audit Committee for review and, as appropriate, approval prior to the initiation of such services. Such presentation shall be accompanied by confirmation by both the Treasurer and the independent accountants that the proposed services will not adversely affect the independence of the independent accountants. Proposed services shall be described in sufficient detail to enable the Audit Committee to assess the appropriateness of such services and fees, and the compatibility of the provision of such services with the auditor’s independence. The Committee shall receive periodic reports on the progress of the audit and other services which are approved by the Committee or by the Committee Chair pursuant to authority delegated in this Policy.
The categories of services enumerated under “Audit Services”, “Audit-related Services”, and “Tax Services” are intended to provide guidance to the Treasurer and the independent accountants as to those categories of services which the Committee believes are generally consistent with the independence of the independent accountants and which the Committee (or the Committee Chair) would expect upon the presentation of specific proposals to pre-approve. The enumerated categories are not intended as an exclusive list of audit, audit-related or tax services, which the Committee (or the Committee Chair) would consider for pre-approval.
Audit Services
The following categories of audit services are considered to be consistent with the role of the Fund’s independent accountants:
| | Ø | | Annual Fund financial statement audits |
| | Ø | | Seed audits (related to new product filings, as required) |
| | Ø | | SEC and regulatory filings and consents |
Audit-related Services
The following categories of audit-related services are considered to be consistent with the role of the Fund’s independent accountants:
| | Ø | | Accounting consultations |
| | Ø | | Fund merger support services |
| | Ø | | Agreed Upon Procedure Reports |
| | Ø | | Other Internal Control Reports |
Individual audit-related services that fall within one of these categories and are not presented to the Audit Committee as part of the annual pre-approval process will be subject to pre-approval by the Committee Chair (or any other Committee member on whom this responsibility has been delegated) so long as the estimated fee for those services does not exceed $50,000.
Tax Services
The following categories of tax services are considered to be consistent with the role of the Fund’s independent accountants:
| | Ø | | Tax compliance services related to the filing or amendment of the following: |
| | ¡ | | Federal, state and local income tax compliance; and, |
| | ¡ | | Sales and use tax compliance |
| | Ø | | Timely RIC qualification reviews |
| | Ø | | Tax distribution analysis and planning |
| | Ø | | Tax authority examination services |
| | Ø | | Tax appeals support services |
| | Ø | | Accounting methods studies |
| | Ø | | Fund merger support services |
| | Ø | | Tax consulting services and related projects |
Individual tax services that fall within one of these categories and are not presented to the Audit Committee as part of the annual pre-approval process will be subject to pre-approval by the Committee Chair (or any other Committee member on whom this responsibility has been delegated) so long as the estimated fee for those services does not exceed $50,000.
Other Non-audit Services
Certain non-audit services that the independent accountants are legally permitted to render will be subject to pre-approval by the Committee or by one or more Committee members to whom the Committee has delegated this authority and who will report to the full Committee any pre-approval decisions made pursuant to this Policy. Non-audit services presented for pre-approval pursuant to this paragraph will be accompanied by a confirmation from both the Treasurer and the independent accountants that the proposed services will not adversely affect the independence of the independent accountants.
Proscribed Services
The Fund’s independent accountants will not render services in the following categories of non-audit services:
| | Ø | | Bookkeeping or other services related to the accounting records or financial statements of the Fund |
| | Ø | | Financial information systems design and implementation |
| | Ø | | Appraisal or valuation services, fairness opinions, or contribution-in-kind reports |
| | Ø | | Internal audit outsourcing services |
| | Ø | | Management functions or human resources |
| | Ø | | Broker or dealer, investment adviser, or investment banking services |
| | Ø | | Legal services and expert services unrelated to the audit |
| | Ø | | Any other service that the Public Company Accounting Oversight Board determines, by regulation, is impermissible. |
Pre-approval of Non-Audit Services Provided to Other Entities Within the Prudential Fund Complex
Certain non-audit services provided to Prudential Investments LLC or any of its affiliates that also provide ongoing services to the Prudential Mutual Funds will be subject to pre-approval by the Audit Committee. The only non-audit services provided to these entities that will require pre-approval are those related directly to the operations and financial reporting of the Funds. Individual projects that are not presented to the Audit Committee as part of the annual pre-approval process will be subject to pre-approval by the Committee Chair (or any other Committee member on whom this responsibility has been delegated) so long as the estimated fee for those services does not exceed $50,000. Services presented for pre-approval pursuant to this paragraph will be accompanied by a confirmation from both the Treasurer and the independent accountants that the proposed services will not adversely affect the independence of the independent accountants.
Although the Audit Committee will not pre-approve all services provided to Prudential Investments LLC and its affiliates, the Committee will receive an annual report from the Fund’s independent accounting firm showing the aggregate fees for all services provided to Prudential Investments and its affiliates.
| (e) | (2) Percentage of services referred to in 4(b) – 4(d) that were approved by the audit committee — |
Not applicable.
| (f) | Percentage of hours expended attributable to work performed by other than full time employees of principal accountant if greater than 50%. |
The percentage of hours expended on the principal accountant’s engagement to audit the registrant’s financial statements for the most recent fiscal year that were attributed to work performed by persons other than the principal accountant’s full-time, permanent employees was 0%.
(g) Non-Audit Fees
Not applicable to Registrant for the fiscal years 2014 and 2013. The aggregate non-audit fees billed by KPMG for services rendered to the registrant’s investment adviser and any entity controlling, controlled by, or under common control with the investment adviser that provides ongoing services to the registrant for the fiscal years 2014 and 2013 was $0 and $0, respectively.
(h) Principal Accountant’s Independence
Not applicable as KPMG has not provided non-audit services to the registrant’s investment adviser and any entity controlling, controlled by, or under common control with the investment adviser that provides ongoing services to the registrant that were not pre-approved pursuant to Rule 2-01(c)(7)(ii) of Regulation S-X.
| | | | |
| Item 5 | | — | | Audit Committee of Listed Registrants — Not applicable. |
| | |
| Item 6 | | — | | Schedule of Investments — The schedule is included as part of the report to shareholders filed under Item 1 of this Form. |
| | |
| Item 7 | | — | | Disclosure of Proxy Voting Policies and Procedures for Closed-End Management Investment Companies — Not applicable. |
| | |
| Item 8 | | — | | Portfolio Managers of Closed-End Management Investment Companies — Not applicable. |
| | |
| Item 9 | | — | | Purchases of Equity Securities by Closed-End Management Investment Company and Affiliated Purchasers — Not applicable. |
| | |
| Item 10 | | — | | Submission of Matters to a Vote of Security Holders — Not applicable. |
| | |
| Item 11 | | — | | Controls and Procedures |
| | (a) | It is the conclusion of the registrant’s principal executive officer and principal financial officer that the effectiveness of the registrant’s current disclosure controls and procedures (such disclosure controls and procedures having been evaluated within 90 days of the date of this filing) provide reasonable assurance that the information required to be disclosed by the registrant has been recorded, processed, summarized and reported within the time period specified in the Commission’s rules and forms and that the information required to be disclosed by the registrant has been accumulated and communicated to the registrant’s principal executive officer and principal financial officer in order to allow timely decisions regarding required disclosure. |
| | (b) | There has been no significant change in the registrant’s internal control over financial reporting that occurred during the registrant’s most recent fiscal quarter of the period covered by this report that has materially affected, or is likely to materially affect, the registrant’s internal control over financial reporting. |
Item 12 — Exhibits
| | (a) | (1) Code of Ethics — Attached hereto as Exhibit EX-99.CODE-ETH |
(2) Certifications pursuant to Section 302 of the Sarbanes-Oxley Act — Attached hereto as Exhibit EX-99.CERT.
(3) Any written solicitation to purchase securities under Rule 23c-1. — Not applicable.
| | (b) | Certifications pursuant to Section 906 of the Sarbanes-Oxley Act — Attached hereto as Exhibit EX-99.906CERT. |
SIGNATURES
Pursuant to the requirements of the Securities Exchange Act of 1934 and the Investment Company Act of 1940, the registrant has duly caused this report to be signed on its behalf by the undersigned, thereunto duly authorized.
| | |
Registrant: | | The Prudential Series Fund |
| |
| By: | | /s/Deborah A. Docs |
| | Deborah A. Docs Secretary |
| |
Date: | | February 17, 2015 |
Pursuant to the requirements of the Securities Exchange Act of 1934 and the Investment Company Act of 1940, this report has been signed below by the following persons on behalf of the registrant and in the capacities and on the dates indicated.
| | |
By: | | /s/Robert F. O’Donnell |
| | Robert F. O’Donnell President and Principal Executive Officer |
| |
Date: | | February 17, 2015 |
| |
| By: | | /s/M. Sadiq Peshimam |
| | M. Sadiq Peshimam Treasurer and Principal Financial and Accounting Officer |
| |
| Date: | | February 17, 2015 |